lshtm research online - core
TRANSCRIPT
LSHTM Research Online
Nkurunungi, G; (2019) Helminth-allergy associations in rural and urban Uganda: insights from an-tibody studies. PhD (research paper style) thesis, London School of Hygiene & Tropical Medicine.DOI: https://doi.org/10.17037/PUBS.04654393
Downloaded from: http://researchonline.lshtm.ac.uk/id/eprint/4654393/
DOI: https://doi.org/10.17037/PUBS.04654393
Usage Guidelines:
Please refer to usage guidelines at https://researchonline.lshtm.ac.uk/policies.html or alternativelycontact [email protected].
Available under license: http://creativecommons.org/licenses/by-nc-nd/2.5/
https://researchonline.lshtm.ac.uk
Helminth-allergy associations in rural and urban Uganda: insights from antibody studies
GYAVIIRA NKURUNUNGI
Thesis submitted in accordance with the requirements for the degree of
Doctor of Philosophy of the
University of London
FEBRUARY 2019
Department of Clinical Research
Faculty of Infectious and Tropical Diseases
LONDON SCHOOL OF HYGIENE & TROPICAL MEDICINE Funded by
1. African Partnership for Chronic Disease Research (APCDR) 2. Wellcome Trust 3. European Academy of Allergy and Clinical Immunology (EAACI) 4. Royal Society of Tropical Medicine and Hygiene (RSTMH)
Research group affiliation(s)
Immunomodulation and Vaccines Programme, MRC/UVRI and LSHTM Uganda Research Unit
1

Dedicated to Eva, Silver, Florence, Gloria, Monica, Isabella, Jerome, Yvonne and
Martina, who are some of my most favourite people in the world.
2
DECLARATION
I, Gyaviira Nkurunungi, declare that this thesis has been written by me, is an original
report of my research and has not been submitted in any previous application for a
degree or other professional qualification. Except where it is acknowledged, or stated
otherwise by reference, the work herein is my own. Parts of this work have been
published as open access articles in Clinical and Experimental Allergy, Parasite
Immunology, Transactions of the Royal Society of Tropical Medicine and Hygiene,
Allergy and Clinical Infectious Diseases. One research paper is In Press (Scientific
Reports), while another has been submitted to the Journal of Allergy and Clinical
Immunology. My contribution (and that of co-authors) to these manuscripts is explicitly
indicated in this thesis.
Gyaviira Nkurunungi
February 2019
3
ABSTRACT
Background
Allergy-related disease (ARD) is a major cause of morbidity in high-income countries
(HICs). Although populations in tropical low-income countries (LICs), and in rural
(compared to urban) settings, seem to be remarkably protected, the trends are fast
changing as these communities undergo an epidemiological transition exemplified by
changing helminth exposure patterns. Helminth exposure is of particular interest in
understanding the epidemiology of ARD because of the homology between several
helminth antigens and allergens, and the many similarities between helminth- and
allergen-specific immune responses. Antibodies, especially IgE, are key constituents of
the analogous immune responses to helminths and allergens, and are among the chief
mediators of the effector cell activation underlying ARDs. While mindful of effects of other
environmental exposures on epidemiological trends of ARDs in LICs, this PhD project
postulated a crucial role for helminth-induced antibody profiles.
Methods
This research project obtained data on current helminth infections and allergy-related
outcomes, and measured helminth- and allergen-specific antibody profiles, with
immunoassays that included allergen and carbohydrate microarrays. Samples used
were collected from Ugandan participants of three cross-sectional surveys: the baseline
and outcome surveys of a cluster-randomised trial of intensive versus standard
anthelminthic treatment in rural Schistosoma mansoni (Sm)-endemic islands, and a
parallel survey in proximate urban communities with lower helminth exposure. A case-
control study on asthma among schoolchildren enabled assessment of a role for
antibodies in allergic disease.
Results
4
Cross-sectional analyses showed that setting (rural vs. urban) was an effect modifier for
risk factors (such as location of birth, current helminth [Sm] infection and other helminth-
related factors) for atopy and clinical allergy outcomes, and for atopy–clinical allergy
associations. Although Sm infection was an important risk factor for skin prick test (SPT)
reactivity and allergen-specific (as) IgE sensitisation (inversely or otherwise), definitive
statistical proof for a role of helminth exposure in the observed effect modification
between the two settings was not evident: helminths alone may not fully explain the
differences observed.
To obtain further insight into helminth-allergy associations, this project assessed total,
Sm- and asIgE and asIgG4 and found strong positive associations with current Sm
infection and atopic sensitisation (but not with ARD), but inverse associations between
total IgE/ asIgE ratios, asIgG4/ asIgE ratios and SPT reactivity and asthma. This
supported a role for helminth-induced antibodies in individual positive helminth-atopy
associations, and for the IgG4–IgE balance and the total IgE–allergen-specific IgE
balance in the low overall prevalence of clinical allergies in such settings.
Helminths have a range of antigens that are strikingly homologous to common allergens,
including cross-reactive carbohydrate determinant (CCD) N-glycans carrying core b-1,2-
xylose and a-1,3-fucose epitopes. Analyses showed distinctive relationships between
IgE/IgG reactivity to these motifs and Sm infection intensity and the rural (versus urban)
environment, and implied that they are abundant on common allergen extracts (such as
house dust mite, German cockroach and peanut extracts used in standard ImmunoCAP
assays), which likely results in false diagnosis of allergic sensitisation in tropical
helminth-endemic settings. Microarray component-resolved IgE analyses showed that
rural participants had lower responses to non-glycosylated, established major allergenic
protein components, but higher reactivity to CCDs, than urban participants. Elevated
anti-CCD IgE did not translate into clinical allergy. Indeed, an inverse association
between asthma and reactivity to core a-1,3-fucose substituted N-glycans suggested
5

that reactivity to specific (but not all) CCD epitopes might contribute to protection against
clinical allergy.
Conclusions
The current PhD research provides important insight into mechanisms underlying the
complex epidemiological helminth-allergy trends in LICs. Notably, this work highlights
the importance of balance in IgG4–IgE and total IgE–asIgE in inhibition of clinical allergy.
This work also demonstrates strong associations between Sm exposure and anti-CCD
IgE, which complicates atopy assessment, with implications for understanding the
contribution of atopy to ARD in tropical LICs. The finding that schistosomiasis-associated
core a-1,3-fucose-specific IgE is inversely associated with asthma is suggestive of a
potential role of specific carbohydrate epitopes in protection against clinical allergy,
which merits further investigation.
6
PREFACE
This thesis is written in the ‘Research Paper style’, in accordance with guidelines
provided by the London School of Hygiene and Tropical Medicine. The results chapters
consist of four papers that have either been published or submitted for publication in
peer-reviewed journals, and which describe work emanating from my PhD studies. In
this thesis, each paper is preceded by a cover sheet that provides publication details and
states my contribution (as first author) to the work therein. Between the research papers
is ‘linking material’ that comprises supplementary material (published or to be published
online with the papers), related unpublished material (if any) and a preamble describing
how each chapter (paper) logically leads to the next. Three more papers are presented
as appendices to this thesis. All published papers included in this thesis are open access
articles of which the authors retain the copyright. The remainder of the thesis comprises
background literature to the research conducted, details of the clinical, laboratory and
statistical methods, and a general discussion and summary of the research findings. All
material was written by Gyaviira Nkurunungi.
7

ACKNOWLEDGEMENTS
I am deeply indebted to my PhD supervisors Prof. Alison Elliott and Prof. dr. Maria
Yazdanbakhsh for walking this journey with me, right from when I first took baby steps in
the beautiful hills of Ouro Preto four years ago, unwaveringly guiding, mentoring and
supporting me all the way. I am very grateful to Dr Emily Webb for tirelessly providing
me with statistical support and for frequently taking time out to keenly read and critique
every single one of my research papers. I thank my PhD upgrading examiners Dr Helena
Helmby and Prof. David Dunne, and the PhD upgrading Chair Dr John Raynes for
reviewing the original research proposal and giving advice that has been remarkably
useful during my PhD research.
I thank members of the Parasitology Department at the Leiden University Medical
Centre, led by Maria, for warmly welcoming me and showing me the ropes during my
time there. Specifically, I am grateful to Ron, Angela, Michelle and Linh for the guidance
in interpretation of glycan array data, and Abena, Eunice, Yoanne, Maria K for the
friendship and for helping me settle in. I also thank Prof. Ronald van Ree and Serge
Versteeg of the Department of Experimental Immunology at the Amsterdam University
Academic Centres (AMC), for all help rendered to me in conducting the allergen-specific
immunoassays, and for critically reviewing the resultant manuscripts.
I am grateful to the various organisations that funded the work described in this thesis:
the African Partnership for Chronic Disease Research (APCDR) for supporting me with
a PhD fellowship, the Wellcome Trust for funding many of the field, clinic and laboratory
This work would not have been possible without the participants and field and clinic staff
of the LaVIISWA, Urban Survey and SONA studies. Many thanks to Richard, Maggie and
Harriet, respectively, who were project leaders on these studies. I am also very thankful
for the support of current and past members of the MRC IVac laboratory team: Steve,
Patrice, Dennison, Joy, Angela, Bridgious, Vianney, Jacent, Simon, Moses, Irene,
Marjorie, Beatrice, Rebecca, Grace N, Grace K, Gloria, Prossy, Emma, and Elson.
8
procedures, the Royal Society of Tropical Medicine and Hygiene (RSTMH) for providing
me with a small grant award to conduct glycan microarray experiments, and the
European Academy of Allergy and Clinical Immunology (EAACI) for the short-term
research fellowship that enabled me to perform allergen microarray experiments. Many
thanks to the Makerere University – Uganda Virus Research Institute Centre of
Excellence for Infection and Immunity Research and Training (MUII-plus), which offered
me an honorary fellowship, thereby allowing me to benefit from its invaluable peer
support structure.
Without the support of my amazing family my efforts would have been futile. To my
dearest Eva, I am eternally grateful for your endless love, support and patience. These
virtues have been the fuel powering this journey. To Mum and Dad, your unconcealable
pride in me for every little achievement, not just during my PhD research, speaks
volumes about your evergreen, extraordinary love. Many thanks to rest of my wonderful
family – the army that I can count on to stand with me through thick and thin: my siblings
(Gloria, Monica, Isabella, Jerome, Yvonne and Martina), my nieces and nephews (Karen,
Kella, Kraig, Karlos, Camilla, Clara, Collette and Luke) and my brother-in-laws (Eddie,
Richard, and Robert).
Above all I thank God, to whom I owe my strength and very existence.
9
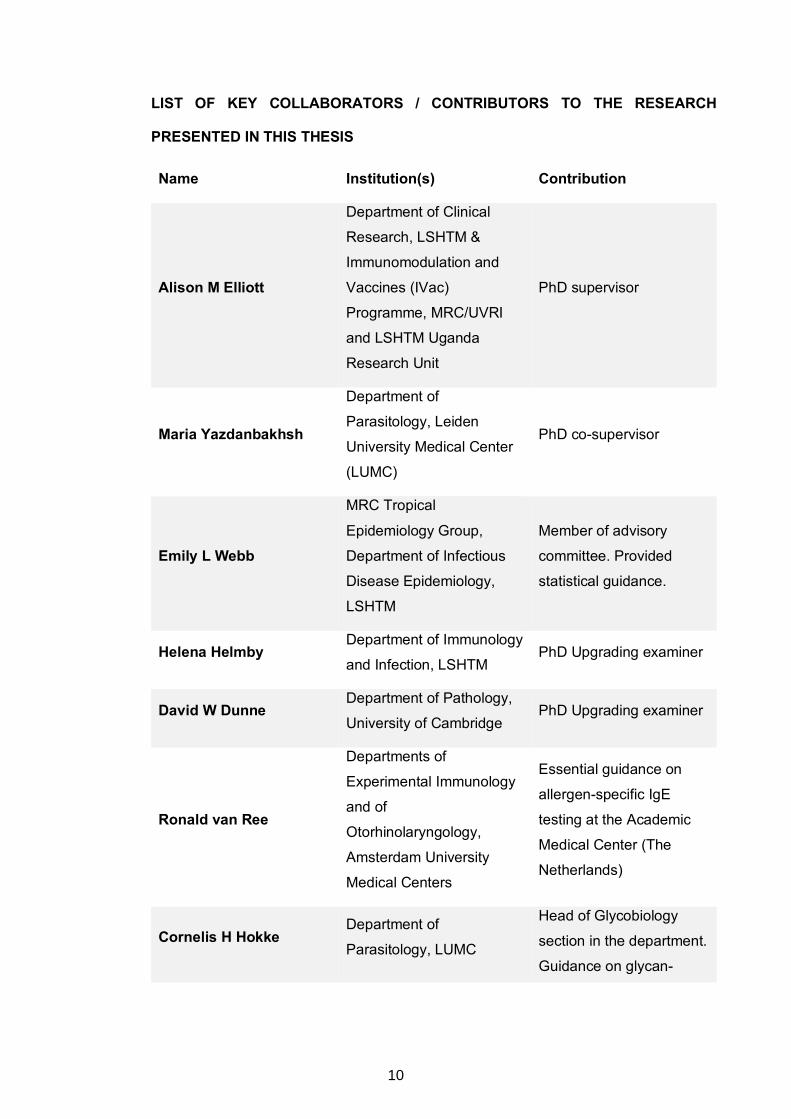
LIST OF KEY COLLABORATORS / CONTRIBUTORS TO THE RESEARCH
PRESENTED IN THIS THESIS
Name Institution(s) Contribution
Alison M Elliott
Department of Clinical
Research, LSHTM &
Immunomodulation and
Vaccines (IVac)
Programme, MRC/UVRI
and LSHTM Uganda
Research Unit
PhD supervisor
Maria Yazdanbakhsh
Department of
Parasitology, Leiden
University Medical Center
(LUMC)
PhD co-supervisor
Emily L Webb
MRC Tropical
Epidemiology Group,
Department of Infectious
Disease Epidemiology,
LSHTM
Member of advisory
committee. Provided
statistical guidance.
Helena Helmby Department of Immunology
and Infection, LSHTM PhD Upgrading examiner
David W Dunne Department of Pathology,
University of Cambridge PhD Upgrading examiner
Ronald van Ree
Departments of
Experimental Immunology
and of
Otorhinolaryngology,
Amsterdam University
Medical Centers
Essential guidance on
allergen-specific IgE
testing at the Academic
Medical Center (The
Netherlands)
Cornelis H Hokke Department of
Parasitology, LUMC
Head of Glycobiology
section in the department.
Guidance on glycan-
10
specific antibody
responses.
Angela van Diepen Department of
Parasitology, LUMC
Guidance on microarray-
assisted glycan-specific
antibody assays.
Margaret Nampijja IVac Programme,
MRC/UVRI and LSHTM
Uganda Research Unit
Project leader, urban
survey on allergy-related
outcomes and the
baseline survey of the
Lake Victoria Island
Intervention Study on
Worms and Allergy-
related diseases
(LaVIISWA). Led field and
clinic procedures.
Richard E Sanya IVac Programme,
MRC/UVRI and LSHTM
Uganda Research Unit
Project leader, LaVIISWA.
Led field and clinic
procedures.
Harriet Mpairwe IVac Programme,
MRC/UVRI and LSHTM
Uganda Research Unit
Principal investigator,
asthma case-control
study. Led field and clinic
procedures.
11

TABLE OF CONTENTS
CHAPTER 1. BACKGROUND ..................................................................................... 27
1.1 THE GLOBAL BURDEN OF ALLERGY ...................................................................27
1.2 THE “OLD FRIENDS HYPOTHESIS” ......................................................................27
1.3 GLOBAL ESTIMATES OF DISEASE BURDEN DUE TO HELMINTHS ............................29
1.4 CELLULAR AND HUMORAL MECHANISMS OF HELMINTH-ALLERGY ASSOCIATIONS ...30
1.4.1 Interaction of helminths with innate immune cells ......................................32
1.4.2 Regulatory T and B cells ............................................................................32
1.4.3 IgG4-mediated regulation of IgE responses ...............................................33
1.4.4 Polyclonal IgE ............................................................................................34
1.4.5 Cross-reactivity between helminth and allergen proteins: implications for
allergic sensitisation and allergic effector responses ............................................34
1.4.6 Carbohydrate-specific IgE and allergy .......................................................35
1.4.6.1 Expression of classical CCD epitopes in plants and human parasites 36
1.4.6.2 Clinical relevance of CCDs .................................................................38
1.4.6.3 Anti-CCD IgE and helminth-allergy associations .................................39
1.4.6.4 Could carbohydrate-specific antibodies be protective against allergic
disease? ...........................................................................................................40
1.5 EFFECT OF ANTHELMINTHIC TREATMENT ON ALLERGIC SENSITISATION AND
DISEASE ....................................................................................................................41
1.7 SCOPE OF THIS THESIS ....................................................................................44
1.8 CHAPTER 1 REFERENCES ................................................................................45
CHAPTER 2. THESIS OBJECTIVES AND STRUCTURE ........................................... 60
2.1 GENERAL HYPOTHESIS ....................................................................................60
2.2 CONCEPTUAL FRAMEWORK ..............................................................................60
2.3 THESIS OBJECTIVES ........................................................................................61
2.4 THESIS STRUCTURE ........................................................................................61
1.6 HELMINTHS, THE RURAL-URBAN ENVIRONMENT AND ALLERGY-RELATED OUTCOMES
43
12
2.5 CHAPTER 2 REFERENCES ................................................................................63
CHAPTER 3. MATERIALS AND METHODS ............................................................... 65
3.1 PREAMBLE......................................................................................................65
3.2 STUDY DESIGN AND POPULATION .....................................................................65
3.2.1 The LaVIISWA trial ....................................................................................65
3.2.2 The urban survey .......................................................................................68
3.2.3 The asthma case-control study ..................................................................70
3.3 PARASITOLOGICAL EXAMINATIONS ....................................................................70
3.3.1 Kato-Katz ...................................................................................................70
3.3.2 Detection of helminth DNA in stool ............................................................71
3.3.2.1 DNA extraction ...................................................................................71
3.3.2.2 Multiplex real-time PCR ......................................................................72
3.3.3 Assessment of circulating cathodic antigen of S. mansoni in urine ............73
3.4 ASSESSMENT OF ALLERGY-RELATED OUTCOMES ...............................................73
3.4.1 Wheeze .....................................................................................................74
3.4.2 Visible flexural dermatitis ...........................................................................74
3.4.3 Rhinitis and urticarial rash ..........................................................................74
3.4.4 Skin prick test reactivity .............................................................................74
3.4.6 Measurement of allergen-specific IgE levels by ELISA ..............................76
3.4.7 Component-resolved assessment of allergen-specific IgE sensitisation
using the ISAC microarray....................................................................................77
3.5 MICROARRAY DETECTION OF N-GLYCAN-SPECIFIC IGE AND IGG ........................77
3.5.1 Glycan microarray image processing and analysis of data .........................78
3.6 OTHER EXPERIMENTAL METHODS .....................................................................79
3.6.1 Allergen-specific IgG4 ELISA .....................................................................79
3.6.2 Total IgE ELISA .........................................................................................80
3.4.5 Measurement of total and allergen-specific IgE using the ImmunoCAP test
75
13

3.6.3 Total IgG4 ELISA .......................................................................................80
3.6.5 S. mansoni adult worm (SWA)- and egg (SEA)-specific IgG ELISA ...........82
3.7 SELECTION OF SAMPLES FOR ANTIBODY STUDIES ..............................................82
3.8 DATA ANALYSIS ...............................................................................................87
3.8.1 Adjusting for survey design in the rural surveys and the urban survey .......87
3.8.2 Distribution of antibody data ......................................................................88
3.8.3 Correction for multiple testing ....................................................................89
3.8.4 Anti-glycan antibody responses: data reduction procedures ......................89
3.9 ETHICAL APPROVALS .......................................................................................90
3.10 CHAPTER 3 REFERENCES ................................................................................90
CHAPTER 4. URBAN-RURAL DIFFERENCES IN RISK FACTORS FOR ALLERGY-RELATED OUTCOMES IN UGANDA: A ROLE FOR HELMINTHS? ......................... 94
4.1 PREAMBLE......................................................................................................94
4.2 RESEARCH PAPER 1: DO HELMINTH INFECTIONS UNDERPIN URBAN-RURAL
DIFFERENCES IN RISK FACTORS FOR ALLERGY-RELATED OUTCOMES? ...........................95
4.3 SUPPLEMENTARY INFORMATION FOR RESEARCH PAPER 1 (ALSO AVAILABLE IN THE
ARTICLE’S ONLINE REPOSITORY AT
HTTPS://ONLINELIBRARY.WILEY.COM/JOURNAL/13652222) ..........................................112
4.3.1 Supplementary methods ………………………………………………………112
4.3.2 Supplementary tables ..............................................................................114
4.3.1.1 S. mansoni adult worm (SWA)- and egg (SEA)-specific IgE and IgG4
ELISA………………………………………………………………………………… 112
4.3.1.2 S. mansoni adult worm (SWA)- and egg (SEA)-specific IgG ELISA …112
CHAPTER 5. ASSOCIATIONS BETWEEN ALLERGY-RELATED OUTCOMES AND
HELMINTH- AND ALLERGEN EXTRACT-SPECIFIC ANTIBODY PROFILES ........ 135
5.1 PREAMBLE....................................................................................................135
5.2 RESEARCH PAPER 2: SCHISTOSOMA MANSONI-SPECIFIC IMMUNE RESPONSES AND
ALLERGY IN UGANDA................................................................................................ 136
3.6.4 S. mansoni adult worm (SWA)- and egg (SEA)-specific IgE and IgG4 ELISA
81
14

5.3 SUPPLEMENTARY INFORMATION FOR RESEARCH PAPER 2 (AVAILABLE IN THE
ARTICLE’S ONLINE REPOSITORY AT
HTTPS://ONLINELIBRARY.WILEY.COM/DOI/10.1111/PIM.12506 ) .................................. 148
5.3.1 Experimental methods .............................................................................148
5.3.1.2 Total IgE ELISA ................................................................................148
5.3.1.3 Total IgG4 ELISA..............................................................................149
5.3.2 Supplementary tables and figures............................................................151
5.4 CHAPTER 5: EXTRA, UNPUBLISHED RESULTS ...................................................159
5.4.1 LaVIISWA year three outcome survey: impact of intensive versus standard
anthelminthic treatment on IgE and IgG4 profiles ...............................................159
5.4.2 LaVIISWA year three outcome survey: relationships between antibody
responses, KK positivity and allergy ...................................................................160
5.4.3 Urban survey of allergy-related outcomes: relationships between antibody
responses, S. mansoni Kato-Katz/PCR positivity and allergy .............................164
5.4.4 Urban-rural differences in IgE and IgG4 profiles ......................................167
5.4.5 Associations between antibody responses and asthma status among
schoolchildren ....................................................................................................169
5.4.6 Summary of conclusions from unpublished data in Chapter 5..................170
CHAPTER 6. CARBOHYDRATE-SPECIFIC ANTIBODIES AND SCHISTOSOMA
MANSONI INFECTION ............................................................................................. 172
6.1 PREAMBLE....................................................................................................172
6.2 RESEARCH PAPER 3: MICROARRAY ASSESSMENT OF N-GLYCAN-SPECIFIC IGE AND
IGG PROFILES ASSOCIATED WITH SCHISTOSOMA MANSONI INFECTION IN RURAL AND
URBAN UGANDA....................................................................................................... 174
6.3 SUPPLEMENTARY INFORMATION FOR RESEARCH PAPER 3 (ALSO AVAILABLE IN THE
ARTICLE’S ONLINE REPOSITORY AT HTTPS://WWW.NATURE.COM/SREP/)....................... 207
6.3.1 Experimental methods ………………………………………………………..207
5.3.1.1 S. mansoni worm (SWA)- and egg (SEA)-specific IgE and IgG4 ELISA
148
6.3.1.1 S. mansoni adult worm (SWA)- and egg (SEA)-specific IgE and IgG4
ELISA………………………………………………………………..……………….207
15
7.2 RESEARCH PAPER 4: SCHISTOSOMIASIS-ASSOCIATED CARBOHYDRATE-SPECIFIC
8.6 ANTIBODY-MEDIATED MECHANISMS OF HELMINTH-ALLERGY ASSOCIATIONS:
6.3.1.2 S. mansoni adult worm (SWA)- and egg (SEA)-specific IgG ELISA ..207
6.3.2 Supplementary figures and tables............................................................209
CHAPTER 7. HELMINTH CARBOHYDRATE-SPECIFIC IGE AND ITS ROLE IN THE
EPIDEMIOLOGY OF ALLERGY IN UGANDA .......................................................... 223
7.1 PREAMBLE……………………………………………………………………...223
7.3.1 Supplementary methods ..........................................................................263
7.3.1.1 Sample size considerations ..............................................................263
7.3.1.2 ImmunoCAP ISAC! sIgE 112 test....................................................264
7.3.1.3 Microarray detection of N-glycan-specific IgE ...................................265
7.3.1.4 Glycan microarray image processing ................................................265
7.3.2 Supplementary tables and figures............................................................266
CHAPTER 8. SUMMARISING DISCUSSION AND CONCLUSIONS......................... 279
8.1 PREAMBLE....................................................................................................279
8.2 SUMMARY AND INTERPRETATION OF MAIN FINDINGS ........................................279
8.2.1 Research Paper 1 (Chapter 4) .................................................................279
8.2.2 Research Paper 2 (Chapter 5) .................................................................281
8.2.3 Research Paper 3 (Chapter 6) .................................................................282
8.2.4 Research Paper 4 (Chapter 7) .................................................................283
8.3 THESIS STRENGTHS ......................................................................................286
8.3.1 Sample sizes and similar procedures across studies ...............................286
8.3.2 Methods...................................................................................................287
8.3.3 New findings ............................................................................................287
8.4 THESIS LIMITATIONS ......................................................................................288
8.5 CONCLUSION(S) ............................................................................................289
FUTURE PERSPECTIVES............................................................................................ 289
IGE AND THE EPIDEMIOLOGY OF ALLERGY: STUDIES FROM UGANDA ............................224
7.3 SUPPLEMENTARY INFORMATION FOR RESEARCH PAPER 4 …………………….. 263
16
9.2 APPENDIX 2: RESEARCH PAPER 6: HELMINTHS ARE POSITIVELY ASSOCIATED
9.4 APPENDIX 3: RESEARCH PAPER 7: THE IMPACT OF INTENSIVE VERSUS
STANDARD ANTHELMINTHIC TREATMENT ON ALLERGY-RELATED OUTCOMES, HELMINTH
INFECTION INTENSITY, AND HELMINTH-RELATED MORBIDITY IN LAKE VICTORIA FISHING
COMMUNITIES, UGANDA: RESULTS FROM THE LAVIISWA CLUSTER-RANDOMIZED TRIAL
8.7 REFERENCES FOR CHAPTER 8 .......................................................................291
APPENDICES……………………………………………………….……………………. 295
9.1 APPENDIX 1: RESEARCH PAPER 5: A LIFE WITHOUT WORMS..........................296
WITH ATOPY AND WHEEZE IN UGANDAN FISHING COMMUNITIES: RESULTS FROM A CROSS-
SECTIONAL SURVEY ................................................................................................. 308
9.3 SUPPLEMENTARY INFORMATION FOR RESEARCH PAPER 6 (ALSO AVAILABLE IN THIS
ARTICLE’S ONLINE REPOSITORY AT
HTTPS://ONLINELIBRARY.WILEY.COM/DOI/FULL/10.1111/ALL.12867) ........................... 325
9.5 SUPPLEMENTARY INFORMATION FOR RESEARCH PAPER 7 (ALSO AVAILABLE IN THIS
ARTICLE’S ONLINE REPOSITORY AT HTTPS://DOI.ORG/10.1093/CID/CIY761) ................. 339
9.5.1 Supplementary Methods ……………………………………………………..339
9.5.1.1 Outcome assessment ……………………………………….…………..339
9.3.1 Supplementary Table 1. Associations between allergy outcomes stratified
by S. mansoni and N. americanus status.………………………………………….325
9.5.1.2 Randomisation: further details ………………………………………….340
9.5.1.3 Sample size justification …………………………………………………340
9.5.1.4 Approach for adjusted analysis of trial outcomes ……………………..340
9.5.2 Supplementary Results……………………………………………………….341
9.5.2.1 Comparison of characteristics of survey participants and non-
participants..…………………………………………………………………….…..341
9.6 APPENDIX 4: COPIES OF ETHICAL APPROVALS…………………………….……352
9.6.1 Copy of ethical approval to conduct PhD studies at LSHTM ……………..352
9.6.2 The Lake Victoria Island Intervention Study on Worms and Allergy-related
diseases (LaVIISWA): copies of ethical approvals……………………..………….355
326
17
9.6.3 The Urban survey of Allergy-related and Metabolic Outcomes: copies of
ethical approvals ………………………………………………………………………358
9.6.4 Study on Asthma and Parasitic Infections: copies of ethical approvals ….363
9.7 APPENDIX 5: EXAMPLE OF A STATA DO FILE USED TO PERFORM PERMUTATION
TESTING .................................................................................................................. 366
18
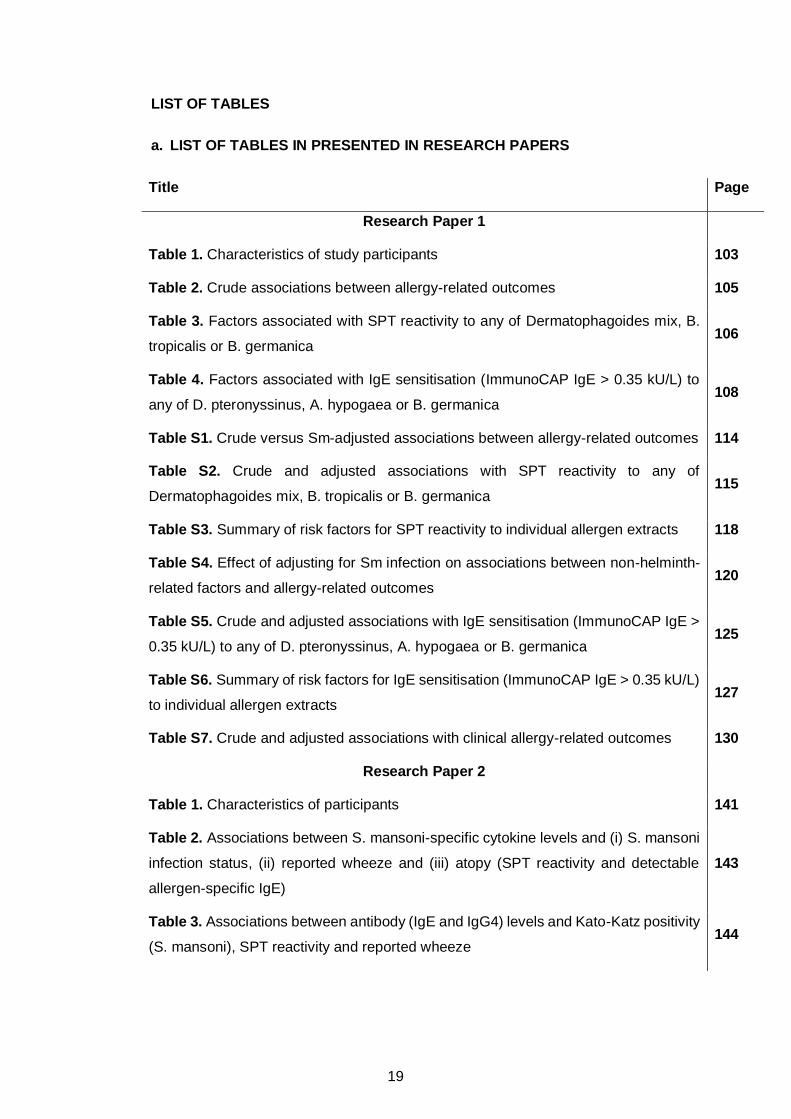
LIST OF TABLES
a. LIST OF TABLES IN PRESENTED IN RESEARCH PAPERS
Title Page
Research Paper 1
Table 1. Characteristics of study participants 103
Table 2. Crude associations between allergy-related outcomes 105
Table 3. Factors associated with SPT reactivity to any of Dermatophagoides mix, B.
tropicalis or B. germanica 106
Table 4. Factors associated with IgE sensitisation (ImmunoCAP IgE > 0.35 kU/L) to
any of D. pteronyssinus, A. hypogaea or B. germanica 108
Table S1. Crude versus Sm-adjusted associations between allergy-related outcomes 114
Table S2. Crude and adjusted associations with SPT reactivity to any of
Dermatophagoides mix, B. tropicalis or B. germanica 115
Table S3. Summary of risk factors for SPT reactivity to individual allergen extracts 118
Table S4. Effect of adjusting for Sm infection on associations between non-helminth-
related factors and allergy-related outcomes 120
Table S5. Crude and adjusted associations with IgE sensitisation (ImmunoCAP IgE >
0.35 kU/L) to any of D. pteronyssinus, A. hypogaea or B. germanica 125
Table S6. Summary of risk factors for IgE sensitisation (ImmunoCAP IgE > 0.35 kU/L)
to individual allergen extracts 127
Table S7. Crude and adjusted associations with clinical allergy-related outcomes 130
Research Paper 2
Table 1. Characteristics of participants 141
Table 2. Associations between S. mansoni-specific cytokine levels and (i) S. mansoni
infection status, (ii) reported wheeze and (iii) atopy (SPT reactivity and detectable
allergen-specific IgE)
143
Table 3. Associations between antibody (IgE and IgG4) levels and Kato-Katz positivity
(S. mansoni), SPT reactivity and reported wheeze 144
19
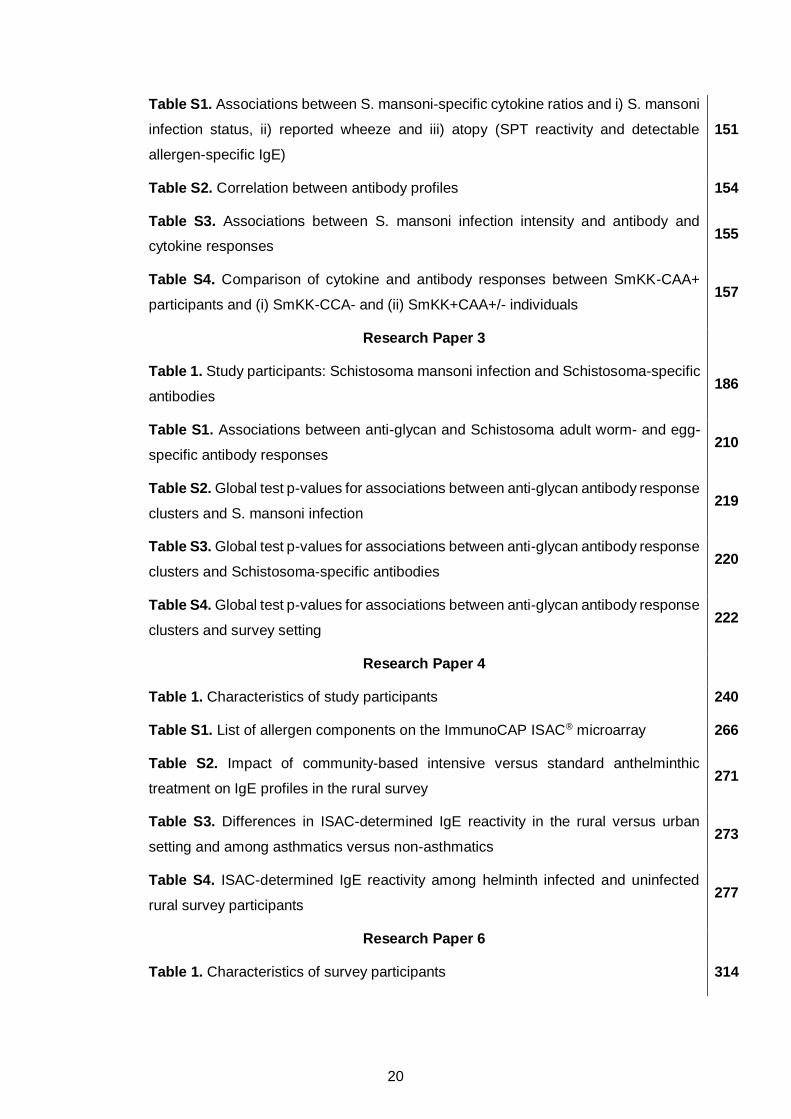
Table S1. Associations between S. mansoni-specific cytokine ratios and i) S. mansoni
infection status, ii) reported wheeze and iii) atopy (SPT reactivity and detectable
allergen-specific IgE)
151
Table S2. Correlation between antibody profiles 154
Table S3. Associations between S. mansoni infection intensity and antibody and
cytokine responses 155
Table S4. Comparison of cytokine and antibody responses between SmKK-CAA+
participants and (i) SmKK-CCA- and (ii) SmKK+CAA+/- individuals 157
Research Paper 3
Table 1. Study participants: Schistosoma mansoni infection and Schistosoma-specific
antibodies 186
Table S1. Associations between anti-glycan and Schistosoma adult worm- and egg-
specific antibody responses 210
Table S2. Global test p-values for associations between anti-glycan antibody response
clusters and S. mansoni infection 219
Table S3. Global test p-values for associations between anti-glycan antibody response
clusters and Schistosoma-specific antibodies 220
Table S4. Global test p-values for associations between anti-glycan antibody response
clusters and survey setting 222
Research Paper 4
Table 1. Characteristics of study participants 240
Table S1. List of allergen components on the ImmunoCAP ISAC® microarray 266
Table S2. Impact of community-based intensive versus standard anthelminthic
treatment on IgE profiles in the rural survey 271
Table S3. Differences in ISAC-determined IgE reactivity in the rural versus urban
setting and among asthmatics versus non-asthmatics 273
Table S4. ISAC-determined IgE reactivity among helminth infected and uninfected
rural survey participants 277
Research Paper 6
Table 1. Characteristics of survey participants
20
314
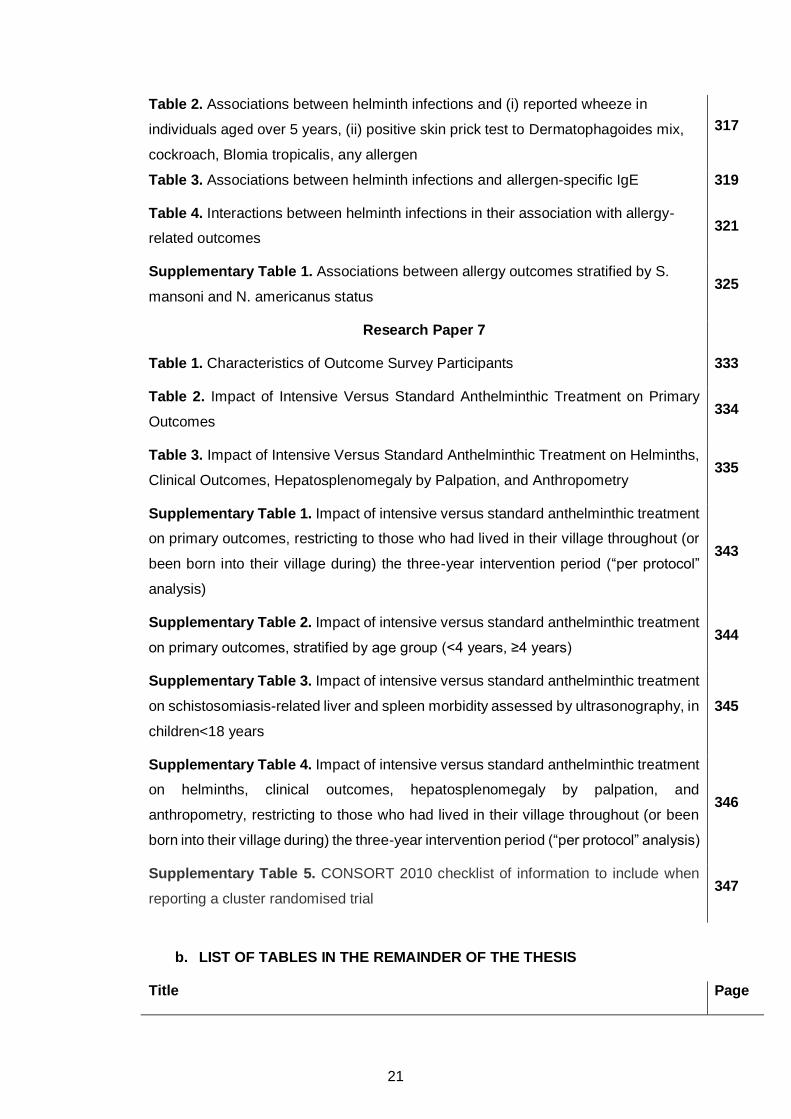
Table 2. Associations between helminth infections and (i) reported wheeze in
individuals aged over 5 years, (ii) positive skin prick test to Dermatophagoides mix,
cockroach, Blomia tropicalis, any allergen
Table 3. Associations between helminth infections and allergen-specific IgE
Table 4. Interactions between helminth infections in their association with allergy-
related outcomes
Supplementary Table 1. Associations between allergy outcomes stratified by S.
mansoni and N. americanus status
Research Paper 7
Table 1. Characteristics of Outcome Survey Participants 333
Table 2. Impact of Intensive Versus Standard Anthelminthic Treatment on Primary
Outcomes 334
Table 3. Impact of Intensive Versus Standard Anthelminthic Treatment on Helminths,
Clinical Outcomes, Hepatosplenomegaly by Palpation, and Anthropometry 335
Supplementary Table 1. Impact of intensive versus standard anthelminthic treatment
on primary outcomes, restricting to those who had lived in their village throughout (or
been born into their village during) the three-year intervention period (“per protocol”
analysis)
343
Supplementary Table 2. Impact of intensive versus standard anthelminthic treatment
on primary outcomes, stratified by age group (<4 years, ≥4 years) 344
Supplementary Table 3. Impact of intensive versus standard anthelminthic treatment
on schistosomiasis-related liver and spleen morbidity assessed by ultrasonography, in
children<18 years
345
Supplementary Table 4. Impact of intensive versus standard anthelminthic treatment
on helminths, clinical outcomes, hepatosplenomegaly by palpation, and
anthropometry, restricting to those who had lived in their village throughout (or been
born into their village during) the three-year intervention period (“per protocol” analysis)
346
Supplementary Table 5. CONSORT 2010 checklist of information to include when
reporting a cluster randomised trial 347
b. LIST OF TABLES IN THE REMAINDER OF THE THESIS
Title Page
21
317
319
321
325
Table E1. Impact of community-based intensive versus standard anthelminthic
treatment on IgE and IgG4 profiles in the LaVIISWA outcome survey 159
Table E2. LaVIISWA year three outcome survey: associations between antibody (IgE
and IgG4) levels and Kato-Katz positivity (S. mansoni), SPT reactivity and reported
wheeze
160
Table E3. Urban survey: associations between antibody (IgE and IgG4) levels and
Kato-Katz / PCR positivity (S. mansoni), SPT reactivity and reported wheeze 164
Table E4. Urban-rural comparisons of IgE and IgG4 profiles 168
Table E5. Asthma case-control study: associations between antibody (IgE and IgG4)
levels and asthma status 169
LIST OF FIGURES
a. LIST OF FIGURES PRESENTED IN RESEARCH PAPERS
Title Page
Research Paper 1
Figure 1. Study flowchart 100
Figure 2. Urban-rural differences in risk factors for allergy-related outcomes in
Uganda: a role for helminths? 104
Research Paper 2
Figure 1. Hypothesized mode of action of S. mansoni-induced cytokines and
antibodies on allergy-related outcomes 140
Figure S1. Summary of associations between antibody levels and i) S. mansoni
infection, ii) SPT reactivity and iii) wheeze 153
Research Paper 3
Figure 1. Non-mammalian carbohydrate substitutions on the N-glycan core 180
Figure 2. Associations between S. mansoni infection and IgE and IgG reactivity to N-
glycans carrying non-mammalian core modifications 188
22
Figure 3. Age-stratified prevalence of S. mansoni infection and median IgE and IgG
reactivity to SWA, SEA and α-1,3-fucosylated and β-1,2-xylosylated N-glycans 191
Figure 4. Principal component analysis of anti-glycan antibody responses 192
Figure 5. Rural-urban comparisons of anti-glycan antibody responses 194
Figure S1. Synthetic N-glycan structural variants on the microarray 209
Figure S2. Associations between S. mansoni infection (KK and/or PCR) and IgE and
IgG reactivity to N-glycan structural variants carrying 1-3 fucose and/or 1-2 xylose 212
Figure S3. Associations between S. mansoni infection and IgE and IgG reactivity to
N-glycans carrying GalNAc1-4GlcNAc (LDN), GalNAc1-4(Fuc1-3)GlcNAc (LDNF)
and Gal1-4(Fuc1-3)GlcNAc (LeX) antennae
215
Figure S4. Hierarchical cluster analysis of anti-glycan IgE and IgG responses 217
Figure S5. Hierarchical cluster analysis of anti-glycan antibody responses in
individuals from both rural and urban settings 221
Research Paper 4
Figure 1. Selection of samples for the ImmunoCAP® test and the ISAC® and glycan
microarray assays 239
Figure 2. Prevalence of sensitisation (IgE≥0.3 ISU) to allergen components on the
ISAC microarray 242
Figure 3. Responses to structures on the glycan microarray 243
Figure 4. IgE reactivity to allergen extracts and their major allergenic components 245
Figure 5. ISAC microarray-determined IgE reactivity to venom components and to
components carrying classical CCDs. 246
Figure 6. Associations between anti-glycan IgE responses and atopic sensitisation
and asthma 249
Figure 7. Associations between asthma and IgE reactivity to glycans 251
Figure S1. Collection of synthetic structural variants on the glycan microarray 270
Research Paper 5
Figure 1. Interactions between helminths and the host immune system, and the impact
on bystander responses 301
Figure 2. Is ‘de-worming’ good for us? 304
23
Research Paper 6
Figure 1. (A) Prevalence of positive SPT response and reported wheeze in last 12
months, by age group. (B) Prevalence and intensity of S. mansoni infections, by age
group
Figure 2. Summary of associations between helminths and allergy-related outcomes
Research Paper 7
Figure 1. Praziquantel and albendazole treatment coverage, by trial arm and
treatment round 332
Figure 2. Trial flowchart 332
Figure 3. Prevalence of Schistosoma mansoni infection in the outcome survey 335
Supplementary Figure. Trial treatment and survey timeline 342
b. LIST OF FIGURES IN THE REMAINDER OF THE THESIS
Title Page
Figure 1.1. Interactions between helminths and the host immune system, and the
impact on bystander responses. 31
Figure 1.2. Non-mammalian carbohydrate substitutions on the N-glycan core. 37
Figure 1.3. Schistosoma mansoni life cycle and summary of expression patterns of
glycan motifs during the cercariae, adult worm and egg stages. 39
Figure 2.1. Conceptual framework 60
Figure 3.1. Entebbe peninsula and Koome islands 66
Figure 3.2. Pictorial representation of living conditions in Koome sub-county and
Entebbe Municipality 69
Figure 3.3. Flow chart for selection of samples for antibody studies 86
24
315
316
LIST OF ACRONYMS
⍺3Fuc Alpha-1,3-fucose
β2Xyl Beta-1,2-xylose
AMC Amsterdam University Medical Centers
APC Antigen presenting cell
APCDR African Partnership for Chronic Disease Research
ARD Allergy-related disease
asIgE Allergen-specific IgE
Breg Regulatory B cell
CCA Circulating cathodic antigen
CCD Cross-reactive carbohydrate determinant
DALYs Disability-adjusted life years
DAMP Damage-associated molecular pattern
EAACI European Academy of Allergy and Clinical Immunology
ELISA Enzyme-linked immunosorbent assay
HCA Hierarchical cluster analysis
HDM House dust mite
HIC High-income country
IgE Immunoglobulin E
IgG Immunoglobulin G
IL Interleukin
ILC2 Type 2 innate lymphoid cell
IFN-γ Interferon gamma
ISAAC International Study on Allergy and Asthma in Children
ISAC Immuno-solid-phase allergen chip
ISU ISAC standardised units
IVac Immunomodulation and Vaccine Programme
KK Kato-Katz
LaVIISWA Lake Victoria Island Intervention Study on Worms and Allergy-related Diseases
LIC Low-income country
LMIC Low- and middle-income country
LSHTM London School of Hygiene and Tropical Medicine
LUMC Leiden University Medical Center
25
MFI Mean fluorescence intensity
MRC Medical Research Council
MS Mass spectrometry
MUII-Plus Makerere University – Uganda Virus Research Institute Centre of Excellence for Infection and Immunity Research and Training
PCA Principal component analysis
PCR Polymerase chain reaction
RSTMH Royal Society of Tropical Medicine and Hygiene
SEA Schistosoma egg antigen
Sm Schistosoma mansoni
SPT Skin prick test
SWA Schistosoma adult worm antigen
TGF-β Transforming growth factor - beta
Th1 T helper 1
Th2 T helper 2
Treg Regulatory T cell
UVRI Uganda Virus Research Institute
26
CHAPTER 1. BACKGROUND
1.1 The global burden of allergy
Worldwide, allergy-related diseases (ARDs) are important public health problems.1
Conditions such as asthma, rhinitis and drug and food allergies can be fatal.2-4
Additionally, these and other conditions such as eczema, conjunctivitis, urticaria,
angioedema and insect allergies represent some of the most important causes of chronic
morbidity. The prevalence of ARDs increased rapidly in the last century, to the extent
that, currently, allergic rhinitis,1,5 asthma1 and food allergies6 affect approximately 400,
300 and 200 million people globally, respectively, and 5-30% of children have eczema.7-
9 Disability-adjusted life years (DALYs) lost due to ARD are substantial. For example,
DALYs lost due to asthma were approximately 26 million in 2015, contributing
approximately 1.1% of the global burden of disease,10 and ranking asthma 23rd out of
310 diseases in a 2015 report of causes of disease burden globally.11 Between 2005 and
2013, dermatitis (atopic, contact, and seborrheic) and urticaria contributed 9.3 million
and 4.7 million DALYs lost, respectively, a contribution of 0.4% and 0.2%, respectively,
to the global disease burden.12 The highest prevalence of ARDs has been reported in
high-income countries (HICs); however, current time trends point to a sharp increase in
low- and middle-income countries (LMICs) as well,13 including those in tropical sub-
Saharan Africa.1,14 Due to ill-equipped health sectors, low-income countries (LICs) bear
the greatest burden of mortality associated with ARD. For example, the mortality rate
among asthmatics is higher in LICs than in HICs.15 Despite these trends, populations in
LICs, and in rural (compared to urban) settings, seem to have remained relatively
protected against allergies.16-20
1.2 The “old friends hypothesis”
Approximately 30 years ago, David Strachan analysed data from a survey of over 17000
British children and observed that younger siblings from larger households seemed
protected against hay fever.21 He postulated that this was possibly because these
children had greater exposure to childhood infections, resulting from unhygienic contact
27
with older siblings. Following these observations, the term ‘hygiene hypothesis’22,23 was
coined. According to this hypothesis, the rise in ARDs may have resulted (at least in part)
from a decrease in exposure to infections. Assessment of epidemiological trends in HICs
provided substantial support for the ‘hygiene hypothesis’: a review by Jean-François
Bach showed that between 1950 and 2000, a dramatic reduction in the incidence of
infectious diseases was paralleled by an equal rise in the incidence of autoimmune and
allergy-related diseases.24 Further support came from studies assessing associations
between allergy-related conditions and the traditional farming setting (and related
microbial exposures) in HICs. For example, in a rural European birth cohort, exposure
to animal sheds was dose-dependently inversely associated with wheezing.25 The United
States Amish population, who have maintained traditional farming methods, have a
significantly lower prevalence of asthma and allergic sensitisation compared to the
Hutterite population, who are of similar genetic descent but have adopted industrialised
farming.26 A remarkable increase in atopic sensitisation was reported among individuals
from rural communities in south-west Poland, following an equally significant reduction
in farm-related exposures in the same population nine years after Poland’s accession to
the European Union.27 Importantly, the prevalence of atopy did not change significantly
in small-town populations in the same region. More studies in HICs report comparable
results.28-31
Common understanding of the hygiene hypothesis, that infectious diseases play a direct
role in protection against inflammatory conditions (including allergies),24 is perhaps
inaccurate.32 In a large study by Benn et al.33 in a Danish birth cohort, infectious diseases
were not protective against atopic dermatitis; in fact, positive associations were
observed. By contrast, family size and farm residence were protective, in line with the
above-mentioned studies.
More recent evidence from epidemiological and experimental human and animal studies
backs a different hypothesis, the ‘old friends hypothesis’. It is postulated that many
28
organisms, ‘old friends’34 that co-evolved with mammalian species, developed
mechanisms to modulate the expression of inflammatory molecules, as a way of
ensuring survival and reproductive success within the dominion of a vigilant host immune
system.
The close evolutionary relationship between these ‘old friends’ and mammals is
epitomized by helminth infections: for the most part of history, at least one type or another
of these complex multicellular organisms has colonised mammalian species.35 In HICs,
the large reduction in helminths (albeit alongside other infectious agents) during the
epidemiological transitions of the last century overlapped with the surge in inflammatory
conditions such as allergies,34 affirming the ‘old friends hypothesis’. Tropical LICs still
harbour the largest burden of parasitic helminth infections.36 In these countries, several
studies37-45 have shown that exposure to helminths is associated with protection against
allergy and may contribute to urban-rural differences in the prevalence of allergy-related
diseases.46 In Uganda, reports from a birth cohort47 showed that maternal hookworm
infection modifies risk factors for childhood eczema, suggesting that exposure to
helminths early in life may also establish protection against allergy.48
1.3 Global estimates of disease burden due to helminths
Although better hygiene practices and mass anthelminthic interventions are contributing
to a decline in helminths in the most affected regions of the world,49 World Health
Organisation reports estimate that approximately a quarter of the world’s population is
still infected with at least one helminth.50 Globally, over 200 million people are infected
with schistosomiasis, while approximately 800 million people are estimated to be infected
with at least one soil transmitted helminth (STH).50 In 2010, up to 5.2 million DALYs were
lost globally due to STH infections, while schistosomiasis and lymphatic filariasis
accounted for approximately 3.3 million and 2.8 million DALYs, respectively.51,52 The
majority of helminth infections affect resource-restrained regions. Over a billion people
infected with at least one helminth reside in the Americas, Asia or sub-Saharan Africa.53
29
Helminth-associated morbidity imposes a huge disease burden in infected individuals.
For example, chronic Schistosoma infections can cause extensive intestinal and liver
pathology,54 and have been significantly associated with anaemia, diarrhoea and
undernutrition.55 Despite the heavy disease burden attributed to helminths, there is
evidence of wider implications for protection against non-communicable diseases (such
as clinical allergies, discussed herein and in Research paper 5, Appendix 1, this thesis),
as well as for susceptibility to communicable diseases (Research paper 5).
1.4 Cellular and humoral mechanisms of helminth-allergy associations
Helminths typically induce Th2-type immune responses, characterised by increased
levels of interleukin (IL)-4, IL-5, IL-13 and immunoglobulin E (IgE).56,57 High levels of
these responses have also been associated with immunity against several helminth
parasites.58-61 Akin to helminth infections, allergy-related conditions are associated with
heightened Th2-type responses.62 These responses are involved in the initiation of
airway smooth muscle contraction,63 eosinophil recruitment and development,64 mucus
hyperproduction65 and production of allergen-specific IgE (asIgE) that mediates effector
cell degranulation.66 Similarities between allergen- and helminth-specific immune
responses may explain observations, in some instances, of positive helminth-allergy
associations67 Potential mechanisms are covered extensively in sections 1.4.5 and
1.4.6.3, below.
These similarities notwithstanding, helminth infections seem to be protective against
allergy-related phenotypes.38,42-45,68 This has been attributed to the strong and complex
network of immunoregulatory mechanisms69,70 aimed at blocking the allergy-like
responses induced by helminths,71 and which serve to avert helminth destruction and
elimination from the host. Evidence of the ability of helminths and their products to
modulate immune responses is derived from animal studies and in vitro immunological
studies in humans, which further demonstrate spillover effects on bystander antigens,72
including allergens.73
30
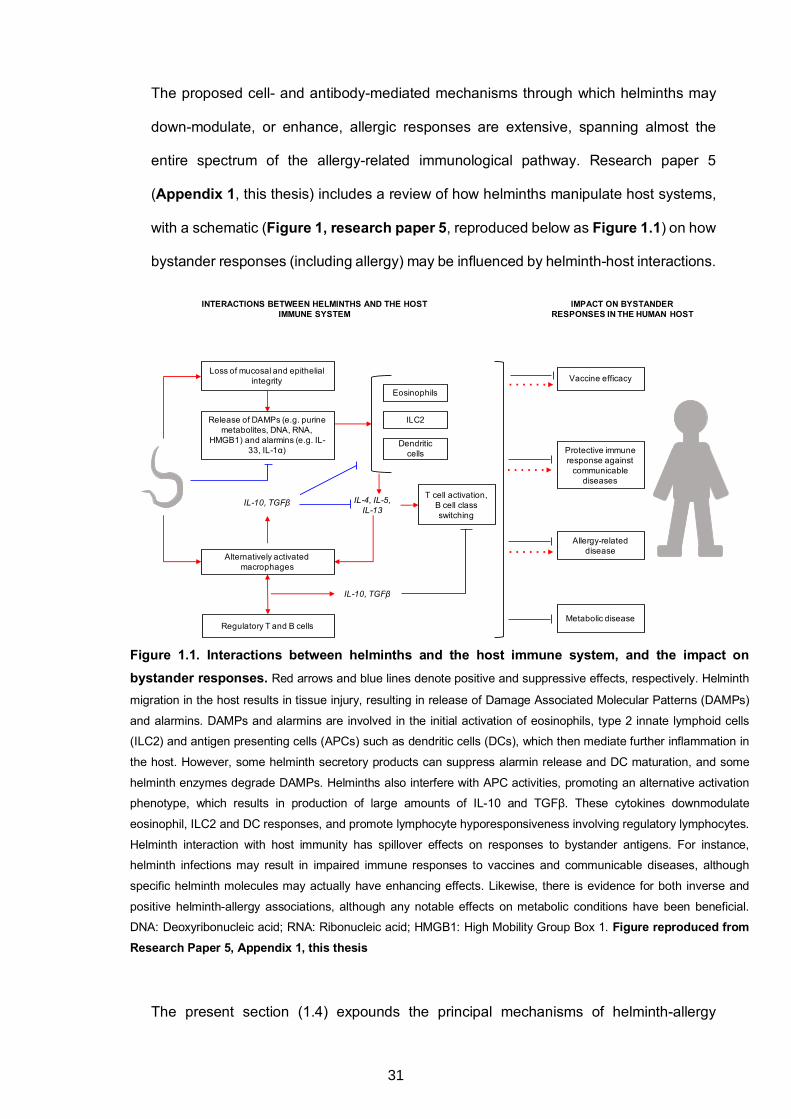
The proposed cell- and antibody-mediated mechanisms through which helminths may
down-modulate, or enhance, allergic responses are extensive, spanning almost the
entire spectrum of the allergy-related immunological pathway. Research paper 5
(Appendix 1, this thesis) includes a review of how helminths manipulate host systems,
with a schematic (Figure 1, research paper 5, reproduced below as Figure 1.1) on how
bystander responses (including allergy) may be influenced by helminth-host interactions.
Figure 1.1. Interactions between helminths and the host immune system, and the impact on bystander responses. Red arrows and blue lines denote positive and suppressive effects, respectively. Helminth
migration in the host results in tissue injury, resulting in release of Damage Associated Molecular Patterns (DAMPs)
and alarmins. DAMPs and alarmins are involved in the initial activation of eosinophils, type 2 innate lymphoid cells
(ILC2) and antigen presenting cells (APCs) such as dendritic cells (DCs), which then mediate further inflammation in
the host. However, some helminth secretory products can suppress alarmin release and DC maturation, and some
helminth enzymes degrade DAMPs. Helminths also interfere with APC activities, promoting an alternative activation
phenotype, which results in production of large amounts of IL-10 and TGFβ. These cytokines downmodulate
eosinophil, ILC2 and DC responses, and promote lymphocyte hyporesponsiveness involving regulatory lymphocytes.
Helminth interaction with host immunity has spillover effects on responses to bystander antigens. For instance,
helminth infections may result in impaired immune responses to vaccines and communicable diseases, although
specific helminth molecules may actually have enhancing effects. Likewise, there is evidence for both inverse and
positive helminth-allergy associations, although any notable effects on metabolic conditions have been beneficial.
DNA: Deoxyribonucleic acid; RNA: Ribonucleic acid; HMGB1: High Mobility Group Box 1. Figure reproduced from Research Paper 5, Appendix 1, this thesis
The present section (1.4) expounds the principal mechanisms of helminth-allergy
Regulatory T and B cells
Loss of mucosal and epithelial integrity
Release of DAMPs (e.g. purine metabolites, DNA, RNA,
HMGB1) and alarmins (e.g. IL-33, IL-1α)
Alternatively activated macrophages
ILC2
Dendritic cells
IL-10, TGFβ IL-4, IL-5, IL-13
IL-10, TGFβ
T cell activation, B cell class switching
IMPACT ON BYSTANDER RESPONSES IN THE HUMAN HOST
Allergy-related disease
Protective immune response against
communicable diseases
Vaccine efficacy
Eosinophils
Metabolic disease
INTERACTIONS BETWEEN HELMINTHS AND THE HOST IMMUNE SYSTEM
31
associations, with a bias towards antibody-mediated mechanisms.
1.4.1 Interaction of helminths with innate immune cells
Loss of mucosal and epithelial integrity resulting from helminth migration or encounter
with allergens and other toxins triggers release of damage-associated molecular patterns
(DAMPs) and alarmin cytokines such as IL-1α and IL-33.23 DAMPs and alarmins are
involved in the initial activation of antigen presenting cells (APCs) such as dendritic cells,
which then mediate further inflammation in the host. Helminth secretory products have
been shown to suppress alarmin release74 and to secrete enzymes that degrade
DAMPs.75,76 Further downstream, they interfere with APC activities, promoting an
alternative activation phenotype, which results in innate cells that produce large amounts
of IL-10 and TGF-β but insignificant levels of pro-inflammatory cytokines.77,78 The
modulation of APC function by helminths mainly occurs through the interaction of
helminth-derived molecules with pattern recognition receptors (PRRs),79-82 and has been
associated with reduced risk of allergic reactivity in both humans83 and mice.84
Approximately nine years ago, type 2 innate lymphoid cells (ILC2) were recognised.85
Important as an innate source of Th2 cytokines during helminth infection,85 ILC2 cells
have additionally been implicated in initiation of allergy.86,87 There is also evidence of
potential inhibition of ILC2 activity by Heligmosomoides polygyrus,74 demonstrating the
broad nature of helminth-mediated innate immunomodulation, which also includes
inhibition of neutrophil activation88,89 and eosinophil recruitment.90
1.4.2 Regulatory T and B cells
Helminths are associated with profound T cell hyporesponsiveness involving regulatory
T cells (Tregs), with related increases in interleukin (IL)-10 and transforming growth
factor (TGF)-β.91 Helminth-induced reduced T cell activity may impact on allergy-related
outcomes: Navarro et al. observed that hookworm anti-inflammatory protein-2
suppressed airway inflammation in a mouse model of asthma, in a Treg-dependent
manner,92 and IL-10 induced during chronic schistosomiasis infection among Gabonese
32
children was shown to be associated with lower prevalence of atopy.45 Besides, in both
mice93 and humans,94,95 IL-10 and Tregs have been implicated in the mitigation of allergy
through allergen-specific immunotherapy.
Helminths also induce B cells with various regulatory properties.96-98 First characterised
among helminth infected multiple sclerosis patients in 2008 by Correale and
colleagues,98 these ‘regulatory B cells’ (Bregs) also produce IL-10, are potent producers
of IgG4,99 and have been associated with inhibition of allergic inflammation.96,98,100 It is
not very clear where in the allergy cascade B and T cell-derived IL-10 applies its
modulatory action. IL-10 may impede activities of antigen presenting cells,101,102 and in
an autocrine manner, inhibit T lymphocyte proliferation and activation by suppressing IL-
2 production.103 In addition to influencing lymphocyte and APC activity, reports indicate
that IL-10 could inhibit IgE-effector cell degranulation104 and hence limit the associated
allergic inflammation.45,105
1.4.3 IgG4-mediated regulation of IgE responses
By inducing high levels of IL-10, helminths may promote immunoglobulin class switching
to IgG4. Moreover, chronic helminth infection is associated with elevated serum IgG4
levels.106 Several studies highlight the importance of helminth-induced IgG4 in allergy:
serum inhibition of specific IgE was associated with competing IgG4 in a Schistosoma
mansoni endemic setting,107 while in allergen immunotherapy, high IgG4:IgE ratios have
been shown to be important.108 Several possible mechanisms may explain IgG4-
mediated protection against IgE-mediated effects. First, IgG4 may block allergen
recognition by IgE, because both antibodies have similar antigenic specificity.107,109,110
Secondly, simultaneous binding of the IgE receptor (FcεRI) and the inhibitory IgG
receptor (FcγRIIB) by IgE and IgG4, respectively, may result in a FcγRIIB-dependent
inhibition of IgE-mediated effector cell activation.110-112 Alternatively, IgG4 might not have
a direct mechanistic role in protection against allergy-related outcomes. Instead, the
inverse association between IgG4 levels and IgE effector function may represent an
33
‘epiphenomenon’, merely reflective of the abundance of IL-10 (and/or TGF-β)-producing
Tregs and Bregs.113
1.4.4 Polyclonal IgE
There is sufficient evidence to link parasitic helminths to stimulation of polyclonal IgE
synthesis in humans, including from studies conducted decades ago.114 For example in
1979, Turner and colleagues showed that Ascaris-specific IgE contributed a small
proportion of total serum IgE induced by Ascaris lumbricoides, suggesting that this
parasite mediates production of high levels of IgE that is not specific to the parasite, or
to inhalant allergens.115 Non-specific polyclonally-stimulated IgE has been proposed to
inhibit allergic responses by competing with allergen-specific IgE (asIgE) to saturate IgE
receptors,116 reducing the chances that an allergen will result in cross-linking of FcεRI-
bound IgE and hence effector cell degranulation.117,118 Nonetheless, there is contrasting
evidence linking high IgE titres to increased expression of IgE receptors on human
basophils,119 implying that high levels of helminth-induced polyclonally-stimulated IgE
may potentiate increased effector cell degranulation. Furthermore, Mitre and colleagues
showed that ratios of polyclonal to asIgE have to exceed 500:1 to suppress basophil
histamine release,120 yet there is no formal proof of these ratios frequently reaching such
high levels during helminth infection. Therefore, the question of whether polyclonally
stimulated IgE mitigates allergic responses remains unresolved.
1.4.5 Cross-reactivity between helminth and allergen proteins: implications for allergic
sensitisation and allergic effector responses
Although many studies report reduced prevalence of allergy-related conditions in
helminth-infected individuals compared to uninfected controls, contradictory evidence
(including that shown in Research Paper 6, Appendix 2, this thesis) suggests that in
some circumstances helminth infections may actually promote allergic responses.121-124
Helminth-specific immune responses can manifest as allergy-like phenomena, such as
Loeffler’s syndrome in response to A. lumbricoides,125 cutaneous larva migrans in
hookworm infection,126 ‘larva currens’ caused by S. stercoralis127 and urticarial rash
34
induced by several helminths.128 Urticarial reactions have also been observed during
vaccination against hookworm129 and in response to helminth antigens following
treatment.130
In addition, protein allergen structures can predict IgE binding to helminth allergen-like
proteins,131 and helminths secrete many proteins that are homologous to known
allergens, meaning that cross-reactive helminth protein-specific IgE may induce allergic
effector responses. For example, tropomyosin from Ascaris lumbricoides132 and
Onchocerca volvulus133 is homologous to tropomyosin from Dermatophagoides
pteronyssinus (Der p 10)132 and cockroach (Blattella germanica, Bla g 7),134 and induces
basophil histamine release.133 Immunoglobulin E sensitisation to the Ascaris
lumbricoides tropomyosin Asc l 3 has been shown to be a risk factor for asthma in
Colombian individuals.135 Other molecules such as paramyosin,136 glutathione-S-
transferase137 and ABA1-like-protein132 have also been identified as homologous to
allergen proteins known to induce IgE-mediated hypersensitivity. As a result of such
cross-reactivity, helminth protein-induced IgE may have implications for serologic-based
assays used in diagnosis of allergic sensitisation.138
1.4.6 Carbohydrate-specific IgE and allergy
While the role of protein cross-reactivity in helminth-allergy associations has been
extensively studied, the importance of cross-reactive carbohydrate groups is less
understood. A substantial body of evidence shows that carbohydrates are strong
inducers of Th2-type responses.139-141 Asparagine (N)- and threonine/serine (O)-linked
glycans are some of the most common environmental immune determinants,142-146
comprising a vast number of epitopes for antibodies,147-150 including IgE.141,151 Glycans
were first linked to allergy in 1981, when Aalberse and colleagues,152 in a study among
venom- and pollen-allergic patients, showed that treatment of food and insect extracts
with periodate (which destroys carbohydrate structures) annulled the initially observed
cross-reactivity between patient serum IgE and these extracts. Twelve years later, the
35
a-1,3-fucose moiety on the N-glycan core (trimannosyl-chitobiose, Man3GlcNAc2)153 was
shown to be majorly responsible for the IgE cross-reactivity between plant and insect
glycans.154 It is now known that some of the commonest sources of cross-reactivity
between allergens and helminths are core modifications on N-glycans expressed by
insect, plant and helminth proteins (termed cross-reactive carbohydrate determinants,
CCDs).
1.4.6.1 Expression of classical CCD epitopes in plants and human parasites
While the N-glycan trimannosyl-chitobiose core (Man3GlcNAc2) is conserved in all
eukaryotes, mass spectrometry (MS)-based analyses of classical CCD N-glycans show
two standout, non-mammalian substitutions145,153 on the Man3GlcNAc2 core: an α-(1,3)
linkage of fucose to the asparagine-linked N-acetylglucosamine (GlcNAc) and a β-1,2-
xylose linkage to the first mannose of the trimannosyl component (Figure 1, Research
Paper 3 [this thesis], reproduced below as Figure 1.2).
Though absent in mammals, core a-1,3-fucose and β-1,2-xylose motifs are expressed
by invertebrate155,156 and plant glycoproteins,157-159 as well as on surface and secreted
antigens of schistosomes160 and the nematodes Haemonchus contortus and
Caenorhabditis elegans.161-164 These core modifications have so far not been detected
on glycoproteins from other helminths that are prevalent in tropical regions.165 Amongst
human helminth parasites, the Schistosoma glycome is the most characterised.165-167
Comprehensive mass spectrometry-based studies have detected neither core β-1,2-
xylose nor core α-1,3-fucose substituted N-glycans in the adult worm stage of
schistosomes; however, both core substitutions are expressed at the miracidia and egg
stage. Core β-1,2-xylosylated N-glycans are expressed by cercariae, while α-1,3-fucose
substitutions have not been found at this life stage.165
36
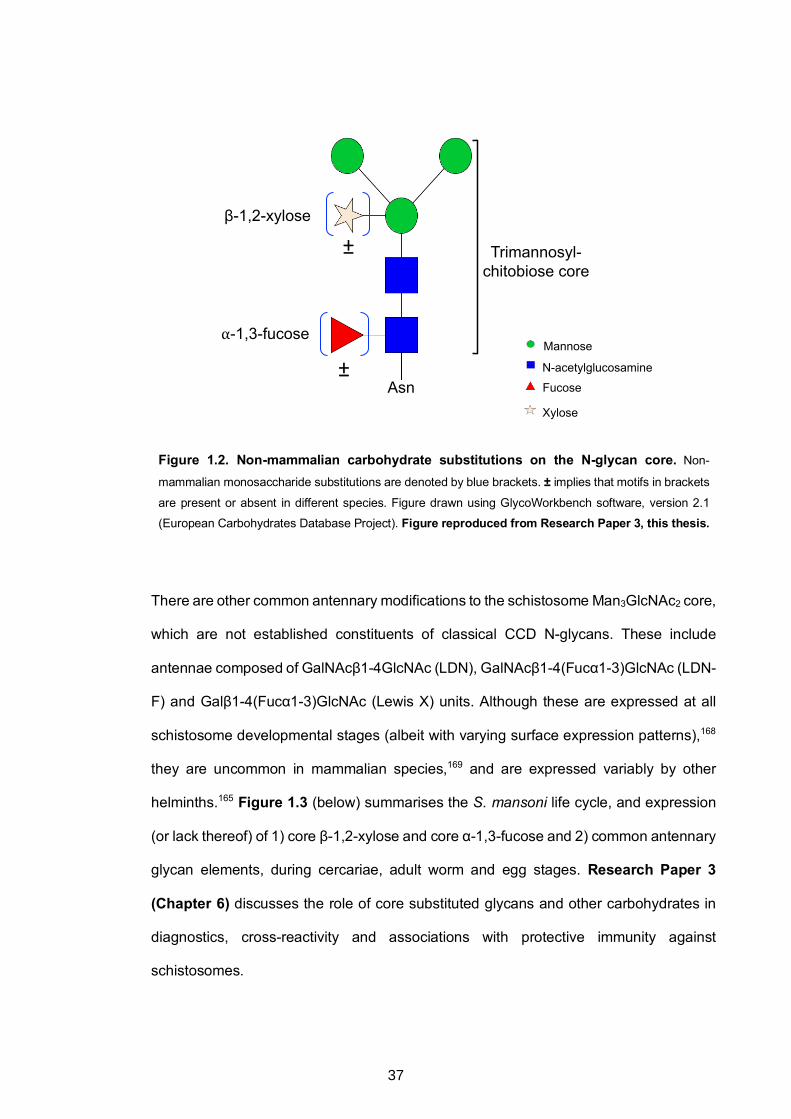
Figure 1.2. Non-mammalian carbohydrate substitutions on the N-glycan core. Non-
mammalian monosaccharide substitutions are denoted by blue brackets. ± implies that motifs in brackets
are present or absent in different species. Figure drawn using GlycoWorkbench software, version 2.1
(European Carbohydrates Database Project). Figure reproduced from Research Paper 3, this thesis.
There are other common antennary modifications to the schistosome Man3GlcNAc2 core,
which are not established constituents of classical CCD N-glycans. These include
antennae composed of GalNAcβ1-4GlcNAc (LDN), GalNAcβ1-4(Fucα1-3)GlcNAc (LDN-
F) and Galβ1-4(Fucα1-3)GlcNAc (Lewis X) units. Although these are expressed at all
schistosome developmental stages (albeit with varying surface expression patterns),168
they are uncommon in mammalian species,169 and are expressed variably by other
helminths.165 Figure 1.3 (below) summarises the S. mansoni life cycle, and expression
(or lack thereof) of 1) core β-1,2-xylose and core α-1,3-fucose and 2) common antennary
glycan elements, during cercariae, adult worm and egg stages. Research Paper 3
(Chapter 6) discusses the role of core substituted glycans and other carbohydrates in
diagnostics, cross-reactivity and associations with protective immunity against
schistosomes.
β-1,2-xylose
⍺-1,3-fucose
±
± Trimannosyl-chitobiose core
AsnN-acetylglucosamine
Mannose
Xylose
Fucose
37
1.4.6.2 Clinical relevance of CCDs
Core a-1,3-fucose and β-1,2-xylose may be the most common N-glycan epitopes
targeted by human IgE antibodies.170 Although a few studies have reported that anti-
glycan IgE from allergic individuals may trigger histamine release,171,172 and that the
mammalian glycan epitope galactose-a-1,3-galactose (alpha-gal) triggers anaphylactic
reactions,173,174 there is overwhelming evidence showing that carbohydrate-specific IgE
generally has insignificant biological activity. For example, individuals with specific IgE
to cross-reactive carbohydrate determinants (CCDs) lack SPT and oral reactivity to the
same molecules.118,141,145,175
Several explanations have been put forward to justify why, predominantly, carbohydrates
are benign as allergenic determinants. Early studies proposed that the low affinity of anti-
CCD IgE was responsible for its low biological activity;176,177 however, using surface
plasmon resonance technology, it was later shown that human IgE and IgG antibodies
against CCDs had high affinity, even comparable to that of protein-specific antibodies.178
Another factor contributing to the low biological activity of anti-CCD IgE may be the
monovalent nature (presence of a single IgE-binding glycan) of most known CCDs (such
as bromelain) and other glycosylated allergens. For mast cells or basophils to release
histamine or other mediators, two occupied IgE receptors have to be cross-linked by
allergens with at least two epitopes. Studies by Mari et al.179,180 showed that bromelain
did not induce skin reactivity in individuals with anti-CCD IgE, while poly-glycosylated
horseradish peroxidase (HRP) induced skin reactivity in 21% of individuals with CCD-
specific IgE. However, in the latter case, reactions were weak, and were mostly observed
in individuals with high anti-CCD IgE levels. The extent to which anti-CCD IgE is benign
as an allergenic determinant remains poorly understood.
38
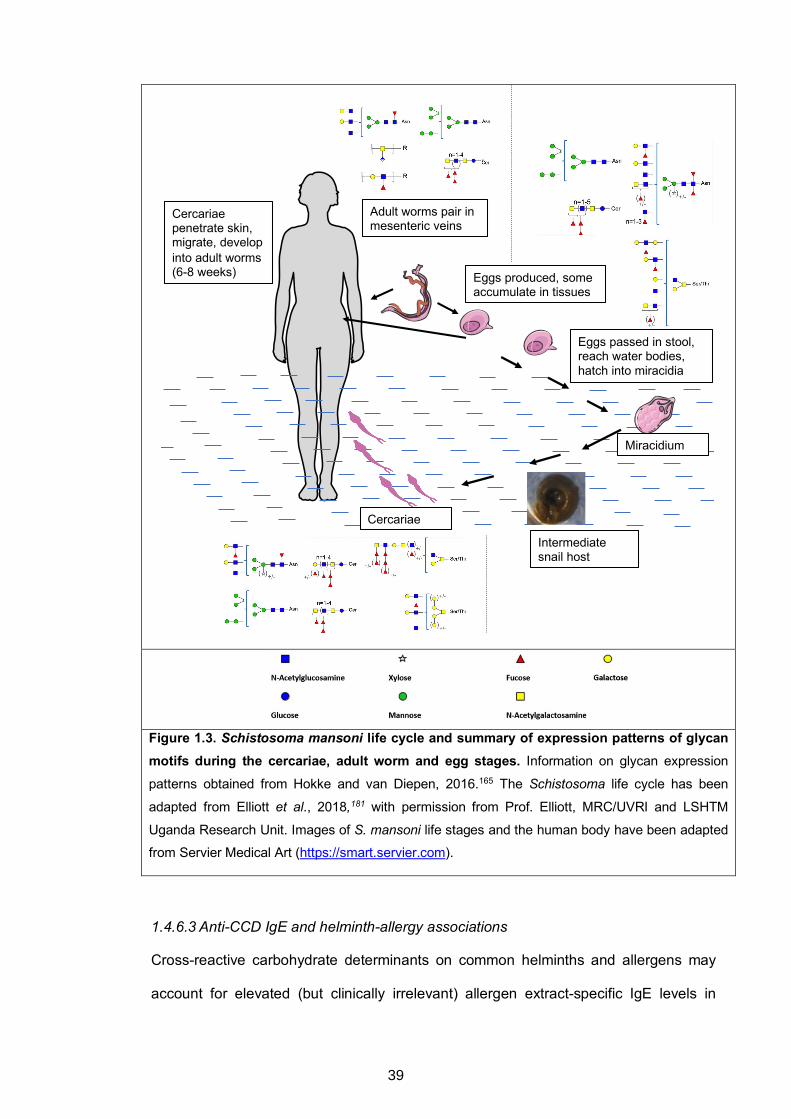
Figure 1.3. Schistosoma mansoni life cycle and summary of expression patterns of glycan motifs during the cercariae, adult worm and egg stages. Information on glycan expression
patterns obtained from Hokke and van Diepen, 2016.165 The Schistosoma life cycle has been
adapted from Elliott et al., 2018,181 with permission from Prof. Elliott, MRC/UVRI and LSHTM
Uganda Research Unit. Images of S. mansoni life stages and the human body have been adapted
from Servier Medical Art (https://smart.servier.com).
1.4.6.3 Anti-CCD IgE and helminth-allergy associations
Cross-reactive carbohydrate determinants on common helminths and allergens may
account for elevated (but clinically irrelevant) allergen extract-specific IgE levels in
Cercariae
Adult worms pair in mesenteric veins
Cercariae penetrate skin, migrate, develop into adult worms (6-8 weeks) Eggs produced, some
accumulate in tissues
Eggs passed in stool, reach water bodies, hatch into miracidia
Miracidium
Intermediate snail host
39
helminth-endemic areas.182 Findings by Amoah et al.183 among Ghanaian schoolchildren
lend strong support to this hypothesis: S. haematobium infection was associated with
peanut extract specific-IgE sensitisation, which was in turn strongly associated with anti-
CCD IgE but not with SPT reactivity. Additionally, in antibody inhibition assays, IgE
reactivity to peanut was inhibited by CCDs and Schistosoma egg antigen (SEA).
Amoah’s results implied that elevated crude peanut extract-specific IgE levels could be
attributed to CCDs (expressed by both the crude extract and schistosome antigens), not
to true protein allergens in the crude extract. Therefore, in addition to contributing to
positive helminth-allergy associations in helminth-endemic areas, elevated anti-CCD IgE
levels plausibly obscure the identity of the molecular drivers, and hence interpretation,
of atopic sensitisation, especially given that it is routinely diagnosed using allergen
extract-based in vivo SPTs and/or in vitro allergen-specific IgE blood immunoassays.
1.4.6.4 Could carbohydrate-specific antibodies be protective against allergic disease?
Analogous to the idea that “blocking” IgG / IgG4 antibodies compete with IgE to bind to
epitopes on allergens,107,109,110 or that they induce FcγRIIB-dependent inhibition of IgE-
mediated effector cell signalling110-112 (discussed in section 1.4.3), it has been further
proposed that high affinity CCD-specific IgG antibodies (resulting from routine contact
with foods and pollen) may block IgE-mediated effector responses184-186 by competing
with IgE for allergen epitopes.187 This represents another potential mechanism of
helminth-mediated protection against allergic disease.
Although largely unexplored, a protective role for helminth-induced anti-CCD IgE is also
possible. The separation of anti-CCD IgE from clinical symptoms of allergy, coupled with
its abundance during chronic helminth infection, raises the question of whether elevated
IgE responses to specific immunogenic glycans during chronic helminth infection might
dominate over allergen protein-specific IgE, resulting in reduced allergic effector
responses. A possible mechanism is that CCD-specific IgE competes with allergen
protein-specific IgE to saturate IgE receptors, reducing the chances that allergen
40
exposure will result in cross-linking of FceRI-bound IgE to cause effector cell
degranulation. It is also plausible that, in an effort by the host immune system to
downregulate elevated anti-CCD antibodies, there are spill-over effects resulting in
regulation of other responses, including anti-protein IgE. Furthermore, many native
allergens occur as glycoproteins; therefore, prior elevated exposure to CCDs (perhaps
from helminth infection) may prime initial and recall IgE responses to preferentially target
CCD rather than the protein epitopes of allergens. This means that in helminth-endemic
settings, IgE is less effectively induced against common protein allergens than against
CCDs.
Besides, CCDs may be involved in helminth-mediated immunoregulation: most N-
glycans on the Schistosoma egg antigen (SEA)-derived glycoprotein omega-1 (which
drives both immunoregulatory188 and Th2 responses,189 the latter in a glycan-dependent
manner82) carry core α-1,3-fucose motifs in combination with terminal Lewis X units.190
Kappa-5, another major SEA component,191 expresses core b-1,2-xylose and core α-
1,3-fucose substituted glycans.192
Population studies assessing associations between anti-CCD antibodies and allergic
disease, as well as mechanistic studies in animal models and in humans, are required
to test the hypothesis that anti-CCD antibodies may be protective against allergic effector
responses. It has recently been shown that helminth glycoproteins (including those
carrying core substitutions) can be reconstructed in plant systems.193 Ready availability
of tailor-made glycans will be important for mechanistic studies, such as those involving
animal models, and could aid development of therapeutics.
1.5 Effect of anthelminthic treatment on allergic sensitisation and disease
Cross-sectional studies are prone to temporality,194 hence it is important to ascertain
causality when assessing helminth-allergy associations. For example, although inverse
helminth-allergy associations could result from helminth-mediated protection against
allergy-related outcomes, it is also likely that individuals who are genetically predisposed
41
to allergies could be resistant to helminths. The latter hypothesis draws support from
studies which report that specific genotypes are associated with both risk of allergy and
resistance to helminth infections.195,196 Assessing the impact of anthelminthic
interventions on allergy-related outcomes is thus an important approach for ascertaining
causality when investigating helminth-allergy associations.
Several anthelminthic intervention studies have been conducted to assess effects on
allergy-related outcomes. In a study conducted 26 years ago among Venezuelan
children, treatment for intestinal helminths was associated with increased SPT reactivity
and serum levels of allergen-specific IgE.197 Notably, among children in the same setting
who declined treatment, increased helminth infection prevalence and total IgE levels
were observed, paralleled by a decrease in SPT reactivity and allergen-specific IgE
levels. In later studies among Gabonese198 and Vietnamese children199 repeated
anthelminthic treatment was also associated with increased SPT reactivity. However,
these studies did not show any effect of anthelminthic treatment on wheeze, eczema or
other clinical allergies. Other studies report effects of treatment on some clinical allergy
outcomes, but not others, and some studies have observed a lack of effect of treatment
on both allergic sensitisation and clinical allergy. For example, Cooper and others found
that ivermectin treatment for Trichuris trichiura infection among Ecuadorian children was
associated with increased prevalence of eczema symptoms (but not asthma
symptoms),200 but did not observe any effect of two-monthly albendazole (for one year)
on atopy or clinical allergy in a large, cluster-randomised trial among schools in rural
Ecuador.201
Barring investigations on the effect of anthelminthic treatment on allergen extract-specific
IgE (as a measure of atopy), very few studies have included detailed work on the effect
of anthelminthic treatment on immunological parameters related to allergy, such as IgE-
mediated histamine release, anti-CCD antibody responses, allergen extract-specific IgG,
or allergen component-resolved antibody reactivity. However, one such study was
42
conducted in Ugandan school children: while hookworm infection abrogated the
predicted association between allergen-specific IgE and basophil histamine release,
albendazole treatment re-established it.202 More animal and population-based studies
are warranted.
1.6 Helminths, the rural-urban environment and allergy-related outcomes
The on-going urbanisation in many tropical LICs is gradually being paralleled by a shift
in disease patterns.203 Non-communicable diseases, including allergy, seem to be on the
increase, especially in urban areas of LICs. Links between urbanisation and allergic
disease are not new. As far back as 1965, urban-rural differences in asthma prevalence
were being reported among German populations.204 Later, studies in Africa,205 Asia206,207
and South America208 reported similar results. Factors that are inversely associated with
allergy-related conditions have been shown to be more common in the rural
environment, as indicated by studies on the protective effect of traditional farming on
allergy outcomes (discussed above).25,26,28-31 Rural settings, especially in tropical LICs,
are characterised by exposure to immunomodulating disease agents such as helminths,
which have been hypothesised to protect against allergy-related disease.34 Changes in
environmental exposures due to urbanisation may drive increases in allergy-related
disease.34 These changes include reduced exposure to helminths. Previous work implies
that there are other potentially relevant differences in the urban-rural exposure that may
influence allergy trends, such as animals and related microbial exposure209 and nutrition
(for example milk pasteurisation27). However, helminths are of special interest because
of their unique molecular relationship with allergens (discussed above). Whether
repeated, intensive anthelminthic treatment in endemic rural settings in the tropics may
shift allergy prevalence or immunological profiles associated with allergy towards an
urban pattern has not been explored fully. While conceivable, such a shift might be
hindered by high re-infection rates in most endemic settings210 and the long-lasting
immunological and epigenetic effects of helminth exposure.211
43
1.7 Scope of this thesis
The prevalence of helminth infections is still high in most tropical LICs, especially in rural
settings. This, coupled with the ongoing epidemiological transition in these countries,
provides unprecedented opportunities to understand helminth-allergy associations, by
exploring the underlying immunological mechanisms. In Uganda, the urban-rural divide
is characterised by differences in helminth exposure intensity between the two settings,
offering opportunities for investigation of the role of helminths (through specific
immunological pathways) in mediating population differences in allergy-related
conditions.
Antibodies, specifically IgE, are key constituents of the analogous immune responses to
helminths and allergens, and are among the chief mediators of the effector cell activation
underlying allergy-related disease. Three studies (described in Chapter 3) have been
conducted in proximate, yet diverse Ugandan settings, primarily to obtain a comparative
assessment of phenotypes, prevalence and risk factors for allergy-related diseases in
rural and urban settings, and among asthmatic schoolchildren (age 5-17 years) and non-
asthmatic controls. These studies provided a unique resource for assessment of the
impact of the rural-urban environment and helminth exposure on helminth protein and
carbohydrate-specific antibody profiles and the relevance of these profiles to the
epidemiological trends of allergy in tropical LICs, specifically Uganda. These
assessments are important for therapeutic strategies against allergy-related disease and
for strategies aimed at minimising the impact of improved hygiene on allergy prevalence
in tropical LICs.
44
1.8 Chapter 1 References
1. Pawankar R, Canonica GW, Holgate ST, Lockey RF, Blaiss MS. WAO White book on Allergy Update 2013. 2013.
2. Santiago S. Food Allergies and Eczema. Pediatr Ann 2015; 44(7): 265-7.
3. Wener RR, Bel EH. Severe refractory asthma: an update. Eur Respir Rev 2013; 22(129): 227-35.
4. Dodiuk-Gad RP, Laws PM, Shear NH. Epidemiology of severe drug hypersensitivity. Semin Cutan Med Surg 2014; 33(1): 2-9.
5. Waage J, Standl M, Curtin JA, et al. Genome-wide association and HLA fine-mapping studies identify risk loci and genetic pathways underlying allergic rhinitis. Nature Genetics 2018; 50(8): 1072-80.
6. Pawankar R. Allergic diseases and asthma: a global public health concern and a call to action. World Allergy Organ J 2014; 7(1): 12.
7. Bieber T. Atopic dermatitis. Ann Dermatol 2010; 22(2): 125-37.
8. Meni C, Bodemer C, Toulon A, et al. Atopic dermatitis burden scale: creation of a specific burden questionnaire for families. J Eur Acad Dermatol Venereol 2013; 27(11): 1426-32.
9. Misery L, Ortonne JP, Cambazard F, et al. PPAD: a tool for presumption of atopic dermatitis. J Dermatol 2012; 39(2): 151-5.
10. Soriano JB, Abajobir AA, Abate KH, et al. Global, regional, and national deaths, prevalence, disability-adjusted life years, and years lived with disability for chronic obstructive pulmonary disease and asthma, 1990–2015: a systematic analysis for the Global Burden of Disease Study 2015. The Lancet Respiratory Medicine 2017; 5(9): 691-706.
11. Global, regional, and national incidence, prevalence, and years lived with disability for 310 diseases and injuries, 1990-2015: a systematic analysis for the Global Burden of Disease Study 2015. Lancet 2016; 388(10053): 1545-602.
12. Karimkhani C, Dellavalle RP, Coffeng LE, et al. Global Skin Disease Morbidity and Mortality: An Update From the Global Burden of Disease Study 2013Global Skin Disease Morbidity and MortalityGlobal Skin Disease Morbidity and Mortality. JAMA Dermatology 2017; 153(5): 406-12.
13. Cooper PJ, Rodrigues LC, Cruz AA, Barreto ML. Asthma in Latin America: a public heath challenge and research opportunity. Allergy 2009; 64(1): 5-17.
14. Bousquet J, Bousquet PJ, Godard P, Daures JP. The public health implications of asthma. Bulletin of the World Health Organization 2005; 83(7): 548-54.
15. The Global Asthma Report 2018. Auckland, New Zealand: Global Asthma Network, 2018.
45
16. Addo-Yobo EO, Woodcock A, Allotey A, Baffoe-Bonnie B, Strachan D, Custovic A. Exercise-induced bronchospasm and atopy in Ghana: two surveys ten years apart. PLoS Med 2007; 4(2): e70.
17. Keeley DJ, Neill P, Gallivan S. Comparison of the prevalence of reversible airways obstruction in rural and urban Zimbabwean children. Thorax 1991; 46(8): 549-53.
18. Ng'ang'a LW, Odhiambo JA, Mungai MW, et al. Prevalence of exercise induced bronchospasm in Kenyan school children: an urban-rural comparison. Thorax 1998; 53(11): 919-26.
19. Nicolaou N, Siddique N, Custovic A. Allergic disease in urban and rural populations: increasing prevalence with increasing urbanization. Allergy 2005; 60(11): 1357-60.
20. Van Niekerk CH, Weinberg EG, Shore SC, Heese HV, Van Schalkwyk J. Prevalence of asthma: a comparative study of urban and rural Xhosa children. Clinical allergy 1979; 9(4): 319-4.
21. Strachan DP. Hay fever, hygiene, and household size. Bmj 1989; 299(6710): 1259-60.
22. Okada H, Kuhn C, Feillet H, Bach JF. The 'hygiene hypothesis' for autoimmune and allergic diseases: an update. Clin Exp Immunol 2010; 160(1): 1-9.
23. Maizels RM, McSorley HJ, Smyth DJ. Helminths in the hygiene hypothesis: sooner or later? Clin Exp Immunol 2014; 177(1): 38-46.
24. Bach JF. The effect of infections on susceptibility to autoimmune and allergic diseases. N Engl J Med 2002; 347(12): 911-20.
25. Loss GJ, Depner M, Hose AJ, et al. The Early Development of Wheeze. Environmental Determinants and Genetic Susceptibility at 17q21. American journal of respiratory and critical care medicine 2016; 193(8): 889 - 97.
26. Stein MM, Hrusch CL, Gozdz J, et al. Innate Immunity and Asthma Risk in Amish and Hutterite Farm Children. N Engl J Med 2016; 375(5): 411-21.
27. Sozanska B, Blaszczyk M, Pearce N, Cullinan P. Atopy and allergic respiratory disease in rural Poland before and after accession to the European Union. The Journal of allergy and clinical immunology 2014; 133(5): 1347-53.
28. Ege MJ, Frei R, Bieli C, et al. Not all farming environments protect against the development of asthma and wheeze in children. The Journal of allergy and clinical immunology 2007; 119(5): 1140-7.
29. Ege MJ, Mayer M, Normand AC, et al. Exposure to environmental microorganisms and childhood asthma. N Engl J Med 2011; 364(8): 701-9.
30. Ege MJ, Strachan DP, Cookson WO, et al. Gene-environment interaction for childhood asthma and exposure to farming in Central Europe. The Journal of allergy and clinical immunology 2011; 127(1): 138-44, 44 e1-4.
46
31. Holbreich M, Genuneit J, Weber J, Braun-Fahrlander C, Waser M, von Mutius E. Amish children living in northern Indiana have a very low prevalence of allergic sensitization. The Journal of allergy and clinical immunology 2012; 129(6): 1671-3.
32. Scudellari M. News Feature: Cleaning up the hygiene hypothesis. Proc Natl Acad Sci U S A 2017; 114(7): 1433-6.
33. Benn CS, Melbye M, Wohlfahrt J, Bjorksten B, Aaby P. Cohort study of sibling effect, infectious diseases, and risk of atopic dermatitis during first 18 months of life. Bmj 2004; 328(7450): 1223.
34. Rook GA. 99th Dahlem conference on infection, inflammation and chronic inflammatory disorders: darwinian medicine and the 'hygiene' or 'old friends' hypothesis. Clin Exp Immunol 2010; 160(1): 70-9.
35. Hotez PJ, Brindley PJ, Bethony JM, King CH, Pearce EJ, Jacobson J. Helminth infections: the great neglected tropical diseases. J Clin Invest 2008; 118(4): 1311-21.
36. Pullan RL, Smith JL, Jasrasaria R, Brooker SJ. Global numbers of infection and disease burden of soil transmitted helminth infections in 2010. Parasit Vectors 2014; 7: 37.
37. Leonardi-Bee J, Pritchard D, Britton J. Asthma and current intestinal parasite infection: systematic review and meta-analysis. Am J Respir Crit Care Med 2006; 174(5): 514-23.
38. Cooper PJ, Chico ME, Rodrigues LC, et al. Reduced risk of atopy among school-age children infected with geohelminth parasites in a rural area of the tropics. The Journal of allergy and clinical immunology 2003; 111(5): 995-1000.
39. Mpairwe H, Webb EL, Muhangi L, et al. Anthelminthic treatment during pregnancy is associated with increased risk of infantile eczema: randomised-controlled trial results. Pediatr Allergy Immunol 2011; 22(3): 305-12.
40. Cooper PJ, Chico ME, Bland M, Griffin GE, Nutman TB. Allergic symptoms, atopy, and geohelminth infections in a rural area of Ecuador. Am J Respir Crit Care Med 2003; 168(3): 313-7.
41. van den Biggelaar AH, Lopuhaa C, van Ree R, et al. The prevalence of parasite infestation and house dust mite sensitization in Gabonese schoolchildren. Int Arch Allergy Immunol 2001; 126(3): 231-8.
42. Medeiros M, Jr., Figueiredo JP, Almeida MC, et al. Schistosoma mansoni infection is associated with a reduced course of asthma. The Journal of allergy and clinical immunology 2003; 111(5): 947-51.
43. Nyan OA, Walraven GE, Banya WA, et al. Atopy, intestinal helminth infection and total serum IgE in rural and urban adult Gambian communities. Clin Exp Allergy 2001; 31(11): 1672-8.
44. Oliveira SM, Bezerra FS, Carneiro TR, Pinheiro MC, Queiroz JA. Association between allergic responses and Schistosoma mansoni infection in residents in a low-endemic setting in Brazil. Rev Soc Bras Med Trop 2014; 47(6): 770-4.
47
45. van den Biggelaar AH, van Ree R, Rodrigues LC, et al. Decreased atopy in children infected with Schistosoma haematobium: a role for parasite-induced interleukin-10. Lancet 2000; 356(9243): 1723-7.
46. Platts-Mills TA, Cooper PJ. Differences in asthma between rural and urban communities in South Africa and other developing countries. The Journal of allergy and clinical immunology 2010; 125(1): 106-7.
47. Elliott AM, Kizza M, Quigley MA, et al. The impact of helminths on the response to immunization and on the incidence of infection and disease in childhood in Uganda: design of a randomized, double-blind, placebo-controlled, factorial trial of deworming interventions delivered in pregnancy and early childhood [ISRCTN32849447]. Clin Trials 2007; 4(1): 42-57.
48. Mpairwe H, Ndibazza J, Webb EL, et al. Maternal hookworm modifies risk factors for childhood eczema: results from a birth cohort in Uganda. Pediatr Allergy Immunol 2014; 25(5): 481-8.
49. WHO. Accelerating work to overcome the global impact of neglected tropical diseases. A roadmap to implemention. Geneva: World Health Organisation, 2012.
50. World Health Organisation. Investing to overcome the global impact of neglected tropical diseases. Third WHO report on neglected tropical diseases. Geneva: World Helath Organisation, 2015.
51. Global Atlas of Helminth Infections. Worms: The Global Burden of Disease study estimates the magnitude of health loss due to diseases and injuries. http://www.thiswormyworld.org/worms/global-burden (accessed 1st February 2019.
52. Hotez PJ, Alvarado M, Basáñez M-G, et al. The global burden of disease study 2010: interpretation and implications for the neglected tropical diseases. PLoS neglected tropical diseases 2014; 8(7): e2865-e.
53. WHO Technical Report Series. Research Priorities for Helminth Infections. Technical Report of the TDR Disease Reference Group on Helminth Infections. Geneva: World Health Organisation, 2012.
54. Olveda DU, Olveda RM, McManus DP, et al. The chronic enteropathogenic disease schistosomiasis. International Journal of Infectious Diseases 2014; 28: 193-203.
55. King CH, Dickman K, Tisch DJ. Reassessment of the cost of chronic helmintic infection: a meta-analysis of disability-related outcomes in endemic schistosomiasis. Lancet 2005; 365(9470): 1561-9.
56. Allen JE, Maizels RM. Diversity and dialogue in immunity to helminths. Nat Rev Immunol 2011; 11(6): 375-88.
57. Maizels RM, Bundy DA, Selkirk ME, Smith DF, Anderson RM. Immunological modulation and evasion by helminth parasites in human populations. Nature 1993; 365(6449): 797-805.
58. Turner JD, Faulkner H, Kamgno J, et al. Th2 cytokines are associated with reduced worm burdens in a human intestinal helminth infection. The Journal of infectious diseases 2003; 188(11): 1768-75.
48
59. Dunne DW, Butterworth AE, Fulford AJ, et al. Immunity after treatment of human schistosomiasis: association between IgE antibodies to adult worm antigens and resistance to reinfection. European journal of immunology 1992; 22(6): 1483-94.
60. Dunne DW, Webster M, Smith P, et al. The isolation of a 22 kDa band after SDS-PAGE of Schistosoma mansoni adult worms and its use to demonstrate that IgE responses against the antigen(s) it contains are associated with human resistance to reinfection. Parasite immunology 1997; 19(2): 79-89.
61. Fitzsimmons CM, Jones FM, Pinot de Moira A, et al. Progressive cross-reactivity in IgE responses: an explanation for the slow development of human immunity to schistosomiasis? Infect Immun 2012; 80(12): 4264-70.
62. Maggi E. The TH1/TH2 paradigm in allergy. Immunotechnology 1998; 3(4): 233-44.
63. Shore SA. Direct effects of Th2 cytokines on airway smooth muscle. Curr Opin Pharmacol 2004; 4(3): 235-40.
64. Greenfeder S, Umland SP, Cuss FM, Chapman RW, Egan RW. Th2 cytokines and asthma. The role of interleukin-5 in allergic eosinophilic disease. Respir Res 2001; 2(2): 71-9.
65. Cohn L, Whittaker L, Niu N, Homer RJ. Cytokine regulation of mucus production in a model of allergic asthma. Novartis Found Symp 2002; 248: 201-13; discussion 13-20, 77-82.
66. Poulsen LK, Hummelshoj L. Triggers of IgE class switching and allergy development. Annals of medicine 2007; 39(6): 440-56.
67. Webb EL, Nampijja M, Kaweesa J, et al. Helminths are positively associated with atopy and wheeze in Ugandan fishing communities: results from a cross-sectional survey. Allergy 2016; 71(8): 1156-69.
68. Araujo MI, Lopes AA, Medeiros M, et al. Inverse association between skin response to aeroallergens and Schistosoma mansoni infection. Int Arch Allergy Immunol 2000; 123(2): 145-8.
69. Smits HH, Everts B, Hartgers FC, Yazdanbakhsh M. Chronic helminth infections protect against allergic diseases by active regulatory processes. Current allergy and asthma reports 2010; 10(1): 3-12.
70. Hewitson JP, Grainger JR, Maizels RM. Helminth immunoregulation: the role of parasite secreted proteins in modulating host immunity. Molecular and biochemical parasitology 2009; 167(1): 1-11.
71. Tyagi N, Farnell EJ, Fitzsimmons CM, et al. Comparisons of Allergenic and Metazoan Parasite Proteins: Allergy the Price of Immunity. PLoS computational biology 2015; 11(10): e1004546.
72. Wammes LJ, Hamid F, Wiria AE, et al. Regulatory T cells in human geohelminth infection suppress immune responses to BCG and Plasmodium falciparum. European journal of immunology 2010; 40(2): 437-42.
49
73. Wilson MS, Taylor MD, Balic A, Finney CA, Lamb JR, Maizels RM. Suppression of allergic airway inflammation by helminth-induced regulatory T cells. The Journal of experimental medicine 2005; 202(9): 1199-212.
74. McSorley HJ, Blair NF, Smith KA, McKenzie AN, Maizels RM. Blockade of IL-33 release and suppression of type 2 innate lymphoid cell responses by helminth secreted products in airway allergy. Mucosal Immunol 2014; 7(5): 1068-78.
75. Gounaris K. Nucleotidase cascades are catalyzed by secreted proteins of the parasitic nematode Trichinella spiralis. Infect Immun 2002; 70(9): 4917-24.
76. Hewitson JP, Harcus Y, Murray J, et al. Proteomic analysis of secretory products from the model gastrointestinal nematode Heligmosomoides polygyrus reveals dominance of venom allergen-like (VAL) proteins. J Proteomics 2011; 74(9): 1573-94.
77. Herbert DR, Holscher C, Mohrs M, et al. Alternative macrophage activation is essential for survival during schistosomiasis and downmodulates T helper 1 responses and immunopathology. Immunity 2004; 20(5): 623-35.
78. Novak ML, Koh TJ. Macrophage phenotypes during tissue repair. Journal of leukocyte biology 2013; 93(6): 875-81.
79. McSorley HJ, Hewitson JP, Maizels RM. Immunomodulation by helminth parasites: defining mechanisms and mediators. International journal for parasitology 2013; 43(3-4): 301-10.
80. Babu S, Bhat SQ, Kumar NP, et al. Attenuation of toll-like receptor expression and function in latent tuberculosis by coexistent filarial infection with restoration following antifilarial chemotherapy. PLoS Negl Trop Dis 2009; 3(7): e489.
81. van Riet E, Hartgers FC, Yazdanbakhsh M. Chronic helminth infections induce immunomodulation: consequences and mechanisms. Immunobiology 2007; 212(6): 475-90.
82. Everts B, Hussaarts L, Driessen NN, et al. Schistosome-derived omega-1 drives Th2 polarization by suppressing protein synthesis following internalization by the mannose receptor. The Journal of experimental medicine 2012; 209(10): 1753-67, S1.
83. Hartgers FC, Obeng BB, Kruize YC, et al. Lower expression of TLR2 and SOCS-3 is associated with Schistosoma haematobium infection and with lower risk for allergic reactivity in children living in a rural area in Ghana. PLoS Negl Trop Dis 2008; 2(4): e227.
84. Liu JY, Lu P, Hu LZ, et al. CD8alpha DC is the major DC subset which mediates inhibition of allergic responses by Schistosoma infection. Parasite immunology 2014; 36(12): 647-57.
85. Neill DR, Wong SH, Bellosi A, et al. Nuocytes represent a new innate effector leukocyte that mediates type-2 immunity. Nature 2010; 464: 1367.
86. Gold MJ, Antignano F, Halim TY, et al. Group 2 innate lymphoid cells facilitate sensitization to local, but not systemic, TH2-inducing allergen exposures. The Journal of allergy and clinical immunology 2014; 133(4): 1142-8.
50
87. Halim TY, Steer CA, Matha L, et al. Group 2 innate lymphoid cells are critical for the initiation of adaptive T helper 2 cell-mediated allergic lung inflammation. Immunity 2014; 40(3): 425-35.
88. Anbu KA, Joshi P. Identification of a 55 kDa Haemonchus contortus excretory/secretory glycoprotein as a neutrophil inhibitory factor. Parasite immunology 2008; 30(1): 23-30.
89. Moyle M, Foster DL, McGrath DE, et al. A hookworm glycoprotein that inhibits neutrophil function is a ligand of the integrin CD11b/CD18. The Journal of biological chemistry 1994; 269(13): 10008-15.
90. Culley FJ, Brown A, Conroy DM, Sabroe I, Pritchard DI, Williams TJ. Eotaxin is specifically cleaved by hookworm metalloproteases preventing its action in vitro and in vivo. Journal of immunology (Baltimore, Md : 1950) 2000; 165(11): 6447-53.
91. Taylor MD, van der Werf N, Maizels RM. T cells in helminth infection: the regulators and the regulated. Trends Immunol 2012; 33(4): 181-9.
92. Navarro S, Pickering DA, Ferreira IB, et al. Hookworm recombinant protein promotes regulatory T cell responses that suppress experimental asthma. Science translational medicine 2016; 8(362): 362ra143.
93. Bohm L, Maxeiner J, Meyer-Martin H, et al. IL-10 and regulatory T cells cooperate in allergen-specific immunotherapy to ameliorate allergic asthma. Journal of immunology (Baltimore, Md : 1950) 2015; 194(3): 887-97.
94. Jutel M, Akdis M, Budak F, et al. IL-10 and TGF-beta cooperate in the regulatory T cell response to mucosal allergens in normal immunity and specific immunotherapy. European journal of immunology 2003; 33(5): 1205-14.
95. Fujita H, Soyka MB, Akdis M, Akdis CA. Mechanisms of allergen-specific immunotherapy. Clin Transl Allergy 2012; 2(1): 2.
96. van der Vlugt LE, Labuda LA, Ozir-Fazalalikhan A, et al. Schistosomes induce regulatory features in human and mouse CD1d(hi) B cells: inhibition of allergic inflammation by IL-10 and regulatory T cells. PLoS One 2012; 7(2): e30883.
97. Mangan NE, Fallon RE, Smith P, van Rooijen N, McKenzie AN, Fallon PG. Helminth infection protects mice from anaphylaxis via IL-10-producing B cells. Journal of immunology (Baltimore, Md : 1950) 2004; 173(10): 6346-56.
98. Correale J, Farez M, Razzitte G. Helminth infections associated with multiple sclerosis induce regulatory B cells. Ann Neurol 2008; 64(2): 187-99.
99. van de Veen W, Stanic B, Yaman G, et al. IgG4 production is confined to human IL-10-producing regulatory B cells that suppress antigen-specific immune responses. The Journal of allergy and clinical immunology 2013; 131(4): 1204-12.
100. van der Vlugt LE, Mlejnek E, Ozir-Fazalalikhan A, et al. CD24(hi)CD27(+) B cells from patients with allergic asthma have impaired regulatory activity in response to lipopolysaccharide. Clin Exp Allergy 2014; 44(4): 517-28.
51
101. Ding L, Linsley PS, Huang LY, Germain RN, Shevach EM. IL-10 inhibits macrophage costimulatory activity by selectively inhibiting the up-regulation of B7 expression. Journal of immunology (Baltimore, Md : 1950) 1993; 151(3): 1224-34.
102. Ding L, Shevach EM. IL-10 inhibits mitogen-induced T cell proliferation by selectively inhibiting macrophage costimulatory function. Journal of immunology (Baltimore, Md : 1950) 1992; 148(10): 3133-9.
103. de Waal Malefyt R, Yssel H, de Vries JE. Direct effects of IL-10 on subsets of human CD4+ T cell clones and resting T cells. Specific inhibition of IL-2 production and proliferation. Journal of immunology (Baltimore, Md : 1950) 1993; 150(11): 4754-65.
104. Royer B, Varadaradjalou S, Saas P, Guillosson JJ, Kantelip JP, Arock M. Inhibition of IgE-induced activation of human mast cells by IL-10. Clin Exp Allergy 2001; 31(5): 694-704.
105. Macaubas C, Sly PD, Burton P, et al. Regulation of T-helper cell responses to inhalant allergen during early childhood. Clin Exp Allergy 1999; 29(9): 1223-31.
106. Figueiredo CA, Barreto ML, Rodrigues LC, et al. Chronic intestinal helminth infections are associated with immune hyporesponsiveness and induction of a regulatory network. Infect Immun 2010; 78(7): 3160-7.
107. Rihet P, Demeure CE, Dessein AJ, Bourgois A. Strong serum inhibition of specific IgE correlated to competing IgG4, revealed by a new methodology in subjects from a S. mansoni endemic area. European journal of immunology 1992; 22(8): 2063-70.
108. Tseng SH, Fu LS, Nong BR, Weng JD, Shyur SD. Changes in serum specific IgG4 and IgG4/ IgE ratio in mite-sensitized Taiwanese children with allergic rhinitis receiving short-term sublingual-swallow immunotherapy: a multicenter, randomized, placebo-controlled trial. Asian Pac J Allergy Immunol 2008; 26(2-3): 105-12.
109. van Neerven RJ, Wikborg T, Lund G, et al. Blocking antibodies induced by specific allergy vaccination prevent the activation of CD4+ T cells by inhibiting serum-IgE-facilitated allergen presentation. Journal of immunology (Baltimore, Md : 1950) 1999; 163(5): 2944-52.
110. James LK, Till SJ. Potential Mechanisms for IgG4 Inhibition of Immediate Hypersensitivity Reactions. Current allergy and asthma reports 2016; 16(3): 23.
111. Cassard L, Jonsson F, Arnaud S, Daeron M. Fcgamma receptors inhibit mouse and human basophil activation. Journal of immunology (Baltimore, Md : 1950) 2012; 189(6): 2995-3006.
112. Strait RT, Morris SC, Finkelman FD. IgG-blocking antibodies inhibit IgE-mediated anaphylaxis in vivo through both antigen interception and Fc gamma RIIb cross-linking. J Clin Invest 2006; 116(3): 833-41.
113. Aalberse R. The role of IgG antibodies in allergy and immunotherapy. Allergy 2011; 66 Suppl 95: 28-30.
114. Jarrett EE, Miller HR. Production and activities of IgE in helminth infection. Prog Allergy 1982; 31: 178-233.
52
115. Turner KJ, Feddema L, Quinn EH. Non-specific potentiation of IgE by parasitic infections in man. Int Arch Allergy Appl Immunol 1979; 58(2): 232-6.
116. Godfrey RC, Gradidge CF. Allergic sensitisation of human lung fragments prevented by saturation of IgE binding sites. Nature 1976; 259(5543): 484-6.
117. Lynch NR, Hagel IA, Palenque ME, et al. Relationship between helminthic infection and IgE response in atopic and nonatopic children in a tropical environment. The Journal of allergy and clinical immunology 1998; 101(2 Pt 1): 217-21.
118. Hamid F, Amoah AS, van Ree R, Yazdanbakhsh M. Helminth-induced IgE and protection against allergic disorders. Current topics in microbiology and immunology 2015; 388: 91-108.
119. MacGlashan DW, Jr., Bochner BS, Adelman DC, et al. Down-regulation of Fc(epsilon)RI expression on human basophils during in vivo treatment of atopic patients with anti-IgE antibody. Journal of immunology (Baltimore, Md : 1950) 1997; 158(3): 1438-45.
120. Mitre E, Norwood S, Nutman TB. Saturation of immunoglobulin E (IgE) binding sites by polyclonal IgE does not explain the protective effect of helminth infections against atopy. Infect Immun 2005; 73(7): 4106-11.
121. da Silva ER, Sly PD, de Pereira MU, et al. Intestinal helminth infestation is associated with increased bronchial responsiveness in children. Pediatr Pulmonol 2008; 43(7): 662-5.
122. Levin M, Muloiwa R, Le Souef P, Motala C. Ascaris sensitization is associated with aeroallergen sensitization and airway hyperresponsiveness but not allergic disease in urban Africa. The Journal of allergy and clinical immunology 2012; 130(1): 265-7.
123. Moncayo AL, Vaca M, Oviedo G, et al. Effects of geohelminth infection and age on the associations between allergen-specific IgE, skin test reactivity and wheeze: a case-control study. Clin Exp Allergy 2013; 43(1): 60-72.
124. Palmer LJ, Celedon JC, Weiss ST, Wang B, Fang Z, Xu X. Ascaris lumbricoides infection is associated with increased risk of childhood asthma and atopy in rural China. Am J Respir Crit Care Med 2002; 165(11): 1489-93.
125. Rexroth G, Keller C. [Chronic course of eosinophilic pneumonia in infection with ascaris lumbricoides]. Pneumologie 1995; 49(2): 77-83.
126. Caumes E. Treatment of cutaneous larva migrans. Clin Infect Dis 2000; 30(5): 811-4.
127. Smith JD, Goette DK, Odom RB. Larva currens. Cutaneous strongyloidiasis. Arch Dermatol 1976; 112(8): 1161-3.
128. Bakiri AH, Mingomataj EC. Parasites Induced Skin Allergy: A Strategic Manipulation of the Host Immunity. Journal of Clinical Medicine Research 2010; 2(6): 247-55.
129. Diemert DJ, Pinto AG, Freire J, et al. Generalized urticaria induced by the Na-ASP-2 hookworm vaccine: implications for the development of vaccines against helminths. The Journal of allergy and clinical immunology 2012; 130(1): 169-76.e6.
53

130. Nahshoni A, Baum S, Barzilai A, Schwartz E. Chronic Urticaria in Returning Travellers: The Role of Anthelmintic Treatment. Dermatology (Basel, Switzerland) 2016; 232(4): 468-71.
131. Farnell EJ, Tyagi N, Ryan S, et al. Known Allergen Structures Predict Schistosoma mansoni IgE-Binding Antigens in Human Infection. Frontiers in immunology 2015; 6: 26-.
132. Acevedo N, Sanchez J, Erler A, et al. IgE cross-reactivity between Ascaris and domestic mite allergens: the role of tropomyosin and the nematode polyprotein ABA-1. Allergy 2009; 64(11): 1635-43.
133. Santiago HC, Bennuru S, Boyd A, Eberhard M, Nutman TB. Structural and immunologic cross-reactivity among filarial and mite tropomyosin: implications for the hygiene hypothesis. The Journal of allergy and clinical immunology 2011; 127(2): 479-86.
134. Santos AB, Rocha GM, Oliver C, et al. Cross-reactive IgE antibody responses to tropomyosins from Ascaris lumbricoides and cockroach. The Journal of allergy and clinical immunology 2008; 121(4): 1040-6 e1.
135. Ahumada V, Garcia E, Dennis R, et al. IgE responses to Ascaris and mite tropomyosins are risk factors for asthma. Clin Exp Allergy 2015; 45(7): 1189-200.
136. Valmonte GR, Cauyan GA, Ramos JD. IgE cross-reactivity between house dust mite allergens and Ascaris lumbricoides antigens. Asia Pac Allergy 2012; 2(1): 35-44.
137. Santiago HC, LeeVan E, Bennuru S, et al. Molecular mimicry between cockroach and helminth glutathione S-transferases promotes cross-reactivity and cross-sensitization. The Journal of allergy and clinical immunology 2012; 130(1): 248-56 e9.
138. Santiago Hda C, Ribeiro-Gomes FL, Bennuru S, Nutman TB. Helminth infection alters IgE responses to allergens structurally related to parasite proteins. Journal of immunology (Baltimore, Md : 1950) 2015; 194(1): 93-100.
139. Faveeuw C, Mallevaey T, Paschinger K, et al. Schistosome N-glycans containing core alpha 3-fucose and core beta 2-xylose epitopes are strong inducers of Th2 responses in mice. European journal of immunology 2003; 33(5): 1271-81.
140. van Ree R, Cabanes-Macheteau M, Akkerdaas J, et al. Beta(1,2)-xylose and alpha(1,3)-fucose residues have a strong contribution in IgE binding to plant glycoallergens. The Journal of biological chemistry 2000; 275(15): 11451-8.
141. Mari A, Ooievaar-de Heer P, Scala E, et al. Evaluation by double-blind placebo-controlled oral challenge of the clinical relevance of IgE antibodies against plant glycans. Allergy 2008; 63(7): 891-6.
142. Hewitson JP, Nguyen DL, van Diepen A, et al. Novel O-linked methylated glycan antigens decorate secreted immunodominant glycoproteins from the intestinal nematode Heligmosomoides polygyrus. International journal for parasitology 2016; 46(3): 157-70.
143. Gleeson PA. The sweet side of immunology: glycobiology of the immune system. Immunol Cell Biol 2008; 86(7): 562-3.
54
144. Wolfert MA, Boons GJ. Adaptive immune activation: glycosylation does matter. Nat Chem Biol 2013; 9(12): 776-84.
145. Altmann F. The role of protein glycosylation in allergy. Int Arch Allergy Immunol 2007; 142(2): 99-115.
146. Bardor M, Faveeuw C, Fitchette AC, et al. Immunoreactivity in mammals of two typical plant glyco-epitopes, core alpha(1,3)-fucose and core xylose. Glycobiology 2003; 13(6): 427-34.
147. Luyai AE, Heimburg-Molinaro J, Prasanphanich NS, et al. Differential expression of anti-glycan antibodies in schistosome-infected humans, rhesus monkeys and mice. Glycobiology 2014; 24(7): 602-18.
148. Oyelaran O, McShane LM, Dodd L, Gildersleeve JC. Profiling human serum antibodies with a carbohydrate antigen microarray. Journal of proteome research 2009; 8(9): 4301-10.
149. Lavine CL, Lao S, Montefiori DC, et al. High-mannose glycan-dependent epitopes are frequently targeted in broad neutralizing antibody responses during human immunodeficiency virus type 1 infection. J Virol 2012; 86(4): 2153-64.
150. van Diepen A, Smit CH, van Egmond L, et al. Differential anti-glycan antibody responses in Schistosoma mansoni-infected children and adults studied by shotgun glycan microarray. PLoS Negl Trop Dis 2012; 6(11): e1922.
151. Fotisch K, Altmann F, Haustein D, Vieths S. Involvement of carbohydrate epitopes in the IgE response of celery-allergic patients. Int Arch Allergy Immunol 1999; 120(1): 30-42.
152. Aalberse RC, Koshte V, Clemens JG. Immunoglobulin E antibodies that crossreact with vegetable foods, pollen, and Hymenoptera venom. The Journal of allergy and clinical immunology 1981; 68(5): 356-64.
153. Commins SP. Carbohydrates as allergens. Current allergy and asthma reports 2015; 15(1): 492.
154. Tretter V, Altmann F, Kubelka V, Marz L, Becker WM. Fucose alpha 1,3-linked to the core region of glycoprotein N-glycans creates an important epitope for IgE from honeybee venom allergic individuals. Int Arch Allergy Immunol 1993; 102(3): 259-66.
155. Aalberse RC, Koshte V, Clemens JGJ. Immunoglobulin E antibodies that crossreact with vegetable foods, pollen, and Hymenoptera venom. Journal of Allergy and Clinical Immunology 1981; 68(5): 356-64.
156. Fabini G, Freilinger A, Altmann F, Wilson IBH. Identification of Core α1,3-Fucosylated Glycans and Cloning of the Requisite Fucosyltransferase cDNA from Drosophila melanogaster : POTENTIAL BASIS OF THE NEURAL ANTI-HORSERADISH PEROXIDASE EPITOPE. Journal of Biological Chemistry 2001; 276(30): 28058-67.
157. Fötisch K, Altmann F, Haustein D, Vieths S. Involvement of Carbohydrate Epitopes in the IgE Response of Celery–Allergic Patients. International Archives of Allergy and Immunology 1999; 120(1): 30-42.
55
158. Fournet B, Leroy Y, Wieruszeski JM, Montreuil J, Poretz RD, Goldberg R. Primary structure of an N-glycosidic carbohydrate unit derived from Sophora japonica lectin. European journal of biochemistry 1987; 166(2): 321-4.
159. Ramirez-Soto D, Poretz RD. The (1----3)-linked alpha-L-fucosyl group of the N-glycans of the Wistaria floribunda lectins is recognized by a rabbit anti-serum. Carbohydrate research 1991; 213: 27-36.
160. Khoo K-H, Chatterjee D, Caulfield JP, Morris HR, Dell A. Structural mapping of the glycans from the egg glycoproteins of Schistosoma mansoni and Schistosoma japonicum: identification of novel core structures and terminal sequences. Glycobiology 1997; 7(5): 663-77.
161. van Die I, Gomord V, Kooyman FN, van den Berg TK, Cummings RD, Vervelde L. Core alpha1-->3-fucose is a common modification of N-glycans in parasitic helminths and constitutes an important epitope for IgE from Haemonchus contortus infected sheep. FEBS letters 1999; 463(1-2): 189-93.
162. Yan S, Vanbeselaere J, Jin C, et al. Core Richness of N-Glycans of Caenorhabditis elegans: A Case Study on Chemical and Enzymatic Release. Analytical chemistry 2018; 90(1): 928-35.
163. Haslam SM, Coles GC, Munn EA, et al. Haemonchus contortus glycoproteins contain N-linked oligosaccharides with novel highly fucosylated core structures. The Journal of biological chemistry 1996; 271(48): 30561-70.
164. Haslam SM, Coles GC, Reason AJ, Morris HR, Dell A. The novel core fucosylation of Haemonchus contortus N-glycans is stage specific. Molecular and Biochemical Parasitology 1998; 93(1): 143-7.
165. Hokke CH, van Diepen A. Helminth glycomics – glycan repertoires and host-parasite interactions. Molecular and Biochemical Parasitology 2017; 215: 47-57.
166. Haslam SM, Morris HR, Dell A. Mass spectrometric strategies: providing structural clues for helminth glycoproteins. Trends in parasitology 2001; 17(5): 231-5.
167. Smit CH, van Diepen A, Nguyen DL, et al. Glycomic Analysis of Life Stages of the Human Parasite Schistosoma mansoni Reveals Developmental Expression Profiles of Functional and Antigenic Glycan Motifs. Mol Cell Proteomics 2015; 14(7): 1750-69.
168. Smit CH, Homann A, van Hensbergen VP, et al. Surface expression patterns of defined glycan antigens change during Schistosoma mansoni cercarial transformation and development of schistosomula. Glycobiology 2015; 25(12): 1465-79.
169. Wuhrer M, Koeleman CA, Deelder AM, Hokke CH. Repeats of LacdiNAc and fucosylated LacdiNAc on N-glycans of the human parasite Schistosoma mansoni. The FEBS journal 2006; 273(2): 347-61.
170. Wilson IB, Altmann F. Structural analysis of N-glycans from allergenic grass, ragweed and tree pollens: core alpha1,3-linked fucose and xylose present in all pollens examined. Glycoconj J 1998; 15(11): 1055-70.
171. Westphal S, Kolarich D, Foetisch K, et al. Molecular characterization and allergenic activity of Lyc e 2 (beta-fructofuranosidase), a glycosylated allergen of tomato. European journal of biochemistry 2003; 270(6): 1327-37.
56
172. Iacovacci P, Afferni C, Butteroni C, et al. Comparison between the native glycosylated and the recombinant Cup a1 allergen: role of carbohydrates in the histamine release from basophils. Clin Exp Allergy 2002; 32(11): 1620-7.
173. Chung CH, Mirakhur B, Chan E, et al. Cetuximab-induced anaphylaxis and IgE specific for galactose-alpha-1,3-galactose. N Engl J Med 2008; 358(11): 1109-17.
174. Commins SP, Platts-Mills TA. Delayed anaphylaxis to red meat in patients with IgE specific for galactose alpha-1,3-galactose (alpha-gal). Current allergy and asthma reports 2013; 13(1): 72-7.
175. van der Veen MJ, van Ree R, Aalberse RC, et al. Poor biologic activity of cross-reactive IgE directed to carbohydrate determinants of glycoproteins. The Journal of allergy and clinical immunology 1997; 100(3): 327-34.
176. van Ree R. Carbohydrate epitopes and their relevance for the diagnosis and treatment of allergic diseases. Int Arch Allergy Immunol 2002; 129(3): 189-97.
177. van Ree R, Aalberse RC. Specific IgE without clinical allergy. Journal of Allergy and Clinical Immunology 1999; 103(6): 1000-1.
178. Jin C, Hantusch B, Hemmer W, Stadlmann J, Altmann F. Affinity of IgE and IgG against cross-reactive carbohydrate determinants on plant and insect glycoproteins. The Journal of allergy and clinical immunology 2008; 121(1): 185-90.e2.
179. Mari A. IgE to cross-reactive carbohydrate determinants: analysis of the distribution and appraisal of the in vivo and in vitro reactivity. Int Arch Allergy Immunol 2002; 129(4): 286-95.
180. Mari A, Iacovacci P, Afferni C, et al. Specific IgE to cross-reactive carbohydrate determinants strongly affect the in vitro diagnosis of allergic diseases. The Journal of allergy and clinical immunology 1999; 103(6): 1005-11.
181. Elliott AM, Roestenberg M, Wajja A, et al. Ethical and scientific considerations on the establishment of a controlled human infection model for schistosomiasis in Uganda: report of a stakeholders’ meeting held in Entebbe, Uganda. [version 1; referees: 2 approved] AAS Open Research 2018.
182. Hamid F, Versteeg SA, Wiria AE, et al. Molecular diagnostics and lack of clinical allergy in helminth-endemic areas in Indonesia. The Journal of allergy and clinical immunology 2017; 140(4): 1196-9 e6.
183. Amoah AS, Obeng BB, Larbi IA, et al. Peanut-specific IgE antibodies in asymptomatic Ghanaian children possibly caused by carbohydrate determinant cross-reactivity. The Journal of allergy and clinical immunology 2013; 132(3): 639-47.
184. Igetei JE, El-Faham M, Liddell S, Schramm G, Doenhoff MJ. Antigenic cross-reactivity between Schistosoma mansoni and pollen allergens from the birch tree (Betula verrucosa) and Timothy grass (Phleum pratense): involvement of shared glycan epitopes and implications for the hygiene hypothesis. International journal for parasitology 2018.
185. Doenhoff MJ, El-Faham M, Liddell S, et al. Cross-Reactivity between Schistosoma mansoni Antigens and the Latex Allergen Hev b 7: Putative Implication of Cross-Reactive Carbohydrate Determinants (CCDs). PLoS One 2016; 11(7): e0159542.
57
186. Igetei JE, El-Faham M, Liddell S, Doenhoff MJ. Antigenic cross-reactivity between Schistosoma mansoni and peanut: a role for cross-reactive carbohydrate determinants (CCDs) and implications for the hygiene hypothesis. Immunology 2017; 150(4): 506-17.
187. Hemmer W. Human IgE Antibodies Against Cross-Reactive Carbohydrate Determinants. In: Kosma P, Müller-Loennies S, eds. Anticarbohydrate Antibodies: From Molecular Basis to Clinical Application. Vienna: Springer Vienna; 2012: 181-202.
188. Zaccone P, Burton OT, Gibbs SE, et al. The S. mansoni glycoprotein omega-1 induces Foxp3 expression in NOD mouse CD4(+) T cells. European journal of immunology 2011; 41(9): 2709-18.
189. Everts B, Perona-Wright G, Smits HH, et al. Omega-1, a glycoprotein secreted by Schistosoma mansoni eggs, drives Th2 responses. The Journal of experimental medicine 2009; 206(8): 1673-80.
190. Meevissen MH, Wuhrer M, Doenhoff MJ, et al. Structural characterization of glycans on omega-1, a major Schistosoma mansoni egg glycoprotein that drives Th2 responses. Journal of proteome research 2010; 9(5): 2630-42.
191. Schramm G, Hamilton JV, Balog CI, et al. Molecular characterisation of kappa-5, a major antigenic glycoprotein from Schistosoma mansoni eggs. Molecular and biochemical parasitology 2009; 166(1): 4-14.
192. Meevissen MH, Balog CI, Koeleman CA, et al. Targeted glycoproteomic analysis reveals that kappa-5 is a major, uniquely glycosylated component of Schistosoma mansoni egg antigens. Mol Cell Proteomics 2011; 10(5): M110 005710.
193. Wilbers RHP, Westerhof LB, van Noort K, et al. Production and glyco-engineering of immunomodulatory helminth glycoproteins in plants. Scientific Reports 2017; 7: 45910.
194. Hennekens CH, Buring JE. Epidemiology in medicine. Boston: Little, Brown; 1997.
195. Kouriba B, Chevillard C, Bream JH, et al. Analysis of the 5q31-q33 locus shows an association between IL13-1055C/T IL-13-591A/G polymorphisms and Schistosoma haematobium infections. Journal of immunology (Baltimore, Md : 1950) 2005; 174(10): 6274-81.
196. Moller M, Gravenor MB, Roberts SE, Sun D, Gao P, Hopkin JM. Genetic haplotypes of Th-2 immune signalling link allergy to enhanced protection to parasitic worms. Human Molecular Genetics 2007; 16(15): 1828-36.
197. Lynch NR, Hagel I, Perez M, Di Prisco MC, Lopez R, Alvarez N. Effect of anthelmintic treatment on the allergic reactivity of children in a tropical slum. The Journal of allergy and clinical immunology 1993; 92(3): 404-11.
198. van den Biggelaar AH, Rodrigues LC, van Ree R, et al. Long-term treatment of intestinal helminths increases mite skin-test reactivity in Gabonese schoolchildren. The Journal of infectious diseases 2004; 189(5): 892-900.
58
199. Flohr C, Tuyen LN, Quinnell RJ, et al. Reduced helminth burden increases allergen skin sensitization but not clinical allergy: a randomized, double-blind, placebo-controlled trial in Vietnam. Clin Exp Allergy 2010; 40(1): 131-42.
200. Endara P, Vaca M, Chico ME, et al. Long-term periodic anthelmintic treatments are associated with increased allergen skin reactivity. Clinical and experimental allergy : journal of the British Society for Allergy and Clinical Immunology 2010; 40(11): 1669-77.
201. Cooper PJ, Chico ME, Vaca MG, et al. Effect of albendazole treatments on the prevalence of atopy in children living in communities endemic for geohelminth parasites: a cluster-randomised trial. Lancet 2006; 367(9522): 1598-603.
202. Pinot de Moira A, Fitzsimmons CM, Jones FM, et al. Suppression of basophil histamine release and other IgE-dependent responses in childhood Schistosoma mansoni/hookworm coinfection. The Journal of infectious diseases 2014; 210(8): 1198-206.
203. WHO. Global Status Report on Noncommunicable Diseases 2014: Attaining the nine global noncommunicable diseases targets; a shared responsibility. Geneva, 2014.
204. Andrejevic M. [On qualitative differences in the bronchial asthma of the urban and rural population]. Allergie und Asthma 1965; 11(4): 156-61.
205. Weinberg EG. Urbanization and childhood asthma: an African perspective. The Journal of allergy and clinical immunology 2000; 105(2 Pt 1): 224-31.
206. Goh KT, Lun KC, Chong YM, Ong TC, Tan JL, Chay SO. Prevalence of respiratory illnesses of school children in the industrial, urban and rural areas of Singapore. Tropical and geographical medicine 1986; 38(4): 344-50.
207. Zhu JL. [Primary investigation on asthma in 142,035 inhabitants both in Shanghai urban and Jiashan rural areas (author's transl)]. Zhonghua jie he he hu xi xi ji bing za zhi = Chinese journal of tuberculosis and respiratory diseases 1981; 4(6): 329-32.
208. Rodriguez A, Vaca M, Oviedo G, et al. Urbanisation is associated with prevalence of childhood asthma in diverse, small rural communities in Ecuador. Thorax 2011; 66(12): 1043-50.
209. von Mutius E. The microbial environment and its influence on asthma prevention in early life. Journal of Allergy and Clinical Immunology 2016; 137(3): 680-9.
210. Jia T-W, Melville S, Utzinger J, King CH, Zhou X-N. Soil-Transmitted Helminth Reinfection after Drug Treatment: A Systematic Review and Meta-Analysis. PLoS neglected tropical diseases 2012; 6(5): e1621.
211. Wenzel MA, Piertney SB. Fine-scale population epigenetic structure in relation to gastrointestinal parasite load in red grouse (Lagopus lagopus scotica). Molecular ecology 2014; 23(17): 4256-73.
59
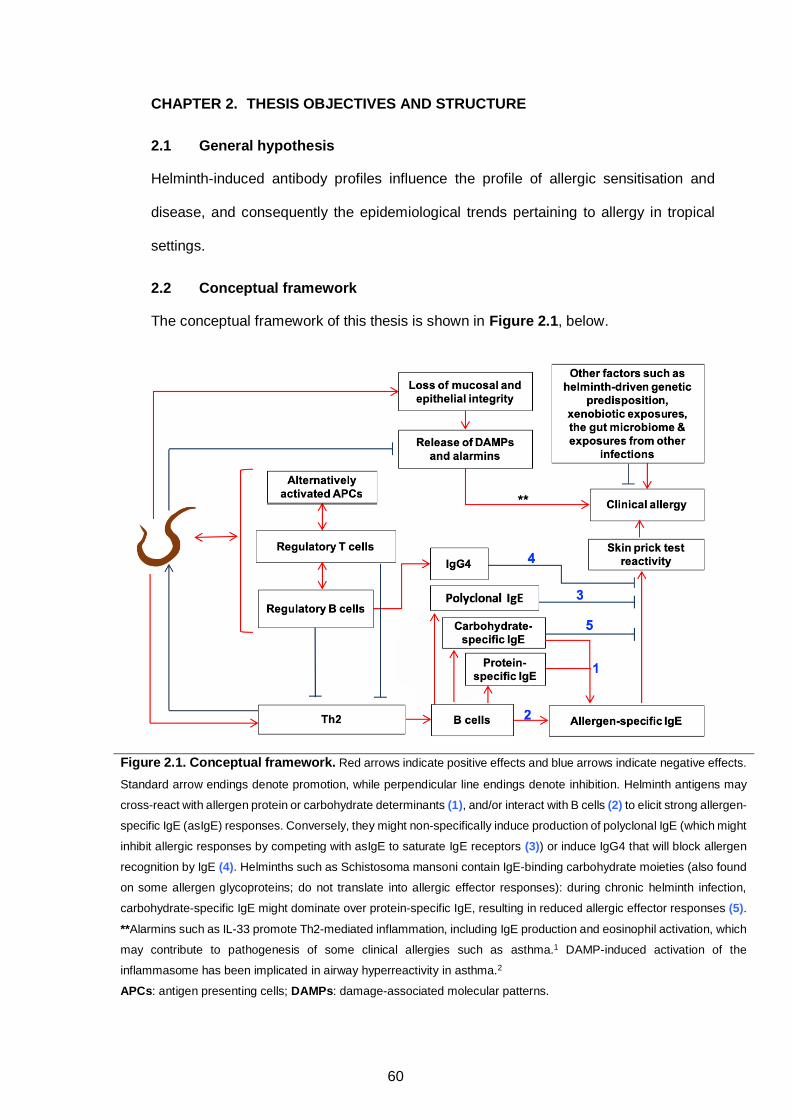
Helminth-induced antibody profiles influence the profile of allergic sensitisation and
disease, and consequently the epidemiological trends pertaining to allergy in tropical
settings.
The conceptual framework of this thesis is shown in Figure 2.1, below.
Figure 2.1. Conceptual framework. Red arrows indicate positive effects and blue arrows indicate negative effects.
Standard arrow endings denote promotion, while perpendicular line endings denote inhibition. Helminth antigens may
cross-react with allergen protein or carbohydrate determinants (1), and/or interact with B cells (2) to elicit strong allergen-
specific IgE (asIgE) responses. Conversely, they might non-specifically induce production of polyclonal IgE (which might
inhibit allergic responses by competing with asIgE to saturate IgE receptors (3)) or induce IgG4 that will block allergen
recognition by IgE (4). Helminths such as Schistosoma mansoni contain IgE-binding carbohydrate moieties (also found
on some allergen glycoproteins; do not translate into allergic effector responses): during chronic helminth infection,
carbohydrate-specific IgE might dominate over protein-specific IgE, resulting in reduced allergic effector responses (5).
**Alarmins such as IL-33 promote Th2-mediated inflammation, including IgE production and eosinophil activation, which
may contribute to pathogenesis of some clinical allergies such as asthma.1 DAMP-induced activation of the
inflammasome has been implicated in airway hyperreactivity in asthma.2
APCs: antigen presenting cells; DAMPs: damage-associated molecular patterns.
CHAPTER 2. THESIS OBJECTIVES AND STRUCTURE
2.1 General hypothesis
2.2 Conceptual framework
60
1) To investigate the extent to which helminth exposure influences rural-urban
differences in prevalence of allergy-related outcomes, and in epidemiological and
immunological risk factors for these outcomes
2) To map the association of total, helminth- and allergen extract-specific IgE and
IgG4 profiles with helminth infection and allergy-related outcomes
3) To assess associations between helminth (S. mansoni) infection (and intensity)
and IgE and IgG responses to classical cross-reactive carbohydrate determinant (CCD)
epitopes
4) To determine the role of CCD-specific IgE in the epidemiology of allergic
sensitisation and disease (asthma)
This thesis is written in the ‘Research paper’ format, and comprises eight chapters. Each
of the seven research papers included in this thesis was written as a stand-alone
manuscript, albeit using data collected from the same study settings. Therefore, there is
inevitable duplication of some of the information among the papers, and between the
papers and the remainder of the thesis. Duplicated material includes information on
study settings, experimental methods and clinical procedures. The research papers are
not presented in the chronological order of publication, but rather in the order in which
research objectives are listed above.
Chapter 1 is the thesis background. It presents literature on the burden of allergy-related
outcomes in the tropics, the helminth-allergen interaction and similarities in the immune
responses associated helminth infections and allergy, current understanding of
hypothesised mechanisms of inverse and positive helminth-allergy associations and the
potential role of helminth and allergen protein- and carbohydrate-specific antibodies in
epidemiological trends of allergy. This section also touches upon current understanding
of the interaction between the rural-urban environment and helminth infection exposure
2.3 Thesis objectives
2.4 Thesis structure
61
and how this may influence the epidemiology of allergy in the tropics. Finally, the scope
of this PhD thesis is given.
Chapter 2 describes the general hypothesis, thesis objectives and the thesis structure.
Chapter 3 provides a detailed account of the study design, study setting, relevant clinical
procedures and experimental methods.
Chapter 4 (Research Paper 1)3 is the first results chapter, and presents findings from
cross-sectional analyses of epidemiological and immunological risk factors for atopy and
clinical allergy outcomes in urban and rural Uganda. This chapter further assesses to
what extent helminth infections contribute to rural-urban differences in these risk factors,
in Uganda.
Chapter 5 (Research Paper 2) describes total, allergen- and S. mansoni-specific IgE
and IgG4 profiles, and their relationship with S. mansoni infection status, atopic
sensitisation and clinical allergy in a rural setting with high prevalence of S. mansoni
infection.4 Although the focus of this thesis is antibodies, this paper also describes
associations between S. mansoni-specific cytokine profiles and allergy-related
outcomes, giving a more complete picture of the association between S. mansoni-
specific immune responses and allergy in Uganda.
Chapter 6 (Research Paper 3) describes population-level antibody responses to key
components of the schistosome glycome: core -1,2-xylose and -1,3-fucose
substituted N-glycans.5 This chapter highlights rural-urban differences in these
responses, describes their relationship with S. mansoni infection and intensity and
discusses their relevance to diagnostics, cross-reactivity and associations with
protective immunity against S. mansoni.
Chapter 7 (Research Paper 4) assesses associations between IgE reactivity to cross-
reactive carbohydrate determinant (CCD) N-glycan epitopes (core -1,2-xylose and/or
-1,3-fucose, introduced in Chapter 6) and allergic sensitisation and disease.
62
Chapter 8 discusses the main findings from this PhD project, and provides an account
of study strengths, limitations and implications. The conclusion and recommendations
for further research are also included in this chapter.
Appendices are included after Chapter 8. Appendix 1 is a published narrative literature
review (Research Paper 5)6 of the benefits and potential detrimental effects of mass
anthelminthic treatment with regard to responses to vaccines and unrelated diseases
(such as allergies). Appendix 2 is an original article (Research paper 6)7 describing
epidemiological associations between helminth infections and allergy-related outcomes
in the Lake Victoria fishing communities, Uganda, prior to community-wide intensive
versus standard anthelminthic treatment. Appendix 3 is also an original article
(Research Paper 7)8 describing an assessment of the impact of community-wide
intensive versus standard anthelminthic treatment on allergy-related outcomes, helminth
infection intensity, and helminth-related morbidity in Lake Victoria fishing communities,
Uganda. Appendix 4 includes copies of ethical approvals.
1. Sy CB, Siracusa MC. The Therapeutic Potential of Targeting Cytokine Alarmins to Treat Allergic Airway Inflammation. Frontiers in physiology 2016; 7: 214-.
2. Lee TH, Song HJ, Park CS. Role of inflammasome activation in development and exacerbation of asthma. Asia Pac Allergy 2014; 4(4): 187-96.
3. Nkurunungi G, Lubyayi L, Versteeg SA, et al. Do helminth infections underpin urban-rural differences in risk factors for allergy-related outcomes? Clin Exp Allergy 2019.
4. Nkurunungi G, Kabagenyi J, Nampijja M, et al. Schistosoma mansoni-specific immune responses and allergy in Uganda. Parasite immunology 2018; 40(1).
5. Nkurunungi G, van Diepen A, Nassuuna J, et al. Microarray assessment of N-glycan-specific IgE and IgG profiles associated with Schistosoma mansoni infection in rural and urban Uganda. Sci Rep 2019; 9(1): 3522.
6. Sanya RE, Nkurunungi G, Andia Biraro I, Mpairwe H, Elliott AM. A life without worms. Transactions of The Royal Society of Tropical Medicine and Hygiene 2017; 111(1): 3-11.
7. Webb EL, Nampijja M, Kaweesa J, et al. Helminths are positively associated with atopy and wheeze in Ugandan fishing communities: results from a cross-sectional survey. Allergy 2016; 71(8): 1156-69.
2.5 Chapter 2 references
63

8. Sanya RE, Nkurunungi G, Hoek Spaans R, et al. The Impact of Intensive Versus Standard Anthelminthic Treatment on Allergy-related Outcomes, Helminth Infection Intensity, and Helminth-related Morbidity in Lake Victoria Fishing Communities, Uganda: Results From the LaVIISWA Cluster-randomized Trial. Clinical Infectious Diseases 2018: ciy761-ciy.
64
CHAPTER 3. MATERIALS AND METHODS
3.1 Preamble
This chapter provides an overview of context and methods for the work conducted during
this PhD research. Methods are further summarised in the individual Research Papers.
3.2 Study design and population
Most of the data presented in this PhD thesis were obtained using samples from
participants of three cross-sectional surveys in two proximate settings in Uganda, one
characterised as rural and the other as urban. The first two surveys were 1) the baseline
and 2) the allergy outcomes survey of a cluster-randomised trial of community-wide
intensive versus standard anthelminthic treatment in helminth-endemic Ugandan fishing
villages. The third survey was a parallel survey of allergy outcomes in proximate urban
communities with lower helminth exposure. Chapter 5 (Table E5) and Chapter 7 further
include data from samples obtained from a case-control study among asthmatic children
and non-asthmatic controls from urban and peri-urban schools in Uganda. These studies
were part of a portfolio of work on the prevalence, phenotypes and risk factors for allergy-
related outcomes in Uganda, and are described below.
3.2.1 The LaVIISWA trial
Residents of 26 fishing villages in the islands of Koome sub-county (Lake Victoria,
Mukono district, Uganda, Figure 3.1, below) were invited to participate in the Lake
Victoria Island Intervention Study on Worms and Allergy-related diseases (LaVIISWA;
ISRCTN47196031, described below and in Appendices 2 and 3 in more detail).1 Koome
sub-county had a population of 18,778 in 2014, according to the Uganda National
Population and Housing Census report2. The living conditions in Koome islands are
characterised by poor housing and sanitation (Figure 3.2, below), and lack of access to
treated water. Helminth prevalence is very high: up to 85% of individuals living in the
fishing villages in 2016 were infected with Schistosoma mansoni (based on the urine test
for circulating cathodic antigen, CCA) and 9% with hookworm (based on PCR detection
65
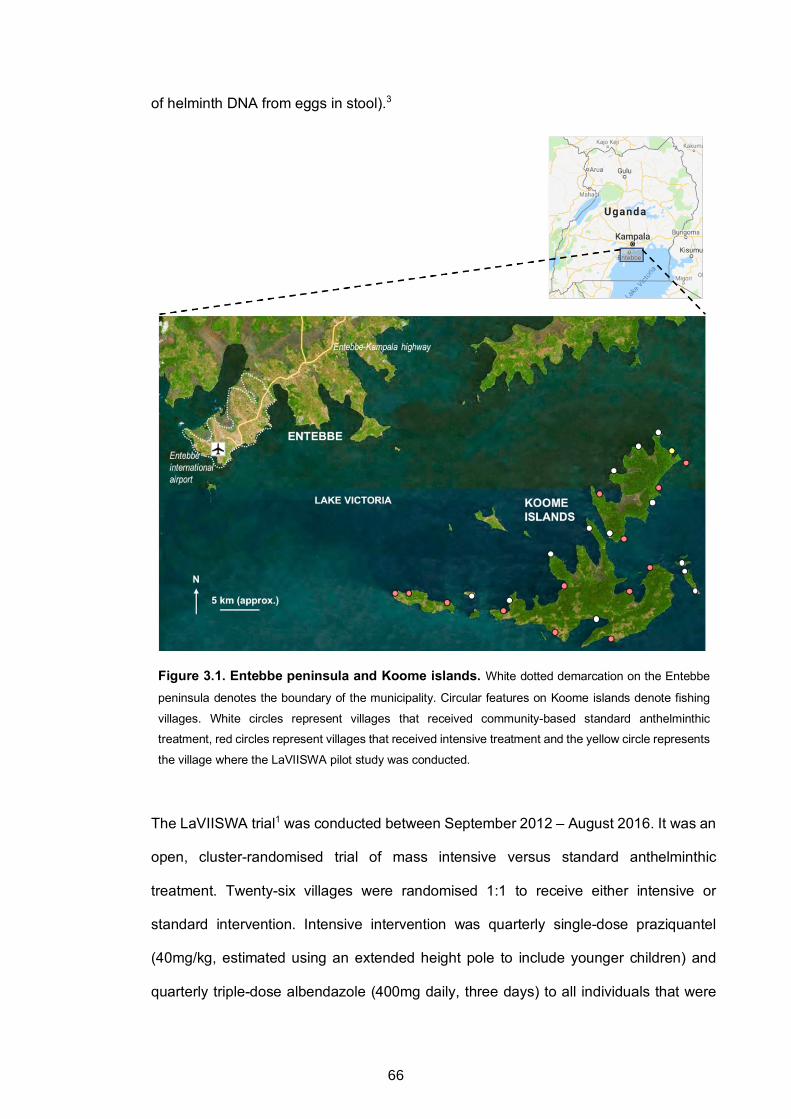
of helminth DNA from eggs in stool).3
Figure 3.1. Entebbe peninsula and Koome islands. White dotted demarcation on the Entebbe
peninsula denotes the boundary of the municipality. Circular features on Koome islands denote fishing
villages. White circles represent villages that received community-based standard anthelminthic
treatment, red circles represent villages that received intensive treatment and the yellow circle represents
the village where the LaVIISWA pilot study was conducted.
The LaVIISWA trial1 was conducted between September 2012 – August 2016. It was an
open, cluster-randomised trial of mass intensive versus standard anthelminthic
treatment. Twenty-six villages were randomised 1:1 to receive either intensive or
standard intervention. Intensive intervention was quarterly single-dose praziquantel
(40mg/kg, estimated using an extended height pole to include younger children) and
quarterly triple-dose albendazole (400mg daily, three days) to all individuals that were
66
one year or older. Standard intervention was annual single-dose praziquantel (40mg/kg,
estimated using a standard height pole), and six-monthly single-dose albendazole
400mg to all individuals that were one year or older. There was no follow-up of individual
participants, as the study did not include a cohort of individuals. This trial was the first of
its kind, and hence provided the first opportunity for population-level evaluation of
changes (in antibody profiles) induced by such intervention. A detailed description of the
LaVIISWA trial, including study design and setting, randomisation procedures,
interventions, surveys and outcomes has been published, and is included in this PhD
thesis as Research Paper 7 (Appendix 3).
LaVIISWA data used in this PhD Research were obtained during two cross-sectional
surveys. A baseline household survey (October 2012 – July 2013) was conducted before
the first round of the trial intervention: epidemiological associations between helminth
infections and allergy-related outcomes are reported in Research paper 6 (Appendix 2,
this thesis). Chapter 5 (Research Paper 2) presents results (on total, allergen- and S.
mansoni-specific IgE and IgG4 profiles) obtained from samples collected during the
baseline survey.
After three years of the trial intervention, an allergy outcomes survey (September 2015
– August 2016) was conducted. Before this survey, a census of households in each
village was done. Seventy households per village were then randomly selected for the
survey, using a Stata program (College Station, Texas). Household members aged ≥
one year were invited to participate. Permission for household participation was granted
by the household head, or another adult, if the former was absent. Results from the
outcome survey indicated that intensive versus standard anthelminthic treatment
reduced hookworm prevalence and S. mansoni infection intensity, but had no effect on
the overall prevalence of other nematodes and S. mansoni, or allergy-related outcomes
(Research Paper 7, Appendix 3). Furthermore, there was no evidence of an effect of
treatment arm on most laboratory outcomes (Table E1, Chapter 5). Therefore,
67
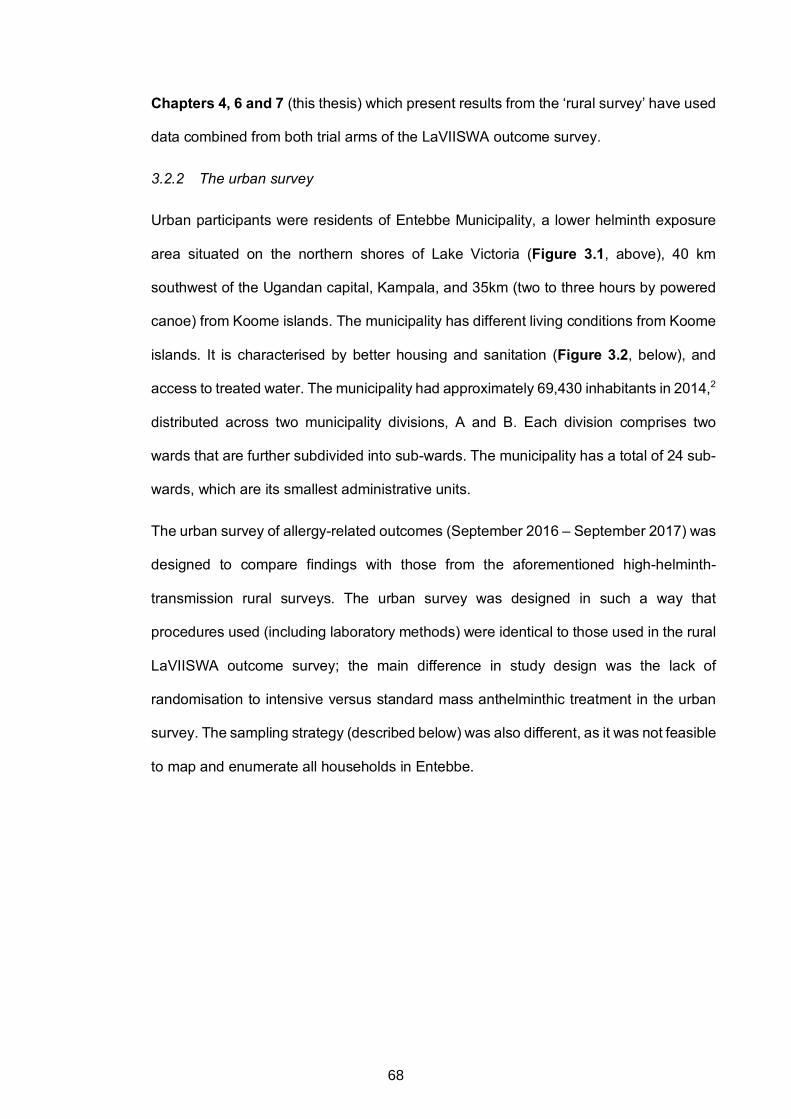
Chapters 4, 6 and 7 (this thesis) which present results from the ‘rural survey’ have used
data combined from both trial arms of the LaVIISWA outcome survey.
3.2.2 The urban survey
Urban participants were residents of Entebbe Municipality, a lower helminth exposure
area situated on the northern shores of Lake Victoria (Figure 3.1, above), 40 km
southwest of the Ugandan capital, Kampala, and 35km (two to three hours by powered
canoe) from Koome islands. The municipality has different living conditions from Koome
islands. It is characterised by better housing and sanitation (Figure 3.2, below), and
access to treated water. The municipality had approximately 69,430 inhabitants in 2014,2
distributed across two municipality divisions, A and B. Each division comprises two
wards that are further subdivided into sub-wards. The municipality has a total of 24 sub-
wards, which are its smallest administrative units.
The urban survey of allergy-related outcomes (September 2016 – September 2017) was
designed to compare findings with those from the aforementioned high-helminth-
transmission rural surveys. The urban survey was designed in such a way that
procedures used (including laboratory methods) were identical to those used in the rural
LaVIISWA outcome survey; the main difference in study design was the lack of
randomisation to intensive versus standard mass anthelminthic treatment in the urban
survey. The sampling strategy (described below) was also different, as it was not feasible
to map and enumerate all households in Entebbe.
68
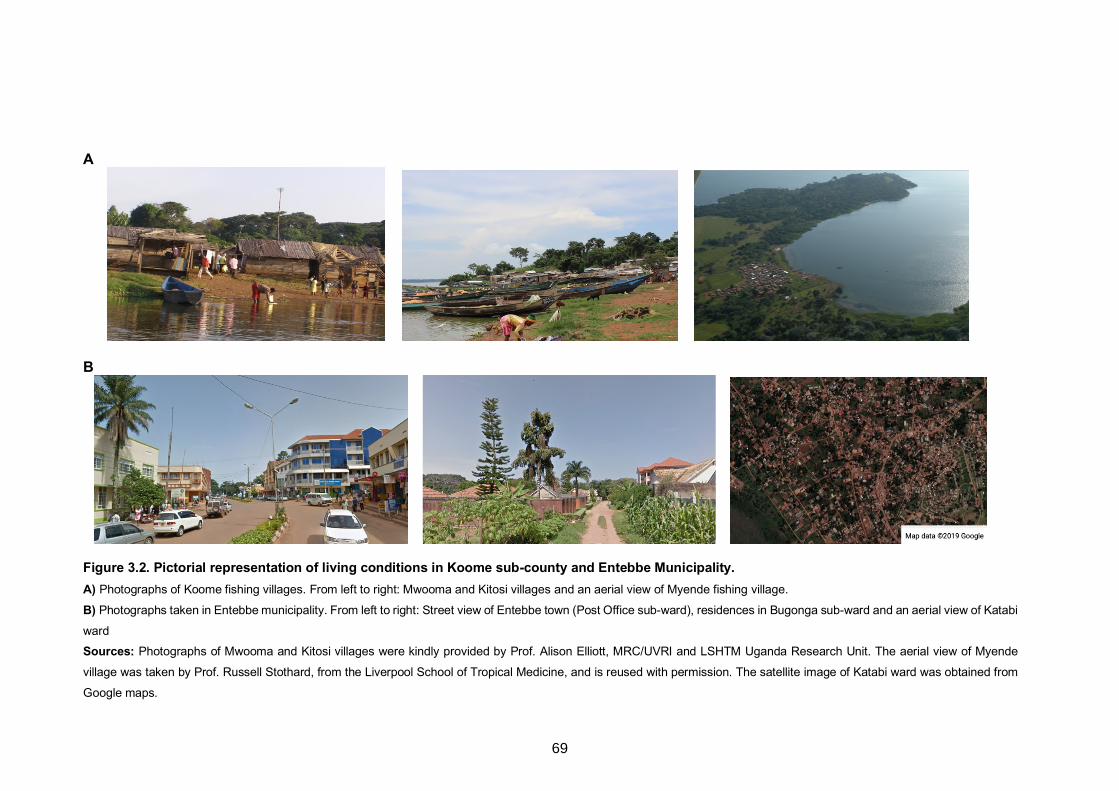
A
B
Figure 3.2. Pictorial representation of living conditions in Koome sub-county and Entebbe Municipality. A) Photographs of Koome fishing villages. From left to right: Mwooma and Kitosi villages and an aerial view of Myende fishing village.
B) Photographs taken in Entebbe municipality. From left to right: Street view of Entebbe town (Post Office sub-ward), residences in Bugonga sub-ward and an aerial view of Katabi
ward Sources: Photographs of Mwooma and Kitosi villages were kindly provided by Prof. Alison Elliott, MRC/UVRI and LSHTM Uganda Research Unit. The aerial view of Myende
village was taken by Prof. Russell Stothard, from the Liverpool School of Tropical Medicine, and is reused with permission. The satellite image of Katabi ward was obtained from
Google maps.
69
Before the start of the survey, each sub-ward was mapped onto satellite images of
Entebbe municipality with the help of locally available maps. A random point generation
function of ArcGIS software (version 10.4.1, Environmental Systems Research Institute,
Redlands, CA) was then used to generate random starting points within each sub-ward.
The number of starting points selected was proportional to the population size of the sub-
ward. Coordinates of the random starting points generated were loaded onto geographic
information system (GIS) devices (eTrex®, Garmin™ Ltd, Olathe, KS). These devices
were then used in the field to identify the selected random points, from which the nearest
four houses were surveyed.
The asthma case-control study
The asthma study (May 2015 – July 2017) enrolled 5-17-year-old asthmatics and non-
asthmatic controls from primary and secondary schools in Entebbe municipality and the
surrounding peri-urban and urban areas in Wakiso District in central Uganda. Asthma
was defined as a history of wheeze in the last 12 months, according to the International
Study on Allergy and Asthma in Children (ISAAC) paper and video questionnaires. All
children without a history of wheezing (ever) were eligible as controls for the study,
provided that they were on the same class register as cases. For each class, a Stata
programme and the class register were used to randomly select participants such that
the number of controls was twice the number of cases. Procedures in the asthma study
were also designed to be identical to those used in the rural and urban surveys.
Kato-Katz
The Kato-Katz technique4 was used for qualitative and semi-quantitative diagnosis of
Schistosoma mansoni infection and intestinal helminth infections caused by hookworm,
Ascaris lumbricoides and Trichuris trichiura. The technique was conducted on one stool
sample per participant, prepared as a 41.7 mg thick smear on two slides. Each slide was
3.2.3
3.3 Parasitological examinations
3.3.1
70
examined under a microscope by different laboratory technologists who were blinded to
each other’s readings. Results were presented as eggs per gram of stool (epg).
Schistosoma mansoni infection (Kato-Katz) intensities were categorised according to
World Health Organisation (WHO) guidelines as follows: light infection 1–99 epg,
moderate infection 100–399 epg and heavy infection ≥400 epg.
3.3.2 Detection of helminth DNA in stool
3.3.2.1 DNA extraction
The remaining stool sample was stored (suspended in ethanol and frozen at -80oC) and
later had total DNA (and hence helminth DNA, if present) extracted using the QIAamp
DNA Mini Kit (catalogue number 51306, QIAGEN) for determination (using multiplex
real-time PCR) of S. mansoni, Strongyloides stercoralis and hookworm (Necator
americanus) infections.
The DNA extraction procedure was conducted with minor changes to the manufacturer’s
instructions as follows: samples were left to thaw at room temperature (RT) and then
vortexed for five seconds to homogenise the ethanol-stool mixture. The homogenized
mixture (0.5 ml) was transferred into a safe-lock microcentrifuge (Eppendorf®) tube and
centrifuged at 13000 rpm for 3 minutes to get rid of the ethanol. The pellet was re-
suspended in 200 μl of 1X phosphate buffered saline (PBS) containing 2%
polyvinylpolypyrrolidone (PVPP) (77627, Fluka analytical, Sigma-Aldrich) and frozen
overnight at -20°C. The stool suspension was heated at 100°C for 10 minutes, 200 µl of
the QIAGEN tissue lysis buffer (ATL) and proteinase K mixture (9 to 1 ratio) added, and
samples vortexed and incubated for two hours or overnight at 55°C in a heat block. The
QIAGEN AL Buffer (400 μl) was then added, mixed thoroughly with the sample by
vortexing and the mixture incubated at 70°C for 10 minutes. This was followed by
centrifugation for one minute at 13000 rpm and transfer of the supernatant to 400 μl of
ethanol (96-100%). The DNA was then purified in QIAamp spin columns using
consecutive washes with QIAGEN AW1 (500 μl) and AW2 (500 μl) buffers. The QIAGEN
71
AE buffer (200 μl) was used to elute the DNA. The DNA was quantified on a NanoDrop™
2000c spectrophotometer (Thermo Fisher Scientific) and then diluted to 50ng/µl.
3.3.2.2 Multiplex real-time PCR
The multiplex real-time PCR was adapted from existing procedures,5,6 and is detailed in
this section. Below are the specific forward (F) and reverse (R) primers and TaqMan®
probes that were used to simultaneously detect DNA from three helminth species:
Necator americanus
Na58F: 5’-CTGTTTGTCGAACGGTACTTGC-3’
Na158R: 5’-ATAACAGCGTGCACATGTTGC-3’
Na81MGB: FAM-5’-CTGTACTACGCATTGTATAC-3’-BHQ1
Schistosoma mansoni
Ssp48F: 5’-GGTCTAGATGACTTGATYGAGATGCT-3’
Ssp124R: 5’-TCCCGAGCGYGTATAATGTCATTA-3’
Ssp78T-RT: Texas Red-5’-TGGGTTGTGCTCGAGTCGTGGC-3’-BHQ2
Strongyloides stercoralis
Stro18S-1530F: 5’-GAATTCCAAGTAAACGTAAGTCATTAGC-3’
Stro18S-1630R: 5’-TGCCTCTGGATATTGCTCAGTTC-3’
Stro18S-1586T: NED-5’-ACACACCGGCCGTCGCTGC-3’-BHQ1
Phocine herpes virus (PhHV) DNA, extracted from the Phocine herpes virus (kindly
provided by Dr. Martin Schutten, Erasmus Medical Center, Rotterdam, the Netherlands),
was included in the PCR master mix, thus distributed to all reaction wells as an internal
control to check for PCR inhibition. The PhHV forward primer PhHV-267s (5’-
GGGCGAATCACAGATTGAATC-3’), reverse primer PhHV-337as (5’-
GCGGTTCCAAACGTACCAA-3’) and probe PhHV-305tq (Cy5-5’-
72
TTTTTATGTGTCCGCCACCATCTGGATC-3’-BHQ2) were used for Phocin herpes virus
DNA detection. A positive pool was included on the plate for every run as a test control.
The positive pool was made up of a mixture of DNA from samples (from among the study
samples) that were highly positive for S. mansoni and N. americanus on Kato-Katz, and
DNA positive for S. stercoralis (kindly provided by Dr. Jaco J. Verweij, St. Elisabeth
Hospital, Tilburg, the Netherlands). The amplification conditions were 10 minutes at
95oC, 50 cycles of 15 seconds at 95oC, 30s at 60oC and 30s at 72oC. DNA amplification,
detection and data analysis were attained with the ABI 7500 Fast Real time machine and
7500 Fast systems software version 1.4.0. Quality control was conducted by Dr. Jaco J.
Verweij, using a small subset of DNA samples.
3.3.3 Assessment of circulating cathodic antigen of S. mansoni in urine
The circulating cathodic antigen (CCA) of S. mansoni was assessed in mid-stream urine
using a point-of-care test from Rapid Medical Diagnostics, South Africa
(http://www.rapid-diagnostics.com). The CCA assays were performed according to the
assay kit manufacturer's instructions. A result was considered invalid if the control band
did not form. Valid results were presented as negative (no test band) or positive
(irrespective of whether the test band was weak or strong).
Schistosoma haematobium is not present in the areas where the studies were
conducted.7
3.4 Assessment of allergy-related outcomes
The main allergy-related outcomes were recent (previous 12 months) self-reported
wheeze (as a proxy for asthma), skin prick test (SPT) reactivity to common allergens in
the study settings,8 and allergen-specific IgE (asIgE) sensitisation. Data were also
obtained on visible flexural dermatitis, recent rhinitis and recent urticarial rash.
73
3.4.1 Wheeze
Standardised paper and video questionnaires about wheeze have been shown to have
good validity for the diagnosis of asthma in epidemiological studies,9,10 and hence were
used to obtain data on recent (previous 12 months) self-reported wheeze. These
questionnaires were interviewer-administered, and used guidelines from ISAAC.11
Wheeze was analysed separately for individuals below and above age five years. The
principal age group of interest was ≥5 years because wheeze among children aged
below five years does not necessarily represent asthma:12 it can be caused by conditions
such as viral bronchiolitis.13
3.4.2 Visible flexural dermatitis
Visible flexural dermatitis, the classical physical sign of eczema, was assessed by
interview using questions from the UK diagnostic criteria on atopic eczema, and by direct
physical examination as described in Williams’ on-line manual.14 In brief, an individual
was recorded as having dermatitis in case of an erythematous rash with surface change
(vesicles, scaling, crusting, oozing, or lichenification) in and around skin creases (fronts
of neck or ankles, folds of elbow, behind the knees), or among infants, on the cheeks,
the trunk and the outer surface of the limbs.15,16
3.4.3 Rhinitis and urticarial rash
Data on rhinitis (runny/blocked nose or sneezing accompanied by watery and itchy eyes,
in absence of a cold or ‘flu’) and urticarial rash (pruritic rash with elevated erythematous
patches [wheals], known as ‘ebilogologo’ in the local Luganda language) were obtained
using interviewer-administered questionnaires.
3.4.4 Skin prick test reactivity
Skin prick test reactivity to common environmental allergens in the study settings8 was
assessed using standard procedures.17 The allergens assessed were
Dermatophagoides mix, Blomia tropicalis and German cockroach (Blattella germanica)
74
(ALK-Abelló; supplied by Laboratory Specialities [Pty] Ltd., South Africa). Individuals
were considered reactive if they had a wheal ≥3mm in diameter, in presence of histamine
(positive) and normal saline (negative) controls. Reactivity was analysed primarily as a
positive SPT response to any of the three allergens versus no response to all three
allergens. SPT reactivity was also assessed as a positive versus negative response to
individual allergens.
3.4.5 Measurement of total and allergen-specific IgE using the ImmunoCAP test
The ImmunoCAPÒ test (Thermo Fisher Scientific, Uppsala, Sweden)18 was used to
measure total and crude house dust mite (Dermatophagoides pteronyssinus), peanut
(Arachis hypogaea), and German cockroach (Blatella germanica) extract-specific
plasma IgE (asIgE) levels. The ImmunoCAP assay uses an automated system that loads
serum / plasma on 1) a hydrophilic polymer sponge (the ‘ImmunoCAP’) covalently
coupled to an allergen (for specific IgE measurement) or 2) an ImmunoCAP reaction
vessel covalently coupled to an anti-IgE antibody (which reacts with total IgE in sample).
Unbound IgE is washed off and a conjugate (anti-IgE antibody grafted with β-
galactosidase) is added. The supernatant is then aspirated, and a substrate (methyl-
umbelliferyl-β-D galactoside) deposited on the ImmunoCAP sponge. A stop solution is
added and the sponge then compressed. The fluorescence generated by the resultant
eluate, a product of enzyme degradation (methyl umbelliferone, proportional to
concentration of IgE in serum/plasma), is measured. Results are reported quantitatively
using a kU/L scale. The calibrator is IgE bound to anti-IgE caps using a six-point
quantitative curve. Calibration concentration ranges from 0 to 100 kU/L for specific IgE
and 2 to 5000 kU/L for total IgE.
A cut-off of 0.35 kU/L was used to define allergen-specific IgE sensitisation to any of
house dust mite, peanut or cockroach, as recommended by the test manufacturer.19
Responses were also assessed as continuous outcomes and as positive (≥0.35 kU/L)
75
versus negative for individual allergens. Total IgE was assessed as a continuous
outcome.
3.4.6 Measurement of allergen-specific IgE levels by ELISA
Crude D. pteronyssinus- and B. germanica extract-specific IgE was measured using an
in-house ELISA, as follows: all but the first 2 columns of MICROLON® high binding 96-
well plates (Greiner bio-one, UK) were coated with 50μl of D. pteronyssinus or B.
germanica allergens (Greer Labs, Lenoir, NC, USA) at a concentration of 5μg/ml in in
bicarbonate (Na2CO3 + NaHCO3) buffer (0.1M, pH 9.6). Two-fold dilutions of human IgE
(Calbiochem, Beeston, UK) standard, diluted in bicarbonate buffer, were added to the
first 2 columns of each plate to form standard curves. The plates were then incubated
overnight at 4ºC. Plates were washed with phosphate-buffered saline (PBS)-Tween 20
solution, blocked with 150μl of skimmed milk diluted in PBS-Tween 20 at room
temperature (RT), and incubated overnight at 4ºC with 50μl of plasma samples diluted
1/20 with 10% fetal bovine serum in PBS-Tween 20 (assay buffer). Plates were washed
and antibody binding detected by incubating the plates overnight at 4ºC with 0.5μg/ml of
biotinylated monoclonal mouse anti-human IgE (BD Pharmingen™), followed by a one-
hour incubation with a streptavidin-Horseradish Peroxidase (strep-HRP) conjugate (Mast
Group Ltd, Bootle, UK), diluted 1/3000 with assay buffer, at RT. Plates were developed
by addition of 100μl of o-phenylenediamine (Sigma-Aldrich) and reactions stopped with
30μl of 2M Sulphuric acid. Optical density values were measured at 490nm (reference
wavelength 630nm) on a 96-well plate ELISA reader. IgE concentrations (ng/ml) were
interpolated from standard curves using a five-parameter curve fit using Gen5 data
collection and analysis software (BioTek Instruments Inc, Vermont, Winooski, USA).
This assay had a lower detection limit of 15.6 ng/ml (hence 312 ng/ml in undiluted
samples). This cut-off was used to assess detectable (versus undetectable) responses
to either D. pteronyssinus or B. germanica. Responses were also assessed as
continuous outcomes.
76
3.4.7 Component-resolved assessment of allergen-specific IgE sensitisation using
the ISAC microarray
The ImmunoCAPÒ ISAC (Immuno Solid-phase Allergen Chip) microarray was used to
measure IgE to 112 natural and recombinant allergen components from 51 allergen
sources. The ISAC array (Thermo Fisher Scientific, Uppsala, Sweden) is an in vitro semi-
quantitative multi-allergen screening assay used in component-resolved diagnosis of
allergic sensitisation.20 The test manufacturer's instructions were followed. Briefly,
ImmunoCAP ISAC sIgE 112 microarray chips were washed, air dried and then incubated
with 30μl of undiluted participant plasma for two hours in a humidified chamber to enable
reactions between IgE and allergen components. The chips were washed again, and
incubated at room temperature for 30 minutes with 30μl of fluorescence-labelled anti-
human IgE detection antibody. After another washing step, the fluorescence intensity of
each microarray was measured by a scanner (LuxScan 10K/A, CapitalBio, Beijing,
China). Analysis of the digitalized images was done using Phadia Microarray Image
Analysis software (Thermo Fisher Scientific). Results were reported in arbitrary semi-
quantitative ISAC Standardised Units (ISU).
Participants were considered sensitised to an allergen component in case of an ISU
measurement of 0.3 or higher, based on the test manufacturer’s recommendations.21
Measurements were also reported as a detectable versus undetectable (lower detection
limit was 0.06 ISU).
3.5 Microarray detection of N-glycan-specific IgE and IgG
Plasma IgE and IgG responses to 135 chemo-enzymatically synthesised N-glycans with
and without core a-1,3-fucosylation and, or, b-1,2-xylosylation were assessed using a
non-commercial microarray (Figure S1, Research Papers 3 and 4). The microarray
slides were constructed by Dr Niels-Christian Reichardt’s glycotechnology laboratory at
Centro de Investigación Cooperativa en Biomateriales (CIC biomaGUNE), in San
Sebastián, Spain. The microarray construction procedures have been published.22,23
77
Each microarray reaction site included fluorescently-labelled bovine serum albumin
(BSA) as a printing control. The antibody binding assay was adapted from existing
procedures,24-27 as follows: Nexterion H N-hydroxysuccinimide-coated microarray slides
(Schott AG, Mainz, Germany) (pre-blocked for 1 hour with 50mM ethanolamine in 50mM
sodium borate buffer pH 9.0, and stored at -20°C) were thawed at room temperature
(RT) and covered with silicone gaskets to create seven wells with printed microarrays
per slide. Each microarray was incubated with 300 μl of a 1:30 plasma dilution in 1%
BSA - 0.01% Tween20 for one hour at RT while shaking. After sequential washes with
PBS-0.05% Tween20 and PBS, the slides were incubated for 30 minutes at RT in the
dark with PromoFluor 647-labelled anti-human IgE (diluted 1/150 in PBS-0.01%
Tween20) and Cy3-labelled anti-human IgG (diluted 1/1000 in PBS-0.01% Tween20),
while shaking. After a final wash with PBS-0.05% Tween20, PBS and deionised water,
sequentially, the slides were dried and kept in the dark until scanning. The slides were
scanned for fluorescence at a 10μm resolution with a G2565BA scanner (Agilent
Technologies, CA, USA) using 633nm and 532nm lasers for detection of reactivity to
glycan-specific IgE and IgG, respectively.
3.5.1 Glycan microarray image processing and analysis of data
Using GenePix Pro 7.0 software (Molecular Devices, CA, USA), a spot-finding algorithm
was used to align and re-size fluorescence spots in the microarray images, without
setting a composite pixel intensity threshold. Data on median fluorescence intensity
(MFI) for each spot and the local background were then exported to Microsoft Excel
software. In all analyses, MFIs that were highlighted as artefacts by the GenePix Pro 7.0
software were excluded. Further processing of IgG MFIs in Excel was done based on
procedures described by Oyelaran et al.28 as follows: for each spot, the MFI of the spot
was subtracted from the local background MFI. For each glycan structure, the average
over four spots (or fewer, in case of unreliable data that were excluded) was obtained.
Any MFI values below 150 were set to 150 to reduce noise at the low end of the MFI
78
range. Median values of negative controls included on each array were subtracted, and
any negative values set to zero. Datasets were then log2-transformed to normalize the
data. Further processing of IgE MFIs in Excel was done as described by Amoah et al.,24
as follows: for each IgE spot, the ratio of the MFI of the spot to the local background MFI
was obtained and then multiplied by the average of background MFI for all the spots on
the array. For each of the structures, the average over four spots (or less, in case of
unreliable data that were excluded) was then log2-transformed.
3.6 Other experimental methods
3.6.1 Allergen-specific IgG4 ELISA
All but the first 2 columns of MICROLON® high binding 96-well plates (Greiner bio-one,
UK) were coated with 50μl of D. pteronyssinus or B. germanica allergens (Greer Labs,
Lenoir, NC, USA) at a concentration of 5μg/ml in bicarbonate (Na2CO3 + NaHCO3) buffer
(0.1M, pH 9.6). Two-fold dilutions of human IgG4 (Sigma-Aldrich) standard, diluted in
bicarbonate buffer, were added to the first 2 columns of each plate to form standard
curves. The plates were then incubated overnight at 4ºC. Plates were washed with
phosphate-buffered saline (PBS)-tween 20 solution, blocked with 150μl of skimmed milk
diluted in PBS-Tween 20 at room temperature (RT), and incubated overnight at 4ºC with
50μl of plasma samples diluted 1/40 with 10% fetal bovine serum in PBS-Tween 20
(assay buffer). Plates were washed and antibody binding detected by incubating the
plates overnight at 4ºC with 0.5μg/ml of biotinylated monoclonal mouse anti-human IgG4
(BD Pharmingen™), followed by a one-hour incubation with a streptavidin-Horseradish
Peroxidase (strep-HRP) conjugate (Mast Group Ltd, Bootle, UK), diluted 1/3000 with
assay buffer, at RT. Plates were developed by addition of 100μl of o-phenylenediamine
(Sigma-Aldrich) and reactions stopped with 30μl of 2M Sulphuric acid. Optical density
values were measured at 490nm (reference wavelength 630nm) on a 96-well plate
ELISA reader. IgG4 concentrations (ng/ml) were interpolated from standard curves using
79
a five-parameter curve fit using Gen5 data collection and analysis software (BioTek
Instruments Inc, Vermont, Winooski, USA).
3.6.2 Total IgE ELISA
96-well Maxisorp plates (VWR, U.S.A) were coated with 100μl of polyclonal rabbit anti
human IgE (Agilent technologies, Dako, Denmark) diluted 1/1000 in bicarbonate buffer
(0.1M, pH 9.6) and incubated overnight at 4ºC. Plates were then washed with phosphate-
buffered saline (PBS)-tween 20 solution and blocked with 120μl of PBS-bovine serum
albumin (BSA) solution for 1 hour at room temperature (RT). Plasma samples (100μl)
diluted 1/50 in assay buffer (0.1M Tris pH 7.5 + 0.05% Tween-20), the blank (assay
buffer) and National Institute for Biological Standards and Control (NIBSC) international
IgE standards were added to the plates and incubated for 1 hour at RT. Plates were then
washed and incubated with 100μl of biotinylated goat anti-human IgE (Vector
laboratories, U.S.A, 0.5mg/ml), diluted 1/1000 with assay buffer, for 1 hour at RT. After
another washing step, the plates were incubated with 100μl of streptavidin alkaline
phosphatase (Roche Life Science), diluted 1/3000 with assay buffer, for 30 minutes at
RT. 4-nitrophenyl phosphate disodium salt hexahydrate (p-NPP), diluted in
diethanolamine buffer (DEA, 0.1M), was added, followed by 20 minutes incubation at RT
in the dark for development. Sodium hydroxide (3M, 100μl) was then added to stop the
reaction. Plates were read at 405 nm using an ELISA reader. Results were interpolated
from standard curves using a five-parameter curve fit using Gen5 data collection and
analysis software (BioTek Instruments Inc, Vermont, Winooski, USA).
3.6.3 Total IgG4 ELISA
96-well Maxisorp plates (VWR, U.S.A) were coated with purified mouse anti-human IgG4
(BD Pharmingen™) in bicarbonate buffer (0.1 M, pH 9.6) overnight at 4ºC, and blocked
for one hour with 3% skimmed milk in 1X PBS at room temperature (RT). Plates were
then incubated with plasma samples (diluted 1/800 in 0.1M Tris pH 7.5 + 0.05% Tween
20) and IgG4 standards (Sigma Aldrich) for one hour. Antibody binding was detected by
80
incubating the plates with mouse anti-human IgG4 conjugated to horseradish peroxidase
(Invitrogen) for one hour, followed by a colour reaction with o-phenylenediamine (Sigma
Aldrich). Reactions were stopped with 2M Sulphuric acid. Absorbance was measured at
490nm (reference wavelength 630nm) on a 96-well plate ELISA reader. IgG4
concentrations (ng/ml) were interpolated from standard curves using a five-parameter
curve fit using Gen5 data collection and analysis software (BioTek Instruments Inc,
Vermont, Winooski, USA).
3.6.4 S. mansoni adult worm (SWA)- and egg (SEA)-specific IgE and IgG4 ELISA
All but the first 2 columns of 4HBX Immulon (Thermo Scientific, NY, USA) 96-well plates
were coated with 50μl of SWA [8 μg/ml] or SEA [2.4 μg/ml] (purchased from Professor
Michael J Doenhoff, University of Nottingham) in bicarbonate (Na2CO3 + NaHCO3) buffer
(0.1M, pH 9.6). Two-fold dilutions of human IgE (Calbiochem, Beeston, UK) or IgG4
(Sigma-Aldrich) standard, diluted in bicarbonate buffer, were added to the first 2 columns
of each plate to form standard curves. The plates were then incubated overnight at 40C.
Plates were washed with phosphate-buffered saline (PBS 1X)-tween 20 solution,
blocked with 150μl of 1% skimmed milk diluted in PBS-Tween 20 at room temperature
(RT), and incubated overnight at 4ºC with 50μl of plasma samples diluted 1/20 (IgE
assay) or 1/200 (IgG4 assay) with 0.1% skimmed milk in PBS-Tween 20 (assay buffer).
Plates were washed and antibody binding detected by incubating the plates overnight at
4ºC with 0.5μg/ml of biotinylated monoclonal mouse anti-human IgE or IgG4 (BD
Pharmingen™). This was followed by a one-hour incubation with a streptavidin-
Horseradish Peroxidase (strep-HRP) conjugate (Mast Group Ltd, Bootle, UK), diluted
1/4000 with assay buffer, at RT. Plates were developed by addition of 100μl of o-
phenylenediamine (Sigma-Aldrich) and reactions stopped after 30 minutes with 25μl of
2M Sulphuric acid. Optical density values were measured at 490nm (reference
wavelength 630nm) on a 96-well plate ELISA reader. IgE or IgG4 concentrations (ng/ml)
81
were interpolated from standard curves using a five-parameter curve fit using Gen5 data
collection and analysis software (BioTek Instruments Inc, Vermont, Winooski, USA).
3.6.5 S. mansoni adult worm (SWA)- and egg (SEA)-specific IgG ELISA
All but the first 2 columns of 4HX Immulon (VWR, UK, Cat No 735-0465) 96-well plates
were coated with 50μl of SWA [8 μg/ml] or SEA [2.4 μg/ml] (purchased from Professor
Michael J Doenhoff, University of Nottingham) in bicarbonate (Na2CO3 + NaHCO3) buffer
(0.1M, pH 9.6). Two-fold dilutions of human IgG (Sigma-Aldrich), diluted in bicarbonate
buffer, were added to the first 2 columns of each plate to form standard curves. The
plates were then incubated overnight at 4ºC. Plates were washed with phosphate-
buffered saline (PBS)-Tween 20 solution, blocked with 150μl of 1% skimmed milk diluted
in PBS-Tween 20 at room temperature (RT), and incubated overnight at 4ºC with 50μl
of plasma samples diluted 1/3000 with 0.1% skimmed milk in PBS-Tween 20 (assay
buffer). Plates were washed and antibody binding detected by incubating the plates for
1 hour at RT with 0.5μg/ml of polyclonal rabbit anti- human IgG/HRP (Dako, Denmark).
Plates were developed by addition of 100μl of o-phenylenediamine (Sigma-Aldrich) and
reactions stopped after 30 minutes with 25μl of 2M Sulphuric acid. Optical density values
were measured at 490nm (reference wavelength 630nm) on a 96-well plate ELISA
reader. IgG concentrations (ng/ml) were interpolated from standard curves using a five-
parameter curve fit using Gen5 data collection and analysis software (BioTek
Instruments Inc, Vermont, Winooski, USA).
3.7 Selection of samples for antibody studies
The flow chart for selection of samples for antibody studies is shown in Figure 3.3,
below.
In the rural (LaVIISWA outcome) survey, 2961 participants from the 26 study villages
had a plasma sample stored and hence qualified to be selected for the ImmunoCAP IgE
test. This test could not be conducted in all participants for cost reasons. Therefore, 780
82
participants (30 per village) were randomly selected using Stata 13.1 software
(StataCorp, College Station, Texas, U.S.A). The main LaVIISWA trial analysis aimed to
compare outcomes between the two trial arms.1,3 A sample size of 780 was expected to
give 80% power to detect a 35% relative difference in the prevalence of ImmunoCAP
allergen-specific IgE sensitisation between the two trial arms, based onan assumed
overall allergen-specific IgE sensitisation prevalence of 50% (from results at baseline),
and an estimated coefficient of variation (in IgE levels between clusters) of 0.2. Enzyme-
linked Immunosorbent Assays (ELISAs) for measurement of total, SWA-, SEA- and
allergen-specific IgE and IgG4, and SWA- and SEA-specific IgG were conducted using
the same 780 samples.
Samples for the glycan and ISAC microarray experiments were randomly selected from
among those with ImmunoCAP data. The aim was to assay 50 samples per trial arm
(100 in total). A total of 209 (glycan array) and 126 samples (ISAC array experiments,
respectively), equally distributed across trial arms, were eventually tested, owing to
availability of further funding from the Royal Society of Tropical Medicine and Hygiene
(RSTMH) and the European Academy of Allergy and Clinical Immunology (EAACI).
Although the sample size was arbitrary, and largely determined by available resources,
similar numbers have been shown to be useful in published studies that have assessed
differences in microarray-assessed antibody levels between helminth infected and
uninfected, and allergic and non-allergic individuals,24,29 and between children and
adults.25
In the urban survey, 1356 participants had a plasma sample stored. Of these samples,
1345 had sufficient volume for antibody assays. All of these plasma samples were
assessed by ELISA for total, SWA-, SEA- and allergen-specific IgE and IgG4, and SWA-
and SEA-specific IgG. For reasons of cost, the ImmunoCAP IgE test could not be
conducted in all these samples. ImmunoCAP data on cockroach- and dust mite-specific
IgE were available for 780 rural survey participants, hence calculations could be
83
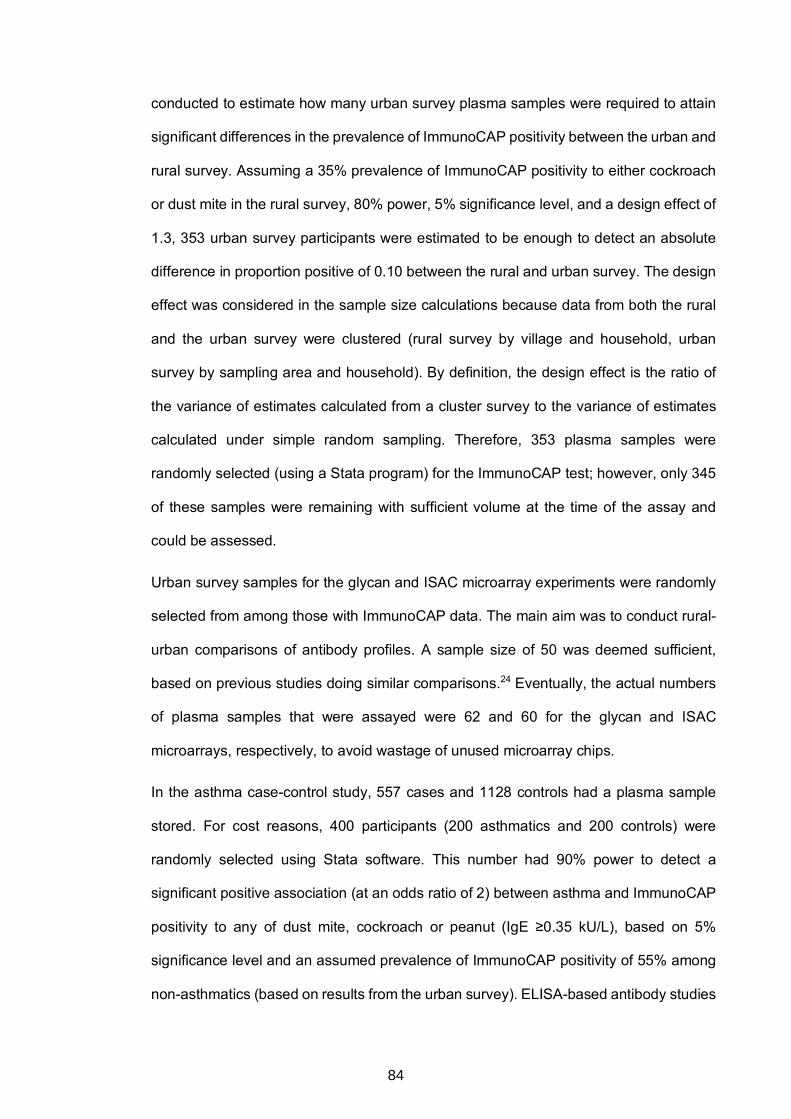
conducted to estimate how many urban survey plasma samples were required to attain
significant differences in the prevalence of ImmunoCAP positivity between the urban and
rural survey. Assuming a 35% prevalence of ImmunoCAP positivity to either cockroach
or dust mite in the rural survey, 80% power, 5% significance level, and a design effect of
1.3, 353 urban survey participants were estimated to be enough to detect an absolute
difference in proportion positive of 0.10 between the rural and urban survey. The design
effect was considered in the sample size calculations because data from both the rural
and the urban survey were clustered (rural survey by village and household, urban
survey by sampling area and household). By definition, the design effect is the ratio of
the variance of estimates calculated from a cluster survey to the variance of estimates
calculated under simple random sampling. Therefore, 353 plasma samples were
randomly selected (using a Stata program) for the ImmunoCAP test; however, only 345
of these samples were remaining with sufficient volume at the time of the assay and
could be assessed.
Urban survey samples for the glycan and ISAC microarray experiments were randomly
selected from among those with ImmunoCAP data. The main aim was to conduct rural-
urban comparisons of antibody profiles. A sample size of 50 was deemed sufficient,
based on previous studies doing similar comparisons.24 Eventually, the actual numbers
of plasma samples that were assayed were 62 and 60 for the glycan and ISAC
microarrays, respectively, to avoid wastage of unused microarray chips.
In the asthma case-control study, 557 cases and 1128 controls had a plasma sample
stored. For cost reasons, 400 participants (200 asthmatics and 200 controls) were
randomly selected using Stata software. This number had 90% power to detect a
significant positive association (at an odds ratio of 2) between asthma and ImmunoCAP
positivity to any of dust mite, cockroach or peanut (IgE ≥0.35 kU/L), based on 5%
significance level and an assumed prevalence of ImmunoCAP positivity of 55% among
non-asthmatics (based on results from the urban survey). ELISA-based antibody studies
84

were conducted using the same samples. For glycan and ISAC microarray experiments,
a sample size of 50 cases and 50 controls was deemed sufficient, based on numbers
used in the rural and the urban survey.
85
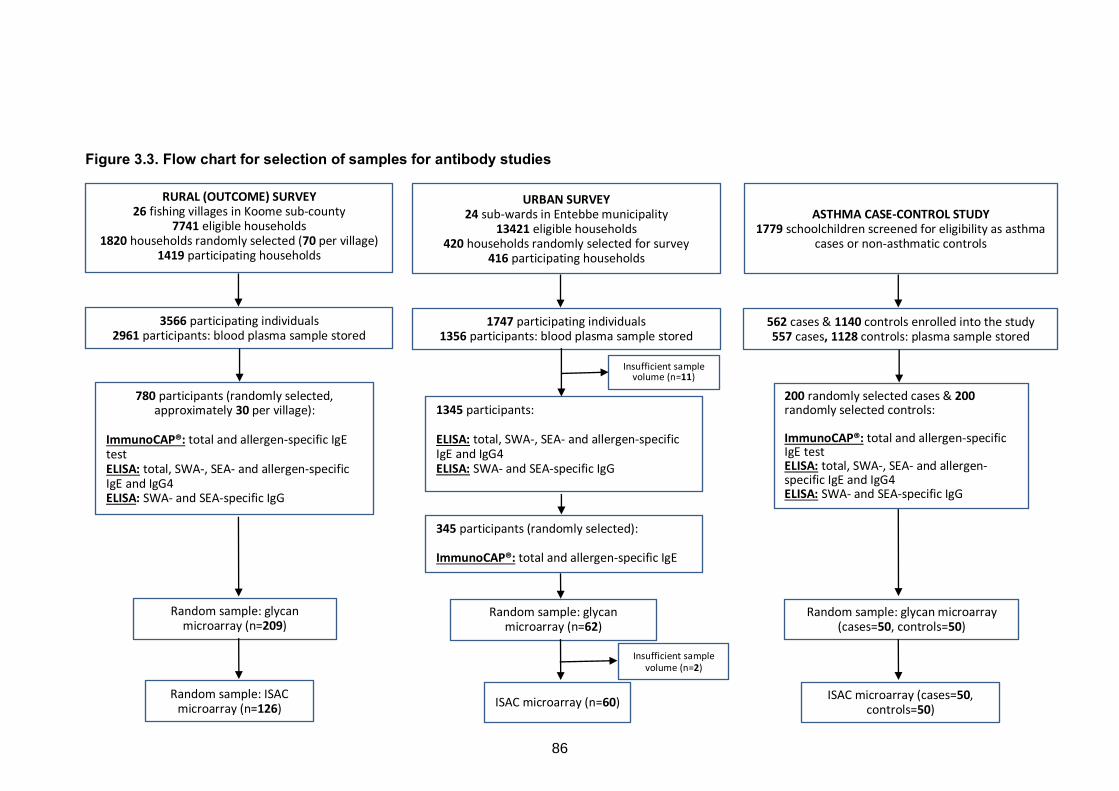
Figure 3.3. Flow chart for selection of samples for antibody studies
RURAL (OUTCOME) SURVEY 26 fishing villages in Koome sub-county
7741 eligible households 1820 households randomly selected (70 per village)
1419 participating households
3566 participating individuals 2961 participants: blood plasma sample stored
Random sample: glycan microarray (n=209)
780 participants (randomly selected, approximately 30 per village):
ImmunoCAP®: total and allergen-specific IgE test ELISA: total, SWA-, SEA- and allergen-specific IgE and IgG4 ELISA: SWA- and SEA-specific IgG
Random sample: ISAC microarray (n=126)
URBAN SURVEY 24 sub-wards in Entebbe municipality
13421 eligible households 420 households randomly selected for survey
416 participating households
1747 participating individuals 1356 participants: blood plasma sample stored
Random sample: glycan microarray (n=62)
1345 participants: ELISA: total, SWA-, SEA- and allergen-specific IgE and IgG4 ELISA: SWA- and SEA-specific IgG
ISAC microarray (n=60)
Insufficient sample volume (n=2)
ASTHMA CASE-CONTROL STUDY 1779 schoolchildren screened for eligibility as asthma
cases or non-asthmatic controls
562 cases & 1140 controls enrolled into the study 557 cases, 1128 controls: plasma sample stored
Random sample: glycan microarray (cases=50, controls=50)
200 randomly selected cases & 200 randomly selected controls: ImmunoCAP®: total and allergen-specific IgE test ELISA: total, SWA-, SEA- and allergen-specific IgE and IgG4 ELISA: SWA- and SEA-specific IgG
ISAC microarray (cases=50, controls=50)
345 participants (randomly selected): ImmunoCAP®: total and allergen-specific IgE test
Insufficient sample volume (n=11)
86
3.8 Data analysis
Quantitative and qualitative data used in this PhD project were generated from
questionnaires, standard clinical record forms (including clinical measurements and field
laboratory measurements, such as parasite counts) and immunological assays. These data
were entered using Microsoft Access and Excel. Information from questionnaires was also
captured on ultra-mobile personal computers (UMPCs) and exported to database servers in
Microsoft Access format. The data were then exported to Stata version 13.1 (StataCorp,
College Station, Texas, USA), GraphPad Prism versions 6.0e and 7.0a (Fay Avenue, La
Jolla, CA, USA) and R software (R foundation for Statistical Computing, Vienna, Austria) via
the RStudio interface (version 1.1.383, RStudio, Inc. Boston, USA), for statistical analysis.
Analysis of data generated during this PhD project is detailed in the Research Paper
chapters in this thesis (Chapters 4 – 7) and in Appendix 3 (Research Paper 7). This section
describes 1) approaches that were used for analysis of data while accounting for the cluster
survey design of the rural and urban surveys, 2) how normal and skewed immunological
data were handled, 3) correction for multiple testing and 4) techniques for reduction and
subsequent analysis of antibody microarray data.
3.8.1 Adjusting for survey design in the rural surveys and the urban survey
The rural surveys were characterised by village-level cluster randomisation.1 For the
outcome survey, initial analyses compared antibody profiles between standard and intensive
trial intervention, using statistical methods that allowed for within-cluster correlations.
Primary analyses were done at the cluster level; cluster-specific proportions (for binary
outcomes) and means (for quantitative outcomes) were calculated and then compared
between trial arms using t-tests. Adjusted analyses were performed to account for
confounders that might not have been balanced by the randomisation procedures.
As already mentioned, intensive versus standard treatment reduced hookworm prevalence
87
and S. mansoni infection intensity, but it had no effect on the overall prevalence of other
nematodes, S. mansoni, allergy-related outcomes (Appendix 3) or on most laboratory
outcomes (this thesis). Therefore, several chapters in this thesis presenting results from the
‘rural survey’ have used data combined from both trial arms of the LaVIISWA outcome
survey. These analyses were primarily based on individual-level data and were conducted
using “svy” survey commands in Stata to allow for the clustering of respondents within
households and households within clusters. Sampling weights were calculated from the
number of households in each cluster, to reflect the fact that households in smaller villages
had a higher probability of selection than households in larger villages (since an equal
number of households was selected from each village). These sampling weights were also
employed in the analysis using the svy commands.
In the urban survey, analysis methods accounted for clustering of respondents within
households and households within sub-wards. The number of geographical segments
selected for sampling was proportional to the population size of each sub-ward, hence the
study design was considered self-weighting. Therefore, svy commands were used to allow
for clustering within sub-wards but not for weighting.
3.8.2 Distribution of antibody data
Similar to most data generated from immunological assays,30 antibody data were
predominantly right-skewed. Log transformations were applied to normalize the data. In
some instances, the data maintained a skewed distribution after log transformation. The
bootstrap resampling method31 is useful in analysis of skewed data without making any
parametric assumptions; however, it is incompatible with svy commands in Stata and hence
was not used in analysis of data in this project. Instead, where possible, non-parametric
statistical tests (such as the Mann Whitney U test and the Kruskal-Wallis test) were
employed. However, these tests cannot be used for multivariable analyses, hence
88
regression analyses that assume parametric distributions were used. Of note, use of
parametric tests to analyse skewed data may still provide approximately valid test statistics,
provided sample sizes are large enough and the data are not severely skewed.30
3.8.3 Correction for multiple testing
Many of the microarray-determined anti-carbohydrate and anti-allergen antibody responses
(Chapter 6 and Chapter 7) were strongly correlated. The commonly used Bonferroni
correction for multiple testing would be a conservative approach to use with these data,
because it assumes independence between tests and is prone to type II errors when the
sample size is modest.32,33 Therefore, using Stata software, a Monte Carlo simulation
approach34 based on 1000 permutations was adopted, to generate empirical p-values. An
example of a Stata ‘do file’ used to perform permutation testing is shown in Appendix 5.
Chapters 4 and 5 report a large number of statistical tests for associations between
epidemiological / immunological outcomes and helminth infections and allergy-related
outcomes. Here, multiplicity was not formally adjusted for; instead, the focus was on patterns
of association and consistency of results, and on biological plausibility with reference to
other published findings.
3.8.4 Anti-glycan antibody responses: data reduction procedures
Principal component analysis (PCA) was run in Stata as a data reduction technique to
transform groups of correlated anti-glycan responses into fewer, uncorrelated artificial
variables (principal components, PCs). Crude and adjusted associations between PC
scores and various comparison groups were assessed using survey design-based linear
regression. Another data reduction technique was hierarchical clustering analysis (HCA,
complete linkage using Euclidean distance), conducted in R to identify homogeneous sets
of N-glycan-specific responses. The resultant response clusters were assessed for
89
associations with comparison groups of interest using the global test35,36 executed in R using
the Globaltest package (version 5.33.0).
3.9 Ethical approvals
3.10 Chapter 3 references
1. Nampijja M, Webb EL, Kaweesa J, et al. The Lake Victoria island intervention study on worms and allergy-related diseases (LaVIISWA): study protocol for a randomised controlled trial. Trials 2015; 16(1): 187.
2. Uganda Bureau of Statistics 2016. The National Population and Housing Census 2014 – Main Report, Kampala, Uganda.
3. Sanya RE, Nkurunungi G, Hoek Spaans R, et al. The Impact of Intensive Versus Standard Anthelminthic Treatment on Allergy-related Outcomes, Helminth Infection Intensity, and Helminth-related Morbidity in Lake Victoria Fishing Communities, Uganda: Results From the LaVIISWA Cluster-randomized Trial. Clinical Infectious Diseases 2018: ciy761-ciy.
4. Katz N, Chaves A, Pellegrino J. A simple device for quantitative stool thick-smear technique in Schistosomiasis mansoni. Revista do Instituto de Medicina Tropical de Sao Paulo 1972; 14(6): 397-400.
5. Verweij JJ, Brienen EA, Ziem J, Yelifari L, Polderman AM, Van Lieshout L. Simultaneous detection and quantification of Ancylostoma duodenale, Necator americanus,
The LaVIISWA trial, the urban survey and the asthma case-control study obtained ethical
approval from ethics committees of Uganda Virus Research Institute and London School of
Hygiene and Tropical Medicine, and Uganda National Council for Science and Technology.
To conduct my PhD research using samples collected from these studies, I obtained
approval from the ethics committee of London School of Hygiene and Tropical Medicine. In
all three studies, participants provided signed informed consent. For minors, participants’
parents or guardians gave this consent. Children aged eight years and above additionally
provided signed informed assent. Consent and assent forms were translated into the local
language (Luganda), for participants to choose which language they preferred or understood
better. Copies of English language versions of ethical approvals are included in Appendix
4.
90
and Oesophagostomum bifurcum in fecal samples using multiplex real-time PCR. The American journal of tropical medicine and hygiene 2007; 77(4): 685-90.
6. Verweij JJ, Canales M, Polman K, et al. Molecular diagnosis of Strongyloides stercoralis in faecal samples using real-time PCR. Transactions of the Royal Society of Tropical Medicine and Hygiene 2009; 103(4): 342-6.
7. Emmanuel IOA, Ekkehard D. Epidemiology, of bilharzias (schistosomiasis) in Uganda from 1902 until 2005. African Health Sciences 2008; 8(4): 239-43.
8. Mpairwe H, Muhangi L, Ndibazza J, et al. Skin prick test reactivity to common allergens among women in Entebbe, Uganda. Transactions of the Royal Society of Tropical Medicine and Hygiene 2008; 102(4): 367-73.
9. Pearce N, Beasley R, Pekkanen J. Role of bronchial responsiveness testing in asthma prevalence surveys. Thorax 2000; 55(5): 352-4.
10. Pekkanen J, Pearce N. Defining asthma in epidemiological studies. The European respiratory journal 1999; 14(4): 951-7.
11. Ellwood P, Asher MI, Beasley R, Clayton TO, Stewart AW. ISAAC Phase Three Manual. ISAAC International Data Centre, Auckland, New Zealand, 2000.
12. Debley J, Stanojevic S, Filbrun AG, Subbarao P. Bronchodilator responsiveness in wheezy infants and toddlers is not associated with asthma risk factors. Pediatr Pulmonol 2012; 47(5): 421-8.
13. Illi S, von Mutius E, Lau S, Niggemann B, Gruber C, Wahn U. Perennial allergen sensitisation early in life and chronic asthma in children: a birth cohort study. Lancet 2006; 368(9537): 763-70.
14. Williams HC. So How Do I Define Atopic Eczema? A Practical manual for researchers wishing to define atopic eczema. http://www.nottingham.ac.uk/~mzzfaq/dermatology/eczema/contents.html (accessed February 6, 2018.
15. Williams HC. Clinical practice. Atopic dermatitis. N Engl J Med 2005; 352(22): 2314-24.
16. Williams HC, Forsdyke H, Boodoo G, Hay RJ, Burney PG. A protocol for recording the sign of flexural dermatitis in children. The British journal of dermatology 1995; 133(6): 941-9.
17. Heinzerling L, Mari A, Bergmann KC, et al. The skin prick test - European standards. Clin Transl Allergy 2013; 3(1): 3.
18. Cavalier E, Carlisi A, Chapelle JP. [Evaluation of the analytical performance of the ImmunoCap 250 (Sweden Diagnostics)]. Ann Biol Clin (Paris) 2006; 64(1): 91-4.
19. ImmunoCAP Specific IgE. http://www.phadia.com/da/Products/Allergy-testing-products/ImmunoCAP-Lab-Tests/sIgE/ (accessed 21 September 2018 2018).
91
20. van Hage M, Schmid-Grendelmeier P, Skevaki C, et al. Performance evaluation of ImmunoCAP® ISAC 112: a multi-site study. Clinical Chemistry and Laboratory Medicine (CCLM); 2017. p. 571.
21. Phadia Multiplexing Diagnostics GmbH, Wien, Austria, and Phadia AB, Uppsala, Sweden. 2009. http://www.phadia.com/Global/Corporate%20Allergy/Files/DfU/Assay%20Kit%20IgE/DfU-ImmunoCAP-ISAC-20-01-02-3-RUO.pdf2018).
22. Echeverria B, Serna S, Achilli S, et al. Chemoenzymatic Synthesis of N-glycan Positional Isomers and Evidence for Branch Selective Binding by Monoclonal Antibodies and Human C-type Lectin Receptors. ACS Chemical Biology 2018; 13(8): 2269-79.
23. Brzezicka K, Echeverria B, Serna S, van Diepen A, Hokke CH, Reichardt NC. Synthesis and microarray-assisted binding studies of core xylose and fucose containing N-glycans. ACS Chem Biol 2015; 10(5): 1290-302.
24. Amoah AS, Asuming-Brempong EK, Obeng BB, et al. Identification of dominant anti-glycan IgE responses in school children by glycan microarray. The Journal of allergy and clinical immunology 2018; 141(3): 1130-3.
25. van Diepen A, Smit CH, van Egmond L, et al. Differential anti-glycan antibody responses in Schistosoma mansoni-infected children and adults studied by shotgun glycan microarray. PLoS Negl Trop Dis 2012; 6(11): e1922.
26. van Diepen A, van der Plas AJ, Kozak RP, Royle L, Dunne DW, Hokke CH. Development of a Schistosoma mansoni shotgun O-glycan microarray and application to the discovery of new antigenic schistosome glycan motifs. International journal for parasitology 2015; 45(7): 465-75.
27. Yang YY, Li XH, Brzezicka K, et al. Specific anti-glycan antibodies are sustained during and after parasite clearance in Schistosoma japonicum-infected rhesus macaques. PLoS Negl Trop Dis 2017; 11(2): e0005339.
28. Oyelaran O, McShane LM, Dodd L, Gildersleeve JC. Profiling human serum antibodies with a carbohydrate antigen microarray. Journal of proteome research 2009; 8(9): 4301-10.
29. Onell A, Hjalle L, Borres MP. Exploring the temporal development of childhood IgE profiles to allergen components. Clin Transl Allergy 2012; 2(1): 24.
30. McGuinness D, Bennett S, Riley E. Statistical analysis of highly skewed immune response data. Journal of immunological methods 1997; 201(1): 99-114.
31. Efron B, Tibshirani RJ. An Introduction to the Bootstrap: Chapman and Hall/CRC; 1993.
32. Ranstam J. Multiple P-values and Bonferroni correction. Osteoarthritis and Cartilage 2016; 24(5): 763-4.
92
33. Shi Q, Pavey ES, Carter RE. Bonferroni-based correction factor for multiple, correlated endpoints. Pharmaceutical statistics 2012; 11(4): 300-9.
34. Jiang Y, Zhang L, Kong F, et al. MCPerm: a Monte Carlo permutation method for accurately correcting the multiple testing in a meta-analysis of genetic association studies. PLoS One 2014; 9(2): e89212.
35. Goeman JJ, van de Geer SA, de Kort F, van Houwelingen HC. A global test for groups of genes: testing association with a clinical outcome. Bioinformatics 2004; 20(1): 93-9.
36. Goeman JJ, Van De Geer SA, Van Houwelingen HC. Testing against a high dimensional alternative. Journal of the Royal Statistical Society: Series B 2006; 68: 477-93.
93
CHAPTER 4. URBAN-RURAL DIFFERENCES IN RISK FACTORS FOR ALLERGY-
RELATED OUTCOMES IN UGANDA: A ROLE FOR HELMINTHS?
4.1 Preamble
This chapter uses questionnaire, clinical and laboratory data from the LaVIISWA outcome
survey (hereinafter “rural survey”) and the urban survey (both described in Chapter 3) to
investigate the extent to which helminth exposure influences rural-urban differences in
prevalence of allergy-related outcomes, and in epidemiological and immunological risk
factors for these outcomes (thesis objective 1). Results are presented in Research paper
1, which is titled “Do helminth infections underpin urban-rural differences in risk factors for
allergy-related outcomes?”, and which has been published as an original article in Clinical
and Experimental Allergy.
Urban-rural differences in 1) prevalence of allergy-related outcomes, helminth infections and
helminth-specific antibody concentrations, and 2) epidemiological and immunological
(schistosome-specific antibodies) risk factors for allergy-related outcomes, are shown.
Importantly, this chapter assesses whether helminth (S. mansoni) infections are effect
modifiers of associations between the above-mentioned risk factors and allergy-related
outcomes, and whether they were likely to mediate the differences seen between the urban
and the rural settings. These analyses lay the foundation for the overarching aim of this
thesis, which is to understand how helminth- and allergen-specific antibody profiles relate to
epidemiological trends of allergy in rural and urban Uganda (assessed in more detail in the
next chapters).
94
4.2 Research paper 1: Do helminth infections underpin urban-rural differences in risk factors for allergy-related outcomes?
95
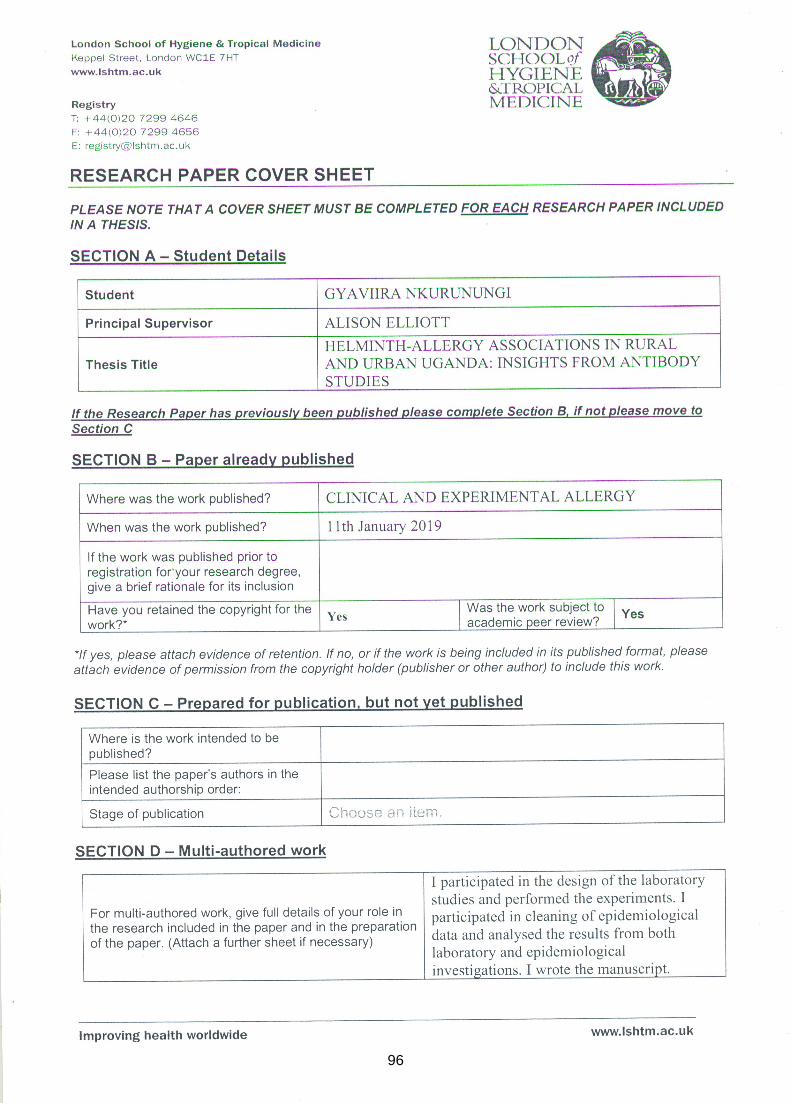
96
97
OR I G I N A L A R T I C L E
Epidemiology of Allergic Disease
Do helminth infections underpin urban‐rural differences inrisk factors for allergy‐related outcomes?
Gyaviira Nkurunungi1,2 | Lawrence Lubyayi1,3 | Serge A. Versteeg4 |
Richard E. Sanya1,5 | Jacent Nassuuna1,2 | Joyce Kabagenyi1,2 | Prossy N. Kabuubi1,2 |
Josephine Tumusiime1,2 | Christopher Zziwa1,2 | Robert Kizindo1,2 |
Emmanuel Niwagaba1,2 | Carol Nanyunja1,2 | Margaret Nampijja1,2 |
Harriet Mpairwe1,2 | Maria Yazdanbakhsh6 | Ronald van Ree4 | Emily L. Webb7 |
Alison M. Elliott1,2
1Immunomodulation and Vaccines
Programme, (MRC/UVRI and LSHTM)
Uganda Research Unit, Medical Research
Council/Uganda Virus Research Institute,
Entebbe, Uganda
2Department of Clinical Research, London
School of Hygiene and Tropical Medicine,
London, UK
3Department of Epidemiology and
Biostatistics, School of Public Health,
University of the Witwatersrand,
Johannesburg, South Africa
4Departments of Experimental Immunology
and of Otorhinolaryngology, Amsterdam
University Medical Centers, Amsterdam,
The Netherlands
5College of Health Sciences, Makerere
University, Kampala, Uganda
6Department of Parasitology, Leiden
University Medical Center, Leiden, The
Netherlands
7MRC Tropical Epidemiology Group,
Department of Infectious Disease
Epidemiology, London School of Hygiene
and Tropical Medicine, London, UK
Correspondence
Gyaviira Nkurunungi, MRC/UVRI and
LSHTM Uganda Research Unit, Entebbe,
Uganda & London School of Hygiene and
Tropical Medicine, London, UK.
Email: [email protected]
Funding information
The LaVIISWA study and the urban survey
were funded by the Wellcome Trust, grant
Summary
Background: It is proposed that helminth exposure protects against allergy‐relateddisease, by mechanisms that include disconnecting risk factors (such as atopy) from
effector responses.
Objective: We aimed to assess how helminth exposure influences rural‐urban differ-
ences in risk factors for allergy‐related outcomes in tropical low‐ and middle‐income
countries.
Methods: In cross‐sectional surveys in Ugandan rural Schistosoma mansoni (Sm)‐endemic islands, and in nearby mainland urban communities with lower helminth
exposure, we assessed risk factors for atopy (allergen‐specific skin prick test [SPT]
reactivity and IgE [asIgE] sensitization) and clinical allergy‐related outcomes (wheeze,
urticaria, rhinitis and visible flexural dermatitis), and effect modification by Sm
exposure.
Results: Dermatitis and SPT reactivity were more prevalent among urban partici-
pants, urticaria and asIgE sensitization among rural participants. Pairwise associations
between clinical outcomes, and between atopy and clinical outcomes, were stronger
in the urban survey. In the rural survey, SPT positivity was inversely associated with
bathing in lakewater, Schistosoma-specific IgG4 and Sm infection. In the urban sur-
vey, SPT positivity was positively associated with age, non‐Ugandan maternal tribe,
being born in a city/town, BCG scar and light Sm infection. Setting (rural vs urban)
was an effect modifier for risk factors including Sm- and Schistosoma-specific IgG4.
In both surveys, the dominant risk factors for asIgE sensitization were Schistosoma‐specific antibody levels and helminth infections. Handwashing and recent malaria
treatment reduced odds of asIgE sensitization among rural but not urban partici-
pants. Risk factors for clinical outcomes also differed by setting. Despite suggestive
- - - - - - - - - - - - - - - - - - - - - - - - - - - - - - - - - - - - - - - - - - - - - - - - - - - - - - - - - - - - - - - - - - - - - - - - - - - - - - - - - - - - - - - - - - - - - - - - - - - - - - - - - - - - - - - - - - - - - - - - - - - - - - - - - - - - - - - - - - - - - - - - - - - - - - - - - - - - - - - - - - - - - -This is an open access article under the terms of the Creative Commons Attribution License, which permits use, distribution and reproduction in any medium,
provided the original work is properly cited.
© 2019 The Authors. Clinical & Experimental Allergy Published by John Wiley & Sons Ltd.
Received: 6 August 2018 | Revised: 20 November 2018 | Accepted: 6 December 2018
DOI: 10.1111/cea.13335
Clin Exp Allergy. 2019;1–14. wileyonlinelibrary.com/journal/cea | 198
095778 awarded to AME. GN is supported
by a PhD fellowship from the African
Partnership for Chronic Disease Research
(APCDR). RES is a PhD fellow, and GN an
honorary fellow, of the Makerere University‐Uganda Virus Research Institute Centre of
Excellence for Infection and Immunity
Research and Training (MUII‐plus). MUII‐plusis funded under the DELTAS Africa Initiative.
The DELTAS Africa Initiative is an
independent funding scheme of the African
Academy of Sciences (AAS), Alliance for
Accelerating Excellence in Science in Africa
(AESA) and supported by the New
Partnership for Africa's Development
Planning and Coordinating Agency (NEPAD
Agency) with funding from the Wellcome
Trust (grant 107743) and the UK
Government. The MRC/UVRI and LSHTM
Uganda Research Unit is jointly funded by
the UK Medical Research Council (MRC) and
the UK Department for International
Development (DFID) under the MRC/DFID
Concordat agreement.
trends, we did not find sufficient evidence to conclude that helminth (Sm) exposure
explained rural‐urban differences in risk factors.
Conclusions and clinical relevance: Risk factors for allergy‐related outcomes differ
between rural and urban communities in Uganda but helminth exposure is unlikely
to be the sole mechanism of the observed effect modification between the two set-
tings. Other environmental exposures may contribute significantly.
K E YWORD S
allergy, effect modification, helminths, risk factors, Uganda, urban-rural
1 | INTRODUCTION
Advances in health and hygiene practices have transformed high‐income countries into “cleaner” environments, with reduced infection
exposure. Consequently, homeostatic immunomodulatory effects of
exposure to microbes and parasites that co‐evolved with mammalian
species (the “old friends hypothesis”) have been lost.1 The surge in
allergy‐related diseases alongside other chronic inflammatory dis-
eases in high‐income countries over recent decades has been partly
attributed to this phenomenon.2 Although other environmental expo-
sures3 may contribute, substantial support for the “old friends
hypothesis” comes from studies in high‐income countries,4-9 which
show that traditional farming and related microbial exposures10 are
associated with protection against allergy‐related diseases. Additional
evidence suggests a parallel relationship between ongoing urbaniza-
tion and increasing allergy‐related disease prevalence in tropical low‐and middle‐income countries (LMICs).11,12
Akin to farming environments in high‐income countries, rural
LMIC settings are relatively protected against allergy‐related dis-
eases.13-17 Animal models and in vitro experiments in human sam-
ples have identified helminths as potent inhibitors of allergic
reactions,18-20 leading to the hypothesis that they are partly respon-
sible for the low overall prevalence of allergy‐related diseases in
tropical LMICs and the observed rural‐urban disparities in allergy‐related disease prevalence in the same settings.16,21 Helminths may
dissociate risk factors, such as atopy, from allergy‐related disease:
work in Ugandan children showing that hookworm infection dissoci-
ates allergen‐specific IgE from the effector phase of the allergic
response22 is strongly suggestive. However, little comparative analy-
sis of risk factors for allergy in rural vs urban LMIC settings has been
ological transition is ongoing, provides an unprecedented opportunity
to better understand interactions between the environment and the
allergic pathway and allergy‐related disease outcomes.
Using data generated from two surveys in Uganda, one in rural
helminth‐endemic Lake Victoria island fishing villages and another in
nearby mainland urban communities with lower helminth exposure,
we investigated socio‐demographic, behavioural, clinical and
immunological characteristics as risk factors for allergy‐related out-
comes and assessed whether helminth infections contribute to rural‐urban differences in these risk factors.
2 | METHODS
2.1 | Study settings and procedures
Rural participants were residents of 26 helminth‐endemic fishing vil-
lages of Koome islands, Mukono district, Uganda (population 18 778
in 201423). Urban participants were residents of Entebbe Municipal-
ity, a lower helminth exposure area situated on the northern shores
of Lake Victoria, 40 km southwest of the Ugandan capital, Kampala,
and 35 km from Koome. The municipality had approximately 69 430
inhabitants in 2014,23 distributed across 24 sub‐wards, the smallest
administrative units.
The “rural survey” was part of the Lake Victoria Island Interven-
tion Study on Worms and Allergy‐related diseases (LaVIISWA;
ISRCTN47196031), a cluster‐randomized trial of standard vs inten-
sive anthelminthic intervention, described elsewhere.24,25 A baseline
household survey preceded the trial intervention; helminth‐allergyassociations at baseline have been reported.24 A household‐based
2 | NKURUNUNGI ET AL.
conducted. Exploration of these factors in LMICs, where an epidemi-
99
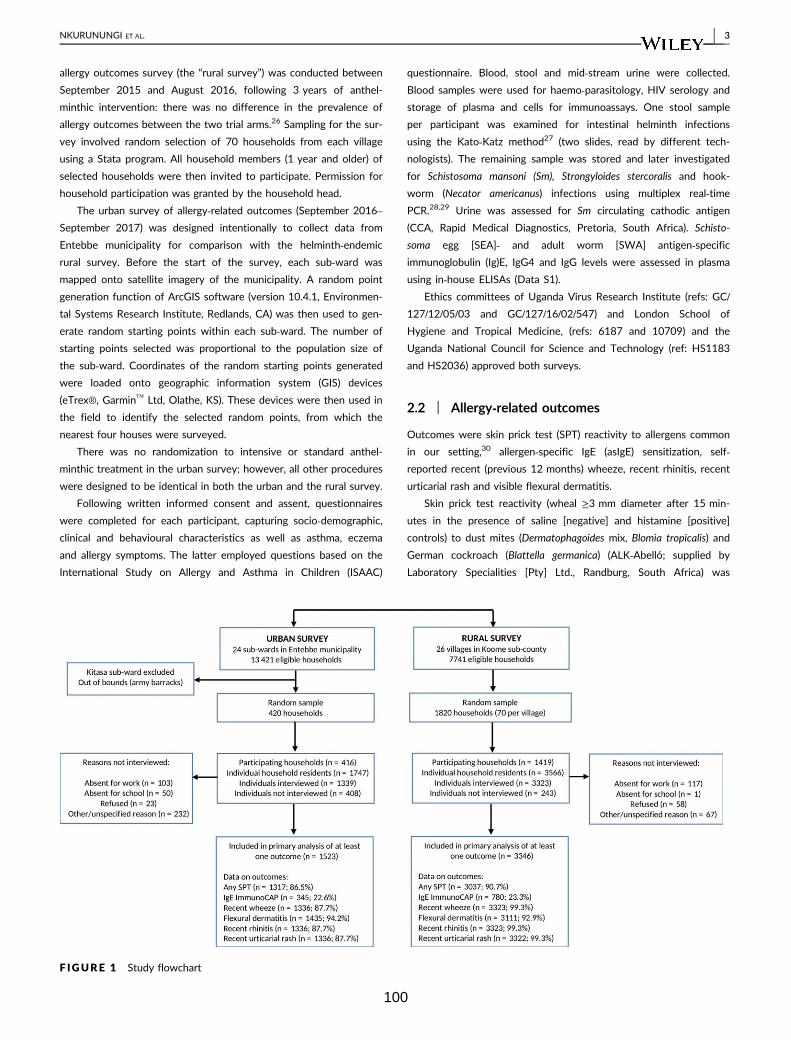
allergy outcomes survey (the “rural survey”) was conducted between
September 2015 and August 2016, following 3 years of anthel-
minthic intervention: there was no difference in the prevalence of
allergy outcomes between the two trial arms.26 Sampling for the sur-
vey involved random selection of 70 households from each village
using a Stata program. All household members (1 year and older) of
selected households were then invited to participate. Permission for
household participation was granted by the household head.
The urban survey of allergy‐related outcomes (September 2016–September 2017) was designed intentionally to collect data from
Entebbe municipality for comparison with the helminth‐endemic
rural survey. Before the start of the survey, each sub‐ward was
mapped onto satellite imagery of the municipality. A random point
generation function of ArcGIS software (version 10.4.1, Environmen-
tal Systems Research Institute, Redlands, CA) was then used to gen-
erate random starting points within each sub‐ward. The number of
starting points selected was proportional to the population size of
the sub‐ward. Coordinates of the random starting points generated
were loaded onto geographic information system (GIS) devices
(eTrex®, Garmin™ Ltd, Olathe, KS). These devices were then used in
the field to identify the selected random points, from which the
nearest four houses were surveyed.
There was no randomization to intensive or standard anthel-
minthic treatment in the urban survey; however, all other procedures
were designed to be identical in both the urban and the rural survey.
Following written informed consent and assent, questionnaires
were completed for each participant, capturing socio‐demographic,
clinical and behavioural characteristics as well as asthma, eczema
and allergy symptoms. The latter employed questions based on the
International Study on Allergy and Asthma in Children (ISAAC)
questionnaire. Blood, stool and mid‐stream urine were collected.
Blood samples were used for haemo‐parasitology, HIV serology and
storage of plasma and cells for immunoassays. One stool sample
per participant was examined for intestinal helminth infections
using the Kato‐Katz method27 (two slides, read by different tech-
nologists). The remaining sample was stored and later investigated
for Schistosoma mansoni (Sm), Strongyloides stercoralis and hook-
worm (Necator americanus) infections using multiplex real‐time
PCR.28,29 Urine was assessed for Sm circulating cathodic antigen
(CCA, Rapid Medical Diagnostics, Pretoria, South Africa). Schisto-
soma egg [SEA]‐ and adult worm [SWA] antigen‐specificimmunoglobulin (Ig)E, IgG4 and IgG levels were assessed in plasma
using in‐house ELISAs (Data S1).
Ethics committees of Uganda Virus Research Institute (refs: GC/
127/12/05/03 and GC/127/16/02/547) and London School of
Hygiene and Tropical Medicine, (refs: 6187 and 10709) and the
Uganda National Council for Science and Technology (ref: HS1183
and HS2036) approved both surveys.
2.2 | Allergy‐related outcomes
Outcomes were skin prick test (SPT) reactivity to allergens common
in our setting,30 allergen‐specific IgE (asIgE) sensitization, self‐reported recent (previous 12 months) wheeze, recent rhinitis, recent
urticarial rash and visible flexural dermatitis.
Skin prick test reactivity (wheal ≥3 mm diameter after 15 min-
utes in the presence of saline [negative] and histamine [positive]
controls) to dust mites (Dermatophagoides mix, Blomia tropicalis) and
German cockroach (Blattella germanica) (ALK‐Abelló; supplied by
Laboratory Specialities [Pty] Ltd., Randburg, South Africa) was
F IGURE 1 Study flowchart
NKURUNUNGI ET AL. | 3
100
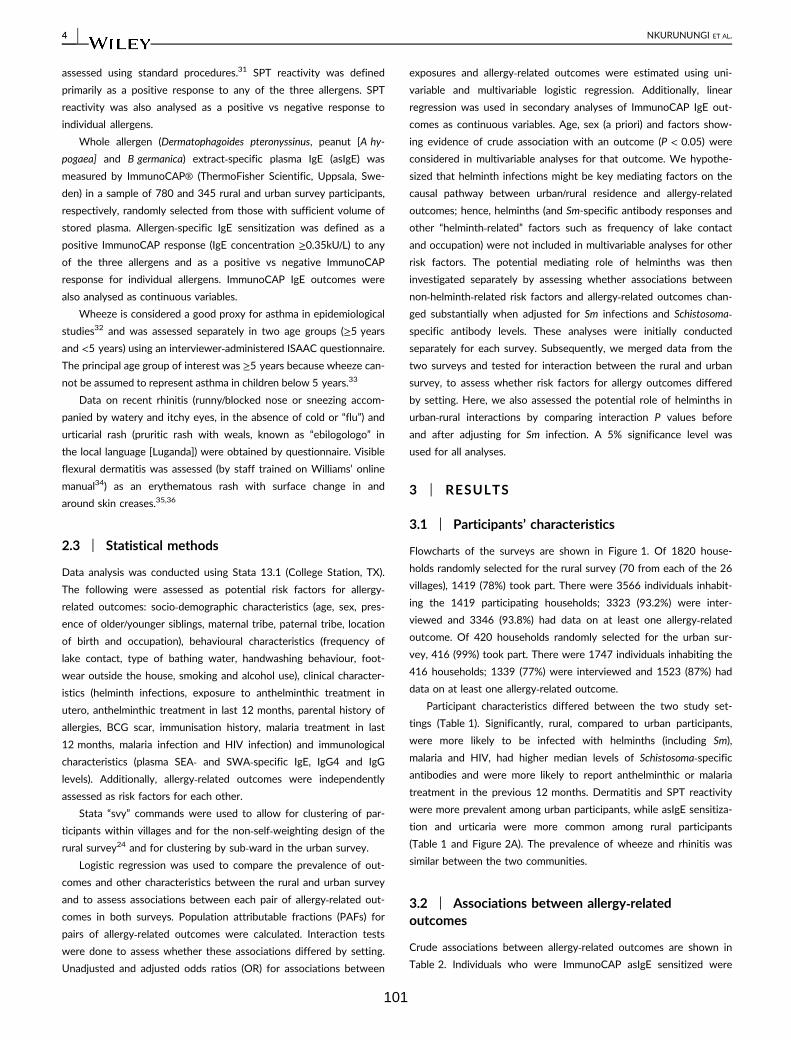
assessed using standard procedures.31 SPT reactivity was defined
primarily as a positive response to any of the three allergens. SPT
reactivity was also analysed as a positive vs negative response to
individual allergens.
Whole allergen (Dermatophagoides pteronyssinus, peanut [A hy-
pogaea] and B germanica) extract‐specific plasma IgE (asIgE) was
measured by ImmunoCAP® (ThermoFisher Scientific, Uppsala, Swe-
den) in a sample of 780 and 345 rural and urban survey participants,
respectively, randomly selected from those with sufficient volume of
stored plasma. Allergen‐specific IgE sensitization was defined as a
positive ImmunoCAP response (IgE concentration ≥0.35kU/L) to any
of the three allergens and as a positive vs negative ImmunoCAP
response for individual allergens. ImmunoCAP IgE outcomes were
also analysed as continuous variables.
Wheeze is considered a good proxy for asthma in epidemiological
studies32 and was assessed separately in two age groups (≥5 years
and <5 years) using an interviewer‐administered ISAAC questionnaire.
The principal age group of interest was ≥5 years because wheeze can-
not be assumed to represent asthma in children below 5 years.33
Data on recent rhinitis (runny/blocked nose or sneezing accom-
panied by watery and itchy eyes, in the absence of cold or “flu”) and
urticarial rash (pruritic rash with weals, known as “ebilogologo” in
the local language [Luganda]) were obtained by questionnaire. Visible
flexural dermatitis was assessed (by staff trained on Williams’ online
manual34) as an erythematous rash with surface change in and
around skin creases.35,36
2.3 | Statistical methods
Data analysis was conducted using Stata 13.1 (College Station, TX).
The following were assessed as potential risk factors for allergy‐related outcomes: socio‐demographic characteristics (age, sex, pres-
ence of older/younger siblings, maternal tribe, paternal tribe, location
of birth and occupation), behavioural characteristics (frequency of
lake contact, type of bathing water, handwashing behaviour, foot-
wear outside the house, smoking and alcohol use), clinical character-
istics (helminth infections, exposure to anthelminthic treatment in
utero, anthelminthic treatment in last 12 months, parental history of
allergies, BCG scar, immunisation history, malaria treatment in last
12 months, malaria infection and HIV infection) and immunological
characteristics (plasma SEA‐ and SWA‐specific IgE, IgG4 and IgG
levels). Additionally, allergy‐related outcomes were independently
assessed as risk factors for each other.
Stata “svy” commands were used to allow for clustering of par-
ticipants within villages and for the non‐self‐weighting design of the
rural survey24 and for clustering by sub‐ward in the urban survey.
Logistic regression was used to compare the prevalence of out-
comes and other characteristics between the rural and urban survey
and to assess associations between each pair of allergy‐related out-
comes in both surveys. Population attributable fractions (PAFs) for
pairs of allergy‐related outcomes were calculated. Interaction tests
were done to assess whether these associations differed by setting.
Unadjusted and adjusted odds ratios (OR) for associations between
exposures and allergy‐related outcomes were estimated using uni-
variable and multivariable logistic regression. Additionally, linear
regression was used in secondary analyses of ImmunoCAP IgE out-
comes as continuous variables. Age, sex (a priori) and factors show-
ing evidence of crude association with an outcome (P < 0.05) were
considered in multivariable analyses for that outcome. We hypothe-
sized that helminth infections might be key mediating factors on the
causal pathway between urban/rural residence and allergy‐relatedoutcomes; hence, helminths (and Sm-specific antibody responses and
other “helminth‐related” factors such as frequency of lake contact
and occupation) were not included in multivariable analyses for other
risk factors. The potential mediating role of helminths was then
investigated separately by assessing whether associations between
non‐helminth‐related risk factors and allergy‐related outcomes chan-
ged substantially when adjusted for Sm infections and Schistosoma‐specific antibody levels. These analyses were initially conducted
separately for each survey. Subsequently, we merged data from the
two surveys and tested for interaction between the rural and urban
survey, to assess whether risk factors for allergy outcomes differed
by setting. Here, we also assessed the potential role of helminths in
urban‐rural interactions by comparing interaction P values before
and after adjusting for Sm infection. A 5% significance level was
used for all analyses.
3 | RESULTS
3.1 | Participants’ characteristics
Flowcharts of the surveys are shown in Figure 1. Of 1820 house-
holds randomly selected for the rural survey (70 from each of the 26
villages), 1419 (78%) took part. There were 3566 individuals inhabit-
ing the 1419 participating households; 3323 (93.2%) were inter-
viewed and 3346 (93.8%) had data on at least one allergy‐relatedoutcome. Of 420 households randomly selected for the urban sur-
vey, 416 (99%) took part. There were 1747 individuals inhabiting the
416 households; 1339 (77%) were interviewed and 1523 (87%) had
data on at least one allergy‐related outcome.
Participant characteristics differed between the two study set-
tings (Table 1). Significantly, rural, compared to urban participants,
were more likely to be infected with helminths (including Sm),
malaria and HIV, had higher median levels of Schistosoma‐specificantibodies and were more likely to report anthelminthic or malaria
treatment in the previous 12 months. Dermatitis and SPT reactivity
were more prevalent among urban participants, while asIgE sensitiza-
tion and urticaria were more common among rural participants
(Table 1 and Figure 2A). The prevalence of wheeze and rhinitis was
similar between the two communities.
3.2 | Associations between allergy‐relatedoutcomes
Crude associations between allergy‐related outcomes are shown in
Table 2. Individuals who were ImmunoCAP asIgE sensitized were
4 | NKURUNUNGI ET AL.
101
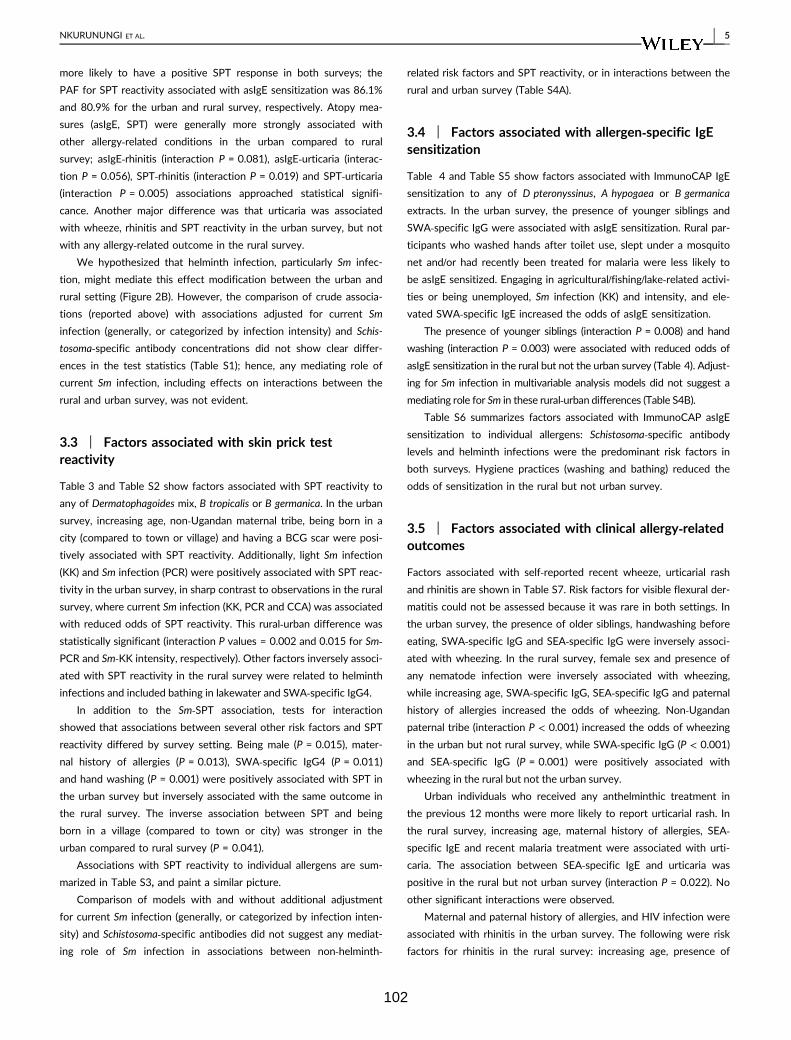
more likely to have a positive SPT response in both surveys; the
PAF for SPT reactivity associated with asIgE sensitization was 86.1%
and 80.9% for the urban and rural survey, respectively. Atopy mea-
sures (asIgE, SPT) were generally more strongly associated with
other allergy‐related conditions in the urban compared to rural
survey; asIgE‐rhinitis (interaction P = 0.081), asIgE‐urticaria (interac-
tion P = 0.056), SPT‐rhinitis (interaction P = 0.019) and SPT‐urticaria(interaction P = 0.005) associations approached statistical signifi-
cance. Another major difference was that urticaria was associated
with wheeze, rhinitis and SPT reactivity in the urban survey, but not
with any allergy‐related outcome in the rural survey.
We hypothesized that helminth infection, particularly Sm infec-
tion, might mediate this effect modification between the urban and
rural setting (Figure 2B). However, the comparison of crude associa-
tions (reported above) with associations adjusted for current Sm
infection (generally, or categorized by infection intensity) and Schis-
tosoma‐specific antibody concentrations did not show clear differ-
ences in the test statistics (Table S1); hence, any mediating role of
current Sm infection, including effects on interactions between the
rural and urban survey, was not evident.
3.3 | Factors associated with skin prick testreactivity
Table 3 and Table S2 show factors associated with SPT reactivity to
any of Dermatophagoides mix, B tropicalis or B germanica. In the urban
survey, increasing age, non‐Ugandan maternal tribe, being born in a
city (compared to town or village) and having a BCG scar were posi-
tively associated with SPT reactivity. Additionally, light Sm infection
(KK) and Sm infection (PCR) were positively associated with SPT reac-
tivity in the urban survey, in sharp contrast to observations in the rural
survey, where current Sm infection (KK, PCR and CCA) was associated
with reduced odds of SPT reactivity. This rural‐urban difference was
statistically significant (interaction P values = 0.002 and 0.015 for Sm‐PCR and Sm‐KK intensity, respectively). Other factors inversely associ-
ated with SPT reactivity in the rural survey were related to helminth
infections and included bathing in lakewater and SWA‐specific IgG4.In addition to the Sm‐SPT association, tests for interaction
showed that associations between several other risk factors and SPT
reactivity differed by survey setting. Being male (P = 0.015), mater-
nal history of allergies (P = 0.013), SWA‐specific IgG4 (P = 0.011)
and hand washing (P = 0.001) were positively associated with SPT in
the urban survey but inversely associated with the same outcome in
the rural survey. The inverse association between SPT and being
born in a village (compared to town or city) was stronger in the
urban compared to rural survey (P = 0.041).
Associations with SPT reactivity to individual allergens are sum-
marized in Table S3, and paint a similar picture.
Comparison of models with and without additional adjustment
for current Sm infection (generally, or categorized by infection inten-
sity) and Schistosoma‐specific antibodies did not suggest any mediat-
ing role of Sm infection in associations between non‐helminth‐
related risk factors and SPT reactivity, or in interactions between the
rural and urban survey (Table S4A).
3.4 | Factors associated with allergen‐specific IgEsensitization
Table 4 and Table S5 show factors associated with ImmunoCAP IgE
sensitization to any of D pteronyssinus, A hypogaea or B germanica
extracts. In the urban survey, the presence of younger siblings and
SWA‐specific IgG were associated with asIgE sensitization. Rural par-
ticipants who washed hands after toilet use, slept under a mosquito
net and/or had recently been treated for malaria were less likely to
be asIgE sensitized. Engaging in agricultural/fishing/lake‐related activi-
ties or being unemployed, Sm infection (KK) and intensity, and ele-
vated SWA‐specific IgE increased the odds of asIgE sensitization.
The presence of younger siblings (interaction P = 0.008) and hand
washing (interaction P = 0.003) were associated with reduced odds of
asIgE sensitization in the rural but not the urban survey (Table 4). Adjust-
ing for Sm infection in multivariable analysis models did not suggest a
mediating role for Sm in these rural‐urban differences (Table S4B).Table S6 summarizes factors associated with ImmunoCAP asIgE
sensitization to individual allergens: Schistosoma‐specific antibody
levels and helminth infections were the predominant risk factors in
both surveys. Hygiene practices (washing and bathing) reduced the
odds of sensitization in the rural but not urban survey.
3.5 | Factors associated with clinical allergy‐relatedoutcomes
Factors associated with self‐reported recent wheeze, urticarial rash
and rhinitis are shown in Table S7. Risk factors for visible flexural der-
matitis could not be assessed because it was rare in both settings. In
the urban survey, the presence of older siblings, handwashing before
eating, SWA‐specific IgG and SEA‐specific IgG were inversely associ-
ated with wheezing. In the rural survey, female sex and presence of
any nematode infection were inversely associated with wheezing,
while increasing age, SWA‐specific IgG, SEA‐specific IgG and paternal
history of allergies increased the odds of wheezing. Non‐Ugandanpaternal tribe (interaction P < 0.001) increased the odds of wheezing
in the urban but not rural survey, while SWA‐specific IgG (P < 0.001)
and SEA‐specific IgG (P = 0.001) were positively associated with
wheezing in the rural but not the urban survey.
Urban individuals who received any anthelminthic treatment in
the previous 12 months were more likely to report urticarial rash. In
the rural survey, increasing age, maternal history of allergies, SEA‐specific IgE and recent malaria treatment were associated with urti-
caria. The association between SEA‐specific IgE and urticaria was
positive in the rural but not urban survey (interaction P = 0.022). No
other significant interactions were observed.
Maternal and paternal history of allergies, and HIV infection were
associated with rhinitis in the urban survey. The following were risk
factors for rhinitis in the rural survey: increasing age, presence of
NKURUNUNGI ET AL. | 5
102
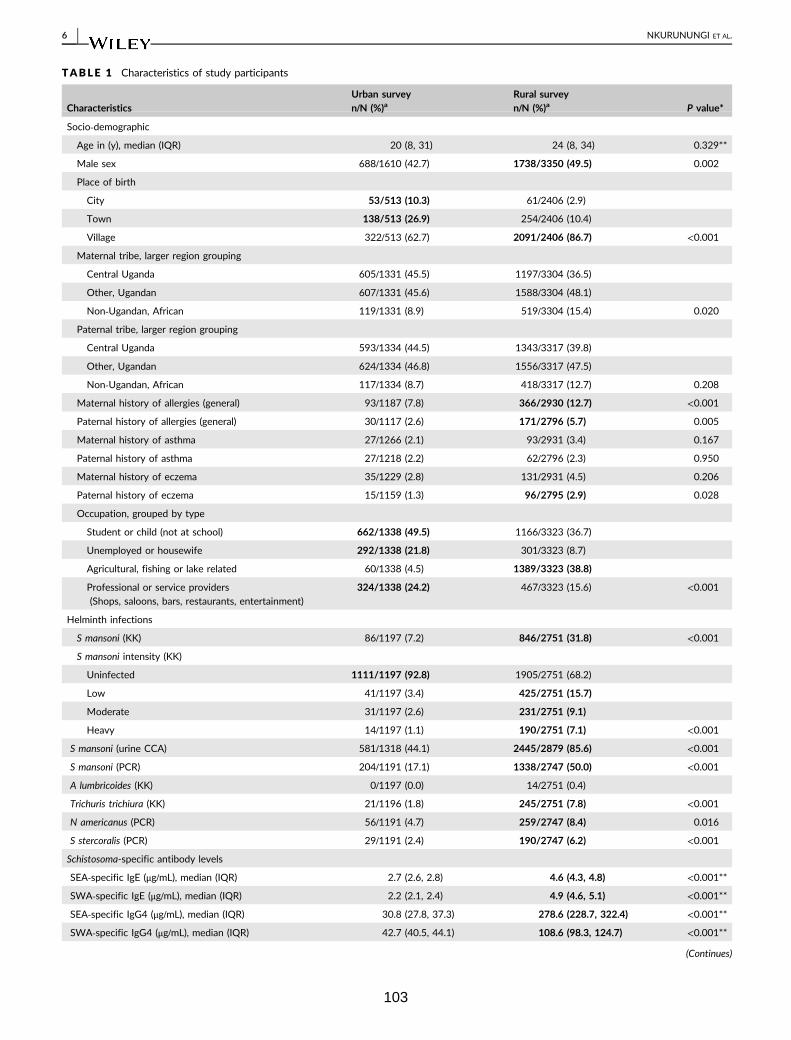
TABLE 1 Characteristics of study participants
CharacteristicsUrban surveyn/N (%)a
Rural surveyn/N (%)a P value*
Socio‐demographic
Age in (y), median (IQR) 20 (8, 31) 24 (8, 34) 0.329**
Male sex 688/1610 (42.7) 1738/3350 (49.5) 0.002
Place of birth
City 53/513 (10.3) 61/2406 (2.9)
Town 138/513 (26.9) 254/2406 (10.4)
Village 322/513 (62.7) 2091/2406 (86.7) <0.001
Maternal tribe, larger region grouping
Central Uganda 605/1331 (45.5) 1197/3304 (36.5)
Other, Ugandan 607/1331 (45.6) 1588/3304 (48.1)
Non‐Ugandan, African 119/1331 (8.9) 519/3304 (15.4) 0.020
Paternal tribe, larger region grouping
Central Uganda 593/1334 (44.5) 1343/3317 (39.8)
Other, Ugandan 624/1334 (46.8) 1556/3317 (47.5)
Non‐Ugandan, African 117/1334 (8.7) 418/3317 (12.7) 0.208
Maternal history of allergies (general) 93/1187 (7.8) 366/2930 (12.7) <0.001
Paternal history of allergies (general) 30/1117 (2.6) 171/2796 (5.7) 0.005
Maternal history of asthma 27/1266 (2.1) 93/2931 (3.4) 0.167
Paternal history of asthma 27/1218 (2.2) 62/2796 (2.3) 0.950
Maternal history of eczema 35/1229 (2.8) 131/2931 (4.5) 0.206
Paternal history of eczema 15/1159 (1.3) 96/2795 (2.9) 0.028
Occupation, grouped by type
Student or child (not at school) 662/1338 (49.5) 1166/3323 (36.7)
Unemployed or housewife 292/1338 (21.8) 301/3323 (8.7)
Agricultural, fishing or lake related 60/1338 (4.5) 1389/3323 (38.8)
Professional or service providers
(Shops, saloons, bars, restaurants, entertainment)
324/1338 (24.2) 467/3323 (15.6) <0.001
Helminth infections
S mansoni (KK) 86/1197 (7.2) 846/2751 (31.8) <0.001
S mansoni intensity (KK)
Uninfected 1111/1197 (92.8) 1905/2751 (68.2)
Low 41/1197 (3.4) 425/2751 (15.7)
Moderate 31/1197 (2.6) 231/2751 (9.1)
Heavy 14/1197 (1.1) 190/2751 (7.1) <0.001
S mansoni (urine CCA) 581/1318 (44.1) 2445/2879 (85.6) <0.001
S mansoni (PCR) 204/1191 (17.1) 1338/2747 (50.0) <0.001
A lumbricoides (KK) 0/1197 (0.0) 14/2751 (0.4)
Trichuris trichiura (KK) 21/1196 (1.8) 245/2751 (7.8) <0.001
N americanus (PCR) 56/1191 (4.7) 259/2747 (8.4) 0.016
S stercoralis (PCR) 29/1191 (2.4) 190/2747 (6.2) <0.001
Schistosoma-specific antibody levels
SEA‐specific IgE (μg/mL), median (IQR) 2.7 (2.6, 2.8) 4.6 (4.3, 4.8) <0.001**
SWA‐specific IgE (μg/mL), median (IQR) 2.2 (2.1, 2.4) 4.9 (4.6, 5.1) <0.001**
SEA‐specific IgG4 (μg/mL), median (IQR) 30.8 (27.8, 37.3) 278.6 (228.7, 322.4) <0.001**
SWA‐specific IgG4 (μg/mL), median (IQR) 42.7 (40.5, 44.1) 108.6 (98.3, 124.7) <0.001**
(Continues)
6 | NKURUNUNGI ET AL.
103
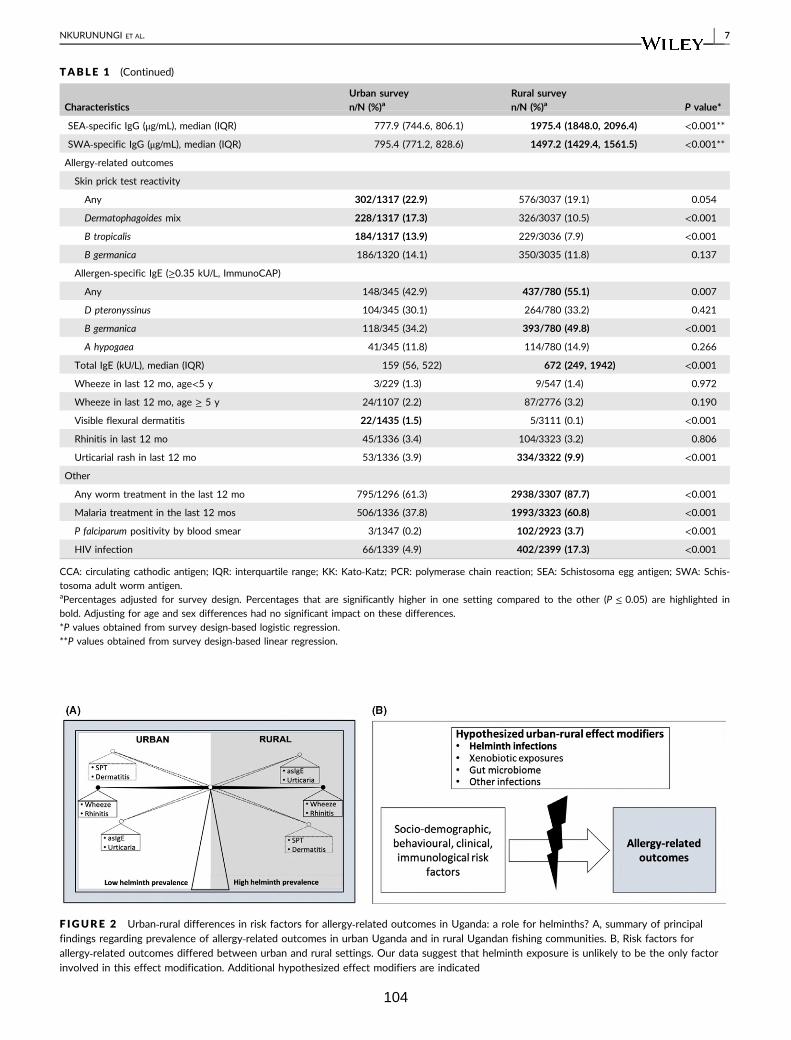
TABLE 1 (Continued)
CharacteristicsUrban surveyn/N (%)a
Rural surveyn/N (%)a P value*
SEA‐specific IgG (μg/mL), median (IQR) 777.9 (744.6, 806.1) 1975.4 (1848.0, 2096.4) <0.001**
SWA‐specific IgG (μg/mL), median (IQR) 795.4 (771.2, 828.6) 1497.2 (1429.4, 1561.5) <0.001**
Allergy‐related outcomes
Skin prick test reactivity
Any 302/1317 (22.9) 576/3037 (19.1) 0.054
Dermatophagoides mix 228/1317 (17.3) 326/3037 (10.5) <0.001
B tropicalis 184/1317 (13.9) 229/3036 (7.9) <0.001
B germanica 186/1320 (14.1) 350/3035 (11.8) 0.137
Allergen‐specific IgE (≥0.35 kU/L, ImmunoCAP)
Any 148/345 (42.9) 437/780 (55.1) 0.007
D pteronyssinus 104/345 (30.1) 264/780 (33.2) 0.421
B germanica 118/345 (34.2) 393/780 (49.8) <0.001
A hypogaea 41/345 (11.8) 114/780 (14.9) 0.266
Total IgE (kU/L), median (IQR) 159 (56, 522) 672 (249, 1942) <0.001
Wheeze in last 12 mo, age<5 y 3/229 (1.3) 9/547 (1.4) 0.972
Wheeze in last 12 mo, age ≥ 5 y 24/1107 (2.2) 87/2776 (3.2) 0.190
Visible flexural dermatitis 22/1435 (1.5) 5/3111 (0.1) <0.001
Rhinitis in last 12 mo 45/1336 (3.4) 104/3323 (3.2) 0.806
Urticarial rash in last 12 mo 53/1336 (3.9) 334/3322 (9.9) <0.001
Other
Any worm treatment in the last 12 mo 795/1296 (61.3) 2938/3307 (87.7) <0.001
Malaria treatment in the last 12 mos 506/1336 (37.8) 1993/3323 (60.8) <0.001
P falciparum positivity by blood smear 3/1347 (0.2) 102/2923 (3.7) <0.001
HIV infection 66/1339 (4.9) 402/2399 (17.3) <0.001
CCA: circulating cathodic antigen; IQR: interquartile range; KK: Kato‐Katz; PCR: polymerase chain reaction; SEA: Schistosoma egg antigen; SWA: Schis-
tosoma adult worm antigen.aPercentages adjusted for survey design. Percentages that are significantly higher in one setting compared to the other (P ≤ 0.05) are highlighted in
bold. Adjusting for age and sex differences had no significant impact on these differences.
*P values obtained from survey design‐based logistic regression.
**P values obtained from survey design‐based linear regression.
F IGURE 2 Urban‐rural differences in risk factors for allergy‐related outcomes in Uganda: a role for helminths? A, summary of principalfindings regarding prevalence of allergy‐related outcomes in urban Uganda and in rural Ugandan fishing communities. B, Risk factors forallergy‐related outcomes differed between urban and rural settings. Our data suggest that helminth exposure is unlikely to be the only factorinvolved in this effect modification. Additional hypothesized effect modifiers are indicated
NKURUNUNGI ET AL. | 7
104
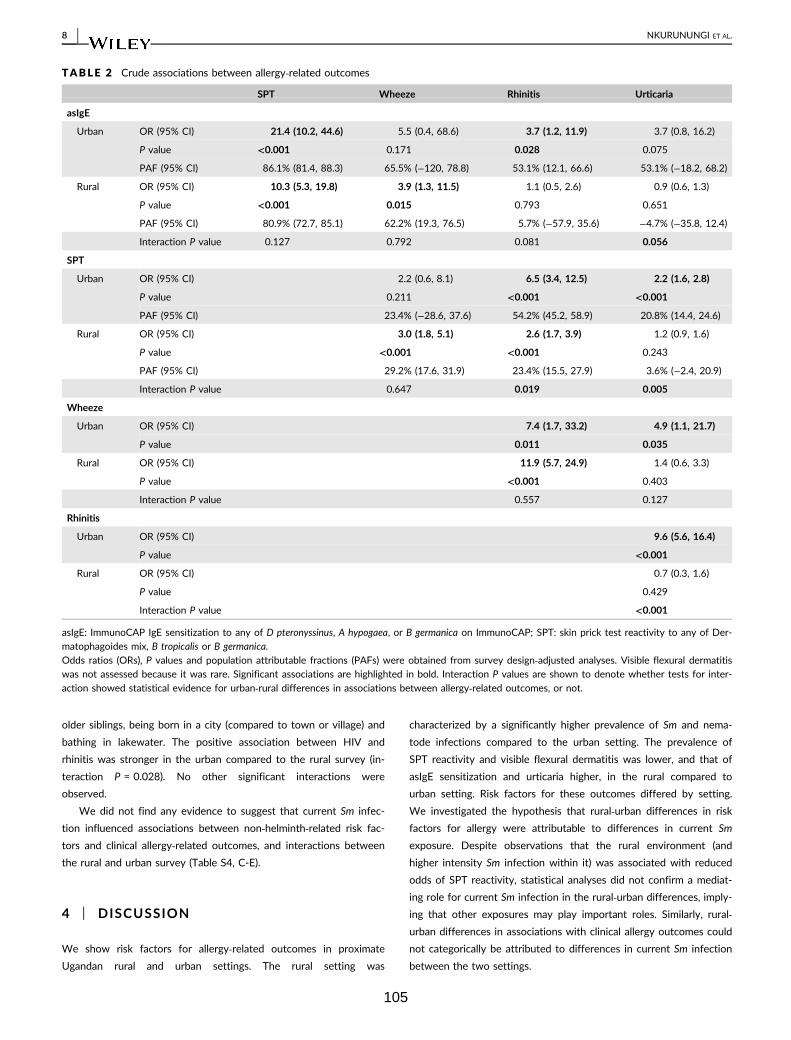
older siblings, being born in a city (compared to town or village) and
bathing in lakewater. The positive association between HIV and
rhinitis was stronger in the urban compared to the rural survey (in-
teraction P = 0.028). No other significant interactions were
observed.
We did not find any evidence to suggest that current Sm infec-
tion influenced associations between non‐helminth‐related risk fac-
tors and clinical allergy‐related outcomes, and interactions between
the rural and urban survey (Table S4, C-E).
4 | DISCUSSION
We show risk factors for allergy‐related outcomes in proximate
Ugandan rural and urban settings. The rural setting was
characterized by a significantly higher prevalence of Sm and nema-
tode infections compared to the urban setting. The prevalence of
SPT reactivity and visible flexural dermatitis was lower, and that of
asIgE sensitization and urticaria higher, in the rural compared to
urban setting. Risk factors for these outcomes differed by setting.
We investigated the hypothesis that rural‐urban differences in risk
factors for allergy were attributable to differences in current Sm
exposure. Despite observations that the rural environment (and
higher intensity Sm infection within it) was associated with reduced
odds of SPT reactivity, statistical analyses did not confirm a mediat-
ing role for current Sm infection in the rural‐urban differences, imply-
ing that other exposures may play important roles. Similarly, rural‐urban differences in associations with clinical allergy outcomes could
not categorically be attributed to differences in current Sm infection
between the two settings.
TABLE 2 Crude associations between allergy‐related outcomes
SPT Wheeze Rhinitis Urticaria
asIgE
Urban OR (95% CI) 21.4 (10.2, 44.6) 5.5 (0.4, 68.6) 3.7 (1.2, 11.9) 3.7 (0.8, 16.2)
P value <0.001 0.171 0.028 0.075
PAF (95% CI) 86.1% (81.4, 88.3) 65.5% (−120, 78.8) 53.1% (12.1, 66.6) 53.1% (−18.2, 68.2)
Rural OR (95% CI) 10.3 (5.3, 19.8) 3.9 (1.3, 11.5) 1.1 (0.5, 2.6) 0.9 (0.6, 1.3)
P value <0.001 0.015 0.793 0.651
PAF (95% CI) 80.9% (72.7, 85.1) 62.2% (19.3, 76.5) 5.7% (−57.9, 35.6) −4.7% (−35.8, 12.4)
Interaction P value 0.127 0.792 0.081 0.056
SPT
Urban OR (95% CI) 2.2 (0.6, 8.1) 6.5 (3.4, 12.5) 2.2 (1.6, 2.8)
P value 0.211 <0.001 <0.001
PAF (95% CI) 23.4% (−28.6, 37.6) 54.2% (45.2, 58.9) 20.8% (14.4, 24.6)
Rural OR (95% CI) 3.0 (1.8, 5.1) 2.6 (1.7, 3.9) 1.2 (0.9, 1.6)
P value <0.001 <0.001 0.243
PAF (95% CI) 29.2% (17.6, 31.9) 23.4% (15.5, 27.9) 3.6% (−2.4, 20.9)
Interaction P value 0.647 0.019 0.005
Wheeze
Urban OR (95% CI) 7.4 (1.7, 33.2) 4.9 (1.1, 21.7)
P value 0.011 0.035
Rural OR (95% CI) 11.9 (5.7, 24.9) 1.4 (0.6, 3.3)
P value <0.001 0.403
Interaction P value 0.557 0.127
Rhinitis
Urban OR (95% CI) 9.6 (5.6, 16.4)
P value <0.001
Rural OR (95% CI) 0.7 (0.3, 1.6)
P value 0.429
Interaction P value <0.001
asIgE: ImmunoCAP IgE sensitization to any of D pteronyssinus, A hypogaea, or B germanica on ImmunoCAP; SPT: skin prick test reactivity to any of Der-
matophagoides mix, B tropicalis or B germanica.
Odds ratios (ORs), P values and population attributable fractions (PAFs) were obtained from survey design‐adjusted analyses. Visible flexural dermatitis
was not assessed because it was rare. Significant associations are highlighted in bold. Interaction P values are shown to denote whether tests for inter-
action showed statistical evidence for urban‐rural differences in associations between allergy‐related outcomes, or not.
8 | NKURUNUNGI ET AL.
105
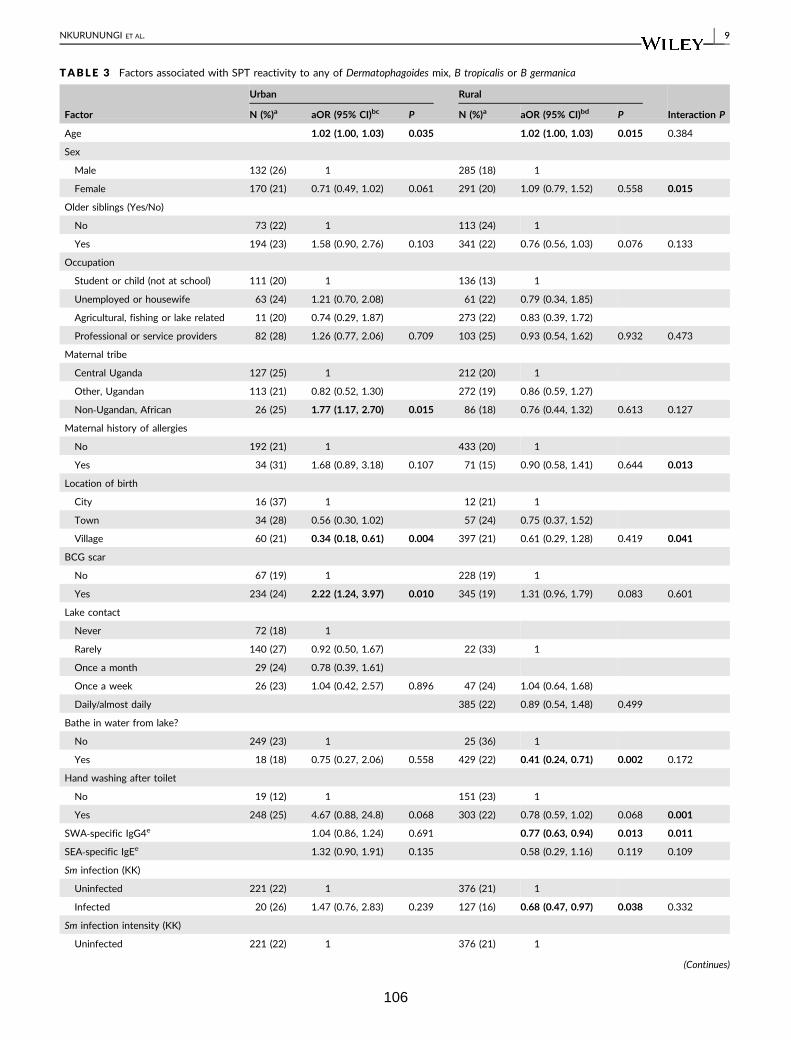
TABLE 3 Factors associated with SPT reactivity to any of Dermatophagoides mix, B tropicalis or B germanica
Factor
Urban Rural
Interaction PN (%)a aOR (95% CI)bc P N (%)a aOR (95% CI)bd P
Age 1.02 (1.00, 1.03) 0.035 1.02 (1.00, 1.03) 0.015 0.384
Sex
Male 132 (26) 1 285 (18) 1
Female 170 (21) 0.71 (0.49, 1.02) 0.061 291 (20) 1.09 (0.79, 1.52) 0.558 0.015
Older siblings (Yes/No)
No 73 (22) 1 113 (24) 1
Yes 194 (23) 1.58 (0.90, 2.76) 0.103 341 (22) 0.76 (0.56, 1.03) 0.076 0.133
Occupation
Student or child (not at school) 111 (20) 1 136 (13) 1
Unemployed or housewife 63 (24) 1.21 (0.70, 2.08) 61 (22) 0.79 (0.34, 1.85)
Agricultural, fishing or lake related 11 (20) 0.74 (0.29, 1.87) 273 (22) 0.83 (0.39, 1.72)
Professional or service providers 82 (28) 1.26 (0.77, 2.06) 0.709 103 (25) 0.93 (0.54, 1.62) 0.932 0.473
Maternal tribe
Central Uganda 127 (25) 1 212 (20) 1
Other, Ugandan 113 (21) 0.82 (0.52, 1.30) 272 (19) 0.86 (0.59, 1.27)
Non‐Ugandan, African 26 (25) 1.77 (1.17, 2.70) 0.015 86 (18) 0.76 (0.44, 1.32) 0.613 0.127
Maternal history of allergies
No 192 (21) 1 433 (20) 1
Yes 34 (31) 1.68 (0.89, 3.18) 0.107 71 (15) 0.90 (0.58, 1.41) 0.644 0.013
Location of birth
City 16 (37) 1 12 (21) 1
Town 34 (28) 0.56 (0.30, 1.02) 57 (24) 0.75 (0.37, 1.52)
Village 60 (21) 0.34 (0.18, 0.61) 0.004 397 (21) 0.61 (0.29, 1.28) 0.419 0.041
BCG scar
No 67 (19) 1 228 (19) 1
Yes 234 (24) 2.22 (1.24, 3.97) 0.010 345 (19) 1.31 (0.96, 1.79) 0.083 0.601
Lake contact
Never 72 (18) 1
Rarely 140 (27) 0.92 (0.50, 1.67) 22 (33) 1
Once a month 29 (24) 0.78 (0.39, 1.61)
Once a week 26 (23) 1.04 (0.42, 2.57) 0.896 47 (24) 1.04 (0.64, 1.68)
Daily/almost daily 385 (22) 0.89 (0.54, 1.48) 0.499
Bathe in water from lake?
No 249 (23) 1 25 (36) 1
Yes 18 (18) 0.75 (0.27, 2.06) 0.558 429 (22) 0.41 (0.24, 0.71) 0.002 0.172
Hand washing after toilet
No 19 (12) 1 151 (23) 1
Yes 248 (25) 4.67 (0.88, 24.8) 0.068 303 (22) 0.78 (0.59, 1.02) 0.068 0.001
SWA‐specific IgG4e 1.04 (0.86, 1.24) 0.691 0.77 (0.63, 0.94) 0.013 0.011
SEA‐specific IgEe 1.32 (0.90, 1.91) 0.135 0.58 (0.29, 1.16) 0.119 0.109
Sm infection (KK)
Uninfected 221 (22) 1 376 (21) 1
Infected 20 (26) 1.47 (0.76, 2.83) 0.239 127 (16) 0.68 (0.47, 0.97) 0.038 0.332
Sm infection intensity (KK)
Uninfected 221 (22) 1 376 (21) 1
(Continues)
NKURUNUNGI ET AL. | 9
106
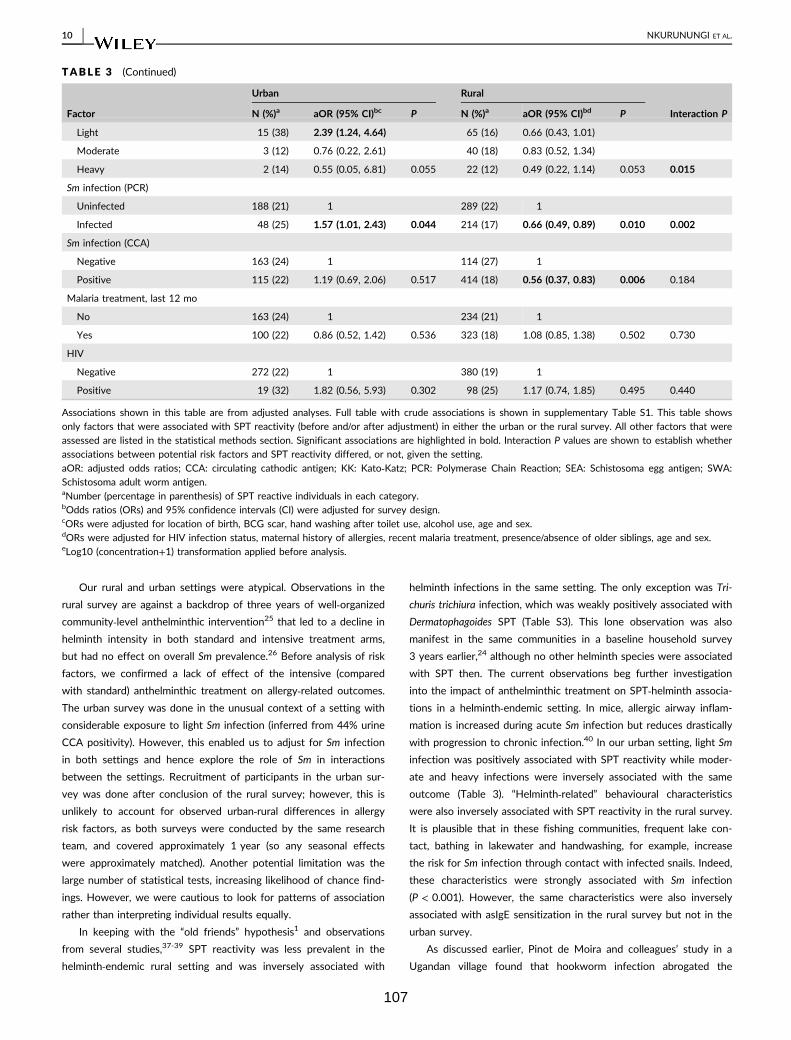
Our rural and urban settings were atypical. Observations in the
rural survey are against a backdrop of three years of well‐organizedcommunity‐level anthelminthic intervention25 that led to a decline in
helminth intensity in both standard and intensive treatment arms,
but had no effect on overall Sm prevalence.26 Before analysis of risk
factors, we confirmed a lack of effect of the intensive (compared
with standard) anthelminthic treatment on allergy‐related outcomes.
The urban survey was done in the unusual context of a setting with
considerable exposure to light Sm infection (inferred from 44% urine
CCA positivity). However, this enabled us to adjust for Sm infection
in both settings and hence explore the role of Sm in interactions
between the settings. Recruitment of participants in the urban sur-
vey was done after conclusion of the rural survey; however, this is
unlikely to account for observed urban‐rural differences in allergy
risk factors, as both surveys were conducted by the same research
team, and covered approximately 1 year (so any seasonal effects
were approximately matched). Another potential limitation was the
large number of statistical tests, increasing likelihood of chance find-
ings. However, we were cautious to look for patterns of association
rather than interpreting individual results equally.
In keeping with the “old friends” hypothesis1 and observations
from several studies,37-39 SPT reactivity was less prevalent in the
helminth‐endemic rural setting and was inversely associated with
helminth infections in the same setting. The only exception was Tri-
churis trichiura infection, which was weakly positively associated with
Dermatophagoides SPT (Table S3). This lone observation was also
manifest in the same communities in a baseline household survey
3 years earlier,24 although no other helminth species were associated
with SPT then. The current observations beg further investigation
into the impact of anthelminthic treatment on SPT‐helminth associa-
tions in a helminth‐endemic setting. In mice, allergic airway inflam-
mation is increased during acute Sm infection but reduces drastically
with progression to chronic infection.40 In our urban setting, light Sm
infection was positively associated with SPT reactivity while moder-
ate and heavy infections were inversely associated with the same
outcome (Table 3). “Helminth‐related” behavioural characteristics
were also inversely associated with SPT reactivity in the rural survey.
It is plausible that in these fishing communities, frequent lake con-
tact, bathing in lakewater and handwashing, for example, increase
the risk for Sm infection through contact with infected snails. Indeed,
these characteristics were strongly associated with Sm infection
(P < 0.001). However, the same characteristics were also inversely
associated with asIgE sensitization in the rural survey but not in the
urban survey.
As discussed earlier, Pinot de Moira and colleagues’ study in a
Ugandan village found that hookworm infection abrogated the
TABLE 3 (Continued)
Factor
Urban Rural
Interaction PN (%)a aOR (95% CI)bc P N (%)a aOR (95% CI)bd P
Light 15 (38) 2.39 (1.24, 4.64) 65 (16) 0.66 (0.43, 1.01)
Moderate 3 (12) 0.76 (0.22, 2.61) 40 (18) 0.83 (0.52, 1.34)
Heavy 2 (14) 0.55 (0.05, 6.81) 0.055 22 (12) 0.49 (0.22, 1.14) 0.053 0.015
Sm infection (PCR)
Uninfected 188 (21) 1 289 (22) 1
Infected 48 (25) 1.57 (1.01, 2.43) 0.044 214 (17) 0.66 (0.49, 0.89) 0.010 0.002
Sm infection (CCA)
Negative 163 (24) 1 114 (27) 1
Positive 115 (22) 1.19 (0.69, 2.06) 0.517 414 (18) 0.56 (0.37, 0.83) 0.006 0.184
Malaria treatment, last 12 mo
No 163 (24) 1 234 (21) 1
Yes 100 (22) 0.86 (0.52, 1.42) 0.536 323 (18) 1.08 (0.85, 1.38) 0.502 0.730
HIV
Negative 272 (22) 1 380 (19) 1
Positive 19 (32) 1.82 (0.56, 5.93) 0.302 98 (25) 1.17 (0.74, 1.85) 0.495 0.440
Associations shown in this table are from adjusted analyses. Full table with crude associations is shown in supplementary Table S1. This table shows
only factors that were associated with SPT reactivity (before and/or after adjustment) in either the urban or the rural survey. All other factors that were
assessed are listed in the statistical methods section. Significant associations are highlighted in bold. Interaction P values are shown to establish whether
associations between potential risk factors and SPT reactivity differed, or not, given the setting.
aOR: adjusted odds ratios; CCA: circulating cathodic antigen; KK: Kato‐Katz; PCR: Polymerase Chain Reaction; SEA: Schistosoma egg antigen; SWA:
Schistosoma adult worm antigen.aNumber (percentage in parenthesis) of SPT reactive individuals in each category.bOdds ratios (ORs) and 95% confidence intervals (CI) were adjusted for survey design.cORs were adjusted for location of birth, BCG scar, hand washing after toilet use, alcohol use, age and sex.dORs were adjusted for HIV infection status, maternal history of allergies, recent malaria treatment, presence/absence of older siblings, age and sex.eLog10 (concentration+1) transformation applied before analysis.
10 | NKURUNUNGI ET AL.
107
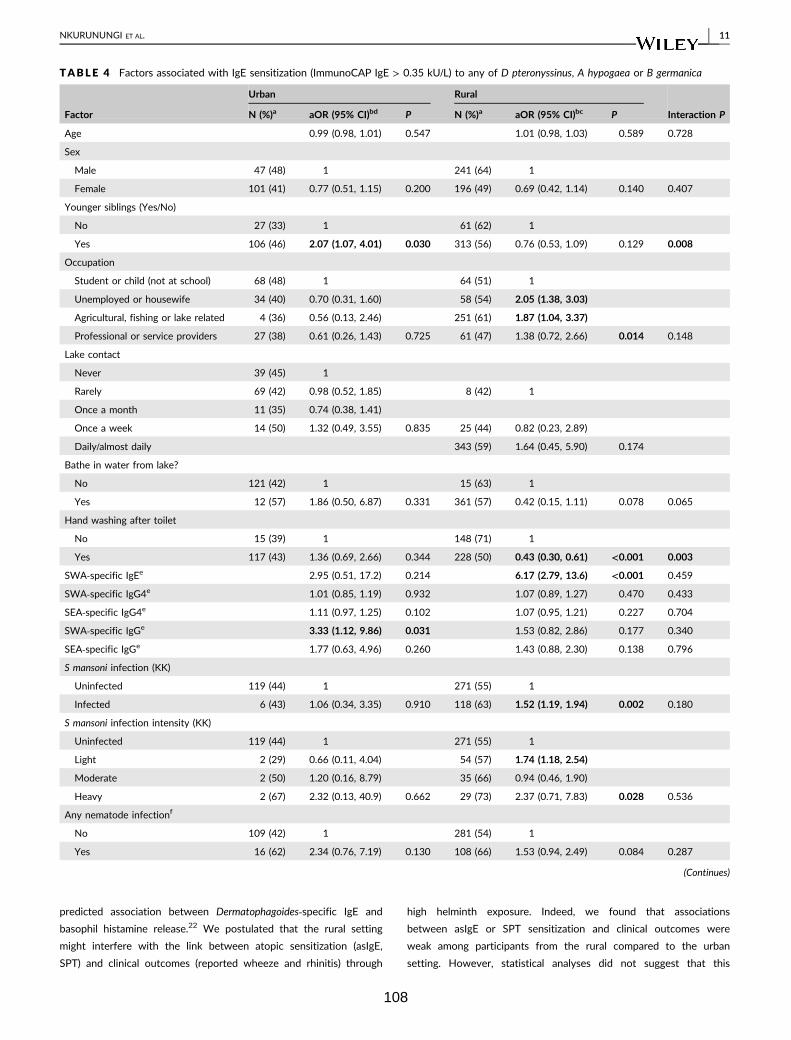
predicted association between Dermatophagoides‐specific IgE and
basophil histamine release.22 We postulated that the rural setting
might interfere with the link between atopic sensitization (asIgE,
SPT) and clinical outcomes (reported wheeze and rhinitis) through
high helminth exposure. Indeed, we found that associations
between asIgE or SPT sensitization and clinical outcomes were
weak among participants from the rural compared to the urban
setting. However, statistical analyses did not suggest that this
TABLE 4 Factors associated with IgE sensitization (ImmunoCAP IgE > 0.35 kU/L) to any of D pteronyssinus, A hypogaea or B germanica
Factor
Urban Rural
Interaction PN (%)a aOR (95% CI)bd P N (%)a aOR (95% CI)bc P
Age 0.99 (0.98, 1.01) 0.547 1.01 (0.98, 1.03) 0.589 0.728
Sex
Male 47 (48) 1 241 (64) 1
Female 101 (41) 0.77 (0.51, 1.15) 0.200 196 (49) 0.69 (0.42, 1.14) 0.140 0.407
Younger siblings (Yes/No)
No 27 (33) 1 61 (62) 1
Yes 106 (46) 2.07 (1.07, 4.01) 0.030 313 (56) 0.76 (0.53, 1.09) 0.129 0.008
Occupation
Student or child (not at school) 68 (48) 1 64 (51) 1
Unemployed or housewife 34 (40) 0.70 (0.31, 1.60) 58 (54) 2.05 (1.38, 3.03)
Agricultural, fishing or lake related 4 (36) 0.56 (0.13, 2.46) 251 (61) 1.87 (1.04, 3.37)
Professional or service providers 27 (38) 0.61 (0.26, 1.43) 0.725 61 (47) 1.38 (0.72, 2.66) 0.014 0.148
Lake contact
Never 39 (45) 1
Rarely 69 (42) 0.98 (0.52, 1.85) 8 (42) 1
Once a month 11 (35) 0.74 (0.38, 1.41)
Once a week 14 (50) 1.32 (0.49, 3.55) 0.835 25 (44) 0.82 (0.23, 2.89)
Daily/almost daily 343 (59) 1.64 (0.45, 5.90) 0.174
Bathe in water from lake?
No 121 (42) 1 15 (63) 1
Yes 12 (57) 1.86 (0.50, 6.87) 0.331 361 (57) 0.42 (0.15, 1.11) 0.078 0.065
Hand washing after toilet
No 15 (39) 1 148 (71) 1
Yes 117 (43) 1.36 (0.69, 2.66) 0.344 228 (50) 0.43 (0.30, 0.61) <0.001 0.003
SWA‐specific IgEe 2.95 (0.51, 17.2) 0.214 6.17 (2.79, 13.6) <0.001 0.459
SWA‐specific IgG4e 1.01 (0.85, 1.19) 0.932 1.07 (0.89, 1.27) 0.470 0.433
SEA‐specific IgG4e 1.11 (0.97, 1.25) 0.102 1.07 (0.95, 1.21) 0.227 0.704
SWA‐specific IgGe 3.33 (1.12, 9.86) 0.031 1.53 (0.82, 2.86) 0.177 0.340
SEA‐specific IgGe 1.77 (0.63, 4.96) 0.260 1.43 (0.88, 2.30) 0.138 0.796
S mansoni infection (KK)
Uninfected 119 (44) 1 271 (55) 1
Infected 6 (43) 1.06 (0.34, 3.35) 0.910 118 (63) 1.52 (1.19, 1.94) 0.002 0.180
S mansoni infection intensity (KK)
Uninfected 119 (44) 1 271 (55) 1
Light 2 (29) 0.66 (0.11, 4.04) 54 (57) 1.74 (1.18, 2.54)
Moderate 2 (50) 1.20 (0.16, 8.79) 35 (66) 0.94 (0.46, 1.90)
Heavy 2 (67) 2.32 (0.13, 40.9) 0.662 29 (73) 2.37 (0.71, 7.83) 0.028 0.536
Any nematode infectionf
No 109 (42) 1 281 (54) 1
Yes 16 (62) 2.34 (0.76, 7.19) 0.130 108 (66) 1.53 (0.94, 2.49) 0.084 0.287
(Continues)
NKURUNUNGI ET AL. | 11
108

difference was mediated by current Sm infection. Furthermore, the
PAF for SPT associated with asIgE in both the helminth‐endemic
rural survey and in the urban survey was high, and adjusting for
Sm or Schistosoma‐specific antibodies had no effect on this
association.
Allergen‐specific IgE sensitization, particularly to cockroach, was
more prevalent in the rural compared to the urban setting, possibly
due to the higher helminth prevalence in the former. Additionally,
helminth infections and Schistosoma‐specific antibody levels were
positively associated with asIgE in both surveys. Our immunoassays
measured IgE sensitization to crude allergen extracts; these may con-
tain cross‐reactive components that are conserved in several hel-
minth antigens,41-46 explaining the above associations. These cross‐reactive components may be less effective at mediating the effector
phase of the allergic response, explaining the lower prevalence of
SPT reactivity in the helminth‐endemic rural survey.
Associations with wheeze and rhinitis should be interpreted with
caution, because these outcomes were relatively rare. Furthermore,
reported wheeze can easily be misclassified in these populations,
because there is no direct translation of the word “wheeze” in the
local languages.24,47 Nonetheless, rural‐urban differences in the risk
factors for these outcomes were visible. For example, while Schisto-
soma‐specific antibody levels were inversely associated with wheez-
ing in the urban survey, the reverse was true in the rural setting.
Urticarial rash was a more common outcome, particularly in the hel-
minth‐endemic rural survey, where it may be indicative of parasite‐induced skin allergy48 and reaction to parasite antigens following
anthelminthic treatment.49 Support for these deductions comes from
our observations that recent anthelminthic treatment (urban survey)
and SEA‐specific IgE (rural survey) were associated with urticaria.
In conclusion, we show that risk factors for allergy‐related out-
comes differ between rural and urban communities in this tropical
setting. However, our analyses did not confirm a role for current
helminth (Sm) infection as the primary mechanism of the observed
effect modification between the two settings, despite indicative
trends. Differences in other environmental exposures may contribute
significantly.
ACKNOWLEDGEMENTS
We thank Entebbe municipality and Koome sub‐county community
members for participating in the urban survey and the rural
(LaVIISWA) study, respectively. These findings are presented on
behalf of the following members of the LaVIISWA and urban survey
research teams: project leaders, physicians, postdoctoral scientists:
Richard Sanya, Margaret Nampijja, Harriet Mpairwe, Geraldine
O'Hara; laboratory staff and collaborators: Gyaviira Nkurunungi, Joyce
Kabagenyi, Jacent Nassuuna, Irene Nambuya, Prossy Kabuubi,
Emmanuel Niwagaba, Moses Kabunga, Gloria Oduru, Grace Kabami,
John Vianney Tushabe, Elson Abayo, Eric Ssebagala, Fred Muwonge,
Dennison Kizito, Stephen Cose, Serge Versteeg, Ronald van Ree,
Linda Wammes, Jaco Verweij, Maria Yazdanbakhsh; statisticians and
data managers: Emily Webb, Remy Hoek Spaans, Lawrence Muhangi,
Lawrence Lubyayi, Helen Akurut, Fatuma Nalukenge, Justin Okello,
Sebastian Owilla, Wilber Ssembajjwe, Jacob Ochola, Jonathan Levin,
Stephen Nash; clinical officers: Carol Nanyunja, Milly Namutebi,
Christopher Zziwa; nurses: Esther Nakazibwe, Josephine Tumusiime,
Caroline Ninsiima, Susan Amongi, Grace Kamukama, Susan Iwala,
Florence Akello, Asherwin Ritah, Rehema Nampijja, Gloria Zalwango;
internal monitor: Mirriam Akello; field workers: Robert Kizindo, Moses
Sewankambo, Denis Nsubuga, Samuel Kiwanuka, Saadh Nsubuga
Mwagalanyi, Samuelson Nambaale; social sciences: Edward Tumwe-
sige; boatman: David Abiriga; driver: Richard Walusimbi; HIV coun-
selling and testing: Cynthia Kabonesa; Vector Control Programme staff:
James Kaweesa, Edridah Tukahebwa; administrative management:
Moses Kizza; principal investigator: Alison Elliott.
TABLE 4 (Continued)
Factor
Urban Rural
Interaction PN (%)a aOR (95% CI)bd P N (%)a aOR (95% CI)bc P
Slept under mosquito net last night?
No 35 (45) 1 203 (62) 1
Yes 97 (42) 0.93 (0.52, 1.66) 0.958 172 (52) 0.63 (0.41, 0.97) 0.037 0.316
Malaria treatment, last 12 mo
No 83 (45) 1 202 (63) 1
Yes 48 (39) 0.78 (0.46, 1.35) 0.365 221 (51) 0.52 (0.34, 0.81) 0.005 0.185
Associations shown in this table are from adjusted analyses. Full table with crude associations is shown in supplementary Table S1. This table shows
only factors that were associated with IgE sensitization (before and/or after adjustment) in either the urban or the rural survey. All other factors that
were assessed are listed in the statistical methods section. Significant associations are highlighted in bold. Interaction P values are shown to denote
whether tests for interaction showed statistical evidence for urban‐rural differences in associations with IgE sensitization, or not.
aOR: adjusted odds ratios; KK: Kato‐Katz; SWA: Schistosoma adult worm antigen; SEA: Schistosoma egg antigen.aNumber (percentage in parenthesis) of IgE sensitized individuals in each category.bOdds ratios (ORs) and 95% confidence intervals (CI) adjusted for survey design.cAll ORs were adjusted for hand washing after toilet use, mosquito net use, malaria treatment, age and sex.dAll ORs were adjusted for age and sex.eLog10 (concentration+1) transformation applied before analysis.fInfection with any of Ascaris lumbricoides, Trichuris trichiura (assessed by KK), Necator americanus, Strongyloides stercoralis (assessed by PCR).
12 | NKURUNUNGI ET AL.
109

CONFLICT OF INTEREST
The authors declare no conflict of interest.
AUTHOR CONTRIBUTIONS
AME conceived the LaVIISWA study and the urban survey. GN,
AME, MY and RvR designed the laboratory studies. GN, JK, JN and
SV performed the laboratory experiments. AME, RES, MN, PNK, JT,
CZ, RK, EN, HM and CN led and participated in field and clinic pro-
cedures. GN analysed the results with significant input from LL,
ELW, HM, MY and AME. GN wrote the manuscript, with all authors
contributing to the interpretation of the results, and revision and
approval of the final manuscript. GN is the guarantor of the article.
REFERENCES
1. Rook GA. 99th Dahlem conference on infection, inflammation and
chronic inflammatory disorders: Darwinian medicine and the ‘hy-giene’ or ‘old friends’ hypothesis. Clin Exp Immunol. 2010;160(1):70‐79.
2. Okada H, Kuhn C, Feillet H, Bach JF. The ‘hygiene hypothesis’ forautoimmune and allergic diseases: an update. Clin Exp Immunol.
2010;160(1):1‐9.3. Takizawa H. Impact of air pollution on allergic diseases. Korean J
Intern Med. 2011;26(3):262‐273.4. Braun-Fahrlander C, Riedler J, Herz U, et al. Environmental exposure
to endotoxin and its relation to asthma in school‐age children. N Engl
J Med. 2002;347(12):869‐877.5. Ege MJ, Frei R, Bieli C, et al. Not all farming environments protect
against the development of asthma and wheeze in children. J Allergy
Clin Immunol. 2007;119(5):1140‐1147.6. Ege MJ, Mayer M, Normand AC, et al. Exposure to environmental
microorganisms and childhood asthma. N Engl J Med. 2011;364
(8):701‐709.7. Ege MJ, Strachan DP, Cookson WO, et al. Gene‐environment inter-
action for childhood asthma and exposure to farming in Central Eur-
ope. J Allergy Clin Immunol. 2011;127(1):138‐144, 144 e131-134.
8. Stein MM, Hrusch CL, Gozdz J, et al. Innate immunity and asthma
risk in Amish and Hutterite farm children. N Engl J Med. 2016;
375(5):411‐421.9. Holbreich M, Genuneit J, Weber J, Braun-Fahrlander C, Waser M,
von Mutius E. Amish children living in northern Indiana have a very
low prevalence of allergic sensitization. J Allergy Clin Immunol.
2012;129(6):1671‐1673.10. von Mutius E. The microbial environment and its influence on
asthma prevention in early life. J Allergy Clin Immunol. 2016;
137(3):680‐689.11. Bousquet J, Bousquet PJ, Godard P, Daures JP. The public health
implications of asthma. Bull World Health Organ. 2005;83(7):548‐554.
12. Pawankar R, Canonica G, Holgate S, Lockey R. WAO White book on
Allergy Update 2013. Milwaukee, WI: WAO; 2013.
13. Addo-Yobo EO, Woodcock A, Allotey A, Baffoe-Bonnie B, Strachan
D, Custovic A. Exercise‐induced bronchospasm and atopy in Ghana:
two surveys ten years apart. PLoS Med. 2007;4(2):e70.
14. Keeley DJ, Neill P, Gallivan S. Comparison of the prevalence of
reversible airways obstruction in rural and urban Zimbabwean chil-
dren. Thorax. 1991;46(8):549‐553.15. Ng'ang'a LW, Odhiambo JA, Mungai MW, et al. Prevalence of exer-
cise induced bronchospasm in Kenyan school children: an urban‐ruralcomparison. Thorax. 1998;53(11):919‐926.
16. Nicolaou N, Siddique N, Custovic A. Allergic disease in urban and
rural populations: increasing prevalence with increasing urbanization.
Allergy. 2005;60(11):1357‐1360.17. Van Niekerk CH, Weinberg EG, Shore SC, Heese HV, Van Schalkwyk
J. Prevalence of asthma: a comparative study of urban and rural
Xhosa children. Clin Allergy. 1979;9(4):319‐314.18. Navarro S, Pickering DA, Ferreira IB, et al. Hookworm recombinant
protein promotes regulatory T cell responses that suppress experi-
mental asthma. Sci Transl Med. 2016;8(362):362ra143.
19. Qiu S, Fan X, Yang Y, et al. Schistosoma japonicum infection down-
regulates house dust mite‐induced allergic airway inflammation in
mice. PLoS One. 2017;12(6):e0179565.
20. Wilson MS, Taylor MD, Balic A, Finney CA, Lamb JR, Maizels RM.
Suppression of allergic airway inflammation by helminth‐induced reg-
ulatory T cells. J Exp Med. 2005;202(9):1199‐1212.21. Schram ME, Tedja AM, Spijker R, Bos JD, Williams HC, Spuls PI. Is
there a rural/urban gradient in the prevalence of eczema? A system-
atic review Br J Dermatol. 2010;162(5):964‐973.22. Pinot de Moira A, Fitzsimmons CM, Jones FM, et al. Suppression of
basophil histamine release and other IgE‐dependent responses in
childhood Schistosoma mansoni/hookworm coinfection. J Infect Dis.
2014;210(8):1198‐1206.23. Uganda Bureau of Statistics. The National Population and Housing
Census 2014 – Main Report. Uganda: Kampala; 2016.
24. Webb EL, Nampijja M, Kaweesa J, et al. Helminths are positively
associated with atopy and wheeze in Ugandan fishing communities:
results from a cross‐sectional survey. Allergy. 2016;71(8):1156‐1169.
25. Nampijja M, Webb EL, Kaweesa J, et al. The Lake Victoria island
intervention study on worms and allergy‐related diseases
(LaVIISWA): study protocol for a randomised controlled trial. Trials.
2015;16(1):187.
26. Sanya RE, Nkurunungi G, Hoek Spaans R, et al. The impact of inten-
sive versus standard anthelminthic treatment on allergy‐related out-
comes, Helminth infection intensity, and Helminth‐related morbidity
in Lake Victoria Fishing Communities, Uganda: results from the
LaVIISWA cluster‐randomized trial. Clin Infect Dis. 2018 ciy761‐ciy761. https://doi.org/10.1093/cid/ciy761
27. Katz N, Chaves A, Pellegrino J. A simple device for quantitative stool
thick‐smear technique in Schistosomiasis mansoni. Rev Inst Med Trop
Sao Paulo. 1972;14(6):397‐400.28. Verweij JJ, Brienen EA, Ziem J, Yelifari L, Polderman AM, Van Liesh-
out L. Simultaneous detection and quantification of Ancylostoma
duodenale, Necator americanus, and Oesophagostomum bifurcum in
fecal samples using multiplex real‐time PCR. Am J Trop Med Hyg.
2007;77(4):685‐690.29. Verweij JJ, Canales M, Polman K, et al. Molecular diagnosis of
Strongyloides stercoralis in faecal samples using real‐time PCR. Trans
R Soc Trop Med Hyg. 2009;103(4):342‐346.30. Mpairwe H, Muhangi L, Ndibazza J, et al. Skin prick test reactivity to
common allergens among women in Entebbe, Uganda. Trans R Soc
Trop Med Hyg. 2008;102(4):367‐373.31. Heinzerling L, Mari A, Bergmann KC, et al. The skin prick test ‐ Euro-
pean standards. Clin Transl Allergy. 2013;3(1):3.
32. Pekkanen J, Pearce N. Defining asthma in epidemiological studies.
Eur Respir J. 1999;14(4):951‐957.33. Debley J, Stanojevic S, Filbrun AG, Subbarao P. Bronchodilator
responsiveness in wheezy infants and toddlers is not associated with
asthma risk factors. Pediatr Pulmonol. 2012;47(5):421‐428.34. Williams HC. So how do i define atopic eczema? A Practical manual
for researchers wishing to define atopic eczema. http://www.nottingha
m.ac.uk/≃mzzfaq/dermatology/eczema/contents.html. Accessed Febru-
ary 6, 2018.
35. Williams HC. Clinical practice. Atopic dermatitis. N Engl J Med.
2005;352(22):2314‐2324.
NKURUNUNGI ET AL. | 13
110
36. Williams HC, Forsdyke H, Boodoo G, Hay RJ, Burney PG. A protocol
for recording the sign of flexural dermatitis in children. Br J Dermatol.
1995;133(6):941‐949.37. Araujo MI, Lopes AA, Medeiros M, et al. Inverse association
between skin response to aeroallergens and Schistosoma mansoni
infection. Int Arch Allergy Immunol. 2000;123(2):145‐148.38. Supali T, Djuardi Y, Wibowo H, van Ree R, Yazdanbakhsh M,
Sartono E. Relationship between different species of helminths
and atopy: a study in a population living in helminth‐endemic area
in Sulawesi, Indonesia. Int Arch Allergy Immunol. 2010;153(4):388‐394.
39. Medeiros M Jr, Almeida MC, Figueiredo JP, et al. Low frequency of
positive skin tests in asthmatic patients infected with Schistosoma
mansoni exposed to high levels of mite allergens. Pediatr Allergy
Immunol. 2004;15(2):142‐147.40. Smits HH, Hammad H, van Nimwegen M, et al. Protective effect of
Schistosoma mansoni infection on allergic airway inflammation
depends on the intensity and chronicity of infection. J Allergy Clin
Immunol. 2007;120(4):932‐940.41. Hamid F, Amoah AS, van Ree R, Yazdanbakhsh M. Helminth‐induced
IgE and protection against allergic disorders. Curr Top Microbiol
Immunol. 2015;388:91‐108.42. Igetei JE, El-Faham M, Liddell S, Schramm G, Doenhoff MJ. Anti-
genic cross‐reactivity between Schistosoma mansoni and pollen aller-
gens from the birch tree (Betula verrucosa) and Timothy grass
(Phleum pratense): involvement of shared glycan epitopes and impli-
cations for the hygiene hypothesis. Int J Parasitol. 2018;48:345‐357.43. Tyagi N, Farnell EJ, Fitzsimmons CM, et al. Comparisons of allergenic
and metazoan parasite proteins: allergy the price of immunity. PLoS
Comput Biol. 2015;11(10):e1004546.
44. Santiago Hda C, Ribeiro-Gomes FL, Bennuru S, Nutman TB. Hel-
minth infection alters IgE responses to allergens structurally related
to parasite proteins. J Immunol. 2015;194(1):93‐100.
45. Santiago HC, Bennuru S, Boyd A, Eberhard M, Nutman TB. Struc-
tural and immunologic cross‐reactivity among filarial and mite tropo-
myosin: implications for the hygiene hypothesis. J Allergy Clin
Immunol. 2011;127(2):479‐486.46. Santiago HC, LeeVan E, Bennuru S, et al. Molecular mimicry
between cockroach and helminth glutathione S‐transferases pro-
motes cross‐reactivity and cross‐sensitization. J Allergy Clin Immunol.
2012;130(1):248‐256. e249.47. Nkurunungi G, Kabagenyi J, Nampijja M, et al. Schistosoma mansoni‐
specific immune responses and allergy in Uganda. Parasite Immunol.
2018;40(1):e12506.
48. Bakiri AH, Mingomataj EC. Parasites induced skin allergy: a strategic
manipulation of the host immunity. J Clin Med Res. 2010;2(6):247‐255.49. Nahshoni A, Baum S, Barzilai A, Schwartz E. Chronic Urticaria in
returning travellers: the role of anthelmintic treatment. Dermatology.
2016;232(4):468‐471.
SUPPORTING INFORMATION
Additional supporting information may be found online in the
Supporting Information section at the end of the article.
How to cite this article: Nkurunungi G, Lubyayi L,
Versteeg SA, et al. Do helminth infections underpin
urban‐rural differences in risk factors for allergy‐relatedoutcomes. Clin Exp Allergy. 2019;00:1–14.https://doi.org/10.1111/cea.13335
14 | NKURUNUNGI ET AL.
111
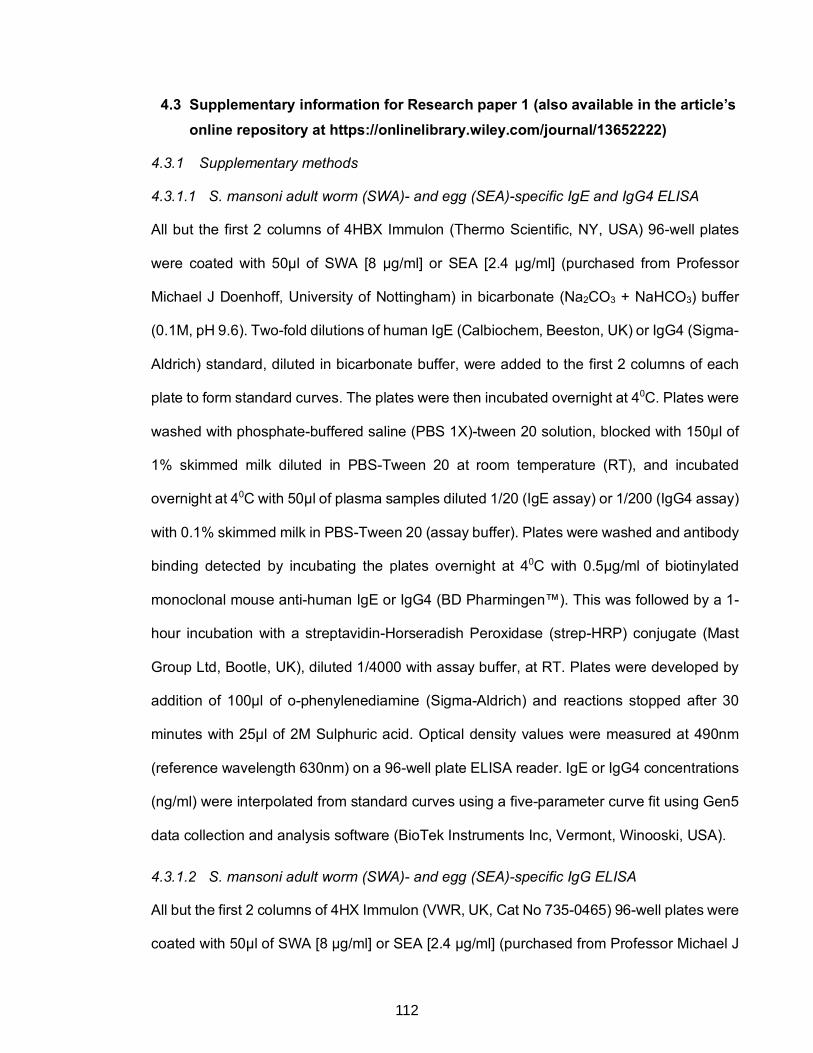
4.3 Supplementary information for Research paper 1 (also available in the article’s online repository at https://onlinelibrary.wiley.com/journal/13652222)
4.3.1 Supplementary methods
4.3.1.1 S. mansoni adult worm (SWA)- and egg (SEA)-specific IgE and IgG4 ELISA
All but the first 2 columns of 4HBX Immulon (Thermo Scientific, NY, USA) 96-well plates
were coated with 50μl of SWA [8 μg/ml] or SEA [2.4 μg/ml] (purchased from Professor
Michael J Doenhoff, University of Nottingham) in bicarbonate (Na2CO3 + NaHCO3) buffer
(0.1M, pH 9.6). Two-fold dilutions of human IgE (Calbiochem, Beeston, UK) or IgG4 (Sigma-
Aldrich) standard, diluted in bicarbonate buffer, were added to the first 2 columns of each
plate to form standard curves. The plates were then incubated overnight at 40C. Plates were
washed with phosphate-buffered saline (PBS 1X)-tween 20 solution, blocked with 150μl of
1% skimmed milk diluted in PBS-Tween 20 at room temperature (RT), and incubated
overnight at 40C with 50μl of plasma samples diluted 1/20 (IgE assay) or 1/200 (IgG4 assay)
with 0.1% skimmed milk in PBS-Tween 20 (assay buffer). Plates were washed and antibody
binding detected by incubating the plates overnight at 40C with 0.5μg/ml of biotinylated
monoclonal mouse anti-human IgE or IgG4 (BD Pharmingen™). This was followed by a 1-
hour incubation with a streptavidin-Horseradish Peroxidase (strep-HRP) conjugate (Mast
Group Ltd, Bootle, UK), diluted 1/4000 with assay buffer, at RT. Plates were developed by
addition of 100μl of o-phenylenediamine (Sigma-Aldrich) and reactions stopped after 30
minutes with 25μl of 2M Sulphuric acid. Optical density values were measured at 490nm
(reference wavelength 630nm) on a 96-well plate ELISA reader. IgE or IgG4 concentrations
(ng/ml) were interpolated from standard curves using a five-parameter curve fit using Gen5
data collection and analysis software (BioTek Instruments Inc, Vermont, Winooski, USA).
4.3.1.2 S. mansoni adult worm (SWA)- and egg (SEA)-specific IgG ELISA
All but the first 2 columns of 4HX Immulon (VWR, UK, Cat No 735-0465) 96-well plates were
coated with 50μl of SWA [8 μg/ml] or SEA [2.4 μg/ml] (purchased from Professor Michael J
112
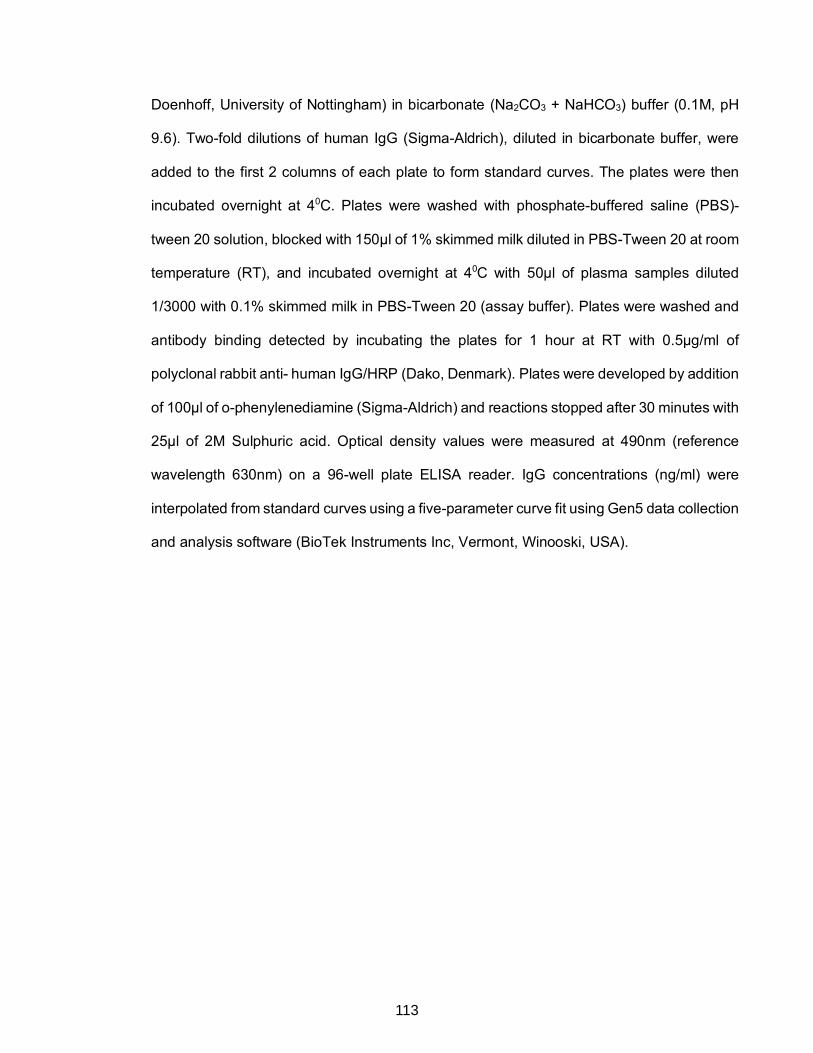
Doenhoff, University of Nottingham) in bicarbonate (Na2CO3 + NaHCO3) buffer (0.1M, pH
9.6). Two-fold dilutions of human IgG (Sigma-Aldrich), diluted in bicarbonate buffer, were
added to the first 2 columns of each plate to form standard curves. The plates were then
incubated overnight at 40C. Plates were washed with phosphate-buffered saline (PBS)-
tween 20 solution, blocked with 150μl of 1% skimmed milk diluted in PBS-Tween 20 at room
temperature (RT), and incubated overnight at 40C with 50μl of plasma samples diluted
1/3000 with 0.1% skimmed milk in PBS-Tween 20 (assay buffer). Plates were washed and
antibody binding detected by incubating the plates for 1 hour at RT with 0.5μg/ml of
polyclonal rabbit anti- human IgG/HRP (Dako, Denmark). Plates were developed by addition
of 100μl of o-phenylenediamine (Sigma-Aldrich) and reactions stopped after 30 minutes with
25μl of 2M Sulphuric acid. Optical density values were measured at 490nm (reference
wavelength 630nm) on a 96-well plate ELISA reader. IgG concentrations (ng/ml) were
interpolated from standard curves using a five-parameter curve fit using Gen5 data collection
and analysis software (BioTek Instruments Inc, Vermont, Winooski, USA).
113
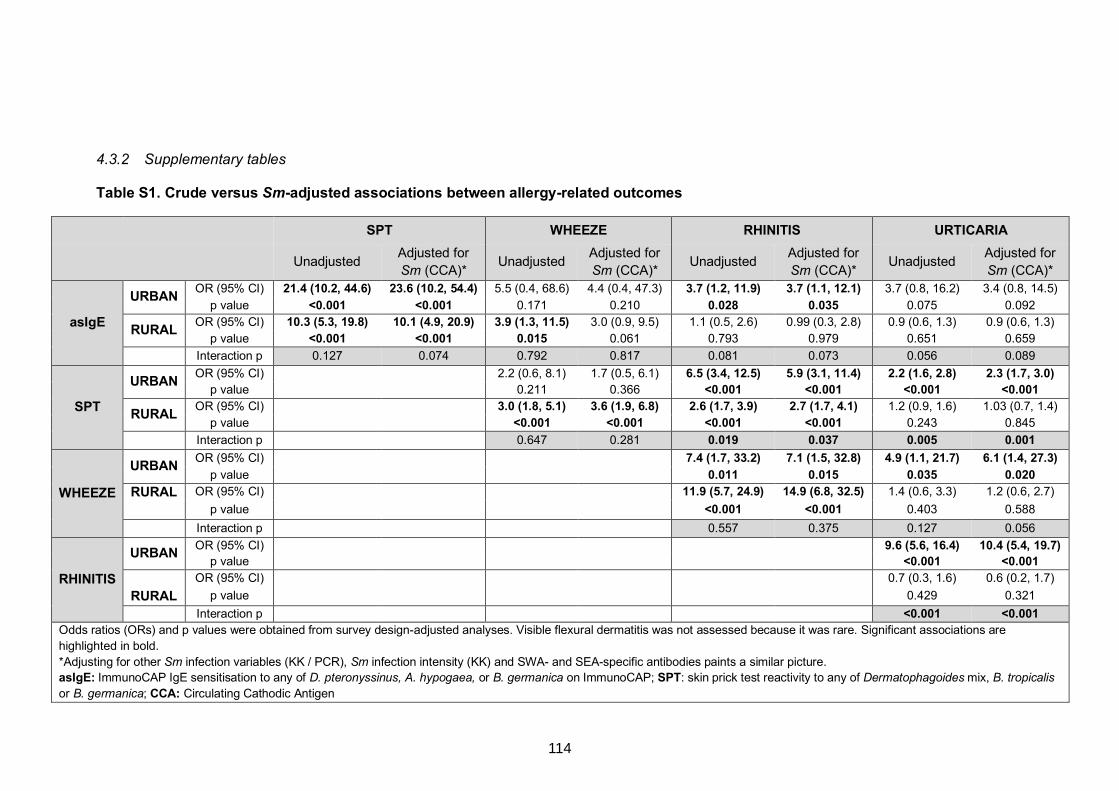
4.3.2 Supplementary tables
Table S1. Crude versus Sm-adjusted associations between allergy-related outcomes
SPT WHEEZE RHINITIS URTICARIA Unadjusted
Adjusted for
Sm (CCA)* Unadjusted
Adjusted for
Sm (CCA)* Unadjusted
Adjusted for
Sm (CCA)* Unadjusted
Adjusted for
Sm (CCA)*
asIgE
URBAN OR (95% CI) 21.4 (10.2, 44.6) 23.6 (10.2, 54.4) 5.5 (0.4, 68.6) 4.4 (0.4, 47.3) 3.7 (1.2, 11.9) 3.7 (1.1, 12.1) 3.7 (0.8, 16.2) 3.4 (0.8, 14.5)
p value <0.001 <0.001 0.171 0.210 0.028 0.035 0.075 0.092
RURAL OR (95% CI) 10.3 (5.3, 19.8) 10.1 (4.9, 20.9) 3.9 (1.3, 11.5) 3.0 (0.9, 9.5) 1.1 (0.5, 2.6) 0.99 (0.3, 2.8) 0.9 (0.6, 1.3) 0.9 (0.6, 1.3)
p value <0.001 <0.001 0.015 0.061 0.793 0.979 0.651 0.659
Interaction p 0.127 0.074 0.792 0.817 0.081 0.073 0.056 0.089
SPT
URBAN OR (95% CI) 2.2 (0.6, 8.1) 1.7 (0.5, 6.1) 6.5 (3.4, 12.5) 5.9 (3.1, 11.4) 2.2 (1.6, 2.8) 2.3 (1.7, 3.0)
p value 0.211 0.366 <0.001 <0.001 <0.001 <0.001
RURAL OR (95% CI) 3.0 (1.8, 5.1) 3.6 (1.9, 6.8) 2.6 (1.7, 3.9) 2.7 (1.7, 4.1) 1.2 (0.9, 1.6) 1.03 (0.7, 1.4)
p value <0.001 <0.001 <0.001 <0.001 0.243 0.845
Interaction p 0.647 0.281 0.019 0.037 0.005 0.001
WHEEZE
URBAN OR (95% CI) 7.4 (1.7, 33.2) 7.1 (1.5, 32.8) 4.9 (1.1, 21.7) 6.1 (1.4, 27.3)
p value 0.011 0.015 0.035 0.020 RURAL
OR (95% CI) 11.9 (5.7, 24.9) 14.9 (6.8, 32.5) 1.4 (0.6, 3.3) 1.2 (0.6, 2.7)
p value <0.001 <0.001 0.403 0.588
Interaction p 0.557 0.375 0.127 0.056
RHINITIS
URBAN OR (95% CI) 9.6 (5.6, 16.4) 10.4 (5.4, 19.7)
p value <0.001 <0.001
RURAL
OR (95% CI) 0.7 (0.3, 1.6) 0.6 (0.2, 1.7)
p value 0.429 0.321
Interaction p <0.001 <0.001 Odds ratios (ORs) and p values were obtained from survey design-adjusted analyses. Visible flexural dermatitis was not assessed because it was rare. Significant associations are
highlighted in bold.
*Adjusting for other Sm infection variables (KK / PCR), Sm infection intensity (KK) and SWA- and SEA-specific antibodies paints a similar picture. asIgE: ImmunoCAP IgE sensitisation to any of D. pteronyssinus, A. hypogaea, or B. germanica on ImmunoCAP; SPT: skin prick test reactivity to any of Dermatophagoides mix, B. tropicalis
or B. germanica; CCA: Circulating Cathodic Antigen
114
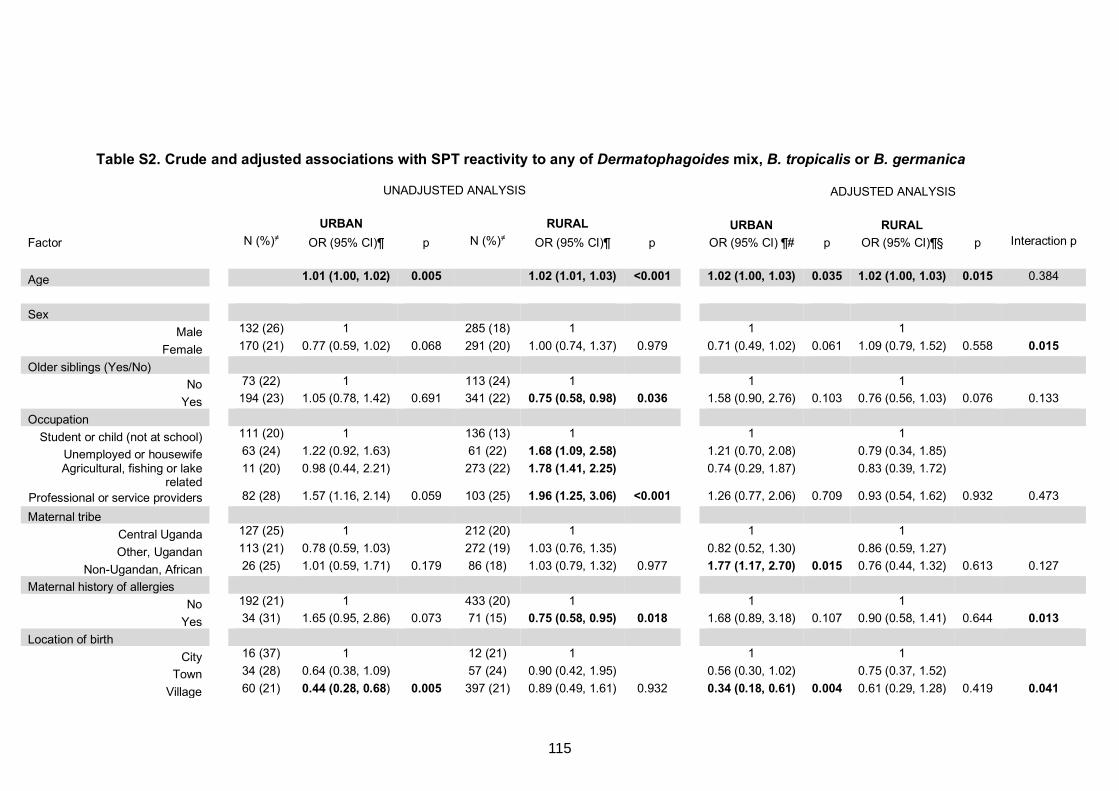
Table S2. Crude and adjusted associations with SPT reactivity to any of Dermatophagoides mix, B. tropicalis or B. germanica
UNADJUSTED ANALYSIS ADJUSTED ANALYSIS
URBAN RURAL URBAN RURAL Factor N (%)≠ OR (95% CI)¶ p N (%)≠ OR (95% CI)¶ p OR (95% CI) ¶# p OR (95% CI)¶§ p Interaction p
Age 1.01 (1.00, 1.02) 0.005 1.02 (1.01, 1.03) <0.001 1.02 (1.00, 1.03) 0.035 1.02 (1.00, 1.03) 0.015 0.384
Sex
Male 132 (26) 1 285 (18) 1 1 1
Female 170 (21) 0.77 (0.59, 1.02) 0.068 291 (20) 1.00 (0.74, 1.37) 0.979 0.71 (0.49, 1.02) 0.061 1.09 (0.79, 1.52) 0.558 0.015 Older siblings (Yes/No)
No 73 (22) 1 113 (24) 1 1 1
Yes 194 (23) 1.05 (0.78, 1.42) 0.691 341 (22) 0.75 (0.58, 0.98) 0.036 1.58 (0.90, 2.76) 0.103 0.76 (0.56, 1.03) 0.076 0.133
Occupation
Student or child (not at school) 111 (20) 1 136 (13) 1 1 1
Unemployed or housewife 63 (24) 1.22 (0.92, 1.63) 61 (22) 1.68 (1.09, 2.58) 1.21 (0.70, 2.08) 0.79 (0.34, 1.85)
Agricultural, fishing or lake related
11 (20) 0.98 (0.44, 2.21) 273 (22) 1.78 (1.41, 2.25) 0.74 (0.29, 1.87) 0.83 (0.39, 1.72)
Professional or service providers 82 (28) 1.57 (1.16, 2.14) 0.059 103 (25) 1.96 (1.25, 3.06) <0.001 1.26 (0.77, 2.06) 0.709 0.93 (0.54, 1.62) 0.932 0.473
Maternal tribe
Central Uganda 127 (25) 1 212 (20) 1 1 1
Other, Ugandan 113 (21) 0.78 (0.59, 1.03) 272 (19) 1.03 (0.76, 1.35) 0.82 (0.52, 1.30) 0.86 (0.59, 1.27)
Non-Ugandan, African 26 (25) 1.01 (0.59, 1.71) 0.179 86 (18) 1.03 (0.79, 1.32) 0.977 1.77 (1.17, 2.70) 0.015 0.76 (0.44, 1.32) 0.613 0.127
Maternal history of allergies
No 192 (21) 1 433 (20) 1 1 1
Yes 34 (31) 1.65 (0.95, 2.86) 0.073 71 (15) 0.75 (0.58, 0.95) 0.018 1.68 (0.89, 3.18) 0.107 0.90 (0.58, 1.41) 0.644 0.013 Location of birth
City 16 (37) 1 12 (21) 1 1 1
Town 34 (28) 0.64 (0.38, 1.09) 57 (24) 0.90 (0.42, 1.95) 0.56 (0.30, 1.02) 0.75 (0.37, 1.52)
Village 60 (21) 0.44 (0.28, 0.68) 0.005 397 (21) 0.89 (0.49, 1.61) 0.932 0.34 (0.18, 0.61) 0.004 0.61 (0.29, 1.28) 0.419 0.041
115
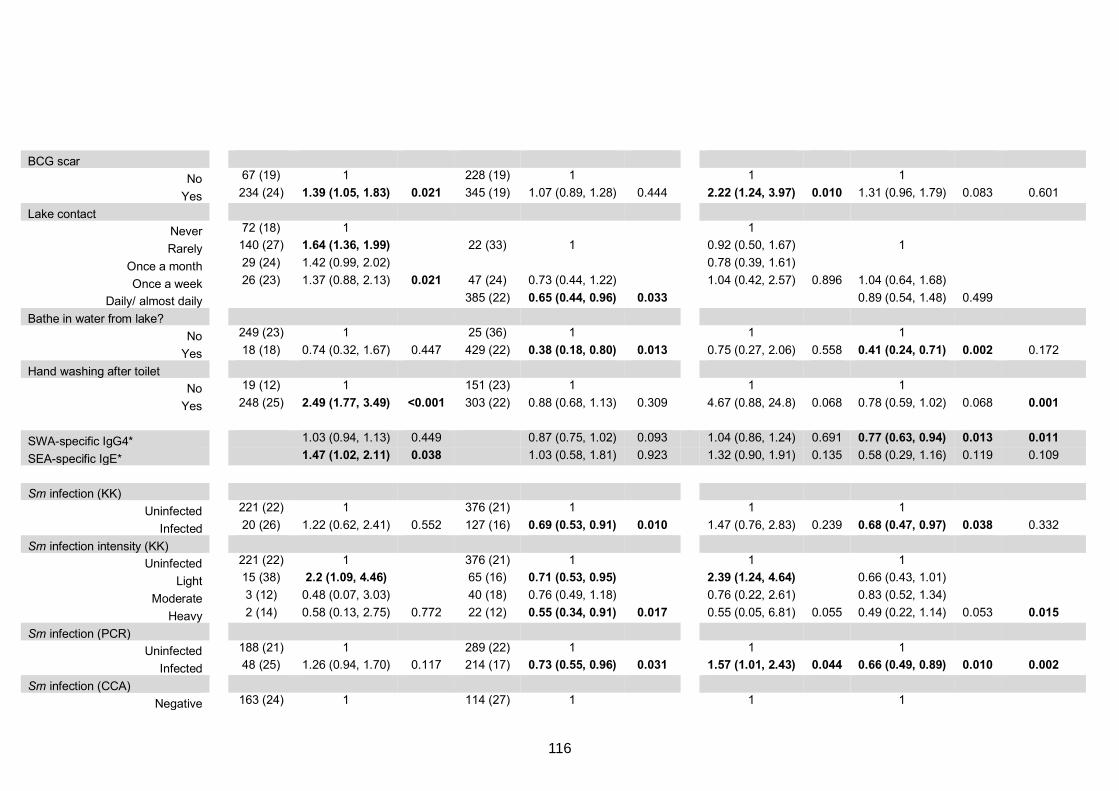
BCG scar
No 67 (19) 1 228 (19) 1 1 1
Yes 234 (24) 1.39 (1.05, 1.83) 0.021 345 (19) 1.07 (0.89, 1.28) 0.444 2.22 (1.24, 3.97) 0.010 1.31 (0.96, 1.79) 0.083 0.601
Lake contact
Never 72 (18) 1 1
Rarely 140 (27) 1.64 (1.36, 1.99) 22 (33) 1 0.92 (0.50, 1.67) 1
Once a month 29 (24) 1.42 (0.99, 2.02) 0.78 (0.39, 1.61)
Once a week 26 (23) 1.37 (0.88, 2.13) 0.021 47 (24) 0.73 (0.44, 1.22) 1.04 (0.42, 2.57) 0.896 1.04 (0.64, 1.68) Daily/ almost daily 385 (22) 0.65 (0.44, 0.96) 0.033 0.89 (0.54, 1.48) 0.499
Bathe in water from lake?
No 249 (23) 1 25 (36) 1 1 1
Yes 18 (18) 0.74 (0.32, 1.67) 0.447 429 (22) 0.38 (0.18, 0.80) 0.013 0.75 (0.27, 2.06) 0.558 0.41 (0.24, 0.71) 0.002 0.172
Hand washing after toilet
No 19 (12) 1 151 (23) 1 1 1
Yes 248 (25) 2.49 (1.77, 3.49) <0.001 303 (22) 0.88 (0.68, 1.13) 0.309 4.67 (0.88, 24.8) 0.068 0.78 (0.59, 1.02) 0.068 0.001
SWA-specific IgG4* 1.03 (0.94, 1.13) 0.449 0.87 (0.75, 1.02) 0.093 1.04 (0.86, 1.24) 0.691 0.77 (0.63, 0.94) 0.013 0.011 SEA-specific IgE* 1.47 (1.02, 2.11) 0.038 1.03 (0.58, 1.81) 0.923 1.32 (0.90, 1.91) 0.135 0.58 (0.29, 1.16) 0.119 0.109
Sm infection (KK)
Uninfected 221 (22) 1 376 (21) 1 1 1
Infected 20 (26) 1.22 (0.62, 2.41) 0.552 127 (16) 0.69 (0.53, 0.91) 0.010 1.47 (0.76, 2.83) 0.239 0.68 (0.47, 0.97) 0.038 0.332
Sm infection intensity (KK)
Uninfected 221 (22) 1 376 (21) 1 1 1
Light 15 (38) 2.2 (1.09, 4.46) 65 (16) 0.71 (0.53, 0.95) 2.39 (1.24, 4.64) 0.66 (0.43, 1.01)
Moderate 3 (12) 0.48 (0.07, 3.03) 40 (18) 0.76 (0.49, 1.18) 0.76 (0.22, 2.61) 0.83 (0.52, 1.34)
Heavy 2 (14) 0.58 (0.13, 2.75) 0.772 22 (12) 0.55 (0.34, 0.91) 0.017 0.55 (0.05, 6.81) 0.055 0.49 (0.22, 1.14) 0.053 0.015 Sm infection (PCR)
Uninfected 188 (21) 1 289 (22) 1 1 1
Infected 48 (25) 1.26 (0.94, 1.70) 0.117 214 (17) 0.73 (0.55, 0.96) 0.031 1.57 (1.01, 2.43) 0.044 0.66 (0.49, 0.89) 0.010 0.002 Sm infection (CCA)
Negative 163 (24) 1 114 (27) 1 1 1
116
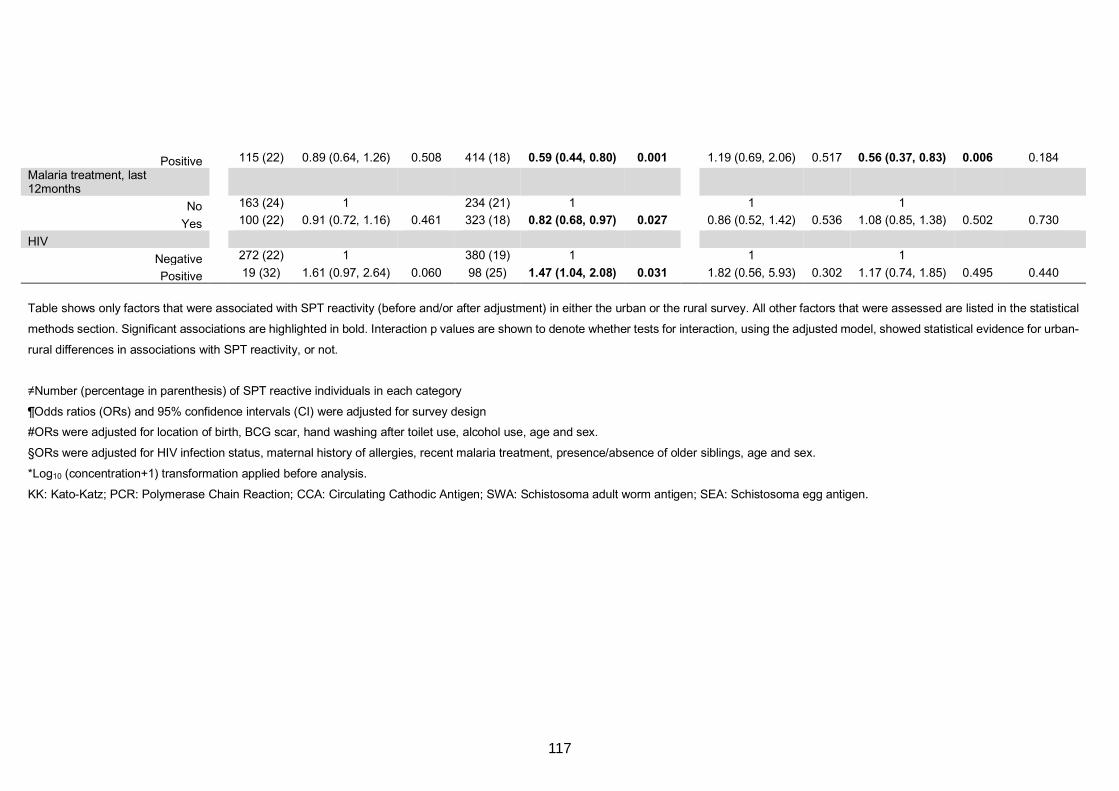
Positive 115 (22) 0.89 (0.64, 1.26) 0.508 414 (18) 0.59 (0.44, 0.80) 0.001 1.19 (0.69, 2.06) 0.517 0.56 (0.37, 0.83) 0.006 0.184
Malaria treatment, last 12months
No 163 (24) 1 234 (21) 1 1 1
Yes 100 (22) 0.91 (0.72, 1.16) 0.461 323 (18) 0.82 (0.68, 0.97) 0.027 0.86 (0.52, 1.42) 0.536 1.08 (0.85, 1.38) 0.502 0.730
HIV
Negative 272 (22) 1 380 (19) 1 1 1
Positive 19 (32) 1.61 (0.97, 2.64) 0.060 98 (25) 1.47 (1.04, 2.08) 0.031 1.82 (0.56, 5.93) 0.302 1.17 (0.74, 1.85) 0.495 0.440
Table shows only factors that were associated with SPT reactivity (before and/or after adjustment) in either the urban or the rural survey. All other factors that were assessed are listed in the statistical
methods section. Significant associations are highlighted in bold. Interaction p values are shown to denote whether tests for interaction, using the adjusted model, showed statistical evidence for urban-
rural differences in associations with SPT reactivity, or not.
≠Number (percentage in parenthesis) of SPT reactive individuals in each category
¶Odds ratios (ORs) and 95% confidence intervals (CI) were adjusted for survey design
#ORs were adjusted for location of birth, BCG scar, hand washing after toilet use, alcohol use, age and sex.
§ORs were adjusted for HIV infection status, maternal history of allergies, recent malaria treatment, presence/absence of older siblings, age and sex.
*Log10 (concentration+1) transformation applied before analysis.
KK: Kato-Katz; PCR: Polymerase Chain Reaction; CCA: Circulating Cathodic Antigen; SWA: Schistosoma adult worm antigen; SEA: Schistosoma egg antigen.
117
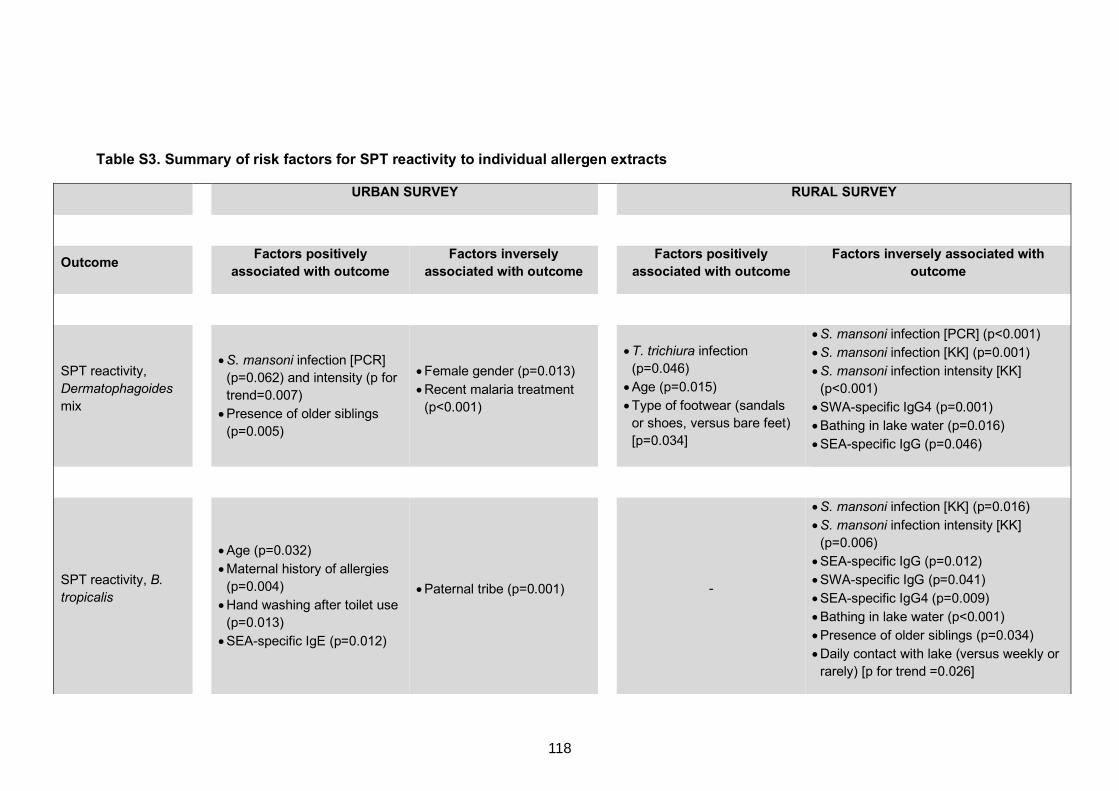
Table S3. Summary of risk factors for SPT reactivity to individual allergen extracts
URBAN SURVEY RURAL SURVEY
Outcome Factors positively associated with outcome
Factors inversely associated with outcome Factors positively
associated with outcome Factors inversely associated with
outcome
SPT reactivity,
Dermatophagoides
mix
• S. mansoni infection [PCR]
(p=0.062) and intensity (p for
trend=0.007)
• Presence of older siblings
(p=0.005)
• Female gender (p=0.013)
• Recent malaria treatment
(p<0.001)
• T. trichiura infection
(p=0.046)
• Age (p=0.015)
• Type of footwear (sandals
or shoes, versus bare feet)
[p=0.034]
• S. mansoni infection [PCR] (p<0.001)
• S. mansoni infection [KK] (p=0.001)
• S. mansoni infection intensity [KK]
(p<0.001)
• SWA-specific IgG4 (p=0.001)
• Bathing in lake water (p=0.016)
• SEA-specific IgG (p=0.046)
SPT reactivity, B. tropicalis
• Age (p=0.032)
• Maternal history of allergies
(p=0.004)
• Hand washing after toilet use
(p=0.013)
• SEA-specific IgE (p=0.012)
• Paternal tribe (p=0.001)
-
• S. mansoni infection [KK] (p=0.016)
• S. mansoni infection intensity [KK]
(p=0.006)
• SEA-specific IgG (p=0.012)
• SWA-specific IgG (p=0.041)
• SEA-specific IgG4 (p=0.009)
• Bathing in lake water (p<0.001)
• Presence of older siblings (p=0.034)
• Daily contact with lake (versus weekly or
rarely) [p for trend =0.026]
118
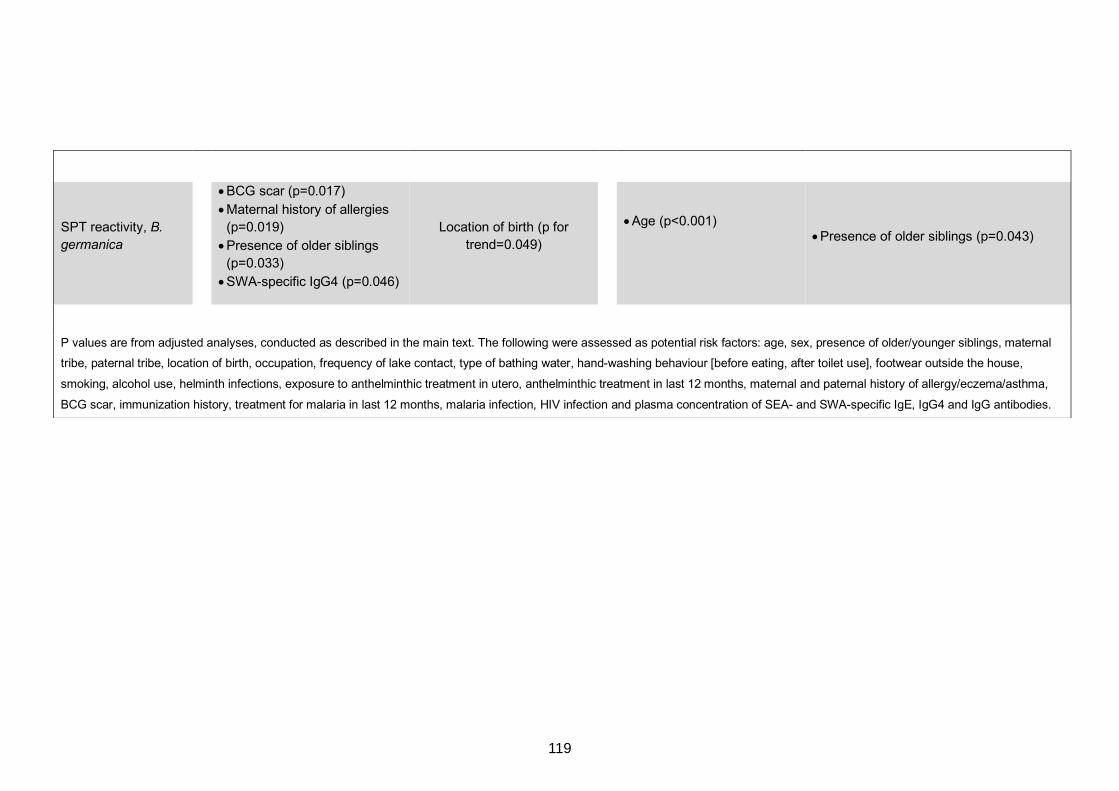
SPT reactivity, B. germanica
• BCG scar (p=0.017)
• Maternal history of allergies
(p=0.019)
• Presence of older siblings
(p=0.033)
• SWA-specific IgG4 (p=0.046)
Location of birth (p for
trend=0.049)
• Age (p<0.001)
• Presence of older siblings (p=0.043)
P values are from adjusted analyses, conducted as described in the main text. The following were assessed as potential risk factors: age, sex, presence of older/younger siblings, maternal
tribe, paternal tribe, location of birth, occupation, frequency of lake contact, type of bathing water, hand-washing behaviour [before eating, after toilet use], footwear outside the house,
smoking, alcohol use, helminth infections, exposure to anthelminthic treatment in utero, anthelminthic treatment in last 12 months, maternal and paternal history of allergy/eczema/asthma,
BCG scar, immunization history, treatment for malaria in last 12 months, malaria infection, HIV infection and plasma concentration of SEA- and SWA-specific IgE, IgG4 and IgG antibodies.
119
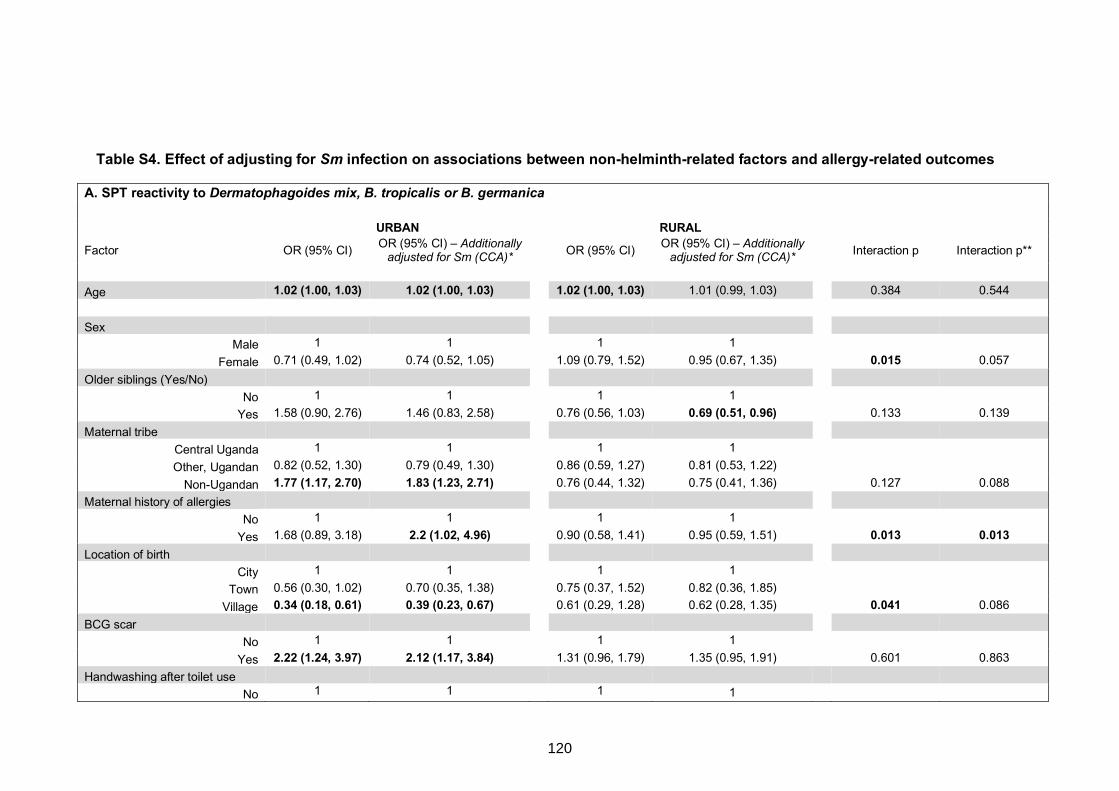
Table S4. Effect of adjusting for Sm infection on associations between non-helminth-related factors and allergy-related outcomes
A. SPT reactivity to Dermatophagoides mix, B. tropicalis or B. germanica URBAN RURAL
Factor OR (95% CI) OR (95% CI) – Additionally
adjusted for Sm (CCA)* OR (95% CI) OR (95% CI) – Additionally
adjusted for Sm (CCA)*
Interaction p Interaction p**
Age 1.02 (1.00, 1.03) 1.02 (1.00, 1.03) 1.02 (1.00, 1.03) 1.01 (0.99, 1.03) 0.384 0.544
Sex
Male 1 1 1 1
Female 0.71 (0.49, 1.02) 0.74 (0.52, 1.05) 1.09 (0.79, 1.52) 0.95 (0.67, 1.35) 0.015 0.057
Older siblings (Yes/No)
No 1 1 1 1
Yes 1.58 (0.90, 2.76) 1.46 (0.83, 2.58) 0.76 (0.56, 1.03) 0.69 (0.51, 0.96) 0.133 0.139
Maternal tribe
Central Uganda 1 1 1 1
Other, Ugandan 0.82 (0.52, 1.30) 0.79 (0.49, 1.30) 0.86 (0.59, 1.27) 0.81 (0.53, 1.22)
Non-Ugandan 1.77 (1.17, 2.70) 1.83 (1.23, 2.71) 0.76 (0.44, 1.32) 0.75 (0.41, 1.36) 0.127 0.088
Maternal history of allergies
No 1 1 1 1
Yes 1.68 (0.89, 3.18) 2.2 (1.02, 4.96) 0.90 (0.58, 1.41) 0.95 (0.59, 1.51) 0.013 0.013 Location of birth
City 1 1 1 1
Town 0.56 (0.30, 1.02) 0.70 (0.35, 1.38) 0.75 (0.37, 1.52) 0.82 (0.36, 1.85)
Village 0.34 (0.18, 0.61) 0.39 (0.23, 0.67) 0.61 (0.29, 1.28) 0.62 (0.28, 1.35) 0.041 0.086
BCG scar
No 1 1 1 1
Yes 2.22 (1.24, 3.97) 2.12 (1.17, 3.84) 1.31 (0.96, 1.79) 1.35 (0.95, 1.91) 0.601 0.863
Handwashing after toilet use
No 1 1 1 1
120
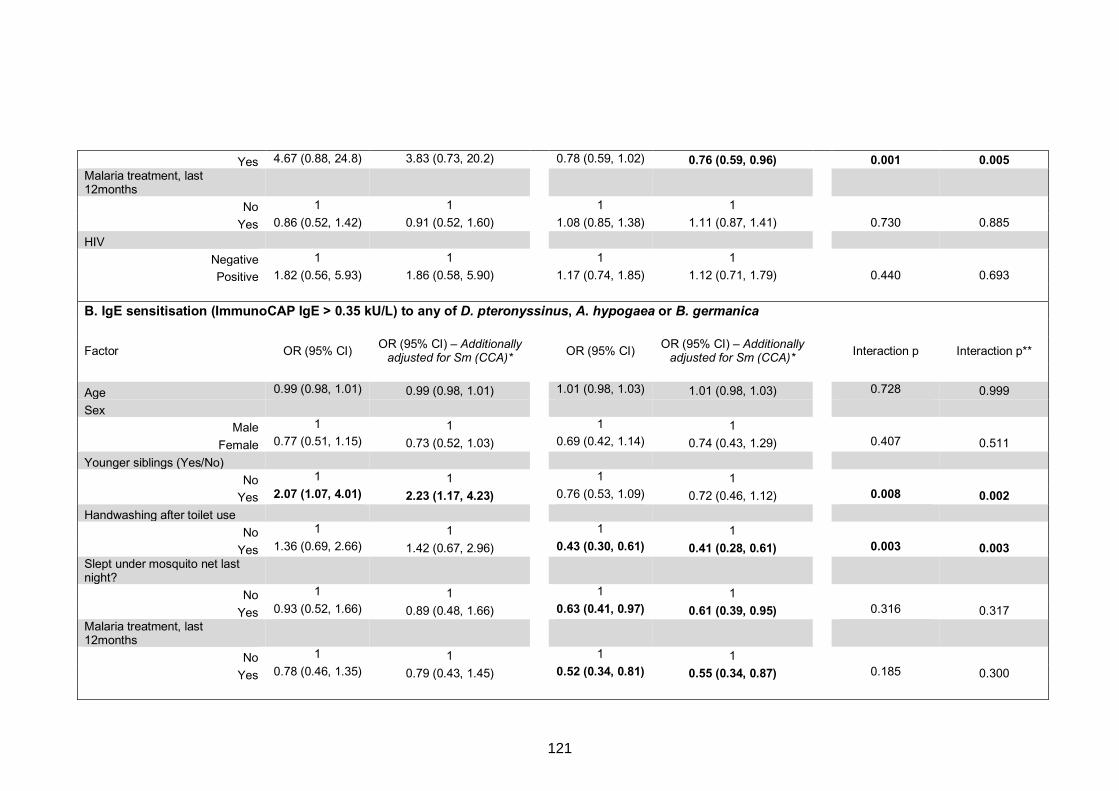
Yes 4.67 (0.88, 24.8) 3.83 (0.73, 20.2) 0.78 (0.59, 1.02) 0.76 (0.59, 0.96) 0.001 0.005 Malaria treatment, last 12months
No 1 1 1 1
Yes 0.86 (0.52, 1.42) 0.91 (0.52, 1.60) 1.08 (0.85, 1.38) 1.11 (0.87, 1.41) 0.730 0.885
HIV
Negative 1 1 1 1
Positive 1.82 (0.56, 5.93) 1.86 (0.58, 5.90) 1.17 (0.74, 1.85) 1.12 (0.71, 1.79) 0.440 0.693
B. IgE sensitisation (ImmunoCAP IgE > 0.35 kU/L) to any of D. pteronyssinus, A. hypogaea or B. germanica
Factor OR (95% CI) OR (95% CI) – Additionally
adjusted for Sm (CCA)* OR (95% CI) OR (95% CI) – Additionally
adjusted for Sm (CCA)*
Interaction p Interaction p**
Age 0.99 (0.98, 1.01) 0.99 (0.98, 1.01) 1.01 (0.98, 1.03) 1.01 (0.98, 1.03) 0.728 0.999
Sex
Male 1 1 1 1
Female 0.77 (0.51, 1.15) 0.73 (0.52, 1.03) 0.69 (0.42, 1.14) 0.74 (0.43, 1.29) 0.407 0.511
Younger siblings (Yes/No)
No 1 1 1 1
Yes 2.07 (1.07, 4.01) 2.23 (1.17, 4.23) 0.76 (0.53, 1.09) 0.72 (0.46, 1.12) 0.008 0.002 Handwashing after toilet use
No 1 1 1 1
Yes 1.36 (0.69, 2.66) 1.42 (0.67, 2.96) 0.43 (0.30, 0.61) 0.41 (0.28, 0.61) 0.003 0.003 Slept under mosquito net last night?
No 1 1 1 1
Yes 0.93 (0.52, 1.66) 0.89 (0.48, 1.66) 0.63 (0.41, 0.97) 0.61 (0.39, 0.95) 0.316 0.317 Malaria treatment, last 12months
No 1 1 1 1
Yes 0.78 (0.46, 1.35) 0.79 (0.43, 1.45) 0.52 (0.34, 0.81) 0.55 (0.34, 0.87) 0.185 0.300
121
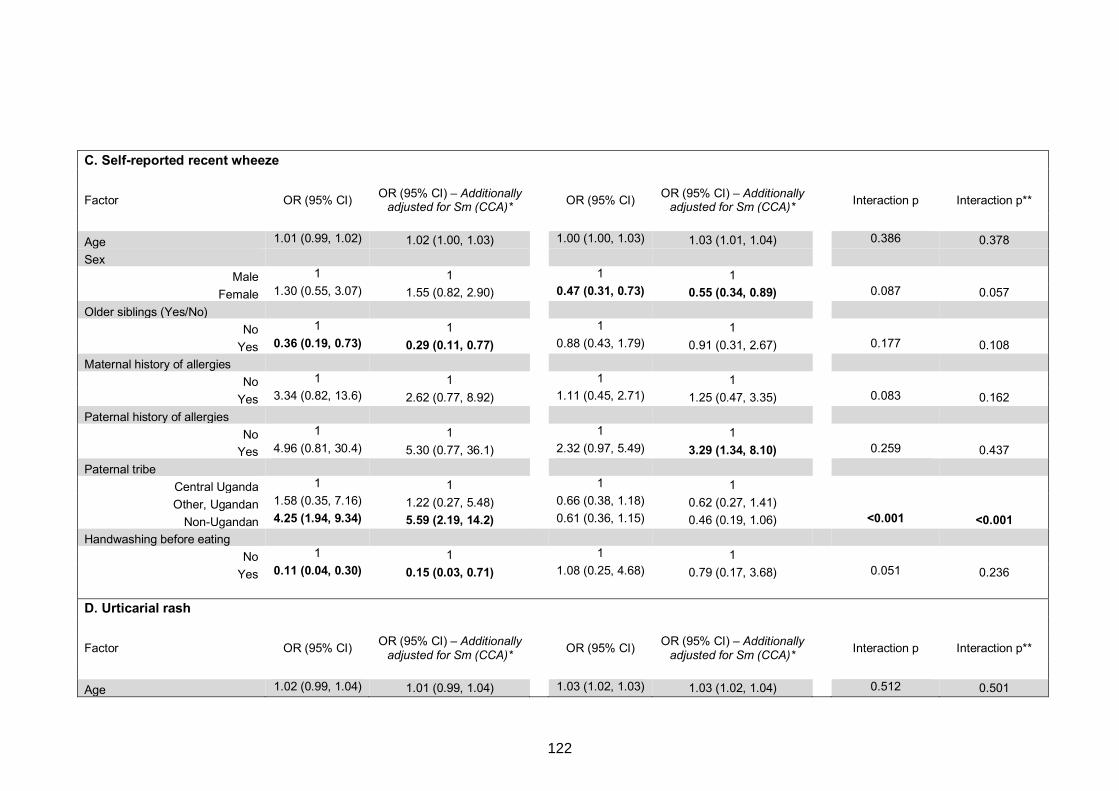
C. Self-reported recent wheeze
Factor OR (95% CI) OR (95% CI) – Additionally
adjusted for Sm (CCA)* OR (95% CI) OR (95% CI) – Additionally
adjusted for Sm (CCA)*
Interaction p Interaction p**
Age 1.01 (0.99, 1.02) 1.02 (1.00, 1.03) 1.00 (1.00, 1.03) 1.03 (1.01, 1.04) 0.386 0.378
Sex
Male 1 1 1 1
Female 1.30 (0.55, 3.07) 1.55 (0.82, 2.90) 0.47 (0.31, 0.73) 0.55 (0.34, 0.89) 0.087 0.057
Older siblings (Yes/No)
No 1 1 1 1
Yes 0.36 (0.19, 0.73) 0.29 (0.11, 0.77) 0.88 (0.43, 1.79) 0.91 (0.31, 2.67) 0.177 0.108
Maternal history of allergies
No 1 1 1 1
Yes 3.34 (0.82, 13.6) 2.62 (0.77, 8.92) 1.11 (0.45, 2.71) 1.25 (0.47, 3.35) 0.083 0.162
Paternal history of allergies
No 1 1 1 1
Yes 4.96 (0.81, 30.4) 5.30 (0.77, 36.1) 2.32 (0.97, 5.49) 3.29 (1.34, 8.10) 0.259 0.437
Paternal tribe
Central Uganda 1 1 1 1
Other, Ugandan 1.58 (0.35, 7.16) 1.22 (0.27, 5.48) 0.66 (0.38, 1.18) 0.62 (0.27, 1.41)
Non-Ugandan 4.25 (1.94, 9.34) 5.59 (2.19, 14.2) 0.61 (0.36, 1.15) 0.46 (0.19, 1.06) <0.001 <0.001 Handwashing before eating
No 1 1 1 1
Yes 0.11 (0.04, 0.30) 0.15 (0.03, 0.71) 1.08 (0.25, 4.68) 0.79 (0.17, 3.68) 0.051 0.236
D. Urticarial rash
Factor OR (95% CI) OR (95% CI) – Additionally
adjusted for Sm (CCA)* OR (95% CI) OR (95% CI) – Additionally
adjusted for Sm (CCA)*
Interaction p Interaction p**
Age 1.02 (0.99, 1.04) 1.01 (0.99, 1.04) 1.03 (1.02, 1.03) 1.03 (1.02, 1.04) 0.512 0.501
122
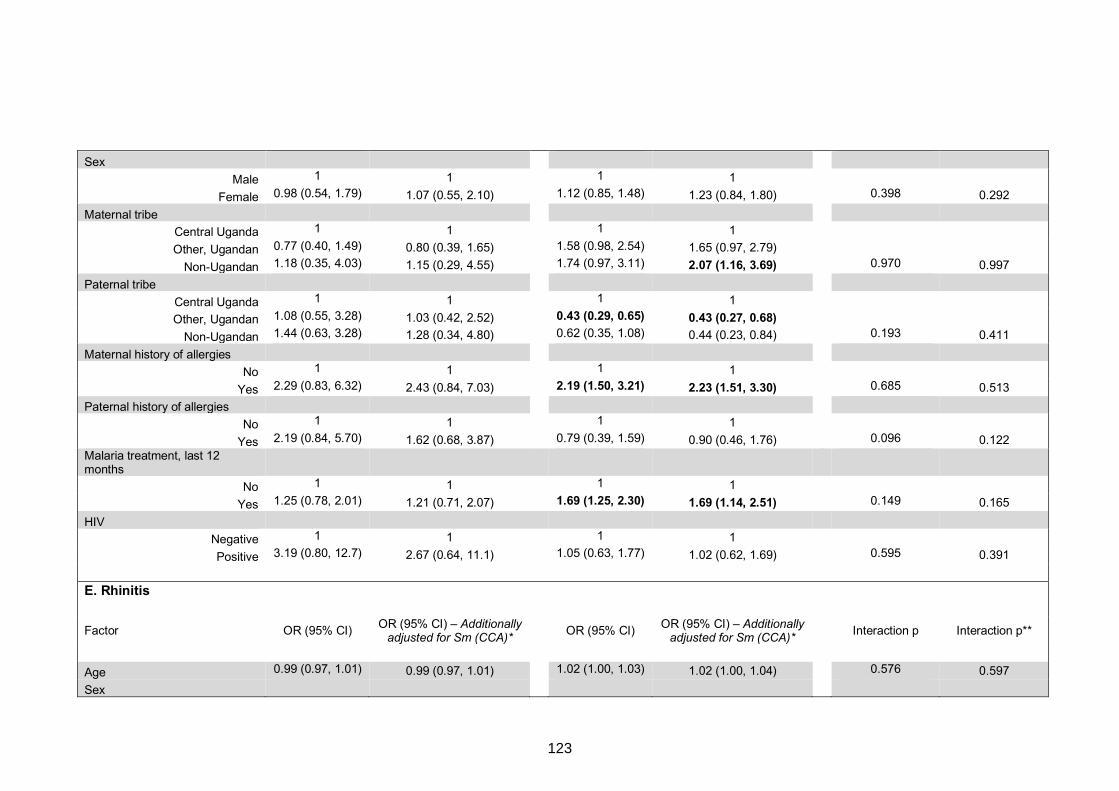
Sex
Male 1 1 1 1
Female 0.98 (0.54, 1.79) 1.07 (0.55, 2.10) 1.12 (0.85, 1.48) 1.23 (0.84, 1.80) 0.398 0.292
Maternal tribe
Central Uganda 1 1 1 1
Other, Ugandan 0.77 (0.40, 1.49) 0.80 (0.39, 1.65) 1.58 (0.98, 2.54) 1.65 (0.97, 2.79)
Non-Ugandan 1.18 (0.35, 4.03) 1.15 (0.29, 4.55) 1.74 (0.97, 3.11) 2.07 (1.16, 3.69) 0.970 0.997
Paternal tribe
Central Uganda 1 1 1 1
Other, Ugandan 1.08 (0.55, 3.28) 1.03 (0.42, 2.52) 0.43 (0.29, 0.65) 0.43 (0.27, 0.68)
Non-Ugandan 1.44 (0.63, 3.28) 1.28 (0.34, 4.80) 0.62 (0.35, 1.08) 0.44 (0.23, 0.84) 0.193 0.411
Maternal history of allergies
No 1 1 1 1
Yes 2.29 (0.83, 6.32) 2.43 (0.84, 7.03) 2.19 (1.50, 3.21) 2.23 (1.51, 3.30) 0.685 0.513
Paternal history of allergies
No 1 1 1 1
Yes 2.19 (0.84, 5.70) 1.62 (0.68, 3.87) 0.79 (0.39, 1.59) 0.90 (0.46, 1.76) 0.096 0.122 Malaria treatment, last 12 months
No 1 1 1 1
Yes 1.25 (0.78, 2.01) 1.21 (0.71, 2.07) 1.69 (1.25, 2.30) 1.69 (1.14, 2.51) 0.149 0.165
HIV
Negative 1 1 1 1
Positive 3.19 (0.80, 12.7) 2.67 (0.64, 11.1) 1.05 (0.63, 1.77) 1.02 (0.62, 1.69) 0.595 0.391
E. Rhinitis
Factor OR (95% CI) OR (95% CI) – Additionally
adjusted for Sm (CCA)* OR (95% CI) OR (95% CI) – Additionally
adjusted for Sm (CCA)*
Interaction p Interaction p**
Age 0.99 (0.97, 1.01) 0.99 (0.97, 1.01) 1.02 (1.00, 1.03) 1.02 (1.00, 1.04) 0.576 0.597
Sex
123
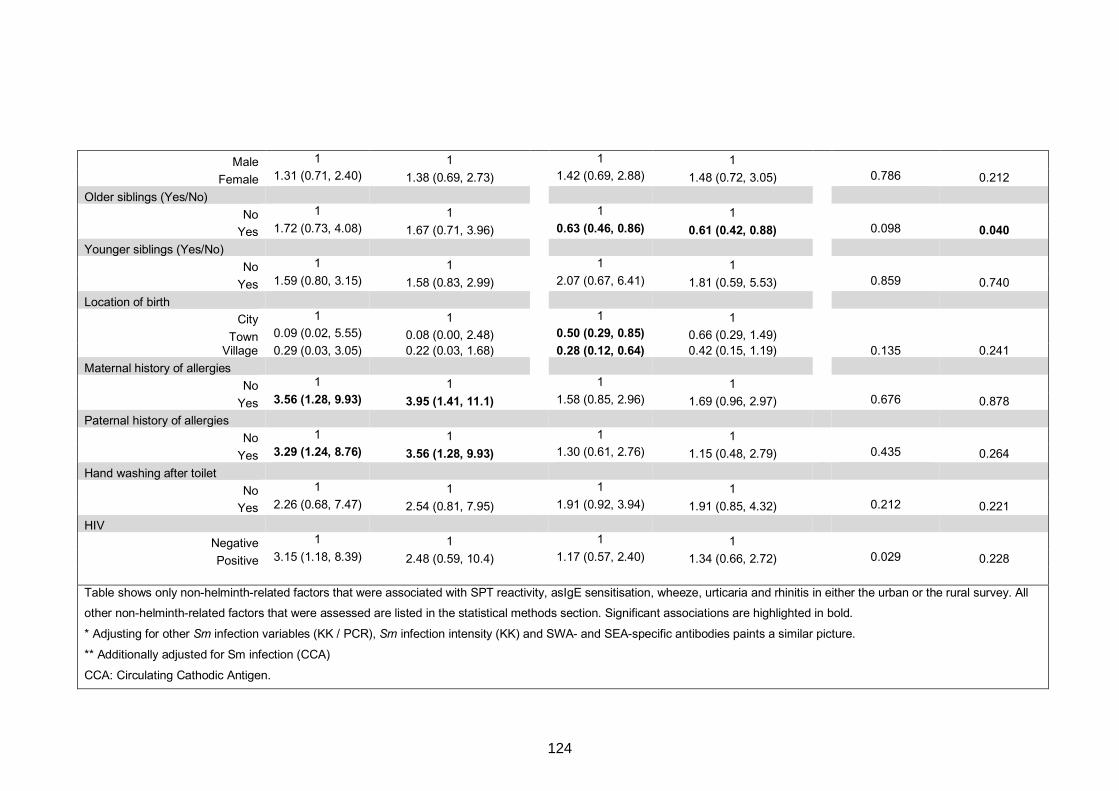
Male 1 1 1 1
Female 1.31 (0.71, 2.40) 1.38 (0.69, 2.73) 1.42 (0.69, 2.88) 1.48 (0.72, 3.05) 0.786 0.212
Older siblings (Yes/No)
No 1 1 1 1
Yes 1.72 (0.73, 4.08) 1.67 (0.71, 3.96) 0.63 (0.46, 0.86) 0.61 (0.42, 0.88) 0.098 0.040 Younger siblings (Yes/No)
No 1 1 1 1
Yes 1.59 (0.80, 3.15) 1.58 (0.83, 2.99) 2.07 (0.67, 6.41) 1.81 (0.59, 5.53) 0.859 0.740
Location of birth
City 1 1 1 1
Town 0.09 (0.02, 5.55) 0.08 (0.00, 2.48) 0.50 (0.29, 0.85) 0.66 (0.29, 1.49) Village 0.29 (0.03, 3.05) 0.22 (0.03, 1.68) 0.28 (0.12, 0.64) 0.42 (0.15, 1.19) 0.135 0.241
Maternal history of allergies
No 1 1 1 1
Yes 3.56 (1.28, 9.93) 3.95 (1.41, 11.1) 1.58 (0.85, 2.96) 1.69 (0.96, 2.97) 0.676 0.878
Paternal history of allergies
No 1 1 1 1
Yes 3.29 (1.24, 8.76) 3.56 (1.28, 9.93) 1.30 (0.61, 2.76) 1.15 (0.48, 2.79) 0.435 0.264
Hand washing after toilet
No 1 1 1 1
Yes 2.26 (0.68, 7.47) 2.54 (0.81, 7.95) 1.91 (0.92, 3.94) 1.91 (0.85, 4.32) 0.212 0.221
HIV
Negative 1 1 1 1
Positive 3.15 (1.18, 8.39) 2.48 (0.59, 10.4) 1.17 (0.57, 2.40) 1.34 (0.66, 2.72) 0.029 0.228
Table shows only non-helminth-related factors that were associated with SPT reactivity, asIgE sensitisation, wheeze, urticaria and rhinitis in either the urban or the rural survey. All
other non-helminth-related factors that were assessed are listed in the statistical methods section. Significant associations are highlighted in bold.
* Adjusting for other Sm infection variables (KK / PCR), Sm infection intensity (KK) and SWA- and SEA-specific antibodies paints a similar picture.
** Additionally adjusted for Sm infection (CCA)
CCA: Circulating Cathodic Antigen.
124
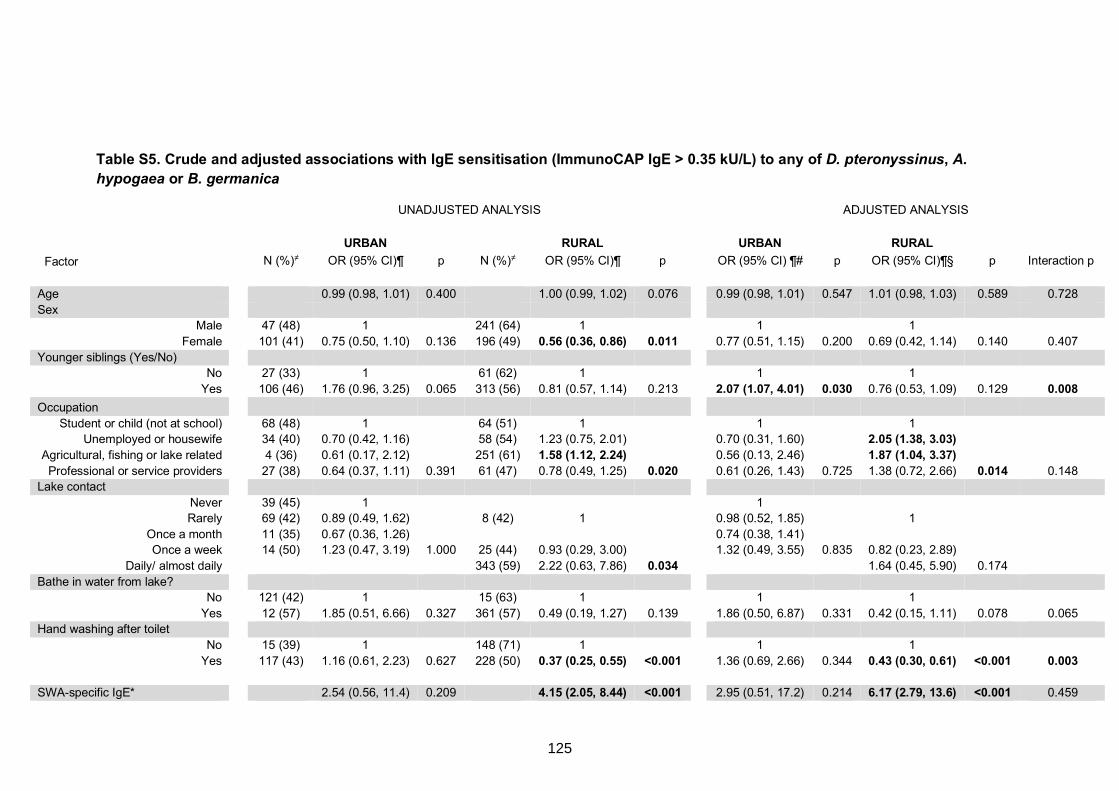
Table S5. Crude and adjusted associations with IgE sensitisation (ImmunoCAP IgE > 0.35 kU/L) to any of D. pteronyssinus, A. hypogaea or B. germanica
UNADJUSTED ANALYSIS ADJUSTED ANALYSIS
URBAN RURAL URBAN RURAL Factor N (%)≠ OR (95% CI)¶ p N (%)≠ OR (95% CI)¶ p OR (95% CI) ¶# p OR (95% CI)¶§ p Interaction p
Age 0.99 (0.98, 1.01) 0.400 1.00 (0.99, 1.02) 0.076 0.99 (0.98, 1.01) 0.547 1.01 (0.98, 1.03) 0.589 0.728
Sex Male 47 (48) 1 241 (64) 1 1 1
Female 101 (41) 0.75 (0.50, 1.10) 0.136 196 (49) 0.56 (0.36, 0.86) 0.011 0.77 (0.51, 1.15) 0.200 0.69 (0.42, 1.14) 0.140 0.407
Younger siblings (Yes/No) No 27 (33) 1 61 (62) 1 1 1
Yes 106 (46) 1.76 (0.96, 3.25) 0.065 313 (56) 0.81 (0.57, 1.14) 0.213 2.07 (1.07, 4.01) 0.030 0.76 (0.53, 1.09) 0.129 0.008 Occupation
Student or child (not at school) 68 (48) 1 64 (51) 1 1 1 Unemployed or housewife 34 (40) 0.70 (0.42, 1.16) 58 (54) 1.23 (0.75, 2.01) 0.70 (0.31, 1.60) 2.05 (1.38, 3.03)
Agricultural, fishing or lake related 4 (36) 0.61 (0.17, 2.12) 251 (61) 1.58 (1.12, 2.24) 0.56 (0.13, 2.46) 1.87 (1.04, 3.37)
Professional or service providers 27 (38) 0.64 (0.37, 1.11) 0.391 61 (47) 0.78 (0.49, 1.25) 0.020 0.61 (0.26, 1.43) 0.725 1.38 (0.72, 2.66) 0.014 0.148 Lake contact
Never 39 (45) 1 1 Rarely 69 (42) 0.89 (0.49, 1.62) 8 (42) 1 0.98 (0.52, 1.85) 1
Once a month 11 (35) 0.67 (0.36, 1.26) 0.74 (0.38, 1.41) Once a week 14 (50) 1.23 (0.47, 3.19) 1.000 25 (44) 0.93 (0.29, 3.00) 1.32 (0.49, 3.55) 0.835 0.82 (0.23, 2.89)
Daily/ almost daily 343 (59) 2.22 (0.63, 7.86) 0.034 1.64 (0.45, 5.90) 0.174 Bathe in water from lake?
No 121 (42) 1 15 (63) 1 1 1
Yes 12 (57) 1.85 (0.51, 6.66) 0.327 361 (57) 0.49 (0.19, 1.27) 0.139 1.86 (0.50, 6.87) 0.331 0.42 (0.15, 1.11) 0.078 0.065 Hand washing after toilet
No 15 (39) 1 148 (71) 1 1 1
Yes 117 (43) 1.16 (0.61, 2.23) 0.627 228 (50) 0.37 (0.25, 0.55) <0.001 1.36 (0.69, 2.66) 0.344 0.43 (0.30, 0.61) <0.001 0.003
SWA-specific IgE* 2.54 (0.56, 11.4) 0.209 4.15 (2.05, 8.44) <0.001 2.95 (0.51, 17.2) 0.214 6.17 (2.79, 13.6) <0.001 0.459
125
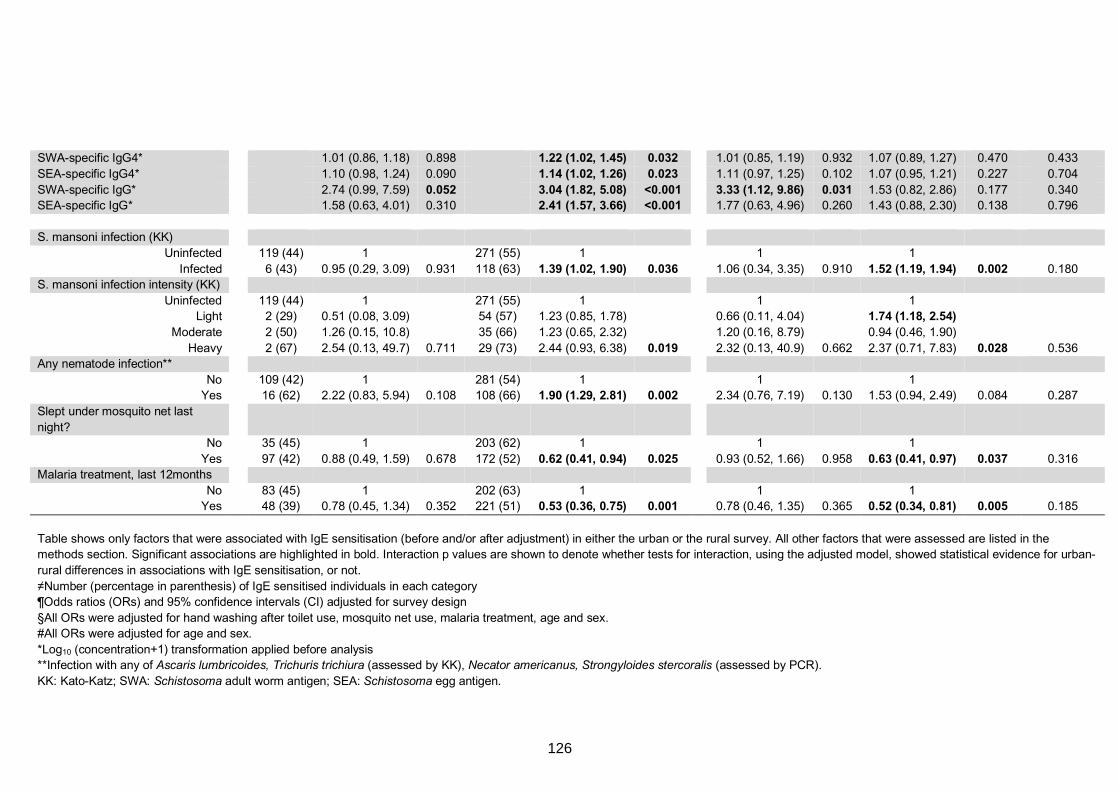
SWA-specific IgG4* 1.01 (0.86, 1.18) 0.898 1.22 (1.02, 1.45) 0.032 1.01 (0.85, 1.19) 0.932 1.07 (0.89, 1.27) 0.470 0.433
SEA-specific IgG4* 1.10 (0.98, 1.24) 0.090 1.14 (1.02, 1.26) 0.023 1.11 (0.97, 1.25) 0.102 1.07 (0.95, 1.21) 0.227 0.704
SWA-specific IgG* 2.74 (0.99, 7.59) 0.052 3.04 (1.82, 5.08) <0.001 3.33 (1.12, 9.86) 0.031 1.53 (0.82, 2.86) 0.177 0.340 SEA-specific IgG* 1.58 (0.63, 4.01) 0.310 2.41 (1.57, 3.66) <0.001 1.77 (0.63, 4.96) 0.260 1.43 (0.88, 2.30) 0.138 0.796
S. mansoni infection (KK)
Uninfected 119 (44) 1 271 (55) 1 1 1
Infected 6 (43) 0.95 (0.29, 3.09) 0.931 118 (63) 1.39 (1.02, 1.90) 0.036 1.06 (0.34, 3.35) 0.910 1.52 (1.19, 1.94) 0.002 0.180 S. mansoni infection intensity (KK)
Uninfected 119 (44) 1 271 (55) 1 1 1 Light 2 (29) 0.51 (0.08, 3.09) 54 (57) 1.23 (0.85, 1.78) 0.66 (0.11, 4.04) 1.74 (1.18, 2.54)
Moderate 2 (50) 1.26 (0.15, 10.8) 35 (66) 1.23 (0.65, 2.32) 1.20 (0.16, 8.79) 0.94 (0.46, 1.90)
Heavy 2 (67) 2.54 (0.13, 49.7) 0.711 29 (73) 2.44 (0.93, 6.38) 0.019 2.32 (0.13, 40.9) 0.662 2.37 (0.71, 7.83) 0.028 0.536 Any nematode infection**
No 109 (42) 1 281 (54) 1 1 1 Yes 16 (62) 2.22 (0.83, 5.94) 0.108 108 (66) 1.90 (1.29, 2.81) 0.002 2.34 (0.76, 7.19) 0.130 1.53 (0.94, 2.49) 0.084 0.287
Slept under mosquito net last
night?
No 35 (45) 1 203 (62) 1 1 1
Yes 97 (42) 0.88 (0.49, 1.59) 0.678 172 (52) 0.62 (0.41, 0.94) 0.025 0.93 (0.52, 1.66) 0.958 0.63 (0.41, 0.97) 0.037 0.316 Malaria treatment, last 12months
No 83 (45) 1 202 (63) 1 1 1 Yes 48 (39) 0.78 (0.45, 1.34) 0.352 221 (51) 0.53 (0.36, 0.75) 0.001 0.78 (0.46, 1.35) 0.365 0.52 (0.34, 0.81) 0.005 0.185
Table shows only factors that were associated with IgE sensitisation (before and/or after adjustment) in either the urban or the rural survey. All other factors that were assessed are listed in the methods section. Significant associations are highlighted in bold. Interaction p values are shown to denote whether tests for interaction, using the adjusted model, showed statistical evidence for urban-
rural differences in associations with IgE sensitisation, or not.
≠Number (percentage in parenthesis) of IgE sensitised individuals in each category ¶Odds ratios (ORs) and 95% confidence intervals (CI) adjusted for survey design
§All ORs were adjusted for hand washing after toilet use, mosquito net use, malaria treatment, age and sex. #All ORs were adjusted for age and sex.
*Log10 (concentration+1) transformation applied before analysis **Infection with any of Ascaris lumbricoides, Trichuris trichiura (assessed by KK), Necator americanus, Strongyloides stercoralis (assessed by PCR).
KK: Kato-Katz; SWA: Schistosoma adult worm antigen; SEA: Schistosoma egg antigen.
126
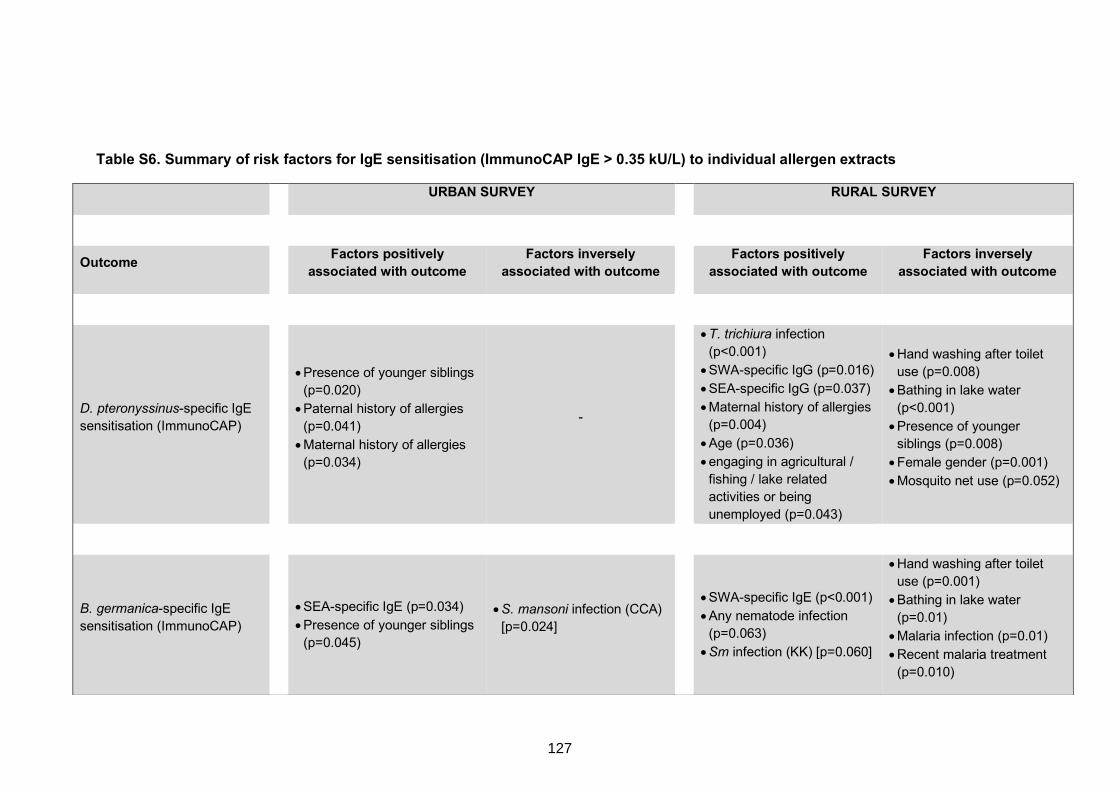
Table S6. Summary of risk factors for IgE sensitisation (ImmunoCAP IgE > 0.35 kU/L) to individual allergen extracts
URBAN SURVEY RURAL SURVEY
Outcome Factors positively associated with outcome
Factors inversely associated with outcome Factors positively
associated with outcome Factors inversely
associated with outcome
D. pteronyssinus-specific IgE
sensitisation (ImmunoCAP)
• Presence of younger siblings
(p=0.020)
• Paternal history of allergies
(p=0.041)
• Maternal history of allergies
(p=0.034)
-
• T. trichiura infection
(p<0.001)
• SWA-specific IgG (p=0.016)
• SEA-specific IgG (p=0.037)
• Maternal history of allergies
(p=0.004)
• Age (p=0.036)
• engaging in agricultural /
fishing / lake related
activities or being
unemployed (p=0.043)
• Hand washing after toilet
use (p=0.008)
• Bathing in lake water
(p<0.001)
• Presence of younger
siblings (p=0.008)
• Female gender (p=0.001)
• Mosquito net use (p=0.052)
B. germanica-specific IgE
sensitisation (ImmunoCAP)
• SEA-specific IgE (p=0.034)
• Presence of younger siblings
(p=0.045)
• S. mansoni infection (CCA)
[p=0.024]
• SWA-specific IgE (p<0.001)
• Any nematode infection
(p=0.063)
• Sm infection (KK) [p=0.060]
• Hand washing after toilet
use (p=0.001)
• Bathing in lake water
(p=0.01)
• Malaria infection (p=0.01)
• Recent malaria treatment
(p=0.010)
127
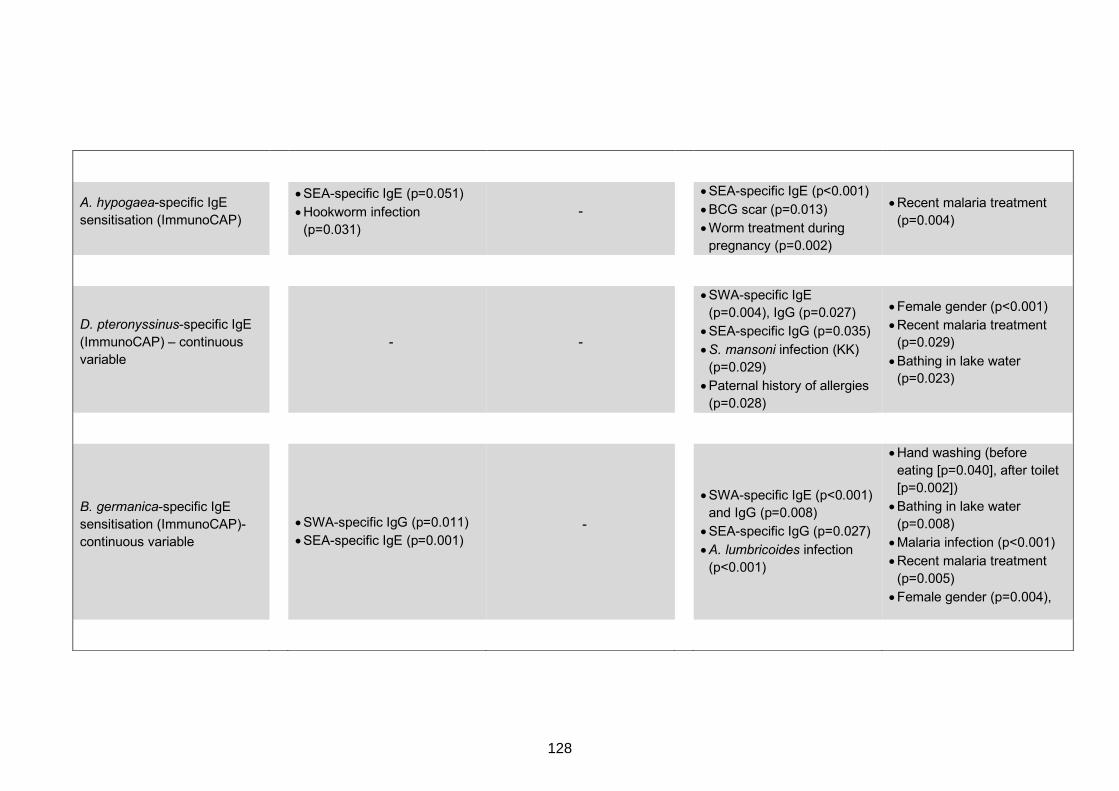
A. hypogaea-specific IgE
sensitisation (ImmunoCAP)
• SEA-specific IgE (p=0.051)
• Hookworm infection
(p=0.031)
-
• SEA-specific IgE (p<0.001)
• BCG scar (p=0.013)
• Worm treatment during
pregnancy (p=0.002)
• Recent malaria treatment
(p=0.004)
D. pteronyssinus-specific IgE
(ImmunoCAP) – continuous
variable
- -
• SWA-specific IgE
(p=0.004), IgG (p=0.027)
• SEA-specific IgG (p=0.035)
• S. mansoni infection (KK)
(p=0.029)
• Paternal history of allergies
(p=0.028)
• Female gender (p<0.001)
• Recent malaria treatment (p=0.029)
• Bathing in lake water (p=0.023)
B. germanica-specific IgE
sensitisation (ImmunoCAP)-
continuous variable
• SWA-specific IgG (p=0.011)
• SEA-specific IgE (p=0.001) -
• SWA-specific IgE (p<0.001)
and IgG (p=0.008)
• SEA-specific IgG (p=0.027)
• A. lumbricoides infection
(p<0.001)
• Hand washing (before
eating [p=0.040], after toilet
[p=0.002])
• Bathing in lake water
(p=0.008)
• Malaria infection (p<0.001)
• Recent malaria treatment
(p=0.005)
• Female gender (p=0.004),
128
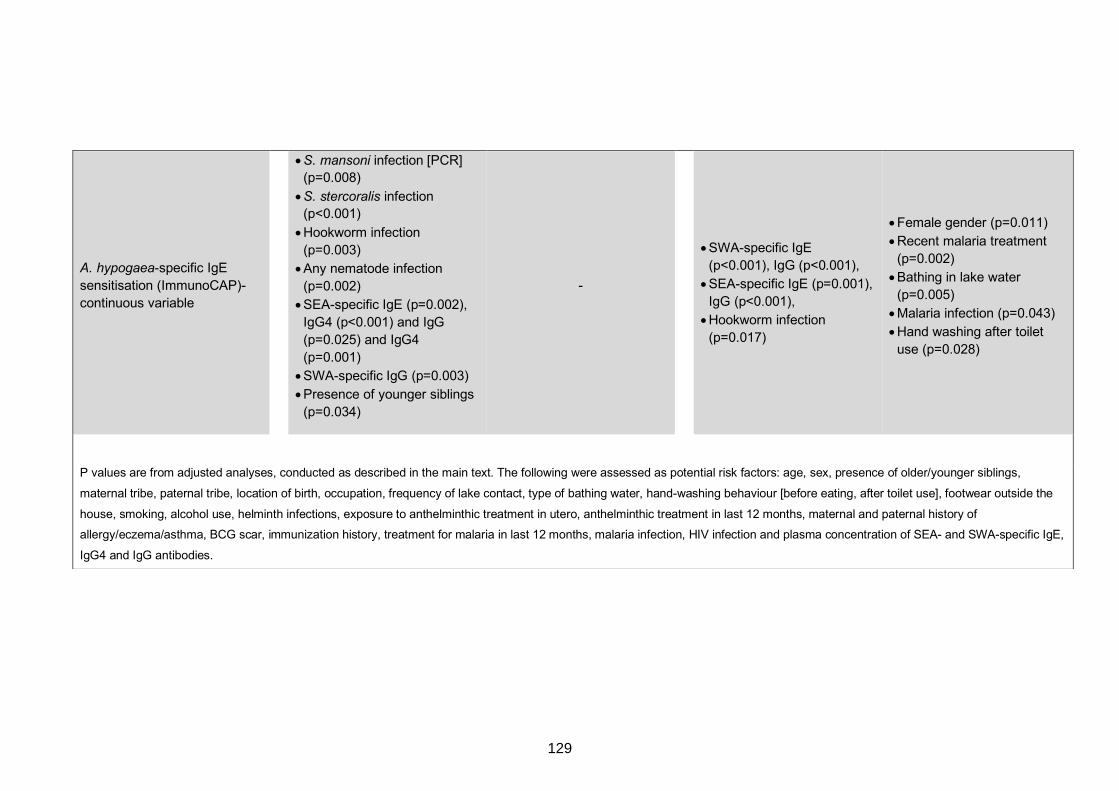
A. hypogaea-specific IgE
sensitisation (ImmunoCAP)-
continuous variable
• S. mansoni infection [PCR] (p=0.008)
• S. stercoralis infection (p<0.001)
• Hookworm infection
(p=0.003)
• Any nematode infection
(p=0.002)
• SEA-specific IgE (p=0.002),
IgG4 (p<0.001) and IgG
(p=0.025) and IgG4
(p=0.001)
• SWA-specific IgG (p=0.003)
• Presence of younger siblings
(p=0.034)
-
• SWA-specific IgE
(p<0.001), IgG (p<0.001),
• SEA-specific IgE (p=0.001),
IgG (p<0.001),
• Hookworm infection
(p=0.017)
• Female gender (p=0.011)
• Recent malaria treatment
(p=0.002)
• Bathing in lake water
(p=0.005)
• Malaria infection (p=0.043)
• Hand washing after toilet
use (p=0.028)
P values are from adjusted analyses, conducted as described in the main text. The following were assessed as potential risk factors: age, sex, presence of older/younger siblings,
maternal tribe, paternal tribe, location of birth, occupation, frequency of lake contact, type of bathing water, hand-washing behaviour [before eating, after toilet use], footwear outside the
house, smoking, alcohol use, helminth infections, exposure to anthelminthic treatment in utero, anthelminthic treatment in last 12 months, maternal and paternal history of
allergy/eczema/asthma, BCG scar, immunization history, treatment for malaria in last 12 months, malaria infection, HIV infection and plasma concentration of SEA- and SWA-specific IgE,
IgG4 and IgG antibodies.
129
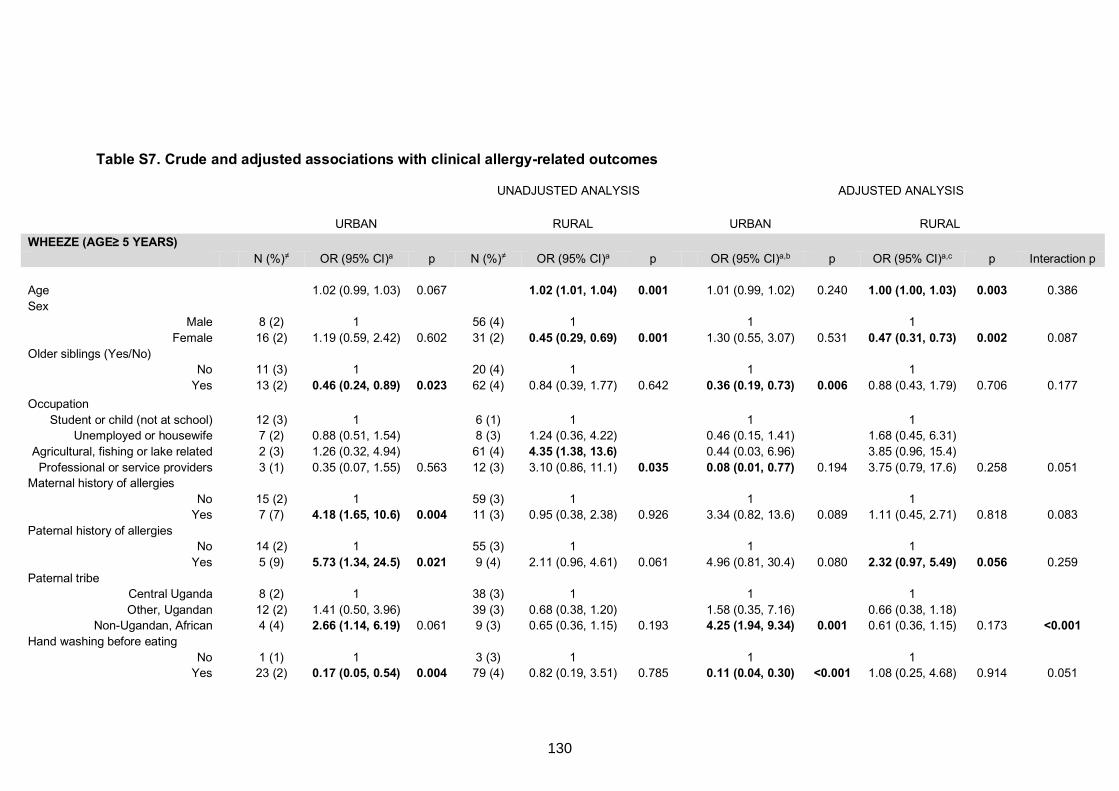
Table S7. Crude and adjusted associations with clinical allergy-related outcomes
UNADJUSTED ANALYSIS ADJUSTED ANALYSIS
URBAN RURAL URBAN RURAL
WHEEZE (AGE≥ 5 YEARS) N (%)≠ OR (95% CI)a p N (%)≠ OR (95% CI)a p OR (95% CI)a,b p OR (95% CI)a,c p Interaction p
Age 1.02 (0.99, 1.03) 0.067 1.02 (1.01, 1.04) 0.001 1.01 (0.99, 1.02) 0.240 1.00 (1.00, 1.03) 0.003 0.386
Sex Male 8 (2) 1 56 (4) 1 1 1
Female 16 (2) 1.19 (0.59, 2.42) 0.602 31 (2) 0.45 (0.29, 0.69) 0.001 1.30 (0.55, 3.07) 0.531 0.47 (0.31, 0.73) 0.002 0.087
Older siblings (Yes/No) No 11 (3) 1 20 (4) 1 1 1
Yes 13 (2) 0.46 (0.24, 0.89) 0.023 62 (4) 0.84 (0.39, 1.77) 0.642 0.36 (0.19, 0.73) 0.006 0.88 (0.43, 1.79) 0.706 0.177
Occupation
Student or child (not at school) 12 (3) 1 6 (1) 1 1 1 Unemployed or housewife 7 (2) 0.88 (0.51, 1.54) 8 (3) 1.24 (0.36, 4.22) 0.46 (0.15, 1.41) 1.68 (0.45, 6.31)
Agricultural, fishing or lake related 2 (3) 1.26 (0.32, 4.94) 61 (4) 4.35 (1.38, 13.6) 0.44 (0.03, 6.96) 3.85 (0.96, 15.4)
Professional or service providers 3 (1) 0.35 (0.07, 1.55) 0.563 12 (3) 3.10 (0.86, 11.1) 0.035 0.08 (0.01, 0.77) 0.194 3.75 (0.79, 17.6) 0.258 0.051 Maternal history of allergies
No 15 (2) 1 59 (3) 1 1 1 Yes 7 (7) 4.18 (1.65, 10.6) 0.004 11 (3) 0.95 (0.38, 2.38) 0.926 3.34 (0.82, 13.6) 0.089 1.11 (0.45, 2.71) 0.818 0.083
Paternal history of allergies No 14 (2) 1 55 (3) 1 1 1
Yes 5 (9) 5.73 (1.34, 24.5) 0.021 9 (4) 2.11 (0.96, 4.61) 0.061 4.96 (0.81, 30.4) 0.080 2.32 (0.97, 5.49) 0.056 0.259
Paternal tribe Central Uganda 8 (2) 1 38 (3) 1 1 1
Other, Ugandan 12 (2) 1.41 (0.50, 3.96) 39 (3) 0.68 (0.38, 1.20) 1.58 (0.35, 7.16) 0.66 (0.38, 1.18) Non-Ugandan, African 4 (4) 2.66 (1.14, 6.19) 0.061 9 (3) 0.65 (0.36, 1.15) 0.193 4.25 (1.94, 9.34) 0.001 0.61 (0.36, 1.15) 0.173 <0.001
Hand washing before eating
No 1 (1) 1 3 (3) 1 1 1 Yes 23 (2) 0.17 (0.05, 0.54) 0.004 79 (4) 0.82 (0.19, 3.51) 0.785 0.11 (0.04, 0.30) <0.001 1.08 (0.25, 4.68) 0.914 0.051
130
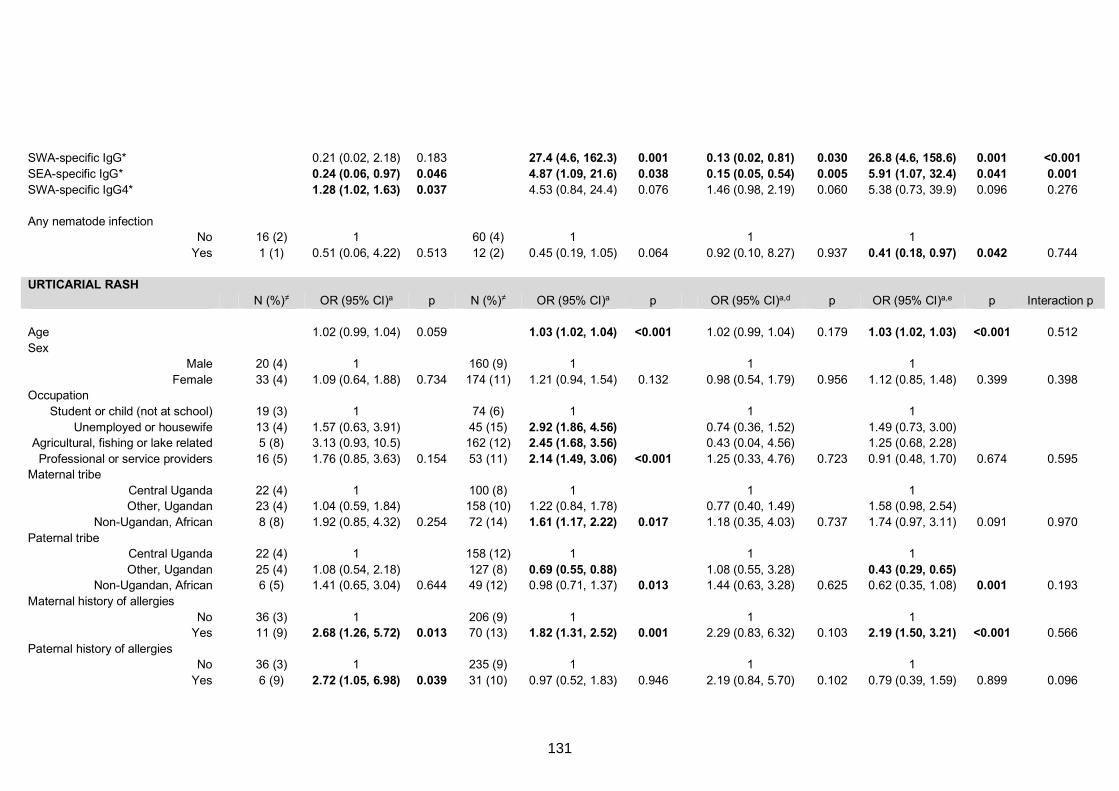
SWA-specific IgG* 0.21 (0.02, 2.18) 0.183 27.4 (4.6, 162.3) 0.001 0.13 (0.02, 0.81) 0.030 26.8 (4.6, 158.6) 0.001 <0.001 SEA-specific IgG* 0.24 (0.06, 0.97) 0.046 4.87 (1.09, 21.6) 0.038 0.15 (0.05, 0.54) 0.005 5.91 (1.07, 32.4) 0.041 0.001 SWA-specific IgG4* 1.28 (1.02, 1.63) 0.037 4.53 (0.84, 24.4) 0.076 1.46 (0.98, 2.19) 0.060 5.38 (0.73, 39.9) 0.096 0.276
Any nematode infection No 16 (2) 1 60 (4) 1 1 1
Yes 1 (1) 0.51 (0.06, 4.22) 0.513 12 (2) 0.45 (0.19, 1.05) 0.064 0.92 (0.10, 8.27) 0.937 0.41 (0.18, 0.97) 0.042 0.744
URTICARIAL RASH
N (%)≠ OR (95% CI)a p N (%)≠ OR (95% CI)a p OR (95% CI)a,d p OR (95% CI)a,e p Interaction p
Age 1.02 (0.99, 1.04) 0.059 1.03 (1.02, 1.04) <0.001 1.02 (0.99, 1.04) 0.179 1.03 (1.02, 1.03) <0.001 0.512
Sex Male 20 (4) 1 160 (9) 1 1 1
Female 33 (4) 1.09 (0.64, 1.88) 0.734 174 (11) 1.21 (0.94, 1.54) 0.132 0.98 (0.54, 1.79) 0.956 1.12 (0.85, 1.48) 0.399 0.398 Occupation
Student or child (not at school) 19 (3) 1 74 (6) 1 1 1
Unemployed or housewife 13 (4) 1.57 (0.63, 3.91) 45 (15) 2.92 (1.86, 4.56) 0.74 (0.36, 1.52) 1.49 (0.73, 3.00) Agricultural, fishing or lake related 5 (8) 3.13 (0.93, 10.5) 162 (12) 2.45 (1.68, 3.56) 0.43 (0.04, 4.56) 1.25 (0.68, 2.28)
Professional or service providers 16 (5) 1.76 (0.85, 3.63) 0.154 53 (11) 2.14 (1.49, 3.06) <0.001 1.25 (0.33, 4.76) 0.723 0.91 (0.48, 1.70) 0.674 0.595 Maternal tribe
Central Uganda 22 (4) 1 100 (8) 1 1 1 Other, Ugandan 23 (4) 1.04 (0.59, 1.84) 158 (10) 1.22 (0.84, 1.78) 0.77 (0.40, 1.49) 1.58 (0.98, 2.54)
Non-Ugandan, African 8 (8) 1.92 (0.85, 4.32) 0.254 72 (14) 1.61 (1.17, 2.22) 0.017 1.18 (0.35, 4.03) 0.737 1.74 (0.97, 3.11) 0.091 0.970
Paternal tribe Central Uganda 22 (4) 1 158 (12) 1 1 1
Other, Ugandan 25 (4) 1.08 (0.54, 2.18) 127 (8) 0.69 (0.55, 0.88) 1.08 (0.55, 3.28) 0.43 (0.29, 0.65) Non-Ugandan, African 6 (5) 1.41 (0.65, 3.04) 0.644 49 (12) 0.98 (0.71, 1.37) 0.013 1.44 (0.63, 3.28) 0.625 0.62 (0.35, 1.08) 0.001 0.193
Maternal history of allergies
No 36 (3) 1 206 (9) 1 1 1 Yes 11 (9) 2.68 (1.26, 5.72) 0.013 70 (13) 1.82 (1.31, 2.52) 0.001 2.29 (0.83, 6.32) 0.103 2.19 (1.50, 3.21) <0.001 0.566
Paternal history of allergies No 36 (3) 1 235 (9) 1 1 1
Yes 6 (9) 2.72 (1.05, 6.98) 0.039 31 (10) 0.97 (0.52, 1.83) 0.946 2.19 (0.84, 5.70) 0.102 0.79 (0.39, 1.59) 0.899 0.096
131
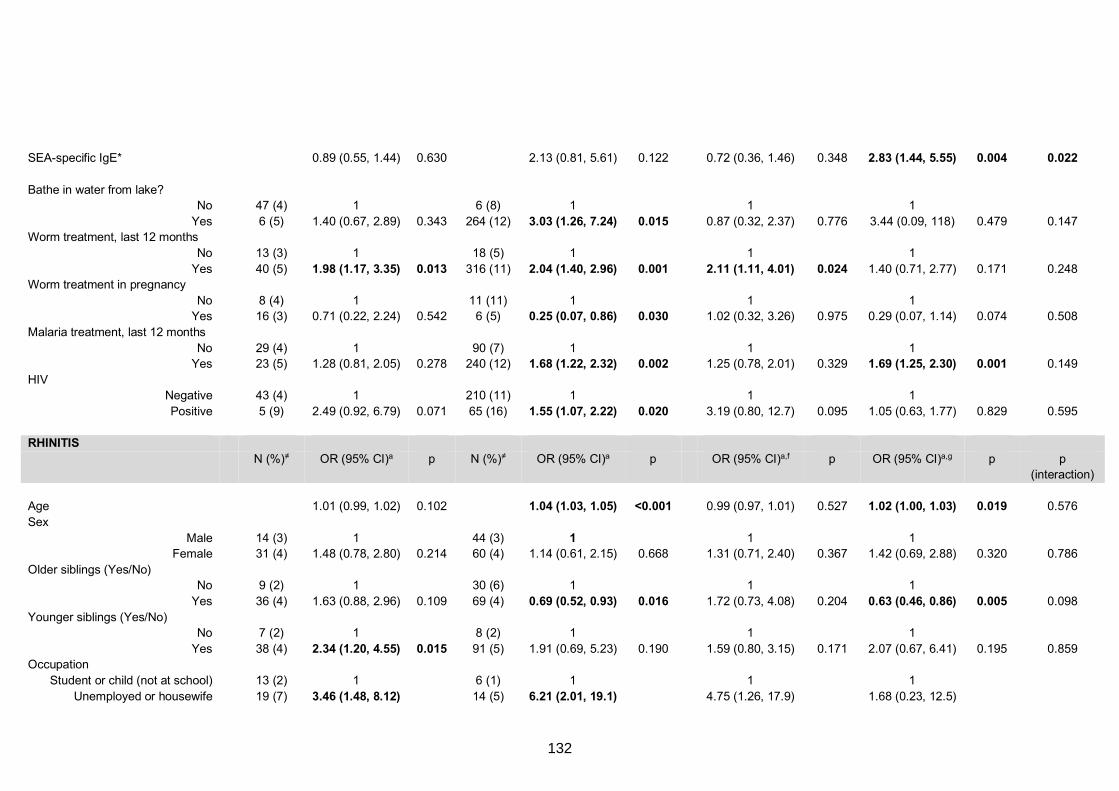
SEA-specific IgE* 0.89 (0.55, 1.44) 0.630 2.13 (0.81, 5.61) 0.122 0.72 (0.36, 1.46) 0.348 2.83 (1.44, 5.55) 0.004 0.022
Bathe in water from lake? No 47 (4) 1 6 (8) 1 1 1
Yes 6 (5) 1.40 (0.67, 2.89) 0.343 264 (12) 3.03 (1.26, 7.24) 0.015 0.87 (0.32, 2.37) 0.776 3.44 (0.09, 118) 0.479 0.147 Worm treatment, last 12 months
No 13 (3) 1 18 (5) 1 1 1
Yes 40 (5) 1.98 (1.17, 3.35) 0.013 316 (11) 2.04 (1.40, 2.96) 0.001 2.11 (1.11, 4.01) 0.024 1.40 (0.71, 2.77) 0.171 0.248 Worm treatment in pregnancy
No 8 (4) 1 11 (11) 1 1 1 Yes 16 (3) 0.71 (0.22, 2.24) 0.542 6 (5) 0.25 (0.07, 0.86) 0.030 1.02 (0.32, 3.26) 0.975 0.29 (0.07, 1.14) 0.074 0.508
Malaria treatment, last 12 months
No 29 (4) 1 90 (7) 1 1 1 Yes 23 (5) 1.28 (0.81, 2.05) 0.278 240 (12) 1.68 (1.22, 2.32) 0.002 1.25 (0.78, 2.01) 0.329 1.69 (1.25, 2.30) 0.001 0.149
HIV Negative 43 (4) 1 210 (11) 1 1 1
Positive 5 (9) 2.49 (0.92, 6.79) 0.071 65 (16) 1.55 (1.07, 2.22) 0.020 3.19 (0.80, 12.7) 0.095 1.05 (0.63, 1.77) 0.829 0.595
RHINITIS
N (%)≠ OR (95% CI)a p N (%)≠ OR (95% CI)a p OR (95% CI)a,f p OR (95% CI)a,g p p
(interaction)
Age 1.01 (0.99, 1.02) 0.102 1.04 (1.03, 1.05) <0.001 0.99 (0.97, 1.01) 0.527 1.02 (1.00, 1.03) 0.019 0.576
Sex
Male 14 (3) 1 44 (3) 1 1 1 Female 31 (4) 1.48 (0.78, 2.80) 0.214 60 (4) 1.14 (0.61, 2.15) 0.668 1.31 (0.71, 2.40) 0.367 1.42 (0.69, 2.88) 0.320 0.786
Older siblings (Yes/No) No 9 (2) 1 30 (6) 1 1 1
Yes 36 (4) 1.63 (0.88, 2.96) 0.109 69 (4) 0.69 (0.52, 0.93) 0.016 1.72 (0.73, 4.08) 0.204 0.63 (0.46, 0.86) 0.005 0.098
Younger siblings (Yes/No) No 7 (2) 1 8 (2) 1 1 1
Yes 38 (4) 2.34 (1.20, 4.55) 0.015 91 (5) 1.91 (0.69, 5.23) 0.190 1.59 (0.80, 3.15) 0.171 2.07 (0.67, 6.41) 0.195 0.859 Occupation
Student or child (not at school) 13 (2) 1 6 (1) 1 1 1
Unemployed or housewife 19 (7) 3.46 (1.48, 8.12) 14 (5) 6.21 (2.01, 19.1) 4.75 (1.26, 17.9) 1.68 (0.23, 12.5)
132
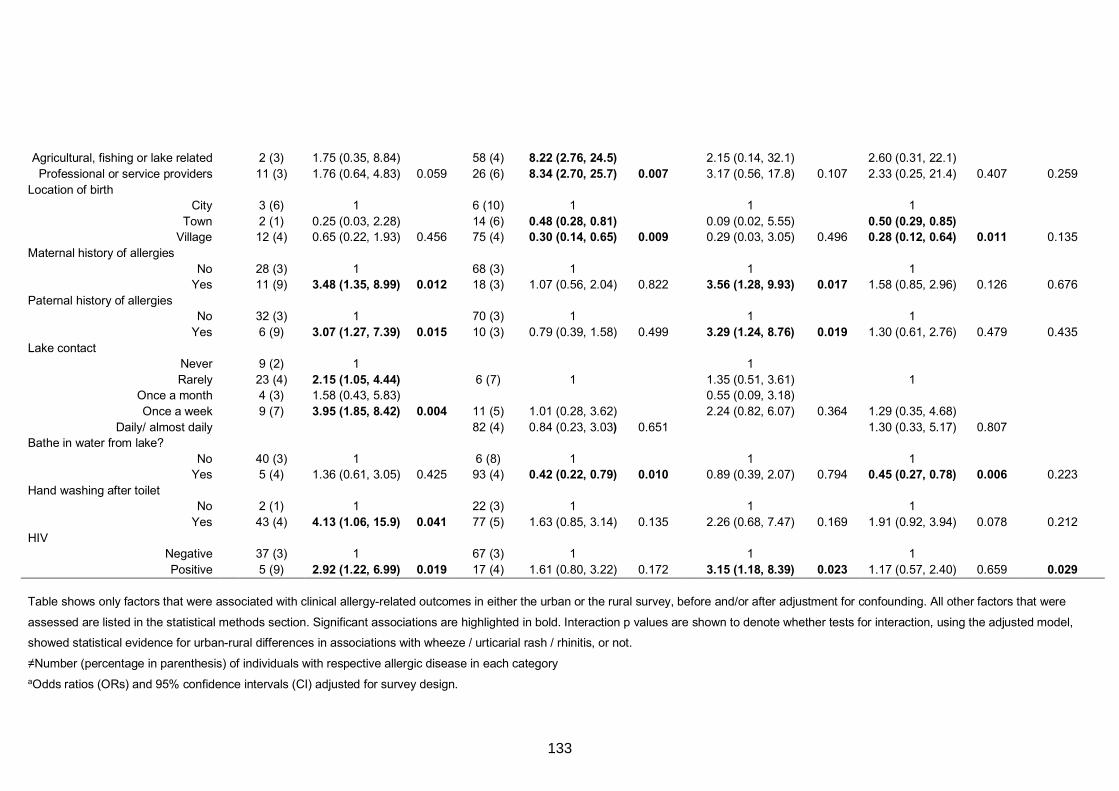
Agricultural, fishing or lake related 2 (3) 1.75 (0.35, 8.84) 58 (4) 8.22 (2.76, 24.5) 2.15 (0.14, 32.1) 2.60 (0.31, 22.1)
Professional or service providers 11 (3) 1.76 (0.64, 4.83) 0.059 26 (6) 8.34 (2.70, 25.7) 0.007 3.17 (0.56, 17.8) 0.107 2.33 (0.25, 21.4) 0.407 0.259
Location of birth City 3 (6) 1 6 (10) 1 1 1
Town 2 (1) 0.25 (0.03, 2.28) 14 (6) 0.48 (0.28, 0.81) 0.09 (0.02, 5.55) 0.50 (0.29, 0.85) Village 12 (4) 0.65 (0.22, 1.93) 0.456 75 (4) 0.30 (0.14, 0.65) 0.009 0.29 (0.03, 3.05) 0.496 0.28 (0.12, 0.64) 0.011 0.135
Maternal history of allergies
No 28 (3) 1 68 (3) 1 1 1 Yes 11 (9) 3.48 (1.35, 8.99) 0.012 18 (3) 1.07 (0.56, 2.04) 0.822 3.56 (1.28, 9.93) 0.017 1.58 (0.85, 2.96) 0.126 0.676
Paternal history of allergies No 32 (3) 1 70 (3) 1 1 1
Yes 6 (9) 3.07 (1.27, 7.39) 0.015 10 (3) 0.79 (0.39, 1.58) 0.499 3.29 (1.24, 8.76) 0.019 1.30 (0.61, 2.76) 0.479 0.435
Lake contact Never 9 (2) 1 1
Rarely 23 (4) 2.15 (1.05, 4.44) 6 (7) 1 1.35 (0.51, 3.61) 1 Once a month 4 (3) 1.58 (0.43, 5.83) 0.55 (0.09, 3.18)
Once a week 9 (7) 3.95 (1.85, 8.42) 0.004 11 (5) 1.01 (0.28, 3.62) 2.24 (0.82, 6.07) 0.364 1.29 (0.35, 4.68)
Daily/ almost daily 82 (4) 0.84 (0.23, 3.03) 0.651 1.30 (0.33, 5.17) 0.807 Bathe in water from lake?
No 40 (3) 1 6 (8) 1 1 1 Yes 5 (4) 1.36 (0.61, 3.05) 0.425 93 (4) 0.42 (0.22, 0.79) 0.010 0.89 (0.39, 2.07) 0.794 0.45 (0.27, 0.78) 0.006 0.223
Hand washing after toilet No 2 (1) 1 22 (3) 1 1 1
Yes 43 (4) 4.13 (1.06, 15.9) 0.041 77 (5) 1.63 (0.85, 3.14) 0.135 2.26 (0.68, 7.47) 0.169 1.91 (0.92, 3.94) 0.078 0.212
HIV Negative 37 (3) 1 67 (3) 1 1 1
Positive 5 (9) 2.92 (1.22, 6.99) 0.019 17 (4) 1.61 (0.80, 3.22) 0.172 3.15 (1.18, 8.39) 0.023 1.17 (0.57, 2.40) 0.659 0.029
Table shows only factors that were associated with clinical allergy-related outcomes in either the urban or the rural survey, before and/or after adjustment for confounding. All other factors that were
assessed are listed in the statistical methods section. Significant associations are highlighted in bold. Interaction p values are shown to denote whether tests for interaction, using the adjusted model,
showed statistical evidence for urban-rural differences in associations with wheeze / urticarial rash / rhinitis, or not.
≠Number (percentage in parenthesis) of individuals with respective allergic disease in each category
aOdds ratios (ORs) and 95% confidence intervals (CI) adjusted for survey design.
133
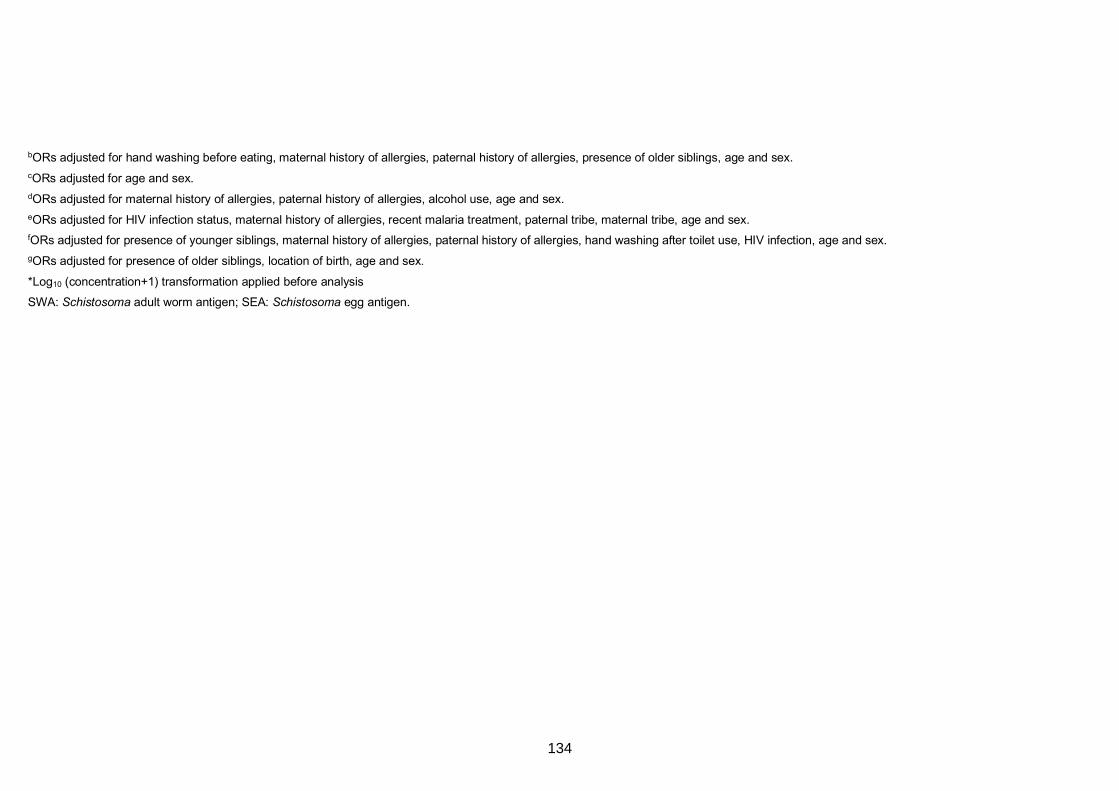
bORs adjusted for hand washing before eating, maternal history of allergies, paternal history of allergies, presence of older siblings, age and sex.
cORs adjusted for age and sex.
dORs adjusted for maternal history of allergies, paternal history of allergies, alcohol use, age and sex.
eORs adjusted for HIV infection status, maternal history of allergies, recent malaria treatment, paternal tribe, maternal tribe, age and sex.
fORs adjusted for presence of younger siblings, maternal history of allergies, paternal history of allergies, hand washing after toilet use, HIV infection, age and sex.
gORs adjusted for presence of older siblings, location of birth, age and sex.
*Log10 (concentration+1) transformation applied before analysis
SWA: Schistosoma adult worm antigen; SEA: Schistosoma egg antigen.
134
CHAPTER 5. ASSOCIATIONS BETWEEN ALLERGY-RELATED OUTCOMES AND
HELMINTH- AND ALLERGEN EXTRACT-SPECIFIC ANTIBODY PROFILES
5.1 Preamble
This chapter uses questionnaire, clinical and laboratory data from the baseline survey of
the Lake Victoria Island Intervention Study on Worms and Allergy-related diseases
(LaVIISWA) to map the association of total, helminth- and allergen extract-specific IgE
and IgG4 profiles with helminth infection and allergy-related outcomes (thesis objective
2). Results are presented in Research paper 2 (below), titled “Schistosoma mansoni-
specific immune responses and allergy in Uganda”, published in Parasite Immunology.
The focus was on infection with Schistosoma mansoni, rather than with other helminths,
because of its high prevalence in the study setting.
This chapter also presents extra, unpublished results, showing associations between
allergy-related outcomes and total, schistosome- and allergen extract-specific IgE and
IgG4 profiles in 1) the outcome survey of the LaVIISWA trial (after three years of
community-based intensive versus standard anthelminthic treatment), 2) the urban
survey and 3) the asthma case-control study. Comparisons of antibody profiles are made
between intensive and standard trial arms of the rural survey, between the urban and
rural survey, and between asthmatic and non-asthmatic school children.
The chapter assesses the relationship between Schistosoma-specific antibody
responses and allergy-related outcomes, seeking to elucidate antibody mechanisms
underlying positive helminth-atopy associations and the low overall prevalence of clinical
allergy in the present study settings. Specifically, the role of IgG4 and total IgE (as a
proxy for polyclonally-stimulated IgE), relative to allergen-specific IgE, is explored.
135

5.2 Research paper 2: Schistosoma mansoni-specific immune responses and
allergy in Uganda
136
137

138
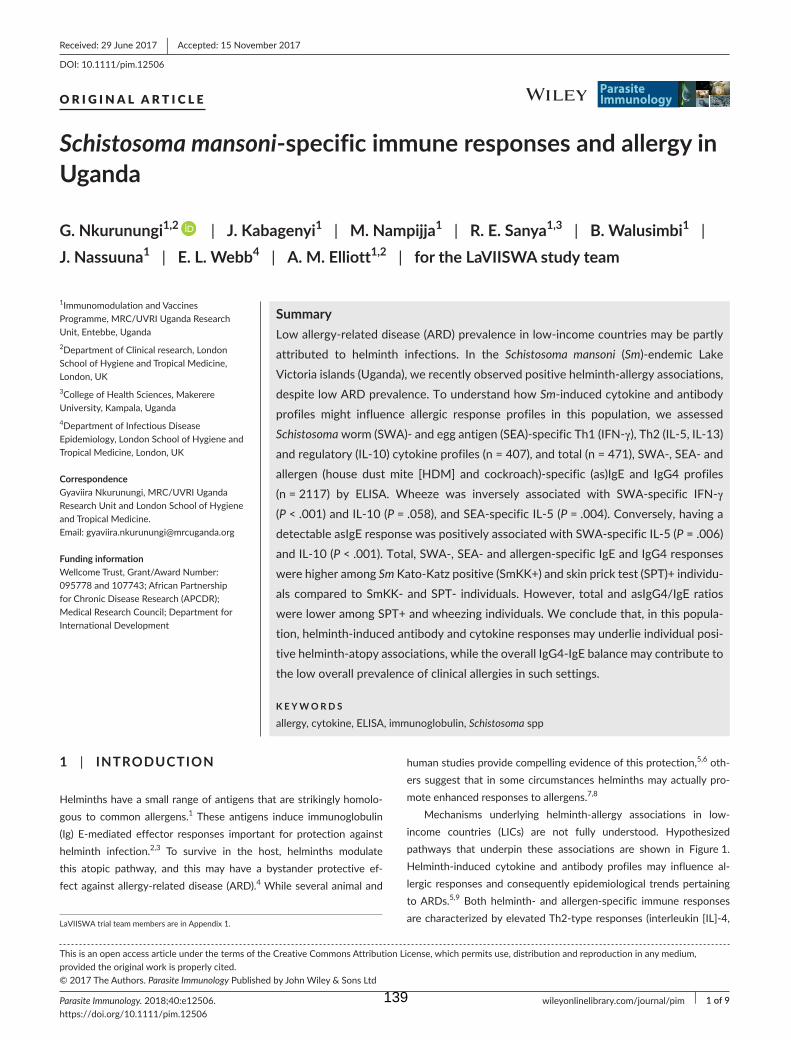
Parasite Immunology. 2018;40:e12506. wileyonlinelibrary.com/journal/pim | 1 of 9https://doi.org/10.1111/pim.12506
Received:29June2017 | Accepted:15November2017DOI: 10.1111/pim.12506
O R I G I N A L A R T I C L E
Schistosoma mansoni- specific immune responses and allergy in Uganda
G. Nkurunungi1,2 | J. Kabagenyi1 | M. Nampijja1 | R. E. Sanya1,3 | B. Walusimbi1 | J. Nassuuna1 | E. L. Webb4 | A. M. Elliott1,2 | for the LaVIISWA study team
1Immunomodulation and Vaccines Programme, MRC/UVRI Uganda Research Unit, Entebbe, Uganda2Department of Clinical research, London School of Hygiene and Tropical Medicine, London, UK3College of Health Sciences, Makerere University, Kampala, Uganda4Department of Infectious Disease Epidemiology, London School of Hygiene and Tropical Medicine, London, UK
CorrespondenceGyaviiraNkurunungi,MRC/UVRIUgandaResearch Unit and London School of Hygiene and Tropical Medicine.Email: [email protected]
Funding informationWellcomeTrust,Grant/AwardNumber:095778and107743;AfricanPartnershipforChronicDiseaseResearch(APCDR);Medical Research Council; Department for International Development
SummaryLowallergy-relateddisease(ARD)prevalenceinlow-incomecountriesmaybepartlyattributed to helminth infections. In the Schistosoma mansoni (Sm)-endemic LakeVictoriaislands(Uganda),werecentlyobservedpositivehelminth-allergyassociations,despitelowARDprevalence.TounderstandhowSm- induced cytokine and antibody profiles might influence allergic response profiles in this population, we assessed Schistosomaworm(SWA)-andeggantigen(SEA)-specificTh1(IFN-γ),Th2(IL-5,IL-13)andregulatory(IL-10)cytokineprofiles(n=407),andtotal(n=471),SWA-,SEA-andallergen (house dustmite [HDM] and cockroach)-specific (as)IgE and IgG4 profiles(n=2117) by ELISA. Wheeze was inversely associated with SWA-specific IFN-γ (P<.001)andIL-10(P=.058),andSEA-specificIL-5(P=.004).Conversely,havingadetectableasIgEresponsewaspositivelyassociatedwithSWA-specificIL-5(P=.006)and IL- 10 (P<.001).Total,SWA-,SEA-andallergen-specificIgEandIgG4responseswere higher among SmKato-Katzpositive(SmKK+)andskinpricktest(SPT)+individu-als compared to SmKK- and SPT- individuals. However, total and asIgG4/IgE ratios wereloweramongSPT+andwheezingindividuals.Weconcludethat,inthispopula-tion, helminth- induced antibody and cytokine responses may underlie individual posi-tive helminth- atopy associations, while the overall IgG4- IgE balance may contribute to the low overall prevalence of clinical allergies in such settings.
K E Y W O R D S
allergy,cytokine,ELISA,immunoglobulin,Schistosoma spp
1 | INTRODUCTION
Helminths have a small range of antigens that are strikingly homolo-gous to common allergens.1 These antigens induce immunoglobulin (Ig) E-mediated effector responses important for protection againsthelminth infection.2,3 To survive in the host, helminths modulate this atopic pathway, and this may have a bystander protective ef-fectagainstallergy-relateddisease(ARD).4 While several animal and
human studies provide compelling evidence of this protection,5,6 oth-ers suggest that in some circumstances helminths may actually pro-mote enhanced responses to allergens.7,8
Mechanisms underlying helminth- allergy associations in low- income countries (LICs) are not fully understood. Hypothesizedpathways that underpin these associations are shown in Figure 1. Helminth- induced cytokine and antibody profiles may influence al-lergic responses and consequently epidemiological trends pertaining toARDs.5,9 Both helminth- and allergen- specific immune responses arecharacterizedbyelevatedTh2-typeresponses(interleukin[IL]-4,LaVIISWAtrialteammembersareinAppendix1.
ThisisanopenaccessarticleunderthetermsoftheCreativeCommonsAttributionLicense,whichpermitsuse,distributionandreproductioninanymedium,provided the original work is properly cited.©2017TheAuthors.Parasite Immunology Published by John Wiley & Sons Ltd
139
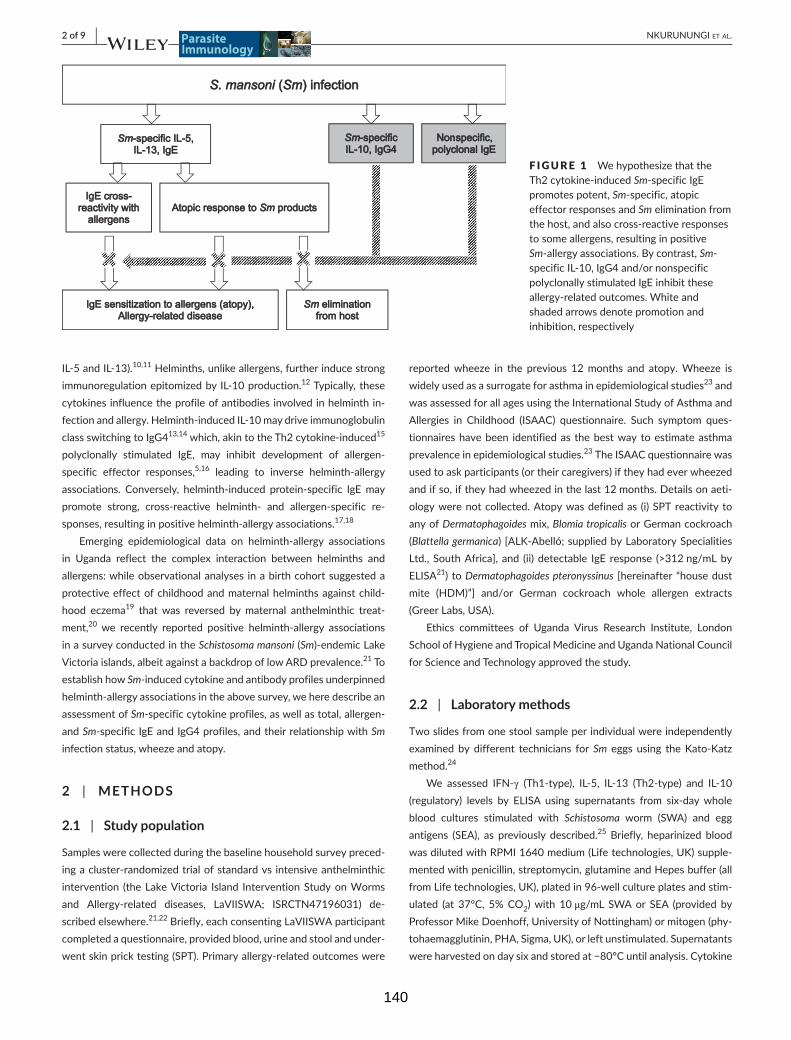
2 of 9 | NKURUNUNGI et al.
IL-5andIL-13).10,11 Helminths, unlike allergens, further induce strong immunoregulationepitomizedbyIL-10production.12 Typically, these cytokines influence the profile of antibodies involved in helminth in-fection and allergy. Helminth- induced IL- 10 may drive immunoglobulin class switching to IgG413,14 which, akin to the Th2 cytokine- induced15 polyclonally stimulated IgE, may inhibit development of allergen- specific effector responses,5,16 leading to inverse helminth- allergy associations. Conversely, helminth- induced protein- specific IgE may promote strong, cross- reactive helminth- and allergen- specific re-sponses, resulting in positive helminth- allergy associations.17,18
Emerging epidemiological data on helminth- allergy associations in Uganda reflect the complex interaction between helminths andallergens: while observational analyses in a birth cohort suggested a protective effect of childhood and maternal helminths against child-hood eczema19 that was reversed by maternal anthelminthic treat-ment,20 we recently reported positive helminth- allergy associations in a survey conducted in the Schistosoma mansoni (Sm)-endemicLakeVictoriaislands,albeitagainstabackdropoflowARDprevalence.21 To establish how Sm-induced cytokine and antibody profiles underpinned helminth- allergy associations in the above survey, we here describe an assessment of Sm-specific cytokine profiles, as well as total, allergen- and Sm-specific IgE and IgG4 profiles, and their relationship with Sm infectionstatus,wheezeandatopy.
2 | METHODS
2.1 | Study population
Samples were collected during the baseline household survey preced-ingacluster-randomizedtrialofstandardvsintensiveanthelminthicintervention (the Lake Victoria Island Intervention Study on Worms and Allergy-related diseases, LaVIISWA; ISRCTN47196031) de-scribed elsewhere.21,22Briefly,eachconsentingLaVIISWAparticipantcompleted a questionnaire, provided blood, urine and stool and under-wentskinpricktesting(SPT).Primaryallergy-relatedoutcomeswere
reportedwheeze in the previous 12months and atopy.Wheeze iswidely used as a surrogate for asthma in epidemiological studies23 and wasassessedforallagesusingtheInternationalStudyofAsthmaandAllergies in Childhood (ISAAC) questionnaire. Such symptom ques-tionnaires have been identified as the best way to estimate asthma prevalence in epidemiological studies.23TheISAACquestionnairewasusedtoaskparticipants(ortheircaregivers)iftheyhadeverwheezedandifso,iftheyhadwheezedinthelast12months.Detailsonaeti-ologywerenotcollected.Atopywasdefinedas (i)SPTreactivitytoany of Dermatophagoidesmix,Blomia tropicalis or German cockroach (Blattella germanica)[ALK-Abelló;suppliedbyLaboratorySpecialitiesLtd.,SouthAfrica], and (ii)detectable IgE response (>312ng/mLbyELISA21)toDermatophagoides pteronyssinus [hereinafter “house dust mite (HDM)”] and/or German cockroach whole allergen extracts(GreerLabs,USA).
Ethics committees of Uganda Virus Research Institute, London SchoolofHygieneandTropicalMedicineandUgandaNationalCouncilfor Science and Technology approved the study.
2.2 | Laboratory methods
Two slides from one stool sample per individual were independently examinedbydifferent technicians forSm eggs using theKato-Katzmethod.24
We assessed IFN-γ (Th1-type), IL-5, IL-13 (Th2-type) and IL-10(regulatory) levels by ELISA using supernatants from six-daywholeblood cultures stimulated with Schistosoma worm (SWA) and eggantigens (SEA), as previously described.25 Briefly, heparinized bloodwasdilutedwithRPMI1640medium(Lifetechnologies,UK)supple-mented with penicillin, streptomycin, glutamine and Hepes buffer (all fromLifetechnologies,UK),platedin96-wellcultureplatesandstim-ulated (at 37°C, 5% CO2)with 10μg/mL SWAor SEA (provided byProfessorMikeDoenhoff,UniversityofNottingham)ormitogen(phy-tohaemagglutinin,PHA,Sigma,UK),orleftunstimulated.Supernatantswereharvestedondaysixandstoredat−80°Cuntilanalysis.Cytokine
F IGURE 1 WehypothesizethattheTh2 cytokine- induced Sm- specific IgE promotes potent, Sm- specific, atopic effector responses and Sm elimination from the host, and also cross- reactive responses to some allergens, resulting in positive Sm- allergy associations. By contrast, Sm-specific IL- 10, IgG4 and/or nonspecific polyclonally stimulated IgE inhibit these allergy- related outcomes. White and shaded arrows denote promotion and inhibition, respectively
140
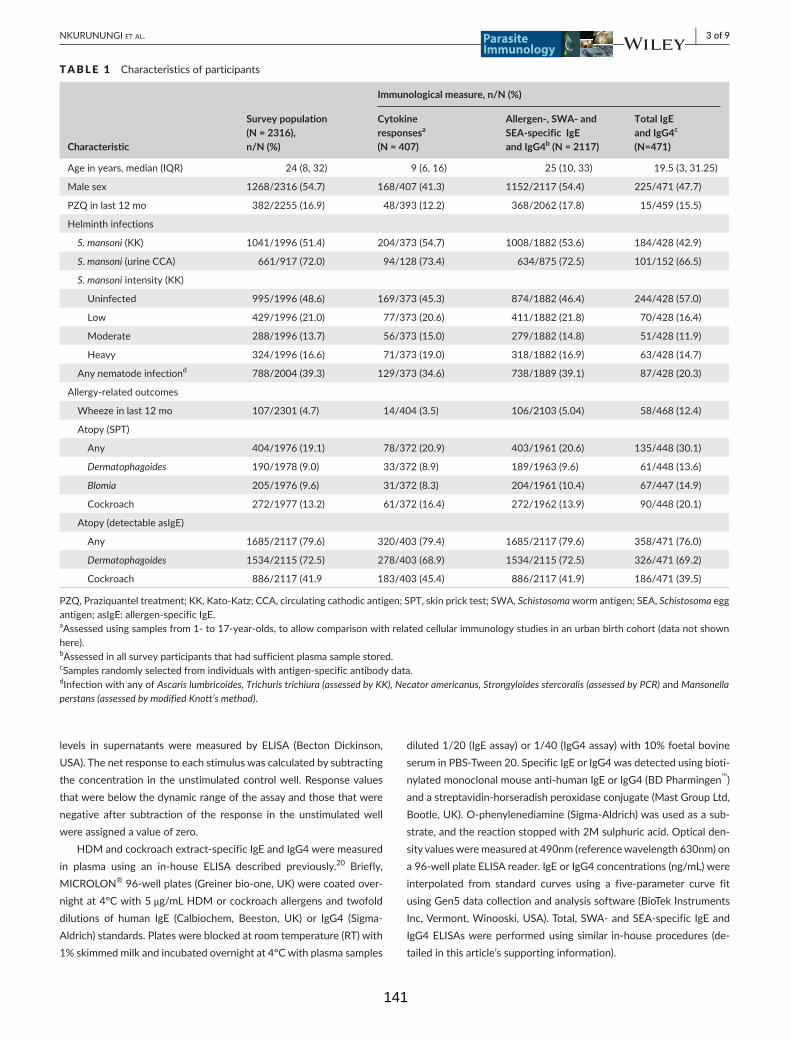
| 3 of 9NKURUNUNGI et al.
levels in supernatantsweremeasured by ELISA (Becton Dickinson,USA).Thenetresponsetoeachstimuluswascalculatedbysubtractingthe concentration in the unstimulated control well. Response values that were below the dynamic range of the assay and those that were negative after subtraction of the response in the unstimulated well wereassignedavalueofzero.
HDMandcockroachextract-specificIgEandIgG4weremeasuredin plasma using an in-house ELISA described previously.20 Briefly, MICROLON®96-wellplates(Greinerbio-one,UK)werecoatedover-night at 4°C with 5 μg/mL HDM or cockroach allergens and twofold dilutions of human IgE (Calbiochem, Beeston, UK) or IgG4 (Sigma-Aldrich)standards.Plateswereblockedatroomtemperature(RT)with1% skimmed milk and incubated overnight at 4°C with plasma samples
diluted1/20(IgEassay)or1/40(IgG4assay)with10%foetalbovineserum in PBS- Tween 20. Specific IgE or IgG4 was detected using bioti-nylated monoclonal mouse anti- human IgE or IgG4 (BD Pharmingen™)andastreptavidin-horseradishperoxidaseconjugate(MastGroupLtd,Bootle,UK).O-phenylenediamine(Sigma-Aldrich)wasusedasasub-strate, and the reaction stopped with 2M sulphuric acid. Optical den-sityvaluesweremeasuredat490nm(referencewavelength630nm)ona96-wellplateELISAreader.IgEorIgG4concentrations(ng/mL)wereinterpolated from standard curves using a five- parameter curve fit using Gen5 data collection and analysis software (BioTek Instruments Inc,Vermont,Winooski,USA).Total,SWA-andSEA-specific IgEandIgG4ELISAswereperformedusingsimilar in-houseprocedures (de-tailedinthisarticle’ssupportinginformation).
TABLE 1 Characteristics of participants
Characteristic
Survey population (N = 2316), n/N (%)
Immunological measure, n/N (%)
Cytokine responsesa
(N = 407)
Allergen- , SWA- and SEA- specific IgE and IgG4b (N = 2117)
Total IgE and IgG4c
(N=471)
Ageinyears,median(IQR) 24(8,32) 9(6,16) 25(10,33) 19.5(3,31.25)
Malesex 1268/2316(54.7) 168/407(41.3) 1152/2117(54.4) 225/471(47.7)
PZQinlast12mo 382/2255(16.9) 48/393(12.2) 368/2062(17.8) 15/459(15.5)
Helminth infections
S. mansoni(KK) 1041/1996(51.4) 204/373(54.7) 1008/1882(53.6) 184/428(42.9)
S. mansoni(urineCCA) 661/917(72.0) 94/128(73.4) 634/875(72.5) 101/152(66.5)
S. mansoniintensity(KK)
Uninfected 995/1996(48.6) 169/373(45.3) 874/1882(46.4) 244/428(57.0)
Low 429/1996(21.0) 77/373(20.6) 411/1882(21.8) 70/428(16.4)
Moderate 288/1996(13.7) 56/373(15.0) 279/1882(14.8) 51/428(11.9)
Heavy 324/1996(16.6) 71/373(19.0) 318/1882(16.9) 63/428(14.7)
Anynematodeinfectiond 788/2004(39.3) 129/373(34.6) 738/1889(39.1) 87/428(20.3)
Allergy-relatedoutcomes
Wheezeinlast12mo 107/2301(4.7) 14/404(3.5) 106/2103(5.04) 58/468(12.4)
Atopy(SPT)
Any 404/1976(19.1) 78/372(20.9) 403/1961(20.6) 135/448(30.1)
Dermatophagoides 190/1978(9.0) 33/372(8.9) 189/1963(9.6) 61/448(13.6)
Blomia 205/1976(9.6) 31/372(8.3) 204/1961(10.4) 67/447(14.9)
Cockroach 272/1977(13.2) 61/372(16.4) 272/1962(13.9) 90/448(20.1)
Atopy(detectableasIgE)
Any 1685/2117(79.6) 320/403(79.4) 1685/2117(79.6) 358/471(76.0)
Dermatophagoides 1534/2115(72.5) 278/403(68.9) 1534/2115(72.5) 326/471(69.2)
Cockroach 886/2117 (41.9 183/403(45.4) 886/2117(41.9) 186/471(39.5)
PZQ,Praziquanteltreatment;KK,Kato-Katz;CCA,circulatingcathodicantigen;SPT,skinpricktest;SWA,Schistosomawormantigen;SEA,Schistosoma egg antigen; asIgE: allergen- specific IgE.aAssessedusingsamplesfrom1-to17-year-olds,toallowcomparisonwithrelatedcellularimmunologystudiesinanurbanbirthcohort(datanotshownhere).bAssessedinallsurveyparticipantsthathadsufficientplasmasamplestored.cSamples randomly selected from individuals with antigen- specific antibody data.dInfection with any of Ascaris lumbricoides, Trichuris trichiura (assessed by KK), Necator americanus, Strongyloides stercoralis (assessed by PCR) and Mansonella perstans (assessed by modified Knott’s method).
141
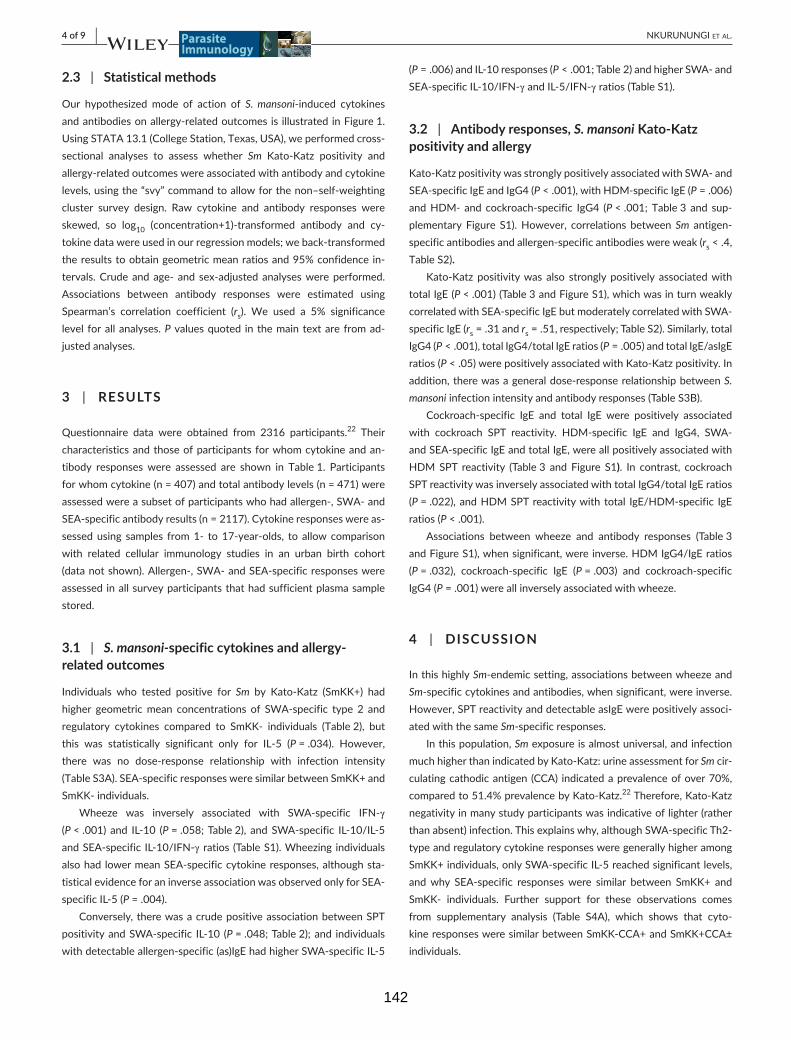
4 of 9 | NKURUNUNGI et al.
2.3 | Statistical methods
Our hypothesized mode of action of S. mansoni- induced cytokines and antibodies on allergy- related outcomes is illustrated in Figure 1. UsingSTATA13.1(CollegeStation,Texas,USA),weperformedcross-sectional analyses to assess whether Sm Kato-Katz positivity andallergy- related outcomes were associated with antibody and cytokine levels,usingthe“svy”commandtoallowforthenon–self-weightingcluster survey design. Raw cytokine and antibody responses were skewed, so log10 (concentration+1)-transformed antibody and cy-tokine data were used in our regression models; we back- transformed the results to obtain geometric mean ratios and 95% confidence in-tervals.Crudeandage- andsex-adjustedanalyseswereperformed.Associations between antibody responses were estimated usingSpearman’s correlation coefficient (rs). We used a 5% significancelevel for all analyses. Pvaluesquoted inthemaintextarefromad-justed analyses.
3 | RESULTS
Questionnaire data were obtained from 2316 participants.22 Their characteristics and those of participants for whom cytokine and an-tibody responses were assessed are shown in Table 1. Participants forwhomcytokine(n=407)andtotalantibodylevels(n=471)wereassessedwereasubsetofparticipantswhohadallergen-,SWA-andSEA-specificantibodyresults(n=2117).Cytokineresponseswereas-sessed using samples from 1- to 17- year- olds, to allow comparison with related cellular immunology studies in an urban birth cohort (datanotshown).Allergen-,SWA-andSEA-specificresponseswereassessed in all survey participants that had sufficient plasma sample stored.
3.1 | S. mansoni-specific cytokines and allergy- related outcomes
Individuals who tested positive for Sm by Kato-Katz (SmKK+) hadhigher geometricmean concentrations of SWA-specific type 2 andregulatory cytokines compared to SmKK- individuals (Table 2), butthis was statistically significant only for IL- 5 (P=.034). However,there was no dose- response relationship with infection intensity (TableS3A).SEA-specificresponsesweresimilarbetweenSmKK+andSmKK- individuals.
Wheeze was inversely associated with SWA-specific IFN-γ (P<.001) and IL-10 (P=.058;Table 2), andSWA-specific IL-10/IL-5andSEA-specific IL-10/IFN-γratios (TableS1).Wheezing individualsalsohad lowermeanSEA-specificcytokineresponses,althoughsta-tisticalevidenceforaninverseassociationwasobservedonlyforSEA-specific IL- 5 (P=.004).
Conversely, there was a crude positive association between SPT positivityandSWA-specific IL-10 (P=.048;Table2);and individualswithdetectableallergen-specific(as)IgEhadhigherSWA-specificIL-5
(P=.006)andIL-10responses(P < .001; Table 2)andhigherSWA-andSEA-specificIL-10/IFN-γandIL-5/IFN-γratios(TableS1).
3.2 | Antibody responses, S. mansoni Kato- Katz positivity and allergy
Kato-KatzpositivitywasstronglypositivelyassociatedwithSWA-andSEA-specificIgEandIgG4(P<.001),withHDM-specific IgE (P=.006)and HDM- and cockroach- specific IgG4 (P < .001; Table 3 and sup-plementary Figure S1).However, correlations betweenSm antigen- specific antibodies and allergen- specific antibodies were weak (rs < .4, TableS2).
Kato-Katz positivitywas also strongly positively associatedwithtotal IgE (P<.001)(Table3andFigureS1),whichwasinturnweaklycorrelatedwithSEA-specificIgEbutmoderatelycorrelatedwithSWA-specific IgE (rs=.31andrs=.51,respectively;TableS2).Similarly,totalIgG4 (P<.001),totalIgG4/totalIgEratios(P=.005)andtotalIgE/asIgEratios (P<.05)werepositivelyassociatedwithKato-Katzpositivity.Inaddition, there was a general dose- response relationship between S. mansoniinfectionintensityandantibodyresponses(TableS3B).
Cockroach- specific IgE and total IgE were positively associated with cockroach SPT reactivity. HDM-specific IgE and IgG4, SWA-andSEA-specificIgEandtotalIgE,wereallpositivelyassociatedwithHDM SPT reactivity (Table 3 and Figure S1). In contrast, cockroach SPT reactivity was inversely associated with total IgG4/total IgE ratios (P=.022),andHDMSPTreactivitywith total IgE/HDM-specific IgEratios (P<.001).
Associations between wheeze and antibody responses (Table3andFigureS1),whensignificant,wereinverse.HDMIgG4/IgEratios(P=.032), cockroach-specific IgE (P=.003) and cockroach-specificIgG4 (P=.001)wereallinverselyassociatedwithwheeze.
4 | DISCUSSION
In this highly Sm-endemicsetting,associationsbetweenwheezeandSm- specific cytokines and antibodies, when significant, were inverse. However, SPT reactivity and detectable asIgE were positively associ-ated with the same Sm- specific responses.
In this population, Smexposureisalmostuniversal,andinfectionmuchhigherthanindicatedbyKato-Katz:urineassessmentforSm cir-culatingcathodicantigen (CCA) indicatedaprevalenceofover70%,comparedto51.4%prevalencebyKato-Katz.22Therefore,Kato-Katznegativity in many study participants was indicative of lighter (rather thanabsent)infection.Thisexplainswhy,althoughSWA-specificTh2-type and regulatory cytokine responses were generally higher among SmKK+individuals,onlySWA-specificIL-5reachedsignificantlevels,andwhy SEA-specific responseswere similar between SmKK+ andSmKK- individuals. Further support for these observations comes from supplementary analysis (Table S4A), which shows that cyto-kineresponsesweresimilarbetweenSmKK-CCA+andSmKK+CCA±individuals.
142
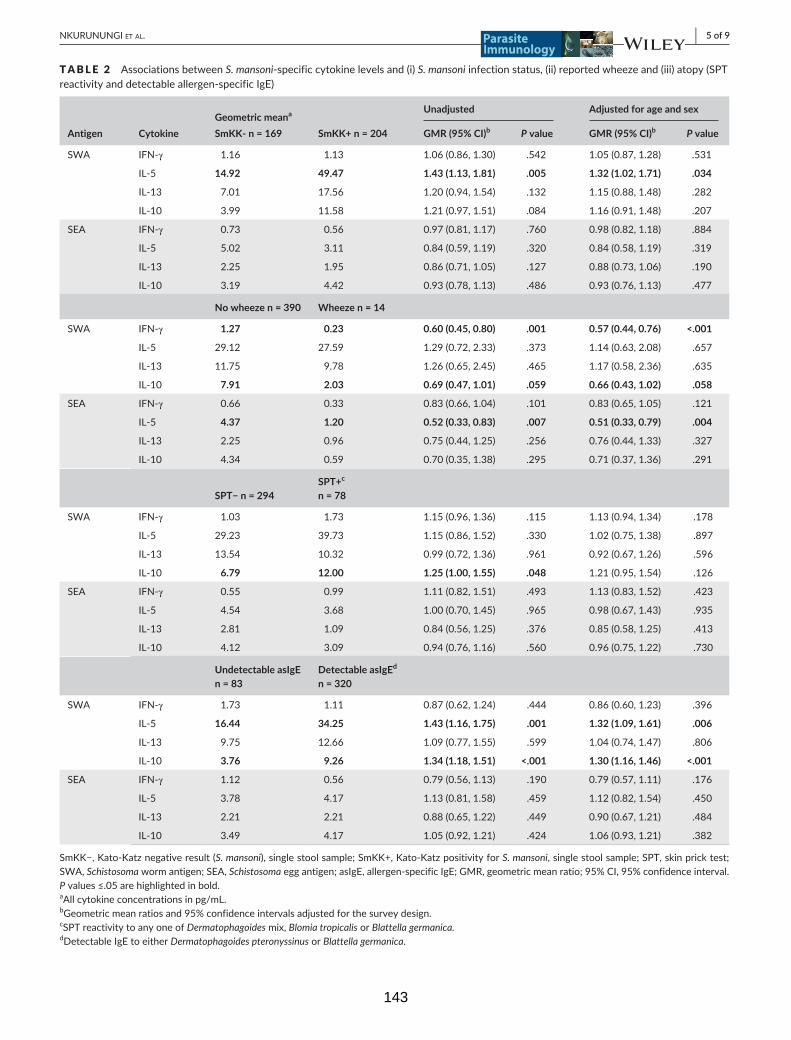
| 5 of 9NKURUNUNGI et al.
TABLE 2 AssociationsbetweenS. mansoni-specificcytokinelevelsand(i)S. mansoniinfectionstatus,(ii)reportedwheezeand(iii)atopy(SPTreactivityanddetectableallergen-specificIgE)
Geometric meana Unadjusted Adjusted for age and sex
Antigen Cytokine SmKK- n = 169 SmKK+ n = 204 GMR (95% CI)b P value GMR (95% CI)b P value
SWA IFN-γ 1.16 1.13 1.06(0.86,1.30) .542 1.05(0.87,1.28) .531
IL- 5 14.92 49.47 1.43 (1.13, 1.81) .005 1.32 (1.02, 1.71) .034
IL- 13 7.01 17.56 1.20(0.94,1.54) .132 1.15(0.88,1.48) .282
IL- 10 3.99 11.58 1.21(0.97,1.51) .084 1.16(0.91,1.48) .207
SEA IFN-γ 0.73 0.56 0.97(0.81,1.17) .760 0.98(0.82,1.18) .884
IL- 5 5.02 3.11 0.84(0.59,1.19) .320 0.84(0.58,1.19) .319
IL- 13 2.25 1.95 0.86(0.71,1.05) .127 0.88(0.73,1.06) .190
IL- 10 3.19 4.42 0.93(0.78,1.13) .486 0.93(0.76,1.13) .477
No wheeze n = 390 Wheeze n = 14
SWA IFN-γ 1.27 0.23 0.60 (0.45, 0.80) .001 0.57 (0.44, 0.76) <.001
IL- 5 29.12 27.59 1.29(0.72,2.33) .373 1.14(0.63,2.08) .657
IL- 13 11.75 9.78 1.26(0.65,2.45) .465 1.17(0.58,2.36) .635
IL- 10 7.91 2.03 0.69 (0.47, 1.01) .059 0.66 (0.43, 1.02) .058
SEA IFN-γ 0.66 0.33 0.83(0.66,1.04) .101 0.83(0.65,1.05) .121
IL- 5 4.37 1.20 0.52 (0.33, 0.83) .007 0.51 (0.33, 0.79) .004
IL- 13 2.25 0.96 0.75(0.44,1.25) .256 0.76(0.44,1.33) .327
IL- 10 4.34 0.59 0.70(0.35,1.38) .295 0.71(0.37,1.36) .291
SPT− n = 294SPT+c
n = 78
SWA IFN-γ 1.03 1.73 1.15(0.96,1.36) .115 1.13(0.94,1.34) .178
IL- 5 29.23 39.73 1.15(0.86,1.52) .330 1.02(0.75,1.38) .897
IL- 13 13.54 10.32 0.99(0.72,1.36) .961 0.92(0.67,1.26) .596
IL- 10 6.79 12.00 1.25 (1.00, 1.55) .048 1.21(0.95,1.54) .126
SEA IFN-γ 0.55 0.99 1.11(0.82,1.51) .493 1.13(0.83,1.52) .423
IL- 5 4.54 3.68 1.00(0.70,1.45) .965 0.98(0.67,1.43) .935
IL- 13 2.81 1.09 0.84(0.56,1.25) .376 0.85(0.58,1.25) .413
IL- 10 4.12 3.09 0.94(0.76,1.16) .560 0.96(0.75,1.22) .730
Undetectable asIgE n = 83
Detectable asIgEd
n = 320
SWA IFN-γ 1.73 1.11 0.87(0.62,1.24) .444 0.86(0.60,1.23) .396
IL- 5 16.44 34.25 1.43 (1.16, 1.75) .001 1.32 (1.09, 1.61) .006
IL- 13 9.75 12.66 1.09(0.77,1.55) .599 1.04(0.74,1.47) .806
IL- 10 3.76 9.26 1.34 (1.18, 1.51) <.001 1.30 (1.16, 1.46) <.001
SEA IFN-γ 1.12 0.56 0.79(0.56,1.13) .190 0.79(0.57,1.11) .176
IL- 5 3.78 4.17 1.13(0.81,1.58) .459 1.12(0.82,1.54) .450
IL- 13 2.21 2.21 0.88(0.65,1.22) .449 0.90(0.67,1.21) .484
IL- 10 3.49 4.17 1.05(0.92,1.21) .424 1.06(0.93,1.21) .382
SmKK−,Kato-Katznegativeresult(S. mansoni),singlestoolsample;SmKK+,Kato-KatzpositivityforS. mansoni, single stool sample; SPT, skin prick test; SWA,Schistosomawormantigen;SEA,Schistosoma egg antigen; asIgE, allergen- specific IgE; GMR, geometric mean ratio; 95% CI, 95% confidence interval. Pvalues≤.05arehighlightedinbold.aAllcytokineconcentrationsinpg/mL.bGeometric mean ratios and 95% confidence intervals adjusted for the survey design.cSPT reactivity to any one of Dermatophagoidesmix,Blomia tropicalis or Blattella germanica.dDetectable IgE to either Dermatophagoides pteronyssinus or Blattella germanica.
143

6 of 9 | NKURUNUNGI et al.
All statistically significant associations between atopy and Sm- specific cytokine responses were positive. Associations with wholeblood cytokine responses are best interpreted taking into account total cell counts, but these data were unavailable. However, atopy- antibody
associations were also positive. Besides, these results mirror our previ-ous epidemiological observations in this population, where Sm infection was positively associated with Dermatophagoides- specific IgE, and atopy- wheezeassociationswerestrongerinthepresenceofSm infection.21
TABLE 3 Associationsbetweenantibody(IgEandIgG4)levelsandKato-Katzpositivity(S. mansoni),SPTreactivityandreportedwheeze
Geometric meana
Antigen Antibody/antibody ratio SmKK− SmKK+ aGMR (95% CI)bc P value
SWA IgE 1080 2433 1.54 (1.28, 1.84) <.001
IgG4 4031 27 355 3.71 (3.14, 4.37) <.001
SEA IgE 1412 1833 1.32 (1.15, 1.52) <.001
IgG4 18 962 241 763 5.51 (4.55, 6.67) <.001
House dust mite IgE 0.782 10.678 1.25 (1.07, 1.45) .006
IgG4 0.001 0.192 1.79 (1.51, 2.13) <.001
IgG4/IgE ratio 0.002 0.033 1.18(0.58,2.41) .629
Cockroach IgE 18.8 19.2 1.00(0.82,1.22) .989
IgG4 0.002 0.292 1.50 (1.34, 1.68) <.001
IgG4/IgE ratio 0.001 0.027 1.32(0.94,1.85) .110
Total IgE 969 3073 1.37 (1.22, 1.54) <.001
Total IgG4 51 453 233 745 1.94 (1.49, 2.52) <.001
Total IgG4/total IgE ratio 52.16 75.24 1.36 (1.11, 1.67) .005
Total IgE/cockroach IgE ratio 3.79 12.60 1.32 (1.06, 1.66) .014
Total IgE/dust mite IgE ratio 0.562 1.301 1.13 (1.02, 1.25) .016
Cockroach SPT− Cockroach SPT+
SWA IgE 1704 1894 1.12(0.94,1.32) .173
IgG4 12 860 14 155 1.04(0.85,1.28) .675
SEA IgE 1611 1876 1.12(0.97,1.29) .092
IgG4 84 831 101 778 1.08(0.92,1.27) .319
Dust mite IgE 2.6 42.2 1.59 (1.35, 1.89) <.001
IgG4 0.022 0.061 1.06(0.87,1.29) .498
IgG4/IgE ratio 0.009 0.001 0.56 (0.36, 0.85) .010
Cockroach IgE 18.9 39.1 1.25 (1.08, 1.46) .004
IgG4 0.054 0.686 1.15(0.95,1.39) .129
IgG4/IgE ratio 0.003 0.017 0.69(0.47,1.02) .064
Total IgE 1462 2787 1.22 (1.05, 1.42) .011
Total IgG4 90 643 126 688 0.84(0.65,1.07) .163
Total IgG4/total IgE ratio 60.41 45.80 0.75 (0.58, 0.95) .022
Total IgE/cockroach IgE ratio 6.07 9.22 1.01(0.82,1.25) .894
Total IgE/dust mite IgE ratio 0.849 0.868 0.93(0.84,1.03) .140
Dust mite SPT− Dust mite SPT+
SWA IgE 1667 2409 1.26 (1.00, 1.57) .043
IgG4 13 088 12 565 1.04(0.79,1.36) .744
SEA IgE 1623 1887 1.23 (0.99, 1.53) .055
IgG4 85 471 102 026 1.20(0.85,1.68) .271
Dust mite IgE 2.5 242.9 2.10 (1.57, 2.81) <.001
IgG4 0.020 0.245 1.41 (0.99, 1.99) .052
IgG4/IgE ratio 0.009 0.001 0.49(0.23,1.04) .064
(Continues)
144
| 7 of 9NKURUNUNGI et al.
Our results were unexpected in view of earlier findings fromGabon9 which showed an inverse association between dust mite SPTandSWA-specific IL-10 (albeitweusedwholebloodcultures,compared to peripheral blood mononuclear cells in the Gabon study).However,althoughIL-10 ischiefly immunomodulatory,26-28 it may also enhance IgE production in already IgE- switched B cells;13 these may be abundant in individuals from this helminth- endemic setting.SWA-andSEA-specific IgEwereweaklypositivelyassoci-ated with HDM SPT reactivity, perhaps unsurprisingly, as helminth antigens may induce cross- reactive helminth- and allergen- specific IgE effector responses. Total serum IgE, elevated during helminth infection mainly due to increased synthesis of polyclonal IgE, has been proposed to inhibit allergic responses.29,30 However, contrast-ingevidencelinkshighserumIgElevelstoincreasedexpressionofIgE receptors on human basophils,31 and we show positive associ-ations between total IgE and SPT reactivity to both cockroach and dust mite.
In keeping with the original hypothesis, associations between wheezeandcytokineandantibodyresponses,whensignificant,wereinverse. Furthermore, total and allergen- specific IgG4/IgE ratios were mostly inversely associated with atopy, implying that the regulatory roleofIgG4againstallergymightbestbeassessedrelativetoIgE.Also,lowertotal/asIgEratiosamongHDMSPT+individualsareconsistentwith the perception that high total/asIgE ratios may be protective against allergic responses, because nonspecific polyclonal IgE may compete with asIgE to saturate IgE receptors.29
One limitation of assessing helminth- allergy associations and un-derlyingmechanismsinthispopulationisthealmostuniversalexpo-sure to helminths, and lack of data on duration of infection. We also report a large number of statistical tests, so some apparently “signifi-cant”findingscouldhaveoccurredbychance.Asweanticipatedthatsome of our measures might be correlated, we did not formally adjust for multiplicity, instead we focussed on patterns of association and con-sistency of results, and on biological plausibility with reference to other
Dust mite SPT− Dust mite SPT+
Cockroach IgE 19.9 33.7 1.21 (1.03, 1.43) .024
IgG4 0.065 0.405 1.13(0.85,1.50) .395
IgG4/IgE ratio 0.004 0.013 0.71(0.48,1.04) .075
Total IgE 1533 2802 1.24 (1.03, 1.49) .025
Total IgG4 89 885 156 204 1.09(0.86,1.38) .438
Total IgG4/total IgE ratio 57.43 55.45 0.89(0.72,1.11) .292
Total IgE/cockroach IgE ratio 6.41 8.11 1.01(0.82,1.26) .893
Total IgE/dust mite IgE ratio 0.937 0.517 0.81 (0.74, 0.89) <.001
No wheeze Wheeze
SWA IgE 1672 2627 1.15(0.81,1.64) .425
IgG4 12 753 14 802 1.05(0.71,1.54) .808
SEA IgE 1636 1547 0.93(0.66,1.29) .662
IgG4 81 698 145 978 1.16(0.77,1.73) .449
House dust mite IgE 2.8 26.6 1.35(0.89,2.04) .148
IgG4 0.007 0.008 0.85(0.59,1.25) .407
IgG4/IgE ratio 0.011 0.001 0.45 (0.22, 0.93) .032
Cockroach IgE 21.2 2.9 0.69 (0.55, 0.87) .003
IgG4 0.021 0.006 0.65 (0.53, 0.82) .001
IgG4/IgE ratio 0.004 0.002 1.14(0.47,2.74) .760
Total IgE 1630 1522 0.88(0.72,1.07) .205
Total IgG4 100 983 74 475 0.85(0.61,1.17) .302
Total IgG4/total IgE ratio 61.00 47.36 0.95(0.77,1.18) .683
Total IgE/cockroach IgE ratio 6.29 6.86 0.91(0.78,1.05) .187
Total IgE/dust mite IgE ratio 0.857 0.752 0.91(0.77,1.05) .188
SWA,Schistosomawormantigen;SEA,Schistosoma egg antigen; SmKK−,Kato-Katznegativeresult(S. mansoni),singlestoolsample;SmKK+,Kato-Katzpositive result, single stool sample; aGMR, adjusted geometric mean ratio; 95% CI, 95% confidence interval. Pvalues≤0.05arehighlightedinbold.aAllantibodyconcentrationsinng/mL.bAllgeometricmeanratiosand95%confidenceintervalsadjustedforsurveydesign,ageandsex.cGeometricmeanratiosand95%confidenceintervalsforassociationsbetweenantibodylevelsandSPTreactivityandwheezewereadditionallyadjustedfor SmKK result.
TABLE 3 (Continued)
145
8 of 9 | NKURUNUNGI et al.
findings.Anotherpotentiallimitationisthatwheezewasrelativelyrarein the study population, and hence, some of our comparison groups (suchastheagegroup1-17years)hadalowprevalence.Besides,re-portedwheezecouldeasilybemisclassifiedinthispopulationduetolackofadirecttranslationof“wheeze”inthenativelanguages.21
Nonetheless, our results generally agree with our epidemiolog-ical observations in the same population,21 where we found a very low prevalence of clinical allergies, despite positive helminth- atopy associations.
ACKNOWLEDGEMENTS
We thank the Koome subcounty community members for participat-ingintheLaVIISWAstudy.WealsothankProf.MariaYazdanbakhshfor her insightful comments during the drafting of this article. The LaVIISWA study is funded by the Wellcome Trust, grant 095778awardedtoAME.GNissupportedbyaPhDfellowshipfromtheAfricanPartnershipforChronicDiseaseResearch(APCDR).RESissupportedby a PhD fellowship awarded under the DELTAS Africa Initiative.TheDELTASAfrica Initiative is an independent funding scheme ofthe African Academy of Sciences (AAS), Alliance for AcceleratingExcellence in Science in Africa (AESA), and supported by theNewPartnership for Africa’s Development Planning and CoordinatingAgency(NEPADAgency)withfundingfromtheWellcomeTrust(grant107743)andtheUKGovernment.TheMRC/UVRIUgandaResearchUnitisjointlyfundedbytheUKMedicalResearchCouncil(MRC)andtheUKDepartmentforInternationalDevelopment(DFID)undertheMRC/DFID Concordat agreement.
DISCLOSURES
None.
AUTHOR CONTRIBUTIONS
AMEconceivedthemainstudy.AME,RESandMNledthefieldandclinicteams.AME,GNandJKparticipatedinthedesignoflabora-tory studies.GN, JK,BWand JNperformed theexperiments.GNand ELWanalysed the results.GNwrote themanuscript,with allauthors contributing to the interpretation of the results, and revi-sion and approval of the finalmanuscript.GN is the guarantor ofthe article.
ORCID
G. Nkurunungi http://orcid.org/0000-0003-4062-9105
REFERENCES
1. TyagiN,FarnellEJ,FitzsimmonsCM,etal.ComparisonsofAllergenicandMetazoanParasiteProteins:AllergythePriceofImmunity.PLoS Comput Biol. 2015;11:e1004546.
2. DunneDW,ButterworthAE,FulfordAJ,etal.Immunityaftertreat-ment of human schistosomiasis: association between IgE antibodies
to adult worm antigens and resistance to reinfection. Eur J Immunol. 1992;22:1483-1494.
3. Dunne DW, Webster M, Smith P, et al. The isolation of a 22 kDa band afterSDS-PAGEofSchistosomamansoniadultwormsanditsusetodemonstratethatIgEresponsesagainsttheantigen(s)itcontainsareassociated with human resistance to reinfection. Parasite Immunol. 1997;19:79-89.
4. SmitsHH,EvertsB,HartgersFC,YazdanbakhshM.Chronichelminthinfections protect against allergic diseases by active regulatory pro-cesses. Curr Allergy Asthma Rep. 2010;10:3-12.
5. HamidF,AmoahAS,vanReeR,YazdanbakhshM.Helminth-inducedIgE and protection against allergic disorders. Curr Top Microbiol Immunol. 2015;388:91-108.
6. MaizelsRM,McSorleyHJ,SmythDJ.Helminths in thehygienehy-pothesis: sooner or later? Clin Exp Immunol. 2014;177:38-46.
7. SantiagoHdaC,Ribeiro-GomesFL,BennuruS,NutmanTB.Helminthinfection alters IgE responses to allergens structurally related to para-site proteins. J Immunol. 2015;194:93-100.
8. LevinM,MuloiwaR,LeSouefP,MotalaC.Ascarissensitizationisas-sociatedwithaeroallergensensitizationandairwayhyperresponsive-nessbutnotallergicdisease inurbanAfrica. J Allergy Clin Immunol. 2012;130:265-267.
9. van den Biggelaar AH, van Ree R, Rodrigues LC, et al. Decreasedatopy in children infected with Schistosoma haematobium: a role for parasite- induced interleukin- 10. Lancet. 2000;356:1723-1727.
10. Allen JE, Maizels RM. Diversity and dialogue in immunity to hel-minths. Nat Rev Immunol. 2011;11:375-388.
11. Licona-LimonP,KimLK,PalmNW,FlavellRA.TH2,allergyandgroup2 innate lymphoid cells. Nat Immunol. 2013;14:536-542.
12. KingCL,MedhatA,Malhotra I, et al.Cytokine control of parasite-specific anergy in human urinary schistosomiasis. IL- 10 modulates lymphocyte reactivity. J Immunol. 1996;156:4715-4721.
13. JeanninP,LecoanetS,DelnesteY,GauchatJF,BonnefoyJY.IgEversusIgG4 production can be differentially regulated by IL- 10. J Immunol. 1998;160:3555-3561.
14. TsuboiH,MatsuoN, IizukaM, et al.Analysis of IgG4 class switch-related molecules in IgG4- related disease. Arthritis Res Ther. 2012;14:R171.
15. Poulsen LK, Hummelshoj L. Triggers of IgE class switching and allergy development. Ann Med. 2007;39:440-456.
16. James LK, Till SJ. Potential Mechanisms for IgG4 Inhibition of Immediate Hypersensitivity Reactions. Curr Allergy Asthma Rep. 2016;16:23.
17. SantiagoHC,BennuruS,BoydA,EberhardM,NutmanTB.Structuraland immunologic cross- reactivity among filarial and mite tropomy-osin: implications for the hygiene hypothesis. J Allergy Clin Immunol. 2011;127:479-486.
18. Santiago HC, LeeVan E, Bennuru S, et al. Molecular mimicry be-tween cockroach and helminth glutathione S- transferases pro-motescross-reactivityandcross-sensitization.J Allergy Clin Immunol. 2012;130:248-256 e9.
19. MpairweH,NdibazzaJ,WebbEL,etal.Maternalhookwormmodi-fiesriskfactorsforchildhoodeczema:resultsfromabirthcohortinUganda. Pediatr Allergy Immunol. 2014;25:481-488.
20. Mpairwe H, Webb EL, Muhangi L, et al. Anthelminthic treatmentduring pregnancy is associated with increased risk of infantile ec-zema: randomised-controlled trial results. Pediatr Allergy Immunol. 2011;22:305-312.
21. WebbEL,NampijjaM,KaweesaJ,etal.Helminthsarepositivelyas-sociatedwithatopyandwheezeinUgandanfishingcommunities:re-sults from a cross- sectional survey. Allergy. 2016;71:1156-1169.
22. Nampijja M, Webb EL, Kaweesa J, et al. The Lake Victoria is-land intervention study on worms and allergy- related diseases (LaVIISWA):studyprotocolforarandomisedcontrolledtrial.Trials. 2015;16:187.
146
| 9 of 9NKURUNUNGI et al.
23. PekkanenJ,PearceN.Definingasthmainepidemiologicalstudies.Eur Respir J. 1999;14:951-957.
24. KatzN,ChavesA,PellegrinoJ.Asimpledeviceforquantitativestoolthick- smear technique in Schistosomiasis mansoni. Rev Inst Med Trop Sao Paulo. 1972;14:397-400.
25. ElliottAM,MawaPA,WebbEL,etal.Effectsofmaternalandinfantco- infections, and of maternal immunisation, on the infant response to BCG and tetanus immunisation. Vaccine. 2010;29:247-255.
26. deWaalMalefytR,YsselH,deVriesJE.DirecteffectsofIL-10onsub-setsofhumanCD4+TcellclonesandrestingTcells.Specificinhibitionof IL- 2 production and proliferation. J Immunol. 1993; 150: 4754-4765.
27. DingL,LinsleyPS,HuangLY,GermainRN,ShevachEM.IL-10inhibitsmacrophage costimulatory activity by selectively inhibiting the up- regulationofB7expression.J Immunol. 1993;151:1224-1234.
28. Ding L, Shevach EM. IL- 10 inhibits mitogen- induced T cell prolifer-ation by selectively inhibiting macrophage costimulatory function. J Immunol. 1992;148:3133-3139.
29. Godfrey RC, Gradidge CF. Allergic sensitisation of human lungfragments prevented by saturation of IgE binding sites. Nature. 1976;259:484-486.
30. LynchNR,HagelIA,PalenqueME,etal.Relationshipbetweenhelmin-thic infection and IgE response in atopic and nonatopic children in a tropical environment. J Allergy Clin Immunol.1998;101(2Pt1):217-221.
31. MacGlashan DW Jr, Bochner BS, Adelman DC, et al. Down-regulationofFc(epsilon)RIexpressiononhumanbasophilsduring invivo treatment of atopic patients with anti- IgE antibody. J Immunol. 1997;158:1438-1445.
SUPPORTING INFORMATION
Additional Supporting Information may be found online in the supporting information tab for this article.
How to cite this article:NkurunungiG,KabagenyiJ,NampijjaM,etal.Schistosoma mansoni- specific immune responses and allergy in Uganda. Parasite Immunol. 2018;40:e12506. https://doi.org/10.1111/pim.12506
APPENDIX
LaVIISWA trial teamProject leaders, physicians and postdoctoral scientists: Richard Sanya, Margaret Nampijja, Harriet Mpairwe, Geraldine O’Hara, BarbaraNerima. Laboratory staff and collaborators:GyaviiraNkurunungi,JoyceKabagenyi,DennisonKizito,JohnVianneyTushabe,JacentNassuuna,Jaco Verweij, Stephen Cose, Linda Wammes, Prossy Kabuubi, Emmanuel Niwagaba, Gloria Oduru, Grace Kabami, Elson Abayo,Eric Ssebagala, Fred Muwonge. Statisticians and data managers: Emily Webb, Remy Hoek Spaans, Lawrence Muhangi, Lawrence Lubyayi, HelenAkurut, FatumaNalukenge,BeatriceMirembe, JustinOkello,SebastianOwilla,JonathanLevin,StephenNash.Clinical officers: Milly Namutebi, Christopher Zziwa.Nurses: EstherNakazibwe, JosephineTumusiime, Caroline Ninsiima, Susan Amongi, Grace Kamukama,Susan Iwala, Florence. Internal monitor: Mirriam Akello. Field work-ers:RobertKizindo,MosesSewankambo,DenisNsubuga.Social sci-ences: Edward Tumwesige. Boatman: David Abiriga.Driver: Richard Walusimbi. HIV counselling and testing: Victoria Nannozi, CynthiaKabonesa. Vector Control Programme staff: James Kaweesa, Edridah Tukahebwa. Administrative management:MosesKizza.Principal inves-tigator:AlisonElliott.
147
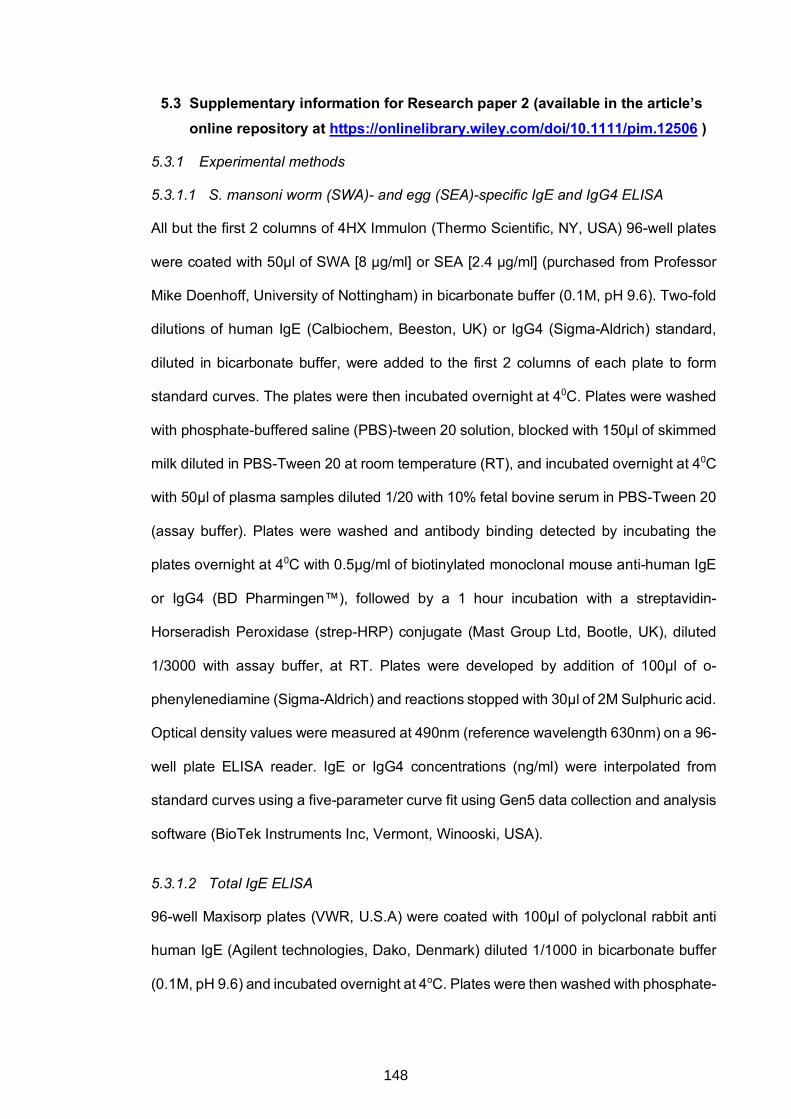
5.3 Supplementary information for Research paper 2 (available in the article’s
online repository at https://onlinelibrary.wiley.com/doi/10.1111/pim.12506 )
5.3.1 Experimental methods
5.3.1.1 S. mansoni worm (SWA)- and egg (SEA)-specific IgE and IgG4 ELISA
All but the first 2 columns of 4HX Immulon (Thermo Scientific, NY, USA) 96-well plates
were coated with 50μl of SWA [8 μg/ml] or SEA [2.4 μg/ml] (purchased from Professor
Mike Doenhoff, University of Nottingham) in bicarbonate buffer (0.1M, pH 9.6). Two-fold
dilutions of human IgE (Calbiochem, Beeston, UK) or IgG4 (Sigma-Aldrich) standard,
diluted in bicarbonate buffer, were added to the first 2 columns of each plate to form
standard curves. The plates were then incubated overnight at 40C. Plates were washed
with phosphate-buffered saline (PBS)-tween 20 solution, blocked with 150μl of skimmed
milk diluted in PBS-Tween 20 at room temperature (RT), and incubated overnight at 40C
with 50μl of plasma samples diluted 1/20 with 10% fetal bovine serum in PBS-Tween 20
(assay buffer). Plates were washed and antibody binding detected by incubating the
plates overnight at 40C with 0.5μg/ml of biotinylated monoclonal mouse anti-human IgE
or IgG4 (BD Pharmingen™), followed by a 1 hour incubation with a streptavidin-
Horseradish Peroxidase (strep-HRP) conjugate (Mast Group Ltd, Bootle, UK), diluted
1/3000 with assay buffer, at RT. Plates were developed by addition of 100μl of o-
phenylenediamine (Sigma-Aldrich) and reactions stopped with 30μl of 2M Sulphuric acid.
Optical density values were measured at 490nm (reference wavelength 630nm) on a 96-
well plate ELISA reader. IgE or IgG4 concentrations (ng/ml) were interpolated from
standard curves using a five-parameter curve fit using Gen5 data collection and analysis
software (BioTek Instruments Inc, Vermont, Winooski, USA).
5.3.1.2 Total IgE ELISA
96-well Maxisorp plates (VWR, U.S.A) were coated with 100μl of polyclonal rabbit anti
human IgE (Agilent technologies, Dako, Denmark) diluted 1/1000 in bicarbonate buffer
(0.1M, pH 9.6) and incubated overnight at 4oC. Plates were then washed with phosphate-
148
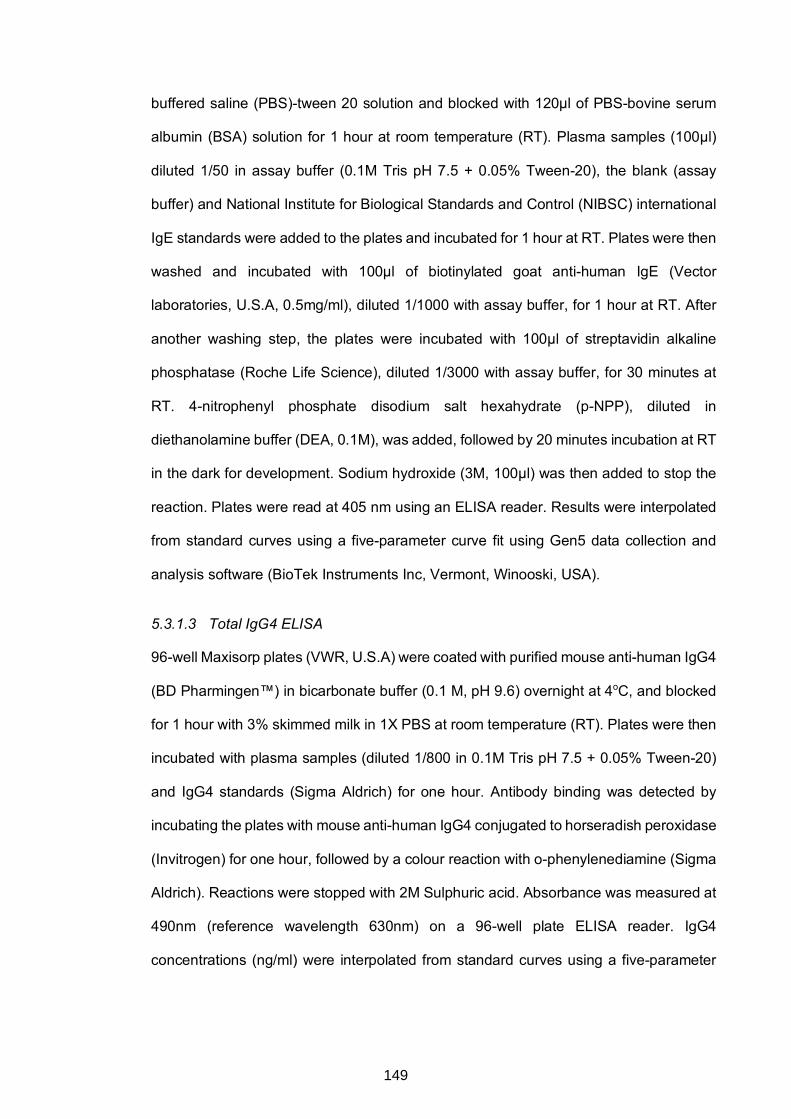
buffered saline (PBS)-tween 20 solution and blocked with 120μl of PBS-bovine serum
albumin (BSA) solution for 1 hour at room temperature (RT). Plasma samples (100μl)
diluted 1/50 in assay buffer (0.1M Tris pH 7.5 + 0.05% Tween-20), the blank (assay
buffer) and National Institute for Biological Standards and Control (NIBSC) international
IgE standards were added to the plates and incubated for 1 hour at RT. Plates were then
washed and incubated with 100μl of biotinylated goat anti-human IgE (Vector
laboratories, U.S.A, 0.5mg/ml), diluted 1/1000 with assay buffer, for 1 hour at RT. After
another washing step, the plates were incubated with 100μl of streptavidin alkaline
phosphatase (Roche Life Science), diluted 1/3000 with assay buffer, for 30 minutes at
RT. 4-nitrophenyl phosphate disodium salt hexahydrate (p-NPP), diluted in
diethanolamine buffer (DEA, 0.1M), was added, followed by 20 minutes incubation at RT
in the dark for development. Sodium hydroxide (3M, 100μl) was then added to stop the
reaction. Plates were read at 405 nm using an ELISA reader. Results were interpolated
from standard curves using a five-parameter curve fit using Gen5 data collection and
analysis software (BioTek Instruments Inc, Vermont, Winooski, USA).
5.3.1.3 Total IgG4 ELISA
96-well Maxisorp plates (VWR, U.S.A) were coated with purified mouse anti-human IgG4
(BD Pharmingen™) in bicarbonate buffer (0.1 M, pH 9.6) overnight at 4oC, and blocked
for 1 hour with 3% skimmed milk in 1X PBS at room temperature (RT). Plates were then
incubated with plasma samples (diluted 1/800 in 0.1M Tris pH 7.5 + 0.05% Tween-20)
and IgG4 standards (Sigma Aldrich) for one hour. Antibody binding was detected by
incubating the plates with mouse anti-human IgG4 conjugated to horseradish peroxidase
(Invitrogen) for one hour, followed by a colour reaction with o-phenylenediamine (Sigma
Aldrich). Reactions were stopped with 2M Sulphuric acid. Absorbance was measured at
490nm (reference wavelength 630nm) on a 96-well plate ELISA reader. IgG4
concentrations (ng/ml) were interpolated from standard curves using a five-parameter
149

curve fit using Gen5 data collection and analysis software (BioTek Instruments Inc,
U.S.A).
150
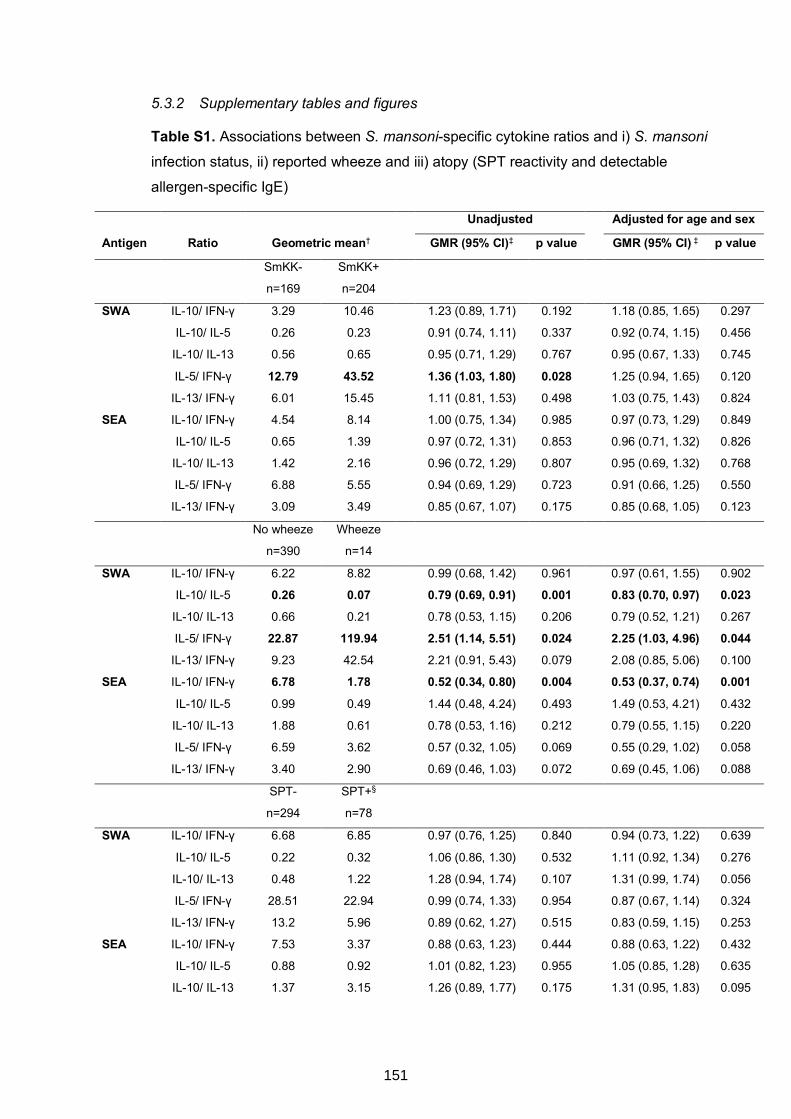
5.3.2 Supplementary tables and figures
Table S1. Associations between S. mansoni-specific cytokine ratios and i) S. mansoni
infection status, ii) reported wheeze and iii) atopy (SPT reactivity and detectable
allergen-specific IgE)
Unadjusted Adjusted for age and sex
Antigen Ratio Geometric mean† GMR (95% CI)‡ p value GMR (95% CI) ‡ p value
SmKK-
n=169
SmKK+
n=204
SWA IL-10/ IFN-γ 3.29 10.46 1.23 (0.89, 1.71) 0.192 1.18 (0.85, 1.65) 0.297
IL-10/ IL-5 0.26 0.23 0.91 (0.74, 1.11) 0.337 0.92 (0.74, 1.15) 0.456
IL-10/ IL-13 0.56 0.65 0.95 (0.71, 1.29) 0.767 0.95 (0.67, 1.33) 0.745
IL-5/ IFN-γ 12.79 43.52 1.36 (1.03, 1.80) 0.028 1.25 (0.94, 1.65) 0.120
IL-13/ IFN-γ 6.01 15.45 1.11 (0.81, 1.53) 0.498 1.03 (0.75, 1.43) 0.824
SEA IL-10/ IFN-γ 4.54 8.14 1.00 (0.75, 1.34) 0.985 0.97 (0.73, 1.29) 0.849
IL-10/ IL-5 0.65 1.39 0.97 (0.72, 1.31) 0.853 0.96 (0.71, 1.32) 0.826
IL-10/ IL-13 1.42 2.16 0.96 (0.72, 1.29) 0.807 0.95 (0.69, 1.32) 0.768
IL-5/ IFN-γ 6.88 5.55 0.94 (0.69, 1.29) 0.723 0.91 (0.66, 1.25) 0.550
IL-13/ IFN-γ 3.09 3.49 0.85 (0.67, 1.07) 0.175 0.85 (0.68, 1.05) 0.123
No wheeze
n=390
Wheeze
n=14
SWA IL-10/ IFN-γ 6.22 8.82 0.99 (0.68, 1.42) 0.961 0.97 (0.61, 1.55) 0.902
IL-10/ IL-5 0.26 0.07 0.79 (0.69, 0.91) 0.001 0.83 (0.70, 0.97) 0.023
IL-10/ IL-13 0.66 0.21 0.78 (0.53, 1.15) 0.206 0.79 (0.52, 1.21) 0.267
IL-5/ IFN-γ 22.87 119.94 2.51 (1.14, 5.51) 0.024 2.25 (1.03, 4.96) 0.044
IL-13/ IFN-γ 9.23 42.54 2.21 (0.91, 5.43) 0.079 2.08 (0.85, 5.06) 0.100
SEA IL-10/ IFN-γ 6.78 1.78 0.52 (0.34, 0.80) 0.004 0.53 (0.37, 0.74) 0.001
IL-10/ IL-5 0.99 0.49 1.44 (0.48, 4.24) 0.493 1.49 (0.53, 4.21) 0.432
IL-10/ IL-13 1.88 0.61 0.78 (0.53, 1.16) 0.212 0.79 (0.55, 1.15) 0.220
IL-5/ IFN-γ 6.59 3.62 0.57 (0.32, 1.05) 0.069 0.55 (0.29, 1.02) 0.058
IL-13/ IFN-γ 3.40 2.90 0.69 (0.46, 1.03) 0.072 0.69 (0.45, 1.06) 0.088
SPT-
n=294
SPT+§
n=78
SWA IL-10/ IFN-γ 6.68 6.85 0.97 (0.76, 1.25) 0.840 0.94 (0.73, 1.22) 0.639
IL-10/ IL-5 0.22 0.32 1.06 (0.86, 1.30) 0.532 1.11 (0.92, 1.34) 0.276
IL-10/ IL-13 0.48 1.22 1.28 (0.94, 1.74) 0.107 1.31 (0.99, 1.74) 0.056
IL-5/ IFN-γ 28.51 22.94 0.99 (0.74, 1.33) 0.954 0.87 (0.67, 1.14) 0.324
IL-13/ IFN-γ 13.2 5.96 0.89 (0.62, 1.27) 0.515 0.83 (0.59, 1.15) 0.253
SEA IL-10/ IFN-γ 7.53 3.37 0.88 (0.63, 1.23) 0.444 0.88 (0.63, 1.22) 0.432
IL-10/ IL-5 0.88 0.92 1.01 (0.82, 1.23) 0.955 1.05 (0.85, 1.28) 0.635
IL-10/ IL-13 1.37 3.15 1.26 (0.89, 1.77) 0.175 1.31 (0.95, 1.83) 0.095
151
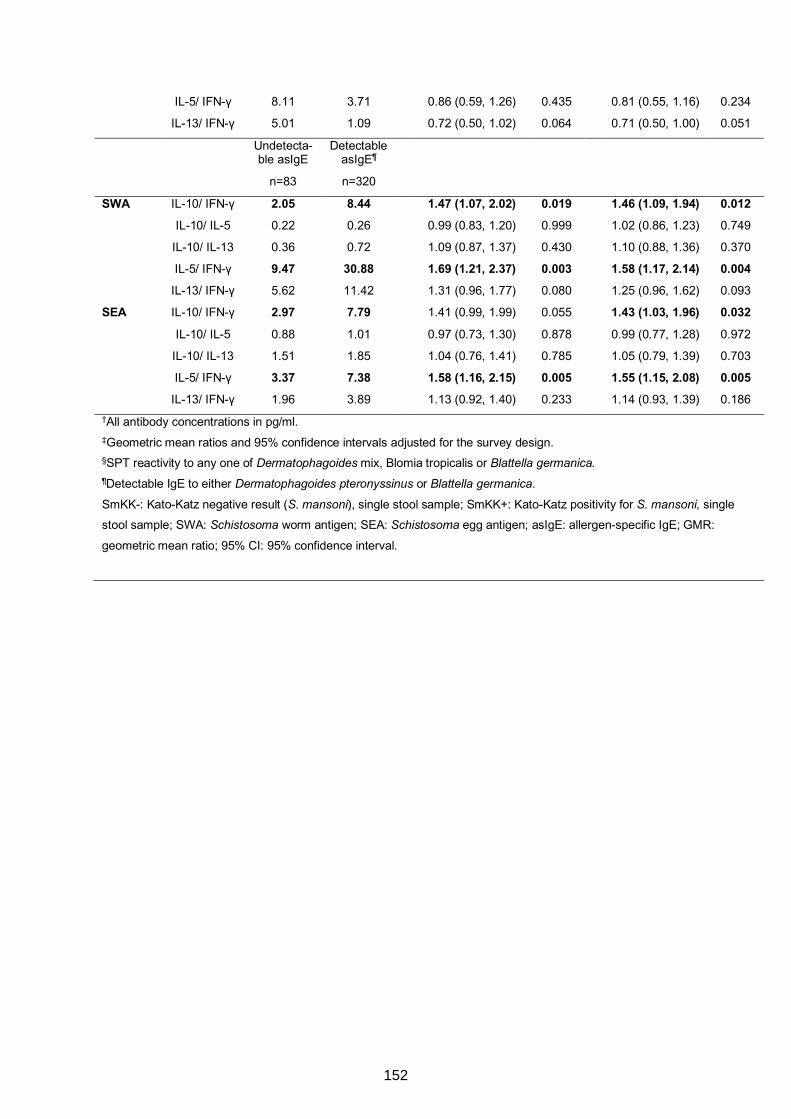
IL-5/ IFN-γ 8.11 3.71 0.86 (0.59, 1.26) 0.435 0.81 (0.55, 1.16) 0.234
IL-13/ IFN-γ 5.01 1.09 0.72 (0.50, 1.02) 0.064 0.71 (0.50, 1.00) 0.051
Undetecta-
ble asIgE
n=83
Detectable
asIgE¶
n=320
SWA IL-10/ IFN-γ 2.05 8.44 1.47 (1.07, 2.02) 0.019 1.46 (1.09, 1.94) 0.012
IL-10/ IL-5 0.22 0.26 0.99 (0.83, 1.20) 0.999 1.02 (0.86, 1.23) 0.749
IL-10/ IL-13 0.36 0.72 1.09 (0.87, 1.37) 0.430 1.10 (0.88, 1.36) 0.370
IL-5/ IFN-γ 9.47 30.88 1.69 (1.21, 2.37) 0.003 1.58 (1.17, 2.14) 0.004
IL-13/ IFN-γ 5.62 11.42 1.31 (0.96, 1.77) 0.080 1.25 (0.96, 1.62) 0.093
SEA IL-10/ IFN-γ 2.97 7.79 1.41 (0.99, 1.99) 0.055 1.43 (1.03, 1.96) 0.032
IL-10/ IL-5 0.88 1.01 0.97 (0.73, 1.30) 0.878 0.99 (0.77, 1.28) 0.972
IL-10/ IL-13 1.51 1.85 1.04 (0.76, 1.41) 0.785 1.05 (0.79, 1.39) 0.703
IL-5/ IFN-γ 3.37 7.38 1.58 (1.16, 2.15) 0.005 1.55 (1.15, 2.08) 0.005
IL-13/ IFN-γ 1.96 3.89 1.13 (0.92, 1.40) 0.233 1.14 (0.93, 1.39) 0.186
†All antibody concentrations in pg/ml.
‡Geometric mean ratios and 95% confidence intervals adjusted for the survey design.
§SPT reactivity to any one of Dermatophagoides mix, Blomia tropicalis or Blattella germanica. ¶Detectable IgE to either Dermatophagoides pteronyssinus or Blattella germanica.
SmKK-: Kato-Katz negative result (S. mansoni), single stool sample; SmKK+: Kato-Katz positivity for S. mansoni, single
stool sample; SWA: Schistosoma worm antigen; SEA: Schistosoma egg antigen; asIgE: allergen-specific IgE; GMR:
geometric mean ratio; 95% CI: 95% confidence interval.
152
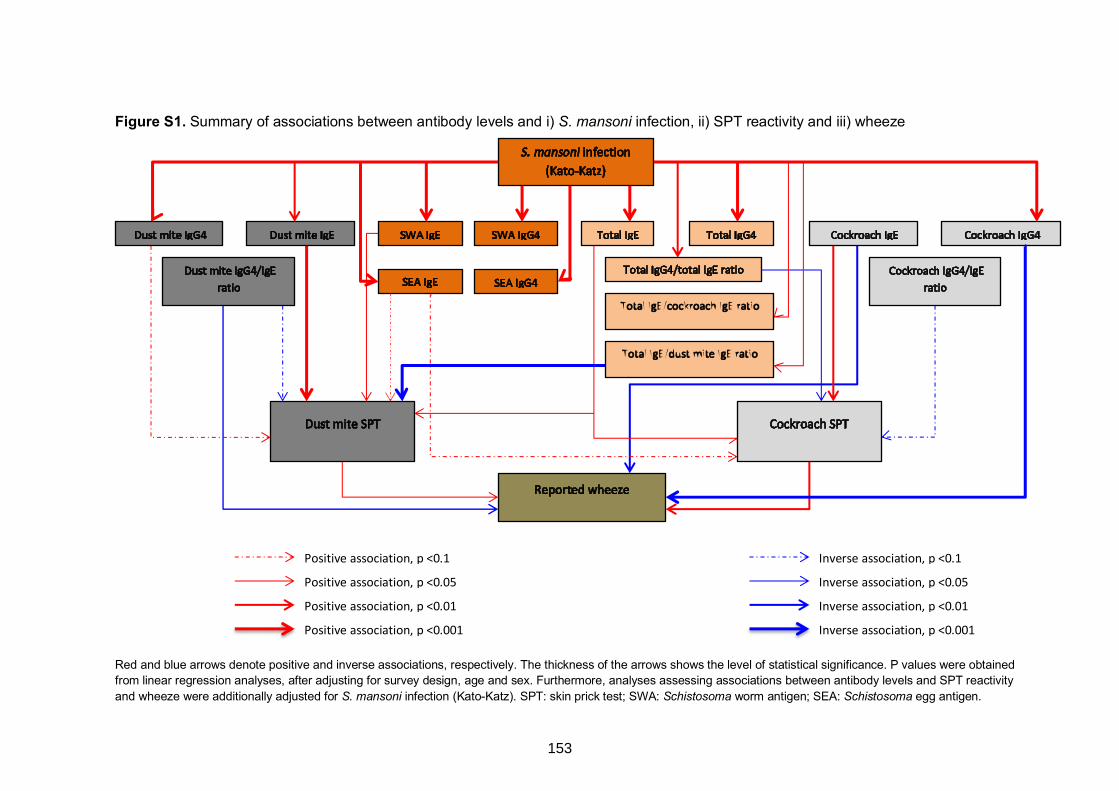
Figure S1. Summary of associations between antibody levels and i) S. mansoni infection, ii) SPT reactivity and iii) wheeze
Red and blue arrows denote positive and inverse associations, respectively. The thickness of the arrows shows the level of statistical significance. P values were obtained from linear regression analyses, after adjusting for survey design, age and sex. Furthermore, analyses assessing associations between antibody levels and SPT reactivity and wheeze were additionally adjusted for S. mansoni infection (Kato-Katz). SPT: skin prick test; SWA: Schistosoma worm antigen; SEA: Schistosoma egg antigen.
Positive association, p <0.1
Positive association, p <0.05
Positive association, p <0.01
Positive association, p <0.001
Inverse association, p <0.1
Inverse association, p <0.05
Inverse association, p <0.01
Inverse association, p <0.001
153
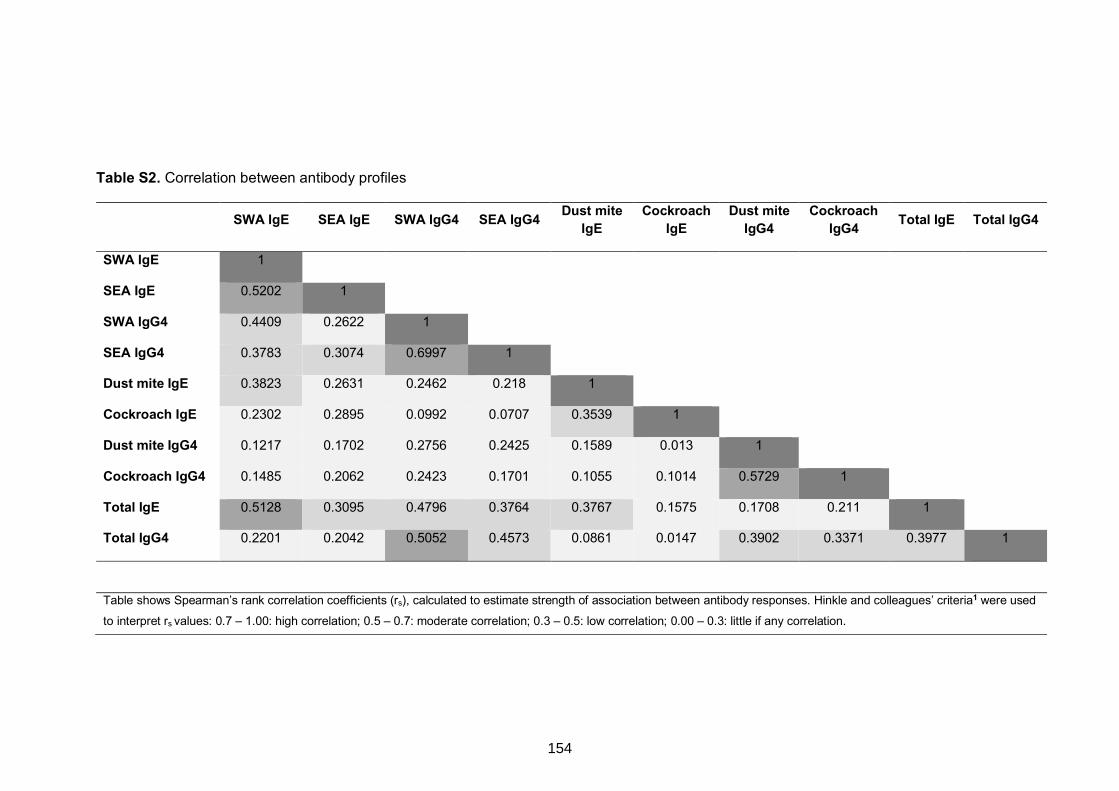
Table S2. Correlation between antibody profiles
SWA IgE SEA IgE SWA IgG4 SEA IgG4 Dust mite IgE
Cockroach IgE
Dust mite IgG4
Cockroach IgG4 Total IgE Total IgG4
SWA IgE 1
SEA IgE 0.5202 1
SWA IgG4 0.4409 0.2622 1
SEA IgG4 0.3783 0.3074 0.6997 1
Dust mite IgE 0.3823 0.2631 0.2462 0.218 1
Cockroach IgE 0.2302 0.2895 0.0992 0.0707 0.3539 1
Dust mite IgG4 0.1217 0.1702 0.2756 0.2425 0.1589 0.013 1
Cockroach IgG4 0.1485 0.2062 0.2423 0.1701 0.1055 0.1014 0.5729 1
Total IgE 0.5128 0.3095 0.4796 0.3764 0.3767 0.1575 0.1708 0.211 1
Total IgG4 0.2201 0.2042 0.5052 0.4573 0.0861 0.0147 0.3902 0.3371 0.3977 1
Table shows Spearman’s rank correlation coefficients (rs), calculated to estimate strength of association between antibody responses. Hinkle and colleagues’ criteria1 were used
to interpret rs values: 0.7 – 1.00: high correlation; 0.5 – 0.7: moderate correlation; 0.3 – 0.5: low correlation; 0.00 – 0.3: little if any correlation.
154
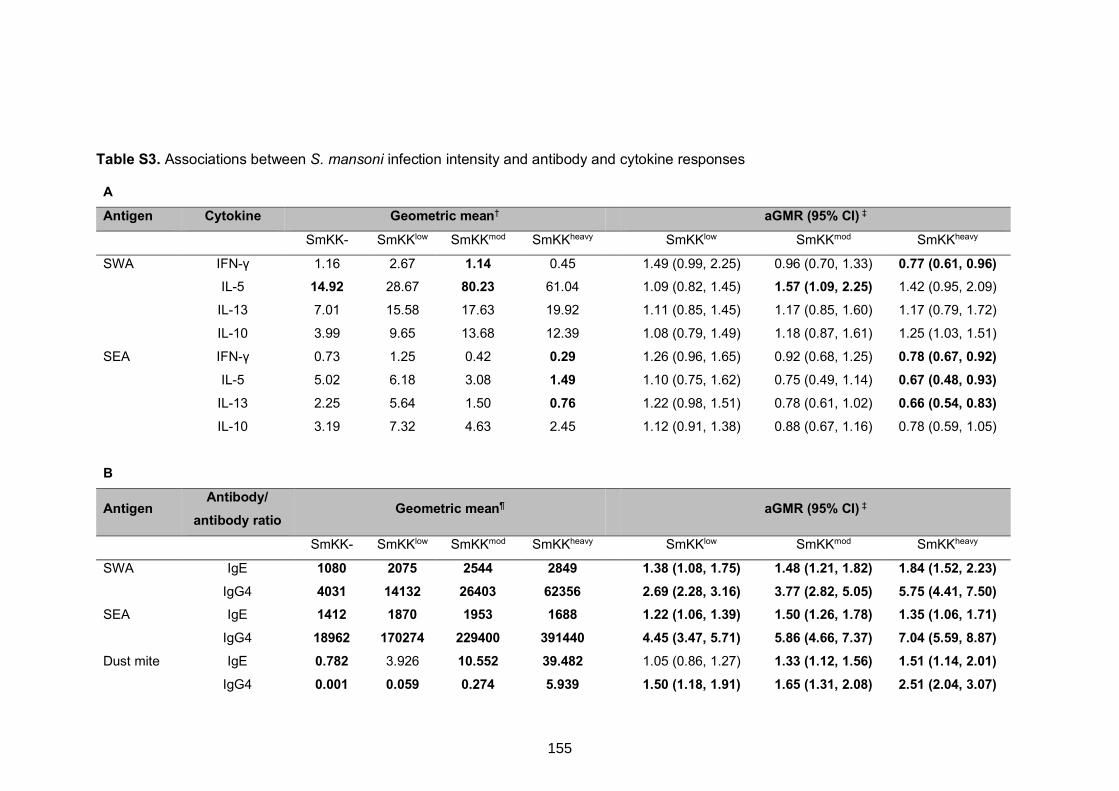
Table S3. Associations between S. mansoni infection intensity and antibody and cytokine responses
A Antigen Cytokine Geometric mean† aGMR (95% CI) ‡
SmKK- SmKKlow SmKKmod SmKKheavy SmKKlow SmKKmod SmKKheavy
SWA IFN-γ 1.16 2.67 1.14 0.45 1.49 (0.99, 2.25) 0.96 (0.70, 1.33) 0.77 (0.61, 0.96) IL-5 14.92 28.67 80.23 61.04 1.09 (0.82, 1.45) 1.57 (1.09, 2.25) 1.42 (0.95, 2.09)
IL-13 7.01 15.58 17.63 19.92 1.11 (0.85, 1.45) 1.17 (0.85, 1.60) 1.17 (0.79, 1.72)
IL-10 3.99 9.65 13.68 12.39 1.08 (0.79, 1.49) 1.18 (0.87, 1.61) 1.25 (1.03, 1.51)
SEA IFN-γ 0.73 1.25 0.42 0.29 1.26 (0.96, 1.65) 0.92 (0.68, 1.25) 0.78 (0.67, 0.92)
IL-5 5.02 6.18 3.08 1.49 1.10 (0.75, 1.62) 0.75 (0.49, 1.14) 0.67 (0.48, 0.93)
IL-13 2.25 5.64 1.50 0.76 1.22 (0.98, 1.51) 0.78 (0.61, 1.02) 0.66 (0.54, 0.83)
IL-10 3.19 7.32 4.63 2.45 1.12 (0.91, 1.38) 0.88 (0.67, 1.16) 0.78 (0.59, 1.05)
B
Antigen Antibody/
antibody ratio Geometric mean¶ aGMR (95% CI) ‡
SmKK- SmKKlow SmKKmod SmKKheavy SmKKlow SmKKmod SmKKheavy
SWA IgE 1080 2075 2544 2849 1.38 (1.08, 1.75) 1.48 (1.21, 1.82) 1.84 (1.52, 2.23) IgG4 4031 14132 26403 62356 2.69 (2.28, 3.16) 3.77 (2.82, 5.05) 5.75 (4.41, 7.50) SEA IgE 1412 1870 1953 1688 1.22 (1.06, 1.39) 1.50 (1.26, 1.78) 1.35 (1.06, 1.71) IgG4 18962 170274 229400 391440 4.45 (3.47, 5.71) 5.86 (4.66, 7.37) 7.04 (5.59, 8.87) Dust mite IgE 0.782 3.926 10.552 39.482 1.05 (0.86, 1.27) 1.33 (1.12, 1.56) 1.51 (1.14, 2.01) IgG4 0.001 0.059 0.274 5.939 1.50 (1.18, 1.91) 1.65 (1.31, 2.08) 2.51 (2.04, 3.07)
155
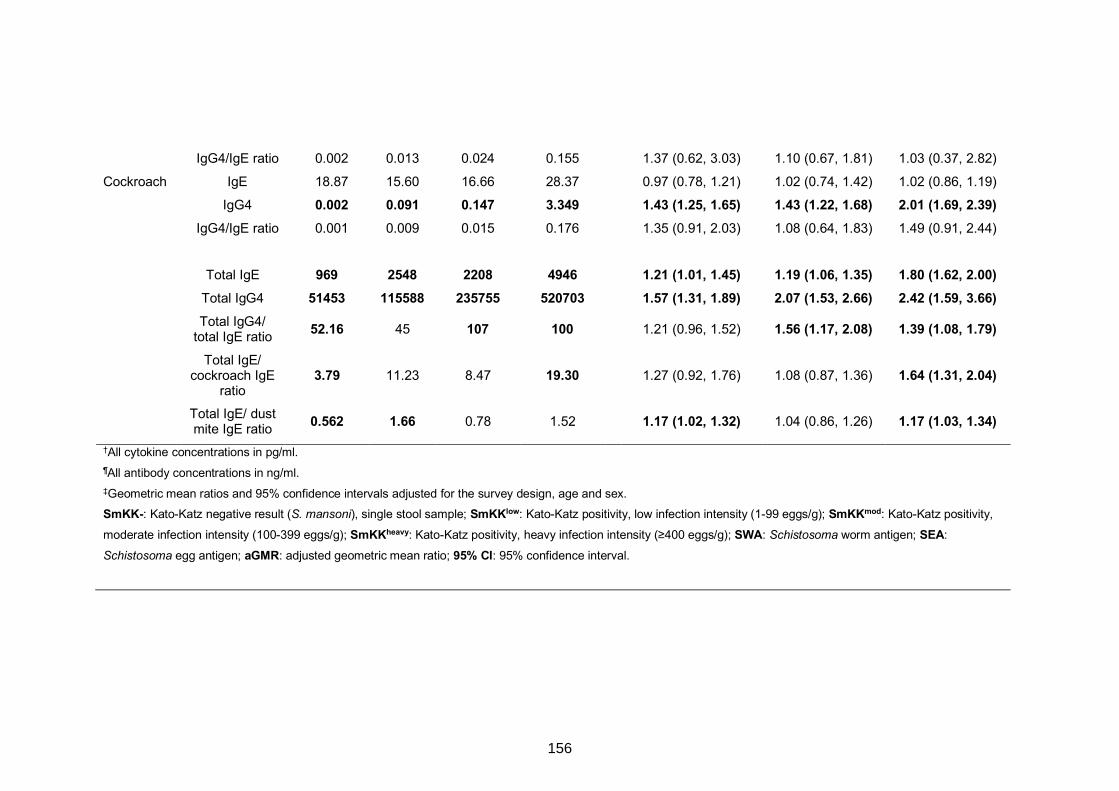
IgG4/IgE ratio 0.002 0.013 0.024 0.155 1.37 (0.62, 3.03) 1.10 (0.67, 1.81) 1.03 (0.37, 2.82)
Cockroach IgE 18.87 15.60 16.66 28.37 0.97 (0.78, 1.21) 1.02 (0.74, 1.42) 1.02 (0.86, 1.19)
IgG4 0.002 0.091 0.147 3.349 1.43 (1.25, 1.65) 1.43 (1.22, 1.68) 2.01 (1.69, 2.39) IgG4/IgE ratio 0.001 0.009 0.015 0.176 1.35 (0.91, 2.03) 1.08 (0.64, 1.83) 1.49 (0.91, 2.44)
Total IgE 969 2548 2208 4946 1.21 (1.01, 1.45) 1.19 (1.06, 1.35) 1.80 (1.62, 2.00) Total IgG4 51453 115588 235755 520703 1.57 (1.31, 1.89) 2.07 (1.53, 2.66) 2.42 (1.59, 3.66)
Total IgG4/
total IgE ratio 52.16 45 107 100 1.21 (0.96, 1.52) 1.56 (1.17, 2.08) 1.39 (1.08, 1.79)
Total IgE/ cockroach IgE
ratio 3.79 11.23 8.47 19.30 1.27 (0.92, 1.76) 1.08 (0.87, 1.36) 1.64 (1.31, 2.04)
Total IgE/ dust mite IgE ratio 0.562 1.66 0.78 1.52 1.17 (1.02, 1.32) 1.04 (0.86, 1.26) 1.17 (1.03, 1.34)
†All cytokine concentrations in pg/ml. ¶All antibody concentrations in ng/ml. ‡Geometric mean ratios and 95% confidence intervals adjusted for the survey design, age and sex. SmKK-: Kato-Katz negative result (S. mansoni), single stool sample; SmKKlow: Kato-Katz positivity, low infection intensity (1-99 eggs/g); SmKKmod: Kato-Katz positivity,
moderate infection intensity (100-399 eggs/g); SmKKheavy: Kato-Katz positivity, heavy infection intensity (≥400 eggs/g); SWA: Schistosoma worm antigen; SEA:
Schistosoma egg antigen; aGMR: adjusted geometric mean ratio; 95% CI: 95% confidence interval.
156
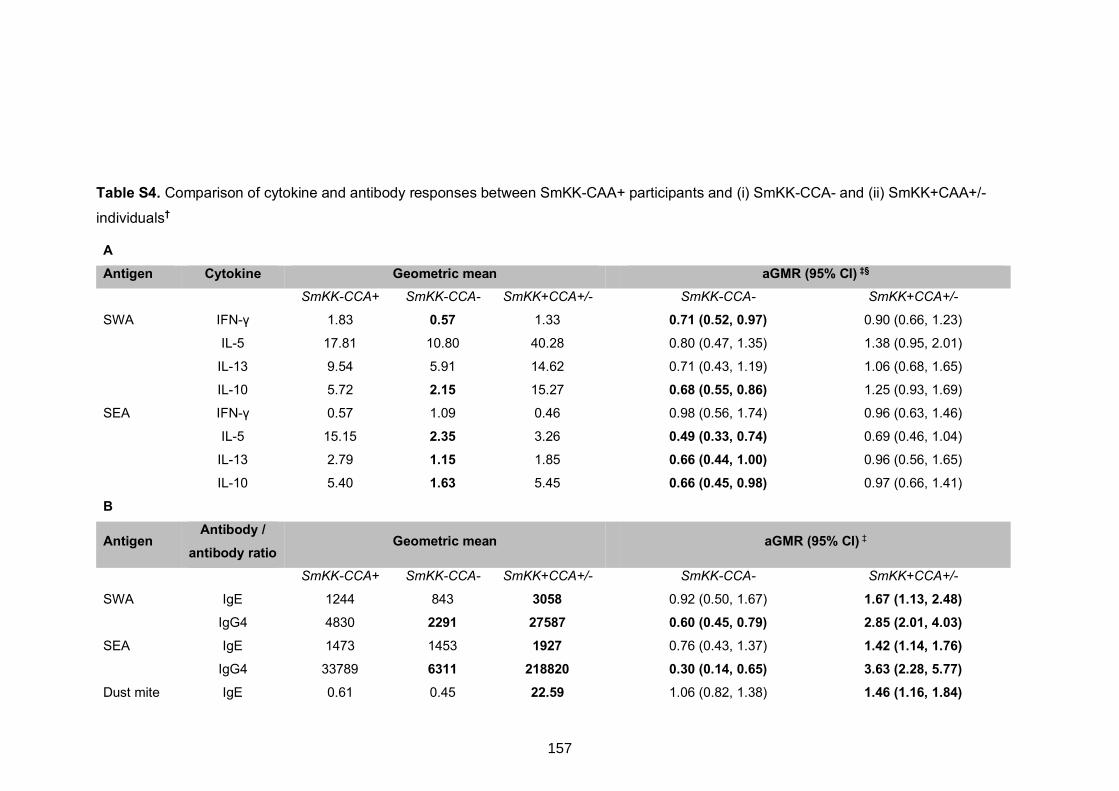
Table S4. Comparison of cytokine and antibody responses between SmKK-CAA+ participants and (i) SmKK-CCA- and (ii) SmKK+CAA+/-
individuals†
A Antigen Cytokine Geometric mean aGMR (95% CI) ‡§
SmKK-CCA+ SmKK-CCA- SmKK+CCA+/- SmKK-CCA- SmKK+CCA+/-
SWA IFN-γ 1.83 0.57 1.33 0.71 (0.52, 0.97) 0.90 (0.66, 1.23) IL-5 17.81 10.80 40.28 0.80 (0.47, 1.35) 1.38 (0.95, 2.01)
IL-13 9.54 5.91 14.62 0.71 (0.43, 1.19) 1.06 (0.68, 1.65)
IL-10 5.72 2.15 15.27 0.68 (0.55, 0.86) 1.25 (0.93, 1.69)
SEA IFN-γ 0.57 1.09 0.46 0.98 (0.56, 1.74) 0.96 (0.63, 1.46)
IL-5 15.15 2.35 3.26 0.49 (0.33, 0.74) 0.69 (0.46, 1.04)
IL-13 2.79 1.15 1.85 0.66 (0.44, 1.00) 0.96 (0.56, 1.65)
IL-10 5.40 1.63 5.45 0.66 (0.45, 0.98) 0.97 (0.66, 1.41)
B
Antigen Antibody /
antibody ratio Geometric mean aGMR (95% CI) ‡
SmKK-CCA+ SmKK-CCA- SmKK+CCA+/- SmKK-CCA- SmKK+CCA+/-
SWA IgE 1244 843 3058 0.92 (0.50, 1.67) 1.67 (1.13, 2.48) IgG4 4830 2291 27587 0.60 (0.45, 0.79) 2.85 (2.01, 4.03) SEA IgE 1473 1453 1927 0.76 (0.43, 1.37) 1.42 (1.14, 1.76) IgG4 33789 6311 218820 0.30 (0.14, 0.65) 3.63 (2.28, 5.77) Dust mite IgE 0.61 0.45 22.59 1.06 (0.82, 1.38) 1.46 (1.16, 1.84)
157
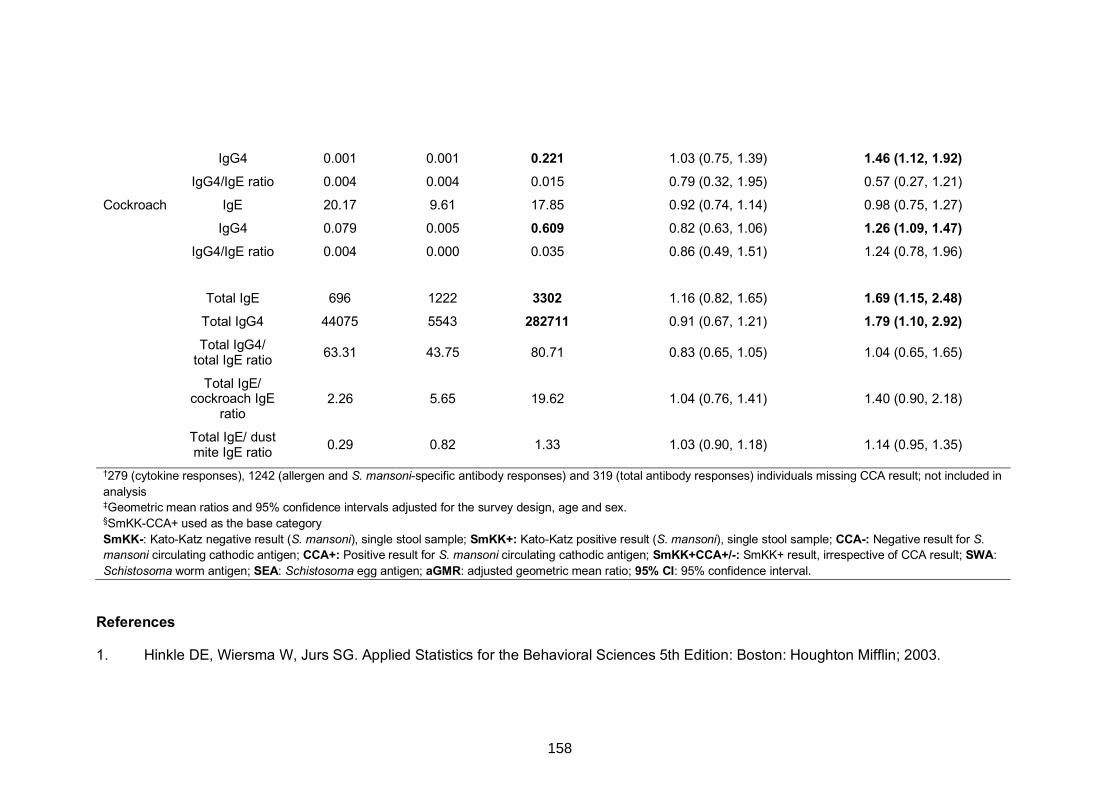
IgG4 0.001 0.001 0.221 1.03 (0.75, 1.39) 1.46 (1.12, 1.92) IgG4/IgE ratio 0.004 0.004 0.015 0.79 (0.32, 1.95) 0.57 (0.27, 1.21)
Cockroach IgE 20.17 9.61 17.85 0.92 (0.74, 1.14) 0.98 (0.75, 1.27)
IgG4 0.079 0.005 0.609 0.82 (0.63, 1.06) 1.26 (1.09, 1.47) IgG4/IgE ratio 0.004 0.000 0.035 0.86 (0.49, 1.51) 1.24 (0.78, 1.96)
Total IgE 696 1222 3302 1.16 (0.82, 1.65) 1.69 (1.15, 2.48) Total IgG4 44075 5543 282711 0.91 (0.67, 1.21) 1.79 (1.10, 2.92)
Total IgG4/
total IgE ratio 63.31 43.75 80.71 0.83 (0.65, 1.05) 1.04 (0.65, 1.65)
Total IgE/ cockroach IgE
ratio 2.26 5.65 19.62 1.04 (0.76, 1.41) 1.40 (0.90, 2.18)
Total IgE/ dust mite IgE ratio 0.29 0.82 1.33 1.03 (0.90, 1.18) 1.14 (0.95, 1.35)
†279 (cytokine responses), 1242 (allergen and S. mansoni-specific antibody responses) and 319 (total antibody responses) individuals missing CCA result; not included in analysis ‡Geometric mean ratios and 95% confidence intervals adjusted for the survey design, age and sex. §SmKK-CCA+ used as the base category SmKK-: Kato-Katz negative result (S. mansoni), single stool sample; SmKK+: Kato-Katz positive result (S. mansoni), single stool sample; CCA-: Negative result for S. mansoni circulating cathodic antigen; CCA+: Positive result for S. mansoni circulating cathodic antigen; SmKK+CCA+/-: SmKK+ result, irrespective of CCA result; SWA: Schistosoma worm antigen; SEA: Schistosoma egg antigen; aGMR: adjusted geometric mean ratio; 95% CI: 95% confidence interval.
References
1. Hinkle DE, Wiersma W, Jurs SG. Applied Statistics for the Behavioral Sciences 5th Edition: Boston: Houghton Mifflin; 2003.
158
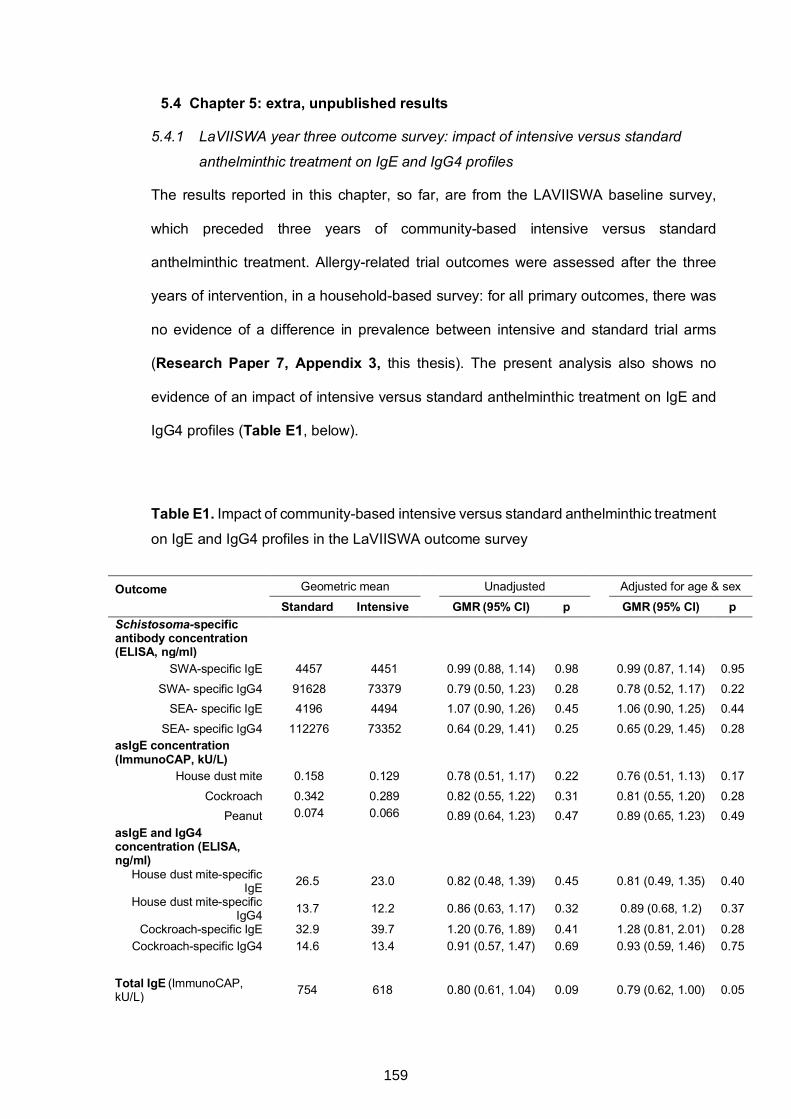
5.4 Chapter 5: extra, unpublished results
5.4.1 LaVIISWA year three outcome survey: impact of intensive versus standard
anthelminthic treatment on IgE and IgG4 profiles
The results reported in this chapter, so far, are from the LAVIISWA baseline survey,
which preceded three years of community-based intensive versus standard
anthelminthic treatment. Allergy-related trial outcomes were assessed after the three
years of intervention, in a household-based survey: for all primary outcomes, there was
no evidence of a difference in prevalence between intensive and standard trial arms
(Research Paper 7, Appendix 3, this thesis). The present analysis also shows no
evidence of an impact of intensive versus standard anthelminthic treatment on IgE and
IgG4 profiles (Table E1, below).
Table E1. Impact of community-based intensive versus standard anthelminthic treatment
on IgE and IgG4 profiles in the LaVIISWA outcome survey
Outcome Geometric mean Unadjusted Adjusted for age & sex
Standard Intensive GMR (95% CI) p GMR (95% CI) p Schistosoma-specific antibody concentration (ELISA, ng/ml)
SWA-specific IgE 4457 4451 0.99 (0.88, 1.14) 0.98 0.99 (0.87, 1.14) 0.95 SWA- specific IgG4 91628 73379 0.79 (0.50, 1.23) 0.28 0.78 (0.52, 1.17) 0.22
SEA- specific IgE 4196 4494 1.07 (0.90, 1.26) 0.45 1.06 (0.90, 1.25) 0.44 SEA- specific IgG4 112276 73352 0.64 (0.29, 1.41) 0.25 0.65 (0.29, 1.45) 0.28
asIgE concentration (ImmunoCAP, kU/L)
House dust mite 0.158 0.129 0.78 (0.51, 1.17) 0.22 0.76 (0.51, 1.13) 0.17 Cockroach 0.342 0.289 0.82 (0.55, 1.22) 0.31 0.81 (0.55, 1.20) 0.28
Peanut 0.074 0.066 0.89 (0.64, 1.23) 0.47 0.89 (0.65, 1.23) 0.49 asIgE and IgG4 concentration (ELISA, ng/ml)
House dust mite-specific IgE 26.5 23.0 0.82 (0.48, 1.39) 0.45 0.81 (0.49, 1.35) 0.40
House dust mite-specific IgG4 13.7 12.2 0.86 (0.63, 1.17) 0.32 0.89 (0.68, 1.2) 0.37
Cockroach-specific IgE 32.9 39.7 1.20 (0.76, 1.89) 0.41 1.28 (0.81, 2.01) 0.28 Cockroach-specific IgG4 14.6 13.4 0.91 (0.57, 1.47) 0.69 0.93 (0.59, 1.46) 0.75
Total IgE (ImmunoCAP, kU/L) 754 618 0.80 (0.61, 1.04) 0.09 0.79 (0.62, 1.00) 0.05
159
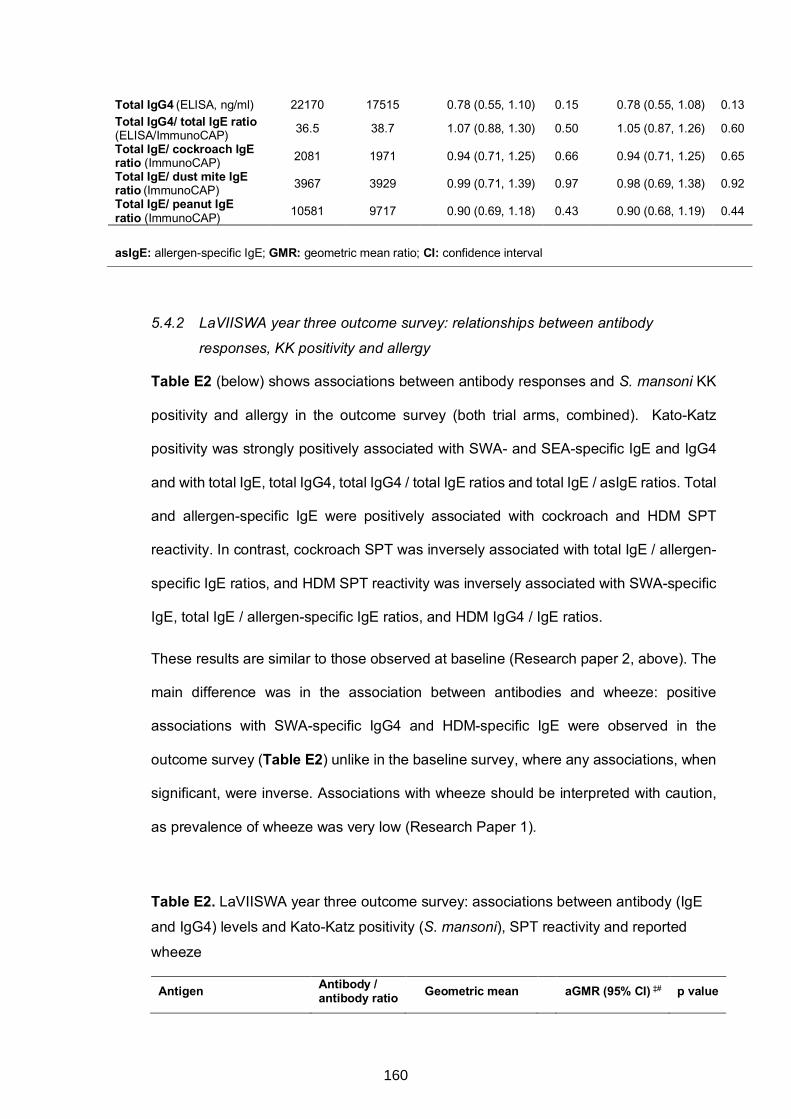
5.4.2 LaVIISWA year three outcome survey: relationships between antibody
responses, KK positivity and allergy
Table E2 (below) shows associations between antibody responses and S. mansoni KK
positivity and allergy in the outcome survey (both trial arms, combined). Kato-Katz
positivity was strongly positively associated with SWA- and SEA-specific IgE and IgG4
and with total IgE, total IgG4, total IgG4 / total IgE ratios and total IgE / asIgE ratios. Total
and allergen-specific IgE were positively associated with cockroach and HDM SPT
reactivity. In contrast, cockroach SPT was inversely associated with total IgE / allergen-
specific IgE ratios, and HDM SPT reactivity was inversely associated with SWA-specific
IgE, total IgE / allergen-specific IgE ratios, and HDM IgG4 / IgE ratios.
These results are similar to those observed at baseline (Research paper 2, above). The
main difference was in the association between antibodies and wheeze: positive
associations with SWA-specific IgG4 and HDM-specific IgE were observed in the
outcome survey (Table E2) unlike in the baseline survey, where any associations, when
significant, were inverse. Associations with wheeze should be interpreted with caution,
as prevalence of wheeze was very low (Research Paper 1).
Table E2. LaVIISWA year three outcome survey: associations between antibody (IgE
and IgG4) levels and Kato-Katz positivity (S. mansoni), SPT reactivity and reported
wheeze
Antigen Antibody / antibody ratio Geometric mean aGMR (95% CI) ‡# p value
Total IgG4 (ELISA, ng/ml) 22170 17515 0.78 (0.55, 1.10) 0.15 0.78 (0.55, 1.08) 0.13 Total IgG4/ total IgE ratio (ELISA/ImmunoCAP) 36.5 38.7 1.07 (0.88, 1.30) 0.50 1.05 (0.87, 1.26) 0.60
Total IgE/ cockroach IgE ratio (ImmunoCAP) 2081 1971 0.94 (0.71, 1.25) 0.66 0.94 (0.71, 1.25) 0.65 Total IgE/ dust mite IgE ratio (ImmunoCAP) 3967 3929 0.99 (0.71, 1.39) 0.97 0.98 (0.69, 1.38) 0.92 Total IgE/ peanut IgE ratio (ImmunoCAP) 10581 9717 0.90 (0.69, 1.18) 0.43 0.90 (0.68, 1.19) 0.44
asIgE: allergen-specific IgE; GMR: geometric mean ratio; CI: confidence interval
160
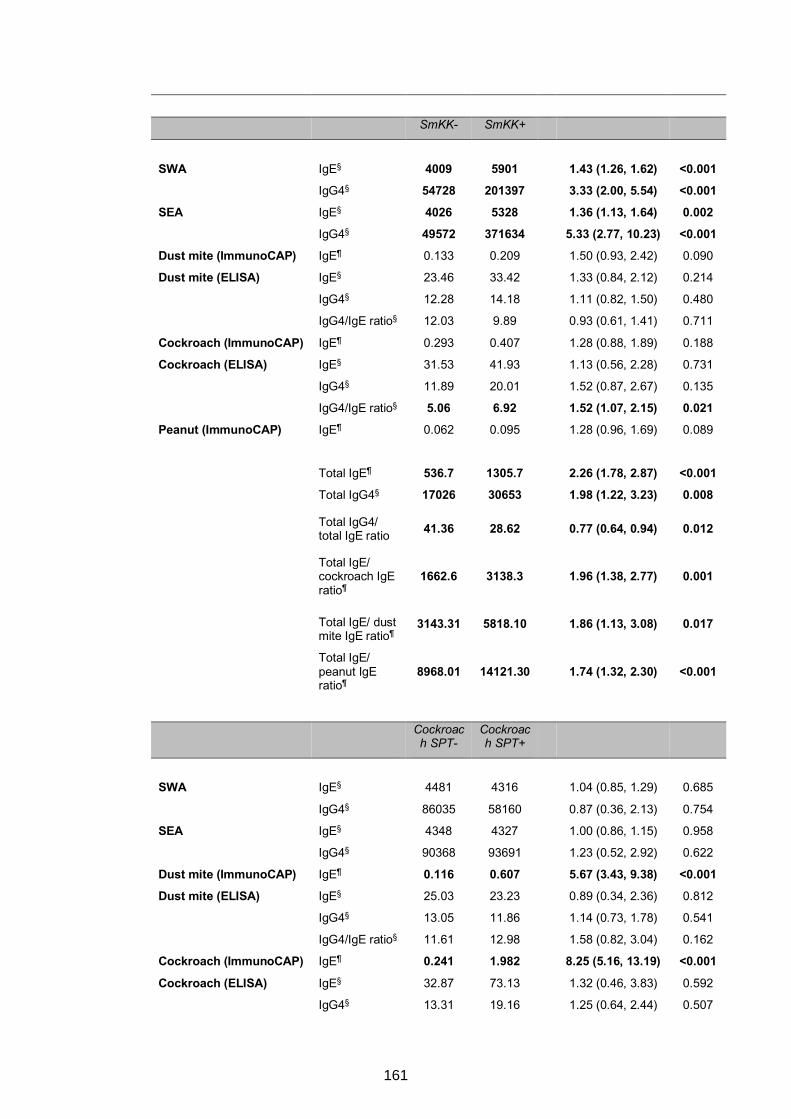
SmKK- SmKK+
SWA IgE§ 4009 5901 1.43 (1.26, 1.62) <0.001 IgG4§ 54728 201397 3.33 (2.00, 5.54) <0.001 SEA IgE§ 4026 5328 1.36 (1.13, 1.64) 0.002
IgG4§ 49572 371634 5.33 (2.77, 10.23) <0.001
Dust mite (ImmunoCAP) IgE¶ 0.133 0.209 1.50 (0.93, 2.42) 0.090
Dust mite (ELISA) IgE§ 23.46 33.42 1.33 (0.84, 2.12) 0.214
IgG4§ 12.28 14.18 1.11 (0.82, 1.50) 0.480
IgG4/IgE ratio§ 12.03 9.89 0.93 (0.61, 1.41) 0.711
Cockroach (ImmunoCAP) IgE¶ 0.293 0.407 1.28 (0.88, 1.89) 0.188
Cockroach (ELISA) IgE§ 31.53 41.93 1.13 (0.56, 2.28) 0.731
IgG4§ 11.89 20.01 1.52 (0.87, 2.67) 0.135
IgG4/IgE ratio§ 5.06 6.92 1.52 (1.07, 2.15) 0.021 Peanut (ImmunoCAP) IgE¶ 0.062 0.095 1.28 (0.96, 1.69) 0.089
Total IgE¶ 536.7 1305.7 2.26 (1.78, 2.87) <0.001
Total IgG4§ 17026 30653 1.98 (1.22, 3.23) 0.008
Total IgG4/ total IgE ratio 41.36 28.62 0.77 (0.64, 0.94) 0.012
Total IgE/ cockroach IgE ratio¶
1662.6 3138.3 1.96 (1.38, 2.77) 0.001
Total IgE/ dust mite IgE ratio¶
3143.31 5818.10 1.86 (1.13, 3.08) 0.017
Total IgE/ peanut IgE ratio¶
8968.01 14121.30 1.74 (1.32, 2.30) <0.001
Cockroach SPT-
Cockroach SPT+
SWA IgE§ 4481 4316 1.04 (0.85, 1.29) 0.685
IgG4§ 86035 58160 0.87 (0.36, 2.13) 0.754
SEA IgE§ 4348 4327 1.00 (0.86, 1.15) 0.958
IgG4§ 90368 93691 1.23 (0.52, 2.92) 0.622
Dust mite (ImmunoCAP) IgE¶ 0.116 0.607 5.67 (3.43, 9.38) <0.001 Dust mite (ELISA) IgE§ 25.03 23.23 0.89 (0.34, 2.36) 0.812
IgG4§ 13.05 11.86 1.14 (0.73, 1.78) 0.541
IgG4/IgE ratio§ 11.61 12.98 1.58 (0.82, 3.04) 0.162
Cockroach (ImmunoCAP) IgE¶ 0.241 1.982 8.25 (5.16, 13.19) <0.001
Cockroach (ELISA) IgE§ 32.87 73.13 1.32 (0.46, 3.83) 0.592
IgG4§ 13.31 19.16 1.25 (0.64, 2.44) 0.507
161
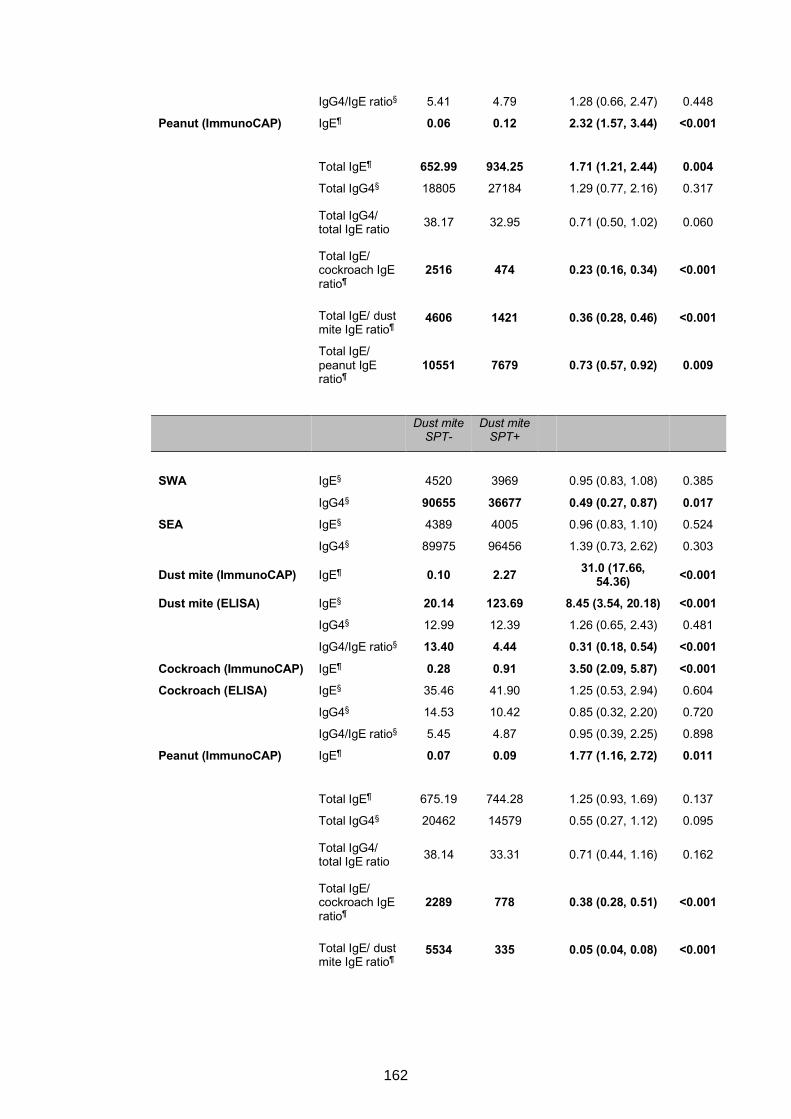
IgG4/IgE ratio§ 5.41 4.79 1.28 (0.66, 2.47) 0.448
Peanut (ImmunoCAP) IgE¶ 0.06 0.12 2.32 (1.57, 3.44) <0.001
Total IgE¶ 652.99 934.25 1.71 (1.21, 2.44) 0.004
Total IgG4§ 18805 27184 1.29 (0.77, 2.16) 0.317
Total IgG4/ total IgE ratio 38.17 32.95 0.71 (0.50, 1.02) 0.060
Total IgE/ cockroach IgE ratio¶
2516 474 0.23 (0.16, 0.34) <0.001
Total IgE/ dust mite IgE ratio¶
4606 1421 0.36 (0.28, 0.46) <0.001
Total IgE/ peanut IgE ratio¶
10551 7679 0.73 (0.57, 0.92) 0.009
Dust mite
SPT- Dust mite
SPT+
SWA IgE§ 4520 3969 0.95 (0.83, 1.08) 0.385
IgG4§ 90655 36677 0.49 (0.27, 0.87) 0.017 SEA IgE§ 4389 4005 0.96 (0.83, 1.10) 0.524
IgG4§ 89975 96456 1.39 (0.73, 2.62) 0.303
Dust mite (ImmunoCAP) IgE¶ 0.10 2.27 31.0 (17.66, 54.36) <0.001
Dust mite (ELISA) IgE§ 20.14 123.69 8.45 (3.54, 20.18) <0.001 IgG4§ 12.99 12.39 1.26 (0.65, 2.43) 0.481
IgG4/IgE ratio§ 13.40 4.44 0.31 (0.18, 0.54) <0.001
Cockroach (ImmunoCAP) IgE¶ 0.28 0.91 3.50 (2.09, 5.87) <0.001 Cockroach (ELISA) IgE§ 35.46 41.90 1.25 (0.53, 2.94) 0.604
IgG4§ 14.53 10.42 0.85 (0.32, 2.20) 0.720
IgG4/IgE ratio§ 5.45 4.87 0.95 (0.39, 2.25) 0.898
Peanut (ImmunoCAP) IgE¶ 0.07 0.09 1.77 (1.16, 2.72) 0.011
Total IgE¶ 675.19 744.28 1.25 (0.93, 1.69) 0.137
Total IgG4§ 20462 14579 0.55 (0.27, 1.12) 0.095
Total IgG4/ total IgE ratio 38.14 33.31 0.71 (0.44, 1.16) 0.162
Total IgE/ cockroach IgE ratio¶
2289 778 0.38 (0.28, 0.51) <0.001
Total IgE/ dust mite IgE ratio¶
5534 335 0.05 (0.04, 0.08) <0.001
162
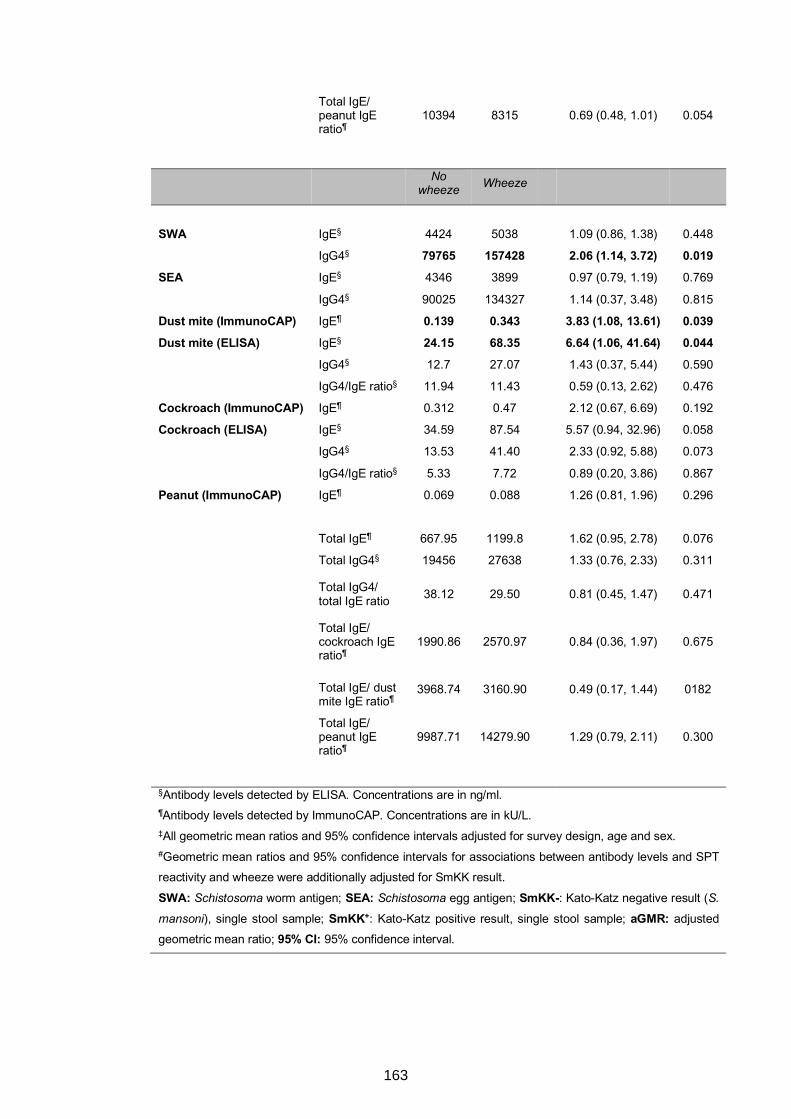
Total IgE/ peanut IgE ratio¶
10394 8315 0.69 (0.48, 1.01) 0.054
No
wheeze Wheeze
SWA IgE§ 4424 5038 1.09 (0.86, 1.38) 0.448
IgG4§ 79765 157428 2.06 (1.14, 3.72) 0.019 SEA IgE§ 4346 3899 0.97 (0.79, 1.19) 0.769
IgG4§ 90025 134327 1.14 (0.37, 3.48) 0.815
Dust mite (ImmunoCAP) IgE¶ 0.139 0.343 3.83 (1.08, 13.61) 0.039 Dust mite (ELISA) IgE§ 24.15 68.35 6.64 (1.06, 41.64) 0.044 IgG4§ 12.7 27.07 1.43 (0.37, 5.44) 0.590
IgG4/IgE ratio§ 11.94 11.43 0.59 (0.13, 2.62) 0.476
Cockroach (ImmunoCAP) IgE¶ 0.312 0.47 2.12 (0.67, 6.69) 0.192
Cockroach (ELISA) IgE§ 34.59 87.54 5.57 (0.94, 32.96) 0.058
IgG4§ 13.53 41.40 2.33 (0.92, 5.88) 0.073
IgG4/IgE ratio§ 5.33 7.72 0.89 (0.20, 3.86) 0.867
Peanut (ImmunoCAP) IgE¶ 0.069 0.088 1.26 (0.81, 1.96) 0.296
Total IgE¶ 667.95 1199.8 1.62 (0.95, 2.78) 0.076
Total IgG4§ 19456 27638 1.33 (0.76, 2.33) 0.311
Total IgG4/ total IgE ratio 38.12 29.50 0.81 (0.45, 1.47) 0.471
Total IgE/ cockroach IgE ratio¶
1990.86 2570.97 0.84 (0.36, 1.97) 0.675
Total IgE/ dust mite IgE ratio¶
3968.74 3160.90 0.49 (0.17, 1.44) 0182
Total IgE/ peanut IgE ratio¶
9987.71 14279.90 1.29 (0.79, 2.11) 0.300
§Antibody levels detected by ELISA. Concentrations are in ng/ml. ¶Antibody levels detected by ImmunoCAP. Concentrations are in kU/L. ‡All geometric mean ratios and 95% confidence intervals adjusted for survey design, age and sex. #Geometric mean ratios and 95% confidence intervals for associations between antibody levels and SPT reactivity and wheeze were additionally adjusted for SmKK result.
SWA: Schistosoma worm antigen; SEA: Schistosoma egg antigen; SmKK-: Kato-Katz negative result (S.
mansoni), single stool sample; SmKK+: Kato-Katz positive result, single stool sample; aGMR: adjusted geometric mean ratio; 95% CI: 95% confidence interval.
163
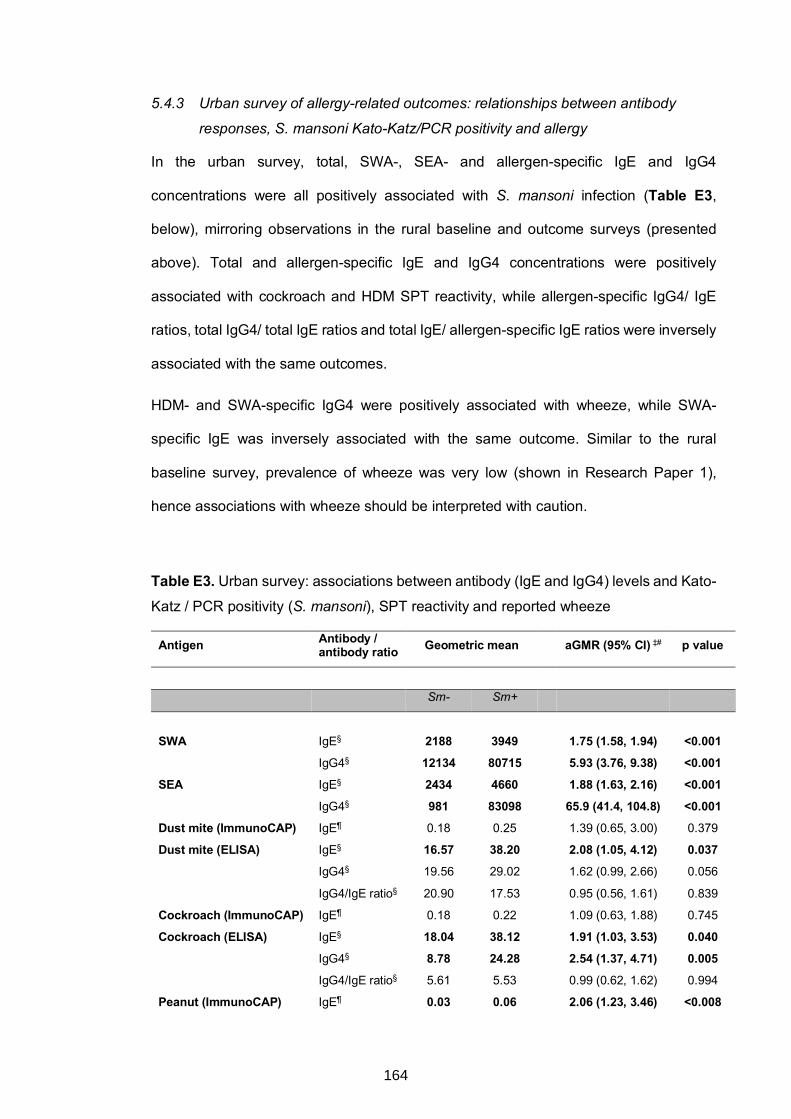
5.4.3 Urban survey of allergy-related outcomes: relationships between antibody
responses, S. mansoni Kato-Katz/PCR positivity and allergy
In the urban survey, total, SWA-, SEA- and allergen-specific IgE and IgG4
concentrations were all positively associated with S. mansoni infection (Table E3,
below), mirroring observations in the rural baseline and outcome surveys (presented
above). Total and allergen-specific IgE and IgG4 concentrations were positively
associated with cockroach and HDM SPT reactivity, while allergen-specific IgG4/ IgE
ratios, total IgG4/ total IgE ratios and total IgE/ allergen-specific IgE ratios were inversely
associated with the same outcomes.
HDM- and SWA-specific IgG4 were positively associated with wheeze, while SWA-
specific IgE was inversely associated with the same outcome. Similar to the rural
baseline survey, prevalence of wheeze was very low (shown in Research Paper 1),
hence associations with wheeze should be interpreted with caution.
Table E3. Urban survey: associations between antibody (IgE and IgG4) levels and Kato-
Katz / PCR positivity (S. mansoni), SPT reactivity and reported wheeze
Antigen Antibody / antibody ratio Geometric mean aGMR (95% CI) ‡# p value
Sm- Sm+
SWA IgE§ 2188 3949 1.75 (1.58, 1.94) <0.001 IgG4§ 12134 80715 5.93 (3.76, 9.38) <0.001 SEA IgE§ 2434 4660 1.88 (1.63, 2.16) <0.001
IgG4§ 981 83098 65.9 (41.4, 104.8) <0.001
Dust mite (ImmunoCAP) IgE¶ 0.18 0.25 1.39 (0.65, 3.00) 0.379
Dust mite (ELISA) IgE§ 16.57 38.20 2.08 (1.05, 4.12) 0.037 IgG4§ 19.56 29.02 1.62 (0.99, 2.66) 0.056
IgG4/IgE ratio§ 20.90 17.53 0.95 (0.56, 1.61) 0.839
Cockroach (ImmunoCAP) IgE¶ 0.18 0.22 1.09 (0.63, 1.88) 0.745
Cockroach (ELISA) IgE§ 18.04 38.12 1.91 (1.03, 3.53) 0.040 IgG4§ 8.78 24.28 2.54 (1.37, 4.71) 0.005 IgG4/IgE ratio§ 5.61 5.53 0.99 (0.62, 1.62) 0.994
Peanut (ImmunoCAP) IgE¶ 0.03 0.06 2.06 (1.23, 3.46) <0.008
164
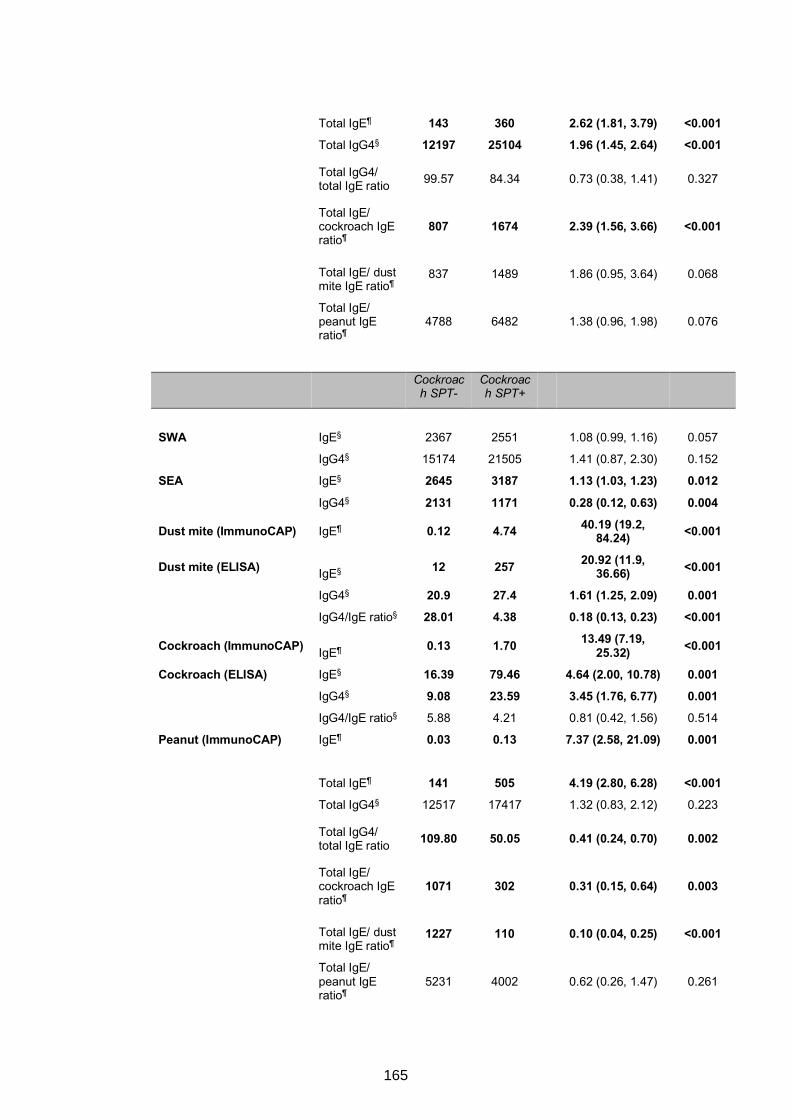
Total IgE¶ 143 360 2.62 (1.81, 3.79) <0.001
Total IgG4§ 12197 25104 1.96 (1.45, 2.64) <0.001
Total IgG4/ total IgE ratio 99.57 84.34 0.73 (0.38, 1.41) 0.327
Total IgE/ cockroach IgE ratio¶
807 1674 2.39 (1.56, 3.66) <0.001
Total IgE/ dust mite IgE ratio¶
837 1489 1.86 (0.95, 3.64) 0.068
Total IgE/ peanut IgE ratio¶
4788 6482 1.38 (0.96, 1.98) 0.076
Cockroach SPT-
Cockroach SPT+
SWA IgE§ 2367 2551 1.08 (0.99, 1.16) 0.057
IgG4§ 15174 21505 1.41 (0.87, 2.30) 0.152
SEA IgE§ 2645 3187 1.13 (1.03, 1.23) 0.012
IgG4§ 2131 1171 0.28 (0.12, 0.63) 0.004
Dust mite (ImmunoCAP) IgE¶ 0.12 4.74 40.19 (19.2, 84.24) <0.001
Dust mite (ELISA) IgE§ 12 257 20.92 (11.9, 36.66) <0.001
IgG4§ 20.9 27.4 1.61 (1.25, 2.09) 0.001 IgG4/IgE ratio§ 28.01 4.38 0.18 (0.13, 0.23) <0.001
Cockroach (ImmunoCAP) IgE¶ 0.13 1.70 13.49 (7.19, 25.32) <0.001
Cockroach (ELISA) IgE§ 16.39 79.46 4.64 (2.00, 10.78) 0.001 IgG4§ 9.08 23.59 3.45 (1.76, 6.77) 0.001 IgG4/IgE ratio§ 5.88 4.21 0.81 (0.42, 1.56) 0.514
Peanut (ImmunoCAP) IgE¶ 0.03 0.13 7.37 (2.58, 21.09) 0.001
Total IgE¶ 141 505 4.19 (2.80, 6.28) <0.001
Total IgG4§ 12517 17417 1.32 (0.83, 2.12) 0.223
Total IgG4/ total IgE ratio 109.80 50.05 0.41 (0.24, 0.70) 0.002
Total IgE/ cockroach IgE ratio¶
1071 302 0.31 (0.15, 0.64) 0.003
Total IgE/ dust mite IgE ratio¶
1227 110 0.10 (0.04, 0.25) <0.001
Total IgE/ peanut IgE ratio¶
5231 4002 0.62 (0.26, 1.47) 0.261
165
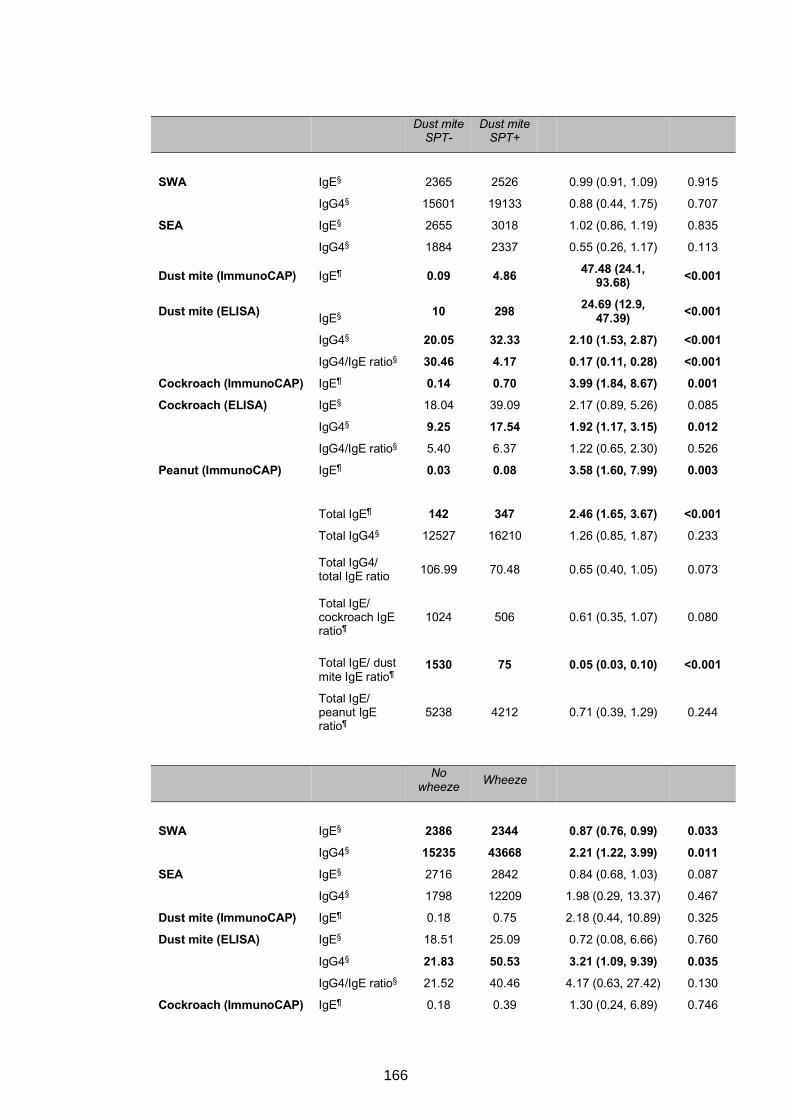
Dust mite
SPT- Dust mite
SPT+
SWA IgE§ 2365 2526 0.99 (0.91, 1.09) 0.915
IgG4§ 15601 19133 0.88 (0.44, 1.75) 0.707
SEA IgE§ 2655 3018 1.02 (0.86, 1.19) 0.835
IgG4§ 1884 2337 0.55 (0.26, 1.17) 0.113
Dust mite (ImmunoCAP) IgE¶ 0.09 4.86 47.48 (24.1, 93.68) <0.001
Dust mite (ELISA) IgE§ 10 298 24.69 (12.9, 47.39) <0.001
IgG4§ 20.05 32.33 2.10 (1.53, 2.87) <0.001 IgG4/IgE ratio§ 30.46 4.17 0.17 (0.11, 0.28) <0.001 Cockroach (ImmunoCAP) IgE¶ 0.14 0.70 3.99 (1.84, 8.67) 0.001 Cockroach (ELISA) IgE§ 18.04 39.09 2.17 (0.89, 5.26) 0.085
IgG4§ 9.25 17.54 1.92 (1.17, 3.15) 0.012 IgG4/IgE ratio§ 5.40 6.37 1.22 (0.65, 2.30) 0.526
Peanut (ImmunoCAP) IgE¶ 0.03 0.08 3.58 (1.60, 7.99) 0.003
Total IgE¶ 142 347 2.46 (1.65, 3.67) <0.001
Total IgG4§ 12527 16210 1.26 (0.85, 1.87) 0.233
Total IgG4/ total IgE ratio 106.99 70.48 0.65 (0.40, 1.05) 0.073
Total IgE/ cockroach IgE ratio¶
1024 506 0.61 (0.35, 1.07) 0.080
Total IgE/ dust mite IgE ratio¶
1530 75 0.05 (0.03, 0.10) <0.001
Total IgE/ peanut IgE ratio¶
5238 4212 0.71 (0.39, 1.29) 0.244
No
wheeze Wheeze
SWA IgE§ 2386 2344 0.87 (0.76, 0.99) 0.033 IgG4§ 15235 43668 2.21 (1.22, 3.99) 0.011 SEA IgE§ 2716 2842 0.84 (0.68, 1.03) 0.087
IgG4§ 1798 12209 1.98 (0.29, 13.37) 0.467
Dust mite (ImmunoCAP) IgE¶ 0.18 0.75 2.18 (0.44, 10.89) 0.325
Dust mite (ELISA) IgE§ 18.51 25.09 0.72 (0.08, 6.66) 0.760
IgG4§ 21.83 50.53 3.21 (1.09, 9.39) 0.035 IgG4/IgE ratio§ 21.52 40.46 4.17 (0.63, 27.42) 0.130
Cockroach (ImmunoCAP) IgE¶ 0.18 0.39 1.30 (0.24, 6.89) 0.746
166
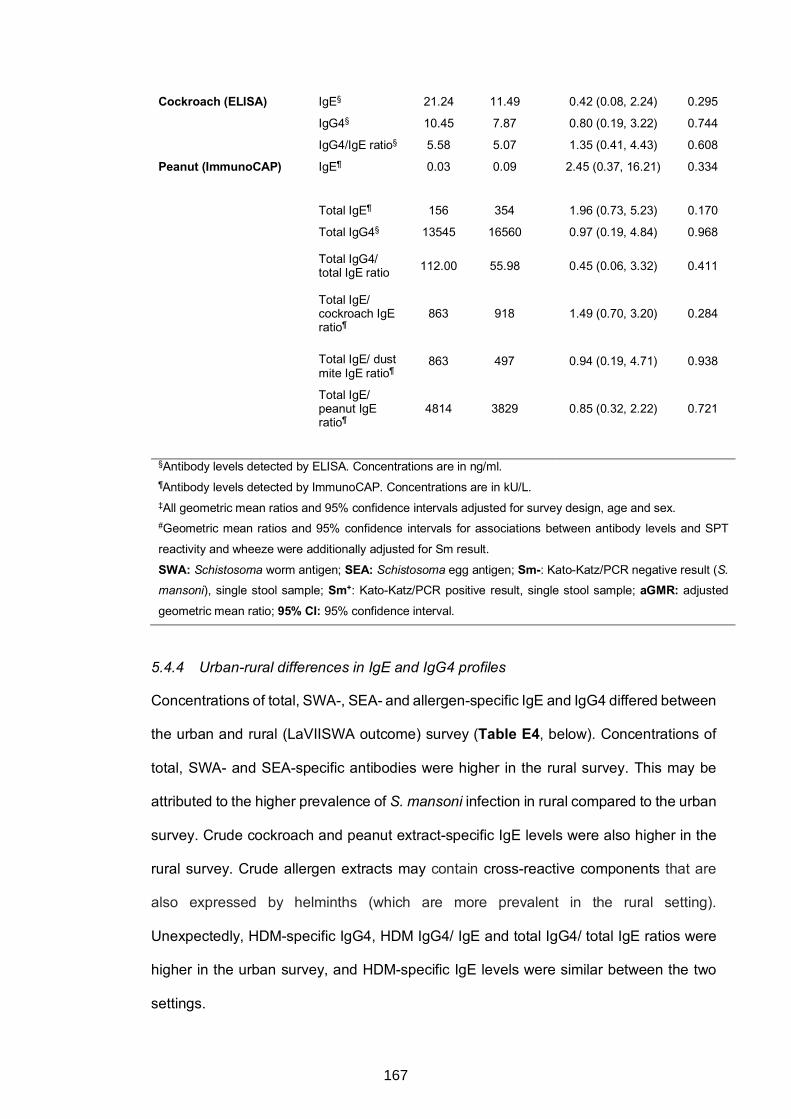
Cockroach (ELISA) IgE§ 21.24 11.49 0.42 (0.08, 2.24) 0.295
IgG4§ 10.45 7.87 0.80 (0.19, 3.22) 0.744
IgG4/IgE ratio§ 5.58 5.07 1.35 (0.41, 4.43) 0.608
Peanut (ImmunoCAP) IgE¶ 0.03 0.09 2.45 (0.37, 16.21) 0.334
Total IgE¶ 156 354 1.96 (0.73, 5.23) 0.170
Total IgG4§ 13545 16560 0.97 (0.19, 4.84) 0.968
Total IgG4/ total IgE ratio 112.00 55.98 0.45 (0.06, 3.32) 0.411
Total IgE/ cockroach IgE ratio¶
863 918 1.49 (0.70, 3.20) 0.284
Total IgE/ dust mite IgE ratio¶
863 497 0.94 (0.19, 4.71) 0.938
Total IgE/ peanut IgE ratio¶
4814 3829 0.85 (0.32, 2.22) 0.721
§Antibody levels detected by ELISA. Concentrations are in ng/ml. ¶Antibody levels detected by ImmunoCAP. Concentrations are in kU/L. ‡All geometric mean ratios and 95% confidence intervals adjusted for survey design, age and sex. #Geometric mean ratios and 95% confidence intervals for associations between antibody levels and SPT
reactivity and wheeze were additionally adjusted for Sm result.
SWA: Schistosoma worm antigen; SEA: Schistosoma egg antigen; Sm-: Kato-Katz/PCR negative result (S.
mansoni), single stool sample; Sm+: Kato-Katz/PCR positive result, single stool sample; aGMR: adjusted
geometric mean ratio; 95% CI: 95% confidence interval.
5.4.4 Urban-rural differences in IgE and IgG4 profiles
Concentrations of total, SWA-, SEA- and allergen-specific IgE and IgG4 differed between
the urban and rural (LaVIISWA outcome) survey (Table E4, below). Concentrations of
total, SWA- and SEA-specific antibodies were higher in the rural survey. This may be
attributed to the higher prevalence of S. mansoni infection in rural compared to the urban
survey. Crude cockroach and peanut extract-specific IgE levels were also higher in the
rural survey. Crude allergen extracts may contain cross-reactive components that are
also expressed by helminths (which are more prevalent in the rural setting).
Unexpectedly, HDM-specific IgG4, HDM IgG4/ IgE and total IgG4/ total IgE ratios were
higher in the urban survey, and HDM-specific IgE levels were similar between the two
settings.
167
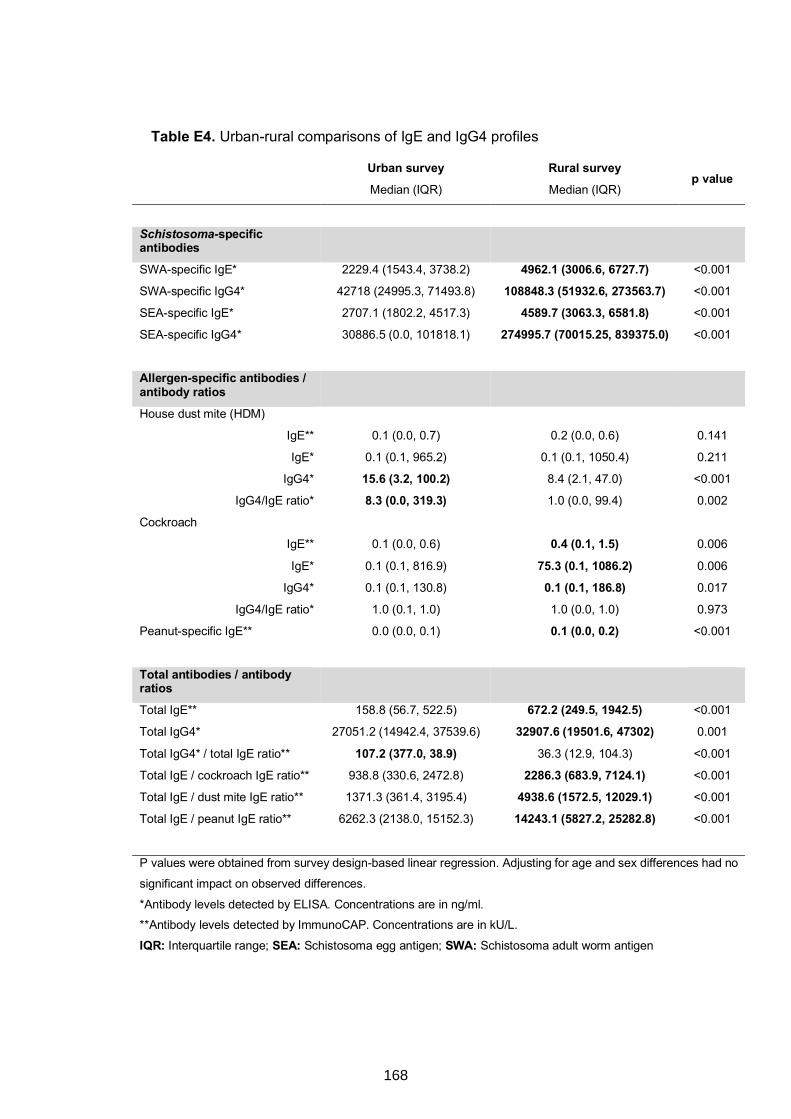
Table E4. Urban-rural comparisons of IgE and IgG4 profiles
Urban survey Rural survey p value
Median (IQR) Median (IQR)
Schistosoma-specific antibodies
SWA-specific IgE* 2229.4 (1543.4, 3738.2) 4962.1 (3006.6, 6727.7) <0.001
SWA-specific IgG4* 42718 (24995.3, 71493.8) 108848.3 (51932.6, 273563.7) <0.001
SEA-specific IgE* 2707.1 (1802.2, 4517.3) 4589.7 (3063.3, 6581.8) <0.001
SEA-specific IgG4* 30886.5 (0.0, 101818.1) 274995.7 (70015.25, 839375.0) <0.001
Allergen-specific antibodies / antibody ratios
House dust mite (HDM)
IgE** 0.1 (0.0, 0.7) 0.2 (0.0, 0.6) 0.141
IgE* 0.1 (0.1, 965.2) 0.1 (0.1, 1050.4) 0.211
IgG4* 15.6 (3.2, 100.2) 8.4 (2.1, 47.0) <0.001
IgG4/IgE ratio* 8.3 (0.0, 319.3) 1.0 (0.0, 99.4) 0.002
Cockroach
IgE** 0.1 (0.0, 0.6) 0.4 (0.1, 1.5) 0.006
IgE* 0.1 (0.1, 816.9) 75.3 (0.1, 1086.2) 0.006
IgG4* 0.1 (0.1, 130.8) 0.1 (0.1, 186.8) 0.017
IgG4/IgE ratio* 1.0 (0.1, 1.0) 1.0 (0.0, 1.0) 0.973
Peanut-specific IgE** 0.0 (0.0, 0.1) 0.1 (0.0, 0.2) <0.001
Total antibodies / antibody ratios
Total IgE** 158.8 (56.7, 522.5) 672.2 (249.5, 1942.5) <0.001
Total IgG4* 27051.2 (14942.4, 37539.6) 32907.6 (19501.6, 47302) 0.001
Total IgG4* / total IgE ratio** 107.2 (377.0, 38.9) 36.3 (12.9, 104.3) <0.001
Total IgE / cockroach IgE ratio** 938.8 (330.6, 2472.8) 2286.3 (683.9, 7124.1) <0.001
Total IgE / dust mite IgE ratio** 1371.3 (361.4, 3195.4) 4938.6 (1572.5, 12029.1) <0.001
Total IgE / peanut IgE ratio** 6262.3 (2138.0, 15152.3) 14243.1 (5827.2, 25282.8) <0.001
P values were obtained from survey design-based linear regression. Adjusting for age and sex differences had no
significant impact on observed differences.
*Antibody levels detected by ELISA. Concentrations are in ng/ml. **Antibody levels detected by ImmunoCAP. Concentrations are in kU/L.
IQR: Interquartile range; SEA: Schistosoma egg antigen; SWA: Schistosoma adult worm antigen
168
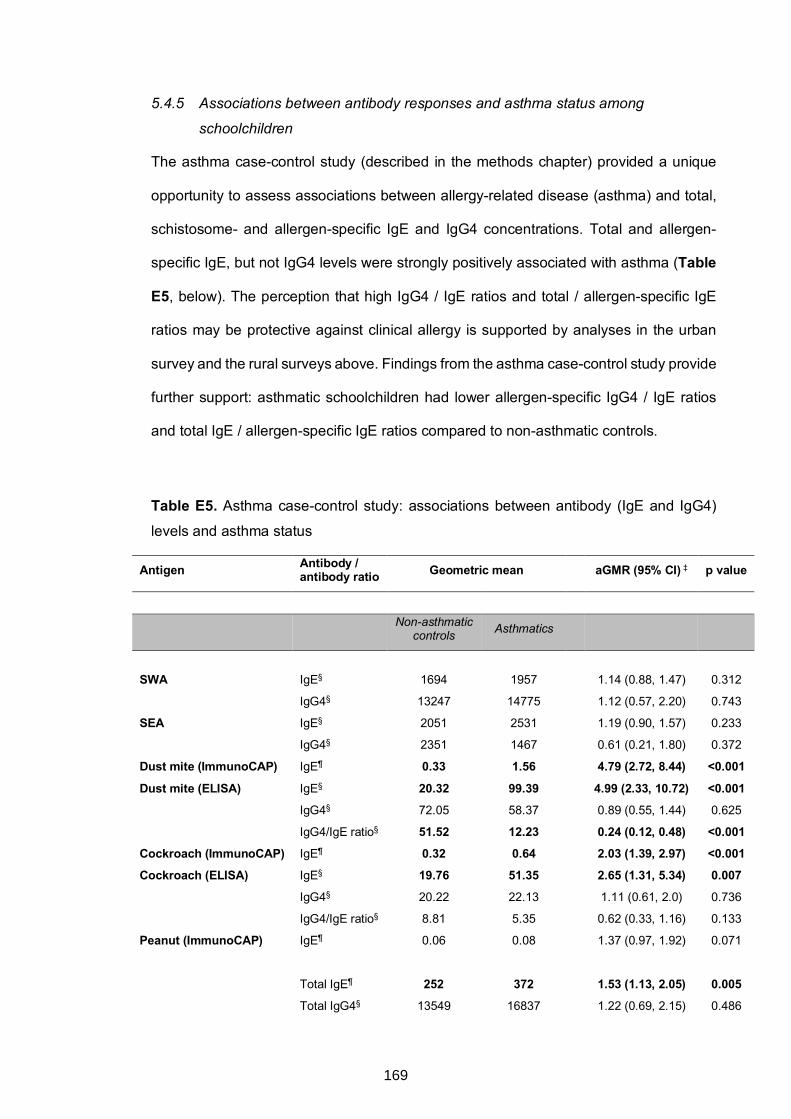
5.4.5 Associations between antibody responses and asthma status among
schoolchildren
The asthma case-control study (described in the methods chapter) provided a unique
opportunity to assess associations between allergy-related disease (asthma) and total,
schistosome- and allergen-specific IgE and IgG4 concentrations. Total and allergen-
specific IgE, but not IgG4 levels were strongly positively associated with asthma (Table
E5, below). The perception that high IgG4 / IgE ratios and total / allergen-specific IgE
ratios may be protective against clinical allergy is supported by analyses in the urban
survey and the rural surveys above. Findings from the asthma case-control study provide
further support: asthmatic schoolchildren had lower allergen-specific IgG4 / IgE ratios
and total IgE / allergen-specific IgE ratios compared to non-asthmatic controls.
Table E5. Asthma case-control study: associations between antibody (IgE and IgG4)
levels and asthma status
Antigen Antibody / antibody ratio Geometric mean aGMR (95% CI) ‡ p value
Non-asthmatic controls
Asthmatics
SWA IgE§ 1694 1957 1.14 (0.88, 1.47) 0.312
IgG4§ 13247 14775 1.12 (0.57, 2.20) 0.743
SEA IgE§ 2051 2531 1.19 (0.90, 1.57) 0.233
IgG4§ 2351 1467 0.61 (0.21, 1.80) 0.372
Dust mite (ImmunoCAP) IgE¶ 0.33 1.56 4.79 (2.72, 8.44) <0.001
Dust mite (ELISA) IgE§ 20.32 99.39 4.99 (2.33, 10.72) <0.001 IgG4§ 72.05 58.37 0.89 (0.55, 1.44) 0.625
IgG4/IgE ratio§ 51.52 12.23 0.24 (0.12, 0.48) <0.001 Cockroach (ImmunoCAP) IgE¶ 0.32 0.64 2.03 (1.39, 2.97) <0.001 Cockroach (ELISA) IgE§ 19.76 51.35 2.65 (1.31, 5.34) 0.007 IgG4§ 20.22 22.13 1.11 (0.61, 2.0) 0.736
IgG4/IgE ratio§ 8.81 5.35 0.62 (0.33, 1.16) 0.133
Peanut (ImmunoCAP) IgE¶ 0.06 0.08 1.37 (0.97, 1.92) 0.071
Total IgE¶ 252 372 1.53 (1.13, 2.05) 0.005
Total IgG4§ 13549 16837 1.22 (0.69, 2.15) 0.486
169
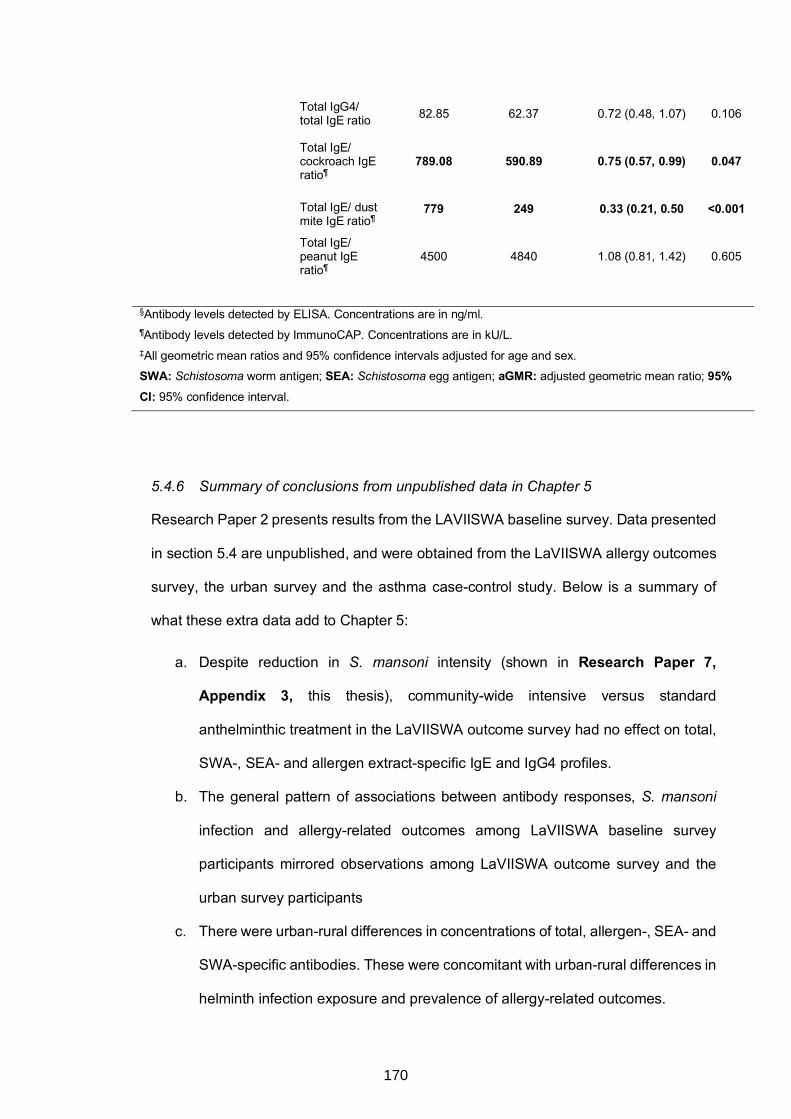
Total IgG4/ total IgE ratio 82.85 62.37 0.72 (0.48, 1.07) 0.106
Total IgE/ cockroach IgE ratio¶
789.08 590.89 0.75 (0.57, 0.99) 0.047
Total IgE/ dust mite IgE ratio¶
779 249 0.33 (0.21, 0.50 <0.001
Total IgE/ peanut IgE ratio¶
4500 4840 1.08 (0.81, 1.42) 0.605
§Antibody levels detected by ELISA. Concentrations are in ng/ml. ¶Antibody levels detected by ImmunoCAP. Concentrations are in kU/L. ‡All geometric mean ratios and 95% confidence intervals adjusted for age and sex. SWA: Schistosoma worm antigen; SEA: Schistosoma egg antigen; aGMR: adjusted geometric mean ratio; 95% CI: 95% confidence interval.
5.4.6 Summary of conclusions from unpublished data in Chapter 5
Research Paper 2 presents results from the LAVIISWA baseline survey. Data presented
in section 5.4 are unpublished, and were obtained from the LaVIISWA allergy outcomes
survey, the urban survey and the asthma case-control study. Below is a summary of
what these extra data add to Chapter 5:
a. Despite reduction in S. mansoni intensity (shown in Research Paper 7,
Appendix 3, this thesis), community-wide intensive versus standard
anthelminthic treatment in the LaVIISWA outcome survey had no effect on total,
SWA-, SEA- and allergen extract-specific IgE and IgG4 profiles.
b. The general pattern of associations between antibody responses, S. mansoni
infection and allergy-related outcomes among LaVIISWA baseline survey
participants mirrored observations among LaVIISWA outcome survey and the
urban survey participants
c. There were urban-rural differences in concentrations of total, allergen-, SEA- and
SWA-specific antibodies. These were concomitant with urban-rural differences in
helminth infection exposure and prevalence of allergy-related outcomes.
170
d. Findings that asthmatic schoolchildren had lower allergen-specific IgG4/ IgE
ratios and total IgE / allergen-specific IgE ratios (compared to non-asthmatic
controls) support the hypothesis that high IgG4/ IgE ratios and total IgE/ allergen-
specific IgE ratios may be protective against clinical allergy.
171
CHAPTER 6. CARBOHYDRATE-SPECIFIC ANTIBODIES AND SCHISTOSOMA
MANSONI INFECTION
6.1 Preamble
This chapter presents findings obtained using data from the rural and urban survey
(described in Chapter 3) to assess associations between helminth (S. mansoni) infection
(and intensity) and IgE and IgG responses to classical cross-reactive carbohydrate
determinant (CCD) epitopes (thesis objective 3). Results are presented in Research
paper 3 (below), titled “Microarray assessment of N-glycan-specific IgE and IgG profiles
associated with Schistosoma mansoni infection in rural and urban Uganda”. This
manuscript has been accepted for publication as an original article in Scientific Reports.
There are important similarities between helminth antigens and common environmental
allergens, key among them presence of non-mammalian core β-1,2-xylose and α-1,3-
fucose substitutions on N-glycans expressed by schistosome, invertebrate and plant
proteins. Immune responses to schistosomes are shaped to a great extent by the
Schistosoma glycome. Responses to non-mammalian core modified N-glycans may
impact schistosome and/or allergy diagnostics, or be utilised in interventions against
schistosome infection or allergy. Furthermore, profiling these responses could be useful
in understanding mechanisms of schistosome-allergy associations. Detailed research,
including characterisation of these responses at a population level, is needed to
determine their role and potential applications.
The current chapter maps associations of core β-1,2-xylose and core α-1,3-fucose with
S. mansoni infection (and intensity) and the urban-rural environment in Uganda, using
glycan microarray plasma IgE and IgG binding studies. This chapter further discusses
the importance of glycan-specific antibodies in immunity to schistosome infection,
diagnostics and cross-reactivity, serving as an important prologue to Chapter 7, which
builds upon this thesis’ overarching hypothesis (that helminth-induced antibodies
172
influence allergy profiles) to further postulate a key role for IgE to cross-reactive
carbohydrate determinants in the epidemiology of allergy in the tropics.
173
6.2 Research Paper 3: Microarray assessment of N-glycan-specific IgE and IgG profiles associated with Schistosoma mansoni infection in rural and urban Uganda
174
175
176
Microarray assessment of N-glycan-specific IgE and IgG profiles associated with
Schistosoma mansoni infection in rural and urban Uganda
Gyaviira Nkurunungi1,2§, Angela van Diepen3, Jacent Nassuuna1, Richard E Sanya1,4,
Margaret Nampijja1, Irene Nambuya1, Joyce Kabagenyi1, Sonia Serna5, Niels-Christian
Reichardt5,6, Ronald van Ree7, Emily L Webb8, Alison M Elliott1,2*, Maria
Yazdanbakhsh3*, Cornelis H Hokke3§*
1Immunomodulation and Vaccines Programme, Medical Research Council / Uganda
Virus Research Institute and London School of Hygiene and Tropical Medicine
(MRC/UVRI and LSHTM) Uganda Research Unit, Entebbe, Uganda
2Department of Clinical Research, London School of Hygiene and Tropical Medicine,
London, United Kingdom
3Department of Parasitology, Leiden University Medical Center, Leiden, The Netherlands
4College of Health Sciences, Makerere University, Kampala, Uganda
5Glycotechnology Laboratory, Centro de Investigación Cooperativa en Biomateriales
(CIC biomaGUNE), San Sebastián, Spain
6Centro de Investigación Biomédica en Red en Bioingeniería, Biomateriales y
Nanomedicina (CIBER-BBN), San Sebastián, Spain
7Amsterdam University Medical Centers, Departments of Experimental Immunology and
of Otorhinolaryngology, Amsterdam, The Netherlands
8MRC Tropical Epidemiology Group, Department of Infectious Disease Epidemiology,
London School of Hygiene and Tropical Medicine, London, United Kingdom
§Correspondence and requests for materials should be addressed to G.N. (email:
[email protected]) or C.H.H. (email: [email protected])
*These authors contributed equally to this work.
177
SUMMARY
Core b-1,2-xylose and a-1,3-fucose are antigenic motifs on schistosome N-glycans, as
well as prominent IgE targets on some plant and insect glycoproteins. To map the
association of schistosome infection with responses to these motifs, we assessed
plasma IgE and IgG reactivity using microarray technology among Ugandans from rural
Schistosoma mansoni (Sm)-endemic islands (n=209), and from proximate urban
communities with lower Sm exposure (n=62). IgE and IgG responses to core b-1,2-
xylose and a-1,3-fucose modified N-glycans were higher in rural versus urban
participants. Among rural participants, IgE and IgG to core b-1,2-xylose were positively
associated with Sm infection and concentration peaks coincided with the infection
intensity peak in early adolescence. Responses to core a-1,3-fucose were elevated
regardless of Sm infection status and peaked before the infection peak. Among urban
participants, Sm infection intensity was predominantly light and positively associated with
responses to both motifs. Principal component and hierarchical cluster analysis reduced
the data to a set of variables that captured core b-1,2-xylose- and a-1,3-fucose-specific
responses, and confirmed associations with Sm and the rural environment. Responses
to core b-1,2-xylose and a-1,3-fucose have distinctive relationships with Sm infection
and intensity that should further be explored for associations with protective immunity,
and cross-reactivity with other exposures.
178
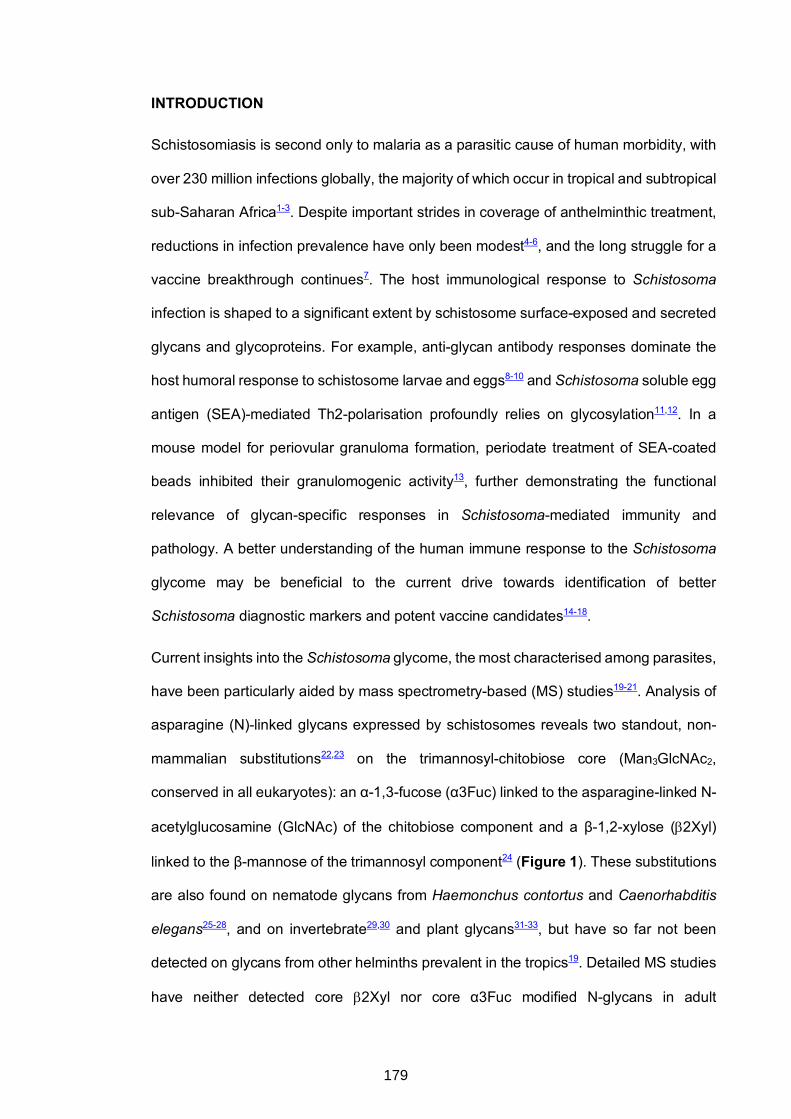
INTRODUCTION
Schistosomiasis is second only to malaria as a parasitic cause of human morbidity, with
over 230 million infections globally, the majority of which occur in tropical and subtropical
sub-Saharan Africa1-3. Despite important strides in coverage of anthelminthic treatment,
reductions in infection prevalence have only been modest4-6, and the long struggle for a
vaccine breakthrough continues7. The host immunological response to Schistosoma
infection is shaped to a significant extent by schistosome surface-exposed and secreted
glycans and glycoproteins. For example, anti-glycan antibody responses dominate the
host humoral response to schistosome larvae and eggs8-10 and Schistosoma soluble egg
antigen (SEA)-mediated Th2-polarisation profoundly relies on glycosylation11,12. In a
mouse model for periovular granuloma formation, periodate treatment of SEA-coated
beads inhibited their granulomogenic activity13, further demonstrating the functional
relevance of glycan-specific responses in Schistosoma-mediated immunity and
pathology. A better understanding of the human immune response to the Schistosoma
glycome may be beneficial to the current drive towards identification of better
Schistosoma diagnostic markers and potent vaccine candidates14-18.
Current insights into the Schistosoma glycome, the most characterised among parasites,
have been particularly aided by mass spectrometry-based (MS) studies19-21. Analysis of
asparagine (N)-linked glycans expressed by schistosomes reveals two standout, non-
mammalian substitutions22,23 on the trimannosyl-chitobiose core (Man3GlcNAc2,
conserved in all eukaryotes): an α-1,3-fucose (α3Fuc) linked to the asparagine-linked N-
acetylglucosamine (GlcNAc) of the chitobiose component and a β-1,2-xylose (b2Xyl)
linked to the β-mannose of the trimannosyl component24 (Figure 1). These substitutions
are also found on nematode glycans from Haemonchus contortus and Caenorhabditis
elegans25-28, and on invertebrate29,30 and plant glycans31-33, but have so far not been
detected on glycans from other helminths prevalent in the tropics19. Detailed MS studies
have neither detected core b2Xyl nor core α3Fuc modified N-glycans in adult
179
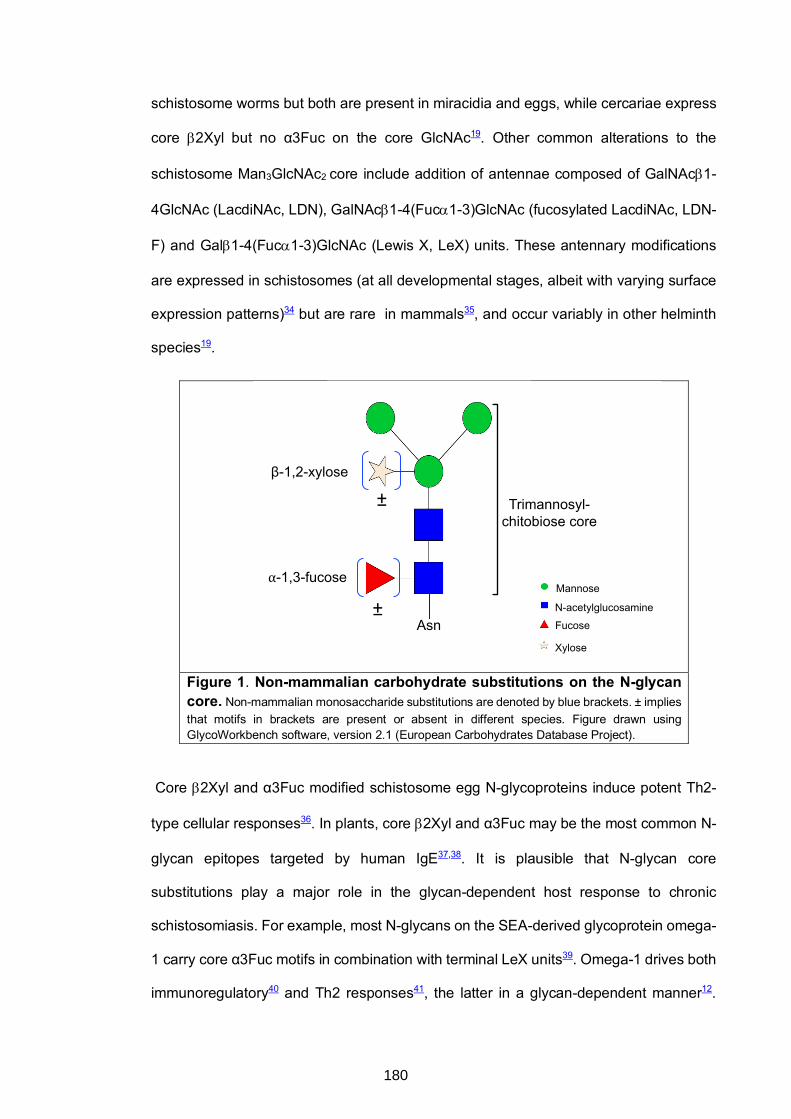
schistosome worms but both are present in miracidia and eggs, while cercariae express
core b2Xyl but no α3Fuc on the core GlcNAc19. Other common alterations to the
schistosome Man3GlcNAc2 core include addition of antennae composed of GalNAcb1-
4GlcNAc (LacdiNAc, LDN), GalNAcb1-4(Fuca1-3)GlcNAc (fucosylated LacdiNAc, LDN-
F) and Galb1-4(Fuca1-3)GlcNAc (Lewis X, LeX) units. These antennary modifications
are expressed in schistosomes (at all developmental stages, albeit with varying surface
expression patterns)34 but are rare in mammals35, and occur variably in other helminth
species19.
Figure 1. Non-mammalian carbohydrate substitutions on the N-glycan core. Non-mammalian monosaccharide substitutions are denoted by blue brackets. ± implies that motifs in brackets are present or absent in different species. Figure drawn using GlycoWorkbench software, version 2.1 (European Carbohydrates Database Project).
Core b2Xyl and α3Fuc modified schistosome egg N-glycoproteins induce potent Th2-
type cellular responses36. In plants, core b2Xyl and α3Fuc may be the most common N-
glycan epitopes targeted by human IgE37,38. It is plausible that N-glycan core
substitutions play a major role in the glycan-dependent host response to chronic
schistosomiasis. For example, most N-glycans on the SEA-derived glycoprotein omega-
1 carry core α3Fuc motifs in combination with terminal LeX units39. Omega-1 drives both
immunoregulatory40 and Th2 responses41, the latter in a glycan-dependent manner12.
β-1,2-xylose
⍺-1,3-fucose
±
± Trimannosyl-chitobiose core
AsnN-acetylglucosamine
Mannose
Xylose
Fucose
180
Kappa-5, another major component of the Th2-polarising SEA42, expresses glycans
modified with both core b2Xyl and core α3Fuc43. Whether protective immunity against
Schistosoma infection and reinfection (long associated with host IgE responses44,45) can
be credited to these epitopes will require further investigations in animal and human
studies.
The advent of glycan microarray technology enabled serum/plasma profiling of
antibodies raised to a wide repertoire of N-glycan variants during schistosome infections.
This technology has been employed in a small number of human studies. Recently, in
Ghana, sera from a few S. haematobium infected schoolchildren showed elevated IgE
responses to core b2Xyl modified N-glycans on a synthetic glycan microarray46, and in
sera from a small cohort of Schistosoma mansoni (Sm)-infected children and adults near
Lake Albert, Uganda, IgG1-4 subclass responses to core b2Xyl and α3Fuc motifs were
examined using the same array47. Two other human studies employing shotgun
microarrays constructed of complex native schistosome N-glycans showed strong anti-
glycan IgG and IgM responses against a wider range of N-glycans during schistosome
infections48,49. A better understanding of population-level immune responses to
Schistosoma glycans is important for research and clinical applications, and requires
larger, well-defined immuno-epidemiological studies in endemic settings.
Fishing villages in the Lake Victoria islands of Koome, Uganda, have a high prevalence
of Sm50-53, and have been surveyed as part of a portfolio of studies on helminth infections
and allergy-related outcomes in Uganda. This setting provided a unique opportunity,
within the context of a well-characterised large study50, to correlate epidemiological
trends pertaining to Sm infection (and intensity) with microarray-detected plasma IgE
and IgG responses to N-glycans with and without core a-1,3-fucosylation and/or b-1,2-
xylosylation. Plasma from residents of nearby mainland urban communities with lower
Sm exposure enabled us to make rural-urban comparisons of anti-glycan antibody
responses.
181
METHODS
Study design and population
Individuals included in the current investigation were randomly selected using a Stata
program (StataCorp, College Station, USA) from participants of two cross-sectional
surveys in rural and urban Uganda, who had a sufficient volume of stored plasma. The
rural survey was the outcome survey (year three, September 2015 – August 2016) of the
Lake Victoria Island Intervention Study on Worms and Allergy-related diseases
(LaVIISWA; ISRCTN47196031)50, a cluster-randomised trial of community-based
standard versus intensive anthelminthic intervention in 26 Sm-endemic fishing villages
of Koome islands (Lake Victoria, Uganda). The trial description50,53 and survey results
after three years of intervention52 have been published: briefly, standard intervention
included annual, community-based, mass drug administration of praziquantel; intensive
intervention included quarterly praziquantel. The urban survey (September 2016 –
September 2017) was conducted in the 24 sub-wards of Entebbe municipality, an area
with lower helminth exposure, located on the northern shores of Lake Victoria
(approximately 35km from Koome). It was designed to collect data from an urban setting
for comparison with the Sm-endemic rural survey.
In both surveys, intestinal helminth infections were assessed using the Kato-Katz (KK)
method54 on a single stool sample (prepared on two slides, read by different technicians).
The remaining sample was stored at -80°C and later investigated for Sm, Necator
americanus and Strongyloides stercoralis infections using multiplex real-time PCR55,56.
Mid-stream urine was also assessed for Sm circulating cathodic antigen (CCA) using a
point-of-care test (Rapid Medical Diagnostics, Pretoria, South Africa). Schistosoma
haematobium is not present in the surveyed areas57. Blood samples were processed to
obtain plasma for immunological measurements, including N-glycan-specific IgE and IgG
by microarray (detailed below) and Schistosoma egg [SEA]- and adult worm [SWA]
antigen-specific IgE, IgG4 and IgG by ELISA (supplementary material).
182
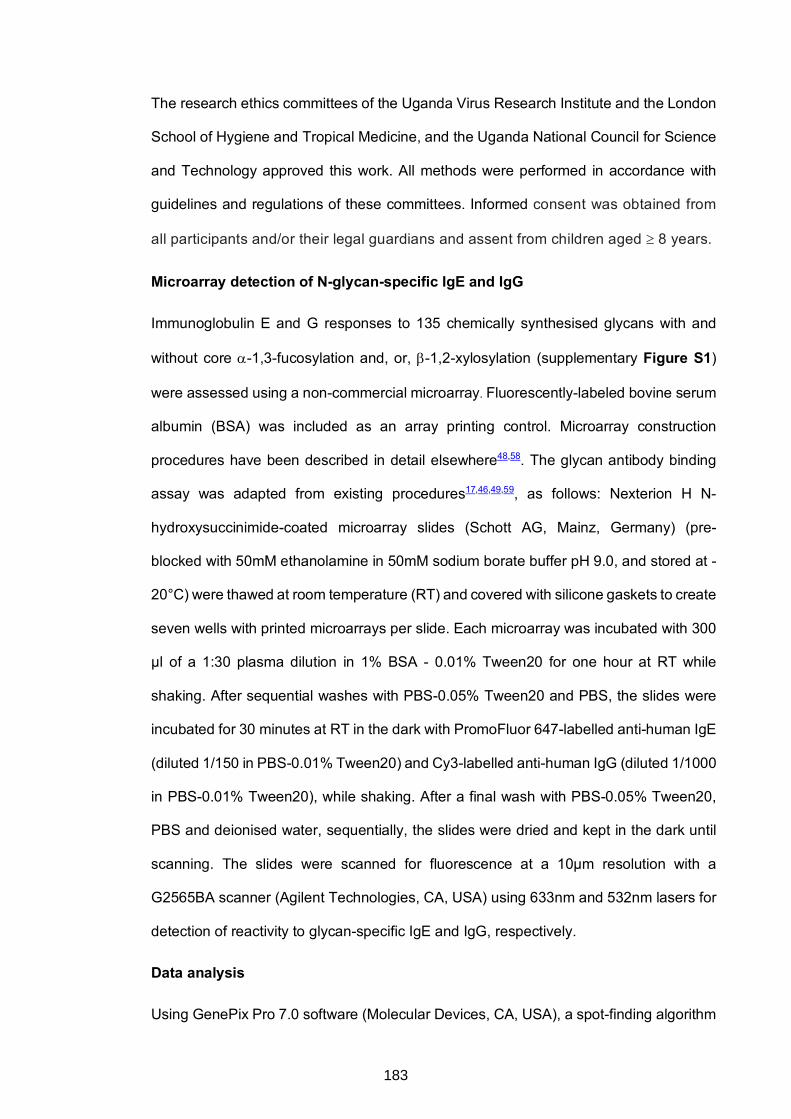
The research ethics committees of the Uganda Virus Research Institute and the London
School of Hygiene and Tropical Medicine, and the Uganda National Council for Science
and Technology approved this work. All methods were performed in accordance with
guidelines and regulations of these committees. Informed consent was obtained from
all participants and/or their legal guardians and assent from children aged ³ 8 years.
Microarray detection of N-glycan-specific IgE and IgG
Immunoglobulin E and G responses to 135 chemically synthesised glycans with and
without core a-1,3-fucosylation and, or, b-1,2-xylosylation (supplementary Figure S1)
were assessed using a non-commercial microarray. Fluorescently-labeled bovine serum
albumin (BSA) was included as an array printing control. Microarray construction
procedures have been described in detail elsewhere48,58. The glycan antibody binding
assay was adapted from existing procedures17,46,49,59, as follows: Nexterion H N-
hydroxysuccinimide-coated microarray slides (Schott AG, Mainz, Germany) (pre-
blocked with 50mM ethanolamine in 50mM sodium borate buffer pH 9.0, and stored at -
20°C) were thawed at room temperature (RT) and covered with silicone gaskets to create
seven wells with printed microarrays per slide. Each microarray was incubated with 300
μl of a 1:30 plasma dilution in 1% BSA - 0.01% Tween20 for one hour at RT while
shaking. After sequential washes with PBS-0.05% Tween20 and PBS, the slides were
incubated for 30 minutes at RT in the dark with PromoFluor 647-labelled anti-human IgE
(diluted 1/150 in PBS-0.01% Tween20) and Cy3-labelled anti-human IgG (diluted 1/1000
in PBS-0.01% Tween20), while shaking. After a final wash with PBS-0.05% Tween20,
PBS and deionised water, sequentially, the slides were dried and kept in the dark until
scanning. The slides were scanned for fluorescence at a 10μm resolution with a
G2565BA scanner (Agilent Technologies, CA, USA) using 633nm and 532nm lasers for
detection of reactivity to glycan-specific IgE and IgG, respectively.
Data analysis
Using GenePix Pro 7.0 software (Molecular Devices, CA, USA), a spot-finding algorithm
183
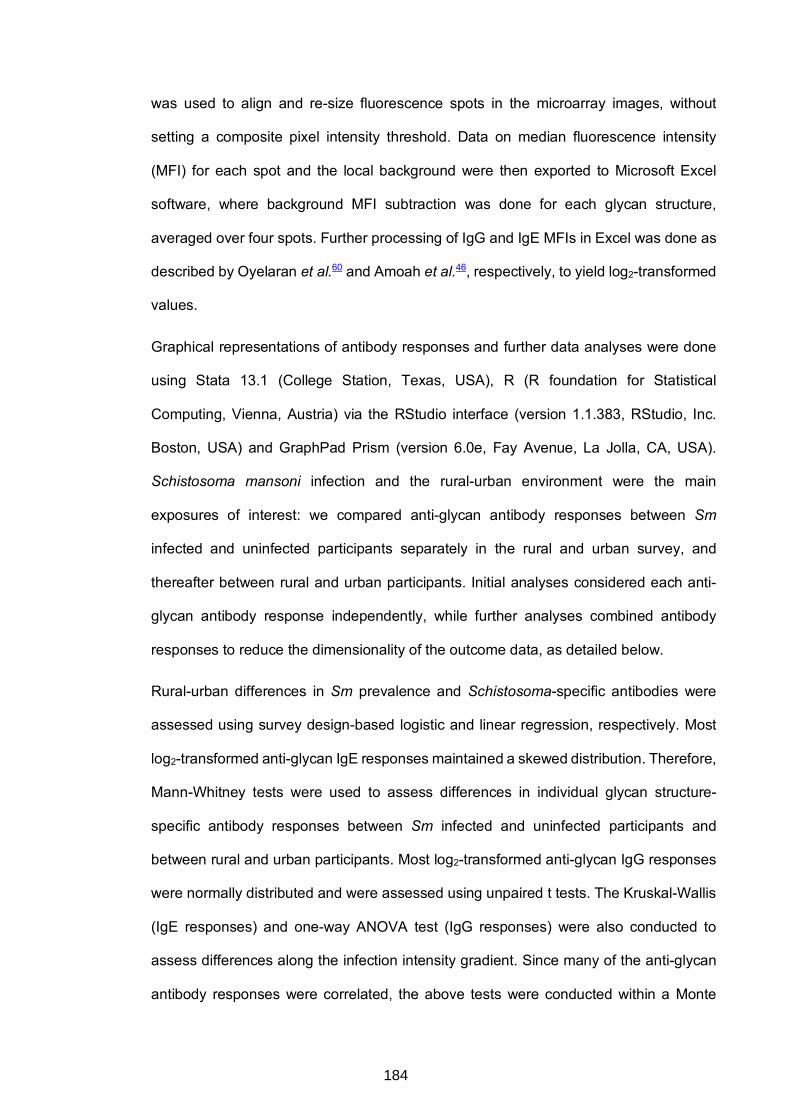
was used to align and re-size fluorescence spots in the microarray images, without
setting a composite pixel intensity threshold. Data on median fluorescence intensity
(MFI) for each spot and the local background were then exported to Microsoft Excel
software, where background MFI subtraction was done for each glycan structure,
averaged over four spots. Further processing of IgG and IgE MFIs in Excel was done as
described by Oyelaran et al.60 and Amoah et al.46, respectively, to yield log2-transformed
values.
Graphical representations of antibody responses and further data analyses were done
using Stata 13.1 (College Station, Texas, USA), R (R foundation for Statistical
Computing, Vienna, Austria) via the RStudio interface (version 1.1.383, RStudio, Inc.
Boston, USA) and GraphPad Prism (version 6.0e, Fay Avenue, La Jolla, CA, USA).
Schistosoma mansoni infection and the rural-urban environment were the main
exposures of interest: we compared anti-glycan antibody responses between Sm
infected and uninfected participants separately in the rural and urban survey, and
thereafter between rural and urban participants. Initial analyses considered each anti-
glycan antibody response independently, while further analyses combined antibody
responses to reduce the dimensionality of the outcome data, as detailed below.
Rural-urban differences in Sm prevalence and Schistosoma-specific antibodies were
assessed using survey design-based logistic and linear regression, respectively. Most
log2-transformed anti-glycan IgE responses maintained a skewed distribution. Therefore,
Mann-Whitney tests were used to assess differences in individual glycan structure-
specific antibody responses between Sm infected and uninfected participants and
between rural and urban participants. Most log2-transformed anti-glycan IgG responses
were normally distributed and were assessed using unpaired t tests. The Kruskal-Wallis
(IgE responses) and one-way ANOVA test (IgG responses) were also conducted to
assess differences along the infection intensity gradient. Since many of the anti-glycan
antibody responses were correlated, the above tests were conducted within a Monte
184
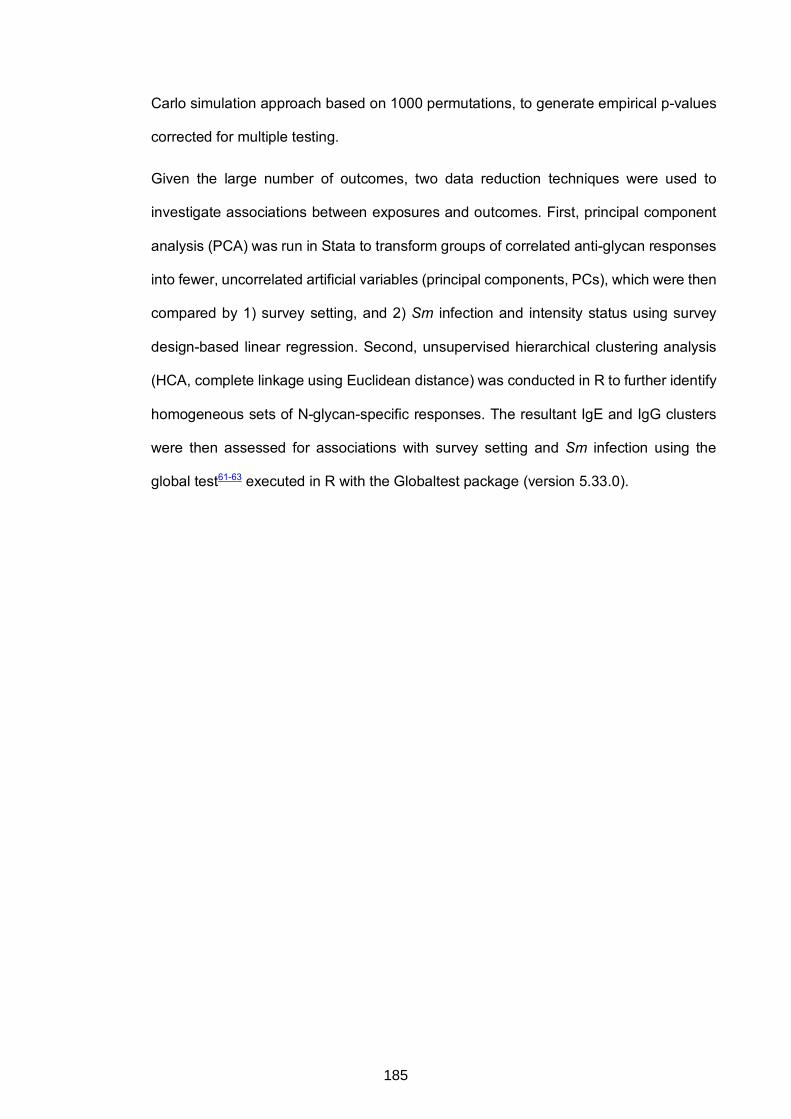
Carlo simulation approach based on 1000 permutations, to generate empirical p-values
corrected for multiple testing.
Given the large number of outcomes, two data reduction techniques were used to
investigate associations between exposures and outcomes. First, principal component
analysis (PCA) was run in Stata to transform groups of correlated anti-glycan responses
into fewer, uncorrelated artificial variables (principal components, PCs), which were then
compared by 1) survey setting, and 2) Sm infection and intensity status using survey
design-based linear regression. Second, unsupervised hierarchical clustering analysis
(HCA, complete linkage using Euclidean distance) was conducted in R to further identify
homogeneous sets of N-glycan-specific responses. The resultant IgE and IgG clusters
were then assessed for associations with survey setting and Sm infection using the
global test61-63 executed in R with the Globaltest package (version 5.33.0).
185
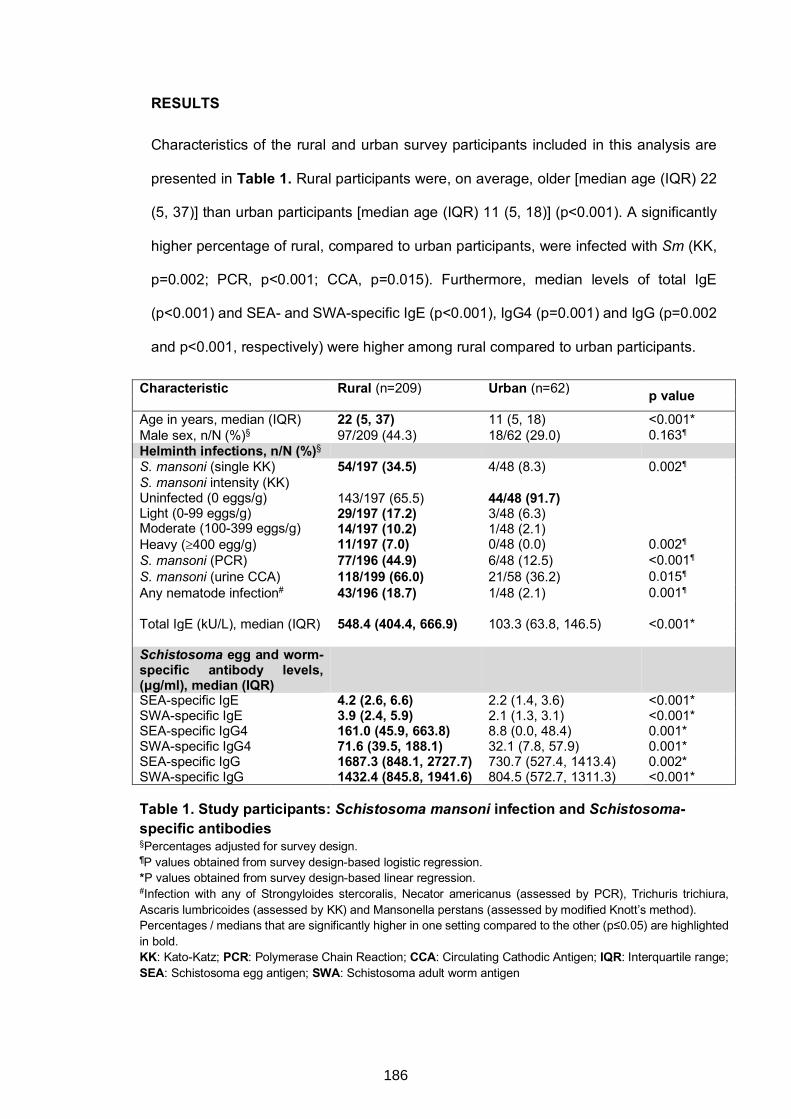
RESULTS
Characteristics of the rural and urban survey participants included in this analysis are
presented in Table 1. Rural participants were, on average, older [median age (IQR) 22
(5, 37)] than urban participants [median age (IQR) 11 (5, 18)] (p<0.001). A significantly
higher percentage of rural, compared to urban participants, were infected with Sm (KK,
p=0.002; PCR, p<0.001; CCA, p=0.015). Furthermore, median levels of total IgE
(p<0.001) and SEA- and SWA-specific IgE (p<0.001), IgG4 (p=0.001) and IgG (p=0.002
and p<0.001, respectively) were higher among rural compared to urban participants.
Characteristic Rural (n=209) Urban (n=62) p value Age in years, median (IQR) 22 (5, 37) 11 (5, 18) <0.001* Male sex, n/N (%)§ 97/209 (44.3) 18/62 (29.0) 0.163¶ Helminth infections, n/N (%)§ S. mansoni (single KK) 54/197 (34.5) 4/48 (8.3) 0.002¶ S. mansoni intensity (KK) Uninfected (0 eggs/g) Light (0-99 eggs/g) Moderate (100-399 eggs/g) Heavy (³400 egg/g)
143/197 (65.5) 29/197 (17.2) 14/197 (10.2) 11/197 (7.0)
44/48 (91.7) 3/48 (6.3) 1/48 (2.1) 0/48 (0.0)
0.002¶
S. mansoni (PCR) 77/196 (44.9) 6/48 (12.5) <0.001¶ S. mansoni (urine CCA) 118/199 (66.0) 21/58 (36.2) 0.015¶ Any nematode infection# 43/196 (18.7) 1/48 (2.1) 0.001¶ Total IgE (kU/L), median (IQR) 548.4 (404.4, 666.9) 103.3 (63.8, 146.5) <0.001* Schistosoma egg and worm-specific antibody levels, (μg/ml), median (IQR)
SEA-specific IgE 4.2 (2.6, 6.6) 2.2 (1.4, 3.6) <0.001* SWA-specific IgE 3.9 (2.4, 5.9) 2.1 (1.3, 3.1) <0.001* SEA-specific IgG4 161.0 (45.9, 663.8) 8.8 (0.0, 48.4) 0.001* SWA-specific IgG4 71.6 (39.5, 188.1) 32.1 (7.8, 57.9) 0.001* SEA-specific IgG 1687.3 (848.1, 2727.7) 730.7 (527.4, 1413.4) 0.002* SWA-specific IgG 1432.4 (845.8, 1941.6) 804.5 (572.7, 1311.3) <0.001* Table 1. Study participants: Schistosoma mansoni infection and Schistosoma-specific antibodies §Percentages adjusted for survey design. ¶P values obtained from survey design-based logistic regression. *P values obtained from survey design-based linear regression. #Infection with any of Strongyloides stercoralis, Necator americanus (assessed by PCR), Trichuris trichiura, Ascaris lumbricoides (assessed by KK) and Mansonella perstans (assessed by modified Knott’s method). Percentages / medians that are significantly higher in one setting compared to the other (p≤0.05) are highlighted in bold. KK: Kato-Katz; PCR: Polymerase Chain Reaction; CCA: Circulating Cathodic Antigen; IQR: Interquartile range; SEA: Schistosoma egg antigen; SWA: Schistosoma adult worm antigen
186
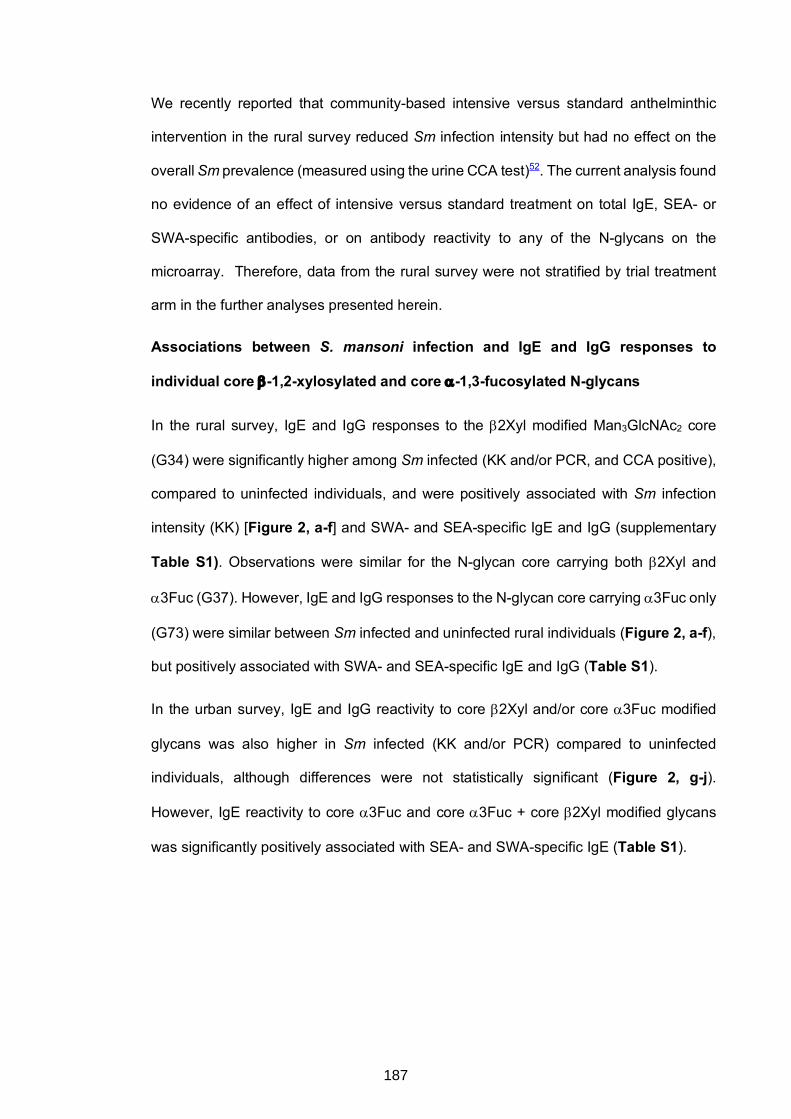
We recently reported that community-based intensive versus standard anthelminthic
intervention in the rural survey reduced Sm infection intensity but had no effect on the
overall Sm prevalence (measured using the urine CCA test)52. The current analysis found
no evidence of an effect of intensive versus standard treatment on total IgE, SEA- or
SWA-specific antibodies, or on antibody reactivity to any of the N-glycans on the
microarray. Therefore, data from the rural survey were not stratified by trial treatment
arm in the further analyses presented herein.
Associations between S. mansoni infection and IgE and IgG responses to
individual core b-1,2-xylosylated and core a-1,3-fucosylated N-glycans
In the rural survey, IgE and IgG responses to the b2Xyl modified Man3GlcNAc2 core
(G34) were significantly higher among Sm infected (KK and/or PCR, and CCA positive),
compared to uninfected individuals, and were positively associated with Sm infection
intensity (KK) [Figure 2, a-f] and SWA- and SEA-specific IgE and IgG (supplementary
Table S1). Observations were similar for the N-glycan core carrying both b2Xyl and
a3Fuc (G37). However, IgE and IgG responses to the N-glycan core carrying a3Fuc only
(G73) were similar between Sm infected and uninfected rural individuals (Figure 2, a-f),
but positively associated with SWA- and SEA-specific IgE and IgG (Table S1).
In the urban survey, IgE and IgG reactivity to core b2Xyl and/or core a3Fuc modified
glycans was also higher in Sm infected (KK and/or PCR) compared to uninfected
individuals, although differences were not statistically significant (Figure 2, g-j).
However, IgE reactivity to core a3Fuc and core a3Fuc + core b2Xyl modified glycans
was significantly positively associated with SEA- and SWA-specific IgE (Table S1).
187
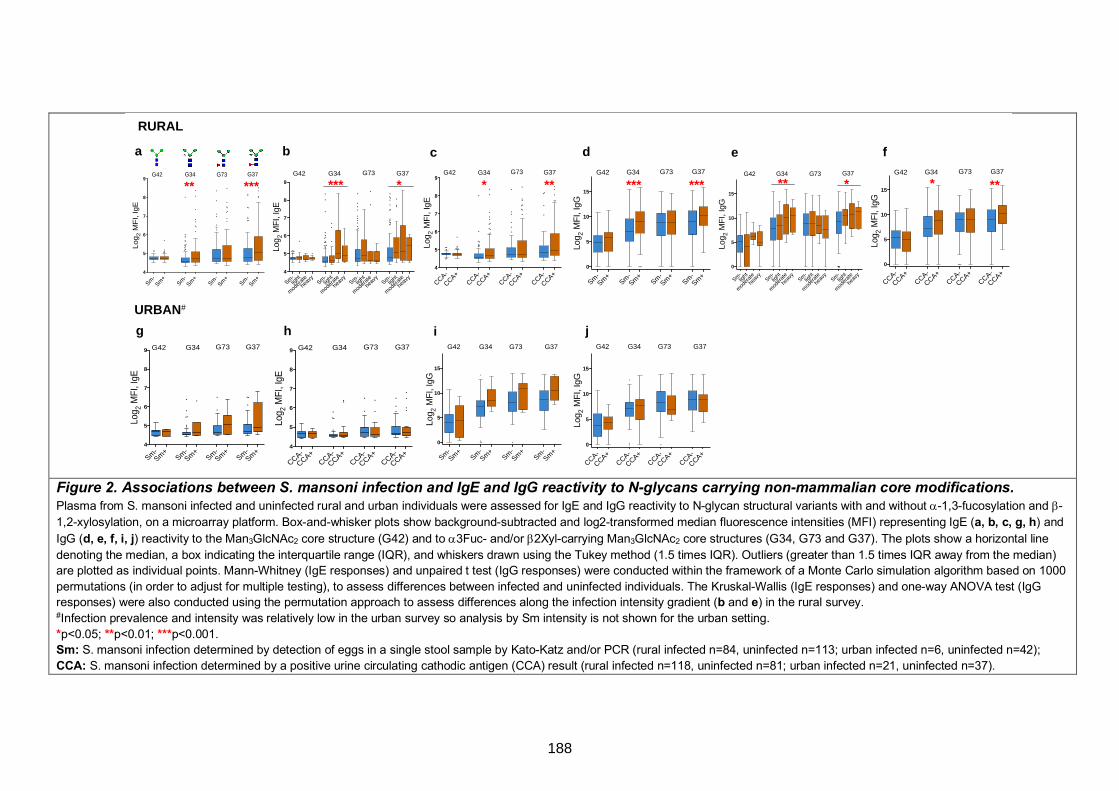
Figure 2. Associations between S. mansoni infection and IgE and IgG reactivity to N-glycans carrying non-mammalian core modifications. Plasma from S. mansoni infected and uninfected rural and urban individuals were assessed for IgE and IgG reactivity to N-glycan structural variants with and without a-1,3-fucosylation and b-1,2-xylosylation, on a microarray platform. Box-and-whisker plots show background-subtracted and log2-transformed median fluorescence intensities (MFI) representing IgE (a, b, c, g, h) and IgG (d, e, f, i, j) reactivity to the Man3GlcNAc2 core structure (G42) and to a3Fuc- and/or b2Xyl-carrying Man3GlcNAc2 core structures (G34, G73 and G37). The plots show a horizontal line denoting the median, a box indicating the interquartile range (IQR), and whiskers drawn using the Tukey method (1.5 times IQR). Outliers (greater than 1.5 times IQR away from the median) are plotted as individual points. Mann-Whitney (IgE responses) and unpaired t test (IgG responses) were conducted within the framework of a Monte Carlo simulation algorithm based on 1000 permutations (in order to adjust for multiple testing), to assess differences between infected and uninfected individuals. The Kruskal-Wallis (IgE responses) and one-way ANOVA test (IgG responses) were also conducted using the permutation approach to assess differences along the infection intensity gradient (b and e) in the rural survey. #Infection prevalence and intensity was relatively low in the urban survey so analysis by Sm intensity is not shown for the urban setting. *p<0.05; **p<0.01; ***p<0.001. Sm: S. mansoni infection determined by detection of eggs in a single stool sample by Kato-Katz and/or PCR (rural infected n=84, uninfected n=113; urban infected n=6, uninfected n=42); CCA: S. mansoni infection determined by a positive urine circulating cathodic antigen (CCA) result (rural infected n=118, uninfected n=81; urban infected n=21, uninfected n=37).
Sm-lig
ht
mod
erat
e
heav
ySm
-lig
ht
mod
erat
e
heav
ySm
-lig
ht
mod
erat
e
heav
ySm
-lig
ht
mod
erat
e
heav
y
0
5
10
15
Log 2
MF
I, Ig
G
G42 G34 G73 G37
Sm-lig
ht
moder
ate
heav
ySm-
light
moder
ate
heav
ySm-
light
moder
ate
heav
ySm-
light
moder
ate
heav
y4
5
6
7
8
9
Log 2
MFI
, IgE
G42 G34 G73 G37
CCA-
CCA+CCA-
CCA+CCA-
CCA+CCA-
CCA+4
5
6
7
8
9
Log 2
MF
I, Ig
E
G42 G34 G73 G37
Sm-
Sm+
Sm-
Sm+
Sm-
Sm+
Sm-
Sm+
4
5
6
7
8
9
Log
2 M
FI,
IgE
G34 G73 G37G42
a d fecb
** *** *** * * **
Sm-Sm
+Sm
-Sm
+Sm
-Sm
+Sm
-Sm
+
0
5
10
15
Log 2
MF
I, Ig
G
G42 G34 G73 G37
*** *** ** *
CCA-
CCA+CCA-
CCA+CCA-
CCA+CCA-
CCA+
0
5
10
15
Log 2
MFI
, IgG
G42 G34 G73 G37
* **
g jih
Sm-Sm+
Sm-Sm+
Sm-Sm+
Sm-Sm+
4
5
6
7
8
9
Log 2
MFI
, IgE
G42 G34 G73 G37
CCA-
CCA+CCA-
CCA+CCA-
CCA+CCA-
CCA+4
5
6
7
8
9
Log 2
MFI
, IgE
G42 G34 G73 G37
Sm-Sm+
Sm-Sm+
Sm-Sm+
Sm-Sm+
0
5
10
15
Log 2
MFI
, IgG
G42 G34 G73 G37
CCA-
CCA+CCA-
CCA+CCA-
CCA+CCA-
CCA+
0
5
10
15
Log 2
MF
I, Ig
G
G42 G34 G73 G37
RURAL
URBAN#
188
In the rural survey, Sm infection prevalence (and intensity) and median levels of
Schistosoma-specific antibodies (except SEA-IgE) and b-1,2-xylosylated glycan (G34)-
specific IgE and IgG were highest among 10-14-year old individuals (Figure 3).
However, IgE and IgG reactivity to glycans carrying either core a3Fuc (G73) or both core
b2Xyl and core a3Fuc (G37) peaked earlier (in the 5-9-year age group), akin to SEA-
specific IgE. Age-stratified antibody reactivity patterns were less clear in the urban
survey.
Immunoglobulin E and G responses to other N-glycan structural variants with core b2Xyl
or both core b2Xyl and core a3Fuc48 were also higher in Sm infected versus uninfected
individuals (Figure S2). IgE and IgG reactivity to non-xylosylated and non-fucosylated
glycans was not associated with Sm infection (data not shown), except for those glycans
with antennae constructed of LDN-F (G90) and LeX (G89) units (Figure S3).
Infection with other helminths, malaria or HIV was not associated with IgE or IgG
reactivity to any glycans on the microarray (data not shown).
Principal component analysis of anti-glycan antibody responses
Antibody responses to individual core modified N-glycans were strongly correlated.
Principal component analysis (PCA) was conducted to summarise these responses, and
to evaluate to what extent the resultant principal components (PCs) were associated with
Sm infection.
Scatterplots of PC1 and PC2 loadings are shown in Figure 4. In the rural survey, the
first two IgE and IgG PCs each accounted for 37% of the total variance in the data (IgE:
PC1 28.2%, PC2 8.8%; IgG: PC1 27.7%, PC2 9.7%). Principal component 1 was
characterized by responses to core b2Xyl and/or a3Fuc modified glycans while PC2 was
characterized by responses to non-xylosylated and non-fucosylated glycans (Figure 4,
panel a and b). Scores for IgE PC1, but not PC2, were higher among Sm infected (KK
or PCR) compared to uninfected individuals (crude p=0.028, age- and sex-adjusted
189
p=0.167). Similarly, IgG PC1 scores were higher among Sm infected (KK or PCR)
compared to uninfected individuals (crude p=0.009, adjusted p=0.027). There were no
differences in PC scores between CCA+ and CCA- individuals.
In the urban survey, the first two IgE and IgG PCs accounted for 31% and 35% of the
total variance, respectively (IgE: PC1 19.4%, PC2 11.5%; IgG: PC1 24.2%, PC2 10.6%).
Interestingly, most IgE responses to glycans carrying core b2Xyl without a3Fuc clustered
with non-xylosylated and non-fucosylated glycans in PC2 while responses to glycans
carrying both core b2Xyl and a3Fuc and those carrying core a3Fuc without b2Xyl
clustered together in PC1 (Figure 4, panel c). Akin to the rural survey, scores for IgE
and IgG PC1 were higher among Sm infected compared to uninfected urban individuals.
Scores for PC1 were positively associated with SWA- and SEA-specific IgE and IgG in
both surveys, while PC2 scores were inversely associated with the same Schistosoma-
specific antibodies (Table S1).
In addition to PCA, we conducted HCA to further identify groups of anti-glycan IgE and
IgG responses that might be jointly elicited in Sm infected versus uninfected individuals.
Figure S4 shows clusters of IgE and IgG responses in the rural and urban survey, and
the dominant core substitutions on the glycans in these clusters. Generally, antibody
clusters comprising core b2Xyl modified glycans were positively associated with Sm
infection and intensity in both surveys (Table S2).
190
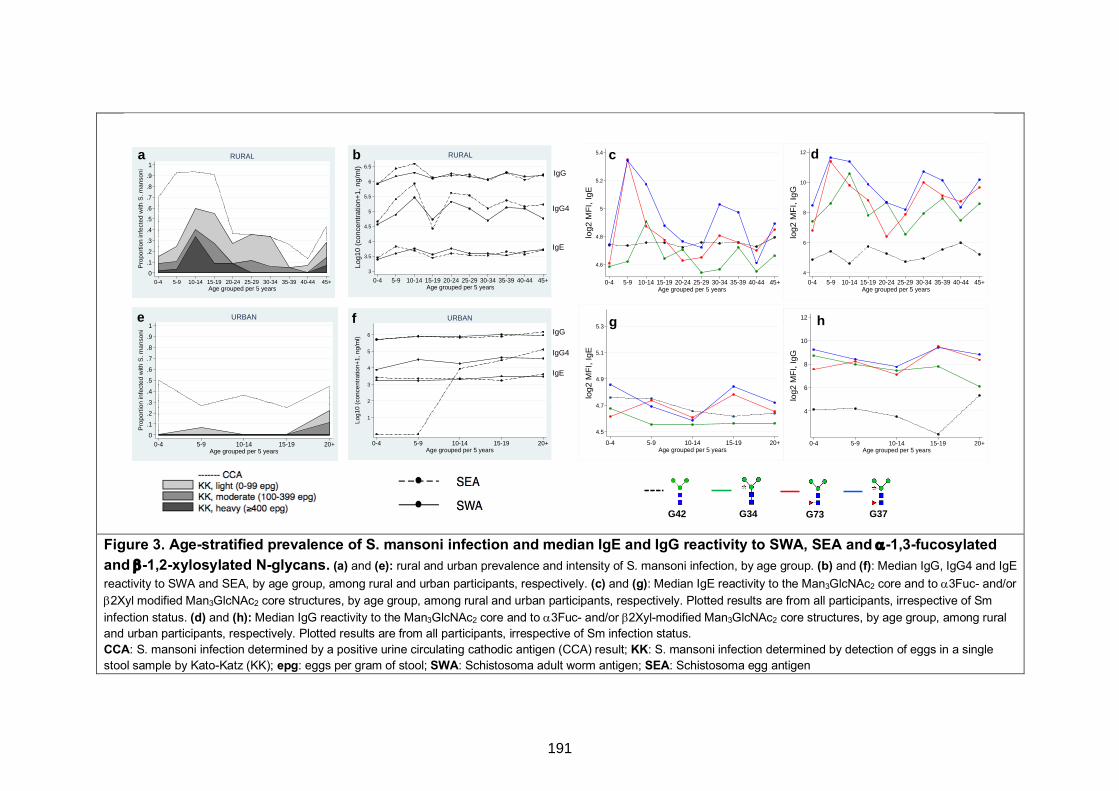
Figure 3. Age-stratified prevalence of S. mansoni infection and median IgE and IgG reactivity to SWA, SEA and a-1,3-fucosylated and b-1,2-xylosylated N-glycans. (a) and (e): rural and urban prevalence and intensity of S. mansoni infection, by age group. (b) and (f): Median IgG, IgG4 and IgE reactivity to SWA and SEA, by age group, among rural and urban participants, respectively. (c) and (g): Median IgE reactivity to the Man3GlcNAc2 core and to a3Fuc- and/or b2Xyl modified Man3GlcNAc2 core structures, by age group, among rural and urban participants, respectively. Plotted results are from all participants, irrespective of Sm infection status. (d) and (h): Median IgG reactivity to the Man3GlcNAc2 core and to a3Fuc- and/or b2Xyl-modified Man3GlcNAc2 core structures, by age group, among rural and urban participants, respectively. Plotted results are from all participants, irrespective of Sm infection status. CCA: S. mansoni infection determined by a positive urine circulating cathodic antigen (CCA) result; KK: S. mansoni infection determined by detection of eggs in a single stool sample by Kato-Katz (KK); epg: eggs per gram of stool; SWA: Schistosoma adult worm antigen; SEA: Schistosoma egg antigen
4
6
8
10
12
log2
MF
I, Ig
G
0-4 5-9 10-14 15-19 20+Age grouped per 5 years
4.5
4.7
4.9
5.1
5.3
log
2 M
FI, Ig
E
0-4 5-9 10-14 15-19 20+Age grouped per 5 years
4
6
8
10
12
log
2 M
FI, Ig
G
0-4 5-9 10-14 15-19 20-24 25-29 30-34 35-39 40-44 45+Age grouped per 5 years
4.6
4.8
5
5.2
5.4
log
2 M
FI, Ig
E
0-4 5-9 10-14 15-19 20-24 25-29 30-34 35-39 40-44 45+Age grouped per 5 years
0
.1
.2
.3
.4
.5
.6
.7
.8
.9
1
Pro
port
ion
infe
cted
with
S. m
anso
ni
0-4 5-9 10-14 15-19 20-24 25-29 30-34 35-39 40-44 45+Age grouped per 5 years
RURAL
0
.1
.2
.3
.4
.5
.6
.7
.8
.9
1
Pro
port
ion
infe
cted
with
S. m
anso
ni
0-4 5-9 10-14 15-19 20+Age grouped per 5 years
URBAN
a
e
dc
hg
3
3.5
4
4.5
5
5.5
6
6.5
Log1
0 (c
once
ntra
tion+
1, n
g/m
l)
0-4 5-9 10-14 15-19 20-24 25-29 30-34 35-39 40-44 45+Age grouped per 5 years
RURAL
1
2
3
4
5
6
Log1
0 (c
once
ntra
tion+
1, n
g/m
l)
0-4 5-9 10-14 15-19 20+Age grouped per 5 years
URBAN
b
f
IgG
IgG4
IgE
IgG
IgG4
IgE
G42 G34 G73 G37
191
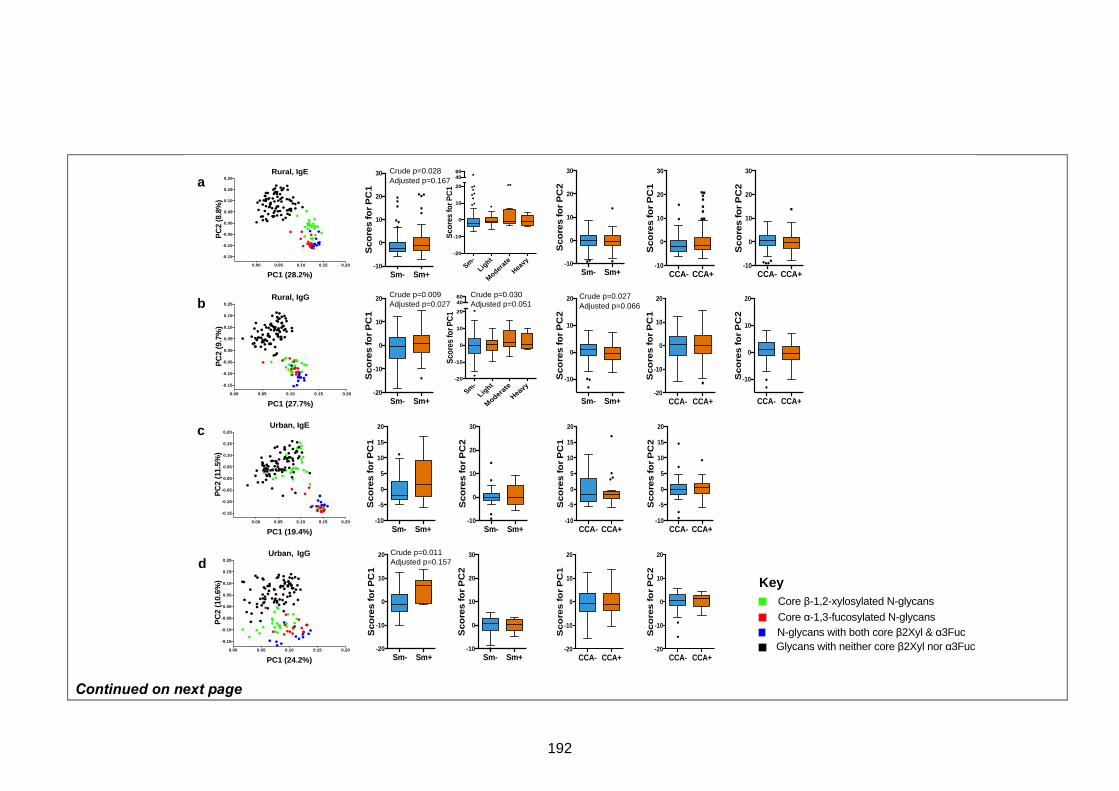
Continued on next page
Sm- Sm+-10
0
10
20
30
Sco
res
for
PC
1
Sm- Sm+-10
0
10
20
30
Sco
res
for
PC
2
Sm- Sm+-20
-10
0
10
20
Sco
res fo
r P
C1
Sm- Sm+
-10
0
10
20
Sco
res fo
r P
C2
Sm- Sm+-10
-5
0
5
10
15
20
Sco
res fo
r P
C1
Sm- Sm+-10
0
10
20
30
Sco
res fo
r P
C2
CCA- CCA+-10
-5
0
5
10
15
20
Sco
res fo
r P
C1
CCA- CCA+-10
-5
0
5
10
15
20
Sco
res fo
r P
C2
Sm- Sm+-20
-10
0
10
20
Sco
res fo
r P
C1
Sm- Sm+-10
0
10
20
30
Sco
res fo
r P
C2
CCA- CCA+-20
-10
0
10
20S
co
res fo
r P
C1
CCA- CCA+-20
-10
0
10
20
Sco
res fo
r P
C2
CCA- CCA+-10
0
10
20
30
Sco
res fo
r P
C1
CCA- CCA+-10
0
10
20
30
Sco
res fo
r P
C2
CCA- CCA+-20
-10
0
10
20
Sco
res fo
r P
C1
CCA- CCA+
-10
0
10
20
Sco
res fo
r P
C2
Sm-Lig
ht
Moderate
Heavy-20
-10
0
10
20
4060
Scor
es fo
r PC
1
Sm-
Light
Moderate
Heavy
-20
-10
0
10
20
4060
Sco
res
for P
C1
Crude p=0.027Adjusted p=0.066
Crude p=0.030Adjusted p=0.051
Crude p=0.028Adjusted p=0.167
Crude p=0.011Adjusted p=0.157
Crude p=0.009Adjusted p=0.027
a
b
c
d
0.00 0.05 0.10 0.15 0.20
-0.15
-0.10
-0.05
0.00
0.05
0.10
0.15
0.20
PC1 (28.2%)
PC
2 (8
.8%
)
Rural, IgE
0.00 0.05 0.10 0.15 0.20
-0.15
-0.10
-0.05
0.00
0.05
0.10
0.15
0.20
PC1 (27.7%)
PC
2 (9
.7%
)
Rural, IgG
0.00 0.05 0.10 0.15 0.20
-0.15
-0.10
-0.05
0.00
0.05
0.10
0.15
0.20
PC1 (19.4%)
PC
2 (1
1.5%
)
Urban, IgE
0.00 0.05 0.10 0.15 0.20
-0.15
-0.10
-0.05
0.00
0.05
0.10
0.15
0.20
PC1 (24.2%)
PC
2 (1
0.6%
)
Urban, IgG
Core β-1,2-xylosylated N-glycans
N-glycans with both core β2Xyl & α3FucCore α-1,3-fucosylated N-glycans
Glycans with neither core β2Xyl nor α3Fuc
Key
192
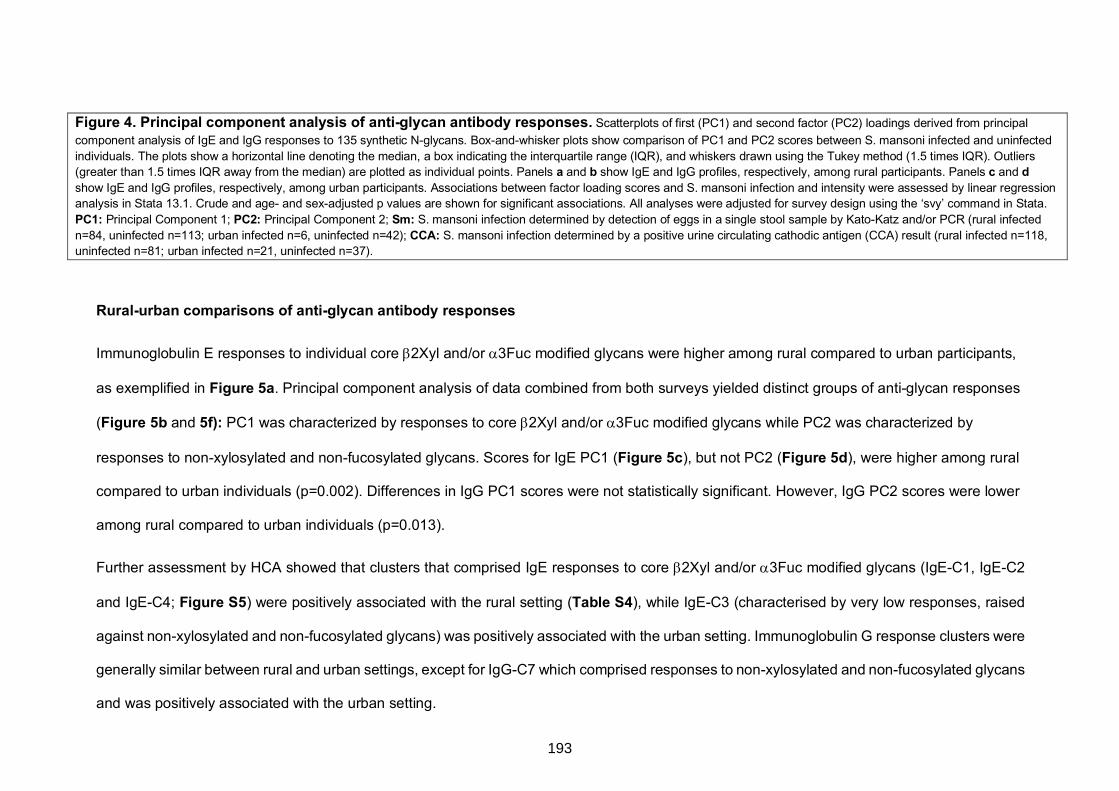
Figure 4. Principal component analysis of anti-glycan antibody responses. Scatterplots of first (PC1) and second factor (PC2) loadings derived from principal component analysis of IgE and IgG responses to 135 synthetic N-glycans. Box-and-whisker plots show comparison of PC1 and PC2 scores between S. mansoni infected and uninfected individuals. The plots show a horizontal line denoting the median, a box indicating the interquartile range (IQR), and whiskers drawn using the Tukey method (1.5 times IQR). Outliers (greater than 1.5 times IQR away from the median) are plotted as individual points. Panels a and b show IgE and IgG profiles, respectively, among rural participants. Panels c and d show IgE and IgG profiles, respectively, among urban participants. Associations between factor loading scores and S. mansoni infection and intensity were assessed by linear regression analysis in Stata 13.1. Crude and age- and sex-adjusted p values are shown for significant associations. All analyses were adjusted for survey design using the ‘svy’ command in Stata. PC1: Principal Component 1; PC2: Principal Component 2; Sm: S. mansoni infection determined by detection of eggs in a single stool sample by Kato-Katz and/or PCR (rural infected n=84, uninfected n=113; urban infected n=6, uninfected n=42); CCA: S. mansoni infection determined by a positive urine circulating cathodic antigen (CCA) result (rural infected n=118, uninfected n=81; urban infected n=21, uninfected n=37).
Rural-urban comparisons of anti-glycan antibody responses
Immunoglobulin E responses to individual core b2Xyl and/or a3Fuc modified glycans were higher among rural compared to urban participants,
as exemplified in Figure 5a. Principal component analysis of data combined from both surveys yielded distinct groups of anti-glycan responses
(Figure 5b and 5f): PC1 was characterized by responses to core b2Xyl and/or a3Fuc modified glycans while PC2 was characterized by
responses to non-xylosylated and non-fucosylated glycans. Scores for IgE PC1 (Figure 5c), but not PC2 (Figure 5d), were higher among rural
compared to urban individuals (p=0.002). Differences in IgG PC1 scores were not statistically significant. However, IgG PC2 scores were lower
among rural compared to urban individuals (p=0.013).
Further assessment by HCA showed that clusters that comprised IgE responses to core b2Xyl and/or a3Fuc modified glycans (IgE-C1, IgE-C2
and IgE-C4; Figure S5) were positively associated with the rural setting (Table S4), while IgE-C3 (characterised by very low responses, raised
against non-xylosylated and non-fucosylated glycans) was positively associated with the urban setting. Immunoglobulin G response clusters were
generally similar between rural and urban settings, except for IgG-C7 which comprised responses to non-xylosylated and non-fucosylated glycans
and was positively associated with the urban setting.
193
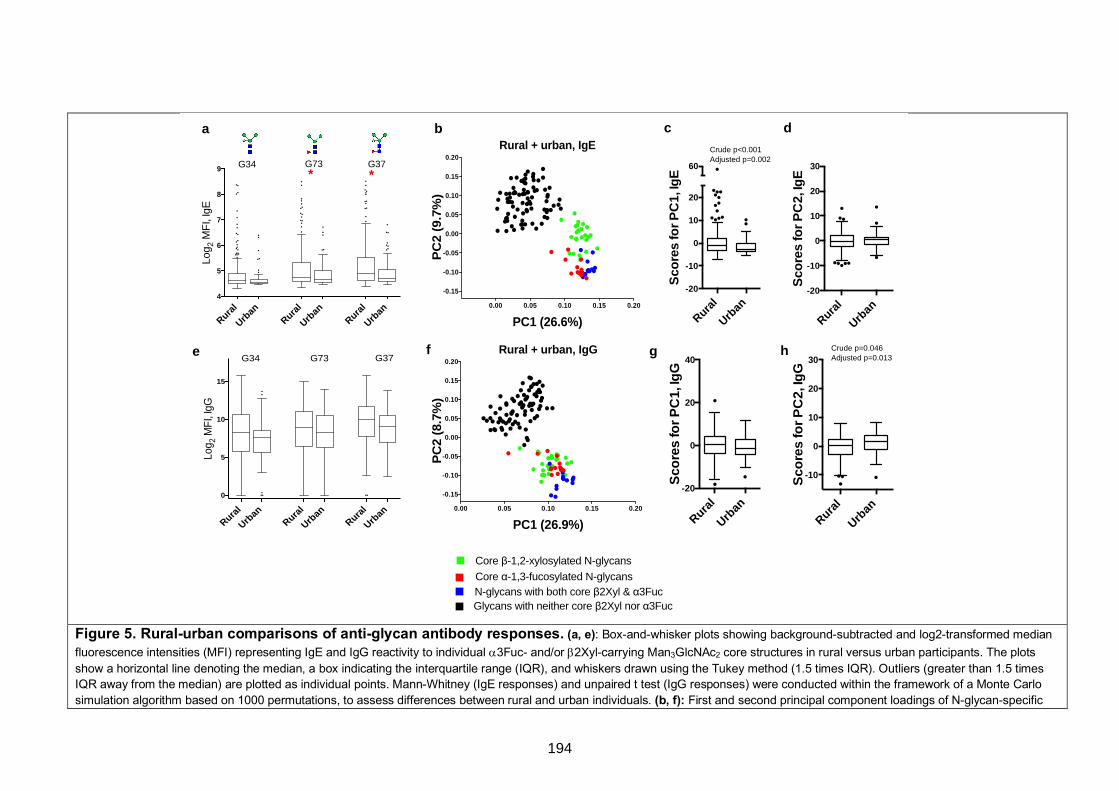
Figure 5. Rural-urban comparisons of anti-glycan antibody responses. (a, e): Box-and-whisker plots showing background-subtracted and log2-transformed median fluorescence intensities (MFI) representing IgE and IgG reactivity to individual a3Fuc- and/or b2Xyl-carrying Man3GlcNAc2 core structures in rural versus urban participants. The plots show a horizontal line denoting the median, a box indicating the interquartile range (IQR), and whiskers drawn using the Tukey method (1.5 times IQR). Outliers (greater than 1.5 times IQR away from the median) are plotted as individual points. Mann-Whitney (IgE responses) and unpaired t test (IgG responses) were conducted within the framework of a Monte Carlo simulation algorithm based on 1000 permutations, to assess differences between rural and urban individuals. (b, f): First and second principal component loadings of N-glycan-specific
Rural
Urban
Rural
Urban
Rural
Urban
4
5
6
7
8
9
Log 2
MF
I, Ig
E
G34 G73 G37
0.00 0.05 0.10 0.15 0.20
-0.15
-0.10
-0.05
0.00
0.05
0.10
0.15
0.20
PC1 (26.9%)
PC
2 (8
.7%
)
Rural + urban, IgG
Rural
Urban
-20
-10
0
10
20
60
Sco
res
for
PC
1, Ig
E
Rural
Urban
-20
-10
0
10
20
30
Sco
res
for
PC
2, Ig
E
Rural
Urban
Rural
Urban
Rural
Urban
0
5
10
15
Log 2
MFI
, IgG
G34 G73 G37
Rural
Urban
-20
0
20
40
Sco
res
for
PC
1, Ig
G
Rural
Urban
-10
0
10
20
30
Sco
res
for
PC
2, Ig
G
Crude p<0.001Adjusted p=0.002
Crude p=0.046Adjusted p=0.013
a b c d
e g hf
0.00 0.05 0.10 0.15 0.20
-0.15
-0.10
-0.05
0.00
0.05
0.10
0.15
0.20
PC1 (26.6%)
PC
2 (9
.7%
)
Rural + urban, IgE
* *
Core β-1,2-xylosylated N-glycans
N-glycans with both core β2Xyl & α3FucCore α-1,3-fucosylated N-glycans
Glycans with neither core β2Xyl nor α3Fuc
194
IgE and IgG responses among all participants, irrespective of survey setting. (c, d, g, h): Box-and-whisker plots showing comparison of PC1 and PC2 scores between rural and urban individuals. Associations between PC scores and survey setting were assessed by linear regression in Stata 13.1. Crude and age- and sex-adjusted p values are shown for significant associations. All analyses were adjusted for survey design using the ‘svy’ command in Stata. *p<0.05; **p<0.01; ***p<0.001. PC1: Principal Component 1; PC2: Principal Component 2
195
DISCUSSION
By studying rural Sm-endemic Ugandan fishing communities and a proximate urban
community, we have dissected antibody responses to core b2Xyl and a3Fuc modified
N-glycans. Antibody responses to the core modified glycans were higher in the rural
communities compared to a proximate urban community. In the urban community, IgE
and IgG to both core b2Xyl and core a3Fuc were positively associated with Sm infection.
In the rural communities, IgE and IgG to core b2Xyl were strongly positively associated
with Sm infection while reactivity to core a3Fuc was elevated in both Sm infected and
uninfected individuals. In the rural communities the concentration of antibodies to core
a3Fuc modified N-glycans peaked ahead of the peak of Sm infection intensity, while the
peak of antibodies to N-glycans with only core b2Xyl coincided with it.
The positive association between current Sm infection and IgE and IgG reactivity to N-
glycans carrying only core a3Fuc in the urban, but not the rural communities, might
reflect universal exposure to infection, and persistence of light infection despite
treatment, in the rural setting. Core a3Fuc is abundant on N-glycans from Sm eggs but
is not expressed by cercarial and adult worm N-glycans19,20,24. It is plausible that
responses to core a3Fuc persist after active infection in high Sm exposure rural settings:
in mice, eggs and hepatic granulomas persist long after clearance of worms64. Another
explanation for elevated responses to a3Fuc in the rural communities, regardless of Sm
infection status, is cross-reactivity. Core α-1,3-fucosylation and b-1,2-xylosylation are
also present on certain plant and insect glycoproteins29,30,65, hence similar core a3Fuc
responses in both Sm infected and uninfected individuals may also be explained by an
exposure other than schistosomes, more prevalent in the rural than the urban setting,
that carries core a3Fuc. The observation that antibodies to core b2Xyl were significantly
higher among Sm infected individuals in both urban and rural settings implies a dominant
role for core b2Xyl (compared to core a3Fuc) in Sm-specific humoral immunity, shown
196
here for the first time. It also appears that responses only to core b2Xyl are more
responsive to change in Sm exposure: core b2Xyl is abundant on cercarial N-glycans
despite being absent in adult worms.
The prominent contribution of core b2Xyl and a3Fuc to cross-reactivity between
schistosomes and other environmental exposures such as pollen, hymenoptera venom
and vegetable foods22,37,38 is a caveat against the use of core modified glycans in
schistosome diagnostic tests. Cross-reactivity with other helminth infections might also
occur, but only a few other helminth species25-28, none of which are prevalent in humans
in our survey settings, have so far been demonstrated to express glycans with core b2Xyl
and a3Fuc motifs. More extensive glycomic studies of other helminths in our survey
settings (S. stercoralis, hookworm, T. trichiura, A. lumbricoides, M. perstans) are
warranted. However, we did not find any significant associations between these
infections and IgE or IgG reactivity to core modified glycans.
Our observations that IgE and IgG reactivity to N-glycans modified with antennae
carrying LDNF and LeX units were associated with Sm infection in both surveys are
consistent with previous studies in animal models and in humans49,66. No associations
were observed with responses to glycans carrying unsubstituted LDN units.
Principal component analysis indicated strong correlations between antibody responses
to b-1,2-xylosylated glycans and responses to a-1,3-fucosylated glycans in both surveys.
Core b2Xyl and a3Fuc epitopes can be found on similar Sm antigens, where they may
be expressed on the same glycoproteins and glycans (such as those expressed by
SEA)19, inducing analogous immune responses36. Non-xylosylated and non-fucosylated
glycans with antennae constructed of LDN, LDN-F or LeX units may be expressed on
the same Sm antigens as glycans with core b2Xyl and a3Fuc motifs. Furthermore, these
terminal antennary substitutions can occur on the same glycans as core b2Xyl and
a3Fuc19,39,43. However, PCA showed that responses to non-core-substituted glycans with
197
LDN, LDN-F or LeX units did not cluster with core b2Xyl/a3Fuc substituted glycans.
Temporal changes in expression of glycans on Sm antigens have been reported20,34; it is
possible that these two groups of glycans are expressed at varying magnitudes during
Sm antigen maturation. Positive associations between Sm infection and the first principal
component (representing responses to core b2Xyl and a3Fuc) reflect the important role
of these core substitutions in the glycan-dependent host response to Sm. To further
evaluate their contribution to the host immune response to Sm, it will be important to
compare their antibody reactivity with that of other highly antigenic terminal motifs absent
from glycans on the array used in this study, such as multi-fucosylated LDN motifs59. It
is important to note that while IgG is abundantly detected to many schistosome glycans,
and is triggered by Sm infection, only to core b2Xyl and a3Fuc modified glycans is IgE
abundantly detected46,47,67.
Notably in the urban survey, PCA showed that IgE responses to core b2Xyl modified
glycans clustered with responses to non-xylosylated and non-fucosylated glycans
(Figure 4c), and IgG responses to core b2Xyl and a3Fuc separated out less distinctly
(Figure 4d) than in the rural survey. The observed b2Xyl clustering patterns may be
attributed to the greater intensity of repeated exposure to schistosome cercariae (core
b2Xyl) and sustained egg deposition (core b2Xyl and a3Fuc) among rural compared to
urban participants. In other words, rural-urban differences in antibody responses to core
modified glycans may be indicative of differences in the intensity of Sm infection and/or
degree of exposure between the two settings. However, this study did not have sufficient
power to assess statistical interactions between the rural and the urban setting. Rural-
urban differences in antibody responses to core modified glycans may also be explained
by exposures other than schistosomes (mentioned above), perhaps more prevalent in
the rural than the urban setting; however, this is unlikely as we observed strong
associations between Sm infection and reactivity to core modified N-glycans, particularly
to those carrying core b2Xyl. It is also noteworthy that urban survey participants were
198
significantly younger than rural participants; however, this disparity did not seem to
influence the observed rural-urban differences in anti-glycan responses, as observed
from test statistics before and after adjusting for age.
One of the key challenges in schistosomiasis vaccine development is the risk of allergic
(IgE) sensitisation to candidate vaccine antigens68. Glycans are attractive vaccine
candidates because they are generally considered to be benign as allergenic
determinants69,70. There are a few known exceptions, such as the galactose-α-1,3-
galactose (α-1,3-gal) epitope (found in non-primate mammalian proteins, and shown to
elicit severe allergy)71, so assessment for any associations between IgE to antigenic Sm
glycans and allergy-related phenomena are important. The case for consideration of core
modified Sm glycans as Schistosoma vaccine candidates will also need definite proof for
an association between reactivity to core modified glycans and protection from Sm
infection/re-infection. Our data suggests that a protective role, if any, is more plausible
for core b2Xyl than core a3Fuc: in the rural survey, antibody responses to core a3Fuc
(G73 and G37, Figure 3C and 3D) peaked in childhood, prior to the Sm infection peak in
early adolescence, while responses to core b2Xyl (G34) coincided with the Sm infection
peak (preceding the more ‘protected’ period in adulthood). However, concrete evidence
is required from further population and mechanistic studies exploring the role of Sm N-
glycans in protective immunity. For example, it may be important to assess antibodies to
these core modifications (and other antigenic terminal motifs) in re-infection study
cohorts evaluating the immunological characteristics of individuals who are Sm-resistant
following anthelminthic treatment.
In conclusion, we provide an immuno-epidemiological description of IgE and IgG
responses to N-glycans in rural and urban Uganda, highlighting the significance of core
b2Xyl and core a3Fuc to the glycan-dependent host immune response during chronic
schistosomiasis. Moreover, our data imply that IgE and IgG responses to core b2Xyl
and a3Fuc modified N-glycans have distinctive relationships with Sm infection and
199
intensity, which may reflect their different contributions towards protective immunity
against Sm that need to be further explored using mechanistic animal and human
studies.
Acknowledgements
We thank Koome sub-county and Entebbe municipality community members for
participating in the rural survey (LaVIISWA) and in the urban survey, respectively. We
are grateful for important contributions from all LaVIISWA and urban survey staff. We
also thank Ms Grace Nabakooza and Mr Moses Egesa for technical assistance in the
implementation of HCA and the global test in R.
Funding
The LaVIISWA study (herein the ‘rural survey’) and the urban survey were funded by the
Wellcome Trust, grant 095778 awarded to A.M.E. G.N is supported by a PhD fellowship
from the African Partnership for Chronic Disease Research (APCDR) and received
further support for glycan microarray experiments from the Royal Society of Tropical
Medicine and Hygiene (grant GR000904). G.N is an honorary fellow, and R.E.S a PhD
fellow, of the Makerere University – Uganda Virus Research Institute Centre of
Excellence for Infection and Immunity Research and Training (MUII-plus). MUII-plus is
funded under the DELTAS Africa Initiative. The DELTAS Africa Initiative is an
independent funding scheme of the African Academy of Sciences (AAS), Alliance for
Accelerating Excellence in Science in Africa (AESA) and supported by the New
Partnership for Africa’s Development Planning and Coordinating Agency (NEPAD
Agency) with funding from the Wellcome Trust (grant 107743) and the UK Government.
Author contributions
G.N, C.H.H, M.Y, A.M.E, R.v.R, and A.v.D contributed to the conception and
experimental design of the study. A.M.E, R.E.S and M.N led the field and clinic
procedures. S.S and N.C.R constructed the synthetic microarrays. G.N conducted the
200
microarray antibody binding experiments. G.N, J.N, J.K and I.N participated in
establishing and conducting all other immunological and parasitological experiments.
G.N analysed the data with important contributions from E.L.W and A.v.D. G.N wrote the
manuscript, with all authors contributing to the interpretation of the results, and revision
and approval of the final manuscript. G.N is the guarantor of the article.
Data availability
The datasets generated during and/or analysed during the current study are available
from the corresponding author on reasonable request.
Competing interests
The authors declare no competing interests.
References
1 Colley, D. G., Bustinduy, A. L., Secor, W. E. & King, C. H. Human schistosomiasis. The Lancet 383, 2253-2264, doi:10.1016/S0140-6736(13)61949-2 (2014).
2 Toor, J. et al. Are We on Our Way to Achieving the 2020 Goals for Schistosomiasis Morbidity Control Using Current World Health Organization Guidelines? Clin Infect Dis 66, S245-S252, doi:10.1093/cid/ciy001 (2018).
3 Global Health Estimates 2015: Disease burden by Cause, Age, Sex, by Country and by Region, 2000-2015. Geneva, World Health Organization; 2016.
4 Secor, W. E. & Montgomery, S. P. Something old, something new: is praziquantel enough for schistosomiasis control? Future Med Chem 7, 681-684, doi:10.4155/fmc.15.9 (2015).
5 King, C. H. The evolving schistosomiasis agenda 2007-2017-Why we are moving beyond morbidity control toward elimination of transmission. PLoS Negl Trop Dis 11, e0005517, doi:10.1371/journal.pntd.0005517 (2017).
6 Sokolow, S. H. et al. Global Assessment of Schistosomiasis Control Over the Past Century Shows Targeting the Snail Intermediate Host Works Best. PLoS Negl Trop Dis 10, e0004794, doi:10.1371/journal.pntd.0004794 (2016).
7 Tebeje, B. M., Harvie, M., You, H., Loukas, A. & McManus, D. P. Schistosomiasis vaccines: where do we stand? Parasites & Vectors 9, 528, doi:10.1186/s13071-016-1799-4 (2016).
8 Omer-Ali, P., Magee, A. I., Kelly, C. & Simpson, A. J. A major role for carbohydrate epitopes preferentially recognized by chronically infected mice in the determination of Schistosoma mansoni schistosomulum surface antigenicity. Journal of immunology (Baltimore, Md. : 1950) 137, 3601-3607 (1986).
201
9 Eberl, M. et al. Antibodies to glycans dominate the host response to schistosome larvae and eggs: is their role protective or subversive? J Infect Dis 183, 1238-1247, doi:10.1086/319691 (2001).
10 Kariuki, T. M., Farah, I. O., Wilson, R. A. & Coulson, P. S. Antibodies elicited by the secretions from schistosome cercariae and eggs are predominantly against glycan epitopes. Parasite immunology 30, 554-562, doi:10.1111/j.1365-3024.2008.01054.x (2008).
11 Okano, M., Satoskar, A. R., Nishizaki, K., Abe, M. & Harn, D. A., Jr. Induction of Th2 responses and IgE is largely due to carbohydrates functioning as adjuvants on Schistosoma mansoni egg antigens. Journal of immunology (Baltimore, Md. : 1950) 163, 6712-6717 (1999).
12 Everts, B. et al. Schistosome-derived omega-1 drives Th2 polarization by suppressing protein synthesis following internalization by the mannose receptor. The Journal of experimental medicine 209, 1753-1767, s1751, doi:10.1084/jem.20111381 (2012).
13 van de Vijver, K. K. et al. Glycans of Schistosoma mansoni and keyhole limpet haemocyanin induce hepatic granulomas in vivo. Int J Parasitol 34, 951-961, doi:10.1016/j.ijpara.2004.04.009 (2004).
14 Elliott, A. M. et al. Ethical and scientific considerations on the establishment of a controlled human infection model for schistosomiasis in Uganda: report of a stakeholders’ meeting held in Entebbe, Uganda. [version 1; referees: 2 approved] AAS Open Research, doi:10.12688/aasopenres.12841.1 (2018).
15 PATH. Schistosomiasis: The Business Case for New Diagnostics. Seattle: PATH; 2016.
16 Utzinger, J., Becker, S. L., van Lieshout, L., van Dam, G. J. & Knopp, S. New diagnostic tools in schistosomiasis. Clinical Microbiology and Infection 21, 529-542, doi:https://doi.org/10.1016/j.cmi.2015.03.014 (2015).
17 van Diepen, A. et al. Development of a Schistosoma mansoni shotgun O-glycan microarray and application to the discovery of new antigenic schistosome glycan motifs. Int J Parasitol 45, 465-475, doi:10.1016/j.ijpara.2015.02.008 (2015).
18 Nyame, A. K., Kawar, Z. S. & Cummings, R. D. Antigenic glycans in parasitic infections: implications for vaccines and diagnostics. Archives of biochemistry and biophysics 426, 182-200, doi:10.1016/j.abb.2004.04.004 (2004).
19 Hokke, C. H. & van Diepen, A. Helminth glycomics – glycan repertoires and host-parasite interactions. Molecular and Biochemical Parasitology 215, 47-57, doi:https://doi.org/10.1016/j.molbiopara.2016.12.001 (2017).
20 Smit, C. H. et al. Glycomic Analysis of Life Stages of the Human Parasite Schistosoma mansoni Reveals Developmental Expression Profiles of Functional and Antigenic Glycan Motifs. Molecular & cellular proteomics : MCP 14, 1750-1769, doi:10.1074/mcp.M115.048280 (2015).
21 Haslam, S. M., Morris, H. R. & Dell, A. Mass spectrometric strategies: providing structural clues for helminth glycoproteins. Trends in parasitology 17, 231-235 (2001).
202
22 Altmann, F. The role of protein glycosylation in allergy. Int Arch Allergy Immunol 142, 99-115, doi:10.1159/000096114 (2007).
23 Commins, S. P. Carbohydrates as allergens. Current allergy and asthma reports 15, 492, doi:10.1007/s11882-014-0492-y (2015).
24 Khoo, K.-H., Chatterjee, D., Caulfield, J. P., Morris, H. R. & Dell, A. Structural mapping of the glycans from the egg glycoproteins of Schistosoma mansoni and Schistosoma japonicum: identification of novel core structures and terminal sequences. Glycobiology 7, 663-677, doi:10.1093/glycob/7.5.663 (1997).
25 van Die, I. et al. Core alpha1-->3-fucose is a common modification of N-glycans in parasitic helminths and constitutes an important epitope for IgE from Haemonchus contortus infected sheep. FEBS letters 463, 189-193 (1999).
26 Yan, S. et al. Core Richness of N-Glycans of Caenorhabditis elegans: A Case Study on Chemical and Enzymatic Release. Analytical chemistry 90, 928-935, doi:10.1021/acs.analchem.7b03898 (2018).
27 Haslam, S. M., Coles, G. C., Reason, A. J., Morris, H. R. & Dell, A. The novel core fucosylation of Haemonchus contortus N-glycans is stage specific. Molecular and Biochemical Parasitology 93, 143-147, doi:https://doi.org/10.1016/S0166-6851(98)00020-6 (1998).
28 Haslam, S. M. et al. Haemonchus contortus glycoproteins contain N-linked oligosaccharides with novel highly fucosylated core structures. The Journal of biological chemistry 271, 30561-30570 (1996).
29 Aalberse, R. C., Koshte, V. & Clemens, J. G. J. Immunoglobulin E antibodies that crossreact with vegetable foods, pollen, and Hymenoptera venom. Journal of Allergy and Clinical Immunology 68, 356-364, doi:https://doi.org/10.1016/0091-6749(81)90133-0 (1981).
30 Fabini, G., Freilinger, A., Altmann, F. & Wilson, I. B. H. Identification of Core α1,3-Fucosylated Glycans and Cloning of the Requisite Fucosyltransferase cDNA from Drosophila melanogaster : POTENTIAL BASIS OF THE NEURAL ANTI-HORSERADISH PEROXIDASE EPITOPE. Journal of Biological Chemistry 276, 28058-28067, doi:10.1074/jbc.M100573200 (2001).
31 Fötisch, K., Altmann, F., Haustein, D. & Vieths, S. Involvement of Carbohydrate Epitopes in the IgE Response of Celery–Allergic Patients. International Archives of Allergy and Immunology 120, 30-42 (1999).
32 Fournet, B. et al. Primary structure of an N-glycosidic carbohydrate unit derived from Sophora japonica lectin. European journal of biochemistry 166, 321-324 (1987).
33 Ramirez-Soto, D. & Poretz, R. D. The (1----3)-linked alpha-L-fucosyl group of the N-glycans of the Wistaria floribunda lectins is recognized by a rabbit anti-serum. Carbohydrate research 213, 27-36 (1991).
34 Smit, C. H. et al. Surface expression patterns of defined glycan antigens change during Schistosoma mansoni cercarial transformation and development of schistosomula. Glycobiology 25, 1465-1479, doi:10.1093/glycob/cwv066 (2015).
203
35 Wuhrer, M., Koeleman, C. A., Deelder, A. M. & Hokke, C. H. Repeats of LacdiNAc and fucosylated LacdiNAc on N-glycans of the human parasite Schistosoma mansoni. The FEBS journal 273, 347-361, doi:10.1111/j.1742-4658.2005.05068.x (2006).
36 Faveeuw, C. et al. Schistosome N-glycans containing core alpha 3-fucose and core beta 2-xylose epitopes are strong inducers of Th2 responses in mice. European journal of immunology 33, 1271-1281, doi:10.1002/eji.200323717 (2003).
37 Wilson, I. B. & Altmann, F. Structural analysis of N-glycans from allergenic grass, ragweed and tree pollens: core alpha1,3-linked fucose and xylose present in all pollens examined. Glycoconj J 15, 1055-1070 (1998).
38 Wilson, I. B. H., Harthill, J. E., Mullin, N. P., Ashford, D. A. & Altmann, F. Core α1,3-fucose is a key part of the epitope recognized by antibodies reacting against plant N-linked oligosaccharides and is present in a wide variety of plant extracts. Glycobiology 8, 651-661, doi:10.1093/glycob/8.7.651 (1998).
39 Meevissen, M. H. et al. Structural characterization of glycans on omega-1, a major Schistosoma mansoni egg glycoprotein that drives Th2 responses. Journal of proteome research 9, 2630-2642, doi:10.1021/pr100081c (2010).
40 Zaccone, P. et al. The S. mansoni glycoprotein omega-1 induces Foxp3 expression in NOD mouse CD4(+) T cells. Eur. J. Immunol. 41, 2709-2718, doi:10.1002/eji.201141429 (2011).
41 Everts, B. et al. Omega-1, a glycoprotein secreted by Schistosoma mansoni eggs, drives Th2 responses. The Journal of experimental medicine 206, 1673-1680, doi:10.1084/jem.20082460 (2009).
42 Schramm, G. et al. Molecular characterisation of kappa-5, a major antigenic glycoprotein from Schistosoma mansoni eggs. Mol Biochem Parasitol 166, 4-14, doi:10.1016/j.molbiopara.2009.02.003 (2009).
43 Meevissen, M. H. et al. Targeted glycoproteomic analysis reveals that kappa-5 is a major, uniquely glycosylated component of Schistosoma mansoni egg antigens. Molecular & cellular proteomics : MCP 10, M110 005710, doi:10.1074/mcp.M110.005710 (2011).
44 Dunne, D. W., Butterworth, A. E., Fulford, A. J., Ouma, J. H. & Sturrock, R. F. Human IgE responses to Schistosoma mansoni and resistance to reinfection. Memorias do Instituto Oswaldo Cruz 87 Suppl 4, 99-103 (1992).
45 Demeure, C. E. et al. Resistance to Schistosoma mansoni in Humans: Influence of the IgE/IgG4 Balance and IgG2 in Immunity to Reinfection after Chemotherapy. The Journal of Infectious Diseases 168, 1000-1008 (1993).
46 Amoah, A. S. et al. Identification of dominant anti-glycan IgE responses in school children by glycan microarray. The Journal of allergy and clinical immunology 141, 1130-1133, doi:10.1016/j.jaci.2017.09.040 (2018).
47 Yang, Y. Y., van Diepen, A., Brzezicka, K., Reichardt, N. C. & Hokke, C. H. Glycan microarray-assisted identification of IgG subclass targets in
204
schistosomiasis. Frontiers in Immunology, doi:10.3389/fimmu.2018.02331 (2018).
48 Brzezicka, K. et al. Synthesis and microarray-assisted binding studies of core xylose and fucose containing N-glycans. ACS Chem Biol 10, 1290-1302, doi:10.1021/cb501023u (2015).
49 van Diepen, A. et al. Differential anti-glycan antibody responses in Schistosoma mansoni-infected children and adults studied by shotgun glycan microarray. PLoS Negl Trop Dis 6, e1922, doi:10.1371/journal.pntd.0001922 (2012).
50 Nampijja, M. et al. The Lake Victoria island intervention study on worms and allergy-related diseases (LaVIISWA): study protocol for a randomised controlled trial. Trials 16, 187, doi:10.1186/s13063-015-0702-5 (2015).
51 Nkurunungi, G. et al. Schistosoma mansoni-specific immune responses and allergy in Uganda. Parasite immunology 40, doi:10.1111/pim.12506 (2018).
52 Sanya, R. E. et al. The Impact of Intensive Versus Standard Anthelminthic Treatment on Allergy-related Outcomes, Helminth Infection Intensity, and Helminth-related Morbidity in Lake Victoria Fishing Communities, Uganda: Results From the LaVIISWA Cluster-randomized Trial. Clinical Infectious Diseases, ciy761-ciy761, doi:10.1093/cid/ciy761 (2018).
53 Webb, E. L. et al. Helminths are positively associated with atopy and wheeze in Ugandan fishing communities: results from a cross-sectional survey. Allergy 71, 1156-1169, doi:10.1111/all.12867 (2016).
54 Katz, N., Chaves, A. & Pellegrino, J. A simple device for quantitative stool thick-smear technique in Schistosomiasis mansoni. Rev Inst Med Trop Sao Paulo 14, 397-400 (1972).
55 Verweij, J. J. et al. Simultaneous detection and quantification of Ancylostoma duodenale, Necator americanus, and Oesophagostomum bifurcum in fecal samples using multiplex real-time PCR. The American journal of tropical medicine and hygiene 77, 685-690 (2007).
56 Verweij, J. J. et al. Molecular diagnosis of Strongyloides stercoralis in faecal samples using real-time PCR. Trans R Soc Trop Med Hyg 103, 342-346, doi:10.1016/j.trstmh.2008.12.001 (2009).
57 Emmanuel, I. O. A. & Ekkehard, D. Epidemiology, of bilharzias (schistosomiasis) in Uganda from 1902 until 2005. African Health Sciences 8, 239-243 (2008).
58 Echeverria, B. et al. Chemoenzymatic Synthesis of N-glycan Positional Isomers and Evidence for Branch Selective Binding by Monoclonal Antibodies and Human C-type Lectin Receptors. ACS Chemical Biology 13, 2269-2279, doi:10.1021/acschembio.8b00431 (2018).
59 Yang, Y. Y. et al. Specific anti-glycan antibodies are sustained during and after parasite clearance in Schistosoma japonicum-infected rhesus macaques. PLoS Negl Trop Dis 11, e0005339, doi:10.1371/journal.pntd.0005339 (2017).
205
60 Oyelaran, O., McShane, L. M., Dodd, L. & Gildersleeve, J. C. Profiling human serum antibodies with a carbohydrate antigen microarray. Journal of proteome research 8, 4301-4310, doi:10.1021/pr900515y (2009).
61 Goeman, J. J. & Oosting, J. Globaltest R package, version 5.33.0. (2016).
62 Goeman, J. J., van de Geer, S. A., de Kort, F. & van Houwelingen, H. C. A global test for groups of genes: testing association with a clinical outcome. Bioinformatics 20, 93-99 (2004).
63 Goeman, J. J., Van De Geer, S. A. & Van Houwelingen, H. C. Testing against a high dimensional alternative. Journal of the Royal Statistical Society: Series B 68, 477-493 (2006).
64 Cheever, A. W., Macedonia, J. G., Deb, S., Cheever, E. A. & Mosimann, J. E. Persistence of eggs and hepatic fibrosis after treatment of Schistosoma mansoni-infected mice. The American journal of tropical medicine and hygiene 46, 752-758 (1992).
65 Bardor, M. et al. Immunoreactivity in mammals of two typical plant glyco-epitopes, core alpha(1,3)-fucose and core xylose. Glycobiology 13, 427-434, doi:10.1093/glycob/cwg024 (2003).
66 Luyai, A. E. et al. Differential expression of anti-glycan antibodies in schistosome-infected humans, rhesus monkeys and mice. Glycobiology 24, 602-618, doi:10.1093/glycob/cwu029 (2014).
67 van Diepen, A., Van der Velden, N. S., Smit, C. H., Meevissen, M. H. & Hokke, C. H. Parasite glycans and antibody-mediated immune responses in Schistosoma infection. Parasitology 139, 1219-1230, doi:10.1017/s0031182012000273 (2012).
68 Diemert, D. J. et al. Generalized urticaria induced by the Na-ASP-2 hookworm vaccine: implications for the development of vaccines against helminths. The Journal of allergy and clinical immunology 130, 169-176.e166, doi:10.1016/j.jaci.2012.04.027 (2012).
69 Mari, A. et al. Evaluation by double-blind placebo-controlled oral challenge of the clinical relevance of IgE antibodies against plant glycans. Allergy 63, 891-896, doi:10.1111/j.1398-9995.2008.01703.x (2008).
70 Hemmer, W. in Anticarbohydrate Antibodies: From Molecular Basis to Clinical Application (eds Paul Kosma & Sven Müller-Loennies) 181-202 (Springer Vienna, 2012).
71 Commins, S. P. et al. Delayed anaphylaxis, angioedema, or urticaria after consumption of red meat in patients with IgE antibodies specific for galactose-α-1,3-galactose. Journal of Allergy and Clinical Immunology 123, 426-433.e422, doi:https://doi.org/10.1016/j.jaci.2008.10.052 (2009).
206
6.3 Supplementary information for Research paper 3 (also available in the
article’s online repository at https://www.nature.com/srep/)
6.3.1 Experimental methods
6.3.1.1 S. mansoni adult worm (SWA)- and egg (SEA)-specific IgE and IgG4 ELISA
All but the first 2 columns of 4HBX Immulon (Thermo Scientific, NY, USA) 96-well plates
were coated with 50μl of SWA [8 μg/ml] or SEA [2.4 μg/ml] (purchased from Professor
Michael J Doenhoff, University of Nottingham) in bicarbonate (Na2CO3 + NaHCO3) buffer
(0.1M, pH 9.6). Two-fold dilutions of human IgE (Calbiochem, Beeston, UK) or IgG4
(Sigma-Aldrich) standard, diluted in bicarbonate buffer, were added to the first 2 columns
of each plate to form standard curves. The plates were then incubated overnight at 4ºC.
Plates were washed with phosphate-buffered saline (PBS 1X)-tween 20 solution,
blocked with 150μl of 1% skimmed milk diluted in PBS-Tween 20 at room temperature
(RT), and incubated overnight at 4ºC with 50μl of plasma samples diluted 1/20 (IgE
assay) or 1/200 (IgG4 assay) with 0.1% skimmed milk in PBS-Tween 20 (assay buffer).
Plates were washed and antibody binding detected by incubating the plates overnight at
4ºC with 0.5μg/ml of biotinylated monoclonal mouse anti-human IgE or IgG4 (BD
Pharmingen™). This was followed by a 1-hour incubation with a streptavidin-
Horseradish Peroxidase (strep-HRP) conjugate (Mast Group Ltd, Bootle, UK), diluted
1/4000 with assay buffer, at RT. Plates were developed by addition of 100μl of o-
phenylenediamine (Sigma-Aldrich) and reactions stopped after 30 minutes with 25μl of
2M Sulphuric acid. Optical density values were measured at 490nm (reference
wavelength 630nm) on a 96-well plate ELISA reader. IgE or IgG4 concentrations (ng/ml)
were interpolated from standard curves using a five-parameter curve fit using Gen5 data
collection and analysis software (BioTek Instruments Inc, Vermont, Winooski, USA).
6.3.1.2 S. mansoni adult worm (SWA)- and egg (SEA)-specific IgG ELISA
All but the first 2 columns of 4HX Immulon (VWR, UK, Cat No 735-0465) 96-well plates
were coated with 50μl of SWA [8 μg/ml] or SEA [2.4 μg/ml] (purchased from Professor
Michael J Doenhoff, University of Nottingham) in bicarbonate (Na2CO3 + NaHCO3) buffer
207
(0.1M, pH 9.6). Two-fold dilutions of human IgG (Sigma-Aldrich), diluted in bicarbonate
buffer, were added to the first 2 columns of each plate to form standard curves. The
plates were then incubated overnight at 4ºC. Plates were washed with phosphate-
buffered saline (PBS)-Tween 20 solution, blocked with 150μl of 1% skimmed milk diluted
in PBS-Tween 20 at room temperature (RT), and incubated overnight at 4ºC with 50μl of
plasma samples diluted 1/3000 with 0.1% skimmed milk in PBS-Tween 20 (assay
buffer). Plates were washed and antibody binding detected by incubating the plates for
1 hour at RT with 0.5μg/ml of polyclonal rabbit anti- human IgG/HRP (Dako, Denmark).
Plates were developed by addition of 100μl of o-phenylenediamine (Sigma-Aldrich) and
reactions stopped after 30 minutes with 25μl of 2M Sulphuric acid. Optical density values
were measured at 490nm (reference wavelength 630nm) on a 96-well plate ELISA
reader. IgG concentrations (ng/ml) were interpolated from standard curves using a five-
parameter curve fit using Gen5 data collection and analysis software (BioTek
Instruments Inc, Vermont, Winooski, USA).
208
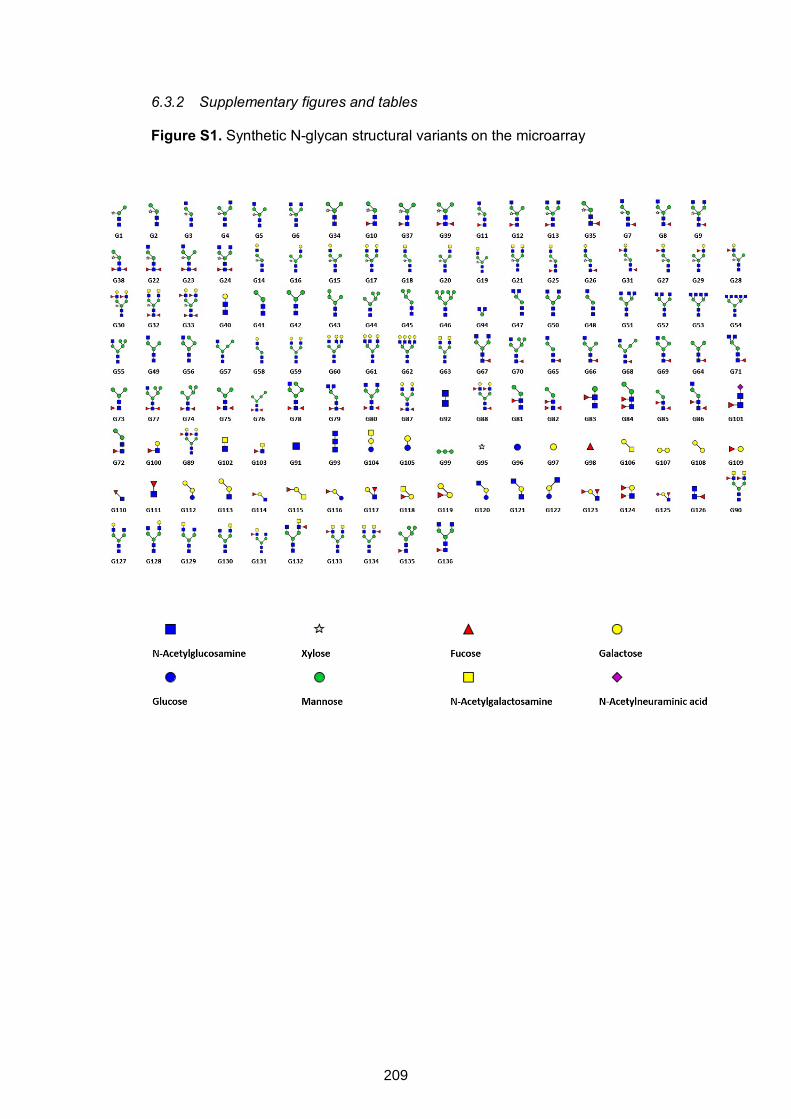
6.3.2 Supplementary figures and tables
Figure S1. Synthetic N-glycan structural variants on the microarray
209
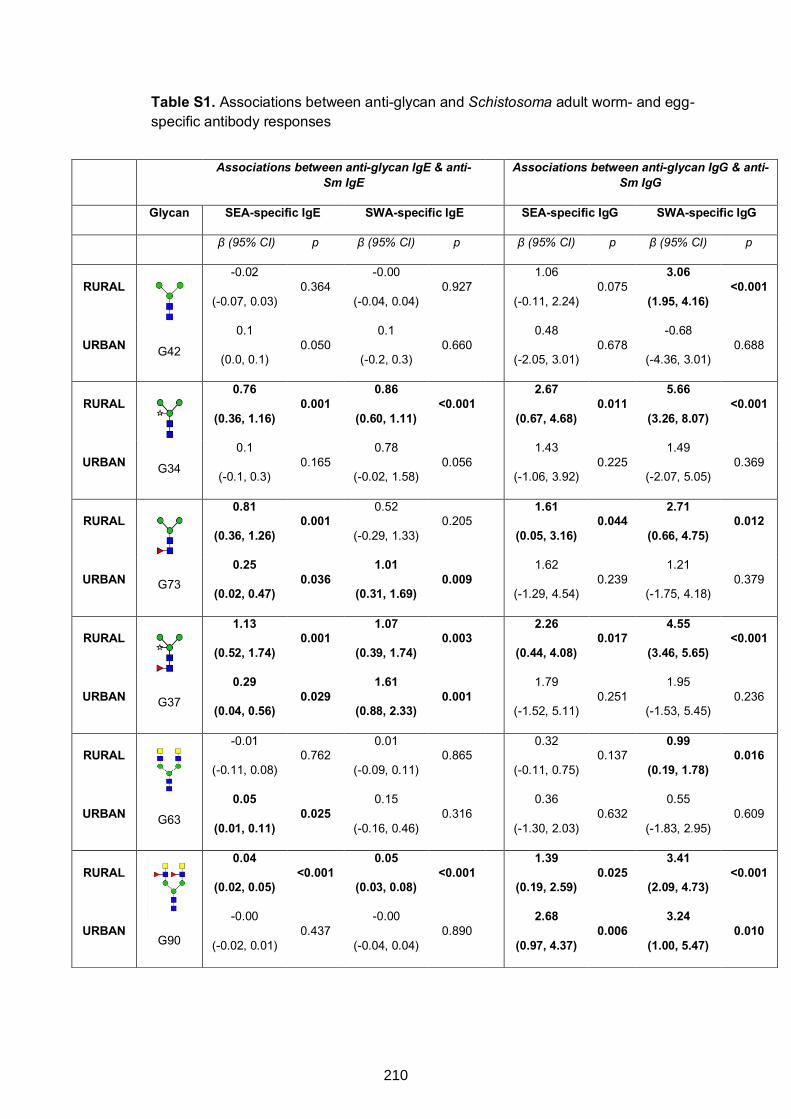
Table S1. Associations between anti-glycan and Schistosoma adult worm- and egg-specific antibody responses
Associations between anti-glycan IgE & anti-Sm IgE Associations between anti-glycan IgG & anti-
Sm IgG
Glycan SEA-specific IgE SWA-specific IgE SEA-specific IgG SWA-specific IgG
β (95% CI) p β (95% CI) p β (95% CI) p β (95% CI) p
RURAL
G42
-0.02
(-0.07, 0.03) 0.364
-0.00
(-0.04, 0.04) 0.927
1.06
(-0.11, 2.24) 0.075
3.06
(1.95, 4.16) <0.001
URBAN 0.1
(0.0, 0.1) 0.050
0.1
(-0.2, 0.3) 0.660
0.48
(-2.05, 3.01) 0.678
-0.68
(-4.36, 3.01) 0.688
RURAL
G34
0.76
(0.36, 1.16) 0.001
0.86
(0.60, 1.11) <0.001
2.67
(0.67, 4.68) 0.011
5.66
(3.26, 8.07) <0.001
URBAN 0.1
(-0.1, 0.3) 0.165
0.78
(-0.02, 1.58) 0.056
1.43
(-1.06, 3.92) 0.225
1.49
(-2.07, 5.05) 0.369
RURAL
G73
0.81
(0.36, 1.26) 0.001
0.52
(-0.29, 1.33) 0.205
1.61
(0.05, 3.16) 0.044
2.71
(0.66, 4.75) 0.012
URBAN 0.25
(0.02, 0.47) 0.036
1.01
(0.31, 1.69) 0.009
1.62
(-1.29, 4.54) 0.239
1.21
(-1.75, 4.18) 0.379
RURAL
G37
1.13
(0.52, 1.74) 0.001
1.07
(0.39, 1.74) 0.003
2.26
(0.44, 4.08) 0.017
4.55
(3.46, 5.65) <0.001
URBAN 0.29
(0.04, 0.56) 0.029
1.61
(0.88, 2.33) 0.001
1.79
(-1.52, 5.11) 0.251
1.95
(-1.53, 5.45) 0.236
RURAL
G63
-0.01
(-0.11, 0.08) 0.762
0.01
(-0.09, 0.11) 0.865
0.32
(-0.11, 0.75) 0.137
0.99
(0.19, 1.78) 0.016
URBAN 0.05
(0.01, 0.11) 0.025
0.15
(-0.16, 0.46) 0.316
0.36
(-1.30, 2.03) 0.632
0.55
(-1.83, 2.95) 0.609
RURAL
G90
0.04
(0.02, 0.05) <0.001
0.05
(0.03, 0.08) <0.001
1.39
(0.19, 2.59) 0.025
3.41
(2.09, 4.73) <0.001
URBAN -0.00
(-0.02, 0.01) 0.437
-0.00
(-0.04, 0.04) 0.890
2.68
(0.97, 4.37) 0.006
3.24
(1.00, 5.47) 0.010
210
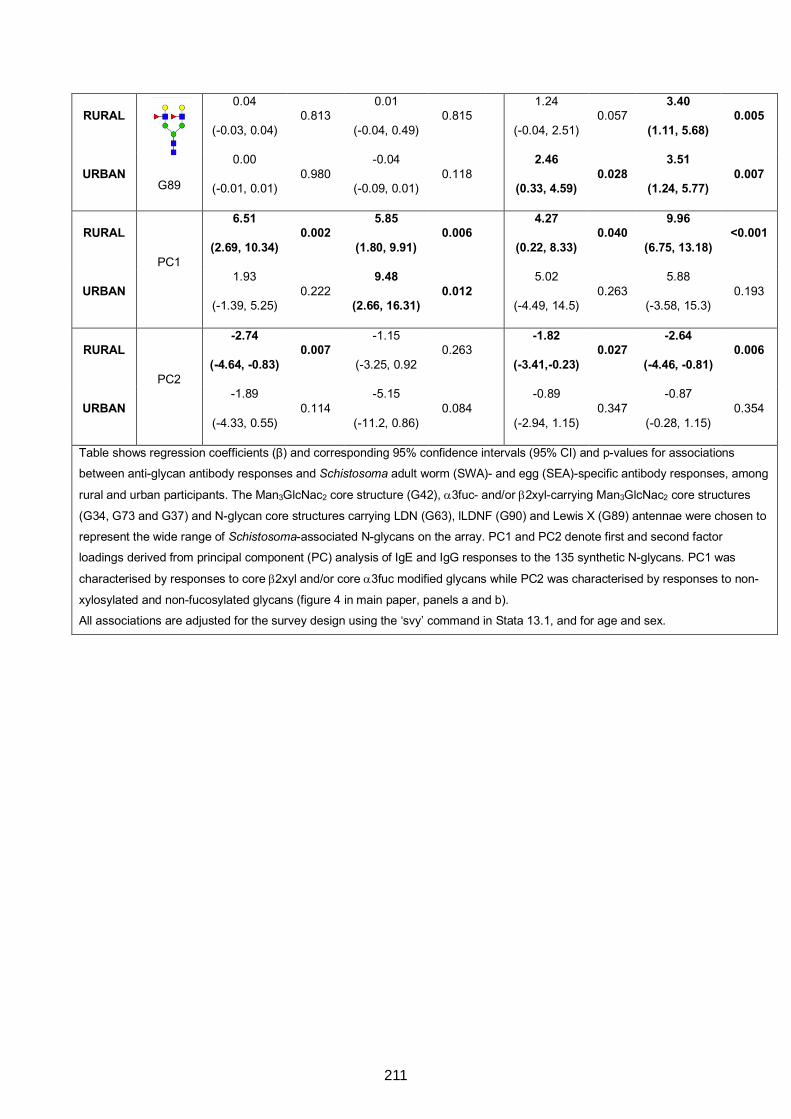
RURAL
G89
0.04
(-0.03, 0.04) 0.813
0.01
(-0.04, 0.49) 0.815
1.24
(-0.04, 2.51) 0.057
3.40
(1.11, 5.68) 0.005
URBAN 0.00
(-0.01, 0.01) 0.980
-0.04
(-0.09, 0.01) 0.118
2.46
(0.33, 4.59) 0.028
3.51
(1.24, 5.77) 0.007
RURAL
PC1
6.51
(2.69, 10.34) 0.002
5.85
(1.80, 9.91) 0.006
4.27
(0.22, 8.33) 0.040
9.96
(6.75, 13.18) <0.001
URBAN 1.93
(-1.39, 5.25) 0.222
9.48
(2.66, 16.31) 0.012
5.02
(-4.49, 14.5) 0.263
5.88
(-3.58, 15.3) 0.193
RURAL
PC2
-2.74
(-4.64, -0.83) 0.007
-1.15
(-3.25, 0.92 0.263
-1.82
(-3.41,-0.23) 0.027
-2.64
(-4.46, -0.81) 0.006
URBAN -1.89
(-4.33, 0.55) 0.114
-5.15
(-11.2, 0.86) 0.084
-0.89
(-2.94, 1.15) 0.347
-0.87
(-0.28, 1.15) 0.354
Table shows regression coefficients (β) and corresponding 95% confidence intervals (95% CI) and p-values for associations
between anti-glycan antibody responses and Schistosoma adult worm (SWA)- and egg (SEA)-specific antibody responses, among
rural and urban participants. The Man3GlcNac2 core structure (G42), a3fuc- and/or b2xyl-carrying Man3GlcNac2 core structures
(G34, G73 and G37) and N-glycan core structures carrying LDN (G63), lLDNF (G90) and Lewis X (G89) antennae were chosen to
represent the wide range of Schistosoma-associated N-glycans on the array. PC1 and PC2 denote first and second factor
loadings derived from principal component (PC) analysis of IgE and IgG responses to the 135 synthetic N-glycans. PC1 was
characterised by responses to core b2xyl and/or core a3fuc modified glycans while PC2 was characterised by responses to non-
xylosylated and non-fucosylated glycans (figure 4 in main paper, panels a and b).
All associations are adjusted for the survey design using the ‘svy’ command in Stata 13.1, and for age and sex.
211

Figure S2. Associations between S. mansoni infection (KK and/or PCR) and IgE and IgG reactivity to N-glycan structural variants carrying a1-3 fucose
and/or b1-2 xylose
RURAL SURVEY
212
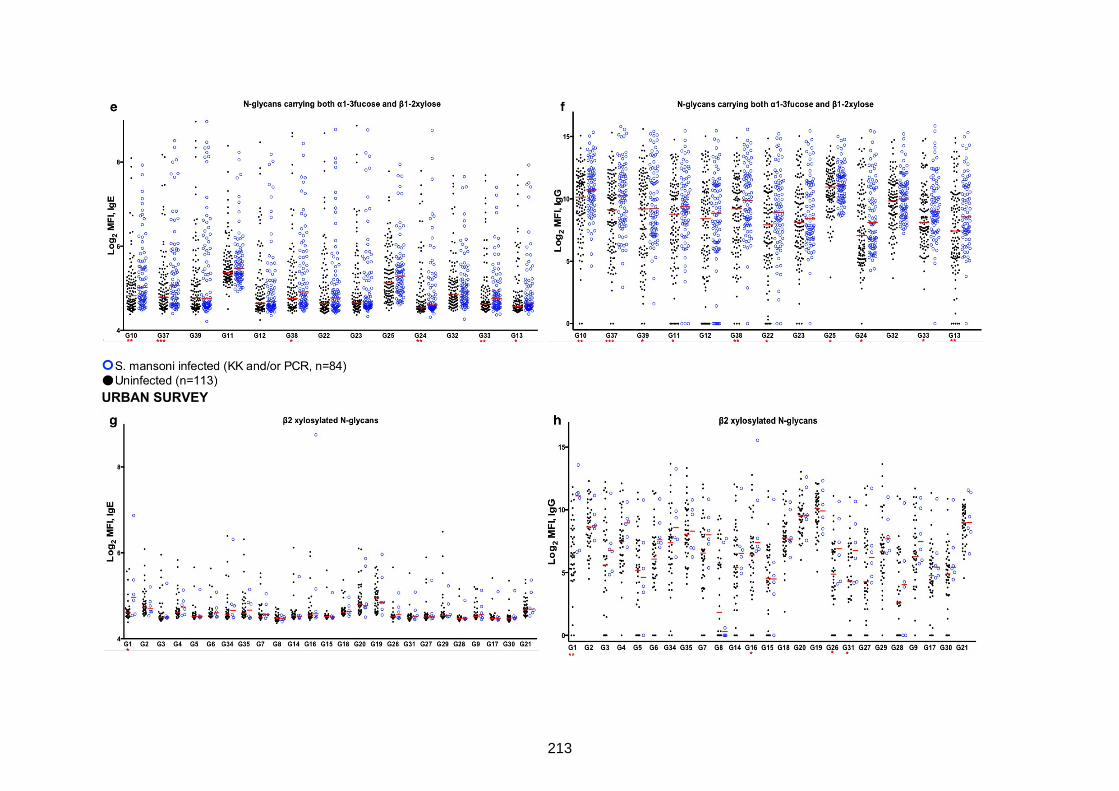
URBAN SURVEY
213
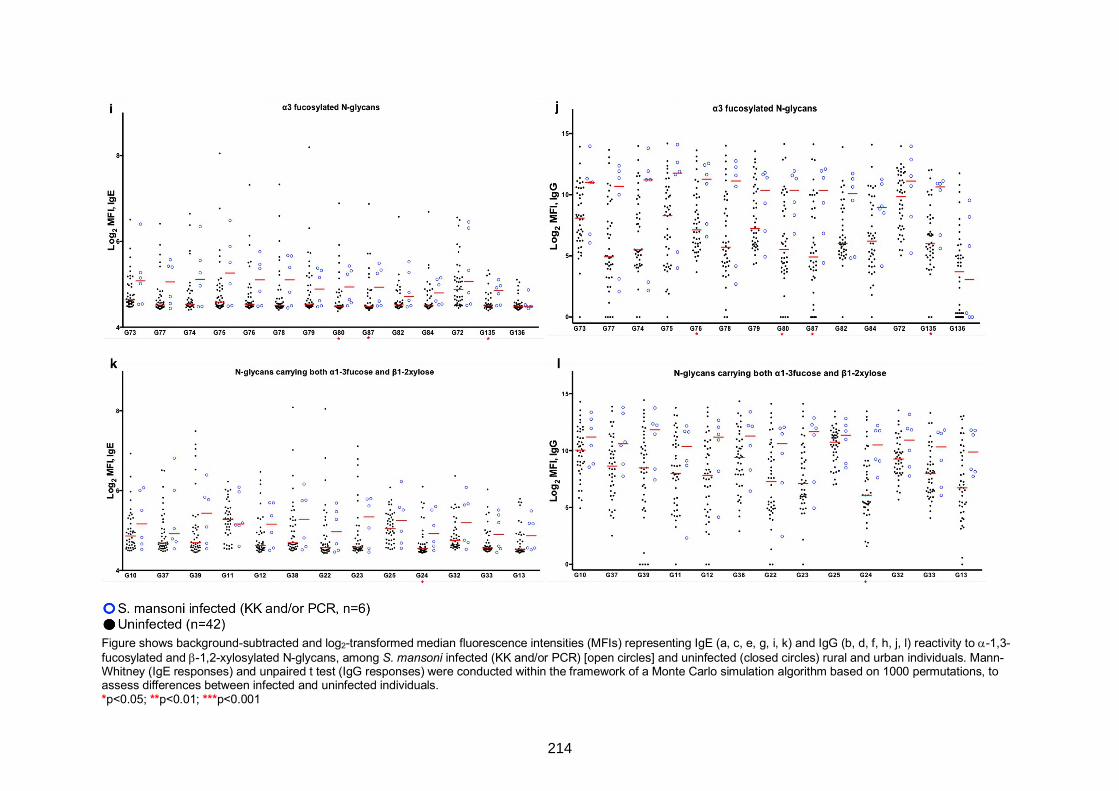
Figure shows background-subtracted and log2-transformed median fluorescence intensities (MFIs) representing IgE (a, c, e, g, i, k) and IgG (b, d, f, h, j, l) reactivity to a-1,3-
fucosylated and b-1,2-xylosylated N-glycans, among S. mansoni infected (KK and/or PCR) [open circles] and uninfected (closed circles) rural and urban individuals. Mann-
Whitney (IgE responses) and unpaired t test (IgG responses) were conducted within the framework of a Monte Carlo simulation algorithm based on 1000 permutations, to
assess differences between infected and uninfected individuals.
*p<0.05; **p<0.01; ***p<0.001
214
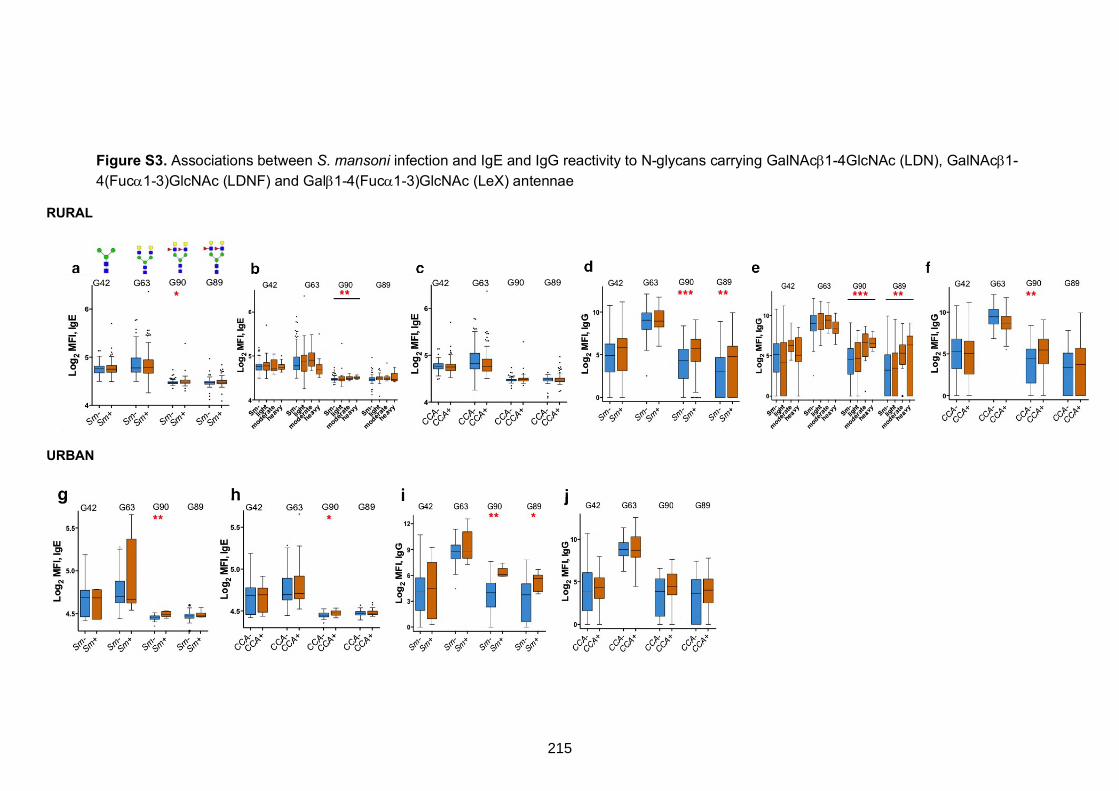
Figure S3. Associations between S. mansoni infection and IgE and IgG reactivity to N-glycans carrying GalNAcb1-4GlcNAc (LDN), GalNAcb1-
4(Fuca1-3)GlcNAc (LDNF) and Galb1-4(Fuca1-3)GlcNAc (LeX) antennae
RURAL
URBAN
215
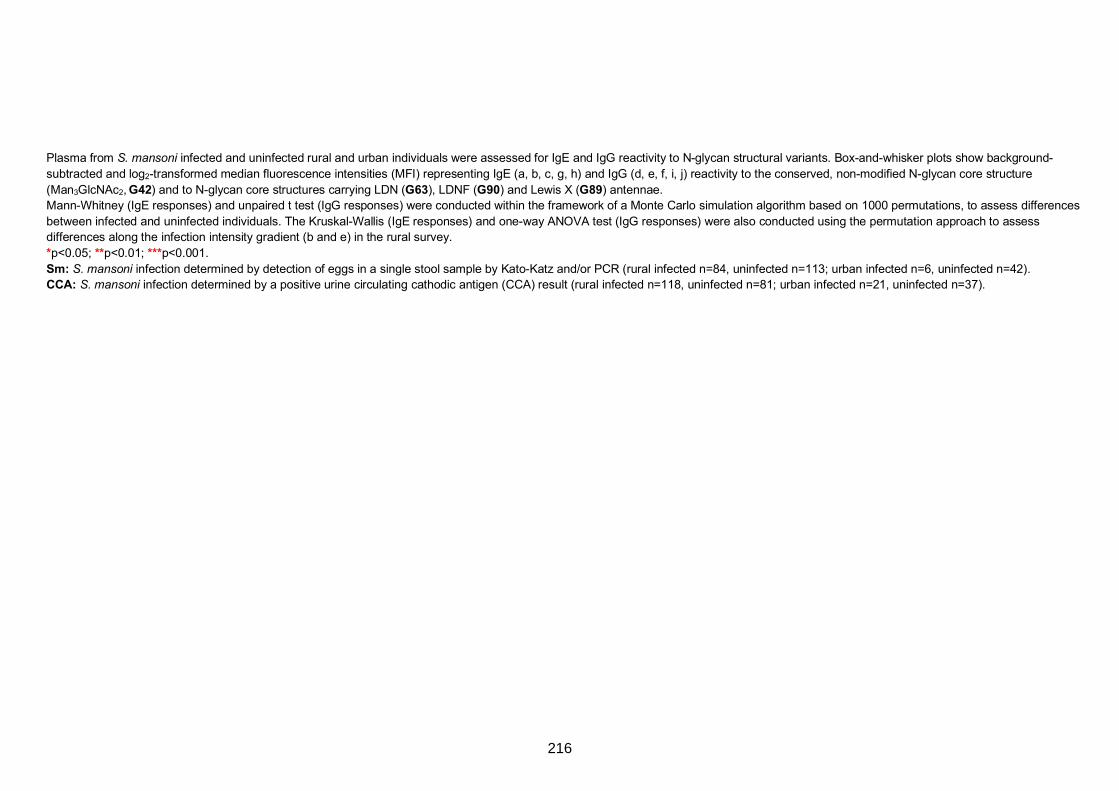
Plasma from S. mansoni infected and uninfected rural and urban individuals were assessed for IgE and IgG reactivity to N-glycan structural variants. Box-and-whisker plots show background-
subtracted and log2-transformed median fluorescence intensities (MFI) representing IgE (a, b, c, g, h) and IgG (d, e, f, i, j) reactivity to the conserved, non-modified N-glycan core structure
(Man3GlcNAc2, G42) and to N-glycan core structures carrying LDN (G63), LDNF (G90) and Lewis X (G89) antennae.
Mann-Whitney (IgE responses) and unpaired t test (IgG responses) were conducted within the framework of a Monte Carlo simulation algorithm based on 1000 permutations, to assess differences
between infected and uninfected individuals. The Kruskal-Wallis (IgE responses) and one-way ANOVA test (IgG responses) were also conducted using the permutation approach to assess
differences along the infection intensity gradient (b and e) in the rural survey.
*p<0.05; **p<0.01; ***p<0.001.
Sm: S. mansoni infection determined by detection of eggs in a single stool sample by Kato-Katz and/or PCR (rural infected n=84, uninfected n=113; urban infected n=6, uninfected n=42).
CCA: S. mansoni infection determined by a positive urine circulating cathodic antigen (CCA) result (rural infected n=118, uninfected n=81; urban infected n=21, uninfected n=37).
216
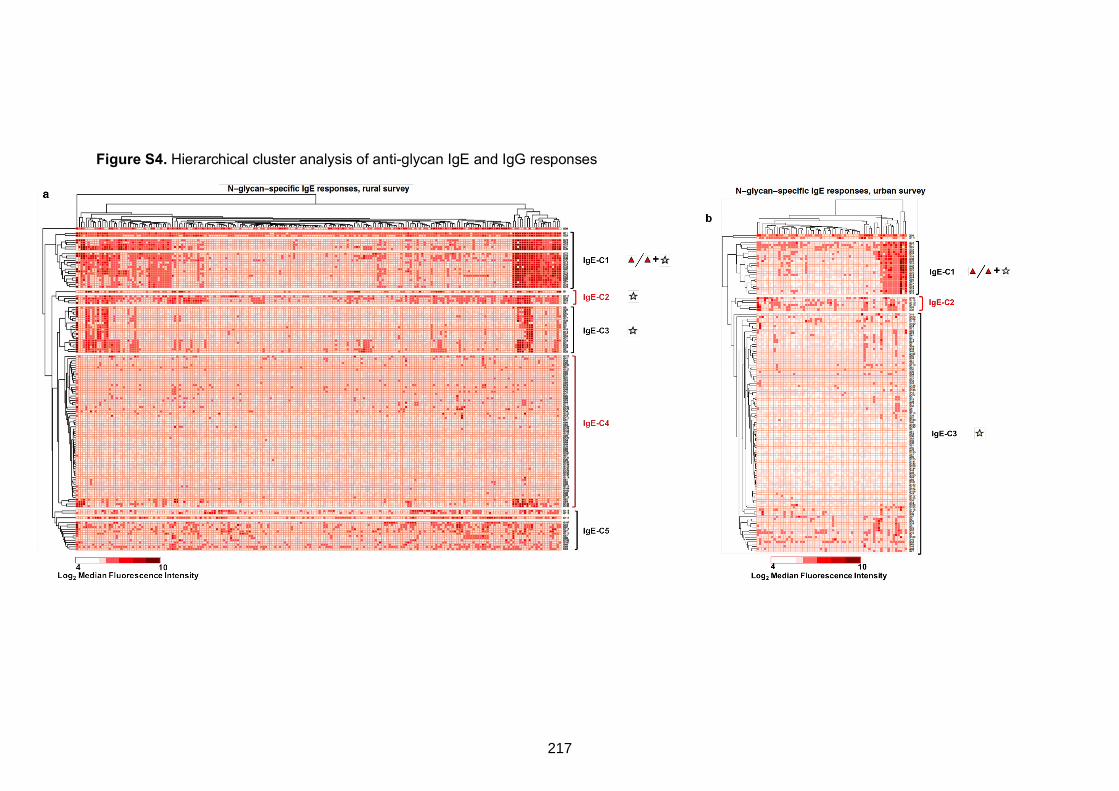
Figure S4. Hierarchical cluster analysis of anti-glycan IgE and IgG responses
217
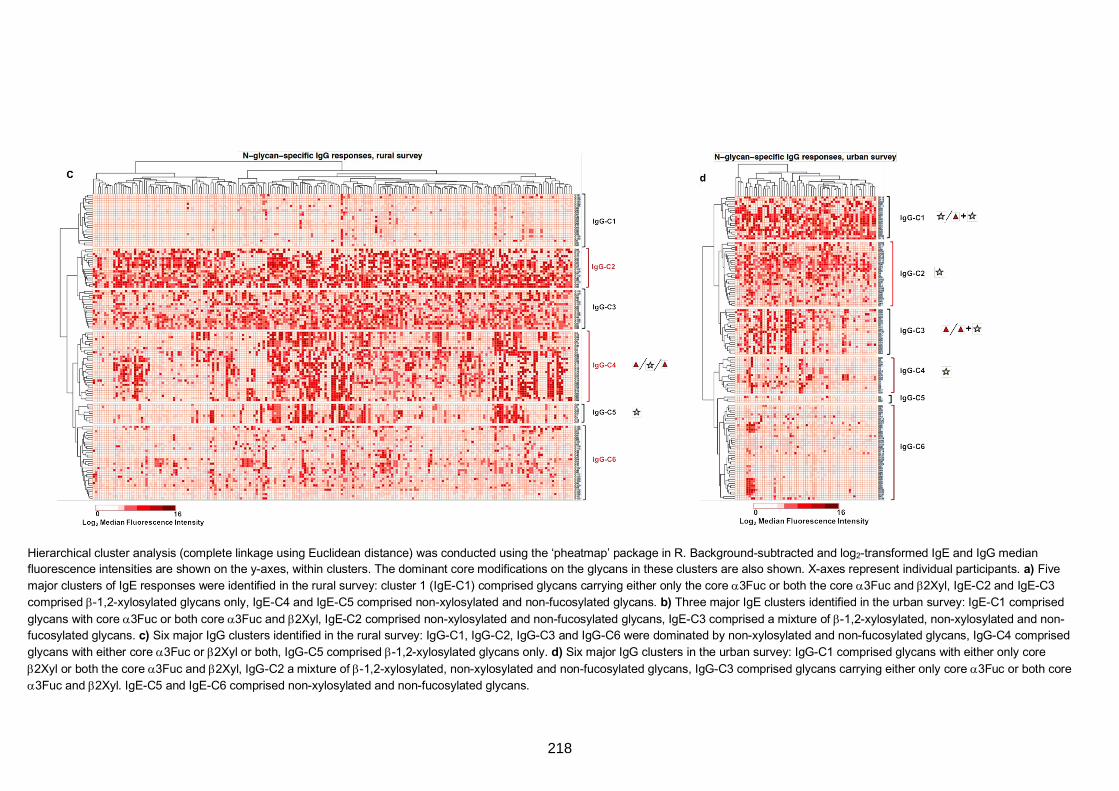
Hierarchical cluster analysis (complete linkage using Euclidean distance) was conducted using the ‘pheatmap’ package in R. Background-subtracted and log2-transformed IgE and IgG median
fluorescence intensities are shown on the y-axes, within clusters. The dominant core modifications on the glycans in these clusters are also shown. X-axes represent individual participants. a) Five
major clusters of IgE responses were identified in the rural survey: cluster 1 (IgE-C1) comprised glycans carrying either only the core a3Fuc or both the core a3Fuc and b2Xyl, IgE-C2 and IgE-C3
comprised b-1,2-xylosylated glycans only, IgE-C4 and IgE-C5 comprised non-xylosylated and non-fucosylated glycans. b) Three major IgE clusters identified in the urban survey: IgE-C1 comprised
glycans with core a3Fuc or both core a3Fuc and b2Xyl, IgE-C2 comprised non-xylosylated and non-fucosylated glycans, IgE-C3 comprised a mixture of b-1,2-xylosylated, non-xylosylated and non-
fucosylated glycans. c) Six major IgG clusters identified in the rural survey: IgG-C1, IgG-C2, IgG-C3 and IgG-C6 were dominated by non-xylosylated and non-fucosylated glycans, IgG-C4 comprised
glycans with either core a3Fuc or b2Xyl or both, IgG-C5 comprised b-1,2-xylosylated glycans only. d) Six major IgG clusters in the urban survey: IgG-C1 comprised glycans with either only core
b2Xyl or both the core a3Fuc and b2Xyl, IgG-C2 a mixture of b-1,2-xylosylated, non-xylosylated and non-fucosylated glycans, IgG-C3 comprised glycans carrying either only core a3Fuc or both core
a3Fuc and b2Xyl. IgE-C5 and IgE-C6 comprised non-xylosylated and non-fucosylated glycans.
218
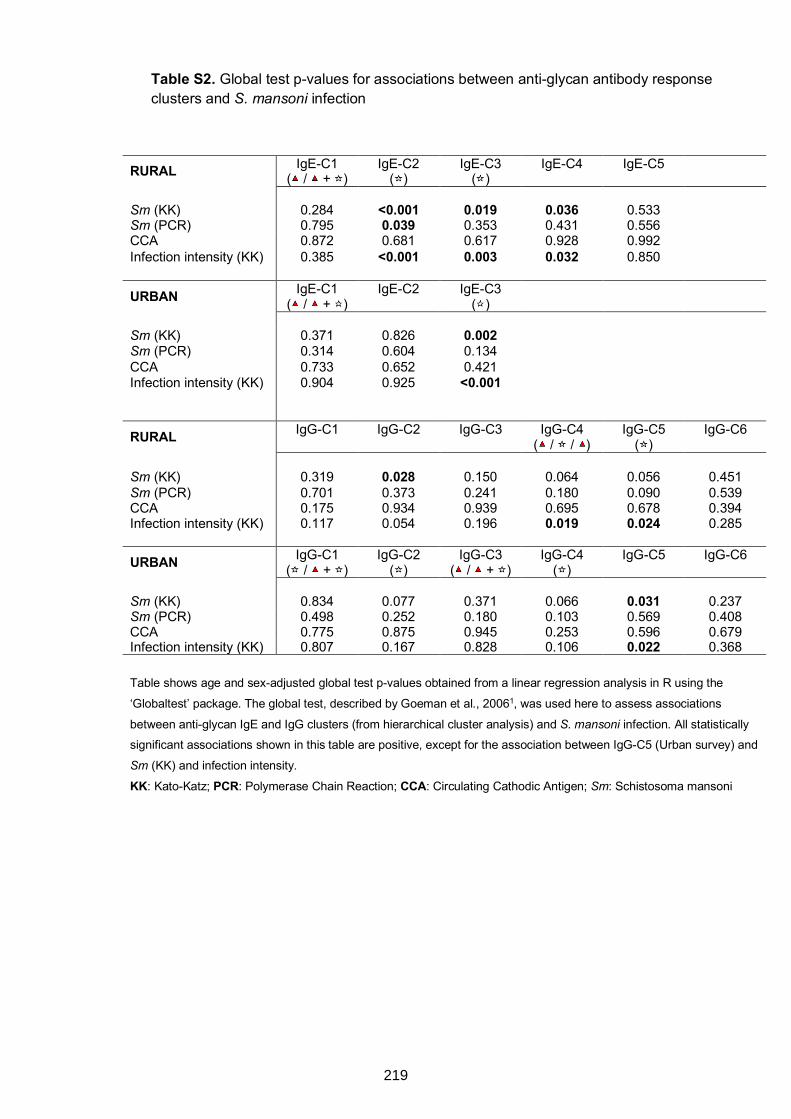
Table S2. Global test p-values for associations between anti-glycan antibody response clusters and S. mansoni infection
RURAL IgE-C1 ( / + )
IgE-C2 ( )
IgE-C3 ( )
IgE-C4
IgE-C5
Sm (KK) 0.284 <0.001 0.019 0.036 0.533 Sm (PCR) 0.795 0.039 0.353 0.431 0.556 CCA 0.872 0.681 0.617 0.928 0.992 Infection intensity (KK) 0.385 <0.001 0.003 0.032 0.850
URBAN IgE-C1 ( / + )
IgE-C2
IgE-C3 ( )
Sm (KK) 0.371 0.826 0.002 Sm (PCR) 0.314 0.604 0.134 CCA 0.733 0.652 0.421 Infection intensity (KK) 0.904 0.925 <0.001
RURAL IgG-C1
IgG-C2
IgG-C3
IgG-C4 ( / / )
IgG-C5 ( )
IgG-C6
Sm (KK) 0.319 0.028 0.150 0.064 0.056 0.451 Sm (PCR) 0.701 0.373 0.241 0.180 0.090 0.539 CCA 0.175 0.934 0.939 0.695 0.678 0.394 Infection intensity (KK) 0.117 0.054 0.196 0.019 0.024 0.285
URBAN IgG-C1 ( / + )
IgG-C2 ( )
IgG-C3 ( / + )
IgG-C4 ( )
IgG-C5
IgG-C6
Sm (KK) 0.834 0.077 0.371 0.066 0.031 0.237 Sm (PCR) 0.498 0.252 0.180 0.103 0.569 0.408 CCA 0.775 0.875 0.945 0.253 0.596 0.679 Infection intensity (KK) 0.807 0.167 0.828 0.106 0.022 0.368
Table shows age and sex-adjusted global test p-values obtained from a linear regression analysis in R using the
‘Globaltest’ package. The global test, described by Goeman et al., 20061, was used here to assess associations
between anti-glycan IgE and IgG clusters (from hierarchical cluster analysis) and S. mansoni infection. All statistically
significant associations shown in this table are positive, except for the association between IgG-C5 (Urban survey) and
Sm (KK) and infection intensity.
KK: Kato-Katz; PCR: Polymerase Chain Reaction; CCA: Circulating Cathodic Antigen; Sm: Schistosoma mansoni
219
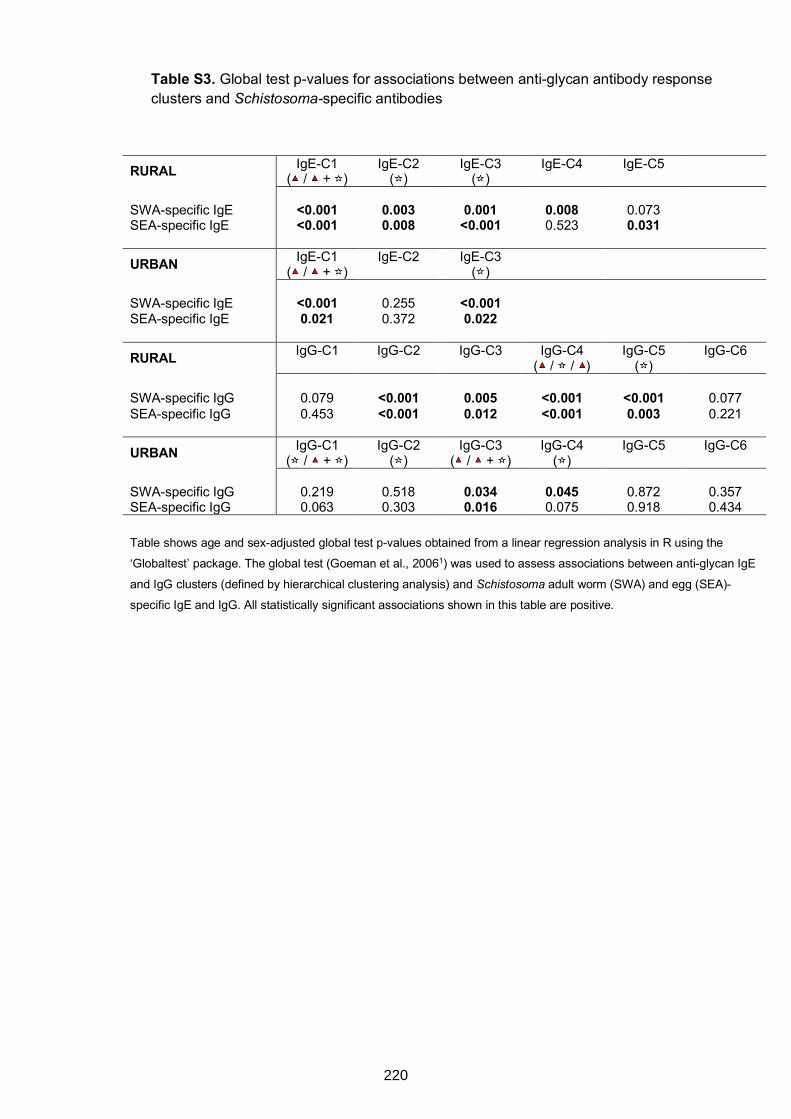
Table S3. Global test p-values for associations between anti-glycan antibody response clusters and Schistosoma-specific antibodies
RURAL IgE-C1 ( / + )
IgE-C2 ( )
IgE-C3 ( )
IgE-C4
IgE-C5
SWA-specific IgE <0.001 0.003 0.001 0.008 0.073 SEA-specific IgE <0.001 0.008 <0.001 0.523 0.031
URBAN IgE-C1 ( / + )
IgE-C2
IgE-C3 ( )
SWA-specific IgE <0.001 0.255 <0.001 SEA-specific IgE 0.021 0.372 0.022
RURAL IgG-C1
IgG-C2
IgG-C3
IgG-C4 ( / / )
IgG-C5 ( )
IgG-C6
SWA-specific IgG 0.079 <0.001 0.005 <0.001 <0.001 0.077 SEA-specific IgG 0.453 <0.001 0.012 <0.001 0.003 0.221
URBAN IgG-C1 ( / + )
IgG-C2 ( )
IgG-C3 ( / + )
IgG-C4 ( )
IgG-C5
IgG-C6
SWA-specific IgG 0.219 0.518 0.034 0.045 0.872 0.357 SEA-specific IgG 0.063 0.303 0.016 0.075 0.918 0.434
Table shows age and sex-adjusted global test p-values obtained from a linear regression analysis in R using the
‘Globaltest’ package. The global test (Goeman et al., 20061) was used to assess associations between anti-glycan IgE
and IgG clusters (defined by hierarchical clustering analysis) and Schistosoma adult worm (SWA) and egg (SEA)-
specific IgE and IgG. All statistically significant associations shown in this table are positive.
220
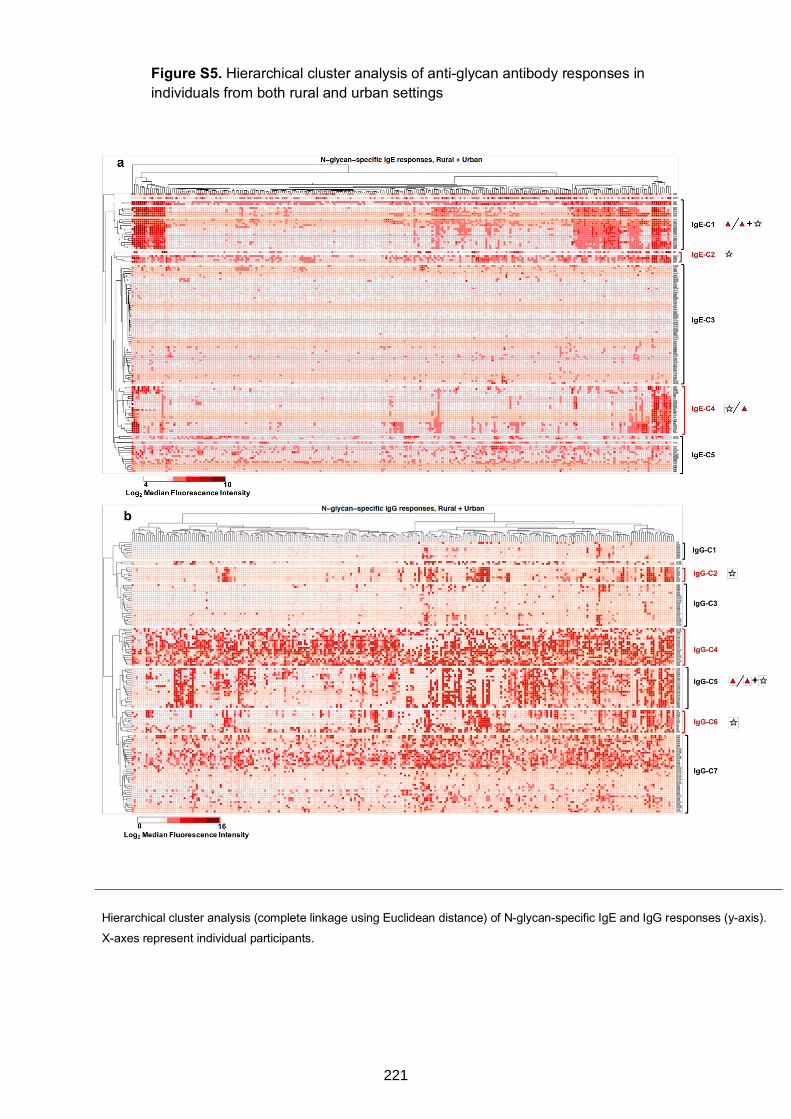
Figure S5. Hierarchical cluster analysis of anti-glycan antibody responses in individuals from both rural and urban settings
Hierarchical cluster analysis (complete linkage using Euclidean distance) of N-glycan-specific IgE and IgG responses (y-axis).
X-axes represent individual participants.
221
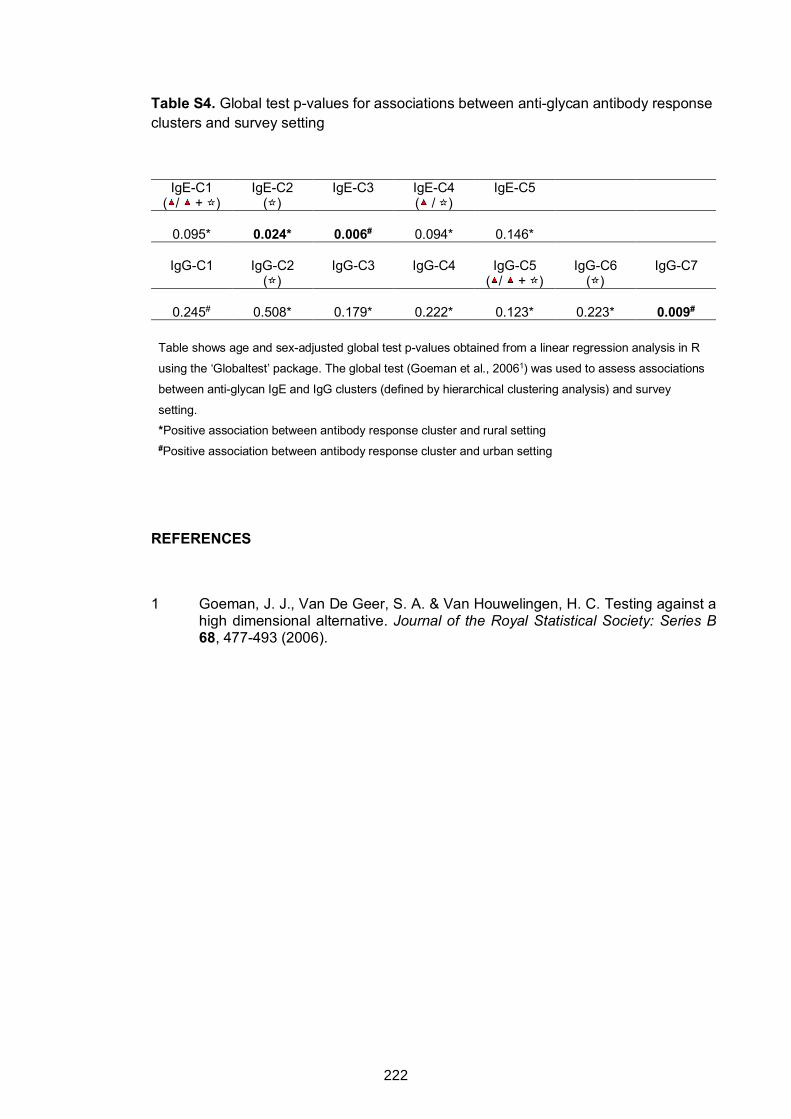
Table S4. Global test p-values for associations between anti-glycan antibody response clusters and survey setting
IgE-C1 ( / + )
IgE-C2 ( )
IgE-C3
IgE-C4 ( / )
IgE-C5
0.095* 0.024* 0.006# 0.094* 0.146*
IgG-C1
IgG-C2
( ) IgG-C3
IgG-C4
IgG-C5
( / + ) IgG-C6
( ) IgG-C7
0.245# 0.508* 0.179* 0.222* 0.123* 0.223* 0.009#
Table shows age and sex-adjusted global test p-values obtained from a linear regression analysis in R
using the ‘Globaltest’ package. The global test (Goeman et al., 20061) was used to assess associations
between anti-glycan IgE and IgG clusters (defined by hierarchical clustering analysis) and survey
setting.
*Positive association between antibody response cluster and rural setting #Positive association between antibody response cluster and urban setting
REFERENCES
1 Goeman, J. J., Van De Geer, S. A. & Van Houwelingen, H. C. Testing against a high dimensional alternative. Journal of the Royal Statistical Society: Series B 68, 477-493 (2006).
222
CHAPTER 7. HELMINTH CARBOHYDRATE-SPECIFIC IgE AND ITS ROLE IN THE
EPIDEMIOLOGY OF ALLERGY IN UGANDA
7.1 Preamble
Findings presented in this chapter are from analyses of data obtained from the rural and
the urban survey, and from the asthma case-control study. These studies are described
in detail in Chapter 3. The present chapter assesses the role of cross-reactive
carbohydrate determinant (CCD)-specific IgE in the epidemiology of allergic sensitisation
and disease (asthma) in Uganda (thesis objective 4). Results are presented in
Research paper 4 (below), titled “Schistosomiasis-associated carbohydrate-specific IgE
and the epidemiology of allergy: studies from Uganda”. This manuscript has been
submitted for publication as an original article in the Journal of Allergy and Clinical
Immunology.
As shown in Chapter 6, the rural environment and S. mansoni infection and intensity
were strongly associated with antibody reactivity to core β-1,2-xylose and ⍺-1,3-fucose
substituted N-glycans. These N-glycan core substitutions are integral constituents of
classical CCDs, which are some of the commonest sources of cross-reactivity between
S. mansoni and allergens. This chapter explores impact of CCD-specific IgE on allergic
sensitisation and disease (asthma), hypothesising that CCD-specific IgE obscures true
allergic sensitisation, and may be involved in protection against clinical allergy.
223
7.2 Research Paper 4: Schistosomiasis-associated carbohydrate-specific IgE and the epidemiology of allergy: studies from Uganda
224
225
226
Schistosomiasis-associated carbohydrate-specific IgE and the epidemiology of
allergy: studies from Uganda
Gyaviira Nkurunungi, MSc1,2*, Harriet Mpairwe, PhD1, Serge A Versteeg, BSc3, Angela
van Diepen, PhD4, Jacent Nassuuna, MSc1, Joyce Kabagenyi, BSc1, Irene Nambuya,
BSc1, Richard E Sanya, MMed1,5, Margaret Nampijja, PhD1, Sonia Serna, PhD6, Niels-
Christian Reichardt, PhD6,7, Cornelis H Hokke, PhD4, Emily L Webb, PhD8, Ronald van
Ree, PhD3§, Maria Yazdanbakhsh, PhD4§, Alison M Elliott, MD1,2§
1Immunomodulation and Vaccines Programme, Medical Research Council / Uganda
Virus Research Institute and London School of Hygiene and Tropical Medicine
(MRC/UVRI and LSHTM) Uganda Research Unit, Entebbe, Uganda
2Department of Clinical Research, London School of Hygiene and Tropical Medicine,
London, United Kingdom
3Departments of Experimental Immunology and of Otorhinolaryngology, Amsterdam
University Medical Centers (AMC), Amsterdam, The Netherlands
4Department of Parasitology, Leiden University Medical Center, Leiden, The Netherlands
5College of Health Sciences, Makerere University, Kampala, Uganda
6Glycotechnology Laboratory, Centro de Investigación Cooperativa en Biomateriales
(CIC biomaGUNE), San Sebastián, Spain
7Centro de Investigación Biomédica en Red en Bioingeniería, Biomateriales y
Nanomedicina (CIBER-BBN), San Sebastián, Spain
8MRC Tropical Epidemiology Group, Department of Infectious Disease Epidemiology,
London School of Hygiene and Tropical Medicine, London, United Kingdom
§These authors contributed equally to this work
*Corresponding author: Gyaviira Nkurunungi, MRC/UVRI and LSHTM Uganda
Research Unit, P.O. Box 49, Plot 51-59 Nakiwogo Road, Entebbe, Uganda & London
School of Hygiene and Tropical Medicine, Keppel Street, London WC1E 7HT, UK. Email:
227
Funding
This work was funded by the Wellcome Trust (grant 095778 awarded to AME for the
urban and rural survey, and grant 102512/Z/13/Z awarded to HM for the asthma study).
GN is supported by a PhD fellowship from the African Partnership for Chronic Disease
Research (APCDR). GN also received a small grant award (GR000904) from the Royal
Society of Tropical Medicine and Hygiene (RSTMH) to conduct glycan microarray
experiments and a short-term research fellowship from the European Academy of Allergy
and Clinical Immunology (EAACI) to conduct ISAC microarray experiments. GN is an
honorary fellow, and RES a PhD fellow, of the Makerere University – Uganda Virus
Research Institute Centre of Excellence for Infection and Immunity Research and
Training (MUII-plus). MUII-plus is funded under the DELTAS Africa Initiative. The
DELTAS Africa Initiative is an independent funding scheme of the African Academy of
Sciences (AAS), Alliance for Accelerating Excellence in Science in Africa (AESA) and
supported by the New Partnership for Africa’s Development Planning and Coordinating
Agency (NEPAD Agency) with funding from the Wellcome Trust (grant 107743) and the
UK Government.
Disclosure of potential conflict of interest
The authors declare that they have no conflicts of interest.
228
SUMMARY
Background
Cross-reactive carbohydrate determinants (CCDs) on schistosome and allergen
glycoproteins may influence allergy epidemiology in the tropics.
Objective
We explored the impact of Schistosoma mansoni (Sm) exposure and rural-urban
environment on anti-CCD IgE, and its relevance to allergic sensitisation and asthma.
Methods
Among Ugandan residents of rural Sm-endemic islands (n=780), proximate urban
communities with lower helminth exposure (n=345), and asthmatic (n=200) and non-
asthmatic schoolchildren (n=200), we measured IgE against house dust mite (HDM),
cockroach and peanut extracts by ImmunoCAP®. In subsets, we measured IgE to
allergen components by ISAC® microarray, and to core b-1,2-xylose and/or a-1,3-fucose
substituted N-glycans (“classical” CCD targets for IgE) by glycan microarray.
Results
IgE sensitisation to crude allergen extracts was highly prevalent (55% in rural, 43% in
urban participants; 73% in asthmatics, 54% in controls). By contrast, IgE sensitisation to
established major allergenic components from HDM, cockroach and peanut was low
amongst rural, urban and non-asthmatic participants (0%-12%, versus 18%-36% in
asthmatics). Instead, up to 40% of all participants recognised insect venom and CCD-
bearing components. Reactivity to classical CCD epitopes was positively associated with
Sm infection, rural environment and allergen extract-specific IgE, but not with
sensitisation to major allergenic components. CCD-specific IgE was not associated with
skin reactivity; however, reactivity specifically to core a-1,3-fucosylated N-glycans was
lower among asthmatics.
Conclusion
229
Reactivity to Sm CCDs obscures IgE sensitisation to established major allergenic
components. The inverse association between reactivity to a-1,3-fucosylated CCD
epitopes and asthma merits further investigation for a possible protective role in
development of allergic disease.
KEY WORDS
Cross-reactive carbohydrate determinant (CCD), helminth, Schistosoma mansoni,
allergy, asthma, IgE sensitisation, ISAC, ImmunoCAP, microarray, b-1,2-xylose, a-1,3-
fucose
KEY MESSAGES
1. In Uganda, sensitisation to allergen extracts does not reflect sensitisation to their
established major allergenic components, but rather to other, cross-reactive
environmental antigens, particularly CCDs expressed by some helminths.
2. Reactivity to a-1,3-fucose, a “classical” CCD target for IgE, is inversely
associated with asthma.
CAPSULE SUMMARY
In Uganda, IgE responses to classical CCD glycans are not merely a smokescreen that
obscures readouts for atopy assessment: IgE to core a-1,3-fucosylated CCD epitopes
associates inversely with clinical allergy, through yet-to-be-defined mechanisms.
ABBREVIATIONS USED
LICs: low-income countries; CCD: cross-reactive carbohydrate determinant; Sm:
Schistosoma mansoni; LaVIISWA: the Lake Victoria Island Intervention Study on Worms
and Allergy-related diseases; ISAAC: International Study on Allergy and Asthma in
Children; SPT: skin prick test; SWA: Schistosoma adult worm antigen; SEA:
Schistosoma egg antigen; PCR: polymerase chain reaction; CCA: circulating cathodic
230

antigen; ISAC: Immuno Solid-phase Allergen Chip; ISU: ISAC standardized units; HDM:
house dust mite; PCA: principal component analysis
231
INTRODUCTION
There are important similarities in host immune responses to helminths and allergens,
and in their molecular targets.1 Helminths elicit strong, complex immunoregulatory
networks to block allergy-like responses induced during infection, primarily to avert their
own destruction and elimination.2 Spill-over effects of this immunoregulation include
inhibition of allergic effector responses,3 perhaps contributing to lower prevalence of
clinical allergies in low-income countries [LICs] (compared to high-income countries) and
rural (compared to urban) settings.4 However, studies in human populations imply
diverse and complex relationships between helminth infections and allergy-related
outcomes. For example, in rural Schistosoma mansoni (Sm)-endemic Ugandan fishing
communities, we found that low prevalence of clinical allergies was paralleled by high
levels of specific IgE against extracts from common allergen sources and positive
helminth-atopy associations.5
Mechanistic studies assessing the impact of protein cross-reactivity between helminths
and allergens have provided important insights into helminth-allergy associations.6 For
example, the Onchocerca volvulus tropomyosin (structurally homologous to dust mite
tropomyosins) induces basophil histamine release7 and some Sm venom allergen-like
(SmVAL) proteins (with orthologues in wasps) and tegumental allergen-like (SmTAL)
proteins show allergenic activity.8,9
The importance of carbohydrate cross reactivity in helminth-allergy associations is less
understood. Some of the commonest sources of cross-reactivity between allergens and
some helminths are specific types of asparagine (N) linked glycan modifications found
on plant, insect and some helminth proteins (termed cross-reactive carbohydrate
determinants, CCDs). The N-glycan trimannosyl-chitobiose core (Man3GlcNAc2) is
conserved in eukaryotes. “Classical” CCD N-glycans expressed by invertebrate and
plant proteins,10,11 and on antigenic surfaces and in secretomes of schistosome eggs 12
and some nematodes,13-16 carry additional, non-mammalian, IgE-binding motifs: 1) β-
232
(1,2) xylose linked to the first mannose of the trimannosyl component and/or 2) α-(1,3)
fucose linked to the asparagine-linked N-acetylglucosamine (GlcNAc) of the glycan
core.17,18 Glycoproteins carrying such N-glycans are potent immune determinants,10,19-22
inducing strong Th2-type responses,23 and comprising epitopes for antibodies,24-27
including IgE.28-30 However, the relevance of these glycan motifs in allergy is unclear.
Barring observations from a few studies,31-33 anti-CCD IgE has poor biological function:
individuals with specific IgE to CCDs lack skin and oral reactivity to the same
molecules.10,29,34 Therefore, in helminth-endemic LICs, elevated, yet clinically irrelevant
allergen extract-specific IgE levels may, to an important extent, be attributed to CCDs.35
Among Ghanaian schoolchildren, Schistosoma haematobium infection was associated
with peanut-IgE-sensitisation, which was in turn strongly associated with anti-CCD IgE,
but not clinical peanut allergy.36 The separation of anti-CCD IgE from clinical allergy
symptoms, coupled with abundance of immunogenic CCDs on some schistosome
antigens, led us to hypothesise that enhanced anti-CCD IgE responses during chronic
Sm infection might dominate over allergen protein-specific IgE, resulting in reduced
allergic effector responses.
We conducted three studies in varied Ugandan settings to obtain a comparative
assessment of allergy-related disease phenotypes, prevalence and risk factors in rural37
and urban38 settings, and among asthmatic children and controls. These studies provide
an unprecedented opportunity to assess the impact of rural-urban environment and Sm
exposure on anti-CCD IgE profiles and the relevance of these profiles to epidemiological
trends of allergy in tropical LICs.
233
METHODS
Study design and population
The three studies comprised rural and urban cross-sectional surveys on allergy
outcomes and a case-control study on asthma risk factors among schoolchildren in
Uganda.
The rural survey (September 2015 – August 2016) was conducted in Sm-endemic fishing
villages of Koome islands, Lake Victoria, Uganda. It was the three-year outcome survey
of the Lake Victoria Island Intervention Study on Worms and Allergy-related diseases
(LaVIISWA; ISRCTN4719603139), a cluster-randomised trial of community-wide
standard versus intensive anthelminthic treatment.5,39 The urban survey (September
2016 – September 2017) was conducted in Entebbe municipality, a lower helminth
exposure, urban setting38 situated on northern shores of Lake Victoria.
The asthma study (May 2015 – July 2017) enrolled children with asthma and controls
from schools in Entebbe and surrounding areas. Asthma was defined as history of
wheeze in the last year, using the International Study on Allergy and Asthma in Children
(ISAAC) questionnaire.40 Children in the same class as cases, with no history of
wheezing, were eligible as controls. A Stata program (College Station, Texas, USA) was
used to randomly select participants from each class register such that the number of
controls was twice the number of cases.
Recent wheeze was also assessed in the rural and urban surveys using ISAAC
questionnaires. Other procedures were identical in all three studies, including
assessment of skin prick test (SPT) reactivity to Dermatophagoides mix, Blomia
tropicalis and Blattella germanica (ALK-Abelló; supplied by Laboratory Specialities [Pty]
Ltd., South Africa), visible flexural dermatitis (evaluated following Williams’ on-line
manual41), and questionnaire-determined recent rhinitis and urticarial rash.
Parasitological examinations
234
Infection with intestinal helminths was investigated using the Kato-Katz technique42
conducted on one stool sample per participant (two slides, read by different technicians).
In the urban and rural surveys, stool was further examined for Sm, Necator americanus
and Strongyloides stercoralis infections using PCR43,44, and urine for Sm circulating
cathodic antigen (CCA, Rapid Medical Diagnostics, South Africa).
Measurement of allergen- and glycan-specific IgE
Allergen- and glycan-specific IgE measurements were conducted in a subset of samples
per study (Figure 1), randomly selected using Stata software. Sample size
considerations are detailed in the Online Repository.
Crude house dust mite (D. pteronyssinus, HDM), peanut (Arachis hypogaea), and
German cockroach (B. germanica) extract-specific plasma IgE levels were measured
using the ImmunoCAPÒ specific IgE test [Thermo Fisher Scientific] (hereinafter
‘ImmunoCAP’), with ≥0.35kU/L defining allergic sensitisation.45
The ImmunoCAPÒ ISAC (Immuno Solid-phase Allergen Chip) microarray (Thermo
Fisher Scientific)46,47 was used to measure IgE to 112 allergen components from 51
sources (Table S1, Online Repository). The array comprises 67 recombinant
components (produced in E. coli, hence non-glycosylated48); and 45 components purified
from natural extracts. Previous work has shown that the glycan epitope from bromelain
(nMUXF3) and glycoproteins from pollen (nPhl p 4, nCyn d 1, nPla a 2, nCry j 1, nCup a
1) and food (nJug r 2), are recognised by anti-CCD IgE, while other natural, possibly
glycosylated allergens on the ISAC are not.49 Therefore, herein, ‘CCD-bearing
components’ denotes ISAC components confirmed to carry core β-1,2-xylose and/or ⍺-
1,3-fucose substituted N-glycans. The binding assay is described in Online Repository.
Participants with an ISAC Standardised Unit (ISU) measurement of ≥0.3 were
considered sensitised to that allergen component.46,50 Measurements were also reported
as detectable versus undetectable (lower detection limit: 0.06 ISU).
235
Samples were also assessed for Schistosoma egg [SEA]- and adult worm [SWA]
antigen-specific IgE, IgG and IgG4, by ELISA (described elsewhere56).
Statistical analysis
Statistical analyses were done in Stata 13.1, GraphPad Prism 7.0a (Fay Avenue, CA,
USA) and R via the RStudio interface (version 1.1.383, Boston, USA). Initial analyses in
the rural survey investigated the impact of trial intervention on IgE profiles using a cluster-
level approach, as previously described.37 Differences in characteristics between rural
and urban survey participants and between asthmatic and non-asthmatic children were
assessed using logistic or linear regression, allowing for the survey designs (clustering
and weighting). Unadjusted analysis of differences in individual N-glycan- / allergen-
specific IgE levels between rural and urban participants, and between asthmatics and
controls was done using the Mann-Whitney U test, correcting for multiple testing using a
Monte Carlo simulation approach57 with 1000 permutations, to generate empirical p-
values. For analyses comparing prevalences of ISAC-determined IgE sensitisation
between these groups, chi-squared tests (or Fisher’s exact test, for expected cell counts
<5) were used.
Since anti-glycan IgE responses were strongly correlated, they were further analysed
using principal component analysis (PCA). Participants from all studies were pooled and
principal component (PC) scores generated. Unadjusted and age- and sex-adjusted
A non-commercial microarray of 135 chemo-enzymatically synthesised glycans with and
without β-1,2-xylosylation and/or !-1,3-fucosylation (Figure S1) was employed to
measure plasma anti-glycan IgE. Microarray construction procedures have been
published.51,52 The IgE binding assay and the microarray image processing procedures
were adapted from previous studies,27,53-55 and are detailed in Online Repository. Median
fluorescence intensities (MFIs) reported herein represent anti-glycan IgE concentrations,
because fluorescence-labelled anti-human IgE was used to detect plasma IgE bound to
individual glycans on the array.
236

associations between PC scores and atopic sensitisation, asthma status, Sm infection
and survey setting were assessed using linear regression.
Ethics statement
This work was approved by ethics committees of Uganda Virus Research Institute and
London School of Hygiene and Tropical Medicine, and Uganda National Council for
Science and Technology. Informed consent was obtained from all participants and/or
their legal guardians. Assent was obtained from children ≥8 years.
237
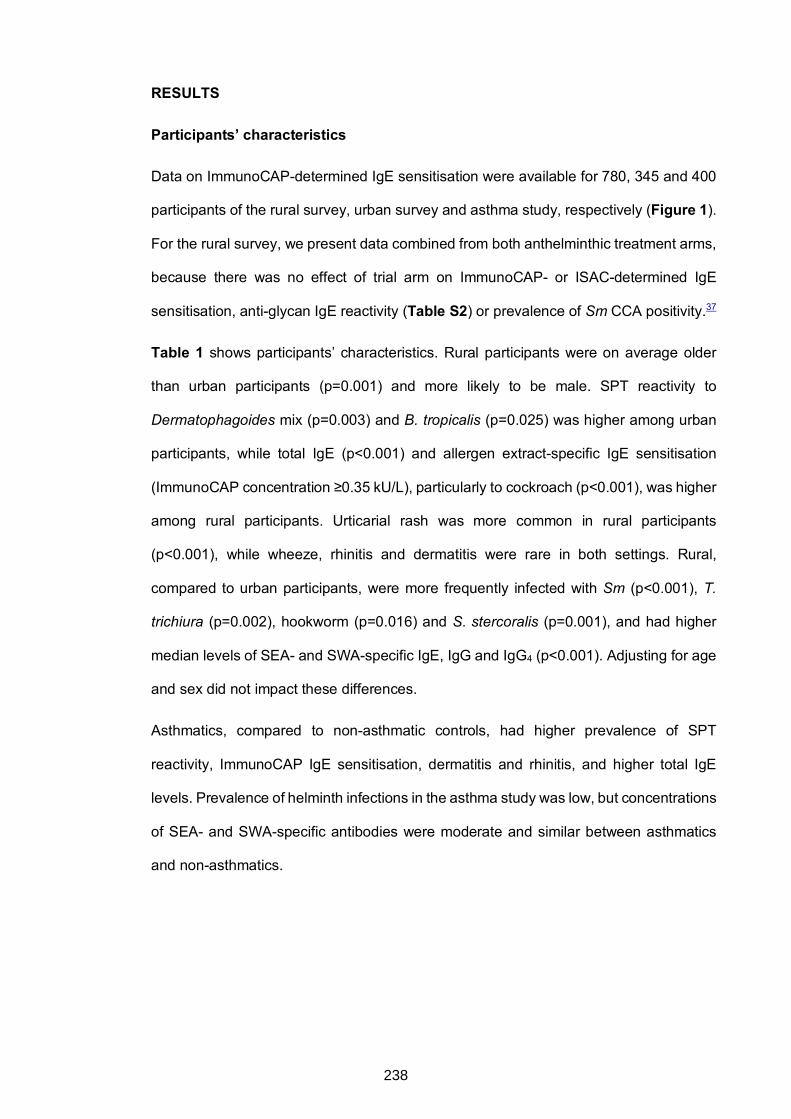
RESULTS
Participants’ characteristics
Data on ImmunoCAP-determined IgE sensitisation were available for 780, 345 and 400
participants of the rural survey, urban survey and asthma study, respectively (Figure 1).
For the rural survey, we present data combined from both anthelminthic treatment arms,
because there was no effect of trial arm on ImmunoCAP- or ISAC-determined IgE
sensitisation, anti-glycan IgE reactivity (Table S2) or prevalence of Sm CCA positivity.37
Table 1 shows participants’ characteristics. Rural participants were on average older
than urban participants (p=0.001) and more likely to be male. SPT reactivity to
Dermatophagoides mix (p=0.003) and B. tropicalis (p=0.025) was higher among urban
participants, while total IgE (p<0.001) and allergen extract-specific IgE sensitisation
(ImmunoCAP concentration ≥0.35 kU/L), particularly to cockroach (p<0.001), was higher
among rural participants. Urticarial rash was more common in rural participants
(p<0.001), while wheeze, rhinitis and dermatitis were rare in both settings. Rural,
compared to urban participants, were more frequently infected with Sm (p<0.001), T.
trichiura (p=0.002), hookworm (p=0.016) and S. stercoralis (p=0.001), and had higher
median levels of SEA- and SWA-specific IgE, IgG and IgG4 (p<0.001). Adjusting for age
and sex did not impact these differences.
Asthmatics, compared to non-asthmatic controls, had higher prevalence of SPT
reactivity, ImmunoCAP IgE sensitisation, dermatitis and rhinitis, and higher total IgE
levels. Prevalence of helminth infections in the asthma study was low, but concentrations
of SEA- and SWA-specific antibodies were moderate and similar between asthmatics
and non-asthmatics.
238
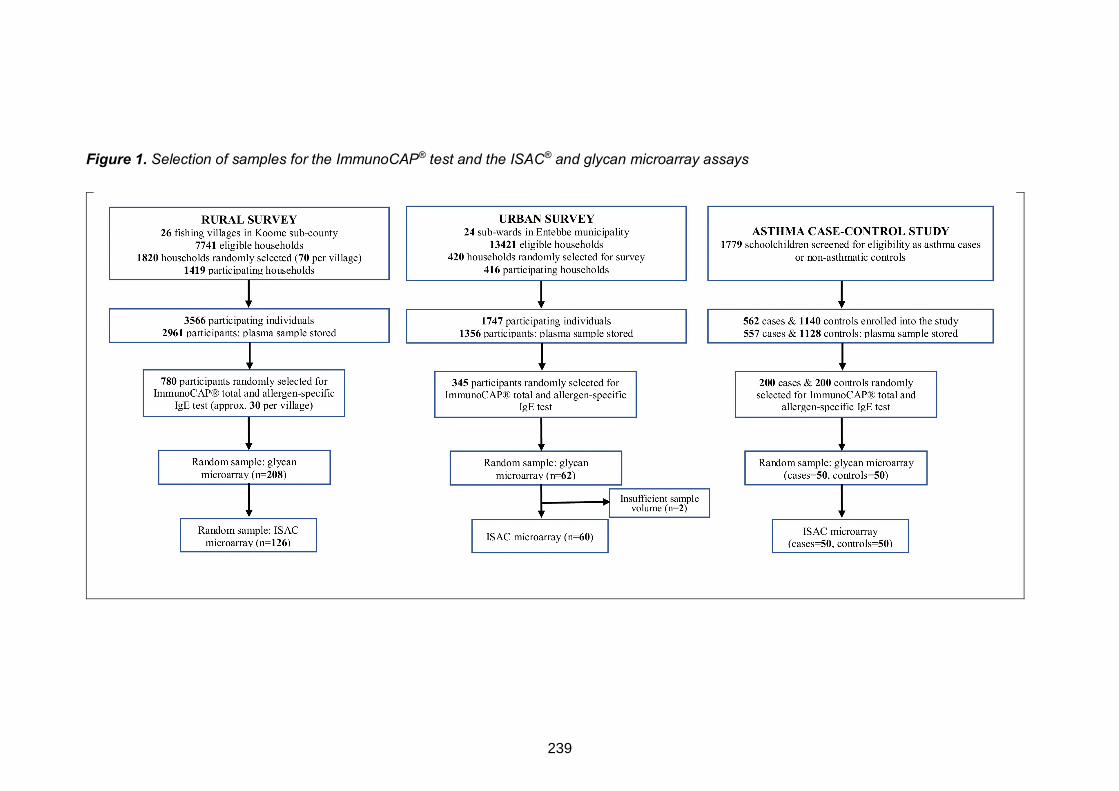
Figure 1. Selection of samples for the ImmunoCAP® test and the ISAC® and glycan microarray assays
239
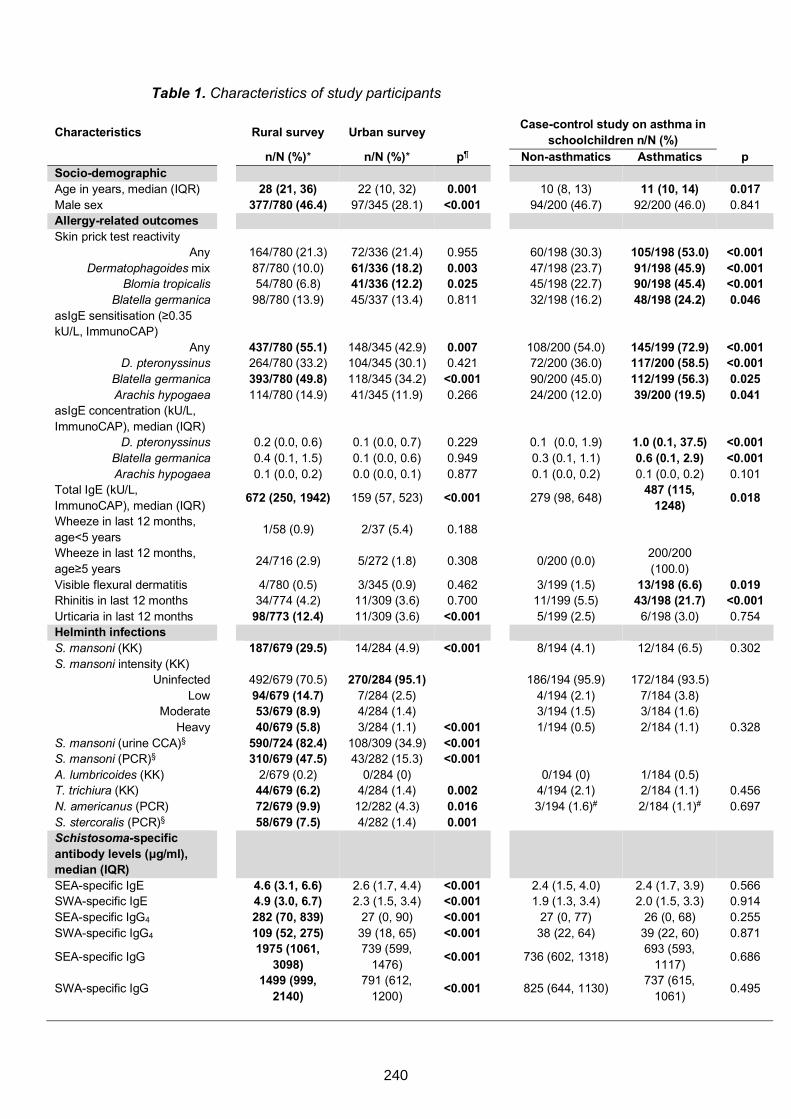
Table 1. Characteristics of study participants
Characteristics Rural survey Urban survey
Case-control study on asthma in schoolchildren n/N (%)
n/N (%)* n/N (%)* p¶ Non-asthmatics Asthmatics p Socio-demographic Age in years, median (IQR) 28 (21, 36) 22 (10, 32) 0.001 10 (8, 13) 11 (10, 14) 0.017 Male sex 377/780 (46.4) 97/345 (28.1) <0.001 94/200 (46.7) 92/200 (46.0) 0.841 Allergy-related outcomes Skin prick test reactivity
Any Dermatophagoides mix
Blomia tropicalis Blatella germanica
164/780 (21.3) 87/780 (10.0) 54/780 (6.8)
98/780 (13.9)
72/336 (21.4) 61/336 (18.2) 41/336 (12.2) 45/337 (13.4)
0.955 0.003 0.025 0.811
60/198 (30.3) 47/198 (23.7) 45/198 (22.7) 32/198 (16.2)
105/198 (53.0) 91/198 (45.9) 90/198 (45.4) 48/198 (24.2)
<0.001 <0.001 <0.001 0.046
asIgE sensitisation (≥0.35 kU/L, ImmunoCAP)
Any D. pteronyssinus
Blatella germanica Arachis hypogaea
437/780 (55.1) 264/780 (33.2) 393/780 (49.8) 114/780 (14.9)
148/345 (42.9) 104/345 (30.1) 118/345 (34.2) 41/345 (11.9)
0.007 0.421
<0.001 0.266
108/200 (54.0) 72/200 (36.0) 90/200 (45.0) 24/200 (12.0)
145/199 (72.9) 117/200 (58.5) 112/199 (56.3) 39/200 (19.5)
<0.001 <0.001 0.025 0.041
asIgE concentration (kU/L, ImmunoCAP), median (IQR)
D. pteronyssinus Blatella germanica Arachis hypogaea
0.2 (0.0, 0.6) 0.4 (0.1, 1.5) 0.1 (0.0, 0.2)
0.1 (0.0, 0.7) 0.1 (0.0, 0.6) 0.0 (0.0, 0.1)
0.229 0.949 0.877
0.1 (0.0, 1.9) 0.3 (0.1, 1.1) 0.1 (0.0, 0.2)
1.0 (0.1, 37.5) 0.6 (0.1, 2.9) 0.1 (0.0, 0.2)
<0.001 <0.001 0.101
Total IgE (kU/L, ImmunoCAP), median (IQR)
672 (250, 1942) 159 (57, 523) <0.001
279 (98, 648)
487 (115, 1248)
0.018
Wheeze in last 12 months, age<5 years
1/58 (0.9) 2/37 (5.4) 0.188
Wheeze in last 12 months, age≥5 years
24/716 (2.9) 5/272 (1.8) 0.308
0/200 (0.0)
200/200 (100.0)
Visible flexural dermatitis 4/780 (0.5) 3/345 (0.9) 0.462 3/199 (1.5) 13/198 (6.6) 0.019 Rhinitis in last 12 months 34/774 (4.2) 11/309 (3.6) 0.700 11/199 (5.5) 43/198 (21.7) <0.001 Urticaria in last 12 months 98/773 (12.4) 11/309 (3.6) <0.001 5/199 (2.5) 6/198 (3.0) 0.754 Helminth infections S. mansoni (KK) 187/679 (29.5) 14/284 (4.9) <0.001 8/194 (4.1) 12/184 (6.5) 0.302 S. mansoni intensity (KK)
Uninfected Low
Moderate Heavy
492/679 (70.5) 94/679 (14.7) 53/679 (8.9) 40/679 (5.8)
270/284 (95.1)
7/284 (2.5) 4/284 (1.4) 3/284 (1.1) <0.001
186/194 (95.9)
4/194 (2.1) 3/194 (1.5) 1/194 (0.5)
172/184 (93.5)
7/184 (3.8) 3/184 (1.6) 2/184 (1.1) 0.328
S. mansoni (urine CCA)§ 590/724 (82.4) 108/309 (34.9) <0.001 S. mansoni (PCR)§ 310/679 (47.5) 43/282 (15.3) <0.001 A. lumbricoides (KK) 2/679 (0.2) 0/284 (0) 0/194 (0) 1/184 (0.5) T. trichiura (KK) 44/679 (6.2) 4/284 (1.4) 0.002 4/194 (2.1) 2/184 (1.1) 0.456 N. americanus (PCR) 72/679 (9.9) 12/282 (4.3) 0.016 3/194 (1.6)# 2/184 (1.1)# 0.697 S. stercoralis (PCR)§ 58/679 (7.5) 4/282 (1.4) 0.001 Schistosoma-specific antibody levels (μg/ml), median (IQR)
SEA-specific IgE 4.6 (3.1, 6.6) 2.6 (1.7, 4.4) <0.001 2.4 (1.5, 4.0) 2.4 (1.7, 3.9) 0.566 SWA-specific IgE 4.9 (3.0, 6.7) 2.3 (1.5, 3.4) <0.001 1.9 (1.3, 3.4) 2.0 (1.5, 3.3) 0.914 SEA-specific IgG4 282 (70, 839) 27 (0, 90) <0.001 27 (0, 77) 26 (0, 68) 0.255 SWA-specific IgG4 109 (52, 275) 39 (18, 65) <0.001 38 (22, 64) 39 (22, 60) 0.871
SEA-specific IgG 1975 (1061,
3098) 739 (599,
1476) <0.001
736 (602, 1318)
693 (593, 1117)
0.686
SWA-specific IgG 1499 (999,
2140) 791 (612,
1200) <0.001
825 (644, 1130)
737 (615, 1061)
0.495
240
Table shows characteristics for individuals with data on ImmunoCAP-determined IgE sensitisation. Probability values are shown for differences in characteristics between rural and urban survey participants and between asthmatic schoolchildren and non-asthmatic controls. *Percentages were adjusted for survey design. Percentages / medians that were significantly higher in one group compared to the other (p≤0.05) are highlighted in bold. Adjusting for age and sex had little impact on these differences. ¶P values obtained from survey design-based logistic or linear regression. §Information not collected in the asthma case-control study. #Necator americanus infection detected by Kato-Katz in the asthma case-control study. asIgE: allergen-specific IgE; KK: Kato-Katz; PCR: Polymerase Chain Reaction; CCA: Circulating Cathodic Antigen; IQR: Interquartile range; SEA: Schistosoma egg antigen; SWA: Schistosoma adult worm antigen
Overall responses to structures on the ISAC and N-glycan microarray
Figure 2 shows prevalence of sensitisation (IgE≥0.3 ISU) to allergen components on the
ISAC microarray. Among rural participants, sensitisation to components on the array was
dominated by reactivity to insect venom proteins (rPol d 5, rVes v 5, rApi m 1) and
components bearing classical CCDs. Among urban participants and non-asthmatics,
sensitisation patterns were more varied: HDM, venom, food and CCD-bearing
components contributed most to sensitisation. However, sensitisation among asthmatics
was dominated by reactivity to major recombinant and natural HDM allergens.
Figure 3 shows average MFIs for structures on the glycan microarray. Although the
highest responses were raised predominantly against core β-1,2-xylose and/or α-1,3-
fucose substituted N-glycans in all three studies, responses to a few other carbohydrate
structural elements such as tri-mannose (G99), fucosylated GlcNAc (G111) and
galactose-alpha-1,3-galactose (α-1,3-gal) [G112, G113] were also as high.
241
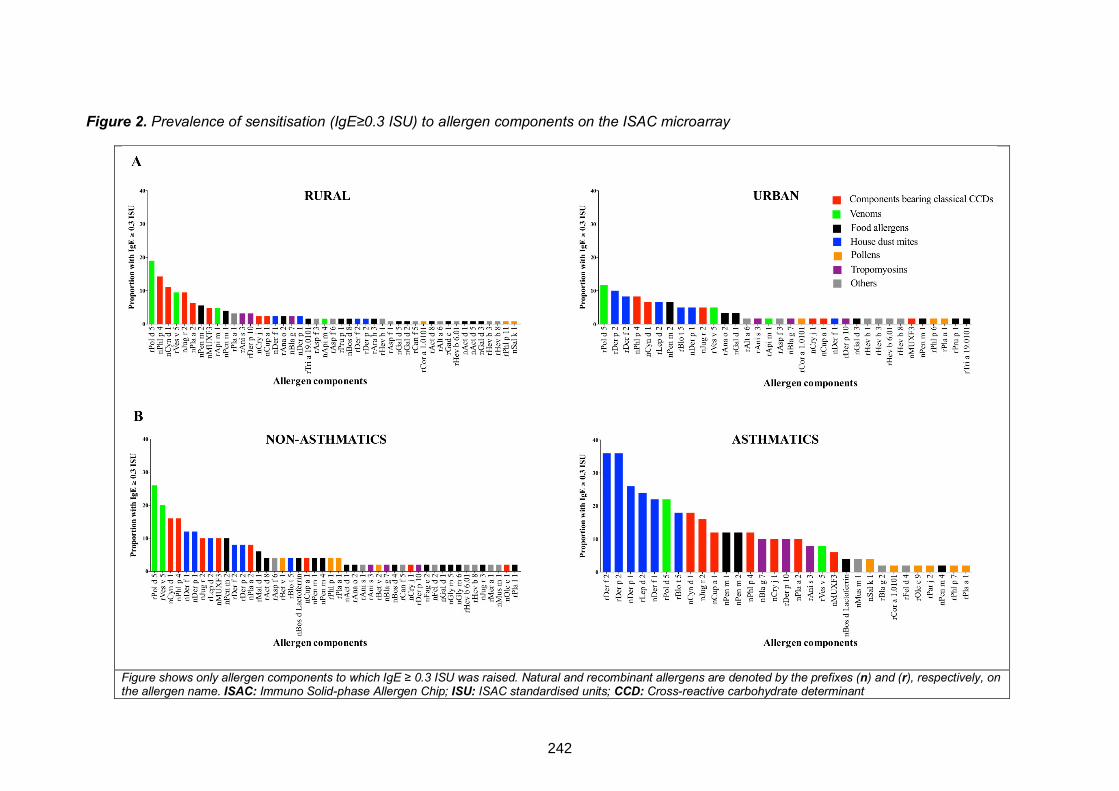
Figure 2. Prevalence of sensitisation (IgE≥0.3 ISU) to allergen components on the ISAC microarray
Figure shows only allergen components to which IgE ≥ 0.3 ISU was raised. Natural and recombinant allergens are denoted by the prefixes (n) and (r), respectively, on the allergen name. ISAC: Immuno Solid-phase Allergen Chip; ISU: ISAC standardised units; CCD: Cross-reactive carbohydrate determinant
242
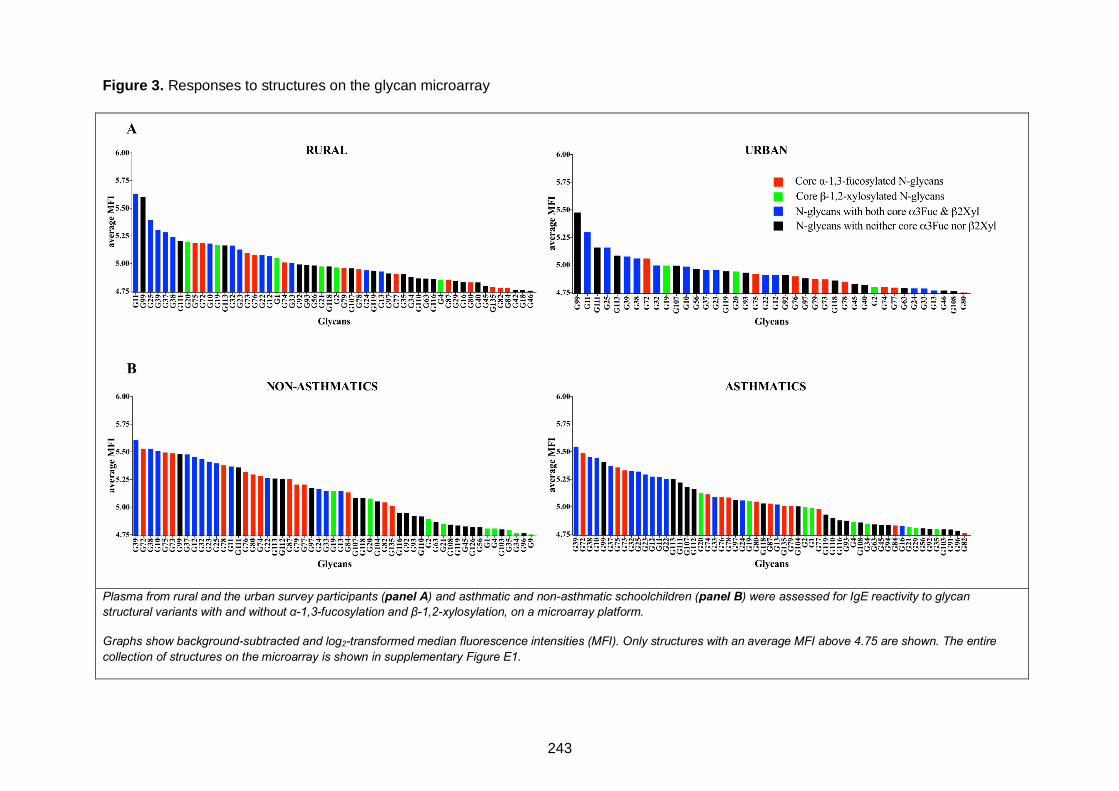
Plasma from rural and the urban survey participants (panel A) and asthmatic and non-asthmatic schoolchildren (panel B) were assessed for IgE reactivity to glycan structural variants with and without α-1,3-fucosylation and β-1,2-xylosylation, on a microarray platform.
Graphs show background-subtracted and log2-transformed median fluorescence intensities (MFI). Only structures with an average MFI above 4.75 are shown. The entire collection of structures on the microarray is shown in supplementary Figure E1.
Figure 3. Responses to structures on the glycan microarray
243
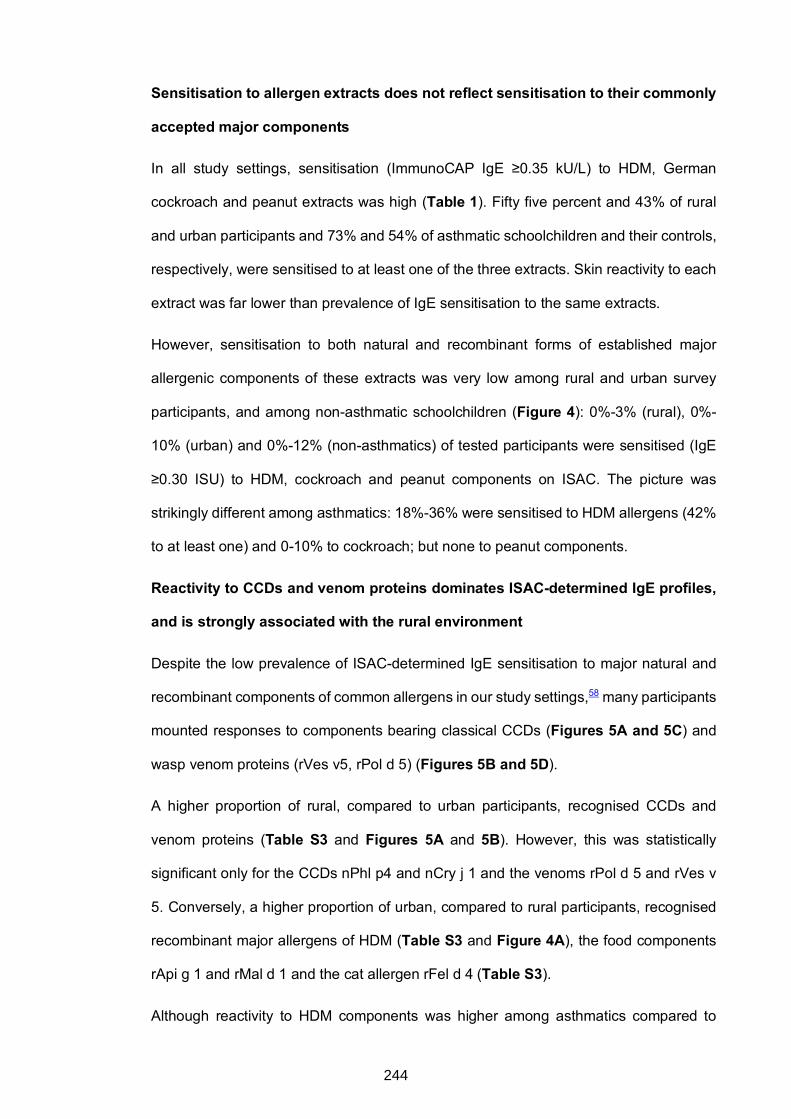
Sensitisation to allergen extracts does not reflect sensitisation to their commonly
accepted major components
In all study settings, sensitisation (ImmunoCAP IgE ≥0.35 kU/L) to HDM, German
cockroach and peanut extracts was high (Table 1). Fifty five percent and 43% of rural
and urban participants and 73% and 54% of asthmatic schoolchildren and their controls,
respectively, were sensitised to at least one of the three extracts. Skin reactivity to each
extract was far lower than prevalence of IgE sensitisation to the same extracts.
However, sensitisation to both natural and recombinant forms of established major
allergenic components of these extracts was very low among rural and urban survey
participants, and among non-asthmatic schoolchildren (Figure 4): 0%-3% (rural), 0%-
10% (urban) and 0%-12% (non-asthmatics) of tested participants were sensitised (IgE
≥0.30 ISU) to HDM, cockroach and peanut components on ISAC. The picture was
strikingly different among asthmatics: 18%-36% were sensitised to HDM allergens (42%
to at least one) and 0-10% to cockroach; but none to peanut components.
Reactivity to CCDs and venom proteins dominates ISAC-determined IgE profiles,
and is strongly associated with the rural environment
Despite the low prevalence of ISAC-determined IgE sensitisation to major natural and
recombinant components of common allergens in our study settings,58 many participants
mounted responses to components bearing classical CCDs (Figures 5A and 5C) and
wasp venom proteins (rVes v5, rPol d 5) (Figures 5B and 5D).
A higher proportion of rural, compared to urban participants, recognised CCDs and
venom proteins (Table S3 and Figures 5A and 5B). However, this was statistically
significant only for the CCDs nPhl p4 and nCry j 1 and the venoms rPol d 5 and rVes v
5. Conversely, a higher proportion of urban, compared to rural participants, recognised
recombinant major allergens of HDM (Table S3 and Figure 4A), the food components
rApi g 1 and rMal d 1 and the cat allergen rFel d 4 (Table S3).
Although reactivity to HDM components was higher among asthmatics compared to
244
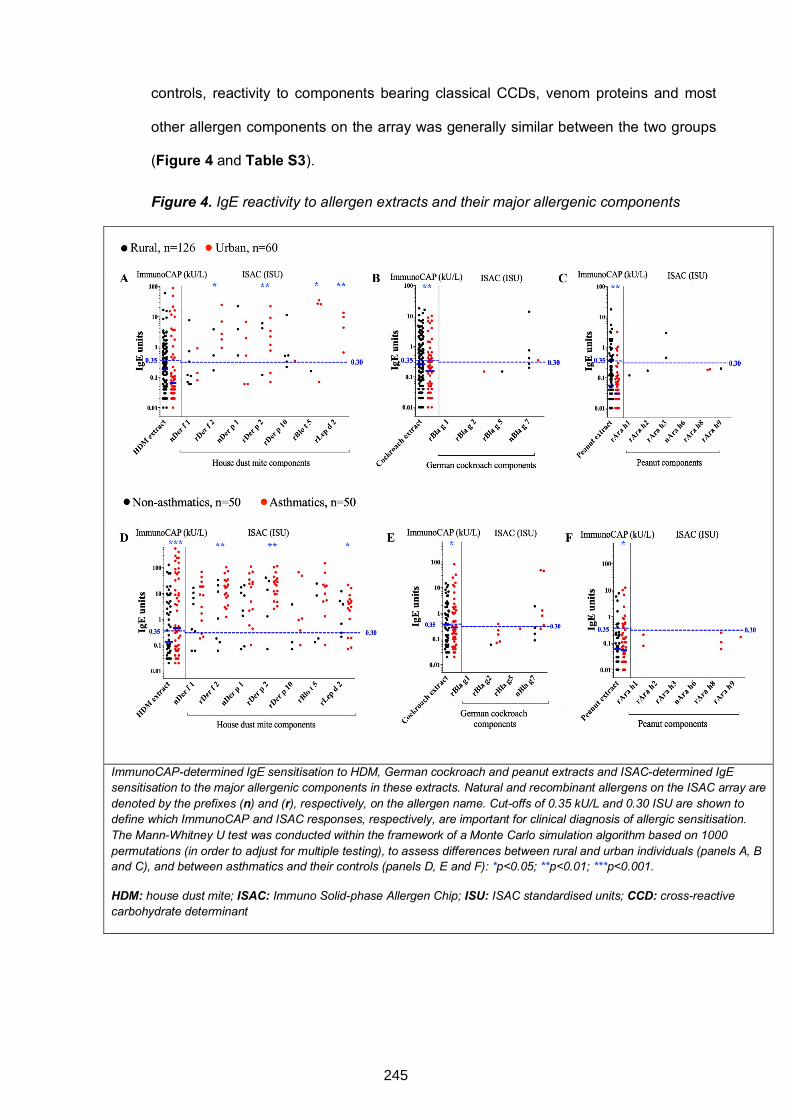
controls, reactivity to components bearing classical CCDs, venom proteins and most
other allergen components on the array was generally similar between the two groups
(Figure 4 and Table S3).
Figure 4. IgE reactivity to allergen extracts and their major allergenic components
ImmunoCAP-determined IgE sensitisation to HDM, German cockroach and peanut extracts and ISAC-determined IgE sensitisation to the major allergenic components in these extracts. Natural and recombinant allergens on the ISAC array are denoted by the prefixes (n) and (r), respectively, on the allergen name. Cut-offs of 0.35 kU/L and 0.30 ISU are shown to define which ImmunoCAP and ISAC responses, respectively, are important for clinical diagnosis of allergic sensitisation. The Mann-Whitney U test was conducted within the framework of a Monte Carlo simulation algorithm based on 1000 permutations (in order to adjust for multiple testing), to assess differences between rural and urban individuals (panels A, B and C), and between asthmatics and their controls (panels D, E and F): *p<0.05; **p<0.01; ***p<0.001.
HDM: house dust mite; ISAC: Immuno Solid-phase Allergen Chip; ISU: ISAC standardised units; CCD: cross-reactive carbohydrate determinant
245
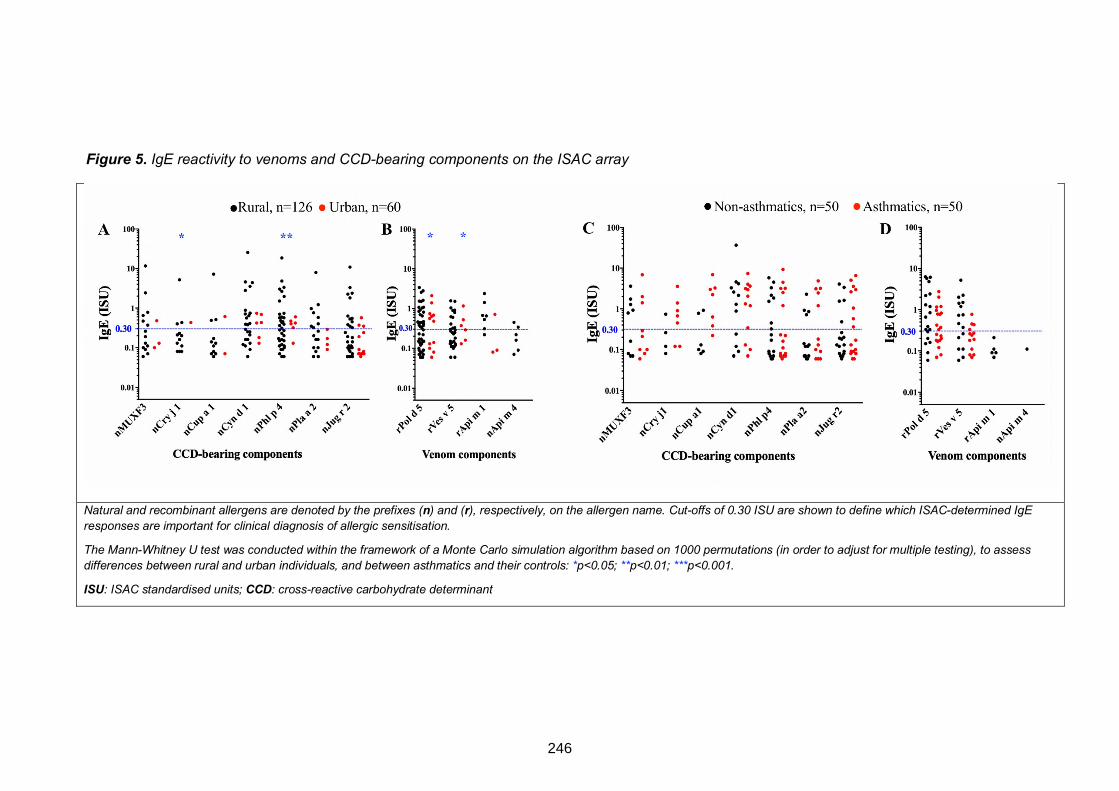
Figure 5. IgE reactivity to venoms and CCD-bearing components on the ISAC array
Natural and recombinant allergens are denoted by the prefixes (n) and (r), respectively, on the allergen name. Cut-offs of 0.30 ISU are shown to define which ISAC-determined IgE responses are important for clinical diagnosis of allergic sensitisation.
The Mann-Whitney U test was conducted within the framework of a Monte Carlo simulation algorithm based on 1000 permutations (in order to adjust for multiple testing), to assess differences between rural and urban individuals, and between asthmatics and their controls: *p<0.05; **p<0.01; ***p<0.001.
ISU: ISAC standardised units; CCD: cross-reactive carbohydrate determinant
246
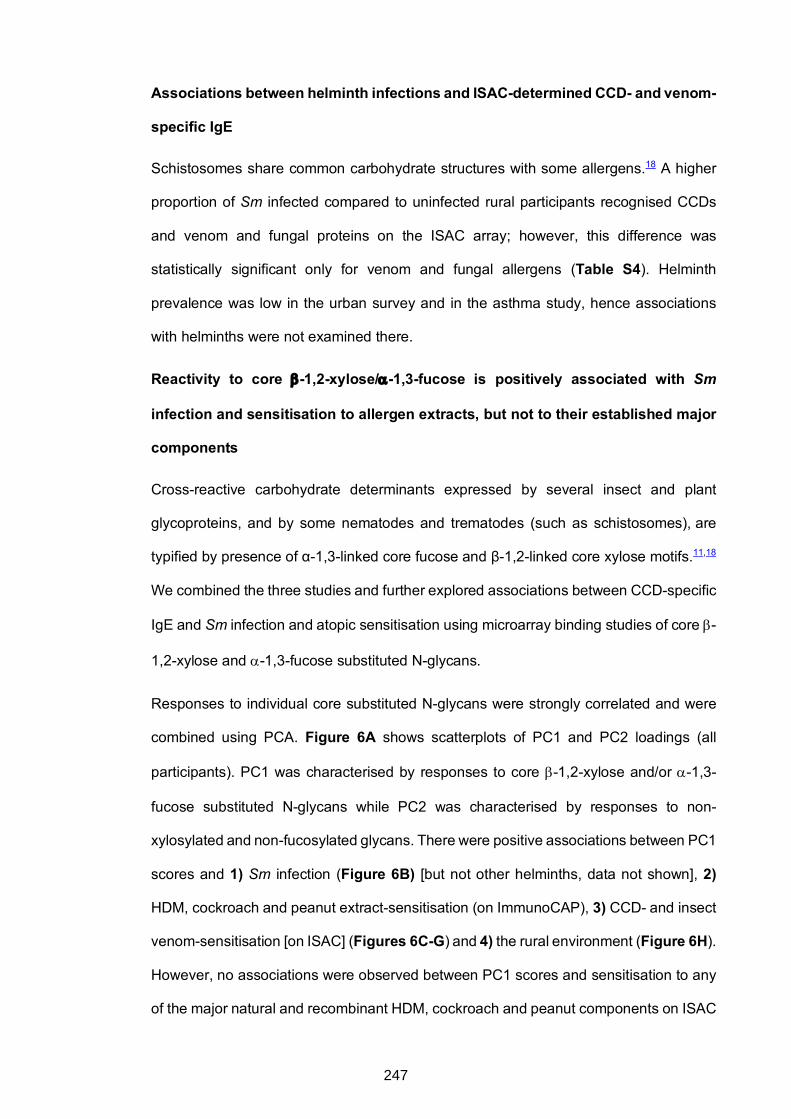
Associations between helminth infections and ISAC-determined CCD- and venom-
specific IgE
Schistosomes share common carbohydrate structures with some allergens.18 A higher
proportion of Sm infected compared to uninfected rural participants recognised CCDs
and venom and fungal proteins on the ISAC array; however, this difference was
statistically significant only for venom and fungal allergens (Table S4). Helminth
prevalence was low in the urban survey and in the asthma study, hence associations
with helminths were not examined there.
Reactivity to core b-1,2-xylose/a-1,3-fucose is positively associated with Sm
infection and sensitisation to allergen extracts, but not to their established major
components
Cross-reactive carbohydrate determinants expressed by several insect and plant
glycoproteins, and by some nematodes and trematodes (such as schistosomes), are
typified by presence of α-1,3-linked core fucose and β-1,2-linked core xylose motifs.11,18
We combined the three studies and further explored associations between CCD-specific
IgE and Sm infection and atopic sensitisation using microarray binding studies of core b-
1,2-xylose and a-1,3-fucose substituted N-glycans.
Responses to individual core substituted N-glycans were strongly correlated and were
combined using PCA. Figure 6A shows scatterplots of PC1 and PC2 loadings (all
participants). PC1 was characterised by responses to core b-1,2-xylose and/or a-1,3-
fucose substituted N-glycans while PC2 was characterised by responses to non-
xylosylated and non-fucosylated glycans. There were positive associations between PC1
scores and 1) Sm infection (Figure 6B) [but not other helminths, data not shown], 2)
HDM, cockroach and peanut extract-sensitisation (on ImmunoCAP), 3) CCD- and insect
venom-sensitisation [on ISAC] (Figures 6C-G) and 4) the rural environment (Figure 6H).
However, no associations were observed between PC1 scores and sensitisation to any
of the major natural and recombinant HDM, cockroach and peanut components on ISAC
247
(Figure 6C-E).
Reactivity to core a-1,3-fucose substituted N-glycans is inversely associated with
asthma
No associations were observed between glycan microarray-assessed IgE response PC
scores and allergic effector responses (asthma or SPT reactivity (Figure 6I-J).
Assessment of associations between asthma and responses to individual glycans on the
array showed that asthmatics, compared to controls, mounted significantly lower
responses to N-glycans carrying core a-1,3-fucose only or in combination with a-1,6-
fucose, but not to any other structures on the array (Figure 7).
248
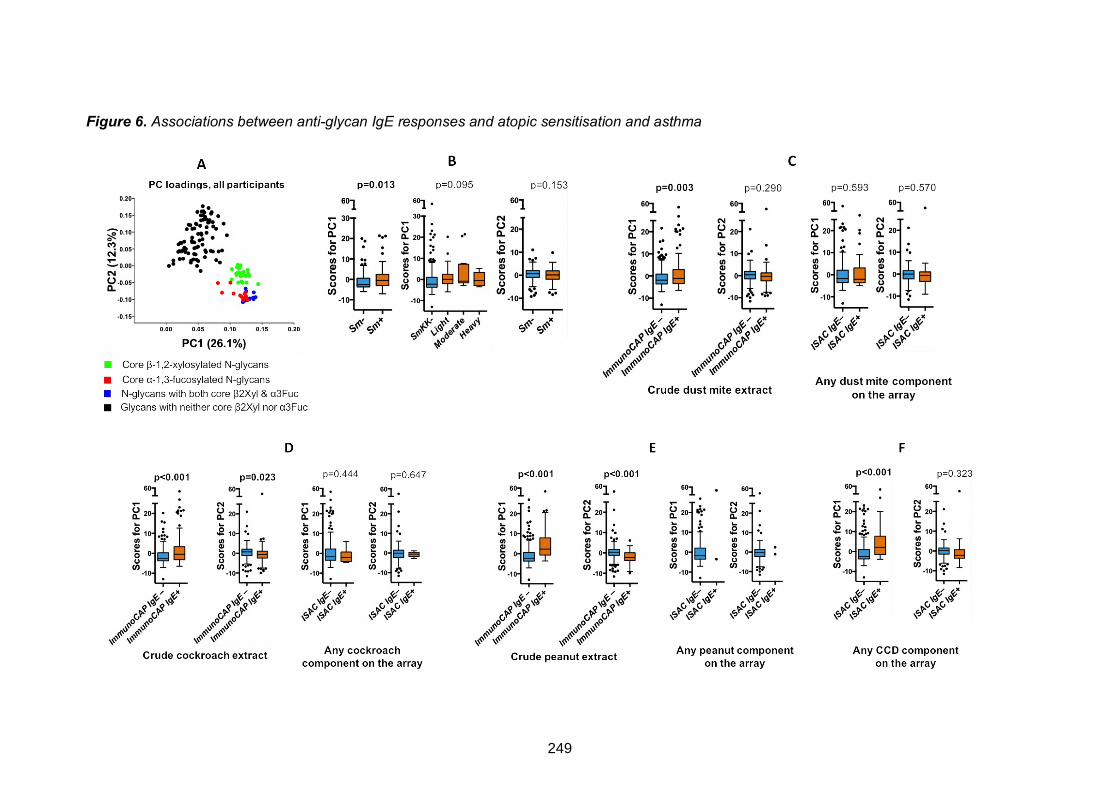
Figure 6. Associations between anti-glycan IgE responses and atopic sensitisation and asthma
249
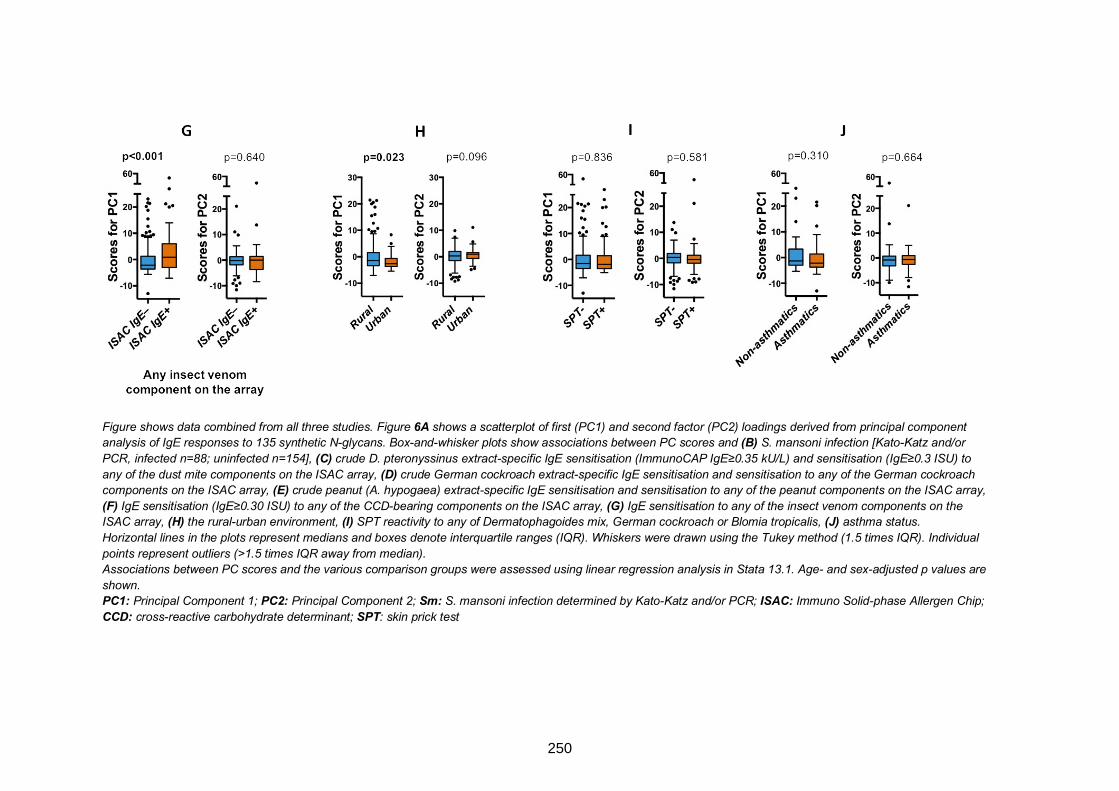
Figure shows data combined from all three studies. Figure 6A shows a scatterplot of first (PC1) and second factor (PC2) loadings derived from principal component
analysis of IgE responses to 135 synthetic N-glycans. Box-and-whisker plots show associations between PC scores and (B) S. mansoni infection [Kato-Katz and/or
PCR, infected n=88; uninfected n=154], (C) crude D. pteronyssinus extract-specific IgE sensitisation (ImmunoCAP IgE≥0.35 kU/L) and sensitisation (IgE≥0.3 ISU) to
any of the dust mite components on the ISAC array, (D) crude German cockroach extract-specific IgE sensitisation and sensitisation to any of the German cockroach
components on the ISAC array, (E) crude peanut (A. hypogaea) extract-specific IgE sensitisation and sensitisation to any of the peanut components on the ISAC array,
(F) IgE sensitisation (IgE≥0.30 ISU) to any of the CCD-bearing components on the ISAC array, (G) IgE sensitisation to any of the insect venom components on the
ISAC array, (H) the rural-urban environment, (I) SPT reactivity to any of Dermatophagoides mix, German cockroach or Blomia tropicalis, (J) asthma status. Horizontal lines in the plots represent medians and boxes denote interquartile ranges (IQR). Whiskers were drawn using the Tukey method (1.5 times IQR). Individual
points represent outliers (>1.5 times IQR away from median).
Associations between PC scores and the various comparison groups were assessed using linear regression analysis in Stata 13.1. Age- and sex-adjusted p values are
shown.
PC1: Principal Component 1; PC2: Principal Component 2; Sm: S. mansoni infection determined by Kato-Katz and/or PCR; ISAC: Immuno Solid-phase Allergen Chip;
CCD: cross-reactive carbohydrate determinant; SPT: skin prick test
250
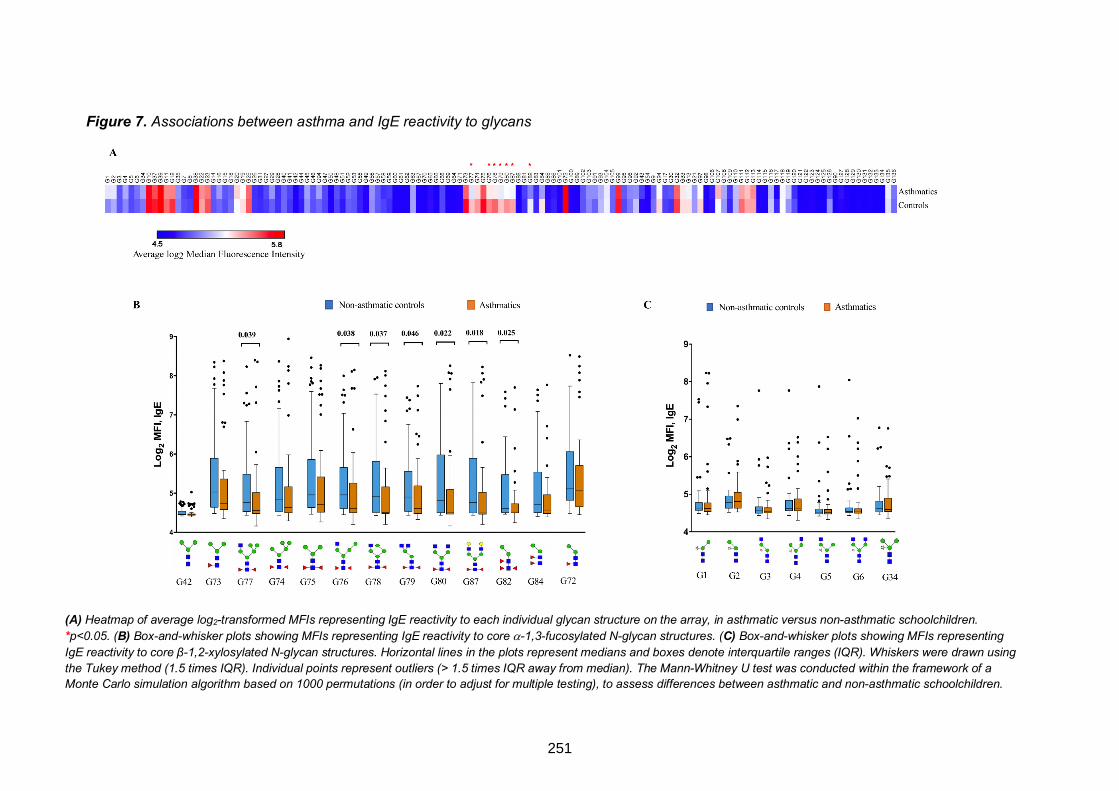
Figure 7. Associations between asthma and IgE reactivity to glycans
(A) Heatmap of average log2-transformed MFIs representing IgE reactivity to each individual glycan structure on the array, in asthmatic versus non-asthmatic schoolchildren.
*p<0.05. (B) Box-and-whisker plots showing MFIs representing IgE reactivity to core a-1,3-fucosylated N-glycan structures. (C) Box-and-whisker plots showing MFIs representing
IgE reactivity to core β-1,2-xylosylated N-glycan structures. Horizontal lines in the plots represent medians and boxes denote interquartile ranges (IQR). Whiskers were drawn using
the Tukey method (1.5 times IQR). Individual points represent outliers (> 1.5 times IQR away from median). The Mann-Whitney U test was conducted within the framework of a
Monte Carlo simulation algorithm based on 1000 permutations (in order to adjust for multiple testing), to assess differences between asthmatic and non-asthmatic schoolchildren.
251

DISCUSSION
We conducted a component-resolved assessment of associations between IgE
responses and allergy outcomes among Ugandan rural and urban individuals, and
among asthmatic schoolchildren and their controls. We hypothesised that anti-CCD IgE
might contribute to protection against clinical allergy, and found that there was a specific
inverse association between reactivity to core a-1,3-fucose substituted N-glycans and
asthma. We also found that among rural, urban and non-asthmatic participants,
sensitisation to extracts from common environmental allergens did not reflect
sensitisation to their established major allergenic components; rather, many participants
recognised CCDs and venom proteins, both known to be expressed on Sm antigens. By
contrast, a high proportion of asthmatics were sensitised to both HDM extract and its
major components, lending substantial support to increasing evidence that much asthma
in tropical LICs is atopic, contrary to earlier perception.59,60 Detailed assessment of IgE
reactivity to core b-1,2-xylose and/or a-1,3-fucose (well-known, non-mammalian,
“classical” CCDs) using a synthetic glycan microarray revealed strong positive
associations with Sm infection, the rural environment and ImmunoCAP-determined
allergen extract-specific IgE sensitisation, but not with ISAC-determined sensitisation to
major natural and non-glycosylated recombinant components of these allergen extracts.
Allergen extracts contain a mixture of allergenic and non-allergenic components,61 as
well as cross-reactive protein and carbohydrate components that are conserved in other
environmental antigens such as those from schistosomes.62 This obscures the identity
of the molecular drivers, and hence interpretation, of atopic sensitisation, which is
regularly diagnosed using allergen extract-based in vivo SPTs and/or in vitro extract-
specific IgE blood immunoassays. Our results show that this has important implications
for diagnosis of atopy and use of population attributable fractions to assess the
contribution of atopy to allergy-related disease in tropical LICs.
252
The high prevalence of sensitisation to allergen extracts but low sensitisation to their
major allergenic components in our high-Sm-transmission rural setting is reminiscent of
previous findings by Hamid et al. among Indonesian schoolchildren from areas endemic
for soil-transmitted helminths (STH) but not schistosomes.35 Hamid’s results imply that
cross-reactive protein motifs and/or CCDs from environmental antigens other than
schistosomes play an important role in allergy epidemiology. While exposure to STH
might theoretically contribute, expression of “classical” CCD epitopes in most STH is not
yet well mapped, with STH glycomes understudied compared to the Schistosoma
glycome. However, absence of significant associations between anti-CCD IgE and
infection with any STH in our studies opposes the notion that STH express “classical”
CCDs.
Sensitisation to components bearing classical CCDs in our studies was more common
than sensitisation to major allergenic components, suggesting that in this setting, IgE to
allergen extracts is raised predominantly against carbohydrate groups shared with
environmental antigens, such as helminths. There is evidence showing that cross-
sensitisation between Schistosoma antigens and peanut, pollen or insect venom
allergens is predominantly caused by CCDs.36,63,64 Our results also imply that CCDs
contribute considerably to sensitisation to HDM and cockroach allergens in helminth-
endemic settings.
Although insect venom N-glycans carry core a-1,3-fucose motifs65,66 (which, akin to core
b-1,2-xylose, are expressed on Schistosoma egg N-glycans17), this is unlikely to explain
why responses to wasp venom components were elevated among rural and Sm infected
participants, as the ISAC array contains recombinant forms of these components. The
observed responses possibly reflect sensitisation to Venom-Allergen-Like (VAL) proteins
expressed by schistosomes67 and other helminths such as hookworm68 and Brugia
malayi.69 Screening the Sm GeneDB database
(http://www.genedb.org/Homepage/Smansoni) for protein homology between Sm and
253
wasp venoms yields 46 Sm protein sequences producing high-scoring segment pairs
with up to 43% identity and 56% similarity to Pol d 5, and 41 Sm proteins with up to 42%
identity and 78% similarity to Ves v 5.
Higher levels of IgE to CCDs in rural compared to urban participants, and among Sm
infected compared to uninfected participants, imply that Sm infection in our setting
contributes considerably to high anti-CCD IgE levels and consequently to high
prevalence of ImmunoCAP sensitisation to allergen extracts expressing these CCDs. It
is likely that previously observed positive associations between Sm and HDM extract-
specific IgE in our rural setting5 are partially attributable to CCD-sensitisation. In the
same population, prevalence of clinical allergies is low, supporting the hypothesis that
helminths may protect against allergic effector responses. The role of CCDs in protection
against allergy, if any, is unclear. Alpha-1,3-gal has been implicated in meat allergy;33
however, our studies did not find any evidence of this, despite elevated α-1,3-gal-specific
IgE concentrations. Other than α-1,3-gal-specific IgE, carbohydrate-specific IgE rarely,
if ever, translates into clinical allergy.10,29,34,36 We postulated that elevated IgE responses
to specific immunogenic glycans during chronic Sm infection might dominate over
allergen protein-specific IgE, resulting in reduced allergic effector responses. Many
native allergens occur as glycoproteins; therefore, prior high exposure to specific CCDs
(perhaps resulting from Sm infection) may prime initial and recall IgE responses to
preferentially target specific CCD rather than the protein epitopes of allergens. Thus in
Sm-endemic settings, IgE may be less effectively induced against common protein
allergens than against CCDs, as implied by responses to components on the ISAC array
in the present study.
In our setting, ISAC-determined anti-CCD IgE was not inversely associated with SPT
reactivity or asthma, and PCA of microarray-determined anti-glycan IgE responses
suggested no overall association (inverse or otherwise) between asthma and anti-glycan
IgE. However, analysis of levels of IgE to individual glycans revealed that reactivity to
254
core a-1,3-fucose substituted N-glycans was lower among asthmatic schoolchildren
compared to controls. We now hypothesise that responses to specific glycans are not
merely a smokescreen that obscures readouts for assessment of atopy; they may be
important in protection against allergic disease through specific, yet-to-be-defined,
mechanisms. Further mechanistic investigations in animal and human studies are
required to investigate this hypothesis. Current efforts to reconstruct helminth
glycoproteins (including those carrying N-glycan core substitutions) in plant systems70
offer great promise for availability of tailored glycan epitopes for initial testing in animal
models.
Overall, our data indicate that in tropical LICs, IgE to allergen extracts (detected in
standard ImmunoCAP assays) reflects sensitisation to a myriad of environmental
exposures (absent in high-income countries), such as CCDs expressed by some
helminths, and may not accurately define allergy-related disease phenotypes. In fact,
our findings suggest that reactivity to specific (but not all) CCD epitopes might contribute
to protection against clinical allergy.
255
Acknowledgements
We thank Koome sub-county and Entebbe municipality community members for
participating in the rural (LaVIISWA) study and the urban survey, respectively. We are
grateful to schoolchildren in Entebbe municipality and the surrounding areas in Wakiso
District who took part in the asthma case-control study. We also thank all study staff.
Author contributions
AME, MY, GN, HM, RvR, CHH and AvD contributed to the conception and experimental
design of the study. AME, RES, HM and MN led the field and clinic procedures. SS and
NCR constructed the glycan microarrays. GN conducted the laboratory experiments,
with SV, JN, IN and JK making key contributions. GN, ELW and AvD analysed the data.
GN wrote the manuscript, with all authors contributing to the interpretation of the results,
and revision and approval of the final manuscript.
256
REFERENCES
1. Tyagi N, Farnell EJ, Fitzsimmons CM, Ryan S, Tukahebwa E, Maizels RM, et al. Comparisons of Allergenic and Metazoan Parasite Proteins: Allergy the Price of Immunity. PLoS Comput Biol 2015; 11:e1004546.
2. Fitzsimmons C, Falcone F, Dunne D. Helminth Allergens, Parasite-Specific IgE, and Its Protective Role in Human Immunity. Frontiers in Immunology 2014; 5.
3. Smits HH, Everts B, Hartgers FC, Yazdanbakhsh M. Chronic helminth infections protect against allergic diseases by active regulatory processes. Curr Allergy Asthma Rep 2010; 10:3-12.
4. Platts-Mills TA, Cooper PJ. Differences in asthma between rural and urban communities in South Africa and other developing countries. J Allergy Clin Immunol 2010; 125:106-7.
5. Webb EL, Nampijja M, Kaweesa J, Kizindo R, Namutebi M, Nakazibwe E, et al. Helminths are positively associated with atopy and wheeze in Ugandan fishing communities: results from a cross-sectional survey. Allergy 2016; 71:1156-69.
6. Yazdanbakhsh M, Kremsner PG, van Ree R. Allergy, Parasites, and the Hygiene Hypothesis. Science 2002; 296:490-4.
7. Santiago HC, Bennuru S, Boyd A, Eberhard M, Nutman TB. Structural and immunologic cross-reactivity among filarial and mite tropomyosin: implications for the hygiene hypothesis. J Allergy Clin Immunol 2011; 127:479-86.
8. Farias LP, Rodrigues D, Cunna V, Rofatto HK, Faquim-Mauro EL, Leite LC. Schistosoma mansoni venom allergen like proteins present differential allergic responses in a murine model of airway inflammation. PLoS Negl Trop Dis 2012; 6:e1510.
9. Wan D, Ludolf F, Alanine DG, Stretton O, Ali Ali E, Al-Barwary N, et al. Use of humanised rat basophilic leukaemia cell line RS-ATL8 for the assessment of allergenicity of Schistosoma mansoni proteins. PLoS Negl Trop Dis 2014; 8:e3124.
10. Altmann F. The role of protein glycosylation in allergy. Int Arch Allergy Immunol 2007; 142:99-115.
11. Commins SP. Carbohydrates as allergens. Curr Allergy Asthma Rep 2015; 15:492.
12. Khoo K-H, Chatterjee D, Caulfield JP, Morris HR, Dell A. Structural mapping of the glycans from the egg glycoproteins of Schistosoma mansoni and Schistosoma japonicum: identification of novel core structures and terminal sequences. Glycobiology 1997; 7:663-77.
13. van Die I, Gomord V, Kooyman FN, van den Berg TK, Cummings RD, Vervelde L. Core alpha1-->3-fucose is a common modification of N-glycans in parasitic helminths and constitutes an important epitope for IgE from Haemonchus contortus infected sheep. FEBS Lett 1999; 463:189-93.
257
14. Yan S, Vanbeselaere J, Jin C, Blaukopf M, Wöls F, Wilson IBH, et al. Core Richness of N-Glycans of Caenorhabditis elegans: A Case Study on Chemical and Enzymatic Release. Anal Chem 2018; 90:928-35.
15. Haslam SM, Coles GC, Munn EA, Smith TS, Smith HF, Morris HR, et al. Haemonchus contortus glycoproteins contain N-linked oligosaccharides with novel highly fucosylated core structures. J Biol Chem 1996; 271:30561-70.
16. Haslam SM, Coles GC, Reason AJ, Morris HR, Dell A. The novel core fucosylation of Haemonchus contortus N-glycans is stage specific. Molecular and Biochemical Parasitology 1998; 93:143-7.
17. Hokke CH, van Diepen A. Helminth glycomics – glycan repertoires and host-parasite interactions. Molecular and Biochemical Parasitology 2017; 215:47-57.
18. Homann A, Schramm G, Jappe U. Glycans and glycan-specific IgE in clinical and molecular allergology: Sensitization, diagnostics, and clinical symptoms. J Allergy Clin Immunol 2017; 140:356-68.
19. Hewitson JP, Nguyen DL, van Diepen A, Smit CH, Koeleman CA, McSorley HJ, et al. Novel O-linked methylated glycan antigens decorate secreted immunodominant glycoproteins from the intestinal nematode Heligmosomoides polygyrus. Int J Parasitol 2016; 46:157-70.
20. Gleeson PA. The sweet side of immunology: glycobiology of the immune system. Immunol Cell Biol 2008; 86:562-3.
21. Wolfert MA, Boons GJ. Adaptive immune activation: glycosylation does matter. Nat Chem Biol 2013; 9:776-84.
22. Bardor M, Faveeuw C, Fitchette AC, Gilbert D, Galas L, Trottein F, et al. Immunoreactivity in mammals of two typical plant glyco-epitopes, core alpha(1,3)-fucose and core xylose. Glycobiology 2003; 13:427-34.
23. Faveeuw C, Mallevaey T, Paschinger K, Wilson IB, Fontaine J, Mollicone R, et al. Schistosome N-glycans containing core alpha 3-fucose and core beta 2-xylose epitopes are strong inducers of Th2 responses in mice. Eur J Immunol 2003; 33:1271-81.
24. Luyai AE, Heimburg-Molinaro J, Prasanphanich NS, Mickum ML, Lasanajak Y, Song X, et al. Differential expression of anti-glycan antibodies in schistosome-infected humans, rhesus monkeys and mice. Glycobiology 2014; 24:602-18.
25. Oyelaran O, McShane LM, Dodd L, Gildersleeve JC. Profiling human serum antibodies with a carbohydrate antigen microarray. J Proteome Res 2009; 8:4301-10.
26. Lavine CL, Lao S, Montefiori DC, Haynes BF, Sodroski JG, Yang X, et al. High-mannose glycan-dependent epitopes are frequently targeted in broad neutralizing antibody responses during human immunodeficiency virus type 1 infection. J Virol 2012; 86:2153-64.
27. van Diepen A, Smit CH, van Egmond L, Kabatereine NB, Pinot de Moira A, Dunne DW, et al. Differential anti-glycan antibody responses in Schistosoma
258
mansoni-infected children and adults studied by shotgun glycan microarray. PLoS Negl Trop Dis 2012; 6:e1922.
28. Fotisch K, Altmann F, Haustein D, Vieths S. Involvement of carbohydrate epitopes in the IgE response of celery-allergic patients. Int Arch Allergy Immunol 1999; 120:30-42.
29. Mari A, Ooievaar-de Heer P, Scala E, Giani M, Pirrotta L, Zuidmeer L, et al. Evaluation by double-blind placebo-controlled oral challenge of the clinical relevance of IgE antibodies against plant glycans. Allergy 2008; 63:891-6.
30. van Ree R, Cabanes-Macheteau M, Akkerdaas J, Milazzo JP, Loutelier-Bourhis C, Rayon C, et al. Beta(1,2)-xylose and alpha(1,3)-fucose residues have a strong contribution in IgE binding to plant glycoallergens. J Biol Chem 2000; 275:11451-8.
31. Iacovacci P, Afferni C, Butteroni C, Pironi L, Puggioni EM, Orlandi A, et al. Comparison between the native glycosylated and the recombinant Cup a1 allergen: role of carbohydrates in the histamine release from basophils. Clin Exp Allergy 2002; 32:1620-7.
32. Westphal S, Kolarich D, Foetisch K, Lauer I, Altmann F, Conti A, et al. Molecular characterization and allergenic activity of Lyc e 2 (beta-fructofuranosidase), a glycosylated allergen of tomato. Eur J Biochem 2003; 270:1327-37.
33. Commins SP, Platts-Mills TA. Delayed anaphylaxis to red meat in patients with IgE specific for galactose alpha-1,3-galactose (alpha-gal). Curr Allergy Asthma Rep 2013; 13:72-7.
34. van der Veen MJ, van Ree R, Aalberse RC, Akkerdaas J, Koppelman SJ, Jansen HM, et al. Poor biologic activity of cross-reactive IgE directed to carbohydrate determinants of glycoproteins. J Allergy Clin Immunol 1997; 100:327-34.
35. Hamid F, Versteeg SA, Wiria AE, Wammes LJ, Wahyuni S, Supali T, et al. Molecular diagnostics and lack of clinical allergy in helminth-endemic areas in Indonesia. J Allergy Clin Immunol 2017; 140:1196-9.e6.
36. Amoah AS, Obeng BB, Larbi IA, Versteeg SA, Aryeetey Y, Akkerdaas JH, et al. Peanut-specific IgE antibodies in asymptomatic Ghanaian children possibly caused by carbohydrate determinant cross-reactivity. J Allergy Clin Immunol 2013; 132:639-47.
37. Sanya RE, Nkurunungi G, Hoek Spaans R, Nampijja M, O’Hara G, Kizindo R, et al. The Impact of Intensive Versus Standard Anthelminthic Treatment on Allergy-related Outcomes, Helminth Infection Intensity, and Helminth-related Morbidity in Lake Victoria Fishing Communities, Uganda: Results From the LaVIISWA Cluster-randomized Trial. Clinical Infectious Diseases 2018:ciy761-ciy.
38. Nkurunungi G, Lubyayi L, Versteeg SA, Sanya RE, Nassuuna J, Kabagenyi J, et al. Do helminth infections underpin urban-rural differences in risk factors for allergy-related outcomes? Clinical & Experimental Allergy 2019; doi: 10.1111/cea.13335.
39. Nampijja M, Webb EL, Kaweesa J, Kizindo R, Namutebi M, Nakazibwe E, et al. The Lake Victoria island intervention study on worms and allergy-related
259
diseases (LaVIISWA): study protocol for a randomised controlled trial. Trials 2015; 16:187.
40. Ellwood P, Asher MI, Beasley R, Clayton TO, Stewart AW. ISAAC Phase Three Manual. ISAAC International Data Centre, Auckland, New Zealand, 2000.
41. So How Do I Define Atopic Eczema? A Practical manual for researchers wishing to define atopic eczema.] Available from http://www.nottingham.ac.uk/~mzzfaq/dermatology/eczema/contents.html.
42. Katz N, Chaves A, Pellegrino J. A simple device for quantitative stool thick-smear technique in Schistosomiasis mansoni. Rev Inst Med Trop Sao Paulo 1972; 14:397-400.
43. Verweij JJ, Brienen EA, Ziem J, Yelifari L, Polderman AM, Van Lieshout L. Simultaneous detection and quantification of Ancylostoma duodenale, Necator americanus, and Oesophagostomum bifurcum in fecal samples using multiplex real-time PCR. Am J Trop Med Hyg 2007; 77:685-90.
44. Verweij JJ, Canales M, Polman K, Ziem J, Brienen EA, Polderman AM, et al. Molecular diagnosis of Strongyloides stercoralis in faecal samples using real-time PCR. Trans R Soc Trop Med Hyg 2009; 103:342-6.
45. ImmunoCAP Specific IgE. ThermoFisher Scientific, Uppsala, Sweden. [Cited 2018.] Available from http://www.phadia.com/da/Products/Allergy-testing-products/ImmunoCAP-Lab-Tests/sIgE/.
46. ImmunoCAP ISAC – When you need the bigger picture in allergy. ThermoFisher Scientific, Uppsala, Sweden. [Cited 2018.] Available from http://www.phadia.com/da/Products/Allergy-testing-products/ImmunoCAP-ISAC/.
47. van Hage M, Schmid-Grendelmeier P, Skevaki C, Plebani M, Canonica W, Kleine-Tebbe J, et al. Performance evaluation of ImmunoCAP® ISAC 112: a multi-site study. Clinical Chemistry and Laboratory Medicine (CCLM), 2017:571.
48. Curin M, Garib V, Valenta R. Single recombinant and purified major allergens and peptides: How they are made and how they change allergy diagnosis and treatment. Annals of Allergy, Asthma & Immunology 2017; 119:201-9.
49. Holzweber F, Svehla E, Fellner W, Dalik T, Stubler S, Hemmer W, et al. Inhibition of IgE binding to cross-reactive carbohydrate determinants enhances diagnostic selectivity. Allergy 2013; 68:1269-77.
50. Phadia Multiplexing Diagnostics GmbH, Wien, Austria, and Phadia AB, Uppsala, Sweden. 2009.] Available from http://www.phadia.com/Global/Corporate%20Allergy/Files/DfU/Assay%20Kit%20IgE/DfU-ImmunoCAP-ISAC-20-01-02-3-RUO.pdf.
51. Echeverria B, Serna S, Achilli S, Vivès C, Pham J, Thépaut M, et al. Chemoenzymatic Synthesis of N-glycan Positional Isomers and Evidence for Branch Selective Binding by Monoclonal Antibodies and Human C-type Lectin Receptors. ACS Chemical Biology 2018; 13:2269-79.
260
52. Brzezicka K, Echeverria B, Serna S, van Diepen A, Hokke CH, Reichardt NC. Synthesis and microarray-assisted binding studies of core xylose and fucose containing N-glycans. ACS Chem Biol 2015; 10:1290-302.
53. Amoah AS, Asuming-Brempong EK, Obeng BB, Versteeg SA, Larbi IA, Aryeetey Y, et al. Identification of dominant anti-glycan IgE responses in school children by glycan microarray. J Allergy Clin Immunol 2018; 141:1130-3.
54. van Diepen A, van der Plas AJ, Kozak RP, Royle L, Dunne DW, Hokke CH. Development of a Schistosoma mansoni shotgun O-glycan microarray and application to the discovery of new antigenic schistosome glycan motifs. Int J Parasitol 2015; 45:465-75.
55. Yang YY, Li XH, Brzezicka K, Reichardt NC, Wilson RA, van Diepen A, et al. Specific anti-glycan antibodies are sustained during and after parasite clearance in Schistosoma japonicum-infected rhesus macaques. PLoS Negl Trop Dis 2017; 11:e0005339.
56. Nkurunungi G, Kabagenyi J, Nampijja M, Sanya RE, Walusimbi B, Nassuuna J, et al. Schistosoma mansoni-specific immune responses and allergy in Uganda. Parasite Immunol 2018; 40.
57. Jiang Y, Zhang L, Kong F, Zhang M, Lv H, Liu G, et al. MCPerm: A Monte Carlo Permutation Method for Accurately Correcting the Multiple Testing in a Meta-Analysis of Genetic Association Studies. PLOS ONE 2014; 9:e89212.
58. Mpairwe H, Muhangi L, Ndibazza J, Tumusiime J, Muwanga M, Rodrigues LC, et al. Skin prick test reactivity to common allergens among women in Entebbe, Uganda. Trans R Soc Trop Med Hyg 2008; 102:367-73.
59. Flohr C, Weiland SK, Weinmayr G, Bjorksten B, Braback L, Brunekreef B, et al. The role of atopic sensitization in flexural eczema: findings from the International Study of Asthma and Allergies in Childhood Phase Two. J Allergy Clin Immunol 2008; 121:141-7 e4.
60. Weinmayr G, Weiland SK, Bjorksten B, Brunekreef B, Buchele G, Cookson WO, et al. Atopic sensitization and the international variation of asthma symptom prevalence in children. Am J Respir Crit Care Med 2007; 176:565-74.
61. Sander I, Fleischer C, Meurer U, Bruning T, Raulf-Heimsoth M. Allergen content of grass pollen preparations for skin prick testing and sublingual immunotherapy. Allergy 2009; 64:1486-92.
62. Hamid F, Amoah AS, van Ree R, Yazdanbakhsh M. Helminth-induced IgE and protection against allergic disorders. Curr Top Microbiol Immunol 2015; 388:91-108.
63. Igetei JE, El-Faham M, Liddell S, Doenhoff MJ. Antigenic cross-reactivity between Schistosoma mansoni and peanut: a role for cross-reactive carbohydrate determinants (CCDs) and implications for the hygiene hypothesis. Immunology 2017; 150:506-17.
64. Igetei JE, El-Faham M, Liddell S, Schramm G, Doenhoff MJ. Antigenic cross-reactivity between Schistosoma mansoni and pollen allergens from the birch tree
261
(Betula verrucosa) and Timothy grass (Phleum pratense): involvement of shared glycan epitopes and implications for the hygiene hypothesis. Int J Parasitol 2018.
65. Staudacher E, Altmann F, Marz L, Hard K, Kamerling JP, Vliegenthart JF. Alpha 1-6(alpha 1-3)-difucosylation of the asparagine-bound N-acetylglucosamine in honeybee venom phospholipase A2. Glycoconj J 1992; 9:82-5.
66. Kubelka V, Altmann F, Staudacher E, Tretter V, Marz L, Hard K, et al. Primary structures of the N-linked carbohydrate chains from honeybee venom phospholipase A2. Eur J Biochem 1993; 213:1193-204.
67. Chen J, Hu X, He S, Wang L, Hu D, Wang X, et al. Expression and immune response analysis of Schistosoma japonicum VAL-1, a homologue of vespid venom allergens. Parasitol Res 2010; 106:1413-8.
68. Diemert DJ, Pinto AG, Freire J, Jariwala A, Santiago H, Hamilton RG, et al. Generalized urticaria induced by the Na-ASP-2 hookworm vaccine: implications for the development of vaccines against helminths. J Allergy Clin Immunol 2012; 130:169-76.e6.
69. Murray J, Gregory WF, Gomez-Escobar N, Atmadja AK, Maizels RM. Expression and immune recognition of Brugiamalayi VAL-1, a homologue of vespid venom allergens and Ancylostoma secreted proteins. Molecular and Biochemical Parasitology 2001; 118:89-96.
70. Wilbers RHP, Westerhof LB, van Noort K, Obieglo K, Driessen NN, Everts B, et al. Production and glyco-engineering of immunomodulatory helminth glycoproteins in plants. Scientific Reports 2017; 7:45910.
262
Sample size considerations
In the rural survey, 2961 participants from the 26 study villages had a plasma sample
stored and hence provided the sampling frame for selection for the ImmunoCAP IgE test.
780 participants (approximately 30 per village) were randomly selected using Stata 13.1
software (StataCorp, College Station, Texas, U.S.A). The rural survey was the three-
year outcome survey of the Lake Victoria Island Intervention Study on Worms and
Allergy-related diseases (LaVIISWA; ISRCTN471960311). The main LaVIISWA trial
analysis aimed to compare outcomes between the two trial arms,1,2 hence a sample size
of 780 was expected to give 80% power to detect a 35% relative difference in the
prevalence of ImmunoCAP allergen-specific IgE sensitisation between the two trial arms,
based on an assumed overall allergen-specific IgE sensitisation prevalence of 50% (from
results at baseline), and an estimated coefficient of variation (in IgE levels between
clusters) of 0.2.
Samples for the glycan and ISAC microarray experiments were randomly selected from
among those with ImmunoCAP data. We initially aimed for 50 samples per trial arm (100
in total), and managed to test a total of 209 (glycan array) and 126 samples (ISAC array
experiments, respectively), owing to availability of further funding. Similar numbers have
been shown to be useful in published studies that have assessed differences in
microarray-assessed antibody levels between helminth infected and uninfected, and
allergic and non-allergic individuals,3,4 and between children and adults.5
In the urban survey, 1356 participants had a plasma sample stored. ImmunoCAP data
on cockroach- and dust mite-specific IgE were available for rural survey participants,
hence calculations could be conducted to estimate how many urban survey plasma
samples were required to attain significant differences in the prevalence of ImmunoCAP
positivity between the urban and rural survey. Assuming a 35% prevalence of
7.3 Supplementary information for Research paper 4
7.3.1 Supplementary methods
7.3.1.1
263
ImmunoCAP positivity to either cockroach or dust mite in the rural survey and a design
effect of 1.3, 353 urban survey participants were required for 80% power to detect an
absolute difference in proportion positive of 0.10 between the rural and urban survey.
For the glycan and ISAC microarray experiments, a sample size of 50 was deemed
sufficient to detect differences between the rural and urban setting, based on previous
studies doing similar comparisons.3
In the asthma case-control study, 557 cases and 1128 controls had a plasma sample
stored. Four hundred participants (200 asthmatics and 200 controls) were randomly
selected for the ImmunoCAP test. This number was expected to yield 90% power to
detect a significant positive association (at an odds ratio of 2) between asthma and
ImmunoCAP positivity to any of dust mite, cockroach or peanut (IgE ≥0.35 kU/L). For
glycan and ISAC microarray experiments, a sample size of 50 cases and 50 controls
was deemed sufficient, based on numbers used in the rural and the urban survey.
ImmunoCAP ISACÒ sIgE 112 test
This test was conducted according to the manufacturer’s instructions. The ISAC
(Immuno Solid-phase Allergen Chip) comprises four reaction sites, each printed with 112
allergen components in a microarray format. Before the immunoassay, each microarray
chip was washed to remove any allergens that were non-covalently bound to the
microarray surface. Each reaction site was then incubated with 30 μl of undiluted
participant plasma for two hours at room temperature in a humidified chamber to enable
reactions between IgE and allergen components. Following a washing step, each
microarray was incubated for 30 minutes with 30 μl of fluorescence-labeled anti-human
IgE detection antibody. Unbound detection antibody was washed off and the
fluorescence intensity of each microarray measured using a scanner (LuxScan 10K/A,
CapitalBio, Beijing, China). Analysis of the resultant digitalized images was done using
Phadia Microarray Image Analysis software (Thermo Fisher Scientific). Results were
reported in arbitrary semi-quantitative ISAC Standardised Units (ISU).
7.3.1.2
264
Microarray detection of N-glycan-specific IgE
Each reaction site on each microarray slide included fluorescently-labeled bovine serum
albumin (BSA) as a printing control. The NEXTERION®-coated microarray slides [Schott
AG, Germany] used in the IgE binding assay were blocked (during microarray
construction) with 50mM ethanolamine in 50mM sodium borate buffer pH 9.0, and stored
at -20°C. On the day of the binding assay, they were thawed at room temperature (RT)
and covered with silicone gaskets to create seven wells with printed microarrays per
slide. Each microarray was incubated with 300 μl of a 1:30 plasma dilution in 1% BSA -
0.01% Tween20 for one hour at RT while shaking. After sequential washes with PBS-
0.05% Tween20 and PBS, the slides were incubated for 30 minutes at RT in the dark
with PromoFluor 647 (VWR, USA)-labeled anti-human IgE clone MH25-1 (Sanquin,
Amsterdam, Netherlands) [diluted 1/150 in PBS-0.01% Tween20], while shaking. After a
final wash with PBS-0.05% Tween20, PBS and deionised water, sequentially, the slides
were dried and kept in the dark until scanning. The slides were scanned for fluorescence
at a 10μm resolution with a G2565BA scanner (Agilent Technologies, CA, USA) using a
633nm laser.
Glycan microarray image processing
Using GenePix Pro 7.0 software (Molecular Devices, CA, USA), a spot-finding algorithm
was used to align and re-size fluorescence spots in the microarray images, without
setting a composite pixel intensity threshold. Data on median fluorescence intensity
(MFI) for each spot and the local background were then exported to Microsoft Excel
software. In all analyses, MFIs that were highlighted as artefacts by the GenePix Pro 7.0
software were excluded. Further processing of IgE MFIs in Excel was done as described
by Amoah et al.,3 as follows: for each IgE spot, the ratio of the MFI of the spot to the local
background MFI was obtained and then multiplied by the average of background MFI for
all the spots on the array. For each of the structures, the average over four spots (or
less, in case of unreliable data that were excluded) was then log2-transformed.
7.3.1.3
7.3.1.4
265
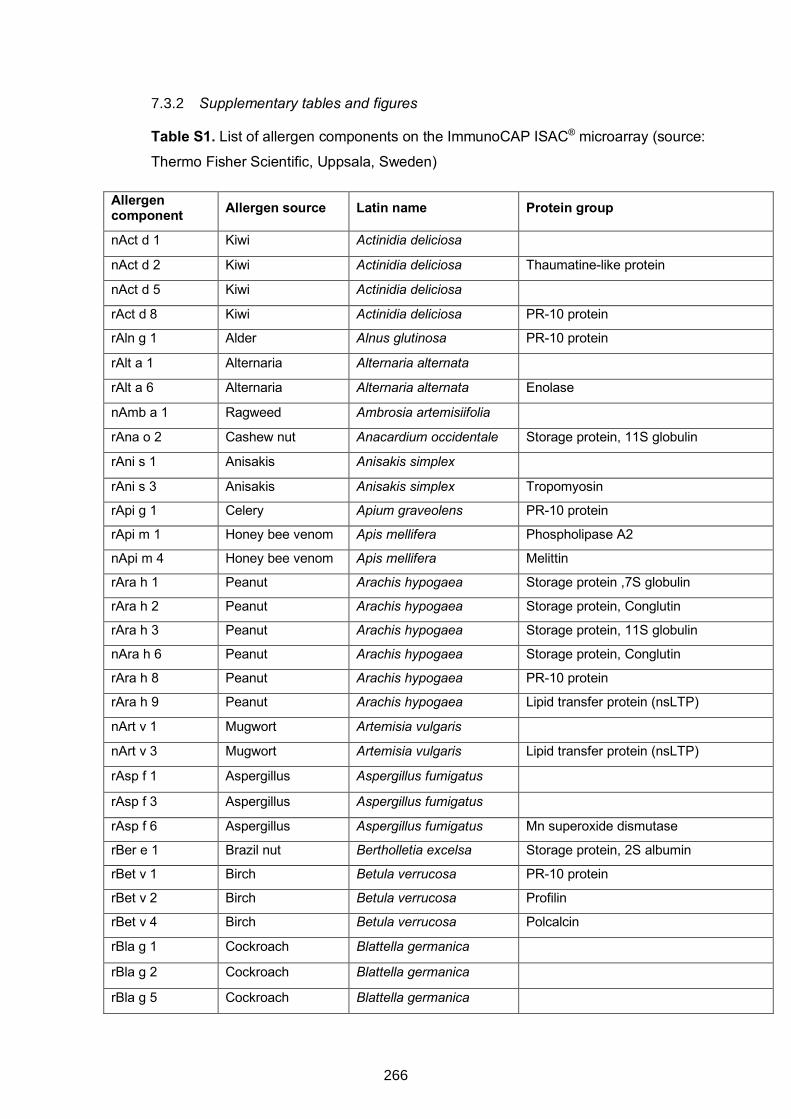
Supplementary tables and figures
Table S1. List of allergen components on the ImmunoCAP ISAC® microarray (source:
Thermo Fisher Scientific, Uppsala, Sweden)
Allergen component Allergen source Latin name Protein group
nAct d 1 Kiwi Actinidia deliciosa nAct d 2 Kiwi Actinidia deliciosa Thaumatine-like protein
nAct d 5 Kiwi Actinidia deliciosa rAct d 8 Kiwi Actinidia deliciosa PR-10 protein
rAln g 1 Alder Alnus glutinosa PR-10 protein
rAlt a 1 Alternaria Alternaria alternata rAlt a 6 Alternaria Alternaria alternata Enolase
nAmb a 1 Ragweed Ambrosia artemisiifolia rAna o 2 Cashew nut Anacardium occidentale Storage protein, 11S globulin
rAni s 1 Anisakis Anisakis simplex rAni s 3 Anisakis Anisakis simplex Tropomyosin
rApi g 1 Celery Apium graveolens PR-10 protein
rApi m 1 Honey bee venom Apis mellifera Phospholipase A2
nApi m 4 Honey bee venom Apis mellifera Melittin
rAra h 1 Peanut Arachis hypogaea Storage protein ,7S globulin
rAra h 2 Peanut Arachis hypogaea Storage protein, Conglutin
rAra h 3 Peanut Arachis hypogaea Storage protein, 11S globulin
nAra h 6 Peanut Arachis hypogaea Storage protein, Conglutin
rAra h 8 Peanut Arachis hypogaea PR-10 protein
rAra h 9 Peanut Arachis hypogaea Lipid transfer protein (nsLTP)
nArt v 1 Mugwort Artemisia vulgaris nArt v 3 Mugwort Artemisia vulgaris Lipid transfer protein (nsLTP)
rAsp f 1 Aspergillus Aspergillus fumigatus
rAsp f 3 Aspergillus Aspergillus fumigatus rAsp f 6 Aspergillus Aspergillus fumigatus Mn superoxide dismutase
rBer e 1 Brazil nut Bertholletia excelsa Storage protein, 2S albumin
rBet v 1 Birch Betula verrucosa PR-10 protein
rBet v 2 Birch Betula verrucosa Profilin
rBet v 4 Birch Betula verrucosa Polcalcin
rBla g 1 Cockroach Blattella germanica rBla g 2 Cockroach Blattella germanica rBla g 5 Cockroach Blattella germanica
7.3.2
266
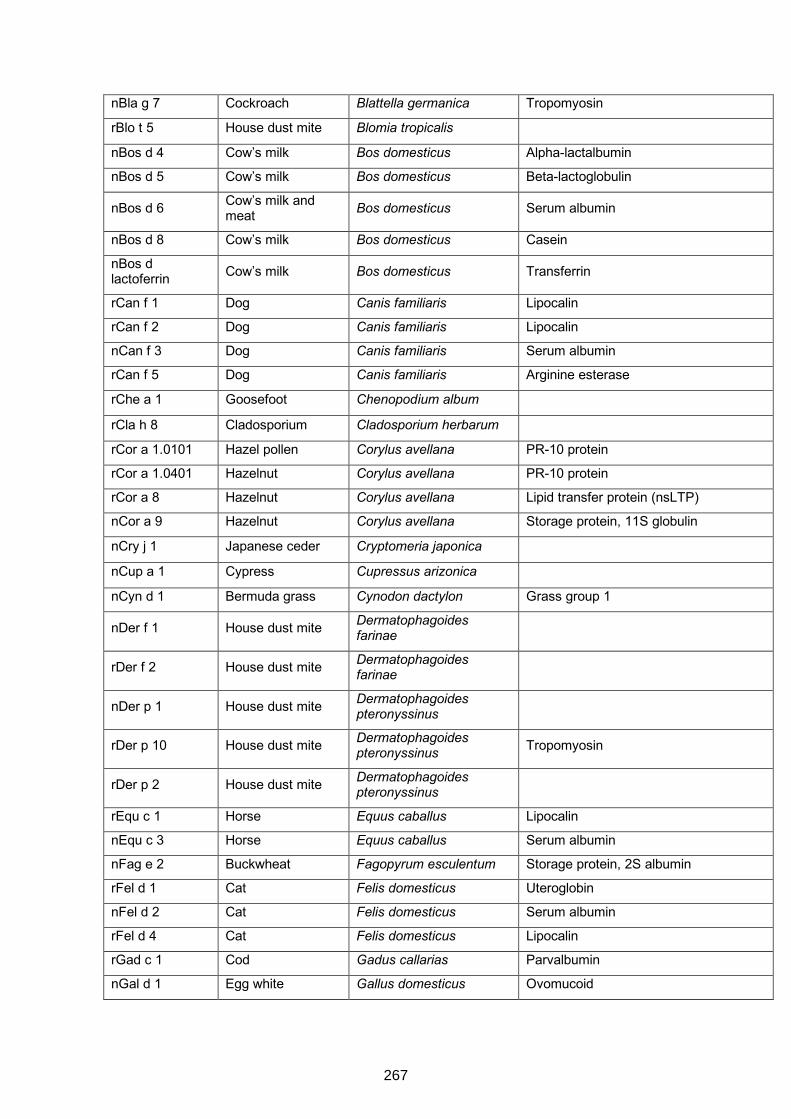
nBla g 7 Cockroach Blattella germanica Tropomyosin
rBlo t 5 House dust mite Blomia tropicalis nBos d 4 Cow’s milk Bos domesticus Alpha-lactalbumin
nBos d 5 Cow’s milk Bos domesticus Beta-lactoglobulin
nBos d 6 Cow’s milk and meat Bos domesticus Serum albumin
nBos d 8 Cow’s milk Bos domesticus Casein
nBos d lactoferrin Cow’s milk Bos domesticus Transferrin
rCan f 1 Dog Canis familiaris Lipocalin
rCan f 2 Dog Canis familiaris Lipocalin
nCan f 3 Dog Canis familiaris Serum albumin
rCan f 5 Dog Canis familiaris Arginine esterase
rChe a 1 Goosefoot Chenopodium album rCla h 8 Cladosporium Cladosporium herbarum rCor a 1.0101 Hazel pollen Corylus avellana PR-10 protein
rCor a 1.0401 Hazelnut Corylus avellana PR-10 protein
rCor a 8 Hazelnut Corylus avellana Lipid transfer protein (nsLTP)
nCor a 9 Hazelnut Corylus avellana Storage protein, 11S globulin
nCry j 1 Japanese ceder Cryptomeria japonica nCup a 1 Cypress Cupressus arizonica nCyn d 1 Bermuda grass Cynodon dactylon Grass group 1
nDer f 1 House dust mite Dermatophagoides farinae
rDer f 2 House dust mite Dermatophagoides farinae
nDer p 1 House dust mite Dermatophagoides pteronyssinus
rDer p 10 House dust mite Dermatophagoides pteronyssinus Tropomyosin
rDer p 2 House dust mite Dermatophagoides pteronyssinus
rEqu c 1 Horse Equus caballus Lipocalin
nEqu c 3 Horse Equus caballus Serum albumin
nFag e 2 Buckwheat Fagopyrum esculentum Storage protein, 2S albumin
rFel d 1 Cat Felis domesticus Uteroglobin
nFel d 2 Cat Felis domesticus Serum albumin
rFel d 4 Cat Felis domesticus Lipocalin
rGad c 1 Cod Gadus callarias Parvalbumin
nGal d 1 Egg white Gallus domesticus Ovomucoid
267
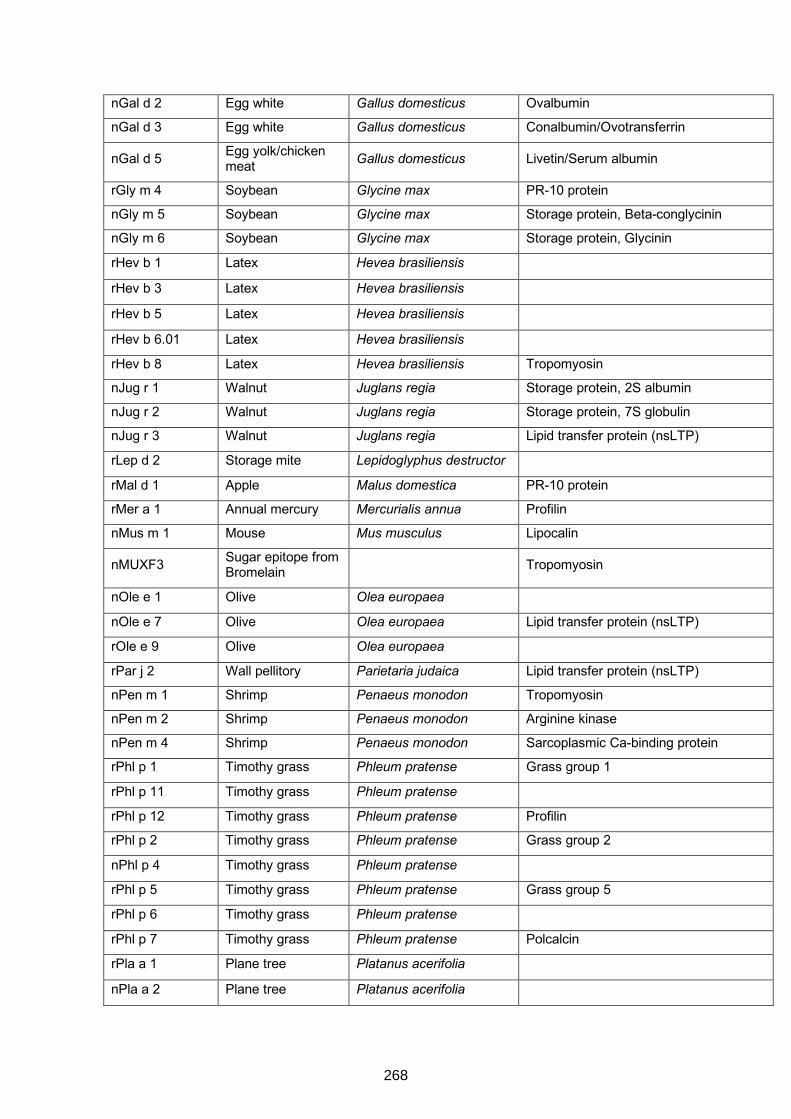
nGal d 2 Egg white Gallus domesticus Ovalbumin
nGal d 3 Egg white Gallus domesticus Conalbumin/Ovotransferrin
nGal d 5 Egg yolk/chicken meat Gallus domesticus Livetin/Serum albumin
rGly m 4 Soybean Glycine max PR-10 protein
nGly m 5 Soybean Glycine max Storage protein, Beta-conglycinin
nGly m 6 Soybean Glycine max Storage protein, Glycinin
rHev b 1 Latex Hevea brasiliensis rHev b 3 Latex Hevea brasiliensis rHev b 5 Latex Hevea brasiliensis rHev b 6.01 Latex Hevea brasiliensis rHev b 8 Latex Hevea brasiliensis Tropomyosin
nJug r 1 Walnut Juglans regia Storage protein, 2S albumin
nJug r 2 Walnut Juglans regia Storage protein, 7S globulin
nJug r 3 Walnut Juglans regia Lipid transfer protein (nsLTP)
rLep d 2 Storage mite Lepidoglyphus destructor rMal d 1 Apple Malus domestica PR-10 protein
rMer a 1 Annual mercury Mercurialis annua Profilin
nMus m 1 Mouse Mus musculus Lipocalin
nMUXF3 Sugar epitope from Bromelain Tropomyosin
nOle e 1 Olive Olea europaea nOle e 7 Olive Olea europaea Lipid transfer protein (nsLTP)
rOle e 9 Olive Olea europaea rPar j 2 Wall pellitory Parietaria judaica Lipid transfer protein (nsLTP)
nPen m 1 Shrimp Penaeus monodon Tropomyosin
nPen m 2 Shrimp Penaeus monodon Arginine kinase
nPen m 4 Shrimp Penaeus monodon Sarcoplasmic Ca-binding protein
rPhl p 1 Timothy grass Phleum pratense Grass group 1
rPhl p 11 Timothy grass Phleum pratense rPhl p 12 Timothy grass Phleum pratense Profilin
rPhl p 2 Timothy grass Phleum pratense Grass group 2
nPhl p 4 Timothy grass Phleum pratense rPhl p 5 Timothy grass Phleum pratense Grass group 5
rPhl p 6 Timothy grass Phleum pratense rPhl p 7 Timothy grass Phleum pratense Polcalcin
rPla a 1 Plane tree Platanus acerifolia nPla a 2 Plane tree Platanus acerifolia
268
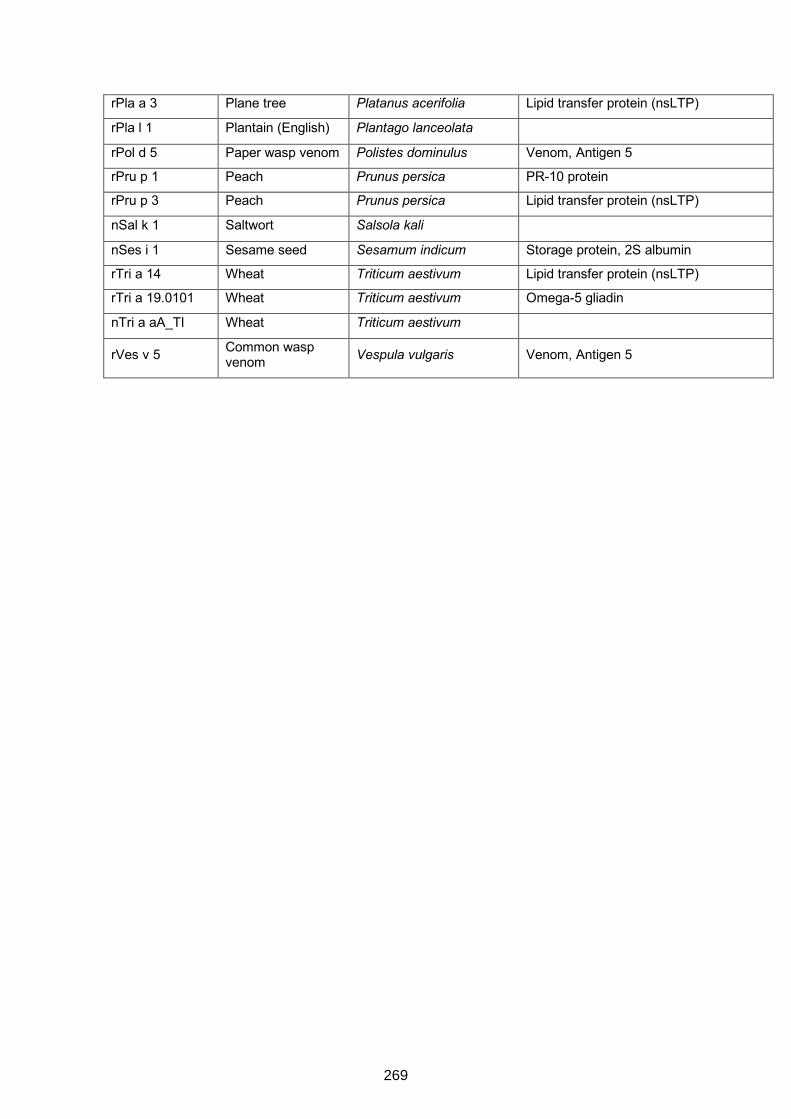
rPla a 3 Plane tree Platanus acerifolia Lipid transfer protein (nsLTP)
rPla l 1 Plantain (English) Plantago lanceolata rPol d 5 Paper wasp venom Polistes dominulus Venom, Antigen 5
rPru p 1 Peach Prunus persica PR-10 protein
rPru p 3 Peach Prunus persica Lipid transfer protein (nsLTP)
nSal k 1 Saltwort Salsola kali nSes i 1 Sesame seed Sesamum indicum Storage protein, 2S albumin
rTri a 14 Wheat Triticum aestivum Lipid transfer protein (nsLTP)
rTri a 19.0101 Wheat Triticum aestivum Omega-5 gliadin
nTri a aA_TI Wheat Triticum aestivum
rVes v 5 Common wasp venom Vespula vulgaris Venom, Antigen 5
269
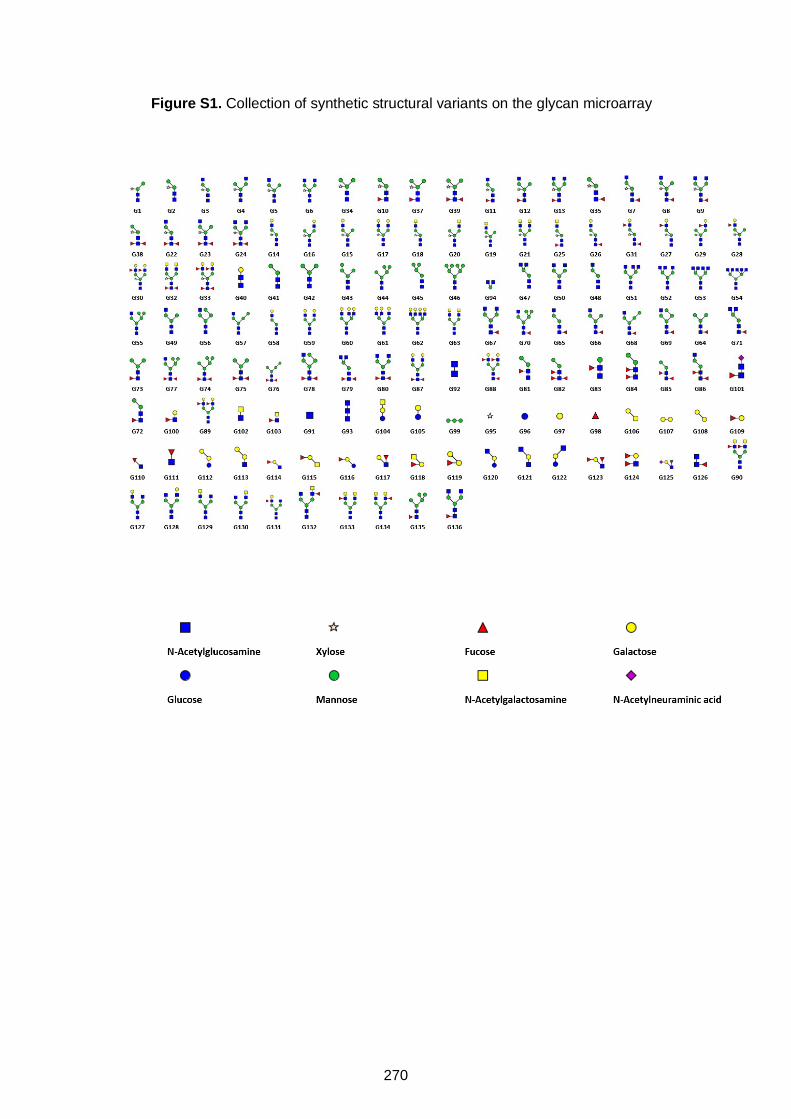
Figure S1. Collection of synthetic structural variants on the glycan microarray
270
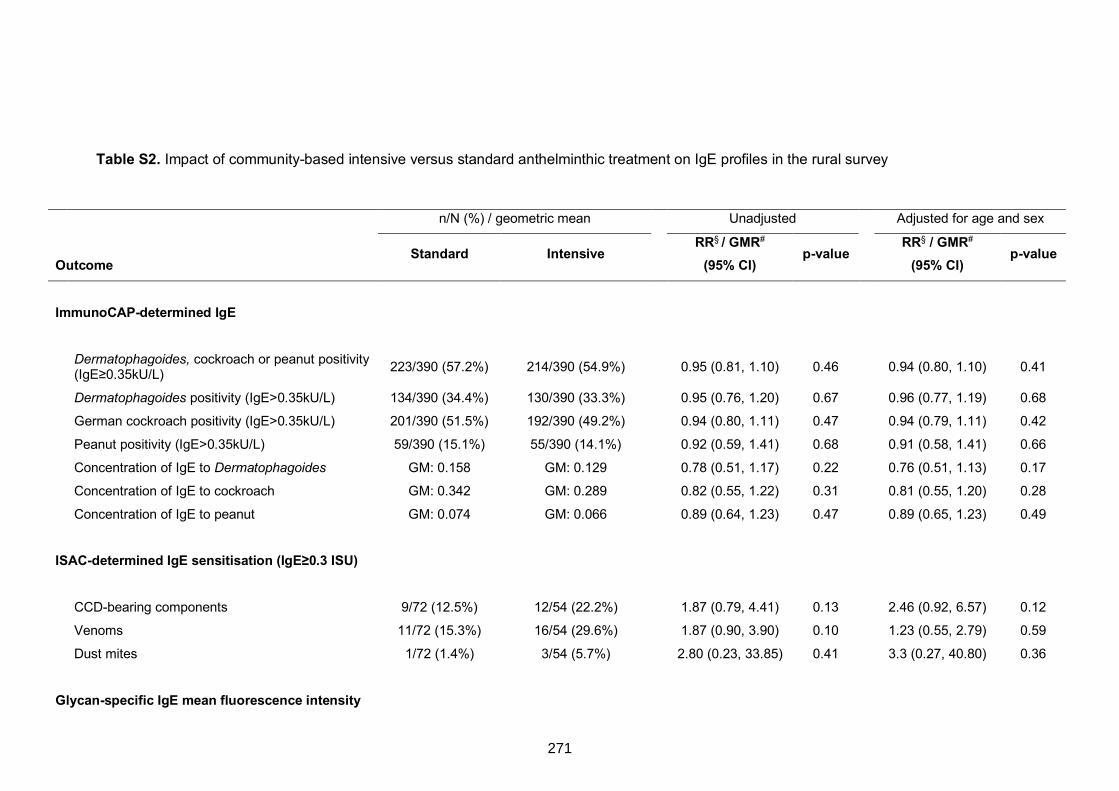
Table S2. Impact of community-based intensive versus standard anthelminthic treatment on IgE profiles in the rural survey
n/N (%) / geometric mean Unadjusted Adjusted for age and sex
Outcome Standard Intensive
RR§ / GMR#
(95% CI) p-value
RR§ / GMR#
(95% CI) p-value
ImmunoCAP-determined IgE
Dermatophagoides, cockroach or peanut positivity (IgE≥0.35kU/L) 223/390 (57.2%) 214/390 (54.9%) 0.95 (0.81, 1.10) 0.46 0.94 (0.80, 1.10) 0.41
Dermatophagoides positivity (IgE>0.35kU/L) 134/390 (34.4%) 130/390 (33.3%) 0.95 (0.76, 1.20) 0.67 0.96 (0.77, 1.19) 0.68
German cockroach positivity (IgE>0.35kU/L) 201/390 (51.5%) 192/390 (49.2%) 0.94 (0.80, 1.11) 0.47 0.94 (0.79, 1.11) 0.42
Peanut positivity (IgE>0.35kU/L) 59/390 (15.1%) 55/390 (14.1%) 0.92 (0.59, 1.41) 0.68 0.91 (0.58, 1.41) 0.66 Concentration of IgE to Dermatophagoides GM: 0.158 GM: 0.129 0.78 (0.51, 1.17) 0.22 0.76 (0.51, 1.13) 0.17 Concentration of IgE to cockroach GM: 0.342 GM: 0.289 0.82 (0.55, 1.22) 0.31 0.81 (0.55, 1.20) 0.28
Concentration of IgE to peanut GM: 0.074 GM: 0.066 0.89 (0.64, 1.23) 0.47 0.89 (0.65, 1.23) 0.49
ISAC-determined IgE sensitisation (IgE≥0.3 ISU)
CCD-bearing components 9/72 (12.5%) 12/54 (22.2%) 1.87 (0.79, 4.41) 0.13 2.46 (0.92, 6.57) 0.12
Venoms 11/72 (15.3%) 16/54 (29.6%) 1.87 (0.90, 3.90) 0.10 1.23 (0.55, 2.79) 0.59
Dust mites 1/72 (1.4%) 3/54 (5.7%) 2.80 (0.23, 33.85) 0.41 3.3 (0.27, 40.80) 0.36
Glycan-specific IgE mean fluorescence intensity
271
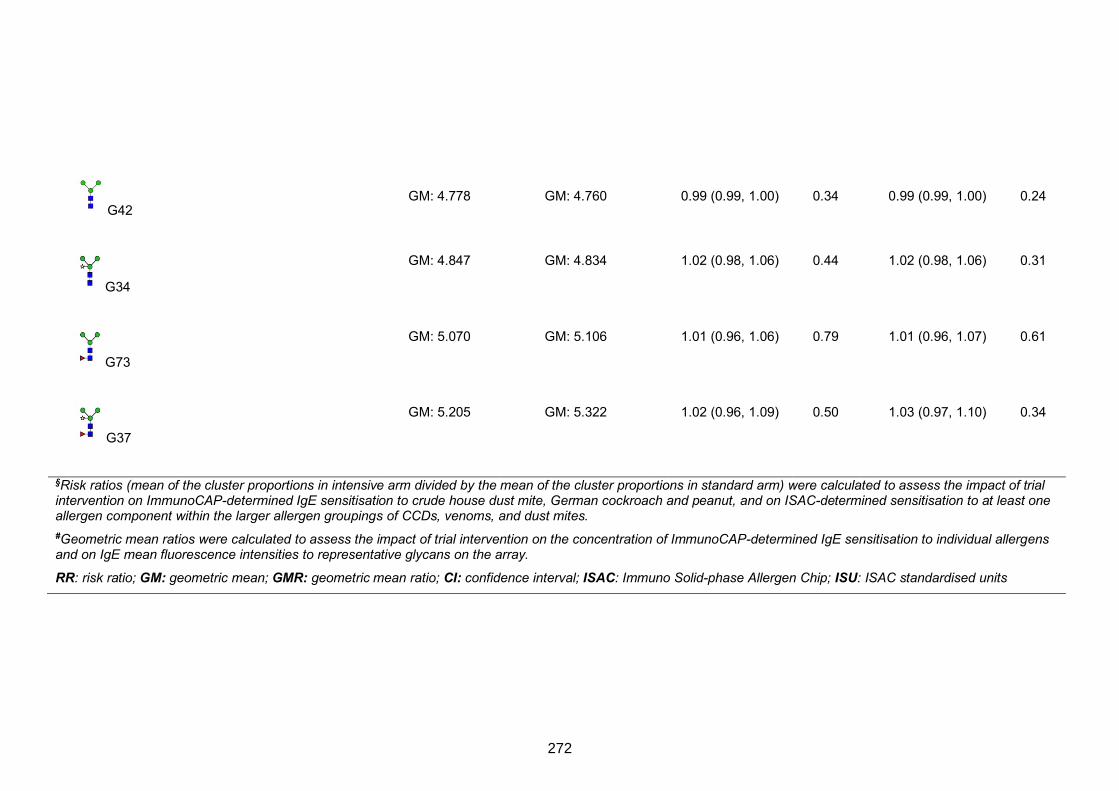
G42
GM: 4.778 GM: 4.760 0.99 (0.99, 1.00) 0.34 0.99 (0.99, 1.00) 0.24
G34
GM: 4.847 GM: 4.834 1.02 (0.98, 1.06) 0.44 1.02 (0.98, 1.06) 0.31
G73
GM: 5.070 GM: 5.106 1.01 (0.96, 1.06) 0.79 1.01 (0.96, 1.07) 0.61
G37
GM: 5.205 GM: 5.322 1.02 (0.96, 1.09) 0.50 1.03 (0.97, 1.10) 0.34
§Risk ratios (mean of the cluster proportions in intensive arm divided by the mean of the cluster proportions in standard arm) were calculated to assess the impact of trial intervention on ImmunoCAP-determined IgE sensitisation to crude house dust mite, German cockroach and peanut, and on ISAC-determined sensitisation to at least one allergen component within the larger allergen groupings of CCDs, venoms, and dust mites. #Geometric mean ratios were calculated to assess the impact of trial intervention on the concentration of ImmunoCAP-determined IgE sensitisation to individual allergens and on IgE mean fluorescence intensities to representative glycans on the array.
RR: risk ratio; GM: geometric mean; GMR: geometric mean ratio; CI: confidence interval; ISAC: Immuno Solid-phase Allergen Chip; ISU: ISAC standardised units
272
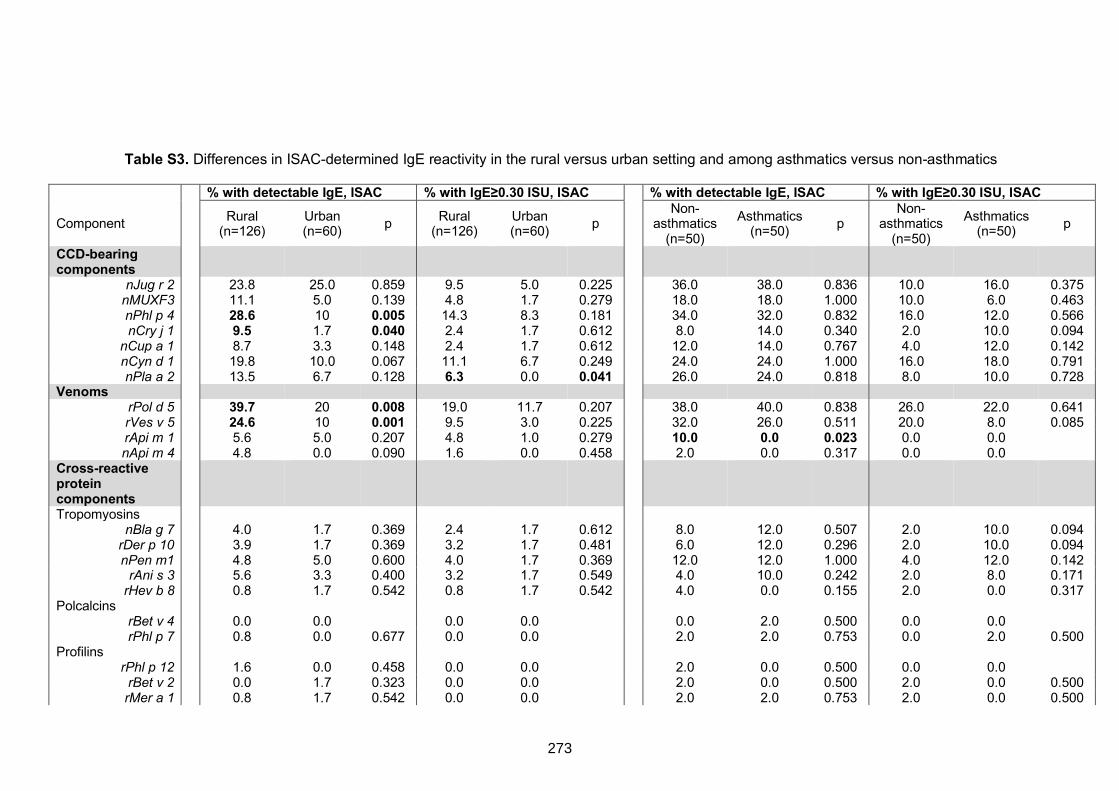
Table S3. Differences in ISAC-determined IgE reactivity in the rural versus urban setting and among asthmatics versus non-asthmatics
% with detectable IgE, ISAC % with IgE≥0.30 ISU, ISAC % with detectable IgE, ISAC % with IgE≥0.30 ISU, ISAC
Component Rural
(n=126) Urban (n=60) p Rural
(n=126) Urban (n=60) p
Non-asthmatics
(n=50) Asthmatics
(n=50) p Non-
asthmatics (n=50)
Asthmatics (n=50) p
CCD-bearing
components
nJug r 2 23.8 25.0 0.859 9.5 5.0 0.225 36.0 38.0 0.836 10.0 16.0 0.375 nMUXF3 11.1 5.0 0.139 4.8 1.7 0.279 18.0 18.0 1.000 10.0 6.0 0.463 nPhl p 4 28.6 10 0.005 14.3 8.3 0.181 34.0 32.0 0.832 16.0 12.0 0.566 nCry j 1 9.5 1.7 0.040 2.4 1.7 0.612 8.0 14.0 0.340 2.0 10.0 0.094
nCup a 1 8.7 3.3 0.148 2.4 1.7 0.612 12.0 14.0 0.767 4.0 12.0 0.142 nCyn d 1 19.8 10.0 0.067 11.1 6.7 0.249 24.0 24.0 1.000 16.0 18.0 0.791 nPla a 2 13.5 6.7 0.128 6.3 0.0 0.041 26.0 24.0 0.818 8.0 10.0 0.728
Venoms rPol d 5 39.7 20 0.008 19.0 11.7 0.207 38.0 40.0 0.838 26.0 22.0 0.641 rVes v 5 24.6 10 0.001 9.5 3.0 0.225 32.0 26.0 0.511 20.0 8.0 0.085 rApi m 1 5.6 5.0 0.207 4.8 1.0 0.279 10.0 0.0 0.023 0.0 0.0 nApi m 4 4.8 0.0 0.090 1.6 0.0 0.458 2.0 0.0 0.317 0.0 0.0
Cross-reactive
protein
components
Tropomyosins nBla g 7 4.0 1.7 0.369 2.4 1.7 0.612 8.0 12.0 0.507 2.0 10.0 0.094
rDer p 10 3.9 1.7 0.369 3.2 1.7 0.481 6.0 12.0 0.296 2.0 10.0 0.094 nPen m1 4.8 5.0 0.600 4.0 1.7 0.369 12.0 12.0 1.000 4.0 12.0 0.142
rAni s 3 5.6 3.3 0.400 3.2 1.7 0.549 4.0 10.0 0.242 2.0 8.0 0.171 rHev b 8 0.8 1.7 0.542 0.8 1.7 0.542 4.0 0.0 0.155 2.0 0.0 0.317
Polcalcins rBet v 4 0.0 0.0 0.0 0.0 0.0 2.0 0.500 0.0 0.0 rPhl p 7 0.8 0.0 0.677 0.0 0.0 2.0 2.0 0.753 0.0 2.0 0.500
Profilins rPhl p 12 1.6 0.0 0.458 0.0 0.0 2.0 0.0 0.500 0.0 0.0 rBet v 2 0.0 1.7 0.323 0.0 0.0 2.0 0.0 0.500 2.0 0.0 0.500 rMer a 1 0.8 1.7 0.542 0.0 0.0 2.0 2.0 0.753 2.0 0.0 0.500
273
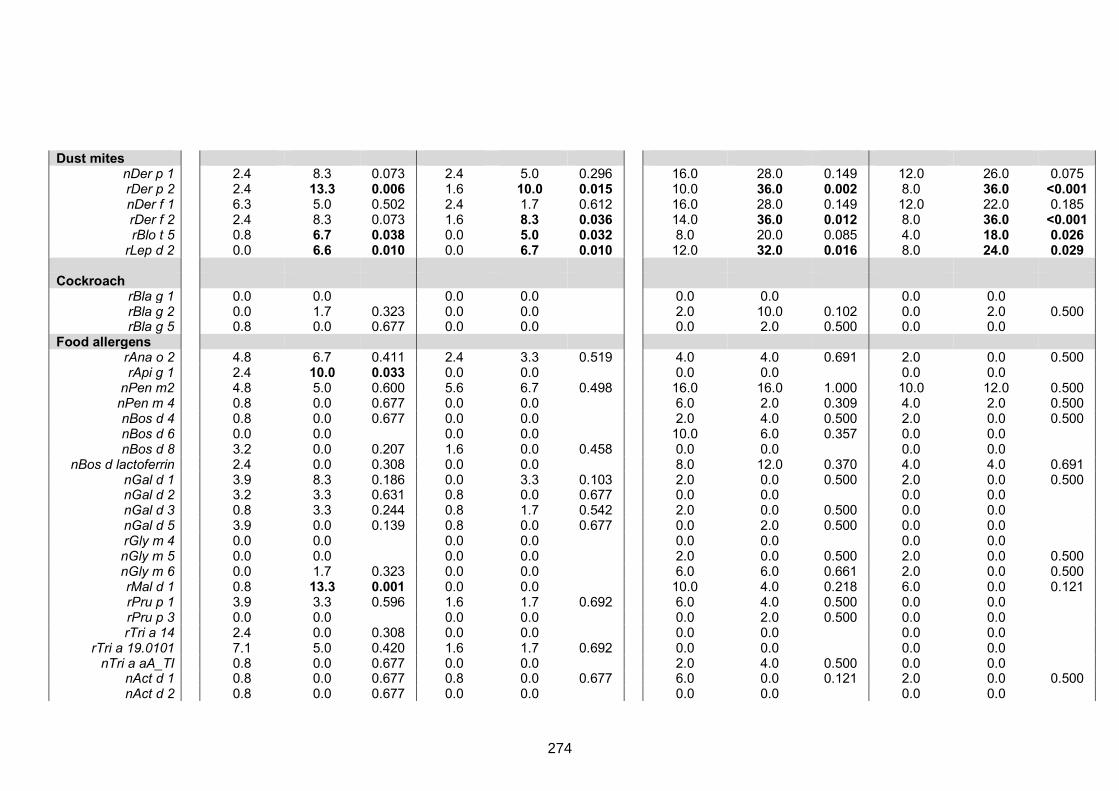
Dust mites nDer p 1 2.4 8.3 0.073 2.4 5.0 0.296 16.0 28.0 0.149 12.0 26.0 0.075 rDer p 2 2.4 13.3 0.006 1.6 10.0 0.015 10.0 36.0 0.002 8.0 36.0 <0.001 nDer f 1 6.3 5.0 0.502 2.4 1.7 0.612 16.0 28.0 0.149 12.0 22.0 0.185 rDer f 2 2.4 8.3 0.073 1.6 8.3 0.036 14.0 36.0 0.012 8.0 36.0 <0.001 rBlo t 5 0.8 6.7 0.038 0.0 5.0 0.032 8.0 20.0 0.085 4.0 18.0 0.026
rLep d 2 0.0 6.6 0.010 0.0 6.7 0.010 12.0 32.0 0.016 8.0 24.0 0.029 Cockroach
rBla g 1 0.0 0.0 0.0 0.0 0.0 0.0 0.0 0.0 rBla g 2 0.0 1.7 0.323 0.0 0.0 2.0 10.0 0.102 0.0 2.0 0.500 rBla g 5 0.8 0.0 0.677 0.0 0.0 0.0 2.0 0.500 0.0 0.0
Food allergens rAna o 2 4.8 6.7 0.411 2.4 3.3 0.519 4.0 4.0 0.691 2.0 0.0 0.500 rApi g 1 2.4 10.0 0.033 0.0 0.0 0.0 0.0 0.0 0.0
nPen m2 4.8 5.0 0.600 5.6 6.7 0.498 16.0 16.0 1.000 10.0 12.0 0.500 nPen m 4 0.8 0.0 0.677 0.0 0.0 6.0 2.0 0.309 4.0 2.0 0.500 nBos d 4 0.8 0.0 0.677 0.0 0.0 2.0 4.0 0.500 2.0 0.0 0.500 nBos d 6 0.0 0.0 0.0 0.0 10.0 6.0 0.357 0.0 0.0 nBos d 8 3.2 0.0 0.207 1.6 0.0 0.458 0.0 0.0 0.0 0.0
nBos d lactoferrin 2.4 0.0 0.308 0.0 0.0 8.0 12.0 0.370 4.0 4.0 0.691 nGal d 1 3.9 8.3 0.186 0.0 3.3 0.103 2.0 0.0 0.500 2.0 0.0 0.500 nGal d 2 3.2 3.3 0.631 0.8 0.0 0.677 0.0 0.0 0.0 0.0 nGal d 3 0.8 3.3 0.244 0.8 1.7 0.542 2.0 0.0 0.500 0.0 0.0 nGal d 5 3.9 0.0 0.139 0.8 0.0 0.677 0.0 2.0 0.500 0.0 0.0 rGly m 4 0.0 0.0 0.0 0.0 0.0 0.0 0.0 0.0 nGly m 5 0.0 0.0 0.0 0.0 2.0 0.0 0.500 2.0 0.0 0.500 nGly m 6 0.0 1.7 0.323 0.0 0.0 6.0 6.0 0.661 2.0 0.0 0.500 rMal d 1 0.8 13.3 0.001 0.0 0.0 10.0 4.0 0.218 6.0 0.0 0.121 rPru p 1 3.9 3.3 0.596 1.6 1.7 0.692 6.0 4.0 0.500 0.0 0.0 rPru p 3 0.0 0.0 0.0 0.0 0.0 2.0 0.500 0.0 0.0 rTri a 14 2.4 0.0 0.308 0.0 0.0 0.0 0.0 0.0 0.0
rTri a 19.0101 7.1 5.0 0.420 1.6 1.7 0.692 0.0 0.0 0.0 0.0 nTri a aA_TI 0.8 0.0 0.677 0.0 0.0 2.0 4.0 0.500 0.0 0.0
nAct d 1 0.8 0.0 0.677 0.8 0.0 0.677 6.0 0.0 0.121 2.0 0.0 0.500 nAct d 2 0.8 0.0 0.677 0.0 0.0 0.0 0.0 0.0 0.0
274
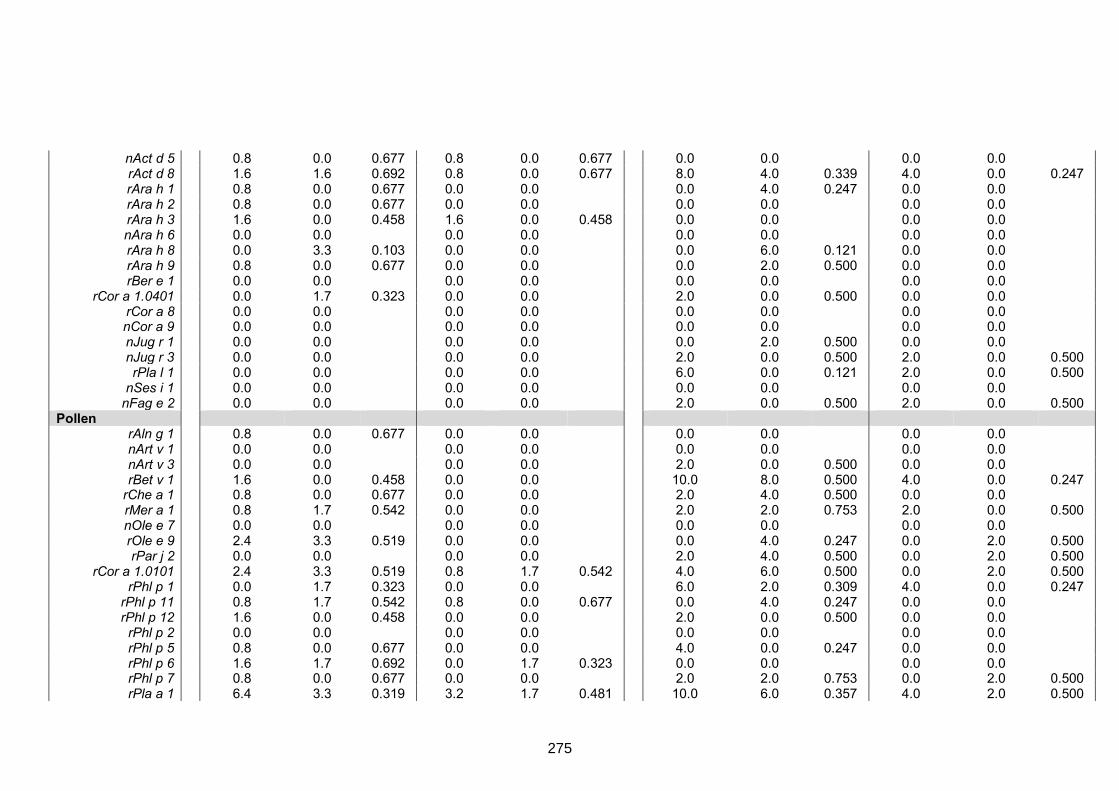
nAct d 5 0.8 0.0 0.677 0.8 0.0 0.677 0.0 0.0 0.0 0.0 rAct d 8 1.6 1.6 0.692 0.8 0.0 0.677 8.0 4.0 0.339 4.0 0.0 0.247 rAra h 1 0.8 0.0 0.677 0.0 0.0 0.0 4.0 0.247 0.0 0.0 rAra h 2 0.8 0.0 0.677 0.0 0.0 0.0 0.0 0.0 0.0 rAra h 3 1.6 0.0 0.458 1.6 0.0 0.458 0.0 0.0 0.0 0.0 nAra h 6 0.0 0.0 0.0 0.0 0.0 0.0 0.0 0.0 rAra h 8 0.0 3.3 0.103 0.0 0.0 0.0 6.0 0.121 0.0 0.0 rAra h 9 0.8 0.0 0.677 0.0 0.0 0.0 2.0 0.500 0.0 0.0 rBer e 1 0.0 0.0 0.0 0.0 0.0 0.0 0.0 0.0
rCor a 1.0401 0.0 1.7 0.323 0.0 0.0 2.0 0.0 0.500 0.0 0.0 rCor a 8 0.0 0.0 0.0 0.0 0.0 0.0 0.0 0.0 nCor a 9 0.0 0.0 0.0 0.0 0.0 0.0 0.0 0.0 nJug r 1 0.0 0.0 0.0 0.0 0.0 2.0 0.500 0.0 0.0 nJug r 3 0.0 0.0 0.0 0.0 2.0 0.0 0.500 2.0 0.0 0.500 rPla l 1 0.0 0.0 0.0 0.0 6.0 0.0 0.121 2.0 0.0 0.500
nSes i 1 0.0 0.0 0.0 0.0 0.0 0.0 0.0 0.0 nFag e 2 0.0 0.0 0.0 0.0 2.0 0.0 0.500 2.0 0.0 0.500
Pollen rAln g 1 0.8 0.0 0.677 0.0 0.0 0.0 0.0 0.0 0.0 nArt v 1 0.0 0.0 0.0 0.0 0.0 0.0 0.0 0.0 nArt v 3 0.0 0.0 0.0 0.0 2.0 0.0 0.500 0.0 0.0 rBet v 1 1.6 0.0 0.458 0.0 0.0 10.0 8.0 0.500 4.0 0.0 0.247
rChe a 1 0.8 0.0 0.677 0.0 0.0 2.0 4.0 0.500 0.0 0.0 rMer a 1 0.8 1.7 0.542 0.0 0.0 2.0 2.0 0.753 2.0 0.0 0.500 nOle e 7 0.0 0.0 0.0 0.0 0.0 0.0 0.0 0.0 rOle e 9 2.4 3.3 0.519 0.0 0.0 0.0 4.0 0.247 0.0 2.0 0.500 rPar j 2 0.0 0.0 0.0 0.0 2.0 4.0 0.500 0.0 2.0 0.500
rCor a 1.0101 2.4 3.3 0.519 0.8 1.7 0.542 4.0 6.0 0.500 0.0 2.0 0.500 rPhl p 1 0.0 1.7 0.323 0.0 0.0 6.0 2.0 0.309 4.0 0.0 0.247
rPhl p 11 0.8 1.7 0.542 0.8 0.0 0.677 0.0 4.0 0.247 0.0 0.0 rPhl p 12 1.6 0.0 0.458 0.0 0.0 2.0 0.0 0.500 0.0 0.0 rPhl p 2 0.0 0.0 0.0 0.0 0.0 0.0 0.0 0.0 rPhl p 5 0.8 0.0 0.677 0.0 0.0 4.0 0.0 0.247 0.0 0.0 rPhl p 6 1.6 1.7 0.692 0.0 1.7 0.323 0.0 0.0 0.0 0.0 rPhl p 7 0.8 0.0 0.677 0.0 0.0 2.0 2.0 0.753 0.0 2.0 0.500 rPla a 1 6.4 3.3 0.319 3.2 1.7 0.481 10.0 6.0 0.357 4.0 2.0 0.500
275

rPla a 3 0.0 0.0 0.0 0.0 0.0 0.0 0.0 0.0 nSal k 1 0.8 0.0 0.677 0.8 0.0 0.677 4.0 10.0 0.218 0.0 4.0 0.247
Fungi rAlt a 1 0.0 0.0 0.0 0.0 0.0 0.0 0.0 0.0 rAlt a 6 1.6 3.3 0.388 0.8 1.7 0.542 4.0 4.0 0.691 0.0 0.0
nAmb a 1 0.8 0.0 0.677 0.0 0.0 0.0 0.0 0.0 0.0 rAsp f 1 5.6 8.3 0.334 0.8 0.0 0.677 4.0 0.0 0.247 0.0 0.0 rAsp f 3 6.4 11.7 0.169 1.6 1.7 0.692 2.0 2.0 0.753 0.0 0.0 rAsp f 6 3.9 1.7 0.369 1.6 0.0 0.458 4.0 0.0 0.247 4.0 0.0 0.247 rCla h 8 0.8 0.0 0.677 0.0 0.0 0.0 2.0 0.500 0.0 0.0
Other, animal rAni s 1 0.0 0.0 0.0 0.0 2.0 0.0 0.500 2.0 0.0 0.500 rCan f 2 0.8 1.7 0.542 0.0 0.0 0.0 0.0 0.0 0.0 nCan f 3 0.0 0.0 0.0 0.0 0.0 4.0 0.247 0.0 0.0 rCan f 5 2.4 1.7 0.612 0.8 0.0 0.677 4.0 0.0 0.247 2.0 0.0 0.500 rEqu c 1 0.8 0.0 0.677 0.0 0.0 0.0 0.0 0.0 0.0 nEqu c 3 0.0 0.0 0.0 0.0 0.0 2.0 0.500 0.0 0.0 rFel d 1 0.0 0.0 0.0 0.0 0.0 0.0 0.0 0.0 nFel d 2 2.4 6.7 0.153 0.0 0.0 6.0 10.0 0.357 2.0 0.0 0.500 rFel d 4 0.8 6.7 0.038 0.0 0.0 2.0 2.0 0.753 0.0 2.0 0.500
nMus m 1 0.0 0.0 0.0 0.0 2.0 6.0 0.309 2.0 4.0 0.500 Latex
rHev b 1 1.6 1.7 0.692 1.6 1.7 0.692 2.0 0.0 0.500 0.0 0.0 rHev b 3 0.8 1.7 0.542 0.8 1.7 0.542 0.0 0.0 0.0 0.0 rHev b 5 0.8 0.0 0.677 0.0 0.0 0.0 0.0 0.0 0.0
rHev b 6.01 1.6 1.7 0.692 0.8 1.7 0.542 2.0 0.0 0.500 2.0 0.0 0.500 rHev b 8 0.8 1.7 0.542 0.8 1.7 0.542 4.0 0.0 0.247 2.0 0.0 0.500
Table shows proportions of participants that had an ISAC-detectable IgE response or were sensitised (IgE≥0.3 ISU) to components on the array. The Chi-square / Fisher’s exact test was conducted to assess differences in proportions between rural and urban individuals, and between asthmatics and their controls. These tests were conducted within the framework of a Monte Carlo simulation algorithm based on 1000 permutations in order to adjust for multiple testing. ISAC: Immuno Solid-phase Allergen Chip; ISU: ISAC standardised units
276
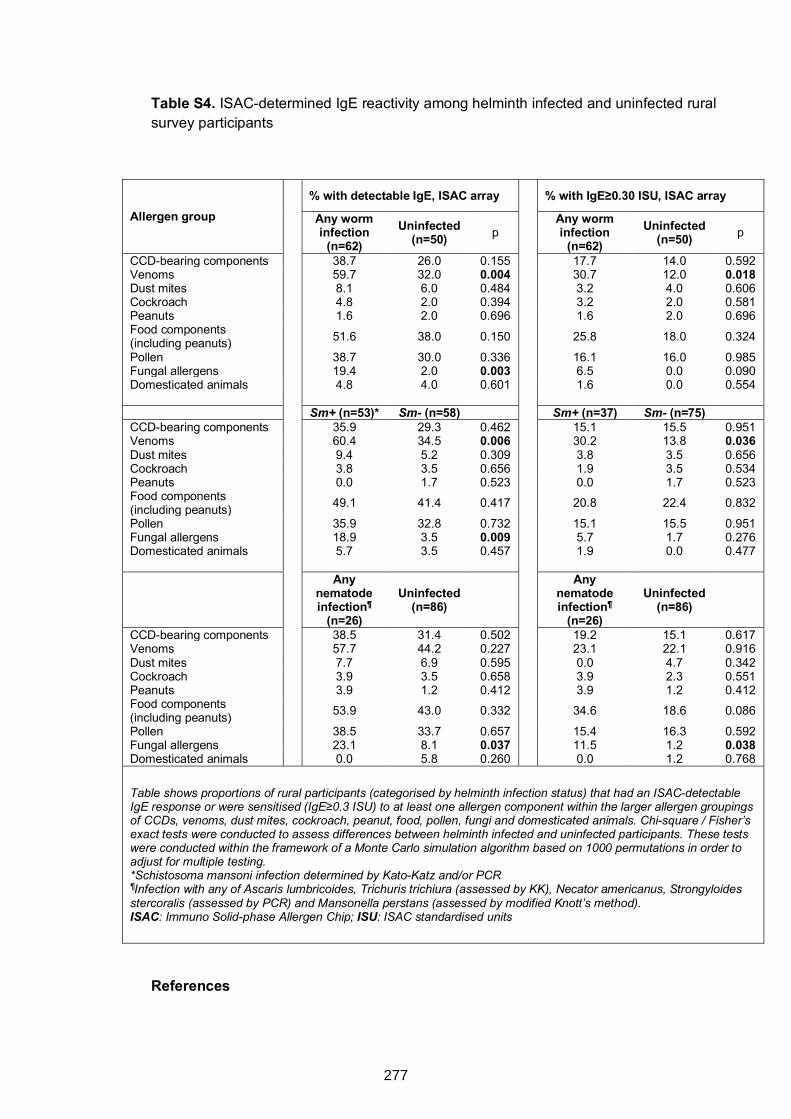
Table S4. ISAC-determined IgE reactivity among helminth infected and uninfected rural survey participants
Allergen group
% with detectable IgE, ISAC array
% with IgE≥0.30 ISU, ISAC array
Any worm infection
(n=62) Uninfected
(n=50) p Any worm
infection (n=62)
Uninfected (n=50) p
CCD-bearing components 38.7 26.0 0.155 17.7 14.0 0.592 Venoms 59.7 32.0 0.004 30.7 12.0 0.018 Dust mites 8.1 6.0 0.484 3.2 4.0 0.606 Cockroach 4.8 2.0 0.394 3.2 2.0 0.581 Peanuts 1.6 2.0 0.696 1.6 2.0 0.696 Food components (including peanuts)
51.6 38.0 0.150 25.8 18.0 0.324
Pollen 38.7 30.0 0.336 16.1 16.0 0.985 Fungal allergens 19.4 2.0 0.003 6.5 0.0 0.090 Domesticated animals 4.8 4.0 0.601 1.6 0.0 0.554 Sm+ (n=53)* Sm- (n=58) Sm+ (n=37) Sm- (n=75) CCD-bearing components 35.9 29.3 0.462 15.1 15.5 0.951 Venoms 60.4 34.5 0.006 30.2 13.8 0.036 Dust mites 9.4 5.2 0.309 3.8 3.5 0.656 Cockroach 3.8 3.5 0.656 1.9 3.5 0.534 Peanuts 0.0 1.7 0.523 0.0 1.7 0.523 Food components (including peanuts)
49.1 41.4 0.417 20.8 22.4 0.832
Pollen 35.9 32.8 0.732 15.1 15.5 0.951 Fungal allergens 18.9 3.5 0.009 5.7 1.7 0.276 Domesticated animals 5.7 3.5 0.457 1.9 0.0 0.477
Any
nematode infection¶
(n=26)
Uninfected (n=86)
Any nematode infection¶
(n=26)
Uninfected (n=86)
CCD-bearing components 38.5 31.4 0.502 19.2 15.1 0.617 Venoms 57.7 44.2 0.227 23.1 22.1 0.916 Dust mites 7.7 6.9 0.595 0.0 4.7 0.342 Cockroach 3.9 3.5 0.658 3.9 2.3 0.551 Peanuts 3.9 1.2 0.412 3.9 1.2 0.412 Food components (including peanuts)
53.9 43.0 0.332 34.6 18.6 0.086
Pollen 38.5 33.7 0.657 15.4 16.3 0.592 Fungal allergens 23.1 8.1 0.037 11.5 1.2 0.038 Domesticated animals 0.0 5.8 0.260 0.0 1.2 0.768
Table shows proportions of rural participants (categorised by helminth infection status) that had an ISAC-detectable IgE response or were sensitised (IgE≥0.3 ISU) to at least one allergen component within the larger allergen groupings of CCDs, venoms, dust mites, cockroach, peanut, food, pollen, fungi and domesticated animals. Chi-square / Fisher’s exact tests were conducted to assess differences between helminth infected and uninfected participants. These tests were conducted within the framework of a Monte Carlo simulation algorithm based on 1000 permutations in order to adjust for multiple testing. *Schistosoma mansoni infection determined by Kato-Katz and/or PCR ¶Infection with any of Ascaris lumbricoides, Trichuris trichiura (assessed by KK), Necator americanus, Strongyloides stercoralis (assessed by PCR) and Mansonella perstans (assessed by modified Knott’s method). ISAC: Immuno Solid-phase Allergen Chip; ISU: ISAC standardised units
References
277
1. Nampijja M, Webb EL, Kaweesa J, Kizindo R, Namutebi M, Nakazibwe E, et al. The Lake Victoria island intervention study on worms and allergy-related diseases (LaVIISWA): study protocol for a randomised controlled trial. Trials 2015; 16:187.
2. Sanya RE, Nkurunungi G, Hoek Spaans R, Nampijja M, O’Hara G, Kizindo R, et al. The impact of intensive versus standard anthelminthic treatment on allergy-related outcomes, helminth infection intensity and helminth-related morbidity in Lake Victoria fishing communities, Uganda: results from the LaVIISWA cluster randomised trial. Clinical Infectious Diseases 2018:ciy761-ciy.
3. Amoah AS, Asuming-Brempong EK, Obeng BB, Versteeg SA, Larbi IA, Aryeetey Y, et al. Identification of dominant anti-glycan IgE responses in school children by glycan microarray. J Allergy Clin Immunol 2018; 141:1130-3.
4. Onell A, Hjalle L, Borres MP. Exploring the temporal development of childhood IgE profiles to allergen components. Clin Transl Allergy 2012; 2:24.
5. van Diepen A, Smit CH, van Egmond L, Kabatereine NB, Pinot de Moira A, Dunne DW, et al. Differential anti-glycan antibody responses in Schistosoma mansoni-infected children and adults studied by shotgun glycan microarray. PLoS Negl Trop Dis 2012; 6:e1922.
278
CHAPTER 8. SUMMARISING DISCUSSION AND CONCLUSIONS
8.1 Preamble
Each Research Paper in this thesis includes a detailed discussion of the results
presented therein. This chapter summarises the main findings in each of the papers,
interprets and synthesises these findings, highlights study strengths and limitations, and
offers recommendations for future research.
8.2 Summary and interpretation of main findings
8.2.1 Research Paper 1 (Chapter 4)
Research Paper 1 shows prevalence and risk factors for SPT reactivity (to common
environmental allergens in the study setting1), allergen extract-specific IgE sensitisation,
wheeze, rhinitis, urticaria and visible flexural dermatitis, in Ugandan rural and urban
settings. Urban-rural differences in prevalence and risk factors for these allergy-related
outcomes, and in prevalence of helminth infection, are shown. The rural setting had a
significantly higher prevalence of helminth infections, allergen extract-specific IgE
sensitisation and urticarial rash, compared to the urban setting. Prevalence of SPT
reactivity and visible flexural dermatitis was higher in the urban setting.
Inverse associations between SPT reactivity and 1) the rural setting, 2) helminth
infections in the rural setting, are in line with previously published findings that support a
protective role (against allergy) for helminths and the rural environment.2-4 Interestingly
in the urban setting, light S. mansoni infection was positively associated with SPT
reactivity, while moderate and heavy infections were inversely associated with the same
outcome. This is not a new phenomenon: protective effects of helminths on allergic
effector responses may depend on intensity and chronicity of infection:5,6 heavy, chronic
helminth infections are associated with immunoregulation (with spill-over inhibitory
effects on allergic responses), while light and/or acute infections may promote allergy-
like responses.5 This phenomenon may not apply in the rural setting described in this
thesis because it is a highly endemic area characterised by heavy infections. Positive
279
associations between allergen extract-specific IgE and helminth infections and helminth-
specific antibodies, in both the rural and the urban survey, may be attributed to protein
cross-reactivity and/or carbohydrate cross-reactivity between helminth antigens and
allergens (the latter is assessed in Chapters 6 and 7).
Risk factors for allergy-related outcomes (dominated by helminth [S. mansoni] infection
and helminth-related immunological and epidemiological factors) also differed by setting.
Pairwise associations between clinical allergy outcomes, and between atopy and clinical
allergy outcomes, were stronger among urban compared to rural participants. Setting
(rural versus urban) was an effect modifier for several allergy risk factors; for example,
associations between SPT reactivity and S. mansoni infection and Schistosoma-specific
IgG4 were positive in the urban setting and inverse in the rural setting.
Research Paper 1 further investigated the hypothesis that helminth (S. mansoni)
infections are effect modifiers of associations between risk factors and allergy-related
outcomes, and whether they were likely to mediate the differences in prevalence and
risk factors for allergy-related outcomes, between the urban and the rural setting. Despite
indicative trends, statistical analyses implied that the helminths (specifically S. mansoni)
are unlikely to be the sole mechanism of the observed effect modification between the
low-helminth exposure urban setting and the high-helminth-transmission rural setting.
Instead, observations that S. mansoni infections were important risk factors for allergy-
related outcomes (inversely or otherwise) imply that helminths mainly impact allergy-
related outcomes through direct effects, rather than as risk modifiers.
Notably, work conducted by Pinot de Moira and colleagues among Ugandan children7
showed that hookworm, but not S. mansoni infection, dissociated house dust mite-
specific IgE from histamine release. This implies that there might be differences in
mechanisms between S. mansoni and other helminth infections. Analyses conducted in
Research Paper 1 did not show a role for hookworm or other helminths; however, the
low prevalence of other helminths gave little power to assess any such effects.
280
8.2.2 Research Paper 2 (Chapter 5)
Research paper 2 reports findings from the LaVIISWA baseline survey, showing that
total, SWA-, SEA- and allergen extract-specific IgE and IgG4 responses are positively
associated with both S. mansoni infection and SPT reactivity. This paper presents results
from data collected before community-based anthelminthic intervention was provided as
part of the LaVIISWA trial. Further, unpublished results presented in Chapter 5 show that
a similar trend was observed after three years of the LaVIISWA trial, as well as in a
parallel urban survey. Similar to helminth infection prevalence patterns in the rural and
urban surveys, concentrations of total, SWA-, SEA- and allergen extract-specific IgE and
IgG4 responses were higher among rural compared to urban survey participants. The
observation that allergen extract-specific IgE levels were also higher in the rural survey
may be attributed to cross-reactivity between helminth antigens and common
environmental allergens in this setting.8-12
These antibody responses did not differ between intensive and standard trial arms in the
rural survey. The main outcome survey of the LaVIISWA trial also found no evidence of
a difference in prevalence of allergy-related disease between intensive and standard trial
arms (Research Paper 7, Appendix 3, this thesis). Factors potentially contributing to
the lack of impact on allergy outcomes are discussed in Research paper 7, and include
failure to eliminate helminth infections from villages in both trial arms, and the
longstanding immunological effects of helminth exposure in this endemic setting. In the
current analysis, persistence of antibodies at pre-intervention levels, and the similarity in
antibody profiles between trial arms, may explain lack of differences in clinical allergy
outcomes between the trial arms, at least in part.
Although IgG4 responses and SWA- and SEA-specific antibody concentrations were
similar between asthmatic schoolchildren and non-asthmatic controls in the asthma
case-control study (unpublished results, section 5.4), total and allergen extract-specific
281
IgE concentrations were higher among asthmatics, providing support to mounting
evidence that most asthma in the tropics is atopic, contrary to previous perception.13,14
The potential protective role of IgG4 against allergic effector responses may best be
assessed relative to IgE. Thesis Chapter 5 shows that total and allergen-specific IgG4/
IgE ratios and total IgE/ allergen-specific IgE ratios were inversely associated with SPT
reactivity, wheezing and asthma. These results strengthen the argument that the IgG4–
IgE balance and/or the total IgE–allergen-specific IgE balance (both significantly
influenced by helminth infection) are important in protection against clinical allergy.
Potential mechanisms are discussed in Chapter 1, and include 1) IgG4-mediated
blockage of allergen recognition by IgE (when IgG4 and IgE have similar antigenic
specificity15-17), 2) FcγRIIB-dependent IgG4 inhibition of IgE-mediated effector cell
activation17-19 and 3) saturation of IgE receptors by non-specific, polyclonally-stimulated
IgE20 hence reducing chances that an allergen will result in cross-linking of FcεRI-bound
IgE.8,21
8.2.3 Research Paper 3 (Chapter 6)
Chapter 6 presents microarray analysis of IgE and IgG responses to core b-1,2-
xylosylated and a-1,3-fucosylated N-glycans, showing that responses to these core
modified N-glycans were higher in the S. mansoni-endemic rural communities compared
to lower S. mansoni transmission urban communities. Mass spectrometry-based
studies,22-24 have shown that core b-1,2-xylose and core a-1,3-fucose motifs are not only
present on glycoproteins of common environmental allergens from plant and invertebrate
sources, they are also expressed during specific schistosome life stages (Figure 1.3,
Chapter 1). This may explain the urban-rural differences (in reactivity to core b-1,2-xylose
and a-1,3-fucose) observed in the current study settings.
Research Paper 3 further shows that associations between S. mansoni infection and IgE
and IgG reactivity to core modified N-glycans vary by setting. In the urban setting, IgE
and IgG responses to both core b-1,2-xylose and core a-1,3-fucose were positively
282
associated with S. mansoni infection. However, in nearby rural communities, IgE and
IgG responses to core b-1,2-xylose were strongly positively associated with S. mansoni
infection while reactivity to core a-1,3-fucose was elevated in both S. mansoni infected
(Sm KK+/PCR+) and uninfected (Sm KK-/PCR-) individuals. As discussed in Research
Paper 3, these observations may be attributed to the universal S. mansoni infection
exposure in the rural setting, where ‘uninfected’ individuals carry light infections not
detectable by Kato-Katz and/or PCR. Core a-1,3-fucose motifs can be found on N-
glycans from S. mansoni eggs, but not on N-glycans from cercariae and adult
worms.22,23,25 It is possible that responses to core a-1,3-fucose persist following active
infection in the high S. mansoni exposure rural communities. Moreover, it has been
shown that eggs and hepatic granulomas stay long after clearance of worms in mice.26
Also in the rural communities, the concentration of antibodies to core a-1,3-fucose
modified N-glycans peaked ahead of the peak of S. mansoni infection intensity, while the
peak of antibodies to N-glycans with only core b-1,2-xylose coincided with it. These
results suggest that reactivity to core b-1,2-xylose is more responsive to change in S.
mansoni exposure: core b-1,2-xylose is present on cercariae, despite being absent in
adult worms.22,23,27
The distinctive relationships between S. mansoni infection (and intensity) and reactivity
to core β-1,2-xylose and α-1,3-fucose modified N-glycans warrant further exploration for
associations with protective immunity against S. mansoni. In Chapter 7 (discussed
below), associations between reactivity to core modified N-glycans and sensitisation to
other environmental exposures (other than S. mansoni) were explored.
8.2.4 Research Paper 4 (Chapter 7)
Chapter 7 aimed to assess to what extent cross-reactive carbohydrate determinant
(CCD)-specific IgE determines helminth-allergy associations in Uganda. The main
hypothesis was that elevated IgE responses to specific immunogenic CCD N-glycans
during chronic helminth infection might dominate over allergen protein-specific IgE,
283
resulting in reduced allergic effector responses. The ImmunoCAP® test was employed
to measure IgE against house dust mite, cockroach and peanut extracts. The ISAC®
microarray provided a component-resolved assessment of IgE reactivity to natural and
recombinant allergen components, including those known to carry CCDs. The key
features of classical CCDs are N-glycans with core b-1,2-xylose and core a-1,3-fucose
substitutions. To further elucidate reactivity to CCDs in Ugandan individuals, a glycan
microarray was employed to measure IgE to glycans with and without core b-1,2-xylose
and core a-1,3-fucose substitutions.
ImmunoCAP-determined allergen extract-specific IgE sensitisation was higher in the
rural compared to the urban survey, and among asthmatics compared to non-asthmatic
controls, similar to findings shown in Chapter 4. However, sensitisation to allergen
extracts did not reflect sensitisation to their major, established natural and recombinant
allergenic components among non-asthmatics and rural and urban participants. Allergen
extracts may contain cross-reactive protein and carbohydrate components that are
conserved in other environmental antigens such as those from S. mansoni.8 Therefore,
sensitisation to established major allergenic components is rare in the study settings
(especially among helminth infected, rural individuals), and estimation of true prevalence
of allergic sensitisation is complicated by protein and/or carbohydrate cross-reactivity
between helminths and allergens.
This postulation is supported by the observation that many participants recognised
natural purified CCD-bearing components on the ISAC allergen microarray, suggesting
that in this setting, allergen extract-specific IgE may primarily be raised against
carbohydrate groups shared with other environmental antigens, such as helminths.
Studies have shown that CCDs contribute significantly to cross-sensitisation between
Schistosoma antigens and peanut, pollen or insect venom allergens.9,10,28 Here also,
glycan array-determined responses to classical CCD epitopes (core b-1,2-xylose and
core a-1,3-fucose) were strongly associated with S. mansoni infection and allergen
284
extract-specific IgE. Sensitisation to recombinant insect venom components was also
high, especially among S. mansoni infected individuals. This may be attributed to
sensitisation to Venom-Allergen-Like proteins expressed by schistosomes.29
As mentioned before, one of the key differences between the rural and the urban setting
was in helminth infection prevalence and intensity. Chapter 7 shows that IgE reactivity
to venom protein components, CCD-bearing components (measured by ISAC) and
classical CCD N-glycan epitopes (assessed by glycan microarray), was higher among
rural participants. Conversely, responses to the major components (predominantly
recombinant proteins) from common environmental allergens in this setting,1 especially
house dust mite, were higher in the urban compared to rural setting, and among
asthmatics compared to controls. These data imply that in the rural Sm-endemic settings,
IgE may be less effectively induced against established major allergenic protein
componentsthan against CCDs.
Carbohydrate-specific IgG has been hypothesised to block IgE-mediated
responses;9,10,30,31 this thesis further hypothesised a protective role for CCD-specific IgE
against allergic effector responses. However, ISAC-determined CCD-specific IgE was
similar between asthmatics and non-asthmatic controls, and between SPT positive and
negative individuals. Instead, glycan microarray IgE reactivity to core a-1,3-fucosylated
N-glycans was inversely associated with asthma. In line with this finding, Do et al.32
recently found that an N-glycan from Bla g 2, a major German cockroach allergen,
inhibited basophil histamine release and IL-4 production. A more detailed analysis of this
N-glycan revealed that it was core fucosylated. However, Do et al. did not show a
protective role for N-glycan-specific IgE. Moreover, glycosylated Bla g 2 was a stronger
inducer of basophil activation than its de-glycosylated counterpart. These findings, and
those reported in this thesis, imply that reactivity to specific glycans or glycan motifs may
be important in protection against allergic disease through yet-to-be-defined
mechanisms. More experimental studies are required to unravel the potential
285
mechanisms.
In helminth-endemic settings, it is also important to consider that any observed inverse
associations between CCD-specific antibodies and clinical allergy may denote an
epiphenomenon, simply reflective of helminth-mediated protection against allergies
through other mechanisms. Therefore, studies exploring potential protective roles of
CCDs in absence of helminth infection are important. Wilbers and colleagues33 have
recently demonstrated that helminth glycoproteins, including those carrying core b-1,2-
xylose and a-1,3-fucose substituted N-glycans, can be reconstructed in plant systems.33
This provides an important avenue for obtaining tailored carbohydrate epitopes to
explore the potential protective role of specific glycans, using animal models and in vitro
human experiments.
8.3 Thesis strengths
8.3.1 Sample sizes and similar procedures across studies
This PhD thesis presents findings from analyses of data collected from three well-
designed large studies on allergy in Uganda. The large sample sizes enabled precise
assessment of associations between epidemiological and immunological factors related
to helminths and allergy. Where subsets of samples were chosen for analysis, such as
for the N-glycan and allergen microarray assays, selections were done in such a way
that sample sizes were comparable to or larger than those reported in similar studies.34-
38
The LaVIISWA trial, the urban survey and the asthma study were all designed specifically
to examine allergy-related outcomes, and the methods (and procedures) were designed
to be as similar as possible between the studies. This ensured validity of the comparisons
(of immunological profiles and other factors) made between the studies.
286
8.3.2 Methods
Robust methods were used in laboratory and statistical analyses. For example, a
component-resolved microarray approach was used to profile allergic responses,
complementing the singleplex immunoassays used for allergy testing. Statistical
procedures such as PCA and HCA were used in data reduction (and consequently for
analysis) of complex allergen and glycan microarray data. For these data, methods used
to compute multiplicity corrected p-values ensured that the findings were statistically
plausible. Several quality control (QC) measures were also implemented for several
laboratory analyses. For example, QC for PCR on stool-derived DNA was conducted by
collaborators in the Netherlands (Dr Jaco Verweij, Laboratory for Medical Microbiology
and Immunology, St Elisabeth Hospital, Tilburg), glycan microarray analyses were
conducted in conjunction with colleagues in the glycobiology department at the Leiden
University Medical Centre, and the ImmunoCAP® and the ImmunoCAP® ISAC
immunoassays were semi-automated with appropriate internal controls. Appropriate
data management and cleaning procedures were also in place, as described in the
Methods section 3.8.
8.3.3 New findings
This thesis highlights the potential role of the total IgE – allergen-specific IgE balance
and the IgG4 – IgE balance in mitigation of allergic effector responses, providing
evidence from large population-based studies. Results showing the potential importance
of the IgG4 – IgE balance in protection against clinical allergy build upon previous
findings that apportion it a significant role in allergen-specific immunotherapy.39
This thesis shows, for the first time, that antibody responses to the classical CCD
epitopes (core b-1,2-xylose and a-1,3-fucose) have distinctive relationships with S.
mansoni infection and intensity, possibly reflecting their different contributions to
immunity to S. mansoni. This thesis further provides invaluable insights into the potential
287
protective effect of IgE reactivity to specific CCD epitopes (such as core a-1,3-fucose)
against clinical allergy, which has not been assessed before in human participants.
8.4 Thesis limitations
The research papers presented in this thesis report a large number of statistical tests,
increasing the possibility of chance findings. In Chapters 4 and 5, no formal adjustment
for multiple testing was done, instead the focus was placed on biological credibility in
reference to published works, as well as on consistency of findings and trends of
associations between exposures and outcomes. In Chapters 6 and 7, correction for
multiple testing was done by conducting permutation tests using a Monte Carlo
simulation approach.
A large proportion of the data used in this thesis was obtained from cross-sectional
surveys; so, assessment of temporality was not possible. Therefore, it was difficult to
establish causality when assessing helminth-allergy associations. The LaVIISWA trial
was originally designed to address this; however, intensive versus standard
anthelminthic treatment had no effect on most primary study outcomes. Nonetheless,
important deductions can be made from this thesis’ findings, owing to the strong patterns
of associations observed.
As discussed in Research Paper 1 (Chapter 4), rural communities had received three
years of mass anthelminthic treatment at the time of the allergy outcomes survey, while
the urban community had considerable exposure to light helminth infections. However,
the two settings were still quite distinct, as helminth prevalence remained high in the rural
setting (presumably due to high re-infection rates), providing an interesting sample for
assessing the impact of urban-rural differences in helminth infection exposure on allergy
related outcomes.
In the rural population, exposure to helminths was universal, and there were no data on
duration of infection. This is a potential limitation in assessment of helminth-allergy
associations and underlying mechanisms. Therefore, comparisons with the low helminth
288
exposure urban setting were important in assessment of plausibility of deductions
derived from analysis of helminth-allergy associations in the rural setting.
8.5 Conclusion(s)
This thesis presents an immuno-epidemiological description of antibody profiles
associated with helminth infection, allergic sensitisation and clinical allergy in rural and
urban Uganda, providing important insight into mechanisms underlying the complex
helminth-allergy associations in tropical low-income countries.
The major conclusions from this PhD research are
1. Despite suggestive trends, there was no statistical proof that helminth (S.
mansoni) infection mediates urban-rural differences in prevalence and risk factors for
allergy-related outcomes in Uganda, implying that helminths are not the sole mechanism.
Other environmental exposures are likely to play a role. The observation that S. mansoni
infection was an important risk factor for allergy-related outcomes (inversely or
otherwise) implies that helminths mainly impact allergy-related outcomes through direct
effects, rather than as risk modifiers.
2. In communities exposed to helminth infections, the IgG4 – IgE balance and the
total IgE – allergen-specific IgE balance may be important in protection against clinical
allergy.
3. In tropical settings, helminth-induced CCD-specific antibody responses
(specifically IgE) obscure readouts for assessment of atopy.
4. Inverse associations between asthma and IgE to a-1,3-fucose substituted N-
glycans imply that antibodies against specific CCD epitopes may be important in
protection against clinical allergy, through yet-to-be-defined mechanisms.
8.6 Antibody-mediated mechanisms of helminth-allergy associations: future perspectives
Chapter 5 highlights the potential importance of the IgG4 – IgE balance in protection
against clinical allergy. Immunoglobulin G4 has been implicated in IgG4-related
289
disease.40 Despite this, immunoregulation during chronic helminth infection appears to
be a more prominent role for IgG4,15 as well as induction of allergen tolerance during
specific immunotherapy.39 Besides, IgG4 does not activate the complement system or
lead to formation of immune complexes, and is not associated with mast cell or basophil
degranulation.41 Its major mode of action against inflammation seems to be blockage of
IgE-mediated processes. This thesis offers solid support for the regulatory role of IgG4.
Further experimental animal studies would be ideal for studying the protective role of
IgG4; however, they are hampered by the absence of IgG4 in mice. Therefore, in vitro
human experiments should be the focus of future work. For example, by using a high-
throughput microarray screening platform, helminth antigens that induce strong serum
IgG4 responses and little or no IgE may be identified. Such antigens may be important
for therapeutic strategies against clinical allergy. For example, IgG4 induced by such
antigens may trigger FcγRIIB-dependent inhibition of IgE-effector cell degranulation.17-19
Immune responses to some helminths are shaped to a great extent by the glycome and
this has been clearly demonstrated for schistosomes (in this thesis and elsewhere).
Responses to carbohydrate antigens may be part of the worm’s strategy to protect itself
from IgE-mediated attack; however, they may also contribute to protective immunity
against helminth infection, or could be useful in diagnostics, but detailed research is
needed to determine their role and potential applications. Furthermore, profiling of
helminth CCD-specific responses may improve current understanding of potential
mechanisms of protection against allergy. Before work conducted as part of this PhD
research, these responses were not yet well characterised at a population level. Chapter
6 highlights rural-urban differences in IgE and IgG responses to key components of the
schistosome glycome (core b-1,2-xylose and a-1,3-fucose substituted N-glycans) and
shows that responses to these components have distinctive relationships with S.
mansoni infection and intensity. It has been previously implied that responses to cross-
reactive carbohydrates have the potential to inhibit clinical peanut allergy;28 Although
290
results presented in Chapter 7 of this thesis showed no overall difference in CCD-specific
IgE between participants with and without SPT positivity or asthma, there were inverse
associations between reactivity to core a-1,3-fucose substituted N-glycans and asthma,
signifying potential for specific CCD epitopes in protection against asthma. Definitive
proof of CCD-mediated protection against clinical allergy is required and mechanistic
studies in animal models, and using human samples in in vitro experiments, are
warranted.
Overall, findings presented in this thesis provide important insight into mechanisms
underlying the complex epidemiological helminth-allergy trends in Uganda. This is
important for approaches aimed at reducing the impact of the on-going epidemiological
transition on allergy prevalence in the tropics and for therapeutic strategies against
allergy-related diseases.
8.7 References for Chapter 8
1. Mpairwe H, Muhangi L, Ndibazza J, et al. Skin prick test reactivity to common allergens among women in Entebbe, Uganda. Transactions of the Royal Society of Tropical Medicine and Hygiene 2008; 102(4): 367-73.
2. Araujo MI, Lopes AA, Medeiros M, et al. Inverse association between skin response to aeroallergens and Schistosoma mansoni infection. Int Arch Allergy Immunol 2000; 123(2): 145-8.
3. Cooper PJ, Chico ME, Rodrigues LC, et al. Reduced risk of atopy among school-age children infected with geohelminth parasites in a rural area of the tropics. The Journal of allergy and clinical immunology 2003; 111(5): 995-1000.
4. Supali T, Djuardi Y, Wibowo H, van Ree R, Yazdanbakhsh M, Sartono E. Relationship between different species of helminths and atopy: a study in a population living in helminth-endemic area in Sulawesi, Indonesia. Int Arch Allergy Immunol 2010; 153(4): 388-94.
5. Cooper PJ. Interactions between helminth parasites and allergy. Current opinion in allergy and clinical immunology 2009; 9(1): 29-37.
6. Smits HH, Hammad H, van Nimwegen M, et al. Protective effect of Schistosoma mansoni infection on allergic airway inflammation depends on the intensity and chronicity of infection. Journal of Allergy and Clinical Immunology 2007; 120(4): 932-40.
291
7. Pinot de Moira A, Fitzsimmons CM, Jones FM, et al. Suppression of basophil histamine release and other IgE-dependent responses in childhood Schistosoma mansoni/hookworm coinfection. The Journal of infectious diseases 2014; 210(8): 1198-206.
8. Hamid F, Amoah AS, van Ree R, Yazdanbakhsh M. Helminth-induced IgE and protection against allergic disorders. Current topics in microbiology and immunology 2015; 388: 91-108.
9. Igetei JE, El-Faham M, Liddell S, Doenhoff MJ. Antigenic cross-reactivity between Schistosoma mansoni and peanut: a role for cross-reactive carbohydrate determinants (CCDs) and implications for the hygiene hypothesis. Immunology 2017; 150(4): 506-17.
10. Igetei JE, El-Faham M, Liddell S, Schramm G, Doenhoff MJ. Antigenic cross-reactivity between Schistosoma mansoni and pollen allergens from the birch tree (Betula verrucosa) and Timothy grass (Phleum pratense): involvement of shared glycan epitopes and implications for the hygiene hypothesis. International journal for parasitology 2018.
11. Tyagi N, Farnell EJ, Fitzsimmons CM, et al. Comparisons of Allergenic and Metazoan Parasite Proteins: Allergy the Price of Immunity. PLoS computational biology 2015; 11(10): e1004546.
12. Santiago Hda C, Ribeiro-Gomes FL, Bennuru S, Nutman TB. Helminth infection alters IgE responses to allergens structurally related to parasite proteins. Journal of immunology (Baltimore, Md : 1950) 2015; 194(1): 93-100.
13. Flohr C, Weiland SK, Weinmayr G, et al. The role of atopic sensitization in flexural eczema: findings from the International Study of Asthma and Allergies in Childhood Phase Two. The Journal of allergy and clinical immunology 2008; 121(1): 141-7 e4.
14. Weinmayr G, Weiland SK, Bjorksten B, et al. Atopic sensitization and the international variation of asthma symptom prevalence in children. Am J Respir Crit Care Med 2007; 176(6): 565-74.
15. Rihet P, Demeure CE, Dessein AJ, Bourgois A. Strong serum inhibition of specific IgE correlated to competing IgG4, revealed by a new methodology in subjects from a S. mansoni endemic area. European journal of immunology 1992; 22(8): 2063-70.
16. van Neerven RJ, Wikborg T, Lund G, et al. Blocking antibodies induced by specific allergy vaccination prevent the activation of CD4+ T cells by inhibiting serum-IgE-facilitated allergen presentation. Journal of immunology (Baltimore, Md : 1950) 1999; 163(5): 2944-52.
17. James LK, Till SJ. Potential Mechanisms for IgG4 Inhibition of Immediate Hypersensitivity Reactions. Current allergy and asthma reports 2016; 16(3): 23.
18. Cassard L, Jonsson F, Arnaud S, Daeron M. Fcgamma receptors inhibit mouse and human basophil activation. Journal of immunology (Baltimore, Md : 1950) 2012; 189(6): 2995-3006.
19. Strait RT, Morris SC, Finkelman FD. IgG-blocking antibodies inhibit IgE-mediated anaphylaxis in vivo through both antigen interception and Fc gamma RIIb cross-linking. J Clin Invest 2006; 116(3): 833-41.
292
20. Godfrey RC, Gradidge CF. Allergic sensitisation of human lung fragments prevented by saturation of IgE binding sites. Nature 1976; 259(5543): 484-6.
21. Lynch NR, Hagel IA, Palenque ME, et al. Relationship between helminthic infection and IgE response in atopic and nonatopic children in a tropical environment. The Journal of allergy and clinical immunology 1998; 101(2 Pt 1): 217-21.
22. Hokke CH, van Diepen A. Helminth glycomics – glycan repertoires and host-parasite interactions. Molecular and Biochemical Parasitology 2017; 215: 47-57.
23. Smit CH, van Diepen A, Nguyen DL, et al. Glycomic Analysis of Life Stages of the Human Parasite Schistosoma mansoni Reveals Developmental Expression Profiles of Functional and Antigenic Glycan Motifs. Mol Cell Proteomics 2015; 14(7): 1750-69.
24. Haslam SM, Morris HR, Dell A. Mass spectrometric strategies: providing structural clues for helminth glycoproteins. Trends in parasitology 2001; 17(5): 231-5.
25. Khoo K-H, Chatterjee D, Caulfield JP, Morris HR, Dell A. Structural mapping of the glycans from the egg glycoproteins of Schistosoma mansoni and Schistosoma japonicum: identification of novel core structures and terminal sequences. Glycobiology 1997; 7(5): 663-77.
26. Cheever AW, Macedonia JG, Deb S, Cheever EA, Mosimann JE. Persistence of eggs and hepatic fibrosis after treatment of Schistosoma mansoni-infected mice. The American journal of tropical medicine and hygiene 1992; 46(6): 752-8.
27. Khoo KH, Chatterjee D, Caulfield JP, Morris HR, Dell A. Structural mapping of the glycans from the egg glycoproteins of Schistosoma mansoni and Schistosoma japonicum: identification of novel core structures and terminal sequences. Glycobiology 1997; 7(5): 663-77.
28. Amoah AS, Obeng BB, Larbi IA, et al. Peanut-specific IgE antibodies in asymptomatic Ghanaian children possibly caused by carbohydrate determinant cross-reactivity. The Journal of allergy and clinical immunology 2013; 132(3): 639-47.
29. Chen J, Hu X, He S, et al. Expression and immune response analysis of Schistosoma japonicum VAL-1, a homologue of vespid venom allergens. Parasitology research 2010; 106(6): 1413-8.
30. Doenhoff MJ, El-Faham M, Liddell S, et al. Cross-Reactivity between Schistosoma mansoni Antigens and the Latex Allergen Hev b 7: Putative Implication of Cross-Reactive Carbohydrate Determinants (CCDs). PLoS One 2016; 11(7): e0159542.
31. Hemmer W. Human IgE Antibodies Against Cross-Reactive Carbohydrate Determinants. In: Kosma P, Müller-Loennies S, eds. Anticarbohydrate Antibodies: From Molecular Basis to Clinical Application. Vienna: Springer Vienna; 2012: 181-202.
32. Do DC, Yang S, Yao X, Hamilton RG, Schroeder JT, Gao P. N�glycan in cockroach allergen regulates human basophil function. Immunity, Inflammation and Disease 2017; 5(4): 386-99.
33. Wilbers RHP, Westerhof LB, van Noort K, et al. Production and glyco-engineering of immunomodulatory helminth glycoproteins in plants. Scientific Reports 2017; 7: 45910.
293
34. Hamid F, Versteeg SA, Wiria AE, et al. Molecular diagnostics and lack of clinical allergy in helminth-endemic areas in Indonesia. The Journal of allergy and clinical immunology 2017; 140(4): 1196-9 e6.
35. Yang YY, Li XH, Brzezicka K, et al. Specific anti-glycan antibodies are sustained during and after parasite clearance in Schistosoma japonicum-infected rhesus macaques. PLoS Negl Trop Dis 2017; 11(2): e0005339.
36. van Diepen A, Smit CH, van Egmond L, et al. Differential anti-glycan antibody responses in Schistosoma mansoni-infected children and adults studied by shotgun glycan microarray. PLoS Negl Trop Dis 2012; 6(11): e1922.
37. Amoah AS, Asuming-Brempong EK, Obeng BB, et al. Identification of dominant anti-glycan IgE responses in school children by glycan microarray. The Journal of allergy and clinical immunology 2018; 141(3): 1130-3.
38. Onell A, Hjalle L, Borres MP. Exploring the temporal development of childhood IgE profiles to allergen components. Clin Transl Allergy 2012; 2(1): 24.
39. Tseng SH, Fu LS, Nong BR, Weng JD, Shyur SD. Changes in serum specific IgG4 and IgG4/ IgE ratio in mite-sensitized Taiwanese children with allergic rhinitis receiving short-term sublingual-swallow immunotherapy: a multicenter, randomized, placebo-controlled trial. Asian Pac J Allergy Immunol 2008; 26(2-3): 105-12.
40. Bledsoe JR, Della-Torre E, Rovati L, Deshpande V. IgG4-related disease: review of the histopathologic features, differential diagnosis, and therapeutic approach. APMIS : acta pathologica, microbiologica, et immunologica Scandinavica 2018; 126(6): 459-76.
41. Aalberse RC, Schuurman J. IgG4 breaking the rules. Immunology 2002; 105(1): 9-19.
294

APPENDICES
295

9.1 APPENDIX 1: Research Paper 5: A life without worms
296
297
298
REV
IEW
Trans R Soc Trop Med Hyg 2017; 111: 3–11doi:10.1093/trstmh/trx010 Advance Access publication 18 March 2017
A life without worms
Richard E. Sanyaa,b,*, Gyaviira Nkurunungia,c, Irene Andia Birarob, Harriet Mpairwea and Alison M. Elliotta,c
aMRC/UVRI Uganda Research Unit, Uganda Virus Research Institute, P.O. Box 49, Entebbe, Uganda; bCollege of Health Sciences,Makerere University, Kampala, Uganda; cDepartment of Clinical Research, London School of Hygiene & Tropical Medicine, Keppel Street,
London WC1E 7HT, UK
*Corresponding author: E-mail: [email protected]
Received 19 January 2017; revised 12 February 2017; editorial decision 14 February 2017; accepted 27 February 2017
Worms have co-evolved with humans over millions of years. To survive, they manipulate host systems bymodulating immune responses so that they cause (in the majority of hosts) relatively subtle harm.Anthelminthic treatment has been promoted as a measure for averting worm specific pathology and to miti-gate subtle morbidities which may include effects on anaemia, growth, cognitive function and economicactivity. With our changing environment marked by rapid population growth, urbanisation, better hygienepractices and anthelminthic treatment, there has been a decline in worm infections and other infectious dis-eases and a rise in non-communicable diseases such as allergy, diabetes and cardiovascular disease. Thisreview reflects upon our age-old interaction with worms, and the broader ramifications of life without wormsfor vaccine responses and susceptibility to other infections, and for allergy-related and metabolic disease. Wetouch upon the controversy around the benefits of mass drug administration for the more-subtle morbiditiesthat have been associated with worm infections and then focus our attention on broader, additional aspectsof life without worms, which may be either beneficial or detrimental.
Keywords: Allergy, Anthelminthic, Helminths, Infectious diseases, Metabolic disease, Vaccines
IntroductionOver a billion people are estimated to be infected with hel-minths, most living in areas of poverty.1,2 Helminths have co-existed with mammals for millions of years. Their lifecycles haveevolved to ensure their survival while minimising harm to themammalian host. Soil transmitted helminths (STH) such as hook-worm, Ascaris lumbricoides, Trichuris trichiura and Strongyloidesstercoralis spend part of their lifecycle in soil and gain access totheir human host through skin penetration or ingestion. For thefilarial nematodes, an insect vector takes up microfilariae dur-ing a blood meal and, after development in the insect, theparasite is injected into the next host during another bloodmeal. For water borne helminths such as Schistosoma, cer-cariae shed by the snail intermediate host access the definitivehuman host by skin penetration during contact with infestedwater. After migratory and development stages, adult wormslodge in body tissues such as the gut, blood vessels and lym-phatics. In most cases, helminths do not replicate in the mam-malian host.3
Helminths induce short and long term morbidity, and path-ology in some body systems: gastrointestinal tract (malabsorp-tion, diarrhoea, macro and micronutrient deficiencies, bleeding,
intestinal obstruction, rectal prolapse), liver (peri-portal fibrosis,cholangitis, cholangiocarcinoma, hepatocellular carcinoma),cardiovascular system (anaemia), lymphatic system (lymphoe-dema), central nervous system (blindness, epilepsy), genito-urinary tract (haematuria, hydronephrosis, bladder cancer),lungs (Loeffler’s syndrome).4 These effects depend on the typeand number of helminths in the host. Treatment is deserved toavert these harmful effects.
Societies in developing countries are experiencing remarkablepopulation growth, urbanisation and lifestyle changes. With bet-ter hygiene and ‘deworming’ interventions, helminth infectionsare declining. Concurrently, there is a rise in non-communicablediseases (NCDs) such as diabetes5 and cardiovascular diseases,6
contributing significantly to global mortality and attributedlargely to changes in diet and lifestyle. Could the decline in hel-minth infections be playing a role in this epidemiological trans-ition? With helminth elimination the ultimate goal of mass drugadministration (MDA) programmes,7 it is of interest to reflect onthe prospect of a worm-free life. Do we clearly understand, arewe ready for, the consequences of life divorced from the part-nership established over millions of years? In this narrativereview we discuss current evidence regarding the benefits ofMDA, ways in which worms manipulate us, and the possible
© The Author 2017. Published by Oxford University Press on behalf of Royal Society of Tropical Medicine and Hygiene.This is an Open Access article distributed under the terms of the Creative Commons Attribution License (http://creativecommons.org/licenses/by/4.0/), which permits unrestricted reuse, distribution, and reproduction in any medium, provided the original work is properly cited.
3299
effects of helminth infection on responses to vaccines and unre-lated infectious diseases, and on allergy and metabolic disease.
How much do we benefit from MDA?MDA entails administration of anthelminthic medicines withoutreference to an individual’s infection status, or test of cure. TheWorld Health Assembly endorsed MDA for school children as aschistosomiasis and STH control strategy for high transmissionsettings8 and this has been widely adopted.
MDA policy is premised on anticipated benefits for helminth-specific pathology, maternal anaemia, birth weight, childhoodgrowth, anaemia, cognitive function, school performance andlong term economic returns. We do not question the benefit ofMDA for controlling pathologies such as schistosome-inducedfibrosis, hookworm-induced anaemia, elephantiasis and riverblindness. However, the impact of MDA on more subtle morbid-ities associated with helminths has been difficult to demonstrate.
Mass treatment for hookworm in the American south at theturn of 20th century was associated with greater school enrol-ment, attendance and literacy and long-term gain in income.9
Further, in 2004, Miguel and Kremmer published a highly influ-ential report showing an association between school-basedMDA and reduced school absenteeism among Kenyan chil-dren.10 Ten years later, these children who were dewormed atschool had more years of school enrolment, more time inemployment and longer work hours each week.11 However,recent reanalyses of the original data have highlighted the chal-lenges of evaluating such interventions.12,13
A large cluster-randomised trial in India with one million pre-school children showed little effect of regular deworming onmortality in pre-school children.14 A Cochrane review15 con-cluded that treating children known to have STH may improveweight gain but evidence of benefits on haemoglobin, schoolattendance and cognitive function is limited; also that commu-nity based treatment programmes had little or no effect onthese outcomes. Similarly, a systematic review found the evi-dence insufficient to link helminths to cognitive performance16
and a further meta-analysis concluded that mass deworming ofchildren had little or no effect on weight, height, cognition,school attendance or mortality.17
WHO recommends anthelminthic treatment during preg-nancy, hoping that it will reduce maternal anaemia, increasebirth weight and reduce mortality. The benefits are not yetclear.18 We, and others, have found limited overall effects19 ofanthelminthic use during pregnancy on maternal anaemia, andnone on birth weight, perinatal mortality or congenital abnor-malities.20–23 Anthelminthic treatment during pregnancy did notaffect infectious disease incidence or response to immunisa-tion.24,25 A Cochrane review notes that evidence is insufficientto recommend use of anthelminthic medication for pregnantwomen in the first trimester and administration of a single doseanthelminthic was not associated with any impact on maternalanaemia.26
There has been debate on the policy of MDA27 and system-atic review methodology has been questioned in its applicationto helminths.28,29 However, it brings to light the need for moreevidence to support MDA and to understand fully its benefits.
How do worms manipulate us?The age-old colonisation of mammals by helminths has beensuccessful mainly because of the latter’s shrewd manipulationof host systems (Figure 1).
Helminths employ enzymes and other excretory/secretoryproteins to disrupt and alter host tissues, thus successfullymigrating, feeding, establishing niches and developing strategiesto exit the host to complete their life-cycles. For example,Schistosoma cercariae contain proteases that aid in skin pene-tration30 while the major excretory/secretory protein of Trichuristrichiura induces pore formation to facilitate helminth entrench-ment in the gut.31
Loss of mucosal and epithelial integrity as helminths take rootin the host is often accompanied by release of inflammatorymediators, such as alarmins and damage associated molecularpatterns,32 normally detrimental to the helminth and its host.However, helminth excretory/secretory products also work to off-set this. For example, secreted products of Heligmosomoidespolygyrus block production of the alarmin IL-33, a key inducer ofTh2-type inflammation.33 Besides, to curb host morbidity fromhelminth-inflicted tissue injury, helminth-induced mediatorsspearhead tissue healing and remodelling.34
But perhaps the helminth’s most potent survival weapon isthe wide array of mechanisms developed to evade or regulate avigilant host immune system. At the helm are helminth-inducedTh2-type and regulatory immune responses. Helminth-inducedTh2 cytokines interleukin (IL)-4 and IL-13 promote alternativeactivation of macrophages, resulting in production of largeamounts of immunomodulatory IL-10 and transforming growthfactor (TGF)-β,35 and T cell hypo-responsiveness involving regula-tory T cells.36 Helminth-induced, IL-10-producing ‘regulatory Bcells’ have also been demonstrated.37 A notable consequenceof helminth-induced immunomodulation is the attenuation ofresponses to ‘bystander’ antigens,38 widely implicated in thehelminth-associated modulation of immune responses to anumber of non-communicable and communicable diseases.
Helminth-allergy interactions are a good example of thebystander effect. Although antigenic targets for allergen- andhelminth-specific immune responses are similar,39 helminthinfections seem to be protective against allergy-related condi-tions in both humans and mice. Current evidence32,40 points toan extensive array of immunomodulatory mechanisms under-lying inverse helminth-allergy associations. They range frominduction of IL-10-producing regulatory T cells, regulatory B cellsand alternatively activated antigen presenting cells, promotionof polyclonal IgE synthesis and immunoglobulin class switchingto IgG4, to suppression of release of alarmins (such as IL-33)and inhibition of type 2 innate lymphoid cell activity.
Host metabolic responses may also be influenced byhelminth infections. For example, S. mansoni egg antigen-treated obese mice have increased levels of white adiposetissue Th2-type cells, modified macrophage activation andreduced adipose tissue mass and improved insulin sensitiv-ity.41 Non-obese diabetic mice infected with H. polygyrus andTrichinella spiralis are protected against type-1 diabetesthrough the Th2-associated reduction of inflammatory auto-immune responses.42 There is also recent evidence in humansand mice that helminths may protect against inflammatory
R. E. Sanya et al.
4 300
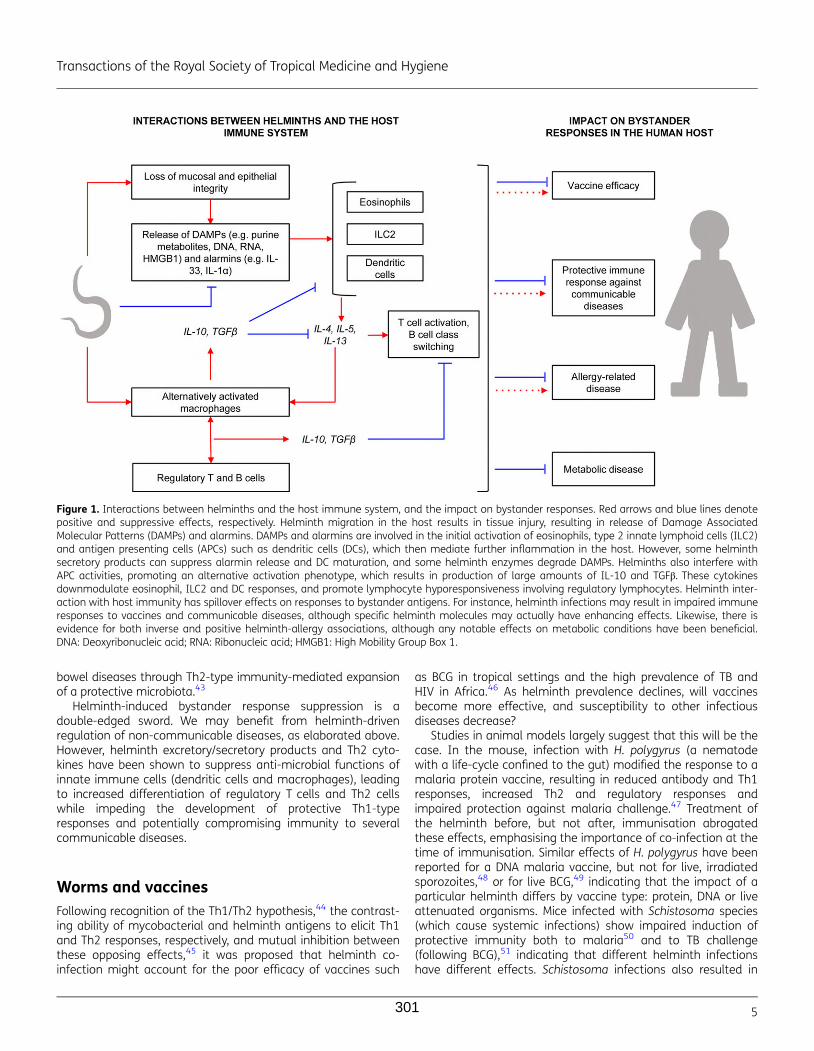
bowel diseases through Th2-type immunity-mediated expansionof a protective microbiota.43
Helminth-induced bystander response suppression is adouble-edged sword. We may benefit from helminth-drivenregulation of non-communicable diseases, as elaborated above.However, helminth excretory/secretory products and Th2 cyto-kines have been shown to suppress anti-microbial functions ofinnate immune cells (dendritic cells and macrophages), leadingto increased differentiation of regulatory T cells and Th2 cellswhile impeding the development of protective Th1-typeresponses and potentially compromising immunity to severalcommunicable diseases.
Worms and vaccinesFollowing recognition of the Th1/Th2 hypothesis,44 the contrast-ing ability of mycobacterial and helminth antigens to elicit Th1and Th2 responses, respectively, and mutual inhibition betweenthese opposing effects,45 it was proposed that helminth co-infection might account for the poor efficacy of vaccines such
as BCG in tropical settings and the high prevalence of TB andHIV in Africa.46 As helminth prevalence declines, will vaccinesbecome more effective, and susceptibility to other infectiousdiseases decrease?
Studies in animal models largely suggest that this will be thecase. In the mouse, infection with H. polygyrus (a nematodewith a life-cycle confined to the gut) modified the response to amalaria protein vaccine, resulting in reduced antibody and Th1responses, increased Th2 and regulatory responses andimpaired protection against malaria challenge.47 Treatment ofthe helminth before, but not after, immunisation abrogatedthese effects, emphasising the importance of co-infection at thetime of immunisation. Similar effects of H. polygyrus have beenreported for a DNA malaria vaccine, but not for live, irradiatedsporozoites,48 or for live BCG,49 indicating that the impact of aparticular helminth differs by vaccine type: protein, DNA or liveattenuated organisms. Mice infected with Schistosoma species(which cause systemic infections) show impaired induction ofprotective immunity both to malaria50 and to TB challenge(following BCG),51 indicating that different helminth infectionshave different effects. Schistosoma infections also resulted in
Figure 1. Interactions between helminths and the host immune system, and the impact on bystander responses. Red arrows and blue lines denotepositive and suppressive effects, respectively. Helminth migration in the host results in tissue injury, resulting in release of Damage AssociatedMolecular Patterns (DAMPs) and alarmins. DAMPs and alarmins are involved in the initial activation of eosinophils, type 2 innate lymphoid cells (ILC2)and antigen presenting cells (APCs) such as dendritic cells (DCs), which then mediate further inflammation in the host. However, some helminthsecretory products can suppress alarmin release and DC maturation, and some helminth enzymes degrade DAMPs. Helminths also interfere withAPC activities, promoting an alternative activation phenotype, which results in production of large amounts of IL-10 and TGFβ. These cytokinesdownmodulate eosinophil, ILC2 and DC responses, and promote lymphocyte hyporesponsiveness involving regulatory lymphocytes. Helminth inter-action with host immunity has spillover effects on responses to bystander antigens. For instance, helminth infections may result in impaired immuneresponses to vaccines and communicable diseases, although specific helminth molecules may actually have enhancing effects. Likewise, there isevidence for both inverse and positive helminth-allergy associations, although any notable effects on metabolic conditions have been beneficial.DNA: Deoxyribonucleic acid; RNA: Ribonucleic acid; HMGB1: High Mobility Group Box 1.
Transactions of the Royal Society of Tropical Medicine and Hygiene
5301
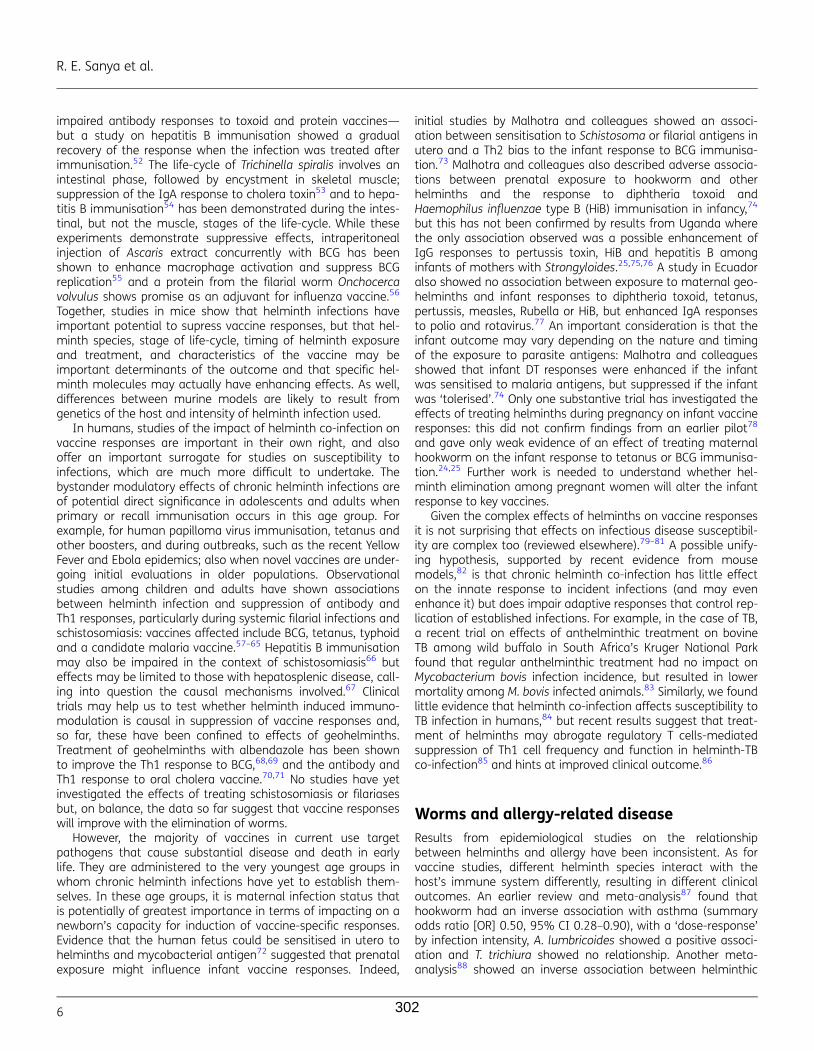
impaired antibody responses to toxoid and protein vaccines—but a study on hepatitis B immunisation showed a gradualrecovery of the response when the infection was treated afterimmunisation.52 The life-cycle of Trichinella spiralis involves anintestinal phase, followed by encystment in skeletal muscle;suppression of the IgA response to cholera toxin53 and to hepa-titis B immunisation54 has been demonstrated during the intes-tinal, but not the muscle, stages of the life-cycle. While theseexperiments demonstrate suppressive effects, intraperitonealinjection of Ascaris extract concurrently with BCG has beenshown to enhance macrophage activation and suppress BCGreplication55 and a protein from the filarial worm Onchocercavolvulus shows promise as an adjuvant for influenza vaccine.56
Together, studies in mice show that helminth infections haveimportant potential to supress vaccine responses, but that hel-minth species, stage of life-cycle, timing of helminth exposureand treatment, and characteristics of the vaccine may beimportant determinants of the outcome and that specific hel-minth molecules may actually have enhancing effects. As well,differences between murine models are likely to result fromgenetics of the host and intensity of helminth infection used.
In humans, studies of the impact of helminth co-infection onvaccine responses are important in their own right, and alsooffer an important surrogate for studies on susceptibility toinfections, which are much more difficult to undertake. Thebystander modulatory effects of chronic helminth infections areof potential direct significance in adolescents and adults whenprimary or recall immunisation occurs in this age group. Forexample, for human papilloma virus immunisation, tetanus andother boosters, and during outbreaks, such as the recent YellowFever and Ebola epidemics; also when novel vaccines are under-going initial evaluations in older populations. Observationalstudies among children and adults have shown associationsbetween helminth infection and suppression of antibody andTh1 responses, particularly during systemic filarial infections andschistosomiasis: vaccines affected include BCG, tetanus, typhoidand a candidate malaria vaccine.57–65 Hepatitis B immunisationmay also be impaired in the context of schistosomiasis66 buteffects may be limited to those with hepatosplenic disease, call-ing into question the causal mechanisms involved.67 Clinicaltrials may help us to test whether helminth induced immuno-modulation is causal in suppression of vaccine responses and,so far, these have been confined to effects of geohelminths.Treatment of geohelminths with albendazole has been shownto improve the Th1 response to BCG,68,69 and the antibody andTh1 response to oral cholera vaccine.70,71 No studies have yetinvestigated the effects of treating schistosomiasis or filariasesbut, on balance, the data so far suggest that vaccine responseswill improve with the elimination of worms.
However, the majority of vaccines in current use targetpathogens that cause substantial disease and death in earlylife. They are administered to the very youngest age groups inwhom chronic helminth infections have yet to establish them-selves. In these age groups, it is maternal infection status thatis potentially of greatest importance in terms of impacting on anewborn’s capacity for induction of vaccine-specific responses.Evidence that the human fetus could be sensitised in utero tohelminths and mycobacterial antigen72 suggested that prenatalexposure might influence infant vaccine responses. Indeed,
initial studies by Malhotra and colleagues showed an associ-ation between sensitisation to Schistosoma or filarial antigens inutero and a Th2 bias to the infant response to BCG immunisa-tion.73 Malhotra and colleagues also described adverse associa-tions between prenatal exposure to hookworm and otherhelminths and the response to diphtheria toxoid andHaemophilus influenzae type B (HiB) immunisation in infancy,74
but this has not been confirmed by results from Uganda wherethe only association observed was a possible enhancement ofIgG responses to pertussis toxin, HiB and hepatitis B amonginfants of mothers with Strongyloides.25,75,76 A study in Ecuadoralso showed no association between exposure to maternal geo-helminths and infant responses to diphtheria toxoid, tetanus,pertussis, measles, Rubella or HiB, but enhanced IgA responsesto polio and rotavirus.77 An important consideration is that theinfant outcome may vary depending on the nature and timingof the exposure to parasite antigens: Malhotra and colleaguesshowed that infant DT responses were enhanced if the infantwas sensitised to malaria antigens, but suppressed if the infantwas ‘tolerised’.74 Only one substantive trial has investigated theeffects of treating helminths during pregnancy on infant vaccineresponses: this did not confirm findings from an earlier pilot78
and gave only weak evidence of an effect of treating maternalhookworm on the infant response to tetanus or BCG immunisa-tion.24,25 Further work is needed to understand whether hel-minth elimination among pregnant women will alter the infantresponse to key vaccines.
Given the complex effects of helminths on vaccine responsesit is not surprising that effects on infectious disease susceptibil-ity are complex too (reviewed elsewhere).79–81 A possible unify-ing hypothesis, supported by recent evidence from mousemodels,82 is that chronic helminth co-infection has little effecton the innate response to incident infections (and may evenenhance it) but does impair adaptive responses that control rep-lication of established infections. For example, in the case of TB,a recent trial on effects of anthelminthic treatment on bovineTB among wild buffalo in South Africa’s Kruger National Parkfound that regular anthelminthic treatment had no impact onMycobacterium bovis infection incidence, but resulted in lowermortality among M. bovis infected animals.83 Similarly, we foundlittle evidence that helminth co-infection affects susceptibility toTB infection in humans,84 but recent results suggest that treat-ment of helminths may abrogate regulatory T cells-mediatedsuppression of Th1 cell frequency and function in helminth-TBco-infection85 and hints at improved clinical outcome.86
Worms and allergy-related diseaseResults from epidemiological studies on the relationshipbetween helminths and allergy have been inconsistent. As forvaccine studies, different helminth species interact with thehost’s immune system differently, resulting in different clinicaloutcomes. An earlier review and meta-analysis87 found thathookworm had an inverse association with asthma (summaryodds ratio [OR] 0.50, 95% CI 0.28–0.90), with a ‘dose-response’by infection intensity, A. lumbricoides showed a positive associ-ation and T. trichiura showed no relationship. Another meta-analysis88 showed an inverse association between helminthic
R. E. Sanya et al.
6 302
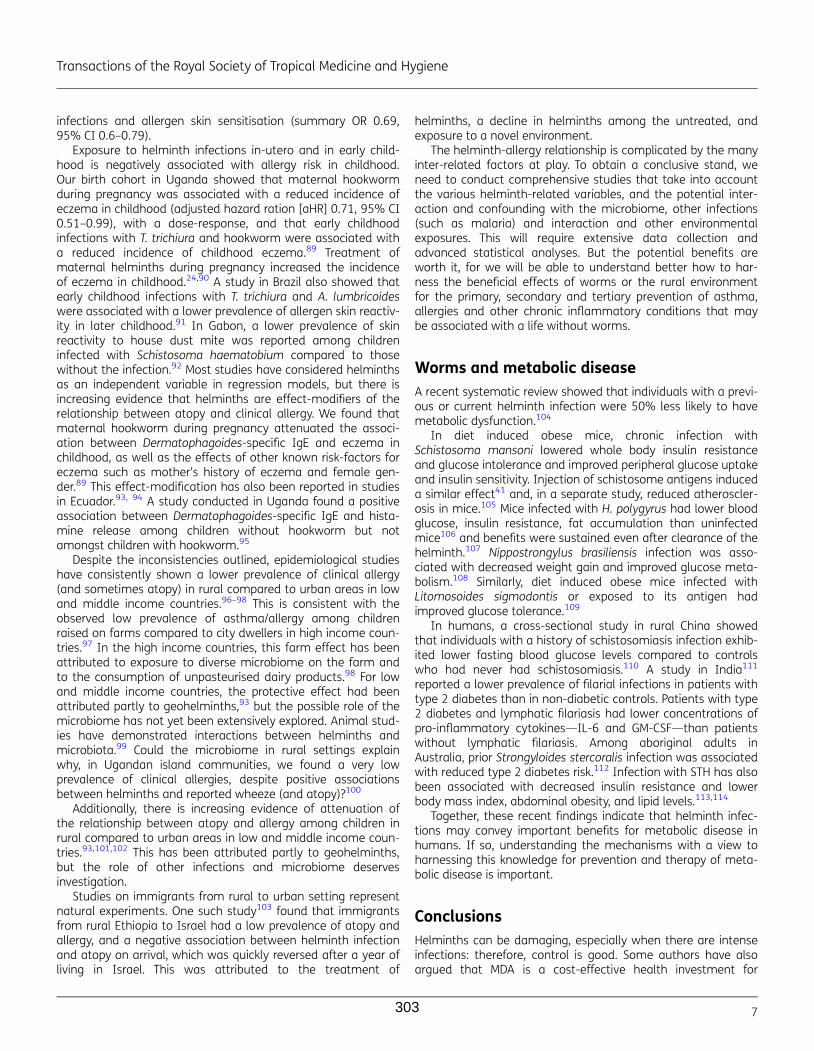
infections and allergen skin sensitisation (summary OR 0.69,95% CI 0.6–0.79).
Exposure to helminth infections in-utero and in early child-hood is negatively associated with allergy risk in childhood.Our birth cohort in Uganda showed that maternal hookwormduring pregnancy was associated with a reduced incidence ofeczema in childhood (adjusted hazard ration [aHR] 0.71, 95% CI0.51–0.99), with a dose-response, and that early childhoodinfections with T. trichiura and hookworm were associated witha reduced incidence of childhood eczema.89 Treatment ofmaternal helminths during pregnancy increased the incidenceof eczema in childhood.24,90 A study in Brazil also showed thatearly childhood infections with T. trichiura and A. lumbricoideswere associated with a lower prevalence of allergen skin reactiv-ity in later childhood.91 In Gabon, a lower prevalence of skinreactivity to house dust mite was reported among childreninfected with Schistosoma haematobium compared to thosewithout the infection.92 Most studies have considered helminthsas an independent variable in regression models, but there isincreasing evidence that helminths are effect-modifiers of therelationship between atopy and clinical allergy. We found thatmaternal hookworm during pregnancy attenuated the associ-ation between Dermatophagoides-specific IgE and eczema inchildhood, as well as the effects of other known risk-factors foreczema such as mother’s history of eczema and female gen-der.89 This effect-modification has also been reported in studiesin Ecuador.93, 94 A study conducted in Uganda found a positiveassociation between Dermatophagoides-specific IgE and hista-mine release among children without hookworm but notamongst children with hookworm.95
Despite the inconsistencies outlined, epidemiological studieshave consistently shown a lower prevalence of clinical allergy(and sometimes atopy) in rural compared to urban areas in lowand middle income countries.96–98 This is consistent with theobserved low prevalence of asthma/allergy among childrenraised on farms compared to city dwellers in high income coun-tries.97 In the high income countries, this farm effect has beenattributed to exposure to diverse microbiome on the farm andto the consumption of unpasteurised dairy products.98 For lowand middle income countries, the protective effect had beenattributed partly to geohelminths,93 but the possible role of themicrobiome has not yet been extensively explored. Animal stud-ies have demonstrated interactions between helminths andmicrobiota.99 Could the microbiome in rural settings explainwhy, in Ugandan island communities, we found a very lowprevalence of clinical allergies, despite positive associationsbetween helminths and reported wheeze (and atopy)?100
Additionally, there is increasing evidence of attenuation ofthe relationship between atopy and allergy among children inrural compared to urban areas in low and middle income coun-tries.93,101,102 This has been attributed partly to geohelminths,but the role of other infections and microbiome deservesinvestigation.
Studies on immigrants from rural to urban setting representnatural experiments. One such study103 found that immigrantsfrom rural Ethiopia to Israel had a low prevalence of atopy andallergy, and a negative association between helminth infectionand atopy on arrival, which was quickly reversed after a year ofliving in Israel. This was attributed to the treatment of
helminths, a decline in helminths among the untreated, andexposure to a novel environment.
The helminth-allergy relationship is complicated by the manyinter-related factors at play. To obtain a conclusive stand, weneed to conduct comprehensive studies that take into accountthe various helminth-related variables, and the potential inter-action and confounding with the microbiome, other infections(such as malaria) and interaction and other environmentalexposures. This will require extensive data collection andadvanced statistical analyses. But the potential benefits areworth it, for we will be able to understand better how to har-ness the beneficial effects of worms or the rural environmentfor the primary, secondary and tertiary prevention of asthma,allergies and other chronic inflammatory conditions that maybe associated with a life without worms.
Worms and metabolic diseaseA recent systematic review showed that individuals with a previ-ous or current helminth infection were 50% less likely to havemetabolic dysfunction.104
In diet induced obese mice, chronic infection withSchistosoma mansoni lowered whole body insulin resistanceand glucose intolerance and improved peripheral glucose uptakeand insulin sensitivity. Injection of schistosome antigens induceda similar effect41 and, in a separate study, reduced atheroscler-osis in mice.105 Mice infected with H. polygyrus had lower bloodglucose, insulin resistance, fat accumulation than uninfectedmice106 and benefits were sustained even after clearance of thehelminth.107 Nippostrongylus brasiliensis infection was asso-ciated with decreased weight gain and improved glucose meta-bolism.108 Similarly, diet induced obese mice infected withLitomosoides sigmodontis or exposed to its antigen hadimproved glucose tolerance.109
In humans, a cross-sectional study in rural China showedthat individuals with a history of schistosomiasis infection exhib-ited lower fasting blood glucose levels compared to controlswho had never had schistosomiasis.110 A study in India111
reported a lower prevalence of filarial infections in patients withtype 2 diabetes than in non-diabetic controls. Patients with type2 diabetes and lymphatic filariasis had lower concentrations ofpro-inflammatory cytokines—IL-6 and GM-CSF—than patientswithout lymphatic filariasis. Among aboriginal adults inAustralia, prior Strongyloides stercoralis infection was associatedwith reduced type 2 diabetes risk.112 Infection with STH has alsobeen associated with decreased insulin resistance and lowerbody mass index, abdominal obesity, and lipid levels.113,114
Together, these recent findings indicate that helminth infec-tions may convey important benefits for metabolic disease inhumans. If so, understanding the mechanisms with a view toharnessing this knowledge for prevention and therapy of meta-bolic disease is important.
ConclusionsHelminths can be damaging, especially when there are intenseinfections: therefore, control is good. Some authors have alsoargued that MDA is a cost-effective health investment for
Transactions of the Royal Society of Tropical Medicine and Hygiene
7303
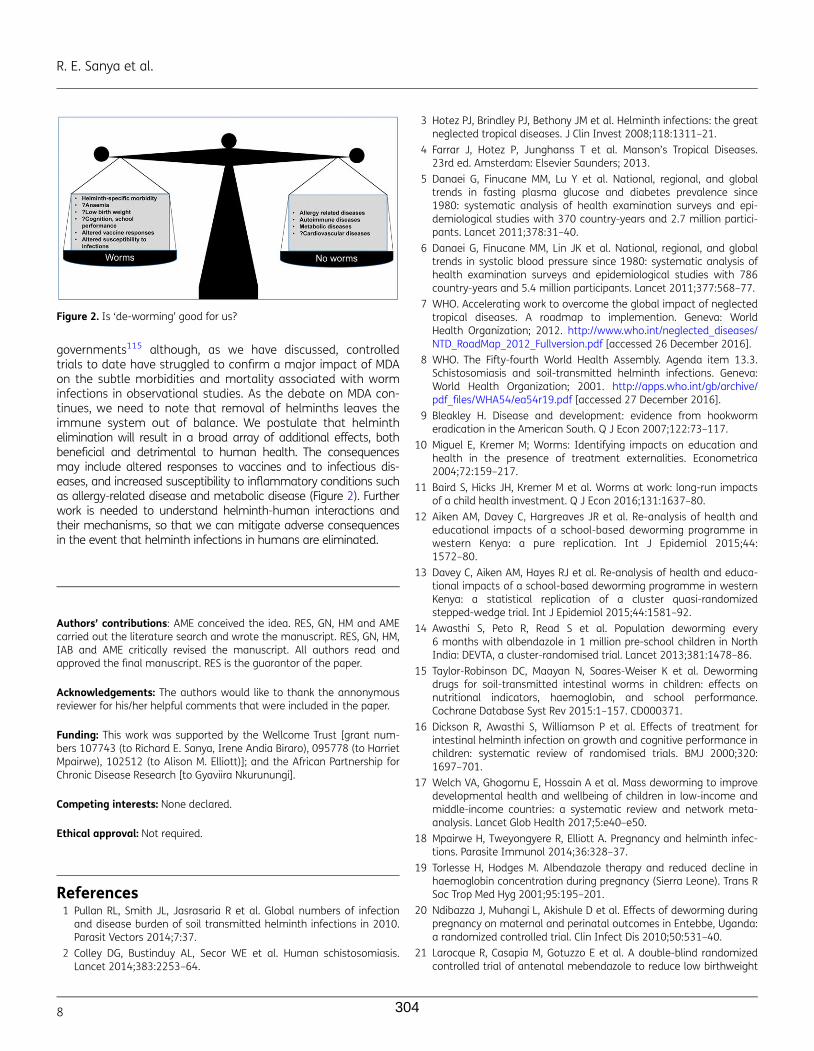
governments115 although, as we have discussed, controlledtrials to date have struggled to confirm a major impact of MDAon the subtle morbidities and mortality associated with worminfections in observational studies. As the debate on MDA con-tinues, we need to note that removal of helminths leaves theimmune system out of balance. We postulate that helminthelimination will result in a broad array of additional effects, bothbeneficial and detrimental to human health. The consequencesmay include altered responses to vaccines and to infectious dis-eases, and increased susceptibility to inflammatory conditions suchas allergy-related disease and metabolic disease (Figure 2). Furtherwork is needed to understand helminth-human interactions andtheir mechanisms, so that we can mitigate adverse consequencesin the event that helminth infections in humans are eliminated.
Authors’ contributions: AME conceived the idea. RES, GN, HM and AMEcarried out the literature search and wrote the manuscript. RES, GN, HM,IAB and AME critically revised the manuscript. All authors read andapproved the final manuscript. RES is the guarantor of the paper.
Acknowledgements: The authors would like to thank the annonymousreviewer for his/her helpful comments that were included in the paper.
Funding: This work was supported by the Wellcome Trust [grant num-bers 107743 (to Richard E. Sanya, Irene Andia Biraro), 095778 (to HarrietMpairwe), 102512 (to Alison M. Elliott)]; and the African Partnership forChronic Disease Research [to Gyaviira Nkurunungi].
Competing interests: None declared.
Ethical approval: Not required.
References1 Pullan RL, Smith JL, Jasrasaria R et al. Global numbers of infection
and disease burden of soil transmitted helminth infections in 2010.Parasit Vectors 2014;7:37.
2 Colley DG, Bustinduy AL, Secor WE et al. Human schistosomiasis.Lancet 2014;383:2253–64.
3 Hotez PJ, Brindley PJ, Bethony JM et al. Helminth infections: the greatneglected tropical diseases. J Clin Invest 2008;118:1311–21.
4 Farrar J, Hotez P, Junghanss T et al. Manson’s Tropical Diseases.23rd ed. Amsterdam: Elsevier Saunders; 2013.
5 Danaei G, Finucane MM, Lu Y et al. National, regional, and globaltrends in fasting plasma glucose and diabetes prevalence since1980: systematic analysis of health examination surveys and epi-demiological studies with 370 country-years and 2.7 million partici-pants. Lancet 2011;378:31–40.
6 Danaei G, Finucane MM, Lin JK et al. National, regional, and globaltrends in systolic blood pressure since 1980: systematic analysis ofhealth examination surveys and epidemiological studies with 786country-years and 5.4 million participants. Lancet 2011;377:568–77.
7 WHO. Accelerating work to overcome the global impact of neglectedtropical diseases. A roadmap to implemention. Geneva: WorldHealth Organization; 2012. http://www.who.int/neglected_diseases/NTD_RoadMap_2012_Fullversion.pdf [accessed 26 December 2016].
8 WHO. The Fifty-fourth World Health Assembly. Agenda item 13.3.Schistosomiasis and soil-transmitted helminth infections. Geneva:World Health Organization; 2001. http://apps.who.int/gb/archive/pdf_files/WHA54/ea54r19.pdf [accessed 27 December 2016].
9 Bleakley H. Disease and development: evidence from hookwormeradication in the American South. Q J Econ 2007;122:73–117.
10 Miguel E, Kremer M; Worms: Identifying impacts on education andhealth in the presence of treatment externalities. Econometrica2004;72:159–217.
11 Baird S, Hicks JH, Kremer M et al. Worms at work: long-run impactsof a child health investment. Q J Econ 2016;131:1637–80.
12 Aiken AM, Davey C, Hargreaves JR et al. Re-analysis of health andeducational impacts of a school-based deworming programme inwestern Kenya: a pure replication. Int J Epidemiol 2015;44:1572–80.
13 Davey C, Aiken AM, Hayes RJ et al. Re-analysis of health and educa-tional impacts of a school-based deworming programme in westernKenya: a statistical replication of a cluster quasi-randomizedstepped-wedge trial. Int J Epidemiol 2015;44:1581–92.
14 Awasthi S, Peto R, Read S et al. Population deworming every6 months with albendazole in 1 million pre-school children in NorthIndia: DEVTA, a cluster-randomised trial. Lancet 2013;381:1478–86.
15 Taylor-Robinson DC, Maayan N, Soares-Weiser K et al. Dewormingdrugs for soil-transmitted intestinal worms in children: effects onnutritional indicators, haemoglobin, and school performance.Cochrane Database Syst Rev 2015:1–157. CD000371.
16 Dickson R, Awasthi S, Williamson P et al. Effects of treatment forintestinal helminth infection on growth and cognitive performance inchildren: systematic review of randomised trials. BMJ 2000;320:1697–701.
17 Welch VA, Ghogomu E, Hossain A et al. Mass deworming to improvedevelopmental health and wellbeing of children in low-income andmiddle-income countries: a systematic review and network meta-analysis. Lancet Glob Health 2017;5:e40–e50.
18 Mpairwe H, Tweyongyere R, Elliott A. Pregnancy and helminth infec-tions. Parasite Immunol 2014;36:328–37.
19 Torlesse H, Hodges M. Albendazole therapy and reduced decline inhaemoglobin concentration during pregnancy (Sierra Leone). Trans RSoc Trop Med Hyg 2001;95:195–201.
20 Ndibazza J, Muhangi L, Akishule D et al. Effects of deworming duringpregnancy on maternal and perinatal outcomes in Entebbe, Uganda:a randomized controlled trial. Clin Infect Dis 2010;50:531–40.
21 Larocque R, Casapia M, Gotuzzo E et al. A double-blind randomizedcontrolled trial of antenatal mebendazole to reduce low birthweight
Figure 2. Is ‘de-worming’ good for us?
R. E. Sanya et al.
8 304
in a hookworm-endemic area of Peru. Trop Med Int Health 2006;11:1485–95.
22 Gyorkos TW, Larocque R, Casapia M et al. Lack of risk of adverse birthoutcomes after deworming in pregnant women. Pediatr Infect Dis J2006;25:791–4.
23 Olveda RM, Acosta LP, Tallo V et al. Efficacy and safety of praziquan-tel for the treatment of human schistosomiasis during pregnancy: aphase 2, randomised, double-blind, placebo-controlled trial. LancetInfect Dis 2016;16:199–208.
24 Webb EL, Mawa PA, Ndibazza J et al. Effect of single-dose anthelmin-tic treatment during pregnancy on an infant’s response to immun-isation and on susceptibility to infectious diseases in infancy: arandomised, double-blind, placebo-controlled trial. Lancet 2011;377:52–62.
25 Nash S, Mentzer AJ, Lule SA et al. The impact of prenatal exposure toparasitic infections and to anthelminthic treatment on antibodyresponses to routine immunisations given in infancy: secondary ana-lysis of a randomised controlled trial. PLoS Negl Trop Dis 2017;11:e0005213.
26 Salam RA, Haider BA, Humayun Q et al. Effect of administration ofantihelminthics for soil-transmitted helminths during pregnancy.Cochrane Database Syst Rev 2015:1–32. CD005547.
27 Allen T, Parker M. Deworming delusions? Mass drug administration inEast African schools. J Biosoc Sci 2016;48(Suppl 1):S116–47.
28 Bundy DA, Kremer M, Bleakley H et al. Deworming and development:asking the right questions, asking the questions right. PLoS Negl TropDis 2009;3:e362.
29 Campbell SJ, Nery SV, Doi SA et al. Complexities and perplexities: acritical appraisal of the evidence for soil-transmitted helminthinfection-related morbidity. PLoS Negl Trop Dis 2016;10:e0004566.
30 Ingram J, Knudsen G, Lim KC et al. Proteomic analysis of human skintreated with larval schistosome peptidases reveals distinct invasionstrategies among species of blood flukes. PLoS Negl Trop Dis 2011;5:e1337.
31 Drake L, Korchev Y, Bashford L et al. The major secreted product ofthe whipworm, Trichuris, is a pore-forming protein. Proc Biol Sci1994;257:255–61.
32 Maizels RM, McSorley HJ, Smyth DJ. Helminths in the hygiene hypoth-esis: sooner or later? Clin Exp Immunol 2014;177:38–46.
33 McSorley HJ, Blair NF, Smith KA et al. Blockade of IL-33 release and sup-pression of type 2 innate lymphoid cell responses by helminth secretedproducts in airway allergy. Mucosal Immunol 2014;7:1068–78.
34 Allen JE, Sutherland TE. Host protective roles of type 2 immunity:parasite killing and tissue repair, flip sides of the same coin. SeminImmunol 2014;26:329–40.
35 Mosser DM, Edwards JP. Exploring the full spectrum of macrophageactivation. Nat Rev Immunol 2008;8:958–69.
36 Taylor MD, van der Werf N, Maizels RM. T cells in helminth infection:the regulators and the regulated. Trends Immunol 2012;33:181–9.
37 Mangan NE, Fallon RE, Smith P et al. Helminth infection protectsmice from anaphylaxis via IL-10-producing B cells. J Immunol 2004;173:6346–56.
38 Wammes LJ, Hamid F, Wiria AE et al. Regulatory T cells in humangeohelminth infection suppress immune responses to BCG andPlasmodium falciparum. Eur J Immunol 2010;40:437–42.
39 Tyagi N, Farnell EJ, Fitzsimmons CM et al. Comparisons of allergenicand Metazoan parasite proteins: allergy the price of immunity. PLoSComput Biol 2015;11(10):e1004546.
40 Hamid F, Amoah AS, van Ree R et al. Helminth-induced IgE and pro-tection against allergic disorders. Curr Top Microbiol Immunol 2015;388:91–108.
41 Hussaarts L, Garcia-Tardon N, van Beek L et al. Chronic helminthinfection and helminth-derived egg antigens promote adipose tissueM2 macrophages and improve insulin sensitivity in obese mice.FASEB J 2015;29:3027–39.
42 Saunders KA, Raine T, Cooke A et al. Inhibition of autoimmune type 1diabetes by gastrointestinal helminth infection. Infect Immun 2007;75:397–407.
43 Ramanan D, Bowcutt R, Lee SC et al. Helminth infection promotescolonization resistance via type 2 immunity. Science 2016;352:608–12.
44 Mosmann TR, Cherwinski H, Bond MW et al. Two types of murinehelper T cell clone. I. Definition according to profiles of lymphokineactivities and secreted proteins. J Immunol 1986;136:2348–57.
45 Del Prete GF, De Carli M, Mastromauro C et al. Purified protein deriva-tive of Mycobacterium tuberculosis and excretory-secretory antigen(s)of Toxocara canis expand in vitro human T cells with stable and oppos-ite (type 1 T helper or type 2 T helper) profile of cytokine production.J Clin Invest 1991;88:346–50.
46 Bentwich Z, Kalinkovich A, Weisman Z et al. Can eradication of hel-minthic infections change the face of AIDS and tuberculosis?Immunol Today 1999;20:485–7.
47 Su Z, Segura M, Stevenson MM. Reduced protective efficacy of ablood-stage malaria vaccine by concurrent nematode infection.Infect Immun 2006;74:2138–44.
48 Noland GS, Chowdhury DR, Urban JF Jr et al. Helminth infectionimpairs the immunogenicity of a Plasmodium falciparum DNA vac-cine, but not irradiated sporozoites, in mice. Vaccine 2010;28:2917–23.
49 Rafi W, Bhatt K, Gause WC et al. Neither primary nor memoryimmunity to Mycobacterium tuberculosis infection is compromised inmice with chronic enteric helminth infection. Infect Immun 2015;83:1217–23.
50 Laranjeiras RF, Brant LC, Lima AC et al. Reduced protective effect ofPlasmodium berghei immunization by concurrent Schistosoma man-soni infection. Mem Inst Oswaldo Cruz 2008;103:674–7.
51 Elias D, Akuffo H, Pawlowski A et al. Schistosoma mansoni infectionreduces the protective efficacy of BCG vaccination against virulentMycobacterium tuberculosis. Vaccine 2005;23:1326–34.
52 Chen L, Liu WQ, Lei JH et al. Chronic Schistosoma japonicum infectionreduces immune response to vaccine against hepatitis B in mice.PLoS One 2012;7:e51512.
53 Ljungstrom I, Holmgren J, Huldt G et al. Effect of experimentaltrichinosis on intestinal secretion and on local antibody forma-tion to cholera toxin. Scand J Infect Dis Suppl 1980;(Suppl 24):79–81.
54 Guan F, Hou X, Nie G et al. Effect of Trichinella spiralis infection onthe immune response to HBV vaccine in a mouse model. FoodbornePathog Dis 2013;10:882–7.
55 Ferreira AP, Aarestrup FM, Bonecini-Almeida MG et al. Effect of theinjection of an extract of Ascaris suum on macrophage activationduring the early phase of Mycobacterium bovis BCG infection inC57Bl/6 mice. Braz J Med Biol Res 1999;32:1429–36.
56 Jiang J, Fisher EM, Hensley SE et al. Antigen sparing and enhancedprotection using a novel rOv-ASP-1 adjuvant in aqueous formulationwith influenza vaccines. Vaccine 2014;32:2696–702.
57 Kilian HD, Nielsen G. Cell-mediated and humoral immune responseto tetanus vaccinations in onchocerciasis patients. Trop MedParasitol 1989;40:285–91.
58 Kilian HD, Nielsen G. Cell-mediated and humoral immune responsesto BCG and rubella vaccinations and to recall antigens in onchocer-ciasis patients. Trop Med Parasitol 1989;40:445–53.
Transactions of the Royal Society of Tropical Medicine and Hygiene
9305
59 Sabin EA, Araujo MI, Carvalho EM et al. Impairment of tetanustoxoid-specific Th1-like immune responses in humans infected withSchistosoma mansoni. J Infect Dis 1996;173:269–72.
60 Nookala S, Srinivasan S, Kaliraj P et al. Impairment of tetanus-specific cellular and humoral responses following tetanus vaccin-ation in human lymphatic filariasis. Infect Immun 2004;72:2598–604.
61 Prost A, Schlumberger M, Fayet MT. Response to tetanus immunizationin onchocerciasis patients. Ann Trop Med Parasitol 1983;77:83–5.
62 Grove DI, Forbes IJ. Immunosuppression in bancroftian filariasis.Trans R Soc Trop Med Hyg 1979;73:23–6.
63 Cooper PJ, Espinel I, Paredes W et al. Impaired tetanus-specific cellu-lar and humoral responses following tetanus vaccination in humanonchocerciasis: a possible role for interleukin-10. J Infect Dis 1998;178:1133–8.
64 Muniz-Junqueira MI, Tavares-Neto J, Prata A et al. Antibody responseto Salmonella typhi in human schistosomiasis mansoni. Rev Soc BrasMed Trop 1996;29:441–5.
65 Esen M, Mordmuller B, de Salazar PM et al. Reduced antibodyresponses against Plasmodium falciparum vaccine candidate anti-gens in the presence of Trichuris trichiura. Vaccine 2012;30:7621–4.
66 Ghaffar YA, Kamel M, Abdel Wahab MF et al. Hepatitis B vaccinationin children infected with Schistosoma mansoni: correlation with ultra-sonographic data. Am J Trop Med Hyg 1990;43:516–9.
67 Bassily S, Strickland GT, Abdel-Wahab MF et al. Efficacy of hepatitis Bvaccination in primary school children from a village endemic forSchistosoma mansoni. J Infect Dis 1992;166:265–8.
68 Elias D, Britton S, Aseffa A et al. Poor immunogenicity of BCG in hel-minth infected population is associated with increased in vitro TGF-beta production. Vaccine 2008;26:3897–902.
69 Elias D, Wolday D, Akuffo H et al. Effect of deworming on humanT cell responses to mycobacterial antigens in helminth-exposed indi-viduals before and after bacille Calmette-Guerin (BCG) vaccination.Clin Exp Immunol 2001;123:219–25.
70 Cooper PJ, Chico M, Sandoval C et al. Human infection with Ascarislumbricoides is associated with suppression of the interleukin-2response to recombinant cholera toxin B subunit following vaccin-ation with the live oral cholera vaccine CVD 103-HgR. Infect Immun2001;69:1574–80.
71 Cooper PJ, Chico ME, Losonsky G et al. Albendazole treatment of chil-dren with ascariasis enhances the vibriocidal antibody response tothe live attenuated oral cholera vaccine CVD 103-HgR. J Infect Dis2000;182:1199–206.
72 Malhotra I, Ouma J, Wamachi A et al. In utero exposure to helminthand mycobacterial antigens generates cytokine responses similar tothat observed in adults. J Clin Invest 1997;99:1759–66.
73 Malhotra I, Mungai P, Wamachi A et al. Helminth- and BacillusCalmette-Guerin-induced immunity in children sensitized in utero tofilariasis and schistosomiasis. J Immunol 1999;162:6843–8.
74 Malhotra I, McKibben M, Mungai P et al. Effect of antenatal parasiticinfections on anti-vaccine IgG levels in children: a prospective birthcohort study in Kenya. PLoS Negl Trop Dis 2015;9:e0003466.
75 Elliott AM, Mawa PA, Webb EL et al. Effects of maternal and infantco-infections, and of maternal immunisation, on the infant responseto BCG and tetanus immunisation. Vaccine 2010;29:247–55.
76 Kizito D, Tweyongyere R, Namatovu A et al. Factors affecting theinfant antibody response to measles immunisation in Entebbe-Uganda. BMC Public Health 2013;13:619.
77 Clark CE, Fay MP, Chico ME et al. Maternal helminth infection is asso-ciated with higher infant immunoglobulin A titers to antigen in orallyadministered vaccines. J Infect Dis 2016;213:1996–2004.
78 Elliott AM, Namujju PB, Mawa PA et al. A randomised controlled trialof the effects of albendazole in pregnancy on maternal responses tomycobacterial antigens and infant responses to Bacille Calmette-Guerin (BCG) immunisation [ISRCTN32849447]. BMC Infect Dis 2005;5:115.
79 Degarege A, Veledar E, Degarege D et al. Plasmodium falciparum andsoil-transmitted helminth co-infections among children in sub-Saharan Africa: a systematic review and meta-analysis. ParasitVectors 2016;9:344.
80 Salgame P, Yap GS, Gause WC. Effect of helminth-induced immunityon infections with microbial pathogens. Nat Immunol 2013;14:1118–26.
81 Means AR, Burns P, Sinclair D et al. Antihelminthics in helminth-endemic areas: effects on HIV disease progression. CochraneDatabase Syst Rev 2016;4:Cd006419.
82 Scheer S, Krempl C, Kallfass C et al. S. mansoni bolsters anti-viralimmunity in the murine respiratory tract. PLoS One 2014;9:e112469.
83 Ezenwa VO, Jolles AE. Epidemiology. Opposite effects of anthelmintictreatment on microbial infection at individual versus populationscales. Science 2015;347:175–7.
84 Biraro IA, Egesa M, Toulza F et al. Impact of co-infections and BCGimmunisation on immune responses among household contacts oftuberculosis patients in a Ugandan cohort. PLoS One 2014;9:e111517.
85 Toulza F, Tsang L, Ottenhoff TH et al. Mycobacterium tuberculosis-specific CD4+ T-cell response is increased, and Treg cells decreased,in anthelmintic-treated patients with latent TB. Eur J Immunol 2016;46(3):752–61.
86 Abate E, Elias D, Getachew A et al. Effects of albendazole on the clin-ical outcome and immunological responses in helminth co-infectedtuberculosis patients: a double blind randomised clinical trial. Int JParasitol 2015;45:133–40.
87 Leonardi-Bee J, Pritchard D, Britton J. Asthma and current intestinalparasite infection: systematic review and meta-analysis. Am J RespirCrit Care Med 2006;174:514–23.
88 Feary J, Britton J, Leonardi-Bee J. Atopy and current intestinal para-site infection: a systematic review and meta-analysis. Allergy 2011;66:569–78.
89 Mpairwe H, Ndibazza J, Webb EL et al. Maternal hookworm modifiesrisk factors for childhood eczema: results from a birth cohort inUganda. Pediatr Allergy Immunol 2014;25:481–8.
90 Ndibazza J, Mpairwe H, Webb EL et al. Impact of anthelminthic treat-ment in pregnancy and childhood on immunisations, infections andeczema in childhood: a randomised controlled trial. PLoS One 2012;7:e50325.
91 Rodrigues LC, Newcombe PJ, Cunha SS et al. Early infection withTrichuris trichiura and allergen skin test reactivity in later childhood.Clin Exp Allergy 2008;38:1769–77.
92 van den Biggelaar AH, van Ree R, Rodrigues LC et al. Decreased atopyin children infected with Schistosoma haematobium: a role forparasite-induced interleukin-10. Lancet 2000;356:1723–7.
93 Endara P, Vaca M, Platts-Mills TA et al. Effect of urban vs. rural resi-dence on the association between atopy and wheeze in LatinAmerica: findings from a case-control analysis. Clin Exp Allergy 2015;45:438–47.
94 Moncayo AL, Vaca M, Oviedo G et al. Effects of geohelminth infectionand age on the associations between allergen-specific IgE, skin testreactivity and wheeze: a case-control study. Clin Exp Allergy 2013;43:60–72.
95 Pinot de Moira A, Fitzsimmons CM, Jones FM et al. Suppression ofbasophil histamine release and other IgE-dependent responses in
R. E. Sanya et al.
10 306
childhood Schistosoma mansoni/hookworm coinfection. J Infect Dis2014;210:1198–206.
96 Hamid F, Wiria AE, Wammes LJ et al. Risk factors associated withthe development of atopic sensitization in Indonesia. PLoS One2013;8:e67064.
97 Scrivener S, Yemaneberhan H, Zebenigus M et al. Independenteffects of intestinal parasite infection and domestic allergen expos-ure on risk of wheeze in Ethiopia: a nested case-control study.Lancet 2001;358:1493–9.
98 von Mutius E, Vercelli D. Farm living: effects on childhood asthmaand allergy. Nat Rev Immunol 2010;10:861–8.
99 Zaiss MM, Rapin A, Lebon L et al. The intestinal microbiota contri-butes to the ability of helminths to modulate allergic inflammation.Immunity 2015;43:998–1010.
100 Webb EL, Nampijja M, Kaweesa J et al. Helminths are positivelyassociated with atopy and wheeze in Ugandan fishing communi-ties: results from a cross-sectional survey. Allergy 2016;71:1156–69
101 Hamid F, Wahyuni S, van Leeuwen A et al. Allergic disorders andsocio-economic status: a study of schoolchildren in an urban areaof Makassar, Indonesia. Clin Exp Allergy 2015;45:1226–36.
102 Obeng BB, Amoah AS, Larbi IA et al. Schistosome infection is nega-tively associated with mite atopy, but not wheeze and asthma inGhanaian schoolchildren. Clin Exp Allergy 2014;44:965–75.
103 Stein M, Greenberg Z, Boaz M et al. The role of helminth infectionand environment in the development of allergy: a prospective studyof newly-arrived Ethiopian immigrants in Israel. PLoS Negl Trop Dis2016;10:e0004208.
104 Tracey EF, McDermott RA, McDonald MI. Do worms protect againstthe metabolic syndrome? A systematic review and meta-analysis.Diabetes Res Clin Pract 2016;120:209–20.
105 Wolfs IM, Stoger JL, Goossens P et al. Reprogramming macro-phages to an anti-inflammatory phenotype by helminth antigensreduces murine atherosclerosis. FASEB J 2014;28:288–99.
106 Morimoto M, Azuma N, Kadowaki H et al. Regulation of type 2 dia-betes by helminth-induced Th2 immune response. J Vet Med Sci2017;78:1855–64.
107 Wu D, Molofsky AB, Liang HE et al. Eosinophils sustain adipose alter-natively activated macrophages associated with glucose homeo-stasis. Science 2011;332:243–7.
108 Yang Z, Grinchuk V, Smith A et al. Parasitic nematode-inducedmodulation of body weight and associated metabolic dysfunctionin mouse models of obesity. Infect Immun 2013;81:1905–14.
109 Berbudi A, Surendar J, Ajendra J et al. Filarial infection or antigenadministration improves glucose tolerance in diet-induced obesemice. J Innate Immun 2016;8:601–16.
110 Chen Y, Lu J, Huang Y et al. Association of previous schistosomeinfection with diabetes and metabolic syndrome: a cross-sectional study in rural China. J Clin Endocrinol Metab 2013;98:E283–7.
111 Aravindhan V, Mohan V, Surendar J et al. Decreased prevalence oflymphatic filariasis among diabetic subjects associated with adiminished pro-inflammatory cytokine response (CURES 83). PLoSNegl Trop Dis 2010;4:e707.
112 Hays R, Esterman A, Giacomin P et al. Does Strongyloides stercoralisinfection protect against type 2 diabetes in humans? Evidence fromAustralian Aboriginal adults. Diabetes Res Clin Pract 2015;107:355–61.
113 Wiria AE, Hamid F, Wammes LJ et al. Infection with soil-transmitted helminths is associated with increased insulin sensitiv-ity. PLoS One 2015;10:e0127746.
114 Wiria AE, Wammes LJ, Hamid F et al. Relationship between carotidintima media thickness and helminth infections on Flores Island,Indonesia. PLoS One 2013;8:e54855.
115 Hicks JH, Kremer M, Miguel E. The case for mass treatment of intes-tinal helminths in endemic areas. PLoS Negl Trop Dis 2015;9:e0004214.
Transactions of the Royal Society of Tropical Medicine and Hygiene
11307
9.2 APPENDIX 2: Research Paper 6: Helminths are positively associated with atopy and wheeze in Ugandan fishing communities: results from a cross-sectional survey
308
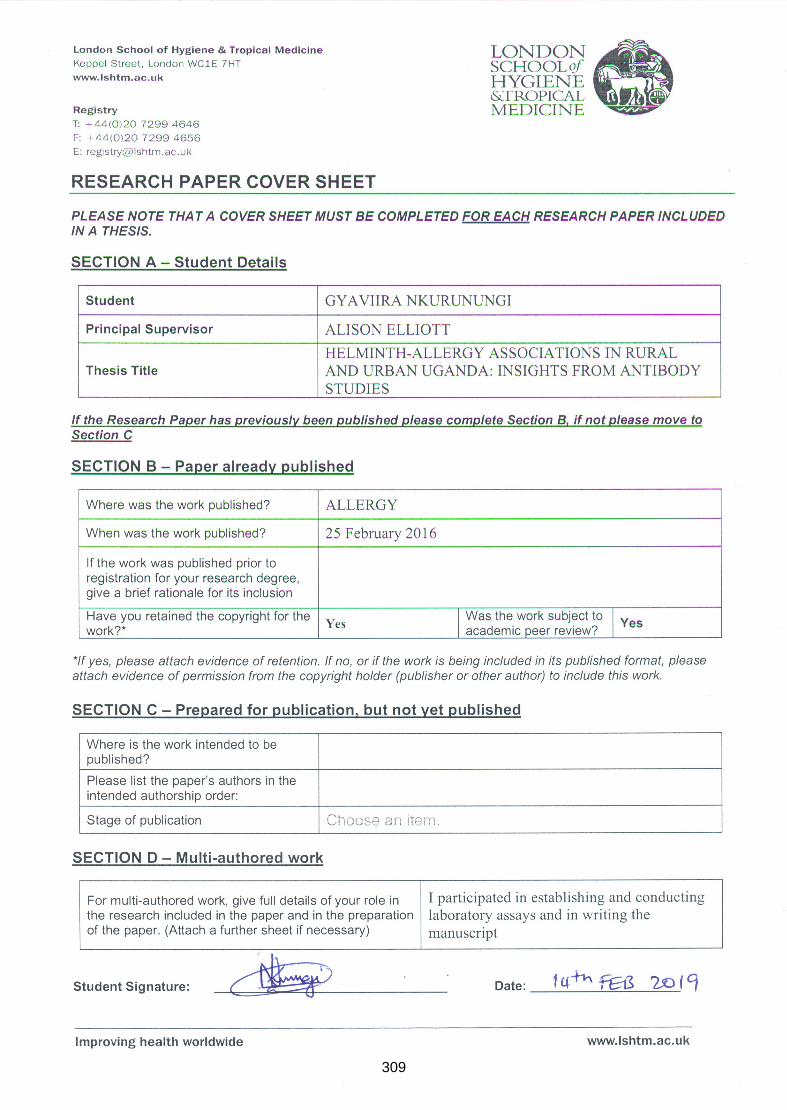
309
310
ORIGINAL ARTICLE EP IDEMIOLOGY AND GENETICS
Helminths are positively associated with atopy andwheeze in Ugandan fishing communities: results from across-sectional surveyE. L. Webb1,a, M. Nampijja2,a, J. Kaweesa3, R. Kizindo2, M. Namutebi2, E. Nakazibwe4, G. Oduru4,P. Kabubi2, J. Kabagenyi2, G. Nkurunungi2, D. Kizito2, L. Muhangi2, M. Akello2, J. J. Verweij5,B. Nerima2, E. Tukahebwa3 & A. M. Elliott1,2 for the LaVIISWA trial team*
1London School of Hygiene and Tropical Medicine, London, UK; 2MRC/UVRI Uganda Research Unit on AIDS, Entebbe; 3Vector Control
Division, Ministry of Health, Kampala; 4Entebbe Hospital, Entebbe, Uganda; 5Laboratory for Medical Microbiology and Immunology, St
Elisabeth Hospital, LC Tilburg, the Netherlands
To cite this article: Webb EL, Nampijja M, Kaweesa J, Kizindo R, Namutebi M, Nakazibwe E, Oduru G, Kabubi P, Kabagenyi J, Nkurunungi G, Kizito D, Muhangi
L, Akello M, Verweij JJ, Nerima B, Tukahebwa E, Elliott AM. Helminths are positively associated with atopy and wheeze in Ugandan fishing communities: results
from a cross-sectional survey. Allergy 2016; 71: 1156–1169.
Keywords
allergy; atopy; helminths; household survey;
wheeze.
Correspondence
Emily L Webb, London School of Hygiene
and Tropical Medicine, Keppel St, London
WC1E 7HT, UK.
Tel.: +44 207 9272012
Fax: +44 207 9272659
E-mail: [email protected]
*LaVIISWA trial team members are present
at the end of the article.
aAuthors contributed equally.
Accepted for publication 18 February 2016
DOI:10.1111/all.12867
Edited by: De Yun Wang
Abstract
Background: Parasitic helminths are potent immunomodulators and chronic infec-
tions may protect against allergy-related disease and atopy. We conducted a
cross-sectional survey to test the hypothesis that in heavily helminth-exposed
fishing villages on Lake Victoria, Uganda, helminth infections would be inversely
associated with allergy-related conditions.
Methods: A household survey was conducted as baseline to an anthelminthic inter-
vention trial. Outcomes were reported wheeze in last year, atopy assessed both by
skin prick test (SPT) and by the measurement of allergen-specific IgE to dust mites
and cockroach in plasma. Helminth infections were ascertained by stool, urine and
haemoparasitology. Associations were examined using multivariable regression.
Results: Two thousand three hundred and sixteen individuals were surveyed.
Prevalence of reported wheeze was 2% in under-fives and 5% in participants
≥5 years; 19% had a positive SPT; median Dermatophagoides-specific IgE and
cockroach-specific IgE were 1440 and 220 ng/ml, respectively. S. mansoni,
N. americanus, S. stercoralis, T. trichiura, M. perstans and A. lumbricoides preva-
lence was estimated as 51%, 22%, 12%, 10%, 2% and 1%, respectively. S. man-
soni was positively associated with Dermatophagoides-specific IgE [adjusted
geometric mean ratio (aGMR) (95% confidence interval) 1.64 (1.23, 2.18)]; T.
trichiura with SPT [adjusted odds ratio (aOR) 2.08 (1.38, 3.15)]; M. perstans with
cockroach-specific IgE [aGMR 2.37 (1.39, 4.06)], A. lumbricoides with wheeze in
participants ≥5 years [aOR 6.36 (1.10, 36.63)] and with Dermatophagoides-specific
IgE [aGMR 2.34 (1.11, 4.95)]. No inverse associations were observed.
Conclusions: Contrary to our hypothesis, we found little evidence of an inverse
relationship between helminths and allergy-related outcomes, but strong evidence
that individuals with certain helminths were more prone to atopy in this setting.
Allergy-related diseases increased dramatically in affluent and
middle-income countries during the twentieth century (1, 2):
asthma now affects about 300 million people (3), and eczema
5–20% of children (4). Although these conditions remain rel-
atively rare in low-income countries (LICs), they appear to
be increasing (5, 6). It has been hypothesized that helminth
infections, still highly prevalent in LICs (7), may contribute
to these geographic differences. Globally, the majority of
asthma and eczema cases are associated with allergen sensiti-
zation or atopy. However, in LICs, the role of atopy in
allergy-related disease is less certain (8, 9).
Parasitic helminths evolved to coexist with their mam-
malian hosts, are often asymptomatic and cause limited mor-
tality. To this end, they have developed mechanisms for
Allergy 71 (2016) 1156–1169 © 2016 The Authors. Allergy Published by John Wiley & Sons Ltd1156This is an open access article under the terms of the Creative Commons Attribution License, which permits use,
distribution and reproduction in any medium, provided the original work is properly cited.
Allergy
311
evading or modulating the host immune response. Evidence
from animal models, and from in vitro studies on human
samples, suggests that helminths can modulate the immune
response not only to themselves, but also to unrelated patho-
gens, antigens and allergens (10, 11). Helminths contain a
range of molecules homologous to known allergens, but
absent from mammals or markedly different from mam-
malian homologues. These induce IgE responses in mam-
malian hosts, and there is a strong evidence that this
pathway is involved in protective immunity against helminths
(12). Modulation of this atopic pathway is likely, therefore,
to be particularly important for helminth survival, while con-
comitantly protecting against allergic disease (13).
Associations between helminths and allergy-related condi-
tions have been investigated in a variety of settings [reviewed
in (14–16)]. The majority of studies investigating helminth–atopy associations have either reported an inverse association
or no evidence of association. However, results for allergy-
related diseases such as asthma and eczema have been less
consistent, varying both within and across helminth species.
Meta-analyses have indicated that for asthma, Ascaris lumbri-
coides infection is positively associated and hookworm inver-
sely associated, with borderline evidence of a positive
association for Trichuris trichiura and no association for
Strongyloides stercoralis (15). Very few studies have investi-
gated associations with schistosomiasis, although those that
have generally report an inverse association with atopy (17–20).
Helminths may have an important role as modifiers of
associations between markers of atopy and allergy-related
diseases. It has been reported that IgE and SPT responses to
house dust mite are positively associated in the absence of
hookworm but unrelated among hookworm-infected individ-
uals (21). Similarly, studies have found that positive associa-
tions between atopy and wheeze, and between atopy and
eczema, exist only among individuals who do not have hook-
worm and not among those infected with hookworm (22,
23). Finally, it has been reported that atopy and wheeze are
only positively associated in the absence of concurrent
Ascaris infection and not in its presence (24).
Intervention studies are an important tool for understand-
ing the relationship between helminths and allergy-related
diseases; however, findings of previous studies on the impact
of anthelminthic treatment on atopy among children are con-
flicting (25–28) and none showed effects on wheeze or
eczema, although statistical power for these outcomes was
usually limited. Variable findings for atopy may be a conse-
quence of heterogeneity between study settings in helminth
species; of note, no trial has yet investigated the effects of
treatment of schistosomiasis on asthma, eczema and atopy.
We designed a cluster-randomized trial, the Lake Victoria
Island Intervention Study on Worms and Allergy-related Dis-
eases (LaVIISWA; ISRCTN47196031), to investigate the
impact of intensive vs standard anthelminthic treatment over
a 3-year period on allergy-related diseases, in a setting with
heavy helminth burden, in particular schistosomiasis (29).
We herein report the findings of a household survey, con-
ducted as baseline, to investigate the hypothesis that helminth
infections would be inversely associated with allergy-related
conditions.
Methods
Study design and procedures
LaVIISWA is being conducted in 26 fishing villages on the
Lake Victoria islands of Koome subcounty, Mukono district,
Uganda, a remote setting accessible in 2–3 h from Entebbe by
powered canoe. Full details of the trial design are described
elsewhere (29). The baseline household survey was conducted
between October 2012 and July 2013, across all trial villages,
immediately preceding intervention roll-out. All households in
participating villages were eligible for inclusion in the survey.
Available household listings were checked and updated by the
research team, and simple random samples of 45 households
were selected from each village. In selected households, all
members were eligible for inclusion in the survey.
Questionnaires were completed regarding household fea-
tures and individual social-demographic characteristics.
Information regarding asthma, eczema and allergy symptoms
was obtained using questions from the International Study
on Allergy and Asthma in Children (ISAAC) questionnaire,
with supplementary questions from the UK diagnostic crite-
ria for atopic eczema (30, 31).
A general history and examination, including height,
weight and hepatosplenomegaly, was performed. All individ-
uals were examined for visible flexural dermatitis: for this, all
team members were trained in the standardized approach
described in (32). SPTs were performed on participants aged
≥1 year, using standard methods, with three allergens [Der-
matophagoides mix, Blomia tropicalis and German cockroach
(Blatella germanica)] and positive and negative controls
(ALK-Abell�o; supplied by Laboratory Specialities (Pty) Ltd.,
Randburg, South Africa). Each participant was asked for
one stool sample; mid-stream urine samples were requested
from all participants in the 15 villages surveyed from Febru-
ary 2013 onwards. Blood samples of 14 ml were obtained
from individuals ≥13 years, 10 ml from children 5–12 years
and 6 ml from children 1–4 years. Individuals were offered
HIV counselling and testing in collaboration with local
health service providers.
Ethical approval was granted by the Research and Ethics
Committee of the Uganda Virus Research Institute, the
Uganda National Council for Science and Technology, and
the London School of Hygiene and Tropical Medicine. Indi-
vidual written informed consent (for adults ≥18 years and
emancipated minors, and for children by a parent or guar-
dian) and assent (for children 8–17 years) was sought for sur-
vey participation.
Laboratory methods
Two slides from each stool sample were examined (by different
technicians) using the Kato-Katz method (33). The remaining
sample was suspended in ethanol and stored at �80°C to allow
further investigation for Necator americanus and Strongyloides
Allergy 71 (2016) 1156–1169 © 2016 The Authors. Allergy Published by John Wiley & Sons Ltd 1157
Webb et al. Positive associations between helminths and allergy
312
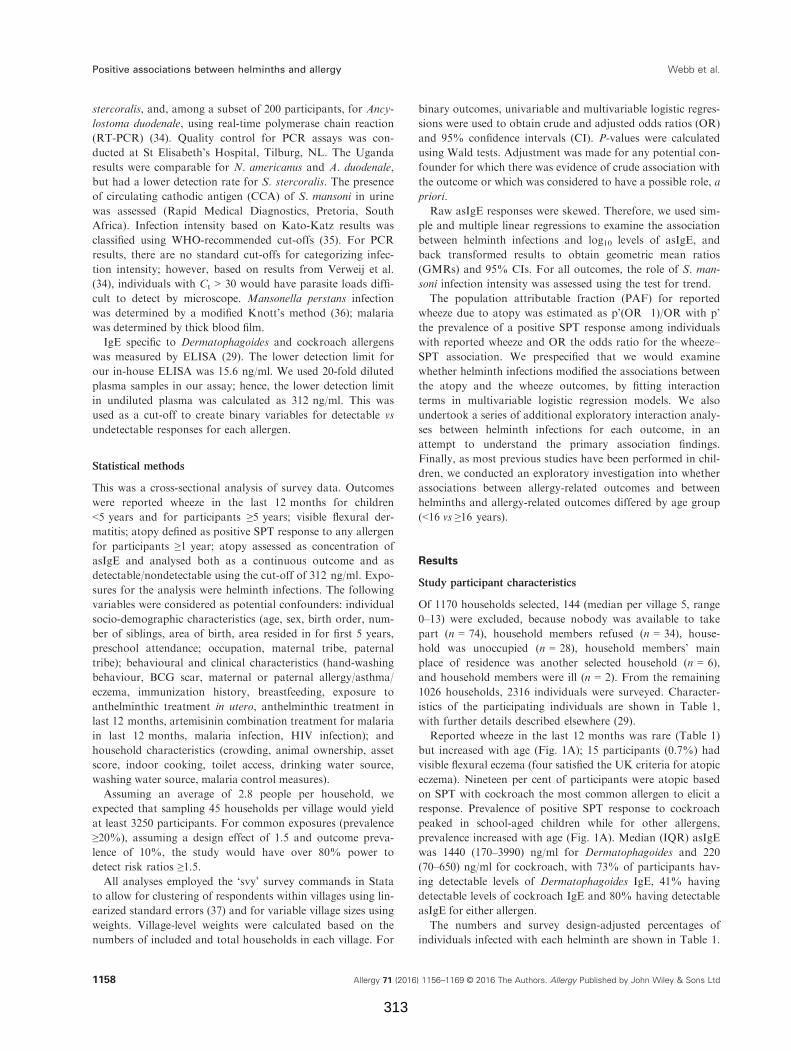
stercoralis, and, among a subset of 200 participants, for Ancy-
lostoma duodenale, using real-time polymerase chain reaction
(RT-PCR) (34). Quality control for PCR assays was con-
ducted at St Elisabeth’s Hospital, Tilburg, NL. The Uganda
results were comparable for N. americanus and A. duodenale,
but had a lower detection rate for S. stercoralis. The presence
of circulating cathodic antigen (CCA) of S. mansoni in urine
was assessed (Rapid Medical Diagnostics, Pretoria, South
Africa). Infection intensity based on Kato-Katz results was
classified using WHO-recommended cut-offs (35). For PCR
results, there are no standard cut-offs for categorizing infec-
tion intensity; however, based on results from Verweij et al.
(34), individuals with Ct > 30 would have parasite loads diffi-
cult to detect by microscope. Mansonella perstans infection
was determined by a modified Knott’s method (36); malaria
was determined by thick blood film.
IgE specific to Dermatophagoides and cockroach allergens
was measured by ELISA (29). The lower detection limit for
our in-house ELISA was 15.6 ng/ml. We used 20-fold diluted
plasma samples in our assay; hence, the lower detection limit
in undiluted plasma was calculated as 312 ng/ml. This was
used as a cut-off to create binary variables for detectable vs
undetectable responses for each allergen.
Statistical methods
This was a cross-sectional analysis of survey data. Outcomes
were reported wheeze in the last 12 months for children
<5 years and for participants ≥5 years; visible flexural der-
matitis; atopy defined as positive SPT response to any allergen
for participants ≥1 year; atopy assessed as concentration of
asIgE and analysed both as a continuous outcome and as
detectable/nondetectable using the cut-off of 312 ng/ml. Expo-
sures for the analysis were helminth infections. The following
variables were considered as potential confounders: individual
socio-demographic characteristics (age, sex, birth order, num-
ber of siblings, area of birth, area resided in for first 5 years,
preschool attendance; occupation, maternal tribe, paternal
tribe); behavioural and clinical characteristics (hand-washing
behaviour, BCG scar, maternal or paternal allergy/asthma/
eczema, immunization history, breastfeeding, exposure to
anthelminthic treatment in utero, anthelminthic treatment in
last 12 months, artemisinin combination treatment for malaria
in last 12 months, malaria infection, HIV infection); and
household characteristics (crowding, animal ownership, asset
score, indoor cooking, toilet access, drinking water source,
washing water source, malaria control measures).
Assuming an average of 2.8 people per household, we
expected that sampling 45 households per village would yield
at least 3250 participants. For common exposures (prevalence
≥20%), assuming a design effect of 1.5 and outcome preva-
lence of 10%, the study would have over 80% power to
detect risk ratios ≥1.5.All analyses employed the ‘svy’ survey commands in Stata
to allow for clustering of respondents within villages using lin-
earized standard errors (37) and for variable village sizes using
weights. Village-level weights were calculated based on the
numbers of included and total households in each village. For
binary outcomes, univariable and multivariable logistic regres-
sions were used to obtain crude and adjusted odds ratios (OR)
and 95% confidence intervals (CI). P-values were calculated
using Wald tests. Adjustment was made for any potential con-
founder for which there was evidence of crude association with
the outcome or which was considered to have a possible role, a
priori.
Raw asIgE responses were skewed. Therefore, we used sim-
ple and multiple linear regressions to examine the association
between helminth infections and log10 levels of asIgE, and
back transformed results to obtain geometric mean ratios
(GMRs) and 95% CIs. For all outcomes, the role of S. man-
soni infection intensity was assessed using the test for trend.
The population attributable fraction (PAF) for reported
wheeze due to atopy was estimated as p’(OR�1)/OR with p’
the prevalence of a positive SPT response among individuals
with reported wheeze and OR the odds ratio for the wheeze–SPT association. We prespecified that we would examine
whether helminth infections modified the associations between
the atopy and the wheeze outcomes, by fitting interaction
terms in multivariable logistic regression models. We also
undertook a series of additional exploratory interaction analy-
ses between helminth infections for each outcome, in an
attempt to understand the primary association findings.
Finally, as most previous studies have been performed in chil-
dren, we conducted an exploratory investigation into whether
associations between allergy-related outcomes and between
helminths and allergy-related outcomes differed by age group
(<16 vs ≥16 years).
Results
Study participant characteristics
Of 1170 households selected, 144 (median per village 5, range
0–13) were excluded, because nobody was available to take
part (n = 74), household members refused (n = 34), house-
hold was unoccupied (n = 28), household members’ main
place of residence was another selected household (n = 6),
and household members were ill (n = 2). From the remaining
1026 households, 2316 individuals were surveyed. Character-
istics of the participating individuals are shown in Table 1,
with further details described elsewhere (29).
Reported wheeze in the last 12 months was rare (Table 1)
but increased with age (Fig. 1A); 15 participants (0.7%) had
visible flexural eczema (four satisfied the UK criteria for atopic
eczema). Nineteen per cent of participants were atopic based
on SPT with cockroach the most common allergen to elicit a
response. Prevalence of positive SPT response to cockroach
peaked in school-aged children while for other allergens,
prevalence increased with age (Fig. 1A). Median (IQR) asIgE
was 1440 (170–3990) ng/ml for Dermatophagoides and 220
(70–650) ng/ml for cockroach, with 73% of participants hav-
ing detectable levels of Dermatophagoides IgE, 41% having
detectable levels of cockroach IgE and 80% having detectable
asIgE for either allergen.
The numbers and survey design-adjusted percentages of
individuals infected with each helminth are shown in Table 1.
Allergy 71 (2016) 1156–1169 © 2016 The Authors. Allergy Published by John Wiley & Sons Ltd1158
Positive associations between helminths and allergy Webb et al.
313
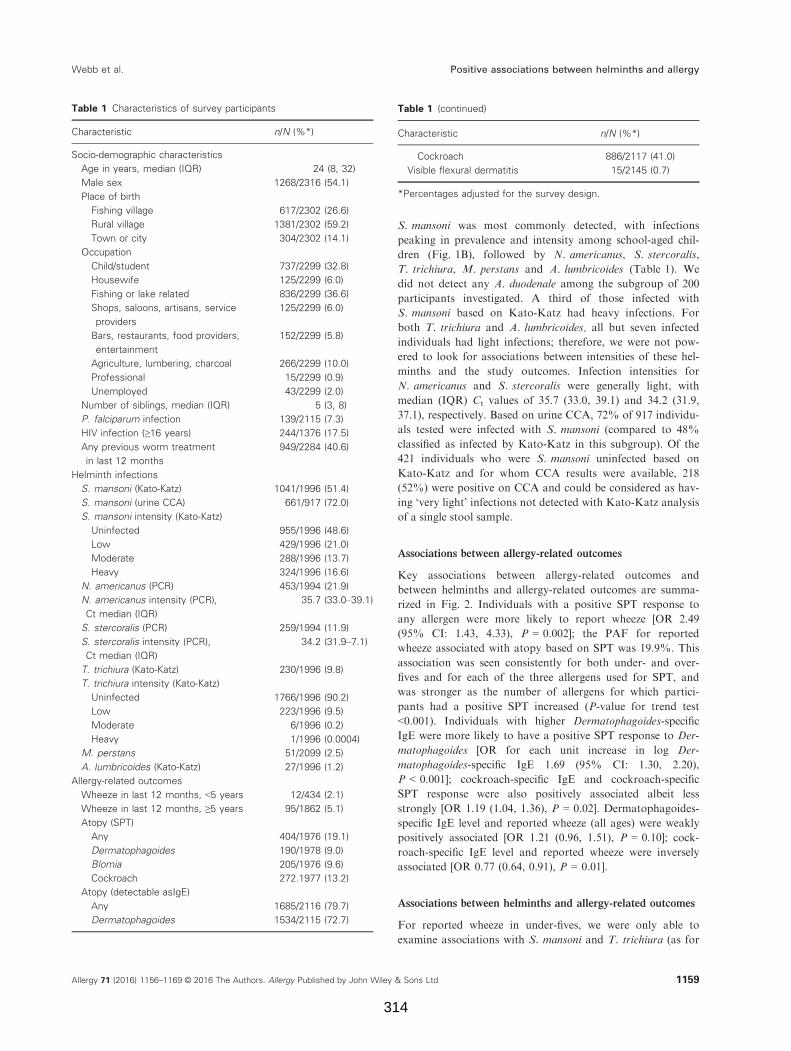
S. mansoni was most commonly detected, with infections
peaking in prevalence and intensity among school-aged chil-
dren (Fig. 1B), followed by N. americanus, S. stercoralis,
T. trichiura, M. perstans and A. lumbricoides (Table 1). We
did not detect any A. duodenale among the subgroup of 200
participants investigated. A third of those infected with
S. mansoni based on Kato-Katz had heavy infections. For
both T. trichiura and A. lumbricoides, all but seven infected
individuals had light infections; therefore, we were not pow-
ered to look for associations between intensities of these hel-
minths and the study outcomes. Infection intensities for
N. americanus and S. stercoralis were generally light, with
median (IQR) Ct values of 35.7 (33.0, 39.1) and 34.2 (31.9,
37.1), respectively. Based on urine CCA, 72% of 917 individu-
als tested were infected with S. mansoni (compared to 48%
classified as infected by Kato-Katz in this subgroup). Of the
421 individuals who were S. mansoni uninfected based on
Kato-Katz and for whom CCA results were available, 218
(52%) were positive on CCA and could be considered as hav-
ing ‘very light’ infections not detected with Kato-Katz analysis
of a single stool sample.
Associations between allergy-related outcomes
Key associations between allergy-related outcomes and
between helminths and allergy-related outcomes are summa-
rized in Fig. 2. Individuals with a positive SPT response to
any allergen were more likely to report wheeze [OR 2.49
(95% CI: 1.43, 4.33), P = 0.002]; the PAF for reported
wheeze associated with atopy based on SPT was 19.9%. This
association was seen consistently for both under- and over-
fives and for each of the three allergens used for SPT, and
was stronger as the number of allergens for which partici-
pants had a positive SPT increased (P-value for trend test
<0.001). Individuals with higher Dermatophagoides-specific
IgE were more likely to have a positive SPT response to Der-
matophagoides [OR for each unit increase in log Der-
matophagoides-specific IgE 1.69 (95% CI: 1.30, 2.20),
P < 0.001]; cockroach-specific IgE and cockroach-specific
SPT response were also positively associated albeit less
strongly [OR 1.19 (1.04, 1.36), P = 0.02]. Dermatophagoides-
specific IgE level and reported wheeze (all ages) were weakly
positively associated [OR 1.21 (0.96, 1.51), P = 0.10]; cock-
roach-specific IgE level and reported wheeze were inversely
associated [OR 0.77 (0.64, 0.91), P = 0.01].
Associations between helminths and allergy-related outcomes
For reported wheeze in under-fives, we were only able to
examine associations with S. mansoni and T. trichiura (as for
Table 1 Characteristics of survey participants
Characteristic n/N (%*)
Socio-demographic characteristics
Age in years, median (IQR) 24 (8, 32)
Male sex 1268/2316 (54.1)
Place of birth
Fishing village 617/2302 (26.6)
Rural village 1381/2302 (59.2)
Town or city 304/2302 (14.1)
Occupation
Child/student 737/2299 (32.8)
Housewife 125/2299 (6.0)
Fishing or lake related 836/2299 (36.6)
Shops, saloons, artisans, service
providers
125/2299 (6.0)
Bars, restaurants, food providers,
entertainment
152/2299 (5.8)
Agriculture, lumbering, charcoal 266/2299 (10.0)
Professional 15/2299 (0.9)
Unemployed 43/2299 (2.0)
Number of siblings, median (IQR) 5 (3, 8)
P. falciparum infection 139/2115 (7.3)
HIV infection (≥16 years) 244/1376 (17.5)
Any previous worm treatment
in last 12 months
949/2284 (40.6)
Helminth infections
S. mansoni (Kato-Katz) 1041/1996 (51.4)
S. mansoni (urine CCA) 661/917 (72.0)
S. mansoni intensity (Kato-Katz)
Uninfected 955/1996 (48.6)
Low 429/1996 (21.0)
Moderate 288/1996 (13.7)
Heavy 324/1996 (16.6)
N. americanus (PCR) 453/1994 (21.9)
N. americanus intensity (PCR),
Ct median (IQR)
35.7 (33.0–39.1)
S. stercoralis (PCR) 259/1994 (11.9)
S. stercoralis intensity (PCR),
Ct median (IQR)
34.2 (31.9–7.1)
T. trichiura (Kato-Katz) 230/1996 (9.8)
T. trichiura intensity (Kato-Katz)
Uninfected 1766/1996 (90.2)
Low 223/1996 (9.5)
Moderate 6/1996 (0.2)
Heavy 1/1996 (0.0004)
M. perstans 51/2099 (2.5)
A. lumbricoides (Kato-Katz) 27/1996 (1.2)
Allergy-related outcomes
Wheeze in last 12 months, <5 years 12/434 (2.1)
Wheeze in last 12 months, ≥5 years 95/1862 (5.1)
Atopy (SPT)
Any 404/1976 (19.1)
Dermatophagoides 190/1978 (9.0)
Blomia 205/1976 (9.6)
Cockroach 272.1977 (13.2)
Atopy (detectable asIgE)
Any 1685/2116 (79.7)
Dermatophagoides 1534/2115 (72.7)
Table 1 (continued)
Characteristic n/N (%*)
Cockroach 886/2117 (41.0)
Visible flexural dermatitis 15/2145 (0.7)
*Percentages adjusted for the survey design.
Allergy 71 (2016) 1156–1169 © 2016 The Authors. Allergy Published by John Wiley & Sons Ltd 1159
Webb et al. Positive associations between helminths and allergy
314
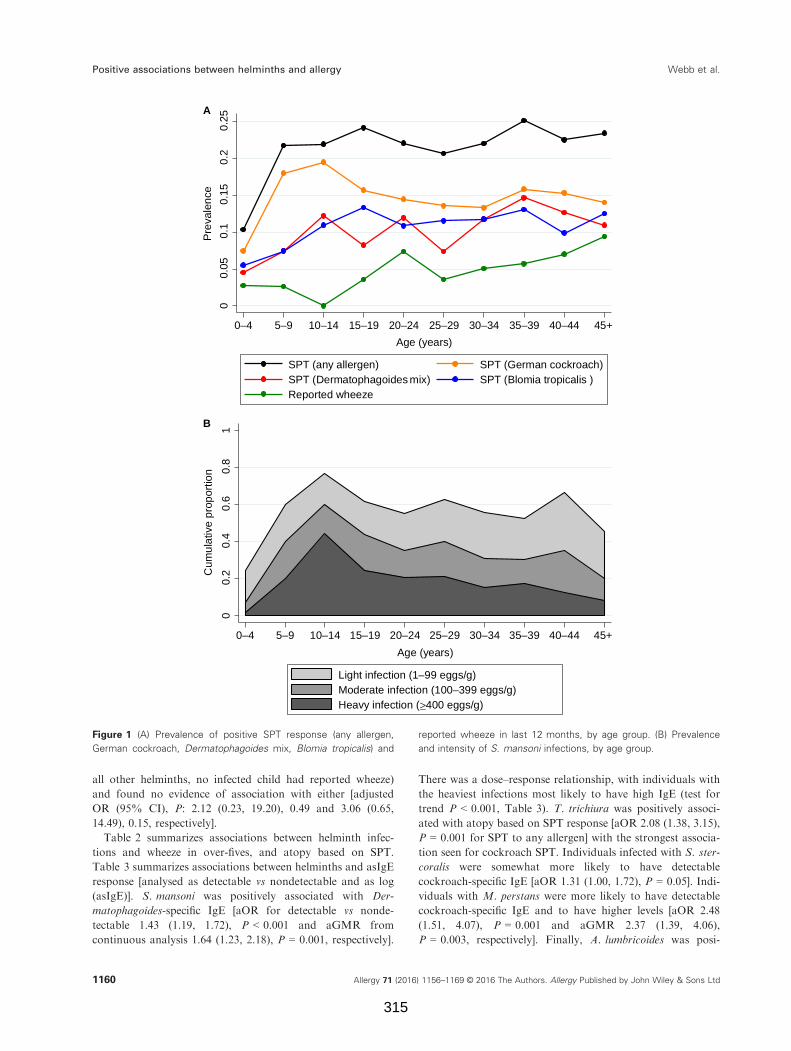
all other helminths, no infected child had reported wheeze)
and found no evidence of association with either [adjusted
OR (95% CI), P: 2.12 (0.23, 19.20), 0.49 and 3.06 (0.65,
14.49), 0.15, respectively].
Table 2 summarizes associations between helminth infec-
tions and wheeze in over-fives, and atopy based on SPT.
Table 3 summarizes associations between helminths and asIgE
response [analysed as detectable vs nondetectable and as log
(asIgE)]. S. mansoni was positively associated with Der-
matophagoides-specific IgE [aOR for detectable vs nonde-
tectable 1.43 (1.19, 1.72), P < 0.001 and aGMR from
continuous analysis 1.64 (1.23, 2.18), P = 0.001, respectively].
There was a dose–response relationship, with individuals with
the heaviest infections most likely to have high IgE (test for
trend P < 0.001, Table 3). T. trichiura was positively associ-
ated with atopy based on SPT response [aOR 2.08 (1.38, 3.15),
P = 0.001 for SPT to any allergen] with the strongest associa-
tion seen for cockroach SPT. Individuals infected with S. ster-
coralis were somewhat more likely to have detectable
cockroach-specific IgE [aOR 1.31 (1.00, 1.72), P = 0.05]. Indi-
viduals with M. perstans were more likely to have detectable
cockroach-specific IgE and to have higher levels [aOR 2.48
(1.51, 4.07), P = 0.001 and aGMR 2.37 (1.39, 4.06),
P = 0.003, respectively]. Finally, A. lumbricoides was posi-
00.
050.
10.
150.
20.
25
Pre
vale
nce
0–4 5–9 10–14 15–19 20–24 25–29 30–34 35–39 40–44 45+
Age (years)
SPT (any allergen) SPT (German cockroach)SPT (Dermatophagoides mix) SPT (Blomia tropicalis )Reported wheeze
00.
20.
40.
60.
81
Cum
ulat
ive
prop
ortio
n
0–4 5–9 10–14 15–19 20–24 25–29 30–34 35–39 40–44 45+
Age (years)
Light infection (1–99 eggs/g)Moderate infection (100–399 eggs/g)Heavy infection (≥400 eggs/g)
A
B
Figure 1 (A) Prevalence of positive SPT response (any allergen,
German cockroach, Dermatophagoides mix, Blomia tropicalis) and
reported wheeze in last 12 months, by age group. (B) Prevalence
and intensity of S. mansoni infections, by age group.
Allergy 71 (2016) 1156–1169 © 2016 The Authors. Allergy Published by John Wiley & Sons Ltd1160
Positive associations between helminths and allergy Webb et al.
315
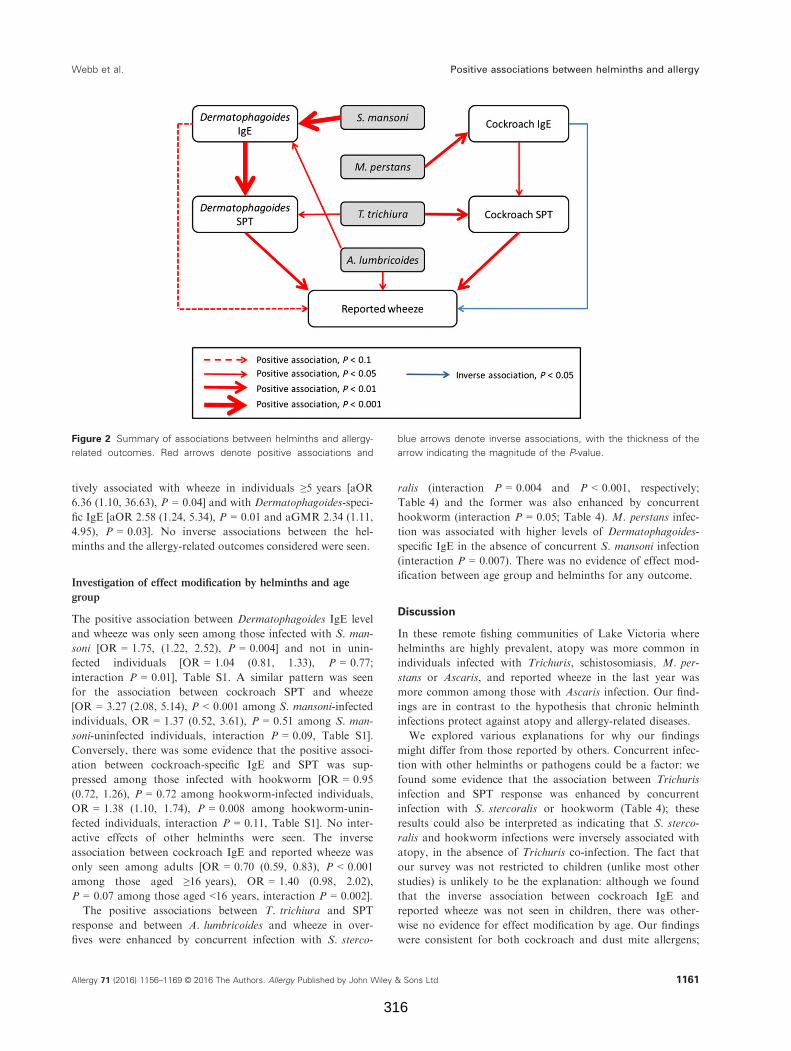
tively associated with wheeze in individuals ≥5 years [aOR
6.36 (1.10, 36.63), P = 0.04] and with Dermatophagoides-speci-
fic IgE [aOR 2.58 (1.24, 5.34), P = 0.01 and aGMR 2.34 (1.11,
4.95), P = 0.03]. No inverse associations between the hel-
minths and the allergy-related outcomes considered were seen.
Investigation of effect modification by helminths and age
group
The positive association between Dermatophagoides IgE level
and wheeze was only seen among those infected with S. man-
soni [OR = 1.75, (1.22, 2.52), P = 0.004] and not in unin-
fected individuals [OR = 1.04 (0.81, 1.33), P = 0.77;
interaction P = 0.01], Table S1. A similar pattern was seen
for the association between cockroach SPT and wheeze
[OR = 3.27 (2.08, 5.14), P < 0.001 among S. mansoni-infected
individuals, OR = 1.37 (0.52, 3.61), P = 0.51 among S. man-
soni-uninfected individuals, interaction P = 0.09, Table S1].
Conversely, there was some evidence that the positive associ-
ation between cockroach-specific IgE and SPT was sup-
pressed among those infected with hookworm [OR = 0.95
(0.72, 1.26), P = 0.72 among hookworm-infected individuals,
OR = 1.38 (1.10, 1.74), P = 0.008 among hookworm-unin-
fected individuals, interaction P = 0.11, Table S1]. No inter-
active effects of other helminths were seen. The inverse
association between cockroach IgE and reported wheeze was
only seen among adults [OR = 0.70 (0.59, 0.83), P < 0.001
among those aged ≥16 years), OR = 1.40 (0.98, 2.02),
P = 0.07 among those aged <16 years, interaction P = 0.002].
The positive associations between T. trichiura and SPT
response and between A. lumbricoides and wheeze in over-
fives were enhanced by concurrent infection with S. sterco-
ralis (interaction P = 0.004 and P < 0.001, respectively;
Table 4) and the former was also enhanced by concurrent
hookworm (interaction P = 0.05; Table 4). M. perstans infec-
tion was associated with higher levels of Dermatophagoides-
specific IgE in the absence of concurrent S. mansoni infection
(interaction P = 0.007). There was no evidence of effect mod-
ification between age group and helminths for any outcome.
Discussion
In these remote fishing communities of Lake Victoria where
helminths are highly prevalent, atopy was more common in
individuals infected with Trichuris, schistosomiasis, M. per-
stans or Ascaris, and reported wheeze in the last year was
more common among those with Ascaris infection. Our find-
ings are in contrast to the hypothesis that chronic helminth
infections protect against atopy and allergy-related diseases.
We explored various explanations for why our findings
might differ from those reported by others. Concurrent infec-
tion with other helminths or pathogens could be a factor: we
found some evidence that the association between Trichuris
infection and SPT response was enhanced by concurrent
infection with S. stercoralis or hookworm (Table 4); these
results could also be interpreted as indicating that S. sterco-
ralis and hookworm infections were inversely associated with
atopy, in the absence of Trichuris co-infection. The fact that
our survey was not restricted to children (unlike most other
studies) is unlikely to be the explanation: although we found
that the inverse association between cockroach IgE and
reported wheeze was not seen in children, there was other-
wise no evidence for effect modification by age. Our findings
were consistent for both cockroach and dust mite allergens;
Figure 2 Summary of associations between helminths and allergy-
related outcomes. Red arrows denote positive associations and
blue arrows denote inverse associations, with the thickness of the
arrow indicating the magnitude of the P-value.
Allergy 71 (2016) 1156–1169 © 2016 The Authors. Allergy Published by John Wiley & Sons Ltd 1161
Webb et al. Positive associations between helminths and allergy
316
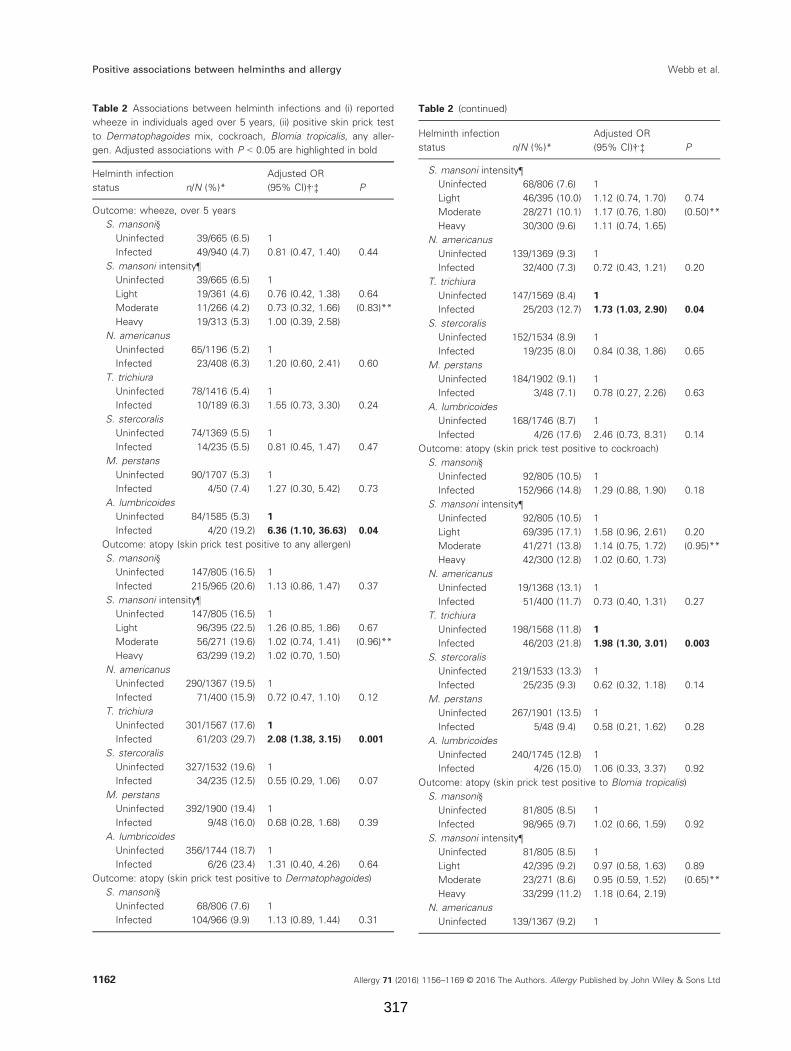
Table 2 Associations between helminth infections and (i) reported
wheeze in individuals aged over 5 years, (ii) positive skin prick test
to Dermatophagoides mix, cockroach, Blomia tropicalis, any aller-
gen. Adjusted associations with P < 0.05 are highlighted in bold
Helminth infection
status n/N (%)*
Adjusted OR
(95% CI)†,‡ P
Outcome: wheeze, over 5 years
S. mansoni§
Uninfected 39/665 (6.5) 1
Infected 49/940 (4.7) 0.81 (0.47, 1.40) 0.44
S. mansoni intensity¶
Uninfected 39/665 (6.5) 1
Light 19/361 (4.6) 0.76 (0.42, 1.38) 0.64
Moderate 11/266 (4.2) 0.73 (0.32, 1.66) (0.83)**
Heavy 19/313 (5.3) 1.00 (0.39, 2.58)
N. americanus
Uninfected 65/1196 (5.2) 1
Infected 23/408 (6.3) 1.20 (0.60, 2.41) 0.60
T. trichiura
Uninfected 78/1416 (5.4) 1
Infected 10/189 (6.3) 1.55 (0.73, 3.30) 0.24
S. stercoralis
Uninfected 74/1369 (5.5) 1
Infected 14/235 (5.5) 0.81 (0.45, 1.47) 0.47
M. perstans
Uninfected 90/1707 (5.3) 1
Infected 4/50 (7.4) 1.27 (0.30, 5.42) 0.73
A. lumbricoides
Uninfected 84/1585 (5.3) 1
Infected 4/20 (19.2) 6.36 (1.10, 36.63) 0.04
Outcome: atopy (skin prick test positive to any allergen)
S. mansoni§
Uninfected 147/805 (16.5) 1
Infected 215/965 (20.6) 1.13 (0.86, 1.47) 0.37
S. mansoni intensity¶
Uninfected 147/805 (16.5) 1
Light 96/395 (22.5) 1.26 (0.85, 1.86) 0.67
Moderate 56/271 (19.6) 1.02 (0.74, 1.41) (0.96)**
Heavy 63/299 (19.2) 1.02 (0.70, 1.50)
N. americanus
Uninfected 290/1367 (19.5) 1
Infected 71/400 (15.9) 0.72 (0.47, 1.10) 0.12
T. trichiura
Uninfected 301/1567 (17.6) 1
Infected 61/203 (29.7) 2.08 (1.38, 3.15) 0.001
S. stercoralis
Uninfected 327/1532 (19.6) 1
Infected 34/235 (12.5) 0.55 (0.29, 1.06) 0.07
M. perstans
Uninfected 392/1900 (19.4) 1
Infected 9/48 (16.0) 0.68 (0.28, 1.68) 0.39
A. lumbricoides
Uninfected 356/1744 (18.7) 1
Infected 6/26 (23.4) 1.31 (0.40, 4.26) 0.64
Outcome: atopy (skin prick test positive to Dermatophagoides)
S. mansoni§
Uninfected 68/806 (7.6) 1
Infected 104/966 (9.9) 1.13 (0.89, 1.44) 0.31
Table 2 (continued)
Helminth infection
status n/N (%)*
Adjusted OR
(95% CI)†,‡ P
S. mansoni intensity¶
Uninfected 68/806 (7.6) 1
Light 46/395 (10.0) 1.12 (0.74, 1.70) 0.74
Moderate 28/271 (10.1) 1.17 (0.76, 1.80) (0.50)**
Heavy 30/300 (9.6) 1.11 (0.74, 1.65)
N. americanus
Uninfected 139/1369 (9.3) 1
Infected 32/400 (7.3) 0.72 (0.43, 1.21) 0.20
T. trichiura
Uninfected 147/1569 (8.4) 1
Infected 25/203 (12.7) 1.73 (1.03, 2.90) 0.04
S. stercoralis
Uninfected 152/1534 (8.9) 1
Infected 19/235 (8.0) 0.84 (0.38, 1.86) 0.65
M. perstans
Uninfected 184/1902 (9.1) 1
Infected 3/48 (7.1) 0.78 (0.27, 2.26) 0.63
A. lumbricoides
Uninfected 168/1746 (8.7) 1
Infected 4/26 (17.6) 2.46 (0.73, 8.31) 0.14
Outcome: atopy (skin prick test positive to cockroach)
S. mansoni§
Uninfected 92/805 (10.5) 1
Infected 152/966 (14.8) 1.29 (0.88, 1.90) 0.18
S. mansoni intensity¶
Uninfected 92/805 (10.5) 1
Light 69/395 (17.1) 1.58 (0.96, 2.61) 0.20
Moderate 41/271 (13.8) 1.14 (0.75, 1.72) (0.95)**
Heavy 42/300 (12.8) 1.02 (0.60, 1.73)
N. americanus
Uninfected 19/1368 (13.1) 1
Infected 51/400 (11.7) 0.73 (0.40, 1.31) 0.27
T. trichiura
Uninfected 198/1568 (11.8) 1
Infected 46/203 (21.8) 1.98 (1.30, 3.01) 0.003
S. stercoralis
Uninfected 219/1533 (13.3) 1
Infected 25/235 (9.3) 0.62 (0.32, 1.18) 0.14
M. perstans
Uninfected 267/1901 (13.5) 1
Infected 5/48 (9.4) 0.58 (0.21, 1.62) 0.28
A. lumbricoides
Uninfected 240/1745 (12.8) 1
Infected 4/26 (15.0) 1.06 (0.33, 3.37) 0.92
Outcome: atopy (skin prick test positive to Blomia tropicalis)
S. mansoni§
Uninfected 81/805 (8.5) 1
Infected 98/965 (9.7) 1.02 (0.66, 1.59) 0.92
S. mansoni intensity¶
Uninfected 81/805 (8.5) 1
Light 42/395 (9.2) 0.97 (0.58, 1.63) 0.89
Moderate 23/271 (8.6) 0.95 (0.59, 1.52) (0.65)**
Heavy 33/299 (11.2) 1.18 (0.64, 2.19)
N. americanus
Uninfected 139/1367 (9.2) 1
Allergy 71 (2016) 1156–1169 © 2016 The Authors. Allergy Published by John Wiley & Sons Ltd1162
Positive associations between helminths and allergy Webb et al.
317
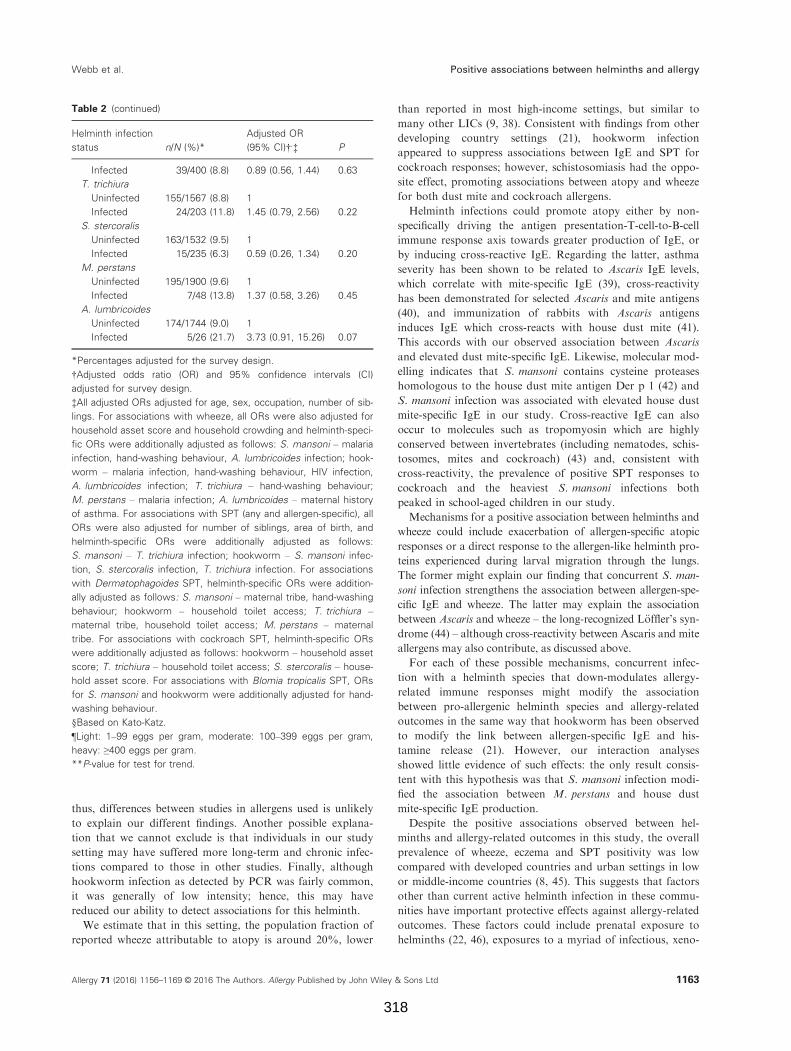
thus, differences between studies in allergens used is unlikely
to explain our different findings. Another possible explana-
tion that we cannot exclude is that individuals in our study
setting may have suffered more long-term and chronic infec-
tions compared to those in other studies. Finally, although
hookworm infection as detected by PCR was fairly common,
it was generally of low intensity; hence, this may have
reduced our ability to detect associations for this helminth.
We estimate that in this setting, the population fraction of
reported wheeze attributable to atopy is around 20%, lower
than reported in most high-income settings, but similar to
many other LICs (9, 38). Consistent with findings from other
developing country settings (21), hookworm infection
appeared to suppress associations between IgE and SPT for
cockroach responses; however, schistosomiasis had the oppo-
site effect, promoting associations between atopy and wheeze
for both dust mite and cockroach allergens.
Helminth infections could promote atopy either by non-
specifically driving the antigen presentation-T-cell-to-B-cell
immune response axis towards greater production of IgE, or
by inducing cross-reactive IgE. Regarding the latter, asthma
severity has been shown to be related to Ascaris IgE levels,
which correlate with mite-specific IgE (39), cross-reactivity
has been demonstrated for selected Ascaris and mite antigens
(40), and immunization of rabbits with Ascaris antigens
induces IgE which cross-reacts with house dust mite (41).
This accords with our observed association between Ascaris
and elevated dust mite-specific IgE. Likewise, molecular mod-
elling indicates that S. mansoni contains cysteine proteases
homologous to the house dust mite antigen Der p 1 (42) and
S. mansoni infection was associated with elevated house dust
mite-specific IgE in our study. Cross-reactive IgE can also
occur to molecules such as tropomyosin which are highly
conserved between invertebrates (including nematodes, schis-
tosomes, mites and cockroach) (43) and, consistent with
cross-reactivity, the prevalence of positive SPT responses to
cockroach and the heaviest S. mansoni infections both
peaked in school-aged children in our study.
Mechanisms for a positive association between helminths and
wheeze could include exacerbation of allergen-specific atopic
responses or a direct response to the allergen-like helminth pro-
teins experienced during larval migration through the lungs.
The former might explain our finding that concurrent S. man-
soni infection strengthens the association between allergen-spe-
cific IgE and wheeze. The latter may explain the association
between Ascaris and wheeze – the long-recognized L€offler’s syn-
drome (44) – although cross-reactivity between Ascaris and mite
allergens may also contribute, as discussed above.
For each of these possible mechanisms, concurrent infec-
tion with a helminth species that down-modulates allergy-
related immune responses might modify the association
between pro-allergenic helminth species and allergy-related
outcomes in the same way that hookworm has been observed
to modify the link between allergen-specific IgE and his-
tamine release (21). However, our interaction analyses
showed little evidence of such effects: the only result consis-
tent with this hypothesis was that S. mansoni infection modi-
fied the association between M. perstans and house dust
mite-specific IgE production.
Despite the positive associations observed between hel-
minths and allergy-related outcomes in this study, the overall
prevalence of wheeze, eczema and SPT positivity was low
compared with developed countries and urban settings in low
or middle-income countries (8, 45). This suggests that factors
other than current active helminth infection in these commu-
nities have important protective effects against allergy-related
outcomes. These factors could include prenatal exposure to
helminths (22, 46), exposures to a myriad of infectious, xeno-
Table 2 (continued)
Helminth infection
status n/N (%)*
Adjusted OR
(95% CI)†,‡ P
Infected 39/400 (8.8) 0.89 (0.56, 1.44) 0.63
T. trichiura
Uninfected 155/1567 (8.8) 1
Infected 24/203 (11.8) 1.45 (0.79, 2.56) 0.22
S. stercoralis
Uninfected 163/1532 (9.5) 1
Infected 15/235 (6.3) 0.59 (0.26, 1.34) 0.20
M. perstans
Uninfected 195/1900 (9.6) 1
Infected 7/48 (13.8) 1.37 (0.58, 3.26) 0.45
A. lumbricoides
Uninfected 174/1744 (9.0) 1
Infected 5/26 (21.7) 3.73 (0.91, 15.26) 0.07
*Percentages adjusted for the survey design.
†Adjusted odds ratio (OR) and 95% confidence intervals (CI)
adjusted for survey design.
‡All adjusted ORs adjusted for age, sex, occupation, number of sib-
lings. For associations with wheeze, all ORs were also adjusted for
household asset score and household crowding and helminth-speci-
fic ORs were additionally adjusted as follows: S. mansoni – malaria
infection, hand-washing behaviour, A. lumbricoides infection; hook-
worm – malaria infection, hand-washing behaviour, HIV infection,
A. lumbricoides infection; T. trichiura – hand-washing behaviour;
M. perstans – malaria infection; A. lumbricoides – maternal history
of asthma. For associations with SPT (any and allergen-specific), all
ORs were also adjusted for number of siblings, area of birth, and
helminth-specific ORs were additionally adjusted as follows:
S. mansoni – T. trichiura infection; hookworm – S. mansoni infec-
tion, S. stercoralis infection, T. trichiura infection. For associations
with Dermatophagoides SPT, helminth-specific ORs were addition-
ally adjusted as follows: S. mansoni – maternal tribe, hand-washing
behaviour; hookworm – household toilet access; T. trichiura –
maternal tribe, household toilet access; M. perstans – maternal
tribe. For associations with cockroach SPT, helminth-specific ORs
were additionally adjusted as follows: hookworm – household asset
score; T. trichiura – household toilet access; S. stercoralis – house-
hold asset score. For associations with Blomia tropicalis SPT, ORs
for S. mansoni and hookworm were additionally adjusted for hand-
washing behaviour.
§Based on Kato-Katz.
¶Light: 1–99 eggs per gram, moderate: 100–399 eggs per gram,
heavy: ≥400 eggs per gram.
**P-value for test for trend.
Allergy 71 (2016) 1156–1169 © 2016 The Authors. Allergy Published by John Wiley & Sons Ltd 1163
Webb et al. Positive associations between helminths and allergy
318
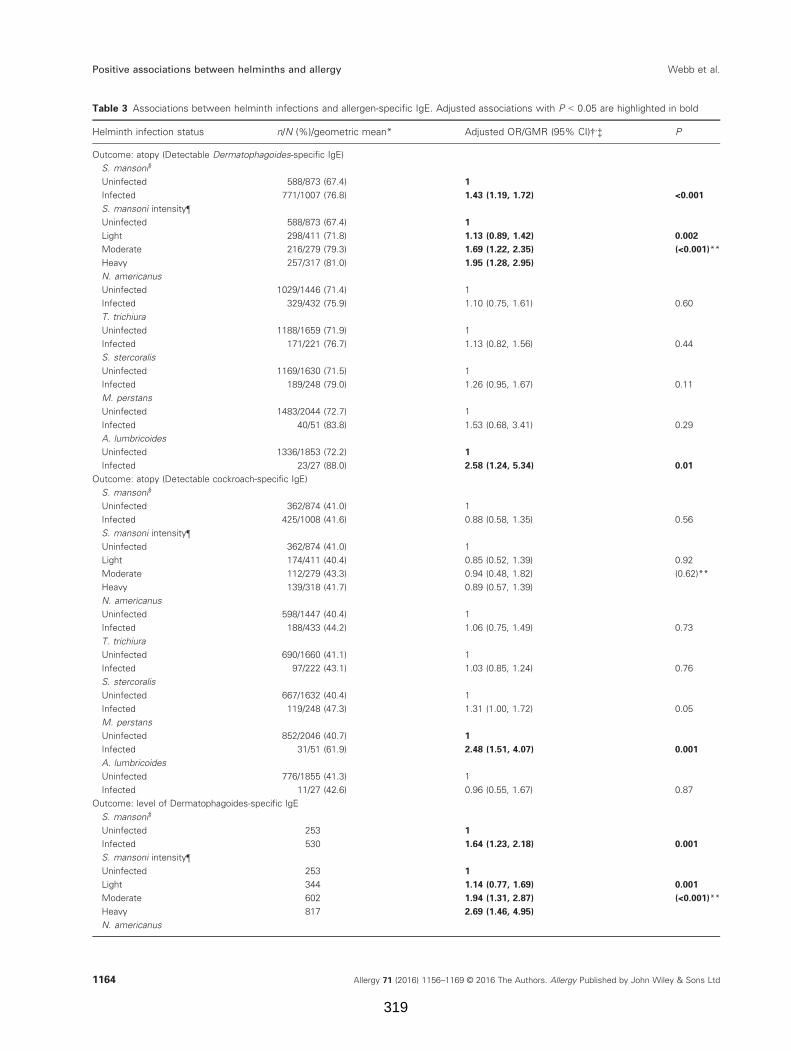
Table 3 Associations between helminth infections and allergen-specific IgE. Adjusted associations with P < 0.05 are highlighted in bold
Helminth infection status n/N (%)/geometric mean* Adjusted OR/GMR (95% CI)†,‡ P
Outcome: atopy (Detectable Dermatophagoides-specific IgE)
S. mansoni§
Uninfected 588/873 (67.4) 1
Infected 771/1007 (76.8) 1.43 (1.19, 1.72) <0.001
S. mansoni intensity¶
Uninfected 588/873 (67.4) 1
Light 298/411 (71.8) 1.13 (0.89, 1.42) 0.002
Moderate 216/279 (79.3) 1.69 (1.22, 2.35) (<0.001)**
Heavy 257/317 (81.0) 1.95 (1.28, 2.95)
N. americanus
Uninfected 1029/1446 (71.4) 1
Infected 329/432 (75.9) 1.10 (0.75, 1.61) 0.60
T. trichiura
Uninfected 1188/1659 (71.9) 1
Infected 171/221 (76.7) 1.13 (0.82, 1.56) 0.44
S. stercoralis
Uninfected 1169/1630 (71.5) 1
Infected 189/248 (79.0) 1.26 (0.95, 1.67) 0.11
M. perstans
Uninfected 1483/2044 (72.7) 1
Infected 40/51 (83.8) 1.53 (0.68, 3.41) 0.29
A. lumbricoides
Uninfected 1336/1853 (72.2) 1
Infected 23/27 (88.0) 2.58 (1.24, 5.34) 0.01
Outcome: atopy (Detectable cockroach-specific IgE)
S. mansoni§
Uninfected 362/874 (41.0) 1
Infected 425/1008 (41.6) 0.88 (0.58, 1.35) 0.56
S. mansoni intensity¶
Uninfected 362/874 (41.0) 1
Light 174/411 (40.4) 0.85 (0.52, 1.39) 0.92
Moderate 112/279 (43.3) 0.94 (0.48, 1.82) (0.62)**
Heavy 139/318 (41.7) 0.89 (0.57, 1.39)
N. americanus
Uninfected 598/1447 (40.4) 1
Infected 188/433 (44.2) 1.06 (0.75, 1.49) 0.73
T. trichiura
Uninfected 690/1660 (41.1) 1
Infected 97/222 (43.1) 1.03 (0.85, 1.24) 0.76
S. stercoralis
Uninfected 667/1632 (40.4) 1
Infected 119/248 (47.3) 1.31 (1.00, 1.72) 0.05
M. perstans
Uninfected 852/2046 (40.7) 1
Infected 31/51 (61.9) 2.48 (1.51, 4.07) 0.001
A. lumbricoides
Uninfected 776/1855 (41.3) 1
Infected 11/27 (42.6) 0.96 (0.55, 1.67) 0.87
Outcome: level of Dermatophagoides-specific IgE
S. mansoni§
Uninfected 253 1
Infected 530 1.64 (1.23, 2.18) 0.001
S. mansoni intensity¶
Uninfected 253 1
Light 344 1.14 (0.77, 1.69) 0.001
Moderate 602 1.94 (1.31, 2.87) (<0.001)**
Heavy 817 2.69 (1.46, 4.95)
N. americanus
Allergy 71 (2016) 1156–1169 © 2016 The Authors. Allergy Published by John Wiley & Sons Ltd1164
Positive associations between helminths and allergy Webb et al.
319
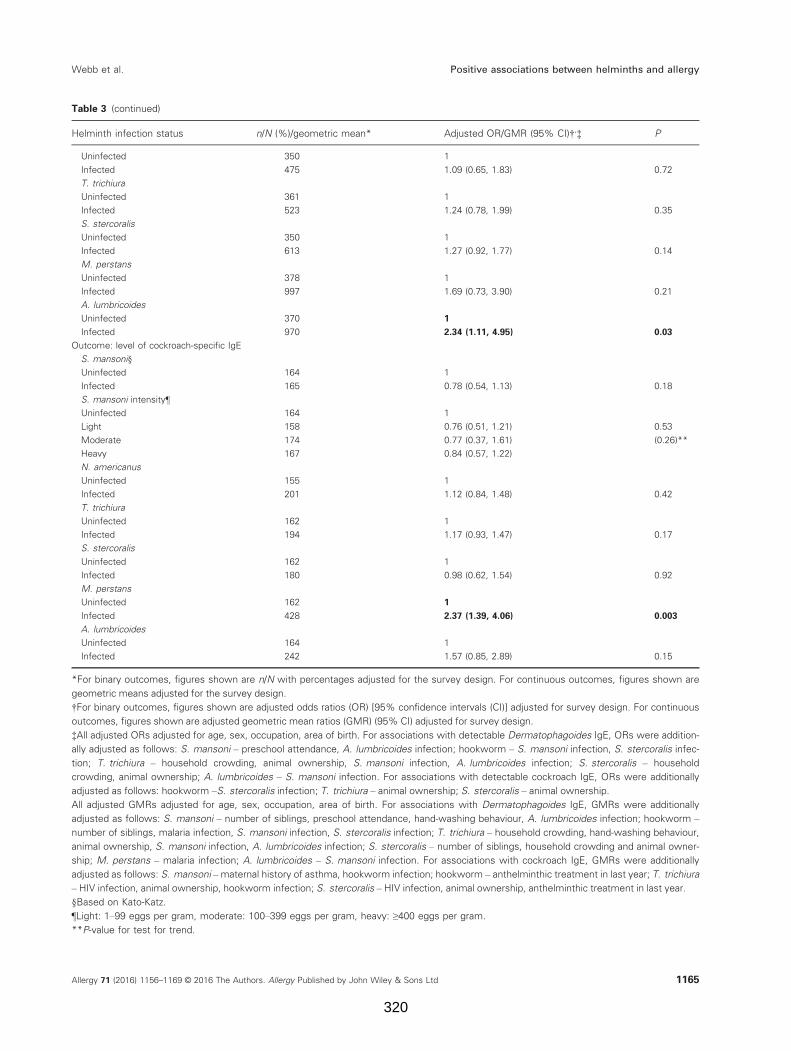
Table 3 (continued)
Helminth infection status n/N (%)/geometric mean* Adjusted OR/GMR (95% CI)†,‡ P
Uninfected 350 1
Infected 475 1.09 (0.65, 1.83) 0.72
T. trichiura
Uninfected 361 1
Infected 523 1.24 (0.78, 1.99) 0.35
S. stercoralis
Uninfected 350 1
Infected 613 1.27 (0.92, 1.77) 0.14
M. perstans
Uninfected 378 1
Infected 997 1.69 (0.73, 3.90) 0.21
A. lumbricoides
Uninfected 370 1
Infected 970 2.34 (1.11, 4.95) 0.03
Outcome: level of cockroach-specific IgE
S. mansoni§
Uninfected 164 1
Infected 165 0.78 (0.54, 1.13) 0.18
S. mansoni intensity¶
Uninfected 164 1
Light 158 0.76 (0.51, 1.21) 0.53
Moderate 174 0.77 (0.37, 1.61) (0.26)**
Heavy 167 0.84 (0.57, 1.22)
N. americanus
Uninfected 155 1
Infected 201 1.12 (0.84, 1.48) 0.42
T. trichiura
Uninfected 162 1
Infected 194 1.17 (0.93, 1.47) 0.17
S. stercoralis
Uninfected 162 1
Infected 180 0.98 (0.62, 1.54) 0.92
M. perstans
Uninfected 162 1
Infected 428 2.37 (1.39, 4.06) 0.003
A. lumbricoides
Uninfected 164 1
Infected 242 1.57 (0.85, 2.89) 0.15
*For binary outcomes, figures shown are n/N with percentages adjusted for the survey design. For continuous outcomes, figures shown are
geometric means adjusted for the survey design.
†For binary outcomes, figures shown are adjusted odds ratios (OR) [95% confidence intervals (CI)] adjusted for survey design. For continuous
outcomes, figures shown are adjusted geometric mean ratios (GMR) (95% CI) adjusted for survey design.
‡All adjusted ORs adjusted for age, sex, occupation, area of birth. For associations with detectable Dermatophagoides IgE, ORs were addition-
ally adjusted as follows: S. mansoni – preschool attendance, A. lumbricoides infection; hookworm – S. mansoni infection, S. stercoralis infec-
tion; T. trichiura – household crowding, animal ownership, S. mansoni infection, A. lumbricoides infection; S. stercoralis – household
crowding, animal ownership; A. lumbricoides – S. mansoni infection. For associations with detectable cockroach IgE, ORs were additionally
adjusted as follows: hookworm –S. stercoralis infection; T. trichiura – animal ownership; S. stercoralis – animal ownership.
All adjusted GMRs adjusted for age, sex, occupation, area of birth. For associations with Dermatophagoides IgE, GMRs were additionally
adjusted as follows: S. mansoni – number of siblings, preschool attendance, hand-washing behaviour, A. lumbricoides infection; hookworm –
number of siblings, malaria infection, S. mansoni infection, S. stercoralis infection; T. trichiura – household crowding, hand-washing behaviour,
animal ownership, S. mansoni infection, A. lumbricoides infection; S. stercoralis – number of siblings, household crowding and animal owner-
ship; M. perstans – malaria infection; A. lumbricoides – S. mansoni infection. For associations with cockroach IgE, GMRs were additionally
adjusted as follows: S. mansoni –maternal history of asthma, hookworm infection; hookworm – anthelminthic treatment in last year; T. trichiura
– HIV infection, animal ownership, hookworm infection; S. stercoralis – HIV infection, animal ownership, anthelminthic treatment in last year.
§Based on Kato-Katz.
¶Light: 1–99 eggs per gram, moderate: 100–399 eggs per gram, heavy: ≥400 eggs per gram.
**P-value for test for trend.
Allergy 71 (2016) 1156–1169 © 2016 The Authors. Allergy Published by John Wiley & Sons Ltd 1165
Webb et al. Positive associations between helminths and allergy
320
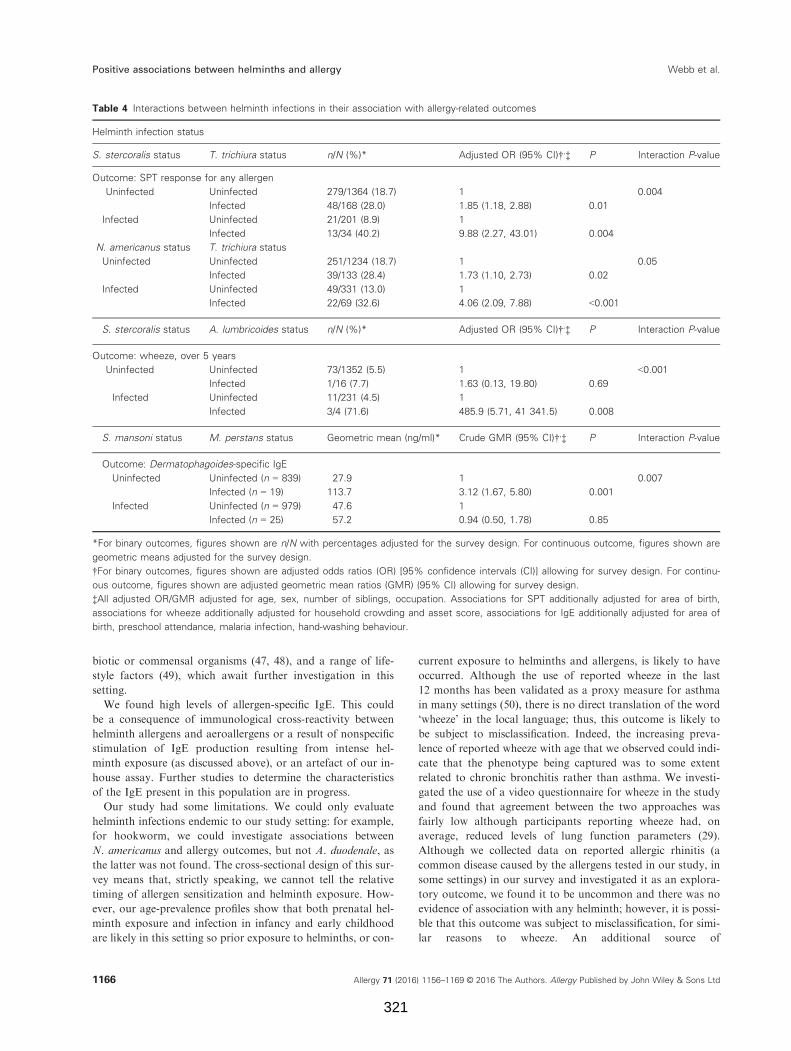
biotic or commensal organisms (47, 48), and a range of life-
style factors (49), which await further investigation in this
setting.
We found high levels of allergen-specific IgE. This could
be a consequence of immunological cross-reactivity between
helminth allergens and aeroallergens or a result of nonspecific
stimulation of IgE production resulting from intense hel-
minth exposure (as discussed above), or an artefact of our in-
house assay. Further studies to determine the characteristics
of the IgE present in this population are in progress.
Our study had some limitations. We could only evaluate
helminth infections endemic to our study setting: for example,
for hookworm, we could investigate associations between
N. americanus and allergy outcomes, but not A. duodenale, as
the latter was not found. The cross-sectional design of this sur-
vey means that, strictly speaking, we cannot tell the relative
timing of allergen sensitization and helminth exposure. How-
ever, our age-prevalence profiles show that both prenatal hel-
minth exposure and infection in infancy and early childhood
are likely in this setting so prior exposure to helminths, or con-
current exposure to helminths and allergens, is likely to have
occurred. Although the use of reported wheeze in the last
12 months has been validated as a proxy measure for asthma
in many settings (50), there is no direct translation of the word
‘wheeze’ in the local language; thus, this outcome is likely to
be subject to misclassification. Indeed, the increasing preva-
lence of reported wheeze with age that we observed could indi-
cate that the phenotype being captured was to some extent
related to chronic bronchitis rather than asthma. We investi-
gated the use of a video questionnaire for wheeze in the study
and found that agreement between the two approaches was
fairly low although participants reporting wheeze had, on
average, reduced levels of lung function parameters (29).
Although we collected data on reported allergic rhinitis (a
common disease caused by the allergens tested in our study, in
some settings) in our survey and investigated it as an explora-
tory outcome, we found it to be uncommon and there was no
evidence of association with any helminth; however, it is possi-
ble that this outcome was subject to misclassification, for simi-
lar reasons to wheeze. An additional source of
Table 4 Interactions between helminth infections in their association with allergy-related outcomes
Helminth infection status
S. stercoralis status T. trichiura status n/N (%)* Adjusted OR (95% CI)†,‡ P Interaction P-value
Outcome: SPT response for any allergen
Uninfected Uninfected 279/1364 (18.7) 1 0.004
Infected 48/168 (28.0) 1.85 (1.18, 2.88) 0.01
Infected Uninfected 21/201 (8.9) 1
Infected 13/34 (40.2) 9.88 (2.27, 43.01) 0.004
N. americanus status T. trichiura status
Uninfected Uninfected 251/1234 (18.7) 1 0.05
Infected 39/133 (28.4) 1.73 (1.10, 2.73) 0.02
Infected Uninfected 49/331 (13.0) 1
Infected 22/69 (32.6) 4.06 (2.09, 7.88) <0.001
S. stercoralis status A. lumbricoides status n/N (%)* Adjusted OR (95% CI)†,‡ P Interaction P-value
Outcome: wheeze, over 5 years
Uninfected Uninfected 73/1352 (5.5) 1 <0.001
Infected 1/16 (7.7) 1.63 (0.13, 19.80) 0.69
Infected Uninfected 11/231 (4.5) 1
Infected 3/4 (71.6) 485.9 (5.71, 41 341.5) 0.008
S. mansoni status M. perstans status Geometric mean (ng/ml)* Crude GMR (95% CI)†,‡ P Interaction P-value
Outcome: Dermatophagoides-specific IgE
Uninfected Uninfected (n = 839) 27.9 1 0.007
Infected (n = 19) 113.7 3.12 (1.67, 5.80) 0.001
Infected Uninfected (n = 979) 47.6 1
Infected (n = 25) 57.2 0.94 (0.50, 1.78) 0.85
*For binary outcomes, figures shown are n/N with percentages adjusted for the survey design. For continuous outcome, figures shown are
geometric means adjusted for the survey design.
†For binary outcomes, figures shown are adjusted odds ratios (OR) [95% confidence intervals (CI)] allowing for survey design. For continu-
ous outcome, figures shown are adjusted geometric mean ratios (GMR) (95% CI) allowing for survey design.
‡All adjusted OR/GMR adjusted for age, sex, number of siblings, occupation. Associations for SPT additionally adjusted for area of birth,
associations for wheeze additionally adjusted for household crowding and asset score, associations for IgE additionally adjusted for area of
birth, preschool attendance, malaria infection, hand-washing behaviour.
Allergy 71 (2016) 1156–1169 © 2016 The Authors. Allergy Published by John Wiley & Sons Ltd1166
Positive associations between helminths and allergy Webb et al.
321
misclassification is that we used single stool samples to assess
helminth infection status (51, 52). Indeed for the subgroup of
participants who underwent urine CCA testing, the prevalence
of S. mansoni was found to be much higher than when tested
using Kato-Katz of the single stool sample. Also, the PCR
method used had limited sensitivity for Strongyloides. This
could have led to underestimation of the size of any true asso-
ciation. The study involved a large number of statistical tests,
for which we made no formal adjustment; however, the consis-
tent patterns of positive associations are unlikely to be
explained by chance. Findings from our interaction analyses
should be treated with caution. Although not all of these anal-
yses were preplanned, we felt they were important to try to
shed light on our unexpected findings.
In conclusion, we found that certain helminth infections
were positively associated with allergy-related outcomes in
this setting, with inverse associations only being seen in sub-
group analyses. The LaVIISWA trial is currently ongoing
and the impact of intensive vs standard anthelminthic treat-
ment will be investigated in a further cross-sectional house-
hold survey in 2016. At that time, we will be able to assess
not only the direct impact of worm removal on allergy-
related outcomes, but also the effect of the trial interventions
on the associations reported herein. If there is a causal rela-
tionship underlying the observed associations, then the
allergy-related outcome prevalence might reduce with the
removal of helminth infection, rather than increasing as ini-
tially hypothesized.
LaVIISWA trial team
Project leaders: Margaret Nampijja, Richard Sanya, Barbara
Nerima. Statisticians and data managers: Emily Webb, Lawr-
ence Muhangi, Beatrice Mirembe, Justin Okello, Jonathan
Levin. Clinical officer: Milly Namutebi, Christopher Zziwa.
Nurses: Esther Nakazibwe, Josephine Tumusiime. Internal
monitor: Mirriam Akello. Field workers: Robert Kizindo,
Moses Sewankambo, Denis Nsubuga. Laboratory staff: Ste-
phen Cose, Linda Wammes, Proscovia Kabubi, Emmanuel
Niwagaba, Gloria Oduru, Grace Kabami, Elson Abayo,
Joyce Kabagenyi, Gyaviira Nkurunungi, Fred Muwonge,
Dennison Kizito. Boatman: David Abiriga. HIV counselling
and testing: Victoria Nannozi. Vector Control Programme
staff: James Kaweesa, Edridah Tukahebwa. Principal investi-
gator: Alison Elliott.
Acknowledgments
We thank the Koome subcounty community members, their
local council leaders and beach management committee mem-
bers, and village health team members for participating in this
study. We thank Koome Health Centre for their support. We
thank the leadership of Mukono District, particularly the dis-
trict health officer (Elly Tumushabe) and the councillor for
Koome subcounty (Asuman Muwumuza), who are the mem-
bers of the Trial Steering Committee (TSC), for their support.
We thank also the other members of the TSC: Heiner Gross-
kurth (chair), Edridah Tukahebwa, Narcis Kabatereine, Neil
Pearce and Anatoli Kamali. We thank the Makerere Univer-
sity, Mbarara University Joint AIDS Programme (MJAP) for
providing voluntary counselling and HIV testing for commu-
nity members, including study participants, in collaboration
with our research programme. The study is funded by the
Wellcome Trust, grant number 095778.
Conflict of interest
The authors declare that they have no conflicts of interest.
Author contributions
AME conceived the study. AME, ELW, ET and M Nampijja
participated in designing the parent trial. AME, M Nampijja, J
Kaweesa, RK, EN and M Namutebi led and participated in
the survey. GO and PK ran the field laboratory, while J Kaba-
genyi, GN, DK and BN participated in establishing and con-
ducting immunological assays and PCR. JJV trained and
assisted in stool PCR. MA monitored the study activities. LM
managed the database. ELW conducted the statistical analysis.
ELW, M Nampijja and AME drafted the manuscript and all
authors reviewed and contributed to it. All authors read and
approved the final version of the manuscript.
Supporting Information
Additional Supporting Information may be found in the
online version of this article:
Table S1. Associations between allergy outcomes stratified
by S. mansoni and N. americanus status.
References
1. Anandan C, Nurmatov U, van Schayck OC,
Sheikh A. Is the prevalence of asthma
declining? Systematic review of epidemiologi-
cal studies Allergy 2010;65:152–167.
2. Cooper PJ, Rodrigues LC, Cruz AA, Bar-
reto ML. Asthma in Latin America: a public
heath challenge and research opportunity.
Allergy 2009;64:5–17.
3. Masoli M, Fabian D, Holt S, Beasley R.
The global burden of asthma: executive
summary of the GINA Dissemination
Committee report. Allergy 2004;59:
469–478.
4. Carroll CL, Balkrishnan R, Feldman SR,
Fleischer AB Jr, Manuel JC. The burden of
atopic dermatitis: impact on the patient,
family, and society. Pediatr Dermatol
2005;22:192–199.
5. Pearce N, Ait-Khaled N, Beasley R, Mallol
J, Keil U, Mitchell E, et al. Worldwide
trends in the prevalence of asthma symp-
toms: phase III of the International Study of
Asthma and Allergies in Childhood
(ISAAC). Thorax 2007;62:758–766.
6. Williams H, Stewart A, von Mutius E,
Cookson W, Anderson HR, International
Study of A, et al. Is eczema really on the
increase worldwide? J Allergy Clin Immunol
2008;121:947–954.
7. Hotez PJ, Brindley PJ, Bethony JM, King
CH, Pearce EJ, Jacobson J. Helminth infec-
tions: the great neglected tropical diseases. J
Clin Invest 2008;118:1311–1321.
Allergy 71 (2016) 1156–1169 © 2016 The Authors. Allergy Published by John Wiley & Sons Ltd 1167
Webb et al. Positive associations between helminths and allergy
322
8. Flohr C, Weiland SK, Weinmayr G, Bjorksten
B, Braback L, Brunekreef B, et al. The role of
atopic sensitization in flexural eczema: findings
from the International Study of Asthma and
Allergies in Childhood Phase Two. J Allergy
Clin Immunol 2008;121:141–147.
9. Weinmayr G, Weiland SK, Bjorksten B,
Brunekreef B, Buchele G, Cookson WO,
et al. Atopic sensitization and the interna-
tional variation of asthma symptom preva-
lence in children. Am J Respir Crit Care
Med 2007;176:565–574.
10. Hewitson JP, Grainger JR, Maizels RM.
Helminth immunoregulation: the role of par-
asite secreted proteins in modulating host
immunity. Mol Biochem Parasitol 2009;167:
1–11.
11. van Riet E, Hartgers FC, Yazdanbakhsh M.
Chronic helminth infections induce
immunomodulation: consequences and mech-
anisms. Immunobiology 2007;212:475–490.
12. Fitzsimmons CM, Dunne DW. Survival of
the fittest: allergology or parasitology?
Trends Parasitol 2009;25:447–451.
13. Smits HH, Everts B, Hartgers FC, Yazdan-
bakhsh M. Chronic helminth infections pro-
tect against allergic diseases by active
regulatory processes. Curr Allergy Asthma
Rep 2010;10:3–12.
14. Flohr C, Quinnell RJ, Britton J. Do hel-
minth parasites protect against atopy and
allergic disease? Clin Exp Allergy 2009;39:
20–32.
15. Leonardi-Bee J, Pritchard D, Britton J.
Asthma and current intestinal parasite infec-
tion: systematic review and meta-analysis. Am
J Respir Crit Care Med 2006;174:514–523.
16. Wammes LJ, Mpairwe H, Elliott AM, Yaz-
danbakhsh M. Helminth therapy or elimina-
tion: epidemiological, immunological, and
clinical considerations. Lancet Infect Dis
2014;14:1150–1162.
17. Araujo MI, Lopes AA, Medeiros M, Cruz
AA, Sousa-Atta L, Sole D, et al. Inverse
association between skin response to aeroal-
lergens and Schistosoma mansoni infection.
Int Arch Allergy Immunol 2000;123:145–148.
18. van den Biggelaar AH, van Ree R, Rodri-
gues LC, Lell B, Deelder AM, Kremsner
PG, et al. Decreased atopy in children
infected with Schistosoma haematobium: a
role for parasite-induced interleukin-10. Lan-
cet 2000;356:1723–1727.
19. Obeng BB, Amoah AS, Larbi IA, de Souza
DK, Uh HW, Fernandez-Rivas M, et al.
Schistosome infection is negatively associ-
ated with mite atopy, but not wheeze and
asthma in Ghanaian schoolchildren. Clin
Exp Allergy 2014;44:965–975.
20. Rujeni N, Nausch N, Bourke CD, Midzi N,
Mduluza T, Taylor DW, et al. Atopy is
inversely related to schistosome infection
intensity: a comparative study in Zimbab-
wean villages with distinct levels of Schisto-
soma haematobium infection. Int Arch
Allergy Immunol 2012;158:288–298.
21. Pinot de Moira A, Fitzsimmons CM, Jones
FM, Wilson S, Cahen P, Tukahebwa E,
et al. Suppression of basophil histamine
release and other IgE-dependent responses in
childhood Schistosoma mansoni/hookworm
coinfection. J Infect Dis 2014;210:1198–1206.
22. Mpairwe H, Ndibazza J, Webb EL, Nampi-
jja M, Muhangi L, Apule B, et al. Maternal
hookworm modifies risk factors for child-
hood eczema: results from a birth cohort in
Uganda. Pediatr Allergy Immunol
2014;25:481–488.
23. Scrivener S, Yemaneberhan H, Zebenigus
M, Tilahun D, Girma S, Ali S, et al. Inde-
pendent effects of intestinal parasite infec-
tion and domestic allergen exposure on risk
of wheeze in Ethiopia: a nested case-control
study. Lancet 2001;358:1493–1499.
24. Moncayo AL, Vaca M, Oviedo G, Workman
LJ, Chico ME, Platts-Mills TA, et al. Effects
of geohelminth infection and age on the asso-
ciations between allergen-specific IgE, skin
test reactivity and wheeze: a case-control
study. Clin Exp Allergy 2013;43:60–72.
25. Lynch NR, Hagel I, Perez M, Di Prisco
MC, Lopez R, Alvarez N. Effect of anthel-
mintic treatment on the allergic reactivity of
children in a tropical slum. J Allergy Clin
Immunol 1993;92:404–411.
26. van den Biggelaar AH, Rodrigues LC, van
Ree R, van der Zee JS, Hoeksma-Kruize
YC, Souverijn JH, et al. Long-term treat-
ment of intestinal helminths increases mite
skin-test reactivity in Gabonese schoolchil-
dren. J Infect Dis 2004;189:892–900.
27. Cooper PJ, Chico ME, Vaca MG, Moncayo
AL, Bland JM, Mafla E, et al. Effect of
albendazole treatments on the prevalence of
atopy in children living in communities ende-
mic for geohelminth parasites: a cluster-ran-
domised trial. Lancet 2006;367:1598–1603.
28. Flohr C, Tuyen LN, Quinnell RJ, Lewis S,
Minh TT, Campbell J, et al. Reduced hel-
minth burden increases allergen skin sensiti-
zation but not clinical allergy: a randomized,
double-blind, placebo-controlled trial in
Vietnam. Clin Exp Allergy 2010;40:131–142.
29. Nampijja M, Webb EL, Kaweesa J, Kizindo
R, Namutebi M, Nakazibwe E, et al. The
Lake Victoria island intervention study on
worms and allergy-related diseases
(LaVIISWA): study protocol for a ran-
domised controlled trial. Trials 2015;16:187.
30. Brenninkmeijer EE, Schram ME, Leeflang
MM, Bos JD, Spuls PI. Diagnostic criteria
for atopic dermatitis: a systematic review. Br
J Dermatol 2008;158:754–765.
31. Ellwood P, Asher M, Beasley R, Clayton T,
Stewart A, Committee IS, et al. ISAAC
Phase Three Manual. 2000.
32. Williams HC. So how do I define Atopic
Eczema? A practical manual for researchers
wishing to define atopic eczema. [cited 15th
September 2010]; Available from: http://
www.nottingham.ac.uk/dermatology/eczema/
index.html
33. Katz N, Chaves A, Pellegrino J. A simple
device for quantitative stool thick-smear
technique in Schistosomiasis mansoni.
Rev Inst Med Trop Sao Paulo 1972;14:397–
400.
34. Verweij JJ, Brienen EA, Ziem J, Yelifari L,
Polderman AM, Van Lieshout L. Simultane-
ous detection and quantification of Ancy-
lostoma duodenale, Necator americanus,
and Oesophagostomum bifurcum in fecal
samples using multiplex real-time PCR. Am
J Trop Med Hyg 2007;77:685–690.
35. WHO. Prevention and Control of Schistoso-
miasis and Soil-transmitted Helminthiasis:
Report of a WHO Expert Committee. Gen-
eva: World Health Organization, 2002.
36. Melrose WD, Turner PF, Pisters P, Turner
B. An improved Knott’s concentration test
for the detection of microfilariae. Trans R
Soc Trop Med Hyg 2000;94:176.
37. Binder DA. On the variances of asymptoti-
cally normal estimators from complex sur-
veys. Int Stat Rev 1983;51:279–292.
38. Pearce N, Pekkanen J, Beasley R. How
much asthma is really attributable to atopy?
Thorax 1999;54:268–272.
39. Buendia E, Zakzuk J, Mercado D, Alvarez
A, Caraballo L. The IgE response to Ascaris
molecular components is associated with
clinical indicators of asthma severity. World
Allergy Organ J 2015;8:8.
40. Acevedo N, Sanchez J, Erler A, Mercado D,
Briza P, Kennedy M, et al. IgE cross-reactiv-
ity between Ascaris and domestic mite aller-
gens: the role of tropomyosin and the
nematode polyprotein ABA-1. Allergy
2009;64:1635–1643.
41. Nakazawa T, Khan AF, Yasueda H, Saito
A, Fukutomi Y, Takai T, et al. Immuniza-
tion of rabbits with nematode Ascaris lum-
bricoides antigens induces antibodies cross-
reactive to house dust mite Der-
matophagoides farinae antigens. Biosci
Biotechnol Biochem 2013;77:145–150.
42. Furmonaviciene R, Sewell HF, Shakib F.
Comparative molecular modelling identifies
a common putative IgE epitope on cysteine
protease allergens of diverse sources. Clin
Exp Allergy 2000;30:1307–1313.
43. Arruda LK, Santos AB. Immunologic
responses to common antigens in hel-
minthic infections and allergic disease.
Curr Opin Allergy Clin Immunol
2005;5:399–402.
44. Loffler W. Transient lung infiltrations with
blood eosinophilia. Int Arch Allergy Appl
Immunol 1956;8:54–59.
Allergy 71 (2016) 1156–1169 © 2016 The Authors. Allergy Published by John Wiley & Sons Ltd1168
Positive associations between helminths and allergy Webb et al.
323
45. Ait-Khaled N, Odhiambo J, Pearce N,
Adjoh KS, Maesano IA, Benhabyles B, et al.
Prevalence of symptoms of asthma, rhinitis
and eczema in 13- to 14-year-old children in
Africa: the International Study of Asthma
and Allergies in Childhood Phase III.
Allergy 2007;62:247–258.
46. Mpairwe H, Webb EL, Muhangi L,
Ndibazza J, Akishule D, Nampijja M,
et al. Anthelminthic treatment during preg-
nancy is associated with increased risk of
infantile eczema: randomised-controlled
trial results. Pediatr Allergy Immunol
2011;22:305–312.
47. von Mutius E, Vercelli D. Farm living:
effects on childhood asthma and allergy. Nat
Rev Immunol 2010;10:861–868.
48. Melli LC, do Carmo-Rodrigues MS, Ara-
ujo-Filho HB, Sole D, de Morais MB.
Intestinal microbiota and allergic diseases:
a systematic review. Allergol Immunopathol
(Madr) 2015;44:177–188.
49. Pearce N, Douwes J. Lifestyle changes and
childhood asthma. Indian J Pediatr 2013;80
(Suppl. 1):S95–S99.
50. Pekkanen J, Pearce N. Defining asthma in
epidemiological studies. Eur Respir J
1999;14:951–957.
51. Knopp S, Salim N, Schindler T, Karagiannis
Voules DA, Rothen J, Lweno O, et al. Diag-
nostic accuracy of Kato-Katz, FLOTAC,
Baermann, and PCR methods for the detec-
tion of light-intensity hookworm and
Strongyloides stercoralis infections in Tanza-
nia. Am J Trop Med Hyg 2014;90:535–545.
52. Utzinger J, Booth M, N’Goran EK, Muller
I, Tanner M, Lengeler C. Relative contri-
bution of day-to-day and intra-specimen
variation in faecal egg counts of Schisto-
soma mansoni before and after treatment
with praziquantel. Parasitology 2001;122:
537–544.
Allergy 71 (2016) 1156–1169 © 2016 The Authors. Allergy Published by John Wiley & Sons Ltd 1169
Webb et al. Positive associations between helminths and allergy
324
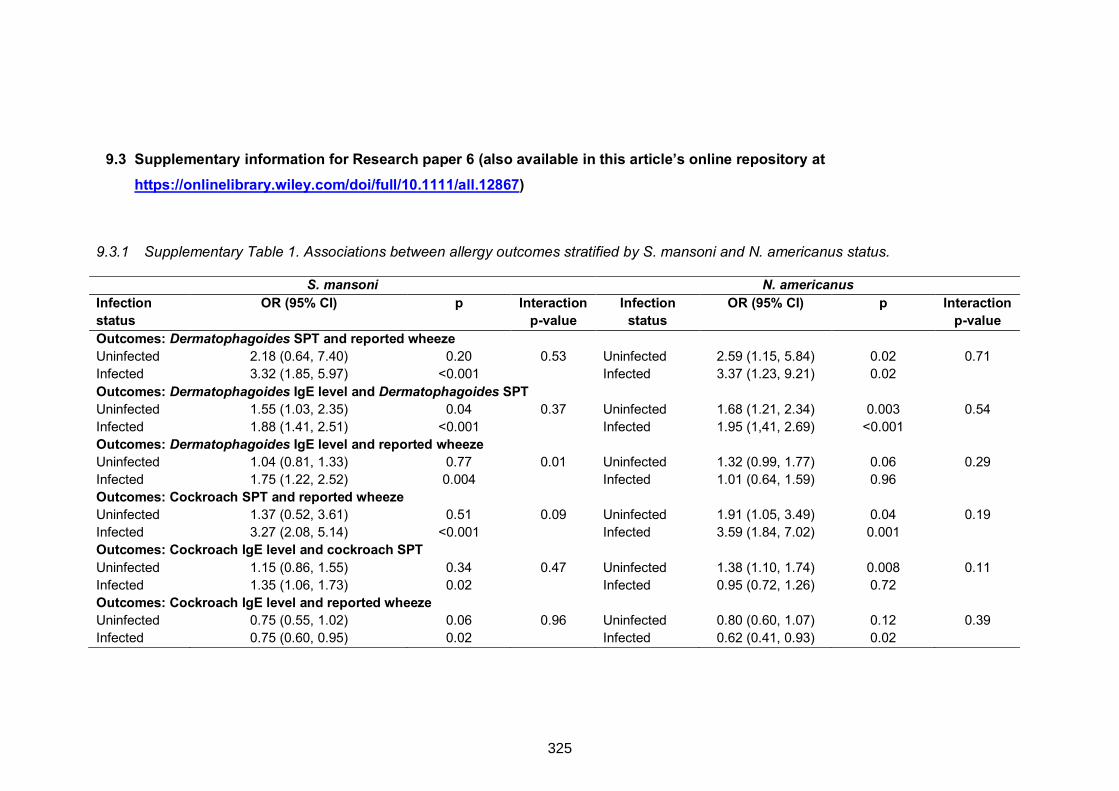
9.3 Supplementary information for Research paper 6 (also available in this article’s online repository at
https://onlinelibrary.wiley.com/doi/full/10.1111/all.12867)
9.3.1 Supplementary Table 1. Associations between allergy outcomes stratified by S. mansoni and N. americanus status.
S. mansoni N. americanus Infection status
OR (95% CI) p Interaction p-value
Infection status
OR (95% CI) p Interaction p-value
Outcomes: Dermatophagoides SPT and reported wheeze Uninfected 2.18 (0.64, 7.40) 0.20 0.53 Uninfected 2.59 (1.15, 5.84) 0.02 0.71 Infected 3.32 (1.85, 5.97) <0.001 Infected 3.37 (1.23, 9.21) 0.02 Outcomes: Dermatophagoides IgE level and Dermatophagoides SPT Uninfected 1.55 (1.03, 2.35) 0.04 0.37 Uninfected 1.68 (1.21, 2.34) 0.003 0.54 Infected 1.88 (1.41, 2.51) <0.001 Infected 1.95 (1,41, 2.69) <0.001 Outcomes: Dermatophagoides IgE level and reported wheeze Uninfected 1.04 (0.81, 1.33) 0.77 0.01 Uninfected 1.32 (0.99, 1.77) 0.06 0.29 Infected 1.75 (1.22, 2.52) 0.004 Infected 1.01 (0.64, 1.59) 0.96 Outcomes: Cockroach SPT and reported wheeze Uninfected 1.37 (0.52, 3.61) 0.51 0.09 Uninfected 1.91 (1.05, 3.49) 0.04 0.19 Infected 3.27 (2.08, 5.14) <0.001 Infected 3.59 (1.84, 7.02) 0.001 Outcomes: Cockroach IgE level and cockroach SPT Uninfected 1.15 (0.86, 1.55) 0.34 0.47 Uninfected 1.38 (1.10, 1.74) 0.008 0.11 Infected 1.35 (1.06, 1.73) 0.02 Infected 0.95 (0.72, 1.26) 0.72 Outcomes: Cockroach IgE level and reported wheeze Uninfected 0.75 (0.55, 1.02) 0.06 0.96 Uninfected 0.80 (0.60, 1.07) 0.12 0.39 Infected 0.75 (0.60, 0.95) 0.02 Infected 0.62 (0.41, 0.93) 0.02
325
9.4 APPENDIX 3: Research Paper 7: The impact of intensive versus standard anthelminthic treatment on allergy-related outcomes, helminth infection intensity, and helminth-related morbidity in Lake Victoria fishing communities, Uganda: results from the LaVIISWA cluster-randomized trial
326
327
328
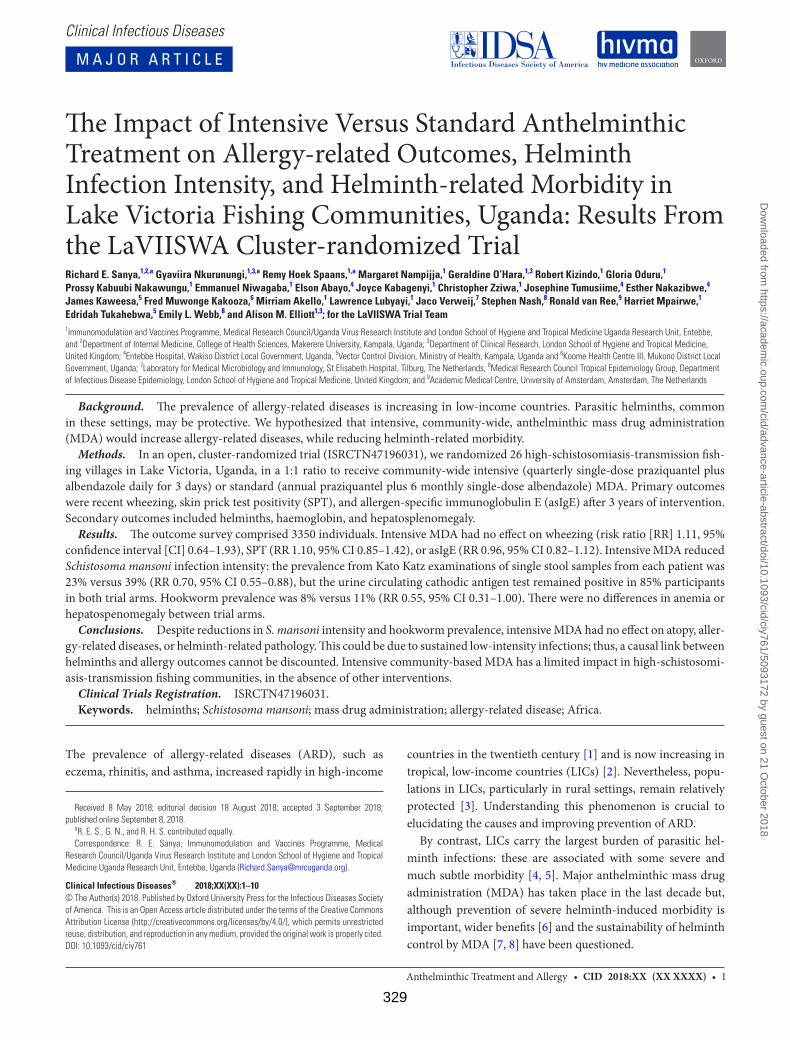
Clinical Infectious Diseases
• CID 2018:XX (XX XXXX) • 1Anthelminthic Treatment and Allergy
The Impact of Intensive Versus Standard Anthelminthic Treatment on Allergy-related Outcomes, Helminth Infection Intensity, and Helminth-related Morbidity in Lake Victoria Fishing Communities, Uganda: Results From the LaVIISWA Cluster-randomized TrialRichard E. Sanya,1,2,a Gyaviira Nkurunungi,1,3,a Remy Hoek Spaans,1,a Margaret Nampijja,1 Geraldine O’Hara,1,3 Robert Kizindo,1 Gloria Oduru,1 Prossy Kabuubi Nakawungu,1 Emmanuel Niwagaba,1 Elson Abayo,4 Joyce Kabagenyi,1 Christopher Zziwa,1 Josephine Tumusiime,4 Esther Nakazibwe,4 James Kaweesa,5 Fred Muwonge Kakooza,6 Mirriam Akello,1 Lawrence Lubyayi,1 Jaco Verweij,7 Stephen Nash,8 Ronald van Ree,9 Harriet Mpairwe,1 Edridah Tukahebwa,5 Emily L. Webb,8 and Alison M. Elliott1,3; for the LaVIISWA Trial Team1Immunomodulation and Vaccines Programme, Medical Research Council/Uganda Virus Research Institute and London School of Hygiene and Tropical Medicine Uganda Research Unit, Entebbe, and 2Department of Internal Medicine, College of Health Sciences, Makerere University, Kampala, Uganda; 3Department of Clinical Research, London School of Hygiene and Tropical Medicine, United Kingdom; 4Entebbe Hospital, Wakiso District Local Government, Uganda, 5Vector Control Division, Ministry of Health, Kampala, Uganda and 6Koome Health Centre III, Mukono District Local Government, Uganda; 7Laboratory for Medical Microbiology and Immunology, St Elisabeth Hospital, Tilburg, The Netherlands; 8Medical Research Council Tropical Epidemiology Group, Department of Infectious Disease Epidemiology, London School of Hygiene and Tropical Medicine, United Kingdom; and 9Academic Medical Centre, University of Amsterdam, Amsterdam, The Netherlands
Background. The prevalence of allergy-related diseases is increasing in low-income countries. Parasitic helminths, common in these settings, may be protective. We hypothesized that intensive, community-wide, anthelminthic mass drug administration (MDA) would increase allergy-related diseases, while reducing helminth-related morbidity.
Methods. In an open, cluster-randomized trial (ISRCTN47196031), we randomized 26 high-schistosomiasis-transmission fish-ing villages in Lake Victoria, Uganda, in a 1:1 ratio to receive community-wide intensive (quarterly single-dose praziquantel plus albendazole daily for 3 days) or standard (annual praziquantel plus 6 monthly single-dose albendazole) MDA. Primary outcomes were recent wheezing, skin prick test positivity (SPT), and allergen-specific immunoglobulin E (asIgE) after 3 years of intervention. Secondary outcomes included helminths, haemoglobin, and hepatosplenomegaly.
Results. The outcome survey comprised 3350 individuals. Intensive MDA had no effect on wheezing (risk ratio [RR] 1.11, 95% confidence interval [CI] 0.64–1.93), SPT (RR 1.10, 95% CI 0.85–1.42), or asIgE (RR 0.96, 95% CI 0.82–1.12). Intensive MDA reduced Schistosoma mansoni infection intensity: the prevalence from Kato Katz examinations of single stool samples from each patient was 23% versus 39% (RR 0.70, 95% CI 0.55–0.88), but the urine circulating cathodic antigen test remained positive in 85% participants in both trial arms. Hookworm prevalence was 8% versus 11% (RR 0.55, 95% CI 0.31–1.00). There were no differences in anemia or hepatospenomegaly between trial arms.
Conclusions. Despite reductions in S. mansoni intensity and hookworm prevalence, intensive MDA had no effect on atopy, aller-gy-related diseases, or helminth-related pathology. This could be due to sustained low-intensity infections; thus, a causal link between helminths and allergy outcomes cannot be discounted. Intensive community-based MDA has a limited impact in high-schistosomi-asis-transmission fishing communities, in the absence of other interventions.
Clinical Trials Registration. ISRCTN47196031.Keywords. helminths; Schistosoma mansoni; mass drug administration; allergy-related disease; Africa.
The prevalence of allergy-related diseases (ARD), such as eczema, rhinitis, and asthma, increased rapidly in high-income
countries in the twentieth century [1] and is now increasing in tropical, low-income countries (LICs) [2]. Nevertheless, popu-lations in LICs, particularly in rural settings, remain relatively protected [3]. Understanding this phenomenon is crucial to elucidating the causes and improving prevention of ARD.
By contrast, LICs carry the largest burden of parasitic hel-minth infections: these are associated with some severe and much subtle morbidity [4, 5]. Major anthelminthic mass drug administration (MDA) has taken place in the last decade but, although prevention of severe helminth-induced morbidity is important, wider benefits [6] and the sustainability of helminth control by MDA [7, 8] have been questioned.
M A J O R A R T I C L E
© The Author(s) 2018. Published by Oxford University Press for the Infectious Diseases Society of America. This is an Open Access article distributed under the terms of the Creative Commons Attribution License (http://creativecommons.org/licenses/by/4.0/), which permits unrestricted reuse, distribution, and reproduction in any medium, provided the original work is properly cited.DOI: 10.1093/cid/ciy761
Received 8 May 2018; editorial decision 18 August 2018; accepted 3 September 2018; published online September 8, 2018.
aR. E. S., G. N., and R. H. S. contributed equally.Correspondence: R. E. Sanya, Immunomodulation and Vaccines Programme, Medical
Research Council/Uganda Virus Research Institute and London School of Hygiene and Tropical Medicine Uganda Research Unit, Entebbe, Uganda ([email protected]).
Clinical Infectious Diseases® 2018;XX(XX):1–10
OA-CC-BY
Dow
nloaded from https://academ
ic.oup.com/cid/advance-article-abstract/doi/10.1093/cid/ciy761/5093172 by guest on 21 O
ctober 2018
329

2 • CID 2018:XX (XX XXXX) • Sanya et al
Certain helminth antigens are highly homologous to allergens; immunoglobulin (Ig)-E and the atopic pathway are presumed to have evolved to protect mammals against such organisms [9]. Parasitic helminths must modulate such responses to survive within mammalian hosts. Animal and human epidemiologi-cal and in vitro studies indicate that, through bystander effects of such immunomodulation, chronic helminth infection pro-tects against atopy and ARD [10]. If helminths protect against ARD, MDA programs may adversely affect these outcomes. Observational studies, many of which indicate an inverse asso-ciation between helminths and ARD, are subject to confounding and reverse causation; therefore, several groups have investi-gated the effects of anthelminthic treatment on ARD in clinical trials. Some studies show increased atopy after anthelminthic intervention, but 2 large, school-based, individually-random-ized intervention trials focusing on soil-transmitted helminths (STH) reported no effect on atopy or ARD [11, 12]. A recent household-randomized trial of intensive albendazole for STH showed no effect on ARD, but upregulated pro-inflammatory responses and reduced immunoregulatory molecules [13].
East African fishing communities bear an intense schisto-somiasis burden [14]. During a Schistosoma mansoni infec-tion, adult worms reside in mesenteric blood vessels and eggs are excreted through intestinal mucosa, causing intestinal and tissue (notably liver) pathology [5]. Schistosoma infection has shown even stronger inverse associations with atopy than STH [15] and there is evidence of increased SPT reactivity with treatment [16], but no large-scale randomized trial on the aller-gy-related effects of intensively treating schistosomiasis has been conducted.
We undertook the Lake Victoria Island Intervention Study on Worms and Allergy-related diseases (LaVIISWA; ISRCTN47196031) [17], a cluster-randomized trial of extended (3-year) intensive versus standard anthelminthic intervention, to assess the causal role of helminths in allergy-related outcomes and the benefits of intensive intervention for helminth-related morbidity in a schistosomiasis hot spot.
METHODS
Design and Setting
This was a 2-arm, open, cluster-randomized trial of intensive versus standard anthelminthic treatment conducted among fishing villages in the Koome islands, Lake Victoria, Uganda, between September 2012 and August 2016. The protocol has been published previously [17]. We randomized 26 villages 1:1 to either intensive or standard intervention. Village-level clus-ter-randomization aimed to minimize contamination from reinfection by untreated neighbours. Before the study, annual praziquantel treatment was offered to these communities, but hampered by logistics. In our baseline survey, 17% participants reported treatment in the prior year [17].
Interventions
Standard intervention, based on the Uganda Ministry of Health guidelines, was annual single dose praziquantel at 40 mg/kg (Cipla; CSPC OUYI Pharmaceuticals, India; AGOG Pharma, India) to community members ≥94 cm, as estimated by a height pole, plus 6 monthly single dose albendazole at 400 mg (CSPC OUYI Pharmaceuticals, India; AGOG Pharma, India; Medreich, India) to all aged ≥1 year. Intensive intervention was quarterly single dose praziquantel at 40 mg/kg to individuals ≥60 cm (to allow treatment of younger children) [18], as estimated by an extended height pole, plus quarterly triple dose albendazole (400 mg daily for 3 days) to all aged ≥1 year. Pregnant women were included in both arms, receiving single dose albendazole [19, 20].
Treatment, distributed house-to-house in collaboration with the Uganda Ministry of Health Vector Control Division, was directly observed and documented against household registers, with the exception of post–day 1 albendazole in the intensive arm.
Participants and Surveys
Leaders of all 27 Koome fishing villages gave written consent for their village’s participation. Allocated interventions were given to all community members (of eligible age and height) unless they were absent, sick, or refused.
Household-based surveys were conducted at baseline [21] and after 3 years of intervention. All primary and most sec-ondary outcomes were assessed in both baseline and outcome surveys. Smaller surveys were conducted at years 1 and 2 to assess helminth trends (Supplementary Figure). Separate ran-dom household samples were selected for each survey (overlap was possible). There was no individual participant follow-up. Surveys were conducted immediately prior to respective quar-terly treatments.
Household registers were updated before each survey. Villages generally comprised an intensely-populated center and a scattered periphery. Peripheral households were excluded from surveys to avoid contamination from neighboring vil-lages, but received allocated interventions.
Baseline survey methods (previously reported) were similar to the 3-year outcome survey described below [21]. For interim surveys, stool and blood samples were collected from commu-nity members selected using a 2-stage method: 1 person was randomly selected from each of 15 randomly-selected house-holds per village. For the 3-year survey, 70 households per vil-lage were randomly selected using a Stata program (StataCorp, College Station). In the selected households, all members ≥1 year were invited to participate. Household heads gave per-mission for household participation and provided the demo-graphic details (age, sex) of all household members. Written informed consent was obtained from all adults and emanci-pated minors and from parents/guardians for children, with
Dow
nloaded from https://academ
ic.oup.com/cid/advance-article-abstract/doi/10.1093/cid/ciy761/5093172 by guest on 21 O
ctober 2018
330
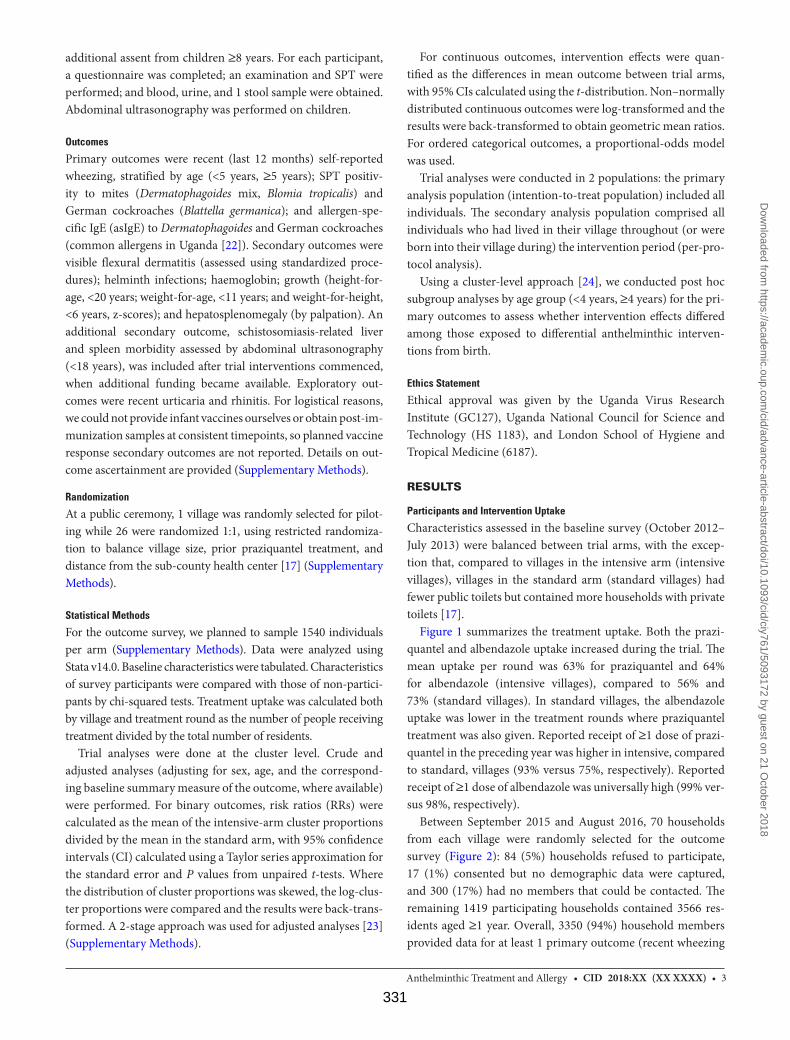
• CID 2018:XX (XX XXXX) • 3Anthelminthic Treatment and Allergy
additional assent from children ≥8 years. For each participant, a questionnaire was completed; an examination and SPT were performed; and blood, urine, and 1 stool sample were obtained. Abdominal ultrasonography was performed on children.
Outcomes
Primary outcomes were recent (last 12 months) self-reported wheezing, stratified by age (<5 years, ≥5 years); SPT positiv-ity to mites (Dermatophagoides mix, Blomia tropicalis) and German cockroaches (Blattella germanica); and allergen-spe-cific IgE (asIgE) to Dermatophagoides and German cockroaches (common allergens in Uganda [22]). Secondary outcomes were visible flexural dermatitis (assessed using standardized proce-dures); helminth infections; haemoglobin; growth (height-for-age, <20 years; weight-for-age, <11 years; and weight-for-height, <6 years, z-scores); and hepatosplenomegaly (by palpation). An additional secondary outcome, schistosomiasis-related liver and spleen morbidity assessed by abdominal ultrasonography (<18 years), was included after trial interventions commenced, when additional funding became available. Exploratory out-comes were recent urticaria and rhinitis. For logistical reasons, we could not provide infant vaccines ourselves or obtain post-im-munization samples at consistent timepoints, so planned vaccine response secondary outcomes are not reported. Details on out-come ascertainment are provided (Supplementary Methods).
Randomization
At a public ceremony, 1 village was randomly selected for pilot-ing while 26 were randomized 1:1, using restricted randomiza-tion to balance village size, prior praziquantel treatment, and distance from the sub-county health center [17] (Supplementary Methods).
Statistical Methods
For the outcome survey, we planned to sample 1540 individuals per arm (Supplementary Methods). Data were analyzed using Stata v14.0. Baseline characteristics were tabulated. Characteristics of survey participants were compared with those of non-partici-pants by chi-squared tests. Treatment uptake was calculated both by village and treatment round as the number of people receiving treatment divided by the total number of residents.
Trial analyses were done at the cluster level. Crude and adjusted analyses (adjusting for sex, age, and the correspond-ing baseline summary measure of the outcome, where available) were performed. For binary outcomes, risk ratios (RRs) were calculated as the mean of the intensive-arm cluster proportions divided by the mean in the standard arm, with 95% confidence intervals (CI) calculated using a Taylor series approximation for the standard error and P values from unpaired t-tests. Where the distribution of cluster proportions was skewed, the log-clus-ter proportions were compared and the results were back-trans-formed. A 2-stage approach was used for adjusted analyses [23] (Supplementary Methods).
For continuous outcomes, intervention effects were quan-tified as the differences in mean outcome between trial arms, with 95% CIs calculated using the t-distribution. Non–normally distributed continuous outcomes were log-transformed and the results were back-transformed to obtain geometric mean ratios. For ordered categorical outcomes, a proportional-odds model was used.
Trial analyses were conducted in 2 populations: the primary analysis population (intention-to-treat population) included all individuals. The secondary analysis population comprised all individuals who had lived in their village throughout (or were born into their village during) the intervention period (per-pro-tocol analysis).
Using a cluster-level approach [24], we conducted post hoc subgroup analyses by age group (<4 years, ≥4 years) for the pri-mary outcomes to assess whether intervention effects differed among those exposed to differential anthelminthic interven-tions from birth.
Ethics Statement
Ethical approval was given by the Uganda Virus Research Institute (GC127), Uganda National Council for Science and Technology (HS 1183), and London School of Hygiene and Tropical Medicine (6187).
RESULTS
Participants and Intervention Uptake
Characteristics assessed in the baseline survey (October 2012–July 2013) were balanced between trial arms, with the excep-tion that, compared to villages in the intensive arm (intensive villages), villages in the standard arm (standard villages) had fewer public toilets but contained more households with private toilets [17].
Figure 1 summarizes the treatment uptake. Both the prazi-quantel and albendazole uptake increased during the trial. The mean uptake per round was 63% for praziquantel and 64% for albendazole (intensive villages), compared to 56% and 73% (standard villages). In standard villages, the albendazole uptake was lower in the treatment rounds where praziquantel treatment was also given. Reported receipt of ≥1 dose of prazi-quantel in the preceding year was higher in intensive, compared to standard, villages (93% versus 75%, respectively). Reported receipt of ≥1 dose of albendazole was universally high (99% ver-sus 98%, respectively).
Between September 2015 and August 2016, 70 households from each village were randomly selected for the outcome survey (Figure 2): 84 (5%) households refused to participate, 17 (1%) consented but no demographic data were captured, and 300 (17%) had no members that could be contacted. The remaining 1419 participating households contained 3566 res-idents aged ≥1 year. Overall, 3350 (94%) household members provided data for at least 1 primary outcome (recent wheezing
Dow
nloaded from https://academ
ic.oup.com/cid/advance-article-abstract/doi/10.1093/cid/ciy761/5093172 by guest on 21 O
ctober 2018
331
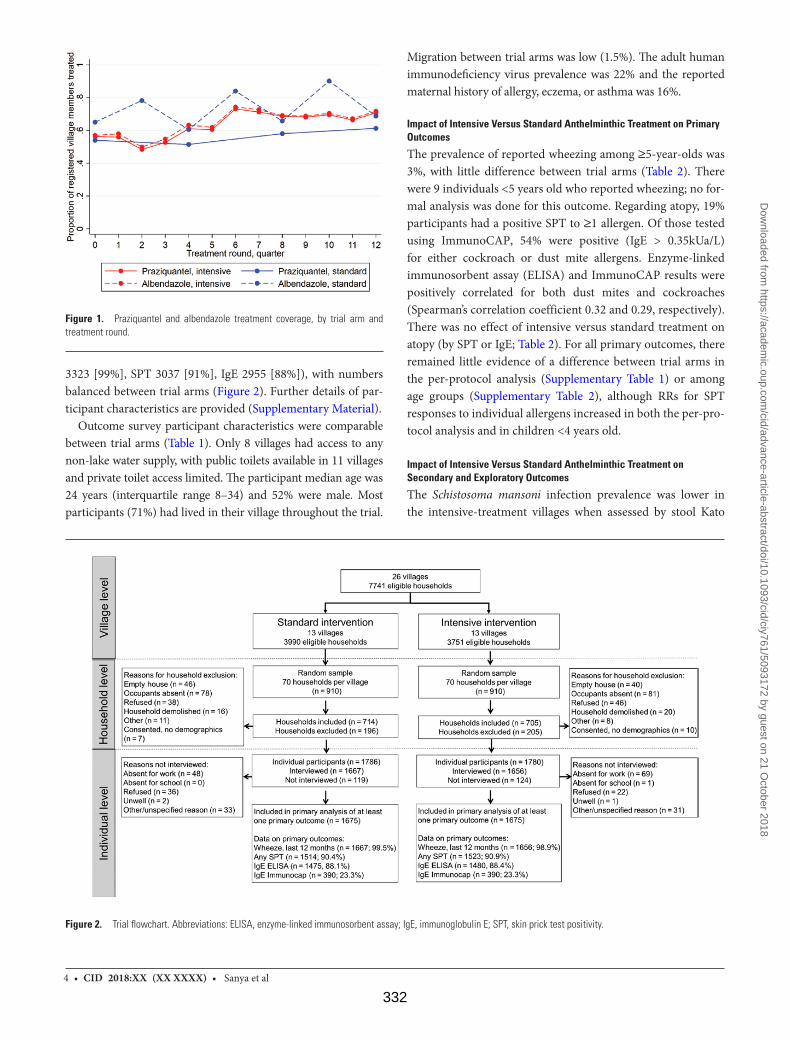
4 • CID 2018:XX (XX XXXX) • Sanya et al
3323 [99%], SPT 3037 [91%], IgE 2955 [88%]), with numbers balanced between trial arms (Figure 2). Further details of par-ticipant characteristics are provided (Supplementary Material).
Outcome survey participant characteristics were comparable between trial arms (Table 1). Only 8 villages had access to any non-lake water supply, with public toilets available in 11 villages and private toilet access limited. The participant median age was 24 years (interquartile range 8–34) and 52% were male. Most participants (71%) had lived in their village throughout the trial.
Migration between trial arms was low (1.5%). The adult human immunodeficiency virus prevalence was 22% and the reported maternal history of allergy, eczema, or asthma was 16%.
Impact of Intensive Versus Standard Anthelminthic Treatment on Primary Outcomes
The prevalence of reported wheezing among ≥5-year-olds was 3%, with little difference between trial arms (Table 2). There were 9 individuals <5 years old who reported wheezing; no for-mal analysis was done for this outcome. Regarding atopy, 19% participants had a positive SPT to ≥1 allergen. Of those tested using ImmunoCAP, 54% were positive (IgE > 0.35kUa/L) for either cockroach or dust mite allergens. Enzyme-linked immunosorbent assay (ELISA) and ImmunoCAP results were positively correlated for both dust mites and cockroaches (Spearman’s correlation coefficient 0.32 and 0.29, respectively). There was no effect of intensive versus standard treatment on atopy (by SPT or IgE; Table 2). For all primary outcomes, there remained little evidence of a difference between trial arms in the per-protocol analysis (Supplementary Table 1) or among age groups (Supplementary Table 2), although RRs for SPT responses to individual allergens increased in both the per-pro-tocol analysis and in children <4 years old.
Impact of Intensive Versus Standard Anthelminthic Treatment on Secondary and Exploratory Outcomes
The Schistosoma mansoni infection prevalence was lower in the intensive-treatment villages when assessed by stool Kato
Figure 2. Trial flowchart. Abbreviations: ELISA, enzyme-linked immunosorbent assay; IgE, immunoglobulin E; SPT, skin prick test positivity.
Figure 1. Praziquantel and albendazole treatment coverage, by trial arm and treatment round.
Dow
nloaded from https://academ
ic.oup.com/cid/advance-article-abstract/doi/10.1093/cid/ciy761/5093172 by guest on 21 O
ctober 2018
332
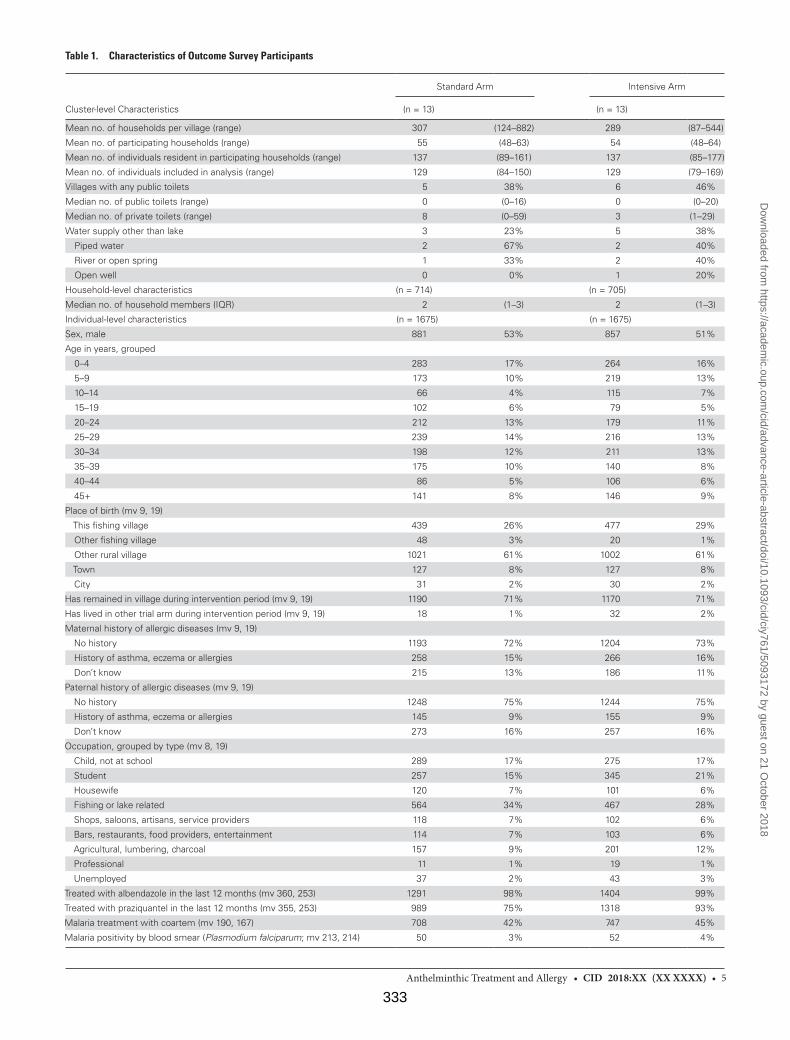
• CID 2018:XX (XX XXXX) • 5Anthelminthic Treatment and Allergy
Table 1. Characteristics of Outcome Survey Participants
Cluster-level Characteristics
Standard Arm Intensive Arm
(n = 13) (n = 13)
Mean no. of households per village (range) 307 (124–882) 289 (87–544)
Mean no. of participating households (range) 55 (48–63) 54 (48–64)
Mean no. of individuals resident in participating households (range) 137 (89–161) 137 (85–177)
Mean no. of individuals included in analysis (range) 129 (84–150) 129 (79–169)
Villages with any public toilets 5 38% 6 46%
Median no. of public toilets (range) 0 (0–16) 0 (0–20)
Median no. of private toilets (range) 8 (0–59) 3 (1–29)
Water supply other than lake 3 23% 5 38%
Piped water 2 67% 2 40%
River or open spring 1 33% 2 40%
Open well 0 0% 1 20%
Household-level characteristics (n = 714) (n = 705)
Median no. of household members (IQR) 2 (1–3) 2 (1–3)
Individual-level characteristics (n = 1675) (n = 1675)
Sex, male 881 53% 857 51%
Age in years, grouped
0–4 283 17% 264 16%
5–9 173 10% 219 13%
10–14 66 4% 115 7%
15–19 102 6% 79 5%
20–24 212 13% 179 11%
25–29 239 14% 216 13%
30–34 198 12% 211 13%
35–39 175 10% 140 8%
40–44 86 5% 106 6%
45+ 141 8% 146 9%
Place of birth (mv 9, 19)
This fishing village 439 26% 477 29%
Other fishing village 48 3% 20 1%
Other rural village 1021 61% 1002 61%
Town 127 8% 127 8%
City 31 2% 30 2%
Has remained in village during intervention period (mv 9, 19) 1190 71% 1170 71%
Has lived in other trial arm during intervention period (mv 9, 19) 18 1% 32 2%
Maternal history of allergic diseases (mv 9, 19)
No history 1193 72% 1204 73%
History of asthma, eczema or allergies 258 15% 266 16%
Don’t know 215 13% 186 11%
Paternal history of allergic diseases (mv 9, 19)
No history 1248 75% 1244 75%
History of asthma, eczema or allergies 145 9% 155 9%
Don’t know 273 16% 257 16%
Occupation, grouped by type (mv 8, 19)
Child, not at school 289 17% 275 17%
Student 257 15% 345 21%
Housewife 120 7% 101 6%
Fishing or lake related 564 34% 467 28%
Shops, saloons, artisans, service providers 118 7% 102 6%
Bars, restaurants, food providers, entertainment 114 7% 103 6%
Agricultural, lumbering, charcoal 157 9% 201 12%
Professional 11 1% 19 1%
Unemployed 37 2% 43 3%
Treated with albendazole in the last 12 months (mv 360, 253) 1291 98% 1404 99%
Treated with praziquantel in the last 12 months (mv 355, 253) 989 75% 1318 93%
Malaria treatment with coartem (mv 190, 167) 708 42% 747 45%
Malaria positivity by blood smear (Plasmodium falciparum; mv 213, 214) 50 3% 52 4%
Dow
nloaded from https://academ
ic.oup.com/cid/advance-article-abstract/doi/10.1093/cid/ciy761/5093172 by guest on 21 O
ctober 2018
333
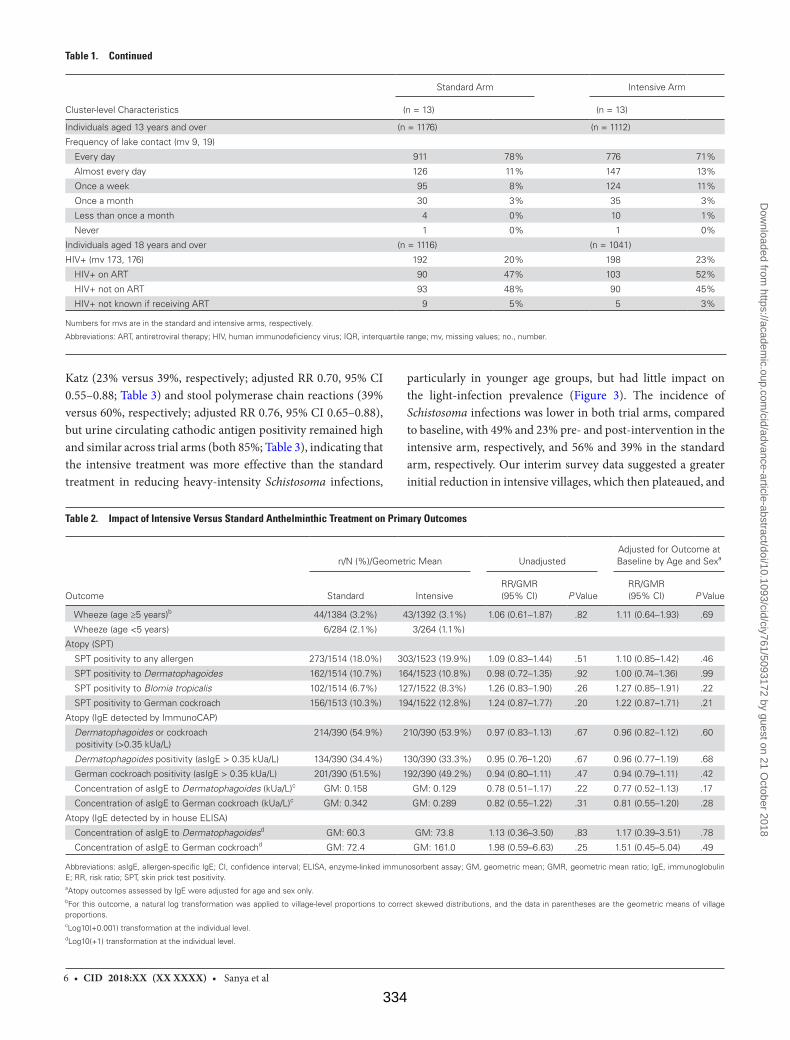
6 • CID 2018:XX (XX XXXX) • Sanya et al
Katz (23% versus 39%, respectively; adjusted RR 0.70, 95% CI 0.55–0.88; Table 3) and stool polymerase chain reactions (39% versus 60%, respectively; adjusted RR 0.76, 95% CI 0.65–0.88), but urine circulating cathodic antigen positivity remained high and similar across trial arms (both 85%; Table 3), indicating that the intensive treatment was more effective than the standard treatment in reducing heavy-intensity Schistosoma infections,
particularly in younger age groups, but had little impact on the light-infection prevalence (Figure 3). The incidence of Schistosoma infections was lower in both trial arms, compared to baseline, with 49% and 23% pre- and post-intervention in the intensive arm, respectively, and 56% and 39% in the standard arm, respectively. Our interim survey data suggested a greater initial reduction in intensive villages, which then plateaued, and
Table 2. Impact of Intensive Versus Standard Anthelminthic Treatment on Primary Outcomes
Outcome
n/N (%)/Geometric Mean UnadjustedAdjusted for Outcome at Baseline by Age and Sexa
Standard IntensiveRR/GMR(95% CI) P Value
RR/GMR(95% CI) P Value
Wheeze (age ≥5 years)b 44/1384 (3.2%) 43/1392 (3.1%) 1.06 (0.61–1.87) .82 1.11 (0.64–1.93) .69
Wheeze (age <5 years) 6/284 (2.1%) 3/264 (1.1%)
Atopy (SPT)
SPT positivity to any allergen 273/1514 (18.0%) 303/1523 (19.9%) 1.09 (0.83–1.44) .51 1.10 (0.85–1.42) .46
SPT positivity to Dermatophagoides 162/1514 (10.7%) 164/1523 (10.8%) 0.98 (0.72–1.35) .92 1.00 (0.74–1.36) .99
SPT positivity to Blomia tropicalis 102/1514 (6.7%) 127/1522 (8.3%) 1.26 (0.83–1.90) .26 1.27 (0.85–1.91) .22
SPT positivity to German cockroach 156/1513 (10.3%) 194/1522 (12.8%) 1.24 (0.87–1.77) .20 1.22 (0.87–1.71) .21
Atopy (IgE detected by ImmunoCAP)
Dermatophagoides or cockroach positivity (>0.35 kUa/L)
214/390 (54.9%) 210/390 (53.9%) 0.97 (0.83–1.13) .67 0.96 (0.82–1.12) .60
Dermatophagoides positivity (asIgE > 0.35 kUa/L) 134/390 (34.4%) 130/390 (33.3%) 0.95 (0.76–1.20) .67 0.96 (0.77–1.19) .68
German cockroach positivity (asIgE > 0.35 kUa/L) 201/390 (51.5%) 192/390 (49.2%) 0.94 (0.80–1.11) .47 0.94 (0.79–1.11) .42
Concentration of asIgE to Dermatophagoides (kUa/L)c GM: 0.158 GM: 0.129 0.78 (0.51–1.17) .22 0.77 (0.52–1.13) .17
Concentration of asIgE to German cockroach (kUa/L)c GM: 0.342 GM: 0.289 0.82 (0.55–1.22) .31 0.81 (0.55–1.20) .28
Atopy (IgE detected by in house ELISA)
Concentration of asIgE to Dermatophagoidesd GM: 60.3 GM: 73.8 1.13 (0.36–3.50) .83 1.17 (0.39–3.51) .78
Concentration of asIgE to German cockroachd GM: 72.4 GM: 161.0 1.98 (0.59–6.63) .25 1.51 (0.45–5.04) .49
Abbreviations: asIgE, allergen-specific IgE; CI, confidence interval; ELISA, enzyme-linked immunosorbent assay; GM, geometric mean; GMR, geometric mean ratio; IgE, immunoglobulin E; RR, risk ratio; SPT, skin prick test positivity.aAtopy outcomes assessed by IgE were adjusted for age and sex only.bFor this outcome, a natural log transformation was applied to village-level proportions to correct skewed distributions, and the data in parentheses are the geometric means of village proportions. cLog10(+0.001) transformation at the individual level.dLog10(+1) transformation at the individual level.
Cluster-level Characteristics
Standard Arm Intensive Arm
(n = 13) (n = 13)
Individuals aged 13 years and over (n = 1176) (n = 1112)
Frequency of lake contact (mv 9, 19)
Every day 911 78% 776 71%
Almost every day 126 11% 147 13%
Once a week 95 8% 124 11%
Once a month 30 3% 35 3%
Less than once a month 4 0% 10 1%
Never 1 0% 1 0%
Individuals aged 18 years and over (n = 1116) (n = 1041)
HIV+ (mv 173, 176) 192 20% 198 23%
HIV+ on ART 90 47% 103 52%
HIV+ not on ART 93 48% 90 45%
HIV+ not known if receiving ART 9 5% 5 3%
Numbers for mvs are in the standard and intensive arms, respectively.
Abbreviations: ART, antiretroviral therapy; HIV, human immunodeficiency virus; IQR, interquartile range; mv, missing values; no., number.
Table 1. Continued
Dow
nloaded from https://academ
ic.oup.com/cid/advance-article-abstract/doi/10.1093/cid/ciy761/5093172 by guest on 21 O
ctober 2018
334
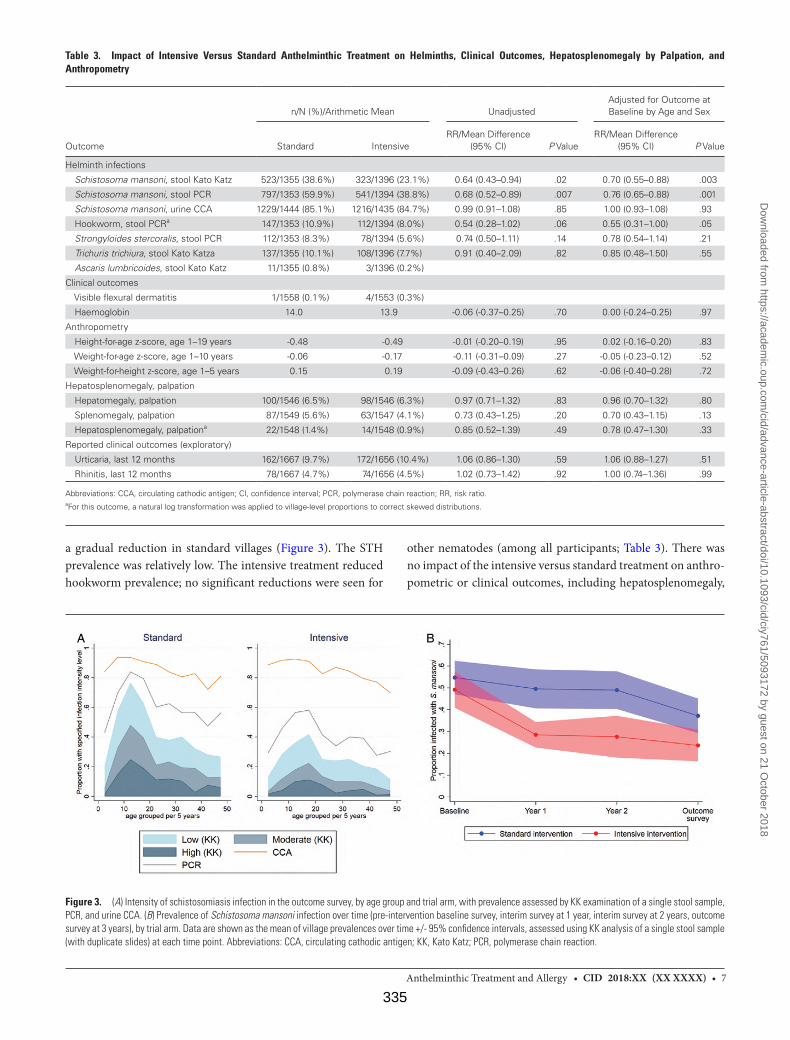
• CID 2018:XX (XX XXXX) • 7Anthelminthic Treatment and Allergy
a gradual reduction in standard villages (Figure 3). The STH prevalence was relatively low. The intensive treatment reduced hookworm prevalence; no significant reductions were seen for
other nematodes (among all participants; Table 3). There was no impact of the intensive versus standard treatment on anthro-pometric or clinical outcomes, including hepatosplenomegaly,
Table 3. Impact of Intensive Versus Standard Anthelminthic Treatment on Helminths, Clinical Outcomes, Hepatosplenomegaly by Palpation, and Anthropometry
Outcome
n/N (%)/Arithmetic Mean UnadjustedAdjusted for Outcome at Baseline by Age and Sex
Standard IntensiveRR/Mean Difference
(95% CI) P ValueRR/Mean Difference
(95% CI) P Value
Helminth infections
Schistosoma mansoni, stool Kato Katz 523/1355 (38.6%) 323/1396 (23.1%) 0.64 (0.43–0.94) .02 0.70 (0.55–0.88) .003
Schistosoma mansoni, stool PCR 797/1353 (59.9%) 541/1394 (38.8%) 0.68 (0.52–0.89) .007 0.76 (0.65–0.88) .001
Schistosoma mansoni, urine CCA 1229/1444 (85.1%) 1216/1435 (84.7%) 0.99 (0.91–1.08) .85 1.00 (0.93–1.08) .93
Hookworm, stool PCRa 147/1353 (10.9%) 112/1394 (8.0%) 0.54 (0.28–1.02) .06 0.55 (0.31–1.00) .05
Strongyloides stercoralis, stool PCR 112/1353 (8.3%) 78/1394 (5.6%) 0.74 (0.50–1.11) .14 0.78 (0.54–1.14) .21
Trichuris trichiura, stool Kato Katza 137/1355 (10.1%) 108/1396 (7.7%) 0.91 (0.40–2.09) .82 0.85 (0.48–1.50) .55
Ascaris lumbricoides, stool Kato Katz 11/1355 (0.8%) 3/1396 (0.2%)
Clinical outcomes
Visible flexural dermatitis 1/1558 (0.1%) 4/1553 (0.3%)
Haemoglobin 14.0 13.9 -0.06 (-0.37–0.25) .70 0.00 (-0.24–0.25) .97
Anthropometry
Height-for-age z-score, age 1–19 years -0.48 -0.49 -0.01 (-0.20–0.19) .95 0.02 (-0.16–0.20) .83
Weight-for-age z-score, age 1–10 years -0.06 -0.17 -0.11 (-0.31–0.09) .27 -0.05 (-0.23–0.12) .52
Weight-for-height z-score, age 1–5 years 0.15 0.19 -0.09 (-0.43–0.26) .62 -0.06 (-0.40–0.28) .72
Hepatosplenomegaly, palpation
Hepatomegaly, palpation 100/1546 (6.5%) 98/1546 (6.3%) 0.97 (0.71–1.32) .83 0.96 (0.70–1.32) .80
Splenomegaly, palpation 87/1549 (5.6%) 63/1547 (4.1%) 0.73 (0.43–1.25) .20 0.70 (0.43–1.15) .13
Hepatosplenomegaly, palpationa 22/1548 (1.4%) 14/1548 (0.9%) 0.85 (0.52–1.39) .49 0.78 (0.47–1.30) .33
Reported clinical outcomes (exploratory)
Urticaria, last 12 months 162/1667 (9.7%) 172/1656 (10.4%) 1.06 (0.86–1.30) .59 1.06 (0.88–1.27) .51
Rhinitis, last 12 months 78/1667 (4.7%) 74/1656 (4.5%) 1.02 (0.73–1.42) .92 1.00 (0.74–1.36) .99
Abbreviations: CCA, circulating cathodic antigen; CI, confidence interval; PCR, polymerase chain reaction; RR, risk ratio.aFor this outcome, a natural log transformation was applied to village-level proportions to correct skewed distributions.
Figure 3. (A) Intensity of schistosomiasis infection in the outcome survey, by age group and trial arm, with prevalence assessed by KK examination of a single stool sample, PCR, and urine CCA. (B) Prevalence of Schistosoma mansoni infection over time (pre-intervention baseline survey, interim survey at 1 year, interim survey at 2 years, outcome survey at 3 years), by trial arm. Data are shown as the mean of village prevalences over time +/- 95% confidence intervals, assessed using KK analysis of a single stool sample (with duplicate slides) at each time point. Abbreviations: CCA, circulating cathodic antigen; KK, Kato Katz; PCR, polymerase chain reaction.
Dow
nloaded from https://academ
ic.oup.com/cid/advance-article-abstract/doi/10.1093/cid/ciy761/5093172 by guest on 21 O
ctober 2018
335
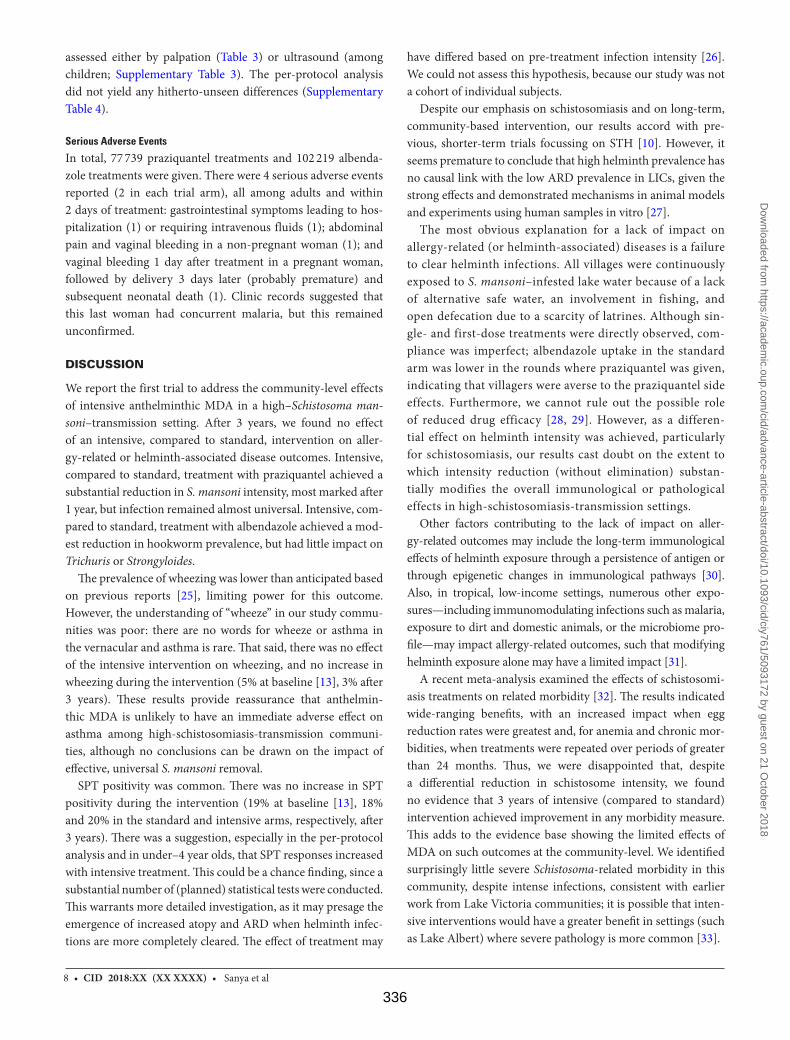
8 • CID 2018:XX (XX XXXX) • Sanya et al
assessed either by palpation (Table 3) or ultrasound (among children; Supplementary Table 3). The per-protocol analysis did not yield any hitherto-unseen differences (Supplementary Table 4).
Serious Adverse Events
In total, 77 739 praziquantel treatments and 102 219 albenda-zole treatments were given. There were 4 serious adverse events reported (2 in each trial arm), all among adults and within 2 days of treatment: gastrointestinal symptoms leading to hos-pitalization (1) or requiring intravenous fluids (1); abdominal pain and vaginal bleeding in a non-pregnant woman (1); and vaginal bleeding 1 day after treatment in a pregnant woman, followed by delivery 3 days later (probably premature) and subsequent neonatal death (1). Clinic records suggested that this last woman had concurrent malaria, but this remained unconfirmed.
DISCUSSION
We report the first trial to address the community-level effects of intensive anthelminthic MDA in a high–Schistosoma man-soni–transmission setting. After 3 years, we found no effect of an intensive, compared to standard, intervention on aller-gy-related or helminth-associated disease outcomes. Intensive, compared to standard, treatment with praziquantel achieved a substantial reduction in S. mansoni intensity, most marked after 1 year, but infection remained almost universal. Intensive, com-pared to standard, treatment with albendazole achieved a mod-est reduction in hookworm prevalence, but had little impact on Trichuris or Strongyloides.
The prevalence of wheezing was lower than anticipated based on previous reports [25], limiting power for this outcome. However, the understanding of “wheeze” in our study commu-nities was poor: there are no words for wheeze or asthma in the vernacular and asthma is rare. That said, there was no effect of the intensive intervention on wheezing, and no increase in wheezing during the intervention (5% at baseline [13], 3% after 3 years). These results provide reassurance that anthelmin-thic MDA is unlikely to have an immediate adverse effect on asthma among high-schistosomiasis-transmission communi-ties, although no conclusions can be drawn on the impact of effective, universal S. mansoni removal.
SPT positivity was common. There was no increase in SPT positivity during the intervention (19% at baseline [13], 18% and 20% in the standard and intensive arms, respectively, after 3 years). There was a suggestion, especially in the per-protocol analysis and in under–4 year olds, that SPT responses increased with intensive treatment. This could be a chance finding, since a substantial number of (planned) statistical tests were conducted. This warrants more detailed investigation, as it may presage the emergence of increased atopy and ARD when helminth infec-tions are more completely cleared. The effect of treatment may
have differed based on pre-treatment infection intensity [26]. We could not assess this hypothesis, because our study was not a cohort of individual subjects.
Despite our emphasis on schistosomiasis and on long-term, community-based intervention, our results accord with pre-vious, shorter-term trials focussing on STH [10]. However, it seems premature to conclude that high helminth prevalence has no causal link with the low ARD prevalence in LICs, given the strong effects and demonstrated mechanisms in animal models and experiments using human samples in vitro [27].
The most obvious explanation for a lack of impact on allergy-related (or helminth-associated) diseases is a failure to clear helminth infections. All villages were continuously exposed to S. mansoni–infested lake water because of a lack of alternative safe water, an involvement in fishing, and open defecation due to a scarcity of latrines. Although sin-gle- and first-dose treatments were directly observed, com-pliance was imperfect; albendazole uptake in the standard arm was lower in the rounds where praziquantel was given, indicating that villagers were averse to the praziquantel side effects. Furthermore, we cannot rule out the possible role of reduced drug efficacy [28, 29]. However, as a differen-tial effect on helminth intensity was achieved, particularly for schistosomiasis, our results cast doubt on the extent to which intensity reduction (without elimination) substan-tially modifies the overall immunological or pathological effects in high-schistosomiasis-transmission settings.
Other factors contributing to the lack of impact on aller-gy-related outcomes may include the long-term immunological effects of helminth exposure through a persistence of antigen or through epigenetic changes in immunological pathways [30]. Also, in tropical, low-income settings, numerous other expo-sures—including immunomodulating infections such as malaria, exposure to dirt and domestic animals, or the microbiome pro-file—may impact allergy-related outcomes, such that modifying helminth exposure alone may have a limited impact [31].
A recent meta-analysis examined the effects of schistosomi-asis treatments on related morbidity [32]. The results indicated wide-ranging benefits, with an increased impact when egg reduction rates were greatest and, for anemia and chronic mor-bidities, when treatments were repeated over periods of greater than 24 months. Thus, we were disappointed that, despite a differential reduction in schistosome intensity, we found no evidence that 3 years of intensive (compared to standard) intervention achieved improvement in any morbidity measure. This adds to the evidence base showing the limited effects of MDA on such outcomes at the community-level. We identified surprisingly little severe Schistosoma-related morbidity in this community, despite intense infections, consistent with earlier work from Lake Victoria communities; it is possible that inten-sive interventions would have a greater benefit in settings (such as Lake Albert) where severe pathology is more common [33].
Dow
nloaded from https://academ
ic.oup.com/cid/advance-article-abstract/doi/10.1093/cid/ciy761/5093172 by guest on 21 O
ctober 2018
336
• CID 2018:XX (XX XXXX) • 9Anthelminthic Treatment and Allergy
Our experience emphasizes that MDA may struggle to eliminate helminths as a public health problem, especially in high-transmission environments. The substantial decline in S. mansoni infections (as measured by Kato Katz) achieved in year 1 led us to hope that intensive intervention could make an important contribution to schistosomiasis control in these challenging hot spots. The subsequent plateau and persistent infection (as measured by by circulating cathodic antigen) were disheartening. This phenomenon (a large drop in prevalence, followed by a subsequent plateau) has also been reported in Kenyan districts bordering Lake Victoria [34]. Besides reinfec-tion, the possibility of selection for praziquantel-resistant or -tol-erant strains is of concern [35]. A radically different approach is needed, with complementary interventions, including improved water supplies and sanitation, behavior changes, and vector con-trols, as well as an effective vaccine against schistosomiasis [36].
Observational analyses addressing the effects of helminths remain limited by confounding by poverty and environment. Our strategy aimed to pinpoint helminth effects by random-izing their treatment, but was constrained by difficulties in achieving removal. Trials designed so that helminths are cleared in settings where reinfection can be avoided, and with substan-tial follow-up, are needed for a full understanding of the risks and benefits of deworming.
Supplementary DataSupplementary materials are available at Clinical Infectious Diseases online. Consisting of data provided by the authors to benefit the reader, the posted materials are not copyedited and are the sole responsibility of the authors, so questions or comments should be addressed to the corresponding author.
NotesThe LaVIISWA trial team project leaders, physicians, and post-doc-
toral scientists are Richard Sanya, Margaret Nampijja, Harriet Mpairwe, Geraldine O’Hara, and Barbara Nerima; the statisticians and data man-agers are Emily Webb, Remy Hoek Spaans, Lawrence Muhangi, Lawrence Lubyayi, Helen Akurut, Fatuma Nalukenge, Beatrice Mirembe, Justin Okello, Sebastian Owilla, Jonathan Levin, and Stephen Nash; the clinical officers are Milly Namutebi and Christopher Zziwa; the nurses are Esther Nakazibwe, Josephine Tumusiime, Caroline Ninsiima, Susan Amongi, Grace Kamukama, Susan Iwala, and Florence Akello; the internal mon-itor is Mirriam Akello; the field workers are Robert Kizindo, Moses Sewankambo, and Denis Nsubuga; the laboratory staff and collaborators are Stephen Cose, Linda Wammes, Prossy Kabuubi Nakawungu, Emmanuel Niwagaba, Gloria Oduru, Grace Kabami, Elson Abayo, Eric Ssebagala, Fred Muwonge Kakooza, Joyce Kabagenyi, Gyaviira Nkurunungi, Angela Nalwoga, Dennison Kizito, John Vianney Tushabe, Jacent Nassuuna, Jaco Verweij, Serge Versteeg, and Ronald van Ree; the social scientist is Edward Tumwesige; the ultrasonographer is Simon Mpooya; the boatman is David Abiriga; the driver is Richard Walusimbi; human immunodeficiency virus counseling and testing is provided by Victoria Nannozi and Cynthia Kabonesa; the Vector Control Programme staff are James Kaweesa and Edridah Tukahebwa; the administrative management is done by Moses Kizza; and the principal investigator is Alison Elliott.
A. M. E. conceived the study. A. M. E., E. L. W., E. T., R. E. S., M. N., and H. M. participated in designing the trial. R. E. S., A. M. E., M. N., G. O’Hara, C. Z., R. K., J. Kaweesa, E. Nakazibwe, J. T., and F. M. K. led and partici-pated in the surveys. G. Oduru, P. K. N., E. A., and E. Niwagaba ran the field laboratory, while G. N. and J. Kabagenyi participated in establishing
and conducting immunological assays and polymerase chain reactions. J. V. trained and assisted in stool polymerase chain reactions. R. vR. con-tributed to the testing of allergen-specific responses. M. A. monitored the study. L. L. managed the database. E. L. W., S. N., and R. H. S. conducted the statistical analysis. R. E. S., G. N., R. H. S., E. L. W., and A. M. E. drafted the manuscript, and all authors reviewed and contributed to it. All authors read and approved the final version of the manuscript.
Acknowledgments. The authors thank the Koome sub-county com-munity members, their local council leaders and beach management committee members, and the village health team members for participat-ing in this study. They thank Koome Health Centre III for their support. They thank the leadership of Mukono District, particularly the district health officer (Elly Tumushabe) and the councillor for Koome sub-county (Asuman Muwumuza), who are members of the Trial Steering Committee, for their support. They also thank the other members of the Trial Steering Committee: Heiner Grosskurth (chair), Edridah Tukahebwa, Narcis Kabatereine, Neil Pearce, Anatoli Kamali, and Monica Kuteesa. They thank the Makerere University Joint AIDS Programme and the Calvary Chapel Island Mission for providing voluntary counselling and human immuno-deficiency virus testing for community members, including study partici-pants, in collaboration with their research program. They thank colleagues, especially Richard Hayes, Narcis Kabatereine, and Heiner Grosskurth, for their comments on the manuscript.
Disclaimer. The funders had no role in the study design, data collection and analysis, decision to publish, or preparation of the manuscript.
Financial support. This work was supported by the Wellcome Trust (grant number 095778). The work was conducted at the Medical Research Council/Uganda Virus Research Institute and London School of Hygiene and Tropical Medicine Uganda Research Unit, which is jointly funded by the UK Medical Research Council and the UK Department for International Development under their Concordat agreement.
Potential conflicts of interest. R. E. S. is supported by a PhD fellow-ship awarded under the Developing Excellence in Leadership, Training and Science (DELTAS) Africa Initiative (grant number 107743), an independent funding scheme of the African Academy of Sciences and the Alliance for Accelerating Excellence in Science in Africa, and sup-ported by the New Partnership for Africa’s Development Planning and Coordinating Agency with funding from the Wellcome Trust (grant number 107743) and the UK Government. G. N. is supported by a PhD fellowship from the African Partnership for Chronic Disease Research. E. L. W. received salary funding from the Medical Research Council (grant number MR/K012126/1): this award is jointly funded by the UK Medical Research Council and the UK Department for International Development under their Concordat agreement and is also part of the European & Developing Countries Clinical Trials Partnership (EDCTP2) program, supported by the European Union. R. vR. reports personal fees from HAL Allergy BV, Citeq BV, and ThermoFisher Scientific outside the submitted work. All other authors report no potential conflicts. All authors have submitted the ICMJE Form for Disclosure of Potential Conflicts of Interest. Conflicts that the editors consider relevant to the content of the manuscript have been disclosed.
References1. Anderson HR, Gupta R, Strachan DP, Limb ES. 50 years of asthma: UK trends
from 1955 to 2004. Thorax 2007; 62:85–90. doi:10.1136/thx.2006.066407.2. Pawankar R. Allergic diseases and asthma: a global public health concern and
a call to action. World Allergy Organ J 2014; 7:12. doi:10.1186/1939-4551-7-12. eCollection 2014.
3. Nicolaou N, Siddique N, Custovic A. Allergic disease in urban and rural pop-ulations: increasing prevalence with increasing urbanization. Allergy 2005; 60:1357–60.
4. Pullan RL, Smith JL, Jasrasaria R, Brooker SJ. Global numbers of infection and disease burden of soil transmitted helminth infections in 2010. Parasit Vectors 2014; 7:37. doi:10.1186/1756-3305-7-37.
5. Colley DG, Bustinduy AL, Secor WE, King CH. Human schistosomiasis. Lancet 2014; 383:2253–64.
6. Allen T, Parker M. Deworming delusions? Mass drug administration in East African schools. J Bio Sci 2016; 48:S116–47. doi:10.1017/s0021932016000171.
Dow
nloaded from https://academ
ic.oup.com/cid/advance-article-abstract/doi/10.1093/cid/ciy761/5093172 by guest on 21 O
ctober 2018
337
10 • CID 2018:XX (XX XXXX) • Sanya et al
7. Gurarie D, Yoon N, Li E, et al. Modelling control of Schistosoma haematobium infection: predictions of the long-term impact of mass drug administration in Africa. Parasit Vectors 2015; 8:529.
8. Phillips AE, Gazzinelli-Guimaraes PH, Aurelio HO, et al. Assessing the ben-efits of five years of different approaches to treatment of urogenital schistoso-miasis: a SCORE project in Northern Mozambique. PLoS Negl Trop Dis 2017; 11:e0006061.
9. Fitzsimmons CM, Dunne DW. Survival of the fittest: allergology or parasitology? Trends Parasitol 2009; 25:447–51.
10. Wammes LJ, Mpairwe H, Elliott AM, Yazdanbakhsh M. Helminth therapy or elimination: epidemiological, immunological, and clinical considerations. Lancet Infect Dis 2014; 14:1150–62.
11. Cooper PJ, Chico ME, Vaca MG, et al. Effect of albendazole treatments on the prevalence of atopy in children living in communities endemic for geohelminth parasites: a cluster-randomised trial. Lancet 2006; 367:1598–603.
12. Flohr C, Tuyen LN, Quinnell RJ, et al. Reduced helminth burden increases aller-gen skin sensitization but not clinical allergy: a randomized, double-blind, place-bo-controlled trial in Vietnam. Clin Exp Allergy 2010; 40:131–42.
13. Wammes LJ, Hamid F, Wiria AE, et al. Community deworming alleviates geo-helminth-induced immune hyporesponsiveness. Proc Natl Acad Sci USA 2016; 113:12526–31.
14. Kabatereine NB, Brooker S, Tukahebwa EM, Kazibwe F, Onapa AW. Epidemiology and geography of Schistosoma mansoni in Uganda: implications for planning con-trol. Trop Med Int Health 2004; 9:372–80.
15. van den Biggelaar AH, van Ree R, Rodrigues LC, et al. Decreased atopy in chil-dren infected with Schistosoma haematobium: a role for parasite-induced inter-leukin-10. Lancet 2000; 356:1723–7.
16. van den Biggelaar AH, Rodrigues LC, van Ree R, et al. Long-term treatment of intestinal helminths increases mite skin-test reactivity in Gabonese schoolchil-dren. J Infect Dis 2004; 189:892–900.
17. Nampijja M, Webb EL, Kaweesa J, et al.; LaVIISWA trial team. The Lake Victoria island intervention study on worms and allergy-related diseases (LaVIISWA): study protocol for a randomised controlled trial. Trials 2015; 16:187.
18. Sousa-Figueiredo JC, Betson M, Stothard JR. Treatment of schistosomiasis in African infants and preschool-aged children: downward extension and biometric optimization of the current praziquantel dose pole. Int Health 2012; 4:95–102.
19. World Health Organization. Report of the WHO informal consultation on hook-worm infection and anaemia in girls and women. Report [Contract No.: WHO/CTD/SIP/96.1]. Geneva, Switzerland: World Health Organization Department of Communicable Disease Prevention, Control and Eradication Schistosomiasis and Intestinal Parasites Unit, 1994.
20. World Health Organization. Report of the WHO informal consultation on the use of praziquantel during pregnancy/lactation and albendazole/mebendazole in children under 24 months [WHO/CDS/CPE/PVC/2002.4]. Geneva, Switzerland: World Health Organization, 2002.
21. Webb EL, Nampijja M, Kaweesa J, et al.; LaVIISWA trial team. Helminths are positively associated with atopy and wheeze in Ugandan fishing communities: results from a cross-sectional survey. Allergy 2016; 71:1156–69.
22. Mpairwe H, Muhangi L, Ndibazza J, et al. Skin prick test reactivity to common allergens among women in Entebbe, Uganda. Trans R Soc Trop Med Hyg 2008; 102:367–73.
23. Hayes RJ, Moulton LH. Cluster randomised trials. CRC Press, Taylor & Francis Group, 2009.
24. Cheung YB, Jeffries D, Thomson A, Milligan P. A simple approach to test for interaction between intervention and an individual-level variable in community randomized trials. Trop Med Int Health 2008;13:247–55.
25. Asher MI, Montefort S, Björkstén B, et al.; ISAAC Phase Three Study Group. Worldwide time trends in the prevalence of symptoms of asthma, allergic rhi-noconjunctivitis, and eczema in childhood: ISAAC Phases One and Three repeat multicountry cross-sectional surveys. Lancet 2006; 368:733–43.
26. Rujeni N, Nausch N, Bourke CD, et al. Atopy is inversely related to schistosome infection intensity: a comparative study in Zimbabwean villages with distinct levels of Schistosoma haematobium infection. Int Arch Allergy Immunol 2012; 158:288–98.
27. Maizels RM, McSorley HJ. Regulation of the host immune system by helminth parasites. J Allergy Clin Immunol 2016; 138:666–75.
28. Bergquist R, Utzinger J, Keiser J. Controlling schistosomiasis with praziquan-tel: how much longer without a viable alternative? Infect Dis Poverty 2017; 6:74.
29. Vale N, Gouveia MJ, Rinaldi G, Brindley PJ, Gartner F, Correia da Costa JM. Praziquantel for schistosomiasis: single-drug metabolism revisited, mode of action, and resistance. Antimicrob Agents Chemother 2017; 61. doi:10.1128/AAC.02582-16.
30. Wenzel MA, Piertney SB. Fine-scale population epigenetic structure in relation to gastrointestinal parasite load in red grouse (Lagopus lagopus scotica). Mol Ecol 2014; 23:4256–73.
31. Smits HH, Hiemstra PS, Prazeres da Costa C, et al. Microbes and asthma: oppor-tunities for intervention. J Allergy Clin Immunol 2016; 137:690–7.
32. Andrade G, Bertsch DJ, Gazzinelli A, King CH. Decline in infection-related morbidities following drug-mediated reductions in the intensity of Schistosoma infection: a systematic review and meta-analysis. PLoS Negl Trop Dis 2017; 11:e0005372.
33. Tukahebwa EM, Magnussen P, Madsen H, et al. A very high infection intensity of Schistosoma mansoni in a Ugandan Lake Victoria Fishing Community is required for association with highly prevalent organ related morbidity. PLoS Negl Trop Dis 2013; 7:e2268.
34. Karanja DMS, Awino EK, Wiegand RE, et al. Cluster randomized trial comparing school-based mass drug administration schedules in areas of western Kenya with moderate initial prevalence of Schistosoma mansoni infections. PLoS Negl Trop Dis 2017; 11:e0006033.
35. Crellen T, Walker M, Lamberton PH, et al. Reduced efficacy of praziquantel against Schistosoma mansoni is associated with multiple rounds of mass drug administration. Clin Infect Dis 2016; 63:1151–9.
36. Alsallaq RA, Gurarie D, Ndeffo Mbah M, Galvani A, King C. Quantitative assess-ment of the impact of partially protective anti-schistosomiasis vaccines. PLoS Negl Trop Dis 2017; 11:e0005544.
Dow
nloaded from https://academ
ic.oup.com/cid/advance-article-abstract/doi/10.1093/cid/ciy761/5093172 by guest on 21 O
ctober 2018
338
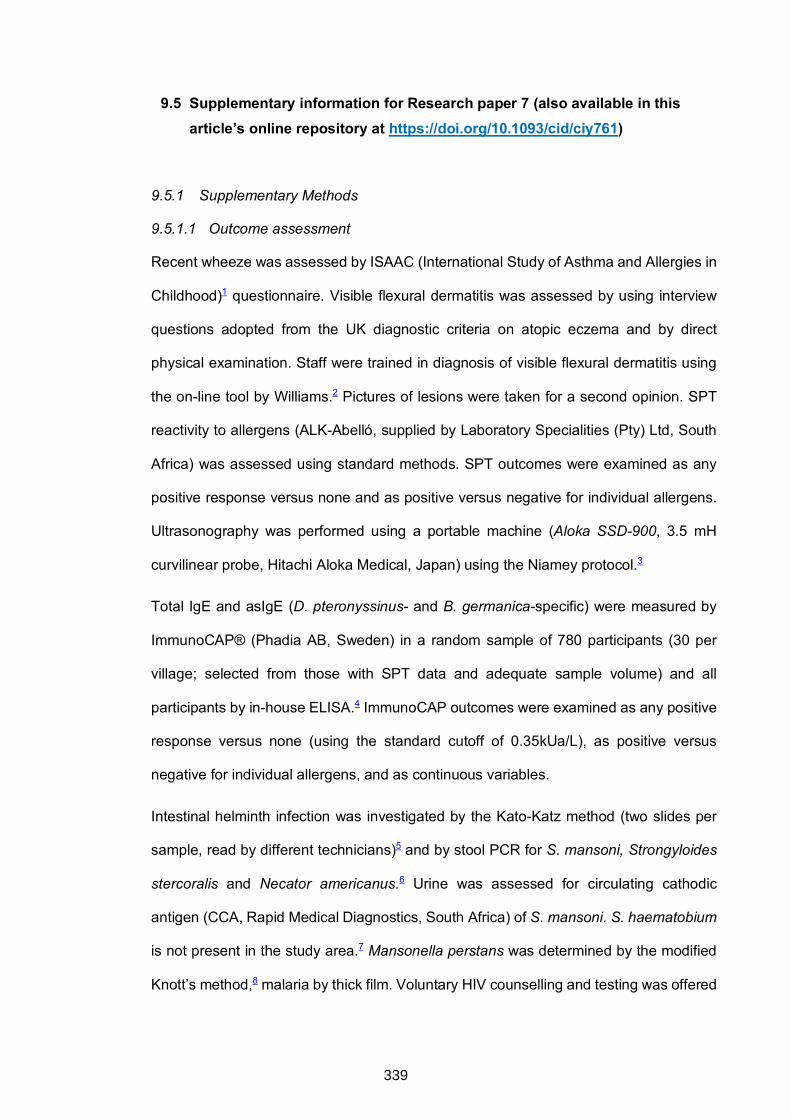
9.5 Supplementary information for Research paper 7 (also available in this article’s online repository at https://doi.org/10.1093/cid/ciy761)
9.5.1 Supplementary Methods
9.5.1.1 Outcome assessment
Recent wheeze was assessed by ISAAC (International Study of Asthma and Allergies in
Childhood)1 questionnaire. Visible flexural dermatitis was assessed by using interview
questions adopted from the UK diagnostic criteria on atopic eczema and by direct
physical examination. Staff were trained in diagnosis of visible flexural dermatitis using
the on-line tool by Williams.2 Pictures of lesions were taken for a second opinion. SPT
reactivity to allergens (ALK-Abelló, supplied by Laboratory Specialities (Pty) Ltd, South
Africa) was assessed using standard methods. SPT outcomes were examined as any
positive response versus none and as positive versus negative for individual allergens.
Ultrasonography was performed using a portable machine (Aloka SSD-900, 3.5 mH
curvilinear probe, Hitachi Aloka Medical, Japan) using the Niamey protocol.3
Total IgE and asIgE (D. pteronyssinus- and B. germanica-specific) were measured by
ImmunoCAP® (Phadia AB, Sweden) in a random sample of 780 participants (30 per
village; selected from those with SPT data and adequate sample volume) and all
participants by in-house ELISA.4 ImmunoCAP outcomes were examined as any positive
response versus none (using the standard cutoff of 0.35kUa/L), as positive versus
negative for individual allergens, and as continuous variables.
Intestinal helminth infection was investigated by the Kato-Katz method (two slides per
sample, read by different technicians)5 and by stool PCR for S. mansoni, Strongyloides
stercoralis and Necator americanus.6 Urine was assessed for circulating cathodic
antigen (CCA, Rapid Medical Diagnostics, South Africa) of S. mansoni. S. haematobium
is not present in the study area.7 Mansonella perstans was determined by the modified
Knott’s method,8 malaria by thick film. Voluntary HIV counselling and testing was offered
339
to all participants. Haemoglobin was determined by HemoCue® (HemoCue AB,
Angelholm, Sweden).
9.5.1.2 Randomisation: further details
A computer-based system was used to generate all possible allocations for assigning 13
villages to each arm of the trial, satisfying restriction criteria. A list of 1000 of these
possible allocations, selected at random from the full list, was provided for the
randomisation ceremony. One of these was selected by village leaders using numbered
balls drawn from an opaque bag (ten balls, numbered 0 to 9, selected separately for
each digit).
9.5.1.3 Sample size justification
For the final survey, we planned to sample 1540 individuals per arm. Based on baseline
survey data,9 estimates for primary outcome prevalence in the standard arm were recent
wheeze over the age of five years 5%, SPT positivity 20% and detectable asIgE 40%.
Assuming a conservative coefficient of variation (k) of 0.3, a sample size of 1540
individuals per arm would give over 80% power to detect (at 5% significance level) a 1.5-
fold difference for SPT positivity and detectable asIgE and a 1.8-fold difference for
wheeze. From the baseline survey, we calculated that randomly selecting 70 households
per village would yield the planned sample size (allowing for absenteeism).
9.5.1.4 Approach for adjusted analysis of trial outcomes
Adjusted analysis was done using a two-stage approach as described by Hayes and
Moulton. For binary outcomes, in the first stage logistic regression of individual-level
outcomes was done, including covariates to be adjusted for (but not trial arm allocation)
and from this risk ratio-residuals (the ratio between observed and predicted prevalence
for each cluster) were calculated. In the second stage, these risk ratio-residuals were
used as the data points for the cluster-level analysis, using the same methods as
described above for the unadjusted analysis. For continuous outcomes, For the two-
340
stage adjusted analysis, linear regression was used in the first stage and mean
difference-residuals were data points for the second stage.
9.5.2 Supplementary Results
9.5.2.1 Comparison of characteristics of survey participants and non-participants
There were 3566 household members aged one year or above, resident in the 1419
participating households. Of these males were less likely to participate in the
questionnaire than females (90% versus 97%), or to give blood (80% versus 87%), stool
(75% versus 81%), urine (79% versus 84%) samples or undergo SPT examination (82%
versus 89%) (all p<0.001). In both arms low numbers of school-aged children were
surveyed because of absence, on the mainland, for schooling. Of those surveyed,
working age (15-45 years) and pre-school aged (under 5 years) members were less likely
to provide samples or undergo SPT (p<0.001) than other age groups (working age 81%,
74% and 82% for blood, stool and SPT, respectively; pre-school age 74%, 78% and
87%, respectively; other age groups 89%, 86% and 92%, respectively). Younger age
groups were under-represented in the subgroup for whom ImmunoCAP assays were
done (162 (12%) of <20 year olds versus 618 (28%) of ≥20 year olds, p<0.001), due to
lower amounts of available plasma.
341
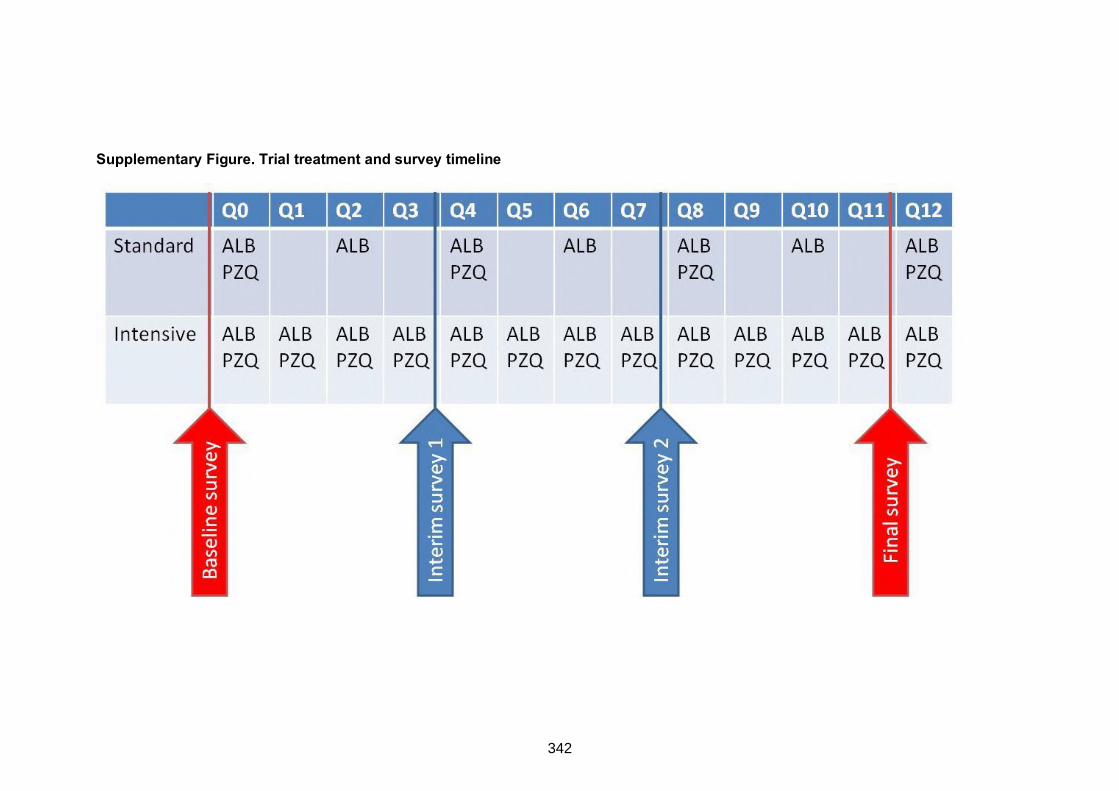
Supplementary Figure. Trial treatment and survey timeline
342
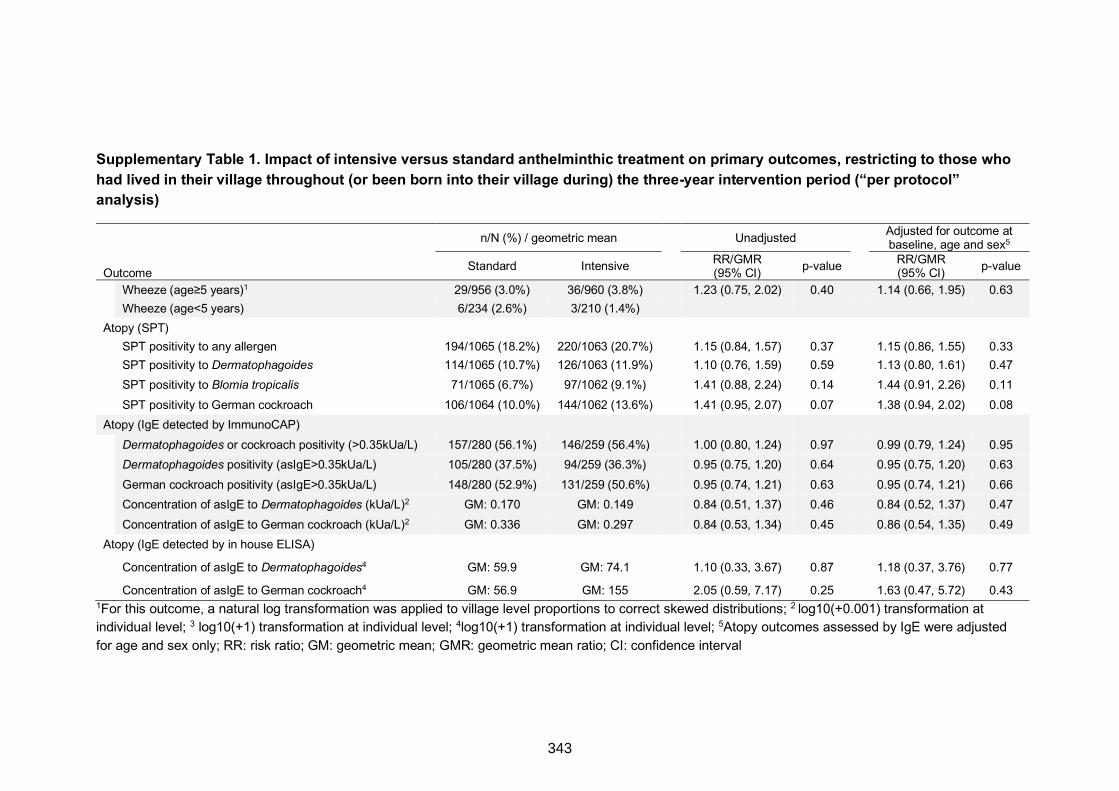
Supplementary Table 1. Impact of intensive versus standard anthelminthic treatment on primary outcomes, restricting to those who had lived in their village throughout (or been born into their village during) the three-year intervention period (“per protocol” analysis)
1For this outcome, a natural log transformation was applied to village level proportions to correct skewed distributions; 2 log10(+0.001) transformation at individual level; 3 log10(+1) transformation at individual level; 4log10(+1) transformation at individual level; 5Atopy outcomes assessed by IgE were adjusted for age and sex only; RR: risk ratio; GM: geometric mean; GMR: geometric mean ratio; CI: confidence interval
n/N (%) / geometric mean Unadjusted Adjusted for outcome at
baseline, age and sex5
Outcome Standard Intensive RR/GMR (95% CI) p-value RR/GMR
(95% CI) p-value Wheeze (age≥5 years)1 29/956 (3.0%) 36/960 (3.8%) 1.23 (0.75, 2.02) 0.40 1.14 (0.66, 1.95) 0.63 Wheeze (age<5 years) 6/234 (2.6%) 3/210 (1.4%)
Atopy (SPT) SPT positivity to any allergen 194/1065 (18.2%) 220/1063 (20.7%) 1.15 (0.84, 1.57) 0.37 1.15 (0.86, 1.55) 0.33 SPT positivity to Dermatophagoides 114/1065 (10.7%) 126/1063 (11.9%) 1.10 (0.76, 1.59) 0.59 1.13 (0.80, 1.61) 0.47 SPT positivity to Blomia tropicalis 71/1065 (6.7%) 97/1062 (9.1%) 1.41 (0.88, 2.24) 0.14 1.44 (0.91, 2.26) 0.11 SPT positivity to German cockroach 106/1064 (10.0%) 144/1062 (13.6%) 1.41 (0.95, 2.07) 0.07 1.38 (0.94, 2.02) 0.08
Atopy (IgE detected by ImmunoCAP) Dermatophagoides or cockroach positivity (>0.35kUa/L) 157/280 (56.1%) 146/259 (56.4%) 1.00 (0.80, 1.24) 0.97 0.99 (0.79, 1.24) 0.95 Dermatophagoides positivity (asIgE>0.35kUa/L) 105/280 (37.5%) 94/259 (36.3%) 0.95 (0.75, 1.20) 0.64 0.95 (0.75, 1.20) 0.63 German cockroach positivity (asIgE>0.35kUa/L) 148/280 (52.9%) 131/259 (50.6%) 0.95 (0.74, 1.21) 0.63 0.95 (0.74, 1.21) 0.66 Concentration of asIgE to Dermatophagoides (kUa/L)2 GM: 0.170 GM: 0.149 0.84 (0.51, 1.37) 0.46 0.84 (0.52, 1.37) 0.47 Concentration of asIgE to German cockroach (kUa/L)2 GM: 0.336 GM: 0.297 0.84 (0.53, 1.34) 0.45 0.86 (0.54, 1.35) 0.49
Atopy (IgE detected by in house ELISA)
Concentration of asIgE to Dermatophagoides4 GM: 59.9 GM: 74.1 1.10 (0.33, 3.67) 0.87 1.18 (0.37, 3.76) 0.77
Concentration of asIgE to German cockroach4 GM: 56.9 GM: 155 2.05 (0.59, 7.17) 0.25 1.63 (0.47, 5.72) 0.43
343
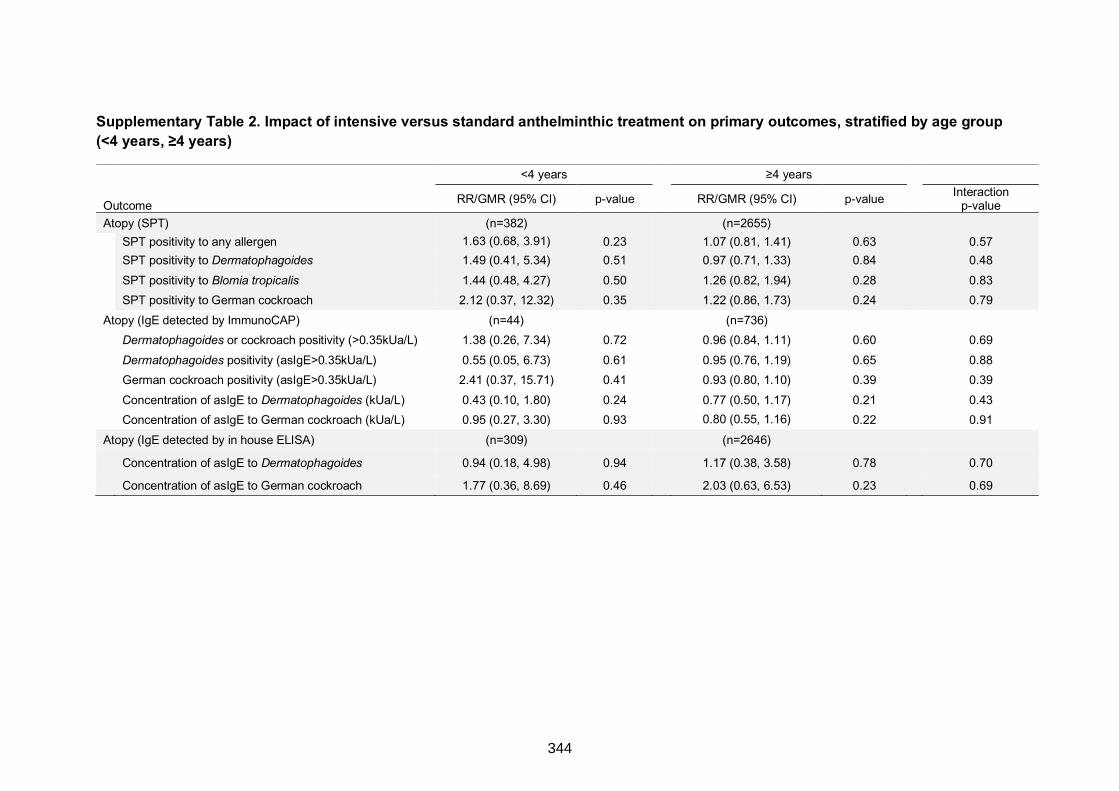
Supplementary Table 2. Impact of intensive versus standard anthelminthic treatment on primary outcomes, stratified by age group (<4 years, ≥4 years)
<4 years ≥4 years
Outcome RR/GMR (95% CI) p-value RR/GMR (95% CI) p-value Interaction p-value
Atopy (SPT) (n=382) (n=2655) SPT positivity to any allergen 1.63 (0.68, 3.91) 0.23 1.07 (0.81, 1.41) 0.63 0.57 SPT positivity to Dermatophagoides 1.49 (0.41, 5.34) 0.51 0.97 (0.71, 1.33) 0.84 0.48 SPT positivity to Blomia tropicalis 1.44 (0.48, 4.27) 0.50 1.26 (0.82, 1.94) 0.28 0.83 SPT positivity to German cockroach 2.12 (0.37, 12.32) 0.35 1.22 (0.86, 1.73) 0.24 0.79
Atopy (IgE detected by ImmunoCAP) (n=44) (n=736) Dermatophagoides or cockroach positivity (>0.35kUa/L) 1.38 (0.26, 7.34) 0.72 0.96 (0.84, 1.11) 0.60 0.69 Dermatophagoides positivity (asIgE>0.35kUa/L) 0.55 (0.05, 6.73) 0.61 0.95 (0.76, 1.19) 0.65 0.88 German cockroach positivity (asIgE>0.35kUa/L) 2.41 (0.37, 15.71) 0.41 0.93 (0.80, 1.10) 0.39 0.39 Concentration of asIgE to Dermatophagoides (kUa/L) 0.43 (0.10, 1.80) 0.24 0.77 (0.50, 1.17) 0.21 0.43 Concentration of asIgE to German cockroach (kUa/L) 0.95 (0.27, 3.30) 0.93 0.80 (0.55, 1.16) 0.22 0.91
Atopy (IgE detected by in house ELISA) (n=309) (n=2646) Concentration of asIgE to Dermatophagoides 0.94 (0.18, 4.98) 0.94 1.17 (0.38, 3.58) 0.78 0.70
Concentration of asIgE to German cockroach 1.77 (0.36, 8.69) 0.46 2.03 (0.63, 6.53) 0.23 0.69
344
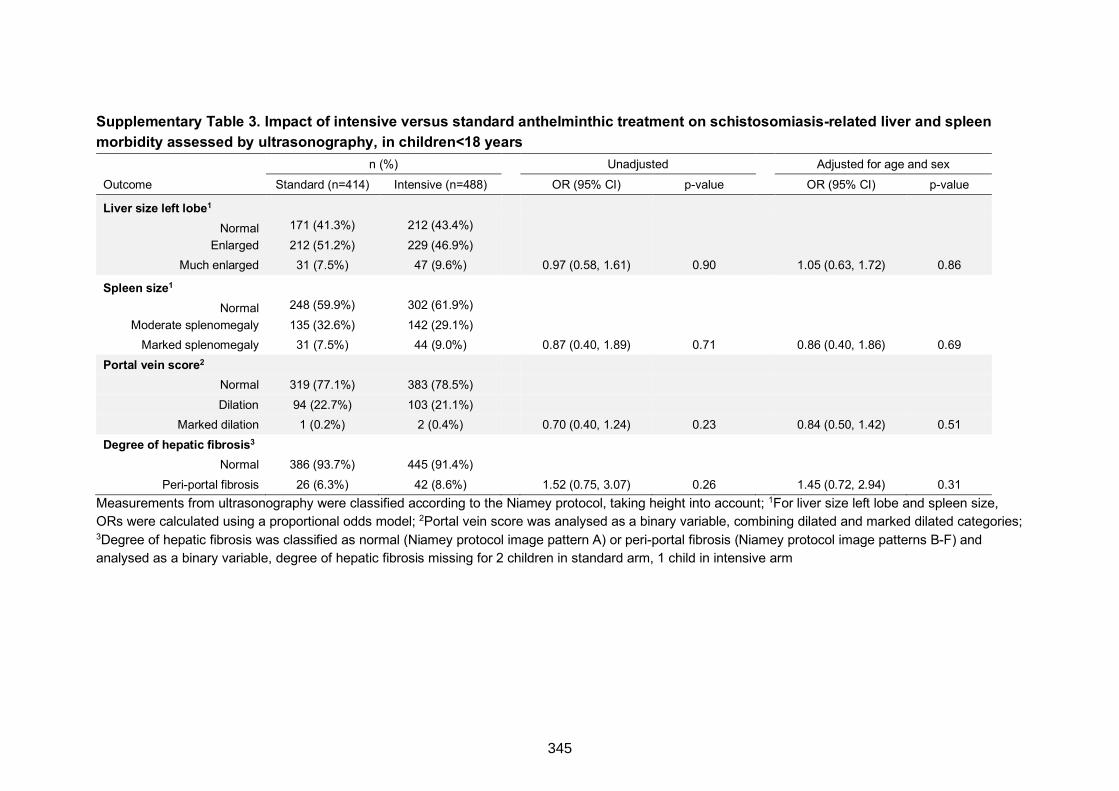
Supplementary Table 3. Impact of intensive versus standard anthelminthic treatment on schistosomiasis-related liver and spleen morbidity assessed by ultrasonography, in children<18 years
n (%) Unadjusted Adjusted for age and sex Outcome Standard (n=414) Intensive (n=488) OR (95% CI) p-value OR (95% CI) p-value
Liver size left lobe1
Normal 171 (41.3%) 212 (43.4%) Enlarged 212 (51.2%) 229 (46.9%)
Much enlarged 31 (7.5%) 47 (9.6%) 0.97 (0.58, 1.61) 0.90 1.05 (0.63, 1.72) 0.86
Spleen size1
Normal 248 (59.9%) 302 (61.9%) Moderate splenomegaly 135 (32.6%) 142 (29.1%)
Marked splenomegaly 31 (7.5%) 44 (9.0%) 0.87 (0.40, 1.89) 0.71 0.86 (0.40, 1.86) 0.69 Portal vein score2
Normal 319 (77.1%) 383 (78.5%) Dilation 94 (22.7%) 103 (21.1%)
Marked dilation 1 (0.2%) 2 (0.4%) 0.70 (0.40, 1.24) 0.23 0.84 (0.50, 1.42) 0.51 Degree of hepatic fibrosis3
Normal 386 (93.7%) 445 (91.4%) Peri-portal fibrosis 26 (6.3%) 42 (8.6%) 1.52 (0.75, 3.07) 0.26 1.45 (0.72, 2.94) 0.31
Measurements from ultrasonography were classified according to the Niamey protocol, taking height into account; 1For liver size left lobe and spleen size, ORs were calculated using a proportional odds model; 2Portal vein score was analysed as a binary variable, combining dilated and marked dilated categories; 3Degree of hepatic fibrosis was classified as normal (Niamey protocol image pattern A) or peri-portal fibrosis (Niamey protocol image patterns B-F) and analysed as a binary variable, degree of hepatic fibrosis missing for 2 children in standard arm, 1 child in intensive arm
345
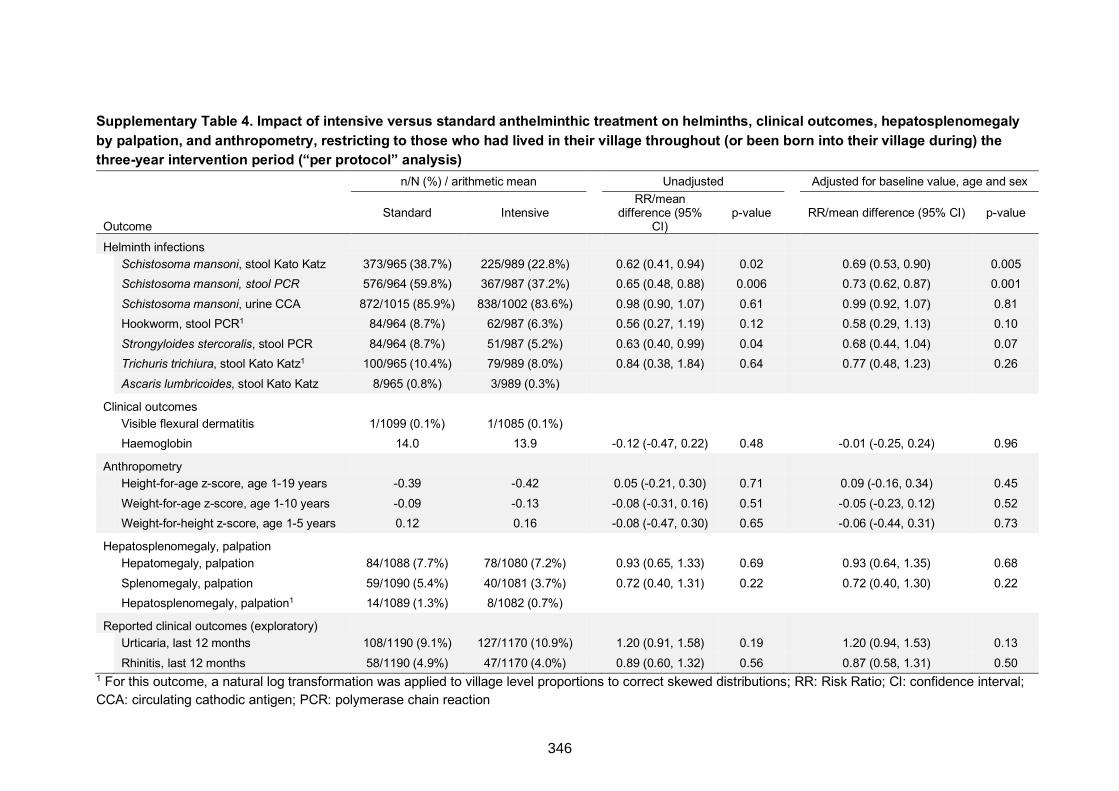
Supplementary Table 4. Impact of intensive versus standard anthelminthic treatment on helminths, clinical outcomes, hepatosplenomegaly by palpation, and anthropometry, restricting to those who had lived in their village throughout (or been born into their village during) the three-year intervention period (“per protocol” analysis)
n/N (%) / arithmetic mean Unadjusted Adjusted for baseline value, age and sex
Outcome Standard Intensive
RR/mean difference (95%
CI) p-value RR/mean difference (95% CI) p-value
Helminth infections
Schistosoma mansoni, stool Kato Katz 373/965 (38.7%) 225/989 (22.8%) 0.62 (0.41, 0.94) 0.02 0.69 (0.53, 0.90) 0.005
Schistosoma mansoni, stool PCR 576/964 (59.8%) 367/987 (37.2%) 0.65 (0.48, 0.88) 0.006 0.73 (0.62, 0.87) 0.001
Schistosoma mansoni, urine CCA 872/1015 (85.9%) 838/1002 (83.6%) 0.98 (0.90, 1.07) 0.61 0.99 (0.92, 1.07) 0.81
Hookworm, stool PCR1 84/964 (8.7%) 62/987 (6.3%) 0.56 (0.27, 1.19) 0.12 0.58 (0.29, 1.13) 0.10
Strongyloides stercoralis, stool PCR 84/964 (8.7%) 51/987 (5.2%) 0.63 (0.40, 0.99) 0.04 0.68 (0.44, 1.04) 0.07
Trichuris trichiura, stool Kato Katz1 100/965 (10.4%) 79/989 (8.0%) 0.84 (0.38, 1.84) 0.64 0.77 (0.48, 1.23) 0.26
Ascaris lumbricoides, stool Kato Katz 8/965 (0.8%) 3/989 (0.3%)
Clinical outcomes
Visible flexural dermatitis 1/1099 (0.1%) 1/1085 (0.1%)
Haemoglobin 14.0 13.9 -0.12 (-0.47, 0.22) 0.48 -0.01 (-0.25, 0.24) 0.96
Anthropometry
Height-for-age z-score, age 1-19 years -0.39 -0.42 0.05 (-0.21, 0.30) 0.71 0.09 (-0.16, 0.34) 0.45
Weight-for-age z-score, age 1-10 years -0.09 -0.13 -0.08 (-0.31, 0.16) 0.51 -0.05 (-0.23, 0.12) 0.52
Weight-for-height z-score, age 1-5 years 0.12 0.16 -0.08 (-0.47, 0.30) 0.65 -0.06 (-0.44, 0.31) 0.73
Hepatosplenomegaly, palpation
Hepatomegaly, palpation 84/1088 (7.7%) 78/1080 (7.2%) 0.93 (0.65, 1.33) 0.69 0.93 (0.64, 1.35) 0.68
Splenomegaly, palpation 59/1090 (5.4%) 40/1081 (3.7%) 0.72 (0.40, 1.31) 0.22 0.72 (0.40, 1.30) 0.22
Hepatosplenomegaly, palpation1 14/1089 (1.3%) 8/1082 (0.7%)
Reported clinical outcomes (exploratory)
Urticaria, last 12 months 108/1190 (9.1%) 127/1170 (10.9%) 1.20 (0.91, 1.58) 0.19 1.20 (0.94, 1.53) 0.13
Rhinitis, last 12 months 58/1190 (4.9%) 47/1170 (4.0%) 0.89 (0.60, 1.32) 0.56 0.87 (0.58, 1.31) 0.50 1 For this outcome, a natural log transformation was applied to village level proportions to correct skewed distributions; RR: Risk Ratio; CI: confidence interval; CCA: circulating cathodic antigen; PCR: polymerase chain reaction
346
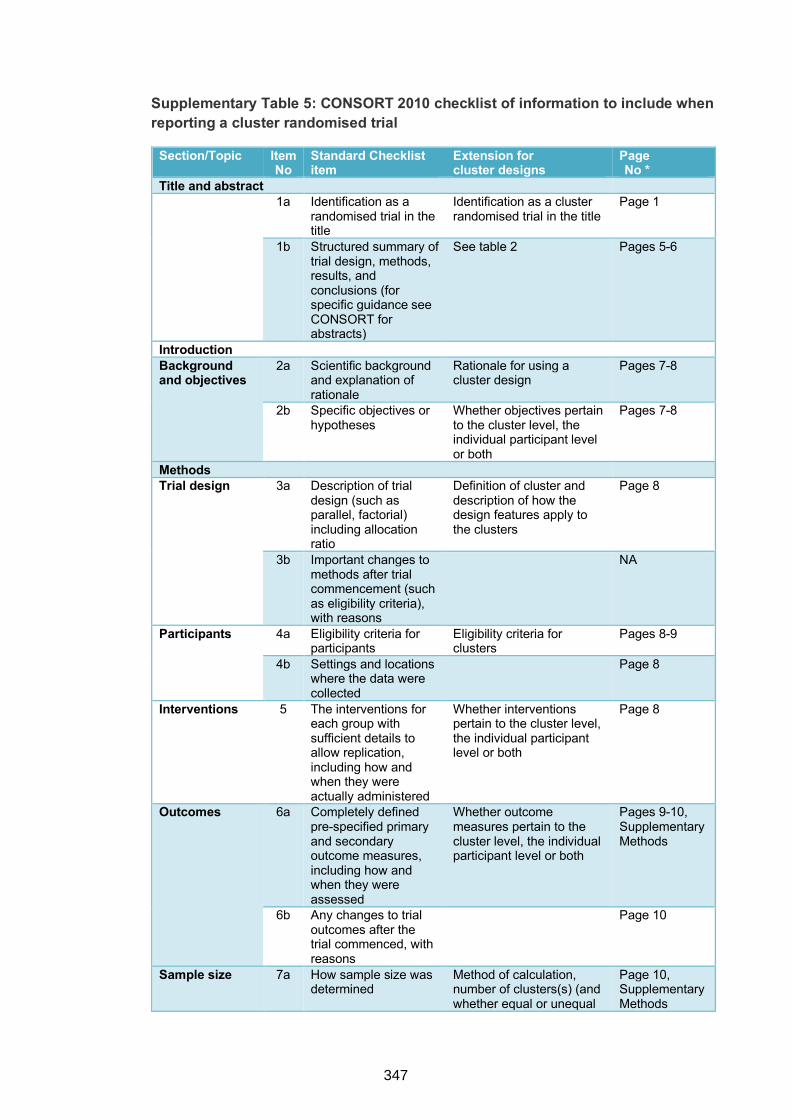
Supplementary Table 5: CONSORT 2010 checklist of information to include when reporting a cluster randomised trial
Section/Topic Item No
Standard Checklist item
Extension for cluster designs
Page No *
Title and abstract 1a Identification as a
randomised trial in the title
Identification as a cluster randomised trial in the title
Page 1
1b Structured summary of trial design, methods, results, and conclusions (for specific guidance see CONSORT for abstracts)
See table 2 Pages 5-6
Introduction Background and objectives
2a Scientific background and explanation of rationale
Rationale for using a cluster design
Pages 7-8
2b Specific objectives or hypotheses
Whether objectives pertain to the cluster level, the individual participant level or both
Pages 7-8
Methods Trial design 3a Description of trial
design (such as parallel, factorial) including allocation ratio
Definition of cluster and description of how the design features apply to the clusters
Page 8
3b Important changes to methods after trial commencement (such as eligibility criteria), with reasons
NA
Participants 4a Eligibility criteria for participants
Eligibility criteria for clusters
Pages 8-9
4b Settings and locations where the data were collected
Page 8
Interventions 5 The interventions for each group with sufficient details to allow replication, including how and when they were actually administered
Whether interventions pertain to the cluster level, the individual participant level or both
Page 8
Outcomes 6a Completely defined pre-specified primary and secondary outcome measures, including how and when they were assessed
Whether outcome measures pertain to the cluster level, the individual participant level or both
Pages 9-10, Supplementary Methods
6b Any changes to trial outcomes after the trial commenced, with reasons
Page 10
Sample size 7a How sample size was determined
Method of calculation, number of clusters(s) (and whether equal or unequal
Page 10, Supplementary Methods
347
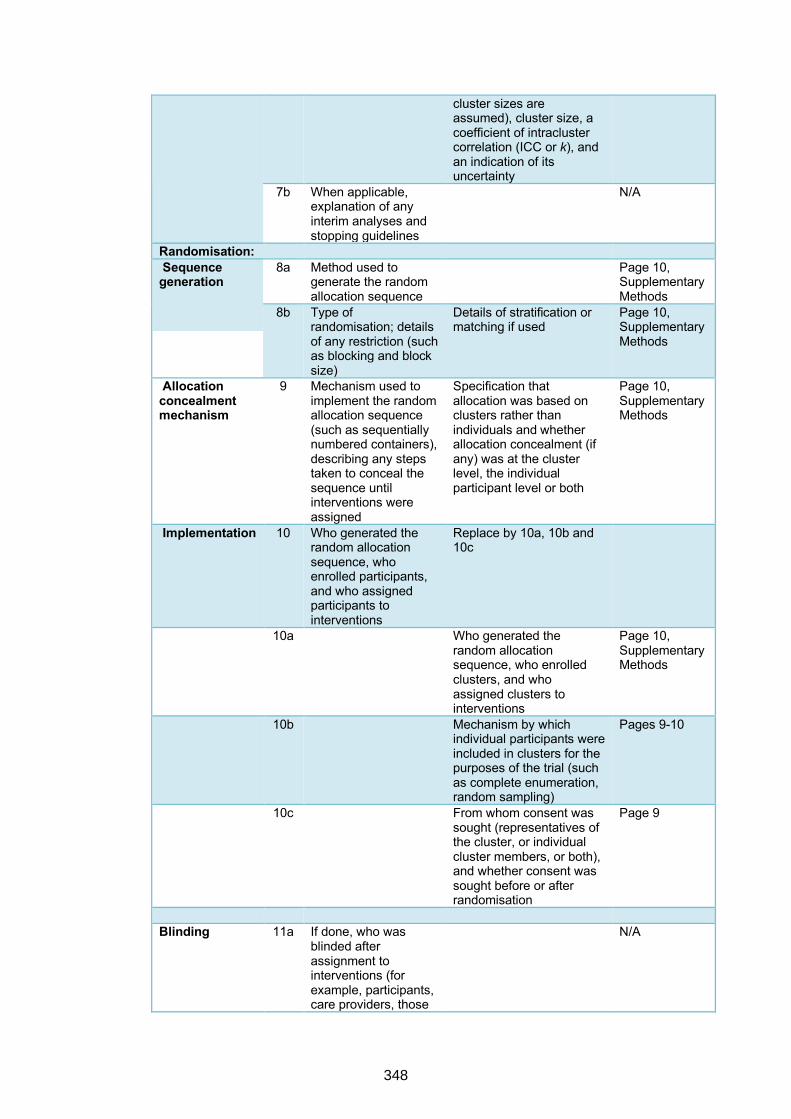
cluster sizes are assumed), cluster size, a coefficient of intracluster correlation (ICC or k), and an indication of its uncertainty
7b When applicable, explanation of any interim analyses and stopping guidelines
N/A
Randomisation: Sequence generation
8a Method used to generate the random allocation sequence
Page 10, Supplementary Methods
8b Type of randomisation; details of any restriction (such as blocking and block size)
Details of stratification or matching if used
Page 10, Supplementary Methods
Allocation concealment mechanism
9 Mechanism used to implement the random allocation sequence (such as sequentially numbered containers), describing any steps taken to conceal the sequence until interventions were assigned
Specification that allocation was based on clusters rather than individuals and whether allocation concealment (if any) was at the cluster level, the individual participant level or both
Page 10, Supplementary Methods
Implementation 10 Who generated the random allocation sequence, who enrolled participants, and who assigned participants to interventions
Replace by 10a, 10b and 10c
10a
Who generated the random allocation sequence, who enrolled clusters, and who assigned clusters to interventions
Page 10, Supplementary Methods
10b
Mechanism by which individual participants were included in clusters for the purposes of the trial (such as complete enumeration, random sampling)
Pages 9-10
10c
From whom consent was sought (representatives of the cluster, or individual cluster members, or both), and whether consent was sought before or after randomisation
Page 9
Blinding 11a If done, who was blinded after assignment to interventions (for example, participants, care providers, those
N/A
348
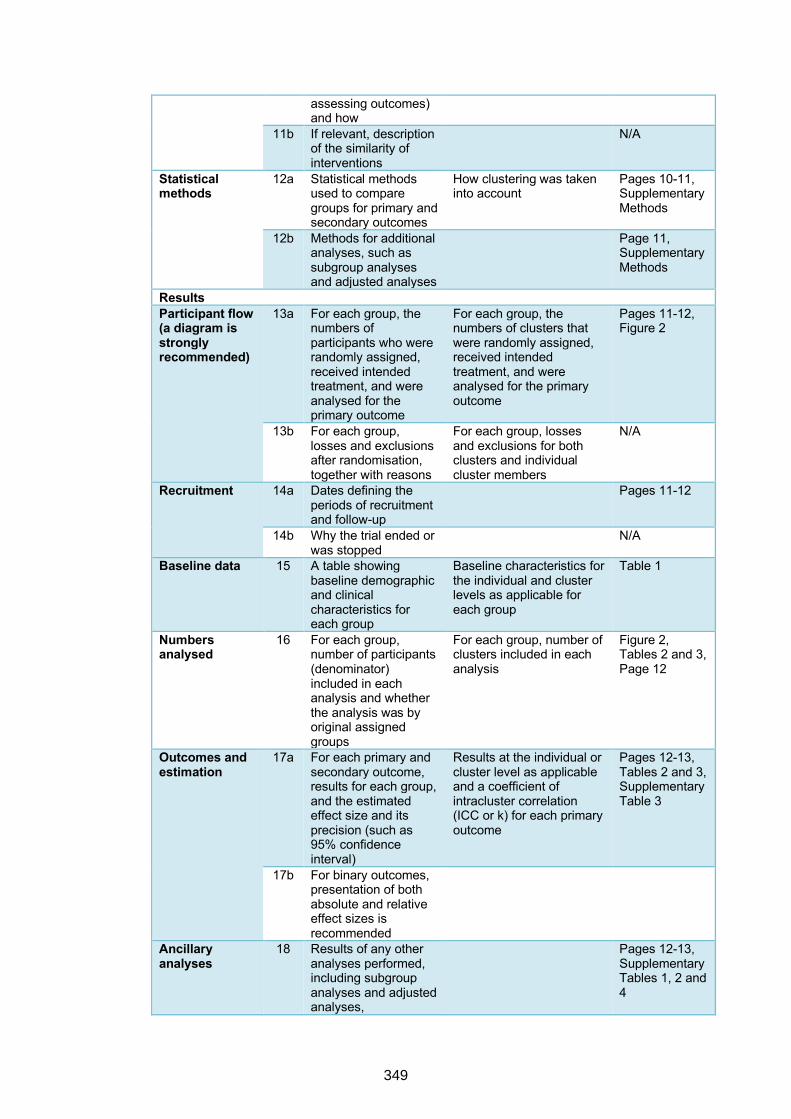
assessing outcomes) and how
11b If relevant, description of the similarity of interventions
N/A
Statistical methods
12a Statistical methods used to compare groups for primary and secondary outcomes
How clustering was taken into account
Pages 10-11, Supplementary Methods
12b Methods for additional analyses, such as subgroup analyses and adjusted analyses
Page 11, Supplementary Methods
Results Participant flow (a diagram is strongly recommended)
13a For each group, the numbers of participants who were randomly assigned, received intended treatment, and were analysed for the primary outcome
For each group, the numbers of clusters that were randomly assigned, received intended treatment, and were analysed for the primary outcome
Pages 11-12, Figure 2
13b For each group, losses and exclusions after randomisation, together with reasons
For each group, losses and exclusions for both clusters and individual cluster members
N/A
Recruitment 14a Dates defining the periods of recruitment and follow-up
Pages 11-12
14b Why the trial ended or was stopped
N/A
Baseline data 15 A table showing baseline demographic and clinical characteristics for each group
Baseline characteristics for the individual and cluster levels as applicable for each group
Table 1
Numbers analysed
16 For each group, number of participants (denominator) included in each analysis and whether the analysis was by original assigned groups
For each group, number of clusters included in each analysis
Figure 2, Tables 2 and 3, Page 12
Outcomes and estimation
17a For each primary and secondary outcome, results for each group, and the estimated effect size and its precision (such as 95% confidence interval)
Results at the individual or cluster level as applicable and a coefficient of intracluster correlation (ICC or k) for each primary outcome
Pages 12-13, Tables 2 and 3, Supplementary Table 3
17b For binary outcomes, presentation of both absolute and relative effect sizes is recommended
Ancillary analyses
18 Results of any other analyses performed, including subgroup analyses and adjusted analyses,
Pages 12-13, Supplementary Tables 1, 2 and 4
349
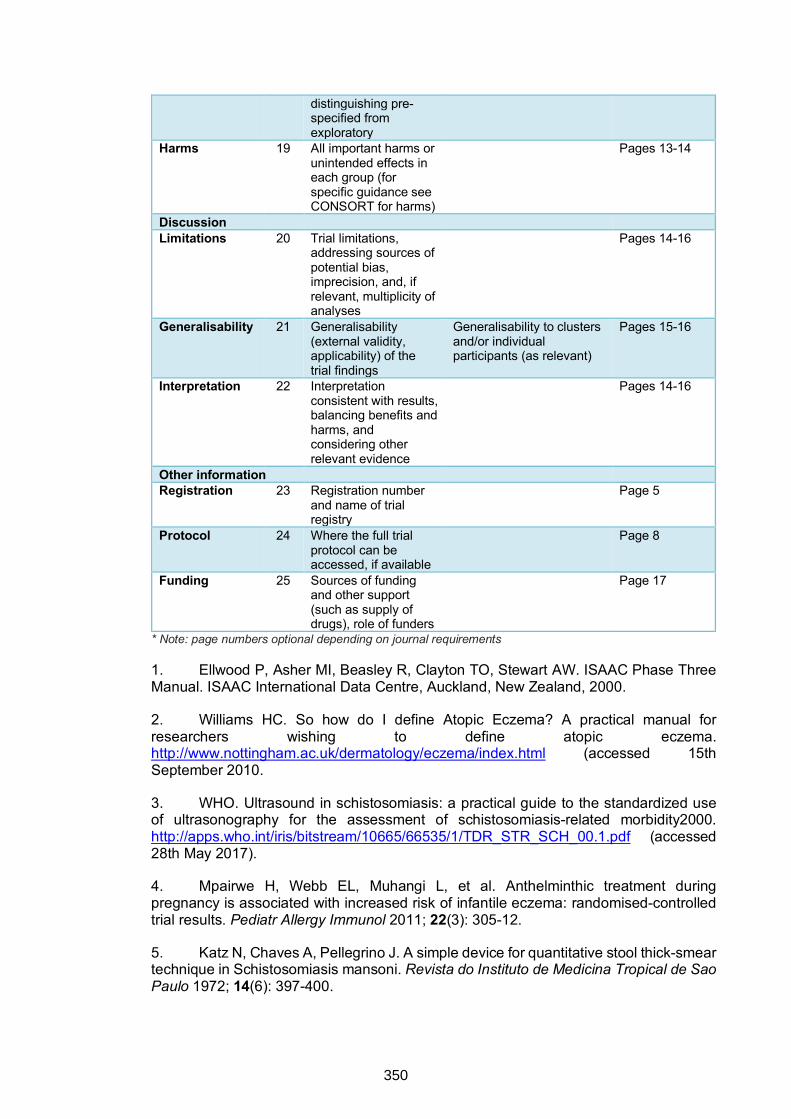
distinguishing pre-specified from exploratory
Harms 19 All important harms or unintended effects in each group (for specific guidance see CONSORT for harms)
Pages 13-14
Discussion Limitations 20 Trial limitations,
addressing sources of potential bias, imprecision, and, if relevant, multiplicity of analyses
Pages 14-16
Generalisability 21 Generalisability (external validity, applicability) of the trial findings
Generalisability to clusters and/or individual participants (as relevant)
Pages 15-16
Interpretation 22 Interpretation consistent with results, balancing benefits and harms, and considering other relevant evidence
Pages 14-16
Other information
Registration 23 Registration number
and name of trial registry
Page 5
Protocol 24 Where the full trial protocol can be accessed, if available
Page 8
Funding 25 Sources of funding and other support (such as supply of drugs), role of funders
Page 17
* Note: page numbers optional depending on journal requirements
1. Ellwood P, Asher MI, Beasley R, Clayton TO, Stewart AW. ISAAC Phase Three Manual. ISAAC International Data Centre, Auckland, New Zealand, 2000.
2. Williams HC. So how do I define Atopic Eczema? A practical manual for researchers wishing to define atopic eczema. http://www.nottingham.ac.uk/dermatology/eczema/index.html (accessed 15th September 2010.
3. WHO. Ultrasound in schistosomiasis: a practical guide to the standardized use of ultrasonography for the assessment of schistosomiasis-related morbidity2000. http://apps.who.int/iris/bitstream/10665/66535/1/TDR_STR_SCH_00.1.pdf (accessed 28th May 2017).
4. Mpairwe H, Webb EL, Muhangi L, et al. Anthelminthic treatment during pregnancy is associated with increased risk of infantile eczema: randomised-controlled trial results. Pediatr Allergy Immunol 2011; 22(3): 305-12.
5. Katz N, Chaves A, Pellegrino J. A simple device for quantitative stool thick-smear technique in Schistosomiasis mansoni. Revista do Instituto de Medicina Tropical de Sao Paulo 1972; 14(6): 397-400.
350
6. Verweij JJ, Canales M, Polman K, et al. Molecular diagnosis of Strongyloides stercoralis in faecal samples using real-time PCR. Transactions of the Royal Society of Tropical Medicine and Hygiene 2009; 103(4): 342-6.
7. Emmanuel IO, Ekkehard D. Epidemiology, of bilharzias (schistosomiasis) in Uganda from 1902 until 2005. African health sciences 2008; 8(4): 239-43.
8. Melrose WD, Turner PF, Pisters P, Turner B. An improved Knott's concentration test for the detection of microfilariae. Transactions of the Royal Society of Tropical Medicine and Hygiene 2000; 94(2): 176.
9. Nampijja M, Webb EL, Kaweesa J, et al. The Lake Victoria Island Intervention Study on Worms and Allergy-related diseases (LaVIISWA): study protocol for a randomised controlled trial. Trials 2015; 16: 187.
351
9.6.1 Copy of ethical approval to conduct PhD studies at LSHTM
Observational/InterventionsResearchEthicsCommittee
MrNKURUNUNGIGYAVIIRA
LSHTM23November2016DearNKURUNUNGI
StudyTitle:Immunologicalmechanismsofhelminth-allergyassociationsinUgandaLSHTMEthicsRef:11838
ThankyouforrespondingtotheObservationalCommittee’srequestforfurtherinformationonthe
aboveresearchandsubmittingreviseddocumentation.Thefurtherinformationhasbeen
consideredonbehalfoftheCommitteebytheChair.
Confirmationofethicalopinion
OnbehalfoftheCommittee,Iampleasedtoconfirmafavourableethicalopinionfortheaboveresearchonthebasisdescribedintheapplicationform,protocolandsupportingdocumentationasrevised,subjecttotheconditionsspecifiedbelow.Conditionsofthefavourableopinion
Approvalisdependentonlocalethicalapprovalhavingbeenreceived,whererelevant.Approveddocuments
ThefinallistofdocumentsreviewedandapprovedbytheCommitteeisasfollows:
Document Type
File Name Date Version
Advertisements 1. LaVIISWA. Information and permission, LC committees_original 08/03/2012 1
Local Approval UVRI REC LaVIISWA Approval april 2012 02/05/2012 01
Local Approval UNCST LaVIISWA Approvals 2012-2015 25/05/2012 01
9.6 APPENDIX 4: Copies of ethical approvals
352
Local Approval LSHTM LaVIISWA Approvals 2012-2016 28/05/2012 01
Information Info and consent form, adults, LaVIISWA main Surveys v 3.2 05/03/2013 3.2 Sheet
Information Info and consent form,adults, LaVIISWA main Surveys v 3.2 Luganda 05/03/2013 3.2 Sheet
Information Info and consent form, parents and guardians, LaVIISWA main surveys v 3.2 05/03/2013 3.2 Sheet
Information Info and consent form, parents and guardians, LaVIISWA main survey v 3.2, 05/03/2013 3.2 Sheet Luganda
Information Info and Assent form, LaVIISWA main Survey, v 3.2 05/03/2013 3.2 Sheet
Information Info and Assent form, LaVIISWA main survey, v 3.2, Luganda 05/03/2013 3.2 Sheet
Local Approval UNCST LaVIISWA APPROVAL_Immunological mechanisms_sept 2015 25/09/2015 01
Local Approval LAVIISWA MTA approval UNCST 15/10/2015 01
Information Sheet
LAVIISWA Inf for adult members - English 05/01/2016 5
Information Sheet
LAVIISWA Inf for adult members - Luganda 05/01/2016 5
Information Sheet
LAVIISWA Inf for children - English 05/01/2016 5
Information Sheet
LAVIISWA Inf for children - Luganda 05/01/2016 5
Information Sheet
LAVIISWA Inf for parents & guardians - English 05/01/2016 5
Information Sheet
LAVIISWA Inf for parents & guardians - Luganda 05/01/2016 5
Information Sheet
Urban Survey Information and Assent for children _Storage of Blood Samples English
08/03/2016 3
Information Sheet
Urban Survey Information and Assent for children _Storage of Blood Samples Luganda
08/03/2016 3
Information Sheet
Urban Survey Information and Assent for children English 08/03/2016 3
Information Sheet
Urban Survey Information and Assent for children Luganda 08/03/2016 3
Information Sheet
Urban Survey Information and Consent for adults _Storage of Blood Samples English
08/03/2016 3
Information Sheet
Urban Survey Information and Consent for adults _Storage of Blood Samples Luganda
08/03/2016 3
Information Sheet
Urban Survey Information and Consent for adults English 08/03/2016 3
Information Sheet
Urban Survey Information and Consent for adults Luganda 08/03/2016 3
Information Sheet
Urban Survey Information and Consent for Parents & Guardians _Storage of Blood Samples English
08/03/2016 3
Information Sheet
Urban Survey Information and Consent for Parents & Guardians _Storage of Blood Samples Luganda
08/03/2016 3
Information Sheet
Urban Survey Information and Consent for Parents & Guardians English 08/03/2016 3
Information Sheet
Urban Survey Information and Consent for Parents & Guardians Luganda 08/03/2016 3
Local Approval LAVIISWA UNCST Approval of transfer of samples to Cambridge University UK[2]
26/04/2016 01
Local Approval Urban survey_approvals 26/07/2016 01
Local Approval LSHTM Letter _Urban Survey 26/07/2016 01
353
Protocol / Proposal
Gyaviira Nkurunungi_protocol_2016 29/07/2016 01
Protocol / Proposal
Gyaviira Nkurunungi_data management plan 29/07/2016 1
Investigator CV Curriculum vitae_Gyaviira Nkurunungi_08_2016 23/08/2016 01
Covering Letter Cover letter_Gyaviira Nkurunungi_ref11838_final 08/11/2016 01
Afterethicalreview
TheChiefInvestigator(CI)ordelegateisresponsibleforinformingtheethicscommitteeofanysubsequentchangestotheapplication.ThesemustbesubmittedtotheCommitteeforreviewusinganAmendmentform.Amendmentsmustnotbeinitiatedbeforereceiptofwrittenfavourableopinionfromthecommittee.TheCIordelegateisalsorequiredtonotifytheethicscommitteeofanyprotocolviolationsand/orSuspectedUnexpectedSeriousAdverseReactions(SUSARs)whichoccurduringtheprojectbysubmittingaSeriousAdverseEventform.Attheendofthestudy,theCIordelegatemustnotifythecommitteeusinganEndofStudyform.Allaforementionedformsareavailableontheethicsonlineapplicationswebsiteandcanonlybesubmittedtothe
committeeviathewebsiteat:http://leo.lshtm.ac.ukAdditionalinformationisavailableat:
www.lshtm.ac.uk/ethics
Yourssincerely,
[email protected]://www.lshtm.ac.uk/ethics/
354

The Lake Victoria Island Intervention Study on Worms and Allergy-related
9.6.2
diseases (LaVIISWA): copies of ethical approvals*
*Approvals for continuation of the study sought for, and obtained each year.
355
356

357
The Urban survey of Allergy-related and Metabolic Outcomes: copies of ethical9.6.3
approvals*
*Approvals for continuation of the study sought for, and obtained each year.
358
359
360
361

362
ilgaurfrm Vfirum tessarsh *nLst*ilxta#lst s"! **9, F,aki1&.ilgil3 Floffd, Eru+lBbtos
F'.3, Emlt dt$. Ents'*h,B-LlgsmdaTEr[: 4g*& 4'l*+ $g$ 3A'$ I B
tF*?4: 'n e.*.S 4t4 3t* 4ESEtxsnll *li{e*n{}ru-dr:&l]irdr3. g$.l,Ifi
L,T\IHNEllga$dln XEtlEfi El listllth**s+ard,$ gngdn{*rtid*
Our Ref: GCI 127 I 14109 I 481
Your Ref: ...,.,
09th September 2014
Dr. Harriet Mpairwe,
RE: I;VRI REC review of protocol titled oostudy on asthma and parasitic infections among children in
Uganda (SONA)."
Thank you for submitting your responses to the queries addressed to you by UVRI REC.
This is to inform you that your responses dated 04ft September 2014 were reviewed and met the
requirements of the UVRI Research Ethics Committee.
UVRI REC annual approval has been given for you to conduct your research up to 09ft September 2015.
Annual progress ..port and request foi extension should be submitted to UVRI REC prior to the expiry
date, to allow timely review.
The reviewed and approved documents included;1. Study protocol Version 1-4 Sept 2014
2. UVRI REC Application form3. Consent forms and information sheets
4. Screening questionnaires5. Applicants'CVs.
You can now continue with your study afterand Technology (UNCST).
Note: UVRI REC requires you to submit
registration with the Uganda National Council for Science
a copy of the UNCST approval letter for the above study
C.C The Director-UVRIC.C Secretary, WRI REC
ttHPL:Br.l( d)f u€&t4tlA,
before commencement.
Mr. Tofi Lutalo
Study on Asthma and Parasitic Infections: copies of ethical approvals9.6.4
363
364
365

9.7 APPENDIX 5: example of a Stata do file used to perform permutation testing
**************************PERMUTATION TESTING*********************** **This is to assess differences between comparison groups, by controlling **for multiple testing of these correlated (non-independent) anti-glycan **responses. It is an alternative to other methods of accounting for multiple **testing that assume that variables are independent of each other, such as **Bonferroni corrections. ** The code for analysing the data and outputting p-values to a matrix, and **then to a dataset, uses a Mann whitney U-test here (note that this can **easily be adapted to other tests, such as regression if adjusting for **confounders). Here we assess differences between S. mansoni infected and **uninfected individuals. Variable name for S. mansoni infection is ‘kasinf’. **The outcomes are IgE responses to the 135 glycans on the array (from G1 to **G136). ** loop through the outcome variables from G1 to G136. When you see `x' it takes values from 1 to 136. foreach x of varlist G1-G136 {
** conduct a Mann whitney test ranksum `x', by(kasinf)
** then extract the p-value scalar p = 2 * normprob(-abs(r(z)))
di p
** add this p-value to a matrix, so have all the p-values from a single ** analysis of all outcomes, in one place. if `x'==G1 matrix pval_vec=p
else matrix pval_vec=(pval_vec \ p)
}
*** Look at the output matrix list pval_vec
**This gives the p-values from tests of association between exposure and **outcome for all 135 outcomes. These are our actual results. ** We want to do this thousands of times, but rather than using the original ** dataset, we want to "muddle up" the exposure variable so that we destroy ** any genuine associations between exposure and the outcome. ** The idea is that we can then see, under the null hypothesis of no **association, how many times we would expect to see a result with this small **a p-value by chance alone. ** For each outcome variable, we can then compare our p-value with the **calculated p-values from each permutation, to see where our p-value lies in **relation to these. ** We can also look globally, i.e. from each permutation, we take the
366

**smallest p-value and we then compare our smallest p-value (from the true) **data with the distribution of smallest p-values from all of the **permutations. *** Firstly, permute the exposure values and repeat: ** To do this, use a command called shufflevar which needs to be installed ssc install shufflevar
** Look through 1000 iterations and for each iteration shuffle up the exposure variable (keeping other data the same). foreach num of numlist 1(1)1000 {
gen eper`num'=kasinf
shufflevar eper`num', dropold
rename eper`num'_shuffled eper`num'
}
**Now that have the mixed-up exposure labels, need to loop through and apply the statistical tests to the permuted data. set more off
foreach y of numlist 1(1)1000 {
foreach x of varlist G1-G136 {
** conduct statistical analysis ranksum `x', by(eper`y')
** then extract the p-value scalar p = 2 * normprob(-abs(r(z)))
di p
** add this p-value to a matrix, so have all the p-values from a single ** analysis of all outcomes, in one place. if `x'==G1 matrix pval_vec`y'=p
else matrix pval_vec`y'=(pval_vec`y' \ p)
}
}
*** Look at the output matrix dir
**We now have a matrix (with 1 column each) of results for the permuted **datasets. ** Each has 136 p-values, one corresponding to each outcome variable. *** Now need to combine the separate matrices so have all in one place. *** Easiest way to do this is to export as .csv file, then bring back into **Stata. ** Output true results p-values first. matrix pval_vect=pval_vec'
mat2txt, matrix(pval_vect) saving("permute_laviiswa_glycan_IgE.csv") replace
** Then output the permutation results.
367

foreach x of numlist 1/1000 {
matrix pval_vec`x't=pval_vec`x''
mat2txt, matrix(pval_vec`x't) saving("permute_laviiswa_glycan_IgE.csv")
append
}
** Bring the p-values back into Stata and do some tidying up import delimited permute_laviiswa_glycan_IgE.csv, clear
drop if v2=="r1"
drop v1
set more off
foreach x of varlist v2-v136 {
destring `x', replace
}
drop v137
** In this dataset, each column represents one of the 30 outcomes. ** The first row represents the true results (from the actual data) - p-values. Each row after that represents the p-values from one permutation. ** We can generate a new variable for the minimum p-value from each permutation egen minp=rowmin(v2-v136)
** We now have the option of comparing our best p-value from the true analysis with our best p-values from all permutations, or we can compare results for each outcome variable to their permuted equivalents individually (or both). ** Globally: gen global=0 if _n>=2
replace global=1 if minp[1]>minp[_n] & _n>=2
** get p-value from the proportion of permutations that have a p-value ** smaller than the actual p-value tab global
** We are looking for a small number of 1s, e.g. if there are only 3 1's out ** of 1000 permutations, then the p-value would be 3/1000 = 0.003. If there were 500 1's out of 1000 permutations, then the p-value would be 0.5. ** For each outcome: foreach x of numlist 2/136 {
local y=`x'-1
gen kasinf`y'p=0 if _n>=2
replace kasinf`y'p=1 if v`x'[1]>v`x'[_n] & _n>=2
}
set more off
foreach x of varlist kasinf1p-kasinf135p {
tab `x'
}
368