durham research online - core
TRANSCRIPT
Durham Research Online
Deposited in DRO:
08 May 2006
Version of attached file:
Published Version
Peer-review status of attached file:
Peer-reviewed
Citation for published item:
Glover, G. and Barnes, D. and Darlington, A-S. (2004) ’Information about mental health and mental healthservice use in England.’, Stockton on Tees: North East Public Health Observatory, p. 103. north east publichealth observatory.
Further information on publisher’s website:
http://www.nepho.org.uk/viewf ile.php?c = 453
Publisher’s copyright statement:
Additional information:
Use policy
The full-text may be used and/or reproduced, and given to third parties in any format or medium, without prior permission or charge, forpersonal research or study, educational, or not-for-profit purposes provided that:
• a full bibliographic reference is made to the original source
• a link is made to the metadata record in DRO
• the full-text is not changed in any way
The full-text must not be sold in any format or medium without the formal permission of the copyright holders.
Please consult the full DRO policy for further details.
Durham University Library, Stockton Road, Durham DH1 3LY, United KingdomTel : +44 (0)191 334 3042 — Fax : +44 (0)191 334 2971
http://dro.dur.ac.uk
CORE Metadata, citation and similar papers at core.ac.uk
Provided by Durham Research Online
Information about Mental Health and Mental Health Service Use in England Gyles Glover, Diana Barnes, Anne-Sophie Darlington

Authors: Gyles Glover, Centre for Public Mental Health
Diana Barnes, Centre for Public Mental Health
Anne-Sophie Darlington, Centre for Public Mental Health
Title: Information about Mental Health and Mental Health Service Use in England
Publisher: North East Public Health Observatory
ISBN: 1-903945-24-0
Editors: Kath Bailey, North East PHO
David Chappel, North East PHO
Date of publication: March 2004
Further copies from:
www.nepho.org.uk
or by contacting
North East Public Health Observatory
Tel: (0191) 3340400
Email: [email protected]

iii
CONTENTS
Contents ................................................................................................. iii
Executive summary ................................................................................ 1 Introduction .......................................................................................................... 1 Users survey ......................................................................................................... 1 Review of key national mental health data sources .................................................. 2 Towards an agenda for the Public Health Observatories ........................................... 3
Introduction ........................................................................................... 5 Mental illness in the population............................................................................... 5 Policy on mental health care................................................................................... 6 Additional key themes............................................................................................ 6 Conclusion............................................................................................................. 9
Information users and their requirements ............................................. 10 Information users .................................................................................................. 10 Information sources currently being used................................................................ 12 Format of available data (Interview study) .............................................................. 16 Findings of questionnaire survey............................................................................. 18 Data desired.......................................................................................................... 19 Future contact with the Public Health Observatory................................................... 22 Conclusions ........................................................................................................... 23
Review of national mental health data sources ..................................... 24 Group 1: Population data ....................................................................................... 25 Group 2: Health and social care.............................................................................. 32 Group 3: Treatment ............................................................................................... 48 Group 4: Outcomes................................................................................................ 52
Case study .............................................................................................. 54 Needs for care....................................................................................................... 54 Services, facilities and their activity......................................................................... 66 Treatments ........................................................................................................... 79 Outcomes of care .................................................................................................. 85
Towards an agenda for the PHO............................................................. 89 Summary of findings .............................................................................................. 89 Gaps in data – the ‘shopping list’ ............................................................................ 90 The role of the Public Health Observatories ............................................................. 91 Conclusions ........................................................................................................... 94
Acknowledgements ................................................................................ 95
References.............................................................................................. 96

1
EXECUTIVE SUMMARY Introduction Detailed intelligence about the prevalence of mental illness, the provision of services, the treatment given and its outcomes is needed now as never before. It is crucial not only to establish whether the needs of people mental health problems are being met effectively but also to steer the transformation of England’s mental health service set out in the National Service Framework (NSF) for Mental Health1 and the NHS Plan2. Mental ill health is widespread; common problems affecting about 1 in 7 adults and severe mental illness affecting about one percent of the adult population. Mental health problems have complex causes and effects, involving social and economic circumstances as well as physical and mental health. Thus effective interventions require the participation of a broad range of health and social care agencies across statutory and voluntary sectors. To plan, commission, provide and manage such services requires detailed data. It is possible for individual organisations to collect new data to answer specific questions, but this is time consuming and expensive, and interpretation of the results often requires comparators. Much data is already collected in the form of a wide range of national statistical returns. The only barriers to free and immediate use of this data are knowledge of its existence and location, and the technical capability to analyse it appropriately. This report seeks to survey data that is available nationally and to consider the extent to which it is currently, or could easily be made available in the forms that would most effectively assist statutory agencies in their work. This Scoping Study of Mental Health Data was carried out by the Centre for Public Mental Health at the University of Durham for the Northern & Yorkshire Public Health Observatory. The scoping was in two parts: a survey of local potential users of the data and a review of data sources currently available. The data sources were then used for a ‘worked example’ to describe what is known of mental health problems and care, looking at the Northern and Yorkshire Region wherever possible. From the emerging themes, the function of the Observatories in increasing access to mental health data is explored. Users survey The survey of users and potential users of mental health data in the Northern and Yorkshire region was carried out in late 2001 and early 2002. It involved both interviews and a postal survey of commissioners and providers of health and social mental health care. The purpose of the survey was to clarify what information sources are currently used, what additional information is wanted and the most accessible format for new information made available. In total responses were received from 40 individuals, 25 (63%) from health, 7 (18%) from social services and 8 (20%) from the voluntary sector. The most common use of mental health data was found to be assessing the need for services and monitoring their activity. Needs assessment made use of demographic data, deprivation indices and prevalence data but dependence was often placed on departments of Public Health or local authority statisticians to interpret the data to produce locality-specific information. In addition, local needs assessments were often commissioned on specific topics.
2
A wide variety of activity data was found to be used and, as these included national data returns, they enabled some inter-district comparisons to be made. However, scope for this benchmarking was reported to be limited. The lack of outcome data was also regretted and tended to be restricted to readmission rates, waiting lists, complaints and suicide with suicide being the most studied through use of a range of data sources. Interest was found in process data such as information supporting audit and quality monitoring and research data providing an evidence base for service development. This was strongly driven by the change agenda encompassed in the NSF. The implementation of change was also increasing the emphasis placed on workforce and finance data. The format of data most used currently was found to be digested tables and text in hard copy reports and bulletins. The use of electronic data was found to be increasing but respondents tended not to be confident about manipulating raw data sources to extract the local information that they needed. The main improvements in data called for were: • More accurate local data (anticipated with the availability of the 2001 Census tables);
• Better use made of information held in primary care;
• Improved links between mental health and criminal justice data on offending and prison health;
• Greater focus on mental health problems experienced by young people such as student-related problems, eating disorders, suicide and self-harm;
• Availability of the Mental Health Minimum Data Set;
• Removal of the incompatibilities of data across health and social care agencies;
• More information on outcomes and the impact of services;
• More trend data dependent on the stability of health economy boundaries so that change can be measured over time;
• A greater ability to benchmark;
• Improved evidence base of new service models and treatment. Essentially users wanted more information that is easily available, relevant to localities, accurate and standardised to enable inter-district comparisons. They lack the time to scope all the information circulated to see what was relevant for them, let alone having time to study data, manipulate and interpret it. Therefore the idea of an information digest which would keep them informed of new developments and be circulated by email was welcomed. Review of key national mental health data sources Key national mental health data sources were systematically reviewed and are summarised with a brief description of the data, its reference, the location of output and comment on its quality, strengths and weaknesses. In total 43 data sources were reviewed.
3
A worked example Following the review of sources, the findings of the national psychiatric surveys and mental health information returns were used to describe what these tell us about the need for mental health services, where existing services are, the activity within them, the treatment delivered and the outcomes for the users of services. Wherever data allowed, a distinction was made between common mental health problems, severe mental illness, alcohol and drug use and mental illness amongst prisoners. A national picture is presented but where information is available, a regional profile for the Northern and Yorkshire Region is developed. This uses regional summaries or data on old health authorities, mental health trusts or PCTs, depending on the detail of data collected, analysed and published. Inevitably the resultant picture is patchy and in some places contradictory. Towards an agenda for the Public Health Observatories Having scoped the complex range of data already collected and accessible, it was found that data users have serious difficulties in interpreting the information to produce a coherent description of an issue and/or a locality. This is due to: • Data sources using inconsistent boundaries, time windows and formats;
• Patchy coverage if issues;
• Data users lacking time and the necessary skills to manipulate raw data or interpret complex tables.
Outstanding data needs were found to fall into 3 types: • New data needs, such as: improved intelligence about mental health needs and
provision in primary care; mental health issues experienced by young people; and the links between mental and physical health.
• Reanalysed data focusing on remodelling existing data using the 2001 Census when it becomes available, repackaging data to take account of new boundaries and health economies and generating trend data to show change against time.
• Policy bulletins and information digests. The setting up of new national mental health surveys is clearly outside the scope of the Public Health Observatories but it was recognised that the Observatories are ideally placed to have an important role in the processing, storage and interpretation of mental health data. These roles would include: • Reanalysing large national data sources;
• Ensuring new data sources are available in appropriate form for local use;
• Developing trend data and drawing this to users’ attention;
• Maintaining a full directory of mental health data sources and publicising their usefulness appropriately;
• Preparing and disseminating policy bulletins as appropriate;
• Reflecting back to the Department of Health what data are and are not offering.

4
While most of the proposed roles for the Public Health Observatories lend themselves to a national approach with one observatory taking lead responsibility for specific tasks, there are also roles best fulfilled at a regional level such as: • Interpreting the data for small areas within regions;
• Monitoring changes in zoning;
• Ensuring information gets to the relevant users; and
• Obtaining feedback from the field, perhaps through information networks. A two-way flow is important as it is not facilitated elsewhere.
Within regions, there should also be scope for making local arrangements about how data/information is delivered as the needs of users across England will vary. Therefore, it is suggested that each regional Observatory should develop a local digest of mental health information and through these ensure that updated information is regularly disseminated.

5
INTRODUCTION This study explores the role that English Regional Public Health Observatories could play in the area of monitoring public mental health, and the provision, use and effectiveness of mental health services. It was commissioned by the Northern & Yorkshire Public Health Observatory, partly to guide local development in this field, and partly in discharge of their lead function in this clinical area within the national Public Health Observatories group. Its original contribution is in two parts: a survey of local potential users of data; and a review of currently available data sources. Working from the emerging themes, it concludes with a discussion of what functions Public Health Observatories could undertake, and the extent to which it would be sensible for these to be undertaken nationally as opposed to being replicated in each region. The report concentrates on the mental illnesses of working age adult life. It does not address dementia, mental illnesses in children and adolescents, or learning disabilities. The report begins by briefly setting out the current mental health policy context and the ambitious agenda for change that is driving the need for reliable and relevant mental health data sources. The types of data wanted are explored in “Information Users and their Requirements”, which describes a survey of potential users. The purpose of the survey was to elicit the views of a range of health, social care and voluntary sector staff on their substantive information needs and the formats in which they would like to see such information presented. “Review of National Mental Health Data Sources” systematically reviews the key national mental health data sources, summarising the purpose, scope and availability of each source. This data is then used in the “Case Study” to describe mental health problems and care in England. Wherever possible, local figures are extrapolated to build up a case study of the Northern and Yorkshire region. On the basis of these reviews, “Towards an Agenda for the PHO” makes a set of proposals about what Regional Public Health Observatories could realistically do to provide the intelligence required. Mental illness in the population The spectrum of mental illnesses is wide. Common problems, including depression and anxiety states affect about one in seven adults. More severe problems, including schizophrenia and manic-depressive illness, affect around one percent of the adult population. The proportion of people in communities who suffer mental health problems varies in ways that are partly predictable. Poverty, unemployment and social isolation have all been shown to be associated with a higher prevalence of illness in working age adults. The degree of variation is greater for more serious mental illnesses. Hence different indices are appropriate in planning for primary and secondary level mental health care. Primary care teams provide the mainstay of care of people with common mental illness. Increasingly they provide not only drugs, but also simple psychological treatments. They also provide a substantial amount of care for people with major mental health problems. These range from the provision of general physical care to a group likely to be in poorer than average health, to the administration of maintenance therapies, such as depot phenothiazines. Many general practitioners undertake the principal management of some psychotic individuals.

6
Specialist services for people with severe mental health problems comprise a wide range of types of provision. Community based teams provide ambulatory care at levels of intensity ranging from clinics to intensive short or long term community care. Day facilities provide care ranging from the treatment of acute crises to longer-term supportive care, employment assistance and leisure activities. Residential facilities provide a wide spectrum of care. Short-term units range from acute crisis houses to hospital wards and short-term intensive care units. Longer-term facilities span near ‘normal’ facilities, such as board and lodging schemes and group homes and units for people needing fulltime nursing care, sometimes in conditions of security. Policy on mental health care The breadth of needs of people with severe mental illnesses covers areas for which several public agencies have responsibility. Recent policy has designated mental illness as a ‘joint lead area for local Health Services and Social Services Departments1,3. Primary Care Trusts, Specialist NHS Trusts and Local Authority social services departments are, between them, responsible for providing for all but the most unusual needs in the local population. Current NHS policy making has focussed on the extent to which older patterns of service organisation, based on short and long-term in-patient wards, out-patient clinics and day centres have been replaced by newer structures which have been demonstrated to be preferable to service users, more efficacious, and in some cases cheaper4. The new models of services and national standards were set out in a National Service Framework for Mental Health in 19991. This also established a national programme for the implementation of the new structures with a system of performance management to monitor progress. This programme for change was reinforced by the NHS Plan2 which introduced further service models and clear targets for when new services were to be in place. Detailed guidance on the new structures is set out in the Mental Health Policy Implementation Guidance5, supplemented by an additional section on Community Mental Health Teams, guidance on acute adult in-patient care and national minimum standards for psychiatric intensive care units and low secure environments6-8. An area of concern surrounding the provision of these services has been the extent to which they are provided in ways that are appropriate to their users. Recent guidance has focussed on aspects of providing care to women9. Guidance on provision of care for members of ethnic minorities is expected shortly. The aspirations of these services for their clients have received attention. ‘The Journey to Recovery’10 sets out a principle that these services should not be seen as simply looking after people who will inevitably remain disabled. Additional key themes Workforce Underlying all areas of mental health care provision in England is the problem of obtaining staff. There is a noticeable gap between the numbers of staff required and the number available. Quantifying this gap with accuracy is hard because many aspects of the service models currently being implemented are relatively new, and the boundaries between the roles occupied by individuals from different professional backgrounds within these services are, to some extent, still emerging. This means that it easier to specify what skills and

7
competencies are needed than what professional groups. In many places the need for existing staff to undergo re-training may be greater than the need to find additional staff11. Psychological Treatments There is now a range of psychological treatments which have been demonstrated to be efficacious for specific types of mental health problem. Progress in this field was reviewed for the Department of Health by Roth and Fonagy12. Recent guidance following their work indicates to Primary Care Trusts the range of psychological therapies that should be available and the gradations of skill needed among practitioners. Survey work in the mid 1990s suggested that provision around the country was very uneven. Recent mapping work shows it still is. Drug treatments Pharmacological therapy for mental health problems raises a range of issues. In primary care, for some years the two major goals have been: • To encourage the identification of the depressive disorders in patients and their
treatment with antidepressants in appropriate doses for appropriate and not excessive periods; and
• To discourage the use of benzodiazepine tranquilisers and night sedatives other than for short periods or occasional specific conditions.
In secondary care, the central problem is to manage the introduction of new and expensive products, ensuring that patients who could benefit do, while indiscriminate use does not incur unsustainable costs. In mental health care the products on which most attention has focussed recently are the atypical antipsychotics and the anti-dementia drugs. National Institute for Clinical Excellence (NICE) guidelines have been published on both. These indicate tightly defined criteria for appropriate use of the agents covered, which should, presumably be a subject for local clinical audit. Controversial treatments A number of types of treatment in mental health care have been the subject of wide public controversy. The only treatment falling under this category provided at present to a large number is electro-convulsive therapy (ECT), currently the subject of a NICE review. Powers and rights Mental health care legislation For some individuals it is considered necessary to provide care either in the absence of the patient’s consent, or against their wishes. The recognised reasons for this are that it is in the interests of the patient’s health or safety or for the protection of the public. Current legislation has its roots in the thinking of the late 1950s, envisaging detention in hospital as the principal vehicle for compulsory treatment. The arbiters of need for detention in non-forensic cases are doctors and social workers. While modified in the early 1980s and the mid 1990s, the Act does not provide the powers for coercion of long-term treatment and care of people living in non-hospital settings many clinicians now feel are needed. Nor does it adequately recognise the multidisciplinary nature of current mental health assessment.

8
New legislation is currently being prepared and it seems likely that it will constitute a genuinely radical overhaul of the structure of the powers of compulsion, on the scale of the Acts of 1890 and 1959. Advocacy People receiving care for major mental health problems may find themselves having important personal decisions made almost for them about, for example, their place of residence or the custody of their children. In some cases the decisions concern their liberty and their right to refuse treatments they do not want. These events may happen at times when they are least able to find out about and work through the options open to them, or to have their voice heard. Advocacy services are intended to assist people in this type of situation with advocates working directly for the service user, supporting them in the way they want. It is likely that a new mental health act will confer some rights of access to this type of service. Outcomes Health services should be judged on the outcomes of the care they provide. For mental health services this is particularly difficult. Many of the problems they care for come on insidiously and last indefinitely, leaving the identification of points for comparison before and after treatment ambiguous. The symptoms and the associated social disability may pervade most areas of people’s lives, and the resulting disadvantage may be cumulative. For individuals these patterns are distinct, leaving a potentially wide range of parameters to measure, none of which is easily quantified. The situation is somewhat easier for some types of illness which are less severe and pervasive, may have a clearer point of onset and may be more susceptible of genuine cure. The Department of Health instigated a programme to develop and implement standard outcome measures as part of the Health of the Nation programme in the early 1990s. This gave rise to the development of the HoNOS scale13 and the Mental Health Minimum Data Set; the patient based record structure through which it is now possible for the Department to develop standard returns of the data. As the Data Set is finally coming into full operation, a study has been launched to review the choice of symptom rating instrument and to explore the feasibility of adding ratings for patients’ quality of life and service satisfaction. Suicide and Homicide The one readily quantifiable outcome for which reasonably un-controversial statistics have been available for many years is suicide. This is undoubtedly associated with mental illness in many, if not most cases. At a wide level, a number of interventions such as the withdrawal of coal gas from domestic supply and the effective withdrawal of barbiturate sleeping tablets have been shown to have been associated with decreases in suicide rate. One pioneering study has suggested that vigorous and co-ordinated mental health care can exert a downwards effect on suicide rates. This is difficult to demonstrate in local statistics because the number of cases is usually small and there is little doubt that other factors than mental health care, for example unemployment, also have a substantial effect. Mental Health promotion The advantages of preventing rather than treating illness are clear in all areas of medicine and the extent to which this is possible for mental illness is now beginning to become
9
clearer. A recent report from the Department of Health14 sets out both a synopsis of the wide range of interventions for which there is now evidence of efficacy, and a review of the structures, processes and challenges of effecting these interventions in local settings. Conclusion In fulfilling their respective roles, Primary Care Trusts, Social Services Departments and the new Care Trusts will need detailed intelligence, not only about their own situation, but about the position nationally. The developing nature of the types of service they are being asked to provide, and indeed of the roles and remits of these organisation themselves, indicates that for the foreseeable future they will need technical assistance in collating and interpreting the information that is available. This report seeks to survey the data that is available nationally, to consider how it could most easily be made most useful to the key individuals in the statutory agencies responsible for the provision of mental health care, and to outline the areas and ways in which it could realistically be enhanced to address the areas where there are currently real gaps.
10
INFORMATION USERS AND THEIR REQUIREMENTS Information users An important factor when scoping data sources is to hear the voice of those who use the information in their daily work. In this study information users were contacted in two ways.
• In stage one, interviews were sought with a range of stakeholders in health and social care to explore: • What data is used; • What information is difficult to obtain; • What other information would be useful; and • The most suitable format for new information.
All health authorities, trusts and local authorities in the region were contacted and invited to respond. In addition a range of voluntary mental health agencies were contacted, including specialist housing providers. A sample of four respondents from each type of agency was taken and the sample was interviewed using a semi structured questionnaire. All additional volunteers were included in the sample for stage two. • Stage two involved a postal survey of staff who were identified to have a lead role in
mental health service planning, commissioning, reviewing or provision. The self-completion questionnaire used was developed from the results of the stage one interviews.
Interviews were completed successfully with 22 individuals. However the response rate to the questionnaire survey was disappointing. In total, 18 of the 45 members of staff targeted returned completed questionnaires, a response rate of 40%. This was due in part to the timing of the study which was carried out during major change in the NHS in early 2002. The implementation of Shifting the Balance of Power15 was already being felt and as a result many respondents were changing jobs and employers. For example, commissioners of health services were transferring from health authorities to primary care trusts and of those working in performance management were moving to the new strategic health authorities. As so many of the posts held by respondents no longer exist, no analysis of them is offered in this report. Instead, a distinction has been made between people working in the NHS, social services and the voluntary sector (Table 2.1) and key areas of responsibility held by respondent have been identified (Figure 2.1).
11
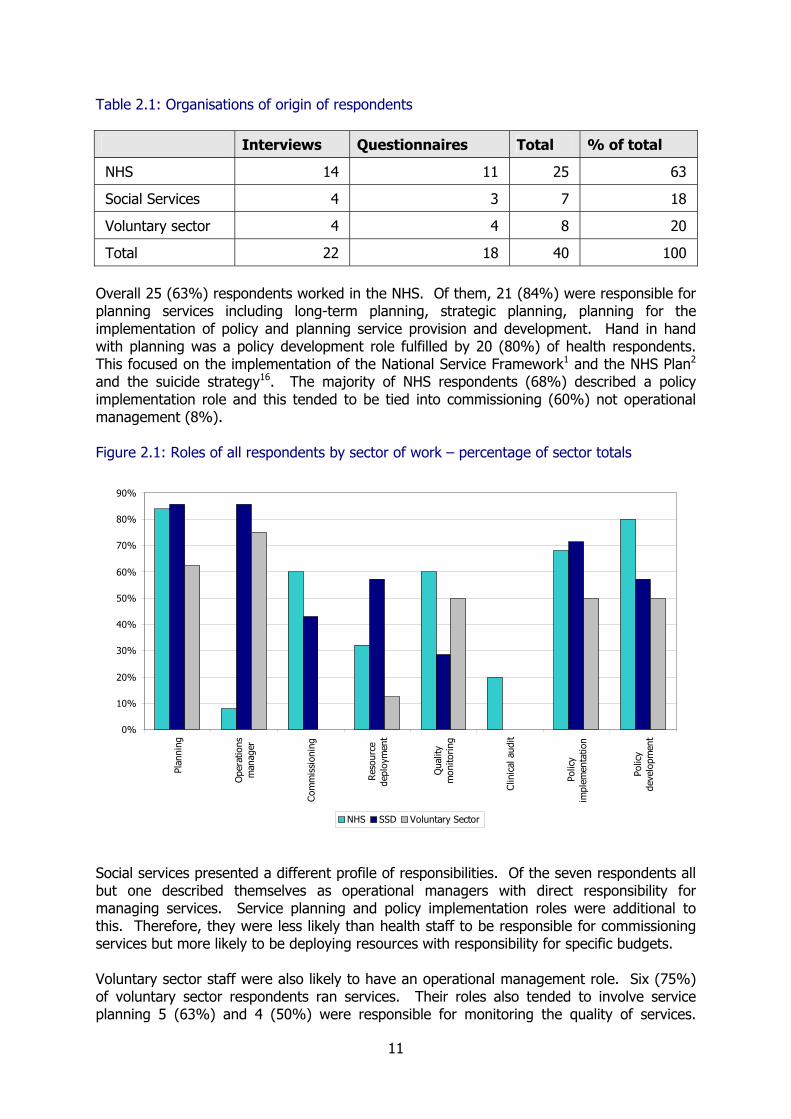
Table 2.1: Organisations of origin of respondents
Interviews Questionnaires Total % of total
NHS 14 11 25 63
Social Services 4 3 7 18
Voluntary sector 4 4 8 20
Total 22 18 40 100
Overall 25 (63%) respondents worked in the NHS. Of them, 21 (84%) were responsible for planning services including long-term planning, strategic planning, planning for the implementation of policy and planning service provision and development. Hand in hand with planning was a policy development role fulfilled by 20 (80%) of health respondents. This focused on the implementation of the National Service Framework1 and the NHS Plan2 and the suicide strategy16. The majority of NHS respondents (68%) described a policy implementation role and this tended to be tied into commissioning (60%) not operational management (8%). Figure 2.1: Roles of all respondents by sector of work – percentage of sector totals
Social services presented a different profile of responsibilities. Of the seven respondents all but one described themselves as operational managers with direct responsibility for managing services. Service planning and policy implementation roles were additional to this. Therefore, they were less likely than health staff to be responsible for commissioning services but more likely to be deploying resources with responsibility for specific budgets. Voluntary sector staff were also likely to have an operational management role. Six (75%) of voluntary sector respondents ran services. Their roles also tended to involve service planning 5 (63%) and 4 (50%) were responsible for monitoring the quality of services.
0%
10%
20%
30%
40%
50%
60%
70%
80%
90%
Plan
ning
Ope
ratio
nsm
anag
er
Com
mis
sion
ing
Res
ourc
ede
ploy
men
t
Qua
lity
mon
itorin
g
Clin
ical
aud
it
Polic
yim
plem
enta
tion
Polic
yde
velo
pmen
t
NHS SSD Voluntary Sector
12
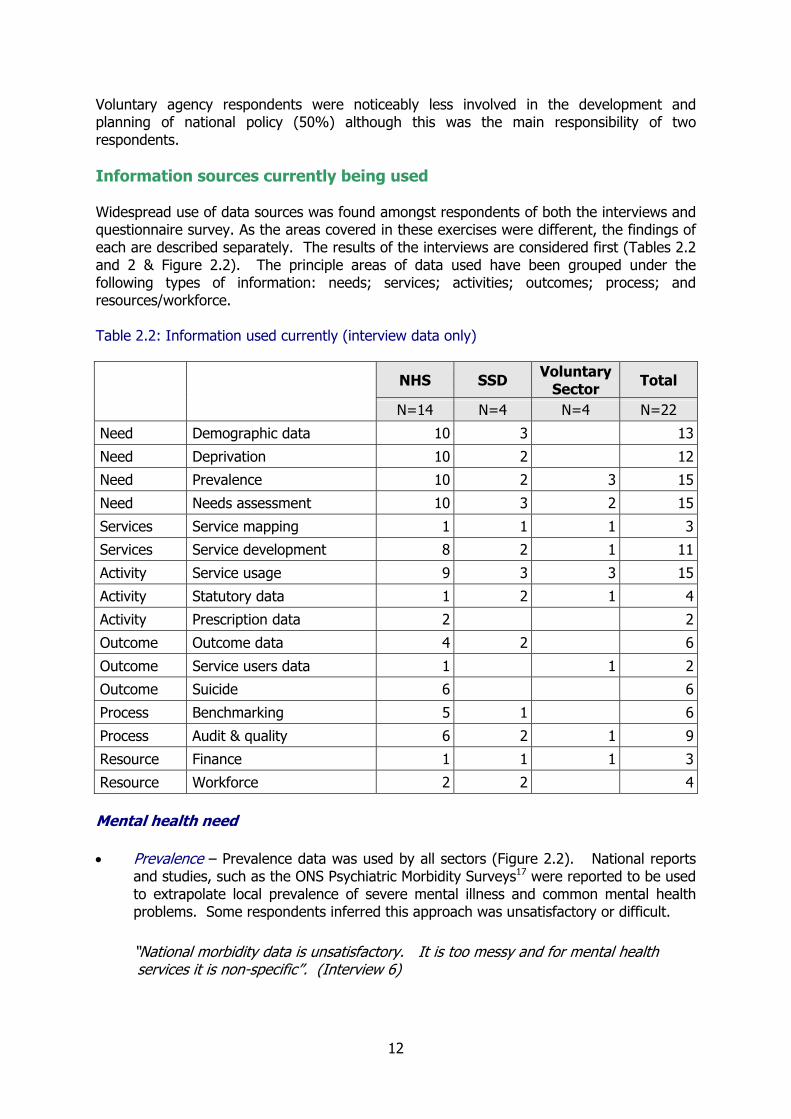
Voluntary agency respondents were noticeably less involved in the development and planning of national policy (50%) although this was the main responsibility of two respondents. Information sources currently being used Widespread use of data sources was found amongst respondents of both the interviews and questionnaire survey. As the areas covered in these exercises were different, the findings of each are described separately. The results of the interviews are considered first (Tables 2.2 and 2 & Figure 2.2). The principle areas of data used have been grouped under the following types of information: needs; services; activities; outcomes; process; and resources/workforce. Table 2.2: Information used currently (interview data only)
NHS SSD Voluntary Sector Total
N=14 N=4 N=4 N=22
Need Demographic data 10 3 13
Need Deprivation 10 2 12
Need Prevalence 10 2 3 15
Need Needs assessment 10 3 2 15
Services Service mapping 1 1 1 3
Services Service development 8 2 1 11
Activity Service usage 9 3 3 15
Activity Statutory data 1 2 1 4
Activity Prescription data 2 2
Outcome Outcome data 4 2 6
Outcome Service users data 1 1 2
Outcome Suicide 6 6
Process Benchmarking 5 1 6
Process Audit & quality 6 2 1 9
Resource Finance 1 1 1 3
Resource Workforce 2 2 4 Mental health need
• Prevalence – Prevalence data was used by all sectors (Figure 2.2). National reports and studies, such as the ONS Psychiatric Morbidity Surveys17 were reported to be used to extrapolate local prevalence of severe mental illness and common mental health problems. Some respondents inferred this approach was unsatisfactory or difficult.
“National morbidity data is unsatisfactory. It is too messy and for mental health services it is non-specific”. (Interview 6)

13
Others depended on their Public Health Department to digest the raw data or commissioned specific studies to develop local prevalence data. Voluntary sector staff found the major national voluntary organisation websites rich sources of data to meet their particular needs.
Figure 2.2: Current use of information by sector (interview data only)
• Demographic data – Census and other demographic data was used at ward and
district levels for age related population statistics and information on housing, homelessness and employment. Local authorities and health authorities tended to ensure this data was easily accessible for staff in the locality. The voluntary sector did not report the use of population data (Figure 2.2).
• Deprivation – Given the links between deprivation and mental ill health, planners were the main users of deprivation data. The use of two deprivation indexes was reported; the York index, and the MINI index.
“Using the York Index we have been able to obtain deprivation scores which translate national figures to information of local relevance which is understandable to lay people”. (Interview 4)
• Needs assessment – The majority of respondents across sectors reported using data to assess need but the type of needs assessments varied considerably. Some formed the basis of locality-wide general policy development and service planning while some were specific to particular concerns. The latter were also described as ‘gap analysis’ to assess where targeted development should be planned. Specific needs assessments were also commissioned to explore issues in depth. Reference was made to commissioned studies in housing needs, mentally disordered offenders, prisons, personality disorder and early onset dementia.
0% 20% 40% 60% 80% 100%
Demographic data
Deprivation
Prevalence
Needs assessment
Service mapping
Service development
Service usage
Statutory data
Prescription data
Outcome data
Service users data
Suicide
Benchmarking
Audit & quality
Finance
Workforce
NHS SSD Voluntary Sector
14
Service provision • Service mapping – Only three respondents used service mapping as a data source. In
the voluntary sector the mapping was carried out by the agency for its own use but NHS and SSD staff who used mapping were familiar with the national mental health service mapping data which is updated annually.
• Service development – The NSF1 was the focus of service development and data being used for this development tended to relate to the new models of services – assertive outreach, crisis resolution and early intervention services. The Sainsbury Centre for Mental Health and the Northern Centre for Mental Health were both cited as sources of useful information for development.
Health and social care activity • Use of services – A great variety of data was included in this category for example:
• Local service and patient data; • Primary and secondary health care data; • Social care data; • Housing information; • Qualitative and quantitative information; • Minimum data set; • NHS and SSD computer recording systems.
National statistical returns were also used for local analysis and to compare one locality against another (see benchmarking below). In addition, local studies of service usage have been carried out.
• Statutory data - Mental Health Act data was used by SSD staff concerned with the
provision of approved social workers. Other specific uses of this data concerned the use of guardianship and ECT.
• Prescription data – Prescription data was being used by public health specialists and
PCT planners. It was particularly linked to suicide. Outcomes • Outcome data – Although the measurement of outcome data is not well developed,
widespread use was being made of readmission data including emergency readmissions. The only other outcomes mentioned were waiting lists, failure to attend statistics and complaints.
• Suicide – A range of data was used for following up suicides and deliberate self harm in localities. This included Coroner’s records, GP and hospital records, prescription data and mortality statistics.
“We look at the Coroner’s Office data, going through the records to get profiles of suicides. We also access GP records to look for evidence of depression and we check the prescriptions for suicide cases”. (Interview 6)
15
• Service user data - There was very little use of service user views of services. This is not strictly outcome data but is included here as the staff who mentioned feedback from service users tend to use it to plan and review the management and commissioning of services (Table 2.3).
Process data • Benchmarking – A number of sources of data were being used to compare the
performance of one locality against another. Data being used in this ‘benchmarking’ included performance assessment framework returns, activity data and finance data. Performance was being ‘benchmarked’ against other PCT data, regional returns and national averages.
• Evidence base – Research and guidance was being used to guide planning and
practice. The focus was on learning from good practice.
“The multidisciplinary team is looking into the evidence based of assessment of different mental health problems; depression, anxiety, schizophrenia, postnatal depression etc.” (Interview 3)
• Audit and quality – Audits were mentioned in the context of:
• Clinical care and governance; • Quality monitoring; • Performance monitoring, particularly NSF implementation assessment.
Resource data • Workforce data - Respondents were interested in data on staff recruitment and
retention, general personnel data and records of staff sickness. Specific studies of mental illness and drug and alcohol problems amongst the staff of mental health services were mentioned. Training needs and continuous professional development were also of interest.
• Finance data – The reported use of finance data included information on budgets
financial allocation, finance benchmarking to guide planning.
16
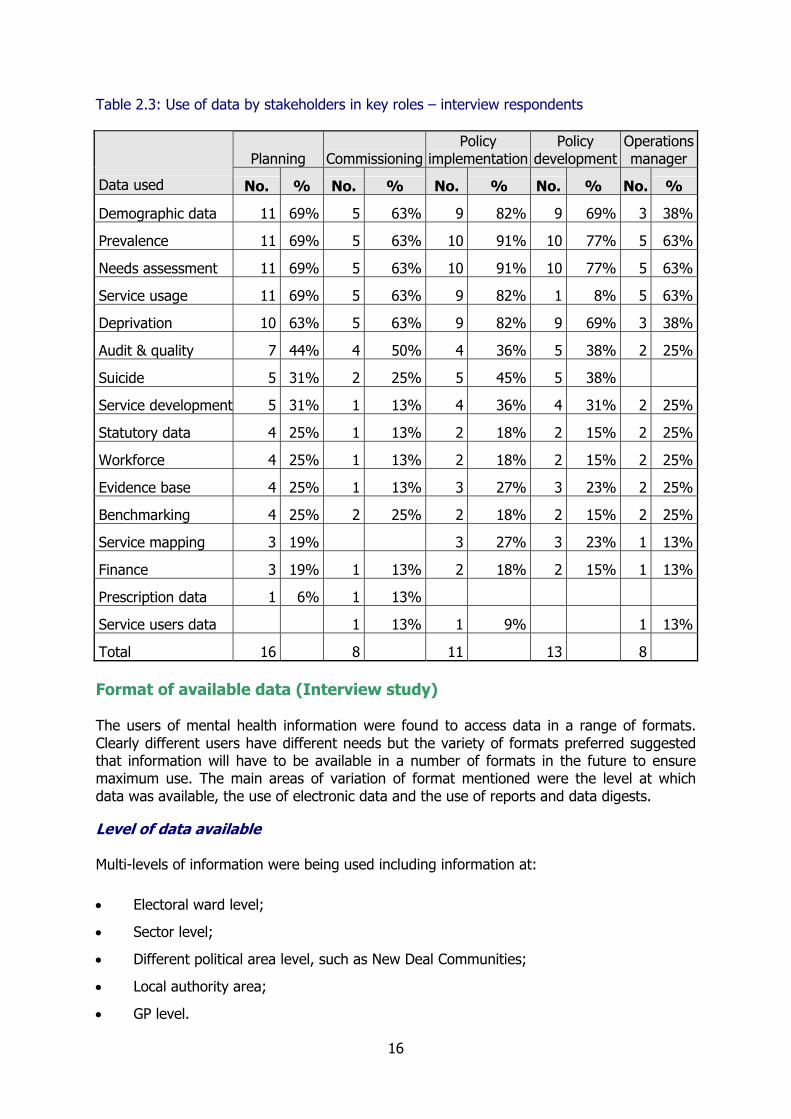
Table 2.3: Use of data by stakeholders in key roles – interview respondents
Planning CommissioningPolicy
implementationPolicy
development Operations manager
Data used No. % No. % No. % No. % No. %
Demographic data 11 69% 5 63% 9 82% 9 69% 3 38%
Prevalence 11 69% 5 63% 10 91% 10 77% 5 63%
Needs assessment 11 69% 5 63% 10 91% 10 77% 5 63%
Service usage 11 69% 5 63% 9 82% 1 8% 5 63%
Deprivation 10 63% 5 63% 9 82% 9 69% 3 38%
Audit & quality 7 44% 4 50% 4 36% 5 38% 2 25%
Suicide 5 31% 2 25% 5 45% 5 38%
Service development 5 31% 1 13% 4 36% 4 31% 2 25%
Statutory data 4 25% 1 13% 2 18% 2 15% 2 25%
Workforce 4 25% 1 13% 2 18% 2 15% 2 25%
Evidence base 4 25% 1 13% 3 27% 3 23% 2 25%
Benchmarking 4 25% 2 25% 2 18% 2 15% 2 25%
Service mapping 3 19% 3 27% 3 23% 1 13%
Finance 3 19% 1 13% 2 18% 2 15% 1 13%
Prescription data 1 6% 1 13%
Service users data 1 13% 1 9% 1 13%
Total 16 8 11 13 8 Format of available data (Interview study) The users of mental health information were found to access data in a range of formats. Clearly different users have different needs but the variety of formats preferred suggested that information will have to be available in a number of formats in the future to ensure maximum use. The main areas of variation of format mentioned were the level at which data was available, the use of electronic data and the use of reports and data digests. Level of data available Multi-levels of information were being used including information at: • Electoral ward level;
• Sector level;
• Different political area level, such as New Deal Communities;
• Local authority area;
• GP level.
17
However, there was recognition that data below these levels also had its value.
“It is useful if the data is as local as possible, which means postcode level is essential, especially for mapping”. (Interview 7)
Electronic data Some use was being made of data accessible on the web. Users who were confident with IT also mentioned the value of CD-Rom data and electronic news or information up-dates. However, there was frustration that support was rarely available from IT staff when help was needed to access or manipulate electronic data. The ability to read across health and social care patient/client recording systems was also reported to limit the usefulness of management information and leave staff dependent on getting their opposite number in health or social services to provide the data that they required. It was also regretted that good information systems were not being used more to support patient care and staff management. Reports The majority of users continued to rely heavily on reports and data summaries to make information accessible. This enabled the respondents to focus on the information they required after relevant tables had been extracted from large raw data sources by others. Time to digest reports was at a premium and so preference was expressed for: • Tables with numbers;
• Data extracted for the locality;
• Short reports.
“I would rather have summaries with concise information than huge reports”. (Interview 10)
Academic papers were regarded as being ‘too complicated’ while in house reports were usually satisfactory. The problems commonly being experienced in the use of mental health data sources included: • Inconsistent use of definitions of terms such as ‘crisis’;
• External information tends to be very crude – not in enough detail to inform localities;
• Inconsistency of information across Trusts in a strategic health authority area;
• Use of different data systems;
• Unsystematic data collection;
• Questionable quality of the information recorded;
• Inconsistency of information across secondary and primary care.
18
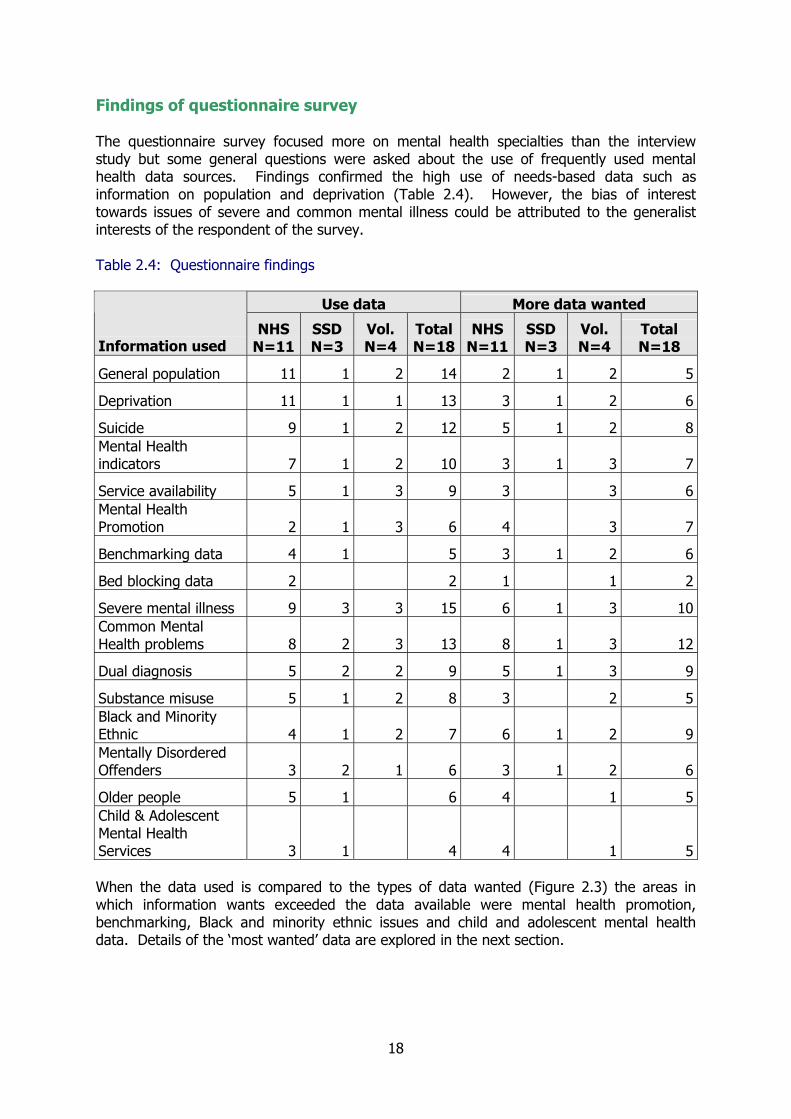
Findings of questionnaire survey The questionnaire survey focused more on mental health specialties than the interview study but some general questions were asked about the use of frequently used mental health data sources. Findings confirmed the high use of needs-based data such as information on population and deprivation (Table 2.4). However, the bias of interest towards issues of severe and common mental illness could be attributed to the generalist interests of the respondent of the survey. Table 2.4: Questionnaire findings
Use data More data wanted
Information used
NHS N=11
SSD N=3
Vol. N=4
Total N=18
NHS N=11
SSD N=3
Vol. N=4
Total N=18
General population 11 1 2 14 2 1 2 5
Deprivation 11 1 1 13 3 1 2 6
Suicide 9 1 2 12 5 1 2 8Mental Health indicators 7 1 2 10 3 1 3 7
Service availability 5 1 3 9 3 3 6Mental Health Promotion 2 1 3 6 4 3 7
Benchmarking data 4 1 5 3 1 2 6
Bed blocking data 2 2 1 1 2
Severe mental illness 9 3 3 15 6 1 3 10Common Mental Health problems 8 2 3 13 8 1 3 12
Dual diagnosis 5 2 2 9 5 1 3 9
Substance misuse 5 1 2 8 3 2 5Black and Minority Ethnic 4 1 2 7 6 1 2 9Mentally Disordered Offenders 3 2 1 6 3 1 2 6
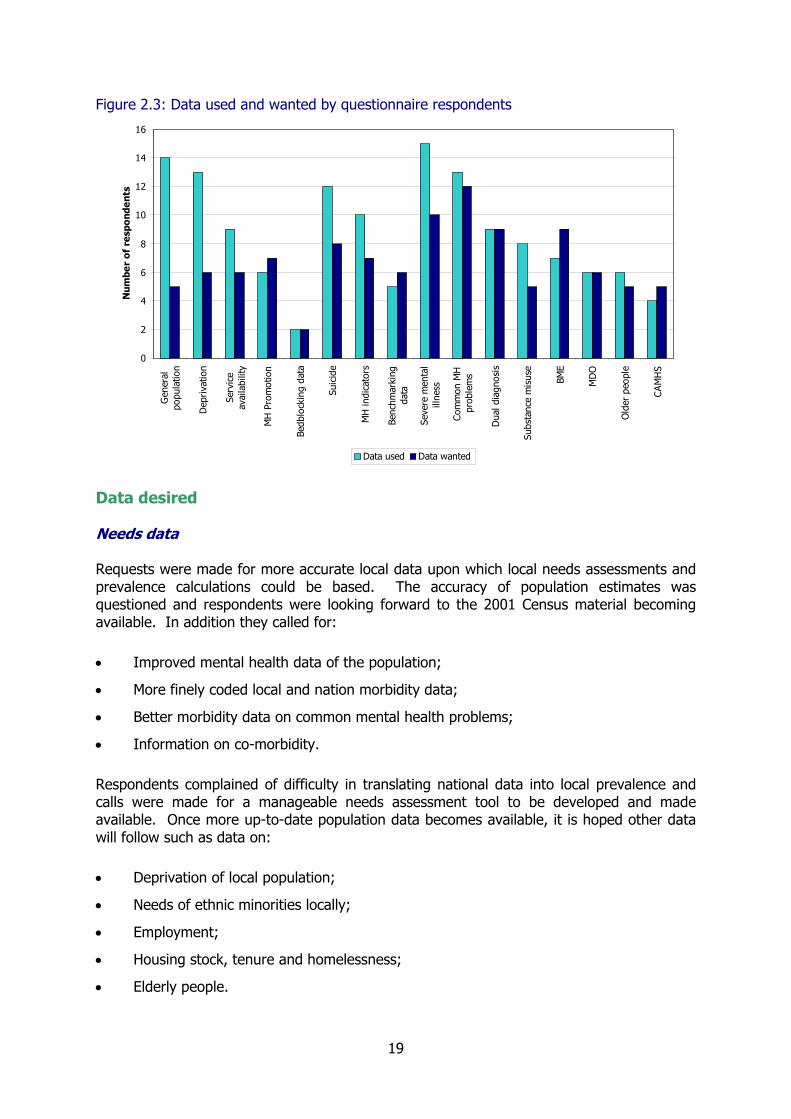
Older people 5 1 6 4 1 5Child & Adolescent Mental Health Services 3 1 4 4 1 5 When the data used is compared to the types of data wanted (Figure 2.3) the areas in which information wants exceeded the data available were mental health promotion, benchmarking, Black and minority ethnic issues and child and adolescent mental health data. Details of the ‘most wanted’ data are explored in the next section.
19
Figure 2.3: Data used and wanted by questionnaire respondents
Data desired Needs data Requests were made for more accurate local data upon which local needs assessments and prevalence calculations could be based. The accuracy of population estimates was questioned and respondents were looking forward to the 2001 Census material becoming available. In addition they called for: • Improved mental health data of the population;
• More finely coded local and nation morbidity data;
• Better morbidity data on common mental health problems;
• Information on co-morbidity. Respondents complained of difficulty in translating national data into local prevalence and calls were made for a manageable needs assessment tool to be developed and made available. Once more up-to-date population data becomes available, it is hoped other data will follow such as data on: • Deprivation of local population;
• Needs of ethnic minorities locally;
• Employment;
• Housing stock, tenure and homelessness;
• Elderly people.
0
2
4
6
8
10
12
14
16
Gen
eral
popu
latio
n
Dep
riva
tion
Serv
ice
avai
labi
lity
MH
Pro
mot
ion
Bedb
lock
ing
data
Suic
ide
MH
indi
cato
rs
Benc
hmar
king
data
Seve
re m
enta
lill
ness
Com
mon
MH
prob
lem
s
Dua
l dia
gnos
is
Subs
tanc
e m
isus
e
BME
MD
O
Old
er p
eopl
e
CAM
HS
Num
ber
of r
espo
nden
ts
Data used Data wanted
20
As primary care remains the place where most mental health care is provided, greater use of primary care data on both mental health and general health was called for to identify levels of need. Primary care was also recognised as a crucial place to identify unmet need and it was feared this information is currently lost.
“We need recognition of information on carers of people with mental health problems. GPs could flag anyone who is a carer, such as children of parents with mental health problems”. (Interview 4)
Another area where improved data was called for was in the links between mental health and the criminal justice system. Data was wanted on the prevalence of psychiatric problems amongst offenders, especially in prisons. Special studies were being commissioned to assess mental health needs in prisoner populations in preparation for PCTs taking over responsibility for commissioning prison health services in 2003 but it was suggested more could be done to make information more easily accessible. The impact of the increase in student numbers was also being felt and more information on mental health problems which tend to be prevalent amongst students and young people was requested, such as, eating disorders, suicide, self-harm. Structural data about services Little additional data was requested about the services which are provided. There was a single call for a better understanding of the care settings in use and another to identify service provision at ‘the severe end’ of the spectrum. Service activity data ‘Where is the Minimum Data Set?’ was asked by a number of respondents as better activity data was called for on: • Monthly admissions data;
• Length of stay;
• Reasons for readmissions;
• Mental Health Act data and sections;
• Bed blocking;
• Outpatients, inpatients and community patients;
• Care Programme Approach activity – this is not felt to be shared by Trusts;
• Tracking pathways of care;
• Primary care activity;
• Psychiatrist activity;
• Social services activity. Responses emphasised the frustration being caused by incompatible information systems that make it impossible to make good use of data across health and social services boundaries and primary and secondary health boundaries. For example:

21
“The trust has inpatient care data, and care programme data but this data has not been fed through to the Strategic Health Authority”. (Interview 2)
Again the lack of good data about mental health provision in primary care was also recognised. Primary care activity data built up from the mental health information contained in GP registers as called for to support arguments for resources for mental health in primary care.
“We need data to show the PCT that mental health is important. We need to use the data to impress them and to enable them to make informed investment decisions. At the moment they are influenced by the GPs who shout the loudest”. (Interview 1)
Outcomes Requests for information on outcomes focused on a wish to know more about the impact of services. Specific data requested included: • The reason for readmissions;
• What happens to service users on discharge into the community;
• Qualitative data on impact of care;
• The impact of counselling in primary care;
• The experience of service users and carers;
• More detailed data on suicides and self harm. Linked to these requests was a desire to use local activity and outcome data to measure performance more effectively and to develop ‘indicators’ of the mental health of the population. Proposed indicators centred on readmission rates and post-discharge follow-up but it was acknowledged this was in part due to the lack of tools available to evaluate care. It was also acknowledged that the Minimum Data Set would enable some much needed analysis to be undertaken. Regret was expressed at the lack of longitudinal data available to make trend analysis possible. With the major changes taking place in the boundaries of the health economies, the collection of datasets spanning a number of years has not been possible. However, there were requests that priority should be given to ensure this data can now be collected and analysed. Specific areas of interest were: • Trend data on learning disabilities;
• Data on projection of future needs;
• Early intervention data;
• Dual diagnosis data;
• Serious incidents trends.
22
Benchmarking Another potential use for mental health data that the majority of respondents wished to develop was benchmarking for primary and secondary care. Reference was made to using local activity and outcome data to compare local performance to the performance elsewhere and to regional and national data. The purpose of the benchmarking was to see how well the locality was doing and reference was made to the wish to carry out financial benchmarking looking at best value and cost effectiveness. Evidence Difficulties in accessing helpful information on research findings and the evidence base for certain interventions and models of care were reported. For example, there were requests for: • Evidence of NSF models for rural areas, not only inner-city areas;
• More accessible information on what treatment works and what doesn’t work than that to be found on national websites;
• Regular information on best practice;
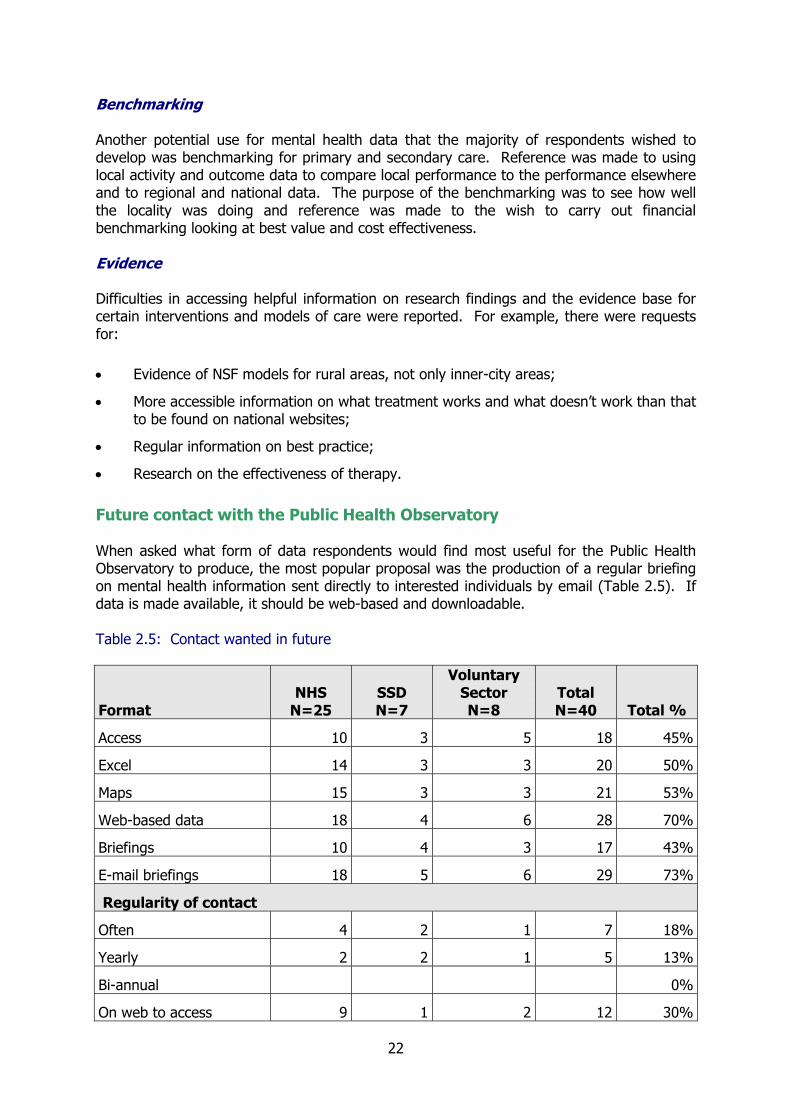
• Research on the effectiveness of therapy. Future contact with the Public Health Observatory When asked what form of data respondents would find most useful for the Public Health Observatory to produce, the most popular proposal was the production of a regular briefing on mental health information sent directly to interested individuals by email (Table 2.5). If data is made available, it should be web-based and downloadable. Table 2.5: Contact wanted in future
Format NHS
N=25 SSD N=7
Voluntary Sector N=8
Total N=40 Total %
Access 10 3 5 18 45%
Excel 14 3 3 20 50%
Maps 15 3 3 21 53%
Web-based data 18 4 6 28 70%
Briefings 10 4 3 17 43%
E-mail briefings 18 5 6 29 73%
Regularity of contact
Often 4 2 1 7 18%
Yearly 2 2 1 5 13%
Bi-annual 0%
On web to access 9 1 2 12 30%

23
Conclusions It was clear from the survey of information users that that they wanted more information that is easily available, relevant to localities, accurate and standardised to enable inter-district comparisons. The need for information was being driven by the change agenda but staff in all roles were feeling the pressure of time. They did not have time to scope all the information circulated to see what was relevant for them, let alone to study data, manipulate and interpret it. Therefore staff welcomed the proposal of an information digest which would keep them informed of new developments and be circulated by email. Alongside this regular bulletin of news, localities were also looking for the ready extraction of local information from national data sets to enable them to evidence their work.
24
REVIEW OF NATIONAL MENTAL HEALTH DATA SOURCES In this section, the key national mental health data sources are systematically reviewed. Each data source is described and referenced. The regularity with which the data is collected is recorded and the person/agency who has responsibility for returning the data is identified. The location of the data source is given as a web reference and where relevant, a location is provided for the source documentation/forms which have to be completed and returned. The quality checks used to validate the data are described where applicable. Finally, where possible, some attempt is made to indicate how much further scope exists for more detailed analysis of the data. The data sources have been grouped as follows: • Population data (mortality, morbidity and prevalence);
• Health and social care (activity, workforce, mapping and performance);
• Treatment data (prescribing, ECT, Mental Health Act);
• Outcomes (accidents and sickness etc, suicide, complaints, patients’ experience). No data is reported in this review. Instead, the data sources have been used in the next chapter to explain the need for mental health care and the ways this need is being met. It should also be stressed that only sources containing data have been reviewed. Sources of general textual information about mental health which can be found on mental health websites maintained by a range of statutory and voluntary agencies are outside the scope of the study. It should be noted that since the publication of this report, the Department of Health has developed a new website and urls for a number of resources have changed. Where possible updated web references have been added to this report.
25
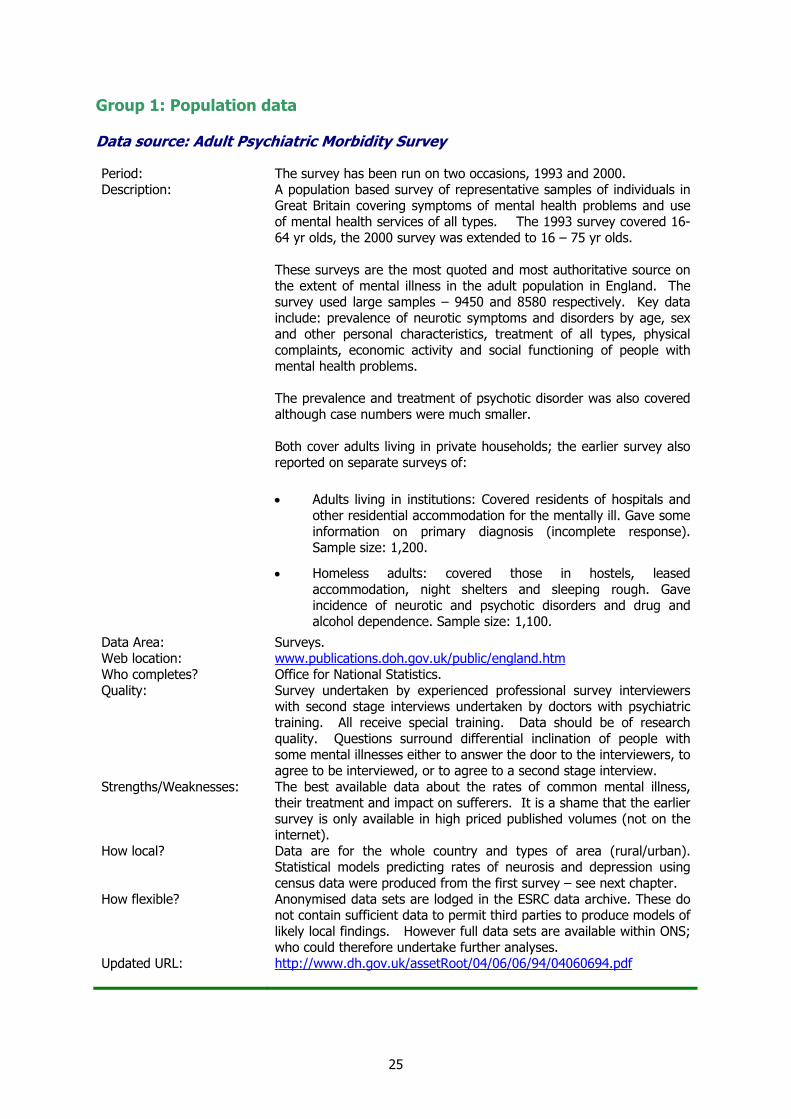
Group 1: Population data Data source: Adult Psychiatric Morbidity Survey Period: The survey has been run on two occasions, 1993 and 2000. Description: A population based survey of representative samples of individuals in
Great Britain covering symptoms of mental health problems and use of mental health services of all types. The 1993 survey covered 16-64 yr olds, the 2000 survey was extended to 16 – 75 yr olds. These surveys are the most quoted and most authoritative source on the extent of mental illness in the adult population in England. The survey used large samples – 9450 and 8580 respectively. Key data include: prevalence of neurotic symptoms and disorders by age, sex and other personal characteristics, treatment of all types, physical complaints, economic activity and social functioning of people with mental health problems. The prevalence and treatment of psychotic disorder was also covered although case numbers were much smaller. Both cover adults living in private households; the earlier survey also reported on separate surveys of:
• Adults living in institutions: Covered residents of hospitals and other residential accommodation for the mentally ill. Gave some information on primary diagnosis (incomplete response). Sample size: 1,200.
• Homeless adults: covered those in hostels, leased accommodation, night shelters and sleeping rough. Gave incidence of neurotic and psychotic disorders and drug and alcohol dependence. Sample size: 1,100.
Data Area: Surveys. Web location: www.publications.doh.gov.uk/public/england.htm Who completes? Office for National Statistics. Quality: Survey undertaken by experienced professional survey interviewers
with second stage interviews undertaken by doctors with psychiatric training. All receive special training. Data should be of research quality. Questions surround differential inclination of people with some mental illnesses either to answer the door to the interviewers, to agree to be interviewed, or to agree to a second stage interview.
Strengths/Weaknesses: The best available data about the rates of common mental illness, their treatment and impact on sufferers. It is a shame that the earlier survey is only available in high priced published volumes (not on the internet).
How local? Data are for the whole country and types of area (rural/urban). Statistical models predicting rates of neurosis and depression using census data were produced from the first survey – see next chapter.
How flexible? Anonymised data sets are lodged in the ESRC data archive. These do not contain sufficient data to permit third parties to produce models of likely local findings. However full data sets are available within ONS; who could therefore undertake further analyses.
Updated URL: http://www.dh.gov.uk/assetRoot/04/06/06/94/04060694.pdf
26
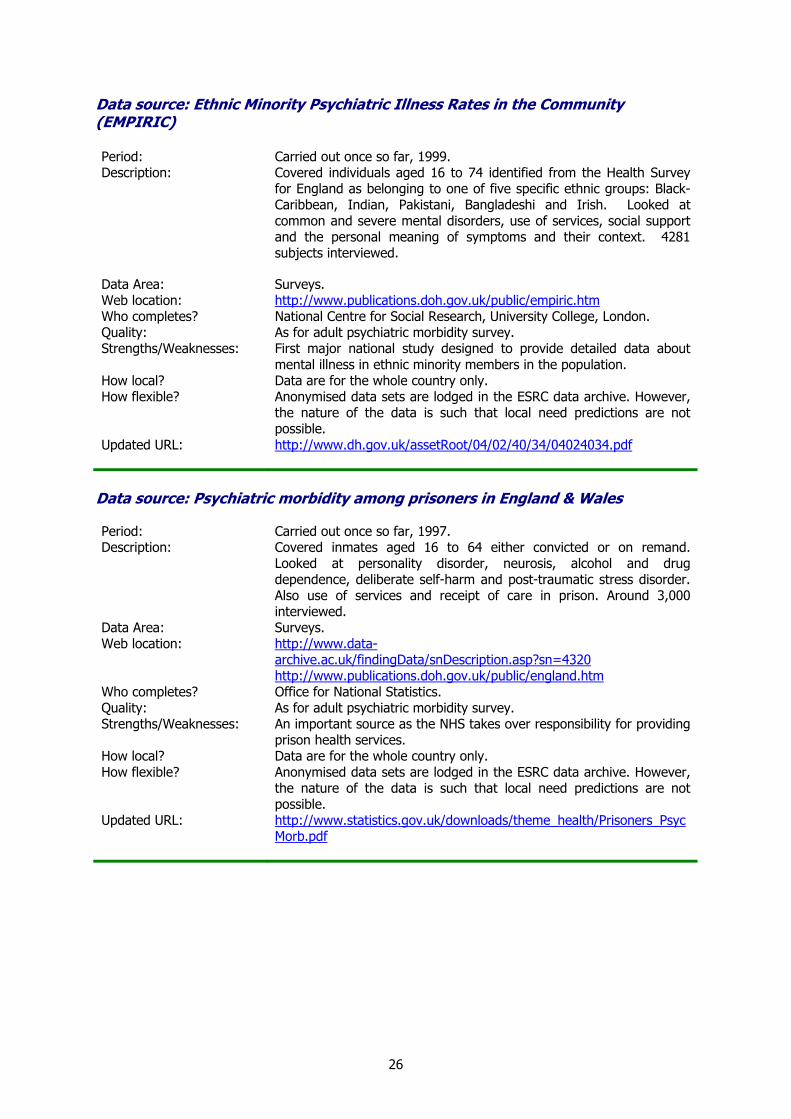
Data source: Ethnic Minority Psychiatric Illness Rates in the Community (EMPIRIC) Period: Carried out once so far, 1999. Description: Covered individuals aged 16 to 74 identified from the Health Survey
for England as belonging to one of five specific ethnic groups: Black-Caribbean, Indian, Pakistani, Bangladeshi and Irish. Looked at common and severe mental disorders, use of services, social support and the personal meaning of symptoms and their context. 4281 subjects interviewed.
Data Area: Surveys. Web location: http://www.publications.doh.gov.uk/public/empiric.htm Who completes? National Centre for Social Research, University College, London. Quality: As for adult psychiatric morbidity survey. Strengths/Weaknesses: First major national study designed to provide detailed data about
mental illness in ethnic minority members in the population. How local? Data are for the whole country only. How flexible? Anonymised data sets are lodged in the ESRC data archive. However,
the nature of the data is such that local need predictions are not possible.
Updated URL: http://www.dh.gov.uk/assetRoot/04/02/40/34/04024034.pdf
Data source: Psychiatric morbidity among prisoners in England & Wales Period: Carried out once so far, 1997. Description: Covered inmates aged 16 to 64 either convicted or on remand.
Looked at personality disorder, neurosis, alcohol and drug dependence, deliberate self-harm and post-traumatic stress disorder. Also use of services and receipt of care in prison. Around 3,000 interviewed.
Data Area: Surveys. Web location: http://www.data-
archive.ac.uk/findingData/snDescription.asp?sn=4320 http://www.publications.doh.gov.uk/public/england.htm
Who completes? Office for National Statistics. Quality: As for adult psychiatric morbidity survey. Strengths/Weaknesses: An important source as the NHS takes over responsibility for providing
prison health services. How local? Data are for the whole country only. How flexible? Anonymised data sets are lodged in the ESRC data archive. However,
the nature of the data is such that local need predictions are not possible.
Updated URL: http://www.statistics.gov.uk/downloads/theme_health/Prisoners_PsycMorb.pdf
27
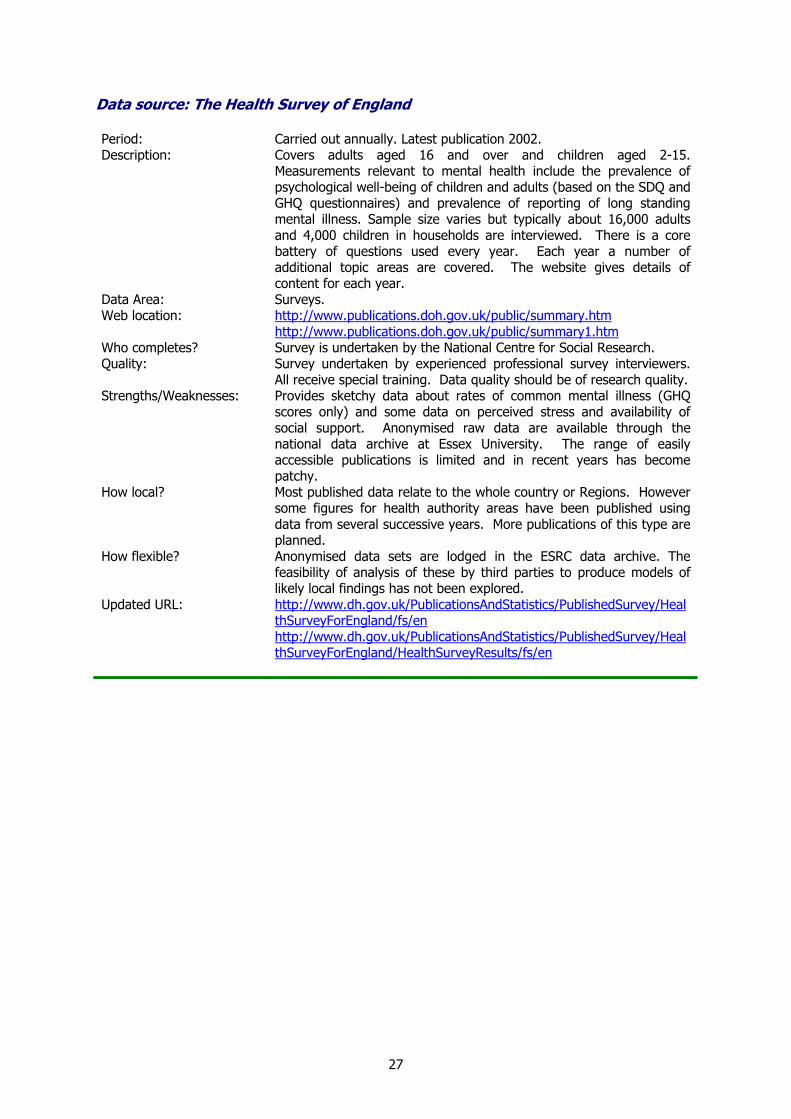
Data source: The Health Survey of England Period: Carried out annually. Latest publication 2002. Description: Covers adults aged 16 and over and children aged 2-15.
Measurements relevant to mental health include the prevalence of psychological well-being of children and adults (based on the SDQ and GHQ questionnaires) and prevalence of reporting of long standing mental illness. Sample size varies but typically about 16,000 adults and 4,000 children in households are interviewed. There is a core battery of questions used every year. Each year a number of additional topic areas are covered. The website gives details of content for each year.
Data Area: Surveys. Web location: http://www.publications.doh.gov.uk/public/summary.htm
http://www.publications.doh.gov.uk/public/summary1.htm Who completes? Survey is undertaken by the National Centre for Social Research. Quality: Survey undertaken by experienced professional survey interviewers.
All receive special training. Data quality should be of research quality. Strengths/Weaknesses: Provides sketchy data about rates of common mental illness (GHQ
scores only) and some data on perceived stress and availability of social support. Anonymised raw data are available through the national data archive at Essex University. The range of easily accessible publications is limited and in recent years has become patchy.
How local? Most published data relate to the whole country or Regions. However some figures for health authority areas have been published using data from several successive years. More publications of this type are planned.
How flexible? Anonymised data sets are lodged in the ESRC data archive. The feasibility of analysis of these by third parties to produce models of likely local findings has not been explored.
Updated URL: http://www.dh.gov.uk/PublicationsAndStatistics/PublishedSurvey/HealthSurveyForEngland/fs/en http://www.dh.gov.uk/PublicationsAndStatistics/PublishedSurvey/HealthSurveyForEngland/HealthSurveyResults/fs/en
28
Data source: The Death Register Period: Continual. Description: Managed by the Office for National Statistics from death registrations.
Data record numbers of deaths by cause, age, sex, area, social class and occupational group. Raw data are available to NHS Authorities. Mental illnesses are sometimes reported as underlying causes of death. Un-natural deaths – by suicide or from undetermined causes - are identifiable. In addition to raw data, a series of annual published volumes report deaths by area and cause.
Data Area: Vital Statistics. Web location: http://www.statistics.gov.uk/STATBASE/Source.asp?vlnk=548 Who completes? Office for National Statistics. Quality: Data may be assumed to be virtually complete. Problems for mental
health research relate to the incompleteness of recording of mental illness as an underlying cause, and the inconsistency between coroners in the attribution of verdicts of suicide and undetermined death.
Strengths/Weaknesses: Useful for monitoring suicide trends, though at local (for example PCT) levels, numbers are too small for these to be informative. Provides a baseline to which the mortality rates of groups of mentally ill people may be compared.
How local? Published volumes cover all types of statutory authority. How flexible? Full local data sets are available within the NHS and to Regional Public
Health Observatories. More detailed further analysis is thus possible.
Data source: Mental Illness Needs Index – MINI, MINI2000 Period: Data from a range of periods 1991-1999. Description: Indicators designed to predict the distribution of mental illness in the
population. Developed by statistical modelling using hospital admissions as dependent variables and nationally available, ward level data about population characteristics as predictor variables. MINI used 1991 admission prevalence data for a region and 1991 census data21. MINI2000 used 1998 admission data for England, with component variables from the Index of Multiple Deprivation20 and the ONS Area classification22. Both produce predicted numbers and rates of admissions for areas chosen as aggregates of electoral wards. MINI is available on computer disc; MINI2000 is available on the Internet.
Data Area: Deprivation Indices. Web location: http://www.dur.ac.uk/mental.health/ Who completes? Developed by Centre for Public Mental Health, University of Durham. Strengths/Weaknesses: Designed specifically to indicate distribution of secondary care level
mental health problems at small area level. Key constraint was that all necessary data should be readily available for electoral wards. Computerised tools available designed to make the indices easy to use. Earlier MINI software relates index to Wing estimates of facility numbers required (see next chapter). This is now somewhat dated.
How local? 1998 data are available for Electoral wards in England.
29
Data source: National Confidential Inquiry into suicides and homicides Period: Latest report published March 2001. Description: The Confidential Inquiry into Homicides and Suicides by Mentally Ill
people was set up in 1992 by the Department of Health following consultation with the Royal College of Psychiatrists. Since 1999, the National Institute for Clinical Excellence (NICE) has taken over administrative responsibility. It collects data about people who commit suicide or homicide in the UK. The Inquiry learns about cases through the Office of National Statistics, the home office, and equivalent bodies outside England. They contact catchment area mental health services and seek information about care received by individuals concerned. In the case of homicides they also seek court reports on the individual’s psychiatric condition. The Inquiry Team published its first major report Safer Services18 in 1999. There were 31 recommendations, which were subsequently covered in the National Services Framework for Mental Health1 and the NHS Plan2. The new report Safety First19 is based on a detailed study of 5,582 suicides and 186 homicides by psychiatric patients in the UK between 1996 and 2000. 24% of suicides and 9% of suicides had contact with local mental health services in the year before the index event.
Data Area: Surveys. Web location: http://www.publications.doh.gov.uk/mentalhealth/safetyfirst/index.ht
m Who completes? National Institute for Clinical Excellence. Strengths/Weaknesses: Useful in identifying practice relating to identifying people at risk of
suicide and aspects of care facilities and practices in which suicide commonly occurs.
How local? National (England and Wales). How flexible? A full data set is available within the Confidential Enquiry office,
though unlikely to be made available in raw form. Further analyses by them are presumably possible.
Updated URL: http://www.dh.gov.uk/assetRoot/04/05/82/43/04058243.pdf
30
Data source: Index of Multiple Deprivation 2000 Period: Data from a range of periods 1991-1999. Description: Key information on the indices on Deprivation 200020 was published
recently by the Department of the Environment, Transport and the Regions (DETR). The new indices provide important new information on 6 key domains of deprivation broken down so that small geographical areas suffering from deprivation can be identified. The 6 domains are; low income, employment, education and training, health, housing and access to services. The new indices will form part of the basis for the allocation of resources in deprived areas.
Data Area: Deprivation Indices. Web location: http://www.odpm.gov.uk/stellent/groups/odpm_urbanpolicy/document
s/page/odpm_urbpol_608104.pdf http://www.odpm.gov.uk/stellent/groups/odpm_urbanpolicy/documents/page/odpm_urbpol_608140.hcsp
Who completes? Developed by Department of Social Policy and Social Work, University of Oxford. Currently serviced by the Office of the Deputy Prime Minister.
Quality: Best available quality of deprivation modelling work. Strengths/Weaknesses: The Index was designed to use only data which could be updated
regularly (i.e., more often than the decennial census). It gives a good impression of where deprivation will be greatest. However, it was designed for local government resource allocation. Thus it does not directly indicate patterns of mental illness and is not calibrated to indicate the extent to which this will impact on mental health problems. Some of the components of the index were used for the MINI2000 index.
How local? 1998 data are available for Electoral wards in England. How flexible? Full data sets, for all electoral wards in England, are available on the
internet in spreadsheet form. These permit a wide range of further analysis.
Updated URL: www.odpm.gov.uk/stellent/groups/odpm_urbanpolicy/documents/page/odpm_urbpol_608104.pdf
Data source: PSSRU Community Psychiatric Index Period: Latest – 1991 data. Description: Indicators designed to predict the distribution of workload for
community psychiatric nursing staff25. Developed for the Department of Health for resource allocation to Health Authorities. Modelling limited by the fact that only 6 areas had sufficiently detailed data about the detailed activity of Community Psychiatric Nurses. Based on 1991 census data.
Data Area: Deprivation Indices. Web location: http://www.dh.gov.uk/PolicyAndGuidance/OrganisationPolicy/FinanceA
ndPlanning/Allocations/AllocationsArticle/fs/en?CONTENT_ID=4001008&chk=UhlBtr. See Table 5.13.
Strengths/Weaknesses: Designed to indicate distribution of community psychiatric nursing care needs. Difficult to calculate for areas smaller than Health or Local Authorities as component Standardised Mortality Ratio data is not easily available.
How local? Health Authorities in England. Updated URL: http://www.dh.gov.uk/assetRoot/04/02/02/60/04020260.xls Table 5.13
31
Data source: York Psychiatric Index Period: Latest – 1991 data. Description: Indicators designed to predict the distribution of mental illness in the
population by modelling admissions in relation to population characteristics23. Developed for the Department of Health for resource allocation to Health Authorities. Modelling strategy used statistical techniques to adjust for varying levels of availability of availability of beds; though the appropriateness of the statistical methods to the system being modelled has been questioned24.
Data Area: Deprivation Indices. Web location: http://www.dh.gov.uk/PolicyAndGuidance/OrganisationPolicy/Finance
AndPlanning/Allocations/AllocationsArticle/fs/en?CONTENT_ID=4001008&chk=UhlBtr. See Table 5.6.
Who completes? Developed by Centre for Health Economics, University of York. Strengths/Weaknesses: Designed to indicate distribution of secondary care level mental health
problems. Provides results very similar to MINI. Difficult to calculate for areas smaller than Health or Local Authorities as component Standardised Mortality Ratio data is not easily available.
How local? Health Authorities in England. Updated URL: http://www.dh.gov.uk/assetRoot/04/02/02/60/04020260.xls
Table 5.6.
32
Group 2: Health and social care Data source: Hospital Episode Statistics (HES) Period: Annual & quarterly. Description: A major and highly flexible data source. Comprises individual records
of each period of care under a consultant in hospital. Includes patient details (age, sex, residential location and GP registration), specialty, diagnosis, and for mental health care, legal status. Wide range of analyses possible. Used for resource allocation modelling, development of health resource groups (HRGs) and reference costs, mapping geographic and temporal variations in health and healthcare, development of national policy on public health and inequalities, and as data source for Performance Indicators and Performance Ratings. Uses have been recently reviewed by Glover26.
Data Area: Activity (Hospital and Community) Returns. Web location: http://www.nhsia.nhs.uk/datastandards/pages/ddm/Package_HES%2
0Top%20Index_312ddec8-82fb-11d6-bbb2-dd831b74c3be_frame.htm http://www.dh.gov.uk/PublicationsAndStatistics/Statistics/HospitalEpisodeStatistics/fs/en
Who completes? NHS Trusts, PCTs, and all providers of NHS hospital inpatient care. Quality: Total numbers are compared with a corroborative source. This used
to be KP70 (discontinued in 2000/1). Now an activity count is sent back to Trusts who are asked to check it. This produces a Trust-level grossing factor for each specialty which is then applied to published data. Data quality indicators identify the frequency of incomplete fields in records. These are sent to Trusts, to improve subsequent performance. Some publications include 'not-specified' rows for some parameters.
Strengths/Weaknesses: The longest standing major data source. Trend data available in some instances back to the late 1940s. Not possible to track successive admissions of individuals (though this was possible in the 1950s!), nor to identify relationship between in-patient and other types of care for individuals.
How local? Individual admissions: patient records can be allocated to any type of administrative geography.
How flexible? Highly flexible because of its individual record format. Copies are stored at Regional Public Health Observatories. Requires relatively skilled work to analyse it. Confidentiality issues are a major concern, and limit the analyses that are permitted.
Updated URL: http://www.dh.gov.uk/PublicationsAndStatistics/Statistics/HospitalEpisodeStatistics/fs/en
33
Data source: Bed Availability and Occupancy (KH03) Period: Annual. Description: Available and occupied bed nights by consultant specialty and ward
classification in NHS Trusts. Figures for mental illness identify child and adolescent, adult and elderly, each sub-divided into short- and long-stay, and secure. For consultant specialty figures, average occupancy is also recorded. It is not possible from this return to identify which PCT population(s) are using the beds.
Data Area: Activity (Hospital and Community) Returns. Web location: http://www.nhsia.nhs.uk/datastandards/pages/ddm/Data_Dictionary/
Messages/Central%20Return_KH03_fee82ffc-3840-11d6-b3c8-879d48022af6_frame.htm http://www.performance.doh.gov.uk/hospitalactivity/data_requests/index.htm
Who completes? NHS Trusts & PCTs as providers. Quality: Entry system used by Trusts to return the data identifies and queries
major variations from previous year. Strengths/Weaknesses: Useful for long term trends in bed availability and pressure on a
national or regional basis. The problem is that as the data is presented by Trust, it is not clear what populations are using the beds.
How local? NHS Trust. How flexible? Published data cannot be further disaggregated. Updated URL: http://www.performance.doh.gov.uk/hospitalactivity/about_data/kh03
.htm
Data Source: NHS Day Care Availability and Use of Facilities (KH14) Period: Annual. Description: A provider based view of NHS day care facility attenders (end-year
number on the books) and their activity - first and total attendances, and those attending for day type activities, or using a hospital bed. Published data shows number of attendances in the year by NHS Trust and broad specialty group (mental illness is a single group). No indication of PCT population(s) from which patients come.
Data Area: Activity (Hospital and Community) Returns. Web location: http://www.nhsia.nhs.uk/datastandards/pages/ddm/Data_Dictionary/
Messages/Central%20Return_KH14_fee9b6a6-3840-11d6-b3c8-879d48022af6_frame.htm http://www.performance.doh.gov.uk/hospitalactivity/data_requests/index.htm
Who completes? NHS Trusts & PCTs. Quality: Entry system used by Trusts to return the data identifies and queries
major variations from previous year. Strengths/Weaknesses: Similar qualifications to Bed availability statistics, but publications
seem more limited. Trend data for England from 1994 are published, but Trust level data do not seem to be published earlier than 2000/1. Mental illness day attendances are divided into children, working age adults and psychiatry of old age.
How local? In recent years, NHS Trusts. How flexible? Published data cannot be further disaggregated. Updated URL: http://www.performance.doh.gov.uk/hospitalactivity/about_data/kh14
.htm
34
Data source: Consultant Outpatient Clinic Activity and waiting lists (KH09, QM08, QM08R) Period: Annual & quarterly. Description: KH09 reports provider-based numbers of first and subsequent
attendances and non-attendances at consultant outpatient clinics by specialty. No relation to PCT populations. QM08 Reports numbers of GP written and other referrals received in a quarter, and GP patients seen for the first time and still waiting to be seen by duration of wait. The data are difficult to make sense of as not all GP referrals give rise to an out patient appointment and thus a period of waiting. QM08R reports as QM08 but by commissioning authorities.
Data Area: Activity (Hospital and Community) Returns. Web location: http://www.nhsia.nhs.uk/datastandards/pages/ddm/Data_Dictionary/
Messages/Central%20Return_KH09_fee9b6a4-3840-11d6-b3c8-879d48022af6_frame.htm http://www.nhsia.nhs.uk/datastandards/pages/ddm/Data_Dictionary/Messages/Central%20Return_QM08_fee9b6b0-3840-11d6-b3c8-879d48022af6_frame.htm http://www.nhsia.nhs.uk/datastandards/pages/ddm/Data_Dictionary/Messages/Central%20Return_QM08R_fee9b6b1-3840-11d6-b3c8-879d48022af6_frame.htm http://www.performance.doh.gov.uk/hospitalactivity/about_data/kh09_kh05.htm http://www.performance.doh.gov.uk/waitingtimes/index.htm
Who completes? NHS Trusts & PCT (in both capacities). Quality: Entry system used by Trusts to return the data identifies and queries
major variations from previous year. However the breadth of variation in data raises questions. For example in QM08R data, the total ‘disposals’ for the 176 PCTs reporting more than 5 adult mental illness referrals in the first quarter of 2002/3 ranged from none to five times the number of GP referrals, with 41 (23%) below 50% and 8 (4.5%) above 150%.
Strengths/Weaknesses: Useful to give some indication of volume of new out-patients and as reference for validity of Mental Health Minimum Data Set data about out patients. Definitional problems impair the use of waiting list statistics in this area; rules are less applicable to the way many mental health teams work. The presentation of QM08 by commissioner makes it more useful for planning.
How local? NHS Trusts and PCTs. How flexible? Published data cannot be further disaggregated. Updated URL: http://www.performance.doh.gov.uk/hospitalactivity/about_data/kh09
_kh05.htm
35
Data source: Summary of Ward Attenders (KH05) Period: Annual. Description: A simple, provider based, count of ward attendances. Mental illness
specialties are all grouped together. Learning disabilities are also counted. Published data shows number of ward attendances in the year by NHS Trust and broad speciality group (mental illness is a single group). No indication of PCT population(s) from which patients come.
Data Area: Activity (Hospital and Community) Returns. Web location: http://www.nhsia.nhs.uk/datastandards/pages/ddm/Data_Dictionary/
Messages/Central%20Return_KH05_fee9b69e-3840-11d6-b3c8-879d48022af6_frame.htm http://www.performance.doh.gov.uk/hospitalactivity/data_requests/index.htm
Who completes? NHS Trusts & PCTs. Quality: Entry system used by Trusts to return the data identifies and queries
major variations from previous year. Strengths/Weaknesses: Similar to KH14 but all for mental illness ward attendances, all ages
are grouped together. How local? NHS Trusts. How flexible? Published data cannot be further disaggregated. Updated URL: http://www.performance.doh.gov.uk/hospitalactivity/about_data/kh09
_kh05.htm
Data source: Summary of Clinical Psychology Services (KT24) Period: Annual. Description: First and initial contacts in the year with a clinical psychologist. Only
about 40% of these are for mental health care, and the published Trust data do not show this breakdown. Trusts are grouped by strategic health authority. The numbers show very large variation (first contacts 11-81 per 100,000 population; initial contacts 16-98 per 100,000 population). If true, this is probably explained by variations in availability.
Data Area: Activity (Hospital and Community) Returns. Web location: http://www.publications.doh.gov.uk/public/kt240102/index.htm Who completes? Trusts (including PCTs). Quality: Rely on data quality at source. Auditing the central return not
possible. Check that figures are consistent from year to year, check with Trusts about oddities. More subtle checks are occasionally undertaken, including attempts to reconcile the data with variation in staffing numbers. In these studies outliers are then questioned.
Strengths/Weaknesses: Difficult to use in view of the fact that not all the work described is mental health care. They make it clear that psychology services are very unevenly distributed, but the structural problems of the data source would make it less illuminating if the inequities were less marked.
How local? NHS Trusts. How flexible? Published data cannot be further disaggregated. Updated URL: http://www.publications.doh.gov.uk/public/work_health_care.htm#co
mmcare
36
Data Source: Summary of Occupational Therapy Services (KT26) Period: Annual. Description: Numbers of Occupational Therapy contacts are recorded by age group
and referring specialty. Published figures do not give specialty breakdown for individual Trusts. Nationally psychiatry comprises 7% of referrals.
Data Area: Activity (Hospital and Community) Returns. Web location: http://www.publications.doh.gov.uk/public/kt260102/index.htm Who completes? Trusts including PCTs as providers. Quality: Rely on data quality at source. Auditing the central return not
possible. Check that figures are consistent from year to year, check with Trusts about oddities. More subtle checks are possible including staffing numbers. In these studies outliers are then questioned. Used to compare initial and first and total contacts. Some ratios are unlikely. Existence of service.
Strengths/Weaknesses: Very little use. The only figures published for individual Trusts are total figures of which mental health care is an indeterminate part.
How local? NHS Trust – for data distinguishing mental health care, England. How flexible? Published data cannot be further disaggregated. Updated URL: http://www.publications.doh.gov.uk/public/work_health_care.htm#co
mmcare
Data source: Demand for Elective Admissions (QF01, KH06, KH06R, KH07A) Period: Quarterly & Annual. Description: Waiting list statistics including end of quarter (QF01 – commissioner
based) summaries and quarterly records of additions, subtractions and reclassifications (KH06 – provider, KH06R commissioner) and deferred admissions (KH07A). All are classified by specialty. These data are not generally helpful as relatively little in-patient mental health care happens on an elective basis.
Data Area: Activity (Hospital and Community) Returns. Web location: http://www.nhsia.nhs.uk/datastandards/pages/ddm/Package_Quarterl
y%20Monitoring%20Top%20Index_8f3a0eaa-8374-11d6-b472-bcb3951ed529_frame.htm http://www.nhsia.nhs.uk/datastandards/pages/ddm/Data_Dictionary/Messages/Central%20Return_KH06_fee9b69f-3840-11d6-b3c8-879d48022af6_frame.htm http://www.nhsia.nhs.uk/datastandards/pages/ddm/Data_Dictionary/Messages/Central%20Return_KH06R_c509fb23-375d-11d6-a913-c6794ab2cd13_frame.htm http://www.nhsia.nhs.uk/datastandards/pages/ddm/Data_Dictionary/Messages/Central%20Return_KH07A_fee9b6a2-3840-11d6-b3c8-879d48022af6_frame.htm http://www.performance.doh.gov.uk/waitingtimes/index.htm
Who completes? NHS Trusts and PCTs. Quality: Probably good as the subject of intense interest. Strengths/Weaknesses: Not very useful for mental health services evaluation and planning. How local? Trust or PCT level. How flexible? Published data cannot be further disaggregated. Updated URL: http://www.performance.doh.gov.uk/waitingtimes/
37
Data source: Patient Care in the Community - Community Psychiatric Nursing (KC57) Period: Annual. Description: First and initial contacts in the year with a community psychiatric
nurse are collated by Trust. These are grouped by strategic health authority. The numbers show very large variation (first contacts 273-1,273 per100,000 population; initial contacts 487-1,892 per 100,000 population), with no obvious explanation raising questions about their validity.
Data Area: Activity (Hospital and Community) Returns. Web location: http://www.nhsia.nhs.uk/datastandards/pages/ddm/Data_Dictionary/
Messages/Central%20Return_KC57_fee82ff3-3840-11d6-b3c8-879d48022af6_frame.htm http://www.publications.doh.gov.uk/public/KC570102/index.htm
Who completes? Trusts including PCTs. Quality: Rely on data quality at source. Auditing the central return not
possible. Department of Health checks that figures are consistent from year to year, asking Trusts about oddities. More subtle checks are possible including comparison with staffing numbers. In these studies outliers are then questioned. The source used also to include total contacts. Then initial and first to total contact ratios were studied as validity checks.
Strengths/Weaknesses: One of the few sources of data which is unambiguously about mental health care in the community. Indicates scale of variation between Trusts. However, not directly relatable to population data as provider based. Useful as a corroborative source for the Mental Health Minimum Data Set.
How local? NHS Trusts. How flexible? Published data cannot be further disaggregated. Updated URL: http://www.publications.doh.gov.uk/public/work_health_care.htm#co
mmcare
Data source: Residential accommodation (RA Form A) Period: Annual. Description: Form covers numbers of places in residential homes broken down by
client age and specialty groups. Mental illness is included as a specialty category and on the data returned; children and adults aged under and over 65 are reported separately.
Data Area: Social Care. Web location: http://www.publications.doh.gov.uk/public/raret.htm
http://www.publications.doh.gov.uk/public/sb0028.htm Who completes? Councils with Social Services Responsibilities. Quality: Compared with Laing and Buisson statistics (an independent
directory). Also compared with previous years data. Discrepancies checked with Local Authorities.
Strengths/Weaknesses: Strength would be in provision of long term time trends. In the published tables, places are categorised separately by age group and specialty group. It is therefore impossible to know how many places there are for working age adult mentally ill clients in each borough as this number is combined with the number of places for elderly people with dementia.
How local? Councils with Social Services Responsibilities.
38
Data source: Private nursing homes, hospitals and clinics (RH(N)) Period: Annual. Description: Numbers of establishments, beds and staff by type of care provided.
Published data show these issues separately. Places are recorded by the location of the home not the origin of the residents.
Data Area: Social Care. Web location: http://www.nhsia.nhs.uk/datastandards/pages/ddm/Data_Dictionary/
Messages/Central%20Return_RH(N)_fee9b6ad-3840-11d6-b3c8-879d48022af6_frame.htm http://www.publications.doh.gov.uk/public/sb0209.htm
Who completes? Health Authority Inspection and Monitoring units. Quality: Compared with Laing and Buisson statistics (an independent
directory). Also compared with previous years data. Discrepancies checked with Local Authorities. This work has now been taken over by the National Care Standards Commission, who in future will produce the statistics. For the first year the Department of Health is doing some validation checks.
Strengths/Weaknesses: Data are interesting in relation to long term national time trends. Locally they are less illuminating. It is not clear how many of the mental illness beds are provided for elderly people with dementia, and how many for working age adults with major mental health problems.
How local? Health Authorities.
Data source: Supported Residents return (SR1) Period: Annual. Description: Numbers of residents, whose residential care is funded by councils, in
residential care homes by age and care group. Age groups are 18-64 and 65 plus, care groups include mental illness, learning disability, physical and sensory impairment and other. Data are subdivided into temporary and permanent headcounts, and the total number at 31st March (these do not correspond). Data do not show total numbers receiving this sort of care. Self-funders and people with 'preserved rights' are omitted. This makes time trends (with the progressive erosion of the group with protected rights) hard to evaluate.
Data Area: Social Care. Web location: http://www.publications.doh.gov.uk/public/sr1ret.htm
http://www.publications.doh.gov.uk/public/sb0219.htm Who completes? Councils with Social Services Responsibilities. Strengths/Weaknesses: Interesting to compare variations in the scale of provision by different
councils. How local? Councils with Social Services Responsibilities. How flexible? Published data cannot be further disaggregated.
39
Data source: Referrals, Assessments and Packages of Care (RAP) Period: Annual. Description: Data are returned on a long set of tabular forms. These detail referrals
(by source), assessments (by age and ethnic group, client type, outcome of assessment and time from first contact to completion of assessment) and packages of care (by client type, type of service received, ethnic group and wait from first contact to care provision).
Data Area: Social Care. Web location: http://www.publications.doh.gov.uk/rap/index.htm
http://www.publications.doh.gov.uk/public/comcare2002/ccstats2002.htm
Who completes? Councils with Social Services Responsibilities. Quality: Data collected by internet data collection facility. This has a lot of
validation rules built in preventing internal inconsistency. Once received the data is compared to previous year. Major changes are queried. Also compared to corresponding figures on Key Stats returns. Compared to PSSEX1 return. From 5 to 38 councils have failed to produce various data items.
Strengths/Weaknesses: As the returns are in tabular form, many aspects cannot be explored (for example assessment outcomes by ethnic group for mental health clients). The term 'packages of care' is strictly a misnomer, since the source does not record the combinations in which care elements are provided. The mental health client group has a subdivision for people with dementia. Data is currently not fully supported by all councils.
How local? Councils with Social Services Responsibilities. How flexible? Published data cannot be further disaggregated.
Data source: Annual HCHS medical and dental workforce census (SBH 50-56) Period: Bi-annual. Description: Data are collected on all doctors and dentists employed by the NHS on
30th September each year. The census identifies individual doctors by their GMC registration numbers. In addition to the details of their current post, their career grade and country of qualification is recorded.
Data Area: Workforce. Web location: http://www.publications.doh.gov.uk/stats/explanations.htm
http://www.publications.doh.gov.uk/public/sb0304.htm Who completes? Strategic Health Authorities and Special Health Authorities, NHS Trusts,
PCTs, PHLS. Quality: Data is checked for validity. Nature of contract must accord with type
of employment. Some specialties are restricted to specific grades. GMC numbers are checked. Trusts asked to correct inconsistencies.
Strengths/Weaknesses: Important data. However, published statistics do not give the key local breakdown: whole time equivalent (WTE) numbers are published by NHS Trust and employment grade, and by Regional Office, specialty and grade, but not by Trust, specialty and grade. This means it cannot be used to identify Trust mental health staff.
How local? Data collected at Trust level. How flexible? Published data are based on a major national database which
theoretically should permit more detailed analysis within the limitations of the scope outlined.
40
Data source: Annual HCHS non-medical workforce census Period: Annual. Description: Headcounts and whole time equivalent (WTE) numbers of staff in post
at 30th September are reported by sex, age, ethnic origin and staff grade and 'area of work' (psychiatry and learning disabilities are the two relevant 'areas of work'). Published figures give figures for the whole of England only. The most interesting aspects of the data are the time trends and age profiles for individual clinical groups.
Data Area: Workforce. Web location: http://www.publications.doh.gov.uk/public/sb0202.htm Who completes? Trusts, PCTs, Strategic Health Authorities. Quality: Large changes from previous year are queried with Trusts concerned.
Where Trust configurations change, extrapolation is attempted. Strengths/Weaknesses: Potentially useful for national manpower planning. Trends in numbers
of creative therapists and psychotherapists can be seen, although the age groups of clients with which they work it is not clear. Trends in Occupational Therapists and Clinical Psychologists are unclear as these are not broken down by area of work.
How local? Completed by Trusts, but no local data are published. How flexible? Published data are based on a major national database. More detailed
analysis within the limitations of the scope should be possible.
Data source: Staff of Local Authority Personal Social Services Departments (SSDS001) Period: Annual. Description: Spreadsheet based form captures whole time-equivalent numbers for
staff by work area, employment grade, sex and ethnic group. Data Area: Workforce. Web location: http://www.publications.doh.gov.uk/Public/ssds001.htm
http://www.publications.doh.gov.uk/public/sb0210.htm Who completes? Councils with Social Services Responsibilities. Strengths/Weaknesses: Published data are unhelpful about staff posted in care teams (the
category used is 'specialist teams', encompassing many other things than mental health). More helpful about staff of day centres, and residential establishments, where ‘establishments mainly for people with a mental health problem’ are itemised distinctly. It is hard to understand why numbers of staff in mental health specialist assessment and treatment teams (figures that would be useful) are not itemised separately, while numbers in residential and day care settings, (where increasing use of independent sector provision make these of limited value) are.
How local? Councils with Social Services Responsibilities. How flexible? Published data cannot be further disaggregated.
41
Data source: Financial and Workforce Information Return (FWIR) Period: Bi-Annual. Description: Monitors the supply and demand for non-medical healthcare
professionals to support workforce planning, keep Ministers informed of likely workforce pressures, and support the PES and budget setting processes.
Data Area: Workforce. Web location: Not published on web. Who completes? Workforce Development Confederations. Quality: Workforce Development Confederations (WDCs) produce the
information and are responsible for its quality. Probably overestimates numbers in training by underestimating attrition rates.
Strengths/Weaknesses: Not helpful as not published. How local? Presumably Workforce Development Confederation areas. How flexible? Published data cannot be further disaggregated.
Data source: Vacancies Survey of NHS Trusts Period: Annual. Description: Tables show proportion of posts vacant for medical, nursing, and
health related professionals. Survey requests numbers of all vacancies that trusts had been actively trying to fill for three months or more as at 31st March 2001. Results are presented as three month vacancy rates, calculated as a percentage of staff in post (from workforce census) plus three month vacancies. Four years’ data available - March 1999 - March 2002.
Data Area: Workforce. Web location: http://www.publications.doh.gov.uk/public/vacancysurvey.htm Who completes? Trusts, PCTs, some Special Health Authorities. Strengths/Weaknesses: Data show regional variations and differences in shortages between
specialties clearly. How local? Health Authorities. How flexible? Published data cannot be further disaggregated.
42
Data source: Comprehensive Mental Health Service Mapping Period: Annual. Description: Annual inventory of all mental health services provided within each
Local Implementation Team (LIT). Covers NHS, social services and independent sector provision. Items of service are assigned first to one of 58 types of provision. The set of questions asked about them depends on the type of item but broadly includes client target groups, special functions undertaken by the service, volume of care provided and staffing levels. More informal care services (such as drop-in centres) are considered in less detail. Data are entered directly into the Service Mapping website by local LIT officers. An annual atlas is published, and live data are displayed on the website. Part of the annual monitoring of progress on Local Implementation Plans.
Data Area: Mapping. Web location: http://www.dur.ac.uk/service.mapping/amh
http://www.dur.ac.uk/service.mapping/amh/queries/ Who completes? Local Implementation Teams (LITs). Quality: A number of items have built-in implausibility checks. A variety of
report formats are available to allow local staff to check the data they have entered. Senior LIT officers are asked to sign-off the accuracy of the data as part of the annual monitoring of progress towards implementation of the NSF1. Most tables on the website permit 'drill-down' showing the detailed data underlying each cell of the table. This is intended to enable detailed scrutiny. Each table indicates the proportion of items which have been updated in the current year's round of data collection.
Strengths/Weaknesses: Highly flexible data, wide range of potential uses. Comparing profiles of care between areas, identifying all services of a particular type, identifying the range of availability of a particular service type, or the patterns of staff deployment are just a few examples. Results can be reported by LIT, PCT or Council with Social Services Responsibility.
How local? Individual services can be mapped by exact location (by postcode) or to standard administrative geographies.
How flexible? Data collected in a major national database. Extensive further analysis is possible.
43
Data source: Financial mapping of adult mental health care Period: Annual. Description: Local Implementation Teams are asked to map current and planned
spend on mental health services. Spending is categorised by the same broad groupings as the Service Mapping (see above). Designed to identify baseline NHS and Local Authority investment in adult mental health services and identify investment plans for achieving change. In particular it is designed to track the use of earmarked monies for specific mental health development. Data is collected on Strategic Health Authority, LIT and PCT basis. Part of the annual monitoring of progress on Local Implementation Plans. Finance mapping was first launched in 2001/2 and is still developing. Very few results were published the first year. Data collection was expanded to collect PCT data in 2002/3 and it is hoped that the findings will be more widely available.
Data Area: Miscellaneous. Web location: http://www.mentalhealthstrategies.co.uk/autreview/downloadfiles200
3.html Who completes? Local Implementation Teams. Quality: Overseen by Mental Health Strategies. Strengths/Weaknesses: Data are not accessible. The Reports available to the present authors
gives spending profiles by clinical area for LITs for single Regions only.
How local? Currently Local Implementation Teams. PCT reports anticipated next year.
How flexible? Extensive analysis should be possible.
Data source: Personal Social Services Expenditure and Unit Costs (PSSEX1) Period: Annual. Description: Return requests details of spending on all recipients of personal social
services along with activity levels. Breakdown shows Adult and older people with mental health problems, sub-divided by types of care provided. Includes cost of direct payments. Data entry mechanism displays the unit costs calculated from it. Data used in Local Authority Performance Assessment Framework.
Data Area: Social Care. Web location: http://www.publications.doh.gov.uk/public/Expend.htm
http://www.publications.doh.gov.uk/public/pss_stat.htm Who completes? Councils with Social Services Responsibilities. Quality: Data return form undertakes a range of consistency checks. Strengths/Weaknesses: Less detailed breakdown than the financial mapping of adult mental
health care. But the collection source includes parallel questions about activity volumes from which unit costs are calculated.
How local? Councils with Social Services Responsibility. How flexible? Published data cannot be further disaggregated.
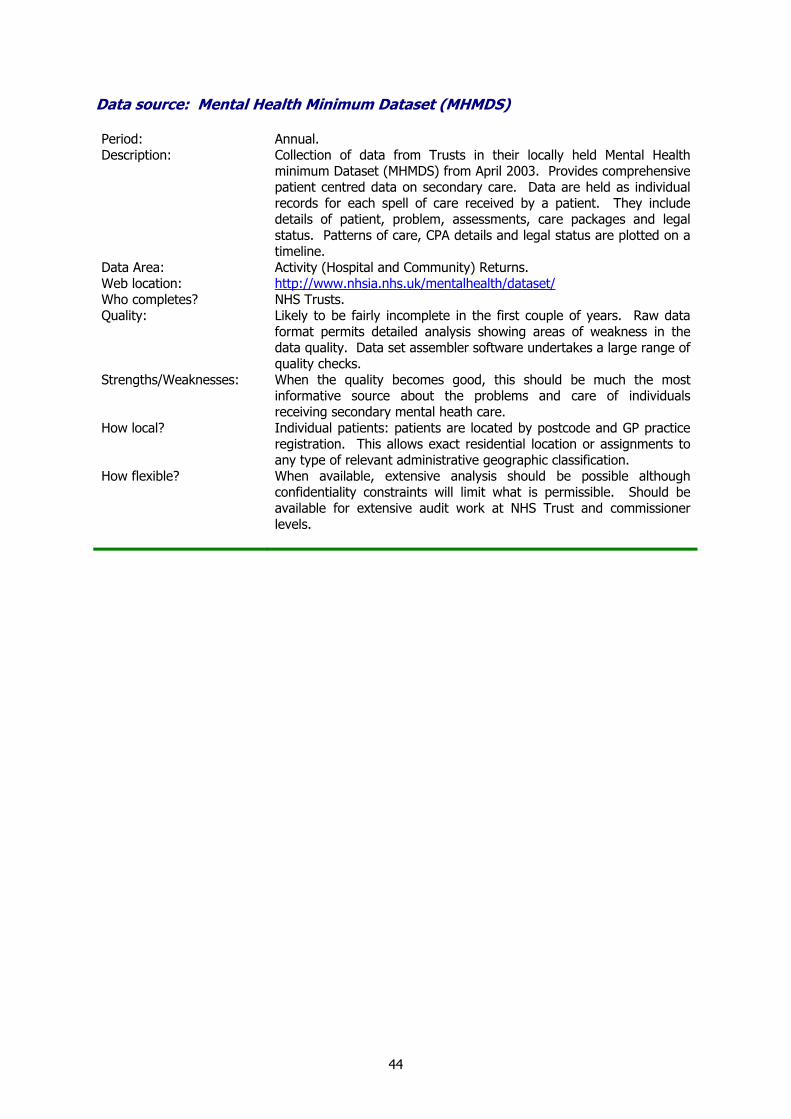
44
Data source: Mental Health Minimum Dataset (MHMDS) Period: Annual. Description: Collection of data from Trusts in their locally held Mental Health
minimum Dataset (MHMDS) from April 2003. Provides comprehensive patient centred data on secondary care. Data are held as individual records for each spell of care received by a patient. They include details of patient, problem, assessments, care packages and legal status. Patterns of care, CPA details and legal status are plotted on a timeline.
Data Area: Activity (Hospital and Community) Returns. Web location: http://www.nhsia.nhs.uk/mentalhealth/dataset/ Who completes? NHS Trusts. Quality: Likely to be fairly incomplete in the first couple of years. Raw data
format permits detailed analysis showing areas of weakness in the data quality. Data set assembler software undertakes a large range of quality checks.
Strengths/Weaknesses: When the quality becomes good, this should be much the most informative source about the problems and care of individuals receiving secondary mental heath care.
How local? Individual patients: patients are located by postcode and GP practice registration. This allows exact residential location or assignments to any type of relevant administrative geographic classification.
How flexible? When available, extensive analysis should be possible although confidentiality constraints will limit what is permissible. Should be available for extensive audit work at NHS Trust and commissioner levels.
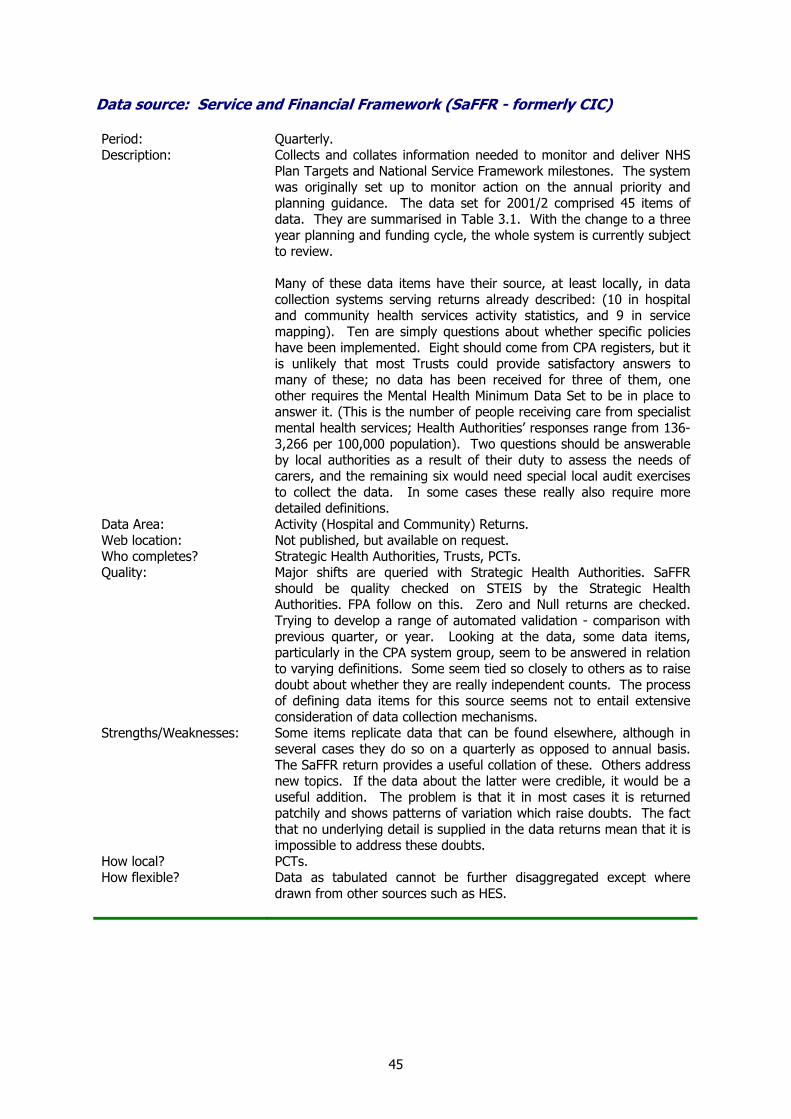
45
Data source: Service and Financial Framework (SaFFR - formerly CIC) Period: Quarterly. Description: Collects and collates information needed to monitor and deliver NHS
Plan Targets and National Service Framework milestones. The system was originally set up to monitor action on the annual priority and planning guidance. The data set for 2001/2 comprised 45 items of data. They are summarised in Table 3.1. With the change to a three year planning and funding cycle, the whole system is currently subject to review. Many of these data items have their source, at least locally, in data collection systems serving returns already described: (10 in hospital and community health services activity statistics, and 9 in service mapping). Ten are simply questions about whether specific policies have been implemented. Eight should come from CPA registers, but it is unlikely that most Trusts could provide satisfactory answers to many of these; no data has been received for three of them, one other requires the Mental Health Minimum Data Set to be in place to answer it. (This is the number of people receiving care from specialist mental health services; Health Authorities’ responses range from 136-3,266 per 100,000 population). Two questions should be answerable by local authorities as a result of their duty to assess the needs of carers, and the remaining six would need special local audit exercises to collect the data. In some cases these really also require more detailed definitions.
Data Area: Activity (Hospital and Community) Returns. Web location: Not published, but available on request. Who completes? Strategic Health Authorities, Trusts, PCTs. Quality: Major shifts are queried with Strategic Health Authorities. SaFFR
should be quality checked on STEIS by the Strategic Health Authorities. FPA follow on this. Zero and Null returns are checked. Trying to develop a range of automated validation - comparison with previous quarter, or year. Looking at the data, some data items, particularly in the CPA system group, seem to be answered in relation to varying definitions. Some seem tied so closely to others as to raise doubt about whether they are really independent counts. The process of defining data items for this source seems not to entail extensive consideration of data collection mechanisms.
Strengths/Weaknesses: Some items replicate data that can be found elsewhere, although in several cases they do so on a quarterly as opposed to annual basis. The SaFFR return provides a useful collation of these. Others address new topics. If the data about the latter were credible, it would be a useful addition. The problem is that it in most cases it is returned patchily and shows patterns of variation which raise doubts. The fact that no underlying detail is supplied in the data returns mean that it is impossible to address these doubts.
How local? PCTs. How flexible? Data as tabulated cannot be further disaggregated except where
drawn from other sources such as HES.
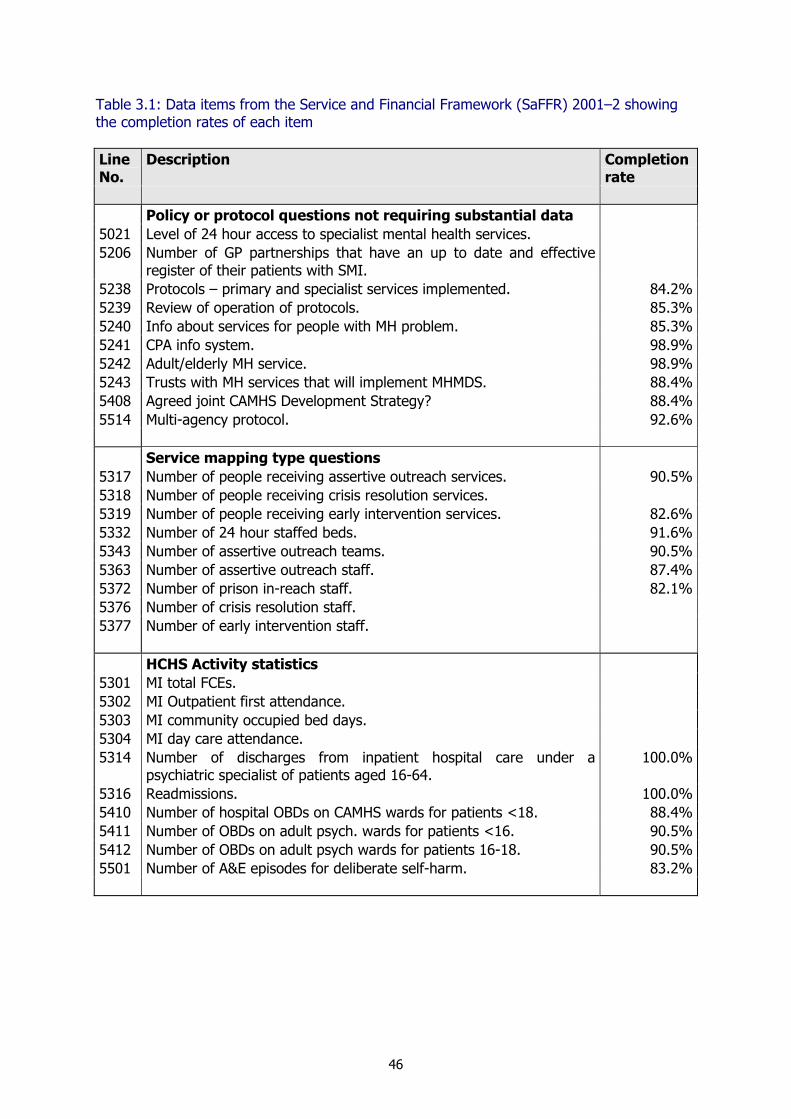
46
Table 3.1: Data items from the Service and Financial Framework (SaFFR) 2001–2 showing the completion rates of each item Line No.
Description Completion rate
Policy or protocol questions not requiring substantial data 5021 Level of 24 hour access to specialist mental health services. 5206 Number of GP partnerships that have an up to date and effective
register of their patients with SMI.
5238 Protocols – primary and specialist services implemented. 84.2%5239 Review of operation of protocols. 85.3%5240 Info about services for people with MH problem. 85.3%5241 CPA info system. 98.9%5242 Adult/elderly MH service. 98.9%5243 Trusts with MH services that will implement MHMDS. 88.4%5408 Agreed joint CAMHS Development Strategy? 88.4%5514 Multi-agency protocol. 92.6% Service mapping type questions 5317 Number of people receiving assertive outreach services. 90.5%5318 Number of people receiving crisis resolution services. 5319 Number of people receiving early intervention services. 82.6%5332 Number of 24 hour staffed beds. 91.6%5343 Number of assertive outreach teams. 90.5%5363 Number of assertive outreach staff. 87.4%5372 Number of prison in-reach staff. 82.1%5376 Number of crisis resolution staff. 5377 Number of early intervention staff. HCHS Activity statistics 5301 MI total FCEs. 5302 MI Outpatient first attendance. 5303 MI community occupied bed days. 5304 MI day care attendance. 5314 Number of discharges from inpatient hospital care under a
psychiatric specialist of patients aged 16-64. 100.0%
5316 Readmissions. 100.0%5410 Number of hospital OBDs on CAMHS wards for patients <18. 88.4%5411 Number of OBDs on adult psych. wards for patients <16. 90.5%5412 Number of OBDs on adult psych wards for patients 16-18. 90.5%5501 Number of A&E episodes for deliberate self-harm. 83.2%
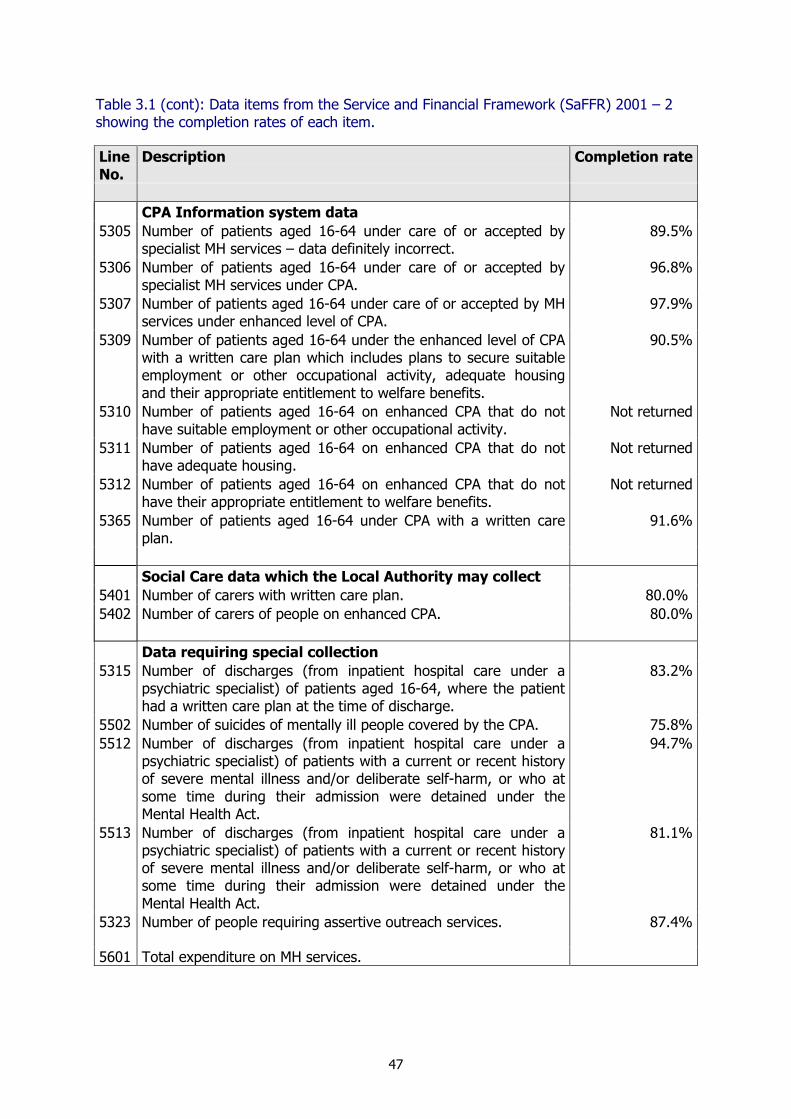
47
Table 3.1 (cont): Data items from the Service and Financial Framework (SaFFR) 2001 – 2 showing the completion rates of each item. Line No.
Description Completion rate
CPA Information system data 5305 Number of patients aged 16-64 under care of or accepted by
specialist MH services – data definitely incorrect. 89.5%
5306 Number of patients aged 16-64 under care of or accepted by specialist MH services under CPA.
96.8%
5307 Number of patients aged 16-64 under care of or accepted by MH services under enhanced level of CPA.
97.9%
5309 Number of patients aged 16-64 under the enhanced level of CPA with a written care plan which includes plans to secure suitable employment or other occupational activity, adequate housing and their appropriate entitlement to welfare benefits.
90.5%
5310 Number of patients aged 16-64 on enhanced CPA that do not have suitable employment or other occupational activity.
Not returned
5311 Number of patients aged 16-64 on enhanced CPA that do not have adequate housing.
Not returned
5312 Number of patients aged 16-64 on enhanced CPA that do not have their appropriate entitlement to welfare benefits.
Not returned
5365 Number of patients aged 16-64 under CPA with a written care plan.
91.6%
Social Care data which the Local Authority may collect 5401 Number of carers with written care plan. 80.0% 5402 Number of carers of people on enhanced CPA. 80.0% Data requiring special collection 5315 Number of discharges (from inpatient hospital care under a
psychiatric specialist) of patients aged 16-64, where the patient had a written care plan at the time of discharge.
83.2%
5502 Number of suicides of mentally ill people covered by the CPA. 75.8%5512 Number of discharges (from inpatient hospital care under a
psychiatric specialist) of patients with a current or recent history of severe mental illness and/or deliberate self-harm, or who at some time during their admission were detained under the Mental Health Act.
94.7%
5513 Number of discharges (from inpatient hospital care under a psychiatric specialist) of patients with a current or recent history of severe mental illness and/or deliberate self-harm, or who at some time during their admission were detained under the Mental Health Act.
81.1%
5323 Number of people requiring assertive outreach services. 87.4%
5601 Total expenditure on MH services.
48
Group 3: Treatment Data source: Patients detained under the Mental Health Act (KP90) Period: Annual. Description: Return forms requests counts of the changes in patients’ legal status,
cross tabulated by legal status before and after the change (which may be 'informal' or any section of the Mental Health Act 1983 allowing for the detention of a patient). Results are published in an annual digest which sets out the position for England, Regions and individual hospital Trusts.
Data Area: Activity (Hospital and Community) Returns. Web location: http://www.nhsia.nhs.uk/datastandards/pages/ddm/Data_Dictionary/
Messages/Central%20Return_KP90_fee9b6ac-3840-11d6-b3c8-879d48022af6_frame.htm http://www.publications.doh.gov.uk/public/sb0226.htm
Who completes? Trusts, Primary Care Trusts, High Secure Hospitals and Health Authorities.
Quality: Data checked for internal consistency. Numbers of sections in unusual categories is checked. Checks to compare with previous years data are made - for those submitting electronically (through web page) these can be run while the user is submitting the data.
Strengths/Weaknesses: National data has been extensively studied for time trends in the use of the Act. At a more local level, data are only available about Trusts. Some indicators are useful quality indicators, such as the outcomes of emergency sections. However interpretation of most aspects of the data are hard as it needs to make allowance for the presence of forensic specialties and intensive care units which frequently cause cross boundary flow of patients.
How local? NHS Trusts. How flexible? Published data cannot be further disaggregated.
49
Data source: Guardianship under the Mental Health Act (SSDA702) Period: Annual. Description: The return form requests details of each individual case of
guardianship in force during the period. These comprise the client's sex, the dates on which the power started and (if applicable finished), the clients main disorder, the source of the order (by application or conviction), and the relationship of guardian (local authority, other person). Overall numbers are small (about 1,000 people at any time, of whom about 75% have mental illness as their main disorder (most of the rest are learning disabled).
Data Area: Social Care. Web location: http://www.dh.gov.uk/PublicationsAndStatistics/Statistics/StatisticalCol
lection/StatisticalCollectionArticle/fs/en?CONTENT_ID=4032562&chk=KuW0bO http://www.publications.doh.gov.uk/public/guardianship2002.htm
Who completes? Councils with Social Services Responsibilities. Quality: Quality control is comparison to last years. Data, number of current
open cases, individual case level, dates of birth, gender and reference numbers are checked. Opening and closing dates are checked where individuals appear or disappear.
Strengths/Weaknesses: Quality is probably good, but this is a small aspect of care. How local? National. How flexible? Published tables based on a national database, but detail very limited;
more detailed analysis possible but likely to be limited by confidentiality and scope.
Data source: National Drug Treatment Monitoring System (NDTMS - previously the Regional Drug Misuse Databases) Period: Bi-annual. Description: Provides information about those people in contact with services, and
about patterns and trends in drug misuse, in order to help develop and monitor policy on addressing the problems of drug misuse. Used to monitor the Government's drug strategy targets and to supply information to bodies such as the Advisory Council on the Misuse of Drugs which provides advice to Ministers on all aspects of drug misuse and the European Monitoring Centre for Drugs and Drug Addiction.
Data Area: Treatment. Web location: http://www.dtmu.org.uk/Datacoll.htm
http://www.publications.doh.gov.uk/public/spndrugs0212.htm Who completes? Drug misuse treatment agencies and GP's treating drug misusers. Quality: Regional Database Manager is responsible for compliance and internal
consistency. Department of Health undertakes additional checks on consistency. New arrangements between the National Treatment Agency and Public Health Observatories, currently being implemented will automate much of this. Data is individual records so both completeness and consistency can be checked.
Strengths/Weaknesses: Provides a picture of people in treatment. This needs to be taken in the context of other data about numbers using substances. The new format will be much more illuminating than the older one once it has become established.
How local? Regional Office and Health Authority. How flexible? Scope not yet fully clear.
50
Data source: Survey on administrations of ECT (DH) Period: January-March 99 published. Description: Gives numbers of administrations of ECT in England, numbers of
patients receiving treatment, legal status of those treated and administrations broken down by ordinary in-patient, day case, outpatient. This is an occasional survey which has been run twice. It was set up in response first to the observation that administration of ECT was not being recorded as an operative procedure in Hospital Episode Statistics (as it should have been) and second to concerns that ECT administered as a day-case procedure would not be recorded anywhere. This should be superseded by the Mental Health Minimum Data Set.
Data Area: Treatment. Web location: http://www.publications.doh.gov.uk/public/ect_bull99.htm Who completes? NHS Trusts. Strengths/Weaknesses: Important as the only useful evidence of a treatment which excites
controversy. How local? Health regions.
Data source: General Practice Research Database ( GPRD) Period: Most recent 1998. Planned as annual. Description: Includes practices in England and Wales submitting data to the GPRD
over a three-year period. Relevant data include numbers registered with the GP with diagnoses of schizophrenia, and numbers treated for depression.
Data Area: Treatment. Web location: http://www.gprd.com/
http://www.gprd.com/documents/Key_Health_Stats_1998.pdf Who completes? Data are extracted automatically from GP information systems in
volunteering practices. Quality: Good. Scale of data is very large. Covers 2.6% of the population. Strengths/Weaknesses: Most recent publication covers 1998, but more recent analyses would
be possible. Impressive scale. Should provide detailed trend data about treatment of mental health problems in primary care. Published data do not indicate the usefulness of the source in relation to counselling and other psychological treatment activity in this setting.
How local? Analyses by region and ONS area type. How flexible? Data based on a major database. Further analysis possible.
51
Data source: Morbidity Statistics from General Practice (MSGP) Period: Most recent Annual Report 1999. Description: Collates data from 78 ‘spotter’ General Practices around the country.
Data provide weekly and annual trends in consulting rates for different conditions. Published data include a category for depression.
Data Area: Treatment. Web location: http://www.rcgp-bru.demon.co.uk/index.htm Who completes? Volunteering GP practices. Quality: Good. Less than half the size of the GP Research Database, but
participating practices all interested in the work of the survey. This may, however make them less representative.
Strengths/Weaknesses: Covers ground similar to the GPRD but on a smaller scale. How local? National. How flexible? Data based on a national database – further analysis possible.
Data source: Prescribing Analysis and Cost (PACT) Period: Continuous collection. Description: Collates data on the volume and cost of drugs dispensed on NHS
general practice prescriptions. Data are classified by GP practice, and thus by PCT, and by drug.
Data Area: Treatment. Web location: http://www.ppa.org.uk/index.htm Who completes? Data collected from dispensing chemists. Quality: Good. Strengths/Weaknesses: Scope is national and covers all types of drugs. Most useful for drugs
normally prescribed by GPs, will give only a partial picture of for example atypical antipsychotics. However, data are not patient based. Data provided include numbers of prescribed items, amount of drug prescribed and a range of measures designed to estimate the number of person days’ treatment represented by the amount of drug prescribed. Local pharmacy advisers would usually advise on the interpretation of the measures provided.
How local? National data are published; practice level data can be obtained by PCTs about their own general practices.
How flexible? Data based on a national database – further analysis possible.
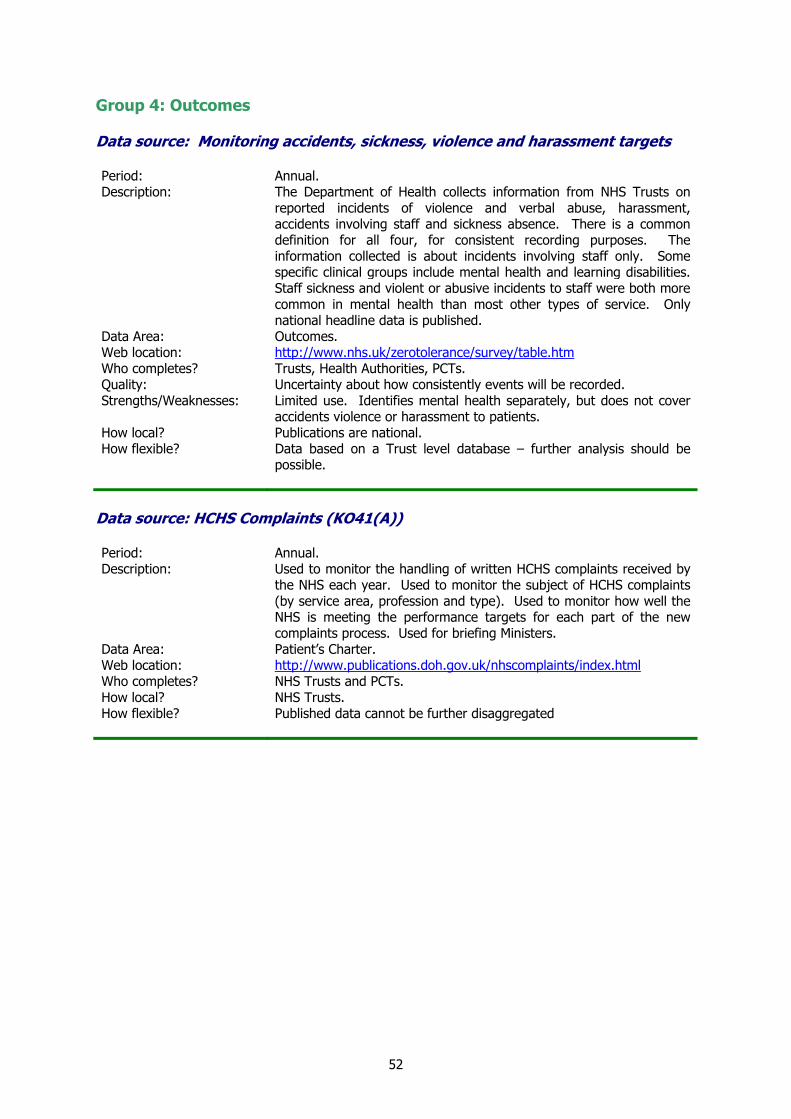
52
Group 4: Outcomes Data source: Monitoring accidents, sickness, violence and harassment targets Period: Annual. Description: The Department of Health collects information from NHS Trusts on
reported incidents of violence and verbal abuse, harassment, accidents involving staff and sickness absence. There is a common definition for all four, for consistent recording purposes. The information collected is about incidents involving staff only. Some specific clinical groups include mental health and learning disabilities. Staff sickness and violent or abusive incidents to staff were both more common in mental health than most other types of service. Only national headline data is published.
Data Area: Outcomes. Web location: http://www.nhs.uk/zerotolerance/survey/table.htm Who completes? Trusts, Health Authorities, PCTs. Quality: Uncertainty about how consistently events will be recorded. Strengths/Weaknesses: Limited use. Identifies mental health separately, but does not cover
accidents violence or harassment to patients. How local? Publications are national. How flexible? Data based on a Trust level database – further analysis should be
possible.
Data source: HCHS Complaints (KO41(A)) Period: Annual. Description: Used to monitor the handling of written HCHS complaints received by
the NHS each year. Used to monitor the subject of HCHS complaints (by service area, profession and type). Used to monitor how well the NHS is meeting the performance targets for each part of the new complaints process. Used for briefing Ministers.
Data Area: Patient’s Charter. Web location: http://www.publications.doh.gov.uk/nhscomplaints/index.html Who completes? NHS Trusts and PCTs. How local? NHS Trusts. How flexible? Published data cannot be further disaggregated
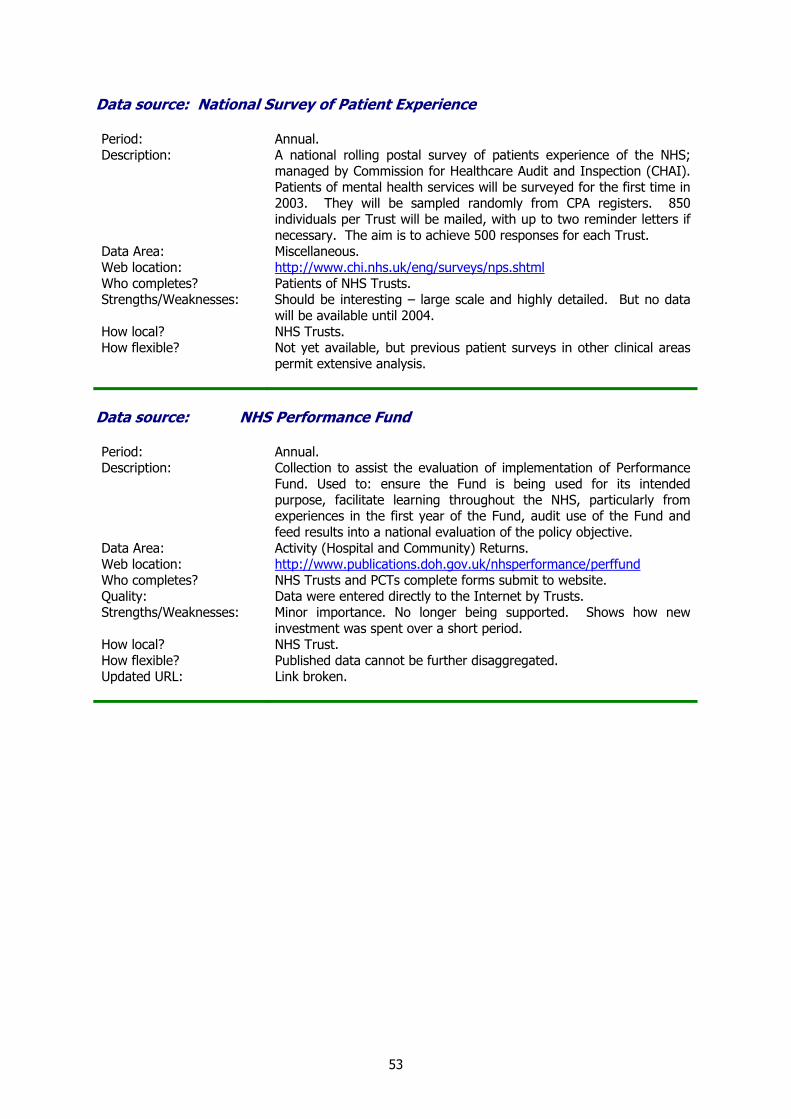
53
Data source: National Survey of Patient Experience Period: Annual. Description: A national rolling postal survey of patients experience of the NHS;
managed by Commission for Healthcare Audit and Inspection (CHAI). Patients of mental health services will be surveyed for the first time in 2003. They will be sampled randomly from CPA registers. 850 individuals per Trust will be mailed, with up to two reminder letters if necessary. The aim is to achieve 500 responses for each Trust.
Data Area: Miscellaneous. Web location: http://www.chi.nhs.uk/eng/surveys/nps.shtml Who completes? Patients of NHS Trusts. Strengths/Weaknesses: Should be interesting – large scale and highly detailed. But no data
will be available until 2004. How local? NHS Trusts. How flexible? Not yet available, but previous patient surveys in other clinical areas
permit extensive analysis.
Data source: NHS Performance Fund Period: Annual. Description: Collection to assist the evaluation of implementation of Performance
Fund. Used to: ensure the Fund is being used for its intended purpose, facilitate learning throughout the NHS, particularly from experiences in the first year of the Fund, audit use of the Fund and feed results into a national evaluation of the policy objective.
Data Area: Activity (Hospital and Community) Returns. Web location: http://www.publications.doh.gov.uk/nhsperformance/perffund Who completes? NHS Trusts and PCTs complete forms submit to website. Quality: Data were entered directly to the Internet by Trusts. Strengths/Weaknesses: Minor importance. No longer being supported. Shows how new
investment was spent over a short period. How local? NHS Trust. How flexible? Published data cannot be further disaggregated. Updated URL: Link broken.
54
CASE STUDY: MENTAL HEALTH AND HEALTH CARE IN THE NORTHERN AND YORKSHIRE REGION This chapter uses the mental health data sources reviewed in the previous chapter to describe the state of mental health and mental health care. This is essentially a national picture as the data sources are national, but wherever possible a case study of the former Northern and Yorkshire health region or its nearest equivalent has been developed. This region was selected for the worked example as it was the area of responsibility of the Public Health Observatory which commissioned the study in 2001. The data sources are used to provide evidence of the information that is available on: • The numbers of people needing care for mental illness;
• The services available to provide care and the activity within those services;
• The treatment which occurs; and
• Its outcomes. The chapter is set out in four major sections covering each of these areas. For the sake of readability, referencing has been kept to a minimum – information about key data sources including their nature, quality, scope and the location can be found in the previous chapter. Within each section of this chapter, wherever data is available, consideration is given to: 1. Common mental health problems;
2. Severe mental illness;
3. Alcohol and drug use;
4. Prisoners. Needs for care Common mental illness Prevalence of common mental illness Mental disorders are diagnosed on the basis of symptoms reported by those suffering them. Surveys to determine the amount of mental illness in the population are based on usually lengthy interviews covering the full range of relevant symptom areas. The most authoritative current evidence comes from the recent National Psychiatric Morbidity Survey of adults aged 16-74 living in private households in England, Scotland and Wales undertaken in 200027. In this, people were asked about their experience of symptoms in the week before interview. The commonest symptoms are not necessarily indicative of illness. 29% of adults report sleep problems, 27% fatigue, 20% irritability and 19% worry. More direct symptoms such as depression, lack of concentration and forgetfulness, depressive ideas and anxiety are reported by about 10%. In addition to these, more specific symptoms include somatic

55
symptoms of distress (7%), worry about physical health (7%), obsessions (6%), phobias (5%) compulsions (3% and panic (2%). The diagnosis that an individual has sufficient problems to be considered as having a mental illness is determined by the presence of a cluster of such symptoms. Nationally, 16.4% of adults report sufficient symptoms to be considered by the yardsticks used by the reports authors to have some type of mental disorder. Most disorders are commoner in women than men. Table 4.1 shows the rates of the common, neurotic disorders nationally and in the Northern and Yorkshire Region. Overall, in women the highest rates of these disorders are found in the 50-54 age group, while for men the peak is five years earlier. The age profile of some disorders diverges from this, however, with mixed anxiety and depressive disorder being much commoner in young women. Table 4.1. Prevalence of neurotic disorders per 1000 adults aged 16-74 in the Northern and Yorkshire Region, 2000.
Great Britain Neurotic disorder
Females Males Adults N&Y Region
Mixed anxiety and depressive disorder
108 68 88 87
Generalised anxiety disorder 46 43 44 49
Depressive episode 28 23 26 32
All phobias 22 13 18 20
Obsessive compulsive disorder 13 9 11 10
Panic disorder 7 7 7 10
Any neurotic disorder 194 135 164 170Source: National Psychiatric Morbidity Survey (2000) The National Psychiatric Morbidity Survey did not have a sufficient sample size to give results about areas smaller than health Regions. However a finer grained, though less detailed, picture of the amount of mental illness in the population is available from the Health Survey for England. This survey includes a short, 12-question screen for common mental illness. By aggregating results from more than one year, results for Health Authorities can be obtained. However, this analysis has only been done once, for 1994/5. Table 4.2 shows figures for the prevalence in the working age adult population of responding positively to 4 or more of the questions. This is the level usually taken to suggest that a person would be likely to be diagnosed as having a mental illness.
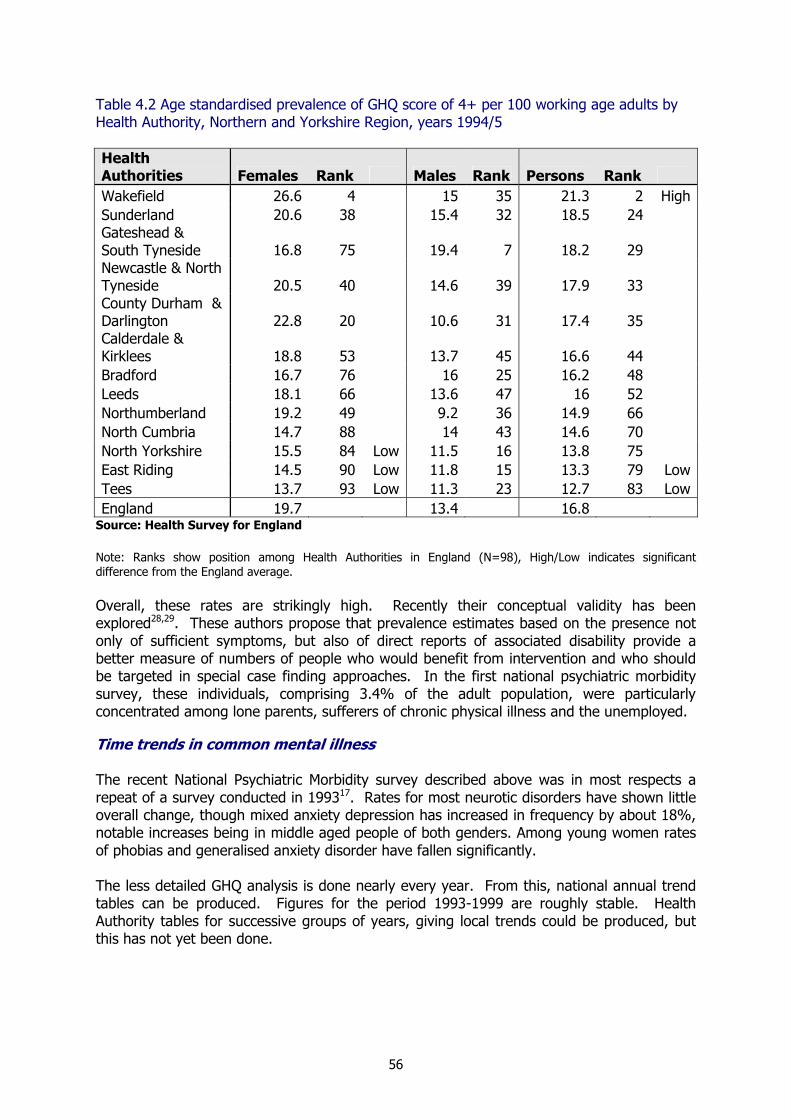
56
Table 4.2 Age standardised prevalence of GHQ score of 4+ per 100 working age adults by Health Authority, Northern and Yorkshire Region, years 1994/5 Health Authorities Females Rank Males Rank Persons Rank Wakefield 26.6 4 15 35 21.3 2 HighSunderland 20.6 38 15.4 32 18.5 24 Gateshead & South Tyneside 16.8 75 19.4 7 18.2 29 Newcastle & North Tyneside 20.5 40 14.6 39 17.9 33 County Durham & Darlington 22.8 20 10.6 31 17.4 35 Calderdale & Kirklees 18.8 53 13.7 45 16.6 44 Bradford 16.7 76 16 25 16.2 48 Leeds 18.1 66 13.6 47 16 52 Northumberland 19.2 49 9.2 36 14.9 66 North Cumbria 14.7 88 14 43 14.6 70 North Yorkshire 15.5 84 Low 11.5 16 13.8 75 East Riding 14.5 90 Low 11.8 15 13.3 79 LowTees 13.7 93 Low 11.3 23 12.7 83 LowEngland 19.7 13.4 16.8
Source: Health Survey for England Note: Ranks show position among Health Authorities in England (N=98), High/Low indicates significant difference from the England average. Overall, these rates are strikingly high. Recently their conceptual validity has been explored28,29. These authors propose that prevalence estimates based on the presence not only of sufficient symptoms, but also of direct reports of associated disability provide a better measure of numbers of people who would benefit from intervention and who should be targeted in special case finding approaches. In the first national psychiatric morbidity survey, these individuals, comprising 3.4% of the adult population, were particularly concentrated among lone parents, sufferers of chronic physical illness and the unemployed. Time trends in common mental illness The recent National Psychiatric Morbidity survey described above was in most respects a repeat of a survey conducted in 199317. Rates for most neurotic disorders have shown little overall change, though mixed anxiety depression has increased in frequency by about 18%, notable increases being in middle aged people of both genders. Among young women rates of phobias and generalised anxiety disorder have fallen significantly. The less detailed GHQ analysis is done nearly every year. From this, national annual trend tables can be produced. Figures for the period 1993-1999 are roughly stable. Health Authority tables for successive groups of years, giving local trends could be produced, but this has not yet been done.
57
Factors associated with common mental illness Neurotic disorders are associated with certain characteristics of individuals. They are more common in: • Separated or divorced people;
• Those with lower IQ, lower educational attainment and from social class V;
• Those who are economically inactive;
• Local authority or housing association tenants, living in urban areas and who have moved home frequently27.
Individually, people who develop mental illness have lower levels of social support than others30-32. In 1993 and 1994 the Health Survey for England monitored perceived stress and its subjective effect. 15% of men and 16% of women had experienced a lot of stress in the four weeks prior to interview and 12% and 14% respectively felt this had affected their health a lot. Both were most keenly felt by people in middle age. Local estimates from statistical models Where the distribution of a type of illness is predictably associated with an identifiable cluster of social variables for which detailed measurements are available in census data, or some other source available for small areas, it is possible to estimate the likely level of illness to be found in any chosen area. This is useful for planning and audit purposes. Following the publication of the 1993 National Psychiatric Morbidity Survey, the Office of National Statistics was commissioned to explore the development of statistical models to do this33. Their report identified three usable models, predicting the mean symptom score, and the proportions of individuals in an area likely to have depression or any neurotic disorder on the basis of data from the 1991 Census. Figure 4.1 shows a map of the estimates of the likely prevalence of depression within the North East and Yorkshire and the Humber Regions. It is clear from the map that the model places considerable weight on the type of authority (metropolitan or not). This gives rise to some implausible discontinuities, for example in the West Yorkshire areas of the map. Therefore, in using the model it is important to be aware of this. A first attempt at a similar modelling exercise was attempted with the 2000 National Psychiatric Morbidity Survey. This failed as the only available census data (still from 1991) simply did not predict the findings well enough. It would be sensible to repeat this exercise when the small area statistics from the 2001 census are available. Ethnic minorities and common mental health problems While the prevalence of severe mental illnesses in various minority ethnic groups in England has been extensively studied, this aspect of the distribution of common mental disorders has only recently been thoroughly documented. In parallel with the 2000 national psychiatric morbidity survey, a national study (EMPIRIC) was conducted to look specifically at the experience of members of ethnic minorities34. It used a sampling frame developed for the Health Survey for England. The survey covered

58
Bangladeshi, Caribbean, Indian, Irish and Pakistani groups. Its findings were complex but generally suggested that there was little difference in the prevalence rates of common mental illnesses between minority ethnic groups and the white population. Specific group differences showed that Irish men and Pakistani women had higher rates, while Bangladeshi women had lower rates. However, evidence from the levels of somatic symptoms of distress and the lack of positive responses to wider psychological questions suggested that rates of common mental illnesses in Bangladeshi men and South Asian (particularly Indian and Pakistani) women may have been underestimated. While social factors commonly associated with mental ill-health were widely prevalent, particularly in the Bangladeshi group, the link between these and illness seemed weaker than in the general population surveys. Figure 4.1: Likely prevalence (%) of depression in the North East and Yorkshire and the Humber Regions by electoral ward, showing NSF Local Implementation Team boundaries
59
Severe mental illness Prevalence in the population Estimating population prevalence and incidence figures is much harder for severe than for common mental illnesses. There are four reasons for this. First they are much rarer. Each of the two National Psychiatric Morbidity Surveys of people living in private households identified only about fifty individuals with psychotic disorders from samples of ten and nine thousand total respondents. Numbers of this order give prevalence estimates with relatively wide confidence intervals; age, gender and region specific estimates are not possible. Second the process of sampling is much more complex. Important numbers of people with chronic psychosis live in institutional settings or are homeless as a result of their disorder. Designing a sampling frame for these people from which a survey can be taken and extrapolated to national estimates is much harder. Third, sufferers may also be more than usually disinclined to participate in a survey35. Fourth, the extent to which people with manic depressive psychosis which is well managed by medication may not be classified as having a psychotic illness by standard interviews. For these reasons, in addition to survey evidence researchers use other strategies. Thornicroft36, for example, employed a ‘key informant’ approach, attempting to identify all the people with psychosis in two defined populations by approaching all agencies likely to come into contact with them and developing a register. The evidence about the epidemiology of severe mental illnesses has been reviewed recently by Lewis et al35. They concluded that between 4.8 and 11.3 people per 1000 population have schizophrenia. Manic-depressive disorders and psychotic depression are found in about one fifth of this number. Other psychoses, mostly associated with substance misuse are much rarer. These findings are broadly in line with estimates from the National Psychiatric Morbidity Survey which found that about 0.6% of male and 0.5% of female respondents had a psychotic disorder. Local estimates from statistical models Prevalence rates vary locally in relation to identifiable personal characteristics. People with schizophrenia are concentrated in low social classes and tend to be single and live alone, all as a consequence of their illness. Population surveys do not identify enough people with these disorders to either produce data for local areas or for developing statistical models. Instead modelling work to identify the patterns of variation in numbers of people with major mental illness has been undertaken using patterns of psychiatric in-patient admission21-23. The first two of these studies related admission patterns in 1991 to population characteristics measured in the 1991 Census. The third, producing the MINI2000 score, related admission patterns for 1998 to contemporary data from the Index of Multiple Deprivation produced for the then Department of the Environment, Transport and the Regions20. Figure 4.2 shows a map of the predicted pattern of variation across the Northern and Yorkshire Region using the most recent of these studies. The MINI2000 score is the predicted admission rate as a percentage of the national average.
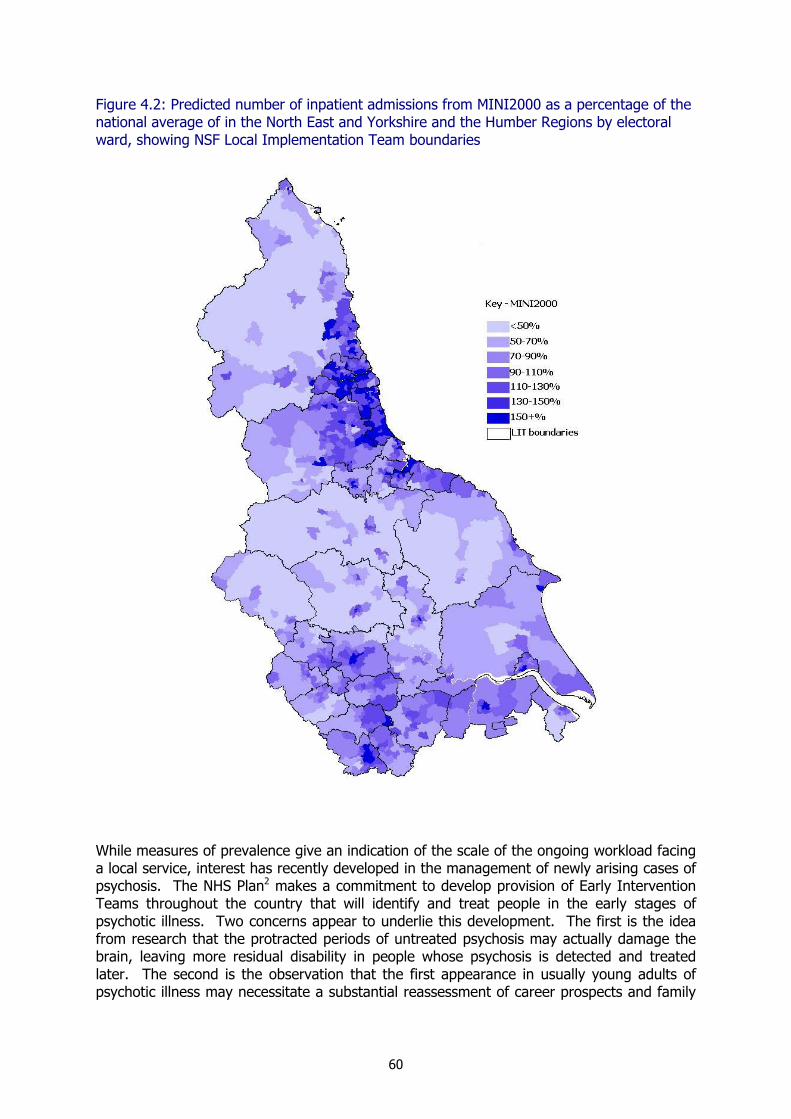
60
Figure 4.2: Predicted number of inpatient admissions from MINI2000 as a percentage of the national average of in the North East and Yorkshire and the Humber Regions by electoral ward, showing NSF Local Implementation Team boundaries
While measures of prevalence give an indication of the scale of the ongoing workload facing a local service, interest has recently developed in the management of newly arising cases of psychosis. The NHS Plan2 makes a commitment to develop provision of Early Intervention Teams throughout the country that will identify and treat people in the early stages of psychotic illness. Two concerns appear to underlie this development. The first is the idea from research that the protracted periods of untreated psychosis may actually damage the brain, leaving more residual disability in people whose psychosis is detected and treated later. The second is the observation that the first appearance in usually young adults of psychotic illness may necessitate a substantial reassessment of career prospects and family
61
relationships. This is profoundly traumatic and needs an approach beyond and perhaps different to the management of subsequent episodes of relapse. To estimate the likely requirements for this type of service, estimates of the incidence (the number of new cases arising in a population per year) are required. For schizophrenia, incidence is probably not distributed the same way as prevalence. Schizophrenia is a long term illness and the location of people experiencing the illness tends to owe more to the consequence of their illness rather than the cause. The disabilities associated with the disease tend to lead sufferers to underachieve socially and economically. They naturally gravitate towards areas of cheap and socially isolated accommodation, accounting for the pattern of distribution seen in prevalence rates. Jones et al37 observed that this social decline was evident prior to diagnosis, reflecting the usually insidious onset of the illness, in contrast to patients with affective psychosis. This makes it difficult to estimate how many new cases per year local services should plan for. Jablensky et al38 calculated an average incidence of schizophrenia from epidemiological studies of 0.11 per 1,000 (range 0.07–0.17 per 1,000) using a narrow definition and 0.24 per 1,000 (range 0.07–0.52 per 1,000) using a wider one. If it were assumed that all would come to the attention of specialist services, early intervention services will need to treat 10-20 new cases per 100,000 population per year. Table 4.3 shows an attempt to estimate number of new cases of psychosis that should present to an early intervention team each year. Two calculations have been made. The first ‘simple’ prediction assumes that Jablensky’s average rate of 0.11 per 1,000 population should be applied to estimate the cases of schizophrenia, and the whole estimate increased by 25% to allow for the fact that schizophrenia accounts for roughly 80% of psychosis – (i.e. 0.1375 per 1,000 population). The second, ‘modified’ approach calculates schizophrenia and other psychoses separately. Jablensky’s estimate multiplied by 25% is applied for cases of non-schizophrenic psychosis. For the schizophrenic cases it is further multiplied by the MINI2000 schizophrenia sub-scale to mirror the distribution of schizophrenic illness found in the general population. Assuming that some but by no means all of the residential drift will occur before people developing schizophrenic psychoses, the best estimate would be somewhere between the simple and the modified estimates. Ethnic variations in prevalence of psychosis A number of research studies have discussed the rates of psychotic illness in the ethnic minority groups in the UK39,40. Most of the work in this area has been undertaken on the basis of numbers of people in treatment by specialist services. There is broad agreement that the rate of psychotic illness in people from the Caribbean is higher than that of white people. There is less agreement about patterns in south Asian people, and the research in other groups is either very old or so small in scale as to be anecdotal. This area was recently studied on a national level by the EMPIRIC study described above as part of the psychiatric morbidity survey programme34. The study concluded that there were distinct differences. Overall Irish people showed similar rates to the indigenous population, though with a greater concentration in young people. Caribbean groups showed a twofold excess, with no gender difference. Indians showed a slight excess, but with a gender reversal – higher rates in women. Pakistanis had a 60% higher, and Bangladeshis a 25% lower rate, both with no apparent gender difference. One interesting use of this data is that it allows the needs of local minority ethic population to be modelled for local psychosis services. Based on 1991 Census figures, in most parts of
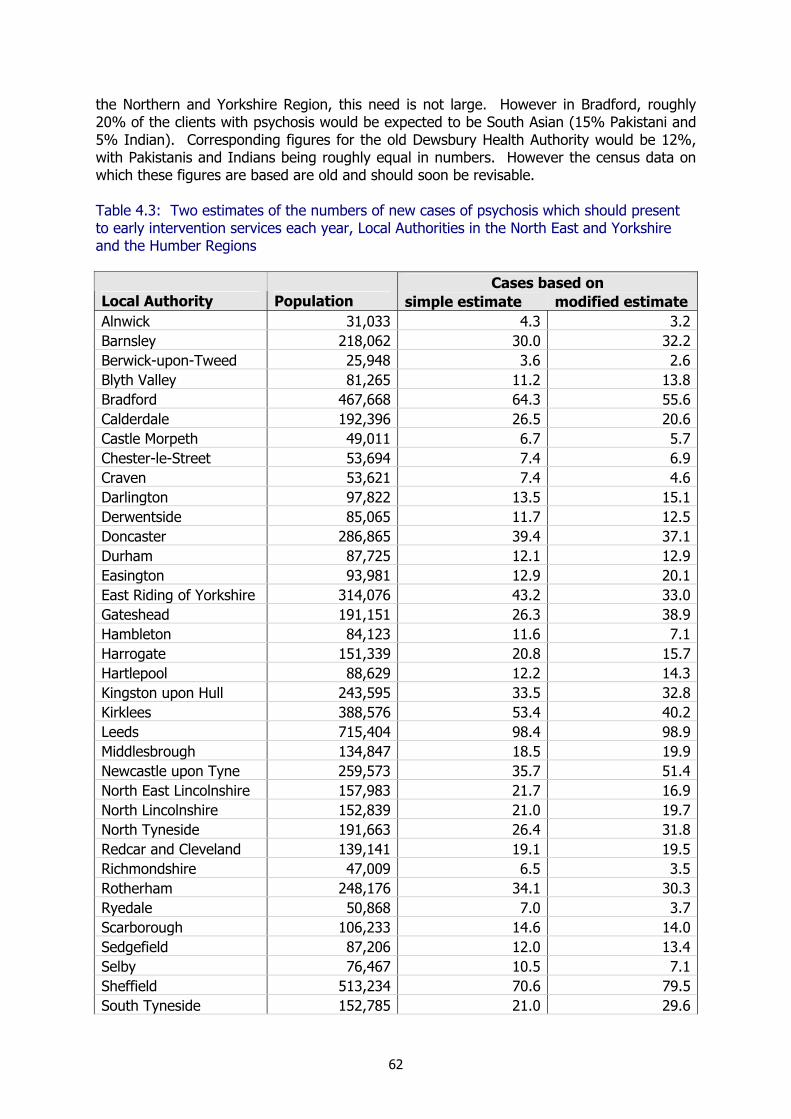
62
the Northern and Yorkshire Region, this need is not large. However in Bradford, roughly 20% of the clients with psychosis would be expected to be South Asian (15% Pakistani and 5% Indian). Corresponding figures for the old Dewsbury Health Authority would be 12%, with Pakistanis and Indians being roughly equal in numbers. However the census data on which these figures are based are old and should soon be revisable. Table 4.3: Two estimates of the numbers of new cases of psychosis which should present to early intervention services each year, Local Authorities in the North East and Yorkshire and the Humber Regions
Cases based on Local Authority Population simple estimate modified estimate Alnwick 31,033 4.3 3.2Barnsley 218,062 30.0 32.2Berwick-upon-Tweed 25,948 3.6 2.6Blyth Valley 81,265 11.2 13.8Bradford 467,668 64.3 55.6Calderdale 192,396 26.5 20.6Castle Morpeth 49,011 6.7 5.7Chester-le-Street 53,694 7.4 6.9Craven 53,621 7.4 4.6Darlington 97,822 13.5 15.1Derwentside 85,065 11.7 12.5Doncaster 286,865 39.4 37.1Durham 87,725 12.1 12.9Easington 93,981 12.9 20.1East Riding of Yorkshire 314,076 43.2 33.0Gateshead 191,151 26.3 38.9Hambleton 84,123 11.6 7.1Harrogate 151,339 20.8 15.7Hartlepool 88,629 12.2 14.3Kingston upon Hull 243,595 33.5 32.8Kirklees 388,576 53.4 40.2Leeds 715,404 98.4 98.9Middlesbrough 134,847 18.5 19.9Newcastle upon Tyne 259,573 35.7 51.4North East Lincolnshire 157,983 21.7 16.9North Lincolnshire 152,839 21.0 19.7North Tyneside 191,663 26.4 31.8Redcar and Cleveland 139,141 19.1 19.5Richmondshire 47,009 6.5 3.5Rotherham 248,176 34.1 30.3Ryedale 50,868 7.0 3.7Scarborough 106,233 14.6 14.0Sedgefield 87,206 12.0 13.4Selby 76,467 10.5 7.1Sheffield 513,234 70.6 79.5South Tyneside 152,785 21.0 29.6
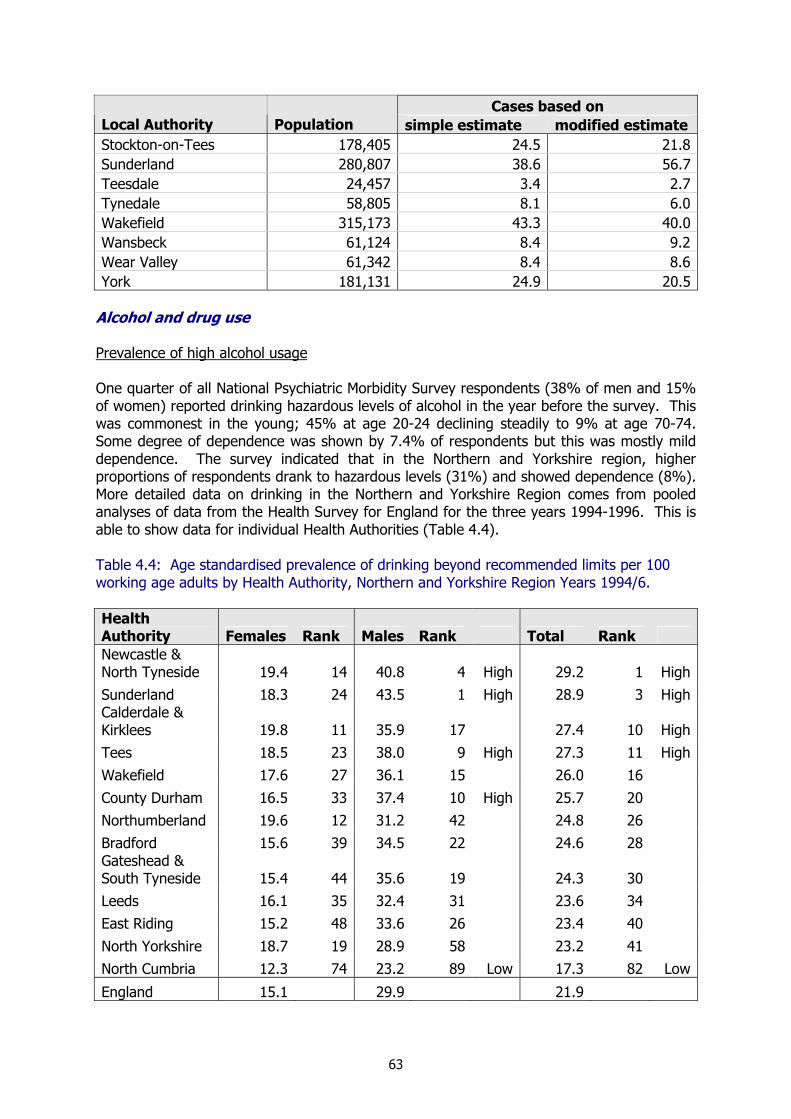
63
Cases based on Local Authority Population simple estimate modified estimate Stockton-on-Tees 178,405 24.5 21.8Sunderland 280,807 38.6 56.7Teesdale 24,457 3.4 2.7Tynedale 58,805 8.1 6.0Wakefield 315,173 43.3 40.0Wansbeck 61,124 8.4 9.2Wear Valley 61,342 8.4 8.6York 181,131 24.9 20.5
Alcohol and drug use Prevalence of high alcohol usage One quarter of all National Psychiatric Morbidity Survey respondents (38% of men and 15% of women) reported drinking hazardous levels of alcohol in the year before the survey. This was commonest in the young; 45% at age 20-24 declining steadily to 9% at age 70-74. Some degree of dependence was shown by 7.4% of respondents but this was mostly mild dependence. The survey indicated that in the Northern and Yorkshire region, higher proportions of respondents drank to hazardous levels (31%) and showed dependence (8%). More detailed data on drinking in the Northern and Yorkshire Region comes from pooled analyses of data from the Health Survey for England for the three years 1994-1996. This is able to show data for individual Health Authorities (Table 4.4). Table 4.4: Age standardised prevalence of drinking beyond recommended limits per 100 working age adults by Health Authority, Northern and Yorkshire Region Years 1994/6. Health Authority Females Rank Males Rank Total Rank Newcastle & North Tyneside 19.4 14 40.8 4 High 29.2 1 HighSunderland 18.3 24 43.5 1 High 28.9 3 HighCalderdale & Kirklees 19.8 11 35.9 17 27.4 10 High
Tees 18.5 23 38.0 9 High 27.3 11 HighWakefield 17.6 27 36.1 15 26.0 16
County Durham 16.5 33 37.4 10 High 25.7 20 Northumberland 19.6 12 31.2 42 24.8 26 Bradford 15.6 39 34.5 22 24.6 28 Gateshead & South Tyneside 15.4 44 35.6 19 24.3 30 Leeds 16.1 35 32.4 31 23.6 34 East Riding 15.2 48 33.6 26 23.4 40
North Yorkshire 18.7 19 28.9 58 23.2 41 North Cumbria 12.3 74 23.2 89 Low 17.3 82 Low
England 15.1 29.9 21.9
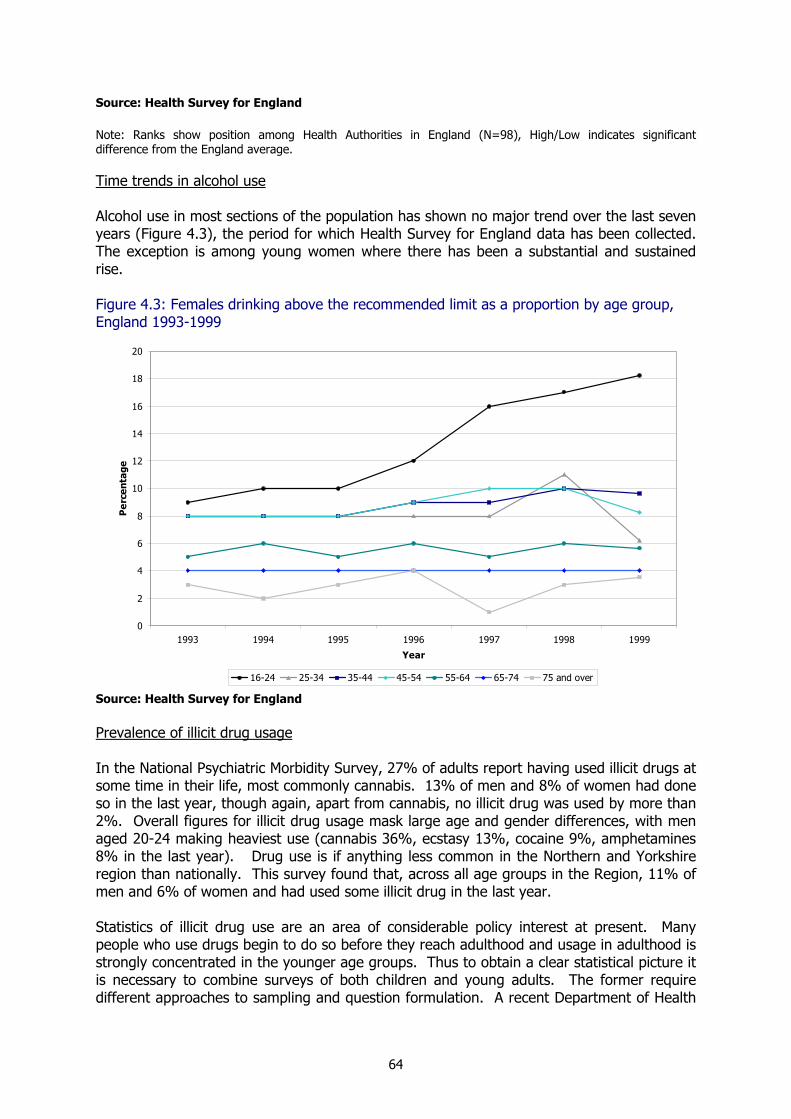
64
Source: Health Survey for England Note: Ranks show position among Health Authorities in England (N=98), High/Low indicates significant difference from the England average. Time trends in alcohol use Alcohol use in most sections of the population has shown no major trend over the last seven years (Figure 4.3), the period for which Health Survey for England data has been collected. The exception is among young women where there has been a substantial and sustained rise. Figure 4.3: Females drinking above the recommended limit as a proportion by age group, England 1993-1999
Source: Health Survey for England Prevalence of illicit drug usage In the National Psychiatric Morbidity Survey, 27% of adults report having used illicit drugs at some time in their life, most commonly cannabis. 13% of men and 8% of women had done so in the last year, though again, apart from cannabis, no illicit drug was used by more than 2%. Overall figures for illicit drug usage mask large age and gender differences, with men aged 20-24 making heaviest use (cannabis 36%, ecstasy 13%, cocaine 9%, amphetamines 8% in the last year). Drug use is if anything less common in the Northern and Yorkshire region than nationally. This survey found that, across all age groups in the Region, 11% of men and 6% of women and had used some illicit drug in the last year. Statistics of illicit drug use are an area of considerable policy interest at present. Many people who use drugs begin to do so before they reach adulthood and usage in adulthood is strongly concentrated in the younger age groups. Thus to obtain a clear statistical picture it is necessary to combine surveys of both children and young adults. The former require different approaches to sampling and question formulation. A recent Department of Health
0
2
4
6
8
10
12
14
16
18
20
1993 1994 1995 1996 1997 1998 1999
Year
Per
cent
age
16-24 25-34 35-44 45-54 55-64 65-74 75 and over

65
statistical bulletin outlines the methodological issues and the range of sources that have been developed41. The best estimate of the recent position is that among 11-15 year olds 12% had used drugs in the last month and 20% in the last year. Use increased rapidly with age in this group, with 39% of 15 year olds having used some illicit drug in the last year, 4% a class A drug (Boreham and Shaw 2002). Among 16-24 year olds 29% had used some drug and 9% a Class A drug. Trends in illicit drug usage Evidence about trends in illicit drug usage is more confused. The difference between the two National Psychiatric Morbidity Surveys (1993 and 2000) suggests a marked increase in usage and dependency among young people of both sexes. However this pattern is not supported by the British Crime Survey which has asked similar questions annually since 1994. This has shown a substantial increase only in the use of cocaine. It is considered that the British Crime Survey is the more credible; with the result in the National Psychiatric Morbidity Survey probably attributable to changes in the way the interview was structured in the first round. Needs of Prisoners People currently in prison are known to have higher rates of almost all types of mental disorders than are normally found in the general population. This is of particular importance to NHS organisations at present as they will assume responsibility for the provision of healthcare in prisons in April 2003. A psychiatric morbidity survey of prisoners was conducted in 1997 using methods largely the same as those used in the first National Psychiatric Morbidity Survey43. The findings were complex, addressing separately the situation for male and female prisoners, and for those who were serving sentences and those on remand. Generally, mental disorders are much commoner in remand than sentenced prisoners, presumably reflecting the fact that many mentally ill on remand will be passed to the health service under section 37 of the Mental Health Act instead of receiving custodial sentences. Common mental disorders are four to five times more prevalent, and severe mental disorders are over than ten times as common as in the general population. Hazardous use of alcohol and use of illicit drugs are two to three times as common. The frequency of suicide attempts is extremely high (Table 4.5). In all respects remand prisoners have even higher rates than sentenced prisoners. This is important for planning service provision as this group pose particularly complex challenges for the co-ordination of their care and for liaison with services outside the prison because many spend only a short time in custody.
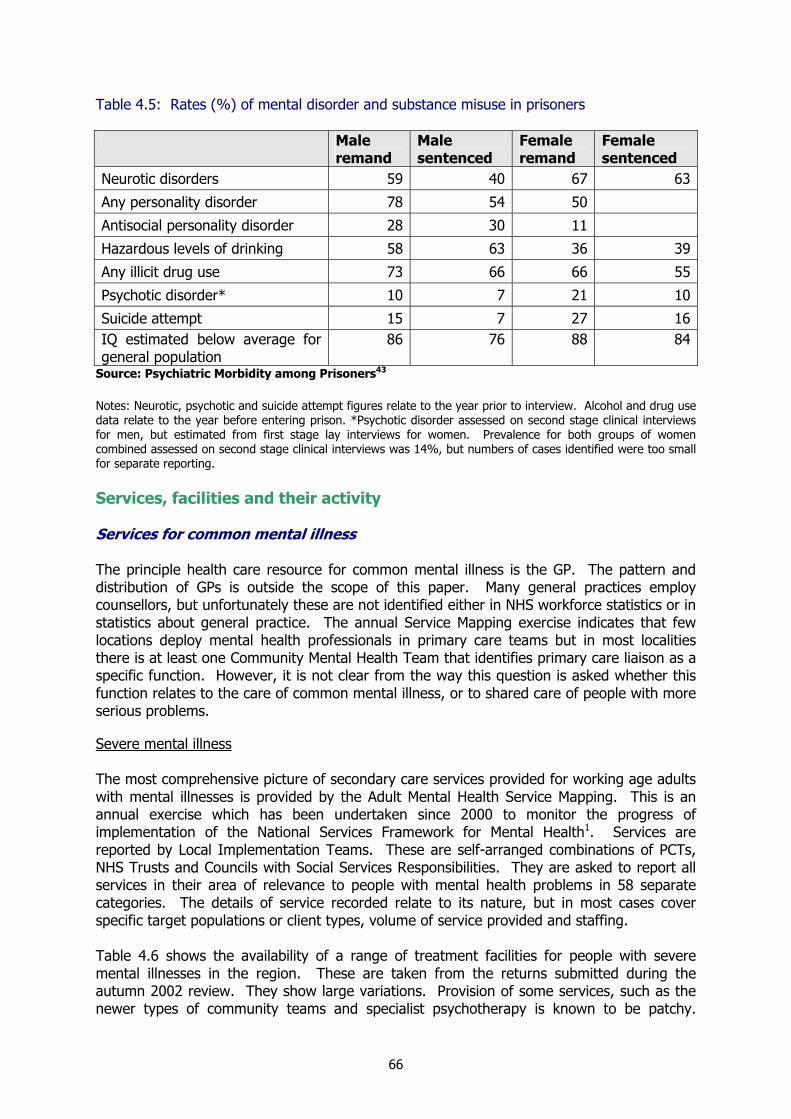
66
Table 4.5: Rates (%) of mental disorder and substance misuse in prisoners Male
remand Male sentenced
Female remand
Female sentenced
Neurotic disorders 59 40 67 63
Any personality disorder 78 54 50
Antisocial personality disorder 28 30 11
Hazardous levels of drinking 58 63 36 39
Any illicit drug use 73 66 66 55
Psychotic disorder* 10 7 21 10
Suicide attempt 15 7 27 16IQ estimated below average for general population
86 76 88 84
Source: Psychiatric Morbidity among Prisoners43 Notes: Neurotic, psychotic and suicide attempt figures relate to the year prior to interview. Alcohol and drug use data relate to the year before entering prison. *Psychotic disorder assessed on second stage clinical interviews for men, but estimated from first stage lay interviews for women. Prevalence for both groups of women combined assessed on second stage clinical interviews was 14%, but numbers of cases identified were too small for separate reporting. Services, facilities and their activity Services for common mental illness The principle health care resource for common mental illness is the GP. The pattern and distribution of GPs is outside the scope of this paper. Many general practices employ counsellors, but unfortunately these are not identified either in NHS workforce statistics or in statistics about general practice. The annual Service Mapping exercise indicates that few locations deploy mental health professionals in primary care teams but in most localities there is at least one Community Mental Health Team that identifies primary care liaison as a specific function. However, it is not clear from the way this question is asked whether this function relates to the care of common mental illness, or to shared care of people with more serious problems. Severe mental illness The most comprehensive picture of secondary care services provided for working age adults with mental illnesses is provided by the Adult Mental Health Service Mapping. This is an annual exercise which has been undertaken since 2000 to monitor the progress of implementation of the National Services Framework for Mental Health1. Services are reported by Local Implementation Teams. These are self-arranged combinations of PCTs, NHS Trusts and Councils with Social Services Responsibilities. They are asked to report all services in their area of relevance to people with mental health problems in 58 separate categories. The details of service recorded relate to its nature, but in most cases cover specific target populations or client types, volume of service provided and staffing. Table 4.6 shows the availability of a range of treatment facilities for people with severe mental illnesses in the region. These are taken from the returns submitted during the autumn 2002 review. They show large variations. Provision of some services, such as the newer types of community teams and specialist psychotherapy is known to be patchy.
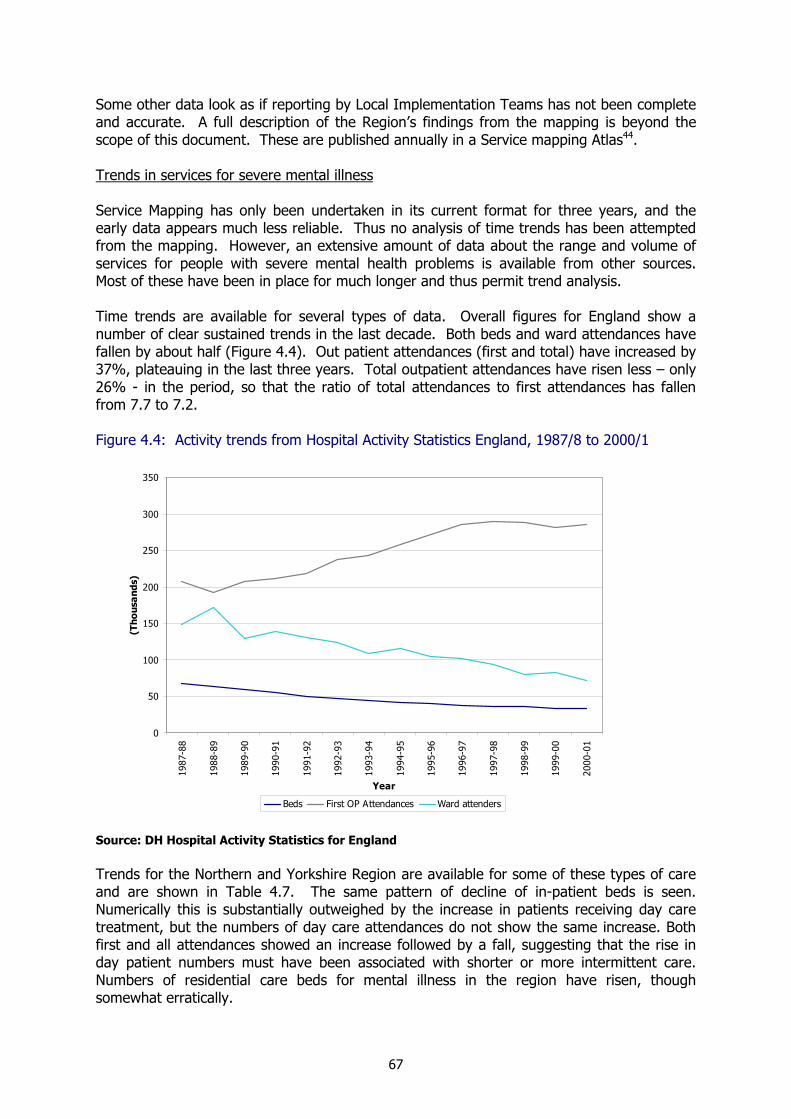
67
Some other data look as if reporting by Local Implementation Teams has not been complete and accurate. A full description of the Region’s findings from the mapping is beyond the scope of this document. These are published annually in a Service mapping Atlas44. Trends in services for severe mental illness Service Mapping has only been undertaken in its current format for three years, and the early data appears much less reliable. Thus no analysis of time trends has been attempted from the mapping. However, an extensive amount of data about the range and volume of services for people with severe mental health problems is available from other sources. Most of these have been in place for much longer and thus permit trend analysis. Time trends are available for several types of data. Overall figures for England show a number of clear sustained trends in the last decade. Both beds and ward attendances have fallen by about half (Figure 4.4). Out patient attendances (first and total) have increased by 37%, plateauing in the last three years. Total outpatient attendances have risen less – only 26% - in the period, so that the ratio of total attendances to first attendances has fallen from 7.7 to 7.2. Figure 4.4: Activity trends from Hospital Activity Statistics England, 1987/8 to 2000/1
Source: DH Hospital Activity Statistics for England Trends for the Northern and Yorkshire Region are available for some of these types of care and are shown in Table 4.7. The same pattern of decline of in-patient beds is seen. Numerically this is substantially outweighed by the increase in patients receiving day care treatment, but the numbers of day care attendances do not show the same increase. Both first and all attendances showed an increase followed by a fall, suggesting that the rise in day patient numbers must have been associated with shorter or more intermittent care. Numbers of residential care beds for mental illness in the region have risen, though somewhat erratically.
0
50
100
150
200
250
300
350
1987
-88
1988
-89
1989
-90
1990
-91
1991
-92
1992
-93
1993
-94
1994
-95
1995
-96
1996
-97
1997
-98
1998
-99
1999
-00
2000
-01
Year
(Tho
usan
ds)
Beds First OP Attendances Ward attenders
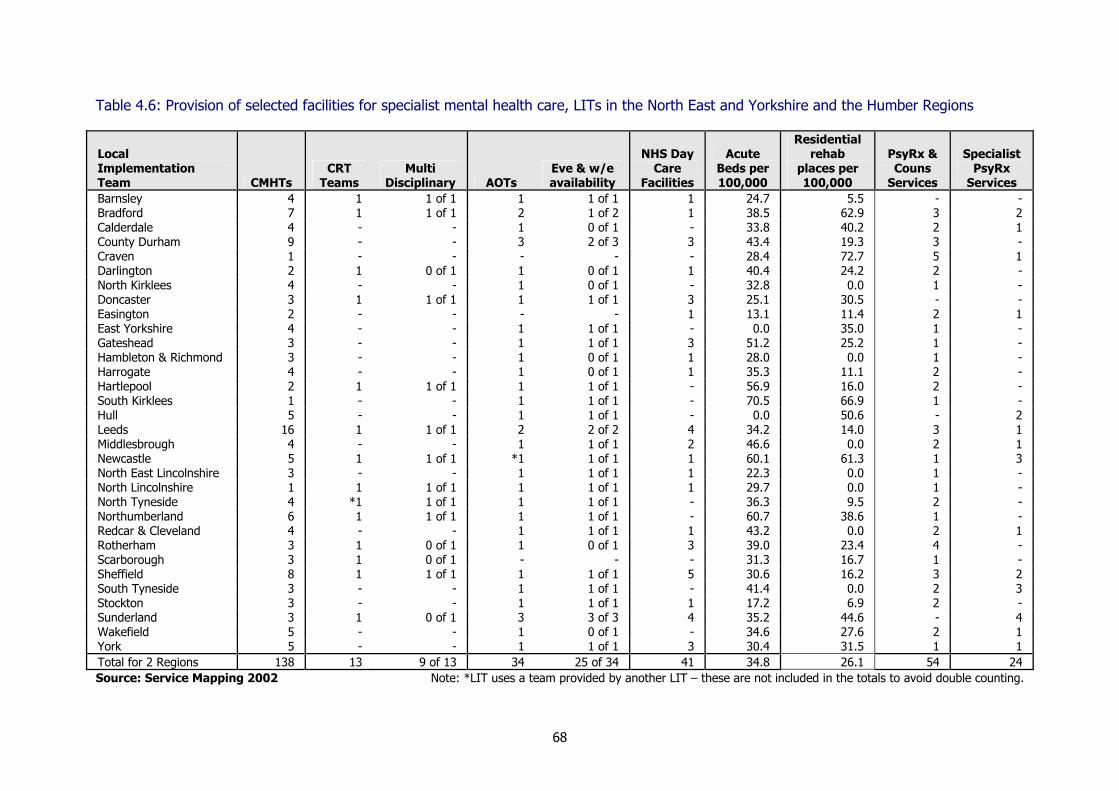
68
Table 4.6: Provision of selected facilities for specialist mental health care, LITs in the North East and Yorkshire and the Humber Regions
Local Implementation Team CMHTs
CRT Teams
Multi Disciplinary AOTs
Eve & w/e availability
NHS Day Care
Facilities
Acute Beds per 100,000
Residential rehab
places per 100,000
PsyRx & Couns
Services
Specialist PsyRx
Services Barnsley 4 1 1 of 1 1 1 of 1 1 24.7 5.5 - - Bradford 7 1 1 of 1 2 1 of 2 1 38.5 62.9 3 2 Calderdale 4 - - 1 0 of 1 - 33.8 40.2 2 1 County Durham 9 - - 3 2 of 3 3 43.4 19.3 3 - Craven 1 - - - - - 28.4 72.7 5 1 Darlington 2 1 0 of 1 1 0 of 1 1 40.4 24.2 2 - North Kirklees 4 - - 1 0 of 1 - 32.8 0.0 1 - Doncaster 3 1 1 of 1 1 1 of 1 3 25.1 30.5 - - Easington 2 - - - - 1 13.1 11.4 2 1 East Yorkshire 4 - - 1 1 of 1 - 0.0 35.0 1 - Gateshead 3 - - 1 1 of 1 3 51.2 25.2 1 - Hambleton & Richmond 3 - - 1 0 of 1 1 28.0 0.0 1 - Harrogate 4 - - 1 0 of 1 1 35.3 11.1 2 - Hartlepool 2 1 1 of 1 1 1 of 1 - 56.9 16.0 2 - South Kirklees 1 - - 1 1 of 1 - 70.5 66.9 1 - Hull 5 - - 1 1 of 1 - 0.0 50.6 - 2 Leeds 16 1 1 of 1 2 2 of 2 4 34.2 14.0 3 1 Middlesbrough 4 - - 1 1 of 1 2 46.6 0.0 2 1 Newcastle 5 1 1 of 1 *1 1 of 1 1 60.1 61.3 1 3 North East Lincolnshire 3 - - 1 1 of 1 1 22.3 0.0 1 - North Lincolnshire 1 1 1 of 1 1 1 of 1 1 29.7 0.0 1 - North Tyneside 4 *1 1 of 1 1 1 of 1 - 36.3 9.5 2 - Northumberland 6 1 1 of 1 1 1 of 1 - 60.7 38.6 1 - Redcar & Cleveland 4 - - 1 1 of 1 1 43.2 0.0 2 1 Rotherham 3 1 0 of 1 1 0 of 1 3 39.0 23.4 4 - Scarborough 3 1 0 of 1 - - - 31.3 16.7 1 - Sheffield 8 1 1 of 1 1 1 of 1 5 30.6 16.2 3 2 South Tyneside 3 - - 1 1 of 1 - 41.4 0.0 2 3 Stockton 3 - - 1 1 of 1 1 17.2 6.9 2 - Sunderland 3 1 0 of 1 3 3 of 3 4 35.2 44.6 - 4 Wakefield 5 - - 1 0 of 1 - 34.6 27.6 2 1 York 5 - - 1 1 of 1 3 30.4 31.5 1 1 Total for 2 Regions 138 13 9 of 13 34 25 of 34 41 34.8 26.1 54 24 Source: Service Mapping 2002 Note: *LIT uses a team provided by another LIT – these are not included in the totals to avoid double counting.
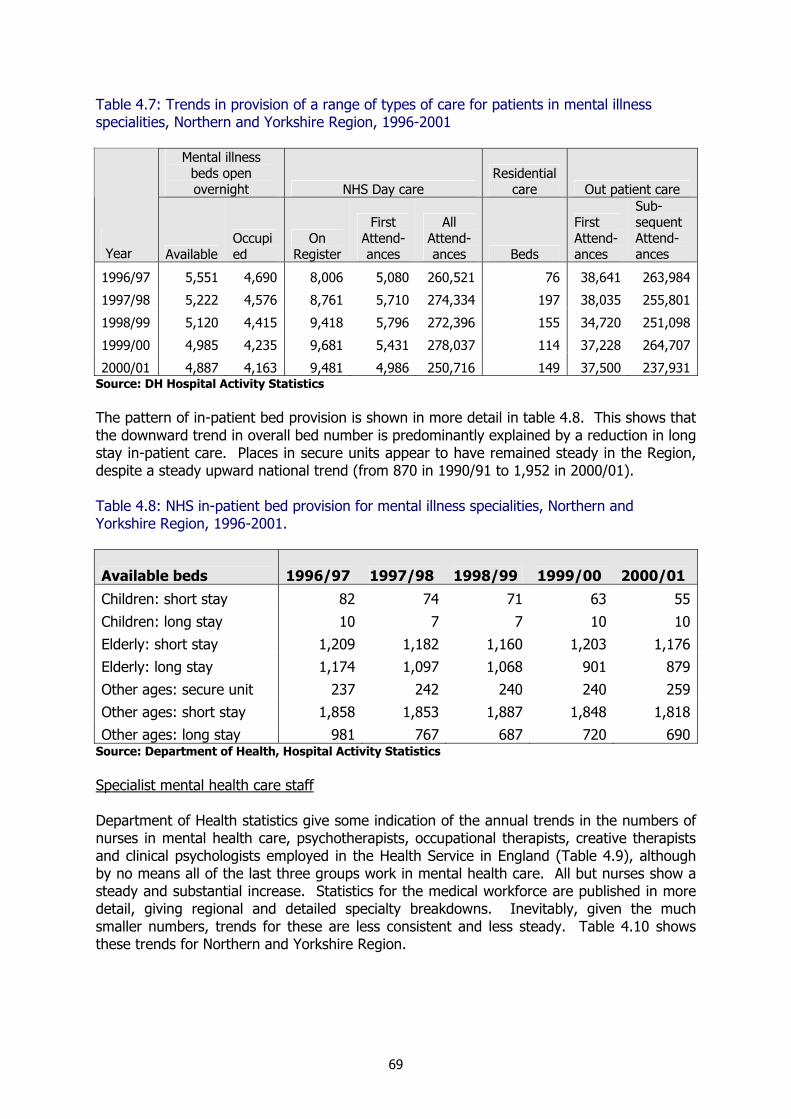
69
Table 4.7: Trends in provision of a range of types of care for patients in mental illness specialities, Northern and Yorkshire Region, 1996-2001
Mental illness beds open overnight NHS Day care
Residential care Out patient care
Year Available
Occupied
On Register
First Attend-ances
All Attend-ances Beds
First Attend-ances
Sub-sequent Attend-ances
1996/97 5,551 4,690 8,006 5,080 260,521 76 38,641 263,984
1997/98 5,222 4,576 8,761 5,710 274,334 197 38,035 255,801
1998/99 5,120 4,415 9,418 5,796 272,396 155 34,720 251,098
1999/00 4,985 4,235 9,681 5,431 278,037 114 37,228 264,707
2000/01 4,887 4,163 9,481 4,986 250,716 149 37,500 237,931Source: DH Hospital Activity Statistics The pattern of in-patient bed provision is shown in more detail in table 4.8. This shows that the downward trend in overall bed number is predominantly explained by a reduction in long stay in-patient care. Places in secure units appear to have remained steady in the Region, despite a steady upward national trend (from 870 in 1990/91 to 1,952 in 2000/01). Table 4.8: NHS in-patient bed provision for mental illness specialities, Northern and Yorkshire Region, 1996-2001.
Available beds 1996/97 1997/98 1998/99 1999/00 2000/01
Children: short stay 82 74 71 63 55
Children: long stay 10 7 7 10 10Elderly: short stay 1,209 1,182 1,160 1,203 1,176Elderly: long stay 1,174 1,097 1,068 901 879
Other ages: secure unit 237 242 240 240 259Other ages: short stay 1,858 1,853 1,887 1,848 1,818Other ages: long stay 981 767 687 720 690
Source: Department of Health, Hospital Activity Statistics Specialist mental health care staff Department of Health statistics give some indication of the annual trends in the numbers of nurses in mental health care, psychotherapists, occupational therapists, creative therapists and clinical psychologists employed in the Health Service in England (Table 4.9), although by no means all of the last three groups work in mental health care. All but nurses show a steady and substantial increase. Statistics for the medical workforce are published in more detail, giving regional and detailed specialty breakdowns. Inevitably, given the much smaller numbers, trends for these are less consistent and less steady. Table 4.10 shows these trends for Northern and Yorkshire Region.
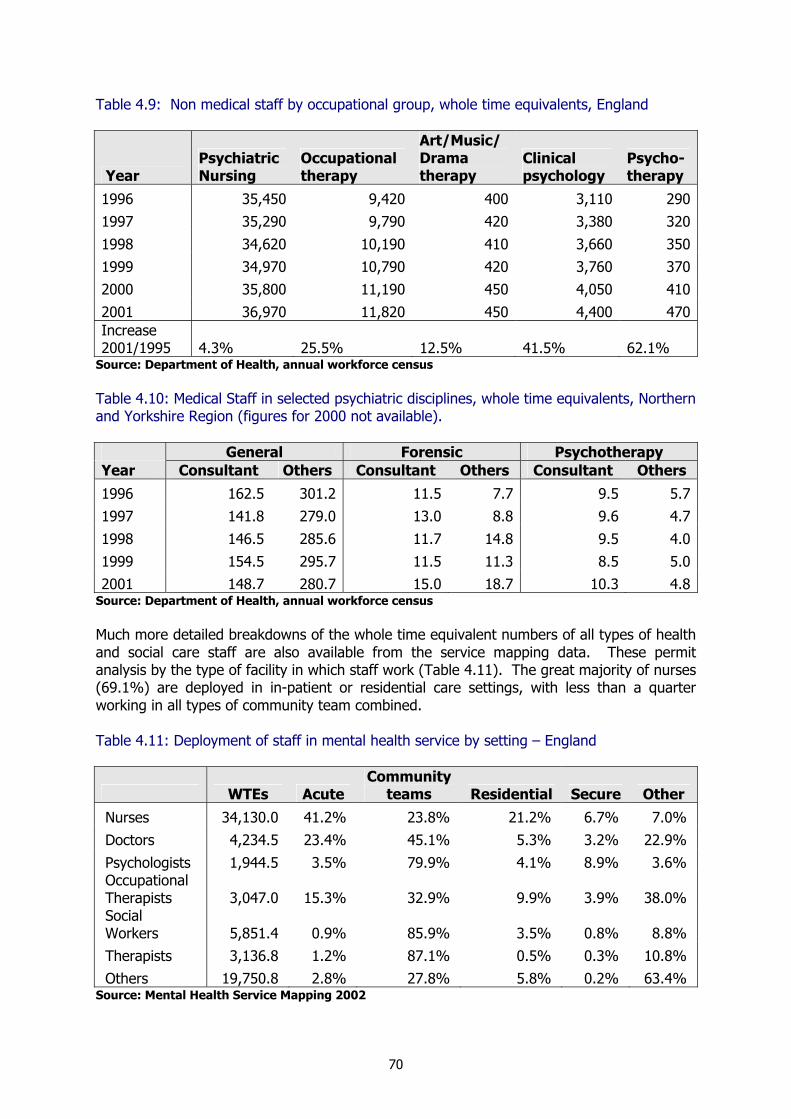
70
Table 4.9: Non medical staff by occupational group, whole time equivalents, England
Year Psychiatric Nursing
Occupational therapy
Art/Music/ Drama therapy
Clinical psychology
Psycho-therapy
1996 35,450 9,420 400 3,110 2901997 35,290 9,790 420 3,380 320
1998 34,620 10,190 410 3,660 3501999 34,970 10,790 420 3,760 3702000 35,800 11,190 450 4,050 410
2001 36,970 11,820 450 4,400 470Increase 2001/1995 4.3% 25.5% 12.5% 41.5% 62.1%
Source: Department of Health, annual workforce census Table 4.10: Medical Staff in selected psychiatric disciplines, whole time equivalents, Northern and Yorkshire Region (figures for 2000 not available). General Forensic Psychotherapy Year Consultant Others Consultant Others Consultant Others
1996 162.5 301.2 11.5 7.7 9.5 5.71997 141.8 279.0 13.0 8.8 9.6 4.7
1998 146.5 285.6 11.7 14.8 9.5 4.01999 154.5 295.7 11.5 11.3 8.5 5.02001 148.7 280.7 15.0 18.7 10.3 4.8
Source: Department of Health, annual workforce census Much more detailed breakdowns of the whole time equivalent numbers of all types of health and social care staff are also available from the service mapping data. These permit analysis by the type of facility in which staff work (Table 4.11). The great majority of nurses (69.1%) are deployed in in-patient or residential care settings, with less than a quarter working in all types of community team combined. Table 4.11: Deployment of staff in mental health service by setting – England
WTEs Acute Community
teams Residential Secure Other
Nurses 34,130.0 41.2% 23.8% 21.2% 6.7% 7.0% Doctors 4,234.5 23.4% 45.1% 5.3% 3.2% 22.9%
Psychologists 1,944.5 3.5% 79.9% 4.1% 8.9% 3.6% Occupational Therapists 3,047.0 15.3% 32.9% 9.9% 3.9% 38.0% Social Workers 5,851.4 0.9% 85.9% 3.5% 0.8% 8.8% Therapists 3,136.8 1.2% 87.1% 0.5% 0.3% 10.8% Others 19,750.8 2.8% 27.8% 5.8% 0.2% 63.4%
Source: Mental Health Service Mapping 2002
71
Table 4.12 presents more detail of staffing levels in each Local Implementation Team area in the North East and Yorkshire and the Humber Regions. These are preliminary analyses and are likely to be revised in the next few months; their purpose is to indicate the scope of the data. In three cases (marked *) individual erroneous or anomalous data entries have been corrected or omitted. The data cover all types of services, and all types of provider (statutory and independent). These figures have two striking features. The first is the overall level of variation which is quite large. This would be appropriate if well correlated with levels of need. An analysis with MINI2000 data for the LIT areas shows that to some extent this is the case: • Numbers of nurses per 100,000 population are strongly correlated with numbers of
doctors, (Pearson’s coefficient = 0.582 p<0.001), psychologists (0.543 p=0.001), Occupational Therapists (0.585 p<0.001), and weakly with numbers of social workers (p=0.038).
• Numbers of nurses are moderately correlated with MINI2000 (0.407 p=0.021).
• Numbers of doctors are strongly correlated with numbers of psychologists (0.709 p<0.001), Occupational Therapists (0.482 p=0.005) and social workers (0.384 p=0.03).
• Numbers of psychologists are correlated with numbers of Occupational Therapists (0.486 p=0.005).
• Numbers of Occupational Therapists are correlated with numbers of social workers (0.448 p=0.01) therapists (0.368 p=0.038) and others – a category which includes volunteers (0.392, p=0.027).
• Numbers of social workers correlated with numbers of therapists (0.402 p=0.022) and numbers of therapists are correlated with numbers of other staff (0.439 p=0.012).
• However, apart from nurses, no group is correlated with MINI2000.
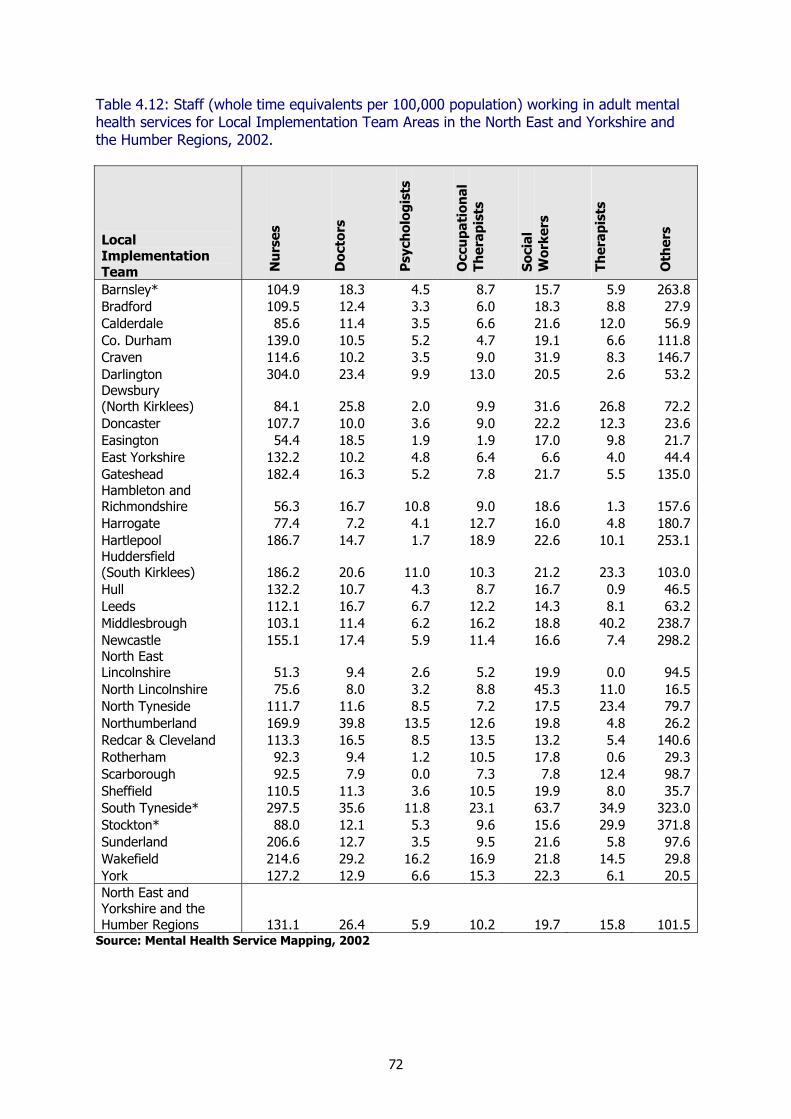
72
Table 4.12: Staff (whole time equivalents per 100,000 population) working in adult mental health services for Local Implementation Team Areas in the North East and Yorkshire and the Humber Regions, 2002.
Local Implementation Team N
urs
es
Doc
tors
Psy
chol
ogis
ts
Occ
upa
tion
al
Ther
apis
ts
Soci
al
Wor
kers
Ther
apis
ts
Oth
ers
Barnsley* 104.9 18.3 4.5 8.7 15.7 5.9 263.8Bradford 109.5 12.4 3.3 6.0 18.3 8.8 27.9Calderdale 85.6 11.4 3.5 6.6 21.6 12.0 56.9Co. Durham 139.0 10.5 5.2 4.7 19.1 6.6 111.8Craven 114.6 10.2 3.5 9.0 31.9 8.3 146.7Darlington 304.0 23.4 9.9 13.0 20.5 2.6 53.2Dewsbury (North Kirklees) 84.1 25.8 2.0 9.9 31.6 26.8 72.2Doncaster 107.7 10.0 3.6 9.0 22.2 12.3 23.6Easington 54.4 18.5 1.9 1.9 17.0 9.8 21.7East Yorkshire 132.2 10.2 4.8 6.4 6.6 4.0 44.4Gateshead 182.4 16.3 5.2 7.8 21.7 5.5 135.0Hambleton and Richmondshire 56.3 16.7 10.8 9.0 18.6 1.3 157.6Harrogate 77.4 7.2 4.1 12.7 16.0 4.8 180.7Hartlepool 186.7 14.7 1.7 18.9 22.6 10.1 253.1Huddersfield (South Kirklees) 186.2 20.6 11.0 10.3 21.2 23.3 103.0Hull 132.2 10.7 4.3 8.7 16.7 0.9 46.5Leeds 112.1 16.7 6.7 12.2 14.3 8.1 63.2Middlesbrough 103.1 11.4 6.2 16.2 18.8 40.2 238.7Newcastle 155.1 17.4 5.9 11.4 16.6 7.4 298.2North East Lincolnshire 51.3 9.4 2.6 5.2 19.9 0.0 94.5North Lincolnshire 75.6 8.0 3.2 8.8 45.3 11.0 16.5North Tyneside 111.7 11.6 8.5 7.2 17.5 23.4 79.7Northumberland 169.9 39.8 13.5 12.6 19.8 4.8 26.2Redcar & Cleveland 113.3 16.5 8.5 13.5 13.2 5.4 140.6Rotherham 92.3 9.4 1.2 10.5 17.8 0.6 29.3Scarborough 92.5 7.9 0.0 7.3 7.8 12.4 98.7Sheffield 110.5 11.3 3.6 10.5 19.9 8.0 35.7South Tyneside* 297.5 35.6 11.8 23.1 63.7 34.9 323.0Stockton* 88.0 12.1 5.3 9.6 15.6 29.9 371.8Sunderland 206.6 12.7 3.5 9.5 21.6 5.8 97.6Wakefield 214.6 29.2 16.2 16.9 21.8 14.5 29.8York 127.2 12.9 6.6 15.3 22.3 6.1 20.5North East and Yorkshire and the Humber Regions 131.1 26.4 5.9 10.2 19.7 15.8 101.5
Source: Mental Health Service Mapping, 2002
73
Social care services and activity Social care encompasses a wide variation of provision. This can include home help services, day care, employment services, service user and carer support and a range of advice and information services, residential care and supported accommodation. Home help services are provided to only a small number of people as a result of mental health problems, but since 1999, Department of Health statistics about provision of home helps do not itemise client groups separately. Residential accommodation forms a central part of social care for mentally ill people. Several types of beds are identifiable in routinely collected statistics. The main distinction is made between residential care homes and nursing homes registered under the Registered Homes Act 1983. Homes of both types are run mainly by private or voluntary providers. Numbers of institutions and beds are reported annually for England. Recent publications show that the North East has a high provision of residential care homes but an average provision of nursing homes. Some analyses are provided of beds by client group, but in most cases these do not neatly provide the information required for the purposes of this study. Altogether in England 16,772 residential care home places were available for people with adult mental illnesses. This figure has declined by about 5% in the last five years. Published figures for individual local authority areas do not distinguish between beds for people with the severe mental illness of younger adult life, and those provided for older clients with dementia. (The latter group number about 30% more than the former nationally, and show a rising trend.) Numbers of registered nursing home beds for mental illness were published by Health Authorities (Table 4.13). The figures are erratic, indicating that the distribution of these beds probably reflects the availability of suitable, and suitably priced, property and favourable planning decisions more than local levels of need. Published statistics about this type of provision also provides details of staffing levels. The number of residents supported in residential and nursing home care by local authorities is also published (Table 4.14). This gives a clearer reflection of the services available to residents, since the figures cover all individuals from the authority’s population supported in residential care whether placed in or out of the authority. These figures are reasonably well correlated with the MINI2000 index described above, which predicts about 40% of the variance in both residential and nursing home placements.
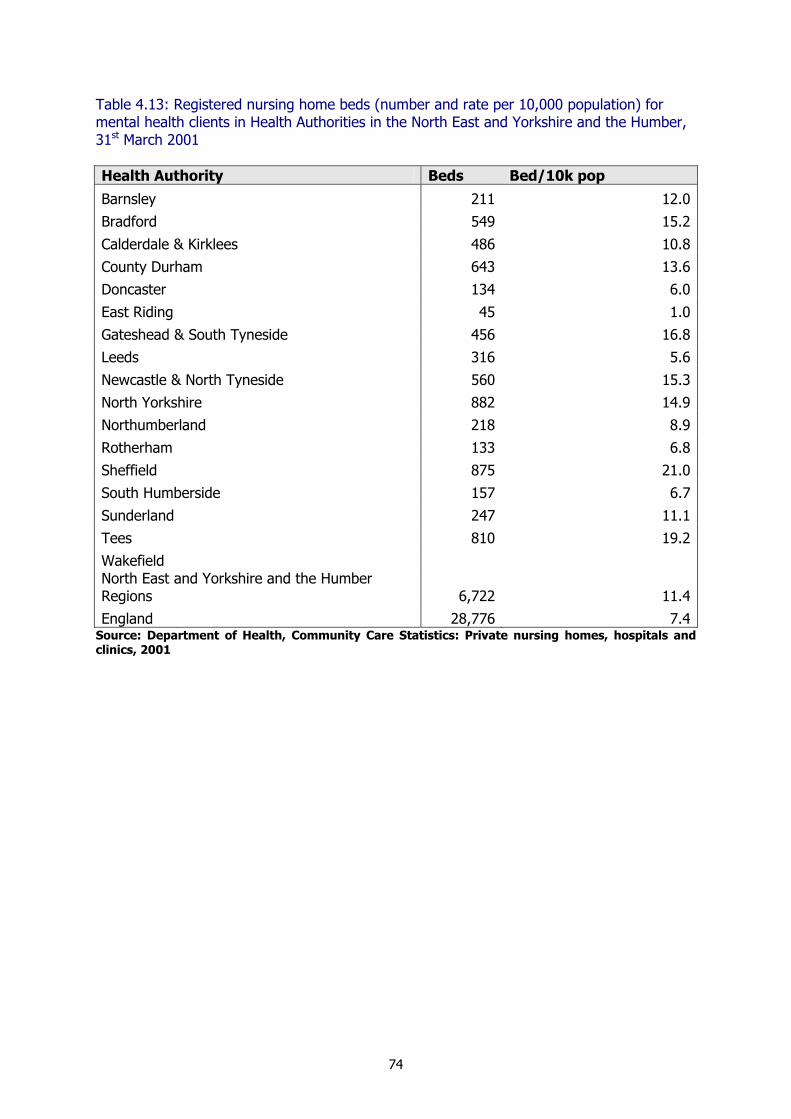
74
Table 4.13: Registered nursing home beds (number and rate per 10,000 population) for mental health clients in Health Authorities in the North East and Yorkshire and the Humber, 31st March 2001 Health Authority Beds Bed/10k pop
Barnsley 211 12.0Bradford 549 15.2
Calderdale & Kirklees 486 10.8County Durham 643 13.6Doncaster 134 6.0
East Riding 45 1.0Gateshead & South Tyneside 456 16.8Leeds 316 5.6
Newcastle & North Tyneside 560 15.3North Yorkshire 882 14.9Northumberland 218 8.9
Rotherham 133 6.8Sheffield 875 21.0South Humberside 157 6.7
Sunderland 247 11.1Tees 810 19.2Wakefield North East and Yorkshire and the Humber Regions 6,722 11.4England 28,776 7.4
Source: Department of Health, Community Care Statistics: Private nursing homes, hospitals and clinics, 2001
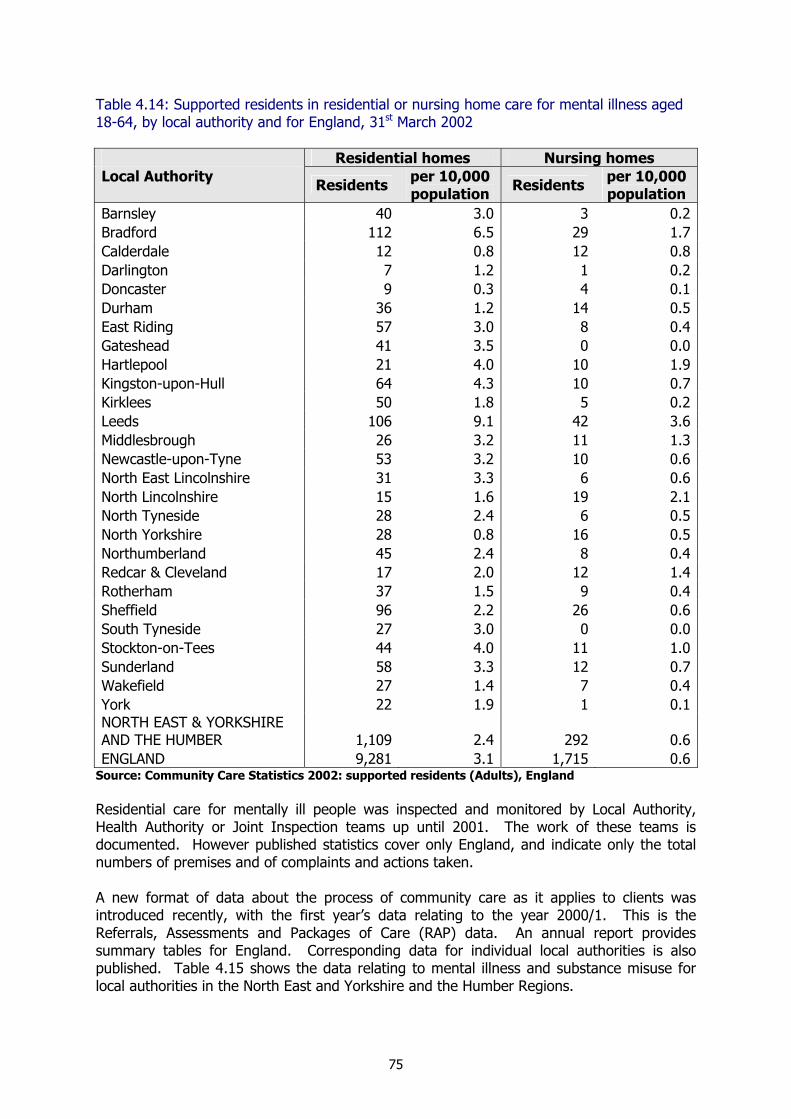
75
Table 4.14: Supported residents in residential or nursing home care for mental illness aged 18-64, by local authority and for England, 31st March 2002 Residential homes Nursing homes Local Authority Residents per 10,000
population Residents per 10,000 population
Barnsley 40 3.0 3 0.2Bradford 112 6.5 29 1.7Calderdale 12 0.8 12 0.8Darlington 7 1.2 1 0.2Doncaster 9 0.3 4 0.1Durham 36 1.2 14 0.5East Riding 57 3.0 8 0.4Gateshead 41 3.5 0 0.0Hartlepool 21 4.0 10 1.9Kingston-upon-Hull 64 4.3 10 0.7Kirklees 50 1.8 5 0.2Leeds 106 9.1 42 3.6Middlesbrough 26 3.2 11 1.3Newcastle-upon-Tyne 53 3.2 10 0.6North East Lincolnshire 31 3.3 6 0.6North Lincolnshire 15 1.6 19 2.1North Tyneside 28 2.4 6 0.5North Yorkshire 28 0.8 16 0.5Northumberland 45 2.4 8 0.4Redcar & Cleveland 17 2.0 12 1.4Rotherham 37 1.5 9 0.4Sheffield 96 2.2 26 0.6South Tyneside 27 3.0 0 0.0Stockton-on-Tees 44 4.0 11 1.0Sunderland 58 3.3 12 0.7Wakefield 27 1.4 7 0.4York 22 1.9 1 0.1NORTH EAST & YORKSHIRE AND THE HUMBER 1,109 2.4 292 0.6ENGLAND 9,281 3.1 1,715 0.6
Source: Community Care Statistics 2002: supported residents (Adults), England Residential care for mentally ill people was inspected and monitored by Local Authority, Health Authority or Joint Inspection teams up until 2001. The work of these teams is documented. However published statistics cover only England, and indicate only the total numbers of premises and of complaints and actions taken. A new format of data about the process of community care as it applies to clients was introduced recently, with the first year’s data relating to the year 2000/1. This is the Referrals, Assessments and Packages of Care (RAP) data. An annual report provides summary tables for England. Corresponding data for individual local authorities is also published. Table 4.15 shows the data relating to mental illness and substance misuse for local authorities in the North East and Yorkshire and the Humber Regions.

76
Table 4.15: Adults aged 18-64 assessed for and receiving social care, rates per 10,000 population for local authorities in the North East and Yorkshire and the Humber Regions, 2000/1
Local authority Assessments Total receiving
services Community based
services LA residential
Care Ind. sector
residential care Nursing home
care
Mental Health
Sub. Misuse
Mental Health
Sub. Misuse
Mental Health
Sub. Misuse
Mental Health
Sub. Misuse
Mental Health
Sub. Misuse
Mental Health
Sub. Misuse
Barnsley 54.6 44.5 65.6 53.1 59.5 53.1 4.5 1.5 Bradford 24.7 2.3 Calderdale 16.2 123.0 32.2 121.7 32.2 0.7 0.7 Darlington 18.7 17.0 14.5 1.7 Doncaster 1.6 8.8 6.9 1.6 0.5 0.2 Durham 23.0 3.6 33.2 2.1 31.9 2.1 1.0 0.5 East Riding 2.7 2.9 30.0 1.6 28.7 1.1 1.9 0.5 0.3 Gateshead 88.6 35.0 26.4 3.0 24.2 1.3 0.9 3.0 2.2 Hartlepool 10.5 22.8 1.9 18.1 1.9 2.9 3.8 1.9 Kingston-upon-Hull 36.2 15.9 50.4 4.4 46.7 4.4 4.7 1.4 Kirklees 18.2 0.7 31.4 3.6 28.5 3.2 2.1 0.9 0.2 0.7 Leeds 60.7 0.9 222.0 0.9 207.0 0.9 4.7 6.8 4.3 Middlesbrough 27.6 3.7 39.3 0.6 35.6 0.6 0.6 1.2 1.8 N E Lincolnshire 17.8 1.6 10.8 1.1 3.2 2.7 0.5 0.5 N Lincolnshire 34.2 4.9 39.1 1.1 36.9 1.1 1.1 2.2 Newcastle upon Tyne 12.2 5.2 46.5 7.0 45.0 6.7 3.7 0.6 North Tyneside 2.6 North Yorkshire 1.5 0.7 31.6 0.6 30.4 0.6 0.7 0.4 Northumberland 31.1 3.2 76.4 4.0 69.7 1.9 2.4 0.5 Redcar & Cleveland 11.4 0.6 27.6 1.2 21.6 0.6 4.2 0.6 1.8 Rotherham 11.1 25.7 25.5 0.2 0.6 0.6 Sheffield 0.6 43.4 42.8 2.1 0.6 South Tyneside Stockton-on-Tees 10.5 0.9 Sunderland 29.7 7.5 24.8 2.0 22.2 2.0 2.9 1.2 0.9 Wakefield 73.2 97.5 94.6 1.0 1.5 0.3 York 42.0 2.2 37.2 0.4 35.4 0.4 2.2 0.0 1.3 - - -
England 25.1 3.1 37.4 3.3 34.1 2.9 0.6 3.3 0.5 0.6
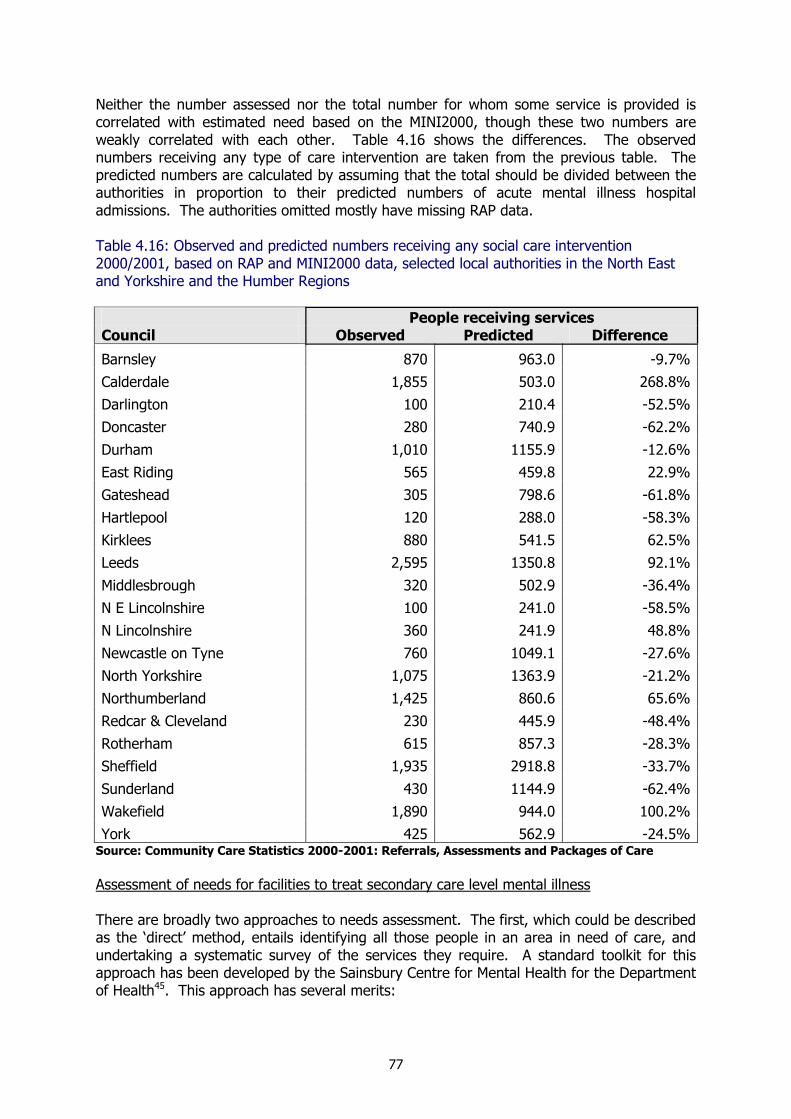
77
Neither the number assessed nor the total number for whom some service is provided is correlated with estimated need based on the MINI2000, though these two numbers are weakly correlated with each other. Table 4.16 shows the differences. The observed numbers receiving any type of care intervention are taken from the previous table. The predicted numbers are calculated by assuming that the total should be divided between the authorities in proportion to their predicted numbers of acute mental illness hospital admissions. The authorities omitted mostly have missing RAP data. Table 4.16: Observed and predicted numbers receiving any social care intervention 2000/2001, based on RAP and MINI2000 data, selected local authorities in the North East and Yorkshire and the Humber Regions People receiving services Council Observed Predicted Difference
Barnsley 870 963.0 -9.7%Calderdale 1,855 503.0 268.8%Darlington 100 210.4 -52.5%Doncaster 280 740.9 -62.2%
Durham 1,010 1155.9 -12.6%East Riding 565 459.8 22.9%Gateshead 305 798.6 -61.8%
Hartlepool 120 288.0 -58.3%Kirklees 880 541.5 62.5%Leeds 2,595 1350.8 92.1%
Middlesbrough 320 502.9 -36.4%N E Lincolnshire 100 241.0 -58.5%N Lincolnshire 360 241.9 48.8%
Newcastle on Tyne 760 1049.1 -27.6%North Yorkshire 1,075 1363.9 -21.2%Northumberland 1,425 860.6 65.6%
Redcar & Cleveland 230 445.9 -48.4%Rotherham 615 857.3 -28.3%Sheffield 1,935 2918.8 -33.7%
Sunderland 430 1144.9 -62.4%Wakefield 1,890 944.0 100.2%York 425 562.9 -24.5%
Source: Community Care Statistics 2000-2001: Referrals, Assessments and Packages of Care Assessment of needs for facilities to treat secondary care level mental illness There are broadly two approaches to needs assessment. The first, which could be described as the ‘direct’ method, entails identifying all those people in an area in need of care, and undertaking a systematic survey of the services they require. A standard toolkit for this approach has been developed by the Sainsbury Centre for Mental Health for the Department of Health45. This approach has several merits:
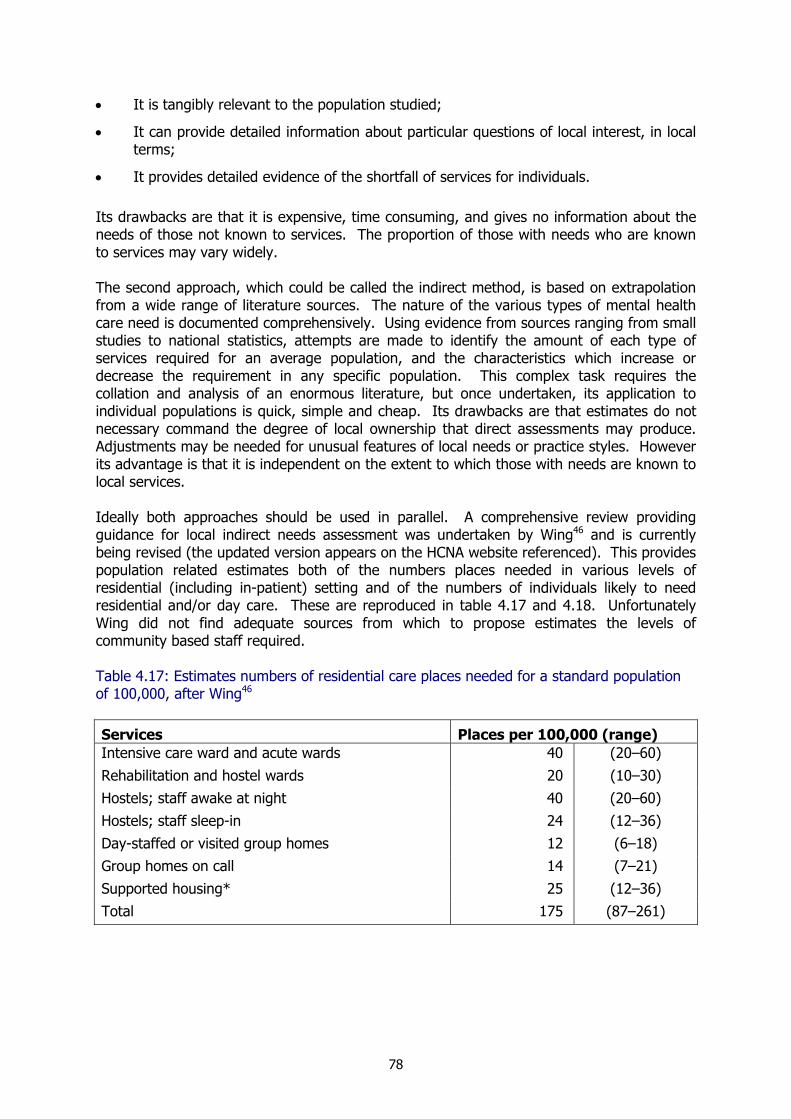
78
• It is tangibly relevant to the population studied;
• It can provide detailed information about particular questions of local interest, in local terms;
• It provides detailed evidence of the shortfall of services for individuals. Its drawbacks are that it is expensive, time consuming, and gives no information about the needs of those not known to services. The proportion of those with needs who are known to services may vary widely. The second approach, which could be called the indirect method, is based on extrapolation from a wide range of literature sources. The nature of the various types of mental health care need is documented comprehensively. Using evidence from sources ranging from small studies to national statistics, attempts are made to identify the amount of each type of services required for an average population, and the characteristics which increase or decrease the requirement in any specific population. This complex task requires the collation and analysis of an enormous literature, but once undertaken, its application to individual populations is quick, simple and cheap. Its drawbacks are that estimates do not necessary command the degree of local ownership that direct assessments may produce. Adjustments may be needed for unusual features of local needs or practice styles. However its advantage is that it is independent on the extent to which those with needs are known to local services. Ideally both approaches should be used in parallel. A comprehensive review providing guidance for local indirect needs assessment was undertaken by Wing46 and is currently being revised (the updated version appears on the HCNA website referenced). This provides population related estimates both of the numbers places needed in various levels of residential (including in-patient) setting and of the numbers of individuals likely to need residential and/or day care. These are reproduced in table 4.17 and 4.18. Unfortunately Wing did not find adequate sources from which to propose estimates the levels of community based staff required. Table 4.17: Estimates numbers of residential care places needed for a standard population of 100,000, after Wing46
Services Places per 100,000 (range) Intensive care ward and acute wards 40 (20–60)
Rehabilitation and hostel wards 20 (10–30) Hostels; staff awake at night 40 (20–60)
Hostels; staff sleep-in 24 (12–36) Day-staffed or visited group homes 12 (6–18) Group homes on call 14 (7–21)
Supported housing* 25 (12–36) Total 175 (87–261)
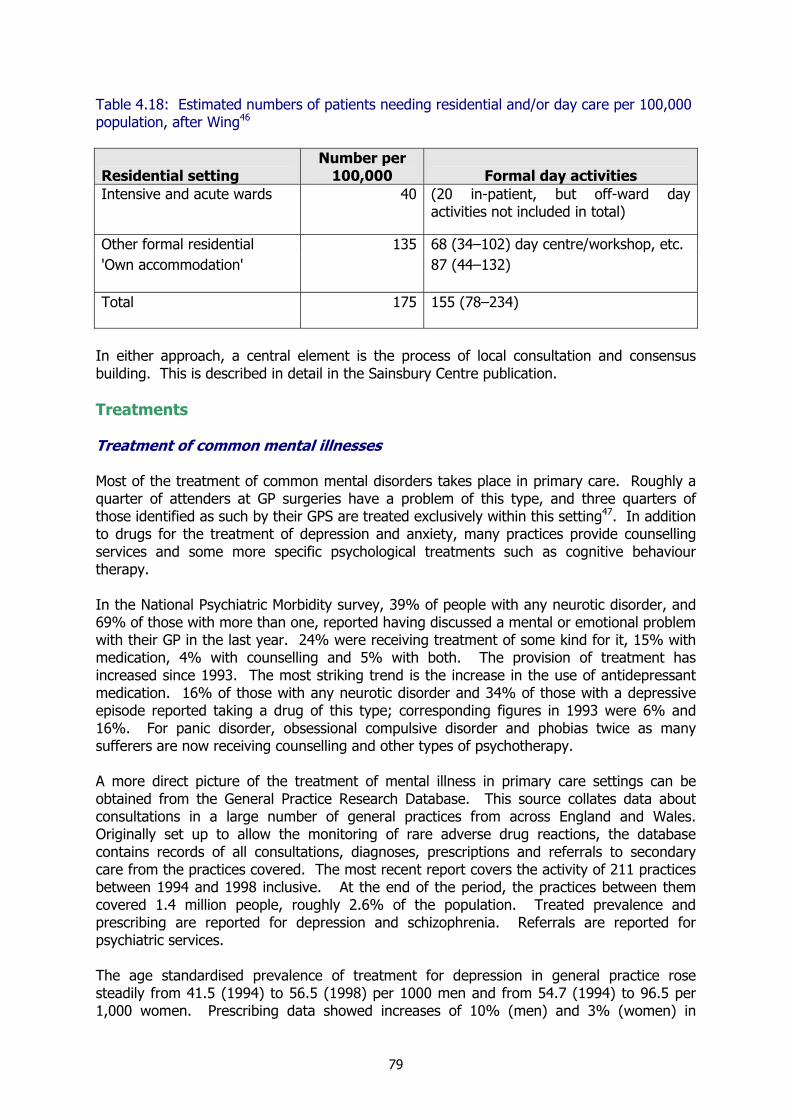
79
Table 4.18: Estimated numbers of patients needing residential and/or day care per 100,000 population, after Wing46
Residential setting Number per
100,000 Formal day activities Intensive and acute wards 40 (20 in-patient, but off-ward day
activities not included in total)
Other formal residential 68 (34–102) day centre/workshop, etc. 'Own accommodation'
13587 (44–132)
Total 175 155 (78–234)
In either approach, a central element is the process of local consultation and consensus building. This is described in detail in the Sainsbury Centre publication. Treatments Treatment of common mental illnesses Most of the treatment of common mental disorders takes place in primary care. Roughly a quarter of attenders at GP surgeries have a problem of this type, and three quarters of those identified as such by their GPS are treated exclusively within this setting47. In addition to drugs for the treatment of depression and anxiety, many practices provide counselling services and some more specific psychological treatments such as cognitive behaviour therapy. In the National Psychiatric Morbidity survey, 39% of people with any neurotic disorder, and 69% of those with more than one, reported having discussed a mental or emotional problem with their GP in the last year. 24% were receiving treatment of some kind for it, 15% with medication, 4% with counselling and 5% with both. The provision of treatment has increased since 1993. The most striking trend is the increase in the use of antidepressant medication. 16% of those with any neurotic disorder and 34% of those with a depressive episode reported taking a drug of this type; corresponding figures in 1993 were 6% and 16%. For panic disorder, obsessional compulsive disorder and phobias twice as many sufferers are now receiving counselling and other types of psychotherapy. A more direct picture of the treatment of mental illness in primary care settings can be obtained from the General Practice Research Database. This source collates data about consultations in a large number of general practices from across England and Wales. Originally set up to allow the monitoring of rare adverse drug reactions, the database contains records of all consultations, diagnoses, prescriptions and referrals to secondary care from the practices covered. The most recent report covers the activity of 211 practices between 1994 and 1998 inclusive. At the end of the period, the practices between them covered 1.4 million people, roughly 2.6% of the population. Treated prevalence and prescribing are reported for depression and schizophrenia. Referrals are reported for psychiatric services. The age standardised prevalence of treatment for depression in general practice rose steadily from 41.5 (1994) to 56.5 (1998) per 1000 men and from 54.7 (1994) to 96.5 per 1,000 women. Prescribing data showed increases of 10% (men) and 3% (women) in

80
conventional anti-depressants, and 129% (men) and 128% (women) in SSRIs. Regional analyses for the five year period as a whole show the Northern and Yorkshire region to have the highest depression treatment prevalence for women (70.6 – range from 46.5 – North Thames, England 61.4) and the second highest (29.6 – range from 18.8 – North Thames to 31.6 – North West, England 24.9). Schizophrenia treatment prevalence remained steady at 1.9 – 2.0 per 1,000 men and 1.7 per 1,000 women, with Northern and Yorkshire having the highest regional figure in both cases. (Men 2.9, lowest 1.3 - Trent and South Thames, England 2.0; Women 2.2, lowest 1.3 – Trent and South and West, England 1.7) The prevalence of patients prescribed drugs used in psychoses increased overall by about 10% in both sexes, with increases in patients aged 16-44 offset somewhat by decreases in patients aged over 75. No trend data was presented for referrals to specialist psychiatric care, but regional data showed that Northern and Yorkshire to have the highest rate in the country for both sexes; (males 8.1 per 1000, range from 5.3 – North Thames, England 6.4; females 8.9 per 1000, range from 6.7 – Trent, England 7.5). Further information about the trends in the treatment of mental illness by GPs can be obtained from prescribing data from the national Prescription Cost Analysis system (Table 4.19). These are based on the numbers of prescribed items dispensed for personal use. They show the increase in the amount of treatment of depression by GPs. They also show substantial increases in the prescription of antipsychotics and antimanic drugs, presumably reflecting a broadening of the role of GPs in the treatment of more severe mental illness. Table 4.19 Prescription items (1000s) dispensed by pharmacists in the community for selected drugs used in the treatment of mental illness by year, England
Drug type 1991 1992 1993 1994 1995 1996 1997 1998 1999
Hypnotics 11,974 11,409 11,034 10,780 10,634 10,555 10,571 10,619 10,634
Anxiolytics 5,488 5,272 5,108 5,065 5,109 5,230 5,391 5,548 5,626Antipsychotic drugs 2,842 3,054 3,244 3,444 3,682 3,924 4,157 4,462 4,689Antipsychotic depot injections 218 237 255 268 275 278 266 252 236
Antimanic drugs 474 502 531 562 590 624 654 677 695Antidepressant drugs 8,955 9,914 10,777 11,816 13,227 14,961 16,823 18,424 20,108Source: Prescription cost analysis Pharoah and Melzer48 used Prescription Pricing Authority data to explore the variation in rates of treatment with psychotropic drugs between practices in a single health authority (Cambridge and Huntingdon). They found wide variations between practices, with rates of hypnotics, anxiolytics and antidepressants being highly intercorrelated. While high prescribing practices were characterised by having higher proportions of older female patients and temporary residents, they were not remarkable in terms of other conventional measures of deprivation. The presence of a practice counselling facility had no apparent effect in reducing psychotropic prescribing. Mackenzie et al49 re-examined this surprising finding in another single health authority (Cornwall and the Isles of Scilly). Using two direct measures of morbidity from the census, (permanent sickness and limiting long term illness) they were able to predict about a quarter of the variation in antidepressant prescribing.

81
Conventional morbidity measures alone, however predicted only 13% of the variance. An obvious question is whether the slightly divergent results reflects the choice of areas. Comparing the distribution of ward scores for predicted general practice level mental health problems, Cornwall and the Isles of Scilly have higher percentile scores for the likely prevalence of patient with a CIS-R score exceeding 12 up to the 75th percentile, above this Cambridge and Huntington had higher percentile scores. This does not suggest that Cornwall presents a greater spread of social geography in which such findings might be easier to spot. Treatments for severe mental health problems Fewer data sources are available about treatments administered in secondary care. Two areas are covered, Electro-Convulsive Therapy (ECT) and the use of compulsion in treatment. ECT ECT, a treatment used mainly for severe depression excites particular public interest and concern. For this reason the Department of Health has undertaken a number of special studies. Its efficacy has recently been reviewed by the National Institute for Clinical Excellence50. The most recent bulletin on the use of ECT51 indicates that the rate of use of this treatment has continued to fall in line with the trend that was apparent when regular specific monitoring was discontinued in the early 1990s. In a quarter year, 5.8 persons per 100,000 received the treatment, having on average 5.8 administrations each. The rate increases sharply with age. Rates for the Northern and Yorkshire Region were close to this (6.3 per 100,000, average 6.0 administrations). Ethnic group comparisons are made in the report for England as a whole, but are hard to interpret as they are not standardised for age. About 15% of patients treated with ECT do not consent, usually because their clinical condition precludes meaningful consent. No regional comparisons are presented of consent patterns. Compulsory Treatment A small proportion of mentally ill people refuse treatment. Where by doing so they endanger their own health or safety or the safety of others, the Mental Health Act provides powers for their detention and treatment in hospital, for their after care in the community, and in some cases for the appointment of a guardian for them. Data about the extent of use of these powers in England is published annually. The current publication format provides most figures only for the whole of England. Commentary also indicates that there have been considerable problems with data quality and completeness. Detentions in hospital are documented in relation to the type of hospital, the category of patient (mentally ill, learning disabled or with psychopathic disorder), and the type of powers. Individuals detained as a result of medical recommendations are detailed separately from those detained by the courts. Overall, compulsory admissions have risen in number by a little over 25% over the decade since 1991, though most of this increase took place in the first half of the 1990s, and in recent years numbers have remained steady or fallen. Compulsory admissions to private hospitals rose more steeply than those to NHS facilities, increasing fourfold over the decade. Compulsory admissions from the courts, comprising about five percent of the total, fell by about 25% through the decade.
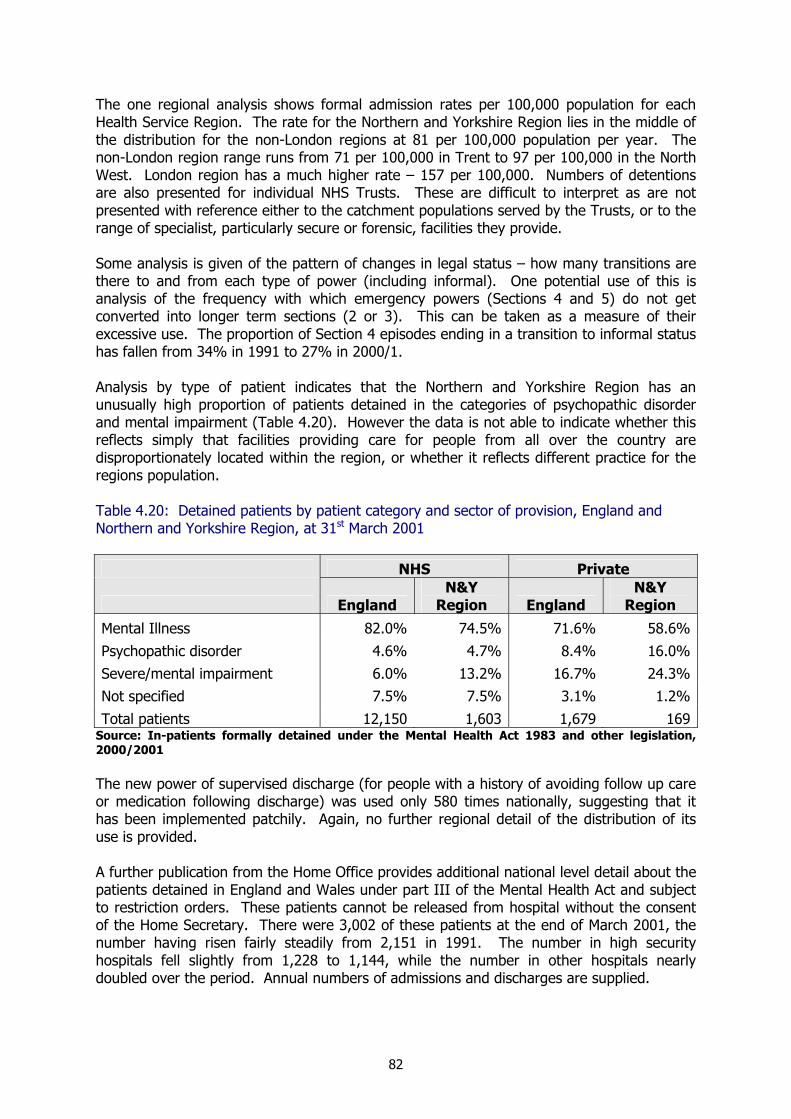
82
The one regional analysis shows formal admission rates per 100,000 population for each Health Service Region. The rate for the Northern and Yorkshire Region lies in the middle of the distribution for the non-London regions at 81 per 100,000 population per year. The non-London region range runs from 71 per 100,000 in Trent to 97 per 100,000 in the North West. London region has a much higher rate – 157 per 100,000. Numbers of detentions are also presented for individual NHS Trusts. These are difficult to interpret as are not presented with reference either to the catchment populations served by the Trusts, or to the range of specialist, particularly secure or forensic, facilities they provide. Some analysis is given of the pattern of changes in legal status – how many transitions are there to and from each type of power (including informal). One potential use of this is analysis of the frequency with which emergency powers (Sections 4 and 5) do not get converted into longer term sections (2 or 3). This can be taken as a measure of their excessive use. The proportion of Section 4 episodes ending in a transition to informal status has fallen from 34% in 1991 to 27% in 2000/1. Analysis by type of patient indicates that the Northern and Yorkshire Region has an unusually high proportion of patients detained in the categories of psychopathic disorder and mental impairment (Table 4.20). However the data is not able to indicate whether this reflects simply that facilities providing care for people from all over the country are disproportionately located within the region, or whether it reflects different practice for the regions population. Table 4.20: Detained patients by patient category and sector of provision, England and Northern and Yorkshire Region, at 31st March 2001
NHS Private
England N&Y
Region England N&Y
Region
Mental Illness 82.0% 74.5% 71.6% 58.6%
Psychopathic disorder 4.6% 4.7% 8.4% 16.0%Severe/mental impairment 6.0% 13.2% 16.7% 24.3%Not specified 7.5% 7.5% 3.1% 1.2%
Total patients 12,150 1,603 1,679 169Source: In-patients formally detained under the Mental Health Act 1983 and other legislation, 2000/2001 The new power of supervised discharge (for people with a history of avoiding follow up care or medication following discharge) was used only 580 times nationally, suggesting that it has been implemented patchily. Again, no further regional detail of the distribution of its use is provided. A further publication from the Home Office provides additional national level detail about the patients detained in England and Wales under part III of the Mental Health Act and subject to restriction orders. These patients cannot be released from hospital without the consent of the Home Secretary. There were 3,002 of these patients at the end of March 2001, the number having risen fairly steadily from 2,151 in 1991. The number in high security hospitals fell slightly from 1,228 to 1,144, while the number in other hospitals nearly doubled over the period. Annual numbers of admissions and discharges are supplied.
83
Treatments for drug misuse Treatments for drug misuse are documented by Regional Drug misuse databases. Until recently these have reported only the numbers of people taken on for a new period of treatment after at least six months without treatment. This was considered to provide an inadequate basis for supporting current policy in two respects. Firstly, they gave no picture of the overall level of treatment being provided as they did not document numbers currently in treatment or details of the treatment received. Second, they did not provide analysis by Health Authority or Drug Action Team areas. A new format of data is currently being implemented. The first report, expected soon, should detail treatments in 2001/2. An interim report was published for 2000/1 based on two special surveys, one a census of people in treatment in April to September 2000, the other a record of new treatments started in October 2000 to March 2001. In contrast to the data on the prevalence of drug misuse cited above, these figures show the Northern and Yorkshire region to have a prevalence of misusers in treatment close to the national average – 239 per 100,000 population in comparison to 237 for England as a whole. The proportion under age 25 (46%) was higher than the average for England (32%). However this conceals large variations between districts. Table 4.21 presents figures for the Drug Action Team areas instead of Health Authorities since these approximate more closely to the new administrative geography of healthcare. The figures for treatment by types of agency also show large variations. These are likely to reflect the differing availability of services. Figures are also coded by the area in which treatment was received, hence they do not necessarily represent rates for the populations covered by the DAT areas. Treatment and after care for mentally disordered prisoners Melzer et al52 undertook a one year follow up survey of 140 prisoners who had been identified as probably suffering a psychotic illness in the National Survey of Psychiatric morbidity in prisons. This showed that the group had received disturbingly poor levels of care. 65% of individuals were still probably psychotic and 78% showed substance dependency. However less than a quarter were currently in touch with mental health services. Of those whose offence was ‘grave’ (violent or sexual) this level of contact was only increased to 41%. Of the half of patients who had been released from prison, 88% had gone into unsupported accommodation. This figure was similar (13/16) for those with grave offences.
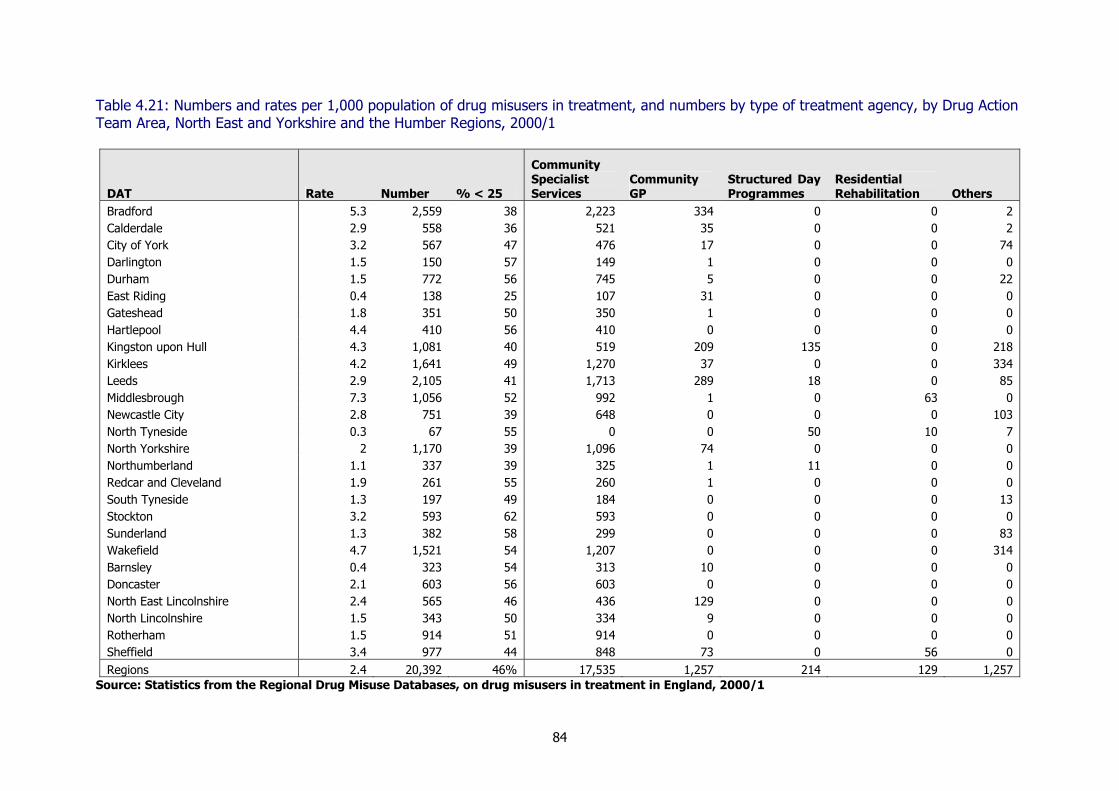
84
Table 4.21: Numbers and rates per 1,000 population of drug misusers in treatment, and numbers by type of treatment agency, by Drug Action Team Area, North East and Yorkshire and the Humber Regions, 2000/1
DAT Rate Number % < 25
Community Specialist Services
Community GP
Structured Day Programmes
Residential Rehabilitation Others
Bradford 5.3 2,559 38 2,223 334 0 0 2 Calderdale 2.9 558 36 521 35 0 0 2 City of York 3.2 567 47 476 17 0 0 74 Darlington 1.5 150 57 149 1 0 0 0 Durham 1.5 772 56 745 5 0 0 22 East Riding 0.4 138 25 107 31 0 0 0 Gateshead 1.8 351 50 350 1 0 0 0 Hartlepool 4.4 410 56 410 0 0 0 0 Kingston upon Hull 4.3 1,081 40 519 209 135 0 218 Kirklees 4.2 1,641 49 1,270 37 0 0 334 Leeds 2.9 2,105 41 1,713 289 18 0 85 Middlesbrough 7.3 1,056 52 992 1 0 63 0 Newcastle City 2.8 751 39 648 0 0 0 103 North Tyneside 0.3 67 55 0 0 50 10 7 North Yorkshire 2 1,170 39 1,096 74 0 0 0 Northumberland 1.1 337 39 325 1 11 0 0 Redcar and Cleveland 1.9 261 55 260 1 0 0 0 South Tyneside 1.3 197 49 184 0 0 0 13 Stockton 3.2 593 62 593 0 0 0 0 Sunderland 1.3 382 58 299 0 0 0 83 Wakefield 4.7 1,521 54 1,207 0 0 0 314 Barnsley 0.4 323 54 313 10 0 0 0 Doncaster 2.1 603 56 603 0 0 0 0 North East Lincolnshire 2.4 565 46 436 129 0 0 0 North Lincolnshire 1.5 343 50 334 9 0 0 0 Rotherham 1.5 914 51 914 0 0 0 0 Sheffield 3.4 977 44 848 73 0 56 0 Regions 2.4 20,392 46% 17,535 1,257 214 129 1,257
Source: Statistics from the Regional Drug Misuse Databases, on drug misusers in treatment in England, 2000/1
85
Outcomes of care Social care outcomes Social Services departments are now required to undertake routine satisfaction surveys of all those new adult clients whom they assess and for whom they agree that services are required. Of 39,000 people surveyed in 2001 on this basis, 9% were receiving care for mental health problems. Two mandatory questions were included in the survey for national analysis: • ‘Did you get help quickly after a decision was made to provide services?’
70% of adults aged 18-64 receiving care for mental illness answered ‘yes’ to this question, compared to 79% of physically disabled.
• ‘Did Social Services staff take note of any important matters in relation to your race, culture or religion?’ 24% of adults aged 18-64 receiving care for mental illness answered ‘yes’ to this question, an almost identical figure to the 23% of physically disabled answering similarly.
Overall figures for the two indicators were published for individual councils, but unfortunately, due to the small numbers involved, these were not subdivided by the categories of client and thus would reflect primarily the experience of the much more numerous group of clients receiving care for physical disability. Health care outcomes Very little satisfactory data is available on the outcomes of mental health care. Performance Indicators The Department of Health publishes three performance indicators which are supposed to give the best indication possible of the effectiveness of mental health services. A fourth performance indicator is listed in the Department of Health documentation, but figures for it are not currently available. These are: • Mortality rate from suicide and injury undetermined whether accidentally or purposely
inflicted per 100,000 population (age standardised);
• New treatments at drug dependency units - no data for indicator is yet available;
• Prescribing rate of Benzodiazepines (age and sex standardised);
• Number of emergency psychiatric readmissions of patients (aged 16-64), within 90 days of discharge from the care of a psychiatric specialist as a percentage of such discharges.
Figures for the Health Authorities in the North East and Yorkshire and the Humber for 2001/2 are shown in the Table 4.22.

86
Table 4.22: Health Authority performance indicators relating to mental health care, values for February 2002
Health Improvement: Suicide rates
Effective delivery of appropriate care: Mental
health in primary care Health Outcomes: Psychiatric
readmissions Health Authority Name Value Improvement Value Improvement Value Improvement Barnsley HA 8.9 7.60% 26.0 8.7% 9.60% 37.30% Bradford HA 9.5 3.20% 23.2 2.4% 9.50% 30.40% Calderdale & Kirklees HA 8.8 6.90% 23.1 7.4% 16.00% -16.60% Co Durham & Darlington HA 9.3 5.60% 17.8 6.9% 15.60% -8.40% Doncaster HA 11.3 1.00% 18.6 9.7% 8.50% 61.10% East Riding & Hull HA 11.4 -17.30% 15.1 10.2% 13.90% -42.90% Gateshead & South Tyneside HA 10.9 0.30% 15.4 4.7% 11.90% 11.10% Leeds HA 8.6 16.10% 15.5 8.0% 18.00% 11.90% Newcastle & North Tyneside HA 12.1 -6.40% 15.2 6.5% 8.20% 26.50% North Yorkshire HA 9.5 8.20% 13.4 7.1% 15.10% -5.00% Northumberland HA 9.7 -3.20% 17.5 7.8% 9.70% 34.10% Rotherham HA 9.2 -0.30% 13.8 3.8% 11.80% 32.80% Sheffield HA 8.5 4.90% 15.3 4.2% 10.30% -22.30% South Humber HA 12.3 -17.20% 20.3 7.9% 10.70% -22.50% Sunderland HA 10.9 -3.30% 16.1 5.6% 15.50% -113.30% Tees HA 10.9 -12.10% 20.4 2.2% 10.90% -113.70% Wakefield HA 12.2 -23.00% 18.7 5.1% 20.30% -143.40% ENGLAND 9.4 -1.00% 14.6 6.3% 12.80% 1.70%
Source: NHS Performance Indicators February 2002 http://www.performance.doh.gov.uk/nhsperformanceindicators/index.htm Definitions: Suicide rate: Directly age-standardised mortality rate from suicide and injury undetermined whether accidentally or purposely inflicted (ICD-9 E950-E959 & E980-E989 excluding E988.8), per 100,000 population. Target is reduction of 20% in the decade to 2010. Mental health in primary care: Age-standardised prescription rates of Benzodiazepines. This relates to the NSF target to deliver better primary mental health care. Psychiatric readmissions: Number of emergency psychiatric readmissions of patients aged 16-64 within 90 days of discharge from the care of a psychiatric specialist as a percentage of such discharges.
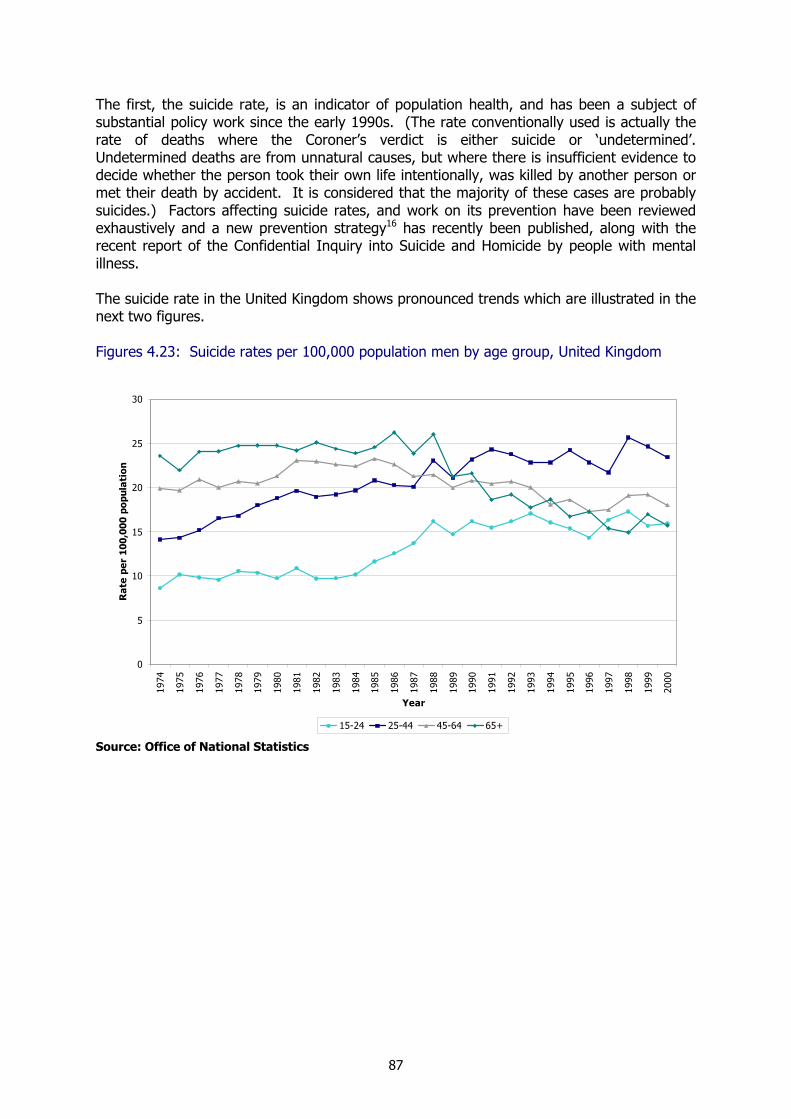
87
The first, the suicide rate, is an indicator of population health, and has been a subject of substantial policy work since the early 1990s. (The rate conventionally used is actually the rate of deaths where the Coroner’s verdict is either suicide or ‘undetermined’. Undetermined deaths are from unnatural causes, but where there is insufficient evidence to decide whether the person took their own life intentionally, was killed by another person or met their death by accident. It is considered that the majority of these cases are probably suicides.) Factors affecting suicide rates, and work on its prevention have been reviewed exhaustively and a new prevention strategy16 has recently been published, along with the recent report of the Confidential Inquiry into Suicide and Homicide by people with mental illness. The suicide rate in the United Kingdom shows pronounced trends which are illustrated in the next two figures. Figures 4.23: Suicide rates per 100,000 population men by age group, United Kingdom
Source: Office of National Statistics
0
5
10
15
20
25
30
1974
1975
1976
1977
1978
1979
1980
1981
1982
1983
1984
1985
1986
1987
1988
1989
1990
1991
1992
1993
1994
1995
1996
1997
1998
1999
2000
Year
Rat
e pe
r 10
0,00
0 po
pula
tion
15-24 25-44 45-64 65+

88
Figure 4.24: Suicide rates per 100,000 population women by age group, United Kingdom
Source: Office of National Statistics Over the last seventeen years, rates have shown marked and differing trends (Fig. 4.23 & 24). For women aged 45 and over, and for men aged 65 and over, rates have fallen. Among younger women they have remained steady for the last the years, though some fall for women of 25-44 was evident in the 1980s. Among younger men they rose sharply in the 1980s, though more recently increases have been less sustained. Walrond and Grandey53 examined figures for the North East in more detail and concluded that while the patterning was less clear given the relatively small numbers, the region roughly followed national trends.
0
5
10
15
20
25
30
1974
1975
1976
1977
1978
1979
1980
1981
1982
1983
1984
1985
1986
1987
1988
1989
1990
1991
1992
1993
1994
1995
1996
1997
1998
1999
2000
Rate per 100,000 population
Yea
r
15-24 25-44 45-64 65+
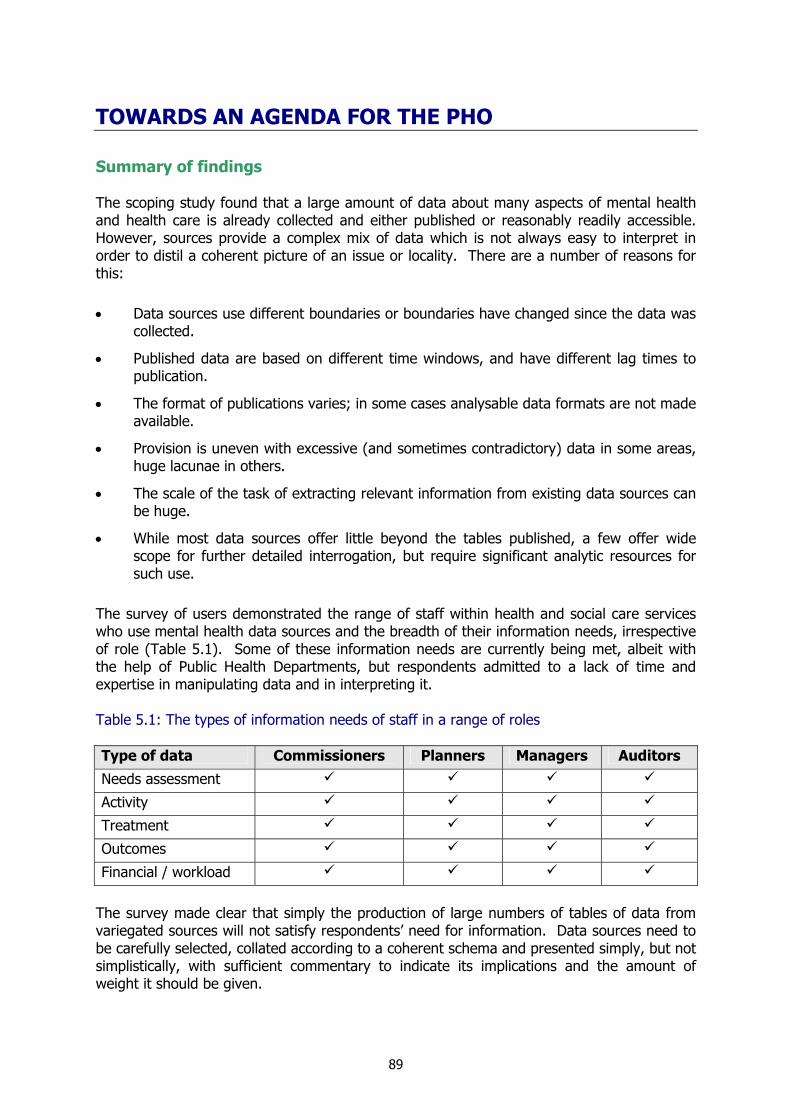
89
TOWARDS AN AGENDA FOR THE PHO Summary of findings The scoping study found that a large amount of data about many aspects of mental health and health care is already collected and either published or reasonably readily accessible. However, sources provide a complex mix of data which is not always easy to interpret in order to distil a coherent picture of an issue or locality. There are a number of reasons for this: • Data sources use different boundaries or boundaries have changed since the data was
collected.
• Published data are based on different time windows, and have different lag times to publication.
• The format of publications varies; in some cases analysable data formats are not made available.
• Provision is uneven with excessive (and sometimes contradictory) data in some areas, huge lacunae in others.
• The scale of the task of extracting relevant information from existing data sources can be huge.
• While most data sources offer little beyond the tables published, a few offer wide scope for further detailed interrogation, but require significant analytic resources for such use.
The survey of users demonstrated the range of staff within health and social care services who use mental health data sources and the breadth of their information needs, irrespective of role (Table 5.1). Some of these information needs are currently being met, albeit with the help of Public Health Departments, but respondents admitted to a lack of time and expertise in manipulating data and in interpreting it. Table 5.1: The types of information needs of staff in a range of roles Type of data Commissioners Planners Managers Auditors
Needs assessment
Activity
Treatment
Outcomes
Financial / workload
The survey made clear that simply the production of large numbers of tables of data from variegated sources will not satisfy respondents’ need for information. Data sources need to be carefully selected, collated according to a coherent schema and presented simply, but not simplistically, with sufficient commentary to indicate its implications and the amount of weight it should be given.
90
In addition the survey identified gaps in data that users wished to be filled. Together with the gaps revealed by the review of data sources, this provides a substantial ‘shopping list’ for new, reworked and differently presented mental health information. This ‘list’ will first be examined before we propose how some of these gaps could be filled. Gaps in data – the ‘shopping list’ Data needs fell into 3 types: New data The principle call for new data was in the field of mental health provision in primary care. Many users surveyed felt that there was data kept in primary care databases which could be helpful in the planning and provision of local services. In fact information stored in GP registers focuses on diagnosis, prescriptions, referrals and tests, and the data tends to be incomplete, inconsistently coded, and may not record suspected mental illness where this is not the main presenting problem. Therefore the task of analysis would be formidable, but research studies are beginning to use this source, so development work is probably timely. In the immediate future, more use could be made of the General Practice Research Database. Other new data requested included information on conditions affecting young people, such as eating disorders, self-harm and mental health problems experienced by students. There were also requests for data on co-morbidity - that is data which examined the links between physical and mental ill health. Two additional types of waiting data, which could reasonably easily be established would be helpful: times of waiting for medium secure unit places (the psychiatric equivalent of medical intensive care beds) and for high support community and residential placements for the severely and chronically mentally ill. These are both areas where anecdotal evidence suggests there are important bottlenecks, probably leading to inappropriate use of the scarce resource of acute in-patient beds. Finally usable measures of the technical quality of mental health care are now available. Some work is underway to make routine the use of these in secondary mental health care, similar developments for the various types of mental health care offered in primary care settings, though harder to achieve would also be very welcome. Without them, it is hard to see how true outcome focussed evaluation will ever be possible. However, the establishment of new national data collections is a very long and expensive process involving difficulties of definition, professional commitment, setting up and validation. In some areas there is no solution but to set up new data systems but this requires careful assessment. It is often possible to obtain some of the desired information through more careful use of existing data sources through re-analysis or re-presentation. Reanalysis and repackaging data As some data sources involve complex modelling making use of the 1991 Census, there is an opportunity for reworking these models using 2001 Census data when it becomes available. In particular, the psychiatric morbidity data (including EMPIRIC data) should be reanalysed in this way. Also the production of new indices of multiple deprivation will mean updating other data sources, such as the MINI2000 index, which rely on them. Because of
91
the value of these data sources, it is hoped the appropriate Government departments will commission the necessary reanalysis. With the emergence of PCTs, strategic health authorities and Local Implementation Teams (LITs), and changes in local authority boundaries in recent years, some data should be reanalysed, or ‘repackaged’, to present information in ways more useful to the various new players in local health and social care economies. This would enable benchmarking to develop and encourage localities to measure themselves against performance in other appropriate locations. The two sets of data which lend themselves to this work are Hospital Episode Statistics and the Mental Health Service Mapping as the data are sufficiently fine grained to allow detailed analysis related to place, so supporting comparisons of like areas. Similarly, thought should be given to the presentation of new data sources that are already running but have not yet produced output. This applies to the Mental Health Minimum Data Set (MHMDS) and the Patient Experience Survey from which useful data should become available within the next two years. The final aspect of reanalysis that should be considered is in the generation of trend data. This is often available but requires a search through numerous tables of data. Relevant tables showing change over time should be drawn up and made accessible. Because of changes in administrative geography, trend tables showing local detail are often difficult or impossible to produce. National and regional trends however can often provide valuable public health messages which can guide service development and provision. Policy briefings and information digests The production of accessible policy briefings are requested when new topics of relevance to mental health and mental health care arise. These may be appropriately produced at a national level but some topics may lend themselves to a regional digest of information with data interpreted for local commissioners or providers. Similarly, information digests were wanted to draw attention to new information as it becomes available and to link this to the change agenda. It was proposed this digest could be economically distributed through email. Underlying the requests for new and reworked data is recognition of the need to improve the flow of information between agencies engaged in mental health care. Although this has not been the subject of the scoping study, it was of importance to the data users surveyed and is certainly a crucial aim of the National Mental Health Strategy54. Data users who were interviewed wished for better data exchange between health, social care and the criminal justice system, and between primary and secondary care. The need to do everything possible to facilitate this should be kept in mind when planning what mental health information should be made available and to whom. The role of the Public Health Observatories The setting up of new national mental health surveys is clearly outside the scope of the Public Health Observatories but this scoping study found that the Observatories are ideally placed to have an important role in the processing, storage and interpretation of mental health data. These roles would include:
92
• Reanalysing large national data sources, such as Hospital Episode Statistics, on up-to-date PCT, LIT, strategic health authority and local authority boundaries.
• Ensuring new data sources such as the Mental Health Service Mapping and the MHMDS, yet to come, are available in appropriate form for local use.
• Developing trend data and drawing this to users’ attention.
• Maintaining a full directory of mental health data sources and publicising their usefulness appropriately. This directory should include pointers to where the data can be accessed. In addition to the national data sources featured in this scoping study, Observatories could disseminate information about local studies which have lessons for a wider audience.
• Preparing and disseminating policy bulletins as appropriate.
• Reflecting back to the Department of Health what data are and are not offering. A regional or national role? Most of the proposed roles for the Public Health Observatories lend themselves to a national approach with one observatory taking lead responsibility for specific tasks. Areas where local Observatories could have an important role include: • Interpreting the data for small areas within regions;
• Monitoring changes in zoning (particularly pertinent with respect to LITs which have no statutory basis and therefore change on a regular basis);
• Ensuring information gets to the relevant users; and
• Obtaining feedback from the field, perhaps through information networks. A two-way flow is important as it is not facilitated elsewhere.
Within regions, there should also be scope for making local arrangements about how data/information is delivered. The needs of users across England will vary – what suits one area will not suit another. It is suggested that each Regional Observatory should develop a local digest of mental health information such as that being developed by us at the Centre for Public Mental Health for the former Northern Region. We have adopted a ‘workbook’ format and have begun by preparing a publication for PCTs. Examples can be seen on the Centres website55 and the proposed content is set out in Figure 5.1. The process of generating these workbooks needs to be an iterative one. Systematic feedback will need to be elicited from potential users of the data about the content, presentation styles and level of analysis presented, and the format will be revised accordingly. Given the frequency with which data are published, updating of the data content of workbooks should probably be an annual process. However in the first year, it may be helpful to produce two editions, an initial draft and a revision in response to consultation.

93
Fig. 5.1 Proposed content for LIT/ PCT/ Local authority workbooks 1. How much mental illness is there in an area? • Prevalence models:
• ONS National models of rates of neurotic illness and specifically of depression; • MINI 2000 model of rates of severe mental illness.
• Survey data. • Suicide rates. 2. What services are available and how many people are they serving? • Service Mapping – provision and activity of:
• Rates of GHQ score 4+ and availability of social support from Health Survey for England;
• Mental health care staff in primary care settings; • Teams and staff providing community based mental health care; • In-patient and day treatment facilities; • Psychological treatment services; • Residential accommodation for long-term care; • Day care and employment support facilities; • Hospital episode statistics data on admissions, admission prevalence and bed
use by diagnosis. • Hospital activity statistics on out-patient and day care 1,3. • Financial mapping and Department of Health resource allocation 1,3 data. • Annual spend on mental health care by service group. • Annual allocation for mental health care through mainstream health funding and in
special allocations. • MHMDS data on service use prevalence. 3. What treatments are available and being used? • GPRD4:
• Depression and schizophrenia treatment prevalence rates; • Rates of relevant drug prescriptions per unit GP list and by diagnostic group.
• Service Mapping: • Caseloads for psychological therapies and counselling services from Service
mapping. • HES and then MHMDS:
• Rates of compulsory treatment; • Longer term MHMDS; • Rates of various types of treatment.
4. What are the results of the care being provided? • Suicide data. • Complaints data for social services departments1,2 and NHS Trusts4. • MHMDS data on re-hospitalisation. • In the longer term MHMDS/Outcomes project data on symptom and QOL
improvement and user/carer satisfaction. • Potentially patient survey data from next year4.
Notes: 1=Cannot be provided at LIT level; 2=Cannot be provided at PCT level; 3=Cannot be provided at CSSD level; 4=Possible levels uncertain.

94
Conclusions This scoping study found a rich profusion of mental health data. However, much of it required a degree of expertise and skills to use to its full potential and even when the detail was interpreted, gaps in intelligence were left which mental health planners, commissioners and managers would like to see filled. Within the gaps analysis, a clear role for the Public Health Observatories was found, not so much in generating new data sources but in ensuring that the best use is made of existing data and data are known about, easily accessible, understood and in usable formats. This would partially be a national task, facilitated by the Internet, but it would also have an important regional dimension tailoring information to fit local need, creating and maintaining local information networks and feeding back comments and concerns to information providers. Looking forward, this role for Public Health Observatories could increase as exciting new data sources, such as the Mental Health Minimum Data Set and the Patients’ Experience Survey, come on stream and the outcomes of mental health care becomes better understood. In considering future mental health information needs, the challenge of finding new ways to present understandable data should not be underestimated. In an environment of major policy change, service investment, the use of new treatments and greater involvement of service users in the design and management of care, the users of mental health data are diversifying. Their information needs are broadening and differing users will be interested in different intelligence. Therefore, the task of producing accessible and relevant data will be ongoing and will require the co-operation of players at all levels of the data production chain.

95
ACKNOWLEDGEMENTS We would like to thank all those who participated in the study for giving their time to answer our questions. Thanks for helpful comments on various drafts are due to David Melzer and Paula Whitty.
96
REFERENCES 1. DEPARTMENT OF HEALTH. National Service Framework for Mental Health: Modern
Standards and Service Models. London: National Health Service Executive, Department of Health. 1999.
2. DEPARTMENT OF HEALTH. The NHS Plan: A Plan for Investment. A Plan for Reform.
Cm 4818-I. London: Department of Health. 2000. 3. SECRETARY OF STATE FOR HEALTH. Modernising Social Services. London: The
Stationery Office. 1998. 4. SCHENE, A. Partial Hospitalisation. in THORNICROFT G & SZMUKLER G. Textbook of
Community Psychiatry. Oxford University Press. 2001. 5. DEPARTMENT OF HEALTH. The Mental Health Policy Implementation Guide. London:
Department of Health. 2001. 6. DEPARTMENT OF HEALTH. Mental Health Policy Implementation Guide: Adult Acute
Inpatient Care Provision. London: Department of Health. 2002. 7. DEPARTMENT OF HEALTH. Mental Health Policy Implementation Guide: Community
Mental Health Teams. London: Department of Health. 2002. 8. DEPARTMENT OF HEALTH. Mental Health Policy Implementation Guide: National
Minimum Standards for General Adult Services in Psychiatric Intensive Care Units (PICU) and Low Secure Environments. London: Department of Health. 2002.
9. DEPARTMENT OF HEALTH. Women’s Mental Health: Into the mainstream. London:
Department of Health. 2002. 10. DEPARTMENT OF HEALTH. The Journey to Recovery. The Government’s Vision for
Mental Health Care. London: Department of Health. 2002. 11. DEPARTMENT OF HEALTH. Final Report of the Workforce Action Team. London:
Department of Health. 2001. 12. ROTH A & FONAGY P. What Works for Whom? A Critical Review of Psychotherapy
Research. New York: Guilford Press. 1996. 13. WING J. Health of the Nation Outcome Scales: HoNOS Field Trials. London: Royal
College of Psychiatrists. 1994. 14. DEPARTMENT OF HEALTH. Making it Happen. A Guide to Delivering Mental Health
Promotion. London: Department of Health. 2001. 15. DEPARTMENT OF HEALTH. Shifting the Balance of Power: the Next Steps. London:
Department of Health. 2002. 16. DEPARTMENT OF HEALTH. National Suicide Prevention Strategy for England.
London: Department of Health. 2002.

97
17. MELTZER H, GILL B, PETTICREW M, & HINDS K. The Prevalence of Psychiatric Morbidity among Adults Living in Private Households. OPCS Surveys of Psychiatric Morbidity in Great Britain. London: HMSO. 1995.
18. APPLEBY L et al. Safer Services. Report of the National Confidential Inquiry into
Suicide and Homicide by People with Mental Illness. London: Department of Health: 1999.
19. NATIONAL CONFIDENTIAL INQUIRY INTO SUICIDE AND HOMICIDE BY PEOPLE WITH
MENTAL ILLNESS. Safety First: Five-year Report of the National Confidential Inquiry into Suicide and Homicide by People with Mental Illness. London: Department of Health. 2001.
20. DEPARTMENT OF ENVIRONMENT, TRANSPORT AND THE REGIONS. The Index of
Deprivation 2000. London, Department of Environment, Transport and the Regions. 2000.
21. GLOVER GR, ROBIN E, EMAMI J, & ARABSCHEIBANI GR. A Needs Index for Mental
Health Care. Social Psychiatry and Psychiatric Epidemiology. 33(2): 89-96. 22. GLOVER G, ARTS G, & WOOFF D. A Needs Index for Mental Health Care in Britain
Based on Updatable Data. Submitted for publication. 23. CARR-HILL RA et al. Allocating Resources to Health Authorities: Development of
Method for Small Area Analysis of Use of Inpatient Services [see comments]. British Medical Journal (Clinical Research Ed.) 309(6961): 1046-1049.
24. LELLIOTT P, JARMAN B, BAJEKHAL M, & GLOVER G. Commentaries on: An Index of
Need for Psychiatric Services based on In-patient Utilisation. British Journal of Psychiatry 169(9): 317-321.
25. BUCKINGHAM K et al. Interim Needs Indicators for Community Health Services.
Canterbury, Kent, Personal Social Services Research Unit, University of Kent. 1996. 26. GLOVER GR. The Use of Routinely Collected Data about Psychiatric In-patient Care in
the English National Health Service. Advances in Psychiatric Treatment. 2003; 9: 300-307.
27. SINGLETON N et al. Psychiatric Morbidity among Adults Living in Private Households,
2000. London: The Stationery Office. 2001. 28. FRYERS T, MELZER D. & JENKINS R. Social Inequalities and the Common Mental
Disorders. Social Psychiatry and Psychiatric Epidemiology. 2003; 38:229-237. 29. MELZER D et al. Social Position and the Common Mental Disorders with Disability:
Estimates from the National Psychiatric Survey of Great Britain. Social Psychiatry and Psychiatric Epidemiology. 2003; 38:238-243.
30. NEELEMAN J & POWER MJ. Social Support and Depression in Three Groups of
Psychiatric Patients and a Group of Medical Controls. Social Psychiatry and Psychiatric Epidemiology. 1994; 29(1): 46-51.
98
31. STANSFELD SA et al. Social Support and Psychiatric Sickness Absence: a Prospective Study of British Civil Servants. Psychological Medicine. 1997; 27(1): 35-48.
32. STANSFELD SA, FUHRER R, & SHIPLEY MJ. Types of Social Support as Predictors of
Psychiatric Morbidity in a Cohort of British Civil Servants (Whitehall II Study). Psychological Medicine. 1998; 28(4): 881-892.
33. HEADY P & RUDDOCK V. Report on a Project to Estimate the Incidence of Psychiatric
Morbidity in Small Areas. London: Methods and Quality Division, Office for National Statistics. 1996.
34. SPROSTON K & NAZROO J (Eds). Ethnic Minority Psychiatric Illness Rates in the
Community. London: The Stationery Office. 2002. 35. LEWIS G, THOMAS H, CANNON M & JONES P. The Application of Epidemiology to
Mental Disorders. in THORNICROFT G, & SZMUKLER G (Eds.) Textbook of Community Psychiatry. Oxford University Press. 2001.
36. THORNICROFT G et al. Rationale and Design. PRiSM Psychosis Study I. British
Journal of Psychiatry. 1998; 173: 363-370. 37. JONES PB et al. Premorbid Social Underachievement in Schizophrenia. Results from
the Camberwell Collaborative Psychosis Study. The British Journal of Psychiatry; the Journal of Mental Science. 1993; 162: 65-71.
38. JABLENSKY A, SARTORIUS N, & ERNBERG G. Schizophrenia: Manifestations,
Incidence and Course in Different Cultures. Psychological Medicine. 1992; 20: 1-97. 39. HARRISON G et al. Increased Incidence of Psychotic Disorders in Migrants from the
Caribbean to the United Kingdom. Psychological Medicine. 1997; 27(4): 799-806. 40. KING M et al. Incidence of Psychotic Illness in London: Comparison of Ethnic Groups.
British Medical Journal. 1994; 309: 1115-1119. 41. DEPARTMENT OF HEALTH. Statistics on Young People and Drug Misuse: England,
2000 and 2001. London: Department of Health. 2002. 42. BOREHAM R & SHAW A. Drug Use, Smoking and Drinking among Young People in
England 2001. London: The Stationery Office. 2002. 43. SINGLETON N et al. Psychiatric Morbidity among Prisoners. London: The Stationery
Office. 1998. 44. GLOVER GR & BARNES D. Mental Health Service Provision for Working Age Adults in
England 2002. Leeds: National Institute for Mental Health in England. 2003. 45. SAINSBURY CENTRE. Needs Assessment Schedule. London: Sainsbury Centre for
Mental Health. 2001. Available at: www.scmh.org.uk (accessed 9th December 2002).
46. WING J. Severe Mental Illness. in STEVENS A & RAFTERY J (Eds). Health Care
Needs Assessment (Volume 1). Ratcliffe Medical Press. 1994.
99
47. GOLDBERG D, MANN A & TYLEE A. Primary Care. in THORNICROFT G & SZMUKLER G (Eds). Textbook of Community Psychiatry. Oxford University Press. 2001.
48. PHAROAH PD & MELZER D. Variation in Prescribing of Hypnotics, Anxiolytics and
Antidepressants between 61 General Practices. British Journal of General Practice. 1995; 45(400):595-599.
49. MACKENZIE IF, BUCKINGHAM K, WANKOWSKI JM & WILCOCK M. Morbidity,
Deprivation, and Antidepressant Prescribing in General Practice. British Journal of General Practice. 1999; 49(448):884-886.
50. GREENHALGH J et al. Electro-Convulsive Therapy (ECT) for Depressive Illness,
Schizophrenia Catatonia and Mania - Draft Final Report. National Institute for Clinical Excellence. 2002. Available at: www.nice.org.uk/pdf/Final_assessment_reportECT.pdf (accessed 27th November 2002).
51. DEPARTMENT OF HEALTH. Electro Convulsive Therapy: Survey Covering the Period
from January 1999 to March 1999. England. London: Department of Health. 1999. Available at: www.doh.gov.uk/pub/docs/doh/ect_bull99.pdf (accessed November 27th 2002).
52. MELZER D et al. Prisoners with Psychosis in England and Wales: a One Year National
Follow-up Study. Howard Journal. 2002; 41:1-13. 53. WALROND S & GRANDEY M. Health Indicators for North East PCTs. Stockton:
Northern & Yorkshire Public Health Observatory. 2002. 54. DEPARTMENT OF HEALTH. Mental Health Information Strategy. London: Department
of Health. 2001. 55. CENTRE FOR PUBLIC MENTAL HEALTH. Primary Care Trust Workbooks. Durham:
University of Durham. 2002. Available at: www.dur.ac.uk/mental.health/

100
North East Public Health Observatory Wolfson Research Institute University of Durham Queen’s Campus University Boulevard Stockton on Tees TS17 6BH United Kingdom Tel: +44(0)191 3340400 Fax: +44(0)191 3340391 Website: http://www.nepho.org.uk Enquiries: [email protected] ISBN: 1-903945-24-0