losses of hemifield contrast sensitivity in patients with pituitary adenoma and normal visual acuity...
TRANSCRIPT
Losses of hemi®eld contrast sensitivity in patients with pituitary adenomaand normal visual acuity and visual ®eld
V. Porciattia, d,*, P. Ciavarellaa, M.R. Ghiggib, V. D'Angeloc, S. Padovanoa, M. Grifaa, G. Morettia
aDivision of Ophthalmology, Hospital Casa Sollievo della Sofferenza, IRCCS, San Giovanni Rotondo, ItalybDivision of Endocrinology, Hospital Casa Sollievo della Sofferenza, IRCCS, San Giovanni Rotondo, ItalycDivision of Neurosurgery, Hospital Casa Sollievo della Sofferenza, IRCCS, San Giovanni Rotondo, Italy
dInstitute of Neurophysiology, CNR, Pisa, Italy
Accepted 20 January 1999
Abstract
Objective: To detect early losses of contrast sensitivity (CS) in patients with pituitary adenomas, before the occurrence of visual acuity
and visual ®eld defects.
Methods: CS has been evaluated in both hemi®elds of 28 patients with different kinds of pituitary adenoma (mainly intrasellar) and normal
visual acuity and visual ®eld, as well as in 15 age-matched controls. Two different stimuli were used: a coarse (0.3 c/deg) dynamic (10 Hz)
grating and a ®ner (2 c/deg) static grating.
Results: On average, CS and/or hemi®eld asymmetry were reduced in patients, whereas perimetric sensitivity was normal. CS losses were
more frequent for 2 c/deg static-, as compared with 0.3 c/deg, 10 Hz stimuli. However selective losses for either stimuli were also found. CS
losses did not correlate with anatomical measurements (size, chiasm involvement) of tumors as established by MRI scans.
Conclusions: CS evaluation may provide a simple and effective tool for early detection and monitoring of visual dysfunction in patients
with pituitary adenoma. The lack of correlation between CS losses and chiasm involvement suggests causes different from chiasmal
compression for visual dysfunction. q 1999 Elsevier Science Ireland Ltd. All rights reserved.
Keywords: Contrast sensitivity; Pituitary adenoma; Magnocellular pathway; Parvocellular pathway
1. Introduction
It is well known that pituitary tumors may cause a typical
pattern of visual loss, primarily characterized by reduced
visual acuity and bitemporal hemianopsia (chiasmal
syndrome: Goldstein and Sherman, 1993; Ikeda and Yoshi-
moto, 1995; Trevino, 1995). Chiasmal syndrome, however,
occurs only when tumors have already progressed substan-
tially. Typically, most of patients with pituitary adenoma
seek care for causes different from vision loss. Clinical
visual symptoms may be absent even in cases of very
large (2.5±4 cm) tumors (Auer et al., 1996). Still, surgical
treatment of pituitary tumors is usually prescribed when the
visual ®eld is affected (Cohen et al., 1985; Wormington,
1989; Glaser, 1990).
A suitable visual test, in patients with pituitary adenoma,
should be sensitive enough to; (i) signal dysfunction of the
visual pathway before the onset of a chiasmal syndrome; (ii)
follow up the course of the disease and the effect of a ther-
apy and (iii) establish upper limits of dysfunction beyond
which surgical reduction of the tumor could be considered.
A possibility in this direction is offered by the evaluation of
contrast sensitivity (CS) to sinusoidal gratings. It is known
that CS, as compared with visual acuity, is a more compre-
hensive evaluation of the visual function (Campbell and
Robson, 1968; Shapley, 1990). In addition, in many neuro-
logical disorders involving the visual pathway, CS has been
reported to be earlier and more severely affected than visual
acuity (Bodis-Wollner, 1972; Lorance et al., 1987). CS can
be measured independently for the right or the left hemi-
®eld, in order to evaluate the CS asymmetry between hemi-
®elds (expected to be speci®cally impaired in chiasmal
dysfunction).
A further possibility offered by CS is that of using a set of
stimuli with spatio-temporal characteristics suitable to
emphasize vision subserved by either the parvocellular or
the magnocellular subsystems of the visual pathway (Meri-
gan and Maunsell, 1993; Van Essen and Gallant, 1994). The
Clinical Neurophysiology 110 (1999) 876±886
CLINPH 986631388-2457/99/$ - see front matter q 1999 Elsevier Science Ireland Ltd. All rights reserved.
PII: S1388-2457(99)00024-3
* Corresponding author. Tel.: 1 39-50-540-770; fax: 1 39-50-540-080.
E-mail address: [email protected] (V. Porciatti)

V. Porciatti et al. / Clinical Neurophysiology 110 (1999) 876±886 877
Table 1
Summary of clinical features of patientsa
Patient Age Sex Tumor size Chiasm involv. Stalk deviat. Hormon secret. Previous therapy Visual acuity Visual ®eld MD
1. BoAn 29 F 2 1 1 ± BC 1.0 2 0.12
1.0 0.23
2. BrVe 32 F 1 5 1 GH ± 1.0 2 1.81
1.0 2 1.97
3. CaAm 40 F 1 1 1 GH Oct 1.0 1.05
1.0 1.25
4. CaMa 38 M 1 1 1 ± ± 0.9 2 1.42
0.9 2 2.37
5. CiMi 58 M 2 1 3 GH ± 1.0 4.04
1.0 3.5
6. CoAm 47 F 2 1 1 GH Oct 0.95 1.08
0.95 2 0.26
7. DiDo 42 F 3 1 4 ± BC 1.0 0.75
1.0 0.07
8. FiBa 29 M 2 4 2 ± NS1 1.0 2 1.05
1.0 2 0.68
9. FrDa 25 M 1 1 1 ACTH NS1 1.0 2 1.65
1.0 2 3.01
10. GiEl 30 F 2 2 1 ± BC 1.0 2 3.57
1.0 2 2.23
11. GuMi 69 M 2 1 1 ± ± 1.0 3.17
0.95 2.18
12. InDo 40 F 2 5 1 ± ± 0.95 2 1.93
0.65 2 2.4
13. IrGi 34 F 3 3 1 ± BC 1.0 2 0.16
1.0 0.14
14. LoPa 24 F 1 1 1 Prol BC 1.0 0.76
1.0 1.27
15. LoMG 26 F 2 1 1 Prol Cab 1.0 2 2.64
NS1 1.0 2 2.59
16. MaAn 46 F 1 5 1 Prol Cab 0.95 2 4.95
0.95 2 6.60
17. MaGi 42 M 3 1 1 ± NS1 ± ±
1.0 2 0.85
18. MiSi 30 F 2 1 4 Prol Cab 1.0 2 0.30
1.0 2 1.76
19. NuEl 30 F 1 1 4 GH Oct 1.0 0.35
NS1 1.0 2 0.70
20. PePa 23 F 2 1 4 GH NS1 1.0 2 0.15
1.0 2 1.99
21. RuAn 58 M 1 1 1 GH Oct 0.75 2 0.96
NS2 1.0 2 3.36
22. SaLo 31 F 2 1 1 ± BC 1.0 2 0.23
1.0 2 0.13
23. SeLu 29 M 1 5 1 GH NS2 1.0 2 1.9
1.0 2 2.23
24. ScGi 49 F 1 5 2 GH Oct 1.0 2 5.97
NS1 1.0 2 5.49
25. TiPa 34 F 1 1 1 Prol BC 1.0 0.61
Cab 1.0 0.88
26. ToCi 23 F 1 1 1 ± ± 1.0 2 1.08
1.0 2 2.09
27. TuFi 38 F 2 1 3 ± ± 1.0 2 4.81
1.0 2 4.99
28. VeLn 25 F 1 5 3 Prol BC 0.9 0.87
1.0 2 0.40
a GH, growth hormone; ACTH, adreno-cortico-trophic-hormone; Prol, prolactin; BC, bromocriptine 1.3 mg/day (patient #1), 2.5 mg/day (patient #13), 5.0
mg/day (patients #7, 10, 22, 28), 7.5 mg/day (patient #14); Cab, cabergoline 1.0 mg/day; Oct, octreotide 0.3 mg/day; NS1, one neurosurgery session; NS2, two
neurosurgery sessions.

P/M systems originate from retinal ganglion cells with
different soma size (small/large), relay to different laminae
of the lateral geniculate nucleus (parvocellular/magnocellu-
lar) and then project to different layers of the striate cortex
(4Cb /4Ca ). P and M systems also display very different
functional characteristics. Neurons of the P system respond
well to stimuli of low temporal- and high spatial frequency,
whereas those of the M system do it for stimuli of high
temporal- and low spatial frequency. It has been shown in
the monkey, that selective lesions of the parvocellular lami-
nae of the lateral geniculate nucleus do not alter the CS for
stimuli of high temporal- and low spatial frequency (which
emphasize the activity of the M system) (Merigan et al.,
1991). By contrast, selective lesions of the magnocellular
laminae of the lateral geniculate nucleus do not alter the CS
for stimuli of low temporal- and high spatial frequency
(which emphasize the activity of the P system) (Merigan
and Maunsell, 1990). So, evaluating the CS for stimuli
with the above characteristics in patients with pituitary
adenoma may help to detect early dysfunction, involving
primarily P or M ®bers. A differential interaction of P and
M ®bers with pituitary tumors may be expected, since ®ber
retinotopy at chiasmal level is reported to be very compli-
cated in primates (Poliak, 1957; Hoyt and Luis, 1963; Reese
and Cowey, 1990; Naito, 1994).
This study reports results obtained in a group of patients
with different kinds of pituitary adenomas. It will be shown
that most of them have substantial losses of CS in presence
of normal visual acuity and visual ®eld. CS losses are poorly
correlated to both the size of the adenoma and the way the
tumor impinges on the optic chiasm, suggesting that chiasm
compression is not the sole source for visual dysfunction.
CS may be selectively altered for stimuli emphasizing the
function of either the P or the M pathway, in keeping with
the notion of segregation of the two subsystems at the level
of the optic chiasm in primates. Part of these results have
been published previously in abstract form (Porciatti et al.,
1997a, b).
2. Methods
2.1. Subjects
Twenty-eight subjects (8 males, 20 females) attending the
Division of Endocrinology of the Hospital Casa Sollievo
della Sofferenza, San Giovanni Rotondo, Italy, were
included in the study. Their age ranged from 23 to 69
years (mean age 36.5, SD 11.7). All cases were diagnosed
having pituitary adenoma, on the basis of standard clinical
criteria and MRI (Asa et al., 1993; Schubiger, 1996). MRI
scans (2 mm resolution, T1-weighted sagittal/coronal spin-
echo sequences before/after Gd enhancement) were also
used to establish the size of the tumor, as well as the way
it impinges on the optic chiasm and/or deviates the pituitary
stalk (Kucharczyk and Davis, 1986; Elster, 1993; Schubi-
ger, 1996). Adenomas were divided into 3 groups, according
their size (Asa et al., 1993; Schubiger, 1996): (1) intrasellar
microadenoma, less than 1 cm; (2) intrasellar macroade-
noma, 1 cm or more and (3) extrasellar macroadenoma.
Five categories of chiasm involvement could be established:
(1) none; (2) indentation; (3) dislocation; (4) compression;
(5) empty sella. Pituitary stalk deviation exerted by adeno-
mas was de®ned as: (1) none; (2) on axis but tilted back-
wards; (3) tilted rightwards (4) tilted leftwards.
Sixteen subjects had secretory tumors (Growth hormone,
n � 9; Prolactin, n � 6; ACTH, n � 1) while 12 had non-
functioning adenomas. Subjects, when necessary, were on
adequate medical therapy with dopamine or somatostatine
agonists (Johnston et al., 1981; Warnet et al., 1989; Ezzat et
al., 1992; Malarkey, 1993; Webster et al., 1994). Eight
subjects had had previous microsurgical transsphenoidal
debulking of the tumor. All patients had a standard ophthal-
mological examination, including Humphrey static perime-
try (program 30-2). All patients had good visual acuity and
visual ®eld, according standard criteria (Sponsel et al.,
1995) in both eyes, except subject #17 whose right eye
was blind due to a previous trauma.
A summary of clinical details of patients is reported in
Table 1. Fifteen normal control subjects, age- and sex-
matched with the patients' group, were also included in
the study. All subjects had no or small refractive errors,
which were suitably corrected for the viewing distance.
All experiments followed the tenets of the declaration of
Helsinky. Informed consent was obtained after the aims
and the experimental techniques were fully explained. The
experiments had the approval of the local ethical committee.
2.2. Visual stimuli
Visual stimuli were vertical sinusoidal gratings, gener-
ated electronically and displayed on a 17 0 0 black and
white monitor (Eizo Flexscan 5500, Jokogawa, Japan) at a
frame rate of 60 Hz, 800 £ 600 pixels, mean luminance 100
cd/sqm. Two kinds of stimuli were used: a coarse, dynamic
grating (0.3 c/deg, sinusoidally modulated in counterphase
at 10 Hz: de®ned as M-stimulus) and a ®ner (2 c/deg), static
grating: de®ned as P-stimulus. These spatio-temporal condi-
tions are close to those at which the CS for dynamic and
static gratings, respectively, is reported to be highest
(Robson, 1966). The system (Mangoni, Pisa, Italy) allowed
presentation of stimuli in the right or left hemi®eld as well
as ®ne adjustment of contrast by speci®c pushbuttons along
a dB scale (de®ned as 20 log10 contrast). Luminance linear-
ization by gamma correction was provided by the factory.
Patterned and unpatterned hemi®elds were equiluminant.
Subjects ®xated monocularly at a small square placed in
the stimulus center from 57 cm distance (visual ®eld 24:5 £32 deg) with natural pupils (measured with a ruler to be in
the range 4±5 mm in all subjects). The stimulus was
occluded to the non-®xating eye by means of a frosted lens.
V. Porciatti et al. / Clinical Neurophysiology 110 (1999) 876±886878
2.3. Psychophysical technique
Sensitivity estimates were obtained with the method of
ascending limits. The experimenter decreased the contrast
of the stimulus until the observer reported that the stimulus
was no longer visible. The contrast was further lowered by
4±8 dB, and then increased in small steps (1 dB) until the
subject reported seeing it, to yield threshold. Subjects were
given adequate time for learning the procedure and the
different kind of stimuli (M-/P-stimulus, Right/Left visual
®eld) whose sequence was randomly chosen. For each
condition, at least 12 measures (divided in two blocks)
were made, to verify consistency of responses. Additional
measures were made when necessary to keep test-retest
reliability within 2 dB. The method of ascending limits
may be considered non-optimal in terms of precision and
progressive shift in threshold due to perceptual learning.
However, the present procedure represented a good compro-
mise between precision, reliability, time constraints and
feasibility in a clinical context.
3. Results
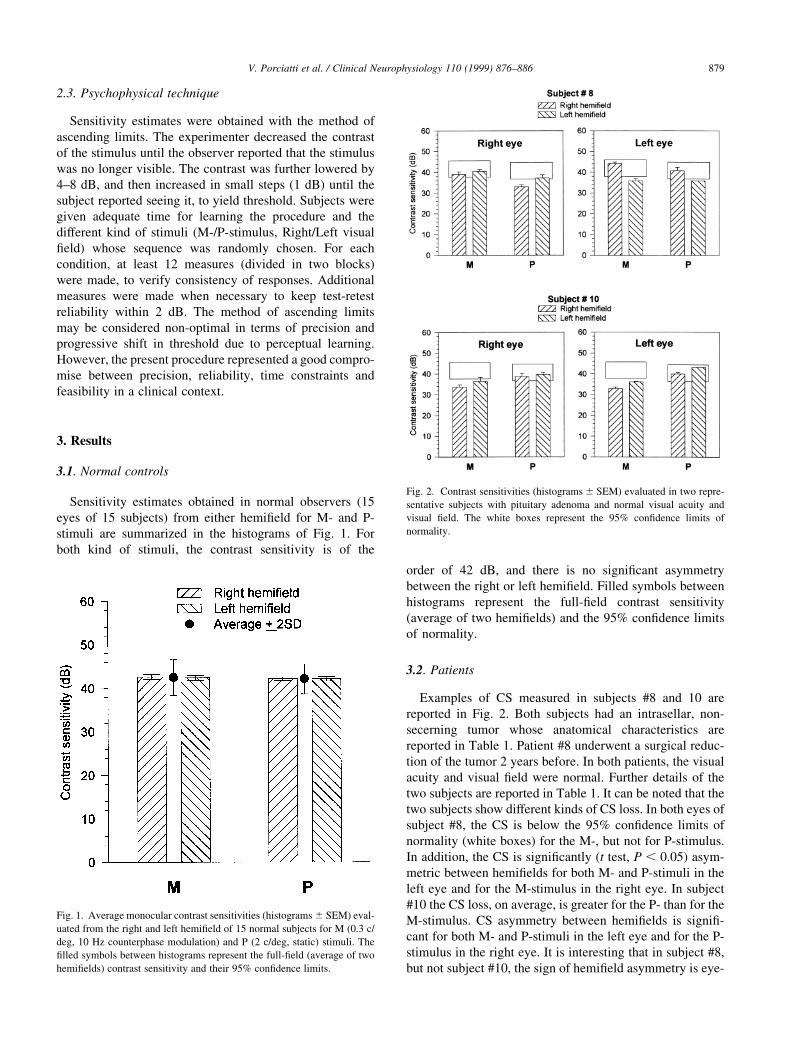
3.1. Normal controls
Sensitivity estimates obtained in normal observers (15
eyes of 15 subjects) from either hemi®eld for M- and P-
stimuli are summarized in the histograms of Fig. 1. For
both kind of stimuli, the contrast sensitivity is of the
order of 42 dB, and there is no signi®cant asymmetry
between the right or left hemi®eld. Filled symbols between
histograms represent the full-®eld contrast sensitivity
(average of two hemi®elds) and the 95% con®dence limits
of normality.
3.2. Patients
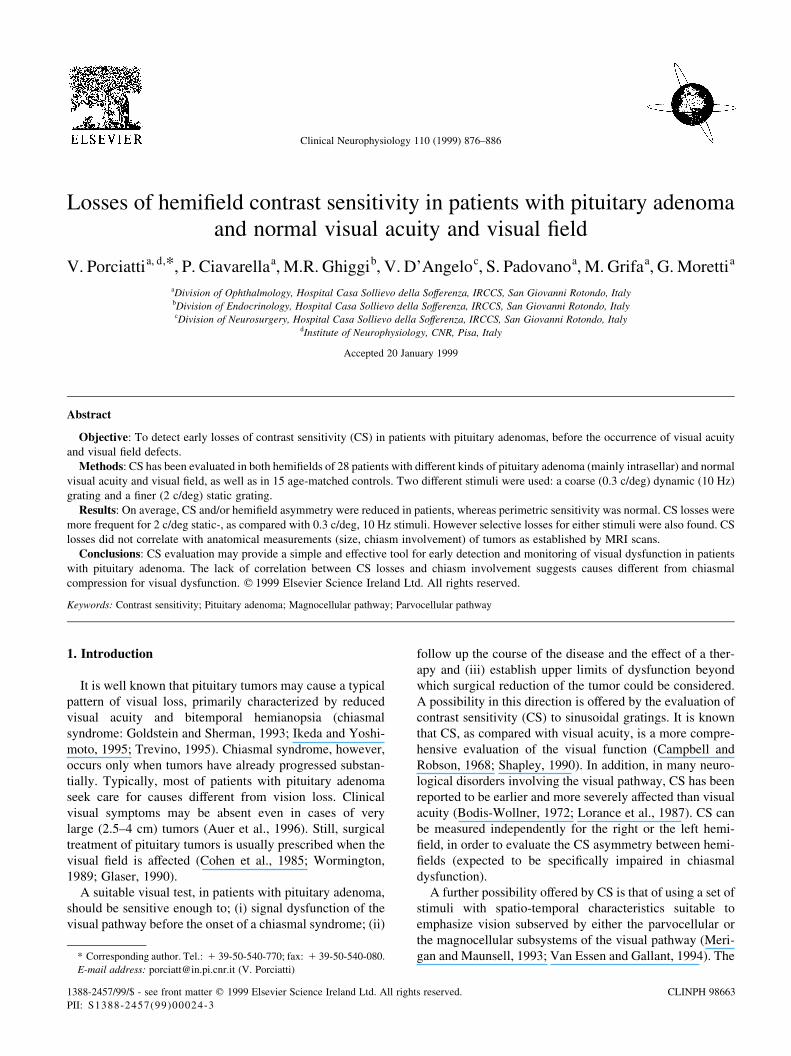
Examples of CS measured in subjects #8 and 10 are
reported in Fig. 2. Both subjects had an intrasellar, non-
secerning tumor whose anatomical characteristics are
reported in Table 1. Patient #8 underwent a surgical reduc-
tion of the tumor 2 years before. In both patients, the visual
acuity and visual ®eld were normal. Further details of the
two subjects are reported in Table 1. It can be noted that the
two subjects show different kinds of CS loss. In both eyes of
subject #8, the CS is below the 95% con®dence limits of
normality (white boxes) for the M-, but not for P-stimulus.
In addition, the CS is signi®cantly (t test, P , 0:05) asym-
metric between hemi®elds for both M- and P-stimuli in the
left eye and for the M-stimulus in the right eye. In subject
#10 the CS loss, on average, is greater for the P- than for the
M-stimulus. CS asymmetry between hemi®elds is signi®-
cant for both M- and P-stimuli in the left eye and for the P-
stimulus in the right eye. It is interesting that in subject #8,
but not subject #10, the sign of hemi®eld asymmetry is eye-
V. Porciatti et al. / Clinical Neurophysiology 110 (1999) 876±886 879
Fig. 1. Average monocular contrast sensitivities (histograms ^ SEM) eval-
uated from the right and left hemi®eld of 15 normal subjects for M (0.3 c/
deg, 10 Hz counterphase modulation) and P (2 c/deg, static) stimuli. The
®lled symbols between histograms represent the full-®eld (average of two
hemi®elds) contrast sensitivity and their 95% con®dence limits.
Fig. 2. Contrast sensitivities (histograms ^ SEM) evaluated in two repre-
sentative subjects with pituitary adenoma and normal visual acuity and
visual ®eld. The white boxes represent the 95% con®dence limits of
normality.
dependent. Overall, histograms in Fig. 2 are representative
of the heterogeneity of ®ndings in patients, indicating that:
(i) CS mean losses may be of different extent for the M- and
the P-stimulus; (ii) signi®cant hemi®eld asymmetries may
be found in presence of normal full-®eld CS; (iii) the sign of
hemi®eld asymmetry may or may not be eye-dependent.
Results obtained in the whole group of patients are summar-
ized below.
3.3. Comparison between CS and clinical measurements of
vision
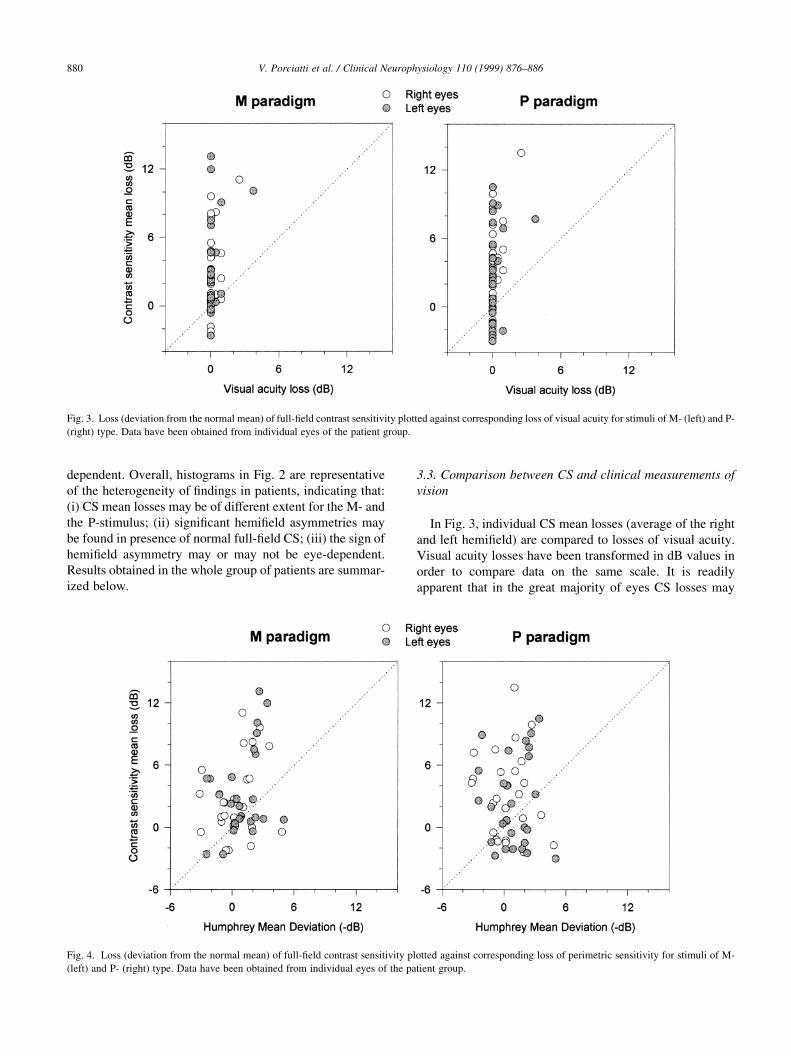
In Fig. 3, individual CS mean losses (average of the right
and left hemi®eld) are compared to losses of visual acuity.
Visual acuity losses have been transformed in dB values in
order to compare data on the same scale. It is readily
apparent that in the great majority of eyes CS losses may
V. Porciatti et al. / Clinical Neurophysiology 110 (1999) 876±886880
Fig. 3. Loss (deviation from the normal mean) of full-®eld contrast sensitivity plotted against corresponding loss of visual acuity for stimuli of M- (left) and P-
(right) type. Data have been obtained from individual eyes of the patient group.
Fig. 4. Loss (deviation from the normal mean) of full-®eld contrast sensitivity plotted against corresponding loss of perimetric sensitivity for stimuli of M-
(left) and P- (right) type. Data have been obtained from individual eyes of the patient group.

be found in presence of normal visual acuity, for both M-
and P-stimuli.
In Fig. 4, CS mean losses are compared with visual ®eld
losses (Humphrey Program 30-2, Mean Deviation). This is a
meaningful comparison, since CS and perimetric sensitivity
are evaluated approximately over the same region of the
visual ®eld. It can be noted that, on average, CS losses
evaluated in individual eyes tend to be larger than peri-
metric losses. For statistical evaluation, sensitivities of the
two eyes have been averaged and used as a single entry. In
addition, subjects who had received surgical treatment (#8,
9, 15, 18-21, 23-24) were distinguished from those who had
received medical treatment only. A two-way ANOVA was
performed. The factors were Treatment (no surgery,
surgery) and Test (Humphrey MD, M-stimulus mean loss,
P-stimulus mean loss). The results are summarized in Fig. 5
as histograms. Signi®cant effects were Surgery:
F�1; 83� � 4:2, P � 0:04 and Test: F�2; 80� � 4:56,
P � 0:001. Post-hoc comparisons (Student-Neuman-Keuls,
P , 0:05) indicated that contrast sensitivity losses (for both
M- and P-stimuli) were, in patients undergoing surgery,
larger than those of patients receiving medical treatment
only. In addition, contrast sensitivity losses (for both the
M- and P-stimuli) were larger than those evaluated with
the Humphrey perimeter. These latter losses did not signi®-
cantly differ from zero.
Fig. 6 compares CS hemi®eld asymmetry evaluated in
individual eyes with corresponding perimetric hemi®eld
asymmetry. This latter measure is not currently available
on standard perimeters. Perimetric asymmetry has been
computed by ®rst averaging deviations of all tested points
in each hemi®eld (n � 19), and then subtracting the aver-
aged values. For both contrast and perimetric asymmetries,
data have been recti®ed to positive values to normalize the
sign of asymmetry. As shown in Fig. 6, the asymmetry in
sensitivity between hemi®elds tends to be somehow larger
V. Porciatti et al. / Clinical Neurophysiology 110 (1999) 876±886 881
Fig. 5. Comparison between average losses of perimetric sensitivity and
full-®eld contrast sensitivity (M- and P-stimuli) in the patient group. Histo-
grams represent the mean sensitivity loss (1SEM) of patients (average of
the two eyes). Cross-hatched and open histograms represent patients who
underwent surgery (n � 8) or medical treatment only (n � 20), respec-
tively.
Fig. 6. Contrast sensitivity hemi®eld asymmetry plotted against perimetric hemi®eld asymmetry for stimuli of the M- (left) and P- (right) type. Data have been
obtained from individual eyes of the patient group.
for CS measurements than for perimetric measurements.
As for CS mean losses, a two-way ANOVA statistics
was performed on data obtained by averaging measures
of the two eyes, and distinguishing subjects receiving
surgical or medical treatment. Factors were Treatment
(no surgery, surgery) and Test (perimetric asymmetry, M-
stimulus asymmetry, P-stimulus asymmetry). Data are
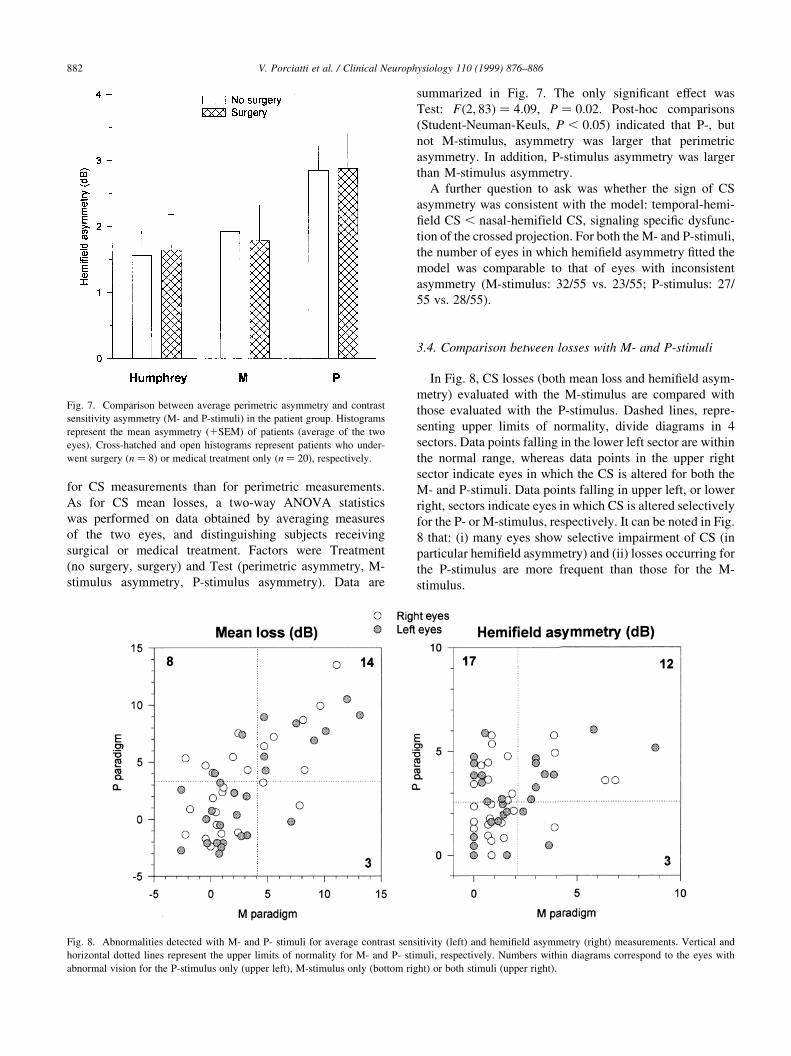
summarized in Fig. 7. The only signi®cant effect was
Test: F�2; 83� � 4:09, P � 0:02. Post-hoc comparisons
(Student-Neuman-Keuls, P , 0:05) indicated that P-, but
not M-stimulus, asymmetry was larger that perimetric
asymmetry. In addition, P-stimulus asymmetry was larger
than M-stimulus asymmetry.
A further question to ask was whether the sign of CS
asymmetry was consistent with the model: temporal-hemi-
®eld CS , nasal-hemifield CS, signaling speci®c dysfunc-
tion of the crossed projection. For both the M- and P-stimuli,
the number of eyes in which hemi®eld asymmetry ®tted the
model was comparable to that of eyes with inconsistent
asymmetry (M-stimulus: 32/55 vs. 23/55; P-stimulus: 27/
55 vs. 28/55).
3.4. Comparison between losses with M- and P-stimuli
In Fig. 8, CS losses (both mean loss and hemi®eld asym-
metry) evaluated with the M-stimulus are compared with
those evaluated with the P-stimulus. Dashed lines, repre-
senting upper limits of normality, divide diagrams in 4
sectors. Data points falling in the lower left sector are within
the normal range, whereas data points in the upper right
sector indicate eyes in which the CS is altered for both the
M- and P-stimuli. Data points falling in upper left, or lower
right, sectors indicate eyes in which CS is altered selectively
for the P- or M-stimulus, respectively. It can be noted in Fig.
8 that: (i) many eyes show selective impairment of CS (in
particular hemi®eld asymmetry) and (ii) losses occurring for
the P-stimulus are more frequent than those for the M-
stimulus.
V. Porciatti et al. / Clinical Neurophysiology 110 (1999) 876±886882
Fig. 7. Comparison between average perimetric asymmetry and contrast
sensitivity asymmetry (M- and P-stimuli) in the patient group. Histograms
represent the mean asymmetry (1SEM) of patients (average of the two
eyes). Cross-hatched and open histograms represent patients who under-
went surgery (n � 8) or medical treatment only (n � 20), respectively.
Fig. 8. Abnormalities detected with M- and P- stimuli for average contrast sensitivity (left) and hemi®eld asymmetry (right) measurements. Vertical and
horizontal dotted lines represent the upper limits of normality for M- and P- stimuli, respectively. Numbers within diagrams correspond to the eyes with
abnormal vision for the P-stimulus only (upper left), M-stimulus only (bottom right) or both stimuli (upper right).

3.5. Association between CS and anatomical measurements
of tumor
A question to ask was whether CS losses were associated
to the anatomical dimensions of adenomas and the extent to
which they interact with the optic chiasm. These anatomical
measures have been obtained from MRI scan (see Section 2
and Table 1). Adenomas were divided into 3 groups, accord-
ing to their size (Asa et al., 1993; Schubiger, 1996): (1)
intrasellar microadenoma, less than 1 cm; (2) intrasellar
macroadenoma, 1 cm or more and (3) extrasellar macroa-
denoma. In Fig. 9, CS mean losses are plotted against corre-
sponding size of adenomas. It can be noted in Fig. 9 that CS
losses are rather independent of the size of adenoma. A two-
way ANOVA was performed on data obtained by averaging
measures of the two eyes. Factors were Tumor size (1±3)
and Stimulus (M, P). No signi®cant effects were found.
A more stringent comparison is between CS mean losses
V. Porciatti et al. / Clinical Neurophysiology 110 (1999) 876±886 883
Fig. 9. Loss of full-®eld contrast sensitivity as a function of adenoma size: (1) intrasellar microadenoma , 1 cm; (2) intrasellar macroadenoma . 1 cm and (3)
extrasellar macroadenoma.
Fig. 10. Loss of full-®eld contrast sensitivity as a function of chiasm involvement: (1) none; (2) indentation; (3) dislocation; (4) compression and (5) empty
sella.

and the extent with which adenomas impinge on the optic
chiasm. From MRI scans it was possible to de®ne 5 cate-
gories of chiasm involvement: (1) none; (2) indentation; (3)
dislocation; (4) compression and (5) empty sella (see section
2 and Table 1). In Fig. 10, CS losses of individual eyes have
been plotted as a function of degree of chiasm involvement.
As shown in Fig. 10, there is no apparent relationship
between CS loss and the extent of chiasmal involvement.
In particular, CS losses found in group 1 (no direct chiasm
involvement) may be equal to, or even larger than, those of
groups with de®nite chiasm involvement.
MRI scans were also used to establish 4 categories of
pituitary stalk deviation exerted by adenomas: (1) none;
(2) on axis but tilted backwards; (3) tilted rightwards and
(4) tilted leftwards (Table 1). There was no signi®cant rela-
tionship between CS loss and pituitary stalk deviation (one-
way ANOVA, not shown in ®gures).
3.6. Association between CS losses and hormonal levels
Since CS losses were poorly correlated to either tumor
size or the way it impinges on the optic chiasm, we asked the
question of whether psychophysical measures depended on
hormonal levels. Patients with secretory adenomas (n � 16)
were divided into two groups: (1) growth-hormone secern-
ing, n � 9 and (2) prolactin secerning, n � 6. Patient no. 9
was excluded, since he was the only representative with
elevated ACTH. At time of testing, growth-hormone level
ranged from 1 to 13 mU/l (mean: 7.4, SD 5), and prolactin
from 0.8 to 115 mU/l (mean: 40.2, SD 45.8). There was no
statistically signi®cant correlation (Pearson) between CS
mean loss/CS hemi®eld asymmetry and the levels of growth
hormone and prolactin.
3.7. Association between CS losses and disease duration
A further question to ask was whether the amount of CS
loss, independently of its anatomical/biochemical causes,
was associated to disease duration. Known duration (time
between ®rst diagnosis and CS testing) ranged between 1
and 84 months (mean: 15.5, SD 18.3). There was no statis-
tically signi®cant correlation (Pearson) between CS mean
loss/CS hemi®eld asymmetry and disease duration.
4. Discussion
The aim of this study was to establish whether the
contrast sensitivity for selected stimuli presented in either
hemi®eld was a suitable test to detect dysfunction of the
visual pathway in patients with pituitary adenoma, before
the onset of a chiasmal syndrome, which represents a rather
late stage in tumor progression (Goldstein and Sherman,
1993; Ikeda and Yoshimoto, 1995; Trevino, 1995). Chias-
mal syndrome, primarily de®ned on the basis of a typically
abnormal visual ®eld, is currently used as a hallmark for
surgical treatment (Cohen et al., 1985; Wormington, 1989;
Glaser, 1990).
Contrast sensitivity measurements have been previously
reported to be impaired in patients with chiasmal compres-
sion and visual complaints (Bodis-Wollner and Diamond,
1976; Kupersmith et al., 1982; Plant, 1985; Lorance et al.,
1987; Grochowicki et al., 1990). The present results indicate
that pituitary adenomas can cause signi®cant dysfunction of
the visual pathway in many patients without chiasmal
compression and normal visual acuity and visual ®eld. In
particular, the comparison between CS losses (both average
loss and hemi®eld asymmetry) and perimetric losses is
meaningful, since both measurements have been obtained
from the same region of the visual ®eld. On average, CS is
signi®cantly altered when perimetric sensitivity is not. In
addition, CS is more altered in previously operated patients
as compared with those receiving medical treatment only.
That CS is able to signal different levels of subclinical visual
dysfunction is of potential interest for both better under-
standing of chiasmal disorders and therapeutical follow-up
of patients. Overall, our data extend previous results show-
ing that CS may be earlier and more severely affected than
visual acuity and/or visual ®eld in many neurological disor-
ders involving the visual pathway (Bodis-Wollner, 1972;
Lorance et al., 1987).
Merigan and Maunsell (1990) and Merigan et al. (1991)
using conditions comparable with those used in the present
study, were able to induce selective CS losses for either M-
or P-stimuli in the monkey with lesion of speci®c laminae of
the lateral geniculate body. Given the overall similarity
between the monkey- and human visual system, it is likely
that the stimuli we have used are adequate to show, at least
in part, differential impairment of P- and M-subsystems. As
shown by our results, CS losses were found for both M- and
P-stimuli. However, several eyes showed selective loss of
CS for one of the two stimuli. This may suggest primary
involvement of either the M- or the P-pathway, in keeping
with the notion of segregation of M- and P-®bers at the level
of the optic chiasm in primates (Reese and Cowey, 1989;
Naito, 1994). A non-uniform damage may depend on the
heterogeneous ways tumors affect the optic chiasm. On
average, CS losses (in particular hemi®eld asymmetry) for
P-stimuli were more frequent than those for the M-stimuli.
This may suggest overall higher vulnerability of P-®bers, as
compared with M-®bers, in chiasmal disease (Reese and
Cowey, 1989).
Psychophysical visual dysfunction in presence of normal
visual acuity and Bjerrum campimetry, in patients with
tumors extending in the suprasellar region, has been
reported for foveally-presented (0.25 deg) ¯ash stimuli
(Gutowsky et al., 1997). Losses were uniform for chromatic,
luminance and temporal sensitivities, indicating unspeci®c
dysfunction of the magno- and parvocellular pathways. Our
results are in keeping with the above ®ndings, in that pitui-
tary adenomas can cause substantial visual dysfunction
which is not detectable with routine examinations. In addi-
V. Porciatti et al. / Clinical Neurophysiology 110 (1999) 876±886884
tion, they extend them indicating that losses may be
detected at earlier stages. Although the psychophysical tech-
niques used in the present and the Gutowsky et al. (1997)
study were different, the overall amount of sensitivity loss is
of the same order. Contrary to the Gutowsky et al. (1997)
results, however, our data suggest differential and speci®c
vulnerability of the magno- and parvocellular pathways.
This discrepancy may well depend on the different contin-
gent of ®bers subserving foveal and more peripheral regions
of the visual ®eld (Reese and Ho, 1988; Naito, 1989, 1994;
Plant and Perry, 1990).
It is interesting that signi®cant CS losses have been found
in many cases in which the size of adenoma was small
enough not to establish any direct or major involvement
of the optic chiasm. This ®nding strongly suggests that
chiasmal compression per se is not the primary cause of
visual dysfunction in our patient sample. Also, interference
with inferior vessels of the optic chiasm (Bergland and Ray,
1969) is unlikely. Hence, other possibilities have to be taken
into account.
At the present stage, the sources of visual dysfunction are
mainly matter of speculation. Our data appear to exclude
hormonal levels and disease duration as signi®cant factors.
Pharmacological treatment might play a role. However,
dopamine agonists are reported to induce positive effects
on the CS of normal subjects (Domenici et al., 1985). An
adverse chemical effect on CS exerted by substances asso-
ciated with developing tumor cannot be excluded. These
include growth factors, proteases, as well as toxic metabo-
lites. Possibly, multiple factors contribute to CS losses in
pituitary adenomas. Gutowsky et al. (1997) also suggested
multifactorial causes for foveal dysfunction in patients with
suprasellar tumors. A better understanding of pathophysio-
logical mechanisms in patients with pituitary adenomas
might be provided by longitudinal studies of patients. Preli-
minary results (Porciatti et al., 1997b) show that some
patients of the same sample, followed-up during the course
of pharmacological treatment, showed clear improvement
of CS loss and CS asymmetry. The improvement could be
selective for either M- or P-stimulus, and occurred at
constant visual acuity, visual ®eld and tumor size as
assessed by MRI scans.
Independently of the mechanisms responsible for visual
dysfunction, the present results suggest that CS evaluation
may provide a simple and effective tool for early detection
and monitoring of visual dysfunction in patients with pitui-
tary adenoma. In prospective, this could offer the possibility
for earlier surgery, before severe damage of the visual path-
way has occurred.
References
Asa SL, Horwath E, Kovacs K. Pituitary neoplasms: an overview of the
clinical presentation, diagnosis, treatment, and pathology. In: Mazza-
ferri EL, Saaman NA, editors. Endocrine tumors, Boston: Blackwell
Scienti®c Publications, 1993. pp. 77±112.
Auer RN, Alakijia P, Sutherland GR. Asymptomatic large pituitary adeno-
mas discovered at autopsy. Surg Neurol 1996;46:28±31.
Bergland R, Ray BS. The arterial supply of the human optic chiasm. J
Neurosurg 1969;31:327±334.
Bodis-Wollner I. Visual acuity and contrast sensitivity in patients with
cerebral lesions. Science 1972;178:769±771.
Bodis-Wollner I, Diamond SP. The measurement of spatial contrast sensi-
tivity in cases of blurred vision associated with cerebral lesions. Brain
1976;99:695±710.
Campbell FW, Robson JG. On the application of Fourier analysis to the
visibility of gratings. J Physiol (Lond) 1968;197:551±556.
Cohen AR, Cooper PR, Kupersmith MJ, Flamm ES, Ransohoff J. Visual
recovery after transsphenoidal removal of pituitary adenomas. Neuro-
surgery 1985;17:446±452.
Domenici L, Trimarchi C, Piccolino M, Fiorentini A, Maffei L. Dopami-
nergic drugs improve human visual contrast sensitivity. Hum Neurobiol
1985;4:195±197.
Elster AD. Modern imaging of the pituitary. Radiology 1993;187:1±4.
Ezzat S, Snyder PJ, Young WF, Boyajy LD, Newmann C, Klibanski A,
Molitch ME, Boyd AE, Cook DM. Octreotide treatment in acromegaly.
A randomized, multicentric study. Ann Int Med 1992;117:711±718.
Glaser JS. Topical diagnosis: the optic chiasm. In: Glaser JS, editor. Neuro-
ophthalmology, Philadelphia: J.B. Lippincott, 1990. pp. 171±212.
Goldstein JE, Sherman JF. Pituitary adenoma. Optom Clin 1993;3:101±
125.
Grochowicki M, Vighetto A, Berguet S, Sassolas G. Contrast sensitivity
function and pituitary adenoma: a study of 40 cases. Br J Ophthalmol
1990;74:358.
Gutowsky NJ, Heron JR, Scase MO. Early impairment of foveal magno-
and parvocellular pathways in juxta chiasmal tumours. Vision Res
1997;37:1401±1408.
Hoyt WF, Luis O. The primate chiasm. Details of visual ®ber organization
studied by silver impregnation techniques. Arch Ophthalmol
1963;70:69±85.
Ikeda H, Yoshimoto T. Visual disturbances in patients with pituitary
adenoma. Acta Neurol Scand 1995;92:157±160.
Johnston DG, Hall K, McGregor A, Ross WM, Kendall-Taylor P, Hall R.
Bromocriptine therapy for non-functioning adenomas. Am J Med
1981;71:1059.
Kucharczyk W, Davis OD. High resolution MR imaging at 1.5 Tl. Radi-
ology 1986;161:761±765.
Kupersmith MJ, Siegel IM, Carr RE. Subtle disturbances of vision with
compressive lesions of the anterior visual pathway measured by
contrast sensitivity. Ophthalmology 1982;89:68±72.
Lorance RW, Kaufman D, Wray SH, Mao C. Contrast visual testing in
neurovisual diagnosis. Neurology 1987;37:923±929.
Malarkey WB. Prolactinomas. In: Mazzaferri EL, Saaman NA, editors.
Endocrine tumors, Boston: Blackwell Scienti®c Publications, 1993.
pp. 124±135.
Merigan WH, Katz LM, Maunsell JHR. The effects of parvocellular lateral
geniculate lesions on the acuity and contrast sensitivity of macaque
monkeys. J Neurosci 1991;11:994±1001.
Merigan WH, Maunsell JHR. Macaque vision after magnocellular lateral
geniculate lesions. Visual Neurosci 1990;5:347±352.
Merigan WH, Maunsell JHR. How parallel are the primate visual path-
ways?. Annu Rev Neurosci 1993;16:369±402.
Naito J. Retinogeniculate projection ®bres in the monkey optic nerve: a
demonstration of the ®ber pathways by retrograde axonal transport of
WGA-HRP. J Comp Neurol 1989;284:174±186.
Naito J. Retinogeniculate projection ®bres in the monkey optic chiasm: a
demonstration of the ®ber arrangement by means of wheat germ agglu-
tinin conjugated with horseradish peroxidase. J Comp Neurol
1994;346:559±571.
Plant GT. Residual visual function in chiasmal compression. J Physiol
(Lond) 1985;360:22P.
Plant GT, Perry VH. The anatomical basis of the caecocentral scotoma.
Brain 1990;113:1441±1457.
V. Porciatti et al. / Clinical Neurophysiology 110 (1999) 876±886 885

Poliak SL. The vertebrate visual sustem. Chicago: The University of
Chicago Press, 1957.
Porciatti V, Ciavarella P, Ghiggi MR, D'Angelo V, Cascione S, Padovano
S, Moretti G. Early visual dysfunction in pituitary adenomas: role of the
P- and M-pathway. Invest Ophthalmol Visual Sci 1997a;38:S7.
Porciatti V, Ciavarella P, Ghiggi MR, D'Angelo V, Cascione S, Padovano
S, Moretti G. Selective loss and recovery of visual function subserved
by P- and M-pathway in pituitary adenomas. Electroenceph clin Neuro-
physiol 1997b;103:188.
Reese BE, Cowey A. The neurologic consequences of a sub-chiasmal tumor
on the retino-geniculo-striate pathway of a macaque monkey. Clin
Vision Sci 1989;4:341±356.
Reese BE, Cowey A. Fibre organization of the monkey's optic tract: I.
Segregation of funtionally distinct axons. J Comp Neurol
1990;295:385±400.
Reese BE, Ho KY. Axon diameter distribution across the monkey's optic
nerve. Neuroscience 1988;27:205±214.
Robson JG. Spatial and temporal contrast sensitivity function of the visual
system. J Opt Soc Am 1966;56:1141±1142.
Schubiger O. Radiology of pituitary adenomas. In: Landolt AM, Vance
ML, Reilly PL, editors. Pituitary adenomas, Churchill Livingstone,
1996. pp. 177±219.
Shapley R. Visual sensitivity and parallel retinocortical channels. Annu
Rev Psychol 1990;41:635±658.
Sponsel WE, Ritch R, Stamper REJH, Anderson D, Wilson MR, Zimmer-
man TJ. Prevent blindness America visual ®eld screening study. Am J
Ophthalmol 1995;120:699±708.
Trevino R. Chiasmal syndrome. J Am Opt Assoc 1995;66:559±575.
Van Essen DC, Gallant JL. Neural mechanisms of form and motion proces-
sing in the primate visual system. Neuron 1994;13:1±10.
Warnet A, Timsit J, Chanson P, Guillasseau PJ, Zam®rescu F, Harris AG,
Derome P, Chopighuh J, Lubetski J. The effect of somatostatin analo-
gue on chiasmal dysfunction from pituitary macroadenomas. J Neuro-
surg 1989;71:687±690.
Webster J, Piscitelli G, Polli A, Ferrari CI, Ismail I, Scanlon MF. A compar-
ison of cabergoline and bromocriptine in the treatment of hyperprolac-
tinemic amenorrhea. N Engl J Med 1994;331:904±999.
Wormington CM. Pituitary adenoma: diagnosis and treatment. J Am Opt
Assoc 1989;60:929±935.
V. Porciatti et al. / Clinical Neurophysiology 110 (1999) 876±886886