long term plan 2018-28 - timaru district council
TRANSCRIPT
LONG TERM PLAN2018-28 SUPPORTINGINFORMATION
Timaru District Council Long term Plan 2018-2028: Supporting Information2
Welcome to the Long Term Plan 2018-28 Supporting Information Pack.
All councils are required by law to have a 10-year Long Term Plan and review it every three years, in consultation with the public. Council has prepared a Consultation Document that outlines significant issues and choices facing the district. It explains the objectives of what is being proposed and how rates, debt and levels of service might be affected.
The Consultation Document and all the supporting information is available online at www.ourplaceourfuture.co.nz or from Council service centres and libraries. The Consultation Document is also being delivered to every letterbox as part of a community newspaper.
The list of what’s included in the Supporting Information Pack is detailed below. We’ve also included a short explanation of some of the key policies and fees changes
You are welcome to give your views on issues highlighted through the Consultation Document, supporting information or any other matters the Council is consulting on through the LTP process.
Have your Say!
Your views on the proposed changes are important. We encourage you to share your views by making a submission. All this information is available for comment from Thursday 8 March until 5pm, Monday 9 April 2018.
How to provide feedback
When making a submission on the proposed changes, please tell us:
what aspect/s of the proposed change you would like to comment on
what you want, what decision you would like Council to make, and the reasons for this.
If I make a submission, do I have to appear at a hearing?
No. All submissions are given due consideration and everyone has the opportunity to make their submission personally if they want to. If you want to make your submission personally to the Council, let us know with your submission. We’ll get back to you with a time and other hearing details.
Is my submission private?
Submissions are public information because in local government we have an obligation to be as transparent as possible. If there are any details you don’t want made public, please let us know.
How will I know my submission has been considered?
All submissions are important and will be considered. We’ll keep you informed along the way. A Council officer will provide comments on your submission and we’ll send this to you before the hearings take place. At the end of the process, we will summarise the decisions made by Council and let you know the outcomes.
What’s happening when?
8 March – Submissions open
9 April at 5pm – Submissions close
30 April -2 May – LTP 2018-28 Hearings
26 June – Any changes made and LTP adopted by Council
Want more information?
The best way to access information quickly is by going to www.ourplaceourfuture.co.nz. Copies of all information are also available through Council’s main office in Timaru, our service centres in Geraldine and Temuka and Timaru library.
Need help?
If you need help, just get in touch any way you like and we’ll help you through the process of making a submission. You can phone, e-mail, or contact us through the website, write to us or come in and see us. Our contact details are as follows:
Phone Mark Low or Ann Fitzgerald on 03 6877200 for advice on making a submission; or
e-mail [email protected]
Where do I send my submission?
Make it online at www.ourplaceourfuture.co.nz ; or
Make it on the Consultation Document form; or
E-mail it to [email protected]; or
Write to LTP Submission, Freepost 95136, Timaru District Council, PO Box 522, Timaru 7940; or
Drop it in to Timaru District Council, 2 King George Place, Timaru or at one of our Service Centres in Temuka or Geraldine.
Supporting Information
Timaru District Council Long term Plan 2018-2028: Supporting Information 3
List of Supporting InformationPage No.
(of pdf)
1. Infrastructure Strategy 5
2. Financial Strategy and Projections for 2018 - 28 90
3. Groups of Activity Statements 108
4. Significant Forecasting Assumptions 213
5. Financial Contributions Policy 224
6. Revenue and Financing Policy 227
7. Rates Remission and Postponement Policy 243
8. Rating/Rates Discount Policy 251
9. Proposed Fees and Charges 2018/19 253
1. Infrastructure Strategy
Details Council’s plans for key infrastructure assets including Roading and Footpaths, Water Supply, Sewer, Stormwater and Waste Minimisation for the next 50 years. Covers Council’s strategy approach, key infrastructural issues, options for addressing key issues and how Council intends to manage this infrastructure going forward.
2. Financial Strategy and Projections
The Financial Strategy brings together important information set out in the Long Term Plan, integrating it with financial forecasts, strategies and policies to arrive at a sustainable and prudent budget. The financial strategy guides the way Council makes decisions over income, expenditure, borrowing and investments. Key financial statements are also provided based on the draft.
3. Groups of Activity Statements
These outline Council’s plans based on the nine Groups of Activities. It includes information about each group, including what the group covers, why Council is involved, key issues facing the activities, the service levels we will provide to the community,
how we will measure our success, key projects and financial information.
4. Significant Forecasting Assumptions
These represent the key assumptions that the Council has used to develop the Long Term Plan, and underpin its planning and financial information.
5. Financial Contributions Policy
A summary of the existing Financial Contributions provisions under the Timaru District Plan.
6. Revenue and Financing Policy
The Revenue and Financing Policy sets out the Council’s funding philosophy and how the Council will fund each of its activities and explains why. The policy provides ratepayers and customers with predictability and certainty about the sources for funding for the Council’s activities. This is a legislatively required policy.
In determining how activities are funded the Council is obliged to equitably share the costs of delivering services across different users as well as ensuring equity between current and future generation. In order to arrive at its chosen funding arrangements Council has to consider:
The community outcomes to which each activity primarily contributes
An analysis of who benefits from the activity
Over what period of time the benefits are delivered
Whether the activity is needed in response to the action(s) (or lack of action(s)) of some person or group
Whether it would be more prudent for the activity to be funded separately or included with other activities
Finally the Council must consider the overall impact of any allocation of liability for revenue needs on the community.
The Policy has been reviewed as part of the Long Term Plan 2018-28 development process and the following changes are proposed:
The removal of the Aquatic Centre targeted rate, with funding to be taken from the differentiated General rate and Uniform Annual General Charge to make this consistent with other leisure and recreation facilities
Timaru District Council Long term Plan 2018-2028: Supporting Information4
The removal of subsidised labour and rural fire activities due to these services no longer being provided by the Council
The addition of borrowing as a funding source for operating expenditure if deemed appropriate, targeted towards large projects (e.g. District Plan review)
Changes in private funding splits for some activities, the most significant being:
Airport (45-55% to 70-80%), due to additional private funding sourced from Airport parking
District Planning (20-30% to 10-20%), due to the level of general rate funding required for the district plan review
Safer Communities (70-80% to 80-90%), due to the majority of funding received via contract funding for Project Turnaround
Theatre Royal (10-20% to 0-10%), due to the anticipated impact on funding from closure of the Theatre for upgrading
Roading and Footpaths – splitting this into subsidised roading and other roading.
The addition of volumetric water charging as a funding source for urban supplies
Minor editing and grammatical changes.
7. Rates Remission and Postponement Policy
These policies define the circumstances in which the Council may remit or postpone rates. Remission of rates involves reducing the amount owing or waiving collection of rates altogether. Postponement of rates means that the payment of rates is not waived in the first instance, but delayed for a certain time or until certain events occur.
The Policy has been reviewed as part of the Long Term Plan 2018-28 development process and is now available for your feedback. The majority of the policy has been retained in its current form, but the following changes are proposed to the previous policy:
Inclusion of a remission policy for rating units that have Earthquake Prone Buildings.
Removal of the Aquatic centre rate as a separate targeted rate as it is proposed that the costs associated with the aquatic centre be incorporated within the Uniform Annual General Charge and General Rate which is consistent with other community facilities.
Minor changes for clarification.
8. Rating/Rates Discount Policy
Rates Policy - This outlines operational aspects of rates setting and collection.
Rates Discount Policy - This allows for a discount for the early payment of total rates that are identified in the rates assessment before the due date or dates for those rates in the current financial year.
Policies have been reviewed as part of the Long Term Plan 2018-28 development process and are now available for your feedback. No changes to the policies are proposed.
9. Proposed Fees and Charges 2018/19
This document outlines the proposed fees and charges for the 2018/19 year. Fees and charges are one of the ways the Council passes on some of the costs directly to those that benefit from Council services and facilities. This means those that benefit from these services pay for them. Most changes are minor. Fee changes are proposed in the following activities:
Cemeteries
Social Housing rents
Community Centres including Westend Hall and the Southern Trust Events Centre
Land Information Memorandums
Waste Minimisation
Sewer special waste charges
Water Supply meter charges
Small fee changes are proposed for the art gallery, museum, halls, and swimming pools. A revised framework for building control charges is also being introduced, with a number of changes.
Timaru District Council 50 Year Infrastructure Strategy
2018 – 2068

Quality Record Sheet
Timaru District Council 50 Year Infrastructure Strategy
2018 - 2068
Issue Information
Issue Purpose Final Draft
Issue Date 27 February 2018
Version Number 1.0
Authorisation
Timaru District Council Ashley Harper
Prepared By TDC Infrastructure Strategy Working Group
Reviewed By TDC Management
Date 27 February 2018
Reference No. Document #1082923

50 Year Infrastructure Strategy
22/02/2018 Document #1082923 Page 5 of 85
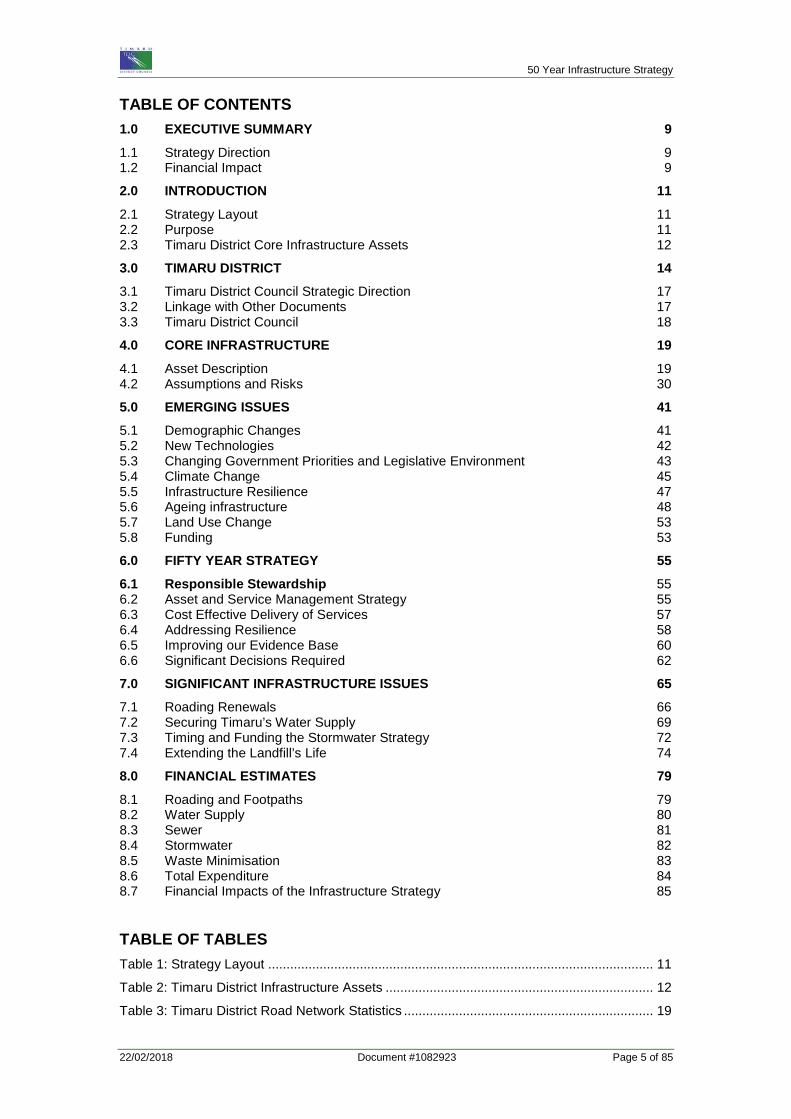
TABLE OF CONTENTS 1.0 EXECUTIVE SUMMARY 9
1.1 Strategy Direction 9 1.2 Financial Impact 9 2.0 INTRODUCTION 11
2.1 Strategy Layout 11 2.2 Purpose 11 2.3 Timaru District Core Infrastructure Assets 12 3.0 TIMARU DISTRICT 14
3.1 Timaru District Council Strategic Direction 17 3.2 Linkage with Other Documents 17 3.3 Timaru District Council 18 4.0 CORE INFRASTRUCTURE 19
4.1 Asset Description 19 4.2 Assumptions and Risks 30 5.0 EMERGING ISSUES 41
5.1 Demographic Changes 41 5.2 New Technologies 42 5.3 Changing Government Priorities and Legislative Environment 43 5.4 Climate Change 45 5.5 Infrastructure Resilience 47 5.6 Ageing infrastructure 48 5.7 Land Use Change 53 5.8 Funding 53 6.0 FIFTY YEAR STRATEGY 55
6.1 Responsible Stewardship 55 6.2 Asset and Service Management Strategy 55 6.3 Cost Effective Delivery of Services 57 6.4 Addressing Resilience 58 6.5 Improving our Evidence Base 60 6.6 Significant Decisions Required 62 7.0 SIGNIFICANT INFRASTRUCTURE ISSUES 65
7.1 Roading Renewals 66 7.2 Securing Timaru’s Water Supply 69 7.3 Timing and Funding the Stormwater Strategy 72 7.4 Extending the Landfill’s Life 74 8.0 FINANCIAL ESTIMATES 79
8.1 Roading and Footpaths 79 8.2 Water Supply 80 8.3 Sewer 81 8.4 Stormwater 82 8.5 Waste Minimisation 83 8.6 Total Expenditure 84 8.7 Financial Impacts of the Infrastructure Strategy 85
TABLE OF TABLES Table 1: Strategy Layout ......................................................................................................... 11
Table 2: Timaru District Infrastructure Assets ......................................................................... 12
Table 3: Timaru District Road Network Statistics .................................................................... 19
50 Year Infrastructure Strategy
Page 6 of 85 Document #1082923 22/02/2018
Table 4: Bridges and Drainage Statistics ................................................................................ 19
Table 5: Significant Assumptions ............................................................................................ 30 Table 6: Data Improvements ................................................................................................... 60
Table 7: Significant Decisions ................................................................................................. 62
Table 8: Roading and Footpaths Significant Issue - Renewals ............................................... 66
Table 9: Water Supply Significant Issue .................................................................................. 69
Table 10: Stormwater Significant Issue ................................................................................... 72
Table 11: Waste Minimisation Significant Issue ...................................................................... 74
TABLE OF FIGURES Figure 1: Timaru District’s Economic Diversity ........................................................................ 15
Figure 2: Timaru District Map .................................................................................................. 16
Figure 3: Infrastructure Strategy Linkage with other Documents ............................................ 17
Figure 4: Timaru District Council Bridges Remaining Useful Life ........................................... 20
Figure 5: Timaru District Council Culvert Remaining Useful Life ............................................ 20 Figure 6: Bridge and Culvert Replacement Value ................................................................... 21
Figure 7: Condition Length of Kerb and Channels by Age Band ............................................ 21
Figure 8: Age Distribution of Kerb and Channel ...................................................................... 22
Figure 9: Quantity of Footpath by Age showing Condition ...................................................... 22
Figure 10: Footpath Renewal. ................................................................................................. 23
Figure 11: Water Supply Reticulation Network Profile ............................................................ 25 Figure 12: Sewer Reticulation Network Profile ........................................................................ 26
Figure 13: Stormwater Reticulation Network Profile ................................................................ 28
Figure 14: Projected Population of the Timaru District 2013-2043, by projection variant ....... 41
Figure 15: Projected Number of Households in the Timaru District 2013-2038, by projection variant ...................................................................................................................................... 42 Figure 16: Age Profile of the Water Supply Network ............................................................... 50
Figure 17: Age Profile of the Water Supply Network - Cost .................................................... 50
Figure 18: Age Profile of the Sewer Network .......................................................................... 51
Figure 19: Age Profile of the Sewer Network - Cost ............................................................... 51
Figure 20: Age Profile of the Stormwater Network ................................................................. 52
Figure 21: Age Profile of the Stormwater Network - Cost ...................................................... 52 Figure 22: Projected Capital Expenditure - Roads and Footpaths ......................................... 79
Figure 23: Projected Capital Expenditure – Water Supply ..................................................... 80
Figure 24: Projected Capital Expenditure - Sewer ................................................................. 81
Figure 25: Projected Capital Expenditure - Stormwater ......................................................... 82
Figure 26: Projected Capital Expenditure - Waste Minimisation ............................................ 83
Figure 27: Projected Capital Expenditure - Infrastructure Assets .......................................... 84 Figure 28: Projected Operational Expenditure – Infrastructure Assets .................................. 85

Working Template 50 Year Infrastructure Strategy
Page 7 of 85 Document# 1082923 22/02/2018

50 Year Infrastructure Strategy
22/02/2018 Document #1082923 Page 9 of 85
1.0 EXECUTIVE SUMMARY
Welcome to the second Timaru District Council Infrastructure Strategy.
Section 101B of the Local Government Act 2002 requires the Council to develop an Infrastructure Strategy (IS). The first IS was developed for the 2015-25 Long Term Plan and this experience has been used to refine the 2018-68 IS.
Council decided during 2017 to extend the IS to 50 years and to add the Waste Minimisation activity. As a minimum, the IS must cover Council’s water, sewer, stormwater and roading activities for 30 years.
The purpose of the IS is to:
• Identify significant infrastructure issues; • Identify principal options for managing those issues; • Identify the implications of the options.
In addition, the Council must outline how it intends to manage its infrastructure assets taking into account the need to:
• Renew or replace existing assets; • Respond to growth or decline in demand; • Increase or decrease in levels of service; • Maintain or improve public health and environmental outcomes; • Provide for infrastructure resilience.
1.1 Strategy Direction
The strategy includes an overriding direction of ‘Responsible Stewardship’ - “ensuring responsible stewardship of our key infrastructure assets to meet the needs of tomorrow’s community”. It aims to ensure the district’s infrastructure is meeting the community’s needs aligned with the Council’s Strategic Direction.
It considers potential future factors that will affect the Council’s infrastructure, particularly the ageing of infrastructure, societal change and resilience. The strategy sets out the Council’s priorities as:
• Timely and cost effective maintenance of infrastructure to optimise its life • Replacing ageing infrastructure in a timely manner • At a minimum, maintaining existing levels of service • Managing the impacts of growth and land use change in a sustainable way • Compliance with legislative requirements • Providing long term affordable services • Managing the impact of technology changes
The IS outlines four key future issues, as follows:
• Roading renewals • Securing Timaru’s water supply • Timing and Funding the Stormwater strategy • Extending the life of the Redruth Landfill.
Options are presented relating to these issues and the Council’s preferred option is included in the overall financial impact of the Strategy.
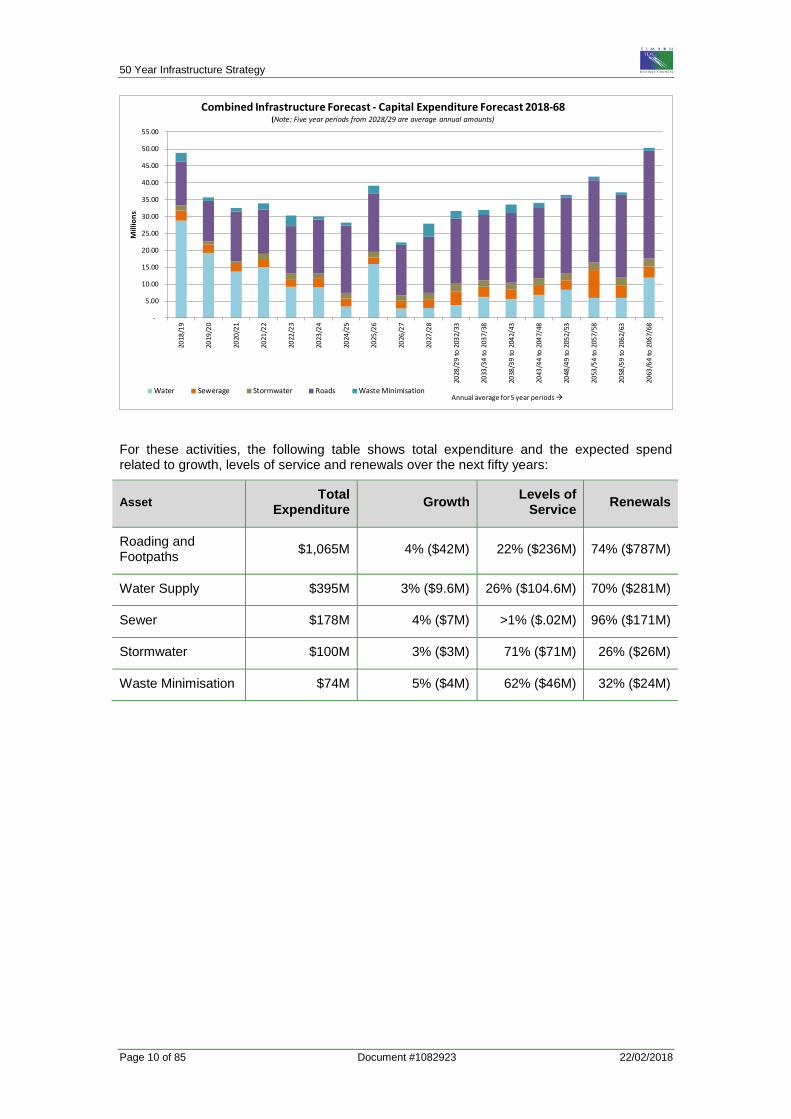
1.2 Financial Impact Capital expenditure of $1.8 billion is included in the proposed draft IS over the 50 years, of which $329 million is currently incorporated into the proposed 10 year budget. Current loan levels are forecast to peak at $156 million in 2021/22. This peak is well within the limits prescribed within the liability management policy.
The graph below shows the planned expenditure (including inflation) across the five activities included in the Strategy:
50 Year Infrastructure Strategy
Page 10 of 85 Document #1082923 22/02/2018
For these activities, the following table shows total expenditure and the expected spend related to growth, levels of service and renewals over the next fifty years:
Asset Total Expenditure Growth Levels of
Service Renewals
Roading and Footpaths $1,065M 4% ($42M) 22% ($236M) 74% ($787M)
Water Supply $395M 3% ($9.6M) 26% ($104.6M) 70% ($281M)
Sewer $178M 4% ($7M) >1% ($.02M) 96% ($171M)
Stormwater $100M 3% ($3M) 71% ($71M) 26% ($26M)
Waste Minimisation $74M 5% ($4M) 62% ($46M) 32% ($24M)
-
5.00
10.00
15.00
20.00
25.00
30.00
35.00
40.00
45.00
50.00
55.00
2018
/19
2019
/20
2020
/21
2021
/22
2022
/23
2023
/24
2024
/25
2025
/26
2026
/27
2027
/28
2028
/29
to 2
032/
33
2033
/34
to 2
037/
38
2038
/39
to 2
042/
43
2043
/44
to 2
047/
48
2048
/49
to 2
052/
53
2053
/54
to 2
057/
58
2058
/59
to 2
062/
63
2063
/64
to 2
067/
68
Mill
ions
Combined Infrastructure Forecast - Capital Expenditure Forecast 2018-68 (Note: Five year periods from 2028/29 are average annual amounts)
Water Sewerage Stormwater Roads Waste MinimisationAnnual average for 5 year periods
Working Template 50 Year Infrastructure Strategy
Page 11 of 85 Document# 1082923 22/02/2018
2.0 INTRODUCTION
This is Timaru District Council’s second Infrastructure Strategy. It has been prepared from Council’s 2018 suite of Activity Management Plans and forms part of the Long Term Plan.
The issues discussed reflect the current legislative environment and the communities’ priorities across the district.
The financial forecasts are estimates and the reliability of the forecasts decreases beyond ten years and towards the fifty-year planning horizon.
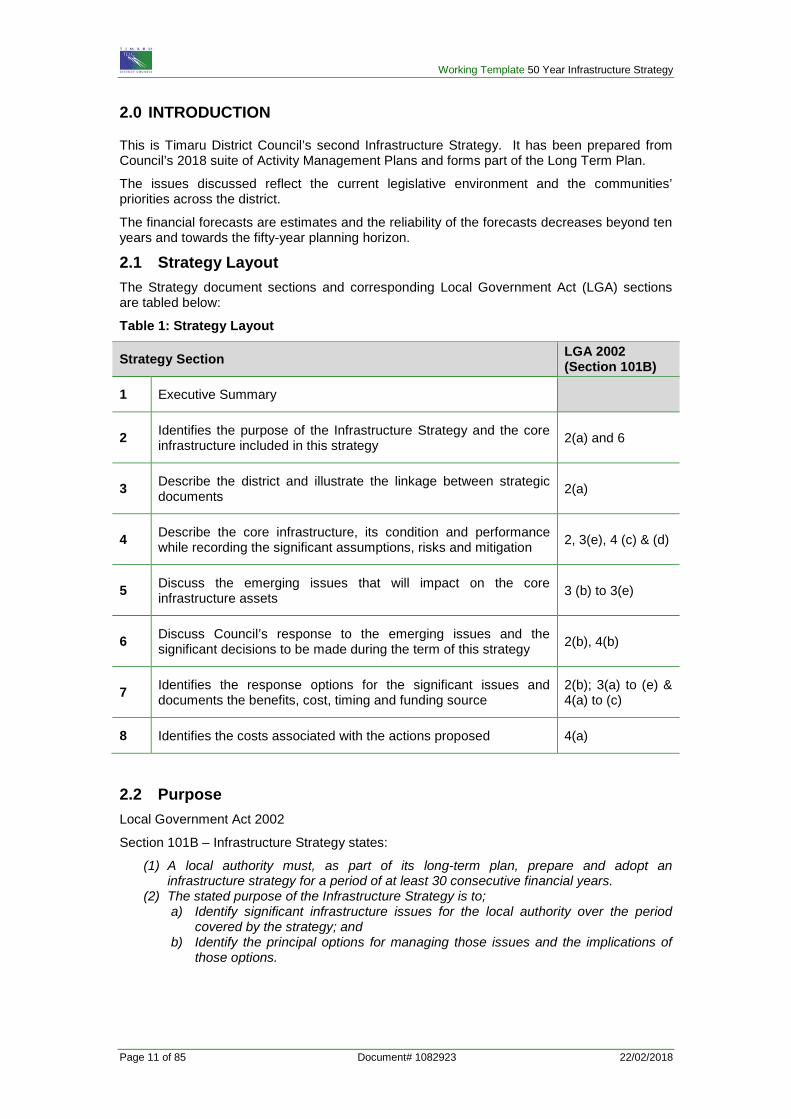
2.1 Strategy Layout The Strategy document sections and corresponding Local Government Act (LGA) sections are tabled below:
Table 1: Strategy Layout
Strategy Section LGA 2002 (Section 101B)
1 Executive Summary
2 Identifies the purpose of the Infrastructure Strategy and the core infrastructure included in this strategy 2(a) and 6
3 Describe the district and illustrate the linkage between strategic documents 2(a)
4 Describe the core infrastructure, its condition and performance while recording the significant assumptions, risks and mitigation 2, 3(e), 4 (c) & (d)
5 Discuss the emerging issues that will impact on the core infrastructure assets 3 (b) to 3(e)
6 Discuss Council’s response to the emerging issues and the significant decisions to be made during the term of this strategy 2(b), 4(b)
7 Identifies the response options for the significant issues and documents the benefits, cost, timing and funding source
2(b); 3(a) to (e) & 4(a) to (c)
8 Identifies the costs associated with the actions proposed 4(a)
2.2 Purpose Local Government Act 2002
Section 101B – Infrastructure Strategy states:
(1) A local authority must, as part of its long-term plan, prepare and adopt an infrastructure strategy for a period of at least 30 consecutive financial years.
(2) The stated purpose of the Infrastructure Strategy is to; a) Identify significant infrastructure issues for the local authority over the period
covered by the strategy; and b) Identify the principal options for managing those issues and the implications of
those options.
50 Year Infrastructure Strategy
Page 12 of 85 Document #1082923 22/02/2018
Section (6) defines infrastructure assets as including:
a) existing or proposed assets to be used to provide services by or on behalf of the local authority in relation to the following groups of activities:
i. water supply: ii. sewerage and the treatment and disposal of sewage: iii. stormwater drainage: iv. flood protection and control works: v. the provision of roads and footpaths; and
b) any other assets that the local authority, in its discretion, wishes to include in the strategy.
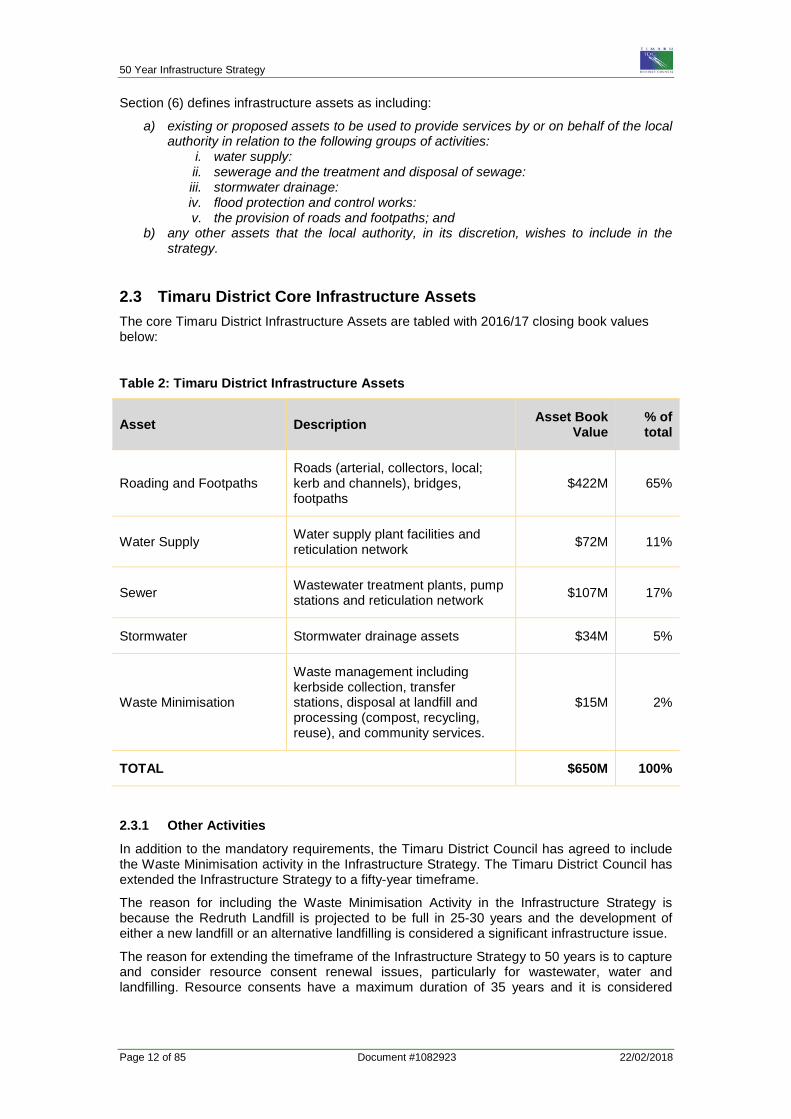
2.3 Timaru District Core Infrastructure Assets The core Timaru District Infrastructure Assets are tabled with 2016/17 closing book values below:
Table 2: Timaru District Infrastructure Assets
Asset Description Asset Book Value
% of total
Roading and Footpaths Roads (arterial, collectors, local; kerb and channels), bridges, footpaths
$422M 65%
Water Supply Water supply plant facilities and reticulation network $72M 11%
Sewer Wastewater treatment plants, pump stations and reticulation network $107M 17%
Stormwater Stormwater drainage assets $34M 5%
Waste Minimisation
Waste management including kerbside collection, transfer stations, disposal at landfill and processing (compost, recycling, reuse), and community services.
$15M 2%
TOTAL $650M 100%
2.3.1 Other Activities In addition to the mandatory requirements, the Timaru District Council has agreed to include the Waste Minimisation activity in the Infrastructure Strategy. The Timaru District Council has extended the Infrastructure Strategy to a fifty-year timeframe.
The reason for including the Waste Minimisation Activity in the Infrastructure Strategy is because the Redruth Landfill is projected to be full in 25-30 years and the development of either a new landfill or an alternative landfilling is considered a significant infrastructure issue.
The reason for extending the timeframe of the Infrastructure Strategy to 50 years is to capture and consider resource consent renewal issues, particularly for wastewater, water and landfilling. Resource consents have a maximum duration of 35 years and it is considered

Working Template 50 Year Infrastructure Strategy
Page 13 of 85 Document# 1082923 22/02/2018
prudent to include any resource consent renewals within the Infrastructure Strategy over a longer than 30 year timeframe.
50 Year Infrastructure Strategy
22/02/2018 Document #1082923 Page 14 of 85
3.0 TIMARU DISTRICT
Geography & Climate Timaru District covers 2,737 square kilometres of South Canterbury. Two rivers naturally define its northern and southern boundaries, the Rangitata and Pareora, with the district stretching along the gentle curve of the South Canterbury coastline. Timaru District is the fourth largest district by population and sixth largest by area in the Canterbury region. It has a population density of approximately 16.5 persons per square kilometre. The district has a temperate climate, with Timaru getting an annual average of 1,826 hours of sunshine and 573mm of rain. The district includes a variety of geographical environments ranging from densely populated low lying urban areas to remote sparsely populated mountain areas. Demographics The estimated resident population of the Timaru District as at June 2017 was 47,100. The 2013 Census population was 43,929. The District’s population is projected to increase to 49,400 (+8.8%) by 2028, peaking in 2038 at 50,200. Population Growth
Population growth is projected to occur at around a rate of 0.6% annually until 2028. Based on the medium projection, the rate of natural increase will become negative from around 2028, meaning there are more deaths than births. This reflects the age makeup of the Timaru District population. Growth from 2028 will be reliant on net migration.1 Ageing population
The District’s population is expected to continue to age into the future. The 65+ age group will grow from 20.1% of the population in 2013 to 28.2% in 2028 and 32.9% in 2043. In population numbers, between 2013 and 2028 this represents an increase of 4,780 people aged over 65. By 2043, the total increase in those aged 65+ will be 7,350. It is noted that this forecast growth is at a slower rate than previously forecast. The population aged over 65 will also get progressively older, with those aged 75+ representing 50.1% of the total 65+ age groups in 2028 (2013: 46.7%) and 61.1% in 2043. Those aged 85+ will represent 13.9% of the total 65+ age groups in 2028 (2013: 13.5%) rising to 21.1% in 2043. Economy The Timaru economy is strongly influenced by its agricultural heritage. Agriculture is diverse, including dairy, sheep and deer farming and land suitable for all kinds of cropping. Significant manufacturing operations are located in the district, including Fonterra’s Clandeboye dairy factory, McCain’s food processing plant, DB Mainland Breweries, NZ Light Leathers, Alliance Group Smithfield plant, Silver Fern Farms Pareora plant and Barkers Fruit Processors. The district is centrally located for distribution and PrimePort Timaru provides a gateway for exports and imports.
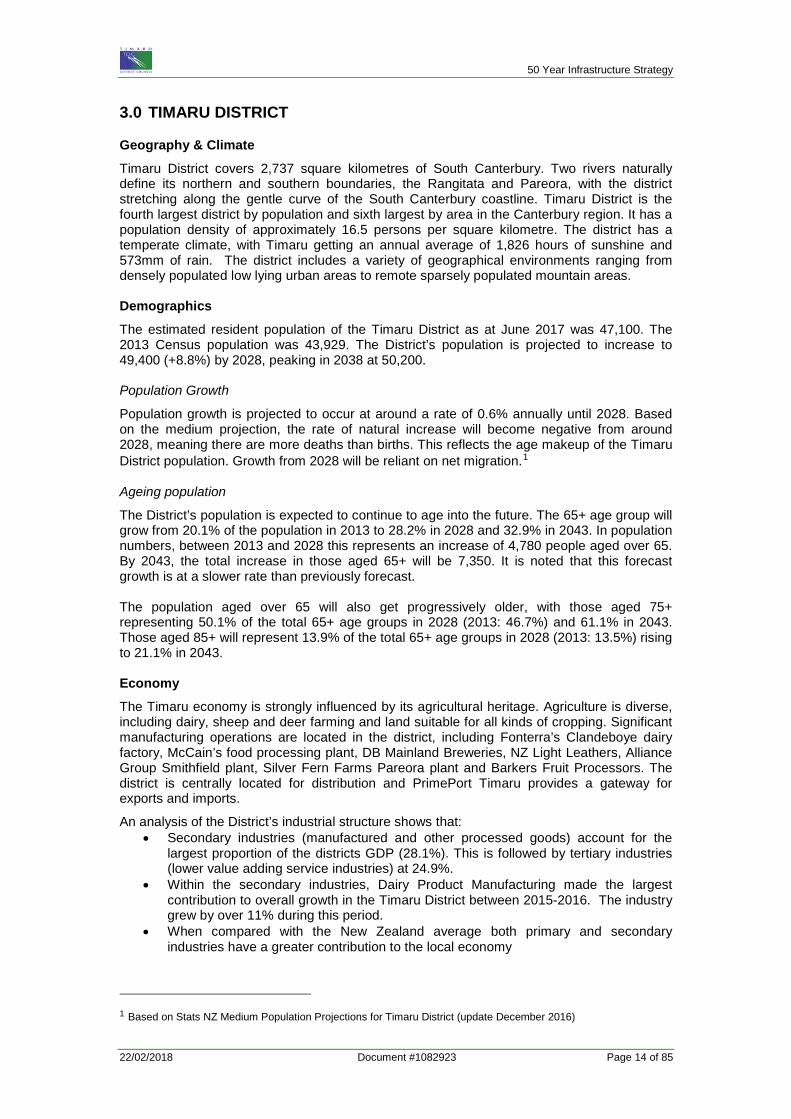
An analysis of the District’s industrial structure shows that: • Secondary industries (manufactured and other processed goods) account for the
largest proportion of the districts GDP (28.1%). This is followed by tertiary industries (lower value adding service industries) at 24.9%.
• Within the secondary industries, Dairy Product Manufacturing made the largest contribution to overall growth in the Timaru District between 2015-2016. The industry grew by over 11% during this period.
• When compared with the New Zealand average both primary and secondary industries have a greater contribution to the local economy
1 Based on Stats NZ Medium Population Projections for Timaru District (update December 2016)
Working Template 50 Year Infrastructure Strategy
Page 15 of 85 Document# 1082923 22/02/2018
Figure 1: Timaru District’s Economic Diversity
Employment Employment in the district is strong, Total employment averaged 24,926 in the year to March 2016, up 0.2% from a year earlier. Sectors that make the largest contribution to employment are manufacturing (18.1%), Heath Care and Social Assistance (11.3%), Retail Trade (10.8%), and Agriculture, Forestry and Fishing (10.2%)2.
Our Communities Timaru is the largest community, housing nearly two thirds of the total population of the district (27,038). The next largest community is Temuka (4,050), followed by Geraldine (2,301) and Pleasant Point (1,278)3. Our communities are well serviced with education, health and recreational services along with a vast range of clubs and organisations. The South Canterbury District Health Board is a major health provider, with the Ara Institute of Canterbury providing local tertiary educational services. Our Environment The diverse landscapes of the Timaru District include rolling downlands, tussock land, coastal plains and wetlands, forest remnants, river gorges and rugged mountain ranges. The coastal plains to the north and downlands to the south are highly modified for intensive cropping, meat, wool and dairy production. Pasture and exotic woodlots dominate the modified hills and downs from Peel Forest to Cave, with occasional shrub and forest remnants. Limestone outcrops and volcanic sediment add to the diversity of the landforms. The district is also defined by a number of waterways, including the Orari, Opihi, Rangitata, Waihi and Pareora Rivers. The Rangitata and Pareora physically define the district and all waterways are highly valued by the community for their recreational, social, natural amenity and economic values. The district has a number of outstanding natural features and landscapes, as well as areas of
2 Based on Timaru District Economic Profile 2016 – Infometrics 3 Based on 2013 census
50 Year Infrastructure Strategy
Page 16 of 85 Document #1082923 22/02/2018
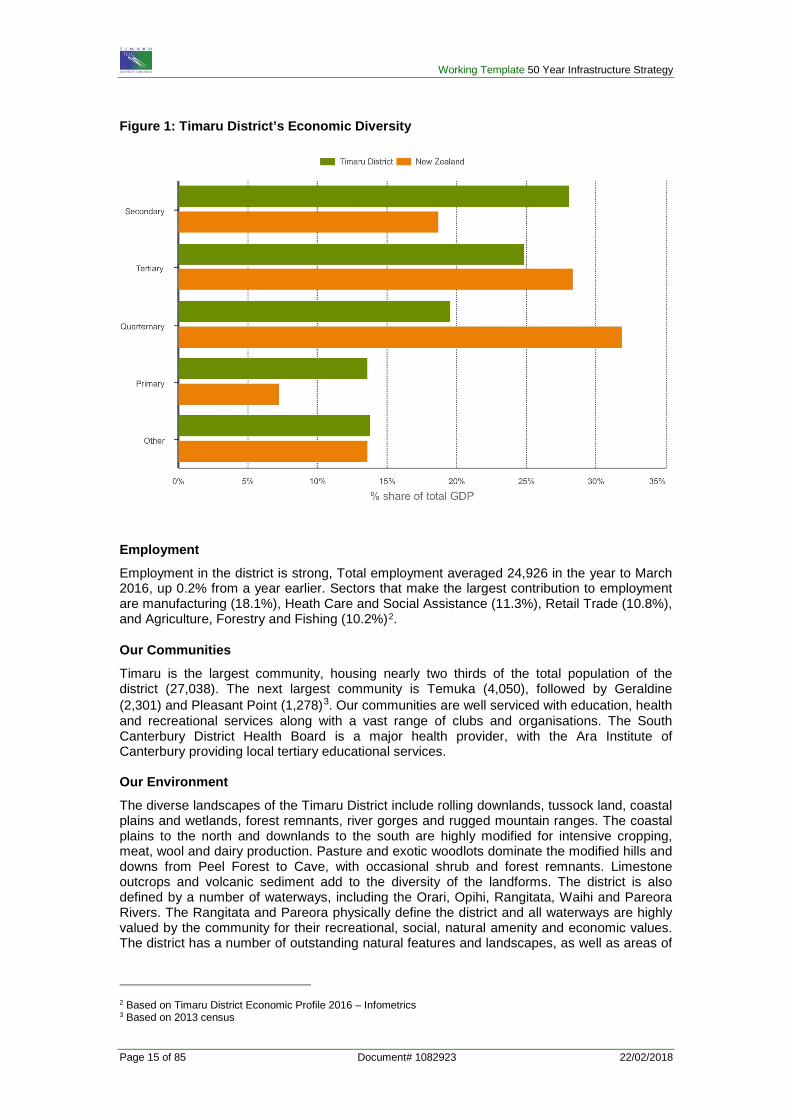
significant native vegetation habitats of native fauna. There are also numerous important heritage sites, buildings and places. Figure 2 shows a map of the district.
Figure 2: Timaru District Map
Working Template 50 Year Infrastructure Strategy
Page 17 of 85 Document# 1082923 22/02/2018
3.1 Timaru District Council Strategic Direction Vision
Fantastic Lifestyle – Thriving Economy – Strong Identity – Inspiring Leadership
• Fantastic, sustainable lifestyle second to none • Thriving and innovative economy where opportunities abound • Strong and enviable reputation and identity • Inspiring, people-focused leadership
The Timaru District Council’s Long Term Plan includes the Council’s strategic direction. This encompasses a Vision, Community Outcomes and Strategic Priorities. The Strategic Direction can be viewed in full in the Long Term Plan.
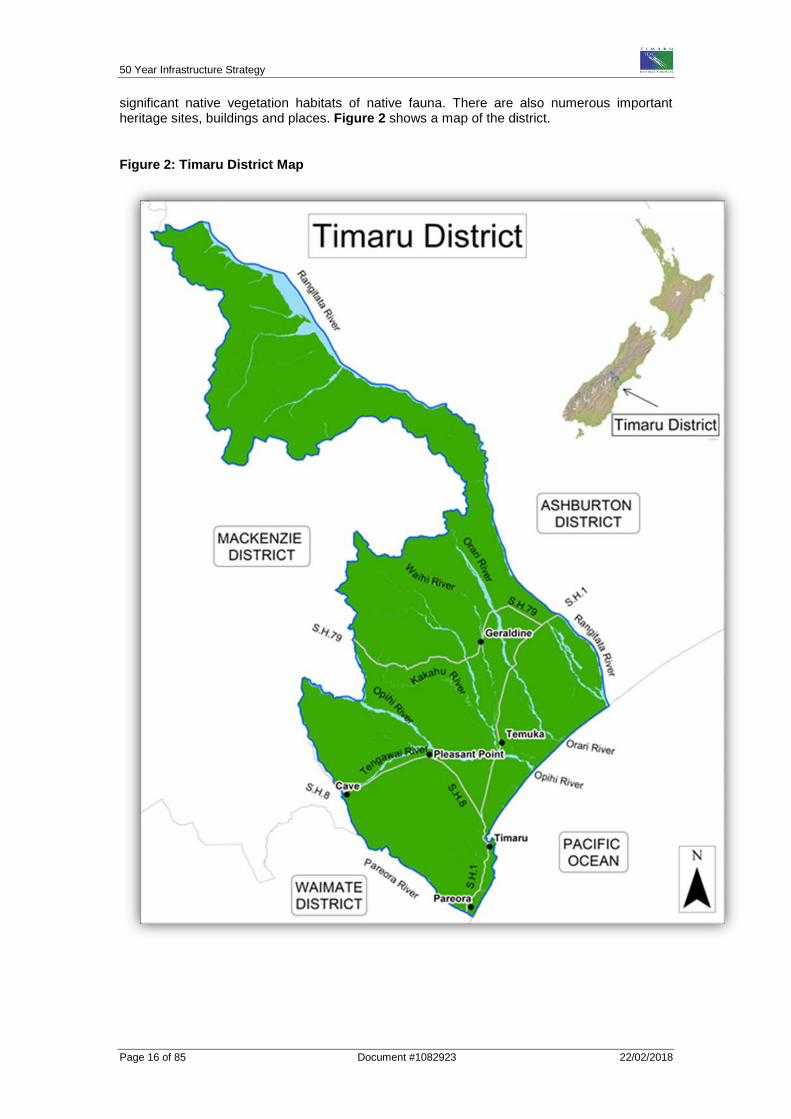
3.2 Linkage with Other Documents The Infrastructure Strategy (IS) and Financial Strategy (FS) feed into the Long Term Plan as foundation documents. Planning for the activities included in the IS is covered within the relevant Activity Management Plan, as well as being informed by other documents such as the Growth Management Strategy and other strategies and legislation as shown in Figure Three.
Figure 3: Infrastructure Strategy Linkage with other Documents
Financial Strategy The Financial Strategy defines the financial direction of the Council over the 10-year period of a Long Term Plan. It provides direction, drawn from a balancing of ratepayer affordability against community needs and aspirations.
50 Year Infrastructure Strategy
Page 18 of 85 Document #1082923 22/02/2018
The relationship between the IS and FS is two way. The FS presents a balance between ratepayer affordability and the following matters that arise from the IS:
• the need to maintain, replace and renew core infrastructure, • the obligation under law to build new infrastructure to meet new standards; and • a desire to respond to the aspirations of the community for new and improved
community infrastructure. Significance and Engagement Policy Council’s Significance and Engagement Policy is the mechanism that underpins Council’s sustainable decision-making. The purpose of the policy is to:
• enable the Council and its communities to identify the degree of significance attached to particular issues, proposals, assets, decisions and activities
• provide clarity about how and when communities can expect to be engaged in decisions about different issues, assets or other matters
• inform the Council from the beginning of a decision-making process about: o the extent of any public engagement that is expected before a particular
decision is made, and o the form or type of engagement required.
With the exception of the Waste Minimisation activity, the assets and networks included in this IS are listed as Strategic Assets in the Significance and Engagement Policy – namely the Roading network as a whole, Wastewater and Stormwater networks as a whole, and Water supply networks as a whole. The policy states that Council will use the Special Consultative Procedure in relation to any decisions to transfer the ownership or control of a strategic asset to or from Council, as required by the Local Government Act. While the Waste Minimisation activity is not listed in the policy as a strategic asset, any decisions relating to the ownership or control of the activity would trigger many of the significance criteria used to determine the level of community engagement required before decisions are made and potentially the Special Consultative procedure.
3.3 Timaru District Council Timaru District Council was formed in 1989 following the amalgamation of the Timaru City Council, Geraldine Borough Council, Strathallan County Council and the Temuka Borough Council.
Currently the Timaru District Council has an elected Mayor and nine Councillors elected over three wards:
• Timaru Ward - 6 Councillors • Pleasant Point-Temuka Ward - 2 Councillors • Geraldine Ward - 1 Councillor
There are three Community Boards in Geraldine, Pleasant Point and Temuka with 16 elected board members.
Working Template 50 Year Infrastructure Strategy
Page 19 of 85 Document# 1082923 22/02/2018
4.0 CORE INFRASTRUCTURE
4.1 Asset Description 4.1.1 Roading and Footpaths The Timaru District’s land transport network comprise of roads, bridges, drainage (e.g. culverts), and footpaths.
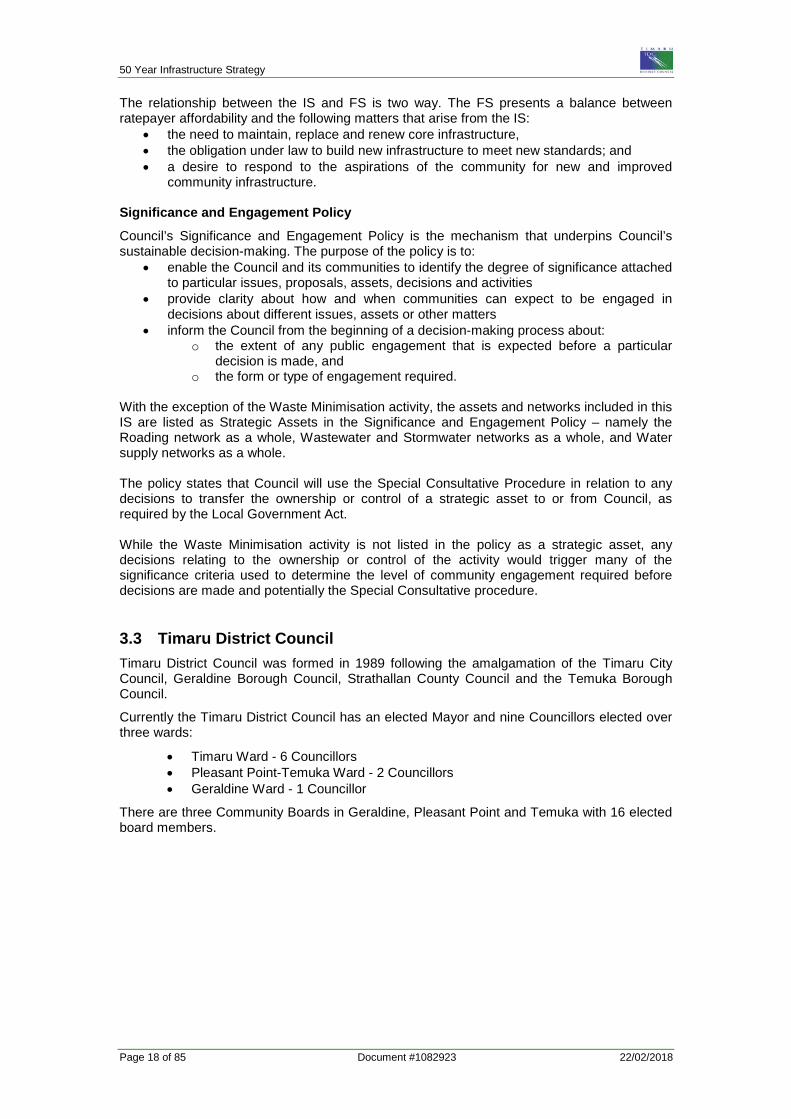
Roads A summary of information on the district’s road network is provided in Table 3 below, by network length (km) and journeys travelled (million vehicle km) based on ONRC performance measures reporting tool (as of October 2017).
Table 3: Timaru District Road Network Statistics
The pavement surfacing on the network is mostly chipseal (96%). However, over a quarter of the highest class routes (Primary Collector, Arterial and Regional) are surfaced in asphalt. Condition data available on the network is limited to visual condition rating, roughness, historical maintenance cost and some pavement strength data. Therefore, data available is at moderate confidence. Council is looking at doing High Speed Data (HSD) capture over the years to improve data confidence.
Based on the latest condition rating survey, cracking is the primary defect. Where cracking is observed, over 40% occurs on asphalt-surfaced pavements. This data suggests there is no observed defect on the majority (>90%) of the network, leading to the expectation the chipseal network is currently in good surface health. The asphalt-surfaced routes are in average condition.
The Amenity measure within NZTA’s ONRC (One Network Road Classification) framework assesses user comfort over the network based on roughness values. The rural network has displayed very smooth travel and is performing well against expectation. However, the urban network is not meeting Amenity measures – specifically Peak Roughness with almost 10% of Urban length exceeding roughness thresholds (ONRC allows up to 5% exceedance).
Council has undertaken FWD (Falling Weight Deflectormeter) testing to ascertain the remaining useful lives of all Access road are above HPMV (High Productivity Motor Vehicles) routes and all Primary Collector (rural) are above ONRC classified roads. High Speed Data (HSD) testing is now proposed in order to provide better asset condition information of the roads. The potential impact of the moderate data confidence in road pavements is that the condition of assets and rate of deterioration is based on best practice assumptions (pavement age), rather than actual condition data. Improved data will better inform decision-making and provide greater confidence in long-term renewal requirements.
Bridges
The information in Table 4 is as at May 2017, and includes stormwater kerb and channels.
Table 4: Bridges and Drainage Statistics
Asset Quantity Asset Quantity
Road Bridges 280 Drainage Facilities
One lane 139 Catchpits, soak pits, sumps 3,226
50 Year Infrastructure Strategy
Page 20 of 85 Document #1082923 22/02/2018
Asset Quantity Asset Quantity
Weight restricted
5 Culverts, side culverts 3,666
Timber bridges (road and foot)
37 Fords (Concrete, natural ground)
135
Footpaths 311.755 km Drains (Subsoil, cut-offs, other channels)
2,801
SW Channel – Kerb and Channel
398 km Others 17
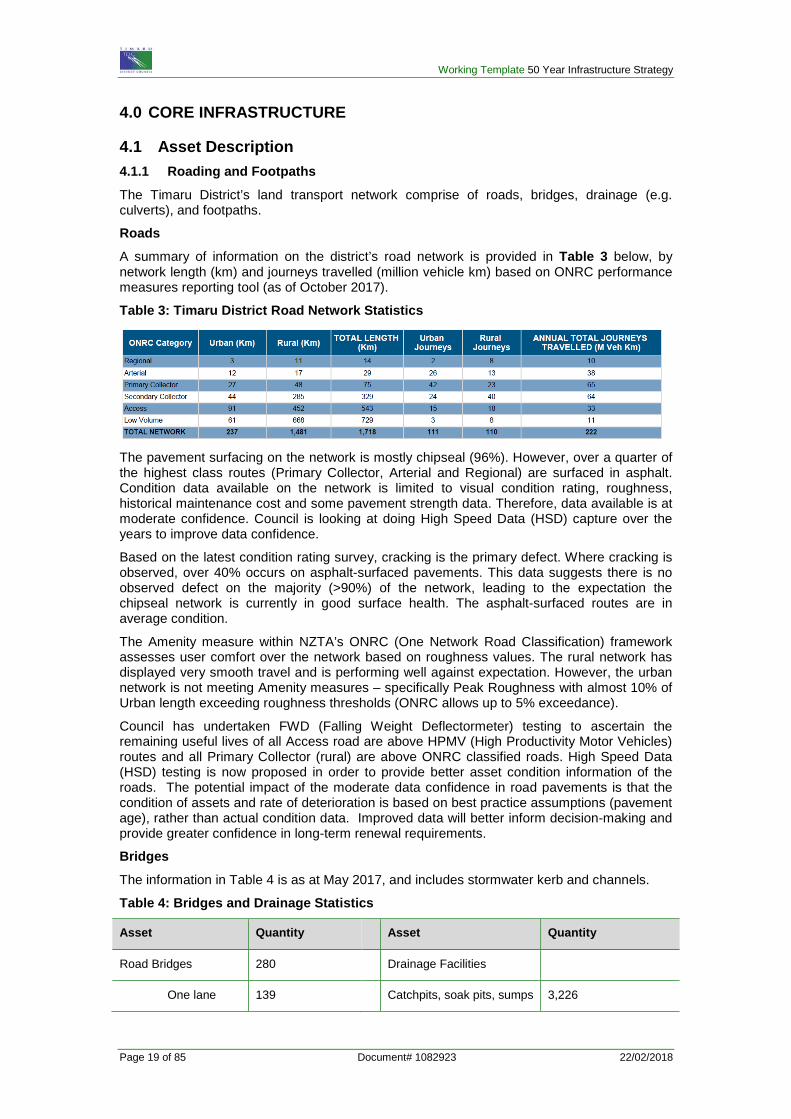
Figure 4 and Figure 5 illustrate the remaining useful life of bridges and major culverts in the District, based on current usage. Information presented is as at September 2015 (Doc #983990) and excludes Footbridges and Stock Underpasses. Assessments are conducted every three years, with the next assessment due in 2018.
The 2015/16 bridge structural inspection report completed by Opus Consultants identified 21 structures that require significant structural component replacements or full bridge renewal within the next 10 years. To date five of these have been renewed or removed. A further ten bridges need to be renewed and six require structural component replacements... The structural component replacements work extends the remaining useful life of the bridge structure and defers full bridge replacement.
Figure 4: Timaru District Council Bridges Remaining Useful Life
Figure 5: Timaru District Council Culvert Remaining Useful Life
Working Template 50 Year Infrastructure Strategy
Page 21 of 85 Document# 1082923 22/02/2018
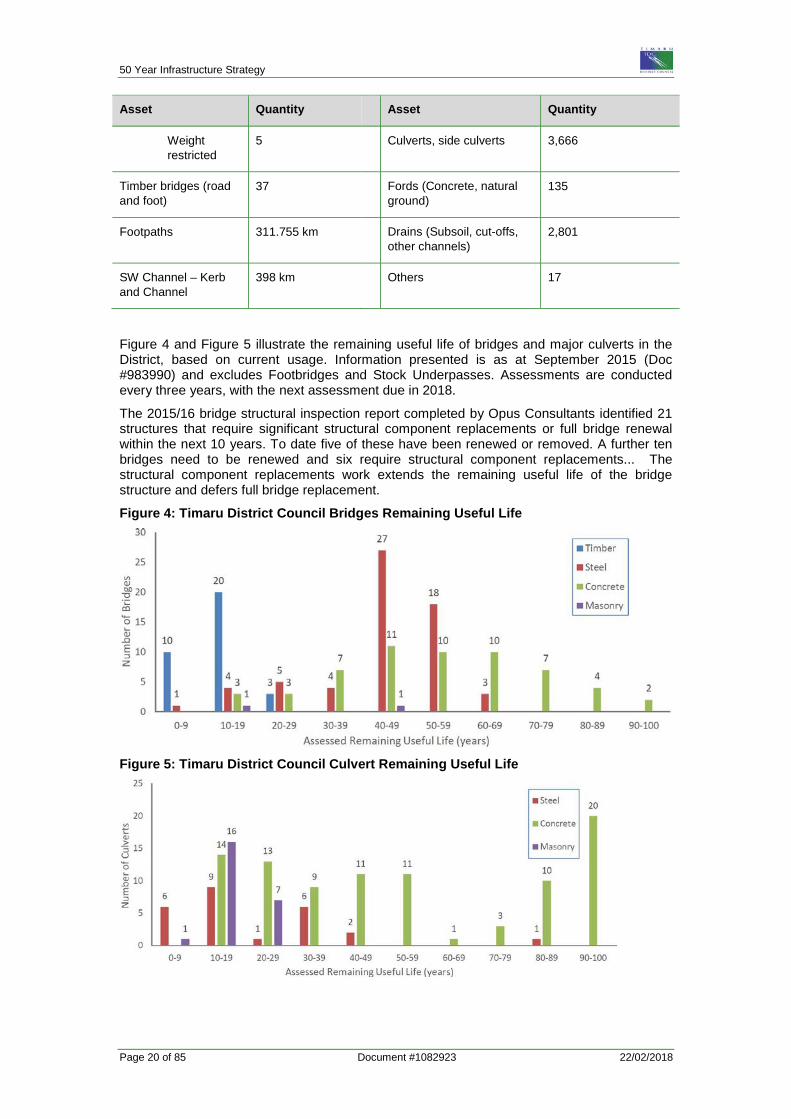
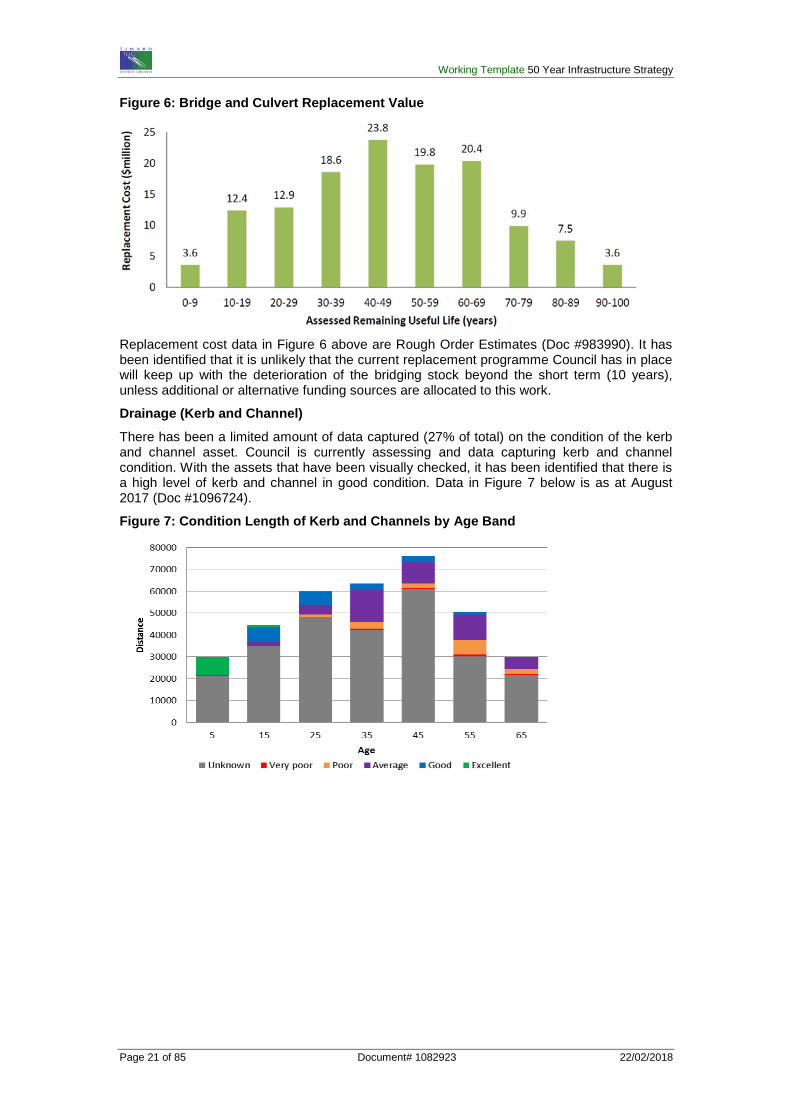
Figure 6: Bridge and Culvert Replacement Value
Replacement cost data in Figure 6 above are Rough Order Estimates (Doc #983990). It has been identified that it is unlikely that the current replacement programme Council has in place will keep up with the deterioration of the bridging stock beyond the short term (10 years), unless additional or alternative funding sources are allocated to this work.
Drainage (Kerb and Channel) There has been a limited amount of data captured (27% of total) on the condition of the kerb and channel asset. Council is currently assessing and data capturing kerb and channel condition. With the assets that have been visually checked, it has been identified that there is a high level of kerb and channel in good condition. Data in Figure 7 below is as at August 2017 (Doc #1096724).
Figure 7: Condition Length of Kerb and Channels by Age Band
50 Year Infrastructure Strategy
Page 22 of 85 Document #1082923 22/02/2018
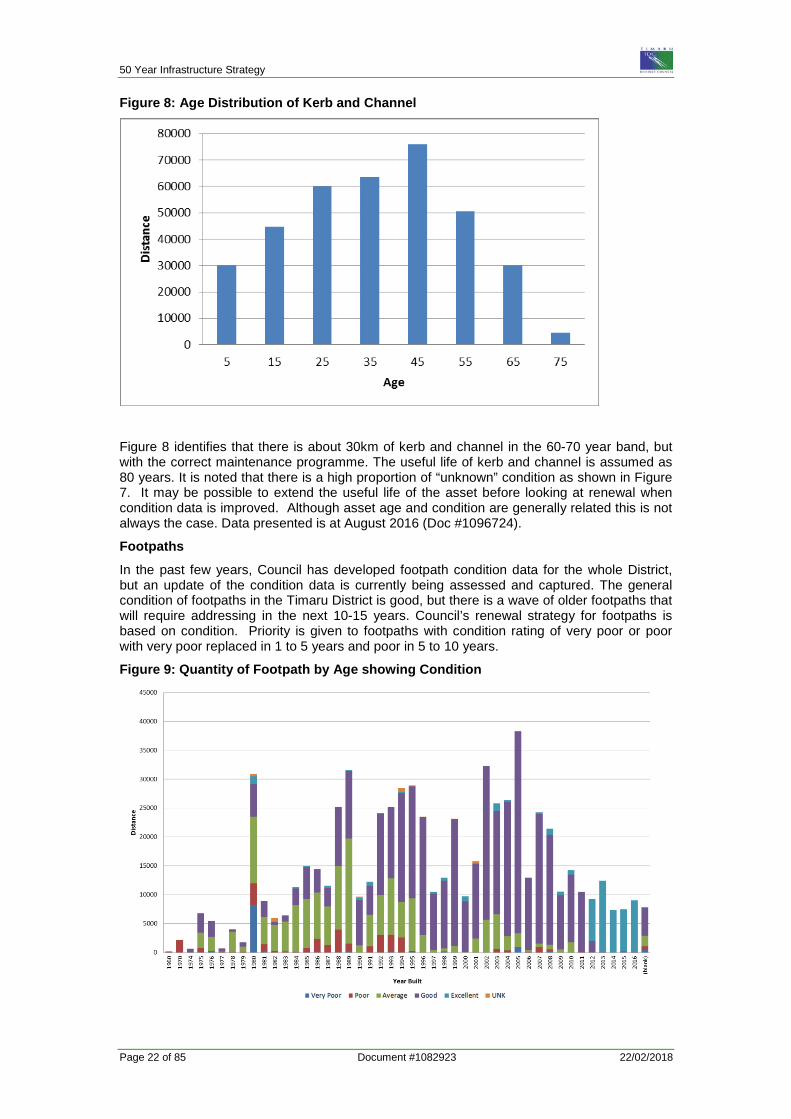
Figure 8: Age Distribution of Kerb and Channel
Figure 8 identifies that there is about 30km of kerb and channel in the 60-70 year band, but with the correct maintenance programme. The useful life of kerb and channel is assumed as 80 years. It is noted that there is a high proportion of “unknown” condition as shown in Figure 7. It may be possible to extend the useful life of the asset before looking at renewal when condition data is improved. Although asset age and condition are generally related this is not always the case. Data presented is at August 2016 (Doc #1096724).
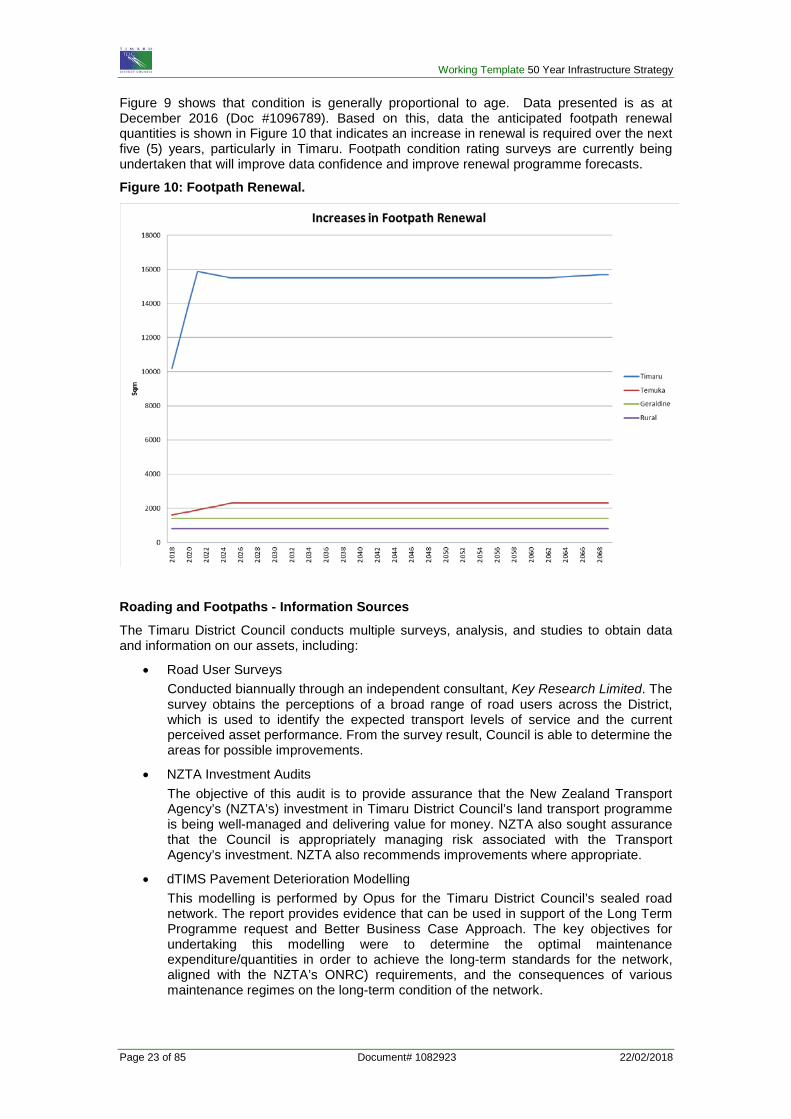
Footpaths In the past few years, Council has developed footpath condition data for the whole District, but an update of the condition data is currently being assessed and captured. The general condition of footpaths in the Timaru District is good, but there is a wave of older footpaths that will require addressing in the next 10-15 years. Council’s renewal strategy for footpaths is based on condition. Priority is given to footpaths with condition rating of very poor or poor with very poor replaced in 1 to 5 years and poor in 5 to 10 years.
Figure 9: Quantity of Footpath by Age showing Condition
Working Template 50 Year Infrastructure Strategy
Page 23 of 85 Document# 1082923 22/02/2018
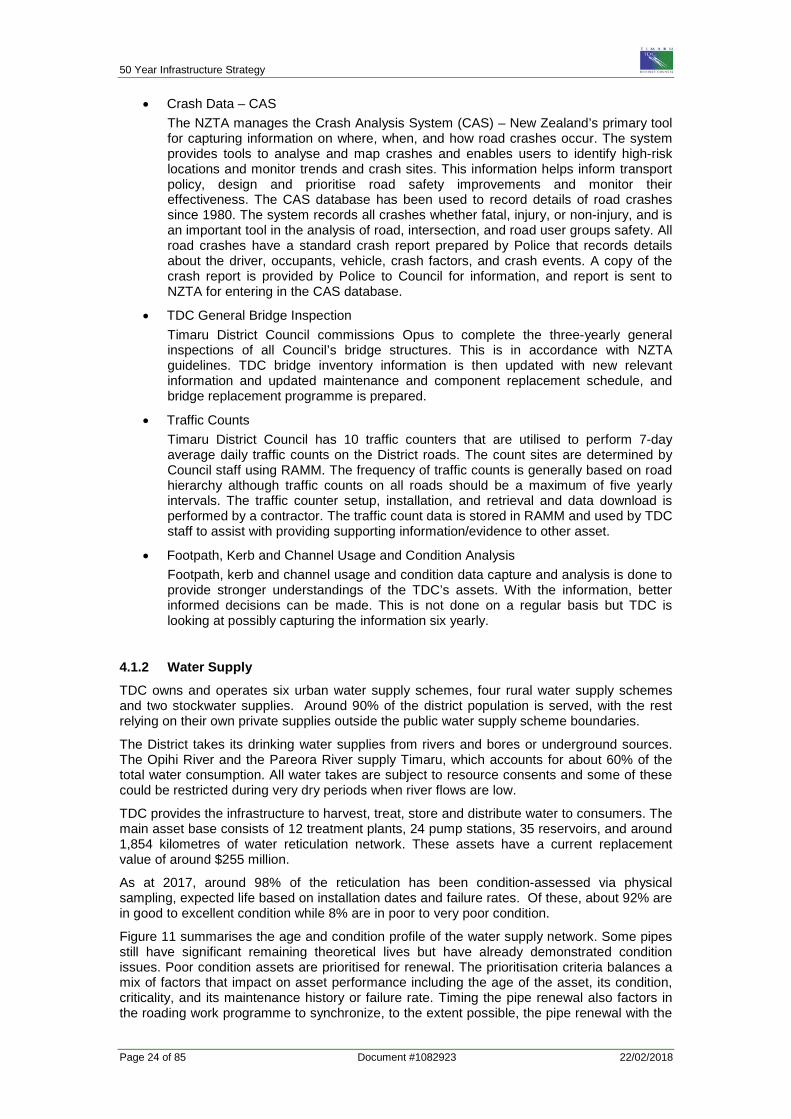
Figure 9 shows that condition is generally proportional to age. Data presented is as at December 2016 (Doc #1096789). Based on this, data the anticipated footpath renewal quantities is shown in Figure 10 that indicates an increase in renewal is required over the next five (5) years, particularly in Timaru. Footpath condition rating surveys are currently being undertaken that will improve data confidence and improve renewal programme forecasts.
Figure 10: Footpath Renewal.
Roading and Footpaths - Information Sources The Timaru District Council conducts multiple surveys, analysis, and studies to obtain data and information on our assets, including:
• Road User Surveys Conducted biannually through an independent consultant, Key Research Limited. The survey obtains the perceptions of a broad range of road users across the District, which is used to identify the expected transport levels of service and the current perceived asset performance. From the survey result, Council is able to determine the areas for possible improvements.
• NZTA Investment Audits The objective of this audit is to provide assurance that the New Zealand Transport Agency’s (NZTA’s) investment in Timaru District Council’s land transport programme is being well-managed and delivering value for money. NZTA also sought assurance that the Council is appropriately managing risk associated with the Transport Agency’s investment. NZTA also recommends improvements where appropriate.
• dTIMS Pavement Deterioration Modelling This modelling is performed by Opus for the Timaru District Council’s sealed road network. The report provides evidence that can be used in support of the Long Term Programme request and Better Business Case Approach. The key objectives for undertaking this modelling were to determine the optimal maintenance expenditure/quantities in order to achieve the long-term standards for the network, aligned with the NZTA’s ONRC) requirements, and the consequences of various maintenance regimes on the long-term condition of the network.
50 Year Infrastructure Strategy
Page 24 of 85 Document #1082923 22/02/2018
• Crash Data – CAS The NZTA manages the Crash Analysis System (CAS) – New Zealand’s primary tool for capturing information on where, when, and how road crashes occur. The system provides tools to analyse and map crashes and enables users to identify high-risk locations and monitor trends and crash sites. This information helps inform transport policy, design and prioritise road safety improvements and monitor their effectiveness. The CAS database has been used to record details of road crashes since 1980. The system records all crashes whether fatal, injury, or non-injury, and is an important tool in the analysis of road, intersection, and road user groups safety. All road crashes have a standard crash report prepared by Police that records details about the driver, occupants, vehicle, crash factors, and crash events. A copy of the crash report is provided by Police to Council for information, and report is sent to NZTA for entering in the CAS database.
• TDC General Bridge Inspection Timaru District Council commissions Opus to complete the three-yearly general inspections of all Council’s bridge structures. This is in accordance with NZTA guidelines. TDC bridge inventory information is then updated with new relevant information and updated maintenance and component replacement schedule, and bridge replacement programme is prepared.
• Traffic Counts Timaru District Council has 10 traffic counters that are utilised to perform 7-day average daily traffic counts on the District roads. The count sites are determined by Council staff using RAMM. The frequency of traffic counts is generally based on road hierarchy although traffic counts on all roads should be a maximum of five yearly intervals. The traffic counter setup, installation, and retrieval and data download is performed by a contractor. The traffic count data is stored in RAMM and used by TDC staff to assist with providing supporting information/evidence to other asset.
• Footpath, Kerb and Channel Usage and Condition Analysis Footpath, kerb and channel usage and condition data capture and analysis is done to provide stronger understandings of the TDC’s assets. With the information, better informed decisions can be made. This is not done on a regular basis but TDC is looking at possibly capturing the information six yearly.
4.1.2 Water Supply TDC owns and operates six urban water supply schemes, four rural water supply schemes and two stockwater supplies. Around 90% of the district population is served, with the rest relying on their own private supplies outside the public water supply scheme boundaries.
The District takes its drinking water supplies from rivers and bores or underground sources. The Opihi River and the Pareora River supply Timaru, which accounts for about 60% of the total water consumption. All water takes are subject to resource consents and some of these could be restricted during very dry periods when river flows are low.
TDC provides the infrastructure to harvest, treat, store and distribute water to consumers. The main asset base consists of 12 treatment plants, 24 pump stations, 35 reservoirs, and around 1,854 kilometres of water reticulation network. These assets have a current replacement value of around $255 million.
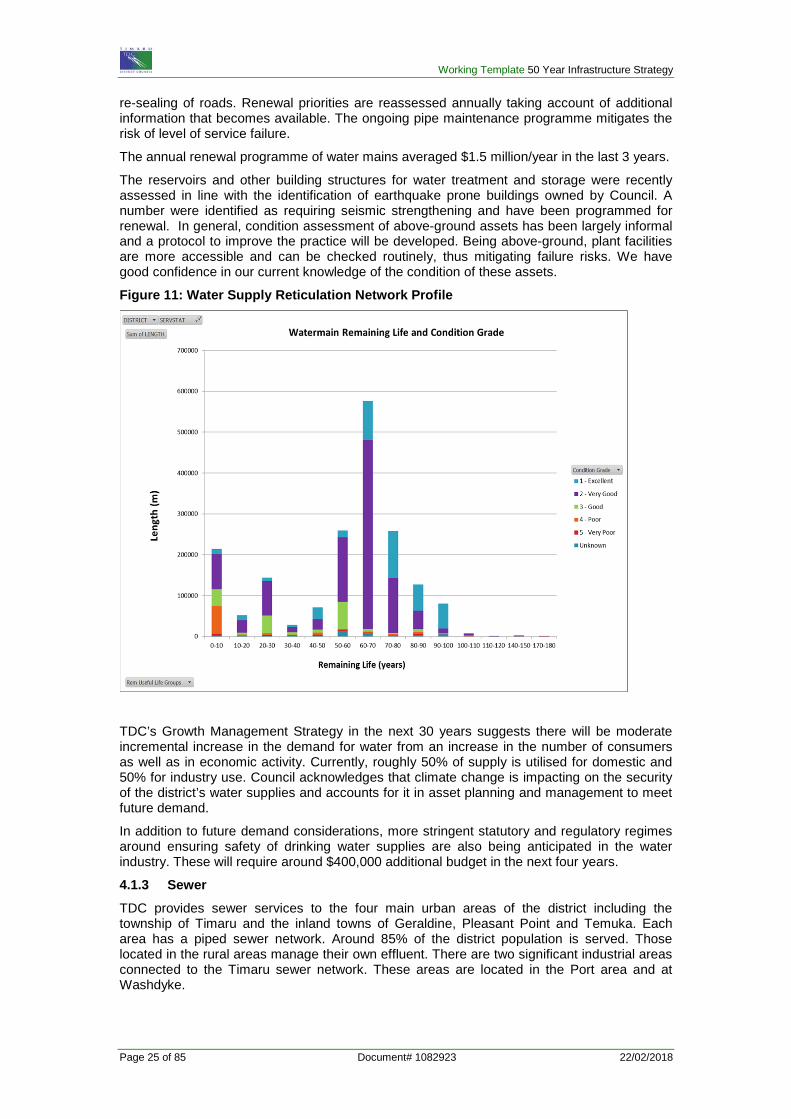
As at 2017, around 98% of the reticulation has been condition-assessed via physical sampling, expected life based on installation dates and failure rates. Of these, about 92% are in good to excellent condition while 8% are in poor to very poor condition.
Figure 11 summarises the age and condition profile of the water supply network. Some pipes still have significant remaining theoretical lives but have already demonstrated condition issues. Poor condition assets are prioritised for renewal. The prioritisation criteria balances a mix of factors that impact on asset performance including the age of the asset, its condition, criticality, and its maintenance history or failure rate. Timing the pipe renewal also factors in the roading work programme to synchronize, to the extent possible, the pipe renewal with the
Working Template 50 Year Infrastructure Strategy
Page 25 of 85 Document# 1082923 22/02/2018
re-sealing of roads. Renewal priorities are reassessed annually taking account of additional information that becomes available. The ongoing pipe maintenance programme mitigates the risk of level of service failure.
The annual renewal programme of water mains averaged $1.5 million/year in the last 3 years.
The reservoirs and other building structures for water treatment and storage were recently assessed in line with the identification of earthquake prone buildings owned by Council. A number were identified as requiring seismic strengthening and have been programmed for renewal. In general, condition assessment of above-ground assets has been largely informal and a protocol to improve the practice will be developed. Being above-ground, plant facilities are more accessible and can be checked routinely, thus mitigating failure risks. We have good confidence in our current knowledge of the condition of these assets.
Figure 11: Water Supply Reticulation Network Profile
TDC’s Growth Management Strategy in the next 30 years suggests there will be moderate incremental increase in the demand for water from an increase in the number of consumers as well as in economic activity. Currently, roughly 50% of supply is utilised for domestic and 50% for industry use. Council acknowledges that climate change is impacting on the security of the district’s water supplies and accounts for it in asset planning and management to meet future demand.
In addition to future demand considerations, more stringent statutory and regulatory regimes around ensuring safety of drinking water supplies are also being anticipated in the water industry. These will require around $400,000 additional budget in the next four years.
4.1.3 Sewer TDC provides sewer services to the four main urban areas of the district including the township of Timaru and the inland towns of Geraldine, Pleasant Point and Temuka. Each area has a piped sewer network. Around 85% of the district population is served. Those located in the rural areas manage their own effluent. There are two significant industrial areas connected to the Timaru sewer network. These areas are located in the Port area and at Washdyke.
50 Year Infrastructure Strategy
Page 26 of 85 Document #1082923 22/02/2018
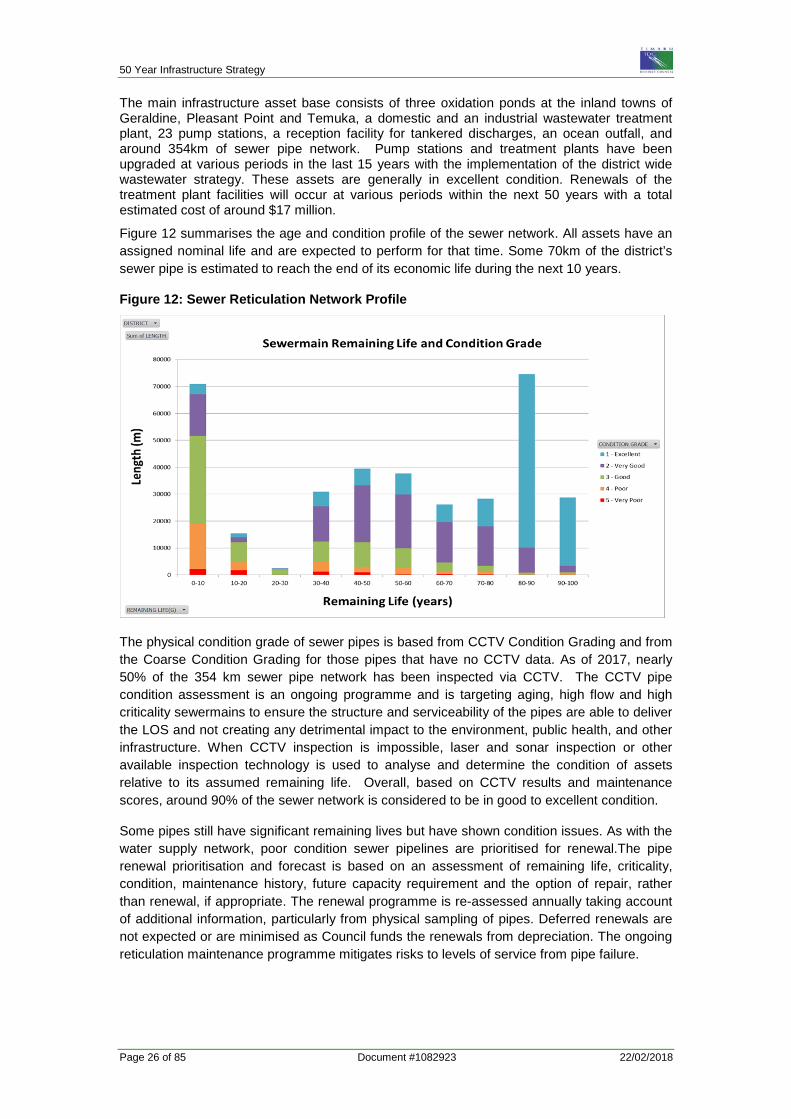
The main infrastructure asset base consists of three oxidation ponds at the inland towns of Geraldine, Pleasant Point and Temuka, a domestic and an industrial wastewater treatment plant, 23 pump stations, a reception facility for tankered discharges, an ocean outfall, and around 354km of sewer pipe network. Pump stations and treatment plants have been upgraded at various periods in the last 15 years with the implementation of the district wide wastewater strategy. These assets are generally in excellent condition. Renewals of the treatment plant facilities will occur at various periods within the next 50 years with a total estimated cost of around $17 million.
Figure 12 summarises the age and condition profile of the sewer network. All assets have an assigned nominal life and are expected to perform for that time. Some 70km of the district’s sewer pipe is estimated to reach the end of its economic life during the next 10 years.
Figure 12: Sewer Reticulation Network Profile
The physical condition grade of sewer pipes is based from CCTV Condition Grading and from the Coarse Condition Grading for those pipes that have no CCTV data. As of 2017, nearly 50% of the 354 km sewer pipe network has been inspected via CCTV. The CCTV pipe condition assessment is an ongoing programme and is targeting aging, high flow and high criticality sewermains to ensure the structure and serviceability of the pipes are able to deliver the LOS and not creating any detrimental impact to the environment, public health, and other infrastructure. When CCTV inspection is impossible, laser and sonar inspection or other available inspection technology is used to analyse and determine the condition of assets relative to its assumed remaining life. Overall, based on CCTV results and maintenance scores, around 90% of the sewer network is considered to be in good to excellent condition.
Some pipes still have significant remaining lives but have shown condition issues. As with the water supply network, poor condition sewer pipelines are prioritised for renewal.The pipe renewal prioritisation and forecast is based on an assessment of remaining life, criticality, condition, maintenance history, future capacity requirement and the option of repair, rather than renewal, if appropriate. The renewal programme is re-assessed annually taking account of additional information, particularly from physical sampling of pipes. Deferred renewals are not expected or are minimised as Council funds the renewals from depreciation. The ongoing reticulation maintenance programme mitigates risks to levels of service from pipe failure.
Working Template 50 Year Infrastructure Strategy
Page 27 of 85 Document# 1082923 22/02/2018
There are inflow and infiltration issues associated with very old pipes in the network. The annual pipe renewal programme prioritises work required to maintain the level of service, and averaged $1.7 million per year in the last 3 years. Estimated total replacement value of assets is around $246 million (2014 assessment).
Currently, domestic wastewater accounts for 40% of the wastewater flows while industry contributes 60%.
Due to the construction of a separate facility for domestic wastewater treatment, there is more plant capacity for industrial wastewater treatment in support of future industrial growth. Most of these industries are located in the Washdyke and Port areas of Timaru.
Additional demand for domestic sewer lines may come from requests for extension of urban services at the periphery of residential zones.
Other than demand factors, the performance of the district’s sewer infrastructure is also impacted by frequent intense or long duration wet weather which causes groundwater inflow and/or stormwater infiltrating into the defects of sewer pipes, thereby consuming some of the capacity of the sewer network with resultant network overflows.
4.1.4 Stormwater TDC provides stormwater services in the urban townships of Timaru, Temuka, Geraldine and Pleasant Point. Rural stormwater is managed mainly through land drainage with minimal infrastructure provided in Winchester, Cave and Pareora. Around 70% of the district’s population is served.
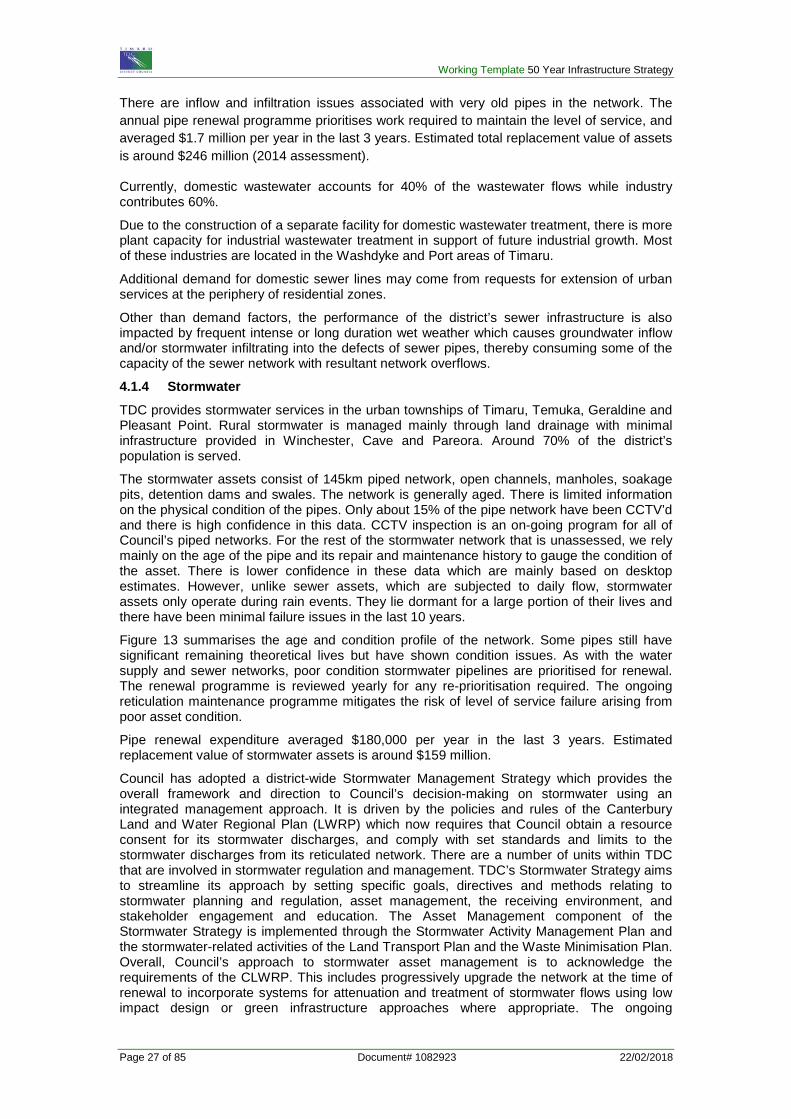
The stormwater assets consist of 145km piped network, open channels, manholes, soakage pits, detention dams and swales. The network is generally aged. There is limited information on the physical condition of the pipes. Only about 15% of the pipe network have been CCTV’d and there is high confidence in this data. CCTV inspection is an on-going program for all of Council’s piped networks. For the rest of the stormwater network that is unassessed, we rely mainly on the age of the pipe and its repair and maintenance history to gauge the condition of the asset. There is lower confidence in these data which are mainly based on desktop estimates. However, unlike sewer assets, which are subjected to daily flow, stormwater assets only operate during rain events. They lie dormant for a large portion of their lives and there have been minimal failure issues in the last 10 years.
Figure 13 summarises the age and condition profile of the network. Some pipes still have significant remaining theoretical lives but have shown condition issues. As with the water supply and sewer networks, poor condition stormwater pipelines are prioritised for renewal. The renewal programme is reviewed yearly for any re-prioritisation required. The ongoing reticulation maintenance programme mitigates the risk of level of service failure arising from poor asset condition.
Pipe renewal expenditure averaged $180,000 per year in the last 3 years. Estimated replacement value of stormwater assets is around $159 million.
Council has adopted a district-wide Stormwater Management Strategy which provides the overall framework and direction to Council’s decision-making on stormwater using an integrated management approach. It is driven by the policies and rules of the Canterbury Land and Water Regional Plan (LWRP) which now requires that Council obtain a resource consent for its stormwater discharges, and comply with set standards and limits to the stormwater discharges from its reticulated network. There are a number of units within TDC that are involved in stormwater regulation and management. TDC’s Stormwater Strategy aims to streamline its approach by setting specific goals, directives and methods relating to stormwater planning and regulation, asset management, the receiving environment, and stakeholder engagement and education. The Asset Management component of the Stormwater Strategy is implemented through the Stormwater Activity Management Plan and the stormwater-related activities of the Land Transport Plan and the Waste Minimisation Plan. Overall, Council’s approach to stormwater asset management is to acknowledge the requirements of the CLWRP. This includes progressively upgrade the network at the time of renewal to incorporate systems for attenuation and treatment of stormwater flows using low impact design or green infrastructure approaches where appropriate. The ongoing
50 Year Infrastructure Strategy
Page 28 of 85 Document #1082923 22/02/2018
development of Stormwater Management Plans for urban catchments within the district will identify more specific infrastructure requirements. This will shape the asset renewal/development programme in the longer term and is expected to have significant cost and funding implications.
Figure 13: Stormwater Reticulation Network Profile
Although growth within the district is not projected to be at a high level, population and household number changes will still impact on stormwater services in the next 50 years. As more areas are built-up, or with increasing infill development, more impervious areas will be created with increased levels of contaminants and there is further potential for the natural paths for stormwater flows and soakage to be occupied. This puts greater pressure on the existing capacity of stormwater networks which increases the infrastructure requirement to manage stormwater flows.
To address these issues, it is necessary to provide treatment for the removal of contaminants and the attenuation of stormwater flows to better match the natural pre-development flows. The use of low impact options, such as first flush retention dams, swales and rain gardens provide appropriate solutions, and these are being built into new residential development areas.
4.1.5 Waste Minimisation TDC provides a comprehensive Waste Minimisation Service with the rating revenue being very similar to that of both the sewer and the water activities. In addition, the current Redruth Landfill is projected to be full in 25-30 years and consideration needs to be given to future options for South Canterbury Waste Disposal. Accordingly, Council considers the provision of this Waste Minimisation Service to be a significant infrastructure activity and therefore is included in the Infrastructure Strategy.
The wide range of waste minimisation services that Council provides include education and business support. Every urban household and many rural households (around 85% total) have access to a three-bin kerbside waste collection service. This service consists of a 240 litre organic waste bin emptied weekly, and a 240 litre recyclables bin and 120 litre residual waste bin emptied on alternate weeks.
All of the district’s population has access to waste services at the transfer stations in Timaru, Temuka, Geraldine and Pleasant Point. Major infrastructure is provided at the Redruth Resource Recovery Park for processing and landfilling in Redruth, Timaru. Organic waste is processed into compost, recyclables are sorted and sold and the residual waste is buried in the landfill.
Working Template 50 Year Infrastructure Strategy
Page 29 of 85 Document# 1082923 22/02/2018
Kerbside collection The kerbside collection system assets comprises of approximately 60,000 wheelie bins. The Timaru District Council receives comprehensive data from their contractor on bin numbers, bin repairs, and bin replacements. The original bin stock is now 12 years old and the budget allows for an increasing number of replacements until the number of replacements stabilises. Based on bin replacements to date and a reassessment of bin life this data is at a high level of confidence.
Transfer stations Transfer stations roads and buildings are in good condition and well maintained. All sites will need renewals of the compactors and compactor bins in the near future. These have been budgeted for.
Materials Recovery Facility (MRF) The Materials Recovery Facility was built in 2005 and has a maintenance schedule. It is in good condition.
Compost Facility The eight compost pads were built in 2005 and have been allocated a life of 20 years. The pads will be rebuilt in a different location at that time with better grounding on a compacted pad. Current pads are in a poor condition due to landfill subsidence, but operational controls, such as regular cleaning mitigate this issue.
Redruth Landfill The current landfill is operated by Waste Management NZ Ltd on behalf of Council. Stage 3 is a modern A-grade landfill with full sub-soil and leachate drainage systems. Each cell will be capped in the short term after completion of filling and an LFG system installed. Filling will recommence in Stage 2 in early 2019, so full capping and gas installation can take place over the next 5 years.
Other businesses The Crows Nest building was built in 2004 and is in good condition.
Asset performance Waste Minimisation assets are recorded in the Hansen database, however, condition and lifecycle information is not allocated. Any assessment of assets is visual rather than databased. This is an area identified in the WMMP Improvement Plan and a project is planned during the next 3-year period to improve condition and lifecycle information to enable better asset planning.
50 Year Infrastructure Strategy
22/02/2018 Document #1082923 Page 30 of 85
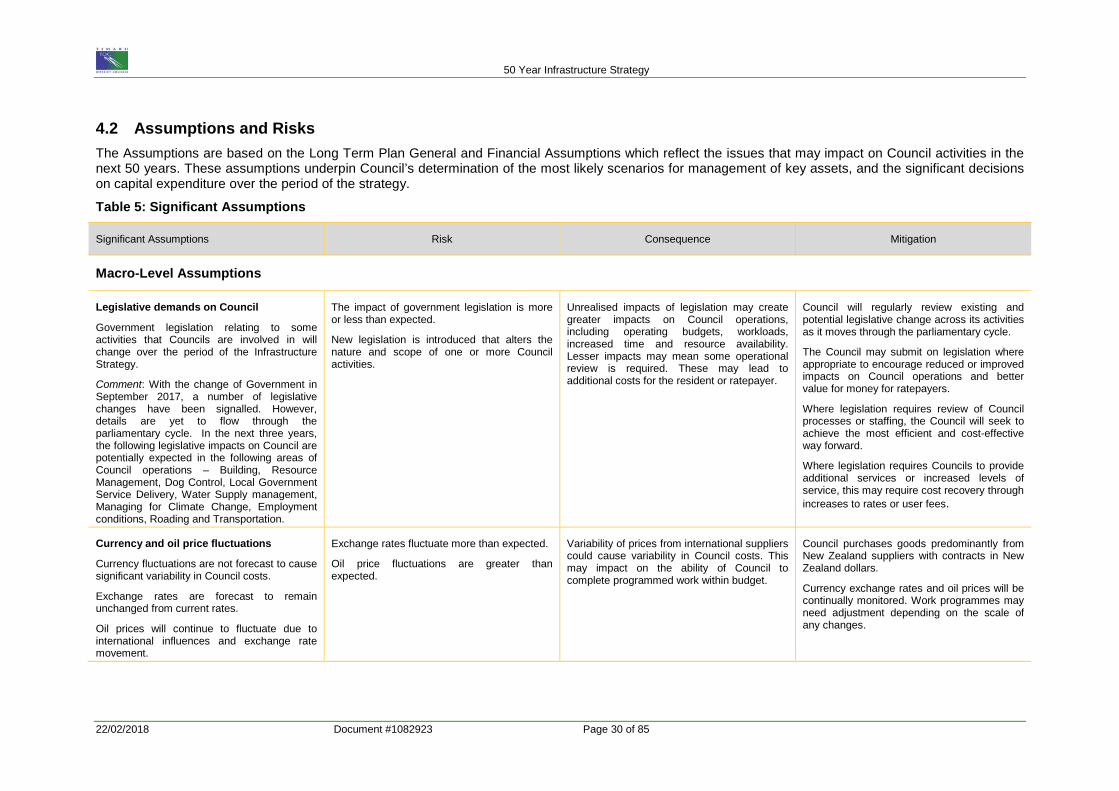
4.2 Assumptions and Risks The Assumptions are based on the Long Term Plan General and Financial Assumptions which reflect the issues that may impact on Council activities in the next 50 years. These assumptions underpin Council’s determination of the most likely scenarios for management of key assets, and the significant decisions on capital expenditure over the period of the strategy.
Table 5: Significant Assumptions
Significant Assumptions Risk Consequence Mitigation
Macro-Level Assumptions
Legislative demands on Council
Government legislation relating to some activities that Councils are involved in will change over the period of the Infrastructure Strategy.
Comment: With the change of Government in September 2017, a number of legislative changes have been signalled. However, details are yet to flow through the parliamentary cycle. In the next three years, the following legislative impacts on Council are potentially expected in the following areas of Council operations – Building, Resource Management, Dog Control, Local Government Service Delivery, Water Supply management, Managing for Climate Change, Employment conditions, Roading and Transportation.
The impact of government legislation is more or less than expected.
New legislation is introduced that alters the nature and scope of one or more Council activities.
Unrealised impacts of legislation may create greater impacts on Council operations, including operating budgets, workloads, increased time and resource availability. Lesser impacts may mean some operational review is required. These may lead to additional costs for the resident or ratepayer.
Council will regularly review existing and potential legislative change across its activities as it moves through the parliamentary cycle.
The Council may submit on legislation where appropriate to encourage reduced or improved impacts on Council operations and better value for money for ratepayers.
Where legislation requires review of Council processes or staffing, the Council will seek to achieve the most efficient and cost-effective way forward.
Where legislation requires Councils to provide additional services or increased levels of service, this may require cost recovery through increases to rates or user fees.
Currency and oil price fluctuations
Currency fluctuations are not forecast to cause significant variability in Council costs.
Exchange rates are forecast to remain unchanged from current rates.
Oil prices will continue to fluctuate due to international influences and exchange rate movement.
Exchange rates fluctuate more than expected.
Oil price fluctuations are greater than expected.
Variability of prices from international suppliers could cause variability in Council costs. This may impact on the ability of Council to complete programmed work within budget.
Council purchases goods predominantly from New Zealand suppliers with contracts in New Zealand dollars.
Currency exchange rates and oil prices will be continually monitored. Work programmes may need adjustment depending on the scale of any changes.
Working Template 50 Year Infrastructure Strategy
Page 31 of 85 Document# 1082923 22/02/2018
Significant Assumptions Risk Consequence Mitigation
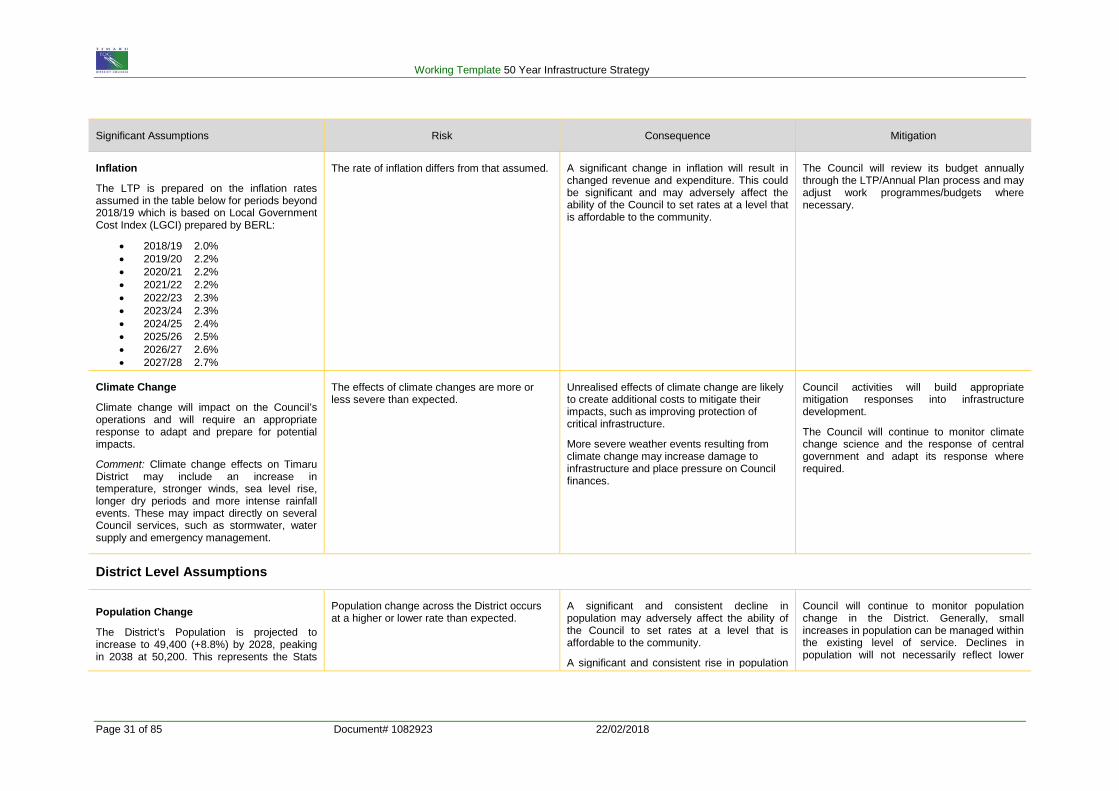
Inflation
The LTP is prepared on the inflation rates assumed in the table below for periods beyond 2018/19 which is based on Local Government Cost Index (LGCI) prepared by BERL:
• 2018/19 2.0% • 2019/20 2.2% • 2020/21 2.2% • 2021/22 2.2% • 2022/23 2.3% • 2023/24 2.3% • 2024/25 2.4% • 2025/26 2.5% • 2026/27 2.6% • 2027/28 2.7%
The rate of inflation differs from that assumed. A significant change in inflation will result in changed revenue and expenditure. This could be significant and may adversely affect the ability of the Council to set rates at a level that is affordable to the community.
The Council will review its budget annually through the LTP/Annual Plan process and may adjust work programmes/budgets where necessary.
Climate Change
Climate change will impact on the Council’s operations and will require an appropriate response to adapt and prepare for potential impacts.
Comment: Climate change effects on Timaru District may include an increase in temperature, stronger winds, sea level rise, longer dry periods and more intense rainfall events. These may impact directly on several Council services, such as stormwater, water supply and emergency management.
The effects of climate changes are more or less severe than expected.
Unrealised effects of climate change are likely to create additional costs to mitigate their impacts, such as improving protection of critical infrastructure.
More severe weather events resulting from climate change may increase damage to infrastructure and place pressure on Council finances.
Council activities will build appropriate mitigation responses into infrastructure development.
The Council will continue to monitor climate change science and the response of central government and adapt its response where required.
District Level Assumptions
Population Change
The District’s Population is projected to increase to 49,400 (+8.8%) by 2028, peaking in 2038 at 50,200. This represents the Stats
Population change across the District occurs at a higher or lower rate than expected.
A significant and consistent decline in population may adversely affect the ability of the Council to set rates at a level that is affordable to the community.
A significant and consistent rise in population
Council will continue to monitor population change in the District. Generally, small increases in population can be managed within the existing level of service. Declines in population will not necessarily reflect lower
50 Year Infrastructure Strategy
Page 32 of 85 Document #1082923 22/02/2018
Significant Assumptions Risk Consequence Mitigation
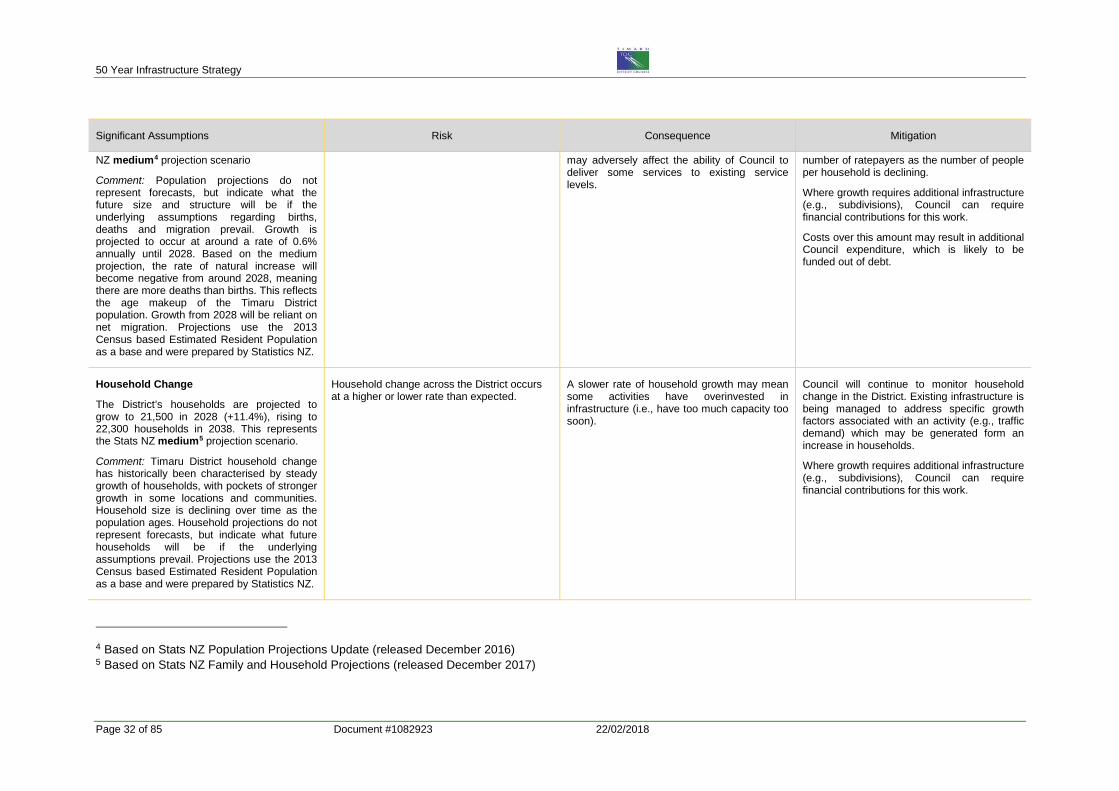
NZ medium4 projection scenario
Comment: Population projections do not represent forecasts, but indicate what the future size and structure will be if the underlying assumptions regarding births, deaths and migration prevail. Growth is projected to occur at around a rate of 0.6% annually until 2028. Based on the medium projection, the rate of natural increase will become negative from around 2028, meaning there are more deaths than births. This reflects the age makeup of the Timaru District population. Growth from 2028 will be reliant on net migration. Projections use the 2013 Census based Estimated Resident Population as a base and were prepared by Statistics NZ.
may adversely affect the ability of Council to deliver some services to existing service levels.
number of ratepayers as the number of people per household is declining.
Where growth requires additional infrastructure (e.g., subdivisions), Council can require financial contributions for this work.
Costs over this amount may result in additional Council expenditure, which is likely to be funded out of debt.
Household Change
The District’s households are projected to grow to 21,500 in 2028 (+11.4%), rising to 22,300 households in 2038. This represents the Stats NZ medium5 projection scenario.
Comment: Timaru District household change has historically been characterised by steady growth of households, with pockets of stronger growth in some locations and communities. Household size is declining over time as the population ages. Household projections do not represent forecasts, but indicate what future households will be if the underlying assumptions prevail. Projections use the 2013 Census based Estimated Resident Population as a base and were prepared by Statistics NZ.
Household change across the District occurs at a higher or lower rate than expected.
A slower rate of household growth may mean some activities have overinvested in infrastructure (i.e., have too much capacity too soon).
Council will continue to monitor household change in the District. Existing infrastructure is being managed to address specific growth factors associated with an activity (e.g., traffic demand) which may be generated form an increase in households.
Where growth requires additional infrastructure (e.g., subdivisions), Council can require financial contributions for this work.
4 Based on Stats NZ Population Projections Update (released December 2016) 5 Based on Stats NZ Family and Household Projections (released December 2017)
Working Template 50 Year Infrastructure Strategy
Page 33 of 85 Document# 1082923 22/02/2018
Significant Assumptions Risk Consequence Mitigation
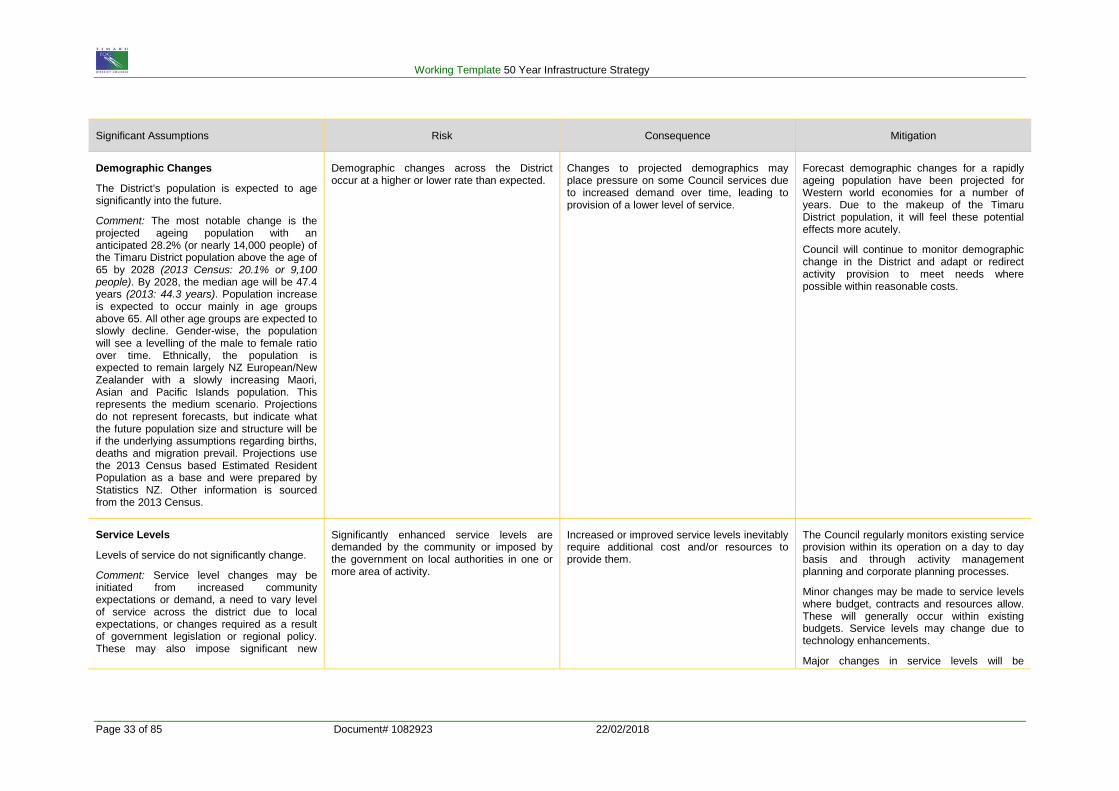
Demographic Changes
The District’s population is expected to age significantly into the future.
Comment: The most notable change is the projected ageing population with an anticipated 28.2% (or nearly 14,000 people) of the Timaru District population above the age of 65 by 2028 (2013 Census: 20.1% or 9,100 people). By 2028, the median age will be 47.4 years (2013: 44.3 years). Population increase is expected to occur mainly in age groups above 65. All other age groups are expected to slowly decline. Gender-wise, the population will see a levelling of the male to female ratio over time. Ethnically, the population is expected to remain largely NZ European/New Zealander with a slowly increasing Maori, Asian and Pacific Islands population. This represents the medium scenario. Projections do not represent forecasts, but indicate what the future population size and structure will be if the underlying assumptions regarding births, deaths and migration prevail. Projections use the 2013 Census based Estimated Resident Population as a base and were prepared by Statistics NZ. Other information is sourced from the 2013 Census.
Demographic changes across the District occur at a higher or lower rate than expected.
Changes to projected demographics may place pressure on some Council services due to increased demand over time, leading to provision of a lower level of service.
Forecast demographic changes for a rapidly ageing population have been projected for Western world economies for a number of years. Due to the makeup of the Timaru District population, it will feel these potential effects more acutely.
Council will continue to monitor demographic change in the District and adapt or redirect activity provision to meet needs where possible within reasonable costs.
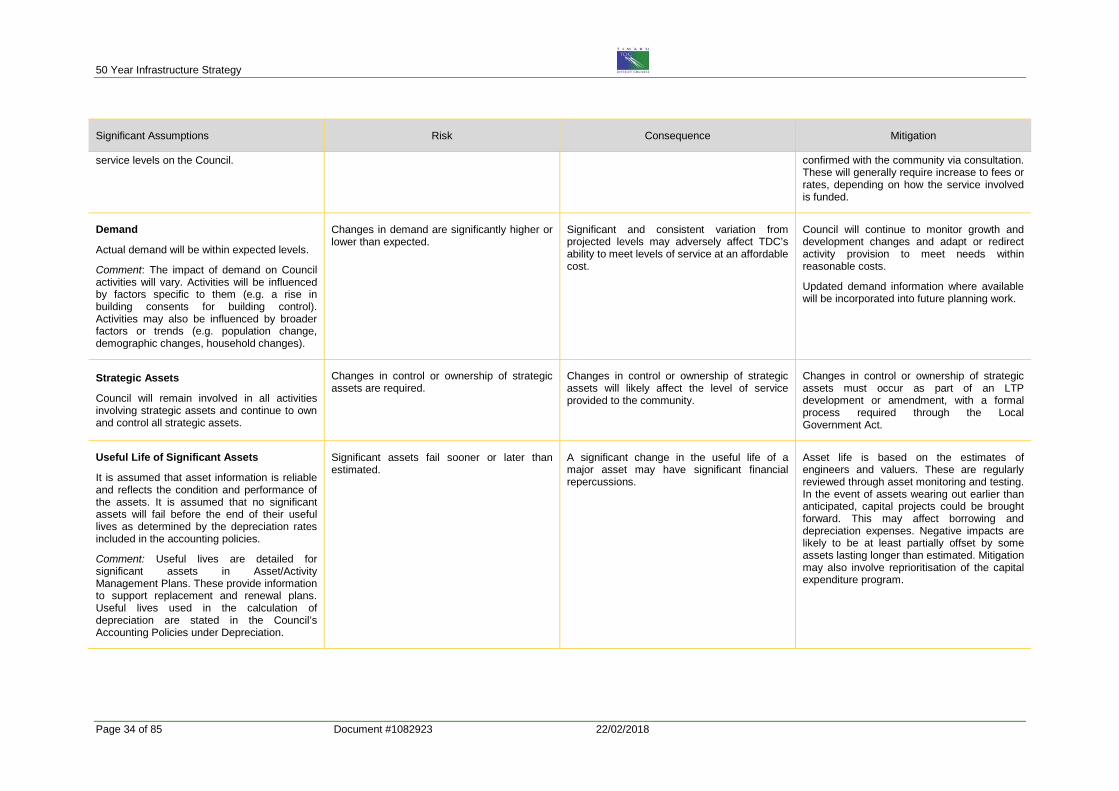
Service Levels
Levels of service do not significantly change.
Comment: Service level changes may be initiated from increased community expectations or demand, a need to vary level of service across the district due to local expectations, or changes required as a result of government legislation or regional policy. These may also impose significant new
Significantly enhanced service levels are demanded by the community or imposed by the government on local authorities in one or more area of activity.
Increased or improved service levels inevitably require additional cost and/or resources to provide them.
The Council regularly monitors existing service provision within its operation on a day to day basis and through activity management planning and corporate planning processes.
Minor changes may be made to service levels where budget, contracts and resources allow. These will generally occur within existing budgets. Service levels may change due to technology enhancements.
Major changes in service levels will be
50 Year Infrastructure Strategy
Page 34 of 85 Document #1082923 22/02/2018
Significant Assumptions Risk Consequence Mitigation
service levels on the Council. confirmed with the community via consultation. These will generally require increase to fees or rates, depending on how the service involved is funded.
Demand
Actual demand will be within expected levels.
Comment: The impact of demand on Council activities will vary. Activities will be influenced by factors specific to them (e.g. a rise in building consents for building control). Activities may also be influenced by broader factors or trends (e.g. population change, demographic changes, household changes).
Changes in demand are significantly higher or lower than expected.
Significant and consistent variation from projected levels may adversely affect TDC’s ability to meet levels of service at an affordable cost.
Council will continue to monitor growth and development changes and adapt or redirect activity provision to meet needs within reasonable costs.
Updated demand information where available will be incorporated into future planning work.
Strategic Assets
Council will remain involved in all activities involving strategic assets and continue to own and control all strategic assets.
Changes in control or ownership of strategic assets are required.
Changes in control or ownership of strategic assets will likely affect the level of service provided to the community.
Changes in control or ownership of strategic assets must occur as part of an LTP development or amendment, with a formal process required through the Local Government Act.
Useful Life of Significant Assets
It is assumed that asset information is reliable and reflects the condition and performance of the assets. It is assumed that no significant assets will fail before the end of their useful lives as determined by the depreciation rates included in the accounting policies.
Comment: Useful lives are detailed for significant assets in Asset/Activity Management Plans. These provide information to support replacement and renewal plans. Useful lives used in the calculation of depreciation are stated in the Council’s Accounting Policies under Depreciation.
Significant assets fail sooner or later than estimated.
A significant change in the useful life of a major asset may have significant financial repercussions.
Asset life is based on the estimates of engineers and valuers. These are regularly reviewed through asset monitoring and testing. In the event of assets wearing out earlier than anticipated, capital projects could be brought forward. This may affect borrowing and depreciation expenses. Negative impacts are likely to be at least partially offset by some assets lasting longer than estimated. Mitigation may also involve reprioritisation of the capital expenditure program.
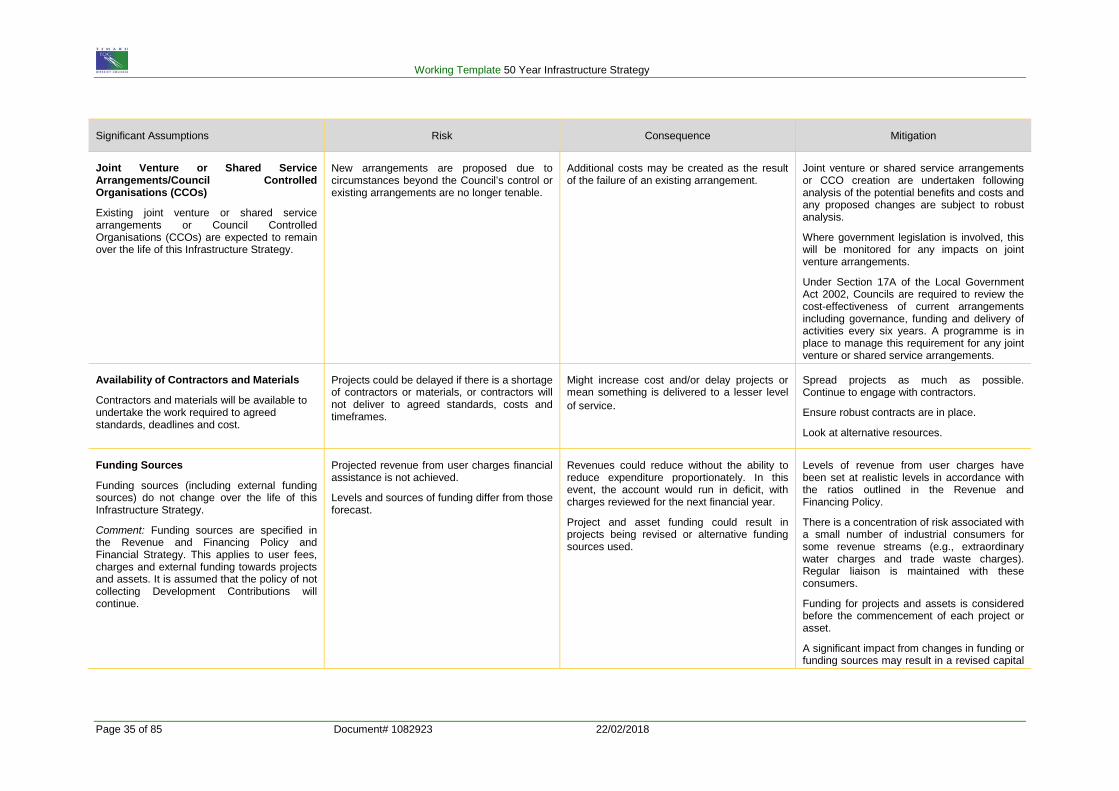
Working Template 50 Year Infrastructure Strategy
Page 35 of 85 Document# 1082923 22/02/2018
Significant Assumptions Risk Consequence Mitigation
Joint Venture or Shared Service Arrangements/Council Controlled Organisations (CCOs)
Existing joint venture or shared service arrangements or Council Controlled Organisations (CCOs) are expected to remain over the life of this Infrastructure Strategy.
New arrangements are proposed due to circumstances beyond the Council’s control or existing arrangements are no longer tenable.
Additional costs may be created as the result of the failure of an existing arrangement.
Joint venture or shared service arrangements or CCO creation are undertaken following analysis of the potential benefits and costs and any proposed changes are subject to robust analysis.
Where government legislation is involved, this will be monitored for any impacts on joint venture arrangements.
Under Section 17A of the Local Government Act 2002, Councils are required to review the cost-effectiveness of current arrangements including governance, funding and delivery of activities every six years. A programme is in place to manage this requirement for any joint venture or shared service arrangements.
Availability of Contractors and Materials
Contractors and materials will be available to undertake the work required to agreed standards, deadlines and cost.
Projects could be delayed if there is a shortage of contractors or materials, or contractors will not deliver to agreed standards, costs and timeframes.
Might increase cost and/or delay projects or mean something is delivered to a lesser level of service.
Spread projects as much as possible. Continue to engage with contractors.
Ensure robust contracts are in place.
Look at alternative resources.
Funding Sources
Funding sources (including external funding sources) do not change over the life of this Infrastructure Strategy.
Comment: Funding sources are specified in the Revenue and Financing Policy and Financial Strategy. This applies to user fees, charges and external funding towards projects and assets. It is assumed that the policy of not collecting Development Contributions will continue.
Projected revenue from user charges financial assistance is not achieved.
Levels and sources of funding differ from those forecast.
Revenues could reduce without the ability to reduce expenditure proportionately. In this event, the account would run in deficit, with charges reviewed for the next financial year.
Project and asset funding could result in projects being revised or alternative funding sources used.
Levels of revenue from user charges have been set at realistic levels in accordance with the ratios outlined in the Revenue and Financing Policy.
There is a concentration of risk associated with a small number of industrial consumers for some revenue streams (e.g., extraordinary water charges and trade waste charges). Regular liaison is maintained with these consumers.
Funding for projects and assets is considered before the commencement of each project or asset.
A significant impact from changes in funding or funding sources may result in a revised capital
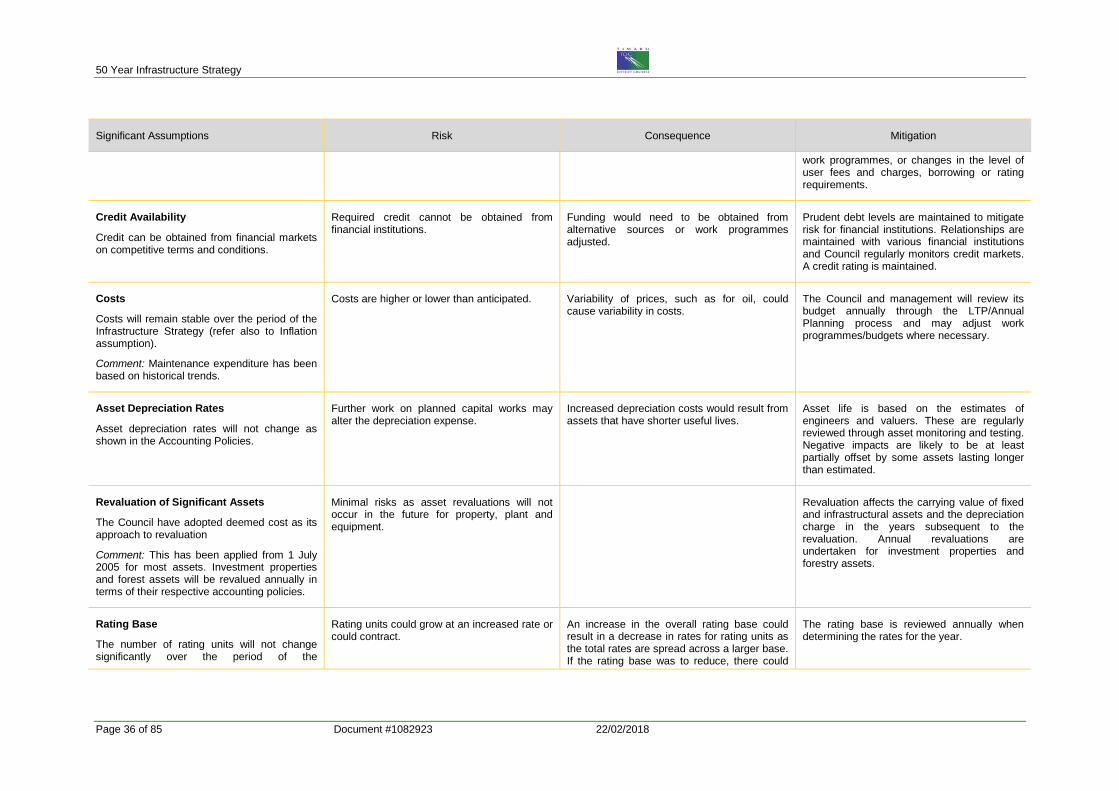
50 Year Infrastructure Strategy
Page 36 of 85 Document #1082923 22/02/2018
Significant Assumptions Risk Consequence Mitigation
work programmes, or changes in the level of user fees and charges, borrowing or rating requirements.
Credit Availability
Credit can be obtained from financial markets on competitive terms and conditions.
Required credit cannot be obtained from financial institutions.
Funding would need to be obtained from alternative sources or work programmes adjusted.
Prudent debt levels are maintained to mitigate risk for financial institutions. Relationships are maintained with various financial institutions and Council regularly monitors credit markets. A credit rating is maintained.
Costs
Costs will remain stable over the period of the Infrastructure Strategy (refer also to Inflation assumption).
Comment: Maintenance expenditure has been based on historical trends.
Costs are higher or lower than anticipated. Variability of prices, such as for oil, could cause variability in costs.
The Council and management will review its budget annually through the LTP/Annual Planning process and may adjust work programmes/budgets where necessary.
Asset Depreciation Rates
Asset depreciation rates will not change as shown in the Accounting Policies.
Further work on planned capital works may alter the depreciation expense.
Increased depreciation costs would result from assets that have shorter useful lives.
Asset life is based on the estimates of engineers and valuers. These are regularly reviewed through asset monitoring and testing. Negative impacts are likely to be at least partially offset by some assets lasting longer than estimated.
Revaluation of Significant Assets
The Council have adopted deemed cost as its approach to revaluation
Comment: This has been applied from 1 July 2005 for most assets. Investment properties and forest assets will be revalued annually in terms of their respective accounting policies.
Minimal risks as asset revaluations will not occur in the future for property, plant and equipment.
Revaluation affects the carrying value of fixed and infrastructural assets and the depreciation charge in the years subsequent to the revaluation. Annual revaluations are undertaken for investment properties and forestry assets.
Rating Base
The number of rating units will not change significantly over the period of the
Rating units could grow at an increased rate or could contract.
An increase in the overall rating base could result in a decrease in rates for rating units as the total rates are spread across a larger base. If the rating base was to reduce, there could
The rating base is reviewed annually when determining the rates for the year.
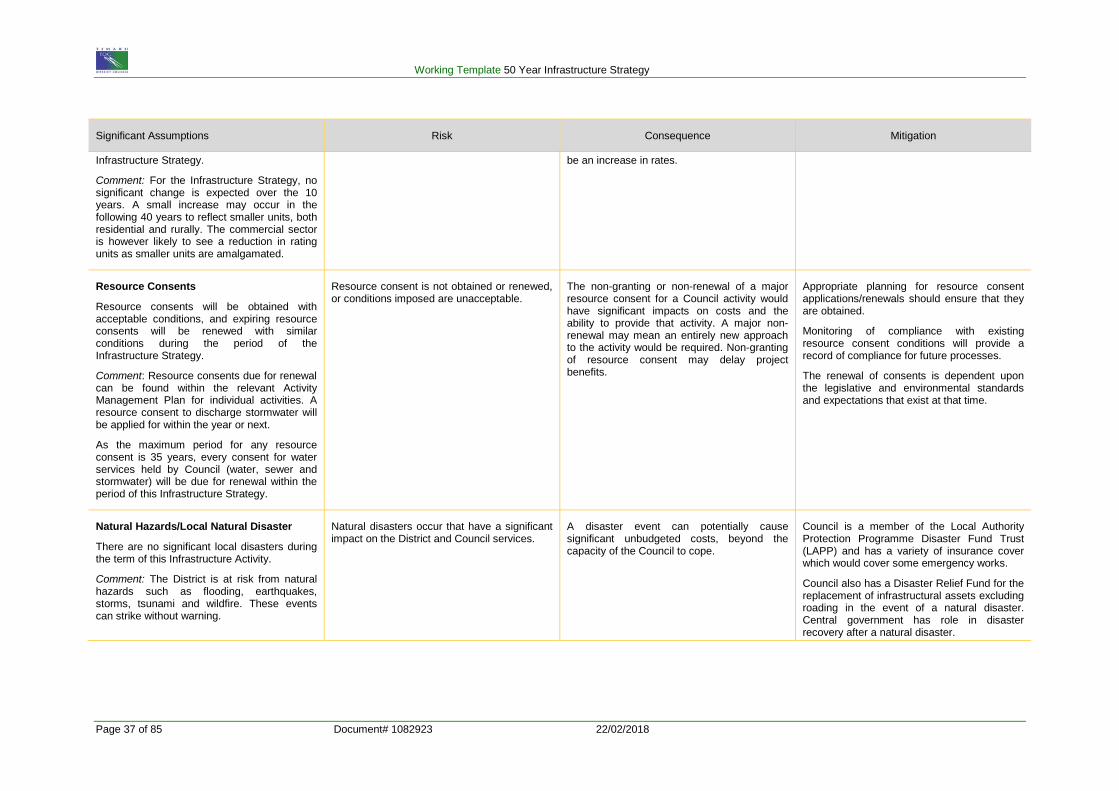
Working Template 50 Year Infrastructure Strategy
Page 37 of 85 Document# 1082923 22/02/2018
Significant Assumptions Risk Consequence Mitigation
Infrastructure Strategy.
Comment: For the Infrastructure Strategy, no significant change is expected over the 10 years. A small increase may occur in the following 40 years to reflect smaller units, both residential and rurally. The commercial sector is however likely to see a reduction in rating units as smaller units are amalgamated.
be an increase in rates.
Resource Consents
Resource consents will be obtained with acceptable conditions, and expiring resource consents will be renewed with similar conditions during the period of the Infrastructure Strategy.
Comment: Resource consents due for renewal can be found within the relevant Activity Management Plan for individual activities. A resource consent to discharge stormwater will be applied for within the year or next.
As the maximum period for any resource consent is 35 years, every consent for water services held by Council (water, sewer and stormwater) will be due for renewal within the period of this Infrastructure Strategy.
Resource consent is not obtained or renewed, or conditions imposed are unacceptable.
The non-granting or non-renewal of a major resource consent for a Council activity would have significant impacts on costs and the ability to provide that activity. A major non-renewal may mean an entirely new approach to the activity would be required. Non-granting of resource consent may delay project benefits.
Appropriate planning for resource consent applications/renewals should ensure that they are obtained.
Monitoring of compliance with existing resource consent conditions will provide a record of compliance for future processes.
The renewal of consents is dependent upon the legislative and environmental standards and expectations that exist at that time.
Natural Hazards/Local Natural Disaster
There are no significant local disasters during the term of this Infrastructure Activity.
Comment: The District is at risk from natural hazards such as flooding, earthquakes, storms, tsunami and wildfire. These events can strike without warning.
Natural disasters occur that have a significant impact on the District and Council services.
A disaster event can potentially cause significant unbudgeted costs, beyond the capacity of the Council to cope.
Council is a member of the Local Authority Protection Programme Disaster Fund Trust (LAPP) and has a variety of insurance cover which would cover some emergency works.
Council also has a Disaster Relief Fund for the replacement of infrastructural assets excluding roading in the event of a natural disaster. Central government has role in disaster recovery after a natural disaster.
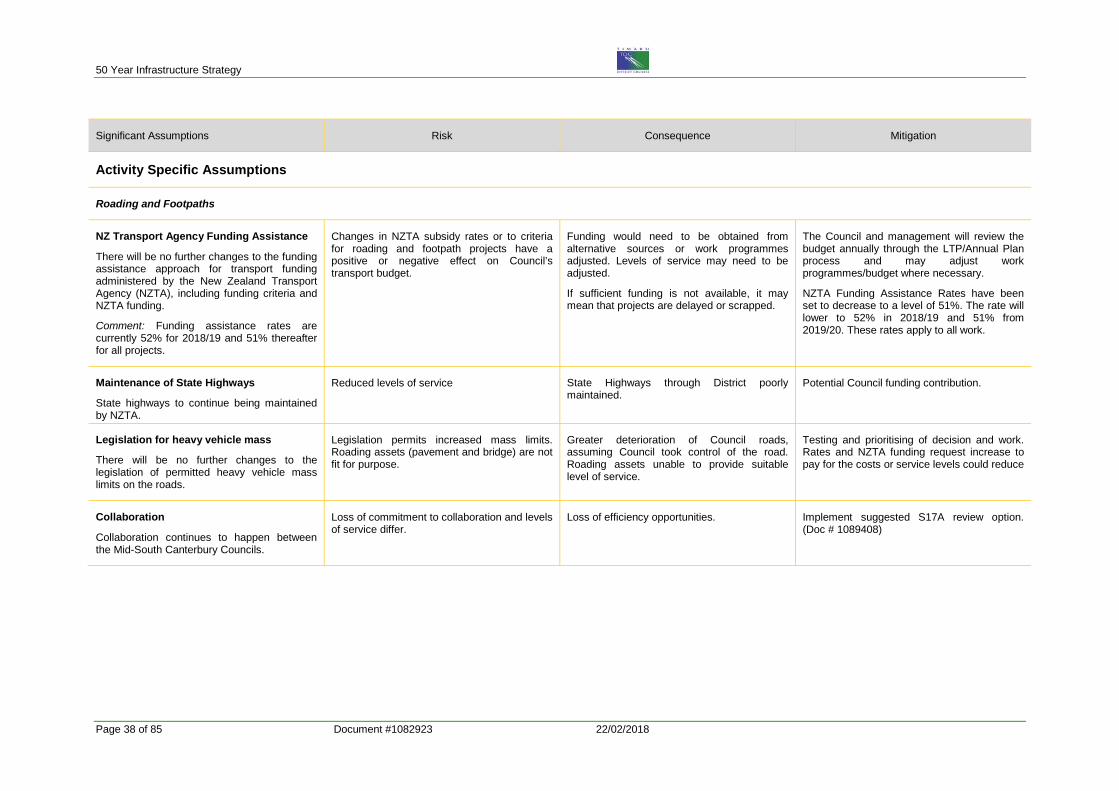
50 Year Infrastructure Strategy
Page 38 of 85 Document #1082923 22/02/2018
Significant Assumptions Risk Consequence Mitigation
Activity Specific Assumptions
Roading and Footpaths
NZ Transport Agency Funding Assistance
There will be no further changes to the funding assistance approach for transport funding administered by the New Zealand Transport Agency (NZTA), including funding criteria and NZTA funding.
Comment: Funding assistance rates are currently 52% for 2018/19 and 51% thereafter for all projects.
Changes in NZTA subsidy rates or to criteria for roading and footpath projects have a positive or negative effect on Council’s transport budget.
Funding would need to be obtained from alternative sources or work programmes adjusted. Levels of service may need to be adjusted.
If sufficient funding is not available, it may mean that projects are delayed or scrapped.
The Council and management will review the budget annually through the LTP/Annual Plan process and may adjust work programmes/budget where necessary.
NZTA Funding Assistance Rates have been set to decrease to a level of 51%. The rate will lower to 52% in 2018/19 and 51% from 2019/20. These rates apply to all work.
Maintenance of State Highways
State highways to continue being maintained by NZTA.
Reduced levels of service State Highways through District poorly maintained.
Potential Council funding contribution.
Legislation for heavy vehicle mass
There will be no further changes to the legislation of permitted heavy vehicle mass limits on the roads.
Legislation permits increased mass limits. Roading assets (pavement and bridge) are not fit for purpose.
Greater deterioration of Council roads, assuming Council took control of the road. Roading assets unable to provide suitable level of service.
Testing and prioritising of decision and work. Rates and NZTA funding request increase to pay for the costs or service levels could reduce
Collaboration
Collaboration continues to happen between the Mid-South Canterbury Councils.
Loss of commitment to collaboration and levels of service differ.
Loss of efficiency opportunities. Implement suggested S17A review option. (Doc # 1089408)
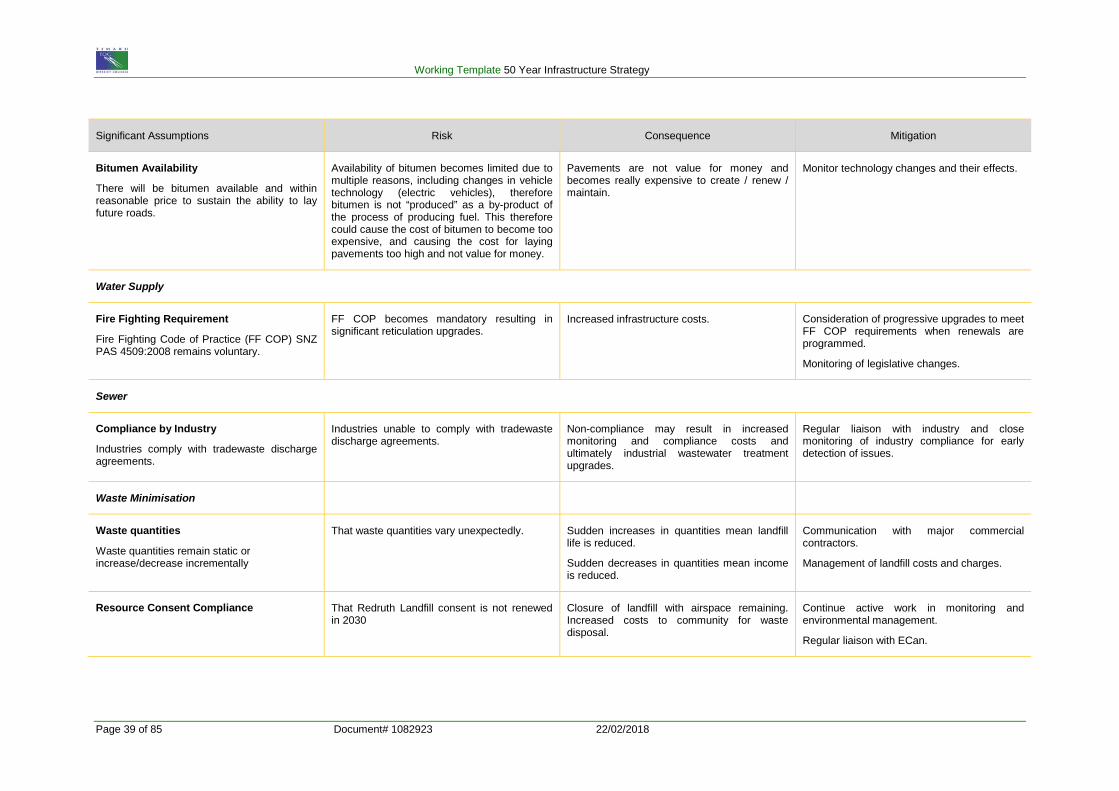
Working Template 50 Year Infrastructure Strategy
Page 39 of 85 Document# 1082923 22/02/2018
Significant Assumptions Risk Consequence Mitigation
Bitumen Availability
There will be bitumen available and within reasonable price to sustain the ability to lay future roads.
Availability of bitumen becomes limited due to multiple reasons, including changes in vehicle technology (electric vehicles), therefore bitumen is not “produced” as a by-product of the process of producing fuel. This therefore could cause the cost of bitumen to become too expensive, and causing the cost for laying pavements too high and not value for money.
Pavements are not value for money and becomes really expensive to create / renew / maintain.
Monitor technology changes and their effects.
Water Supply
Fire Fighting Requirement
Fire Fighting Code of Practice (FF COP) SNZ PAS 4509:2008 remains voluntary.
FF COP becomes mandatory resulting in significant reticulation upgrades.
Increased infrastructure costs. Consideration of progressive upgrades to meet FF COP requirements when renewals are programmed.
Monitoring of legislative changes.
Sewer
Compliance by Industry
Industries comply with tradewaste discharge agreements.
Industries unable to comply with tradewaste discharge agreements.
Non-compliance may result in increased monitoring and compliance costs and ultimately industrial wastewater treatment upgrades.
Regular liaison with industry and close monitoring of industry compliance for early detection of issues.
Waste Minimisation
Waste quantities
Waste quantities remain static or increase/decrease incrementally
That waste quantities vary unexpectedly. Sudden increases in quantities mean landfill life is reduced.
Sudden decreases in quantities mean income is reduced.
Communication with major commercial contractors.
Management of landfill costs and charges.
Resource Consent Compliance
That Redruth Landfill consent is not renewed in 2030
Closure of landfill with airspace remaining. Increased costs to community for waste disposal.
Continue active work in monitoring and environmental management.
Regular liaison with ECan.
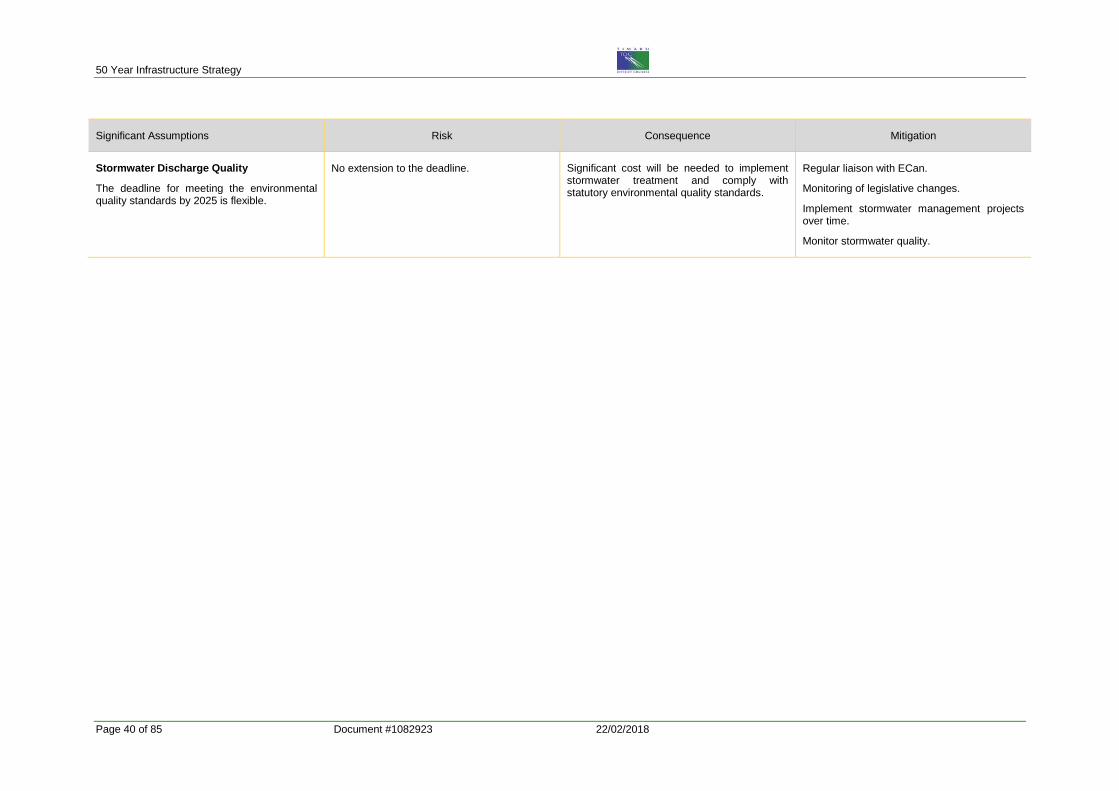
50 Year Infrastructure Strategy
Page 40 of 85 Document #1082923 22/02/2018
Significant Assumptions Risk Consequence Mitigation
Stormwater Discharge Quality
The deadline for meeting the environmental quality standards by 2025 is flexible.
No extension to the deadline. Significant cost will be needed to implement stormwater treatment and comply with statutory environmental quality standards.
Regular liaison with ECan.
Monitoring of legislative changes.
Implement stormwater management projects over time.
Monitor stormwater quality.
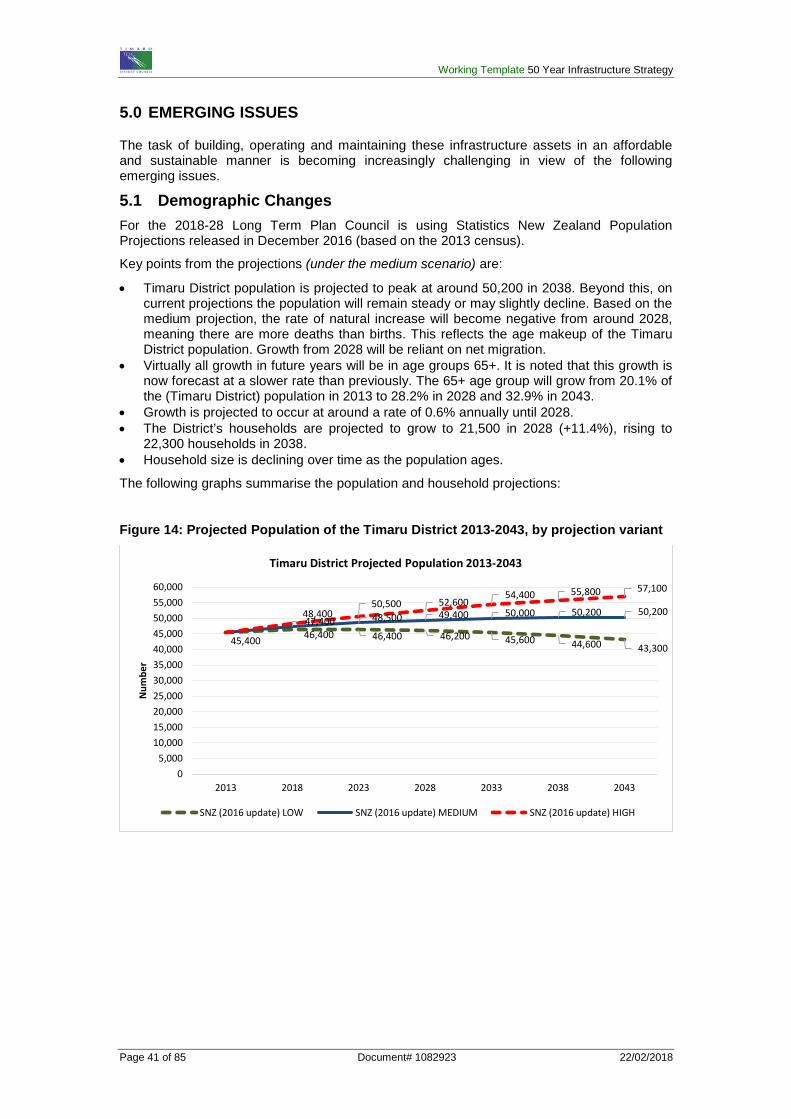
Working Template 50 Year Infrastructure Strategy
Page 41 of 85 Document# 1082923 22/02/2018
5.0 EMERGING ISSUES
The task of building, operating and maintaining these infrastructure assets in an affordable and sustainable manner is becoming increasingly challenging in view of the following emerging issues.
5.1 Demographic Changes For the 2018-28 Long Term Plan Council is using Statistics New Zealand Population Projections released in December 2016 (based on the 2013 census).
Key points from the projections (under the medium scenario) are:
• Timaru District population is projected to peak at around 50,200 in 2038. Beyond this, on current projections the population will remain steady or may slightly decline. Based on the medium projection, the rate of natural increase will become negative from around 2028, meaning there are more deaths than births. This reflects the age makeup of the Timaru District population. Growth from 2028 will be reliant on net migration.
• Virtually all growth in future years will be in age groups 65+. It is noted that this growth is now forecast at a slower rate than previously. The 65+ age group will grow from 20.1% of the (Timaru District) population in 2013 to 28.2% in 2028 and 32.9% in 2043.
• Growth is projected to occur at around a rate of 0.6% annually until 2028. • The District’s households are projected to grow to 21,500 in 2028 (+11.4%), rising to
22,300 households in 2038. • Household size is declining over time as the population ages.
The following graphs summarise the population and household projections:
Figure 14: Projected Population of the Timaru District 2013-2043, by projection variant
46,400 46,400 46,200 45,600 44,600 43,300
47,400 48,500 49,400 50,000 50,200 50,200
45,400
48,400 50,500 52,600
54,400 55,800 57,100
05,000
10,00015,00020,00025,00030,00035,00040,00045,00050,00055,00060,000
2013 2018 2023 2028 2033 2038 2043
Num
ber
Timaru District Projected Population 2013-2043
SNZ (2016 update) LOW SNZ (2016 update) MEDIUM SNZ (2016 update) HIGH
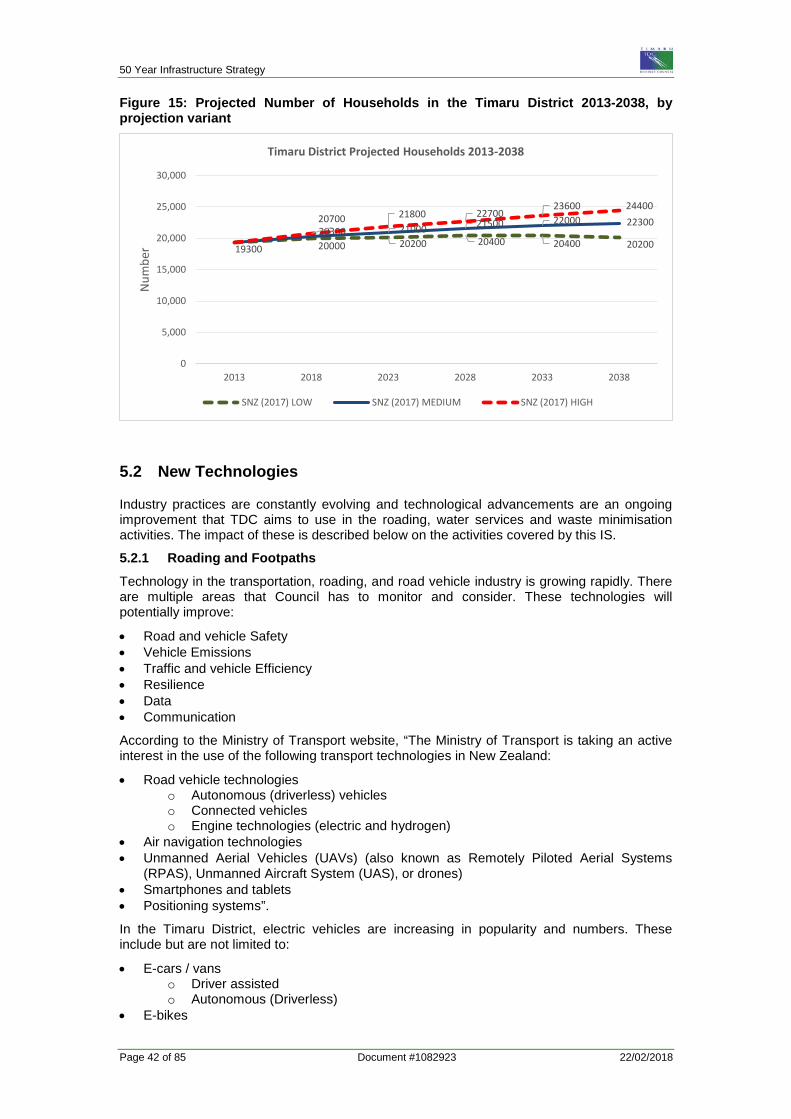
50 Year Infrastructure Strategy
Page 42 of 85 Document #1082923 22/02/2018
Figure 15: Projected Number of Households in the Timaru District 2013-2038, by projection variant
5.2 New Technologies
Industry practices are constantly evolving and technological advancements are an ongoing improvement that TDC aims to use in the roading, water services and waste minimisation activities. The impact of these is described below on the activities covered by this IS.
5.2.1 Roading and Footpaths Technology in the transportation, roading, and road vehicle industry is growing rapidly. There are multiple areas that Council has to monitor and consider. These technologies will potentially improve:
• Road and vehicle Safety • Vehicle Emissions • Traffic and vehicle Efficiency • Resilience • Data • Communication
According to the Ministry of Transport website, “The Ministry of Transport is taking an active interest in the use of the following transport technologies in New Zealand:
• Road vehicle technologies o Autonomous (driverless) vehicles o Connected vehicles o Engine technologies (electric and hydrogen)
• Air navigation technologies • Unmanned Aerial Vehicles (UAVs) (also known as Remotely Piloted Aerial Systems
(RPAS), Unmanned Aircraft System (UAS), or drones) • Smartphones and tablets • Positioning systems”.
In the Timaru District, electric vehicles are increasing in popularity and numbers. These include but are not limited to:
• E-cars / vans o Driver assisted o Autonomous (Driverless)
• E-bikes
19300 20000 20200 20400 20400 2020020300 21000 21500 22000 2230020700 21800 22700
23600 24400
0
5,000
10,000
15,000
20,000
25,000
30,000
2013 2018 2023 2028 2033 2038
Num
ber
Timaru District Projected Households 2013-2038
SNZ (2017) LOW SNZ (2017) MEDIUM SNZ (2017) HIGH
Working Template 50 Year Infrastructure Strategy
Page 43 of 85 Document# 1082923 22/02/2018
• Mobility scooters • Paxters
These sorts of vehicles have their benefits, but have multiple impacts on roading activity (e.g. Road safety - vehicular and pedestrians, charging stations – as demand increases, asset capability, cellular coverage).
Numerous software applications are emerging and in use. Some of these applications/software can assist with providing information to drivers (such as GPS mapping), and some assist organisations in gathering information.
Global Positioning System (GPS) are as good as the information available. If the software is not updated by the user or by the organisation, then the system can send users to unsuitable locations, all dependent of the options selected, such as “shortest routes”. The road user may not have the right vehicle to handle the road conditions that the GPS has identified for them to travel.
With the younger generation more in-tune with the current technology, information such as Wi-Fi direct availability, charging points, online shopping, bus (real-time) location information, are becoming the standard expectation.
5.2.2 Water Services (Water Supply, Sewer and Stormwater) For water services, technological improvements continue to evolve and be promoted within the water services industry. Council acknowledges the utility and advantages of using more up to date materials and processes for operational efficiency. A process is embedded in the procurement of services where Council is provided a choice, for example, of the types of materials and methodologies to be used by contractors. In particular, Council’s assessment of technology is around what could help increase asset performance, minimise life-cycle costs, and sustainably achieve community outcomes. These include, but are not limited to, the following:
• high performance pipe materials (e.g., crack/pressure resistant PE pipes)
• non-destructive pipe condition assessments (e.g., ultrasonic testing, broadband electromagnetic testing)
• more effective and environmentally sustainable treatment processes (e.g., for wastewater odour control; for stormwater treatment)
• greater integration of Information and Communication Technology tools in business processes (e.g., electronic identification and tagging of buried assets; customised computers for field work management)
Looking at the 50-year horizon, Council will continue to pursue technological advancement that will bring about the greatest opportunities for efficiency and effectiveness in service delivery, taking into account the community’s appetite for advancement or modernisation of public services given the associated costs.
5.2.3 Waste Minimisation For waste minimisation, the application of new technology will include:
• RFID tags being trialled as a way to improve delivery of kerbside collection services. • Electric trucks for kerbside collection are likely to be implemented in the next 5 years. • New technologies and product stewardship schemes will emerge to deal with various
waste streams. Council can facilitate a wide range of projects recovering/recycling waste which correlates with the long term vision for the Redruth site to provide a resource recovery hub. Waste to energy may provide an alternative option following the closure of the landfill.
5.3 Changing Government Priorities and Legislative Environment The change of government in September 2017 may impact significantly on the delivery of some infrastructural services. At the time of preparation of this IS much of the associated detail is unclear.
50 Year Infrastructure Strategy
Page 44 of 85 Document #1082923 22/02/2018
The government's current objective is that, “In 2045 New Zealand’s infrastructure will be resilient and coordinated, and contribute to a strong economy and high living standards”6. . This will be achieved through better use of existing assets and better allocation of new investment, as set out in the New Zealand Infrastructure Plan 2015.
Environmental compliance and progress is reflected through national policy statements and promulgated through regional and district plans.
The following provides a summary of the areas likely to impact on the delivery of Council infrastructure, based on current knowledge.
5.3.1 Roading and Footpaths Changes to the Government Policy Statement (GPS) on Land Transport
This is being revised to take account of the government’s priorities, including:
• giving public transport greater priority in cities and expanding the public transport system to support new housing and interregional commuting
• increasing the use of rail to enable efficient passenger and freight use • supporting regional development • increasing support for active modes - walking and cycling • delivering health, safety and environmental improvements • reducing the environmental impact of transport • mode neutrality in freight transport planning.
A draft of the new GPS is expected in early 2018, with the final document not due until August 2018. This will impact on the Regional Land Transport Plan as prepared by all Canterbury Councils, and potentially the funding and approach applied to the delivery of roading and footpaths services in the Timaru District.
5.3.2 Water Services (Water Supply, Sewer and Stormwater) Government Enquiry into Havelock North Drinking Water
With the Havelock North drinking water incident, government has a focus on water quality and the safety of drinking water supplies. There are likely to be changes in standards and regulatory controls with funding and cost implications for water supplies.
An enquiry into the Havelock North water supply contamination incident commenced in 2016 and was completed in December 2017. The second stage of this report deals with recommendations around:
• Any legal or regulatory changes or additions necessary and desirable to prevent or minimise similar incidents
• Any changes or additions to operational practices for monitoring, testing, reporting on and management of drinking water supplies, implementation of drinking water standards, contingency planning, and responses by local and central government to address the lessons from this incident; and
• Any other matter which the Inquiry believes may promote the safety of drinking water and/or prevent the recurrence of similar incidents.
The second stage report was released in December 2017. Government is currently considering their response to the report, and it may have significant implications on the delivery of water supply services.
National Policy Statement for Freshwater Management
The amendment in 2017 of the National Policy Statement for Freshwater Management 2014 (NPS-FM) is one component of central government’s clean water reforms. This could translate into more stringent conditions in obtaining/renewing resource consents with associated asset development/upgrade costs.
6 National Infrastructure Unit, 2015 Thirty year New Zealand Infrastructure Plan, Wellington
Working Template 50 Year Infrastructure Strategy
Page 45 of 85 Document# 1082923 22/02/2018
Environmental compliance and progress is reflected through national policy statements and promulgated through regional and district plans.
5.3.3 Waste Minimisation Indications are that the change of government in late 2017 could bring about further legislative and policy changes that place a greater emphasis on environmental protection.
5.4 Climate Change Climate change is an important consideration in the Council’s long-term planning. Guidance from the New Zealand government, based on the best available climate science is used to support the planning. The Ministry for the Environment information on http://www.mfe.govt.nz/climate-change/how-climate-change-affects-nz/how-might-climate-change-affect-my-region/canterbury provides a summary of projected climate changes over the period 2031-2050 and 2081-2100, compared with 1986-2005 and the key impacts this is likely to have.
Potential key impacts are likely to include: • Water shortages – Higher temperatures, less rainfall and greater evapotranspiration are
likely to cause increasing pressure on water resources. Droughts are likely to become more frequent and more extreme.
• Fire risk – Strong winds, combined with high temperatures, low humidity and seasonal drought may result in an increased fire risk. The length of the fire season is expected to increase.
• Sea level rise – As the climate changes and the sea level rises, the risk of flooding will increase. Coastal erosion is also likely to increase.
• Biosecurity – Climate change could increase the spread of pests and weeds. Banana passionfruit, a frost-tender plant, appears to be spreading, and argentine ants have survived through two winters, which was previously not thought possible. There may also be an increased threat to native species from changed distribution of disease vectors.
• Agriculture – Warmer temperatures, a longer growing season and fewer frosts could provide opportunities to grow new crops. Farmers might also benefit from faster growth of pasture and better crop growing conditions. However, these benefits may be limited by negative effects of climate change such as prolonged drought, increased flood risk, and greater frequency and intensity of storms. There is also likely to be increasing pressure on water resources.
These key likely impacts have been factored into the planning for our infrastructure assets.
5.4.1 Roading and Footpaths Some Roading and Footpaths infrastructure is exposed to the effects of climate change, including:
• Rise of sea level • Adverse weather events:
o Intensity of rainfall o Strong winds o Droughts o Snowfall
• Changes in average temperatures
These effects have the potential to increase:
• Longer dry periods causing increased dust on unsealed roads • High temperatures causing bitumen softening causing flushing and reducing skid
resistance. • Flooding and scouring damaging roads and bridges • Trees and other structures falling / blocking roads
These all can affect road accessibility and network resilience. The mitigation of these will be reactive through timely response to events and repair works undertaken as required.
50 Year Infrastructure Strategy
Page 46 of 85 Document #1082923 22/02/2018
5.4.2 Water Supply The associated risks to water supply relate to the availability and quality of source water. The increasing frequency of droughts could result in the probability of severe restrictions being imposed increasing above the 5% chance of occurring in any one year. More frequent and intense rainfalls could adversely impact on the quality of our raw water sources making it more difficult to treat to drinking water standards. These factors are acknowledged in Council’s planning and operation of its assets, and measures are progressively being put in place (e.g. in design standards) to adapt to the effects of climate change. In the immediate term, universal urban water metering and pricing is being investigated as a demand management measure to encourage more efficient use of water and increase water availability. Over the longer term, greater resilience to climate change may require development of new water sources, investing in additional storage capacity, and/or treatment upgrades to mitigate the risks.
5.4.3 Sewer The occurrence of more intense rainfall events in the district could exacerbate inflow and infiltration (I&I) into the sewer network, with implications on the performance of the assets. Levels of service failure could occur if the existing design capacity of the wastewater network is not able to deal with these more intense rainfall events.
The rate of I&I into the wastewater network is also a key factor in future wastewater volumetric demands. Most urban systems across New Zealand experience I&I with stormwater making up 20% to 40% of wastewater volumes.
Incidents involving overflow from the sewer network due to high levels of I&I make it more likely that breaches of resource consents will occur. Council has an ongoing Inflow and Infiltration Assessment Programme targeting known problem areas and test results are used to inform the pipe renewal programme. Overall, timely renewal of defective pipes is key to mitigating the risk of sewer network overflows.
5.4.4 Stormwater The effects of climate change on the district’s stormwater networks are not quantifiable with any degree of accuracy. What is known is the district’s primary stormwater networks are designed to meet a 1 in 5-year return rainfall event (i.e. a 20% chance of occurring in any one year) in residential areas and a 1 in 10 year return rainfall event (i.e. a 10% chance of occurring in any one year) in industrial and commercial areas.
The district’s stormwater network is generally aged. With higher intensity rain events, some parts of the network do not meet their intended level of service resulting in overflows. Increasing the level of service to contain greater stormwater flow rates and volumes will involve significant investment in network capacity upgrade and development, and will be a major decision for Council and the community to consider. The LTP 2018 Consultation Document includes a decision that needs to be made on the funding and timing of this and other stormwater improvements. It is likely that improvements will be implemented in a staged fashion (short to long term), with environmental outcomes progressively enhanced.
5.4.5 Waste Minimisation Waste has a contributing effect to climate change through the generation of methane gas. Under the National Environmental Standard for Air Quality, Redruth Landfill is required to implement systems for gas collection and destruction. Landfill gas systems are planned for at each stage of cell development capping and closure.
High intensity rainfall will increase stormwater flow within the site and from the surrounding catchment. Stormwater planning will review controls required to mitigate the risks to the landfill stormwater system posed by climate change.
The location of the Redruth Landfill in a coastal area means the site may be at long term risk of erosion. This will be monitored. However, it is noted that the South Island main trunk railway lies between the Redruth landfill and the coast. The Redruth site may also be susceptible to flooding, but high bunds and swales to divert stormwater mitigate the risk.
Working Template 50 Year Infrastructure Strategy
Page 47 of 85 Document# 1082923 22/02/2018
5.4.6 Coastal Erosion & Inundation The district does not have significant roading or wastewater treatment infrastructure subject to the immediate threat of coastal erosion or inundation. However, it does have low lying recreation areas which are subject to it, for example the Otipua Wetlands and associated paths and bridges. The Redruth landfill is also potentially subject to erosion or inundation during the lifetime of this strategy. The issue can be summarised as follows:
• Coastal erosion is occurring along most of the South Canterbury Coastline with the exception of Caroline Bay, which is accreting.
• Erosion has been worsening in recent times as beach shingle is depleted, particularly in severe Northeasterly swells.
• Most at risk from current levels of erosion are coastal walkways, the Rail Corridor for the South Island main trunk railway line, Otipua Beach and the Otipua Wetlands.
Looking to the next 25 to 50 years, more significant assets in terms of infrastructure may be affected by coastal erosion. If sea levels rise as predicted, together with more frequent extreme weather events, the rate of erosion and inundation will increase. This could potentially affect the following:
• Washdyke Lagoon – if the seaward side of the lagoon were to be completely eroded, it may expose a main sewer line to the risk of damage from the effects of coastal erosion
The TDC Wastewater Treatment Plant and Oxidation Ponds have been built outside the coastal erosion zone, as defined by Environment Canterbury. It is anticipated that the plant and ponds may be at risk but not within the 100 year timeframe.
The Redruth landfill could be affected by erosion and inundation during the next 50 years. This could largely depend on whether KiwiRail take steps to protect the South Island main trunk railway line. If they do, that protection will likely protect the landfill. If not, the landfill could be at risk depending on the rate of erosion
Coastal erosion and inundation is a dynamic and variable phenomenon, which is hard to predict and does not occur in a linear manner. Accordingly, this is an issue that Council needs to monitor closely and address as required.
5.5 Infrastructure Resilience Customers have a high expectation of continuing functionality and service delivery. Resilience is based on a design philosophy which acknowledges that failure will occur. Resilience requires early detection and recovery, but not necessarily through re-establishing the failed system. Multiple projects ongoing or planned contribute to improving resilience. For example, the installation of a new trunk water main to Washdyke is currently being investigated.
We have to consider managing and mitigating the risks to, and the resilience of our infrastructure assets not only from natural disasters but also from the impact of development and other factors (e.g. unexpected failure). Weakness in asset condition monitoring is also a risk to asset performance.
To be resilient and sustainable, we need to plan for and respond to both anticipated and unexpected changes. Canterbury faces disruption from acute events, such as floods, winds, earthquakes or serious vehicle crashes. The design of infrastructure and provision of alternative routes can help alleviate these risks.
More gradual and predictable threats provide even greater challenges in the long-term. Changes in demand will occur due to population growth, demographic and economic growth changes. Other changes need to be anticipated and planned for such as climate change.
The current heavy reliance on non-renewable fuels and its contributions to climate change emissions is a sustainability issue. At a regional level, the infrastructure and services provided will make relatively little difference to these issues. More substantial progress requires
50 Year Infrastructure Strategy
Page 48 of 85 Document #1082923 22/02/2018
national and international responses, including strong policy responses and the introduction of new technology.
The integration of infrastructure and services with land use planning also contributes to long term sustainability as it can reduce costs and enhance accessibility, amenity and safety. More accurate physical condition assessment of assets can improve targeting of renewals and increase resilience of the infrastructure networks.
5.6 Ageing infrastructure The district’s infrastructure is ageing and the district is approaching an important period to ensure that its infrastructure assets continue to meet the current and future needs of the community.
TDC’s renewal strategy is intended to provide for the progressive replacement of individual assets that have reached the end of their useful life. The rate of asset renewal is intended to maintain the overall condition of the asset system at a standard, which reflects its age profile, and ensures that the community’s investment in the district’s Roading and Footpaths, Water Services (Water Supply, Sewer and Stormwater) and Waste Minimisation infrastructure is maintained. The rate of required renewals determines the funding required. Deferred renewals may affect levels of service and increase maintenance costs. Timely renewal intervention in accordance with good asset management practice is needed to ensure long-term maintenance costs are minimised, Levels of Service are maintained and renewal costs optimised. As stated by Office of the Auditor General, “Asset management interventions should be driven by data about the factors that determine the cost of service to ratepayers and other users. This includes information about:
• Performance, condition, works, and cost, which is required to understand the current cost of service and trends;
• Cost driven information such as demand, volume, input price, and demand-related decay models, which is required to forecast maintenance and renewal need and cost; and
• Works achieved compared to target/expectation, maintenance compared to renewals expenditure, unit service delivery costs, and condition, which is required to assess trends in the effectiveness and efficiency of maintenance and renewal programmes.”
5.6.1 Roading and Footpaths A significant amount of the District roading infrastructure was constructed between 50 and 80 years ago during the “pioneer” or “boom” times that provided access to land, industry, rail and ports. As a consequence these assets are in the second half of their useful life. This is most evident in the district’s bridge stock where many will need replacing in 10 to 20 years time. Provision must be made for this “hump” of renewal expenditure.
In recent years, there has been a significant growth in the freight task and a modal shift to road transport. The result is more heavy vehicles using our roads and increases in the mass of these vehicles. This has accelerated the deterioration of our road assets shortening their useful lives. Hence, a significant renewal programme is required. This is monitored on an ongoing basis by the following:
• Lifecycle assets strategy and plan implementation • Condition monitoring and assessment • Deterioration modelling (dTIMS) • Effective and timely maintenance • Renewals programmed and completed in effective and timely manner • Costs recorded and intervention actions based on whole of life costs.
Currently, dTIMS (deterioration predictive modelling) is used for pavements, which identifies intervention strategies and determines timing, frequency and treatment type to be implemented. This also optimises intervention strategies and produces expenditure forecasts, work programmes and predictions of future condition.
Working Template 50 Year Infrastructure Strategy
Page 49 of 85 Document# 1082923 22/02/2018
Bridges are inspected and structurally assessed every three years and renewal programmes are reviewed based on these assessments. The ageing of the assets and accelerated deterioration will result in challenges for future funding and resources to meet demand. This is a significant issue for the Council.
5.6.2 Water Services TDC’s issue with the ageing of its water, sewer and stormwater services infrastructure is more relevant to its underground assets or buried pipes as they cannot always be visually inspected anytime, and condition assessment is generally inferred from the theoretical age of the asset and from sampling of certain portions of the entire pipe network. The timing of renewal of the asset becomes crucial and decisions around deferring a renewal is critical as there is always a considered risk that adjusted asset lives or extended use of an expired asset could cause operational issues and service level failure anytime.
5.6.2.1 Water Supply The district’s water supplies were established at various periods, the oldest being the Timaru town water supply in 1880, followed by Temuka in 1906, and Downlands, Geraldine and Pleasant Point in 1938. The Peel Forest supply was established prior to 1950. The Winchester reticulation was installed in 1966-67. Seadown, Te Moana and Orari supplies were installed in the 1970s. Figure 16 and Figure 17 show the age profile of the water supply network and the cost of the renewal programme, respectively. Around 200km of water mains (or 10% of the entire network) needs replacement within the next 10 years with an associated cost of around $60M. These comprise mainly of steel and asbestos cement (A/C) pipes which were the typical older pipe installations. The quantum of pipes reaching the end of their theoretical economic life is going to progressively increase from an estimated 10% in the next 10 years to about 30% of the entire water supply network within the 50 year period of this Infrastructure Strategy. Renewals of assets are generally funded from reserves which have previously been funded from rates. If there are insufficient funds in the appropriate reserve for the renewal expenditure, council has elected to borrow to pay for some of the renewals. Later in the period (i.e. from around year 50) there is a significant jump in pipe renewals required, yet they appear to cost significantly less. The difference relates to the size (diameter) of the pipes being replaced. For example, a large trunk main can cost many millions of dollars (e.g. $20M for Pareora pipeline), whereas smaller water mains pipes cost a lot less to replace. Because of the identification of unexpected degradation of the Temuka trunk main in December 2017, it is proposed to carry out a review of the sampling, testing and determination of remaining life of asbestos cement water pipes in the Timaru District.
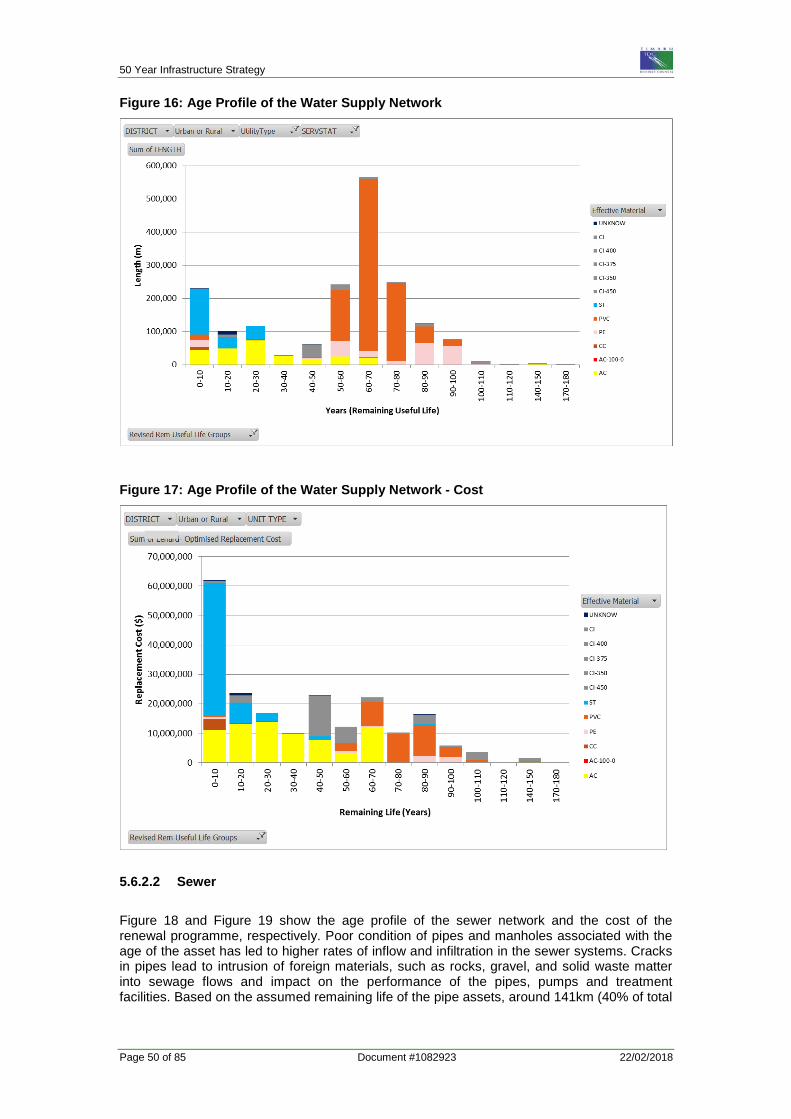
50 Year Infrastructure Strategy
Page 50 of 85 Document #1082923 22/02/2018
Figure 16: Age Profile of the Water Supply Network
Figure 17: Age Profile of the Water Supply Network - Cost
5.6.2.2 Sewer Figure 18 and Figure 19 show the age profile of the sewer network and the cost of the renewal programme, respectively. Poor condition of pipes and manholes associated with the age of the asset has led to higher rates of inflow and infiltration in the sewer systems. Cracks in pipes lead to intrusion of foreign materials, such as rocks, gravel, and solid waste matter into sewage flows and impact on the performance of the pipes, pumps and treatment facilities. Based on the assumed remaining life of the pipe assets, around 141km (40% of total
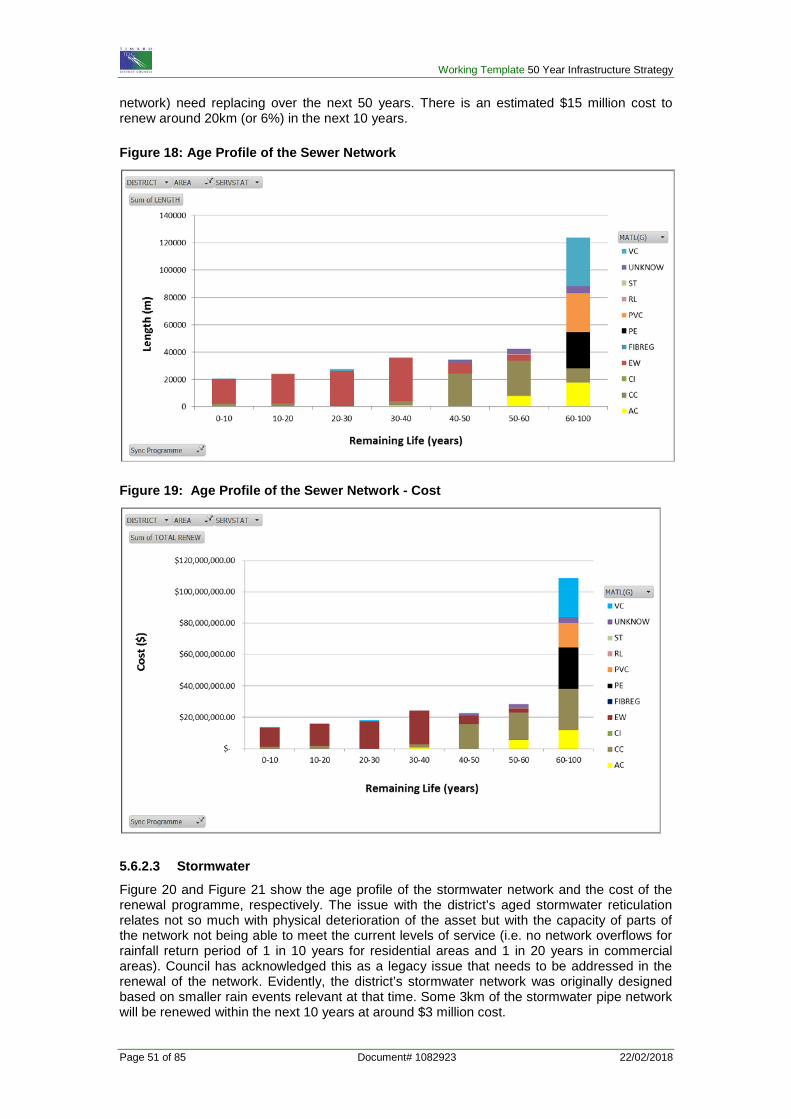
Working Template 50 Year Infrastructure Strategy
Page 51 of 85 Document# 1082923 22/02/2018
network) need replacing over the next 50 years. There is an estimated $15 million cost to renew around 20km (or 6%) in the next 10 years. Figure 18: Age Profile of the Sewer Network
Figure 19: Age Profile of the Sewer Network - Cost
5.6.2.3 Stormwater Figure 20 and Figure 21 show the age profile of the stormwater network and the cost of the renewal programme, respectively. The issue with the district’s aged stormwater reticulation relates not so much with physical deterioration of the asset but with the capacity of parts of the network not being able to meet the current levels of service (i.e. no network overflows for rainfall return period of 1 in 10 years for residential areas and 1 in 20 years in commercial areas). Council has acknowledged this as a legacy issue that needs to be addressed in the renewal of the network. Evidently, the district’s stormwater network was originally designed based on smaller rain events relevant at that time. Some 3km of the stormwater pipe network will be renewed within the next 10 years at around $3 million cost.
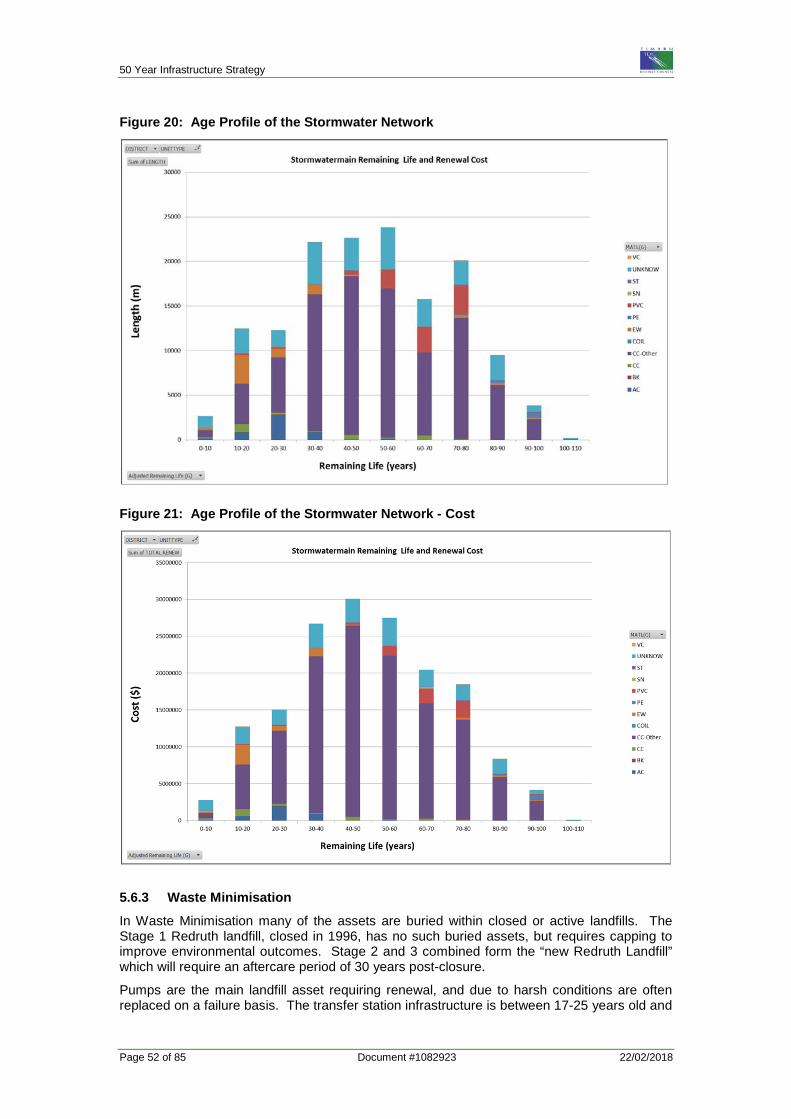
50 Year Infrastructure Strategy
Page 52 of 85 Document #1082923 22/02/2018
Figure 20: Age Profile of the Stormwater Network
Figure 21: Age Profile of the Stormwater Network - Cost
5.6.3 Waste Minimisation In Waste Minimisation many of the assets are buried within closed or active landfills. The Stage 1 Redruth landfill, closed in 1996, has no such buried assets, but requires capping to improve environmental outcomes. Stage 2 and 3 combined form the “new Redruth Landfill” which will require an aftercare period of 30 years post-closure.
Pumps are the main landfill asset requiring renewal, and due to harsh conditions are often replaced on a failure basis. The transfer station infrastructure is between 17-25 years old and
Working Template 50 Year Infrastructure Strategy
Page 53 of 85 Document# 1082923 22/02/2018
generally in good condition. Renewals are required for compactors after the initial 10-year period.
Above ground assets are listed in a database and more work is required to date and report on these assets to improve renewals planning and funding requirements.
5.7 Land Use Change The use of land in the Timaru District has changed substantially in the last 15 years. In the future, significant growth in demand for infrastructure services is expected to occur in the following parts of the District:
• Washdyke as the main industrial growth area • Timaru CBD and (potentially) the Showgrounds land for commercial use • Residential growth continuing in Gleniti areas as well as Old North Road area • Port-related land
At Washdyke, in 2011-14, Council rezoned 120 hectares of land from Rural to Industrial. This rezoning will result in developments that will require extensive new infrastructure, particularly roads, piped networks and electricity distribution systems. Council has determined that this recently zoned land will have infrastructure provided by developers at the time of development.
Rural land intensification has also occurred throughout the District with resultant impacts on infrastructure, particularly roads and bridges. In more recent times heavy trucks have been approved at a 50 tonne gross vehicle mass. The additional vehicle movements have resulted in extra costs in order to meet specified community levels of service.
Land use change impacts on water services are also significant. The increasing number of lifestyle blocks on the fringes of the District’s urban areas has increased demand for extension of water supply services to these properties. As residential development continues, the extent of impervious areas grows and creates more demand for stormwater infrastructure services.
The current District Plan Review and subsequent revisions is required by the Resource Management Act 1991 to provide for the expected demand for additional urban land. The plan-led strategic approach taken by the Draft Growth Management Strategy (GMS), which will inform the District Plan Review will ensure that any new areas of urban land are serviced with or can be serviced with infrastructure and that infrastructure is a key consideration in any decision on managing urban growth. This will help ensure new infrastructure provision is efficient. The issue of who prepares Outline Development Plans (ODPs) will be addressed in the GMS or by a Council policy. If Council decides to prepare ODPs, that will increase the demand for design work.
5.8 Funding Capital, maintenance, and operational funding of the Roading and Footpaths, Water Services and Waste Minimisation activities is complex and made up of a number of streams.
Existing funding sources are as follows:
Roading and Footpaths
- General Rates based on land values and differentiated - NZ Transport Agency (NZTA) Funding Assistance - Depreciation funds - Loans - User charges - Private parties
Water Services - General Rates based on land values based on community of interest for
stormwater - Targeted Rates via uniform annual charges for water and sewer
50 Year Infrastructure Strategy
Page 54 of 85 Document #1082923 22/02/2018
- Targeted Rates via land area (for rural water) - Targeted Rates via water volumes (for rural water) - Subsidies for approved sewer schemes - Depreciation funds - Loans - User charges - Private parties
Waste Minimisation - Targeted Rates via uniform annual charges - Depreciation funds - Loans - User charges - Private parties - leases
For details on how these activities are funded, refer to the Council’s Revenue and Financing Policy in the Long Term Plan. This policy outlines the proportion of funding that will come from each source. Financial Contributions are charged under the current Financial Contributions policy in the District Plan. Currently, the Council does not use Development Contributions as provided for in the Local Government Act. However, Financial Contributions are being legislatively phased out and the Development Contributions Policy is to be reviewed before 2021.
Rating for these activities differs according to where the property is located, the land value of the property and the services received.
5.8.1 Roading and Footpaths – Government Funding Funding for Roading and Footpaths from government through NZTA is reducing. This is subject to a number of potential changes as summarised below:
• Government Policy Statement (GPS) - funding category allocations are being reviewed by the government.
• Funding Assistance Rule (FAR) - the NZTA FAR review has implemented a flat rate for all activities and the outcome for Timaru is a reduced FAR of 52% for 2018/19 and 51% thereafter.
• Business Cases – business cases are to be prepared to support national priorities and contestability issues.
• One Network Road Classification (ONRC) – this is a national road classification hierarchy system. The ONRC system allows comparative analysis both nationally and with relevant peer groups. These comparative analysis reports provide evidence on a district’s expenditure and asset management strategy efficiency.
Timaru District must carefully manage its investment in infrastructure to ensure it gets value for every dollar spent and provide infrastructure in a lawful, functional and affordable manner.
5.8.2 Waste Waste Minimisation income from user charges varies annually according to tonnages disposed of. This presents a risk that income from user charges can vary significantly, particularly if waste flight occurs.
Working Template 50 Year Infrastructure Strategy
Page 55 of 85 Document# 1082923 22/02/2018
6.0 FIFTY YEAR STRATEGY
Timaru District Council will comply with the relevant New Zealand legislation, while working towards the Strategic Direction, as outlined earlier in this document.
6.1 Responsible Stewardship
The main theme underpinning this Infrastructure Strategy is ensuring responsible stewardship of our key infrastructure assets to meet the needs of tomorrow’s community.
This acknowledges the many and varied factors that influence the delivery of the district’s infrastructure, as discussed in Section 5, including: • Ageing Infrastructure – the need to address a ‘bulge’ of infrastructure that is nearing the
end of its life. Infrastructure needs replacement to modern design and environmental standards. In some instances, significant redesign may be required to ensure it is fit for purpose.
• Societal change – our society is rapidly changing. Land use change, changing demographics, new government legislation and demands, technological change and increasing community expectations. New infrastructure development needs to be future-proofed and responsive to this change.
• Resilience – Built infrastructure needs to be able to handle the impact of natural hazards, at a minimum to protect human life. But this is not all, it must also cope with future demand and change, such as the impact of a growing economy and changes in land use.
Some of these challenges are legacy issues (e.g. the decisions of past Councils or how things were built over 40 years ago). Others are simply the demands of a progressive society that is constantly seeking to improve. Either way, the Council is responsible for ensuring built infrastructure enhances community wellbeing and is fit for purpose, good quality, safe, future-proofed, cost effective and appropriately funded.
The Council’s priorities are: • Timely and cost effective maintenance of infrastructure to optimise its life • Replacing ageing infrastructure in a timely manner • At a minimum, maintaining existing levels of service • Managing the impacts of growth and land use change in a sustainable way • Compliance with legislative requirements • Providing long term affordable services • Managing the impact of technology changes
6.2 Asset and Service Management Strategy Council’s management strategy is to be a prudent and knowledgeable asset manager that makes investment decisions based on asset age, condition, performance, deterioration and maintenance factors. Increasing legislative standards are acknowledged and actioned in all asset renewal projects.
Strategic and organisational priorities set the direction for planning of infrastructure that will continue to support quality living, economic development and environmental integrity in the District in the long-term. Looking ahead to the next 50 years, Council’s approach is to be prudent in its investment decisions using a holistic lifecycle approach to asset management, responding to changes in demand for services, allowing for changes in levels of service, and mitigating identified risks. In planning and providing the district’s infrastructure requirements in the next 50 years, Council will:
• Maintain and optimise asset life - through timely and effective maintenance. TDC’s philosophy is to view maintenance as a value driver rather than a cost centre. The decision to perform maintenance at any time is based on cost/benefit analysis, understanding that maintenance can add economic value to assets. There is no one-size-fits-all care programme for all of council’s infrastructural assets. TDC will continue to utilize a mix of approaches, including preventive maintenance, reactive
50 Year Infrastructure Strategy
Page 56 of 85 Document #1082923 22/02/2018
maintenance, run-to-failure (breakdown maintenance), predictive maintenance which is condition rather than age based, and risk-based maintenance for critical assets that need to be monitored more frequently. The decision on what will work best requires a delicate balancing between the value that improved reliability can bring and the cost of maintenance.
• Continue to replace ageing infrastructure – through a robust asset renewal programme. Council has adopted a cyclic renewal strategy that provides for the progressive replacement of assets that are reaching the end of their useful life. The rate of asset renewal is intended to maintain the overall condition of the asset system at a standard which reflects its criticality and age profile, and ensures that the community’s investment in the infrastructure is sustained.
Deciding the timing of capital and maintenance expenditures is based on Council’s understanding of the current condition and capacity of the assets, as well as future capacity, criticality and reliability requirements. Council will also consider the cost and risk associated with implementing or deferring renewals, upgrades or improvements. Council’s strategy will be to: • Prioritise capital and renewal projects within the next ten year period based on
the strategic objectives of the Timaru District’s Long Term Plan and Infrastructure Strategy and a holistic risk based condition assessment; and
• Forecast capital renewal, replacement and upgrade costs over the following 40 year period; and
• Forecast the funding requirements based on estimates of costs and asset valuations
• Maintain the current level of service - through a holistic lifecycle approach to asset management that covers the assets and their supporting resources, business processes, data and enabling technologies, critical to sustainably delivering agreed levels of service. This holistic approach to lifecycle asset management enables critical asset data, particularly condition and performance tracking, to be effectively used on a practical day-to-day business level to maximise the performance and life of the asset.
• Manage the impacts of growth and land use change – by providing the conceptual framework of infrastructure in support of development. The TDC’s Growth Management Strategy provides guidance on potential future infrastructure development in the district through identifying the potential location and scale of future growth. Contributions from development will be taken to fund necessary infrastructure so that growth pays for growth, and costs are not unfairly borne by established communities.
• Comply with legislative requirements – by acknowledging and actioning legislated standards in infrastructure planning and development. Compliance with the RMA, through the resource consenting process, will drive sewer and stormwater including road infrastructure expenditures. Anticipated increase in regulatory controls for drinking water supplies signals that additional capital expenditures will need to be made to upgrade water treatment processes and other infrastructure (e.g. A/C pipes).
Land Transport must continue to meet increasing requirements of the Land Transport Management Act, Transport Act and new road user rules such as heavy vehicle mass.
• Provide long-term affordable services - through prudent financial management that complements asset management. The financial strategy will continue to reflect the balancing of ratepayer affordability against community needs and aspirations.
• Manage the impacts of technology changes – through monitoring technology developments and appropriate responses. The next 50 years will see significant advances in technology, particularly in transportation, and roading infrastructure will need to respond to support these changes. These will include electric vehicle/bike charging stations, information technology on direction, travel and safety and providing appropriate infrastructure for autonomous vehicles. Other potential technology changes that may need a response are in waste disposal areas such as incineration, water quality monitoring, energy sources and use.
Working Template 50 Year Infrastructure Strategy
Page 57 of 85 Document# 1082923 22/02/2018
The Council has an Activity Management Policy that defines the appropriate level of asset management in line with the International Infrastructure Management Manual 2015 (IIMM). Activity Management Plans are prepared that incorporate key information for managing each individual aspect of the activity. These plans are reviewed regularly.
6.3 Cost Effective Delivery of Services Section 10 (Purpose of Local Government) of the Local Government Act 2002, sets out a clear requirement to meet the current and future needs of communities for good-quality local infrastructure, local public services, and performance of regulatory functions in a way that is most cost-effective for households and businesses.
The Act defines good-quality, in relation to local infrastructure, local public services, and performance of regulatory functions, as infrastructure, services, and performance that are:
(a) efficient; and
(b) effective; and
(c) appropriate to present and anticipated future circumstances.
In order to deliver services that are efficient, effective and appropriate, Timaru District Council has adopted a philosophy of using a mix of in-house resources and consultants/contractors to carry out its work programme.
Core work is carried out by a wide range of professionals and support staff employed by the Timaru District Council. These staff carry out a base load of work and consultants are hired to carry out specialised work and also when the volume of work is greater than the internal capacity. The cost of hiring staff versus utilising consultants is evaluated on a job by job basis.
Water and Wastewater treatment operations are carried out by inhouse TDC staff. The reason for this approach is that Council wishes to be risk averse where public health and environmental matters are a priority. The consequence of failure to comply with Drinking Water Standards or resource consent conditions are so important to the TDC organisation it has been determined that close and direct control is required and therefore these tasks are carried out inhouse.
As for service delivery, whether for maintenance or construction work TDC has determined that contractors will be used. The Timaru area is well resourced with contractors with many national companies having bases in the District. The engagement of contractors is by negotiation, quotation or tender. Evaluation and assessment of quotations and tenders for roading work is via lowest price, weighted attributes or Price Quality methods as specified by the New Zealand Transport Agency.
The TDC has a procurement strategy that contains guidelines as well as a flow chart to guide asset managers on how to procure external resources to carry out work.
Currently, in the Land Transport activity, Timaru District Council is working in collaboration with other boundary Councils (Ashburton, Mackenzie, Waimate District Councils) as part of the Mid-South Canterbury (Aoraki) Roading Collaboration (ARC). This collaboration was established to actively seek to collaborate and co-operate with each other to improve effectiveness and efficiency. The Councils aim to improve management and operations of their roading networks by working together. As part of the collaboration, the following contracts have been successfully awarded:
1. Road Network Operations and Maintenance Contract o Joint procurement and documentation
2. Road Resurfacing Contract o Single South Canterbury joint contract (2 years from 1/8/17)
6.3.1 LGA Section 17A Delivery of Services TDC undertook a review of the delivery of its services to meet the transitional provision under Section 17A of the Local Government Act 2002 Amendment Act 2014, requiring all services to be reviewed before 7 August 2017.
50 Year Infrastructure Strategy
Page 58 of 85 Document #1082923 22/02/2018
For the Water Supply, Sewer, Stormwater and the Waste Minimisation activities, Council determined that the services are being delivered cost effectively under existing governance, funding, management, and delivery approaches including contracting arrangements for operation, repair and maintenance of council assets.
In July 2017, Council received a Morrison Low report on the Land Transport activity. A wide range of service delivery options were considered for the future delivery of the Land Transport activity by the Council. The following two options were the service delivery options recommended in the review report that could provide improvements to the status quo for the Council:
1. Enhanced Status Quo a. Involves implementing the improvement initiatives to build upon the regional
collaboration that has already taken place in the physical works space. 2. Shared Service Agreement between the Councils
a. Involves a major change from the status quo and would represent a transformational shift in the way that the roading activity was managed and delivered in South Canterbury.
b. Includes the development of a formal South Canterbury Roading Alliance with a shared services business unit incorporating all roading teams from the participating Councils.
Council’s Policy and Development Committee in July 2017 considered a report presenting the recommendations and resolved the following:
a “That Timaru District Council supports the enhancement of the status quo for the delivery of roading professional services, building further on the Mid-South Canterbury Collaboration work to date.
b That Timaru District Council supports further investigation of the development of a roading professional services alliance with Ashburton, Mackenzie, and Waimate District Councils and enters into discussions with them to explore the implementation of this option.”
6.4 Addressing Resilience “The infrastructure strategy must outline how the local authority intends to manage its infrastructure assets, taking into account the need to…provide for the resilience of infrastructure assets by identifying and managing risks relating to natural hazards and by making appropriate financial provision for those risks.” (Source: LGA Section 101B (3)(e))
TDC’s Risk Management Policy provides that risks, to which Council is exposed, must either be avoided or controlled to an acceptable level. The policy directs the development of subsidiary risk management plans for each of Council’s activities. A register of risks is held on Council’s infrastructure assets. Risks are generally managed through the lifecycle management of assets which covers capital works, operations and maintenance.
6.4.1 Natural Hazards In terms of natural hazards, the District’s overall risk profile identifies earthquakes and flooding as the predominant natural hazards for Timaru7.
Council’s primary approach in addressing risks from natural hazards is ensuring strong organisational capacity and capability to respond to events that may occur. This means having an operable local Emergency Response Management Plan, Contingency Plan or Business Continuity Plan in place. Ongoing capability building on emergency response is provided to TDC personnel through Council’s Emergency Operations Centre.
Regionally, TDC is a member of the Canterbury CDEM Group. The group adopted a Canterbury CDEM Group Plan in June 2014, a strategic document that provides direction on how comprehensive, risk-based emergency management will be implemented in the Canterbury region. In implementing the plan, the Canterbury CDEM Group will work towards its vision of “A Resilient Canterbury — Waitaha Tukaha”.
7Source: Canterbury CDEM Group Plan (2014), Annex B – Timaru District Risk Profile
Working Template 50 Year Infrastructure Strategy
Page 59 of 85 Document# 1082923 22/02/2018
In particular, the Canterbury CDEM Group has established coordinative linkages among the region’s Lifeline utilities that provide essential infrastructure services to the community (e.g. water, wastewater, transport, energy and telecommunications). Lifeline utilities are required by section 60 of the CDEM Act to continue to provide their services to the fullest possible extent during and following emergency events. Lifeline utilities in the region have developed and maintain response arrangements. Should, for example, a major event occurs that results in prolonged power outage in the district or the region, Council has standby generators and fuel supply as a contingency measure. However, it can be expected that the power utility and fuel suppliers will assist us through their own response plans.
Financial provision for replacement of water supply, sewer and stormwater infrastructure assets following catastrophic damage by natural disaster is covered by insurance. The below-ground assets are insured by Local Authority Protection Programme (LAPP). The above-ground assets are insured by Council’s general insurance policy.
Provision for funding road damage from significant natural events is jointly provided by the NZ Transport Agency from the National Land Transport Fund and Council from the Disaster Recovery Fund.
6.4.2 Asset Resilience On a day-to day basis, Council addresses all types of hazards to its assets and operations and progressively builds resilience through a whole-of-life approach to asset management. The aim is to continue to deliver the required level of service at all times. Activity Management Plans are updated on a 3-yearly cycle and identify specific risks to assets and operations. These are factored into the development of the associated capital expenditure strategies/programmes. For example, seismic assessments of Council buildings have indicated a high risk of structural failure of the Pleasant Point and the Temuka water supply reservoirs in the event of a local earthquake occurring. Seismic strengthening is therefore a major design input into the renewal of these facilities.
Resilience to changes in the demand for Council’s infrastructure-based services (e.g. increased traffic on roads, bigger volumes of waste to the landfill, increased volume of stormwater flows, declining industry demand for water) is a major consideration in the long term planning of the district’s infrastructure. Key performance indicators are continually measured and trended for significance. Any projected capital works are funded through the LTP budget, consistent with the financial/funding strategy at the time.
Both physical and system resilience are crucial. This means:
• Design and construction standards (where cost effective) that ensure infrastructure is able to withstand natural hazards and long term changes in circumstances such as those resulting from climate change.
• Organisations and networks of organisations with the ability to identify hazards must share information, assess vulnerabilities, and plan for and respond to emergencies.
• Acknowledging the value of adaptability and redundancy in the network to improve business confidence.
• Identifying and managing cross-sectoral dependencies, such as power supply for communications infrastructure.
In order to improve resilience, the Council’s approach will be to:
• Investigate options for alternative service provision and system redundancy • Identify critical assets and ensure mitigation methods are developed • Better integration of resiliency criteria in infrastructure design and ensure design
standards meet climate change effects. • Improve accuracy of asset condition data for better targeting of renewals • Strengthen integration of infrastructure services planning with land use planning • Obtain insurance where this is deemed to be the most cost effective approach or
ensure Council funding provision for large scale events is available. • Plan for Resilience - Network Resilience Maintenance, Monitoring and Prioritised
Improvement Plan in place and actionable. • Do Proactive Maintenance - number of events where journeys are lost due to loss of
road function through proactive maintenance taking place
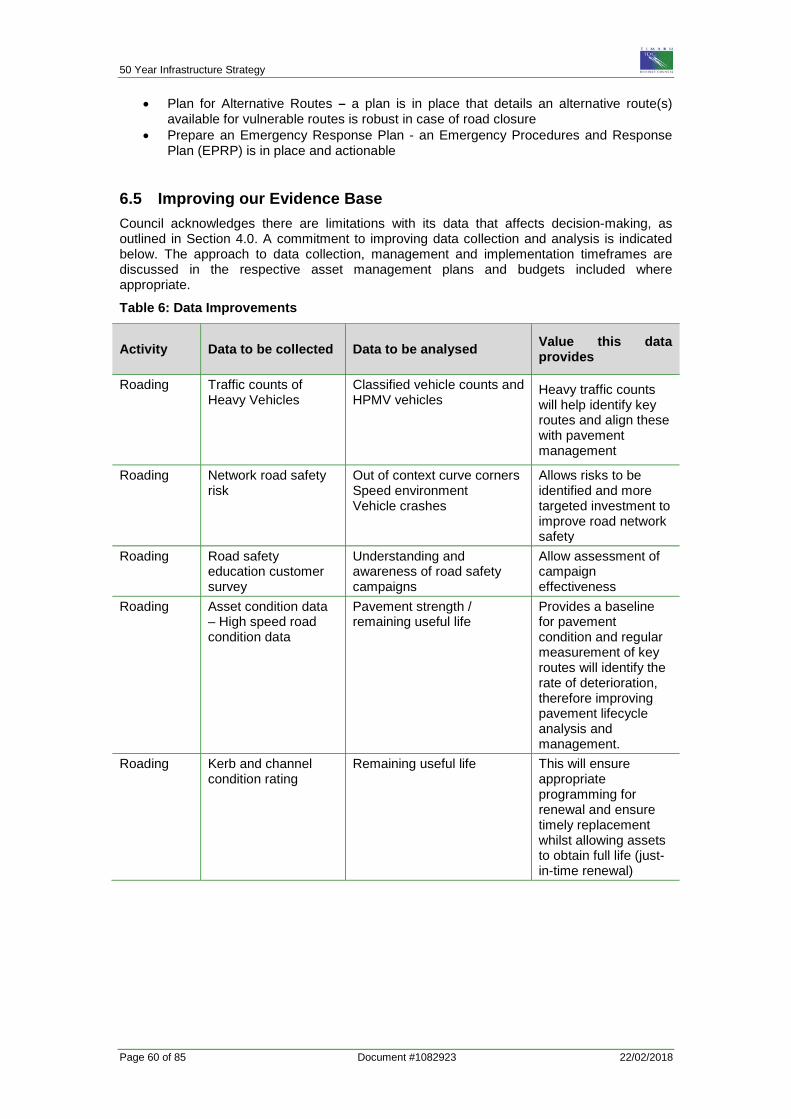
50 Year Infrastructure Strategy
Page 60 of 85 Document #1082923 22/02/2018
• Plan for Alternative Routes – a plan is in place that details an alternative route(s) available for vulnerable routes is robust in case of road closure
• Prepare an Emergency Response Plan - an Emergency Procedures and Response Plan (EPRP) is in place and actionable
6.5 Improving our Evidence Base Council acknowledges there are limitations with its data that affects decision-making, as outlined in Section 4.0. A commitment to improving data collection and analysis is indicated below. The approach to data collection, management and implementation timeframes are discussed in the respective asset management plans and budgets included where appropriate.
Table 6: Data Improvements
Activity Data to be collected Data to be analysed Value this data provides
Roading Traffic counts of Heavy Vehicles
Classified vehicle counts and HPMV vehicles
Heavy traffic counts will help identify key routes and align these with pavement management
Roading Network road safety risk
Out of context curve corners Speed environment Vehicle crashes
Allows risks to be identified and more targeted investment to improve road network safety
Roading Road safety education customer survey
Understanding and awareness of road safety campaigns
Allow assessment of campaign effectiveness
Roading Asset condition data – High speed road condition data
Pavement strength / remaining useful life
Provides a baseline for pavement condition and regular measurement of key routes will identify the rate of deterioration, therefore improving pavement lifecycle analysis and management.
Roading Kerb and channel condition rating
Remaining useful life This will ensure appropriate programming for renewal and ensure timely replacement whilst allowing assets to obtain full life (just-in-time renewal)
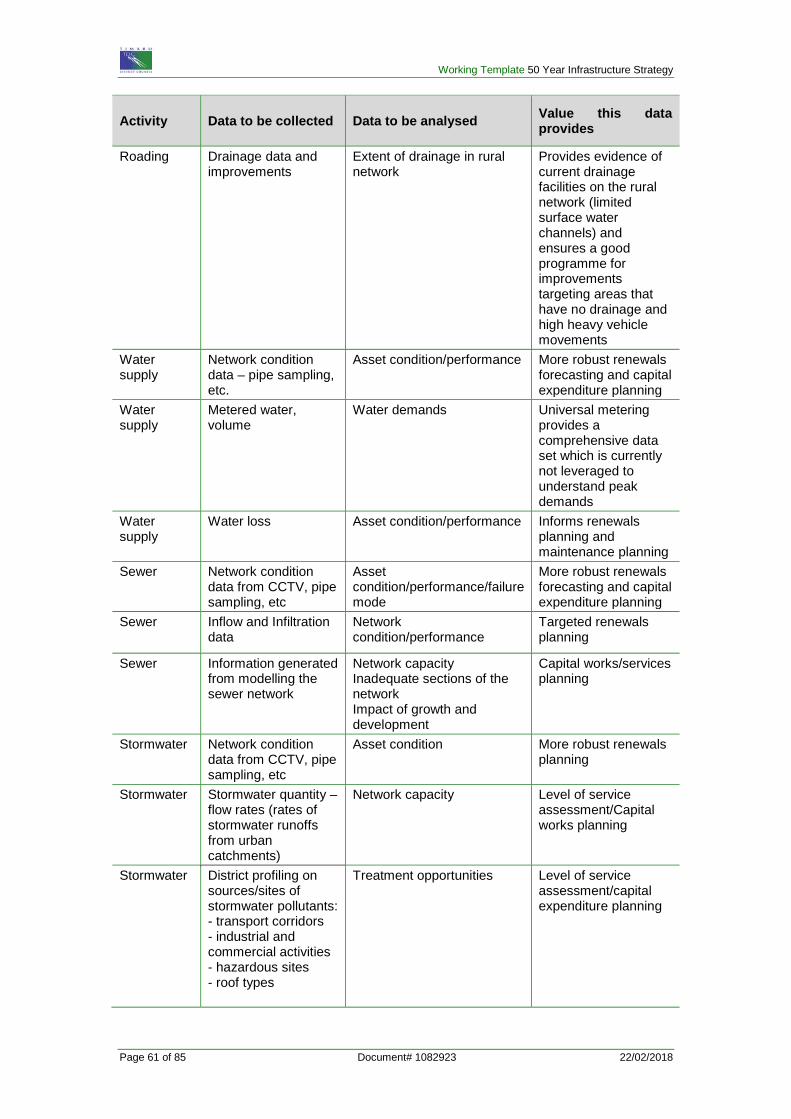
Working Template 50 Year Infrastructure Strategy
Page 61 of 85 Document# 1082923 22/02/2018
Activity Data to be collected Data to be analysed Value this data provides
Roading Drainage data and improvements
Extent of drainage in rural network
Provides evidence of current drainage facilities on the rural network (limited surface water channels) and ensures a good programme for improvements targeting areas that have no drainage and high heavy vehicle movements
Water supply
Network condition data – pipe sampling, etc.
Asset condition/performance More robust renewals forecasting and capital expenditure planning
Water supply
Metered water, volume
Water demands Universal metering provides a comprehensive data set which is currently not leveraged to understand peak demands
Water supply
Water loss Asset condition/performance Informs renewals planning and maintenance planning
Sewer Network condition data from CCTV, pipe sampling, etc
Asset condition/performance/failure mode
More robust renewals forecasting and capital expenditure planning
Sewer Inflow and Infiltration data
Network condition/performance
Targeted renewals planning
Sewer Information generated from modelling the sewer network
Network capacity Inadequate sections of the network Impact of growth and development
Capital works/services planning
Stormwater Network condition data from CCTV, pipe sampling, etc
Asset condition More robust renewals planning
Stormwater Stormwater quantity – flow rates (rates of stormwater runoffs from urban catchments)
Network capacity Level of service assessment/Capital works planning
Stormwater District profiling on sources/sites of stormwater pollutants: - transport corridors - industrial and commercial activities - hazardous sites - roof types
Treatment opportunities Level of service assessment/capital expenditure planning
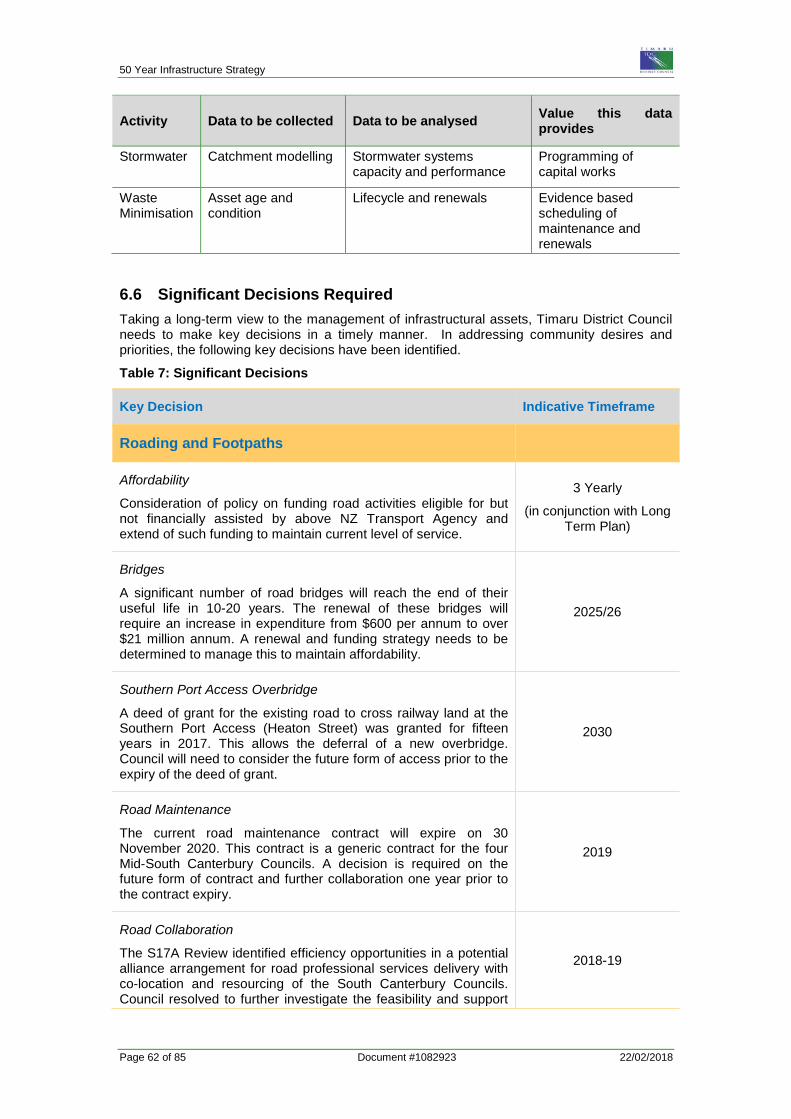
50 Year Infrastructure Strategy
Page 62 of 85 Document #1082923 22/02/2018
Activity Data to be collected Data to be analysed Value this data provides
Stormwater Catchment modelling Stormwater systems capacity and performance
Programming of capital works
Waste Minimisation
Asset age and condition
Lifecycle and renewals Evidence based scheduling of maintenance and renewals
6.6 Significant Decisions Required Taking a long-term view to the management of infrastructural assets, Timaru District Council needs to make key decisions in a timely manner. In addressing community desires and priorities, the following key decisions have been identified.
Table 7: Significant Decisions
Key Decision Indicative Timeframe
Roading and Footpaths
Affordability
Consideration of policy on funding road activities eligible for but not financially assisted by above NZ Transport Agency and extend of such funding to maintain current level of service.
3 Yearly
(in conjunction with Long Term Plan)
Bridges
A significant number of road bridges will reach the end of their useful life in 10-20 years. The renewal of these bridges will require an increase in expenditure from $600 per annum to over $21 million annum. A renewal and funding strategy needs to be determined to manage this to maintain affordability.
2025/26
Southern Port Access Overbridge
A deed of grant for the existing road to cross railway land at the Southern Port Access (Heaton Street) was granted for fifteen years in 2017. This allows the deferral of a new overbridge. Council will need to consider the future form of access prior to the expiry of the deed of grant.
2030
Road Maintenance
The current road maintenance contract will expire on 30 November 2020. This contract is a generic contract for the four Mid-South Canterbury Councils. A decision is required on the future form of contract and further collaboration one year prior to the contract expiry.
2019
Road Collaboration
The S17A Review identified efficiency opportunities in a potential alliance arrangement for road professional services delivery with co-location and resourcing of the South Canterbury Councils. Council resolved to further investigate the feasibility and support
2018-19
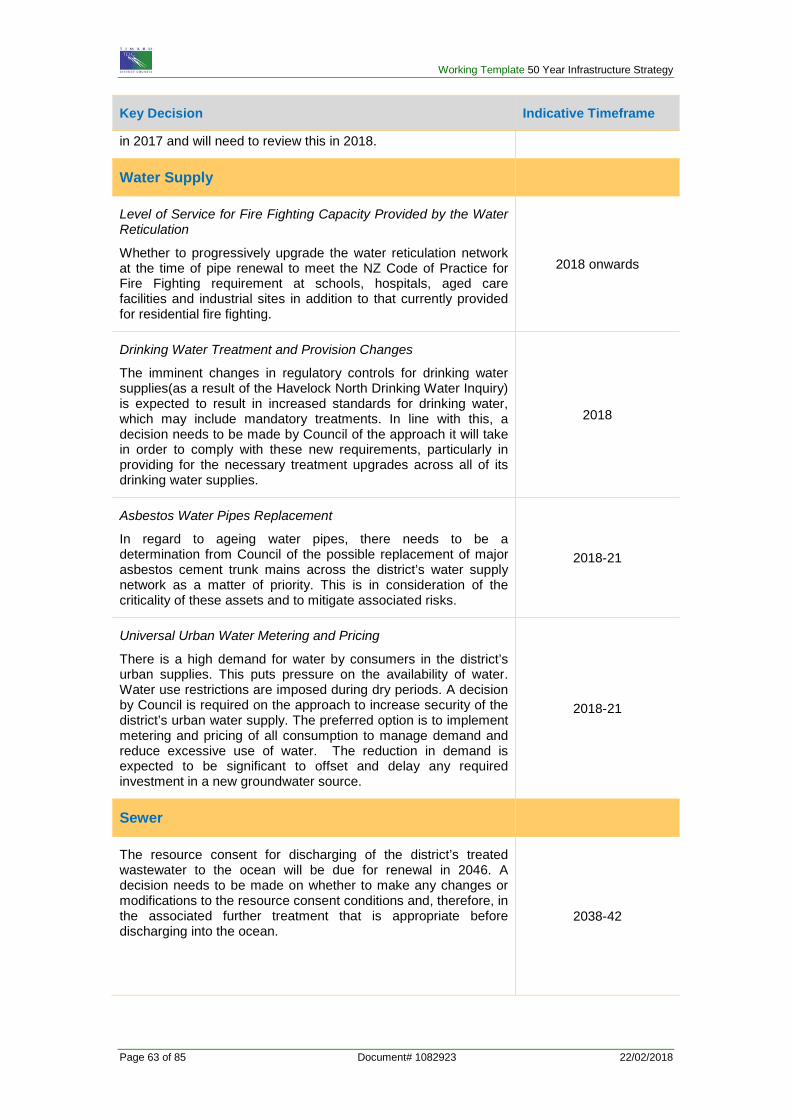
Working Template 50 Year Infrastructure Strategy
Page 63 of 85 Document# 1082923 22/02/2018
Key Decision Indicative Timeframe
in 2017 and will need to review this in 2018.
Water Supply
Level of Service for Fire Fighting Capacity Provided by the Water Reticulation
Whether to progressively upgrade the water reticulation network at the time of pipe renewal to meet the NZ Code of Practice for Fire Fighting requirement at schools, hospitals, aged care facilities and industrial sites in addition to that currently provided for residential fire fighting.
2018 onwards
Drinking Water Treatment and Provision Changes
The imminent changes in regulatory controls for drinking water supplies(as a result of the Havelock North Drinking Water Inquiry) is expected to result in increased standards for drinking water, which may include mandatory treatments. In line with this, a decision needs to be made by Council of the approach it will take in order to comply with these new requirements, particularly in providing for the necessary treatment upgrades across all of its drinking water supplies.
2018
Asbestos Water Pipes Replacement
In regard to ageing water pipes, there needs to be a determination from Council of the possible replacement of major asbestos cement trunk mains across the district’s water supply network as a matter of priority. This is in consideration of the criticality of these assets and to mitigate associated risks.
2018-21
Universal Urban Water Metering and Pricing
There is a high demand for water by consumers in the district’s urban supplies. This puts pressure on the availability of water. Water use restrictions are imposed during dry periods. A decision by Council is required on the approach to increase security of the district’s urban water supply. The preferred option is to implement metering and pricing of all consumption to manage demand and reduce excessive use of water. The reduction in demand is expected to be significant to offset and delay any required investment in a new groundwater source.
2018-21
Sewer
The resource consent for discharging of the district’s treated wastewater to the ocean will be due for renewal in 2046. A decision needs to be made on whether to make any changes or modifications to the resource consent conditions and, therefore, in the associated further treatment that is appropriate before discharging into the ocean.
2038-42
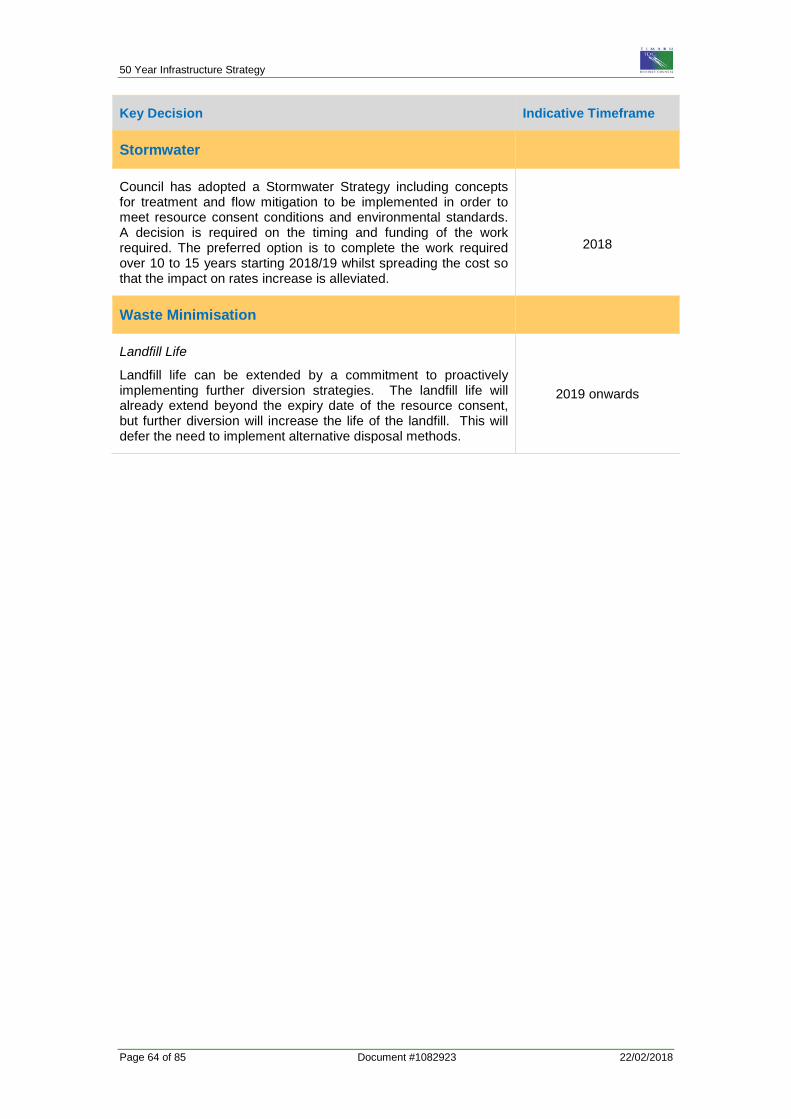
50 Year Infrastructure Strategy
Page 64 of 85 Document #1082923 22/02/2018
Key Decision Indicative Timeframe
Stormwater
Council has adopted a Stormwater Strategy including concepts for treatment and flow mitigation to be implemented in order to meet resource consent conditions and environmental standards. A decision is required on the timing and funding of the work required. The preferred option is to complete the work required over 10 to 15 years starting 2018/19 whilst spreading the cost so that the impact on rates increase is alleviated.
2018
Waste Minimisation
Landfill Life
Landfill life can be extended by a commitment to proactively implementing further diversion strategies. The landfill life will already extend beyond the expiry date of the resource consent, but further diversion will increase the life of the landfill. This will defer the need to implement alternative disposal methods.
2019 onwards
Working Template 50 Year Infrastructure Strategy
Page 65 of 85 Document# 1082923 22/02/2018
7.0 SIGNIFICANT INFRASTRUCTURE ISSUES
The Local Government Act 2002 Section 101B – Infrastructure Strategy states:
“(2) The purpose of the infrastructure strategy is to—
(a) identify significant infrastructure issues for the local authority over the period covered by the strategy; and
(b) identify the principal options for managing those issues and the implications of those options.”
In developing this 50 Year Strategy Council identified the anticipated significant infrastructure issues using its Significance and Engagement Policy as criteria (refer to details in Section 3.1), the considered actions, and the associated costs and benefits of the actions.
The significant infrastructure issues with the options to address these are presented in sections 7.1 to 7.4 and include the following:
• Roading Renewals • What price….Our water? - A resilient future water supply? How should we achieve this? -
Securing Timaru’s Water Supply • Do we really want better waterways? - Dealing with Stormwater to improve our
environment - Timing and Funding the Stormwater Strategy • Extending the Landfill’s Life
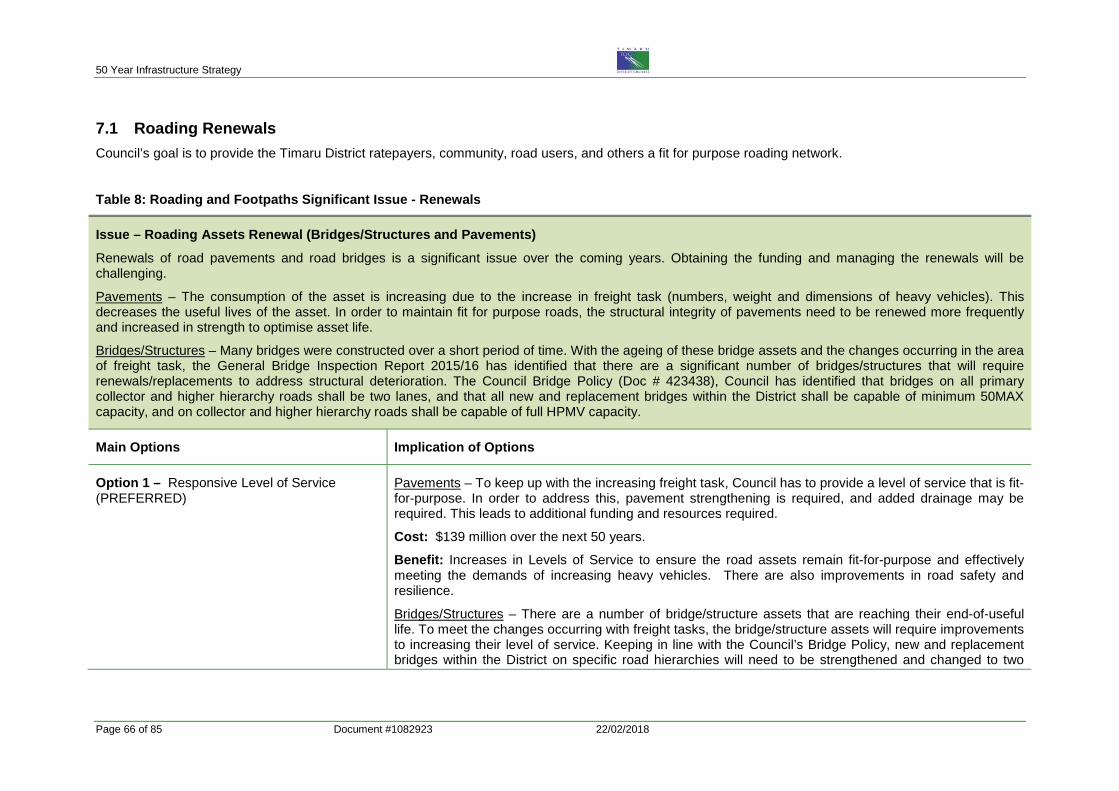
50 Year Infrastructure Strategy
Page 66 of 85 Document #1082923 22/02/2018
7.1 Roading Renewals Council’s goal is to provide the Timaru District ratepayers, community, road users, and others a fit for purpose roading network.
Table 8: Roading and Footpaths Significant Issue - Renewals
Issue – Roading Assets Renewal (Bridges/Structures and Pavements) Renewals of road pavements and road bridges is a significant issue over the coming years. Obtaining the funding and managing the renewals will be challenging.
Pavements – The consumption of the asset is increasing due to the increase in freight task (numbers, weight and dimensions of heavy vehicles). This decreases the useful lives of the asset. In order to maintain fit for purpose roads, the structural integrity of pavements need to be renewed more frequently and increased in strength to optimise asset life.
Bridges/Structures – Many bridges were constructed over a short period of time. With the ageing of these bridge assets and the changes occurring in the area of freight task, the General Bridge Inspection Report 2015/16 has identified that there are a significant number of bridges/structures that will require renewals/replacements to address structural deterioration. The Council Bridge Policy (Doc # 423438), Council has identified that bridges on all primary collector and higher hierarchy roads shall be two lanes, and that all new and replacement bridges within the District shall be capable of minimum 50MAX capacity, and on collector and higher hierarchy roads shall be capable of full HPMV capacity.
Main Options Implication of Options
Option 1 – Responsive Level of Service (PREFERRED)
Pavements – To keep up with the increasing freight task, Council has to provide a level of service that is fit-for-purpose. In order to address this, pavement strengthening is required, and added drainage may be required. This leads to additional funding and resources required.
Cost: $139 million over the next 50 years.
Benefit: Increases in Levels of Service to ensure the road assets remain fit-for-purpose and effectively meeting the demands of increasing heavy vehicles. There are also improvements in road safety and resilience.
Bridges/Structures – There are a number of bridge/structure assets that are reaching their end-of-useful life. To meet the changes occurring with freight tasks, the bridge/structure assets will require improvements to increasing their level of service. Keeping in line with the Council’s Bridge Policy, new and replacement bridges within the District on specific road hierarchies will need to be strengthened and changed to two
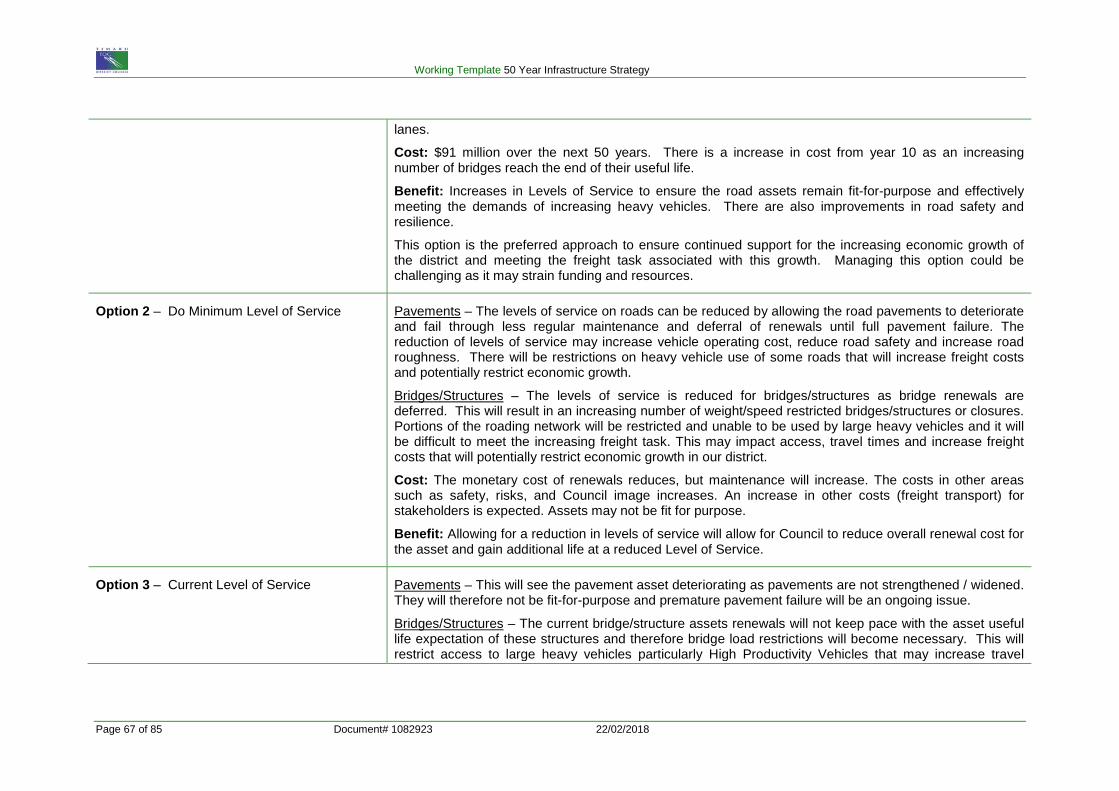
Working Template 50 Year Infrastructure Strategy
Page 67 of 85 Document# 1082923 22/02/2018
lanes.
Cost: $91 million over the next 50 years. There is a increase in cost from year 10 as an increasing number of bridges reach the end of their useful life.
Benefit: Increases in Levels of Service to ensure the road assets remain fit-for-purpose and effectively meeting the demands of increasing heavy vehicles. There are also improvements in road safety and resilience.
This option is the preferred approach to ensure continued support for the increasing economic growth of the district and meeting the freight task associated with this growth. Managing this option could be challenging as it may strain funding and resources.
Option 2 – Do Minimum Level of Service Pavements – The levels of service on roads can be reduced by allowing the road pavements to deteriorate and fail through less regular maintenance and deferral of renewals until full pavement failure. The reduction of levels of service may increase vehicle operating cost, reduce road safety and increase road roughness. There will be restrictions on heavy vehicle use of some roads that will increase freight costs and potentially restrict economic growth.
Bridges/Structures – The levels of service is reduced for bridges/structures as bridge renewals are deferred. This will result in an increasing number of weight/speed restricted bridges/structures or closures. Portions of the roading network will be restricted and unable to be used by large heavy vehicles and it will be difficult to meet the increasing freight task. This may impact access, travel times and increase freight costs that will potentially restrict economic growth in our district.
Cost: The monetary cost of renewals reduces, but maintenance will increase. The costs in other areas such as safety, risks, and Council image increases. An increase in other costs (freight transport) for stakeholders is expected. Assets may not be fit for purpose.
Benefit: Allowing for a reduction in levels of service will allow for Council to reduce overall renewal cost for the asset and gain additional life at a reduced Level of Service.
Option 3 – Current Level of Service Pavements – This will see the pavement asset deteriorating as pavements are not strengthened / widened. They will therefore not be fit-for-purpose and premature pavement failure will be an ongoing issue.
Bridges/Structures – The current bridge/structure assets renewals will not keep pace with the asset useful life expectation of these structures and therefore bridge load restrictions will become necessary. This will restrict access to large heavy vehicles particularly High Productivity Vehicles that may increase travel
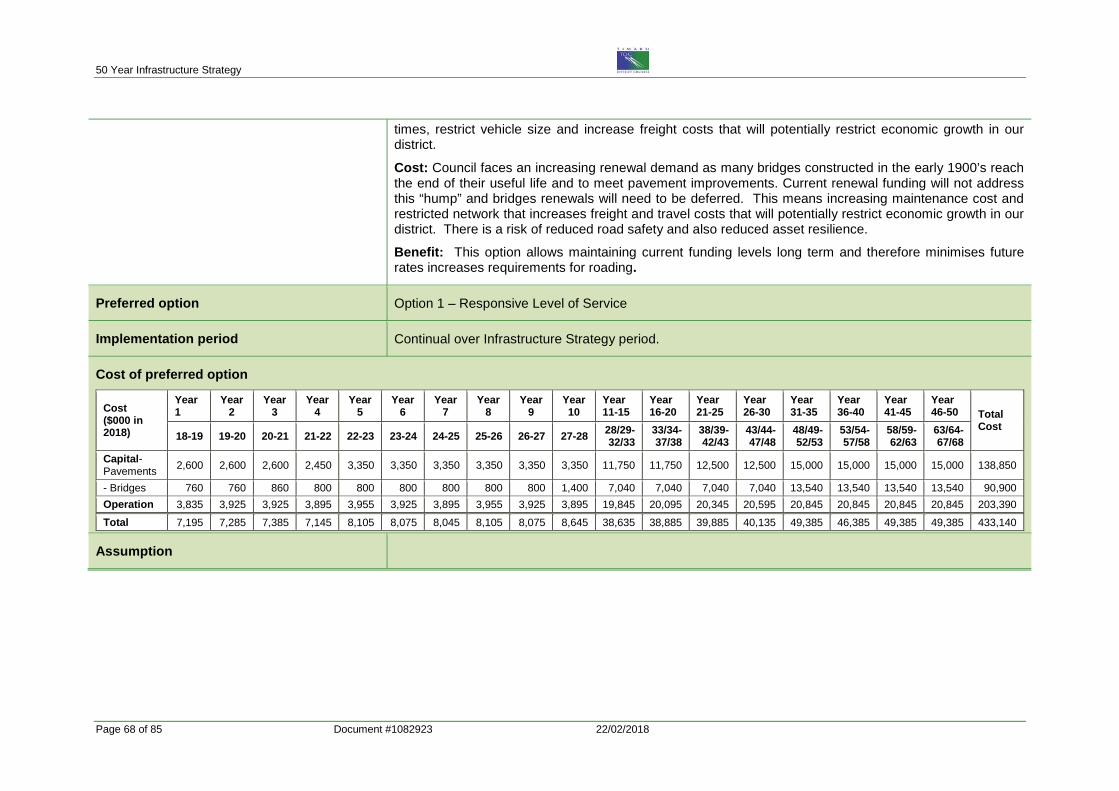
50 Year Infrastructure Strategy
Page 68 of 85 Document #1082923 22/02/2018
times, restrict vehicle size and increase freight costs that will potentially restrict economic growth in our district.
Cost: Council faces an increasing renewal demand as many bridges constructed in the early 1900’s reach the end of their useful life and to meet pavement improvements. Current renewal funding will not address this “hump” and bridges renewals will need to be deferred. This means increasing maintenance cost and restricted network that increases freight and travel costs that will potentially restrict economic growth in our district. There is a risk of reduced road safety and also reduced asset resilience.
Benefit: This option allows maintaining current funding levels long term and therefore minimises future rates increases requirements for roading.
Preferred option Option 1 – Responsive Level of Service
Implementation period Continual over Infrastructure Strategy period.
Cost of preferred option
Cost ($000 in 2018)
Year 1
Year 2
Year 3
Year 4
Year 5
Year 6
Year 7
Year 8
Year 9
Year 10
Year 11-15
Year 16-20
Year 21-25
Year 26-30
Year 31-35
Year 36-40
Year 41-45
Year 46-50 Total
Cost 18-19 19-20 20-21 21-22 22-23 23-24 24-25 25-26 26-27 27-28 28/29-
32/33 33/34-37/38
38/39-42/43
43/44-47/48
48/49-52/53
53/54-57/58
58/59-62/63
63/64-67/68
Capital- Pavements 2,600 2,600 2,600 2,450 3,350 3,350 3,350 3,350 3,350 3,350 11,750 11,750 12,500 12,500 15,000 15,000 15,000 15,000 138,850
- Bridges 760 760 860 800 800 800 800 800 800 1,400 7,040 7,040 7,040 7,040 13,540 13,540 13,540 13,540 90,900 Operation 3,835 3,925 3,925 3,895 3,955 3,925 3,895 3,955 3,925 3,895 19,845 20,095 20,345 20,595 20,845 20,845 20,845 20,845 203,390 Total 7,195 7,285 7,385 7,145 8,105 8,075 8,045 8,105 8,075 8,645 38,635 38,885 39,885 40,135 49,385 46,385 49,385 49,385 433,140
Assumption
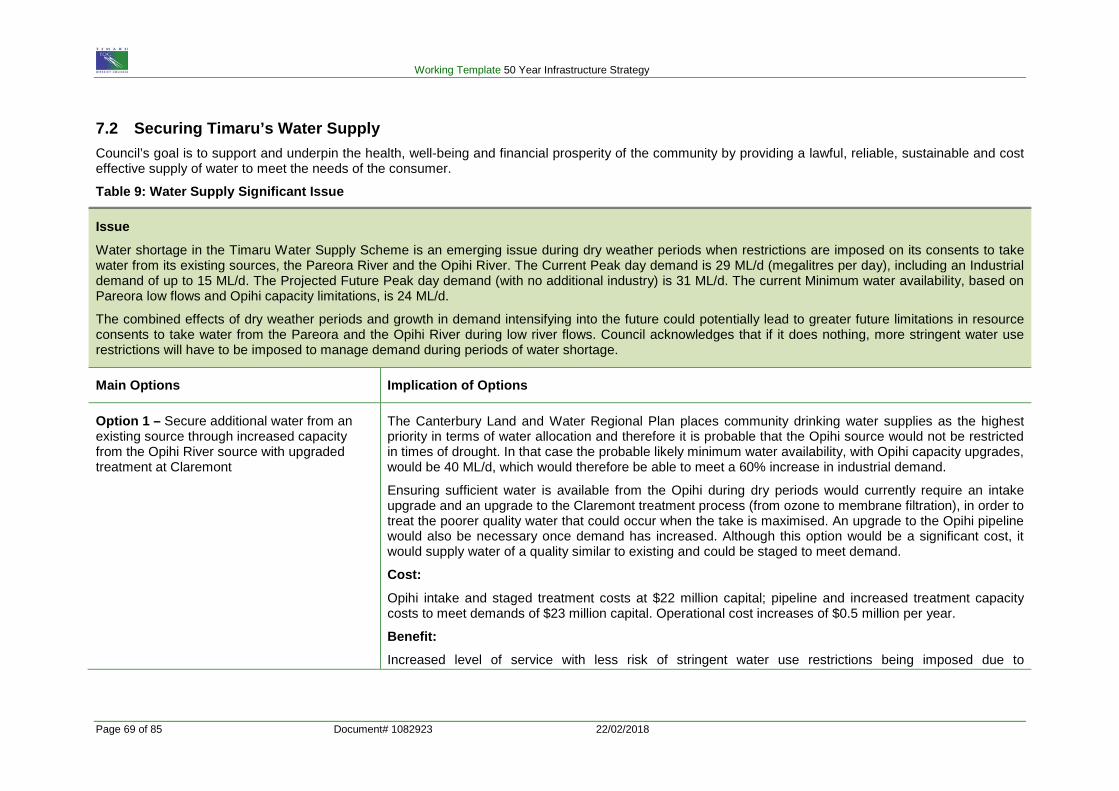
Working Template 50 Year Infrastructure Strategy
Page 69 of 85 Document# 1082923 22/02/2018
7.2 Securing Timaru’s Water Supply Council’s goal is to support and underpin the health, well-being and financial prosperity of the community by providing a lawful, reliable, sustainable and cost effective supply of water to meet the needs of the consumer.
Table 9: Water Supply Significant Issue
Issue Water shortage in the Timaru Water Supply Scheme is an emerging issue during dry weather periods when restrictions are imposed on its consents to take water from its existing sources, the Pareora River and the Opihi River. The Current Peak day demand is 29 ML/d (megalitres per day), including an Industrial demand of up to 15 ML/d. The Projected Future Peak day demand (with no additional industry) is 31 ML/d. The current Minimum water availability, based on Pareora low flows and Opihi capacity limitations, is 24 ML/d.
The combined effects of dry weather periods and growth in demand intensifying into the future could potentially lead to greater future limitations in resource consents to take water from the Pareora and the Opihi River during low river flows. Council acknowledges that if it does nothing, more stringent water use restrictions will have to be imposed to manage demand during periods of water shortage.
Main Options Implication of Options
Option 1 – Secure additional water from an existing source through increased capacity from the Opihi River source with upgraded treatment at Claremont
The Canterbury Land and Water Regional Plan places community drinking water supplies as the highest priority in terms of water allocation and therefore it is probable that the Opihi source would not be restricted in times of drought. In that case the probable likely minimum water availability, with Opihi capacity upgrades, would be 40 ML/d, which would therefore be able to meet a 60% increase in industrial demand.
Ensuring sufficient water is available from the Opihi during dry periods would currently require an intake upgrade and an upgrade to the Claremont treatment process (from ozone to membrane filtration), in order to treat the poorer quality water that could occur when the take is maximised. An upgrade to the Opihi pipeline would also be necessary once demand has increased. Although this option would be a significant cost, it would supply water of a quality similar to existing and could be staged to meet demand.
Cost: Opihi intake and staged treatment costs at $22 million capital; pipeline and increased treatment capacity costs to meet demands of $23 million capital. Operational cost increases of $0.5 million per year.
Benefit: Increased level of service with less risk of stringent water use restrictions being imposed due to
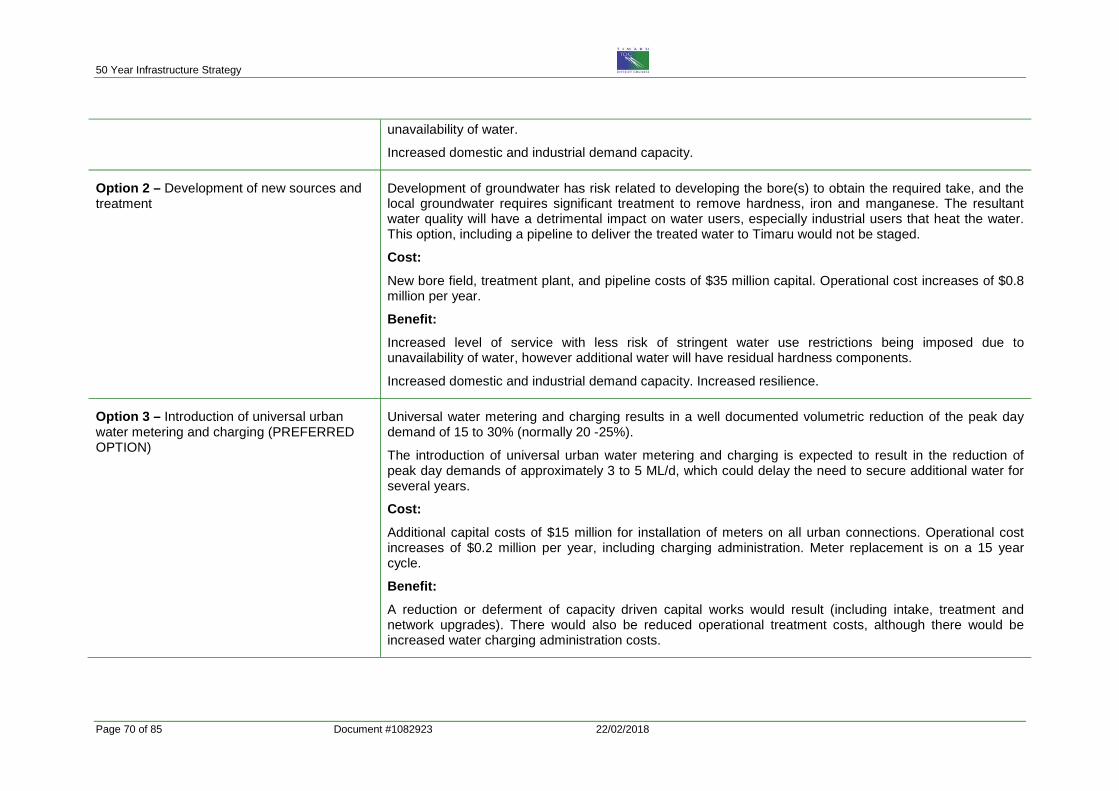
50 Year Infrastructure Strategy
Page 70 of 85 Document #1082923 22/02/2018
unavailability of water.
Increased domestic and industrial demand capacity.
Option 2 – Development of new sources and treatment
Development of groundwater has risk related to developing the bore(s) to obtain the required take, and the local groundwater requires significant treatment to remove hardness, iron and manganese. The resultant water quality will have a detrimental impact on water users, especially industrial users that heat the water. This option, including a pipeline to deliver the treated water to Timaru would not be staged.
Cost: New bore field, treatment plant, and pipeline costs of $35 million capital. Operational cost increases of $0.8 million per year.
Benefit: Increased level of service with less risk of stringent water use restrictions being imposed due to unavailability of water, however additional water will have residual hardness components.
Increased domestic and industrial demand capacity. Increased resilience.
Option 3 – Introduction of universal urban water metering and charging (PREFERRED OPTION)
Universal water metering and charging results in a well documented volumetric reduction of the peak day demand of 15 to 30% (normally 20 -25%).
The introduction of universal urban water metering and charging is expected to result in the reduction of peak day demands of approximately 3 to 5 ML/d, which could delay the need to secure additional water for several years.
Cost: Additional capital costs of $15 million for installation of meters on all urban connections. Operational cost increases of $0.2 million per year, including charging administration. Meter replacement is on a 15 year cycle.
Benefit: A reduction or deferment of capacity driven capital works would result (including intake, treatment and network upgrades). There would also be reduced operational treatment costs, although there would be increased water charging administration costs.
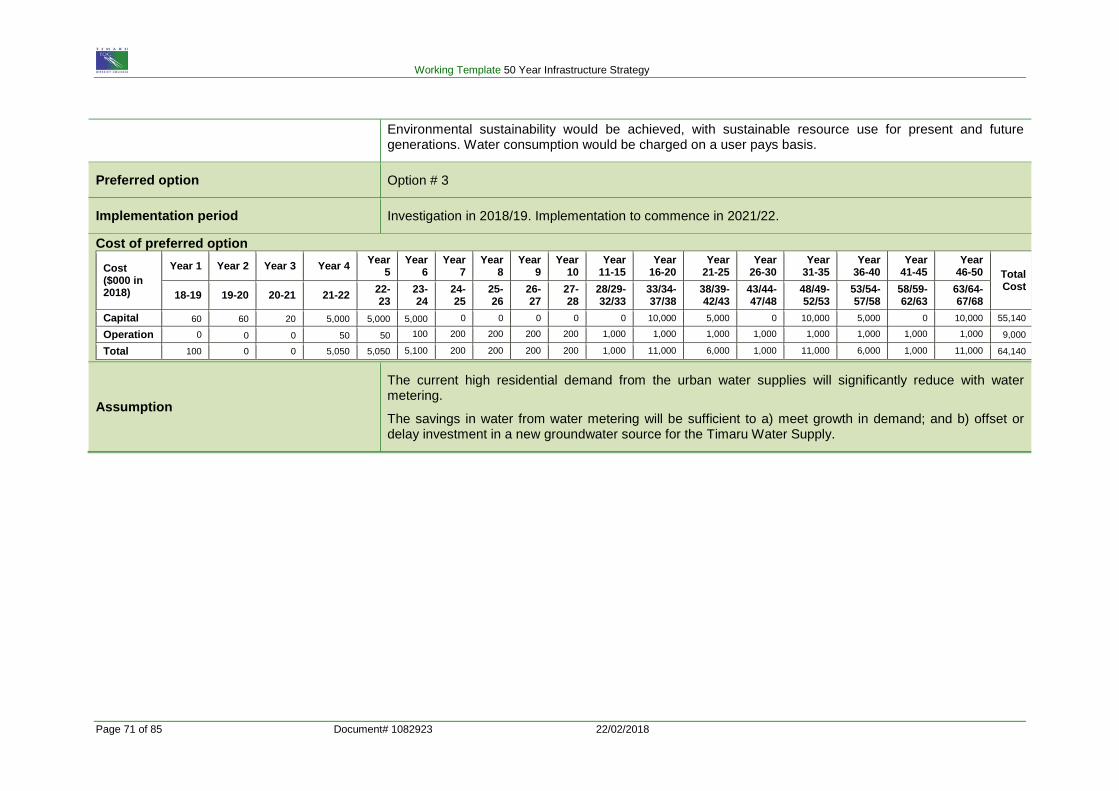
Working Template 50 Year Infrastructure Strategy
Page 71 of 85 Document# 1082923 22/02/2018
Environmental sustainability would be achieved, with sustainable resource use for present and future generations. Water consumption would be charged on a user pays basis.
Preferred option Option # 3
Implementation period Investigation in 2018/19. Implementation to commence in 2021/22.
Cost of preferred option
Cost ($000 in 2018)
Year 1 Year 2 Year 3 Year 4 Year 5
Year 6
Year 7
Year 8
Year 9
Year 10
Year 11-15
Year 16-20
Year 21-25
Year 26-30
Year 31-35
Year 36-40
Year 41-45
Year 46-50 Total
Cost 18-19 19-20 20-21 21-22 22-
23 23-24
24-25
25-26
26-27
27-28
28/29-32/33
33/34-37/38
38/39-42/43
43/44-47/48
48/49-52/53
53/54-57/58
58/59-62/63
63/64-67/68
Capital 60 60 20 5,000 5,000 5,000 0 0 0 0 0 10,000 5,000 0 10,000 5,000 0 10,000 55,140
Operation 0 0 0 50 50 100 200 200 200 200 1,000 1,000 1,000 1,000 1,000 1,000 1,000 1,000 9,000
Total 100 0 0 5,050 5,050 5,100 200 200 200 200 1,000 11,000 6,000 1,000 11,000 6,000 1,000 11,000 64,140
Assumption
The current high residential demand from the urban water supplies will significantly reduce with water metering.
The savings in water from water metering will be sufficient to a) meet growth in demand; and b) offset or delay investment in a new groundwater source for the Timaru Water Supply.
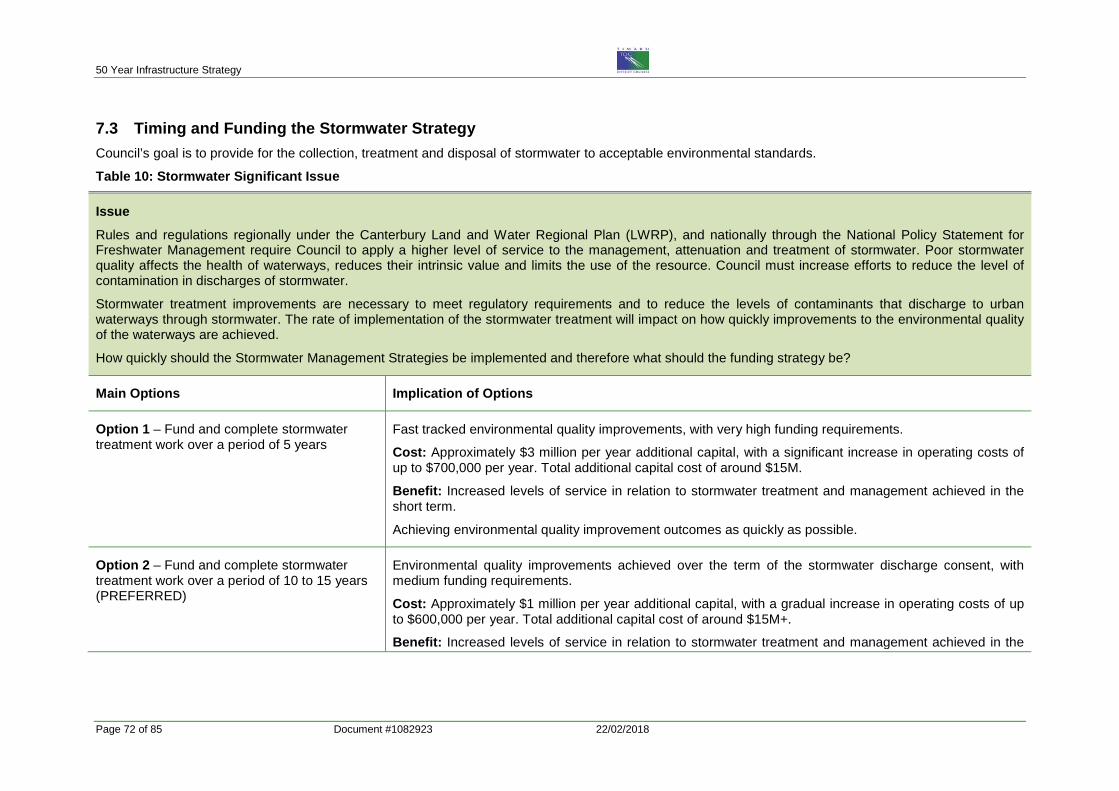
50 Year Infrastructure Strategy
Page 72 of 85 Document #1082923 22/02/2018
7.3 Timing and Funding the Stormwater Strategy Council’s goal is to provide for the collection, treatment and disposal of stormwater to acceptable environmental standards.
Table 10: Stormwater Significant Issue
Issue Rules and regulations regionally under the Canterbury Land and Water Regional Plan (LWRP), and nationally through the National Policy Statement for Freshwater Management require Council to apply a higher level of service to the management, attenuation and treatment of stormwater. Poor stormwater quality affects the health of waterways, reduces their intrinsic value and limits the use of the resource. Council must increase efforts to reduce the level of contamination in discharges of stormwater.
Stormwater treatment improvements are necessary to meet regulatory requirements and to reduce the levels of contaminants that discharge to urban waterways through stormwater. The rate of implementation of the stormwater treatment will impact on how quickly improvements to the environmental quality of the waterways are achieved.
How quickly should the Stormwater Management Strategies be implemented and therefore what should the funding strategy be?
Main Options Implication of Options
Option 1 – Fund and complete stormwater treatment work over a period of 5 years
Fast tracked environmental quality improvements, with very high funding requirements.
Cost: Approximately $3 million per year additional capital, with a significant increase in operating costs of up to $700,000 per year. Total additional capital cost of around $15M.
Benefit: Increased levels of service in relation to stormwater treatment and management achieved in the short term.
Achieving environmental quality improvement outcomes as quickly as possible.
Option 2 – Fund and complete stormwater treatment work over a period of 10 to 15 years (PREFERRED)
Environmental quality improvements achieved over the term of the stormwater discharge consent, with medium funding requirements.
Cost: Approximately $1 million per year additional capital, with a gradual increase in operating costs of up to $600,000 per year. Total additional capital cost of around $15M+.
Benefit: Increased levels of service in relation to stormwater treatment and management achieved in the
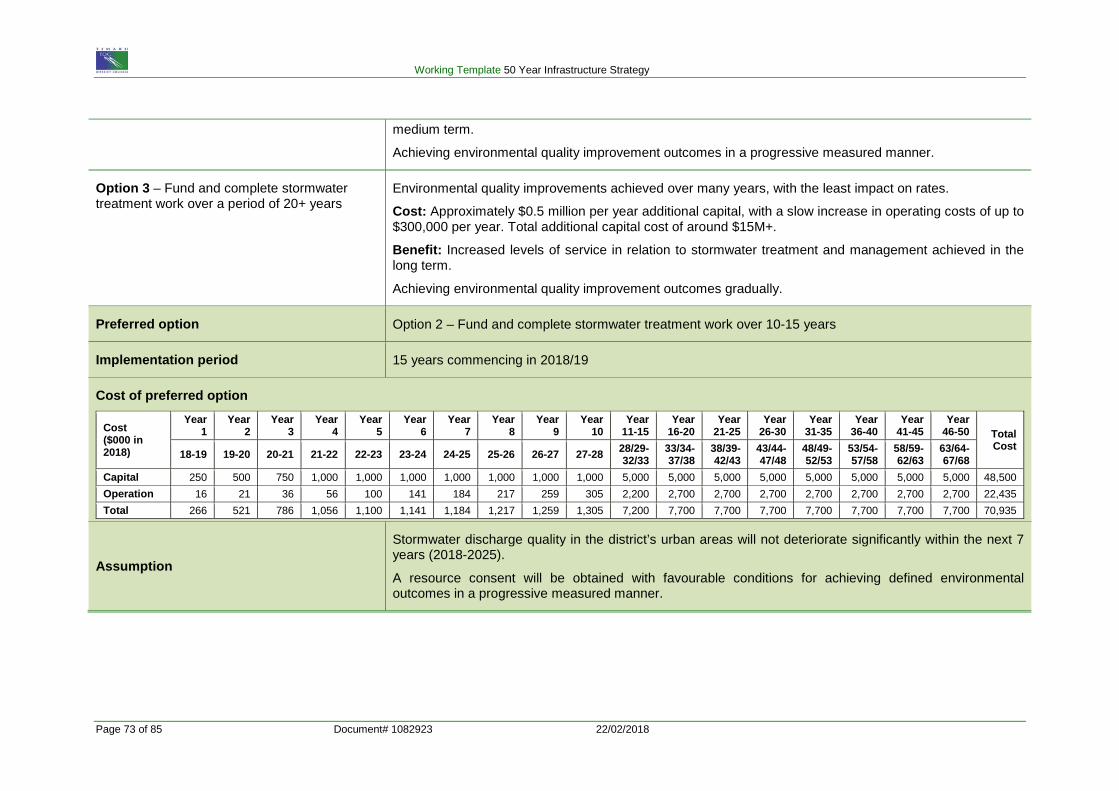
Working Template 50 Year Infrastructure Strategy
Page 73 of 85 Document# 1082923 22/02/2018
medium term.
Achieving environmental quality improvement outcomes in a progressive measured manner.
Option 3 – Fund and complete stormwater treatment work over a period of 20+ years
Environmental quality improvements achieved over many years, with the least impact on rates.
Cost: Approximately $0.5 million per year additional capital, with a slow increase in operating costs of up to $300,000 per year. Total additional capital cost of around $15M+.
Benefit: Increased levels of service in relation to stormwater treatment and management achieved in the long term.
Achieving environmental quality improvement outcomes gradually.
Preferred option Option 2 – Fund and complete stormwater treatment work over 10-15 years
Implementation period 15 years commencing in 2018/19
Cost of preferred option
Cost ($000 in 2018)
Year 1
Year 2
Year 3
Year 4
Year 5
Year 6
Year 7
Year 8
Year 9
Year 10
Year 11-15
Year 16-20
Year 21-25
Year 26-30
Year 31-35
Year 36-40
Year 41-45
Year 46-50 Total
Cost 18-19 19-20 20-21 21-22 22-23 23-24 24-25 25-26 26-27 27-28 28/29-
32/33 33/34-37/38
38/39-42/43
43/44-47/48
48/49-52/53
53/54-57/58
58/59-62/63
63/64-67/68
Capital 250 500 750 1,000 1,000 1,000 1,000 1,000 1,000 1,000 5,000 5,000 5,000 5,000 5,000 5,000 5,000 5,000 48,500 Operation 16 21 36 56 100 141 184 217 259 305 2,200 2,700 2,700 2,700 2,700 2,700 2,700 2,700 22,435 Total 266 521 786 1,056 1,100 1,141 1,184 1,217 1,259 1,305 7,200 7,700 7,700 7,700 7,700 7,700 7,700 7,700 70,935
Assumption
Stormwater discharge quality in the district’s urban areas will not deteriorate significantly within the next 7 years (2018-2025).
A resource consent will be obtained with favourable conditions for achieving defined environmental outcomes in a progressive measured manner.
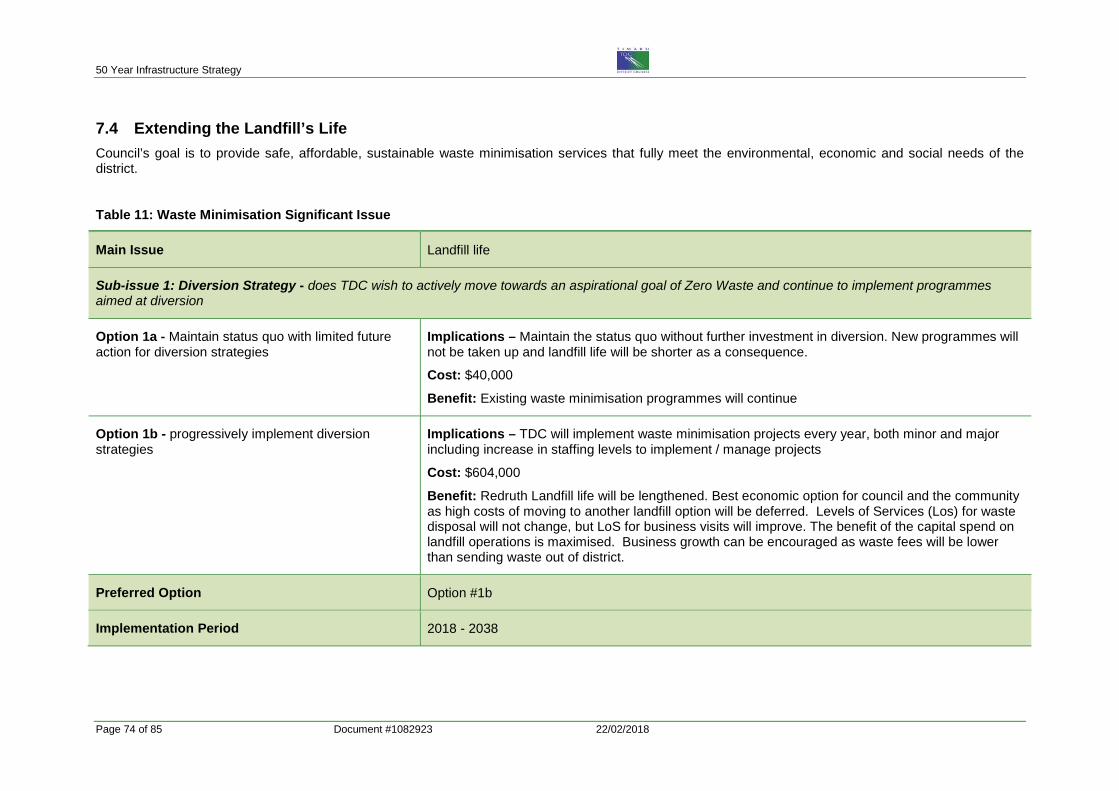
50 Year Infrastructure Strategy
Page 74 of 85 Document #1082923 22/02/2018
7.4 Extending the Landfill’s Life Council’s goal is to provide safe, affordable, sustainable waste minimisation services that fully meet the environmental, economic and social needs of the district.
Table 11: Waste Minimisation Significant Issue
Main Issue Landfill life
Sub-issue 1: Diversion Strategy - does TDC wish to actively move towards an aspirational goal of Zero Waste and continue to implement programmes aimed at diversion
Option 1a - Maintain status quo with limited future action for diversion strategies
Implications – Maintain the status quo without further investment in diversion. New programmes will not be taken up and landfill life will be shorter as a consequence.
Cost: $40,000
Benefit: Existing waste minimisation programmes will continue
Option 1b - progressively implement diversion strategies
Implications – TDC will implement waste minimisation projects every year, both minor and major including increase in staffing levels to implement / manage projects
Cost: $604,000
Benefit: Redruth Landfill life will be lengthened. Best economic option for council and the community as high costs of moving to another landfill option will be deferred. Levels of Services (Los) for waste disposal will not change, but LoS for business visits will improve. The benefit of the capital spend on landfill operations is maximised. Business growth can be encouraged as waste fees will be lower than sending waste out of district.
Preferred Option Option #1b
Implementation Period 2018 - 2038
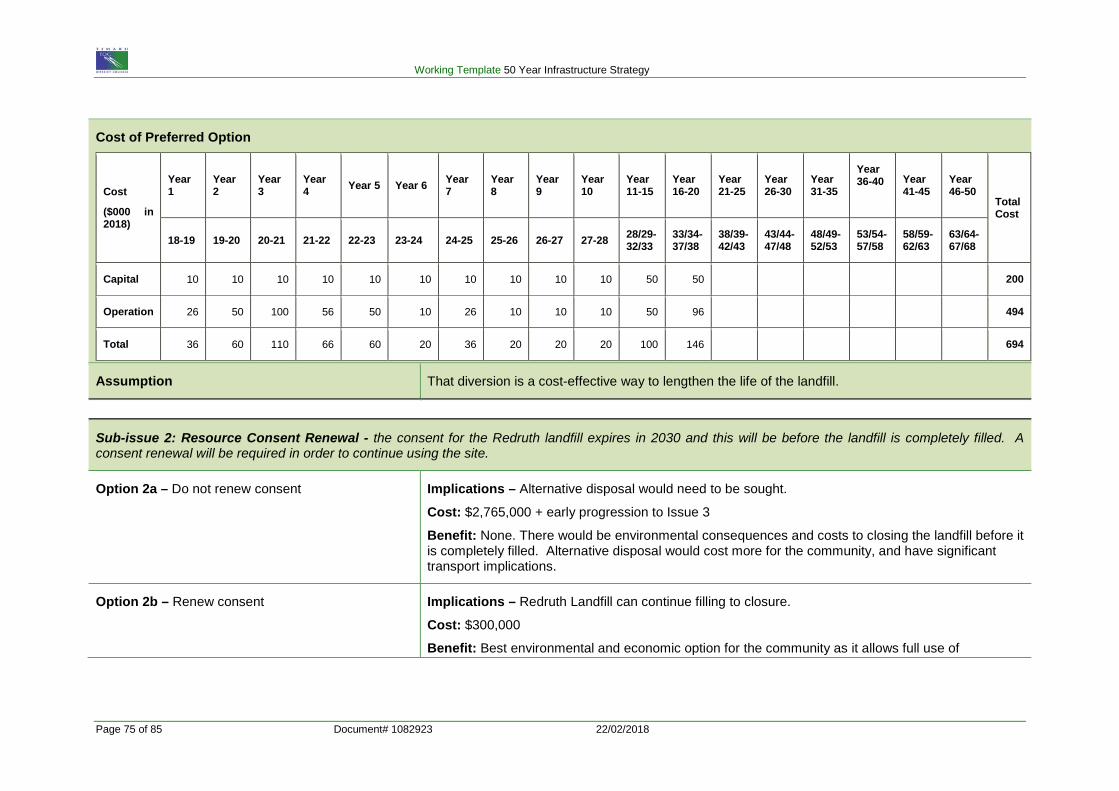
Working Template 50 Year Infrastructure Strategy
Page 75 of 85 Document# 1082923 22/02/2018
Cost of Preferred Option
Cost
($000 in 2018)
Year 1
Year 2
Year 3
Year 4 Year 5 Year 6 Year
7 Year 8
Year 9
Year 10
Year 11-15
Year 16-20
Year 21-25
Year 26-30
Year 31-35
Year 36-40
Year 41-45
Year 46-50
Total Cost
18-19 19-20 20-21 21-22 22-23 23-24 24-25 25-26 26-27 27-28 28/29-32/33
33/34-37/38
38/39-42/43
43/44-47/48
48/49-52/53
53/54-57/58
58/59-62/63
63/64-67/68
Capital 10 10 10 10 10 10 10 10 10 10 50 50 200
Operation 26 50 100 56 50 10 26 10 10 10 50 96 494
Total 36 60 110 66 60 20 36 20 20 20 100 146 694
Assumption That diversion is a cost-effective way to lengthen the life of the landfill.
Sub-issue 2: Resource Consent Renewal - the consent for the Redruth landfill expires in 2030 and this will be before the landfill is completely filled. A consent renewal will be required in order to continue using the site.
Option 2a – Do not renew consent Implications – Alternative disposal would need to be sought. Cost: $2,765,000 + early progression to Issue 3 Benefit: None. There would be environmental consequences and costs to closing the landfill before it is completely filled. Alternative disposal would cost more for the community, and have significant transport implications.
Option 2b – Renew consent Implications – Redruth Landfill can continue filling to closure.
Cost: $300,000 Benefit: Best environmental and economic option for the community as it allows full use of
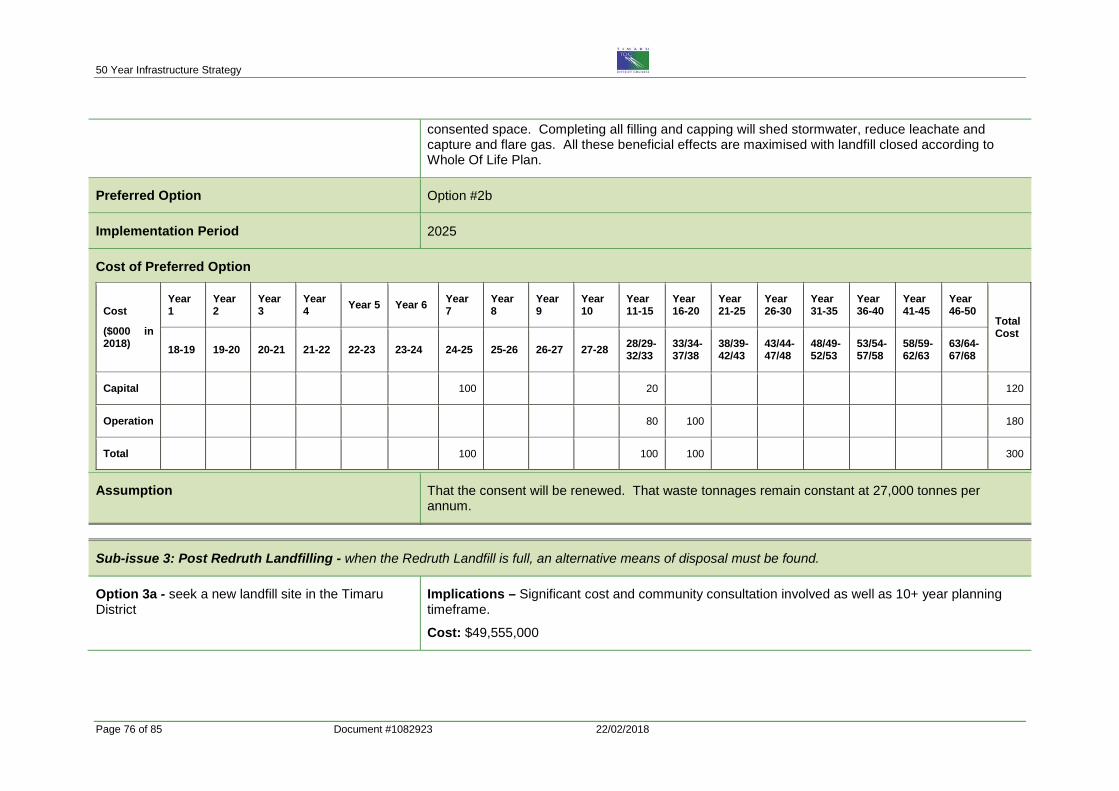
50 Year Infrastructure Strategy
Page 76 of 85 Document #1082923 22/02/2018
consented space. Completing all filling and capping will shed stormwater, reduce leachate and capture and flare gas. All these beneficial effects are maximised with landfill closed according to Whole Of Life Plan.
Preferred Option Option #2b
Implementation Period 2025
Cost of Preferred Option
Cost
($000 in 2018)
Year 1
Year 2
Year 3
Year 4 Year 5 Year 6 Year
7 Year 8
Year 9
Year 10
Year 11-15
Year 16-20
Year 21-25
Year 26-30
Year 31-35
Year 36-40
Year 41-45
Year 46-50
Total Cost
18-19 19-20 20-21 21-22 22-23 23-24 24-25 25-26 26-27 27-28 28/29-32/33
33/34-37/38
38/39-42/43
43/44-47/48
48/49-52/53
53/54-57/58
58/59-62/63
63/64-67/68
Capital 100 20 120
Operation 80 100 180
Total 100 100 100 300
Assumption That the consent will be renewed. That waste tonnages remain constant at 27,000 tonnes per annum.
Sub-issue 3: Post Redruth Landfilling - when the Redruth Landfill is full, an alternative means of disposal must be found.
Option 3a - seek a new landfill site in the Timaru District
Implications – Significant cost and community consultation involved as well as 10+ year planning timeframe.
Cost: $49,555,000
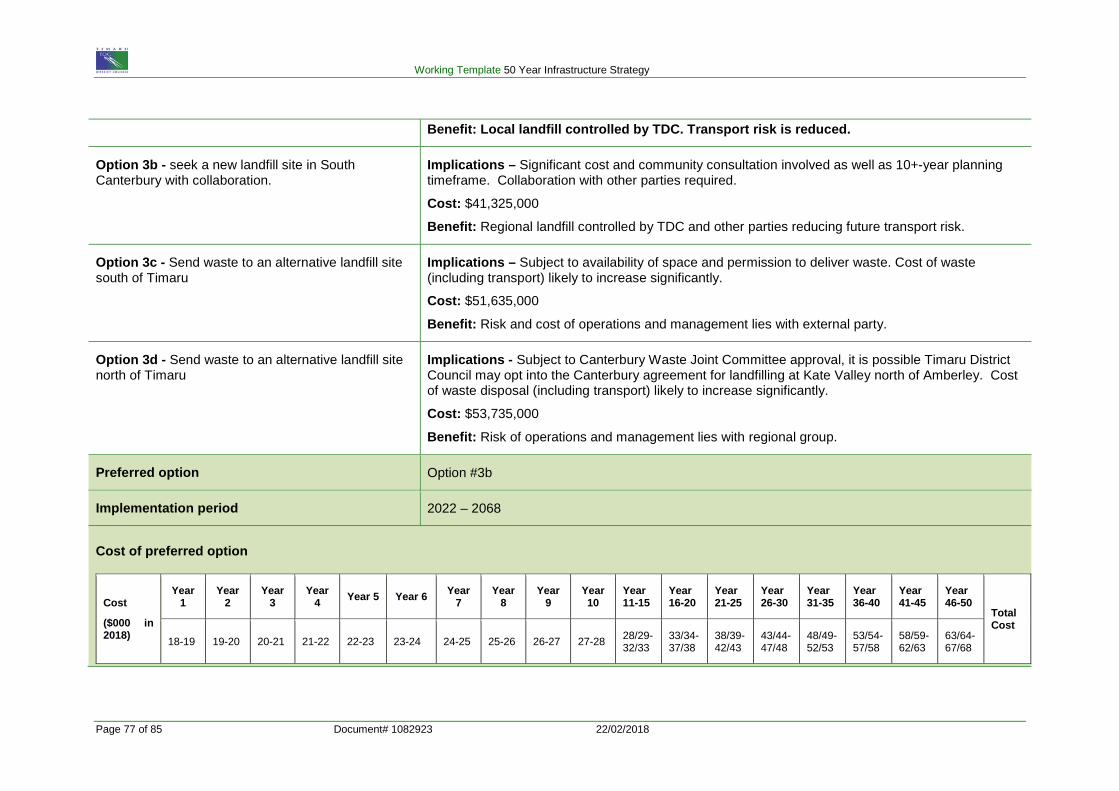
Working Template 50 Year Infrastructure Strategy
Page 77 of 85 Document# 1082923 22/02/2018
Benefit: Local landfill controlled by TDC. Transport risk is reduced.
Option 3b - seek a new landfill site in South Canterbury with collaboration.
Implications – Significant cost and community consultation involved as well as 10+-year planning timeframe. Collaboration with other parties required.
Cost: $41,325,000 Benefit: Regional landfill controlled by TDC and other parties reducing future transport risk.
Option 3c - Send waste to an alternative landfill site south of Timaru
Implications – Subject to availability of space and permission to deliver waste. Cost of waste (including transport) likely to increase significantly.
Cost: $51,635,000 Benefit: Risk and cost of operations and management lies with external party.
Option 3d - Send waste to an alternative landfill site north of Timaru
Implications - Subject to Canterbury Waste Joint Committee approval, it is possible Timaru District Council may opt into the Canterbury agreement for landfilling at Kate Valley north of Amberley. Cost of waste disposal (including transport) likely to increase significantly.
Cost: $53,735,000 Benefit: Risk of operations and management lies with regional group.
Preferred option Option #3b
Implementation period 2022 – 2068
Cost of preferred option
Cost
($000 in 2018)
Year 1
Year 2
Year 3
Year 4 Year 5 Year 6 Year
7 Year
8 Year
9 Year 10
Year 11-15
Year 16-20
Year 21-25
Year 26-30
Year 31-35
Year 36-40
Year 41-45
Year 46-50
Total Cost
18-19 19-20 20-21 21-22 22-23 23-24 24-25 25-26 26-27 27-28 28/29-32/33
33/34-37/38
38/39-42/43
43/44-47/48
48/49-52/53
53/54-57/58
58/59-62/63
63/64-67/68
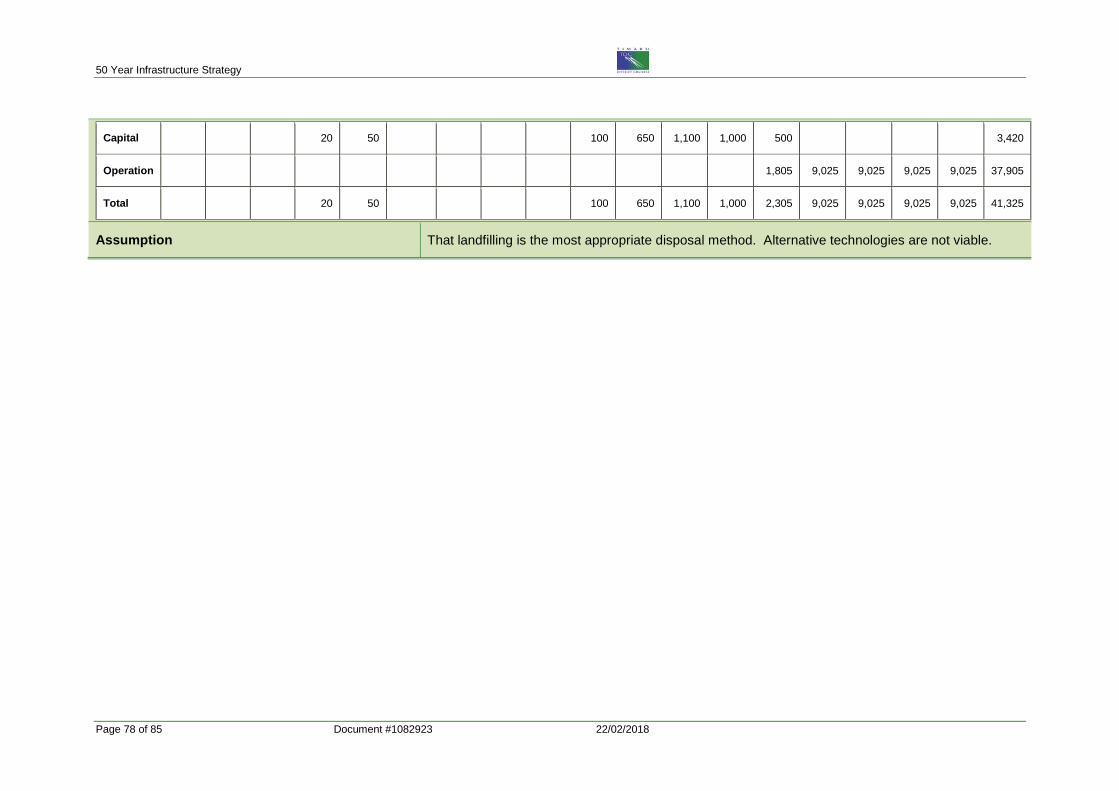
50 Year Infrastructure Strategy
Page 78 of 85 Document #1082923 22/02/2018
Capital 20 50 100 650 1,100 1,000 500 3,420
Operation 1,805 9,025 9,025 9,025 9,025 37,905
Total 20 50 100 650 1,100 1,000 2,305 9,025 9,025 9,025 9,025 41,325
Assumption That landfilling is the most appropriate disposal method. Alternative technologies are not viable.
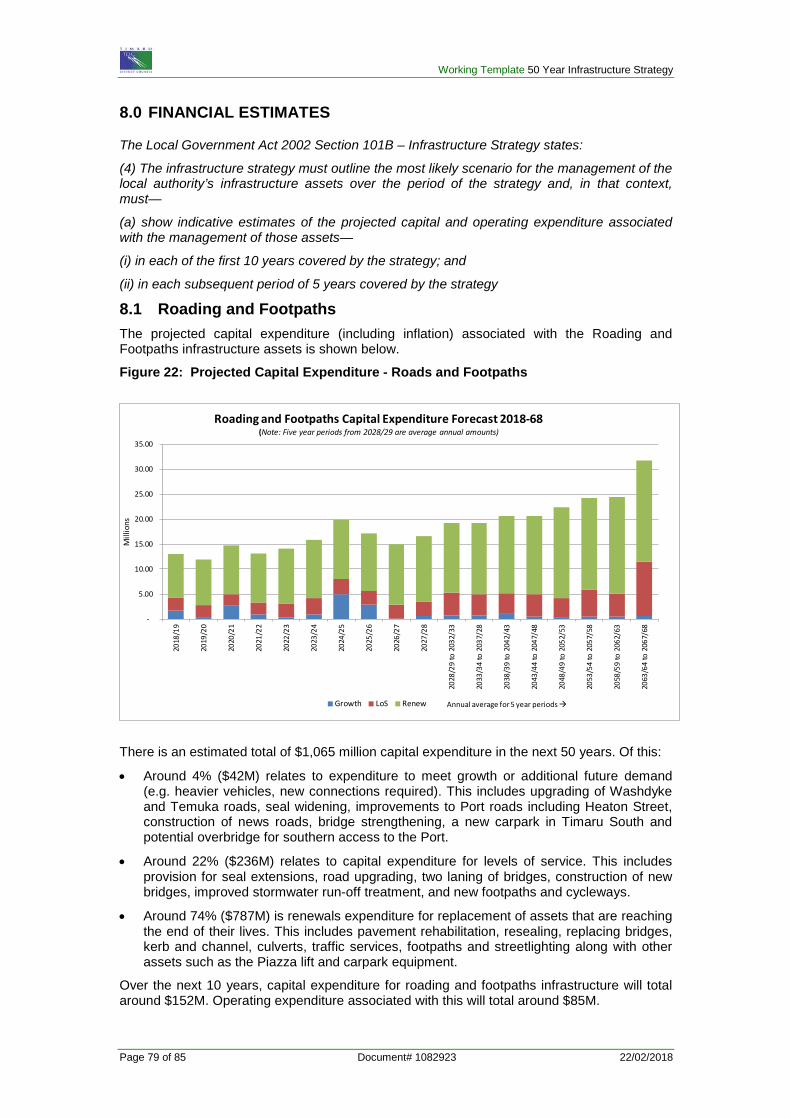
Working Template 50 Year Infrastructure Strategy
Page 79 of 85 Document# 1082923 22/02/2018
8.0 FINANCIAL ESTIMATES
The Local Government Act 2002 Section 101B – Infrastructure Strategy states:
(4) The infrastructure strategy must outline the most likely scenario for the management of the local authority’s infrastructure assets over the period of the strategy and, in that context, must—
(a) show indicative estimates of the projected capital and operating expenditure associated with the management of those assets—
(i) in each of the first 10 years covered by the strategy; and
(ii) in each subsequent period of 5 years covered by the strategy
8.1 Roading and Footpaths The projected capital expenditure (including inflation) associated with the Roading and Footpaths infrastructure assets is shown below.
Figure 22: Projected Capital Expenditure - Roads and Footpaths
There is an estimated total of $1,065 million capital expenditure in the next 50 years. Of this:
• Around 4% ($42M) relates to expenditure to meet growth or additional future demand (e.g. heavier vehicles, new connections required). This includes upgrading of Washdyke and Temuka roads, seal widening, improvements to Port roads including Heaton Street, construction of news roads, bridge strengthening, a new carpark in Timaru South and potential overbridge for southern access to the Port.
• Around 22% ($236M) relates to capital expenditure for levels of service. This includes provision for seal extensions, road upgrading, two laning of bridges, construction of new bridges, improved stormwater run-off treatment, and new footpaths and cycleways.
• Around 74% ($787M) is renewals expenditure for replacement of assets that are reaching the end of their lives. This includes pavement rehabilitation, resealing, replacing bridges, kerb and channel, culverts, traffic services, footpaths and streetlighting along with other assets such as the Piazza lift and carpark equipment.
Over the next 10 years, capital expenditure for roading and footpaths infrastructure will total around $152M. Operating expenditure associated with this will total around $85M.
-
5.00
10.00
15.00
20.00
25.00
30.00
35.00
2018
/19
2019
/20
2020
/21
2021
/22
2022
/23
2023
/24
2024
/25
2025
/26
2026
/27
2027
/28
2028
/29
to 2
032/
33
2033
/34
to 2
037/
28
2038
/39
to 2
042/
43
2043
/44
to 2
047/
48
2048
/49
to 2
052/
53
2053
/54
to 2
057/
58
2058
/59
to 2
062/
63
2063
/64
to 2
067/
68
Mill
ions
Roading and Footpaths Capital Expenditure Forecast 2018-68 (Note: Five year periods from 2028/29 are average annual amounts)
Growth LoS Renew Annual average for 5 year periods
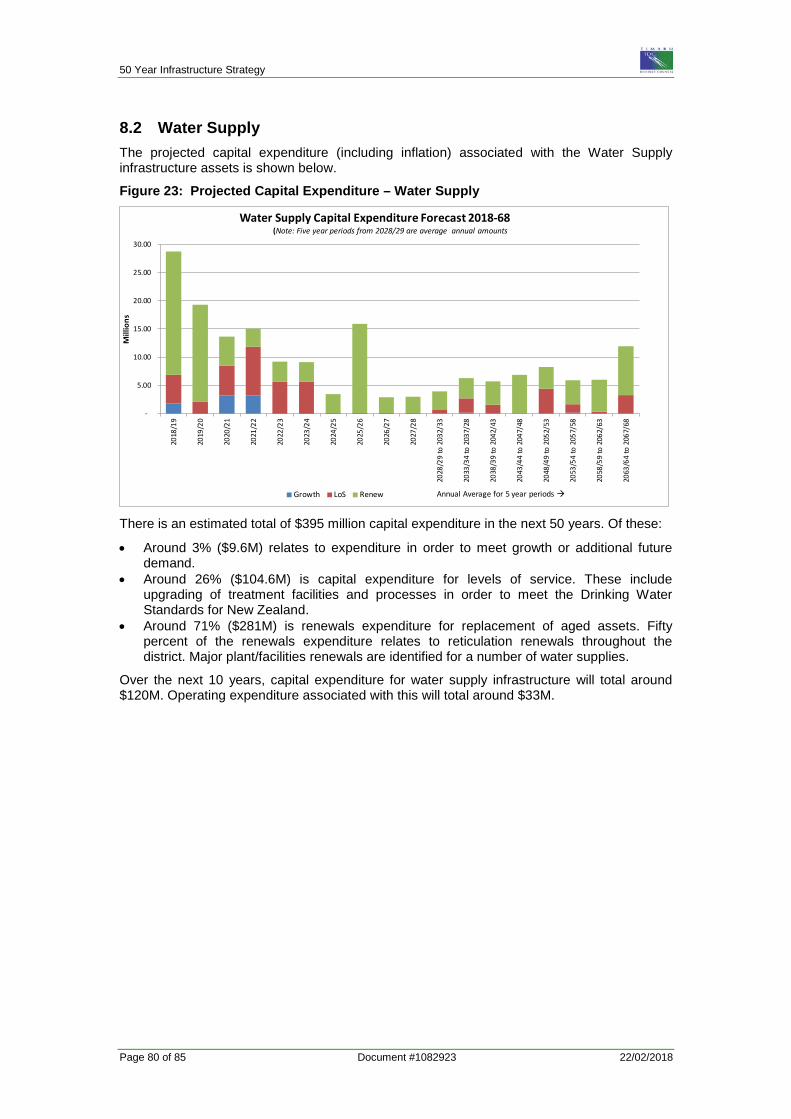
50 Year Infrastructure Strategy
Page 80 of 85 Document #1082923 22/02/2018
8.2 Water Supply The projected capital expenditure (including inflation) associated with the Water Supply infrastructure assets is shown below.
Figure 23: Projected Capital Expenditure – Water Supply
There is an estimated total of $395 million capital expenditure in the next 50 years. Of these:
• Around 3% ($9.6M) relates to expenditure in order to meet growth or additional future demand.
• Around 26% ($104.6M) is capital expenditure for levels of service. These include upgrading of treatment facilities and processes in order to meet the Drinking Water Standards for New Zealand.
• Around 71% ($281M) is renewals expenditure for replacement of aged assets. Fifty percent of the renewals expenditure relates to reticulation renewals throughout the district. Major plant/facilities renewals are identified for a number of water supplies.
Over the next 10 years, capital expenditure for water supply infrastructure will total around $120M. Operating expenditure associated with this will total around $33M.
-
5.00
10.00
15.00
20.00
25.00
30.00
2018
/19
2019
/20
2020
/21
2021
/22
2022
/23
2023
/24
2024
/25
2025
/26
2026
/27
2027
/28
2028
/29
to 2
032/
33
2033
/34
to 2
037/
28
2038
/39
to 2
042/
43
2043
/44
to 2
047/
48
2048
/49
to 2
052/
53
2053
/54
to 2
057/
58
2058
/59
to 2
062/
63
2063
/64
to 2
067/
68
Mill
ions
Water Supply Capital Expenditure Forecast 2018-68 (Note: Five year periods from 2028/29 are average annual amounts
Growth LoS Renew Annual Average for 5 year periods
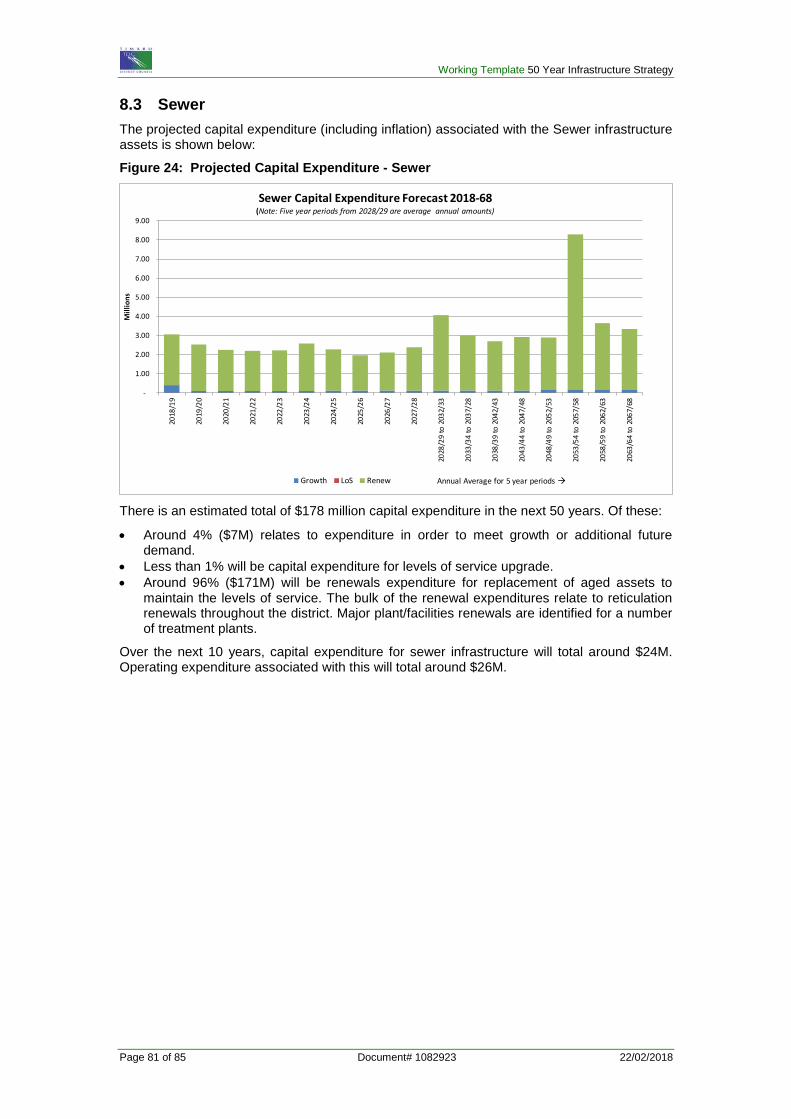
Working Template 50 Year Infrastructure Strategy
Page 81 of 85 Document# 1082923 22/02/2018
8.3 Sewer The projected capital expenditure (including inflation) associated with the Sewer infrastructure assets is shown below:
Figure 24: Projected Capital Expenditure - Sewer
There is an estimated total of $178 million capital expenditure in the next 50 years. Of these:
• Around 4% ($7M) relates to expenditure in order to meet growth or additional future demand.
• Less than 1% will be capital expenditure for levels of service upgrade. • Around 96% ($171M) will be renewals expenditure for replacement of aged assets to
maintain the levels of service. The bulk of the renewal expenditures relate to reticulation renewals throughout the district. Major plant/facilities renewals are identified for a number of treatment plants.
Over the next 10 years, capital expenditure for sewer infrastructure will total around $24M. Operating expenditure associated with this will total around $26M.
-
1.00
2.00
3.00
4.00
5.00
6.00
7.00
8.00
9.00
2018
/19
2019
/20
2020
/21
2021
/22
2022
/23
2023
/24
2024
/25
2025
/26
2026
/27
2027
/28
2028
/29
to 2
032/
33
2033
/34
to 2
037/
28
2038
/39
to 2
042/
43
2043
/44
to 2
047/
48
2048
/49
to 2
052/
53
2053
/54
to 2
057/
58
2058
/59
to 2
062/
63
2063
/64
to 2
067/
68
Mill
ions
Sewer Capital Expenditure Forecast 2018-68 (Note: Five year periods from 2028/29 are average annual amounts)
Growth LoS Renew Annual Average for 5 year periods
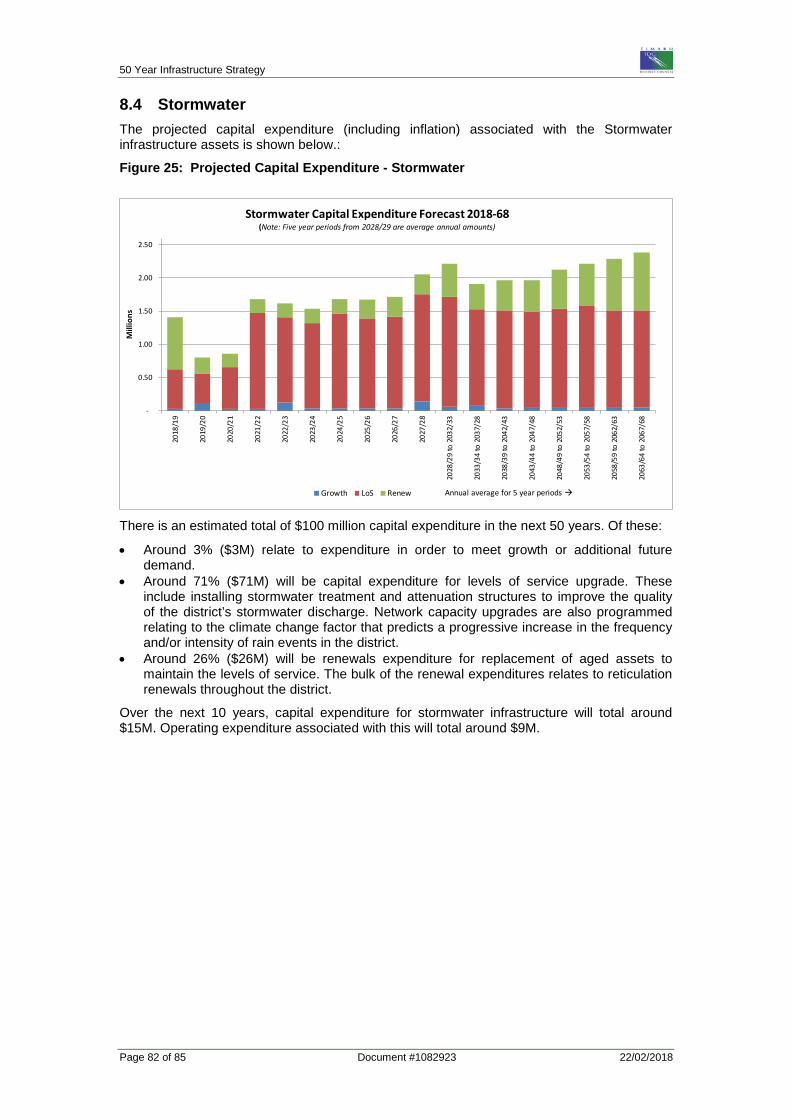
50 Year Infrastructure Strategy
Page 82 of 85 Document #1082923 22/02/2018
8.4 Stormwater The projected capital expenditure (including inflation) associated with the Stormwater infrastructure assets is shown below.:
Figure 25: Projected Capital Expenditure - Stormwater
There is an estimated total of $100 million capital expenditure in the next 50 years. Of these:
• Around 3% ($3M) relate to expenditure in order to meet growth or additional future demand.
• Around 71% ($71M) will be capital expenditure for levels of service upgrade. These include installing stormwater treatment and attenuation structures to improve the quality of the district’s stormwater discharge. Network capacity upgrades are also programmed relating to the climate change factor that predicts a progressive increase in the frequency and/or intensity of rain events in the district.
• Around 26% ($26M) will be renewals expenditure for replacement of aged assets to maintain the levels of service. The bulk of the renewal expenditures relates to reticulation renewals throughout the district.
Over the next 10 years, capital expenditure for stormwater infrastructure will total around $15M. Operating expenditure associated with this will total around $9M.
-
0.50
1.00
1.50
2.00
2.50
2018
/19
2019
/20
2020
/21
2021
/22
2022
/23
2023
/24
2024
/25
2025
/26
2026
/27
2027
/28
2028
/29
to 2
032/
33
2033
/34
to 2
037/
28
2038
/39
to 2
042/
43
2043
/44
to 2
047/
48
2048
/49
to 2
052/
53
2053
/54
to 2
057/
58
2058
/59
to 2
062/
63
2063
/64
to 2
067/
68
Mill
ions
Stormwater Capital Expenditure Forecast 2018-68 (Note: Five year periods from 2028/29 are average annual amounts)
Growth LoS Renew Annual average for 5 year periods
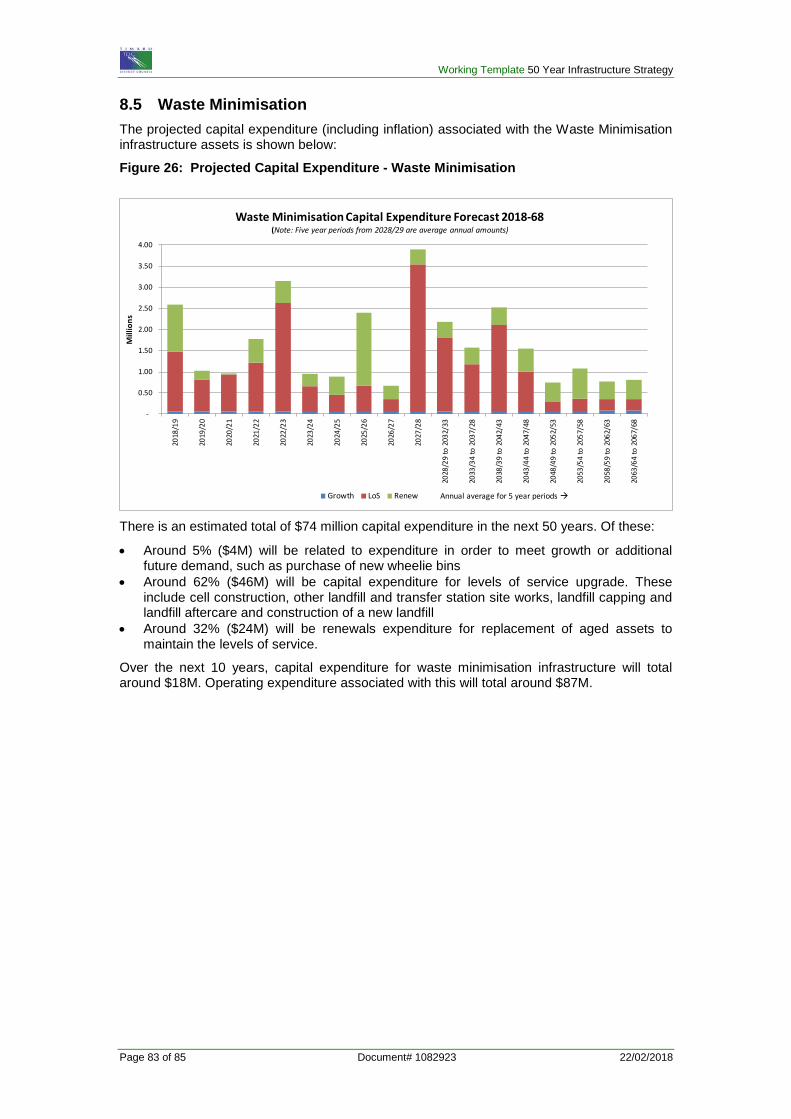
Working Template 50 Year Infrastructure Strategy
Page 83 of 85 Document# 1082923 22/02/2018
8.5 Waste Minimisation The projected capital expenditure (including inflation) associated with the Waste Minimisation infrastructure assets is shown below:
Figure 26: Projected Capital Expenditure - Waste Minimisation
There is an estimated total of $74 million capital expenditure in the next 50 years. Of these:
• Around 5% ($4M) will be related to expenditure in order to meet growth or additional future demand, such as purchase of new wheelie bins
• Around 62% ($46M) will be capital expenditure for levels of service upgrade. These include cell construction, other landfill and transfer station site works, landfill capping and landfill aftercare and construction of a new landfill
• Around 32% ($24M) will be renewals expenditure for replacement of aged assets to maintain the levels of service.
Over the next 10 years, capital expenditure for waste minimisation infrastructure will total around $18M. Operating expenditure associated with this will total around $87M.
-
0.50
1.00
1.50
2.00
2.50
3.00
3.50
4.00
2018
/19
2019
/20
2020
/21
2021
/22
2022
/23
2023
/24
2024
/25
2025
/26
2026
/27
2027
/28
2028
/29
to 2
032/
33
2033
/34
to 2
037/
28
2038
/39
to 2
042/
43
2043
/44
to 2
047/
48
2048
/49
to 2
052/
53
2053
/54
to 2
057/
58
2058
/59
to 2
062/
63
2063
/64
to 2
067/
68
Mill
ions
Waste Minimisation Capital Expenditure Forecast 2018-68 (Note: Five year periods from 2028/29 are average annual amounts)
Growth LoS Renew Annual average for 5 year periods
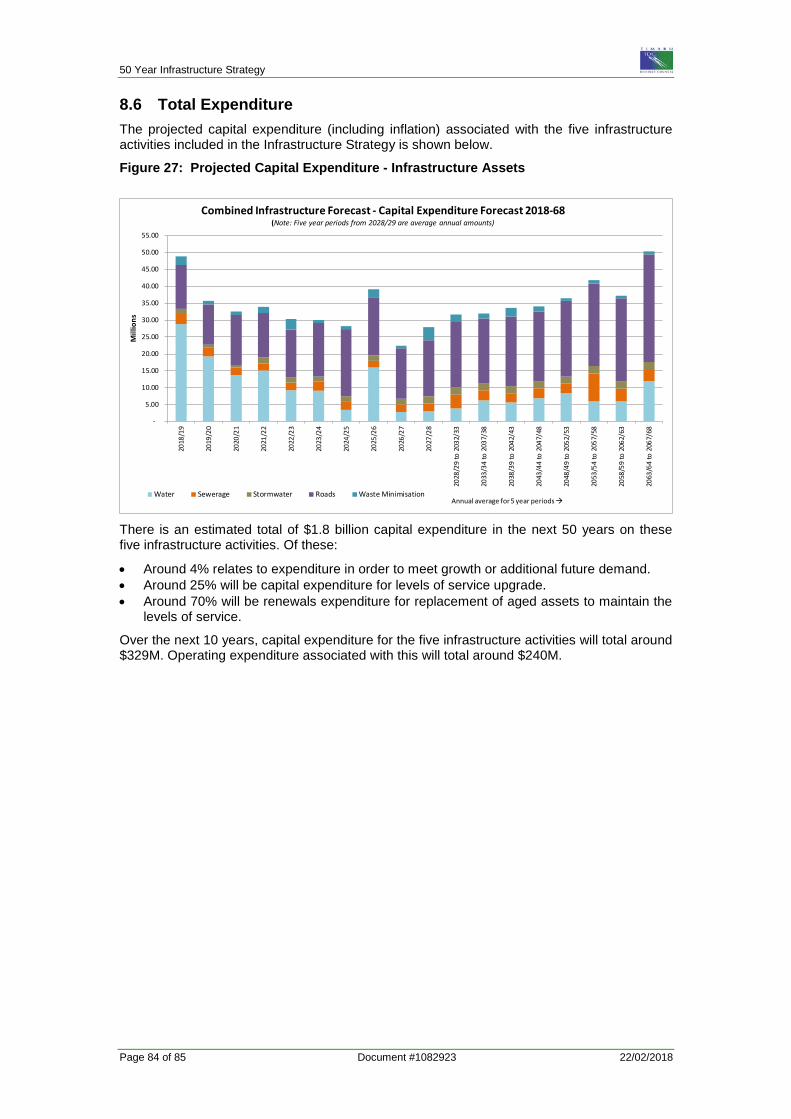
50 Year Infrastructure Strategy
Page 84 of 85 Document #1082923 22/02/2018
8.6 Total Expenditure The projected capital expenditure (including inflation) associated with the five infrastructure activities included in the Infrastructure Strategy is shown below. Figure 27: Projected Capital Expenditure - Infrastructure Assets
There is an estimated total of $1.8 billion capital expenditure in the next 50 years on these five infrastructure activities. Of these:
• Around 4% relates to expenditure in order to meet growth or additional future demand. • Around 25% will be capital expenditure for levels of service upgrade. • Around 70% will be renewals expenditure for replacement of aged assets to maintain the
levels of service.
Over the next 10 years, capital expenditure for the five infrastructure activities will total around $329M. Operating expenditure associated with this will total around $240M.
-
5.00
10.00
15.00
20.00
25.00
30.00
35.00
40.00
45.00
50.00
55.00
2018
/19
2019
/20
2020
/21
2021
/22
2022
/23
2023
/24
2024
/25
2025
/26
2026
/27
2027
/28
2028
/29
to 2
032/
33
2033
/34
to 2
037/
38
2038
/39
to 2
042/
43
2043
/44
to 2
047/
48
2048
/49
to 2
052/
53
2053
/54
to 2
057/
58
2058
/59
to 2
062/
63
2063
/64
to 2
067/
68
Mill
ions
Combined Infrastructure Forecast - Capital Expenditure Forecast 2018-68 (Note: Five year periods from 2028/29 are average annual amounts)
Water Sewerage Stormwater Roads Waste MinimisationAnnual average for 5 year periods
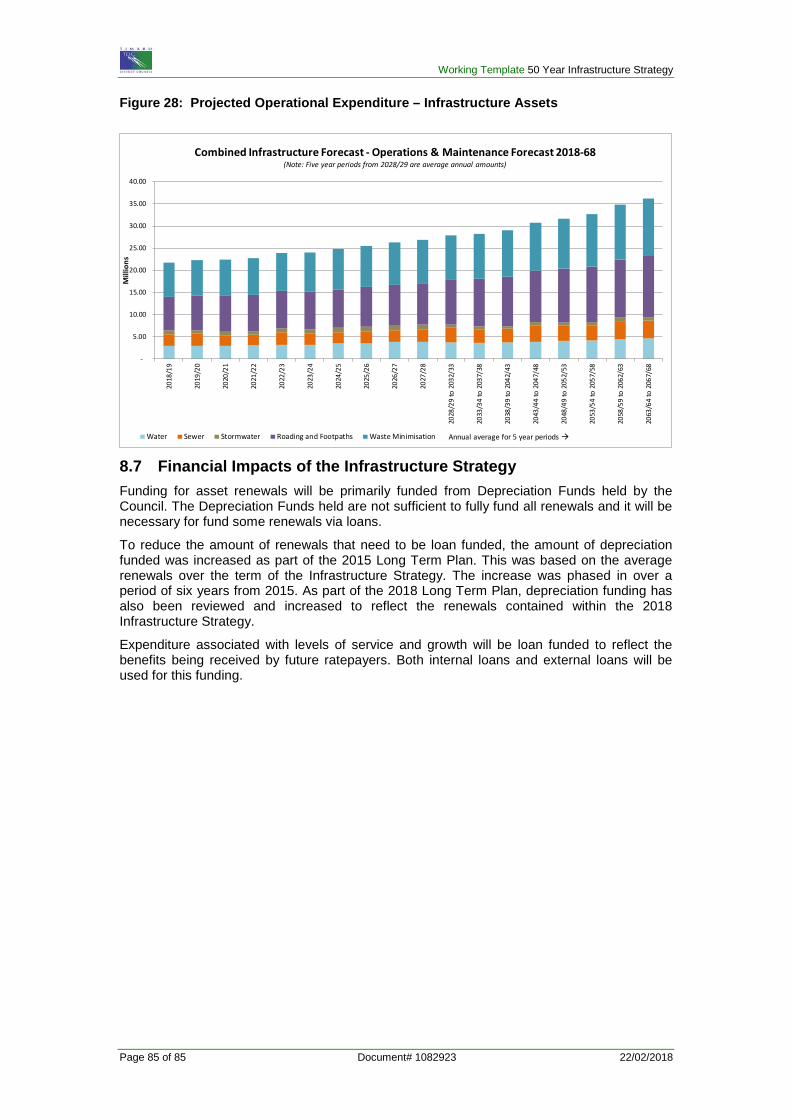
Working Template 50 Year Infrastructure Strategy
Page 85 of 85 Document# 1082923 22/02/2018
Figure 28: Projected Operational Expenditure – Infrastructure Assets
8.7 Financial Impacts of the Infrastructure Strategy Funding for asset renewals will be primarily funded from Depreciation Funds held by the Council. The Depreciation Funds held are not sufficient to fully fund all renewals and it will be necessary for fund some renewals via loans.
To reduce the amount of renewals that need to be loan funded, the amount of depreciation funded was increased as part of the 2015 Long Term Plan. This was based on the average renewals over the term of the Infrastructure Strategy. The increase was phased in over a period of six years from 2015. As part of the 2018 Long Term Plan, depreciation funding has also been reviewed and increased to reflect the renewals contained within the 2018 Infrastructure Strategy.
Expenditure associated with levels of service and growth will be loan funded to reflect the benefits being received by future ratepayers. Both internal loans and external loans will be used for this funding.
-
5.00
10.00
15.00
20.00
25.00
30.00
35.00
40.00
2018
/19
2019
/20
2020
/21
2021
/22
2022
/23
2023
/24
2024
/25
2025
/26
2026
/27
2027
/28
2028
/29
to 2
032/
33
2033
/34
to 2
037/
38
2038
/39
to 2
042/
43
2043
/44
to 2
047/
48
2048
/49
to 2
052/
53
2053
/54
to 2
057/
58
2058
/59
to 2
062/
63
2063
/64
to 2
067/
68
Mill
ions
Combined Infrastructure Forecast - Operations & Maintenance Forecast 2018-68 (Note: Five year periods from 2028/29 are average annual amounts)
Water Sewer Stormwater Roading and Footpaths Waste Minimisation Annual average for 5 year periods
FINANCIAL INFORMATION

Financial Strategy and Statements
Timaru District Council Long Term Plan 2018-2028: Financial Information - Supporting Information 3
SummaryThis Financial Strategy brings together important information set out in the Long Term Plan, integrating it with financial forecasts, strategies and policies to arrive at a sustainable and prudent budget. The financial strategy guides the way Council makes decisions over income, expenditure, borrowing and investments. It helps to explain how it plans to balance the books and summarises the implications of these plans for ratepayers. It links the decisions the Council makes on what services to provide and how they will be paid for. This acknowledges that at all times the Council is managing finances that belong to the Timaru District community.
A key part of the Council’s consideration of the Long Term Plan has been the affordability for the community of the plan’s work programme. The Council continues to face financial pressures while maintaining levels of service and meeting environmental, legislative and community demands.
The Council is in a sound financial position. Recent years’ financial results have been positive, borrowing is well within the Council’s limit and we retain a range of high performing investments.
Community facilities will be a focus for the next 10 years. This includes earthquake strengthening of facilities, refurbishing the Timaru library, enhancing the Theatre Royal and the potential development of a new heritage exhibition facility. These facilities are vital to meeting our strategic direction, maintaining our vibrant community and to ensure a high quality of facilities that are available locally.
Our core role remains to maintain and develop high quality, reliable infrastructure such as roads, water supplies, stormwater, wastewater networks, and waste management as well as parks and recreational facilities and the provision of regulatory functions.
In addition, a review of the District Plan is to be completed within the next 10 years. This is a significant project which guides development of the District into the future.
The main theme underpinning the Infrastructure Strategy is ensuring responsible stewardship of our key infrastructure assets to meet the needs of tomorrow’s community. Key influences facing the delivery of the district’s future infrastructure are:
Ageing Infrastructure – the need to address a ‘bulge’ of
Financial Strategyinfrastructure that is nearing the end of its life. Infrastructure needs replacement to modern design and environmental standards. In some instances, significant redesign may be required to ensure it is fit for purpose.
Societal change – our society is rapidly changing. Land use change, changing demographics, new government legislation and demands, technological change and increasing community expectations. New infrastructure development needs to be future-proofed and responsive to this change.
Resilience – Built infrastructure needs to handle the impact of natural hazards, at a minimum to protect human life. However, this is not all. It must also cope with future demand and change, (such as the impact of a growing economy, changes in land use) and the impacts of key issues like climate change.
Some of these challenges are legacy issues (e.g. the decisions of past Councils or how things were built 40+ years ago). Others are simply the demands of a progressive society that is constantly seeking to improve.
The Council’s priorities are:
Timely and cost effective maintenance of infrastructure to optimise its life
Replacing ageing infrastructure in a timely manner
At a minimum, maintaining existing levels of service
Managing the impacts of growth and land use change on infrastructure
Compliance with legislative requirements
Providing long term affordable services
Managing the impact of technology changes
While rates will need to increase above the rate of inflation, the level of increase will be tightly managed and rates will remain reasonable. The level of borrowing will also be controlled so that it will not leave an unreasonable burden for current and future ratepayers.
The Council is forecasting average rate rises of less than 3.4% per year over the next 10 years (excluding inflation). This compares favourably against the limit set by the Council of not exceeding 6% plus inflation based on the Local Government Cost Index, per annum.
The Council forecasts that net borrowing (loans less investments)
will rise to $152 million over the period of the LTP. This additional borrowing will be used to help fund the Councils’ major capital projects that will benefit the community for years to come. The forecast debt is well within the debt limits included in this financial strategy. The Council is satisfied that the forecast level of borrowing is affordable and will not overburden future ratepayers.
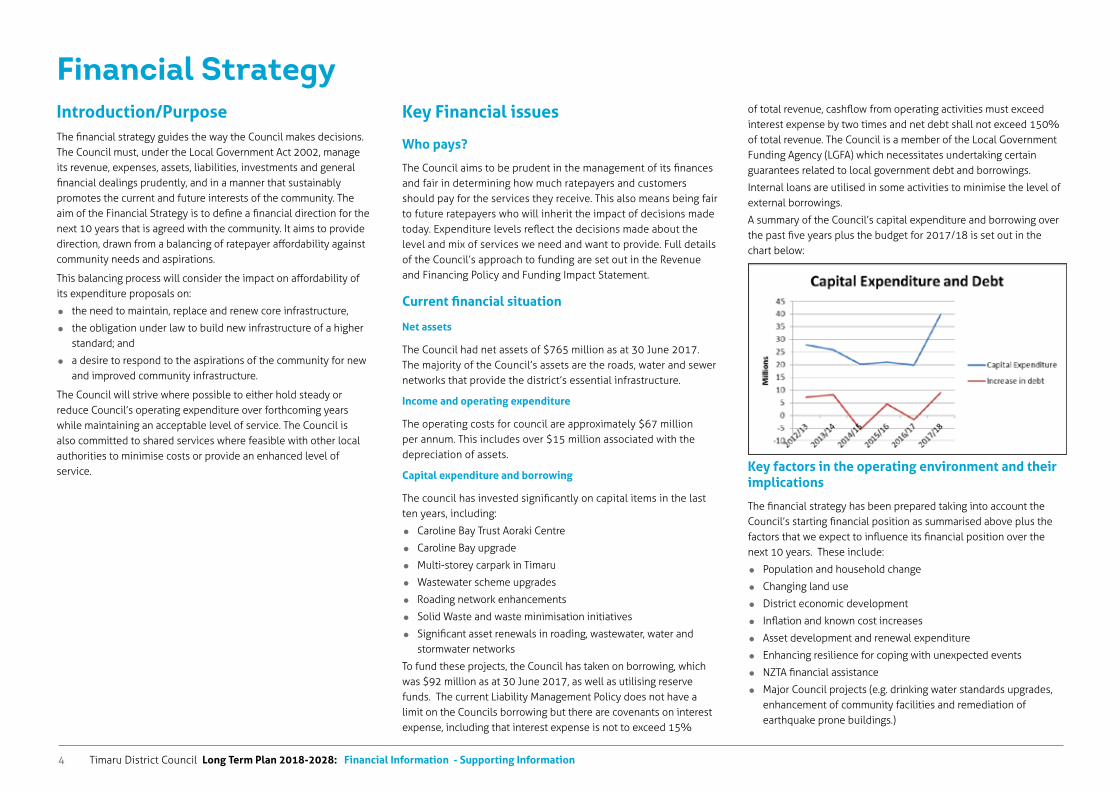
Timaru District Council Long Term Plan 2018-2028: Financial Information - Supporting Information4
Financial StrategyIntroduction/PurposeThe financial strategy guides the way the Council makes decisions. The Council must, under the Local Government Act 2002, manage its revenue, expenses, assets, liabilities, investments and general financial dealings prudently, and in a manner that sustainably promotes the current and future interests of the community. The aim of the Financial Strategy is to define a financial direction for the next 10 years that is agreed with the community. It aims to provide direction, drawn from a balancing of ratepayer affordability against community needs and aspirations.
This balancing process will consider the impact on affordability of its expenditure proposals on:
the need to maintain, replace and renew core infrastructure,
the obligation under law to build new infrastructure of a higher standard; and
a desire to respond to the aspirations of the community for new and improved community infrastructure.
The Council will strive where possible to either hold steady or reduce Council’s operating expenditure over forthcoming years while maintaining an acceptable level of service. The Council is also committed to shared services where feasible with other local authorities to minimise costs or provide an enhanced level of service.
Key Financial issues
Who pays?
The Council aims to be prudent in the management of its finances and fair in determining how much ratepayers and customers should pay for the services they receive. This also means being fair to future ratepayers who will inherit the impact of decisions made today. Expenditure levels reflect the decisions made about the level and mix of services we need and want to provide. Full details of the Council’s approach to funding are set out in the Revenue and Financing Policy and Funding Impact Statement.
Current financial situation
Net assets
The Council had net assets of $765 million as at 30 June 2017. The majority of the Council’s assets are the roads, water and sewer networks that provide the district’s essential infrastructure.
Income and operating expenditure
The operating costs for council are approximately $67 million per annum. This includes over $15 million associated with the depreciation of assets.
Capital expenditure and borrowing
The council has invested significantly on capital items in the last ten years, including:
Caroline Bay Trust Aoraki Centre
Caroline Bay upgrade
Multi-storey carpark in Timaru
Wastewater scheme upgrades
Roading network enhancements
Solid Waste and waste minimisation initiatives
Significant asset renewals in roading, wastewater, water and stormwater networks
To fund these projects, the Council has taken on borrowing, which was $92 million as at 30 June 2017, as well as utilising reserve funds. The current Liability Management Policy does not have a limit on the Councils borrowing but there are covenants on interest expense, including that interest expense is not to exceed 15%
of total revenue, cashflow from operating activities must exceed interest expense by two times and net debt shall not exceed 150% of total revenue. The Council is a member of the Local Government Funding Agency (LGFA) which necessitates undertaking certain guarantees related to local government debt and borrowings.
Internal loans are utilised in some activities to minimise the level of external borrowings.
A summary of the Council’s capital expenditure and borrowing over the past five years plus the budget for 2017/18 is set out in the chart below:
Key factors in the operating environment and their implications
The financial strategy has been prepared taking into account the Council’s starting financial position as summarised above plus the factors that we expect to influence its financial position over the next 10 years. These include:
Population and household change
Changing land use
District economic development
Inflation and known cost increases
Asset development and renewal expenditure
Enhancing resilience for coping with unexpected events
NZTA financial assistance
Major Council projects (e.g. drinking water standards upgrades, enhancement of community facilities and remediation of earthquake prone buildings.)
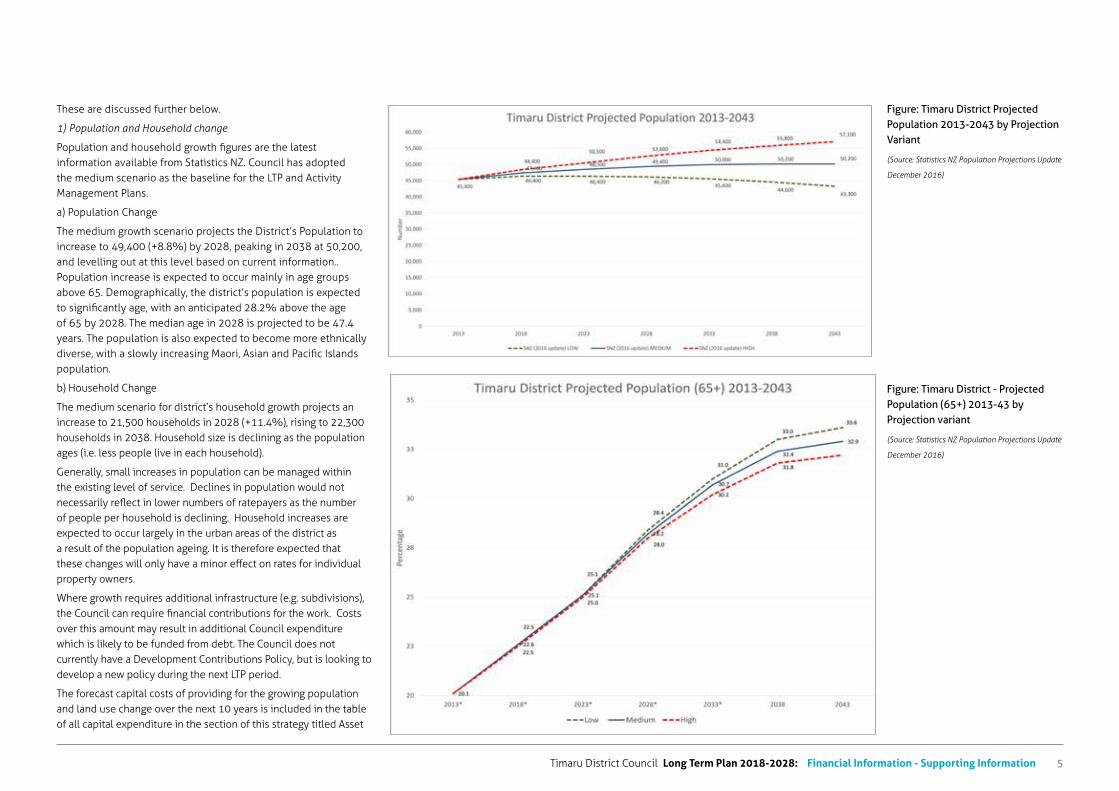
Timaru District Council Long Term Plan 2018-2028: Financial Information - Supporting Information 5
These are discussed further below.
1) Population and Household change
Population and household growth figures are the latest information available from Statistics NZ. Council has adopted the medium scenario as the baseline for the LTP and Activity Management Plans.
a) Population Change
The medium growth scenario projects the District’s Population to increase to 49,400 (+8.8%) by 2028, peaking in 2038 at 50,200, and levelling out at this level based on current information.. Population increase is expected to occur mainly in age groups above 65. Demographically, the district’s population is expected to significantly age, with an anticipated 28.2% above the age of 65 by 2028. The median age in 2028 is projected to be 47.4 years. The population is also expected to become more ethnically diverse, with a slowly increasing Maori, Asian and Pacific Islands population.
b) Household Change
The medium scenario for district’s household growth projects an increase to 21,500 households in 2028 (+11.4%), rising to 22,300 households in 2038. Household size is declining as the population ages (i.e. less people live in each household).
Generally, small increases in population can be managed within the existing level of service. Declines in population would not necessarily reflect in lower numbers of ratepayers as the number of people per household is declining. Household increases are expected to occur largely in the urban areas of the district as a result of the population ageing. It is therefore expected that these changes will only have a minor effect on rates for individual property owners.
Where growth requires additional infrastructure (e.g. subdivisions), the Council can require financial contributions for the work. Costs over this amount may result in additional Council expenditure which is likely to be funded from debt. The Council does not currently have a Development Contributions Policy, but is looking to develop a new policy during the next LTP period.
The forecast capital costs of providing for the growing population and land use change over the next 10 years is included in the table of all capital expenditure in the section of this strategy titled Asset
Figure: Timaru District - Projected Population (65+) 2013-43 by Projection variant
(Source: Statistics NZ Population Projections Update
December 2016)
Figure: Timaru District Projected Population 2013-2043 by Projection Variant
(Source: Statistics NZ Population Projections Update
December 2016)
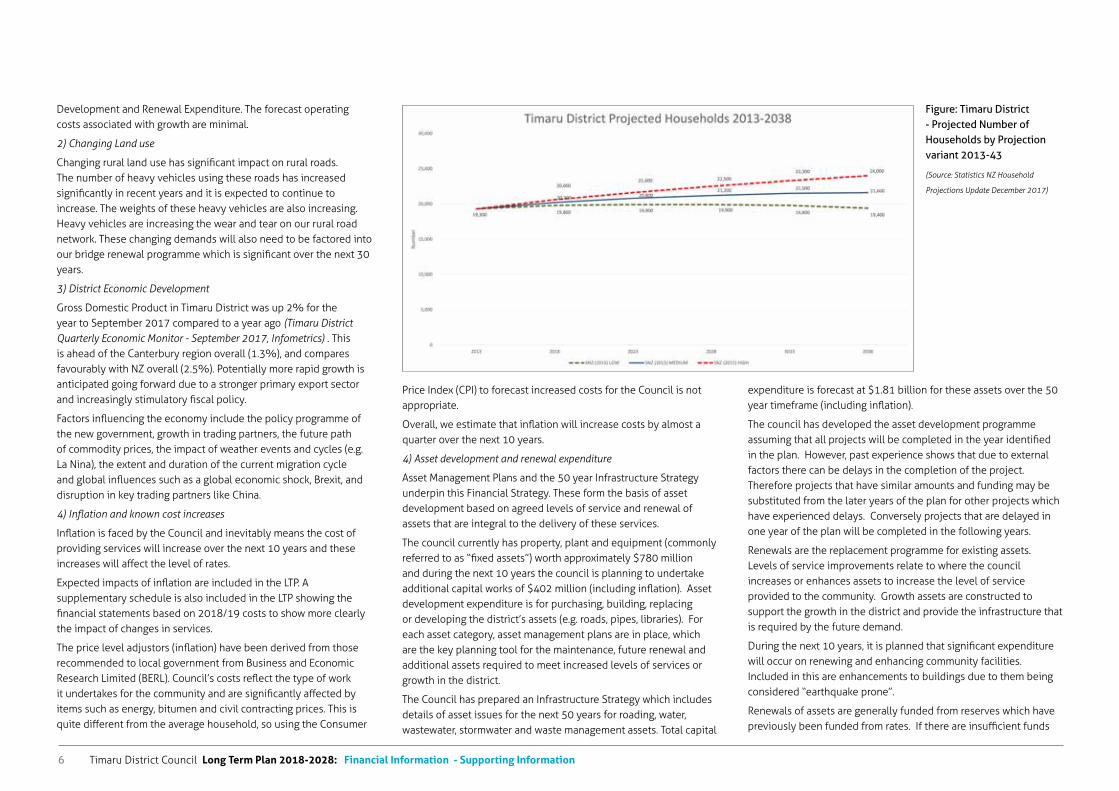
Timaru District Council Long Term Plan 2018-2028: Financial Information - Supporting Information6
Development and Renewal Expenditure. The forecast operating costs associated with growth are minimal.
2) Changing Land use
Changing rural land use has significant impact on rural roads. The number of heavy vehicles using these roads has increased significantly in recent years and it is expected to continue to increase. The weights of these heavy vehicles are also increasing. Heavy vehicles are increasing the wear and tear on our rural road network. These changing demands will also need to be factored into our bridge renewal programme which is significant over the next 30 years.
3) District Economic Development
Gross Domestic Product in Timaru District was up 2% for the year to September 2017 compared to a year ago (Timaru District Quarterly Economic Monitor - September 2017, Infometrics) . This is ahead of the Canterbury region overall (1.3%), and compares favourably with NZ overall (2.5%). Potentially more rapid growth is anticipated going forward due to a stronger primary export sector and increasingly stimulatory fiscal policy.
Factors influencing the economy include the policy programme of the new government, growth in trading partners, the future path of commodity prices, the impact of weather events and cycles (e.g. La Nina), the extent and duration of the current migration cycle and global influences such as a global economic shock, Brexit, and disruption in key trading partners like China.
4) Inflation and known cost increases
Inflation is faced by the Council and inevitably means the cost of providing services will increase over the next 10 years and these increases will affect the level of rates.
Expected impacts of inflation are included in the LTP. A supplementary schedule is also included in the LTP showing the financial statements based on 2018/19 costs to show more clearly the impact of changes in services.
The price level adjustors (inflation) have been derived from those recommended to local government from Business and Economic Research Limited (BERL). Council’s costs reflect the type of work it undertakes for the community and are significantly affected by items such as energy, bitumen and civil contracting prices. This is quite different from the average household, so using the Consumer
Figure: Timaru District - Projected Number of Households by Projection variant 2013-43
(Source: Statistics NZ Household
Projections Update December 2017)
Price Index (CPI) to forecast increased costs for the Council is not appropriate.
Overall, we estimate that inflation will increase costs by almost a quarter over the next 10 years.
4) Asset development and renewal expenditure
Asset Management Plans and the 50 year Infrastructure Strategy underpin this Financial Strategy. These form the basis of asset development based on agreed levels of service and renewal of assets that are integral to the delivery of these services.
The council currently has property, plant and equipment (commonly referred to as “fixed assets”) worth approximately $780 million and during the next 10 years the council is planning to undertake additional capital works of $402 million (including inflation). Asset development expenditure is for purchasing, building, replacing or developing the district’s assets (e.g. roads, pipes, libraries). For each asset category, asset management plans are in place, which are the key planning tool for the maintenance, future renewal and additional assets required to meet increased levels of services or growth in the district.
The Council has prepared an Infrastructure Strategy which includes details of asset issues for the next 50 years for roading, water, wastewater, stormwater and waste management assets. Total capital
expenditure is forecast at $1.81 billion for these assets over the 50 year timeframe (including inflation).
The council has developed the asset development programme assuming that all projects will be completed in the year identified in the plan. However, past experience shows that due to external factors there can be delays in the completion of the project. Therefore projects that have similar amounts and funding may be substituted from the later years of the plan for other projects which have experienced delays. Conversely projects that are delayed in one year of the plan will be completed in the following years.
Renewals are the replacement programme for existing assets. Levels of service improvements relate to where the council increases or enhances assets to increase the level of service provided to the community. Growth assets are constructed to support the growth in the district and provide the infrastructure that is required by the future demand.
During the next 10 years, it is planned that significant expenditure will occur on renewing and enhancing community facilities. Included in this are enhancements to buildings due to them being considered “earthquake prone”.
Renewals of assets are generally funded from reserves which have previously been funded from rates. If there are insufficient funds
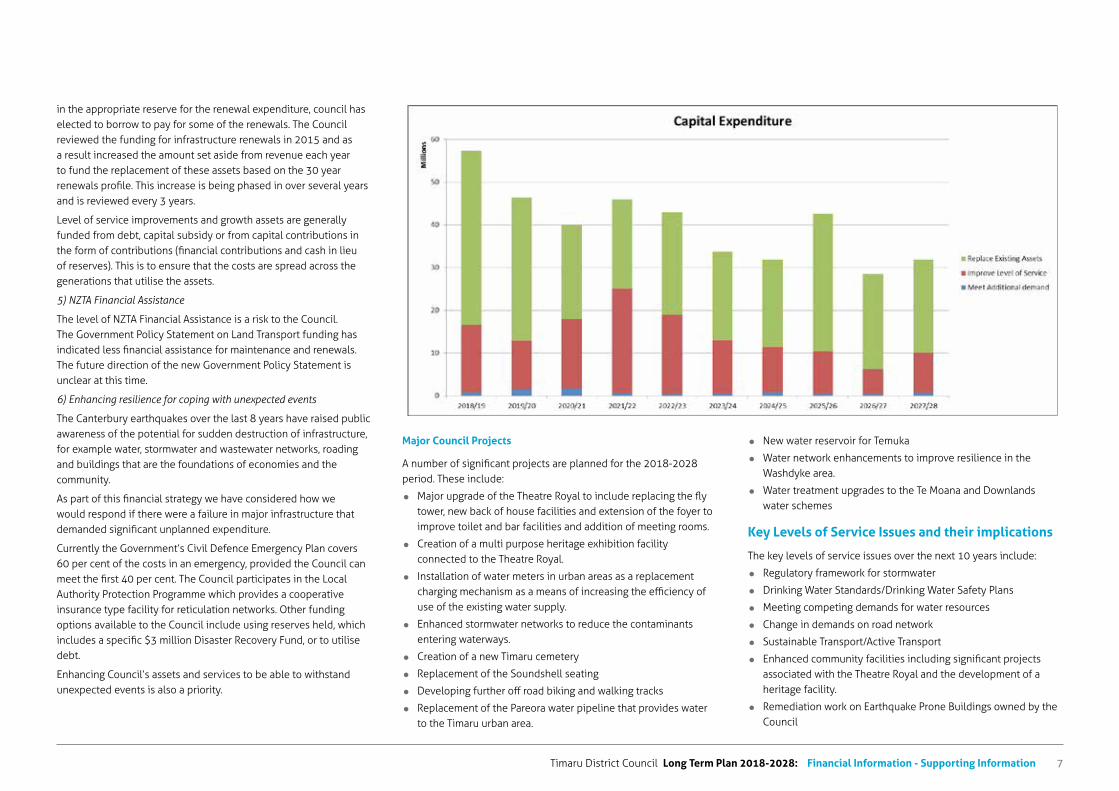
Timaru District Council Long Term Plan 2018-2028: Financial Information - Supporting Information 7
in the appropriate reserve for the renewal expenditure, council has elected to borrow to pay for some of the renewals. The Council reviewed the funding for infrastructure renewals in 2015 and as a result increased the amount set aside from revenue each year to fund the replacement of these assets based on the 30 year renewals profile. This increase is being phased in over several years and is reviewed every 3 years.
Level of service improvements and growth assets are generally funded from debt, capital subsidy or from capital contributions in the form of contributions (financial contributions and cash in lieu of reserves). This is to ensure that the costs are spread across the generations that utilise the assets.
5) NZTA Financial Assistance
The level of NZTA Financial Assistance is a risk to the Council. The Government Policy Statement on Land Transport funding has indicated less financial assistance for maintenance and renewals. The future direction of the new Government Policy Statement is unclear at this time.
6) Enhancing resilience for coping with unexpected events
The Canterbury earthquakes over the last 8 years have raised public awareness of the potential for sudden destruction of infrastructure, for example water, stormwater and wastewater networks, roading and buildings that are the foundations of economies and the community.
As part of this financial strategy we have considered how we would respond if there were a failure in major infrastructure that demanded significant unplanned expenditure.
Currently the Government’s Civil Defence Emergency Plan covers 60 per cent of the costs in an emergency, provided the Council can meet the first 40 per cent. The Council participates in the Local Authority Protection Programme which provides a cooperative insurance type facility for reticulation networks. Other funding options available to the Council include using reserves held, which includes a specific $3 million Disaster Recovery Fund, or to utilise debt.
Enhancing Council’s assets and services to be able to withstand unexpected events is also a priority.
Major Council Projects
A number of significant projects are planned for the 2018-2028 period. These include:
Major upgrade of the Theatre Royal to include replacing the fly tower, new back of house facilities and extension of the foyer to improve toilet and bar facilities and addition of meeting rooms.
Creation of a multi purpose heritage exhibition facility connected to the Theatre Royal.
Installation of water meters in urban areas as a replacement charging mechanism as a means of increasing the efficiency of use of the existing water supply.
Enhanced stormwater networks to reduce the contaminants entering waterways.
Creation of a new Timaru cemetery
Replacement of the Soundshell seating
Developing further off road biking and walking tracks
Replacement of the Pareora water pipeline that provides water to the Timaru urban area.
New water reservoir for Temuka
Water network enhancements to improve resilience in the Washdyke area.
Water treatment upgrades to the Te Moana and Downlands water schemes
Key Levels of Service Issues and their implications
The key levels of service issues over the next 10 years include:
Regulatory framework for stormwater
Drinking Water Standards/Drinking Water Safety Plans
Meeting competing demands for water resources
Change in demands on road network
Sustainable Transport/Active Transport
Enhanced community facilities including significant projects associated with the Theatre Royal and the development of a heritage facility.
Remediation work on Earthquake Prone Buildings owned by the Council
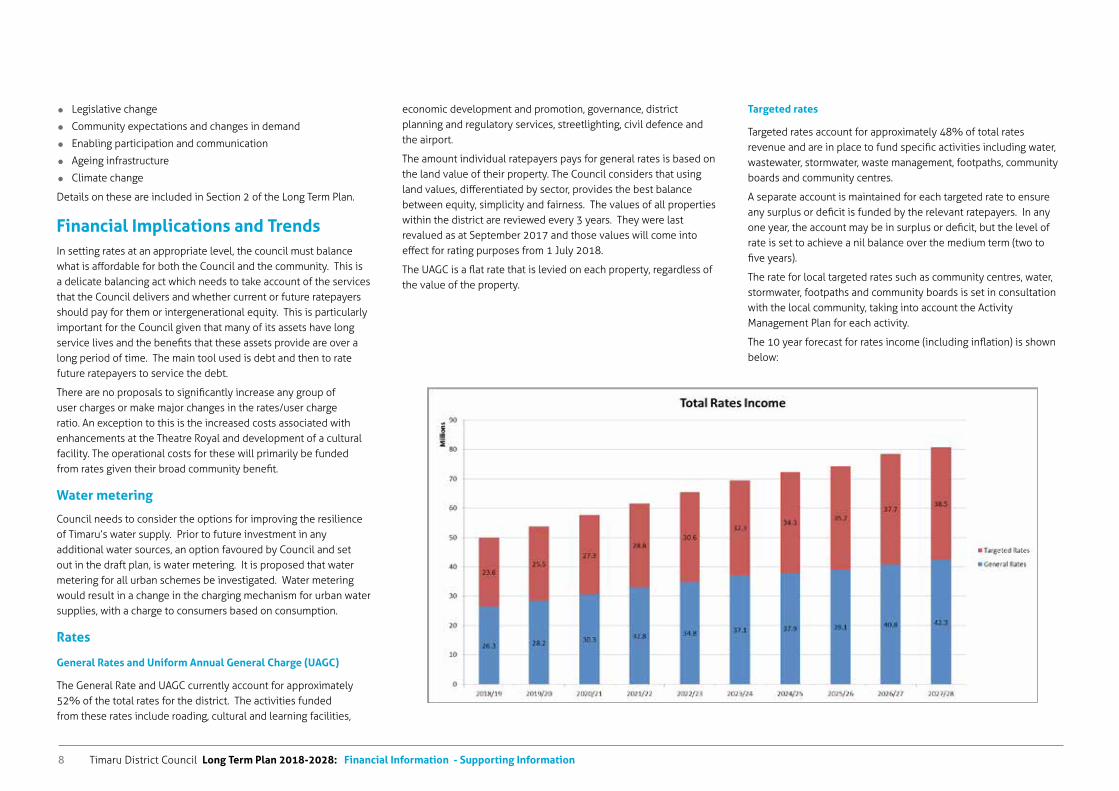
Timaru District Council Long Term Plan 2018-2028: Financial Information - Supporting Information8
Legislative change
Community expectations and changes in demand
Enabling participation and communication
Ageing infrastructure
Climate change
Details on these are included in Section 2 of the Long Term Plan.
Financial Implications and TrendsIn setting rates at an appropriate level, the council must balance what is affordable for both the Council and the community. This is a delicate balancing act which needs to take account of the services that the Council delivers and whether current or future ratepayers should pay for them or intergenerational equity. This is particularly important for the Council given that many of its assets have long service lives and the benefits that these assets provide are over a long period of time. The main tool used is debt and then to rate future ratepayers to service the debt.
There are no proposals to significantly increase any group of user charges or make major changes in the rates/user charge ratio. An exception to this is the increased costs associated with enhancements at the Theatre Royal and development of a cultural facility. The operational costs for these will primarily be funded from rates given their broad community benefit.
Water metering
Council needs to consider the options for improving the resilience of Timaru’s water supply. Prior to future investment in any additional water sources, an option favoured by Council and set out in the draft plan, is water metering. It is proposed that water metering for all urban schemes be investigated. Water metering would result in a change in the charging mechanism for urban water supplies, with a charge to consumers based on consumption.
Rates
General Rates and Uniform Annual General Charge (UAGC)
The General Rate and UAGC currently account for approximately 52% of the total rates for the district. The activities funded from these rates include roading, cultural and learning facilities,
economic development and promotion, governance, district planning and regulatory services, streetlighting, civil defence and the airport.
The amount individual ratepayers pays for general rates is based on the land value of their property. The Council considers that using land values, differentiated by sector, provides the best balance between equity, simplicity and fairness. The values of all properties within the district are reviewed every 3 years. They were last revalued as at September 2017 and those values will come into effect for rating purposes from 1 July 2018.
The UAGC is a flat rate that is levied on each property, regardless of the value of the property.
Targeted rates
Targeted rates account for approximately 48% of total rates revenue and are in place to fund specific activities including water, wastewater, stormwater, waste management, footpaths, community boards and community centres.
A separate account is maintained for each targeted rate to ensure any surplus or deficit is funded by the relevant ratepayers. In any one year, the account may be in surplus or deficit, but the level of rate is set to achieve a nil balance over the medium term (two to five years).
The rate for local targeted rates such as community centres, water, stormwater, footpaths and community boards is set in consultation with the local community, taking into account the Activity Management Plan for each activity.
The 10 year forecast for rates income (including inflation) is shown below:
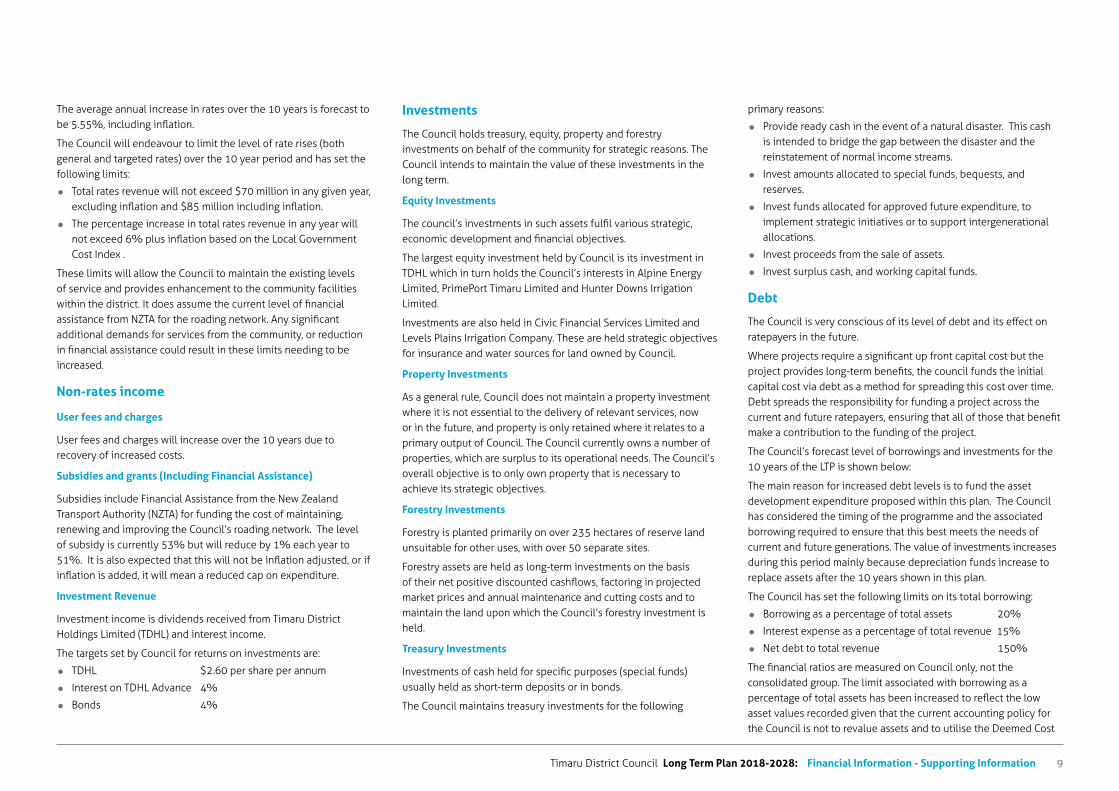
Timaru District Council Long Term Plan 2018-2028: Financial Information - Supporting Information 9
The average annual increase in rates over the 10 years is forecast to be 5.55%, including inflation.
The Council will endeavour to limit the level of rate rises (both general and targeted rates) over the 10 year period and has set the following limits:
Total rates revenue will not exceed $70 million in any given year, excluding inflation and $85 million including inflation.
The percentage increase in total rates revenue in any year will not exceed 6% plus inflation based on the Local Government Cost Index .
These limits will allow the Council to maintain the existing levels of service and provides enhancement to the community facilities within the district. It does assume the current level of financial assistance from NZTA for the roading network. Any significant additional demands for services from the community, or reduction in financial assistance could result in these limits needing to be increased.
Non-rates income
User fees and charges
User fees and charges will increase over the 10 years due to recovery of increased costs.
Subsidies and grants (Including Financial Assistance)
Subsidies include Financial Assistance from the New Zealand Transport Authority (NZTA) for funding the cost of maintaining, renewing and improving the Council’s roading network. The level of subsidy is currently 53% but will reduce by 1% each year to 51%. It is also expected that this will not be inflation adjusted, or if inflation is added, it will mean a reduced cap on expenditure.
Investment Revenue
Investment income is dividends received from Timaru District Holdings Limited (TDHL) and interest income.
The targets set by Council for returns on investments are:
TDHL $2.60 per share per annum
Interest on TDHL Advance 4%
Bonds 4%
Investments
The Council holds treasury, equity, property and forestry investments on behalf of the community for strategic reasons. The Council intends to maintain the value of these investments in the long term.
Equity Investments
The council’s investments in such assets fulfil various strategic, economic development and financial objectives.
The largest equity investment held by Council is its investment in TDHL which in turn holds the Council’s interests in Alpine Energy Limited, PrimePort Timaru Limited and Hunter Downs Irrigation Limited.
Investments are also held in Civic Financial Services Limited and Levels Plains Irrigation Company. These are held strategic objectives for insurance and water sources for land owned by Council.
Property Investments
As a general rule, Council does not maintain a property investment where it is not essential to the delivery of relevant services, now or in the future, and property is only retained where it relates to a primary output of Council. The Council currently owns a number of properties, which are surplus to its operational needs. The Council’s overall objective is to only own property that is necessary to achieve its strategic objectives.
Forestry Investments
Forestry is planted primarily on over 235 hectares of reserve land unsuitable for other uses, with over 50 separate sites.
Forestry assets are held as long-term investments on the basis of their net positive discounted cashflows, factoring in projected market prices and annual maintenance and cutting costs and to maintain the land upon which the Council’s forestry investment is held.
Treasury Investments
Investments of cash held for specific purposes (special funds) usually held as short-term deposits or in bonds.
The Council maintains treasury investments for the following
primary reasons:
Provide ready cash in the event of a natural disaster. This cash is intended to bridge the gap between the disaster and the reinstatement of normal income streams.
Invest amounts allocated to special funds, bequests, and reserves.
Invest funds allocated for approved future expenditure, to implement strategic initiatives or to support intergenerational allocations.
Invest proceeds from the sale of assets.
Invest surplus cash, and working capital funds.
Debt
The Council is very conscious of its level of debt and its effect on ratepayers in the future.
Where projects require a significant up front capital cost but the project provides long-term benefits, the council funds the initial capital cost via debt as a method for spreading this cost over time. Debt spreads the responsibility for funding a project across the current and future ratepayers, ensuring that all of those that benefit make a contribution to the funding of the project.
The Council’s forecast level of borrowings and investments for the 10 years of the LTP is shown below:
The main reason for increased debt levels is to fund the asset development expenditure proposed within this plan. The Council has considered the timing of the programme and the associated borrowing required to ensure that this best meets the needs of current and future generations. The value of investments increases during this period mainly because depreciation funds increase to replace assets after the 10 years shown in this plan.
The Council has set the following limits on its total borrowing:
Borrowing as a percentage of total assets 20%
Interest expense as a percentage of total revenue 15%
Net debt to total revenue 150%
The financial ratios are measured on Council only, not the consolidated group. The limit associated with borrowing as a percentage of total assets has been increased to reflect the low asset values recorded given that the current accounting policy for the Council is not to revalue assets and to utilise the Deemed Cost
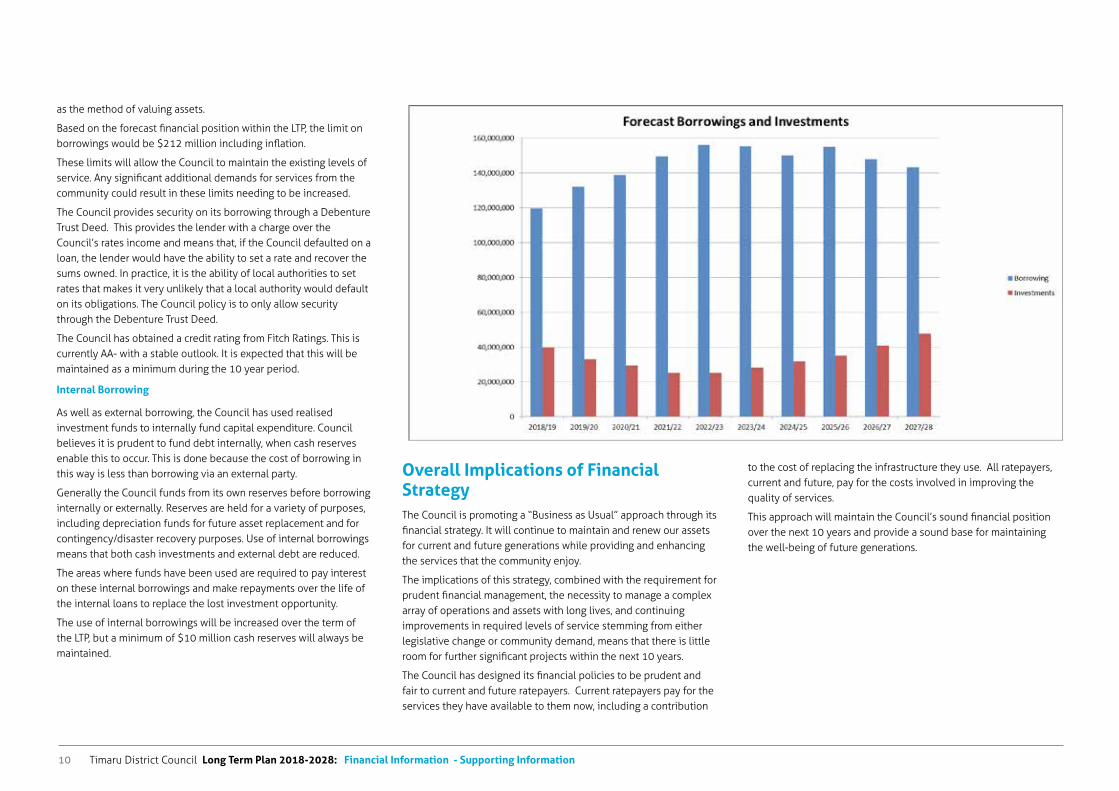
Timaru District Council Long Term Plan 2018-2028: Financial Information - Supporting Information10
as the method of valuing assets.
Based on the forecast financial position within the LTP, the limit on borrowings would be $212 million including inflation.
These limits will allow the Council to maintain the existing levels of service. Any significant additional demands for services from the community could result in these limits needing to be increased.
The Council provides security on its borrowing through a Debenture Trust Deed. This provides the lender with a charge over the Council’s rates income and means that, if the Council defaulted on a loan, the lender would have the ability to set a rate and recover the sums owned. In practice, it is the ability of local authorities to set rates that makes it very unlikely that a local authority would default on its obligations. The Council policy is to only allow security through the Debenture Trust Deed.
The Council has obtained a credit rating from Fitch Ratings. This is currently AA- with a stable outlook. It is expected that this will be maintained as a minimum during the 10 year period.
Internal Borrowing
As well as external borrowing, the Council has used realised investment funds to internally fund capital expenditure. Council believes it is prudent to fund debt internally, when cash reserves enable this to occur. This is done because the cost of borrowing in this way is less than borrowing via an external party.
Generally the Council funds from its own reserves before borrowing internally or externally. Reserves are held for a variety of purposes, including depreciation funds for future asset replacement and for contingency/disaster recovery purposes. Use of internal borrowings means that both cash investments and external debt are reduced.
The areas where funds have been used are required to pay interest on these internal borrowings and make repayments over the life of the internal loans to replace the lost investment opportunity.
The use of internal borrowings will be increased over the term of the LTP, but a minimum of $10 million cash reserves will always be maintained.
Overall Implications of Financial Strategy The Council is promoting a “Business as Usual” approach through its financial strategy. It will continue to maintain and renew our assets for current and future generations while providing and enhancing the services that the community enjoy.
The implications of this strategy, combined with the requirement for prudent financial management, the necessity to manage a complex array of operations and assets with long lives, and continuing improvements in required levels of service stemming from either legislative change or community demand, means that there is little room for further significant projects within the next 10 years.
The Council has designed its financial policies to be prudent and fair to current and future ratepayers. Current ratepayers pay for the services they have available to them now, including a contribution
to the cost of replacing the infrastructure they use. All ratepayers, current and future, pay for the costs involved in improving the quality of services.
This approach will maintain the Council’s sound financial position over the next 10 years and provide a sound base for maintaining the well-being of future generations.
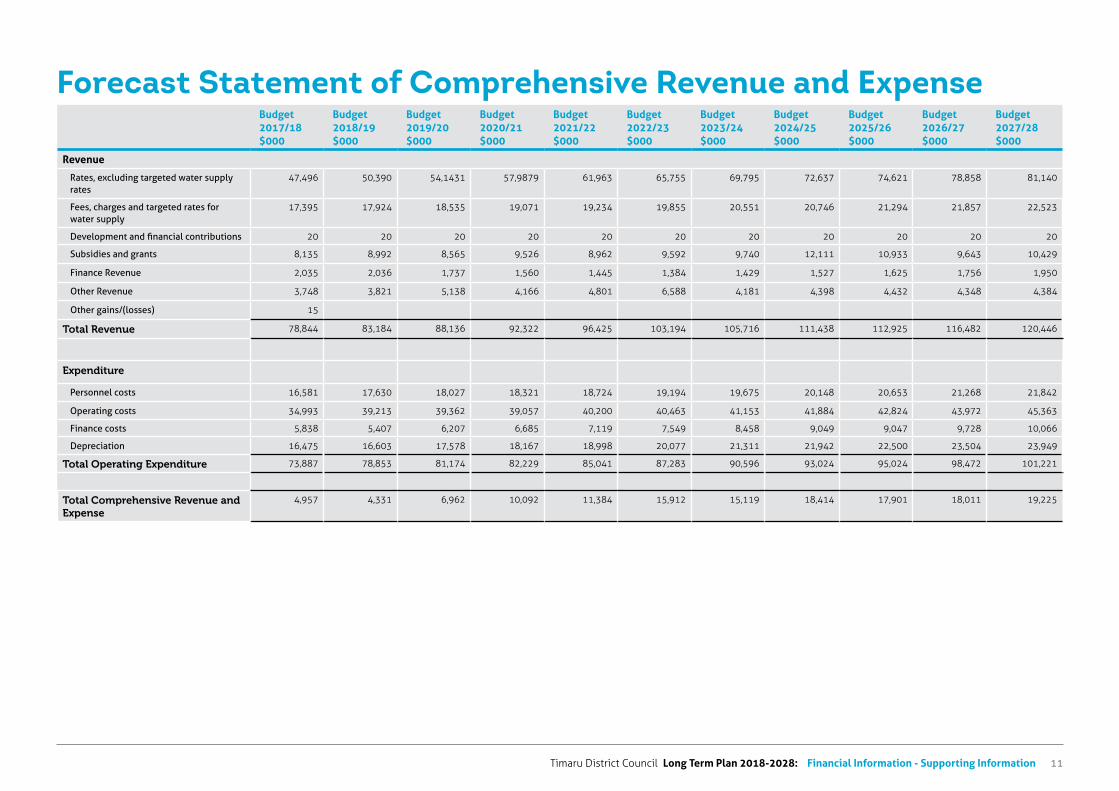
Timaru District Council Long Term Plan 2018-2028: Financial Information - Supporting Information 11
Forecast Statement of Comprehensive Revenue and ExpenseBudget 2017/18 $000
Budget 2018/19 $000
Budget 2019/20 $000
Budget 2020/21 $000
Budget 2021/22 $000
Budget 2022/23 $000
Budget 2023/24 $000
Budget 2024/25 $000
Budget 2025/26 $000
Budget 2026/27 $000
Budget 2027/28 $000
Revenue
Rates, excluding targeted water supply rates
47,496 50,390 54,1431 57,9879 61,963 65,755 69,795 72,637 74,621 78,858 81,140
Fees, charges and targeted rates for water supply
17,395 17,924 18,535 19,071 19,234 19,855 20,551 20,746 21,294 21,857 22,523
Development and financial contributions 20 20 20 20 20 20 20 20 20 20 20
Subsidies and grants 8,135 8,992 8,565 9,526 8,962 9,592 9,740 12,111 10,933 9,643 10,429
Finance Revenue 2,035 2,036 1,737 1,560 1,445 1,384 1,429 1,527 1,625 1,756 1,950
Other Revenue 3,748 3,821 5,138 4,166 4,801 6,588 4,181 4,398 4,432 4,348 4,384
Other gains/(losses) 15
Total Revenue 78,844 83,184 88,136 92,322 96,425 103,194 105,716 111,438 112,925 116,482 120,446
Expenditure
Personnel costs 16,581 17,630 18,027 18,321 18,724 19,194 19,675 20,148 20,653 21,268 21,842
Operating costs 34,993 39,213 39,362 39,057 40,200 40,463 41,153 41,884 42,824 43,972 45,363
Finance costs 5,838 5,407 6,207 6,685 7,119 7,549 8,458 9,049 9,047 9,728 10,066
Depreciation 16,475 16,603 17,578 18,167 18,998 20,077 21,311 21,942 22,500 23,504 23,949
Total Operating Expenditure 73,887 78,853 81,174 82,229 85,041 87,283 90,596 93,024 95,024 98,472 101,221
Total Comprehensive Revenue and Expense
4,957 4,331 6,962 10,092 11,384 15,912 15,119 18,414 17,901 18,011 19,225
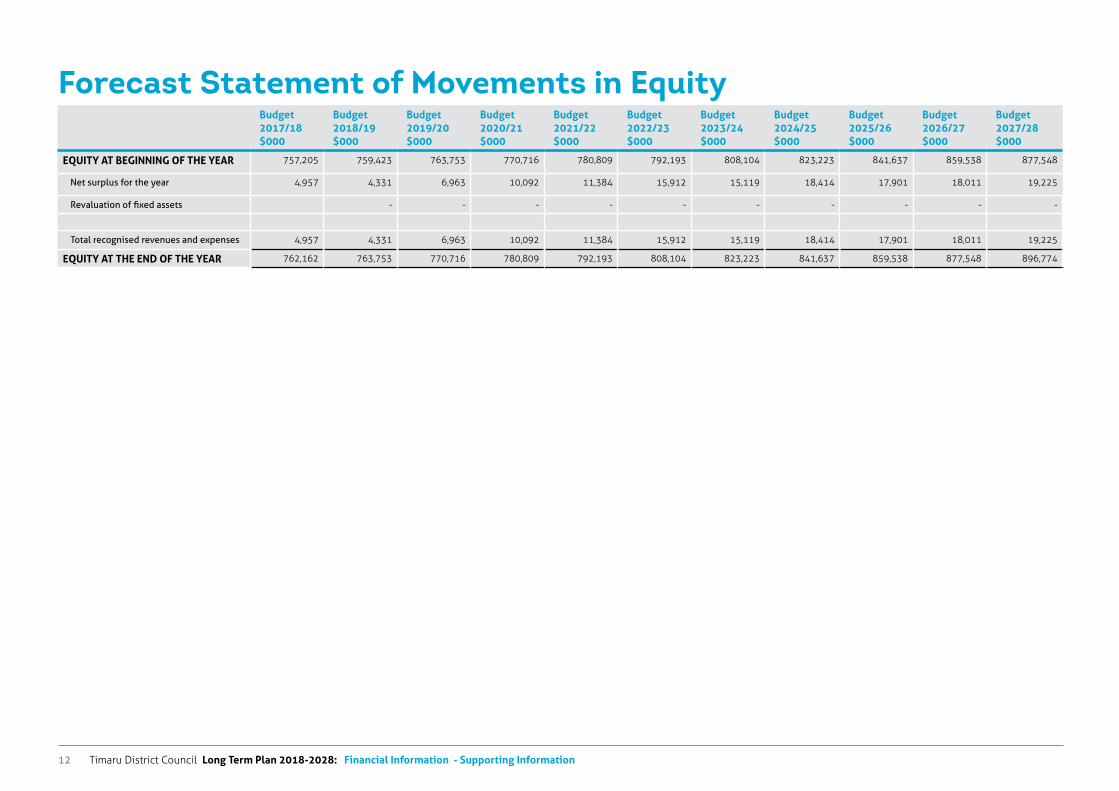
Timaru District Council Long Term Plan 2018-2028: Financial Information - Supporting Information12
Forecast Statement of Movements in EquityBudget 2017/18 $000
Budget 2018/19 $000
Budget 2019/20 $000
Budget 2020/21 $000
Budget 2021/22 $000
Budget 2022/23 $000
Budget 2023/24 $000
Budget 2024/25 $000
Budget 2025/26 $000
Budget 2026/27 $000
Budget 2027/28 $000
EQUITY AT BEGINNING OF THE YEAR 757,205 759,423 763,753 770,716 780,809 792,193 808,104 823,223 841,637 859,538 877,548
Net surplus for the year 4,957 4,331 6,963 10,092 11,384 15,912 15,119 18,414 17,901 18,011 19,225
Revaluation of fixed assets - - - - - - - - - -
Total recognised revenues and expenses 4,957 4,331 6,963 10,092 11,384 15,912 15,119 18,414 17,901 18,011 19,225
EQUITY AT THE END OF THE YEAR 762,162 763,753 770,716 780,809 792,193 808,104 823,223 841,637 859,538 877,548 896,774
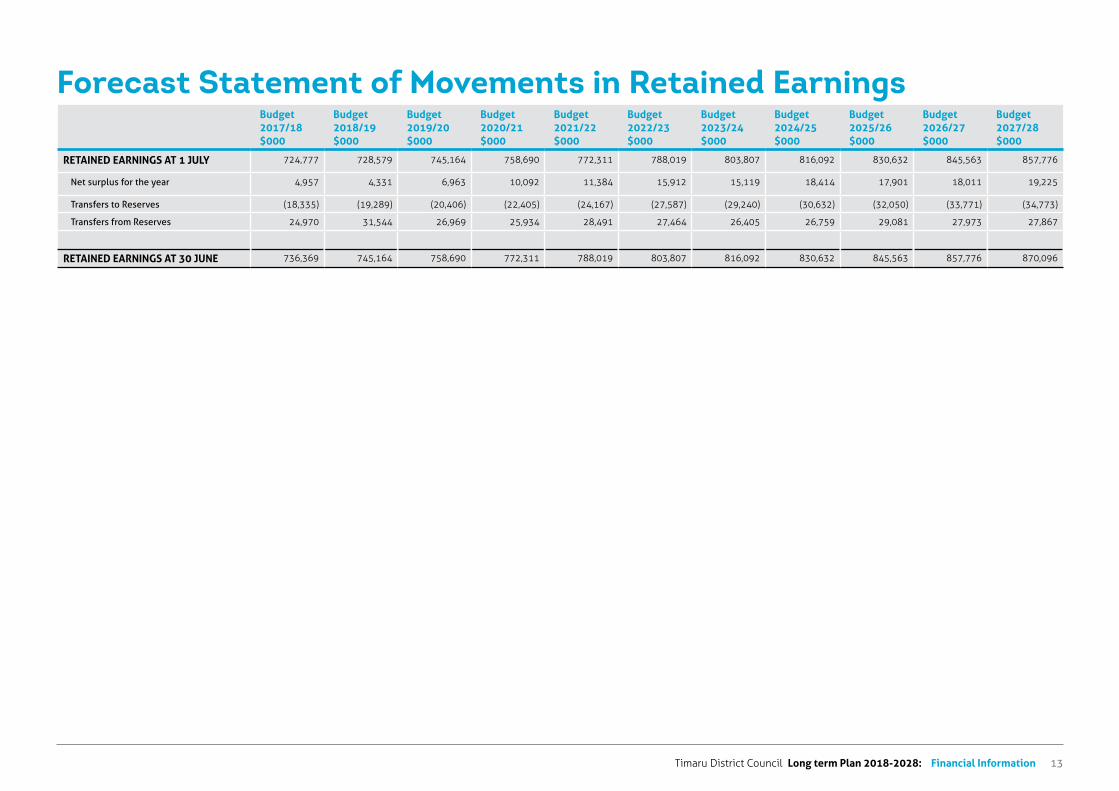
Timaru District Council Long term Plan 2018-2028: Financial Information 13
Forecast Statement of Movements in Retained EarningsBudget 2017/18 $000
Budget 2018/19 $000
Budget 2019/20 $000
Budget 2020/21 $000
Budget 2021/22 $000
Budget 2022/23 $000
Budget 2023/24 $000
Budget 2024/25 $000
Budget 2025/26 $000
Budget 2026/27 $000
Budget 2027/28 $000
RETAINED EARNINGS AT 1 JULY 724,777 728,579 745,164 758,690 772,311 788,019 803,807 816,092 830,632 845,563 857,776
Net surplus for the year 4,957 4,331 6,963 10,092 11,384 15,912 15,119 18,414 17,901 18,011 19,225
Transfers to Reserves (18,335) (19,289) (20,406) (22,405) (24,167) (27,587) (29,240) (30,632) (32,050) (33,771) (34,773)
Transfers from Reserves 24,970 31,544 26,969 25,934 28,491 27,464 26,405 26,759 29,081 27,973 27,867
RETAINED EARNINGS AT 30 JUNE 736,369 745,164 758,690 772,311 788,019 803,807 816,092 830,632 845,563 857,776 870,096
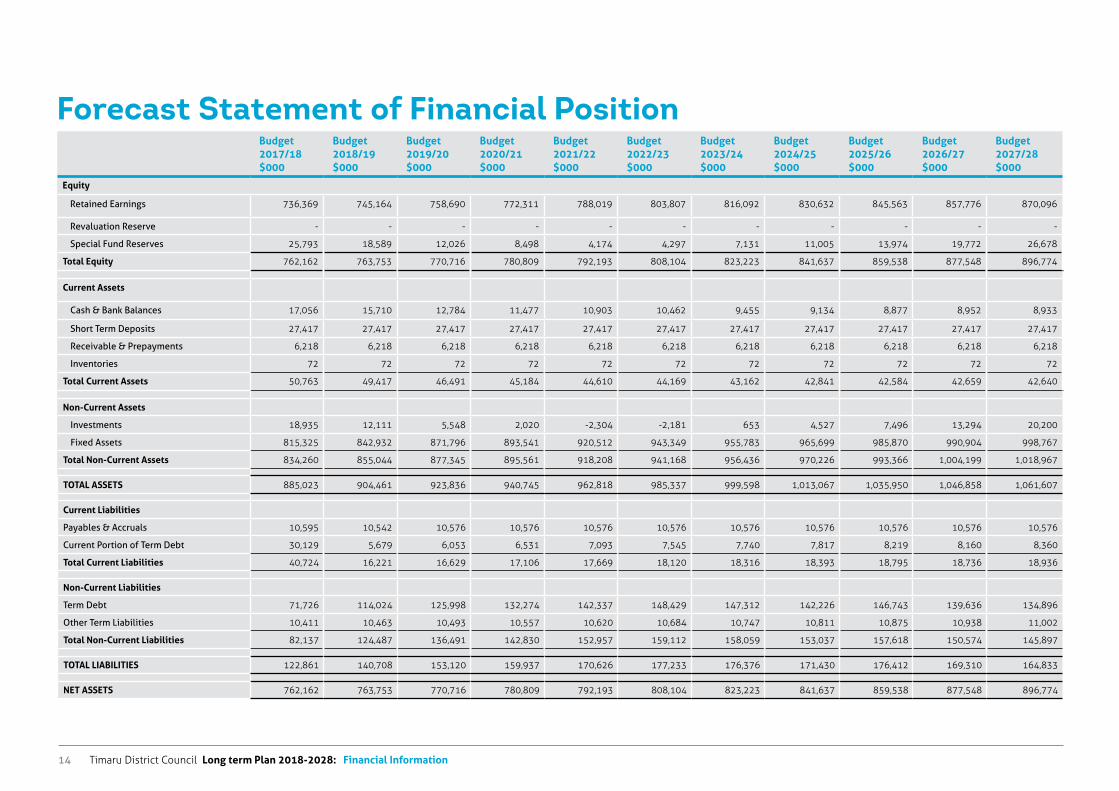
Timaru District Council Long term Plan 2018-2028: Financial Information14
Forecast Statement of Financial PositionBudget 2017/18 $000
Budget 2018/19 $000
Budget 2019/20 $000
Budget 2020/21 $000
Budget 2021/22 $000
Budget 2022/23 $000
Budget 2023/24 $000
Budget 2024/25 $000
Budget 2025/26 $000
Budget 2026/27 $000
Budget 2027/28 $000
Equity
Retained Earnings 736,369 745,164 758,690 772,311 788,019 803,807 816,092 830,632 845,563 857,776 870,096
Revaluation Reserve - - - - - - - - - - -
Special Fund Reserves 25,793 18,589 12,026 8,498 4,174 4,297 7,131 11,005 13,974 19,772 26,678
Total Equity 762,162 763,753 770,716 780,809 792,193 808,104 823,223 841,637 859,538 877,548 896,774
Current Assets
Cash & Bank Balances 17,056 15,710 12,784 11,477 10,903 10,462 9,455 9,134 8,877 8,952 8,933
Short Term Deposits 27,417 27,417 27,417 27,417 27,417 27,417 27,417 27,417 27,417 27,417 27,417
Receivable & Prepayments 6,218 6,218 6,218 6,218 6,218 6,218 6,218 6,218 6,218 6,218 6,218
Inventories 72 72 72 72 72 72 72 72 72 72 72
Total Current Assets 50,763 49,417 46,491 45,184 44,610 44,169 43,162 42,841 42,584 42,659 42,640
Non-Current Assets
Investments 18,935 12,111 5,548 2,020 -2,304 -2,181 653 4,527 7,496 13,294 20,200
Fixed Assets 815,325 842,932 871,796 893,541 920,512 943,349 955,783 965,699 985,870 990,904 998,767
Total Non-Current Assets 834,260 855,044 877,345 895,561 918,208 941,168 956,436 970,226 993,366 1,004,199 1,018,967
TOTAL ASSETS 885,023 904,461 923,836 940,745 962,818 985,337 999,598 1,013,067 1,035,950 1,046,858 1,061,607
Current Liabilities
Payables & Accruals 10,595 10,542 10,576 10,576 10,576 10,576 10,576 10,576 10,576 10,576 10,576
Current Portion of Term Debt 30,129 5,679 6,053 6,531 7,093 7,545 7,740 7,817 8,219 8,160 8,360
Total Current Liabilities 40,724 16,221 16,629 17,106 17,669 18,120 18,316 18,393 18,795 18,736 18,936
Non-Current Liabilities
Term Debt 71,726 114,024 125,998 132,274 142,337 148,429 147,312 142,226 146,743 139,636 134,896
Other Term Liabilities 10,411 10,463 10,493 10,557 10,620 10,684 10,747 10,811 10,875 10,938 11,002
Total Non-Current Liabilities 82,137 124,487 136,491 142,830 152,957 159,112 158,059 153,037 157,618 150,574 145,897
TOTAL LIABILITIES 122,861 140,708 153,120 159,937 170,626 177,233 176,376 171,430 176,412 169,310 164,833
NET ASSETS 762,162 763,753 770,716 780,809 792,193 808,104 823,223 841,637 859,538 877,548 896,774
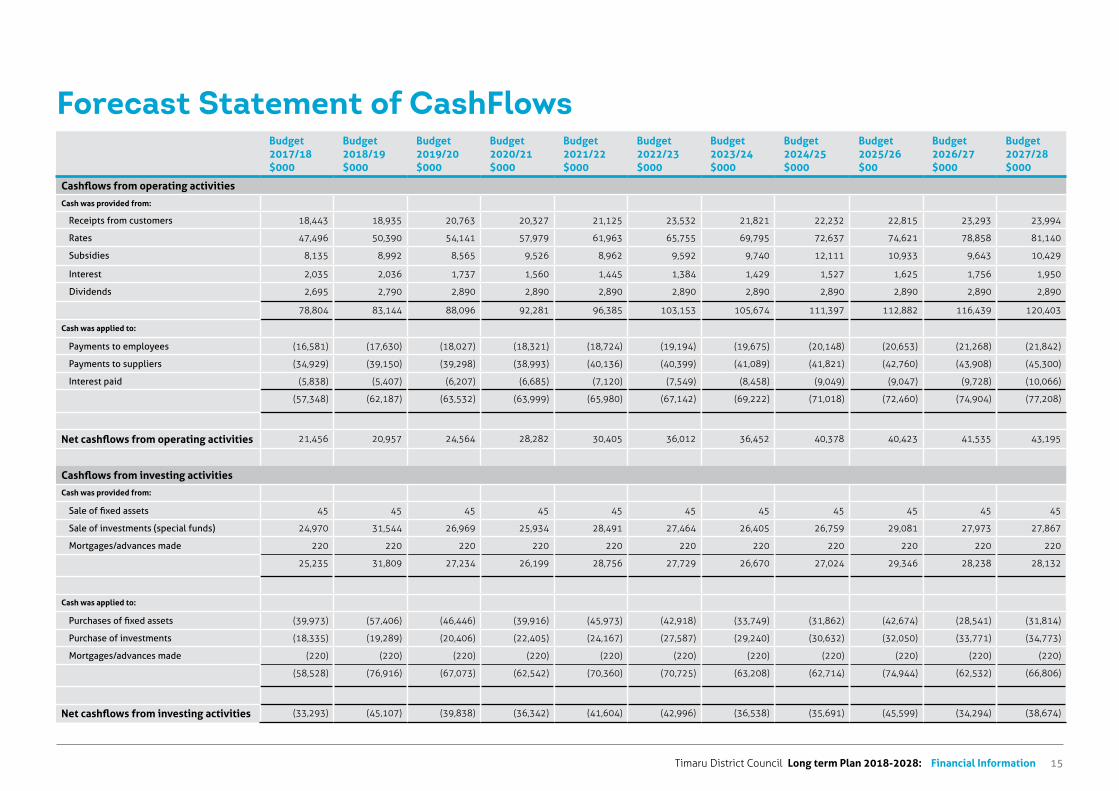
Timaru District Council Long term Plan 2018-2028: Financial Information 15
Forecast Statement of CashFlowsBudget 2017/18 $000
Budget 2018/19 $000
Budget 2019/20 $000
Budget 2020/21 $000
Budget 2021/22 $000
Budget 2022/23 $000
Budget 2023/24 $000
Budget 2024/25 $000
Budget 2025/26 $00
Budget 2026/27 $000
Budget 2027/28 $000
Cashflows from operating activities
Cash was provided from:
Receipts from customers 18,443 18,935 20,763 20,327 21,125 23,532 21,821 22,232 22,815 23,293 23,994
Rates 47,496 50,390 54,141 57,979 61,963 65,755 69,795 72,637 74,621 78,858 81,140
Subsidies 8,135 8,992 8,565 9,526 8,962 9,592 9,740 12,111 10,933 9,643 10,429
Interest 2,035 2,036 1,737 1,560 1,445 1,384 1,429 1,527 1,625 1,756 1,950
Dividends 2,695 2,790 2,890 2,890 2,890 2,890 2,890 2,890 2,890 2,890 2,890
78,804 83,144 88,096 92,281 96,385 103,153 105,674 111,397 112,882 116,439 120,403
Cash was applied to:
Payments to employees (16,581) (17,630) (18,027) (18,321) (18,724) (19,194) (19,675) (20,148) (20,653) (21,268) (21,842)
Payments to suppliers (34,929) (39,150) (39,298) (38,993) (40,136) (40,399) (41,089) (41,821) (42,760) (43,908) (45,300)
Interest paid (5,838) (5,407) (6,207) (6,685) (7,120) (7,549) (8,458) (9,049) (9,047) (9,728) (10,066)
(57,348) (62,187) (63,532) (63,999) (65,980) (67,142) (69,222) (71,018) (72,460) (74,904) (77,208)
Net cashflows from operating activities 21,456 20,957 24,564 28,282 30,405 36,012 36,452 40,378 40,423 41,535 43,195
Cashflows from investing activities
Cash was provided from:
Sale of fixed assets 45 45 45 45 45 45 45 45 45 45 45
Sale of investments (special funds) 24,970 31,544 26,969 25,934 28,491 27,464 26,405 26,759 29,081 27,973 27,867
Mortgages/advances made 220 220 220 220 220 220 220 220 220 220 220
25,235 31,809 27,234 26,199 28,756 27,729 26,670 27,024 29,346 28,238 28,132
Cash was applied to:
Purchases of fixed assets (39,973) (57,406) (46,446) (39,916) (45,973) (42,918) (33,749) (31,862) (42,674) (28,541) (31,814)
Purchase of investments (18,335) (19,289) (20,406) (22,405) (24,167) (27,587) (29,240) (30,632) (32,050) (33,771) (34,773)
Mortgages/advances made (220) (220) (220) (220) (220) (220) (220) (220) (220) (220) (220)
(58,528) (76,916) (67,073) (62,542) (70,360) (70,725) (63,208) (62,714) (74,944) (62,532) (66,806)
Net cashflows from investing activities (33,293) (45,107) (39,838) (36,342) (41,604) (42,996) (36,538) (35,691) (45,599) (34,294) (38,674)
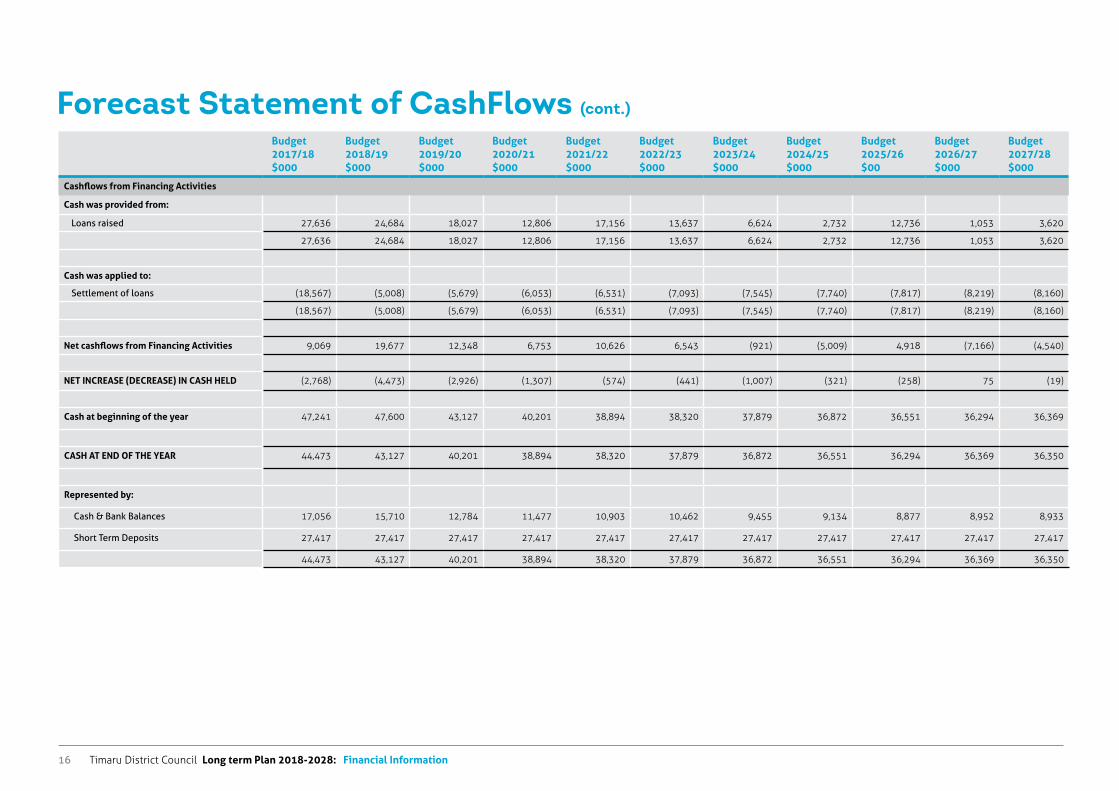
Timaru District Council Long term Plan 2018-2028: Financial Information16
Budget 2017/18 $000
Budget 2018/19 $000
Budget 2019/20 $000
Budget 2020/21 $000
Budget 2021/22 $000
Budget 2022/23 $000
Budget 2023/24 $000
Budget 2024/25 $000
Budget 2025/26 $00
Budget 2026/27 $000
Budget 2027/28 $000
Cashflows from Financing Activities
Cash was provided from:
Loans raised 27,636 24,684 18,027 12,806 17,156 13,637 6,624 2,732 12,736 1,053 3,620
27,636 24,684 18,027 12,806 17,156 13,637 6,624 2,732 12,736 1,053 3,620
Cash was applied to:
Settlement of loans (18,567) (5,008) (5,679) (6,053) (6,531) (7,093) (7,545) (7,740) (7,817) (8,219) (8,160)
(18,567) (5,008) (5,679) (6,053) (6,531) (7,093) (7,545) (7,740) (7,817) (8,219) (8,160)
Net cashflows from Financing Activities 9,069 19,677 12,348 6,753 10,626 6,543 (921) (5,009) 4,918 (7,166) (4,540)
NET INCREASE (DECREASE) IN CASH HELD (2,768) (4,473) (2,926) (1,307) (574) (441) (1,007) (321) (258) 75 (19)
Cash at beginning of the year 47,241 47,600 43,127 40,201 38,894 38,320 37,879 36,872 36,551 36,294 36,369
CASH AT END OF THE YEAR 44,473 43,127 40,201 38,894 38,320 37,879 36,872 36,551 36,294 36,369 36,350
Represented by:
Cash & Bank Balances 17,056 15,710 12,784 11,477 10,903 10,462 9,455 9,134 8,877 8,952 8,933
Short Term Deposits 27,417 27,417 27,417 27,417 27,417 27,417 27,417 27,417 27,417 27,417 27,417
44,473 43,127 40,201 38,894 38,320 37,879 36,872 36,551 36,294 36,369 36,350
Forecast Statement of CashFlows (cont.)
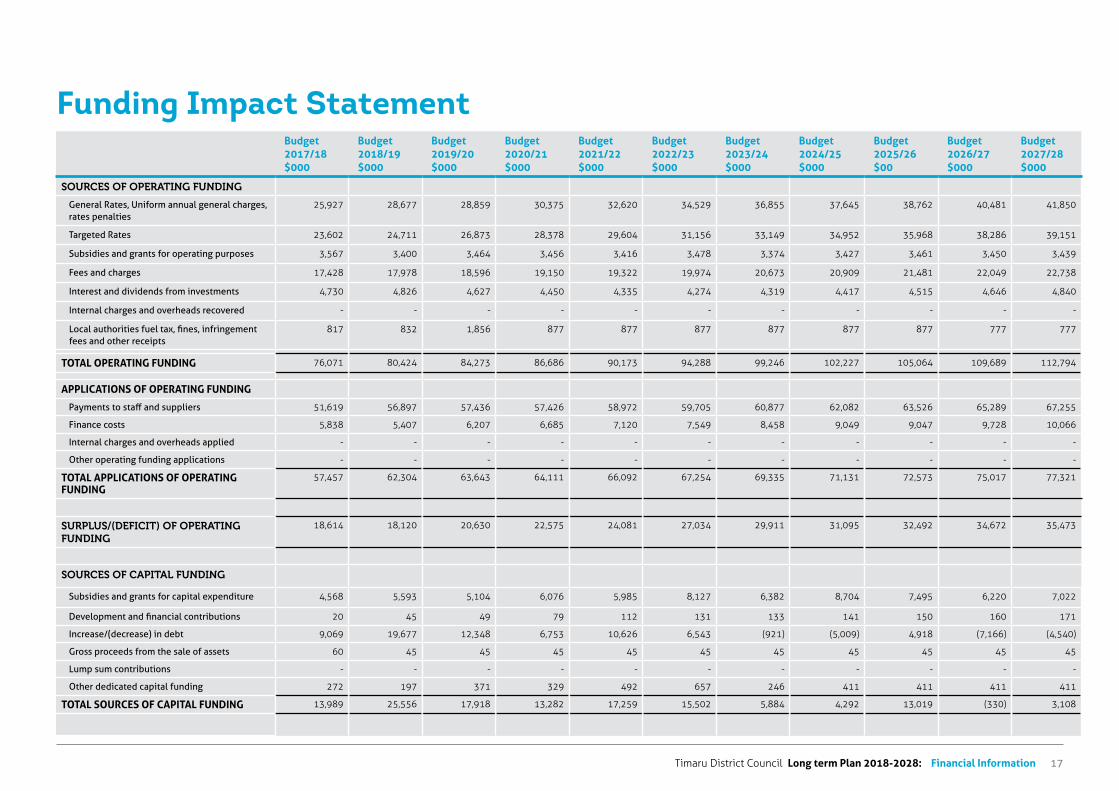
Timaru District Council Long term Plan 2018-2028: Financial Information 17
Funding Impact StatementBudget 2017/18 $000
Budget 2018/19 $000
Budget 2019/20 $000
Budget 2020/21 $000
Budget 2021/22 $000
Budget 2022/23 $000
Budget 2023/24 $000
Budget 2024/25 $000
Budget 2025/26 $00
Budget 2026/27 $000
Budget 2027/28 $000
SOURCES OF OPERATING FUNDING
General Rates, Uniform annual general charges, rates penalties
25,927 28,677 28,859 30,375 32,620 34,529 36,855 37,645 38,762 40,481 41,850
Targeted Rates 23,602 24,711 26,873 28,378 29,604 31,156 33,149 34,952 35,968 38,286 39,151
Subsidies and grants for operating purposes 3,567 3,400 3,464 3,456 3,416 3,478 3,374 3,427 3,461 3,450 3,439
Fees and charges 17,428 17,978 18,596 19,150 19,322 19,974 20,673 20,909 21,481 22,049 22,738
Interest and dividends from investments 4,730 4,826 4,627 4,450 4,335 4,274 4,319 4,417 4,515 4,646 4,840
Internal charges and overheads recovered - - - - - - - - - - -
Local authorities fuel tax, fines, infringement fees and other receipts
817 832 1,856 877 877 877 877 877 877 777 777
TOTAL OPERATING FUNDING 76,071 80,424 84,273 86,686 90,173 94,288 99,246 102,227 105,064 109,689 112,794
APPLICATIONS OF OPERATING FUNDING
Payments to staff and suppliers 51,619 56,897 57,436 57,426 58,972 59,705 60,877 62,082 63,526 65,289 67,255
Finance costs 5,838 5,407 6,207 6,685 7,120 7,549 8,458 9,049 9,047 9,728 10,066
Internal charges and overheads applied - - - - - - - - - - -
Other operating funding applications - - - - - - - - - - -
TOTAL APPLICATIONS OF OPERATING FUNDING
57,457 62,304 63,643 64,111 66,092 67,254 69,335 71,131 72,573 75,017 77,321
SURPLUS/(DEFICIT) OF OPERATING FUNDING
18,614 18,120 20,630 22,575 24,081 27,034 29,911 31,095 32,492 34,672 35,473
SOURCES OF CAPITAL FUNDING
Subsidies and grants for capital expenditure 4,568 5,593 5,104 6,076 5,985 8,127 6,382 8,704 7,495 6,220 7,022
Development and financial contributions 20 45 49 79 112 131 133 141 150 160 171
Increase/(decrease) in debt 9,069 19,677 12,348 6,753 10,626 6,543 (921) (5,009) 4,918 (7,166) (4,540)
Gross proceeds from the sale of assets 60 45 45 45 45 45 45 45 45 45 45
Lump sum contributions - - - - - - - - - - -
Other dedicated capital funding 272 197 371 329 492 657 246 411 411 411 411
TOTAL SOURCES OF CAPITAL FUNDING 13,989 25,556 17,918 13,282 17,259 15,502 5,884 4,292 13,019 (330) 3,108
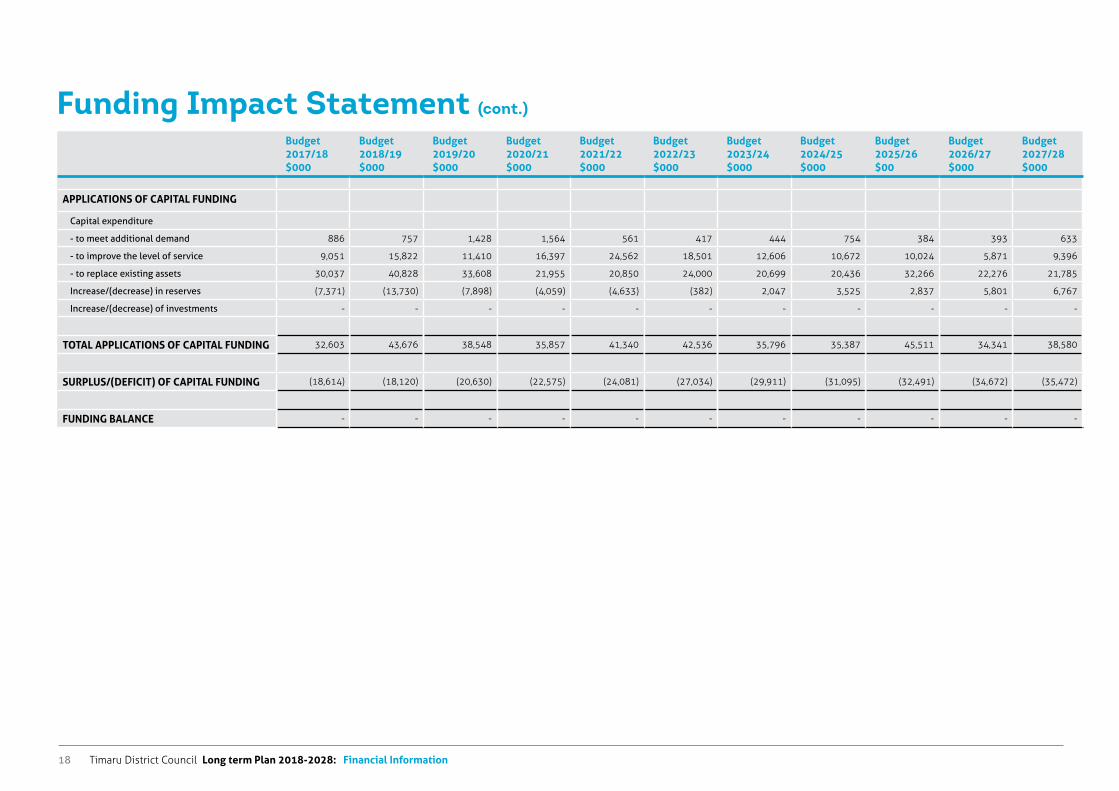
Timaru District Council Long term Plan 2018-2028: Financial Information18
Budget 2017/18 $000
Budget 2018/19 $000
Budget 2019/20 $000
Budget 2020/21 $000
Budget 2021/22 $000
Budget 2022/23 $000
Budget 2023/24 $000
Budget 2024/25 $000
Budget 2025/26 $00
Budget 2026/27 $000
Budget 2027/28 $000
APPLICATIONS OF CAPITAL FUNDING
Capital expenditure
- to meet additional demand 886 757 1,428 1,564 561 417 444 754 384 393 633
- to improve the level of service 9,051 15,822 11,410 16,397 24,562 18,501 12,606 10,672 10,024 5,871 9,396
- to replace existing assets 30,037 40,828 33,608 21,955 20,850 24,000 20,699 20,436 32,266 22,276 21,785
Increase/(decrease) in reserves (7,371) (13,730) (7,898) (4,059) (4,633) (382) 2,047 3,525 2,837 5,801 6,767
Increase/(decrease) of investments - - - - - - - - - - -
TOTAL APPLICATIONS OF CAPITAL FUNDING 32,603 43,676 38,548 35,857 41,340 42,536 35,796 35,387 45,511 34,341 38,580
SURPLUS/(DEFICIT) OF CAPITAL FUNDING (18,614) (18,120) (20,630) (22,575) (24,081) (27,034) (29,911) (31,095) (32,491) (34,672) (35,472)
FUNDING BALANCE - - - - - - - - - - -
Funding Impact Statement (cont.)
COUNCIL ACTIVITIES
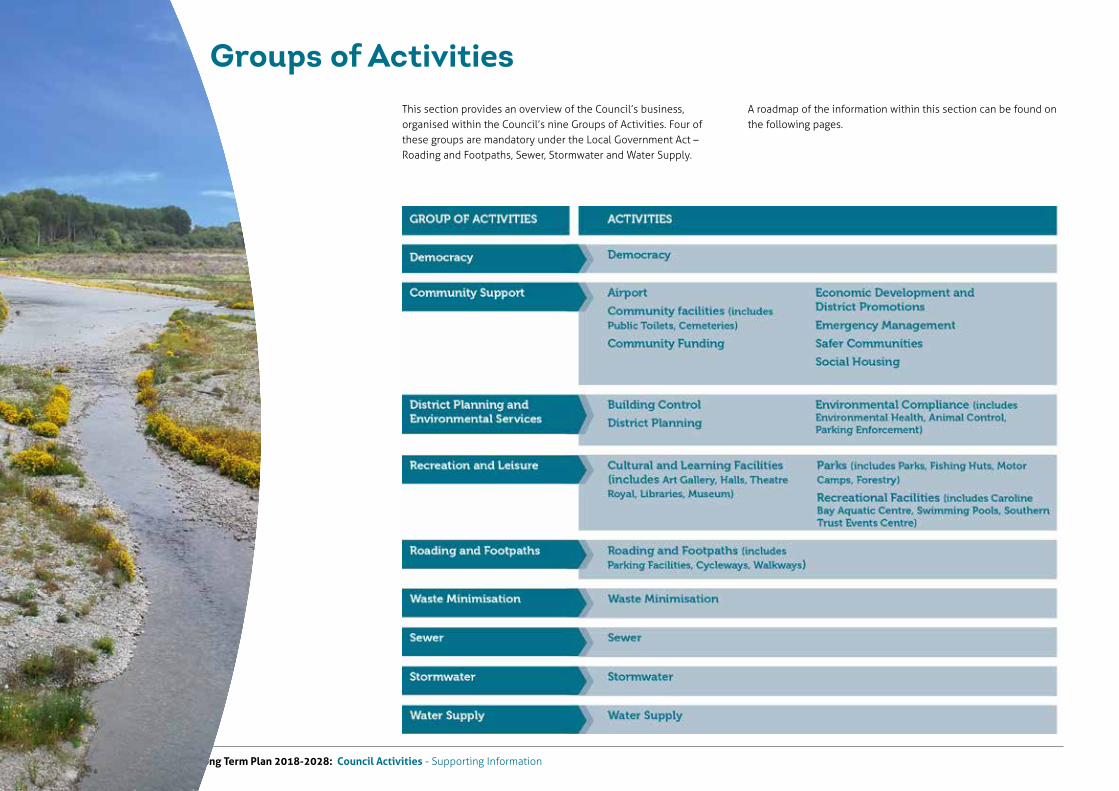
Timaru District Council Long Term Plan 2018-2028: Council Activities - Supporting Information2
Groups of ActivitiesThis section provides an overview of the Council’s business, organised within the Council’s nine Groups of Activities. Four of these groups are mandatory under the Local Government Act – Roading and Footpaths, Sewer, Stormwater and Water Supply.
A roadmap of the information within this section can be found on the following pages.
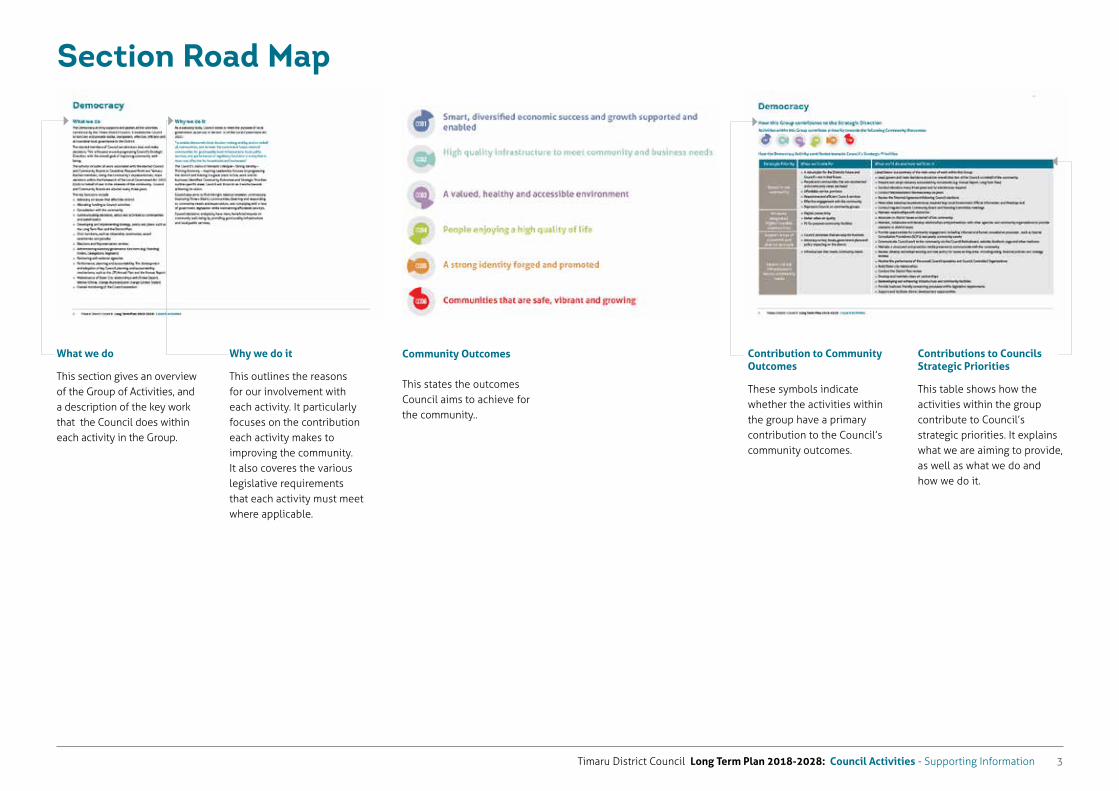
Timaru District Council Long Term Plan 2018-2028: Council Activities - Supporting Information 3
Contribution to Community Outcomes
These symbols indicate whether the activities within the group have a primary contribution to the Council’s community outcomes.
Community Outcomes
This states the outcomes Council aims to achieve for the community..
What we do
This section gives an overview of the Group of Activities, and a description of the key work that the Council does within each activity in the Group.
Why we do it
This outlines the reasons for our involvement with each activity. It particularly focuses on the contribution each activity makes to improving the community. It also coveres the various legislative requirements that each activity must meet where applicable.
Section Road Map
Contributions to Councils Strategic Priorities
This table shows how the activities within the group contribute to Council’s strategic priorities. It explains what we are aiming to provide, as well as what we do and how we do it.
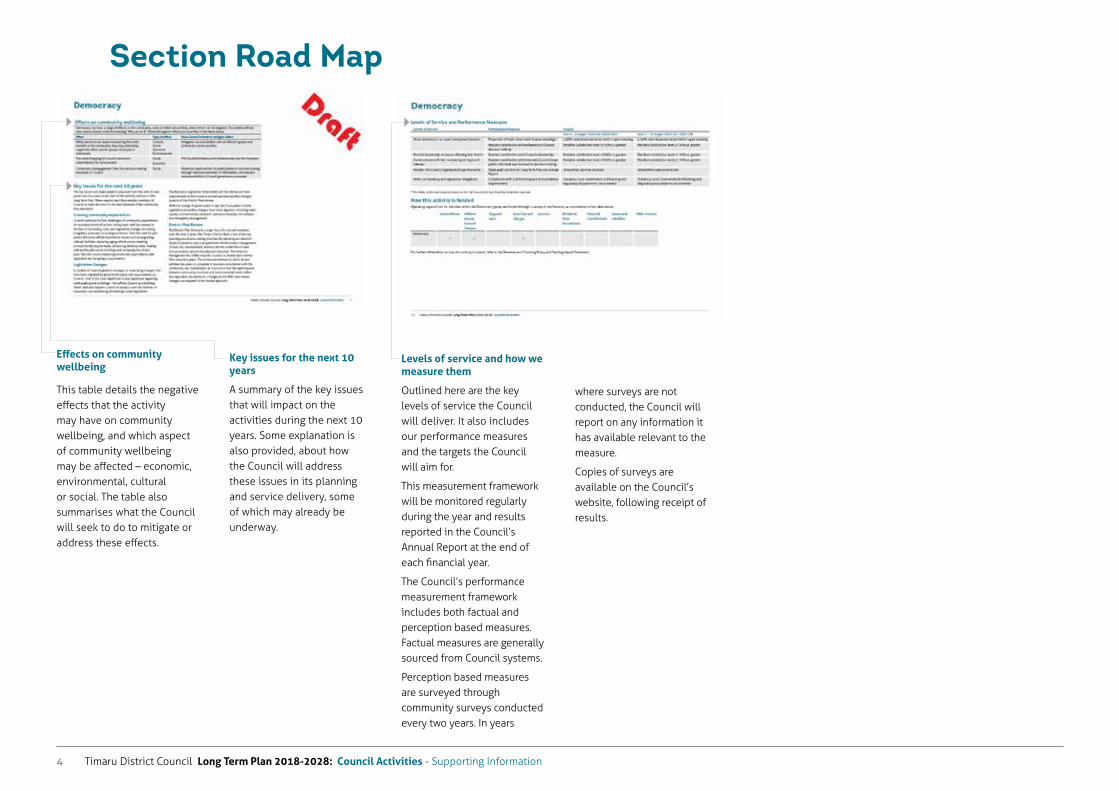
Timaru District Council Long Term Plan 2018-2028: Council Activities - Supporting Information4
Section Road Map
Levels of service and how we measure them
Outlined here are the key levels of service the Council will deliver. It also includes our performance measures and the targets the Council will aim for.
This measurement framework will be monitored regularly during the year and results reported in the Council’s Annual Report at the end of each financial year.
The Council’s performance measurement framework includes both factual and perception based measures. Factual measures are generally sourced from Council systems.
Perception based measures are surveyed through community surveys conducted every two years. In years
where surveys are not conducted, the Council will report on any information it has available relevant to the measure.
Copies of surveys are available on the Council’s website, following receipt of results.
Effects on community wellbeing
This table details the negative effects that the activity may have on community wellbeing, and which aspect of community wellbeing may be affected – economic, environmental, cultural or social. The table also summarises what the Council will seek to do to mitigate or address these effects.
Key issues for the next 10 years
A summary of the key issues that will impact on the activities during the next 10 years. Some explanation is also provided, about how the Council will address these issues in its planning and service delivery, some of which may already be underway.
Timaru District Council Long Term Plan 2018-2028: Council Activities - Supporting Information 5
Democracy
Timaru District Council Long Term Plan 2018-2028: Council Activities - Supporting Information6
What we doThe Democracy activity supports and guides all the activities carried out by the Timaru District Council. It enables the Council to function and provide stable, transparent, effective, efficient and accountable local governance to the District.
The elected members of Council set direction, lead and make decisions. This is focused around progressing Council’s Strategic Direction, with the overall goal of improving community well-being.
The activity includes all work associated with the elected Council and Community Boards in Geraldine, Pleasant Point and Temuka. Elected members, being the community’s representatives, make decisions within the framework of the Local Government Act 2002 (LGA) on behalf of and in the interests of the community. Council and Community Boards are elected every three years.
The key functions include
Advocacy on issues that affect the district
Allocating funding to Council activities
Consultation with the community
Communicating decisions, policy and activities to communities and stakeholders
Developing and implementing strategy, policy and plans, such as the Long Term Plan and the District Plan
Civic functions, such as citizenship ceremonies, award ceremonies and parades
Elections and Representation reviews
Administering statutory governance functions (e.g. Standing Orders, Delegations Registers)
Partnering with external agencies
Performance, planning and accountability. The development and adoption of key Council planning and accountability mechanisms, such as the LTP, Annual Plan and the Annual Report
Maintenance of Sister City relationships with Eniwa (Japan), Weihai (China), Orange (Australia) and Orange (United States)
Overall monitoring of the Council operation.
Why we do itAs a statutory body, Council exists to meet the purpose of local government, as set out in Section 10 of the Local Government Act 2002:
“to enable democratic local decision making and by, and on behalf of, communities; and to meet the current and future needs of communities for good quality local infrastructure, local public services, and performance of regulatory functions in a way that is most cost effective for households and businesses”
The Council’s vision of Fantastic Lifestyle – Strong Identity – Thriving Economy – Inspiring Leadership focuses on progressing the district and making it a great place to live, work and do business. Identified Community Outcomes and Strategic Priorities outline specific areas Council will focus on as it works towards achieving its vision.
Council also aims to find the right balance between continuously improving Timaru District communities, listening and responding to community needs and expectations, and complying with a host of government legislation while maintaining affordable services.
Council decisions and policy have many beneficial impacts on community well-being by providing good quality infrastructure and local public services,
DemocracyDemocracy
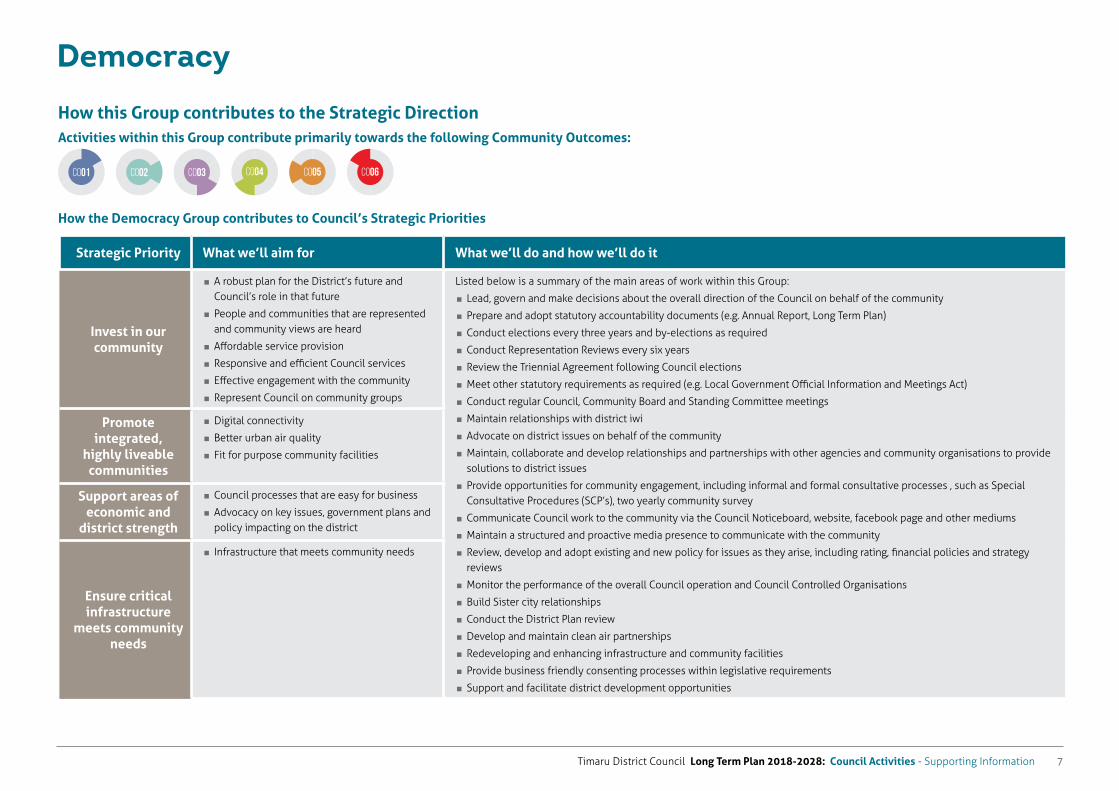
Timaru District Council Long Term Plan 2018-2028: Council Activities - Supporting Information 7
How this Group contributes to the Strategic DirectionActivities within this Group contribute primarily towards the following Community Outcomes:
How the Democracy Group contributes to Council’s Strategic Priorities
Strategic Priority What we’ll aim for What we’ll do and how we’ll do it
Invest in our community
� A robust plan for the District’s future and Council’s role in that future
� People and communities that are represented and community views are heard
� Affordable service provision
� Responsive and efficient Council services
� Effective engagement with the community
� Represent Council on community groups
Listed below is a summary of the main areas of work within this Group:
� Lead, govern and make decisions about the overall direction of the Council on behalf of the community
� Prepare and adopt statutory accountability documents (e.g. Annual Report, Long Term Plan)
� Conduct elections every three years and by-elections as required
� Conduct Representation Reviews every six years
� Review the Triennial Agreement following Council elections
� Meet other statutory requirements as required (e.g. Local Government Official Information and Meetings Act)
� Conduct regular Council, Community Board and Standing Committee meetings
� Maintain relationships with district iwi
� Advocate on district issues on behalf of the community
� Maintain, collaborate and develop relationships and partnerships with other agencies and community organisations to provide solutions to district issues
� Provide opportunities for community engagement, including informal and formal consultative processes , such as Special Consultative Procedures (SCP’s), two yearly community survey
� Communicate Council work to the community via the Council Noticeboard, website, facebook page and other mediums
� Maintain a structured and proactive media presence to communicate with the community
� Review, develop and adopt existing and new policy for issues as they arise, including rating, financial policies and strategy reviews
� Monitor the performance of the overall Council operation and Council Controlled Organisations
� Build Sister city relationships
� Conduct the District Plan review
� Develop and maintain clean air partnerships
� Redeveloping and enhancing infrastructure and community facilities
� Provide business friendly consenting processes within legislative requirements
� Support and facilitate district development opportunities
Promote integrated,
highly liveable communities
� Digital connectivity
� Better urban air quality
� Fit for purpose community facilities
Support areas of economic and
district strength
� Council processes that are easy for business
� Advocacy on key issues, government plans and policy impacting on the district
Ensure critical infrastructure
meets community needs
� Infrastructure that meets community needs
Democracy
CO01 CO04 CO05 CO06CO02 CO03
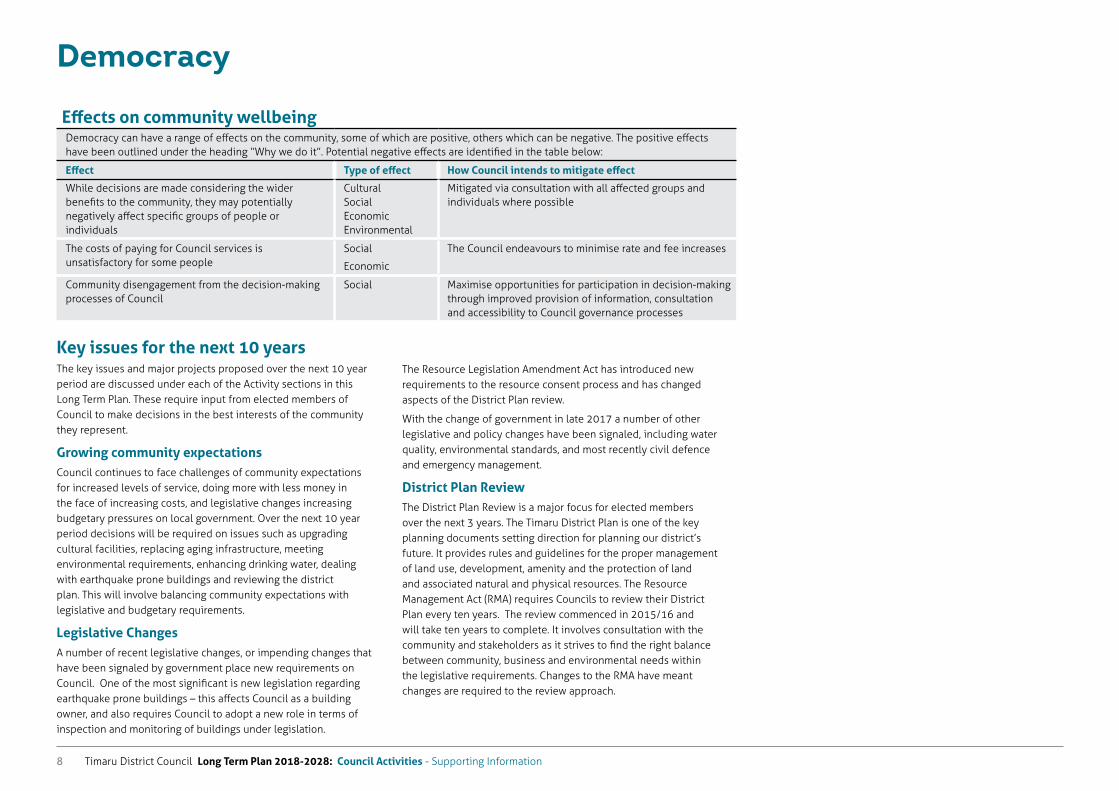
Timaru District Council Long Term Plan 2018-2028: Council Activities - Supporting Information8
Key issues for the next 10 yearsThe key issues and major projects proposed over the next 10 year period are discussed under each of the Activity sections in this Long Term Plan. These require input from elected members of Council to make decisions in the best interests of the community they represent.
Growing community expectationsCouncil continues to face challenges of community expectations for increased levels of service, doing more with less money in the face of increasing costs, and legislative changes increasing budgetary pressures on local government. Over the next 10 year period decisions will be required on issues such as upgrading cultural facilities, replacing aging infrastructure, meeting environmental requirements, enhancing drinking water, dealing with earthquake prone buildings and reviewing the district plan. This will involve balancing community expectations with legislative and budgetary requirements.
Legislative ChangesA number of recent legislative changes, or impending changes that have been signaled by government place new requirements on Council. One of the most significant is new legislation regarding earthquake prone buildings – this affects Council as a building owner, and also requires Council to adopt a new role in terms of inspection and monitoring of buildings under legislation.
The Resource Legislation Amendment Act has introduced new requirements to the resource consent process and has changed aspects of the District Plan review.
With the change of government in late 2017 a number of other legislative and policy changes have been signaled, including water quality, environmental standards, and most recently civil defence and emergency management.
District Plan ReviewThe District Plan Review is a major focus for elected members over the next 3 years. The Timaru District Plan is one of the key planning documents setting direction for planning our district’s future. It provides rules and guidelines for the proper management of land use, development, amenity and the protection of land and associated natural and physical resources. The Resource Management Act (RMA) requires Councils to review their District Plan every ten years. The review commenced in 2015/16 and will take ten years to complete. It involves consultation with the community and stakeholders as it strives to find the right balance between community, business and environmental needs within the legislative requirements. Changes to the RMA have meant changes are required to the review approach.
Democracy
Effects on community wellbeingDemocracy can have a range of effects on the community, some of which are positive, others which can be negative. The positive effects have been outlined under the heading “Why we do it”. Potential negative effects are identified in the table below:
Effect Type of effect How Council intends to mitigate effect
While decisions are made considering the wider benefits to the community, they may potentially negatively affect specific groups of people or individuals
Cultural Social Economic Environmental
Mitigated via consultation with all affected groups and individuals where possible
The costs of paying for Council services is unsatisfactory for some people
Social
Economic
The Council endeavours to minimise rate and fee increases
Community disengagement from the decision-making processes of Council
Social Maximise opportunities for participation in decision-making through improved provision of information, consultation and accessibility to Council governance processes
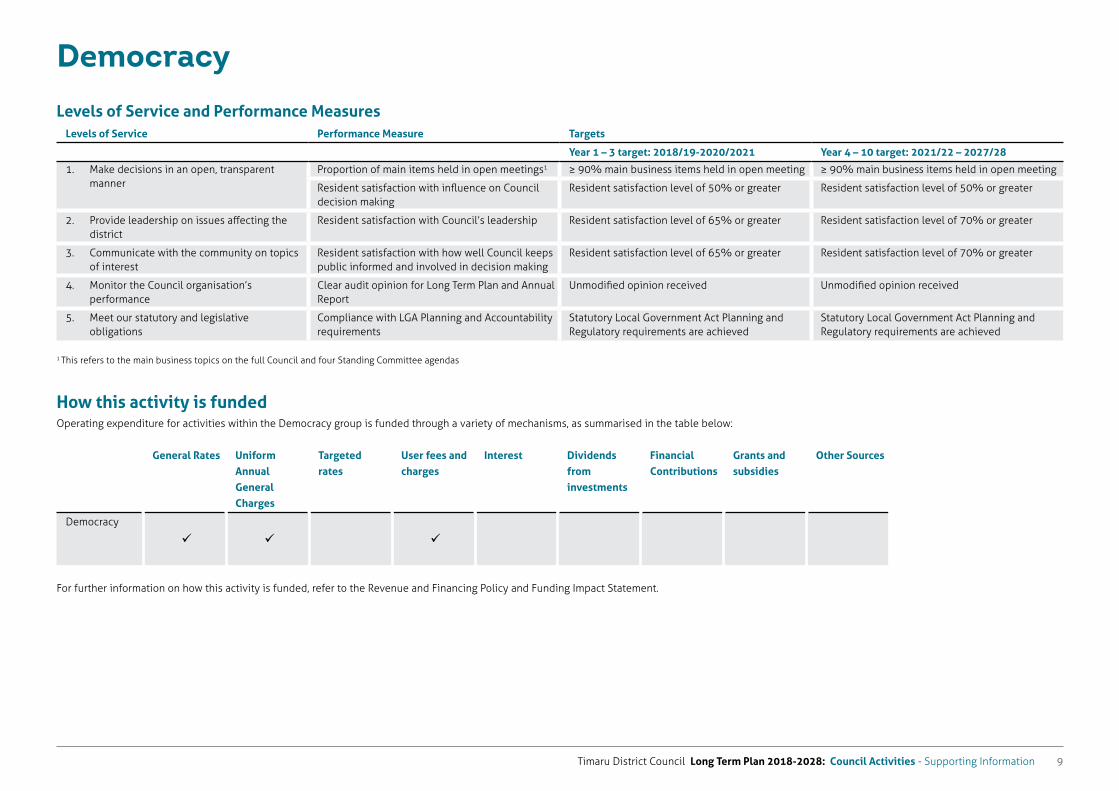
Timaru District Council Long Term Plan 2018-2028: Council Activities - Supporting Information 9
DemocracyLevels of Service and Performance Measures
Levels of Service Performance Measure Targets
Year 1 – 3 target: 2018/19-2020/2021 Year 4 – 10 target: 2021/22 – 2027/28
1. Make decisions in an open, transparent manner
Proportion of main items held in open meetings1 ≥ 90% main business items held in open meeting ≥ 90% main business items held in open meeting
Resident satisfaction with influence on Council decision making
Resident satisfaction level of 50% or greater Resident satisfaction level of 50% or greater
2. Provide leadership on issues affecting the district
Resident satisfaction with Council’s leadership Resident satisfaction level of 65% or greater Resident satisfaction level of 70% or greater
3. Communicate with the community on topics of interest
Resident satisfaction with how well Council keeps public informed and involved in decision making
Resident satisfaction level of 65% or greater Resident satisfaction level of 70% or greater
4. Monitor the Council organisation’s performance
Clear audit opinion for Long Term Plan and Annual Report
Unmodified opinion received Unmodified opinion received
5. Meet our statutory and legislative obligations
Compliance with LGA Planning and Accountability requirements
Statutory Local Government Act Planning and Regulatory requirements are achieved
Statutory Local Government Act Planning and Regulatory requirements are achieved
1 This refers to the main business topics on the full Council and four Standing Committee agendas
How this activity is fundedOperating expenditure for activities within the Democracy group is funded through a variety of mechanisms, as summarised in the table below:
General Rates Uniform Annual General Charges
Targeted rates
User fees and charges
Interest Dividends from investments
Financial Contributions
Grants and subsidies
Other Sources
Democracy
For further information on how this activity is funded, refer to the Revenue and Financing Policy and Funding Impact Statement.
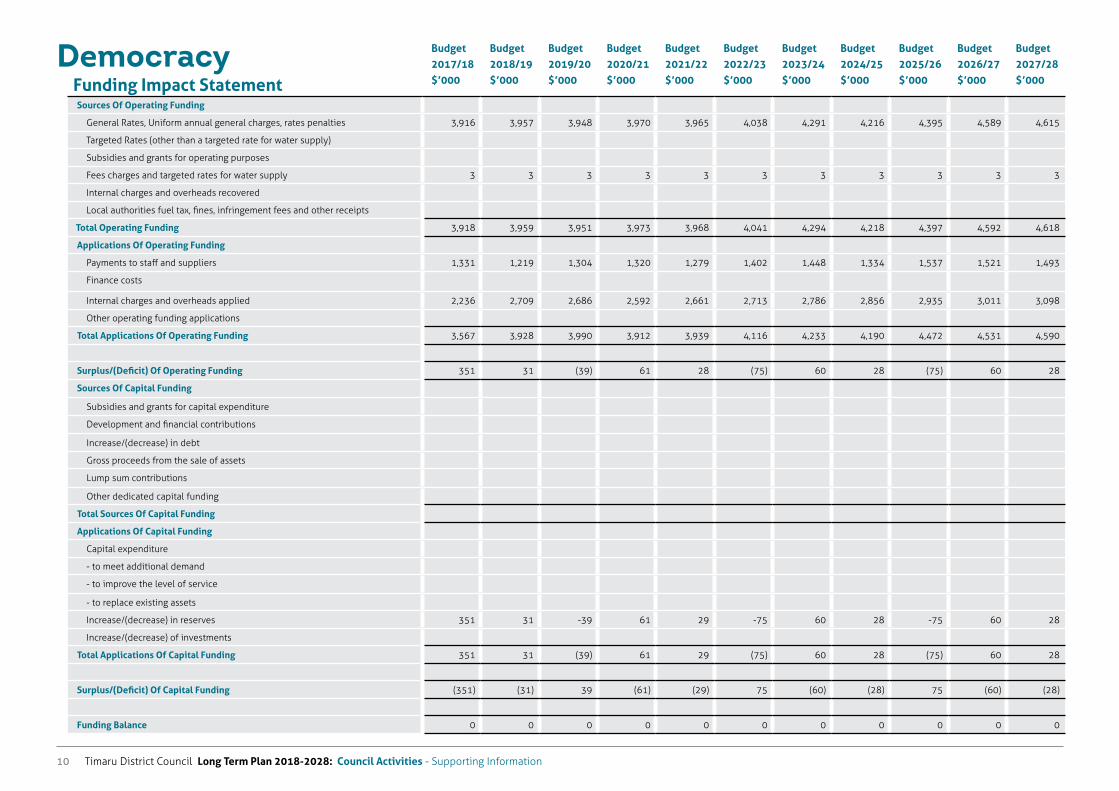
Timaru District Council Long Term Plan 2018-2028: Council Activities - Supporting Information10
DemocracyFunding Impact Statement
Budget 2017/18 $’000
Budget 2018/19 $’000
Budget 2019/20 $’000
Budget 2020/21 $’000
Budget 2021/22 $’000
Budget 2022/23 $’000
Budget 2023/24 $’000
Budget 2024/25 $’000
Budget 2025/26 $’000
Budget 2026/27 $’000
Budget 2027/28 $’000
Sources Of Operating Funding
General Rates, Uniform annual general charges, rates penalties 3,916 3,957 3,948 3,970 3,965 4,038 4,291 4,216 4,395 4,589 4,615
Targeted Rates (other than a targeted rate for water supply)
Subsidies and grants for operating purposes
Fees charges and targeted rates for water supply 3 3 3 3 3 3 3 3 3 3 3
Internal charges and overheads recovered
Local authorities fuel tax, fines, infringement fees and other receipts
Total Operating Funding 3,918 3,959 3,951 3,973 3,968 4,041 4,294 4,218 4,397 4,592 4,618
Applications Of Operating Funding
Payments to staff and suppliers 1,331 1,219 1,304 1,320 1,279 1,402 1,448 1,334 1,537 1,521 1,493
Finance costs
Internal charges and overheads applied 2,236 2,709 2,686 2,592 2,661 2,713 2,786 2,856 2,935 3,011 3,098
Other operating funding applications
Total Applications Of Operating Funding 3,567 3,928 3,990 3,912 3,939 4,116 4,233 4,190 4,472 4,531 4,590
Surplus/(Deficit) Of Operating Funding 351 31 (39) 61 28 (75) 60 28 (75) 60 28
Sources Of Capital Funding
Subsidies and grants for capital expenditure
Development and financial contributions
Increase/(decrease) in debt
Gross proceeds from the sale of assets
Lump sum contributions
Other dedicated capital funding
Total Sources Of Capital Funding
Applications Of Capital Funding
Capital expenditure
- to meet additional demand
- to improve the level of service
- to replace existing assets
Increase/(decrease) in reserves 351 31 -39 61 29 -75 60 28 -75 60 28
Increase/(decrease) of investments
Total Applications Of Capital Funding 351 31 (39) 61 29 (75) 60 28 (75) 60 28
Surplus/(Deficit) Of Capital Funding (351) (31) 39 (61) (29) 75 (60) (28) 75 (60) (28)
Funding Balance 0 0 0 0 0 0 0 0 0 0 0
Timaru District Council Long Term Plan 2018-2028: Council Activities - Supporting Information 11
Community Support
Timaru District Council Long Term Plan 2018-2028: Council Activities - Supporting Information12
Community Support
What we doThe Community Support group of activities provided by Council includes the following:
Airport
Community Facilities (Cemeteries and Public Toilets)
Community Funding
Economic Development and District Promotions
Emergency Management
Safer Communities
Social Housing
AirportThe Council manages the Richard Pearse airport located approximately 10 kilometres northwest of Timaru. The airport provides a key business and community link from the district to Wellington with daily return flights. The Council owns and manages the asset – the main airport facility, including the terminal building and runway. Council is responsible for ensuring the airport is run to legislative and Civil Aviation rules and provides other services such as car parking and land for lease to commercial and private aircraft hangars and aviation orientated industry.
Community FacilitiesCommunity Facilities includes cemeteries and public toilets. Council currently operates eight cemeteries for burial and cremation interments at Timaru, Temuka, Pleasant Point, Geraldine, Arundel, Woodbury, Mesopotamia and Pareora West. The day to day maintenance and interments at Mesopotamia and Woodbury cemeteries are managed by local communities.
Council provides 45 public toilet facilities throughout the district. Toilet facilities range from central city complexes that are open 24 hours, to envirotoilets in remote areas. Services associated with public toilets (e.g. cleaning, maintenance) are managed by the Council and carried out by contract.
Community FundingCommunity Funding involves assisting groups with projects and activities through various Council funding schemes, where they comply with Council policies. Council policy is focused on local
events, rural community halls, museums and community services and on substantial donations or loans for improved or new facilities. Funding support is also provided to community groups through low interest loans. Council administers the Creative Communities Scheme supported by Creative NZ. This activity also includes internal grants for rate remissions, a sport and recreation sewer charge and over 65’s and over 80’s swimming concessions.
Economic Development and District PromotionsThis activity is concerned with promoting and assisting economic development and visitor opportunities in the district.
Council makes a major contribution to economic development through the provision of infrastructure and facilities and other services provided to the community. It is an advocate for district and individual businesses where needed.
A specific economic development component is delivered in partnership with a Council Controlled Organisation (CCO), Aoraki Development.
Key objectives for Aoraki Development include actively attracting and assisting the establishment of new business, assisting businesses to retain and attract a skilled workforce, encouraging new opportunities and facilitating the growth of existing businesses.
The District Promotions component, called Aoraki Tourism, is delivered via contract. The principal objective of the contract is to lead, coordinate and promote the Timaru District’s visitor industry.
Emergency ManagementCommunities that are safe, vibrant and growing are the cornerstone of emergency management. Developing resilient communities in an effective, adaptable and sustainable way is achieved through the ‘4Rs’: Readiness, Reduction, Response and Recovery. Timaru District Council is an active member of the Canterbury Civil Defence Emergency Management Group (CDEM) and closely coordinates with neighbouring local authorities and other agencies to deliver services. By coordinating with partner emergency, health and welfare agencies, emergency events can be managed more effectively and in a manner that the community can support. Council works with communities in writing community and agency response plans, facilitating strong communication networks, and providing best practice training for
volunteers and staff.
Safer CommunitiesThe Safer Communities activity helps to enhance the safety of the community, both now and in the future. It includes:
Project Turnaround - A Restorative Justice programme funded by the Ministry of Justice
Safer Communities - Targeted programmes, such as dealing with graffiti, run in conjunction with strategic partners with the aim of helping to reduce crime, raise awareness of issues and facilitate communication.
Social HousingCouncil has 236 social housing units that fill a need in the community for quality but affordable housing for those in need. This compliments other rental property provided by central government community housing, rest homes and the private sector. Demand for the units is high, with an occupancy rate of 95%+ and a large waiting list. A comprehensive social housing policy sets the criteria for tenant selection, and requires the activity to be self-funding without any rates input.
Timaru District Council Long Term Plan 2018-2028: Council Activities - Supporting Information 13
Community Support
Why we do itCommunity Support contributes to all aspects of the Council’s Strategic Direction. This group primarily includes activities that help:
build strong, connected and supportive communities
provide high quality community facilities (cemeteries and public toilets)
support people, organisations and the business community
ensure healthy communities
assist vulnerable people in our communities
individuals and communities be prepared and resilient in times of adversity
AirportAirport land is specifically designated for aerodrome purposes. The airport is a strategic asset for connecting South Canterbury residents and businesses to the rest of New Zealand and the world. It provides an essential transportation link from South Canterbury to enable movement of people, goods and services. It is also important as a base for recreational pursuits and aeronautically linked businesses.
Community FacilitiesCemeteries and Public Toilets are essential community facilities expected by district residents and visitors. Public Toilets are important to maintain public health and correct disposal of human waste. High profile public toilets can help create a good impression for visitors to the district.
Local authorities have a legal obligation under the Burial and Cremations Act 1964 to ensure sufficient cemeteries are provided. Cemeteries provide spaces for remembrance of loved ones and an important historical record for future generations. They also ensure public health is maintained through proper burial. Cemeteries provide some amenity values through their preservation as parkland once they have reached capacity.
Community FundingWhere Council policy criteria is met, community funding supports the provision of events, services and facilities that help meet the community’s social and cultural needs, and enhance the district’s
identity.
Economic Development and District PromotionsEconomic Development is essential to enabling people and communities improve their standard of living and lifestyle. This activity helps create a vibrant and innovative business community by facilitating the creation of employment and business opportunities, encouraging and supporting business enterprise and innovation and promoting a positive profile for the district that and will help attract visitors, events and investment.
Emergency ManagementEmergency Management is concerned with safeguarding life and property through providing a coordination role in the preparation for, response to and recovery from emergencies. Resilient communities are developed by identifying and understanding the risks from natural hazards and reducing those risks where possible.
To help build resilient communities Council works with communities and individuals through public education, Civil Defence training for volunteers and staff, relationship building and establishment of communications networks that will function in adverse conditions.. A prepared and more resilient community enables the potential impacts of a disaster to be reduced and an effective recovery to occur following an emergency event.
Council’s emergency management role and responsibilities are formally identified in the Civil Defence Emergency Management Act 2002. Council
Safer CommunitiesSafer Communities aims to enhance the safety of people in the Timaru district, both now and in the future. It encourages a coordinated approach to emerging district crime issues. This increases community participation, ownership and involvement in these issues, enabling effective local solutions to be developed and implemented.
Council also contributes financially towards services for “At risk” youth via a partner agency. Working together with other agencies means strategies for reducing rates of youth crime can be implemented.
Restorative justice is a proven tool for reducing offending and
improving outcomes for victims of crime.
The Safer Community activity also contributes to maintaining and improving the image and perception of the district, both through physical actions such as graffiti removal and through addressing issues that could damage the district’s reputation.
Social HousingSocial housing fills a need for quality housing units that are comfortable and affordable. Provision of these services reflects a community that cares for its most vulnerable citizens.
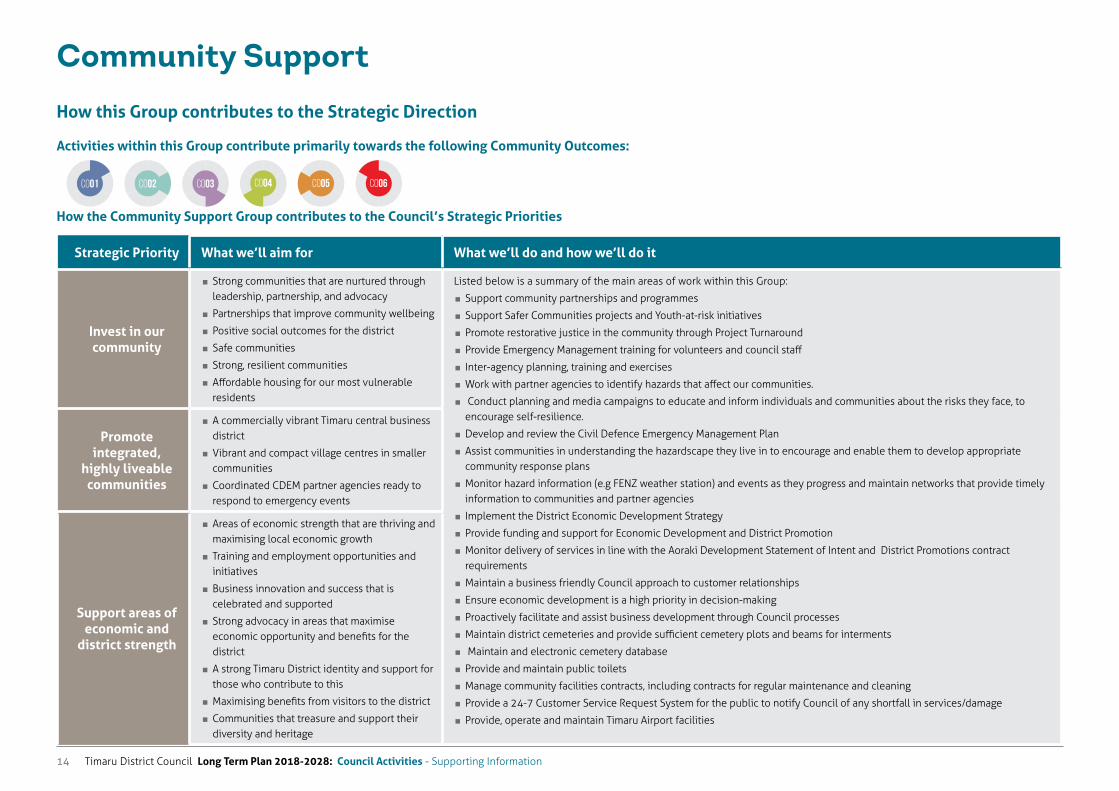
Timaru District Council Long Term Plan 2018-2028: Council Activities - Supporting Information14
Community Support
CO01 CO04 CO05 CO06CO02 CO03
How this Group contributes to the Strategic Direction
Activities within this Group contribute primarily towards the following Community Outcomes:
How the Community Support Group contributes to the Council’s Strategic Priorities
Strategic Priority What we’ll aim for What we’ll do and how we’ll do it
Invest in our community
� Strong communities that are nurtured through leadership, partnership, and advocacy
� Partnerships that improve community wellbeing
� Positive social outcomes for the district
� Safe communities
� Strong, resilient communities
� Affordable housing for our most vulnerable residents
Listed below is a summary of the main areas of work within this Group:
� Support community partnerships and programmes
� Support Safer Communities projects and Youth-at-risk initiatives
� Promote restorative justice in the community through Project Turnaround
� Provide Emergency Management training for volunteers and council staff
� Inter-agency planning, training and exercises
� Work with partner agencies to identify hazards that affect our communities.
� Conduct planning and media campaigns to educate and inform individuals and communities about the risks they face, to encourage self-resilience.
� Develop and review the Civil Defence Emergency Management Plan
� Assist communities in understanding the hazardscape they live in to encourage and enable them to develop appropriate community response plans
� Monitor hazard information (e.g FENZ weather station) and events as they progress and maintain networks that provide timely information to communities and partner agencies
� Implement the District Economic Development Strategy
� Provide funding and support for Economic Development and District Promotion
� Monitor delivery of services in line with the Aoraki Development Statement of Intent and District Promotions contract requirements
� Maintain a business friendly Council approach to customer relationships
� Ensure economic development is a high priority in decision-making
� Proactively facilitate and assist business development through Council processes
� Maintain district cemeteries and provide sufficient cemetery plots and beams for interments
� Maintain and electronic cemetery database
� Provide and maintain public toilets
� Manage community facilities contracts, including contracts for regular maintenance and cleaning
� Provide a 24-7 Customer Service Request System for the public to notify Council of any shortfall in services/damage
� Provide, operate and maintain Timaru Airport facilities
Promote integrated,
highly liveable communities
� A commercially vibrant Timaru central business district
� Vibrant and compact village centres in smaller communities
� Coordinated CDEM partner agencies ready to respond to emergency events
Support areas of economic and
district strength
� Areas of economic strength that are thriving and maximising local economic growth
� Training and employment opportunities and initiatives
� Business innovation and success that is celebrated and supported
� Strong advocacy in areas that maximise economic opportunity and benefits for the district
� A strong Timaru District identity and support for those who contribute to this
� Maximising benefits from visitors to the district
� Communities that treasure and support their diversity and heritage
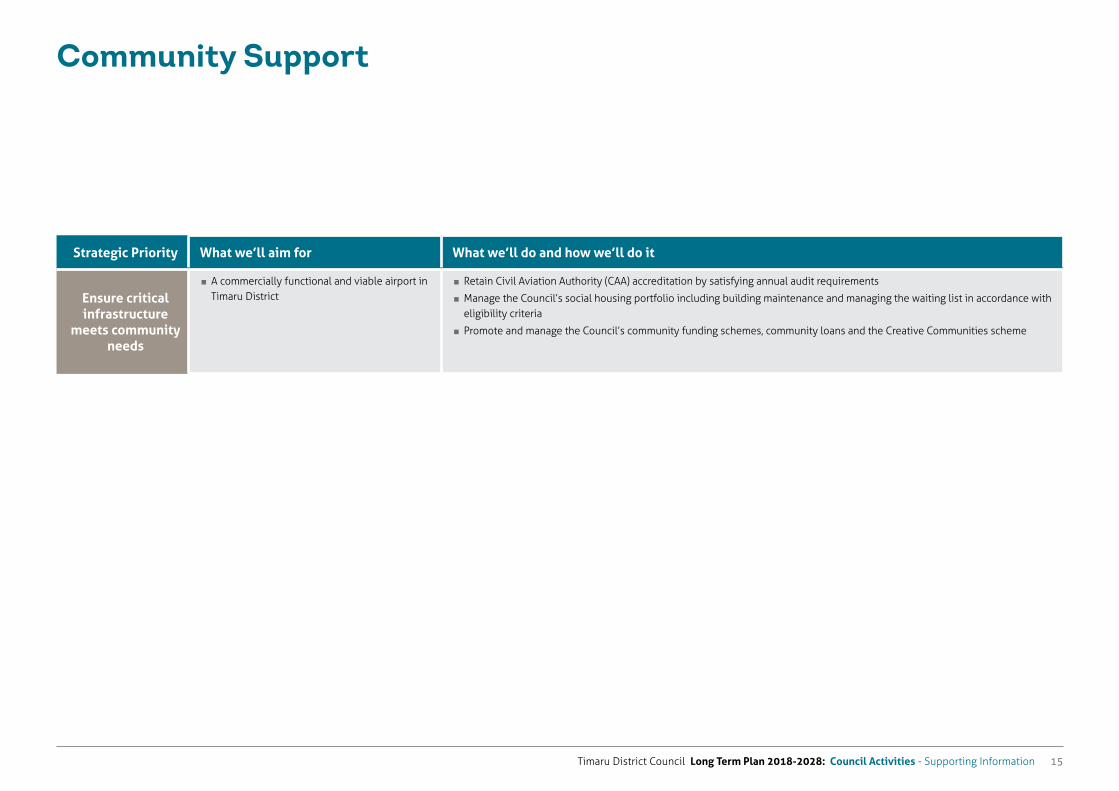
Timaru District Council Long Term Plan 2018-2028: Council Activities - Supporting Information 15
How this Group contributes to the Strategic Direction
Activities within this Group contribute primarily towards the following Community Outcomes:
How the Community Support Group contributes to the Council’s Strategic Priorities
Strategic Priority What we’ll aim for What we’ll do and how we’ll do it
Ensure critical infrastructure
meets community needs
� A commercially functional and viable airport in Timaru District
� Retain Civil Aviation Authority (CAA) accreditation by satisfying annual audit requirements
� Manage the Council’s social housing portfolio including building maintenance and managing the waiting list in accordance with eligibility criteria
� Promote and manage the Council’s community funding schemes, community loans and the Creative Communities scheme
Community Support
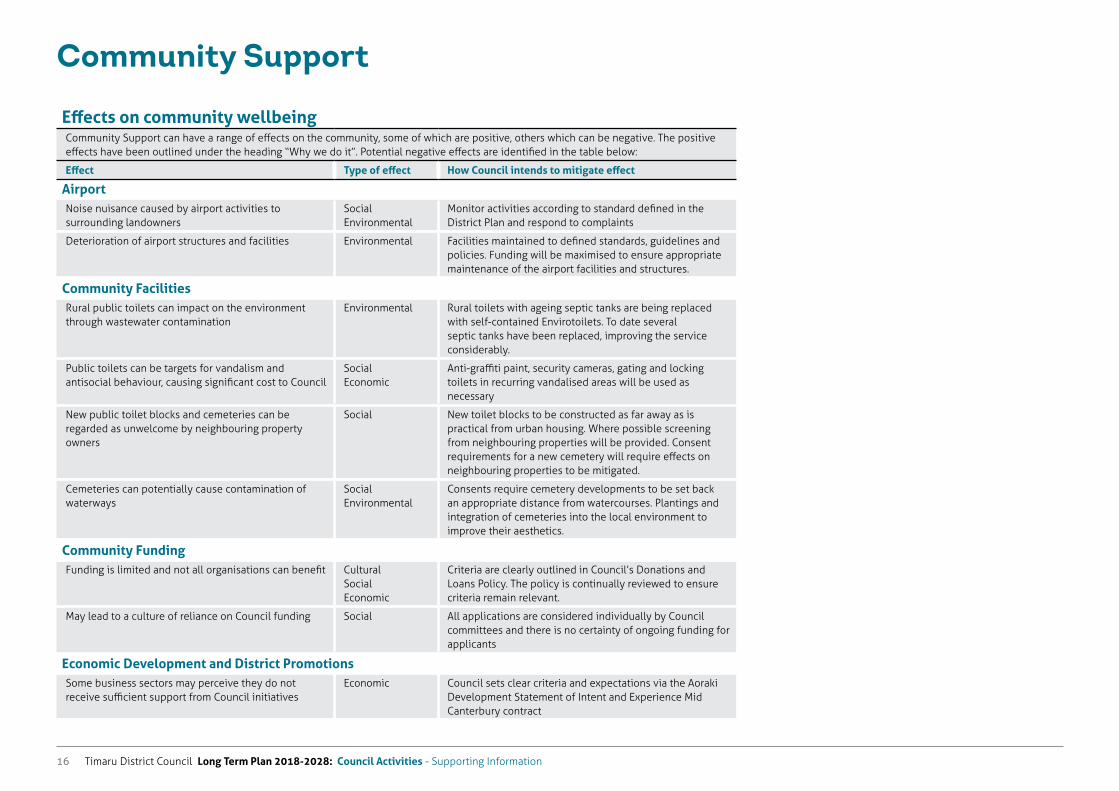
Timaru District Council Long Term Plan 2018-2028: Council Activities - Supporting Information16
Community Support
Effects on community wellbeingCommunity Support can have a range of effects on the community, some of which are positive, others which can be negative. The positive effects have been outlined under the heading “Why we do it”. Potential negative effects are identified in the table below:
Effect Type of effect How Council intends to mitigate effect
AirportNoise nuisance caused by airport activities to surrounding landowners
Social Environmental
Monitor activities according to standard defined in the District Plan and respond to complaints
Deterioration of airport structures and facilities Environmental Facilities maintained to defined standards, guidelines and policies. Funding will be maximised to ensure appropriate maintenance of the airport facilities and structures.
Community FacilitiesRural public toilets can impact on the environment through wastewater contamination
Environmental Rural toilets with ageing septic tanks are being replaced with self-contained Envirotoilets. To date several septic tanks have been replaced, improving the service considerably.
Public toilets can be targets for vandalism and antisocial behaviour, causing significant cost to Council
Social Economic
Anti-graffiti paint, security cameras, gating and locking toilets in recurring vandalised areas will be used as necessary
New public toilet blocks and cemeteries can be regarded as unwelcome by neighbouring property owners
Social New toilet blocks to be constructed as far away as is practical from urban housing. Where possible screening from neighbouring properties will be provided. Consent requirements for a new cemetery will require effects on neighbouring properties to be mitigated.
Cemeteries can potentially cause contamination of waterways
Social Environmental
Consents require cemetery developments to be set back an appropriate distance from watercourses. Plantings and integration of cemeteries into the local environment to improve their aesthetics.
Community FundingFunding is limited and not all organisations can benefit Cultural
Social Economic
Criteria are clearly outlined in Council’s Donations and Loans Policy. The policy is continually reviewed to ensure criteria remain relevant.
May lead to a culture of reliance on Council funding Social All applications are considered individually by Council committees and there is no certainty of ongoing funding for applicants
Economic Development and District PromotionsSome business sectors may perceive they do not receive sufficient support from Council initiatives
Economic Council sets clear criteria and expectations via the Aoraki Development Statement of Intent and Experience Mid Canterbury contract
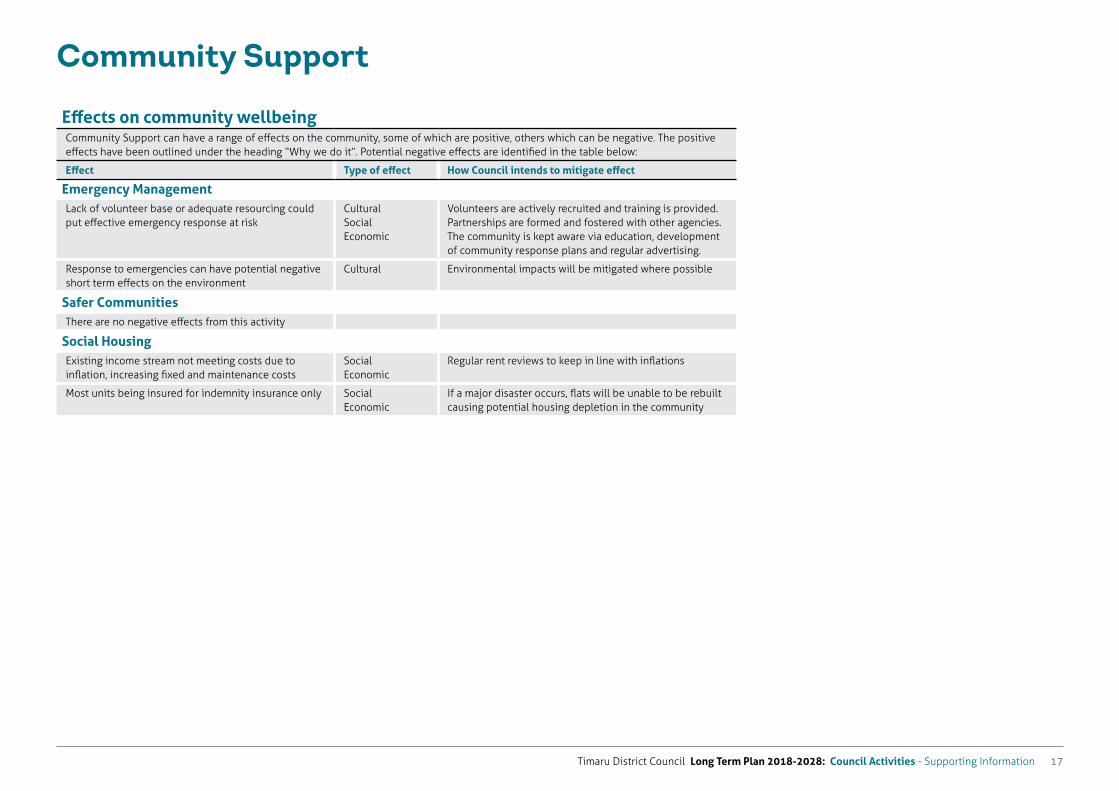
Timaru District Council Long Term Plan 2018-2028: Council Activities - Supporting Information 17
Community Support
Effects on community wellbeingCommunity Support can have a range of effects on the community, some of which are positive, others which can be negative. The positive effects have been outlined under the heading “Why we do it”. Potential negative effects are identified in the table below:
Effect Type of effect How Council intends to mitigate effect
Emergency ManagementLack of volunteer base or adequate resourcing could put effective emergency response at risk
Cultural Social Economic
Volunteers are actively recruited and training is provided. Partnerships are formed and fostered with other agencies. The community is kept aware via education, development of community response plans and regular advertising.
Response to emergencies can have potential negative short term effects on the environment
Cultural Environmental impacts will be mitigated where possible
Safer CommunitiesThere are no negative effects from this activity
Social HousingExisting income stream not meeting costs due to inflation, increasing fixed and maintenance costs
Social Economic
Regular rent reviews to keep in line with inflations
Most units being insured for indemnity insurance only Social Economic
If a major disaster occurs, flats will be unable to be rebuilt causing potential housing depletion in the community
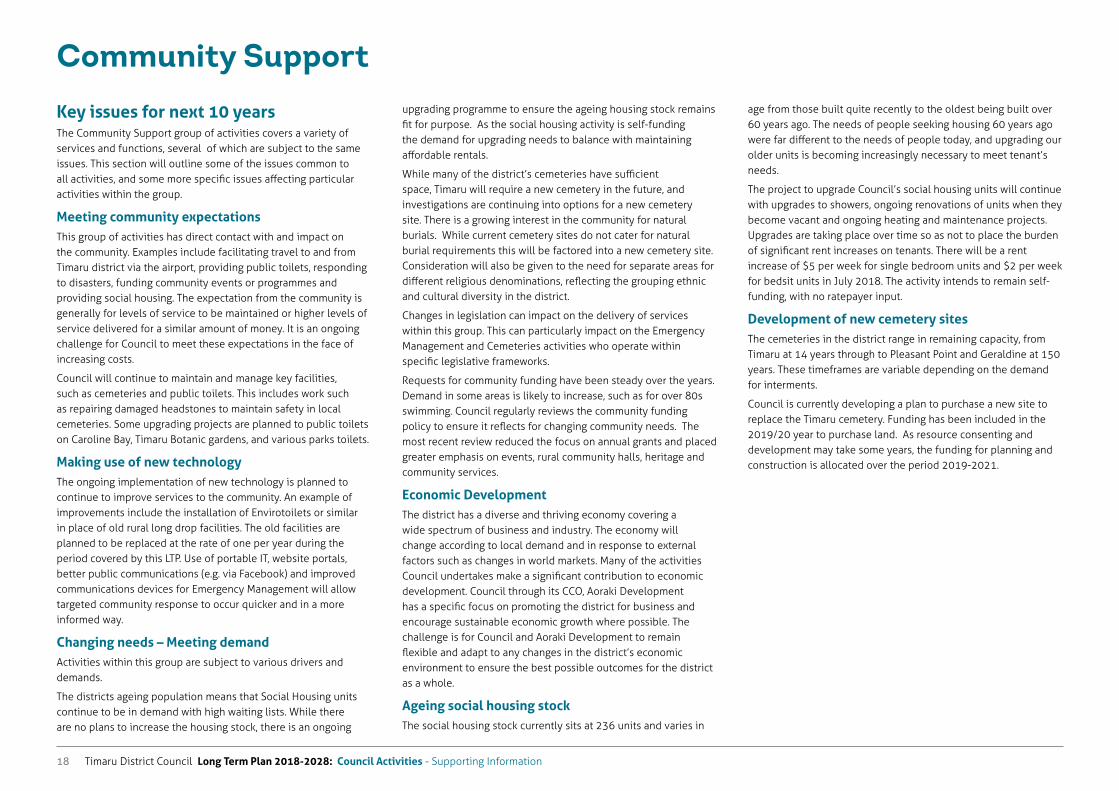
Timaru District Council Long Term Plan 2018-2028: Council Activities - Supporting Information18
Community Support
Key issues for next 10 yearsThe Community Support group of activities covers a variety of services and functions, several of which are subject to the same issues. This section will outline some of the issues common to all activities, and some more specific issues affecting particular activities within the group.
Meeting community expectationsThis group of activities has direct contact with and impact on the community. Examples include facilitating travel to and from Timaru district via the airport, providing public toilets, responding to disasters, funding community events or programmes and providing social housing. The expectation from the community is generally for levels of service to be maintained or higher levels of service delivered for a similar amount of money. It is an ongoing challenge for Council to meet these expectations in the face of increasing costs.
Council will continue to maintain and manage key facilities, such as cemeteries and public toilets. This includes work such as repairing damaged headstones to maintain safety in local cemeteries. Some upgrading projects are planned to public toilets on Caroline Bay, Timaru Botanic gardens, and various parks toilets.
Making use of new technologyThe ongoing implementation of new technology is planned to continue to improve services to the community. An example of improvements include the installation of Envirotoilets or similar in place of old rural long drop facilities. The old facilities are planned to be replaced at the rate of one per year during the period covered by this LTP. Use of portable IT, website portals, better public communications (e.g. via Facebook) and improved communications devices for Emergency Management will allow targeted community response to occur quicker and in a more informed way.
Changing needs – Meeting demandActivities within this group are subject to various drivers and demands.
The districts ageing population means that Social Housing units continue to be in demand with high waiting lists. While there are no plans to increase the housing stock, there is an ongoing
upgrading programme to ensure the ageing housing stock remains fit for purpose. As the social housing activity is self-funding the demand for upgrading needs to balance with maintaining affordable rentals.
While many of the district’s cemeteries have sufficient space, Timaru will require a new cemetery in the future, and investigations are continuing into options for a new cemetery site. There is a growing interest in the community for natural burials. While current cemetery sites do not cater for natural burial requirements this will be factored into a new cemetery site. Consideration will also be given to the need for separate areas for different religious denominations, reflecting the grouping ethnic and cultural diversity in the district.
Changes in legislation can impact on the delivery of services within this group. This can particularly impact on the Emergency Management and Cemeteries activities who operate within specific legislative frameworks.
Requests for community funding have been steady over the years. Demand in some areas is likely to increase, such as for over 80s swimming. Council regularly reviews the community funding policy to ensure it reflects for changing community needs. The most recent review reduced the focus on annual grants and placed greater emphasis on events, rural community halls, heritage and community services.
Economic DevelopmentThe district has a diverse and thriving economy covering a wide spectrum of business and industry. The economy will change according to local demand and in response to external factors such as changes in world markets. Many of the activities Council undertakes make a significant contribution to economic development. Council through its CCO, Aoraki Development has a specific focus on promoting the district for business and encourage sustainable economic growth where possible. The challenge is for Council and Aoraki Development to remain flexible and adapt to any changes in the district’s economic environment to ensure the best possible outcomes for the district as a whole.
Ageing social housing stockThe social housing stock currently sits at 236 units and varies in
age from those built quite recently to the oldest being built over 60 years ago. The needs of people seeking housing 60 years ago were far different to the needs of people today, and upgrading our older units is becoming increasingly necessary to meet tenant’s needs.
The project to upgrade Council’s social housing units will continue with upgrades to showers, ongoing renovations of units when they become vacant and ongoing heating and maintenance projects. Upgrades are taking place over time so as not to place the burden of significant rent increases on tenants. There will be a rent increase of $5 per week for single bedroom units and $2 per week for bedsit units in July 2018. The activity intends to remain self- funding, with no ratepayer input.
Development of new cemetery sitesThe cemeteries in the district range in remaining capacity, from Timaru at 14 years through to Pleasant Point and Geraldine at 150 years. These timeframes are variable depending on the demand for interments.
Council is currently developing a plan to purchase a new site to replace the Timaru cemetery. Funding has been included in the 2019/20 year to purchase land. As resource consenting and development may take some years, the funding for planning and construction is allocated over the period 2019-2021.
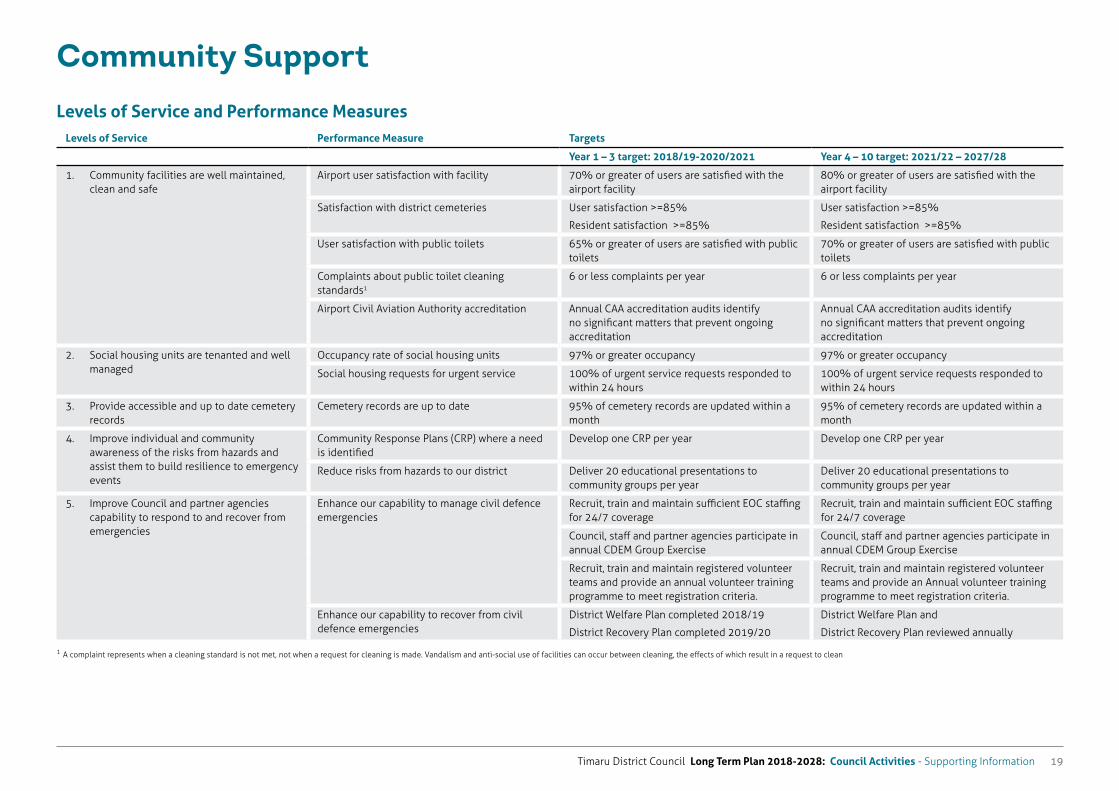
Timaru District Council Long Term Plan 2018-2028: Council Activities - Supporting Information 19
1 A complaint represents when a cleaning standard is not met, not when a request for cleaning is made. Vandalism and anti-social use of facilities can occur between cleaning, the effects of which result in a request to clean
Community Support
Levels of Service and Performance MeasuresLevels of Service Performance Measure Targets
Year 1 – 3 target: 2018/19-2020/2021 Year 4 – 10 target: 2021/22 – 2027/28
1. Community facilities are well maintained, clean and safe
Airport user satisfaction with facility 70% or greater of users are satisfied with the airport facility
80% or greater of users are satisfied with the airport facility
Satisfaction with district cemeteries User satisfaction >=85%
Resident satisfaction >=85%
User satisfaction >=85%
Resident satisfaction >=85%
User satisfaction with public toilets 65% or greater of users are satisfied with public toilets
70% or greater of users are satisfied with public toilets
Complaints about public toilet cleaning standards1
6 or less complaints per year 6 or less complaints per year
Airport Civil Aviation Authority accreditation Annual CAA accreditation audits identify no significant matters that prevent ongoing accreditation
Annual CAA accreditation audits identify no significant matters that prevent ongoing accreditation
2. Social housing units are tenanted and well managed
Occupancy rate of social housing units 97% or greater occupancy 97% or greater occupancy
Social housing requests for urgent service 100% of urgent service requests responded to within 24 hours
100% of urgent service requests responded to within 24 hours
3. Provide accessible and up to date cemetery records
Cemetery records are up to date 95% of cemetery records are updated within a month
95% of cemetery records are updated within a month
4. Improve individual and community awareness of the risks from hazards and assist them to build resilience to emergency events
Community Response Plans (CRP) where a need is identified
Develop one CRP per year Develop one CRP per year
Reduce risks from hazards to our district Deliver 20 educational presentations to community groups per year
Deliver 20 educational presentations to community groups per year
5. Improve Council and partner agencies capability to respond to and recover from emergencies
Enhance our capability to manage civil defence emergencies
Recruit, train and maintain sufficient EOC staffing for 24/7 coverage
Recruit, train and maintain sufficient EOC staffing for 24/7 coverage
Council, staff and partner agencies participate in annual CDEM Group Exercise
Council, staff and partner agencies participate in annual CDEM Group Exercise
Recruit, train and maintain registered volunteer teams and provide an annual volunteer training programme to meet registration criteria.
Recruit, train and maintain registered volunteer teams and provide an Annual volunteer training programme to meet registration criteria.
Enhance our capability to recover from civil defence emergencies
District Welfare Plan completed 2018/19
District Recovery Plan completed 2019/20
District Welfare Plan and
District Recovery Plan reviewed annually
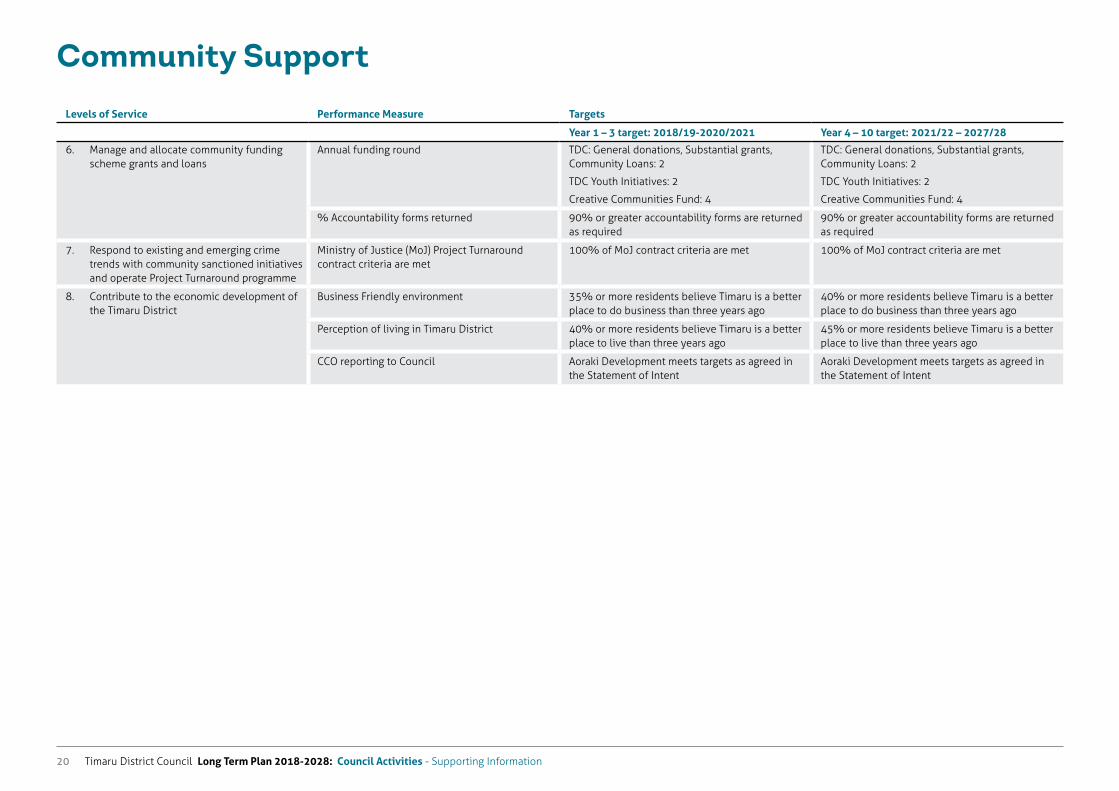
Timaru District Council Long Term Plan 2018-2028: Council Activities - Supporting Information20
Community Support
Levels of Service Performance Measure Targets
Year 1 – 3 target: 2018/19-2020/2021 Year 4 – 10 target: 2021/22 – 2027/28
6. Manage and allocate community funding scheme grants and loans
Annual funding round TDC: General donations, Substantial grants, Community Loans: 2
TDC Youth Initiatives: 2
Creative Communities Fund: 4
TDC: General donations, Substantial grants, Community Loans: 2
TDC Youth Initiatives: 2
Creative Communities Fund: 4
% Accountability forms returned 90% or greater accountability forms are returned as required
90% or greater accountability forms are returned as required
7. Respond to existing and emerging crime trends with community sanctioned initiatives and operate Project Turnaround programme
Ministry of Justice (MoJ) Project Turnaround contract criteria are met
100% of MoJ contract criteria are met 100% of MoJ contract criteria are met
8. Contribute to the economic development of the Timaru District
Business Friendly environment 35% or more residents believe Timaru is a better place to do business than three years ago
40% or more residents believe Timaru is a better place to do business than three years ago
Perception of living in Timaru District 40% or more residents believe Timaru is a better place to live than three years ago
45% or more residents believe Timaru is a better place to live than three years ago
CCO reporting to Council Aoraki Development meets targets as agreed in the Statement of Intent
Aoraki Development meets targets as agreed in the Statement of Intent
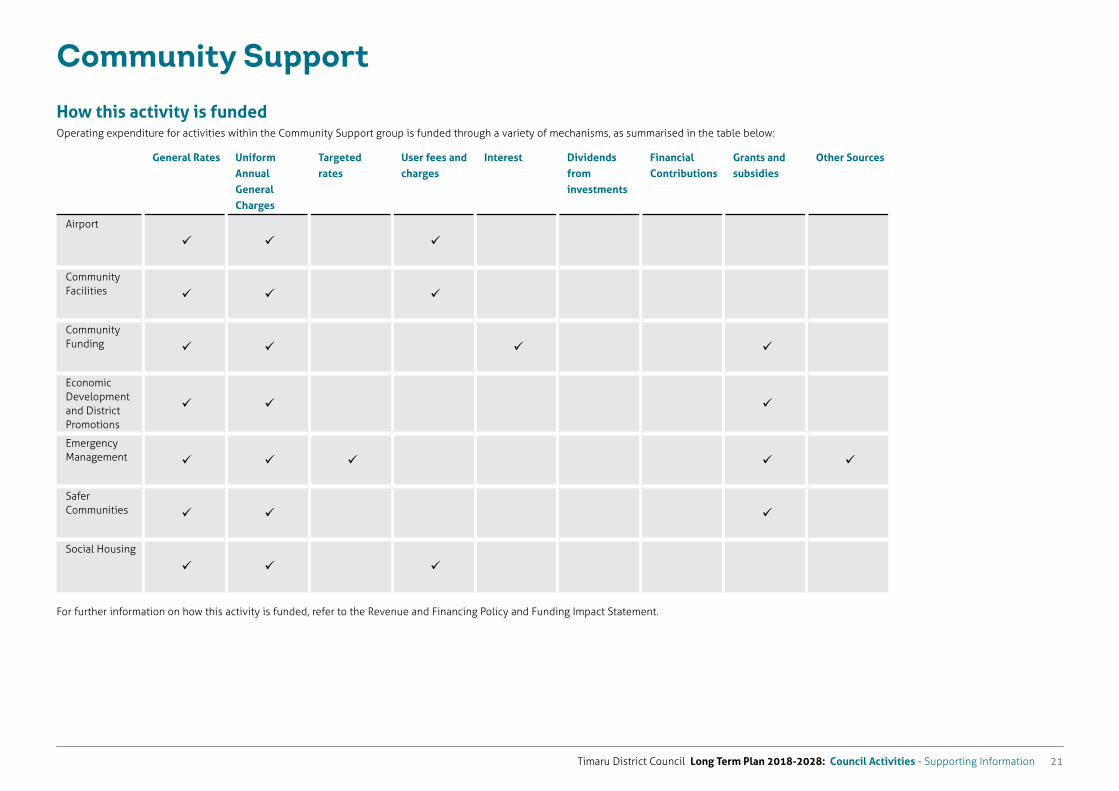
Timaru District Council Long Term Plan 2018-2028: Council Activities - Supporting Information 21
Community Support
How this activity is fundedOperating expenditure for activities within the Community Support group is funded through a variety of mechanisms, as summarised in the table below:
General Rates Uniform Annual General Charges
Targeted rates
User fees and charges
Interest Dividends from investments
Financial Contributions
Grants and subsidies
Other Sources
Airport
Community Facilities
Community Funding
Economic Development and District Promotions
Emergency Management
Safer Communities
Social Housing
For further information on how this activity is funded, refer to the Revenue and Financing Policy and Funding Impact Statement.
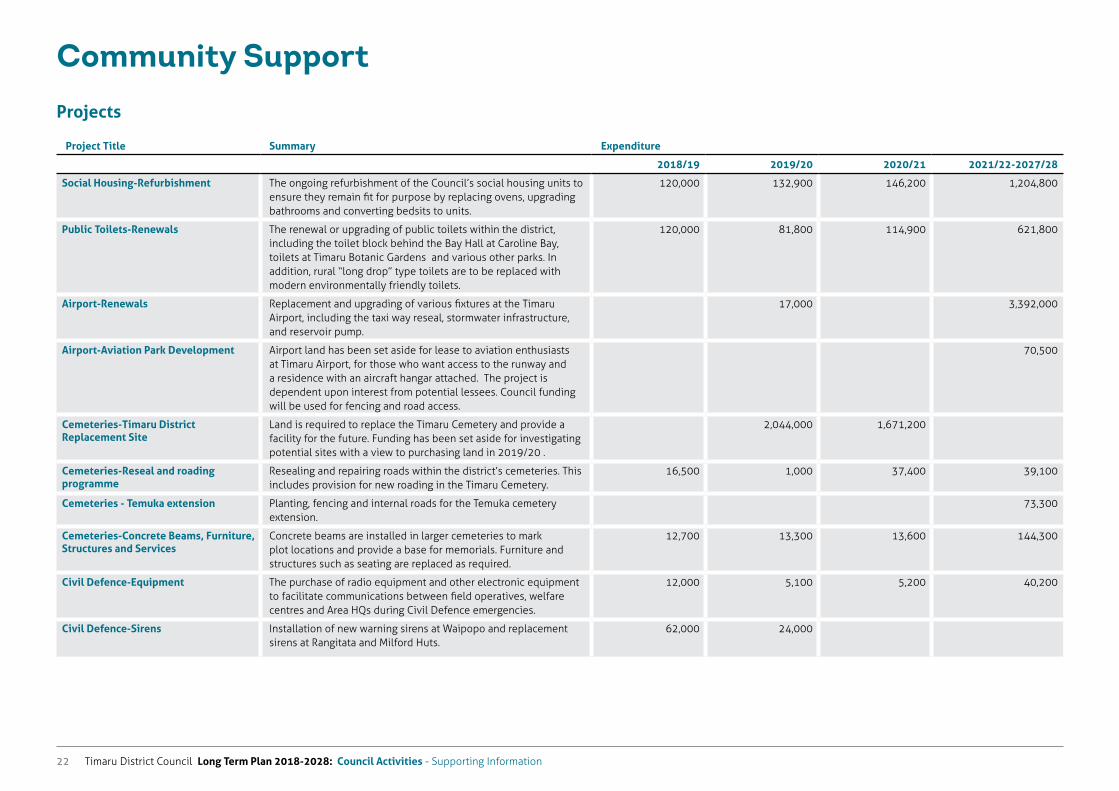
Timaru District Council Long Term Plan 2018-2028: Council Activities - Supporting Information22
Community Support
Projects
Project Title Summary Expenditure
2018/19 2019/20 2020/21 2021/22-2027/28
Social Housing-Refurbishment The ongoing refurbishment of the Council’s social housing units to ensure they remain fit for purpose by replacing ovens, upgrading bathrooms and converting bedsits to units.
120,000 132,900 146,200 1,204,800
Public Toilets-Renewals The renewal or upgrading of public toilets within the district, including the toilet block behind the Bay Hall at Caroline Bay, toilets at Timaru Botanic Gardens and various other parks. In addition, rural “long drop” type toilets are to be replaced with modern environmentally friendly toilets.
120,000 81,800 114,900 621,800
Airport-Renewals Replacement and upgrading of various fixtures at the Timaru Airport, including the taxi way reseal, stormwater infrastructure, and reservoir pump.
17,000 3,392,000
Airport-Aviation Park Development Airport land has been set aside for lease to aviation enthusiasts at Timaru Airport, for those who want access to the runway and a residence with an aircraft hangar attached. The project is dependent upon interest from potential lessees. Council funding will be used for fencing and road access.
70,500
Cemeteries-Timaru District Replacement Site
Land is required to replace the Timaru Cemetery and provide a facility for the future. Funding has been set aside for investigating potential sites with a view to purchasing land in 2019/20 .
2,044,000 1,671,200
Cemeteries-Reseal and roading programme
Resealing and repairing roads within the district’s cemeteries. This includes provision for new roading in the Timaru Cemetery.
16,500 1,000 37,400 39,100
Cemeteries - Temuka extension Planting, fencing and internal roads for the Temuka cemetery extension.
73,300
Cemeteries-Concrete Beams, Furniture, Structures and Services
Concrete beams are installed in larger cemeteries to mark plot locations and provide a base for memorials. Furniture and structures such as seating are replaced as required.
12,700 13,300 13,600 144,300
Civil Defence-Equipment The purchase of radio equipment and other electronic equipment to facilitate communications between field operatives, welfare centres and Area HQs during Civil Defence emergencies.
12,000 5,100 5,200 40,200
Civil Defence-Sirens Installation of new warning sirens at Waipopo and replacement sirens at Rangitata and Milford Huts.
62,000 24,000
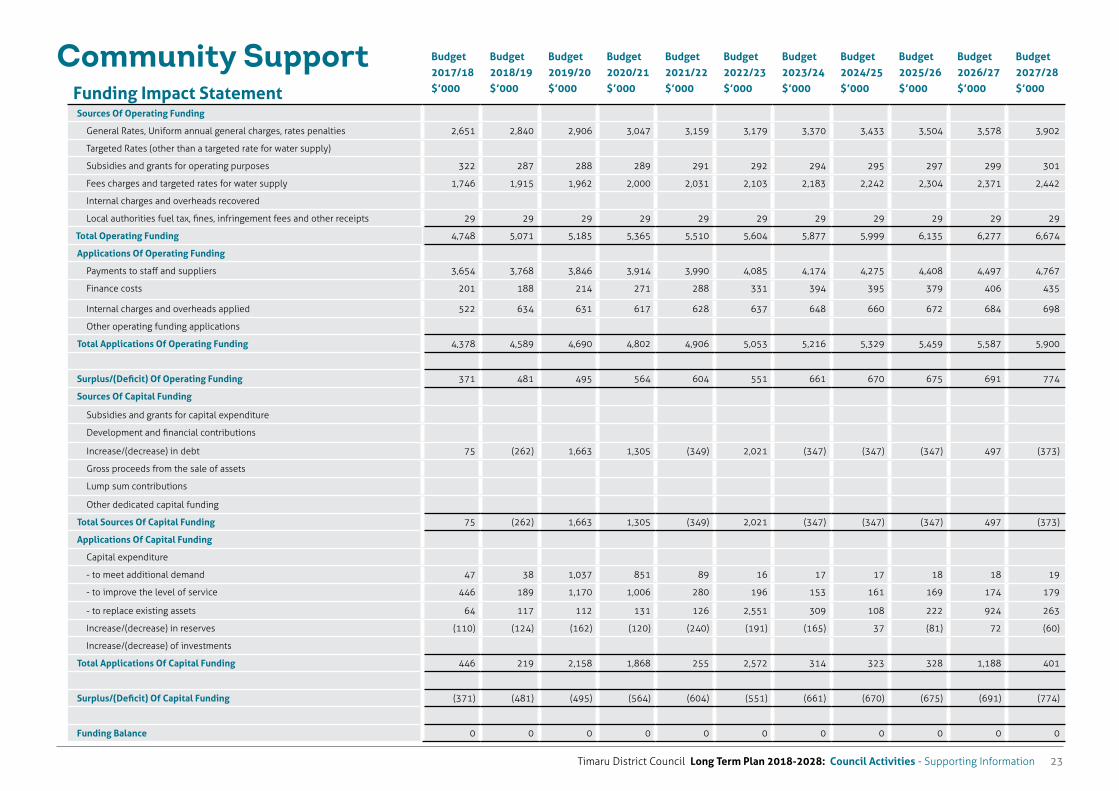
Timaru District Council Long Term Plan 2018-2028: Council Activities - Supporting Information 23
Community SupportFunding Impact Statement
Budget 2017/18 $’000
Budget 2018/19 $’000
Budget 2019/20 $’000
Budget 2020/21 $’000
Budget 2021/22 $’000
Budget 2022/23 $’000
Budget 2023/24 $’000
Budget 2024/25 $’000
Budget 2025/26 $’000
Budget 2026/27 $’000
Budget 2027/28 $’000
Sources Of Operating Funding
General Rates, Uniform annual general charges, rates penalties 2,651 2,840 2,906 3,047 3,159 3,179 3,370 3,433 3,504 3,578 3,902
Targeted Rates (other than a targeted rate for water supply)
Subsidies and grants for operating purposes 322 287 288 289 291 292 294 295 297 299 301
Fees charges and targeted rates for water supply 1,746 1,915 1,962 2,000 2,031 2,103 2,183 2,242 2,304 2,371 2,442
Internal charges and overheads recovered
Local authorities fuel tax, fines, infringement fees and other receipts 29 29 29 29 29 29 29 29 29 29 29
Total Operating Funding 4,748 5,071 5,185 5,365 5,510 5,604 5,877 5,999 6,135 6,277 6,674
Applications Of Operating Funding
Payments to staff and suppliers 3,654 3,768 3,846 3,914 3,990 4,085 4,174 4,275 4,408 4,497 4,767
Finance costs 201 188 214 271 288 331 394 395 379 406 435
Internal charges and overheads applied 522 634 631 617 628 637 648 660 672 684 698
Other operating funding applications
Total Applications Of Operating Funding 4,378 4,589 4,690 4,802 4,906 5,053 5,216 5,329 5,459 5,587 5,900
Surplus/(Deficit) Of Operating Funding 371 481 495 564 604 551 661 670 675 691 774
Sources Of Capital Funding
Subsidies and grants for capital expenditure
Development and financial contributions
Increase/(decrease) in debt 75 (262) 1,663 1,305 (349) 2,021 (347) (347) (347) 497 (373)
Gross proceeds from the sale of assets
Lump sum contributions
Other dedicated capital funding
Total Sources Of Capital Funding 75 (262) 1,663 1,305 (349) 2,021 (347) (347) (347) 497 (373)
Applications Of Capital Funding
Capital expenditure
- to meet additional demand 47 38 1,037 851 89 16 17 17 18 18 19
- to improve the level of service 446 189 1,170 1,006 280 196 153 161 169 174 179
- to replace existing assets 64 117 112 131 126 2,551 309 108 222 924 263
Increase/(decrease) in reserves (110) (124) (162) (120) (240) (191) (165) 37 (81) 72 (60)
Increase/(decrease) of investments
Total Applications Of Capital Funding 446 219 2,158 1,868 255 2,572 314 323 328 1,188 401
Surplus/(Deficit) Of Capital Funding (371) (481) (495) (564) (604) (551) (661) (670) (675) (691) (774)
Funding Balance 0 0 0 0 0 0 0 0 0 0 0
Timaru District Council Long Term Plan 2018-2028: Council Activities - Supporting Information24
District Planning and Environmental Services
Timaru District Council Long Term Plan 2018-2028: Council Activities - Supporting Information 25
District Planning and Environmental Services
What we doDistrict Planning and Environmental Services activities provided by Council include:
Building Control
District Planning
Environmental Compliance
These activities are concerned with consenting, compliance, monitoring and enforcement functions across a wide cross-section of statutes that focus on the protection of community health, well-being, safety and amenity.
Building ControlBuilding Control is responsible for administering and implementing the provisions of the Building Act 2004 (the Act). This involves balancing delivery of a customer focused service within legislative requirements, while managing the risk to the community and Council.
Under the Act, Council must maintain accreditation as a Building Consent Authority. It is responsible for processing and granting building consents, inspecting and monitoring building work, issuing Code Compliance Certificates, Certificates of Public Use, and processing Land and Project Information Memorandums, providing advice on building related matters and enforcing numerous other provisions under the Act. The Act’s main purpose is to provide for the regulation of building work, the establishment of a licensing regime for building practitioners, and the setting of performance standards for buildings. As a result of a 2016 amendment to the Building Act Council has a requirement to ensure that all potentially Earthquake Prone Buildings within the Timaru district are assessed within the statutory time frame for the purpose of identifying their level of structural compliance.
District PlanningThe District Planning Activity is primarily concerned with managing how land is used and how subdivision is undertaken in the district. The key tool for managing this is the Timaru District Plan. This outlines the district’s resource management issues and objectives, policies, methods and rules. These are used to achieve integrated management of the effects of the use, development, or protection of land and associated natural and physical resources
of the district.
On a day to day basis, the activity is concerned with providing advice on district planning matters, processing land use and subdivision consent applications, providing policy advice and monitoring work. The activity also provides policy advice on planning and development, conservation, design, heritage and environmental issues that affect the Timaru District.
Environmental ComplianceThe Environmental Compliance activity is primarily concerned with preserving, improving, and promoting public health and safety in the Timaru District. It deals with a multitude of issues such as food safety, disease containment, noise control, hazardous substances, liquor licensing, environmental nuisance, gambling control, parking enforcement and animal control. The activity is also responsible for the general administration, review and enforcement of the Timaru District Consolidated Bylaw 2018. The bylaws cover a wide variety of issues in the community that require rules, ranging from premises such as tattooists and ear piercing businesses, to overgrown or overhanging vegetation.
Council has two shared service arrangements with Mackenzie District Council and Waimate District Council, to provide health protection, bylaw, liquor and health licencing services.
This activity administers the District Licensing Committee which considers applications and renewals relating to liquor licences, including Special Licences obtained for selling liquor at events or special occasions under the Sale and Supply of Alcohol Act.
Timaru District Council Long Term Plan 2018-2028: Council Activities - Supporting Information26
District Planning and Environmental Services
Why we do itDistrict Planning and Environmental Services particularly contribute to the economy, lifestyle and identity aspects of the Council’s vision. The group includes activities that help ensure:
The district’s built and natural environment is safe to live, work and play in
Building or land developments are managed in a safe and sustainable way and land is used appropriately through enforcing building and planning legislation
Negative effect of activities that may occur in the district are minimised or managed (e.g. noise, animals, overhanging trees)
Commercial food premises practice a high standard of hygiene
The natural and built environment is managed sustainably
Building ControlBuilding Control services are provided to ensure a safe residential and commercial built environment exists for people to use in accordance with the provisions of the Building Act. The Council has a responsibility as the regulator and Building Consent Authority to ensure the purposes of the Building Act 2004 are met. This varies from inspecting and consenting building developments to strict standards set by legislation to ensuring existing buildings are safe and hazards dealt with. Recent amendments to the Building Act have introduced new requirements in relation to earthquake prone buildings and inspection of swimming pools. This will be a key focus over this LTP period.
District PlanningDistrict Planning services are provided to ensure that land use and subdivision activities do not adversely affect the environment, including the community, now and in the future.. The Council has a responsibility under the Timaru District Plan and Resource Management Act 1991 to manage the adverse effects of development on the natural and physical resources of the district and protect the environment’s life supporting capacity. This means that people and businesses can develop land and other resources in ways that fit with the surrounding community and environment. Decisions made by District Planning influence the nature of Timaru District communities and how the district will develop in the future.
Environmental ComplianceThe Council provides Environmental Compliance services to ensure that people, communities and the environment are kept safe and nuisances are mitigated or managed. This varies from dealing with dangerous dogs to ensuring high standards of hygiene are maintained at food premises, to enforcing district bylaws that set out expected standards. This occurs under several pieces of legislation, including the Dog Control Act, Food Act, Sale and Supply of Alcohol Act and the Health Act. These activities help support the well-being of the community.
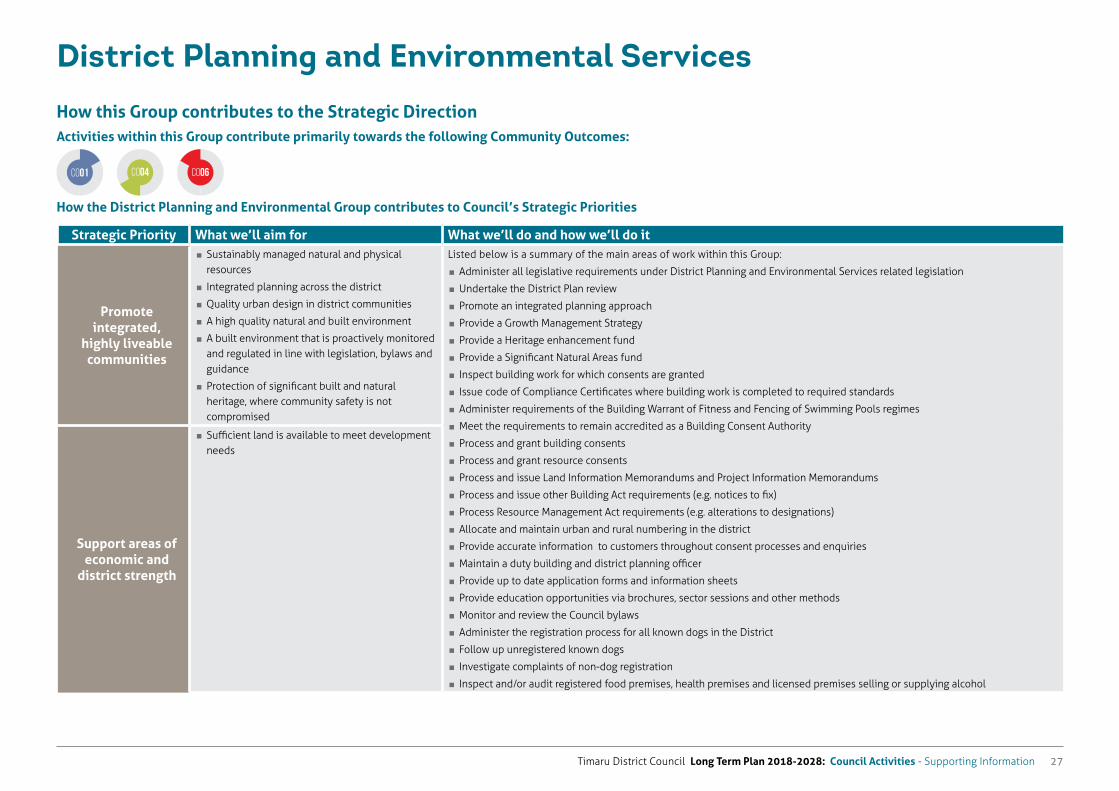
Timaru District Council Long Term Plan 2018-2028: Council Activities - Supporting Information 27
District Planning and Environmental Services
How this Group contributes to the Strategic DirectionActivities within this Group contribute primarily towards the following Community Outcomes:
How the District Planning and Environmental Group contributes to Council’s Strategic Priorities
Strategic Priority What we’ll aim for What we’ll do and how we’ll do it
Promote integrated,
highly liveable communities
� Sustainably managed natural and physical resources
� Integrated planning across the district
� Quality urban design in district communities
� A high quality natural and built environment
� A built environment that is proactively monitored and regulated in line with legislation, bylaws and guidance
� Protection of significant built and natural heritage, where community safety is not compromised
Listed below is a summary of the main areas of work within this Group:
� Administer all legislative requirements under District Planning and Environmental Services related legislation
� Undertake the District Plan review
� Promote an integrated planning approach
� Provide a Growth Management Strategy
� Provide a Heritage enhancement fund
� Provide a Significant Natural Areas fund
� Inspect building work for which consents are granted
� Issue code of Compliance Certificates where building work is completed to required standards
� Administer requirements of the Building Warrant of Fitness and Fencing of Swimming Pools regimes
� Meet the requirements to remain accredited as a Building Consent Authority
� Process and grant building consents
� Process and grant resource consents
� Process and issue Land Information Memorandums and Project Information Memorandums
� Process and issue other Building Act requirements (e.g. notices to fix)
� Process Resource Management Act requirements (e.g. alterations to designations)
� Allocate and maintain urban and rural numbering in the district
� Provide accurate information to customers throughout consent processes and enquiries
� Maintain a duty building and district planning officer
� Provide up to date application forms and information sheets
� Provide education opportunities via brochures, sector sessions and other methods
� Monitor and review the Council bylaws
� Administer the registration process for all known dogs in the District
� Follow up unregistered known dogs
� Investigate complaints of non-dog registration
� Inspect and/or audit registered food premises, health premises and licensed premises selling or supplying alcohol
Support areas of economic and
district strength
� Sufficient land is available to meet development needs
CO01 CO04 CO06
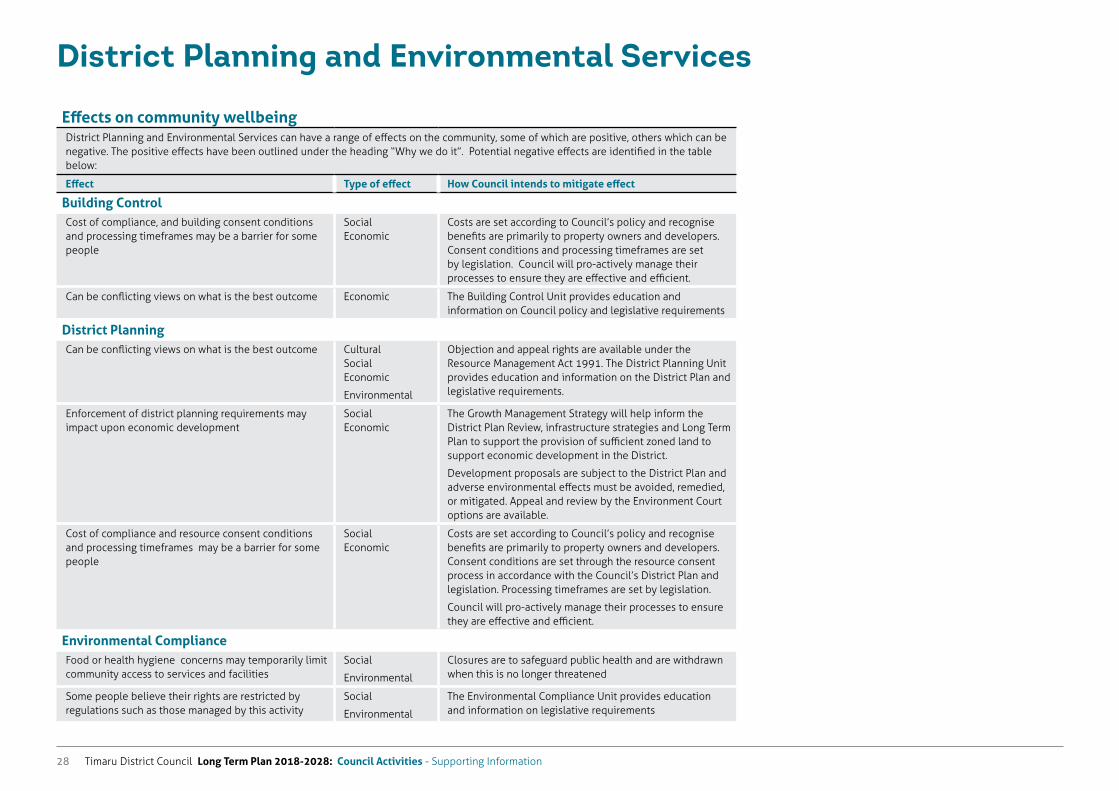
Timaru District Council Long Term Plan 2018-2028: Council Activities - Supporting Information28
District Planning and Environmental Services
Effects on community wellbeingDistrict Planning and Environmental Services can have a range of effects on the community, some of which are positive, others which can be negative. The positive effects have been outlined under the heading “Why we do it”. Potential negative effects are identified in the table below:
Effect Type of effect How Council intends to mitigate effect
Building ControlCost of compliance, and building consent conditions and processing timeframes may be a barrier for some people
Social Economic
Costs are set according to Council’s policy and recognise benefits are primarily to property owners and developers. Consent conditions and processing timeframes are set by legislation. Council will pro-actively manage their processes to ensure they are effective and efficient.
Can be conflicting views on what is the best outcome Economic The Building Control Unit provides education and information on Council policy and legislative requirements
District PlanningCan be conflicting views on what is the best outcome Cultural
Social Economic
Environmental
Objection and appeal rights are available under the Resource Management Act 1991. The District Planning Unit provides education and information on the District Plan and legislative requirements.
Enforcement of district planning requirements may impact upon economic development
Social Economic
The Growth Management Strategy will help inform the District Plan Review, infrastructure strategies and Long Term Plan to support the provision of sufficient zoned land to support economic development in the District.
Development proposals are subject to the District Plan and adverse environmental effects must be avoided, remedied, or mitigated. Appeal and review by the Environment Court options are available.
Cost of compliance and resource consent conditions and processing timeframes may be a barrier for some people
Social Economic
Costs are set according to Council’s policy and recognise benefits are primarily to property owners and developers. Consent conditions are set through the resource consent process in accordance with the Council’s District Plan and legislation. Processing timeframes are set by legislation.
Council will pro-actively manage their processes to ensure they are effective and efficient.
Environmental ComplianceFood or health hygiene concerns may temporarily limit community access to services and facilities
Social
Environmental
Closures are to safeguard public health and are withdrawn when this is no longer threatened
Some people believe their rights are restricted by regulations such as those managed by this activity
Social
Environmental
The Environmental Compliance Unit provides education and information on legislative requirements
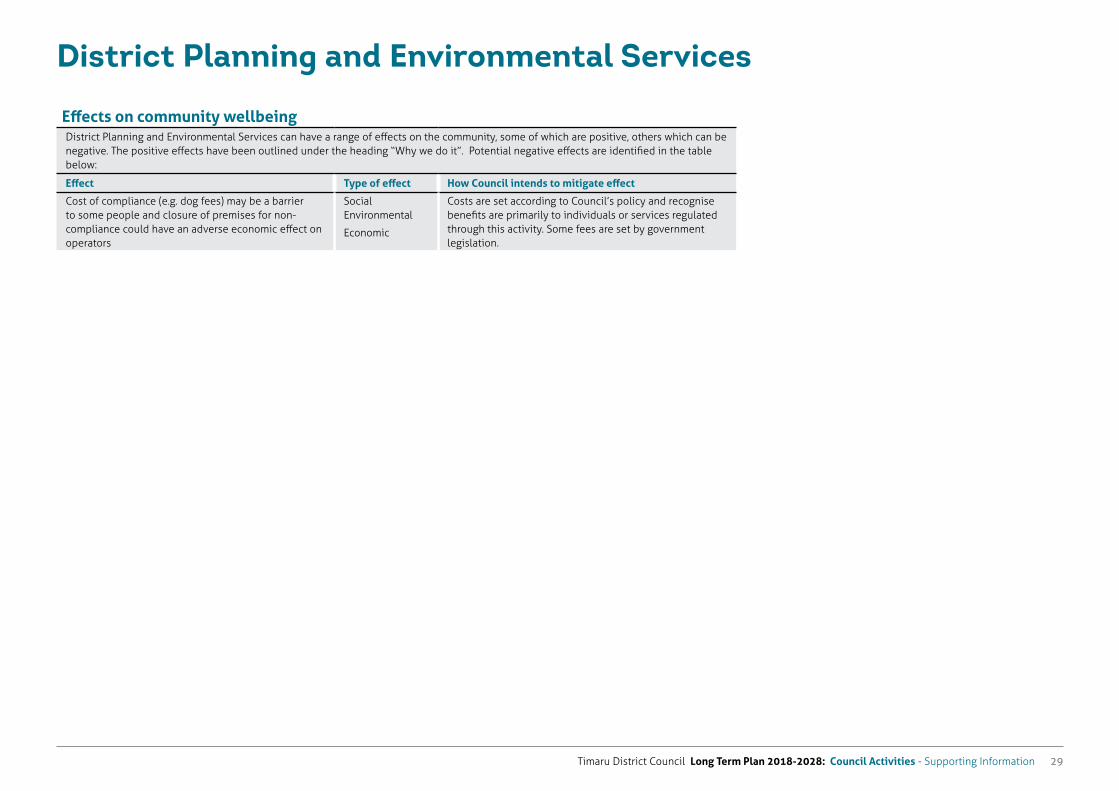
Timaru District Council Long Term Plan 2018-2028: Council Activities - Supporting Information 29
Effects on community wellbeingDistrict Planning and Environmental Services can have a range of effects on the community, some of which are positive, others which can be negative. The positive effects have been outlined under the heading “Why we do it”. Potential negative effects are identified in the table below:
Effect Type of effect How Council intends to mitigate effect
Cost of compliance (e.g. dog fees) may be a barrier to some people and closure of premises for non- compliance could have an adverse economic effect on operators
Social Environmental
Economic
Costs are set according to Council’s policy and recognise benefits are primarily to individuals or services regulated through this activity. Some fees are set by government legislation.
District Planning and Environmental Services
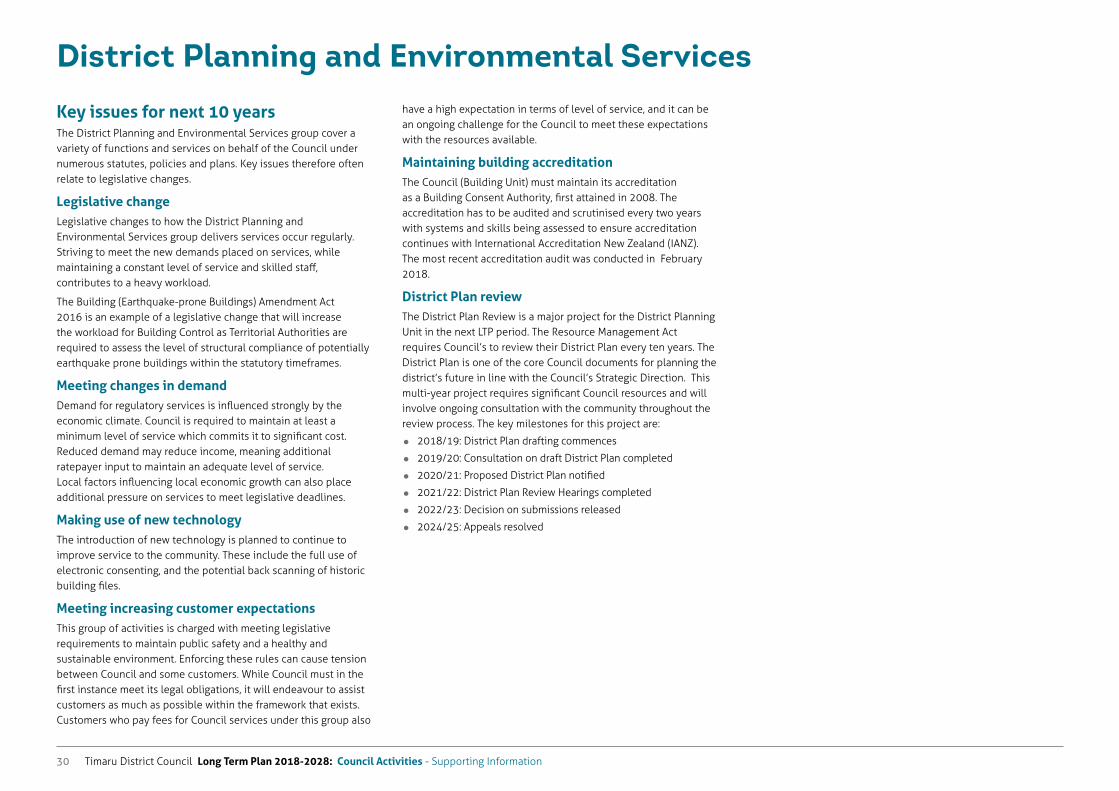
Timaru District Council Long Term Plan 2018-2028: Council Activities - Supporting Information30
District Planning and Environmental Services
Key issues for next 10 yearsThe District Planning and Environmental Services group cover a variety of functions and services on behalf of the Council under numerous statutes, policies and plans. Key issues therefore often relate to legislative changes.
Legislative changeLegislative changes to how the District Planning and Environmental Services group delivers services occur regularly. Striving to meet the new demands placed on services, while maintaining a constant level of service and skilled staff, contributes to a heavy workload.
The Building (Earthquake-prone Buildings) Amendment Act 2016 is an example of a legislative change that will increase the workload for Building Control as Territorial Authorities are required to assess the level of structural compliance of potentially earthquake prone buildings within the statutory timeframes.
Meeting changes in demandDemand for regulatory services is influenced strongly by the economic climate. Council is required to maintain at least a minimum level of service which commits it to significant cost. Reduced demand may reduce income, meaning additional ratepayer input to maintain an adequate level of service. Local factors influencing local economic growth can also place additional pressure on services to meet legislative deadlines.
Making use of new technologyThe introduction of new technology is planned to continue to improve service to the community. These include the full use of electronic consenting, and the potential back scanning of historic building files.
Meeting increasing customer expectationsThis group of activities is charged with meeting legislative requirements to maintain public safety and a healthy and sustainable environment. Enforcing these rules can cause tension between Council and some customers. While Council must in the first instance meet its legal obligations, it will endeavour to assist customers as much as possible within the framework that exists. Customers who pay fees for Council services under this group also
have a high expectation in terms of level of service, and it can be an ongoing challenge for the Council to meet these expectations with the resources available.
Maintaining building accreditation The Council (Building Unit) must maintain its accreditation as a Building Consent Authority, first attained in 2008. The accreditation has to be audited and scrutinised every two years with systems and skills being assessed to ensure accreditation continues with International Accreditation New Zealand (IANZ). The most recent accreditation audit was conducted in February 2018.
District Plan reviewThe District Plan Review is a major project for the District Planning Unit in the next LTP period. The Resource Management Act requires Council’s to review their District Plan every ten years. The District Plan is one of the core Council documents for planning the district’s future in line with the Council’s Strategic Direction. This multi-year project requires significant Council resources and will involve ongoing consultation with the community throughout the review process. The key milestones for this project are:
2018/19: District Plan drafting commences
2019/20: Consultation on draft District Plan completed
2020/21: Proposed District Plan notified
2021/22: District Plan Review Hearings completed
2022/23: Decision on submissions released
2024/25: Appeals resolved
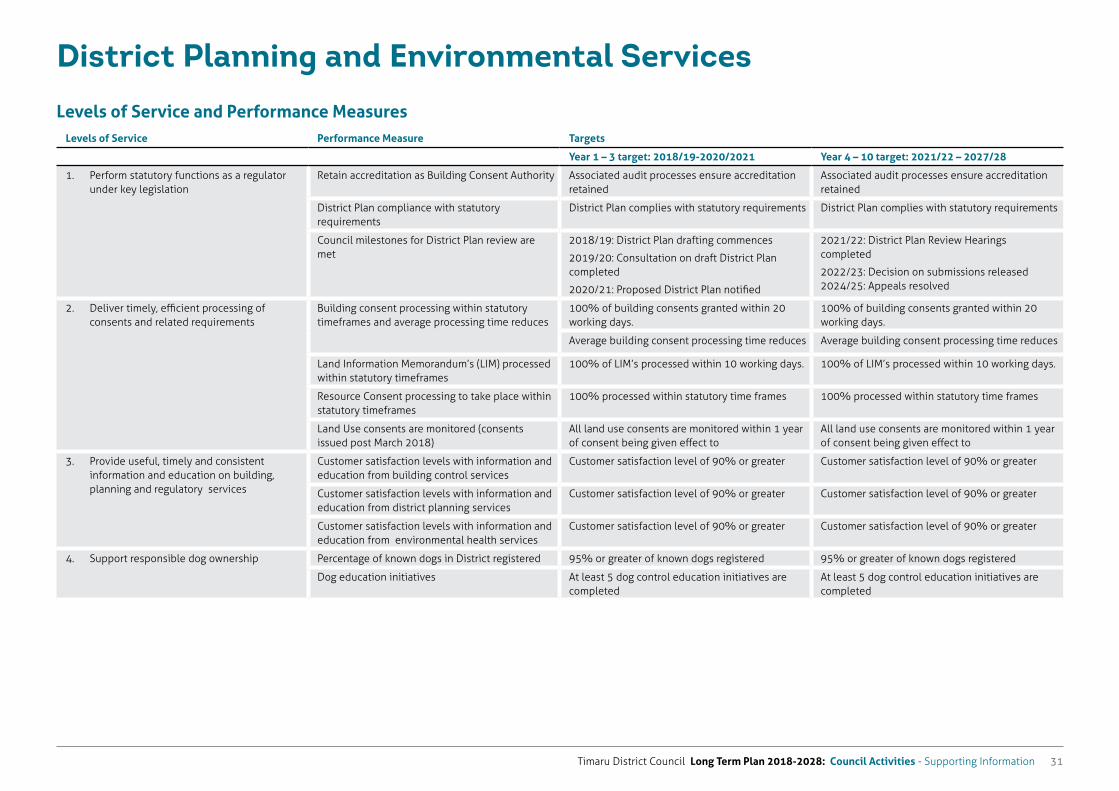
Timaru District Council Long Term Plan 2018-2028: Council Activities - Supporting Information 31
District Planning and Environmental Services
Levels of Service and Performance MeasuresLevels of Service Performance Measure Targets
Year 1 – 3 target: 2018/19-2020/2021 Year 4 – 10 target: 2021/22 – 2027/28
1. Perform statutory functions as a regulator under key legislation
Retain accreditation as Building Consent Authority Associated audit processes ensure accreditation retained
Associated audit processes ensure accreditation retained
District Plan compliance with statutory requirements
District Plan complies with statutory requirements District Plan complies with statutory requirements
Council milestones for District Plan review are met
2018/19: District Plan drafting commences
2019/20: Consultation on draft District Plan completed
2020/21: Proposed District Plan notified
2021/22: District Plan Review Hearings completed
2022/23: Decision on submissions released 2024/25: Appeals resolved
2. Deliver timely, efficient processing of consents and related requirements
Building consent processing within statutory timeframes and average processing time reduces
100% of building consents granted within 20 working days.
100% of building consents granted within 20 working days.
Average building consent processing time reduces Average building consent processing time reduces
Land Information Memorandum’s (LIM) processed within statutory timeframes
100% of LIM’s processed within 10 working days. 100% of LIM’s processed within 10 working days.
Resource Consent processing to take place within statutory timeframes
100% processed within statutory time frames 100% processed within statutory time frames
Land Use consents are monitored (consents issued post March 2018)
All land use consents are monitored within 1 year of consent being given effect to
All land use consents are monitored within 1 year of consent being given effect to
3. Provide useful, timely and consistent information and education on building, planning and regulatory services
Customer satisfaction levels with information and education from building control services
Customer satisfaction level of 90% or greater Customer satisfaction level of 90% or greater
Customer satisfaction levels with information and education from district planning services
Customer satisfaction level of 90% or greater Customer satisfaction level of 90% or greater
Customer satisfaction levels with information and education from environmental health services
Customer satisfaction level of 90% or greater Customer satisfaction level of 90% or greater
4. Support responsible dog ownership Percentage of known dogs in District registered 95% or greater of known dogs registered 95% or greater of known dogs registered
Dog education initiatives At least 5 dog control education initiatives are completed
At least 5 dog control education initiatives are completed
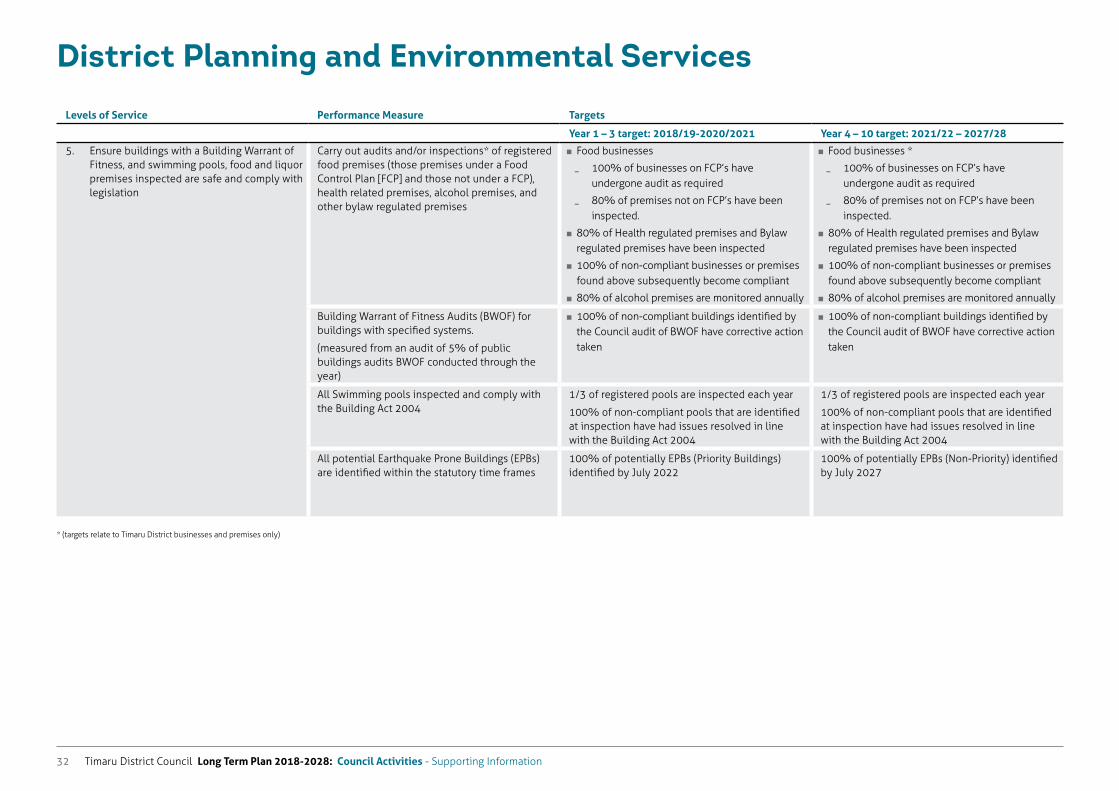
Timaru District Council Long Term Plan 2018-2028: Council Activities - Supporting Information32
Levels of Service Performance Measure Targets
Year 1 – 3 target: 2018/19-2020/2021 Year 4 – 10 target: 2021/22 – 2027/28
5. Ensure buildings with a Building Warrant of Fitness, and swimming pools, food and liquor premises inspected are safe and comply with legislation
Carry out audits and/or inspections* of registered food premises (those premises under a Food Control Plan [FCP] and those not under a FCP), health related premises, alcohol premises, and other bylaw regulated premises
� Food businesses
� 100% of businesses on FCP’s have undergone audit as required
� 80% of premises not on FCP’s have been inspected.
� 80% of Health regulated premises and Bylaw regulated premises have been inspected
� 100% of non-compliant businesses or premises found above subsequently become compliant
� 80% of alcohol premises are monitored annually
� Food businesses *
� 100% of businesses on FCP’s have undergone audit as required
� 80% of premises not on FCP’s have been inspected.
� 80% of Health regulated premises and Bylaw regulated premises have been inspected
� 100% of non-compliant businesses or premises found above subsequently become compliant
� 80% of alcohol premises are monitored annually
Building Warrant of Fitness Audits (BWOF) for buildings with specified systems.
(measured from an audit of 5% of public buildings audits BWOF conducted through the year)
� 100% of non-compliant buildings identified by the Council audit of BWOF have corrective action taken
� 100% of non-compliant buildings identified by the Council audit of BWOF have corrective action taken
All Swimming pools inspected and comply with the Building Act 2004
1/3 of registered pools are inspected each year
100% of non-compliant pools that are identified at inspection have had issues resolved in line with the Building Act 2004
1/3 of registered pools are inspected each year
100% of non-compliant pools that are identified at inspection have had issues resolved in line with the Building Act 2004
All potential Earthquake Prone Buildings (EPBs) are identified within the statutory time frames
100% of potentially EPBs (Priority Buildings) identified by July 2022
100% of potentially EPBs (Non-Priority) identified by July 2027
* (targets relate to Timaru District businesses and premises only)
District Planning and Environmental Services
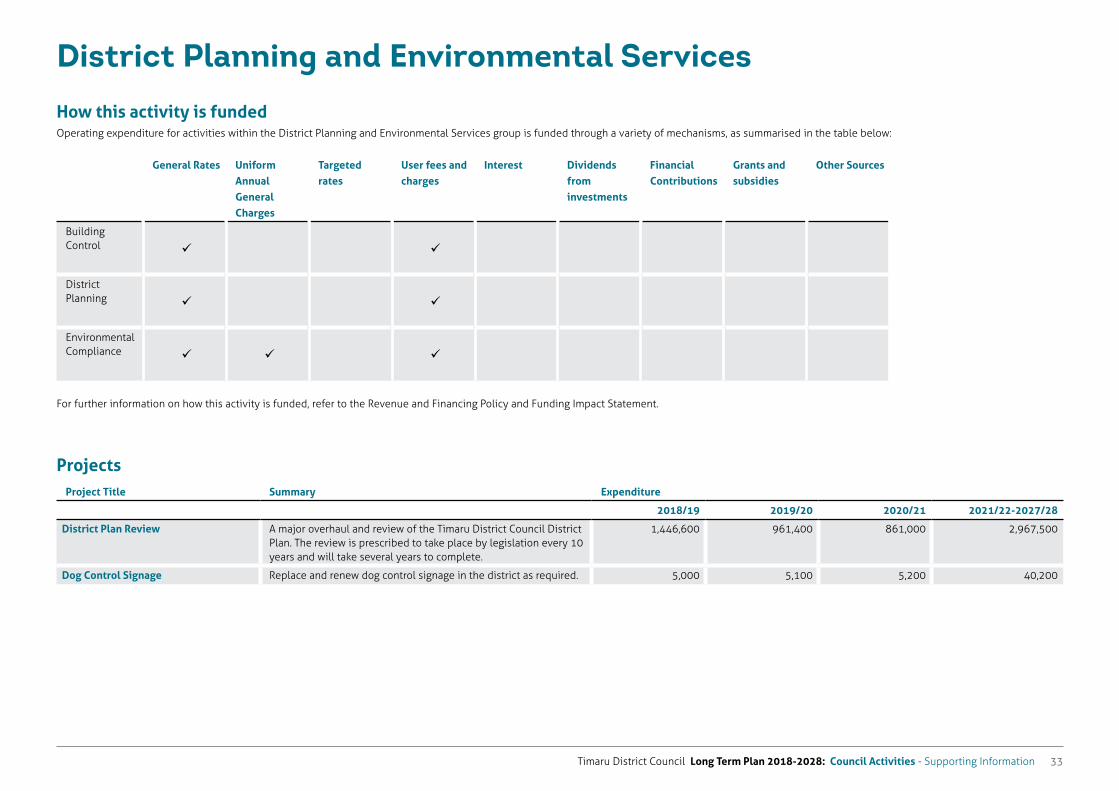
Timaru District Council Long Term Plan 2018-2028: Council Activities - Supporting Information 33
How this activity is fundedOperating expenditure for activities within the District Planning and Environmental Services group is funded through a variety of mechanisms, as summarised in the table below:
General Rates Uniform Annual General Charges
Targeted rates
User fees and charges
Interest Dividends from investments
Financial Contributions
Grants and subsidies
Other Sources
Building Control
District Planning
Environmental Compliance
For further information on how this activity is funded, refer to the Revenue and Financing Policy and Funding Impact Statement.
District Planning and Environmental Services
ProjectsProject Title Summary Expenditure
2018/19 2019/20 2020/21 2021/22-2027/28
District Plan Review A major overhaul and review of the Timaru District Council District Plan. The review is prescribed to take place by legislation every 10 years and will take several years to complete.
1,446,600 961,400 861,000 2,967,500
Dog Control Signage Replace and renew dog control signage in the district as required. 5,000 5,100 5,200 40,200
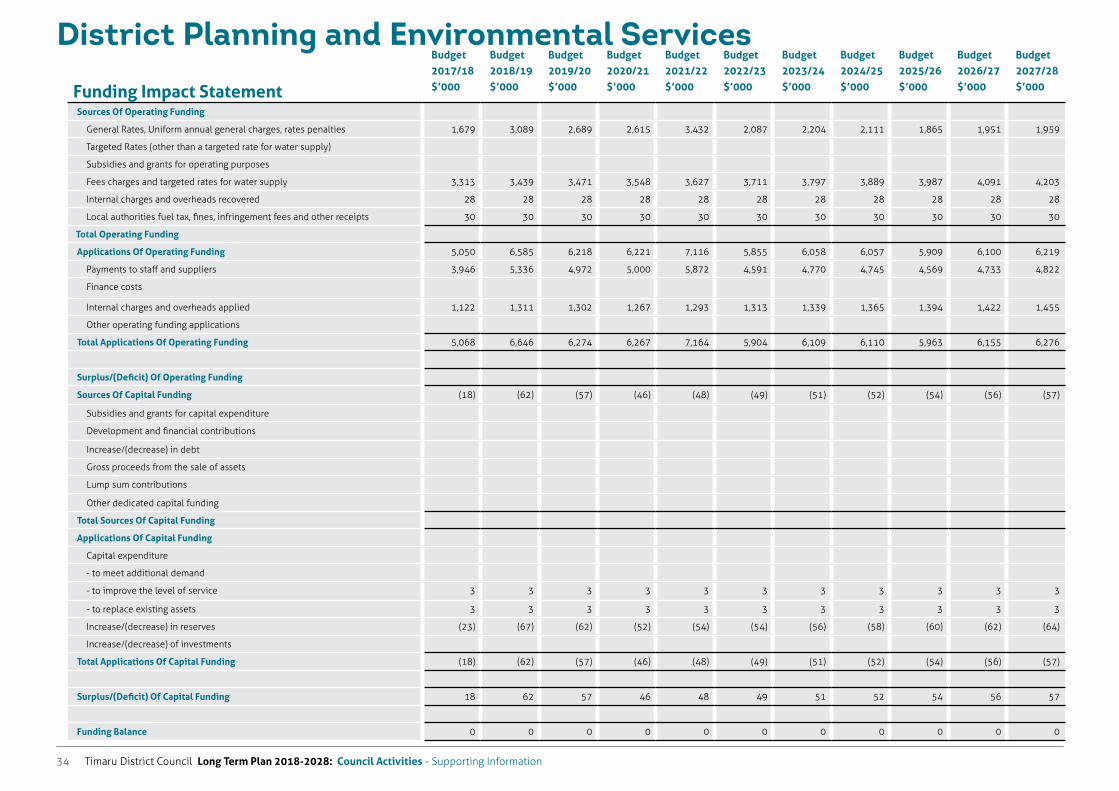
Timaru District Council Long Term Plan 2018-2028: Council Activities - Supporting Information34
District Planning and Environmental Services
Funding Impact Statement
Budget 2017/18 $’000
Budget 2018/19 $’000
Budget 2019/20 $’000
Budget 2020/21 $’000
Budget 2021/22 $’000
Budget 2022/23 $’000
Budget 2023/24 $’000
Budget 2024/25 $’000
Budget 2025/26 $’000
Budget 2026/27 $’000
Budget 2027/28 $’000
Sources Of Operating Funding
General Rates, Uniform annual general charges, rates penalties 1,679 3,089 2,689 2,615 3,432 2,087 2,204 2,111 1,865 1,951 1,959
Targeted Rates (other than a targeted rate for water supply)
Subsidies and grants for operating purposes
Fees charges and targeted rates for water supply 3,313 3,439 3,471 3,548 3,627 3,711 3,797 3,889 3,987 4,091 4,203
Internal charges and overheads recovered 28 28 28 28 28 28 28 28 28 28 28
Local authorities fuel tax, fines, infringement fees and other receipts 30 30 30 30 30 30 30 30 30 30 30
Total Operating Funding
Applications Of Operating Funding 5,050 6,585 6,218 6,221 7,116 5,855 6,058 6,057 5,909 6,100 6,219
Payments to staff and suppliers 3,946 5,336 4,972 5,000 5,872 4,591 4,770 4,745 4,569 4,733 4,822
Finance costs
Internal charges and overheads applied 1,122 1,311 1,302 1,267 1,293 1,313 1,339 1,365 1,394 1,422 1,455
Other operating funding applications
Total Applications Of Operating Funding 5,068 6,646 6,274 6,267 7,164 5,904 6,109 6,110 5,963 6,155 6,276
Surplus/(Deficit) Of Operating Funding
Sources Of Capital Funding (18) (62) (57) (46) (48) (49) (51) (52) (54) (56) (57)
Subsidies and grants for capital expenditure
Development and financial contributions
Increase/(decrease) in debt
Gross proceeds from the sale of assets
Lump sum contributions
Other dedicated capital funding
Total Sources Of Capital Funding
Applications Of Capital Funding
Capital expenditure
- to meet additional demand
- to improve the level of service 3 3 3 3 3 3 3 3 3 3 3
- to replace existing assets 3 3 3 3 3 3 3 3 3 3 3
Increase/(decrease) in reserves (23) (67) (62) (52) (54) (54) (56) (58) (60) (62) (64)
Increase/(decrease) of investments
Total Applications Of Capital Funding (18) (62) (57) (46) (48) (49) (51) (52) (54) (56) (57)
Surplus/(Deficit) Of Capital Funding 18 62 57 46 48 49 51 52 54 56 57
Funding Balance 0 0 0 0 0 0 0 0 0 0 0
Timaru District Council Long Term Plan 2018-2028: Council Activities - Supporting Information 35
Recreation and Leisure
Timaru District Council Long Term Plan 2018-2028: Council Activities - Supporting Information36
Recreation and Leisure
What we doRecreation and Leisure includes the following activities provided by the Council:
Cultural and Learning Facilities
Parks
Recreational Facilities
Cultural and Learning Facilities
Aigantighe Art Gallery
The Aigantighe (pronounced egg-and- tie) Art Gallery is a public art gallery in Timaru that collects, exhibits, preserves, researches and educates about visual art. Its rich and growing permanent art collection is shown in the original House Gallery through revolving exhibitions, while temporary exhibitions are held in the 1978 extension. The Aigantighe is regarded as the regional art gallery of South Canterbury due to its focus on regional art both in the permanent collection and in temporary exhibition programme. The gallery is open 6 days a week and is free to visit.
South Canterbury Museum
The South Canterbury Museum is a regional museum of nature, history and culture located in Timaru. It provides access to unique collections of local heritage items, images, archives and information, long term displays, a programme of short term exhibitions, a variety of public programmes and services and heritage programmes for schools both at the museum and around the District (Government funded). The museum is open 6 days a week with free admission.
Timaru District Libraries
Timaru District Libraries provide public library services delivered from facilities in Timaru, Temuka and Geraldine and online. Temuka and Geraldine libraries also double as Council Service Centres, with an Information Centre at Temuka. The main Timaru library provides a public library service and coordinates branch services. Library facilities are heavily used for other community purposes such as study places, computers, WiFi, photocopying, and historical collections for in-library reading, writing, research, relaxation and communication. The libraries are also meeting places for groups and a place for the sharing of community
information.
Timaru District libraries cooperate nationally with other agencies to enable access to Interloan services and various online databases. Free internet and computer use is provided via the Aotearoa People’s Network Kaharoa, funded jointly by the government and Council. Deliveries are also made to housebound people and rest homes. Timaru Library is open seven days per week and Temuka and Geraldine Library/Service Centres six days. All facilities are free to visit and membership is free to Timaru District residents.
Halls and Theatres
The Council owns and manages the Theatre Royal in Timaru. This Category B Heritage building seats up to 1,000 people. The theatre is the premier venue for visiting cultural and entertainment shows and also available for community use.
The Council also provides or supports a number of other venues, including:
Facilities owned and managed solely by TDC These include the Caroline Bay Hall, Lounge, Entertainment Centre and Sound Shell, Pleasant Point Hall, Temuka Alpine Energy Centre, Winchester Hall and Washdyke Community Hall and Sports Centre. These facilities are managed entirely by Council, including hall bookings, maintenance, upgrades and payment of rates and insurance.
Facilities owned by Council and managed by committees Eleven community halls are owned by Council (e.g. Clandeboye, Pleasant Valley, Taiko Halls). These halls are managed by local communities through committees, who are responsible for upkeep and annual expenses. The Westend Hall in Timaru is also owned by Council and available to the public but leased and managed by the Masonic Lodge. Council will occasionally provide funding for major structural or capital work, or support halls through existing TDC community funding schemes.
Facilities operated by the Council but not owned Since 1 February 2012, the Council has leased the Aorangi Stadium from the Aorangi Stadium Trust and promotes and manages this facility in conjunction with the Caroline Bay Trust Aoraki Centre. There are also a number of halls owned by community organisations ( e.g. Claremont, Seadown and Fairview halls). These are supported via targeted rates which are
collected on behalf of the hall owners.
Parks
The Parks activity provides and manages over 615 hectares (excluding Crown leases) of parks, reserves, sports grounds and gardens throughout the district. The district’s parks network is grouped into five main categories as follows:
Premier Parks Premier Parks are parks of particular significance to the district and are generally developed and maintained to a high standard. Examples are the Timaru Botanic Gardens, Caroline Bay and parts of Temuka and Geraldine Domains.
Sports and Recreation Parks Sports and Recreation Parks are primarily used for active sport and recreation and may provide for other community activities. Examples include the Pleasant Point Domain, Gunnion Square in Temuka and Aorangi Park in Timaru.
Neighbourhood Parks Neighbourhood Parks are developed urban parks and usually contain a children’s playground. Examples include Cornwall Park and Lough Park in Timaru.
Amenity Parks Amenity Parks cover a wide range of purposes, from developed areas with mown grass, gardens or trees through to undeveloped natural green areas providing corridors for native fauna along rivers and streams. Generally these areas enhance the environment with open spaces and plantings. Examples include Kennedy Park in Geraldine, independently managed rural domains, Patiti Point Reserve and Centennial Park in Timaru.
Natural Parks Natural Parks provide opportunities for people to experience nature. Predominantly located in rural areas, these include native bush areas, wetlands and riparian areas. Many of the areas include walking tracks, mountain biking tracks and picnic areas with facilities in each area to support the particular activities catered for. Examples include the Claremont Bush and Otipua Wetland in Timaru and Pekapeka Gully in Geraldine.
Other park categories include Special Purpose Parks (e.g. Cultural Heritage Parks such as memorials and historic structures and places) and Civic Spaces. Exclusive Use Land is also leased or occupied by sporting and community groups and generally not
Timaru District Council Long Term Plan 2018-2028: Council Activities - Supporting Information 37
freely available to the public.
The level of park development varies from location to location. A rural esplanade reserve or scenic reserve may have virtually no improvements, whereas a premier urban park will contain buildings, structures, lighting, paths, vehicle access ways and car parks, signs, fencing, furniture, services and a range of vegetation from grass to mature trees.
Parks encompass a number of uses such as the new area in Redruth, Timaru designated as a dog park. Outdoor events are often held using park facilities and several clubs and organisations use them for their activities, including hockey, croquet, cricket, bowling, cycling, soccer, rugby league, tennis, netball and pistol shooting.
Some recreation planning, co-ordination and provision is also managed through this activity, and is currently contracted to Sport Canterbury.
A parks strategy provides a vision for parks in the Timaru District that, while not binding, gives an indication of Council’s intentions for the future provision of park land in the district.
Forestry
The Council manages a small forestry programme comprising mixed aged and species plantations. Forestry is planted primarily on over 235 hectares of reserve land unsuitable for other uses, with 58 separate sites. The primary species planted are Radiata Pine (65%), Douglas Fir/Oregon Pine (28%), Macrocarpa (5%) and Poplar/Other species (2%). The forestry resource is wholly owned by the Council and is operated as a land management activity, with some investment return.
Fishing Huts and Motor Camps
Council manages two fishing huts sites on reserve land, subject to the Reserves Act 1977. Fishing huts sites are located at South Rangitata and Stratheona near Pleasant Point. Land on which privately owned fishing huts are located is leased to hut owners, who are responsible for all hut and site maintenance.
Five motor camps are managed on domain reserves at Geraldine, Temuka, Pleasant Point, South Rangitata and Winchester. Geraldine, Temuka and Winchester are open permanently, while Pleasant Point and South Rangitata are seasonal. All motor camps,
except Pleasant Point, are leased under management agreements. The Pleasant Point Motor Camp is managed by the Council with local businesses supporting its operation.
Recreational Facilities
Swimming Pools
The district’s premier swimming complex, the Caroline Bay Trust Aoraki Centre (CBay) is located at Maori Park, Timaru. CBay opened in July 2012. It incorporates a 50 metre outdoor pool and an indoor complex featuring a ten-lane 25 metre lap pool, a programme pool, a 250m2 leisure pool with a lazy river and learn to swim area, an attached toddlers pool and wet playground, a chillax area featuring a spa pool, a steam room and sauna as well as a Fitness facility. There is also a café and retail space within the facility.
Pool complexes are also provided at the following locations:
Geraldine - 25 metre outdoor pool and learners pool
Pleasant Point - 25 metre outdoor pool and learners pool
Temuka - 30 metre outdoor pool and toddlers pool
Southern Trust Events Centre
This facility is a triple basketball court complex located on Aorangi Park, Timaru. It was previously operated by the Aorangi Stadium Trust, however Council assumed operational management in 2012. It also contains a fitness studio which is available for hire by non-profit groups, several tenanted rooms (main tenants are Sport Canterbury and South Canterbury Basketball) and a lounge facility which is also available for hire. The facility is owned by Aorangi Stadium Trust - a Council Controlled Organisation.
Recreation and Leisure
Timaru District Council Long Term Plan 2018-2028: Council Activities - Supporting Information38
Why we do itRecreation and Leisure activities contribute to the economy and lifestyle aspects of the Council’s vision. This group includes activities that help:
Meet the community’s recreational needs
Encourage a strong community identity and an active lifestyle
Encourage a sense of community wellness and connectedness
Provide venues for sporting and recreational events
Facilitate learning and literacy
Enable the care and preservation of valuable art and heritage
Encourage water confidence and competence
Cultural and Learning FacilitiesCultural and Learning Facilities are essential community facilities that enrich individual and community wellbeing. They provide shared community meeting spaces and venues for study, relaxation, learning and recreation. They are a necessary part of the fabric of a civilised and democratic society. They provide recreational and educational opportunities that people could not individually afford.
The Museum and Art Gallery are focal points for local heritage and art works. They enable access to unique local collections and a range of regional, national and international exhibitions. They are crucial to understanding, celebrating and storing our creativity, heritage and local diversity and enable communities and individuals to research where they have come from.
Library facilities help foster lifelong learning through the broad range of literature and other information they make available for the community. Service Centres in Geraldine and Temuka also provide local access to Council services for residents.
The Cultural and Learning facilities are important visitor attractions that showcase the district‘s heritage They benefit the district economy, both through providing employment and supporting businesses and employees with information and resources.
Preservation and safe storage of collections of art, objects, images, documents and information is provided through this activity for the benefit of present and future generations.
Provision and management of these facilities enables the Council
to fulfil legal obligations in respect of donated buildings, art works, funds and heritage.
The Theatre Royal provides a venue for visiting cultural and entertainment shows and also available for community use.
Community halls are an important part of the fabric of the district. As well as providing meeting places for small communities they are also venues in times of emergency. Partnerships with local institutions, businesses and community groups enhance community ownership and pride.
ParksParks are the ‘shop window’ for the district, promoting its unique character, and are a significant contributor to community pride. Parks and gardens help enhance and improve the environment, through enhancing open spaces, suppressing pest plants and animals, enabling native revegetation programmes and providing habitats for native wildlife. They also act as a carbon sink. Esplanade strips enable the filtering of contaminants to improve water quality. Local parks can also provide a focal point for smaller suburbs.
Many parks are protected through legislation, their ownership status and previous Council policies. A large portion of parkland is vested in the Council under the Reserves Act 1977 for Recreation Reserve, with some also for Local Purpose, Scenic or Historic Reserves. Where vested under the Reserves Act, the Council is statutorily required to manage these reserves.
The Forestry activity is self funding and it provides some investment income. It is also a mechanism for storing carbon, and has a positive contribution to Council’s carbon credit balance.
Recreational FacilitiesRecreational facilities including swimming pools and the Southern Trust Events Centre are essential facilities for enhancing people’s health and wellbeing. They enable and promote participation and active and healthy lifestyles. Individuals and teams are able to enjoy recreational and sporting pursuits and learn and develop skills.
A controlled pool environment provides a safe venue for learning to swim, developing water confidence and generally having fun in the water. Swimming pool facilities can also have therapeutic
benefits in helping heal injury and ease aches and pains. These facilities are an integral part of the fabric of the community, providing spaces for events, entertainment, recreational pursuits and other activities.
Recreation and Leisure
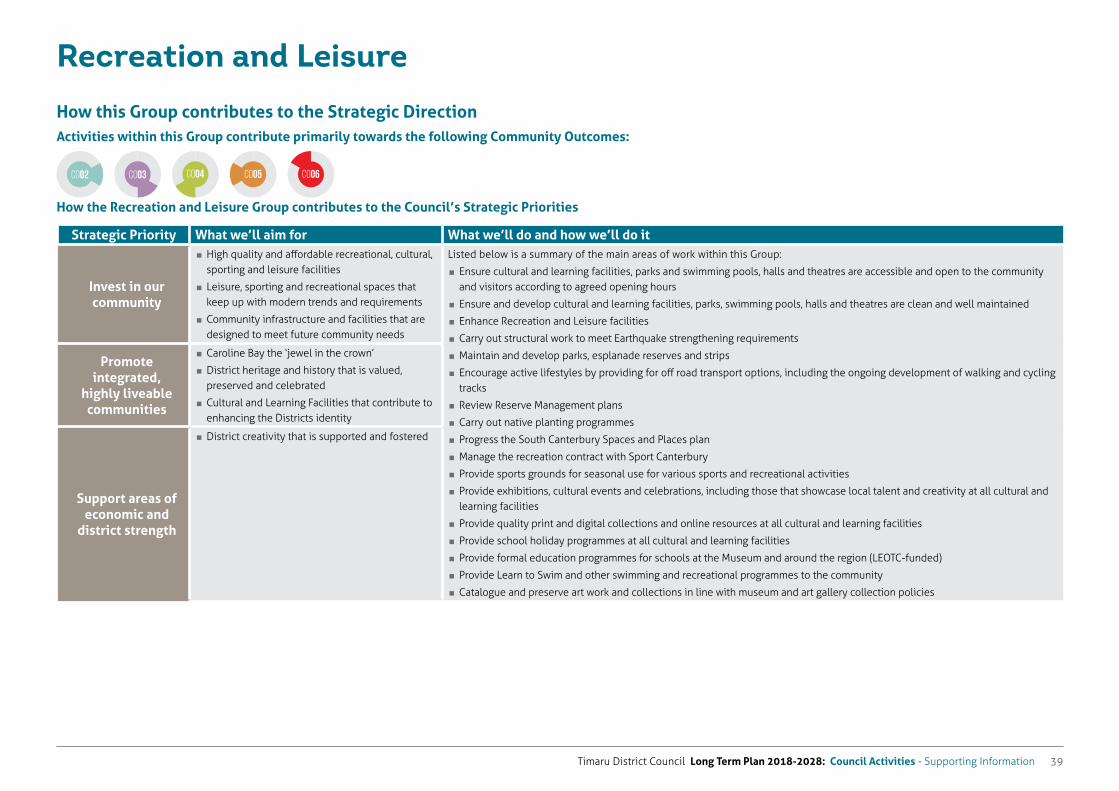
Timaru District Council Long Term Plan 2018-2028: Council Activities - Supporting Information 39
How this Group contributes to the Strategic DirectionActivities within this Group contribute primarily towards the following Community Outcomes:
How the Recreation and Leisure Group contributes to the Council’s Strategic Priorities
Strategic Priority What we’ll aim for What we’ll do and how we’ll do it
Invest in our community
� High quality and affordable recreational, cultural, sporting and leisure facilities
� Leisure, sporting and recreational spaces that keep up with modern trends and requirements
� Community infrastructure and facilities that are designed to meet future community needs
Listed below is a summary of the main areas of work within this Group:
� Ensure cultural and learning facilities, parks and swimming pools, halls and theatres are accessible and open to the community and visitors according to agreed opening hours
� Ensure and develop cultural and learning facilities, parks, swimming pools, halls and theatres are clean and well maintained
� Enhance Recreation and Leisure facilities
� Carry out structural work to meet Earthquake strengthening requirements
� Maintain and develop parks, esplanade reserves and strips
� Encourage active lifestyles by providing for off road transport options, including the ongoing development of walking and cycling tracks
� Review Reserve Management plans
� Carry out native planting programmes
� Progress the South Canterbury Spaces and Places plan
� Manage the recreation contract with Sport Canterbury
� Provide sports grounds for seasonal use for various sports and recreational activities
� Provide exhibitions, cultural events and celebrations, including those that showcase local talent and creativity at all cultural and learning facilities
� Provide quality print and digital collections and online resources at all cultural and learning facilities
� Provide school holiday programmes at all cultural and learning facilities
� Provide formal education programmes for schools at the Museum and around the region (LEOTC-funded)
� Provide Learn to Swim and other swimming and recreational programmes to the community
� Catalogue and preserve art work and collections in line with museum and art gallery collection policies
Promote integrated,
highly liveable communities
� Caroline Bay the ‘jewel in the crown’
� District heritage and history that is valued, preserved and celebrated
� Cultural and Learning Facilities that contribute to enhancing the Districts identity
Support areas of economic and
district strength
� District creativity that is supported and fostered
CO04 CO05 CO06CO02 CO03
Recreation and Leisure
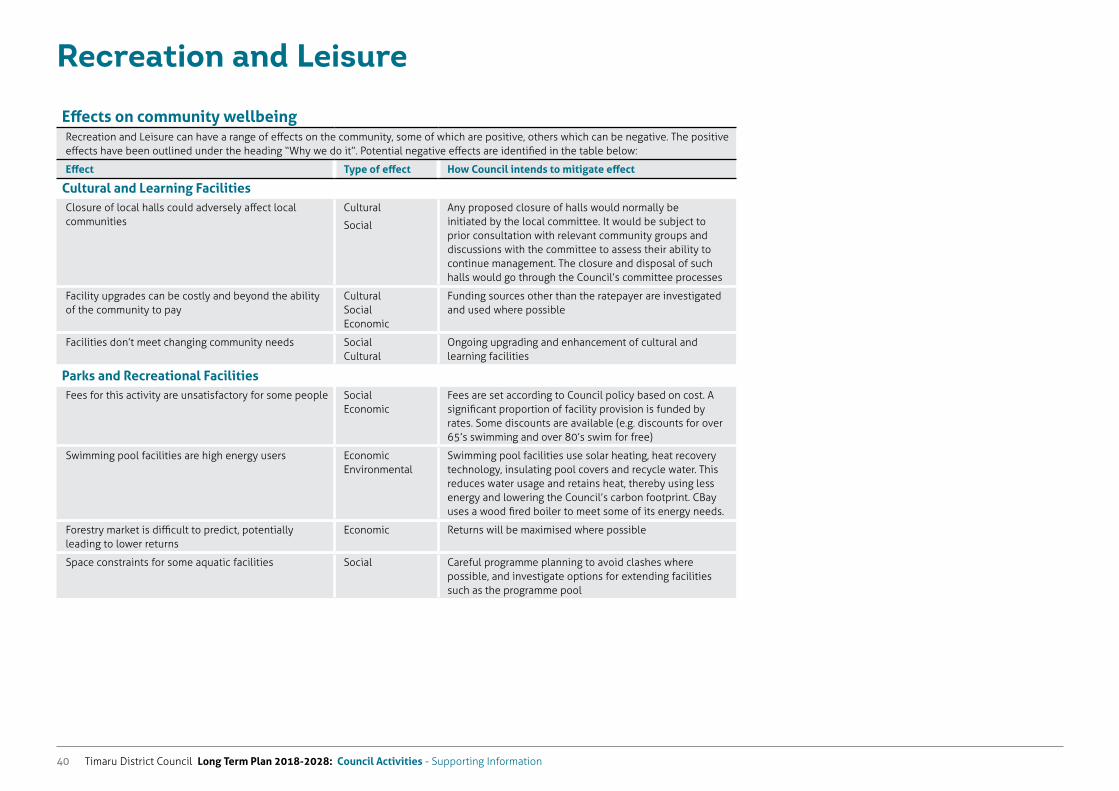
Timaru District Council Long Term Plan 2018-2028: Council Activities - Supporting Information40
Recreation and Leisure
Effects on community wellbeingRecreation and Leisure can have a range of effects on the community, some of which are positive, others which can be negative. The positive effects have been outlined under the heading “Why we do it”. Potential negative effects are identified in the table below:
Effect Type of effect How Council intends to mitigate effect
Cultural and Learning FacilitiesClosure of local halls could adversely affect local communities
Cultural
Social
Any proposed closure of halls would normally be initiated by the local committee. It would be subject to prior consultation with relevant community groups and discussions with the committee to assess their ability to continue management. The closure and disposal of such halls would go through the Council’s committee processes
Facility upgrades can be costly and beyond the ability of the community to pay
Cultural Social Economic
Funding sources other than the ratepayer are investigated and used where possible
Facilities don’t meet changing community needs Social Cultural
Ongoing upgrading and enhancement of cultural and learning facilities
Parks and Recreational FacilitiesFees for this activity are unsatisfactory for some people Social
EconomicFees are set according to Council policy based on cost. A significant proportion of facility provision is funded by rates. Some discounts are available (e.g. discounts for over 65’s swimming and over 80’s swim for free)
Swimming pool facilities are high energy users Economic Environmental
Swimming pool facilities use solar heating, heat recovery technology, insulating pool covers and recycle water. This reduces water usage and retains heat, thereby using less energy and lowering the Council’s carbon footprint. CBay uses a wood fired boiler to meet some of its energy needs.
Forestry market is difficult to predict, potentially leading to lower returns
Economic Returns will be maximised where possible
Space constraints for some aquatic facilities Social Careful programme planning to avoid clashes where possible, and investigate options for extending facilities such as the programme pool
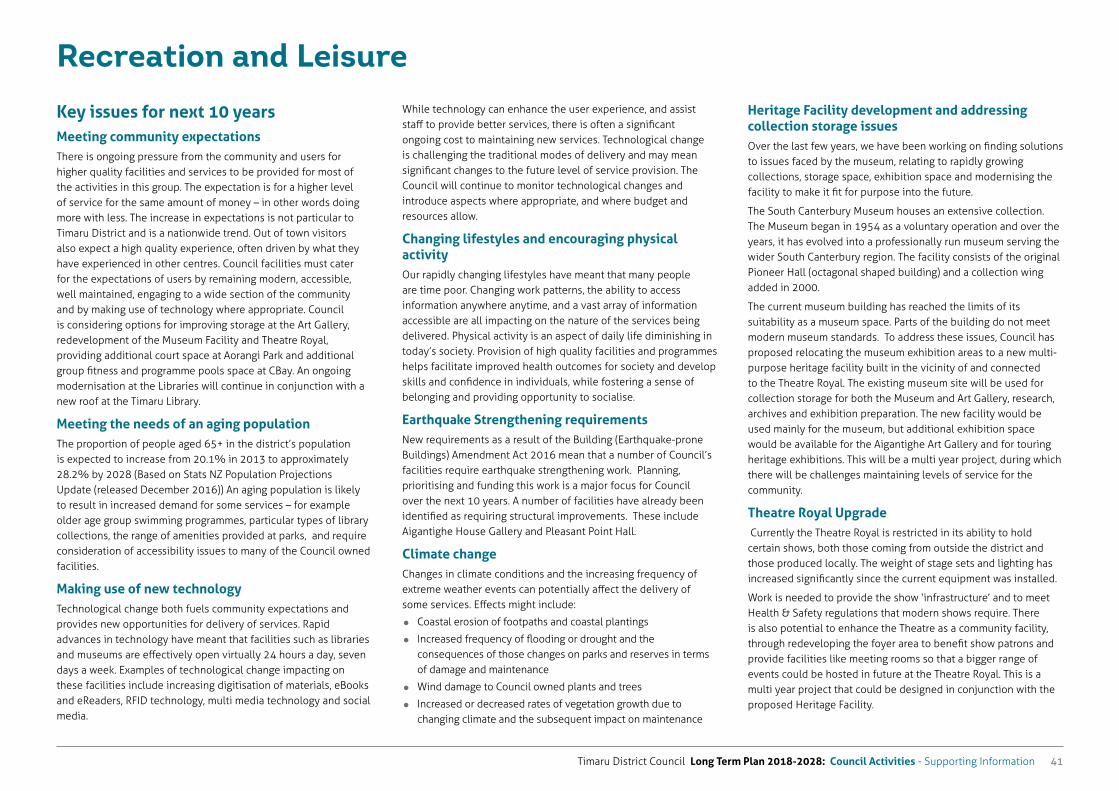
Timaru District Council Long Term Plan 2018-2028: Council Activities - Supporting Information 41
Recreation and Leisure
Key issues for next 10 yearsMeeting community expectationsThere is ongoing pressure from the community and users for higher quality facilities and services to be provided for most of the activities in this group. The expectation is for a higher level of service for the same amount of money – in other words doing more with less. The increase in expectations is not particular to Timaru District and is a nationwide trend. Out of town visitors also expect a high quality experience, often driven by what they have experienced in other centres. Council facilities must cater for the expectations of users by remaining modern, accessible, well maintained, engaging to a wide section of the community and by making use of technology where appropriate. Council is considering options for improving storage at the Art Gallery, redevelopment of the Museum Facility and Theatre Royal, providing additional court space at Aorangi Park and additional group fitness and programme pools space at CBay. An ongoing modernisation at the Libraries will continue in conjunction with a new roof at the Timaru Library.
Meeting the needs of an aging populationThe proportion of people aged 65+ in the district’s population is expected to increase from 20.1% in 2013 to approximately 28.2% by 2028 (Based on Stats NZ Population Projections Update (released December 2016)) An aging population is likely to result in increased demand for some services – for example older age group swimming programmes, particular types of library collections, the range of amenities provided at parks, and require consideration of accessibility issues to many of the Council owned facilities.
Making use of new technologyTechnological change both fuels community expectations and provides new opportunities for delivery of services. Rapid advances in technology have meant that facilities such as libraries and museums are effectively open virtually 24 hours a day, seven days a week. Examples of technological change impacting on these facilities include increasing digitisation of materials, eBooks and eReaders, RFID technology, multi media technology and social media.
While technology can enhance the user experience, and assist staff to provide better services, there is often a significant ongoing cost to maintaining new services. Technological change is challenging the traditional modes of delivery and may mean significant changes to the future level of service provision. The Council will continue to monitor technological changes and introduce aspects where appropriate, and where budget and resources allow.
Changing lifestyles and encouraging physical activityOur rapidly changing lifestyles have meant that many people are time poor. Changing work patterns, the ability to access information anywhere anytime, and a vast array of information accessible are all impacting on the nature of the services being delivered. Physical activity is an aspect of daily life diminishing in today’s society. Provision of high quality facilities and programmes helps facilitate improved health outcomes for society and develop skills and confidence in individuals, while fostering a sense of belonging and providing opportunity to socialise.
Earthquake Strengthening requirementsNew requirements as a result of the Building (Earthquake-prone Buildings) Amendment Act 2016 mean that a number of Council’s facilities require earthquake strengthening work. Planning, prioritising and funding this work is a major focus for Council over the next 10 years. A number of facilities have already been identified as requiring structural improvements. These include Aigantighe House Gallery and Pleasant Point Hall.
Climate changeChanges in climate conditions and the increasing frequency of extreme weather events can potentially affect the delivery of some services. Effects might include:
Coastal erosion of footpaths and coastal plantings
Increased frequency of flooding or drought and the consequences of those changes on parks and reserves in terms of damage and maintenance
Wind damage to Council owned plants and trees
Increased or decreased rates of vegetation growth due to changing climate and the subsequent impact on maintenance
Heritage Facility development and addressing collection storage issuesOver the last few years, we have been working on finding solutions to issues faced by the museum, relating to rapidly growing collections, storage space, exhibition space and modernising the facility to make it fit for purpose into the future.
The South Canterbury Museum houses an extensive collection. The Museum began in 1954 as a voluntary operation and over the years, it has evolved into a professionally run museum serving the wider South Canterbury region. The facility consists of the original Pioneer Hall (octagonal shaped building) and a collection wing added in 2000.
The current museum building has reached the limits of its suitability as a museum space. Parts of the building do not meet modern museum standards. To address these issues, Council has proposed relocating the museum exhibition areas to a new multi-purpose heritage facility built in the vicinity of and connected to the Theatre Royal. The existing museum site will be used for collection storage for both the Museum and Art Gallery, research, archives and exhibition preparation. The new facility would be used mainly for the museum, but additional exhibition space would be available for the Aigantighe Art Gallery and for touring heritage exhibitions. This will be a multi year project, during which there will be challenges maintaining levels of service for the community.
Theatre Royal Upgrade Currently the Theatre Royal is restricted in its ability to hold certain shows, both those coming from outside the district and those produced locally. The weight of stage sets and lighting has increased significantly since the current equipment was installed.
Work is needed to provide the show ‘infrastructure’ and to meet Health & Safety regulations that modern shows require. There is also potential to enhance the Theatre as a community facility, through redeveloping the foyer area to benefit show patrons and provide facilities like meeting rooms so that a bigger range of events could be hosted in future at the Theatre Royal. This is a multi year project that could be designed in conjunction with the proposed Heritage Facility.
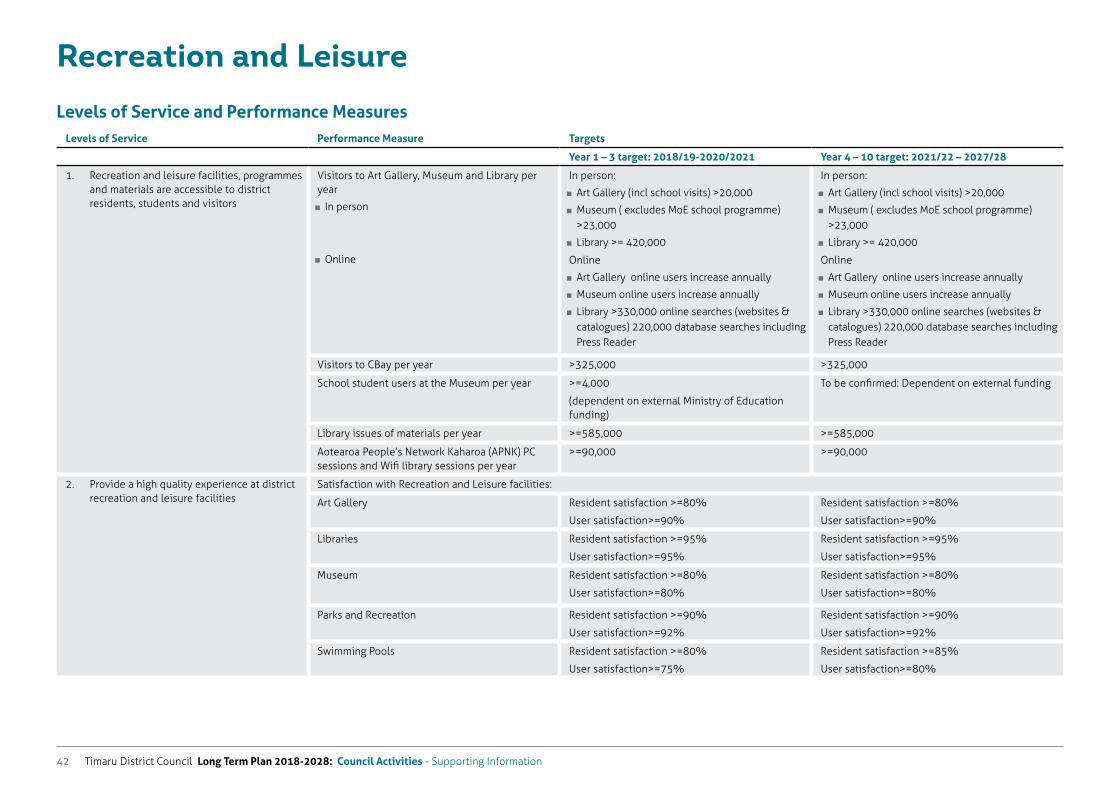
Timaru District Council Long Term Plan 2018-2028: Council Activities - Supporting Information42
Recreation and Leisure
Levels of Service and Performance MeasuresLevels of Service Performance Measure Targets
Year 1 – 3 target: 2018/19-2020/2021 Year 4 – 10 target: 2021/22 – 2027/28
1. Recreation and leisure facilities, programmes and materials are accessible to district residents, students and visitors
Visitors to Art Gallery, Museum and Library per year
� In person
� Online
In person:
� Art Gallery (incl school visits) >20,000
� Museum ( excludes MoE school programme) >23,000
� Library >= 420,000
Online
� Art Gallery online users increase annually
� Museum online users increase annually
� Library >330,000 online searches (websites & catalogues) 220,000 database searches including Press Reader
Visitors to CBay per year >325,000 >325,000
School student users at the Museum per year >=4,000
(dependent on external Ministry of Education funding)
To be confirmed: Dependent on external funding
Library issues of materials per year >=585,000 >=585,000
Aotearoa People’s Network Kaharoa (APNK) PC sessions and Wifi library sessions per year
>=90,000 >=90,000
2. Provide a high quality experience at district recreation and leisure facilities
Satisfaction with Recreation and Leisure facilities:
Art Gallery Resident satisfaction >=80%
User satisfaction>=90%
Resident satisfaction >=80%
User satisfaction>=90%
Libraries Resident satisfaction >=95%
User satisfaction>=95%
Resident satisfaction >=95%
User satisfaction>=95%
Museum Resident satisfaction >=80%
User satisfaction>=80%
Resident satisfaction >=80%
User satisfaction>=80%
Parks and Recreation Resident satisfaction >=90%
User satisfaction>=92%
Resident satisfaction >=90%
User satisfaction>=92%
Swimming Pools Resident satisfaction >=80%
User satisfaction>=75%
Resident satisfaction >=85%
User satisfaction>=80%
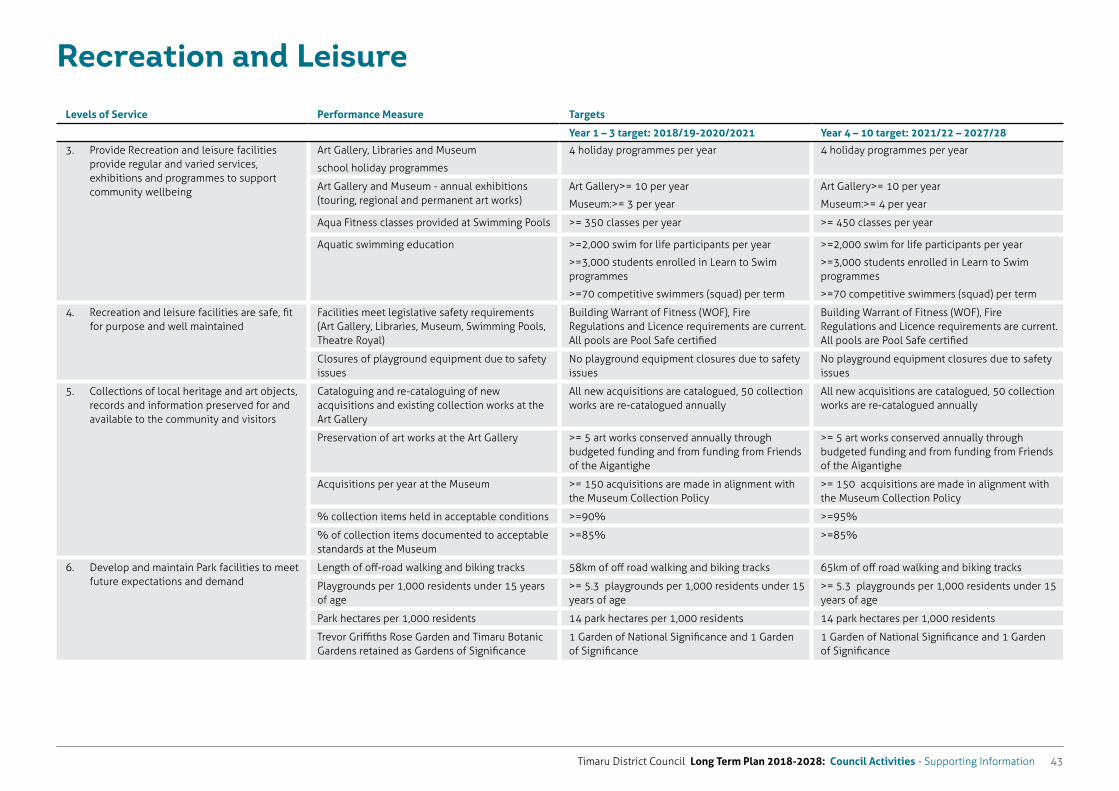
Timaru District Council Long Term Plan 2018-2028: Council Activities - Supporting Information 43
Recreation and Leisure
Levels of Service Performance Measure Targets
Year 1 – 3 target: 2018/19-2020/2021 Year 4 – 10 target: 2021/22 – 2027/28
3. Provide Recreation and leisure facilities provide regular and varied services, exhibitions and programmes to support community wellbeing
Art Gallery, Libraries and Museum
school holiday programmes
4 holiday programmes per year 4 holiday programmes per year
Art Gallery and Museum - annual exhibitions (touring, regional and permanent art works)
Art Gallery>= 10 per year
Museum:>= 3 per year
Art Gallery>= 10 per year
Museum:>= 4 per year
Aqua Fitness classes provided at Swimming Pools >= 350 classes per year >= 450 classes per year
Aquatic swimming education >=2,000 swim for life participants per year
>=3,000 students enrolled in Learn to Swim programmes
>=70 competitive swimmers (squad) per term
>=2,000 swim for life participants per year
>=3,000 students enrolled in Learn to Swim programmes
>=70 competitive swimmers (squad) per term
4. Recreation and leisure facilities are safe, fit for purpose and well maintained
Facilities meet legislative safety requirements (Art Gallery, Libraries, Museum, Swimming Pools, Theatre Royal)
Building Warrant of Fitness (WOF), Fire Regulations and Licence requirements are current. All pools are Pool Safe certified
Building Warrant of Fitness (WOF), Fire Regulations and Licence requirements are current. All pools are Pool Safe certified
Closures of playground equipment due to safety issues
No playground equipment closures due to safety issues
No playground equipment closures due to safety issues
5. Collections of local heritage and art objects, records and information preserved for and available to the community and visitors
Cataloguing and re-cataloguing of new acquisitions and existing collection works at the Art Gallery
All new acquisitions are catalogued, 50 collection works are re-catalogued annually
All new acquisitions are catalogued, 50 collection works are re-catalogued annually
Preservation of art works at the Art Gallery >= 5 art works conserved annually through budgeted funding and from funding from Friends of the Aigantighe
>= 5 art works conserved annually through budgeted funding and from funding from Friends of the Aigantighe
Acquisitions per year at the Museum >= 150 acquisitions are made in alignment with the Museum Collection Policy
>= 150 acquisitions are made in alignment with the Museum Collection Policy
% collection items held in acceptable conditions >=90% >=95%
% of collection items documented to acceptable standards at the Museum
>=85% >=85%
6. Develop and maintain Park facilities to meet future expectations and demand
Length of off-road walking and biking tracks 58km of off road walking and biking tracks 65km of off road walking and biking tracks
Playgrounds per 1,000 residents under 15 years of age
>= 5.3 playgrounds per 1,000 residents under 15 years of age
>= 5.3 playgrounds per 1,000 residents under 15 years of age
Park hectares per 1,000 residents 14 park hectares per 1,000 residents 14 park hectares per 1,000 residents
Trevor Griffiths Rose Garden and Timaru Botanic Gardens retained as Gardens of Significance
1 Garden of National Significance and 1 Garden of Significance
1 Garden of National Significance and 1 Garden of Significance
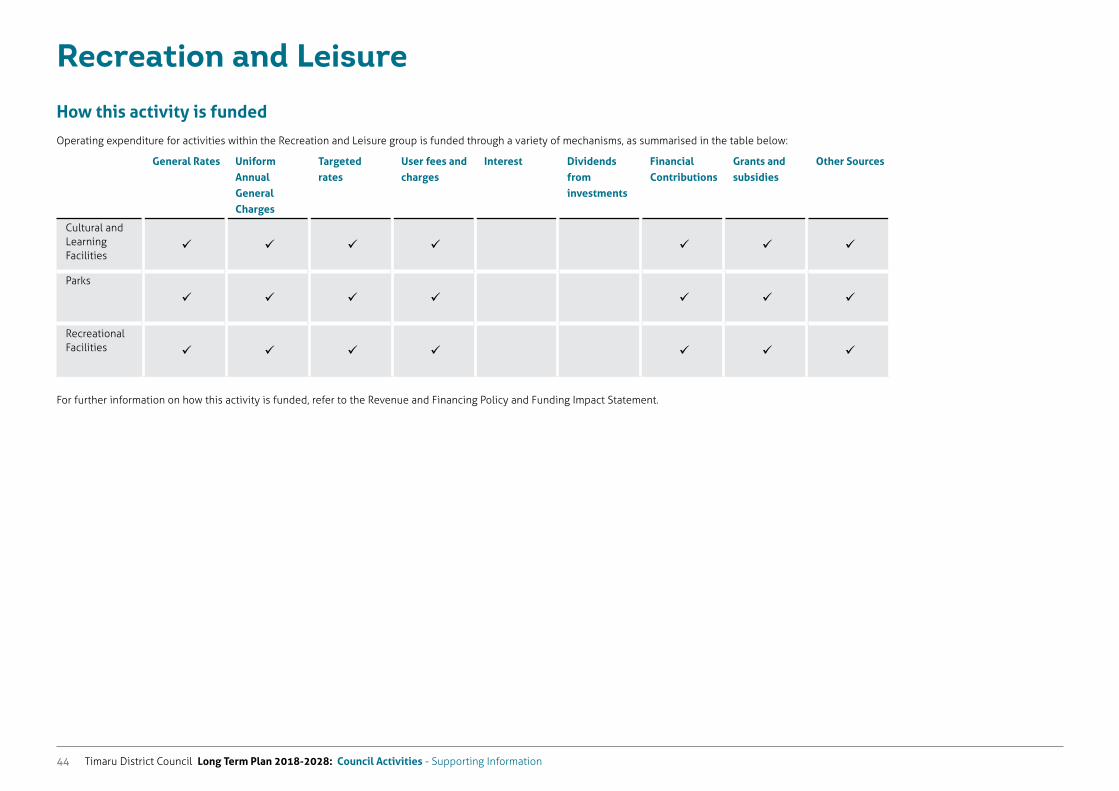
Timaru District Council Long Term Plan 2018-2028: Council Activities - Supporting Information44
How this activity is funded
Operating expenditure for activities within the Recreation and Leisure group is funded through a variety of mechanisms, as summarised in the table below:
General Rates Uniform Annual General Charges
Targeted rates
User fees and charges
Interest Dividends from investments
Financial Contributions
Grants and subsidies
Other Sources
Cultural and Learning Facilities
Parks
Recreational Facilities
For further information on how this activity is funded, refer to the Revenue and Financing Policy and Funding Impact Statement.
Recreation and Leisure
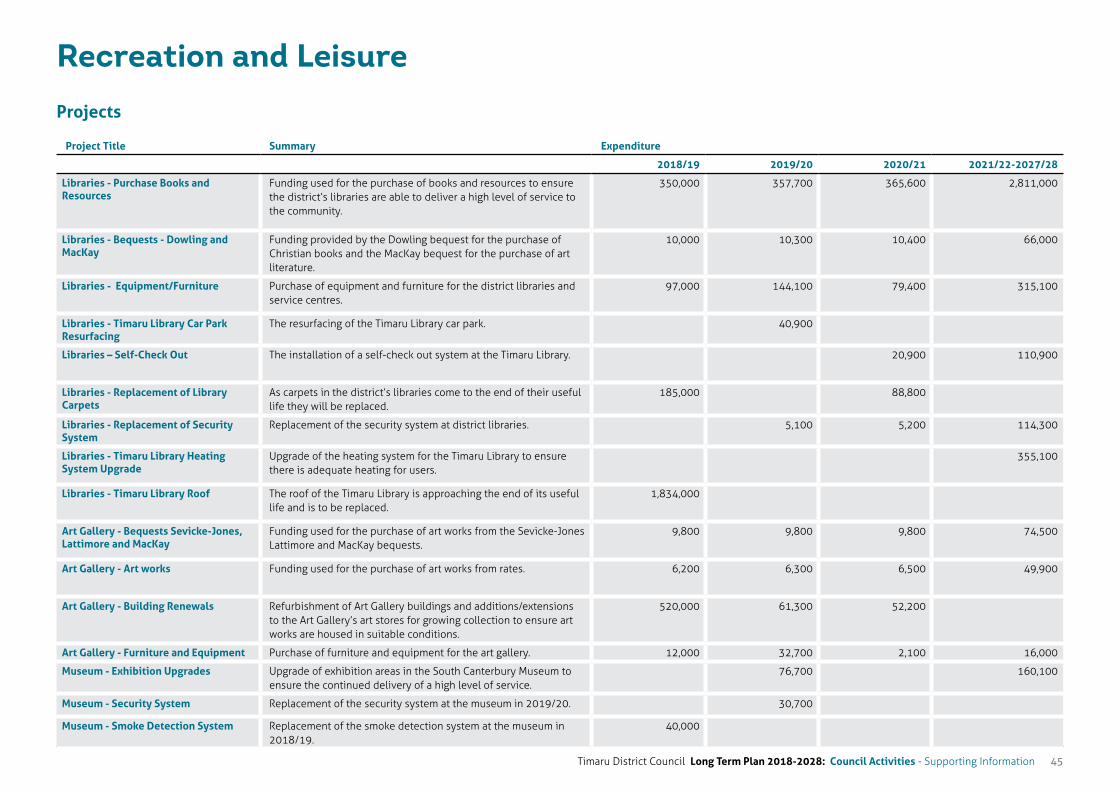
Timaru District Council Long Term Plan 2018-2028: Council Activities - Supporting Information 45
Projects
Project Title Summary Expenditure
2018/19 2019/20 2020/21 2021/22-2027/28
Libraries - Purchase Books and Resources
Funding used for the purchase of books and resources to ensure the district’s libraries are able to deliver a high level of service to the community.
350,000 357,700 365,600 2,811,000
Libraries - Bequests - Dowling and MacKay
Funding provided by the Dowling bequest for the purchase of Christian books and the MacKay bequest for the purchase of art literature.
10,000 10,300 10,400 66,000
Libraries - Equipment/Furniture Purchase of equipment and furniture for the district libraries and service centres.
97,000 144,100 79,400 315,100
Libraries - Timaru Library Car Park Resurfacing
The resurfacing of the Timaru Library car park. 40,900
Libraries – Self-Check Out The installation of a self-check out system at the Timaru Library. 20,900 110,900
Libraries - Replacement of Library Carpets
As carpets in the district’s libraries come to the end of their useful life they will be replaced.
185,000 88,800
Libraries - Replacement of Security System
Replacement of the security system at district libraries. 5,100 5,200 114,300
Libraries - Timaru Library Heating System Upgrade
Upgrade of the heating system for the Timaru Library to ensure there is adequate heating for users.
355,100
Libraries - Timaru Library Roof The roof of the Timaru Library is approaching the end of its useful life and is to be replaced.
1,834,000
Art Gallery - Bequests Sevicke-Jones, Lattimore and MacKay
Funding used for the purchase of art works from the Sevicke-Jones Lattimore and MacKay bequests.
9,800 9,800 9,800 74,500
Art Gallery - Art works Funding used for the purchase of art works from rates. 6,200 6,300 6,500 49,900
Art Gallery - Building Renewals Refurbishment of Art Gallery buildings and additions/extensions to the Art Gallery’s art stores for growing collection to ensure art works are housed in suitable conditions.
520,000 61,300 52,200
Art Gallery - Furniture and Equipment Purchase of furniture and equipment for the art gallery. 12,000 32,700 2,100 16,000
Museum - Exhibition Upgrades Upgrade of exhibition areas in the South Canterbury Museum to ensure the continued delivery of a high level of service.
76,700 160,100
Museum - Security System Replacement of the security system at the museum in 2019/20. 30,700
Museum - Smoke Detection System Replacement of the smoke detection system at the museum in 2018/19.
40,000
Recreation and Leisure
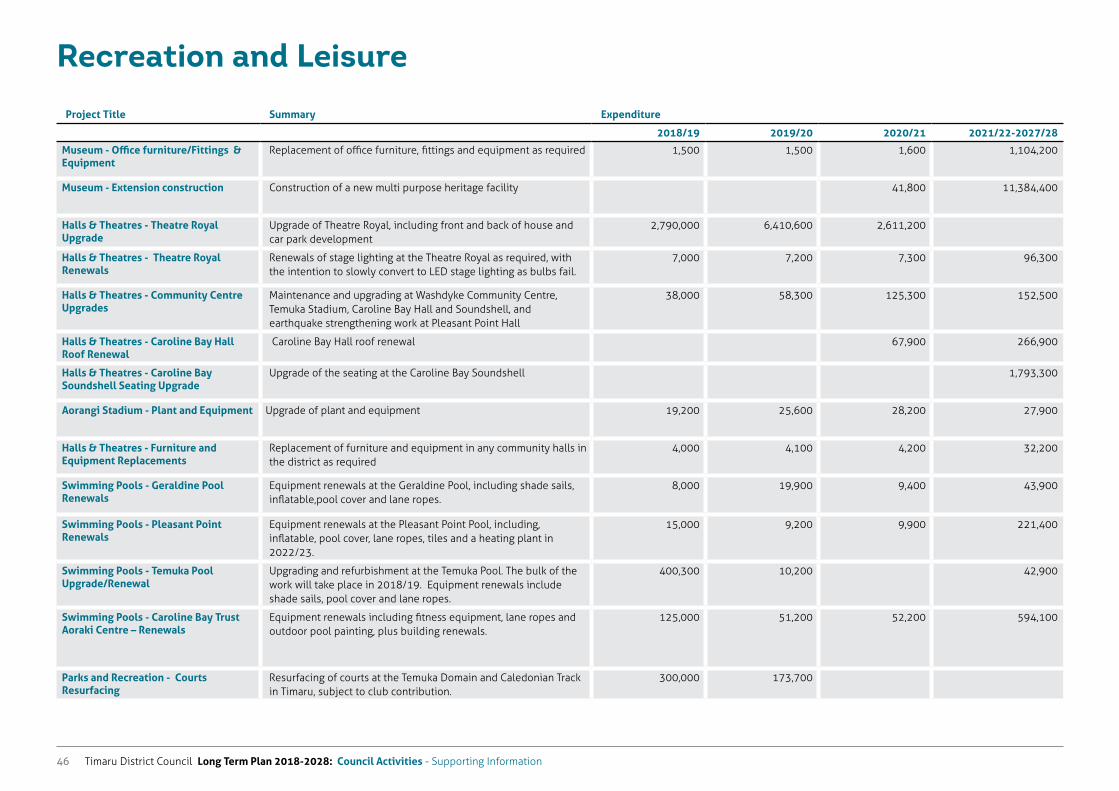
Timaru District Council Long Term Plan 2018-2028: Council Activities - Supporting Information46
Project Title Summary Expenditure
2018/19 2019/20 2020/21 2021/22-2027/28
Museum - Office furniture/Fittings & Equipment
Replacement of office furniture, fittings and equipment as required 1,500 1,500 1,600 1,104,200
Museum - Extension construction Construction of a new multi purpose heritage facility 41,800 11,384,400
Halls & Theatres - Theatre Royal Upgrade
Upgrade of Theatre Royal, including front and back of house and car park development
2,790,000 6,410,600 2,611,200
Halls & Theatres - Theatre Royal Renewals
Renewals of stage lighting at the Theatre Royal as required, with the intention to slowly convert to LED stage lighting as bulbs fail.
7,000 7,200 7,300 96,300
Halls & Theatres - Community Centre Upgrades
Maintenance and upgrading at Washdyke Community Centre, Temuka Stadium, Caroline Bay Hall and Soundshell, and earthquake strengthening work at Pleasant Point Hall
38,000 58,300 125,300 152,500
Halls & Theatres - Caroline Bay Hall Roof Renewal
Caroline Bay Hall roof renewal 67,900 266,900
Halls & Theatres - Caroline Bay Soundshell Seating Upgrade
Upgrade of the seating at the Caroline Bay Soundshell 1,793,300
Aorangi Stadium - Plant and Equipment Upgrade of plant and equipment 19,200 25,600 28,200 27,900
Halls & Theatres - Furniture and Equipment Replacements
Replacement of furniture and equipment in any community halls in the district as required
4,000 4,100 4,200 32,200
Swimming Pools - Geraldine Pool Renewals
Equipment renewals at the Geraldine Pool, including shade sails, inflatable,pool cover and lane ropes.
8,000 19,900 9,400 43,900
Swimming Pools - Pleasant Point Renewals
Equipment renewals at the Pleasant Point Pool, including, inflatable, pool cover, lane ropes, tiles and a heating plant in 2022/23.
15,000 9,200 9,900 221,400
Swimming Pools - Temuka Pool Upgrade/Renewal
Upgrading and refurbishment at the Temuka Pool. The bulk of the work will take place in 2018/19. Equipment renewals include shade sails, pool cover and lane ropes.
400,300 10,200 42,900
Swimming Pools - Caroline Bay Trust Aoraki Centre – Renewals
Equipment renewals including fitness equipment, lane ropes and outdoor pool painting, plus building renewals.
125,000 51,200 52,200 594,100
Parks and Recreation - Courts Resurfacing
Resurfacing of courts at the Temuka Domain and Caledonian Track in Timaru, subject to club contribution.
300,000 173,700
Recreation and Leisure
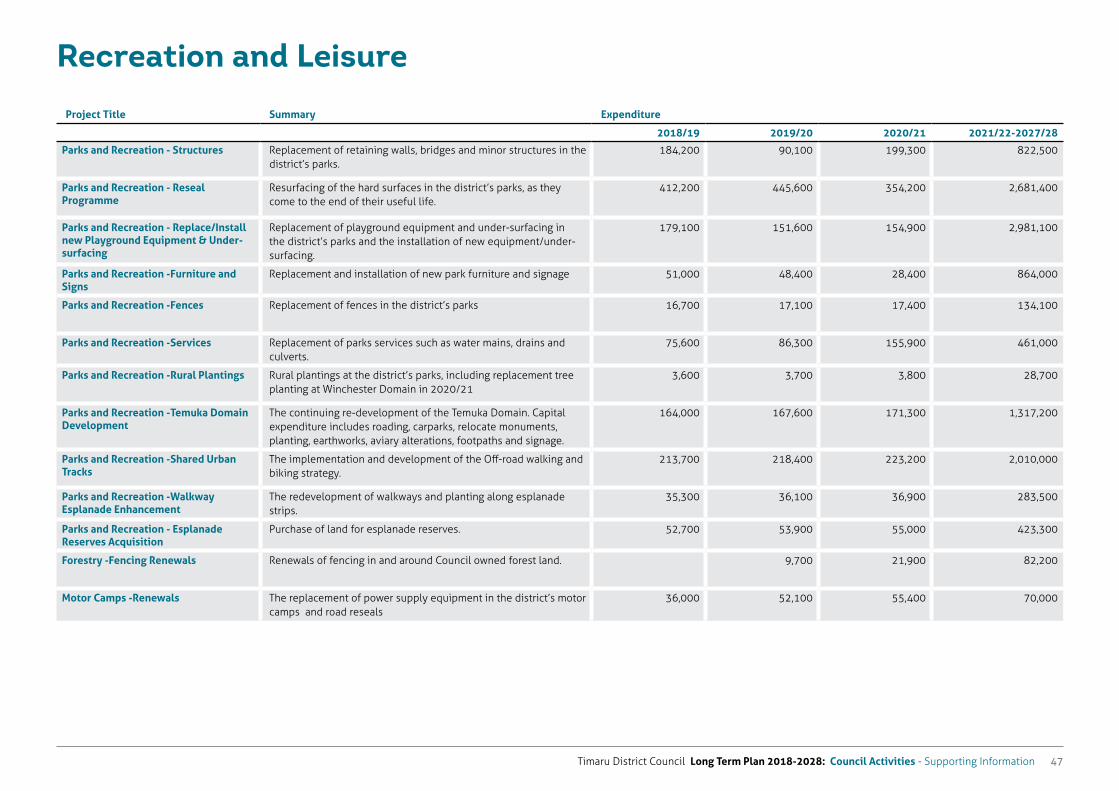
Timaru District Council Long Term Plan 2018-2028: Council Activities - Supporting Information 47
Project Title Summary Expenditure
2018/19 2019/20 2020/21 2021/22-2027/28
Parks and Recreation - Structures Replacement of retaining walls, bridges and minor structures in the district’s parks.
184,200 90,100 199,300 822,500
Parks and Recreation - Reseal Programme
Resurfacing of the hard surfaces in the district’s parks, as they come to the end of their useful life.
412,200 445,600 354,200 2,681,400
Parks and Recreation - Replace/Install new Playground Equipment & Under-surfacing
Replacement of playground equipment and under-surfacing in the district’s parks and the installation of new equipment/under-surfacing.
179,100 151,600 154,900 2,981,100
Parks and Recreation -Furniture and Signs
Replacement and installation of new park furniture and signage 51,000 48,400 28,400 864,000
Parks and Recreation -Fences Replacement of fences in the district’s parks 16,700 17,100 17,400 134,100
Parks and Recreation -Services Replacement of parks services such as water mains, drains and culverts.
75,600 86,300 155,900 461,000
Parks and Recreation -Rural Plantings Rural plantings at the district’s parks, including replacement tree planting at Winchester Domain in 2020/21
3,600 3,700 3,800 28,700
Parks and Recreation -Temuka Domain Development
The continuing re-development of the Temuka Domain. Capital expenditure includes roading, carparks, relocate monuments, planting, earthworks, aviary alterations, footpaths and signage.
164,000 167,600 171,300 1,317,200
Parks and Recreation -Shared Urban Tracks
The implementation and development of the Off-road walking and biking strategy.
213,700 218,400 223,200 2,010,000
Parks and Recreation -Walkway Esplanade Enhancement
The redevelopment of walkways and planting along esplanade strips.
35,300 36,100 36,900 283,500
Parks and Recreation - Esplanade Reserves Acquisition
Purchase of land for esplanade reserves. 52,700 53,900 55,000 423,300
Forestry -Fencing Renewals Renewals of fencing in and around Council owned forest land. 9,700 21,900 82,200
Motor Camps -Renewals The replacement of power supply equipment in the district’s motor camps and road reseals
36,000 52,100 55,400 70,000
Recreation and Leisure
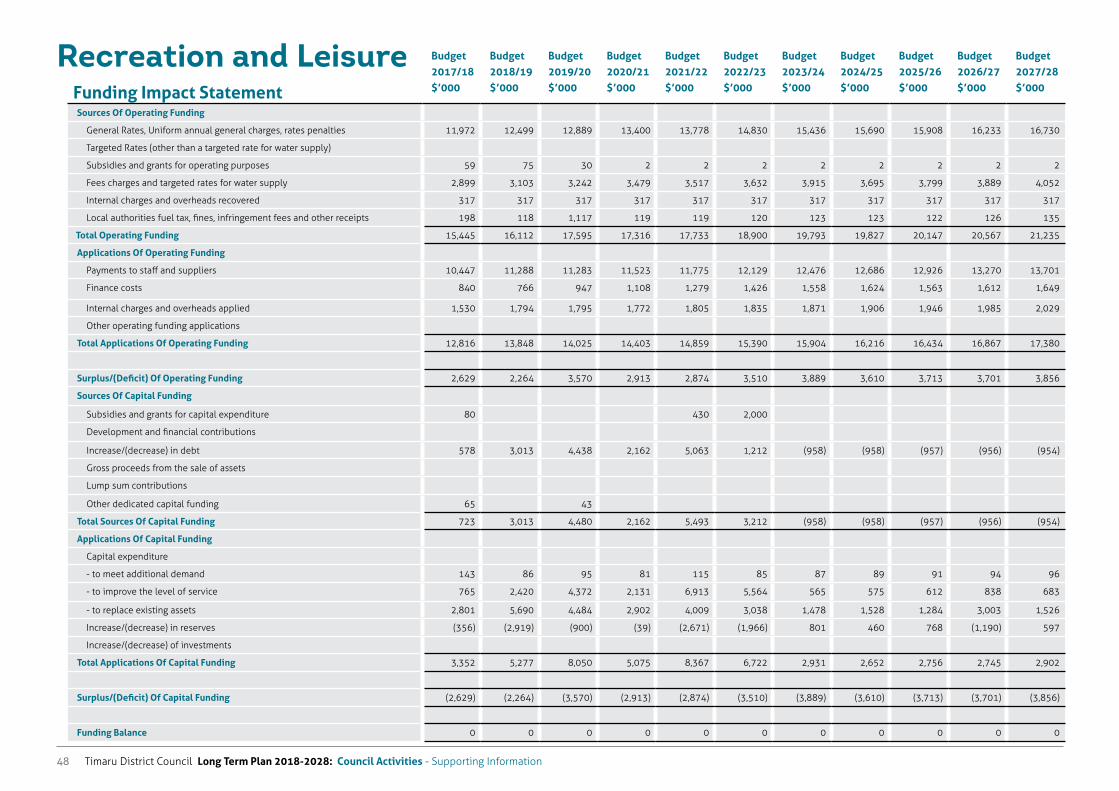
Timaru District Council Long Term Plan 2018-2028: Council Activities - Supporting Information48
Funding Impact Statement
Budget 2017/18 $’000
Budget 2018/19 $’000
Budget 2019/20 $’000
Budget 2020/21 $’000
Budget 2021/22 $’000
Budget 2022/23 $’000
Budget 2023/24 $’000
Budget 2024/25 $’000
Budget 2025/26 $’000
Budget 2026/27 $’000
Budget 2027/28 $’000
Sources Of Operating Funding
General Rates, Uniform annual general charges, rates penalties 11,972 12,499 12,889 13,400 13,778 14,830 15,436 15,690 15,908 16,233 16,730
Targeted Rates (other than a targeted rate for water supply)
Subsidies and grants for operating purposes 59 75 30 2 2 2 2 2 2 2 2
Fees charges and targeted rates for water supply 2,899 3,103 3,242 3,479 3,517 3,632 3,915 3,695 3,799 3,889 4,052
Internal charges and overheads recovered 317 317 317 317 317 317 317 317 317 317 317
Local authorities fuel tax, fines, infringement fees and other receipts 198 118 1,117 119 119 120 123 123 122 126 135
Total Operating Funding 15,445 16,112 17,595 17,316 17,733 18,900 19,793 19,827 20,147 20,567 21,235
Applications Of Operating Funding
Payments to staff and suppliers 10,447 11,288 11,283 11,523 11,775 12,129 12,476 12,686 12,926 13,270 13,701
Finance costs 840 766 947 1,108 1,279 1,426 1,558 1,624 1,563 1,612 1,649
Internal charges and overheads applied 1,530 1,794 1,795 1,772 1,805 1,835 1,871 1,906 1,946 1,985 2,029
Other operating funding applications
Total Applications Of Operating Funding 12,816 13,848 14,025 14,403 14,859 15,390 15,904 16,216 16,434 16,867 17,380
Surplus/(Deficit) Of Operating Funding 2,629 2,264 3,570 2,913 2,874 3,510 3,889 3,610 3,713 3,701 3,856
Sources Of Capital Funding
Subsidies and grants for capital expenditure 80 430 2,000
Development and financial contributions
Increase/(decrease) in debt 578 3,013 4,438 2,162 5,063 1,212 (958) (958) (957) (956) (954)
Gross proceeds from the sale of assets
Lump sum contributions
Other dedicated capital funding 65 43
Total Sources Of Capital Funding 723 3,013 4,480 2,162 5,493 3,212 (958) (958) (957) (956) (954)
Applications Of Capital Funding
Capital expenditure
- to meet additional demand 143 86 95 81 115 85 87 89 91 94 96
- to improve the level of service 765 2,420 4,372 2,131 6,913 5,564 565 575 612 838 683
- to replace existing assets 2,801 5,690 4,484 2,902 4,009 3,038 1,478 1,528 1,284 3,003 1,526
Increase/(decrease) in reserves (356) (2,919) (900) (39) (2,671) (1,966) 801 460 768 (1,190) 597
Increase/(decrease) of investments
Total Applications Of Capital Funding 3,352 5,277 8,050 5,075 8,367 6,722 2,931 2,652 2,756 2,745 2,902
Surplus/(Deficit) Of Capital Funding (2,629) (2,264) (3,570) (2,913) (2,874) (3,510) (3,889) (3,610) (3,713) (3,701) (3,856)
Funding Balance 0 0 0 0 0 0 0 0 0 0 0
Recreation and Leisure
Timaru District Council Long Term Plan 2018-2028: Council Activities - Supporting Information 49
Roading and Footpaths
Timaru District Council Long Term Plan 2018-2028: Council Activities - Supporting Information50
Roading and Footpaths
What we doRoading and Footpaths includes the following activities provided by Council:
Roading and Footpaths
Cycleways and Walkways
Parking Facilities
Roading and Footpaths is concerned with provision of the land transport network and associated assets and services throughout the district. It delivers both asset (such as roads, signs, and infrastructure) and non-asset functions (such as street cleaning, garden/berm maintenance, temporary traffic management and road safety initiatives).
Timaru District is a regional transportation hub, servicing significant agricultural areas, associated processing plants and a significant port operation. Council currently manages over 1,700km of sealed and unsealed roads, 297 bridges, (126 large culverts, 17 footbridges), 312km of footpath, drainage facilities (e.g. soak pits, culverts), street furniture, signs, bus stops, carparks, traffic signals, kerb and channel, 4,406 street lights, cycleways, road marking and some minor structures. Overall management of the assets is provided by the Council, with operational work carried out by contractors.
The activity also includes managing the parking asset (e.g. parking meters and carparks). Monitoring parking compliance in the district is carried out by the Environmental Services Group.
Council also provides many cycleways and walkways throughout the district. These range from cycleways in the road corridor, to combined walkways and cycleways that are off-road, such as beside urban and rural streams. Off road walkways and cycleways are often managed jointly between the Parks and Recreation Unit and the Land Transport Unit.
Service delivery is influenced by a complex array of government legislation and policies as well as national and regional strategies. The Council also has several strategies that help guide delivery, headlined by the Timaru Transportation Strategy, with other strategies for active transport, off road walking and cycling, public transport, road safety, lifecycle management and parking.
Funding for the management and maintenance of the roading and footpaths network is provided from rates, loans, and user
charges together with funding assistance received from central government through the New Zealand Transport Agency (NZTA). The NZTA is also responsible for the State Highway network.
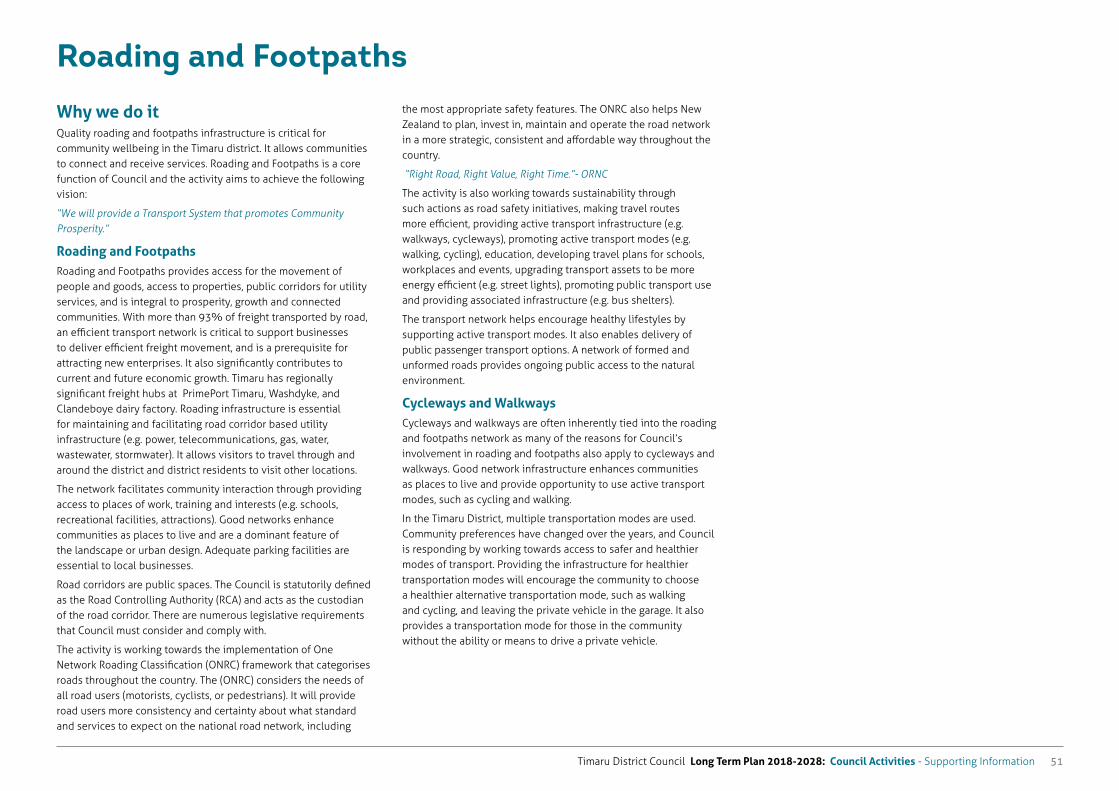
Timaru District Council Long Term Plan 2018-2028: Council Activities - Supporting Information 51
Roading and Footpaths
Why we do itQuality roading and footpaths infrastructure is critical for community wellbeing in the Timaru district. It allows communities to connect and receive services. Roading and Footpaths is a core function of Council and the activity aims to achieve the following vision:
“We will provide a Transport System that promotes Community Prosperity.”
Roading and FootpathsRoading and Footpaths provides access for the movement of people and goods, access to properties, public corridors for utility services, and is integral to prosperity, growth and connected communities. With more than 93% of freight transported by road, an efficient transport network is critical to support businesses to deliver efficient freight movement, and is a prerequisite for attracting new enterprises. It also significantly contributes to current and future economic growth. Timaru has regionally significant freight hubs at PrimePort Timaru, Washdyke, and Clandeboye dairy factory. Roading infrastructure is essential for maintaining and facilitating road corridor based utility infrastructure (e.g. power, telecommunications, gas, water, wastewater, stormwater). It allows visitors to travel through and around the district and district residents to visit other locations.
The network facilitates community interaction through providing access to places of work, training and interests (e.g. schools, recreational facilities, attractions). Good networks enhance communities as places to live and are a dominant feature of the landscape or urban design. Adequate parking facilities are essential to local businesses.
Road corridors are public spaces. The Council is statutorily defined as the Road Controlling Authority (RCA) and acts as the custodian of the road corridor. There are numerous legislative requirements that Council must consider and comply with.
The activity is working towards the implementation of One Network Roading Classification (ONRC) framework that categorises roads throughout the country. The (ONRC) considers the needs of all road users (motorists, cyclists, or pedestrians). It will provide road users more consistency and certainty about what standard and services to expect on the national road network, including
the most appropriate safety features. The ONRC also helps New Zealand to plan, invest in, maintain and operate the road network in a more strategic, consistent and affordable way throughout the country.
“Right Road, Right Value, Right Time.”- ORNC
The activity is also working towards sustainability through such actions as road safety initiatives, making travel routes more efficient, providing active transport infrastructure (e.g. walkways, cycleways), promoting active transport modes (e.g. walking, cycling), education, developing travel plans for schools, workplaces and events, upgrading transport assets to be more energy efficient (e.g. street lights), promoting public transport use and providing associated infrastructure (e.g. bus shelters).
The transport network helps encourage healthy lifestyles by supporting active transport modes. It also enables delivery of public passenger transport options. A network of formed and unformed roads provides ongoing public access to the natural environment.
Cycleways and WalkwaysCycleways and walkways are often inherently tied into the roading and footpaths network as many of the reasons for Council’s involvement in roading and footpaths also apply to cycleways and walkways. Good network infrastructure enhances communities as places to live and provide opportunity to use active transport modes, such as cycling and walking.
In the Timaru District, multiple transportation modes are used. Community preferences have changed over the years, and Council is responding by working towards access to safer and healthier modes of transport. Providing the infrastructure for healthier transportation modes will encourage the community to choose a healthier alternative transportation mode, such as walking and cycling, and leaving the private vehicle in the garage. It also provides a transportation mode for those in the community without the ability or means to drive a private vehicle.
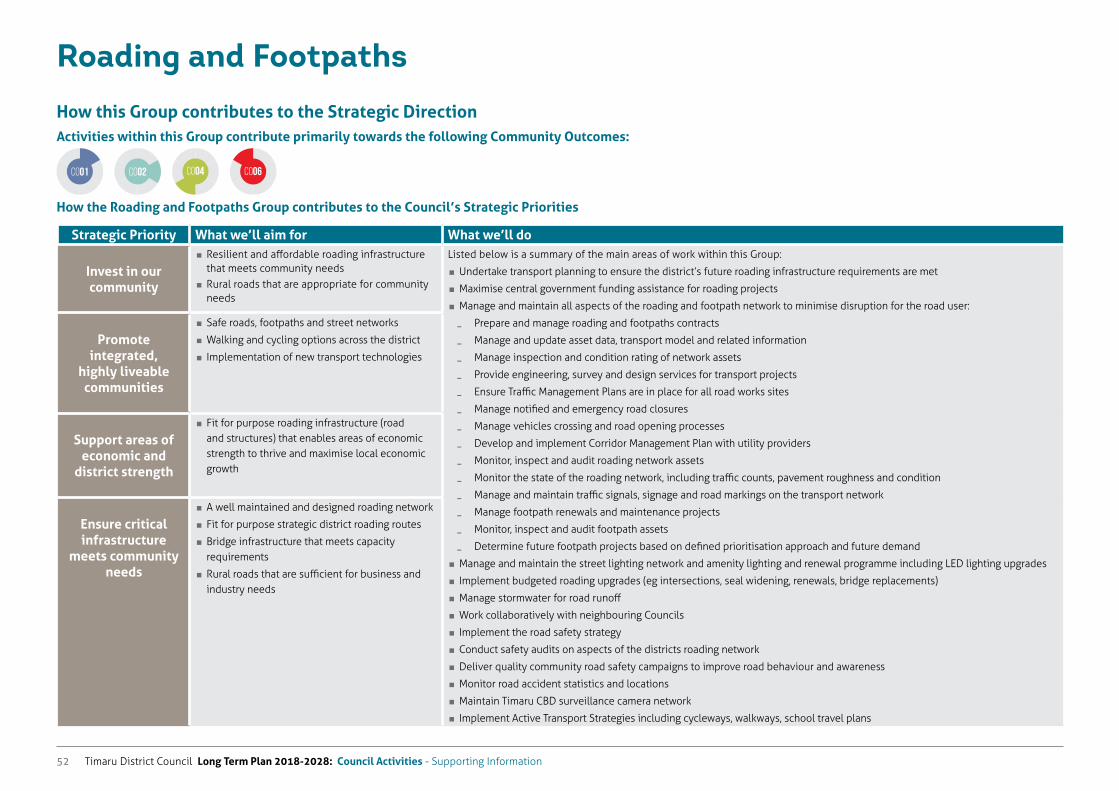
Timaru District Council Long Term Plan 2018-2028: Council Activities - Supporting Information52
Roading and Footpaths
How this Group contributes to the Strategic DirectionActivities within this Group contribute primarily towards the following Community Outcomes:
How the Roading and Footpaths Group contributes to the Council’s Strategic Priorities
Strategic Priority What we’ll aim for What we’ll do
Invest in our community
� Resilient and affordable roading infrastructure that meets community needs � Rural roads that are appropriate for community needs
Listed below is a summary of the main areas of work within this Group:
� Undertake transport planning to ensure the district’s future roading infrastructure requirements are met
� Maximise central government funding assistance for roading projects
� Manage and maintain all aspects of the roading and footpath network to minimise disruption for the road user:
� Prepare and manage roading and footpaths contracts
� Manage and update asset data, transport model and related information
� Manage inspection and condition rating of network assets
� Provide engineering, survey and design services for transport projects
� Ensure Traffic Management Plans are in place for all road works sites
� Manage notified and emergency road closures
� Manage vehicles crossing and road opening processes
� Develop and implement Corridor Management Plan with utility providers
� Monitor, inspect and audit roading network assets
� Monitor the state of the roading network, including traffic counts, pavement roughness and condition
� Manage and maintain traffic signals, signage and road markings on the transport network
� Manage footpath renewals and maintenance projects
� Monitor, inspect and audit footpath assets
� Determine future footpath projects based on defined prioritisation approach and future demand
� Manage and maintain the street lighting network and amenity lighting and renewal programme including LED lighting upgrades
� Implement budgeted roading upgrades (eg intersections, seal widening, renewals, bridge replacements)
� Manage stormwater for road runoff
� Work collaboratively with neighbouring Councils
� Implement the road safety strategy
� Conduct safety audits on aspects of the districts roading network
� Deliver quality community road safety campaigns to improve road behaviour and awareness
� Monitor road accident statistics and locations
� Maintain Timaru CBD surveillance camera network
� Implement Active Transport Strategies including cycleways, walkways, school travel plans
Promote
integrated, highly liveable communities
� Safe roads, footpaths and street networks
� Walking and cycling options across the district
� Implementation of new transport technologies
Support areas of
economic and district strength
� Fit for purpose roading infrastructure (road and structures) that enables areas of economic strength to thrive and maximise local economic growth
Ensure critical infrastructure
meets community needs
� A well maintained and designed roading network
� Fit for purpose strategic district roading routes
� Bridge infrastructure that meets capacity requirements
� Rural roads that are sufficient for business and industry needs
CO01 CO04 CO06CO02
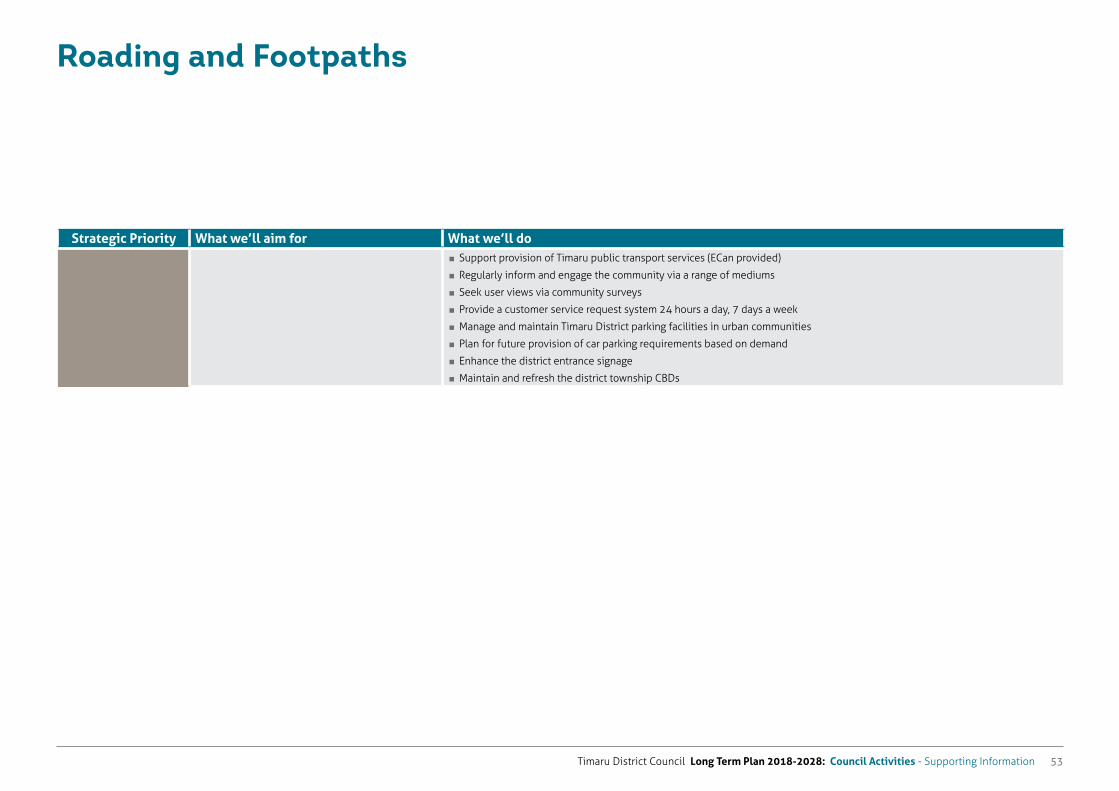
Timaru District Council Long Term Plan 2018-2028: Council Activities - Supporting Information 53
Strategic Priority What we’ll aim for What we’ll do � Support provision of Timaru public transport services (ECan provided)
� Regularly inform and engage the community via a range of mediums
� Seek user views via community surveys
� Provide a customer service request system 24 hours a day, 7 days a week
� Manage and maintain Timaru District parking facilities in urban communities
� Plan for future provision of car parking requirements based on demand
� Enhance the district entrance signage
� Maintain and refresh the district township CBDs
Roading and Footpaths
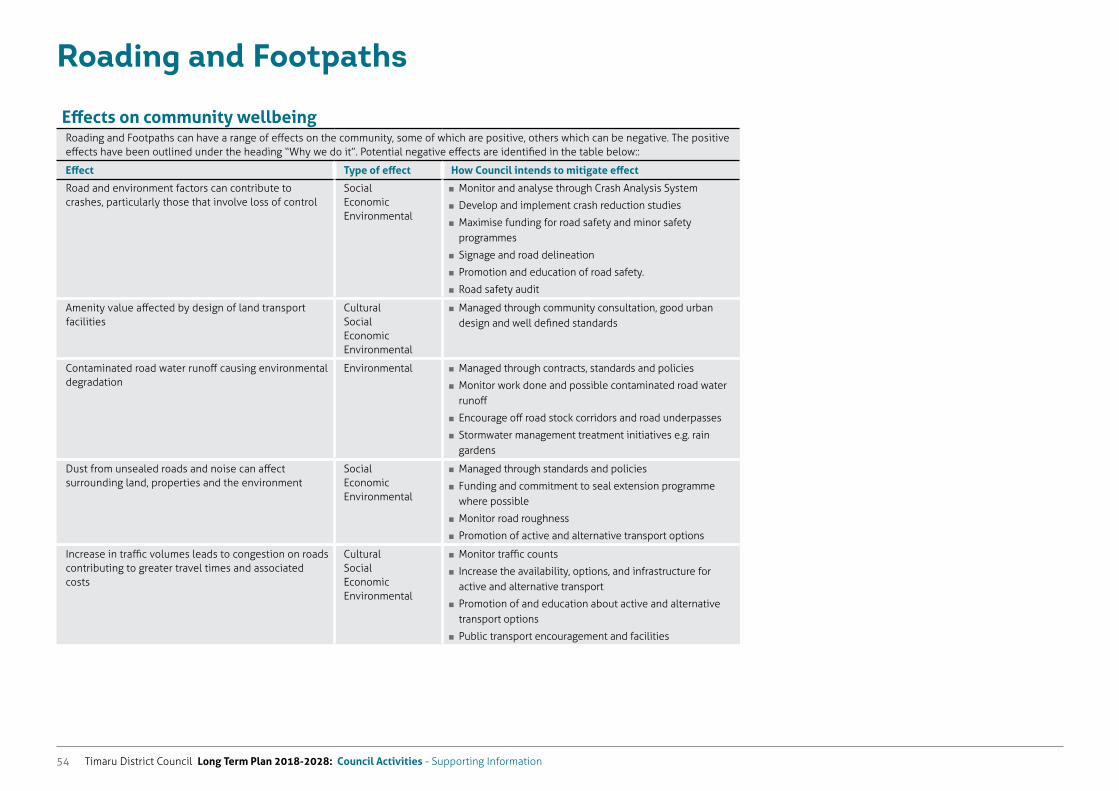
Timaru District Council Long Term Plan 2018-2028: Council Activities - Supporting Information54
Roading and Footpaths
Effects on community wellbeingRoading and Footpaths can have a range of effects on the community, some of which are positive, others which can be negative. The positive effects have been outlined under the heading “Why we do it”. Potential negative effects are identified in the table below::
Effect Type of effect How Council intends to mitigate effect
Road and environment factors can contribute to crashes, particularly those that involve loss of control
Social Economic Environmental
� Monitor and analyse through Crash Analysis System
� Develop and implement crash reduction studies
� Maximise funding for road safety and minor safety programmes
� Signage and road delineation
� Promotion and education of road safety.
� Road safety audit
Amenity value affected by design of land transport facilities
Cultural Social Economic Environmental
� Managed through community consultation, good urban design and well defined standards
Contaminated road water runoff causing environmental degradation
Environmental � Managed through contracts, standards and policies
� Monitor work done and possible contaminated road water runoff
� Encourage off road stock corridors and road underpasses
� Stormwater management treatment initiatives e.g. rain gardens
Dust from unsealed roads and noise can affect surrounding land, properties and the environment
Social Economic Environmental
� Managed through standards and policies
� Funding and commitment to seal extension programme where possible
� Monitor road roughness
� Promotion of active and alternative transport options
Increase in traffic volumes leads to congestion on roads contributing to greater travel times and associated costs
Cultural Social Economic Environmental
� Monitor traffic counts
� Increase the availability, options, and infrastructure for active and alternative transport
� Promotion of and education about active and alternative transport options
� Public transport encouragement and facilities
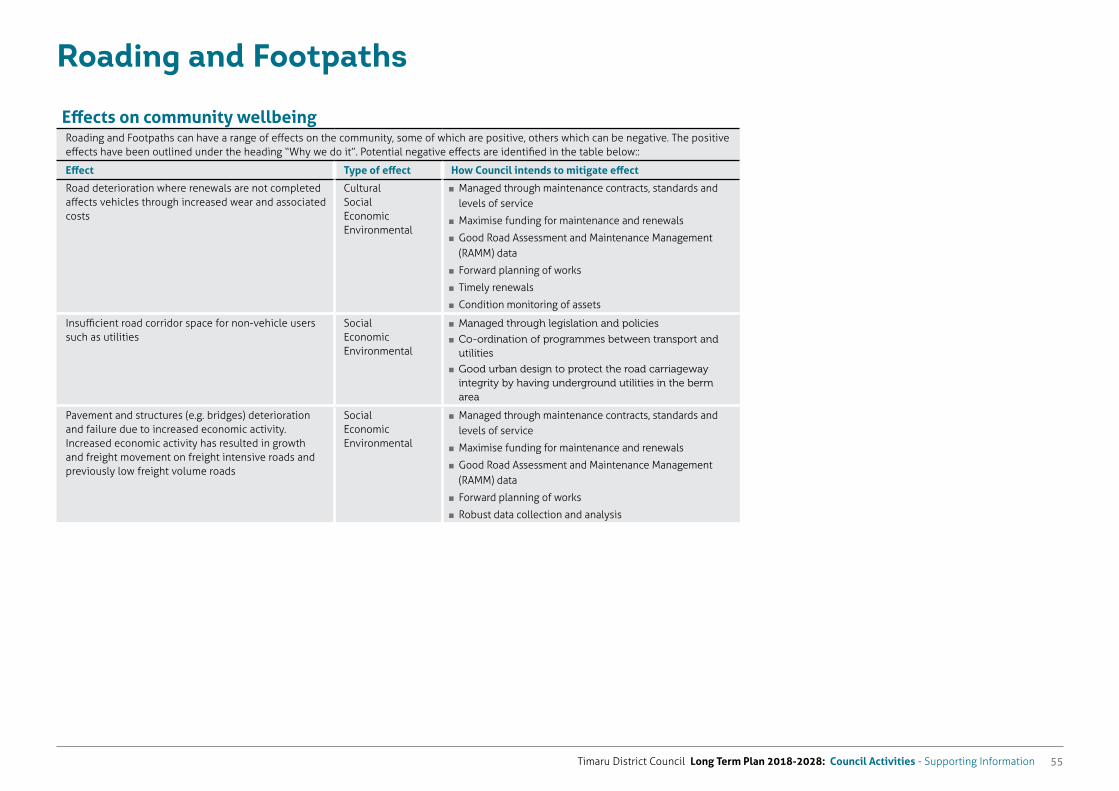
Timaru District Council Long Term Plan 2018-2028: Council Activities - Supporting Information 55
Roading and Footpaths
Effects on community wellbeingRoading and Footpaths can have a range of effects on the community, some of which are positive, others which can be negative. The positive effects have been outlined under the heading “Why we do it”. Potential negative effects are identified in the table below::
Effect Type of effect How Council intends to mitigate effect
Road deterioration where renewals are not completed affects vehicles through increased wear and associated costs
Cultural Social Economic Environmental
� Managed through maintenance contracts, standards and levels of service
� Maximise funding for maintenance and renewals
� Good Road Assessment and Maintenance Management (RAMM) data
� Forward planning of works
� Timely renewals
� Condition monitoring of assets
Insufficient road corridor space for non-vehicle users such as utilities
Social Economic Environmental
� Managed through legislation and policies
� Co-ordination of programmes between transport and utilities
� Good urban design to protect the road carriageway integrity by having underground utilities in the berm area
Pavement and structures (e.g. bridges) deterioration and failure due to increased economic activity. Increased economic activity has resulted in growth and freight movement on freight intensive roads and previously low freight volume roads
Social Economic Environmental
� Managed through maintenance contracts, standards and levels of service
� Maximise funding for maintenance and renewals
� Good Road Assessment and Maintenance Management (RAMM) data
� Forward planning of works
� Robust data collection and analysis
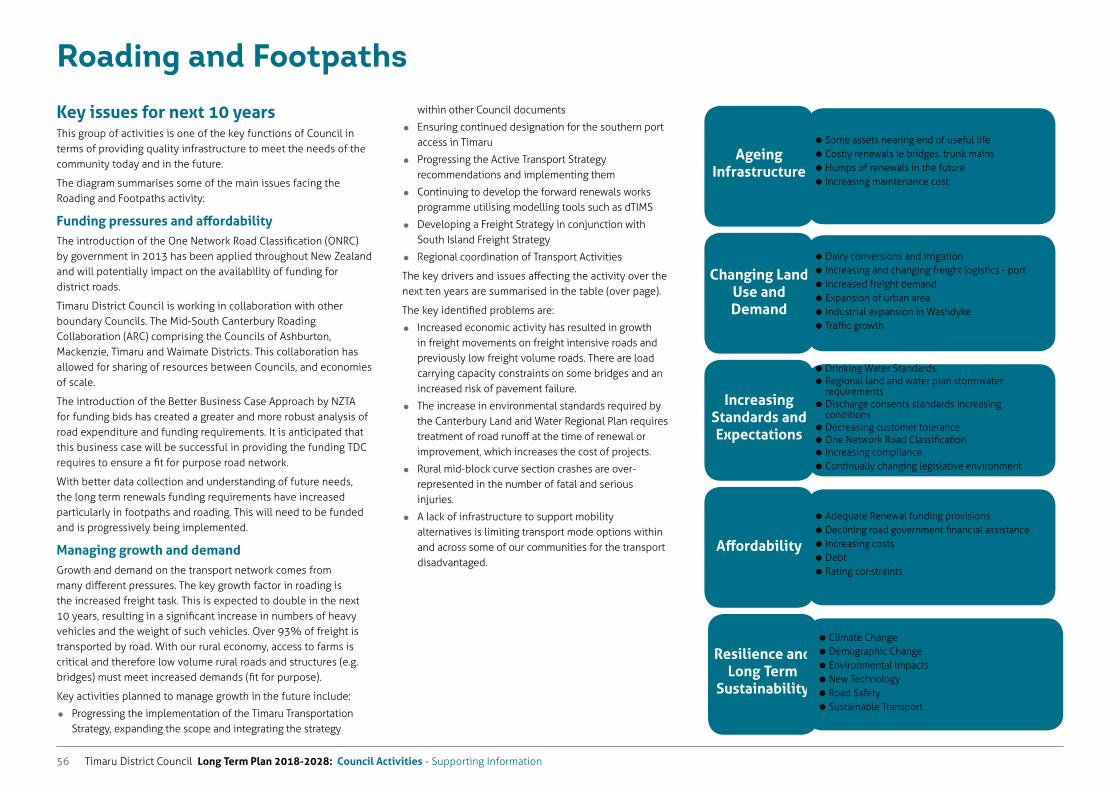
Timaru District Council Long Term Plan 2018-2028: Council Activities - Supporting Information56
Roading and Footpaths
Key issues for next 10 yearsThis group of activities is one of the key functions of Council in terms of providing quality infrastructure to meet the needs of the community today and in the future.
The diagram summarises some of the main issues facing the Roading and Footpaths activity:
Funding pressures and affordabilityThe introduction of the One Network Road Classification (ONRC) by government in 2013 has been applied throughout New Zealand and will potentially impact on the availability of funding for district roads.
Timaru District Council is working in collaboration with other boundary Councils. The Mid-South Canterbury Roading Collaboration (ARC) comprising the Councils of Ashburton, Mackenzie, Timaru and Waimate Districts. This collaboration has allowed for sharing of resources between Councils, and economies of scale.
The introduction of the Better Business Case Approach by NZTA for funding bids has created a greater and more robust analysis of road expenditure and funding requirements. It is anticipated that this business case will be successful in providing the funding TDC requires to ensure a fit for purpose road network.
With better data collection and understanding of future needs, the long term renewals funding requirements have increased particularly in footpaths and roading. This will need to be funded and is progressively being implemented.
Managing growth and demandGrowth and demand on the transport network comes from many different pressures. The key growth factor in roading is the increased freight task. This is expected to double in the next 10 years, resulting in a significant increase in numbers of heavy vehicles and the weight of such vehicles. Over 93% of freight is transported by road. With our rural economy, access to farms is critical and therefore low volume rural roads and structures (e.g. bridges) must meet increased demands (fit for purpose).
Key activities planned to manage growth in the future include:
Progressing the implementation of the Timaru Transportation Strategy, expanding the scope and integrating the strategy
within other Council documents
Ensuring continued designation for the southern port access in Timaru
Progressing the Active Transport Strategy recommendations and implementing them
Continuing to develop the forward renewals works programme utilising modelling tools such as dTIMS
Developing a Freight Strategy in conjunction with South Island Freight Strategy
Regional coordination of Transport Activities
The key drivers and issues affecting the activity over the next ten years are summarised in the table (over page).
The key identified problems are:
Increased economic activity has resulted in growth in freight movements on freight intensive roads and previously low freight volume roads. There are load carrying capacity constraints on some bridges and an increased risk of pavement failure.
The increase in environmental standards required by the Canterbury Land and Water Regional Plan requires treatment of road runoff at the time of renewal or improvement, which increases the cost of projects.
Rural mid-block curve section crashes are over-represented in the number of fatal and serious injuries.
A lack of infrastructure to support mobility alternatives is limiting transport mode options within and across some of our communities for the transport disadvantaged.
Ageing Infrastructure
Some assets nearing end of useful life Costly renewals ie bridges, trunk mains Humps of renewals in the future Increasing maintenance cost
Changing Land Use and Demand
Dairy conversions and irrigation Increasing and changing freight logistics - port Increased freight demand Expansion of urban area Industrial expansion in Washdyke Traffic growth
Increasing Standards and Expectations
Drinking Water Standards Regional land and water plan stormwater requirements Discharge consents standards increasing conditions Decreasing customer tolerance One Network Road Classification Increasing compliance Continually changing legislative environment
Affordability
Adequate Renewal funding provisions Declining road government financial assistance Increasing costs Debt Rating constraints
Resilience and Long Term
Sustainability
Climate Change Demographic Change Environmental Impacts New Technology Road Safety Sustainable Transport
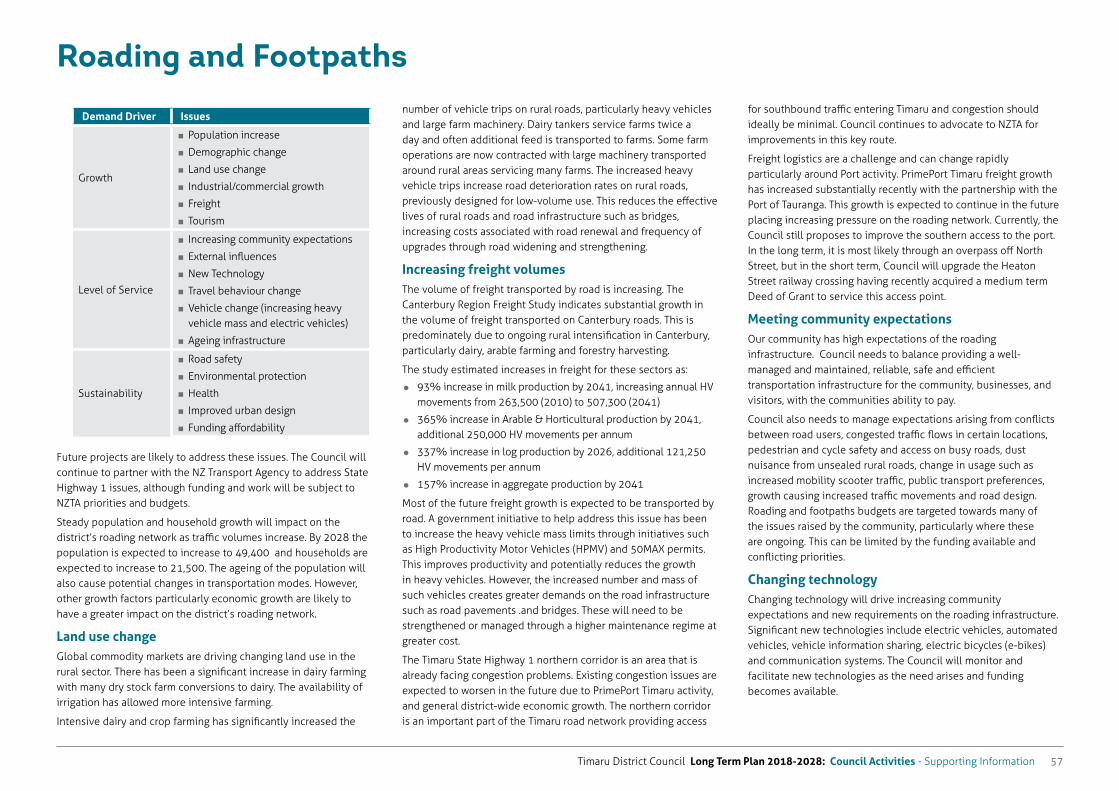
Timaru District Council Long Term Plan 2018-2028: Council Activities - Supporting Information 57
Roading and Footpaths
Demand Driver Issues
Growth
� Population increase
� Demographic change
� Land use change
� Industrial/commercial growth
� Freight
� Tourism
Level of Service
� Increasing community expectations
� External influences
� New Technology
� Travel behaviour change
� Vehicle change (increasing heavy vehicle mass and electric vehicles)
� Ageing infrastructure
Sustainability
� Road safety
� Environmental protection
� Health
� Improved urban design
� Funding affordability
Future projects are likely to address these issues. The Council will continue to partner with the NZ Transport Agency to address State Highway 1 issues, although funding and work will be subject to NZTA priorities and budgets.
Steady population and household growth will impact on the district’s roading network as traffic volumes increase. By 2028 the population is expected to increase to 49,400 and households are expected to increase to 21,500. The ageing of the population will also cause potential changes in transportation modes. However, other growth factors particularly economic growth are likely to have a greater impact on the district’s roading network.
Land use changeGlobal commodity markets are driving changing land use in the rural sector. There has been a significant increase in dairy farming with many dry stock farm conversions to dairy. The availability of irrigation has allowed more intensive farming.
Intensive dairy and crop farming has significantly increased the
number of vehicle trips on rural roads, particularly heavy vehicles and large farm machinery. Dairy tankers service farms twice a day and often additional feed is transported to farms. Some farm operations are now contracted with large machinery transported around rural areas servicing many farms. The increased heavy vehicle trips increase road deterioration rates on rural roads, previously designed for low-volume use. This reduces the effective lives of rural roads and road infrastructure such as bridges, increasing costs associated with road renewal and frequency of upgrades through road widening and strengthening.
Increasing freight volumesThe volume of freight transported by road is increasing. The Canterbury Region Freight Study indicates substantial growth in the volume of freight transported on Canterbury roads. This is predominately due to ongoing rural intensification in Canterbury, particularly dairy, arable farming and forestry harvesting.
The study estimated increases in freight for these sectors as:
93% increase in milk production by 2041, increasing annual HV movements from 263,500 (2010) to 507,300 (2041)
365% increase in Arable & Horticultural production by 2041, additional 250,000 HV movements per annum
337% increase in log production by 2026, additional 121,250 HV movements per annum
157% increase in aggregate production by 2041
Most of the future freight growth is expected to be transported by road. A government initiative to help address this issue has been to increase the heavy vehicle mass limits through initiatives such as High Productivity Motor Vehicles (HPMV) and 50MAX permits. This improves productivity and potentially reduces the growth in heavy vehicles. However, the increased number and mass of such vehicles creates greater demands on the road infrastructure such as road pavements .and bridges. These will need to be strengthened or managed through a higher maintenance regime at greater cost.
The Timaru State Highway 1 northern corridor is an area that is already facing congestion problems. Existing congestion issues are expected to worsen in the future due to PrimePort Timaru activity, and general district-wide economic growth. The northern corridor is an important part of the Timaru road network providing access
for southbound traffic entering Timaru and congestion should ideally be minimal. Council continues to advocate to NZTA for improvements in this key route.
Freight logistics are a challenge and can change rapidly particularly around Port activity. PrimePort Timaru freight growth has increased substantially recently with the partnership with the Port of Tauranga. This growth is expected to continue in the future placing increasing pressure on the roading network. Currently, the Council still proposes to improve the southern access to the port. In the long term, it is most likely through an overpass off North Street, but in the short term, Council will upgrade the Heaton Street railway crossing having recently acquired a medium term Deed of Grant to service this access point.
Meeting community expectationsOur community has high expectations of the roading infrastructure. Council needs to balance providing a well-managed and maintained, reliable, safe and efficient transportation infrastructure for the community, businesses, and visitors, with the communities ability to pay.
Council also needs to manage expectations arising from conflicts between road users, congested traffic flows in certain locations, pedestrian and cycle safety and access on busy roads, dust nuisance from unsealed rural roads, change in usage such as increased mobility scooter traffic, public transport preferences, growth causing increased traffic movements and road design. Roading and footpaths budgets are targeted towards many of the issues raised by the community, particularly where these are ongoing. This can be limited by the funding available and conflicting priorities.
Changing technologyChanging technology will drive increasing community expectations and new requirements on the roading infrastructure. Significant new technologies include electric vehicles, automated vehicles, vehicle information sharing, electric bicycles (e-bikes) and communication systems. The Council will monitor and facilitate new technologies as the need arises and funding becomes available.
Timaru District Council Long Term Plan 2018-2028: Council Activities - Supporting Information58
Roading and FootpathsPlanning and funding framework for roading and footpathsA complex planning and funding framework exists for transport, which encompasses local, regional and central government. Government legislation and Regional Land Transport policies, strategies have a significant impact on funding of the activity and the targets it has to meet. Key legislation includes the Land Transport Management Act 2003 (LTMA) and Local Government Act 2002 (LGA). The purpose of the LTMA is to contribute to an effective, efficient, and safe land transport system in the public interest.
Roading projects are subject to a regional approval process through the Canterbury Regional Transport Committee. This in turn is subject to the priorities identified by government through the Government Policy Statement on Land Transport. Currently, the final approved national Land Transport programme occurs in August, which follows Council’s consultation on and adoption of the LTP . This means that funding is not guaranteed for projects identified in the Council’s programme.
Ageing infrastructureA significant amount of the district’s roading, bridge and footpaths infrastructure was constructed between 50 and 80 years ago, during “pioneer” or “boom” times to provide access to land, industry, rail and ports. At this time there was significant optimism of continued growth and infrastructure was often designed to accommodate these future demands. While this foresight has had benefits, a proportion of the district’s roading assets are now nearing the end of their service life.
Planned work includes reconstruction of roads, renewal of kerb and channel, footpaths, traffic signals and signs, resealing, bridge replacements and culvert renewals.
While the district’s 297 bridges are generally in good condition, many are ageing and will require replacement in 10-20 years time. Larger and heavier farm machinery and trucks are also demanding a higher level of service for bridges, many of which are rural, one-lane and narrow. Funding requirements will increase in future years as more bridges need replacement, with a larger increase beyond 2020.
Road safetyImproving road safety in the district continues to be a priority for Council. Of particular concern is the over representation of rural mid-block curve section crashes in the number of fatal and serious injury crashes. Other issues include speed, intersections, alcohol, poor observation and young drivers. Improving road safety is also about changing behaviour and attitudes. This can often take generations and there are no quick fix solutions.
In recent years, some gains have been made and crash statistics have continually trended downwards. Work is ongoing and includes both improvements to the existing road network and educating drivers about appropriate behaviour. Council aims to work with partner agencies to improve road safety in the district and is the lead agency for the South Canterbury sub-region (Timaru, Mackenzie, and Waimate Districts) for road safety education.
Active transport promotionCouncil aims to encourage active lifestyles within the district and the Active Transport Strategy forms part of this. It provides a framework that recognises that our roads are public spaces and not simply the domain of vehicles, and recognises that our network also has to cater for other modes of transport such as cycling, walking and the use of public transport. The strategy will continue to be implemented as funding permits.
Stormwater quality improvementsNew requirements under the Canterbury Land and Water Plan mean stormwater quality has to improve. This has implications for the activity as it will potentially require stormwater treatment or retention options to be built into roading renewal work, such as swales or rain gardens. Challenges in achieving this include land availability in the road reserve, ongoing maintenance costs and the capital installation cost.
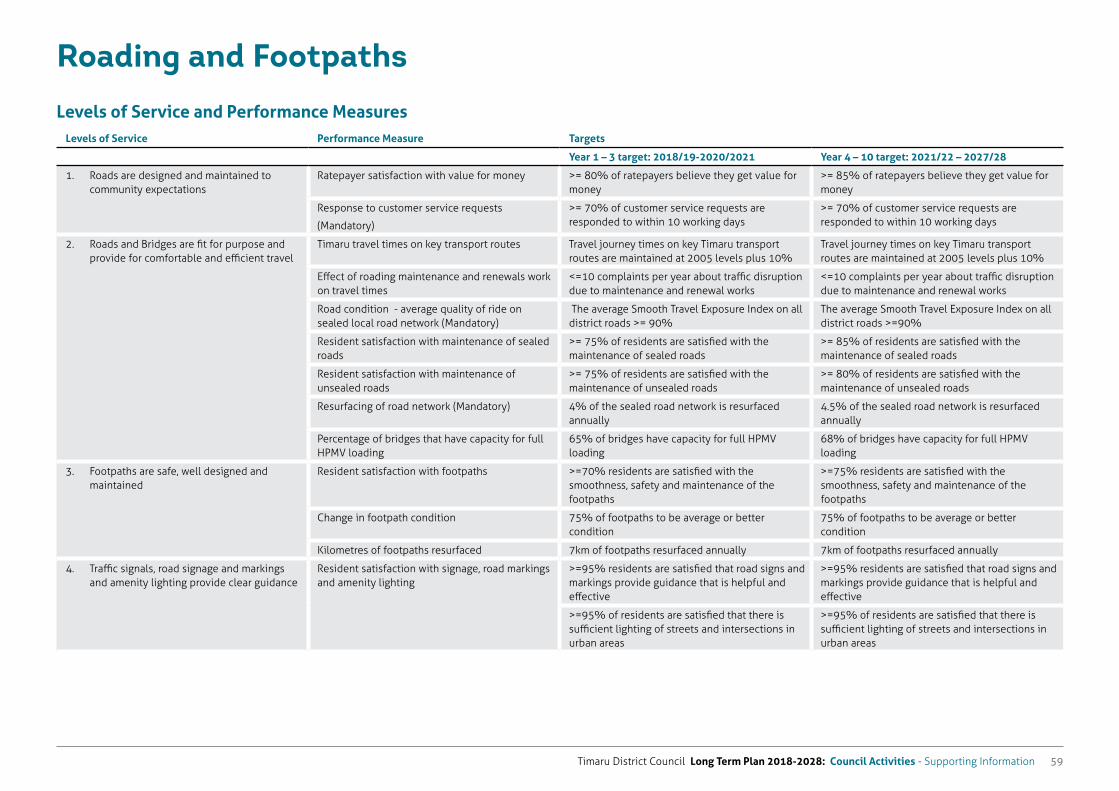
Timaru District Council Long Term Plan 2018-2028: Council Activities - Supporting Information 59
Roading and Footpaths
Levels of Service and Performance MeasuresLevels of Service Performance Measure Targets
Year 1 – 3 target: 2018/19-2020/2021 Year 4 – 10 target: 2021/22 – 2027/28
1. Roads are designed and maintained to community expectations
Ratepayer satisfaction with value for money >= 80% of ratepayers believe they get value for money
>= 85% of ratepayers believe they get value for money
Response to customer service requests
(Mandatory)
>= 70% of customer service requests are responded to within 10 working days
>= 70% of customer service requests are responded to within 10 working days
2. Roads and Bridges are fit for purpose and provide for comfortable and efficient travel
Timaru travel times on key transport routes Travel journey times on key Timaru transport routes are maintained at 2005 levels plus 10%
Travel journey times on key Timaru transport routes are maintained at 2005 levels plus 10%
Effect of roading maintenance and renewals work on travel times
<=10 complaints per year about traffic disruption due to maintenance and renewal works
<=10 complaints per year about traffic disruption due to maintenance and renewal works
Road condition - average quality of ride on sealed local road network (Mandatory)
The average Smooth Travel Exposure Index on all district roads >= 90%
The average Smooth Travel Exposure Index on all district roads >=90%
Resident satisfaction with maintenance of sealed roads
>= 75% of residents are satisfied with the maintenance of sealed roads
>= 85% of residents are satisfied with the maintenance of sealed roads
Resident satisfaction with maintenance of unsealed roads
>= 75% of residents are satisfied with the maintenance of unsealed roads
>= 80% of residents are satisfied with the maintenance of unsealed roads
Resurfacing of road network (Mandatory) 4% of the sealed road network is resurfaced annually
4.5% of the sealed road network is resurfaced annually
Percentage of bridges that have capacity for full HPMV loading
65% of bridges have capacity for full HPMV loading
68% of bridges have capacity for full HPMV loading
3. Footpaths are safe, well designed and maintained
Resident satisfaction with footpaths >=70% residents are satisfied with the smoothness, safety and maintenance of the footpaths
>=75% residents are satisfied with the smoothness, safety and maintenance of the footpaths
Change in footpath condition 75% of footpaths to be average or better condition
75% of footpaths to be average or better condition
Kilometres of footpaths resurfaced 7km of footpaths resurfaced annually 7km of footpaths resurfaced annually
4. Traffic signals, road signage and markings and amenity lighting provide clear guidance
Resident satisfaction with signage, road markings and amenity lighting
>=95% residents are satisfied that road signs and markings provide guidance that is helpful and effective
>=95% residents are satisfied that road signs and markings provide guidance that is helpful and effective
>=95% of residents are satisfied that there is sufficient lighting of streets and intersections in urban areas
>=95% of residents are satisfied that there is sufficient lighting of streets and intersections in urban areas
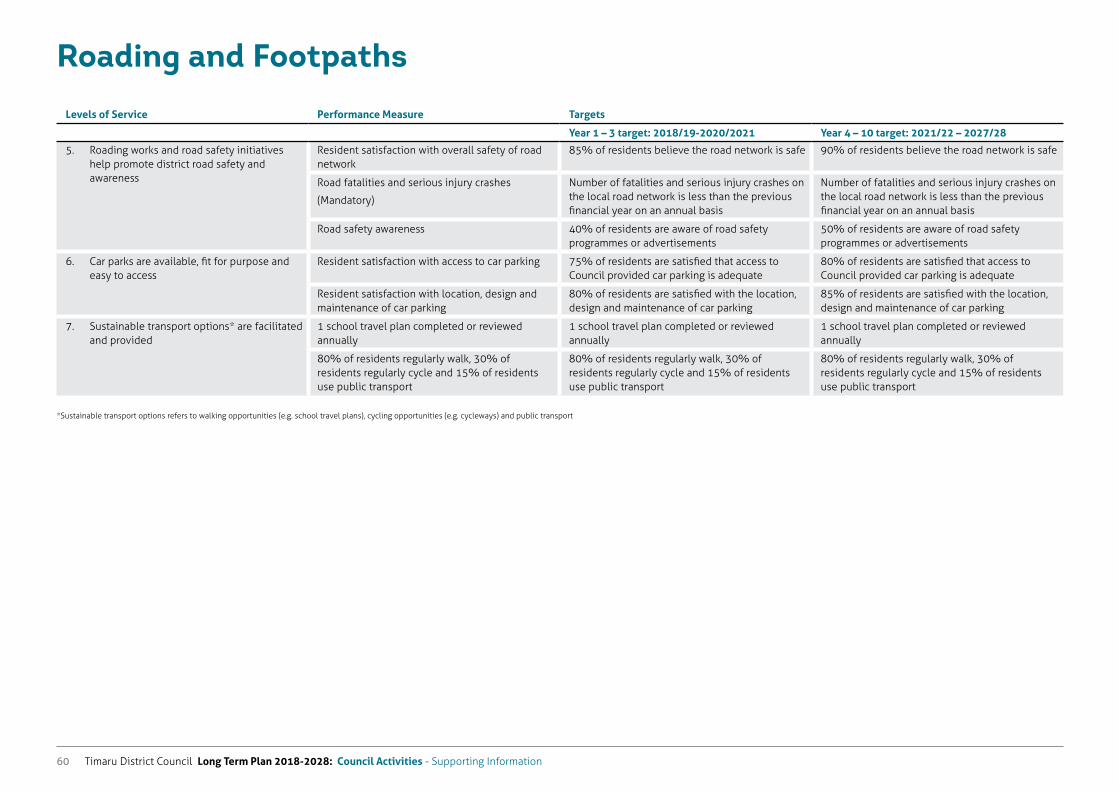
Timaru District Council Long Term Plan 2018-2028: Council Activities - Supporting Information60
Roading and Footpaths
Levels of Service Performance Measure Targets
Year 1 – 3 target: 2018/19-2020/2021 Year 4 – 10 target: 2021/22 – 2027/28
5. Roading works and road safety initiatives help promote district road safety and awareness
Resident satisfaction with overall safety of road network
85% of residents believe the road network is safe 90% of residents believe the road network is safe
Road fatalities and serious injury crashes
(Mandatory)
Number of fatalities and serious injury crashes on the local road network is less than the previous financial year on an annual basis
Number of fatalities and serious injury crashes on the local road network is less than the previous financial year on an annual basis
Road safety awareness 40% of residents are aware of road safety programmes or advertisements
50% of residents are aware of road safety programmes or advertisements
6. Car parks are available, fit for purpose and easy to access
Resident satisfaction with access to car parking 75% of residents are satisfied that access to Council provided car parking is adequate
80% of residents are satisfied that access to Council provided car parking is adequate
Resident satisfaction with location, design and maintenance of car parking
80% of residents are satisfied with the location, design and maintenance of car parking
85% of residents are satisfied with the location, design and maintenance of car parking
7. Sustainable transport options* are facilitated and provided
1 school travel plan completed or reviewed annually
1 school travel plan completed or reviewed annually
1 school travel plan completed or reviewed annually
80% of residents regularly walk, 30% of residents regularly cycle and 15% of residents use public transport
80% of residents regularly walk, 30% of residents regularly cycle and 15% of residents use public transport
80% of residents regularly walk, 30% of residents regularly cycle and 15% of residents use public transport
*Sustainable transport options refers to walking opportunities (e.g. school travel plans), cycling opportunities (e.g. cycleways) and public transport
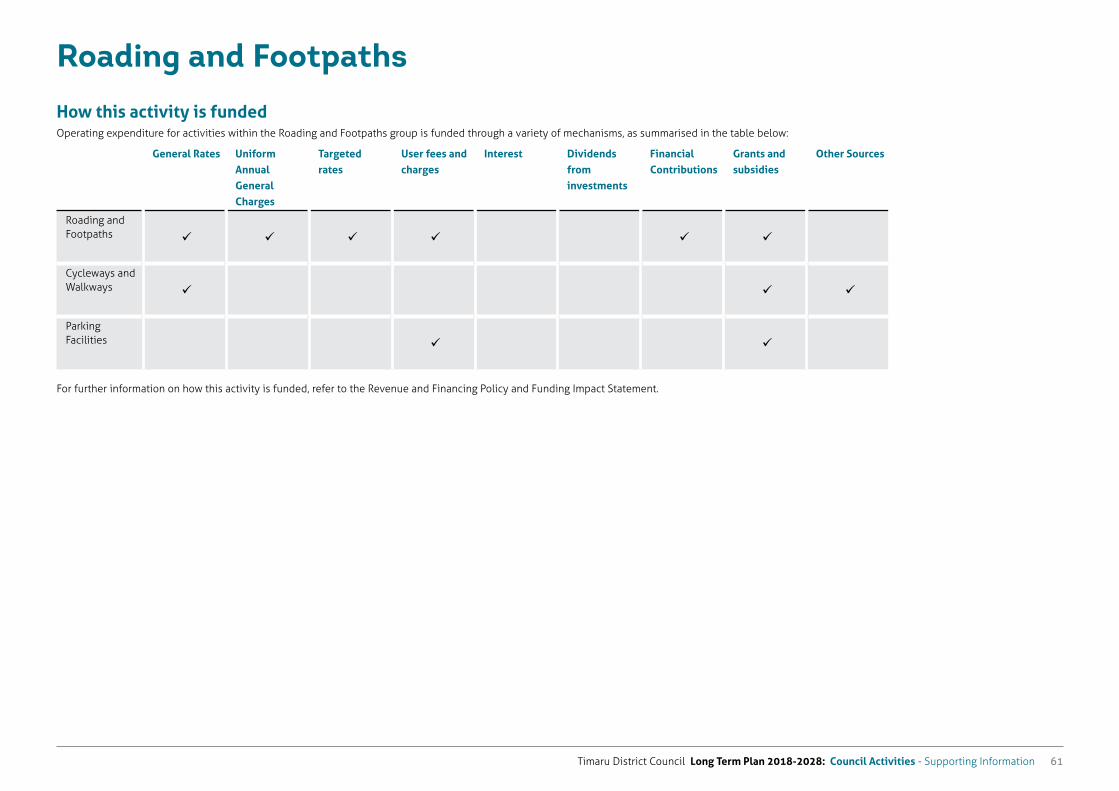
Timaru District Council Long Term Plan 2018-2028: Council Activities - Supporting Information 61
Roading and Footpaths
How this activity is fundedOperating expenditure for activities within the Roading and Footpaths group is funded through a variety of mechanisms, as summarised in the table below:
General Rates Uniform Annual General Charges
Targeted rates
User fees and charges
Interest Dividends from investments
Financial Contributions
Grants and subsidies
Other Sources
Roading and Footpaths
Cycleways and Walkways
Parking Facilities
For further information on how this activity is funded, refer to the Revenue and Financing Policy and Funding Impact Statement.
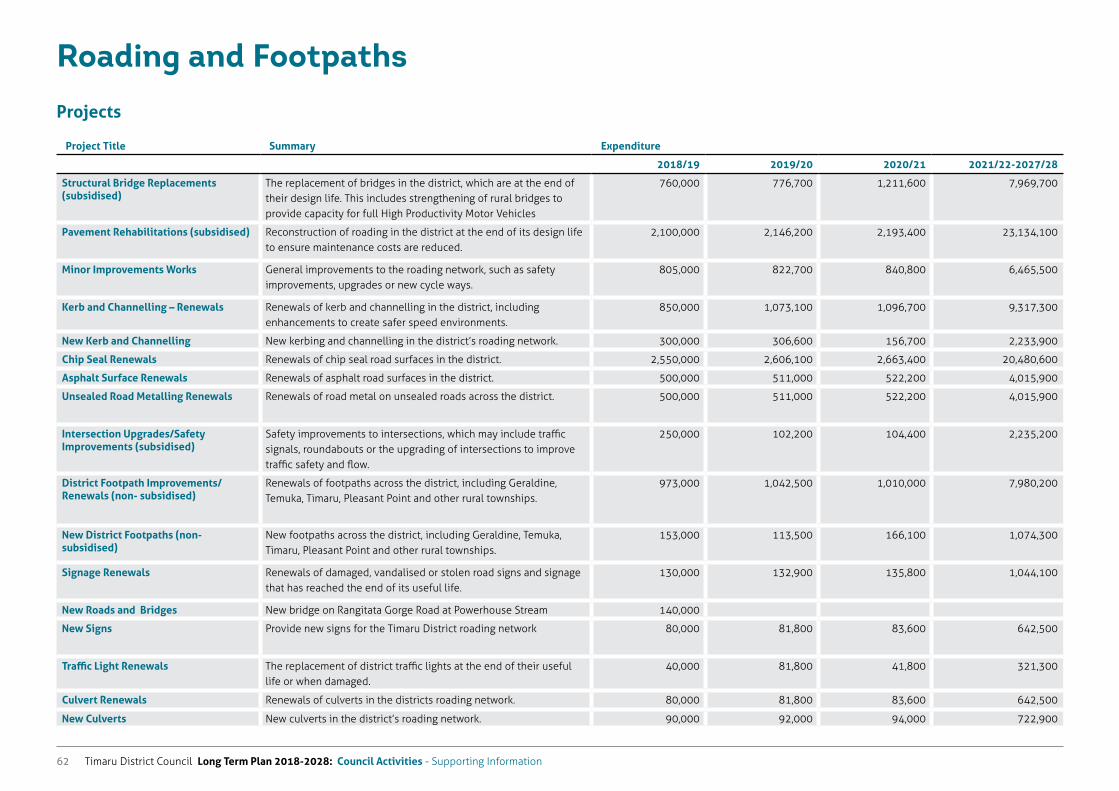
Timaru District Council Long Term Plan 2018-2028: Council Activities - Supporting Information62
Roading and Footpaths
Projects
Project Title Summary Expenditure
2018/19 2019/20 2020/21 2021/22-2027/28
Structural Bridge Replacements (subsidised)
The replacement of bridges in the district, which are at the end of their design life. This includes strengthening of rural bridges to provide capacity for full High Productivity Motor Vehicles
760,000 776,700 1,211,600 7,969,700
Pavement Rehabilitations (subsidised) Reconstruction of roading in the district at the end of its design life to ensure maintenance costs are reduced.
2,100,000 2,146,200 2,193,400 23,134,100
Minor Improvements Works General improvements to the roading network, such as safety improvements, upgrades or new cycle ways.
805,000 822,700 840,800 6,465,500
Kerb and Channelling – Renewals Renewals of kerb and channelling in the district, including enhancements to create safer speed environments.
850,000 1,073,100 1,096,700 9,317,300
New Kerb and Channelling New kerbing and channelling in the district’s roading network. 300,000 306,600 156,700 2,233,900
Chip Seal Renewals Renewals of chip seal road surfaces in the district. 2,550,000 2,606,100 2,663,400 20,480,600
Asphalt Surface Renewals Renewals of asphalt road surfaces in the district. 500,000 511,000 522,200 4,015,900
Unsealed Road Metalling Renewals Renewals of road metal on unsealed roads across the district. 500,000 511,000 522,200 4,015,900
Intersection Upgrades/Safety Improvements (subsidised)
Safety improvements to intersections, which may include traffic signals, roundabouts or the upgrading of intersections to improve traffic safety and flow.
250,000 102,200 104,400 2,235,200
District Footpath Improvements/Renewals (non- subsidised)
Renewals of footpaths across the district, including Geraldine, Temuka, Timaru, Pleasant Point and other rural townships.
973,000 1,042,500 1,010,000 7,980,200
New District Footpaths (non-subsidised)
New footpaths across the district, including Geraldine, Temuka, Timaru, Pleasant Point and other rural townships.
153,000 113,500 166,100 1,074,300
Signage Renewals Renewals of damaged, vandalised or stolen road signs and signage that has reached the end of its useful life.
130,000 132,900 135,800 1,044,100
New Roads and Bridges New bridge on Rangitata Gorge Road at Powerhouse Stream 140,000
New Signs Provide new signs for the Timaru District roading network 80,000 81,800 83,600 642,500
Traffic Light Renewals The replacement of district traffic lights at the end of their useful life or when damaged.
40,000 81,800 41,800 321,300
Culvert Renewals Renewals of culverts in the districts roading network. 80,000 81,800 83,600 642,500
New Culverts New culverts in the district’s roading network. 90,000 92,000 94,000 722,900
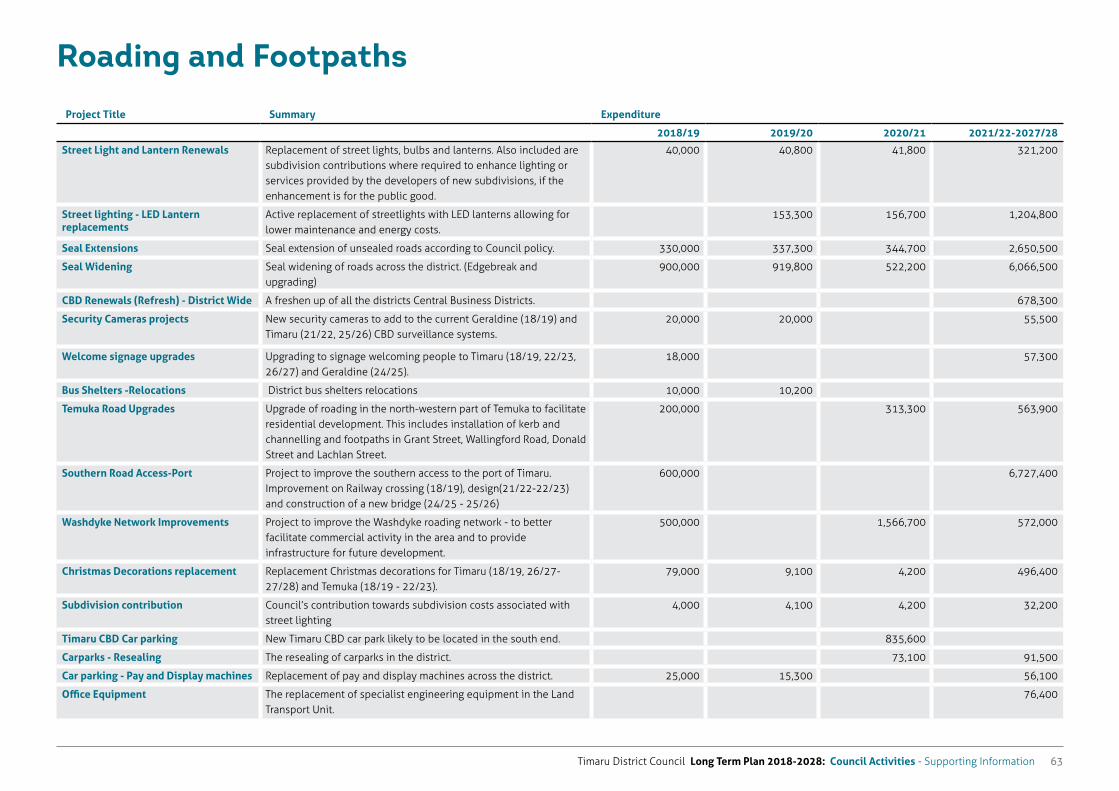
Timaru District Council Long Term Plan 2018-2028: Council Activities - Supporting Information 63
Roading and Footpaths
Project Title Summary Expenditure
2018/19 2019/20 2020/21 2021/22-2027/28
Street Light and Lantern Renewals Replacement of street lights, bulbs and lanterns. Also included are subdivision contributions where required to enhance lighting or services provided by the developers of new subdivisions, if the enhancement is for the public good.
40,000 40,800 41,800 321,200
Street lighting - LED Lantern replacements
Active replacement of streetlights with LED lanterns allowing for lower maintenance and energy costs.
153,300 156,700 1,204,800
Seal Extensions Seal extension of unsealed roads according to Council policy. 330,000 337,300 344,700 2,650,500
Seal Widening Seal widening of roads across the district. (Edgebreak and upgrading)
900,000 919,800 522,200 6,066,500
CBD Renewals (Refresh) - District Wide A freshen up of all the districts Central Business Districts. 678,300
Security Cameras projects New security cameras to add to the current Geraldine (18/19) and Timaru (21/22, 25/26) CBD surveillance systems.
20,000 20,000 55,500
Welcome signage upgrades Upgrading to signage welcoming people to Timaru (18/19, 22/23, 26/27) and Geraldine (24/25).
18,000 57,300
Bus Shelters -Relocations District bus shelters relocations 10,000 10,200
Temuka Road Upgrades Upgrade of roading in the north-western part of Temuka to facilitate residential development. This includes installation of kerb and channelling and footpaths in Grant Street, Wallingford Road, Donald Street and Lachlan Street.
200,000 313,300 563,900
Southern Road Access-Port Project to improve the southern access to the port of Timaru. Improvement on Railway crossing (18/19), design(21/22-22/23) and construction of a new bridge (24/25 - 25/26)
600,000 6,727,400
Washdyke Network Improvements Project to improve the Washdyke roading network - to better facilitate commercial activity in the area and to provide infrastructure for future development.
500,000 1,566,700 572,000
Christmas Decorations replacement Replacement Christmas decorations for Timaru (18/19, 26/27-27/28) and Temuka (18/19 - 22/23).
79,000 9,100 4,200 496,400
Subdivision contribution Council’s contribution towards subdivision costs associated with street lighting
4,000 4,100 4,200 32,200
Timaru CBD Car parking New Timaru CBD car park likely to be located in the south end. 835,600
Carparks - Resealing The resealing of carparks in the district. 73,100 91,500
Car parking - Pay and Display machines Replacement of pay and display machines across the district. 25,000 15,300 56,100
Office Equipment The replacement of specialist engineering equipment in the Land Transport Unit.
76,400
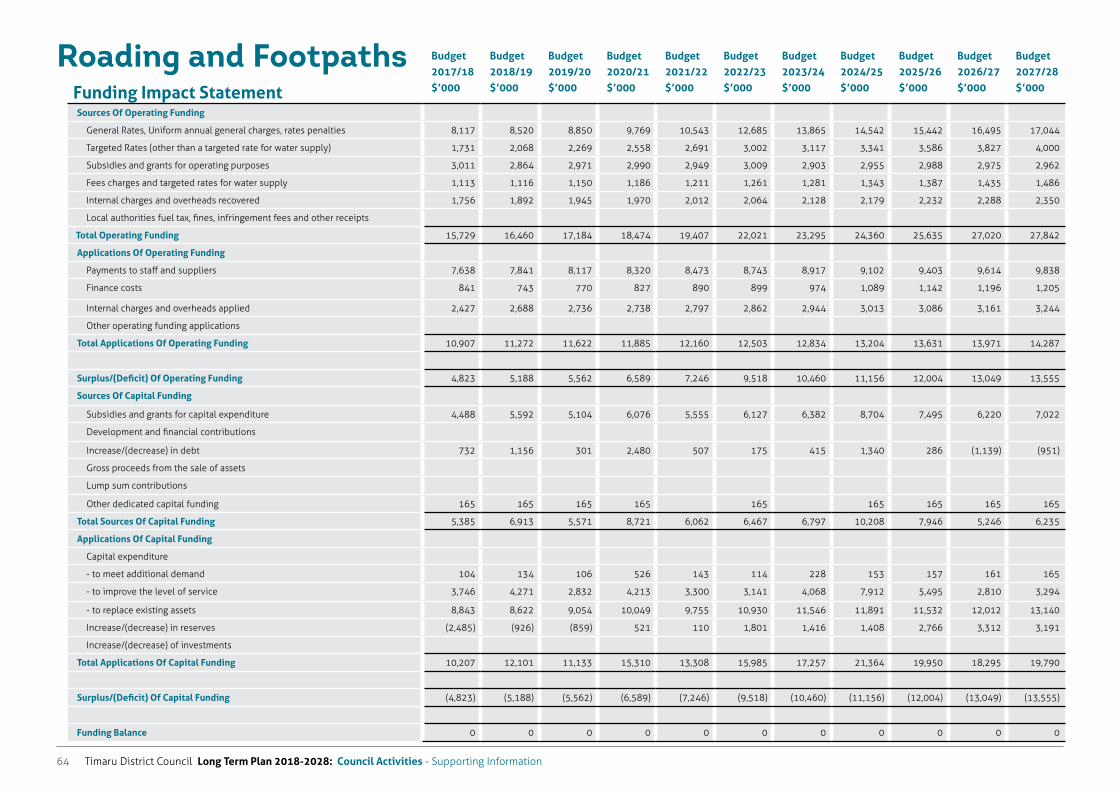
Timaru District Council Long Term Plan 2018-2028: Council Activities - Supporting Information64
Roading and FootpathsFunding Impact Statement
Budget 2017/18 $’000
Budget 2018/19 $’000
Budget 2019/20 $’000
Budget 2020/21 $’000
Budget 2021/22 $’000
Budget 2022/23 $’000
Budget 2023/24 $’000
Budget 2024/25 $’000
Budget 2025/26 $’000
Budget 2026/27 $’000
Budget 2027/28 $’000
Sources Of Operating Funding
General Rates, Uniform annual general charges, rates penalties 8,117 8,520 8,850 9,769 10,543 12,685 13,865 14,542 15,442 16,495 17,044
Targeted Rates (other than a targeted rate for water supply) 1,731 2,068 2,269 2,558 2,691 3,002 3,117 3,341 3,586 3,827 4,000
Subsidies and grants for operating purposes 3,011 2,864 2,971 2,990 2,949 3,009 2,903 2,955 2,988 2,975 2,962
Fees charges and targeted rates for water supply 1,113 1,116 1,150 1,186 1,211 1,261 1,281 1,343 1,387 1,435 1,486
Internal charges and overheads recovered 1,756 1,892 1,945 1,970 2,012 2,064 2,128 2,179 2,232 2,288 2,350
Local authorities fuel tax, fines, infringement fees and other receipts
Total Operating Funding 15,729 16,460 17,184 18,474 19,407 22,021 23,295 24,360 25,635 27,020 27,842
Applications Of Operating Funding
Payments to staff and suppliers 7,638 7,841 8,117 8,320 8,473 8,743 8,917 9,102 9,403 9,614 9,838
Finance costs 841 743 770 827 890 899 974 1,089 1,142 1,196 1,205
Internal charges and overheads applied 2,427 2,688 2,736 2,738 2,797 2,862 2,944 3,013 3,086 3,161 3,244
Other operating funding applications
Total Applications Of Operating Funding 10,907 11,272 11,622 11,885 12,160 12,503 12,834 13,204 13,631 13,971 14,287
Surplus/(Deficit) Of Operating Funding 4,823 5,188 5,562 6,589 7,246 9,518 10,460 11,156 12,004 13,049 13,555
Sources Of Capital Funding
Subsidies and grants for capital expenditure 4,488 5,592 5,104 6,076 5,555 6,127 6,382 8,704 7,495 6,220 7,022
Development and financial contributions
Increase/(decrease) in debt 732 1,156 301 2,480 507 175 415 1,340 286 (1,139) (951)
Gross proceeds from the sale of assets
Lump sum contributions
Other dedicated capital funding 165 165 165 165 165 165 165 165 165
Total Sources Of Capital Funding 5,385 6,913 5,571 8,721 6,062 6,467 6,797 10,208 7,946 5,246 6,235
Applications Of Capital Funding
Capital expenditure
- to meet additional demand 104 134 106 526 143 114 228 153 157 161 165
- to improve the level of service 3,746 4,271 2,832 4,213 3,300 3,141 4,068 7,912 5,495 2,810 3,294
- to replace existing assets 8,843 8,622 9,054 10,049 9,755 10,930 11,546 11,891 11,532 12,012 13,140
Increase/(decrease) in reserves (2,485) (926) (859) 521 110 1,801 1,416 1,408 2,766 3,312 3,191
Increase/(decrease) of investments
Total Applications Of Capital Funding 10,207 12,101 11,133 15,310 13,308 15,985 17,257 21,364 19,950 18,295 19,790
Surplus/(Deficit) Of Capital Funding (4,823) (5,188) (5,562) (6,589) (7,246) (9,518) (10,460) (11,156) (12,004) (13,049) (13,555)
Funding Balance 0 0 0 0 0 0 0 0 0 0 0
Timaru District Council Long Term Plan 2018-2028: Council Activities - Supporting Information 65
Sewer
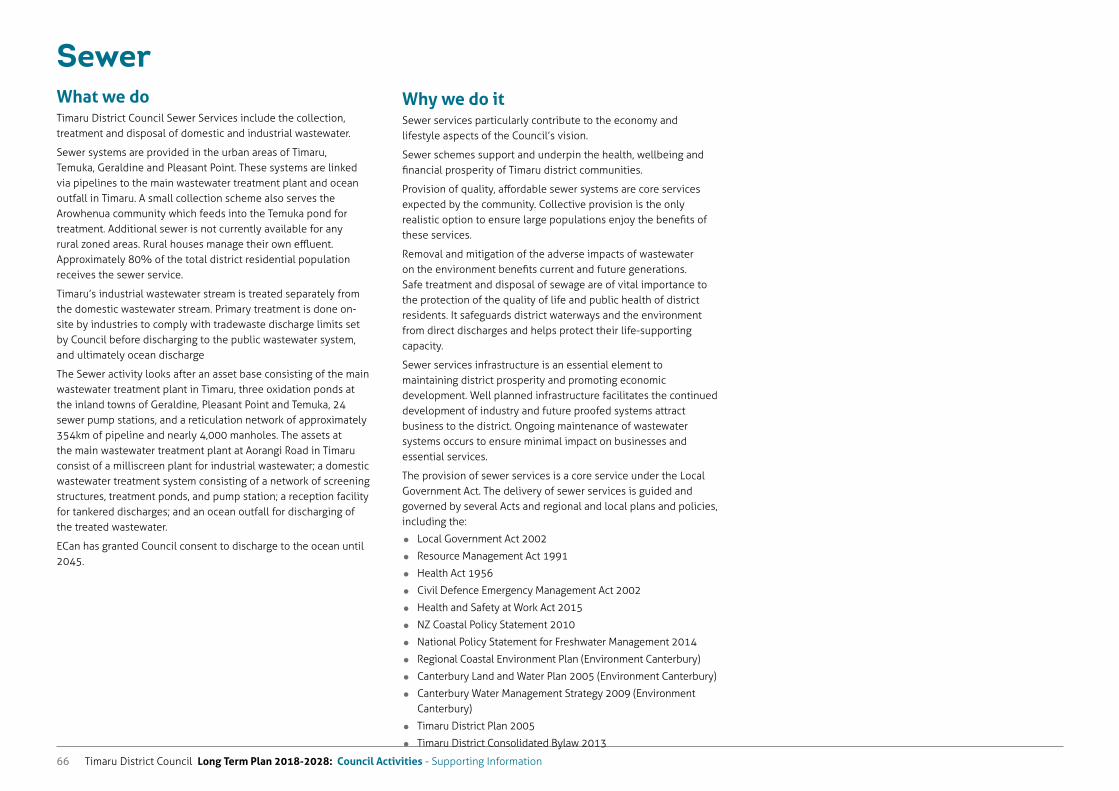
Timaru District Council Long Term Plan 2018-2028: Council Activities - Supporting Information66
SewerWhat we doTimaru District Council Sewer Services include the collection, treatment and disposal of domestic and industrial wastewater.
Sewer systems are provided in the urban areas of Timaru, Temuka, Geraldine and Pleasant Point. These systems are linked via pipelines to the main wastewater treatment plant and ocean outfall in Timaru. A small collection scheme also serves the Arowhenua community which feeds into the Temuka pond for treatment. Additional sewer is not currently available for any rural zoned areas. Rural houses manage their own effluent. Approximately 80% of the total district residential population receives the sewer service.
Timaru’s industrial wastewater stream is treated separately from the domestic wastewater stream. Primary treatment is done on-site by industries to comply with tradewaste discharge limits set by Council before discharging to the public wastewater system, and ultimately ocean discharge
The Sewer activity looks after an asset base consisting of the main wastewater treatment plant in Timaru, three oxidation ponds at the inland towns of Geraldine, Pleasant Point and Temuka, 24 sewer pump stations, and a reticulation network of approximately 354km of pipeline and nearly 4,000 manholes. The assets at the main wastewater treatment plant at Aorangi Road in Timaru consist of a milliscreen plant for industrial wastewater; a domestic wastewater treatment system consisting of a network of screening structures, treatment ponds, and pump station; a reception facility for tankered discharges; and an ocean outfall for discharging of the treated wastewater.
ECan has granted Council consent to discharge to the ocean until 2045.
Why we do itSewer services particularly contribute to the economy and lifestyle aspects of the Council’s vision.
Sewer schemes support and underpin the health, wellbeing and financial prosperity of Timaru district communities.
Provision of quality, affordable sewer systems are core services expected by the community. Collective provision is the only realistic option to ensure large populations enjoy the benefits of these services.
Removal and mitigation of the adverse impacts of wastewater on the environment benefits current and future generations. Safe treatment and disposal of sewage are of vital importance to the protection of the quality of life and public health of district residents. It safeguards district waterways and the environment from direct discharges and helps protect their life-supporting capacity.
Sewer services infrastructure is an essential element to maintaining district prosperity and promoting economic development. Well planned infrastructure facilitates the continued development of industry and future proofed systems attract business to the district. Ongoing maintenance of wastewater systems occurs to ensure minimal impact on businesses and essential services.
The provision of sewer services is a core service under the Local Government Act. The delivery of sewer services is guided and governed by several Acts and regional and local plans and policies, including the:
Local Government Act 2002
Resource Management Act 1991
Health Act 1956
Civil Defence Emergency Management Act 2002
Health and Safety at Work Act 2015
NZ Coastal Policy Statement 2010
National Policy Statement for Freshwater Management 2014
Regional Coastal Environment Plan (Environment Canterbury)
Canterbury Land and Water Plan 2005 (Environment Canterbury)
Canterbury Water Management Strategy 2009 (Environment Canterbury)
Timaru District Plan 2005
Timaru District Consolidated Bylaw 2013
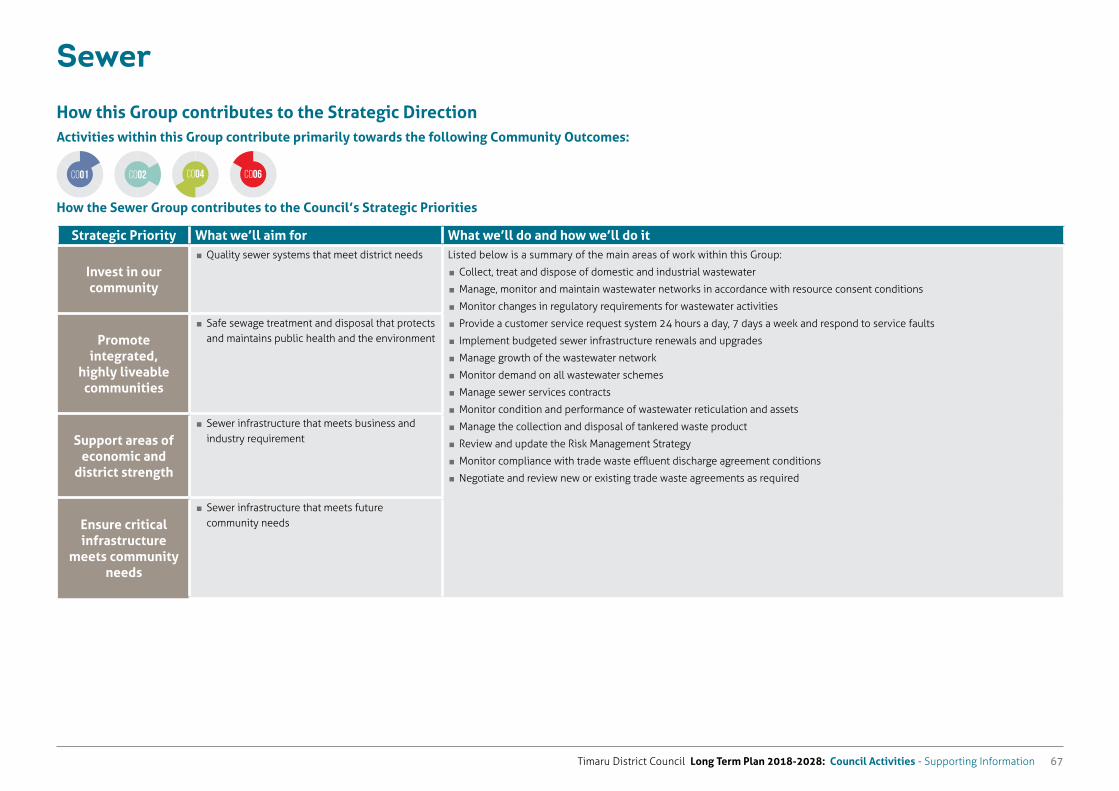
Timaru District Council Long Term Plan 2018-2028: Council Activities - Supporting Information 67
Sewer
How this Group contributes to the Strategic DirectionActivities within this Group contribute primarily towards the following Community Outcomes:
How the Sewer Group contributes to the Council’s Strategic Priorities
Strategic Priority What we’ll aim for What we’ll do and how we’ll do it
Invest in our community
� Quality sewer systems that meet district needs Listed below is a summary of the main areas of work within this Group:
� Collect, treat and dispose of domestic and industrial wastewater
� Manage, monitor and maintain wastewater networks in accordance with resource consent conditions
� Monitor changes in regulatory requirements for wastewater activities
� Provide a customer service request system 24 hours a day, 7 days a week and respond to service faults
� Implement budgeted sewer infrastructure renewals and upgrades
� Manage growth of the wastewater network
� Monitor demand on all wastewater schemes
� Manage sewer services contracts
� Monitor condition and performance of wastewater reticulation and assets
� Manage the collection and disposal of tankered waste product
� Review and update the Risk Management Strategy
� Monitor compliance with trade waste effluent discharge agreement conditions
� Negotiate and review new or existing trade waste agreements as required
Promote
integrated, highly liveable communities
� Safe sewage treatment and disposal that protects and maintains public health and the environment
Support areas of
economic and district strength
� Sewer infrastructure that meets business and industry requirement
Ensure critical infrastructure
meets community needs
� Sewer infrastructure that meets future community needs
CO01 CO04 CO06CO02
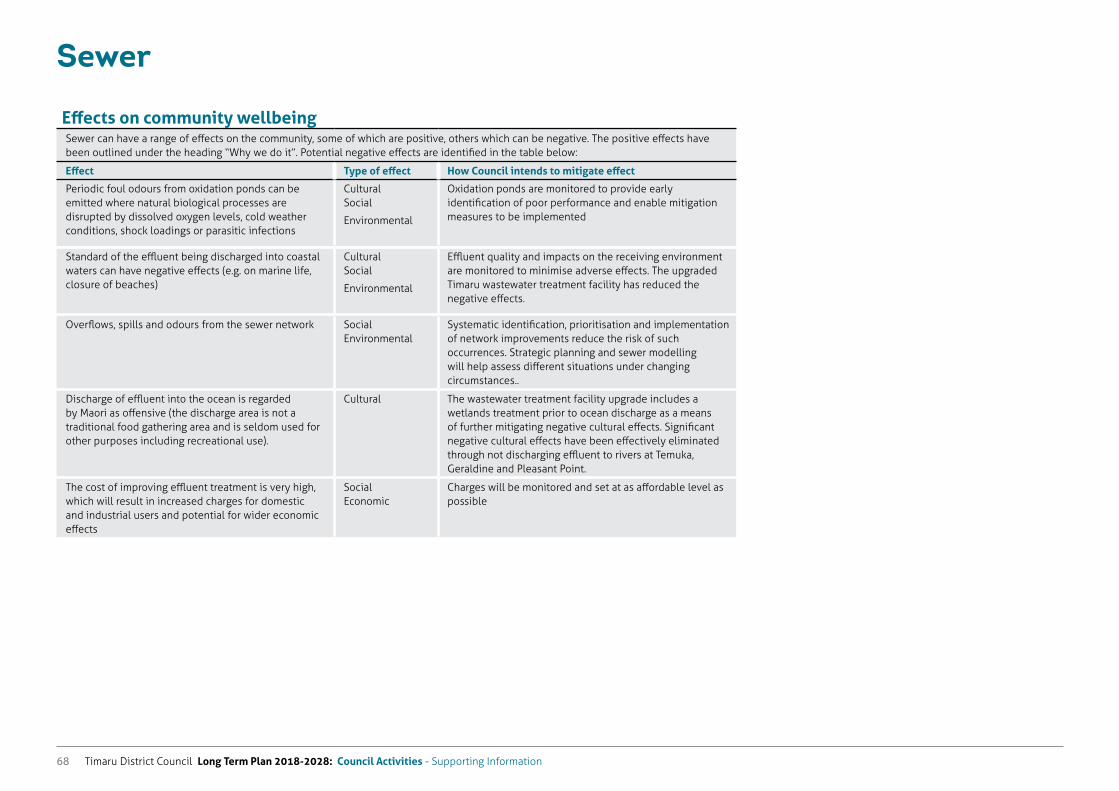
Timaru District Council Long Term Plan 2018-2028: Council Activities - Supporting Information68
Sewer
Effects on community wellbeingSewer can have a range of effects on the community, some of which are positive, others which can be negative. The positive effects have been outlined under the heading “Why we do it”. Potential negative effects are identified in the table below:
Effect Type of effect How Council intends to mitigate effect
Periodic foul odours from oxidation ponds can be emitted where natural biological processes are disrupted by dissolved oxygen levels, cold weather conditions, shock loadings or parasitic infections
Cultural Social
Environmental
Oxidation ponds are monitored to provide early identification of poor performance and enable mitigation measures to be implemented
Standard of the effluent being discharged into coastal waters can have negative effects (e.g. on marine life, closure of beaches)
Cultural Social
Environmental
Effluent quality and impacts on the receiving environment are monitored to minimise adverse effects. The upgraded Timaru wastewater treatment facility has reduced the negative effects.
Overflows, spills and odours from the sewer network Social Environmental
Systematic identification, prioritisation and implementation of network improvements reduce the risk of such occurrences. Strategic planning and sewer modelling will help assess different situations under changing circumstances..
Discharge of effluent into the ocean is regarded by Maori as offensive (the discharge area is not a traditional food gathering area and is seldom used for other purposes including recreational use).
Cultural The wastewater treatment facility upgrade includes a wetlands treatment prior to ocean discharge as a means of further mitigating negative cultural effects. Significant negative cultural effects have been effectively eliminated through not discharging effluent to rivers at Temuka, Geraldine and Pleasant Point.
The cost of improving effluent treatment is very high, which will result in increased charges for domestic and industrial users and potential for wider economic effects
Social Economic
Charges will be monitored and set at as affordable level as possible
Timaru District Council Long Term Plan 2018-2028: Council Activities - Supporting Information 69
Sewer
Key issues for next 10 yearsThe Timaru District Wastewater Strategy implemented in the last 10 years provided significant improvements in the sewer services infrastructure enabling a district-wide system of sewer treatment and disposal to be implemented along with meeting the requirements of resource consents.
The main issues for the Sewer activity are expected to come from meeting environmental standards for treatment and disposal, replacing ageing infrastructure and meeting demand.
Replacing below ground sewer infrastructurePoor pipe condition has led to higher rates of inflow and infiltration where rain and groundwater enter the sewers through pipe defects. Based on the assessed remaining life of these assets, there are around 70km of pipes (20% of the network) that will be due for replacement in the next 10 years. Estimated cost is around $15 million.
Growth and developmentDemand for sewer services is primarily driven by demographic and economic growth factors. While population and households are expected to slowly increase, they are not expected to significantly impact on sewer services in the next ten years.
Industrial and commercial growth is expected to remain gradual and manageable within the existing capacity of the sewerage systems provided. However, if a major ‘wet’ industry left or established in Timaru District, the impact could be significant either on wastewater quantities or maintaining the affordability of the scheme.
Climate changeClimate change may cause issues in the future with wastewater networks. The main potential impact may be as a result of increased inflow from intense rainfall events. Major rain events could cause sewer overflows or other service failure if the network cannot deal with the inflows or rainfall is beyond the levels the system is designed for. High rainfall events can also increase the level of stormwater infiltration into the sewer system. Greater effort will be required in inspecting the assets, monitoring performance and maintaining the network.
Maintaining affordability and meeting community expectationsThe community expects a high quality delivery of service (i.e. their waste disappearing down the toilet never to be seen again) and that sewage will have a minimal impact on environmental quality. The Council must balance these expectations with the ability of the community to pay, the need to meet environment standards, the impact on community wellbeing and the need to plan effectively for the district’s future needs.
Monitoring sewer systems usageIn 2014, Trade Waste Agreements were made with all the major industries discharging to the Timaru District Sewer System. These set the volume and strength limits of their trade waste discharges. Some are currently outside their permitted loadings, and further monitoring will be required to ensure industries are complying.
Active monitoring is required to ensure tankered discharges disposed of at Council treatment facilities are meeting requirements and not impacting negatively on the Council operation.
Network extensionsIn some residentially zoned vacant land areas there are no sewer or stormwater pipes to service potential building sites. Council has allocated funding to enable trunk sewer and stormwater pipes to be installed to service this land. Council will recoup the costs of the installation over time, from each developer as the land is subdivided for building purposes. Roads, footpaths and water mains will also be provided by the developer at their own cost.
Consumer educationEffective communication with users is required regarding the consequences of inappropriate practices and materials being flushed down toilets and drains. Specifically, there needs to be greater consumer awareness of:
The consequential level of service failure due to blockages and the unnecessary cost of clearing up the sewer network of foreign materials
The importance of commercial and industrial discharges obtaining and adhering to trade waste consent conditions
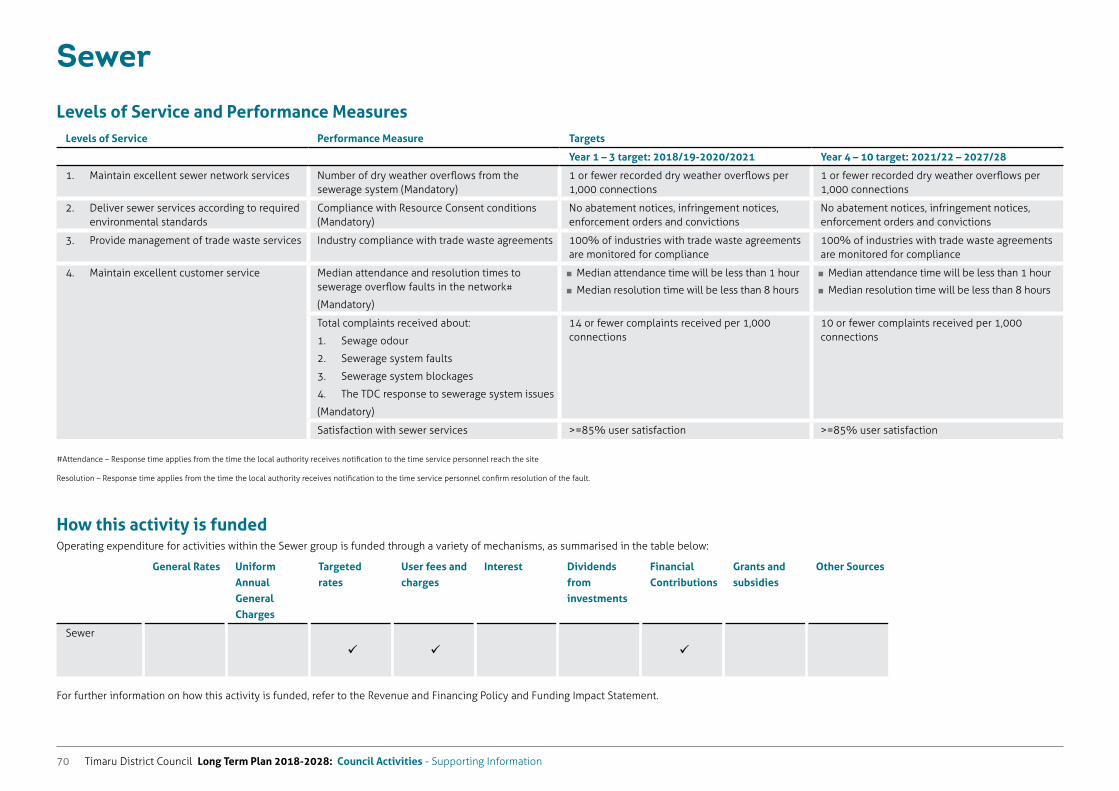
Timaru District Council Long Term Plan 2018-2028: Council Activities - Supporting Information70
Sewer
Levels of Service and Performance MeasuresLevels of Service Performance Measure Targets
Year 1 – 3 target: 2018/19-2020/2021 Year 4 – 10 target: 2021/22 – 2027/28
1. Maintain excellent sewer network services Number of dry weather overflows from the sewerage system (Mandatory)
1 or fewer recorded dry weather overflows per 1,000 connections
1 or fewer recorded dry weather overflows per 1,000 connections
2. Deliver sewer services according to required environmental standards
Compliance with Resource Consent conditions (Mandatory)
No abatement notices, infringement notices, enforcement orders and convictions
No abatement notices, infringement notices, enforcement orders and convictions
3. Provide management of trade waste services Industry compliance with trade waste agreements 100% of industries with trade waste agreements are monitored for compliance
100% of industries with trade waste agreements are monitored for compliance
4. Maintain excellent customer service Median attendance and resolution times to sewerage overflow faults in the network#
(Mandatory)
� Median attendance time will be less than 1 hour
� Median resolution time will be less than 8 hours
� Median attendance time will be less than 1 hour
� Median resolution time will be less than 8 hours
Total complaints received about:
1. Sewage odour
2. Sewerage system faults
3. Sewerage system blockages
4. The TDC response to sewerage system issues
(Mandatory)
14 or fewer complaints received per 1,000 connections
10 or fewer complaints received per 1,000 connections
Satisfaction with sewer services >=85% user satisfaction >=85% user satisfaction
#Attendance – Response time applies from the time the local authority receives notification to the time service personnel reach the site
Resolution – Response time applies from the time the local authority receives notification to the time service personnel confirm resolution of the fault.
How this activity is fundedOperating expenditure for activities within the Sewer group is funded through a variety of mechanisms, as summarised in the table below:
General Rates Uniform Annual General Charges
Targeted rates
User fees and charges
Interest Dividends from investments
Financial Contributions
Grants and subsidies
Other Sources
Sewer
For further information on how this activity is funded, refer to the Revenue and Financing Policy and Funding Impact Statement.
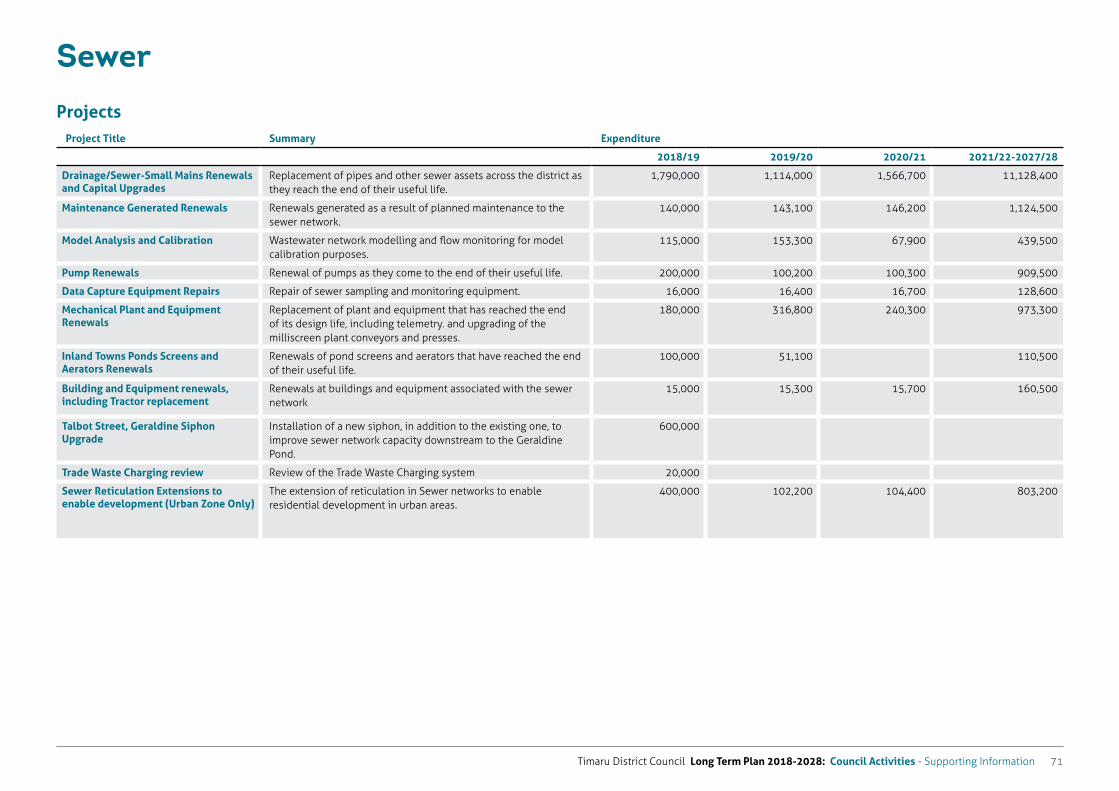
Timaru District Council Long Term Plan 2018-2028: Council Activities - Supporting Information 71
Sewer
ProjectsProject Title Summary Expenditure
2018/19 2019/20 2020/21 2021/22-2027/28
Drainage/Sewer-Small Mains Renewals and Capital Upgrades
Replacement of pipes and other sewer assets across the district as they reach the end of their useful life.
1,790,000 1,114,000 1,566,700 11,128,400
Maintenance Generated Renewals Renewals generated as a result of planned maintenance to the sewer network.
140,000 143,100 146,200 1,124,500
Model Analysis and Calibration Wastewater network modelling and flow monitoring for model calibration purposes.
115,000 153,300 67,900 439,500
Pump Renewals Renewal of pumps as they come to the end of their useful life. 200,000 100,200 100,300 909,500
Data Capture Equipment Repairs Repair of sewer sampling and monitoring equipment. 16,000 16,400 16,700 128,600
Mechanical Plant and Equipment Renewals
Replacement of plant and equipment that has reached the end of its design life, including telemetry. and upgrading of the milliscreen plant conveyors and presses.
180,000 316,800 240,300 973,300
Inland Towns Ponds Screens and Aerators Renewals
Renewals of pond screens and aerators that have reached the end of their useful life.
100,000 51,100 110,500
Building and Equipment renewals, including Tractor replacement
Renewals at buildings and equipment associated with the sewer network
15,000 15,300 15,700 160,500
Talbot Street, Geraldine Siphon Upgrade
Installation of a new siphon, in addition to the existing one, to improve sewer network capacity downstream to the Geraldine Pond.
600,000
Trade Waste Charging review Review of the Trade Waste Charging system 20,000
Sewer Reticulation Extensions to enable development (Urban Zone Only)
The extension of reticulation in Sewer networks to enable residential development in urban areas.
400,000 102,200 104,400 803,200
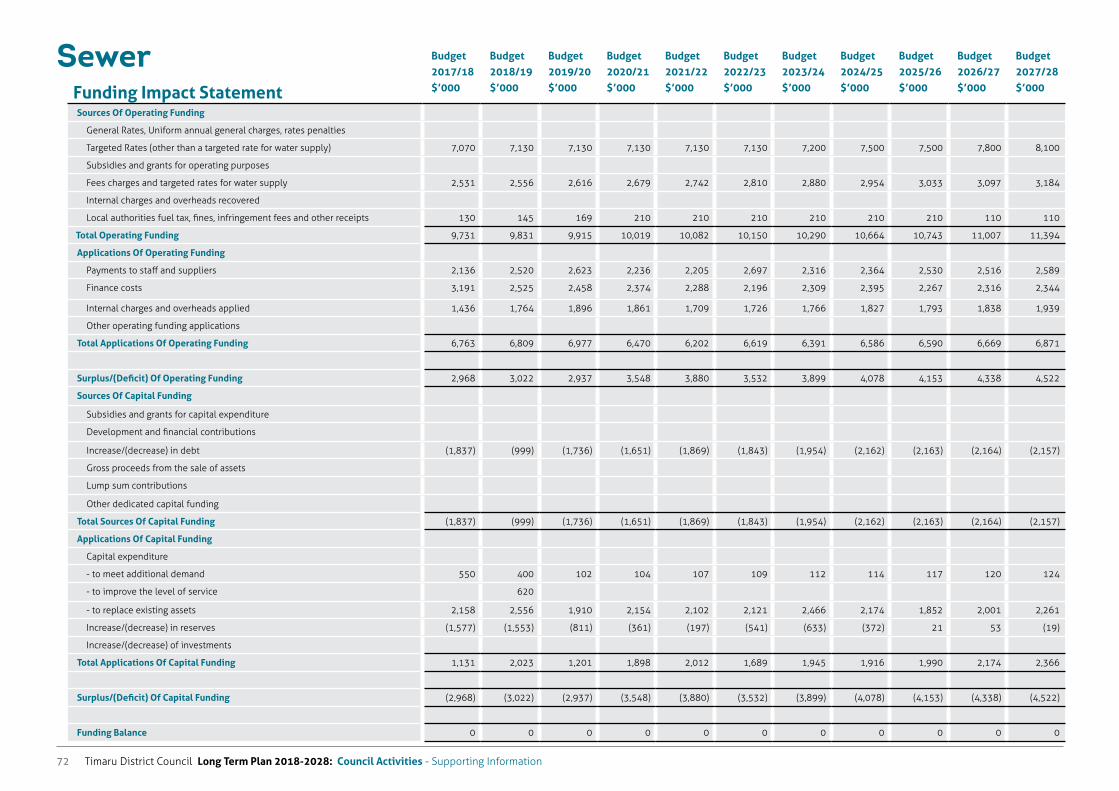
Timaru District Council Long Term Plan 2018-2028: Council Activities - Supporting Information72
Funding Impact Statement
Budget 2017/18 $’000
Budget 2018/19 $’000
Budget 2019/20 $’000
Budget 2020/21 $’000
Budget 2021/22 $’000
Budget 2022/23 $’000
Budget 2023/24 $’000
Budget 2024/25 $’000
Budget 2025/26 $’000
Budget 2026/27 $’000
Budget 2027/28 $’000
Sources Of Operating Funding
General Rates, Uniform annual general charges, rates penalties
Targeted Rates (other than a targeted rate for water supply) 7,070 7,130 7,130 7,130 7,130 7,130 7,200 7,500 7,500 7,800 8,100
Subsidies and grants for operating purposes
Fees charges and targeted rates for water supply 2,531 2,556 2,616 2,679 2,742 2,810 2,880 2,954 3,033 3,097 3,184
Internal charges and overheads recovered
Local authorities fuel tax, fines, infringement fees and other receipts 130 145 169 210 210 210 210 210 210 110 110
Total Operating Funding 9,731 9,831 9,915 10,019 10,082 10,150 10,290 10,664 10,743 11,007 11,394
Applications Of Operating Funding
Payments to staff and suppliers 2,136 2,520 2,623 2,236 2,205 2,697 2,316 2,364 2,530 2,516 2,589
Finance costs 3,191 2,525 2,458 2,374 2,288 2,196 2,309 2,395 2,267 2,316 2,344
Internal charges and overheads applied 1,436 1,764 1,896 1,861 1,709 1,726 1,766 1,827 1,793 1,838 1,939
Other operating funding applications
Total Applications Of Operating Funding 6,763 6,809 6,977 6,470 6,202 6,619 6,391 6,586 6,590 6,669 6,871
Surplus/(Deficit) Of Operating Funding 2,968 3,022 2,937 3,548 3,880 3,532 3,899 4,078 4,153 4,338 4,522
Sources Of Capital Funding
Subsidies and grants for capital expenditure
Development and financial contributions
Increase/(decrease) in debt (1,837) (999) (1,736) (1,651) (1,869) (1,843) (1,954) (2,162) (2,163) (2,164) (2,157)
Gross proceeds from the sale of assets
Lump sum contributions
Other dedicated capital funding
Total Sources Of Capital Funding (1,837) (999) (1,736) (1,651) (1,869) (1,843) (1,954) (2,162) (2,163) (2,164) (2,157)
Applications Of Capital Funding
Capital expenditure
- to meet additional demand 550 400 102 104 107 109 112 114 117 120 124
- to improve the level of service 620
- to replace existing assets 2,158 2,556 1,910 2,154 2,102 2,121 2,466 2,174 1,852 2,001 2,261
Increase/(decrease) in reserves (1,577) (1,553) (811) (361) (197) (541) (633) (372) 21 53 (19)
Increase/(decrease) of investments
Total Applications Of Capital Funding 1,131 2,023 1,201 1,898 2,012 1,689 1,945 1,916 1,990 2,174 2,366
Surplus/(Deficit) Of Capital Funding (2,968) (3,022) (2,937) (3,548) (3,880) (3,532) (3,899) (4,078) (4,153) (4,338) (4,522)
Funding Balance 0 0 0 0 0 0 0 0 0 0 0
Sewer
Timaru District Council Long Term Plan 2018-2028: Council Activities - Supporting Information 73
Stormwater
Timaru District Council Long Term Plan 2018-2028: Council Activities - Supporting Information74
What we doTimaru District Council provides stormwater services in the urban townships of Timaru, Temuka, Geraldine and Pleasant Point. The schemes range from piped to open channel systems and comprise Council’s primary stormwater networks. Stormwater is disposed to soakpits, surface water bodies (e.g. drains, rivers) or the ocean, depending on the scheme.
Rural stormwater is managed mainly through land drainage with minimal conveyances provided in Winchester, Cave and Pareora.
The management of stormwater is critical for the safety of the community and the protection of public and private property. If not effectively collected and drained, stormwater can become a significant hazard and can cause damage to structures and properties. The discharge of stormwater also has the potential to cause adverse effects on the environment and subsequently the wellbeing of communities. The natural attributes of rivers, lakes and other freshwater bodies can be degraded by excessive sediment and contaminant inputs or by the flow rates and volumes of stormwater discharges. Council has a responsibility to ensure that stormwater is managed in a manner that sustainably supports the environmental, social, cultural and economic wellbeing of the communities it serves.
The activity looks after an asset base of around 146km of pipeline, 33km of open channel, 6 detention dams, 1 retention and filtration basin, 2 pump stations, over 2,344 manholes, 216 soak pits, over 3,000 sumps, and secondary/overland flow paths.
Where practicable Council is making increasing use of low impact design systems that when not used for stormwater purposes, provide open green space for people to enjoy.
Stormwater schemes in residential areas are designed to cope with a 1 in 5-year return rainfall event (i.e. the event has a 20% chance of occurring in any one year). In industrial and commercial zones they are designed to cope with a 1 in 10 year return rainfall event (i.e. the event has a 10% chance of occurring in any one year). Rainfall events of this size may cause temporary ponding, while some surface flooding may result where events exceed this size.
For larger rainfall events, stormwater systems are designed to flow along escape routes or secondary flow paths such as roads
and gullies, to prevent damage to structures. These are generally designed for a 1 in 50 year return rainfall event (i.e. the event has a 2% chance of occurring in any one year)
Stormwater
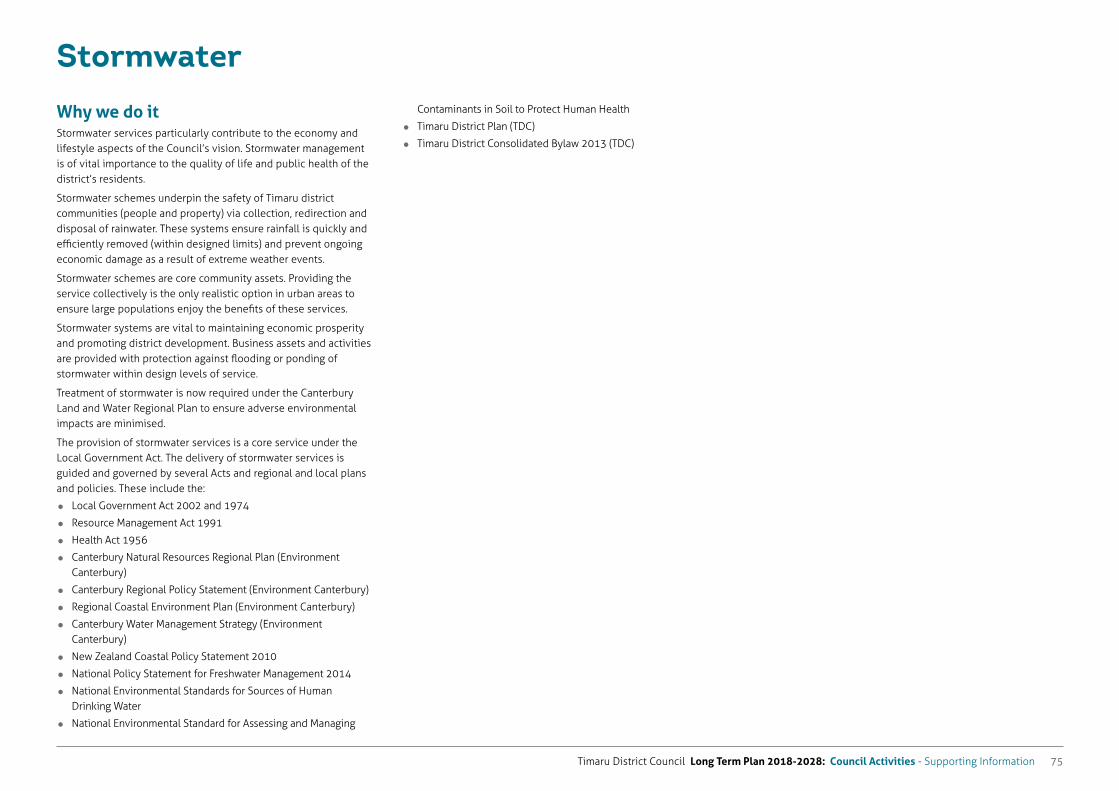
Timaru District Council Long Term Plan 2018-2028: Council Activities - Supporting Information 75
Stormwater
Why we do itStormwater services particularly contribute to the economy and lifestyle aspects of the Council’s vision. Stormwater management is of vital importance to the quality of life and public health of the district’s residents.
Stormwater schemes underpin the safety of Timaru district communities (people and property) via collection, redirection and disposal of rainwater. These systems ensure rainfall is quickly and efficiently removed (within designed limits) and prevent ongoing economic damage as a result of extreme weather events.
Stormwater schemes are core community assets. Providing the service collectively is the only realistic option in urban areas to ensure large populations enjoy the benefits of these services.
Stormwater systems are vital to maintaining economic prosperity and promoting district development. Business assets and activities are provided with protection against flooding or ponding of stormwater within design levels of service.
Treatment of stormwater is now required under the Canterbury Land and Water Regional Plan to ensure adverse environmental impacts are minimised.
The provision of stormwater services is a core service under the Local Government Act. The delivery of stormwater services is guided and governed by several Acts and regional and local plans and policies. These include the:
Local Government Act 2002 and 1974
Resource Management Act 1991
Health Act 1956
Canterbury Natural Resources Regional Plan (Environment Canterbury)
Canterbury Regional Policy Statement (Environment Canterbury)
Regional Coastal Environment Plan (Environment Canterbury)
Canterbury Water Management Strategy (Environment Canterbury)
New Zealand Coastal Policy Statement 2010
National Policy Statement for Freshwater Management 2014
National Environmental Standards for Sources of Human Drinking Water
National Environmental Standard for Assessing and Managing
Contaminants in Soil to Protect Human Health
Timaru District Plan (TDC)
Timaru District Consolidated Bylaw 2013 (TDC)
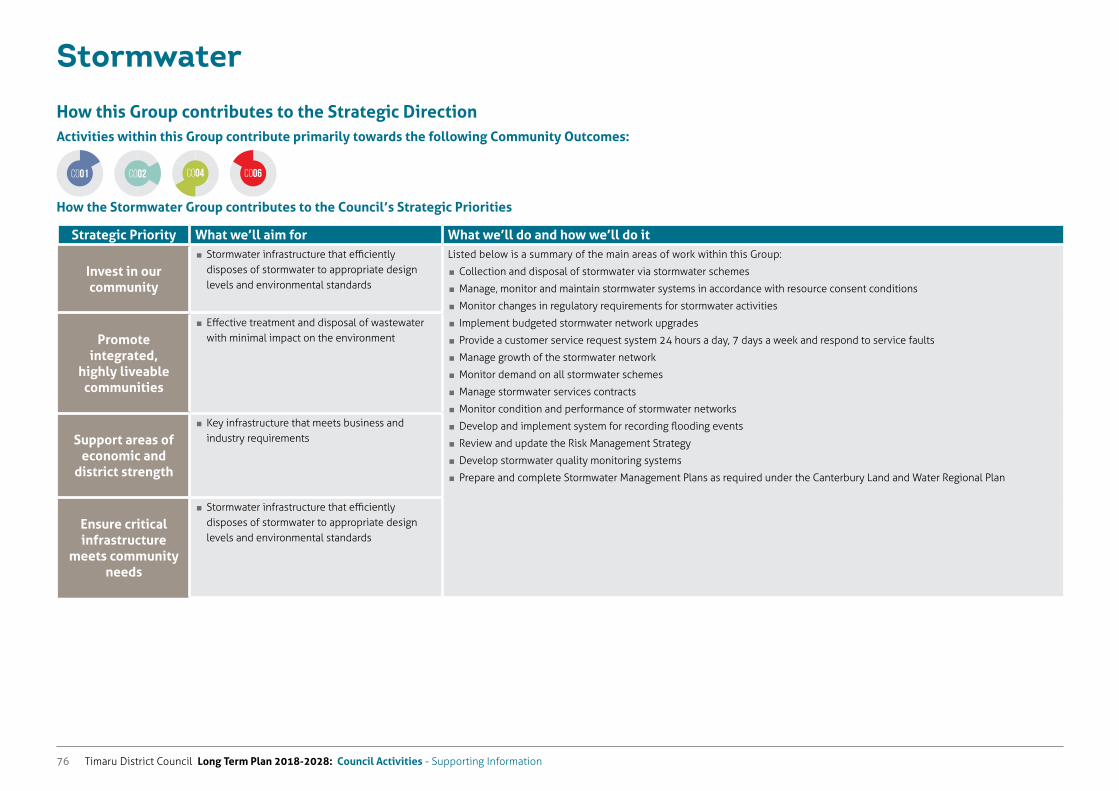
Timaru District Council Long Term Plan 2018-2028: Council Activities - Supporting Information76
Stormwater
How this Group contributes to the Strategic DirectionActivities within this Group contribute primarily towards the following Community Outcomes:
How the Stormwater Group contributes to the Council’s Strategic Priorities
Strategic Priority What we’ll aim for What we’ll do and how we’ll do it
Invest in our community
� Stormwater infrastructure that efficiently disposes of stormwater to appropriate design levels and environmental standards
Listed below is a summary of the main areas of work within this Group:
� Collection and disposal of stormwater via stormwater schemes
� Manage, monitor and maintain stormwater systems in accordance with resource consent conditions
� Monitor changes in regulatory requirements for stormwater activities
� Implement budgeted stormwater network upgrades
� Provide a customer service request system 24 hours a day, 7 days a week and respond to service faults
� Manage growth of the stormwater network
� Monitor demand on all stormwater schemes
� Manage stormwater services contracts
� Monitor condition and performance of stormwater networks
� Develop and implement system for recording flooding events
� Review and update the Risk Management Strategy
� Develop stormwater quality monitoring systems
� Prepare and complete Stormwater Management Plans as required under the Canterbury Land and Water Regional Plan
Promote
integrated, highly liveable communities
� Effective treatment and disposal of wastewater with minimal impact on the environment
Support areas of
economic and district strength
� Key infrastructure that meets business and industry requirements
Ensure critical infrastructure
meets community needs
� Stormwater infrastructure that efficiently disposes of stormwater to appropriate design levels and environmental standards
CO01 CO04 CO06CO02
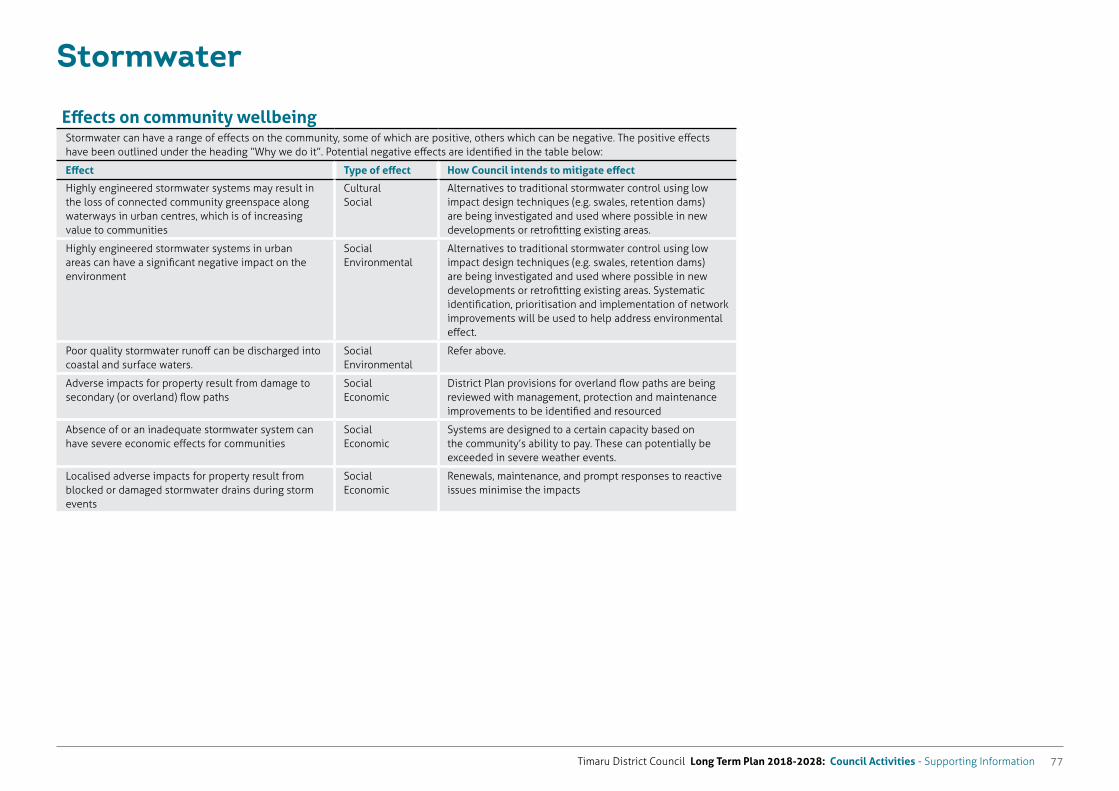
Timaru District Council Long Term Plan 2018-2028: Council Activities - Supporting Information 77
Stormwater
Effects on community wellbeingStormwater can have a range of effects on the community, some of which are positive, others which can be negative. The positive effects have been outlined under the heading “Why we do it”. Potential negative effects are identified in the table below:
Effect Type of effect How Council intends to mitigate effect
Highly engineered stormwater systems may result in the loss of connected community greenspace along waterways in urban centres, which is of increasing value to communities
Cultural Social
Alternatives to traditional stormwater control using low impact design techniques (e.g. swales, retention dams) are being investigated and used where possible in new developments or retrofitting existing areas.
Highly engineered stormwater systems in urban areas can have a significant negative impact on the environment
Social Environmental
Alternatives to traditional stormwater control using low impact design techniques (e.g. swales, retention dams) are being investigated and used where possible in new developments or retrofitting existing areas. Systematic identification, prioritisation and implementation of network improvements will be used to help address environmental effect.
Poor quality stormwater runoff can be discharged into coastal and surface waters.
Social Environmental
Refer above.
Adverse impacts for property result from damage to secondary (or overland) flow paths
Social Economic
District Plan provisions for overland flow paths are being reviewed with management, protection and maintenance improvements to be identified and resourced
Absence of or an inadequate stormwater system can have severe economic effects for communities
Social Economic
Systems are designed to a certain capacity based on the community’s ability to pay. These can potentially be exceeded in severe weather events.
Localised adverse impacts for property result from blocked or damaged stormwater drains during storm events
Social Economic
Renewals, maintenance, and prompt responses to reactive issues minimise the impacts
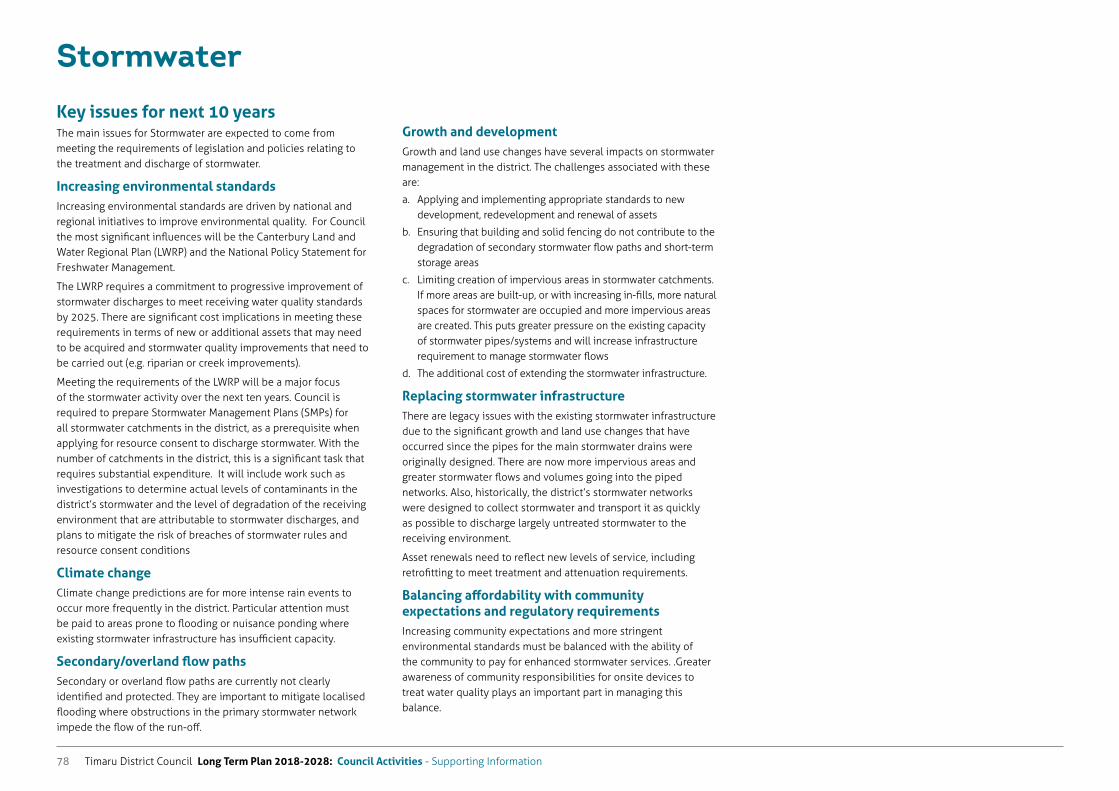
Timaru District Council Long Term Plan 2018-2028: Council Activities - Supporting Information78
Stormwater
Key issues for next 10 yearsThe main issues for Stormwater are expected to come from meeting the requirements of legislation and policies relating to the treatment and discharge of stormwater.
Increasing environmental standardsIncreasing environmental standards are driven by national and regional initiatives to improve environmental quality. For Council the most significant influences will be the Canterbury Land and Water Regional Plan (LWRP) and the National Policy Statement for Freshwater Management.
The LWRP requires a commitment to progressive improvement of stormwater discharges to meet receiving water quality standards by 2025. There are significant cost implications in meeting these requirements in terms of new or additional assets that may need to be acquired and stormwater quality improvements that need to be carried out (e.g. riparian or creek improvements).
Meeting the requirements of the LWRP will be a major focus of the stormwater activity over the next ten years. Council is required to prepare Stormwater Management Plans (SMPs) for all stormwater catchments in the district, as a prerequisite when applying for resource consent to discharge stormwater. With the number of catchments in the district, this is a significant task that requires substantial expenditure. It will include work such as investigations to determine actual levels of contaminants in the district’s stormwater and the level of degradation of the receiving environment that are attributable to stormwater discharges, and plans to mitigate the risk of breaches of stormwater rules and resource consent conditions
Climate changeClimate change predictions are for more intense rain events to occur more frequently in the district. Particular attention must be paid to areas prone to flooding or nuisance ponding where existing stormwater infrastructure has insufficient capacity.
Secondary/overland flow pathsSecondary or overland flow paths are currently not clearly identified and protected. They are important to mitigate localised flooding where obstructions in the primary stormwater network impede the flow of the run-off.
Growth and developmentGrowth and land use changes have several impacts on stormwater management in the district. The challenges associated with these are:
a. Applying and implementing appropriate standards to new development, redevelopment and renewal of assets
b. Ensuring that building and solid fencing do not contribute to the degradation of secondary stormwater flow paths and short-term storage areas
c. Limiting creation of impervious areas in stormwater catchments. If more areas are built-up, or with increasing in-fills, more natural spaces for stormwater are occupied and more impervious areas are created. This puts greater pressure on the existing capacity of stormwater pipes/systems and will increase infrastructure requirement to manage stormwater flows
d. The additional cost of extending the stormwater infrastructure.
Replacing stormwater infrastructureThere are legacy issues with the existing stormwater infrastructure due to the significant growth and land use changes that have occurred since the pipes for the main stormwater drains were originally designed. There are now more impervious areas and greater stormwater flows and volumes going into the piped networks. Also, historically, the district’s stormwater networks were designed to collect stormwater and transport it as quickly as possible to discharge largely untreated stormwater to the receiving environment.
Asset renewals need to reflect new levels of service, including retrofitting to meet treatment and attenuation requirements.
Balancing affordability with community expectations and regulatory requirementsIncreasing community expectations and more stringent environmental standards must be balanced with the ability of the community to pay for enhanced stormwater services. .Greater awareness of community responsibilities for onsite devices to treat water quality plays an important part in managing this balance.
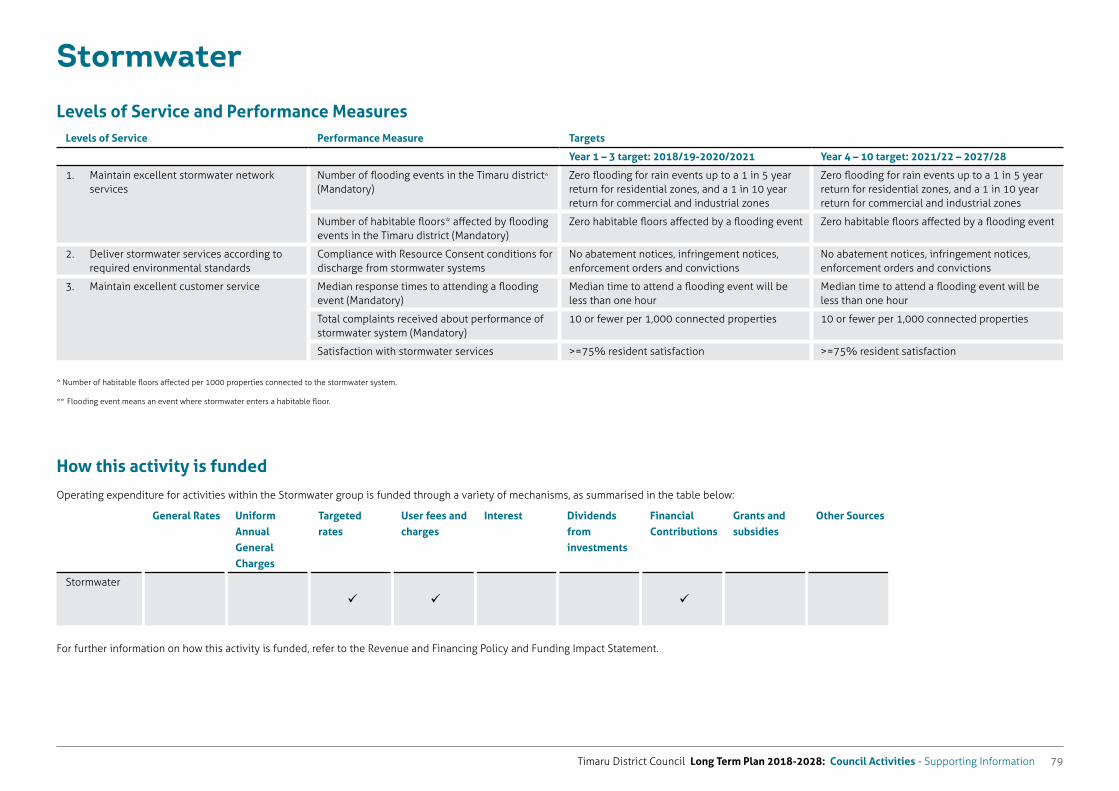
Timaru District Council Long Term Plan 2018-2028: Council Activities - Supporting Information 79
Stormwater
Levels of Service and Performance MeasuresLevels of Service Performance Measure Targets
Year 1 – 3 target: 2018/19-2020/2021 Year 4 – 10 target: 2021/22 – 2027/28
1. Maintain excellent stormwater network services
Number of flooding events in the Timaru district* (Mandatory)
Zero flooding for rain events up to a 1 in 5 year return for residential zones, and a 1 in 10 year return for commercial and industrial zones
Zero flooding for rain events up to a 1 in 5 year return for residential zones, and a 1 in 10 year return for commercial and industrial zones
Number of habitable floors* affected by flooding events in the Timaru district (Mandatory)
Zero habitable floors affected by a flooding event Zero habitable floors affected by a flooding event
2. Deliver stormwater services according to required environmental standards
Compliance with Resource Consent conditions for discharge from stormwater systems
No abatement notices, infringement notices, enforcement orders and convictions
No abatement notices, infringement notices, enforcement orders and convictions
3. Maintain excellent customer service Median response times to attending a flooding event (Mandatory)
Median time to attend a flooding event will be less than one hour
Median time to attend a flooding event will be less than one hour
Total complaints received about performance of stormwater system (Mandatory)
10 or fewer per 1,000 connected properties 10 or fewer per 1,000 connected properties
Satisfaction with stormwater services >=75% resident satisfaction >=75% resident satisfaction
* Number of habitable floors affected per 1000 properties connected to the stormwater system.
** Flooding event means an event where stormwater enters a habitable floor.
How this activity is funded
Operating expenditure for activities within the Stormwater group is funded through a variety of mechanisms, as summarised in the table below:
General Rates Uniform Annual General Charges
Targeted rates
User fees and charges
Interest Dividends from investments
Financial Contributions
Grants and subsidies
Other Sources
Stormwater
For further information on how this activity is funded, refer to the Revenue and Financing Policy and Funding Impact Statement.
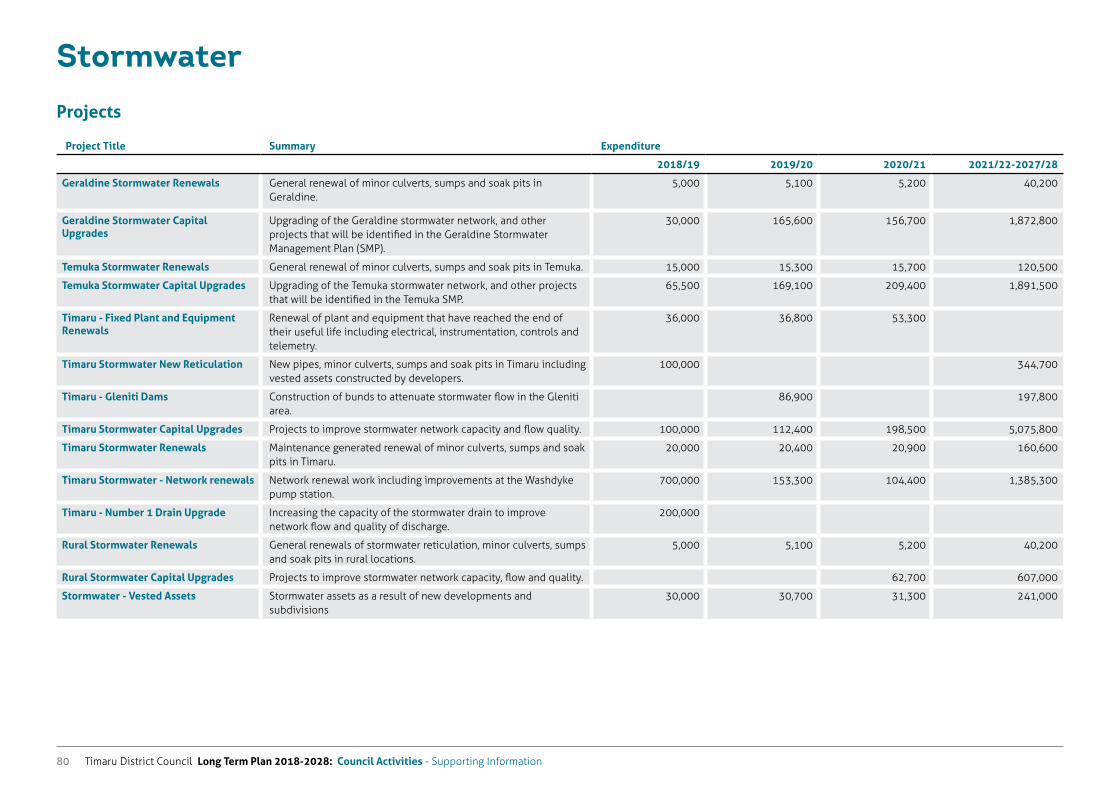
Timaru District Council Long Term Plan 2018-2028: Council Activities - Supporting Information80
Stormwater
Projects
Project Title Summary Expenditure
2018/19 2019/20 2020/21 2021/22-2027/28
Geraldine Stormwater Renewals General renewal of minor culverts, sumps and soak pits in Geraldine.
5,000 5,100 5,200 40,200
Geraldine Stormwater Capital Upgrades
Upgrading of the Geraldine stormwater network, and other projects that will be identified in the Geraldine Stormwater Management Plan (SMP).
30,000 165,600 156,700 1,872,800
Temuka Stormwater Renewals General renewal of minor culverts, sumps and soak pits in Temuka. 15,000 15,300 15,700 120,500
Temuka Stormwater Capital Upgrades Upgrading of the Temuka stormwater network, and other projects that will be identified in the Temuka SMP.
65,500 169,100 209,400 1,891,500
Timaru - Fixed Plant and Equipment Renewals
Renewal of plant and equipment that have reached the end of their useful life including electrical, instrumentation, controls and telemetry.
36,000 36,800 53,300
Timaru Stormwater New Reticulation New pipes, minor culverts, sumps and soak pits in Timaru including vested assets constructed by developers.
100,000 344,700
Timaru - Gleniti Dams Construction of bunds to attenuate stormwater flow in the Gleniti area.
86,900 197,800
Timaru Stormwater Capital Upgrades Projects to improve stormwater network capacity and flow quality. 100,000 112,400 198,500 5,075,800
Timaru Stormwater Renewals Maintenance generated renewal of minor culverts, sumps and soak pits in Timaru.
20,000 20,400 20,900 160,600
Timaru Stormwater - Network renewals Network renewal work including improvements at the Washdyke pump station.
700,000 153,300 104,400 1,385,300
Timaru - Number 1 Drain Upgrade Increasing the capacity of the stormwater drain to improve network flow and quality of discharge.
200,000
Rural Stormwater Renewals General renewals of stormwater reticulation, minor culverts, sumps and soak pits in rural locations.
5,000 5,100 5,200 40,200
Rural Stormwater Capital Upgrades Projects to improve stormwater network capacity, flow and quality. 62,700 607,000
Stormwater - Vested Assets Stormwater assets as a result of new developments and subdivisions
30,000 30,700 31,300 241,000
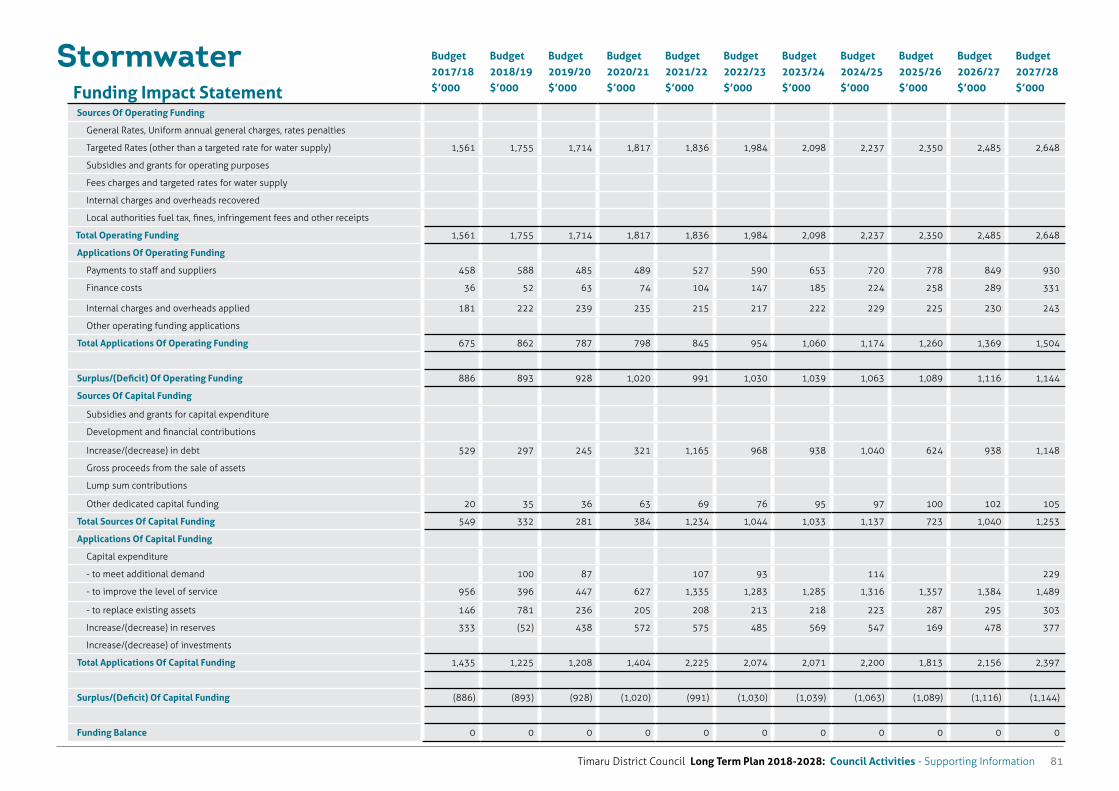
Timaru District Council Long Term Plan 2018-2028: Council Activities - Supporting Information 81
Funding Impact Statement
Budget 2017/18 $’000
Budget 2018/19 $’000
Budget 2019/20 $’000
Budget 2020/21 $’000
Budget 2021/22 $’000
Budget 2022/23 $’000
Budget 2023/24 $’000
Budget 2024/25 $’000
Budget 2025/26 $’000
Budget 2026/27 $’000
Budget 2027/28 $’000
Sources Of Operating Funding
General Rates, Uniform annual general charges, rates penalties
Targeted Rates (other than a targeted rate for water supply) 1,561 1,755 1,714 1,817 1,836 1,984 2,098 2,237 2,350 2,485 2,648
Subsidies and grants for operating purposes
Fees charges and targeted rates for water supply
Internal charges and overheads recovered
Local authorities fuel tax, fines, infringement fees and other receipts
Total Operating Funding 1,561 1,755 1,714 1,817 1,836 1,984 2,098 2,237 2,350 2,485 2,648
Applications Of Operating Funding
Payments to staff and suppliers 458 588 485 489 527 590 653 720 778 849 930
Finance costs 36 52 63 74 104 147 185 224 258 289 331
Internal charges and overheads applied 181 222 239 235 215 217 222 229 225 230 243
Other operating funding applications
Total Applications Of Operating Funding 675 862 787 798 845 954 1,060 1,174 1,260 1,369 1,504
Surplus/(Deficit) Of Operating Funding 886 893 928 1,020 991 1,030 1,039 1,063 1,089 1,116 1,144
Sources Of Capital Funding
Subsidies and grants for capital expenditure
Development and financial contributions
Increase/(decrease) in debt 529 297 245 321 1,165 968 938 1,040 624 938 1,148
Gross proceeds from the sale of assets
Lump sum contributions
Other dedicated capital funding 20 35 36 63 69 76 95 97 100 102 105
Total Sources Of Capital Funding 549 332 281 384 1,234 1,044 1,033 1,137 723 1,040 1,253
Applications Of Capital Funding
Capital expenditure
- to meet additional demand 100 87 107 93 114 229
- to improve the level of service 956 396 447 627 1,335 1,283 1,285 1,316 1,357 1,384 1,489
- to replace existing assets 146 781 236 205 208 213 218 223 287 295 303
Increase/(decrease) in reserves 333 (52) 438 572 575 485 569 547 169 478 377
Increase/(decrease) of investments
Total Applications Of Capital Funding 1,435 1,225 1,208 1,404 2,225 2,074 2,071 2,200 1,813 2,156 2,397
Surplus/(Deficit) Of Capital Funding (886) (893) (928) (1,020) (991) (1,030) (1,039) (1,063) (1,089) (1,116) (1,144)
Funding Balance 0 0 0 0 0 0 0 0 0 0 0
Stormwater
Timaru District Council Long Term Plan 2018-2028: Council Activities - Supporting Information82
Waste Minimisation
Timaru District Council Long Term Plan 2018-2028: Council Activities - Supporting Information 83
Waste Minimisation
What we doWaste Minimisation addresses the management of waste generated in the Timaru district. This involves the safe and effective collection, recycling, recovery and disposal of waste materials with a focus on minimizing waste. Since 2006, the Council has operated the 3-2-1-ZERO kerbside collection in the District. This highly successful system provides 85% of the district’s households with organic waste, recycling and rubbish bins which are collected regularly with materials sorted and managed at the Redruth Resource Recovery Park.
The vision for Waste Minimisation is:
“A sustainable community that is able to reuse, recycle and recover discarded resources and minimise residual waste to landfill, while ensuring protection of public health and the environment.”
Council manages the overall activity including the services listed below and owns waste minimisation sites and facilities where operational work is carried out by contractors. Waste Management New Zealand Ltd (WMNZ) is contracted until June 2021 to provide kerbside collection, transfer stations, landfill, composting and recycling operations. Council services provided are:
kerbside collection service to urban and some rural residents for organic (green) waste, recycling and rubbish
transfer station facilities at Geraldine, Pleasant Point, Temuka and Timaru (Redruth) incorporating:
� recycling, composting and rubbish dropoff
� escrap dropoff
� scrap metal and cleanfill dropoff
� household hazardous waste dropoff
� reusable goods dropoff
Waste Minimisation facilities at Redruth Resource Recovery Park including:
� landfill
� recycling and composting facilities
� a retail shop for reusable materials called “The Crow’s Nest” at Redruth. This also offers a kerbside collection service for large reusable goods
An off-site scrap metal recycling drop-off
Information and education resources for the public and
businesses
3-2-1-ZERO waste minimisation support for public zero waste events
3-2-1-Zero Public Place Recycling
Implementation of business and community waste minimisation programmes such as the modern cloth nappy programme
Under the Waste Minimisation Act 2008, Councils must complete a Waste Management and Minimisation Plan (WMMP) every six years that assesses the provision of existing services and provides options for the delivery of future services.
A full review is being conducted in conjunction with the 2018-28 LTP. This commenced with a waste assessment in 2017 which highlighted the need for continuing to implement waste diversion opportunities. These have been incorporated in the draft WMMP which is being discussed with the community as part of consultation on the 2018-28 LTP.
Timaru District Council Long Term Plan 2018-2028: Council Activities - Supporting Information84
Waste Minimisation
Why we do itWaste Minimisation contributes to the economy and lifestyle aspects of the Council’s vision. Provision of waste minimisation services is a core service for the community. In line with the NZ waste strategy, the focus is on separating waste materials and minimising waste. to lengthen the life of the Redruth landfill.
Waste initiatives contribute to improving and maintaining a healthy environment. Numerous environmental benefits stem from the separation of waste, including a reduction of waste to landfill, fewer greenhouse gas emissions, composting of green waste (which eventually goes back onto the land to improve soil structure), and reusing waste materials which can lower the demand for raw materials. Managing waste locally avoids the significant financial and environmental cost of transporting waste out of district for disposal.
An effective waste management system also promotes Timaru district as sustainable and environmentally responsible, and maintains a tidy and attractive district. This activity is critical in protecting human health. Collection and appropriate disposal of waste reduces the potential for disease and vermin issues, and degradation of the environment (land and water). The activity positively impacts communities through creating a social ethic to ‘do the right thing’ with waste. Education of individuals, community groups, schools and workplaces helps to minimise waste and contributes to improved sustainability outcomes.
Landscaping of facilities and closed landfill areas provides enhanced amenity areas (e.g. Saltwater Creek walkway) and recreational venues. The implementation of Council’s Waste Management and Minimisation Plan has created new jobs in the district and opportunities for secondary industries. The recovery of waste material for recycling and composting has created new revenue streams that partially offset the cost of the activity.
The delivery of waste management services is guided and governed by several Acts and regional and local plans and policies including the:
Waste Minimisation Act (WMA) 2008
NZ Waste Strategy 2010
Local Government Act 2002
Hazardous Substances and New Organisms Act 1996
Resource Management Act 1991
Canterbury Hazardous Waste Strategy
Timaru District Council Waste Management and Minimisation Plan 2018 (WMMP)
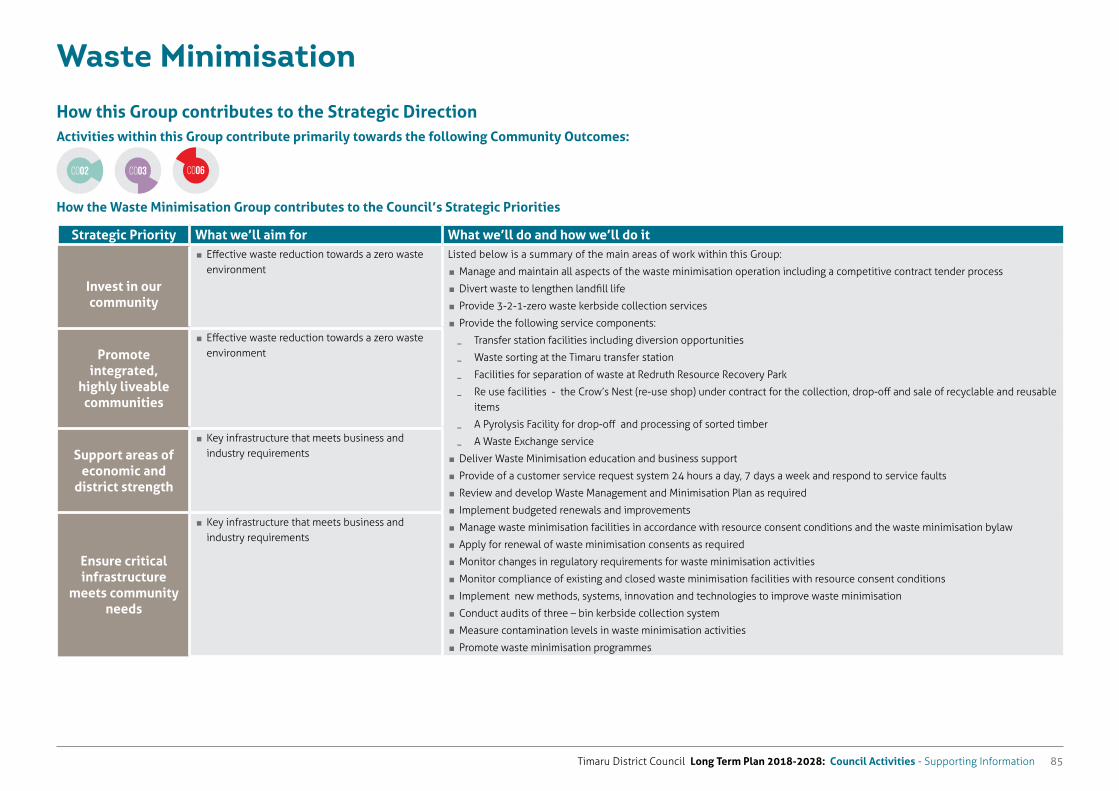
Timaru District Council Long Term Plan 2018-2028: Council Activities - Supporting Information 85
Waste Minimisation
How this Group contributes to the Strategic DirectionActivities within this Group contribute primarily towards the following Community Outcomes:
How the Waste Minimisation Group contributes to the Council’s Strategic Priorities
Strategic Priority What we’ll aim for What we’ll do and how we’ll do it
Invest in our community
� Effective waste reduction towards a zero waste environment
Listed below is a summary of the main areas of work within this Group:
� Manage and maintain all aspects of the waste minimisation operation including a competitive contract tender process
� Divert waste to lengthen landfill life
� Provide 3-2-1-zero waste kerbside collection services
� Provide the following service components:
� Transfer station facilities including diversion opportunities
� Waste sorting at the Timaru transfer station
� Facilities for separation of waste at Redruth Resource Recovery Park
� Re use facilities - the Crow’s Nest (re-use shop) under contract for the collection, drop-off and sale of recyclable and reusable items
� A Pyrolysis Facility for drop-off and processing of sorted timber
� A Waste Exchange service
� Deliver Waste Minimisation education and business support
� Provide of a customer service request system 24 hours a day, 7 days a week and respond to service faults
� Review and develop Waste Management and Minimisation Plan as required
� Implement budgeted renewals and improvements
� Manage waste minimisation facilities in accordance with resource consent conditions and the waste minimisation bylaw
� Apply for renewal of waste minimisation consents as required
� Monitor changes in regulatory requirements for waste minimisation activities
� Monitor compliance of existing and closed waste minimisation facilities with resource consent conditions
� Implement new methods, systems, innovation and technologies to improve waste minimisation
� Conduct audits of three – bin kerbside collection system
� Measure contamination levels in waste minimisation activities
� Promote waste minimisation programmes
Promote
integrated, highly liveable communities
� Effective waste reduction towards a zero waste environment
Support areas of
economic and district strength
� Key infrastructure that meets business and industry requirements
Ensure critical infrastructure
meets community needs
� Key infrastructure that meets business and industry requirements
CO06CO02 CO03
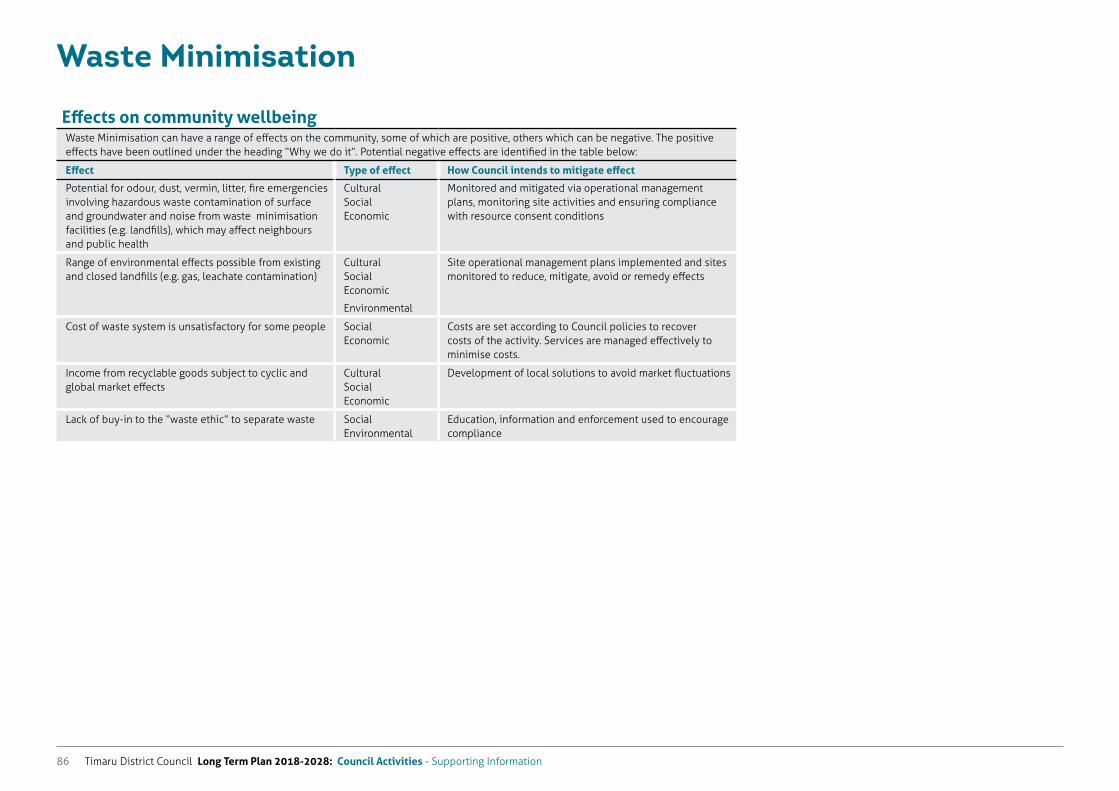
Timaru District Council Long Term Plan 2018-2028: Council Activities - Supporting Information86
Waste Minimisation
Effects on community wellbeingWaste Minimisation can have a range of effects on the community, some of which are positive, others which can be negative. The positive effects have been outlined under the heading “Why we do it”. Potential negative effects are identified in the table below:
Effect Type of effect How Council intends to mitigate effect
Potential for odour, dust, vermin, litter, fire emergencies involving hazardous waste contamination of surface and groundwater and noise from waste minimisation facilities (e.g. landfills), which may affect neighbours and public health
Cultural Social Economic
Monitored and mitigated via operational management plans, monitoring site activities and ensuring compliance with resource consent conditions
Range of environmental effects possible from existing and closed landfills (e.g. gas, leachate contamination)
Cultural Social Economic
Environmental
Site operational management plans implemented and sites monitored to reduce, mitigate, avoid or remedy effects
Cost of waste system is unsatisfactory for some people Social Economic
Costs are set according to Council policies to recover costs of the activity. Services are managed effectively to minimise costs.
Income from recyclable goods subject to cyclic and global market effects
Cultural Social Economic
Development of local solutions to avoid market fluctuations
Lack of buy-in to the “waste ethic” to separate waste Social Environmental
Education, information and enforcement used to encourage compliance
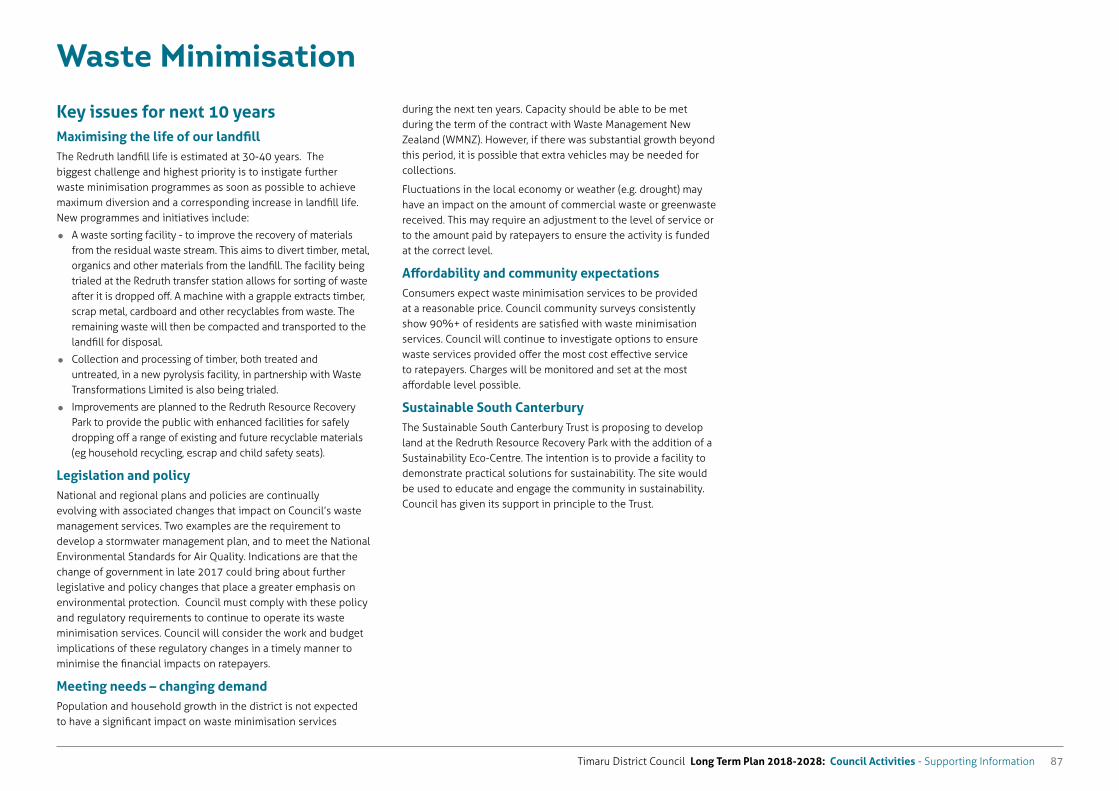
Timaru District Council Long Term Plan 2018-2028: Council Activities - Supporting Information 87
Waste Minimisation
Key issues for next 10 yearsMaximising the life of our landfill The Redruth landfill life is estimated at 30-40 years. The biggest challenge and highest priority is to instigate further waste minimisation programmes as soon as possible to achieve maximum diversion and a corresponding increase in landfill life. New programmes and initiatives include:
A waste sorting facility - to improve the recovery of materials from the residual waste stream. This aims to divert timber, metal, organics and other materials from the landfill. The facility being trialed at the Redruth transfer station allows for sorting of waste after it is dropped off. A machine with a grapple extracts timber, scrap metal, cardboard and other recyclables from waste. The remaining waste will then be compacted and transported to the landfill for disposal.
Collection and processing of timber, both treated and untreated, in a new pyrolysis facility, in partnership with Waste Transformations Limited is also being trialed.
Improvements are planned to the Redruth Resource Recovery Park to provide the public with enhanced facilities for safely dropping off a range of existing and future recyclable materials (eg household recycling, escrap and child safety seats).
Legislation and policyNational and regional plans and policies are continually evolving with associated changes that impact on Council’s waste management services. Two examples are the requirement to develop a stormwater management plan, and to meet the National Environmental Standards for Air Quality. Indications are that the change of government in late 2017 could bring about further legislative and policy changes that place a greater emphasis on environmental protection. Council must comply with these policy and regulatory requirements to continue to operate its waste minimisation services. Council will consider the work and budget implications of these regulatory changes in a timely manner to minimise the financial impacts on ratepayers.
Meeting needs – changing demandPopulation and household growth in the district is not expected to have a significant impact on waste minimisation services
during the next ten years. Capacity should be able to be met during the term of the contract with Waste Management New Zealand (WMNZ). However, if there was substantial growth beyond this period, it is possible that extra vehicles may be needed for collections.
Fluctuations in the local economy or weather (e.g. drought) may have an impact on the amount of commercial waste or greenwaste received. This may require an adjustment to the level of service or to the amount paid by ratepayers to ensure the activity is funded at the correct level.
Affordability and community expectationsConsumers expect waste minimisation services to be provided at a reasonable price. Council community surveys consistently show 90%+ of residents are satisfied with waste minimisation services. Council will continue to investigate options to ensure waste services provided offer the most cost effective service to ratepayers. Charges will be monitored and set at the most affordable level possible.
Sustainable South CanterburyThe Sustainable South Canterbury Trust is proposing to develop land at the Redruth Resource Recovery Park with the addition of a Sustainability Eco-Centre. The intention is to provide a facility to demonstrate practical solutions for sustainability. The site would be used to educate and engage the community in sustainability. Council has given its support in principle to the Trust.
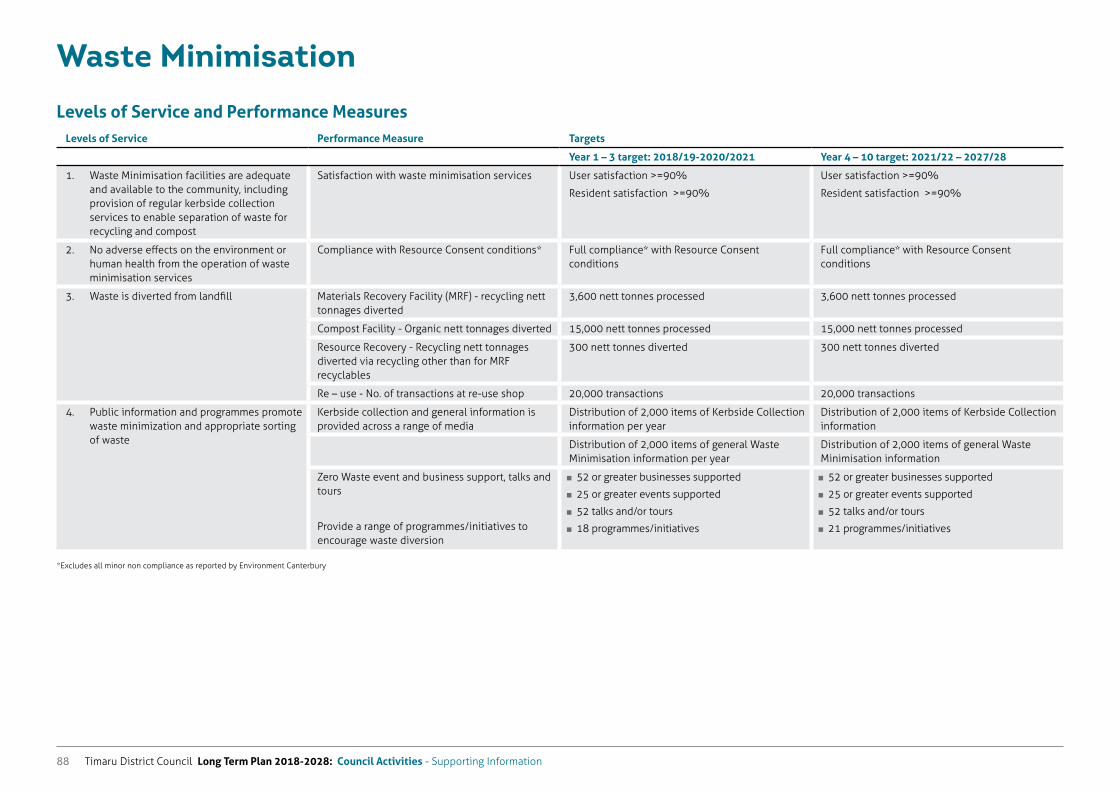
Timaru District Council Long Term Plan 2018-2028: Council Activities - Supporting Information88
Waste Minimisation
Levels of Service and Performance MeasuresLevels of Service Performance Measure Targets
Year 1 – 3 target: 2018/19-2020/2021 Year 4 – 10 target: 2021/22 – 2027/28
1. Waste Minimisation facilities are adequate and available to the community, including provision of regular kerbside collection services to enable separation of waste for recycling and compost
Satisfaction with waste minimisation services User satisfaction >=90%
Resident satisfaction >=90%
User satisfaction >=90%
Resident satisfaction >=90%
2. No adverse effects on the environment or human health from the operation of waste minimisation services
Compliance with Resource Consent conditions* Full compliance* with Resource Consent conditions
Full compliance* with Resource Consent conditions
3. Waste is diverted from landfill Materials Recovery Facility (MRF) - recycling nett tonnages diverted
3,600 nett tonnes processed 3,600 nett tonnes processed
Compost Facility - Organic nett tonnages diverted 15,000 nett tonnes processed 15,000 nett tonnes processed
Resource Recovery - Recycling nett tonnages diverted via recycling other than for MRF recyclables
300 nett tonnes diverted 300 nett tonnes diverted
Re – use - No. of transactions at re-use shop 20,000 transactions 20,000 transactions
4. Public information and programmes promote waste minimization and appropriate sorting of waste
Kerbside collection and general information is provided across a range of media
Distribution of 2,000 items of Kerbside Collection information per year
Distribution of 2,000 items of Kerbside Collection information
Distribution of 2,000 items of general Waste Minimisation information per year
Distribution of 2,000 items of general Waste Minimisation information
Zero Waste event and business support, talks and tours
Provide a range of programmes/initiatives to encourage waste diversion
� 52 or greater businesses supported
� 25 or greater events supported
� 52 talks and/or tours
� 18 programmes/initiatives
� 52 or greater businesses supported
� 25 or greater events supported
� 52 talks and/or tours
� 21 programmes/initiatives
*Excludes all minor non compliance as reported by Environment Canterbury
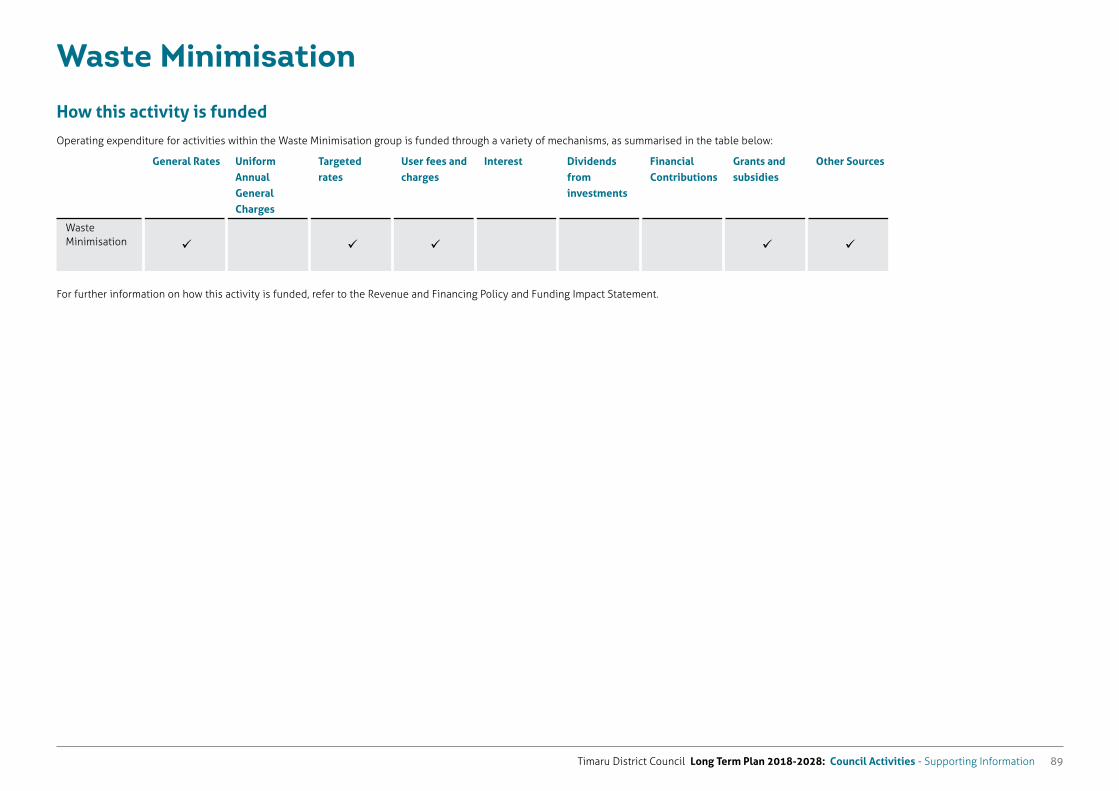
Timaru District Council Long Term Plan 2018-2028: Council Activities - Supporting Information 89
Waste Minimisation
How this activity is funded
Operating expenditure for activities within the Waste Minimisation group is funded through a variety of mechanisms, as summarised in the table below:
General Rates Uniform Annual General Charges
Targeted rates
User fees and charges
Interest Dividends from investments
Financial Contributions
Grants and subsidies
Other Sources
Waste Minimisation
For further information on how this activity is funded, refer to the Revenue and Financing Policy and Funding Impact Statement.
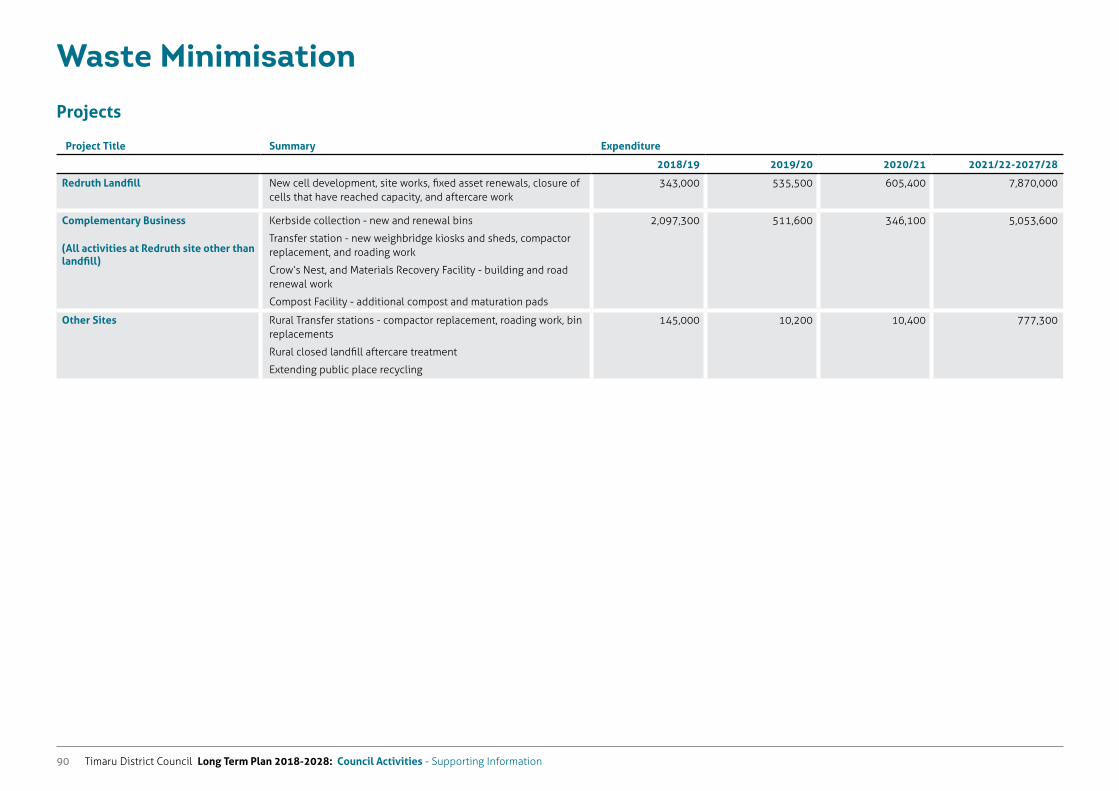
Timaru District Council Long Term Plan 2018-2028: Council Activities - Supporting Information90
Waste Minimisation
Projects
Project Title Summary Expenditure
2018/19 2019/20 2020/21 2021/22-2027/28
Redruth Landfill New cell development, site works, fixed asset renewals, closure of cells that have reached capacity, and aftercare work
343,000 535,500 605,400 7,870,000
Complementary Business
(All activities at Redruth site other than landfill)
Kerbside collection - new and renewal bins
Transfer station - new weighbridge kiosks and sheds, compactor replacement, and roading work
Crow’s Nest, and Materials Recovery Facility - building and road renewal work
Compost Facility - additional compost and maturation pads
2,097,300 511,600 346,100 5,053,600
Other Sites Rural Transfer stations - compactor replacement, roading work, bin replacements
Rural closed landfill aftercare treatment
Extending public place recycling
145,000 10,200 10,400 777,300
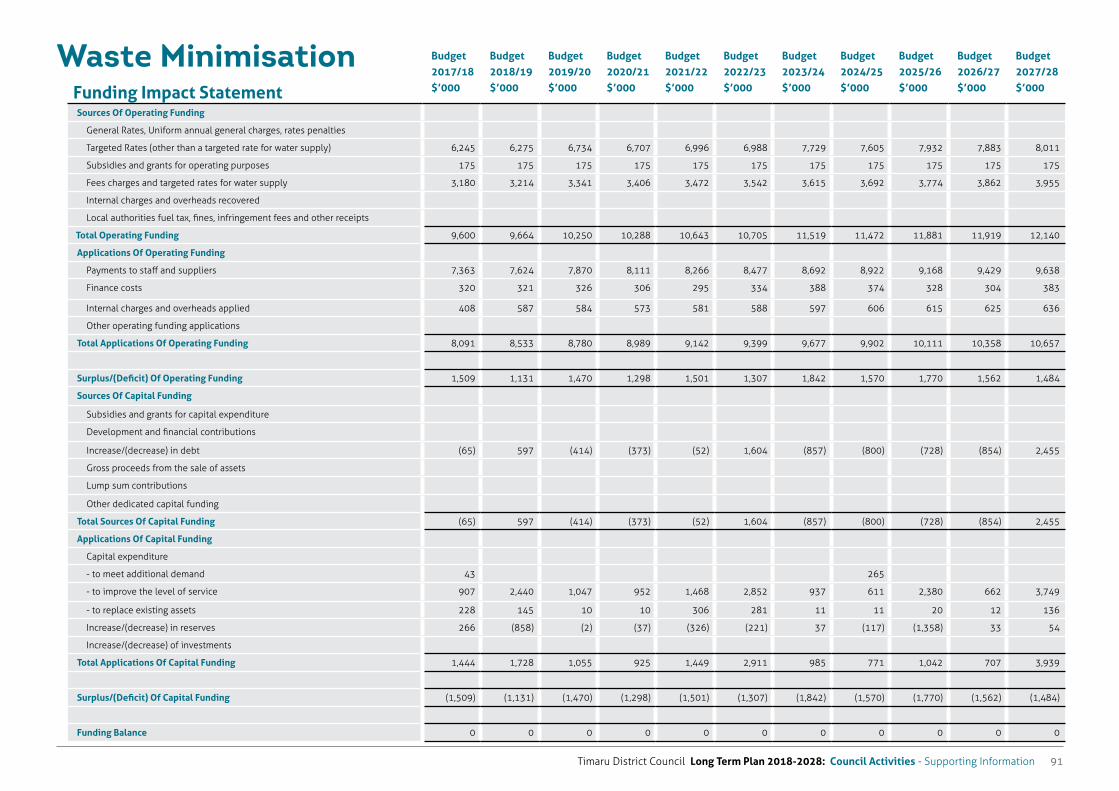
Timaru District Council Long Term Plan 2018-2028: Council Activities - Supporting Information 91
Funding Impact Statement
Budget 2017/18 $’000
Budget 2018/19 $’000
Budget 2019/20 $’000
Budget 2020/21 $’000
Budget 2021/22 $’000
Budget 2022/23 $’000
Budget 2023/24 $’000
Budget 2024/25 $’000
Budget 2025/26 $’000
Budget 2026/27 $’000
Budget 2027/28 $’000
Sources Of Operating Funding
General Rates, Uniform annual general charges, rates penalties
Targeted Rates (other than a targeted rate for water supply) 6,245 6,275 6,734 6,707 6,996 6,988 7,729 7,605 7,932 7,883 8,011
Subsidies and grants for operating purposes 175 175 175 175 175 175 175 175 175 175 175
Fees charges and targeted rates for water supply 3,180 3,214 3,341 3,406 3,472 3,542 3,615 3,692 3,774 3,862 3,955
Internal charges and overheads recovered
Local authorities fuel tax, fines, infringement fees and other receipts
Total Operating Funding 9,600 9,664 10,250 10,288 10,643 10,705 11,519 11,472 11,881 11,919 12,140
Applications Of Operating Funding
Payments to staff and suppliers 7,363 7,624 7,870 8,111 8,266 8,477 8,692 8,922 9,168 9,429 9,638
Finance costs 320 321 326 306 295 334 388 374 328 304 383
Internal charges and overheads applied 408 587 584 573 581 588 597 606 615 625 636
Other operating funding applications
Total Applications Of Operating Funding 8,091 8,533 8,780 8,989 9,142 9,399 9,677 9,902 10,111 10,358 10,657
Surplus/(Deficit) Of Operating Funding 1,509 1,131 1,470 1,298 1,501 1,307 1,842 1,570 1,770 1,562 1,484
Sources Of Capital Funding
Subsidies and grants for capital expenditure
Development and financial contributions
Increase/(decrease) in debt (65) 597 (414) (373) (52) 1,604 (857) (800) (728) (854) 2,455
Gross proceeds from the sale of assets
Lump sum contributions
Other dedicated capital funding
Total Sources Of Capital Funding (65) 597 (414) (373) (52) 1,604 (857) (800) (728) (854) 2,455
Applications Of Capital Funding
Capital expenditure
- to meet additional demand 43 265
- to improve the level of service 907 2,440 1,047 952 1,468 2,852 937 611 2,380 662 3,749
- to replace existing assets 228 145 10 10 306 281 11 11 20 12 136
Increase/(decrease) in reserves 266 (858) (2) (37) (326) (221) 37 (117) (1,358) 33 54
Increase/(decrease) of investments
Total Applications Of Capital Funding 1,444 1,728 1,055 925 1,449 2,911 985 771 1,042 707 3,939
Surplus/(Deficit) Of Capital Funding (1,509) (1,131) (1,470) (1,298) (1,501) (1,307) (1,842) (1,570) (1,770) (1,562) (1,484)
Funding Balance 0 0 0 0 0 0 0 0 0 0 0
Waste Minimisation
Timaru District Council Long Term Plan 2018-2028: Council Activities - Supporting Information92
Water Supply
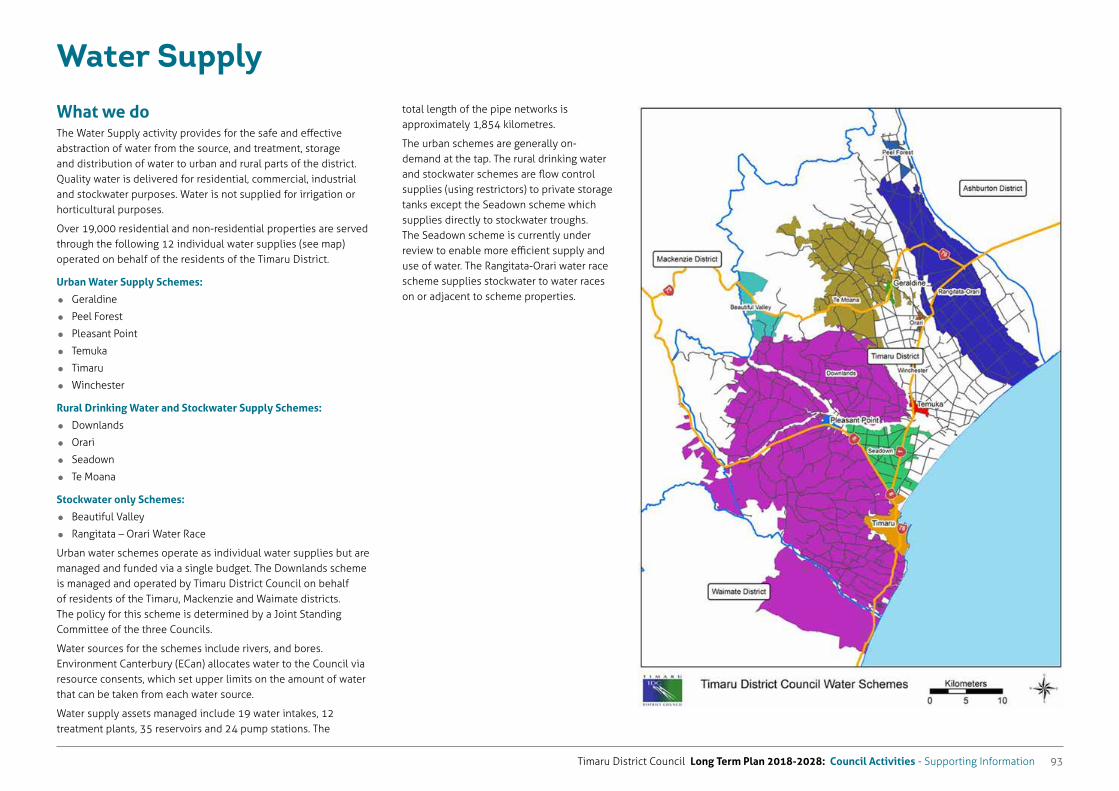
Timaru District Council Long Term Plan 2018-2028: Council Activities - Supporting Information 93
Water Supply
What we doThe Water Supply activity provides for the safe and effective abstraction of water from the source, and treatment, storage and distribution of water to urban and rural parts of the district. Quality water is delivered for residential, commercial, industrial and stockwater purposes. Water is not supplied for irrigation or horticultural purposes.
Over 19,000 residential and non-residential properties are served through the following 12 individual water supplies (see map)operated on behalf of the residents of the Timaru District.
Urban Water Supply Schemes:
Geraldine
Peel Forest
Pleasant Point
Temuka
Timaru
Winchester
Rural Drinking Water and Stockwater Supply Schemes:
Downlands
Orari
Seadown
Te Moana
Stockwater only Schemes:
Beautiful Valley
Rangitata – Orari Water Race
Urban water schemes operate as individual water supplies but are managed and funded via a single budget. The Downlands scheme is managed and operated by Timaru District Council on behalf of residents of the Timaru, Mackenzie and Waimate districts. The policy for this scheme is determined by a Joint Standing Committee of the three Councils.
Water sources for the schemes include rivers, and bores. Environment Canterbury (ECan) allocates water to the Council via resource consents, which set upper limits on the amount of water that can be taken from each water source.
Water supply assets managed include 19 water intakes, 12 treatment plants, 35 reservoirs and 24 pump stations. The
total length of the pipe networks is approximately 1,854 kilometres.
The urban schemes are generally on-demand at the tap. The rural drinking water and stockwater schemes are flow control supplies (using restrictors) to private storage tanks except the Seadown scheme which supplies directly to stockwater troughs. The Seadown scheme is currently under review to enable more efficient supply and use of water. The Rangitata-Orari water race scheme supplies stockwater to water races on or adjacent to scheme properties.
Timaru District Council Long Term Plan 2018-2028: Council Activities - Supporting Information94
Water Supply
Why we do itWater Supply particularly contributes to the economy and lifestyle aspects of the Council’s vision.
Water supply is a core service expected by the community. Provision of safe water is essential to maintain and protect public health. It also assists with fire fighting in most urban reticulated areas to protect public safety.
Collective provision of water supply services is the only realistic option to ensure large populations enjoy the benefits of safe, collective treatment and distribution of water for human use.
Water is necessary for maintaining provision of critical public services and promoting economic growth. Industries, businesses, hospitals and schools require water to operate. High quality and a reliable quantity of water facilitates the continued development of public, private and business interests. Reliable and future proofed water supply systems attract business to the district.
Water abstraction must occur within allowable limits to safeguard the environment and protect cultural values of water bodies. Provision of water aims to provide the best balance between economic, environmental and community needs. Managing water use in a sustainable way minimises adverse impacts on the environment for the benefit of current and future generations, discourages water wastage and ensures water is directed to the best purposes.
The delivery of water supply services is governed by national legislation and regional and local policies. These include the:
Local Government Act 2002
Health Act 1956
Resource Management Act 1991
Drinking Water Standards for New Zealand (DWSNZ) 2005 (Revised 2008)
National Policy Statement for Freshwater Management 2014
National Environmental Standard for Sources of Human Drinking Water 2008
Civil Defence and Emergency Management Act 2002
Health and Safety at Work Act 2015
Canterbury Water Management Strategy 2009 (Environment Canterbury)
Canterbury Land and Water Regional Plan 2016 (LWRP) (Environment Canterbury)
Opihi River Regional Plan 2000 (Environment Canterbury)
Pareora Catchment Environmental Flow and Water Allocation Regional Plan 2012 (Environment Canterbury)
Canterbury Regional Policy Statement 2013 (Environment Canterbury)
Timaru District Plan 2005
Timaru District Consolidated Bylaw 2018
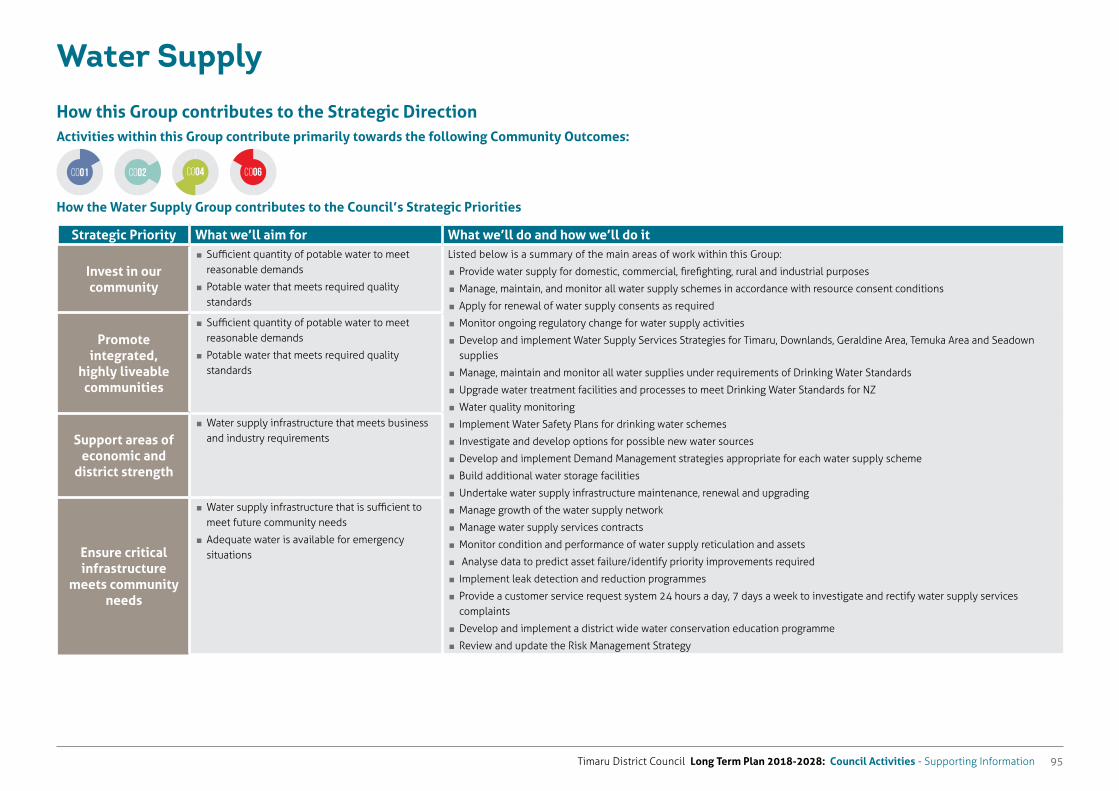
Timaru District Council Long Term Plan 2018-2028: Council Activities - Supporting Information 95
Water Supply
How this Group contributes to the Strategic DirectionActivities within this Group contribute primarily towards the following Community Outcomes:
How the Water Supply Group contributes to the Council’s Strategic Priorities
Strategic Priority What we’ll aim for What we’ll do and how we’ll do it
Invest in our community
� Sufficient quantity of potable water to meet reasonable demands
� Potable water that meets required quality standards
Listed below is a summary of the main areas of work within this Group:
� Provide water supply for domestic, commercial, firefighting, rural and industrial purposes
� Manage, maintain, and monitor all water supply schemes in accordance with resource consent conditions
� Apply for renewal of water supply consents as required
� Monitor ongoing regulatory change for water supply activities
� Develop and implement Water Supply Services Strategies for Timaru, Downlands, Geraldine Area, Temuka Area and Seadown supplies
� Manage, maintain and monitor all water supplies under requirements of Drinking Water Standards
� Upgrade water treatment facilities and processes to meet Drinking Water Standards for NZ
� Water quality monitoring
� Implement Water Safety Plans for drinking water schemes
� Investigate and develop options for possible new water sources
� Develop and implement Demand Management strategies appropriate for each water supply scheme
� Build additional water storage facilities
� Undertake water supply infrastructure maintenance, renewal and upgrading
� Manage growth of the water supply network
� Manage water supply services contracts
� Monitor condition and performance of water supply reticulation and assets
� Analyse data to predict asset failure/identify priority improvements required
� Implement leak detection and reduction programmes
� Provide a customer service request system 24 hours a day, 7 days a week to investigate and rectify water supply services complaints
� Develop and implement a district wide water conservation education programme
� Review and update the Risk Management Strategy
Promote
integrated, highly liveable communities
� Sufficient quantity of potable water to meet reasonable demands
� Potable water that meets required quality standards
Support areas of
economic and district strength
� Water supply infrastructure that meets business and industry requirements
Ensure critical infrastructure
meets community needs
� Water supply infrastructure that is sufficient to meet future community needs
� Adequate water is available for emergency situations
CO01 CO04 CO06CO02
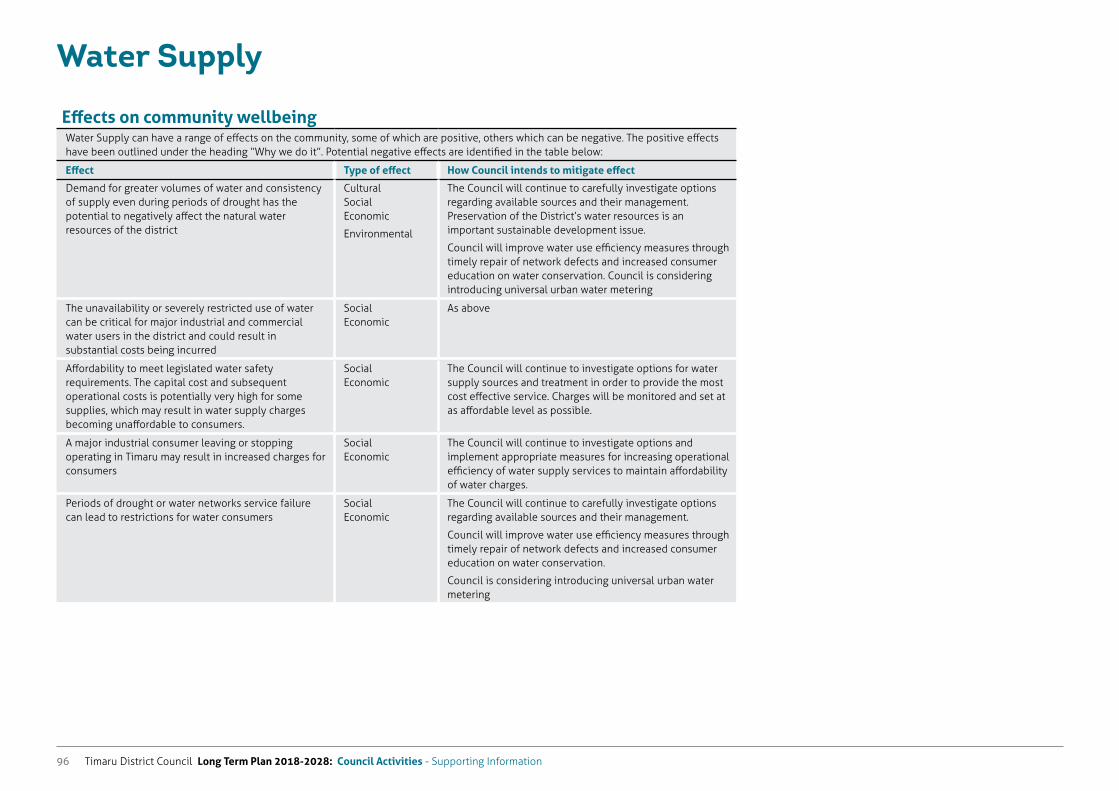
Timaru District Council Long Term Plan 2018-2028: Council Activities - Supporting Information96
Water Supply
Effects on community wellbeingWater Supply can have a range of effects on the community, some of which are positive, others which can be negative. The positive effects have been outlined under the heading “Why we do it”. Potential negative effects are identified in the table below:
Effect Type of effect How Council intends to mitigate effect
Demand for greater volumes of water and consistency of supply even during periods of drought has the potential to negatively affect the natural water resources of the district
Cultural Social Economic
Environmental
The Council will continue to carefully investigate options regarding available sources and their management. Preservation of the District’s water resources is an important sustainable development issue.
Council will improve water use efficiency measures through timely repair of network defects and increased consumer education on water conservation. Council is considering introducing universal urban water metering
The unavailability or severely restricted use of water can be critical for major industrial and commercial water users in the district and could result in substantial costs being incurred
Social Economic
As above
Affordability to meet legislated water safety requirements. The capital cost and subsequent operational costs is potentially very high for some supplies, which may result in water supply charges becoming unaffordable to consumers.
Social Economic
The Council will continue to investigate options for water supply sources and treatment in order to provide the most cost effective service. Charges will be monitored and set at as affordable level as possible.
A major industrial consumer leaving or stopping operating in Timaru may result in increased charges for consumers
Social Economic
The Council will continue to investigate options and implement appropriate measures for increasing operational efficiency of water supply services to maintain affordability of water charges.
Periods of drought or water networks service failure can lead to restrictions for water consumers
Social Economic
The Council will continue to carefully investigate options regarding available sources and their management.
Council will improve water use efficiency measures through timely repair of network defects and increased consumer education on water conservation.
Council is considering introducing universal urban water metering
Timaru District Council Long Term Plan 2018-2028: Council Activities - Supporting Information 97
Water Supply
Key issues for next 10 yearsThe main issues for Water Supply are expected to come from the need for Council to maintain an affordable service while complying with standards and legislated requirements, and meeting consumer expectations. These are discussed further below.
Meeting NZ Drinking Water StandardsCouncil is required to take all practicable steps to comply with the Drinking Water Standards for New Zealand (DWSNZ) for all drinking water supplies. An approved Water Safety Plan (formerly Public Health Risk Management Plan) for drinking water schemes must be implemented addressing identified public health risks within set timelines. While all of Council’s drinking water supplies are safe, some risks have been identified in a number of supplies, largely requiring upgrading of water treatment processes and construction of water treatment infrastructure. Upgrades of water treatment facilities have already been completed at Pleasant Point, Temuka, Peel Forest, Seadown and Pareora pipeline (Downlands). Upgrades are planned for the remaining drinking water supplies. There could be more stringent standards and regulatory controls around the supply of drinking water arising from the recommendations of the Government Inquiry into the Havelock North Drinking Water Contamination.
Changes in national/regional plans and policiesWater is a highly regulated resource, with national and regional policies, standards and plans directing how Council must use it (e.g. how much water Council can take, quality of drinking water supplies). These regulations are continually evolving with associated changes in requirements that impact on Council’s operation of its water supplies. In 2016, the Canterbury Land and Water Regional Plan (LWRP) replaced the Natural Resources Regional Plan (NRRP). In 2017, the National Policy Statement for Freshwater Management 2014 (NPS-FM) was amended in line with central government’s clean water reforms. The more stringent water management regimes in these policy instruments could translate into higher resource consent requirements for Council’s water abstractions.
The Government Inquiry into the Havelock North Drinking Water Contamination has recommended amendments to the Health Act
and to the Resource Management Act for stricter enforcement of regulations governing supply of safe drinking water.
Council must account for these increased requirements and associated costs in implementing its Water Safety Plans and in planning the upgrade of its water supplies. Government policy with respect to the Havelock North Stage 2 report of the Havelock North Drinking Water Contamination Inquiry is expected to be announced in early 2018.
Council must comply with these policy and regulatory requirements to continue to operate its water supplies. Council plans must consider the work and budget implications of these regulatory requirements.
Climate changeAn increased frequency of droughts diminishes the availability of source water for Council water supplies, with associated water take restrictions. An increased frequency of high intensity rainfalls impacts on raw water quality with the need for more complex treatment processes. These issues have implications for the security of the district’s water supply and Council’s ability to meet demand. Council will continue to investigate options regarding available sources and their management.
Meeting competing demands for water resourcesMeeting the water supply requirements of consumers a paramount objective of Council’s water supply services. However, there are many competing uses for water, ranging from recreational to industry use. These competing demands place pressure on water resources in the district. The schemes managed by Council are subject to resource consent conditions which limit the amount of water that can be taken from the water source. Significant growth in demand is likely to result in the need for substantial infrastructure upgrades.
While population and household growth in the district is not expected to have a significant impact on water supply requirements over the next 10 years, land use change and industry growth may potentially mean higher demand for water and infrastructure to provide the service.
There are six water supply schemes that supply water for stock use. Three of these schemes have on-farm flow control (restrictors) and currently have limited ability to meet any future growth in
demand. Council continues to investigate options to improve delivery mechanisms in these rural water schemes.
Council needs to consistently advocate for more efficient use of water by all consumers (i.e domestic, commercial, industrial, non-residential) to ensure that the water supplies continue to meet demand now and in the future.
Replacing water supply infrastructureIn late 2017 asbestos was discovered in the Temuka water scheme. The source of the asbestos was determined to be the 9km Trunk Water Main constructed in 1964 using 300mm asbestos cement pipe. As a matter of urgency the pipe is being replaced. A further assessment of the remaining life of all asbestos cement pipes is to be carried out.
Other plant, facilities and a significant amount of the District’s water supply network will need replacing based on age and performance issues. An assessment of the remaining life of the pipe assets estimates around $59.8M pipe renewal costs in the next 10 years. This includes approximately $42.7M for the reticulation network in urban areas and $17.1M for the rural networks.
TDC is carrying out further pipe condition assessment based on factors such as asset performance and maintenance history in order to confirm the renewals programme. It is crucial that the assessment methodologies are robust to allow greater accuracy in estimating the remaining life of assets, and mitigate the risk of an asset failing ahead of its estimated expiry date. The condition of ageing infrastructure will continue to be reviewed along with its current and future adequacy to meet consumer requirements.
Maintaining affordability and meeting community expectationsThe cost of providing water is likely to increase over the next 10 years as the above issues are addressed. Consumers expect good quality water to be available on demand in reasonable quantities at a reasonable price. Balancing cost and affordability is a major challenge and Council must continue to investigate options in order to provide the most cost effective service.
Council has decided to consult with the community on whether urban water meters should be installed, commencing in approximately 2021/22. The purpose of installing the meters
Timaru District Council Long Term Plan 2018-2028: Council Activities - Supporting Information98
Water Supplyis to help ensure water is not wasted and is used as effectively as possible. Water meters will result in a reduction in water usage thereby delaying the need to invest in additional water sources.
Resilience buildingThere is a growing focus on resilience in asset management, driven primarily by increased awareness of the many hazards made apparent by recent major natural disasters and events, such as the earthquakes in Christchurch (2011) and Kaikoura (2017), the flooding in the Bay of Plenty (2017), and the contamination of drinking water in Havelock North (2017). An increased understanding of the vulnerability of the Timaru district’s public water supply services is necessary, not only to build resilience to natural disasters but also other factors such as an economic crisis, and decline in population. Council must then invest in the right solutions to build or strengthen the asset and organisational capacity to withstand disruption, act effectively and adapt to change.
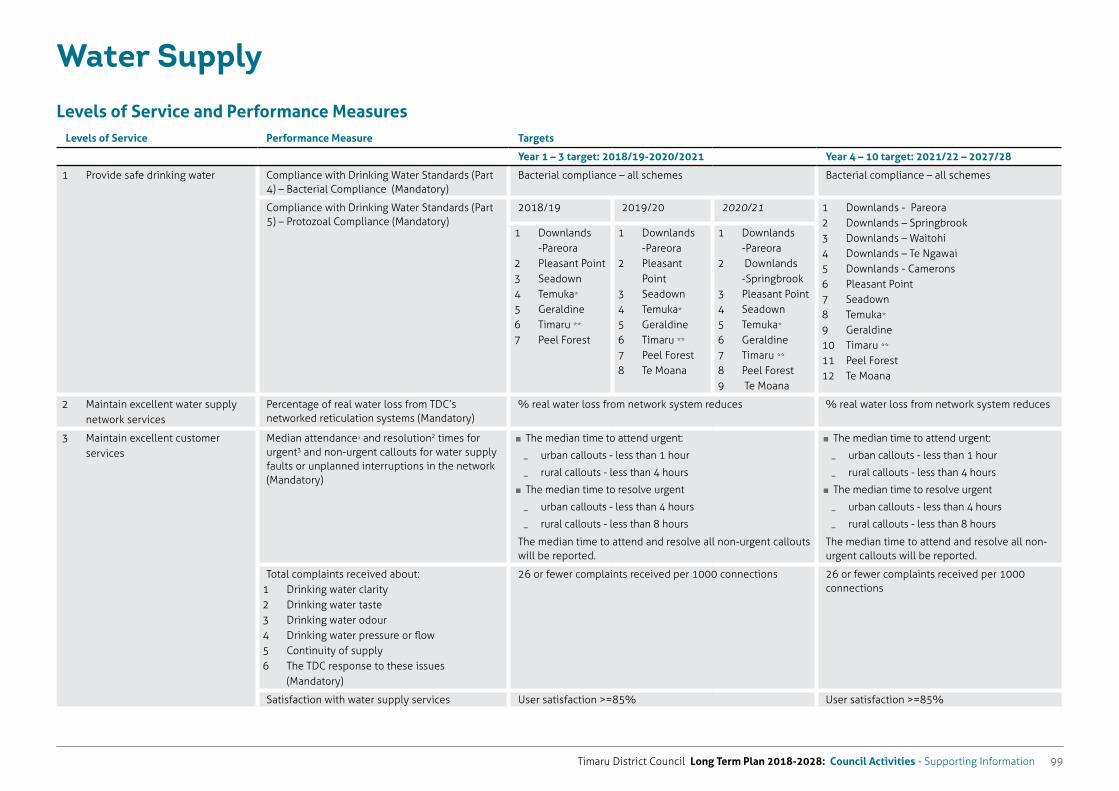
Timaru District Council Long Term Plan 2018-2028: Council Activities - Supporting Information 99
Water Supply
Levels of Service and Performance MeasuresLevels of Service Performance Measure Targets
Year 1 – 3 target: 2018/19-2020/2021 Year 4 – 10 target: 2021/22 – 2027/28
1 Provide safe drinking water Compliance with Drinking Water Standards (Part 4) – Bacterial Compliance (Mandatory)
Bacterial compliance – all schemes Bacterial compliance – all schemes
Compliance with Drinking Water Standards (Part 5) – Protozoal Compliance (Mandatory)
2018/19 2019/20 2020/21 1 Downlands - Pareora2 Downlands – Springbrook3 Downlands – Waitohi 4 Downlands – Te Ngawai5 Downlands - Camerons6 Pleasant Point 7 Seadown 8 Temuka* 9 Geraldine 10 Timaru **
11 Peel Forest12 Te Moana
1 Downlands -Pareora
2 Pleasant Point3 Seadown 4 Temuka* 5 Geraldine 6 Timaru **
7 Peel Forest
1 Downlands -Pareora
2 Pleasant Point
3 Seadown 4 Temuka* 5 Geraldine 6 Timaru **
7 Peel Forest8 Te Moana
1 Downlands -Pareora
2 Downlands -Springbrook
3 Pleasant Point4 Seadown 5 Temuka* 6 Geraldine 7 Timaru **
8 Peel Forest9 Te Moana
2 Maintain excellent water supply network services
Percentage of real water loss from TDC’s networked reticulation systems (Mandatory)
% real water loss from network system reduces % real water loss from network system reduces
3 Maintain excellent customer services
Median attendance1 and resolution2 times for urgent3 and non-urgent callouts for water supply faults or unplanned interruptions in the network (Mandatory)
� The median time to attend urgent:
� urban callouts - less than 1 hour
� rural callouts - less than 4 hours
� The median time to resolve urgent
� urban callouts - less than 4 hours
� rural callouts - less than 8 hours
The median time to attend and resolve all non-urgent callouts will be reported.
� The median time to attend urgent:
� urban callouts - less than 1 hour
� rural callouts - less than 4 hours
� The median time to resolve urgent
� urban callouts - less than 4 hours
� rural callouts - less than 8 hours
The median time to attend and resolve all non-urgent callouts will be reported.
Total complaints received about:1 Drinking water clarity2 Drinking water taste3 Drinking water odour4 Drinking water pressure or flow5 Continuity of supply6 The TDC response to these issues
(Mandatory)
26 or fewer complaints received per 1000 connections 26 or fewer complaints received per 1000 connections
Satisfaction with water supply services User satisfaction >=85% User satisfaction >=85%
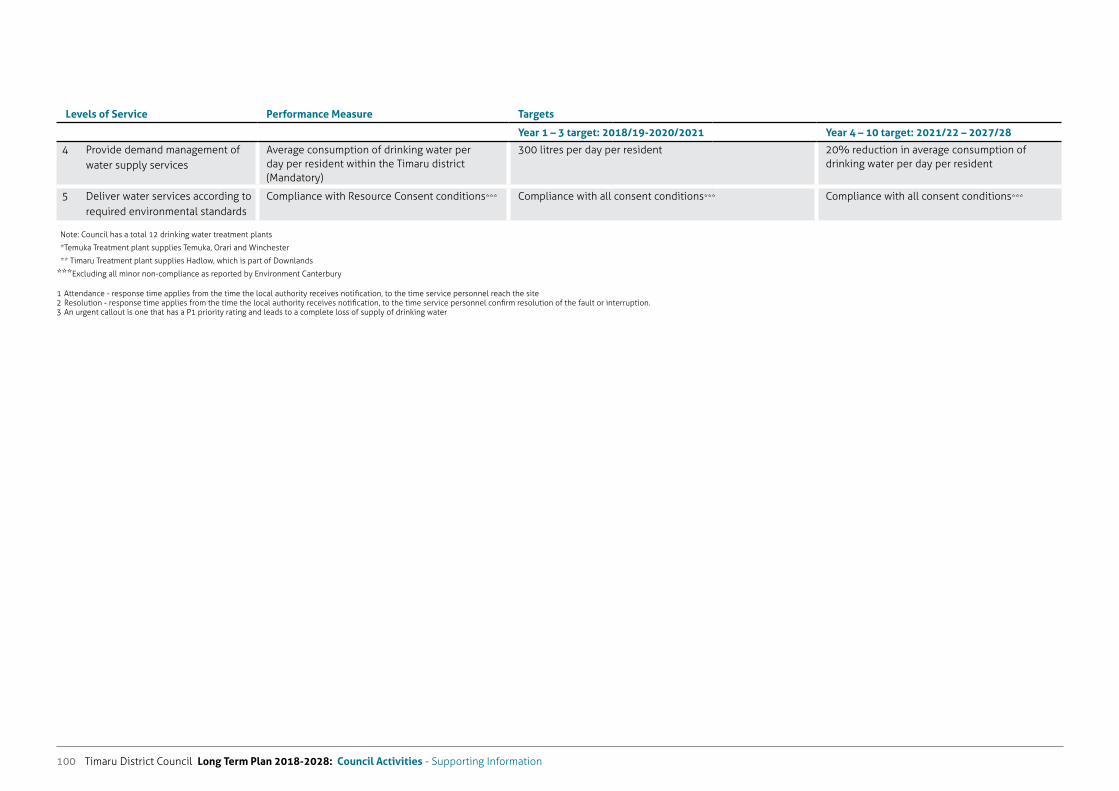
Timaru District Council Long Term Plan 2018-2028: Council Activities - Supporting Information100
Levels of Service Performance Measure Targets
Year 1 – 3 target: 2018/19-2020/2021 Year 4 – 10 target: 2021/22 – 2027/28
4 Provide demand management of water supply services
Average consumption of drinking water per day per resident within the Timaru district (Mandatory)
300 litres per day per resident 20% reduction in average consumption of drinking water per day per resident
5 Deliver water services according to required environmental standards
Compliance with Resource Consent conditions*** Compliance with all consent conditions*** Compliance with all consent conditions***
Note: Council has a total 12 drinking water treatment plants
*Temuka Treatment plant supplies Temuka, Orari and Winchester
** Timaru Treatment plant supplies Hadlow, which is part of Downlands
***Excluding all minor non-compliance as reported by Environment Canterbury
1 Attendance - response time applies from the time the local authority receives notification, to the time service personnel reach the site2 Resolution - response time applies from the time the local authority receives notification, to the time service personnel confirm resolution of the fault or interruption.3 An urgent callout is one that has a P1 priority rating and leads to a complete loss of supply of drinking water
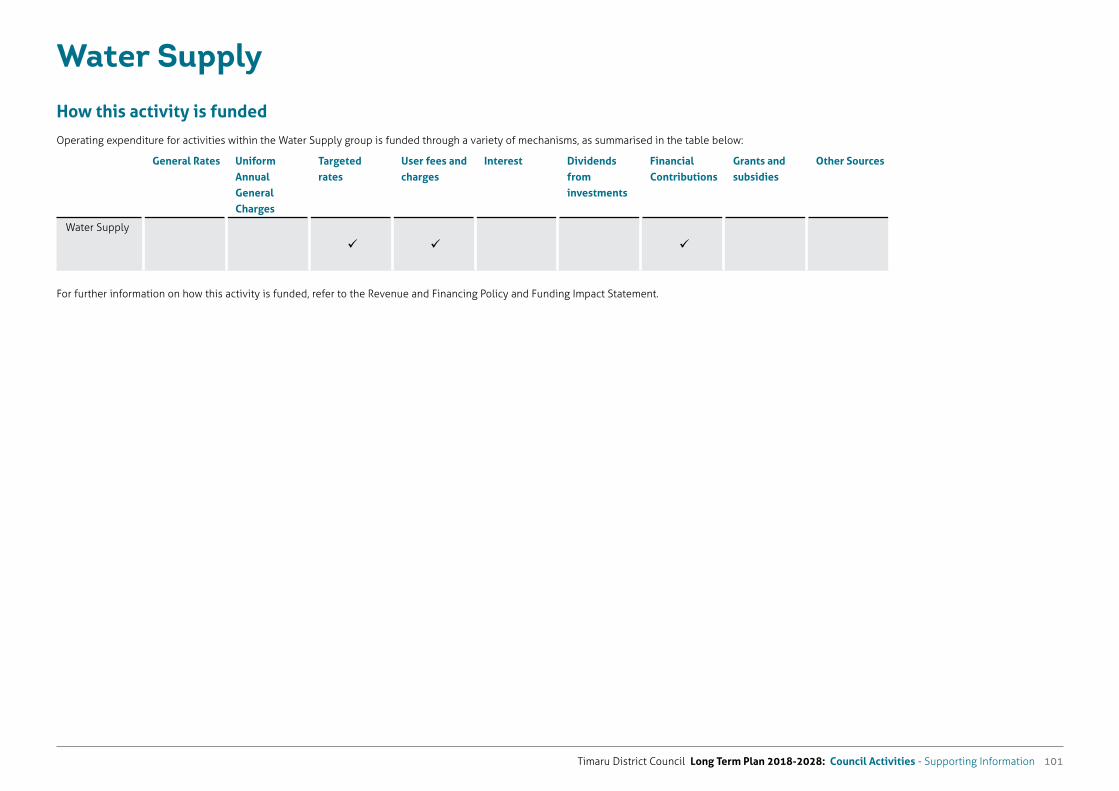
Timaru District Council Long Term Plan 2018-2028: Council Activities - Supporting Information 101
Water Supply
How this activity is funded
Operating expenditure for activities within the Water Supply group is funded through a variety of mechanisms, as summarised in the table below:
General Rates Uniform Annual General Charges
Targeted rates
User fees and charges
Interest Dividends from investments
Financial Contributions
Grants and subsidies
Other Sources
Water Supply
For further information on how this activity is funded, refer to the Revenue and Financing Policy and Funding Impact Statement.
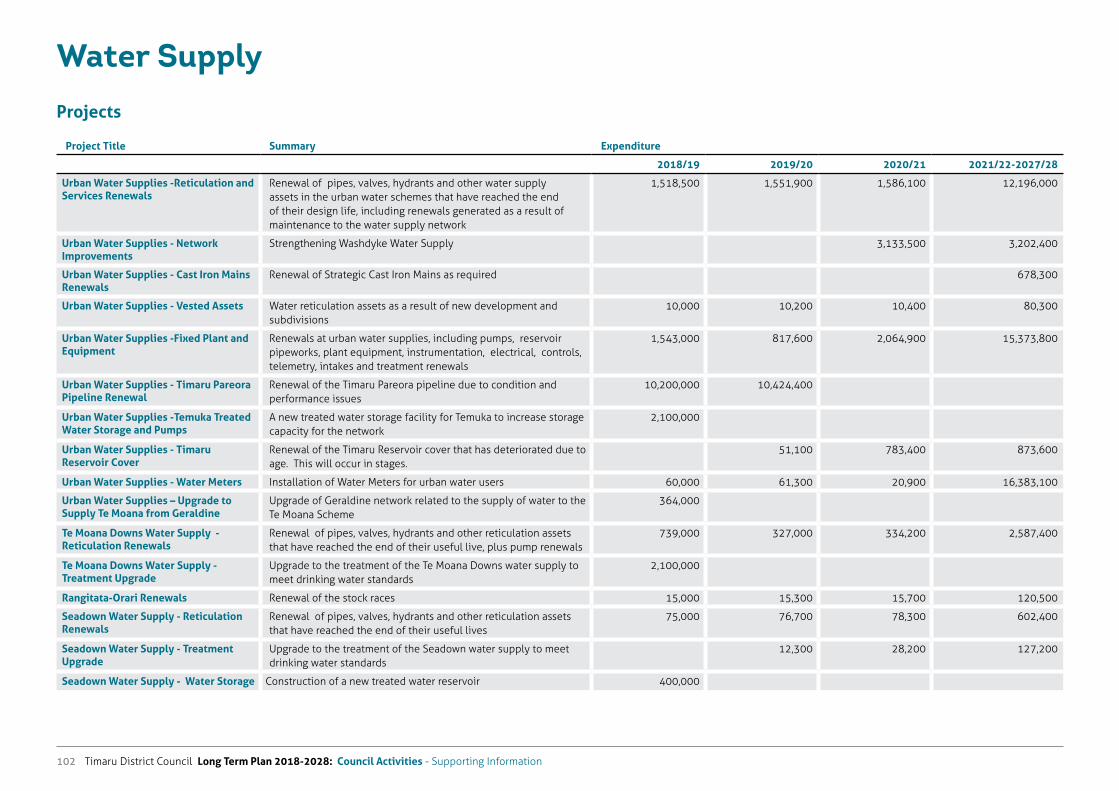
Timaru District Council Long Term Plan 2018-2028: Council Activities - Supporting Information102
Water Supply
Projects
Project Title Summary Expenditure
2018/19 2019/20 2020/21 2021/22-2027/28
Urban Water Supplies -Reticulation and Services Renewals
Renewal of pipes, valves, hydrants and other water supply assets in the urban water schemes that have reached the end of their design life, including renewals generated as a result of maintenance to the water supply network
1,518,500 1,551,900 1,586,100 12,196,000
Urban Water Supplies - Network Improvements
Strengthening Washdyke Water Supply 3,133,500 3,202,400
Urban Water Supplies - Cast Iron Mains Renewals
Renewal of Strategic Cast Iron Mains as required 678,300
Urban Water Supplies - Vested Assets Water reticulation assets as a result of new development and subdivisions
10,000 10,200 10,400 80,300
Urban Water Supplies -Fixed Plant and Equipment
Renewals at urban water supplies, including pumps, reservoir pipeworks, plant equipment, instrumentation, electrical, controls, telemetry, intakes and treatment renewals
1,543,000 817,600 2,064,900 15,373,800
Urban Water Supplies - Timaru Pareora Pipeline Renewal
Renewal of the Timaru Pareora pipeline due to condition and performance issues
10,200,000 10,424,400
Urban Water Supplies -Temuka Treated Water Storage and Pumps
A new treated water storage facility for Temuka to increase storage capacity for the network
2,100,000
Urban Water Supplies - Timaru Reservoir Cover
Renewal of the Timaru Reservoir cover that has deteriorated due to age. This will occur in stages.
51,100 783,400 873,600
Urban Water Supplies - Water Meters Installation of Water Meters for urban water users 60,000 61,300 20,900 16,383,100
Urban Water Supplies – Upgrade to Supply Te Moana from Geraldine
Upgrade of Geraldine network related to the supply of water to the Te Moana Scheme
364,000
Te Moana Downs Water Supply - Reticulation Renewals
Renewal of pipes, valves, hydrants and other reticulation assets that have reached the end of their useful live, plus pump renewals
739,000 327,000 334,200 2,587,400
Te Moana Downs Water Supply - Treatment Upgrade
Upgrade to the treatment of the Te Moana Downs water supply to meet drinking water standards
2,100,000
Rangitata-Orari Renewals Renewal of the stock races 15,000 15,300 15,700 120,500
Seadown Water Supply - Reticulation Renewals
Renewal of pipes, valves, hydrants and other reticulation assets that have reached the end of their useful lives
75,000 76,700 78,300 602,400
Seadown Water Supply - Treatment Upgrade
Upgrade to the treatment of the Seadown water supply to meet drinking water standards
12,300 28,200 127,200
Seadown Water Supply - Water Storage Construction of a new treated water reservoir 400,000
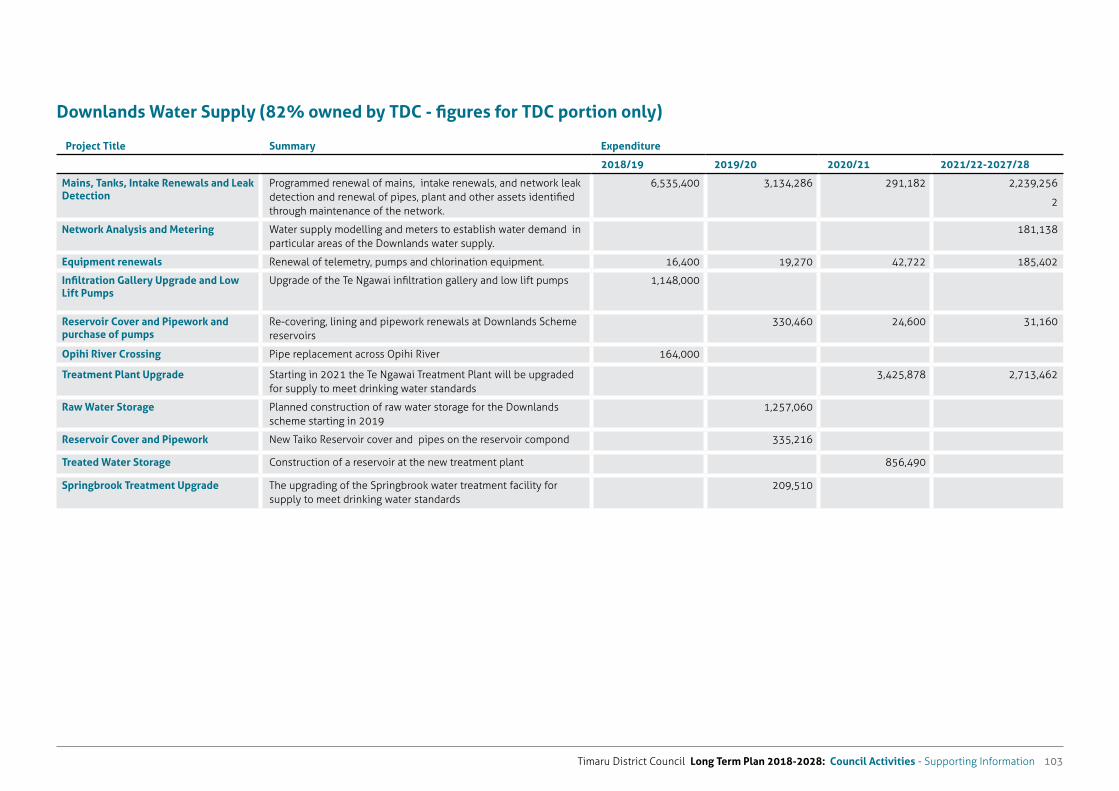
Timaru District Council Long Term Plan 2018-2028: Council Activities - Supporting Information 103
Downlands Water Supply (82% owned by TDC - figures for TDC portion only)
Project Title Summary Expenditure
2018/19 2019/20 2020/21 2021/22-2027/28
Mains, Tanks, Intake Renewals and Leak Detection
Programmed renewal of mains, intake renewals, and network leak detection and renewal of pipes, plant and other assets identified through maintenance of the network.
6,535,400 3,134,286 291,182 2,239,256
2
Network Analysis and Metering Water supply modelling and meters to establish water demand in particular areas of the Downlands water supply.
181,138
Equipment renewals Renewal of telemetry, pumps and chlorination equipment. 16,400 19,270 42,722 185,402
Infiltration Gallery Upgrade and Low Lift Pumps
Upgrade of the Te Ngawai infiltration gallery and low lift pumps 1,148,000
Reservoir Cover and Pipework and purchase of pumps
Re-covering, lining and pipework renewals at Downlands Scheme reservoirs
330,460 24,600 31,160
Opihi River Crossing Pipe replacement across Opihi River 164,000
Treatment Plant Upgrade Starting in 2021 the Te Ngawai Treatment Plant will be upgraded for supply to meet drinking water standards
3,425,878 2,713,462
Raw Water Storage Planned construction of raw water storage for the Downlands scheme starting in 2019
1,257,060
Reservoir Cover and Pipework New Taiko Reservoir cover and pipes on the reservoir compond 335,216
Treated Water Storage Construction of a reservoir at the new treatment plant 856,490
Springbrook Treatment Upgrade The upgrading of the Springbrook water treatment facility for supply to meet drinking water standards
209,510
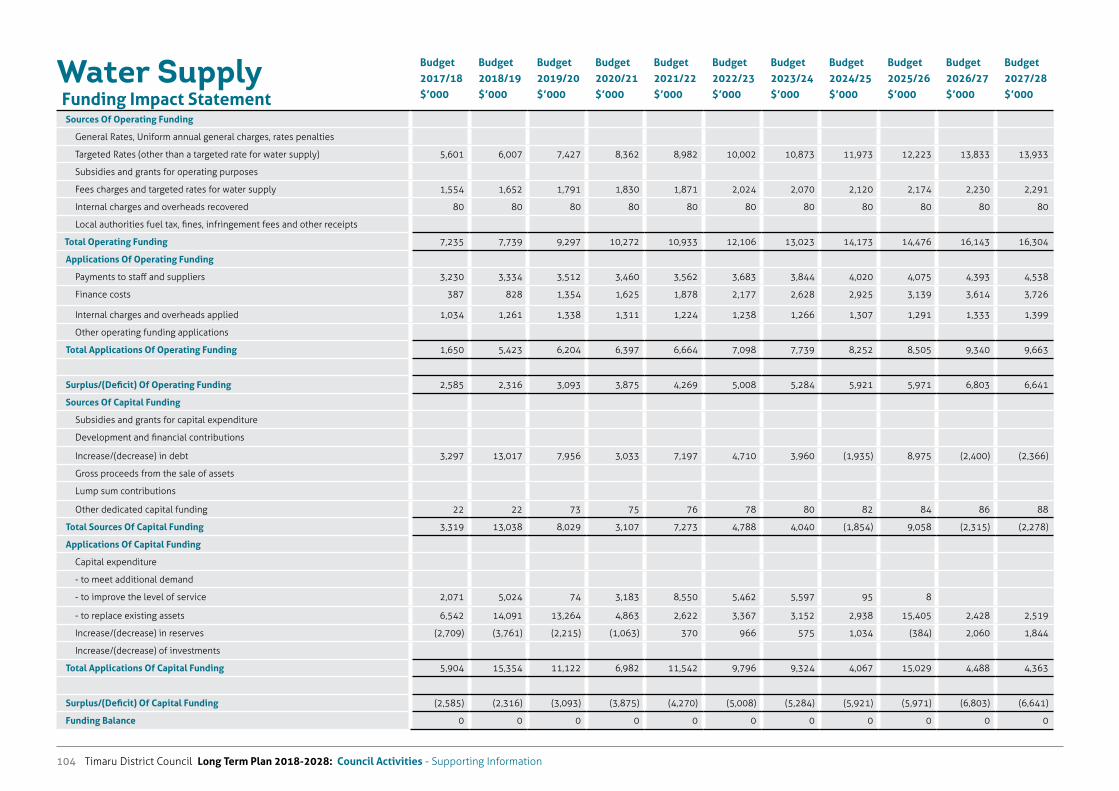
Timaru District Council Long Term Plan 2018-2028: Council Activities - Supporting Information104
Water SupplyFunding Impact Statement
Budget 2017/18 $’000
Budget 2018/19 $’000
Budget 2019/20 $’000
Budget 2020/21 $’000
Budget 2021/22 $’000
Budget 2022/23 $’000
Budget 2023/24 $’000
Budget 2024/25 $’000
Budget 2025/26 $’000
Budget 2026/27 $’000
Budget 2027/28 $’000
Sources Of Operating Funding
General Rates, Uniform annual general charges, rates penalties
Targeted Rates (other than a targeted rate for water supply) 5,601 6,007 7,427 8,362 8,982 10,002 10,873 11,973 12,223 13,833 13,933
Subsidies and grants for operating purposes
Fees charges and targeted rates for water supply 1,554 1,652 1,791 1,830 1,871 2,024 2,070 2,120 2,174 2,230 2,291
Internal charges and overheads recovered 80 80 80 80 80 80 80 80 80 80 80
Local authorities fuel tax, fines, infringement fees and other receipts
Total Operating Funding 7,235 7,739 9,297 10,272 10,933 12,106 13,023 14,173 14,476 16,143 16,304
Applications Of Operating Funding
Payments to staff and suppliers 3,230 3,334 3,512 3,460 3,562 3,683 3,844 4,020 4,075 4,393 4,538
Finance costs 387 828 1,354 1,625 1,878 2,177 2,628 2,925 3,139 3,614 3,726
Internal charges and overheads applied 1,034 1,261 1,338 1,311 1,224 1,238 1,266 1,307 1,291 1,333 1,399
Other operating funding applications
Total Applications Of Operating Funding 1,650 5,423 6,204 6,397 6,664 7,098 7,739 8,252 8,505 9,340 9,663
Surplus/(Deficit) Of Operating Funding 2,585 2,316 3,093 3,875 4,269 5,008 5,284 5,921 5,971 6,803 6,641
Sources Of Capital Funding
Subsidies and grants for capital expenditure
Development and financial contributions
Increase/(decrease) in debt 3,297 13,017 7,956 3,033 7,197 4,710 3,960 (1,935) 8,975 (2,400) (2,366)
Gross proceeds from the sale of assets
Lump sum contributions
Other dedicated capital funding 22 22 73 75 76 78 80 82 84 86 88
Total Sources Of Capital Funding 3,319 13,038 8,029 3,107 7,273 4,788 4,040 (1,854) 9,058 (2,315) (2,278)
Applications Of Capital Funding
Capital expenditure
- to meet additional demand
- to improve the level of service 2,071 5,024 74 3,183 8,550 5,462 5,597 95 8
- to replace existing assets 6,542 14,091 13,264 4,863 2,622 3,367 3,152 2,938 15,405 2,428 2,519
Increase/(decrease) in reserves (2,709) (3,761) (2,215) (1,063) 370 966 575 1,034 (384) 2,060 1,844
Increase/(decrease) of investments
Total Applications Of Capital Funding 5,904 15,354 11,122 6,982 11,542 9,796 9,324 4,067 15,029 4,488 4,363
Surplus/(Deficit) Of Capital Funding (2,585) (2,316) (3,093) (3,875) (4,270) (5,008) (5,284) (5,921) (5,971) (6,803) (6,641)
Funding Balance 0 0 0 0 0 0 0 0 0 0 0
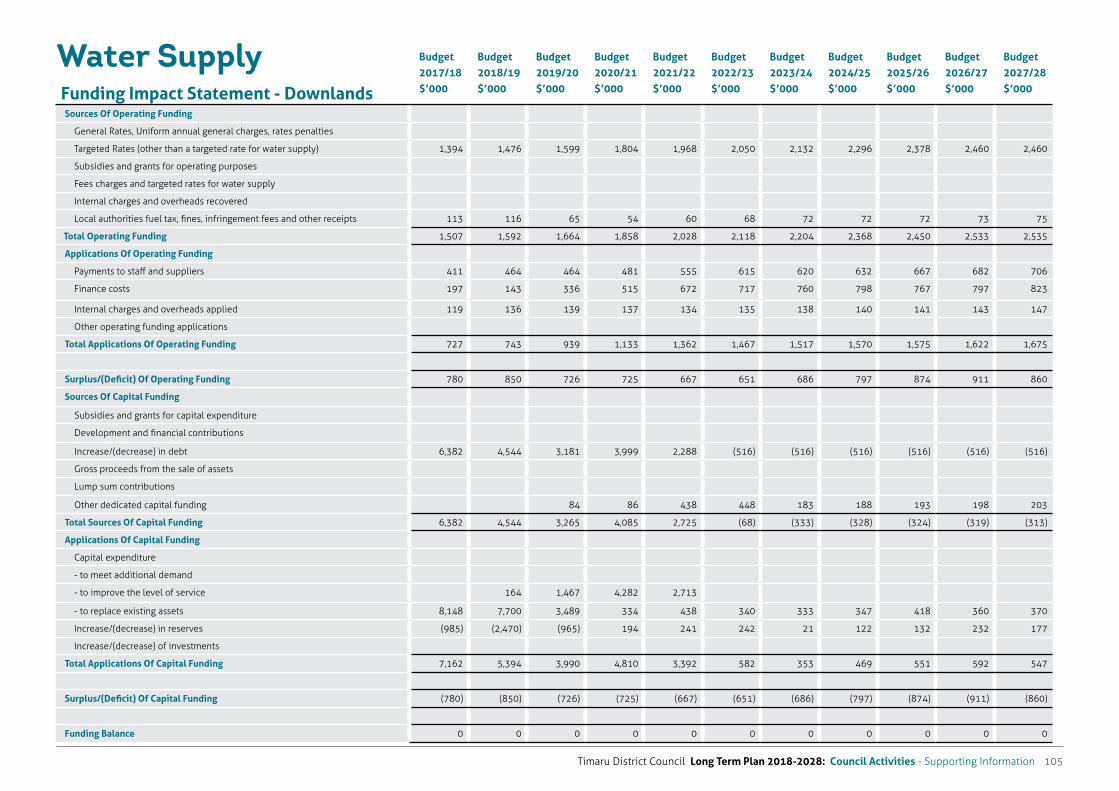
Timaru District Council Long Term Plan 2018-2028: Council Activities - Supporting Information 105
Water SupplyFunding Impact Statement - Downlands
Budget 2017/18 $’000
Budget 2018/19 $’000
Budget 2019/20 $’000
Budget 2020/21 $’000
Budget 2021/22 $’000
Budget 2022/23 $’000
Budget 2023/24 $’000
Budget 2024/25 $’000
Budget 2025/26 $’000
Budget 2026/27 $’000
Budget 2027/28 $’000
Sources Of Operating Funding
General Rates, Uniform annual general charges, rates penalties
Targeted Rates (other than a targeted rate for water supply) 1,394 1,476 1,599 1,804 1,968 2,050 2,132 2,296 2,378 2,460 2,460
Subsidies and grants for operating purposes
Fees charges and targeted rates for water supply
Internal charges and overheads recovered
Local authorities fuel tax, fines, infringement fees and other receipts 113 116 65 54 60 68 72 72 72 73 75
Total Operating Funding 1,507 1,592 1,664 1,858 2,028 2,118 2,204 2,368 2,450 2,533 2,535
Applications Of Operating Funding
Payments to staff and suppliers 411 464 464 481 555 615 620 632 667 682 706
Finance costs 197 143 336 515 672 717 760 798 767 797 823
Internal charges and overheads applied 119 136 139 137 134 135 138 140 141 143 147
Other operating funding applications
Total Applications Of Operating Funding 727 743 939 1,133 1,362 1,467 1,517 1,570 1,575 1,622 1,675
Surplus/(Deficit) Of Operating Funding 780 850 726 725 667 651 686 797 874 911 860
Sources Of Capital Funding
Subsidies and grants for capital expenditure
Development and financial contributions
Increase/(decrease) in debt 6,382 4,544 3,181 3,999 2,288 (516) (516) (516) (516) (516) (516)
Gross proceeds from the sale of assets
Lump sum contributions
Other dedicated capital funding 84 86 438 448 183 188 193 198 203
Total Sources Of Capital Funding 6,382 4,544 3,265 4,085 2,725 (68) (333) (328) (324) (319) (313)
Applications Of Capital Funding
Capital expenditure
- to meet additional demand
- to improve the level of service 164 1,467 4,282 2,713
- to replace existing assets 8,148 7,700 3,489 334 438 340 333 347 418 360 370
Increase/(decrease) in reserves (985) (2,470) (965) 194 241 242 21 122 132 232 177
Increase/(decrease) of investments
Total Applications Of Capital Funding 7,162 5,394 3,990 4,810 3,392 582 353 469 551 592 547
Surplus/(Deficit) Of Capital Funding (780) (850) (726) (725) (667) (651) (686) (797) (874) (911) (860)
Funding Balance 0 0 0 0 0 0 0 0 0 0 0
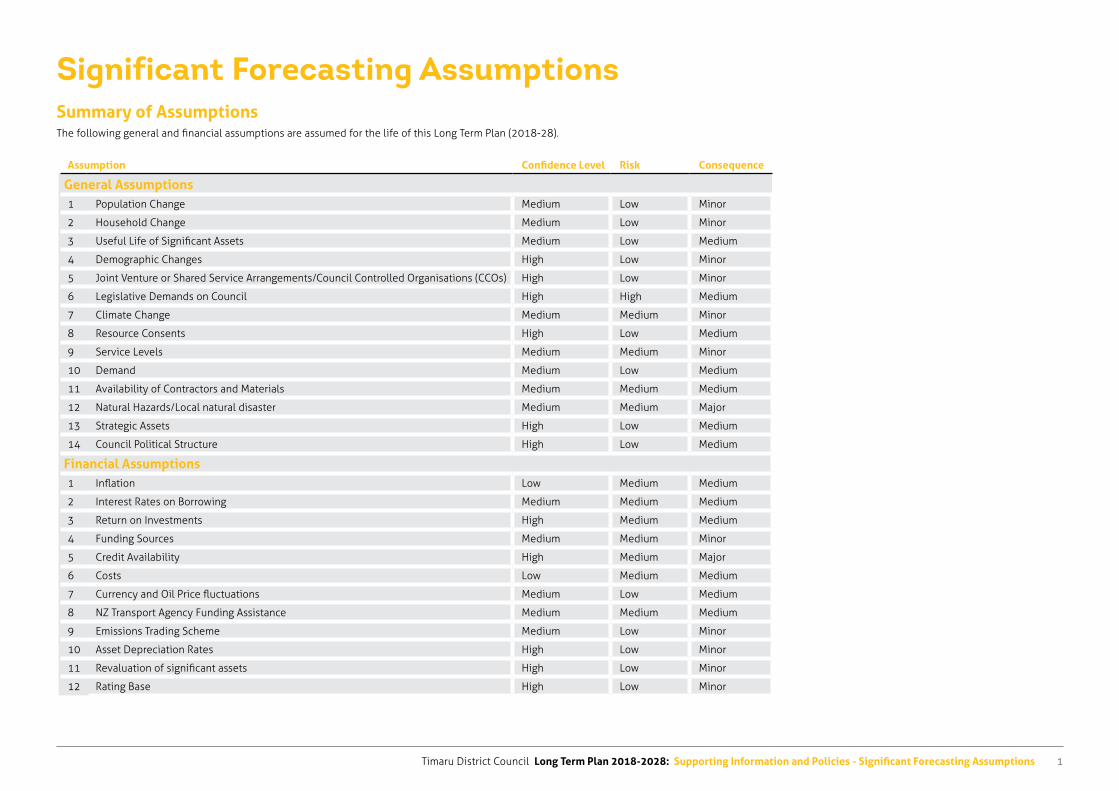
Timaru District Council Long Term Plan 2018-2028: Supporting Information and Policies - Significant Forecasting Assumptions 1
Significant Forecasting AssumptionsSummary of AssumptionsThe following general and financial assumptions are assumed for the life of this Long Term Plan (2018-28).
Assumption Confidence Level Risk Consequence
General Assumptions1 Population Change Medium Low Minor
2 Household Change Medium Low Minor
3 Useful Life of Significant Assets Medium Low Medium
4 Demographic Changes High Low Minor
5 Joint Venture or Shared Service Arrangements/Council Controlled Organisations (CCOs) High Low Minor
6 Legislative Demands on Council High High Medium
7 Climate Change Medium Medium Minor
8 Resource Consents High Low Medium
9 Service Levels Medium Medium Minor
10 Demand Medium Low Medium
11 Availability of Contractors and Materials Medium Medium Medium
12 Natural Hazards/Local natural disaster Medium Medium Major
13 Strategic Assets High Low Medium
14 Council Political Structure High Low Medium
Financial Assumptions1 Inflation Low Medium Medium
2 Interest Rates on Borrowing Medium Medium Medium
3 Return on Investments High Medium Medium
4 Funding Sources Medium Medium Minor
5 Credit Availability High Medium Major
6 Costs Low Medium Medium
7 Currency and Oil Price fluctuations Medium Low Medium
8 NZ Transport Agency Funding Assistance Medium Medium Medium
9 Emissions Trading Scheme Medium Low Minor
10 Asset Depreciation Rates High Low Minor
11 Revaluation of significant assets High Low Minor
12 Rating Base High Low Minor
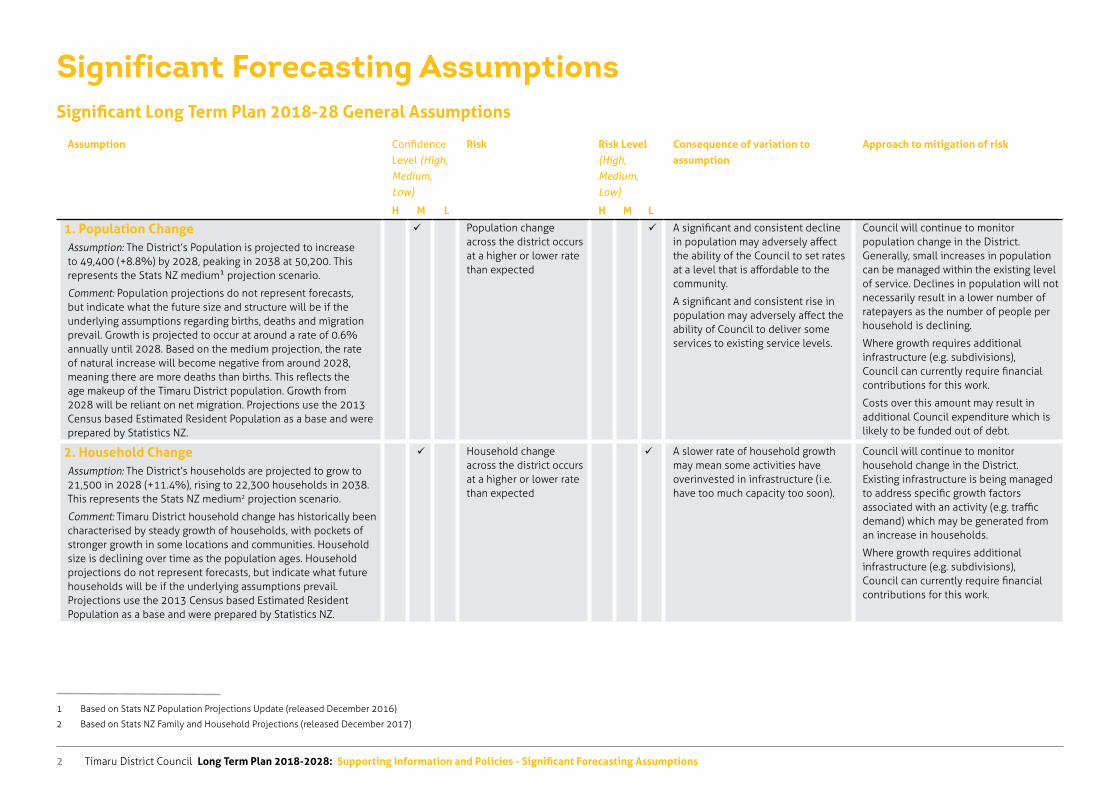
Timaru District Council Long Term Plan 2018-2028: Supporting Information and Policies - Significant Forecasting Assumptions2
Significant Forecasting AssumptionsSignificant Long Term Plan 2018-28 General Assumptions
Assumption Confidence Level (High, Medium, Low)
Risk Risk Level (High, Medium, Low)
Consequence of variation to assumption
Approach to mitigation of risk
H M L H M L
1. Population ChangeAssumption: The District’s Population is projected to increase to 49,400 (+8.8%) by 2028, peaking in 2038 at 50,200. This represents the Stats NZ medium1 projection scenario.
Comment: Population projections do not represent forecasts, but indicate what the future size and structure will be if the underlying assumptions regarding births, deaths and migration prevail. Growth is projected to occur at around a rate of 0.6% annually until 2028. Based on the medium projection, the rate of natural increase will become negative from around 2028, meaning there are more deaths than births. This reflects the age makeup of the Timaru District population. Growth from 2028 will be reliant on net migration. Projections use the 2013 Census based Estimated Resident Population as a base and were prepared by Statistics NZ.
Population change across the district occurs at a higher or lower rate than expected
A significant and consistent decline in population may adversely affect the ability of the Council to set rates at a level that is affordable to the community.
A significant and consistent rise in population may adversely affect the ability of Council to deliver some services to existing service levels.
Council will continue to monitor population change in the District. Generally, small increases in population can be managed within the existing level of service. Declines in population will not necessarily result in a lower number of ratepayers as the number of people per household is declining.
Where growth requires additional infrastructure (e.g. subdivisions), Council can currently require financial contributions for this work.
Costs over this amount may result in additional Council expenditure which is likely to be funded out of debt.
2. Household ChangeAssumption: The District’s households are projected to grow to 21,500 in 2028 (+11.4%), rising to 22,300 households in 2038. This represents the Stats NZ medium2 projection scenario.
Comment: Timaru District household change has historically been characterised by steady growth of households, with pockets of stronger growth in some locations and communities. Household size is declining over time as the population ages. Household projections do not represent forecasts, but indicate what future households will be if the underlying assumptions prevail. Projections use the 2013 Census based Estimated Resident Population as a base and were prepared by Statistics NZ.
Household change across the district occurs at a higher or lower rate than expected
A slower rate of household growth may mean some activities have overinvested in infrastructure (i.e. have too much capacity too soon).
Council will continue to monitor household change in the District. Existing infrastructure is being managed to address specific growth factors associated with an activity (e.g. traffic demand) which may be generated from an increase in households.
Where growth requires additional infrastructure (e.g. subdivisions), Council can currently require financial contributions for this work.
1 Based on Stats NZ Population Projections Update (released December 2016)
2 Based on Stats NZ Family and Household Projections (released December 2017)
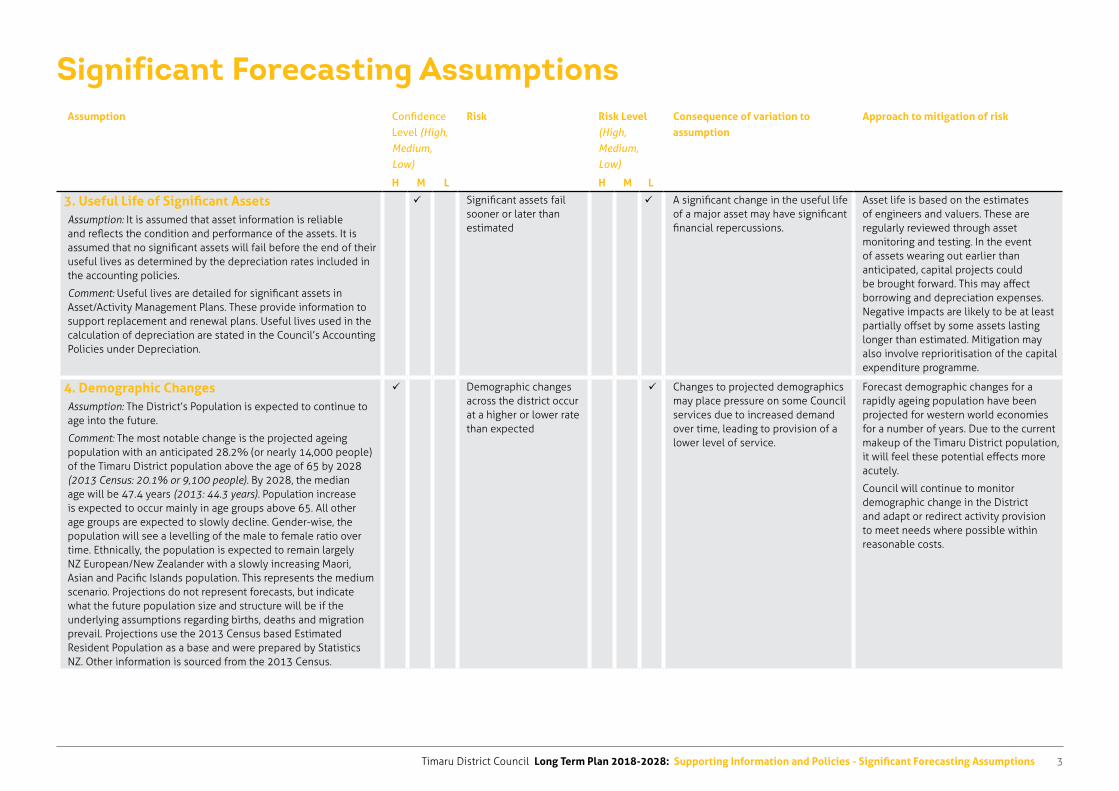
Timaru District Council Long Term Plan 2018-2028: Supporting Information and Policies - Significant Forecasting Assumptions 3
Significant Forecasting AssumptionsAssumption Confidence
Level (High, Medium, Low)
Risk Risk Level (High, Medium, Low)
Consequence of variation to assumption
Approach to mitigation of risk
H M L H M L
3. Useful Life of Significant AssetsAssumption: It is assumed that asset information is reliable and reflects the condition and performance of the assets. It is assumed that no significant assets will fail before the end of their useful lives as determined by the depreciation rates included in the accounting policies.
Comment: Useful lives are detailed for significant assets in Asset/Activity Management Plans. These provide information to support replacement and renewal plans. Useful lives used in the calculation of depreciation are stated in the Council’s Accounting Policies under Depreciation.
Significant assets fail sooner or later than estimated
A significant change in the useful life of a major asset may have significant financial repercussions.
Asset life is based on the estimates of engineers and valuers. These are regularly reviewed through asset monitoring and testing. In the event of assets wearing out earlier than anticipated, capital projects could be brought forward. This may affect borrowing and depreciation expenses. Negative impacts are likely to be at least partially offset by some assets lasting longer than estimated. Mitigation may also involve reprioritisation of the capital expenditure programme.
4. Demographic ChangesAssumption: The District’s Population is expected to continue to age into the future.
Comment: The most notable change is the projected ageing population with an anticipated 28.2% (or nearly 14,000 people) of the Timaru District population above the age of 65 by 2028 (2013 Census: 20.1% or 9,100 people). By 2028, the median age will be 47.4 years (2013: 44.3 years). Population increase is expected to occur mainly in age groups above 65. All other age groups are expected to slowly decline. Gender-wise, the population will see a levelling of the male to female ratio over time. Ethnically, the population is expected to remain largely NZ European/New Zealander with a slowly increasing Maori, Asian and Pacific Islands population. This represents the medium scenario. Projections do not represent forecasts, but indicate what the future population size and structure will be if the underlying assumptions regarding births, deaths and migration prevail. Projections use the 2013 Census based Estimated Resident Population as a base and were prepared by Statistics NZ. Other information is sourced from the 2013 Census.
Demographic changes across the district occur at a higher or lower rate than expected
Changes to projected demographics may place pressure on some Council services due to increased demand over time, leading to provision of a lower level of service.
Forecast demographic changes for a rapidly ageing population have been projected for western world economies for a number of years. Due to the current makeup of the Timaru District population, it will feel these potential effects more acutely.
Council will continue to monitor demographic change in the District and adapt or redirect activity provision to meet needs where possible within reasonable costs.
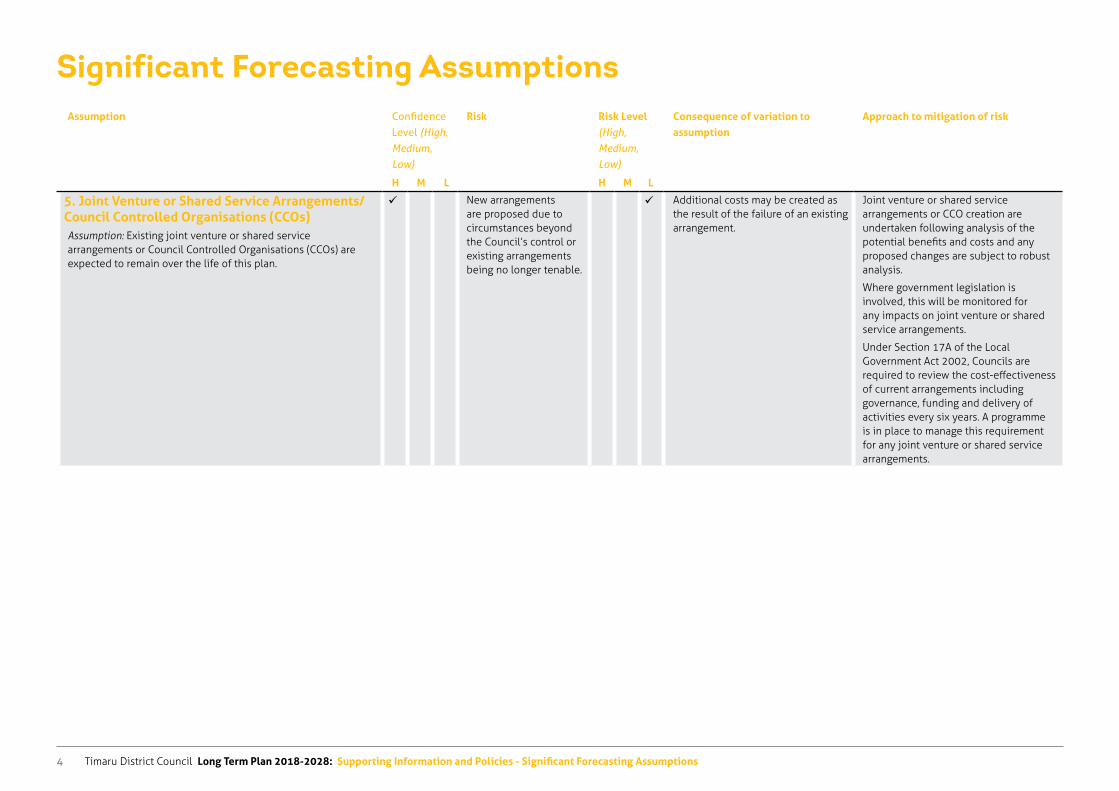
Timaru District Council Long Term Plan 2018-2028: Supporting Information and Policies - Significant Forecasting Assumptions4
Significant Forecasting AssumptionsAssumption Confidence
Level (High, Medium, Low)
Risk Risk Level (High, Medium, Low)
Consequence of variation to assumption
Approach to mitigation of risk
H M L H M L
5. Joint Venture or Shared Service Arrangements/Council Controlled Organisations (CCOs)Assumption: Existing joint venture or shared service arrangements or Council Controlled Organisations (CCOs) are expected to remain over the life of this plan.
New arrangements are proposed due to circumstances beyond the Council’s control or existing arrangements being no longer tenable.
Additional costs may be created as the result of the failure of an existing arrangement.
Joint venture or shared service arrangements or CCO creation are undertaken following analysis of the potential benefits and costs and any proposed changes are subject to robust analysis.
Where government legislation is involved, this will be monitored for any impacts on joint venture or shared service arrangements.
Under Section 17A of the Local Government Act 2002, Councils are required to review the cost-effectiveness of current arrangements including governance, funding and delivery of activities every six years. A programme is in place to manage this requirement for any joint venture or shared service arrangements.
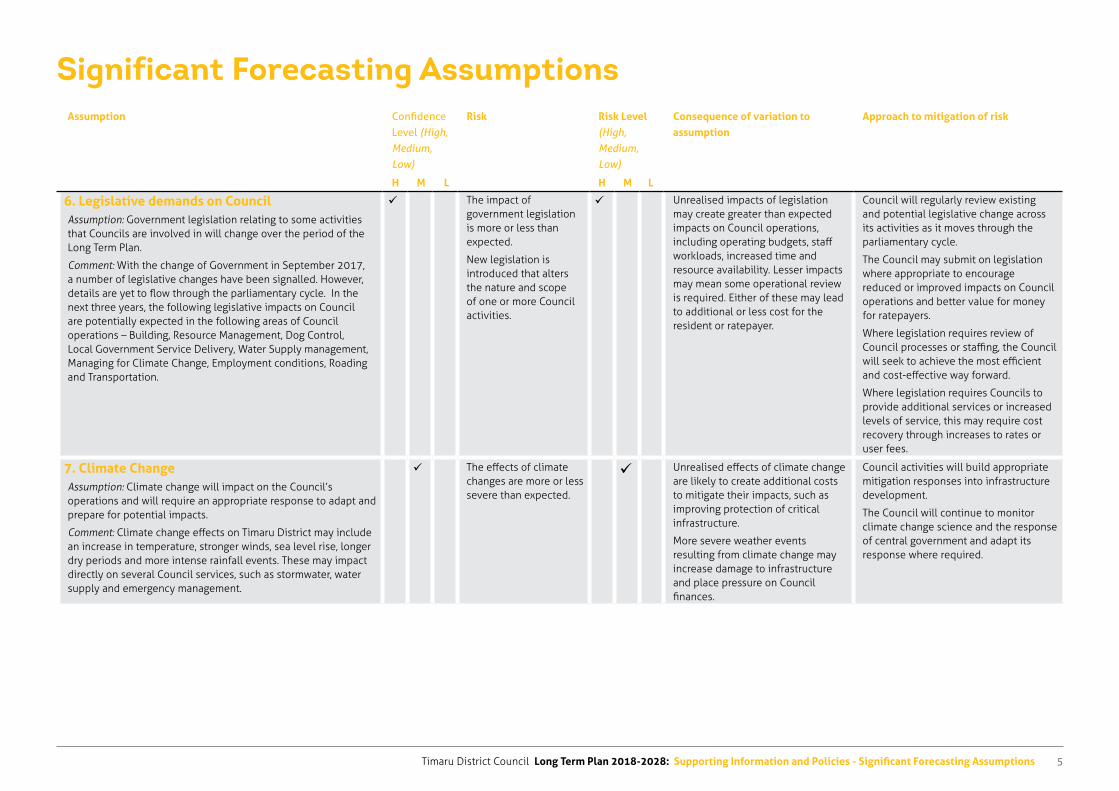
Timaru District Council Long Term Plan 2018-2028: Supporting Information and Policies - Significant Forecasting Assumptions 5
Significant Forecasting AssumptionsAssumption Confidence
Level (High, Medium, Low)
Risk Risk Level (High, Medium, Low)
Consequence of variation to assumption
Approach to mitigation of risk
H M L H M L
6. Legislative demands on CouncilAssumption: Government legislation relating to some activities that Councils are involved in will change over the period of the Long Term Plan.
Comment: With the change of Government in September 2017, a number of legislative changes have been signalled. However, details are yet to flow through the parliamentary cycle. In the next three years, the following legislative impacts on Council are potentially expected in the following areas of Council operations – Building, Resource Management, Dog Control, Local Government Service Delivery, Water Supply management, Managing for Climate Change, Employment conditions, Roading and Transportation.
The impact of government legislation is more or less than expected.
New legislation is introduced that alters the nature and scope of one or more Council activities.
Unrealised impacts of legislation may create greater than expected impacts on Council operations, including operating budgets, staff workloads, increased time and resource availability. Lesser impacts may mean some operational review is required. Either of these may lead to additional or less cost for the resident or ratepayer.
Council will regularly review existing and potential legislative change across its activities as it moves through the parliamentary cycle.
The Council may submit on legislation where appropriate to encourage reduced or improved impacts on Council operations and better value for money for ratepayers.
Where legislation requires review of Council processes or staffing, the Council will seek to achieve the most efficient and cost-effective way forward.
Where legislation requires Councils to provide additional services or increased levels of service, this may require cost recovery through increases to rates or user fees.
7. Climate ChangeAssumption: Climate change will impact on the Council’s operations and will require an appropriate response to adapt and prepare for potential impacts.
Comment: Climate change effects on Timaru District may include an increase in temperature, stronger winds, sea level rise, longer dry periods and more intense rainfall events. These may impact directly on several Council services, such as stormwater, water supply and emergency management.
The effects of climate changes are more or less severe than expected.
Unrealised effects of climate change are likely to create additional costs to mitigate their impacts, such as improving protection of critical infrastructure.
More severe weather events resulting from climate change may increase damage to infrastructure and place pressure on Council finances.
Council activities will build appropriate mitigation responses into infrastructure development.
The Council will continue to monitor climate change science and the response of central government and adapt its response where required.
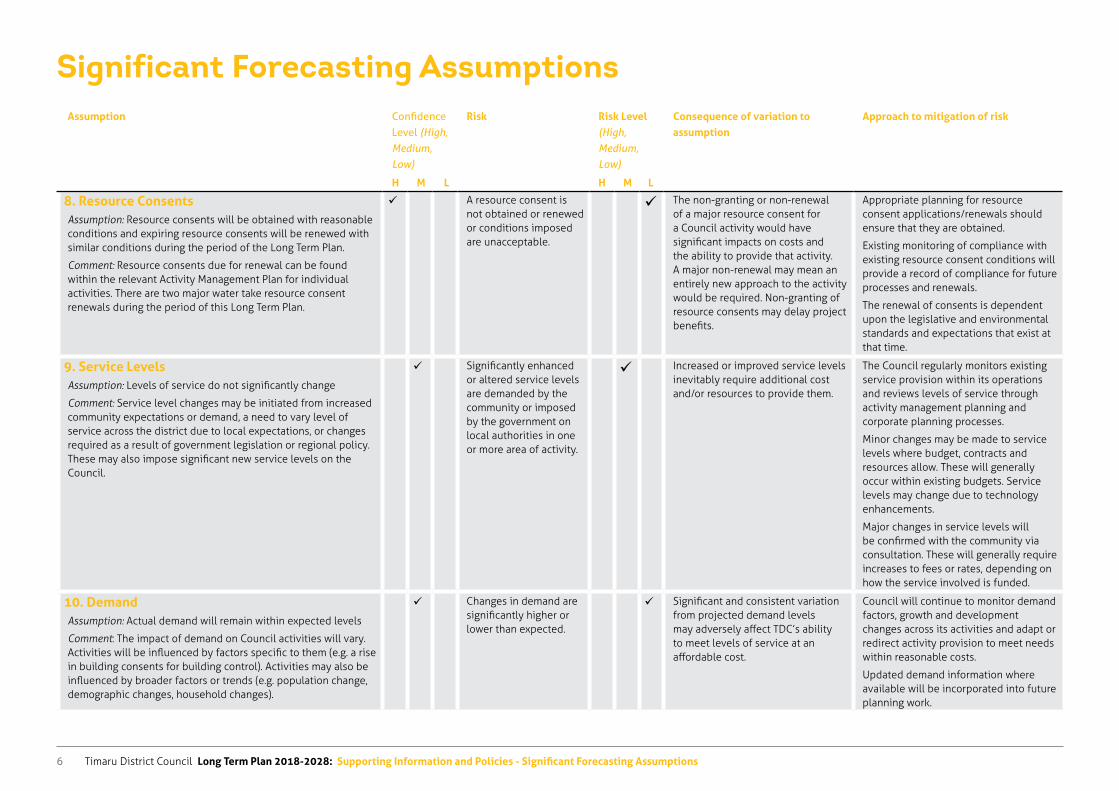
Timaru District Council Long Term Plan 2018-2028: Supporting Information and Policies - Significant Forecasting Assumptions6
Significant Forecasting AssumptionsAssumption Confidence
Level (High, Medium, Low)
Risk Risk Level (High, Medium, Low)
Consequence of variation to assumption
Approach to mitigation of risk
H M L H M L
8. Resource Consents Assumption: Resource consents will be obtained with reasonable conditions and expiring resource consents will be renewed with similar conditions during the period of the Long Term Plan.
Comment: Resource consents due for renewal can be found within the relevant Activity Management Plan for individual activities. There are two major water take resource consent renewals during the period of this Long Term Plan.
A resource consent is not obtained or renewed or conditions imposed are unacceptable.
The non-granting or non-renewal of a major resource consent for a Council activity would have significant impacts on costs and the ability to provide that activity. A major non-renewal may mean an entirely new approach to the activity would be required. Non-granting of resource consents may delay project benefits.
Appropriate planning for resource consent applications/renewals should ensure that they are obtained.
Existing monitoring of compliance with existing resource consent conditions will provide a record of compliance for future processes and renewals.
The renewal of consents is dependent upon the legislative and environmental standards and expectations that exist at that time.
9. Service LevelsAssumption: Levels of service do not significantly change
Comment: Service level changes may be initiated from increased community expectations or demand, a need to vary level of service across the district due to local expectations, or changes required as a result of government legislation or regional policy. These may also impose significant new service levels on the Council.
Significantly enhanced or altered service levels are demanded by the community or imposed by the government on local authorities in one or more area of activity.
Increased or improved service levels inevitably require additional cost and/or resources to provide them.
The Council regularly monitors existing service provision within its operations and reviews levels of service through activity management planning and corporate planning processes.
Minor changes may be made to service levels where budget, contracts and resources allow. These will generally occur within existing budgets. Service levels may change due to technology enhancements.
Major changes in service levels will be confirmed with the community via consultation. These will generally require increases to fees or rates, depending on how the service involved is funded.
10. DemandAssumption: Actual demand will remain within expected levels
Comment: The impact of demand on Council activities will vary. Activities will be influenced by factors specific to them (e.g. a rise in building consents for building control). Activities may also be influenced by broader factors or trends (e.g. population change, demographic changes, household changes).
Changes in demand are significantly higher or lower than expected.
Significant and consistent variation from projected demand levels may adversely affect TDC’s ability to meet levels of service at an affordable cost.
Council will continue to monitor demand factors, growth and development changes across its activities and adapt or redirect activity provision to meet needs within reasonable costs.
Updated demand information where available will be incorporated into future planning work.
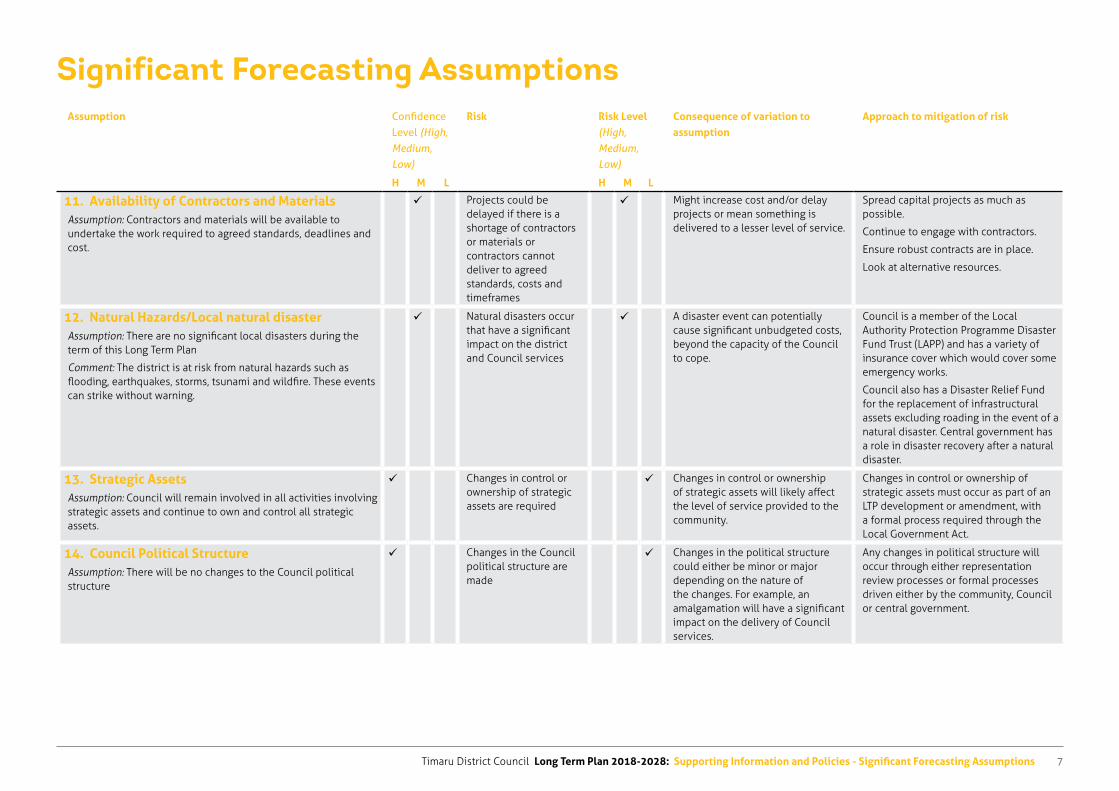
Timaru District Council Long Term Plan 2018-2028: Supporting Information and Policies - Significant Forecasting Assumptions 7
Significant Forecasting AssumptionsAssumption Confidence
Level (High, Medium, Low)
Risk Risk Level (High, Medium, Low)
Consequence of variation to assumption
Approach to mitigation of risk
H M L H M L
11. Availability of Contractors and MaterialsAssumption: Contractors and materials will be available to undertake the work required to agreed standards, deadlines and cost.
Projects could be delayed if there is a shortage of contractors or materials or contractors cannot deliver to agreed standards, costs and timeframes
Might increase cost and/or delay projects or mean something is delivered to a lesser level of service.
Spread capital projects as much as possible.
Continue to engage with contractors.
Ensure robust contracts are in place.
Look at alternative resources.
12. Natural Hazards/Local natural disasterAssumption: There are no significant local disasters during the term of this Long Term Plan
Comment: The district is at risk from natural hazards such as flooding, earthquakes, storms, tsunami and wildfire. These events can strike without warning.
Natural disasters occur that have a significant impact on the district and Council services
A disaster event can potentially cause significant unbudgeted costs, beyond the capacity of the Council to cope.
Council is a member of the Local Authority Protection Programme Disaster Fund Trust (LAPP) and has a variety of insurance cover which would cover some emergency works.
Council also has a Disaster Relief Fund for the replacement of infrastructural assets excluding roading in the event of a natural disaster. Central government has a role in disaster recovery after a natural disaster.
13. Strategic AssetsAssumption: Council will remain involved in all activities involving strategic assets and continue to own and control all strategic assets.
Changes in control or ownership of strategic assets are required
Changes in control or ownership of strategic assets will likely affect the level of service provided to the community.
Changes in control or ownership of strategic assets must occur as part of an LTP development or amendment, with a formal process required through the Local Government Act.
14. Council Political StructureAssumption: There will be no changes to the Council political structure
Changes in the Council political structure are made
Changes in the political structure could either be minor or major depending on the nature of the changes. For example, an amalgamation will have a significant impact on the delivery of Council services.
Any changes in political structure will occur through either representation review processes or formal processes driven either by the community, Council or central government.
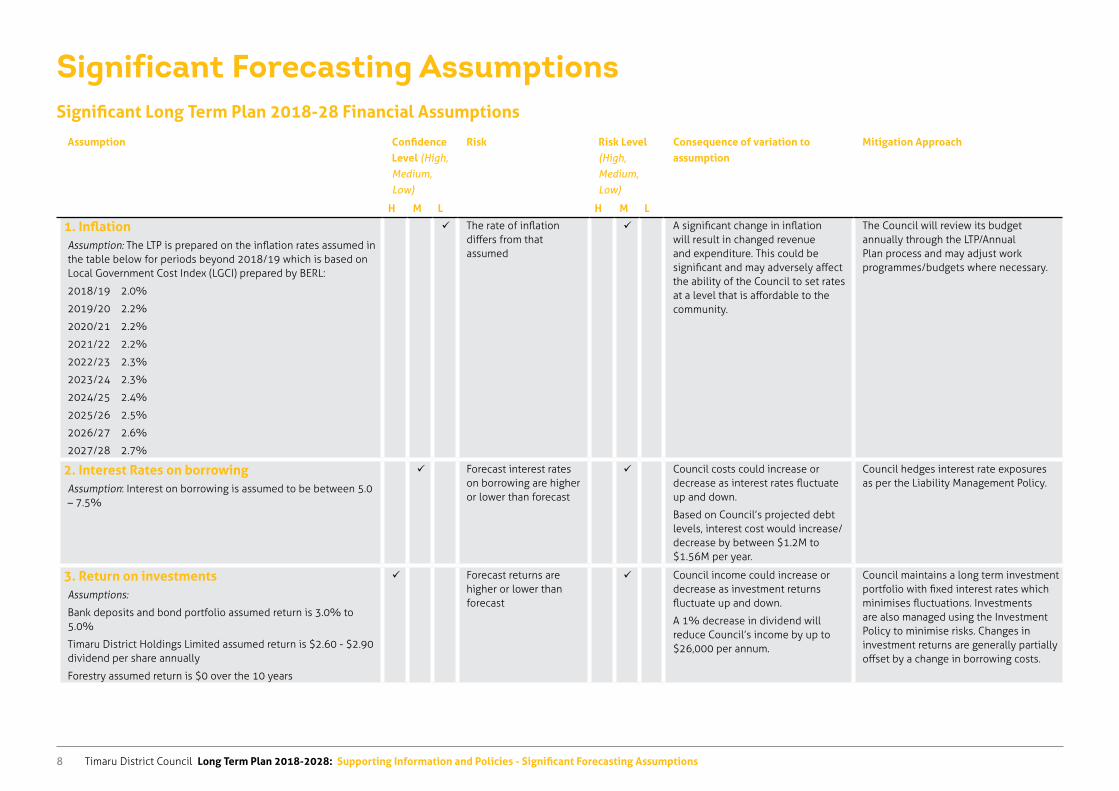
Timaru District Council Long Term Plan 2018-2028: Supporting Information and Policies - Significant Forecasting Assumptions8
Significant Forecasting AssumptionsSignificant Long Term Plan 2018-28 Financial Assumptions
Assumption Confidence Level (High, Medium, Low)
Risk Risk Level (High, Medium, Low)
Consequence of variation to assumption
Mitigation Approach
H M L H M L
1. Inflation Assumption: The LTP is prepared on the inflation rates assumed in the table below for periods beyond 2018/19 which is based on Local Government Cost Index (LGCI) prepared by BERL:
2018/19 2.0%
2019/20 2.2%
2020/21 2.2%
2021/22 2.2%
2022/23 2.3%
2023/24 2.3%
2024/25 2.4%
2025/26 2.5%
2026/27 2.6%
2027/28 2.7%
The rate of inflation differs from that assumed
A significant change in inflation will result in changed revenue and expenditure. This could be significant and may adversely affect the ability of the Council to set rates at a level that is affordable to the community.
The Council will review its budget annually through the LTP/Annual Plan process and may adjust work programmes/budgets where necessary.
2. Interest Rates on borrowingAssumption: Interest on borrowing is assumed to be between 5.0 – 7.5%
Forecast interest rates on borrowing are higher or lower than forecast
Council costs could increase or decrease as interest rates fluctuate up and down.
Based on Council’s projected debt levels, interest cost would increase/decrease by between $1.2M to $1.56M per year.
Council hedges interest rate exposures as per the Liability Management Policy.
3. Return on investments Assumptions:
Bank deposits and bond portfolio assumed return is 3.0% to 5.0%
Timaru District Holdings Limited assumed return is $2.60 - $2.90 dividend per share annually
Forestry assumed return is $0 over the 10 years
Forecast returns are higher or lower than forecast
Council income could increase or decrease as investment returns fluctuate up and down.
A 1% decrease in dividend will reduce Council’s income by up to $26,000 per annum.
Council maintains a long term investment portfolio with fixed interest rates which minimises fluctuations. Investments are also managed using the Investment Policy to minimise risks. Changes in investment returns are generally partially offset by a change in borrowing costs.
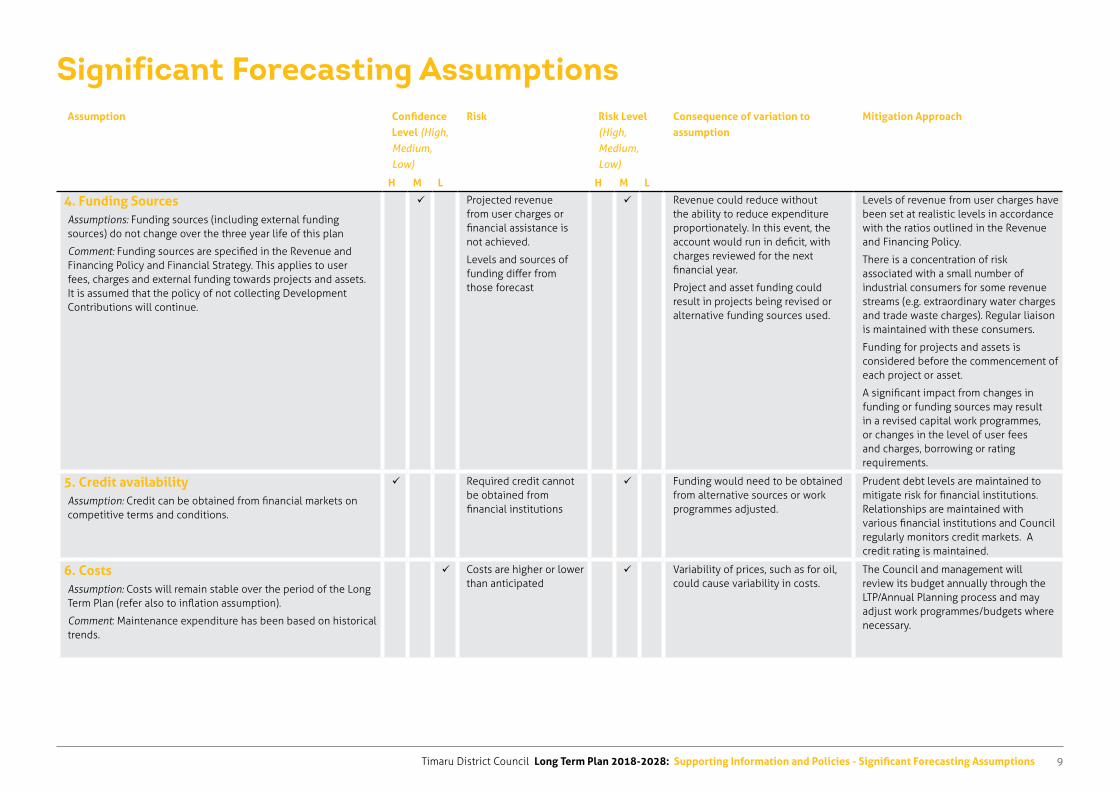
Timaru District Council Long Term Plan 2018-2028: Supporting Information and Policies - Significant Forecasting Assumptions 9
Significant Forecasting AssumptionsAssumption Confidence
Level (High, Medium, Low)
Risk Risk Level (High, Medium, Low)
Consequence of variation to assumption
Mitigation Approach
H M L H M L
4. Funding SourcesAssumptions: Funding sources (including external funding sources) do not change over the three year life of this plan
Comment: Funding sources are specified in the Revenue and Financing Policy and Financial Strategy. This applies to user fees, charges and external funding towards projects and assets. It is assumed that the policy of not collecting Development Contributions will continue.
Projected revenue from user charges or financial assistance is not achieved.
Levels and sources of funding differ from those forecast
Revenue could reduce without the ability to reduce expenditure proportionately. In this event, the account would run in deficit, with charges reviewed for the next financial year.
Project and asset funding could result in projects being revised or alternative funding sources used.
Levels of revenue from user charges have been set at realistic levels in accordance with the ratios outlined in the Revenue and Financing Policy.
There is a concentration of risk associated with a small number of industrial consumers for some revenue streams (e.g. extraordinary water charges and trade waste charges). Regular liaison is maintained with these consumers.
Funding for projects and assets is considered before the commencement of each project or asset.
A significant impact from changes in funding or funding sources may result in a revised capital work programmes, or changes in the level of user fees and charges, borrowing or rating requirements.
5. Credit availability Assumption: Credit can be obtained from financial markets on competitive terms and conditions.
Required credit cannot be obtained from financial institutions
Funding would need to be obtained from alternative sources or work programmes adjusted.
Prudent debt levels are maintained to mitigate risk for financial institutions. Relationships are maintained with various financial institutions and Council regularly monitors credit markets. A credit rating is maintained.
6. Costs Assumption: Costs will remain stable over the period of the Long Term Plan (refer also to inflation assumption).
Comment: Maintenance expenditure has been based on historical trends.
Costs are higher or lower than anticipated
Variability of prices, such as for oil, could cause variability in costs.
The Council and management will review its budget annually through the LTP/Annual Planning process and may adjust work programmes/budgets where necessary.
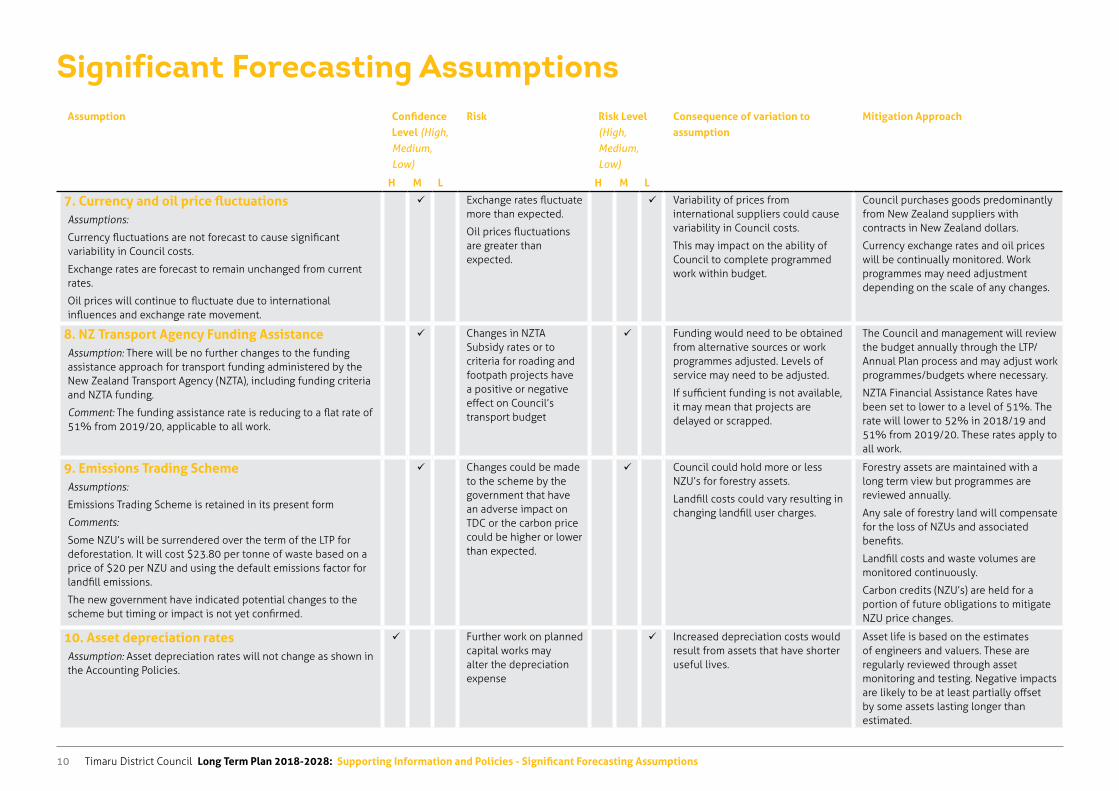
Timaru District Council Long Term Plan 2018-2028: Supporting Information and Policies - Significant Forecasting Assumptions10
Significant Forecasting AssumptionsAssumption Confidence
Level (High, Medium, Low)
Risk Risk Level (High, Medium, Low)
Consequence of variation to assumption
Mitigation Approach
H M L H M L
7. Currency and oil price fluctuations Assumptions:
Currency fluctuations are not forecast to cause significant variability in Council costs.
Exchange rates are forecast to remain unchanged from current rates.
Oil prices will continue to fluctuate due to international influences and exchange rate movement.
Exchange rates fluctuate more than expected.
Oil prices fluctuations are greater than expected.
Variability of prices from international suppliers could cause variability in Council costs.
This may impact on the ability of Council to complete programmed work within budget.
Council purchases goods predominantly from New Zealand suppliers with contracts in New Zealand dollars.
Currency exchange rates and oil prices will be continually monitored. Work programmes may need adjustment depending on the scale of any changes.
8. NZ Transport Agency Funding AssistanceAssumption: There will be no further changes to the funding assistance approach for transport funding administered by the New Zealand Transport Agency (NZTA), including funding criteria and NZTA funding.
Comment: The funding assistance rate is reducing to a flat rate of 51% from 2019/20, applicable to all work.
Changes in NZTA Subsidy rates or to criteria for roading and footpath projects have a positive or negative effect on Council’s transport budget
Funding would need to be obtained from alternative sources or work programmes adjusted. Levels of service may need to be adjusted.
If sufficient funding is not available, it may mean that projects are delayed or scrapped.
The Council and management will review the budget annually through the LTP/Annual Plan process and may adjust work programmes/budgets where necessary.
NZTA Financial Assistance Rates have been set to lower to a level of 51%. The rate will lower to 52% in 2018/19 and 51% from 2019/20. These rates apply to all work.
9. Emissions Trading SchemeAssumptions:
Emissions Trading Scheme is retained in its present form
Comments:
Some NZU’s will be surrendered over the term of the LTP for deforestation. It will cost $23.80 per tonne of waste based on a price of $20 per NZU and using the default emissions factor for landfill emissions.
The new government have indicated potential changes to the scheme but timing or impact is not yet confirmed.
Changes could be made to the scheme by the government that have an adverse impact on TDC or the carbon price could be higher or lower than expected.
Council could hold more or less NZU’s for forestry assets.
Landfill costs could vary resulting in changing landfill user charges.
Forestry assets are maintained with a long term view but programmes are reviewed annually.
Any sale of forestry land will compensate for the loss of NZUs and associated benefits.
Landfill costs and waste volumes are monitored continuously.
Carbon credits (NZU’s) are held for a portion of future obligations to mitigate NZU price changes.
10. Asset depreciation rates Assumption: Asset depreciation rates will not change as shown in the Accounting Policies.
Further work on planned capital works may alter the depreciation expense
Increased depreciation costs would result from assets that have shorter useful lives.
Asset life is based on the estimates of engineers and valuers. These are regularly reviewed through asset monitoring and testing. Negative impacts are likely to be at least partially offset by some assets lasting longer than estimated.
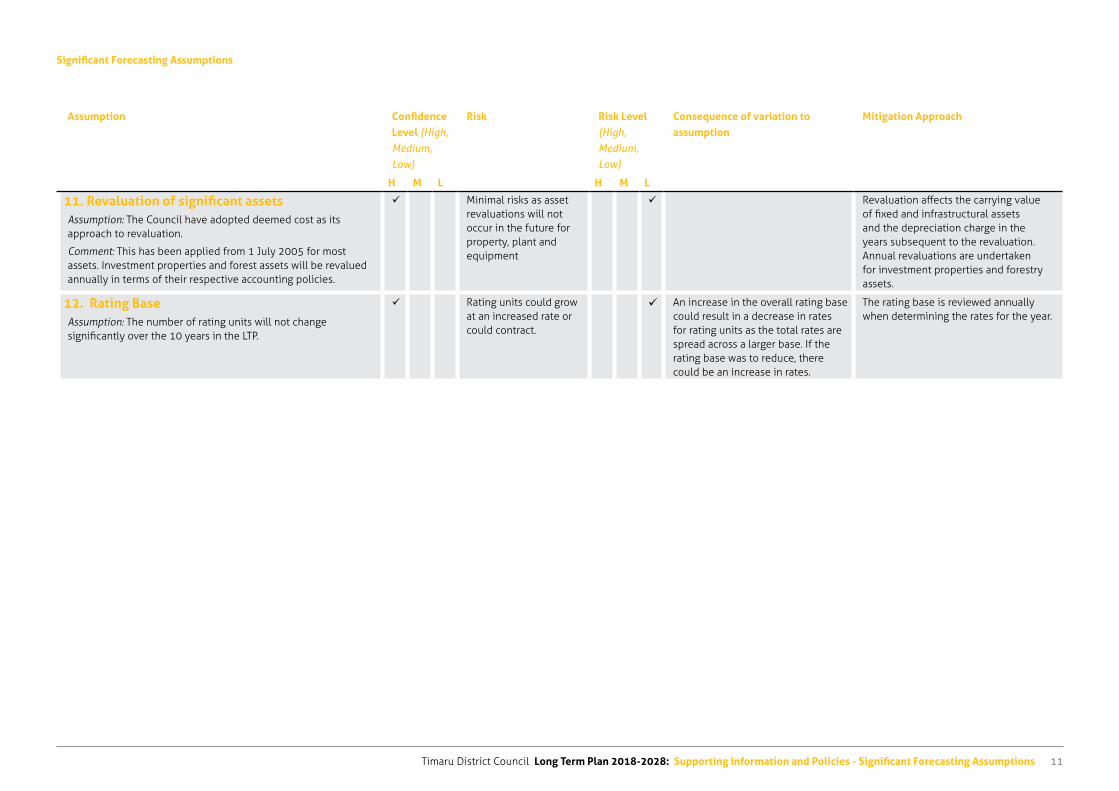
Timaru District Council Long Term Plan 2018-2028: Supporting Information and Policies - Significant Forecasting Assumptions 11
Significant Forecasting Assumptions
Assumption Confidence Level (High, Medium, Low)
Risk Risk Level (High, Medium, Low)
Consequence of variation to assumption
Mitigation Approach
H M L H M L
11. Revaluation of significant assetsAssumption: The Council have adopted deemed cost as its approach to revaluation.
Comment: This has been applied from 1 July 2005 for most assets. Investment properties and forest assets will be revalued annually in terms of their respective accounting policies.
Minimal risks as asset revaluations will not occur in the future for property, plant and equipment
Revaluation affects the carrying value of fixed and infrastructural assets and the depreciation charge in the years subsequent to the revaluation. Annual revaluations are undertaken for investment properties and forestry assets.
12. Rating BaseAssumption: The number of rating units will not change significantly over the 10 years in the LTP.
Rating units could grow at an increased rate or could contract.
An increase in the overall rating base could result in a decrease in rates for rating units as the total rates are spread across a larger base. If the rating base was to reduce, there could be an increase in rates.
The rating base is reviewed annually when determining the rates for the year.
Timaru District Council Long Term Plan 2018-2028: Supporting Information and Policies - Financial Contributions Policy 1
Financial Contributions PolicyIntroductionCouncil is required to adopt a Development or Financial Contributions Policy under section 102 of the Local Government Act 2002 (the Act).
Development Contributions provide Council with a method to obtain contributions to fund infrastructure required due to growth.
The Timaru District Council does not currently intend to implement a Development Contributions Policy as outlined in Section 106 of the Act. A review of this approach is intended in the next few years, which may lead to a Development Contributions Policy being implemented.
Timaru District Council has an operative Financial Contributions Policy as set out in Part D, Section 6 of the Timaru District Plan. The existing Financial Contributions Policy allows the Council to apply a charge for water, sewer, stormwater and open space and recreation.
The financial contribution is a contribution from developers of cash or kind, or a mix of these. Financial contributions are provided for under the Resource Management Act 1991 and are used to offset or mitigate any adverse impacts on the natural and physical environment including utilities, services or a new development.
Minor amounts of the capital expenditure budget for parks and recreation have been identified as coming from financial contributions. Amounts to be funded from financial contributions for water supply, sewer and stormwater services will be determined from Council decisions at the time of development.
Financial Contributions PolicyA summary of the existing Financial Contributions provisions under the Timaru District Plan is included below. The full provisions can be found in the District Plan document under Section D: General Rules - 6.5: Water, Sewer, Stormwater and Open Space and Recreation Contributions.
6.5.1.2 WATER SUPPLIES: RULES FOR FINANCIAL CONTRIBUTIONS FOR WATER SCHEMES1 Within the boundaries of an urban water scheme
Where proposed allotments, sites or buildings are intended
for human habitation or occupation within the boundaries of an urban water scheme (Timaru, Temuka, Geraldine, Pleasant Point) the following contributions are payable:
a) Where water from a water network utility service is able to be delivered to the subdivision or land concerned from an existing water network utility:i) the full actual cost of all necessary reticulation within
the subdivision or development for each allotment, site or building; plus
ii) the full actual cost of connections between the reticulation in the subdivision or development and the existing water network utility system; plus
iii) the full actual cost of any additions or modifications to the existing water network utility system that are required to provide for the expected effects of the subdivision, development or building on that utility system; plus
iv) an equitable share of the cost of the existing water network utility system where additional capacity has been created in anticipation of future development to a maximum value of $3,000 for each allotment.
b) When calculating (a)(iii) and (iv) above, the Council shall give consideration to whether any part of the cost of any additions or modifications to the existing network should be borne by Council or other subdividers or developers, and whether the subdivision or development benefits the present residents of the community or District to a degree that some or all of the cost of the existing network need not be charged.
c) The contribution may be in cash or kind or a mix of these, but in all cases the amount to be paid shall be based on an analysis of actual costs and be able to be substantiated by Council.
2 Within the boundaries of a rural water schemea) The Council shall not grant its consent to any subdivision
application which identifies a Rural Water Supply Scheme as its source of water without evidence of approval by the water supply authority for that connection.
b) Completion of the required connection works shall be achieved prior to sealing the survey plan.
c) Where a source of water supply other than a Rural Water
Supply Scheme is identified a consent notice shall be placed on the title of each allotment stating that the provision of water to the site is the owners responsibility on a continuing basis.
[NOTE: Rural water supply schemes have capital contributions for new connections, additional water, the cost of connecting from the existing pipe work to the tank or property connection, and upgrading of mains upstream of the consumer to enable connection to be made. Connection to the rural water supply is not possible without approval from the water supply authority. The appropriate capital contribution will be advised when approval is given].3 Controlled Activity
The following are controlled activities subject to complying with all the Performance Standards for the zone and the General Rules with the exercise of Council’s discretion restricted to the matter(s) specified.
Development and activities within the Washdyke Industrial Expansion Outline Development Plan area (as set out in Appendix 2 of Part D4), where water from a water network utility service is able to be delivered to the development. All such development and activities are a controlled activity in respect to financial contributions.
A financial contribution in the form of cash, land or a combination of both shall be payable. The costs shall be calculated in accordance with Section 6.5.1.2 (1) of this plan. Council shall advise the amount of contribution at the time of development.
6.5.2 OPEN SPACE AND RECREATION: RULES FOR OPEN SPACE AND RECREATION1 Subdivision for Residential Activities
For subdivisions resulting in additional allotments for residential purposes, a fee of $500.00 shall be payable for each additional allotment, except where any additional allotment has an existing household unit.
2 Household Unitsa) At the time of uplifting a building consent for a household
unit, a payment of $500.00 shall be made, except where this is the first or will be the only household unit on the site. This fee may be reduced by up to 50% if the household unit is part of a complex or institution where
Timaru District Council Long Term Plan 2018-2028: Supporting Information and Policies - Financial Contributions Policy2
Financial Contributions Policyspecific community and recreational facilities are provided on the site.
b) Where there are existing household units on a site to be replaced by new household units, the total fees for the new household units are to be reduced by $500.00 for each existing household unit being replaced.
c) A contribution of land or payment of cash shall be required for any development solely or principally for multi- unit residential purposes. This contribution shall be $500.00 for each unit, except for the first unit.
d) Allotments over two hectares in area, subdivided after 7 October 1995, shall be subject to a contribution of $500.00 when a household unit is placed on the site.
e) If the household unit is of a relocatable construction and caters for dependent relatives a refund will be available if the building is removed within 10 years. This refund will reduce by 10% of the original fee paid per annum up until year 10 when no refund will be given.
3 Discretionary Activity Any application to have General Rule 6.5.2.2.1 or 6.5.2.2.2 varied or waived is a discretionary activity.
4 Residential 6 Zone - Proposed Neighbourhood Park The new Proposed Neighbourhood Park and all stormwater swales identified on Appendix A - Gleniti Indicative Development Plan shall be vested in the Timaru District Council at the time of subdivision in lieu of open space and recreation contributions payable at the time of subdivision on the land described as Lot 1 DP 53112, Lot 19 DP 334402, Lots 6 and 8 DP 342480, Lots 6 and 7 DP 346964, and Lot 20 DP 334402 as at 1 December 2006.
6.5.3.2 STORMWATER SYSTEMS FOR URBAN AREAS: RULES ON FINANCIAL CONTRIBUTIONS1 At the time of subdivision, consideration shall be given to
taking a financial contribution in the form of cash, land, works or services (or a combination of these). Council shall advise the amount of the contribution at the time of the subdivision consent.
2 Where a financial contribution has not been taken at the time of subdivision Council may require a financial contribution to be taken as a condition of land use.
3 Where a connection to an existing stormwater drainage
network utility system is not available to serve the subdivision or development the maximum amount of the financial contribution should be the full and actual cost of providing:
a) A system for the disposal of stormwater; andb) Connections between the reticulation in the subdivision
or development and the existing stormwater drainage network utility system; and
c) All necessary reticulation and control structures within the subdivision or development; and
d) A stormwater connection for each allotment, site or building.
4 When calculating the financial contribution and to avoid disproportionate costs falling on developers at the lower end of catchments a cost sharing system shall apply as set out below:
a) Each area affected by the need for a cost sharing arrangement will be defined and treated separately to determine the share of costs to be borne by subdividers. The Council’s proposals for the basis of cost sharing will be made available to the subdividers in broad terms, ie rate of levy on defined areas, basis of adjustment and details of services proposed.
b) The contribution is to be based on estimated costs of providing the services, the estimates to be prepared on the basis of present day costs and supported by detailed engineering plans and formal detailed costing procedures for each service in each catchment area; costs are to include design fees. The date of the estimates is to be stated.
c) The contribution shall be allocated by spreading the estimated cost of each service for the catchment on an area basis over the land in that catchment and the contribution charged as it is subdivided. The result to be a levy per hectare for stormwater and main drains.
d) Although the contribution is to be calculated on an area basis, it shall be adjusted to allow for the direct benefit to be obtained by any one land owner. For example: the reticulation necessary in a subdivision is reduced considerably where a main drain goes right through that subdivision. In contrast the fringe areas do not receive
such a benefit as the main drain comes only to the boundary. The method of adjustment is to be a deduction from the gross cost for the catchment of an estimate of the direct benefit pertaining throughout the catchment before determining the contribution per hectare.
e) Where a subdivision is to receive a direct benefit the estimated amount is to be added back to the basic levy. The direct benefit received by any subdivision will reflect the projected load due to anticipated land use. This applies where a catchment has land which is zoned for different purposes. The direct benefit shall be calculated on the estimated cost of providing the necessary services for that subdivision (i.e. a certain size drain).
f) The contribution is to be applied on the basis of the catchment envisaged in the defined area referred to under Rule 6.5.3.2(4)(a) above, even if the final link for that subdivision is to services in another catchment. This provision is to ensure equity between different parts of the catchment.
g) The contribution rate per hectare will be updated according to the most recently published quarterly figure of the Works Construction Cost Index (WCCI) to cover the increase in costs which will have taken place between the time the estimate is prepared and the subdivision approval given.
h) The levied amount shall be made a condition of subdivisional approval. Payment to be required or a suitable bond entered into before the plan is sealed with such levy not subject to escalation during the period of approval.
i) Where agreements such as set out above exist they shall continue to be applied to further development within the specific catchment.
5 Where an existing stormwater drainage network utility system is available to serve the subdivision or development the maximum amount of the financial contribution shall be the full and actual cost of:
a) All necessary reticulation in the subdivision or development and a stormwater connection for each allotment, site or building; and
b) Connections between the reticulation in the subdivision
Timaru District Council Long Term Plan 2018-2028: Supporting Information and Policies - Financial Contributions Policy 3
Financial Contributions Policyor development and the existing stormwater network utility system; and
c) Any upgrading of the existing network utility system that is required to provide for the expected effects of the subdivision, development or building on that utility system.
6 At Gleniti, where open drainage channels are to be established and managed as stormwater swales (with or without associated detention dams) as part of a comprehensive stormwater management system, financial contribution shall be calculated in accordance with all of the above provisions.
Washdyke Industrial Expansion Area7 Controlled Activity
The following are controlled activities subject to complying with all the Performance Standards for the zone and the General Rules with the exercise of Council’s discretion restricted to the matter(s) specified. Development and activities within the Washdyke Industrial Expansion Outline Development Plan area (as set out in Appendix 2 of Part D4), where stormwater utility services are able to be delivered to the development. All such development and activities are a controlled activity in respect to financial contributions. A financial contribution in the form of cash, land or a combination of both shall be payable. The costs shall be calculated in accordance with Section 6.5.3.2 (4) of this plan. Council shall advise the amount of contribution at the time of development.
8 Rules no. (2) to (5) in this section shall apply to all land use development in the Washdyke Industrial Expansion Outline Development Plan area (as set out in Appendix 2 of Part D4).
6.5.4.2 SANITARY SEWER SYSTEMS: RULES ON FINANCIAL CONTRIBUTIONS1 At the time of subdivision, consideration shall be given to
taking a financial contribution in the form of cash, land, works or services (or a combination of these). Council shall advise the amount of the contribution at the time of the subdivision consent.
2 Where a financial contribution has not been taken at the time
of subdivision, Council may require a financial contribution to be taken as a condition of land use.
3 Where a connection to an existing sewerage system is not able to be made to the subdivision or development the maximum amount of the financial contribution shall be the full and actual cost of:
a) Providing a sanitary sewerage system for the subdivision, development or building; and
b) All necessary reticulation within the subdivision or development for each allotment, site or building.
4 Where a subdivision creates the need for a sanitary sewage system and adjoining land or buildings are discharging sanitary or trade wastes which are adversely affecting the environment then the sewage system constructed shall service both the land subject to the resource consent and the other lands.
5 The cost of the sewage system in Rule 6.5.4.2(4) shall be shared equitably between the lands served and calculated as follows:
a) Treatment plant capital and operating:i) In proportion to Biological Oxygen Demand (BOD) kg/
dayii) Suspended Solids (SS) kg/dayiii) Volume m3 dayiv) All equally weighted
b) Pumping installations capital and operating:i) In proportion to Volume m3/dayii) Peak flow rate/seciii) All equally weighted
c) Reticulationi) See criteria in Rule 6.5.3.2(4).
6 Where a connection to an existing sanitary sewerage network utility is available to serve the subdivision or land use the maximum amount of the financial contribution shall be the full and actual cost of:
a) All necessary reticulation within the subdivision or land use for each allotment, site or building.
b) Connections between the reticulation in the subdivision or development and the existing sanitary sewerage network utility system.
c) Any upgrading to the existing sanitary sewerage network
utility system that is required to provide for the expected effects of the subdivision, development or building on that utility system.
d) An equitable share of the cost of the new sanitary sewerage utility systems or upgraded (sewerage utility) systems, including design costs, where additional capacity will be required by the cumulative effects of the development of an area. The share will be calculated by dividing the cost of the work by the new or upgraded system.
Washdyke Industrial Expansion Area7 Controlled Activity8 The following are controlled activities subject to complying
with all the Performance Standards for the zone and the General Rules with the exercise of Council’s discretion restricted to the matter(s) specified.
9 Development and activities within the Washdyke Industrial Expansion Outline Development Plan area (as set out in Appendix 2 of Part D4), where sanitary sewer utility services are able to be delivered to the development. All such development and activities are a controlled activity in respect to financial contributions.
10 A financial contribution in the form of cash, land or a combination of both shall be payable. The costs shall be calculated in accordance with Section 6.5.4.2 (6) of this plan. Council shall advise the amount of contribution at the time of development.
11 Rules no. (2) to (6) in this section shall apply to all land use development in the Washdyke Industrial Expansion Outline Development Plan area (as set out in Appendix 2 of Part D4).
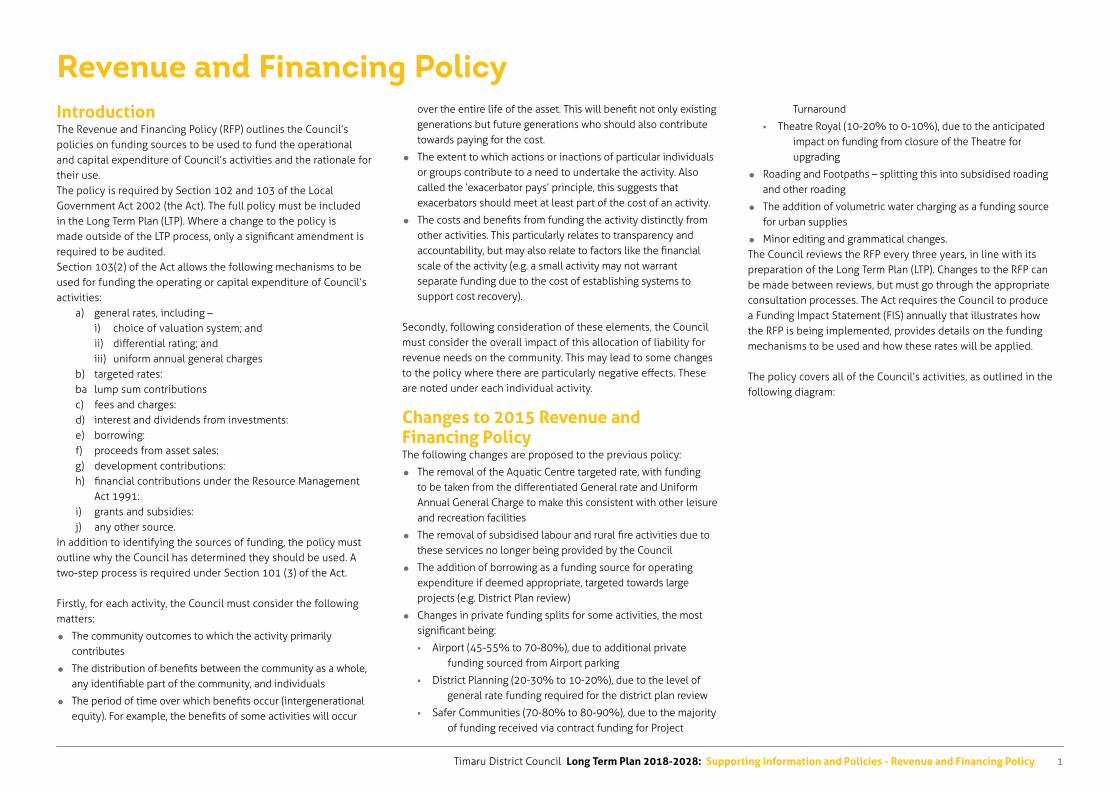
Timaru District Council Long Term Plan 2018-2028: Supporting Information and Policies - Revenue and Financing Policy 1
Revenue and Financing PolicyIntroductionThe Revenue and Financing Policy (RFP) outlines the Council’s policies on funding sources to be used to fund the operational and capital expenditure of Council’s activities and the rationale for their use.The policy is required by Section 102 and 103 of the Local Government Act 2002 (the Act). The full policy must be included in the Long Term Plan (LTP). Where a change to the policy is made outside of the LTP process, only a significant amendment is required to be audited.Section 103(2) of the Act allows the following mechanisms to be used for funding the operating or capital expenditure of Council’s activities:
a) general rates, including –i) choice of valuation system; andii) differential rating; andiii) uniform annual general charges
b) targeted rates:ba lump sum contributionsc) fees and charges:d) interest and dividends from investments:e) borrowing:f) proceeds from asset sales: g) development contributions:h) financial contributions under the Resource Management
Act 1991:i) grants and subsidies:j) any other source.
In addition to identifying the sources of funding, the policy must outline why the Council has determined they should be used. A two-step process is required under Section 101 (3) of the Act.
Firstly, for each activity, the Council must consider the following matters:
The community outcomes to which the activity primarily contributes
The distribution of benefits between the community as a whole, any identifiable part of the community, and individuals
The period of time over which benefits occur (intergenerational equity). For example, the benefits of some activities will occur
over the entire life of the asset. This will benefit not only existing generations but future generations who should also contribute towards paying for the cost.
The extent to which actions or inactions of particular individuals or groups contribute to a need to undertake the activity. Also called the ‘exacerbator pays’ principle, this suggests that exacerbators should meet at least part of the cost of an activity.
The costs and benefits from funding the activity distinctly from other activities. This particularly relates to transparency and accountability, but may also relate to factors like the financial scale of the activity (e.g. a small activity may not warrant separate funding due to the cost of establishing systems to support cost recovery).
Secondly, following consideration of these elements, the Council must consider the overall impact of this allocation of liability for revenue needs on the community. This may lead to some changes to the policy where there are particularly negative effects. These are noted under each individual activity.
Changes to 2015 Revenue and Financing PolicyThe following changes are proposed to the previous policy:
The removal of the Aquatic Centre targeted rate, with funding to be taken from the differentiated General rate and Uniform Annual General Charge to make this consistent with other leisure and recreation facilities
The removal of subsidised labour and rural fire activities due to these services no longer being provided by the Council
The addition of borrowing as a funding source for operating expenditure if deemed appropriate, targeted towards large projects (e.g. District Plan review)
Changes in private funding splits for some activities, the most significant being:
� Airport (45-55% to 70-80%), due to additional private funding sourced from Airport parking
� District Planning (20-30% to 10-20%), due to the level of general rate funding required for the district plan review
� Safer Communities (70-80% to 80-90%), due to the majority of funding received via contract funding for Project
Turnaround
� Theatre Royal (10-20% to 0-10%), due to the anticipated impact on funding from closure of the Theatre for upgrading
Roading and Footpaths – splitting this into subsidised roading and other roading
The addition of volumetric water charging as a funding source for urban supplies
Minor editing and grammatical changes.The Council reviews the RFP every three years, in line with its preparation of the Long Term Plan (LTP). Changes to the RFP can be made between reviews, but must go through the appropriate consultation processes. The Act requires the Council to produce a Funding Impact Statement (FIS) annually that illustrates how the RFP is being implemented, provides details on the funding mechanisms to be used and how these rates will be applied.
The policy covers all of the Council’s activities, as outlined in the following diagram:
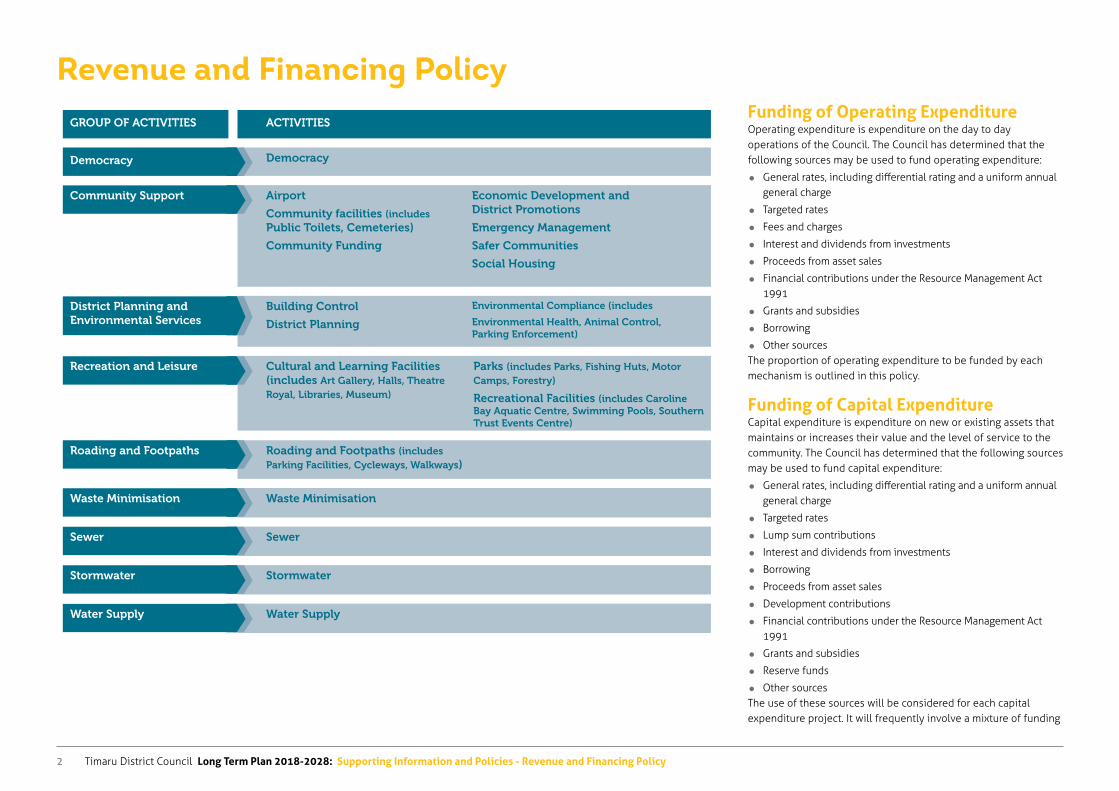
Timaru District Council Long Term Plan 2018-2028: Supporting Information and Policies - Revenue and Financing Policy2
Revenue and Financing Policy
Democracy Democracy
Waste Minimisation Waste Minimisation
Sewer Sewer
Stormwater Stormwater
Water Supply Water Supply
GROUP OF ACTIVITIES ACTIVITIES
District Planning and Environmental Services
Building Control
District Planning
Environmental Compliance (includes
Environmental Health, Animal Control, Parking Enforcement)
Community Support Airport
Community facilities (includes Public Toilets, Cemeteries)
Community Funding
Economic Development and District Promotions
Emergency Management
Safer Communities
Social Housing
Recreation and Leisure Cultural and Learning Facilities (includes Art Gallery, Halls, Theatre Royal, Libraries, Museum)
Parks (includes Parks, Fishing Huts, Motor Camps, Forestry)
Recreational Facilities (includes Caroline Bay Aquatic Centre, Swimming Pools, Southern Trust Events Centre)
Roading and Footpaths Roading and Footpaths (includes Parking Facilities, Cycleways, Walkways)
Funding of Operating ExpenditureOperating expenditure is expenditure on the day to day operations of the Council. The Council has determined that the following sources may be used to fund operating expenditure:
General rates, including differential rating and a uniform annual general charge
Targeted rates
Fees and charges
Interest and dividends from investments
Proceeds from asset sales
Financial contributions under the Resource Management Act 1991
Grants and subsidies
Borrowing
Other sourcesThe proportion of operating expenditure to be funded by each mechanism is outlined in this policy.
Funding of Capital ExpenditureCapital expenditure is expenditure on new or existing assets that maintains or increases their value and the level of service to the community. The Council has determined that the following sources may be used to fund capital expenditure:
General rates, including differential rating and a uniform annual general charge
Targeted rates
Lump sum contributions
Interest and dividends from investments
Borrowing
Proceeds from asset sales
Development contributions
Financial contributions under the Resource Management Act 1991
Grants and subsidies
Reserve funds
Other sourcesThe use of these sources will be considered for each capital expenditure project. It will frequently involve a mixture of funding
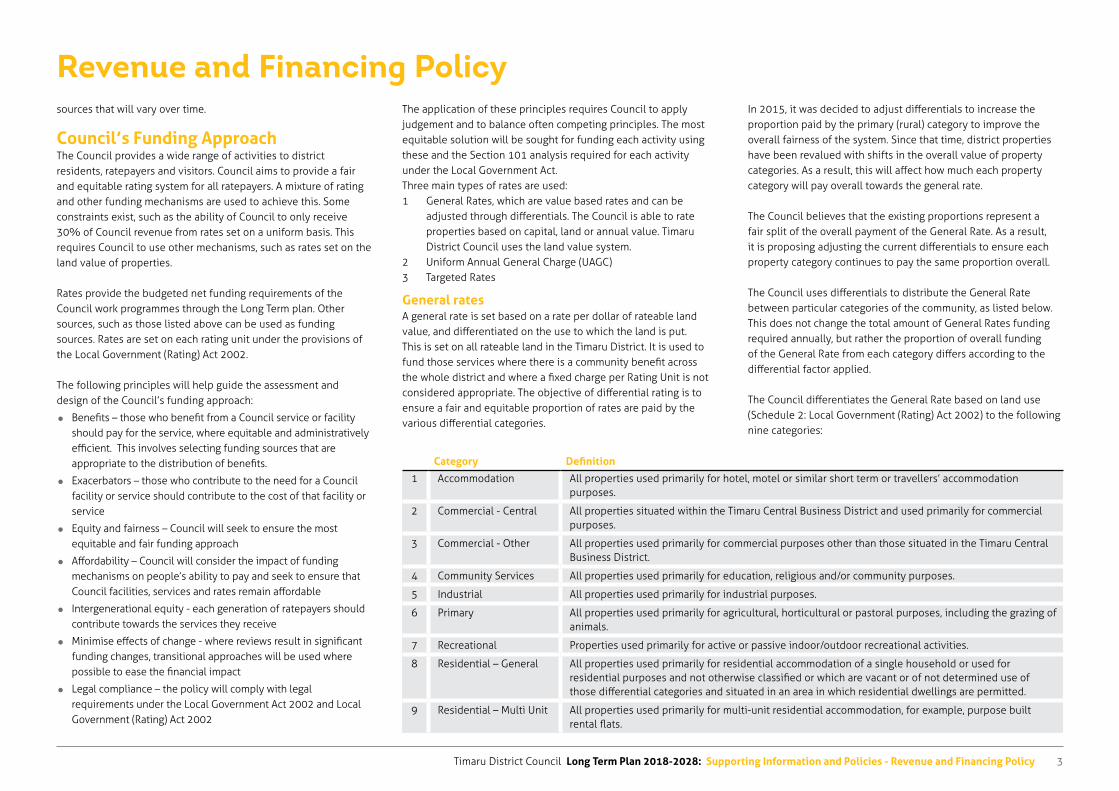
Timaru District Council Long Term Plan 2018-2028: Supporting Information and Policies - Revenue and Financing Policy 3
Revenue and Financing Policysources that will vary over time.
Council’s Funding ApproachThe Council provides a wide range of activities to district residents, ratepayers and visitors. Council aims to provide a fair and equitable rating system for all ratepayers. A mixture of rating and other funding mechanisms are used to achieve this. Some constraints exist, such as the ability of Council to only receive 30% of Council revenue from rates set on a uniform basis. This requires Council to use other mechanisms, such as rates set on the land value of properties.
Rates provide the budgeted net funding requirements of the Council work programmes through the Long Term plan. Other sources, such as those listed above can be used as funding sources. Rates are set on each rating unit under the provisions of the Local Government (Rating) Act 2002.
The following principles will help guide the assessment and design of the Council’s funding approach:
Benefits – those who benefit from a Council service or facility should pay for the service, where equitable and administratively efficient. This involves selecting funding sources that are appropriate to the distribution of benefits.
Exacerbators – those who contribute to the need for a Council facility or service should contribute to the cost of that facility or service
Equity and fairness – Council will seek to ensure the most equitable and fair funding approach
Affordability – Council will consider the impact of funding mechanisms on people’s ability to pay and seek to ensure that Council facilities, services and rates remain affordable
Intergenerational equity - each generation of ratepayers should contribute towards the services they receive
Minimise effects of change - where reviews result in significant funding changes, transitional approaches will be used where possible to ease the financial impact
Legal compliance – the policy will comply with legal requirements under the Local Government Act 2002 and Local Government (Rating) Act 2002
The application of these principles requires Council to apply judgement and to balance often competing principles. The most equitable solution will be sought for funding each activity using these and the Section 101 analysis required for each activity under the Local Government Act.Three main types of rates are used:1 General Rates, which are value based rates and can be
adjusted through differentials. The Council is able to rate properties based on capital, land or annual value. Timaru District Council uses the land value system.
2 Uniform Annual General Charge (UAGC)3 Targeted Rates
General ratesA general rate is set based on a rate per dollar of rateable land value, and differentiated on the use to which the land is put. This is set on all rateable land in the Timaru District. It is used to fund those services where there is a community benefit across the whole district and where a fixed charge per Rating Unit is not considered appropriate. The objective of differential rating is to ensure a fair and equitable proportion of rates are paid by the various differential categories.
In 2015, it was decided to adjust differentials to increase the proportion paid by the primary (rural) category to improve the overall fairness of the system. Since that time, district properties have been revalued with shifts in the overall value of property categories. As a result, this will affect how much each property category will pay overall towards the general rate.
The Council believes that the existing proportions represent a fair split of the overall payment of the General Rate. As a result, it is proposing adjusting the current differentials to ensure each property category continues to pay the same proportion overall.
The Council uses differentials to distribute the General Rate between particular categories of the community, as listed below. This does not change the total amount of General Rates funding required annually, but rather the proportion of overall funding of the General Rate from each category differs according to the differential factor applied.
The Council differentiates the General Rate based on land use (Schedule 2: Local Government (Rating) Act 2002) to the following nine categories:
Category Definition
1 Accommodation All properties used primarily for hotel, motel or similar short term or travellers’ accommodation purposes.
2 Commercial - Central All properties situated within the Timaru Central Business District and used primarily for commercial purposes.
3 Commercial - Other All properties used primarily for commercial purposes other than those situated in the Timaru Central Business District.
4 Community Services All properties used primarily for education, religious and/or community purposes.
5 Industrial All properties used primarily for industrial purposes.
6 Primary All properties used primarily for agricultural, horticultural or pastoral purposes, including the grazing of animals.
7 Recreational Properties used primarily for active or passive indoor/outdoor recreational activities.
8 Residential – General All properties used primarily for residential accommodation of a single household or used for residential purposes and not otherwise classified or which are vacant or of not determined use of those differential categories and situated in an area in which residential dwellings are permitted.
9 Residential – Multi Unit All properties used primarily for multi-unit residential accommodation, for example, purpose built rental flats.
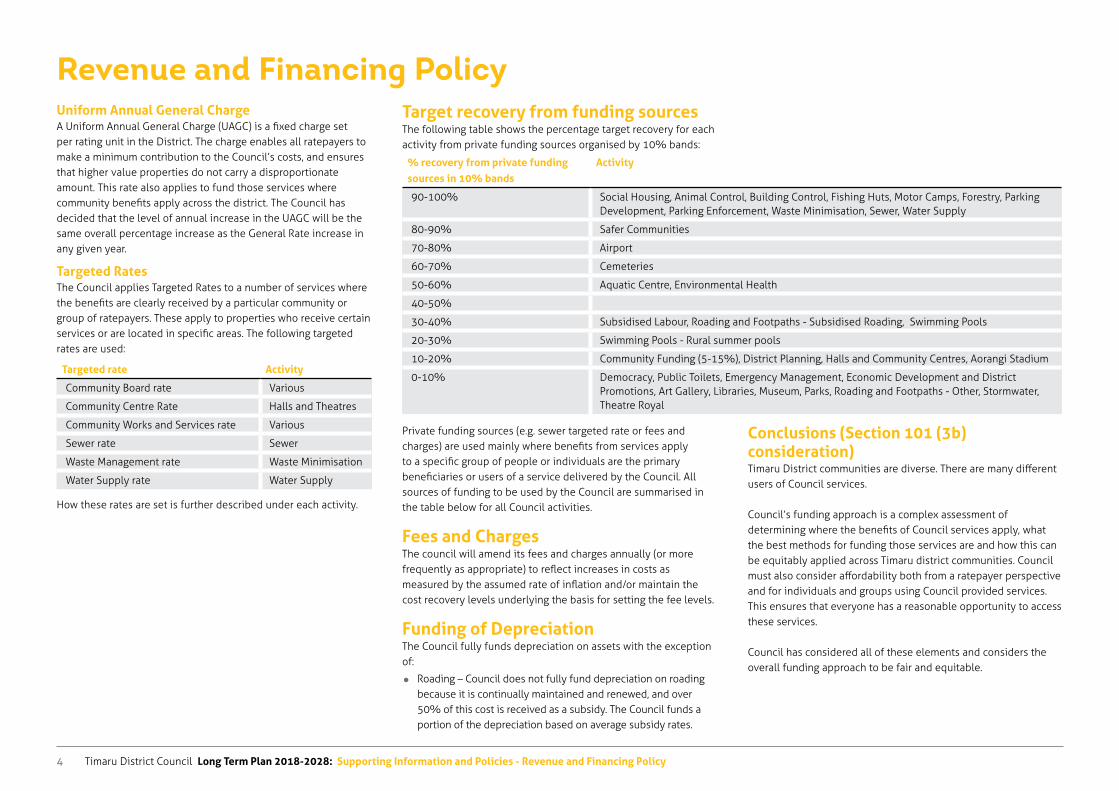
Timaru District Council Long Term Plan 2018-2028: Supporting Information and Policies - Revenue and Financing Policy4
Revenue and Financing PolicyUniform Annual General ChargeA Uniform Annual General Charge (UAGC) is a fixed charge set per rating unit in the District. The charge enables all ratepayers to make a minimum contribution to the Council’s costs, and ensures that higher value properties do not carry a disproportionate amount. This rate also applies to fund those services where community benefits apply across the district. The Council has decided that the level of annual increase in the UAGC will be the same overall percentage increase as the General Rate increase in any given year.
Targeted RatesThe Council applies Targeted Rates to a number of services where the benefits are clearly received by a particular community or group of ratepayers. These apply to properties who receive certain services or are located in specific areas. The following targeted rates are used:
Targeted rate Activity
Community Board rate Various
Community Centre Rate Halls and Theatres
Community Works and Services rate Various
Sewer rate Sewer
Waste Management rate Waste Minimisation
Water Supply rate Water Supply
How these rates are set is further described under each activity.
Private funding sources (e.g. sewer targeted rate or fees and charges) are used mainly where benefits from services apply to a specific group of people or individuals are the primary beneficiaries or users of a service delivered by the Council. All sources of funding to be used by the Council are summarised in the table below for all Council activities.
Fees and ChargesThe council will amend its fees and charges annually (or more frequently as appropriate) to reflect increases in costs as measured by the assumed rate of inflation and/or maintain the cost recovery levels underlying the basis for setting the fee levels.
Funding of DepreciationThe Council fully funds depreciation on assets with the exception of:
Roading – Council does not fully fund depreciation on roading because it is continually maintained and renewed, and over 50% of this cost is received as a subsidy. The Council funds a portion of the depreciation based on average subsidy rates.
% recovery from private funding sources in 10% bands
Activity
90-100% Social Housing, Animal Control, Building Control, Fishing Huts, Motor Camps, Forestry, Parking Development, Parking Enforcement, Waste Minimisation, Sewer, Water Supply
80-90% Safer Communities
70-80% Airport
60-70% Cemeteries
50-60% Aquatic Centre, Environmental Health
40-50%
30-40% Subsidised Labour, Roading and Footpaths - Subsidised Roading, Swimming Pools
20-30% Swimming Pools - Rural summer pools
10-20% Community Funding (5-15%), District Planning, Halls and Community Centres, Aorangi Stadium
0-10% Democracy, Public Toilets, Emergency Management, Economic Development and District Promotions, Art Gallery, Libraries, Museum, Parks, Roading and Footpaths - Other, Stormwater, Theatre Royal
Conclusions (Section 101 (3b) consideration)Timaru District communities are diverse. There are many different users of Council services.
Council’s funding approach is a complex assessment of determining where the benefits of Council services apply, what the best methods for funding those services are and how this can be equitably applied across Timaru district communities. Council must also consider affordability both from a ratepayer perspective and for individuals and groups using Council provided services. This ensures that everyone has a reasonable opportunity to access these services.
Council has considered all of these elements and considers the overall funding approach to be fair and equitable.
Target recovery from funding sourcesThe following table shows the percentage target recovery for each activity from private funding sources organised by 10% bands:
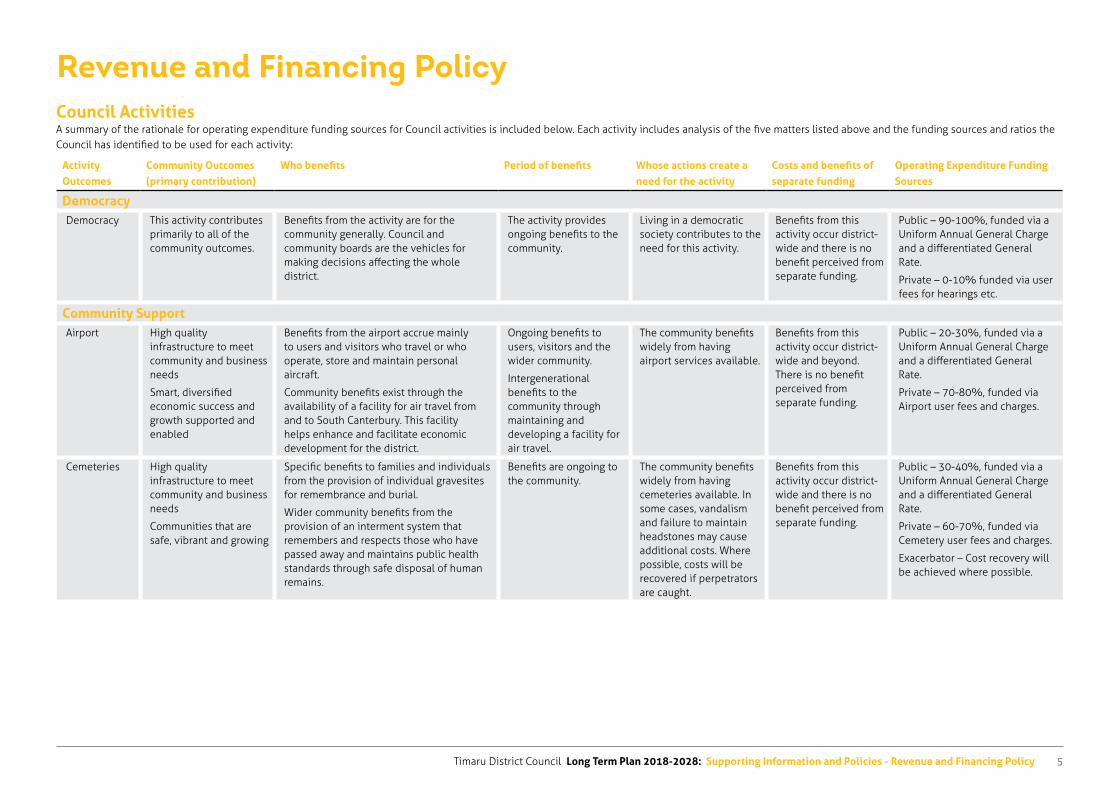
Timaru District Council Long Term Plan 2018-2028: Supporting Information and Policies - Revenue and Financing Policy 5
Revenue and Financing PolicyCouncil ActivitiesA summary of the rationale for operating expenditure funding sources for Council activities is included below. Each activity includes analysis of the five matters listed above and the funding sources and ratios the Council has identified to be used for each activity:
Activity Outcomes
Community Outcomes (primary contribution)
Who benefits Period of benefits Whose actions create a need for the activity
Costs and benefits of separate funding
Operating Expenditure Funding Sources
DemocracyDemocracy This activity contributes
primarily to all of the community outcomes.
Benefits from the activity are for the community generally. Council and community boards are the vehicles for making decisions affecting the whole district.
The activity provides ongoing benefits to the community.
Living in a democratic society contributes to the need for this activity.
Benefits from this activity occur district-wide and there is no benefit perceived from separate funding.
Public – 90-100%, funded via a Uniform Annual General Charge and a differentiated General Rate.
Private – 0-10% funded via user fees for hearings etc.
Community SupportAirport High quality
infrastructure to meet community and business needs
Smart, diversified economic success and growth supported and enabled
Benefits from the airport accrue mainly to users and visitors who travel or who operate, store and maintain personal aircraft.
Community benefits exist through the availability of a facility for air travel from and to South Canterbury. This facility helps enhance and facilitate economic development for the district.
Ongoing benefits to users, visitors and the wider community.
Intergenerational benefits to the community through maintaining and developing a facility for air travel.
The community benefits widely from having airport services available.
Benefits from this activity occur district-wide and beyond. There is no benefit perceived from separate funding.
Public – 20-30%, funded via a Uniform Annual General Charge and a differentiated General Rate.
Private – 70-80%, funded via Airport user fees and charges.
Cemeteries High quality infrastructure to meet community and business needs
Communities that are safe, vibrant and growing
Specific benefits to families and individuals from the provision of individual gravesites for remembrance and burial.
Wider community benefits from the provision of an interment system that remembers and respects those who have passed away and maintains public health standards through safe disposal of human remains.
Benefits are ongoing to the community.
The community benefits widely from having cemeteries available. In some cases, vandalism and failure to maintain headstones may cause additional costs. Where possible, costs will be recovered if perpetrators are caught.
Benefits from this activity occur district-wide and there is no benefit perceived from separate funding.
Public – 30-40%, funded via a Uniform Annual General Charge and a differentiated General Rate.
Private – 60-70%, funded via Cemetery user fees and charges.
Exacerbator – Cost recovery will be achieved where possible.
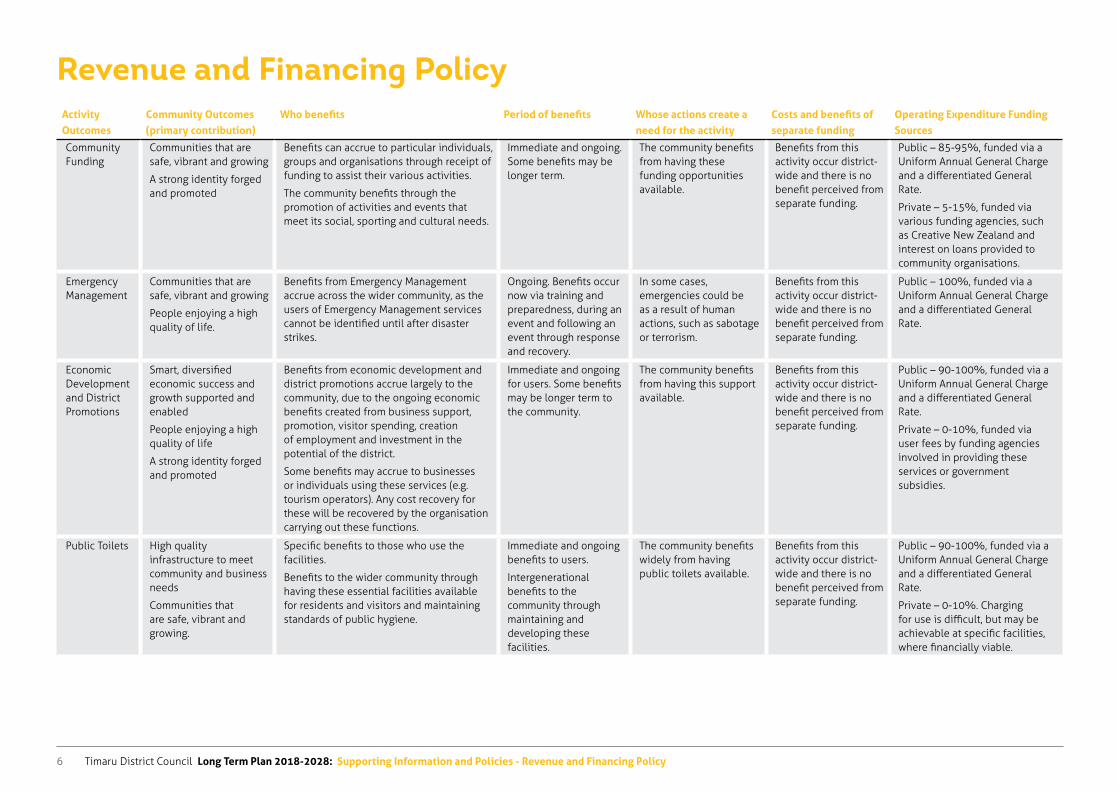
Timaru District Council Long Term Plan 2018-2028: Supporting Information and Policies - Revenue and Financing Policy6
Revenue and Financing PolicyActivity Outcomes
Community Outcomes (primary contribution)
Who benefits Period of benefits Whose actions create a need for the activity
Costs and benefits of separate funding
Operating Expenditure Funding Sources
Community Funding
Communities that are safe, vibrant and growing
A strong identity forged and promoted
Benefits can accrue to particular individuals, groups and organisations through receipt of funding to assist their various activities.
The community benefits through the promotion of activities and events that meet its social, sporting and cultural needs.
Immediate and ongoing. Some benefits may be longer term.
The community benefits from having these funding opportunities available.
Benefits from this activity occur district-wide and there is no benefit perceived from separate funding.
Public – 85-95%, funded via a Uniform Annual General Charge and a differentiated General Rate.
Private – 5-15%, funded via various funding agencies, such as Creative New Zealand and interest on loans provided to community organisations.
Emergency Management
Communities that are safe, vibrant and growing
People enjoying a high quality of life.
Benefits from Emergency Management accrue across the wider community, as the users of Emergency Management services cannot be identified until after disaster strikes.
Ongoing. Benefits occur now via training and preparedness, during an event and following an event through response and recovery.
In some cases, emergencies could be as a result of human actions, such as sabotage or terrorism.
Benefits from this activity occur district-wide and there is no benefit perceived from separate funding.
Public – 100%, funded via a Uniform Annual General Charge and a differentiated General Rate.
Economic Development and District Promotions
Smart, diversified economic success and growth supported and enabled
People enjoying a high quality of life
A strong identity forged and promoted
Benefits from economic development and district promotions accrue largely to the community, due to the ongoing economic benefits created from business support, promotion, visitor spending, creation of employment and investment in the potential of the district.
Some benefits may accrue to businesses or individuals using these services (e.g. tourism operators). Any cost recovery for these will be recovered by the organisation carrying out these functions.
Immediate and ongoing for users. Some benefits may be longer term to the community.
The community benefits from having this support available.
Benefits from this activity occur district-wide and there is no benefit perceived from separate funding.
Public – 90-100%, funded via a Uniform Annual General Charge and a differentiated General Rate.
Private – 0-10%, funded via user fees by funding agencies involved in providing these services or government subsidies.
Public Toilets High quality infrastructure to meet community and business needs
Communities that are safe, vibrant and growing.
Specific benefits to those who use the facilities.
Benefits to the wider community through having these essential facilities available for residents and visitors and maintaining standards of public hygiene.
Immediate and ongoing benefits to users.
Intergenerational benefits to the community through maintaining and developing these facilities.
The community benefits widely from having public toilets available.
Benefits from this activity occur district-wide and there is no benefit perceived from separate funding.
Public – 90-100%, funded via a Uniform Annual General Charge and a differentiated General Rate.
Private – 0-10%. Charging for use is difficult, but may be achievable at specific facilities, where financially viable.
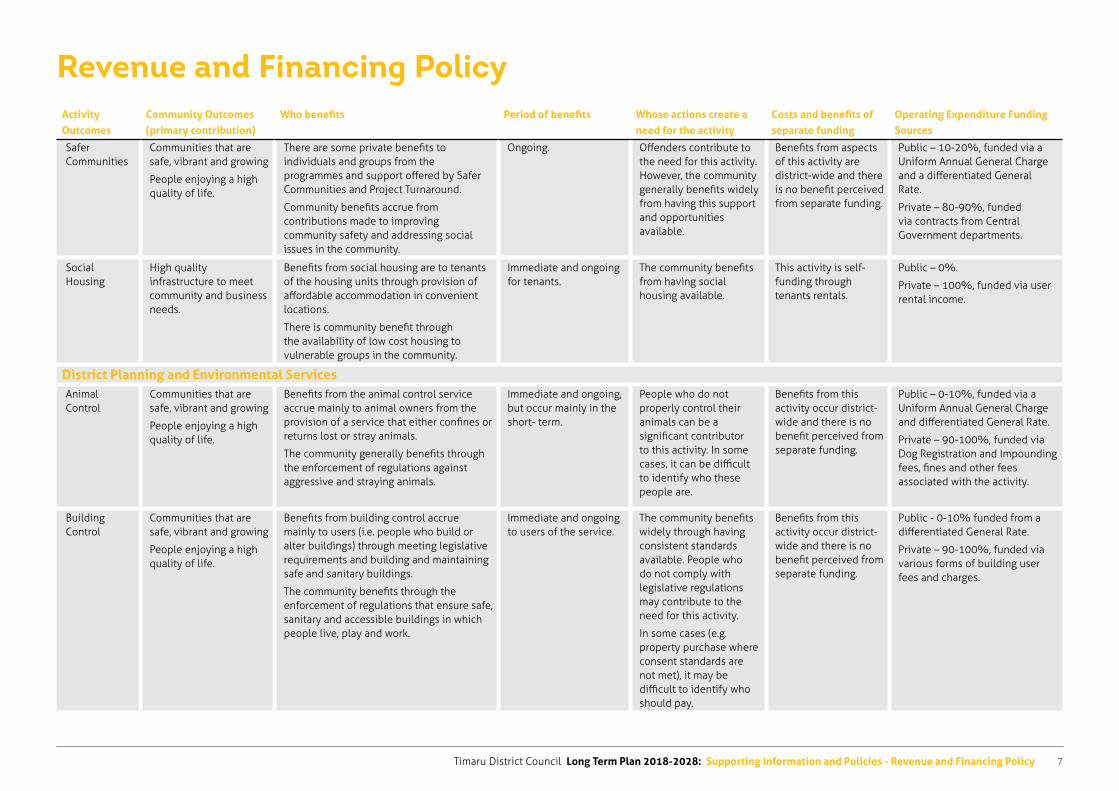
Timaru District Council Long Term Plan 2018-2028: Supporting Information and Policies - Revenue and Financing Policy 7
Revenue and Financing PolicyActivity Outcomes
Community Outcomes (primary contribution)
Who benefits Period of benefits Whose actions create a need for the activity
Costs and benefits of separate funding
Operating Expenditure Funding Sources
Safer Communities
Communities that are safe, vibrant and growing
People enjoying a high quality of life.
There are some private benefits to individuals and groups from the programmes and support offered by Safer Communities and Project Turnaround.
Community benefits accrue from contributions made to improving community safety and addressing social issues in the community.
Ongoing. Offenders contribute to the need for this activity. However, the community generally benefits widely from having this support and opportunities available.
Benefits from aspects of this activity are district-wide and there is no benefit perceived from separate funding.
Public – 10-20%, funded via a Uniform Annual General Charge and a differentiated General Rate.
Private – 80-90%, funded via contracts from Central Government departments.
Social Housing
High quality infrastructure to meet community and business needs.
Benefits from social housing are to tenants of the housing units through provision of affordable accommodation in convenient locations.
There is community benefit through the availability of low cost housing to vulnerable groups in the community.
Immediate and ongoing for tenants.
The community benefits from having social housing available.
This activity is self- funding through tenants rentals.
Public – 0%.
Private – 100%, funded via user rental income.
District Planning and Environmental ServicesAnimal Control
Communities that are safe, vibrant and growing
People enjoying a high quality of life.
Benefits from the animal control service accrue mainly to animal owners from the provision of a service that either confines or returns lost or stray animals.
The community generally benefits through the enforcement of regulations against aggressive and straying animals.
Immediate and ongoing, but occur mainly in the short- term.
People who do not properly control their animals can be a significant contributor to this activity. In some cases, it can be difficult to identify who these people are.
Benefits from this activity occur district-wide and there is no benefit perceived from separate funding.
Public – 0-10%, funded via a Uniform Annual General Charge and differentiated General Rate.
Private – 90-100%, funded via Dog Registration and Impounding fees, fines and other fees associated with the activity.
Building Control
Communities that are safe, vibrant and growing
People enjoying a high quality of life.
Benefits from building control accrue mainly to users (i.e. people who build or alter buildings) through meeting legislative requirements and building and maintaining safe and sanitary buildings.
The community benefits through the enforcement of regulations that ensure safe, sanitary and accessible buildings in which people live, play and work.
Immediate and ongoing to users of the service.
The community benefits widely through having consistent standards available. People who do not comply with legislative regulations may contribute to the need for this activity.
In some cases (e.g. property purchase where consent standards are not met), it may be difficult to identify who should pay.
Benefits from this activity occur district-wide and there is no benefit perceived from separate funding.
Public - 0-10% funded from a differentiated General Rate.
Private – 90-100%, funded via various forms of building user fees and charges.
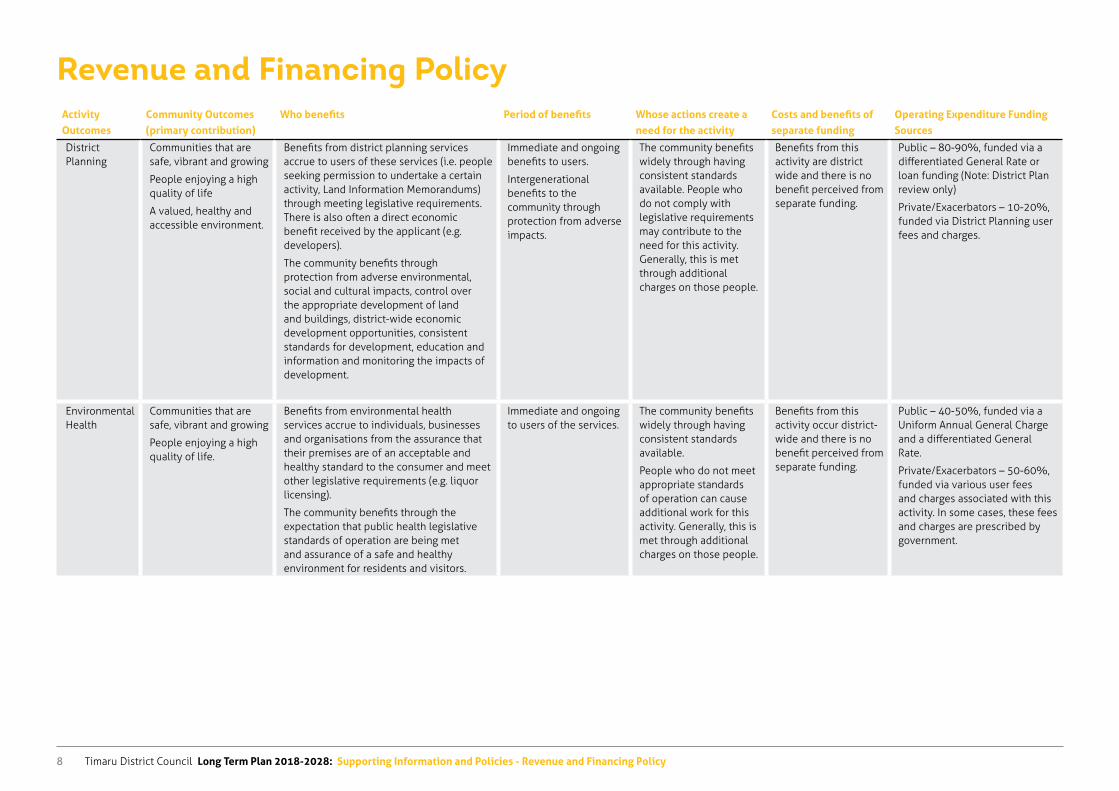
Timaru District Council Long Term Plan 2018-2028: Supporting Information and Policies - Revenue and Financing Policy8
Revenue and Financing PolicyActivity Outcomes
Community Outcomes (primary contribution)
Who benefits Period of benefits Whose actions create a need for the activity
Costs and benefits of separate funding
Operating Expenditure Funding Sources
District Planning
Communities that are safe, vibrant and growing
People enjoying a high quality of life
A valued, healthy and accessible environment.
Benefits from district planning services accrue to users of these services (i.e. people seeking permission to undertake a certain activity, Land Information Memorandums) through meeting legislative requirements. There is also often a direct economic benefit received by the applicant (e.g. developers).
The community benefits through protection from adverse environmental, social and cultural impacts, control over the appropriate development of land and buildings, district-wide economic development opportunities, consistent standards for development, education and information and monitoring the impacts of development.
Immediate and ongoing benefits to users.
Intergenerational benefits to the community through protection from adverse impacts.
The community benefits widely through having consistent standards available. People who do not comply with legislative requirements may contribute to the need for this activity. Generally, this is met through additional charges on those people.
Benefits from this activity are district wide and there is no benefit perceived from separate funding.
Public – 80-90%, funded via a differentiated General Rate or loan funding (Note: District Plan review only)
Private/Exacerbators – 10-20%, funded via District Planning user fees and charges.
Environmental Health
Communities that are safe, vibrant and growing
People enjoying a high quality of life.
Benefits from environmental health services accrue to individuals, businesses and organisations from the assurance that their premises are of an acceptable and healthy standard to the consumer and meet other legislative requirements (e.g. liquor licensing).
The community benefits through the expectation that public health legislative standards of operation are being met and assurance of a safe and healthy environment for residents and visitors.
Immediate and ongoing to users of the services.
The community benefits widely through having consistent standards available.
People who do not meet appropriate standards of operation can cause additional work for this activity. Generally, this is met through additional charges on those people.
Benefits from this activity occur district-wide and there is no benefit perceived from separate funding.
Public – 40-50%, funded via a Uniform Annual General Charge and a differentiated General Rate.
Private/Exacerbators – 50-60%, funded via various user fees and charges associated with this activity. In some cases, these fees and charges are prescribed by government.
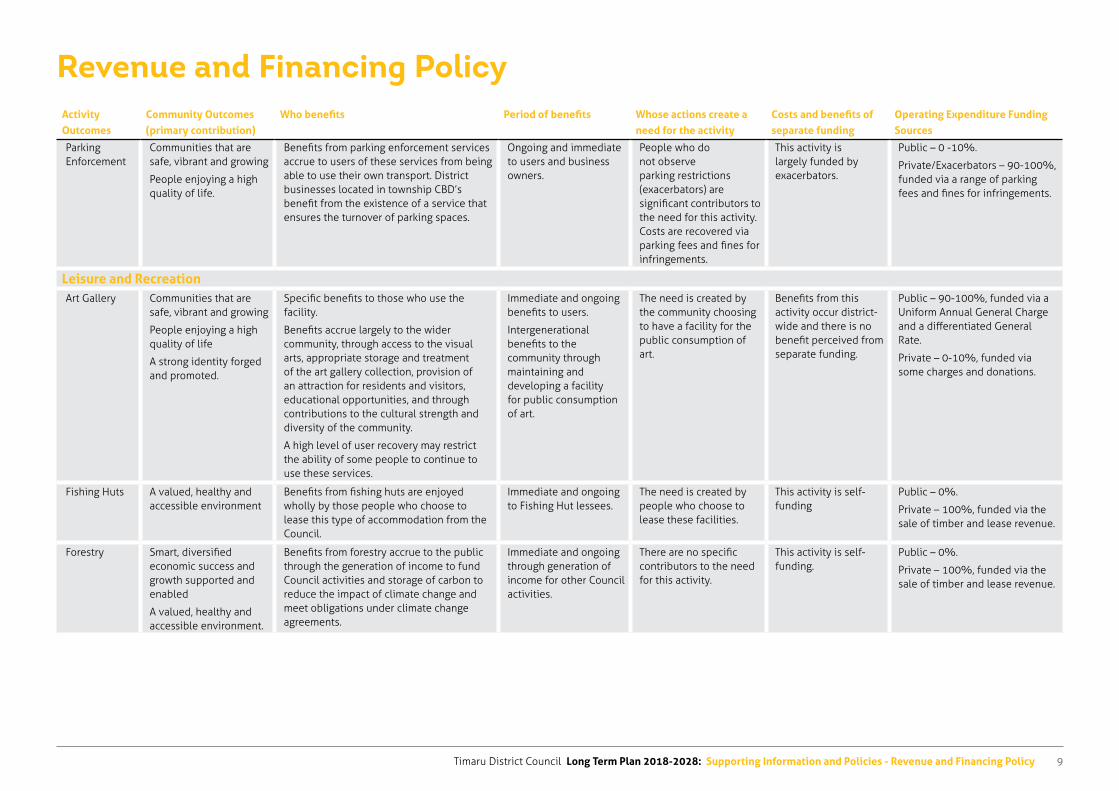
Timaru District Council Long Term Plan 2018-2028: Supporting Information and Policies - Revenue and Financing Policy 9
Revenue and Financing PolicyActivity Outcomes
Community Outcomes (primary contribution)
Who benefits Period of benefits Whose actions create a need for the activity
Costs and benefits of separate funding
Operating Expenditure Funding Sources
Parking Enforcement
Communities that are safe, vibrant and growing
People enjoying a high quality of life.
Benefits from parking enforcement services accrue to users of these services from being able to use their own transport. District businesses located in township CBD’s benefit from the existence of a service that ensures the turnover of parking spaces.
Ongoing and immediate to users and business owners.
People who do not observe parking restrictions (exacerbators) are significant contributors to the need for this activity. Costs are recovered via parking fees and fines for infringements.
This activity is largely funded by exacerbators.
Public – 0 -10%.
Private/Exacerbators – 90-100%, funded via a range of parking fees and fines for infringements.
Leisure and RecreationArt Gallery Communities that are
safe, vibrant and growing
People enjoying a high quality of life
A strong identity forged and promoted.
Specific benefits to those who use the facility.
Benefits accrue largely to the wider community, through access to the visual arts, appropriate storage and treatment of the art gallery collection, provision of an attraction for residents and visitors, educational opportunities, and through contributions to the cultural strength and diversity of the community.
A high level of user recovery may restrict the ability of some people to continue to use these services.
Immediate and ongoing benefits to users.
Intergenerational benefits to the community through maintaining and developing a facility for public consumption of art.
The need is created by the community choosing to have a facility for the public consumption of art.
Benefits from this activity occur district-wide and there is no benefit perceived from separate funding.
Public – 90-100%, funded via a Uniform Annual General Charge and a differentiated General Rate.
Private – 0-10%, funded via some charges and donations.
Fishing Huts A valued, healthy and accessible environment
Benefits from fishing huts are enjoyed wholly by those people who choose to lease this type of accommodation from the Council.
Immediate and ongoing to Fishing Hut lessees.
The need is created by people who choose to lease these facilities.
This activity is self-funding
Public – 0%.
Private – 100%, funded via the sale of timber and lease revenue.
Forestry Smart, diversified economic success and growth supported and enabled
A valued, healthy and accessible environment.
Benefits from forestry accrue to the public through the generation of income to fund Council activities and storage of carbon to reduce the impact of climate change and meet obligations under climate change agreements.
Immediate and ongoing through generation of income for other Council activities.
There are no specific contributors to the need for this activity.
This activity is self- funding.
Public – 0%.
Private – 100%, funded via the sale of timber and lease revenue.
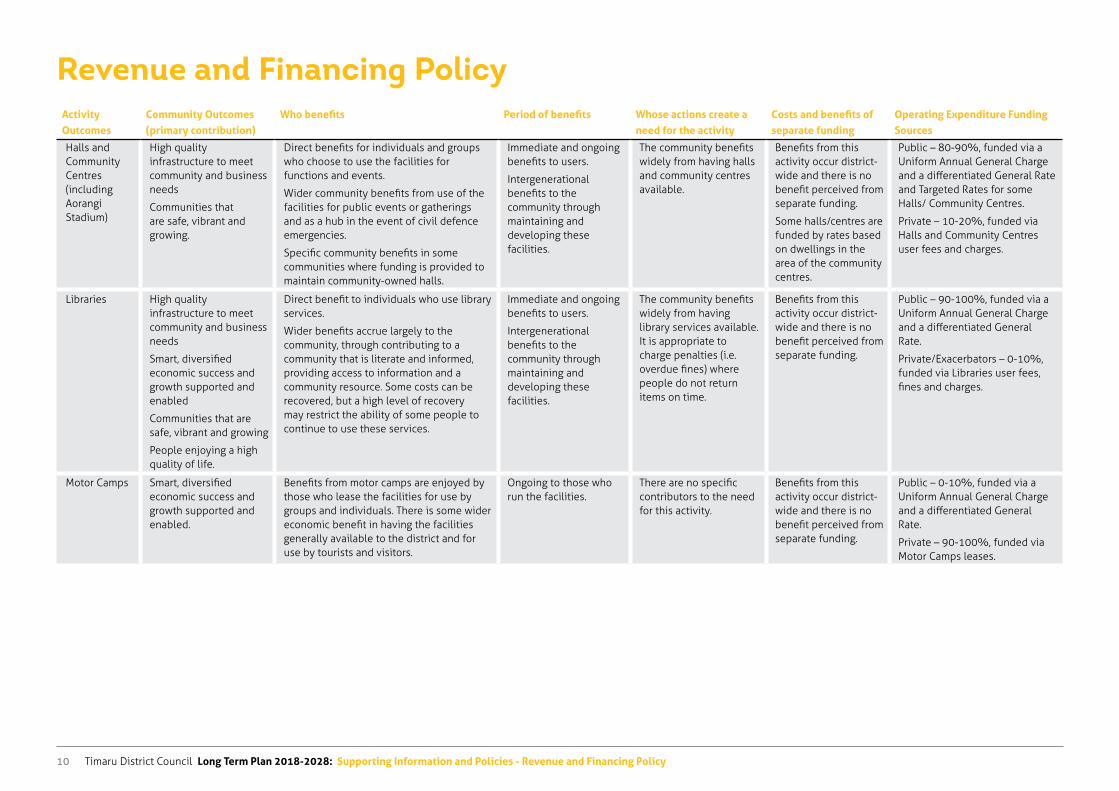
Timaru District Council Long Term Plan 2018-2028: Supporting Information and Policies - Revenue and Financing Policy10
Revenue and Financing PolicyActivity Outcomes
Community Outcomes (primary contribution)
Who benefits Period of benefits Whose actions create a need for the activity
Costs and benefits of separate funding
Operating Expenditure Funding Sources
Halls and Community Centres (including Aorangi Stadium)
High quality infrastructure to meet community and business needs
Communities that are safe, vibrant and growing.
Direct benefits for individuals and groups who choose to use the facilities for functions and events.
Wider community benefits from use of the facilities for public events or gatherings and as a hub in the event of civil defence emergencies.
Specific community benefits in some communities where funding is provided to maintain community-owned halls.
Immediate and ongoing benefits to users.
Intergenerational benefits to the community through maintaining and developing these facilities.
The community benefits widely from having halls and community centres available.
Benefits from this activity occur district-wide and there is no benefit perceived from separate funding.
Some halls/centres are funded by rates based on dwellings in the area of the community centres.
Public – 80-90%, funded via a Uniform Annual General Charge and a differentiated General Rate and Targeted Rates for some Halls/ Community Centres.
Private – 10-20%, funded via Halls and Community Centres user fees and charges.
Libraries High quality infrastructure to meet community and business needs
Smart, diversified economic success and growth supported and enabled
Communities that are safe, vibrant and growing
People enjoying a high quality of life.
Direct benefit to individuals who use library services.
Wider benefits accrue largely to the community, through contributing to a community that is literate and informed, providing access to information and a community resource. Some costs can be recovered, but a high level of recovery may restrict the ability of some people to continue to use these services.
Immediate and ongoing benefits to users.
Intergenerational benefits to the community through maintaining and developing these facilities.
The community benefits widely from having library services available. It is appropriate to charge penalties (i.e. overdue fines) where people do not return items on time.
Benefits from this activity occur district-wide and there is no benefit perceived from separate funding.
Public – 90-100%, funded via a Uniform Annual General Charge and a differentiated General Rate.
Private/Exacerbators – 0-10%, funded via Libraries user fees, fines and charges.
Motor Camps Smart, diversified economic success and growth supported and enabled.
Benefits from motor camps are enjoyed by those who lease the facilities for use by groups and individuals. There is some wider economic benefit in having the facilities generally available to the district and for use by tourists and visitors.
Ongoing to those who run the facilities.
There are no specific contributors to the need for this activity.
Benefits from this activity occur district-wide and there is no benefit perceived from separate funding.
Public – 0-10%, funded via a Uniform Annual General Charge and a differentiated General Rate.
Private – 90-100%, funded via Motor Camps leases.
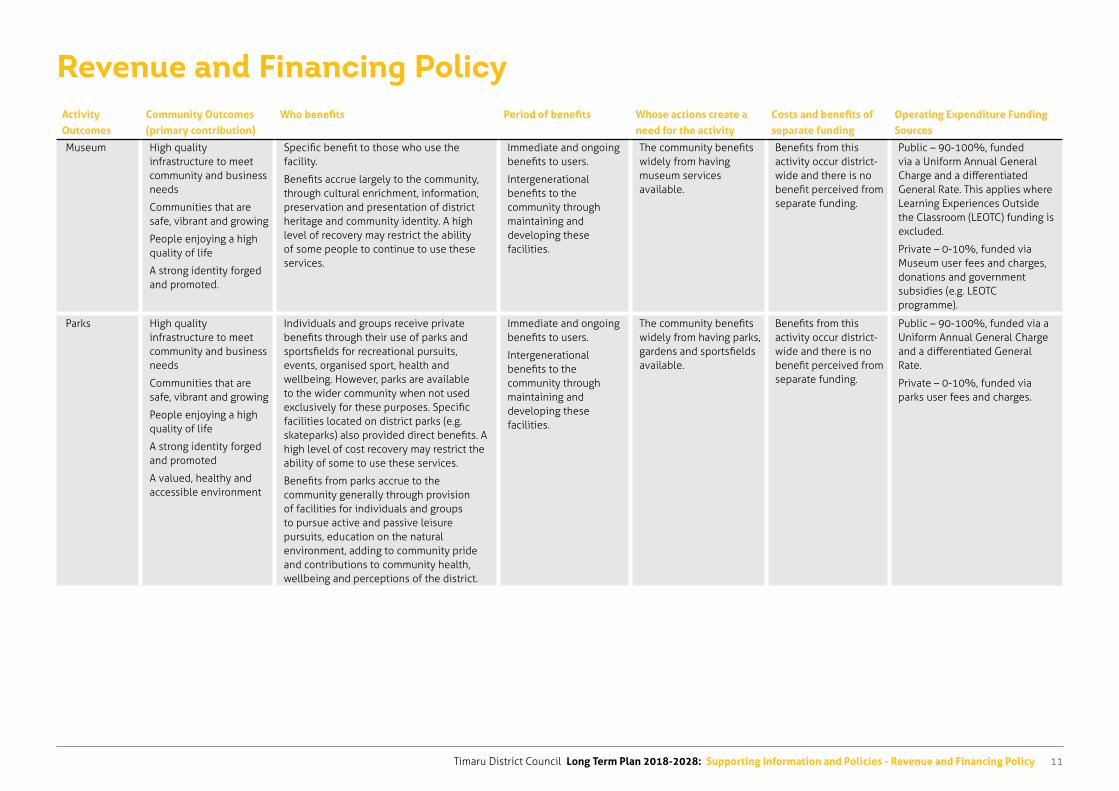
Timaru District Council Long Term Plan 2018-2028: Supporting Information and Policies - Revenue and Financing Policy 11
Revenue and Financing PolicyActivity Outcomes
Community Outcomes (primary contribution)
Who benefits Period of benefits Whose actions create a need for the activity
Costs and benefits of separate funding
Operating Expenditure Funding Sources
Museum High quality infrastructure to meet community and business needs
Communities that are safe, vibrant and growing
People enjoying a high quality of life
A strong identity forged and promoted.
Specific benefit to those who use the facility.
Benefits accrue largely to the community, through cultural enrichment, information, preservation and presentation of district heritage and community identity. A high level of recovery may restrict the ability of some people to continue to use these services.
Immediate and ongoing benefits to users.
Intergenerational benefits to the community through maintaining and developing these facilities.
The community benefits widely from having museum services available.
Benefits from this activity occur district-wide and there is no benefit perceived from separate funding.
Public – 90-100%, funded via a Uniform Annual General Charge and a differentiated General Rate. This applies where Learning Experiences Outside the Classroom (LEOTC) funding is excluded.
Private – 0-10%, funded via Museum user fees and charges, donations and government subsidies (e.g. LEOTC programme).
Parks High quality infrastructure to meet community and business needs
Communities that are safe, vibrant and growing
People enjoying a high quality of life
A strong identity forged and promoted
A valued, healthy and accessible environment
Individuals and groups receive private benefits through their use of parks and sportsfields for recreational pursuits, events, organised sport, health and wellbeing. However, parks are available to the wider community when not used exclusively for these purposes. Specific facilities located on district parks (e.g. skateparks) also provided direct benefits. A high level of cost recovery may restrict the ability of some to use these services.
Benefits from parks accrue to the community generally through provision of facilities for individuals and groups to pursue active and passive leisure pursuits, education on the natural environment, adding to community pride and contributions to community health, wellbeing and perceptions of the district.
Immediate and ongoing benefits to users.
Intergenerational benefits to the community through maintaining and developing these facilities.
The community benefits widely from having parks, gardens and sportsfields available.
Benefits from this activity occur district-wide and there is no benefit perceived from separate funding.
Public – 90-100%, funded via a Uniform Annual General Charge and a differentiated General Rate.
Private – 0-10%, funded via parks user fees and charges.
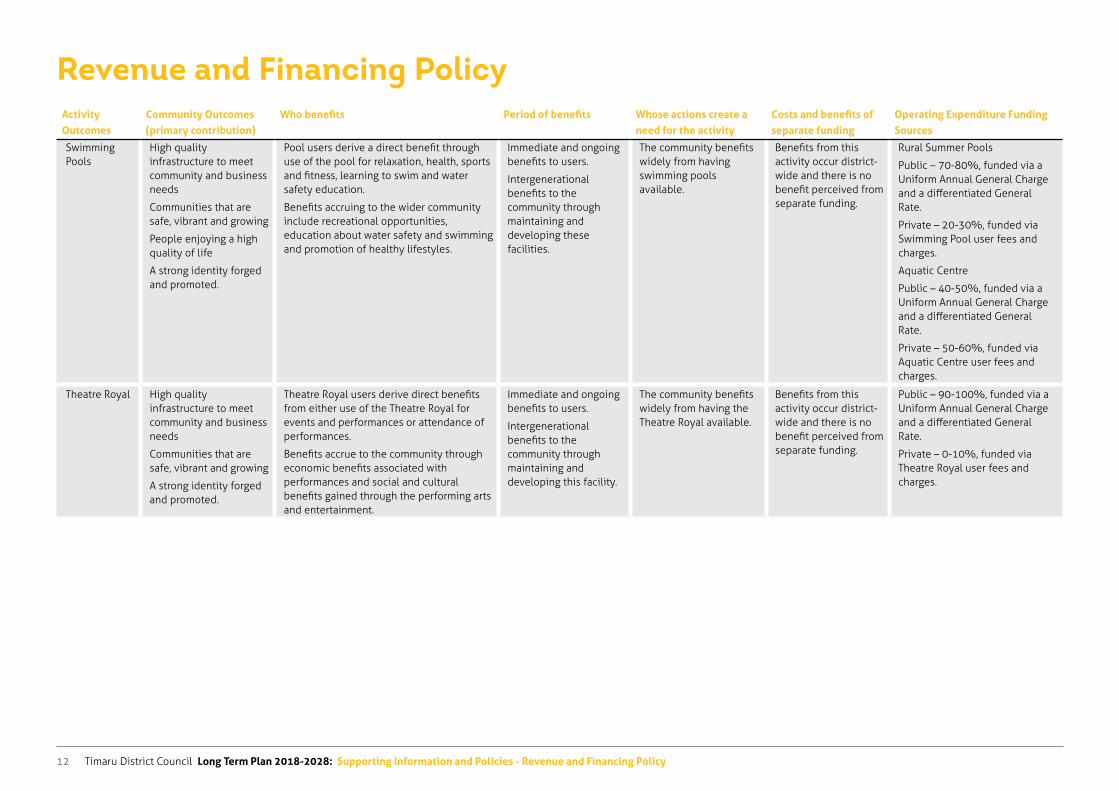
Timaru District Council Long Term Plan 2018-2028: Supporting Information and Policies - Revenue and Financing Policy12
Revenue and Financing PolicyActivity Outcomes
Community Outcomes (primary contribution)
Who benefits Period of benefits Whose actions create a need for the activity
Costs and benefits of separate funding
Operating Expenditure Funding Sources
Swimming Pools
High quality infrastructure to meet community and business needs
Communities that are safe, vibrant and growing
People enjoying a high quality of life
A strong identity forged and promoted.
Pool users derive a direct benefit through use of the pool for relaxation, health, sports and fitness, learning to swim and water safety education.
Benefits accruing to the wider community include recreational opportunities, education about water safety and swimming and promotion of healthy lifestyles.
Immediate and ongoing benefits to users.
Intergenerational benefits to the community through maintaining and developing these facilities.
The community benefits widely from having swimming pools available.
Benefits from this activity occur district-wide and there is no benefit perceived from separate funding.
Rural Summer Pools
Public – 70-80%, funded via a Uniform Annual General Charge and a differentiated General Rate.
Private – 20-30%, funded via Swimming Pool user fees and charges.
Aquatic Centre
Public – 40-50%, funded via a Uniform Annual General Charge and a differentiated General Rate.
Private – 50-60%, funded via Aquatic Centre user fees and charges.
Theatre Royal High quality infrastructure to meet community and business needs
Communities that are safe, vibrant and growing
A strong identity forged and promoted.
Theatre Royal users derive direct benefits from either use of the Theatre Royal for events and performances or attendance of performances.
Benefits accrue to the community through economic benefits associated with performances and social and cultural benefits gained through the performing arts and entertainment.
Immediate and ongoing benefits to users.
Intergenerational benefits to the community through maintaining and developing this facility.
The community benefits widely from having the Theatre Royal available.
Benefits from this activity occur district-wide and there is no benefit perceived from separate funding.
Public – 90-100%, funded via a Uniform Annual General Charge and a differentiated General Rate.
Private – 0-10%, funded via Theatre Royal user fees and charges.
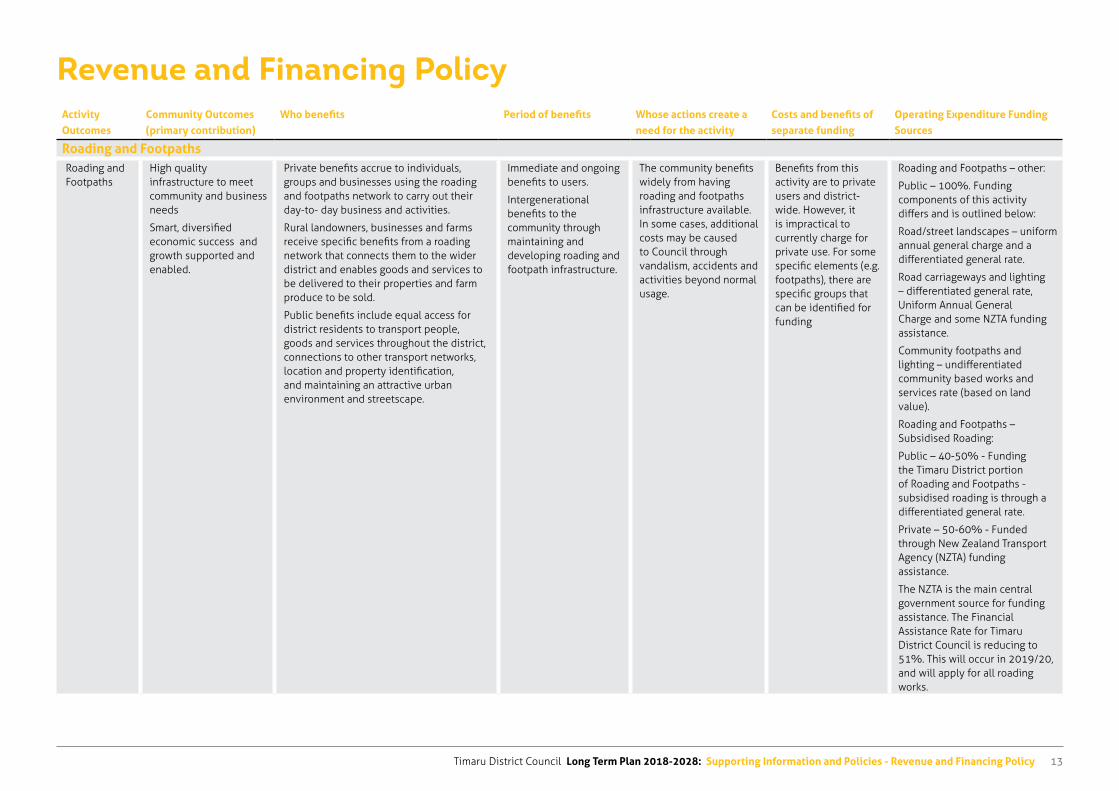
Timaru District Council Long Term Plan 2018-2028: Supporting Information and Policies - Revenue and Financing Policy 13
Revenue and Financing PolicyActivity Outcomes
Community Outcomes (primary contribution)
Who benefits Period of benefits Whose actions create a need for the activity
Costs and benefits of separate funding
Operating Expenditure Funding Sources
Roading and FootpathsRoading and Footpaths
High quality infrastructure to meet community and business needs
Smart, diversified economic success and growth supported and enabled.
Private benefits accrue to individuals, groups and businesses using the roading and footpaths network to carry out their day-to- day business and activities.
Rural landowners, businesses and farms receive specific benefits from a roading network that connects them to the wider district and enables goods and services to be delivered to their properties and farm produce to be sold.
Public benefits include equal access for district residents to transport people, goods and services throughout the district, connections to other transport networks, location and property identification, and maintaining an attractive urban environment and streetscape.
Immediate and ongoing benefits to users.
Intergenerational benefits to the community through maintaining and developing roading and footpath infrastructure.
The community benefits widely from having roading and footpaths infrastructure available. In some cases, additional costs may be caused to Council through vandalism, accidents and activities beyond normal usage.
Benefits from this activity are to private users and district-wide. However, it is impractical to currently charge for private use. For some specific elements (e.g. footpaths), there are specific groups that can be identified for funding
Roading and Footpaths – other:
Public – 100%. Funding components of this activity differs and is outlined below:
Road/street landscapes – uniform annual general charge and a differentiated general rate.
Road carriageways and lighting – differentiated general rate, Uniform Annual General Charge and some NZTA funding assistance.
Community footpaths and lighting – undifferentiated community based works and services rate (based on land value).
Roading and Footpaths –Subsidised Roading:
Public – 40-50% - Funding the Timaru District portion of Roading and Footpaths - subsidised roading is through a differentiated general rate.
Private – 50-60% - Funded through New Zealand Transport Agency (NZTA) funding assistance.
The NZTA is the main central government source for funding assistance. The Financial Assistance Rate for Timaru District Council is reducing to 51%. This will occur in 2019/20, and will apply for all roading works.
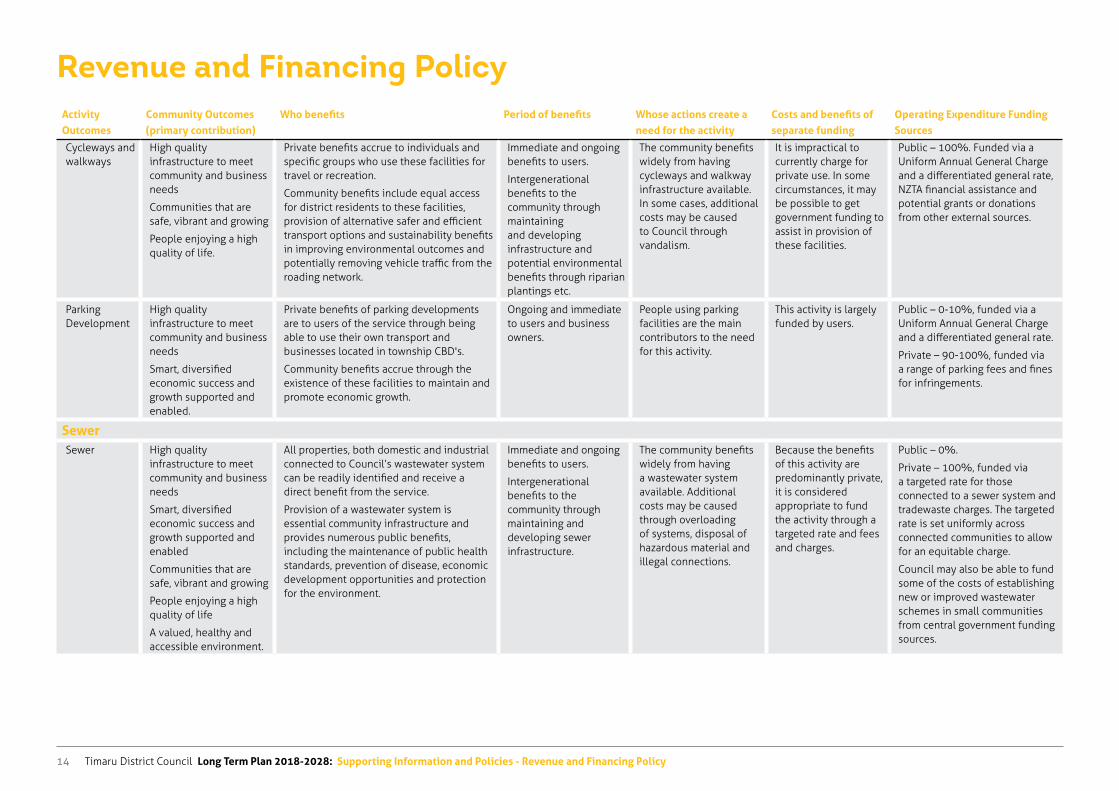
Timaru District Council Long Term Plan 2018-2028: Supporting Information and Policies - Revenue and Financing Policy14
Revenue and Financing PolicyActivity Outcomes
Community Outcomes (primary contribution)
Who benefits Period of benefits Whose actions create a need for the activity
Costs and benefits of separate funding
Operating Expenditure Funding Sources
Cycleways and walkways
High quality infrastructure to meet community and business needs
Communities that are safe, vibrant and growing
People enjoying a high quality of life.
Private benefits accrue to individuals and specific groups who use these facilities for travel or recreation.
Community benefits include equal access for district residents to these facilities, provision of alternative safer and efficient transport options and sustainability benefits in improving environmental outcomes and potentially removing vehicle traffic from the roading network.
Immediate and ongoing benefits to users.
Intergenerational benefits to the community through maintaining and developing infrastructure and potential environmental benefits through riparian plantings etc.
The community benefits widely from having cycleways and walkway infrastructure available. In some cases, additional costs may be caused to Council through vandalism.
It is impractical to currently charge for private use. In some circumstances, it may be possible to get government funding to assist in provision of these facilities.
Public – 100%. Funded via a Uniform Annual General Charge and a differentiated general rate, NZTA financial assistance and potential grants or donations from other external sources.
Parking Development
High quality infrastructure to meet community and business needs
Smart, diversified economic success and growth supported and enabled.
Private benefits of parking developments are to users of the service through being able to use their own transport and businesses located in township CBD's.
Community benefits accrue through the existence of these facilities to maintain and promote economic growth.
Ongoing and immediate to users and business owners.
People using parking facilities are the main contributors to the need for this activity.
This activity is largely funded by users.
Public – 0-10%, funded via a Uniform Annual General Charge and a differentiated general rate.
Private – 90-100%, funded via a range of parking fees and fines for infringements.
SewerSewer High quality
infrastructure to meet community and business needs
Smart, diversified economic success and growth supported and enabled
Communities that are safe, vibrant and growing
People enjoying a high quality of life
A valued, healthy and accessible environment.
All properties, both domestic and industrial connected to Council’s wastewater system can be readily identified and receive a direct benefit from the service.
Provision of a wastewater system is essential community infrastructure and provides numerous public benefits, including the maintenance of public health standards, prevention of disease, economic development opportunities and protection for the environment.
Immediate and ongoing benefits to users.
Intergenerational benefits to the community through maintaining and developing sewer infrastructure.
The community benefits widely from having a wastewater system available. Additional costs may be caused through overloading of systems, disposal of hazardous material and illegal connections.
Because the benefits of this activity are predominantly private, it is considered appropriate to fund the activity through a targeted rate and fees and charges.
Public – 0%.
Private – 100%, funded via a targeted rate for those connected to a sewer system and tradewaste charges. The targeted rate is set uniformly across connected communities to allow for an equitable charge.
Council may also be able to fund some of the costs of establishing new or improved wastewater schemes in small communities from central government funding sources.
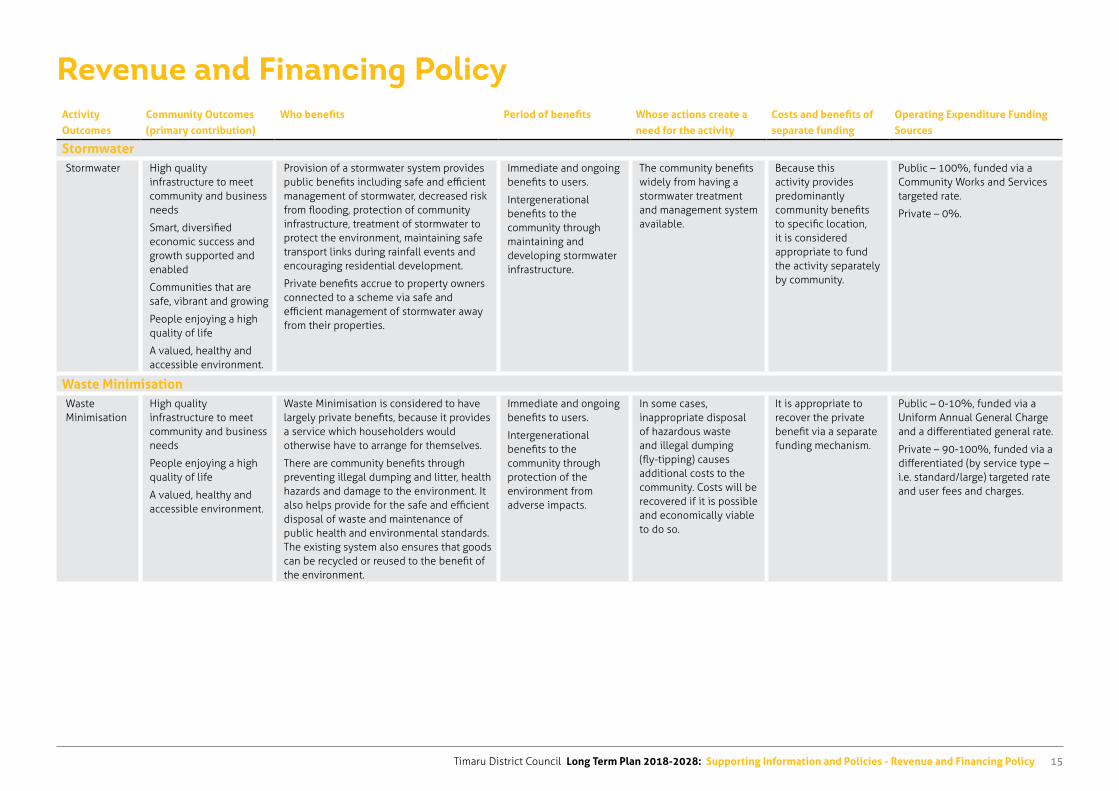
Timaru District Council Long Term Plan 2018-2028: Supporting Information and Policies - Revenue and Financing Policy 15
Revenue and Financing PolicyActivity Outcomes
Community Outcomes (primary contribution)
Who benefits Period of benefits Whose actions create a need for the activity
Costs and benefits of separate funding
Operating Expenditure Funding Sources
StormwaterStormwater High quality
infrastructure to meet community and business needs
Smart, diversified economic success and growth supported and enabled
Communities that are safe, vibrant and growing
People enjoying a high quality of life
A valued, healthy and accessible environment.
Provision of a stormwater system provides public benefits including safe and efficient management of stormwater, decreased risk from flooding, protection of community infrastructure, treatment of stormwater to protect the environment, maintaining safe transport links during rainfall events and encouraging residential development.
Private benefits accrue to property owners connected to a scheme via safe and efficient management of stormwater away from their properties.
Immediate and ongoing benefits to users.
Intergenerational benefits to the community through maintaining and developing stormwater infrastructure.
The community benefits widely from having a stormwater treatment and management system available.
Because this activity provides predominantly community benefits to specific location, it is considered appropriate to fund the activity separately by community.
Public – 100%, funded via a Community Works and Services targeted rate.
Private – 0%.
Waste MinimisationWaste Minimisation
High quality infrastructure to meet community and business needs
People enjoying a high quality of life
A valued, healthy and accessible environment.
Waste Minimisation is considered to have largely private benefits, because it provides a service which householders would otherwise have to arrange for themselves.
There are community benefits through preventing illegal dumping and litter, health hazards and damage to the environment. It also helps provide for the safe and efficient disposal of waste and maintenance of public health and environmental standards. The existing system also ensures that goods can be recycled or reused to the benefit of the environment.
Immediate and ongoing benefits to users.
Intergenerational benefits to the community through protection of the environment from adverse impacts.
In some cases, inappropriate disposal of hazardous waste and illegal dumping (fly-tipping) causes additional costs to the community. Costs will be recovered if it is possible and economically viable to do so.
It is appropriate to recover the private benefit via a separate funding mechanism.
Public – 0-10%, funded via a Uniform Annual General Charge and a differentiated general rate.
Private – 90-100%, funded via a differentiated (by service type – i.e. standard/large) targeted rate and user fees and charges.
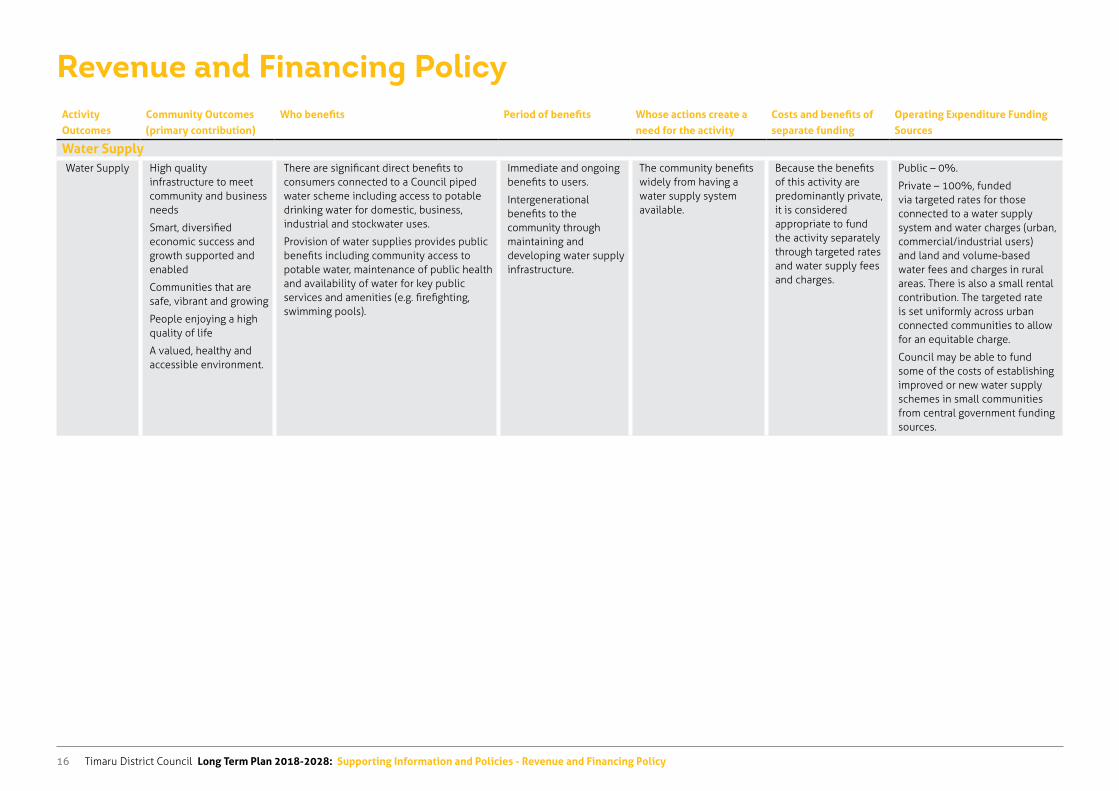
Timaru District Council Long Term Plan 2018-2028: Supporting Information and Policies - Revenue and Financing Policy16
Activity Outcomes
Community Outcomes (primary contribution)
Who benefits Period of benefits Whose actions create a need for the activity
Costs and benefits of separate funding
Operating Expenditure Funding Sources
Water SupplyWater Supply High quality
infrastructure to meet community and business needs
Smart, diversified economic success and growth supported and enabled
Communities that are safe, vibrant and growing
People enjoying a high quality of life
A valued, healthy and accessible environment.
There are significant direct benefits to consumers connected to a Council piped water scheme including access to potable drinking water for domestic, business, industrial and stockwater uses.
Provision of water supplies provides public benefits including community access to potable water, maintenance of public health and availability of water for key public services and amenities (e.g. firefighting, swimming pools).
Immediate and ongoing benefits to users.
Intergenerational benefits to the community through maintaining and developing water supply infrastructure.
The community benefits widely from having a water supply system available.
Because the benefits of this activity are predominantly private, it is considered appropriate to fund the activity separately through targeted rates and water supply fees and charges.
Public – 0%.
Private – 100%, funded via targeted rates for those connected to a water supply system and water charges (urban, commercial/industrial users) and land and volume-based water fees and charges in rural areas. There is also a small rental contribution. The targeted rate is set uniformly across urban connected communities to allow for an equitable charge.
Council may be able to fund some of the costs of establishing improved or new water supply schemes in small communities from central government funding sources.
Revenue and Financing Policy
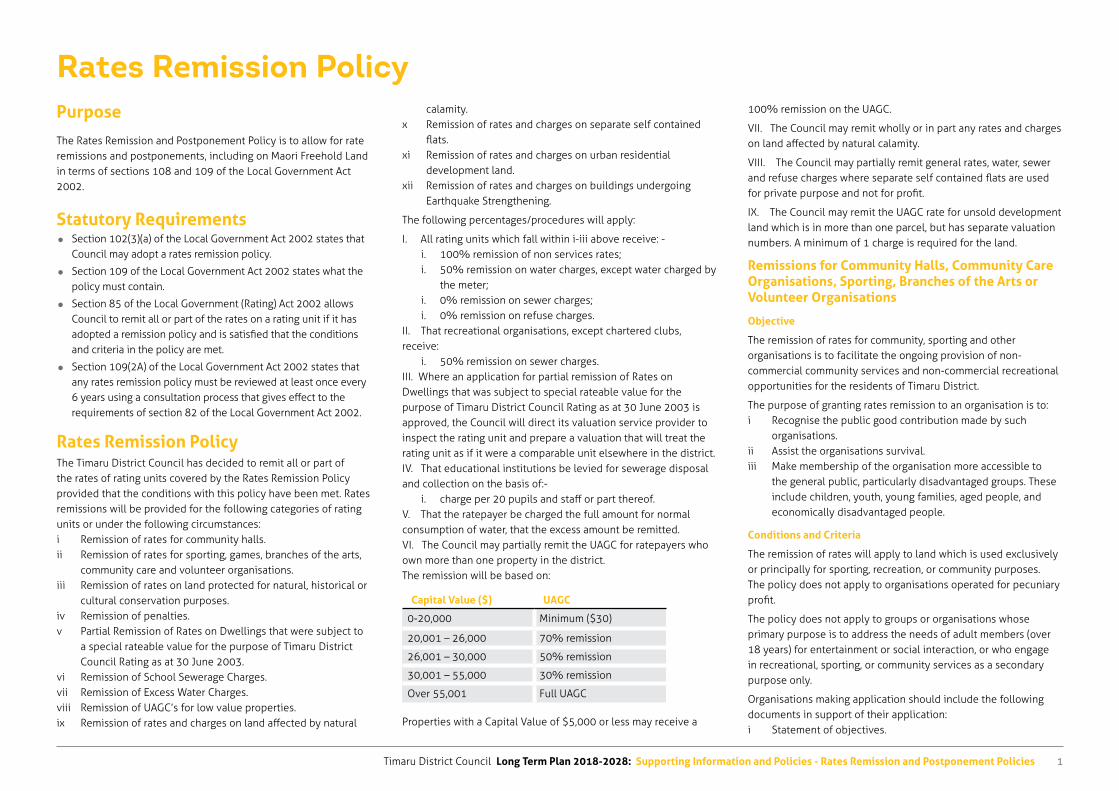
Timaru District Council Long Term Plan 2018-2028: Supporting Information and Policies - Rates Remission and Postponement Policies 1
Rates Remission PolicyPurpose
The Rates Remission and Postponement Policy is to allow for rate remissions and postponements, including on Maori Freehold Land in terms of sections 108 and 109 of the Local Government Act 2002.
Statutory Requirements Section 102(3)(a) of the Local Government Act 2002 states that
Council may adopt a rates remission policy.
Section 109 of the Local Government Act 2002 states what the policy must contain.
Section 85 of the Local Government (Rating) Act 2002 allows Council to remit all or part of the rates on a rating unit if it has adopted a remission policy and is satisfied that the conditions and criteria in the policy are met.
Section 109(2A) of the Local Government Act 2002 states that any rates remission policy must be reviewed at least once every 6 years using a consultation process that gives effect to the requirements of section 82 of the Local Government Act 2002.
Rates Remission PolicyThe Timaru District Council has decided to remit all or part of the rates of rating units covered by the Rates Remission Policy provided that the conditions with this policy have been met. Rates remissions will be provided for the following categories of rating units or under the following circumstances:i Remission of rates for community halls.ii Remission of rates for sporting, games, branches of the arts,
community care and volunteer organisations.iii Remission of rates on land protected for natural, historical or
cultural conservation purposes.iv Remission of penalties.v Partial Remission of Rates on Dwellings that were subject to
a special rateable value for the purpose of Timaru District Council Rating as at 30 June 2003.
vi Remission of School Sewerage Charges.vii Remission of Excess Water Charges.viii Remission of UAGC’s for low value properties.ix Remission of rates and charges on land affected by natural
calamity.x Remission of rates and charges on separate self contained
flats.xi Remission of rates and charges on urban residential
development land.xii Remission of rates and charges on buildings undergoing
Earthquake Strengthening.
The following percentages/procedures will apply:
I. All rating units which fall within i-iii above receive: -i. 100% remission of non services rates;i. 50% remission on water charges, except water charged by
the meter;i. 0% remission on sewer charges;i. 0% remission on refuse charges.
II. That recreational organisations, except chartered clubs, receive:
i. 50% remission on sewer charges.III. Where an application for partial remission of Rates on Dwellings that was subject to special rateable value for the purpose of Timaru District Council Rating as at 30 June 2003 is approved, the Council will direct its valuation service provider to inspect the rating unit and prepare a valuation that will treat the rating unit as if it were a comparable unit elsewhere in the district.IV. That educational institutions be levied for sewerage disposal and collection on the basis of:-
i. charge per 20 pupils and staff or part thereof.V. That the ratepayer be charged the full amount for normal consumption of water, that the excess amount be remitted.VI. The Council may partially remit the UAGC for ratepayers who own more than one property in the district. The remission will be based on:
Capital Value ($) UAGC
0-20,000 Minimum ($30)
20,001 – 26,000 70% remission
26,001 – 30,000 50% remission
30,001 – 55,000 30% remission
Over 55,001 Full UAGC
Properties with a Capital Value of $5,000 or less may receive a
100% remission on the UAGC.
VII. The Council may remit wholly or in part any rates and charges on land affected by natural calamity.
VIII. The Council may partially remit general rates, water, sewer and refuse charges where separate self contained flats are used for private purpose and not for profit.
IX. The Council may remit the UAGC rate for unsold development land which is in more than one parcel, but has separate valuation numbers. A minimum of 1 charge is required for the land.
Remissions for Community Halls, Community Care Organisations, Sporting, Branches of the Arts or Volunteer Organisations
Objective
The remission of rates for community, sporting and other organisations is to facilitate the ongoing provision of non-commercial community services and non-commercial recreational opportunities for the residents of Timaru District.
The purpose of granting rates remission to an organisation is to:i Recognise the public good contribution made by such
organisations.ii Assist the organisations survival.iii Make membership of the organisation more accessible to
the general public, particularly disadvantaged groups. These include children, youth, young families, aged people, and economically disadvantaged people.
Conditions and Criteria
The remission of rates will apply to land which is used exclusively or principally for sporting, recreation, or community purposes. The policy does not apply to organisations operated for pecuniary profit.
The policy does not apply to groups or organisations whose primary purpose is to address the needs of adult members (over 18 years) for entertainment or social interaction, or who engage in recreational, sporting, or community services as a secondary purpose only.
Organisations making application should include the following documents in support of their application:i Statement of objectives.
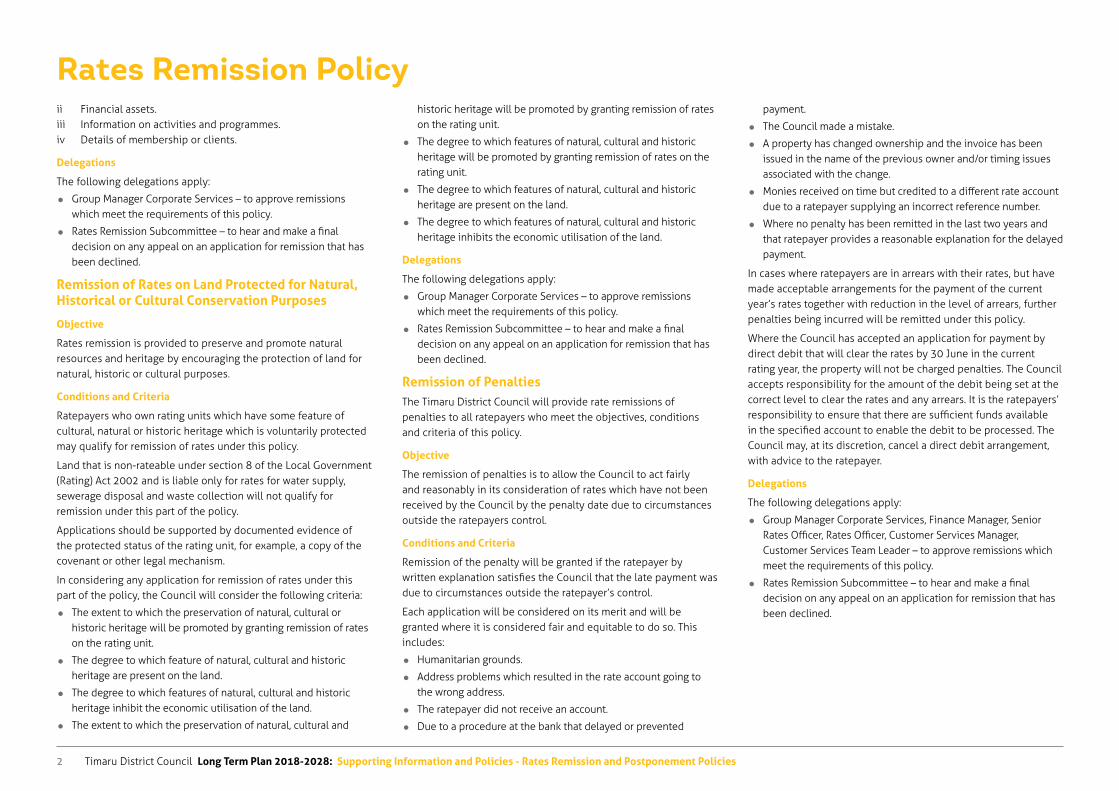
Timaru District Council Long Term Plan 2018-2028: Supporting Information and Policies - Rates Remission and Postponement Policies2
Rates Remission Policyii Financial assets.iii Information on activities and programmes.iv Details of membership or clients.
Delegations
The following delegations apply:
Group Manager Corporate Services – to approve remissions which meet the requirements of this policy.
Rates Remission Subcommittee – to hear and make a final decision on any appeal on an application for remission that has been declined.
Remission of Rates on Land Protected for Natural, Historical or Cultural Conservation Purposes
Objective
Rates remission is provided to preserve and promote natural resources and heritage by encouraging the protection of land for natural, historic or cultural purposes.
Conditions and Criteria
Ratepayers who own rating units which have some feature of cultural, natural or historic heritage which is voluntarily protected may qualify for remission of rates under this policy.
Land that is non-rateable under section 8 of the Local Government (Rating) Act 2002 and is liable only for rates for water supply, sewerage disposal and waste collection will not qualify for remission under this part of the policy.
Applications should be supported by documented evidence of the protected status of the rating unit, for example, a copy of the covenant or other legal mechanism.
In considering any application for remission of rates under this part of the policy, the Council will consider the following criteria:
The extent to which the preservation of natural, cultural or historic heritage will be promoted by granting remission of rates on the rating unit.
The degree to which feature of natural, cultural and historic heritage are present on the land.
The degree to which features of natural, cultural and historic heritage inhibit the economic utilisation of the land.
The extent to which the preservation of natural, cultural and
historic heritage will be promoted by granting remission of rates on the rating unit.
The degree to which features of natural, cultural and historic heritage will be promoted by granting remission of rates on the rating unit.
The degree to which features of natural, cultural and historic heritage are present on the land.
The degree to which features of natural, cultural and historic heritage inhibits the economic utilisation of the land.
Delegations
The following delegations apply:
Group Manager Corporate Services – to approve remissions which meet the requirements of this policy.
Rates Remission Subcommittee – to hear and make a final decision on any appeal on an application for remission that has been declined.
Remission of PenaltiesThe Timaru District Council will provide rate remissions of penalties to all ratepayers who meet the objectives, conditions and criteria of this policy.
Objective
The remission of penalties is to allow the Council to act fairly and reasonably in its consideration of rates which have not been received by the Council by the penalty date due to circumstances outside the ratepayers control.
Conditions and Criteria
Remission of the penalty will be granted if the ratepayer by written explanation satisfies the Council that the late payment was due to circumstances outside the ratepayer’s control.
Each application will be considered on its merit and will be granted where it is considered fair and equitable to do so. This includes:
Humanitarian grounds.
Address problems which resulted in the rate account going to the wrong address.
The ratepayer did not receive an account.
Due to a procedure at the bank that delayed or prevented
payment.
The Council made a mistake.
A property has changed ownership and the invoice has been issued in the name of the previous owner and/or timing issues associated with the change.
Monies received on time but credited to a different rate account due to a ratepayer supplying an incorrect reference number.
Where no penalty has been remitted in the last two years and that ratepayer provides a reasonable explanation for the delayed payment.
In cases where ratepayers are in arrears with their rates, but have made acceptable arrangements for the payment of the current year’s rates together with reduction in the level of arrears, further penalties being incurred will be remitted under this policy.
Where the Council has accepted an application for payment by direct debit that will clear the rates by 30 June in the current rating year, the property will not be charged penalties. The Council accepts responsibility for the amount of the debit being set at the correct level to clear the rates and any arrears. It is the ratepayers’ responsibility to ensure that there are sufficient funds available in the specified account to enable the debit to be processed. The Council may, at its discretion, cancel a direct debit arrangement, with advice to the ratepayer.
Delegations
The following delegations apply:
Group Manager Corporate Services, Finance Manager, Senior Rates Officer, Rates Officer, Customer Services Manager, Customer Services Team Leader – to approve remissions which meet the requirements of this policy.
Rates Remission Subcommittee – to hear and make a final decision on any appeal on an application for remission that has been declined.
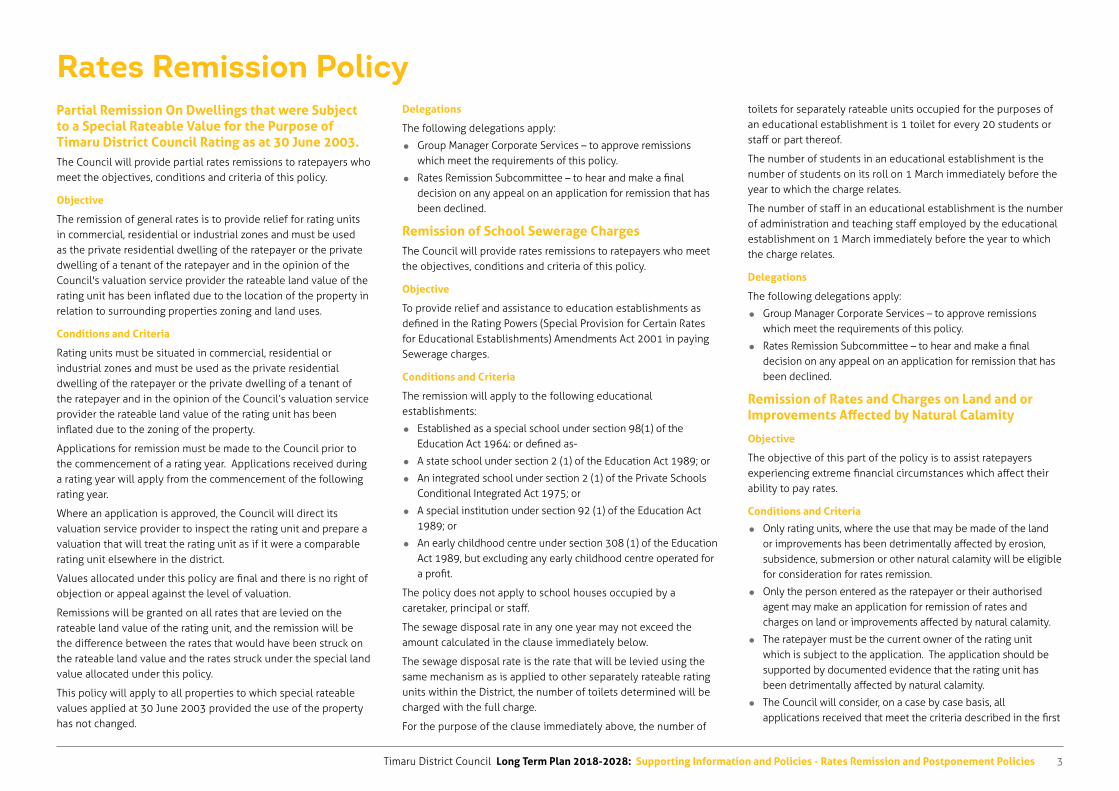
Timaru District Council Long Term Plan 2018-2028: Supporting Information and Policies - Rates Remission and Postponement Policies 3
Rates Remission PolicyPartial Remission On Dwellings that were Subject to a Special Rateable Value for the Purpose of Timaru District Council Rating as at 30 June 2003.The Council will provide partial rates remissions to ratepayers who meet the objectives, conditions and criteria of this policy.
Objective
The remission of general rates is to provide relief for rating units in commercial, residential or industrial zones and must be used as the private residential dwelling of the ratepayer or the private dwelling of a tenant of the ratepayer and in the opinion of the Council's valuation service provider the rateable land value of the rating unit has been inflated due to the location of the property in relation to surrounding properties zoning and land uses.
Conditions and Criteria
Rating units must be situated in commercial, residential or industrial zones and must be used as the private residential dwelling of the ratepayer or the private dwelling of a tenant of the ratepayer and in the opinion of the Council’s valuation service provider the rateable land value of the rating unit has been inflated due to the zoning of the property.
Applications for remission must be made to the Council prior to the commencement of a rating year. Applications received during a rating year will apply from the commencement of the following rating year.
Where an application is approved, the Council will direct its valuation service provider to inspect the rating unit and prepare a valuation that will treat the rating unit as if it were a comparable rating unit elsewhere in the district.
Values allocated under this policy are final and there is no right of objection or appeal against the level of valuation.
Remissions will be granted on all rates that are levied on the rateable land value of the rating unit, and the remission will be the difference between the rates that would have been struck on the rateable land value and the rates struck under the special land value allocated under this policy.
This policy will apply to all properties to which special rateable values applied at 30 June 2003 provided the use of the property has not changed.
Delegations
The following delegations apply:
Group Manager Corporate Services – to approve remissions which meet the requirements of this policy.
Rates Remission Subcommittee – to hear and make a final decision on any appeal on an application for remission that has been declined.
Remission of School Sewerage ChargesThe Council will provide rates remissions to ratepayers who meet the objectives, conditions and criteria of this policy.
Objective
To provide relief and assistance to education establishments as defined in the Rating Powers (Special Provision for Certain Rates for Educational Establishments) Amendments Act 2001 in paying Sewerage charges.
Conditions and Criteria
The remission will apply to the following educational establishments:
Established as a special school under section 98(1) of the Education Act 1964: or defined as-
A state school under section 2 (1) of the Education Act 1989; or
An integrated school under section 2 (1) of the Private Schools Conditional Integrated Act 1975; or
A special institution under section 92 (1) of the Education Act 1989; or
An early childhood centre under section 308 (1) of the Education Act 1989, but excluding any early childhood centre operated for a profit.
The policy does not apply to school houses occupied by a caretaker, principal or staff.
The sewage disposal rate in any one year may not exceed the amount calculated in the clause immediately below.
The sewage disposal rate is the rate that will be levied using the same mechanism as is applied to other separately rateable rating units within the District, the number of toilets determined will be charged with the full charge.
For the purpose of the clause immediately above, the number of
toilets for separately rateable units occupied for the purposes of an educational establishment is 1 toilet for every 20 students or staff or part thereof.
The number of students in an educational establishment is the number of students on its roll on 1 March immediately before the year to which the charge relates.
The number of staff in an educational establishment is the number of administration and teaching staff employed by the educational establishment on 1 March immediately before the year to which the charge relates.
Delegations
The following delegations apply:
Group Manager Corporate Services – to approve remissions which meet the requirements of this policy.
Rates Remission Subcommittee – to hear and make a final decision on any appeal on an application for remission that has been declined.
Remission of Rates and Charges on Land and or Improvements Affected by Natural Calamity
Objective
The objective of this part of the policy is to assist ratepayers experiencing extreme financial circumstances which affect their ability to pay rates.
Conditions and Criteria
Only rating units, where the use that may be made of the land or improvements has been detrimentally affected by erosion, subsidence, submersion or other natural calamity will be eligible for consideration for rates remission.
Only the person entered as the ratepayer or their authorised agent may make an application for remission of rates and charges on land or improvements affected by natural calamity.
The ratepayer must be the current owner of the rating unit which is subject to the application. The application should be supported by documented evidence that the rating unit has been detrimentally affected by natural calamity.
The Council will consider, on a case by case basis, all applications received that meet the criteria described in the first
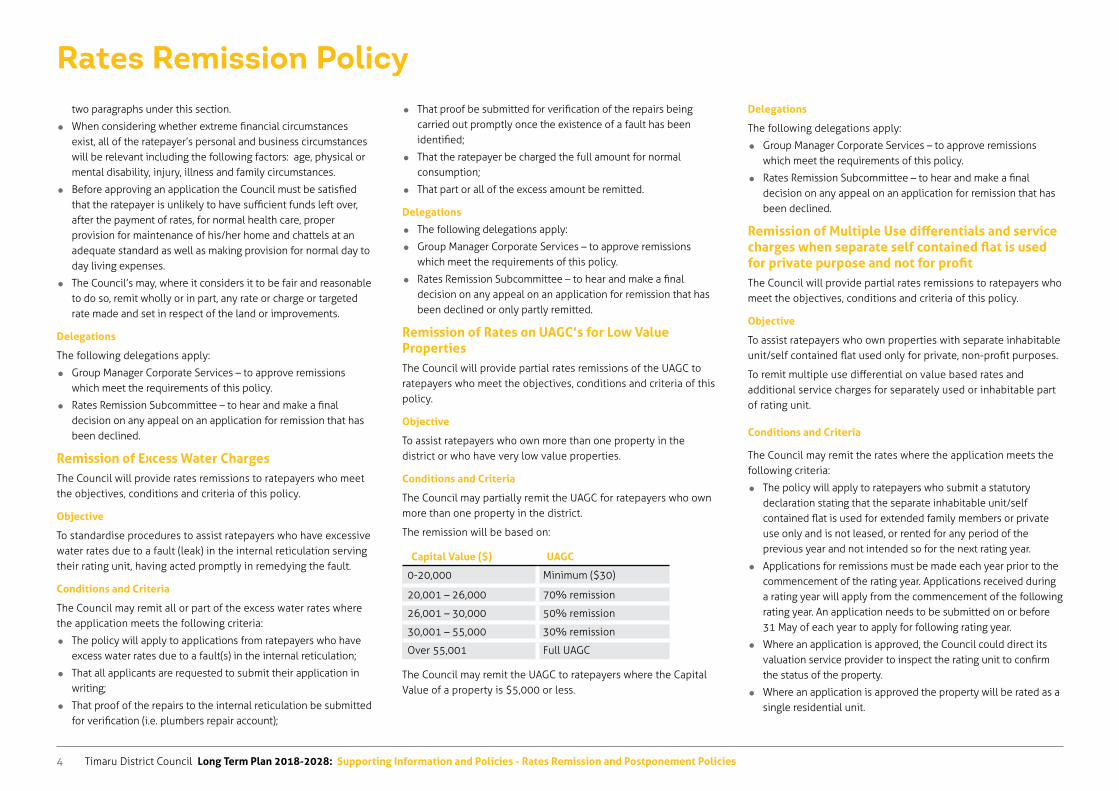
Timaru District Council Long Term Plan 2018-2028: Supporting Information and Policies - Rates Remission and Postponement Policies4
Rates Remission Policytwo paragraphs under this section.
When considering whether extreme financial circumstances exist, all of the ratepayer’s personal and business circumstances will be relevant including the following factors: age, physical or mental disability, injury, illness and family circumstances.
Before approving an application the Council must be satisfied that the ratepayer is unlikely to have sufficient funds left over, after the payment of rates, for normal health care, proper provision for maintenance of his/her home and chattels at an adequate standard as well as making provision for normal day to day living expenses.
The Council’s may, where it considers it to be fair and reasonable to do so, remit wholly or in part, any rate or charge or targeted rate made and set in respect of the land or improvements.
Delegations
The following delegations apply:
Group Manager Corporate Services – to approve remissions which meet the requirements of this policy.
Rates Remission Subcommittee – to hear and make a final decision on any appeal on an application for remission that has been declined.
Remission of Excess Water ChargesThe Council will provide rates remissions to ratepayers who meet the objectives, conditions and criteria of this policy.
Objective
To standardise procedures to assist ratepayers who have excessive water rates due to a fault (leak) in the internal reticulation serving their rating unit, having acted promptly in remedying the fault.
Conditions and Criteria
The Council may remit all or part of the excess water rates where the application meets the following criteria:
The policy will apply to applications from ratepayers who have excess water rates due to a fault(s) in the internal reticulation;
That all applicants are requested to submit their application in writing;
That proof of the repairs to the internal reticulation be submitted for verification (i.e. plumbers repair account);
That proof be submitted for verification of the repairs being carried out promptly once the existence of a fault has been identified;
That the ratepayer be charged the full amount for normal consumption;
That part or all of the excess amount be remitted.
Delegations
The following delegations apply:
Group Manager Corporate Services – to approve remissions which meet the requirements of this policy.
Rates Remission Subcommittee – to hear and make a final decision on any appeal on an application for remission that has been declined or only partly remitted.
Remission of Rates on UAGC’s for Low Value PropertiesThe Council will provide partial rates remissions of the UAGC to ratepayers who meet the objectives, conditions and criteria of this policy.
Objective
To assist ratepayers who own more than one property in the district or who have very low value properties.
Conditions and Criteria
The Council may partially remit the UAGC for ratepayers who own more than one property in the district.
The remission will be based on:
Capital Value ($) UAGC
0-20,000 Minimum ($30)
20,001 – 26,000 70% remission
26,001 – 30,000 50% remission
30,001 – 55,000 30% remission
Over 55,001 Full UAGC
The Council may remit the UAGC to ratepayers where the Capital Value of a property is $5,000 or less.
Delegations
The following delegations apply:
Group Manager Corporate Services – to approve remissions which meet the requirements of this policy.
Rates Remission Subcommittee – to hear and make a final decision on any appeal on an application for remission that has been declined.
Remission of Multiple Use differentials and service charges when separate self contained flat is used for private purpose and not for profitThe Council will provide partial rates remissions to ratepayers who meet the objectives, conditions and criteria of this policy.
Objective
To assist ratepayers who own properties with separate inhabitable unit/self contained flat used only for private, non-profit purposes.
To remit multiple use differential on value based rates and additional service charges for separately used or inhabitable part of rating unit.
Conditions and Criteria
The Council may remit the rates where the application meets the following criteria:
The policy will apply to ratepayers who submit a statutory declaration stating that the separate inhabitable unit/self contained flat is used for extended family members or private use only and is not leased, or rented for any period of the previous year and not intended so for the next rating year.
Applications for remissions must be made each year prior to the commencement of the rating year. Applications received during a rating year will apply from the commencement of the following rating year. An application needs to be submitted on or before 31 May of each year to apply for following rating year.
Where an application is approved, the Council could direct its valuation service provider to inspect the rating unit to confirm the status of the property.
Where an application is approved the property will be rated as a single residential unit.
Timaru District Council Long Term Plan 2018-2028: Supporting Information and Policies - Rates Remission and Postponement Policies 5
Rates Remission PolicyDelegations
The following delegations apply:
Group Manager Corporate Services – to approve remissions which meet the requirements of this policy.
Rates Remission Subcommittee – to hear and make a final decision on any appeal on an application for remission that has been declined.
Remission of Rates for Development LandThe Council will provide partial rates remissions to ratepayers who meet the objectives, conditions and criteria of this policy.
Objective
To assist ratepayers who undertake significant development of land. The objective is to ensure that unsold development land which is in more than one parcel, but has separate valuation assessment numbers, does not pay more than one uniform annual general charge.
Conditions and Criteria
The Council may remit the rates where the application meets the following criteria:
The policy will apply to ratepayers who apply in writing providing details of the multiple lot subdivision.
Applications for remissions must be made each year prior to the commencement of the rating year. Applications received during a rating year will apply from the commencement of the following rating year. An application needs to be submitted on or before 31 May of each year to apply for following rating year.
The remission will only apply to development (defined as one deposited plan) where there are more than 2 allotments.
The ratepayer will receive a 100% remission on the Uniform Annual General Charge on the second and subsequent allotments.
The remission will be for a maximum period of three rating years.
The remission shall cease for any allotment if:
� Any interest in the land is passed by the developer to another party, or
� An application for a building consent is granted, or
� The land is developed in some other way.
Delegations
The following delegations apply:
Group Manager Corporate Services – to approve remissions which meet the requirements of this policy.
Rates Remission Subcommittee – to hear and make a final decision on any appeal on an application for remission that has been declined.
Remission of Rates and Charges on Buildings undergoing Earthquake Strengthening.
Objective
The objective of this part of the policy is to assist ratepayers who are unable to occupy their property while earthquake strengthening is being undertaken.
Conditions and Criteria
Only the person entered as the ratepayer or their authorised agent may make an application for remission of rates and charges on Buildings undergoing Earthquake Strengthening.
Only properties where buildings have been determined by Council to be an Earthquake Prone Building will be eligible for a remission.
The property (rating unit) must not be used for any purpose, apart from the earthquake strengthening work and will not generate any revenue stream.
The Council will consider, on a case by case basis, all applications received that meet the criteria above. A remission of up to 75% of the general rate will be granted.
Applications for remissions must be made each year prior to the commencement of the rating year. Applications received during a rating year will apply from the commencement of the following rating year. An application needs to be submitted on or before 31 May of each year to apply for following rating year.
The remission will only be available for a maximum of 2 rating years.
Delegations
The following delegations apply:
Group Manager Corporate Services – to approve remissions which meet the requirements of this policy.
Rates Remission Subcommittee – to hear and make a final decision on any appeal on an application for remission that has been declined. Rates Postponement Policy
Timaru District Council Long Term Plan 2018-2028: Supporting Information and Policies - Rates Remission and Postponement Policies6
Rates Postponement Policy“ratepayer” must not own any other rating units or investment properties (whether in the district or in another district).
The ratepayer (or authorised agent) must make an application to Council.
The Council will consider, on a case by case basis, all applications received that meet the criteria described in the first two paragraphs under this section. The Council will delegate authority to approve applications for rates postponement to Council officers.
When considering whether extreme financial circumstances exist, all of the ratepayer’s personal circumstances will be relevant including the following factors: age, physical or mental disability, injury, illness and family circumstances.
Before approving an application the Council must be satisfied that the ratepayer is unlikely to have sufficient funds left over, after the payment of rates, for normal health care, proper provision for maintenance of his/her home and chattels at an adequate standard as well as making provision for normal day to day living expenses.
Where the Council decides to postpone rates the ratepayer must first make acceptable arrangements for payment of future rates, for example by setting up a system for regular payments.
Any postponed rates will be postponed until:
The death of the ratepayer(s); or
Until the ratepayer(s) ceases to be the owner or occupier of the rating unit; or
Until the ratepayer ceases to use the property as his/her residence; or
Until a date specified by the Council.
The Council will charge an annual fee on postponed rates for the period between the due date and the date they are paid. This fee is designed to cover the Council’s administrative and financial costs and may vary from year to year. The fee that will be charged in the 2018/19 financial year is $100.00.
Even if rates are postponed, as a general rule the ratepayer will be required to pay the first $1,000.00 of the rate account.
The policy will apply from the beginning of the rating year in which the application is made although the Council may consider
backdating past the rating year in which the application is made depending on the circumstances.
The postponed rates or any part thereof may be paid at any time. The applicant may elect to postpone the payment of a lesser sum than that which they would be entitled to have postponed pursuant to this policy.
Postponed rates will be registered as a statutory land charge on the rating unit title. This means that the Council will have the first call on the proceeds of any revenue from the sale or lease of the rating unit.
Delegations
The following delegations apply:
Group Manager Corporate Services Manager – to approve postponements which meet the requirements of this policy.
PurposeThe Rates Remission and Postponement Policy is to allow for rate remissions and postponements, including on Maori Freehold Land in terms of sections 108 and 109 of the Local Government Act 2002.
Statutory Requirements Section 102(3)(b) of the Local Government Act 2002 states that
the Council may adopt a Rates Postponement Policy.
Section 110 of the Local Government Act 2002 states what the policy must contain.
Section 115 of the Local Government (Rating) Act 2002 allows the Council to postpone all or part of the rates on a rating unit if it has adopted a postponement policy, the ratepayer has applied in writing for a postponement and Council is satisfied that the conditions and criteria in the policy are met.
Section 110(2A) of the Local Government Act 2002 states that any rates postponement policy must be reviewed at least once every 6 years using a consultation process that gives effect to the requirements of section 82 of the Local Government Act 2002.
Rates Postponement PolicyExtreme Financial Circumstances
Objective
The objective of this part of the policy is to assist ratepayers experiencing extreme financial circumstances which affect their ability to pay rates.
Conditions and Criteria
Only rating units used solely for residential purposes will be eligible for consideration for rates postponement for extreme financial circumstances.
Only the person entered as the ratepayer, or their authorised agent, may make an application for rates postponement for extreme financial circumstances. The ratepayer must be the current owner of, and have owned for not less than 5 years, the rating unit which is the subject of the application. The person entered on the Council’s rating information database as the
Timaru District Council Long Term Plan 2018-2028: Supporting Information and Policies - Rates Remission and Postponement Policies 7
Rates Remission and Postponement on Maori Freehold Land PoliciesPurposeThe Rates Remission and Postponement Policy is to allow for rate remissions and postponements, including on Maori Freehold Land in terms of sections 108 and 109 of the Local Government Act 2002.
Statutory Requirements Section 102(2)(e) of the Local Government Act 2002 states that
Council must adopt a policy on the remission and postponement of rates on Maori freehold land.
Section 108 and Schedule 11 of the Local Government Act 2002 states what the policy must contain.
Section 114 of the Local Government (Rating) Act 2002 allows the Council to remit all or part of the rates on a rating unit if it has adopted a remission policy and is satisfied that the conditions and criteria in the policy are met.
Section 115 of the Local Government (Rating) Act 2002 requires the Council to postpone all or part of the rates on a rating unit if it has adopted a postponement policy and is satisfied that the conditions and criteria in the policy are met.
Section 108(4A) of the Local Government Act 2002 states that this policy must be reviewed at least once every 6 years using a consultation process that gives effect to the requirements of section 82 of the Local Government Act 2002.
Remission of Rates on Maori Freehold LandThis policy aims to ensure the fair and equitable collection of rates from all sectors of the community recognising that certain Maori owned lands have particular conditions, features, ownership structures or other circumstances which make if appropriate to provide relief from rates.
ObjectivesThe remission of rates on Maori freehold land is to:i Recognise situations where there is no occupier or person
gaining an economic or financial benefit from the land.ii Set aside land that is better set aside for non-use because of
its natural features (whenua rahui).iii Recognise matters related to the physical accessibility of the
land.iv Recognise and take account of the presence of wāhi tapu that
may affect the use of the land for other purposes.v Grant remission for the portion of land not occupied where
part only of a block is occupied.vi Facilitate the development or use of the land where the
Council considers rates based on actual land value make the actual use of the land uneconomic.
vii Recognise and take account of the importance of land in providing economic and infrastructure support for marae and associated papakainga housing.
viii Recognise and take into account the importance of the land for community goals relating to:
The preservation of the natural character of the coastal environment.
The protection of outstanding natural features.
The protection of significant indigenous vegetation and significant habitat of indigenous fauna.
PrinciplesThe principles used in establishing this policy on the remission of rates on Maori freehold land are that:i As defined in Section 91 of the Local Government (Rating)
Act 2002, Maori freehold land is liable for rates in the same manner as if it were general land.
ii The Council is required to consider whether it should have a policy on rates relief on Maori freehold land.
iii The Council and the community benefit through the efficient collection of rates that are properly payable and the removal of rating debt that is considered non-collectable.
iv Applications for relief meet the criteria set by the Council.v The policy does not provide for the permanent remission or
postponement of rates on the property concerned.
Conditions and CriteriaMaori freehold land is defined in the Local Government (Rating) Act 2002 as land whose beneficial ownership has been determined by a freehold order issued by the Maori Land Court. Only land that is the subject of such an order may qualify for remission under this policy.
The Council will maintain a register titled the Maori Land Rates
Relief Register (the register) for the purpose of recording properties on which it has agreed to remit rates pursuant to this policy. The register will comprise two category lists, these being:i The Maori Land General Remissions List.ii The Maori Land Economic Adjustment Remissions List.
Owners or trustees making application should include the following information in their applications:i Details of the property.ii The objectives that will be achieved by providing a remission.iii Documentation that proves the land, which is the subject of
the application, is Maori freehold land.
The Council may, at its own discretion, add properties to the lists.
Relief, and the extent thereof, is at the sole discretion of the Council and may be cancelled and reduced at any time.
The Council will review the register annually and may:i Add properties that comply.ii Remove properties where there the circumstances have
changed and they no longer comply.
Maori Land General Remissions ListThe Council will consider remission of rates on land that comes within the following criteria:i The land is unoccupied and no income is derived from the
use or occupation of that land, orii The land is better set aside for non-use (whenua rahui)
because of its natural features, or is unoccupied, and no income is derived from the use or occupation of that land.
iii The land is inaccessible and is unoccupied.iv Only a portion of the land is occupied.
Maori Economic Adjustment Remissions ListThe Council will consider remission for land that carries a best potential use value that is significantly in excess of the economic value arising from its actual use.
The remission for land recorded in the Maori Land Economic Adjustment Remissions List will be the difference between the rates as assessed and the rates that would be assessed based on the actual use of the land.
Remissions100% remission of any rates except targeted rates made for water
Timaru District Council Long Term Plan 2018-2028: Supporting Information and Policies - Rates Remission and Postponement Policies8
Rates Remission and Postponement on Maori Freehold Land Policiessupply, sewerage disposal or waste management.
Postponement of Rates on Maori Freehold LandThe Council will provide rates postponement on Maori freehold land to all ratepayers who meet the objectives, conditions and criteria of this policy.
ObjectiveThe postponement on rates on Maori freehold land is to facilitate the development and use of the land for economic use where the Council considers utilisation would be uneconomic if full rates were required during the years of development and establishment.
Conditions and CriteriaMaori freehold land is defined in the Local Government (Rating) Act 2002 as land whose beneficial ownership has been determined by a freehold order issued by the Maori Land Court. Only land that is subject of such an order may qualify for postponement under this policy.
The Council will consider postponement of rates where previously unoccupied land is subject to clearing, development and commercial use where the Council considers utilisation would be uneconomic if full rates were required during the years of development and establishment.
Application should be made prior to commencement of the development. Applications made after the commencement of the development may be accepted at the discretion of the Council.
Owners or trustees making application should include the following information in their applications:i Details of the property.ii The objectives that will be achieved by providing
postponement.iii Details of the proposed development.
The Council may also, at its discretion, partially remit rates that are otherwise subject to postponement.
DelegationsThe following delegations apply:
Group Manager Corporate Services – to approve remissions and postponements which meet the requirements of this policy.
Rates Remission Subcommittee – to hear and make a final decision on any appeal on an application for remission and postponements that has been declined.
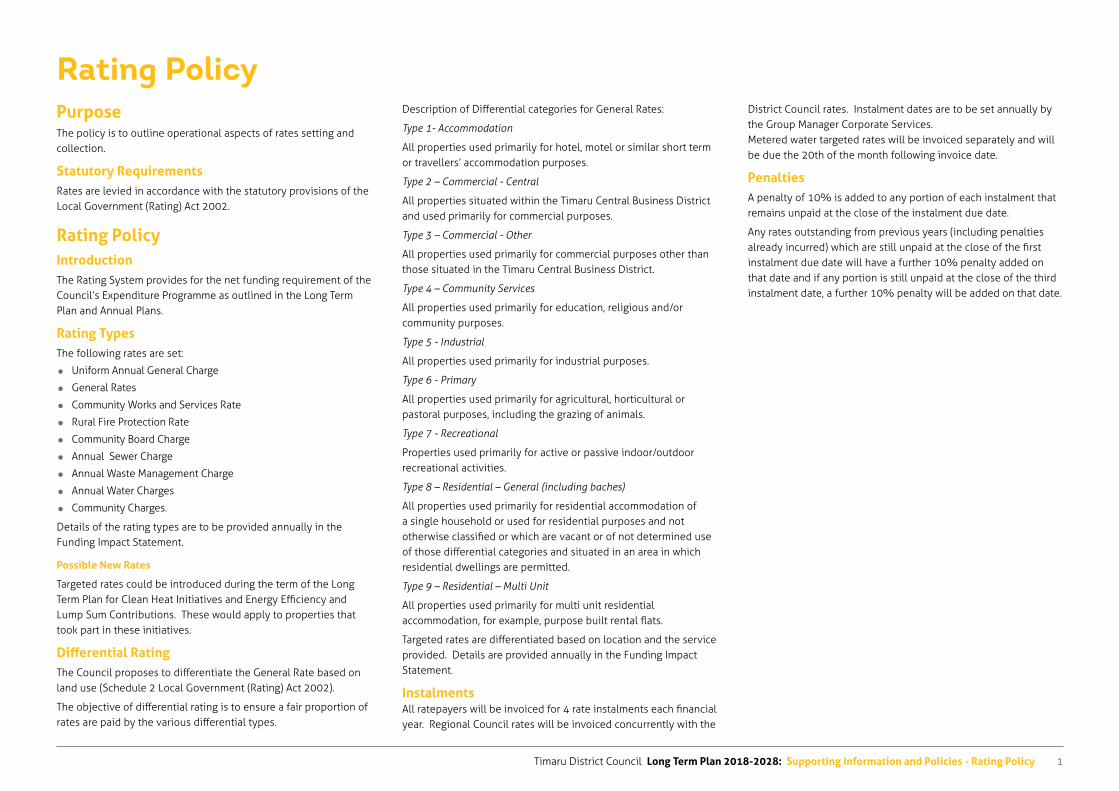
Timaru District Council Long Term Plan 2018-2028: Supporting Information and Policies - Rating Policy 1
Rating PolicyPurpose The policy is to outline operational aspects of rates setting and collection.
Statutory RequirementsRates are levied in accordance with the statutory provisions of the Local Government (Rating) Act 2002.
Rating PolicyIntroductionThe Rating System provides for the net funding requirement of the Council’s Expenditure Programme as outlined in the Long Term Plan and Annual Plans.
Rating TypesThe following rates are set:
Uniform Annual General Charge
General Rates
Community Works and Services Rate
Rural Fire Protection Rate
Community Board Charge
Annual Sewer Charge
Annual Waste Management Charge
Annual Water Charges
Community Charges.
Details of the rating types are to be provided annually in the Funding Impact Statement.
Possible New Rates
Targeted rates could be introduced during the term of the Long Term Plan for Clean Heat Initiatives and Energy Efficiency and Lump Sum Contributions. These would apply to properties that took part in these initiatives.
Differential RatingThe Council proposes to differentiate the General Rate based on land use (Schedule 2 Local Government (Rating) Act 2002).
The objective of differential rating is to ensure a fair proportion of rates are paid by the various differential types.
Description of Differential categories for General Rates:
Type 1- Accommodation
All properties used primarily for hotel, motel or similar short term or travellers’ accommodation purposes.
Type 2 – Commercial - Central
All properties situated within the Timaru Central Business District and used primarily for commercial purposes.
Type 3 – Commercial - Other
All properties used primarily for commercial purposes other than those situated in the Timaru Central Business District.
Type 4 – Community Services
All properties used primarily for education, religious and/or community purposes.
Type 5 - Industrial
All properties used primarily for industrial purposes.
Type 6 - Primary
All properties used primarily for agricultural, horticultural or pastoral purposes, including the grazing of animals.
Type 7 - Recreational
Properties used primarily for active or passive indoor/outdoor recreational activities.
Type 8 – Residential – General (including baches)
All properties used primarily for residential accommodation of a single household or used for residential purposes and not otherwise classified or which are vacant or of not determined use of those differential categories and situated in an area in which residential dwellings are permitted.
Type 9 – Residential – Multi Unit
All properties used primarily for multi unit residential accommodation, for example, purpose built rental flats.
Targeted rates are differentiated based on location and the service provided. Details are provided annually in the Funding Impact Statement.
InstalmentsAll ratepayers will be invoiced for 4 rate instalments each financial year. Regional Council rates will be invoiced concurrently with the
District Council rates. Instalment dates are to be set annually by the Group Manager Corporate Services.Metered water targeted rates will be invoiced separately and will be due the 20th of the month following invoice date.
PenaltiesA penalty of 10% is added to any portion of each instalment that remains unpaid at the close of the instalment due date.
Any rates outstanding from previous years (including penalties already incurred) which are still unpaid at the close of the first instalment due date will have a further 10% penalty added on that date and if any portion is still unpaid at the close of the third instalment date, a further 10% penalty will be added on that date.
Timaru District Council Long Term Plan 2018-2028: Supporting Information and Policies - Rates Discount Policy 1
Rates Discount policyPurposeTo specify the policy for early payment of rates in the current financial year in terms of section 55 of the Local Government (Rating) Act 2002.
Background Rates are set on properties in accordance with the statutory provisions of the Local Government (Rating) Act 2002. A local authority may adopt a policy for the payment of some or all rates that are identified in the rates assessment before the due date or dates for those rates in the current financial year.
This policy has been in place since 2002, with similar policies operating under previous legislation prior to this date.
This policy must be adopted using the special consultative procedure and may be included in the long-term plan.
Key DefinitionsFinancial year – a period of 12 months beginning on 1 July.
PolicyA discount of 2.5% will be allowed on the total rates set for the financial year, if the rates for a financial year, including any current penalties, are paid in full on or before the due date of the first instalment for that financial year.
TIMARU DISTRICT COUNCIL
FEES AND CHARGES
FOR PERIOD 1 JULY 2018 TO 30 JUNE 2019
# 1105953 PROPOSED 2018/19 Fees & Charges
TABLE OF CONTENTS AIRPORT ....................................................................................................................................................................................................... 1 ANIMAL CONTROL - DOG REGISTRATION ................................................................................................................................................ 2 ANIMAL CONTROL - DOG IMPOUNDING FEES ......................................................................................................................................... 3 ANIMAL CONTROL - IMPOUNDING FEES (OTHER THAN DOGS) ............................................................................................................. 4 ART GALLERY .............................................................................................................................................................................................. 5 ASSIGNMENT OF OTHER LEASES ............................................................................................................................................................. 6 BUILDING CONTROL SERVICES ................................................................................................................................................................. 7 CEMETERIES .............................................................................................................................................................................................. 10 COUNCIL AND STANDING COMMITTEE AGENDAS ................................................................................................................................ 11 INFRASTRUCTURE GROUP ADMINISTRATION FEES ............................................................................................................................. 12 FACILITY HIRE - ALPINE ENERGY COMMUNITY CENTRE - TEMUKA ................................................................................................... 13 FACILITY HIRE – CAROLINE BAY ENTERTAINMENT CENTRE .............................................................................................................. 15 FACILITY HIRE – CAROLINE BAY LOUNGE ............................................................................................................................................. 16 FACILITY HIRE - CAROLINE BAY HALL ................................................................................................................................................... 17 FACILITY HIRE - CAROLINE BAY SOUNDSHELL .................................................................................................................................... 19 FACILITY HIRE - PLEASANT POINT TOWN HALL ................................................................................................................................... 21 FACILITY HIRE - PLEASANT POINT GYMNASIUM ................................................................................................................................... 22 FACILITY HIRE – THE SOUTHERN TRUST EVENTS CENTRE ................................................................................................................ 23 FACILITY HIRE - THEATRE ROYAL TIMARU ............................................................................................................................................ 25 FACILITY HIRE – WASHDYKE COMMUNITY & SPORTS CENTRE .......................................................................................................... 27 FACILITY HIRE - WEST END HALL ........................................................................................................................................................... 28 FISHING HUTS ............................................................................................................................................................................................ 29 LAND INFORMATION MEMORANDUM...................................................................................................................................................... 30 LAND TRANSPORT .................................................................................................................................................................................... 31 LATTER STREET CAR PARK .................................................................................................................................................................... 33 LIBRARY ..................................................................................................................................................................................................... 34 LICENCE FEES ........................................................................................................................................................................................... 35 MUSEUM ..................................................................................................................................................................................................... 41 MOTOR CAMPS .......................................................................................................................................................................................... 43 PARKING..................................................................................................................................................................................................... 44 PLANNING .................................................................................................................................................................................................. 45 RECORDS AND INFORMATION SERVICES CHARGES ........................................................................................................................... 49 SEWER ........................................................................................................................................................................................................ 50 SOCIAL HOUSING ...................................................................................................................................................................................... 51 SPORTS GROUNDS ................................................................................................................................................................................... 53 STORMWATER ........................................................................................................................................................................................... 54 SWIMMING POOLS: GERALDINE, PLEASANT POINT AND TEMUKA ................................................................................................... 55 SWIMMING POOLS: CAROLINE BAY TRUST AORAKI CENTRE (CBAY) .............................................................................................. 56 WATER ........................................................................................................................................................................................................ 58 WASTE MINIMISATION .............................................................................................................................................................................. 59
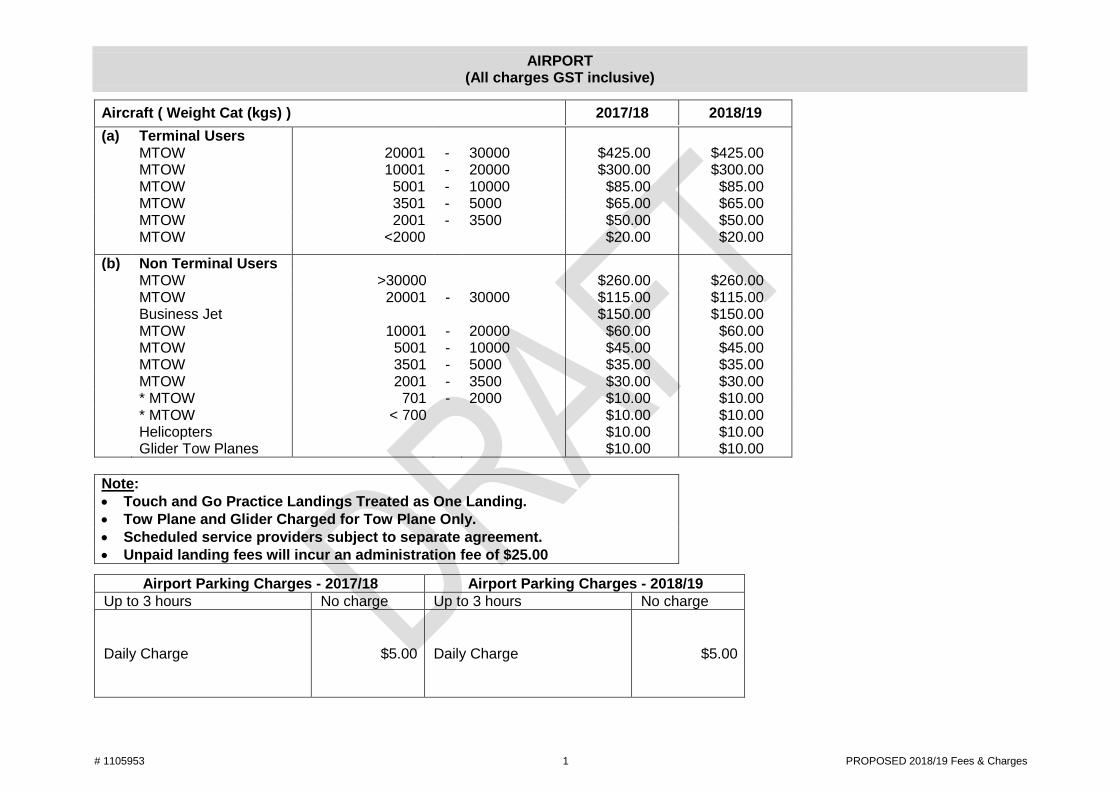
# 1105953 1 PROPOSED 2018/19 Fees & Charges
AIRPORT (All charges GST inclusive)
Aircraft ( Weight Cat (kgs) ) 2017/18 2018/19
(a) Terminal Users MTOW 20001 - 30000 $425.00 $425.00 MTOW 10001 - 20000 $300.00 $300.00 MTOW 5001 - 10000 $85.00 $85.00 MTOW 3501 - 5000 $65.00 $65.00 MTOW 2001 - 3500 $50.00 $50.00 MTOW <2000 $20.00 $20.00
(b) Non Terminal Users MTOW >30000 $260.00 $260.00 MTOW 20001 - 30000 $115.00 $115.00 Business Jet $150.00 $150.00 MTOW 10001 - 20000 $60.00 $60.00 MTOW 5001 - 10000 $45.00 $45.00 MTOW 3501 - 5000 $35.00 $35.00 MTOW 2001 - 3500 $30.00 $30.00 * MTOW 701 - 2000 $10.00 $10.00 * MTOW < 700 $10.00 $10.00 Helicopters $10.00 $10.00 Glider Tow Planes $10.00 $10.00
Note: • Touch and Go Practice Landings Treated as One Landing. • Tow Plane and Glider Charged for Tow Plane Only. • Scheduled service providers subject to separate agreement. • Unpaid landing fees will incur an administration fee of $25.00
Airport Parking Charges - 2017/18 Airport Parking Charges - 2018/19 Up to 3 hours No charge Up to 3 hours No charge
Daily Charge $5.00 Daily Charge $5.00
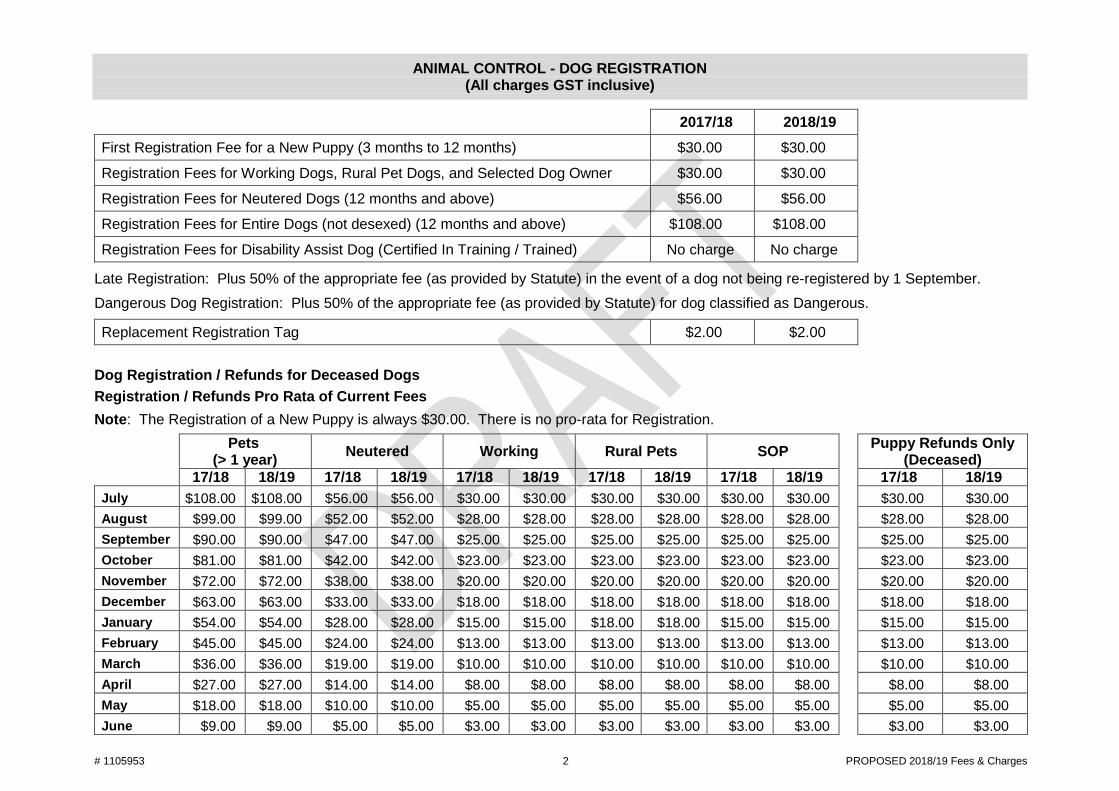
# 1105953 2 PROPOSED 2018/19 Fees & Charges
ANIMAL CONTROL - DOG REGISTRATION (All charges GST inclusive)
2017/18 2018/19 First Registration Fee for a New Puppy (3 months to 12 months) $30.00 $30.00
Registration Fees for Working Dogs, Rural Pet Dogs, and Selected Dog Owner $30.00 $30.00
Registration Fees for Neutered Dogs (12 months and above) $56.00 $56.00
Registration Fees for Entire Dogs (not desexed) (12 months and above) $108.00 $108.00
Registration Fees for Disability Assist Dog (Certified In Training / Trained) No charge No charge
Late Registration: Plus 50% of the appropriate fee (as provided by Statute) in the event of a dog not being re-registered by 1 September.
Dangerous Dog Registration: Plus 50% of the appropriate fee (as provided by Statute) for dog classified as Dangerous.
Replacement Registration Tag $2.00 $2.00
Dog Registration / Refunds for Deceased Dogs
Registration / Refunds Pro Rata of Current Fees
Note: The Registration of a New Puppy is always $30.00. There is no pro-rata for Registration.
Pets (> 1 year) Neutered Working Rural Pets SOP Puppy Refunds Only
(Deceased) 17/18 18/19 17/18 18/19 17/18 18/19 17/18 18/19 17/18 18/19 17/18 18/19
July $108.00 $108.00 $56.00 $56.00 $30.00 $30.00 $30.00 $30.00 $30.00 $30.00 $30.00 $30.00 August $99.00 $99.00 $52.00 $52.00 $28.00 $28.00 $28.00 $28.00 $28.00 $28.00 $28.00 $28.00 September $90.00 $90.00 $47.00 $47.00 $25.00 $25.00 $25.00 $25.00 $25.00 $25.00 $25.00 $25.00 October $81.00 $81.00 $42.00 $42.00 $23.00 $23.00 $23.00 $23.00 $23.00 $23.00 $23.00 $23.00 November $72.00 $72.00 $38.00 $38.00 $20.00 $20.00 $20.00 $20.00 $20.00 $20.00 $20.00 $20.00 December $63.00 $63.00 $33.00 $33.00 $18.00 $18.00 $18.00 $18.00 $18.00 $18.00 $18.00 $18.00 January $54.00 $54.00 $28.00 $28.00 $15.00 $15.00 $18.00 $18.00 $15.00 $15.00 $15.00 $15.00 February $45.00 $45.00 $24.00 $24.00 $13.00 $13.00 $13.00 $13.00 $13.00 $13.00 $13.00 $13.00 March $36.00 $36.00 $19.00 $19.00 $10.00 $10.00 $10.00 $10.00 $10.00 $10.00 $10.00 $10.00 April $27.00 $27.00 $14.00 $14.00 $8.00 $8.00 $8.00 $8.00 $8.00 $8.00 $8.00 $8.00 May $18.00 $18.00 $10.00 $10.00 $5.00 $5.00 $5.00 $5.00 $5.00 $5.00 $5.00 $5.00 June $9.00 $9.00 $5.00 $5.00 $3.00 $3.00 $3.00 $3.00 $3.00 $3.00 $3.00 $3.00
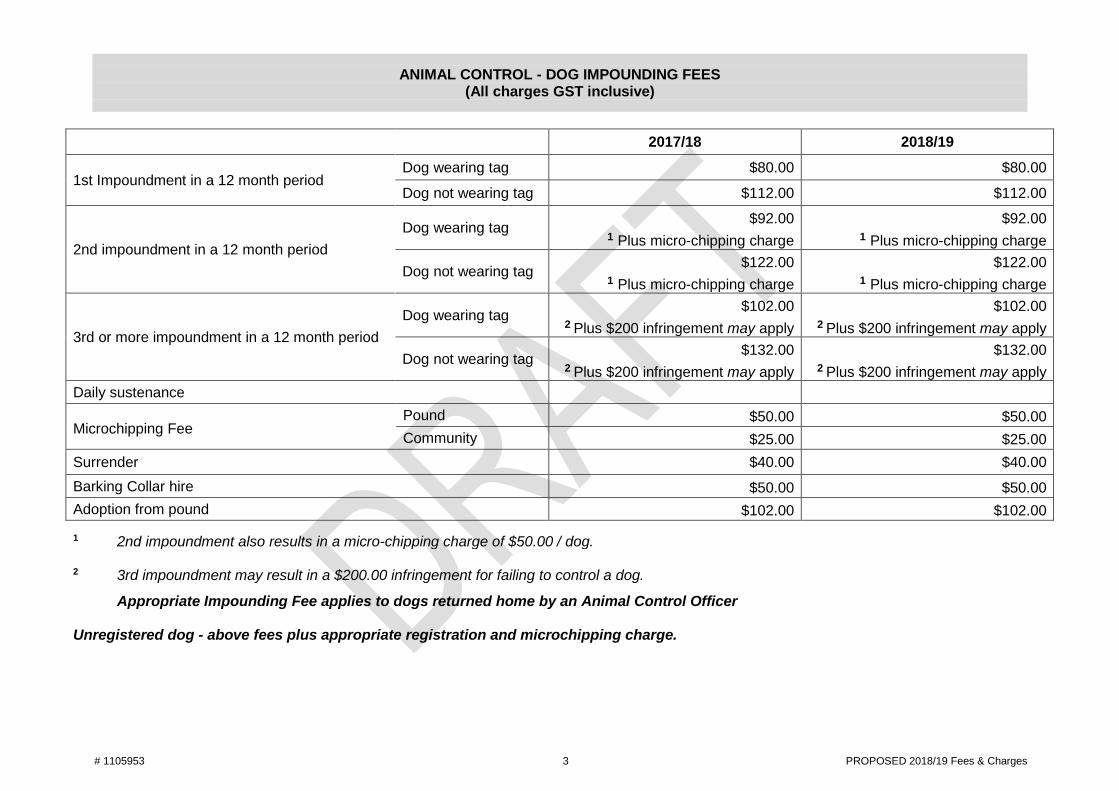
# 1105953 3 PROPOSED 2018/19 Fees & Charges
ANIMAL CONTROL - DOG IMPOUNDING FEES (All charges GST inclusive)
2017/18 2018/19
1st Impoundment in a 12 month period Dog wearing tag $80.00 $80.00
Dog not wearing tag $112.00 $112.00
2nd impoundment in a 12 month period Dog wearing tag $92.00
1 Plus micro-chipping charge $92.00
1 Plus micro-chipping charge
Dog not wearing tag $122.00 1 Plus micro-chipping charge
$122.00 1 Plus micro-chipping charge
3rd or more impoundment in a 12 month period Dog wearing tag $102.00
2 Plus $200 infringement may apply $102.00
2 Plus $200 infringement may apply
Dog not wearing tag $132.00 2 Plus $200 infringement may apply
$132.00 2 Plus $200 infringement may apply
Daily sustenance
Microchipping Fee Pound $50.00 $50.00 Community $25.00 $25.00
Surrender $40.00 $40.00 Barking Collar hire $50.00 $50.00 Adoption from pound $102.00 $102.00
1 2nd impoundment also results in a micro-chipping charge of $50.00 / dog. 2 3rd impoundment may result in a $200.00 infringement for failing to control a dog.
Appropriate Impounding Fee applies to dogs returned home by an Animal Control Officer Unregistered dog - above fees plus appropriate registration and microchipping charge.
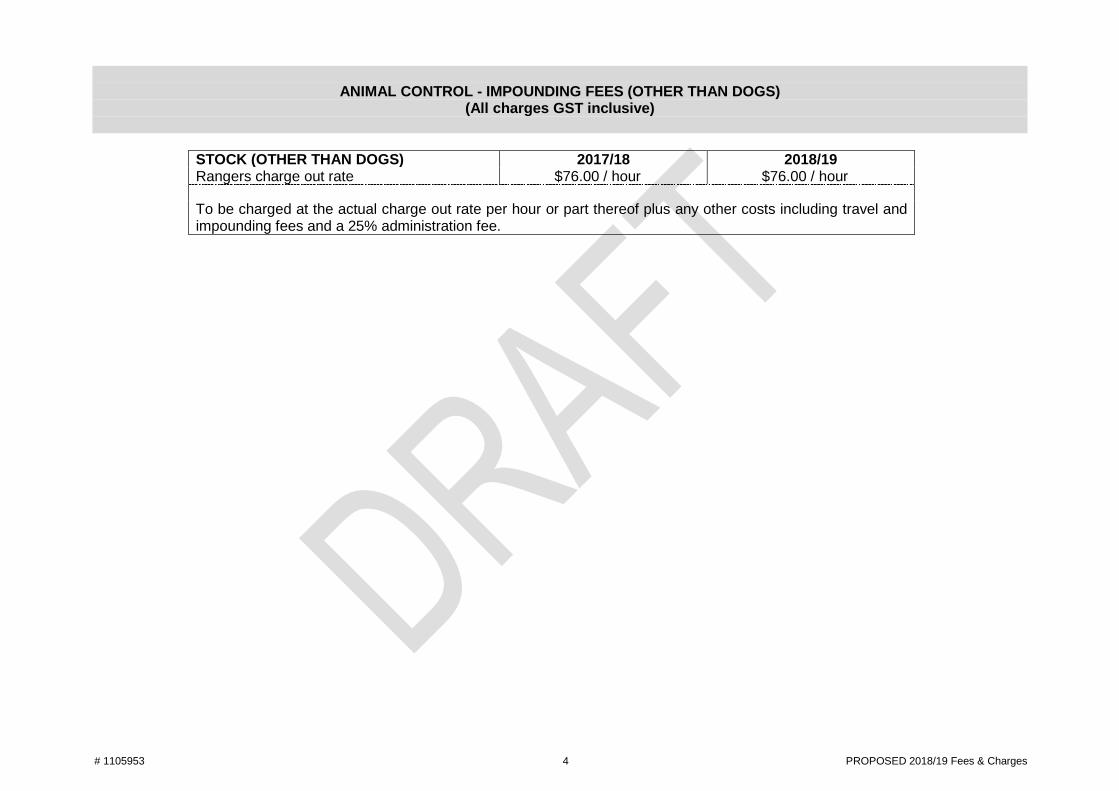
# 1105953 4 PROPOSED 2018/19 Fees & Charges
ANIMAL CONTROL - IMPOUNDING FEES (OTHER THAN DOGS) (All charges GST inclusive)
STOCK (OTHER THAN DOGS) 2017/18 2018/19 Rangers charge out rate $76.00 / hour $76.00 / hour
To be charged at the actual charge out rate per hour or part thereof plus any other costs including travel and impounding fees and a 25% administration fee.
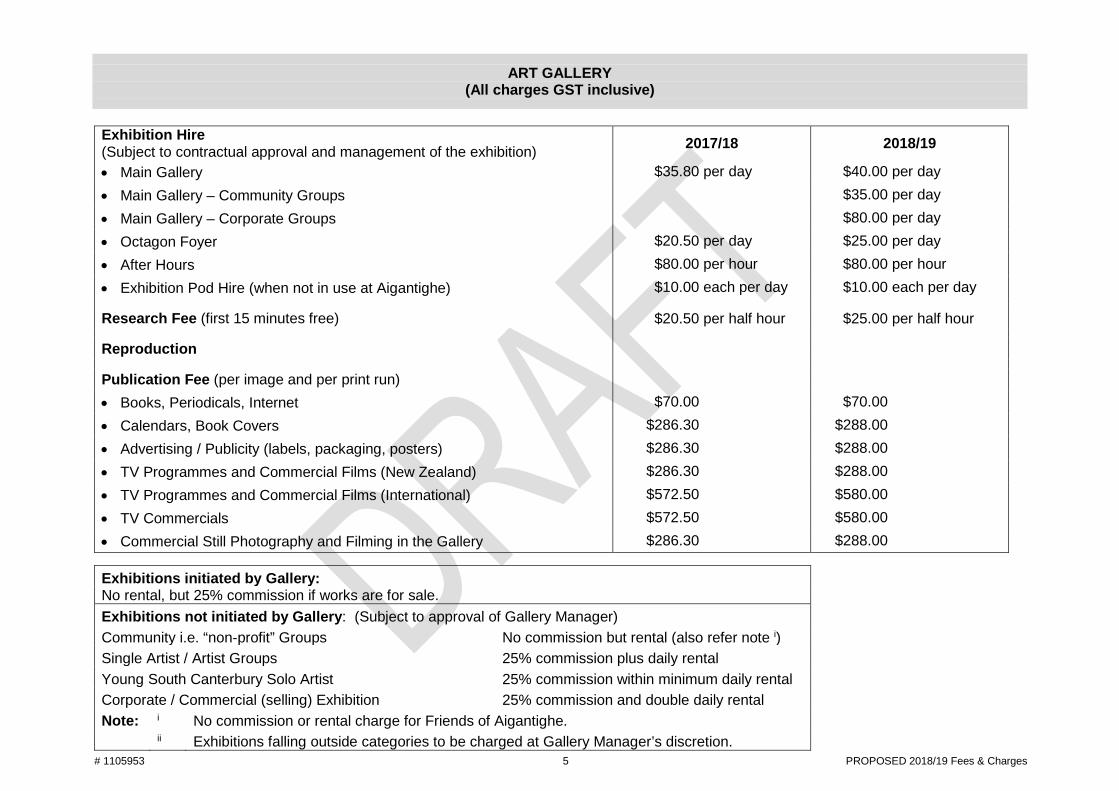
# 1105953 5 PROPOSED 2018/19 Fees & Charges
ART GALLERY (All charges GST inclusive)
Exhibition Hire (Subject to contractual approval and management of the exhibition) 2017/18 2018/19
• Main Gallery $35.80 per day $40.00 per day • Main Gallery – Community Groups $35.00 per day • Main Gallery – Corporate Groups $80.00 per day • Octagon Foyer $20.50 per day $25.00 per day • After Hours $80.00 per hour $80.00 per hour • Exhibition Pod Hire (when not in use at Aigantighe) $10.00 each per day $10.00 each per day
Research Fee (first 15 minutes free) $20.50 per half hour $25.00 per half hour
Reproduction
Publication Fee (per image and per print run) • Books, Periodicals, Internet $70.00 $70.00 • Calendars, Book Covers $286.30 $288.00 • Advertising / Publicity (labels, packaging, posters) $286.30 $288.00 • TV Programmes and Commercial Films (New Zealand) $286.30 $288.00 • TV Programmes and Commercial Films (International) $572.50 $580.00 • TV Commercials $572.50 $580.00 • Commercial Still Photography and Filming in the Gallery $286.30 $288.00
Exhibitions initiated by Gallery: No rental, but 25% commission if works are for sale. Exhibitions not initiated by Gallery: (Subject to approval of Gallery Manager) Community i.e. “non-profit” Groups No commission but rental (also refer note i) Single Artist / Artist Groups 25% commission plus daily rental Young South Canterbury Solo Artist 25% commission within minimum daily rental Corporate / Commercial (selling) Exhibition 25% commission and double daily rental Note: i No commission or rental charge for Friends of Aigantighe. ii Exhibitions falling outside categories to be charged at Gallery Manager’s discretion.
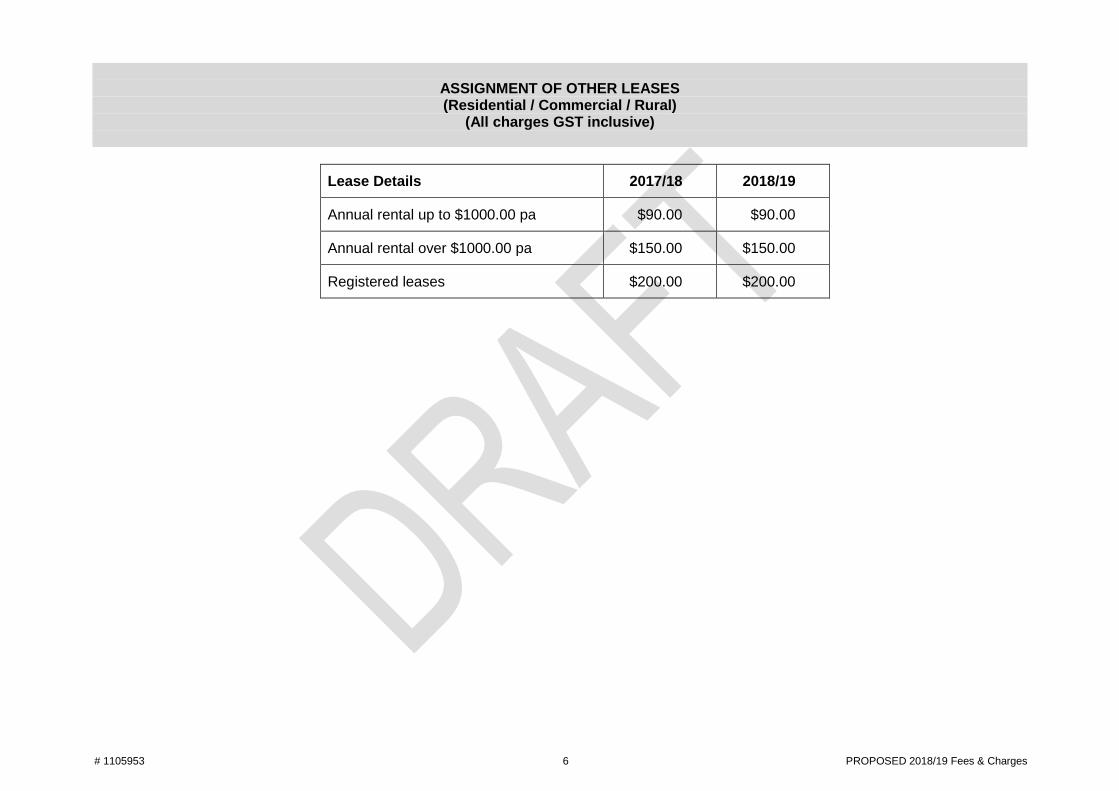
# 1105953 6 PROPOSED 2018/19 Fees & Charges
ASSIGNMENT OF OTHER LEASES (Residential / Commercial / Rural)
(All charges GST inclusive)
Lease Details 2017/18 2018/19
Annual rental up to $1000.00 pa $90.00 $90.00
Annual rental over $1000.00 pa $150.00 $150.00
Registered leases $200.00 $200.00
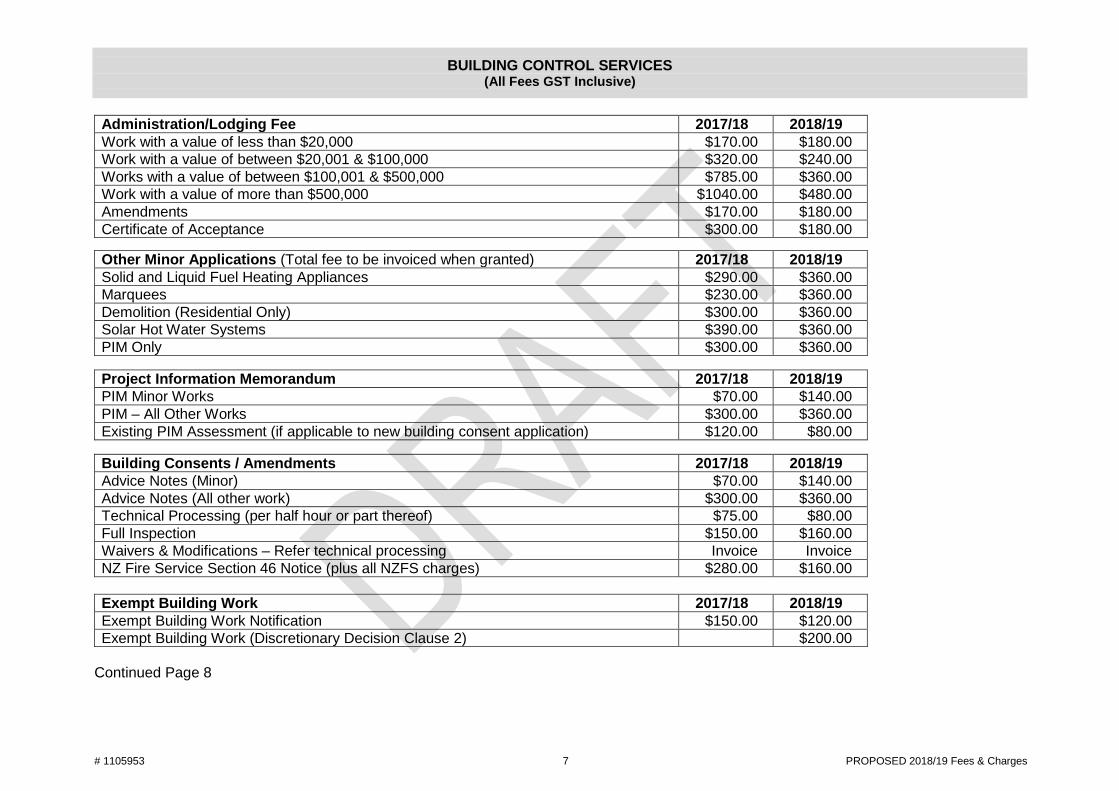
# 1105953 7 PROPOSED 2018/19 Fees & Charges
BUILDING CONTROL SERVICES (All Fees GST Inclusive)
Administration/Lodging Fee 2017/18 2018/19 Work with a value of less than $20,000 $170.00 $180.00 Work with a value of between $20,001 & $100,000 $320.00 $240.00 Works with a value of between $100,001 & $500,000 $785.00 $360.00 Work with a value of more than $500,000 $1040.00 $480.00 Amendments $170.00 $180.00 Certificate of Acceptance $300.00 $180.00
Other Minor Applications (Total fee to be invoiced when granted) 2017/18 2018/19 Solid and Liquid Fuel Heating Appliances $290.00 $360.00 Marquees $230.00 $360.00 Demolition (Residential Only) $300.00 $360.00 Solar Hot Water Systems $390.00 $360.00 PIM Only $300.00 $360.00
Project Information Memorandum 2017/18 2018/19 PIM Minor Works $70.00 $140.00 PIM – All Other Works $300.00 $360.00 Existing PIM Assessment (if applicable to new building consent application) $120.00 $80.00
Building Consents / Amendments 2017/18 2018/19 Advice Notes (Minor) $70.00 $140.00 Advice Notes (All other work) $300.00 $360.00 Technical Processing (per half hour or part thereof) $75.00 $80.00 Full Inspection $150.00 $160.00 Waivers & Modifications – Refer technical processing Invoice Invoice NZ Fire Service Section 46 Notice (plus all NZFS charges) $280.00 $160.00
Exempt Building Work 2017/18 2018/19 Exempt Building Work Notification $150.00 $120.00 Exempt Building Work (Discretionary Decision Clause 2) $200.00
Continued Page 8
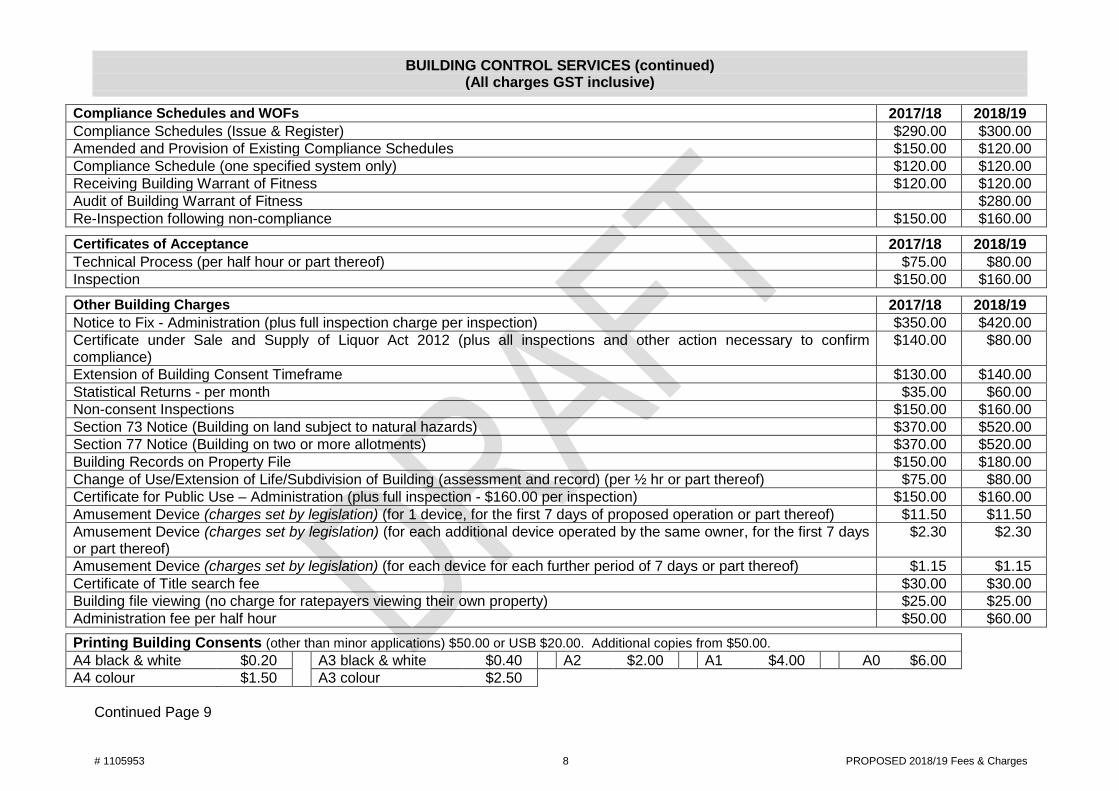
# 1105953 8 PROPOSED 2018/19 Fees & Charges
BUILDING CONTROL SERVICES (continued) (All charges GST inclusive)
Compliance Schedules and WOFs 2017/18 2018/19 Compliance Schedules (Issue & Register) $290.00 $300.00 Amended and Provision of Existing Compliance Schedules $150.00 $120.00 Compliance Schedule (one specified system only) $120.00 $120.00 Receiving Building Warrant of Fitness $120.00 $120.00 Audit of Building Warrant of Fitness $280.00 Re-Inspection following non-compliance $150.00 $160.00
Certificates of Acceptance 2017/18 2018/19 Technical Process (per half hour or part thereof) $75.00 $80.00 Inspection $150.00 $160.00
Other Building Charges 2017/18 2018/19 Notice to Fix - Administration (plus full inspection charge per inspection) $350.00 $420.00 Certificate under Sale and Supply of Liquor Act 2012 (plus all inspections and other action necessary to confirm compliance)
$140.00 $80.00
Extension of Building Consent Timeframe $130.00 $140.00 Statistical Returns - per month $35.00 $60.00 Non-consent Inspections $150.00 $160.00 Section 73 Notice (Building on land subject to natural hazards) $370.00 $520.00 Section 77 Notice (Building on two or more allotments) $370.00 $520.00 Building Records on Property File $150.00 $180.00 Change of Use/Extension of Life/Subdivision of Building (assessment and record) (per ½ hr or part thereof) $75.00 $80.00 Certificate for Public Use – Administration (plus full inspection - $160.00 per inspection) $150.00 $160.00 Amusement Device (charges set by legislation) (for 1 device, for the first 7 days of proposed operation or part thereof) $11.50 $11.50 Amusement Device (charges set by legislation) (for each additional device operated by the same owner, for the first 7 days or part thereof)
$2.30 $2.30
Amusement Device (charges set by legislation) (for each device for each further period of 7 days or part thereof) $1.15 $1.15 Certificate of Title search fee $30.00 $30.00 Building file viewing (no charge for ratepayers viewing their own property) $25.00 $25.00 Administration fee per half hour $50.00 $60.00
Printing Building Consents (other than minor applications) $50.00 or USB $20.00. Additional copies from $50.00. A4 black & white $0.20 A3 black & white $0.40 A2 $2.00 A1 $4.00 A0 $6.00 A4 colour $1.50 A3 colour $2.50
Continued Page 9
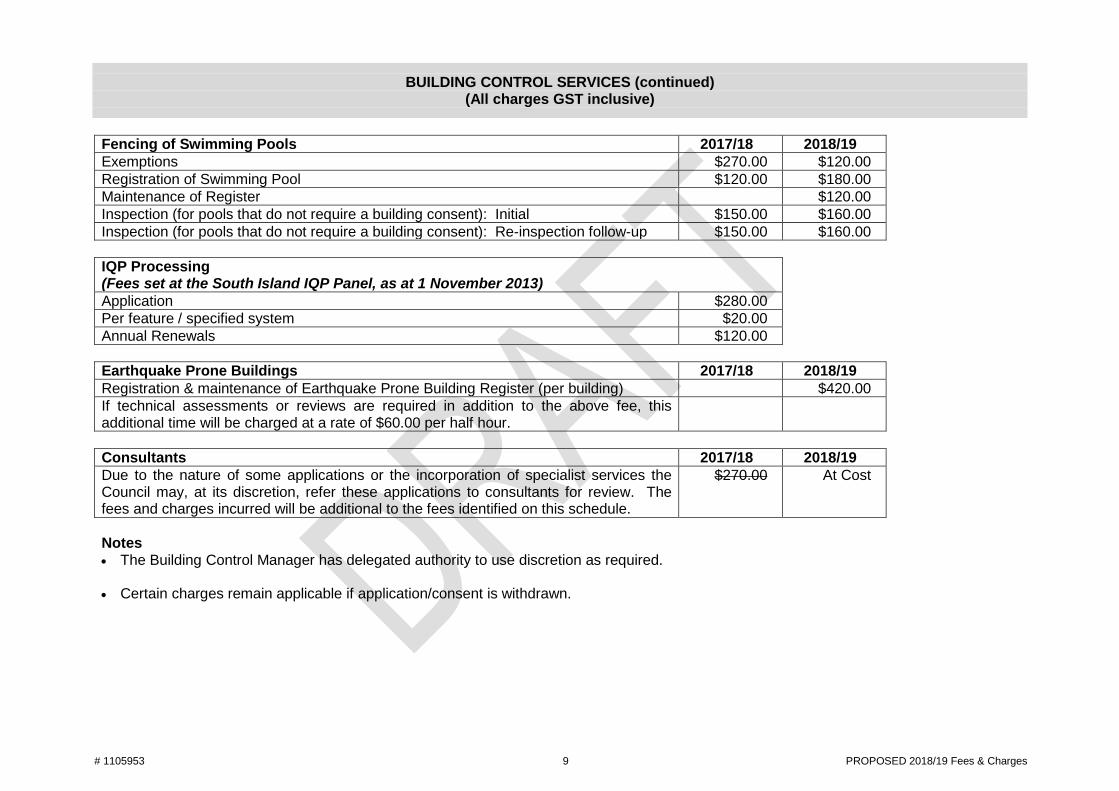
# 1105953 9 PROPOSED 2018/19 Fees & Charges
BUILDING CONTROL SERVICES (continued) (All charges GST inclusive)
Fencing of Swimming Pools 2017/18 2018/19 Exemptions $270.00 $120.00 Registration of Swimming Pool $120.00 $180.00 Maintenance of Register $120.00 Inspection (for pools that do not require a building consent): Initial $150.00 $160.00 Inspection (for pools that do not require a building consent): Re-inspection follow-up $150.00 $160.00
IQP Processing (Fees set at the South Island IQP Panel, as at 1 November 2013) Application $280.00 Per feature / specified system $20.00 Annual Renewals $120.00
Earthquake Prone Buildings 2017/18 2018/19 Registration & maintenance of Earthquake Prone Building Register (per building) $420.00 If technical assessments or reviews are required in addition to the above fee, this additional time will be charged at a rate of $60.00 per half hour.
Consultants 2017/18 2018/19 Due to the nature of some applications or the incorporation of specialist services the Council may, at its discretion, refer these applications to consultants for review. The fees and charges incurred will be additional to the fees identified on this schedule.
$270.00 At Cost
Notes • The Building Control Manager has delegated authority to use discretion as required.
• Certain charges remain applicable if application/consent is withdrawn.
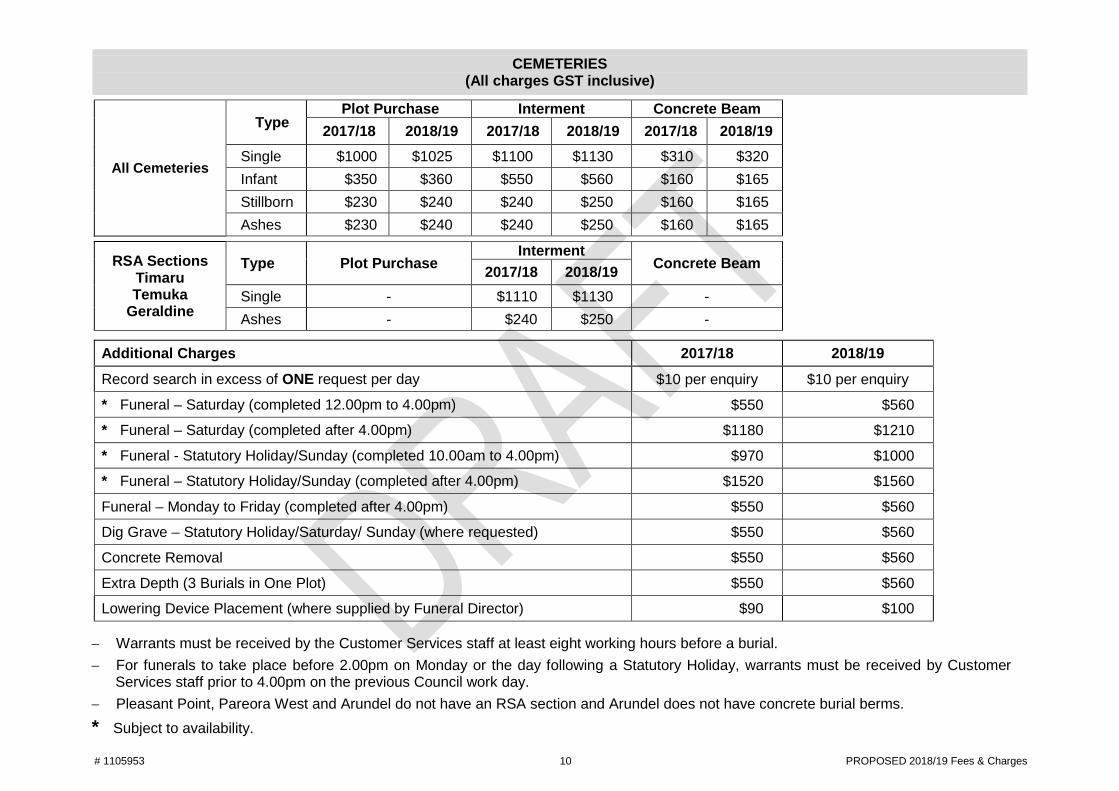
# 1105953 10 PROPOSED 2018/19 Fees & Charges
CEMETERIES (All charges GST inclusive)
All Cemeteries
Type Plot Purchase Interment Concrete Beam
2017/18 2018/19 2017/18 2018/19 2017/18 2018/19 Single $1000 $1025 $1100 $1130 $310 $320 Infant $350 $360 $550 $560 $160 $165 Stillborn $230 $240 $240 $250 $160 $165 Ashes $230 $240 $240 $250 $160 $165
RSA Sections Timaru Temuka
Geraldine
Type Plot Purchase Interment
Concrete Beam 2017/18 2018/19 Single - $1110 $1130 - Ashes - $240 $250 -
Additional Charges 2017/18 2018/19 Record search in excess of ONE request per day $10 per enquiry $10 per enquiry
* Funeral – Saturday (completed 12.00pm to 4.00pm) $550 $560
* Funeral – Saturday (completed after 4.00pm) $1180 $1210
* Funeral - Statutory Holiday/Sunday (completed 10.00am to 4.00pm) $970 $1000
* Funeral – Statutory Holiday/Sunday (completed after 4.00pm) $1520 $1560
Funeral – Monday to Friday (completed after 4.00pm) $550 $560
Dig Grave – Statutory Holiday/Saturday/ Sunday (where requested) $550 $560
Concrete Removal $550 $560
Extra Depth (3 Burials in One Plot) $550 $560
Lowering Device Placement (where supplied by Funeral Director) $90 $100 − Warrants must be received by the Customer Services staff at least eight working hours before a burial. − For funerals to take place before 2.00pm on Monday or the day following a Statutory Holiday, warrants must be received by Customer
Services staff prior to 4.00pm on the previous Council work day. − Pleasant Point, Pareora West and Arundel do not have an RSA section and Arundel does not have concrete burial berms. * Subject to availability.
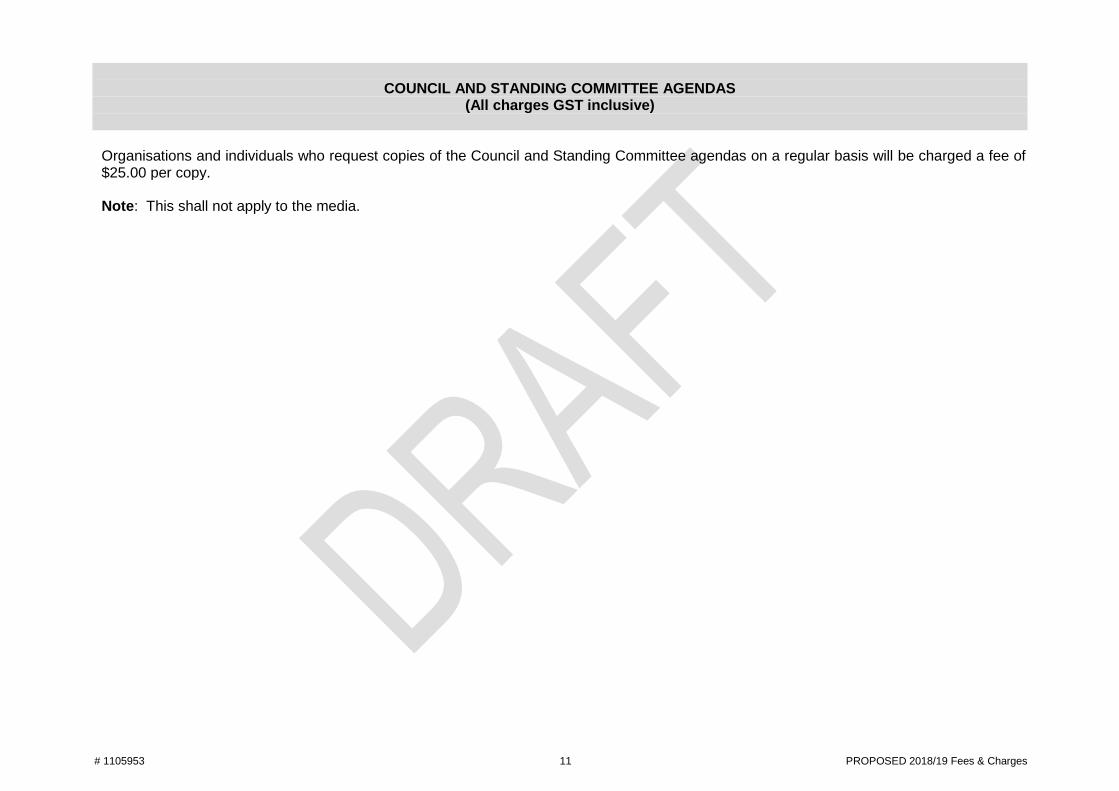
# 1105953 11 PROPOSED 2018/19 Fees & Charges
COUNCIL AND STANDING COMMITTEE AGENDAS (All charges GST inclusive)
Organisations and individuals who request copies of the Council and Standing Committee agendas on a regular basis will be charged a fee of $25.00 per copy. Note: This shall not apply to the media.
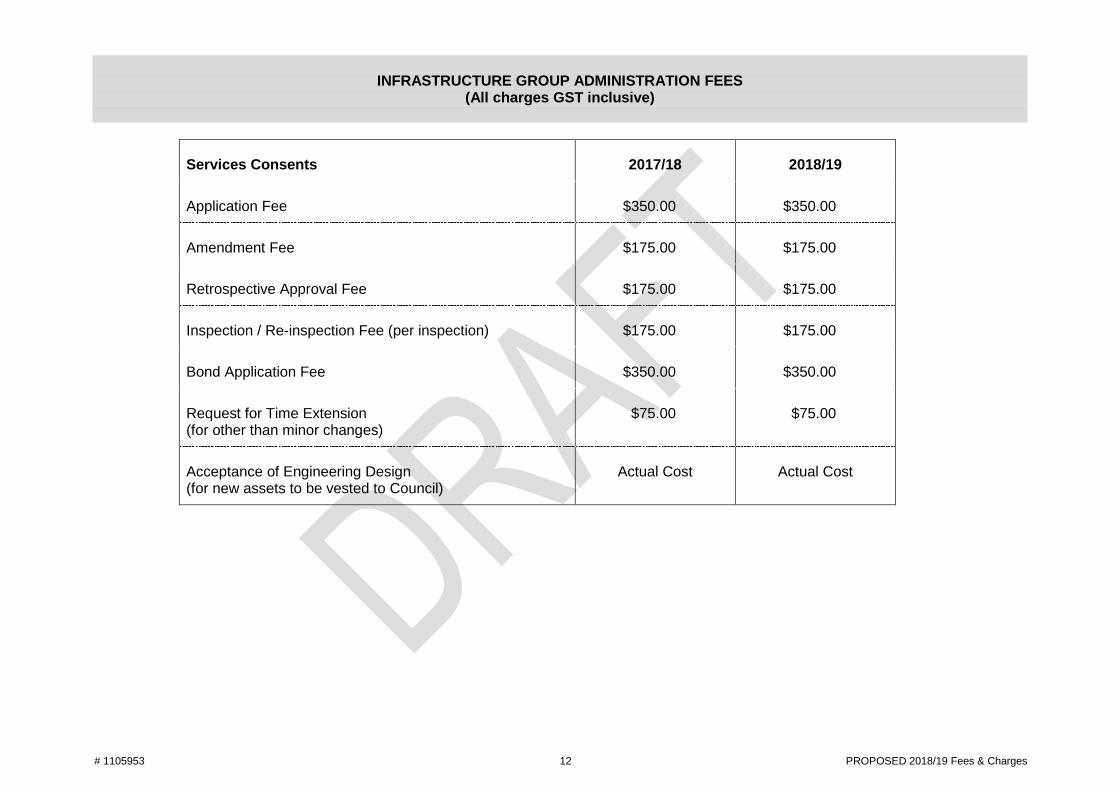
# 1105953 12 PROPOSED 2018/19 Fees & Charges
INFRASTRUCTURE GROUP ADMINISTRATION FEES
(All charges GST inclusive)
Services Consents 2017/18 2018/19
Application Fee $350.00 $350.00
Amendment Fee $175.00 $175.00
Retrospective Approval Fee $175.00 $175.00
Inspection / Re-inspection Fee (per inspection) $175.00 $175.00
Bond Application Fee $350.00 $350.00
Request for Time Extension (for other than minor changes)
$75.00 $75.00
Acceptance of Engineering Design (for new assets to be vested to Council)
Actual Cost Actual Cost
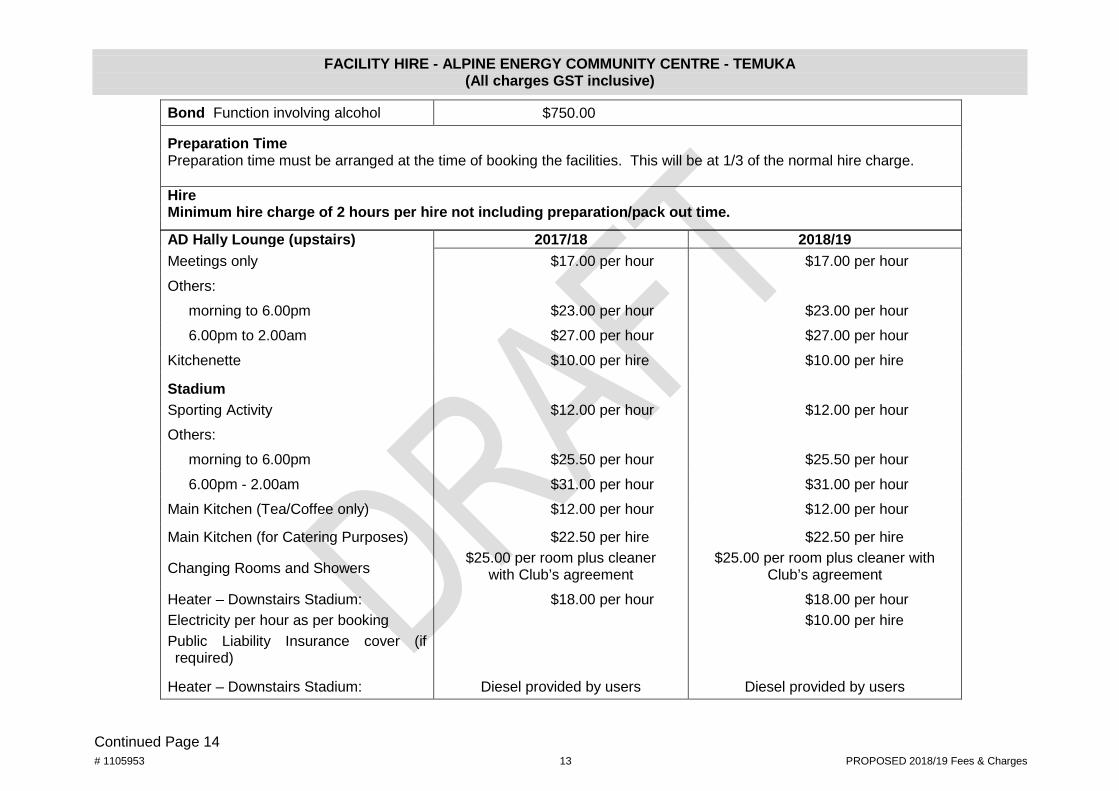
# 1105953 13 PROPOSED 2018/19 Fees & Charges
FACILITY HIRE - ALPINE ENERGY COMMUNITY CENTRE - TEMUKA (All charges GST inclusive)
Bond Function involving alcohol $750.00
Preparation Time Preparation time must be arranged at the time of booking the facilities. This will be at 1/3 of the normal hire charge.
Hire Minimum hire charge of 2 hours per hire not including preparation/pack out time.
AD Hally Lounge (upstairs) 2017/18 2018/19 Meetings only $17.00 per hour $17.00 per hour Others:
morning to 6.00pm $23.00 per hour $23.00 per hour 6.00pm to 2.00am $27.00 per hour $27.00 per hour
Kitchenette $10.00 per hire $10.00 per hire
Stadium Sporting Activity $12.00 per hour $12.00 per hour Others:
morning to 6.00pm $25.50 per hour $25.50 per hour 6.00pm - 2.00am $31.00 per hour $31.00 per hour
Main Kitchen (Tea/Coffee only) $12.00 per hour $12.00 per hour
Main Kitchen (for Catering Purposes) $22.50 per hire $22.50 per hire
Changing Rooms and Showers $25.00 per room plus cleaner
with Club’s agreement $25.00 per room plus cleaner with
Club’s agreement Heater – Downstairs Stadium: Electricity per hour as per booking Public Liability Insurance cover (if required)
$18.00 per hour $18.00 per hour $10.00 per hire
Heater – Downstairs Stadium: Diesel provided by users Diesel provided by users Continued Page 14
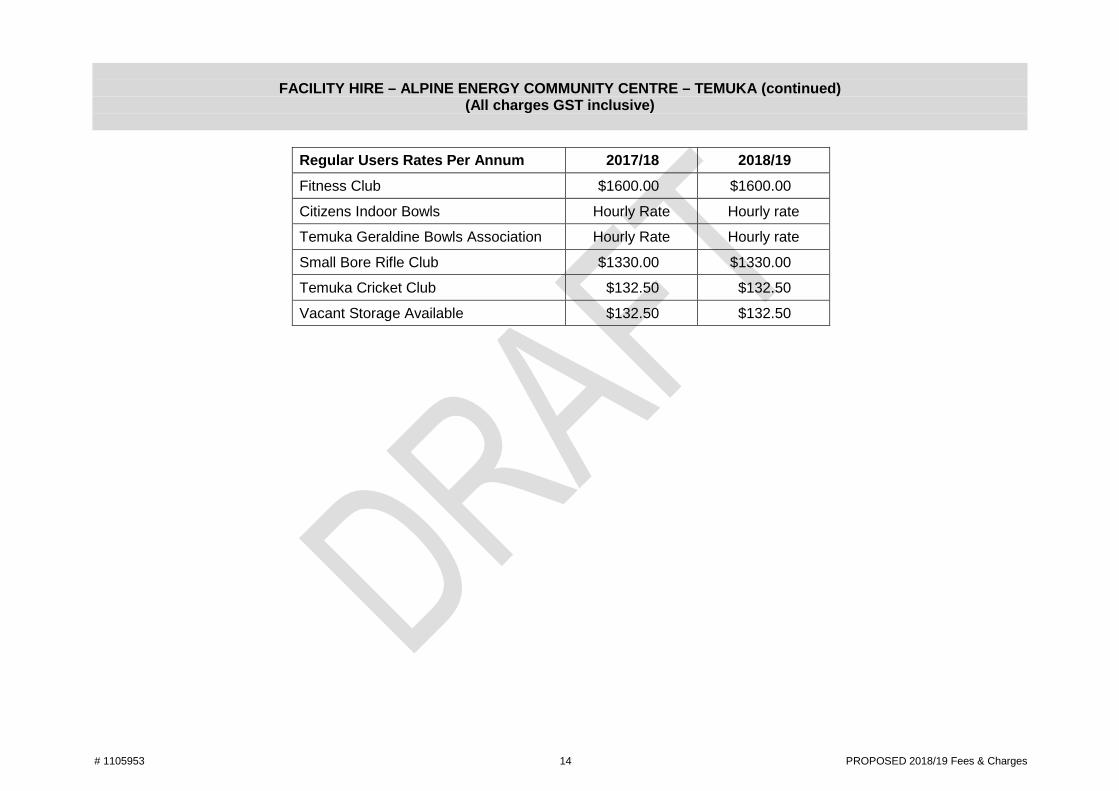
# 1105953 14 PROPOSED 2018/19 Fees & Charges
FACILITY HIRE – ALPINE ENERGY COMMUNITY CENTRE – TEMUKA (continued) (All charges GST inclusive)
Regular Users Rates Per Annum 2017/18 2018/19 Fitness Club $1600.00 $1600.00
Citizens Indoor Bowls Hourly Rate Hourly rate
Temuka Geraldine Bowls Association Hourly Rate Hourly rate
Small Bore Rifle Club $1330.00 $1330.00
Temuka Cricket Club $132.50 $132.50
Vacant Storage Available $132.50 $132.50
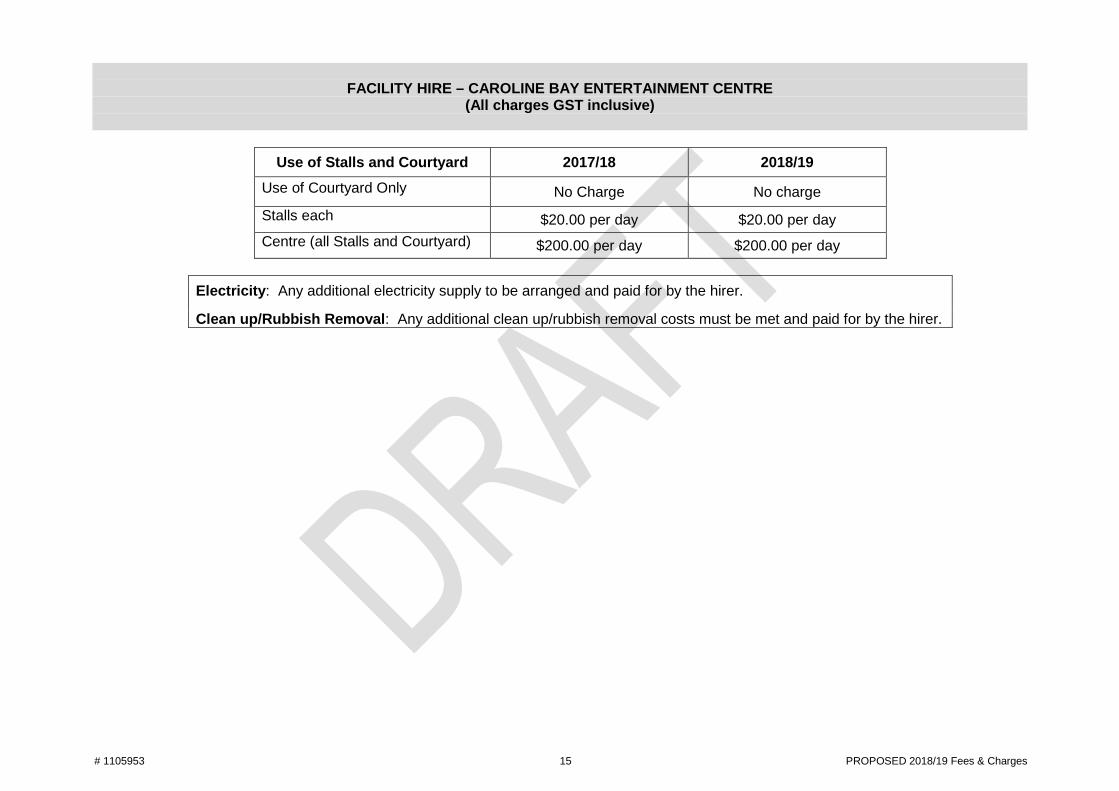
# 1105953 15 PROPOSED 2018/19 Fees & Charges
FACILITY HIRE – CAROLINE BAY ENTERTAINMENT CENTRE (All charges GST inclusive)
Use of Stalls and Courtyard 2017/18 2018/19 Use of Courtyard Only No Charge No charge Stalls each $20.00 per day $20.00 per day Centre (all Stalls and Courtyard) $200.00 per day $200.00 per day
Electricity: Any additional electricity supply to be arranged and paid for by the hirer.
Clean up/Rubbish Removal: Any additional clean up/rubbish removal costs must be met and paid for by the hirer.
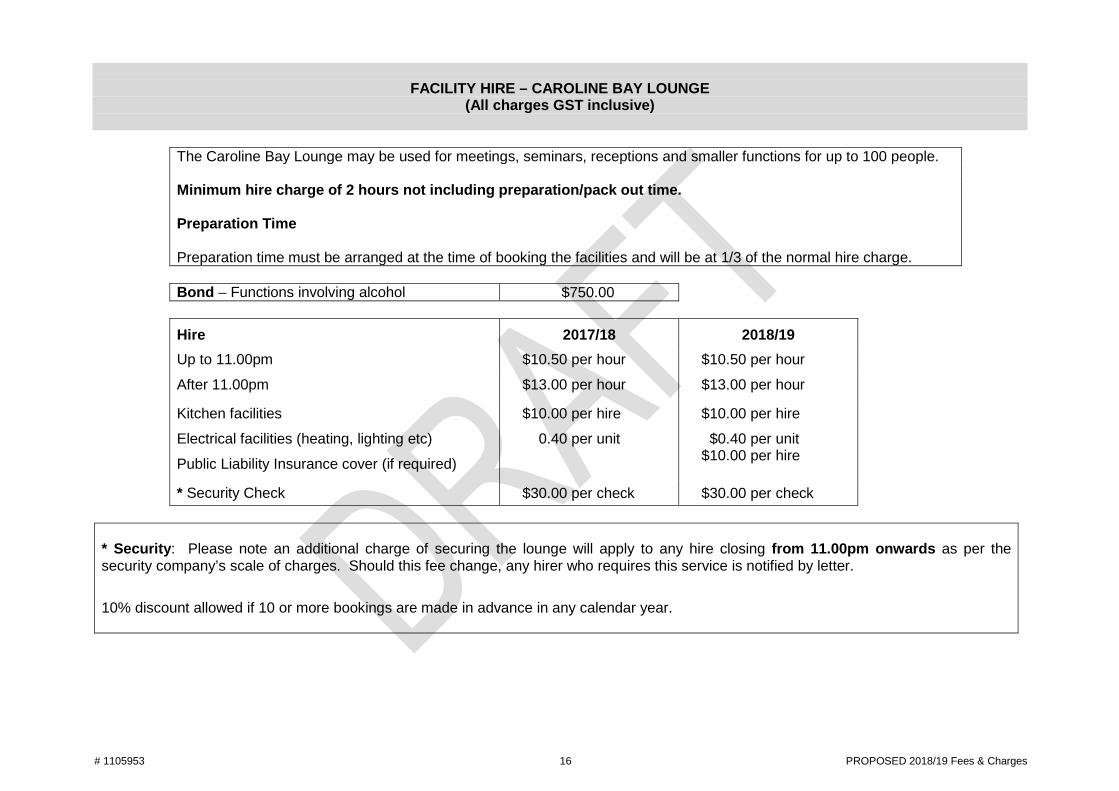
# 1105953 16 PROPOSED 2018/19 Fees & Charges
FACILITY HIRE – CAROLINE BAY LOUNGE (All charges GST inclusive)
The Caroline Bay Lounge may be used for meetings, seminars, receptions and smaller functions for up to 100 people. Minimum hire charge of 2 hours not including preparation/pack out time. Preparation Time Preparation time must be arranged at the time of booking the facilities and will be at 1/3 of the normal hire charge.
Bond – Functions involving alcohol $750.00
Hire 2017/18 2018/19 Up to 11.00pm $10.50 per hour $10.50 per hour
After 11.00pm $13.00 per hour $13.00 per hour
Kitchen facilities $10.00 per hire $10.00 per hire
Electrical facilities (heating, lighting etc)
Public Liability Insurance cover (if required)
0.40 per unit $0.40 per unit $10.00 per hire
* Security Check $30.00 per check $30.00 per check * Security: Please note an additional charge of securing the lounge will apply to any hire closing from 11.00pm onwards as per the security company’s scale of charges. Should this fee change, any hirer who requires this service is notified by letter.
10% discount allowed if 10 or more bookings are made in advance in any calendar year.
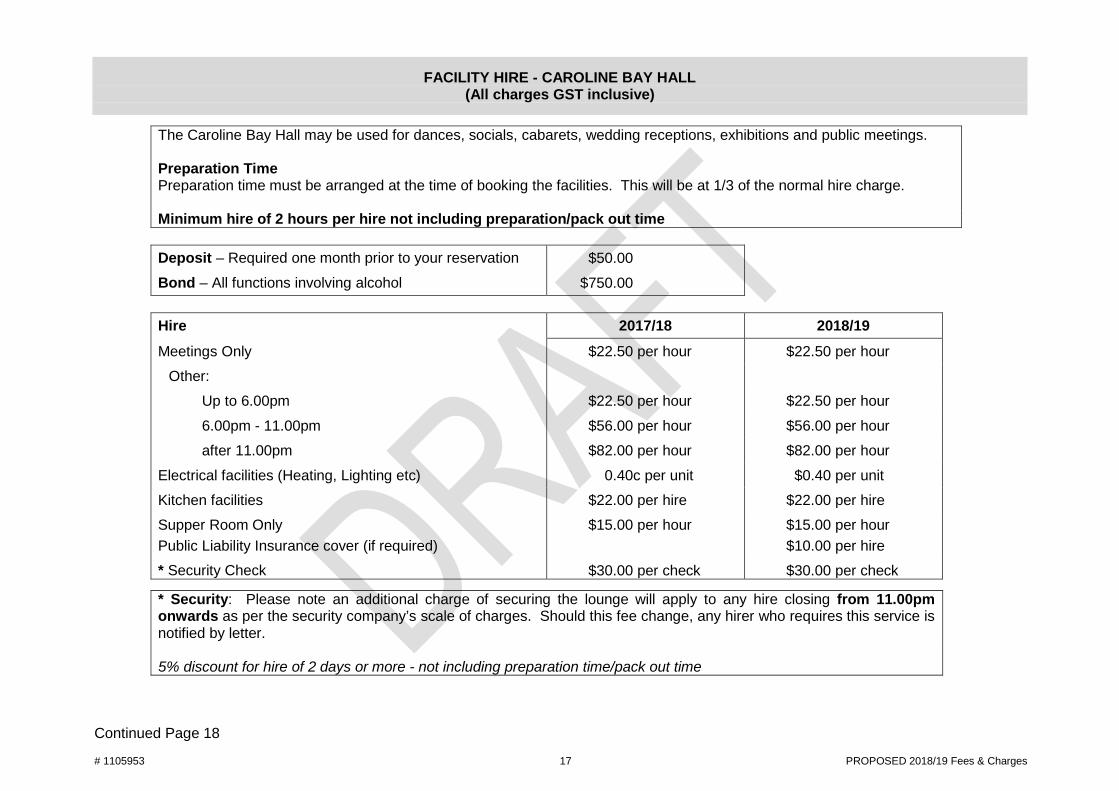
# 1105953 17 PROPOSED 2018/19 Fees & Charges
FACILITY HIRE - CAROLINE BAY HALL (All charges GST inclusive)
The Caroline Bay Hall may be used for dances, socials, cabarets, wedding receptions, exhibitions and public meetings. Preparation Time Preparation time must be arranged at the time of booking the facilities. This will be at 1/3 of the normal hire charge. Minimum hire of 2 hours per hire not including preparation/pack out time
Deposit – Required one month prior to your reservation $50.00 Bond – All functions involving alcohol $750.00
Hire 2017/18 2018/19 Meetings Only $22.50 per hour $22.50 per hour
Other: Up to 6.00pm $22.50 per hour $22.50 per hour 6.00pm - 11.00pm $56.00 per hour $56.00 per hour after 11.00pm $82.00 per hour $82.00 per hour
Electrical facilities (Heating, Lighting etc) 0.40c per unit $0.40 per unit Kitchen facilities $22.00 per hire $22.00 per hire Supper Room Only Public Liability Insurance cover (if required)
$15.00 per hour $15.00 per hour $10.00 per hire
* Security Check $30.00 per check $30.00 per check
* Security: Please note an additional charge of securing the lounge will apply to any hire closing from 11.00pm onwards as per the security company’s scale of charges. Should this fee change, any hirer who requires this service is notified by letter. 5% discount for hire of 2 days or more - not including preparation time/pack out time
Continued Page 18
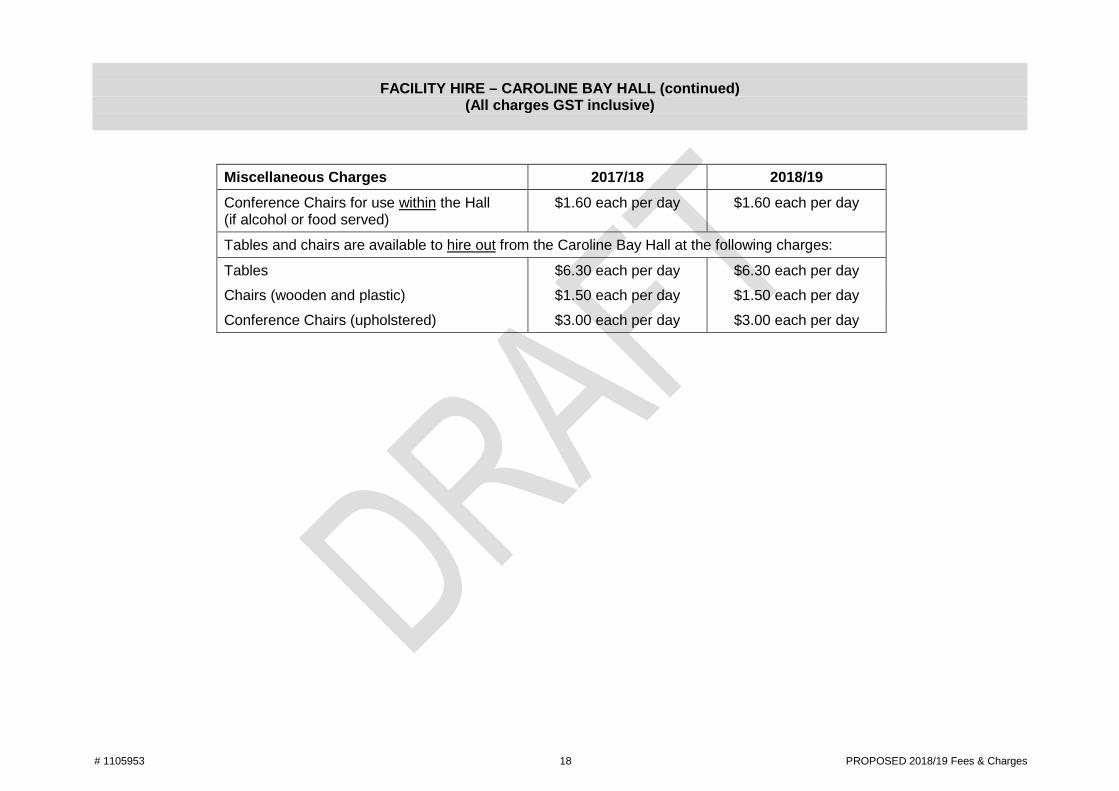
# 1105953 18 PROPOSED 2018/19 Fees & Charges
FACILITY HIRE – CAROLINE BAY HALL (continued) (All charges GST inclusive)
Miscellaneous Charges 2017/18 2018/19 Conference Chairs for use within the Hall (if alcohol or food served)
$1.60 each per day $1.60 each per day
Tables and chairs are available to hire out from the Caroline Bay Hall at the following charges: Tables $6.30 each per day $6.30 each per day Chairs (wooden and plastic) $1.50 each per day $1.50 each per day Conference Chairs (upholstered) $3.00 each per day $3.00 each per day
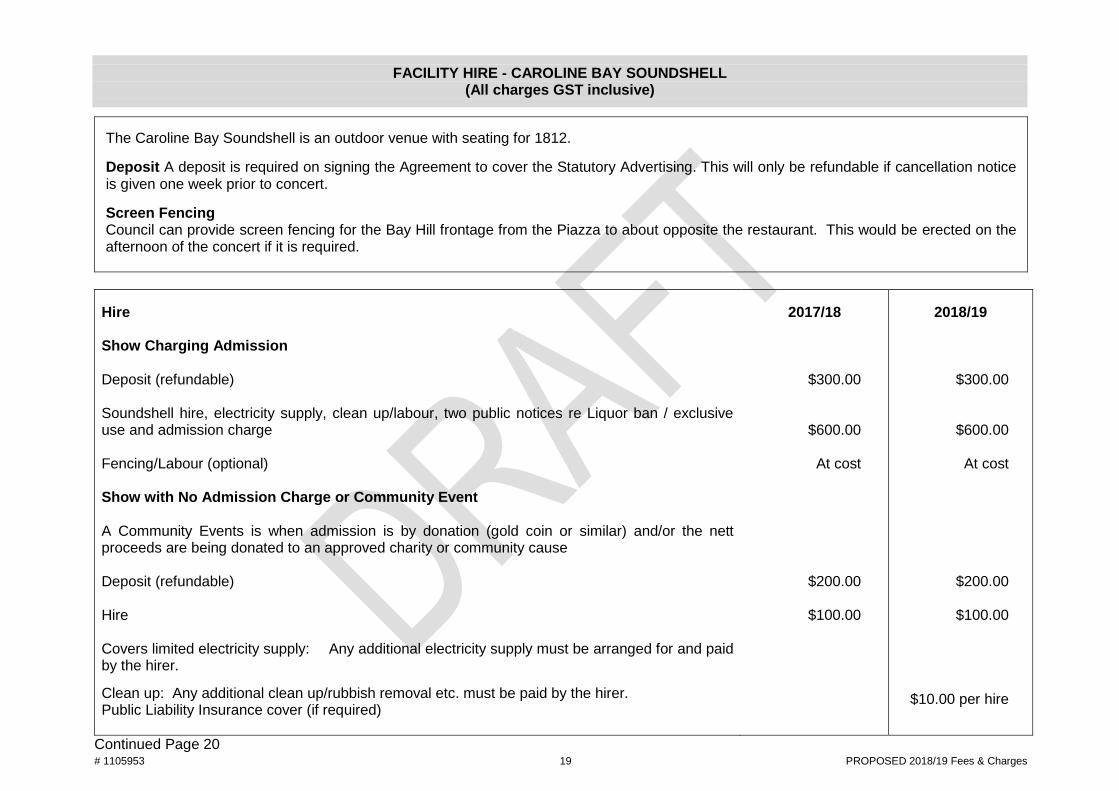
# 1105953 19 PROPOSED 2018/19 Fees & Charges
FACILITY HIRE - CAROLINE BAY SOUNDSHELL (All charges GST inclusive)
The Caroline Bay Soundshell is an outdoor venue with seating for 1812. Deposit A deposit is required on signing the Agreement to cover the Statutory Advertising. This will only be refundable if cancellation notice is given one week prior to concert. Screen Fencing Council can provide screen fencing for the Bay Hill frontage from the Piazza to about opposite the restaurant. This would be erected on the afternoon of the concert if it is required.
Hire Show Charging Admission Deposit (refundable) Soundshell hire, electricity supply, clean up/labour, two public notices re Liquor ban / exclusive use and admission charge Fencing/Labour (optional) Show with No Admission Charge or Community Event A Community Events is when admission is by donation (gold coin or similar) and/or the nett proceeds are being donated to an approved charity or community cause Deposit (refundable) Hire Covers limited electricity supply: Any additional electricity supply must be arranged for and paid by the hirer. Clean up: Any additional clean up/rubbish removal etc. must be paid by the hirer. Public Liability Insurance cover (if required)
2017/18
$300.00
$600.00
At cost
$200.00
$100.00
2018/19
$300.00
$600.00
At cost
$200.00
$100.00
$10.00 per hire
Continued Page 20
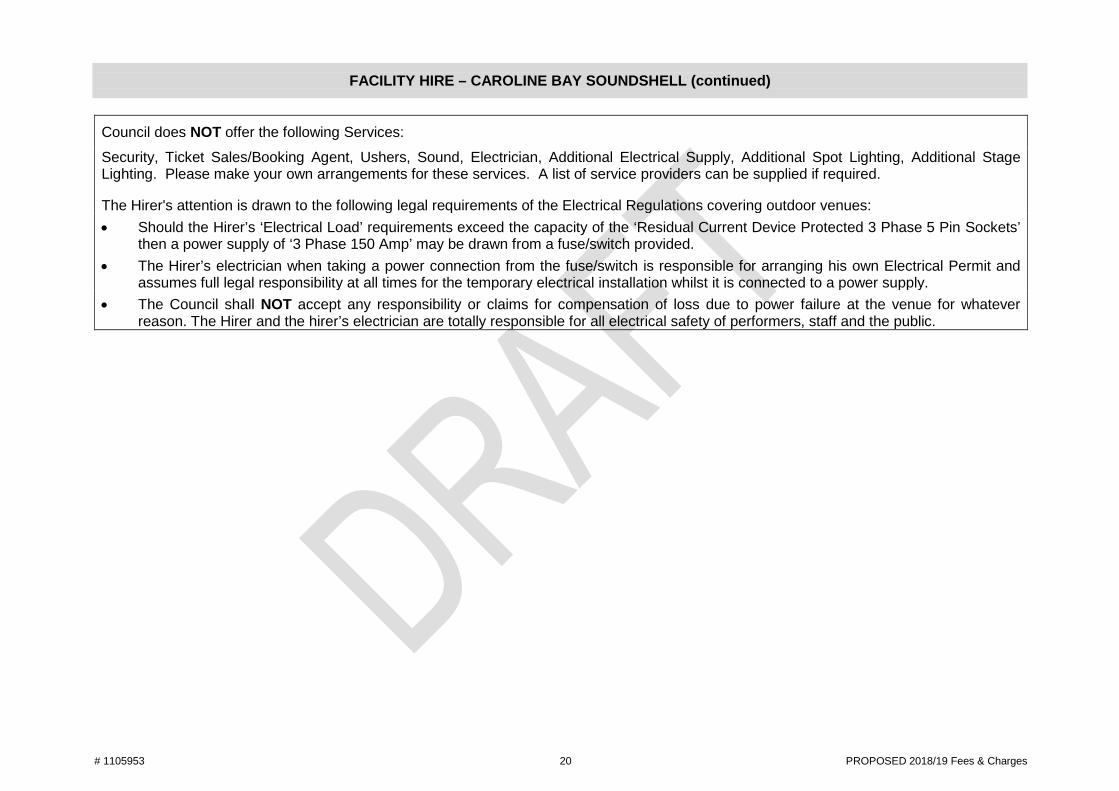
# 1105953 20 PROPOSED 2018/19 Fees & Charges
FACILITY HIRE – CAROLINE BAY SOUNDSHELL (continued)
Council does NOT offer the following Services:
Security, Ticket Sales/Booking Agent, Ushers, Sound, Electrician, Additional Electrical Supply, Additional Spot Lighting, Additional Stage Lighting. Please make your own arrangements for these services. A list of service providers can be supplied if required.
The Hirer's attention is drawn to the following legal requirements of the Electrical Regulations covering outdoor venues: • Should the Hirer’s ‘Electrical Load’ requirements exceed the capacity of the ‘Residual Current Device Protected 3 Phase 5 Pin Sockets’
then a power supply of ‘3 Phase 150 Amp’ may be drawn from a fuse/switch provided. • The Hirer’s electrician when taking a power connection from the fuse/switch is responsible for arranging his own Electrical Permit and
assumes full legal responsibility at all times for the temporary electrical installation whilst it is connected to a power supply. • The Council shall NOT accept any responsibility or claims for compensation of loss due to power failure at the venue for whatever
reason. The Hirer and the hirer’s electrician are totally responsible for all electrical safety of performers, staff and the public.
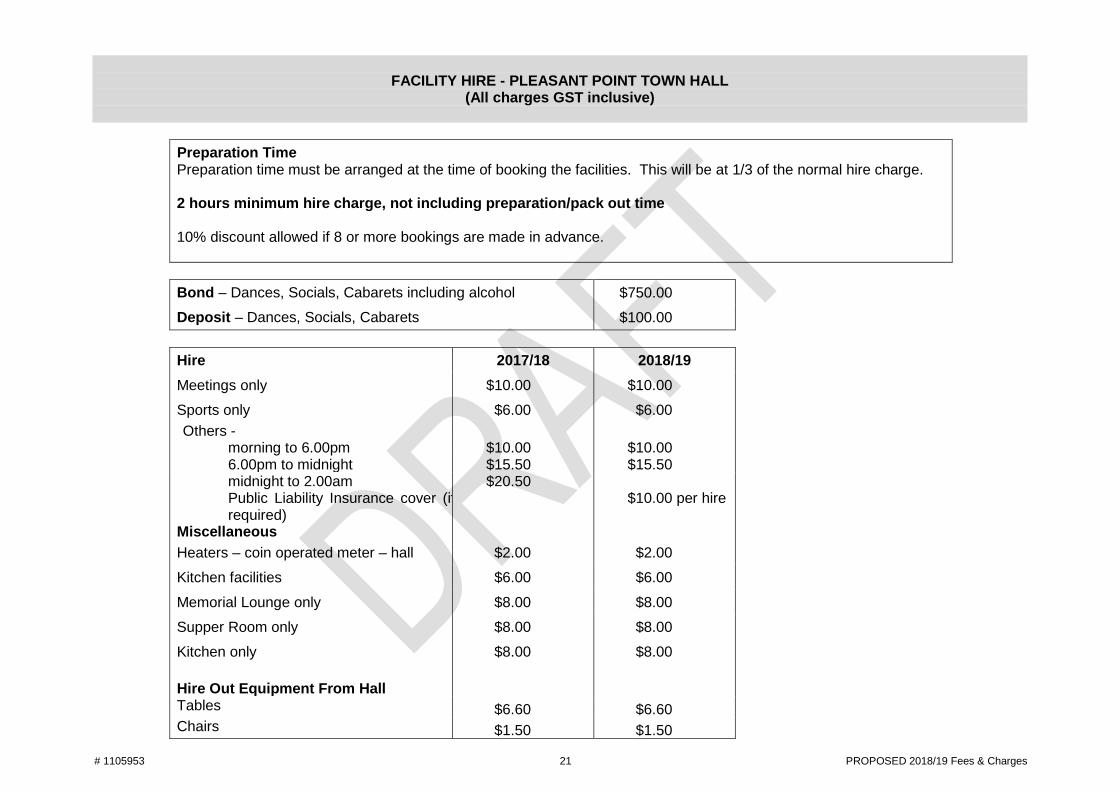
# 1105953 21 PROPOSED 2018/19 Fees & Charges
FACILITY HIRE - PLEASANT POINT TOWN HALL
(All charges GST inclusive)
Preparation Time Preparation time must be arranged at the time of booking the facilities. This will be at 1/3 of the normal hire charge. 2 hours minimum hire charge, not including preparation/pack out time 10% discount allowed if 8 or more bookings are made in advance.
Bond – Dances, Socials, Cabarets including alcohol $750.00 Deposit – Dances, Socials, Cabarets $100.00
Hire 2017/18 2018/19 Meetings only $10.00 $10.00 Sports only $6.00 $6.00 Others -
morning to 6.00pm $10.00 $10.00 6.00pm to midnight $15.50 $15.50 midnight to 2.00am Public Liability Insurance cover (if required)
$20.50 $10.00 per hire
Miscellaneous Heaters – coin operated meter – hall $2.00 $2.00 Kitchen facilities $6.00 $6.00 Memorial Lounge only $8.00 $8.00 Supper Room only $8.00 $8.00 Kitchen only $8.00 $8.00
Hire Out Equipment From Hall Tables $6.60 $6.60 Chairs $1.50 $1.50
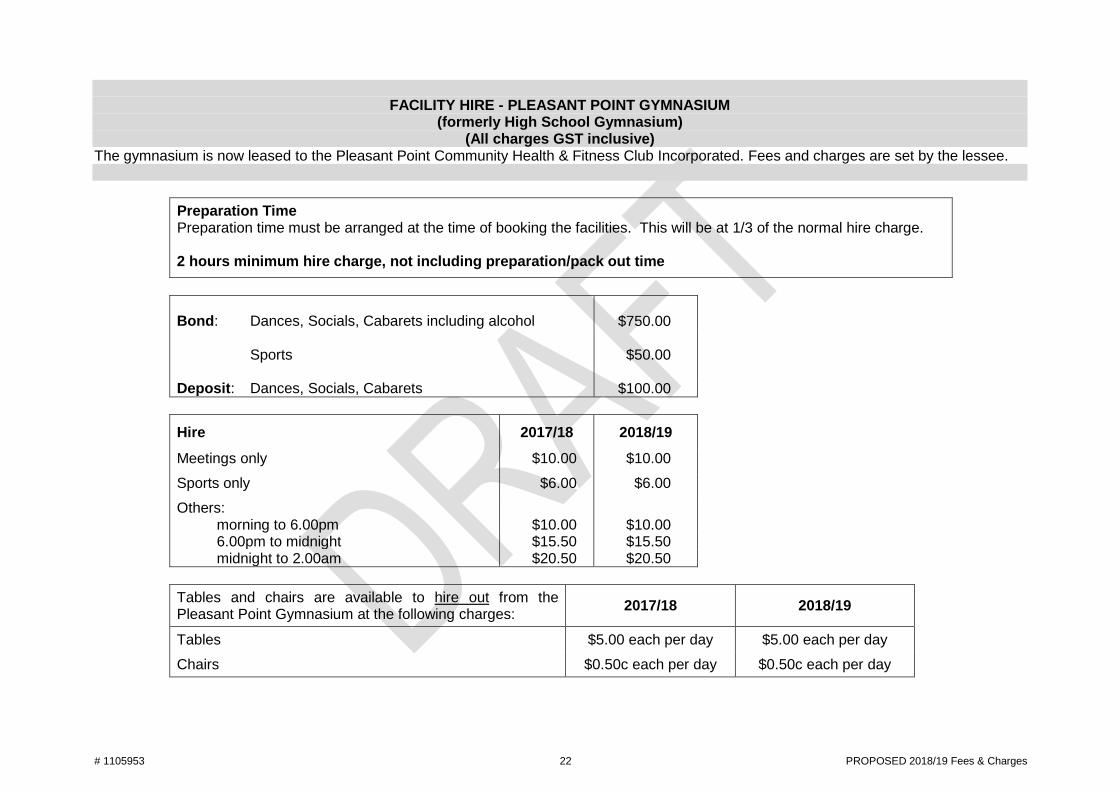
# 1105953 22 PROPOSED 2018/19 Fees & Charges
FACILITY HIRE - PLEASANT POINT GYMNASIUM
(formerly High School Gymnasium) (All charges GST inclusive)
The gymnasium is now leased to the Pleasant Point Community Health & Fitness Club Incorporated. Fees and charges are set by the lessee.
Preparation Time Preparation time must be arranged at the time of booking the facilities. This will be at 1/3 of the normal hire charge. 2 hours minimum hire charge, not including preparation/pack out time
Bond: Dances, Socials, Cabarets including alcohol
$750.00
Sports
$50.00
Deposit: Dances, Socials, Cabarets $100.00
Hire 2017/18 2018/19 Meetings only $10.00 $10.00 Sports only $6.00 $6.00 Others:
morning to 6.00pm $10.00 $10.00 6.00pm to midnight $15.50 $15.50 midnight to 2.00am $20.50 $20.50
Tables and chairs are available to hire out from the Pleasant Point Gymnasium at the following charges: 2017/18 2018/19
Tables $5.00 each per day $5.00 each per day Chairs $0.50c each per day $0.50c each per day
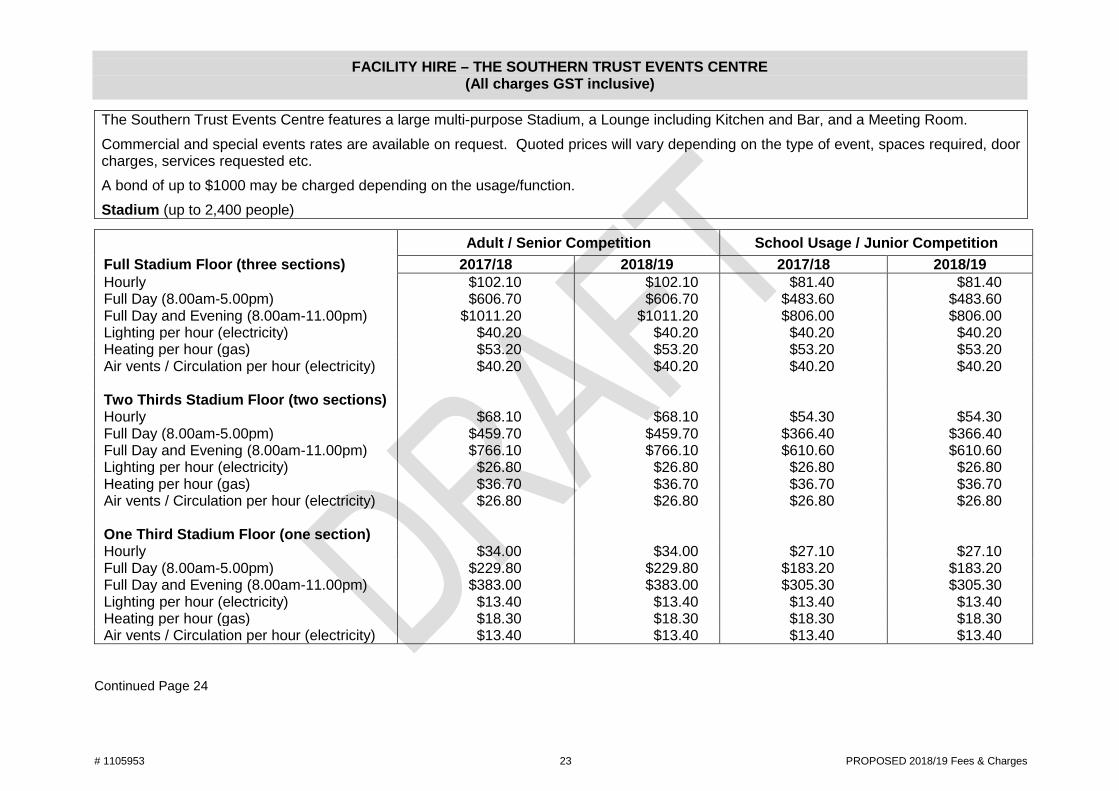
# 1105953 23 PROPOSED 2018/19 Fees & Charges
FACILITY HIRE – THE SOUTHERN TRUST EVENTS CENTRE (All charges GST inclusive)
The Southern Trust Events Centre features a large multi-purpose Stadium, a Lounge including Kitchen and Bar, and a Meeting Room.
Commercial and special events rates are available on request. Quoted prices will vary depending on the type of event, spaces required, door charges, services requested etc.
A bond of up to $1000 may be charged depending on the usage/function.
Stadium (up to 2,400 people)
Full Stadium Floor (three sections) Adult / Senior Competition School Usage / Junior Competition
2017/18 2018/19 2017/18 2018/19 Hourly $102.10 $102.10 $81.40 $81.40 Full Day (8.00am-5.00pm) $606.70 $606.70 $483.60 $483.60 Full Day and Evening (8.00am-11.00pm) $1011.20 $1011.20 $806.00 $806.00 Lighting per hour (electricity) $40.20 $40.20 $40.20 $40.20 Heating per hour (gas) $53.20 $53.20 $53.20 $53.20 Air vents / Circulation per hour (electricity) $40.20 $40.20 $40.20 $40.20 Two Thirds Stadium Floor (two sections) Hourly $68.10 $68.10 $54.30 $54.30 Full Day (8.00am-5.00pm) $459.70 $459.70 $366.40 $366.40 Full Day and Evening (8.00am-11.00pm) $766.10 $766.10 $610.60 $610.60 Lighting per hour (electricity) $26.80 $26.80 $26.80 $26.80 Heating per hour (gas) $36.70 $36.70 $36.70 $36.70 Air vents / Circulation per hour (electricity) $26.80 $26.80 $26.80 $26.80 One Third Stadium Floor (one section) Hourly $34.00 $34.00 $27.10 $27.10 Full Day (8.00am-5.00pm) $229.80 $229.80 $183.20 $183.20 Full Day and Evening (8.00am-11.00pm) $383.00 $383.00 $305.30 $305.30 Lighting per hour (electricity) $13.40 $13.40 $13.40 $13.40 Heating per hour (gas) $18.30 $18.30 $18.30 $18.30 Air vents / Circulation per hour (electricity) $13.40 $13.40 $13.40 $13.40
Continued Page 24
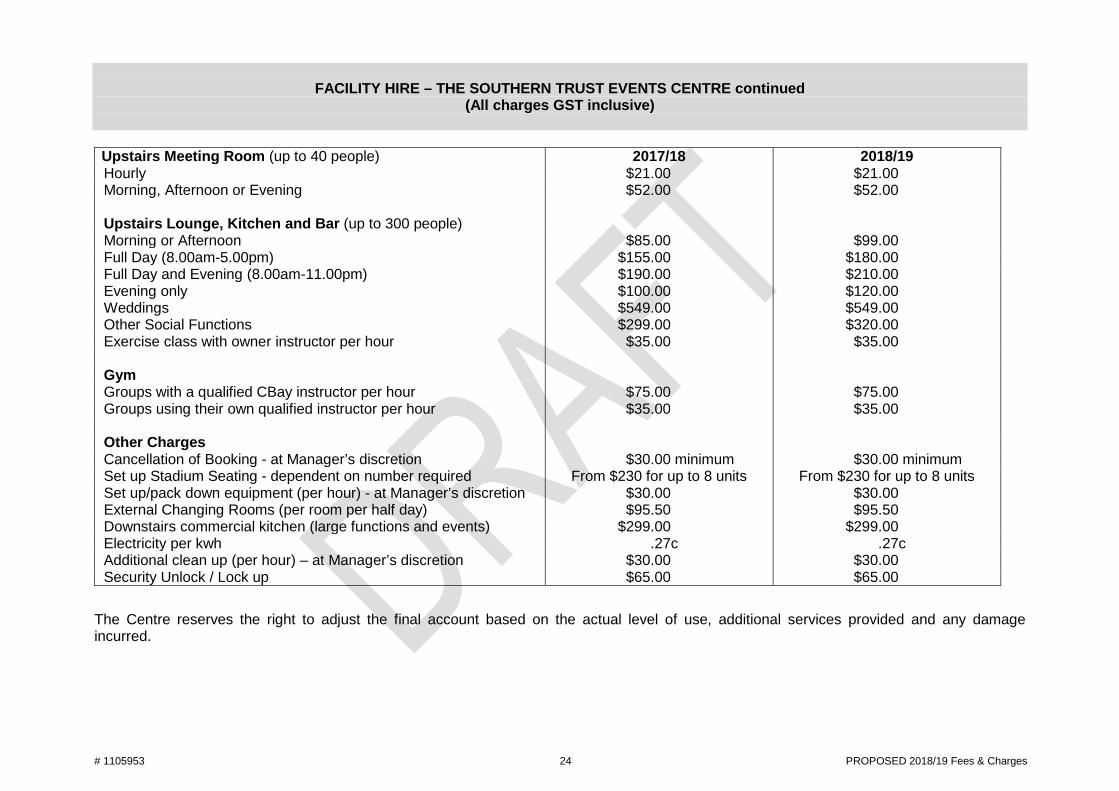
# 1105953 24 PROPOSED 2018/19 Fees & Charges
FACILITY HIRE – THE SOUTHERN TRUST EVENTS CENTRE continued (All charges GST inclusive)
Upstairs Meeting Room (up to 40 people) 2017/18 2018/19 Hourly $21.00 $21.00 Morning, Afternoon or Evening $52.00 $52.00 Upstairs Lounge, Kitchen and Bar (up to 300 people) Morning or Afternoon $85.00 $99.00 Full Day (8.00am-5.00pm) $155.00 $180.00 Full Day and Evening (8.00am-11.00pm) $190.00 $210.00 Evening only $100.00 $120.00 Weddings $549.00 $549.00 Other Social Functions $299.00 $320.00 Exercise class with owner instructor per hour $35.00 $35.00 Gym Groups with a qualified CBay instructor per hour $75.00 $75.00 Groups using their own qualified instructor per hour $35.00 $35.00 Other Charges Cancellation of Booking - at Manager’s discretion $30.00 minimum $30.00 minimum Set up Stadium Seating - dependent on number required From $230 for up to 8 units From $230 for up to 8 units Set up/pack down equipment (per hour) - at Manager’s discretion $30.00 $30.00 External Changing Rooms (per room per half day) $95.50 $95.50 Downstairs commercial kitchen (large functions and events) $299.00 $299.00 Electricity per kwh .27c .27c Additional clean up (per hour) – at Manager’s discretion $30.00 $30.00 Security Unlock / Lock up $65.00 $65.00
The Centre reserves the right to adjust the final account based on the actual level of use, additional services provided and any damage incurred.
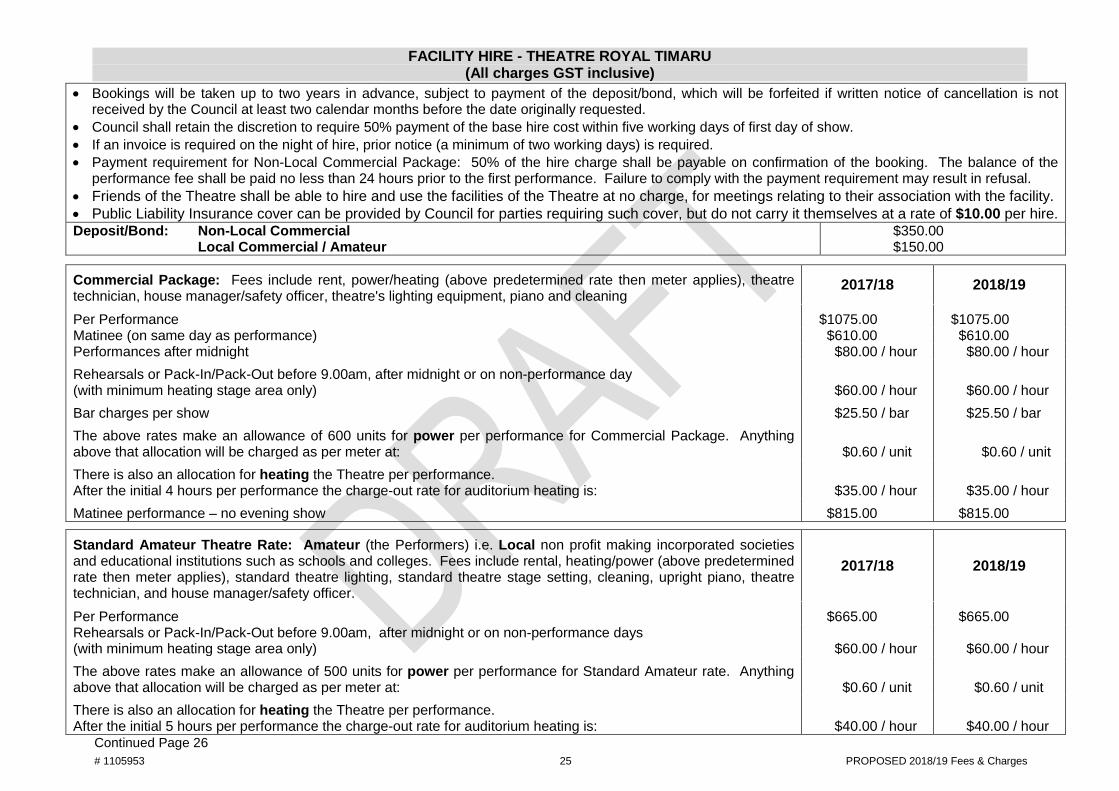
# 1105953 25 PROPOSED 2018/19 Fees & Charges
FACILITY HIRE - THEATRE ROYAL TIMARU (All charges GST inclusive)
• Bookings will be taken up to two years in advance, subject to payment of the deposit/bond, which will be forfeited if written notice of cancellation is not received by the Council at least two calendar months before the date originally requested.
• Council shall retain the discretion to require 50% payment of the base hire cost within five working days of first day of show. • If an invoice is required on the night of hire, prior notice (a minimum of two working days) is required. • Payment requirement for Non-Local Commercial Package: 50% of the hire charge shall be payable on confirmation of the booking. The balance of the
performance fee shall be paid no less than 24 hours prior to the first performance. Failure to comply with the payment requirement may result in refusal. • Friends of the Theatre shall be able to hire and use the facilities of the Theatre at no charge, for meetings relating to their association with the facility. • Public Liability Insurance cover can be provided by Council for parties requiring such cover, but do not carry it themselves at a rate of $10.00 per hire. Deposit/Bond: Non-Local Commercial $350.00 Local Commercial / Amateur $150.00
Commercial Package: Fees include rent, power/heating (above predetermined rate then meter applies), theatre technician, house manager/safety officer, theatre's lighting equipment, piano and cleaning
2017/18 2018/19
Per Performance $1075.00 $1075.00 Matinee (on same day as performance) $610.00 $610.00 Performances after midnight $80.00 / hour $80.00 / hour Rehearsals or Pack-In/Pack-Out before 9.00am, after midnight or on non-performance day (with minimum heating stage area only) $60.00 / hour $60.00 / hour Bar charges per show $25.50 / bar $25.50 / bar The above rates make an allowance of 600 units for power per performance for Commercial Package. Anything above that allocation will be charged as per meter at:
$0.60 / unit $0.60 / unit
There is also an allocation for heating the Theatre per performance. After the initial 4 hours per performance the charge-out rate for auditorium heating is:
$35.00 / hour $35.00 / hour
Matinee performance – no evening show $815.00 $815.00
Standard Amateur Theatre Rate: Amateur (the Performers) i.e. Local non profit making incorporated societies and educational institutions such as schools and colleges. Fees include rental, heating/power (above predetermined rate then meter applies), standard theatre lighting, standard theatre stage setting, cleaning, upright piano, theatre technician, and house manager/safety officer.
2017/18 2018/19
Per Performance $665.00 $665.00 Rehearsals or Pack-In/Pack-Out before 9.00am, after midnight or on non-performance days (with minimum heating stage area only)
$60.00 / hour $60.00 / hour
The above rates make an allowance of 500 units for power per performance for Standard Amateur rate. Anything above that allocation will be charged as per meter at:
$0.60 / unit $0.60 / unit
There is also an allocation for heating the Theatre per performance. After the initial 5 hours per performance the charge-out rate for auditorium heating is:
$40.00 / hour $40.00 / hour
Continued Page 26
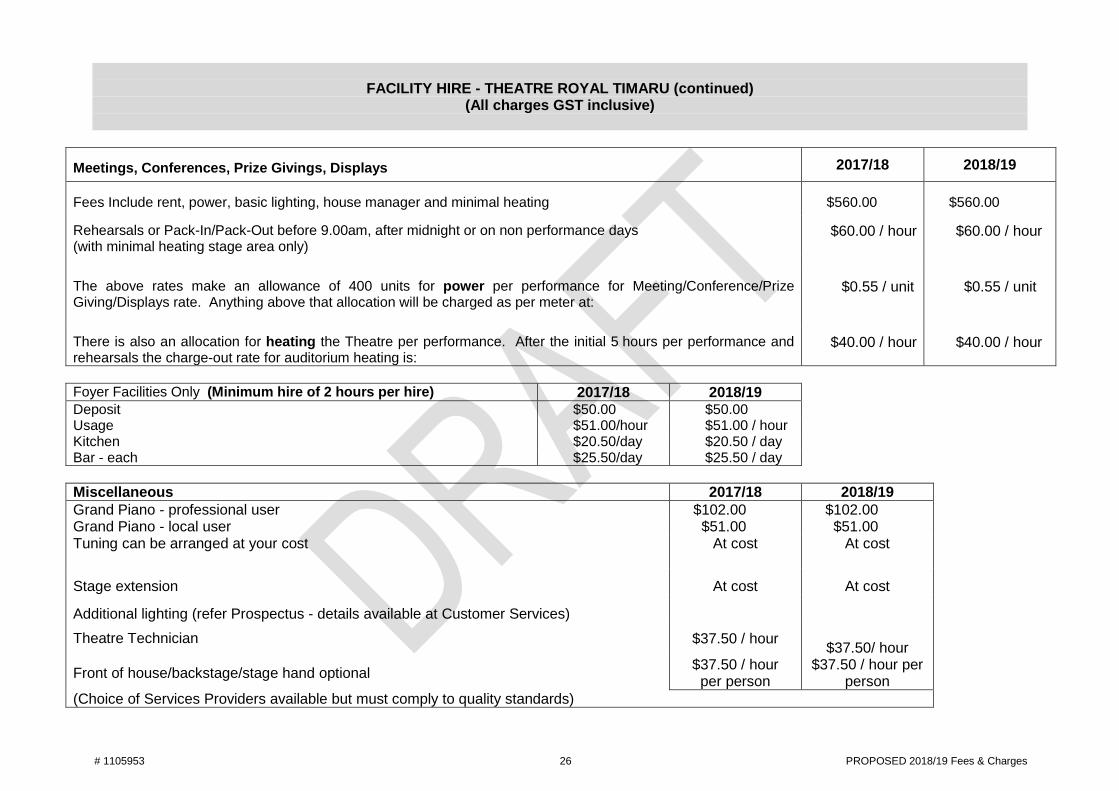
# 1105953 26 PROPOSED 2018/19 Fees & Charges
FACILITY HIRE - THEATRE ROYAL TIMARU (continued) (All charges GST inclusive)
Meetings, Conferences, Prize Givings, Displays 2017/18 2018/19
Fees Include rent, power, basic lighting, house manager and minimal heating $560.00 $560.00
Rehearsals or Pack-In/Pack-Out before 9.00am, after midnight or on non performance days (with minimal heating stage area only)
$60.00 / hour $60.00 / hour
The above rates make an allowance of 400 units for power per performance for Meeting/Conference/Prize Giving/Displays rate. Anything above that allocation will be charged as per meter at:
$0.55 / unit $0.55 / unit
There is also an allocation for heating the Theatre per performance. After the initial 5 hours per performance and rehearsals the charge-out rate for auditorium heating is:
$40.00 / hour $40.00 / hour
Foyer Facilities Only (Minimum hire of 2 hours per hire) 2017/18 2018/19 Deposit $50.00 $50.00 Usage $51.00/hour $51.00 / hour Kitchen $20.50/day $20.50 / day Bar - each $25.50/day $25.50 / day
Miscellaneous 2017/18 2018/19 Grand Piano - professional user $102.00 $102.00 Grand Piano - local user $51.00 $51.00 Tuning can be arranged at your cost At cost At cost
Stage extension
At cost At cost Additional lighting (refer Prospectus - details available at Customer Services)
Theatre Technician $37.50 / hour $37.50/ hour
Front of house/backstage/stage hand optional $37.50 / hour per person
$37.50 / hour per person
(Choice of Services Providers available but must comply to quality standards)
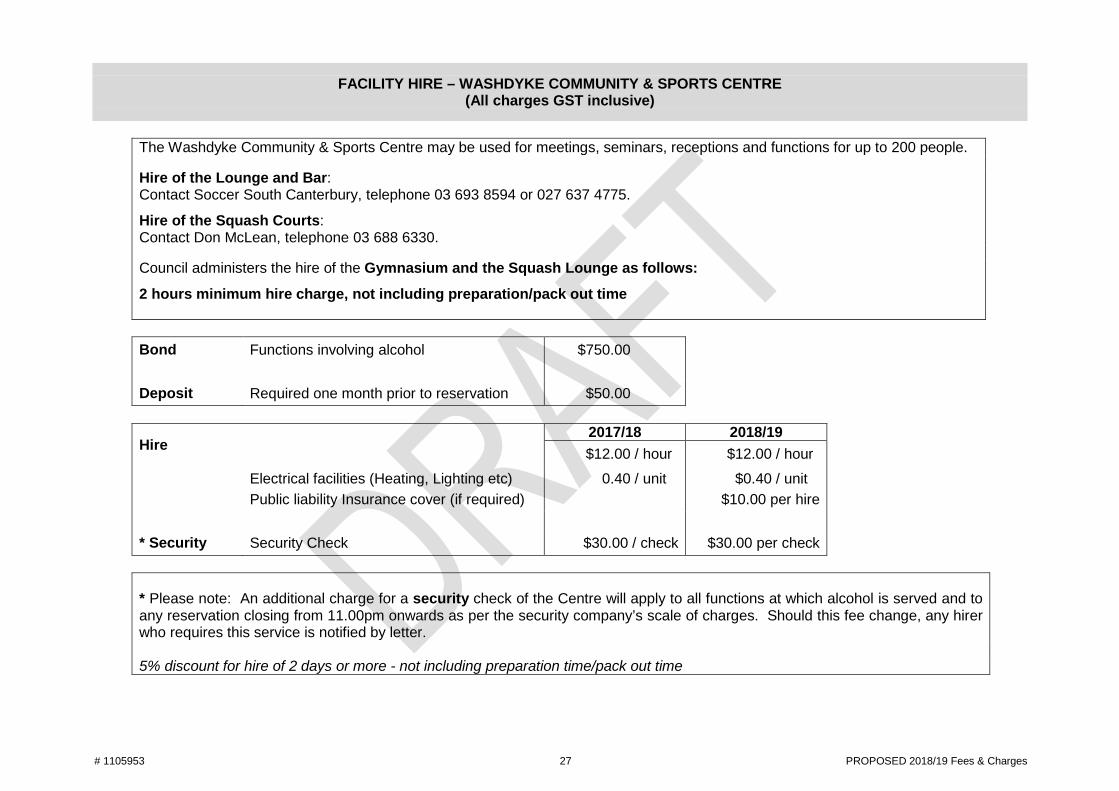
# 1105953 27 PROPOSED 2018/19 Fees & Charges
FACILITY HIRE – WASHDYKE COMMUNITY & SPORTS CENTRE (All charges GST inclusive)
The Washdyke Community & Sports Centre may be used for meetings, seminars, receptions and functions for up to 200 people. Hire of the Lounge and Bar: Contact Soccer South Canterbury, telephone 03 693 8594 or 027 637 4775.
Hire of the Squash Courts: Contact Don McLean, telephone 03 688 6330. Council administers the hire of the Gymnasium and the Squash Lounge as follows:
2 hours minimum hire charge, not including preparation/pack out time
Bond Functions involving alcohol $750.00
Deposit Required one month prior to reservation $50.00
Hire 2017/18 2018/19 $12.00 / hour $12.00 / hour
Electrical facilities (Heating, Lighting etc) Public liability Insurance cover (if required)
0.40 / unit $0.40 / unit $10.00 per hire
* Security Security Check $30.00 / check $30.00 per check
* Please note: An additional charge for a security check of the Centre will apply to all functions at which alcohol is served and to any reservation closing from 11.00pm onwards as per the security company’s scale of charges. Should this fee change, any hirer who requires this service is notified by letter. 5% discount for hire of 2 days or more - not including preparation time/pack out time
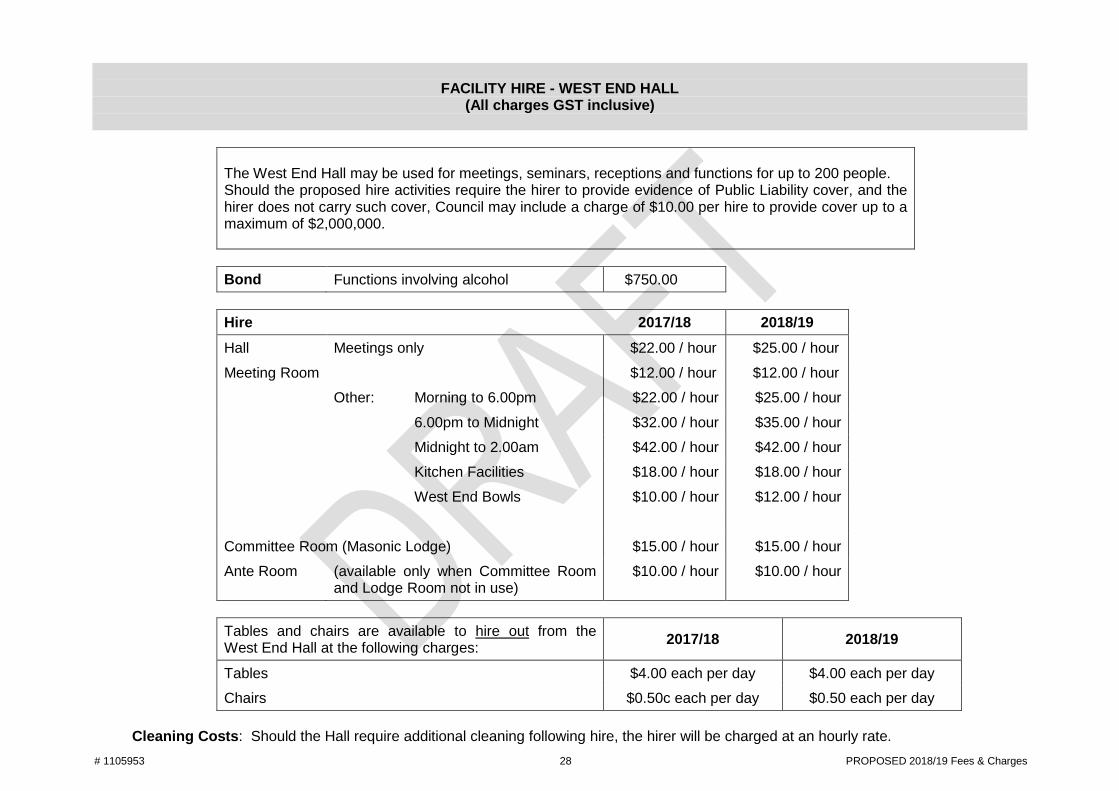
# 1105953 28 PROPOSED 2018/19 Fees & Charges
FACILITY HIRE - WEST END HALL (All charges GST inclusive)
The West End Hall may be used for meetings, seminars, receptions and functions for up to 200 people. Should the proposed hire activities require the hirer to provide evidence of Public Liability cover, and the hirer does not carry such cover, Council may include a charge of $10.00 per hire to provide cover up to a maximum of $2,000,000.
Bond Functions involving alcohol $750.00
Hire 2017/18 2018/19 Hall Meetings only $22.00 / hour $25.00 / hour Meeting Room $12.00 / hour $12.00 / hour Other: Morning to 6.00pm $22.00 / hour $25.00 / hour 6.00pm to Midnight $32.00 / hour $35.00 / hour Midnight to 2.00am $42.00 / hour $42.00 / hour Kitchen Facilities $18.00 / hour $18.00 / hour West End Bowls $10.00 / hour $12.00 / hour
Committee Room (Masonic Lodge) $15.00 / hour $15.00 / hour Ante Room (available only when Committee Room
and Lodge Room not in use) $10.00 / hour $10.00 / hour
Tables and chairs are available to hire out from the West End Hall at the following charges: 2017/18 2018/19
Tables $4.00 each per day $4.00 each per day Chairs $0.50c each per day $0.50 each per day
Cleaning Costs: Should the Hall require additional cleaning following hire, the hirer will be charged at an hourly rate.
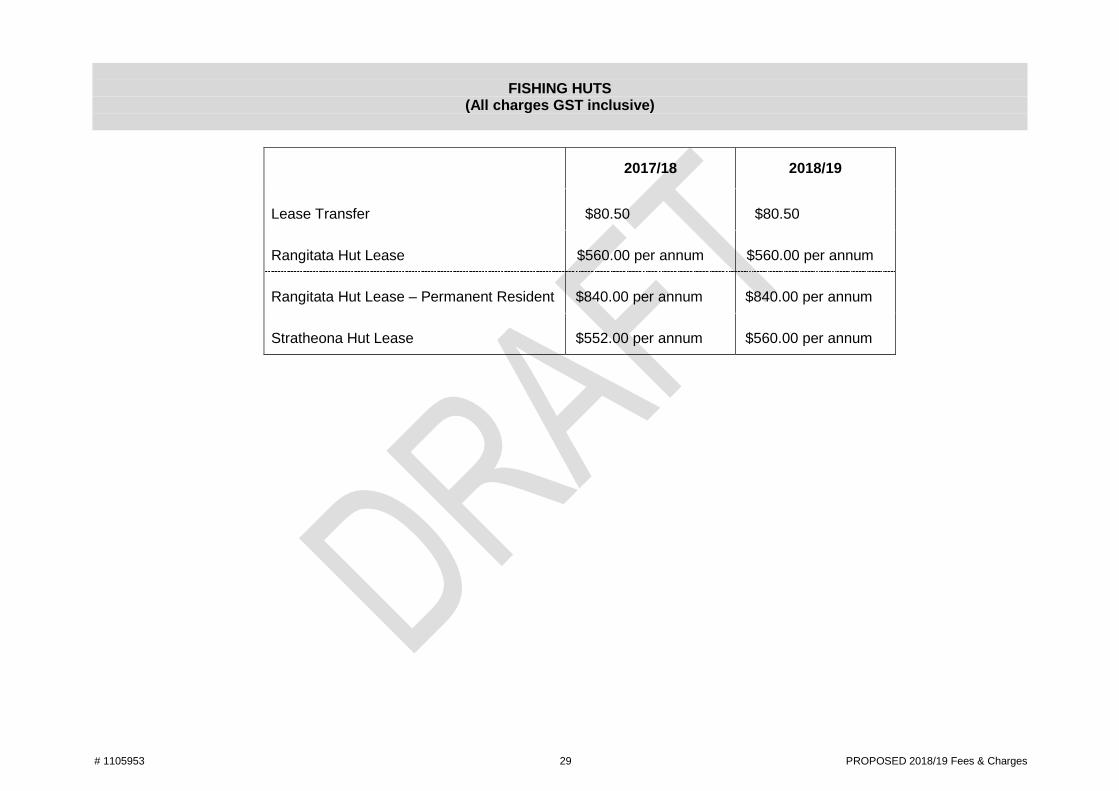
# 1105953 29 PROPOSED 2018/19 Fees & Charges
FISHING HUTS (All charges GST inclusive)
2017/18 2018/19
Lease Transfer $80.50 $80.50
Rangitata Hut Lease $560.00 per annum $560.00 per annum
Rangitata Hut Lease – Permanent Resident $840.00 per annum $840.00 per annum
Stratheona Hut Lease $552.00 per annum $560.00 per annum
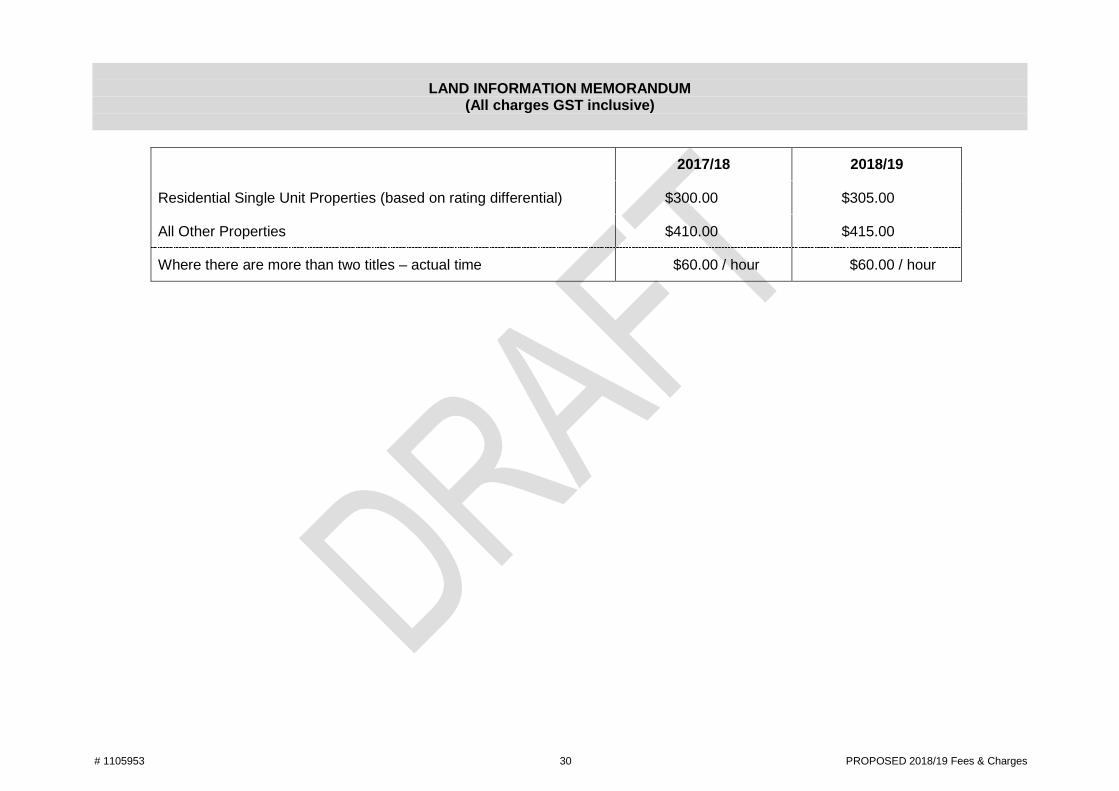
# 1105953 30 PROPOSED 2018/19 Fees & Charges
LAND INFORMATION MEMORANDUM (All charges GST inclusive)
2017/18 2018/19
Residential Single Unit Properties (based on rating differential) $300.00 $305.00
All Other Properties $410.00 $415.00
Where there are more than two titles – actual time $60.00 / hour $60.00 / hour
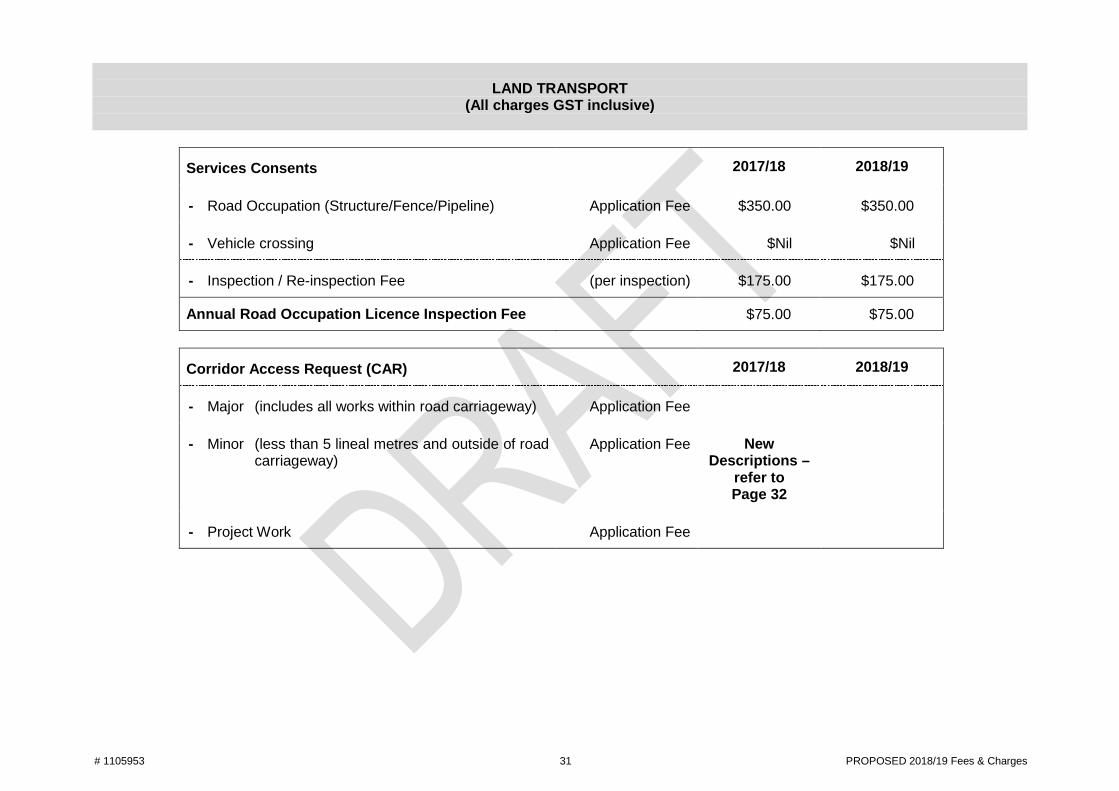
# 1105953 31 PROPOSED 2018/19 Fees & Charges
LAND TRANSPORT (All charges GST inclusive)
Services Consents 2017/18 2018/19
- Road Occupation (Structure/Fence/Pipeline) Application Fee $350.00 $350.00
- Vehicle crossing Application Fee $Nil $Nil
- Inspection / Re-inspection Fee (per inspection) $175.00 $175.00
Annual Road Occupation Licence Inspection Fee $75.00 $75.00
Corridor Access Request (CAR) 2017/18 2018/19
- Major (includes all works within road carriageway) Application Fee
- Minor (less than 5 lineal metres and outside of road carriageway)
Application Fee New Descriptions –
refer to Page 32
- Project Work Application Fee
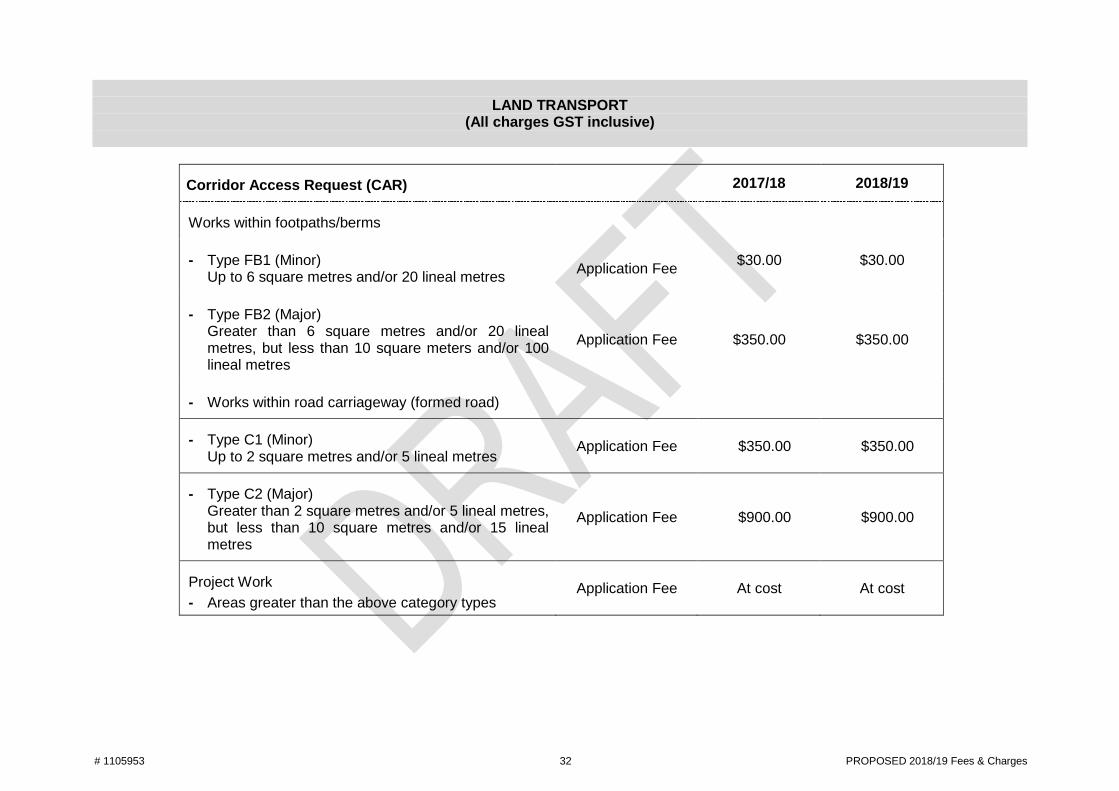
# 1105953 32 PROPOSED 2018/19 Fees & Charges
LAND TRANSPORT
(All charges GST inclusive)
Corridor Access Request (CAR) 2017/18 2018/19
Works within footpaths/berms
- Type FB1 (Minor) Up to 6 square metres and/or 20 lineal metres Application Fee $30.00 $30.00
- Type FB2 (Major) Greater than 6 square metres and/or 20 lineal metres, but less than 10 square meters and/or 100 lineal metres
Application Fee $350.00 $350.00
- Works within road carriageway (formed road)
- Type C1 (Minor) Up to 2 square metres and/or 5 lineal metres
Application Fee $350.00 $350.00
- Type C2 (Major) Greater than 2 square metres and/or 5 lineal metres, but less than 10 square metres and/or 15 lineal metres
Application Fee $900.00 $900.00
Project Work - Areas greater than the above category types
Application Fee At cost At cost
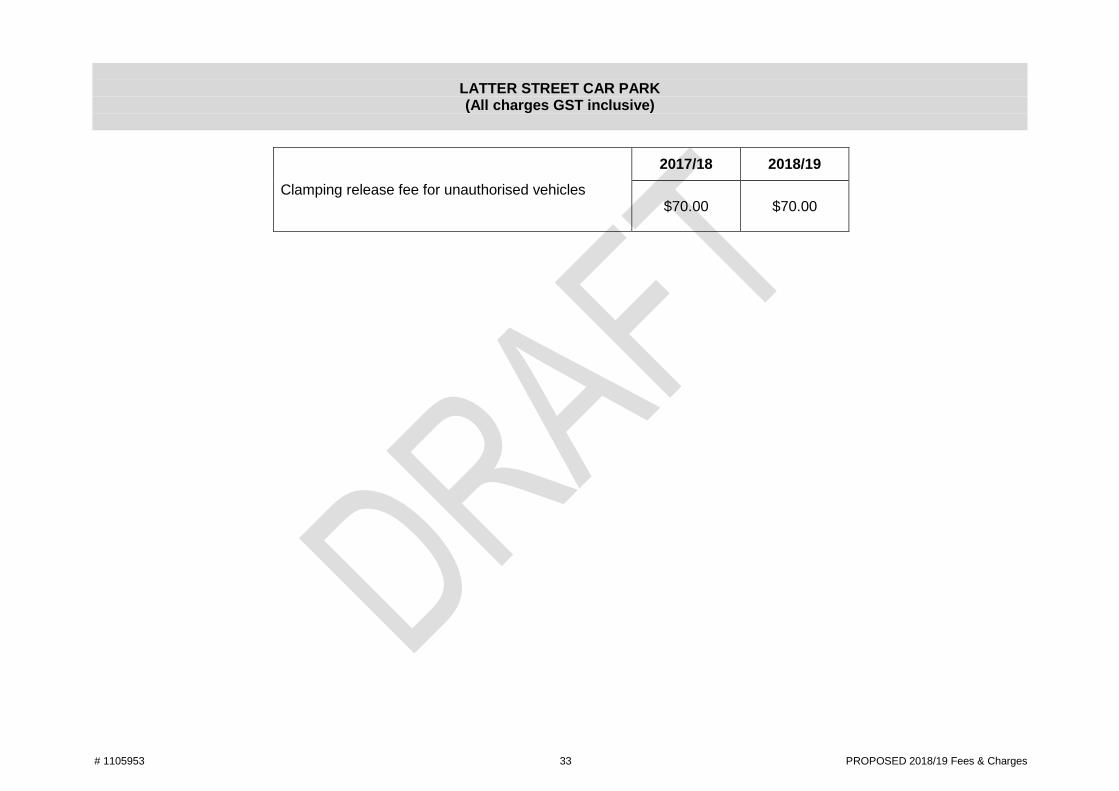
# 1105953 33 PROPOSED 2018/19 Fees & Charges
LATTER STREET CAR PARK (All charges GST inclusive)
Clamping release fee for unauthorised vehicles
2017/18 2018/19
$70.00
$70.00
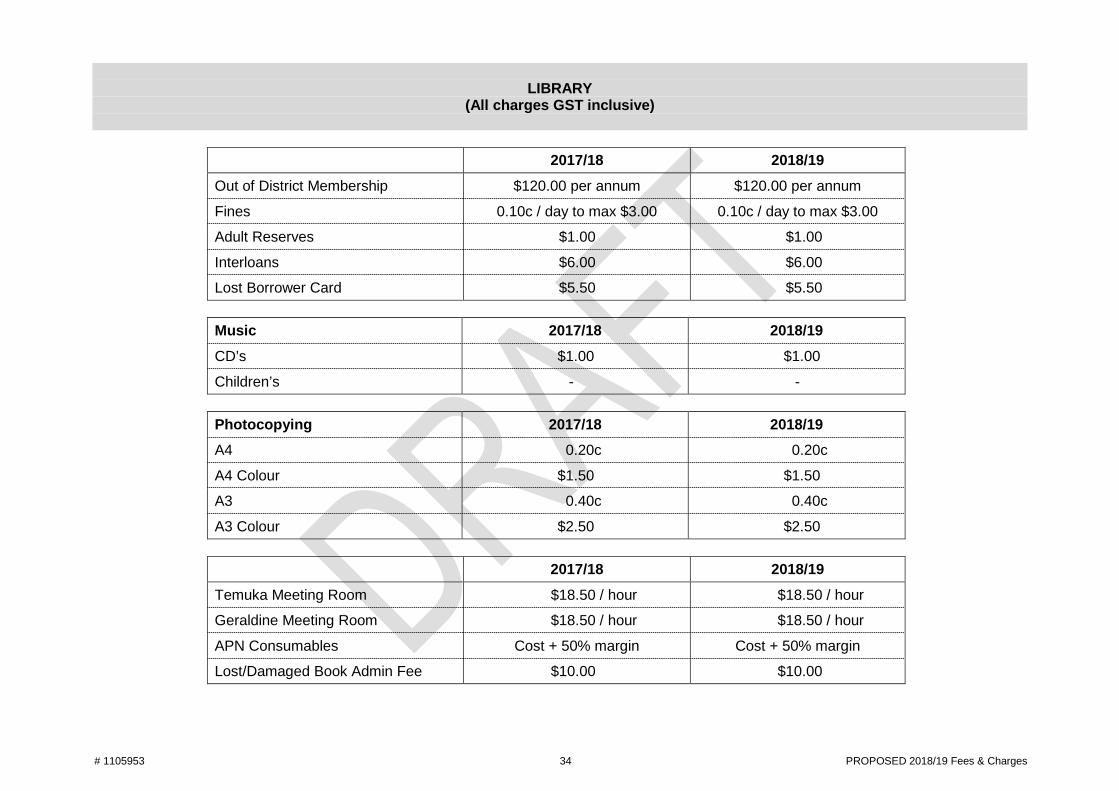
# 1105953 34 PROPOSED 2018/19 Fees & Charges
LIBRARY (All charges GST inclusive)
2017/18 2018/19 Out of District Membership $120.00 per annum $120.00 per annum
Fines 0.10c / day to max $3.00 0.10c / day to max $3.00
Adult Reserves $1.00 $1.00
Interloans $6.00 $6.00
Lost Borrower Card $5.50 $5.50
Music 2017/18 2018/19 CD’s $1.00 $1.00
Children’s - -
Photocopying 2017/18 2018/19 A4 0.20c 0.20c
A4 Colour $1.50 $1.50
A3 0.40c 0.40c
A3 Colour $2.50 $2.50
2017/18 2018/19 Temuka Meeting Room $18.50 / hour $18.50 / hour
Geraldine Meeting Room $18.50 / hour $18.50 / hour
APN Consumables Cost + 50% margin Cost + 50% margin
Lost/Damaged Book Admin Fee $10.00 $10.00
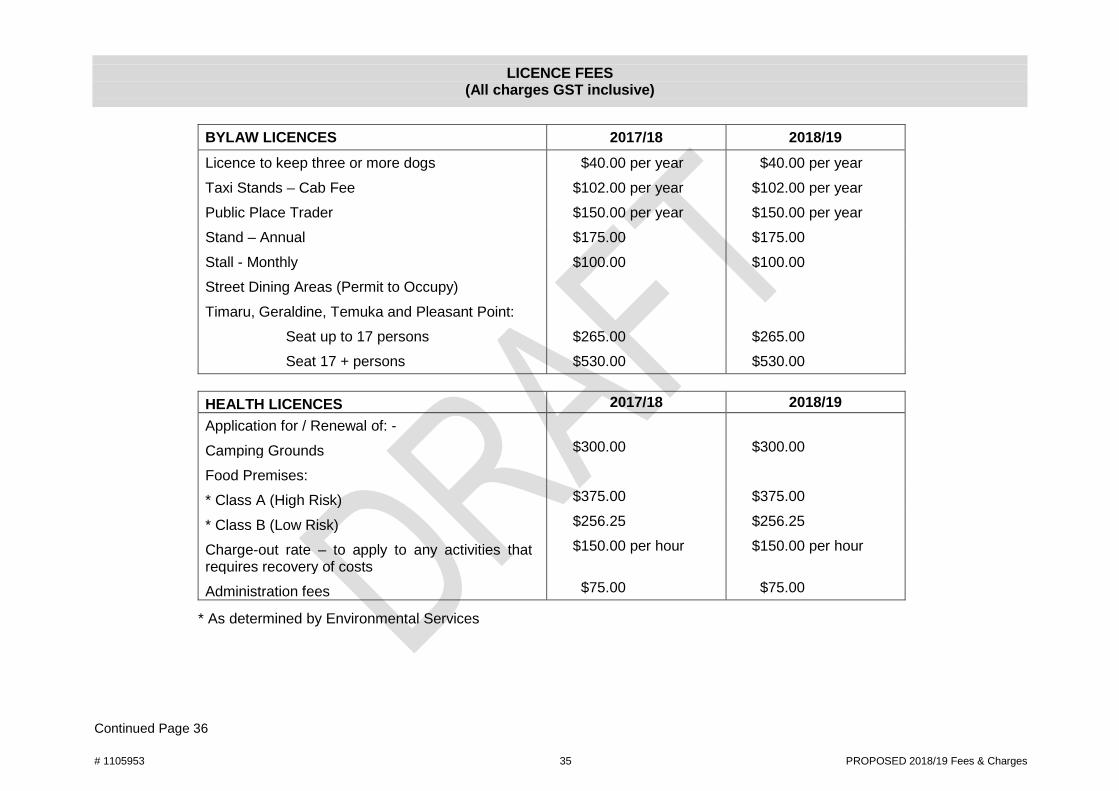
# 1105953 35 PROPOSED 2018/19 Fees & Charges
LICENCE FEES (All charges GST inclusive)
BYLAW LICENCES 2017/18 2018/19 Licence to keep three or more dogs $40.00 per year $40.00 per year Taxi Stands – Cab Fee $102.00 per year $102.00 per year Public Place Trader $150.00 per year $150.00 per year Stand – Annual $175.00 $175.00 Stall - Monthly $100.00 $100.00 Street Dining Areas (Permit to Occupy) Timaru, Geraldine, Temuka and Pleasant Point: Seat up to 17 persons $265.00 $265.00 Seat 17 + persons $530.00 $530.00
HEALTH LICENCES 2017/18 2018/19 Application for / Renewal of: - Camping Grounds $300.00 $300.00
Food Premises:
* Class A (High Risk) $375.00 $375.00
* Class B (Low Risk) $256.25 $256.25
Charge-out rate – to apply to any activities that requires recovery of costs
$150.00 per hour $150.00 per hour
Administration fees $75.00 $75.00
* As determined by Environmental Services
Continued Page 36
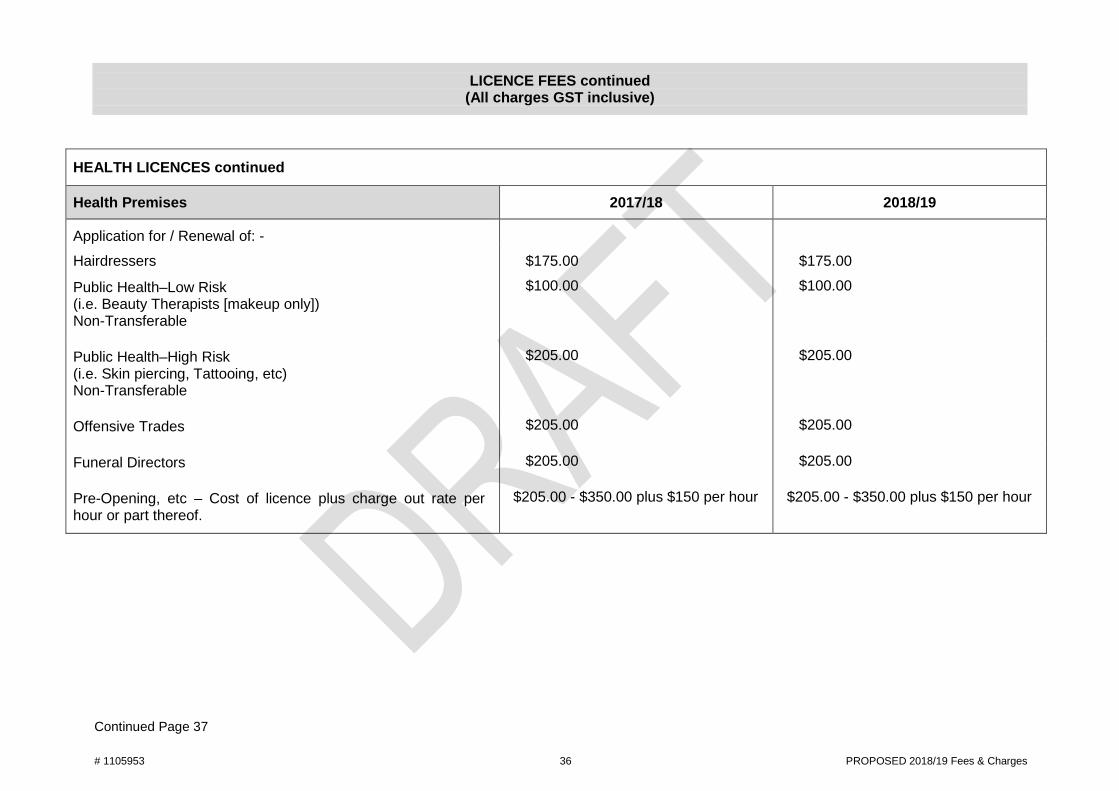
# 1105953 36 PROPOSED 2018/19 Fees & Charges
LICENCE FEES continued (All charges GST inclusive)
HEALTH LICENCES continued
Health Premises 2017/18 2018/19
Application for / Renewal of: - Hairdressers $175.00 $175.00
Public Health–Low Risk (i.e. Beauty Therapists [makeup only]) Non-Transferable
$100.00 $100.00
Public Health–High Risk (i.e. Skin piercing, Tattooing, etc) Non-Transferable
$205.00 $205.00
Offensive Trades $205.00 $205.00
Funeral Directors $205.00 $205.00
Pre-Opening, etc – Cost of licence plus charge out rate per hour or part thereof.
$205.00 - $350.00 plus $150 per hour $205.00 - $350.00 plus $150 per hour
Continued Page 37
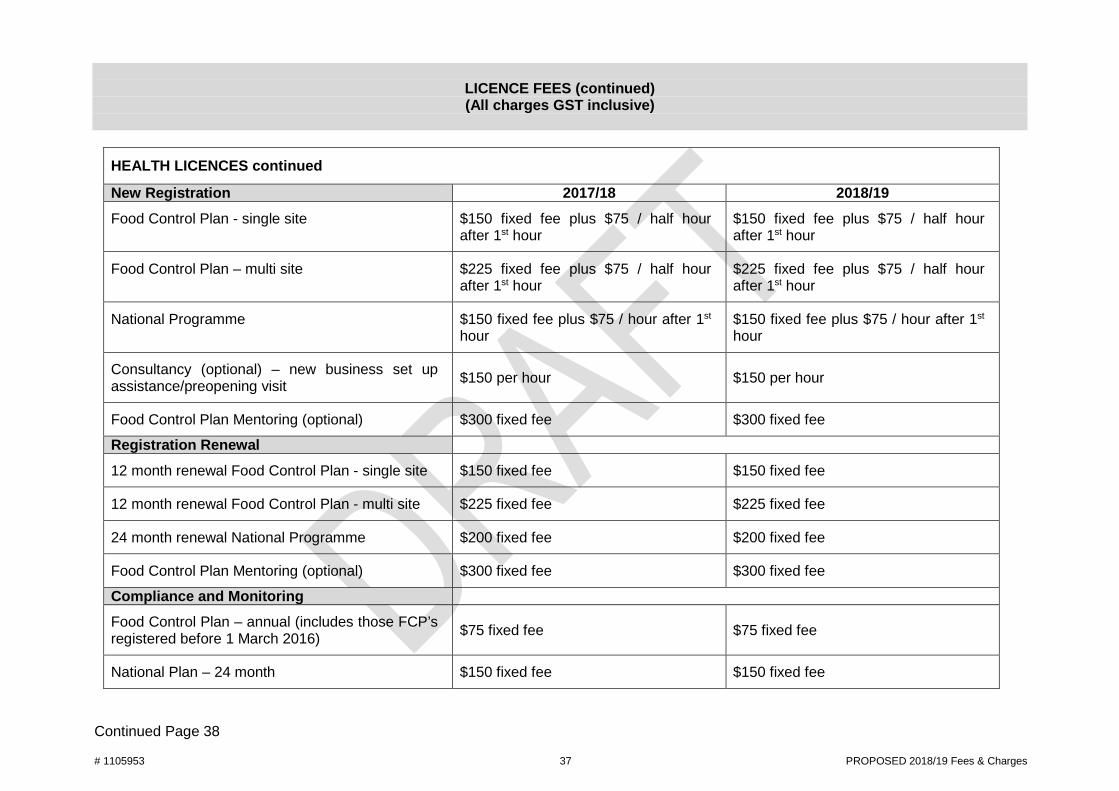
# 1105953 37 PROPOSED 2018/19 Fees & Charges
LICENCE FEES (continued) (All charges GST inclusive)
HEALTH LICENCES continued
New Registration 2017/18 2018/19 Food Control Plan - single site $150 fixed fee plus $75 / half hour
after 1st hour $150 fixed fee plus $75 / half hour after 1st hour
Food Control Plan – multi site $225 fixed fee plus $75 / half hour after 1st hour
$225 fixed fee plus $75 / half hour after 1st hour
National Programme $150 fixed fee plus $75 / hour after 1st hour
$150 fixed fee plus $75 / hour after 1st hour
Consultancy (optional) – new business set up assistance/preopening visit $150 per hour $150 per hour
Food Control Plan Mentoring (optional) $300 fixed fee $300 fixed fee
Registration Renewal 12 month renewal Food Control Plan - single site $150 fixed fee $150 fixed fee
12 month renewal Food Control Plan - multi site $225 fixed fee $225 fixed fee
24 month renewal National Programme $200 fixed fee $200 fixed fee
Food Control Plan Mentoring (optional) $300 fixed fee $300 fixed fee
Compliance and Monitoring Food Control Plan – annual (includes those FCP’s registered before 1 March 2016) $75 fixed fee $75 fixed fee
National Plan – 24 month $150 fixed fee $150 fixed fee
Continued Page 38
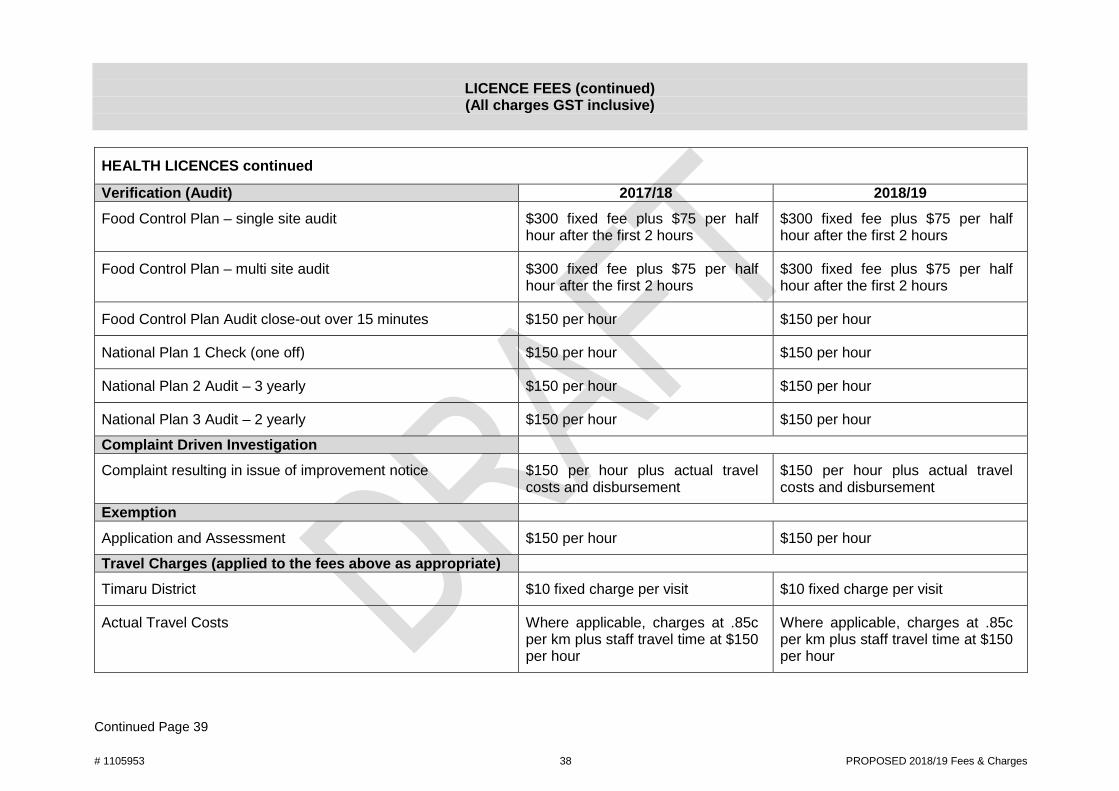
# 1105953 38 PROPOSED 2018/19 Fees & Charges
LICENCE FEES (continued) (All charges GST inclusive)
HEALTH LICENCES continued
Verification (Audit) 2017/18 2018/19 Food Control Plan – single site audit $300 fixed fee plus $75 per half
hour after the first 2 hours $300 fixed fee plus $75 per half hour after the first 2 hours
Food Control Plan – multi site audit $300 fixed fee plus $75 per half hour after the first 2 hours
$300 fixed fee plus $75 per half hour after the first 2 hours
Food Control Plan Audit close-out over 15 minutes $150 per hour $150 per hour
National Plan 1 Check (one off) $150 per hour $150 per hour
National Plan 2 Audit – 3 yearly $150 per hour $150 per hour
National Plan 3 Audit – 2 yearly $150 per hour $150 per hour
Complaint Driven Investigation Complaint resulting in issue of improvement notice $150 per hour plus actual travel
costs and disbursement $150 per hour plus actual travel costs and disbursement
Exemption Application and Assessment $150 per hour $150 per hour
Travel Charges (applied to the fees above as appropriate) Timaru District $10 fixed charge per visit $10 fixed charge per visit
Actual Travel Costs Where applicable, charges at .85c per km plus staff travel time at $150 per hour
Where applicable, charges at .85c per km plus staff travel time at $150 per hour
Continued Page 39
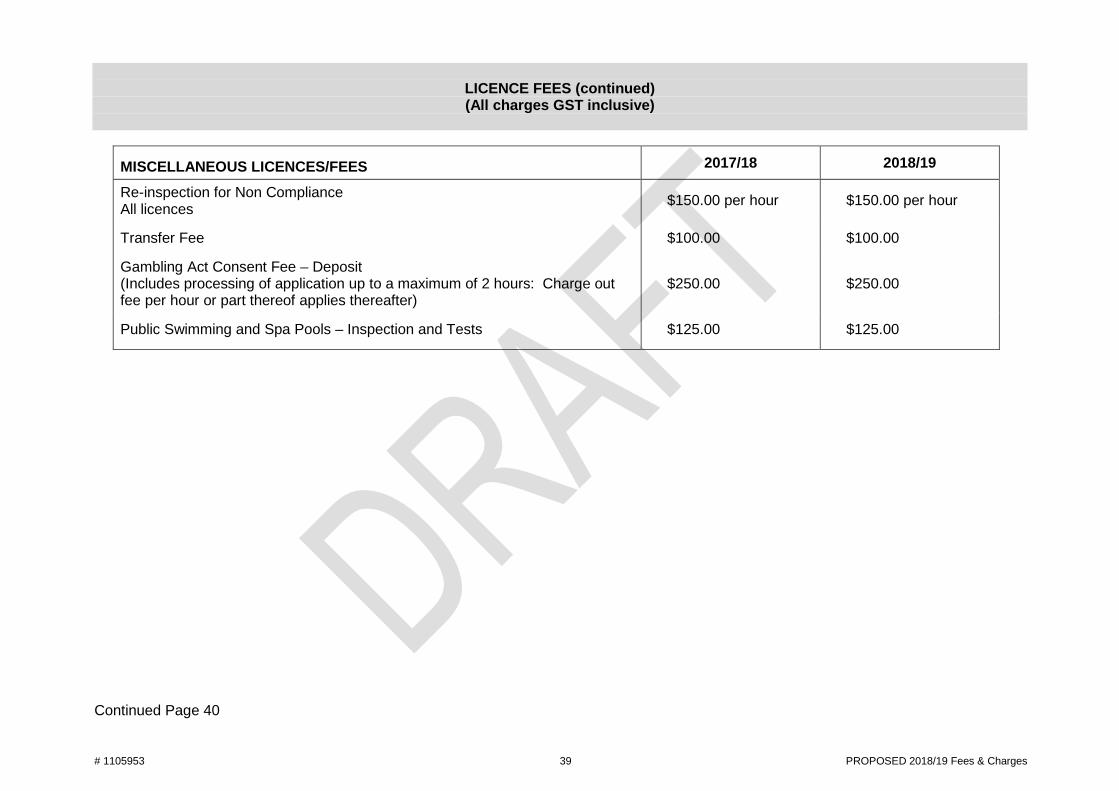
# 1105953 39 PROPOSED 2018/19 Fees & Charges
LICENCE FEES (continued) (All charges GST inclusive)
MISCELLANEOUS LICENCES/FEES 2017/18 2018/19
Re-inspection for Non Compliance All licences $150.00 per hour $150.00 per hour
Transfer Fee $100.00 $100.00
Gambling Act Consent Fee – Deposit (Includes processing of application up to a maximum of 2 hours: Charge out fee per hour or part thereof applies thereafter)
$250.00 $250.00
Public Swimming and Spa Pools – Inspection and Tests $125.00 $125.00
Continued Page 40
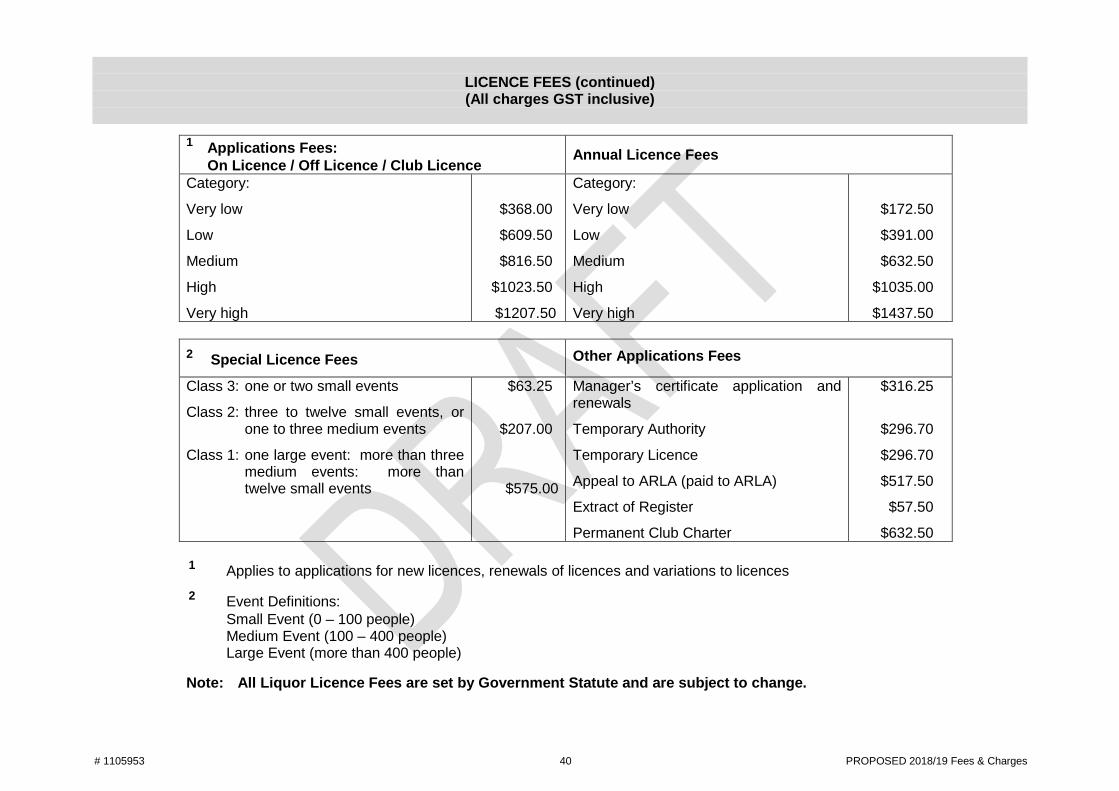
# 1105953 40 PROPOSED 2018/19 Fees & Charges
LICENCE FEES (continued) (All charges GST inclusive)
1 Applications Fees: On Licence / Off Licence / Club Licence
Annual Licence Fees
Category:
Very low
Low
Medium
High
Very high
$368.00
$609.50
$816.50
$1023.50
$1207.50
Category:
Very low
Low
Medium
High
Very high
$172.50
$391.00
$632.50
$1035.00
$1437.50
2 Special Licence Fees Other Applications Fees
Class 3: one or two small events
Class 2: three to twelve small events, or one to three medium events
Class 1: one large event: more than three medium events: more than twelve small events
$63.25
$207.00
$575.00
Manager’s certificate application and renewals
Temporary Authority
Temporary Licence
Appeal to ARLA (paid to ARLA)
Extract of Register
Permanent Club Charter
$316.25
$296.70
$296.70
$517.50
$57.50
$632.50
1 Applies to applications for new licences, renewals of licences and variations to licences
2 Event Definitions: Small Event (0 – 100 people) Medium Event (100 – 400 people) Large Event (more than 400 people)
Note: All Liquor Licence Fees are set by Government Statute and are subject to change.
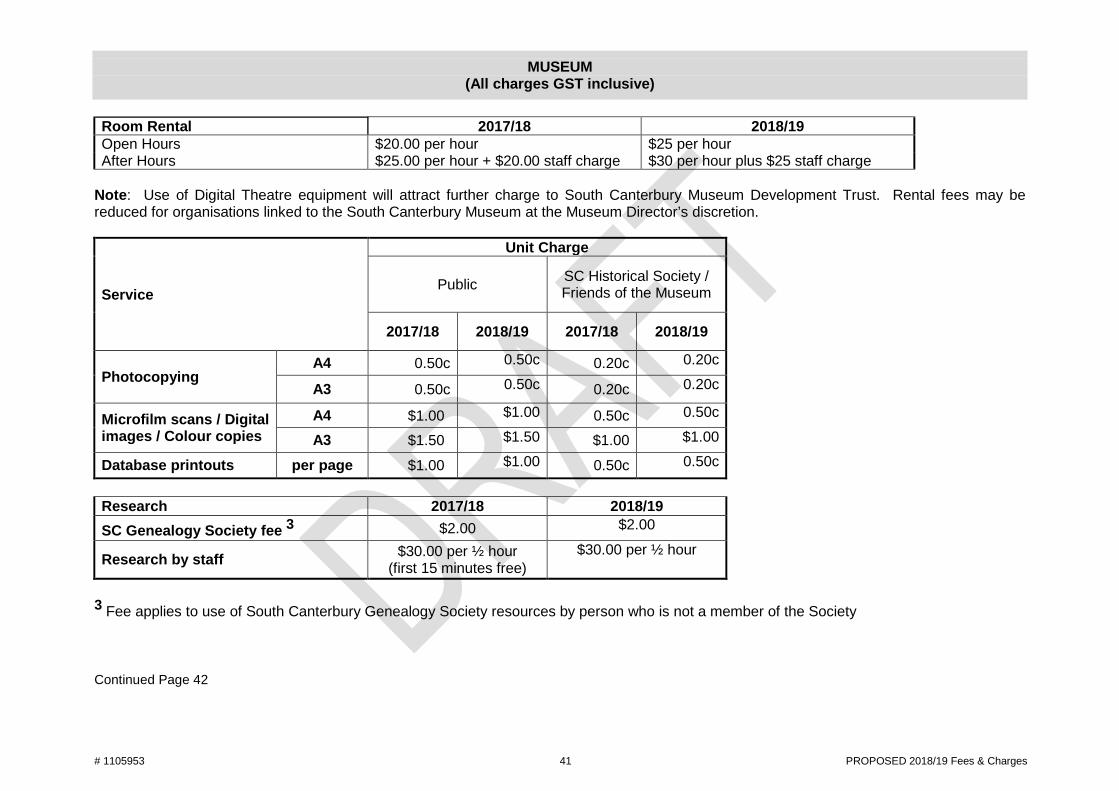
# 1105953 41 PROPOSED 2018/19 Fees & Charges
MUSEUM (All charges GST inclusive)
Room Rental 2017/18 2018/19 Open Hours $20.00 per hour $25 per hour After Hours $25.00 per hour + $20.00 staff charge $30 per hour plus $25 staff charge
Note: Use of Digital Theatre equipment will attract further charge to South Canterbury Museum Development Trust. Rental fees may be reduced for organisations linked to the South Canterbury Museum at the Museum Director’s discretion.
Service
Unit Charge
Public SC Historical Society / Friends of the Museum
2017/18 2018/19 2017/18 2018/19
Photocopying A4 0.50c 0.50c 0.20c 0.20c
A3 0.50c 0.50c 0.20c 0.20c
Microfilm scans / Digital images / Colour copies
A4 $1.00 $1.00 0.50c 0.50c
A3 $1.50 $1.50 $1.00 $1.00
Database printouts per page $1.00 $1.00 0.50c 0.50c
Research 2017/18 2018/19 SC Genealogy Society fee 3 $2.00 $2.00
Research by staff $30.00 per ½ hour (first 15 minutes free)
$30.00 per ½ hour
3 Fee applies to use of South Canterbury Genealogy Society resources by person who is not a member of the Society
Continued Page 42
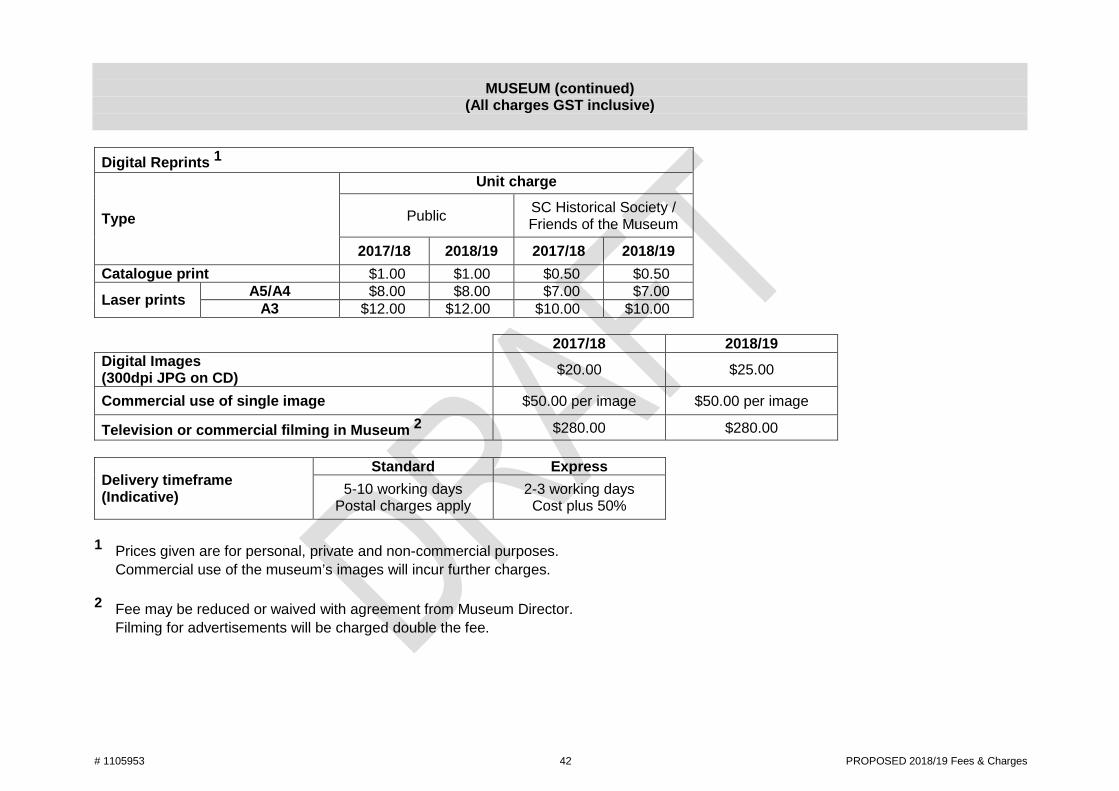
# 1105953 42 PROPOSED 2018/19 Fees & Charges
MUSEUM (continued) (All charges GST inclusive)
Digital Reprints 1
Type
Unit charge
Public SC Historical Society / Friends of the Museum
2017/18 2018/19 2017/18 2018/19 Catalogue print $1.00 $1.00 $0.50 $0.50
Laser prints A5/A4 $8.00 $8.00 $7.00 $7.00 A3 $12.00 $12.00 $10.00 $10.00
2017/18 2018/19 Digital Images (300dpi JPG on CD) $20.00 $25.00
Commercial use of single image $50.00 per image $50.00 per image
Television or commercial filming in Museum 2 $280.00 $280.00
Delivery timeframe (Indicative)
Standard Express 5-10 working days
Postal charges apply 2-3 working days Cost plus 50%
1 Prices given are for personal, private and non-commercial purposes. Commercial use of the museum’s images will incur further charges. 2 Fee may be reduced or waived with agreement from Museum Director. Filming for advertisements will be charged double the fee.
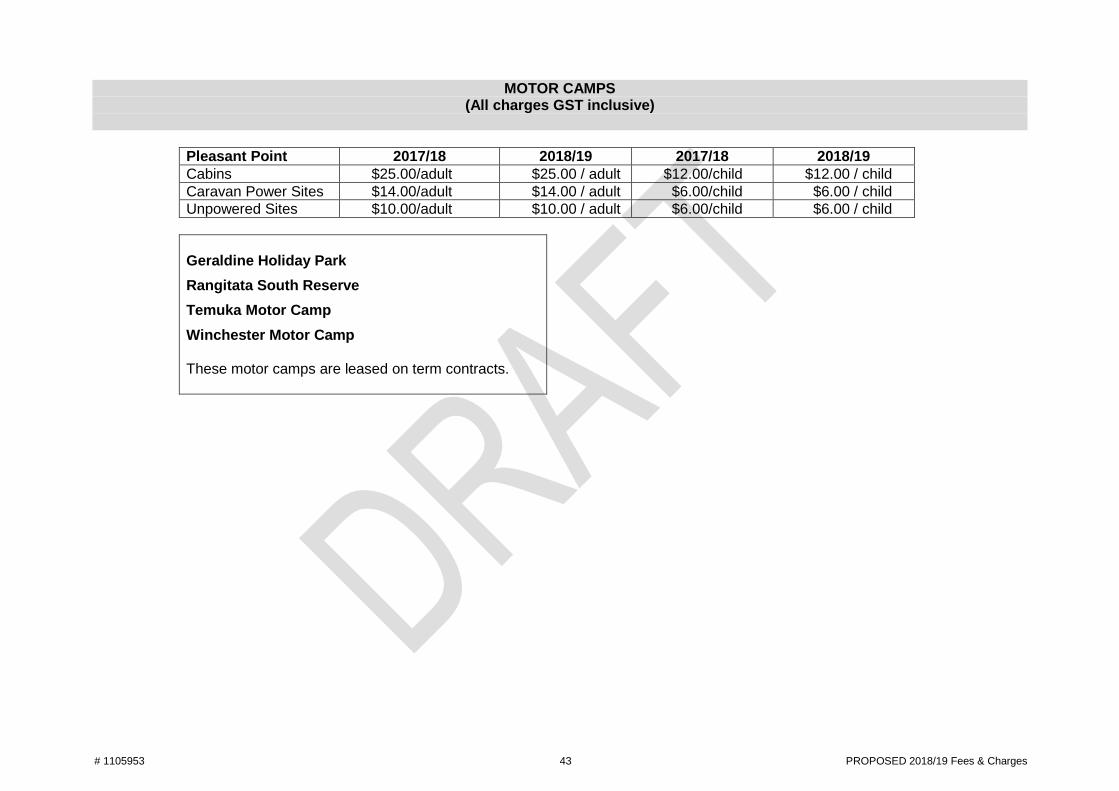
# 1105953 43 PROPOSED 2018/19 Fees & Charges
MOTOR CAMPS (All charges GST inclusive)
Pleasant Point 2017/18 2018/19 2017/18 2018/19 Cabins $25.00/adult $25.00 / adult $12.00/child $12.00 / child Caravan Power Sites $14.00/adult $14.00 / adult $6.00/child $6.00 / child Unpowered Sites $10.00/adult $10.00 / adult $6.00/child $6.00 / child
Geraldine Holiday Park Rangitata South Reserve Temuka Motor Camp Winchester Motor Camp These motor camps are leased on term contracts.
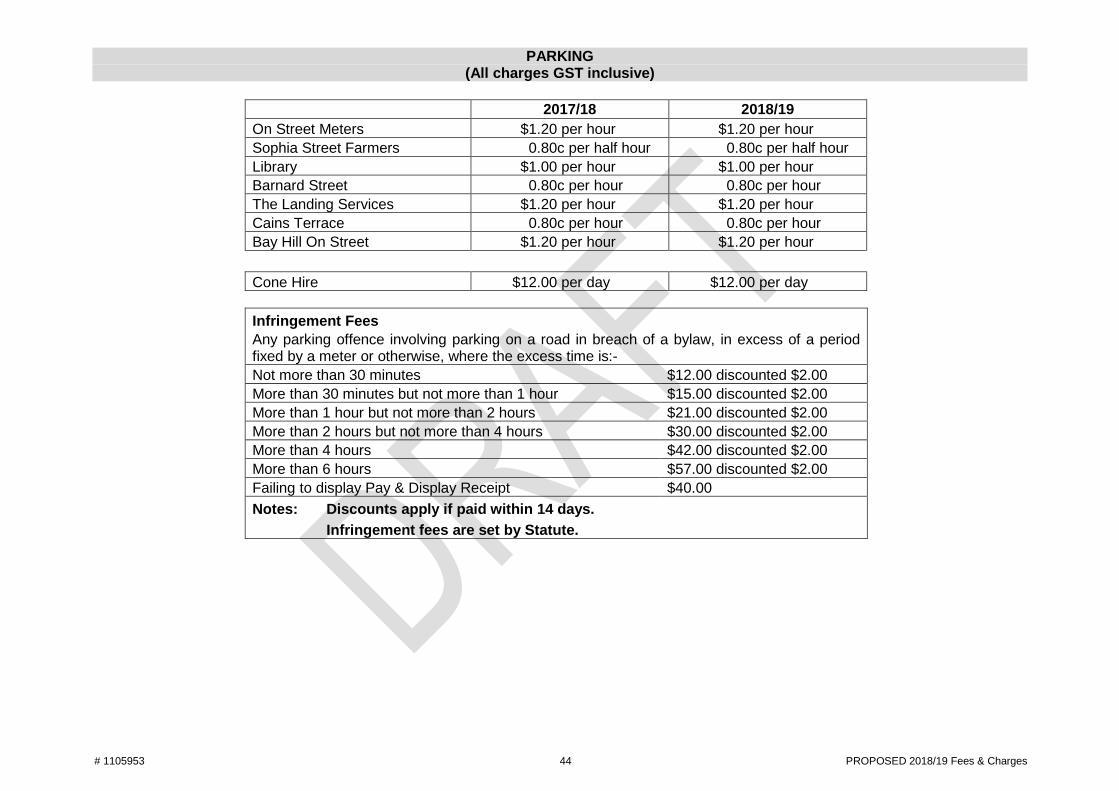
# 1105953 44 PROPOSED 2018/19 Fees & Charges
PARKING (All charges GST inclusive)
2017/18 2018/19 On Street Meters $1.20 per hour $1.20 per hour Sophia Street Farmers 0.80c per half hour 0.80c per half hour Library $1.00 per hour $1.00 per hour Barnard Street 0.80c per hour 0.80c per hour The Landing Services $1.20 per hour $1.20 per hour Cains Terrace 0.80c per hour 0.80c per hour Bay Hill On Street $1.20 per hour $1.20 per hour Cone Hire $12.00 per day $12.00 per day
Infringement Fees Any parking offence involving parking on a road in breach of a bylaw, in excess of a period fixed by a meter or otherwise, where the excess time is:- Not more than 30 minutes $12.00 discounted $2.00 More than 30 minutes but not more than 1 hour $15.00 discounted $2.00 More than 1 hour but not more than 2 hours $21.00 discounted $2.00 More than 2 hours but not more than 4 hours $30.00 discounted $2.00 More than 4 hours $42.00 discounted $2.00 More than 6 hours $57.00 discounted $2.00 Failing to display Pay & Display Receipt $40.00 Notes: Discounts apply if paid within 14 days. Infringement fees are set by Statute.
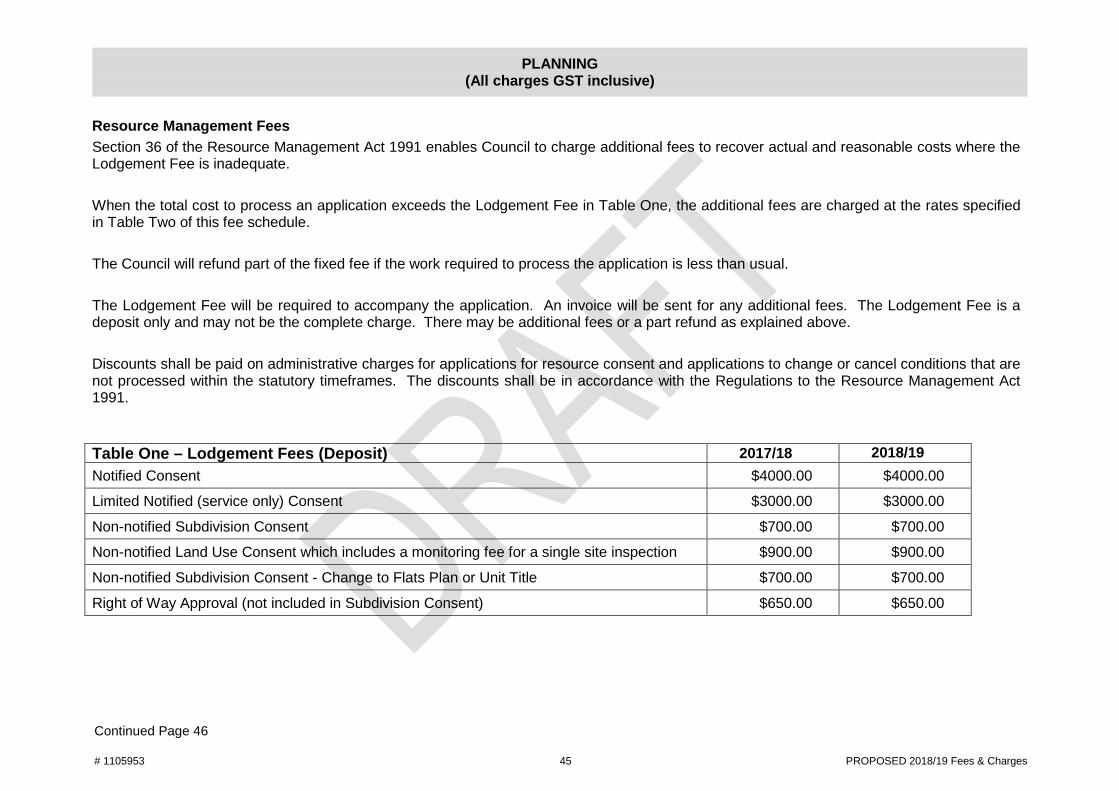
# 1105953 45 PROPOSED 2018/19 Fees & Charges
.
PLANNING (All charges GST inclusive)
Resource Management Fees Section 36 of the Resource Management Act 1991 enables Council to charge additional fees to recover actual and reasonable costs where the Lodgement Fee is inadequate. When the total cost to process an application exceeds the Lodgement Fee in Table One, the additional fees are charged at the rates specified in Table Two of this fee schedule. The Council will refund part of the fixed fee if the work required to process the application is less than usual. The Lodgement Fee will be required to accompany the application. An invoice will be sent for any additional fees. The Lodgement Fee is a deposit only and may not be the complete charge. There may be additional fees or a part refund as explained above. Discounts shall be paid on administrative charges for applications for resource consent and applications to change or cancel conditions that are not processed within the statutory timeframes. The discounts shall be in accordance with the Regulations to the Resource Management Act 1991. Table One – Lodgement Fees (Deposit) 2017/18 2018/19 Notified Consent $4000.00 $4000.00
Limited Notified (service only) Consent $3000.00 $3000.00
Non-notified Subdivision Consent $700.00 $700.00
Non-notified Land Use Consent which includes a monitoring fee for a single site inspection $900.00 $900.00
Non-notified Subdivision Consent - Change to Flats Plan or Unit Title $700.00 $700.00
Right of Way Approval (not included in Subdivision Consent) $650.00 $650.00 Continued Page 46
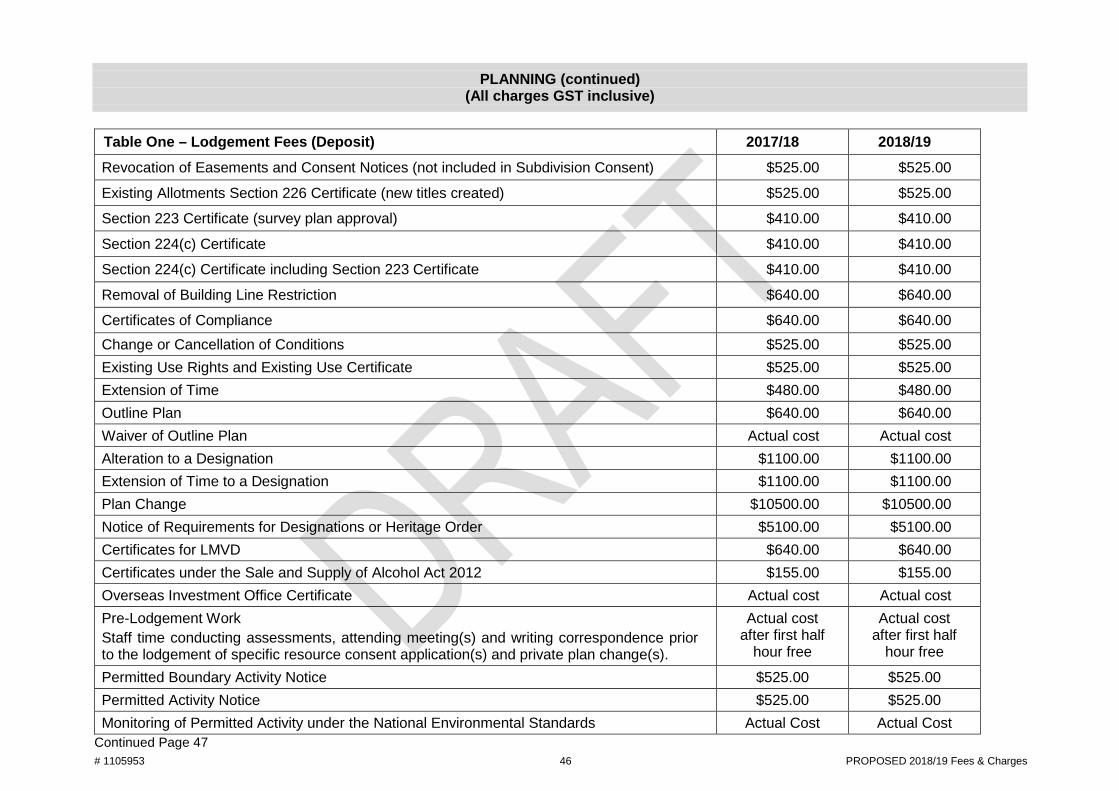
# 1105953 46 PROPOSED 2018/19 Fees & Charges
PLANNING (continued) (All charges GST inclusive)
Table One – Lodgement Fees (Deposit) 2017/18 2018/19 Revocation of Easements and Consent Notices (not included in Subdivision Consent) $525.00 $525.00
Existing Allotments Section 226 Certificate (new titles created) $525.00 $525.00
Section 223 Certificate (survey plan approval) $410.00 $410.00
Section 224(c) Certificate $410.00 $410.00
Section 224(c) Certificate including Section 223 Certificate $410.00 $410.00
Removal of Building Line Restriction $640.00 $640.00
Certificates of Compliance $640.00 $640.00 Change or Cancellation of Conditions $525.00 $525.00 Existing Use Rights and Existing Use Certificate $525.00 $525.00 Extension of Time $480.00 $480.00 Outline Plan $640.00 $640.00 Waiver of Outline Plan Actual cost Actual cost Alteration to a Designation $1100.00 $1100.00 Extension of Time to a Designation $1100.00 $1100.00 Plan Change $10500.00 $10500.00 Notice of Requirements for Designations or Heritage Order $5100.00 $5100.00 Certificates for LMVD $640.00 $640.00 Certificates under the Sale and Supply of Alcohol Act 2012 $155.00 $155.00 Overseas Investment Office Certificate Actual cost Actual cost Pre-Lodgement Work Staff time conducting assessments, attending meeting(s) and writing correspondence prior to the lodgement of specific resource consent application(s) and private plan change(s).
Actual cost after first half
hour free
Actual cost after first half
hour free
Permitted Boundary Activity Notice $525.00 $525.00 Permitted Activity Notice $525.00 $525.00 Monitoring of Permitted Activity under the National Environmental Standards Actual Cost Actual Cost
Continued Page 47
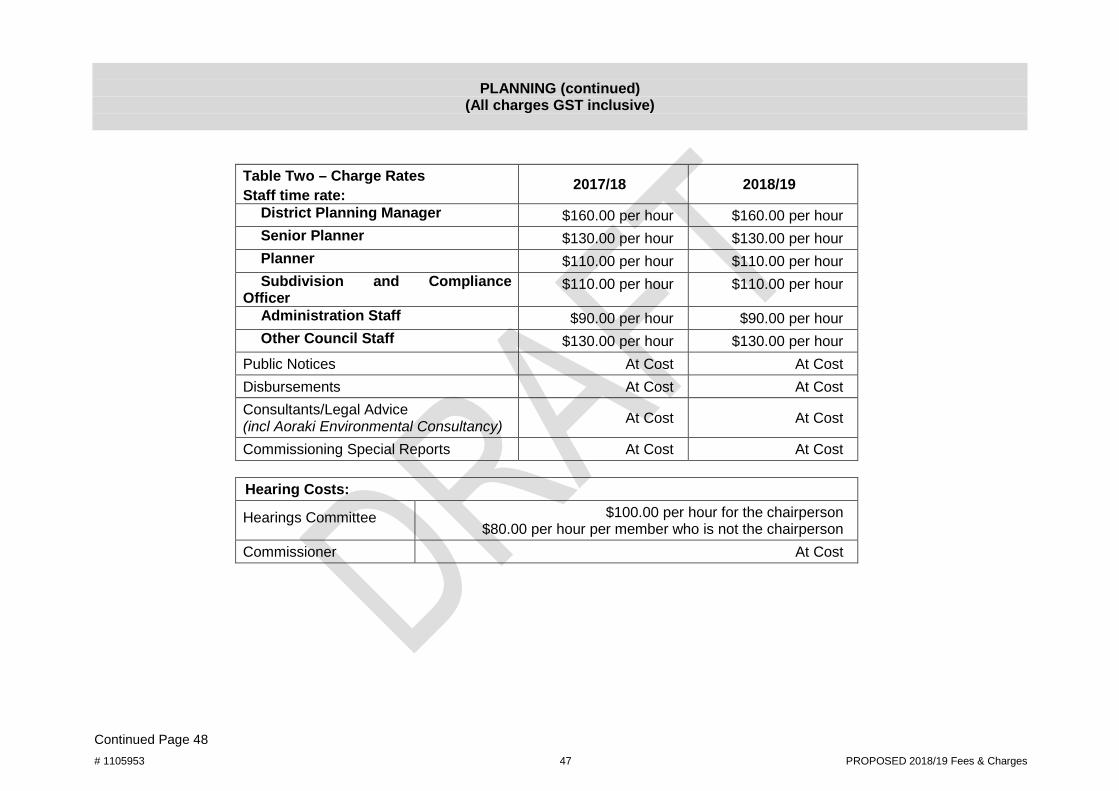
# 1105953 47 PROPOSED 2018/19 Fees & Charges
PLANNING (continued) (All charges GST inclusive)
Table Two – Charge Rates Staff time rate:
2017/18 2018/19
District Planning Manager $160.00 per hour $160.00 per hour Senior Planner $130.00 per hour $130.00 per hour Planner $110.00 per hour $110.00 per hour Subdivision and Compliance Officer
$110.00 per hour $110.00 per hour
Administration Staff $90.00 per hour $90.00 per hour Other Council Staff $130.00 per hour $130.00 per hour Public Notices At Cost At Cost Disbursements At Cost At Cost Consultants/Legal Advice (incl Aoraki Environmental Consultancy) At Cost At Cost
Commissioning Special Reports At Cost At Cost
Hearing Costs:
Hearings Committee $100.00 per hour for the chairperson $80.00 per hour per member who is not the chairperson
Commissioner At Cost Continued Page 48
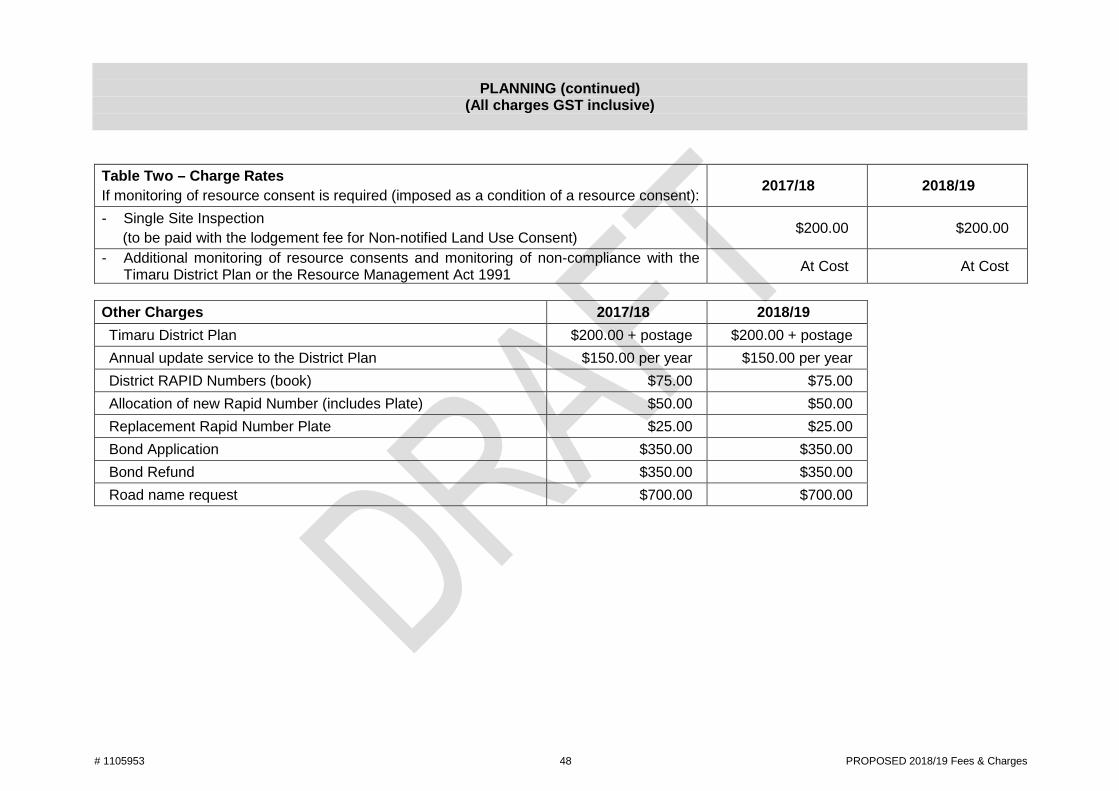
# 1105953 48 PROPOSED 2018/19 Fees & Charges
PLANNING (continued) (All charges GST inclusive)
Table Two – Charge Rates If monitoring of resource consent is required (imposed as a condition of a resource consent): 2017/18 2018/19
- Single Site Inspection (to be paid with the lodgement fee for Non-notified Land Use Consent) $200.00 $200.00
- Additional monitoring of resource consents and monitoring of non-compliance with the Timaru District Plan or the Resource Management Act 1991 At Cost At Cost
Other Charges 2017/18 2018/19 Timaru District Plan $200.00 + postage $200.00 + postage Annual update service to the District Plan $150.00 per year $150.00 per year District RAPID Numbers (book) $75.00 $75.00 Allocation of new Rapid Number (includes Plate) $50.00 $50.00 Replacement Rapid Number Plate $25.00 $25.00 Bond Application $350.00 $350.00 Bond Refund $350.00 $350.00 Road name request $700.00 $700.00
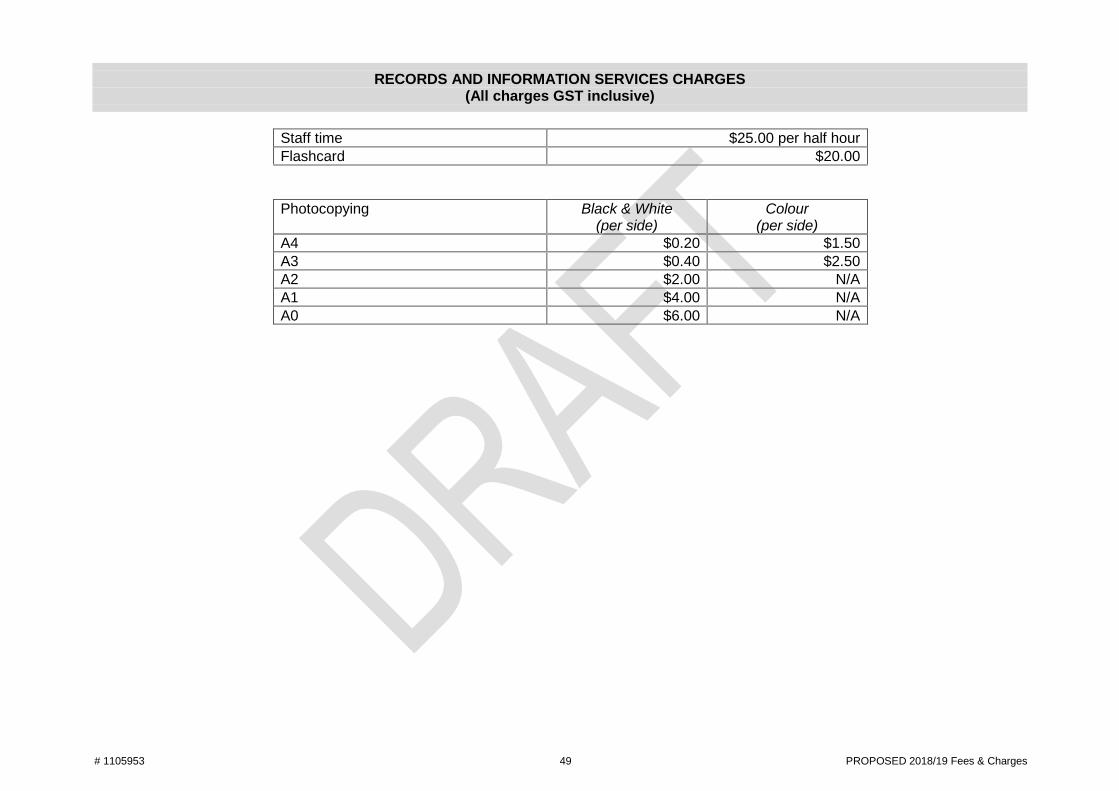
# 1105953 49 PROPOSED 2018/19 Fees & Charges
RECORDS AND INFORMATION SERVICES CHARGES (All charges GST inclusive)
Staff time $25.00 per half hour Flashcard $20.00
Photocopying Black & White (per side)
Colour (per side)
A4 $0.20 $1.50 A3 $0.40 $2.50 A2 $2.00 N/A A1 $4.00 N/A A0 $6.00 N/A
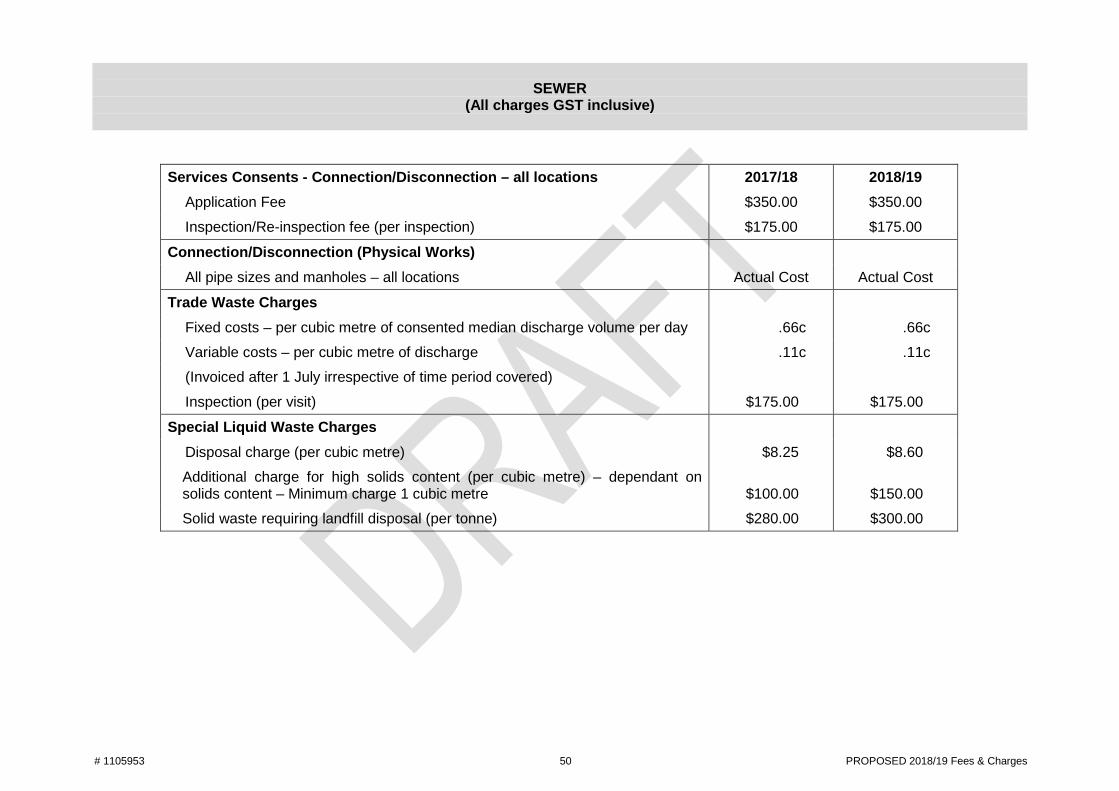
# 1105953 50 PROPOSED 2018/19 Fees & Charges
SEWER (All charges GST inclusive)
Services Consents - Connection/Disconnection – all locations 2017/18 2018/19 Application Fee $350.00 $350.00 Inspection/Re-inspection fee (per inspection) $175.00 $175.00
Connection/Disconnection (Physical Works) All pipe sizes and manholes – all locations Actual Cost Actual Cost
Trade Waste Charges Fixed costs – per cubic metre of consented median discharge volume per day .66c .66c Variable costs – per cubic metre of discharge .11c .11c (Invoiced after 1 July irrespective of time period covered) Inspection (per visit) $175.00 $175.00
Special Liquid Waste Charges Disposal charge (per cubic metre) $8.25 $8.60 Additional charge for high solids content (per cubic metre) – dependant on
solids content – Minimum charge 1 cubic metre $100.00
$150.00
Solid waste requiring landfill disposal (per tonne) $280.00 $300.00
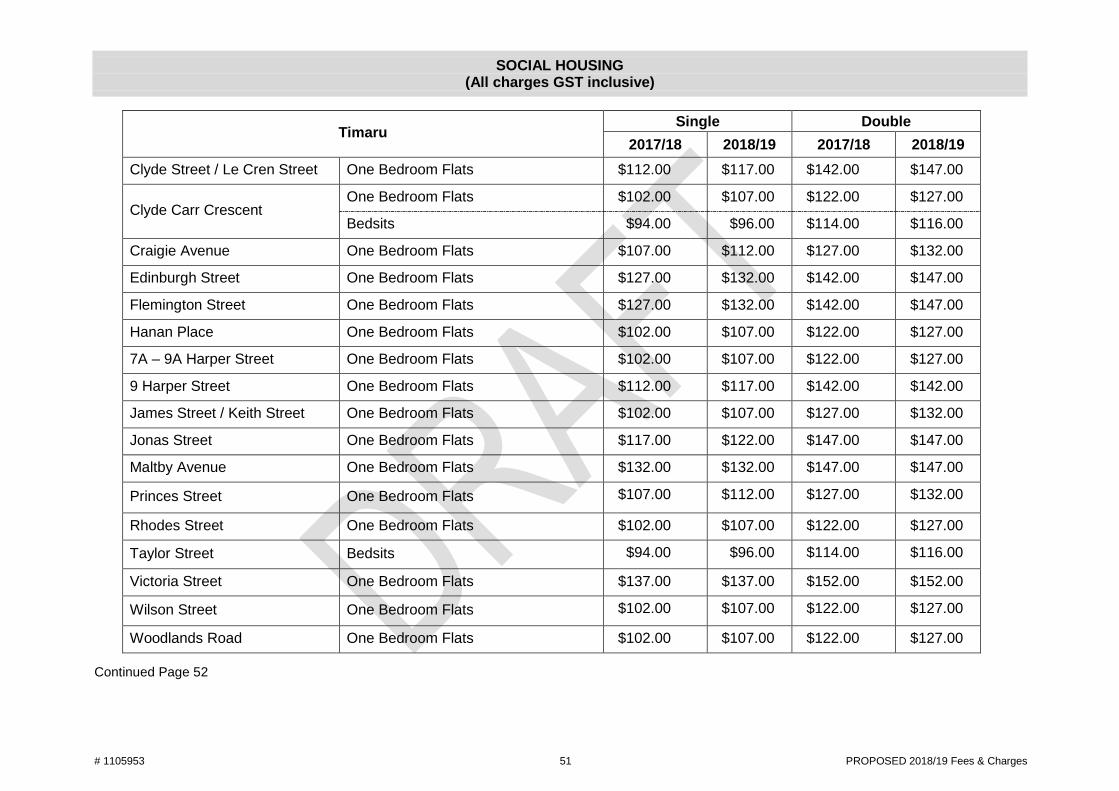
# 1105953 51 PROPOSED 2018/19 Fees & Charges
SOCIAL HOUSING (All charges GST inclusive)
Timaru Single Double
2017/18 2018/19 2017/18 2018/19 Clyde Street / Le Cren Street One Bedroom Flats $112.00 $117.00 $142.00 $147.00
Clyde Carr Crescent One Bedroom Flats $102.00 $107.00 $122.00 $127.00
Bedsits $94.00 $96.00 $114.00 $116.00
Craigie Avenue One Bedroom Flats $107.00 $112.00 $127.00 $132.00
Edinburgh Street One Bedroom Flats $127.00 $132.00 $142.00 $147.00
Flemington Street One Bedroom Flats $127.00 $132.00 $142.00 $147.00
Hanan Place One Bedroom Flats $102.00 $107.00 $122.00 $127.00
7A – 9A Harper Street One Bedroom Flats $102.00 $107.00 $122.00 $127.00
9 Harper Street One Bedroom Flats $112.00 $117.00 $142.00 $142.00
James Street / Keith Street One Bedroom Flats $102.00 $107.00 $127.00 $132.00
Jonas Street One Bedroom Flats $117.00 $122.00 $147.00 $147.00
Maltby Avenue One Bedroom Flats $132.00 $132.00 $147.00 $147.00
Princes Street One Bedroom Flats $107.00 $112.00 $127.00 $132.00
Rhodes Street One Bedroom Flats $102.00 $107.00 $122.00 $127.00
Taylor Street Bedsits $94.00 $96.00 $114.00 $116.00
Victoria Street One Bedroom Flats $137.00 $137.00 $152.00 $152.00
Wilson Street One Bedroom Flats $102.00 $107.00 $122.00 $127.00
Woodlands Road One Bedroom Flats $102.00 $107.00 $122.00 $127.00 Continued Page 52
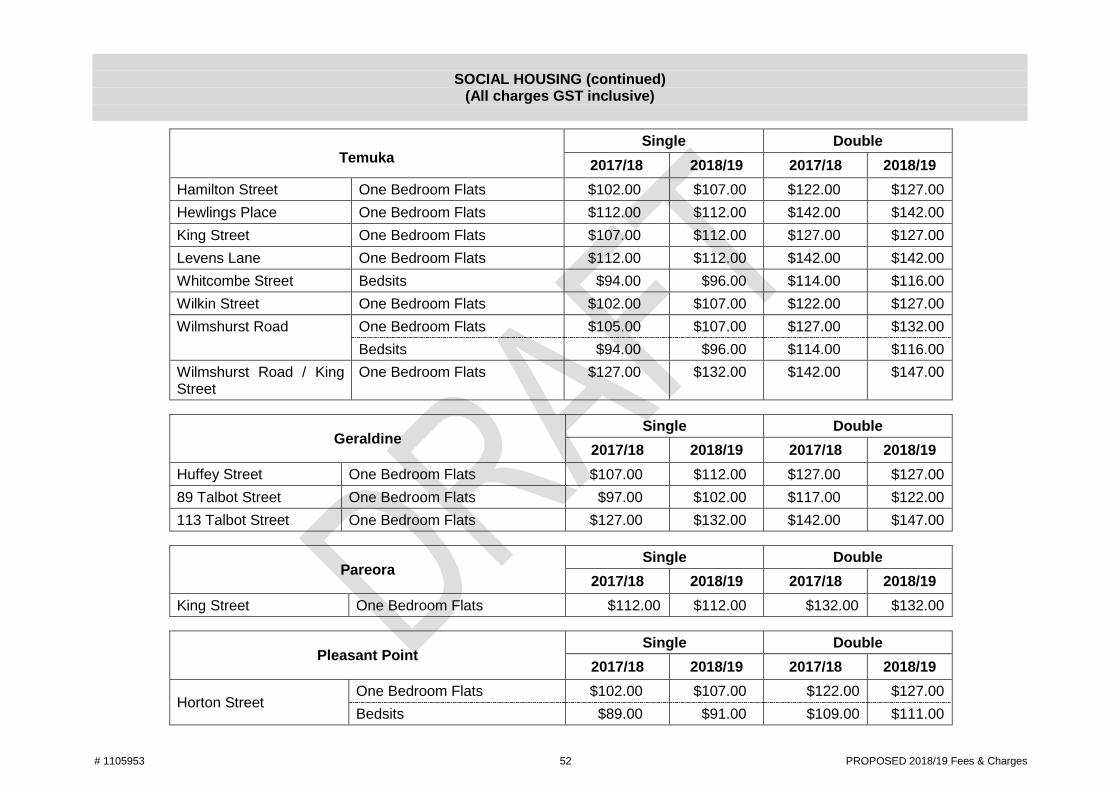
# 1105953 52 PROPOSED 2018/19 Fees & Charges
SOCIAL HOUSING (continued)
(All charges GST inclusive)
Temuka Single Double
2017/18 2018/19 2017/18 2018/19 Hamilton Street One Bedroom Flats $102.00 $107.00 $122.00 $127.00 Hewlings Place One Bedroom Flats $112.00 $112.00 $142.00 $142.00 King Street One Bedroom Flats $107.00 $112.00 $127.00 $127.00 Levens Lane One Bedroom Flats $112.00 $112.00 $142.00 $142.00 Whitcombe Street Bedsits $94.00 $96.00 $114.00 $116.00 Wilkin Street One Bedroom Flats $102.00 $107.00 $122.00 $127.00 Wilmshurst Road One Bedroom Flats $105.00 $107.00 $127.00 $132.00
Bedsits $94.00 $96.00 $114.00 $116.00 Wilmshurst Road / King Street
One Bedroom Flats $127.00 $132.00 $142.00 $147.00
Geraldine Single Double
2017/18 2018/19 2017/18 2018/19 Huffey Street One Bedroom Flats $107.00 $112.00 $127.00 $127.00 89 Talbot Street One Bedroom Flats $97.00 $102.00 $117.00 $122.00 113 Talbot Street One Bedroom Flats $127.00 $132.00 $142.00 $147.00
Pareora Single Double
2017/18 2018/19 2017/18 2018/19 King Street One Bedroom Flats $112.00 $112.00 $132.00 $132.00
Pleasant Point Single Double
2017/18 2018/19 2017/18 2018/19
Horton Street One Bedroom Flats $102.00 $107.00 $122.00 $127.00 Bedsits $89.00 $91.00 $109.00 $111.00
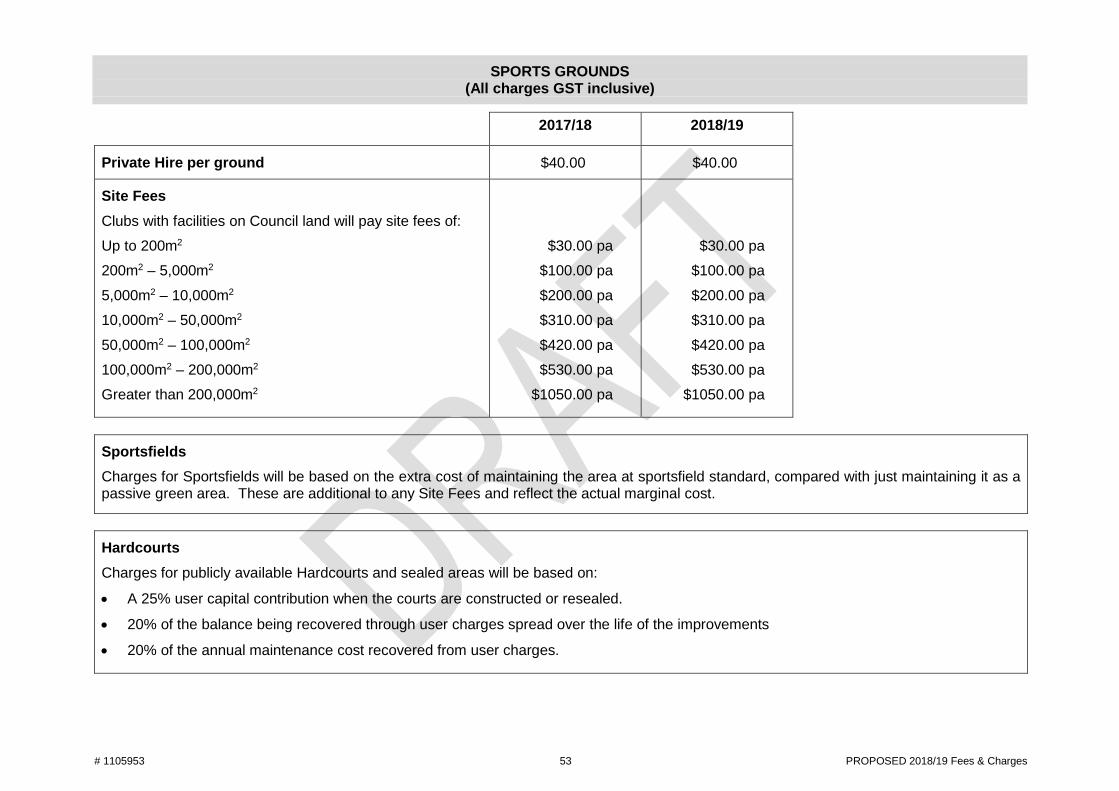
# 1105953 53 PROPOSED 2018/19 Fees & Charges
SPORTS GROUNDS (All charges GST inclusive)
2017/18 2018/19
Private Hire per ground $40.00 $40.00
Site Fees Clubs with facilities on Council land will pay site fees of: Up to 200m2
200m2 – 5,000m2 5,000m2 – 10,000m2 10,000m2 – 50,000m2 50,000m2 – 100,000m2 100,000m2 – 200,000m2 Greater than 200,000m2
$30.00 pa $100.00 pa $200.00 pa $310.00 pa $420.00 pa $530.00 pa
$1050.00 pa
$30.00 pa $100.00 pa $200.00 pa $310.00 pa $420.00 pa $530.00 pa
$1050.00 pa
Sportsfields Charges for Sportsfields will be based on the extra cost of maintaining the area at sportsfield standard, compared with just maintaining it as a passive green area. These are additional to any Site Fees and reflect the actual marginal cost.
Hardcourts Charges for publicly available Hardcourts and sealed areas will be based on:
• A 25% user capital contribution when the courts are constructed or resealed.
• 20% of the balance being recovered through user charges spread over the life of the improvements
• 20% of the annual maintenance cost recovered from user charges.
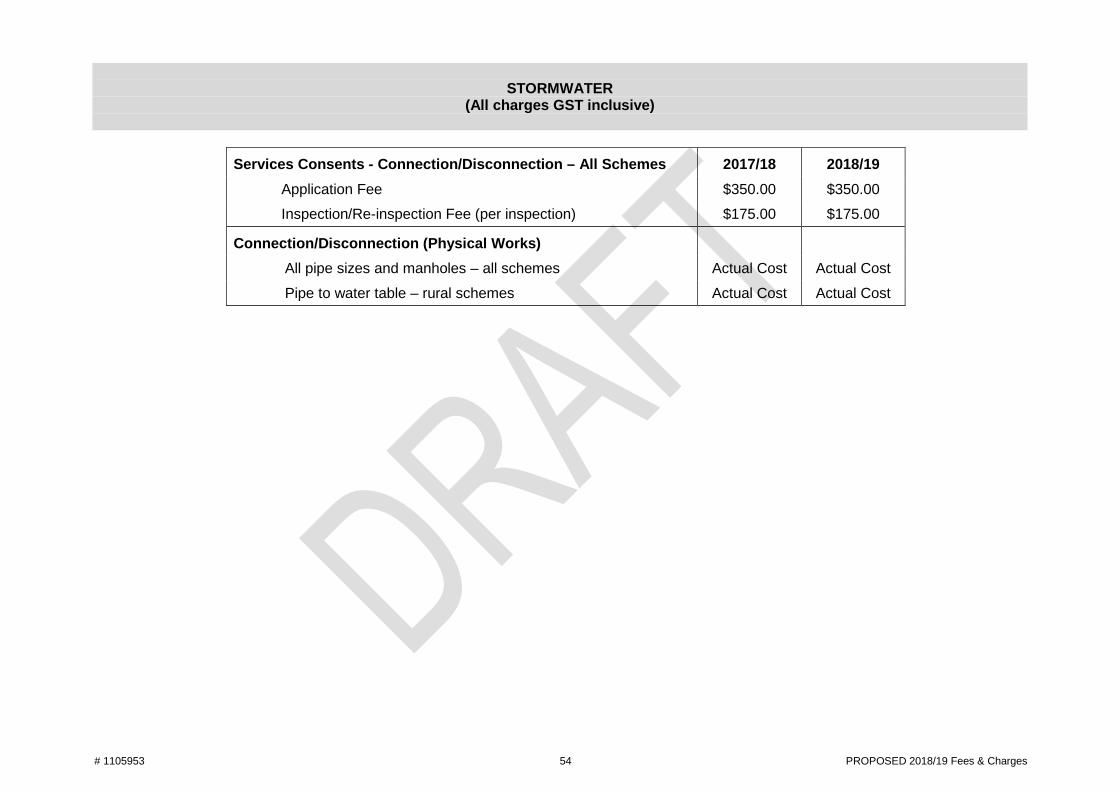
# 1105953 54 PROPOSED 2018/19 Fees & Charges
STORMWATER (All charges GST inclusive)
Services Consents - Connection/Disconnection – All Schemes 2017/18 2018/19 Application Fee $350.00 $350.00 Inspection/Re-inspection Fee (per inspection) $175.00 $175.00
Connection/Disconnection (Physical Works) All pipe sizes and manholes – all schemes Actual Cost Actual Cost Pipe to water table – rural schemes Actual Cost Actual Cost
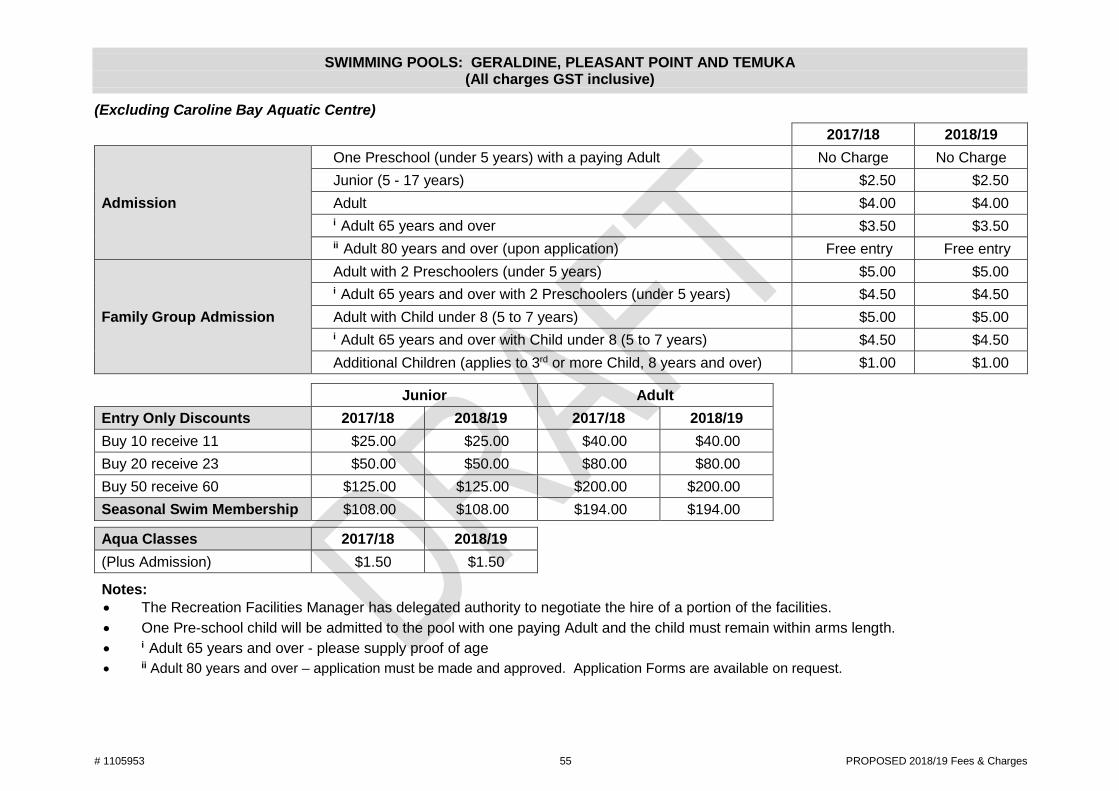
# 1105953 55 PROPOSED 2018/19 Fees & Charges
SWIMMING POOLS: GERALDINE, PLEASANT POINT AND TEMUKA (All charges GST inclusive)
(Excluding Caroline Bay Aquatic Centre)
2017/18 2018/19
Admission
One Preschool (under 5 years) with a paying Adult No Charge No Charge Junior (5 - 17 years) $2.50 $2.50 Adult $4.00 $4.00 i Adult 65 years and over $3.50 $3.50 ii Adult 80 years and over (upon application) Free entry Free entry
Family Group Admission
Adult with 2 Preschoolers (under 5 years) $5.00 $5.00 i Adult 65 years and over with 2 Preschoolers (under 5 years) $4.50 $4.50 Adult with Child under 8 (5 to 7 years) $5.00 $5.00 i Adult 65 years and over with Child under 8 (5 to 7 years) $4.50 $4.50 Additional Children (applies to 3rd or more Child, 8 years and over) $1.00 $1.00
Junior Adult Entry Only Discounts 2017/18 2018/19 2017/18 2018/19 Buy 10 receive 11 $25.00 $25.00 $40.00 $40.00 Buy 20 receive 23 $50.00 $50.00 $80.00 $80.00 Buy 50 receive 60 $125.00 $125.00 $200.00 $200.00 Seasonal Swim Membership $108.00 $108.00 $194.00 $194.00
Aqua Classes 2017/18 2018/19 (Plus Admission) $1.50 $1.50
Notes: • The Recreation Facilities Manager has delegated authority to negotiate the hire of a portion of the facilities. • One Pre-school child will be admitted to the pool with one paying Adult and the child must remain within arms length. • i Adult 65 years and over - please supply proof of age • ii Adult 80 years and over – application must be made and approved. Application Forms are available on request.
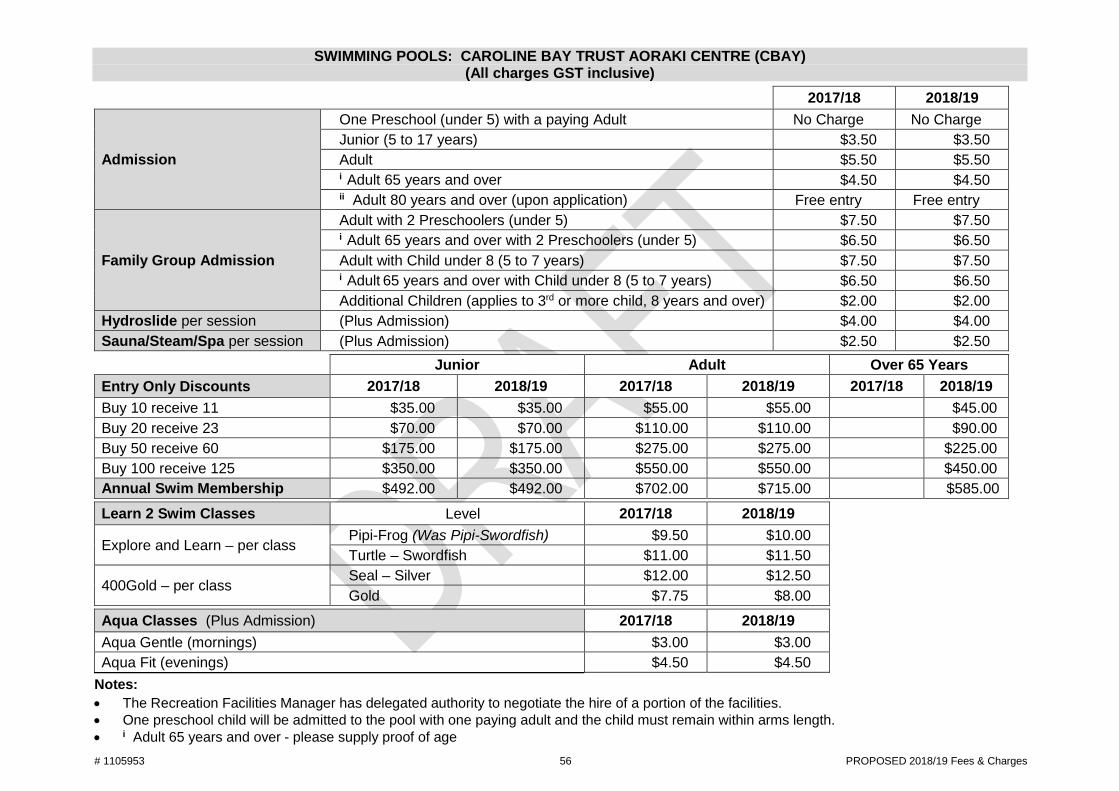
# 1105953 56 PROPOSED 2018/19 Fees & Charges
SWIMMING POOLS: CAROLINE BAY TRUST AORAKI CENTRE (CBAY) (All charges GST inclusive)
2017/18 2018/19
Admission
One Preschool (under 5) with a paying Adult No Charge No Charge Junior (5 to 17 years) $3.50 $3.50 Adult $5.50 $5.50 i Adult 65 years and over $4.50 $4.50 ii Adult 80 years and over (upon application) Free entry Free entry
Family Group Admission
Adult with 2 Preschoolers (under 5) $7.50 $7.50 i Adult 65 years and over with 2 Preschoolers (under 5) $6.50 $6.50 Adult with Child under 8 (5 to 7 years) $7.50 $7.50 i Adult 65 years and over with Child under 8 (5 to 7 years) $6.50 $6.50 Additional Children (applies to 3rd or more child, 8 years and over) $2.00 $2.00
Hydroslide per session (Plus Admission) $4.00 $4.00 Sauna/Steam/Spa per session (Plus Admission) $2.50 $2.50
Junior Adult Over 65 Years Entry Only Discounts 2017/18 2018/19 2017/18 2018/19 2017/18 2018/19 Buy 10 receive 11 $35.00 $35.00 $55.00 $55.00 $45.00 Buy 20 receive 23 $70.00 $70.00 $110.00 $110.00 $90.00 Buy 50 receive 60 $175.00 $175.00 $275.00 $275.00 $225.00 Buy 100 receive 125 $350.00 $350.00 $550.00 $550.00 $450.00 Annual Swim Membership $492.00 $492.00 $702.00 $715.00 $585.00
Learn 2 Swim Classes Level 2017/18 2018/19
Explore and Learn – per class Pipi-Frog (Was Pipi-Swordfish) $9.50 $10.00 Turtle – Swordfish $11.00 $11.50
400Gold – per class Seal – Silver $12.00 $12.50 Gold $7.75 $8.00
Aqua Classes (Plus Admission) 2017/18 2018/19 Aqua Gentle (mornings) $3.00 $3.00 Aqua Fit (evenings) $4.50 $4.50
Notes:
• The Recreation Facilities Manager has delegated authority to negotiate the hire of a portion of the facilities. • One preschool child will be admitted to the pool with one paying adult and the child must remain within arms length. • i Adult 65 years and over - please supply proof of age
# 1105953 57 PROPOSED 2018/19 Fees & Charges
• ii Adult 80 years and over – application must be made and approved. Application Forms are available on request.
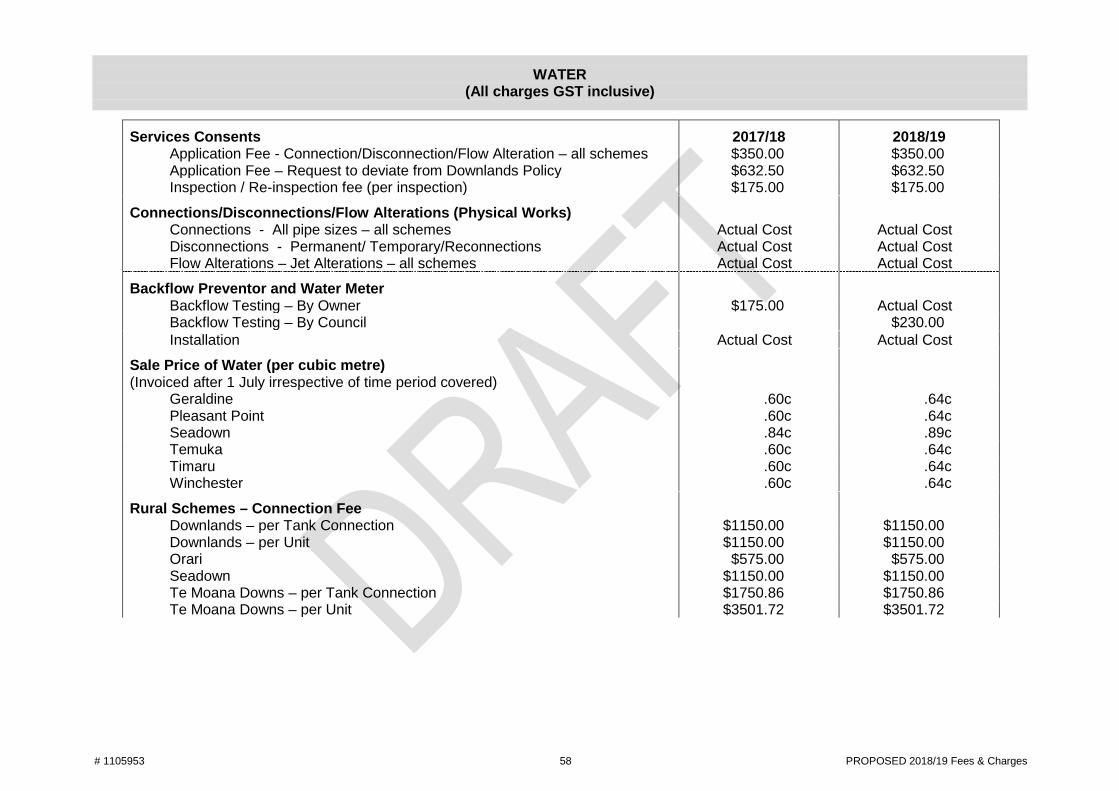
# 1105953 58 PROPOSED 2018/19 Fees & Charges
WATER (All charges GST inclusive)
Services Consents 2017/18 2018/19 Application Fee - Connection/Disconnection/Flow Alteration – all schemes $350.00 $350.00 Application Fee – Request to deviate from Downlands Policy $632.50 $632.50 Inspection / Re-inspection fee (per inspection) $175.00 $175.00
Connections/Disconnections/Flow Alterations (Physical Works) Connections - All pipe sizes – all schemes Actual Cost Actual Cost Disconnections - Permanent/ Temporary/Reconnections Actual Cost Actual Cost Flow Alterations – Jet Alterations – all schemes Actual Cost Actual Cost
Backflow Preventor and Water Meter Backflow Testing – By Owner $175.00 Actual Cost Backflow Testing – By Council $230.00 Installation Actual Cost Actual Cost
Sale Price of Water (per cubic metre) (Invoiced after 1 July irrespective of time period covered)
Geraldine .60c .64c Pleasant Point .60c .64c Seadown .84c .89c Temuka .60c .64c Timaru .60c .64c Winchester .60c .64c
Rural Schemes – Connection Fee Downlands – per Tank Connection $1150.00 $1150.00 Downlands – per Unit $1150.00 $1150.00 Orari $575.00 $575.00 Seadown $1150.00 $1150.00 Te Moana Downs – per Tank Connection $1750.86 $1750.86 Te Moana Downs – per Unit $3501.72 $3501.72
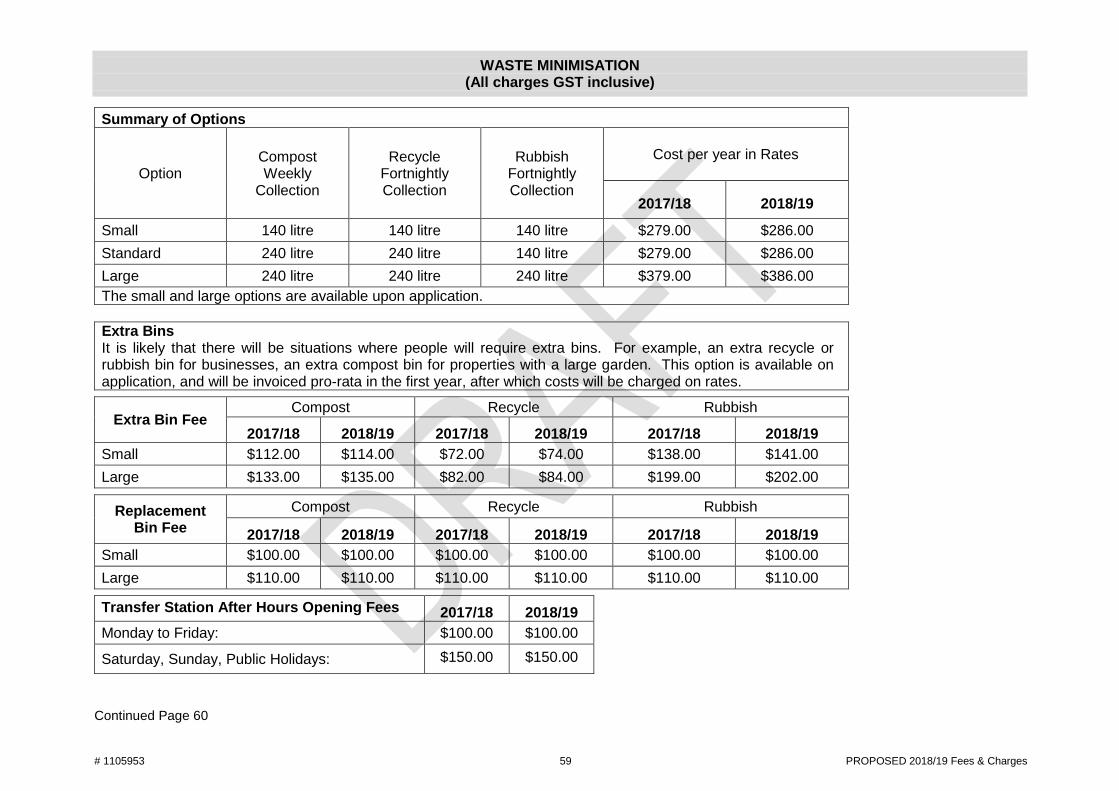
# 1105953 59 PROPOSED 2018/19 Fees & Charges
WASTE MINIMISATION (All charges GST inclusive)
Summary of Options
Option Compost Weekly
Collection
Recycle Fortnightly Collection
Rubbish Fortnightly Collection
Cost per year in Rates
2017/18 2018/19
Small 140 litre 140 litre 140 litre $279.00 $286.00 Standard 240 litre 240 litre 140 litre $279.00 $286.00 Large 240 litre 240 litre 240 litre $379.00 $386.00 The small and large options are available upon application.
Extra Bins It is likely that there will be situations where people will require extra bins. For example, an extra recycle or rubbish bin for businesses, an extra compost bin for properties with a large garden. This option is available on application, and will be invoiced pro-rata in the first year, after which costs will be charged on rates.
Extra Bin Fee Compost Recycle Rubbish
2017/18 2018/19 2017/18 2018/19 2017/18 2018/19 Small $112.00 $114.00 $72.00 $74.00 $138.00 $141.00 Large $133.00 $135.00 $82.00 $84.00 $199.00 $202.00
Replacement Bin Fee
Compost Recycle Rubbish
2017/18 2018/19 2017/18 2018/19 2017/18 2018/19 Small $100.00 $100.00 $100.00 $100.00 $100.00 $100.00 Large $110.00 $110.00 $110.00 $110.00 $110.00 $110.00
Transfer Station After Hours Opening Fees 2017/18 2018/19 Monday to Friday: $100.00 $100.00
Saturday, Sunday, Public Holidays: $150.00 $150.00
Continued Page 60
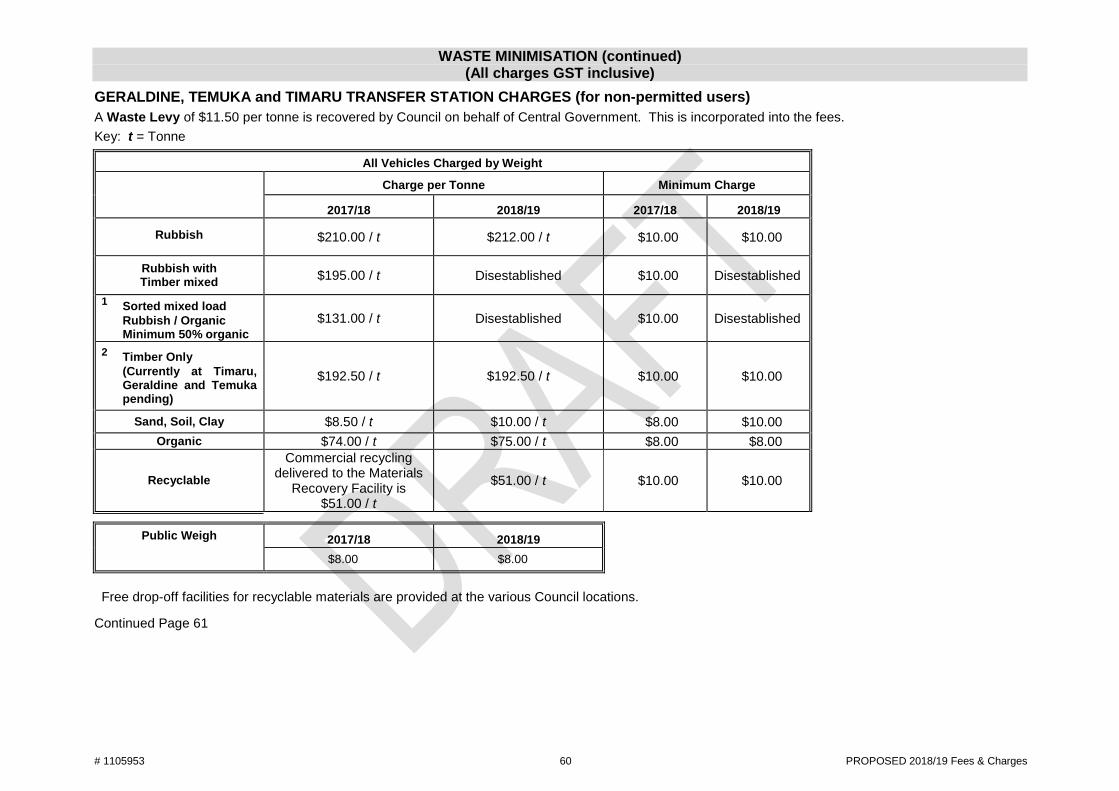
# 1105953 60 PROPOSED 2018/19 Fees & Charges
WASTE MINIMISATION (continued) (All charges GST inclusive)
GERALDINE, TEMUKA and TIMARU TRANSFER STATION CHARGES (for non-permitted users) A Waste Levy of $11.50 per tonne is recovered by Council on behalf of Central Government. This is incorporated into the fees. Key: t = Tonne
All Vehicles Charged by Weight
Charge per Tonne Minimum Charge
2017/18 2018/19 2017/18 2018/19
Rubbish $210.00 / t $212.00 / t $10.00 $10.00
Rubbish with Timber mixed $195.00 / t Disestablished $10.00 Disestablished
1 Sorted mixed load Rubbish / Organic Minimum 50% organic
$131.00 / t Disestablished $10.00 Disestablished
2 Timber Only (Currently at Timaru,
Geraldine and Temuka pending)
$192.50 / t $192.50 / t $10.00 $10.00
Sand, Soil, Clay $8.50 / t $10.00 / t $8.00 $10.00 Organic $74.00 / t $75.00 / t $8.00 $8.00
Recyclable
Commercial recycling delivered to the Materials
Recovery Facility is $51.00 / t
$51.00 / t $10.00 $10.00
Public Weigh 2017/18 2018/19 $8.00 $8.00
Free drop-off facilities for recyclable materials are provided at the various Council locations.
Continued Page 61
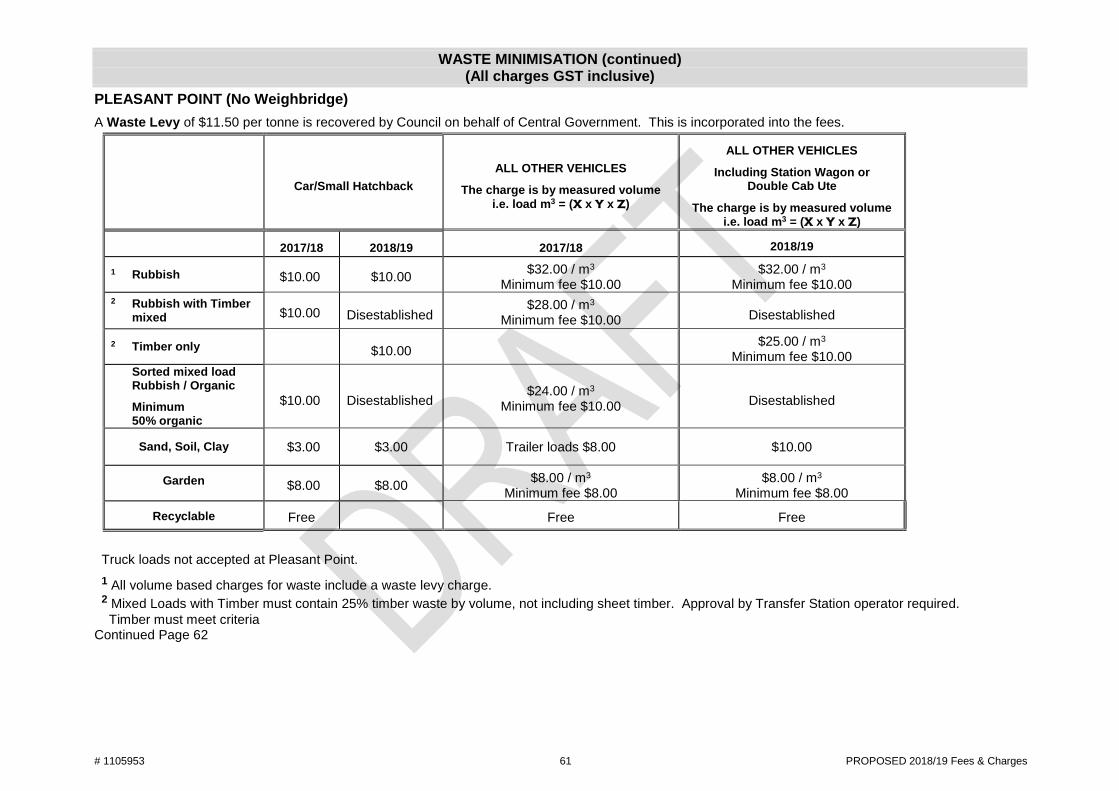
# 1105953 61 PROPOSED 2018/19 Fees & Charges
WASTE MINIMISATION (continued) (All charges GST inclusive)
PLEASANT POINT (No Weighbridge)
A Waste Levy of $11.50 per tonne is recovered by Council on behalf of Central Government. This is incorporated into the fees.
Car/Small Hatchback ALL OTHER VEHICLES
The charge is by measured volume i.e. load m3 = (X x Y x Z)
ALL OTHER VEHICLES
Including Station Wagon or Double Cab Ute
The charge is by measured volume i.e. load m3 = (X x Y x Z)
2017/18 2018/19 2017/18 2018/19
1 Rubbish $10.00 $10.00 $32.00 / m3 Minimum fee $10.00
$32.00 / m3 Minimum fee $10.00
2 Rubbish with Timber mixed $10.00 Disestablished
$28.00 / m3 Minimum fee $10.00 Disestablished
2 Timber only $10.00 $25.00 / m3 Minimum fee $10.00
Sorted mixed load Rubbish / Organic
Minimum 50% organic
$10.00 Disestablished $24.00 / m3
Minimum fee $10.00 Disestablished
Sand, Soil, Clay $3.00 $3.00 Trailer loads $8.00 $10.00
Garden $8.00 $8.00 $8.00 / m3
Minimum fee $8.00 $8.00 / m3
Minimum fee $8.00
Recyclable Free Free Free
Truck loads not accepted at Pleasant Point. 1 All volume based charges for waste include a waste levy charge. 2 Mixed Loads with Timber must contain 25% timber waste by volume, not including sheet timber. Approval by Transfer Station operator required. Timber must meet criteria
Continued Page 62
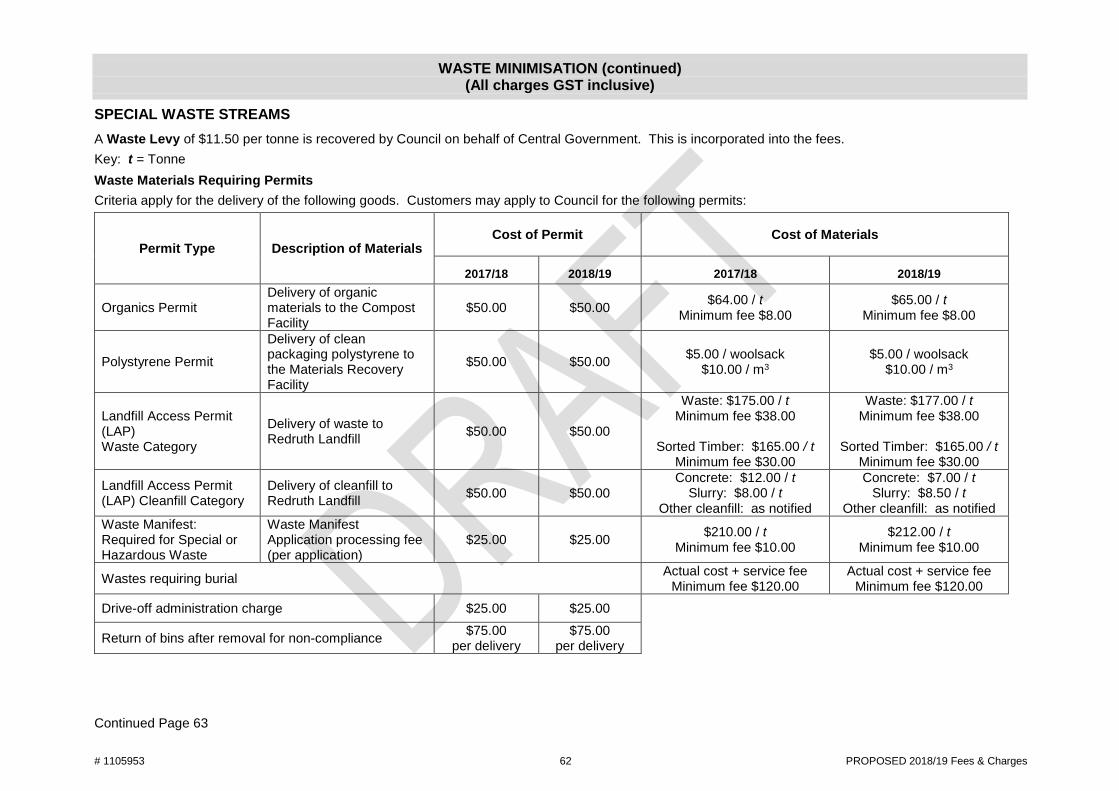
# 1105953 62 PROPOSED 2018/19 Fees & Charges
WASTE MINIMISATION (continued) (All charges GST inclusive)
SPECIAL WASTE STREAMS
A Waste Levy of $11.50 per tonne is recovered by Council on behalf of Central Government. This is incorporated into the fees.
Key: t = Tonne
Waste Materials Requiring Permits
Criteria apply for the delivery of the following goods. Customers may apply to Council for the following permits:
Permit Type Description of Materials Cost of Permit Cost of Materials
2017/18 2018/19 2017/18 2018/19
Organics Permit Delivery of organic materials to the Compost Facility
$50.00 $50.00 $64.00 / t Minimum fee $8.00
$65.00 / t Minimum fee $8.00
Polystyrene Permit
Delivery of clean packaging polystyrene to the Materials Recovery Facility
$50.00 $50.00 $5.00 / woolsack $10.00 / m3
$5.00 / woolsack $10.00 / m3
Landfill Access Permit (LAP) Waste Category
Delivery of waste to Redruth Landfill $50.00 $50.00
Waste: $175.00 / t Minimum fee $38.00
Sorted Timber: $165.00 / t
Minimum fee $30.00
Waste: $177.00 / t Minimum fee $38.00
Sorted Timber: $165.00 / t
Minimum fee $30.00
Landfill Access Permit (LAP) Cleanfill Category
Delivery of cleanfill to Redruth Landfill $50.00 $50.00
Concrete: $12.00 / t Slurry: $8.00 / t
Other cleanfill: as notified
Concrete: $7.00 / t Slurry: $8.50 / t
Other cleanfill: as notified Waste Manifest: Required for Special or Hazardous Waste
Waste Manifest Application processing fee (per application)
$25.00 $25.00 $210.00 / t Minimum fee $10.00
$212.00 / t Minimum fee $10.00
Wastes requiring burial Actual cost + service fee Minimum fee $120.00
Actual cost + service fee Minimum fee $120.00
Drive-off administration charge $25.00 $25.00
Return of bins after removal for non-compliance $75.00 per delivery
$75.00 per delivery
Continued Page 63
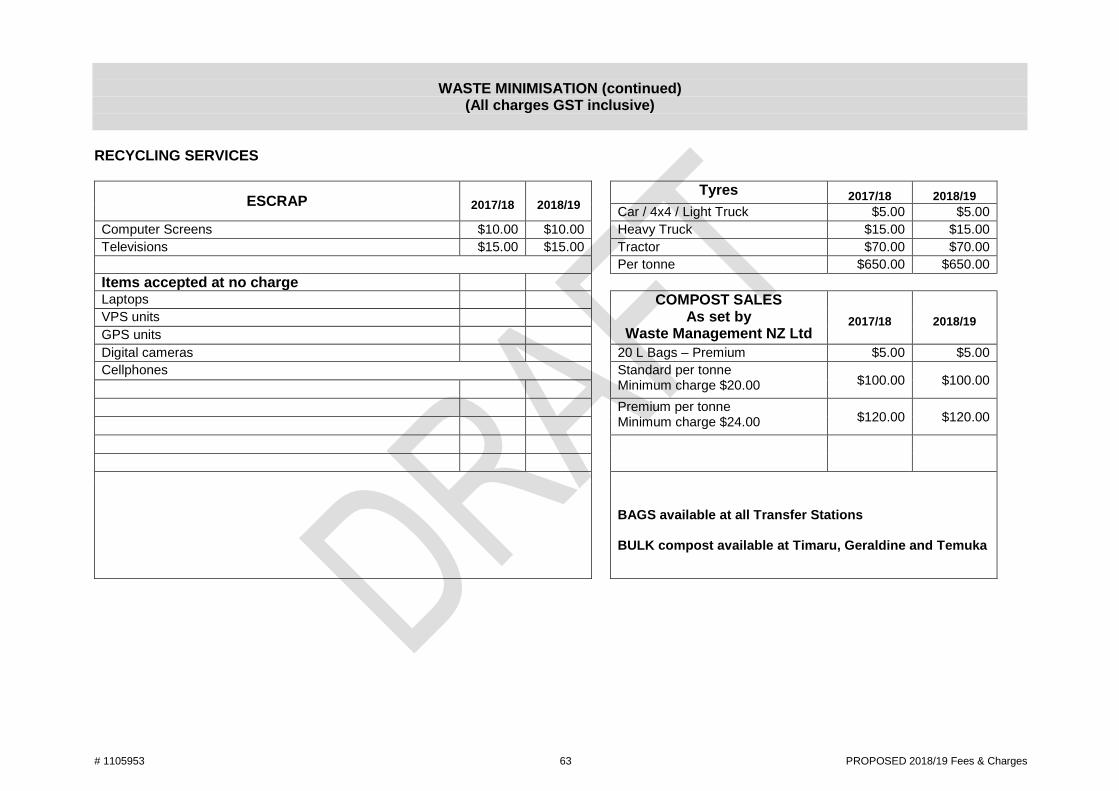
# 1105953 63 PROPOSED 2018/19 Fees & Charges
WASTE MINIMISATION (continued) (All charges GST inclusive)
RECYCLING SERVICES
ESCRAP 2017/18 2018/19 Tyres 2017/18 2018/19 Car / 4x4 / Light Truck $5.00 $5.00
Computer Screens $10.00 $10.00 Heavy Truck $15.00 $15.00 Televisions $15.00 $15.00 Tractor $70.00 $70.00 Per tonne $650.00 $650.00 Items accepted at no charge Laptops COMPOST SALES
As set by Waste Management NZ Ltd
2017/18 2018/19 VPS units GPS units Digital cameras 20 L Bags – Premium $5.00 $5.00 Cellphones Standard per tonne
Minimum charge $20.00 $100.00 $100.00 Premium per tonne
Minimum charge $24.00 $120.00 $120.00
BAGS available at all Transfer Stations BULK compost available at Timaru, Geraldine and Temuka