long-term damage of historic masonry: a probabilistic model
TRANSCRIPT

Available online at www.sciencedirect.com Construction
www.elsevier.com/locate/conbuildmat
Construction and Building Materials 23 (2009) 713–724
and Building
MATERIALS
Long-term damage of historic masonry: A probabilistic model
Anna Anzani *, Elsa Garavaglia, Luigia Binda
Politecnico di Milano, Department of Structural Engineering, Milano, Italy
Received 10 July 2006; received in revised form 19 February 2008; accepted 20 February 2008Available online 18 April 2008
Abstract
Creep and the creep-fatigue interaction have shown to strongly influence the mechanical behaviour of ancient masonry and long-termheavy loads proved to cause a continuous damage. The problem of achieving a reliable life-time estimate of historic masonry toward theeffects of persistent loading has been dealt with by a probabilistic approach. The results of pseudo-creep tests on ancient masonry ofdifferent ages and their interpretation through a probabilistic model are presented, aimed to the individuation of a random variableas a significant index of vulnerability, and to the solution of the classic problem of reliability in stochastic conditions.� 2008 Elsevier Ltd. All rights reserved.
Keywords: Pseudo-creep; Historic masonry; Damage; Probabilistic model; Residual life prevision
1. Introduction
The main part of the European territory is characterizedby the presence of historic masonry structures often char-acterized by non-homogeneous load-bearing sections that,during their service life, can be subjected to decay due toaggressive environmental attacks, aging and damage dueto long-term heavy loads. Together with other synergeticaspects, time-dependent behaviour has proved to beinvolved in the collapse of historical buildings occurredduring the last twenty years including the recent failuresof the Meldert Bell-tower and the Maagdentoren Towerat Zichem (Belgium, 2006). The conservation of the pre-existing heritage gains an increasing relevance toward thesafeguard of the memory and the complex relationship thatthe architectural culture has to carry out with its past, inview of a responsible and sustainable future. Among therisk factors menacing the safety of ancient structures, inaddition to external factors like the lack of maintenance,the load increase due to building modifications, soil settle-ments, mechanical shocks due to earthquakes, fires, etc., an
0950-0618/$ - see front matter � 2008 Elsevier Ltd. All rights reserved.
doi:10.1016/j.conbuildmat.2008.02.010
* Corresponding author. Tel.: +39 02 2399 4208; fax: +39 02 2399 4220.E-mail addresses: [email protected] (A. Anzani), garava@stru.
polimi.it (E. Garavaglia), [email protected] (L. Binda).
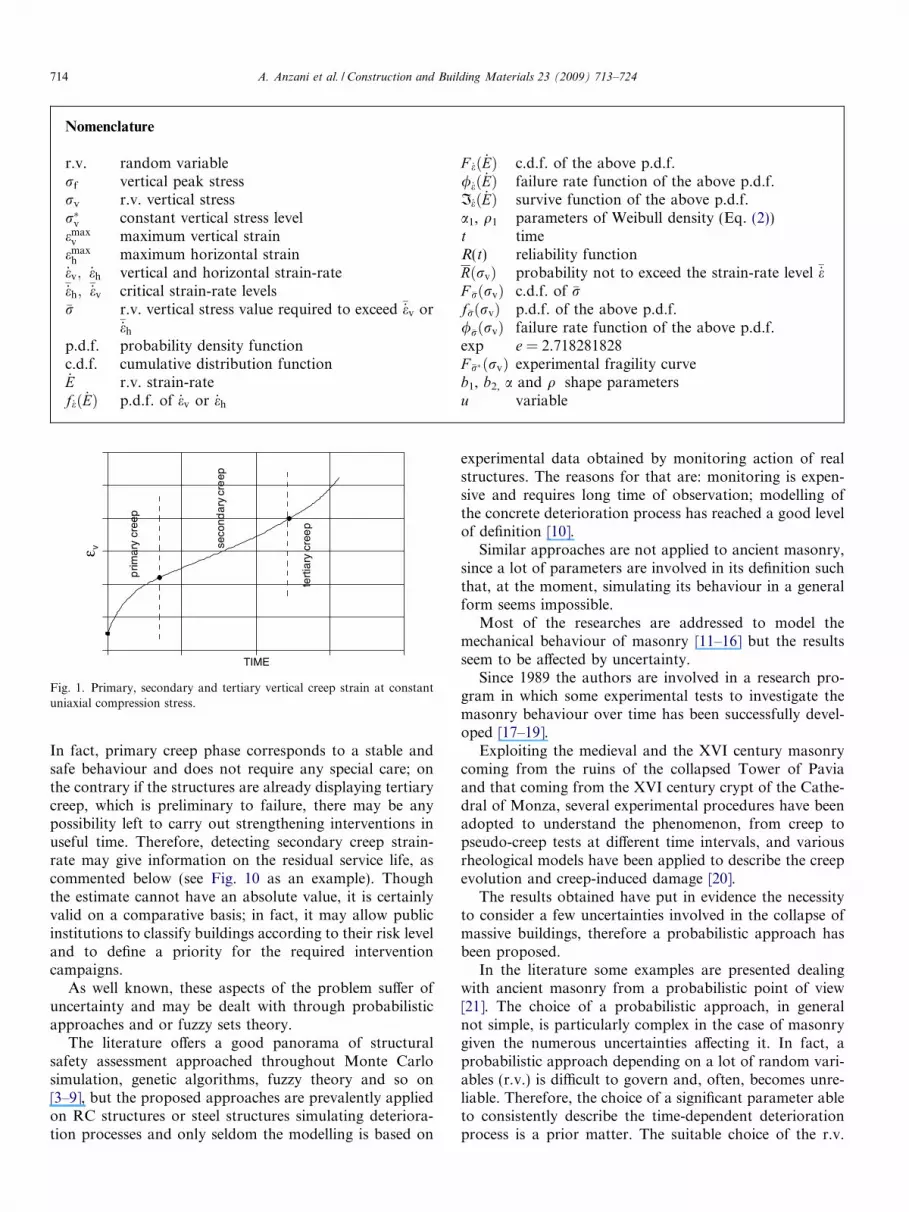
intrinsic feature of masonry (as of any rock-like materials)has to be highlighted. This feature, basically related to theself-weight and denominated time-dependent behaviour orcreep, had not been recognized as a structurally crucialaspect, probably because it develops in the long run.Although it was well known in mining engineering androck and soil mechanics [1], it had never been considereda risk factor in the safety assessment of ancient masonrybuildings. The influence of time becomes evident forinstance in compressive tests at vertical constant load. Inparticular, if a vertical constant load is applied to amasonry specimen, an increase in the vertical and horizon-tal deformation takes place, which is commonly subdividedinto three phases (Fig. 1): the so-called primary, secondaryand tertiary creep [2], respectively, corresponding to thevisco-elastic branch at decreasing strain-rate (decreasingslope of the diagram) and reversible strain; to the visco-plastic branch at a constant slope; to the final highly unsta-ble branch, characterized by strain developing at increasingrate and ending with the specimen failure. The appearanceof one or more of these phases and the strain-rate of thesecondary creep phase depends on the level of the appliedconstant stress. In view of the safeguard of historical build-ings and of preventing their failure, the possibility ofdetecting secondary creep strain-rate is mostly relevant.
TIME
ε v
prim
ary
cree
p
seco
ndar
ycr
eep
tert
iary
cre
ep
Fig. 1. Primary, secondary and tertiary vertical creep strain at constantuniaxial compression stress.
Nomenclature
r.v. random variablerf vertical peak stressrv r.v. vertical stressr�v constant vertical stress levelemax
v maximum vertical strainemax
h maximum horizontal strain_ev; _eh vertical and horizontal strain-rate�_eh; �_ev critical strain-rate levels�r r.v. vertical stress value required to exceed �_ev or
�_eh
p.d.f. probability density functionc.d.f. cumulative distribution function_E r.v. strain-ratef_eð _EÞ p.d.f. of _ev or _eh
F _eð _EÞ c.d.f. of the above p.d.f./_eð _EÞ failure rate function of the above p.d.f.I_eð _EÞ survive function of the above p.d.f.a1, q1 parameters of Weibull density (Eq. (2))t timeR(t) reliability functionRðrvÞ probability not to exceed the strain-rate level �_eF �rðrvÞ c.d.f. of �rf�rðrvÞ p.d.f. of the above p.d.f./�rðrvÞ failure rate function of the above p.d.f.exp e = 2.718281828F �r� ðrvÞ experimental fragility curveb1, b2, a and q shape parametersu variable
714 A. Anzani et al. / Construction and Building Materials 23 (2009) 713–724
In fact, primary creep phase corresponds to a stable andsafe behaviour and does not require any special care; onthe contrary if the structures are already displaying tertiarycreep, which is preliminary to failure, there may be anypossibility left to carry out strengthening interventions inuseful time. Therefore, detecting secondary creep strain-rate may give information on the residual service life, ascommented below (see Fig. 10 as an example). Thoughthe estimate cannot have an absolute value, it is certainlyvalid on a comparative basis; in fact, it may allow publicinstitutions to classify buildings according to their risk leveland to define a priority for the required interventioncampaigns.
As well known, these aspects of the problem suffer ofuncertainty and may be dealt with through probabilisticapproaches and or fuzzy sets theory.
The literature offers a good panorama of structuralsafety assessment approached throughout Monte Carlosimulation, genetic algorithms, fuzzy theory and so on[3–9], but the proposed approaches are prevalently appliedon RC structures or steel structures simulating deteriora-tion processes and only seldom the modelling is based on
experimental data obtained by monitoring action of realstructures. The reasons for that are: monitoring is expen-sive and requires long time of observation; modelling ofthe concrete deterioration process has reached a good levelof definition [10].
Similar approaches are not applied to ancient masonry,since a lot of parameters are involved in its definition suchthat, at the moment, simulating its behaviour in a generalform seems impossible.
Most of the researches are addressed to model themechanical behaviour of masonry [11–16] but the resultsseem to be affected by uncertainty.
Since 1989 the authors are involved in a research pro-gram in which some experimental tests to investigate themasonry behaviour over time has been successfully devel-oped [17–19].
Exploiting the medieval and the XVI century masonrycoming from the ruins of the collapsed Tower of Paviaand that coming from the XVI century crypt of the Cathe-dral of Monza, several experimental procedures have beenadopted to understand the phenomenon, from creep topseudo-creep tests at different time intervals, and variousrheological models have been applied to describe the creepevolution and creep-induced damage [20].
The results obtained have put in evidence the necessityto consider a few uncertainties involved in the collapse ofmassive buildings, therefore a probabilistic approach hasbeen proposed.
In the literature some examples are presented dealingwith ancient masonry from a probabilistic point of view[21]. The choice of a probabilistic approach, in generalnot simple, is particularly complex in the case of masonrygiven the numerous uncertainties affecting it. In fact, aprobabilistic approach depending on a lot of random vari-ables (r.v.) is difficult to govern and, often, becomes unre-liable. Therefore, the choice of a significant parameter ableto consistently describe the time-dependent deteriorationprocess is a prior matter. The suitable choice of the r.v.

A. Anzani et al. / Construction and Building Materials 23 (2009) 713–724 715
describing the deterioration process can lead to model theprocess in a simple, but reliable, way.
By experimental evidence, the strain evolution con-nected with a given stress history of a viscous material likea historic masonry can be described through vertical andhorizontal strain-rate connected with a well defined creepphase.
Since the strain-rate is related to the residual life of thematerial, to model its evolution over stresses the fragility
curves approach is proposed, greatly used in seismic vulner-ability analysis. The method is simple and, if suitable datacoming from monitoring of ancient buildings were avail-able, it could be adopted for the safety evaluation of exist-ing structures.
Aim of the paper is to suggest an experimental proce-dure suitable to study in the laboratory creep behaviour,and in particular to catch critical secondary creep strain-rate and to propose a probabilistic approach for the esti-mate of the residual life of the material. Further develop-ment will be the application of the approach to theinterpretation of data coming from long-term monitoringof historic buildings in view of their safeguard and failureprevention.
2. Experimental activity
2.1. Previous research
After the collapse of the Civic Tower of Pavia (XI toXVI century), during the investigation for searching thecauses of the collapse, many prisms of different dimensionswere obtained from the large blocks coming from the ruinsof the tower [22] and constituting the medieval trunk of thestructure (Fig. 1). The prisms, subjected to mechanicaltests, had mainly been obtained from the conglomerateforming the very thick internal part of the 2800 mmthree-leaf walls (Fig. 2); a few of them were coming fromthe fairly regular external leaves made of brick masonryof thickness varying between 150 and 490 mm; no speci-
Fig. 2. Civic Tower of Pavia: (a) before failure and (b
mens were sampled from the plain masonry constitutingthe XVI century belfry, not involved in the initiation ofthe collapse [22,17,18]. Purpose of the testing activity hasbeen initially the identification of the creep behaviour asa possible cause of the collapse of buildings, once under-stood that the portion of tower where the failure startedwas the base (highest value of the vertical stress and its con-centration due to the presence of a door and the staircase),then the study of factors affecting creep (rate of loading,stress level, . . .) and the set up of the most suitable testingprocedures to understand the phenomenon, finally the indi-viduation of significant parameters (strain-rate of second-ary creep phase, . . .) that may be referred to as riskindicators in real structures. The prisms dimensions wereinitially 400 � 600 � 700 mm, i.e. the maximum compati-ble with the testing machine; subsequently they were pro-gressively reduced to better exploit the available historicmasonry, ending with prisms of 100 � 100 � 180 mm.
In addition to monotonic and cyclic tests (Fig. 3), sixprisms of dimensions 300 � 300 � 510 mm were tested incompression in controlled conditions of 20 �C and 50%RH, using hydraulic machines able to keep constant a max-imum load of 1000 kN. The load was applied in subsequentsteps, kept constant until either the creep strain reached aconstant value or a steady state was attained. The firststress level was chosen between 40% and 50% of the staticpeak stress of the prisms, estimated by sonic tests [17]. Thestrain vs. time diagrams of the prisms tested are reported inFig. 4a and b. From the experimental data, the develop-ment of all the creep phases was evident, with secondarycreep showing even at 41% of the estimated material peakstress and tertiary creep showing at about 70%; materialdilation took place under severe compressive stress corre-sponding to high values of the horizontal strain due to slowcrack propagation until failure [17].
Considering that long-term tests require constantthermo-hygrometric conditions and especially designedtesting apparatus, a more rapid and therefore more conve-nient testing procedure was subsequently preferred. The
) detail of the 2800 mm thick medieval masonry.
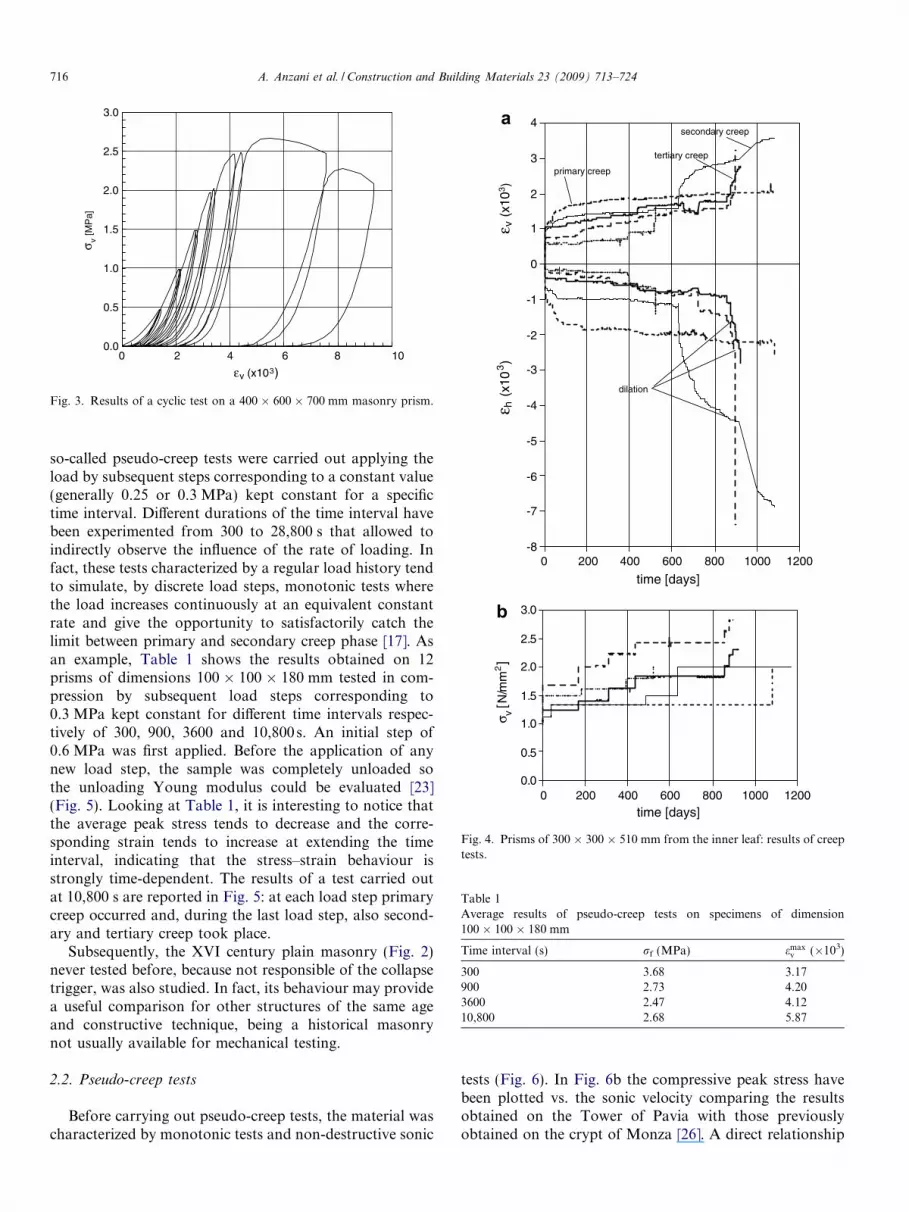
Table 1Average results of pseudo-creep tests on specimens of dimension100 � 100 � 180 mm
Time interval (s) rf (MPa) emaxv (�103)
300 3.68 3.17900 2.73 4.203600 2.47 4.1210,800 2.68 5.87
0 200 400 600 800 1000 1200
time [days]
-8
-7
-6
-5
-4
-3
-2
-1
0
1
2
3
4
ε h(x
103)
ε v(x
103)
primary creep
tertiary creep
secondary creep
dilation
0 200 400 600 800 1000 1200
time [days]
0.0
0.5
1.0
1.5
2.0
2.5
3.0
σ v[N
/mm
2]
a
b
Fig. 4. Prisms of 300 � 300 � 510 mm from the inner leaf: results of creeptests.
0 2 4 6 8 10
εv (x103)
0.0
0.5
1.0
1.5
2.0
2.5
3.0
σ v[M
Pa]
Fig. 3. Results of a cyclic test on a 400 � 600 � 700 mm masonry prism.
716 A. Anzani et al. / Construction and Building Materials 23 (2009) 713–724
so-called pseudo-creep tests were carried out applying theload by subsequent steps corresponding to a constant value(generally 0.25 or 0.3 MPa) kept constant for a specifictime interval. Different durations of the time interval havebeen experimented from 300 to 28,800 s that allowed toindirectly observe the influence of the rate of loading. Infact, these tests characterized by a regular load history tendto simulate, by discrete load steps, monotonic tests wherethe load increases continuously at an equivalent constantrate and give the opportunity to satisfactorily catch thelimit between primary and secondary creep phase [17]. Asan example, Table 1 shows the results obtained on 12prisms of dimensions 100 � 100 � 180 mm tested in com-pression by subsequent load steps corresponding to0.3 MPa kept constant for different time intervals respec-tively of 300, 900, 3600 and 10,800 s. An initial step of0.6 MPa was first applied. Before the application of anynew load step, the sample was completely unloaded sothe unloading Young modulus could be evaluated [23](Fig. 5). Looking at Table 1, it is interesting to notice thatthe average peak stress tends to decrease and the corre-sponding strain tends to increase at extending the timeinterval, indicating that the stress–strain behaviour isstrongly time-dependent. The results of a test carried outat 10,800 s are reported in Fig. 5: at each load step primarycreep occurred and, during the last load step, also second-ary and tertiary creep took place.
Subsequently, the XVI century plain masonry (Fig. 2)never tested before, because not responsible of the collapsetrigger, was also studied. In fact, its behaviour may providea useful comparison for other structures of the same ageand constructive technique, being a historical masonrynot usually available for mechanical testing.
2.2. Pseudo-creep tests
Before carrying out pseudo-creep tests, the material wascharacterized by monotonic tests and non-destructive sonic
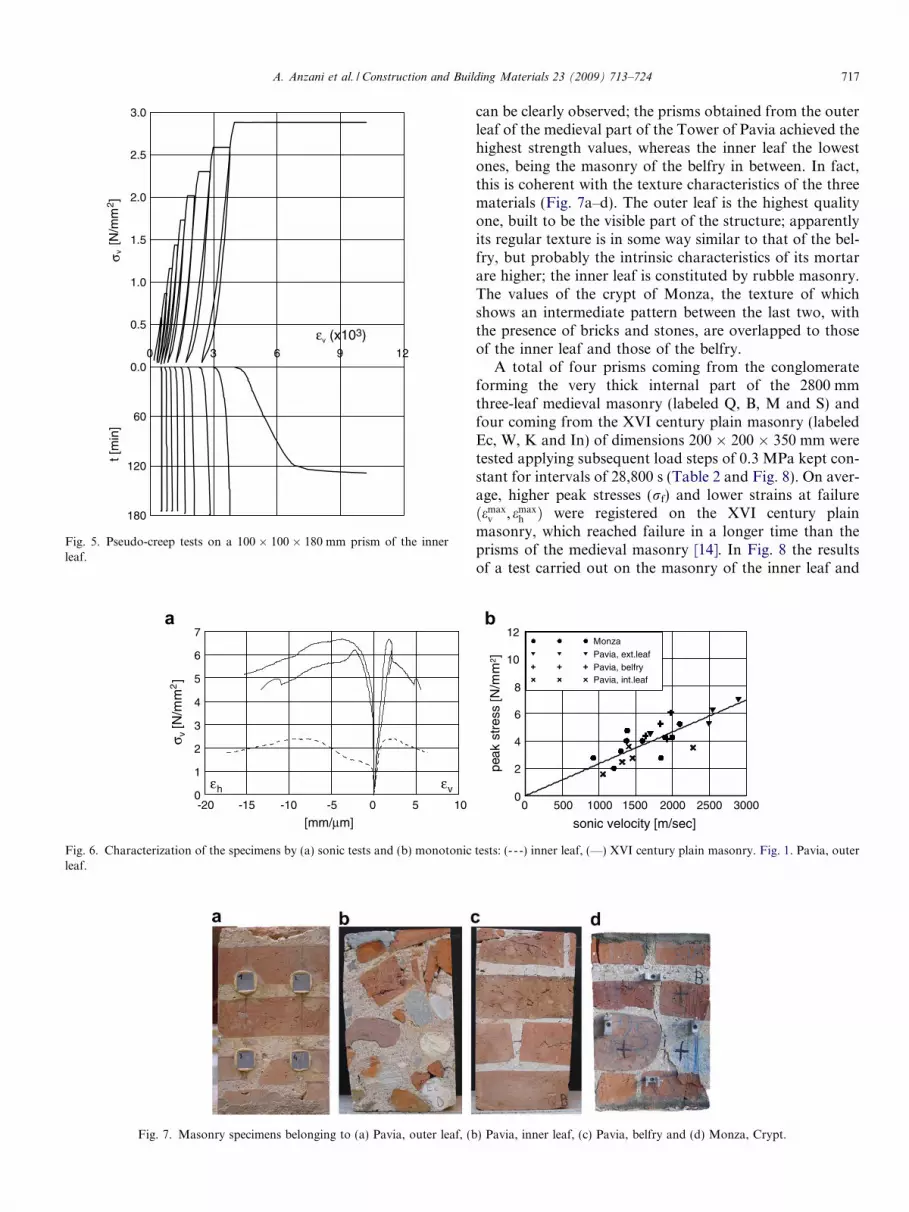
tests (Fig. 6). In Fig. 6b the compressive peak stress havebeen plotted vs. the sonic velocity comparing the resultsobtained on the Tower of Pavia with those previouslyobtained on the crypt of Monza [26]. A direct relationship
0 3 6 9 12
εv (x103)
0.0
0.5
1.0
1.5
2.0
2.5
3.0σ v
[N/m
m2 ]
60
120
180
t [m
in]
Fig. 5. Pseudo-creep tests on a 100 � 100 � 180 mm prism of the innerleaf.
-20 -15 -10 -5 0 5 10
εh εv
[mm/μm]
0
1
2
3
4
5
6
7
σ v[N
/mm
2]
a
Fig. 6. Characterization of the specimens by (a) sonic tests and (b) monotonicleaf.
Fig. 7. Masonry specimens belonging to (a) Pavia, outer leaf, (b
A. Anzani et al. / Construction and Building Materials 23 (2009) 713–724 717
can be clearly observed; the prisms obtained from the outerleaf of the medieval part of the Tower of Pavia achieved thehighest strength values, whereas the inner leaf the lowestones, being the masonry of the belfry in between. In fact,this is coherent with the texture characteristics of the threematerials (Fig. 7a–d). The outer leaf is the highest qualityone, built to be the visible part of the structure; apparentlyits regular texture is in some way similar to that of the bel-fry, but probably the intrinsic characteristics of its mortarare higher; the inner leaf is constituted by rubble masonry.The values of the crypt of Monza, the texture of whichshows an intermediate pattern between the last two, withthe presence of bricks and stones, are overlapped to thoseof the inner leaf and those of the belfry.
A total of four prisms coming from the conglomerateforming the very thick internal part of the 2800 mmthree-leaf medieval masonry (labeled Q, B, M and S) andfour coming from the XVI century plain masonry (labeledEc, W, K and In) of dimensions 200 � 200 � 350 mm weretested applying subsequent load steps of 0.3 MPa kept con-stant for intervals of 28,800 s (Table 2 and Fig. 8). On aver-age, higher peak stresses (rf) and lower strains at failureðemax
v , emaxh Þ were registered on the XVI century plain
masonry, which reached failure in a longer time than theprisms of the medieval masonry [14]. In Fig. 8 the resultsof a test carried out on the masonry of the inner leaf and
0 500 1000 1500 2000 2500 3000
sonic velocity [m/sec]
0
2
4
6
8
10
12
peak
stre
ss [N
/mm
2 ]
MonzaPavia, ext.leafPavia, belfryPavia, int.leaf
b
tests: (- - -) inner leaf, (—) XVI century plain masonry. Fig. 1. Pavia, outer
) Pavia, inner leaf, (c) Pavia, belfry and (d) Monza, Crypt.

Table 2Results of pseudo-creep tests of the second series
Specimen Masonry rf (MPa) emaxv (lm/mm) emax
h (lm/mm)
Prism Q Belfry 6.07 9.52 �20.39Prism B 4.36 5.98 �26.46Prism M 5.27 4.67 �15.56Prism S 4.13 7.19 �17.23Average 4.96 6.84 �19.91
Prism Ec Inner leaf 3.59 8.43 �11.84Prism W 2.75 4.00 �7.89Prism K 1.56 3.99 �45.35Prism In 2.47 4.78 �18.30Average 2.59 5.30 �20.85
718 A. Anzani et al. / Construction and Building Materials 23 (2009) 713–724
those of a test carried out on the masonry of the XVI cen-tury plain masonry are respectively shown. In particular, inthe case of the XVI century masonry a more brittle behav-iour can be observed, governed by the presence of thebricks that in this masonry are more regularly and abun-dantly present than the mortar. It is interesting to comparethe trends of horizontal strain, which are differently influ-enced by the first crack appearance, however showing astrong dilation in both cases. In the case of the medievalinner leaf, the observed behaviour is non-brittle, the dia-gram is markedly non-linear and failure is graduallyreached (Fig. 9a). In the case of the XVI century masonry,the diagram becomes bilinear with a change in its slope at astress value of 3 N/mm2 (Fig. 9b).
This behaviour is coherent with the crack pattern at fail-ure: in the case of the inner leaf (Fig. 10a) the cracks do notcut the bricks and the stones, but mainly involve mortarand tend to propagate at the interface between mortarand resistant elements. In the case of the XVI centurymasonry (Fig. 10b) cracks are clearly vertical and involveboth bricks and the mortar.
Considering the last load step for each specimen, the sec-ondary creep rate before collapse has been calculated and
-40 -30 -20 -10 0 10
εh εv0
1
2
3
4
5
6
7
σ v[N
/mm
2]
[μm/mm]
Q
M
BS
Ec
W
K
Q
M
BSEc
WIn
K
In
33
a b
Fig. 8. Pseudo-creep curves: (- - -) inner leaf, (—) XVI century plain
then related to the duration of the last load step, whichcan be regarded as the residual life of the material. InFig. 11 these values have been plotted comparing themasonry of Monza [23,14,24] previously tested with thoseof the Tower of Pavia. An interesting inverse relationshipcan be found, which seems to apply to the different materi-als considered together, as well as to other brittle materialslike concrete, subjected to creep and fatigue tests [25]. Theobserved strong correlation could be used as a reliableparameter to predict the residual life of a material elementsubjected to a given sustained stress.
3. The strain-rate behaviour approached through a
probabilistic model
By experimental evidence, the strain evolution con-nected with a given stress history of a viscous material likea historic masonry can be described through the verticaland horizontal strain-rate reached at a certain verticalstress level rv. Therefore, in the preservation of historicbuildings from major damage or even failure it would bevery useful to indicate a critical value of the strain-rateunder which the residual life of the building is greater thanthe required service life.
As reported in Fig. 11, an inverse relationship betweenthe secondary creep strain-rate and the residual life of thematerial has been observed.
With the aim to investigate the residual life of materialas a function of the strain-rate, the parameters _ev and _eh,respectively, defined as the vertical and horizontal strain-rate, are quantified by the slope of the linear branches ofthe strain versus time diagrams obtained in the experimen-tal tests (Fig. 8); their values are recorded at the constantapplied stress level r�v; here and in the following the exper-imental stress values will be denoted with *.
For each r�v the high randomness connected with thechanging of strain-rate, due to the high non-homogeneity
0 200000 400000 600000 800000
time [sec]
-40
-30
-20
-10
0
10
ε h(x
10)
ε v(x
10)
S
S
Q
Q
M
M
B
B
Ec
Ec
In
In
K
K
W
W
masonry; letters indicate individual specimens quoted in Table 2.

0
1
2
3
4
5
6
σ v[N
/mm
2 ]
σ v[N
/mm
2 ]
80000
60000
40000
20000
0
t [se
c]
-20 -15 -10 -5 0 5
εh εv
[mm/μm]-20 -15 -10 -5 0 5
[mm/μm]
0
1
2
3
4
5
6
80000
60000
40000
20000
0
t [se
c]
εh εv
a b
Fig. 9. Pseudo-creep tests: (a) on prism In of the inner leaf, (b) on prism M, XVI century masonry.
Fig. 10. Crack pattern at the end of Pseduo-creep tests: (a) on prism In of the inner leaf and (b) on prism M of the XVI century masonry.
100 1000 10000 100000time [sec]
0.01
0.10
1.00
10.00
Δε v
( *10
6 )/Δ
t [se
c-1]
MonzaPavia, ext. leafPavia, XVI cent. plain masonryPavia, inner leaf
Fig. 11. Secondary creep strain-rate vs. duration of last load step.
A. Anzani et al. / Construction and Building Materials 23 (2009) 713–724 719
of the masonry, allows for the treatment of _ev and _eh as ran-dom variables (r.v.) with a certain distribution of values(Fig. 12a and b). Seen in this way, the deformation process
can be interpreted as a stochastic process of the consideredr.v. The strain-rate also depends on the stress level r�v, cor-responding to which the deformation is recorded. There-fore, for each stress level r�v, the strain-rate (measured ine/s) can be modelled with a probability density function(p.d.f.) f_eð _EÞ, which is dependent on r�v and on the strain-rate. In order to model f_eð _EÞ at every stress level r�v(Fig. 13a and b), a family of theoretical distributions mustbe chosen.
Choosing the suitable p.d.f. modelling a given phenom-enon is a delicate and important matter; it must be foundaccording to the physical aspects of the phenomenon itself,and to the characteristics of the distribution function in its‘‘tail”, where often no experimental data can be collected.This latter aspect can be investigated analyzing the behav-iour of the failure rate function /_eð _EÞ at every stress level r�vconnected with the chosen distribution function:
/_eð _EÞd _E ¼ Prf _E < _e 6 _E þ d _Ej_e > _Eg 8 r�v;
_e ¼ _eh or _e ¼ _ev ð1Þ

0 1 2 3 4 5 6
σv [ N/mm2]
0.0x100
5.0x10⁻⁵
1.0x10⁻⁴
1.5x10⁻⁴
2.0x10⁻⁴
2.5x10⁻⁴
3.0x10⁻⁴
3.5x10⁻⁴
4.0x10⁻⁴
4.5x10⁻⁴
5.0x10⁻⁴
ε v[ (
ε vx1
03 )/se
c ]
0 1 2 3 4 5 6
σv[ N/mm2 ]
0.0x100
1.0x10⁻⁴
2.0x10⁻⁴
3.0x10⁻⁴
4.0x10⁻⁴
5.0x10⁻⁴
6.0x10⁻⁴
7.0x10⁻⁴
8.0x10⁻⁴
9.0x10⁻⁴
1.0x10⁻³
. ε h[ (
ε hx1
03 )
/ se
c]
a b
Fig. 12. Interpolation of the vertical (a) and horizontal (b) strain-rate vs. applied stress.
0 1 2 3 4 5 6
σv [ N/mm2 ]
0.0x100
5.0x10⁻⁵
1.0x10⁻⁴
1.5x10⁻⁴
2.0x10⁻⁴
2.5x10⁻⁴
3.0x10⁻⁴
3.5x10⁻⁴
4.0x10⁻⁴
4.5x10⁻⁴
5.0x10⁻⁴
ε v[ (
ε vx1
03 )/
sec
]
ε._v=1x10- 4
f ε. ( Ε. )
σ*v
ε._v=5x10- 5
0 1 2 3 4 5 6
σv [ N/mm2 ]
0.0x100
5.0x10⁻⁵
1.0x10⁻⁴
1.5x10⁻⁴
2.0x10⁻⁴
2.5x10⁻⁴
3.0x10⁻⁴
3.5x10⁻⁴
4.0x10⁻⁴
4.5x10⁻⁴
5.0x10⁻⁴
5.5x10⁻⁴
6.0x10⁻⁴
6.5x10⁻⁴. ε h
[ (ε h
x103 )
/ se
c ]
σ*v
ε._h=5x10- 5
ε._h=1x10- 4
f ε. ( Ε. )
a b
Fig. 13. Vertical (a) and horizontal (b) secondary creep strain-rate vs. applied stress (***) modelled with a Weibull p.d.f f_eð _EÞ (—).
720 A. Anzani et al. / Construction and Building Materials 23 (2009) 713–724
The function (1) is able to describe the immediate occur-rence rate of a given event. It can present three fundamen-tal behaviours. A constant hazard-rate means: that since asystem has functioned for some time without failing, thereis no effect on the failure probability for the period ahead.A decreasing failure rate means that the failure probabilityfor the period ahead is favourably affected by the systemsatisfactorily functioning for a certain time. An increasing
failure rate means that the system has already been in ser-vice for some time and has reduced its reliability, so itsprobability of failure is increasing. In an actual material,a combination of these respective cases is possible. Moredetails on this subject are given in [26,27].
Considering the recorded experimental data, a conven-tional value of _e may be assumed as a critical value indicat-ing a safety limit. Consequently, for a given stress level r�vthe probability to record the critical strain-rate connectedwith the secondary creep safety limit increases if thestrain-rate increases. In other words, at a given stress levelr�v, the probability that the secondary creep strain-rate falls
in the interval f _E < _e 6 _E þ d _Eg increases as the strain-rate increases. This hypothesis, assumed as a satisfying(but not unique) physical interpretation of the decay pro-cess, associated with the information given by (1) on thehazard-rate behaviour of various p.d.f. families, leads tomodel the behaviour of the strain-rate at the stress levelr�v with a Weibull p.d.f. as follows:
f_eð _EÞ ¼ a1q1ðq1_EÞa1�1 exp½�ðq1
_EÞa1 � 8 r�v ð2ÞThis family of distributions presents an hazard-rate
function (1) which increases if the value of _E increasesand tends to 1 if _E !1; this fact seems to respect thephysical interpretation of the strain-rate behaviour previ-ously proposed.
3.1. The strain-rate behaviour as a reliability problem
It is furthermore interesting to evaluate the probabilitythat the system will reach, or exceed a given strain-ratelevel �_eh or �_ev over a stress history. Considering a significant

A. Anzani et al. / Construction and Building Materials 23 (2009) 713–724 721
strain-rate level �_eh or �_ev and the variable stress needed toexceed it, the strain-rate behaviour can be treated as a reli-ability problem [27,28].
Reliability R(t) is related to the performance of a systemover time, and is defined as the probability that the systemdoes not fail by time t. This definition is extended here,denoting by RðrvÞ the probability that a system will notexceed a given significant strain-rate level by stress rv.The random variable that is used to quantify reliability is�r, which is simply the stress it takes to exceed damage �_eh
or �_ev. Thus, from this point of view, the reliability functionis given by [29]
RðrvÞ ¼ Prð�r > rvÞ ¼ 1� F �rðrvÞ ð3Þwhere F �rðrvÞ is the distribution function for �r.
Computing F �rðrvÞ for different damage levels �_eh (or �_evÞallows us to build the corresponding fragility curves
0 1 2 3 4 5 6
σv [ N/mm2]
0.0x100
5.0x10⁻⁵
1.0x10⁻⁴
1.5x10⁻⁴
2.0x10⁻⁴
2.5x10⁻⁴
3.0x10⁻⁴
3.5x10⁻⁴
4.0x10⁻⁴
4.5x10⁻⁴
5.0x10⁻⁴
ε v[ (
ε vx1
03)/
sec
]
σ*v
ε._v=1x10- 4
f ε. ( Ε. )
Fig. 14. Exceedance probability to cross the threshold �_e.
0 1 2 3 4 5σv (N/mm2)
0
0.1
0.2
0.3
0.4
0.5
0.6
0.7
0.8
0.9
1 F σ (σv)
ε•– h=5.0x10⁻⁵
ε•– h=1.0x10- 4
a b
Fig. 15. Inner leaf medieval masonry: experimental ðN�_eh;�_ev ¼ 5:0� 10�5;N
strain-rate and (b) vertical strain-rate.
describing the probability of exceeding a given strain-rateover stress [30] that is expressed as the area above thethreshold �_eh (or �_evÞ (Fig. 14) and can be calculated by usingthe survive function
I_eð _EÞ ¼ 1� F _eð _EÞ 8 r�v ð4Þwhere F _eð _EÞ is the cumulative distribution function of thep.d.f. (2) at every r�v. The computation of I_eð _EÞ at everyr�v is possible with the use of any kind of computer codefor numerical integration. The areas computed over differ-ent strain-rate thresholds provide the experimental fragilitycurves F �r� ðrvÞ. In other words, the probability to exceed acertain level �_eh (or �_evÞ at different experimental stress valuesr�v can be plotted in graphical form here called experimen-tal fragility curve: for each �_eh (or �_evÞ chosen an experimen-tal fragility curve can be built.
Since the experimental fragility curves are composed bya discrete number of points (Fig. 15) to describe theirbehaviour over rv a probabilistic modelling is needed. Todo it a density function f�rðrvÞ has to be assumed for ther.v. �r consequently, the failure rate function /�rðrvÞ is givenby [29]
/�rðrvÞ ¼f�rðrvÞRðrvÞ
ð5Þ
To model the experimental fragility curves, a Weibulldistribution has been chosen [21,27,31,32] that seems toprovide a good interpretation of the physical phenomenon.In fact, experimental evidence indicates that the failure ratefunction /�rðrvÞ has a polynomial form and, consequently,must be [29,31]
/�rðrvÞ ¼ b1rb2v ð6Þ
where b1 > 0 and �1 < b2 < +1 are constants.Since RðrvÞ ¼ expf�
R rv
0 /�rðuÞdug and f�rðrvÞ ¼ /�rðrvÞexpf�
R rv
0/�rðuÞdug and assuming: b1 = aqa and b2 + 1 = a
(with a and q equal constants) we obtain
0 1 2 3 4 5
σv (N/mm2)
0
0.1
0.2
0.3
0.4
0.5
0.6
0.7
0.8
0.9
1 F σ(σv)
ε•– v=1.0x10⁻⁴
ε•– v=5.0x10 - 5
�_eh;�_ev ¼ 1:0� 10�4Þ and theoretical (—–) fragility curves; (a) horizontal
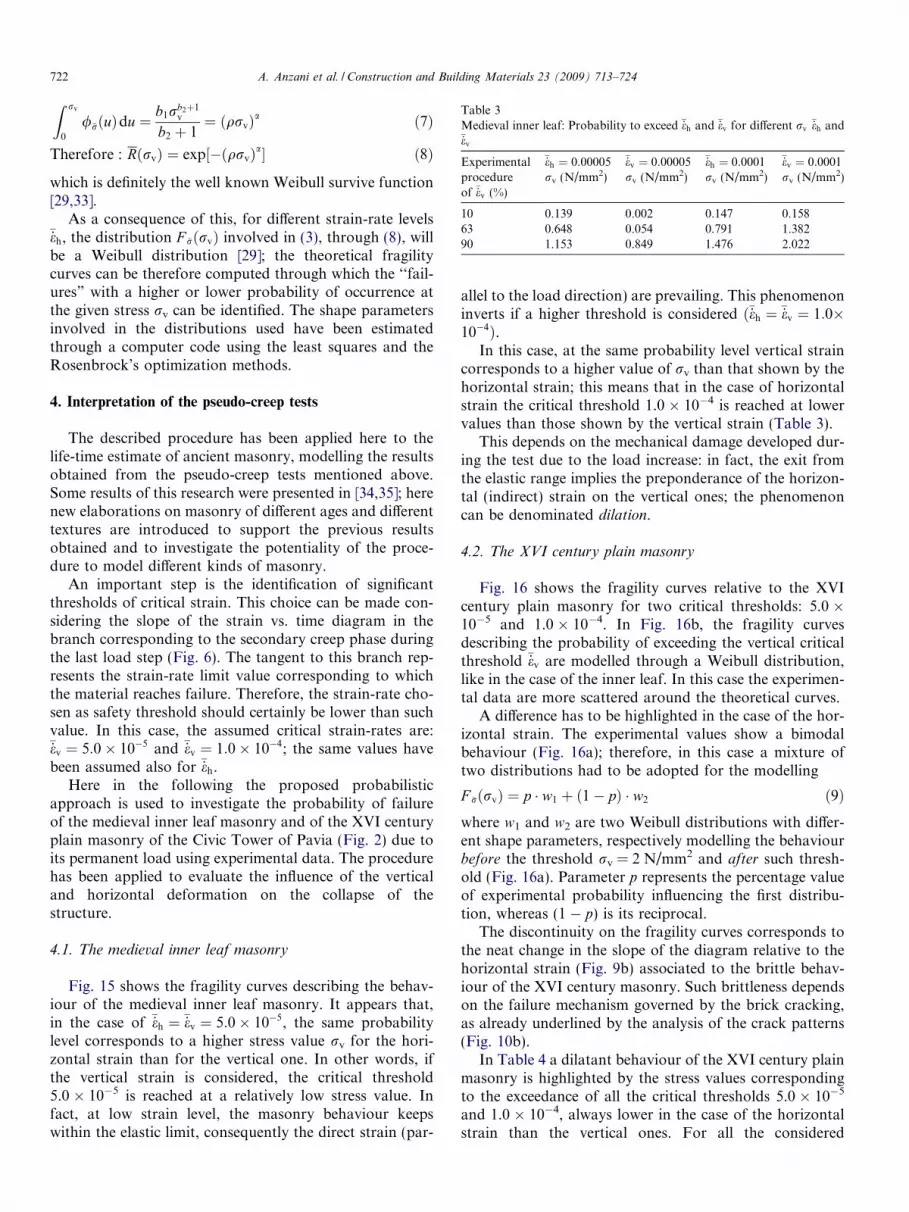
Table 3Medieval inner leaf: Probability to exceed �_eh and �_ev for different rv
�_eh and�_ev
Experimentalprocedureof �_ev (%)
�_eh ¼ 0:00005 �_ev ¼ 0:00005 �_eh ¼ 0:0001 �_ev ¼ 0:0001rv (N/mm2) rv (N/mm2) rv (N/mm2) rv (N/mm2)
10 0.139 0.002 0.147 0.15863 0.648 0.054 0.791 1.38290 1.153 0.849 1.476 2.022
722 A. Anzani et al. / Construction and Building Materials 23 (2009) 713–724
Z rv
0
/�rðuÞdu ¼ b1rb2þ1v
b2 þ 1¼ ðqrvÞa ð7Þ
Therefore : RðrvÞ ¼ exp½�ðqrvÞa� ð8Þ
which is definitely the well known Weibull survive function[29,33].
As a consequence of this, for different strain-rate levels�_eh, the distribution F �rðrvÞ involved in (3), through (8), willbe a Weibull distribution [29]; the theoretical fragilitycurves can be therefore computed through which the ‘‘fail-ures” with a higher or lower probability of occurrence atthe given stress rv can be identified. The shape parametersinvolved in the distributions used have been estimatedthrough a computer code using the least squares and theRosenbrock’s optimization methods.
4. Interpretation of the pseudo-creep tests
The described procedure has been applied here to thelife-time estimate of ancient masonry, modelling the resultsobtained from the pseudo-creep tests mentioned above.Some results of this research were presented in [34,35]; herenew elaborations on masonry of different ages and differenttextures are introduced to support the previous resultsobtained and to investigate the potentiality of the proce-dure to model different kinds of masonry.
An important step is the identification of significantthresholds of critical strain. This choice can be made con-sidering the slope of the strain vs. time diagram in thebranch corresponding to the secondary creep phase duringthe last load step (Fig. 6). The tangent to this branch rep-resents the strain-rate limit value corresponding to whichthe material reaches failure. Therefore, the strain-rate cho-sen as safety threshold should certainly be lower than suchvalue. In this case, the assumed critical strain-rates are:�_ev ¼ 5:0� 10�5 and �_ev ¼ 1:0� 10�4; the same values havebeen assumed also for �_eh.
Here in the following the proposed probabilisticapproach is used to investigate the probability of failureof the medieval inner leaf masonry and of the XVI centuryplain masonry of the Civic Tower of Pavia (Fig. 2) due toits permanent load using experimental data. The procedurehas been applied to evaluate the influence of the verticaland horizontal deformation on the collapse of thestructure.
4.1. The medieval inner leaf masonry
Fig. 15 shows the fragility curves describing the behav-iour of the medieval inner leaf masonry. It appears that,in the case of �_eh ¼ �_ev ¼ 5:0� 10�5, the same probabilitylevel corresponds to a higher stress value rv for the hori-zontal strain than for the vertical one. In other words, ifthe vertical strain is considered, the critical threshold5.0 � 10�5 is reached at a relatively low stress value. Infact, at low strain level, the masonry behaviour keepswithin the elastic limit, consequently the direct strain (par-
allel to the load direction) are prevailing. This phenomenoninverts if a higher threshold is considered ð�_eh ¼ �_ev ¼ 1:0�10�4Þ.
In this case, at the same probability level vertical straincorresponds to a higher value of rv than that shown by thehorizontal strain; this means that in the case of horizontalstrain the critical threshold 1.0 � 10�4 is reached at lowervalues than those shown by the vertical strain (Table 3).
This depends on the mechanical damage developed dur-ing the test due to the load increase: in fact, the exit fromthe elastic range implies the preponderance of the horizon-tal (indirect) strain on the vertical ones; the phenomenoncan be denominated dilation.
4.2. The XVI century plain masonry
Fig. 16 shows the fragility curves relative to the XVIcentury plain masonry for two critical thresholds: 5.0 �10�5 and 1.0 � 10�4. In Fig. 16b, the fragility curvesdescribing the probability of exceeding the vertical criticalthreshold �_ev are modelled through a Weibull distribution,like in the case of the inner leaf. In this case the experimen-tal data are more scattered around the theoretical curves.
A difference has to be highlighted in the case of the hor-izontal strain. The experimental values show a bimodalbehaviour (Fig. 16a); therefore, in this case a mixture oftwo distributions had to be adopted for the modelling
F �rðrvÞ ¼ p � w1 þ ð1� pÞ � w2 ð9Þwhere w1 and w2 are two Weibull distributions with differ-ent shape parameters, respectively modelling the behaviourbefore the threshold rv = 2 N/mm2 and after such thresh-old (Fig. 16a). Parameter p represents the percentage valueof experimental probability influencing the first distribu-tion, whereas (1 � p) is its reciprocal.
The discontinuity on the fragility curves corresponds tothe neat change in the slope of the diagram relative to thehorizontal strain (Fig. 9b) associated to the brittle behav-iour of the XVI century masonry. Such brittleness dependson the failure mechanism governed by the brick cracking,as already underlined by the analysis of the crack patterns(Fig. 10b).
In Table 4 a dilatant behaviour of the XVI century plainmasonry is highlighted by the stress values correspondingto the exceedance of all the critical thresholds 5.0 � 10�5
and 1.0 � 10�4, always lower in the case of the horizontalstrain than the vertical ones. For all the considered

0 1 2 3 4 5
σv (N/mm2)
0
0.1
0.2
0.3
0.4
0.5
0.6
0.7
0.8
0.9
1 F σ (σv)
ε•– h=5.0x10⁻⁵
ε•– h=1.0 x10⁻⁴
0 1 2 3 4 5
σv (N/mm2)
0
0.1
0.2
0.3
0.4
0.5
0.6
0.7
0.8
0.9
1 F σ(σv)
ε•– v=5.0x10⁻⁵
ε•– v=1.0x10⁻⁴
a b
Fig. 16. XVI century plain masonry: experimental ðN�_eh;�_ev ¼ 5:0� 10�5; ��_eh;�_ev ¼ 1:0� 10�4Þ and theoretical (—-) fragility curves; (a) horizontal strain-rate and (b) vertical strain-rate.
Table 4XVI century plain masonry: probability to exceed �_eh and �_ev for differentrv
�_eh and �_ev
Experimentalprocedureof �_ev (%)
�_eh ¼ 0:00005 �_ev ¼ 0:00005 �_eh ¼ 0:0001 �_ev ¼ 0:0001rv (N/mm2) rv (N/mm2) rv (N/mm2) rv (N/mm2)
10 0.150 0.700 0.897 1.10063 1.375 1.833 2.267 2.78190 2.450 2.652 2.675 3.924
A. Anzani et al. / Construction and Building Materials 23 (2009) 713–724 723
thresholds, the behaviour of the material can be consideredexternal to the elastic range, since the indirect strains arealways prevailing on the vertical ones.
5. Conclusions
The time-dependent behaviour, together with other fac-tors acting in a synergetic way, proved to be responsible ofthe collapse of some monumental buildings happened dur-ing the last twenty years. The problem has been facedthrough an experimental programme showing that labora-tory pseudo-creep tests provide useful results for a deeperknowledge of the primary, secondary and tertiary creepphases. The applied probabilistic model seems to appropri-ately interpret the experimental results, allows an estimateof the exceedance of the critical thresholds in vertical andhorizontal strain-rate that are related to the residual servicelife, and also captures the difference between masonry ofdifferent ages and characteristics.
For the safety assessment of time-dependent historicmasonry buildings, useful information aimed to the previ-sion of the residual life may be provided by in situ long-term monitoring campaigns recording the evolution ofthe main crack opening and/or the variations of masonrywall thickness combined with complementary informationon the states of stress and on the quality of masonryrecorded through single and double flat-jack tests and sonic
tests. The results obtained through the proposed probabi-listic approach indicate an interesting research directiontoward the interpretation of data collected through themonitoring of monumental buildings, to prevent total orpartial failure. The precocious recognition in situ of criticalvalues of secondary creep strain-rate related to the residualservice life will allow to design strengthening interventionsfinalized both to directly repair damage and to remove thevulnerability sources.
Acknowledgements
Arch. Serena Sironi and Arch. Roberta Tassi are grate-fully acknowledged for their assistance in the experimentalwork and data elaboration; Mr Marco Antico for his tech-nical support in the laboratory; Mrs Cinzia Arcadi for herassistance in the editing activity. The research has beensupported by COFIN 2002 MIUR funds.
References
[1] Goodman RE. Rock mechanics. New York: John Wiley & Sons Inc.;1989.
[2] Jaeger JC, Cook NG. Fundamentals of rock mechanics. 2nd ed.London: Chapman & Hall; 1976.
[3] Enright MP, Frangopol DM. Failure time prediction of deterioratingfail-safe structures. J Struct Eng – ASCE, USA 1998;124(12):1448–57.
[4] Sarja A, Vesikari E. Durability design of concrete structures. RILEMReport 14, RILEM Technical Committee 130-CSL, E & FN Spon;1996.
[5] Biondini F, Bontempi F, Frangopol DM, Malerba PG. Cellularautomata approach to durability analysis of concrete structures. JStruct Eng – ASCE, USA 2004;130(11):1724–37.
[6] Biondini F, Bontempi F, Frangopol DM, Malerba PG. Probabilisticservice life assessment and maintenance planning of concrete struc-tures. J Struct Eng – ASCE, USA 2006;132(5):810–25.
[7] Mori Y, Ellingwood B. Reliability-based service-life assessment ofaging concrete structures. J Struct Eng – ASCE 1993;119(5):159–76.
[8] Val DV, Melchers RE. Reliability of deteriorating RC slab bridges. JStruct Eng – ASCE 1997;123(12):1638–44.

724 A. Anzani et al. / Construction and Building Materials 23 (2009) 713–724
[9] Ibarra L, Krawinkler H. Effect of uncertainty in system deteriorationparameters on the variance of collapse capability. In: Augusti G,Schueller GI, Ciampoli M, editors. ICOSSAR’05, Internationalconference on structural safety and reliability, Rome, Italy, 2005.Rotterdam, The Nethertland: Millpress; 2005. p. 3583–90. CD-ROM.
[10] Bentz DP, Garboczi EJ. Modelling the leaching of calcium hydroxidefrom cement paste: effects of pore space percolation and diffusivity.Mater Struct 1992;25:523–33.
[11] Papa E, Taliercio A, Binda L. Creep failure of ancient masonry:experimental investigation and numerical modeling. In: Brebbia CA,editor. Seventh SSRMHB, International conference structural stud-ies, repairs, and maintenance of historic buildings, Bologna, Italy,2001. p. 285–94.
[12] Papa E, Taliercio A. A theoretical model for the description of staticand creep-induced damage in brittle materials under non-propor-tional loading. In: Owen DRJ, Onate E, Suarez B, editors. Compu-tational plasticity VII – fundamentals and applications, Barcelona,Spain, 2003. CIMNE, CD ROM.
[13] Anzani A, Binda L, Taliercio A. Experimental and numerical study ofthe long term behaviour of ancient masonry. In: Brebbia CA,Torpiano A, editors. Ninth STREMAH, International conference onstructural studies, repairs and maintenance of heritage architecture,Malta, 2005. p. 577–86. Section 9.
[14] Anzani A, Binda L, Taliercio A. Application of a damage model tothe study of the long term behavior of ancient towers. In: FirstCanadian conference on effectiveness design of structures, Hamilton,Ontario, Canada, 2005. p. 401–12. CD-ROM.
[15] Valluzzi MR, Modena C. Mechanical behaviour of masonry struc-tures strengthened with different improvement techniques. Fractureand failure of natural building stones. Netherlands: Springer; 2006.
[16] Casolo S. Modelling in-plane micro-structure of masonry walls byrigid elements. Int J Solids Struct Elsevier Science Ltd. 2004;41(13):3625–41.
[17] Anzani A, Binda L, Melchiorri G. Time dependent damage of rubblemasonry walls. Proc Brit Masonry Soc London, UK 1995;7(2):341–51.
[18] Binda L, Anzani A. The time-dependent behaviour of masonryprisms: an interpretation. Masonry Soc J 1993;2(11):17–34.
[19] Anzani A, Binda L, Mirabella Roberti G. The effect of heavypersistent actions into the behaviour of ancient masonry. MaterStruct 2000;33:251–61.
[20] Anzani A, Binda L, Mirabella Roberti G. Experimental researches intolong term behaviour of historical masonry. In: Binda L, editor.Learning from failure. Southampton, UK: WIT Press; 2007 [chapter 2].
[21] Bekker PCF. Durability testing of masonry: statistical models andmethods. Masonry Int 1999;13(1):32–8.
[22] Binda L, Gatti G, Mangano G, Poggi C, Sacchi Landriani G. Thecollapse of the Civic Tower of Pavia: a survey of the materials andstructure. Masonry Int 1992;6(1):11–20.
[23] Anzani A, Binda L, Garavaglia E. Simple checks to prevent thecollapse of heavy historical structures and residual life previsionthrough a probabilistic model. In: Binda L, editor. Learning fromfailure. Southampton, UK: WIT Press; 2007. p. 205–23 [chapter 9].
[24] Mirabella Roberti G, Binda L, Anzani A. Experimental investigationinto the effects of persistent and cyclic loads on the masonry ofancient towers. In: Forde MC, editor. Seventh international confer-ence on structural faults and repair, vol. 3. Edinburgh: EngineeringTechnics Press; 1997. p. 339–47.
[25] Taliercio A, Gobbi E. Fatigue life and change in mechanicalproperties of plain concrete under triaxial deviatoric cyclic stresses.Mag Concrete Res 1998;50(3):247–56.
[26] Binda L, Molina C. Building materials durability semi-Markovapproach. J Mater Civil Eng – ASCE, USA 1990;2(4):223–39.
[27] Garavaglia E, Gianni A, Molina C. Reliability of porous materials:two stochastic approaches. J Mater Civil Eng – ASCE, USA2004;16(5):419–26.
[28] Garavaglia E, Anzani A, Binda L. Application of a probabilisticmodel to the assessment of historic building under permanentloading. Fourth international seminar structural analysis of historicalconstructions, Padua, 2004, vol. 1. p. 589–96.
[29] Evans DH. Probability and its applications for engineers. New York,NJ, USA: Marcel Dekker Inc.; 1992.
[30] Singhal A, Kerimidjian AS. Method for probabilistic evaluation ofseismic structural damage. J Struct Eng – ASCE 1996;122(12):1459–67.
[31] Garavaglia E, Lubelli B, Binda L. Two different stochasticapproaches modelling the deterioration process of masonry wall overtime. Mater Struct 2002;248(35):246–56.
[32] Cranmer DC, Richerson DW. Mechanical testing methodology forceramic design and reliability. New York, NJ, USA: Marcel DekkerInc.; 1998.
[33] Cox DR. Renewal theory. London, UK, EU: Methuen Ltd.; 1962.[34] Anzani A, Garavaglia E, Binda L. A probabilistic approach for the
interpretation of long term damage of historic masonry. In: Lissen S,Benz C, Hagel M, Yuen C, Shrive N, editors. 10th Canadian masonrysymposium, Banff, Alberta, Canada, 2005, vol. I. The University ofCalgary, Canada: Dept. of Civil Eng.; 2005. p. 664–73.
[35] Garavaglia E, Anzani A, Binda L. A probabilistic model for theassessment of historic buildings under permanent loading. J MaterCivil Eng – ASCE 2006;18(6):858–67.