long-term competitiveness based
TRANSCRIPT
�
LONG-TERM COMPETITIVENESS BASED ON VALUE ADDED MEASURES AS PART OF HIGHLY PROFESSIONALIZED CORPORATE GOVERNANCE MANAGEMENT OF GERMAN DAX 30 CORPORATIONS
Guenter Blendinger, Grzegorz Michalski
AbstractThis paper shows how long-term value added driven competitiveness is widely adopted by Ger-man DAX 30 corporations and how it can be measured. It explains and shows how different measures such as shareholder value, economic value added (EVA), return on capital employed (ROCE), return on equity (ROE) and others are calculated and how they correlate to show long-term value added and, therefore, competitive differentiation. As part of the highly professional-ized corporate governance approach, the German Corporate Governance Codex (Regierung-skommision Deutscher Corporate Governance Kodex, 2015) asks for “sustainable creation of value”. The analyses of 2015 and 2016 annual reports of all 30 corporations state that 80% of the firms show financially relevant value added data and as such measurable competitive advantage on the long run. The paper focuses on which measures are used to quantify the competitive value addition and then shows how EVA or company specific EVA-like measures in addition to ROCE are the most used ones. Furthermore, the paper shows that ROCE with a factor of 0.97 in 2015 and 0.74 in 2016 correlates best with EVA and, in absence of an EVA calculation, is the best measure to represent value creation as a competitive differentiator. The results can be useful to strengthen competitiveness for policymakers both in non-profit and for-profit social economy entities.
Keywords: competitiveness, value add, corporate governance, ROCE, competitiveness in NGOs, DAX 30 JEL Classification: G30, G32, G34, O16, O52
1. IntroductIonThe objective of the theoretical part of this paper is to identify and analyse financial measures against their usefulness, to show financial value addition as a competitive differentiator as part of a professionalized corporate governance. The second part’s objective is to show, analyse and discuss which financial measures are actually used by the German DAX 30 corporations to do so. An additional intention is to provide inputs from doing this research to members of the board of directors or supervisory boards.
Claessens & Yurtoglu (2013) find that better corporate governance benefits firms through a greater access to financing, lower cost of capital, better performance, therefore, higher com-petiveness and more favourable treatment of all stakeholders. Further findings of how better
▪
Vol. 10, Issue 1, pp. 5 - 20, June 2018pp. 5 - 20, June 2018 ISSN 1804-171X (Print), ISSN 1804-1728 (On-line), DOI: 10.7441/joc.2018.02.01
Journal of Competitiveness
joc2-2018-v4.indd 5 20.6.2018 20:43:16
Journal of Competitiveness �
corporate governance increases financial positions and, therefore, competiveness include Khan et al., (2013) who examined the relationship between corporate governance and the extent of corporate social responsibility (CSR) disclosures (Khan, Muttakin, & Siddiqui, 2013; Belas, Anh, & Smrcka, 2016). The results suggest that although CSR disclosures have generally a negative association with managerial ownership, such a relationship becomes significant and positive for export-oriented industries (Khan, Muttakin, & Siddiqui, 2013; Michalski, 2016; Bem & Michal-ski, 2015). Aguilera & Jackson (2003) develop a theoretical model to describe and explain varia-tion in corporate governance among advanced capitalist economies.
Liu, McConnell, & Xu (2017) find that the media can play a role in corporate governance by in-fluencing the value of CEOs’ human capital. Jensen & Meckling (1976) integrate elements from the theory of agency, the theory of property rights and the theory of finance to develop a theory of the ownership structure of the firm. Apart from that, Jensen & Meckling (1976) demonstrate who bears costs agency and investigate the Pareto optimality of existence agency costs during corporate governance process.
Kalodimos (2017) found that the effect of internal governance on performance is potentially economically significant and as such increases competitiveness but may be difficult to identify. Gompers, Ishii, & Metrick (2003) found that firms with stronger shareholder rights had higher firm value growth and lower capital expenditures and, therefore, have a much higher competi-tive sustainability.
Corporate governance has become increasingly important over the past 15 years. Following local corporate governance guidelines and codices, it has become a de facto standard. This is made fully transparent in annual and corporate governance reports in today’s world of stock market listed firms. On top of that, more and more firms not only document compliance, they use certain financial measures to make their long-term competitive success of adding value to the company transparent. The questions arise, which is the most appropriate approach and which financial measures are best-suited to reflect value addition, ensuring the ongoing competitive-ness. While shareholder value in the meantime has a somewhat negative touch in the sense of being short-term and capital focused only, Economic Value Added (EVA) ™ seems to be the best known and often used measure applied by firms in recent years. The author believes that while EVA ™ on the one hand, is well-if not best-suited, however, on the other hand, due to its constraints, it has limitations. Therefore, the hypothesis is that there is not one consistent metric used among the firms yet.
Corporate governance was institutionalized in the early 2000s in several countries such as in the United States with the Sarbanes-Oxley-Act of 2002 (“Sarbanes-Oxley Act,” 2002) or in Germany with the German Corporate Governance Codex (GCGC). The Sarbanes-Oxley Act of 2002 (often shortened to SarbOx or SOX) is a legislation passed by the U.S. Congress to protect shareholders and the general public from accounting errors and fraudulent practices in the enterprise, as well as to improve the accuracy of corporate disclosures. The U.S. Securi-ties and Exchange Commission (SEC) administers the act, which sets deadlines for compliance and publishes rules on requirements. The German Corporate Governance Code ‘presents essential statutory regulations for the management and supervision (governance) of German listed companies and contains internationally and nationally recognized standards for good and responsible governance. The code aims to make
joc2-2018-v4.indd 6 20.6.2018 20:43:16
�
the German Corporate Governance system transparent and understandable. Its purpose is to promote the trust of international and national investors, customers, employees and the general public in the management and supervi-sion of listed German stock corporations, ensuring a fair competitiveness.
The code clarifies the obligation of the Management Board and the Supervisory Board to ensure the continued existence of the enterprise and its sustainable creation of value in conformity with the principles of the social market economy (interest of the enterprise). A dual board system is prescribed by law for German stock corporations. Furthermore, the code clarifies the obligation of the Management Board and the Supervisory Board to ensure the continued existence of the enterprise and its sustainable creation of value in conformity with the principles of the social market economy (interest of the enterprise).’ (Regierungskommision Deutscher Corporate Govern-ance Kodex, 2015)
This paper focuses on the so-called “sustainable creation of value” and especially how it can be measured from a financial point of view to quantify sustainable competitive advantage.
Already in the mid-1990s, Joel Stern developed the Economical Value Added (EVA)™ approach ( Joel Stern, Stewart, & Chew, 1996) which was trademarked by Stern Stewart & Co. This meas-ure has been adopted by many companies ever since, however, there are several other financial measures which are being used and need to be considered in this context. In the first steps of this paper different financial measures EVA ™ are being identified, explained and evaluated including literature search. Other considered financial measures besides EVA ™ are without particular order: Shareholder Value, Return On Assets ROA, Return On Net Assets RONA, Return On Equity ROE, Return On Capital Employed ROCE, Return on Investment ROI, Cash flow, free cash flow, Tobin’s Q as well as Financial Value Add and Value Add.
Second, the annual reports of the German DAX listed corporations are evaluated in order to find out whether a financial value add measure is used and if so which one it is. Thereafter, these measures are being discussed before a future outlook from the author that concludes the paper.
2. research objectIve and methodologyThe paper aims to judge financial measures towards their usefulness for the corporate govern-ance objective to grow the financial value and increase the financially competitive position of a firm in a sustainable way. It intends to take the view from a board of director’s member whose duty is to make sure value is added. It is not meant to provide a complete analysis of financial measures used in corporate balance sheets. Also, the author takes it as common knowledge that a singular financial measure cannot be reflective of the financial health of a company, which means even with a proper financial value add measure additional financial indicators need to be considered in order to get a full picture and judgement of a firm’s financial constitution com-pared to competitive players at any given time (Becker, 2013; Brealey, Myers, & Marcus, 2015; Wöhe, 2016; Gavurova, Belas, & Kocisova, 2017).
As mentioned before, EVA ™ has been developed by Joel Stern and trademarked by Stern Stew-art & Co. Stern raises high expectations stating that “ … EVA … is not just a performance measure. When fully implemented it is the center-piece of an integrated financial management system that encompasses the full range of corporate financial decision making …. .” ( Joel Stern
joc2-2018-v4.indd 7 20.6.2018 20:43:16

Journal of Competitiveness �
et al., 1996). While it might be a bit ambitious, it has at least made its way into many corporate finance departments and boards as the measure and indicator for financial value add throughout the years until today, which we will see in the empirical research later in this paper. Furthermore Joel Stern emphasizes “EVA is not a metric but a way of thinking, a mindset.” ( Joel Stern et al., 1996)
German Professor, Stefan Hilbert, in an article says that while the shareholder value approach in principle is wel- suited as corporate management instrument, it has constraints as it is rather mathematical and difficult to communicate (Hilbert, n.d.) Therefore, he claims that EVA ™ as a more practical approach has been more successful.
EVA calculation
EVA=(ROCE-WACC)×NOA or alternatively (1)
EVA=(NOPAT-WACC)×NOA (2)
In which ROCE = Return On Capital Employed / WACC = Weighted Average Cost of Capital / NOA = Net Operating Assets / NOPAT = Net Operating Profit after Taxes
The delta between ROCE and WACC is the so-called spread which if positive says that value was created, as then, the return of the employed capital was higher than the costs to finance. Prof. Hilbert cautions to simply use balance sheet data to calculate as it should be mandatory to use current market conditions for valuation to eliminate balance sheet effects for calculating asset values.
NOPAT is a company’s potential cash earnings if it had no depth. Therefore, NOPAT is a more accurate look at operating efficiency for companies with depth, as it does not include the tax sav-ings many companies get because of existing debt. Nevertheless, EVA can be used as value based management system for a firm or even within a firm for individual business units to compare performance. The downside of the EVA calculation and approach is that in order to boost EVA mid- to long-term investments can be reduced or abandoned resulting in short-term actions and mind-set with the risk of harming mid- and long-term term success. In addition, the formula might show a limited viability for companies with high intangible assets, such as small to mid-size high tech firms with several patents and high intellectual property (IP).
Knowing these shortcomings, EVA still might be of very good use and an instrument also for the board of directors or supervisory board in combination with additional means and measures. This could be, for example, the governed execution of a strategic plan ensuring a balanced ap-proach between short-, mid- and long-term investments.
2.1. Shareholder ValueAlfred Rappaport is often seen as an intellectual founder of shareholder value (Rappaport, 1986). Already in 1983, he published “ … the experience of companies that have implemented the shareholder value contribution criterion … is not only a conceptionally appealing performance standard, but a wholly operational one as well. …. Should improve companies opportunities for creating economic value ….” (Rappaport, 1983).
joc2-2018-v4.indd 8 20.6.2018 20:43:16
�
With Jack Welch’s increasing success as CEO of General Electric Corporate, shareholder value became the synonym for financial success in corporate America in the 90’s and early 2000’s. In the meantime “…it is en vogue to dismiss the idea that creating shareholder value should be a CEO’s guiding objective. “ (Mauboussin, 2011): He says that it is “a profound misunderstand-ing” that shareholders value management is all about optimizing the stock price for the short term. On the other hand it is “ to create value and then let the stock price reflect the value” (Mauboussin, 2011). Value creation, by means of maximizing long-term free cash flow, pro-vides the appropriate approach to judge alternative strategies and subsequent performance and competitiveness. There are two important points mentioned, one is the financial measure of long-term free cash flow, we come back to that shortly. The second one is value creation which he ties directly to long-term free cash flow. This explains why cash flow is one of the key finan-cial measures and indicators (Dittmar & Mahrt-Smith, 2007). See also Hilbert’s calculation of Shareholder Value (Hilbert, 2011). Shareholder value (SHV) is the value of a firm which is left at the end of a business cycle, after all debts have been paid. This money, the free cash flow(s) is for the shareholder(s). In financial terms, it is the value of a company which is defined as the net present value (NPV) of all future cash-flows plus the value of the non-operating assets of the company less the future claims (debts).
SHV=Corporate Value-Debts ( future claims) (3)
SHV=(NPV+value of non-operating assets)-debts ( future claims) (4)
Brealey et al. (2015) in their book provide a more practical view on shareholder value and state that “shareholder value depends on good investment decisions” and “ … on good financing decisions”.
Taking all of this into account, it becomes obvious that shareholder value can be an excellent management approach, if it is used to its advantage and not as the sole indicator of value add. If not used properly as a management guidance and bonus system for top management, it may lead to short-term optimization of cash flows to boost shareholder value while harming long-term investments (Rieg, 2015). Being a full promoter of the shareholder value approach in his early publications in the 80’s, Rappaport (2005) in his article states “Financial analysts fixate on quarterly earnings at the expense of fundamental research. Corporate executives … point to the behaviours of the investment community to rationalize their own obsession with earnings. Short-termism is the decease; earnings and tracking error are the carriers.” (Rappaport, 2005)
2.2 Cash Flow and Free Cash Flow“The value of a company depends on how much cash it can generate for investors after it has paid for any new capital investments. This cash is called … free cash flow. “ (Brealey et al., 2015). It is obvious that cash flows are a very important part, if not the most important one in defining and judging value add of a firm. As a matter of fact in a recent talk with a controller of a medium-sized german stock market listed and fast growing company, he said that cash flow is the key financial indicator for him.
The importance of cash is also emphasized by the “Answer to the question ‘Does it matter if firms hold large cash reserves ?’ is yes ” (Dittmar & Mahrt-Smith, 2007). There seems to be also
joc2-2018-v4.indd 9 20.6.2018 20:43:17
Journal of Competitiveness 10
the unified agreement that corporate governance does not have much impact on how much cash is generated, that is clearly in the hand of the executives “ … governance has a relatively minor impact on how firms accumulate cash, but a significant impact on how firms spend their money. “ (Dittmar & Mahrt-Smith, 2007). However, the use of available cash seems to be indeed tight to the level of corporate governance of a firm “… . show that governance has a substantial impact on value through its impact on cash ….(Dittmar & Mahrt-Smith, 2007) Furthermore, they state that “… $1.00 of cash in a poorly governed firm is value at only $ 0.42 to $ 0.88. Good govern-ance approximately doubles this value.” (Dittmar & Mahrt-Smith, 2007). Also interesting and at the same time not surprising are the findings of Harford “… shows that … firms with large cash reserves spend more on acquisitions” (Harford, 1999).
2.3. ROI/ROE/ROA/RONA/ROCEEVA measures “how many dollars a business is earning after deducting the cost of capital.” which means “ the more assets a manager has to work with, the greater the opportunity to gener-ate large EVA” (Brealey et al., 2015). Therefore, additional supporting measures are helpful. The most common ones among those are Return On Capital (ROC) or Return On Capital Employed (ROCE) or Return on Investment (ROI) and Return On Equity (ROE), as well as Return On Assets (ROA) or Return On Net Assets (RONA).
Stiglbauer (2010b) defines a set of five different financial criteria as endo-gene variables to re-flect the correlation between corporate governance and corporate success which directly relates with competitiveness. These are Return On Equity (ROE), Return On Investment (ROI) as two balance sheet criteria, and two so-called hybrid criteria Tobin’s Q and the market to book value of equity as well as one stock market related criteria which is return on stock.
Mäkelainen (1998) sees these measures critical “ All accounting based rate of returns (ROI, RONA, ROCE, ROIC) fail to assess the true or economic return of a firm, because they are based on the historical asset values, which in turn are distorted by inflation and other factors. Stewart defines his rate of return as return on beginning capital and as return after taxes but these adjustments do not affect the problems attached to accounting rate of return. The shortcomings of accounting rate of returns and the current research on the subject are presented in detail in the next section. The valuation formula of EVA, however, is always equivalent to discounted cash flow and net present value, if EVA is calculated as Stewart presents.” (Mäkelainen, 1998).
2.4. ROC/ROA/ROE – Return on Capital/Assets/EquityROC is defined as (Brealey et al., 2015): Net income plus after-tax interest as a percentage of long-term capital. It is equal to after-tax operating income divided by total capitalization. Im-portant to know is when calculating ROC, a so-called flow measure (income over the period of a year) is combined with a snapshot measure (capital at the start of a year). Therefore, it may be a more accurate reflection of realities if the average of the total capitalization at the beginning and end of the year is taken. ROA is defined as: Net income plus after-tax interest as a percentage of total assets. It measures the after-tax operating income as a fraction of the firm’s total assets. Total assets equal total liabilities plus shareholders equity are greater than total capitalization because total capitalization does not include current liabilities. ROE is defined as: Net income as
joc2-2018-v4.indd 10 20.6.2018 20:43:17
11
a percentage of shareholders equity. It measures the income to shareholders per Dollar they have invested. Again, to ensure flow measures are used consistently, net income divided by average equity should be taken.
2.5 The use of financial value add measures to increase competitiveness in practice – an empirical analysis of the 30 German DAX listed corporationsIn order to evaluate the use of financial measures in practice as part of this research, an empirical approach has been chosen. Analysing the 2015 and 2016 annual reports of the 30 German DAX listed companies with the following objectives has been performed:
identify whether and which financial measures are used beyond the standard financial re-porting needs in order to reflect financial return and value creation
document the values of these measures by a firm
analyse and discuss measures and data
This empirical analysis is to set the basis for further research as part of a dissertation. Below, there are two tables compiling and summarizing financial measures, first from the theoretical part of the paper and, second from the empirical research done. Table 1 takes financial measures and how these are calculated, adding commentary to it on how it is calculated or what advantages or limitations it might have. The fourth and fifth columns then reflect in which 2016 and 2015 annual report of the German DAX 30 corporations the respective measure is used. The approach was to read through every single annual report of the 30 companies in both years 2015 and 2016, which totals to 60 reports. While one would expect to find the appropriate information and data in the corporate governance section of the reports that proved not to be the case. The corporate governance section typically is to explain and document everything about the supervisory board – members, number of meetings, committees, remuneration, et cetera and foremost obviously compliance to the corporate governance code. The data the authors were looking for are buried in other sections such as key figures, consolidated financial data, management report and alike. Most key data on specific value add measurements applied and how these are calculated are in a different section dependent on the company, therefore, needed to be looked for. In other words, the 60 annual reports were scanned in its entirety. Doing this for every one of the companies besides EBIT or operating profit, the relevant value add data as described in Section 2 of this paper have been captured. A total of 145 data points from the 60 reports in 2015 and 2016 were captured. The financial values were checked to be consistent a. within the reports and b. espe-cially for value add calculations which formula and input data have been used.
By doing this, it unveiled that for 5 companies data points from 2015 were restated in 2016, which also as a consequence led to restatements of the value add data. One of the companies did not report a ROCE and value add value anymore in 2016 while doing so in 2015.
2. results oF emPIrIcal analysIsThe empirical research reveals that those firms which are using a true value add measure are us-ing EVA or an EVA like calculation. Such examples are Continental Value Creation (CVC), Thys-
1.
2.
3.
joc2-2018-v4.indd 11 20.6.2018 20:43:17

Journal of Competitiveness 1�
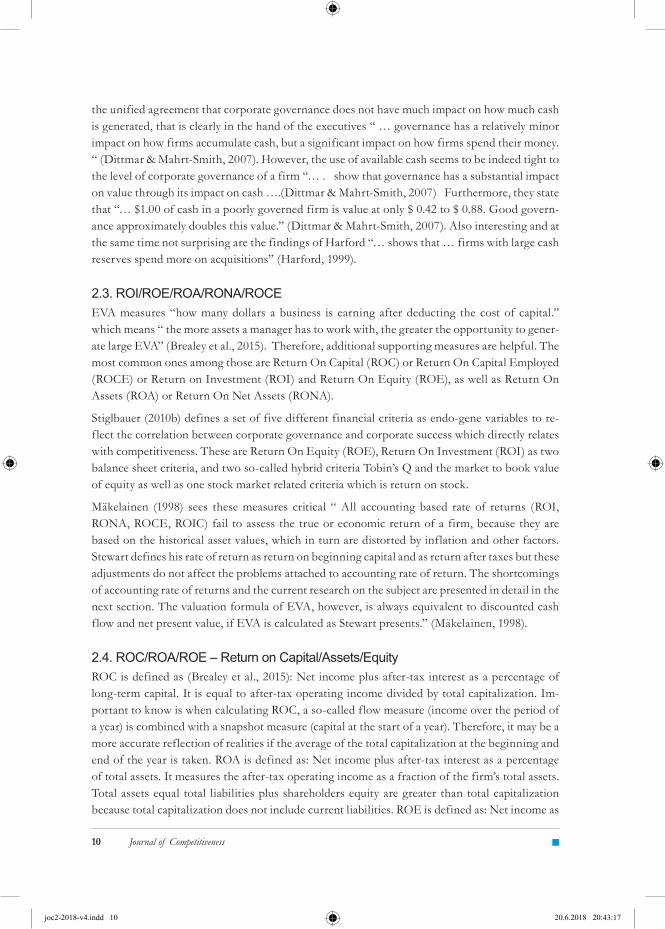
senKrupp Value Added (tkVA) or Merck Economic Value Added (MEVA) or simply Financial Value Add (Daimler), Value Add(ed) (Bayer, BASF, BMW, EON) or Value Creation (Henkel). Table 1 shows which measure is used by which company, how it is calculated and again, there is commentary including whether it is just a financial metric or value add is used and implemented as a management approach to compare different business units with each other or to steer and measure management and teams towards value creation (Henkel, Continental).
Tab. 1 – Value add measurements as defined and used by German DAX30 firms in 2015 and 2016 annual reports. Source: own
DAX 30 Firms
Value Add Measures
calculation comments in 2016 annual report in 2015 annual report
Continental AG Value Contribu-tion (CVC)
CVC=(ROCE - WACC)*average operating assets
CVC - Continental Value Contribution based on ROCE, EBIT, WACC - part of value driver system, to also compare business units
Continental AG, Annual Report 2016, page 40
Continental AG, Annual Report 2015, page 50
EAC (Deutsche Post DHL AG)
EAC=EBIT- (Net Asset Base x WACC)
EAC = EBIT minus Asset Charge, Asset Charge is the cost of capital component, taking into account the weighted average cost of capital (WACC)
Deutsche Post DHL AG annual report 2016, page 32
EACC (Lufthansa AG)
EACC = (Adjusted) EBIT + Interest - Tax - WACC
Earnings after Cost of Capital EACC as well as ROCE replacing CVA (Cash Value Added = Ac-tual Cash Flow - Minimal needed Cash Flow)
Lufthansa Annual report 2016 page 2,18
Lufthansa Annual Report 2015, page 13
Financial Value Add (Daimler AG)
FVA=NOPAT-(NOA*CC%)/CC FVA=(ROS*NAP-CC%)*NOA
value added is calculated taking cost of capital as the result of net assets and cost of capital expressed as a percentage, which is subtracted from earnings
Daimler slightly changed termionology from financial value add to value add in 2016 annual report, pages 95,107
Daimler AG Annual Report 2015, page 77
MEVA (Merck AG)
MEVA = ROCE - WACC Merck: ROCE/MEVA as KPIs but no data
Merck Annual report 2016 MEVA page 62
Merck Annual report 2015 MEVA page 60
NAV Net Assets Value (Vonavia AG)
NAV=Equity attributable to Vonovia’s sharehold-ers + Deferred taxes on investment properties and assetsheld for sale +/- Fair value of derivative finan-cial instruments +/- De-ferred taxes on derivative financial instruments
Growth from operating activities and the value of our property assets are two factors that are decisive for the further develop-ment of our company and that are reflected in the net asset value (NAV) – a standard parameter in our sector
Vonovia Annual Report 2016 page 90
Vonovia Annual Re-port 2015 page 105
Thyssenk-rupp Value Added (tkVA)
tkVA = EBIT - WACC * CE
tkVA is the value created and per-mits comparison of the financial performance of businesses with different capital intensity. tkVA is calculated as EBIT minus or plus the cost of capital employed in the business. To obtain the cost of capital, capital employed (CE) is multiplied by the weighted average cost of capital (WACC), which includes equity, debt and the interest rate for pension
Thyssenkrupp Annual Report 2016 page 52
Thyssenkrupp An-nual Report 2015 page 40
joc2-2018-v4.indd 12 20.6.2018 20:43:17
1�
Value Creation (Henkel AG)
EVA Value creation as corporate approach - Goal of 3x value / footprint by 2030 / taking into account EBIT, ROCE, WACC by BU / EVA as measure
Henkel Annual Report 2016, page 69
Henkel Annual Re-port 2015, page 71
Value add (BASF AG)
Value added = Financial Performance - (depre-ciation & amortization) - (services purchased & energy costs & other expenses) - (cost of raw materials and merchan-dize)
Financial performance minus goods and services purchased, depreciation and amortization. Business performance includes sales revenues, other operating income and interest income, as well as income from sharehold-ings.Value add as company strategy reflected in individual employee’s goals
BASF Group Annual Report 2016, page 3 / page 28
BASF Group Annual Report 2015, page 3 / page 31: Value Added = EBIT - WACC, value add as company strategy re-flected in individual employee’s goals
Value add (Bayer AG)
Value Add = total operat-ing performance - costs of procured goods and services - depreciation and amortization
Bayer: value added is defined as the company’s total operating performance in the previous fiscal year less the costs of procured and consumed goods and services, depreciation and amortization. 2015 AR, page 67
Bayer in 2016 decided to go away from their so far used internal value add measure and standardize on ROCE in their 2016 annual report and also provide value add data online on the corporate website.
Bayer AG 2015 An-nual Report, page 67
Value Added (BMW AG)
VA = earnings - (cost of capital rate * capital epmloyed)
the contribution made to busi-ness value growth during the financial year is measured in terms of “value added”
BMW AG Annual Re-port 2016, pages 74-75
BMW AG Annual Report 2015, pages 20-21 and 57
Value Added (EON AG)
Value added = (ROACE – cost of capital) x average capital employed
Value added measures the return that exceeds the cost of capital employed
EON in 2016 changed their value added calcu-lation from ROACE to ROCE. With ROACE, depreciable assets are recorded at half of their original acquisition or production cost; with ROCE, depreciable assets are recorded at their book value.
EON AG Annual Report 2015, pages 2 and 47
Value based manage-ment SAP AG
SAP - approach of value-based management as holistic view. No specific financial measure mentioned in this section.
SAP AG Annual Report 2016, page 9
SAP AG Annual Re-port 2015, page 63
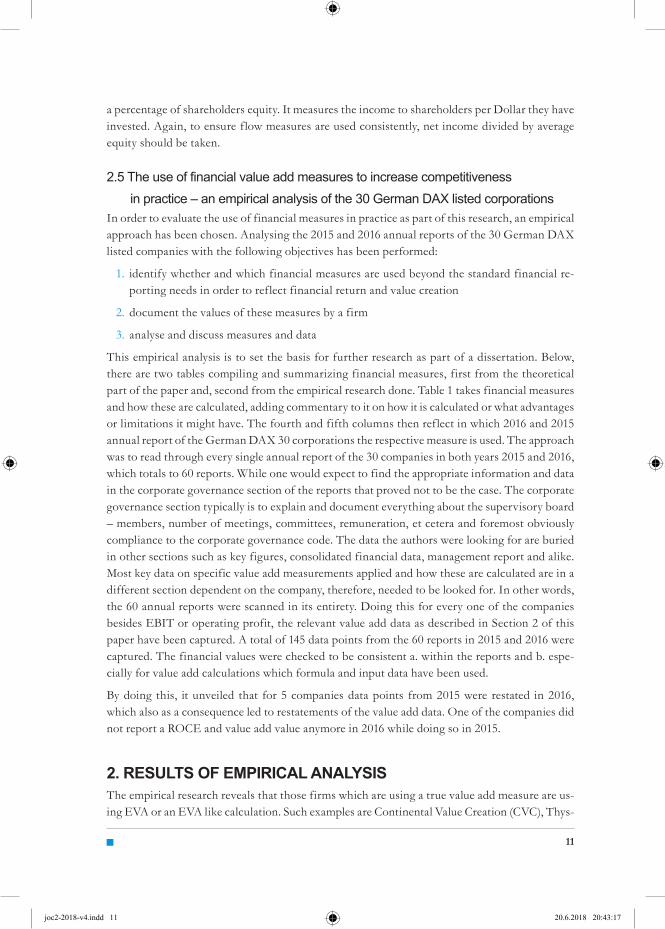
Fig. 1 – 2016 Value add data tracing over EBIT / Operating Profit / Source: own; Fig. 2 – 2015 Value add data tracing over EBIT / Operating Profit / Source: own
2016 value add and ebIt/operating Profit 2015 value add and ebIt/operating Profit 2016 value add and ebIt/operating Profit 2015 value add and ebIt/operating Profit
joc2-2018-v4.indd 13 20.6.2018 20:43:17
Journal of Competitiveness 1�
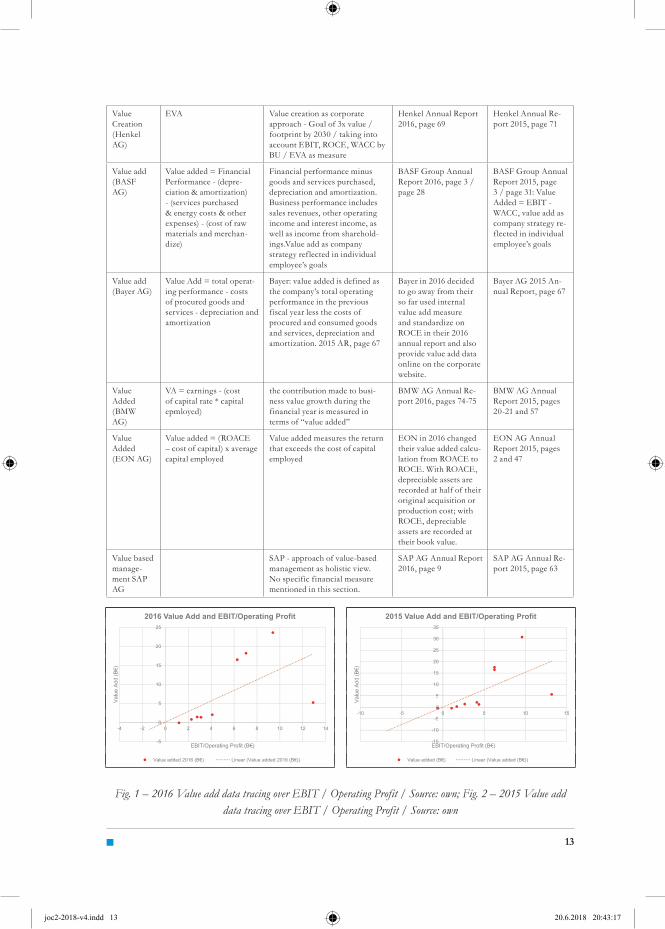
Fig. 3 – 2016 ROCE data tracing over EBIT / Operating Profit. / Source: own; Fig. 4 – 2015 ROCE data tracing over EBIT / Operating Profit / Source: own
Fig.5 – 2016 ROE data tracing over EBIT / Operating Profit. / Source: own; Fig.6 – 2015 ROE data tracing over EBIT / Operating Profit / Source: own
Figures 1 to 6 above show the absolute value added, ROCE and ROE data from the companies and how these trace over the reported EBIT/Operating Profit number. There is a huge spread between value added results among companies, on average, every 10M€ additional EBIT result in 15M€ value added. At first, this may seem as a contradiction in terms, but it becomes clearer by looking at the EVA calculation formula, with WACC and assets being important factors of the equation. With 46% or 14 out of 30 firms, the most used metric is ROCE. Tracing ROCE over EBIT/Operating Profit as shown in Figures 3 and 4, presents that the spread is way less compared to value addition. On average, a 1 M€ higher EBIT results in 3.3% higher ROCE. Furthermore, 7 out of 30 firms use ROE as a metric. Fig.5 shows also that the highest ROE has been achieved with one of the lowest EBIT values. Obviously this is due to the underlying equity values of different firms, and with a low absolute equity, high ROE values are possible, as the graph shows.
In order to identify those measures best-suited to represent value addition, the following cor-relation analyses were performed for the 2015 and 2016 data. First, the authors ran a series of
2016 roce and ebIt/operating Profit 2015 roce and ebIt/operating Profit 2016 roce and ebIt/operating Profit 2015 roce and ebIt/operating Profit
2016 roe and ebIt/operating Profit 2015 roe and ebIt/operating Profit 2016 roe and ebIt/operating Profit 2015 roe and ebIt/operating Profit
2016 roce and ebIt/operating Profit 2015 roce and ebIt/operating Profit 2016 roce and ebIt/operating Profit 2015 roce and ebIt/operating Profit
2016 roe and ebIt/operating Profit 2015 roe and ebIt/operating Profit 2016 roe and ebIt/operating Profit 2015 roe and ebIt/operating Profit
joc2-2018-v4.indd 14 20.6.2018 20:43:17

1�
correlations and for each took the respective data points from the annual reports for a given year: ROE with EBIT, ROCE with EBIT, Value Added with EBIT, ROA with EBIT, Value Added with ROCE and Value Added with ROA. A Value Added with ROE correlation was not per-formed due to too few data points. Out of all correlations performed, the tables below show the two most relevant ones for each year. The first shows how EBIT correlates with value added data and the second ROCE. EBIT was chosen, as the data is available for every company and every year and, therefore, was an easy way to go. ROCE, not unexpectedly looking at the calculation formula, should come close to the EVA calculation.
Tab. 2 – Value Added/EBIT and Value Added/ROCE correlation factors for 2016 and 2015. Source: own creation
�01�
Value Add / EBIT correlation Value Add / ROCE correlationColumn 1 Column 2 Column 1 Column 2
Column 1 1 Column 1 1Column 2 0.58227083 1 Column 2 0.735339681 1
�01�
Value Add / EBIT correlation Value Add / ROCE correlationColumn 1 Column 2 Column 1 Column 2
Column 1 1 Column 1 1Column 2 0.600791617 1 Column 2 0.97378784 1
The correlation analysis in Table 2 shows that ROCE obviously correlates best with the value added measure and therefore, in case there is no specific value added data point available, ROCE is a good replacement indicator. Not surprisingly, 14 in 2015 and 13 in 2016 out of the 30 DAX firms are using and stating ROCE data in their reports.
3. dIscussIon oF results and conclusIonThe intention of this paper, and especially the empirical analysis, was to prove that sustainable value creation as part of the corporate governance code guidance, is indeed taking place. In or-der to do so, it first required the identification of relevant measures, which was done in Section 2, and second, to show whether and how these measures are applied by the top 30 companies in Germany. The data analysis shows that 80% of the companies provide value added relevant financial data with no significant difference between the reports for 2015 and 2016. Out of these 24 companies, 38% do use and show EVA or a company specific EVA like value added measure while 54% show ROCE values. Further key takeaways are that
there is no consistent approach in terms of using the same metric(s) across the 30 DAX corporations with 30% using value addition, 46% ROCE, 36% ROE, 13% ROA and 20% none of these (total is higher than 100% as several measures are used by some companies).
joc2-2018-v4.indd 15 20.6.2018 20:43:17
Journal of Competitiveness 1�
if EVA or an EVA equivalent measure is not used, then ROCE correlates best and is best-suited to indicate value addition as a long-term competitive advantage
while a shareholder value as measure is not used by any of the firms, the value addition is increasingly taken and institutionalized as a managerial approach to drive competitiveness and also to professionalize corporate governance (Mauboussin, 2011).
The authors believe that this paper supports the statement that creating sustainable value addi-tion as part of corporate governance holds true. 80% of the 30 companies between the 2015 and 2016 annual reports show financially relevant value added data. Ryan and Trahan stated already that “the typical firm significantly improves … residual income after adopting value-based man-agement.” (2007). While the analysis clearly shows high relevance of a value added approach by these companies, there are some limitations of which to be aware. With regard to terminology, it is important to clarify that sustainability in the sense of sustainable value addition is related to financial measures and not to environmental sustainability (Figge and Hahn, 2004). Also, while the 145 data points from 2015 and 2016 provide strong evidence for the status quo, it might be limited regarding statistical relevance to predicting future situations.
Needless to say that the authors also suggest, besides value addition, to take additional metrics into account when judging and rating a firm’s position. Most of the mentioned measures are periodic measures and can be optimized within the given time period at the expense of longer aspects. Therefore, it is strongly recommended, even when looking for value creation judgements besides EVA, ROCE, ROE and ROA, to take also into account the trends of those over several years and to include cash flow (Dittmar and Mahrt-Smith, 2007), cash position and equity ratio as well as total assets as factors.
The empirical part of this paper focuses on the DAX 30 value added measures in 2015 and 2016 annual reports. It will be interesting to see how it evolves at times when the economy is chal-lenged and the financial results are not as good as they are currently. The future hypothesis is that we will not see major shifts in the coming years, however, it is expected that value addition becomes increasingly important also as the indicator of competitive positioning beyond the sheer financial measures and metrics. Therefore, value based management approaches reflect-ed in management guidance, business unit measurements, employee objectives and executives’ compensation is what the authors believe we will see more of in the future. This research paper provides the basis for these future trends.
AcknowledegmentThe presented work with is results is part of a monothematic cycle done as part of the grant, “Determinants of capital structure in non-profit organizations’’. The work is supported by the National Science Centre and financed from the Polish budget resources in 2016-2019, according to contract UMO-2015/19/B/HS4/01686 as the research project DEC-2015/19/B/HS4/01686.
ReferencesAndriowsky, A., & Auerbach, A. (2011). Handbuch Corporate Governance von Banken. (K. J. Hopt, Ed.). München: Vahlen [u.a.].
Becker, H. P. (2013). Investition und Finanzierung (Springer Gabler).
1.
2.
joc2-2018-v4.indd 16 20.6.2018 20:43:17
1�
Belas, J., Anh, N., & Smrcka, L. (2016). Financial literacy of secondary school students. Case study from the Czech Republic and Slovakia. Economics & Sociolog y, 9(4), 191–206. https://doi.org/10.14254/2071-789X.2016/9-4/12.
Bem, A. & Michalski, G. (2015). Hospital Profitability vs. Selected Healthcare System Indicators, Central European Conference on Finance and Economics (CEFE). Central European Conference in Finance And Economics, 52–61.
Berthelot, S., Francoeur, C., & Labelle, R. (2012). Corporate governance mechanisms, accounting results and stock valuation in Canada. International Journal of Managerial Finance, 8(4), 332–343. https://doi.org/10.1108/17439131211261251.
Berthelot, S., Morris, T., & Morrill, C. (2010). Corporate governance rating and financial performance: a Canadian study. Corporate Governance, 10(5), 635–646. https://doi.org/10.1108/14720701011085599.
Boubaker, S. & Nguyen, D. K. (2014). Corporate Governance in Emerging Markets. Springer.
Brealey, R., Meyers, S., & Marcus, A. (2015). Fundamentals of Corporate Finance (8th ed.). McGraw Hill.
Carter, D., Simkins, B., & Simpson, G. (2003). Corporate Governance, Board Diversity, and Firm Value. The Financial Review, 38(1), 33–53. https://doi.org/10.1111/1540-6288.00034.
Chiang, H. (2005). An Empirical Study of Corporate Governance and Corporate Performance. The Journal of American Academy of Business, 95–101.
Conyon, M., Judge, W., & Ussem, M. (2011). Corporate Governance and the 2008–09 Financial Crisis, 19(5), 399–404. https://doi.org/10.1111/j.1467-8683.2011.00879.x.
Cromme, G. (2005). Corporate Governance in Germany and the German Corporate Governance Code. Corporate Governance, 13(3), 362–367. https://doi.org/10.1111/j.1467-8683.2005.00430.x.
Dittmar, A. & Mahrt-Smith, J. (2007). Corporate governance and the value of cash holdings. Journal of Financial Economics, 83(3), 599–634. https://doi.org/10.1016/j.jfineco.2005.12.006.
Drobetz, W. (2004). Corporate Governance – Legal Fiction or Economic Reality. Financial Markets and Portfolio Management, 4(16), 431–439. https://doi.org/10.1007/s11408-002-0401-6.
Drobetz, W. & Beiner, S. (2004). Is Board Size an Independent Corporate Governance Mechanism? International Review for Social Sciences, 57(1), 327–356. https://doi.org/10.1111/j.0023-5962.2004.00257.x.
Drobetz, W., Grüninger, M., & Hirschvogl, S. (2010). Information asymmetry and the value of cash. Journal of Banking & Finance, 34(1), 2168–2184. https://doi.org/10.1016/j.jbankfin.2010.02.002.
Ertugrul, M. & Hegde, S. (2009). Corporate Governance Ratings and Firm Performance. Financial Management, 38(1), 139–160. https://doi.org/10.1111/j.1755-053X.2009.01031.x.
Figge, F. & Hahn, T. (2004). Sustainable Value Add - Ein neues Maß des Nachhaltigkeitsbeitrags von Unternehmen am Beispiel der Henkel KGaA. DIW Vierteljahreshefte, 73(1), 126–141. https://doi.org/10.3790/vjh.73.1.126.
3.
4.
5.
6.
7.
8.
9.
10.
11.
12.
13.
14.
15.
16.
17.
18.
joc2-2018-v4.indd 17 20.6.2018 20:43:17

Journal of Competitiveness 1�
Foley, F., Hartzell, J., Titman, S., & Twite, G. (2007). Why do firms hold so much cash? A tax-based explanation. Journal of Financial Economics, 86(1), 579–607. https://doi.org/10.1016/j.jfineco.2006.11.006.
Gavurova, B., Belas, J., & Kocisova, K. (2017). Revenue and cost efficiency of banking sectors in the european union countries: do they depend on size, location or crisis period? Transformations in Business & Economics, 16(2), 124–146.
Gompers, P., Ishii, J., & Metrick, A. (2003). Corporate Governance and Equity Prices. Journal of Economics, 107–155. https://doi.org/10.1162/00335530360535162.
Gupta, S., & Garg, U. (2012). Corporate Governance and Value Based Management. International Journal of Management Research and Review, 2(1), 212–221.
Han, S., & Qiu, J. (2007). Corporate precautionary cash holdings. Journal of Corporate Finance, 13, 43–57. https://doi.org/10.1016/j.jcorpfin.2006.05.002.
Harford, J. (1999). Corporate Cash and Acquisitions. The Journal of Finance, 6, 1969–1997. https://doi.org/https://doi.org/10.1111/0022-1082.00179.
Hilbert, S. (2011). Nachhaltiges Controlling fordern und fördern—Ethische Grundwerte als Basis. Controller Magazin, 36(1), 4.
Hilbert, S. (n.d.). Wertorientierte Unternehmensführung.
Jensen, M. & Meckling, W. (1976). Theory of the firm: Managerial behavior, agency costs and ownership structure. Journal of Financial Economics, 3(4), 305–360. https://doi.org/10.1016/0304-405X(76)90026-X.
Joel Stern, Stewart, B., & Chew, D. (1996). EVA: An integrated financial management system. European Financial Management, 2(2), 223–245. https://doi.org/10.1111/j.1468-036X.1996.tb00039.x
Jung, E. (2006). Performancemessung und -reporting als Instrumente der wertorientierten Unternehmensführung - Eine Untersuchung börsennotierter Industrieunternehmen.
Kalodimos, J. (2017). Internal governance and performance: Evidence from when external discipline is weak. Journal of Corporate Finance, 43(1), 193–216. https://doi.org/10.1016/j.jcorpfin.2017.01.005.
Khan, A., Muttakin, M. B., & Siddiqui, J. (2013). Corporate Governance and Corporate Social Responsibility Disclosures: Evidence from an Emerging Economy. Journal of Business Ethics, 114(2), 207–223. https://doi.org/10.1016/j.jbankfin.2016.12.004, pp. 175–188.
Knaup, M. (2014). Einfluss von Corporate Governance auf den Shareholder Value. Retrieved from http://content.grin.com/document/v277581.pdf.
Krafft, J., Qu, Y., Quatraro, F., & Ravix, J. L. (2013). Corporate governance, value and performance of firms: New empirical results on convergence from a large international database. Industrial and Corporate Change, 23(2). https://doi.org/10.1093/icc/dtt007.
Liu, B., McConnell, J. J., & Xu, W. (2017). The power of the pen reconsidered: The media, CEO human capital, and corporate governance. Journal of Banking and Finance, 76(1). 175-188. https://doi.org/10.1016/j.jbankfin.2016.12.004, 175–188.
19.
20.
21.
22.
23.
24.
25.
26.
27.
28.
29.
30.
31.
32.
33.
34.
joc2-2018-v4.indd 18 20.6.2018 20:43:17
1�
Macharzina, K., & Wolf, J. (2015). Unternehmensführung (9th ed.).
Mäkelainen, E. (1998). Economic Value Added as a management tool. Helsinki School of Economics.
Mauboussin, M. (2011). What Shareholder Value is Really About. Harvard Business Review 2011(10). Retrieved from https://hbr.org/2011/10/ceos-must-understand-what-crea
Michalski, G. (2016). Risk pressure and inventories levels. Influence of risk sensitivity on working capital levels. Economic Computation and Economic Cybernetic Studies and Research, 50(1), 189–196.
Opler, T., Pinkowitz, L., Stulz, R., & Williamson, R. (1999). The determinants and implications of corporate cash holdings. Journal of Financial Economics, 52, 3–46. https://doi.org/10.1016/S0304-405X(99)00003-3.
Rappaport, A. (1983). Corporate Performance Standards and Shareholder Value. Journal of Business Strateg y, 3(28). https://doi.org/10.1108/eb038987.
Rappaport, A. (1986). Creating Shareholder Value. The Free Press, A Division of Macmillan Publishers.
Rappaport, A. (2005). The Economics of Short-Term Performance Obsession. Financial Analysts Journal, 61(3), 65–79. https://doi.org/10.2469/faj.v61.n3.2729.
Regierungskommision Deutscher Corporate Governance Kodex. (2015). German Corporate Governance Code.
Reichl, M. (2015). Corporate Governance Ohne Paragraphen. Linde.
Rieg, R. (2015). Dynamics of value-based management: does shareholder value cause short-termism? Springer Online, 193–224. https://doi.org/10.1007/s00187-015-0211-4.
Ryan, H., & Trahan, E. (2007). Corporate Financial Control Mechanisms and Firm Performance: The Case of Value-Based Management Systems. Journal of Business Finance & Accounting, 34(1–2), 111–138. https://doi.org/10.1111/j.1468-5957.2006.00660.x.
Sarbanes-Oxley Act. (2002). US Federal Law.
Stiglbauer, M. (2010). Corporate Governance Berichterstattung als Instrument wertorientierter Unternehmensführung: Empirische Erkenntnisse für den deutschen Kapitalmarkt. ZFM, 5 (1), 359–384. https://doi.org/10.1007/s12354-010-0132-y.
Stiglbauer, M., & Velte, P. (2014). Impact of soft law regulation by corporate governance codes on firm valuation: the case of Germany. Corporate Governance, 14(3), 395–406. https://doi.org/10.1108/CG-05-2012-0043.
Strenger, C. (2004). The Corporate Governance Scorecard: a tool for the implementation of corporate governance. Corporate Governance, 12(1), 11–15. doi:10.1111/j.1467-8683.2004.00339.x
van Essen, M., Engelen, P.-J., & Carney, M. (2013). Does “Good” Corporate Governance Help in a Crisis? The Impact of Country- and Firm-Level Governance Mechanisms in the European Financial Crisis. Corporate Governance, 21(3), 201–224. https://doi.org/10.1111/corg.12010.
35.
36.
37.
38.
39.
40.
41.
42.
43.
44.
45.
46.
47.
48.
49.
50.
51.
joc2-2018-v4.indd 19 20.6.2018 20:43:17
Journal of Competitiveness �0
Welge, M. K., & Eulerich, M. (2014). Corporate-Governance-Management (Vol. 2. Auflage). Springer Gabler.
Werner, H. (2014). Economic Value Added (EVA). Supply Chain Controlling, 151–152. https://doi.org/10.1007/978-3-658-05622-3_8.
Wöhe. (2016). Einführung in die Allgemeine Betriebswirtschaftslehre (26. Auflage). Vahlen.
Contact information:Guenter BlendingerTechnical University of Kosice TUKE, Faculty of Economics Lecturer at University of Applied Sciences Heilbronn, GermanyDinkelweg 28, 74523 Schwäbisch Hall GermanyE-mail: [email protected] or [email protected]: http://orcid.org/0000-0002-7791-3364
Prof. UE Grzegorz Michalski PhDWroclaw University of Economics Faculty of Engineering and EconomicsKomandorska 118, PL53345 WroclawPolandE-mail: [email protected]: http://orcid.org/0000-0002-8211-4057
52.
53.
54.
joc2-2018-v4.indd 20 20.6.2018 20:43:17