long-term agricultural land-use trends in nebraska, 1866���2007
TRANSCRIPT
Manuscriptreceivedforreview,November2008;acceptedforpublication,February2009.
LONG-TERM AGRICULTURAL LAND-USE TRENDS
IN NEBRASKA, 1866–2007
Tim L. Hiller and Larkin A. Powell
School of Natural Resources404 Hardin Hall
University of Nebraska–LincolnLincoln, NE 68583-0974
Tim D. McCoy and Jeffrey J. Lusk
Nebraska Game and Parks Commission2200 North 33rd Street
Lincoln, NE 68503
ABSTRACT—Although landscape changes from anthropogenic causes occur at much faster rates than those
from natural processes (e.g., geological, vegetation succession), human perception of such changes is often
subjective, inaccurate, or nonexistent. Given the large-scale land-use changes that have occurred throughout
the Great Plains, the potential impacts of land-use changes on ecological systems, and the insight gained from
knowledge of land-use trends (e.g., to compare to wildlife population trends), we synthesized information related
to land-use trends in Nebraska during 1866–2007. We discussed and interpreted known and potential causes of
short- and long-term land-use trends based on agricultural and weather data; farm policies and programs; and
local, state, and global events. During the study period, mean farm size steadily increased, whereas number of
farms rapidly increased until about 1900, remained stable until about 1930, then rapidly decreased. Total area
of cropland in Nebraska increased until the 1930s, but then showed long-term stability with large short-term
luctuations. Crop diversity was highest during 1955–1965, then slowly decreased; corn was always a dominant crop, but sorghum and oats were increasingly replaced by soybeans after the 1960s. Land-use changes were
affected by farm policies and programs attempting to stabilize commodity supply and demand, reduce erosion,
and reduce impacts to wildlife and ecological systems; direct and indirect effects of war (e.g., food demand,
pesticides, fertilizers); technological advances (e.g., mechanization); and human population growth and redis-
tribution. Although these causes of change will continue to affect Nebraska’s landscape, as well as that of other
Great Plains states, new large-scale trends such as increasing energy demands (e.g., biofuels) may contribute to
an already highly modiied landscape.
Key Words: agriculture, biofuels, Conservation Reserve Program, farm policy, farm programs, land use, Ne-
braska, wildlife
INTRODUCTION
The effects of natural processes (e.g., geological,
vegetation succession) on landscape change are normally
slow with punctuations caused by cataclysmic events,
such as meteor strikes, volcanic activity, or ire. Anthro-
pogenic changes occur at higher rates of speed (Antrop
1998, 2000). However, change is usually incremental and
the rate of change may be slower than most people can
perceive, which can lead to subjectivity when interpreting
landscape changes (Antrop 2000). Human perceptions of
landscape directly inluence future landscape conditions (Nassauer 1995); thus, inaccurate or misinformed percep-
tions by the public have the potential to increase dificulty in policy, planning, or management decision-making
processes. In our ield of study, wildlife ecology and management, the public may perceive lower populations
of wildlife during relatively short time periods. They
have opportunities to observe wildlife during the year,
and short-term population trend data is published in local
newspapers each fall, designed to provide forecasts of
225
Great Plains Research 19 (Fall 2009):225-37©2009CopyrightbytheCenterforGreatPlainsStudies,UniversityofNebraska–Lincoln

GreatPlainsResearchVol.19No.2,2009226
©2009CenterforGreatPlainsStudies,UniversityofNebraska–Lincoln
hunting opportunities. However, people may not perceive
trajectories in landscape change that may be the cause of
wildlife population luctuations. The ecological function affected by decisions that
cause landscape change may be hidden (Nassauer 1992).
Ecological systems are both complex and dynamic, often
making perception of change by landscape inhabitants
difficult (Nassauer 1992). Biologists often simplify
systems during landscape studies by concentrating on
very inite units of time and space. Limits of human understanding of such complex systems, among other
constraints, necessitate this simplicity. However, descrip-
tive studies that are broad in both space and time have the
potential to be insightful to landscape inhabitants, as well
as to decision-makers.
“Nebraska’s growth and development are directly
related to an abundance of soils of high natural fertil-
ity” (Elder 1969:1), but certainly other factors have been
involved given the complexity of agricultural, economic,
and ecological systems. For example, within the Great
Plains, changes in agriculture have largely been the result
of multiple factors, such as weather patterns, agricultural
commodity prices, and technology (Parton et al. 2007).
Nebraska’s population has increased by an average of 5% each year since 1960 (U.S. Census Bureau 2008), so it is no surprise that some level of land-use change has been
occurring. However, the impact of human population
growth on agriculture seems more prevalent as spatial
scale increases from local to national to global perspec-
tive (Parton et al. 2007).
Although historical land-use trends for much of the
United States and Canada have been described (Turner and Ruscher 1988; Warner 1994; Medley et al. 1995; Igl and Johnson 1997; Boren et al. 1999; Pan et al. 1999; Ra-
mankutty and Foley 1999), there has been no descriptive
synthesis for the state of Nebraska. Such a description of
land use, based on scientiic data as opposed to human perception, could improve understanding of the func-
tioning of Nebraska’s ecological systems and could prove
instrumental in future decisions made in agricultural
systems (Goklany 2002). Also lacking is a description of
events related to land-use changes in Nebraska. Such a
description could promote new research hypotheses and
serve as a basis for research in many disciplines, includ-
ing agriculture, economics, forestry, political science, and
wildlife. In our ield of wildlife management, knowledge of long-term land-use trends can be linked to long-term
wildlife population trends through monitoring programs
such as the North American Breeding Bird Survey (Sauer
et al. 2008) and rural mail-carrier surveys. Our objective
was to describe land-use changes in Nebraska during
1866–2007, with an emphasis on agricultural trends. We
also discuss known and potential causes of short- and
long-term land-use trends and synthesize information
useful for natural-resource applications in Nebraska
and other Great Plains states. We used the best available
information on which to provide our interpretations of
events directly or indirectly related to land-use changes
in Nebraska.
STUDYAREA
The state of Nebraska is located in the Great Plains of
the central United States, and exhibits diverse ecological
systems, particularly along a longitudinal gradient. El-
evation starts at about 300 m in the east, steadily sloping
to over 1,500 m in the west, a result of sediment deposi-tion occurring east of the Rocky Mountains during the Tertiary period (Maher et al. 2003). The western extent of glacial moraine, deposited during the Quaternary pe-
riod, is limited to eastern Nebraska (Maher et al. 2003). The rolling hills of eastern Nebraska are the result of
this glacial deposition, while topography in the north-
central region is dominated by the Sandhills; much of the
remaining topography consists of bluffs, escarpments,
plains, and the Platte River valley (Carlson 1993). Eight soil parent materials are present in Nebraska, with sand
and loess dominating the landscape (Elder 1969). The
Sandhills (grass-stabilized sand dunes) are a large ex-
panse resulting from 10,000 years of blowing sand; loess
covers the eastern Rolling Hills and southern portions of the state (Carlson 1993). Large deposits of sand and gravel in east-central Nebraska increased groundwater storage
capacity (Carlson 1993). Much of Nebraska contains a large-volume aquifer holding high-quality water (Conser-vation and Survey Division 1986).
Nebraska is divided into two climate types under the
modiied Köppen system: humid continental in the east and semiarid midlatitude steppe in the west (Elder 1969;
McKnight 1996:ig. 8-5). Normal annual precipitation in Nebraska during 1971–2000 ranged from about 34.8 cm in the west to 89.1 cm in the east (High Plains Regional Climate Center 2008), an increasing gradient from west to east (Neild 1977:ig. 1.1). Most (>70%) precipitation falls during April–September (High Plains Regional Cli-mate Center 2008). Nebraska covers about 199,100 km2 (U.S. Census Bureau 2008), and is divided into 93 counties. Human
population during 2006 was about 1.77 million people;
population density increased from 7.9/km2 in 1990 to
Long-TermAgriculturalLand-UseTrendsinNebraska,1866-2007•TimL.Hilleretal. 227
©2009CenterforGreatPlainsStudies,UniversityofNebraska–Lincoln
8.9/km2 in 2006 (U.S Census Bureau 2008). Agricul-ture is a major component of Nebraska’s economy, with
186,150 km2 producing almost $10 billion of agricultural-
related products (e.g., crops, livestock) during 2002 (U.S.
Department of Agriculture [USDA] 2004). The Panhan-
dle and north-central Nebraska are generally considered
rangeland suitable for grazing livestock, whereas the
remainder is predominately cultivated (Neild 1977:ig. 1.9). The growing season ranges from 120 days in the
northwestern Panhandle to 170 days in the southeast
(Neild 1977).
METHODS
We used multiple sources to describe land-use changes
in Nebraska during 1866–2007. We compiled agricultural
land-use data from the USDA National Agricultural Sta-
tistics Service (2008a) database. This source contained an-
nual area planted to each crop type (e.g., alfalfa [Medicago
sativa], corn, oats [Avena spp.], soybeans [Glycine max],
wheat); in years prior to about 1920, only data on land area
(ha) harvested were available which we then used as a sur-
rogate measure of area planted to each crop type. Data on
hay were not collected until 1909, so our analyses for the
period 1866–1908 lack this information.
We calculated an annual Simpson Reciprocal Index of Diversity (SRID; Simpson 1949; Krebs 1999:443) to quantify diversity of crops within Nebraska during our
study period. Diversity increases with greater SRID val-ues (Krebs 1999:443) according to:
,
where pi is the proportion of crop area within the state
planted in crop i (i = 1,2, …, m). For our study, we used m
= 15 seed-crops (alfalfa, barley [Horduem spp.], chickpeas
[Cicer arietinum], corn, dry edible beans [Phaseolus spp.],
laxseed [Linum usitatissimum], oats, potatoes [Solanum
brevifolia], proso millet [Panicum miliaceum], rye [Secale
spp.], sorghum [Sorghum spp.], soybeans, sugar beets [Beta
vulgaris], sunlower [Helianthus spp.], wheat) planted
or harvested in Nebraska during 1866–2007. The SRID increases with an increasing number of species (e.g., crop
types) and with species evenness (i.e., as each species be-
comes more evenly represented) in the sample. Thus, SRID should be lower in our study during years when fewer crops
were planted in Nebraska or during years when a small
number of crops dominated the landscape.
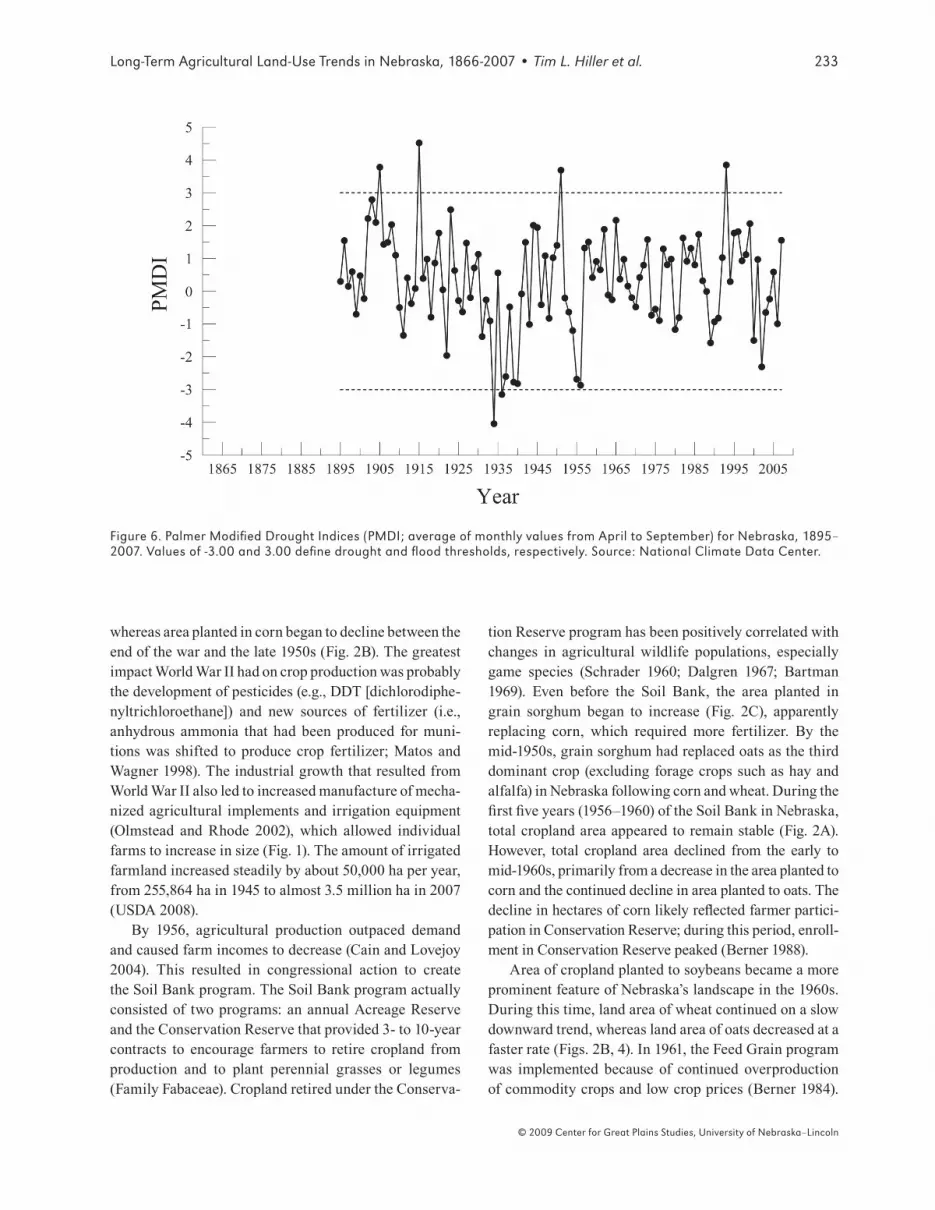
We used Palmer Modiied Drought Index (PMDI) data (National Climate Data Center 2008), an assess-
ment of long-term meteorological drought, to describe
conditions during the period available (1895–2007) for the state of Nebraska. The PMDI is derived from several weather-related measurements (e.g., precipitation, tem-
perature, evapotranspiration) calculated on a monthly
basis and indexed to long-term normal conditions (i.e.,
PMDI = -0.49 to 0.49 for normal years; severe drought = -3.99 to -3.00; very wet = 3.00 to 3.99; Heddinghaus and
Sabol 1991). We calculated mean statewide PMDI dur-ing April–September of each year to describe growing-
season conditions. We deined a drought event and a lood event as any year with PMDI < -3.00 and PMDI > 3.00, re-
spectively. We gathered a description of events causing or
correlated with land-use changes in Nebraska (see Table
1). We used ProStat v4.81 (Poly Software International, Inc., Pearl River, NY) for statistical analyses and igure construction.
RESULTSANDDISCUSSION
Despite minor instances of missing data, our analyses
provided patterns of descriptive value for a statewide
assessment of agricultural land-use trends. For example,
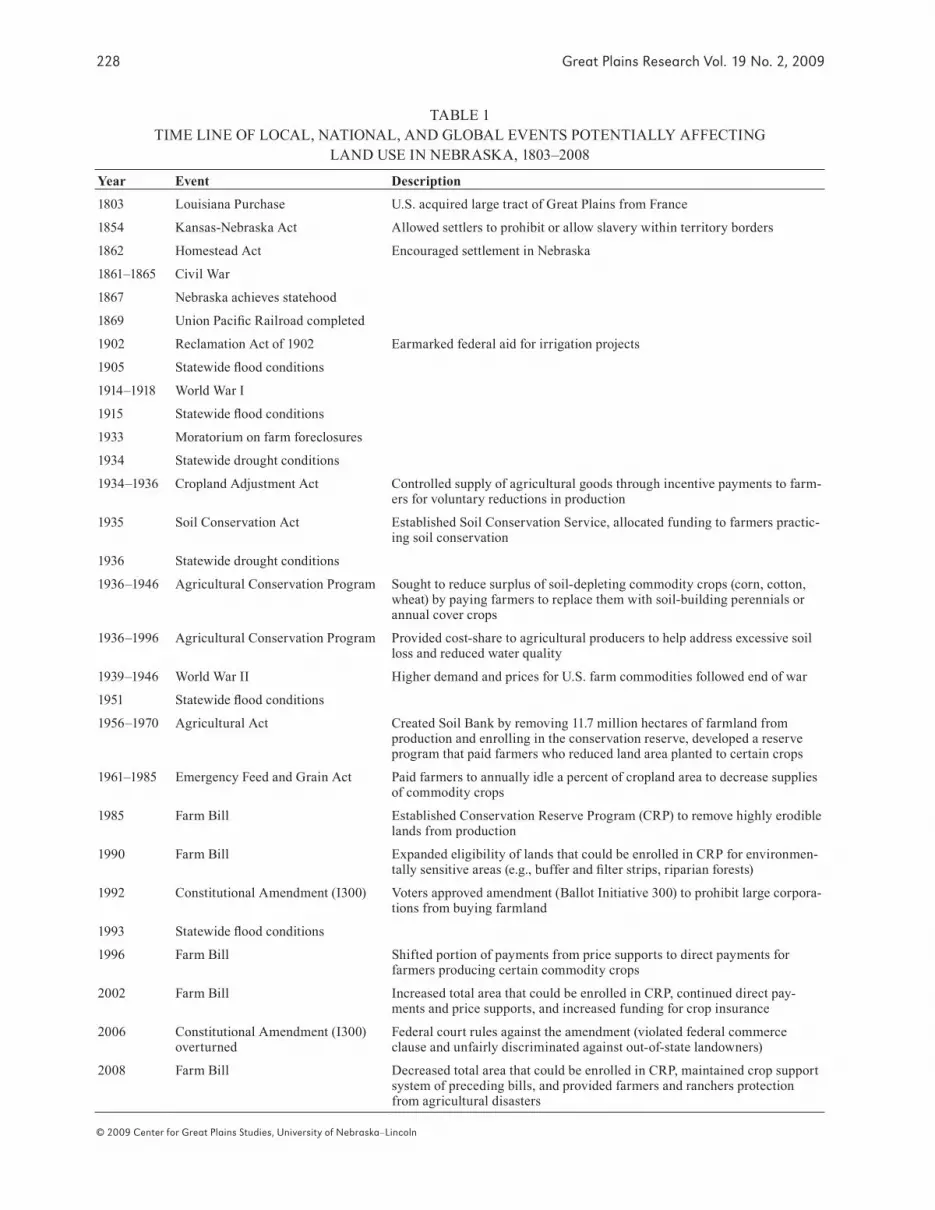
the number of farms increased at the highest rate im-
mediately following statehood (1867) to the beginning of
the 20th century; the number of farms remained stable
until the 1930s, then declined steadily so that 2002 values
were similar to that of about 1870 (Fig. 1). Mean size of farms (ha), however, increased steadily since about 1880
and peaked in 2002 at about 380 ha (Fig. 1). Total area
in cropland showed the greatest rate of increase during
1865–1930; from about 1930 to about 1970, cropland area decreased, after which it was relatively stable (Fig. 2A).
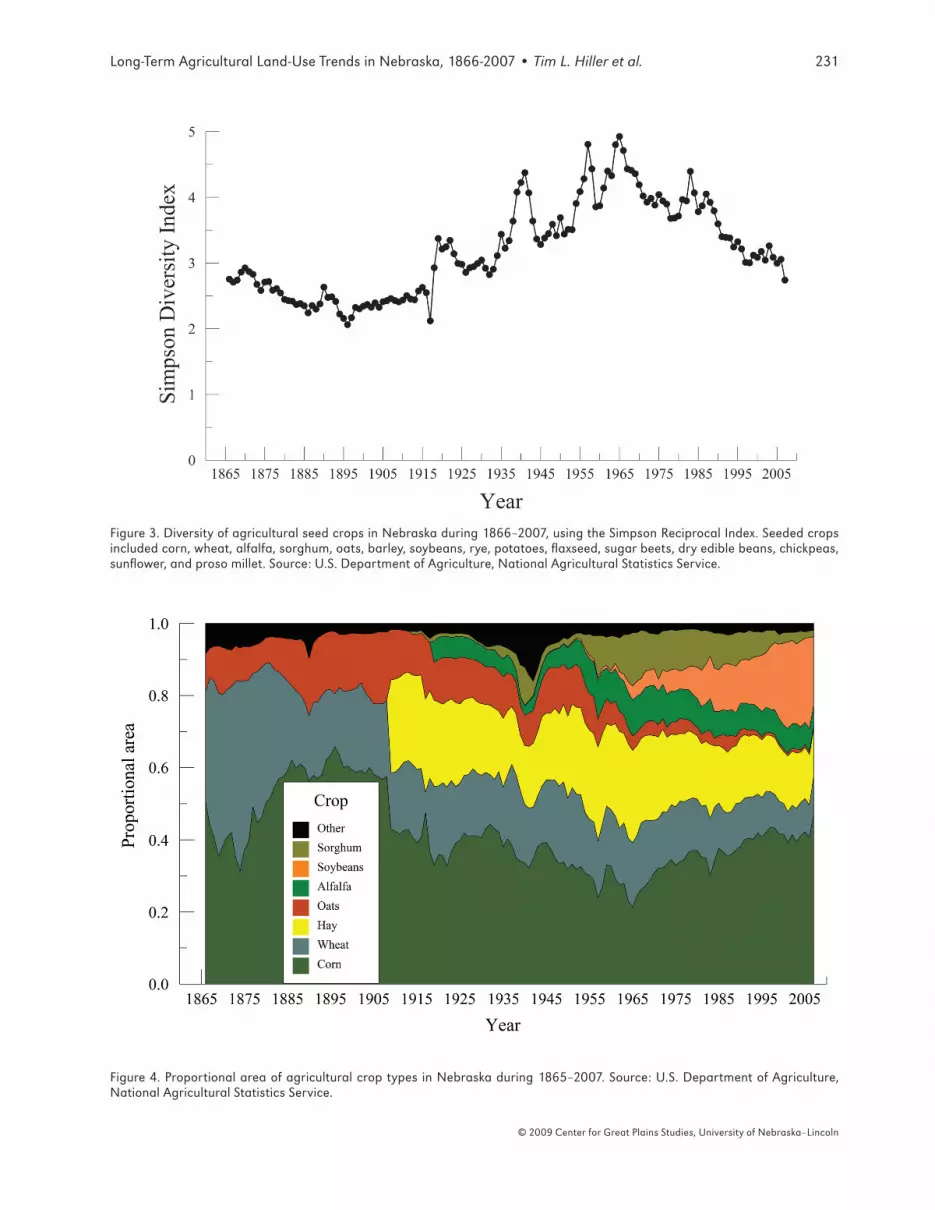
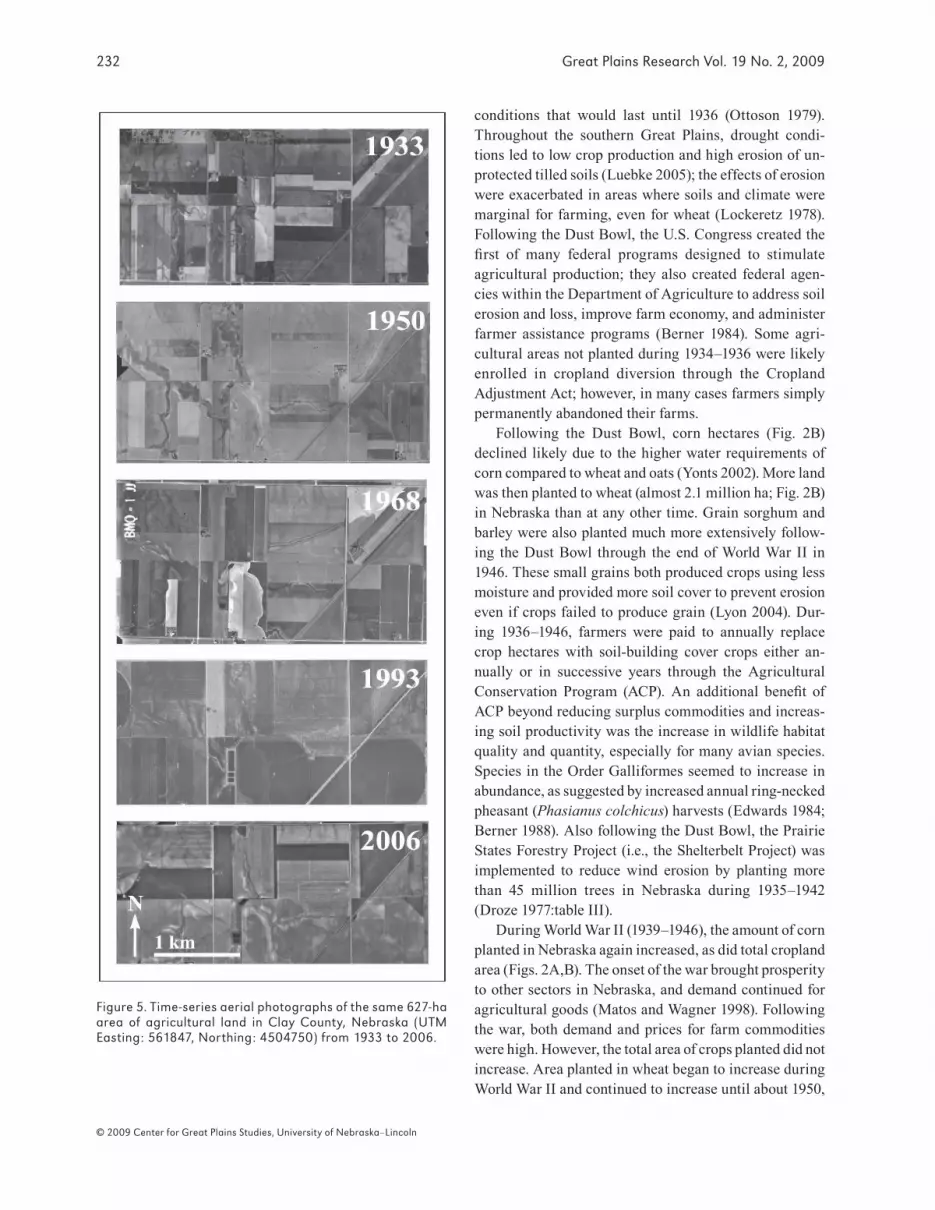
The statewide diversity of seed-crops in Nebraska
peaked in the 1950s and 1960s (Fig. 3). Since 1966, crop diversity in Nebraska has steadily decreased, and crop-
land is currently dominated by corn and soybeans (Figs.
4, 5). During the peak crop-diversity period (1950–1965), cropland area in wheat, sorghum, and oats was higher
than present-day levels. Corn, wheat, and oats dominated the landscape during the early periods of lower crop di-
versity (1866–1915). Local diversity of agricultural land-
scapes also decreased during the 20th century as larger
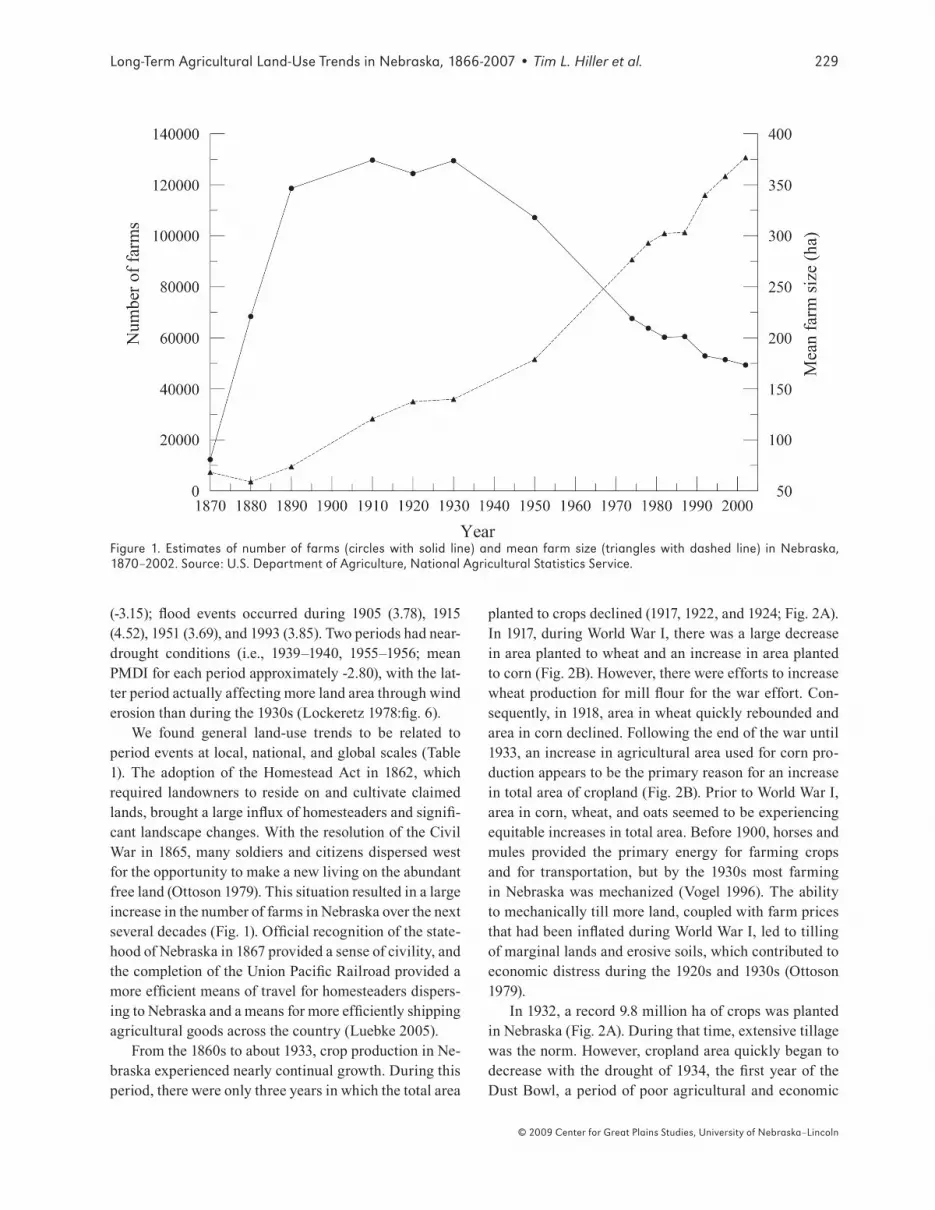
farms (Fig. 1) were composed of larger ields (Fig. 5). Using our threshold values of -3.00 (drought) and
3.00 (lood), we deined two statewide drought events and four statewide lood events (Fig. 6; Table 1). Drought events occurred during 1934 (PMDI = -4.04) and 1936
∑==
m
i
ipD
1
2
11
GreatPlainsResearchVol.19No.2,2009228
©2009CenterforGreatPlainsStudies,UniversityofNebraska–Lincoln
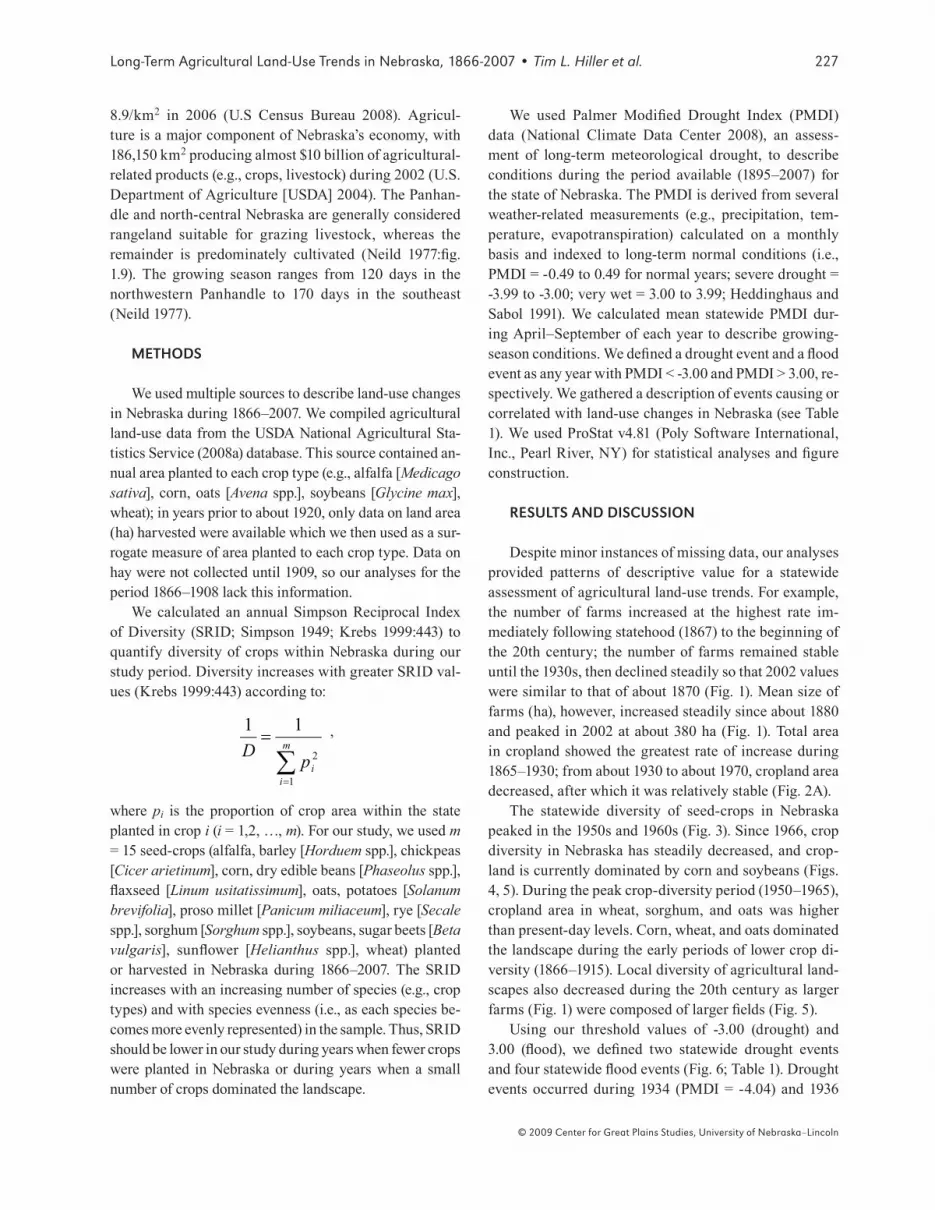
TABLE 1
TIME LINE OF LOCAL, NATIONAL, AND GLOBAL EVENTS POTENTIALLY AFFECTINGLAND USE IN NEBRASKA, 1803–2008
Year Event Description
1803 Louisiana Purchase U.S. acquired large tract of Great Plains from France
1854 Kansas-Nebraska Act Allowed settlers to prohibit or allow slavery within territory borders
1862 Homestead Act Encouraged settlement in Nebraska
1861–1865 Civil War
1867 Nebraska achieves statehood
1869 Union Paciic Railroad completed
1902 Reclamation Act of 1902 Earmarked federal aid for irrigation projects
1905 Statewide lood conditions
1914–1918 World War I
1915 Statewide lood conditions
1933 Moratorium on farm foreclosures
1934 Statewide drought conditions
1934–1936 Cropland Adjustment Act Controlled supply of agricultural goods through incentive payments to farm-ers for voluntary reductions in production
1935 Soil Conservation Act Established Soil Conservation Service, allocated funding to farmers practic-ing soil conservation
1936 Statewide drought conditions
1936–1946 Agricultural Conservation Program Sought to reduce surplus of soil-depleting commodity crops (corn, cotton, wheat) by paying farmers to replace them with soil-building perennials or annual cover crops
1936–1996 Agricultural Conservation Program Provided cost-share to agricultural producers to help address excessive soil loss and reduced water quality
1939–1946 World War II Higher demand and prices for U.S. farm commodities followed end of war
1951 Statewide lood conditions
1956–1970 Agricultural Act Created Soil Bank by removing 11.7 million hectares of farmland from production and enrolling in the conservation reserve, developed a reserve program that paid farmers who reduced land area planted to certain crops
1961–1985 Emergency Feed and Grain Act Paid farmers to annually idle a percent of cropland area to decrease supplies of commodity crops
1985 Farm Bill Established Conservation Reserve Program (CRP) to remove highly erodible lands from production
1990 Farm Bill Expanded eligibility of lands that could be enrolled in CRP for environmen-tally sensitive areas (e.g., buffer and ilter strips, riparian forests)
1992 Constitutional Amendment (I300) Voters approved amendment (Ballot Initiative 300) to prohibit large corpora-tions from buying farmland
1993 Statewide lood conditions
1996 Farm Bill Shifted portion of payments from price supports to direct payments for farmers producing certain commodity crops
2002 Farm Bill Increased total area that could be enrolled in CRP, continued direct pay-ments and price supports, and increased funding for crop insurance
2006 Constitutional Amendment (I300) overturned
Federal court rules against the amendment (violated federal commerce clause and unfairly discriminated against out-of-state landowners)
2008 Farm Bill Decreased total area that could be enrolled in CRP, maintained crop support system of preceding bills, and provided farmers and ranchers protection from agricultural disasters
Long-TermAgriculturalLand-UseTrendsinNebraska,1866-2007•TimL.Hilleretal. 229
©2009CenterforGreatPlainsStudies,UniversityofNebraska–Lincoln
(-3.15); lood events occurred during 1905 (3.78), 1915 (4.52), 1951 (3.69), and 1993 (3.85). Two periods had near-drought conditions (i.e., 1939–1940, 1955–1956; mean PMDI for each period approximately -2.80), with the lat-ter period actually affecting more land area through wind
erosion than during the 1930s (Lockeretz 1978:ig. 6). We found general land-use trends to be related to
period events at local, national, and global scales (Table
1). The adoption of the Homestead Act in 1862, which
required landowners to reside on and cultivate claimed
lands, brought a large inlux of homesteaders and signii-
cant landscape changes. With the resolution of the Civil War in 1865, many soldiers and citizens dispersed west for the opportunity to make a new living on the abundant
free land (Ottoson 1979). This situation resulted in a large
increase in the number of farms in Nebraska over the next
several decades (Fig. 1). Oficial recognition of the state-
hood of Nebraska in 1867 provided a sense of civility, and
the completion of the Union Paciic Railroad provided a more eficient means of travel for homesteaders dispers-
ing to Nebraska and a means for more eficiently shipping agricultural goods across the country (Luebke 2005). From the 1860s to about 1933, crop production in Ne-
braska experienced nearly continual growth. During this
period, there were only three years in which the total area
planted to crops declined (1917, 1922, and 1924; Fig. 2A). In 1917, during World War I, there was a large decrease
in area planted to wheat and an increase in area planted
to corn (Fig. 2B). However, there were efforts to increase
wheat production for mill lour for the war effort. Con-
sequently, in 1918, area in wheat quickly rebounded and
area in corn declined. Following the end of the war until
1933, an increase in agricultural area used for corn pro-
duction appears to be the primary reason for an increase
in total area of cropland (Fig. 2B). Prior to World War I,
area in corn, wheat, and oats seemed to be experiencing
equitable increases in total area. Before 1900, horses and
mules provided the primary energy for farming crops
and for transportation, but by the 1930s most farming
in Nebraska was mechanized (Vogel 1996). The ability to mechanically till more land, coupled with farm prices
that had been inlated during World War I, led to tilling of marginal lands and erosive soils, which contributed to
economic distress during the 1920s and 1930s (Ottoson
1979).
In 1932, a record 9.8 million ha of crops was planted
in Nebraska (Fig. 2A). During that time, extensive tillage
was the norm. However, cropland area quickly began to
decrease with the drought of 1934, the irst year of the Dust Bowl, a period of poor agricultural and economic
Figure1.Estimatesofnumberof farms (circleswith solid line)andmean farmsize (triangleswithdashed line) inNebraska,1870–2002.Source:U.S.DepartmentofAgriculture,NationalAgriculturalStatisticsService.
GreatPlainsResearchVol.19No.2,2009230
©2009CenterforGreatPlainsStudies,UniversityofNebraska–Lincoln
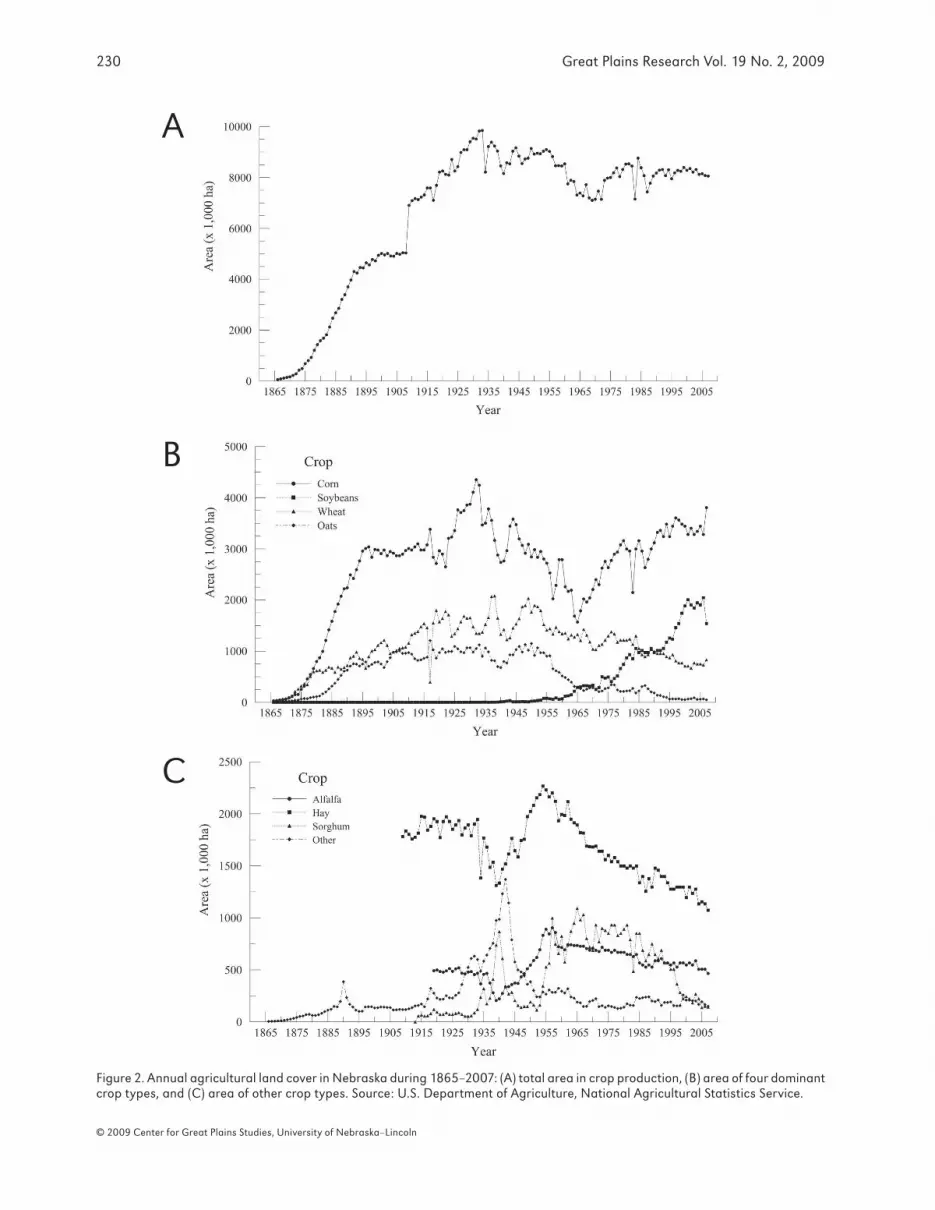
Figure2.AnnualagriculturallandcoverinNebraskaduring1865–2007:(A)totalareaincropproduction,(B)areaoffourdominantcroptypes,and(C)areaofothercroptypes.Source:U.S.DepartmentofAgriculture,NationalAgriculturalStatisticsService.
A
B
C
Long-TermAgriculturalLand-UseTrendsinNebraska,1866-2007•TimL.Hilleretal. 231
©2009CenterforGreatPlainsStudies,UniversityofNebraska–Lincoln
Figure3.DiversityofagriculturalseedcropsinNebraskaduring1866–2007,usingtheSimpsonReciprocalIndex.Seededcropsincludedcorn,wheat,alfalfa,sorghum,oats,barley,soybeans,rye,potatoes,laxseed,sugarbeets,dryediblebeans,chickpeas,sunlower,andprosomillet.Source:U.S.DepartmentofAgriculture,NationalAgriculturalStatisticsService.
Figure4.ProportionalareaofagriculturalcroptypesinNebraskaduring1865–2007.Source:U.S.DepartmentofAgriculture,NationalAgriculturalStatisticsService.
GreatPlainsResearchVol.19No.2,2009232
©2009CenterforGreatPlainsStudies,UniversityofNebraska–Lincoln
conditions that would last until 1936 (Ottoson 1979).
Throughout the southern Great Plains, drought condi-
tions led to low crop production and high erosion of un-
protected tilled soils (Luebke 2005); the effects of erosion were exacerbated in areas where soils and climate were
marginal for farming, even for wheat (Lockeretz 1978).
Following the Dust Bowl, the U.S. Congress created the irst of many federal programs designed to stimulate agricultural production; they also created federal agen-
cies within the Department of Agriculture to address soil
erosion and loss, improve farm economy, and administer
farmer assistance programs (Berner 1984). Some agri-cultural areas not planted during 1934–1936 were likely enrolled in cropland diversion through the Cropland Adjustment Act; however, in many cases farmers simply
permanently abandoned their farms.
Following the Dust Bowl, corn hectares (Fig. 2B)
declined likely due to the higher water requirements of
corn compared to wheat and oats (Yonts 2002). More land was then planted to wheat (almost 2.1 million ha; Fig. 2B)
in Nebraska than at any other time. Grain sorghum and
barley were also planted much more extensively follow-
ing the Dust Bowl through the end of World War II in
1946. These small grains both produced crops using less moisture and provided more soil cover to prevent erosion
even if crops failed to produce grain (Lyon 2004). Dur-ing 1936–1946, farmers were paid to annually replace crop hectares with soil-building cover crops either an-
nually or in successive years through the Agricultural
Conservation Program (ACP). An additional beneit of ACP beyond reducing surplus commodities and increas-
ing soil productivity was the increase in wildlife habitat
quality and quantity, especially for many avian species.
Species in the Order Galliformes seemed to increase in
abundance, as suggested by increased annual ring-necked
pheasant (Phasianus colchicus) harvests (Edwards 1984; Berner 1988). Also following the Dust Bowl, the Prairie
States Forestry Project (i.e., the Shelterbelt Project) was
implemented to reduce wind erosion by planting more
than 45 million trees in Nebraska during 1935–1942 (Droze 1977:table III).
During World War II (1939–1946), the amount of corn planted in Nebraska again increased, as did total cropland
area (Figs. 2A,B). The onset of the war brought prosperity
to other sectors in Nebraska, and demand continued for
agricultural goods (Matos and Wagner 1998). Following the war, both demand and prices for farm commodities
were high. However, the total area of crops planted did not
increase. Area planted in wheat began to increase during
World War II and continued to increase until about 1950,
Figure5.Time-seriesaerialphotographsofthesame627-haarea of agricultural land in Clay County, Nebraska (UTMEasting:561847,Northing:4504750)from1933to2006.
Long-TermAgriculturalLand-UseTrendsinNebraska,1866-2007•TimL.Hilleretal. 233
©2009CenterforGreatPlainsStudies,UniversityofNebraska–Lincoln
whereas area planted in corn began to decline between the
end of the war and the late 1950s (Fig. 2B). The greatest impact World War II had on crop production was probably
the development of pesticides (e.g., DDT [dichlorodiphe-
nyltrichloroethane]) and new sources of fertilizer (i.e.,
anhydrous ammonia that had been produced for muni-
tions was shifted to produce crop fertilizer; Matos and Wagner 1998). The industrial growth that resulted from
World War II also led to increased manufacture of mecha-
nized agricultural implements and irrigation equipment
(Olmstead and Rhode 2002), which allowed individual farms to increase in size (Fig. 1). The amount of irrigated
farmland increased steadily by about 50,000 ha per year, from 255,864 ha in 1945 to almost 3.5 million ha in 2007 (USDA 2008).
By 1956, agricultural production outpaced demand and caused farm incomes to decrease (Cain and Lovejoy 2004). This resulted in congressional action to create the Soil Bank program. The Soil Bank program actually
consisted of two programs: an annual Acreage Reserve and the Conservation Reserve that provided 3- to 10-year contracts to encourage farmers to retire cropland from
production and to plant perennial grasses or legumes
(Family Fabaceae). Cropland retired under the Conserva-
tion Reserve program has been positively correlated with changes in agricultural wildlife populations, especially
game species (Schrader 1960; Dalgren 1967; Bartman
1969). Even before the Soil Bank, the area planted in
grain sorghum began to increase (Fig. 2C), apparently replacing corn, which required more fertilizer. By the
mid-1950s, grain sorghum had replaced oats as the third dominant crop (excluding forage crops such as hay and
alfalfa) in Nebraska following corn and wheat. During the
irst ive years (1956–1960) of the Soil Bank in Nebraska, total cropland area appeared to remain stable (Fig. 2A).
However, total cropland area declined from the early to
mid-1960s, primarily from a decrease in the area planted to
corn and the continued decline in area planted to oats. The
decline in hectares of corn likely relected farmer partici-pation in Conservation Reserve; during this period, enroll-ment in Conservation Reserve peaked (Berner 1988). Area of cropland planted to soybeans became a more
prominent feature of Nebraska’s landscape in the 1960s.
During this time, land area of wheat continued on a slow
downward trend, whereas land area of oats decreased at a
faster rate (Figs. 2B, 4). In 1961, the Feed Grain program was implemented because of continued overproduction
of commodity crops and low crop prices (Berner 1984).
Figure6.PalmerModiiedDroughtIndices(PMDI;averageofmonthlyvaluesfromApriltoSeptember)forNebraska,1895–2007.Valuesof-3.00and3.00deinedroughtandloodthresholds,respectively.Source:NationalClimateDataCenter.
GreatPlainsResearchVol.19No.2,2009234
©2009CenterforGreatPlainsStudies,UniversityofNebraska–Lincoln
Corn and grain sorghum were the initial targets of the Feed Grain program, and landowners were required to
replace crop hectares with conservation areas, which
remained fallow to receive program compensation (Cain and Lovejoy 2004). Nebraska had signiicant reductions of corn hectares during this period (Fig. 2A), but grain
sorghum hectares increased during the early 1960s (Fig.
2B). For farmers, inancial compensation from the Feed Grain program for having only a portion of their land in
crop production was more lucrative than compensation
from the Conservation Reserve program; payments for corn were typically higher than those for other commod-
ity crops covered by the programs (Berner 1984). From the late 1960s through the mid-1980s, crop-
land area planted by Nebraska farmers and area planted
in corn and soybeans generally continued to increase,
whereas area planted to wheat and oats generally con-
tinued to decrease (Fig. 2B). One factor contributing to
this trend was Earl Butz’s encouragement of farmers to
farm “from fence row to fence row” (Fig. 5). Butz, the U.S. secretary of agriculture from 1971 to 1976, called on
farmers to increase production to provide food for Rus-
sia, and Russian grain purchases kept demand and prices high. Conservation areas from previous programs were replaced by crops during this period (Cain and Lovejoy 2004). Nebraska’s cropland increased during the 1970s (Fig. 1B), especially for corn and soybeans (Fig. 2B).
In 1983, a record number of hectares was set-aside
from production in exchange for Feed Grain program
payments, resulting in an almost 1.3 million-ha decrease
in area planted within a single year (Fig. 2A); this seemed
to be the only interruption of the decline in number of
farms and the increase in mean farm size since the 1930s
(Fig. 1). The large reduction in area planted was part of
the Payment-in-Kind effort to stabilize agricultural eco-
nomics due to surplus commodity crops, low crop prices,
and problems in the farm credit and banking sectors due
to a substantial decrease in agricultural land values (Cook 1983; Berner 1984). However, after idling a signiicant amount of cropland in 1983, Nebraska farmers increased
the total amount of land in crop production in 1984 to a level not seen since 1940, despite low prices and surplus supplies of farm commodities.
The 1985 Farm Bill (i.e., Food Security Act) was the irst to include a separate conservation title, including the creation of the Conservation Reserve Program (CRP), a voluntary, long-term land-retirement program that paid
farmers to establish and maintain permanent cover on
highly erodible croplands (Heard 2000). The CRP initially was focused on reducing soil erosion and controlling com-
modity supplies, but evolved into a multifaceted conserva-
tion program that has continued in each successive farm
bill since 1985 (Heard 2000). The area in crop production in Nebraska initially declined as land was enrolled in the
program during the irst few years following enactment of the 1985 Farm Bill. However, enrollment of approximately 28,000 ha in CRP in 1986 cannot explain the decrease in over 400,000 ha of cropland between 1985 and 1986, which could have further been affected by a poor agricultural
market. Following the irst few years of declining cropland after 1985, the total area in cropland began to increase, and generally continued to do so, especially for corn and
soybean production, through 2007. In 1986, soybeans sup-
planted wheat as the second most dominant crop planted
in Nebraska in terms of land area (Figs. 2B, 4). Corn and soybean crops combined now make up >66% of Nebraska’s total cropland area (Fig. 4).
FUTURELAND-USETRENDS
Nebraska’s agricultural landscape has been affected
by foreign policy, mechanization, economics, politics,
energy policy, and availability of agricultural chemical
inputs. Although the factors are large-scale and often
international in scope, we are constantly reminded that
individual landowners make the annual decisions that
affect Nebraska’s landscape. In part, decisions have been
formed based on agricultural policies and programs,
some of which may not be well suited to address new
forces affecting contemporary issues in U.S. agricul-
tural economy (Dimitri et al. 2005). Individual farms are unique, but Nebraska has seen a general trend of fewer
and larger farms that produce a less diverse portfolio of
commodities. Nebraska mirrors other states in the Great
Plains with these agricultural trends (Dimitri et al. 2005; National Agricultural Statistics Service 2008b).
As wildlife biologists, we are interested in landscape
compositional and structural changes. Certainly, the loss of cover through fencerow removal and landscape
simpliication (Fig. 5) has the potential to impact wildlife populations (Flather et al. 1992). We encourage biologists
to use spatial, historic landscape, and wildlife monitor-
ing data to investigate the effects of landscape change in
Nebraska on wildlife. We hypothesize that most Nebras-
kans have not perceived the broad scope of long-term
land-use changes outlined in this paper. We encourage
state and federal agency personnel who work with private
landowners to share information, which may encourage
better-informed decisions by landowners concerned with
wildlife habitat and landscape issues. There are lessons in

Long-TermAgriculturalLand-UseTrendsinNebraska,1866-2007•TimL.Hilleretal. 235
©2009CenterforGreatPlainsStudies,UniversityofNebraska–Lincoln
history and Nebraska’s policymakers may be able to learn
from the lessons imbedded in past policy decisions.
Current pressures for biofuels have the potential to act in similar fashion to Earl Butz’s call to plant crops
throughout the Great Plains. Just as conservation hectares
disappeared from the landscape in the 1970s, we antici-
pate a dramatic drop in conservation hectares in Nebraska
during the next 5–10 years. Because corn and soybeans are both used in biofuels, we do not anticipate a change
in the trajectory of Nebraska’s crop diversity; corn and
soybeans will likely continue to dominate agricultural
area. For wildlife, this trend is not promising.
The potential for switchgrass (P. virgatum) use as a
biofuel (Parrish and Fike 2005) provides one possible adjustment to our predictions. If regional markets for
switchgrass are successfully developed, Nebraska’s land-
scape may become much more diverse. Switchgrass can
increase habitat quality and quantity for some grassland
birds and other wildlife species (Murray and Best 2003), although a monoculture of switchgrass provides habitat
conditions that are very different from the diversity of
native prairie plants. The future of Nebraska’s landscape
is not certain, but we are certain the state’s landscape
will continue to be affected by the same forces we have
documented for past land-use decisions. Documentation
of future impacts will remain critical.
ACKNOWLEDGMENTS
We thank J.R. Brandle, T.H. Hiller, T.W. Matthews, and two anonymous reviewers for providing useful com-
ments that improved our manuscript. We are also grateful
to S.M. Vantassel for assistance with constructing Figure 5. The School of Natural Resources at the University of Nebraska–Lincoln provided support for TLH and LAP
for this study. The Nebraska Game and Parks Commis-
sion provided support for TDM and JJL. This research was also supported by Hatch Act funds through the
University of Nebraska Agricultural Research Division, Lincoln, NE. Historic aerial photos were obtained from
the Conservation Survey Division in the School of Natu-
ral Resources at the University of Nebraska–Lincoln.
REFERENCES
Antrop, M. 1998. Landscape change: Plan or chaos? Landscape and Urban Planning 41:155-61.
Antrop, M. 2000. Background concepts for integrated landscape analysis. Agriculture, Ecosystems, and
the Environment 77:17-28.
Bartman, R.M. 1969. Pheasant nesting on soil bank land in northern Utah. Journal of Wildlife Management
33:1020-23.
Berner, A.H. 1984. Federal land retirement program: a land management albatross. Transactions of the
North American Wildlife and Natural Resources
Conference 49:118-31.Berner, A.H. 1988. Federal pheasants: Impact of federal
agricultural programs on pheasant habitat, 1934–1985. In Pheasants: Symptoms of Wildlife Problems
on Agricultural Lands, ed. D.L. Hallett, W.R. Ed-
wards, and G.V. Burger, 45-93. The Wildlife Soci-ety, North Central Section, Bloomington, IL.
Boren, J.C., D.M. Engle, M.W. Palmer, R.E. Masters, and T. Criner. 1999. Land use change effects on breed-
ing bird community composition. Journal of Range
Management 52:420-30.Cain, Z., and S. Lovejoy. 2004. History and outlook for
Farm Bill conservation programs. Choices 19:37-
42.Carlson, M.P. 1993. Geology, Geologic Time, and Ne-
braska. University of Nebraska–Lincoln, Conser-vation and Survey Division, Educational Circular no. 10.
Conservation and Survey Division. 1986. The Ground-
water Atlas of Nebraska. Conservation and Survey Division, Institute of Agriculture and Natural Re-
sources, University of Nebraska–Lincoln, Resource Atlas no. 4/1986.
Cook, K. 1983. Soil conservation: PIK in a poke. Journal
of Soil and Water Conservation 38:475-76.Dalgren, R.B. 1967. What happened to our pheasants in
1966? South Dakota Conservation Digest 34:6-9.Dimitri, C., A. Efland, and N. Conklin. 2005. The 20th
century transformation of U.S. agriculture and farm
policy. U.S. Department of Agriculture, Economic
Research Service, Economic Information Bulletin no. 3.
Droze, W.H. 1977. Trees, Prairies, and People. Texas
Woman’s University, Denton, TX.
Edwards, W.R. 1984. Early ACP pheasants boom and bust! Proceedings of Perdix III:71-83.
Elder, J.A. 1969. Soils of Nebraska. University of Nebras-
ka–Lincoln, Conservation and Survey Division, Resource Report no. 2.
Flather, C.H., S.J. Brady, and D.B. Inkley. 1992. Regional habitat appraisals of wildlife communities: A land-
scape-level evaluation of a resource planning model
using avian distribution data. Landscape Ecology
7:137-47.
GreatPlainsResearchVol.19No.2,2009236
©2009CenterforGreatPlainsStudies,UniversityofNebraska–Lincoln
Goklany, I.M. 2002. Comparing 20th century trends in the U.S. and global agricultural water and land use.
Water International 27:321-29.
Heard, L.P. 2000. Introduction. In A Comprehensive
Review of Farm Bill Contributions to Wildlife
Conservation, 1985–2000, ed. W.L. Hohman and
D.J. Halloum, 1-4. U.S. Department of Agriculture, Natural Resources Conservation Service, Wildlife Habitat Management Institute, Technical Report, USDA/NRCS/WHMI-2000.
Heddinghaus, T.R., and P. Sabol. 1991. A review of the Palmer Drought Severity Index and where do we
go from here? Proceedings of Applied Climatology
Conference 7:242-46.High Plains Regional Climate Center. 2008. 1971–2000
Monthly Climate Summary, Monthly Tabular Data,
Average Total Precipitation (Mitchell 5E [255590],
Falls City 2NE [252850]). http://www.hprcc.unl.
edu/data/historical/ (accessed August 19, 2008).
Igl, L.D., and D.H. Johnson. 1997. Changes in breeding bird populations in North Dakota: 1967 to 1992–93.
Auk 114:74-92.Krebs, C.J. 1999. Ecological Methodology, 2nd ed. Ben-
jamin Cummings, Menlo Park, CA.Lockeretz, W. 1978. The lessons of the Dust Bowl. Ameri-
can Scientist 66:560-69.Luebke, F.C. 2005. Nebraska: An Illustrated History.
University of Nebraska Press, Lincoln.
Lyon, D.J. 2004. Wind Erosion and Its Control. NebGuide
G1573. University of Nebraska–Lincoln Extension, Institute of Agriculture and Natural Resources.
Maher, Jr., H.D., G.F. Engelmann, and R.D. Shuster. 2003. Roadside Geology of Nebraska. Mountain Press Publishing, Missoula, MT.
Matos, G., and L. Wagner. 1998. Consumption of materi-als in the United States, 1900–1995. Annual Review
of Energy and the Environment 23:107-22.
McKnight, T.L. 1996. Physical Geography: A Landscape
Appreciation. Prentice Hall, Upper Saddle River, NJ.
Medley, K.E., B.W. Okey, G.W. Barrett, M.F. Lucas, and W.H. Renwick. 1995. Landscape change with agricultural intensiication in a rural watershed, southwestern Ohio, U.S.A. Landscape Ecology
10:161-76.
Murray, L.D., and L.B. Best. 2003. Short-term bird re-
sponse to harvesting switchgrass for biomass in
Iowa. Journal of Wildlife Management 67:611-21.
Nassauer, J.I. 1992. The appearance of ecological systems
as a matter of policy. Landscape Ecology 6:239-50.
Nassauer, J.I. 1995. Culture and changing landscape structure. Landscape Ecology 10:229-37.
National Agricultural Statistics Service. 2008a. Quick
Stats, Nebraska County Data—Crops. http://www.
nass.usda.gov/QuickStats/Create_County_Indv.jsp. (accessed August 15, 2008).
National Agricultural Statistics Service. 2008b. 2002
Census of Agriculture Quick Stats, Census, U.S.—
State Data. http://www.nass.usda.gov/Census/Cre-
ate_Census_US.jsp (accessed October 29, 2008).National Climate Data Center. 2008. Divisional Data
Select: Nebraska Drought Data. http://www7.ncdc.
noaa.gov/CDO/CDODivisionalSelect.jsp# (ac-
cessed August 19, 2008).
Neild, R.E. 1977. Agroclimatic resources. In Agricultural
Atlas of Nebraska, ed. J.H. Williams and D. Murf-ield, 1-12. University of Nebraska Press, Lincoln.
Olmstead, A.L., and P.W. Rhode. 2002. Reshaping the landscape: The impact and diffusion of the tractor
in American agriculture, 1910–1960. Journal of
Economic History 61:663-98.
Ottoson, H.W. 1979. Land and People in the Northern
Plains Transition Area. Ayer Publishing, Man-
chester, NH.
Pan, D., G. Domon, S. de Blois, and A. Bouchard. 1999.
Temporal (1958–1993) and spatial patterns of land use changes in Haut-Saint-Laurent (Quebec,
Canada) and their relation to landscape physical at-tributes. Landscape Ecology 14:35-52.
Parrish, D.J., and J.H. Fike. 2005. The biology and agron-
omy of switchgrass for biofuels. Critical Reviews in
Plant Sciences 24:423-59.Parton, W.J., M.P. Gutmann, and D. Ojima. 2007. Long-
term trends in population, farm income, and crop
production in the Great Plains. Bioscience 57:737-47.
Ramankutty, N., and J.A. Foley. 1999. Estimating his-
torical changes in land cover: North American
croplands from 1850 to 1992. Global Ecology and
Biogeography 8:381-96.
Sauer, J.R., J.E. Hines, and J. Fallon. 2008. The North
American Breeding Bird Survey, Results and
Analysis, 1966–2007. Patuxent Wildlife Research Center, U.S. Geological Survey, Laurel, MD. http://www.mbr-pwrc.usgs.gov/bbs/ (accessed October 8,
2008).
Schrader, T.A. 1960. Does soil bank aid pheasants? Con-
servation Volunteer 23:34-37.Simpson, E.H. 1949. Measurement of diversity. Nature
163:688.

Long-TermAgriculturalLand-UseTrendsinNebraska,1866-2007•TimL.Hilleretal. 237
©2009CenterforGreatPlainsStudies,UniversityofNebraska–Lincoln
Turner, M.G., and C.L. Ruscher. 1988. Changers in land-
scape patterns in Georgia, USA. Landscape Ecol-
ogy 1:241-51.U.S. Census Bureau. 2008. State and County Quick
Facts: Nebraska. http://quickfacts.census.gov/qfd/
states/31000.html (accessed June 24, 2008).U.S. Department of Agriculture. 2004. 2002 Census of Ag-
riculture, Nebraska State and County Data. USDA
National Agricultural Statistics Service, Geograph-
ic Area Series, vol. 1, pt. 27, AC-02-A-27.U.S. Department of Agriculture. 2008. The census of ag-
riculture, 2007 census, 1997 census (1998 farm and
ranch irrigation survey), 1950 census. http://www.agcensus.usda.gov/ (accessed February 5, 2009).
Vogel, K.P. 1996. Energy production from forages for American agriculture: Back to the future. Journal
of Soil and Water Conservation 51:137-39.Warner, R.E. 1994. Agricultural land use and grassland
habitat in Illinois: Future shock for midwestern
birds? Conservation Biology 8:147-56.Yonts, C.D. 2002. Crop Water Use in Western Nebraska.
NebGuide G1465. University of Nebraska–Lincoln Extension, Institute of Agriculture and Natural
Resources.