long span high strength steel trusses
TRANSCRIPT
Long span high strength steel trusses
Authors: Vaidas Alechnavičius
József Bálint
Supervisor: Panagiotis Manoleas
University: Luleå University of Technology
Luleå University of Technology
2014/01/17
Long span high strength steel trusses
Vaidas Alechnavičius
József Bálint
Luleå University of Technology
Department of Civil, Environmental and Natural Resources Engineering
Division of Structural and Construction Engineering - Steel Structures
SE - 971 87 LULEÅ
www.ltu.se/sbn

European Erasmus Mundus Master Sustainable Constructions under natural hazards and catastrophic events 520121-1-2011-1-CZ-ERA MUNDUS-EMMC/ Vaidas Alechnavicius, Jozsef Balint
- I -
PREFACE
This thesis represents our work for the final semester of the Erasmus Mundus SUSCOS
Master Programme of which the first semester we spent in University of Coimbra,
Portugal, whilst the second semester was held in Czech Technical University of Prague.
Therefore, we would like to thank all the staff members with whom we worked with in
these two Universities.
Our research was performed at the Department of Civil, Environmental and Natural
Resources Engineering of Luleå University of Technology at the Division of Structural
and Construction Engineering in the Steel Structures Research Group.
We would like to thank our coordinator Milan Veljkovic for his guidance throughout
our stay in Luleå and present our gratitude to our supervisor Panagiotis Manoleas for all
his guidance and assistance on our thesis.
Moreover, we want to acknowledge Ulf Stenman and the rest of the COMPLAB staff
members for their support during the experiments we carried out in the laboratory.
We thank our families and friends for all their support during the study period.
On behalf of József Bálint, special thanks are addressed to Zsolt Nagy, from Technical
University of Cluj-Napoca for all his assistance and help.
European Erasmus Mundus Master Sustainable Constructions under natural hazards and catastrophic events 520121-1-2011-1-CZ-ERA MUNDUS-EMMC/ Vaidas Alechnavicius, Jozsef Balint
- II -
ABSTRACT
Long span truss elements are required in modern applications like stadiums, show-
rooms, exhibition halls, airports. Problems may be arise due to the dimensions and
weight of the truss itself. Instability, buckling and finally collapse of the structure may
be caused, if not installed and braced properly.
A convenient solution to this may be the use of HSS, since this will lead to a reduction
in weight of the steel structure and implicitly in the foundation area (not to be analysed
in this work). Also, smaller amounts of CO2 emissions would be emitted (due to the
reduced material and less transportation needs), which makes the study of the HSS
usage an appealing one.
For an even greater weight reduction and a more sustainable solution, a truss
constructed of built-up polygonal cross-sections is analysed and proposed, instead of the
classic circular hollow sections approach for the chord and diagonal members. U shaped
profile will be considered for the lower chord, which is subjected to tensional forces, a
shape that optimally uses the necessary area for undertaking the tensional stresses.
Computational analysis will be performed in Abaqus Finite Element software. The main
concern is the behaviour of the connections in the tension chord under various load
levels and the buckling analysis of polygonal members.
For understanding deeper the advantages of using HSS, 3 steel grades (S355, S500 and
S650) are compared from an economical and environmental point of view, both for the
CHS and the built-up polygonal section trusses.

European Erasmus Mundus Master Sustainable Constructions under natural hazards and catastrophic events 520121-1-2011-1-CZ-ERA MUNDUS-EMMC/ Vaidas Alechnavicius, Jozsef Balint
- III -
European Erasmus Mundus Master Sustainable Constructions under natural hazards and catastrophic events 520121-1-2011-1-CZ-ERA MUNDUS-EMMC/ Vaidas Alechnavicius, Jozsef Balint
- IV -
NOTATIONS
Latin capital letters
A area of a cross section
Aeff effective cross sectional area
Ag gross cross sectional area
E modulus of elasticity
Fy tensile strength of steel
Fya average yield stress in cold-formed section
Fyf yield stress at flat part of section
Fu tensile strength of steel
Fw.Rd design value of the weld force per unit length
G shear modulus
I second moment of inertia
L full length of member
Lcr critical length of member
Nb.Rk characteristic buckling resistance
Nc.Rd design resistance to normal forces of the cross-section for uniform
compression
Nc.Rk characteristic value of resistance to compression
Ncr elastic critical force for the relevant buckling mode based on the gross cross
sectional properties
Nt.Rd design values of the resistance to tension forces
European Erasmus Mundus Master Sustainable Constructions under natural hazards and catastrophic events 520121-1-2011-1-CZ-ERA MUNDUS-EMMC/ Vaidas Alechnavicius, Jozsef Balint
- V -
Latin small letters
a weld throat thickness
b flat width of plate
bp notional width of plate
beff effective width of plate
fy yield strength
fya average yield strength
fyb basic yield strength
fu ultimate tensile strength
fvw.d design shear strength of the weld
i radius of gyration
k effective length factor
kσ plate buckling coefficient
t element thickness
Greekcapital letters
∆P hardening constant
Θ degree of bent corners
Greeksmall letters
α imperfection factor
βw correlation factor for fillet welds
γM0 partial factor for resistance of cross-sections
γM2 partial factor for resistance of cross-sections in tension to fracture
εtrue true strain
European Erasmus Mundus Master Sustainable Constructions under natural hazards and catastrophic events 520121-1-2011-1-CZ-ERA MUNDUS-EMMC/ Vaidas Alechnavicius, Jozsef Balint
- VI -
εxx strain in x direction
εyy strain in y direction
𝜆 relative slenderness
𝜆 p plate slenderness
ν Poisson’s ratio in elastic stage
ρ reduction factor to determine the effective width of the plate
σtrue true normal stress
σ11 maximum principal stress
σ22 minimum principal stress
σY yield stress of material
σxx normal stress x direction
σyy normal stress y direction
σzz normal stress z direction
σcr critical buckling stress
σνm von Mises stress
τxy tangent (shear) stress xy direction
Φ value to determine the reduction factor χ
χ reduction factor for buckling resistance
ѱ ratio of moments in segment
European Erasmus Mundus Master Sustainable Constructions under natural hazards and catastrophic events 520121-1-2011-1-CZ-ERA MUNDUS-EMMC/ Vaidas Alechnavicius, Jozsef Balint
- VII -
LIST OF FIGURES
Figure 1.1 Friends Arena, Stockholm .............................................................................. 2
Figure 1.2 Firth of Forth bridge (Scotland) .................................................................... 4
Figure 1.3 Connection of semi-closed polygonal cross sections chords to diagonals .... 7
Figure 1.4 U-shaped tension chord joint detail with diagonal; an alternative with
tubular diagonals is shown for the sake of illustration ............................................ 7
Figure 2.1 Layout of the truss ........................................................................................ 11
Figure 2.2 Gap joint node .............................................................................................. 12
Figure 2.3 3D model of the truss ................................................................................... 12
Figure 2.4 Axial force in the horizontal bracings .......................................................... 13
Figure 2.5 Axial force in the diagonals ......................................................................... 13
Figure 2.6 Axial force diagram ...................................................................................... 13
Figure 2.7 Bending moment diagram ............................................................................ 14
Figure 2.8 Shear force diagram ..................................................................................... 14
Figure 2.9 Buckling curves[23] ..................................................................................... 16
Figure 2.10 Types of joints designed ............................................................................. 17
Figure 2.11 Joint types in truss[21] ............................................................................... 17
Figure 2.12 Truss top chord built-up sections ............................................................... 22
Figure 2.13 Truss diagonals built-up sections ............................................................... 23
Figure 2.14 Open U-shaped profile ............................................................................... 23
Figure 2.15 Notional flat width[26] .............................................................................. 24
Figure 2.16 Flat width b and notional flat width bp in bended plate ............................ 25
Figure 2.17 U-shaped bottom chord (S650) .................................................................. 28
Figure 3.1 U-section ...................................................................................................... 32
Figure 3.2 Element of a structure in a biaxial stress state ............................................ 33
Figure 3.3 Acting forces at the connection area ............................................................ 34
Figure 3.4 Stress-strain diagram for ductile material ................................................... 35
Figure 3.5 Dimensions of U section (S650) ................................................................... 36
Figure 3.6 Compression (+) and tension (-) members in designed scaled down truss . 37
Figure 3.7 Compression (+) and tension (-) members in regular truss arrangement ... 37
European Erasmus Mundus Master Sustainable Constructions under natural hazards and catastrophic events 520121-1-2011-1-CZ-ERA MUNDUS-EMMC/ Vaidas Alechnavicius, Jozsef Balint
- VIII -
Figure 3.8 Loads applied on connection ....................................................................... 37
Figure 3.9 Different types of connection under investigation........................................ 38
Figure 3.10 Model of the connection without stiffeners ................................................ 39
Figure 3.11 Local material orientations in the U channel ............................................ 40
Figure 3.12 Connecting surface ties .............................................................................. 40
Figure 3.13 Loads and boundary conditions on the model ........................................... 41
Figure 3.14 Meshed FE model ....................................................................................... 42
Figure 3.15 Paths in z and y directions ......................................................................... 43
Figure 3.16 Stress fields in joints without stiffener ....................................................... 44
Figure 3.17 Stress in member along horizontal direction. Tension only. (Connection
without stiffener) ..................................................................................................... 45
Figure 3.18 Stress in member along horizontal direction. Full loading. (Connection
without stiffener) ..................................................................................................... 45
Figure 3.19 Stress fields in joints with stiffener between the plates .............................. 46
Figure 3.20 Stress in member along horizontal direction. Tension only. (With middle
stiffener) .................................................................................................................. 47
Figure 3.21 Stress in member along horizontal direction. Full loading. (With middle
stiffener) .................................................................................................................. 47
Figure 3.22 Stress fields in joints with 6mm thick u-shaped stiffener ........................... 48
Figure 3.23 Stress in member along horizontal direction. Tension only. (Connection
with 6mm U insert) ................................................................................................. 49
Figure 3.24 Stress in member along horizontal direction. Full loading. (Connection
with 6mm U insert) ................................................................................................. 49
Figure 3.25 Stress fields in joints with 3mm thick u-shaped stiffener ........................... 50
Figure 3.26 Stress in member along horizontal direction. Tension only. (Connection
with 3mm U insert) ................................................................................................. 51
Figure 3.27 Stress in member along horizontal direction. Tension only. (Connection
with 3mm U insert) ................................................................................................. 51
Figure 3.28 Stress distribution in connections along longitudinal (z) axis. Tension only
................................................................................................................................ 52
Figure 3.29 Stress distribution in connections along longitudinal (z) axis. Full load .. 52
Figure 3.30 Stress distribution in connections along vertical (y) axis. Tension only .... 53
European Erasmus Mundus Master Sustainable Constructions under natural hazards and catastrophic events 520121-1-2011-1-CZ-ERA MUNDUS-EMMC/ Vaidas Alechnavicius, Jozsef Balint
- IX -
Figure 3.31 Stress distribution in connections along vertical (y) axis. Full load ......... 53
Figure 4.1 Polygonal built-up sections for chords (top) and diagonals (bottom) ......... 55
Figure 4.2 Effect of cold work on mechanical properties in cold-formed steel sections:
a – channel section, b- joist chord [29] .................................................................. 57
Figure 4.3 Effects of strain hardening and strain aging on stress-strain
characteristics[30] ................................................................................................. 58
Figure 4.4 Coupon specimen[36] .................................................................................. 62
Figure 4.5 Idealisation of residual stress[39] ............................................................... 65
Figure 4.6 Residual flower for plain and lipped channel sections[40] ......................... 65
Figure 4.7 Typical unstable static response[42] ........................................................... 67
Figure 4.8 The comparison between nominal data and true material data[43] ........... 68
Figure 4.9 Dimensions of the single plate ..................................................................... 69
Figure 4.10 Shell plates and assembled section ............................................................ 71
Figure 4.11 Assembly by fasteners in Abaqus ............................................................... 72
Figure 4.12 Meshed section ........................................................................................... 72
Figure 4.13 Boundary conditions on the polygonal model ............................................ 73
Figure 4.14 First two buckling modes when spacing of the bolts is 500mm ................. 74
Figure 4.15 Four buckling modes for polygonal section (spacing of bolts is 250mm) . 75
Figure 4.16 The deformed shape of the polygonal section (plastic analysis) ................ 76
Figure 4.17 Load-displacement curve (S650) ................................................................ 76
Figure 4.18 Load-displacement curve (increased yield strength by EC 1993-1-3) ....... 77
Figure 4.19 Load-displacement curve (yield strength increased at corner zones only) 77
Figure 4.20 Comparison of load-displacement curves .................................................. 78
Figure 5.1 Priority triangle ........................................................................................... 80
Figure 5.2 Cost breakdown of steel structures .............................................................. 81
Figure 5.3 Cost distribution for CHS S650 .................................................................... 86
Figure 5.4 Cost distribution for CHS S500 .................................................................... 86
Figure 5.5 Cost distribution for CHS S355 .................................................................... 87
Figure 5.6 Cost distribution for POL S650 .................................................................... 87
Figure 5.7 Cost distribution for POL S500 .................................................................... 88
Figure 5.8 Cost distribution for POL S355 .................................................................... 88
Figure 5.9 Total cost for each type of truss ................................................................... 89
European Erasmus Mundus Master Sustainable Constructions under natural hazards and catastrophic events 520121-1-2011-1-CZ-ERA MUNDUS-EMMC/ Vaidas Alechnavicius, Jozsef Balint
- X -
Figure 5.10 Total weight for each type of truss (in kg) ................................................. 89
Figure 5.11 Total weight reduction obtained when ....................................................... 90
Figure 5.12 Total cost reduction obtained when ........................................................... 90
Figure 5.13 Cost reduction when using HSS ................................................................. 91
Figure 5.14 CO2 emissions during production of steel, cradle to gate[12] .................. 93
Figure 5.15 Greenhouse Gas Emissions by Gas (2011) ................................................ 93
Figure 5.16 CO2 emissions of different processes......................................................... 97
Figure 5.17 CO2 emissions of different processes......................................................... 97
Figure 5.18 CO2 emissions of different processes......................................................... 98
Figure 5.19 CO2 emissions of different processes......................................................... 98
Figure 5.20 CO2 emissions of different processes......................................................... 99
Figure 5.21 CO2 emissions of different processes......................................................... 99
Figure 5.22 CO2 emissions reduction when using HSS (in kg of CO2) ...................... 100
Figure 5.23 Total CO2 emissions for each type of truss (in kg of CO2) ..................... 101
European Erasmus Mundus Master Sustainable Constructions under natural hazards and catastrophic events 520121-1-2011-1-CZ-ERA MUNDUS-EMMC/ Vaidas Alechnavicius, Jozsef Balint
- XI -
LIST OF TABLES
Table 2.1 Steel grades used for trusses .......................................................................... 14
Table 2.2 Cross sectional classification limits ............................................................... 15
Table 2.3 Range of validity for welded joints between CHS brace members and CHS
chords. .................................................................................................................... 18
Table 2.4 K and Y joint resistance formulae .................................................................. 18
Table 2.5 KK type of joint checking procedure .............................................................. 19
Table 2.6 CHS truss made out of S650 steel .................................................................. 20
Table 2.7 CHS truss made out of S500 steel .................................................................. 21
Table 2.8 CHS truss made out of S355 steel .................................................................. 21
Table 2.9 Built-up polygonal section truss made out of S650 steel ............................... 28
Table 2.10 Built-up polygonal section truss made out of S500 steel ............................. 29
Table 2.11 Built-up polygonal section truss made out of S355 steel ............................. 29
Table 3.1 List of FE models .......................................................................................... 42
Table 4.1 Nominal Stress, Strains and Plastic Strains for S355 steel ............................ 67
Table 4.2 Material properties for input to numerical model ......................................... 71
Table 4.3 Ultimate buckling loads ................................................................................. 78
Table 5.1 CHS truss environmental savings ................................................................ 101
Table 5.2 Built-up polygonal truss environmental savings .......................................... 101
European Erasmus Mundus Master Sustainable Constructions under natural hazards and catastrophic events 520121-1-2011-1-CZ-ERA MUNDUS-EMMC/ Vaidas Alechnavicius, Jozsef Balint
- XII -
TABLE OF CONTENTS
PREFACE ................................................................................................................................................... I
ABSTRACT ............................................................................................................................................... II
NOTATIONS ........................................................................................................................................... IV
LIST OF FIGURES ................................................................................................................................ VII
LIST OF TABLES ................................................................................................................................... XI
1 INTRODUCTION ................................................................................................................................ 1
1.1 BACKGROUND................................................................................................................................. 1
1.2 CIRCULAR HOLLOW SECTION TRUSSES ............................................................................................ 4
1.3 SEMI-CLOSED POLYGONAL SECTION TRUSSES ................................................................................. 5
1.4 OBJECTIVES AND RESEARCH QUESTIONS ......................................................................................... 7
1.5 LIMITATIONS................................................................................................................................... 8
1.6 SCIENTIFIC APPROACH .................................................................................................................... 9
1.7 STRUCTURE OF THE THESIS ............................................................................................................. 9
2 STRUCTURAL DESIGN OF THE CIRCULAR HOLLOW SECTION AND POLYGONAL
SECTION TRUSS ELEMENTS, ACCORDING TO EUROCODES ................................................. 11
2.1 TRUSS LAYOUT AND GEOMETRY ................................................................................................... 11
2.2 TRUSS STRUCTURAL ANALYSIS ..................................................................................................... 12
2.3 DESIGN OF THE TRUSS WITH CIRCULAR HOLLOW SECTIONS ......................................................... 14
2.3.1 Member design according to Eurocodes ............................................................................ 14
2.3.2 Joint design (according to Eurocode & CIDECT) ............................................................. 16
2.3.3 Weld design ........................................................................................................................ 20
2.3.4 Results and conclusions ...................................................................................................... 20
2.4 SEMI-CLOSED POLYGONAL SECTIONS TRUSS DESIGN .................................................................... 22
2.4.1 Layout and assembly of truss members .............................................................................. 22
2.4.2 Design of thin walled members ........................................................................................... 24
2.4.3 Results ................................................................................................................................ 28
2.5 GLOBAL BUCKLING VERIFICATION OF THE ENTIRE TRUSS ............................................................. 29
3 CONNECTION BEHAVIOUR ANALYSIS AT THE TENSION CHORD .................................. 32
3.1 INTRODUCTION ............................................................................................................................. 32
3.2 STRESSES IN THE PLATES .............................................................................................................. 33
3.3 THEORIES OF FAILURE ................................................................................................................... 34
3.4 METHOD ....................................................................................................................................... 36
European Erasmus Mundus Master Sustainable Constructions under natural hazards and catastrophic events 520121-1-2011-1-CZ-ERA MUNDUS-EMMC/ Vaidas Alechnavicius, Jozsef Balint
- XIII -
3.5 MODELLING IN ABAQUS ............................................................................................................... 39
3.6 ANALYSIS AND RESULTS ............................................................................................................... 42
3.7 CONCLUSIONS ............................................................................................................................... 52
4 BUCKLING ANALYSIS OF THE POLYGONAL CHORD ......................................................... 55
4.1 INTRODUCTION ............................................................................................................................. 55
4.2 INFLUENCE OF COLD WORK ON MECHANICAL PROPERTIES OF STEEL ............................................. 56
4.3 GEOMETRICAL IMPERFECTIONS AND RESIDUAL STRESSES............................................................. 63
4.4 METHOD ....................................................................................................................................... 65
4.5 MODELLING IN ABAQUS ............................................................................................................... 71
4.6 ANALYSIS AND RESULTS ............................................................................................................... 74
4.7 CONCLUSIONS .......................................................................................................................... 78
5 COMPARATIVE STUDY FROM AN ECONOMICAL AND ENVIRONMENTAL POINT OF
VIEW ......................................................................................................................................................... 80
5.1 COST DETERMINATION .................................................................................................................. 80
5.1.1 Background ......................................................................................................................... 80
5.1.2 Method ................................................................................................................................ 81
5.1.3 Results ................................................................................................................................ 86
5.2 CO2 FOOTPRINT CALCULATION ..................................................................................................... 91
5.2.1 Background ......................................................................................................................... 91
5.2.2 Method ................................................................................................................................ 94
5.2.3 Results ................................................................................................................................ 96
CONCLUSIONS ..................................................................................................................................... 103
FUTURE RESEARCH .......................................................................................................................... 107
REFERENCES ....................................................................................................................................... 108
APPENDICES ........................................................................................................................................ 111
European Erasmus Mundus Master Sustainable Constructions under natural hazards and catastrophic events 520121-1-2011-1-CZ-ERA MUNDUS-EMMC/ Vaidas Alechnavicius, Jozsef Balint
- XIV -
European Erasmus Mundus Master Sustainable Constructions under natural hazards and catastrophic events 520121-1-2011-1-CZ-ERA MUNDUS-EMMC/ Vaidas Alechnavicius, Jozsef Balint
- 1 -
1 INTRODUCTION
Long span trusses are eligible solutions for a variety of engineering structures which
require wide open spaces: stadiums, show-rooms, exhibition halls, airports, museums.
The more common they are used, the more it is of interest to reduce the cost of these
type of structures. One way to do this is by using HSS elements, instead of the regular
steel grades. Any grade higher than S355 will be considered HSS. For further reducing
the weight of the structure and achieve better results, a truss constructed by built-up
polygonal sections is proposed.
1.1 Background
Modern steel mills are able to produce high [HSS] strength and ultrahigh strength steel
[UHSS] of tensile strength up to 1400MPa, thanks to continuous annealing[1]. Use of
higher steel grades has been well established and documented in several production
applications, especially the automotive industry [2]. In construction though, its use is
not extended mainly due to serviceability, ductility and cost issues. Documentation
around cost is not absent [3] but scarce none the less.
An effort is put during recent years to overcome the previous obstacles and increase the
interest of engineers. The possibility to use such types of steel, provides an excellent
solution for long span truss applications. The biggest advantages are the total reduction
of the final structure weight and cost, which has been speculated for long [4] as well as
the reduction of carbon footprint[5].
Apart from that, other applications have been considered in construction like bridges
[6][7][8], hybrid girders [9] and other special applications like cranes which are proved
to be economical [10].
Sport arenas, show-rooms, airports, stadiums demand large, column-less open areas in
order to maximize the available free space. The need for such civil engineering
structures requires a special attention to be given to the elements sustaining the roof.
European Erasmus Mundus Master Sustainable Constructions under natural hazards and catastrophic events 520121-1-2011-1-CZ-ERA MUNDUS-EMMC/ Vaidas Alechnavicius, Jozsef Balint
- 2 -
Two popular solutions are used to undertake loads from the roof. Either beam elements
are used, or a truss is designed. In the case of long spans (assumed to be anything higher
or equal to 12 m), the governing limit state would most probably be the serviceability
one, due to the large deformations that are to be dealt with in the case of big openings.
Simple beams are not stiff enough to meet the deflection requirements for a long span,
except large sections are designed. This is an uneconomical approach, the best solution
being the design of a large truss, with slender elements which provides both the required
strength and stiffness. Therefore, a big amount of steel which is not necessary to
undertake the ultimate limit states load can be saved using HSS.
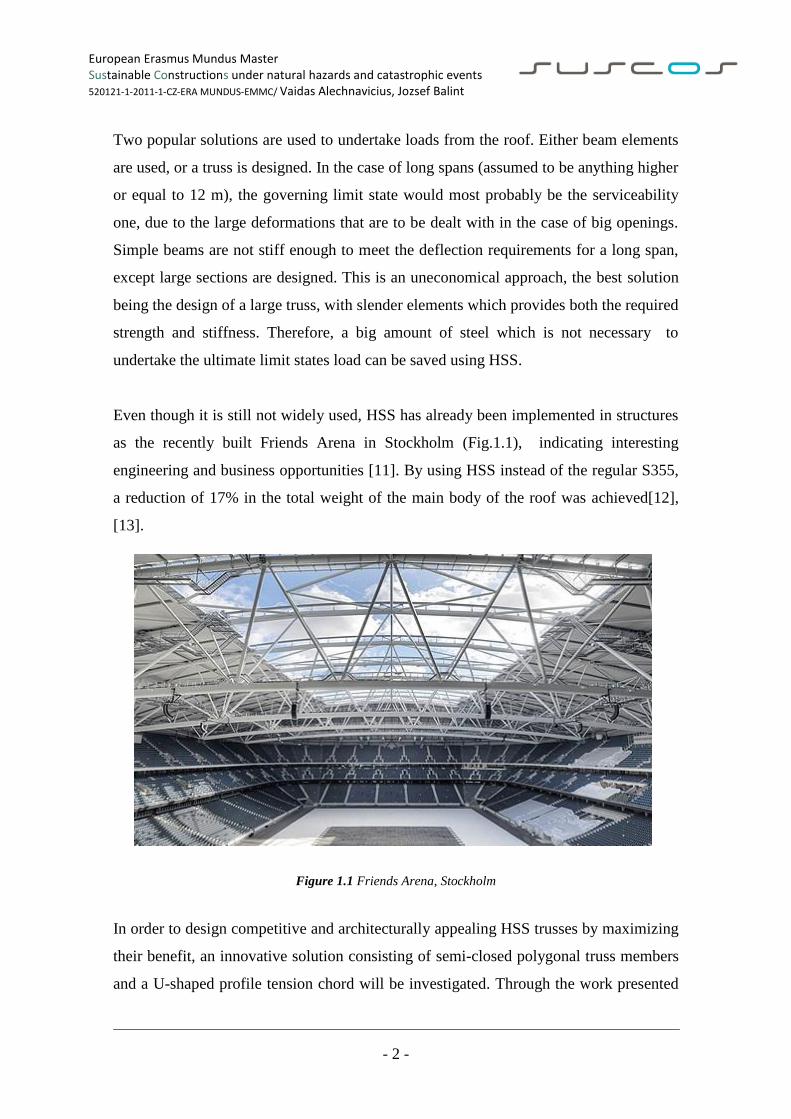
Even though it is still not widely used, HSS has already been implemented in structures
as the recently built Friends Arena in Stockholm (Fig.1.1), indicating interesting
engineering and business opportunities [11]. By using HSS instead of the regular S355,
a reduction of 17% in the total weight of the main body of the roof was achieved[12],
[13].
Figure 1.1 Friends Arena, Stockholm
In order to design competitive and architecturally appealing HSS trusses by maximizing
their benefit, an innovative solution consisting of semi-closed polygonal truss members
and a U-shaped profile tension chord will be investigated. Through the work presented
European Erasmus Mundus Master Sustainable Constructions under natural hazards and catastrophic events 520121-1-2011-1-CZ-ERA MUNDUS-EMMC/ Vaidas Alechnavicius, Jozsef Balint
- 3 -
herein a CHS truss is compared to a built-up section structure and the advantages of the
latter one will be highlighted.
Studies on the behaviour of the CHS have been performed while working on different
aspects of the hollow sections. Interest has been shown on the out-of-plane buckling
length for truss girders with K-joints [14], or buckling of thin-walled long steel
cylinders[15]. Attention has been paid to joints design in [16] where over 100 tests were
performed in order to establish a formulation of the multi-planar joints strength, or in
[17] where multi-planar K joints made of RHS have been investigated.
Literature on the built-up type of cross-sections is short, therefore a lot of questions and
unknowns arise when using them. In this work, numerous questions are addressed
regarding the design of the two types of trusses: the buckling analysis of the
compression chord, the numerical analysis of the joint between the tension U-channel
and the two polygonal diagonals and finally, the evaluation of cost and CO2 emissions.
For the conventional truss structures made from hot-rolled sections, the design was
optimized over the past decades, but in the case of trusses made from cold formed
sections, new cross-sectional shapes and joint details still need to be developed. In [18]
a HSS pentagon shaped cross-section is proposed and investigated through a calculation
method based on the Generalized Beam Theory (GBT), which was compared to
numerical calculations and experimental data.
The main concepts and steps that need to be followed when developing the numerical
implementation of a GBT formulation aimed to perform first-order elastic–plastic
analyses of thin-walled members have been presented in [19]. All the GBT results were
compared to Abaqus shell finite element value, very good agreement between the two
being obtained.
However, it is shown that FEM analysis provides better and more precise results than
the GBT procedure and therefore, in this work an Abaqus approach is preferred.
European Erasmus Mundus Master Sustainable Constructions under natural hazards and catastrophic events 520121-1-2011-1-CZ-ERA MUNDUS-EMMC/ Vaidas Alechnavicius, Jozsef Balint
- 4 -
1.2 Hollow section trusses
Nature provides us with several examples of the tubular shape behaviour when
subjected to compression, torsion or bending.
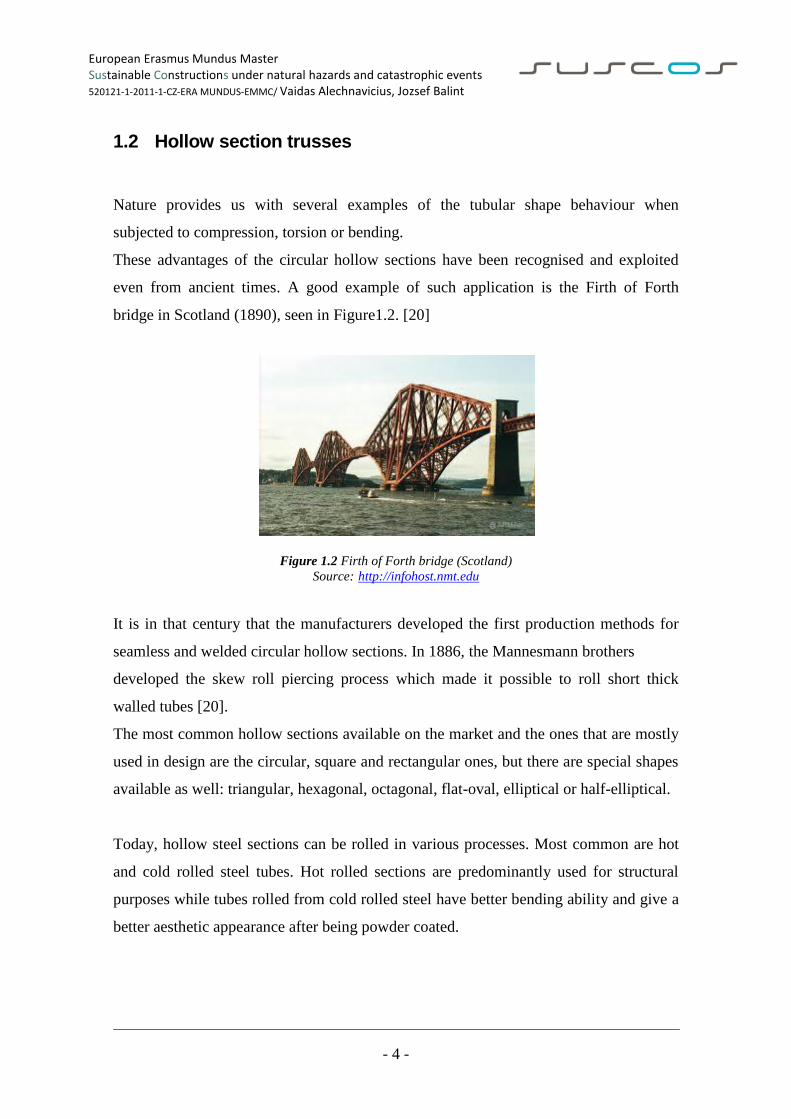
These advantages of the circular hollow sections have been recognised and exploited
even from ancient times. A good example of such application is the Firth of Forth
bridge in Scotland (1890), seen in Figure1.2. [20]
Figure 1.2 Firth of Forth bridge (Scotland)
Source: http://infohost.nmt.edu
It is in that century that the manufacturers developed the first production methods for
seamless and welded circular hollow sections. In 1886, the Mannesmann brothers
developed the skew roll piercing process which made it possible to roll short thick
walled tubes [20].
The most common hollow sections available on the market and the ones that are mostly
used in design are the circular, square and rectangular ones, but there are special shapes
available as well: triangular, hexagonal, octagonal, flat-oval, elliptical or half-elliptical.
Today, hollow steel sections can be rolled in various processes. Most common are hot
and cold rolled steel tubes. Hot rolled sections are predominantly used for structural
purposes while tubes rolled from cold rolled steel have better bending ability and give a
better aesthetic appearance after being powder coated.
European Erasmus Mundus Master Sustainable Constructions under natural hazards and catastrophic events 520121-1-2011-1-CZ-ERA MUNDUS-EMMC/ Vaidas Alechnavicius, Jozsef Balint
- 5 -
The tubular members have excellent mechanical properties. They present a high
bending and torsional rigidity in comparison with I-shaped beams with the same mass,
since the material is distributed further away from the section's centroid and they behave
excellently under compression actions. Moreover, it represents a great shape against
wind, water or wave loading, combined with the fact that it behaves perfectly against
compression, bending and torsion, and having an architecturally attractive shape[21],
the CHS is frequently chosen for structural elements in today's modern architecture. The
exterior surface of the hollow sections is reduced compared to open cross-section, thus
reducing also the cost for painting and fire protection solutions. The paint thickness is
easy to achieve due to the big enough rounding of the elements. Applications may vary
as follows: buildings, halls, bridges, barriers, masts, towers, offshore and special
applications, such as glass houses, radio telescopes, sign gantries, parapets, cranes, jibs,
sculptures, etc.[21].
1.3 Semi-closed polygonal section trusses
The idea of using HSS in polygonal sections for the truss elements is an innovative and
emerging one, therefore the research and previous studies about this matter are still
scarce. Nevertheless, the polygonal shapes have been implemented already by Ruukki
in the construction of lattice towers for wind turbines.
A detailed research study about this was performed by Olga Garzon [22], who
investigated the resistance of the polygonal cross-sections. The focus the thesis is the
use of thinner walls on bolted elements in wind tower applications and the assessment
of the design methods according to Eurocodes in comparison with FEM analysis.
The results of the study show that the Eurocode 3 part 1-3 and part 1-6 are in a good
agreement when compared to the laboratory tests and FEM analysis performed,
whenever the axial resistance was done on the folded plates. A smaller difference
between numerical and analytical results was obtained when calculating the critical load
with part 1-5, rather than with part 1-6 [22]. Therefore, in this thesis also part 1-5 is
European Erasmus Mundus Master Sustainable Constructions under natural hazards and catastrophic events 520121-1-2011-1-CZ-ERA MUNDUS-EMMC/ Vaidas Alechnavicius, Jozsef Balint
- 6 -
used in order to determine the critical load of plates. It is also shown that the strength of
the folded plate, even with less material used in the cross-section has a higher efficiency
than the plates with circular cross-sections [22].
The use of HSS in polygonal shaped plates is further researched by Ruukki in a program
called HISTWIN II, which desires to develop high wind turbine towers, based on a
cylindrical tower concept. The project is being coordinated at LTU.
The proposed solution of a truss with built-up polygonal profile members, is an
innovative idea. The objective is to maximize the efficiency of the cross-section by its
geometry, while minimizing the quantity of steel used. This can lead to great
economical and environmental benefits, as it will be shown later in this work.
There is no extended research and literature behind this type of built-up hollow sections
so far and therefore there are many uncertainties on how these elements would behave
under loads.
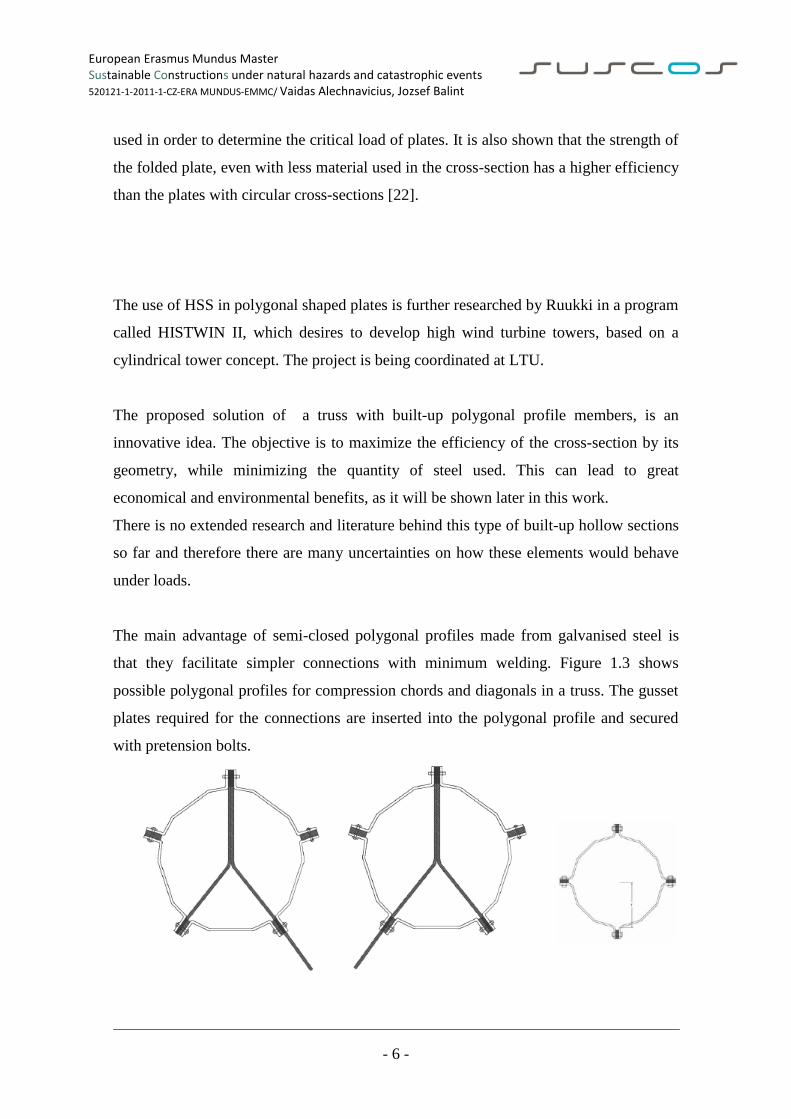
The main advantage of semi-closed polygonal profiles made from galvanised steel is
that they facilitate simpler connections with minimum welding. Figure 1.3 shows
possible polygonal profiles for compression chords and diagonals in a truss. The gusset
plates required for the connections are inserted into the polygonal profile and secured
with pretension bolts.
European Erasmus Mundus Master Sustainable Constructions under natural hazards and catastrophic events 520121-1-2011-1-CZ-ERA MUNDUS-EMMC/ Vaidas Alechnavicius, Jozsef Balint
- 7 -
Figure 1.3 Connection of semi-closed polygonal cross sections chords to diagonals
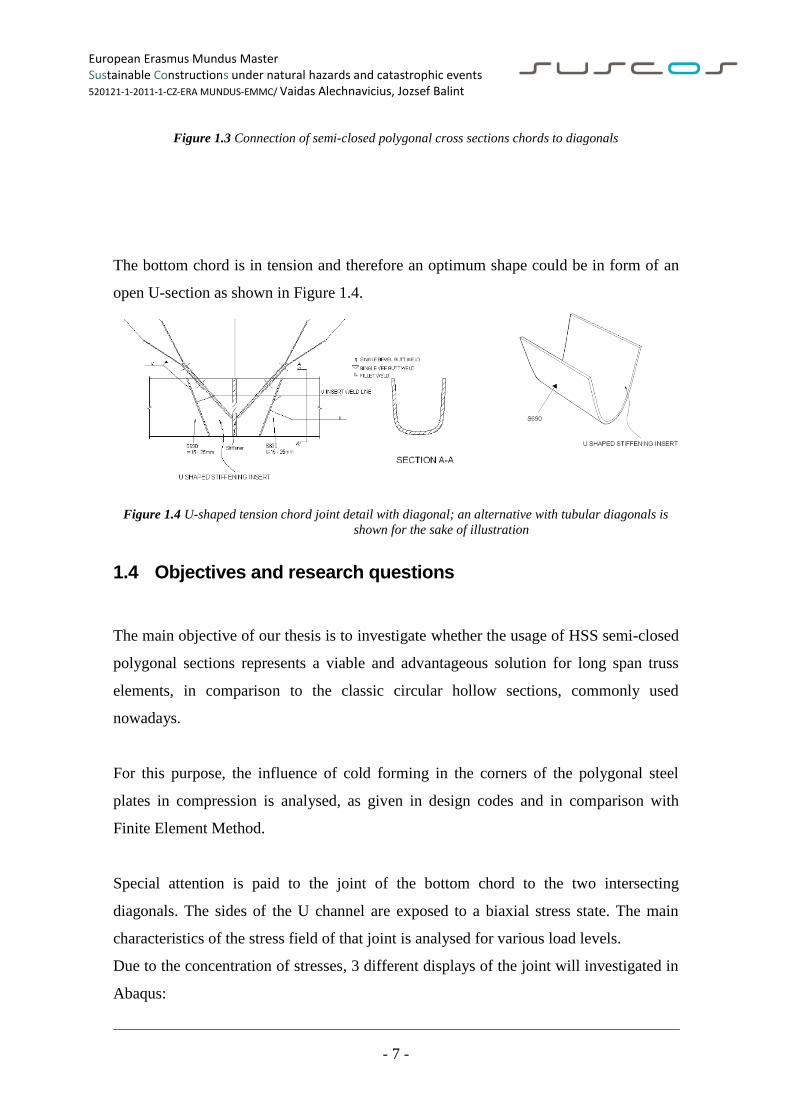
The bottom chord is in tension and therefore an optimum shape could be in form of an
open U-section as shown in Figure 1.4.
Figure 1.4 U-shaped tension chord joint detail with diagonal; an alternative with tubular diagonals is
shown for the sake of illustration
1.4 Objectives and research questions
The main objective of our thesis is to investigate whether the usage of HSS semi-closed
polygonal sections represents a viable and advantageous solution for long span truss
elements, in comparison to the classic circular hollow sections, commonly used
nowadays.
For this purpose, the influence of cold forming in the corners of the polygonal steel
plates in compression is analysed, as given in design codes and in comparison with
Finite Element Method.
Special attention is paid to the joint of the bottom chord to the two intersecting
diagonals. The sides of the U channel are exposed to a biaxial stress state. The main
characteristics of the stress field of that joint is analysed for various load levels.
Due to the concentration of stresses, 3 different displays of the joint will investigated in
Abaqus:
European Erasmus Mundus Master Sustainable Constructions under natural hazards and catastrophic events 520121-1-2011-1-CZ-ERA MUNDUS-EMMC/ Vaidas Alechnavicius, Jozsef Balint
- 8 -
diagonals' gusset plates welded to the U-channel, without any
stiffener
diagonals' gusset plates welded to the U-channel with the
presence of an extra plate as stiffener between the gusset
plates[Fig.1.4]
diagonals' gusset plates welded to the U-channel with a U-shaped
welded stiffening insert
Buckling analysis of the compressed upper chords of the truss will be performed
according to Eurocode and numerical methods (Abaqus).
A total of six cost and carbon footprint estimations will be performed in order to better
emphasize the advantages of the use of HSS polygonal cross-sections:
S355, S500, S650 for CHS truss
S355, S500, S650 for the polygonal section truss
1.5 Limitations
There is a lack of literature regarding the use and behaviour of polygonal cross-sections
in structural engineering.
Even though HSS structures have started to be more and more widely used, EN1993-1-
12 still does not provide a lot of information about steel grades higher than S355.
Tests were performed in COMPLAB, at LTU, but the geometry of the compressed
single plates (circular and polygonal) differ than those used in this work. There are
plans to conduct experiments on complete scaled-down truss in the future at the
COMPLAB.
Because of the high complexity of an entire truss model, we have analysed in Abaqus
just a segment of the tension chord, to a distance from the connection area and a single
compressed polygonal chord.
European Erasmus Mundus Master Sustainable Constructions under natural hazards and catastrophic events 520121-1-2011-1-CZ-ERA MUNDUS-EMMC/ Vaidas Alechnavicius, Jozsef Balint
- 9 -
Due to difficulties in obtaining the price cost, several manufacturing processes were
neglected from calculations, leading to an approximate estimation of the truss costs.
Nevertheless, this should not affect the comparative study, since the processes were
neglected on both types of trusses.
1.6 Scientific approach
In order to address these research questions the following approach was carried out:
1. Experimental laboratory tests were conducted on single plate circular and
polygonal cross-sections made of S650 steel. The steel specimens were provided
by Ruukki and the compression tests took place at COMPLAB Luleå University
of Technology.
2. CHS and semi-closed trusses were designed according to EN 1993 part 1-1, EN
1993 part 1-3, EN 1993 part 1-5, EN 1993 part 1-8, EN 1993 part 1-12.
3. Connections and chords numerically analysed using Finite Element models.
Results compared with hand calculations and theoretical values.
4. Cost and environmental evaluation, after obtaining the final cross-sections of the
trusses' members.
1.7 Structure of the thesis
The first part consists of an introduction and background presentation, which is meant to
present to the reader the scope of the project and the current situation of the studied
subject. A short briefing of the details and outlines of the thesis should provide the
reader with a generalized idea about the work performed.
The thesis will be structured on different chapters, each one treating different aspects, as
follows:
Chapter 1 provides the reader with the first impression of the studied problem, the
limitations encountered and the scientific approach that is used to answer the research
questions.

European Erasmus Mundus Master Sustainable Constructions under natural hazards and catastrophic events 520121-1-2011-1-CZ-ERA MUNDUS-EMMC/ Vaidas Alechnavicius, Jozsef Balint
- 10 -
Chapter 2 layout of the trusses and the design of CHS and polygonal elements,
according to Eurocodes and CIDECT recommendations.
Chapter 3 gives the background of the numerical modelling of the connection in the
tension chord.
Chapter 4 buckling analysis of the compressed cold-formed polygonal chord.
Chapter 5 results regarding the comparison of different types of steel and different
cross-sections, with respect to the cost and carbon footprint evaluations.
Vaidas Alechnavicius worked on Chapter 3 and Chapter 4, whilst Jozsef Balint created
Chapter 2 and Chapter 5. Chapter 1 was written by both students, on a common
agreement.
European Erasmus Mundus Master Sustainable Constructions under natural hazards and catastrophic events 520121-1-2011-1-CZ-ERA MUNDUS-EMMC/ Vaidas Alechnavicius, Jozsef Balint
- 11 -
2 STRUCTURAL DESIGN OF THE CIRCULAR HOLLOW SECTION AND
POLYGONAL SECTION TRUSS ELEMENTS, ACCORDING TO
EUROCODES
2.1 Truss layout and geometry
As mentioned in the previous chapter, CHS truss elements combine excellent structural
behaviour with appealing shapes from architectural perspective.
Moreover, trusses are pleasant, modern and light structures, which require a relatively
simple design and a small number of joints. The suggested layout for the studied truss is
shown in the figure below. The same layout is applied to both the CHS and the
polygonal cross-section trusses.
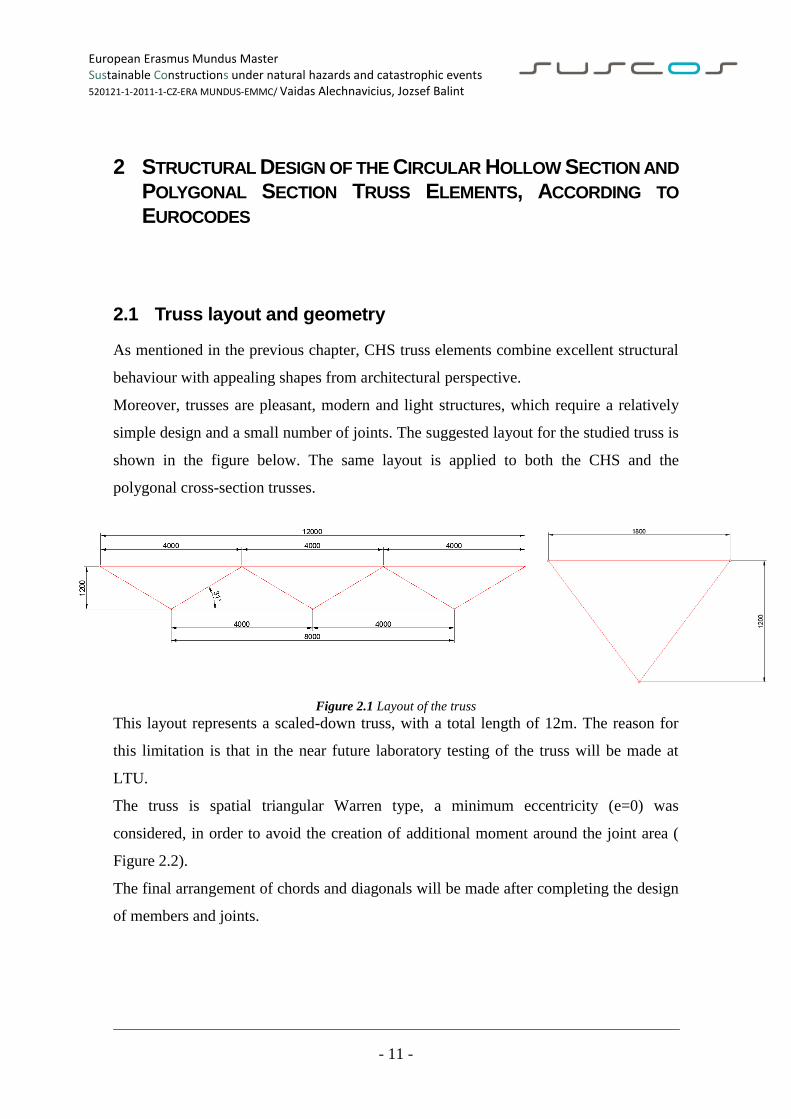
Figure 2.1 Layout of the truss
This layout represents a scaled-down truss, with a total length of 12m. The reason for
this limitation is that in the near future laboratory testing of the truss will be made at
LTU.
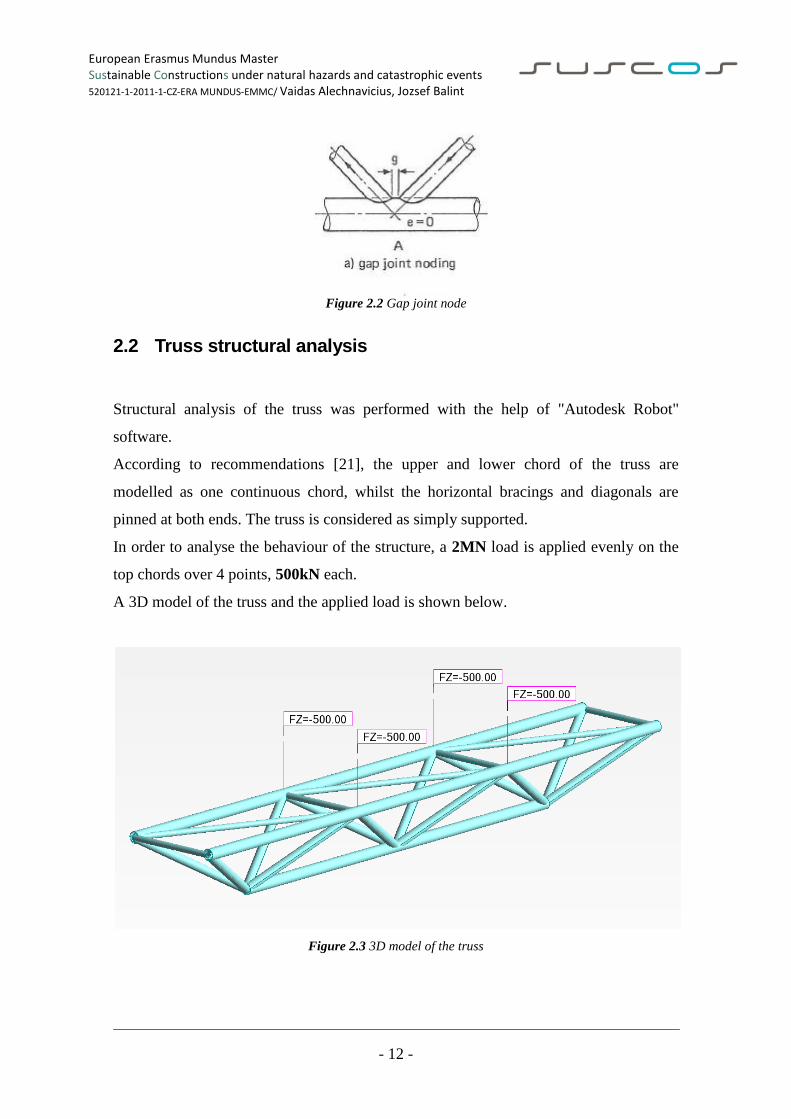
The truss is spatial triangular Warren type, a minimum eccentricity (e=0) was
considered, in order to avoid the creation of additional moment around the joint area (
Figure 2.2).
The final arrangement of chords and diagonals will be made after completing the design
of members and joints.
European Erasmus Mundus Master Sustainable Constructions under natural hazards and catastrophic events 520121-1-2011-1-CZ-ERA MUNDUS-EMMC/ Vaidas Alechnavicius, Jozsef Balint
- 12 -
Figure 2.2 Gap joint node
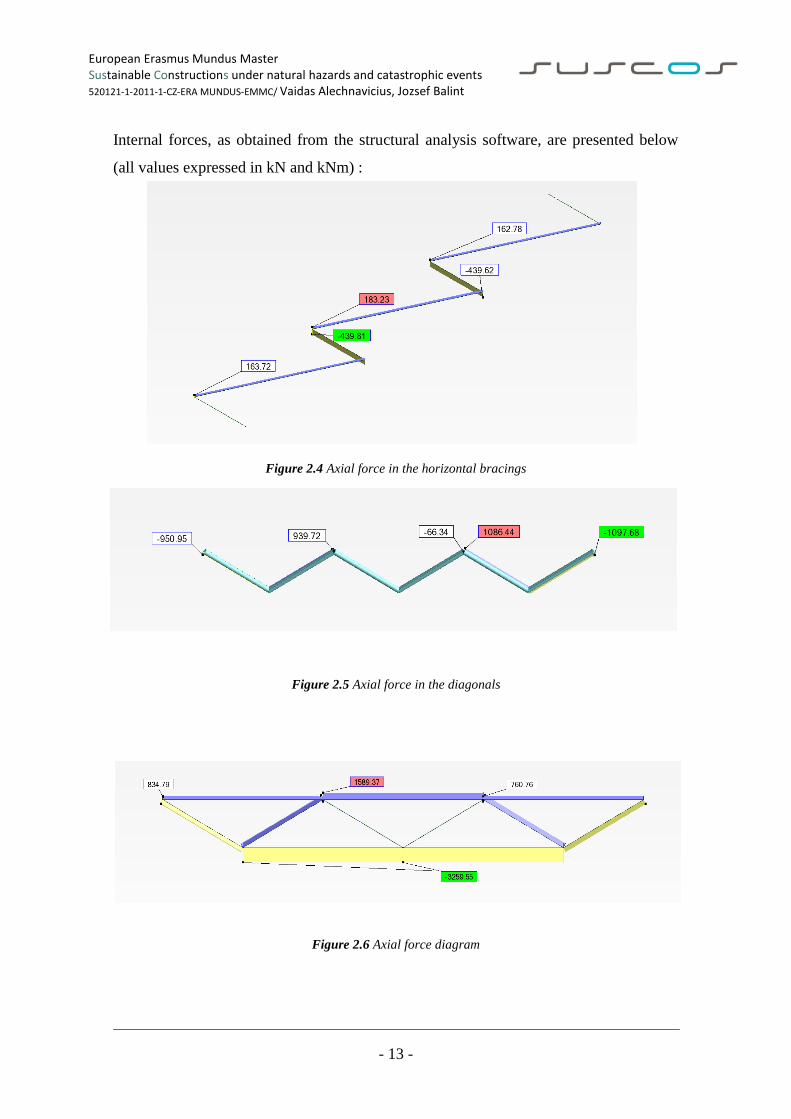
2.2 Truss structural analysis
Structural analysis of the truss was performed with the help of "Autodesk Robot"
software.
According to recommendations [21], the upper and lower chord of the truss are
modelled as one continuous chord, whilst the horizontal bracings and diagonals are
pinned at both ends. The truss is considered as simply supported.
In order to analyse the behaviour of the structure, a 2MN load is applied evenly on the
top chords over 4 points, 500kN each.
A 3D model of the truss and the applied load is shown below.
Figure 2.3 3D model of the truss
European Erasmus Mundus Master Sustainable Constructions under natural hazards and catastrophic events 520121-1-2011-1-CZ-ERA MUNDUS-EMMC/ Vaidas Alechnavicius, Jozsef Balint
- 13 -
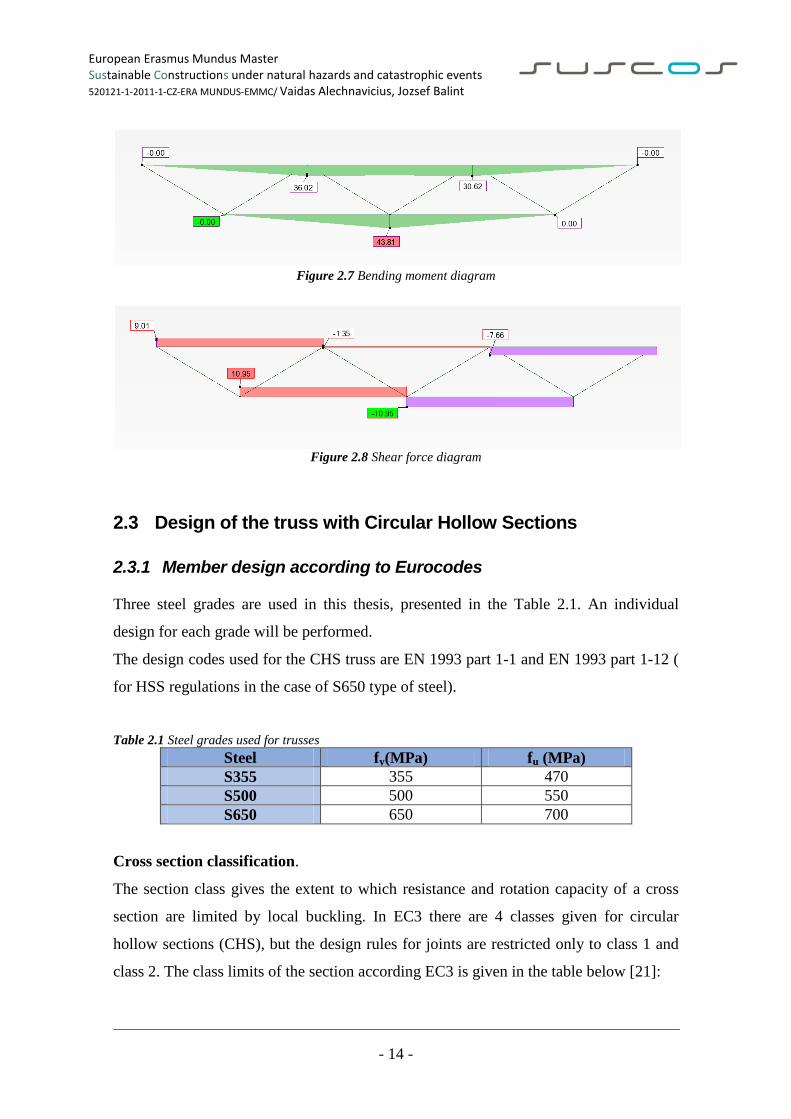
Internal forces, as obtained from the structural analysis software, are presented below
(all values expressed in kN and kNm) :
Figure 2.4 Axial force in the horizontal bracings
Figure 2.5 Axial force in the diagonals
Figure 2.6 Axial force diagram
European Erasmus Mundus Master Sustainable Constructions under natural hazards and catastrophic events 520121-1-2011-1-CZ-ERA MUNDUS-EMMC/ Vaidas Alechnavicius, Jozsef Balint
- 14 -
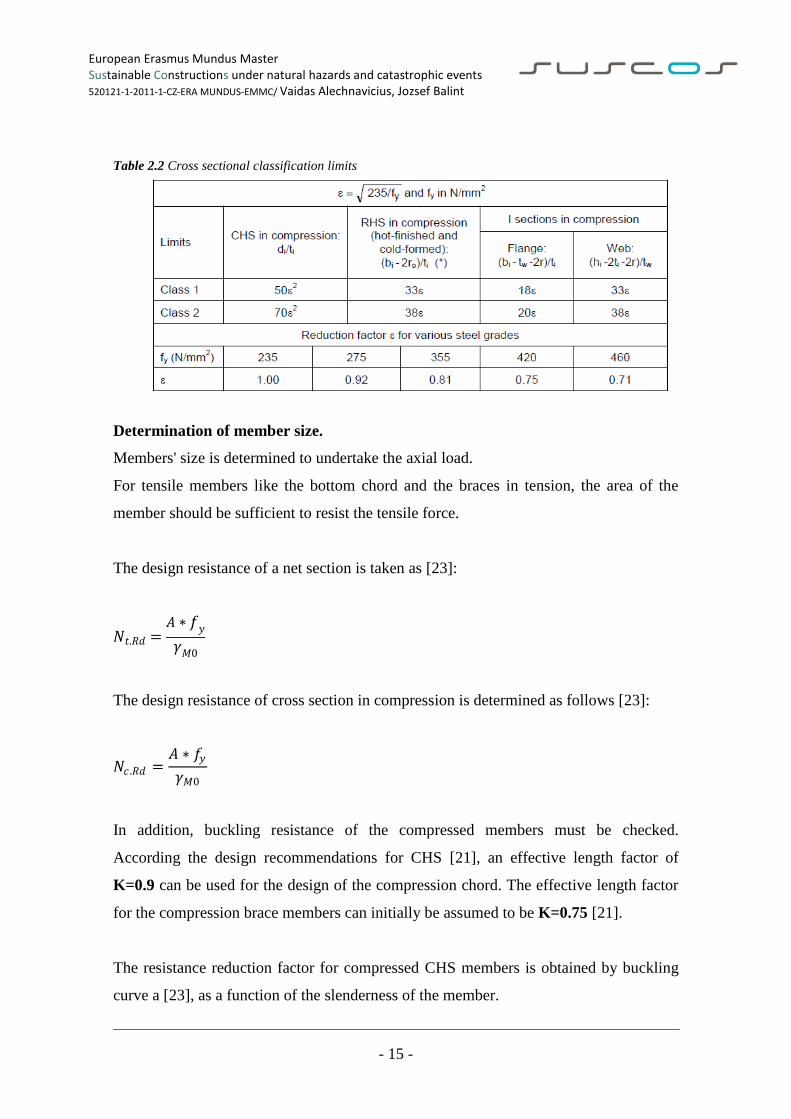
Figure 2.7 Bending moment diagram
Figure 2.8 Shear force diagram
2.3 Design of the truss with Circular Hollow Sections
2.3.1 Member design according to Eurocodes
Three steel grades are used in this thesis, presented in the Table 2.1. An individual
design for each grade will be performed.
The design codes used for the CHS truss are EN 1993 part 1-1 and EN 1993 part 1-12 (
for HSS regulations in the case of S650 type of steel).
Table 2.1 Steel grades used for trusses
Steel fy(MPa) fu (MPa)
S355 355 470
S500 500 550
S650 650 700
Cross section classification.
The section class gives the extent to which resistance and rotation capacity of a cross
section are limited by local buckling. In EC3 there are 4 classes given for circular
hollow sections (CHS), but the design rules for joints are restricted only to class 1 and
class 2. The class limits of the section according EC3 is given in the table below [21]:
European Erasmus Mundus Master Sustainable Constructions under natural hazards and catastrophic events 520121-1-2011-1-CZ-ERA MUNDUS-EMMC/ Vaidas Alechnavicius, Jozsef Balint
- 15 -
Table 2.2 Cross sectional classification limits
Determination of member size.
Members' size is determined to undertake the axial load.
For tensile members like the bottom chord and the braces in tension, the area of the
member should be sufficient to resist the tensile force.
The design resistance of a net section is taken as [23]:
𝑁𝑡.𝑅𝑑 =𝐴 ∗ 𝑓𝑦𝛾𝑀0
The design resistance of cross section in compression is determined as follows [23]:
𝑁𝑐 .𝑅𝑑 =𝐴 ∗ 𝑓𝑦
𝛾𝑀0
In addition, buckling resistance of the compressed members must be checked.
According the design recommendations for CHS [21], an effective length factor of
K=0.9 can be used for the design of the compression chord. The effective length factor
for the compression brace members can initially be assumed to be K=0.75 [21].
The resistance reduction factor for compressed CHS members is obtained by buckling
curve a [23], as a function of the slenderness of the member.
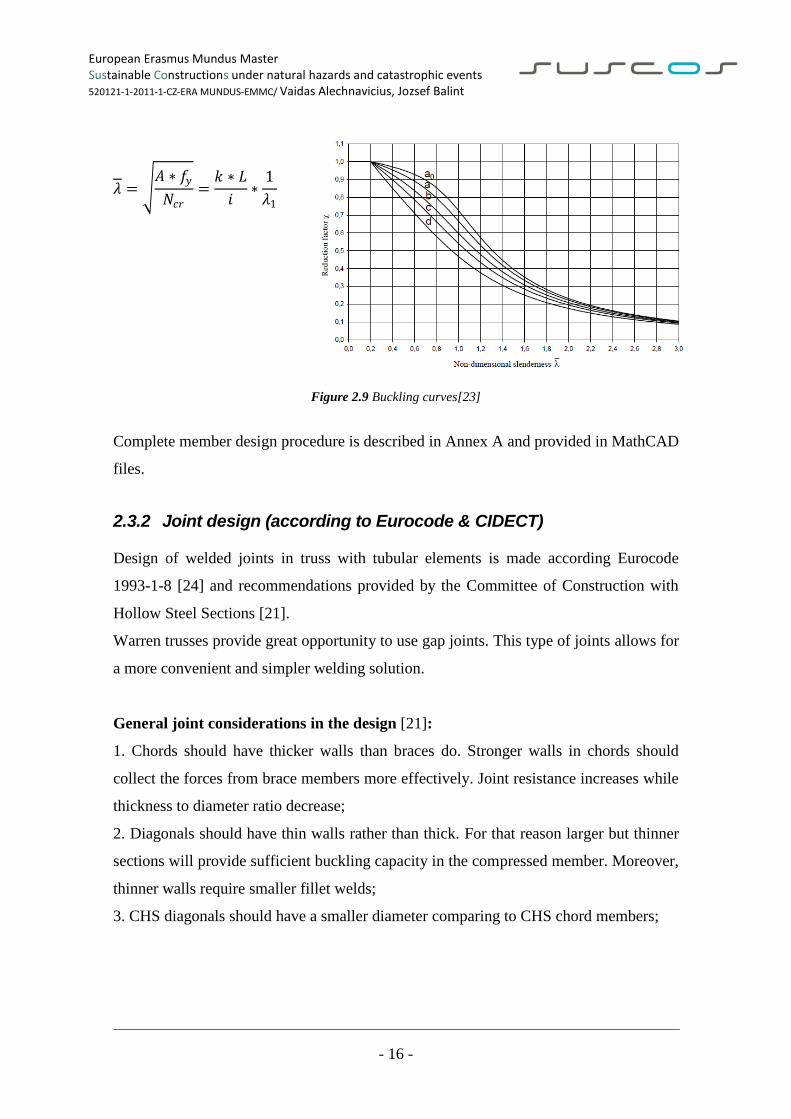
European Erasmus Mundus Master Sustainable Constructions under natural hazards and catastrophic events 520121-1-2011-1-CZ-ERA MUNDUS-EMMC/ Vaidas Alechnavicius, Jozsef Balint
- 16 -
𝜆 = 𝐴 ∗ 𝑓𝑦
𝑁𝑐𝑟=𝑘 ∗ 𝐿
𝑖∗
1
𝜆1
Figure 2.9 Buckling curves[23]
Complete member design procedure is described in Annex A and provided in MathCAD
files.
2.3.2 Joint design (according to Eurocode & CIDECT)
Design of welded joints in truss with tubular elements is made according Eurocode
1993-1-8 [24] and recommendations provided by the Committee of Construction with
Hollow Steel Sections [21].
Warren trusses provide great opportunity to use gap joints. This type of joints allows for
a more convenient and simpler welding solution.
General joint considerations in the design [21]:
1. Chords should have thicker walls than braces do. Stronger walls in chords should
collect the forces from brace members more effectively. Joint resistance increases while
thickness to diameter ratio decrease;
2. Diagonals should have thin walls rather than thick. For that reason larger but thinner
sections will provide sufficient buckling capacity in the compressed member. Moreover,
thinner walls require smaller fillet welds;
3. CHS diagonals should have a smaller diameter comparing to CHS chord members;
European Erasmus Mundus Master Sustainable Constructions under natural hazards and catastrophic events 520121-1-2011-1-CZ-ERA MUNDUS-EMMC/ Vaidas Alechnavicius, Jozsef Balint
- 17 -
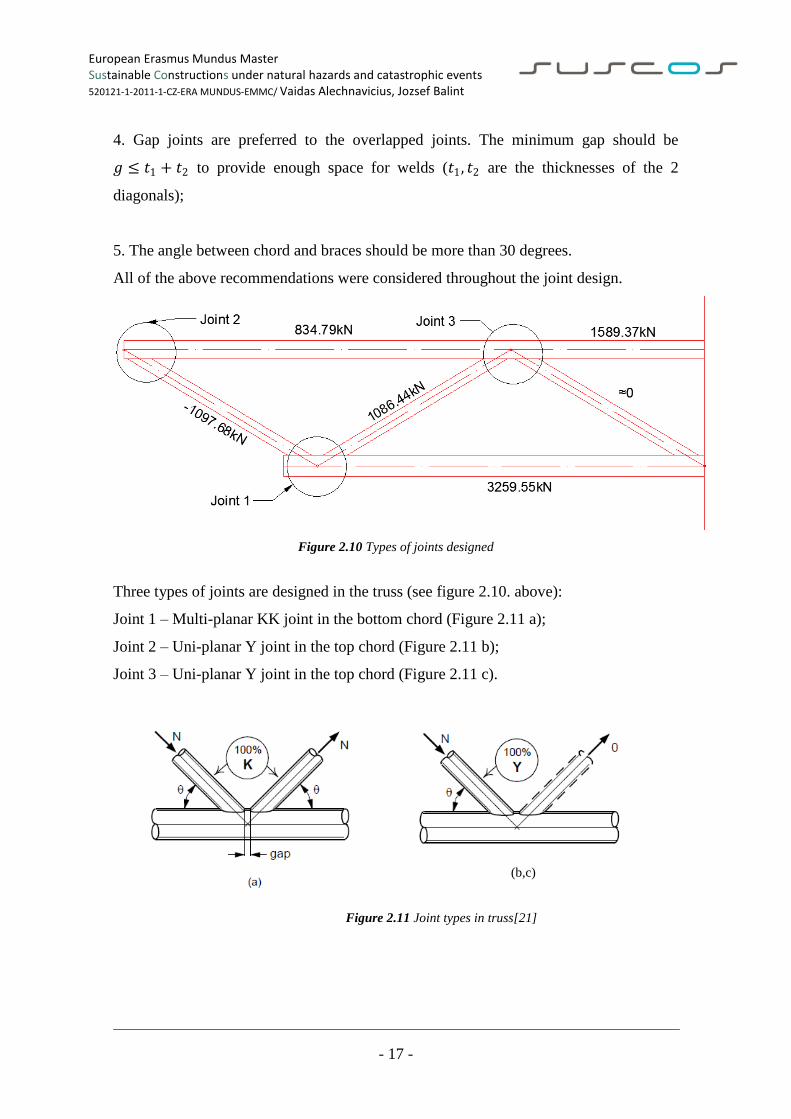
4. Gap joints are preferred to the overlapped joints. The minimum gap should be
𝑔 ≤ 𝑡1 + 𝑡2 to provide enough space for welds (𝑡1, 𝑡2 are the thicknesses of the 2
diagonals);
5. The angle between chord and braces should be more than 30 degrees.
All of the above recommendations were considered throughout the joint design.
Figure 2.10 Types of joints designed
Three types of joints are designed in the truss (see figure 2.10. above):
Joint 1 – Multi-planar KK joint in the bottom chord (Figure 2.11 a);
Joint 2 – Uni-planar Y joint in the top chord (Figure 2.11 b);
Joint 3 – Uni-planar Y joint in the top chord (Figure 2.11 c).
Figure 2.11 Joint types in truss[21]
(b,c)
European Erasmus Mundus Master Sustainable Constructions under natural hazards and catastrophic events 520121-1-2011-1-CZ-ERA MUNDUS-EMMC/ Vaidas Alechnavicius, Jozsef Balint
- 18 -
Limitations due to material.
There is quite a big reduction in the design resistance of the joint provided by Eurocode
for HSS members. For steel grades higher than S460 the joint resistance reduction factor
is 0,8 [25].
2 main failure modes are considered in welded joint design [24]:
a) Chord face failure (plastic failure the chord face) or chord plastification;
b) Punching shear failure of a hollow section chord wall.
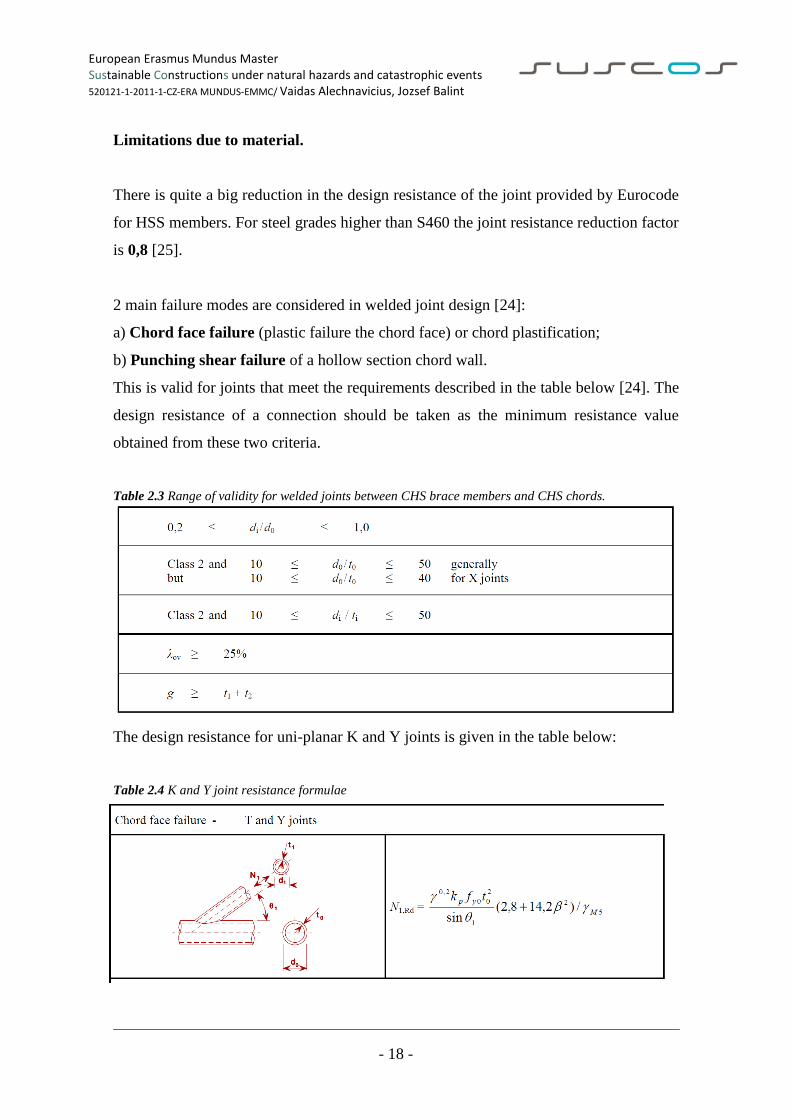
This is valid for joints that meet the requirements described in the table below [24]. The
design resistance of a connection should be taken as the minimum resistance value
obtained from these two criteria.
Table 2.3 Range of validity for welded joints between CHS brace members and CHS chords.
The design resistance for uni-planar K and Y joints is given in the table below:
Table 2.4 K and Y joint resistance formulae
European Erasmus Mundus Master Sustainable Constructions under natural hazards and catastrophic events 520121-1-2011-1-CZ-ERA MUNDUS-EMMC/ Vaidas Alechnavicius, Jozsef Balint
- 19 -
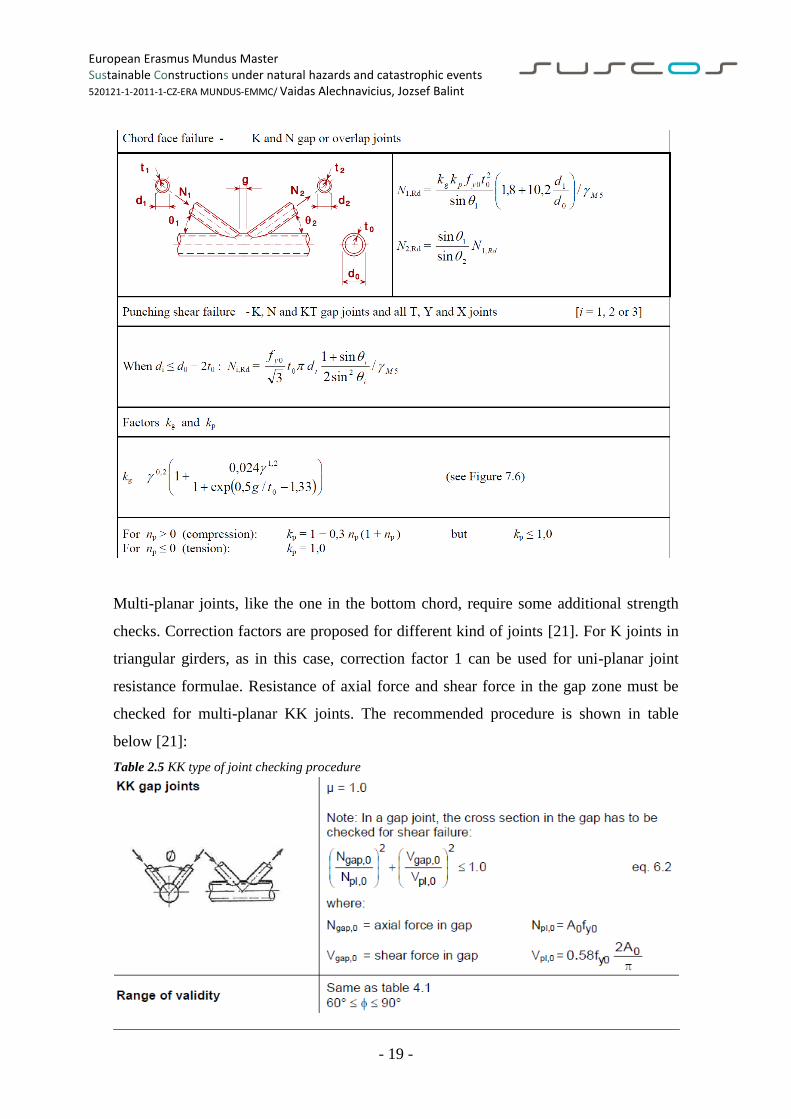
Multi-planar joints, like the one in the bottom chord, require some additional strength
checks. Correction factors are proposed for different kind of joints [21]. For K joints in
triangular girders, as in this case, correction factor 1 can be used for uni-planar joint
resistance formulae. Resistance of axial force and shear force in the gap zone must be
checked for multi-planar KK joints. The recommended procedure is shown in table
below [21]:
Table 2.5 KK type of joint checking procedure
European Erasmus Mundus Master Sustainable Constructions under natural hazards and catastrophic events 520121-1-2011-1-CZ-ERA MUNDUS-EMMC/ Vaidas Alechnavicius, Jozsef Balint
- 20 -
Complete design of joints for all the steel grades is given in Annex A.
2.3.3 Weld design
K or Y joints require a welding around the entire perimeter of the connected member by
means of butt weld, fillet weld or by combination of both. Fillet welds are designed to
resist higher load than the brace member capacity. According to Eurocode 3 [24], the
following minimal throat thickness a can be calculated. The higher steel class, the larger
throat thickness is required:
For S355:𝑎 ≥ 1.10𝑡For S460:𝑎 ≥ 1.48𝑡
For steel grades greater than S460 and up to S700 the filler metal may have lower
strength than the base.
The design shear strength of the weld is determined from [[24]. (4.4)]:
𝑓𝑣𝑤 .𝑑 =𝑓𝑢/ 3
𝛽𝑤 ∗ 𝛾𝑀2;
The design resistance per unit length is determined from [[24]. (4.3)]:
𝐹𝑤 .𝑅𝑑 = 𝑓𝑣𝑤 .𝑑 ∗ 𝑎;
Design calculations of the welds are given in Annex A.
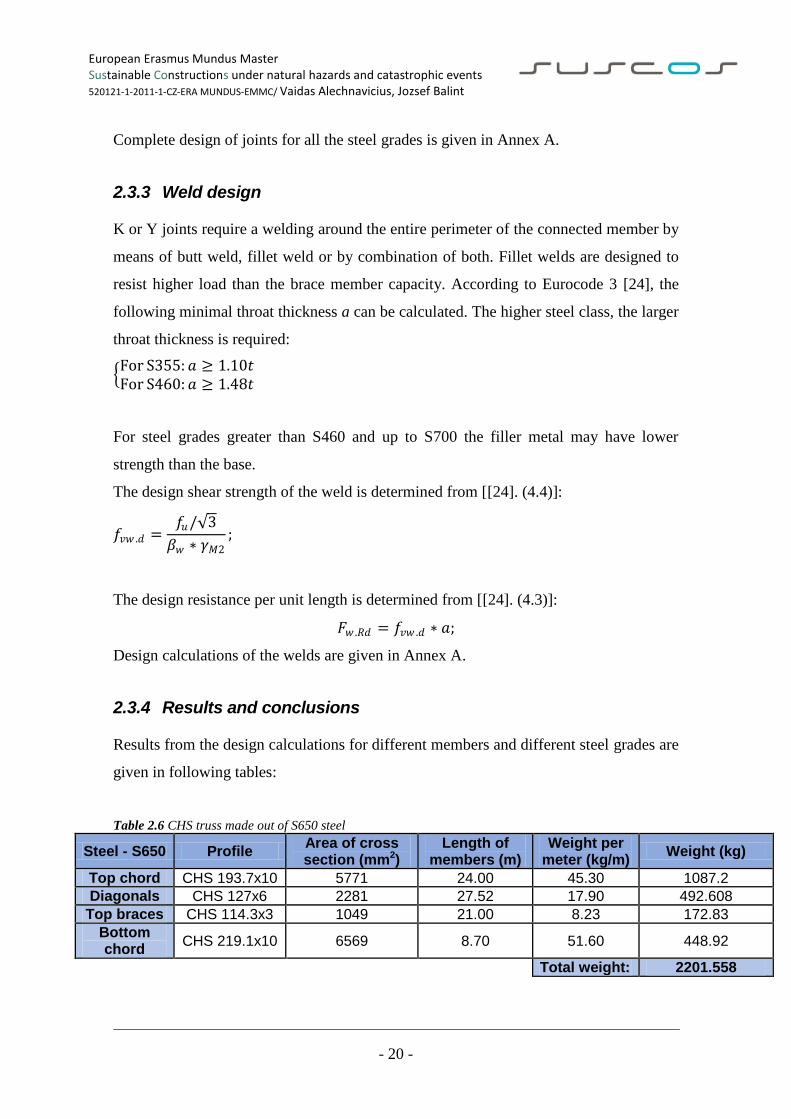
2.3.4 Results and conclusions
Results from the design calculations for different members and different steel grades are
given in following tables:
Table 2.6 CHS truss made out of S650 steel
Steel - S650 Profile Area of cross section (mm2)
Length of members (m)
Weight per meter (kg/m)
Weight (kg)
Top chord CHS 193.7x10 5771 24.00 45.30 1087.2
Diagonals CHS 127x6 2281 27.52 17.90 492.608
Top braces CHS 114.3x3 1049 21.00 8.23 172.83
Bottom chord
CHS 219.1x10 6569 8.70 51.60 448.92
Total weight: 2201.558
European Erasmus Mundus Master Sustainable Constructions under natural hazards and catastrophic events 520121-1-2011-1-CZ-ERA MUNDUS-EMMC/ Vaidas Alechnavicius, Jozsef Balint
- 21 -
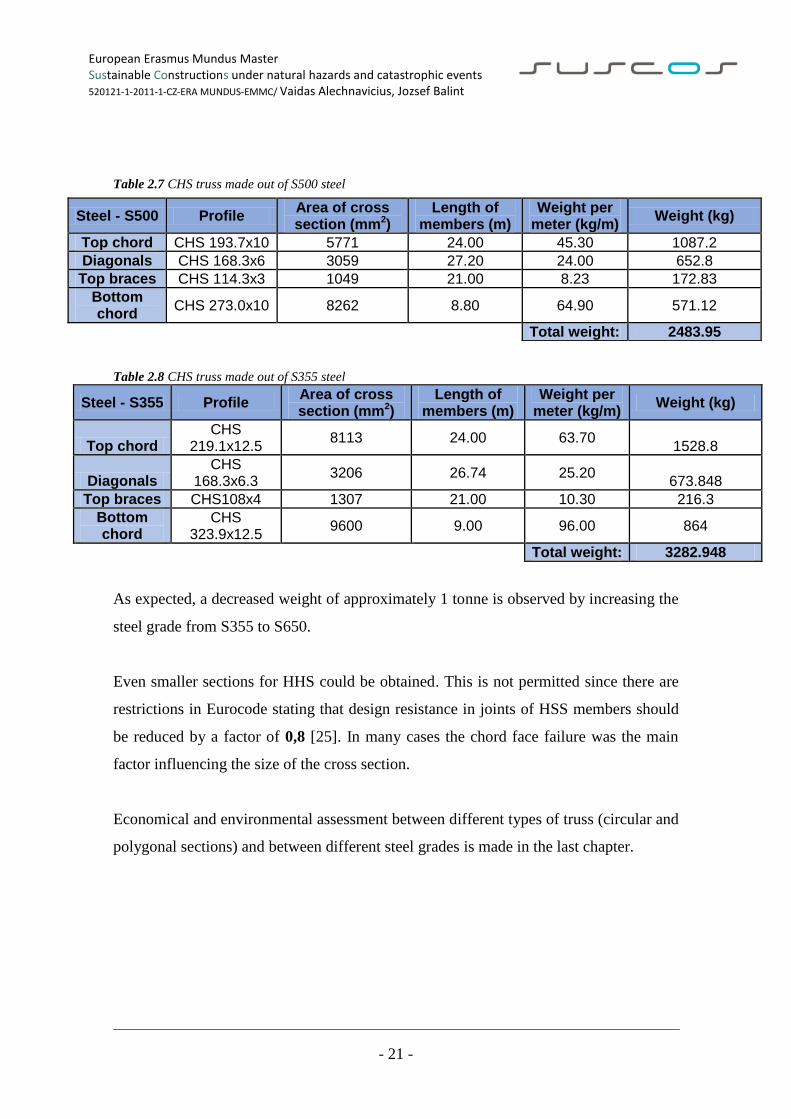
Table 2.7 CHS truss made out of S500 steel
Table 2.8 CHS truss made out of S355 steel
Steel - S355 Profile Area of cross section (mm2)
Length of members (m)
Weight per meter (kg/m)
Weight (kg)
Top chord CHS
219.1x12.5 8113 24.00 63.70
1528.8
Diagonals CHS
168.3x6.3 3206 26.74 25.20
673.848
Top braces CHS108x4 1307 21.00 10.30 216.3
Bottom chord
CHS 323.9x12.5
9600 9.00 96.00 864
Total weight: 3282.948
As expected, a decreased weight of approximately 1 tonne is observed by increasing the
steel grade from S355 to S650.
Even smaller sections for HHS could be obtained. This is not permitted since there are
restrictions in Eurocode stating that design resistance in joints of HSS members should
be reduced by a factor of 0,8 [25]. In many cases the chord face failure was the main
factor influencing the size of the cross section.
Economical and environmental assessment between different types of truss (circular and
polygonal sections) and between different steel grades is made in the last chapter.
Steel - S500 Profile Area of cross section (mm2)
Length of members (m)
Weight per meter (kg/m)
Weight (kg)
Top chord CHS 193.7x10 5771 24.00 45.30 1087.2
Diagonals CHS 168.3x6 3059 27.20 24.00 652.8
Top braces CHS 114.3x3 1049 21.00 8.23 172.83
Bottom chord
CHS 273.0x10 8262 8.80 64.90 571.12
Total weight: 2483.95
European Erasmus Mundus Master Sustainable Constructions under natural hazards and catastrophic events 520121-1-2011-1-CZ-ERA MUNDUS-EMMC/ Vaidas Alechnavicius, Jozsef Balint
- 22 -
2.4 Semi-closed polygonal sections truss design
The idea is to design the truss using built-up polygonal cross sections made from cold
formed plate elements. The bottom chord is designed as a U-shaped profile. Moreover,
bracings between the top chords of the truss are circular hollow sections. Due to the
small diameter needed for these braces, the usage of polygonal sections is not
beneficial.
This type of structure requires some advanced solutions in joint detailing and the design
process is not as straight forward as for CHS since there is not much research and
experience about this type of profiles.
Design of the members is performed according to the given rules in Eurocodes 1993-1-1
[23], 1993-1-3 [26] for cold formed members and 1993-1-5 [27] for plate elements.
Additional rules from Eurocode 1993-1-12 [25] for HSS are applied.
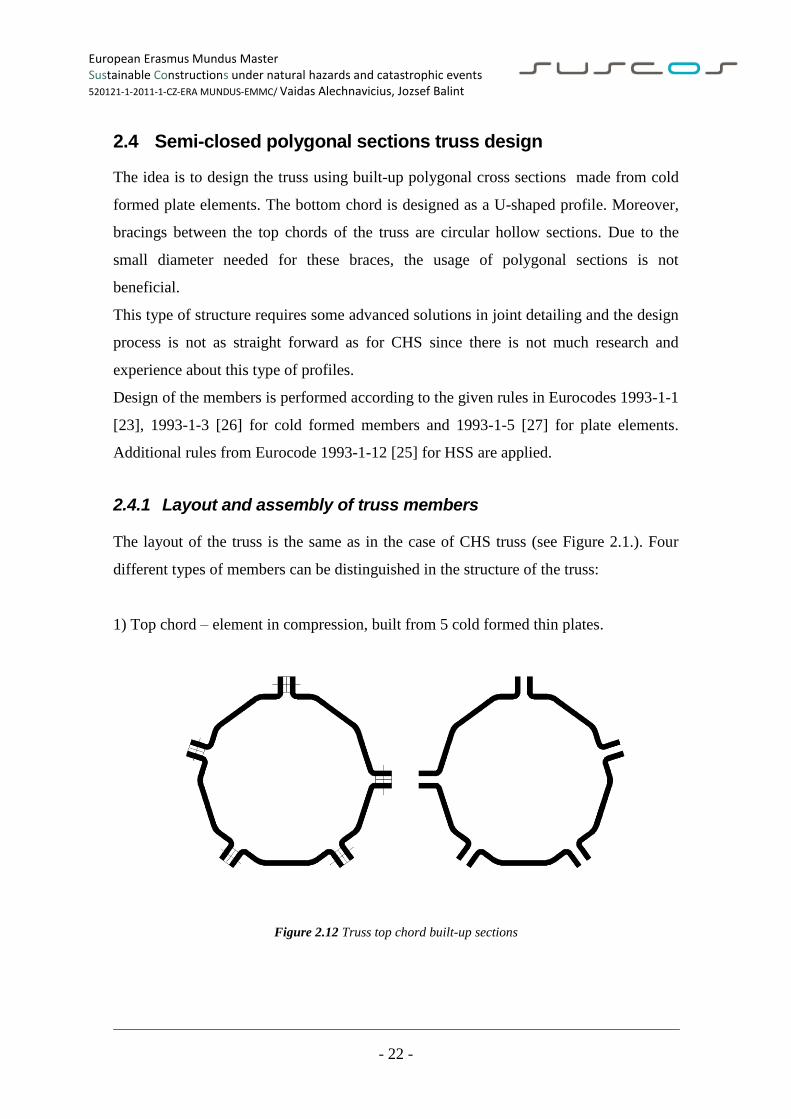
2.4.1 Layout and assembly of truss members
The layout of the truss is the same as in the case of CHS truss (see Figure 2.1.). Four
different types of members can be distinguished in the structure of the truss:
1) Top chord – element in compression, built from 5 cold formed thin plates.
Figure 2.12 Truss top chord built-up sections
European Erasmus Mundus Master Sustainable Constructions under natural hazards and catastrophic events 520121-1-2011-1-CZ-ERA MUNDUS-EMMC/ Vaidas Alechnavicius, Jozsef Balint
- 23 -
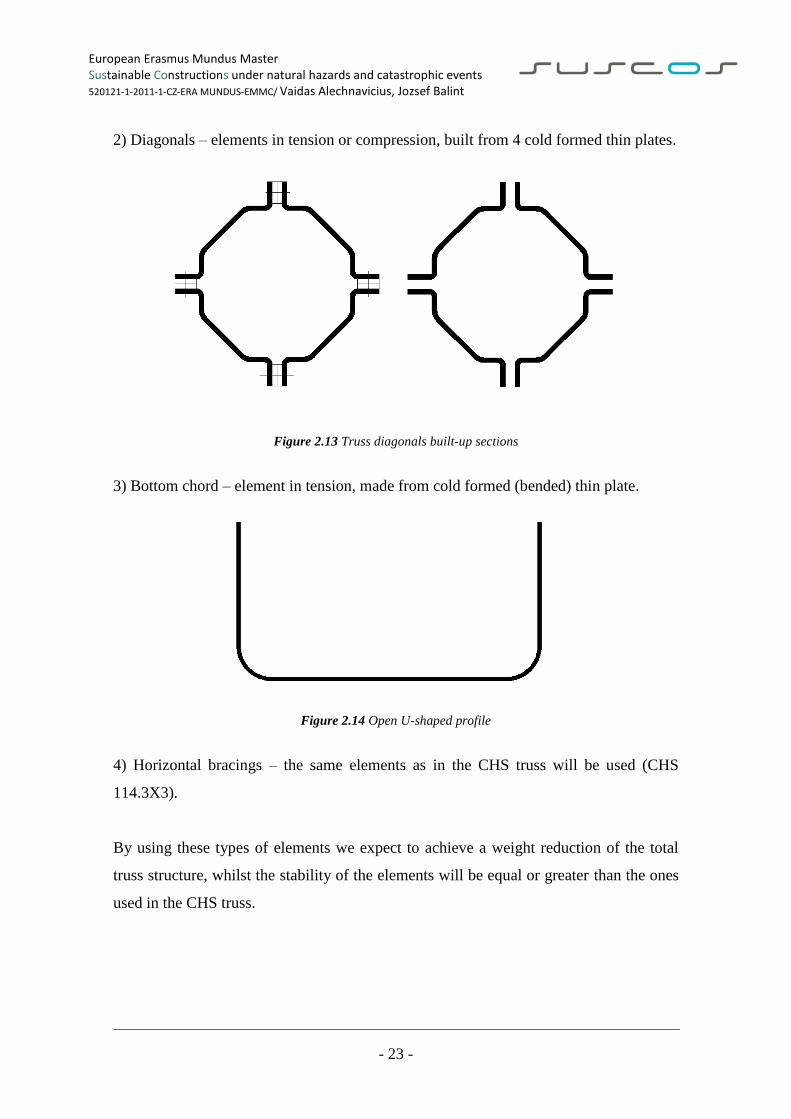
2) Diagonals – elements in tension or compression, built from 4 cold formed thin plates.
Figure 2.13 Truss diagonals built-up sections
3) Bottom chord – element in tension, made from cold formed (bended) thin plate.
Figure 2.14 Open U-shaped profile
4) Horizontal bracings – the same elements as in the CHS truss will be used (CHS
114.3X3).
By using these types of elements we expect to achieve a weight reduction of the total
truss structure, whilst the stability of the elements will be equal or greater than the ones
used in the CHS truss.
European Erasmus Mundus Master Sustainable Constructions under natural hazards and catastrophic events 520121-1-2011-1-CZ-ERA MUNDUS-EMMC/ Vaidas Alechnavicius, Jozsef Balint
- 24 -
2.4.2 Design of thin walled members
Design of plate members is made according to the regulations of Eurocodes. The
internal forces are considered the same as in the design of tubular truss (see previous
chapter).
Material properties of cold formed sections
The strength of the cold formed section is influenced by the number and size of the
corners of the member. The increased average yield strength can be determined as
proposed by 3.2.2 (3) in [26]:
𝑓𝑦𝑎 = 𝑓𝑦𝑏 + (𝑓𝑢 − 𝑓𝑦𝑏 )𝑘𝑛𝑡 2
𝐴𝑔 but 𝑓𝑦𝑎 ≤
(𝑓𝑢+𝑓𝑦𝑏 )
2
k – a numerical coefficient that depends on the type of forming (7 for roll forming, 5 for
other methods of forming)
n – the number of 90 degree bends in the cross-section with an internal radius 𝑟 ≤ 5𝑡
(fractions of 90 degree bends should be counted as fractions of n)
Classification of cross sections
Classification of the cross sections is made according to the table 5.2 in Eurocode 1993-
1-1 for internal and external compressed parts. For class 4 cross section, effective area
and widths should be used for calculations.
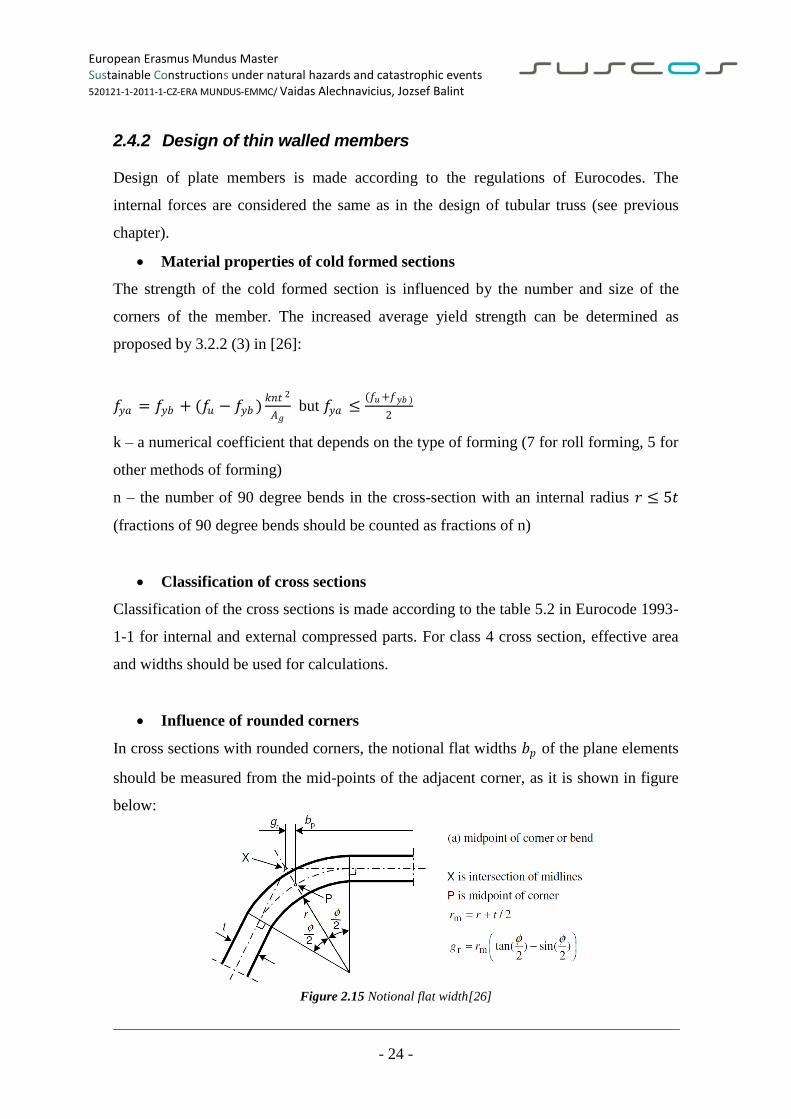
Influence of rounded corners
In cross sections with rounded corners, the notional flat widths 𝑏𝑝 of the plane elements
should be measured from the mid-points of the adjacent corner, as it is shown in figure
below:
Figure 2.15 Notional flat width[26]
European Erasmus Mundus Master Sustainable Constructions under natural hazards and catastrophic events 520121-1-2011-1-CZ-ERA MUNDUS-EMMC/ Vaidas Alechnavicius, Jozsef Balint
- 25 -
Local buckling
Critical compressive stress for buckling plate element is defined by [28]:
𝜍𝑐𝑟 = 𝑘𝜍 ∗𝜋2 ∗ 𝐸
12 ∗ 1 − 𝜈2 ∗𝑡2
𝑏2
Where 𝑘𝜍 is the plate buckling coefficient depending on the support conditions of the
plate.
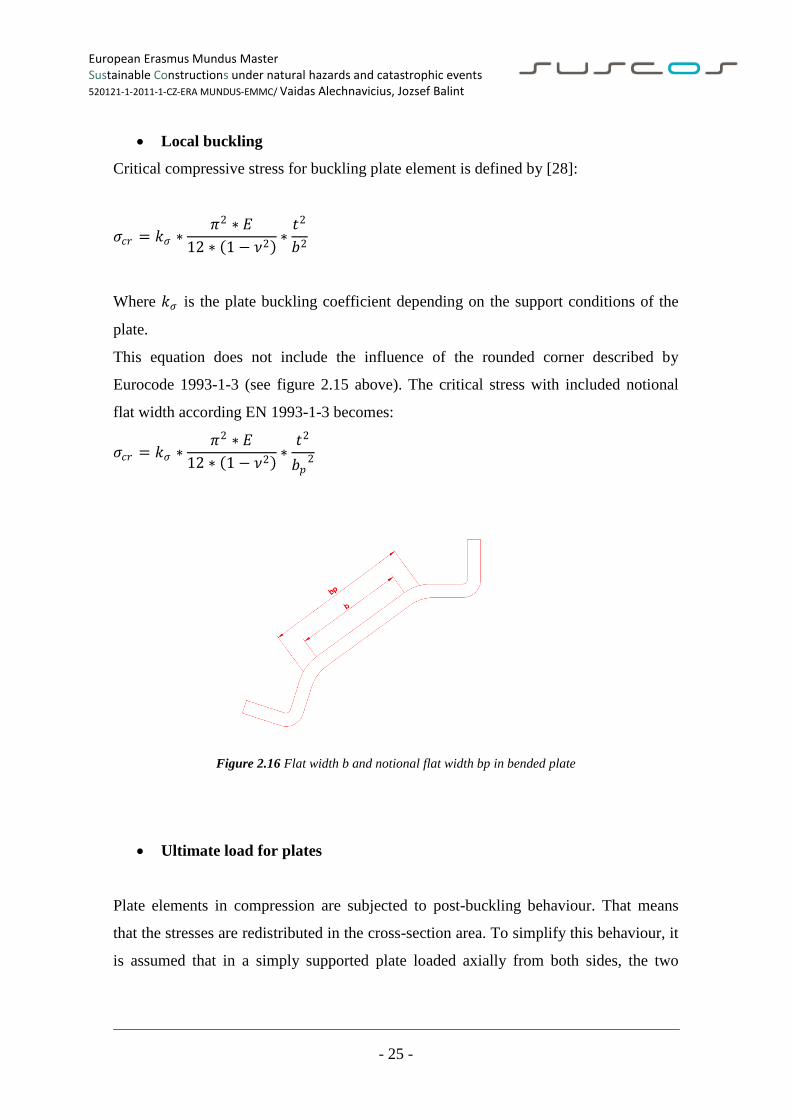
This equation does not include the influence of the rounded corner described by
Eurocode 1993-1-3 (see figure 2.15 above). The critical stress with included notional
flat width according EN 1993-1-3 becomes:
𝜍𝑐𝑟 = 𝑘𝜍 ∗𝜋2 ∗ 𝐸
12 ∗ 1 − 𝜈2 ∗𝑡2
𝑏𝑝2
Figure 2.16 Flat width b and notional flat width bp in bended plate
Ultimate load for plates
Plate elements in compression are subjected to post-buckling behaviour. That means
that the stresses are redistributed in the cross-section area. To simplify this behaviour, it
is assumed that in a simply supported plate loaded axially from both sides, the two
European Erasmus Mundus Master Sustainable Constructions under natural hazards and catastrophic events 520121-1-2011-1-CZ-ERA MUNDUS-EMMC/ Vaidas Alechnavicius, Jozsef Balint
- 26 -
stress blocks with constant stress over the total width appear [27]. The effective width
is determined by using a reduction factor 𝜌 and it is obtained by:
𝑏𝑒𝑓𝑓 = 𝜌 ∗ 𝑏
In this case, the width b should be replaced by the notional flat width bp [26] (see
above):
𝑏𝑒𝑓𝑓 = 𝜌 ∗ 𝑏𝑝
In those equations:
𝜌 = 1 if 𝜆𝑝 ≤ 0,673
For double supported elements in compression:
𝜌 =1−0,055∗(3+𝜓)
𝜆𝑝2 if 𝜆𝑝 ≥ 0,673 but 𝜌 ≤ 1,0
For outstand compression element:
𝜌 =1 − 0,188
𝜆𝑝2
Two expressions for cross section area are obtained:
𝐴𝑔 = 𝑏𝑝 ∗ 𝑡
𝑛
𝑖=1
𝐴𝑒𝑓𝑓 = 𝑏𝑒𝑓𝑓 ∗ 𝑡
𝑛
𝑖=1
European Erasmus Mundus Master Sustainable Constructions under natural hazards and catastrophic events 520121-1-2011-1-CZ-ERA MUNDUS-EMMC/ Vaidas Alechnavicius, Jozsef Balint
- 27 -
Characteristic resistance for compressed member is obtained by EN 1993-1-3 chapter
6.1.3(1):
𝑁𝑐 ,𝑅𝑘 = 𝐴𝑒𝑓𝑓 ∗ 𝑓𝑦𝑏 if 𝐴𝑒𝑓𝑓 < 𝐴𝑔
𝑁𝑐 ,𝑅𝑘 = 𝐴𝑔 𝑓𝑦𝑏 + 𝑓𝑦𝑎 − 𝑓𝑦𝑏 ∗ 4 ∗ 1 −𝜆
𝜆𝑒𝑙 ≤ 𝐴𝑔 ∗ 𝑓𝑦𝑎 if𝐴𝑒𝑓𝑓 = 𝐴𝑔
Buckling resistance for the flexural buckling of a compressed member made of a plate is
based on the relative slenderness 𝜆 [23]:
𝜆 = 𝐴∗𝑓𝑦
𝑁𝑐𝑟 for class 1,2,3 of cross sections;
𝜆 = 𝐴𝑒𝑓𝑓 ∗𝑓𝑦
𝑁𝑐𝑟=
𝐿𝑐𝑟
𝑖∗ 𝐴𝑒𝑓𝑓
𝐴
𝜆1 for class 4 of cross sections;
𝜆1 = 𝜋 ∗ 𝐸
𝑓𝑦 ; 𝑖 =
𝐼
𝐴
Reduction factor 𝜒 is calculated using relative slenderness and the imperfection factor
of 𝛼 = 0.49 (Eurocode 1993-1-1, buckling curve “c”):
𝜒 =1
𝜙 + [𝜙2 − 𝜆2
]0.5
𝜙 = 0.5 ∗ (1 + 𝛼 ∗ 𝜆 − 0.2 + 𝜆2
)
Characteristic buckling resistance of the member:
𝑁𝑏 ,𝑅𝑘 = 𝜒 ∗ 𝐴 ∗ 𝑓𝑦 for class 1, 2, 3 of cross sections;
𝑁𝑏 ,𝑅𝑘 = 𝜒 ∗ 𝐴𝑒𝑓𝑓 ∗ 𝑓𝑦 for class 4 of cross sections;
For tensile members, like the U-shaped bottom chord, the area of the member should be
sufficient to resist the tensile force. Design resistance of a net section is taken as [23]:
European Erasmus Mundus Master Sustainable Constructions under natural hazards and catastrophic events 520121-1-2011-1-CZ-ERA MUNDUS-EMMC/ Vaidas Alechnavicius, Jozsef Balint
- 28 -
𝑁𝑡.𝑅𝑑 =𝐴 ∗ 𝑓𝑦𝛾𝑀0
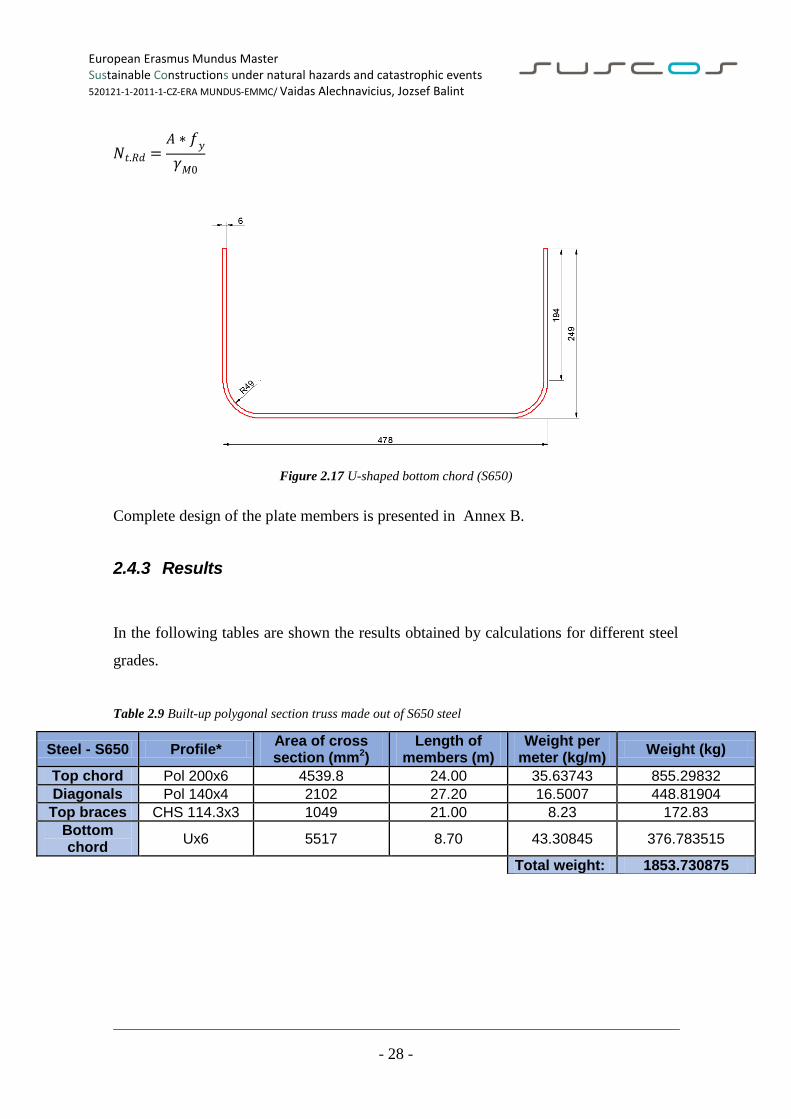
Figure 2.17 U-shaped bottom chord (S650)
Complete design of the plate members is presented in Annex B.
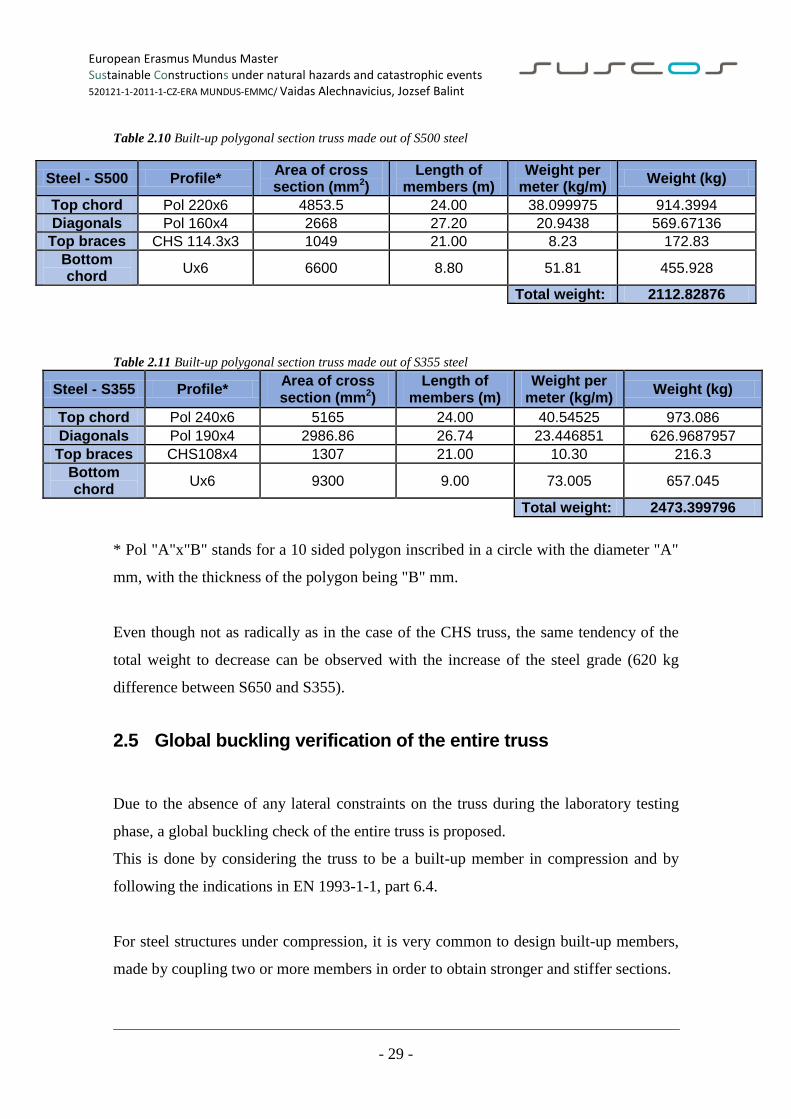
2.4.3 Results
In the following tables are shown the results obtained by calculations for different steel
grades.
Table 2.9 Built-up polygonal section truss made out of S650 steel
Steel - S650 Profile* Area of cross section (mm2)
Length of members (m)
Weight per meter (kg/m)
Weight (kg)
Top chord Pol 200x6 4539.8 24.00 35.63743 855.29832
Diagonals Pol 140x4 2102 27.20 16.5007 448.81904
Top braces CHS 114.3x3 1049 21.00 8.23 172.83
Bottom chord
Ux6 5517 8.70 43.30845 376.783515
Total weight: 1853.730875
European Erasmus Mundus Master Sustainable Constructions under natural hazards and catastrophic events 520121-1-2011-1-CZ-ERA MUNDUS-EMMC/ Vaidas Alechnavicius, Jozsef Balint
- 29 -
Table 2.10 Built-up polygonal section truss made out of S500 steel
Table 2.11 Built-up polygonal section truss made out of S355 steel
Steel - S355 Profile* Area of cross section (mm2)
Length of members (m)
Weight per meter (kg/m)
Weight (kg)
Top chord Pol 240x6 5165 24.00 40.54525 973.086
Diagonals Pol 190x4 2986.86 26.74 23.446851 626.9687957
Top braces CHS108x4 1307 21.00 10.30 216.3
Bottom chord
Ux6 9300 9.00 73.005 657.045
Total weight: 2473.399796
* Pol "A"x"B" stands for a 10 sided polygon inscribed in a circle with the diameter "A"
mm, with the thickness of the polygon being "B" mm.
Even though not as radically as in the case of the CHS truss, the same tendency of the
total weight to decrease can be observed with the increase of the steel grade (620 kg
difference between S650 and S355).
2.5 Global buckling verification of the entire truss
Due to the absence of any lateral constraints on the truss during the laboratory testing
phase, a global buckling check of the entire truss is proposed.
This is done by considering the truss to be a built-up member in compression and by
following the indications in EN 1993-1-1, part 6.4.
For steel structures under compression, it is very common to design built-up members,
made by coupling two or more members in order to obtain stronger and stiffer sections.
Steel - S500 Profile* Area of cross section (mm2)
Length of members (m)
Weight per meter (kg/m)
Weight (kg)
Top chord Pol 220x6 4853.5 24.00 38.099975 914.3994
Diagonals Pol 160x4 2668 27.20 20.9438 569.67136
Top braces CHS 114.3x3 1049 21.00 8.23 172.83
Bottom chord
Ux6 6600 8.80 51.81 455.928
Total weight: 2112.82876
European Erasmus Mundus Master Sustainable Constructions under natural hazards and catastrophic events 520121-1-2011-1-CZ-ERA MUNDUS-EMMC/ Vaidas Alechnavicius, Jozsef Balint
- 30 -
The connection of the members can be done either by lacings or battening. The former
method is used for this truss.
The truss of the two top chords may be considered to be a column with an initial
imperfection of 𝑒0 =𝐿
500.
Verification is performed using the design chord forces 𝑁𝑐 .𝐸𝑑 from compression forces
𝑁𝐸𝑑and moments 𝑀𝐸𝑑at mid span of the built-up member.
The design chord force is given by:
𝑁𝑐 .𝐸𝑑 = 0.5 × 𝑁𝐸𝑑 +𝑀𝐸𝑑 0𝐴𝑐
2𝐼𝑒𝑓𝑓 where 𝑀𝐸𝑑 =
𝑁𝐸𝑑 ×𝑒0+𝑀𝐸𝑑𝐼
1−𝑁𝐸𝑑𝑁𝑐𝑟
−𝑁𝐸𝑑𝑆𝑉
𝑁𝐸𝑑 is the design value of the compression force to the built-up member
𝑁𝑐𝑟 is the effective critical force of the built-up member
𝑀𝐸𝑑 is the design value of the maximum moment in the middle of the built-up member
considering second order effects
𝑀𝐸𝑑𝐼 is the design value of the maximum moment in the middle of the built-up member
without second order effects
0is the distance between the centroids of chords
𝐴𝑐 is the cross-sectional area of one chord
𝐼𝑒𝑓𝑓 is the effective second moment of area of the built-up member
𝑆𝑉is the shear stiffness of the lacings or battened panel
In this case 𝑀𝐸𝑑𝐼 is zero, since in the truss there is no moment on this direction.
𝐼𝑒𝑓𝑓 = 0.5 × 02 × 𝐴𝑐 , as given in formula (6.72) of EN 1993-1-1.
𝑆𝑉 is taken from Figure 6.9 in EN 1993-1-1, according to the situation that suits the case
( 3rd
case for this truss).
European Erasmus Mundus Master Sustainable Constructions under natural hazards and catastrophic events 520121-1-2011-1-CZ-ERA MUNDUS-EMMC/ Vaidas Alechnavicius, Jozsef Balint
- 31 -
The buckling verification for the chords should be performed as:
𝑁𝑐 .𝐸𝑑
𝑁𝑏 .𝑅𝑑≤ 1
where 𝑁𝑏 .𝑅𝑑 is the design value of the buckling resistance of the chord taking the
buckling length Lch.
The buckling length Lch suggested by the Eurocode is equal to the length of one truss
member in this case (fig. 6.8 from EN 1993-1-1).
Except that aspect, the determination of the design value of the buckling resistance is
done according to the usual rules of Eurocode 3, part 1-1.
The detailed calculations are presented in Annex C.
European Erasmus Mundus Master Sustainable Constructions under natural hazards and catastrophic events 520121-1-2011-1-CZ-ERA MUNDUS-EMMC/ Vaidas Alechnavicius, Jozsef Balint
- 32 -
3 CONNECTION BEHAVIOUR ANALYSIS AT THE TENSION CHORD
In this chapter are described the methods and numerical analysis for the bottom chord
connection, followed by the obtained results and conclusions.
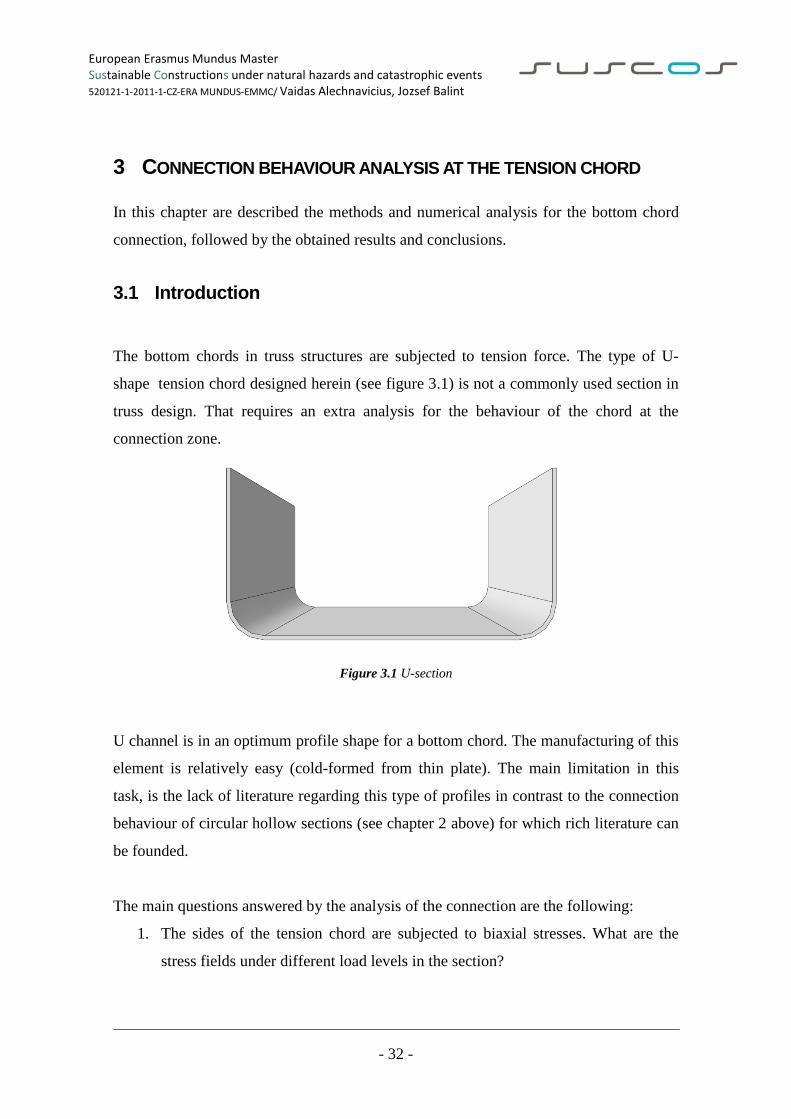
3.1 Introduction
The bottom chords in truss structures are subjected to tension force. The type of U-
shape tension chord designed herein (see figure 3.1) is not a commonly used section in
truss design. That requires an extra analysis for the behaviour of the chord at the
connection zone.
Figure 3.1 U-section
U channel is in an optimum profile shape for a bottom chord. The manufacturing of this
element is relatively easy (cold-formed from thin plate). The main limitation in this
task, is the lack of literature regarding this type of profiles in contrast to the connection
behaviour of circular hollow sections (see chapter 2 above) for which rich literature can
be founded.
The main questions answered by the analysis of the connection are the following:
1. The sides of the tension chord are subjected to biaxial stresses. What are the
stress fields under different load levels in the section?
European Erasmus Mundus Master Sustainable Constructions under natural hazards and catastrophic events 520121-1-2011-1-CZ-ERA MUNDUS-EMMC/ Vaidas Alechnavicius, Jozsef Balint
- 33 -
2. The connection is assembled in three configurations: no stiffener between gusset
plates - stiffener between the plates - U-shaped stiffener. How does the
connection behave in each case and what is the necessity for a stiffener?
3. If a stiffener is necessary, which type performs better and for what thickness?
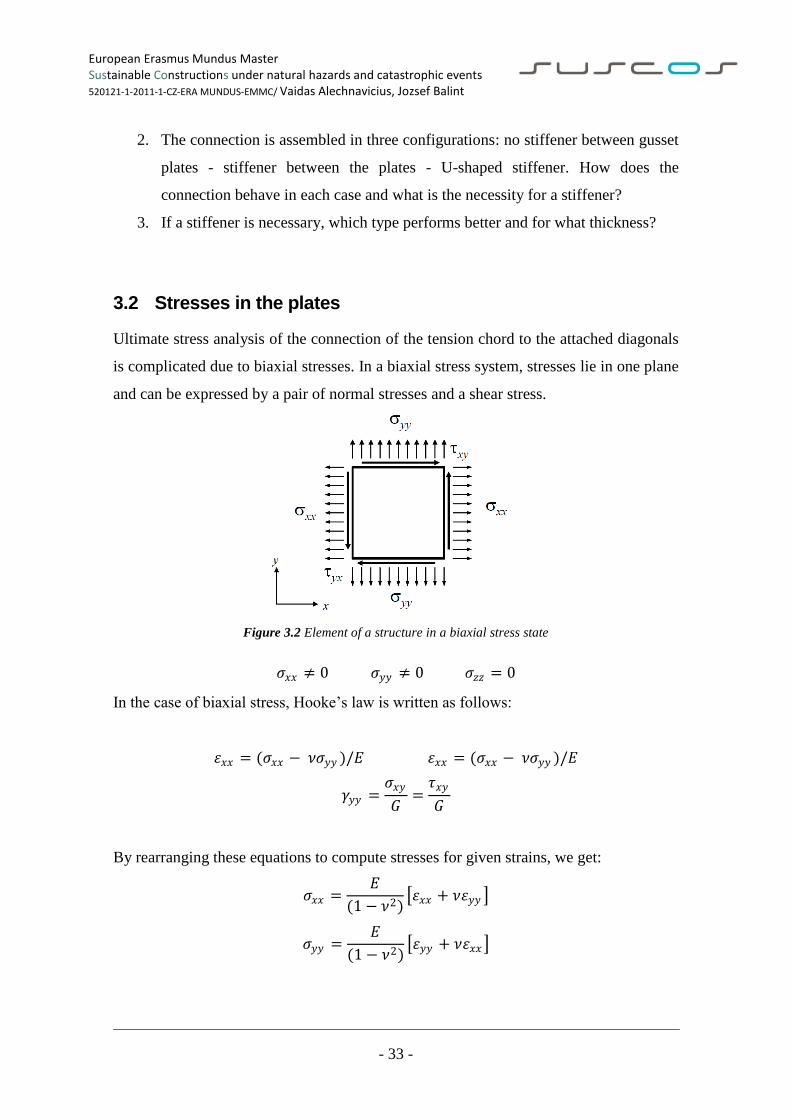
3.2 Stresses in the plates
Ultimate stress analysis of the connection of the tension chord to the attached diagonals
is complicated due to biaxial stresses. In a biaxial stress system, stresses lie in one plane
and can be expressed by a pair of normal stresses and a shear stress.
Figure 3.2 Element of a structure in a biaxial stress state
𝜍𝑥𝑥 ≠ 0 𝜍𝑦𝑦 ≠ 0 𝜍𝑧𝑧 = 0
In the case of biaxial stress, Hooke’s law is written as follows:
𝜀𝑥𝑥 = (𝜍𝑥𝑥 − 𝜈𝜍𝑦𝑦 )/𝐸 𝜀𝑥𝑥 = (𝜍𝑥𝑥 − 𝜈𝜍𝑦𝑦 )/𝐸
𝛾𝑦𝑦 =𝜍𝑥𝑦
𝐺=𝜏𝑥𝑦
𝐺
By rearranging these equations to compute stresses for given strains, we get:
𝜍𝑥𝑥 =𝐸
(1 − 𝜈2) 𝜀𝑥𝑥 + 𝜈𝜀𝑦𝑦
𝜍𝑦𝑦 =𝐸
(1 − 𝜈2) 𝜀𝑦𝑦 + 𝜈𝜀𝑥𝑥
European Erasmus Mundus Master Sustainable Constructions under natural hazards and catastrophic events 520121-1-2011-1-CZ-ERA MUNDUS-EMMC/ Vaidas Alechnavicius, Jozsef Balint
- 34 -
𝜏𝑥𝑦 = 𝐺𝛾𝑥𝑦 =𝐸
2(1 + 𝜈)𝛾𝑥𝑦
In a thin metal a biaxial stress state for all stresses lay within the plane of the material.
Such a stress system is called Plane Stress.
In the bottom chord, where the member is subjected to tensile force, only uniaxial stress
state exists. The maximum stress in this area is determined:
𝜍𝑥𝑥 =𝐹
𝐴=
3259550𝑁
5516.1769𝑚𝑚2= 590.907𝑀𝑃𝑎
𝐹 - axial force in the member;
𝐴 - area of the cross-section.
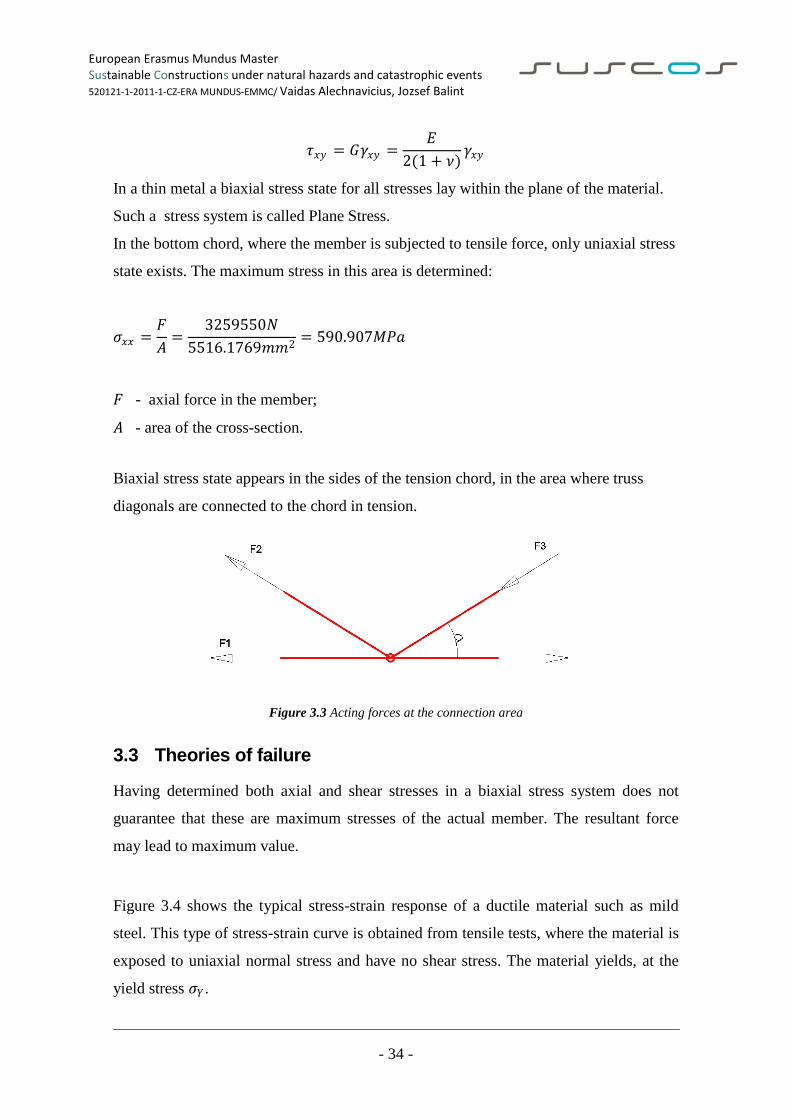
Biaxial stress state appears in the sides of the tension chord, in the area where truss
diagonals are connected to the chord in tension.
Figure 3.3 Acting forces at the connection area
3.3 Theories of failure
Having determined both axial and shear stresses in a biaxial stress system does not
guarantee that these are maximum stresses of the actual member. The resultant force
may lead to maximum value.
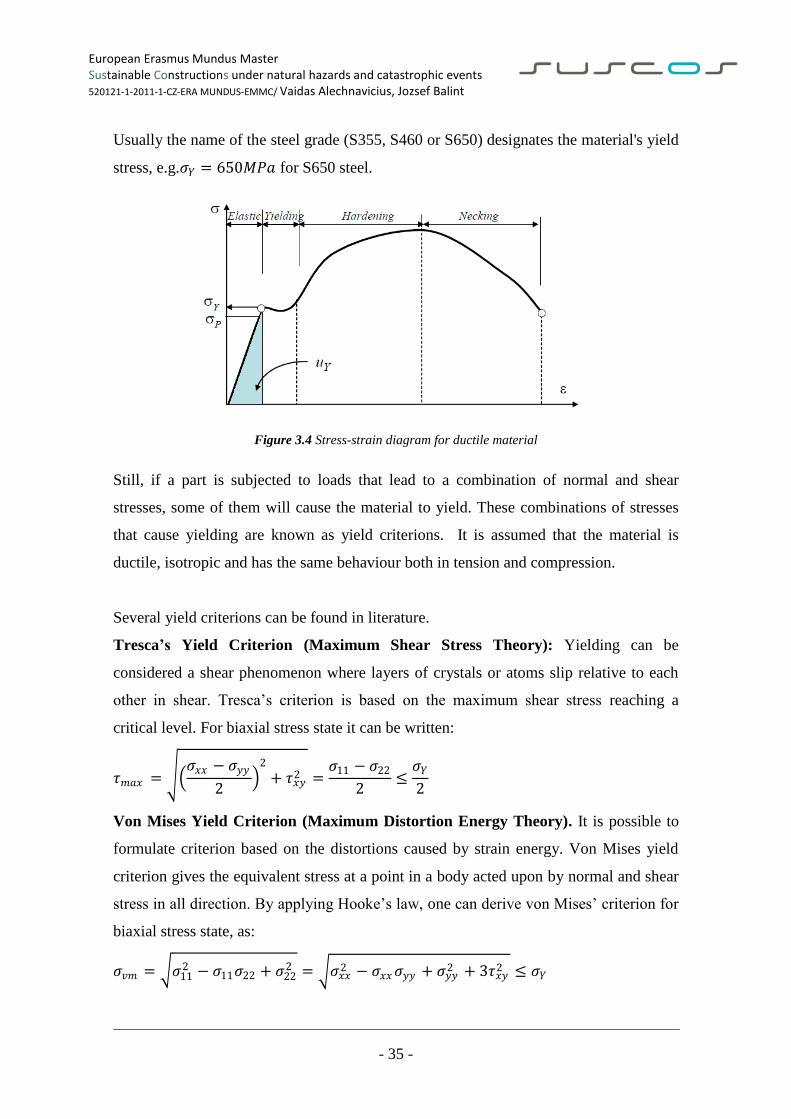
Figure 3.4 shows the typical stress-strain response of a ductile material such as mild
steel. This type of stress-strain curve is obtained from tensile tests, where the material is
exposed to uniaxial normal stress and have no shear stress. The material yields, at the
yield stress 𝜍𝑌.
European Erasmus Mundus Master Sustainable Constructions under natural hazards and catastrophic events 520121-1-2011-1-CZ-ERA MUNDUS-EMMC/ Vaidas Alechnavicius, Jozsef Balint
- 35 -
Usually the name of the steel grade (S355, S460 or S650) designates the material's yield
stress, e.g.𝜍𝑌 = 650𝑀𝑃𝑎 for S650 steel.
Figure 3.4 Stress-strain diagram for ductile material
Still, if a part is subjected to loads that lead to a combination of normal and shear
stresses, some of them will cause the material to yield. These combinations of stresses
that cause yielding are known as yield criterions. It is assumed that the material is
ductile, isotropic and has the same behaviour both in tension and compression.
Several yield criterions can be found in literature.
Tresca’s Yield Criterion (Maximum Shear Stress Theory): Yielding can be
considered a shear phenomenon where layers of crystals or atoms slip relative to each
other in shear. Tresca’s criterion is based on the maximum shear stress reaching a
critical level. For biaxial stress state it can be written:
𝜏𝑚𝑎𝑥 = 𝜍𝑥𝑥 − 𝜍𝑦𝑦
2
2
+ 𝜏𝑥𝑦2 =𝜍11 − 𝜍22
2≤𝜍𝑌2
Von Mises Yield Criterion (Maximum Distortion Energy Theory). It is possible to
formulate criterion based on the distortions caused by strain energy. Von Mises yield
criterion gives the equivalent stress at a point in a body acted upon by normal and shear
stress in all direction. By applying Hooke’s law, one can derive von Mises’ criterion for
biaxial stress state, as:
𝜍𝑣𝑚 = 𝜍112 − 𝜍11𝜍22 + 𝜍22
2 = 𝜍𝑥𝑥2 − 𝜍𝑥𝑥𝜍𝑦𝑦 + 𝜍𝑦𝑦2 + 3𝜏𝑥𝑦2 ≤ 𝜍𝑌
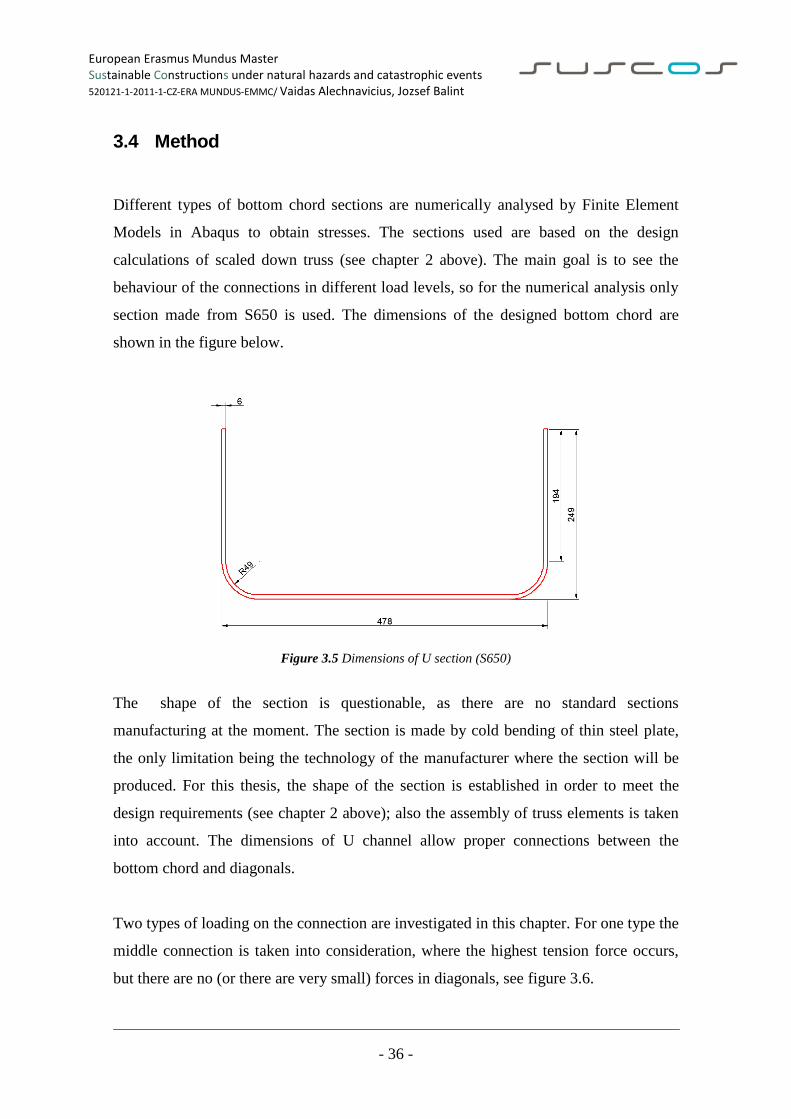
European Erasmus Mundus Master Sustainable Constructions under natural hazards and catastrophic events 520121-1-2011-1-CZ-ERA MUNDUS-EMMC/ Vaidas Alechnavicius, Jozsef Balint
- 36 -
3.4 Method
Different types of bottom chord sections are numerically analysed by Finite Element
Models in Abaqus to obtain stresses. The sections used are based on the design
calculations of scaled down truss (see chapter 2 above). The main goal is to see the
behaviour of the connections in different load levels, so for the numerical analysis only
section made from S650 is used. The dimensions of the designed bottom chord are
shown in the figure below.
Figure 3.5 Dimensions of U section (S650)
The shape of the section is questionable, as there are no standard sections
manufacturing at the moment. The section is made by cold bending of thin steel plate,
the only limitation being the technology of the manufacturer where the section will be
produced. For this thesis, the shape of the section is established in order to meet the
design requirements (see chapter 2 above); also the assembly of truss elements is taken
into account. The dimensions of U channel allow proper connections between the
bottom chord and diagonals.
Two types of loading on the connection are investigated in this chapter. For one type the
middle connection is taken into consideration, where the highest tension force occurs,
but there are no (or there are very small) forces in diagonals, see figure 3.6.
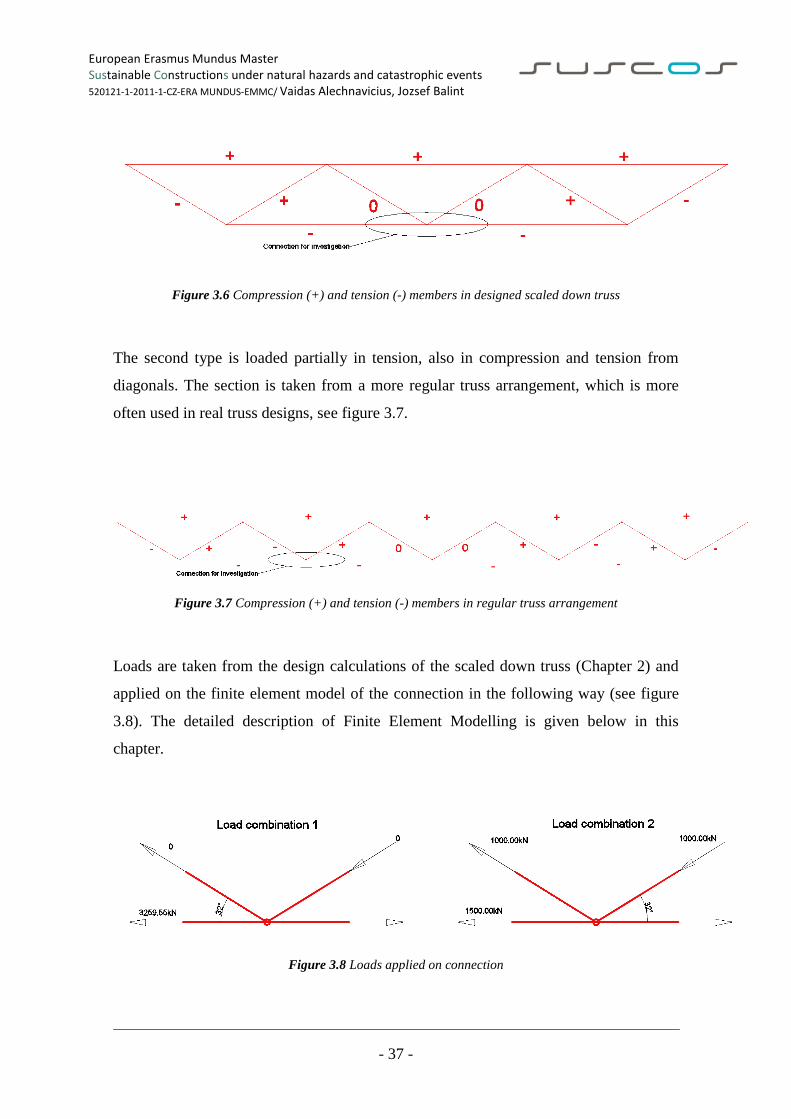
European Erasmus Mundus Master Sustainable Constructions under natural hazards and catastrophic events 520121-1-2011-1-CZ-ERA MUNDUS-EMMC/ Vaidas Alechnavicius, Jozsef Balint
- 37 -
Figure 3.6 Compression (+) and tension (-) members in designed scaled down truss
The second type is loaded partially in tension, also in compression and tension from
diagonals. The section is taken from a more regular truss arrangement, which is more
often used in real truss designs, see figure 3.7.
Figure 3.7 Compression (+) and tension (-) members in regular truss arrangement
Loads are taken from the design calculations of the scaled down truss (Chapter 2) and
applied on the finite element model of the connection in the following way (see figure
3.8). The detailed description of Finite Element Modelling is given below in this
chapter.
Figure 3.8 Loads applied on connection
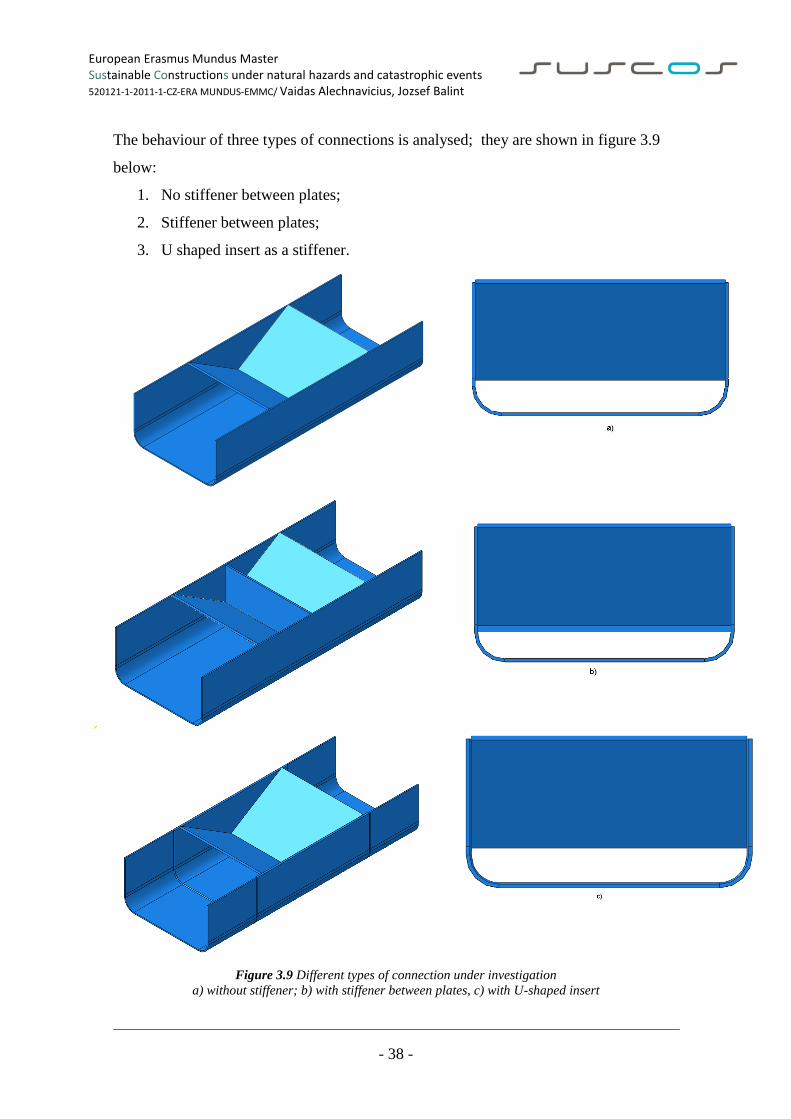
European Erasmus Mundus Master Sustainable Constructions under natural hazards and catastrophic events 520121-1-2011-1-CZ-ERA MUNDUS-EMMC/ Vaidas Alechnavicius, Jozsef Balint
- 38 -
The behaviour of three types of connections is analysed; they are shown in figure 3.9
below:
1. No stiffener between plates;
2. Stiffener between plates;
3. U shaped insert as a stiffener.
Figure 3.9 Different types of connection under investigation
a) without stiffener; b) with stiffener between plates, c) with U-shaped insert
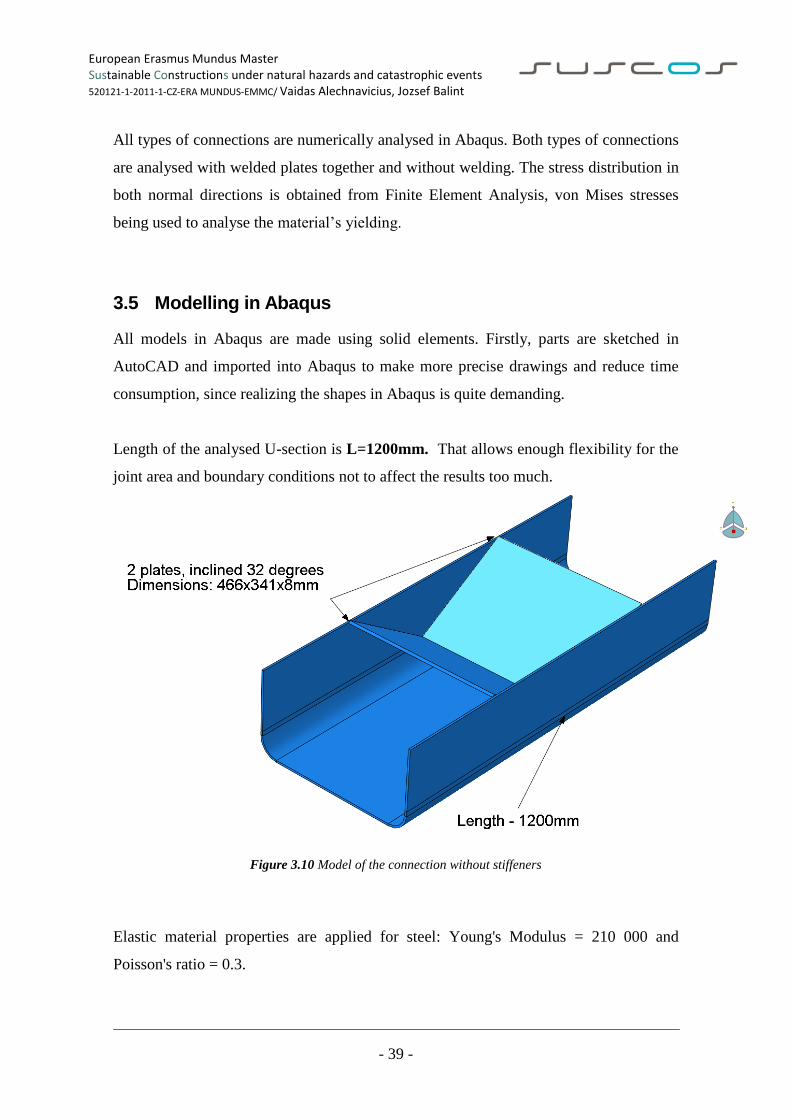
European Erasmus Mundus Master Sustainable Constructions under natural hazards and catastrophic events 520121-1-2011-1-CZ-ERA MUNDUS-EMMC/ Vaidas Alechnavicius, Jozsef Balint
- 39 -
All types of connections are numerically analysed in Abaqus. Both types of connections
are analysed with welded plates together and without welding. The stress distribution in
both normal directions is obtained from Finite Element Analysis, von Mises stresses
being used to analyse the material’s yielding.
3.5 Modelling in Abaqus
All models in Abaqus are made using solid elements. Firstly, parts are sketched in
AutoCAD and imported into Abaqus to make more precise drawings and reduce time
consumption, since realizing the shapes in Abaqus is quite demanding.
Length of the analysed U-section is L=1200mm. That allows enough flexibility for the
joint area and boundary conditions not to affect the results too much.
Figure 3.10 Model of the connection without stiffeners
Elastic material properties are applied for steel: Young's Modulus = 210 000 and
Poisson's ratio = 0.3.
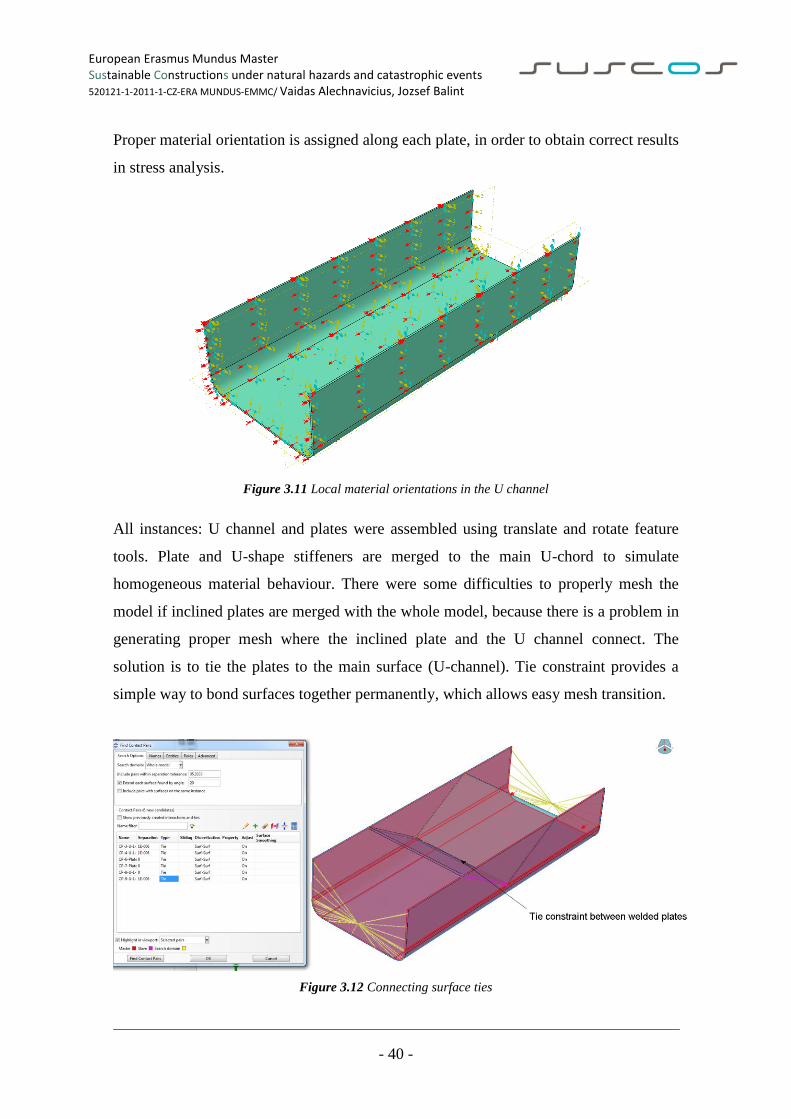
European Erasmus Mundus Master Sustainable Constructions under natural hazards and catastrophic events 520121-1-2011-1-CZ-ERA MUNDUS-EMMC/ Vaidas Alechnavicius, Jozsef Balint
- 40 -
Proper material orientation is assigned along each plate, in order to obtain correct results
in stress analysis.
Figure 3.11 Local material orientations in the U channel
All instances: U channel and plates were assembled using translate and rotate feature
tools. Plate and U-shape stiffeners are merged to the main U-chord to simulate
homogeneous material behaviour. There were some difficulties to properly mesh the
model if inclined plates are merged with the whole model, because there is a problem in
generating proper mesh where the inclined plate and the U channel connect. The
solution is to tie the plates to the main surface (U-channel). Tie constraint provides a
simple way to bond surfaces together permanently, which allows easy mesh transition.
Figure 3.12 Connecting surface ties
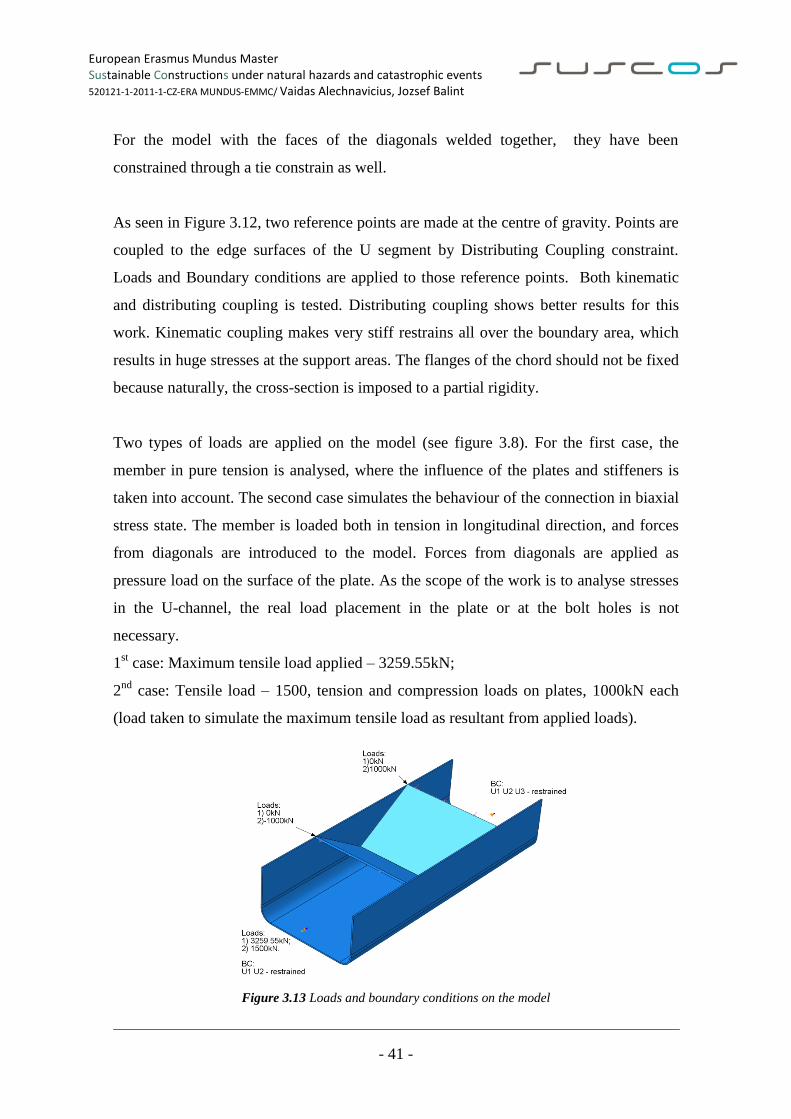
European Erasmus Mundus Master Sustainable Constructions under natural hazards and catastrophic events 520121-1-2011-1-CZ-ERA MUNDUS-EMMC/ Vaidas Alechnavicius, Jozsef Balint
- 41 -
For the model with the faces of the diagonals welded together, they have been
constrained through a tie constrain as well.
As seen in Figure 3.12, two reference points are made at the centre of gravity. Points are
coupled to the edge surfaces of the U segment by Distributing Coupling constraint.
Loads and Boundary conditions are applied to those reference points. Both kinematic
and distributing coupling is tested. Distributing coupling shows better results for this
work. Kinematic coupling makes very stiff restrains all over the boundary area, which
results in huge stresses at the support areas. The flanges of the chord should not be fixed
because naturally, the cross-section is imposed to a partial rigidity.
Two types of loads are applied on the model (see figure 3.8). For the first case, the
member in pure tension is analysed, where the influence of the plates and stiffeners is
taken into account. The second case simulates the behaviour of the connection in biaxial
stress state. The member is loaded both in tension in longitudinal direction, and forces
from diagonals are introduced to the model. Forces from diagonals are applied as
pressure load on the surface of the plate. As the scope of the work is to analyse stresses
in the U-channel, the real load placement in the plate or at the bolt holes is not
necessary.
1st case: Maximum tensile load applied – 3259.55kN;
2nd
case: Tensile load – 1500, tension and compression loads on plates, 1000kN each
(load taken to simulate the maximum tensile load as resultant from applied loads).
Figure 3.13 Loads and boundary conditions on the model
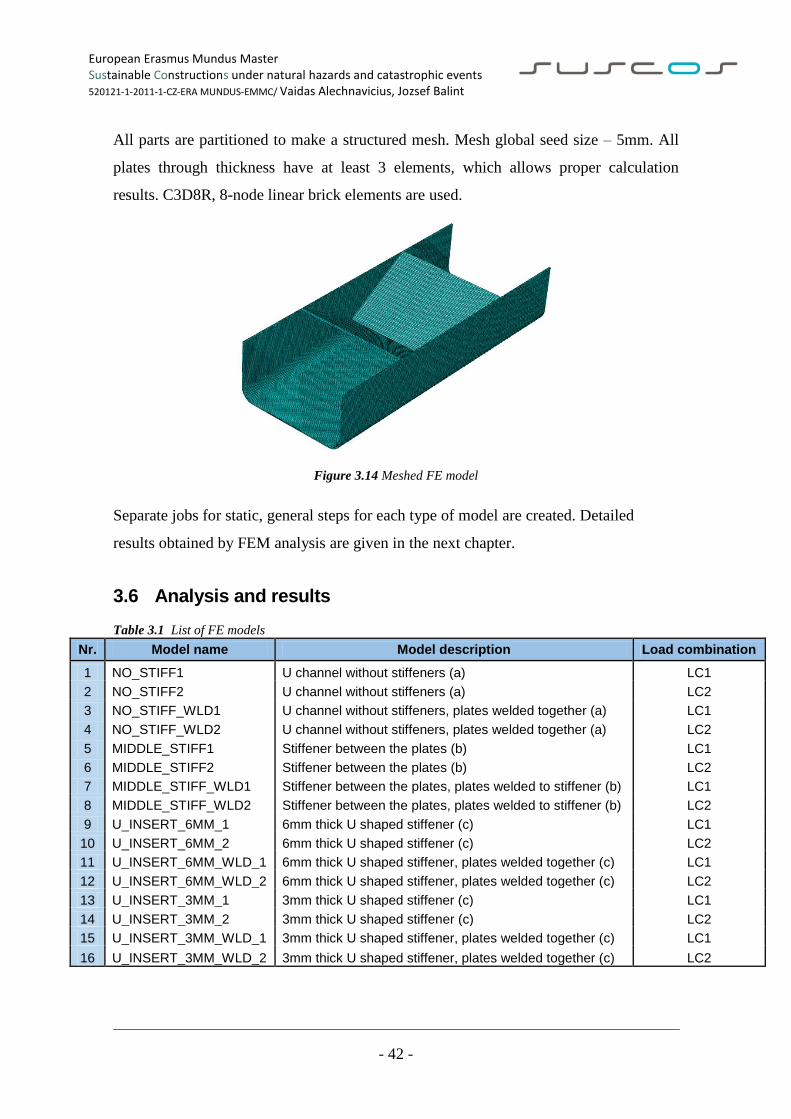
European Erasmus Mundus Master Sustainable Constructions under natural hazards and catastrophic events 520121-1-2011-1-CZ-ERA MUNDUS-EMMC/ Vaidas Alechnavicius, Jozsef Balint
- 42 -
All parts are partitioned to make a structured mesh. Mesh global seed size – 5mm. All
plates through thickness have at least 3 elements, which allows proper calculation
results. C3D8R, 8-node linear brick elements are used.
Figure 3.14 Meshed FE model
Separate jobs for static, general steps for each type of model are created. Detailed
results obtained by FEM analysis are given in the next chapter.
3.6 Analysis and results
Table 3.1 List of FE models
Nr. Model name Model description Load combination
1 NO_STIFF1 U channel without stiffeners (a) LC1
2 NO_STIFF2 U channel without stiffeners (a) LC2
3 NO_STIFF_WLD1 U channel without stiffeners, plates welded together (a) LC1
4 NO_STIFF_WLD2 U channel without stiffeners, plates welded together (a) LC2
5 MIDDLE_STIFF1 Stiffener between the plates (b) LC1
6 MIDDLE_STIFF2 Stiffener between the plates (b) LC2
7 MIDDLE_STIFF_WLD1 Stiffener between the plates, plates welded to stiffener (b) LC1
8 MIDDLE_STIFF_WLD2 Stiffener between the plates, plates welded to stiffener (b) LC2
9 U_INSERT_6MM_1 6mm thick U shaped stiffener (c) LC1
10 U_INSERT_6MM_2 6mm thick U shaped stiffener (c) LC2
11 U_INSERT_6MM_WLD_1 6mm thick U shaped stiffener, plates welded together (c) LC1
12 U_INSERT_6MM_WLD_2 6mm thick U shaped stiffener, plates welded together (c) LC2
13 U_INSERT_3MM_1 3mm thick U shaped stiffener (c) LC1
14 U_INSERT_3MM_2 3mm thick U shaped stiffener (c) LC2
15 U_INSERT_3MM_WLD_1 3mm thick U shaped stiffener, plates welded together (c) LC1
16 U_INSERT_3MM_WLD_2 3mm thick U shaped stiffener, plates welded together (c) LC2
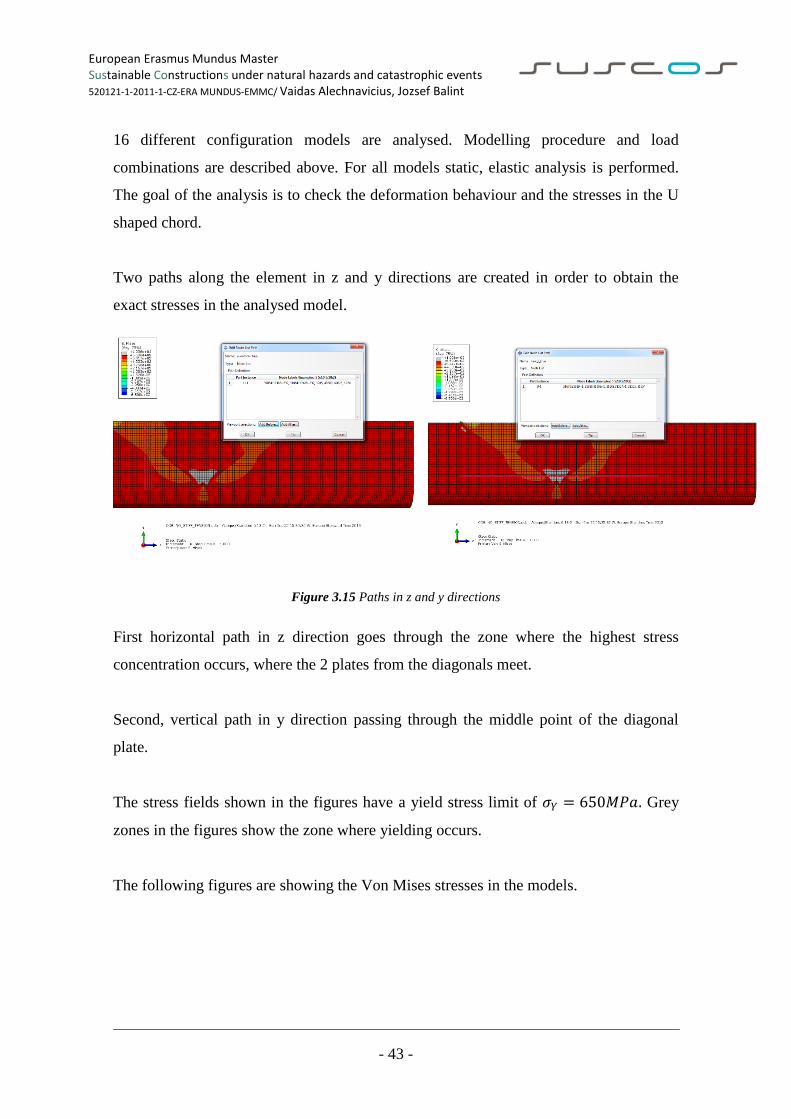
European Erasmus Mundus Master Sustainable Constructions under natural hazards and catastrophic events 520121-1-2011-1-CZ-ERA MUNDUS-EMMC/ Vaidas Alechnavicius, Jozsef Balint
- 43 -
16 different configuration models are analysed. Modelling procedure and load
combinations are described above. For all models static, elastic analysis is performed.
The goal of the analysis is to check the deformation behaviour and the stresses in the U
shaped chord.
Two paths along the element in z and y directions are created in order to obtain the
exact stresses in the analysed model.
Figure 3.15 Paths in z and y directions
First horizontal path in z direction goes through the zone where the highest stress
concentration occurs, where the 2 plates from the diagonals meet.
Second, vertical path in y direction passing through the middle point of the diagonal
plate.
The stress fields shown in the figures have a yield stress limit of 𝜍𝑌 = 650𝑀𝑃𝑎. Grey
zones in the figures show the zone where yielding occurs.
The following figures are showing the Von Mises stresses in the models.
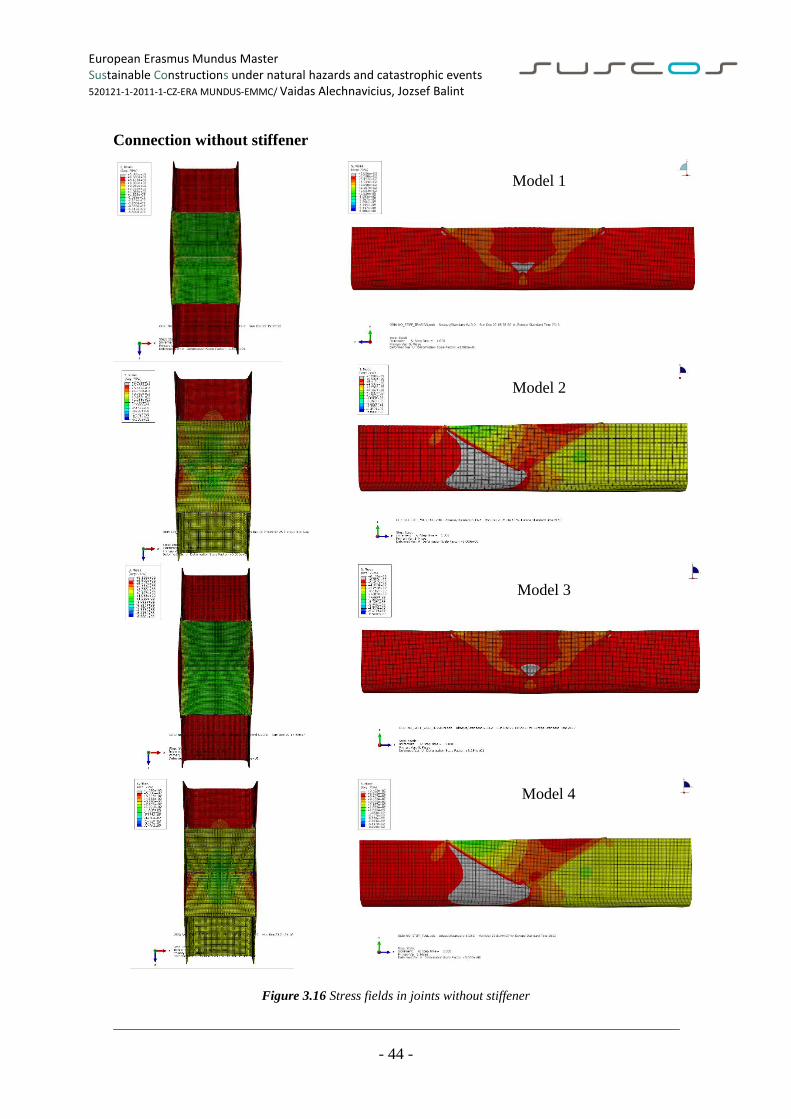
European Erasmus Mundus Master Sustainable Constructions under natural hazards and catastrophic events 520121-1-2011-1-CZ-ERA MUNDUS-EMMC/ Vaidas Alechnavicius, Jozsef Balint
- 44 -
Model 3
Model 4
Model 2
Model 1
Connection without stiffener
Figure 3.16 Stress fields in joints without stiffener
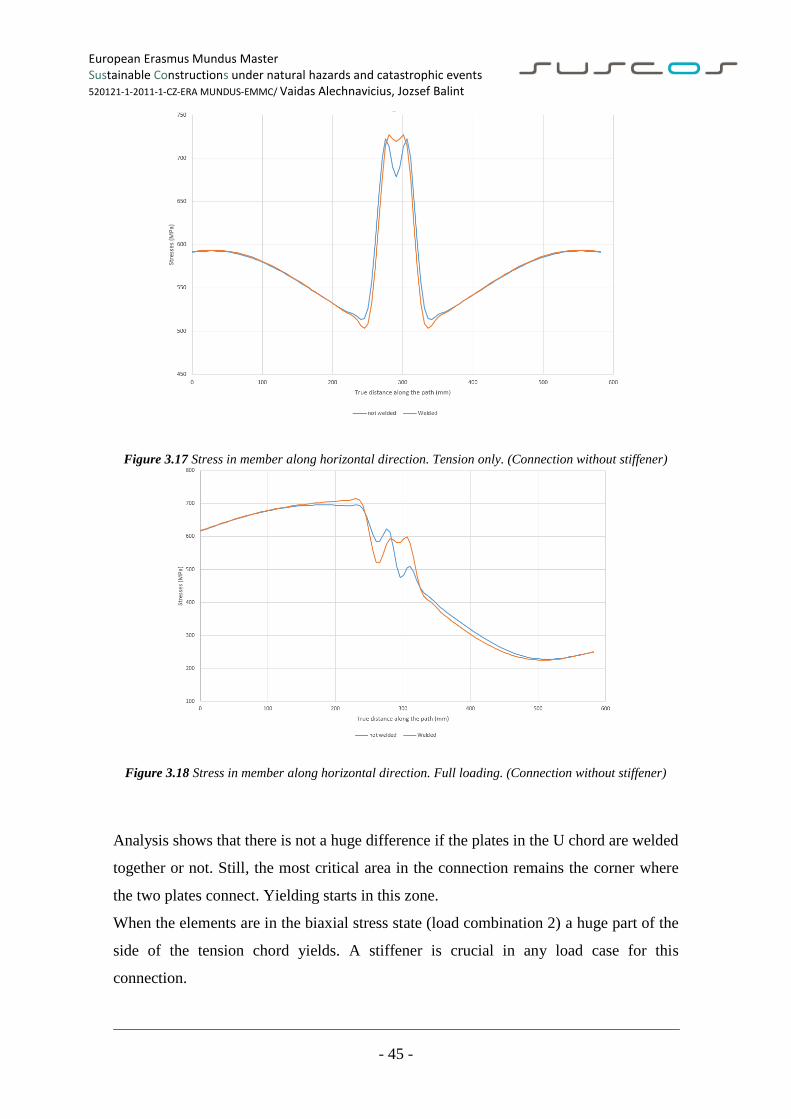
European Erasmus Mundus Master Sustainable Constructions under natural hazards and catastrophic events 520121-1-2011-1-CZ-ERA MUNDUS-EMMC/ Vaidas Alechnavicius, Jozsef Balint
- 45 -
Figure 3.17 Stress in member along horizontal direction. Tension only. (Connection without stiffener)
Figure 3.18 Stress in member along horizontal direction. Full loading. (Connection without stiffener)
Analysis shows that there is not a huge difference if the plates in the U chord are welded
together or not. Still, the most critical area in the connection remains the corner where
the two plates connect. Yielding starts in this zone.
When the elements are in the biaxial stress state (load combination 2) a huge part of the
side of the tension chord yields. A stiffener is crucial in any load case for this
connection.
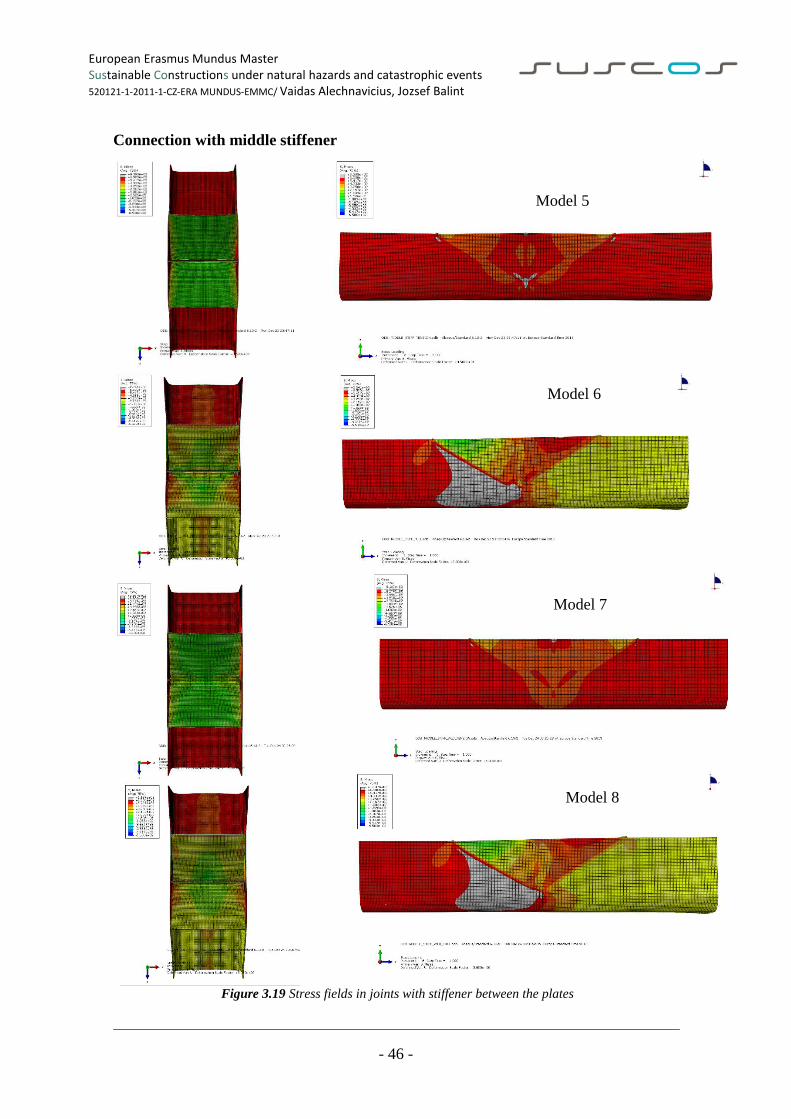
European Erasmus Mundus Master Sustainable Constructions under natural hazards and catastrophic events 520121-1-2011-1-CZ-ERA MUNDUS-EMMC/ Vaidas Alechnavicius, Jozsef Balint
- 46 -
Model 5
Model 6
Model 7
Model 8
Connection with middle stiffener
Figure 3.19 Stress fields in joints with stiffener between the plates
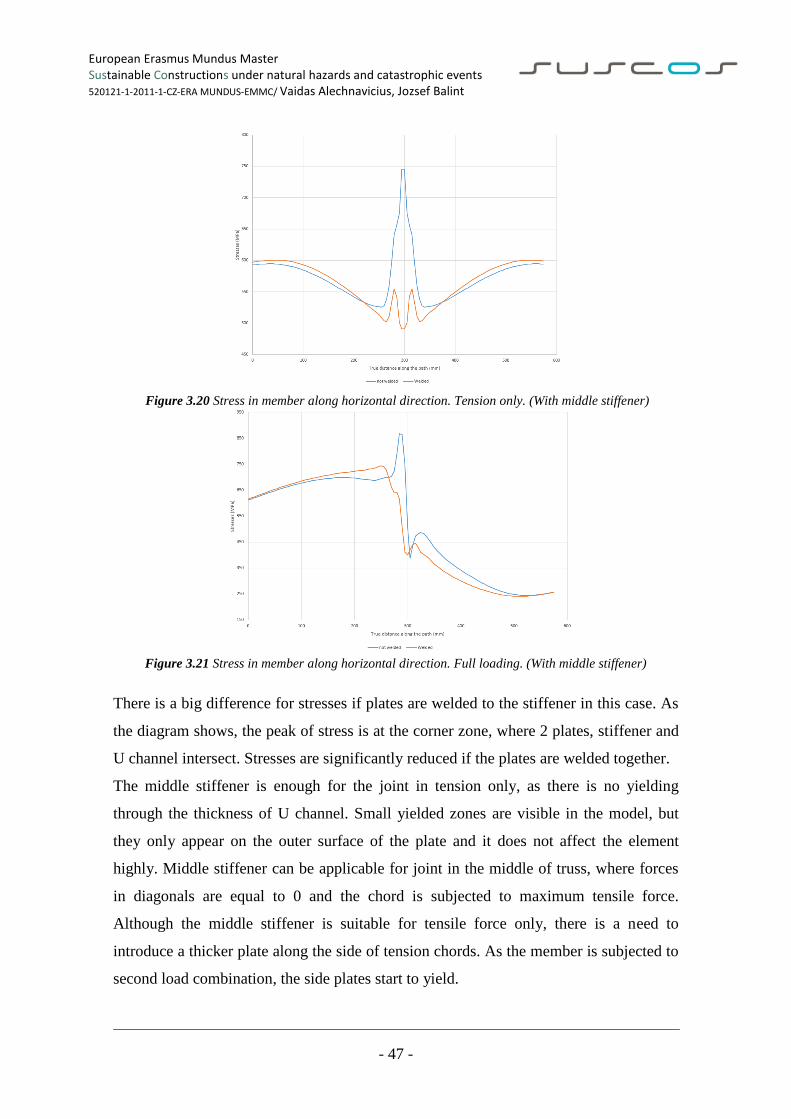
European Erasmus Mundus Master Sustainable Constructions under natural hazards and catastrophic events 520121-1-2011-1-CZ-ERA MUNDUS-EMMC/ Vaidas Alechnavicius, Jozsef Balint
- 47 -
Figure 3.20 Stress in member along horizontal direction. Tension only. (With middle stiffener)
Figure 3.21 Stress in member along horizontal direction. Full loading. (With middle stiffener)
There is a big difference for stresses if plates are welded to the stiffener in this case. As
the diagram shows, the peak of stress is at the corner zone, where 2 plates, stiffener and
U channel intersect. Stresses are significantly reduced if the plates are welded together.
The middle stiffener is enough for the joint in tension only, as there is no yielding
through the thickness of U channel. Small yielded zones are visible in the model, but
they only appear on the outer surface of the plate and it does not affect the element
highly. Middle stiffener can be applicable for joint in the middle of truss, where forces
in diagonals are equal to 0 and the chord is subjected to maximum tensile force.
Although the middle stiffener is suitable for tensile force only, there is a need to
introduce a thicker plate along the side of tension chords. As the member is subjected to
second load combination, the side plates start to yield.
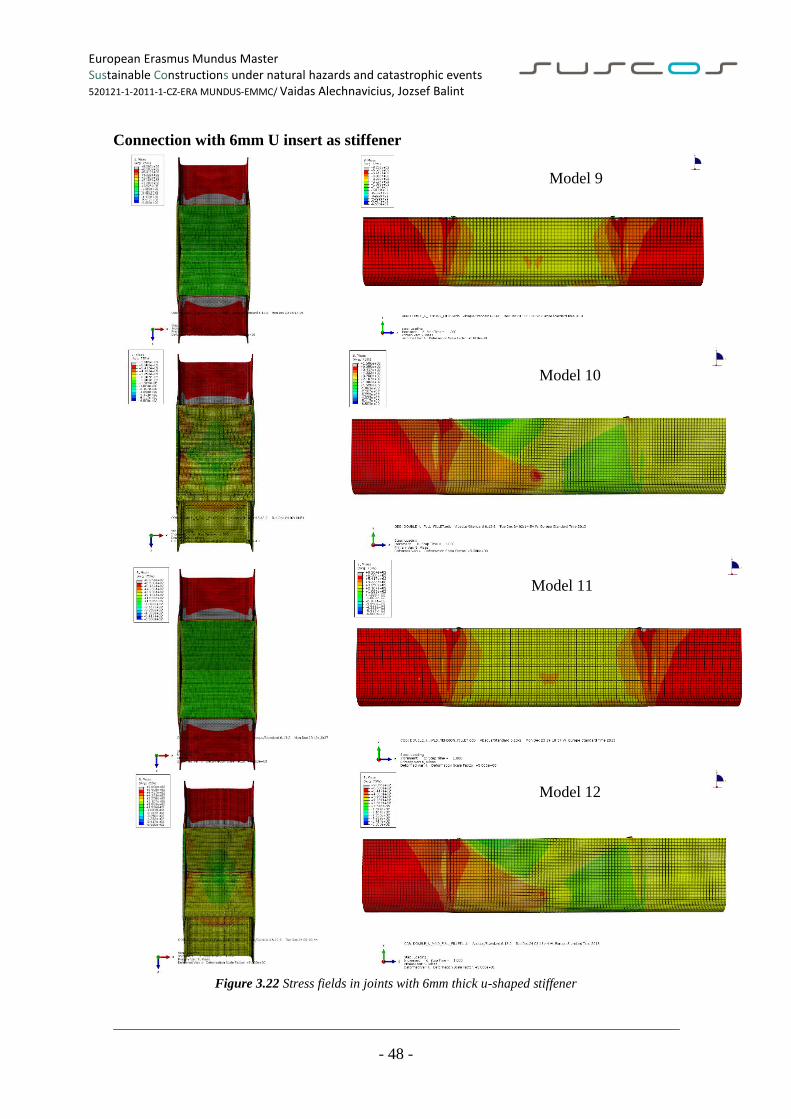
European Erasmus Mundus Master Sustainable Constructions under natural hazards and catastrophic events 520121-1-2011-1-CZ-ERA MUNDUS-EMMC/ Vaidas Alechnavicius, Jozsef Balint
- 48 -
Model 9
Model 10
Model 11
Model 12
Connection with 6mm U insert as stiffener
Figure 3.22 Stress fields in joints with 6mm thick u-shaped stiffener
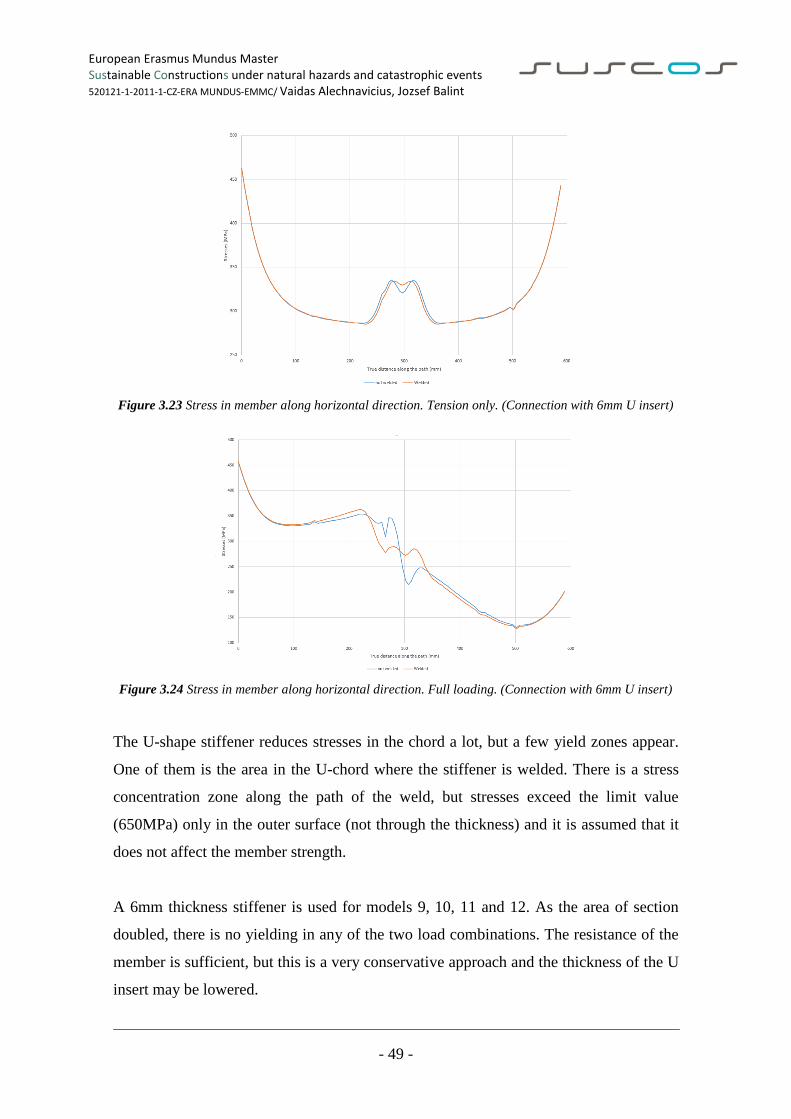
European Erasmus Mundus Master Sustainable Constructions under natural hazards and catastrophic events 520121-1-2011-1-CZ-ERA MUNDUS-EMMC/ Vaidas Alechnavicius, Jozsef Balint
- 49 -
Figure 3.23 Stress in member along horizontal direction. Tension only. (Connection with 6mm U insert)
Figure 3.24 Stress in member along horizontal direction. Full loading. (Connection with 6mm U insert)
The U-shape stiffener reduces stresses in the chord a lot, but a few yield zones appear.
One of them is the area in the U-chord where the stiffener is welded. There is a stress
concentration zone along the path of the weld, but stresses exceed the limit value
(650MPa) only in the outer surface (not through the thickness) and it is assumed that it
does not affect the member strength.
A 6mm thickness stiffener is used for models 9, 10, 11 and 12. As the area of section
doubled, there is no yielding in any of the two load combinations. The resistance of the
member is sufficient, but this is a very conservative approach and the thickness of the U
insert may be lowered.
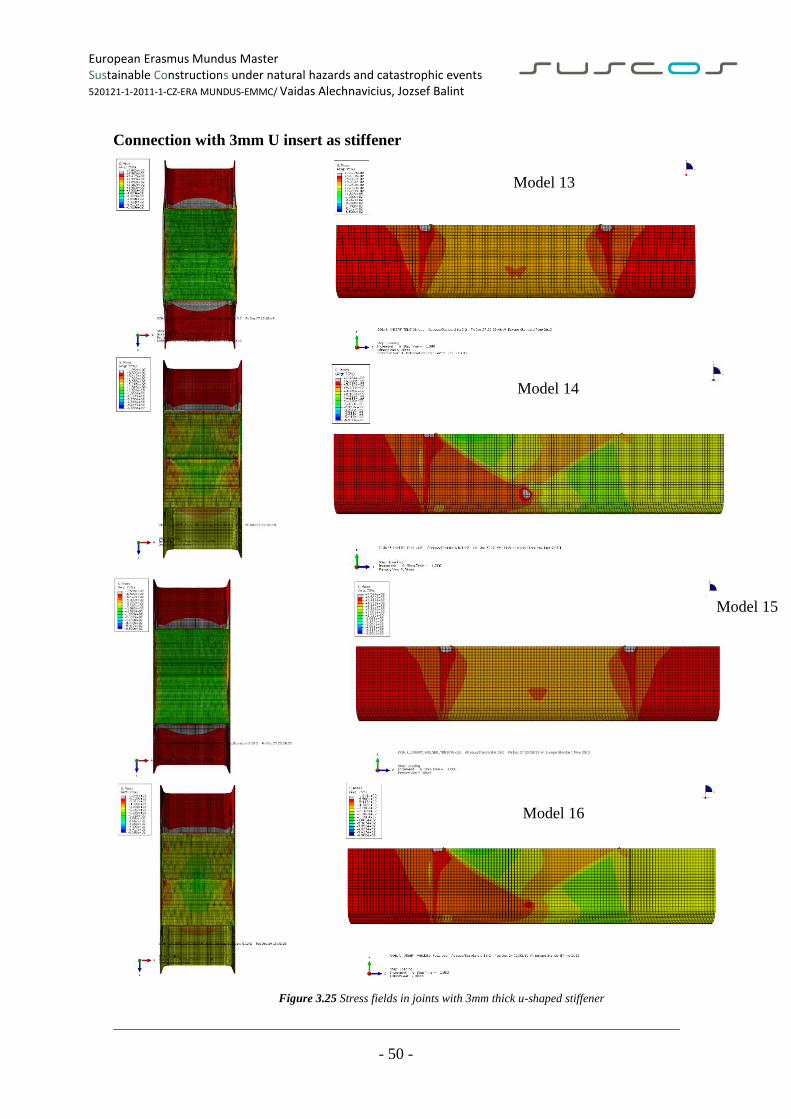
European Erasmus Mundus Master Sustainable Constructions under natural hazards and catastrophic events 520121-1-2011-1-CZ-ERA MUNDUS-EMMC/ Vaidas Alechnavicius, Jozsef Balint
- 50 -
Model 13
Model 14
Model 15
Model 16
Connection with 3mm U insert as stiffener
Figure 3.25 Stress fields in joints with 3mm thick u-shaped stiffener
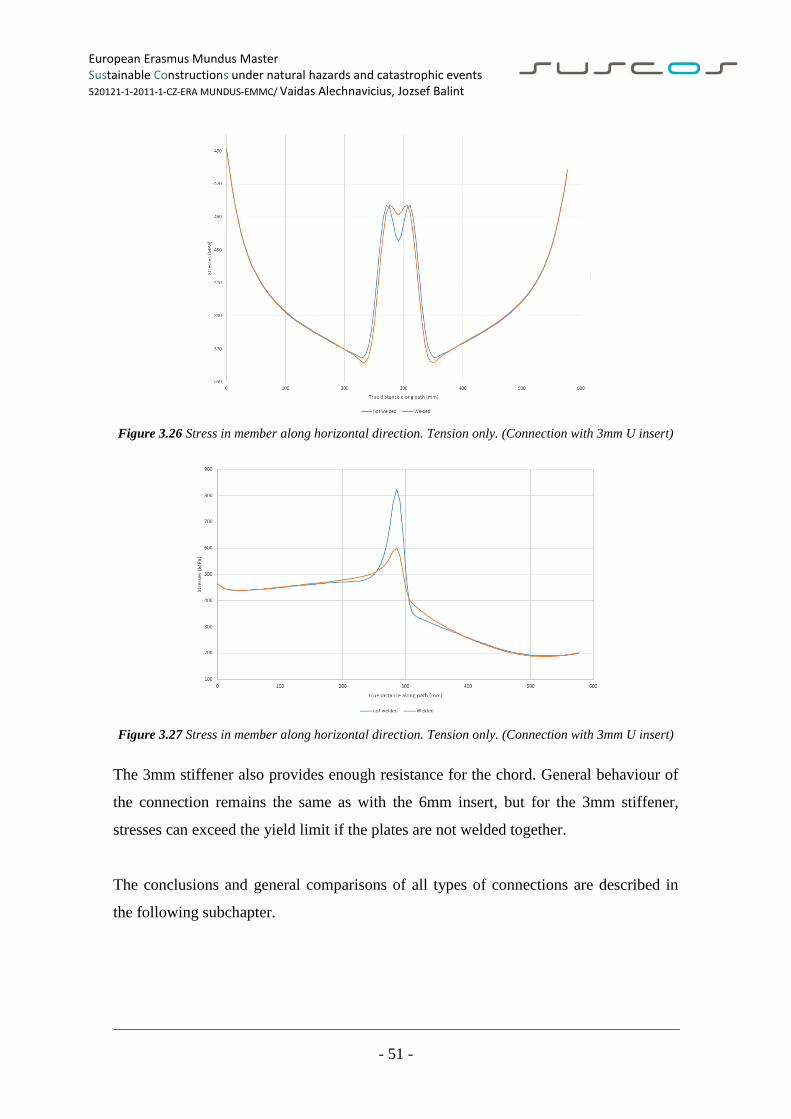
European Erasmus Mundus Master Sustainable Constructions under natural hazards and catastrophic events 520121-1-2011-1-CZ-ERA MUNDUS-EMMC/ Vaidas Alechnavicius, Jozsef Balint
- 51 -
Figure 3.26 Stress in member along horizontal direction. Tension only. (Connection with 3mm U insert)
Figure 3.27 Stress in member along horizontal direction. Tension only. (Connection with 3mm U insert)
The 3mm stiffener also provides enough resistance for the chord. General behaviour of
the connection remains the same as with the 6mm insert, but for the 3mm stiffener,
stresses can exceed the yield limit if the plates are not welded together.
The conclusions and general comparisons of all types of connections are described in
the following subchapter.
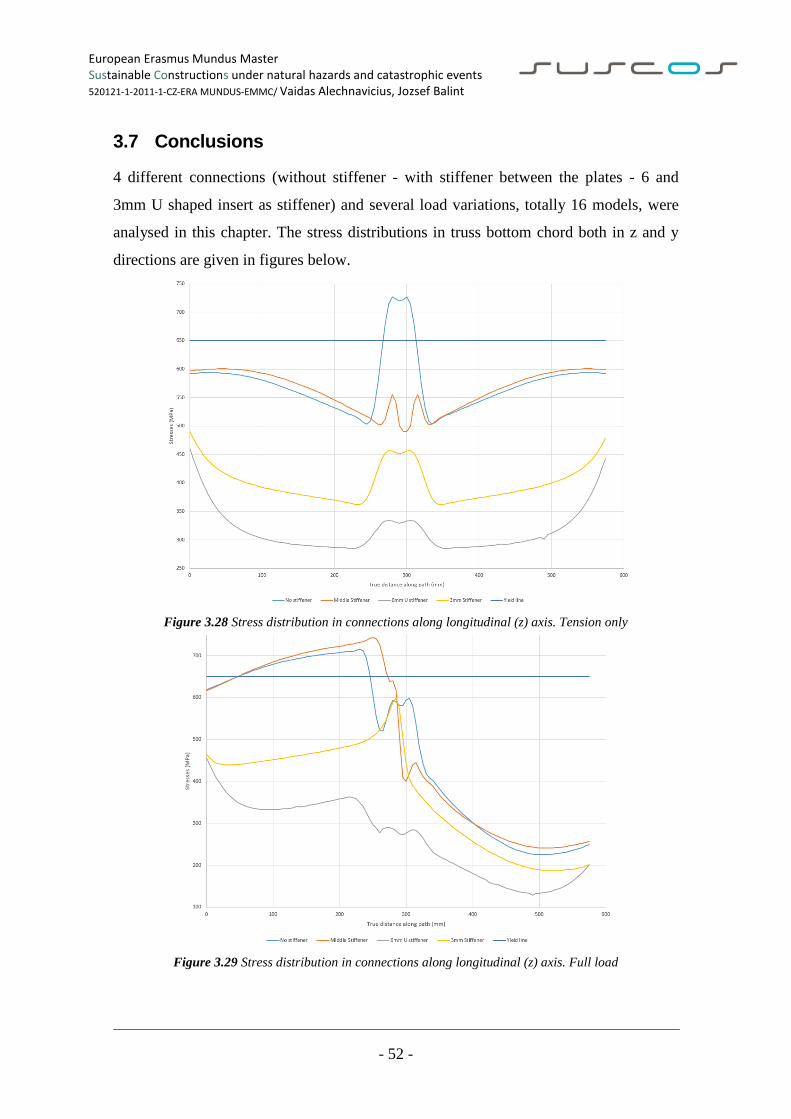
European Erasmus Mundus Master Sustainable Constructions under natural hazards and catastrophic events 520121-1-2011-1-CZ-ERA MUNDUS-EMMC/ Vaidas Alechnavicius, Jozsef Balint
- 52 -
3.7 Conclusions
4 different connections (without stiffener - with stiffener between the plates - 6 and
3mm U shaped insert as stiffener) and several load variations, totally 16 models, were
analysed in this chapter. The stress distributions in truss bottom chord both in z and y
directions are given in figures below.
Figure 3.28 Stress distribution in connections along longitudinal (z) axis. Tension only
Figure 3.29 Stress distribution in connections along longitudinal (z) axis. Full load
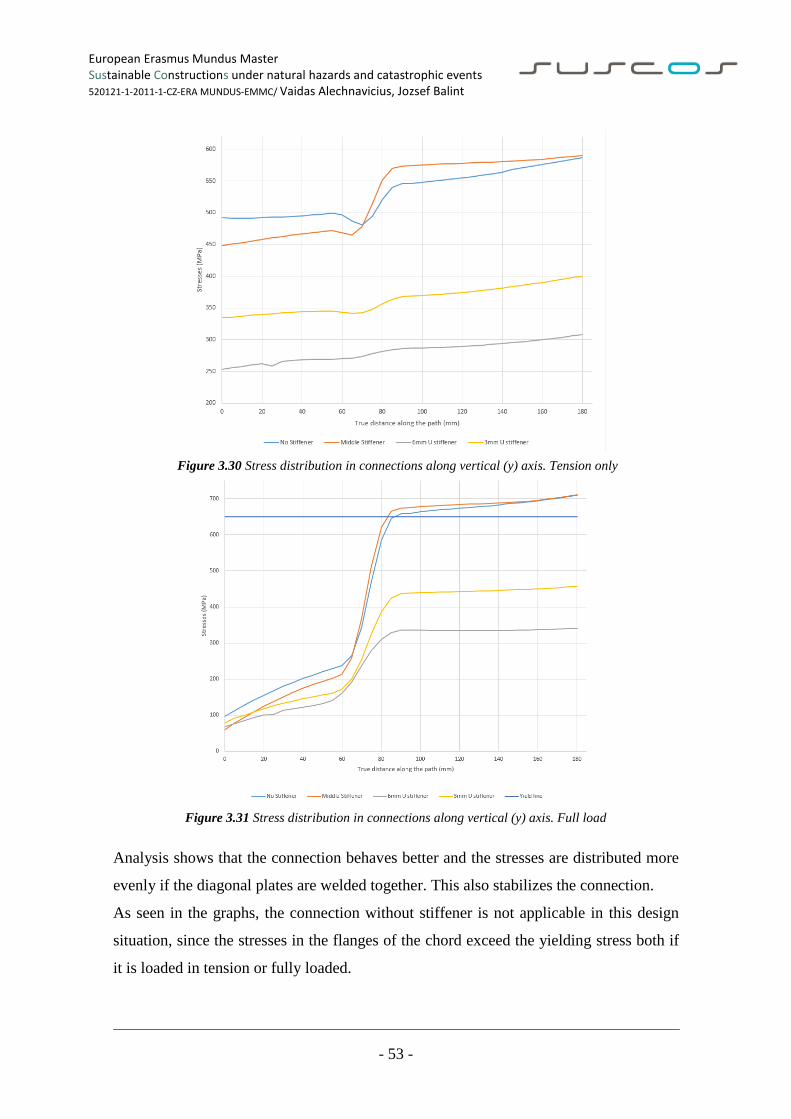
European Erasmus Mundus Master Sustainable Constructions under natural hazards and catastrophic events 520121-1-2011-1-CZ-ERA MUNDUS-EMMC/ Vaidas Alechnavicius, Jozsef Balint
- 53 -
Figure 3.30 Stress distribution in connections along vertical (y) axis. Tension only
Figure 3.31 Stress distribution in connections along vertical (y) axis. Full load
Analysis shows that the connection behaves better and the stresses are distributed more
evenly if the diagonal plates are welded together. This also stabilizes the connection.
As seen in the graphs, the connection without stiffener is not applicable in this design
situation, since the stresses in the flanges of the chord exceed the yielding stress both if
it is loaded in tension or fully loaded.
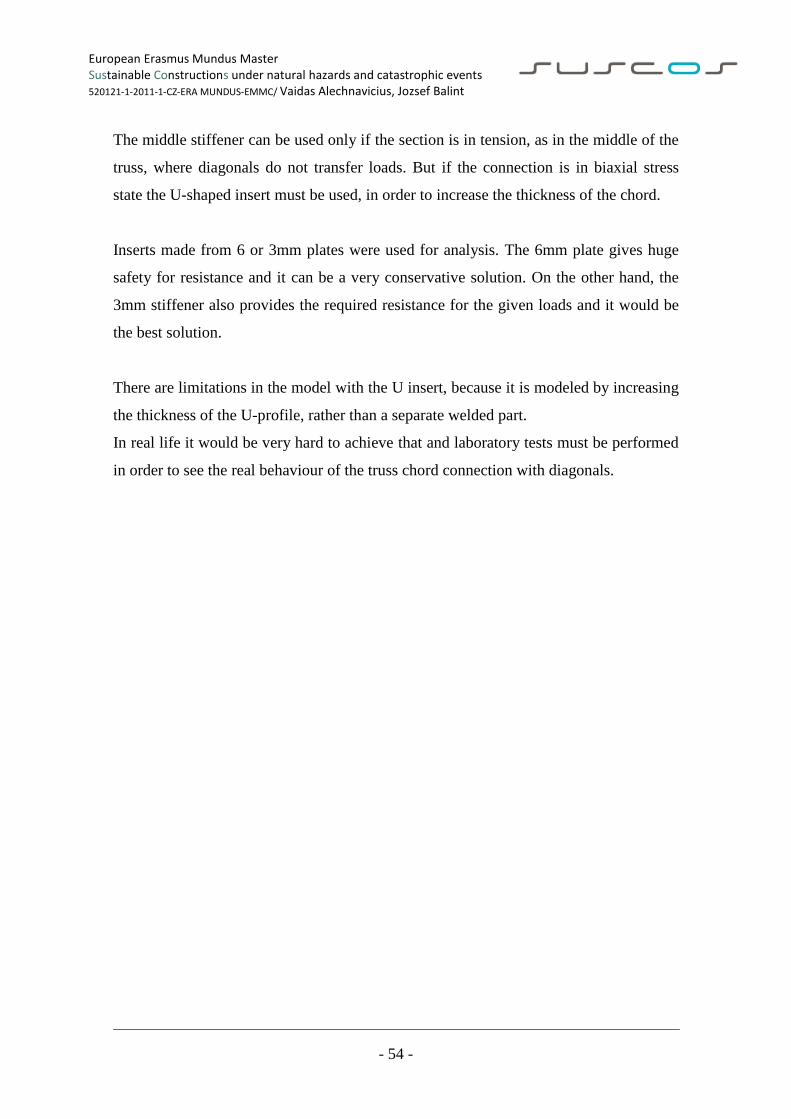
European Erasmus Mundus Master Sustainable Constructions under natural hazards and catastrophic events 520121-1-2011-1-CZ-ERA MUNDUS-EMMC/ Vaidas Alechnavicius, Jozsef Balint
- 54 -
The middle stiffener can be used only if the section is in tension, as in the middle of the
truss, where diagonals do not transfer loads. But if the connection is in biaxial stress
state the U-shaped insert must be used, in order to increase the thickness of the chord.
Inserts made from 6 or 3mm plates were used for analysis. The 6mm plate gives huge
safety for resistance and it can be a very conservative solution. On the other hand, the
3mm stiffener also provides the required resistance for the given loads and it would be
the best solution.
There are limitations in the model with the U insert, because it is modeled by increasing
the thickness of the U-profile, rather than a separate welded part.
In real life it would be very hard to achieve that and laboratory tests must be performed
in order to see the real behaviour of the truss chord connection with diagonals.
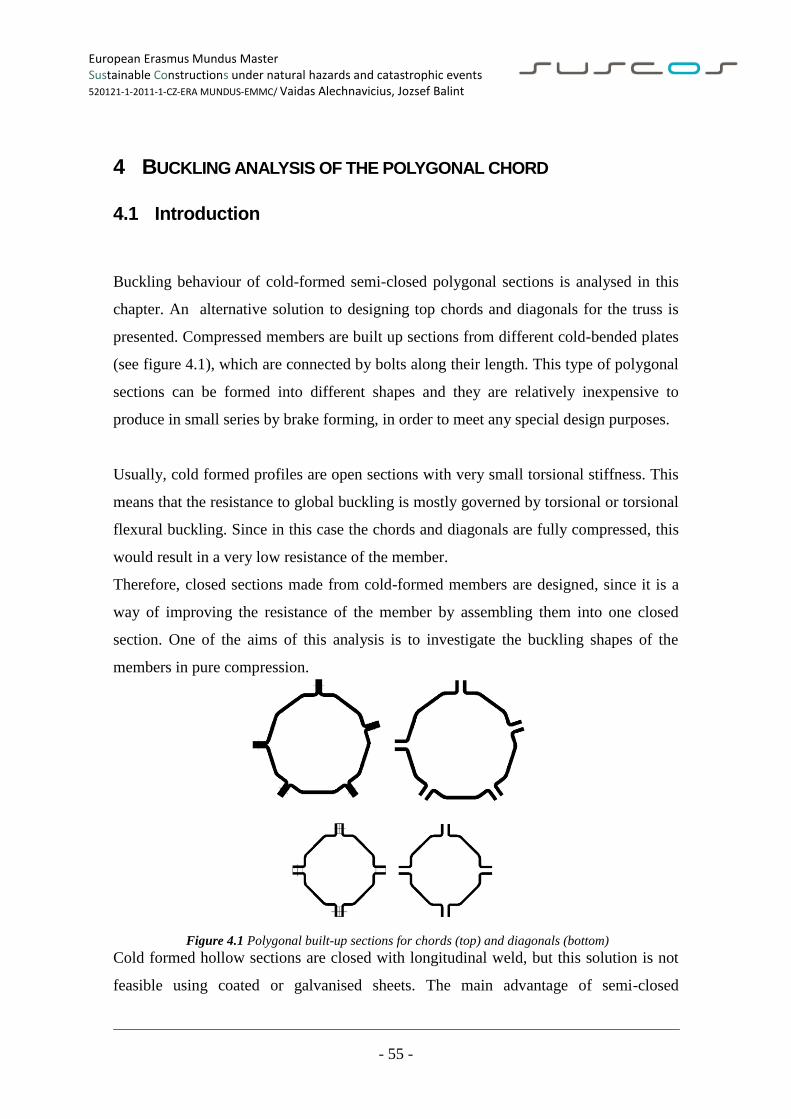
European Erasmus Mundus Master Sustainable Constructions under natural hazards and catastrophic events 520121-1-2011-1-CZ-ERA MUNDUS-EMMC/ Vaidas Alechnavicius, Jozsef Balint
- 55 -
4 BUCKLING ANALYSIS OF THE POLYGONAL CHORD
4.1 Introduction
Buckling behaviour of cold-formed semi-closed polygonal sections is analysed in this
chapter. An alternative solution to designing top chords and diagonals for the truss is
presented. Compressed members are built up sections from different cold-bended plates
(see figure 4.1), which are connected by bolts along their length. This type of polygonal
sections can be formed into different shapes and they are relatively inexpensive to
produce in small series by brake forming, in order to meet any special design purposes.
Usually, cold formed profiles are open sections with very small torsional stiffness. This
means that the resistance to global buckling is mostly governed by torsional or torsional
flexural buckling. Since in this case the chords and diagonals are fully compressed, this
would result in a very low resistance of the member.
Therefore, closed sections made from cold-formed members are designed, since it is a
way of improving the resistance of the member by assembling them into one closed
section. One of the aims of this analysis is to investigate the buckling shapes of the
members in pure compression.
Figure 4.1 Polygonal built-up sections for chords (top) and diagonals (bottom)
Cold formed hollow sections are closed with longitudinal weld, but this solution is not
feasible using coated or galvanised sheets. The main advantage of semi-closed
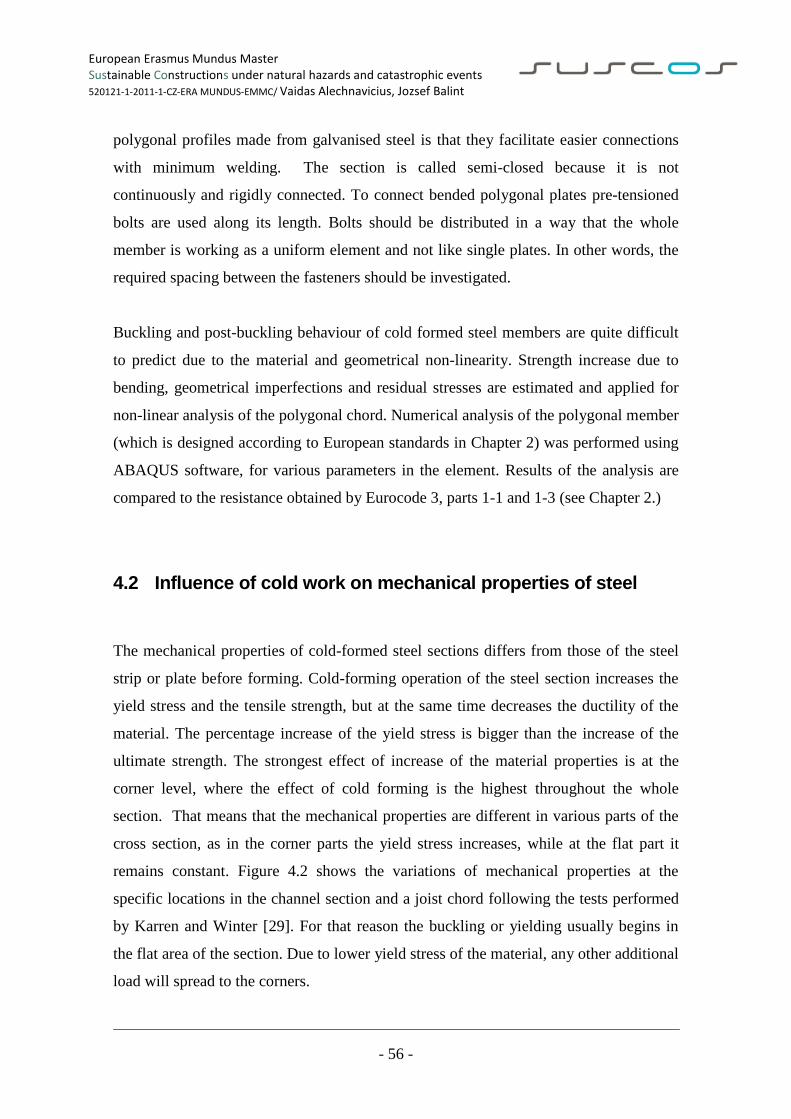
European Erasmus Mundus Master Sustainable Constructions under natural hazards and catastrophic events 520121-1-2011-1-CZ-ERA MUNDUS-EMMC/ Vaidas Alechnavicius, Jozsef Balint
- 56 -
polygonal profiles made from galvanised steel is that they facilitate easier connections
with minimum welding. The section is called semi-closed because it is not
continuously and rigidly connected. To connect bended polygonal plates pre-tensioned
bolts are used along its length. Bolts should be distributed in a way that the whole
member is working as a uniform element and not like single plates. In other words, the
required spacing between the fasteners should be investigated.
Buckling and post-buckling behaviour of cold formed steel members are quite difficult
to predict due to the material and geometrical non-linearity. Strength increase due to
bending, geometrical imperfections and residual stresses are estimated and applied for
non-linear analysis of the polygonal chord. Numerical analysis of the polygonal member
(which is designed according to European standards in Chapter 2) was performed using
ABAQUS software, for various parameters in the element. Results of the analysis are
compared to the resistance obtained by Eurocode 3, parts 1-1 and 1-3 (see Chapter 2.)
4.2 Influence of cold work on mechanical properties of steel
The mechanical properties of cold-formed steel sections differs from those of the steel
strip or plate before forming. Cold-forming operation of the steel section increases the
yield stress and the tensile strength, but at the same time decreases the ductility of the
material. The percentage increase of the yield stress is bigger than the increase of the
ultimate strength. The strongest effect of increase of the material properties is at the
corner level, where the effect of cold forming is the highest throughout the whole
section. That means that the mechanical properties are different in various parts of the
cross section, as in the corner parts the yield stress increases, while at the flat part it
remains constant. Figure 4.2 shows the variations of mechanical properties at the
specific locations in the channel section and a joist chord following the tests performed
by Karren and Winter [29]. For that reason the buckling or yielding usually begins in
the flat area of the section. Due to lower yield stress of the material, any other additional
load will spread to the corners.
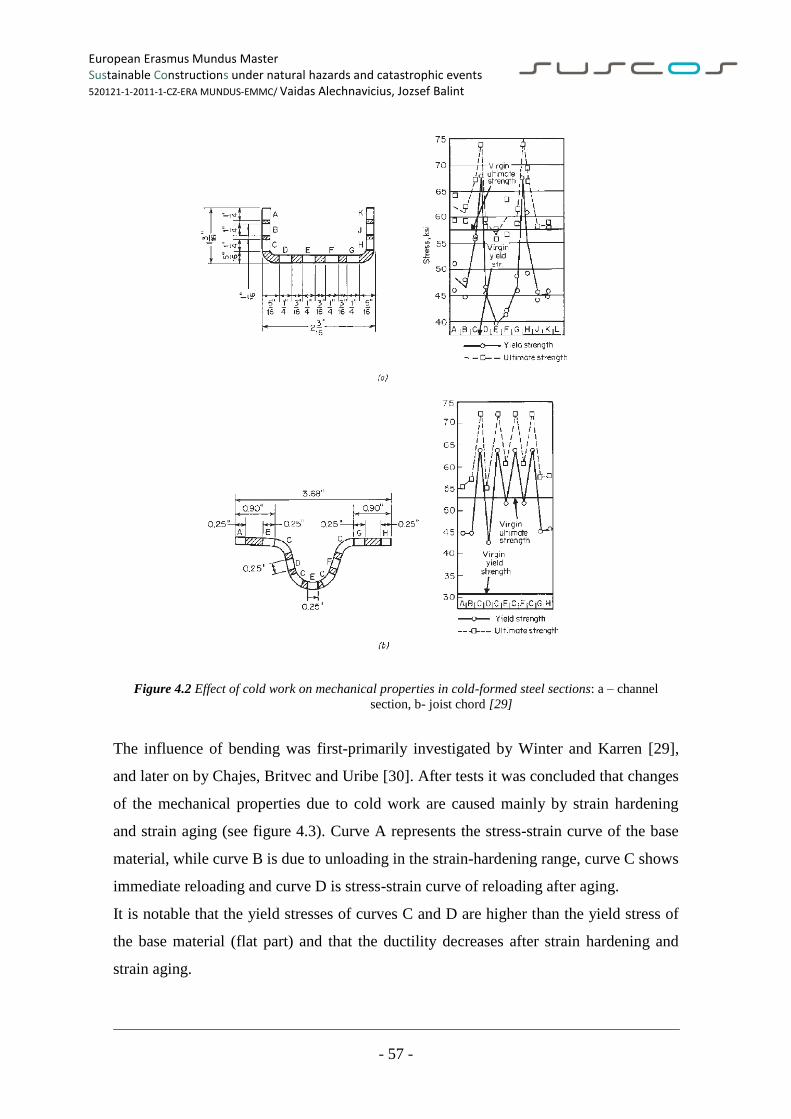
European Erasmus Mundus Master Sustainable Constructions under natural hazards and catastrophic events 520121-1-2011-1-CZ-ERA MUNDUS-EMMC/ Vaidas Alechnavicius, Jozsef Balint
- 57 -
Figure 4.2 Effect of cold work on mechanical properties in cold-formed steel sections: a – channel
section, b- joist chord [29]
The influence of bending was first-primarily investigated by Winter and Karren [29],
and later on by Chajes, Britvec and Uribe [30]. After tests it was concluded that changes
of the mechanical properties due to cold work are caused mainly by strain hardening
and strain aging (see figure 4.3). Curve A represents the stress-strain curve of the base
material, while curve B is due to unloading in the strain-hardening range, curve C shows
immediate reloading and curve D is stress-strain curve of reloading after aging.
It is notable that the yield stresses of curves C and D are higher than the yield stress of
the base material (flat part) and that the ductility decreases after strain hardening and
strain aging.
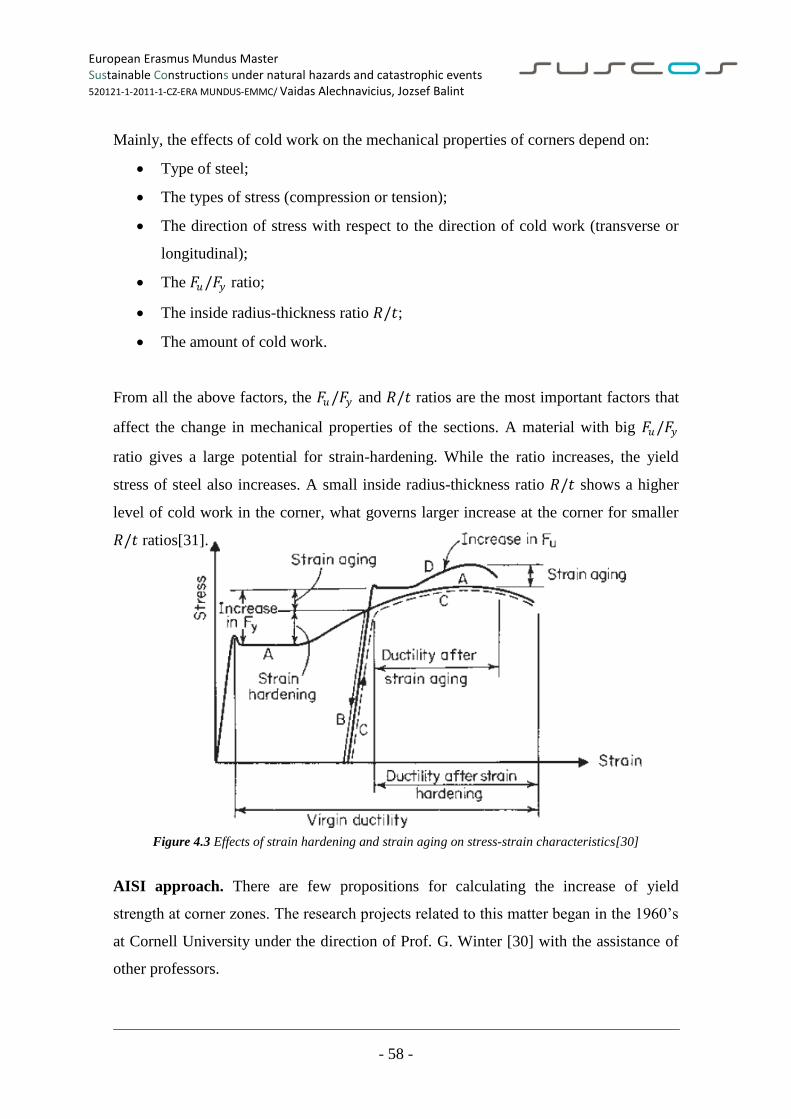
European Erasmus Mundus Master Sustainable Constructions under natural hazards and catastrophic events 520121-1-2011-1-CZ-ERA MUNDUS-EMMC/ Vaidas Alechnavicius, Jozsef Balint
- 58 -
Mainly, the effects of cold work on the mechanical properties of corners depend on:
Type of steel;
The types of stress (compression or tension);
The direction of stress with respect to the direction of cold work (transverse or
longitudinal);
The 𝐹𝑢/𝐹𝑦 ratio;
The inside radius-thickness ratio 𝑅/𝑡;
The amount of cold work.
From all the above factors, the 𝐹𝑢/𝐹𝑦 and 𝑅/𝑡 ratios are the most important factors that
affect the change in mechanical properties of the sections. A material with big 𝐹𝑢/𝐹𝑦
ratio gives a large potential for strain-hardening. While the ratio increases, the yield
stress of steel also increases. A small inside radius-thickness ratio 𝑅/𝑡 shows a higher
level of cold work in the corner, what governs larger increase at the corner for smaller
𝑅/𝑡 ratios[31].
Figure 4.3 Effects of strain hardening and strain aging on stress-strain characteristics[30]
AISI approach. There are few propositions for calculating the increase of yield
strength at corner zones. The research projects related to this matter began in the 1960’s
at Cornell University under the direction of Prof. G. Winter [30] with the assistance of
other professors.
European Erasmus Mundus Master Sustainable Constructions under natural hazards and catastrophic events 520121-1-2011-1-CZ-ERA MUNDUS-EMMC/ Vaidas Alechnavicius, Jozsef Balint
- 59 -
After experimental works Karren and Winter [29] proposed the following equation for
the corner yield strength:
𝐹𝑦𝑐
𝐹𝑦𝑣=
𝐵𝑐
(𝑅
𝑡)𝑚
Where the empirical coefficients:
𝐵𝑐 = 3,69 ∗𝐹𝑢𝑣𝐹𝑦𝑣
− 0.819 ∗ 𝐹𝑢𝑣𝐹𝑦𝑣
− 1.79
𝑚 = 0.192 ∗𝐹𝑢𝑣𝐹𝑦𝑣
− 0.068
where:
𝐹𝑦𝑐 - yield stress at corner zone;
𝐹𝑦𝑣 - yield stress for virgin material;
𝐹𝑢𝑣 - tensile strength for virgin material;
𝑅 - inside bent radius;
𝑡 - thickness of the plate.
This equation was soon adopted by American Iron and Steel Institute (AISI) [32],
whose specification gives the weighted average of yield stress in the whole section by
the equation:
𝐹𝑦𝑎 = 𝐶𝐹𝑦𝑐 + (1 + 𝐶)𝐹𝑦𝑓
where:
𝐹𝑦𝑐 =𝐵𝑐𝐹𝑦𝑣
(𝑅
𝑡)𝑚
C – ratio of corner area to total cross-sectional area.
European Erasmus Mundus Master Sustainable Constructions under natural hazards and catastrophic events 520121-1-2011-1-CZ-ERA MUNDUS-EMMC/ Vaidas Alechnavicius, Jozsef Balint
- 60 -
Lind and Schroff [33] used the tests in [29] to develop a new expression for corner yield
strength, as they said that the theory presented by Karren is “complicated and is not in a
good agreement with the material behaviour”. To develop less complicated models, they
focused in analysing a linear strain hardening law and a simplified design rule based on
hardening margin. For example, the difference between the virgin ultimate and yield
strengths 𝑓𝑢 − 𝑓𝑦 and strain hardening constant which would be the same for all
materials[34]. Lind and Schroff explain their idea as: "The idea of the theory is simple.
Whether a corner of a large or small radius is formed, the cold work, equal to the
integral of the applied moment with respect to the angle of bend, should be about equal
if strain hardening is linear. A small corner just concentrates the same work in a smaller
volume of material. If the material hardens linearly, the work is independent of the
radius, neglecting the elastic part. Further, if the increase in yield stress is a linear
function of the work of forming, the increase in yield force for the corner will be a
linear function of the work of forming“. They did not carry any tests to prove this theory
and just analysed and adapted previous test data. The hardening constant 5t was
established and applied to the simple expression as follows:
Δ𝑃 = 5𝑡2(𝑓𝑢 − 𝑓𝑦)(Θ°
90°)
The rule states that the yield strength is obtained by replacing the yield stress with the
ultimate stress over an area of 5𝑡2 at each 90° corner. Therefore, the corner yield
strength can be calculated using equation:
𝐹𝑦𝑐 = 𝐹𝑦 +Δ𝑃
𝑎𝑟𝑒𝑎 𝑜𝑓 𝑐𝑜𝑟𝑛𝑒𝑟
S136 (Canadian norms) approach. Lind and Schroff [33] compared their calculations
of the corner yield strength with the study of Karren and found good agreement. [33]
shows that the increase of yield strength at a corner can be related to the strain
hardening margin 𝑓𝑢 − 𝑓𝑦 and the strain hardening constant 5t. Canadian codes (S136)
adopted Lind and Schroff expressions as a basic for calculating yield strength increase
due to cold forming, as follows:
European Erasmus Mundus Master Sustainable Constructions under natural hazards and catastrophic events 520121-1-2011-1-CZ-ERA MUNDUS-EMMC/ Vaidas Alechnavicius, Jozsef Balint
- 61 -
𝐹𝑦′ = 𝐹𝑦 + 5𝐷𝐴(𝐹𝑢 − 𝐹𝑦)/𝑊∗
where:
𝐹𝑦 - virgin yield strength of steel;
𝐹𝑢 - ultimate yield strength of steel;
𝐷𝐴 - number of 90° corners or total number of degrees in the section divided by 90°
𝑊∗ - ratio of the centreline of a flange cross-section of a member in bending, or of
the entire cross section of a tensile or compressive member, to the
thickness (w/t).
Waterloo test program [35] was created in order to investigate the difference between
AISI and S136 proposed methods. Tensile tests were performed with different bended
and flat plates. Results were compared with theoretical calculations. Analysis showed
that the results obtained by testing and by theoretical calculations (both by Karren and
Lind/Schroff theories) were in good agreement and the results were almost identical. It
was concluded that a simpler S136 method can be used in calculating the yield strength
increase by cold bending.
Eurocode 3 approach. Eurocode 3 Part 1-3 [26] gives an equation to calculate the
average yield strength 𝑓𝑦𝑎 for a full section. This equation is a modification of the
formula used by AISI specifications, where a zone close to the corner is considered as
fully plastified:
𝑓𝑦𝑎 = 𝑓𝑦𝑏 + 𝐶 ∗ 𝑛 ∗𝑡2
𝐴𝑔 ∗ (𝑓𝑢 − 𝑓𝑦𝑏 )
𝐴𝑔 is the gross cross sectional area and 𝑛 is the number of 90° bends in the section, with
internal radius 𝑟 < 5𝑡 and 𝐶 is a factor depending on the steel forming method; 𝐶 = 7
for cold-rolling and 𝐶 = 5 for other methods of forming [26].
The average yield strength cannot exceed the boundaries:
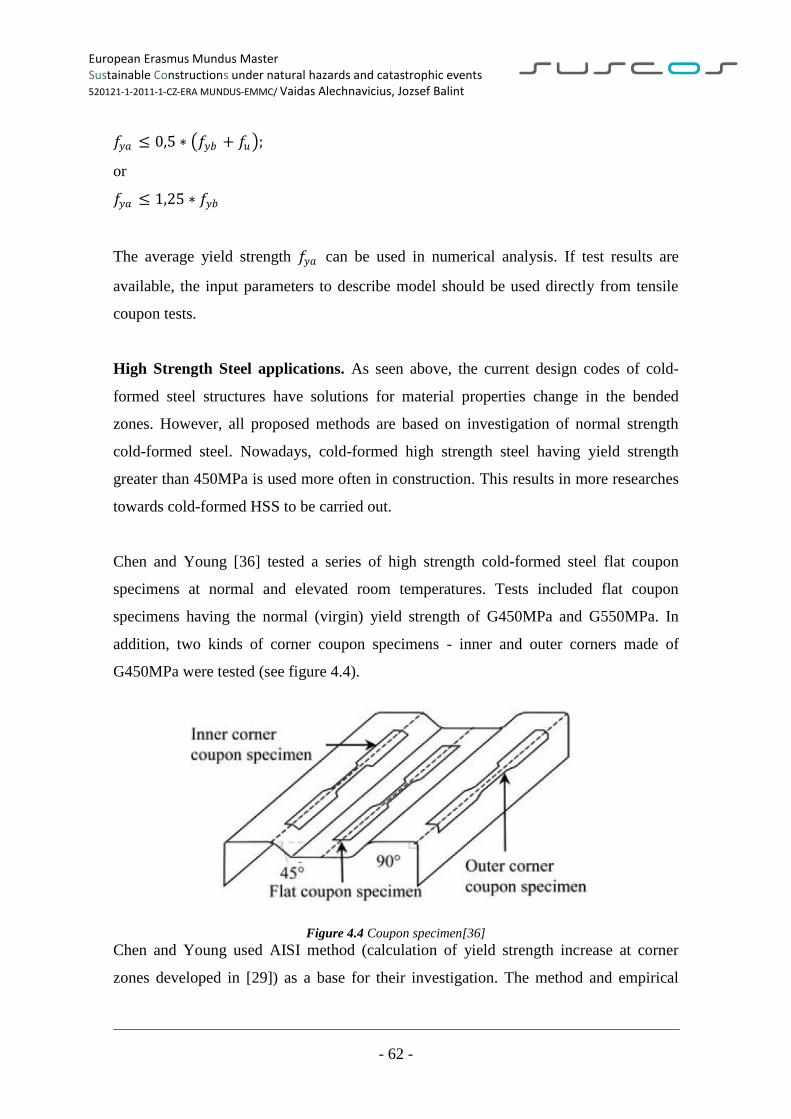
European Erasmus Mundus Master Sustainable Constructions under natural hazards and catastrophic events 520121-1-2011-1-CZ-ERA MUNDUS-EMMC/ Vaidas Alechnavicius, Jozsef Balint
- 62 -
𝑓𝑦𝑎 ≤ 0,5 ∗ 𝑓𝑦𝑏 + 𝑓𝑢 ;
or
𝑓𝑦𝑎 ≤ 1,25 ∗ 𝑓𝑦𝑏
The average yield strength 𝑓𝑦𝑎 can be used in numerical analysis. If test results are
available, the input parameters to describe model should be used directly from tensile
coupon tests.
High Strength Steel applications. As seen above, the current design codes of cold-
formed steel structures have solutions for material properties change in the bended
zones. However, all proposed methods are based on investigation of normal strength
cold-formed steel. Nowadays, cold-formed high strength steel having yield strength
greater than 450MPa is used more often in construction. This results in more researches
towards cold-formed HSS to be carried out.
Chen and Young [36] tested a series of high strength cold-formed steel flat coupon
specimens at normal and elevated room temperatures. Tests included flat coupon
specimens having the normal (virgin) yield strength of G450MPa and G550MPa. In
addition, two kinds of corner coupon specimens - inner and outer corners made of
G450MPa were tested (see figure 4.4).
Figure 4.4 Coupon specimen[36]
Chen and Young used AISI method (calculation of yield strength increase at corner
zones developed in [29]) as a base for their investigation. The method and empirical
European Erasmus Mundus Master Sustainable Constructions under natural hazards and catastrophic events 520121-1-2011-1-CZ-ERA MUNDUS-EMMC/ Vaidas Alechnavicius, Jozsef Balint
- 63 -
coefficients used by AISI are developed and based on normal strength cold-formed
steel. [36] obtained the new strength coefficient k and strain-hardening exponent n, by
measuring the stress-strain curves. They obtained new empirical coefficients:
For G550 steel:
𝐵𝑐 = 3,65 𝐹𝑢𝑣
𝐹𝑦𝑣 − 0,728
𝐹𝑢𝑣
𝐹𝑦𝑣
2
− 1,75,
𝑚 = 0,171 𝐹𝑢𝑣𝐹𝑦𝑣
− 0,073;
For G450 steel:
𝐵𝑐 = 3,70 𝐹𝑢𝑣
𝐹𝑦𝑣 − 0,728
𝐹𝑢𝑣
𝐹𝑦𝑣
2
− 1,88,
𝑚 = 0,171 𝐹𝑢𝑣𝐹𝑦𝑣
− 0,08;
The proposed model accurately predicted the corner strength enhancement in
comparison with the experimental results.
4.3 Geometrical imperfections and residual stresses
To perform a proper geometrical non-linear analysis, some kind of disturbances in the
member shape and material properties must be considered, in order to simulate a real
behaviour of the member. Various characteristics should be analysed and taken into
account if the strength of the member is studied. In the case of cold-formed sections,
these characteristics are:
geometrical imperfections, locally and along the member;
residual stresses and change of yield strength due to cold forming effect.
The magnitude of the imperfection in the member, depends of the shape of the buckling
mode, which can be obtained by eigenbuckling analysis of the compressed member.
Usually, the geometrical imperfections are introduced in numerical models using

European Erasmus Mundus Master Sustainable Constructions under natural hazards and catastrophic events 520121-1-2011-1-CZ-ERA MUNDUS-EMMC/ Vaidas Alechnavicius, Jozsef Balint
- 64 -
equivalent sinusoidal shapes, with half-wavelength corresponding to the instability
mode. Maximum measured imperfections can be conservatively used as an amplitude of
the sinusoidal shape.
Imperfections of cold-formed steel members include bowing, warping and twisting, also
local deviations and bar deflections. The polygonal sections designed in this work
should be prevented from torsional buckling (bowing, warping, twisting) while the main
issue remains the flexural buckling of the whole member and local buckling of the plate.
In the concern of sinusoidal imperfections (bar deflections), the magnitude of 1/1500
times of the member length L is proposed. This value corresponds to a statistical mean
of imperfections of carbon steel columns, as Bjorhovde [37] suggests. Otherwise, the
more conservative value of L/1000 is proposed by ECCS recommendation [38]. For
local imperfections in the plate, usually the value b/200 is taken. b corresponds to the
width of the plate.
Another effect which occurs in the member corners by cold-forming is residual stress. It
is complicated to adequately model residual stresses in the analysis. Lack of data makes
selecting an appropriate magnitude difficult. As a result, residual stresses are often
excluded from the analysis or the stress-strain behaviour of the material is modified to
approximate the effect of residual stresses.
Residual stresses in hot rolled members do not vary throughout the entire thickness –
membrane residual stresses are dominant in this case. Flexural residual stresses
dominate in the cold-formed members, through thickness variation. This variation of
residual stresses can lead to early yielding on the faces of the cold-formed steel plates
and can influence their local buckling strength [39].
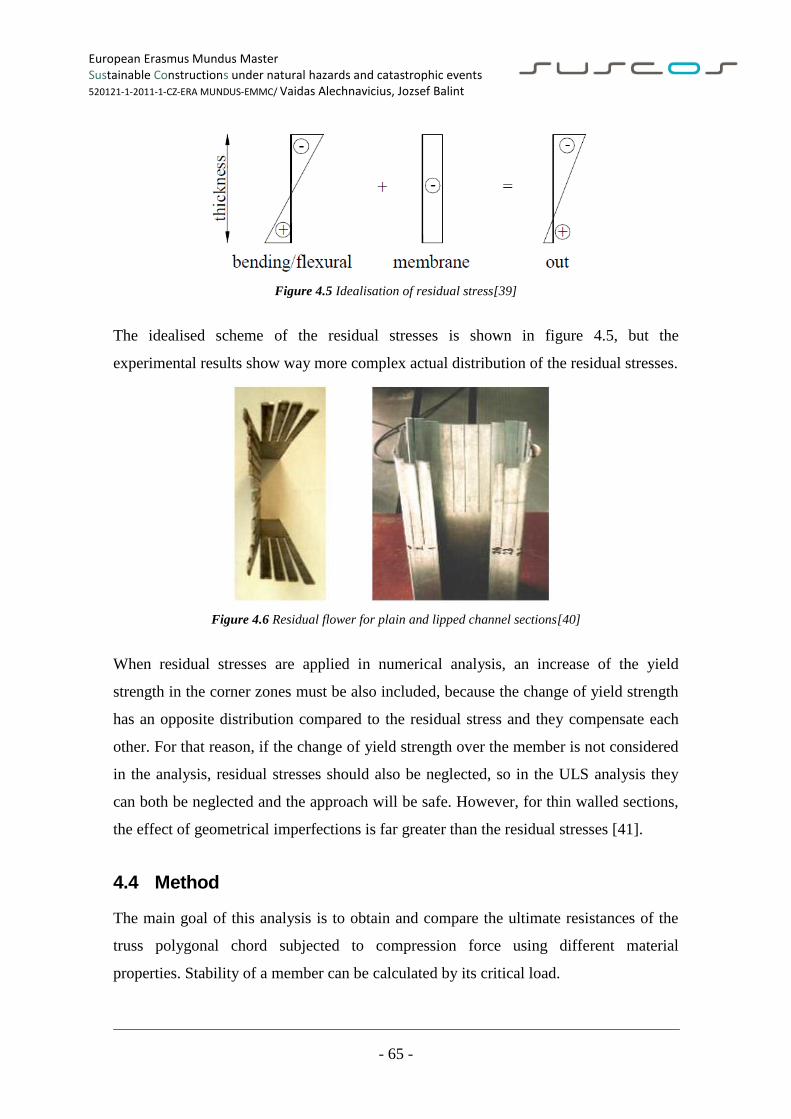
European Erasmus Mundus Master Sustainable Constructions under natural hazards and catastrophic events 520121-1-2011-1-CZ-ERA MUNDUS-EMMC/ Vaidas Alechnavicius, Jozsef Balint
- 65 -
Figure 4.5 Idealisation of residual stress[39]
The idealised scheme of the residual stresses is shown in figure 4.5, but the
experimental results show way more complex actual distribution of the residual stresses.
Figure 4.6 Residual flower for plain and lipped channel sections[40]
When residual stresses are applied in numerical analysis, an increase of the yield
strength in the corner zones must be also included, because the change of yield strength
has an opposite distribution compared to the residual stress and they compensate each
other. For that reason, if the change of yield strength over the member is not considered
in the analysis, residual stresses should also be neglected, so in the ULS analysis they
can both be neglected and the approach will be safe. However, for thin walled sections,
the effect of geometrical imperfections is far greater than the residual stresses [41].
4.4 Method
The main goal of this analysis is to obtain and compare the ultimate resistances of the
truss polygonal chord subjected to compression force using different material
properties. Stability of a member can be calculated by its critical load.
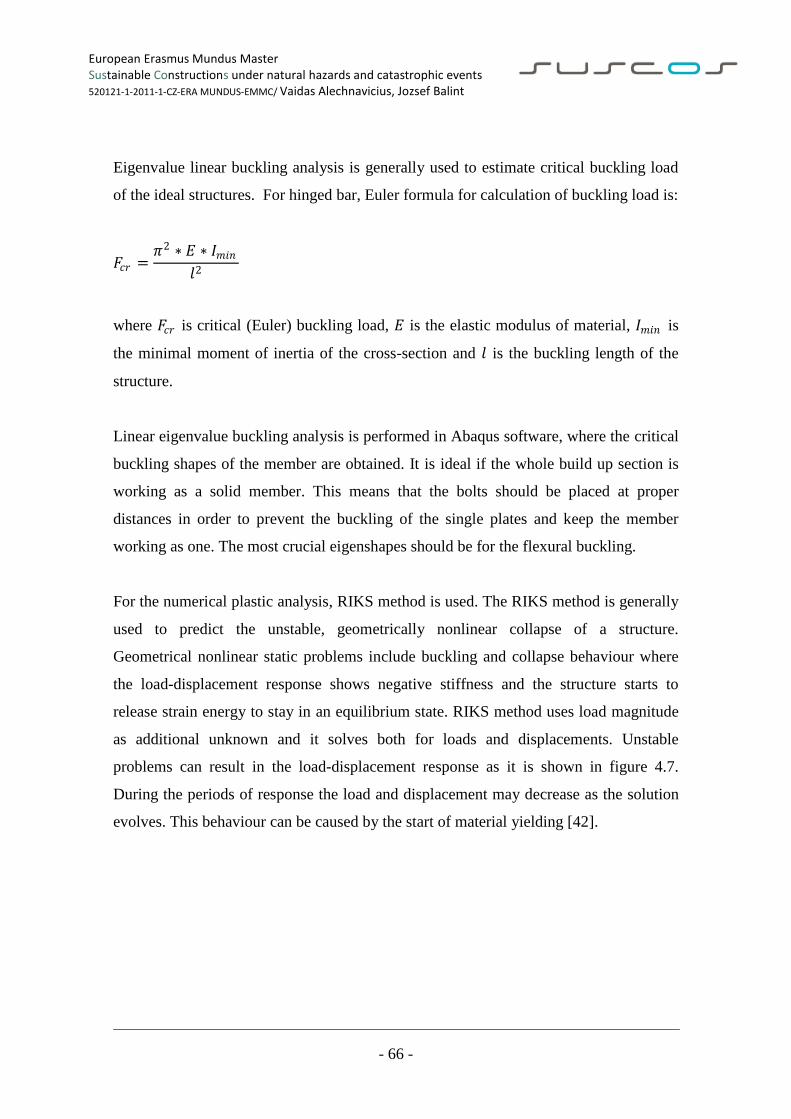
European Erasmus Mundus Master Sustainable Constructions under natural hazards and catastrophic events 520121-1-2011-1-CZ-ERA MUNDUS-EMMC/ Vaidas Alechnavicius, Jozsef Balint
- 66 -
Eigenvalue linear buckling analysis is generally used to estimate critical buckling load
of the ideal structures. For hinged bar, Euler formula for calculation of buckling load is:
𝐹𝑐𝑟 =𝜋2 ∗ 𝐸 ∗ 𝐼𝑚𝑖𝑛
𝑙2
where 𝐹𝑐𝑟 is critical (Euler) buckling load, 𝐸 is the elastic modulus of material, 𝐼𝑚𝑖𝑛 is
the minimal moment of inertia of the cross-section and 𝑙 is the buckling length of the
structure.
Linear eigenvalue buckling analysis is performed in Abaqus software, where the critical
buckling shapes of the member are obtained. It is ideal if the whole build up section is
working as a solid member. This means that the bolts should be placed at proper
distances in order to prevent the buckling of the single plates and keep the member
working as one. The most crucial eigenshapes should be for the flexural buckling.
For the numerical plastic analysis, RIKS method is used. The RIKS method is generally
used to predict the unstable, geometrically nonlinear collapse of a structure.
Geometrical nonlinear static problems include buckling and collapse behaviour where
the load-displacement response shows negative stiffness and the structure starts to
release strain energy to stay in an equilibrium state. RIKS method uses load magnitude
as additional unknown and it solves both for loads and displacements. Unstable
problems can result in the load-displacement response as it is shown in figure 4.7.
During the periods of response the load and displacement may decrease as the solution
evolves. This behaviour can be caused by the start of material yielding [42].
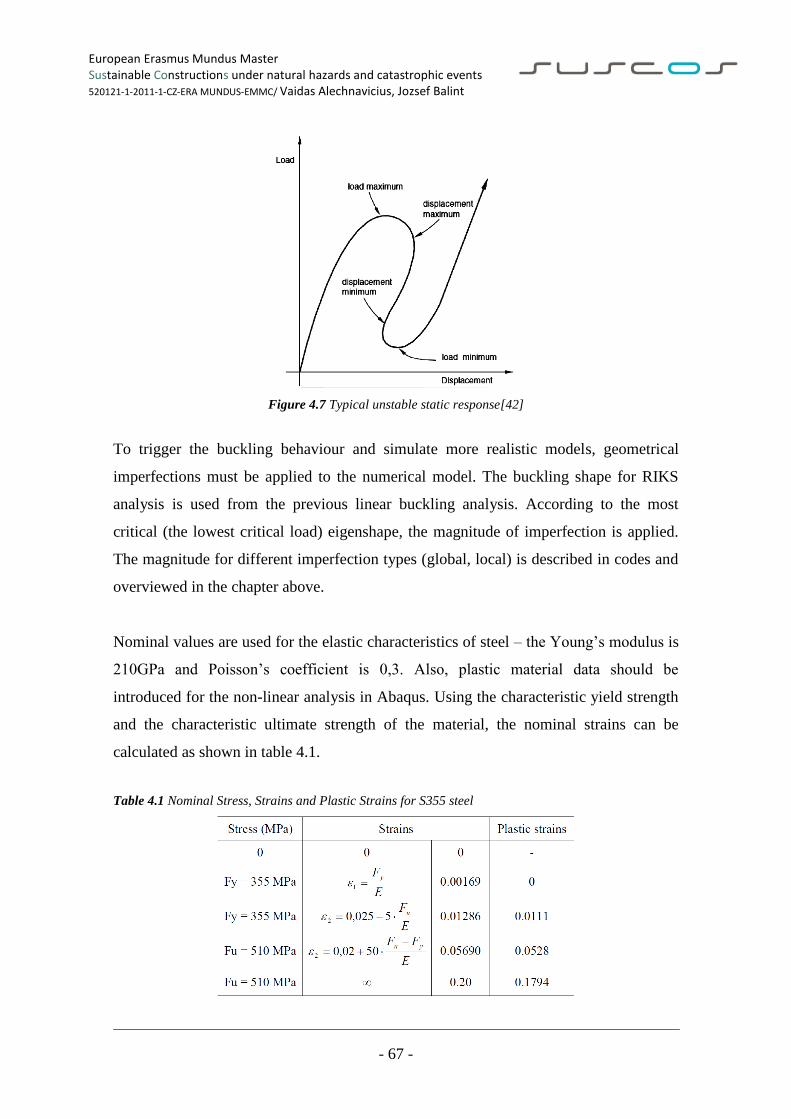
European Erasmus Mundus Master Sustainable Constructions under natural hazards and catastrophic events 520121-1-2011-1-CZ-ERA MUNDUS-EMMC/ Vaidas Alechnavicius, Jozsef Balint
- 67 -
Figure 4.7 Typical unstable static response[42]
To trigger the buckling behaviour and simulate more realistic models, geometrical
imperfections must be applied to the numerical model. The buckling shape for RIKS
analysis is used from the previous linear buckling analysis. According to the most
critical (the lowest critical load) eigenshape, the magnitude of imperfection is applied.
The magnitude for different imperfection types (global, local) is described in codes and
overviewed in the chapter above.
Nominal values are used for the elastic characteristics of steel – the Young’s modulus is
210GPa and Poisson’s coefficient is 0,3. Also, plastic material data should be
introduced for the non-linear analysis in Abaqus. Using the characteristic yield strength
and the characteristic ultimate strength of the material, the nominal strains can be
calculated as shown in table 4.1.
Table 4.1 Nominal Stress, Strains and Plastic Strains for S355 steel
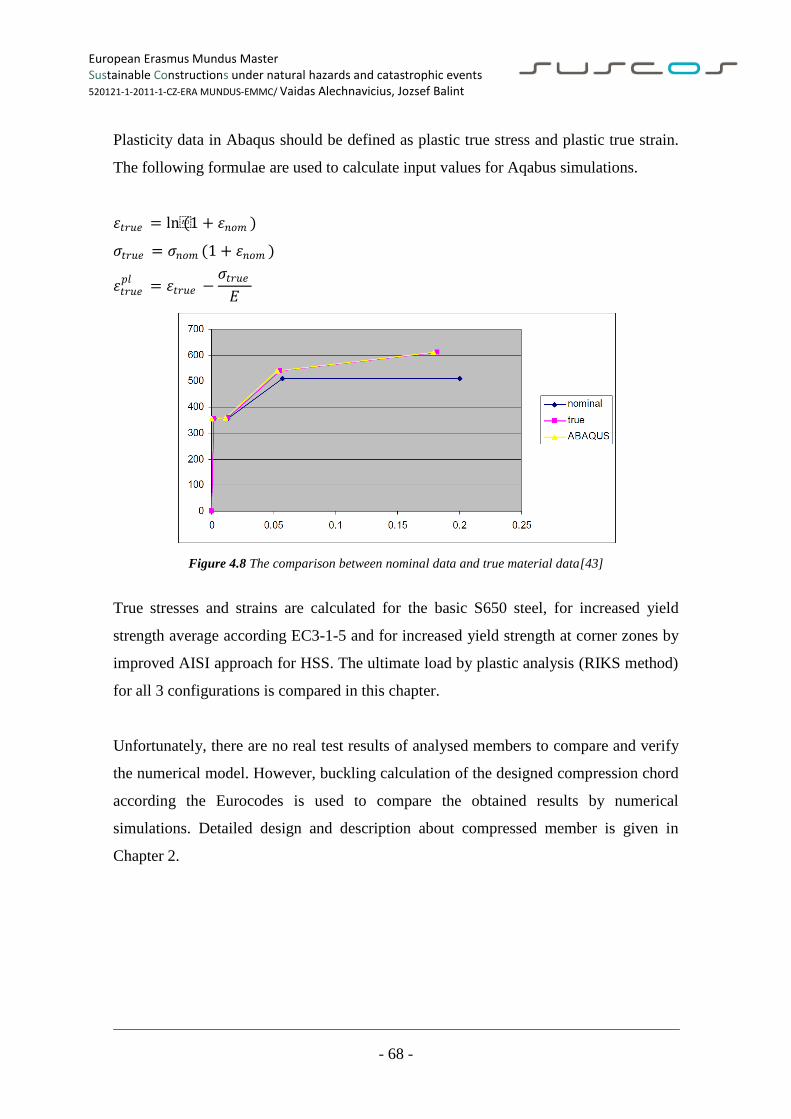
European Erasmus Mundus Master Sustainable Constructions under natural hazards and catastrophic events 520121-1-2011-1-CZ-ERA MUNDUS-EMMC/ Vaidas Alechnavicius, Jozsef Balint
- 68 -
Plasticity data in Abaqus should be defined as plastic true stress and plastic true strain.
The following formulae are used to calculate input values for Aqabus simulations.
𝜀𝑡𝑟𝑢𝑒 = ln(1 + 𝜀𝑛𝑜𝑚 )
𝜍𝑡𝑟𝑢𝑒 = 𝜍𝑛𝑜𝑚 (1 + 𝜀𝑛𝑜𝑚 )
𝜀𝑡𝑟𝑢𝑒𝑝𝑙 = 𝜀𝑡𝑟𝑢𝑒 −
𝜍𝑡𝑟𝑢𝑒𝐸
Figure 4.8 The comparison between nominal data and true material data[43]
True stresses and strains are calculated for the basic S650 steel, for increased yield
strength average according EC3-1-5 and for increased yield strength at corner zones by
improved AISI approach for HSS. The ultimate load by plastic analysis (RIKS method)
for all 3 configurations is compared in this chapter.
Unfortunately, there are no real test results of analysed members to compare and verify
the numerical model. However, buckling calculation of the designed compression chord
according the Eurocodes is used to compare the obtained results by numerical
simulations. Detailed design and description about compressed member is given in
Chapter 2.
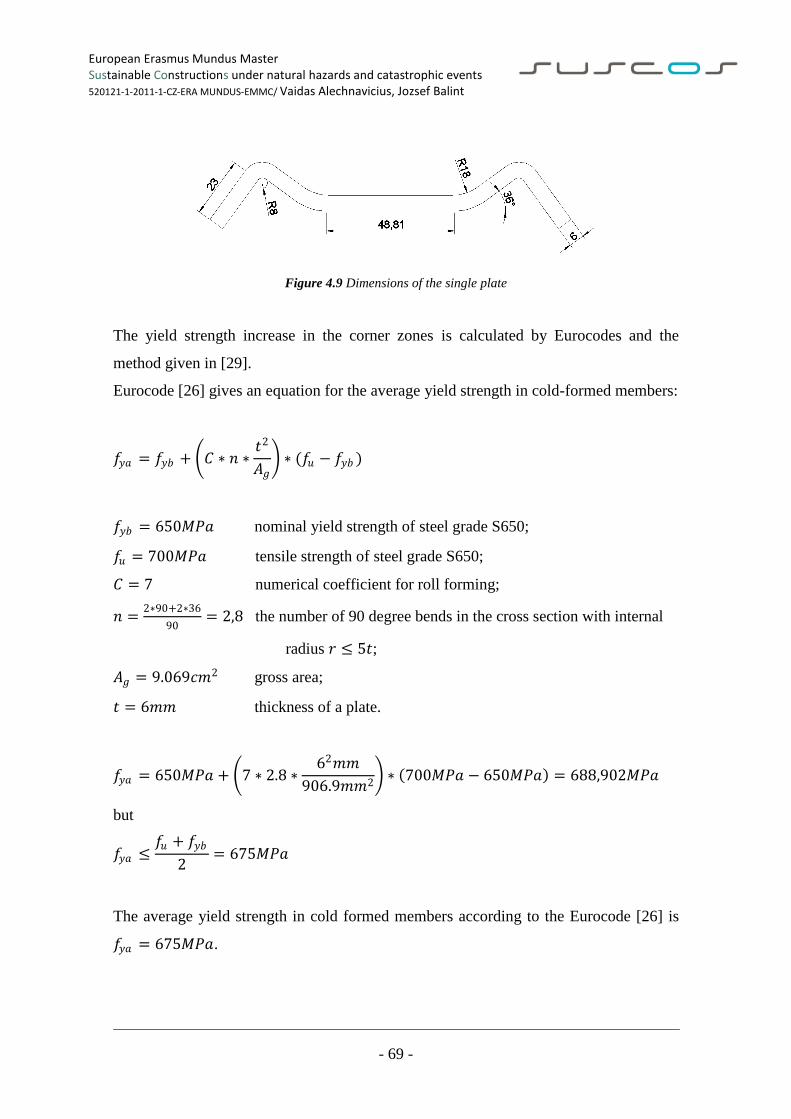
European Erasmus Mundus Master Sustainable Constructions under natural hazards and catastrophic events 520121-1-2011-1-CZ-ERA MUNDUS-EMMC/ Vaidas Alechnavicius, Jozsef Balint
- 69 -
Figure 4.9 Dimensions of the single plate
The yield strength increase in the corner zones is calculated by Eurocodes and the
method given in [29].
Eurocode [26] gives an equation for the average yield strength in cold-formed members:
𝑓𝑦𝑎 = 𝑓𝑦𝑏 + 𝐶 ∗ 𝑛 ∗𝑡2
𝐴𝑔 ∗ (𝑓𝑢 − 𝑓𝑦𝑏 )
𝑓𝑦𝑏 = 650𝑀𝑃𝑎 nominal yield strength of steel grade S650;
𝑓𝑢 = 700𝑀𝑃𝑎 tensile strength of steel grade S650;
𝐶 = 7 numerical coefficient for roll forming;
𝑛 =2∗90+2∗36
90= 2,8 the number of 90 degree bends in the cross section with internal
radius 𝑟 ≤ 5𝑡;
𝐴𝑔 = 9.069𝑐𝑚2 gross area;
𝑡 = 6𝑚𝑚 thickness of a plate.
𝑓𝑦𝑎 = 650𝑀𝑃𝑎 + 7 ∗ 2.8 ∗62𝑚𝑚
906.9𝑚𝑚2 ∗ 700𝑀𝑃𝑎 − 650𝑀𝑃𝑎 = 688,902𝑀𝑃𝑎
but
𝑓𝑦𝑎 ≤𝑓𝑢 + 𝑓𝑦𝑏
2= 675𝑀𝑃𝑎
The average yield strength in cold formed members according to the Eurocode [26] is
𝑓𝑦𝑎 = 675𝑀𝑃𝑎.
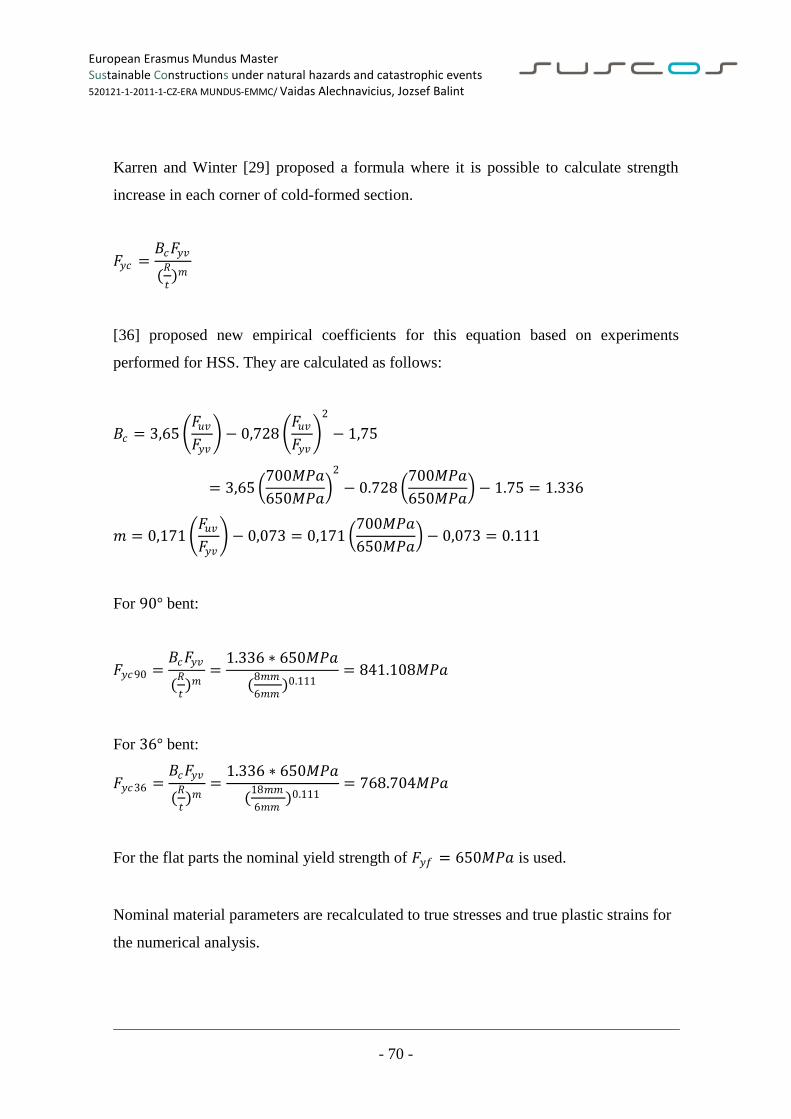
European Erasmus Mundus Master Sustainable Constructions under natural hazards and catastrophic events 520121-1-2011-1-CZ-ERA MUNDUS-EMMC/ Vaidas Alechnavicius, Jozsef Balint
- 70 -
Karren and Winter [29] proposed a formula where it is possible to calculate strength
increase in each corner of cold-formed section.
𝐹𝑦𝑐 =𝐵𝑐𝐹𝑦𝑣
(𝑅
𝑡)𝑚
[36] proposed new empirical coefficients for this equation based on experiments
performed for HSS. They are calculated as follows:
𝐵𝑐 = 3,65 𝐹𝑢𝑣𝐹𝑦𝑣
− 0,728 𝐹𝑢𝑣𝐹𝑦𝑣
2
− 1,75
= 3,65 700𝑀𝑃𝑎
650𝑀𝑃𝑎
2
− 0.728 700𝑀𝑃𝑎
650𝑀𝑃𝑎 − 1.75 = 1.336
𝑚 = 0,171 𝐹𝑢𝑣𝐹𝑦𝑣
− 0,073 = 0,171 700𝑀𝑃𝑎
650𝑀𝑃𝑎 − 0,073 = 0.111
For 90° bent:
𝐹𝑦𝑐90 =𝐵𝑐𝐹𝑦𝑣
(𝑅
𝑡)𝑚
=1.336 ∗ 650𝑀𝑃𝑎
(8𝑚𝑚
6𝑚𝑚)0.111
= 841.108𝑀𝑃𝑎
For 36° bent:
𝐹𝑦𝑐36 =𝐵𝑐𝐹𝑦𝑣
(𝑅
𝑡)𝑚
=1.336 ∗ 650𝑀𝑃𝑎
(18𝑚𝑚
6𝑚𝑚)0.111
= 768.704𝑀𝑃𝑎
For the flat parts the nominal yield strength of 𝐹𝑦𝑓 = 650𝑀𝑃𝑎 is used.
Nominal material parameters are recalculated to true stresses and true plastic strains for
the numerical analysis.
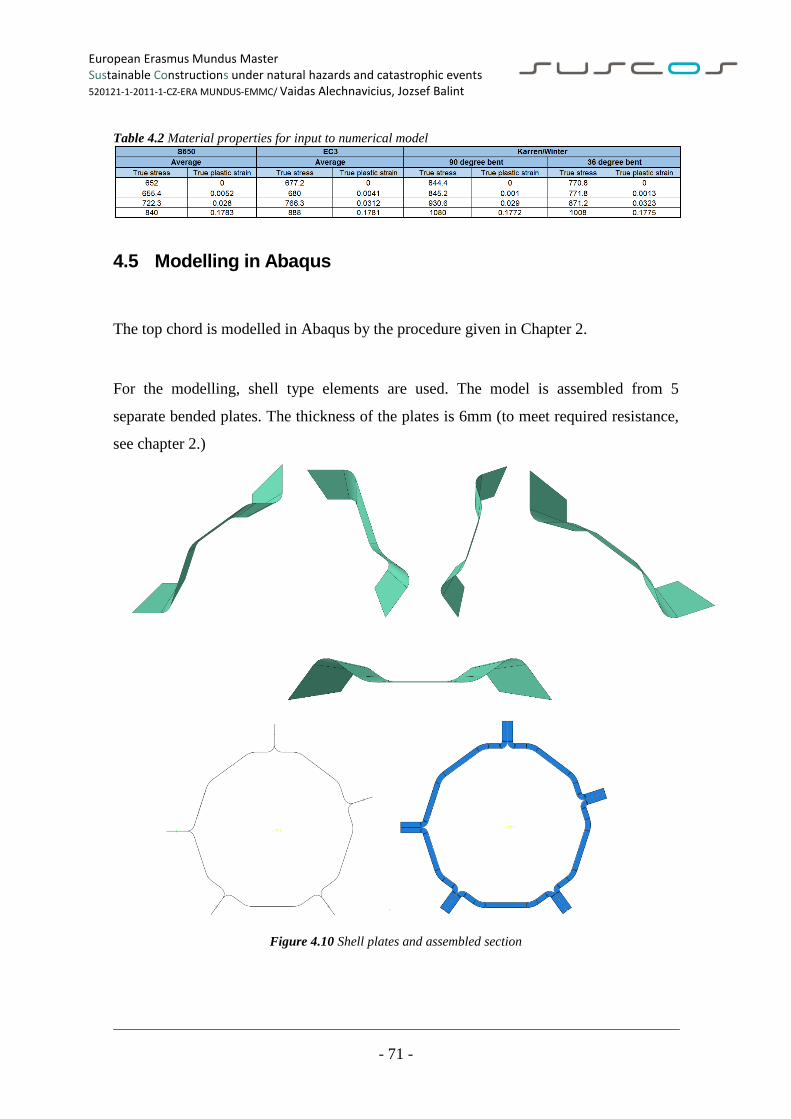
European Erasmus Mundus Master Sustainable Constructions under natural hazards and catastrophic events 520121-1-2011-1-CZ-ERA MUNDUS-EMMC/ Vaidas Alechnavicius, Jozsef Balint
- 71 -
Table 4.2 Material properties for input to numerical model
4.5 Modelling in Abaqus
The top chord is modelled in Abaqus by the procedure given in Chapter 2.
For the modelling, shell type elements are used. The model is assembled from 5
separate bended plates. The thickness of the plates is 6mm (to meet required resistance,
see chapter 2.)
Figure 4.10 Shell plates and assembled section
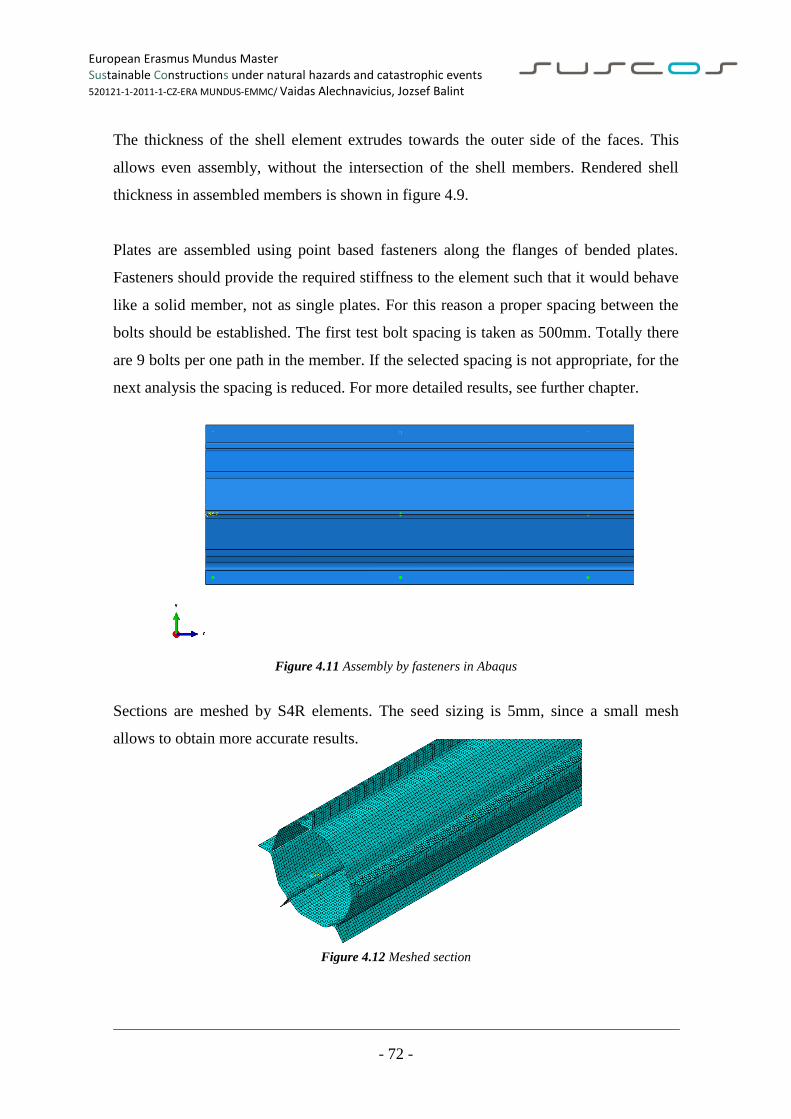
European Erasmus Mundus Master Sustainable Constructions under natural hazards and catastrophic events 520121-1-2011-1-CZ-ERA MUNDUS-EMMC/ Vaidas Alechnavicius, Jozsef Balint
- 72 -
The thickness of the shell element extrudes towards the outer side of the faces. This
allows even assembly, without the intersection of the shell members. Rendered shell
thickness in assembled members is shown in figure 4.9.
Plates are assembled using point based fasteners along the flanges of bended plates.
Fasteners should provide the required stiffness to the element such that it would behave
like a solid member, not as single plates. For this reason a proper spacing between the
bolts should be established. The first test bolt spacing is taken as 500mm. Totally there
are 9 bolts per one path in the member. If the selected spacing is not appropriate, for the
next analysis the spacing is reduced. For more detailed results, see further chapter.
Figure 4.11 Assembly by fasteners in Abaqus
Sections are meshed by S4R elements. The seed sizing is 5mm, since a small mesh
allows to obtain more accurate results.
Figure 4.12 Meshed section
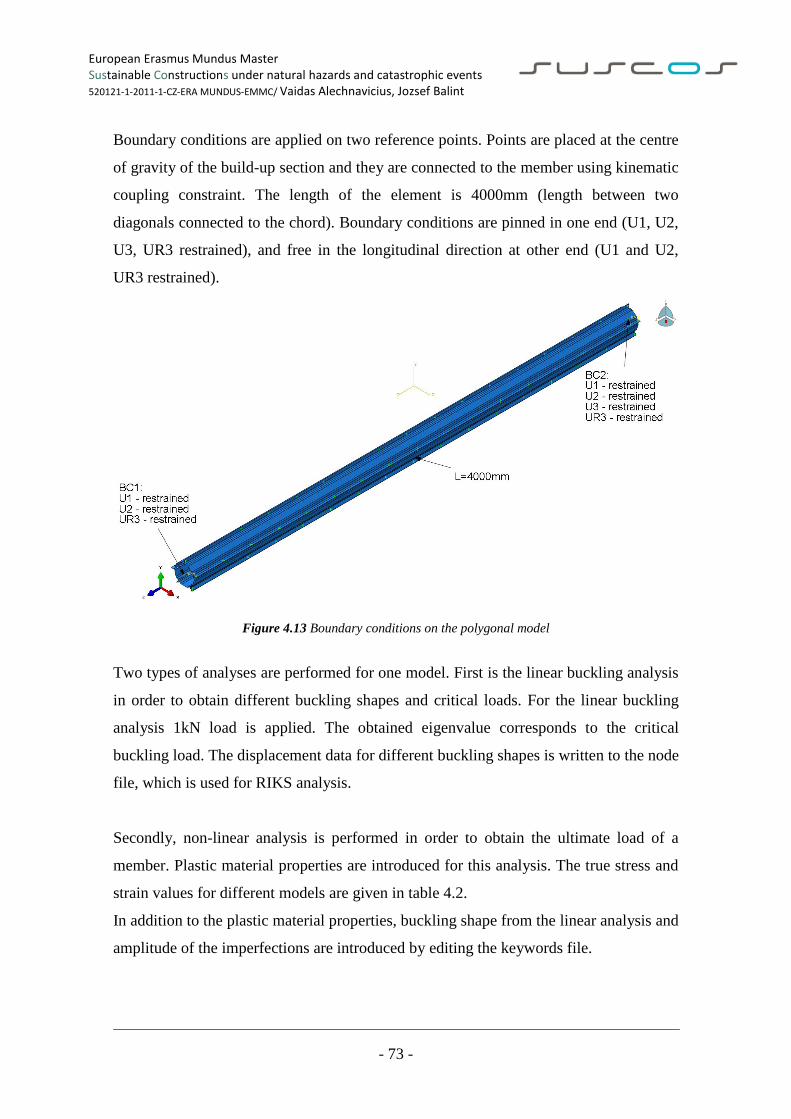
European Erasmus Mundus Master Sustainable Constructions under natural hazards and catastrophic events 520121-1-2011-1-CZ-ERA MUNDUS-EMMC/ Vaidas Alechnavicius, Jozsef Balint
- 73 -
Boundary conditions are applied on two reference points. Points are placed at the centre
of gravity of the build-up section and they are connected to the member using kinematic
coupling constraint. The length of the element is 4000mm (length between two
diagonals connected to the chord). Boundary conditions are pinned in one end (U1, U2,
U3, UR3 restrained), and free in the longitudinal direction at other end (U1 and U2,
UR3 restrained).
Figure 4.13 Boundary conditions on the polygonal model
Two types of analyses are performed for one model. First is the linear buckling analysis
in order to obtain different buckling shapes and critical loads. For the linear buckling
analysis 1kN load is applied. The obtained eigenvalue corresponds to the critical
buckling load. The displacement data for different buckling shapes is written to the node
file, which is used for RIKS analysis.
Secondly, non-linear analysis is performed in order to obtain the ultimate load of a
member. Plastic material properties are introduced for this analysis. The true stress and
strain values for different models are given in table 4.2.
In addition to the plastic material properties, buckling shape from the linear analysis and
amplitude of the imperfections are introduced by editing the keywords file.
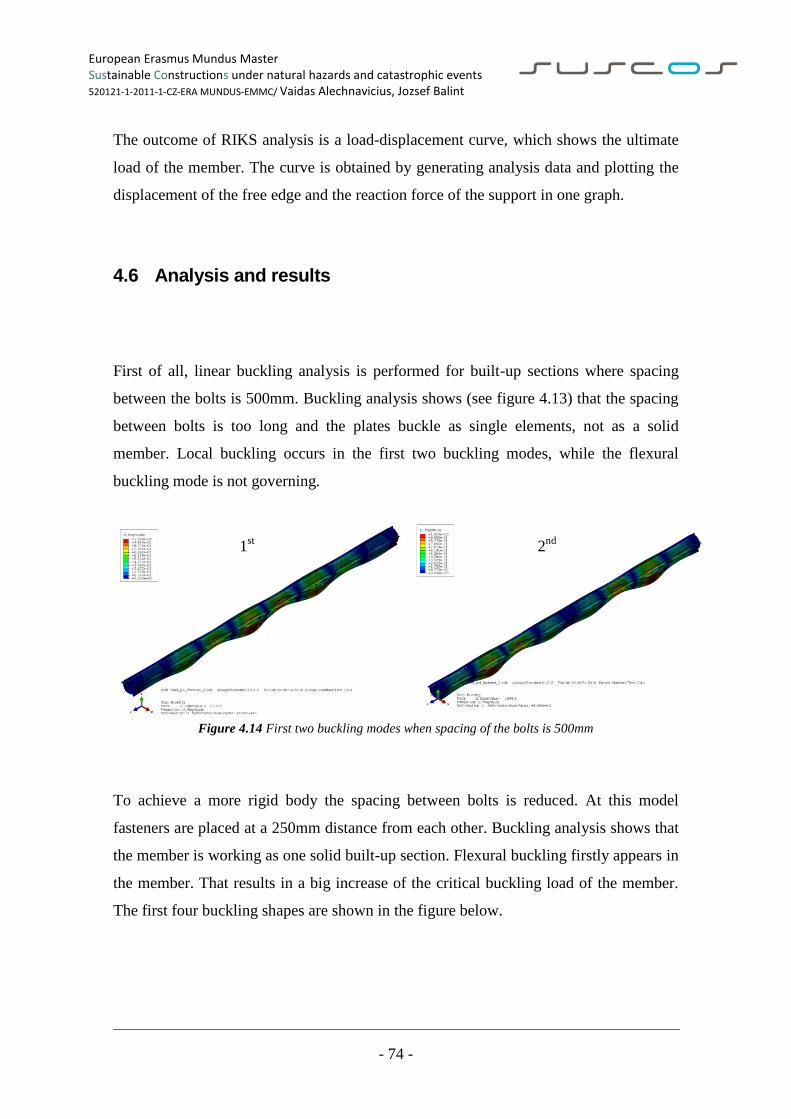
European Erasmus Mundus Master Sustainable Constructions under natural hazards and catastrophic events 520121-1-2011-1-CZ-ERA MUNDUS-EMMC/ Vaidas Alechnavicius, Jozsef Balint
- 74 -
1st
2nd
The outcome of RIKS analysis is a load-displacement curve, which shows the ultimate
load of the member. The curve is obtained by generating analysis data and plotting the
displacement of the free edge and the reaction force of the support in one graph.
4.6 Analysis and results
First of all, linear buckling analysis is performed for built-up sections where spacing
between the bolts is 500mm. Buckling analysis shows (see figure 4.13) that the spacing
between bolts is too long and the plates buckle as single elements, not as a solid
member. Local buckling occurs in the first two buckling modes, while the flexural
buckling mode is not governing.
Figure 4.14 First two buckling modes when spacing of the bolts is 500mm
To achieve a more rigid body the spacing between bolts is reduced. At this model
fasteners are placed at a 250mm distance from each other. Buckling analysis shows that
the member is working as one solid built-up section. Flexural buckling firstly appears in
the member. That results in a big increase of the critical buckling load of the member.
The first four buckling shapes are shown in the figure below.
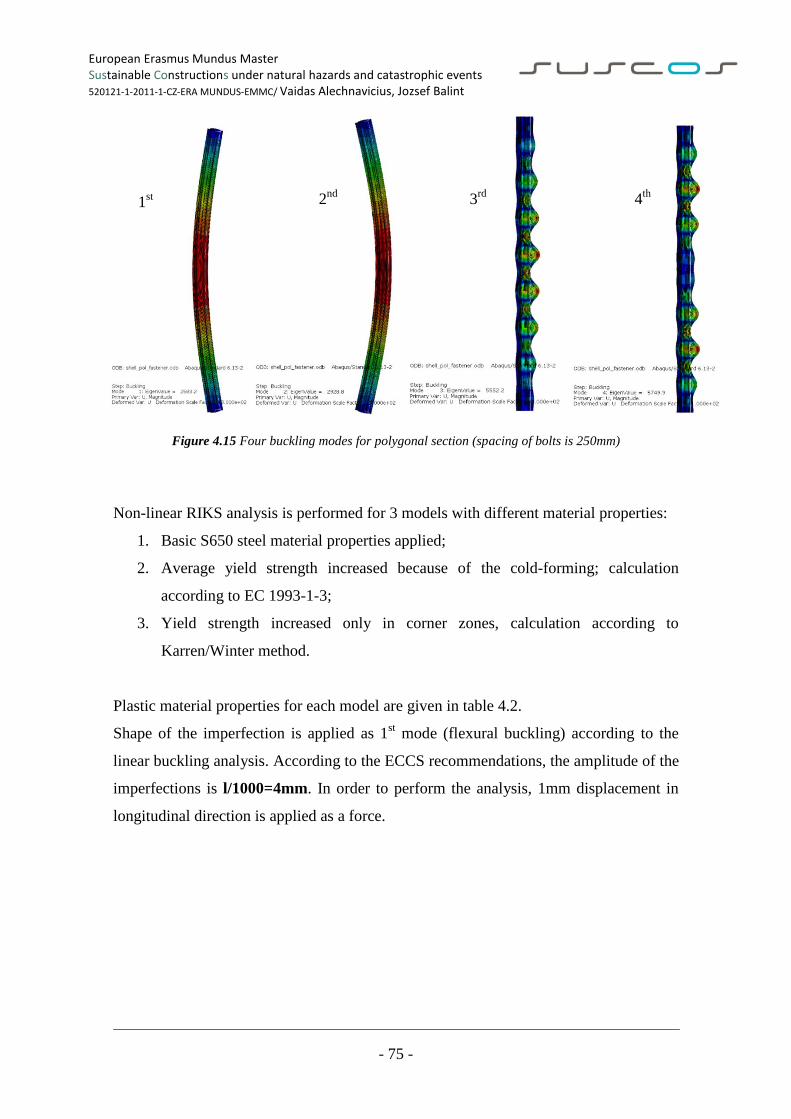
European Erasmus Mundus Master Sustainable Constructions under natural hazards and catastrophic events 520121-1-2011-1-CZ-ERA MUNDUS-EMMC/ Vaidas Alechnavicius, Jozsef Balint
- 75 -
1st 2
nd 3
rd 4
th
Figure 4.15 Four buckling modes for polygonal section (spacing of bolts is 250mm)
Non-linear RIKS analysis is performed for 3 models with different material properties:
1. Basic S650 steel material properties applied;
2. Average yield strength increased because of the cold-forming; calculation
according to EC 1993-1-3;
3. Yield strength increased only in corner zones, calculation according to
Karren/Winter method.
Plastic material properties for each model are given in table 4.2.
Shape of the imperfection is applied as 1st mode (flexural buckling) according to the
linear buckling analysis. According to the ECCS recommendations, the amplitude of the
imperfections is l/1000=4mm. In order to perform the analysis, 1mm displacement in
longitudinal direction is applied as a force.
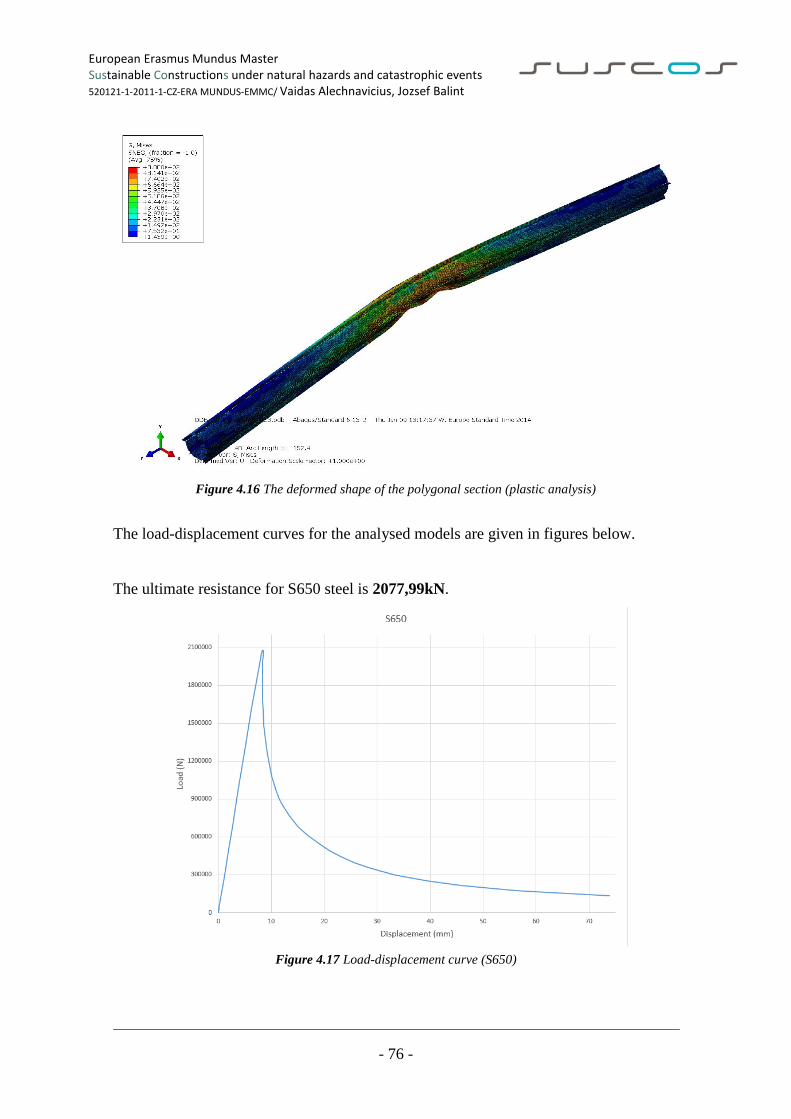
European Erasmus Mundus Master Sustainable Constructions under natural hazards and catastrophic events 520121-1-2011-1-CZ-ERA MUNDUS-EMMC/ Vaidas Alechnavicius, Jozsef Balint
- 76 -
Figure 4.16 The deformed shape of the polygonal section (plastic analysis)
The load-displacement curves for the analysed models are given in figures below.
The ultimate resistance for S650 steel is 2077,99kN.
Figure 4.17 Load-displacement curve (S650)
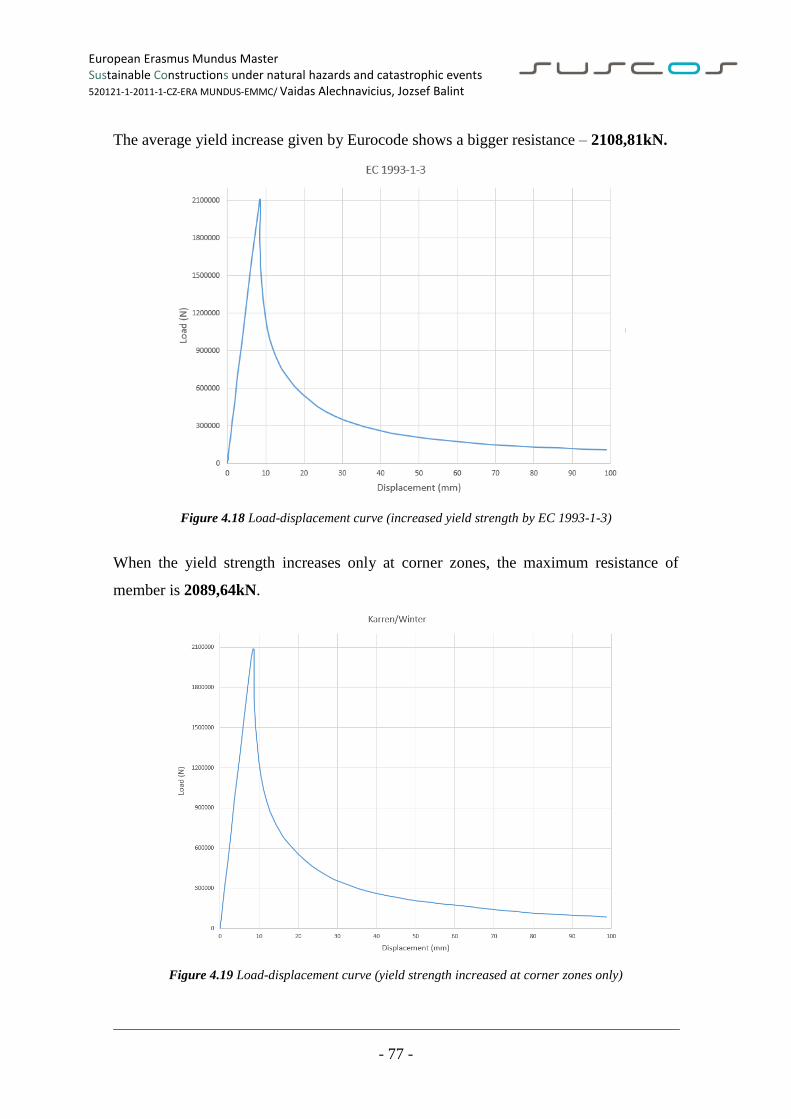
European Erasmus Mundus Master Sustainable Constructions under natural hazards and catastrophic events 520121-1-2011-1-CZ-ERA MUNDUS-EMMC/ Vaidas Alechnavicius, Jozsef Balint
- 77 -
The average yield increase given by Eurocode shows a bigger resistance – 2108,81kN.
Figure 4.18 Load-displacement curve (increased yield strength by EC 1993-1-3)
When the yield strength increases only at corner zones, the maximum resistance of
member is 2089,64kN.
Figure 4.19 Load-displacement curve (yield strength increased at corner zones only)
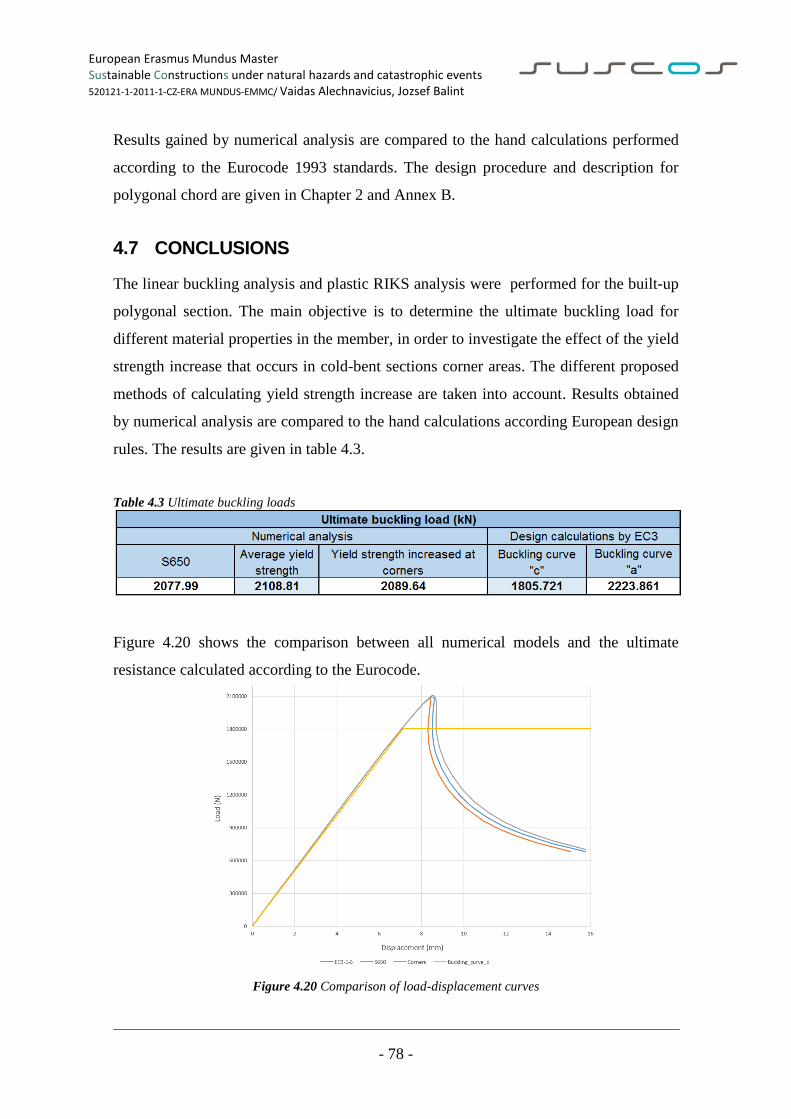
European Erasmus Mundus Master Sustainable Constructions under natural hazards and catastrophic events 520121-1-2011-1-CZ-ERA MUNDUS-EMMC/ Vaidas Alechnavicius, Jozsef Balint
- 78 -
Results gained by numerical analysis are compared to the hand calculations performed
according to the Eurocode 1993 standards. The design procedure and description for
polygonal chord are given in Chapter 2 and Annex B.
4.7 CONCLUSIONS
The linear buckling analysis and plastic RIKS analysis were performed for the built-up
polygonal section. The main objective is to determine the ultimate buckling load for
different material properties in the member, in order to investigate the effect of the yield
strength increase that occurs in cold-bent sections corner areas. The different proposed
methods of calculating yield strength increase are taken into account. Results obtained
by numerical analysis are compared to the hand calculations according European design
rules. The results are given in table 4.3.
Table 4.3 Ultimate buckling loads
Figure 4.20 shows the comparison between all numerical models and the ultimate
resistance calculated according to the Eurocode.
Figure 4.20 Comparison of load-displacement curves
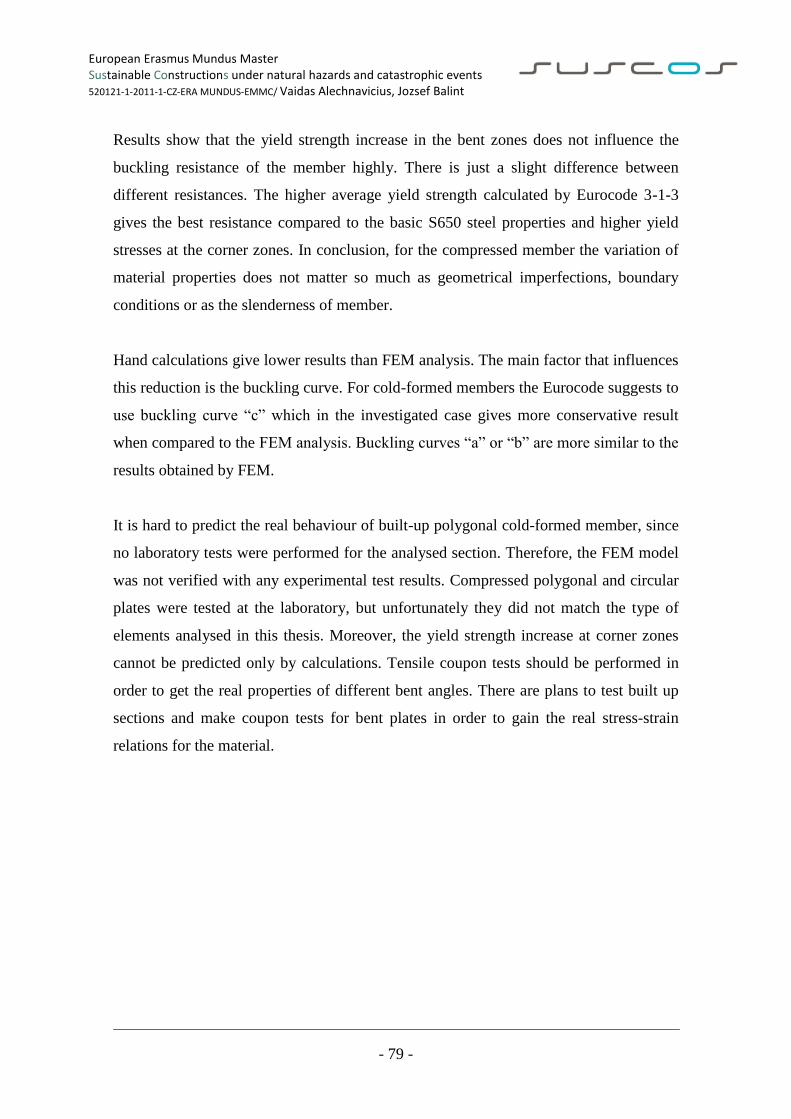
European Erasmus Mundus Master Sustainable Constructions under natural hazards and catastrophic events 520121-1-2011-1-CZ-ERA MUNDUS-EMMC/ Vaidas Alechnavicius, Jozsef Balint
- 79 -
Results show that the yield strength increase in the bent zones does not influence the
buckling resistance of the member highly. There is just a slight difference between
different resistances. The higher average yield strength calculated by Eurocode 3-1-3
gives the best resistance compared to the basic S650 steel properties and higher yield
stresses at the corner zones. In conclusion, for the compressed member the variation of
material properties does not matter so much as geometrical imperfections, boundary
conditions or as the slenderness of member.
Hand calculations give lower results than FEM analysis. The main factor that influences
this reduction is the buckling curve. For cold-formed members the Eurocode suggests to
use buckling curve “c” which in the investigated case gives more conservative result
when compared to the FEM analysis. Buckling curves “a” or “b” are more similar to the
results obtained by FEM.
It is hard to predict the real behaviour of built-up polygonal cold-formed member, since
no laboratory tests were performed for the analysed section. Therefore, the FEM model
was not verified with any experimental test results. Compressed polygonal and circular
plates were tested at the laboratory, but unfortunately they did not match the type of
elements analysed in this thesis. Moreover, the yield strength increase at corner zones
cannot be predicted only by calculations. Tensile coupon tests should be performed in
order to get the real properties of different bent angles. There are plans to test built up
sections and make coupon tests for bent plates in order to gain the real stress-strain
relations for the material.
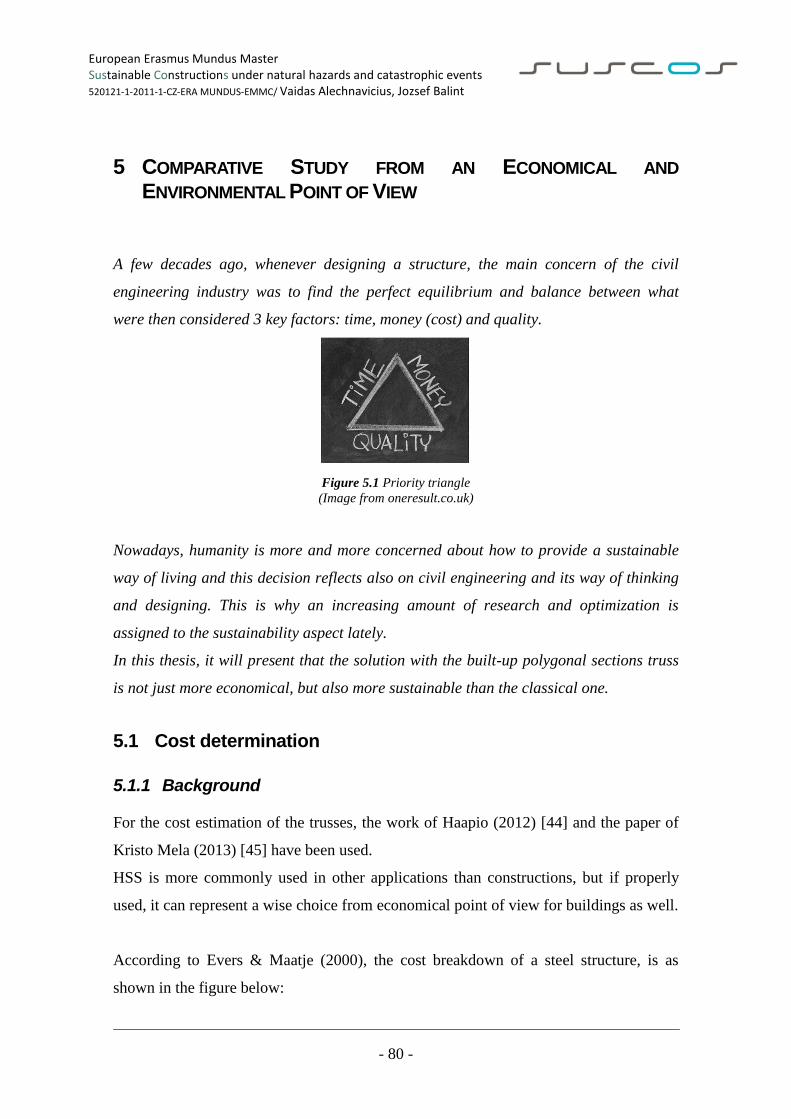
European Erasmus Mundus Master Sustainable Constructions under natural hazards and catastrophic events 520121-1-2011-1-CZ-ERA MUNDUS-EMMC/ Vaidas Alechnavicius, Jozsef Balint
- 80 -
5 COMPARATIVE STUDY FROM AN ECONOMICAL AND
ENVIRONMENTAL POINT OF VIEW
A few decades ago, whenever designing a structure, the main concern of the civil
engineering industry was to find the perfect equilibrium and balance between what
were then considered 3 key factors: time, money (cost) and quality.
Figure 5.1 Priority triangle
(Image from oneresult.co.uk)
Nowadays, humanity is more and more concerned about how to provide a sustainable
way of living and this decision reflects also on civil engineering and its way of thinking
and designing. This is why an increasing amount of research and optimization is
assigned to the sustainability aspect lately.
In this thesis, it will present that the solution with the built-up polygonal sections truss
is not just more economical, but also more sustainable than the classical one.
5.1 Cost determination
5.1.1 Background
For the cost estimation of the trusses, the work of Haapio (2012) [44] and the paper of
Kristo Mela (2013) [45] have been used.
HSS is more commonly used in other applications than constructions, but if properly
used, it can represent a wise choice from economical point of view for buildings as well.
According to Evers & Maatje (2000), the cost breakdown of a steel structure, is as
shown in the figure below:
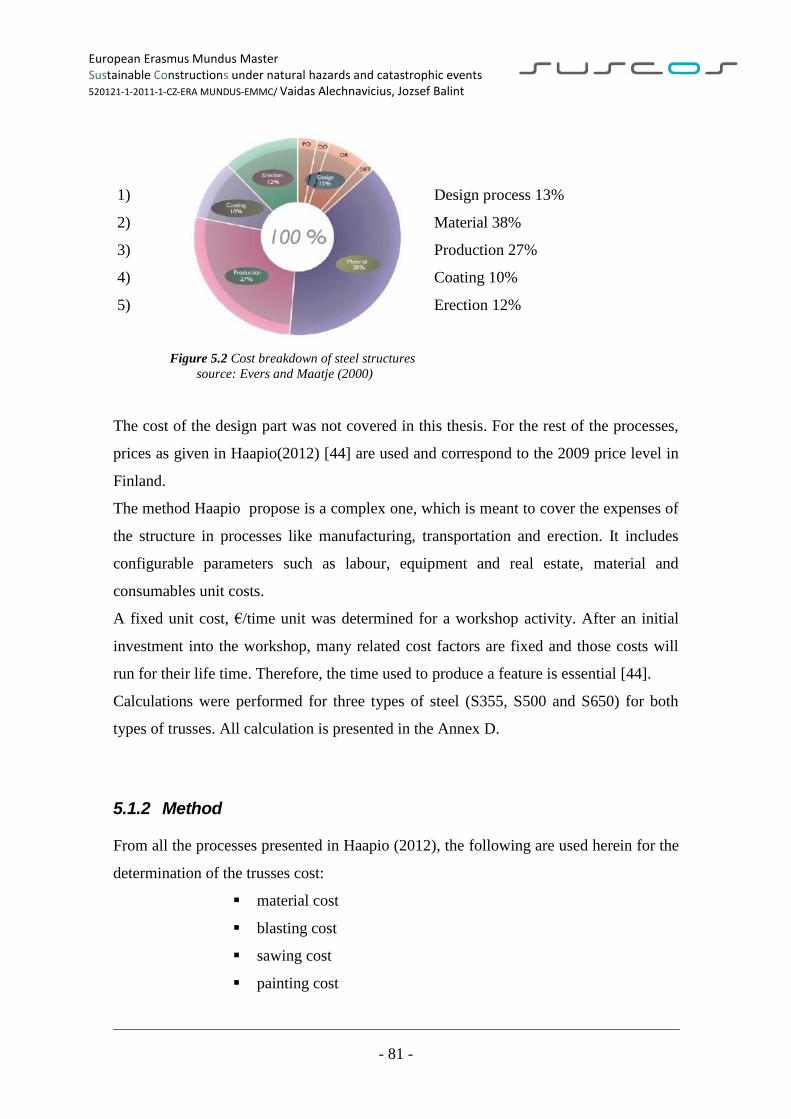
European Erasmus Mundus Master Sustainable Constructions under natural hazards and catastrophic events 520121-1-2011-1-CZ-ERA MUNDUS-EMMC/ Vaidas Alechnavicius, Jozsef Balint
- 81 -
1) Design process 13%
2) Material 38%
3) Production 27%
4) Coating 10%
5) Erection 12%
Figure 5.2 Cost breakdown of steel structures
source: Evers and Maatje (2000)
The cost of the design part was not covered in this thesis. For the rest of the processes,
prices as given in Haapio(2012) [44] are used and correspond to the 2009 price level in
Finland.
The method Haapio propose is a complex one, which is meant to cover the expenses of
the structure in processes like manufacturing, transportation and erection. It includes
configurable parameters such as labour, equipment and real estate, material and
consumables unit costs.
A fixed unit cost, €/time unit was determined for a workshop activity. After an initial
investment into the workshop, many related cost factors are fixed and those costs will
run for their life time. Therefore, the time used to produce a feature is essential [44].
Calculations were performed for three types of steel (S355, S500 and S650) for both
types of trusses. All calculation is presented in the Annex D.
5.1.2 Method
From all the processes presented in Haapio (2012), the following are used herein for the
determination of the trusses cost:
material cost
blasting cost
sawing cost
painting cost
European Erasmus Mundus Master Sustainable Constructions under natural hazards and catastrophic events 520121-1-2011-1-CZ-ERA MUNDUS-EMMC/ Vaidas Alechnavicius, Jozsef Balint
- 82 -
transportation cost
erecting cost
Therefore, the total costs are just approximate to the real values, but this should not
affect the aim of the comparative study between the CHS truss and the polygonal cross-
section truss, since both types of trusses are calculated using the same method and
principle.
Next, details are presented about how each of the mentioned processes is calculated and
what variables are taken into account.
Note should be taken that for some processes formulae from [45] are used, which may
differ as form from the original ones, but they also have as basis formulae from Haapio
(2012). That is the reason for which some calculation data is not matching [44].
Material cost.
The total cost of the steel elements is calculated using the following formula:
𝐶𝑆𝑀 = 𝑊𝑠𝑚𝑝𝑙 × 𝐶𝑠𝑚𝑏𝑝 + 𝐶𝑠𝑚𝑔 + 𝐶𝑠𝑚𝑡 + 𝐶𝑠𝑚𝑞
where
𝑊𝑠𝑚𝑝𝑙 [kg] is the steel weight
𝐶𝑠𝑚𝑏𝑝 [€/kg] is the basic cost
𝐶𝑠𝑚𝑔 [€/kg] is the steel grade add-on
𝐶𝑠𝑚𝑡 [€/kg] is the thickness add-on
𝐶𝑠𝑚𝑞 [€/kg] is the quantity add-on
Blasting cost.
The elements are introduced into a shot blasting chamber at a constant speed. The total
blasting cost can be calculated by the following formula:
𝐶𝐵 = 𝑇𝑃𝐵 × 𝑐𝐿𝐵 + 𝑐𝐸𝑞𝐵 + 𝑐𝑀𝐵 + 𝑐𝑅𝐸𝐵 + 𝑐𝑆𝑒𝐵 + 𝑐𝐶𝐵 + 𝑐𝐸𝑛𝐵 ×1
𝑢𝐵
European Erasmus Mundus Master Sustainable Constructions under natural hazards and catastrophic events 520121-1-2011-1-CZ-ERA MUNDUS-EMMC/ Vaidas Alechnavicius, Jozsef Balint
- 83 -
The time needed for processing the element (𝑇𝑃𝐵) is obtained by dividing the member's
length (𝐿𝐵 [mm]) to the conveyor's speed, 𝜐𝑐 [mm/min]. The conveyor's speed is
considered to be 3000mm/min (Gietart).
𝑐𝐿𝐵 is the labour unit cost of the blasting process. It's assumed that only one machine
operator is used, at a rate of€0.46/min.
𝑐𝐸𝑞𝐵 represents the equipment cost, calculated at the value of €16050, or €0.13/min.
𝑐𝑀𝐵= €0.01/min is the cost of annual equipment maintenance.
𝑐𝑅𝐸𝐵= €0.16/min gives the real estate investment cost.
𝑐𝑆𝑒𝐵= is €0.24/min the real estate maintenance cost.
𝑐𝐶𝐵 represents the cost of consumables, steel shot in this case. The unit cost is of
€0.02/min.
𝑐𝐸𝑛𝐵 is the cost of energy used during the blasting process. The given energy
consumption unit cost is 𝑐𝐸𝑛𝐵=€0.07/min.
𝑢𝐵 is the utilisation ratio of the cost centre (set to 1).
Therefore, the final formula becomes:
𝐶𝐵 =𝐿𝐵𝜐𝑐
× 0.46 + 0.13 + 0.01 + 0.16 + 0.24 + 0.02 + 0.07 /1
or
𝐶𝐵 = 𝐿𝐵 × 0.000363 [€/min]
Sawing cost.
The sawing cost is considered under the following form, as given by Mela(2013) [45]:
𝐶𝑠 = 1.2013 × 𝑇𝑁𝑆 + 𝑇𝑃𝑆 + 𝑇𝑃𝑆 × 𝑐𝑐𝑠 + 𝑐𝑒𝑛𝑠
𝑇𝑁𝑆 is the non-productive time and it is equal to 𝑇𝑁𝑆 = 4.5 + 𝐿/20000𝑚𝑖𝑛.
𝑐𝑒𝑛𝑠 = 0.02€/min, represents the cost of energy.
The productive time depends on the position of the cross-section when the sawing is
performed, but in this case this is not an issue, since the shapes of the elements are
circular and polygonal.
European Erasmus Mundus Master Sustainable Constructions under natural hazards and catastrophic events 520121-1-2011-1-CZ-ERA MUNDUS-EMMC/ Vaidas Alechnavicius, Jozsef Balint
- 84 -
It is determined by the following relation:
𝑇𝑃𝑆 =𝐴𝑄
where
𝐴 [mm2] is the cross-sectional area of the profile
𝑄 [mm2/min] is the sawing efficiency of the blade; this value changes according to the
steel grades
𝑐𝑐𝑠 is a factor which takes into account the steel grade
Painting cost.
The painting cost includes the cost needed for drying and is expressed as:
𝐶𝑝 = 4.17 × 10⁻⁶ × 𝐿 × 𝐴𝑢 + 0.36𝐿 × 10−3 × 𝑊𝐴 𝑚𝑖𝑛 × 10−3
(Mela (2013) [45]).
where
𝐴𝑢 represents the painted area per unit length
𝑊𝐴 𝑚𝑖𝑛 is the smallest width dimension of the beam
Transportation cost.
Haapio (2012) proposes that the transportation is made with the help of a truck with an
Euro trailer. Its dimensions give a total volume of 91m3, whilst its maximum load cargo
is limited to 24 tonnes. The maximum weight and maximum volume limitations lead to
the limit ratio of 264kg/m3. In case the ratio is below or equal to this limit, then the
transportation cost is determined by the volume; otherwise it is determined by its
weight.
The equations used for the two situations are the following:
𝐶𝑇 = 𝑉𝐴 × 0.0106 × 𝑑𝑤𝑠 + 1.2729 [€], for cost determined by volume
𝐶𝑇 = 𝑊𝐴 × 0.00004 × 𝑑𝑤𝑠 + 0.0048 [€], for cost determined by weight
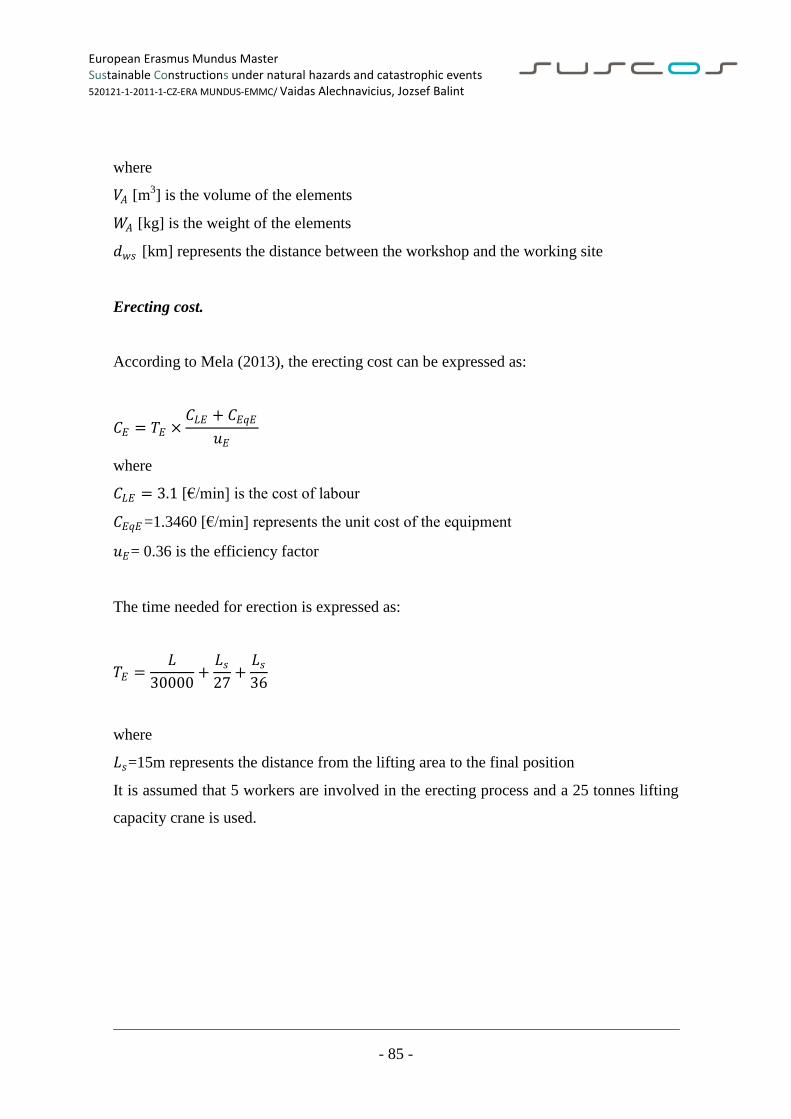
European Erasmus Mundus Master Sustainable Constructions under natural hazards and catastrophic events 520121-1-2011-1-CZ-ERA MUNDUS-EMMC/ Vaidas Alechnavicius, Jozsef Balint
- 85 -
where
𝑉𝐴 [m3] is the volume of the elements
𝑊𝐴 [kg] is the weight of the elements
𝑑𝑤𝑠 [km] represents the distance between the workshop and the working site
Erecting cost.
According to Mela (2013), the erecting cost can be expressed as:
𝐶𝐸 = 𝑇𝐸 ×𝐶𝐿𝐸 + 𝐶𝐸𝑞𝐸
𝑢𝐸
where
𝐶𝐿𝐸 = 3.1 [€/min] is the cost of labour
𝐶𝐸𝑞𝐸=1.3460 [€/min] represents the unit cost of the equipment
𝑢𝐸= 0.36 is the efficiency factor
The time needed for erection is expressed as:
𝑇𝐸 =𝐿
30000+𝐿𝑠27
+𝐿𝑠36
where
𝐿𝑠=15m represents the distance from the lifting area to the final position
It is assumed that 5 workers are involved in the erecting process and a 25 tonnes lifting
capacity crane is used.
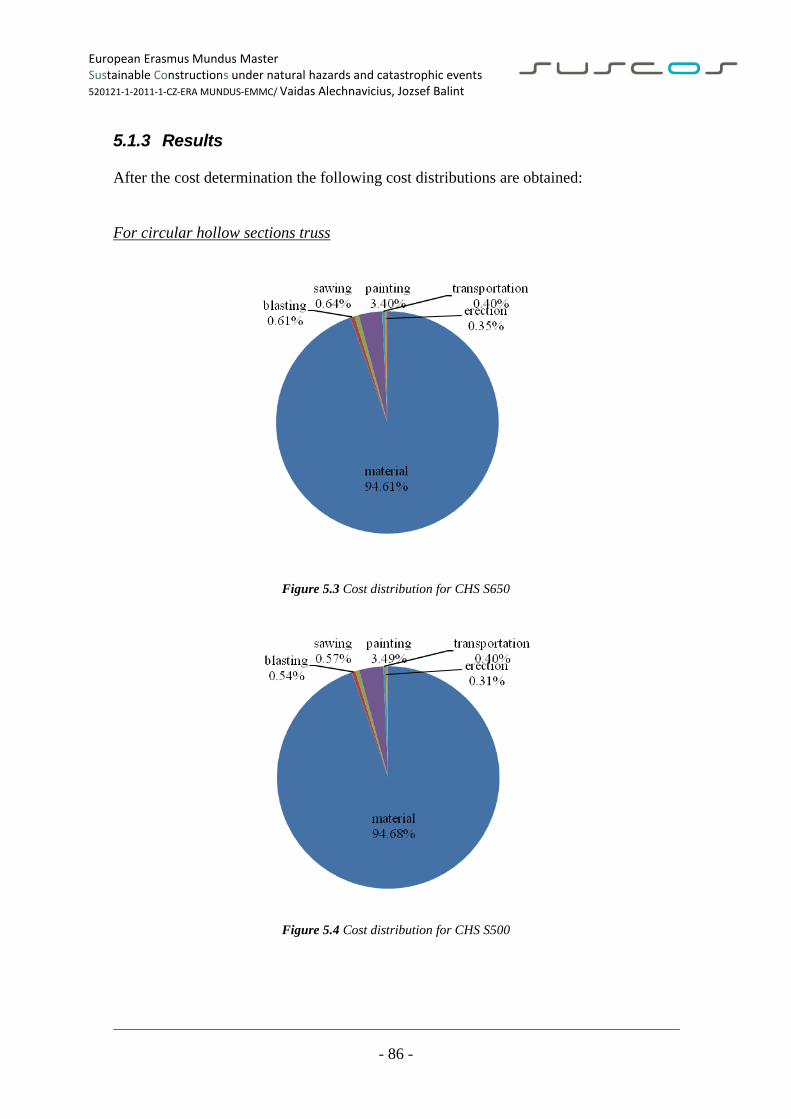
European Erasmus Mundus Master Sustainable Constructions under natural hazards and catastrophic events 520121-1-2011-1-CZ-ERA MUNDUS-EMMC/ Vaidas Alechnavicius, Jozsef Balint
- 86 -
5.1.3 Results
After the cost determination the following cost distributions are obtained:
For circular hollow sections truss
Figure 5.3 Cost distribution for CHS S650
Figure 5.4 Cost distribution for CHS S500
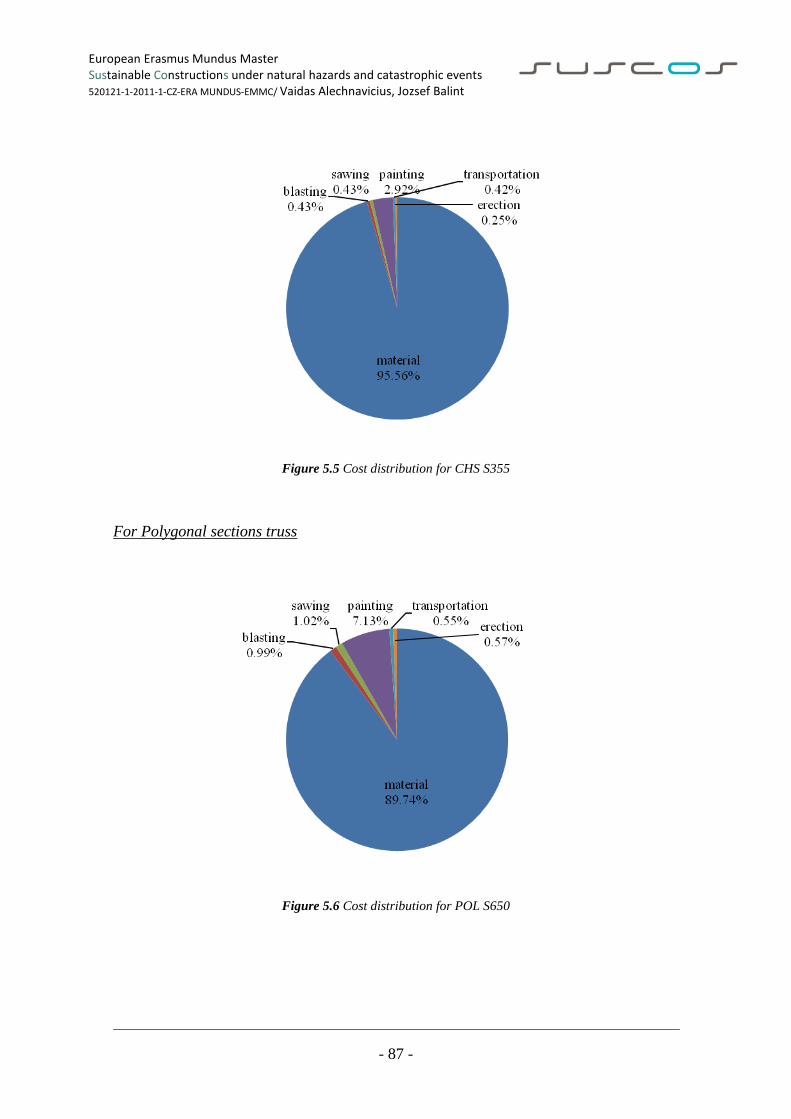
European Erasmus Mundus Master Sustainable Constructions under natural hazards and catastrophic events 520121-1-2011-1-CZ-ERA MUNDUS-EMMC/ Vaidas Alechnavicius, Jozsef Balint
- 87 -
Figure 5.5 Cost distribution for CHS S355
For Polygonal sections truss
Figure 5.6 Cost distribution for POL S650
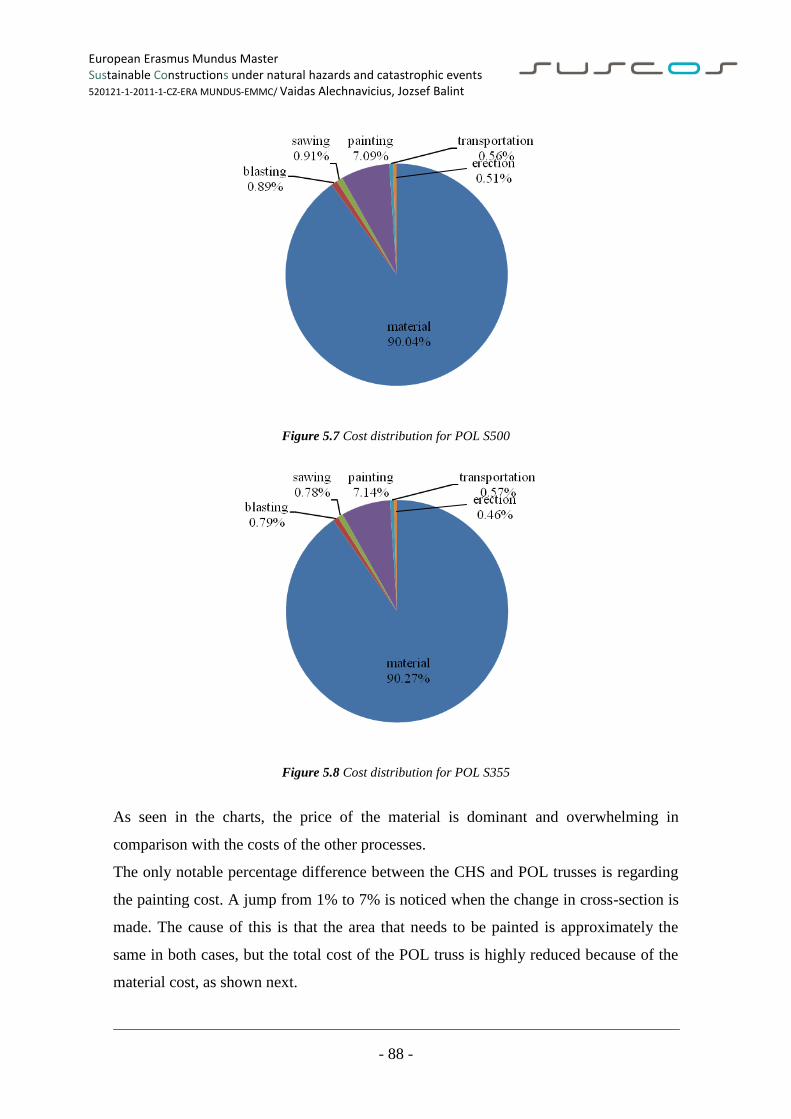
European Erasmus Mundus Master Sustainable Constructions under natural hazards and catastrophic events 520121-1-2011-1-CZ-ERA MUNDUS-EMMC/ Vaidas Alechnavicius, Jozsef Balint
- 88 -
Figure 5.7 Cost distribution for POL S500
Figure 5.8 Cost distribution for POL S355
As seen in the charts, the price of the material is dominant and overwhelming in
comparison with the costs of the other processes.
The only notable percentage difference between the CHS and POL trusses is regarding
the painting cost. A jump from 1% to 7% is noticed when the change in cross-section is
made. The cause of this is that the area that needs to be painted is approximately the
same in both cases, but the total cost of the POL truss is highly reduced because of the
material cost, as shown next.
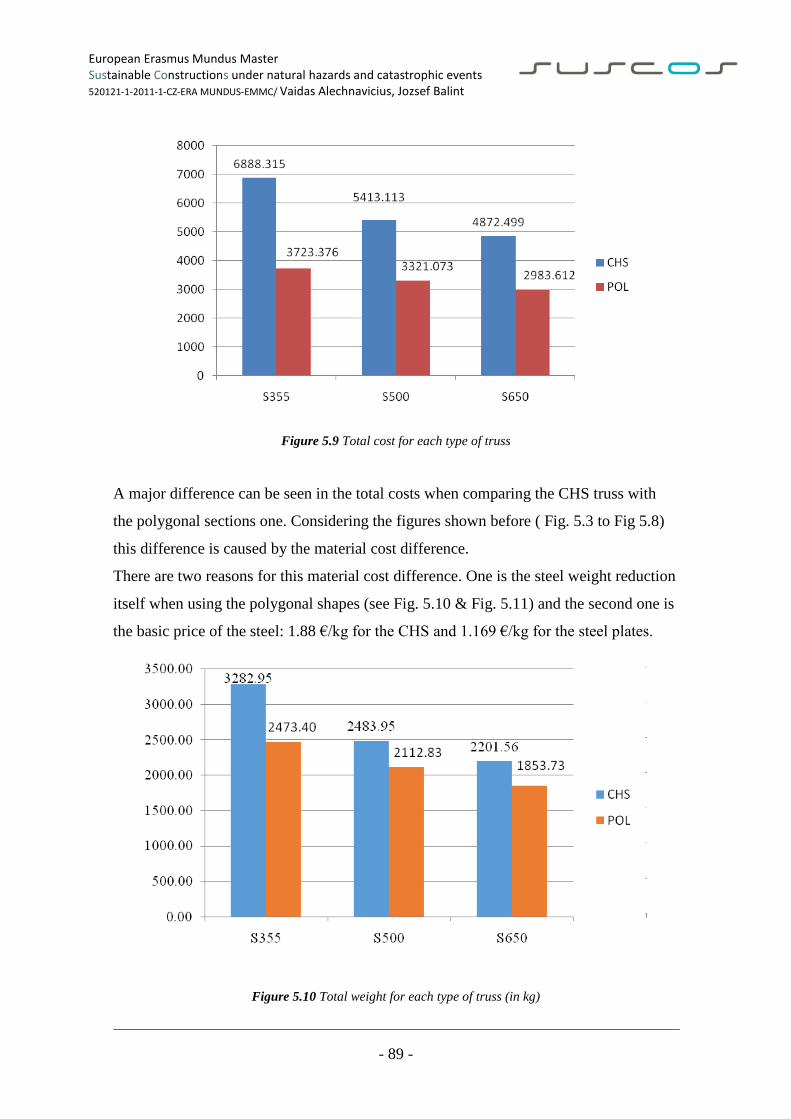
European Erasmus Mundus Master Sustainable Constructions under natural hazards and catastrophic events 520121-1-2011-1-CZ-ERA MUNDUS-EMMC/ Vaidas Alechnavicius, Jozsef Balint
- 89 -
Figure 5.9 Total cost for each type of truss
A major difference can be seen in the total costs when comparing the CHS truss with
the polygonal sections one. Considering the figures shown before ( Fig. 5.3 to Fig 5.8)
this difference is caused by the material cost difference.
There are two reasons for this material cost difference. One is the steel weight reduction
itself when using the polygonal shapes (see Fig. 5.10 & Fig. 5.11) and the second one is
the basic price of the steel: 1.88 €/kg for the CHS and 1.169 €/kg for the steel plates.
Figure 5.10 Total weight for each type of truss (in kg)
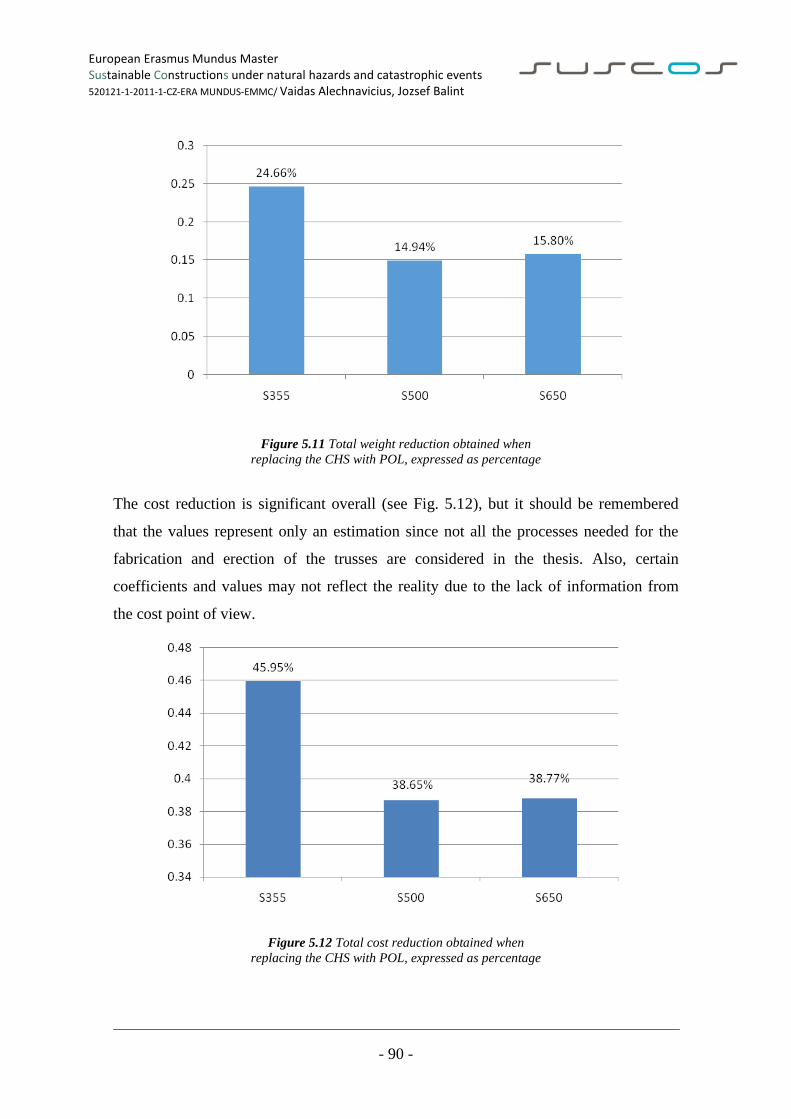
European Erasmus Mundus Master Sustainable Constructions under natural hazards and catastrophic events 520121-1-2011-1-CZ-ERA MUNDUS-EMMC/ Vaidas Alechnavicius, Jozsef Balint
- 90 -
Figure 5.11 Total weight reduction obtained when
replacing the CHS with POL, expressed as percentage
The cost reduction is significant overall (see Fig. 5.12), but it should be remembered
that the values represent only an estimation since not all the processes needed for the
fabrication and erection of the trusses are considered in the thesis. Also, certain
coefficients and values may not reflect the reality due to the lack of information from
the cost point of view.
Figure 5.12 Total cost reduction obtained when
replacing the CHS with POL, expressed as percentage
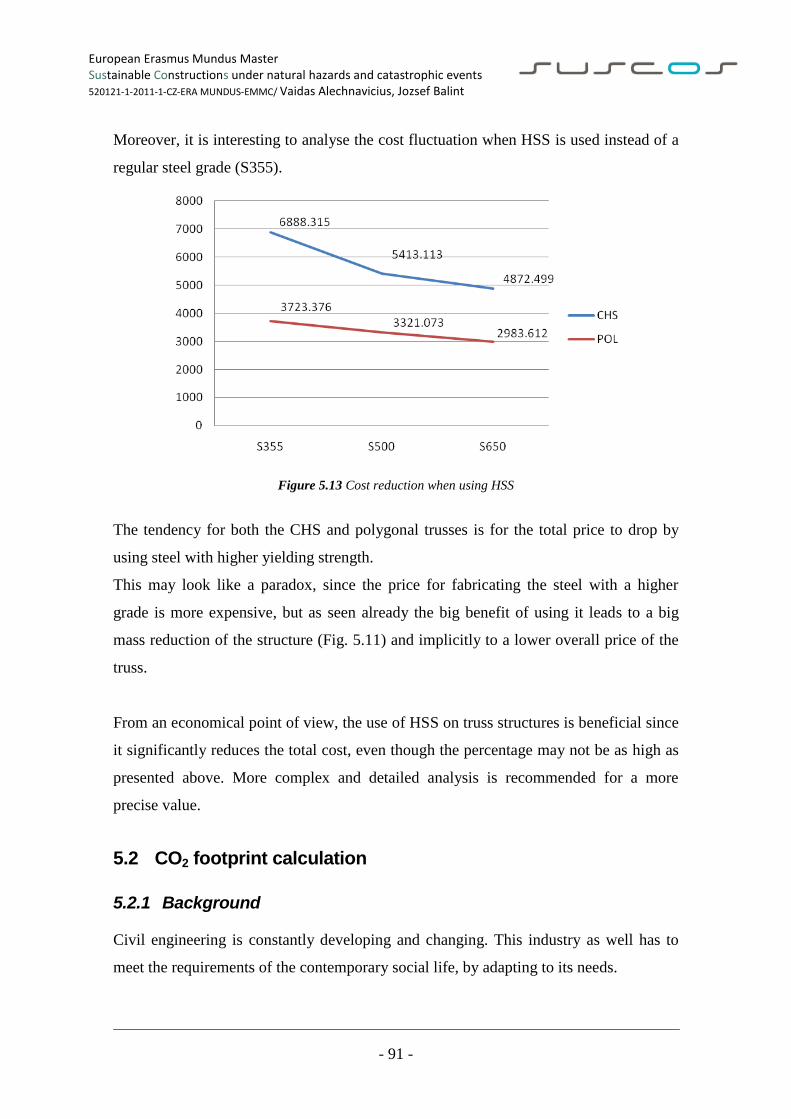
European Erasmus Mundus Master Sustainable Constructions under natural hazards and catastrophic events 520121-1-2011-1-CZ-ERA MUNDUS-EMMC/ Vaidas Alechnavicius, Jozsef Balint
- 91 -
Moreover, it is interesting to analyse the cost fluctuation when HSS is used instead of a
regular steel grade (S355).
Figure 5.13 Cost reduction when using HSS
The tendency for both the CHS and polygonal trusses is for the total price to drop by
using steel with higher yielding strength.
This may look like a paradox, since the price for fabricating the steel with a higher
grade is more expensive, but as seen already the big benefit of using it leads to a big
mass reduction of the structure (Fig. 5.11) and implicitly to a lower overall price of the
truss.
From an economical point of view, the use of HSS on truss structures is beneficial since
it significantly reduces the total cost, even though the percentage may not be as high as
presented above. More complex and detailed analysis is recommended for a more
precise value.
5.2 CO2 footprint calculation
5.2.1 Background
Civil engineering is constantly developing and changing. This industry as well has to
meet the requirements of the contemporary social life, by adapting to its needs.
European Erasmus Mundus Master Sustainable Constructions under natural hazards and catastrophic events 520121-1-2011-1-CZ-ERA MUNDUS-EMMC/ Vaidas Alechnavicius, Jozsef Balint
- 92 -
Nowadays, there is a new balance that must be met and this is an equilibrium between
the economic, social and environmental objectives. This is now known as Sustainable
Development and is given an increasing attention, for the sake of future generations.
It is argued that Sustainable Development is now absolutely central to the practice of
Civil Engineering [46].
The most comprehensive definition of sustainability comes from the Brundtland
Commission Report of the United Nations in 1987 which states “sustainability is the
development that meets the needs of the present without compromising the ability of
future generations to meet their own needs.”
It was in 1969 that the concept was introduced to the public by the incorporation of
National Environment Policy Act a.k.a (NEPA) [47].
The study of HSS is of great interest, since using this type of steel brings advantages
environmentally wise.
HSS is known to provide major sustainable gains in active structures, since it provides
material savings in production, it offers a bigger life span and reduces fuel consumption.
The difference between the active and passive structures is that the latter one is not
influencing the environmental impact during its usage phase. Only production,
transportation and erection are considered to have an impact.
Nevertheless, HSS can be a wise choice for passive, civil structures as well.
As shown by Jan-Olof Sperle, during the presentation "Environmental Advantages of
using Advanced High Strength Steel in Steel Structures" in Oslo (2012) the high
strength steel has the following advantages:
the structure becomes lighter as the steel strength increases
it is possible to obtain a weight reduction of 20 up to 40%
there is less usage of natural resources involved
as an outcome, there are environmental savings
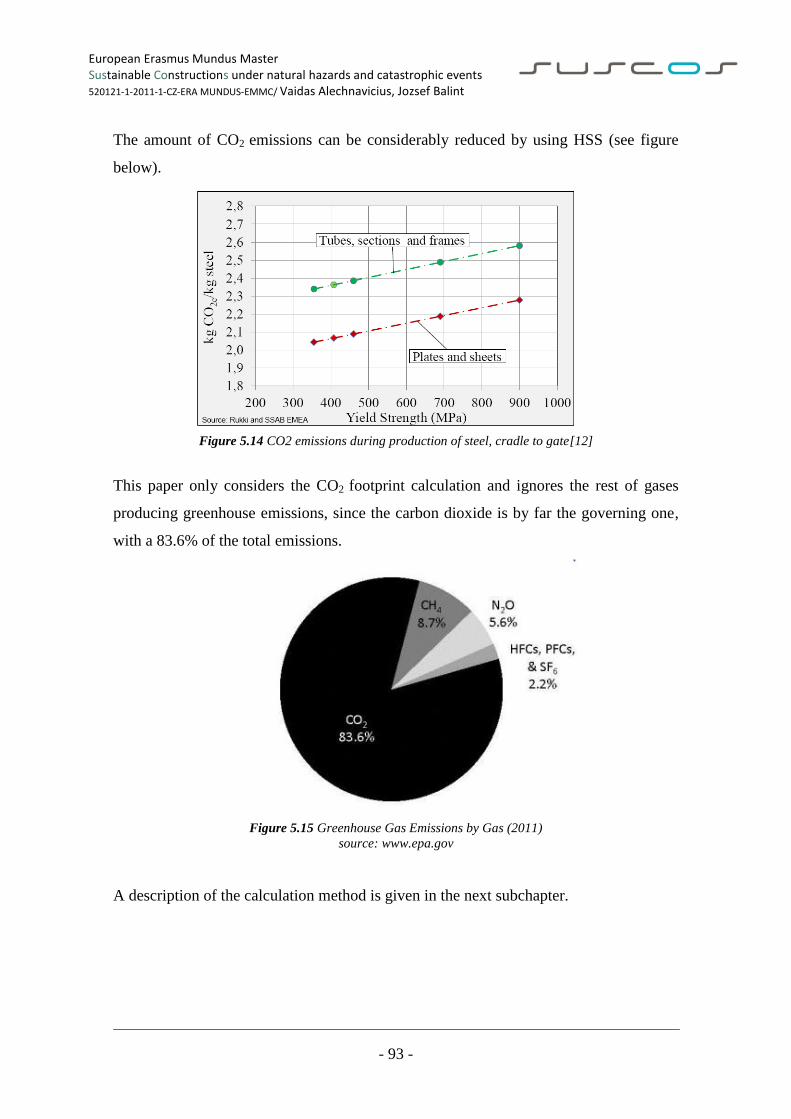
European Erasmus Mundus Master Sustainable Constructions under natural hazards and catastrophic events 520121-1-2011-1-CZ-ERA MUNDUS-EMMC/ Vaidas Alechnavicius, Jozsef Balint
- 93 -
The amount of CO2 emissions can be considerably reduced by using HSS (see figure
below).
Figure 5.14 CO2 emissions during production of steel, cradle to gate[12]
This paper only considers the CO2 footprint calculation and ignores the rest of gases
producing greenhouse emissions, since the carbon dioxide is by far the governing one,
with a 83.6% of the total emissions.
Figure 5.15 Greenhouse Gas Emissions by Gas (2011)
source: www.epa.gov
A description of the calculation method is given in the next subchapter.
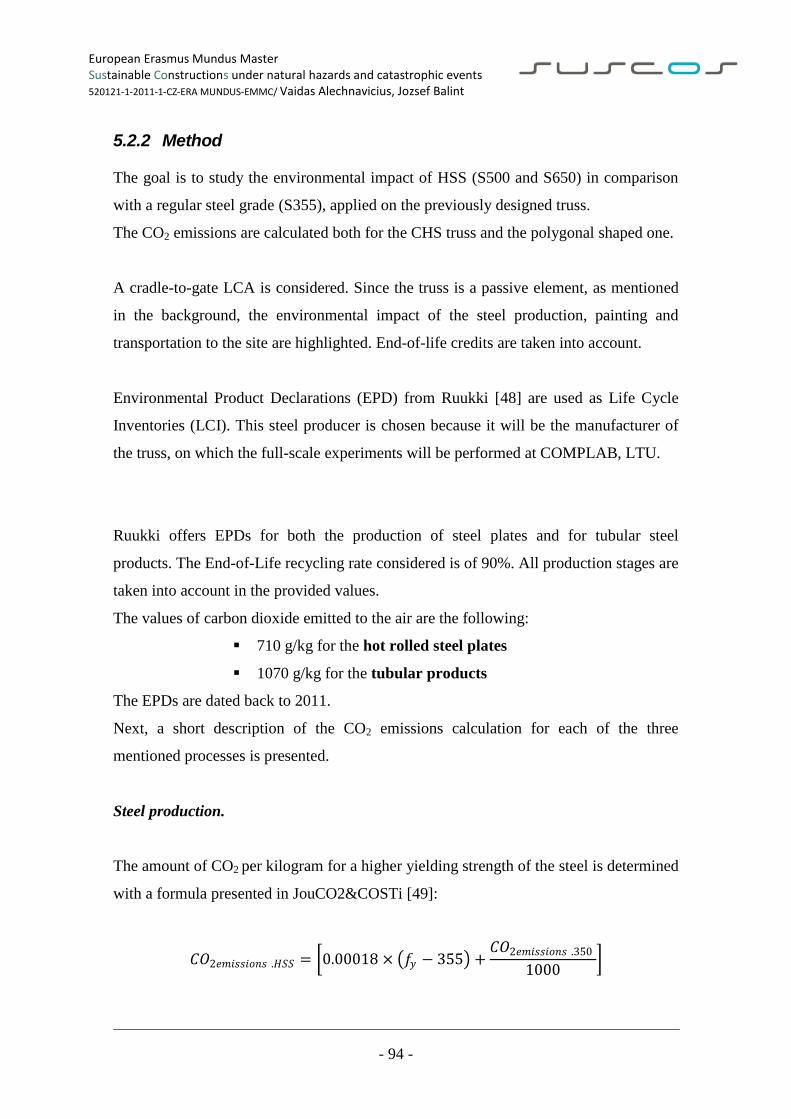
European Erasmus Mundus Master Sustainable Constructions under natural hazards and catastrophic events 520121-1-2011-1-CZ-ERA MUNDUS-EMMC/ Vaidas Alechnavicius, Jozsef Balint
- 94 -
5.2.2 Method
The goal is to study the environmental impact of HSS (S500 and S650) in comparison
with a regular steel grade (S355), applied on the previously designed truss.
The CO2 emissions are calculated both for the CHS truss and the polygonal shaped one.
A cradle-to-gate LCA is considered. Since the truss is a passive element, as mentioned
in the background, the environmental impact of the steel production, painting and
transportation to the site are highlighted. End-of-life credits are taken into account.
Environmental Product Declarations (EPD) from Ruukki [48] are used as Life Cycle
Inventories (LCI). This steel producer is chosen because it will be the manufacturer of
the truss, on which the full-scale experiments will be performed at COMPLAB, LTU.
Ruukki offers EPDs for both the production of steel plates and for tubular steel
products. The End-of-Life recycling rate considered is of 90%. All production stages are
taken into account in the provided values.
The values of carbon dioxide emitted to the air are the following:
710 g/kg for the hot rolled steel plates
1070 g/kg for the tubular products
The EPDs are dated back to 2011.
Next, a short description of the CO2 emissions calculation for each of the three
mentioned processes is presented.
Steel production.
The amount of CO2 per kilogram for a higher yielding strength of the steel is determined
with a formula presented in JouCO2&COSTi [49]:
𝐶𝑂2𝑒𝑚𝑖𝑠𝑠𝑖𝑜𝑛𝑠 .𝐻𝑆𝑆 = 0.00018 × 𝑓𝑦 − 355 +𝐶𝑂2𝑒𝑚𝑖𝑠𝑠𝑖𝑜𝑛𝑠 .350
1000
European Erasmus Mundus Master Sustainable Constructions under natural hazards and catastrophic events 520121-1-2011-1-CZ-ERA MUNDUS-EMMC/ Vaidas Alechnavicius, Jozsef Balint
- 95 -
where
𝐶𝑂2𝑒𝑚𝑖𝑠𝑠𝑖𝑜𝑛𝑠 .350 represents the quantity of CO2 emissions given for the S355 steel type.
Values given by Ruukki's EPD, as presented above, are used.
The total emissions for the steel production is obtained by multiplying the total mass of
steel for a certain truss with the 𝐶𝑂2𝑒𝑚𝑖𝑠𝑠𝑖𝑜𝑛𝑠 .𝐻𝑆𝑆 value.
For the regular S355 steel, for multiplication the value given in the EPD is directly used.
Painting.
An intumescent acrylic paint is used to offer the truss elements a fire resistance of R30.
It is considered that all the elements are painted all around.
The thickness of the applied paint is of 𝑡𝑝𝑎𝑖𝑛𝑡 = 1.5𝑚𝑚.
The total volume of paint is calculated:
𝑉𝑝𝑎𝑖𝑛𝑡 = 𝐴𝑝𝑎𝑖𝑛𝑡 × 𝑡𝑝𝑎𝑖𝑛𝑡
where 𝐴𝑝𝑎𝑖𝑛𝑡 is the total area that needs to be covered by paint.
JouCO2&COSTi is presenting an amount of CO2 emissions of the acrylic paint equal to
𝑚𝑎𝑐𝑟𝑦𝑙 =2.5kg/L.
Therefore, the total amount of carbon dioxide is determined by:
𝐶𝑂2.𝑝𝑎𝑖𝑛𝑡 = 𝑚𝑎𝑐𝑟𝑦𝑙 × 𝑉𝑝𝑎𝑖𝑛𝑡
Transportation.
For the transportation a semi-track with a 25tonne load capacity is used.
Environmental data from Lipasto.vtt.fi from the year 2011 is used [50].
European Erasmus Mundus Master Sustainable Constructions under natural hazards and catastrophic events 520121-1-2011-1-CZ-ERA MUNDUS-EMMC/ Vaidas Alechnavicius, Jozsef Balint
- 96 -
According to this source, the CO2 emissions for the truck is the following:
𝐶𝑂2.𝑡𝑟𝑎𝑐𝑘 = 41𝑔
𝑡𝑜𝑛𝑛𝑒 × 𝑘𝑔
A distance of 100 km between the manufacturer and the site is considered.
The transportation from the workshop to the working site is determined as:
𝐶𝑂2.𝑡𝑟𝑎𝑛𝑠𝑝 = 𝑚 × 100𝑘𝑚 × 𝐶𝑂2.𝑡𝑟𝑎𝑐𝑘
According to Lipasto [50] the empty track has the following emission:
𝐶𝑂2.𝑡𝑟𝑎𝑐𝑘 .𝑒𝑚𝑝𝑡𝑦 = 757𝑔
𝑘𝑚
The environmental impact of the return of the track is easily determined by multiplying
the above mentioned value to the distance the track covers.
𝐶𝑂2.𝑡𝑟𝑎𝑛𝑠𝑝 .𝑟𝑒𝑡𝑢𝑟𝑛 = 𝐶𝑂2.𝑡𝑟𝑎𝑐𝑘 .𝑒𝑚𝑝𝑡𝑦 × 100𝑘𝑚
The total emissions for the transportation are obtained by summing the emissions for the
round trip of the track.
Detailed calculation is provided in Annex E.
5.2.3 Results
Contribution of each of the three above mentioned processes to the total environmental
impact is presented in the charts below.
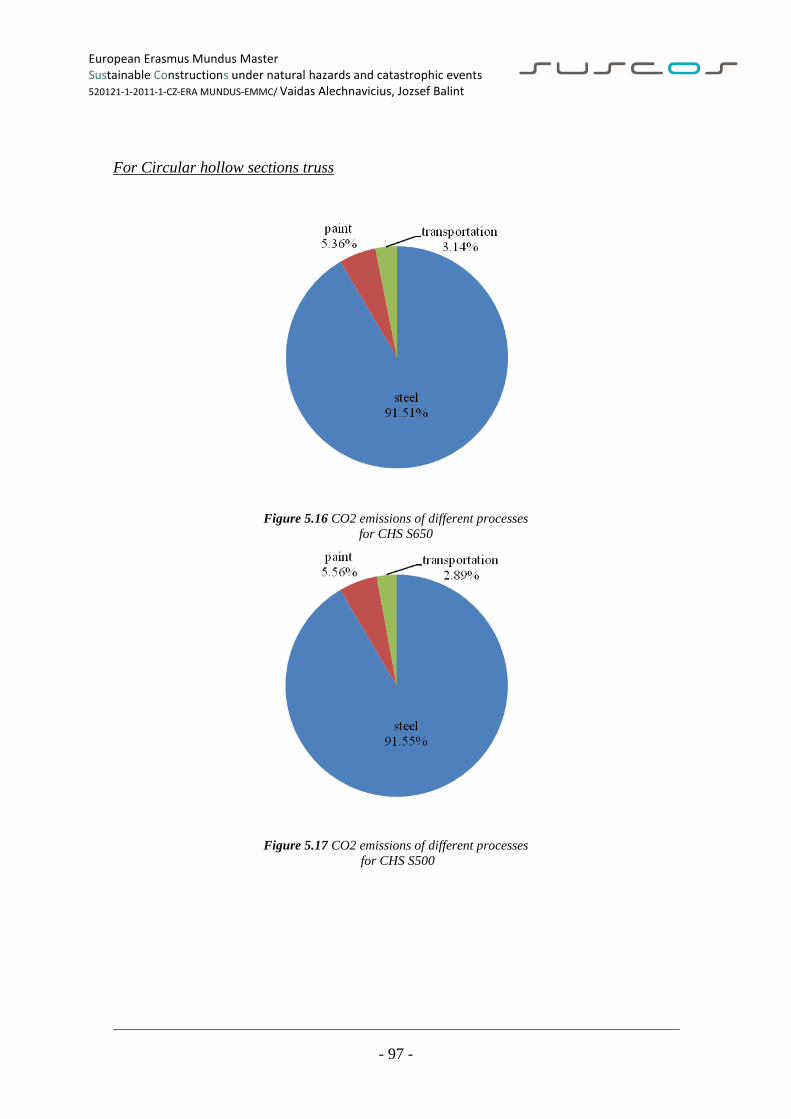
European Erasmus Mundus Master Sustainable Constructions under natural hazards and catastrophic events 520121-1-2011-1-CZ-ERA MUNDUS-EMMC/ Vaidas Alechnavicius, Jozsef Balint
- 97 -
For Circular hollow sections truss
Figure 5.16 CO2 emissions of different processes
for CHS S650
Figure 5.17 CO2 emissions of different processes
for CHS S500
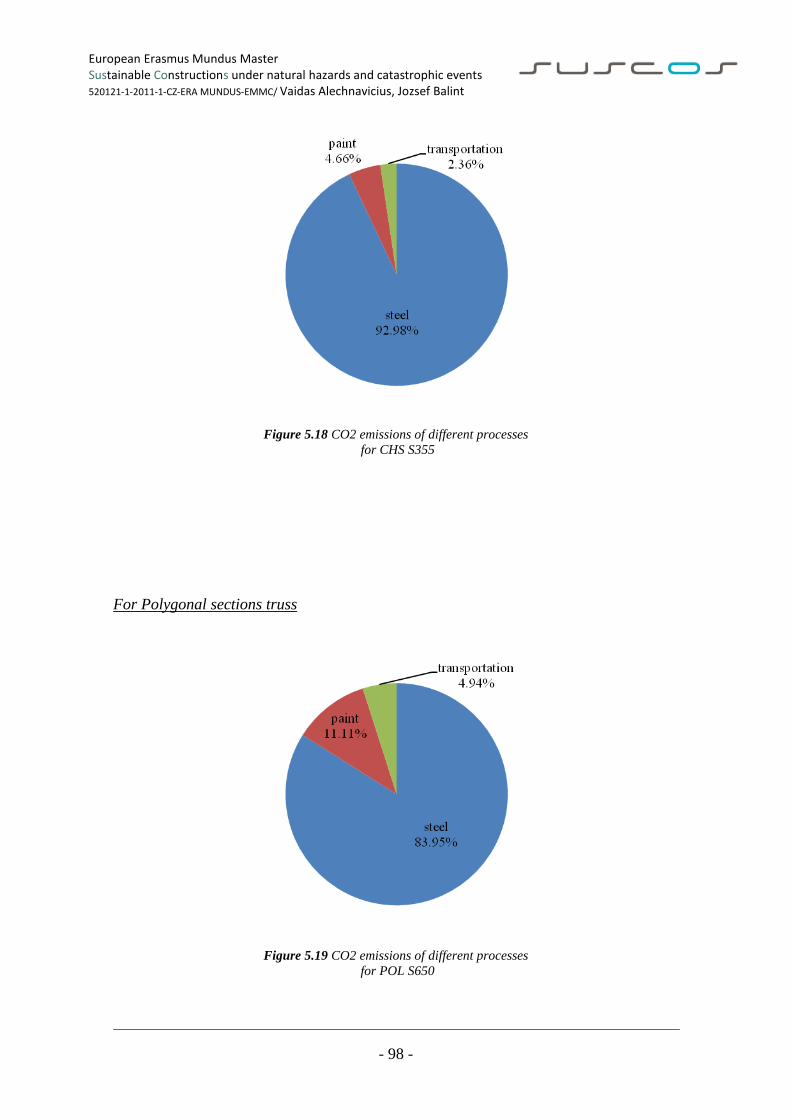
European Erasmus Mundus Master Sustainable Constructions under natural hazards and catastrophic events 520121-1-2011-1-CZ-ERA MUNDUS-EMMC/ Vaidas Alechnavicius, Jozsef Balint
- 98 -
Figure 5.18 CO2 emissions of different processes
for CHS S355
For Polygonal sections truss
Figure 5.19 CO2 emissions of different processes
for POL S650
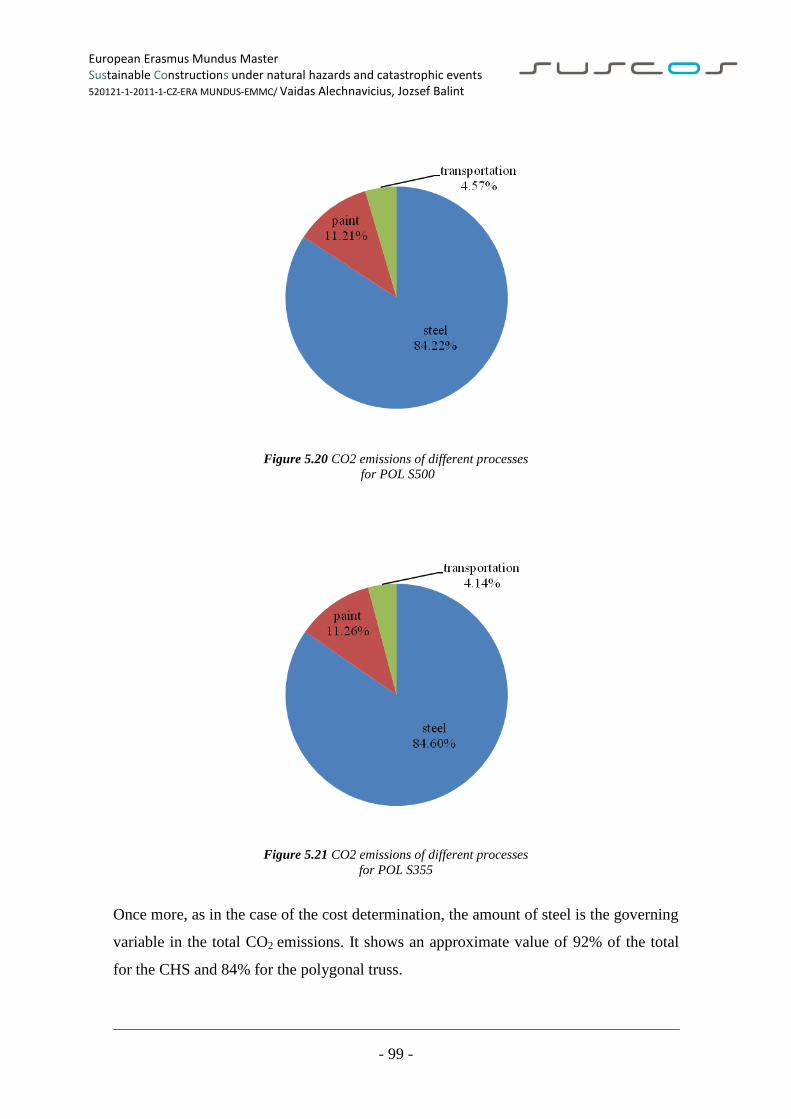
European Erasmus Mundus Master Sustainable Constructions under natural hazards and catastrophic events 520121-1-2011-1-CZ-ERA MUNDUS-EMMC/ Vaidas Alechnavicius, Jozsef Balint
- 99 -
Figure 5.20 CO2 emissions of different processes
for POL S500
Figure 5.21 CO2 emissions of different processes
for POL S355
Once more, as in the case of the cost determination, the amount of steel is the governing
variable in the total CO2 emissions. It shows an approximate value of 92% of the total
for the CHS and 84% for the polygonal truss.
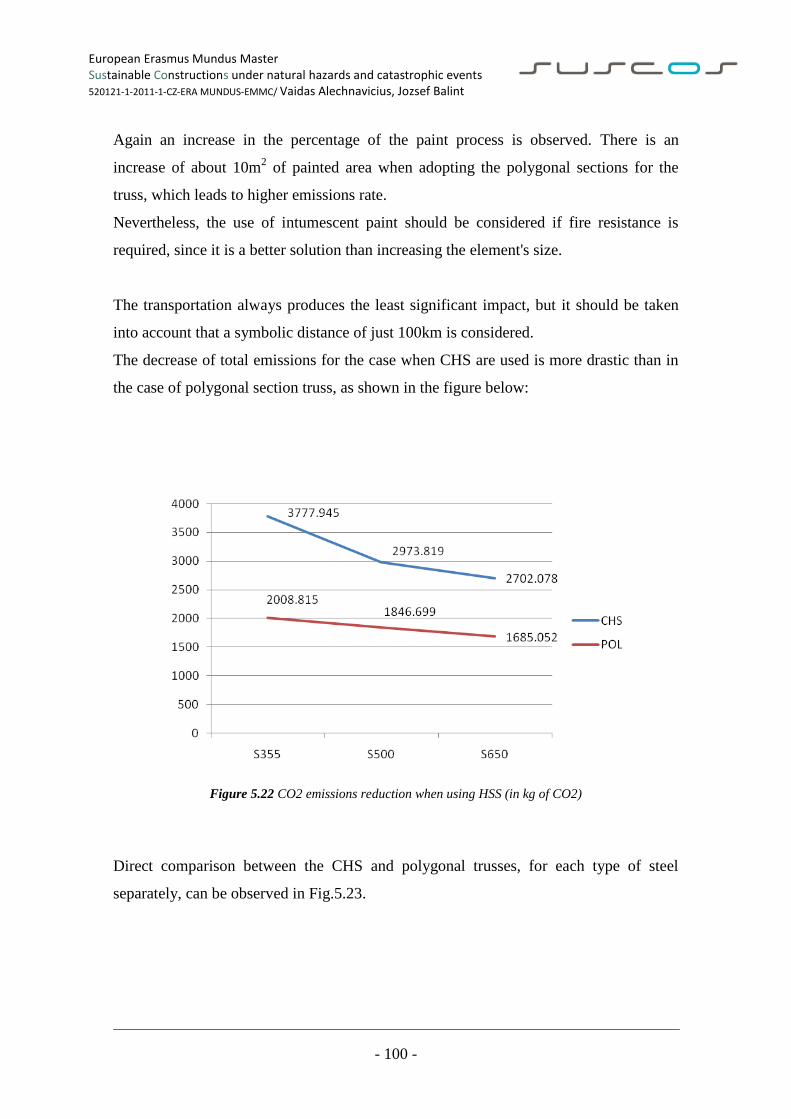
European Erasmus Mundus Master Sustainable Constructions under natural hazards and catastrophic events 520121-1-2011-1-CZ-ERA MUNDUS-EMMC/ Vaidas Alechnavicius, Jozsef Balint
- 100 -
Again an increase in the percentage of the paint process is observed. There is an
increase of about 10m2 of painted area when adopting the polygonal sections for the
truss, which leads to higher emissions rate.
Nevertheless, the use of intumescent paint should be considered if fire resistance is
required, since it is a better solution than increasing the element's size.
The transportation always produces the least significant impact, but it should be taken
into account that a symbolic distance of just 100km is considered.
The decrease of total emissions for the case when CHS are used is more drastic than in
the case of polygonal section truss, as shown in the figure below:
Figure 5.22 CO2 emissions reduction when using HSS (in kg of CO2)
Direct comparison between the CHS and polygonal trusses, for each type of steel
separately, can be observed in Fig.5.23.
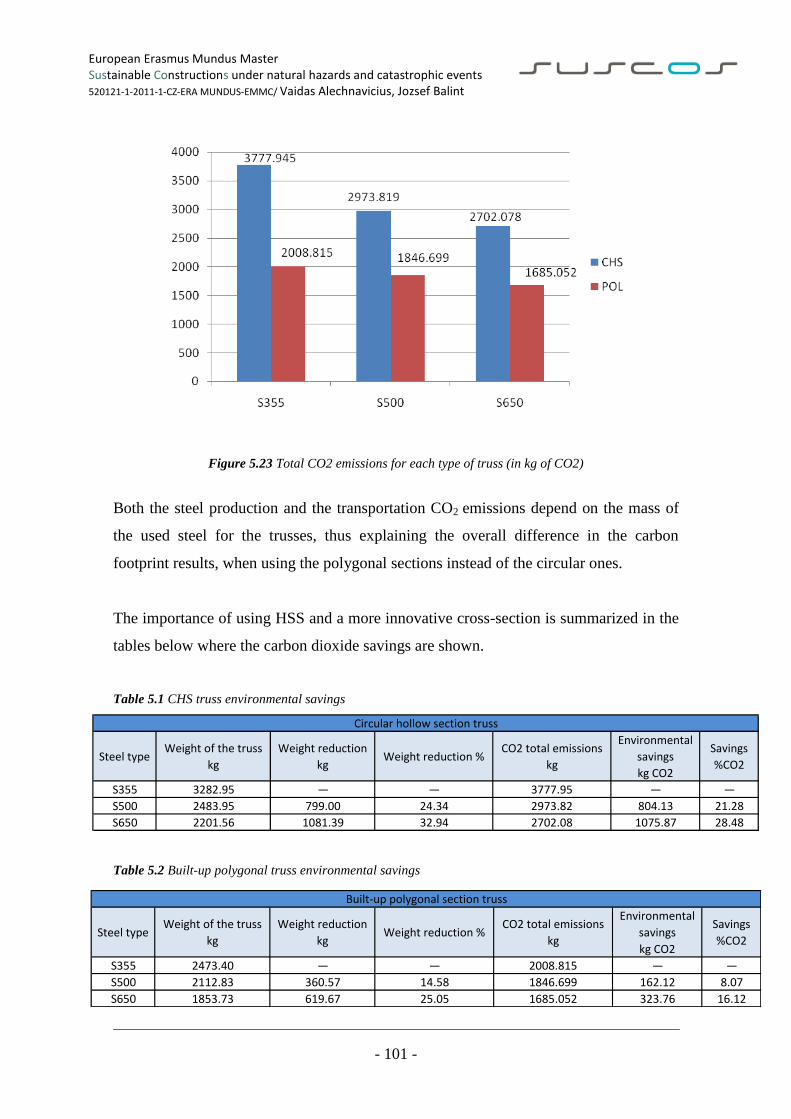
European Erasmus Mundus Master Sustainable Constructions under natural hazards and catastrophic events 520121-1-2011-1-CZ-ERA MUNDUS-EMMC/ Vaidas Alechnavicius, Jozsef Balint
- 101 -
Steel typeWeight of the truss
kg
Weight reduction
kgWeight reduction %
CO2 total emissions
kg
Environmental
savings
kg CO2
Savings
%CO2
S355 3282.95 — — 3777.95 — —
S500 2483.95 799.00 24.34 2973.82 804.13 21.28
S650 2201.56 1081.39 32.94 2702.08 1075.87 28.48
Circular hollow section truss
Steel typeWeight of the truss
kg
Weight reduction
kgWeight reduction %
CO2 total emissions
kg
Environmental
savings
kg CO2
Savings
%CO2
S355 2473.40 — — 2008.815 — —
S500 2112.83 360.57 14.58 1846.699 162.12 8.07
S650 1853.73 619.67 25.05 1685.052 323.76 16.12
Built-up polygonal section truss
Figure 5.23 Total CO2 emissions for each type of truss (in kg of CO2)
Both the steel production and the transportation CO2 emissions depend on the mass of
the used steel for the trusses, thus explaining the overall difference in the carbon
footprint results, when using the polygonal sections instead of the circular ones.
The importance of using HSS and a more innovative cross-section is summarized in the
tables below where the carbon dioxide savings are shown.
Table 5.1 CHS truss environmental savings
Table 5.2 Built-up polygonal truss environmental savings
European Erasmus Mundus Master Sustainable Constructions under natural hazards and catastrophic events 520121-1-2011-1-CZ-ERA MUNDUS-EMMC/ Vaidas Alechnavicius, Jozsef Balint
- 102 -
As expected, because of the weight reduction, the CO2 emissions quantity is reduced
with the increase of steel strength.
In the case of the CHS truss a reduction of 21% (for S500) up to 28% (S650) is seen.
For the polygonal truss the reduction is not as significant, but savings of 8% for the
S500 steel and 16% for S650 are still obtained. The cause of this is that when
upgrading to a higher steel for the polygonal truss, smaller weight reductions are
reached, which lead to a smaller CO2 emissions saving. The manufacturing of steel is
the dominant producer of carbon dioxide, as seen in Fig 5.19 to Fig 5.21.
Therefore, the use of HSS for the truss design is recommended, both from an
economical point of view and from an environmental one.
European Erasmus Mundus Master Sustainable Constructions under natural hazards and catastrophic events 520121-1-2011-1-CZ-ERA MUNDUS-EMMC/ Vaidas Alechnavicius, Jozsef Balint
- 103 -
CONCLUSIONS
This thesis represents the very beginning of the research which is planned by LTU to
investigate new solutions for HSS truss design. The matters covered by this work can be
used as first reference for future researchers who are going to work on this project.
Several innovative ideas in designing modern long span steel trusses were investigated
in this thesis. The first one is to design the steel trusses made from high strength steel.
The second one concerns new types of sections: semi-closed built-up polygonal and U-
shaped profiles were used in design. It was expected that high strength steel and cold-
formed profiles will provide higher strength along with a significant reduction of
weight, but there were some additional unknowns that should have been answered by
this work.
The main questions to be answered were mainly regarding the new proposed polygonal
truss. One of the issues was the investigation of the behaviour of the joint in the bottom
chord, where two diagonals meet. Another aspect that required special attention was the
compressed polygonal chord, built up from cold-bent steel plates. The buckling
resistance was analysed taking into account different material properties that are
influenced by cold-bending. Moreover, it was worth to investigate the difference in cost
and the environmental impact that could be achieved by designing HSS polygonal
trusses instead of the more common tubular hollow section trusses.
To achieve these goals, two types of trusses were designed. The quite well known
solution of tubular hollow section truss was compared to the innovative truss made
from built-up polygonal and U-shaped sections. In order to achieve a more complex
comparison study, each of the both types of trusses was designed to be made out of 3
types of steel: regular S355 and HSS S500 and S650.
The main aspects in the design procedures were buckling resistance of compressed
chords and diagonals, tension resistance of bottom chord, lateral buckling of the entire
European Erasmus Mundus Master Sustainable Constructions under natural hazards and catastrophic events 520121-1-2011-1-CZ-ERA MUNDUS-EMMC/ Vaidas Alechnavicius, Jozsef Balint
- 104 -
truss. Design was made using current Eurocodes. CIDECT recommendations for
circular hollow section truss design were used. Special attention was paid to the
difference in the design rules for HSS. In some cases the reduction factor for the
resistance of HSS is not necessary or is too conservative. For example the joint
resistance for any HSS hollow section joint should be reduced by 20% (factor 0.8). The
resistance of the joint was one of the governing factors in CHS truss design, which lead
to bigger cross sections. Therefore, this reduction factor was significant and research
should be done, in order to see if it is really needed.
The weight of each designed truss is given in table below:
Weight (kg)
S355 S500 S650
CHS 3282.95 2483.95 2201.56
Polygonal 2473.40 2112.83 1853.73
The behaviour investigation of the bottom chord connection is broadly described in
Chapter 3. Various models of connection were numerically investigated using Abaqus
software. Two types of loading were analysed – tension only and tension load combined
with load from diagonals. The objective of this research was to analyse the behaviour of
different types of stiffeners in the connection. Models with no stiffener, plate stiffener
between diagonals and U-shape insert as a stiffener with different thicknesses were
analysed. Results showed that U stiffeners must be used almost in all cases, whilst there
are too big stress concentrations in some zones with plate stiffener. Plate stiffener can
be used while the connection is only subjected to tension force. The 3mm thickness U
insert is enough for any case, while diagonal plates are welded together. Analysis
showed that the connection with diagonal plates welded together performs better, since
it reduces stress concentrations and stabilises the connection.
The mechanical properties of cold-formed steel sections differ from those of the steel
strip or the plate before forming. The cold-forming operation of the steel section
increases the yield stress and the tensile strength, but at the same time decreases the
ductility of material. This phenomena was investigated in Chapter 4 by analysis of built
European Erasmus Mundus Master Sustainable Constructions under natural hazards and catastrophic events 520121-1-2011-1-CZ-ERA MUNDUS-EMMC/ Vaidas Alechnavicius, Jozsef Balint
- 105 -
up polygonal chord in compression. Firstly, linear buckling analysis was performed in
order to obtain the critical buckling loads and buckling shapes for the member. Different
spacing between bolts was investigated and the results showed that the limit of spacing
in which the flexural buckling governs, rather than the local buckling, is 250-500mm.
At 500mm spacing, the local buckling is the most crucial, every plate working as a
single element. While spacing is reduced to 250mm, the member is working as one solid
element and the flexural buckling is governing.
Plastic RIKS analysis was performed in order to obtain the ultimate load of the member,
whilst introducing different plastic material properties proposed by various methods.
Results showed that the yield strength increase in the bent zones does not influence the
buckling resistance of the member. There is just a slight difference between the
resistance values. FEM analysis was compared to hand calculations performed
according to the Eurocodes. Hand calculations gave lower results than the FEM
analysis, regarding the member resistance. The main factor that influences this
reduction is the buckling curve. For cold-formed members the Eurocode suggests to use
buckling curve “c”, which gives more conservative results in comparison with the ones
obtained by FEM analysis, whilst curves “a” or “b” give more similar results to FEM
analysis.
An approximate cost of the trusses was determined. The processes taken into account
for this were the cost of material, blasting, sawing, painting, transportation and erecting.
By far, the governing cost was determined by the material (around 90% of total cost),
both in the case of CHS and polygonal shaped section trusses.
The high reduction in the total mass of the trusses led to a cost drop of up to 46% for
S355 and around 38% for the HSS, when replacing CHS with built-up sections. Another
reason for the lower price of the built-up section truss is that the basic price of steel
differs a lot: 1.88 €/kg for the CHS and 1.169 €/kg for the steel plates.
An almost linear total cost reduction was obtained both for CHS and polygonal trusses,
when increasing the steel grade.
European Erasmus Mundus Master Sustainable Constructions under natural hazards and catastrophic events 520121-1-2011-1-CZ-ERA MUNDUS-EMMC/ Vaidas Alechnavicius, Jozsef Balint
- 106 -
A sustainability approach was taken into account as well for the 6 types of trusses
investigated. For this, a cradle-to-gate life cycle analysis (LCA) was considered, using
Environmental Product Declarations (EPD) from Ruukki.
This work only took into account the CO2 footprint calculation and ignored the rest of
the greenhouse effect producing gases, since the carbon dioxide accounts for 83.6% of
the total emissions.
The steel production, the painting and the transportation of the elements were the
processes investigated regarding the carbon footprint. For both CHS and polygonal
section trusses, the biggest percentage was represented, once more, by the steel
production with a 92% of the total for the CHS and 84% for the built-up cross-section
truss.
The CO2 emissions were reduced drastically with the increase of the steel grade. In the
case of the CHS truss a reduction of 21% (for S500) up to 28% (S650) is seen. For the
polygonal truss the reduction is not as significant, but savings of 8% for the S500 steel
and 16% for S650 are still obtained.
It is safe to say that the use of HSS and of built-up cold formed sections for this type of
long span trusses is beneficial both from an economical and environmental point of
view.
European Erasmus Mundus Master Sustainable Constructions under natural hazards and catastrophic events 520121-1-2011-1-CZ-ERA MUNDUS-EMMC/ Vaidas Alechnavicius, Jozsef Balint
- 107 -
FUTURE RESEARCH
There is a high need for future research, in order to verify the results obtained by
calculations and numerical analyses.
First of all, the laboratory tests for the connection should be performed to investigate a
real element behaviour of that area. The approximation of the connection model made
by FEM may not lead to the real behaviour of truss joint, therefore it must be compared
to experimental results.
True material properties should be obtained from tensile coupon tests, testing plates
with different bent angles. This is already scheduled to be performed at LTU and it is
just matter of time until they will be received.
Also, the compression test of built-up polygonal member could be performed, in order
to obtain test data for the finite model verification.
As it was mentioned above, LTU is part of the project involving investigation of this
type of trusses and there will be enough experimental tests conducted on this matter.
From the design point of view, serviceability limit states are very important for long
span truss structures. As the scope of this thesis did not cover this aspect, the prevention
of big deflection of long span trusses should be investigated in future research.
Moreover, different load combinations, such as reverse loading (suction force) should
be investigated, since it produces compression forces in the bottom chord, which might
lead to the buckling of the thin flanges of the U-shaped section.
Finally, a cost optimization is suggested, in order to obtain more realistic total cost
values for the trusses.
European Erasmus Mundus Master Sustainable Constructions under natural hazards and catastrophic events 520121-1-2011-1-CZ-ERA MUNDUS-EMMC/ Vaidas Alechnavicius, Jozsef Balint
- 108 -
REFERENCES
[1] J.-O. Sperle and K. Olsson, “High strength and ultra high strength steels for weight
reduction in structural and safety-related applications,” in 29 th International
Symposium on Automotive Technology and Automation., 1996, vol. 1, pp. 115–125.
[2] WorldAutoSteel, “Advanced High Strength Steel (AHSS) Application Guidelines.”
World Steel Association, Jun-2009.
[3] B. Johansson, “Use and design of high strength steel structures,” Rev. Metall. Cah.
Inf. Tech., vol. 100, no. 11, pp. 1115–1123+vi–ix, 2003.
[4] J. Farkas, “ECONOMY ACHIEVED BY USING HIGHER STRENGTH STEELS
IN TRUSSES WELDED FROM SQUARE HOLLOW SECTIONS,” in Welding of
Tubular Structures - Proceedings of the Second International Conference Held in
Boston, Massachusetts, USA, 16 – 17 July 1984, Under the Auspices of the
International Institute of Welding, Boston, 1984, pp. 137–144.
[5] J.-O. Sperle, L. Hallberg, J. Larsson, and H. Groth, “THE ENVIRONMENTAL
VALUE OF HIGH STRENGTH STEEL STRUCTURES (88044).”
[6] Lars Jensen, “Application of high strength steel in super long span modern
suspension bridge design,” Malmo, Sweden, 2009.
[7] C. Miki, K. Homma, and T. Tominaga, “High strength and high performance steels
and their use in bridge structures,” J. Constr. Steel Res., vol. 58, no. 1, pp. 3–20,
Jan. 2002.
[8] C. Shim, J. Whang, C. Chung, and P. Lee, “Design of Double Composite Bridges
using High Strength Steel,” Procedia Eng., vol. 14, pp. 1825–1829, 2011.
[9] M. Veljkovic and B. Johansson, “Design of hybrid steel girders,” J. Constr. Steel
Res., vol. 60, no. 3–5, pp. 535–547, Mar. 2004.
[10] J. Farkas, “Economy of higher-strength steels in overhead travelling cranes with
double-box girders,” J. Constr. Steel Res., vol. 6, no. 4, pp. 285–301, 1986.
[11] “Ruukki to install EUR20m structures at Swedbank Arena.,” Nordic Business
Report, 19-Oct-2009.
[12] Jan-Olof Sperle, “HIGH STRENGTH STEEL IN THE ROOF OF SWEDBANK
ARENA SAVINGS IN WEIGHT, COST AND ENVIRONMENTAL IMPACT,” in
Nordic Steel Construction Conference Proceedings, Oslo, 2012, p. 15.
[13] Innovation & Research FOCUS, “High strength long span structures,” no. 92,
pp. 4–5, Feb-2013.
[14] U. Hornung and H. Saal, “A method for calculating the out-of-plane buckling
length of diagonals of truss girders with hollow sections and K-joints,” J. Constr.
Steel Res., vol. 46, no. 1–3, p. 489, Apr. 1998.
[15] S. Houliara and S. A. Karamanos, “Buckling of Thin-Walled Long Steel
Cylinders Subjected to Bending,” J. Press. Vessel Technol., vol. 133, no. 1, pp.
011201–011201, Dec. 2010.
[16] M. M. K. Lee and S. R. Wilmshurst, “Parametric study of strength of tubular
multiplanar KK-joints,” J. Struct. Eng., vol. 122, no. 8, pp. 893–904, 1996.
[17] S. Herion and F. Mang, “Parametric Study on Multiplanas K-joints Made of
RHS Regarding Axial Force, In-Plane Bending and Out-of-Plane Bending
Moments,” in The Proceedings of the 4th (1994) International Offshore and Polar
European Erasmus Mundus Master Sustainable Constructions under natural hazards and catastrophic events 520121-1-2011-1-CZ-ERA MUNDUS-EMMC/ Vaidas Alechnavicius, Jozsef Balint
- 109 -
Engineering Conference, Osaka, Japan, April 10-15, 1994, vol. 4, International
Society of Offshore and Polar Engineers, 1994.
[18] S. Blümel and M. Fontana, “Load-bearing and deformation behaviour of truss
joints using thin-walled pentagon cross-sections,” Thin-Walled Struct., vol. 42, no.
2, pp. 295–307, Feb. 2004.
[19] M. Abambres, D. Camotim, and N. Silvestre, “Physically non-linear GBT
analysis of thin-walled members,” Comput. Struct., vol. 129, pp. 148–165, Dec.
2013.
[20] J. Wardenier, Hollow sections in structural applications. Geneva; Zoetermeer,
Netherlands: CIDECT ; Bouwen met Staal, 2010.
[21] Wardenier J, Design guide for circular hollow section (CHS) joint under
predominantly static loading. 2008.
[22] Olga Garzon, “Resistance of polygonal cross-sections - Application on Steel
Towers for Wind Turbine,” Licentiate, Luleå University of Technology, Luleå,
2013.
[23] “Eurocode 3: Design of steel structures. Part 1-1: General rules and rules for
buildings.” May-2005.
[24] “Eurocode 3: Design of steel structures. Part 1-8: Design of joints.” May-2005.
[25] “Eurocode 3 – Design of steel structures. Part 1-12: Additional rules for the
extension of EN 1993 up to steel grades S700.” Feb-2007.
[26] “Eurocode 3: Design of steel structures. Part 1-3: General rules – Supplementary
rules for cold-formed members and sheeting.” Oct-2006.
[27] “Eurocode 3 - Design of steel structures - Part 1-5: Plated structural elements.”
Oct-2006.
[28] S. Timoshenko, Theory of elastic stability. McGraw-Hill, 1961.
[29] Karren, K. W., and G. Winter, “Effects of Cold-Forming on Light-Gage Steel
Members,” J. Struct. Div., vol. vol. 93, Feb. 1967.
[30] Chajes, A., S. J. Britvec, and G. Winter, “Effects of Cold- Straining on
Structural Sheet Steels,” J. Struct. Div., vol. vol. 89, Apr. 1963.
[31] W. Yu and R. A. LaBoube, Cold-formed steel design. Hoboken, N.J.: Wiley,
2010.
[32] “North American Specification for the Design of Cold-Formed Steel Structural
Members.” Edition-2007.
[33] Lind, N.C., and Schroff, D.K., “Utilization of Cold Work in Light Gage Steel,”
J. Struct. Div. ASCE, vol. Vol. 101, Jan. 1975.
[34] P. A. Sloof and R. M. Schuster, “Yield strength increase of cold formed sections
due to cold work of forming,” in Fifteenth international specialty conference on
cold-formed steel structures., 2000.
[35] Sioof, P.A., Yield Strength Increase of Cold Formed Sections Due to Cold Work
of Forming. Waterloo, Ontario, Canada, 1999.
[36] J. Chen and W. Jin, “Corner strength enhancement of high strength cold-formed
steel at normal room and elevated temperatures,” J. Zhejiang Univ. Sci. A, vol. 9,
no. 9, pp. 1251–1257, Aug. 2008.
[37] Bjorhovde, R, “Deterministic and probabilistic approaches to the strength of
steel columns,” Lehigh University, PA, 1972.
[38] ECCS, “European Recommendations for the Design of Light Gauge Steel
Members,” p. Brussels, 1978.
European Erasmus Mundus Master Sustainable Constructions under natural hazards and catastrophic events 520121-1-2011-1-CZ-ERA MUNDUS-EMMC/ Vaidas Alechnavicius, Jozsef Balint
- 110 -
[39] Schafer, B.W. – Peköz, T, “Computational modelling of cold-formed steel
characterising geometric imperfections and residual stresses,” J. Constr. Steel Res.,
no. 47, pp. 193–210, 1998.
[40] Rondal, J. – Dubina, D. – Bivolaru, “Residual stresses and the behaviour of
cold-formed steel structures,” presented at the 17th Czech and Slovak International
Conference on Steel Structures and Bridges, Bratislava, Slovakia, 1994, pp. 193–
197.
[41] Rondal, J. - Dubina, D. - Ungueanu V., “Imperfections and computational
modelling of cold-formed members.”
[42] M. Życzkowski, “Post-buckling analysis of non-prismatic columns under
general behaviour of loading,” Int. J. Non-Linear Mech., vol. 40, no. 4, pp. 445–
463, May 2005.
[43] Tim Heistermann, Naveed Iqbal, Marouene Limam, and Christine Heistermann,
Milan Veljkovic, “Compendium for the course S7001B Applied FEM Basics and at
elevated temperatures.” Department of Civil, Mining and Environmental
Engineering Division of Structural Engineering – Steel Structures, Luleå, 2010.
[44] J. Haapio, “Feature-Based Costing Method for Skeletal Steel Structures based on
the Process Approach,” Mar. 2012.
[45] Kristo Mela, Markku Heinisuo, and Teemu Tiainen, “Deliverable D4.5,” TUT
Tampere University of Technology, RUOSTE Project Report D4.5, 2013.
[46] P. W. Jowitt, “Sustainability and the formation of the civil engineer,” Proc. ICE-
Eng. Sustain., vol. 157, no. 2, pp. 79–88, 2004.
[47] “What is Sustainability and where did it come from????,” GREEN
MOVEMENT: INNOVATIVE AND IDEAL. .
[48] Ruukki, “Certificates, EC- and environmental declarations - Ruukki.” [Online].
Available: http://www.ruukki.com/Products-and-solutions/Certificates-EC--and-
environmental-declarations. [Accessed: 09-Jan-2014].
[49] TUT, Tampere University of Technology, “JouCO2 & COSTi,”
Metallirakentamisen tutkimuskeskus. [Online]. Available:
http://metallirakentaminen.fi/jouco2-amp-costi. [Accessed: 09-Jan-2014].
[50] Kari Mäkelä, “Semi trailer combination Gross vehicle mass 40t, pay load
capacity 25t Highway driving,” 25-Apr-2012. [Online]. Available:
http://lipasto.vtt.fi/yksikkopaastot/tavaraliikennee/tieliikennee/kapptiee.htm.
[Accessed: 09-Jan-2014].
European Erasmus Mundus Master Sustainable Constructions under natural hazards and catastrophic events 520121-1-2011-1-CZ-ERA MUNDUS-EMMC/ Vaidas Alechnavicius, Jozsef Balint
- 111 -
APPENDICES
Annex A - Design calculation of CHS truss elements, joints and welds for S355, S500,
S650
Annex B - Design calculation of the built-up polygonal section truss elements for S355,
S500, S650
Annex C - Global buckling design calculation of the CHS and polygonal built-up truss
for S355, S500, S650
Annex D - Cost determination for CHS and polygonal trusses, using S355, S500 and
S650
Annex E - CO2 emissions calculation for CHS and polygonal trusses, using S355, S500
and S650
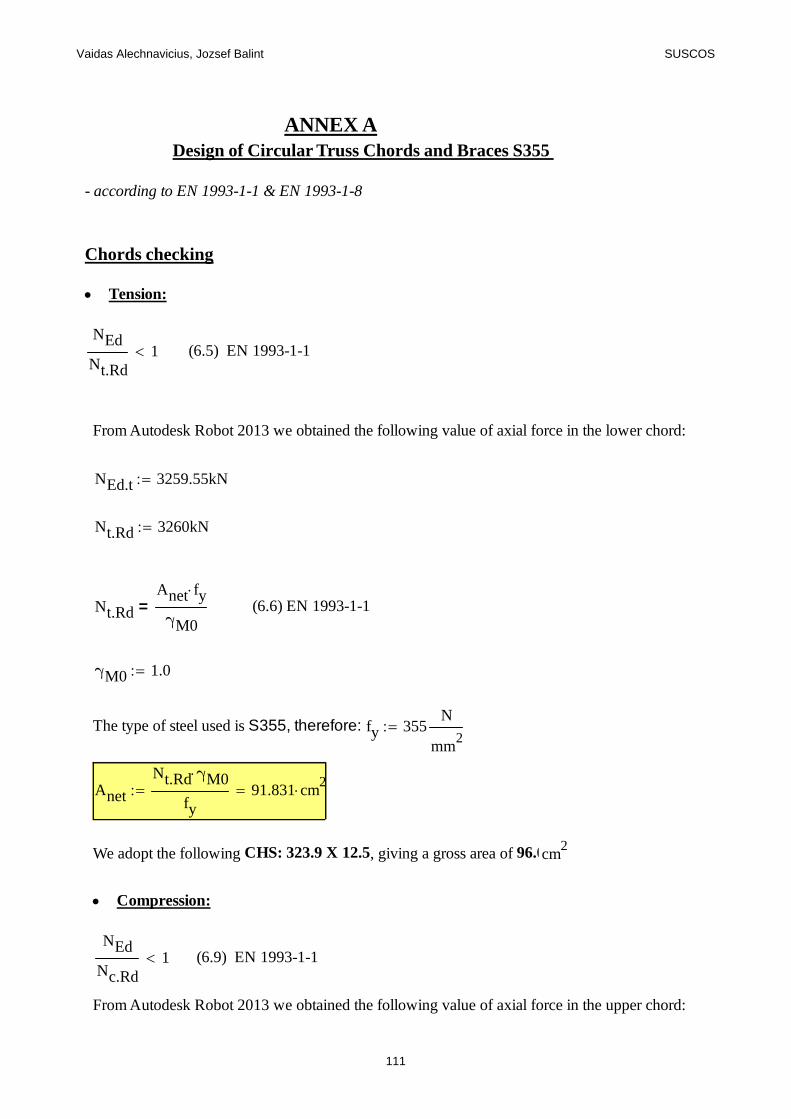
Vaidas Alechnavicius, Jozsef Balint SUSCOS
ANNEX A Design of Circular Truss Chords and Braces S355
- according to EN 1993-1-1 & EN 1993-1-8
Chords checking
Tension:
NEd
Nt.Rd1 (6.5) EN 1993-1-1
From Autodesk Robot 2013 we obtained the following value of axial force in the lower chord:
NEd.t 3259.55kN
Nt.Rd 3260kN
Nt.Rd
Anet fy
γM0= (6.6) EN 1993-1-1
γM0 1.0
The type of steel used is S355, therefore: fy 355N
mm2
Anet
Nt.Rd γM0
fy91.831 cm
2
We adopt the following CHS: 323.9 X 12.5, giving a gross area of 96.00 cm2
Compression:
NEd
Nc.Rd1 (6.9) EN 1993-1-1
From Autodesk Robot 2013 we obtained the following value of axial force in the upper chord:
111
Vaidas Alechnavicius, Jozsef Balint SUSCOS
NEd.c 1589.37kN
Cross-section classification:
- according to Table 5.2 from EN 1993-1-1
ε235
3550.814 ε
20.662
d 219.1mm t 10mm
d
t21.91 < 50 ε
2 33.099
Therefore, the Cross-section is Class 1.
Nc.Rd
A fy
γM0= (6.10) EN 1993-1-1
Nc.Rd 1590kN
γM0 1
fy 355N
mm2
ANc.Rd γM0
fy44.789 cm
2
We adopt the following CHS: 219.1 X 12.5, giving a gross area of 81.13cm2 (value adopted due to
joint verification)
Buckling resistance:
NEd
Nb.Rd1 (6.46) EN 1993-1-1
A 81.13cm2
112
Vaidas Alechnavicius, Jozsef Balint SUSCOS
Nb.Rd
χ A fy
γM1=
γM1 1
Ncr
π2
E Iy
Lcr2
= Lcr k L=
E 210GPa Iy 4344.58cm4 L 4m k 0.9 (for chord)
Lcr k L 3.6m
Ncr
π2
E Iy
Lcr2
6948.032 kN
λA fy
Ncr0.644
According to Table 6.2, EN 1993-1-1, buckling curve "c" must be used.
α 0.49
Φ 0.5 1 α λ 0.2( ) λ2 0.816
χ1
Φ Φ2
λ2
0.759 < 1 (6.49)
Nb.Rd
χ A fy
γM12.186 10
3 kN
NEd 1590kN
NEd
Nb.Rd0.727 < 1
113
Vaidas Alechnavicius, Jozsef Balint SUSCOS
Diagonals checking
Lbr 2.5m0.3239m
2
0.2191m
2 2.228m
Diagonals in tension:
NEd
Nt.Rd1 (6.5) EN 1993-1-1
From Autodesk Robot 2013 we obtained the following value of axial force in diagonal:
NEd.t 1097.68kN
Nt.Rd 1098kN
Nt.Rd
Anet fy
γM0= (6.6) EN 1993-1-1
γM0 1.0
The type of steel used is S355, therefore: fy 355N
mm2
Anet
Nt.Rd γM0
fy30.93 cm
2
We adopt the following CHS: 168.3 X 6.3, giving a gross area of 32.06cm2.
Compression:
NEd
Nc.Rd1 (6.9) EN 1993-1-1
From Autodesk Robot 2013 we obtained the following value of axial force in diagonal:
NEd.c 1086.44kN
114
Vaidas Alechnavicius, Jozsef Balint SUSCOS
Cross-section classification:
- according to Table 5.2 from EN 1993-1-1
ε235
3550.814 ε
20.662
d 168.3mm t 6.3mm
d
t26.714 < 50 ε
2 33.099
Therefore, the Cross-section is Class 1.
Nc.Rd
A fy
γM0= (6.10) EN 1993-1-1
Nc.Rd 1087kN
γM0 1
fy 355N
mm2
ANc.Rd γM0
fy30.62 cm
2
We adopt the following CHS: 168.3 X 6.3, giving a gross area of 32.06cm2 (value adopted due tothe buckling verification)
Buckling resistance:
NEd
Nb.Rd1 (6.46) EN 1993-1-1
A 32.06cm2
Nb.Rd
χ A fy
γM1=
γM1 1
115

Vaidas Alechnavicius, Jozsef Balint SUSCOS
Ncr
π2
E Iy
Lcr2
= Lcr k Lbr=
E 210GPa Iy 1053.42cm4 k 0.75 (for brace)
Lcr k Lbr 1.671m
Ncr
π2
E Iy
Lcr2
7815.788 kN
λA fy
Ncr0.382
According to Table 6.2, EN 1993-1-1, buckling curve "c" must be used.
α 0.49
Φ 0.5 1 α λ 0.2( ) λ2 0.617
χ1
Φ Φ2
λ2
0.907 < 1 (6.49)
Nb.Rd
χ A fy
γM11.032 10
3 kN
NEd 1025kN
NEd
Nb.Rd0.993 < 1
Design of top brace in tension:
NEd
Nt.Rd1 (6.5) EN 1993-1-1
116
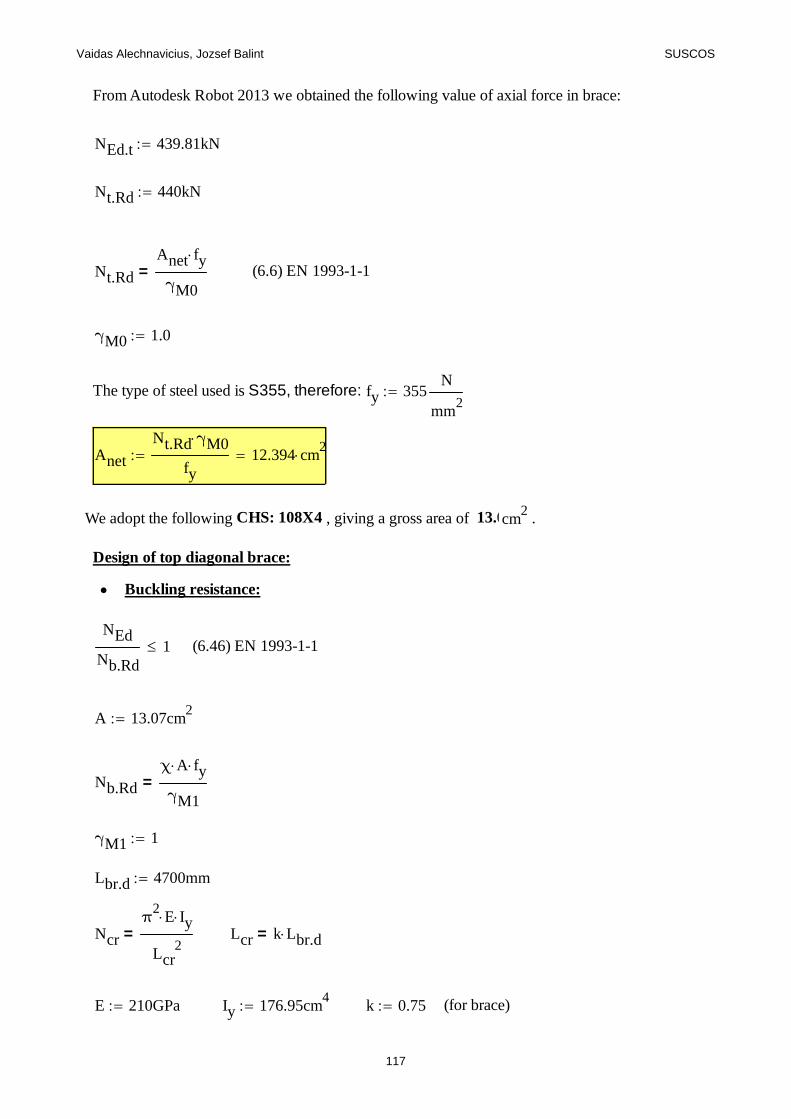
Vaidas Alechnavicius, Jozsef Balint SUSCOS
From Autodesk Robot 2013 we obtained the following value of axial force in brace:
NEd.t 439.81kN
Nt.Rd 440kN
Nt.Rd
Anet fy
γM0= (6.6) EN 1993-1-1
γM0 1.0
The type of steel used is S355, therefore: fy 355N
mm2
Anet
Nt.Rd γM0
fy12.394 cm
2
We adopt the following CHS: 108X4 , giving a gross area of 13.07cm2 .
Design of top diagonal brace:
Buckling resistance:
NEd
Nb.Rd1 (6.46) EN 1993-1-1
A 13.07cm2
Nb.Rd
χ A fy
γM1=
γM1 1
Lbr.d 4700mm
Ncr
π2
E Iy
Lcr2
= Lcr k Lbr.d=
E 210GPa Iy 176.95cm4 k 0.75 (for brace)
117
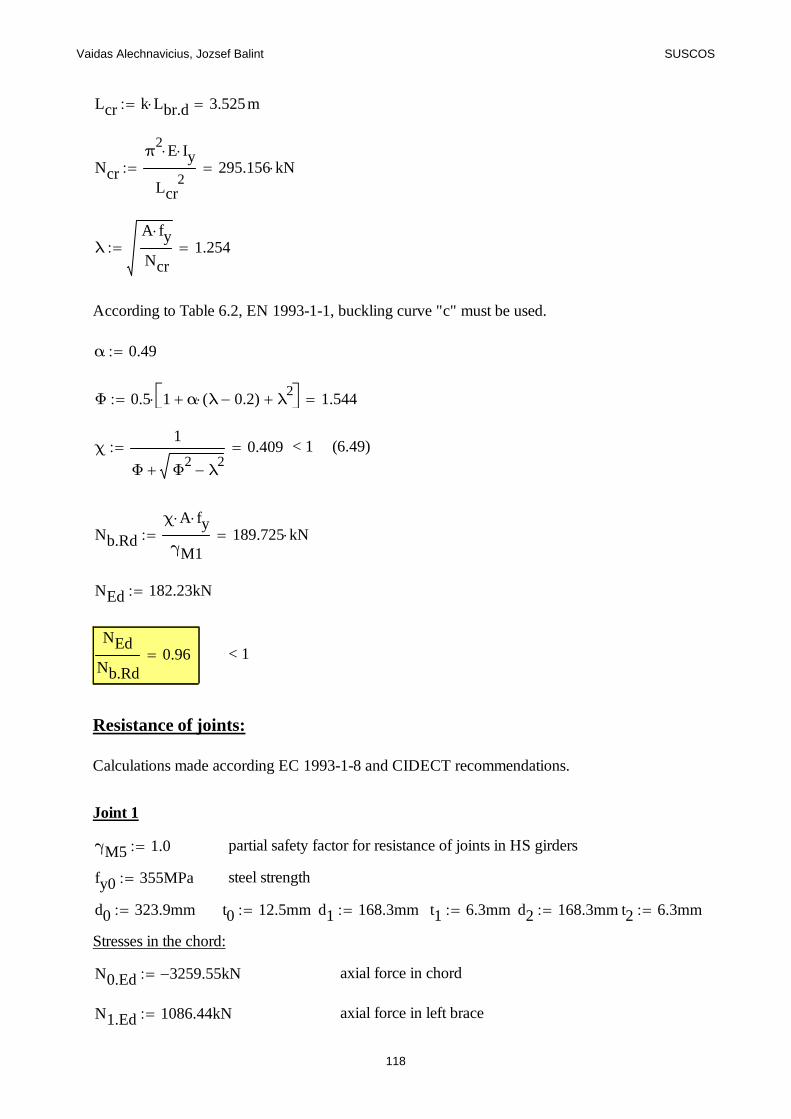
Vaidas Alechnavicius, Jozsef Balint SUSCOS
Lcr k Lbr.d 3.525m
Ncr
π2
E Iy
Lcr2
295.156 kN
λA fy
Ncr1.254
According to Table 6.2, EN 1993-1-1, buckling curve "c" must be used.
α 0.49
Φ 0.5 1 α λ 0.2( ) λ2 1.544
χ1
Φ Φ2
λ2
0.409 < 1 (6.49)
Nb.Rd
χ A fy
γM1189.725 kN
NEd 182.23kN
NEd
Nb.Rd0.96 < 1
Resistance of joints:
Calculations made according EC 1993-1-8 and CIDECT recommendations.
Joint 1
γM5 1.0 partial safety factor for resistance of joints in HS girders
fy0 355MPa steel strength
d0 323.9mm t0 12.5mm d1 168.3mm t1 6.3mm d2 168.3mm t2 6.3mm
Stresses in the chord:
N0.Ed 3259.55 kN axial force in chord
N1.Ed 1086.44kN axial force in left brace
118
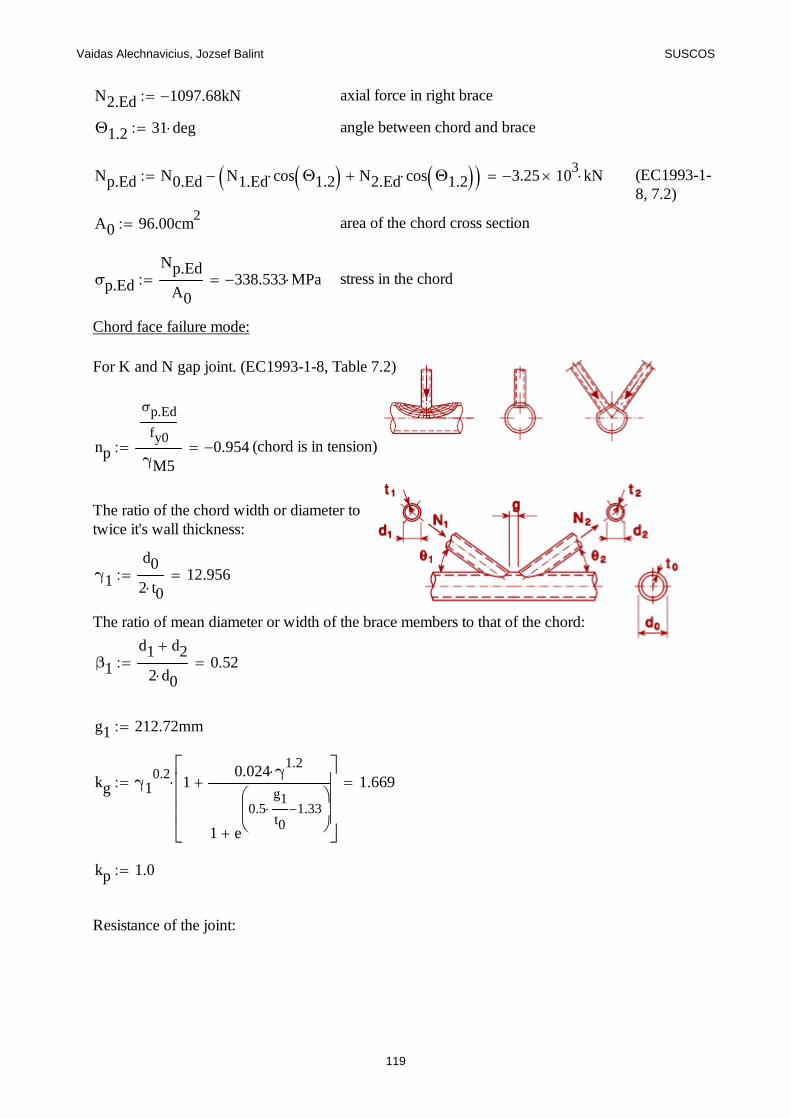
Vaidas Alechnavicius, Jozsef Balint SUSCOS
N2.Ed 1097.68 kN axial force in right brace
Θ1.2 31 deg angle between chord and brace
Np.Ed N0.Ed N1.Ed cos Θ1.2 N2.Ed cos Θ1.2 3.25 103 kN (EC1993-1-
8, 7.2)
A0 96.00cm2 area of the chord cross section
σp.Ed
Np.Ed
A0338.533 MPa stress in the chord
Chord face failure mode:
For K and N gap joint. (EC1993-1-8, Table 7.2)
np
σp.Ed
fy0
γM50.954 (chord is in tension)
The ratio of the chord width or diameter totwice it's wall thickness:
γ1
d0
2 t012.956
The ratio of mean diameter or width of the brace members to that of the chord:
β1
d1 d2
2 d00.52
g1 212.72mm
kg γ10.2
10.024 γ
1.2
1 e
0.5g1
t0 1.33
1.669
kp 1.0
Resistance of the joint:
119
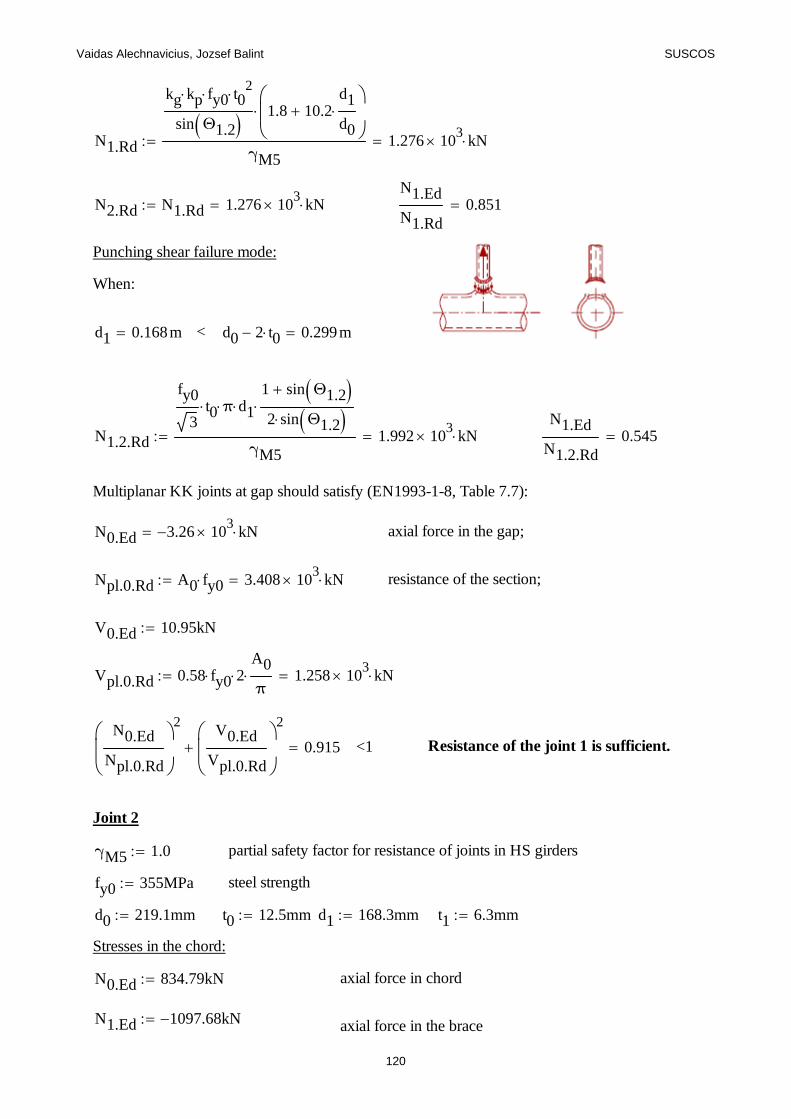
Vaidas Alechnavicius, Jozsef Balint SUSCOS
N1.Rd
kg kp fy0 t02
sin Θ1.2 1.8 10.2d1
d0
γM51.276 10
3 kN
N2.Rd N1.Rd 1.276 103 kN
N1.Ed
N1.Rd0.851
Punching shear failure mode:
When:
d1 0.168m < d0 2 t0 0.299m
N1.2.Rd
fy0
3t0 π d1
1 sin Θ1.2
2 sin Θ1.2
γM51.992 10
3 kNN1.Ed
N1.2.Rd0.545
Multiplanar KK joints at gap should satisfy (EN1993-1-8, Table 7.7):
N0.Ed 3.26 103 kN axial force in the gap;
Npl.0.Rd A0 fy0 3.408 103 kN resistance of the section;
V0.Ed 10.95kN
Vpl.0.Rd 0.58 fy0 2A0
π 1.258 10
3 kN
N0.Ed
Npl.0.Rd
2V0.Ed
Vpl.0.Rd
2
0.915 <1 Resistance of the joint 1 is sufficient.
Joint 2
γM5 1.0 partial safety factor for resistance of joints in HS girders
fy0 355MPa steel strength
d0 219.1mm t0 12.5mm d1 168.3mm t1 6.3mm
Stresses in the chord:
N0.Ed 834.79kN axial force in chord
N1.Ed 1097.68 kN axial force in the brace
120
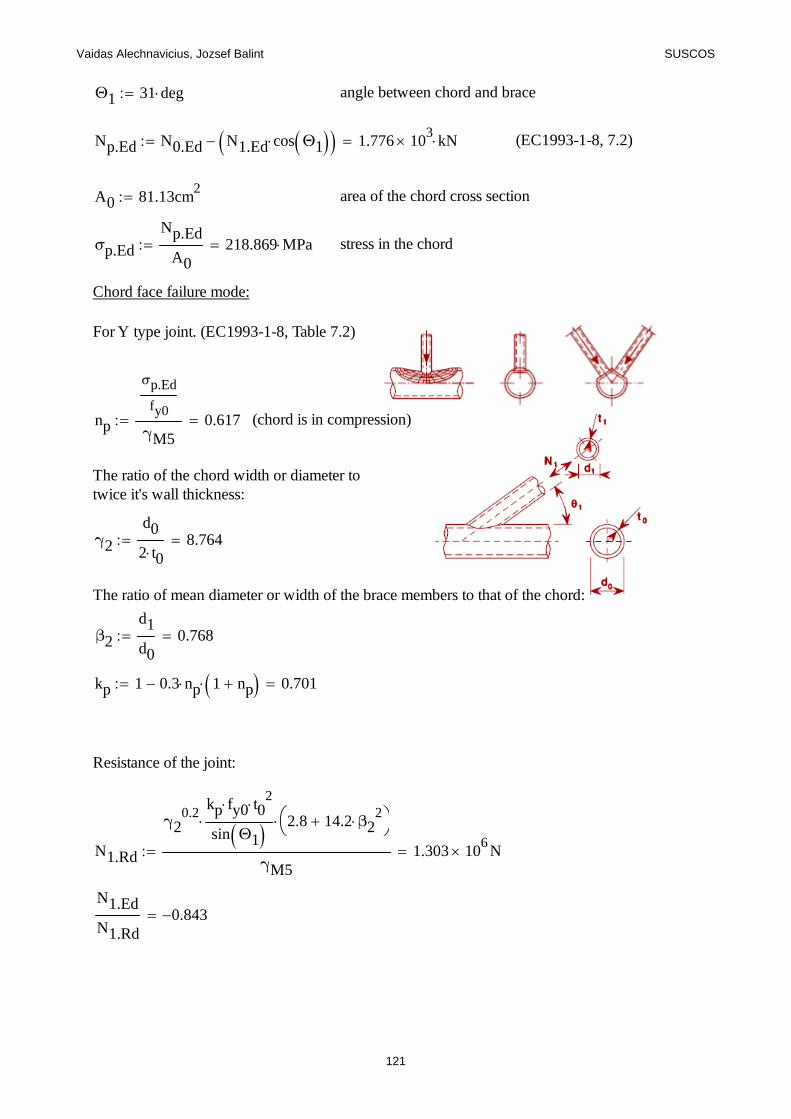
Vaidas Alechnavicius, Jozsef Balint SUSCOS
Θ1 31 deg angle between chord and brace
Np.Ed N0.Ed N1.Ed cos Θ1 1.776 103 kN (EC1993-1-8, 7.2)
A0 81.13cm2 area of the chord cross section
σp.Ed
Np.Ed
A0218.869 MPa stress in the chord
Chord face failure mode:
For Y type joint. (EC1993-1-8, Table 7.2)
np
σp.Ed
fy0
γM50.617 (chord is in compression)
The ratio of the chord width or diameter totwice it's wall thickness:
γ2
d0
2 t08.764
The ratio of mean diameter or width of the brace members to that of the chord:
β2
d1
d00.768
kp 1 0.3 np 1 np 0.701
Resistance of the joint:
N1.Rd
γ20.2
kp fy0 t02
sin Θ1 2.8 14.2 β22
γM51.303 10
6 N
N1.Ed
N1.Rd0.843
121
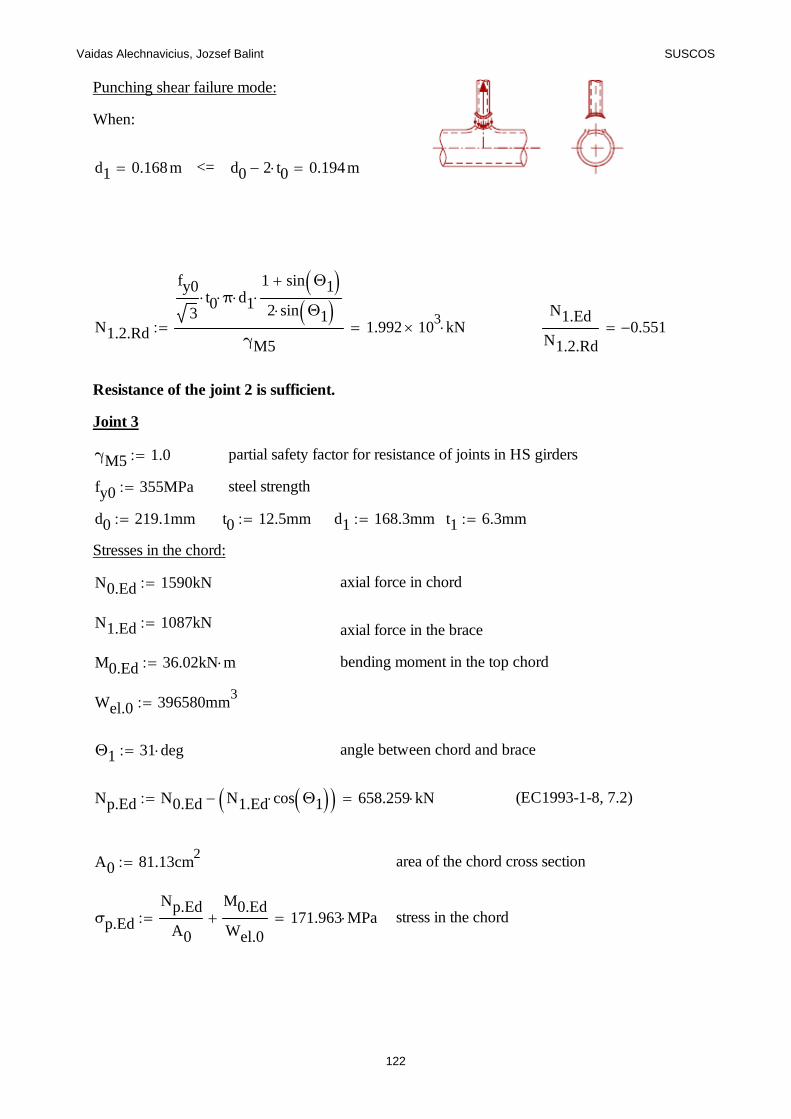
Vaidas Alechnavicius, Jozsef Balint SUSCOS
Punching shear failure mode:
When:
d1 0.168m <= d0 2 t0 0.194m
N1.2.Rd
fy0
3t0 π d1
1 sin Θ1
2 sin Θ1
γM51.992 10
3 kNN1.Ed
N1.2.Rd0.551
Resistance of the joint 2 is sufficient.
Joint 3
γM5 1.0 partial safety factor for resistance of joints in HS girders
fy0 355MPa steel strength
d0 219.1mm t0 12.5mm d1 168.3mm t1 6.3mm
Stresses in the chord:
N0.Ed 1590kN axial force in chord
N1.Ed 1087kN axial force in the brace
M0.Ed 36.02kN m bending moment in the top chord
Wel.0 396580mm3
Θ1 31 deg angle between chord and brace
Np.Ed N0.Ed N1.Ed cos Θ1 658.259 kN (EC1993-1-8, 7.2)
A0 81.13cm2 area of the chord cross section
σp.Ed
Np.Ed
A0
M0.Ed
Wel.0 171.963 MPa stress in the chord
122
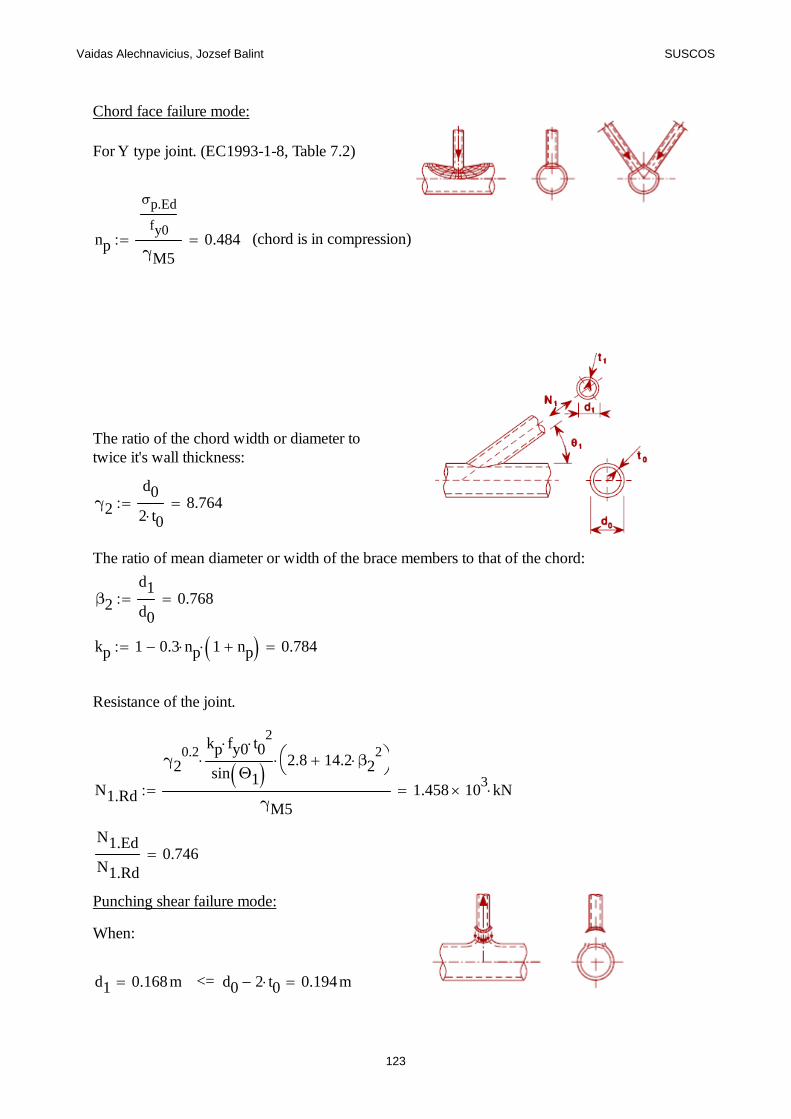
Vaidas Alechnavicius, Jozsef Balint SUSCOS
Chord face failure mode:
For Y type joint. (EC1993-1-8, Table 7.2)
np
σp.Ed
fy0
γM50.484 (chord is in compression)
The ratio of the chord width or diameter totwice it's wall thickness:
γ2
d0
2 t08.764
The ratio of mean diameter or width of the brace members to that of the chord:
β2
d1
d00.768
kp 1 0.3 np 1 np 0.784
Resistance of the joint.
N1.Rd
γ20.2
kp fy0 t02
sin Θ1 2.8 14.2 β22
γM51.458 10
3 kN
N1.Ed
N1.Rd0.746
Punching shear failure mode:
When:
d1 0.168m <= d0 2 t0 0.194m
123
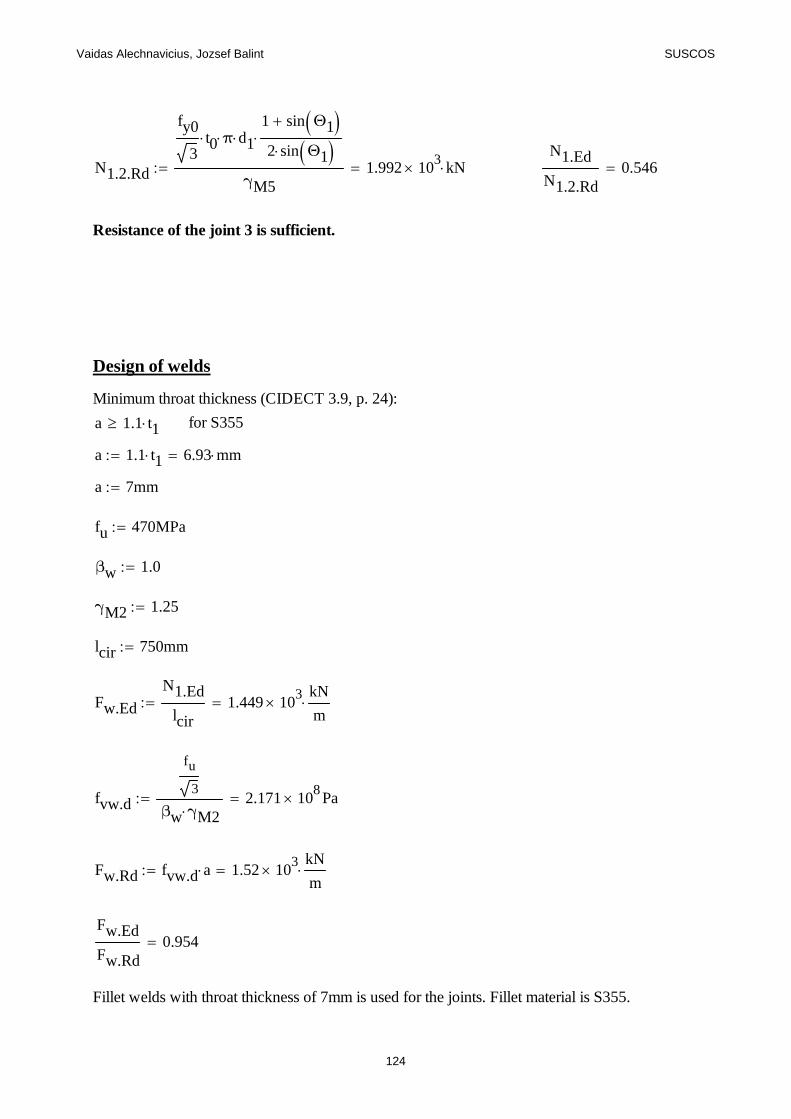
Vaidas Alechnavicius, Jozsef Balint SUSCOS
N1.2.Rd
fy0
3t0 π d1
1 sin Θ1
2 sin Θ1
γM51.992 10
3 kNN1.Ed
N1.2.Rd0.546
Resistance of the joint 3 is sufficient.
Design of welds
Minimum throat thickness (CIDECT 3.9, p. 24):
a 1.1 t1 for S355
a 1.1 t1 6.93 mm
a 7mm
fu 470MPa
βw 1.0
γM2 1.25
lcir 750mm
Fw.Ed
N1.Ed
lcir1.449 10
3kN
m
fvw.d
fu
3
βw γM22.171 10
8 Pa
Fw.Rd fvw.d a 1.52 103
kN
m
Fw.Ed
Fw.Rd0.954
Fillet welds with throat thickness of 7mm is used for the joints. Fillet material is S355.
124
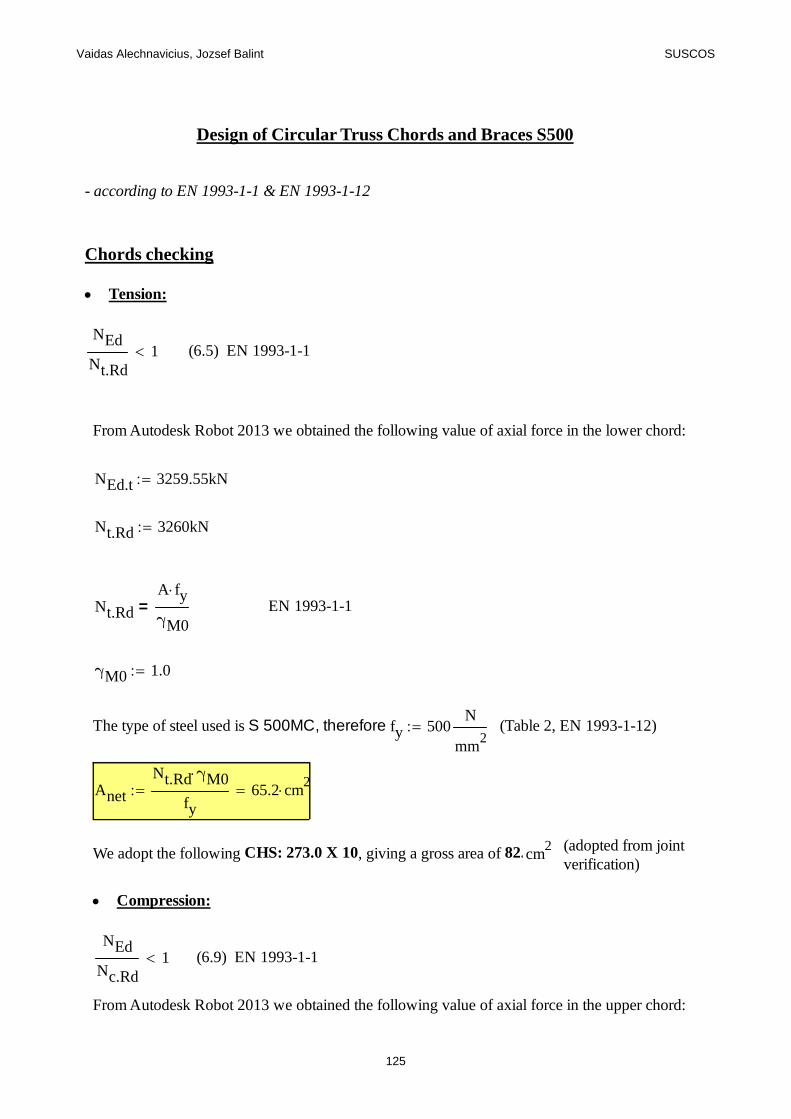
Vaidas Alechnavicius, Jozsef Balint SUSCOS
Design of Circular Truss Chords and Braces S500
- according to EN 1993-1-1 & EN 1993-1-12
Chords checking
Tension:
NEd
Nt.Rd1 (6.5) EN 1993-1-1
From Autodesk Robot 2013 we obtained the following value of axial force in the lower chord:
NEd.t 3259.55kN
Nt.Rd 3260kN
Nt.Rd
A fy
γM0= EN 1993-1-1
γM0 1.0
The type of steel used is S 500MC, therefore: fy 500N
mm2
(Table 2, EN 1993-1-12)
Anet
Nt.Rd γM0
fy65.2 cm
2
(adopted from jointverification)
We adopt the following CHS: 273.0 X 10, giving a gross area of 82.62 cm2
Compression:
NEd
Nc.Rd1 (6.9) EN 1993-1-1
From Autodesk Robot 2013 we obtained the following value of axial force in the upper chord:
125
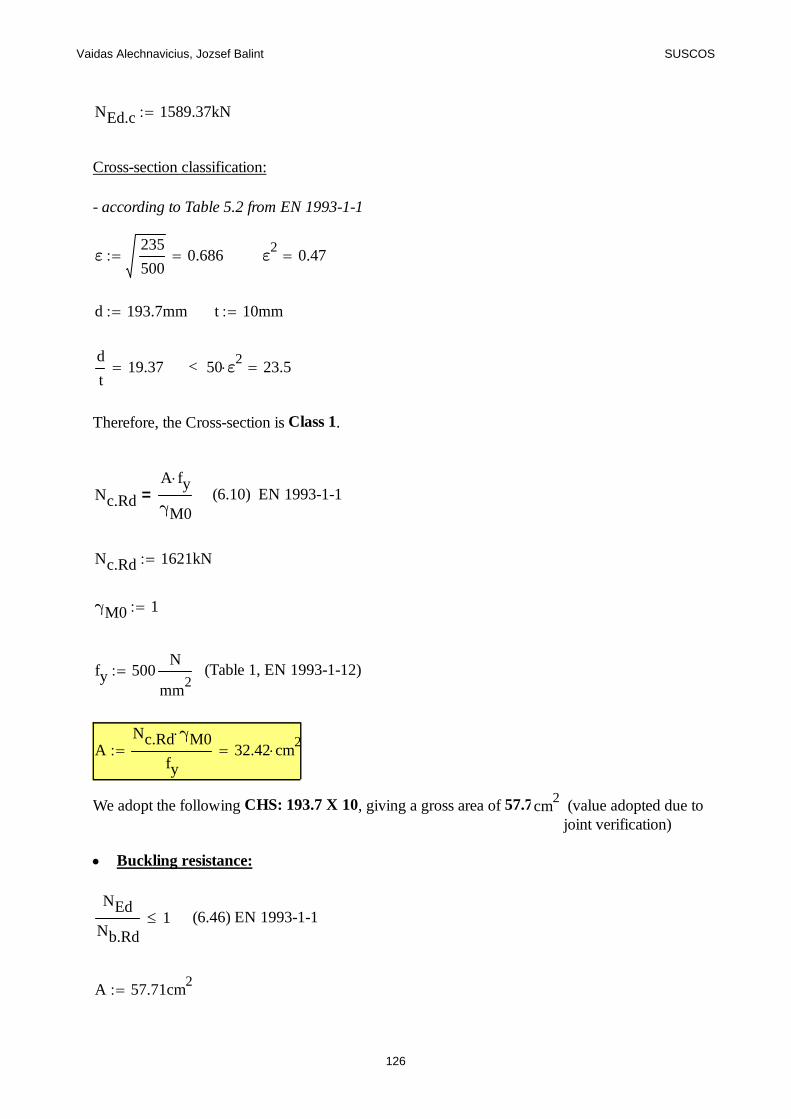
Vaidas Alechnavicius, Jozsef Balint SUSCOS
NEd.c 1589.37kN
Cross-section classification:
- according to Table 5.2 from EN 1993-1-1
ε235
5000.686 ε
20.47
d 193.7mm t 10mm
d
t19.37 < 50 ε
2 23.5
Therefore, the Cross-section is Class 1.
Nc.Rd
A fy
γM0= (6.10) EN 1993-1-1
Nc.Rd 1621kN
γM0 1
fy 500N
mm2
(Table 1, EN 1993-1-12)
ANc.Rd γM0
fy32.42 cm
2
We adopt the following CHS: 193.7 X 10, giving a gross area of 57.71cm2 (value adopted due to
joint verification)
Buckling resistance:
NEd
Nb.Rd1 (6.46) EN 1993-1-1
A 57.71cm2
126
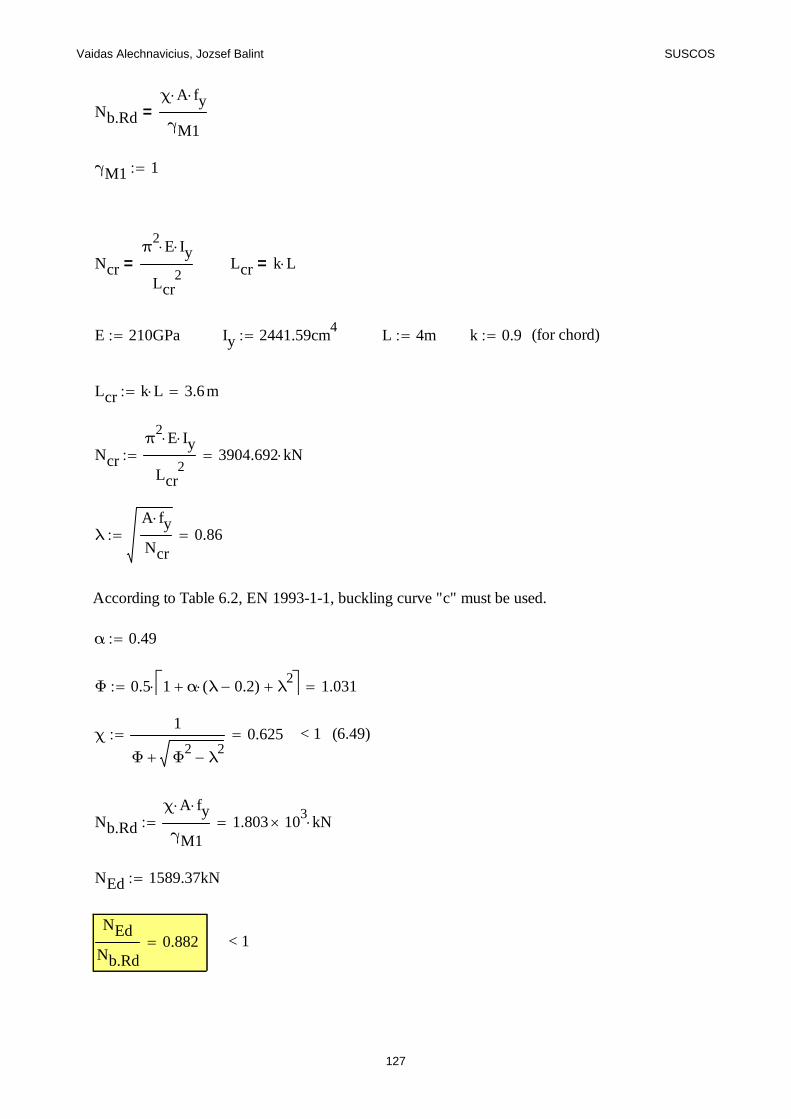
Vaidas Alechnavicius, Jozsef Balint SUSCOS
Nb.Rd
χ A fy
γM1=
γM1 1
Ncr
π2
E Iy
Lcr2
= Lcr k L=
E 210GPa Iy 2441.59cm4 L 4m k 0.9 (for chord)
Lcr k L 3.6m
Ncr
π2
E Iy
Lcr2
3904.692 kN
λA fy
Ncr0.86
According to Table 6.2, EN 1993-1-1, buckling curve "c" must be used.
α 0.49
Φ 0.5 1 α λ 0.2( ) λ2 1.031
χ1
Φ Φ2
λ2
0.625 < 1 (6.49)
Nb.Rd
χ A fy
γM11.803 10
3 kN
NEd 1589.37kN
NEd
Nb.Rd0.882 < 1
127
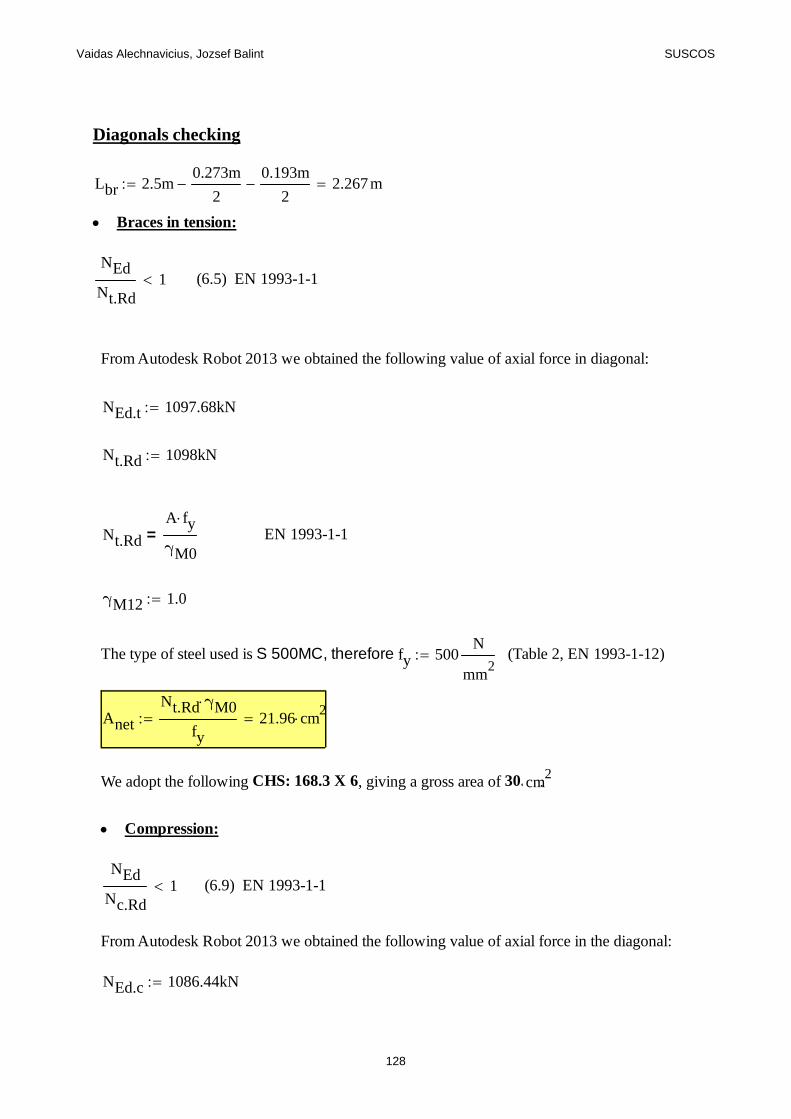
Vaidas Alechnavicius, Jozsef Balint SUSCOS
Diagonals checking
Lbr 2.5m0.273m
2
0.193m
2 2.267m
Braces in tension:
NEd
Nt.Rd1 (6.5) EN 1993-1-1
From Autodesk Robot 2013 we obtained the following value of axial force in diagonal:
NEd.t 1097.68kN
Nt.Rd 1098kN
Nt.Rd
A fy
γM0= EN 1993-1-1
γM12 1.0
The type of steel used is S 500MC, therefore: fy 500N
mm2
(Table 2, EN 1993-1-12)
Anet
Nt.Rd γM0
fy21.96 cm
2
We adopt the following CHS: 168.3 X 6, giving a gross area of 30.59 cm2.
Compression:
NEd
Nc.Rd1 (6.9) EN 1993-1-1
From Autodesk Robot 2013 we obtained the following value of axial force in the diagonal:
NEd.c 1086.44kN
128
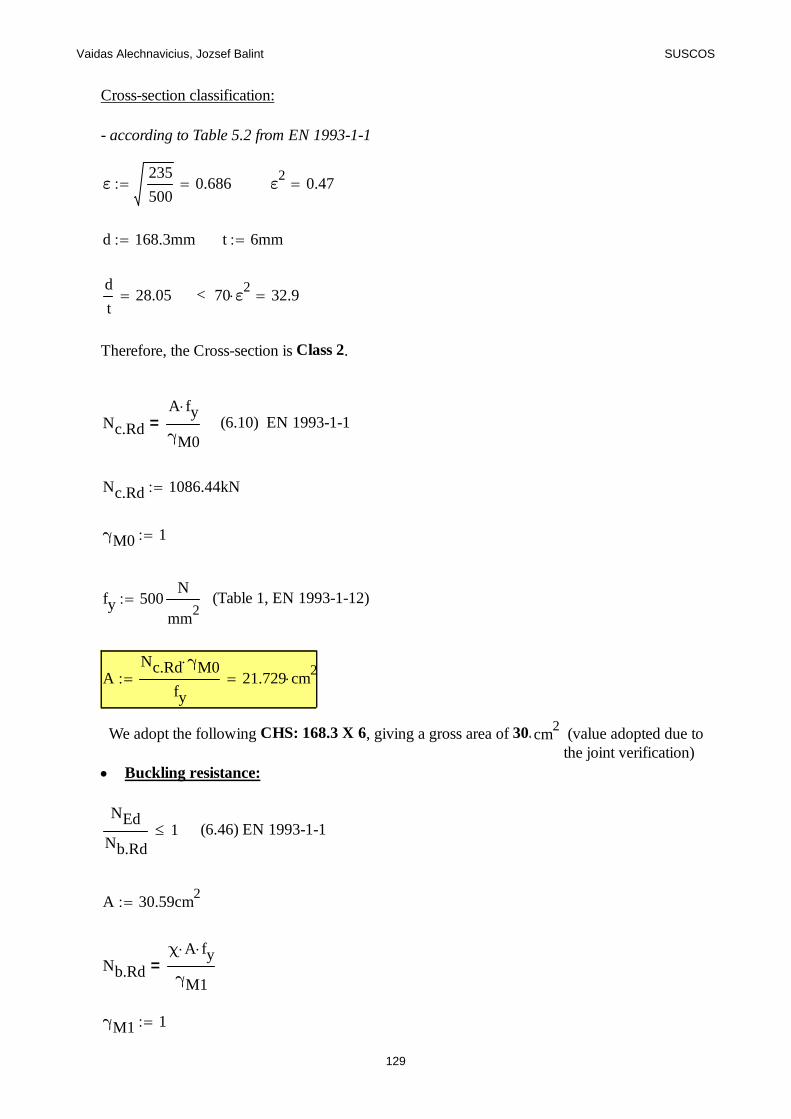
Vaidas Alechnavicius, Jozsef Balint SUSCOS
Cross-section classification:
- according to Table 5.2 from EN 1993-1-1
ε235
5000.686 ε
20.47
d 168.3mm t 6mm
d
t28.05 < 70 ε
2 32.9
Therefore, the Cross-section is Class 2.
Nc.Rd
A fy
γM0= (6.10) EN 1993-1-1
Nc.Rd 1086.44kN
γM0 1
fy 500N
mm2
(Table 1, EN 1993-1-12)
ANc.Rd γM0
fy21.729 cm
2
We adopt the following CHS: 168.3 X 6, giving a gross area of 30.59 cm2 (value adopted due to
the joint verification) Buckling resistance:
NEd
Nb.Rd1 (6.46) EN 1993-1-1
A 30.59cm2
Nb.Rd
χ A fy
γM1=
γM1 1
129
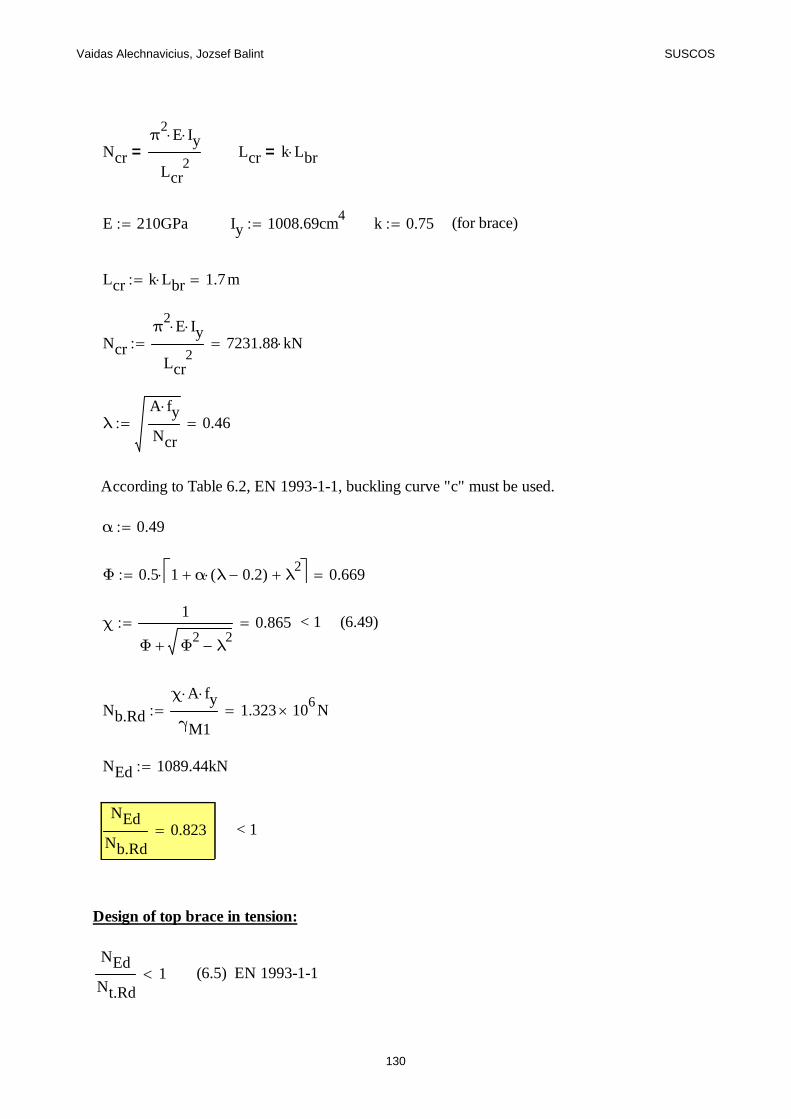
Vaidas Alechnavicius, Jozsef Balint SUSCOS
Ncr
π2
E Iy
Lcr2
= Lcr k Lbr=
E 210GPa Iy 1008.69cm4 k 0.75 (for brace)
Lcr k Lbr 1.7m
Ncr
π2
E Iy
Lcr2
7231.88 kN
λA fy
Ncr0.46
According to Table 6.2, EN 1993-1-1, buckling curve "c" must be used.
α 0.49
Φ 0.5 1 α λ 0.2( ) λ2 0.669
χ1
Φ Φ2
λ2
0.865 < 1 (6.49)
Nb.Rd
χ A fy
γM11.323 10
6 N
NEd 1089.44kN
NEd
Nb.Rd0.823 < 1
Design of top brace in tension:
NEd
Nt.Rd1 (6.5) EN 1993-1-1
130
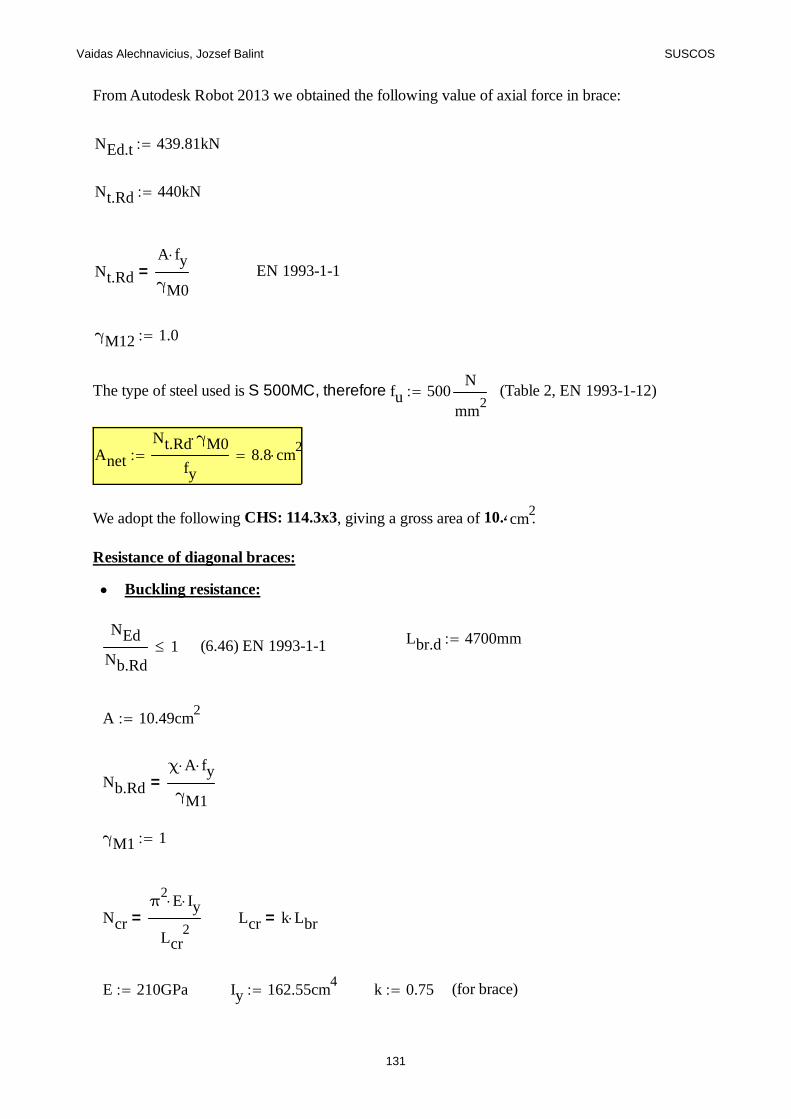
Vaidas Alechnavicius, Jozsef Balint SUSCOS
From Autodesk Robot 2013 we obtained the following value of axial force in brace:
NEd.t 439.81kN
Nt.Rd 440kN
Nt.Rd
A fy
γM0= EN 1993-1-1
γM12 1.0
The type of steel used is S 500MC, therefore: fu 500N
mm2
(Table 2, EN 1993-1-12)
Anet
Nt.Rd γM0
fy8.8 cm
2
We adopt the following CHS: 114.3x3, giving a gross area of 10.49 cm2.
Resistance of diagonal braces:
Buckling resistance:
Lbr.d 4700mmNEd
Nb.Rd1 (6.46) EN 1993-1-1
A 10.49cm2
Nb.Rd
χ A fy
γM1=
γM1 1
Ncr
π2
E Iy
Lcr2
= Lcr k Lbr=
E 210GPa Iy 162.55cm4 k 0.75 (for brace)
131
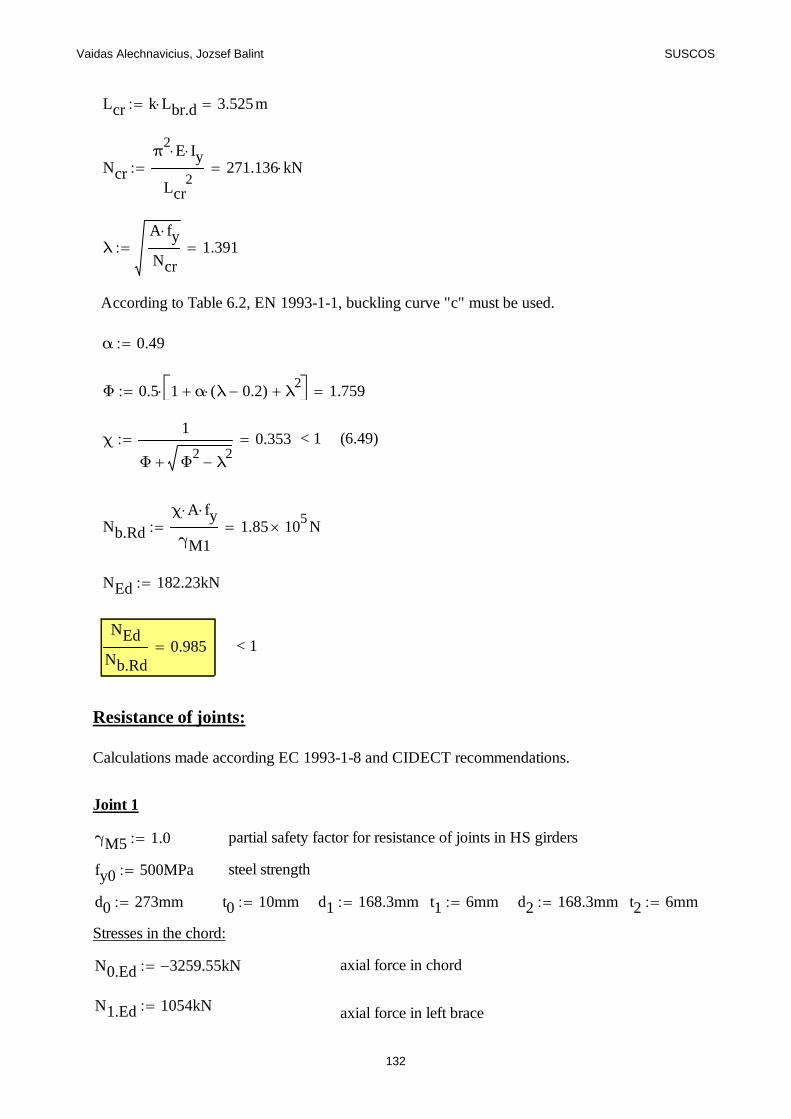
Vaidas Alechnavicius, Jozsef Balint SUSCOS
Lcr k Lbr.d 3.525m
Ncr
π2
E Iy
Lcr2
271.136 kN
λA fy
Ncr1.391
According to Table 6.2, EN 1993-1-1, buckling curve "c" must be used.
α 0.49
Φ 0.5 1 α λ 0.2( ) λ2 1.759
χ1
Φ Φ2
λ2
0.353 < 1 (6.49)
Nb.Rd
χ A fy
γM11.85 10
5 N
NEd 182.23kN
NEd
Nb.Rd0.985 < 1
Resistance of joints:
Calculations made according EC 1993-1-8 and CIDECT recommendations.
Joint 1
γM5 1.0 partial safety factor for resistance of joints in HS girders
fy0 500MPa steel strength
d0 273mm t0 10mm d1 168.3mm t1 6mm d2 168.3mm t2 6mm
Stresses in the chord:
N0.Ed 3259.55 kN axial force in chord
N1.Ed 1054kN axial force in left brace
132
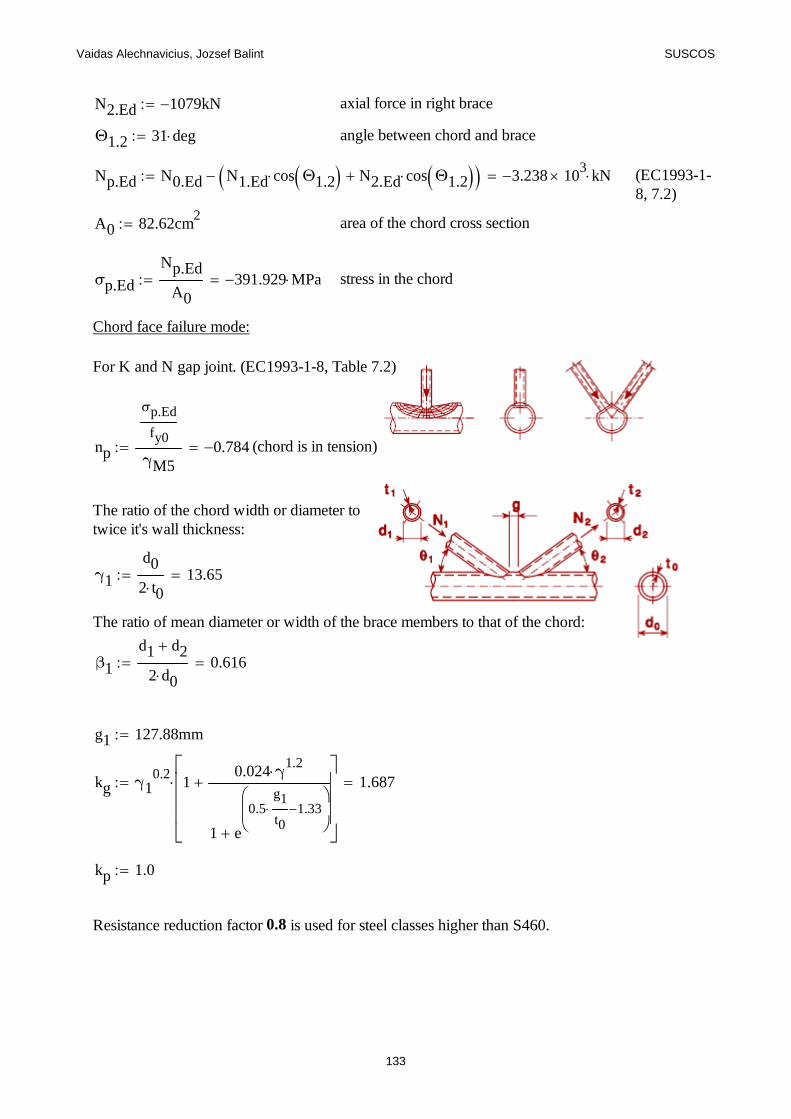
Vaidas Alechnavicius, Jozsef Balint SUSCOS
N2.Ed 1079 kN axial force in right brace
Θ1.2 31 deg angle between chord and brace
Np.Ed N0.Ed N1.Ed cos Θ1.2 N2.Ed cos Θ1.2 3.238 103 kN (EC1993-1-
8, 7.2)
A0 82.62cm2 area of the chord cross section
σp.Ed
Np.Ed
A0391.929 MPa stress in the chord
Chord face failure mode:
For K and N gap joint. (EC1993-1-8, Table 7.2)
np
σp.Ed
fy0
γM50.784 (chord is in tension)
The ratio of the chord width or diameter totwice it's wall thickness:
γ1
d0
2 t013.65
The ratio of mean diameter or width of the brace members to that of the chord:
β1
d1 d2
2 d00.616
g1 127.88mm
kg γ10.2
10.024 γ
1.2
1 e
0.5g1
t0 1.33
1.687
kp 1.0
Resistance reduction factor 0.8 is used for steel classes higher than S460.
133
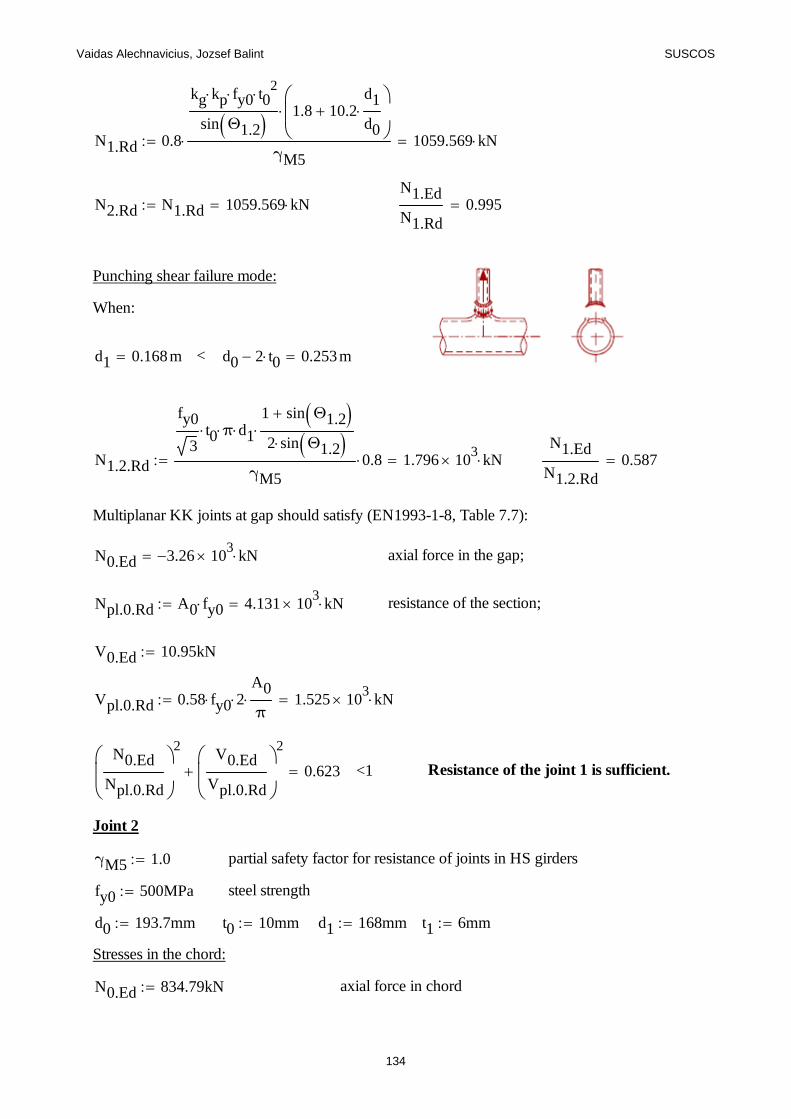
Vaidas Alechnavicius, Jozsef Balint SUSCOS
N1.Rd 0.8
kg kp fy0 t02
sin Θ1.2 1.8 10.2d1
d0
γM5 1059.569 kN
N2.Rd N1.Rd 1059.569 kNN1.Ed
N1.Rd0.995
Punching shear failure mode:
When:
d1 0.168m < d0 2 t0 0.253m
N1.2.Rd
fy0
3t0 π d1
1 sin Θ1.2
2 sin Θ1.2
γM50.8 1.796 10
3 kNN1.Ed
N1.2.Rd0.587
Multiplanar KK joints at gap should satisfy (EN1993-1-8, Table 7.7):
N0.Ed 3.26 103 kN axial force in the gap;
Npl.0.Rd A0 fy0 4.131 103 kN resistance of the section;
V0.Ed 10.95kN
Vpl.0.Rd 0.58 fy0 2A0
π 1.525 10
3 kN
N0.Ed
Npl.0.Rd
2V0.Ed
Vpl.0.Rd
2
0.623 <1 Resistance of the joint 1 is sufficient.
Joint 2
γM5 1.0 partial safety factor for resistance of joints in HS girders
fy0 500MPa steel strength
d0 193.7mm t0 10mm d1 168mm t1 6mm
Stresses in the chord:
N0.Ed 834.79kN axial force in chord
134
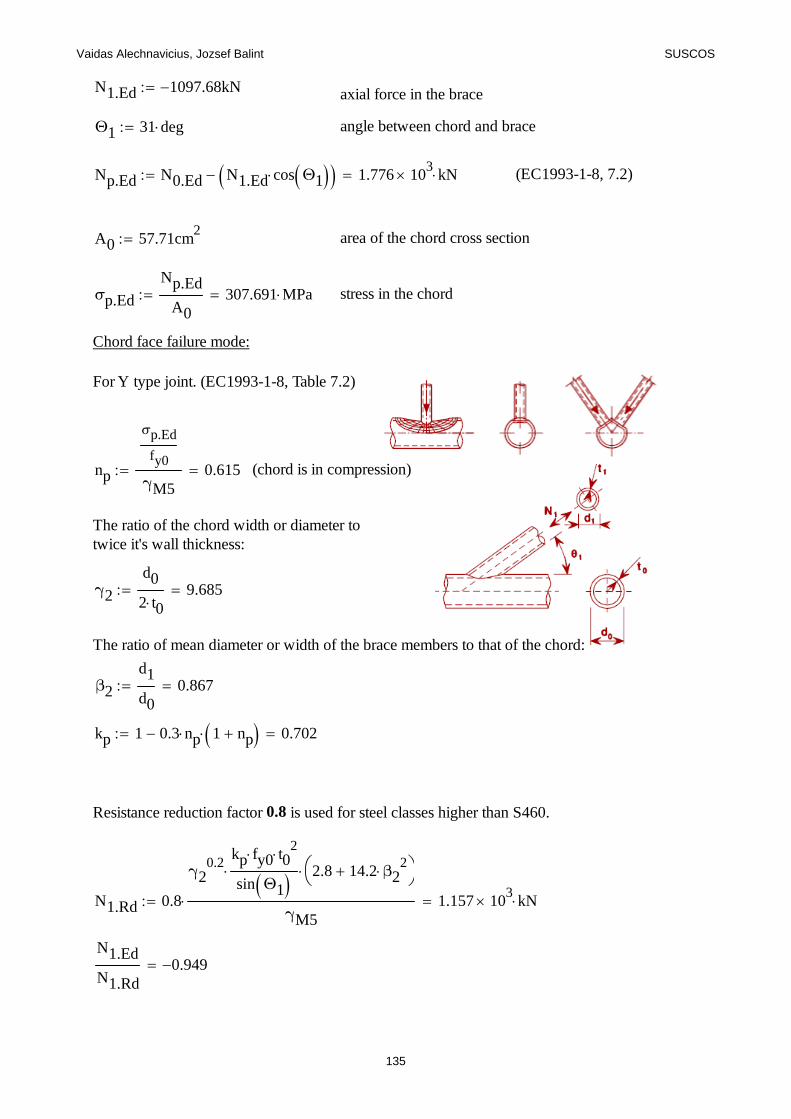
Vaidas Alechnavicius, Jozsef Balint SUSCOS
N1.Ed 1097.68 kN axial force in the brace
Θ1 31 deg angle between chord and brace
Np.Ed N0.Ed N1.Ed cos Θ1 1.776 103 kN (EC1993-1-8, 7.2)
A0 57.71cm2 area of the chord cross section
σp.Ed
Np.Ed
A0307.691 MPa stress in the chord
Chord face failure mode:
For Y type joint. (EC1993-1-8, Table 7.2)
np
σp.Ed
fy0
γM50.615 (chord is in compression)
The ratio of the chord width or diameter totwice it's wall thickness:
γ2
d0
2 t09.685
The ratio of mean diameter or width of the brace members to that of the chord:
β2
d1
d00.867
kp 1 0.3 np 1 np 0.702
Resistance reduction factor 0.8 is used for steel classes higher than S460.
N1.Rd 0.8
γ20.2
kp fy0 t02
sin Θ1 2.8 14.2 β22
γM5 1.157 10
3 kN
N1.Ed
N1.Rd0.949
135
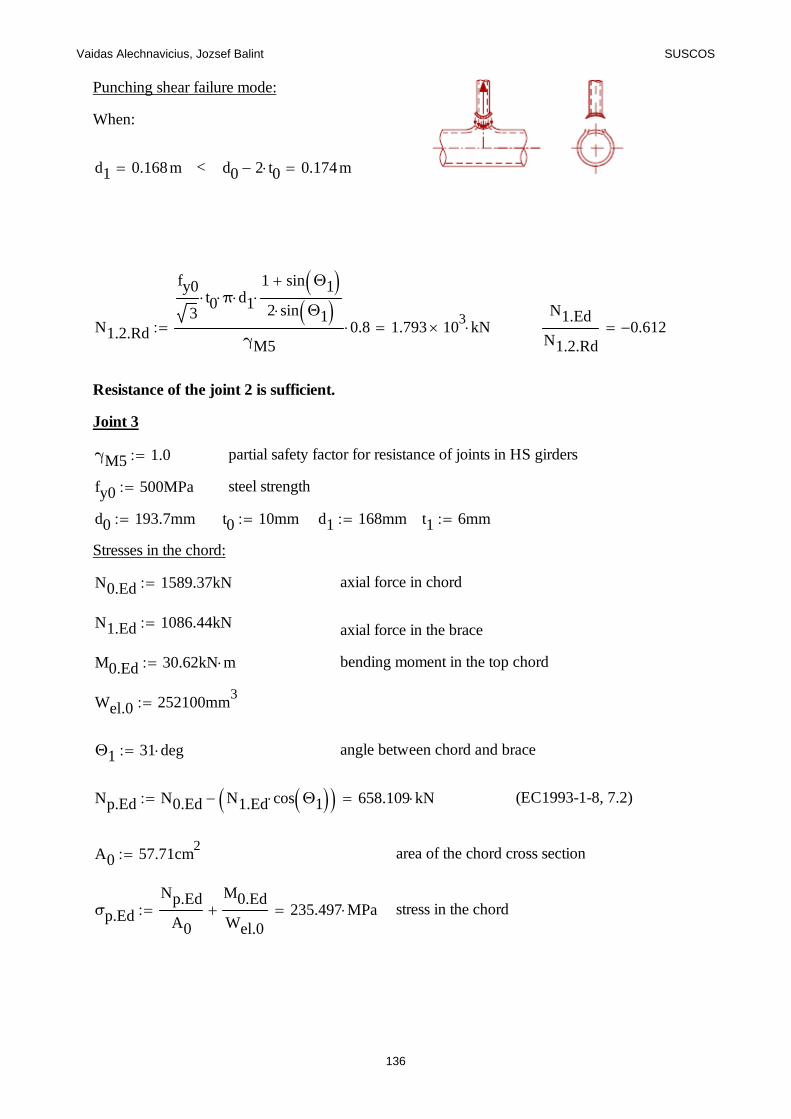
Vaidas Alechnavicius, Jozsef Balint SUSCOS
Punching shear failure mode:
When:
d1 0.168m < d0 2 t0 0.174m
N1.2.Rd
fy0
3t0 π d1
1 sin Θ1
2 sin Θ1
γM50.8 1.793 10
3 kNN1.Ed
N1.2.Rd0.612
Resistance of the joint 2 is sufficient.
Joint 3
γM5 1.0 partial safety factor for resistance of joints in HS girders
fy0 500MPa steel strength
d0 193.7mm t0 10mm d1 168mm t1 6mm
Stresses in the chord:
N0.Ed 1589.37kN axial force in chord
N1.Ed 1086.44kN axial force in the brace
M0.Ed 30.62kN m bending moment in the top chord
Wel.0 252100mm3
Θ1 31 deg angle between chord and brace
Np.Ed N0.Ed N1.Ed cos Θ1 658.109 kN (EC1993-1-8, 7.2)
A0 57.71cm2 area of the chord cross section
σp.Ed
Np.Ed
A0
M0.Ed
Wel.0 235.497 MPa stress in the chord
136
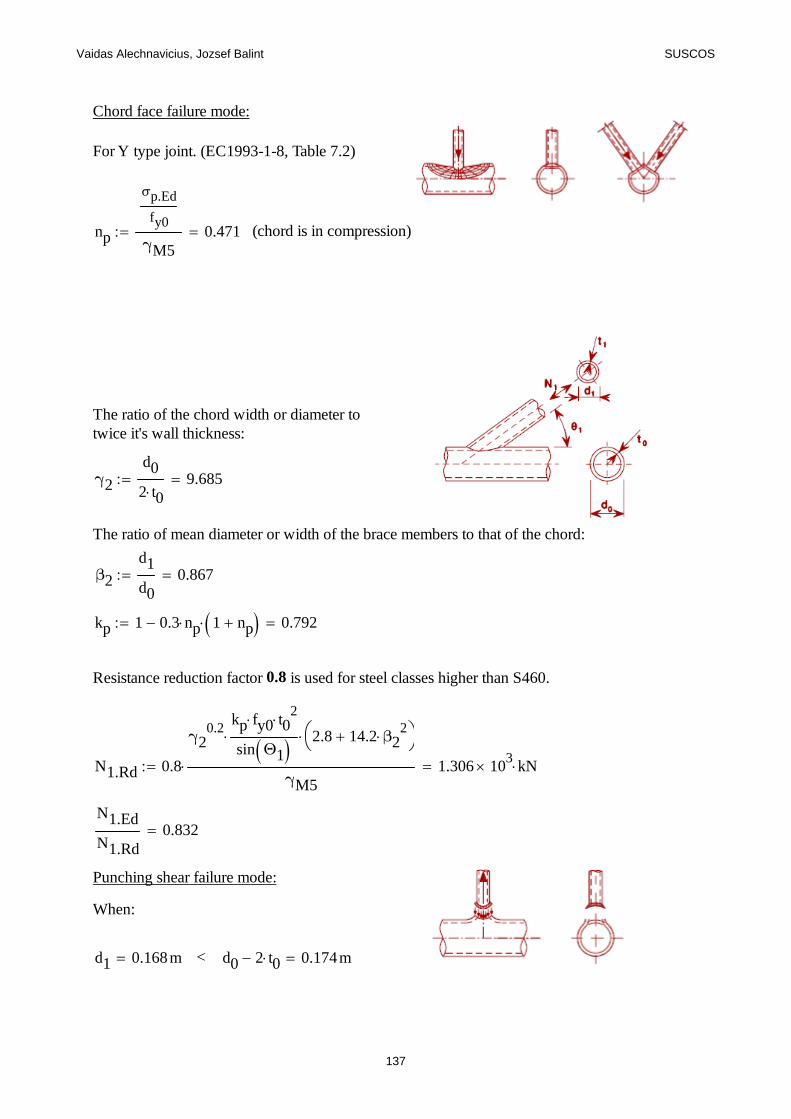
Vaidas Alechnavicius, Jozsef Balint SUSCOS
Chord face failure mode:
For Y type joint. (EC1993-1-8, Table 7.2)
np
σp.Ed
fy0
γM50.471 (chord is in compression)
The ratio of the chord width or diameter totwice it's wall thickness:
γ2
d0
2 t09.685
The ratio of mean diameter or width of the brace members to that of the chord:
β2
d1
d00.867
kp 1 0.3 np 1 np 0.792
Resistance reduction factor 0.8 is used for steel classes higher than S460.
N1.Rd 0.8
γ20.2
kp fy0 t02
sin Θ1 2.8 14.2 β22
γM5 1.306 10
3 kN
N1.Ed
N1.Rd0.832
Punching shear failure mode:
When:
d1 0.168m < d0 2 t0 0.174m
137
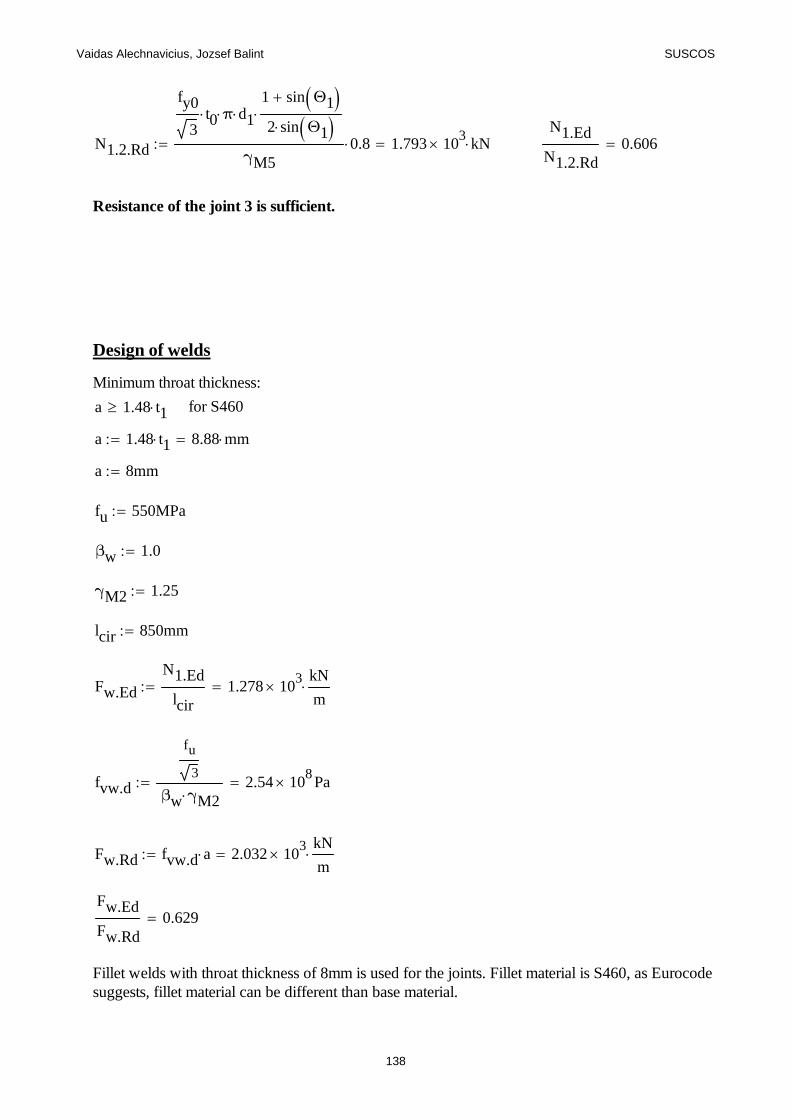
Vaidas Alechnavicius, Jozsef Balint SUSCOS
N1.2.Rd
fy0
3t0 π d1
1 sin Θ1
2 sin Θ1
γM50.8 1.793 10
3 kNN1.Ed
N1.2.Rd0.606
Resistance of the joint 3 is sufficient.
Design of welds
Minimum throat thickness:
a 1.48 t1 for S460
a 1.48 t1 8.88 mm
a 8mm
fu 550MPa
βw 1.0
γM2 1.25
lcir 850mm
Fw.Ed
N1.Ed
lcir1.278 10
3kN
m
fvw.d
fu
3
βw γM22.54 10
8 Pa
Fw.Rd fvw.d a 2.032 103
kN
m
Fw.Ed
Fw.Rd0.629
Fillet welds with throat thickness of 8mm is used for the joints. Fillet material is S460, as Eurocodesuggests, fillet material can be different than base material.
138
Vaidas Alechnavicius, Jozsef Balint SUSCOS
Design of Circular Truss Chords and Braces S650
- according to EN 1993-1-1 & EN 1993-1-12
Chords checking
Tension:
NEd
Nt.Rd1 (6.5) EN 1993-1-1
From Autodesk Robot 2013 we obtained the following value of axial force in the lower chord:
NEd.t 3259.55kN
Nt.Rd 3260kN
Nt.Rd
A fy
γM0= EN 1993-1-1
γM0 1.0
The type of steel used is S 650MC, therefore: fy 650N
mm2
(Table 2, EN 1993-1-12)
Anet
Nt.Rd γM0
fy50.154 cm
2
(adopted form jointverification)
We adopt the following CHS: 219.1 X 10, giving a gross area of 65.69 cm2
Compression:
NEd
Nc.Rd1 (6.9) EN 1993-1-1
From Autodesk Robot 2013 we obtained the following value of axial force in the upper chord:
139
Vaidas Alechnavicius, Jozsef Balint SUSCOS
NEd.c 1589.37kN
Cross-section classification:
- according to Table 5.2 from EN 1993-1-1
ε235
6500.601 ε
20.362
d 193.7mm t 10mm
d
t19.37 < 70 ε
2 25.308
Therefore, the Cross-section is Class 2.
Nc.Rd
A fy
γM0= (6.10) EN 1993-1-1
Nc.Rd 1621kN
γM0 1
fy 650N
mm2
(Table 1, EN 1993-1-12)
ANc.Rd γM0
fy24.938 cm
2
We adopt the following CHS: 193.7 X 10, giving a gross area of 57.71cm2 (value adopted due to
joint verification)
Buckling resistance:
NEd
Nb.Rd1 (6.46) EN 1993-1-1
A 57.71cm2
140

Vaidas Alechnavicius, Jozsef Balint SUSCOS
Nb.Rd
χ A fy
γM1=
γM1 1
Ncr
π2
E Iy
Lcr2
= Lcr k L=
E 210GPa Iy 2441.59cm4 L 4m k 0.9 (for chord)
Lcr k L 3.6m
Ncr
π2
E Iy
Lcr2
3904.692 kN
λA fy
Ncr0.98
According to Table 6.2, EN 1993-1-1, buckling curve "c" must be used.
α 0.49
Φ 0.5 1 α λ 0.2( ) λ2 1.171
χ1
Φ Φ2
λ2
0.552 < 1 (6.49)
Nb.Rd
χ A fy
γM12.069 10
3 kN
NEd 1589.37kN
NEd
Nb.Rd0.768 < 1
141
Vaidas Alechnavicius, Jozsef Balint SUSCOS
Diagonals checking
Lbr 2.5m0.2191m
2
0.193m
2 2.294m
Diagonals in tension:
NEd
Nt.Rd1 (6.5) EN 1993-1-1
From Autodesk Robot 2013 we obtained the following value of axial force in brace:
NEd.t 1097.68kN
Nt.Rd 1098kN
Nt.Rd
A fy
γM0= EN 1993-1-1
γM0 1.0
The type of steel used is S 650MC, therefore: fy 650N
mm2
(Table 2, EN 1993-1-12)
Anet
Nt.Rd γM0
fy16.892 cm
2
We adopt the following CHS: 127 X 6, giving a gross area of 22.81 cm2.
Compression:
NEd
Nc.Rd1 (6.9) EN 1993-1-1
From Autodesk Robot 2013 we obtained the following value of axial force in the upper chord:
NEd.c 1086.44kN
142
Vaidas Alechnavicius, Jozsef Balint SUSCOS
Cross-section classification:
- according to Table 5.2 from EN 1993-1-1
ε235
6500.601 ε
20.362
d 127mm t 6mm
d
t21.167 < 70 ε
2 25.308
Therefore, the Cross-section is Class 2.
Nc.Rd
A fy
γM0= (6.10) EN 1993-1-1
Nc.Rd 1086.44kN
γM0 1
fy 650N
mm2
(Table 1, EN 1993-1-12)
ANc.Rd γM0
fy16.714 cm
2
We adopt the following CHS: 127 X 6, giving a gross area of 22.81 cm2 (value adopted due to
the buckling verification) Buckling resistance:
NEd
Nb.Rd1 (6.46) EN 1993-1-1
A 22.81cm2
Nb.Rd
χ A fy
γM1=
γM1 1
143

Vaidas Alechnavicius, Jozsef Balint SUSCOS
Ncr
π2
E Iy
Lcr2
= Lcr k Lbr=
E 210GPa Iy 458.44cm4 k 0.75 (for brace)
Lcr k Lbr 1.72m
Ncr
π2
E Iy
Lcr2
3210.045 kN
λA fy
Ncr0.68
According to Table 6.2, EN 1993-1-1, buckling curve "c" must be used.
α 0.49
Φ 0.5 1 α λ 0.2( ) λ2 0.848
χ1
Φ Φ2
λ2
0.737 < 1 (6.49)
Nb.Rd
χ A fy
γM11.093 10
3 kN
NEd 1086.44kN
NEd
Nb.Rd0.994 < 1
Design of top brace in tension:
NEd
Nt.Rd1 (6.5) EN 1993-1-1
144
Vaidas Alechnavicius, Jozsef Balint SUSCOS
From Autodesk Robot 2013 we obtained the following value of axial force in brace:
NEd.t 439.81kN
Nt.Rd 440kN
Nt.Rd
A fy
γM0= EN 1993-1-12
γM12 1.0
The type of steel used is S 650MC, therefore: fy 650N
mm2
(Table 2, EN 1993-1-12)
Anet
Nt.Rd γM0
fy6.769 cm
2
We adopt the following CHS: 114.3X3, giving a gross area of 10.49cm2.
Resistance of top diagonl braces:
Buckling resistance:
Lbr.d 4700mmNEd
Nb.Rd1 (6.46) EN 1993-1-1
A 10.49cm2
Nb.Rd
χ A fy
γM1=
γM1 1
Ncr
π2
E Iy
Lcr2
= Lcr k Lbr.d=
E 210GPa Iy 162.55cm4 k 0.75 (for brace)
145
Vaidas Alechnavicius, Jozsef Balint SUSCOS
Lcr k Lbr.d 3.525m
Ncr
π2
E Iy
Lcr2
271.136 kN
λA fy
Ncr1.586
According to Table 6.2, EN 1993-1-1, buckling curve "c" must be used.
α 0.49
Φ 0.5 1 α λ 0.2( ) λ2 2.097
χ1
Φ Φ2
λ2
0.288 < 1 (6.49)
Nb.Rd
χ A fy
γM1196.562 kN
NEd 182.23kN
NEd
Nb.Rd0.927 < 1
We adopt the following CHS: 114.3X3, giving a gross area of 10.49cm2.
Resistance of joints:
Calculations made according EC 1993-1-8 and CIDECT recommendations.
Joint 1
γM5 1.0 partial safety factor for resistance of joints in HS girders
fy0 650MPa steel strength
d0 219.1mm t0 10mm d1 127mm t1 6mm d2 127mm t2 6mm
Stresses in the chord:
N0.Ed 3259.55 kN axial force in chord
N1.Ed 1086.44kN axial force in left brace
146
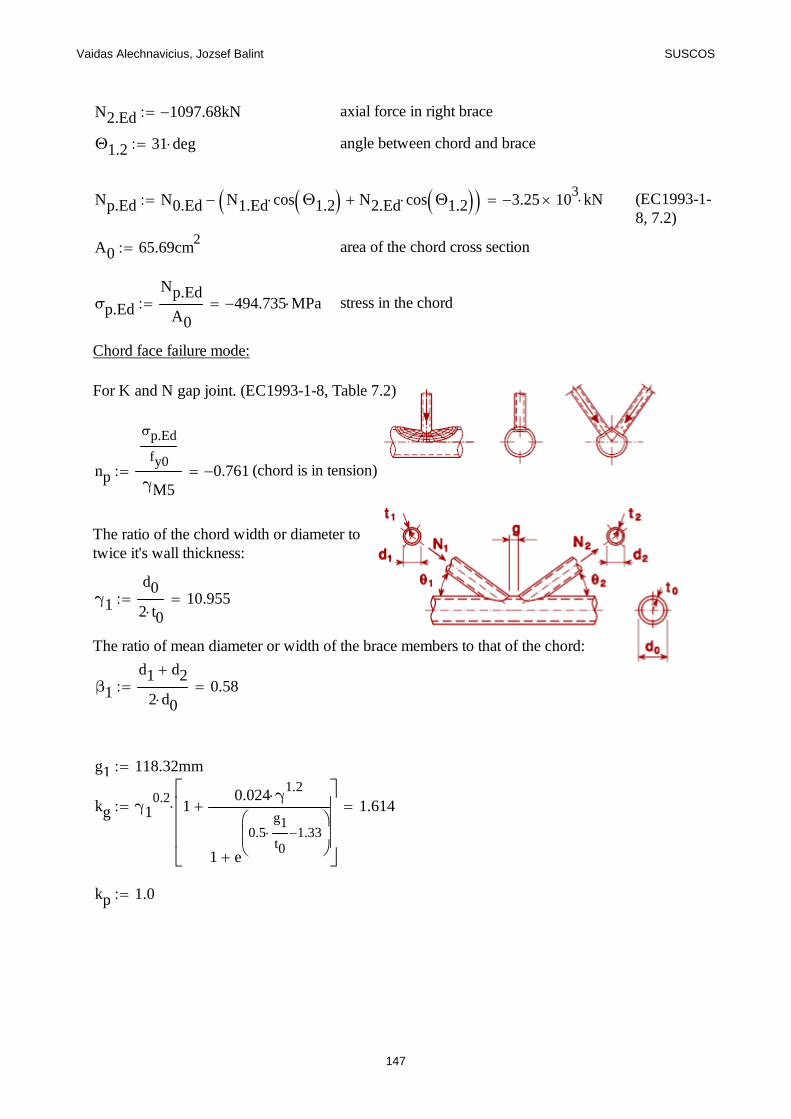
Vaidas Alechnavicius, Jozsef Balint SUSCOS
N2.Ed 1097.68 kN axial force in right brace
Θ1.2 31 deg angle between chord and brace
Np.Ed N0.Ed N1.Ed cos Θ1.2 N2.Ed cos Θ1.2 3.25 103 kN (EC1993-1-
8, 7.2)
A0 65.69cm2 area of the chord cross section
σp.Ed
Np.Ed
A0494.735 MPa stress in the chord
Chord face failure mode:
For K and N gap joint. (EC1993-1-8, Table 7.2)
np
σp.Ed
fy0
γM50.761 (chord is in tension)
The ratio of the chord width or diameter totwice it's wall thickness:
γ1
d0
2 t010.955
The ratio of mean diameter or width of the brace members to that of the chord:
β1
d1 d2
2 d00.58
g1 118.32mm
kg γ10.2
10.024 γ
1.2
1 e
0.5g1
t0 1.33
1.614
kp 1.0
147
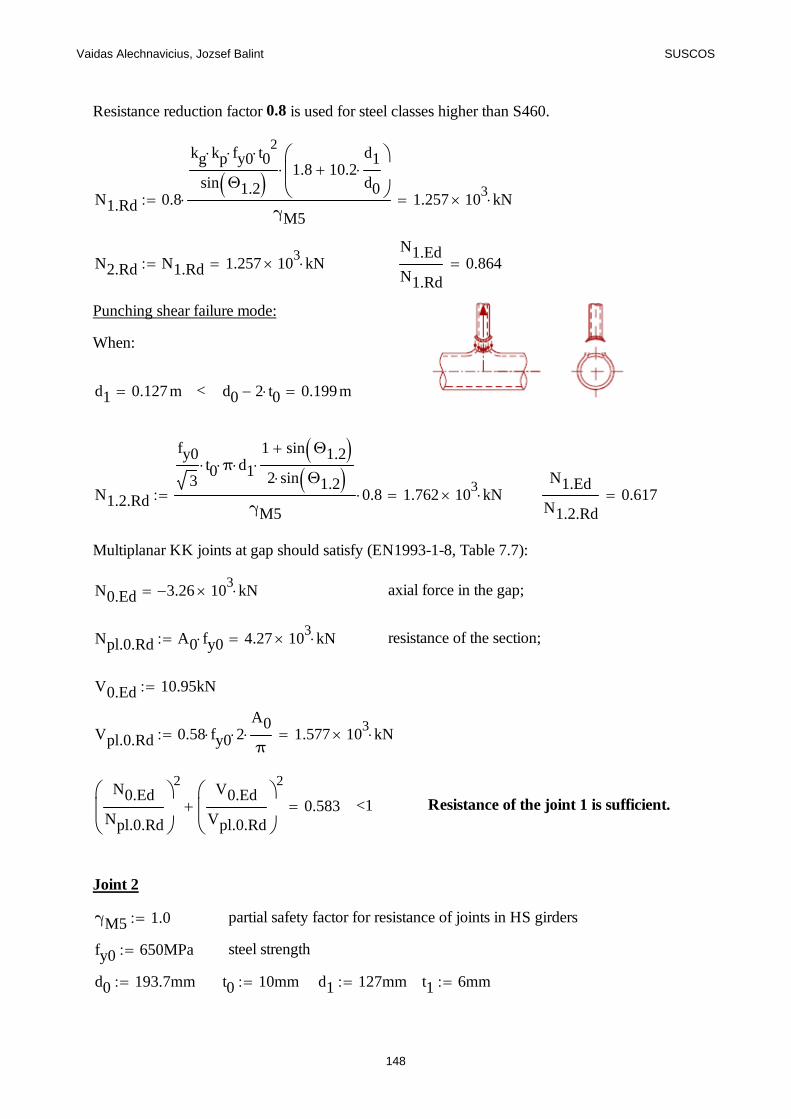
Vaidas Alechnavicius, Jozsef Balint SUSCOS
Resistance reduction factor 0.8 is used for steel classes higher than S460.
N1.Rd 0.8
kg kp fy0 t02
sin Θ1.2 1.8 10.2d1
d0
γM5 1.257 10
3 kN
N2.Rd N1.Rd 1.257 103 kN
N1.Ed
N1.Rd0.864
Punching shear failure mode:
When:
d1 0.127m < d0 2 t0 0.199m
N1.2.Rd
fy0
3t0 π d1
1 sin Θ1.2
2 sin Θ1.2
γM50.8 1.762 10
3 kNN1.Ed
N1.2.Rd0.617
Multiplanar KK joints at gap should satisfy (EN1993-1-8, Table 7.7):
N0.Ed 3.26 103 kN axial force in the gap;
Npl.0.Rd A0 fy0 4.27 103 kN resistance of the section;
V0.Ed 10.95kN
Vpl.0.Rd 0.58 fy0 2A0
π 1.577 10
3 kN
N0.Ed
Npl.0.Rd
2V0.Ed
Vpl.0.Rd
2
0.583 <1 Resistance of the joint 1 is sufficient.
Joint 2
γM5 1.0 partial safety factor for resistance of joints in HS girders
fy0 650MPa steel strength
d0 193.7mm t0 10mm d1 127mm t1 6mm
148
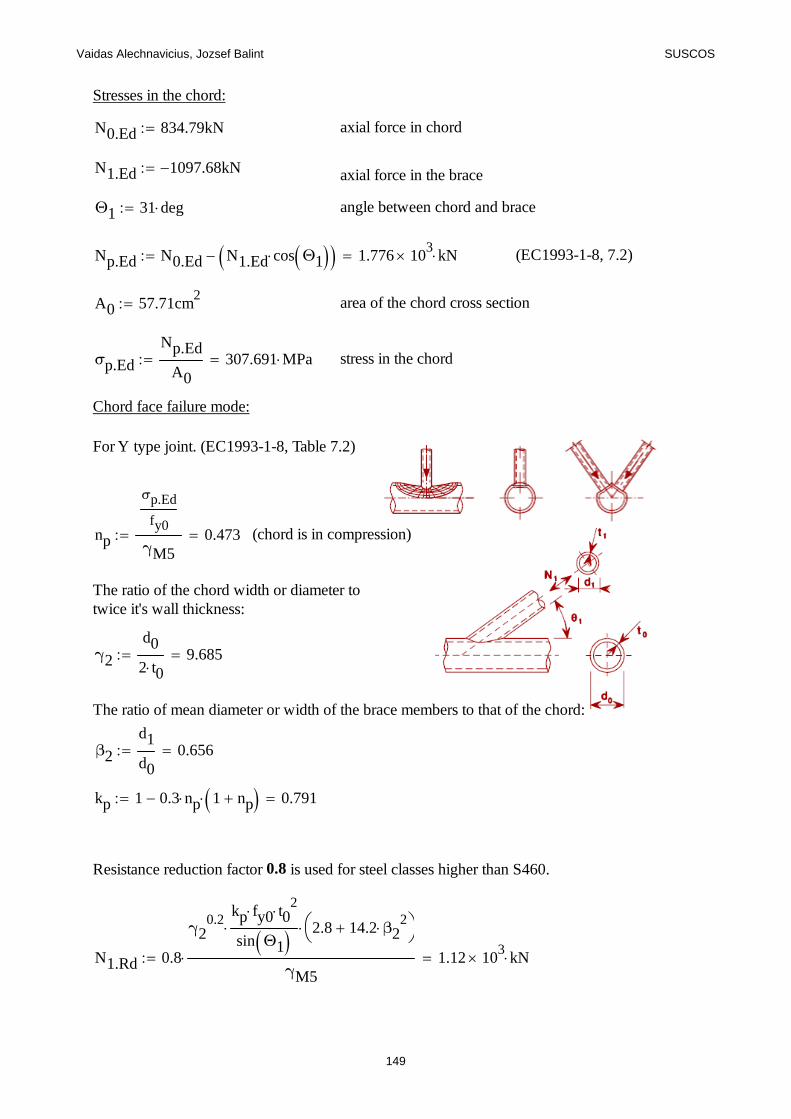
Vaidas Alechnavicius, Jozsef Balint SUSCOS
Stresses in the chord:
N0.Ed 834.79kN axial force in chord
N1.Ed 1097.68 kN axial force in the brace
Θ1 31 deg angle between chord and brace
Np.Ed N0.Ed N1.Ed cos Θ1 1.776 103 kN (EC1993-1-8, 7.2)
A0 57.71cm2 area of the chord cross section
σp.Ed
Np.Ed
A0307.691 MPa stress in the chord
Chord face failure mode:
For Y type joint. (EC1993-1-8, Table 7.2)
np
σp.Ed
fy0
γM50.473 (chord is in compression)
The ratio of the chord width or diameter totwice it's wall thickness:
γ2
d0
2 t09.685
The ratio of mean diameter or width of the brace members to that of the chord:
β2
d1
d00.656
kp 1 0.3 np 1 np 0.791
Resistance reduction factor 0.8 is used for steel classes higher than S460.
N1.Rd 0.8
γ20.2
kp fy0 t02
sin Θ1 2.8 14.2 β22
γM5 1.12 10
3 kN
149
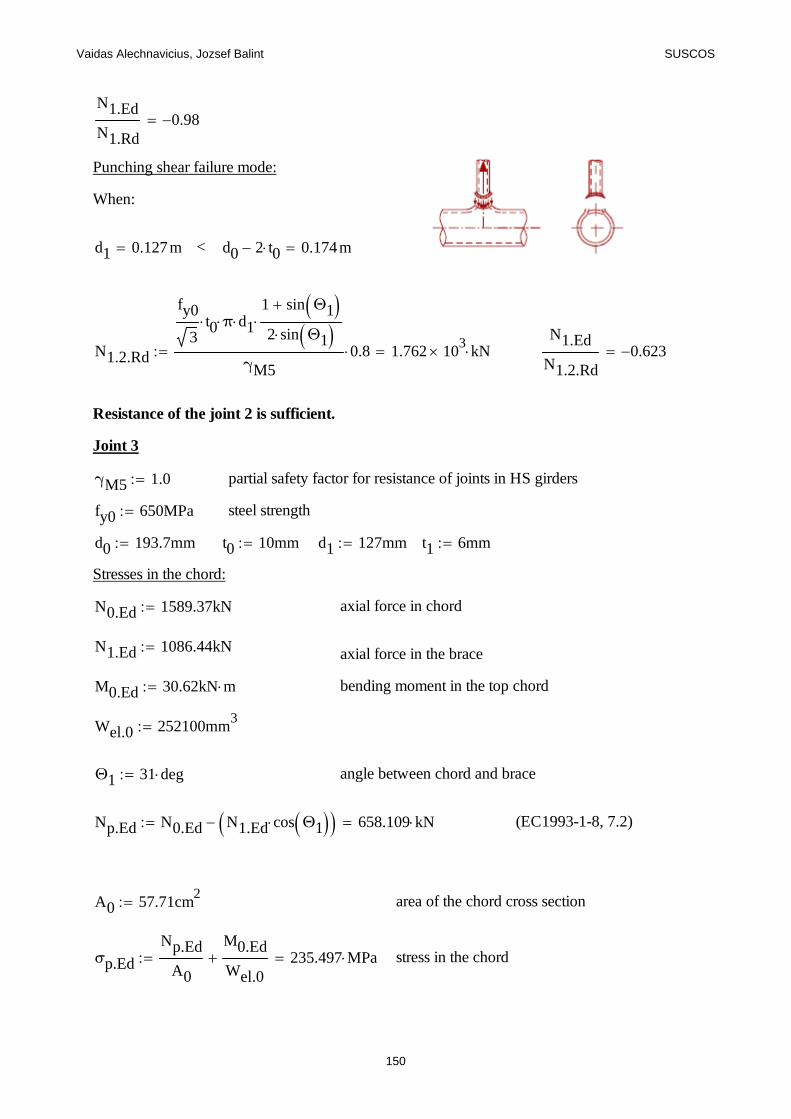
Vaidas Alechnavicius, Jozsef Balint SUSCOS
N1.Ed
N1.Rd0.98
Punching shear failure mode:
When:
d1 0.127m < d0 2 t0 0.174m
N1.2.Rd
fy0
3t0 π d1
1 sin Θ1
2 sin Θ1
γM50.8 1.762 10
3 kNN1.Ed
N1.2.Rd0.623
Resistance of the joint 2 is sufficient.
Joint 3
γM5 1.0 partial safety factor for resistance of joints in HS girders
fy0 650MPa steel strength
d0 193.7mm t0 10mm d1 127mm t1 6mm
Stresses in the chord:
N0.Ed 1589.37kN axial force in chord
N1.Ed 1086.44kN axial force in the brace
M0.Ed 30.62kN m bending moment in the top chord
Wel.0 252100mm3
Θ1 31 deg angle between chord and brace
Np.Ed N0.Ed N1.Ed cos Θ1 658.109 kN (EC1993-1-8, 7.2)
A0 57.71cm2 area of the chord cross section
σp.Ed
Np.Ed
A0
M0.Ed
Wel.0 235.497 MPa stress in the chord
150
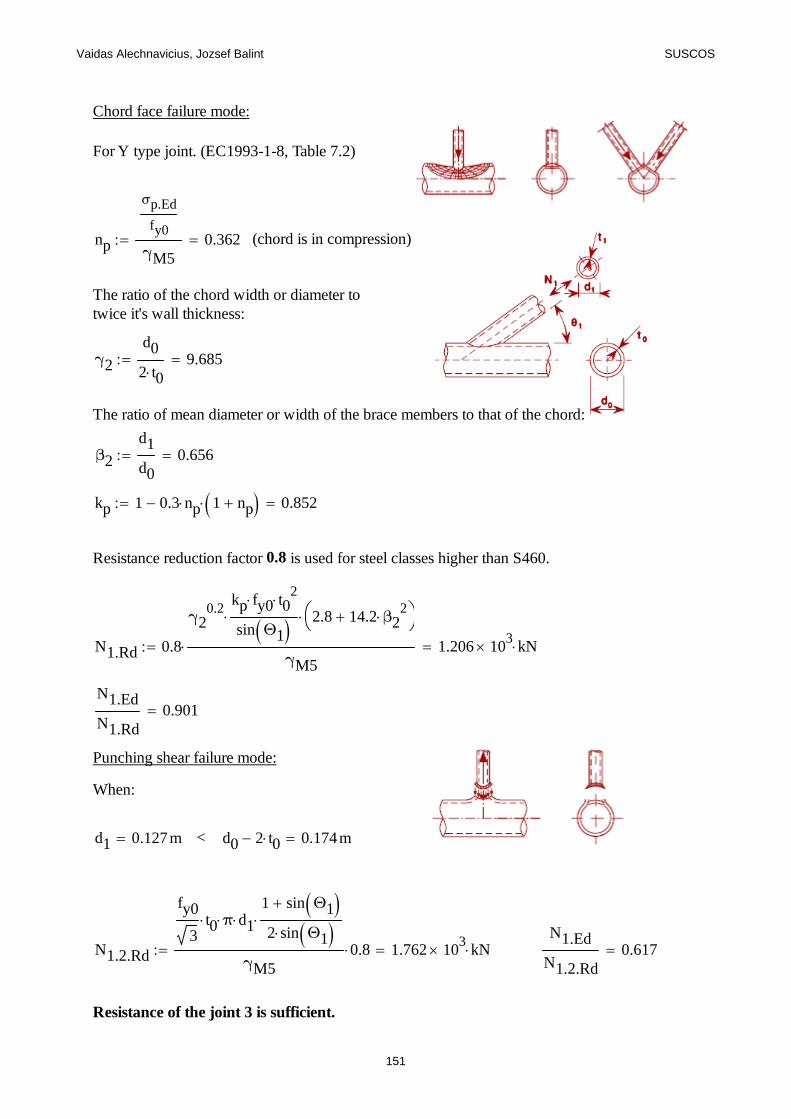
Vaidas Alechnavicius, Jozsef Balint SUSCOS
Chord face failure mode:
For Y type joint. (EC1993-1-8, Table 7.2)
np
σp.Ed
fy0
γM50.362 (chord is in compression)
The ratio of the chord width or diameter totwice it's wall thickness:
γ2
d0
2 t09.685
The ratio of mean diameter or width of the brace members to that of the chord:
β2
d1
d00.656
kp 1 0.3 np 1 np 0.852
Resistance reduction factor 0.8 is used for steel classes higher than S460.
N1.Rd 0.8
γ20.2
kp fy0 t02
sin Θ1 2.8 14.2 β22
γM5 1.206 10
3 kN
N1.Ed
N1.Rd0.901
Punching shear failure mode:
When:
d1 0.127m < d0 2 t0 0.174m
N1.2.Rd
fy0
3t0 π d1
1 sin Θ1
2 sin Θ1
γM50.8 1.762 10
3 kNN1.Ed
N1.2.Rd0.617
Resistance of the joint 3 is sufficient.
151
Vaidas Alechnavicius, Jozsef Balint SUSCOS
Design of welds
Minimum throat thickness:
a 1.48 t1 for S460
a 1.48 t1 8.88 mm
a 8mm
fu 700MPa
βw 1.0
γM2 1.25
lcir 750mm
Fw.Ed
N1.Ed
lcir1.449 10
3kN
m
fvw.d
fu
3
βw γM23.233 10
8 Pa
Fw.Rd fvw.d a 2.587 103
kN
m
Fw.Ed
Fw.Rd0.56
Fillet welds with throat thickness of 8mm is used for the joints. Fillet material is S460, as Eurocodesuggests, fillet material can be different than base material.
152
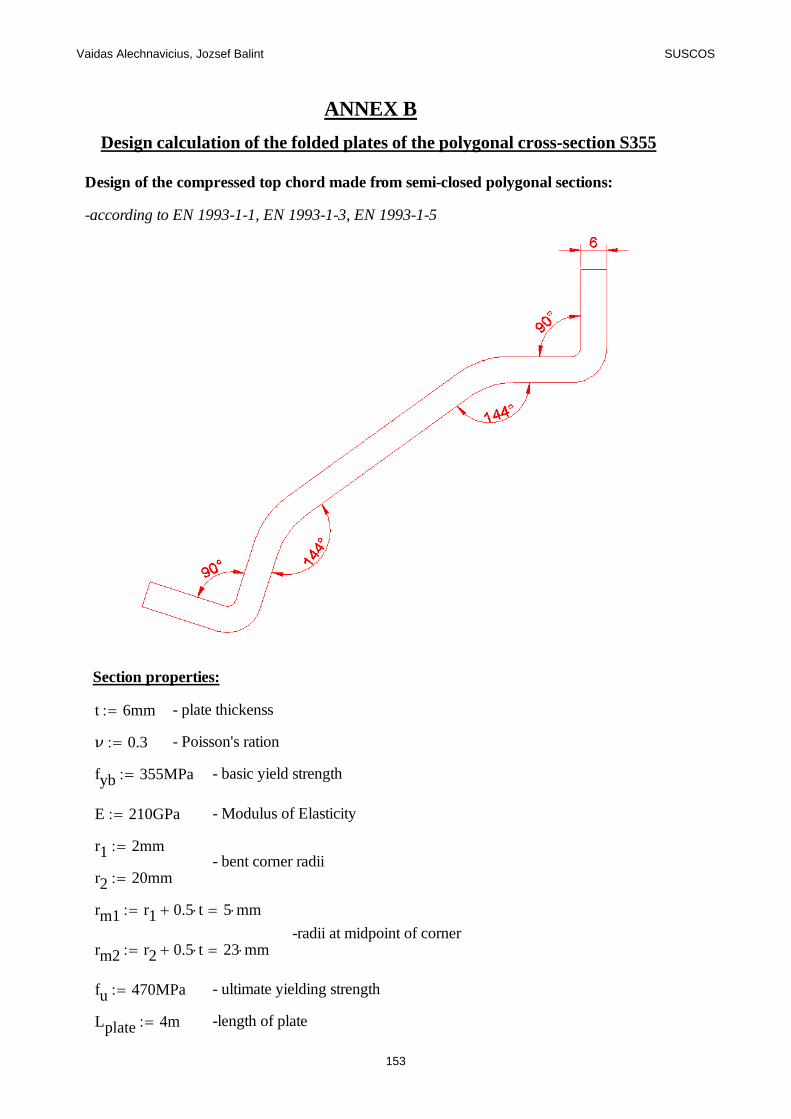
Vaidas Alechnavicius, Jozsef Balint SUSCOS
ANNEX B
Design calculation of the folded plates of the polygonal cross-section S355
Design of the compressed top chord made from semi-closed polygonal sections:
-according to EN 1993-1-1, EN 1993-1-3, EN 1993-1-5
Section properties:
t 6mm - plate thickenss
ν 0.3 - Poisson's ration
fyb 355MPa - basic yield strength
E 210GPa - Modulus of Elasticity
r1 2mm- bent corner radii
r2 20mm
rm1 r1 0.5 t 5 mm-radii at midpoint of corner
rm2 r2 0.5 t 23 mm
fu 470MPa - ultimate yielding strength
Lplate 4m -length of plate
153
Vaidas Alechnavicius, Jozsef Balint SUSCOS
ε235MPa
fyb0.814 -strain coefficient
Normal widths of the flat parts
b1 18mm
b2 18.58mm
b3 61.17mm
b4 b2
b5 b1
Section classification
Class of b.1 part
b1
t3 < 33 ε 26.849
Classb1 1
Class of b.2 part
b2
t3.097 < 33 ε 26.849
Classb2 1
Class of b.3 part
b3
t10.195 < 33 ε 26.849
Classb3 1
154
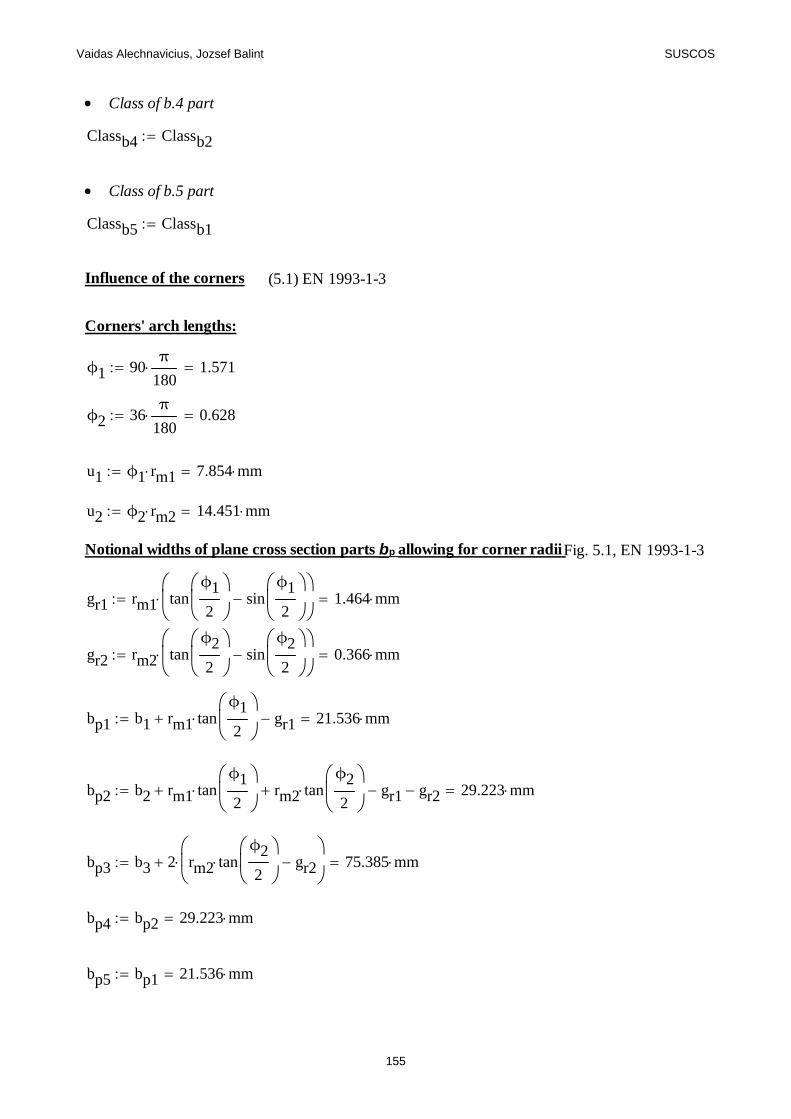
Vaidas Alechnavicius, Jozsef Balint SUSCOS
Class of b.4 part
Classb4 Classb2
Class of b.5 part
Classb5 Classb1
Influence of the corners (5.1) EN 1993-1-3
Corners' arch lengths:
ϕ1 90π
180 1.571
ϕ2 36π
180 0.628
u1 ϕ1 rm1 7.854 mm
u2 ϕ2 rm2 14.451 mm
Notional widths of plane cross section parts b p allowing for corner radii Fig. 5.1, EN 1993-1-3
gr1 rm1 tanϕ1
2
sinϕ1
2
1.464 mm
gr2 rm2 tanϕ2
2
sinϕ2
2
0.366 mm
bp1 b1 rm1 tanϕ1
2
gr1 21.536 mm
bp2 b2 rm1 tanϕ1
2
rm2 tanϕ2
2
gr1 gr2 29.223 mm
bp3 b3 2 rm2 tanϕ2
2
gr2
75.385 mm
bp4 bp2 29.223 mm
bp5 bp1 21.536 mm
155

Vaidas Alechnavicius, Jozsef Balint SUSCOS
Maximum width to thickness ratios (Table 5.1, EN 1993-1-3)
ϕ 36deg
bp1
t50 1
bp2
t500 sin ϕ( ) 1
bp3
t50 1
Since all the geometrical ratios are inside the limits, the provisions of EN 1993-1-3 may be applied.
Average yield strenght (3.2.2) EN 1993-1-3
n2 90 deg 2 36 deg
90deg2.8 the number of 90° bends in the cross-section with an internal radius
<= 5t
k 7 - numerical coefficient for roll forming
Ag 10.33cm2 - gross area (value taken from AutoCAD)
fya fyb fu fyb k n t2
Ag 433.552 MPa (3.1) - average yield strength
fya
fu fyb
2 0
then:
fya 412.5MPa
Determination of effective widths for a plane element without stiffeners (5.5.2 EN 1993-1-3)
The effective widths of the element will be equal to the calculated widths, since the class of thecross-section is Class 1.
156
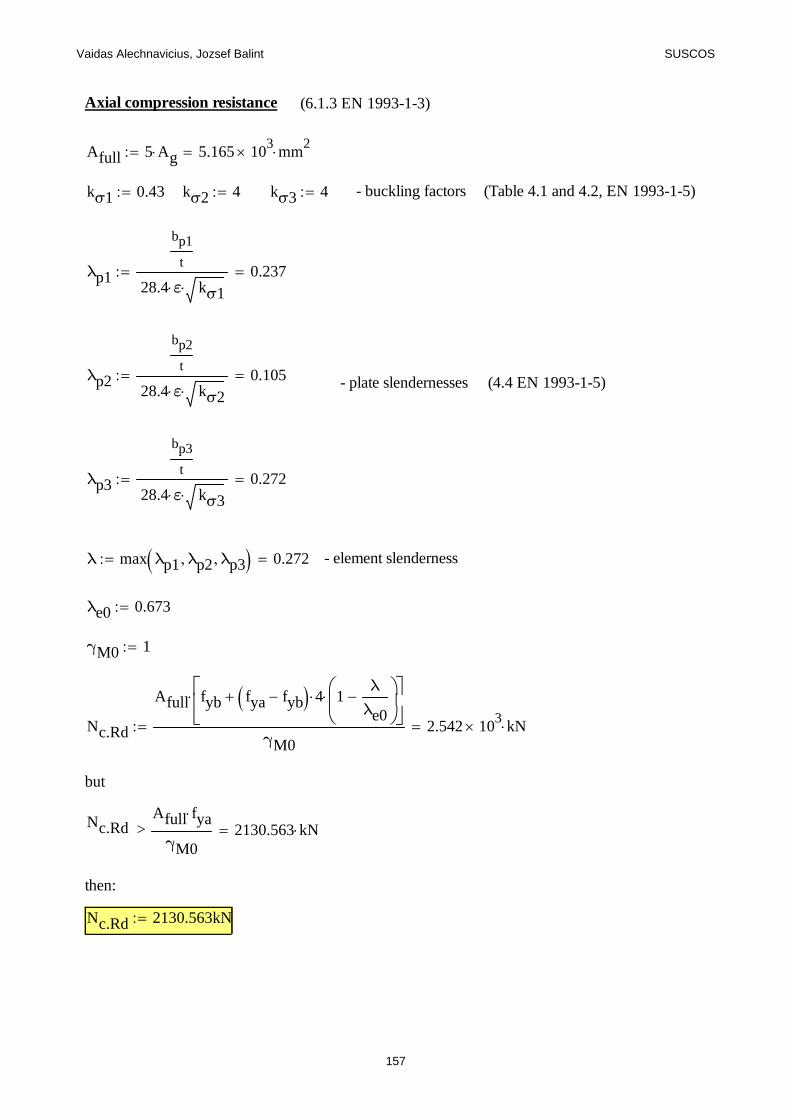
Vaidas Alechnavicius, Jozsef Balint SUSCOS
Axial compression resistance (6.1.3 EN 1993-1-3)
Afull 5 Ag 5.165 103 mm
2
kσ1 0.43 kσ2 4 kσ3 4 - buckling factors (Table 4.1 and 4.2, EN 1993-1-5)
λp1
bp1
t
28.4 ε kσ10.237
λp2
bp2
t
28.4 ε kσ20.105 - plate slendernesses (4.4 EN 1993-1-5)
λp3
bp3
t
28.4 ε kσ30.272
λ max λp1 λp2 λp3 0.272 - element slenderness
λe0 0.673
γM0 1
Nc.Rd
Afull fyb fya fyb 4 1λ
λe0
γM02.542 10
3 kN
but
Nc.Rd >Afull fya
γM02130.563 kN
then:
Nc.Rd 2130.563kN
157
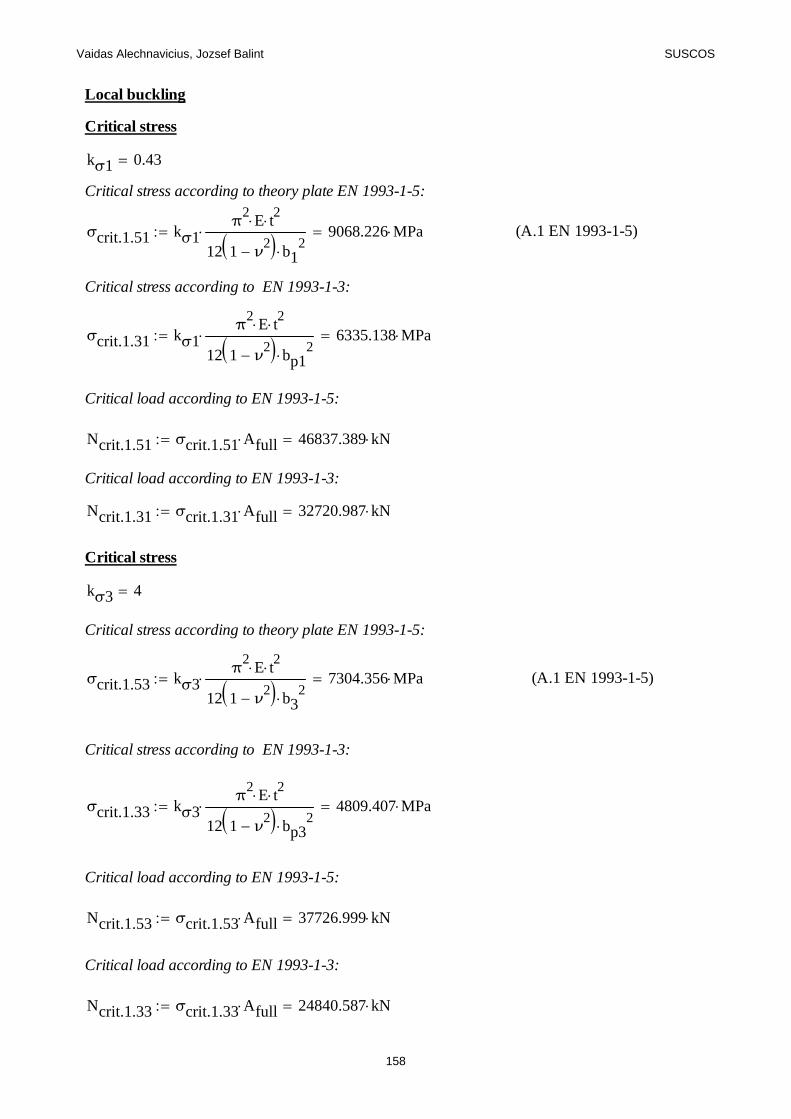
Vaidas Alechnavicius, Jozsef Balint SUSCOS
Local buckling
Critical stress
kσ1 0.43
Critical stress according to theory plate EN 1993-1-5:
σcrit.1.51 kσ1π
2E t
2
12 1 ν2 b1
2 9068.226 MPa (A.1 EN 1993-1-5)
Critical stress according to EN 1993-1-3:
σcrit.1.31 kσ1π
2E t
2
12 1 ν2 bp1
2 6335.138 MPa
Critical load according to EN 1993-1-5:
Ncrit.1.51 σcrit.1.51 Afull 46837.389 kN
Critical load according to EN 1993-1-3:
Ncrit.1.31 σcrit.1.31 Afull 32720.987 kN
Critical stress
kσ3 4
Critical stress according to theory plate EN 1993-1-5:
σcrit.1.53 kσ3π
2E t
2
12 1 ν2 b3
2 7304.356 MPa (A.1 EN 1993-1-5)
Critical stress according to EN 1993-1-3:
σcrit.1.33 kσ3π
2E t
2
12 1 ν2 bp3
2 4809.407 MPa
Critical load according to EN 1993-1-5:
Ncrit.1.53 σcrit.1.53 Afull 37726.999 kN
Critical load according to EN 1993-1-3:
Ncrit.1.33 σcrit.1.33 Afull 24840.587 kN
158
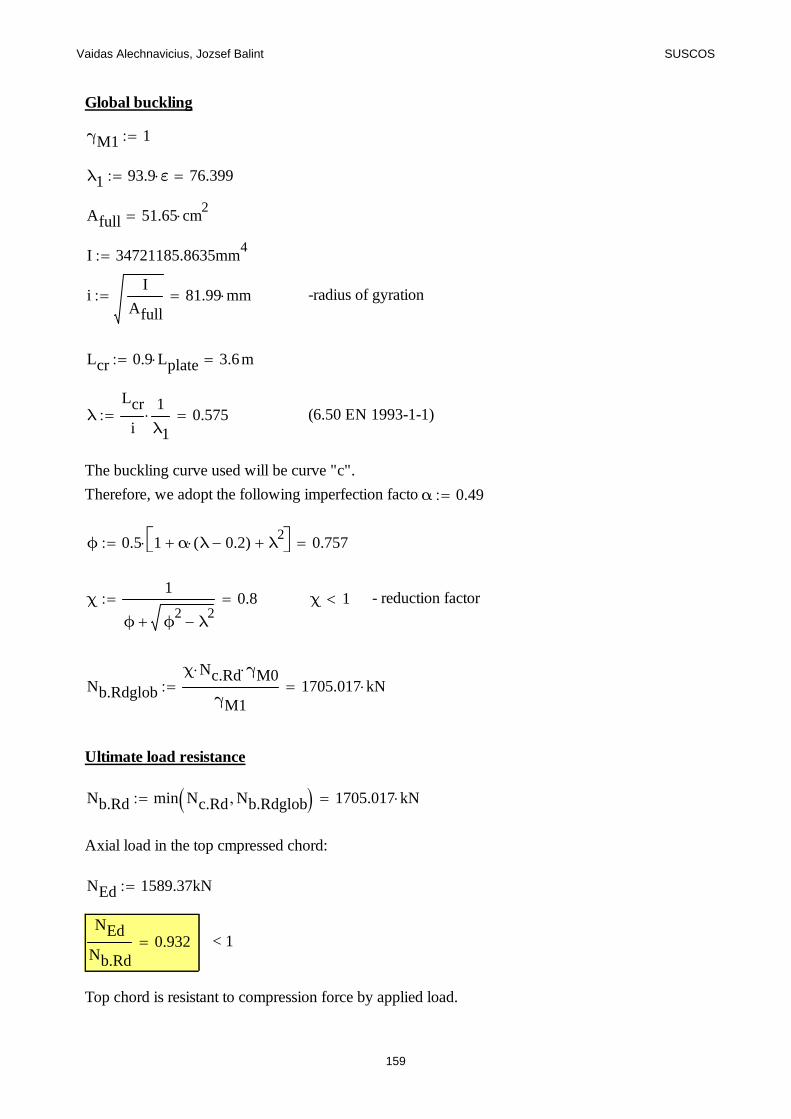
Vaidas Alechnavicius, Jozsef Balint SUSCOS
Global buckling
γM1 1
λ1 93.9 ε 76.399
Afull 51.65 cm2
I 34721185.8635mm4
iI
Afull81.99 mm -radius of gyration
Lcr 0.9 Lplate 3.6m
λLcr
i
1
λ1 0.575 (6.50 EN 1993-1-1)
The buckling curve used will be curve "c".
Therefore, we adopt the following imperfection factor:α 0.49
ϕ 0.5 1 α λ 0.2( ) λ2 0.757
χ1
ϕ ϕ2
λ2
0.8 χ 1 - reduction factor
Nb.Rdglob
χ Nc.Rd γM0
γM11705.017 kN
Ultimate load resistance
Nb.Rd min Nc.Rd Nb.Rdglob 1705.017 kN
Axial load in the top cmpressed chord:
NEd 1589.37kN
NEd
Nb.Rd0.932 < 1
Top chord is resistant to compression force by applied load.
159
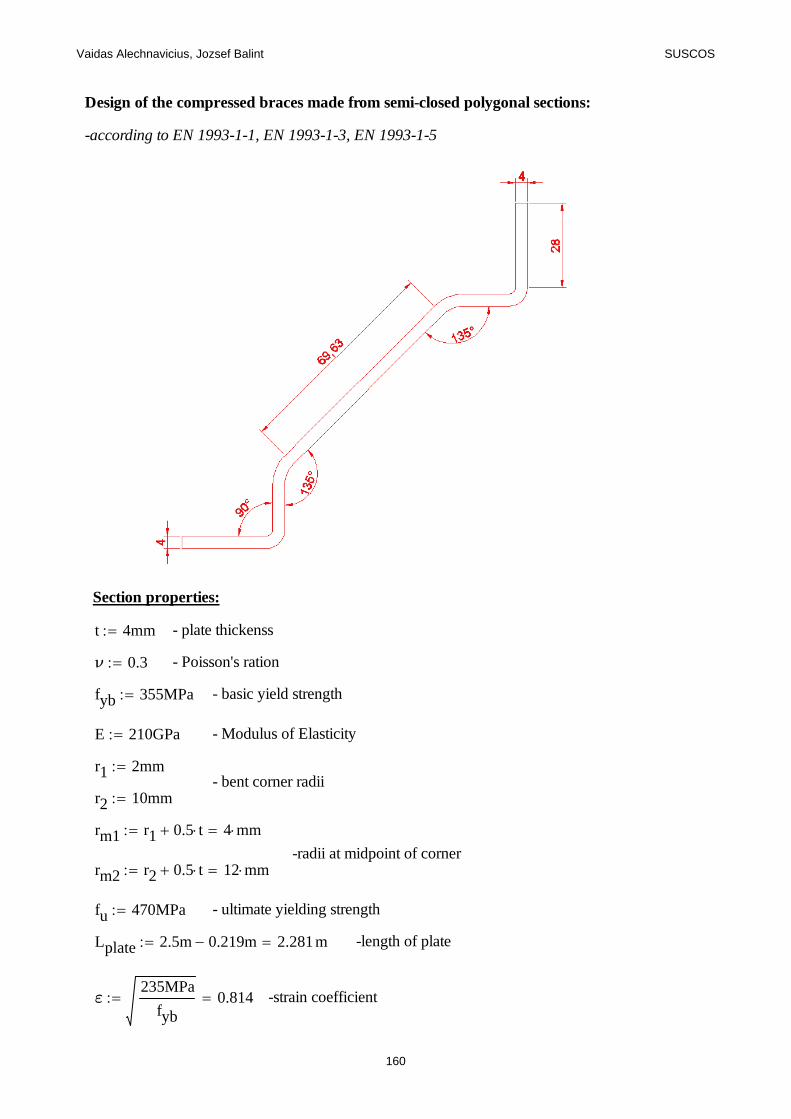
Vaidas Alechnavicius, Jozsef Balint SUSCOS
Design of the compressed braces made from semi-closed polygonal sections:
-according to EN 1993-1-1, EN 1993-1-3, EN 1993-1-5
Section properties:
t 4mm - plate thickenss
ν 0.3 - Poisson's ration
fyb 355MPa - basic yield strength
E 210GPa - Modulus of Elasticity
r1 2mm- bent corner radii
r2 10mm
rm1 r1 0.5 t 4 mm-radii at midpoint of corner
rm2 r2 0.5 t 12 mm
fu 470MPa - ultimate yielding strength
Lplate 2.5m 0.219m 2.281m -length of plate
ε235MPa
fyb0.814 -strain coefficient
160
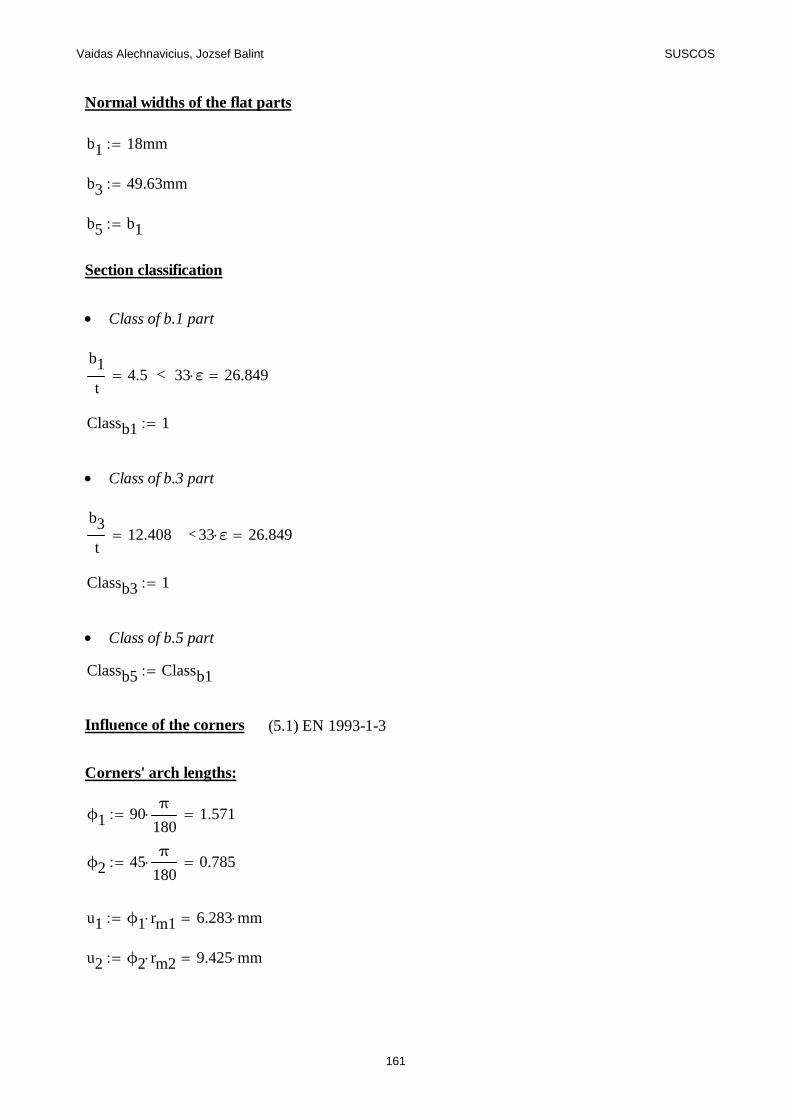
Vaidas Alechnavicius, Jozsef Balint SUSCOS
Normal widths of the flat parts
b1 18mm
b3 49.63mm
b5 b1
Section classification
Class of b.1 part
b1
t4.5 < 33 ε 26.849
Classb1 1
Class of b.3 part
b3
t12.408 <33 ε 26.849
Classb3 1
Class of b.5 part
Classb5 Classb1
Influence of the corners (5.1) EN 1993-1-3
Corners' arch lengths:
ϕ1 90π
180 1.571
ϕ2 45π
180 0.785
u1 ϕ1 rm1 6.283 mm
u2 ϕ2 rm2 9.425 mm
161
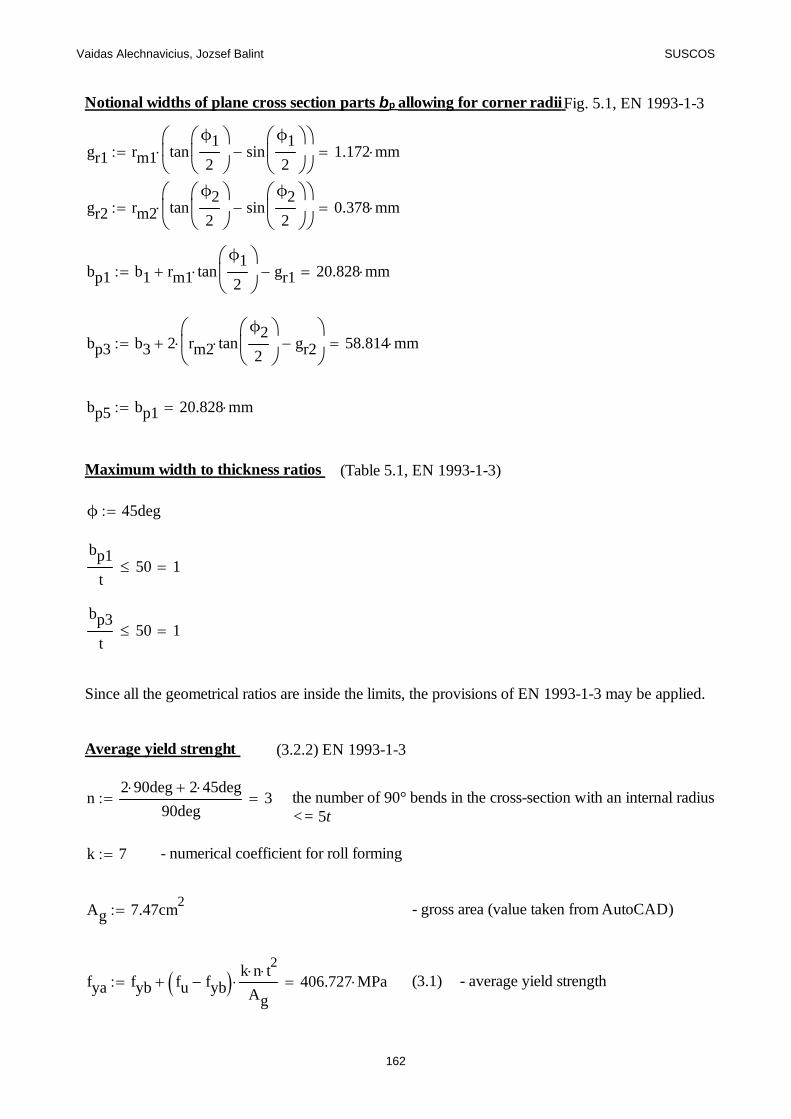
Vaidas Alechnavicius, Jozsef Balint SUSCOS
Notional widths of plane cross section parts b p allowing for corner radii Fig. 5.1, EN 1993-1-3
gr1 rm1 tanϕ1
2
sinϕ1
2
1.172 mm
gr2 rm2 tanϕ2
2
sinϕ2
2
0.378 mm
bp1 b1 rm1 tanϕ1
2
gr1 20.828 mm
bp3 b3 2 rm2 tanϕ2
2
gr2
58.814 mm
bp5 bp1 20.828 mm
Maximum width to thickness ratios (Table 5.1, EN 1993-1-3)
ϕ 45deg
bp1
t50 1
bp3
t50 1
Since all the geometrical ratios are inside the limits, the provisions of EN 1993-1-3 may be applied.
Average yield strenght (3.2.2) EN 1993-1-3
n2 90 deg 2 45 deg
90deg3 the number of 90° bends in the cross-section with an internal radius
<= 5t
k 7 - numerical coefficient for roll forming
Ag 7.47cm2 - gross area (value taken from AutoCAD)
fya fyb fu fyb k n t2
Ag 406.727 MPa (3.1) - average yield strength
162
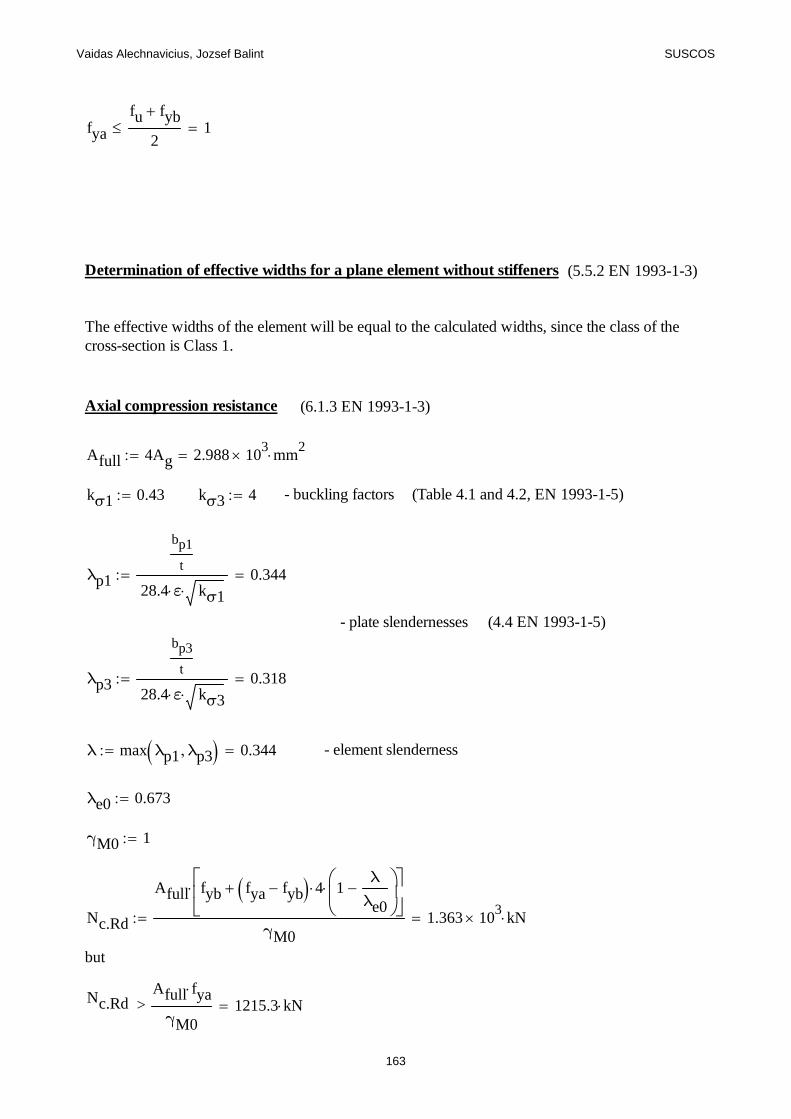
Vaidas Alechnavicius, Jozsef Balint SUSCOS
fya
fu fyb
2 1
Determination of effective widths for a plane element without stiffeners (5.5.2 EN 1993-1-3)
The effective widths of the element will be equal to the calculated widths, since the class of thecross-section is Class 1.
Axial compression resistance (6.1.3 EN 1993-1-3)
Afull 4Ag 2.988 103 mm
2
kσ1 0.43 kσ3 4 - buckling factors (Table 4.1 and 4.2, EN 1993-1-5)
λp1
bp1
t
28.4 ε kσ10.344
- plate slendernesses (4.4 EN 1993-1-5)
λp3
bp3
t
28.4 ε kσ30.318
λ max λp1 λp3 0.344 - element slenderness
λe0 0.673
γM0 1
Nc.Rd
Afull fyb fya fyb 4 1λ
λe0
γM01.363 10
3 kN
but
Nc.Rd >Afull fya
γM01215.3 kN
163
Vaidas Alechnavicius, Jozsef Balint SUSCOS
then:
Nc.Rd 1215.3kN
Local buckling
Critical stress
kσ1 0.43
Critical stress according to theory plate EN 1993-1-5:
σcrit.1.51 kσ1π
2E t
2
12 1 ν2 b1
2 4030.323 MPa (A.1 EN 1993-1-5)
Critical stress according to EN 1993-1-3:
σcrit.1.31 kσ1π
2E t
2
12 1 ν2 bp1
2 3010.037 MPa
Critical load according to EN 1993-1-5:
Ncrit.1.51 σcrit.1.51 Afull 12042.604 kN
Critical load according to EN 1993-1-3:
Ncrit.1.31 σcrit.1.31 Afull 8993.992 kN
Critical stress
kσ3 4
Critical stress according to theory plate EN 1993-1-5:
σcrit.1.53 kσ3π
2E t
2
12 1 ν2 b3
2 4931.6 MPa (A.1 EN 1993-1-5)
Critical stress according to EN 1993-1-3:
σcrit.1.33 kσ3π
2E t
2
12 1 ν2 bp3
2 3511.632 MPa
Critical load according to EN 1993-1-5:
Ncrit.1.53 σcrit.1.53 Afull 14735.62 kN
164
Vaidas Alechnavicius, Jozsef Balint SUSCOS
Critical load according to EN 1993-1-3:
Ncrit.1.33 σcrit.1.33 Afull 10492.756 kN
Global buckling
γM1 1
λ1 93.9 ε 76.399
Afull 29.88 cm2
I 12682813.4639mm4
iI
Afull65.15 mm -radius of gyration
Lcr 0.75 Lplate 1.711m
λLcr
i
1
λ1 0.344 (6.50 EN 1993-1-1)
The buckling curve used will be curve "c".
Therefore, we adopt the following imperfection factor:α 0.49
ϕ 0.5 1 α λ 0.2( ) λ2 0.594
χ1
ϕ ϕ2
λ2
0.927 χ 1 - reduction factor
Nb.Rdglob
χ Nc.Rd γM0
γM11126.247 kN
Ultimate load resistance
Nb.Rd min Nc.Rd Nb.Rdglob 1126.247 kN
Axial load in the diagonal:
NEd 1086.44kN
NEd
Nb.Rd0.965 < 1 Brace is resistant to compression force by applied load.
165
Vaidas Alechnavicius, Jozsef Balint SUSCOS
Design of top braces:
Top braces are made from CHS, the design is given in previous calculations of CHS, as they areidentical.
Desing of U-shaped bottom chord in tension:
Bottom chord in the truss must sustain the tensile force:
NEd
Nt.Rd1 (6.5) EN 1993-1-1
From Autodesk Robot 2013 we obtained the following value of axial force in the lower chord:
NEd.t 3258.90kN
Nt.Rd 3259kN
Nt.Rd
Anet fy
γM0= (6.6) EN 1993-1-1
γM0 1.0
The type of steel used is S355, therefore: fy 355N
mm2
Anet
Nt.Rd γM0
fy91.803 cm
2
We adopt the following U-shape section, giving a gross area of 93.00 cm2
166
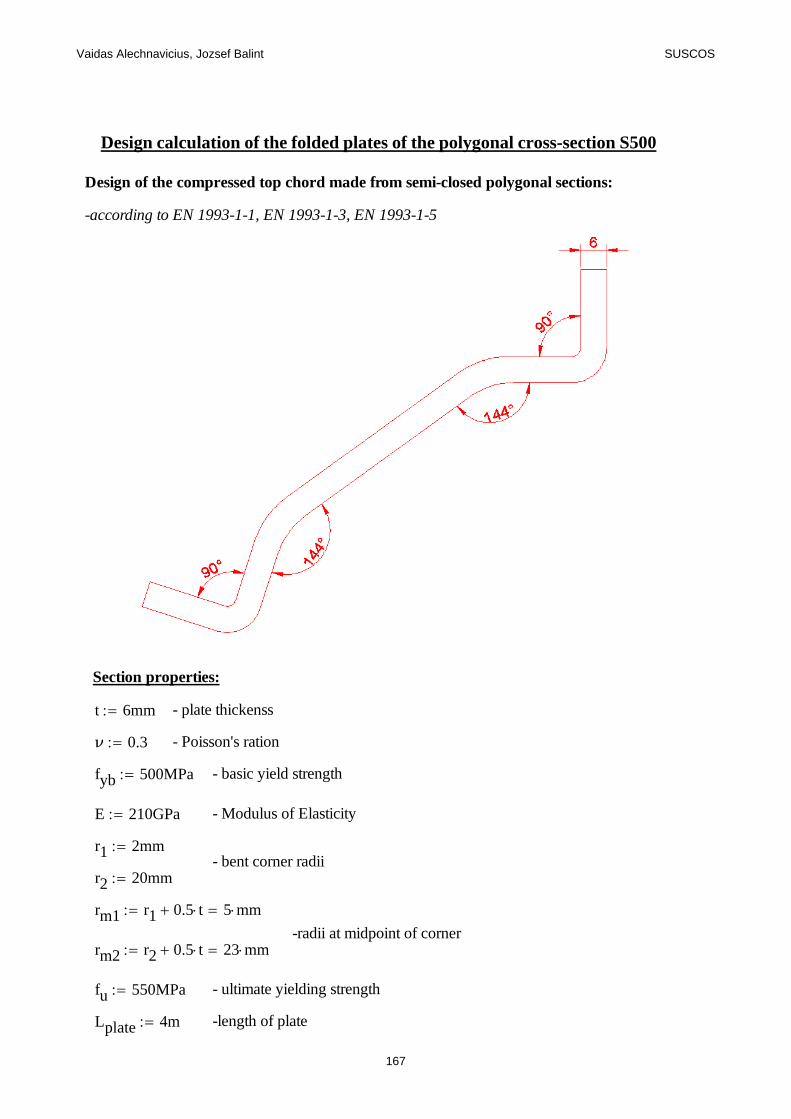
Vaidas Alechnavicius, Jozsef Balint SUSCOS
Design calculation of the folded plates of the polygonal cross-section S500
Design of the compressed top chord made from semi-closed polygonal sections:
-according to EN 1993-1-1, EN 1993-1-3, EN 1993-1-5
Section properties:
t 6mm - plate thickenss
ν 0.3 - Poisson's ration
fyb 500MPa - basic yield strength
E 210GPa - Modulus of Elasticity
r1 2mm- bent corner radii
r2 20mm
rm1 r1 0.5 t 5 mm-radii at midpoint of corner
rm2 r2 0.5 t 23 mm
fu 550MPa - ultimate yielding strength
Lplate 4m -length of plate
167
Vaidas Alechnavicius, Jozsef Balint SUSCOS
ε235MPa
fyb0.686 -strain coefficient
Normal widths of the flat parts
b1 18mm
b2 15.49mm
b3 54.99mm
b4 b2
b5 b1
Section classification
Class of b.1 part
b1
t3 < 33 ε 22.624
Classb1 1
Class of b.2 part
b2
t2.582 < 33 ε 22.624
Classb2 1
Class of b.3 part
b3
t9.165 < 33 ε 22.624
Classb3 1
168
Vaidas Alechnavicius, Jozsef Balint SUSCOS
Class of b.4 part
Classb4 Classb2
Class of b.5 part
Classb5 Classb1
Influence of the corners (5.1) EN 1993-1-3
Corners' arch lengths:
ϕ1 90π
180 1.571
ϕ2 36π
180 0.628
u1 ϕ1 rm1 7.854 mm
u2 ϕ2 rm2 14.451 mm
Notional widths of plane cross section parts b p allowing for corner radii Fig. 5.1, EN 1993-1-3
gr1 rm1 tanϕ1
2
sinϕ1
2
1.464 mm
gr2 rm2 tanϕ2
2
sinϕ2
2
0.366 mm
bp1 b1 rm1 tanϕ1
2
gr1 21.536 mm
bp2 b2 rm1 tanϕ1
2
rm2 tanϕ2
2
gr1 gr2 26.133 mm
bp3 b3 2 rm2 tanϕ2
2
gr2
69.205 mm
bp4 bp2 26.133 mm
bp5 bp1 21.536 mm
169

Vaidas Alechnavicius, Jozsef Balint SUSCOS
Maximum width to thickness ratios (Table 5.1, EN 1993-1-3)
ϕ 36deg
bp1
t50 1
bp2
t500 sin ϕ( ) 1
bp3
t50 1
Since all the geometrical ratios are inside the limits, the provisions of EN 1993-1-3 may be applied.
Average yield strenght (3.2.2) EN 1993-1-3
n2 90 deg 2 36 deg
90deg2.8 the number of 90° bends in the cross-section with an internal radius
<= 5t
k 7 - numerical coefficient for roll forming
Ag 9.707cm2 - gross area (value taken from AutoCAD)
fya fyb fu fyb k n t2
Ag 536.345 MPa (3.1) - average yield strength
fya
fu fyb
2 0
then:
fya 525MPa
Determination of effective widths for a plane element without stiffeners (5.5.2 EN 1993-1-3)
The effective widths of the element will be equal to the calculated widths, since the class of thecross-section is Class 1.
170

Vaidas Alechnavicius, Jozsef Balint SUSCOS
Axial compression resistance (6.1.3 EN 1993-1-3)
Afull 5 Ag 4.854 103 mm
2
kσ1 0.43 kσ2 4 kσ3 4 - buckling factors (Table 4.1 and 4.2, EN 1993-1-5)
λp1
bp1
t
28.4 ε kσ10.281
λp2
bp2
t
28.4 ε kσ20.112 - plate slendernesses (4.4 EN 1993-1-5)
λp3
bp3
t
28.4 ε kσ30.296
λ max λp1 λp2 λp3 0.296 - element slenderness
λe0 0.673
γM0 1
Nc.Rd
Afull fyb fya fyb 4 1λ
λe0
γM02.698 10
3 kN
but
Nc.Rd >Afull fya
γM02548.088 kN
then:
Nc.Rd 2548.088kN
171

Vaidas Alechnavicius, Jozsef Balint SUSCOS
Local buckling
Critical stress
kσ1 0.43
Critical stress according to theory plate EN 1993-1-5:
σcrit.1.51 kσ1π
2E t
2
12 1 ν2 b1
2 9068.226 MPa (A.1 EN 1993-1-5)
Critical stress according to EN 1993-1-3:
σcrit.1.31 kσ1π
2E t
2
12 1 ν2 bp1
2 6335.138 MPa
Critical load according to EN 1993-1-5:
Ncrit.1.51 σcrit.1.51 Afull 44012.636 kN
Critical load according to EN 1993-1-3:
Ncrit.1.31 σcrit.1.31 Afull 30747.592 kN
Critical stress
kσ3 4
Critical stress according to theory plate EN 1993-1-5:
σcrit.1.53 kσ3π
2E t
2
12 1 ν2 b3
2 9038.398 MPa (A.1 EN 1993-1-5)
Critical stress according to EN 1993-1-3:
σcrit.1.33 kσ3π
2E t
2
12 1 ν2 bp3
2 5706.722 MPa
Critical load according to EN 1993-1-5:
Ncrit.1.53 σcrit.1.53 Afull 43867.864 kN
Critical load according to EN 1993-1-3:
Ncrit.1.33 σcrit.1.33 Afull 27697.573 kN
172

Vaidas Alechnavicius, Jozsef Balint SUSCOS
Global buckling
γM1 1
λ1 93.9 ε 64.375
Afull 48.535 cm2
I 27519242.4093mm4
iI
Afull75.299 mm -radius of gyration
Lcr 0.9 Lplate 3.6m
λLcr
i
1
λ1 0.743 (6.50 EN 1993-1-1)
The buckling curve used will be curve "c".
Therefore, we adopt the following imperfection factor:α 0.49
ϕ 0.5 1 α λ 0.2( ) λ2 0.909
χ1
ϕ ϕ2
λ2
0.698 χ 1 - reduction factor
Nb.Rdglob
χ Nc.Rd γM0
γM11778.877 kN
Ultimate load resistance
Nb.Rd min Nc.Rd Nb.Rdglob 1778.877 kN
Axial load in the top cmpressed chord:
NEd 1589.37kN
NEd
Nb.Rd0.893 < 1
Top chord is resistant to compression force by applied load.
173
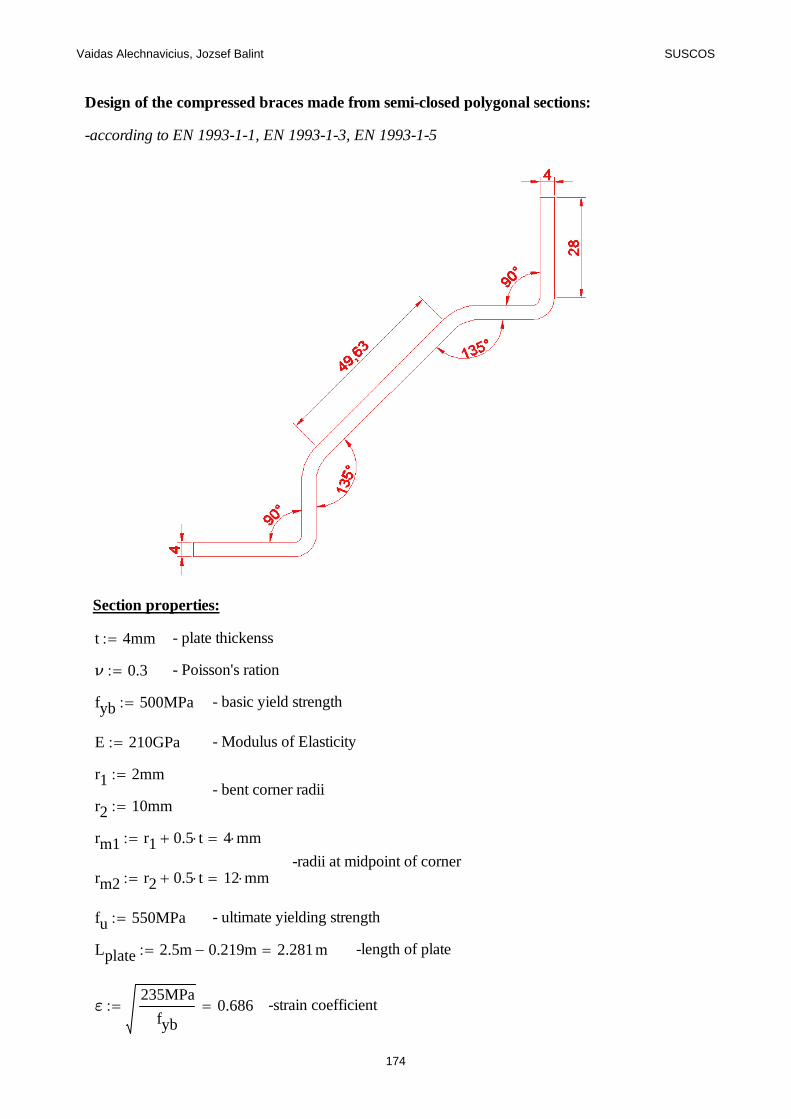
Vaidas Alechnavicius, Jozsef Balint SUSCOS
Design of the compressed braces made from semi-closed polygonal sections:
-according to EN 1993-1-1, EN 1993-1-3, EN 1993-1-5
Section properties:
t 4mm - plate thickenss
ν 0.3 - Poisson's ration
fyb 500MPa - basic yield strength
E 210GPa - Modulus of Elasticity
r1 2mm- bent corner radii
r2 10mm
rm1 r1 0.5 t 4 mm-radii at midpoint of corner
rm2 r2 0.5 t 12 mm
fu 550MPa - ultimate yielding strength
Lplate 2.5m 0.219m 2.281m -length of plate
ε235MPa
fyb0.686 -strain coefficient
174
Vaidas Alechnavicius, Jozsef Balint SUSCOS
Normal widths of the flat parts
b1 28mm
b3 49.63mm
b5 b1
Section classification
Class of b.1 part
b1
t7 < 33 ε 22.624
Classb1 1
Class of b.3 part
b3
t12.408 <33 ε 22.624
Classb3 1
Class of b.5 part
Classb5 Classb1
Influence of the corners (5.1) EN 1993-1-3
Corners' arch lengths:
ϕ1 90π
180 1.571
ϕ2 45π
180 0.785
u1 ϕ1 rm1 6.283 mm
u2 ϕ2 rm2 9.425 mm
175
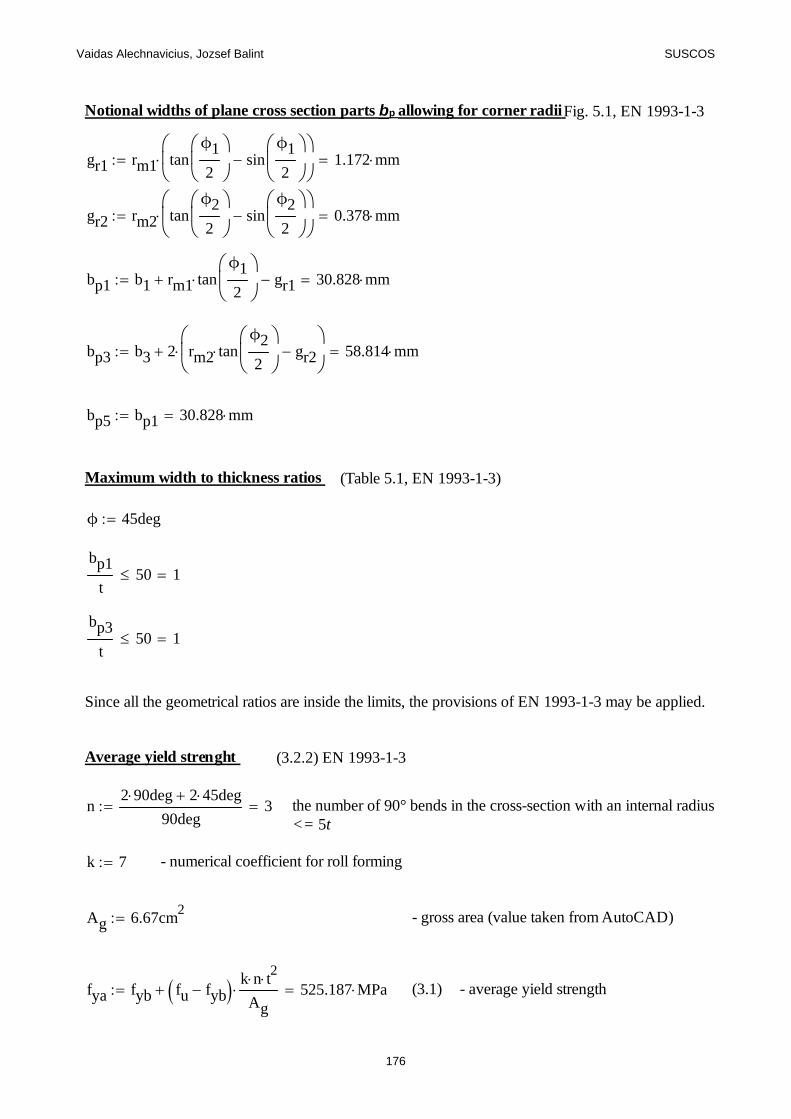
Vaidas Alechnavicius, Jozsef Balint SUSCOS
Notional widths of plane cross section parts b p allowing for corner radii Fig. 5.1, EN 1993-1-3
gr1 rm1 tanϕ1
2
sinϕ1
2
1.172 mm
gr2 rm2 tanϕ2
2
sinϕ2
2
0.378 mm
bp1 b1 rm1 tanϕ1
2
gr1 30.828 mm
bp3 b3 2 rm2 tanϕ2
2
gr2
58.814 mm
bp5 bp1 30.828 mm
Maximum width to thickness ratios (Table 5.1, EN 1993-1-3)
ϕ 45deg
bp1
t50 1
bp3
t50 1
Since all the geometrical ratios are inside the limits, the provisions of EN 1993-1-3 may be applied.
Average yield strenght (3.2.2) EN 1993-1-3
n2 90 deg 2 45 deg
90deg3 the number of 90° bends in the cross-section with an internal radius
<= 5t
k 7 - numerical coefficient for roll forming
Ag 6.67cm2 - gross area (value taken from AutoCAD)
fya fyb fu fyb k n t2
Ag 525.187 MPa (3.1) - average yield strength
176
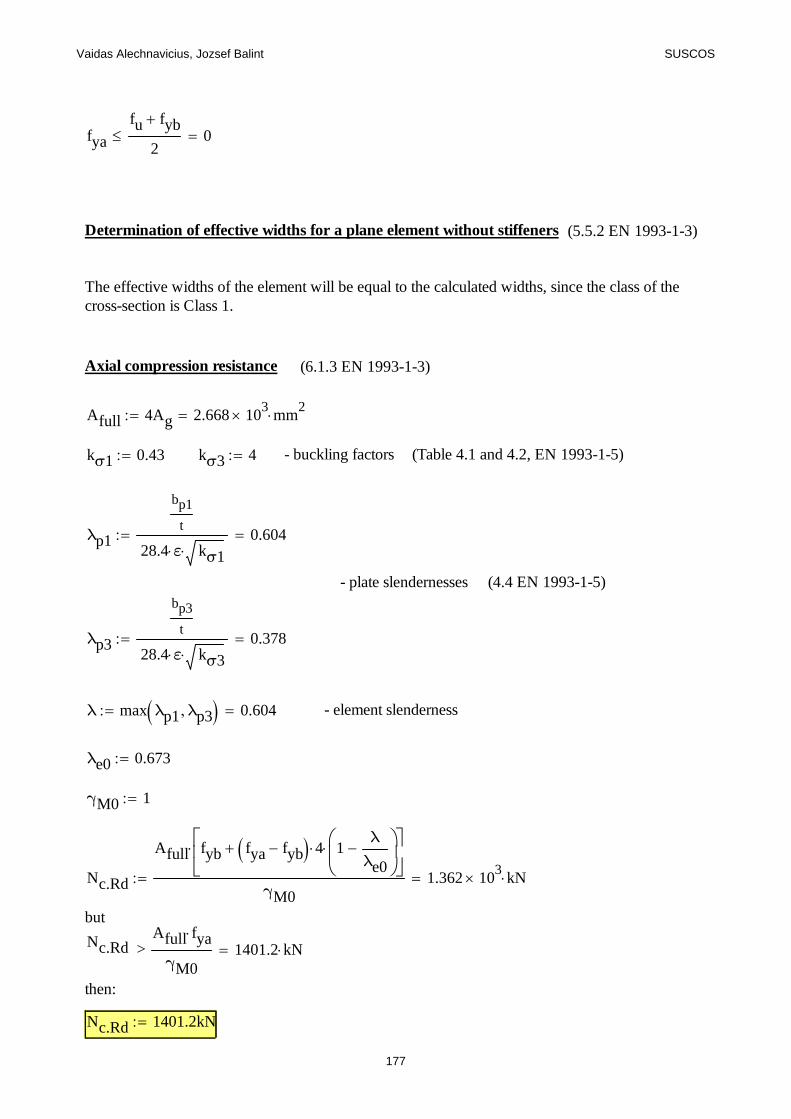
Vaidas Alechnavicius, Jozsef Balint SUSCOS
fya
fu fyb
2 0
Determination of effective widths for a plane element without stiffeners (5.5.2 EN 1993-1-3)
The effective widths of the element will be equal to the calculated widths, since the class of thecross-section is Class 1.
Axial compression resistance (6.1.3 EN 1993-1-3)
Afull 4Ag 2.668 103 mm
2
kσ1 0.43 kσ3 4 - buckling factors (Table 4.1 and 4.2, EN 1993-1-5)
λp1
bp1
t
28.4 ε kσ10.604
- plate slendernesses (4.4 EN 1993-1-5)
λp3
bp3
t
28.4 ε kσ30.378
λ max λp1 λp3 0.604 - element slenderness
λe0 0.673
γM0 1
Nc.Rd
Afull fyb fya fyb 4 1λ
λe0
γM01.362 10
3 kN
but
Nc.Rd >Afull fya
γM01401.2 kN
then:
Nc.Rd 1401.2kN
177
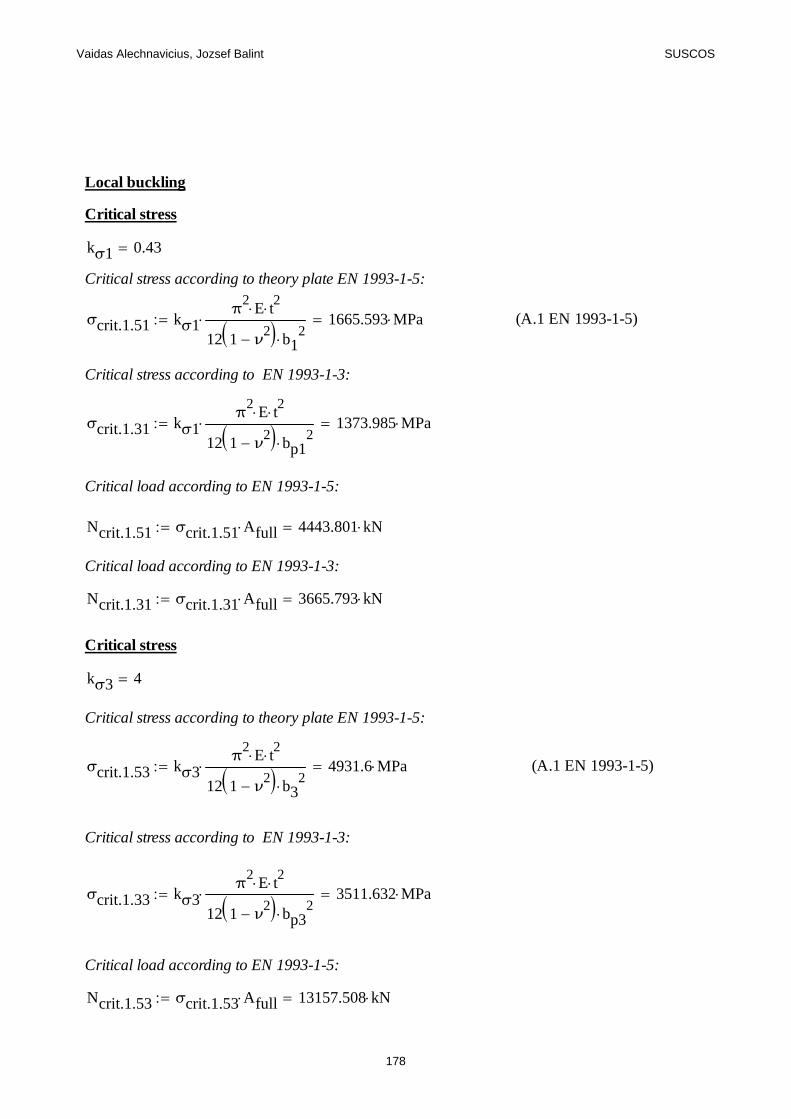
Vaidas Alechnavicius, Jozsef Balint SUSCOS
Local buckling
Critical stress
kσ1 0.43
Critical stress according to theory plate EN 1993-1-5:
σcrit.1.51 kσ1π
2E t
2
12 1 ν2 b1
2 1665.593 MPa (A.1 EN 1993-1-5)
Critical stress according to EN 1993-1-3:
σcrit.1.31 kσ1π
2E t
2
12 1 ν2 bp1
2 1373.985 MPa
Critical load according to EN 1993-1-5:
Ncrit.1.51 σcrit.1.51 Afull 4443.801 kN
Critical load according to EN 1993-1-3:
Ncrit.1.31 σcrit.1.31 Afull 3665.793 kN
Critical stress
kσ3 4
Critical stress according to theory plate EN 1993-1-5:
σcrit.1.53 kσ3π
2E t
2
12 1 ν2 b3
2 4931.6 MPa (A.1 EN 1993-1-5)
Critical stress according to EN 1993-1-3:
σcrit.1.33 kσ3π
2E t
2
12 1 ν2 bp3
2 3511.632 MPa
Critical load according to EN 1993-1-5:
Ncrit.1.53 σcrit.1.53 Afull 13157.508 kN
178
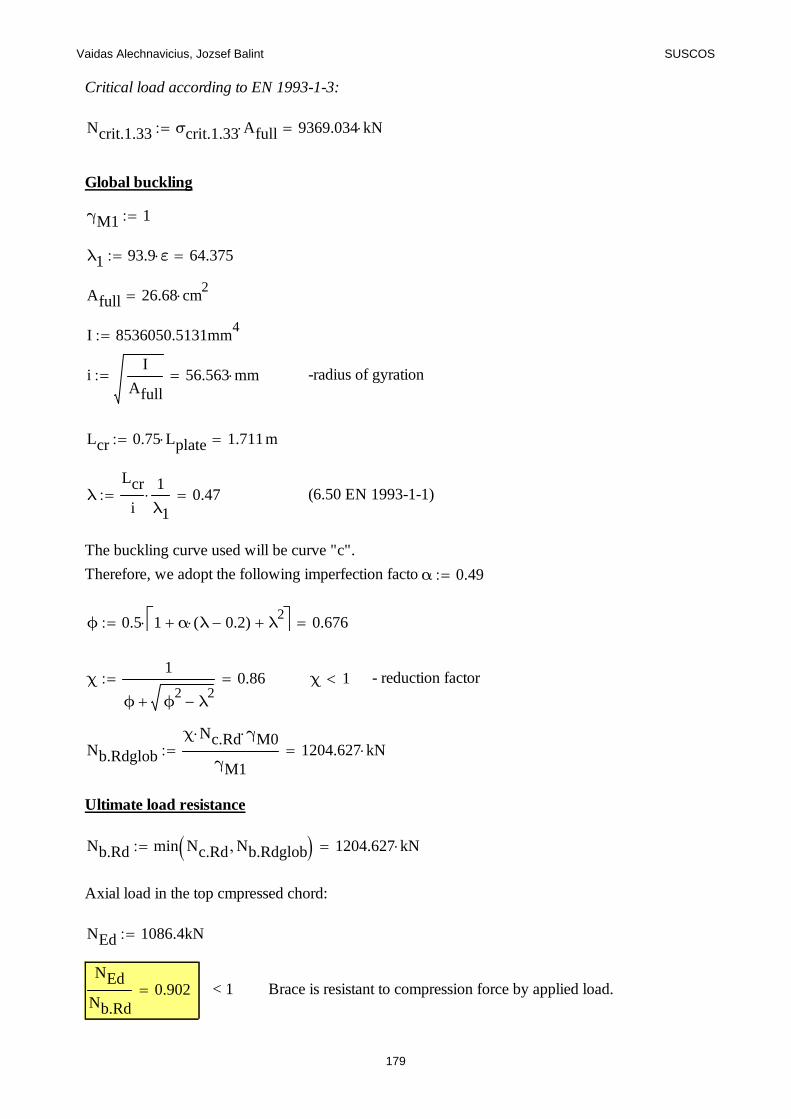
Vaidas Alechnavicius, Jozsef Balint SUSCOS
Critical load according to EN 1993-1-3:
Ncrit.1.33 σcrit.1.33 Afull 9369.034 kN
Global buckling
γM1 1
λ1 93.9 ε 64.375
Afull 26.68 cm2
I 8536050.5131mm4
iI
Afull56.563 mm -radius of gyration
Lcr 0.75 Lplate 1.711m
λLcr
i
1
λ1 0.47 (6.50 EN 1993-1-1)
The buckling curve used will be curve "c".
Therefore, we adopt the following imperfection factor:α 0.49
ϕ 0.5 1 α λ 0.2( ) λ2 0.676
χ1
ϕ ϕ2
λ2
0.86 χ 1 - reduction factor
Nb.Rdglob
χ Nc.Rd γM0
γM11204.627 kN
Ultimate load resistance
Nb.Rd min Nc.Rd Nb.Rdglob 1204.627 kN
Axial load in the top cmpressed chord:
NEd 1086.4kN
NEd
Nb.Rd0.902 < 1 Brace is resistant to compression force by applied load.
179
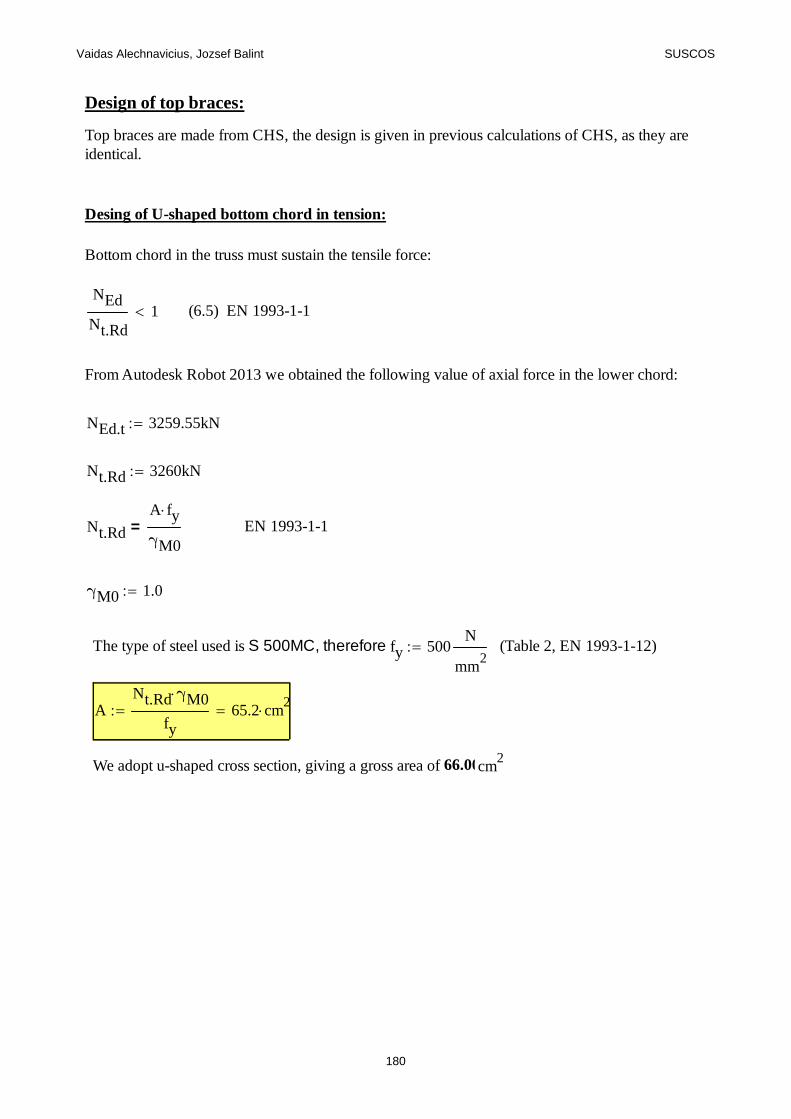
Vaidas Alechnavicius, Jozsef Balint SUSCOS
Design of top braces:
Top braces are made from CHS, the design is given in previous calculations of CHS, as they areidentical.
Desing of U-shaped bottom chord in tension:
Bottom chord in the truss must sustain the tensile force:
NEd
Nt.Rd1 (6.5) EN 1993-1-1
From Autodesk Robot 2013 we obtained the following value of axial force in the lower chord:
NEd.t 3259.55kN
Nt.Rd 3260kN
Nt.Rd
A fy
γM0= EN 1993-1-1
γM0 1.0
The type of steel used is S 500MC, therefore: fy 500N
mm2
(Table 2, EN 1993-1-12)
ANt.Rd γM0
fy65.2 cm
2
We adopt u-shaped cross section, giving a gross area of 66.00 cm2
180

Vaidas Alechnavicius, Jozsef Balint SUSCOS
Design calculation of the folded plates of the polygonal cross-section S650
Design of the compressed top chord made from semi-closed polygonal sections:
-according to EN 1993-1-1, EN 1993-1-3, EN 1993-1-5
Section properties:
t 6mm - plate thickenss
ν 0.3 - Poisson's ration
fyb 650MPa - basic yield strength
E 210GPa - Modulus of Elasticity
r1 2mm- bent corner radii
r2 20mm
rm1 r1 0.5 t 5 mm-radii at midpoint of corner
rm2 r2 0.5 t 23 mm
fu 700MPa - ultimate yielding strength
Lplate 4m -length of plate
181
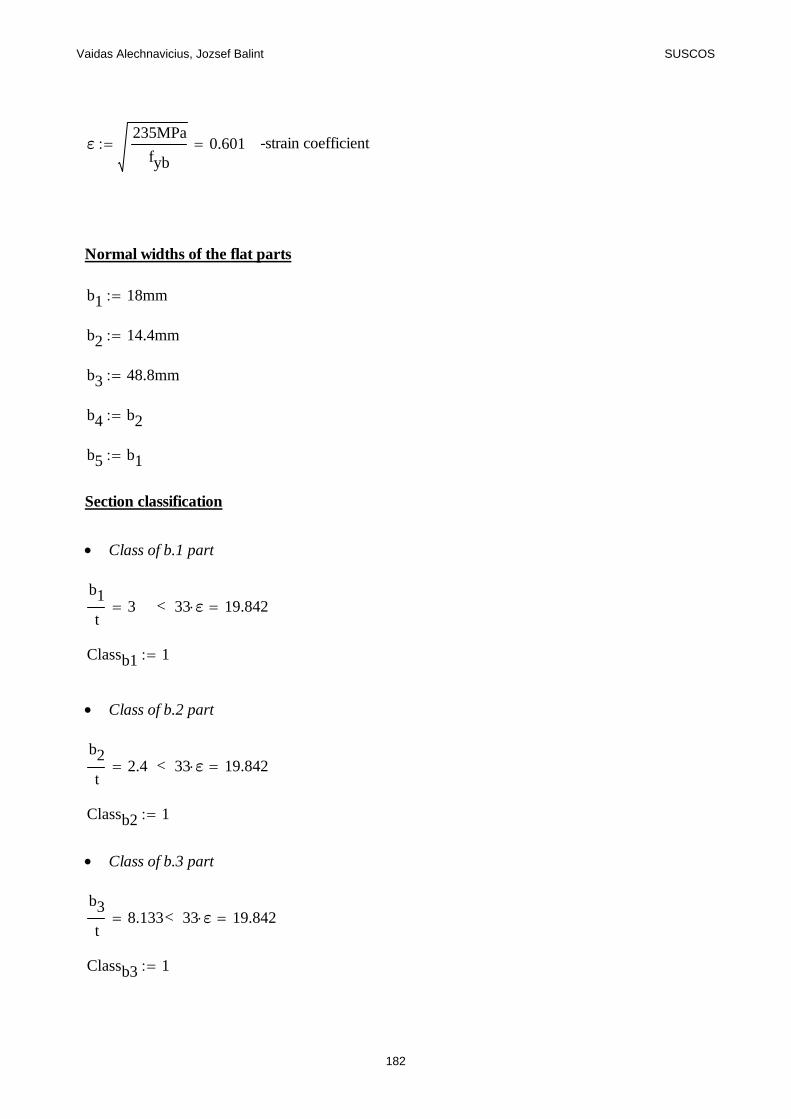
Vaidas Alechnavicius, Jozsef Balint SUSCOS
ε235MPa
fyb0.601 -strain coefficient
Normal widths of the flat parts
b1 18mm
b2 14.4mm
b3 48.8mm
b4 b2
b5 b1
Section classification
Class of b.1 part
b1
t3 < 33 ε 19.842
Classb1 1
Class of b.2 part
b2
t2.4 < 33 ε 19.842
Classb2 1
Class of b.3 part
b3
t8.133 < 33 ε 19.842
Classb3 1
182

Vaidas Alechnavicius, Jozsef Balint SUSCOS
Class of b.4 part
Classb4 Classb2
Class of b.5 part
Classb5 Classb1
Influence of the corners (5.1) EN 1993-1-3
Corners' arch lengths:
ϕ1 90π
180 1.571
ϕ2 36π
180 0.628
u1 ϕ1 rm1 7.854 mm
u2 ϕ2 rm2 14.451 mm
Notional widths of plane cross section parts b p allowing for corner radii Fig. 5.1, EN 1993-1-3
gr1 rm1 tanϕ1
2
sinϕ1
2
1.464 mm
gr2 rm2 tanϕ2
2
sinϕ2
2
0.366 mm
bp1 b1 rm1 tanϕ1
2
gr1 21.536 mm
bp2 b2 rm1 tanϕ1
2
rm2 tanϕ2
2
gr1 gr2 25.043 mm
bp3 b3 2 rm2 tanϕ2
2
gr2
63.015 mm
bp4 bp2 25.043 mm
bp5 bp1 21.536 mm
183
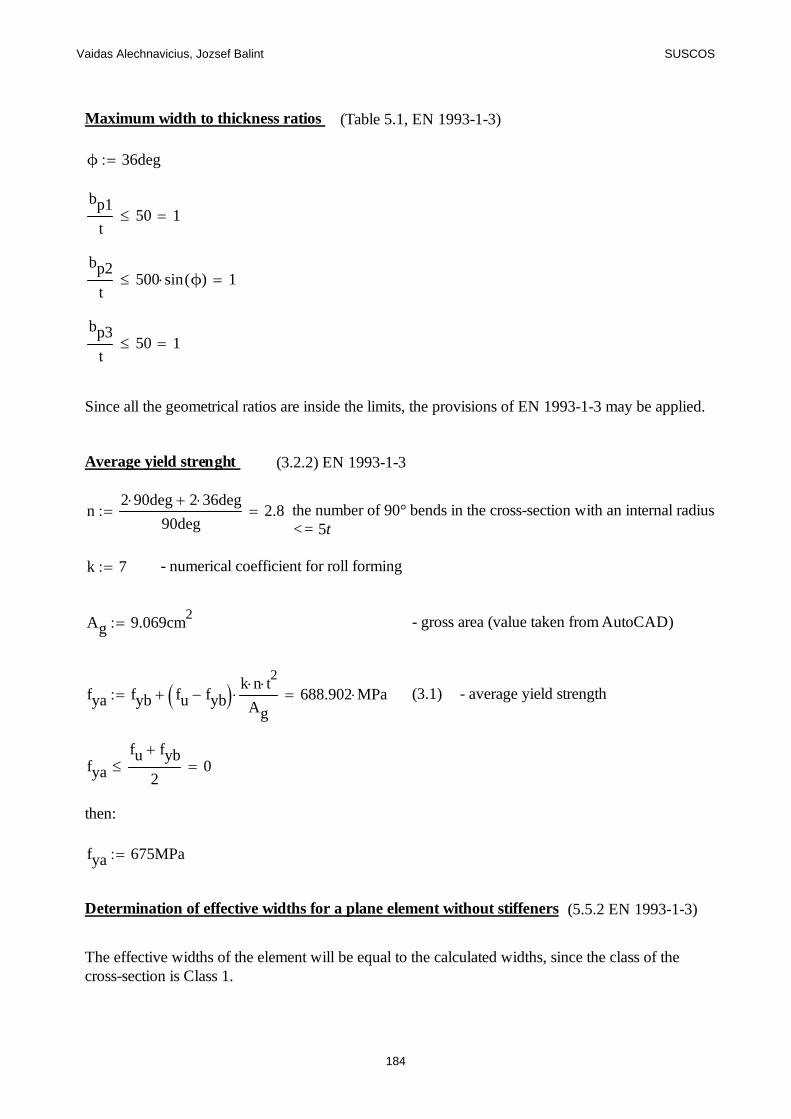
Vaidas Alechnavicius, Jozsef Balint SUSCOS
Maximum width to thickness ratios (Table 5.1, EN 1993-1-3)
ϕ 36deg
bp1
t50 1
bp2
t500 sin ϕ( ) 1
bp3
t50 1
Since all the geometrical ratios are inside the limits, the provisions of EN 1993-1-3 may be applied.
Average yield strenght (3.2.2) EN 1993-1-3
n2 90 deg 2 36 deg
90deg2.8 the number of 90° bends in the cross-section with an internal radius
<= 5t
k 7 - numerical coefficient for roll forming
Ag 9.069cm2 - gross area (value taken from AutoCAD)
fya fyb fu fyb k n t2
Ag 688.902 MPa (3.1) - average yield strength
fya
fu fyb
2 0
then:
fya 675MPa
Determination of effective widths for a plane element without stiffeners (5.5.2 EN 1993-1-3)
The effective widths of the element will be equal to the calculated widths, since the class of thecross-section is Class 1.
184
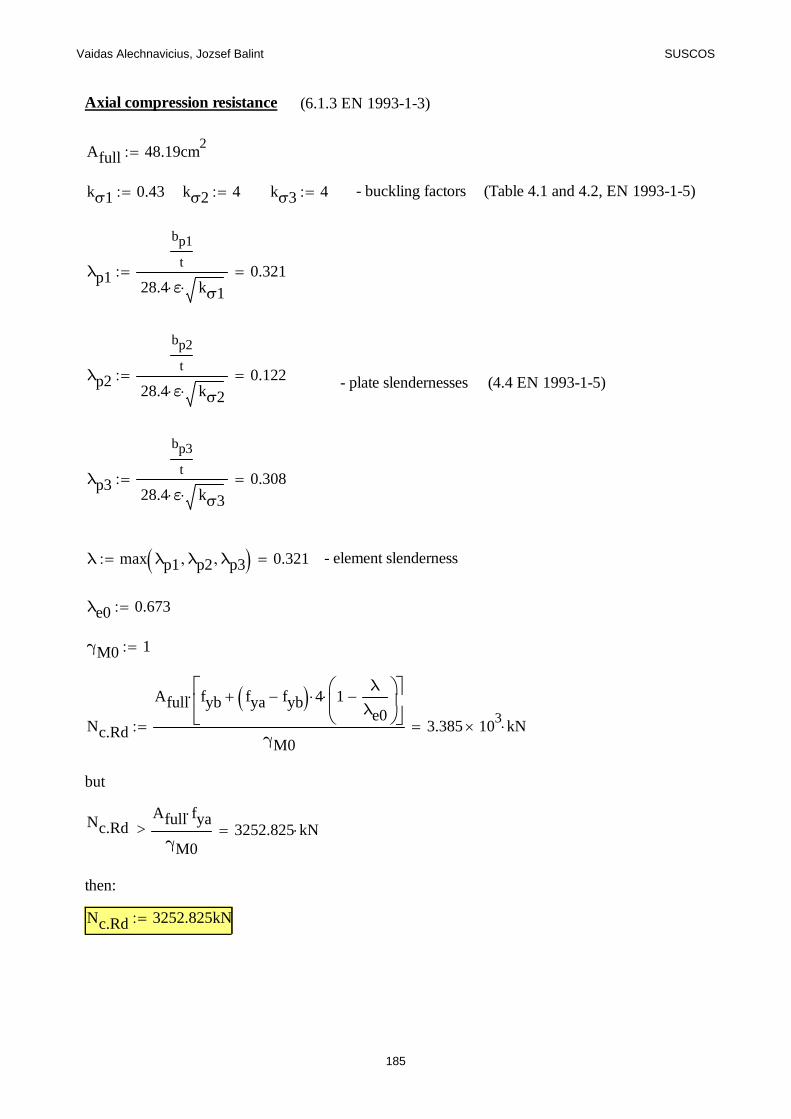
Vaidas Alechnavicius, Jozsef Balint SUSCOS
Axial compression resistance (6.1.3 EN 1993-1-3)
Afull 48.19cm2
kσ1 0.43 kσ2 4 kσ3 4 - buckling factors (Table 4.1 and 4.2, EN 1993-1-5)
λp1
bp1
t
28.4 ε kσ10.321
λp2
bp2
t
28.4 ε kσ20.122 - plate slendernesses (4.4 EN 1993-1-5)
λp3
bp3
t
28.4 ε kσ30.308
λ max λp1 λp2 λp3 0.321 - element slenderness
λe0 0.673
γM0 1
Nc.Rd
Afull fyb fya fyb 4 1λ
λe0
γM03.385 10
3 kN
but
Nc.Rd >Afull fya
γM03252.825 kN
then:
Nc.Rd 3252.825kN
185

Vaidas Alechnavicius, Jozsef Balint SUSCOS
Local buckling
Critical stress
kσ1 0.43
Critical stress according to theory plate EN 1993-1-5:
σcrit.1.51 kσ1π
2E t
2
12 1 ν2 b1
2 9068.226 MPa (A.1 EN 1993-1-5)
Critical stress according to EN 1993-1-3:
σcrit.1.31 kσ1π
2E t
2
12 1 ν2 bp1
2 6335.138 MPa
Critical load according to EN 1993-1-5:
Ncrit.1.51 σcrit.1.51 Afull 43699.782 kN
Critical load according to EN 1993-1-3:
Ncrit.1.31 σcrit.1.31 Afull 30529.029 kN
Critical stress
kσ3 4
Critical stress according to theory plate EN 1993-1-5:
σcrit.1.53 kσ3π
2E t
2
12 1 ν2 b3
2 11476.759 MPa (A.1 EN 1993-1-5)
Critical stress according to EN 1993-1-3:
σcrit.1.33 kσ3π
2E t
2
12 1 ν2 bp3
2 6882.941 MPa
Critical load according to EN 1993-1-5:
Ncrit.1.53 σcrit.1.53 Afull 55306.5 kN
Critical load according to EN 1993-1-3:
Ncrit.1.33 σcrit.1.33 Afull 33168.891 kN
186

Vaidas Alechnavicius, Jozsef Balint SUSCOS
Global buckling
γM1 1
λ1 93.9 ε 56.46
Afull 48.19 cm2
I 20648815.6419mm4
iI
Afull65.459 mm -radius of gyration
Lcr 0.9 Lplate 3.6m
λLcr
i
1
λ1 0.974 (6.50 EN 1993-1-1)
The buckling curve used will be curve "c".
Therefore, we adopt the following imperfection factor:α 0.49
ϕ 0.5 1 α λ 0.2( ) λ2 1.164
χ1
ϕ ϕ2
λ2
0.555 χ 1 - reduction factor
Nb.Rdglob
χ Nc.Rd γM0
γM11805.721 kN
Ultimate load resistance
Nb.Rd min Nc.Rd Nb.Rdglob 1805.721 kN
Axial load in the top cmpressed chord:
NEd 1589.37kN
NEd
Nb.Rd0.88 < 1
Top chord is resistant to compression force by applied load.
187
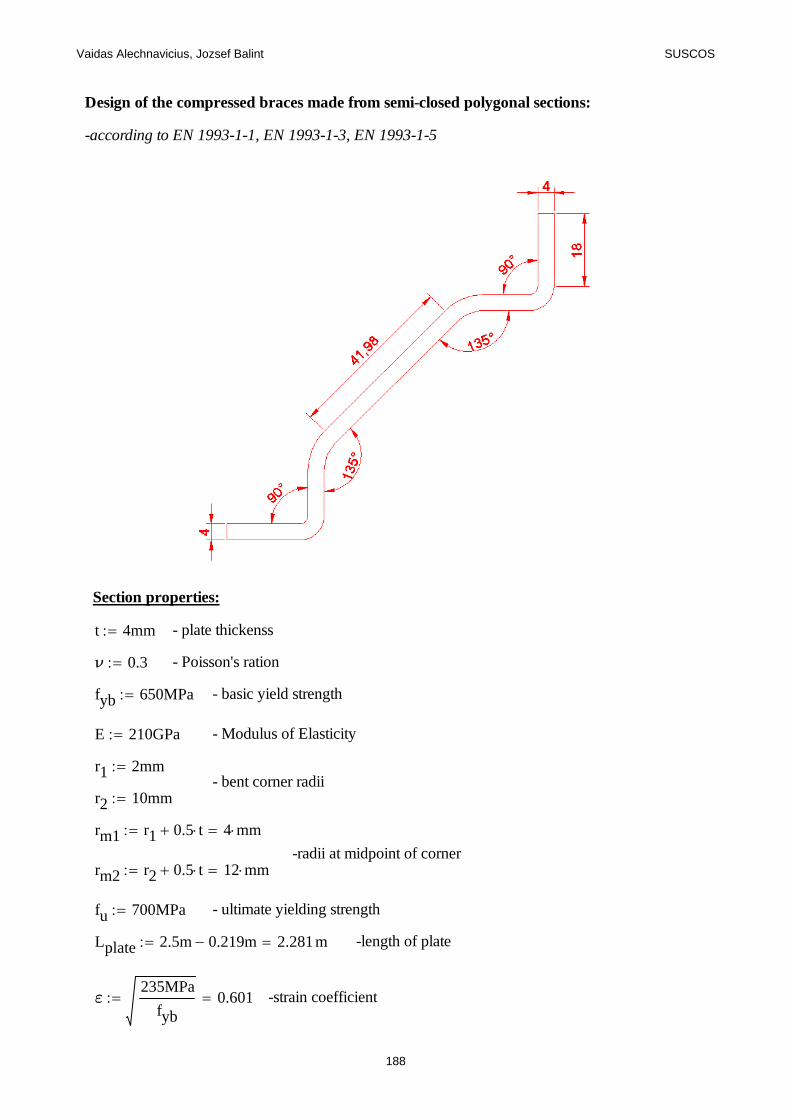
Vaidas Alechnavicius, Jozsef Balint SUSCOS
Design of the compressed braces made from semi-closed polygonal sections:
-according to EN 1993-1-1, EN 1993-1-3, EN 1993-1-5
Section properties:
t 4mm - plate thickenss
ν 0.3 - Poisson's ration
fyb 650MPa - basic yield strength
E 210GPa - Modulus of Elasticity
r1 2mm- bent corner radii
r2 10mm
rm1 r1 0.5 t 4 mm-radii at midpoint of corner
rm2 r2 0.5 t 12 mm
fu 700MPa - ultimate yielding strength
Lplate 2.5m 0.219m 2.281m -length of plate
ε235MPa
fyb0.601 -strain coefficient
188
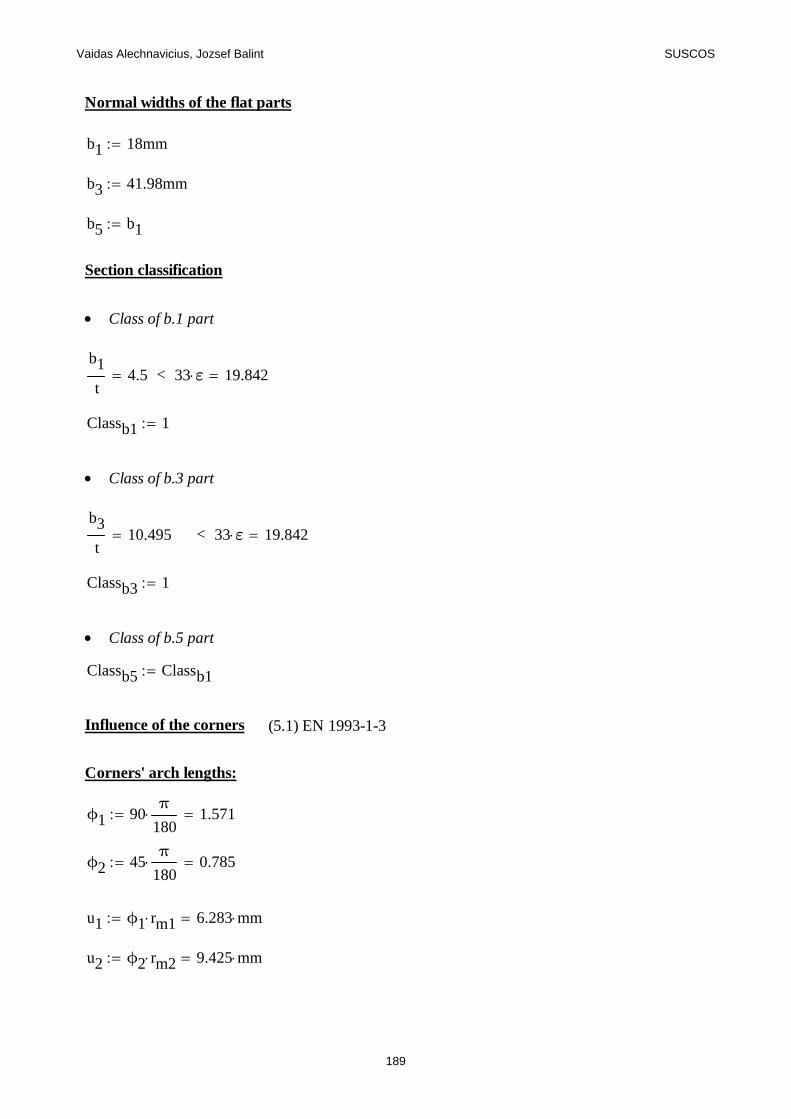
Vaidas Alechnavicius, Jozsef Balint SUSCOS
Normal widths of the flat parts
b1 18mm
b3 41.98mm
b5 b1
Section classification
Class of b.1 part
b1
t4.5 < 33 ε 19.842
Classb1 1
Class of b.3 part
b3
t10.495 < 33 ε 19.842
Classb3 1
Class of b.5 part
Classb5 Classb1
Influence of the corners (5.1) EN 1993-1-3
Corners' arch lengths:
ϕ1 90π
180 1.571
ϕ2 45π
180 0.785
u1 ϕ1 rm1 6.283 mm
u2 ϕ2 rm2 9.425 mm
189
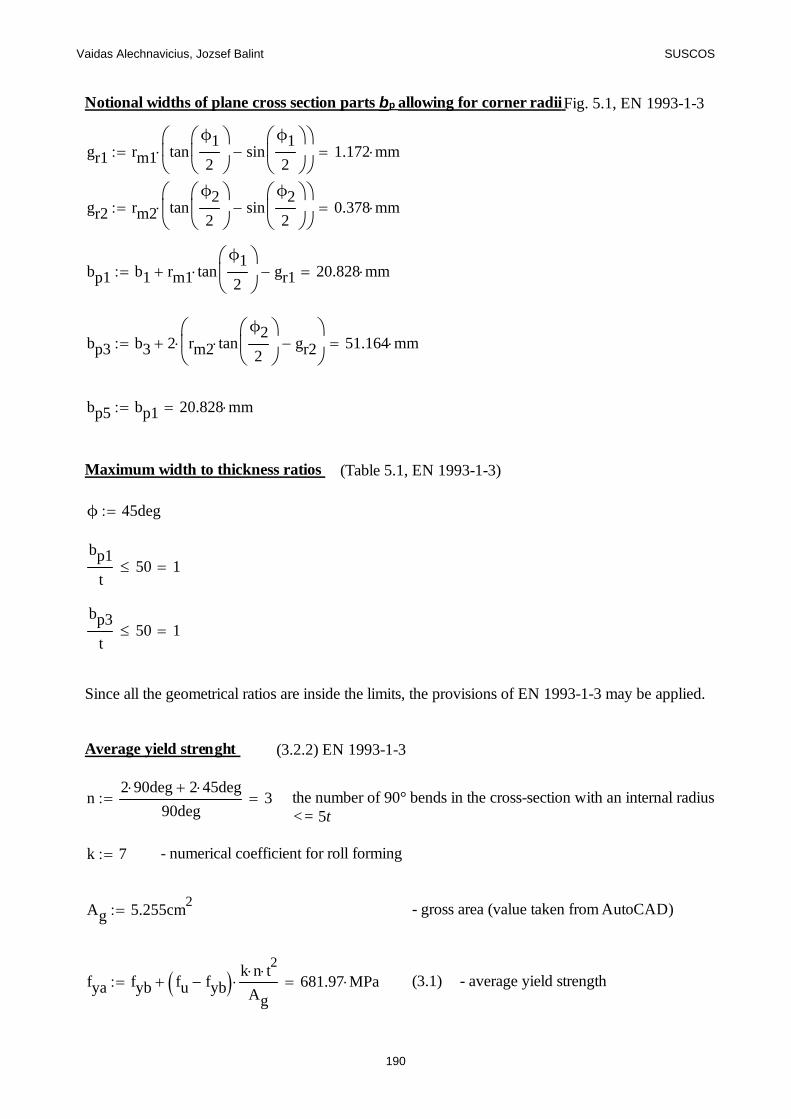
Vaidas Alechnavicius, Jozsef Balint SUSCOS
Notional widths of plane cross section parts b p allowing for corner radii Fig. 5.1, EN 1993-1-3
gr1 rm1 tanϕ1
2
sinϕ1
2
1.172 mm
gr2 rm2 tanϕ2
2
sinϕ2
2
0.378 mm
bp1 b1 rm1 tanϕ1
2
gr1 20.828 mm
bp3 b3 2 rm2 tanϕ2
2
gr2
51.164 mm
bp5 bp1 20.828 mm
Maximum width to thickness ratios (Table 5.1, EN 1993-1-3)
ϕ 45deg
bp1
t50 1
bp3
t50 1
Since all the geometrical ratios are inside the limits, the provisions of EN 1993-1-3 may be applied.
Average yield strenght (3.2.2) EN 1993-1-3
n2 90 deg 2 45 deg
90deg3 the number of 90° bends in the cross-section with an internal radius
<= 5t
k 7 - numerical coefficient for roll forming
Ag 5.255cm2 - gross area (value taken from AutoCAD)
fya fyb fu fyb k n t2
Ag 681.97 MPa (3.1) - average yield strength
190
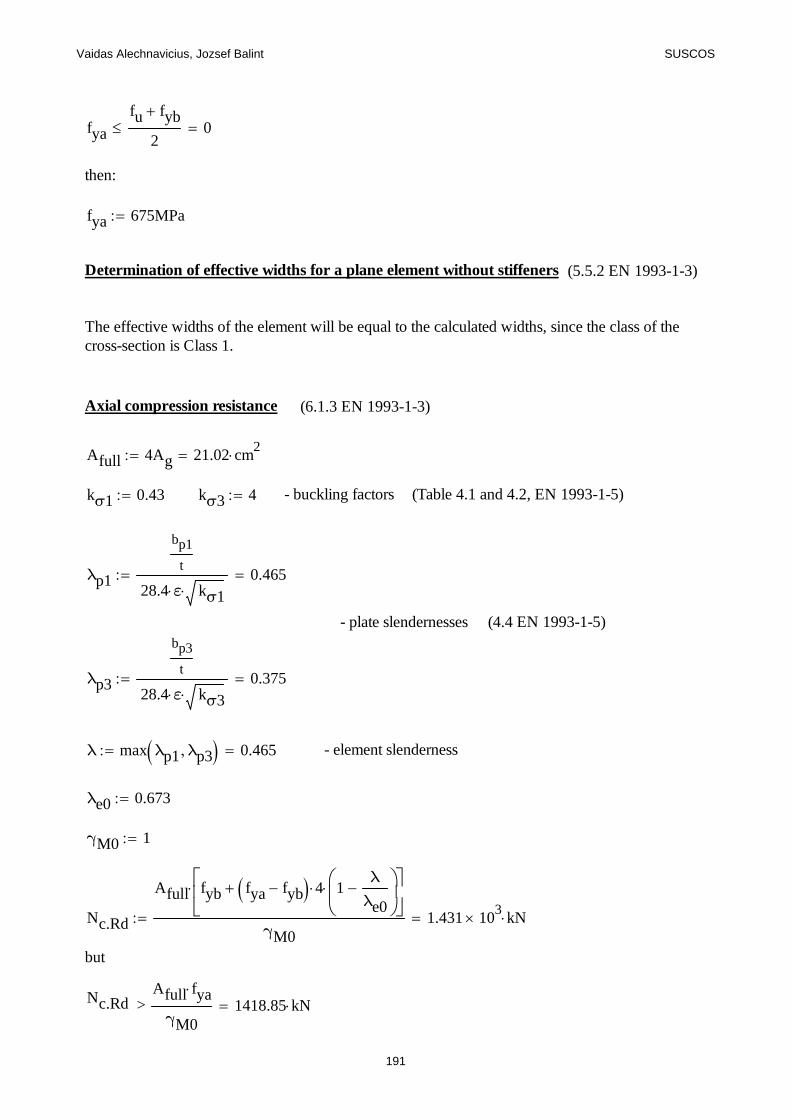
Vaidas Alechnavicius, Jozsef Balint SUSCOS
fya
fu fyb
2 0
then:
fya 675MPa
Determination of effective widths for a plane element without stiffeners (5.5.2 EN 1993-1-3)
The effective widths of the element will be equal to the calculated widths, since the class of thecross-section is Class 1.
Axial compression resistance (6.1.3 EN 1993-1-3)
Afull 4Ag 21.02 cm2
kσ1 0.43 kσ3 4 - buckling factors (Table 4.1 and 4.2, EN 1993-1-5)
λp1
bp1
t
28.4 ε kσ10.465
- plate slendernesses (4.4 EN 1993-1-5)
λp3
bp3
t
28.4 ε kσ30.375
λ max λp1 λp3 0.465 - element slenderness
λe0 0.673
γM0 1
Nc.Rd
Afull fyb fya fyb 4 1λ
λe0
γM01.431 10
3 kN
but
Nc.Rd >Afull fya
γM01418.85 kN
191
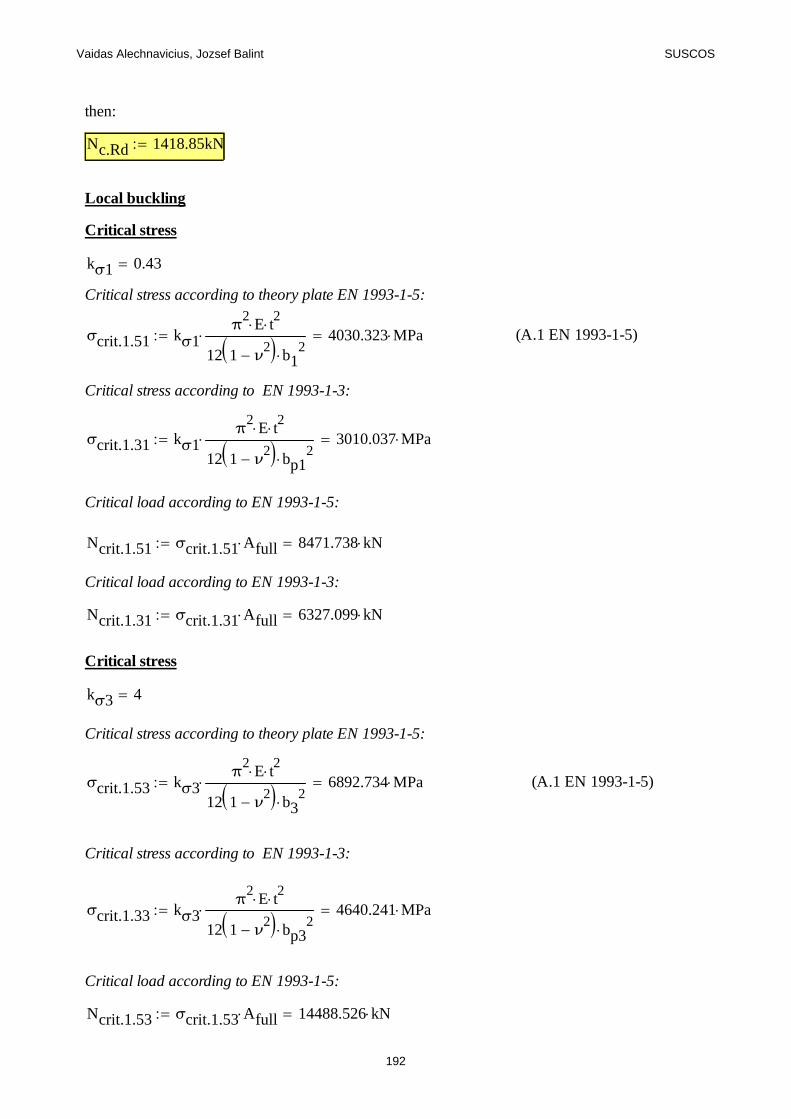
Vaidas Alechnavicius, Jozsef Balint SUSCOS
then:
Nc.Rd 1418.85kN
Local buckling
Critical stress
kσ1 0.43
Critical stress according to theory plate EN 1993-1-5:
σcrit.1.51 kσ1π
2E t
2
12 1 ν2 b1
2 4030.323 MPa (A.1 EN 1993-1-5)
Critical stress according to EN 1993-1-3:
σcrit.1.31 kσ1π
2E t
2
12 1 ν2 bp1
2 3010.037 MPa
Critical load according to EN 1993-1-5:
Ncrit.1.51 σcrit.1.51 Afull 8471.738 kN
Critical load according to EN 1993-1-3:
Ncrit.1.31 σcrit.1.31 Afull 6327.099 kN
Critical stress
kσ3 4
Critical stress according to theory plate EN 1993-1-5:
σcrit.1.53 kσ3π
2E t
2
12 1 ν2 b3
2 6892.734 MPa (A.1 EN 1993-1-5)
Critical stress according to EN 1993-1-3:
σcrit.1.33 kσ3π
2E t
2
12 1 ν2 bp3
2 4640.241 MPa
Critical load according to EN 1993-1-5:
Ncrit.1.53 σcrit.1.53 Afull 14488.526 kN
192
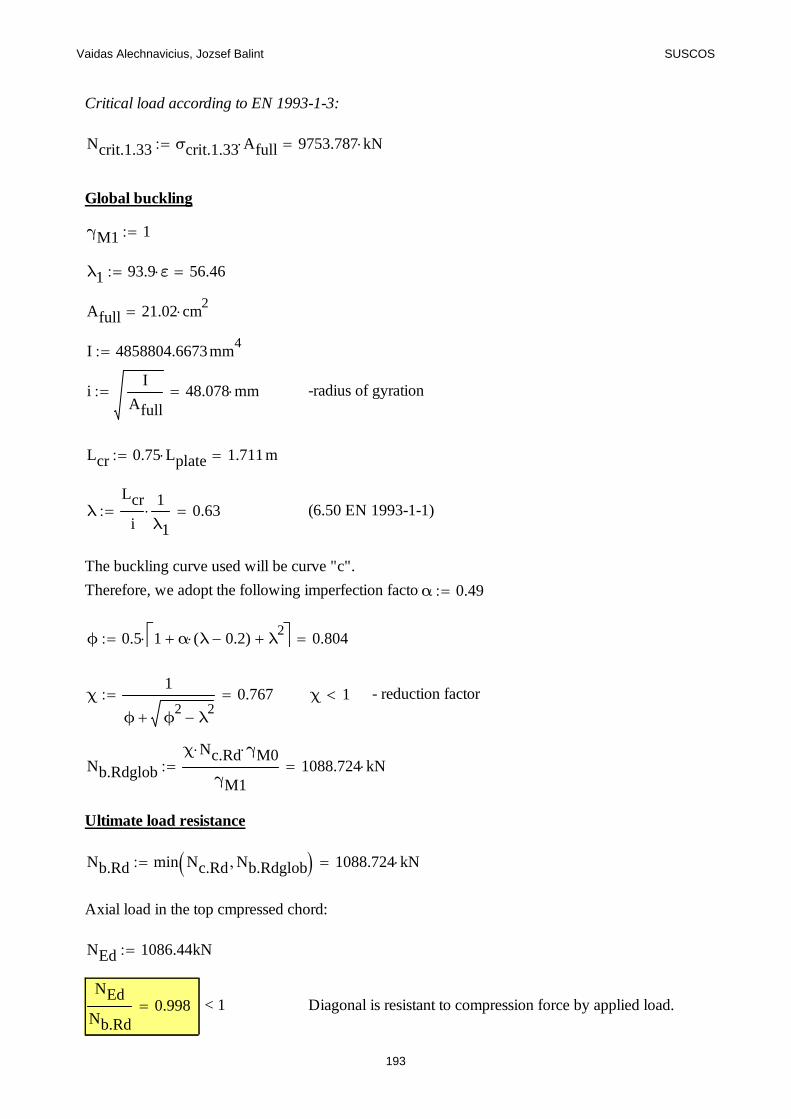
Vaidas Alechnavicius, Jozsef Balint SUSCOS
Critical load according to EN 1993-1-3:
Ncrit.1.33 σcrit.1.33 Afull 9753.787 kN
Global buckling
γM1 1
λ1 93.9 ε 56.46
Afull 21.02 cm2
I 4858804.6673mm4
iI
Afull48.078 mm -radius of gyration
Lcr 0.75 Lplate 1.711m
λLcr
i
1
λ1 0.63 (6.50 EN 1993-1-1)
The buckling curve used will be curve "c".
Therefore, we adopt the following imperfection factor:α 0.49
ϕ 0.5 1 α λ 0.2( ) λ2 0.804
χ1
ϕ ϕ2
λ2
0.767 χ 1 - reduction factor
Nb.Rdglob
χ Nc.Rd γM0
γM11088.724 kN
Ultimate load resistance
Nb.Rd min Nc.Rd Nb.Rdglob 1088.724 kN
Axial load in the top cmpressed chord:
NEd 1086.44kN
NEd
Nb.Rd0.998 < 1 Diagonal is resistant to compression force by applied load.
193
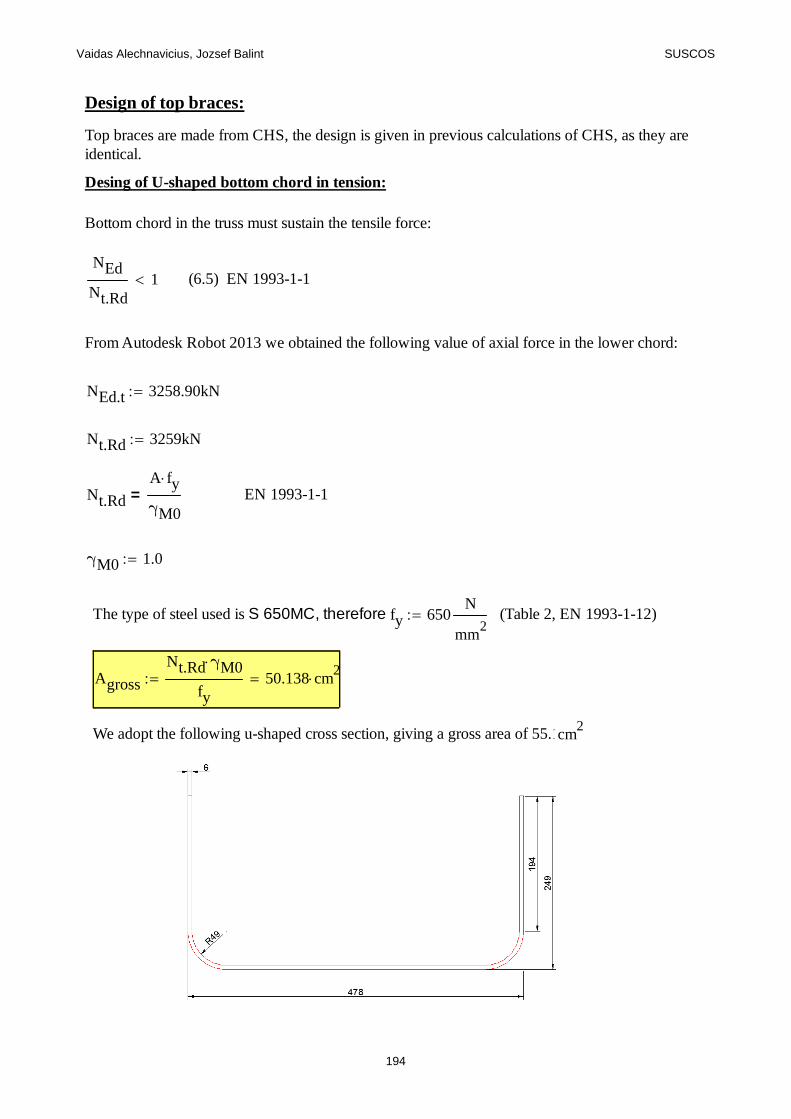
Vaidas Alechnavicius, Jozsef Balint SUSCOS
Design of top braces:
Top braces are made from CHS, the design is given in previous calculations of CHS, as they areidentical.
Desing of U-shaped bottom chord in tension:
Bottom chord in the truss must sustain the tensile force:
NEd
Nt.Rd1 (6.5) EN 1993-1-1
From Autodesk Robot 2013 we obtained the following value of axial force in the lower chord:
NEd.t 3258.90kN
Nt.Rd 3259kN
Nt.Rd
A fy
γM0= EN 1993-1-1
γM0 1.0
The type of steel used is S 650MC, therefore: fy 650N
mm2
(Table 2, EN 1993-1-12)
Agross
Nt.Rd γM0
fy50.138 cm
2
We adopt the following u-shaped cross section, giving a gross area of 55.17 cm2
194
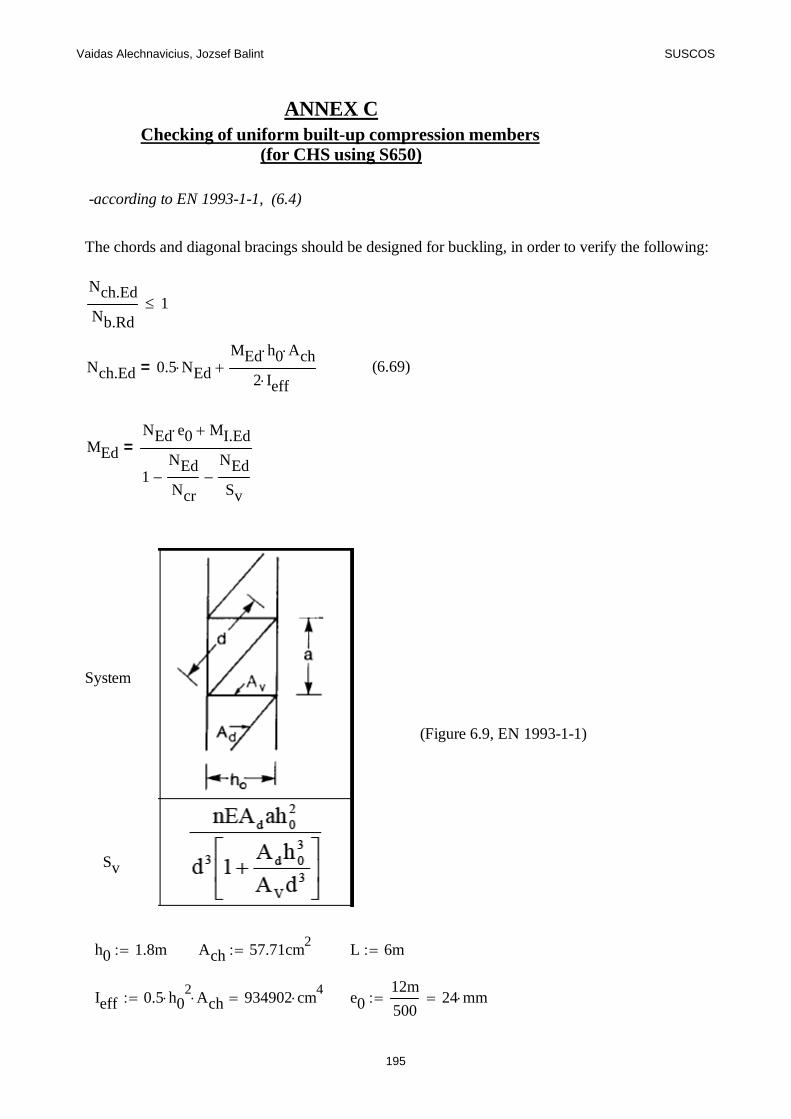
Vaidas Alechnavicius, Jozsef Balint SUSCOS
ANNEX C Checking of uniform built-up compression members
(for CHS using S650)
-according to EN 1993-1-1, (6.4)
The chords and diagonal bracings should be designed for buckling, in order to verify the following:
Nch.Ed
Nb.Rd1
Nch.Ed 0.5 NEdMEd h0 Ach
2 Ieff= (6.69)
MEd
NEd e0 MI.Ed
1NEd
Ncr
NEd
Sv
=
System
(Figure 6.9, EN 1993-1-1)
Sv
h0 1.8m Ach 57.71cm2 L 6m
Ieff 0.5 h02 Ach 934902 cm
4 e012m
50024 mm
195
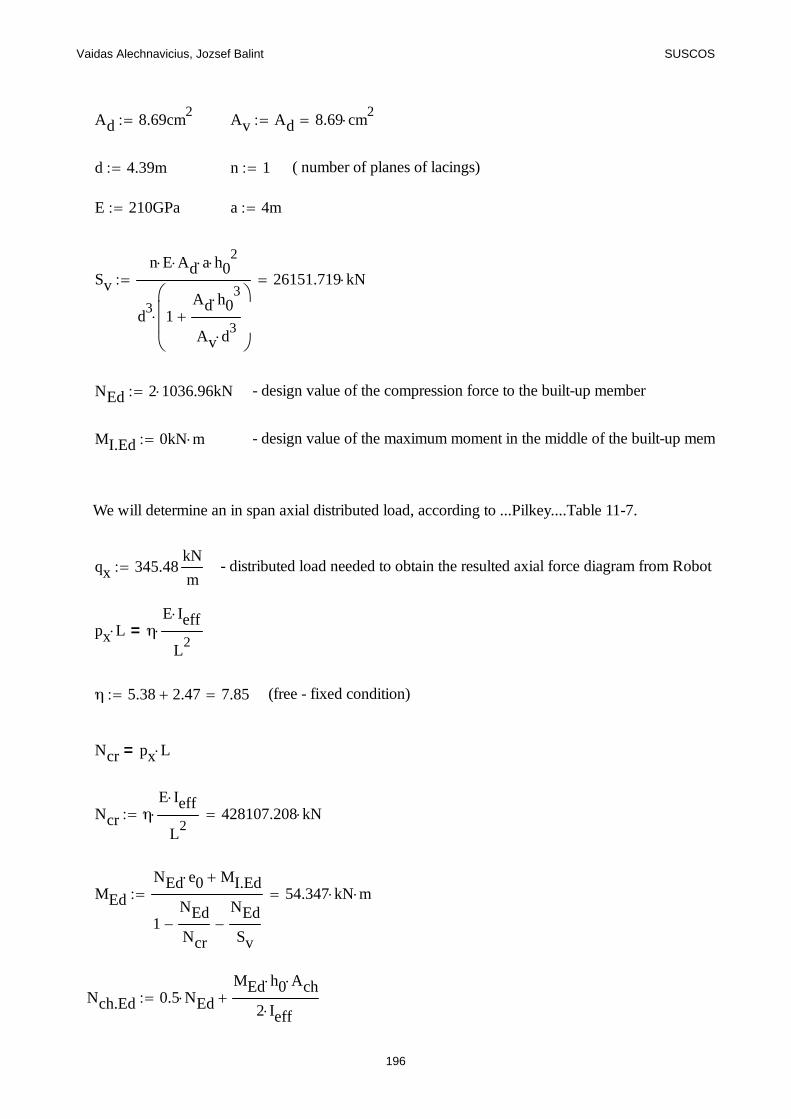
Vaidas Alechnavicius, Jozsef Balint SUSCOS
Ad 8.69cm2 Av Ad 8.69 cm
2
d 4.39m n 1 ( number of planes of lacings)
E 210GPa a 4m
Sv
n E Ad a h02
d3
1Ad h0
3
Av d3
26151.719 kN
NEd 2 1036.96 kN - design value of the compression force to the built-up member
MI.Ed 0kN m - design value of the maximum moment in the middle of the built-up memb
We will determine an in span axial distributed load, according to ...Pilkey....Table 11-7.
qx 345.48kN
m - distributed load needed to obtain the resulted axial force diagram from Robot
px L ηE Ieff
L2
=
η 5.38 2.47 7.85 (free - fixed condition)
Ncr px L=
Ncr ηE Ieff
L2
428107.208 kN
MEd
NEd e0 MI.Ed
1NEd
Ncr
NEd
Sv
54.347 kN m
Nch.Ed 0.5 NEdMEd h0 Ach
2 Ieff
196
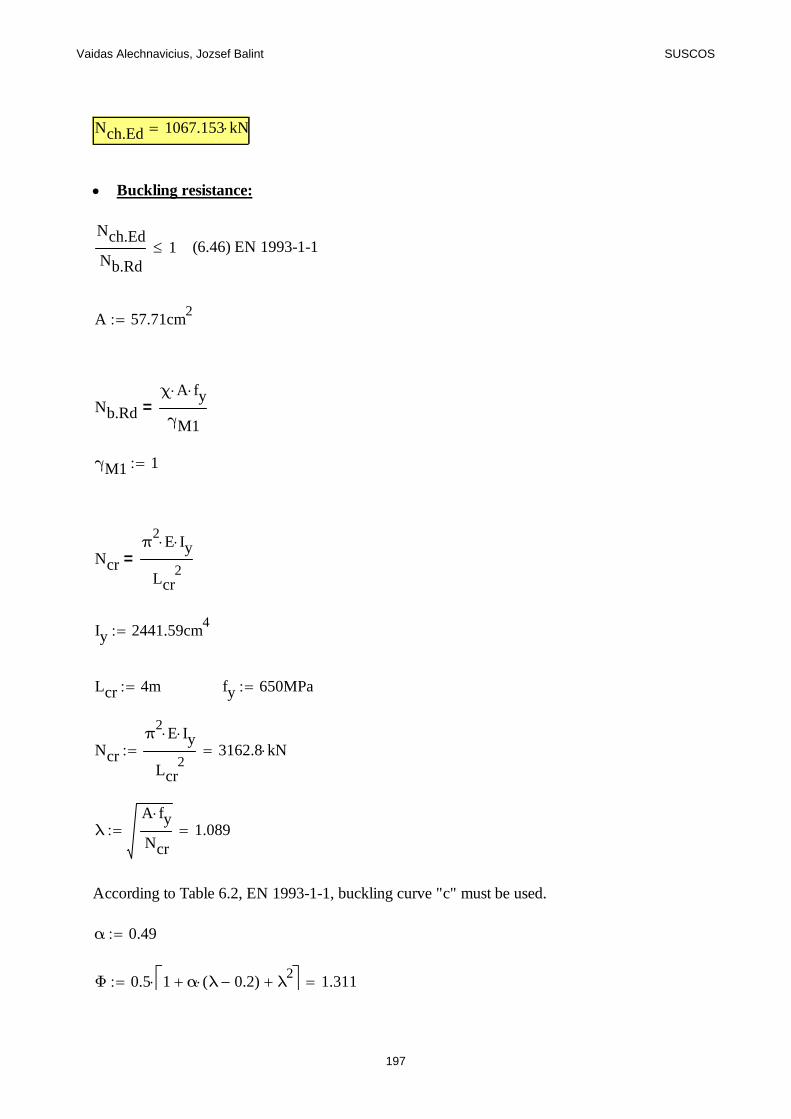
Vaidas Alechnavicius, Jozsef Balint SUSCOS
Nch.Ed 1067.153 kN
Buckling resistance:
Nch.Ed
Nb.Rd1 (6.46) EN 1993-1-1
A 57.71cm2
Nb.Rd
χ A fy
γM1=
γM1 1
Ncr
π2
E Iy
Lcr2
=
Iy 2441.59cm4
Lcr 4m fy 650MPa
Ncr
π2
E Iy
Lcr2
3162.8 kN
λA fy
Ncr1.089
According to Table 6.2, EN 1993-1-1, buckling curve "c" must be used.
α 0.49
Φ 0.5 1 α λ 0.2( ) λ2 1.311
197
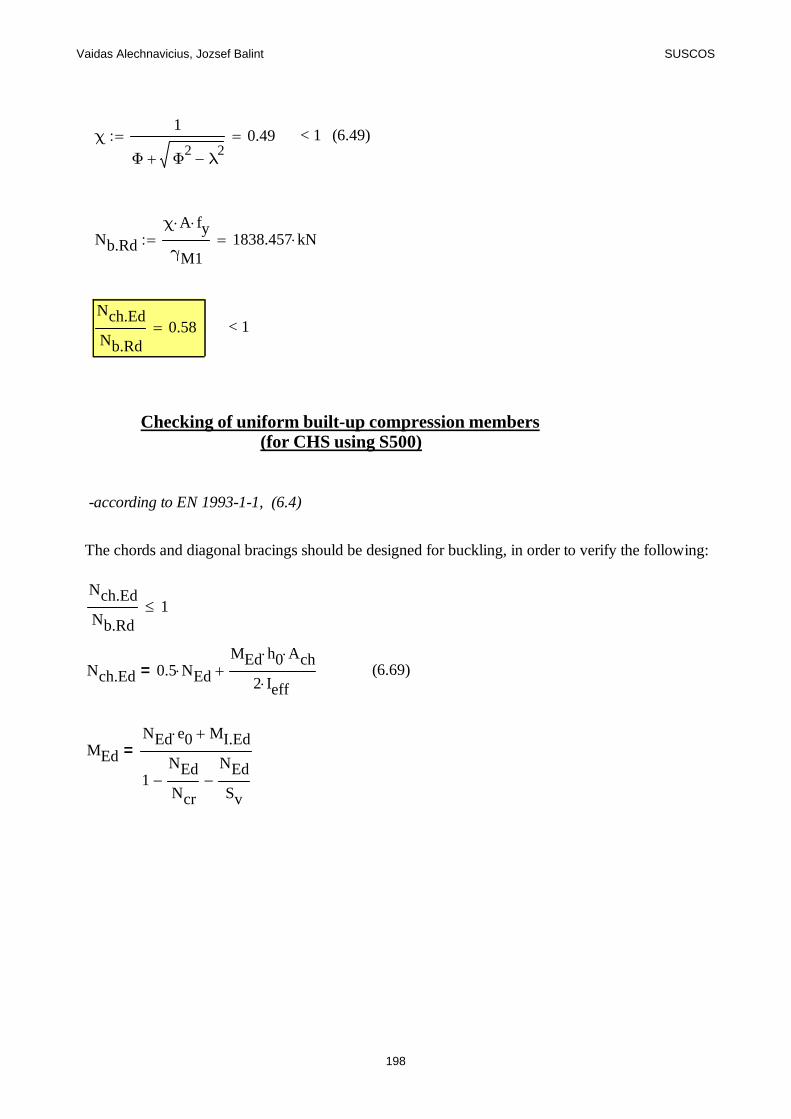
Vaidas Alechnavicius, Jozsef Balint SUSCOS
χ1
Φ Φ2
λ2
0.49 < 1 (6.49)
Nb.Rd
χ A fy
γM11838.457 kN
Nch.Ed
Nb.Rd0.58 < 1
Checking of uniform built-up compression members (for CHS using S500)
-according to EN 1993-1-1, (6.4)
The chords and diagonal bracings should be designed for buckling, in order to verify the following:
Nch.Ed
Nb.Rd1
Nch.Ed 0.5 NEdMEd h0 Ach
2 Ieff= (6.69)
MEd
NEd e0 MI.Ed
1NEd
Ncr
NEd
Sv
=
198
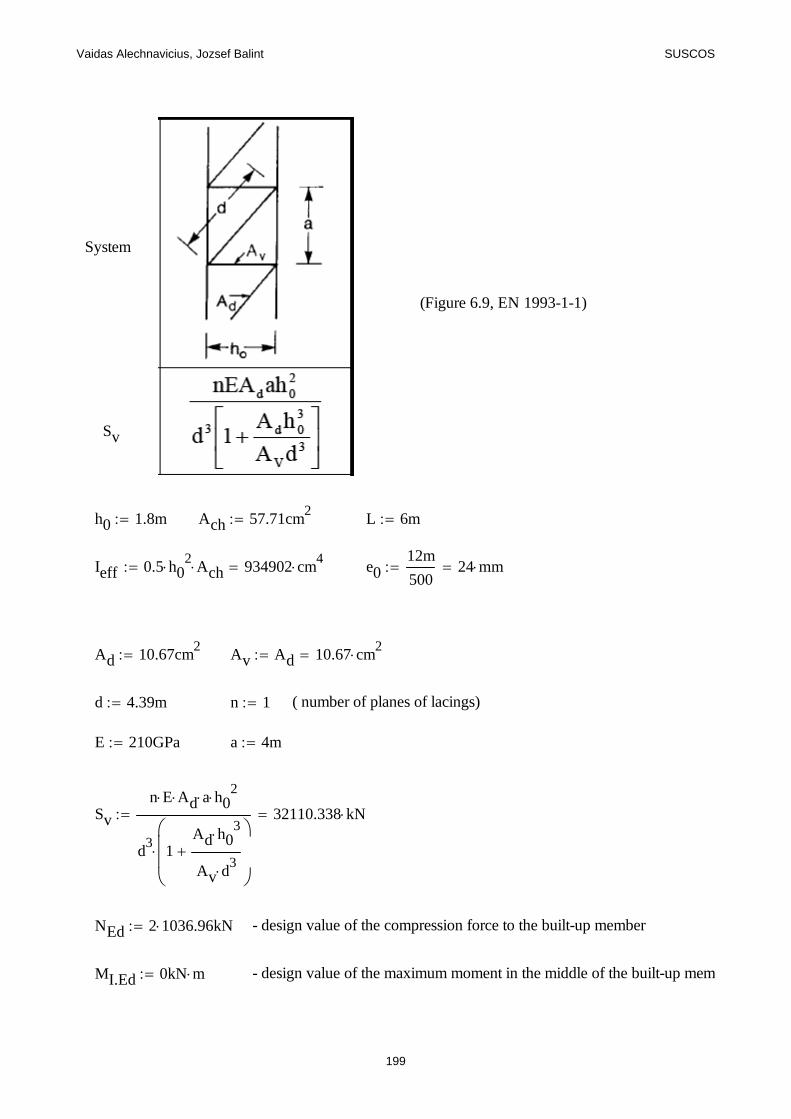
Vaidas Alechnavicius, Jozsef Balint SUSCOS
System
(Figure 6.9, EN 1993-1-1)
Sv
h0 1.8m Ach 57.71cm2 L 6m
Ieff 0.5 h02 Ach 934902 cm
4 e012m
50024 mm
Ad 10.67cm2 Av Ad 10.67 cm
2
d 4.39m n 1 ( number of planes of lacings)
E 210GPa a 4m
Sv
n E Ad a h02
d3
1Ad h0
3
Av d3
32110.338 kN
NEd 2 1036.96 kN - design value of the compression force to the built-up member
MI.Ed 0kN m - design value of the maximum moment in the middle of the built-up memb
199
Vaidas Alechnavicius, Jozsef Balint SUSCOS
We will determine an in span axial distributed load, according to ...Pilkey....Table 11-7.
qx 345.48kN
m - distributed load needed to obtain the resulted axial force diagram from Robot
px L ηE Ieff
L2
=
η 5.38 2.47 7.85 (free - fixed condition)
Ncr px L=
Ncr ηE Ieff
L2
428107.208 kN
MEd
NEd e0 MI.Ed
1NEd
Ncr
NEd
Sv
53.488 kN m
Nch.Ed 0.5 NEdMEd h0 Ach
2 Ieff
Nch.Ed 1066.675 kN
Buckling resistance:
Nch.Ed
Nb.Rd1 (6.46) EN 1993-1-1
A 57.71cm2
Nb.Rd
χ A fy
γM1=
200
Vaidas Alechnavicius, Jozsef Balint SUSCOS
γM1 1
Ncr
π2
E Iy
Lcr2
=
Iy 2441.59cm4
Lcr 4m fy 500MPa
Ncr
π2
E Iy
Lcr2
3162.8 kN
λA fy
Ncr0.955
According to Table 6.2, EN 1993-1-1, buckling curve "c" must be used.
α 0.49
Φ 0.5 1 α λ 0.2( ) λ2 1.141
χ1
Φ Φ2
λ2
0.566 < 1 (6.49)
Nb.Rd
χ A fy
γM11634.25 kN
Nch.Ed
Nb.Rd0.653 < 1
201
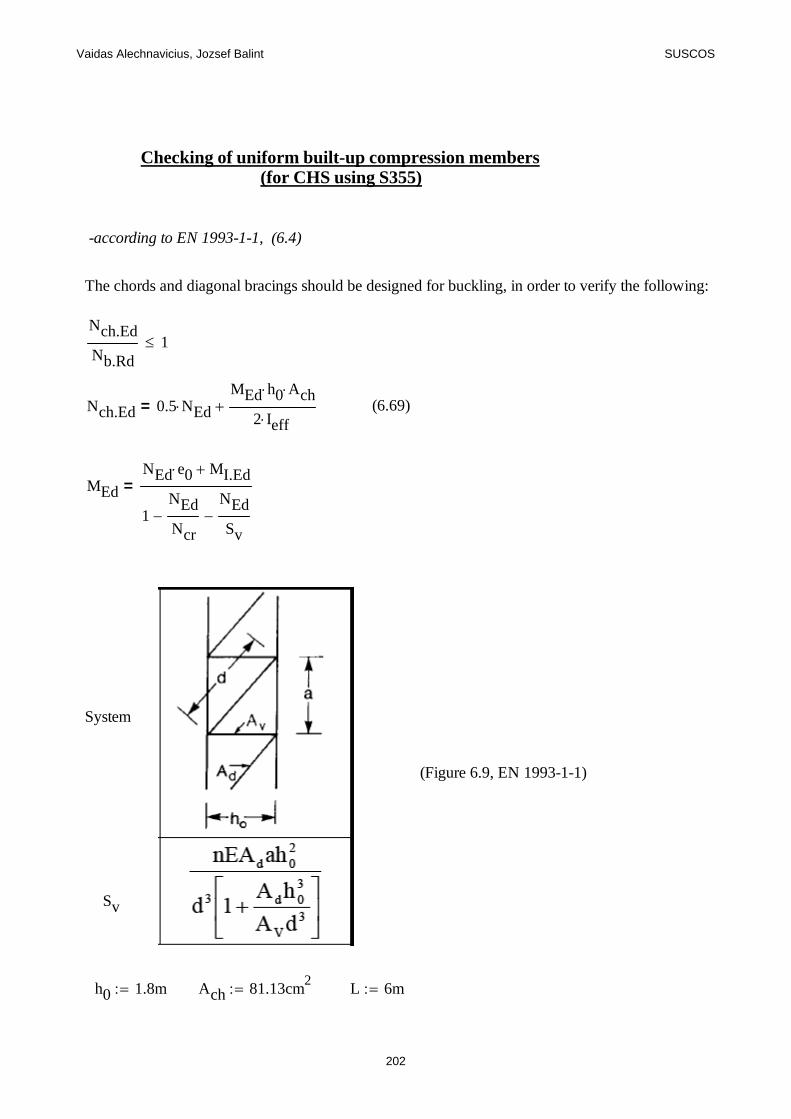
Vaidas Alechnavicius, Jozsef Balint SUSCOS
Checking of uniform built-up compression members (for CHS using S355)
-according to EN 1993-1-1, (6.4)
The chords and diagonal bracings should be designed for buckling, in order to verify the following:
Nch.Ed
Nb.Rd1
Nch.Ed 0.5 NEdMEd h0 Ach
2 Ieff= (6.69)
MEd
NEd e0 MI.Ed
1NEd
Ncr
NEd
Sv
=
System
(Figure 6.9, EN 1993-1-1)
Sv
h0 1.8m Ach 81.13cm2 L 6m
202
Vaidas Alechnavicius, Jozsef Balint SUSCOS
Ieff 0.5 h02 Ach 1314306 cm
4 e012m
50024 mm
Ad 10.67cm2 Av Ad 10.67 cm
2
d 4.39m n 1 ( number of planes of lacings)
E 210GPa a 4m
Sv
n E Ad a h02
d3
1Ad h0
3
Av d3
32110.338 kN
NEd 2 1036.96 kN - design value of the compression force to the built-up member
MI.Ed 0kN m - design value of the maximum moment in the middle of the built-up memb
We will determine an in span axial distributed load, according to ...Pilkey....Table 11-7.
qx 345.48kN
m - distributed load needed to obtain the resulted axial force diagram from Robot
px L ηE Ieff
L2
=
η 5.38 2.47 7.85 (free - fixed condition)
Ncr px L=
Ncr ηE Ieff
L2
601842.623 kN
MEd
NEd e0 MI.Ed
1NEd
Ncr
NEd
Sv
53.408 kN m
203
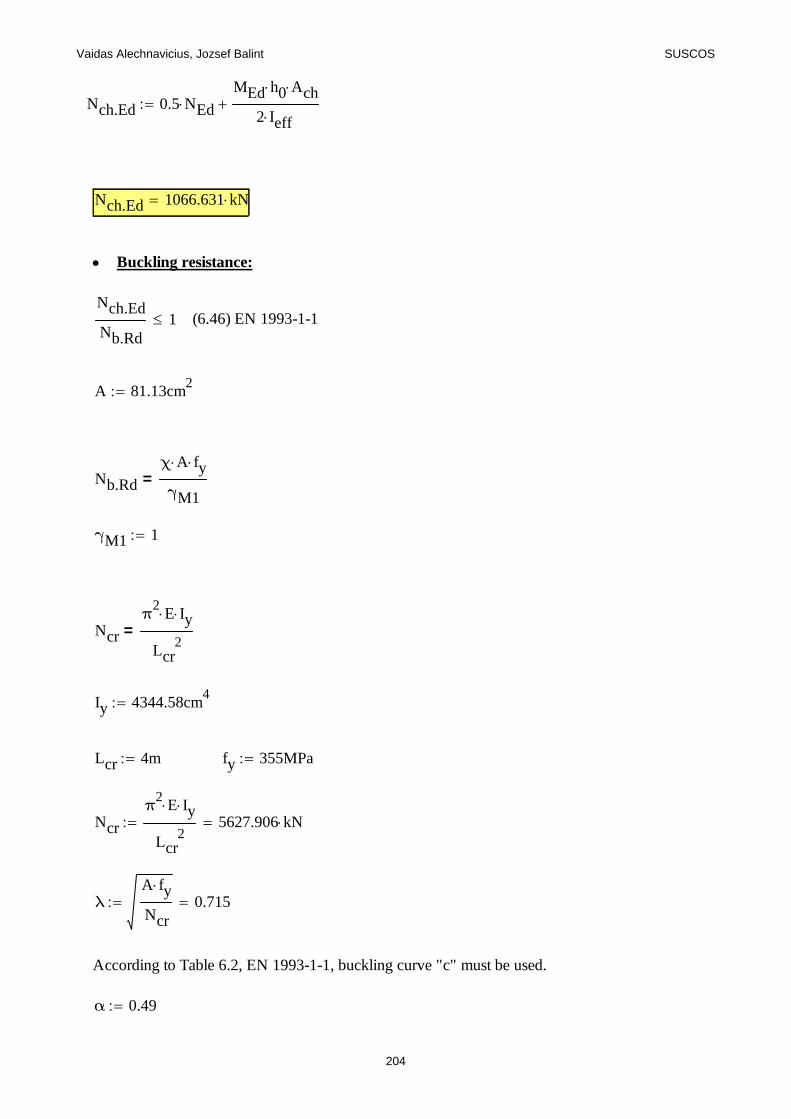
Vaidas Alechnavicius, Jozsef Balint SUSCOS
Nch.Ed 0.5 NEdMEd h0 Ach
2 Ieff
Nch.Ed 1066.631 kN
Buckling resistance:
Nch.Ed
Nb.Rd1 (6.46) EN 1993-1-1
A 81.13cm2
Nb.Rd
χ A fy
γM1=
γM1 1
Ncr
π2
E Iy
Lcr2
=
Iy 4344.58cm4
Lcr 4m fy 355MPa
Ncr
π2
E Iy
Lcr2
5627.906 kN
λA fy
Ncr0.715
According to Table 6.2, EN 1993-1-1, buckling curve "c" must be used.
α 0.49
204
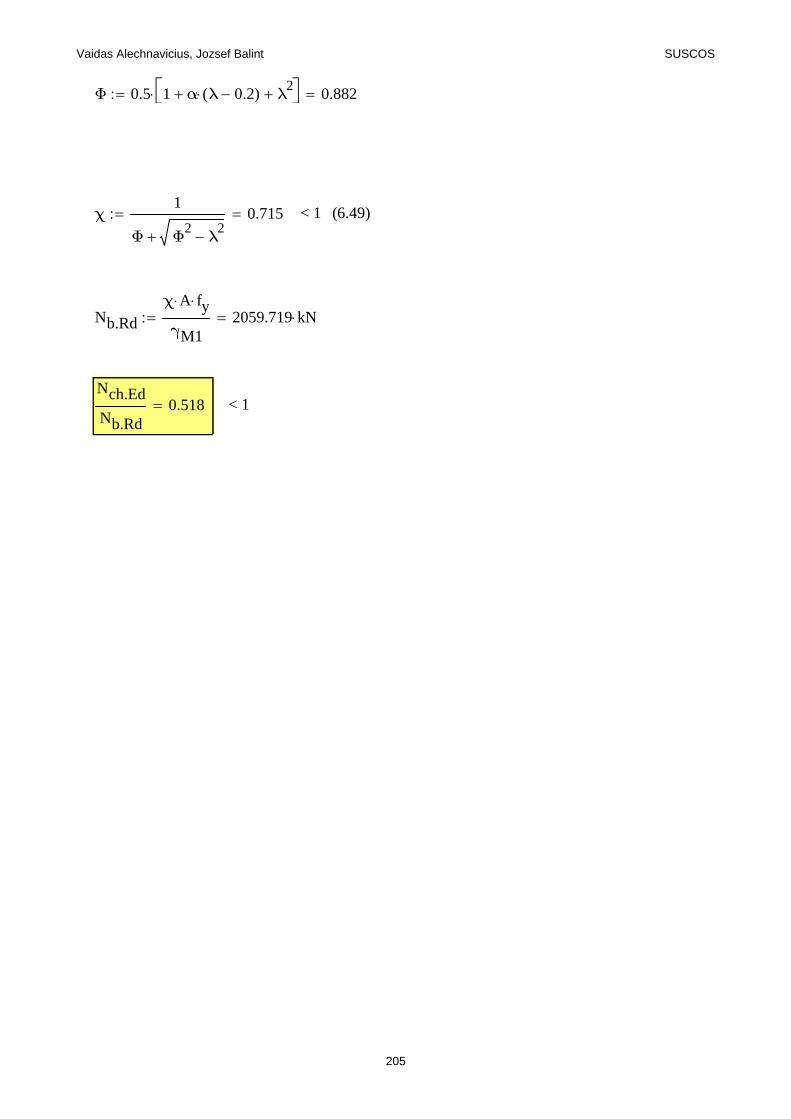
Vaidas Alechnavicius, Jozsef Balint SUSCOS
Φ 0.5 1 α λ 0.2( ) λ2 0.882
χ1
Φ Φ2
λ2
0.715 < 1 (6.49)
Nb.Rd
χ A fy
γM12059.719 kN
Nch.Ed
Nb.Rd0.518 < 1
205
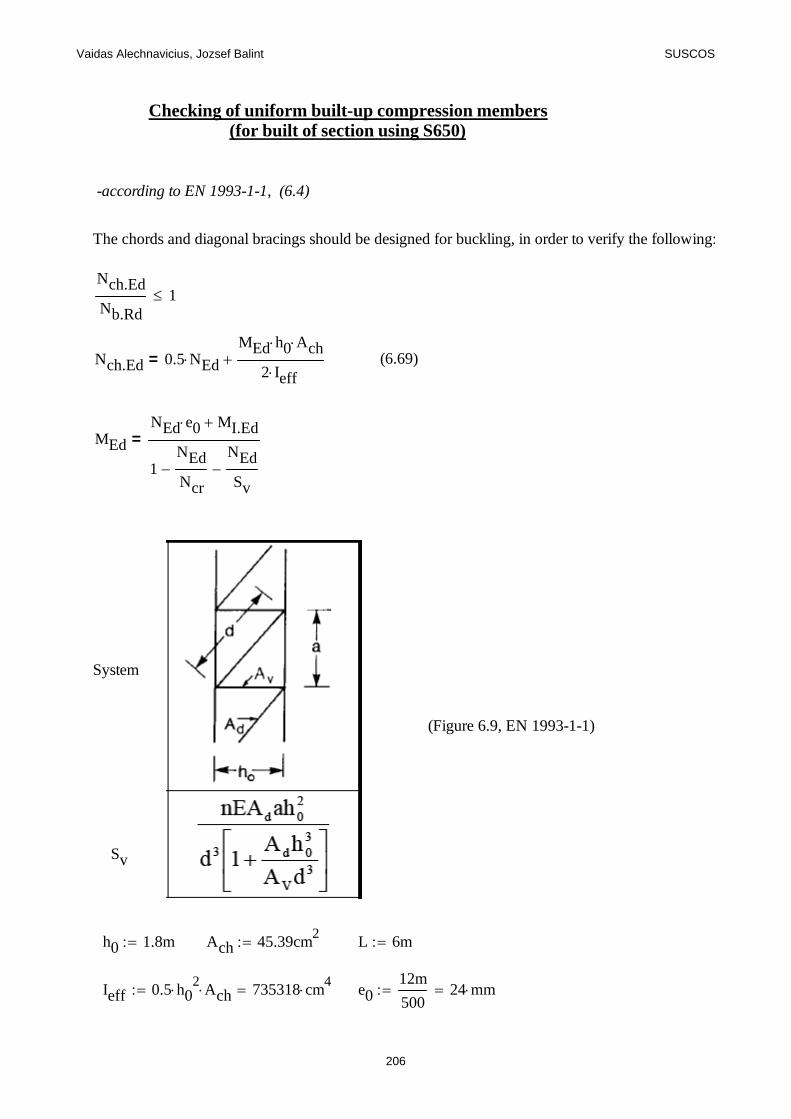
Vaidas Alechnavicius, Jozsef Balint SUSCOS
Checking of uniform built-up compression members (for built of section using S650)
-according to EN 1993-1-1, (6.4)
The chords and diagonal bracings should be designed for buckling, in order to verify the following:
Nch.Ed
Nb.Rd1
Nch.Ed 0.5 NEdMEd h0 Ach
2 Ieff= (6.69)
MEd
NEd e0 MI.Ed
1NEd
Ncr
NEd
Sv
=
System
(Figure 6.9, EN 1993-1-1)
Sv
h0 1.8m Ach 45.39cm2 L 6m
Ieff 0.5 h02 Ach 735318 cm
4 e012m
50024 mm
206
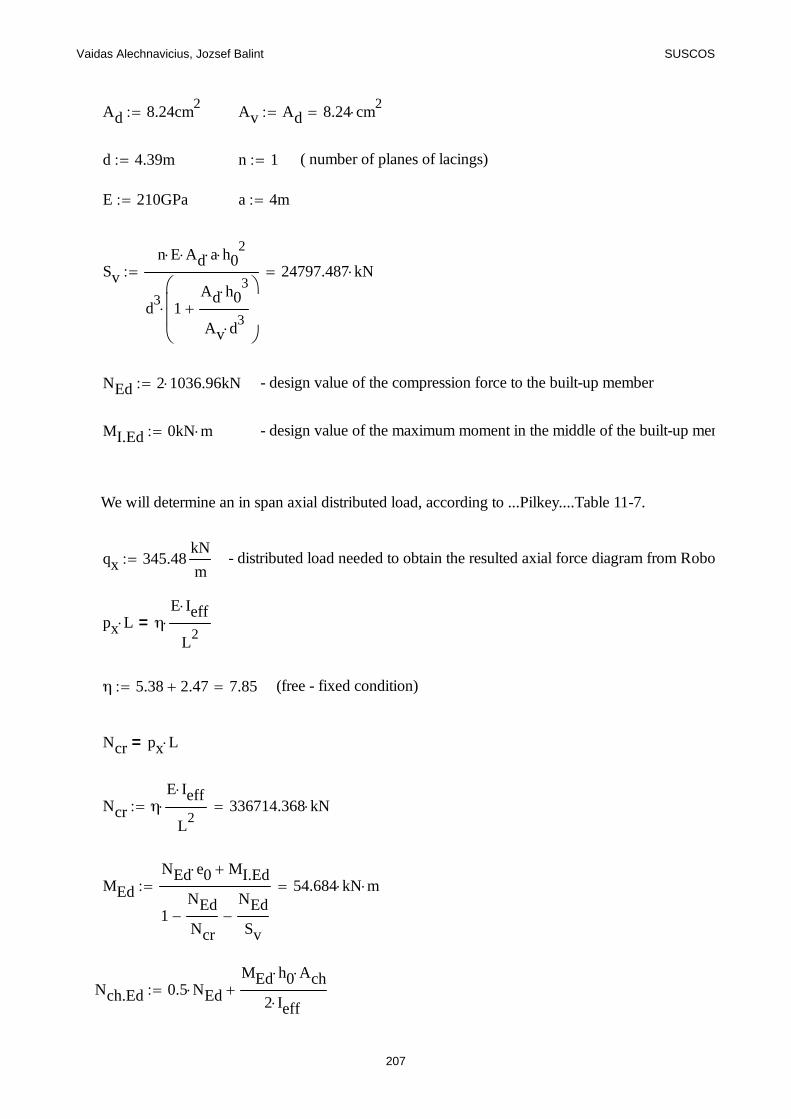
Vaidas Alechnavicius, Jozsef Balint SUSCOS
Ad 8.24cm2 Av Ad 8.24 cm
2
d 4.39m n 1 ( number of planes of lacings)
E 210GPa a 4m
Sv
n E Ad a h02
d3
1Ad h0
3
Av d3
24797.487 kN
NEd 2 1036.96 kN - design value of the compression force to the built-up member
MI.Ed 0kN m - design value of the maximum moment in the middle of the built-up mem
We will determine an in span axial distributed load, according to ...Pilkey....Table 11-7.
qx 345.48kN
m - distributed load needed to obtain the resulted axial force diagram from Robo
px L ηE Ieff
L2
=
η 5.38 2.47 7.85 (free - fixed condition)
Ncr px L=
Ncr ηE Ieff
L2
336714.368 kN
MEd
NEd e0 MI.Ed
1NEd
Ncr
NEd
Sv
54.684 kN m
Nch.Ed 0.5 NEdMEd h0 Ach
2 Ieff
207
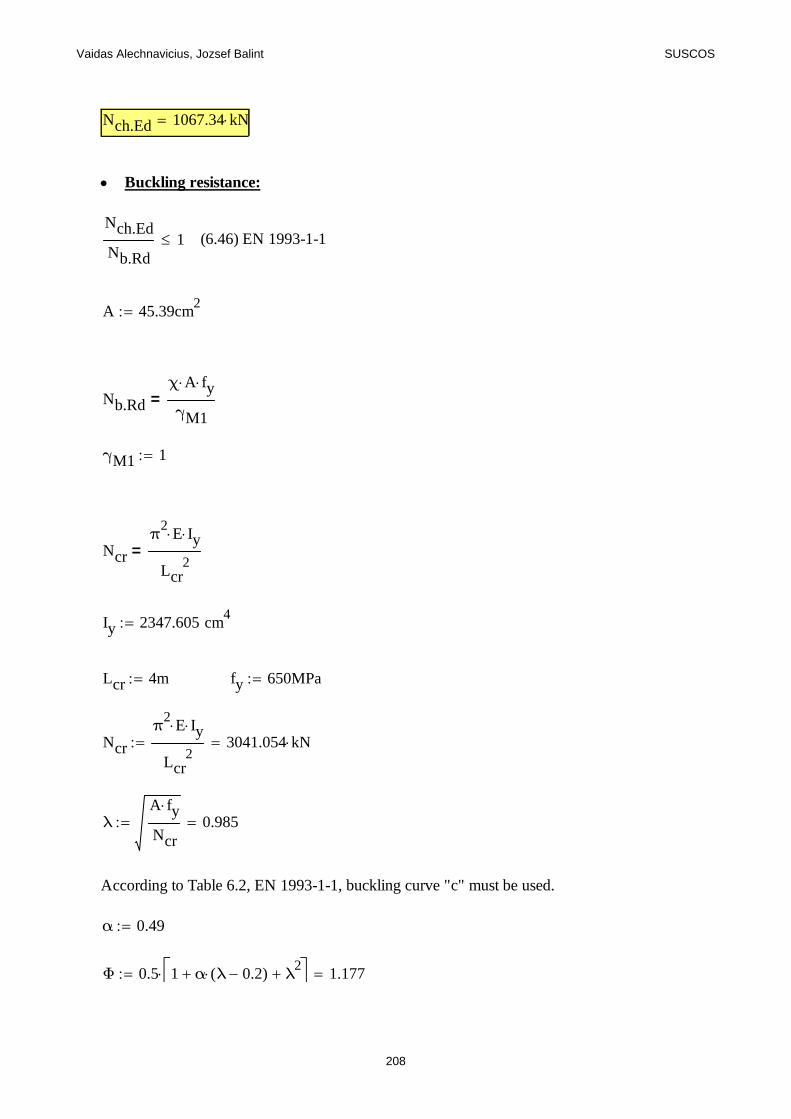
Vaidas Alechnavicius, Jozsef Balint SUSCOS
Nch.Ed 1067.34 kN
Buckling resistance:
Nch.Ed
Nb.Rd1 (6.46) EN 1993-1-1
A 45.39cm2
Nb.Rd
χ A fy
γM1=
γM1 1
Ncr
π2
E Iy
Lcr2
=
Iy 2347.605 cm4
Lcr 4m fy 650MPa
Ncr
π2
E Iy
Lcr2
3041.054 kN
λA fy
Ncr0.985
According to Table 6.2, EN 1993-1-1, buckling curve "c" must be used.
α 0.49
Φ 0.5 1 α λ 0.2( ) λ2 1.177
208
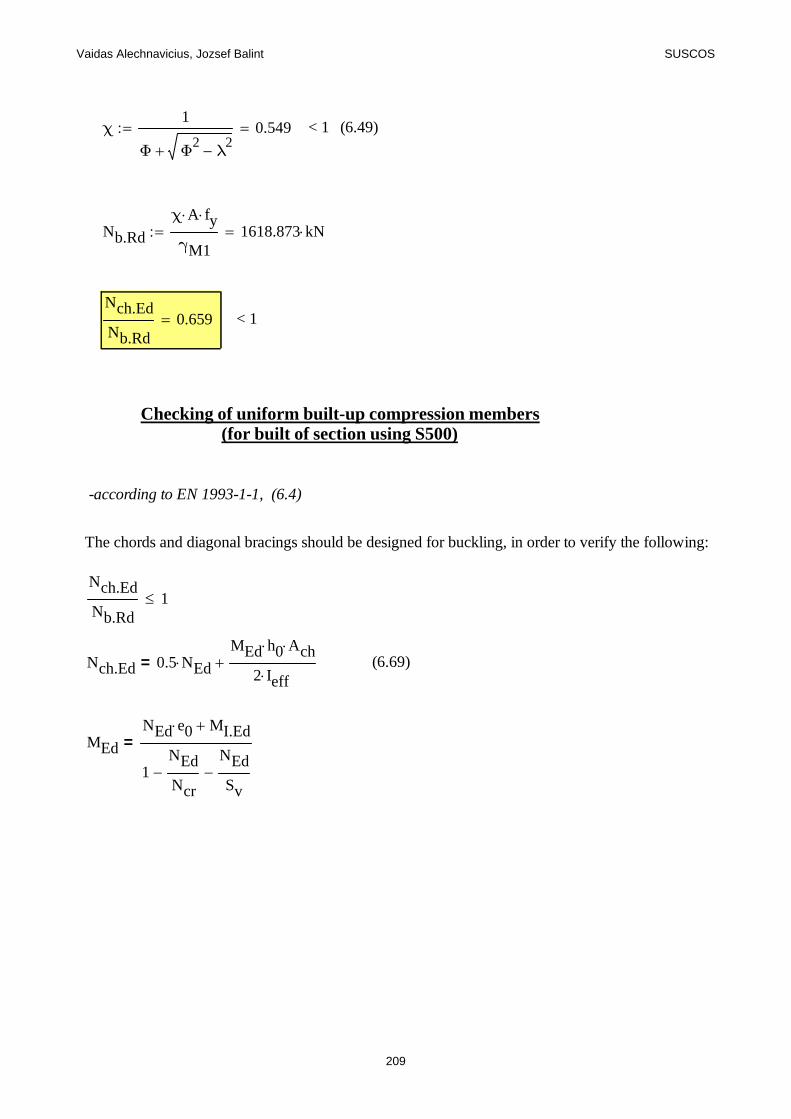
Vaidas Alechnavicius, Jozsef Balint SUSCOS
χ1
Φ Φ2
λ2
0.549 < 1 (6.49)
Nb.Rd
χ A fy
γM11618.873 kN
Nch.Ed
Nb.Rd0.659 < 1
Checking of uniform built-up compression members (for built of section using S500)
-according to EN 1993-1-1, (6.4)
The chords and diagonal bracings should be designed for buckling, in order to verify the following:
Nch.Ed
Nb.Rd1
Nch.Ed 0.5 NEdMEd h0 Ach
2 Ieff= (6.69)
MEd
NEd e0 MI.Ed
1NEd
Ncr
NEd
Sv
=
209
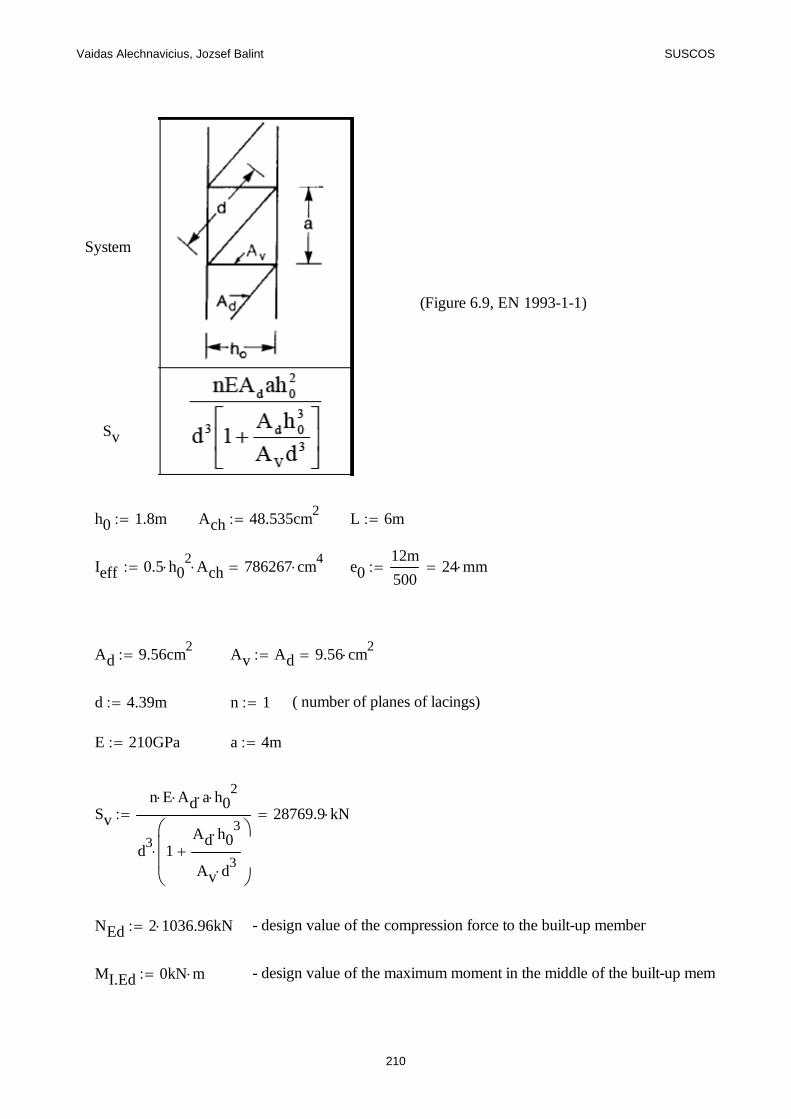
Vaidas Alechnavicius, Jozsef Balint SUSCOS
System
(Figure 6.9, EN 1993-1-1)
Sv
h0 1.8m Ach 48.535cm2 L 6m
Ieff 0.5 h02 Ach 786267 cm
4 e012m
50024 mm
Ad 9.56cm2 Av Ad 9.56 cm
2
d 4.39m n 1 ( number of planes of lacings)
E 210GPa a 4m
Sv
n E Ad a h02
d3
1Ad h0
3
Av d3
28769.9 kN
NEd 2 1036.96 kN - design value of the compression force to the built-up member
MI.Ed 0kN m - design value of the maximum moment in the middle of the built-up memb
210
Vaidas Alechnavicius, Jozsef Balint SUSCOS
We will determine an in span axial distributed load, according to ...Pilkey....Table 11-7.
qx 345.48kN
m - distributed load needed to obtain the resulted axial force diagram from Robot
px L ηE Ieff
L2
=
η 5.38 2.47 7.85 (free - fixed condition)
Ncr px L=
Ncr ηE Ieff
L2
360044.764 kN
MEd
NEd e0 MI.Ed
1NEd
Ncr
NEd
Sv
53.976 kN m
Nch.Ed 0.5 NEdMEd h0 Ach
2 Ieff
Nch.Ed 1066.947 kN
Buckling resistance:
Nch.Ed
Nb.Rd1 (6.46) EN 1993-1-1
A 48.535cm2
Nb.Rd
χ A fy
γM1=
γM1 1
211
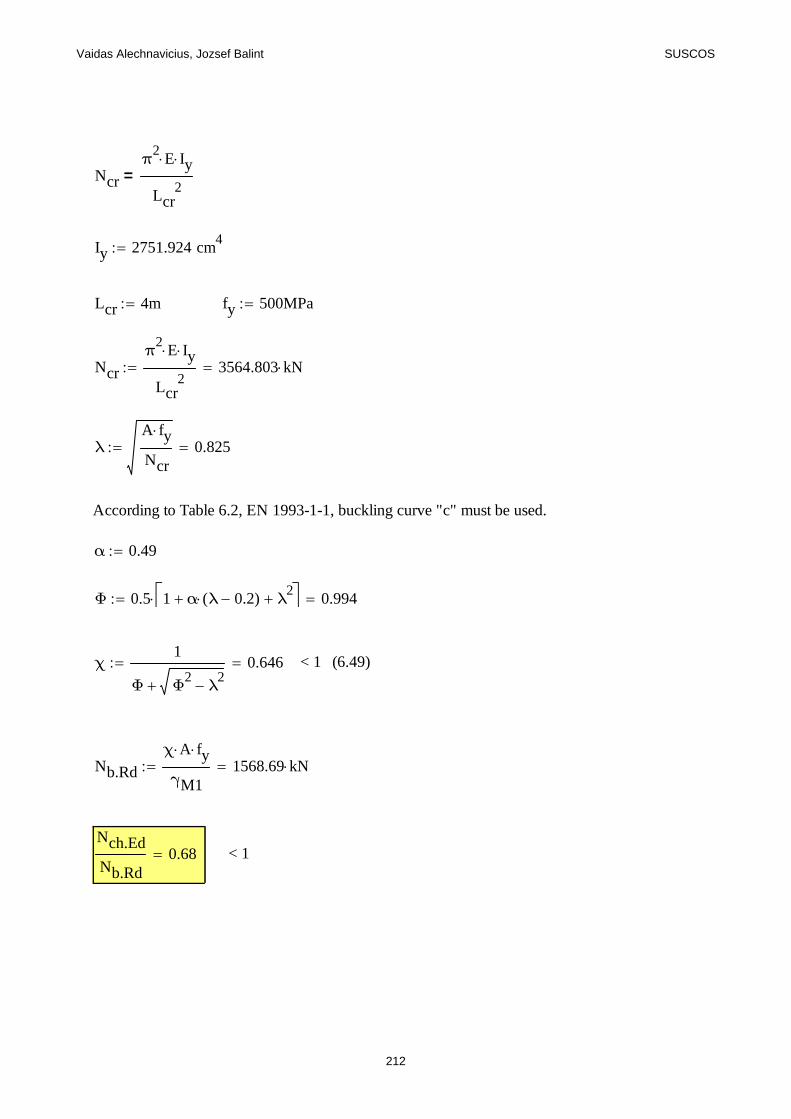
Vaidas Alechnavicius, Jozsef Balint SUSCOS
Ncr
π2
E Iy
Lcr2
=
Iy 2751.924 cm4
Lcr 4m fy 500MPa
Ncr
π2
E Iy
Lcr2
3564.803 kN
λA fy
Ncr0.825
According to Table 6.2, EN 1993-1-1, buckling curve "c" must be used.
α 0.49
Φ 0.5 1 α λ 0.2( ) λ2 0.994
χ1
Φ Φ2
λ2
0.646 < 1 (6.49)
Nb.Rd
χ A fy
γM11568.69 kN
Nch.Ed
Nb.Rd0.68 < 1
212
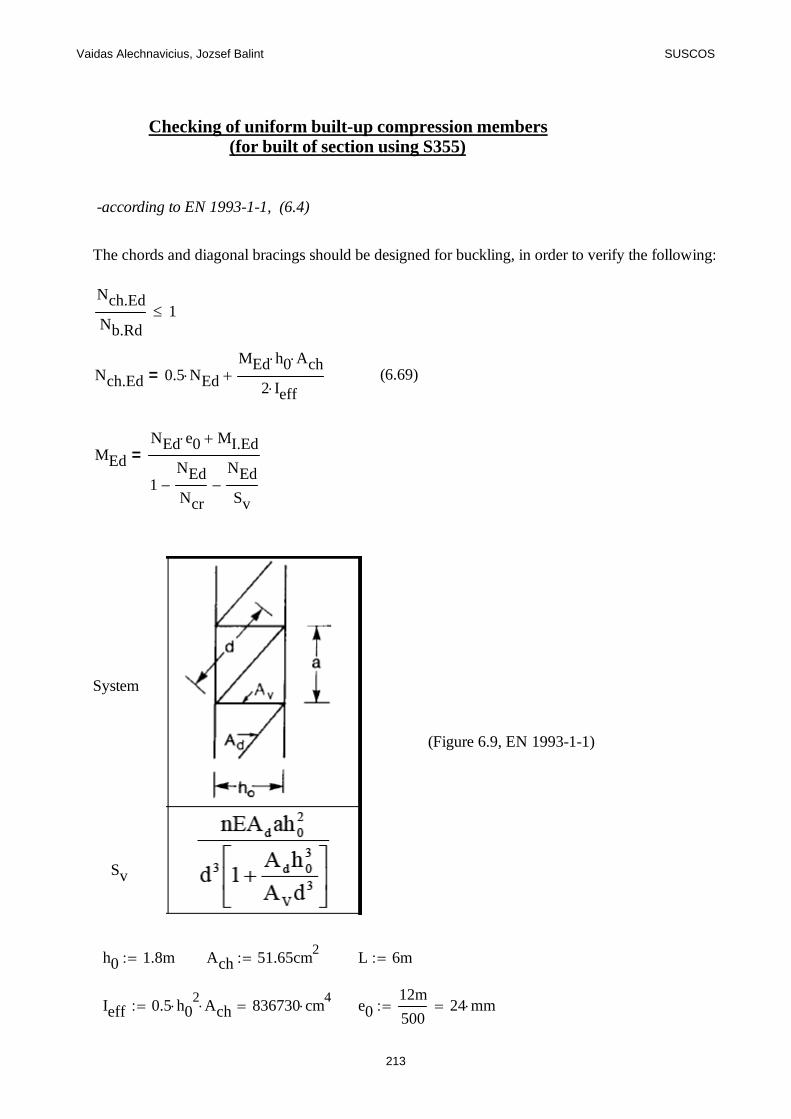
Vaidas Alechnavicius, Jozsef Balint SUSCOS
Checking of uniform built-up compression members (for built of section using S355)
-according to EN 1993-1-1, (6.4)
The chords and diagonal bracings should be designed for buckling, in order to verify the following:
Nch.Ed
Nb.Rd1
Nch.Ed 0.5 NEdMEd h0 Ach
2 Ieff= (6.69)
MEd
NEd e0 MI.Ed
1NEd
Ncr
NEd
Sv
=
System
(Figure 6.9, EN 1993-1-1)
Sv
h0 1.8m Ach 51.65cm2 L 6m
Ieff 0.5 h02 Ach 836730 cm
4 e012m
50024 mm
213
Vaidas Alechnavicius, Jozsef Balint SUSCOS
Ad 10.43cm2 Av Ad 10.43 cm
2
d 4.39m n 1 ( number of planes of lacings)
E 210GPa a 4m
Sv
n E Ad a h02
d3
1Ad h0
3
Av d3
31388.081 kN
NEd 2 1036.96 kN - design value of the compression force to the built-up member
MI.Ed 0kN m - design value of the maximum moment in the middle of the built-up mem
We will determine an in span axial distributed load, according to ...Pilkey....Table 11-7.
qx 345.48kN
m - distributed load needed to obtain the resulted axial force diagram from Robo
px L ηE Ieff
L2
=
η 5.38 2.47 7.85 (free - fixed condition)
Ncr px L=
Ncr ηE Ieff
L2
383152.613 kN
MEd
NEd e0 MI.Ed
1NEd
Ncr
NEd
Sv
53.606 kN m
Nch.Ed 0.5 NEdMEd h0 Ach
2 Ieff
214
Vaidas Alechnavicius, Jozsef Balint SUSCOS
Nch.Ed 1066.741 kN
Buckling resistance:
Nch.Ed
Nb.Rd1 (6.46) EN 1993-1-1
A 51.65cm2
Nb.Rd
χ A fy
γM1=
γM1 1
Ncr
π2
E Iy
Lcr2
=
Iy 3472.119 cm4
Lcr 4m fy 650MPa
Ncr
π2
E Iy
Lcr2
4497.733 kN
λA fy
Ncr0.864
According to Table 6.2, EN 1993-1-1, buckling curve "c" must be used.
α 0.49
Φ 0.5 1 α λ 0.2( ) λ2 1.036
215
Vaidas Alechnavicius, Jozsef Balint SUSCOS
χ1
Φ Φ2
λ2
0.622 < 1 (6.49)
Nb.Rd
χ A fy
γM12088.619 kN
Nch.Ed
Nb.Rd0.511 < 1
216
Vaidas Alechnavicius, Jozsef Balint SUSCOS
ANNEX D
Determination of the total cost of S650 circular truss
Total cost is determined by:
CT CSM CB Cs CP Ct CE=
where:
CT -total cost
CSM - material cost
CB - blasting cost
Cs - sawing cost
CP - painting cost
Ct - tranporting cost
CE - erecting cost
All prices are expressed in euro.
Material cost
The material cost will be calculated according to Haapio (2012) with the following formula:
CSM Wsmpl Csmbp Csmg Csmt Csmq =
Wsmpl -weight of the plate [kg]
Csmbp - is basic cost
Csmg - is steel grade add-on
Csmt -is thickness add-on
Csmq - is quantity add-on
217
Vaidas Alechnavicius, Jozsef Balint SUSCOS
Top chords
Wsmpl 1087.2kg
Csmbp1.88
kg €
Csmg110
tonne €
Csmt12
tonne €
Csmq64
tonne €
CSM.tc Wsmpl Csmbp Csmg Csmt Csmq 2246.155 €
Diagonals
Wsmpl 492.608kg
Csmbp1.88
kg €
Csmg110
tonne €
Csmt82
tonne €
Csmq64
tonne €
CSM.db Wsmpl Csmbp Csmg Csmt Csmq 1052.211 €
Top braces
Wsmpl 172.83kg
Csmbp1.88
kg €
Csmg110
tonne €
Csmt140
tonne €
218
Vaidas Alechnavicius, Jozsef Balint SUSCOS
Csmq64
tonne €
CSM.tb Wsmpl Csmbp Csmg Csmt Csmq 379.189 €
Bottom chord
Wsmpl 448.92kg
Csmbp1.88
kg €
Csmg110
tonne €
Csmt23
tonne €
Csmq64
tonne €
CSM.bc Wsmpl Csmbp Csmg Csmt Csmq 932.407 €
Total material cost:
CSM CSM.tc CSM.db CSM.tb CSM.bc 4609.962 €
Blasting cost
The blasting cost depends on the length of the beam.
CBL
υc0.46 0.13 0.01 0.16 0.24 0.02 0.07( )= €/min
L 81.22m -total length of chords and braces
υc 3000mm
min - conveyor speed (Gietart)
CBL
υc0.46 0.13 0.01 0.16 0.24 0.02 0.07( )
1
min 29.51 €
Sawing cost
Cs 1.2013 TNS TPS TPS ccs cens =
TNS - non-productive time
219
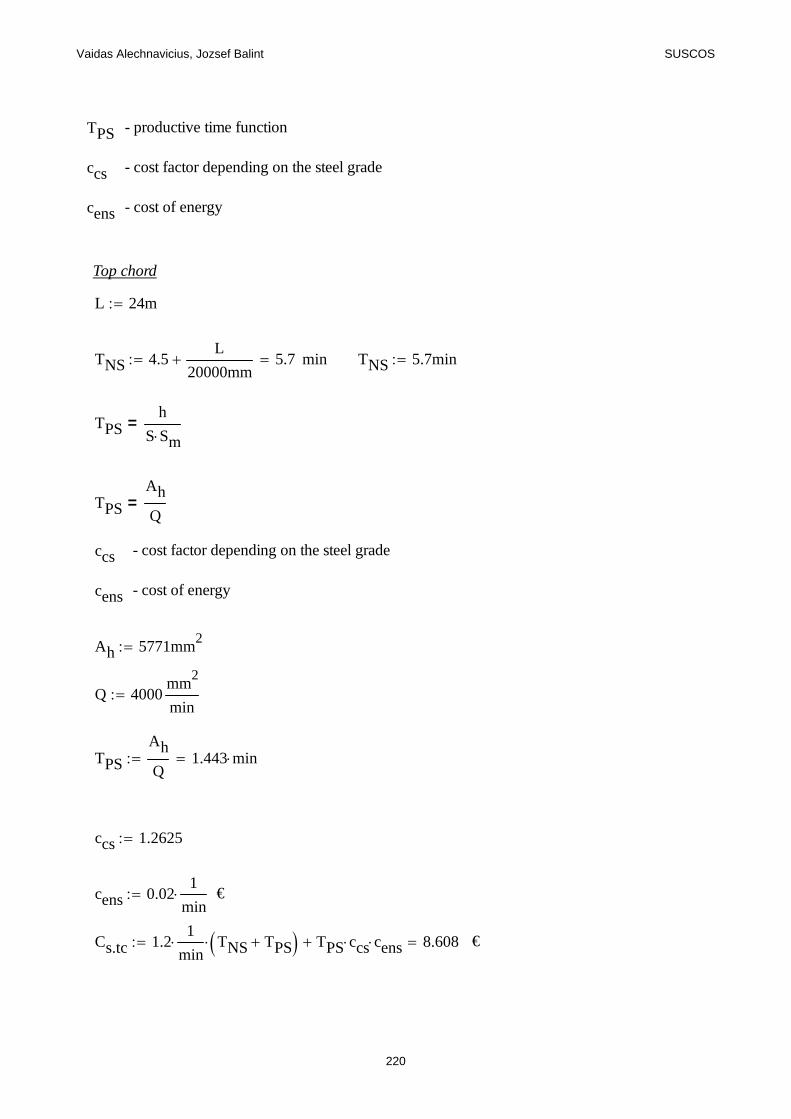
Vaidas Alechnavicius, Jozsef Balint SUSCOS
TPS - productive time function
ccs - cost factor depending on the steel grade
cens - cost of energy
Top chord
L 24m
TNS 4.5L
20000mm 5.7 min TNS 5.7min
TPSh
S Sm=
TPS
Ah
Q=
ccs - cost factor depending on the steel grade
cens - cost of energy
Ah 5771mm2
Q 4000mm
2
min
TPS
Ah
Q1.443 min
ccs 1.2625
cens 0.021
min €
Cs.tc 1.21
min TNS TPS TPS ccs cens 8.608 €
220
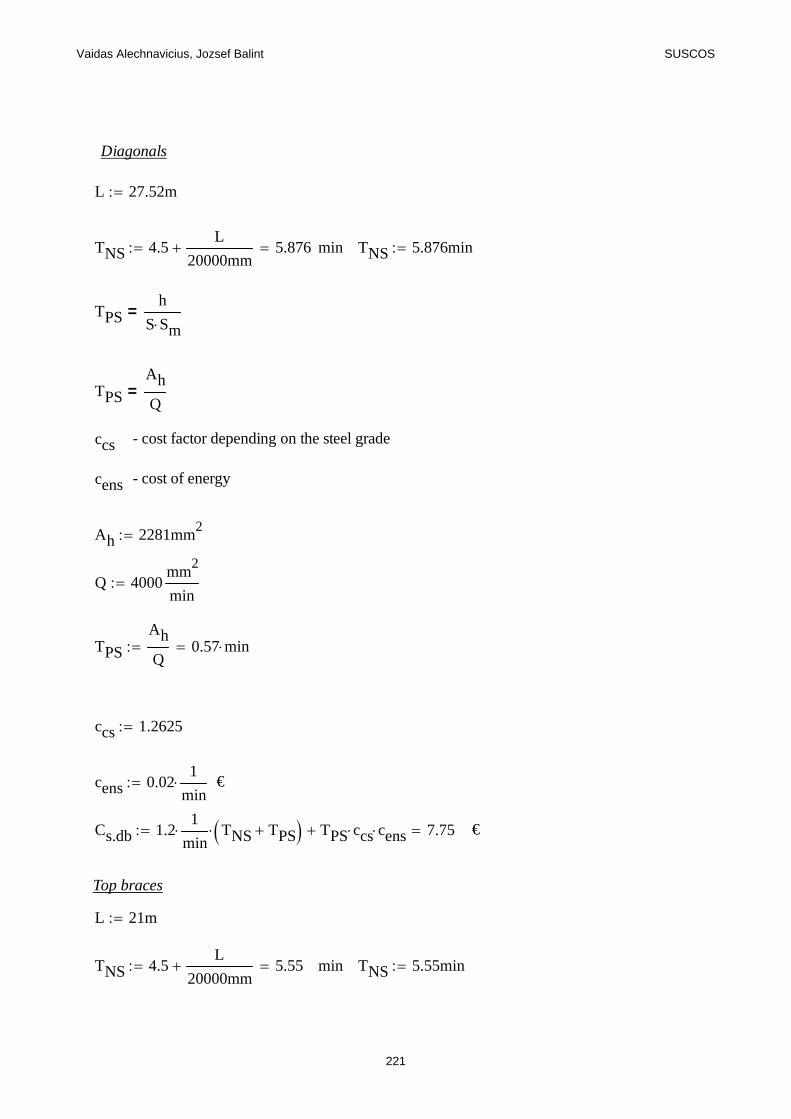
Vaidas Alechnavicius, Jozsef Balint SUSCOS
Diagonals
L 27.52m
TNS 4.5L
20000mm 5.876 min TNS 5.876min
TPSh
S Sm=
TPS
Ah
Q=
ccs - cost factor depending on the steel grade
cens - cost of energy
Ah 2281mm2
Q 4000mm
2
min
TPS
Ah
Q0.57 min
ccs 1.2625
cens 0.021
min €
Cs.db 1.21
min TNS TPS TPS ccs cens 7.75 €
Top braces
L 21m
TNS 4.5L
20000mm 5.55 min TNS 5.55min
221
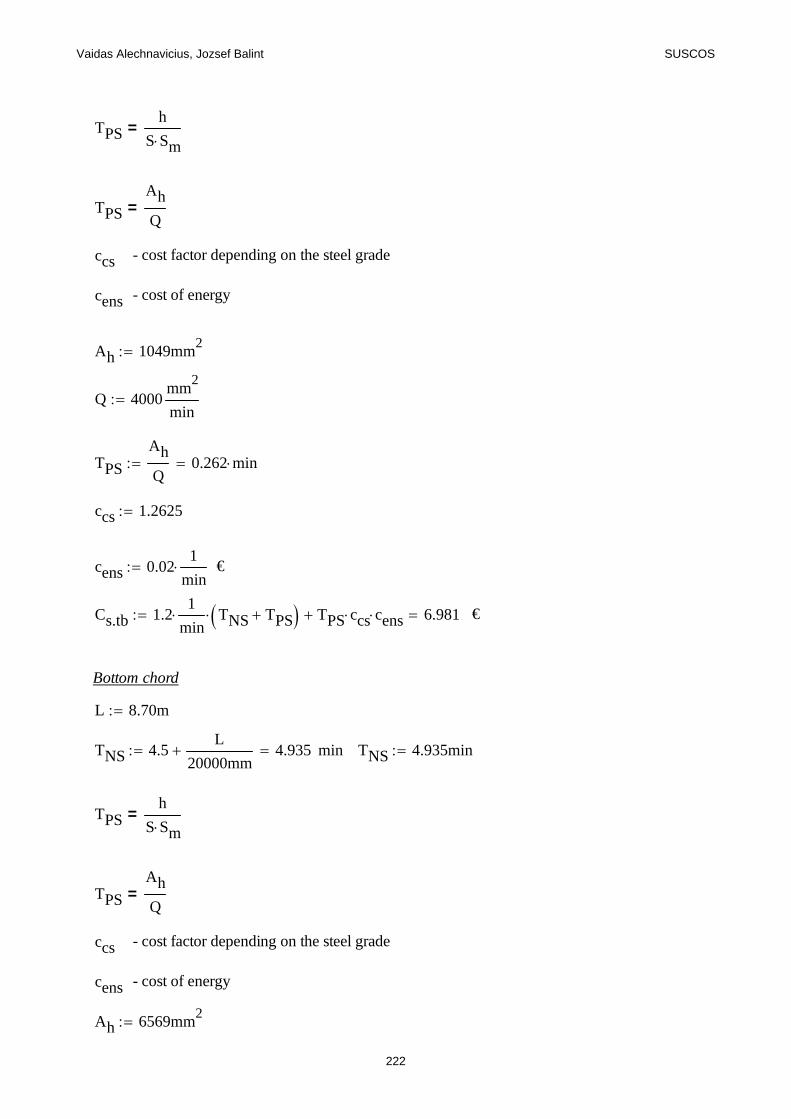
Vaidas Alechnavicius, Jozsef Balint SUSCOS
TPSh
S Sm=
TPS
Ah
Q=
ccs - cost factor depending on the steel grade
cens - cost of energy
Ah 1049mm2
Q 4000mm
2
min
TPS
Ah
Q0.262 min
ccs 1.2625
cens 0.021
min €
Cs.tb 1.21
min TNS TPS TPS ccs cens 6.981 €
Bottom chord
L 8.70m
TNS 4.5L
20000mm 4.935 min TNS 4.935min
TPSh
S Sm=
TPS
Ah
Q=
ccs - cost factor depending on the steel grade
cens - cost of energy
Ah 6569mm2
222
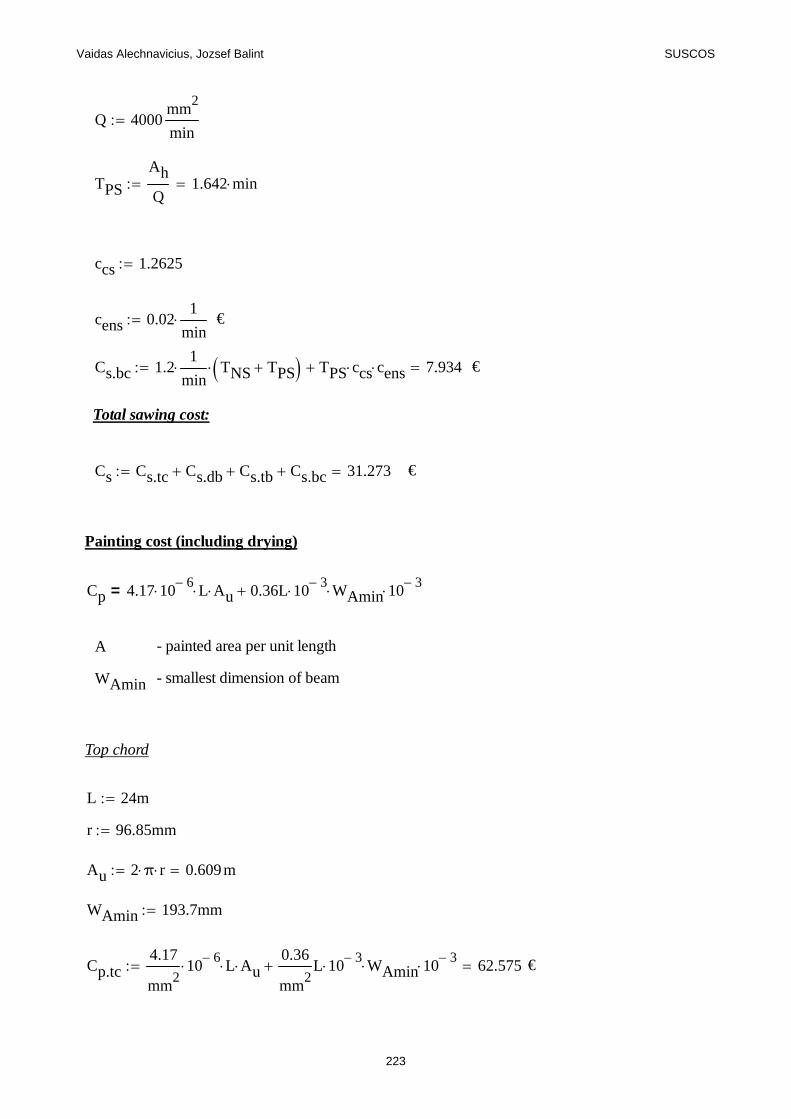
Vaidas Alechnavicius, Jozsef Balint SUSCOS
Q 4000mm
2
min
TPS
Ah
Q1.642 min
ccs 1.2625
cens 0.021
min €
Cs.bc 1.21
min TNS TPS TPS ccs cens 7.934 €
Total sawing cost:
Cs Cs.tc Cs.db Cs.tb Cs.bc 31.273 €
Painting cost (including drying)
Cp 4.17 106 L Au 0.36L 10
3 WAmin 103=
A - painted area per unit length
WAmin - smallest dimension of beam
Top chord
L 24m
r 96.85mm
Au 2 π r 0.609m
WAmin 193.7mm
Cp.tc4.17
mm2
106 L Au
0.36
mm2
L 103 WAmin 10
3 62.575 €
223
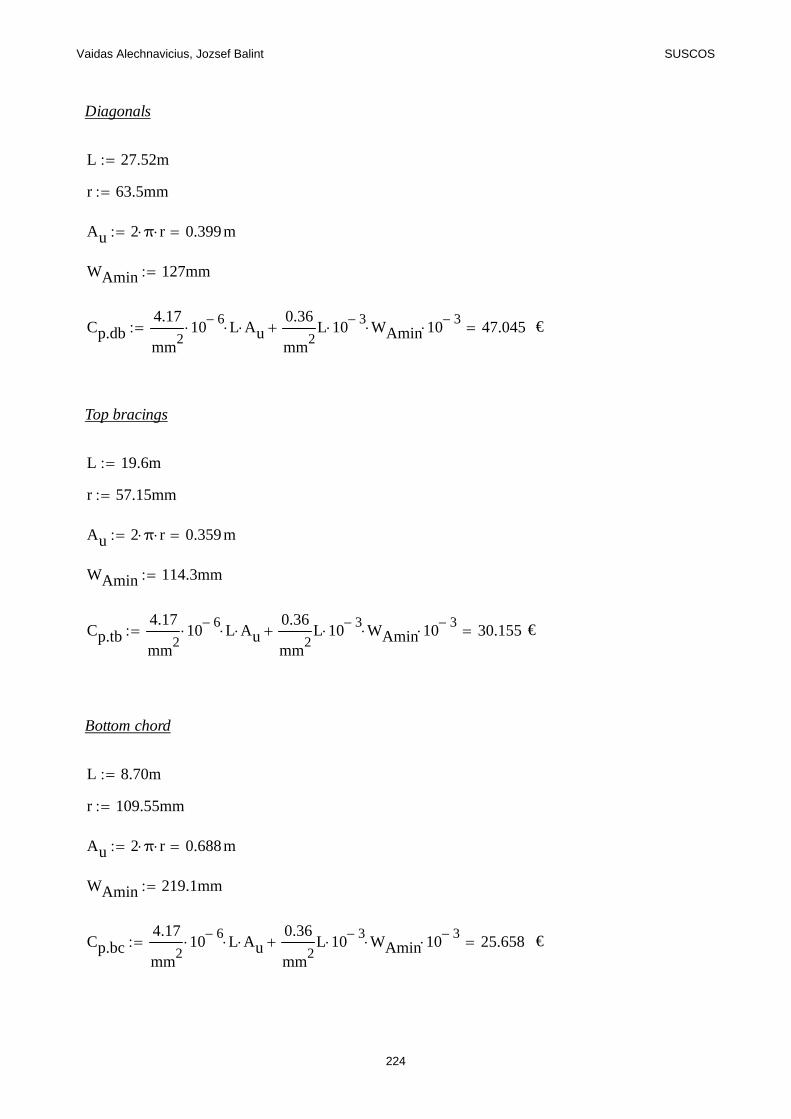
Vaidas Alechnavicius, Jozsef Balint SUSCOS
Diagonals
L 27.52m
r 63.5mm
Au 2 π r 0.399m
WAmin 127mm
Cp.db4.17
mm2
106 L Au
0.36
mm2
L 103 WAmin 10
3 47.045 €
Top bracings
L 19.6m
r 57.15mm
Au 2 π r 0.359m
WAmin 114.3mm
Cp.tb4.17
mm2
106 L Au
0.36
mm2
L 103 WAmin 10
3 30.155 €
Bottom chord
L 8.70m
r 109.55mm
Au 2 π r 0.688m
WAmin 219.1mm
Cp.bc4.17
mm2
106 L Au
0.36
mm2
L 103 WAmin 10
3 25.658 €
224
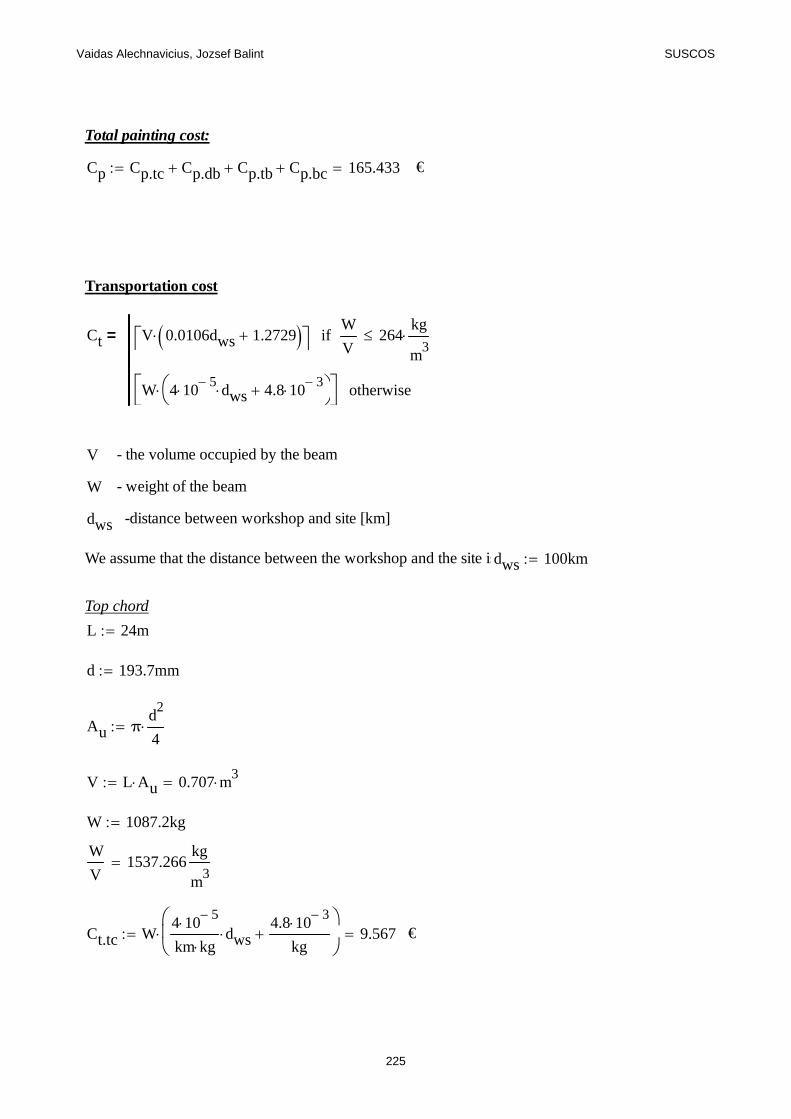
Vaidas Alechnavicius, Jozsef Balint SUSCOS
Total painting cost:
Cp Cp.tc Cp.db Cp.tb Cp.bc 165.433 €
Transportation cost
Ct V 0.0106dws 1.2729 W
V264
kg
m3
if
W 4 105 dws 4.8 10
3
otherwise
=
V - the volume occupied by the beam
W - weight of the beam
dws -distance between workshop and site [km]
We assume that the distance between the workshop and the site isdws 100km
Top chord
L 24m
d 193.7mm
Au π
d2
4
V L Au 0.707 m3
W 1087.2kg
W
V1537.266
kg
m3
Ct.tc W4 10
5km kg
dws4.8 10
3kg
9.567 €
225
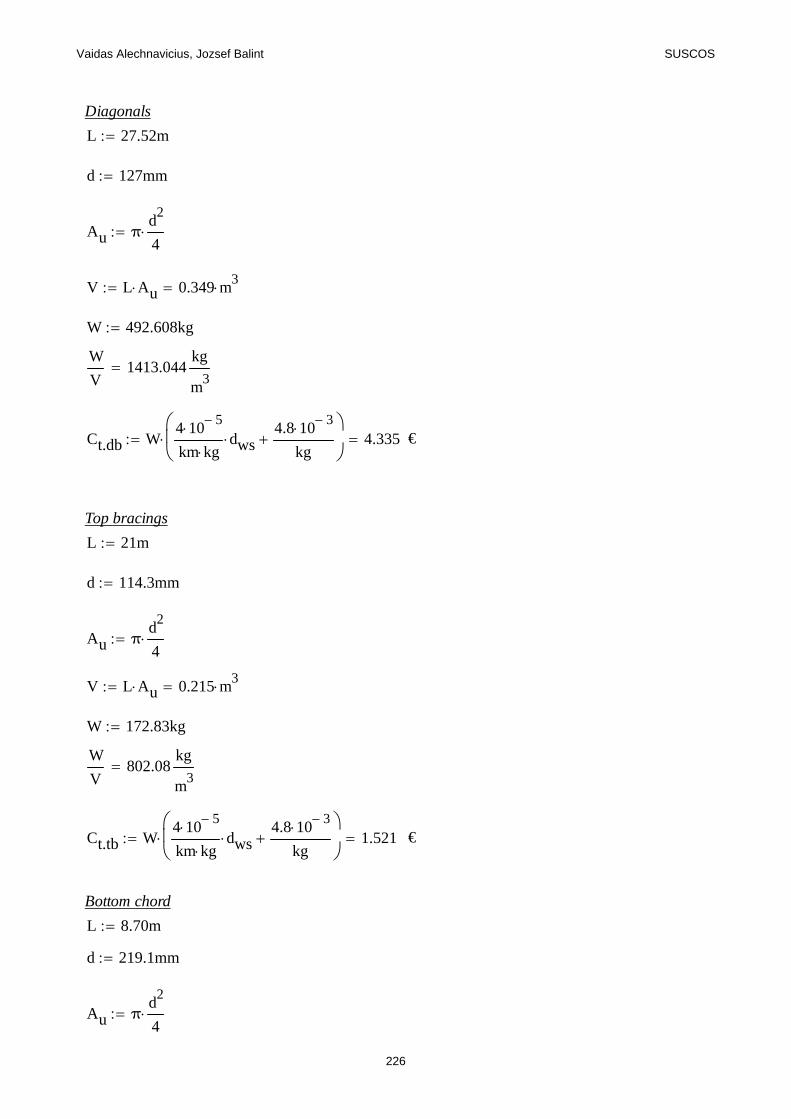
Vaidas Alechnavicius, Jozsef Balint SUSCOS
Diagonals
L 27.52m
d 127mm
Au π
d2
4
V L Au 0.349 m3
W 492.608kg
W
V1413.044
kg
m3
Ct.db W4 10
5km kg
dws4.8 10
3kg
4.335 €
Top bracings
L 21m
d 114.3mm
Au π
d2
4
V L Au 0.215 m3
W 172.83kg
W
V802.08
kg
m3
Ct.tb W4 10
5km kg
dws4.8 10
3kg
1.521 €
Bottom chord
L 8.70m
d 219.1mm
Au π
d2
4
226
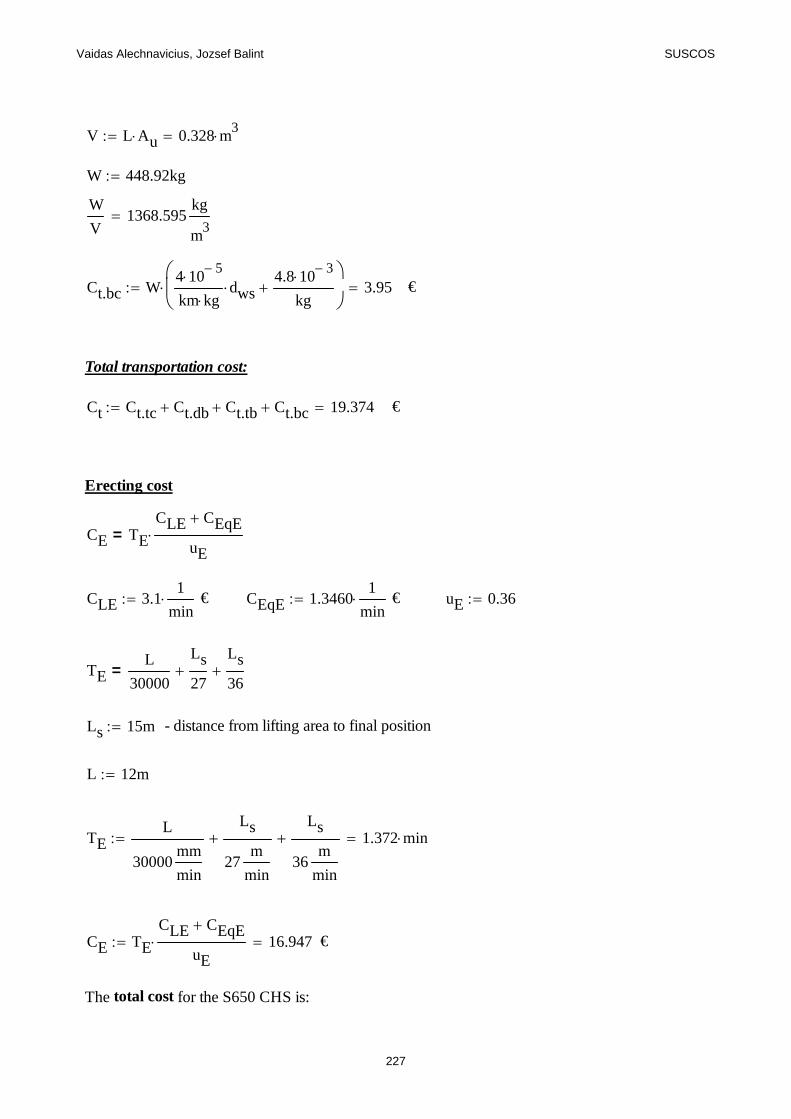
Vaidas Alechnavicius, Jozsef Balint SUSCOS
V L Au 0.328 m3
W 448.92kg
W
V1368.595
kg
m3
Ct.bc W4 10
5km kg
dws4.8 10
3kg
3.95 €
Total transportation cost:
Ct Ct.tc Ct.db Ct.tb Ct.bc 19.374 €
Erecting cost
CE TE
CLE CEqE
uE=
CLE 3.11
min € CEqE 1.3460
1
min € uE 0.36
TEL
30000
Ls
27
Ls
36=
Ls 15m - distance from lifting area to final position
L 12m
TEL
30000mm
min
Ls
27m
min
Ls
36m
min
1.372 min
CE TE
CLE CEqE
uE 16.947 €
The total cost for the S650 CHS is:
227
Vaidas Alechnavicius, Jozsef Balint SUSCOS
CT.650 CSM CB Cs Cp Ct CE 4872.498 €
Determination of the total cost of S500 circular truss
Total cost is determined by:
CT CSM CB Cs CP Ct CE=
where:
CT -total cost
CSM - material cost
CB - blasting cost
Cs - sawing cost
CP - painting cost
Ct - tranporting cost
CE - erecting cost
All prices are expressed in euro.
Material cost
CSM Wsmpl Csmbp Csmg Csmt Csmq =
Wsmpl -weight of the plate [kg]
Csmbp - is basic cost
Csmg - is steel grade add-on
Csmt -is thickness add-on
Csmq - is quantity add-on
228
Vaidas Alechnavicius, Jozsef Balint SUSCOS
Top chords
Wsmpl 1087.2kg
Csmbp1.88
kg €
Csmg80
tonne €
Csmt12
tonne €
Csmq64
tonne €
CSM.tc Wsmpl Csmbp Csmg Csmt Csmq 2213.539 €
Diagonals
Wsmpl 652.8kg
Csmbp1.88
kg €
Csmg80
tonne €
Csmt82
tonne €
Csmq64
tonne €
CSM.db Wsmpl Csmbp Csmg Csmt Csmq 1374.797 €
Top braces
Wsmpl 172.83kg
Csmbp1.88
kg €
Csmg80
tonne €
Csmt140
tonne €
229
Vaidas Alechnavicius, Jozsef Balint SUSCOS
Csmq64
tonne €
CSM.tb Wsmpl Csmbp Csmg Csmt Csmq 374.004 €
Bottom chord
Wsmpl 571.12kg
Csmbp1.88
kg €
Csmg80
tonne €
Csmt12
tonne €
Csmq64
tonne €
CSM.bc Wsmpl Csmbp Csmg Csmt Csmq 1162.8 €
Total material cost:
CSM CSM.tc CSM.db CSM.tb CSM.bc 5125.14 €
Blasting cost
The blasting cost deppends on the length of the beam.
CBL
υc0.46 0.13 0.01 0.16 0.24 0.02 0.07( )= €/min
L 81m -total length of chords and braces
υc 3000mm
min - conveyor speed (Gietart)
CBL
υc0.46 0.13 0.01 0.16 0.24 0.02 0.07( )
1
min 29.43 €
Sawing cost
Cs 1.2013 TNS TPS TPS ccs cens =
230
Vaidas Alechnavicius, Jozsef Balint SUSCOS
TNS - non-productive time
TPS - productive time function
ccs - cost factor depending on the steel grade
cens - cost of energy
Top chord
L 24m
TNS 4.5L
20000mm 5.7 min TNS 5.7min
TPSh
S Sm=
TPS
Ah
Q=
ccs - cost factor depending on the steel grade
cens - cost of energy
Ah 5771mm2
Q 5000mm
2
min
TPS
Ah
Q1.154 min
ccs 1.15
cens 0.021
min €
Cs.tc 1.21
min TNS TPS TPS ccs cens 8.252 €
231
Vaidas Alechnavicius, Jozsef Balint SUSCOS
Diagonals
L 27.20m
TNS 4.5L
20000mm 5.86 min TNS 5.86min
TPSh
S Sm=
TPS
Ah
Q=
ccs - cost factor depending on the steel grade
cens - cost of energy
Ah 3059mm2
Q 5000mm
2
min
TPS
Ah
Q0.612 min
ccs 1.15
cens 0.021
min €
Cs.db 1.21
min TNS TPS TPS ccs cens 7.78 €
Top braces
L 21m
TNS 4.5L
20000mm 5.55 min TNS 5.55min
TPSh
S Sm=
232
Vaidas Alechnavicius, Jozsef Balint SUSCOS
TPS
Ah
Q=
ccs - cost factor depending on the steel grade
cens - cost of energy
Ah 1049mm2
Q 5000mm
2
min
TPS
Ah
Q0.21 min
ccs 1.15
cens 0.021
min €
Cs.tb 1.21
min TNS TPS TPS ccs cens 6.917 €
Bottom chord
L 8.80m
TNS 4.5L
20000mm 4.94 min TNS 4.94min
TPSh
S Sm=
TPS
Ah
Q=
ccs - cost factor depending on the steel grade
cens - cost of energy
233
Vaidas Alechnavicius, Jozsef Balint SUSCOS
Ah 8262mm2
Q 5000mm
2
min
TPS
Ah
Q1.652 min
ccs 1.15
cens 0.021
min €
Cs.bc 1.21
min TNS TPS TPS ccs cens 7.949 €
Total sawing cost:
Cs Cs.tc Cs.db Cs.tb Cs.bc 30.897 €
Painting cost (including drying)
Cp 4.17 106 L Au 0.36L 10
3 WAmin 103=
A - painted area per unit length
WAmin - smallest dimension of beam
Top chord
L 24m
r 96.85mm
Au 2 π r 0.609m
WAmin 193.7mm
234
Vaidas Alechnavicius, Jozsef Balint SUSCOS
Cp.tc4.17
mm2
106 L Au
0.36
mm2
L 103 WAmin 10
3 62.575 €
Diagonals
L 27.20m
r 84.15mm
Au 2 π r 0.529m
WAmin 168.3mm
Cp.db4.17
mm2
106 L Au
0.36
mm2
L 103 WAmin 10
3 61.619 €
Top bracings
L 21m
r 57.15mm
Au 2 π r 0.359m
WAmin 114.3mm
Cp.tb4.17
mm2
106 L Au
0.36
mm2
L 103 WAmin 10
3 32.309 €
Bottom chord
L 8.80m
r 136.5mm
Au 2 π r 0.858m
WAmin 273mm
Cp.bc4.17
mm2
106 L Au
0.36
mm2
L 103 WAmin 10
3 32.337 €
235
Vaidas Alechnavicius, Jozsef Balint SUSCOS
Total painting cost:
Cp Cp.tc Cp.db Cp.tb Cp.bc 188.84 €
Transportation cost
Ct V 0.0106dws 1.2729 W
V264
kg
m3
if
W 4 105 dws 4.8 10
3
otherwise
=
V - the volume occupied by the beam
W - weight of the beam
dws -distance between workshop and site [km]
We assume that the distance between the workshop and the site isdws 100km
Top chord
L 24m
d 193.7mm
Au π
d2
4
V L Au 0.707 m3
W 1087.2kg
W
V1537.266
kg
m3
Ct.tc W4 10
5km kg
dws4.8 10
3kg
9.567 €
Diagonals
L 27.2m
d 168.3mm
236
Vaidas Alechnavicius, Jozsef Balint SUSCOS
Au π
d2
4
V L Au 0.605 m3
W 652.8kg
W
V1078.83
kg
m3
Ct.db W4 10
5km kg
dws4.8 10
3kg
5.745 €
Top bracings
L 21m
d 114.3mm
Au π
d2
4
V L Au 0.215 m3
W 172.83kg
W
V802.08
kg
m3
Ct.tb W4 10
5km kg
dws4.8 10
3kg
1.521 €
Bottom chord
L 8.80m
d 273mm
Au π
d2
4
V L Au 0.515 m3
W 571.12kg
237
Vaidas Alechnavicius, Jozsef Balint SUSCOS
W
V1108.74
kg
m3
Ct.bc W4 10
5km kg
dws4.8 10
3kg
5.026 €
Total transportation cost:
Ct Ct.tc Ct.db Ct.tb Ct.bc 21.859 €
Erecting cost
CE TE
CLE CEqE
uE=
CLE 3.11
min € CEqE 1.3460
1
min € uE 0.36
TEL
30000
Ls
27
Ls
36=
Ls 15m - distance from lifting area to final position
L 12m
TEL
30000mm
min
Ls
27m
min
Ls
36m
min
1.372 min
CE TE
CLE CEqE
uE 16.947 €
The total cost for the S500 CHS is:
CT.500 CSM CB Cs Cp Ct CE 5413.113 €
238
Vaidas Alechnavicius, Jozsef Balint SUSCOS
Determination of the total cost of S355 circular truss
Total cost is determined by:
CT CSM CB Cs CP Ct CE=
where:
CT -total cost
CSM - material cost
CB - blasting cost
Cs - sawing cost
CP - painting cost
Ct - tranporting cost
CE - erecting cost
All prices are expressed in euro.
Material cost
CSM Wsmpl Csmbp Csmg Csmt Csmq =
Wsmpl -weight of the plate [kg]
Csmbp - is basic cost
239
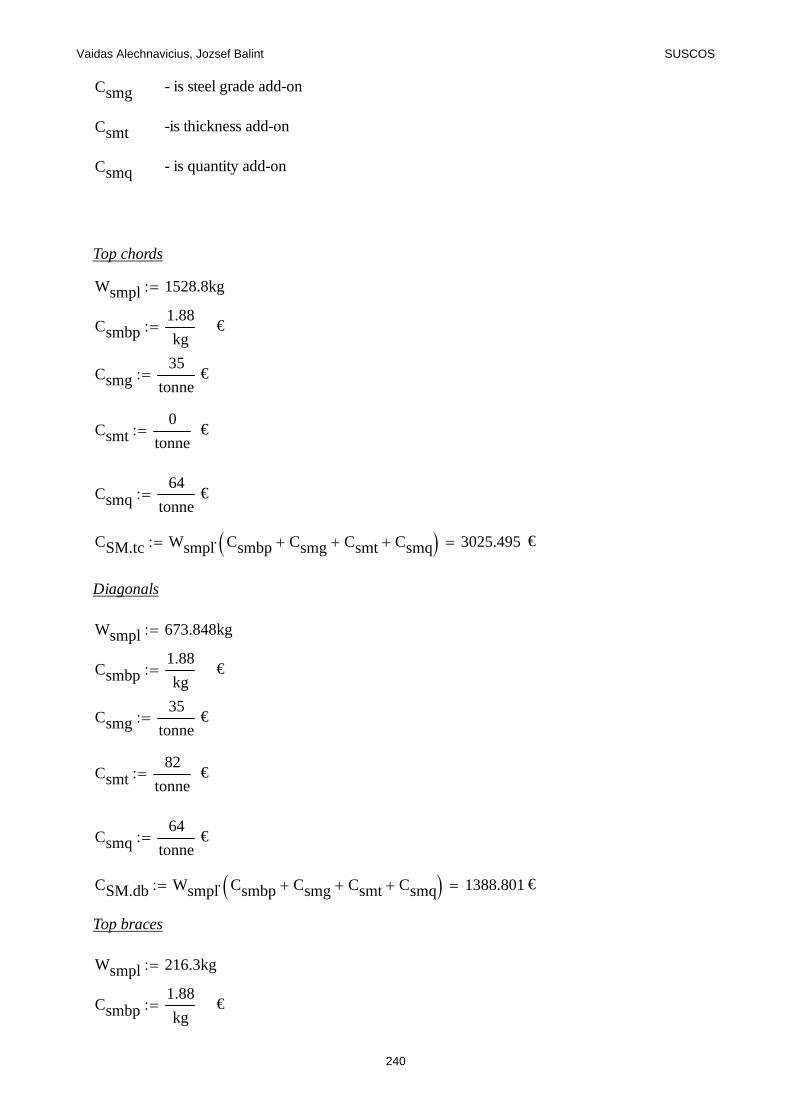
Vaidas Alechnavicius, Jozsef Balint SUSCOS
Csmg - is steel grade add-on
Csmt -is thickness add-on
Csmq - is quantity add-on
Top chords
Wsmpl 1528.8kg
Csmbp1.88
kg €
Csmg35
tonne €
Csmt0
tonne €
Csmq64
tonne €
CSM.tc Wsmpl Csmbp Csmg Csmt Csmq 3025.495 €
Diagonals
Wsmpl 673.848kg
Csmbp1.88
kg €
Csmg35
tonne €
Csmt82
tonne €
Csmq64
tonne €
CSM.db Wsmpl Csmbp Csmg Csmt Csmq 1388.801 €
Top braces
Wsmpl 216.3kg
Csmbp1.88
kg €
240
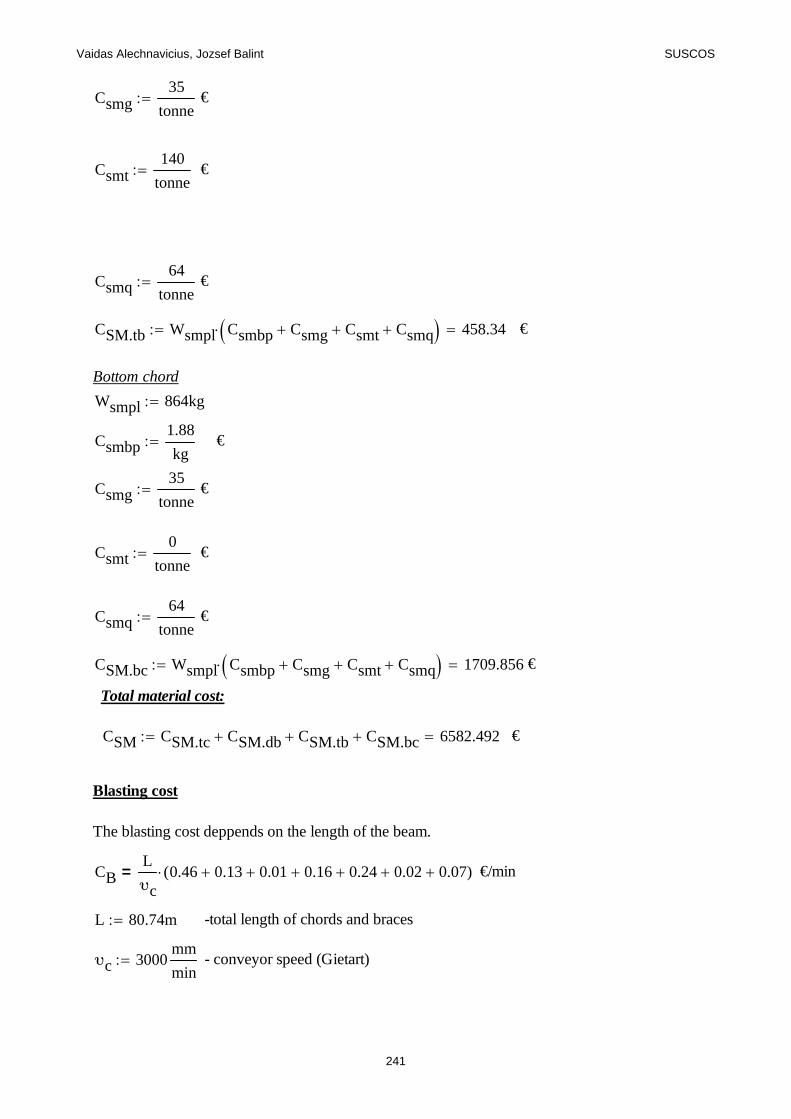
Vaidas Alechnavicius, Jozsef Balint SUSCOS
Csmg35
tonne €
Csmt140
tonne €
Csmq64
tonne €
CSM.tb Wsmpl Csmbp Csmg Csmt Csmq 458.34 €
Bottom chord
Wsmpl 864kg
Csmbp1.88
kg €
Csmg35
tonne €
Csmt0
tonne €
Csmq64
tonne €
CSM.bc Wsmpl Csmbp Csmg Csmt Csmq 1709.856 €
Total material cost:
CSM CSM.tc CSM.db CSM.tb CSM.bc 6582.492 €
Blasting cost
The blasting cost deppends on the length of the beam.
CBL
υc0.46 0.13 0.01 0.16 0.24 0.02 0.07( )= €/min
L 80.74m -total length of chords and braces
υc 3000mm
min - conveyor speed (Gietart)
241
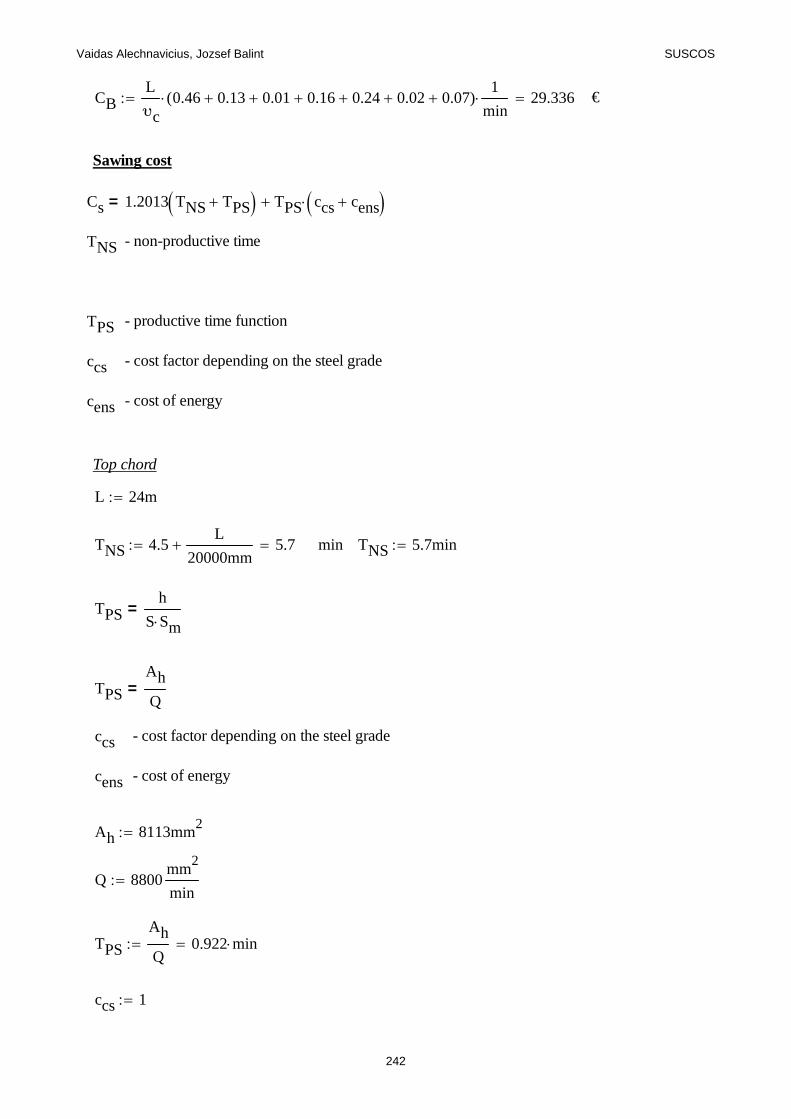
Vaidas Alechnavicius, Jozsef Balint SUSCOS
CBL
υc0.46 0.13 0.01 0.16 0.24 0.02 0.07( )
1
min 29.336 €
Sawing cost
Cs 1.2013 TNS TPS TPS ccs cens =
TNS - non-productive time
TPS - productive time function
ccs - cost factor depending on the steel grade
cens - cost of energy
Top chord
L 24m
TNS 4.5L
20000mm 5.7 min TNS 5.7min
TPSh
S Sm=
TPS
Ah
Q=
ccs - cost factor depending on the steel grade
cens - cost of energy
Ah 8113mm2
Q 8800mm
2
min
TPS
Ah
Q0.922 min
ccs 1
242
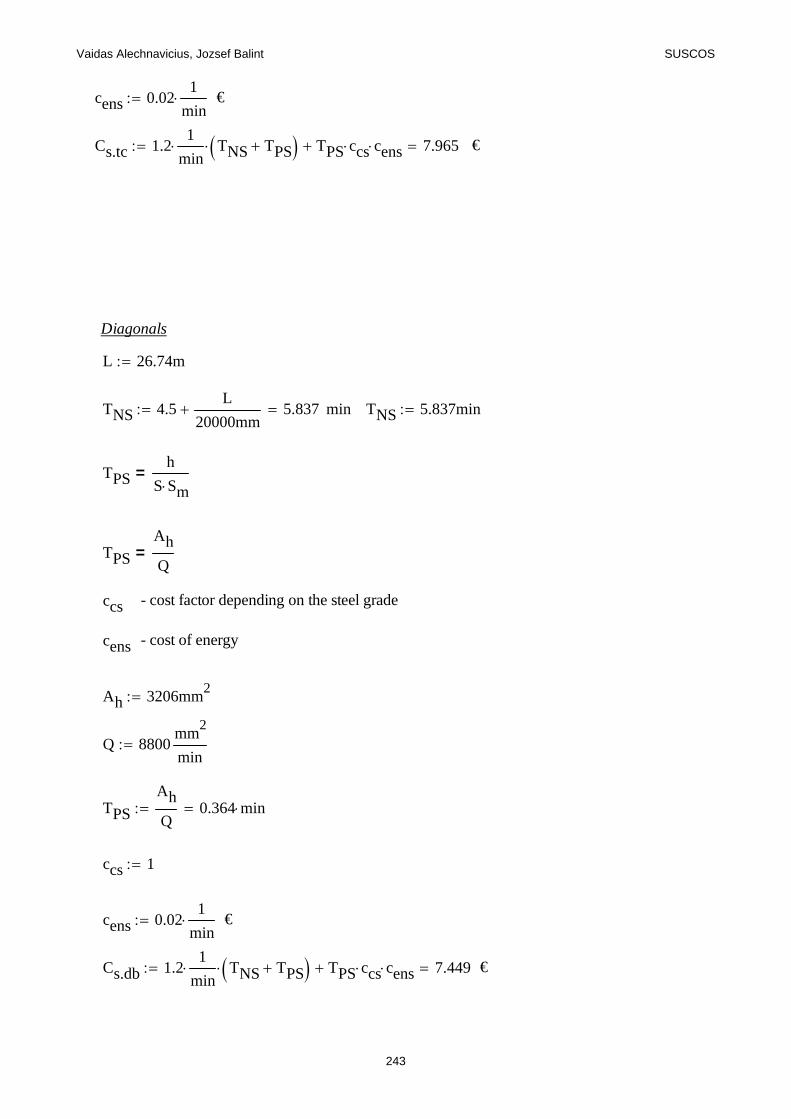
Vaidas Alechnavicius, Jozsef Balint SUSCOS
cens 0.021
min €
Cs.tc 1.21
min TNS TPS TPS ccs cens 7.965 €
Diagonals
L 26.74m
TNS 4.5L
20000mm 5.837 min TNS 5.837min
TPSh
S Sm=
TPS
Ah
Q=
ccs - cost factor depending on the steel grade
cens - cost of energy
Ah 3206mm2
Q 8800mm
2
min
TPS
Ah
Q0.364 min
ccs 1
cens 0.021
min €
Cs.db 1.21
min TNS TPS TPS ccs cens 7.449 €
243
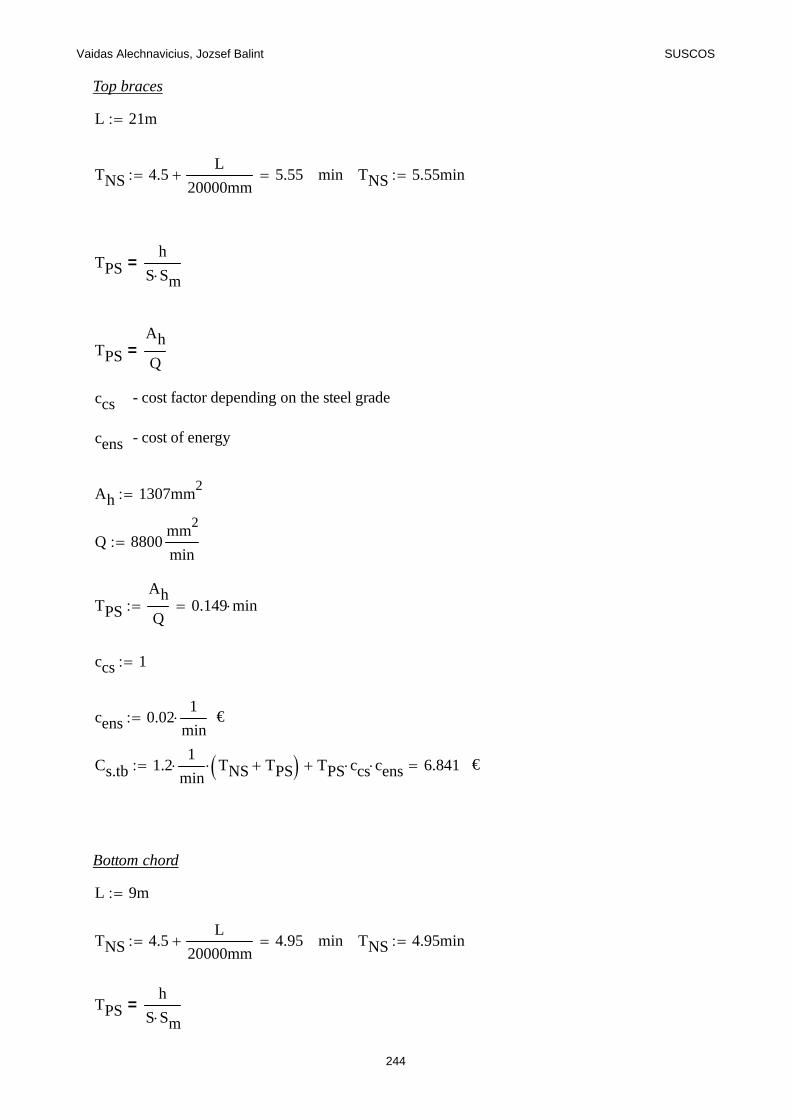
Vaidas Alechnavicius, Jozsef Balint SUSCOS
Top braces
L 21m
TNS 4.5L
20000mm 5.55 min TNS 5.55min
TPSh
S Sm=
TPS
Ah
Q=
ccs - cost factor depending on the steel grade
cens - cost of energy
Ah 1307mm2
Q 8800mm
2
min
TPS
Ah
Q0.149 min
ccs 1
cens 0.021
min €
Cs.tb 1.21
min TNS TPS TPS ccs cens 6.841 €
Bottom chord
L 9m
TNS 4.5L
20000mm 4.95 min TNS 4.95min
TPSh
S Sm=
244
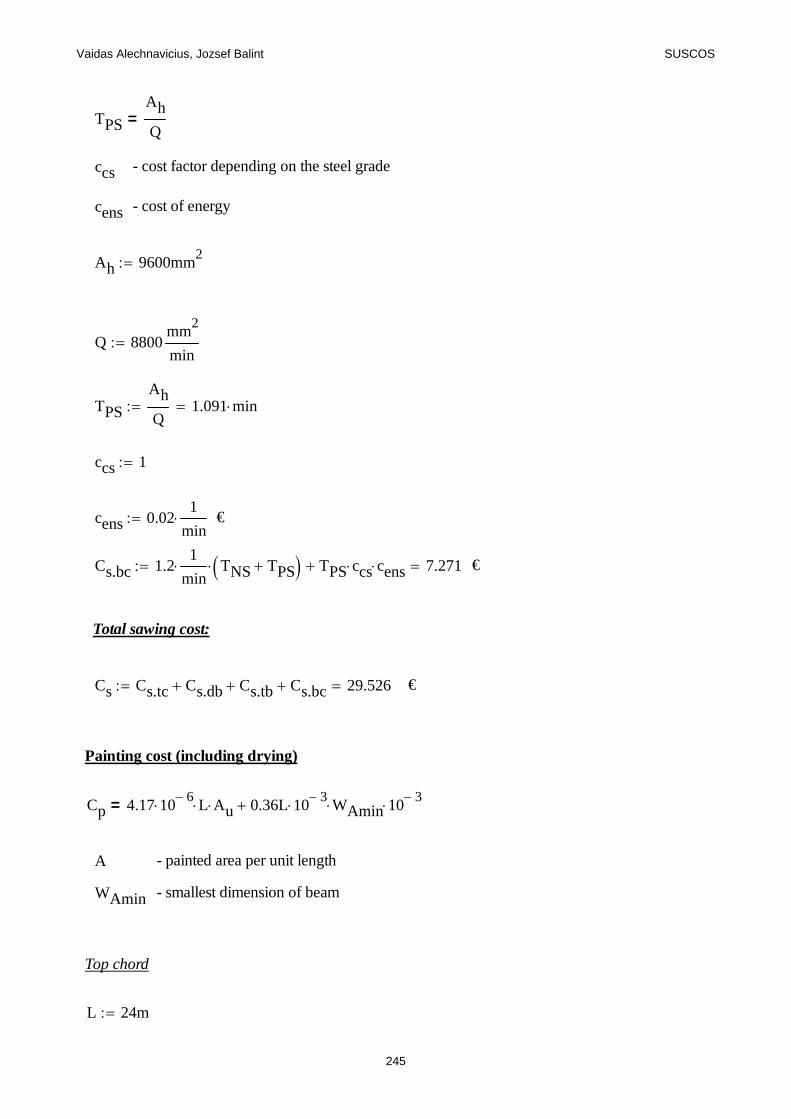
Vaidas Alechnavicius, Jozsef Balint SUSCOS
TPS
Ah
Q=
ccs - cost factor depending on the steel grade
cens - cost of energy
Ah 9600mm2
Q 8800mm
2
min
TPS
Ah
Q1.091 min
ccs 1
cens 0.021
min €
Cs.bc 1.21
min TNS TPS TPS ccs cens 7.271 €
Total sawing cost:
Cs Cs.tc Cs.db Cs.tb Cs.bc 29.526 €
Painting cost (including drying)
Cp 4.17 106 L Au 0.36L 10
3 WAmin 103=
A - painted area per unit length
WAmin - smallest dimension of beam
Top chord
L 24m
245
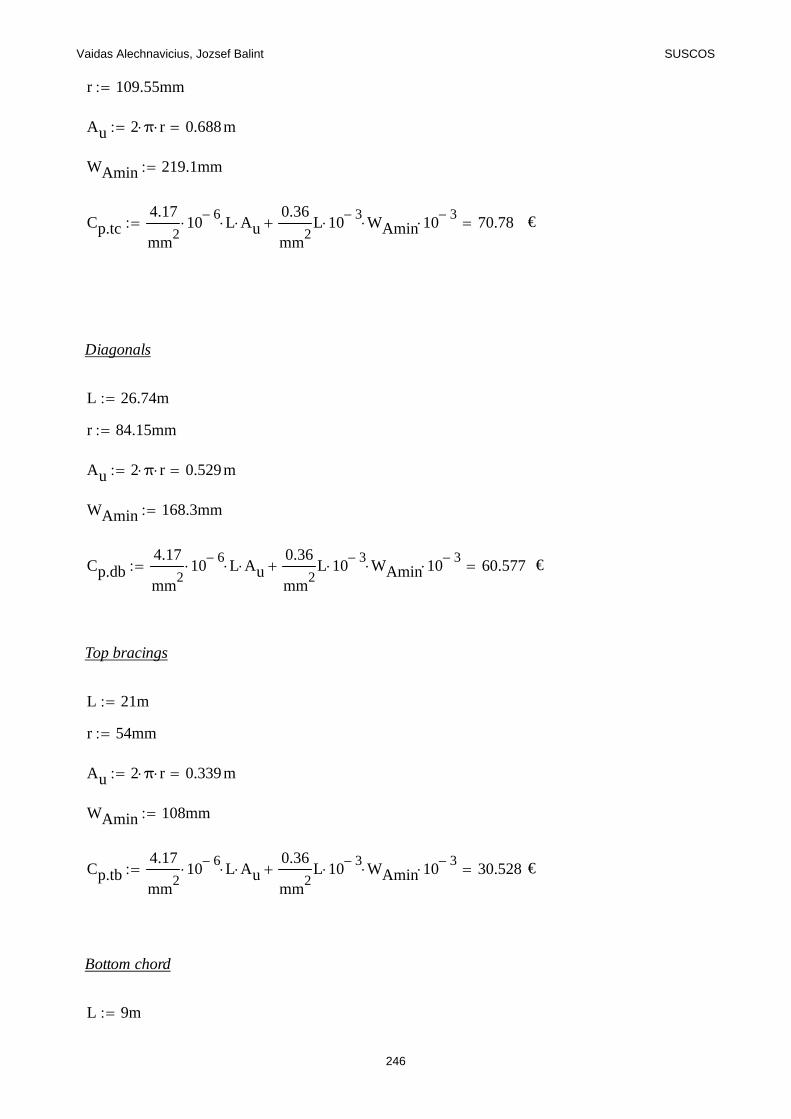
Vaidas Alechnavicius, Jozsef Balint SUSCOS
r 109.55mm
Au 2 π r 0.688m
WAmin 219.1mm
Cp.tc4.17
mm2
106 L Au
0.36
mm2
L 103 WAmin 10
3 70.78 €
Diagonals
L 26.74m
r 84.15mm
Au 2 π r 0.529m
WAmin 168.3mm
Cp.db4.17
mm2
106 L Au
0.36
mm2
L 103 WAmin 10
3 60.577 €
Top bracings
L 21m
r 54mm
Au 2 π r 0.339m
WAmin 108mm
Cp.tb4.17
mm2
106 L Au
0.36
mm2
L 103 WAmin 10
3 30.528 €
Bottom chord
L 9m
246
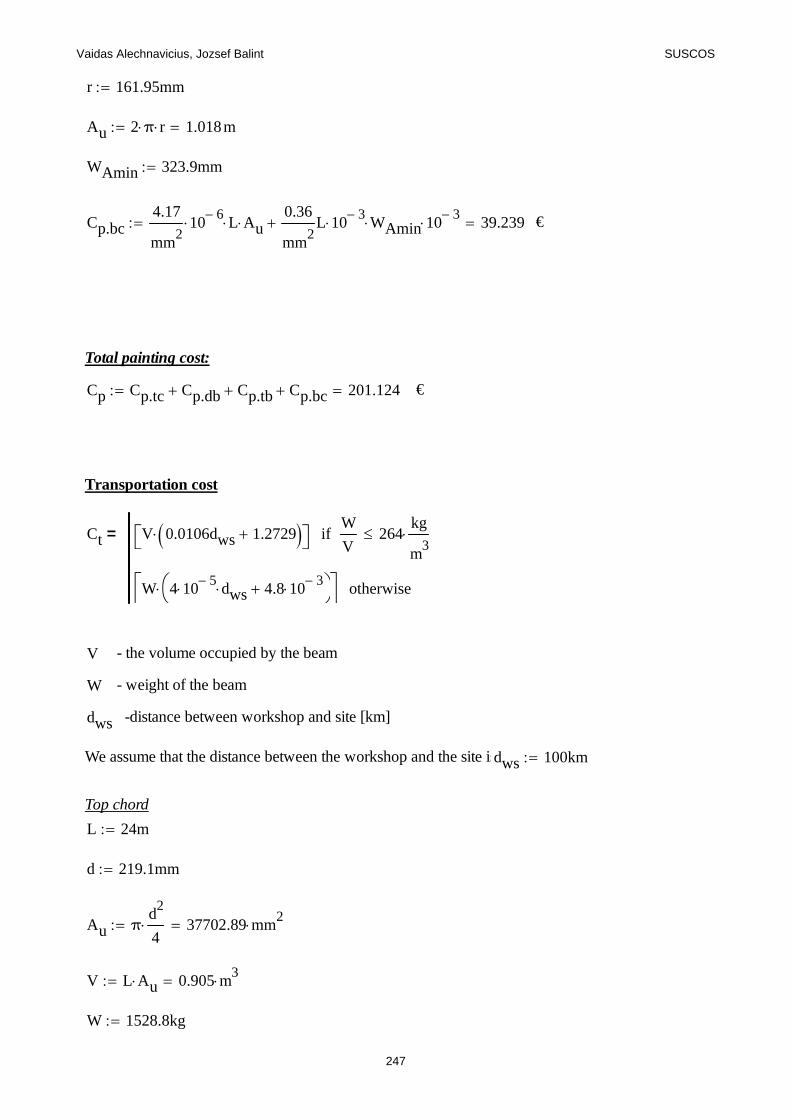
Vaidas Alechnavicius, Jozsef Balint SUSCOS
r 161.95mm
Au 2 π r 1.018m
WAmin 323.9mm
Cp.bc4.17
mm2
106 L Au
0.36
mm2
L 103 WAmin 10
3 39.239 €
Total painting cost:
Cp Cp.tc Cp.db Cp.tb Cp.bc 201.124 €
Transportation cost
Ct V 0.0106dws 1.2729 W
V264
kg
m3
if
W 4 105 dws 4.8 10
3
otherwise
=
V - the volume occupied by the beam
W - weight of the beam
dws -distance between workshop and site [km]
We assume that the distance between the workshop and the site isdws 100km
Top chord
L 24m
d 219.1mm
Au π
d2
4 37702.89 mm
2
V L Au 0.905 m3
W 1528.8kg
247
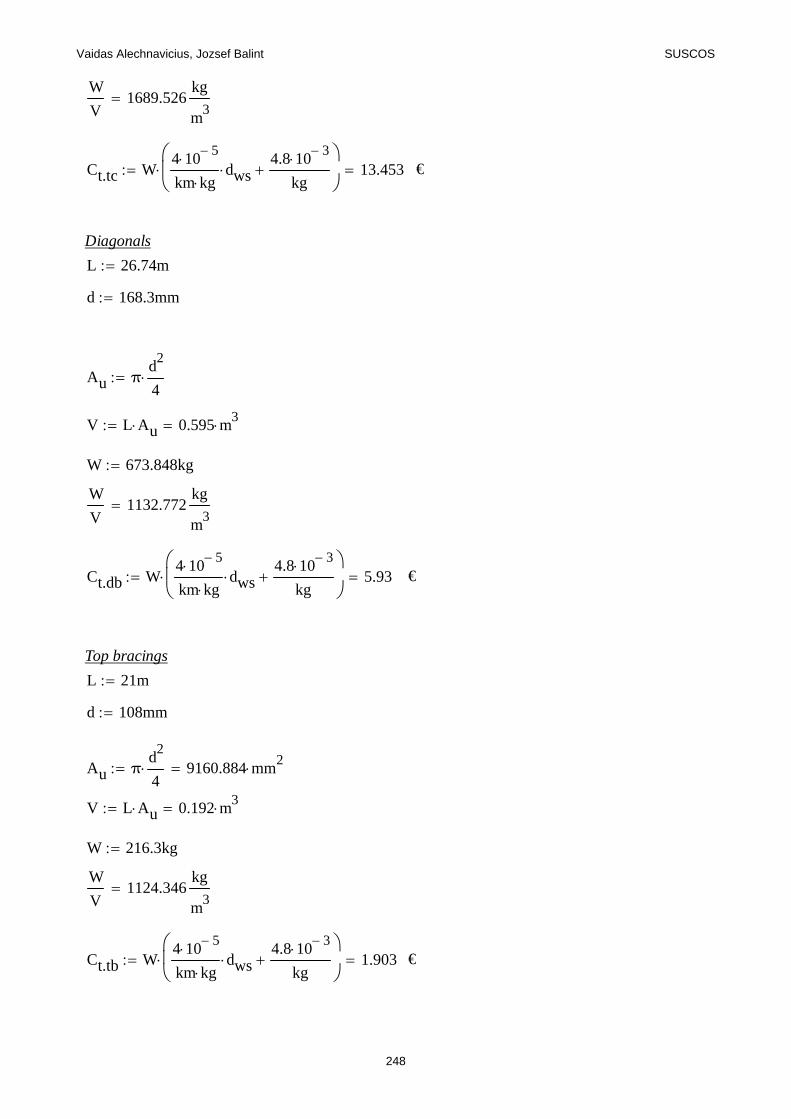
Vaidas Alechnavicius, Jozsef Balint SUSCOS
W
V1689.526
kg
m3
Ct.tc W4 10
5km kg
dws4.8 10
3kg
13.453 €
Diagonals
L 26.74m
d 168.3mm
Au π
d2
4
V L Au 0.595 m3
W 673.848kg
W
V1132.772
kg
m3
Ct.db W4 10
5km kg
dws4.8 10
3kg
5.93 €
Top bracings
L 21m
d 108mm
Au π
d2
4 9160.884 mm
2
V L Au 0.192 m3
W 216.3kg
W
V1124.346
kg
m3
Ct.tb W4 10
5km kg
dws4.8 10
3kg
1.903 €
248
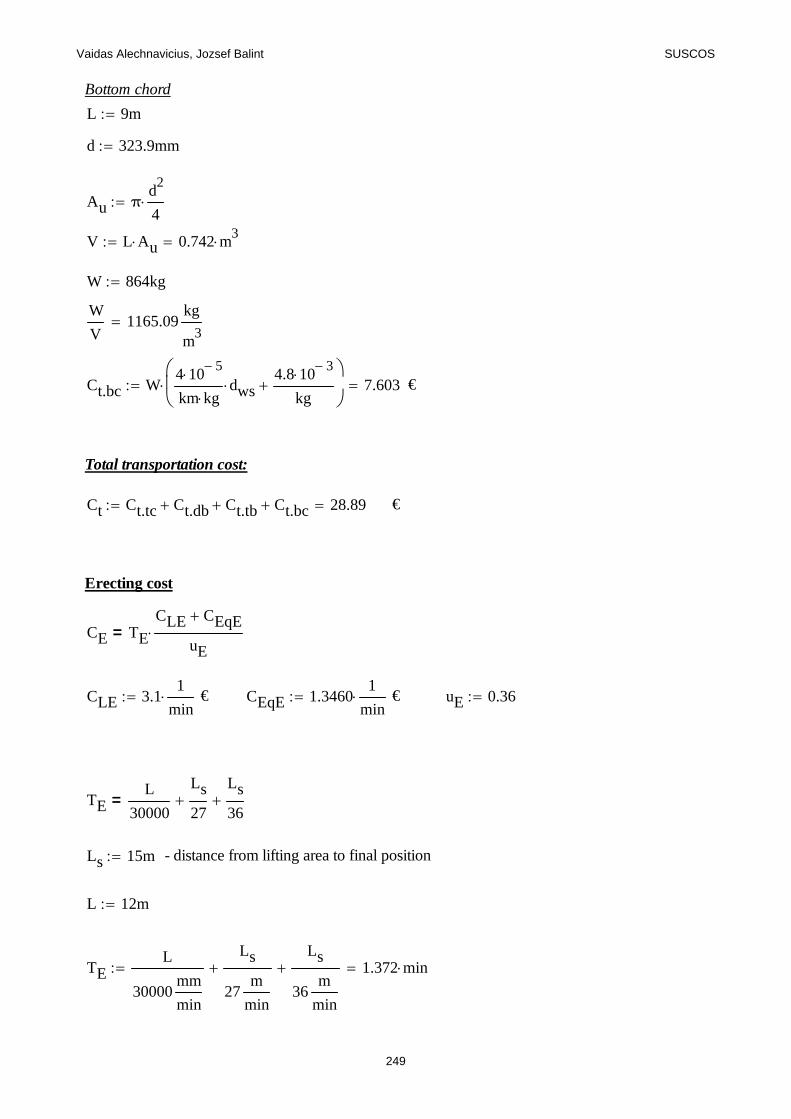
Vaidas Alechnavicius, Jozsef Balint SUSCOS
Bottom chord
L 9m
d 323.9mm
Au π
d2
4
V L Au 0.742 m3
W 864kg
W
V1165.09
kg
m3
Ct.bc W4 10
5km kg
dws4.8 10
3kg
7.603 €
Total transportation cost:
Ct Ct.tc Ct.db Ct.tb Ct.bc 28.89 €
Erecting cost
CE TE
CLE CEqE
uE=
CLE 3.11
min € CEqE 1.3460
1
min € uE 0.36
TEL
30000
Ls
27
Ls
36=
Ls 15m - distance from lifting area to final position
L 12m
TEL
30000mm
min
Ls
27m
min
Ls
36m
min
1.372 min
249
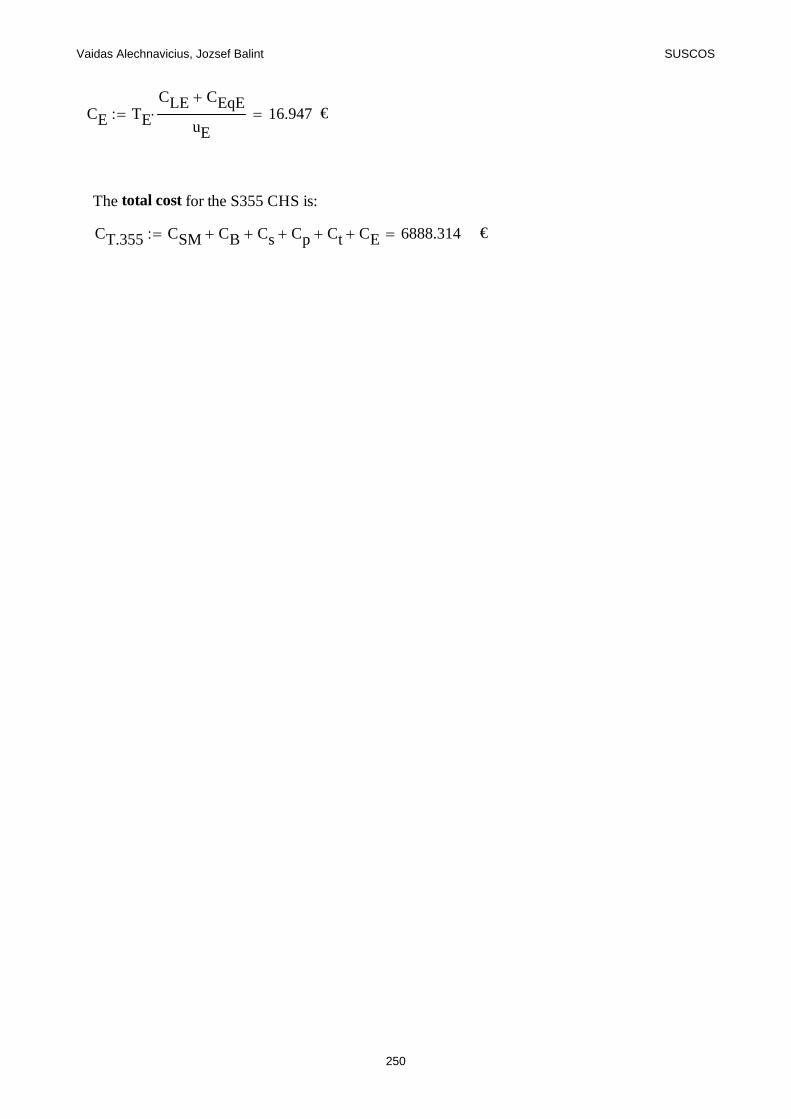
Vaidas Alechnavicius, Jozsef Balint SUSCOS
CE TE
CLE CEqE
uE 16.947 €
The total cost for the S355 CHS is:
CT.355 CSM CB Cs Cp Ct CE 6888.314 €
250
Vaidas Alechnavicius, Jozsef Balint SUSCOS
Determination of the total cost of S650 polygonal truss
Total cost is determined by:
CT CSM CB Cs CP Ct CE=
where:
CT -total cost
CSM - material cost
CB - blasting cost
Cs - sawing cost
CP - painting cost
Ct - tranporting cost
CE - erecting cost
All prices are expressed in euro.
Material cost
The material cost will be calculated according to Haapio (2012) with the following formula:
CSM Wsmpl Csmbp Csmg Csmt Csmq =
Wsmpl -weight of the plate [kg]
Csmbp - is basic cost
Csmg - is steel grade add-on
Csmt -is thickness add-on
Csmq - is quantity add-on
251
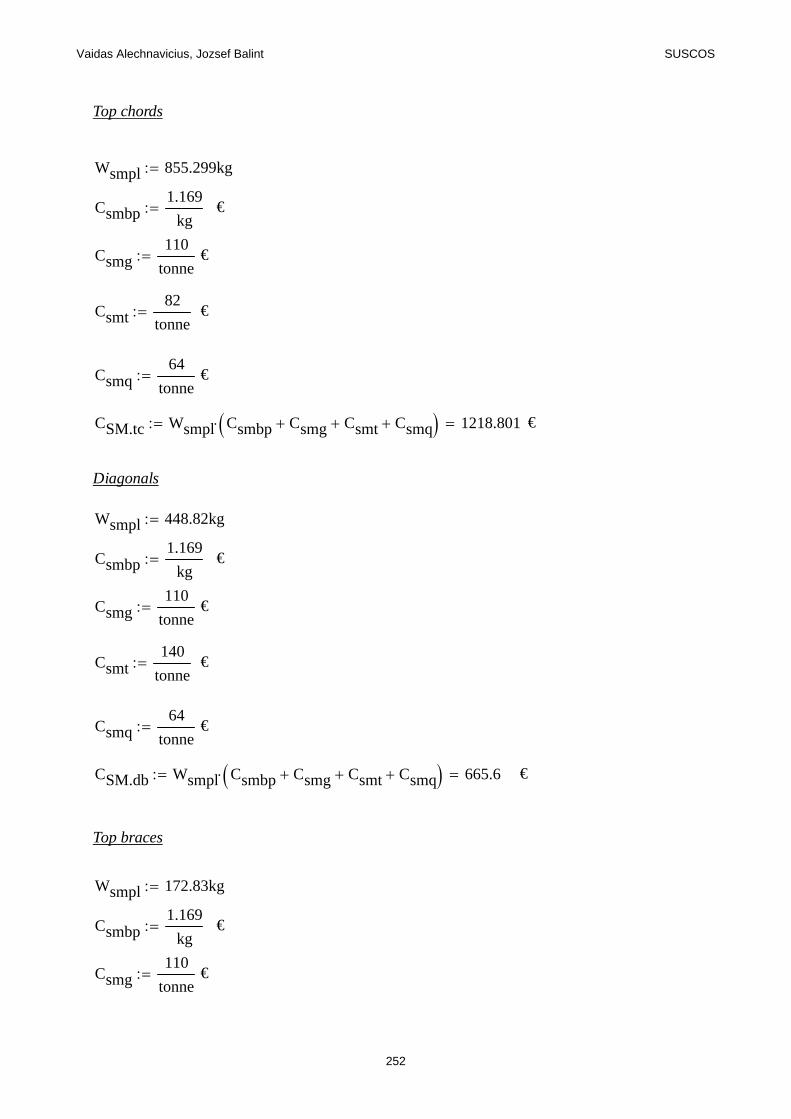
Vaidas Alechnavicius, Jozsef Balint SUSCOS
Top chords
Wsmpl 855.299kg
Csmbp1.169
kg €
Csmg110
tonne €
Csmt82
tonne €
Csmq64
tonne €
CSM.tc Wsmpl Csmbp Csmg Csmt Csmq 1218.801 €
Diagonals
Wsmpl 448.82kg
Csmbp1.169
kg €
Csmg110
tonne €
Csmt140
tonne €
Csmq64
tonne €
CSM.db Wsmpl Csmbp Csmg Csmt Csmq 665.6 €
Top braces
Wsmpl 172.83kg
Csmbp1.169
kg €
Csmg110
tonne €
252
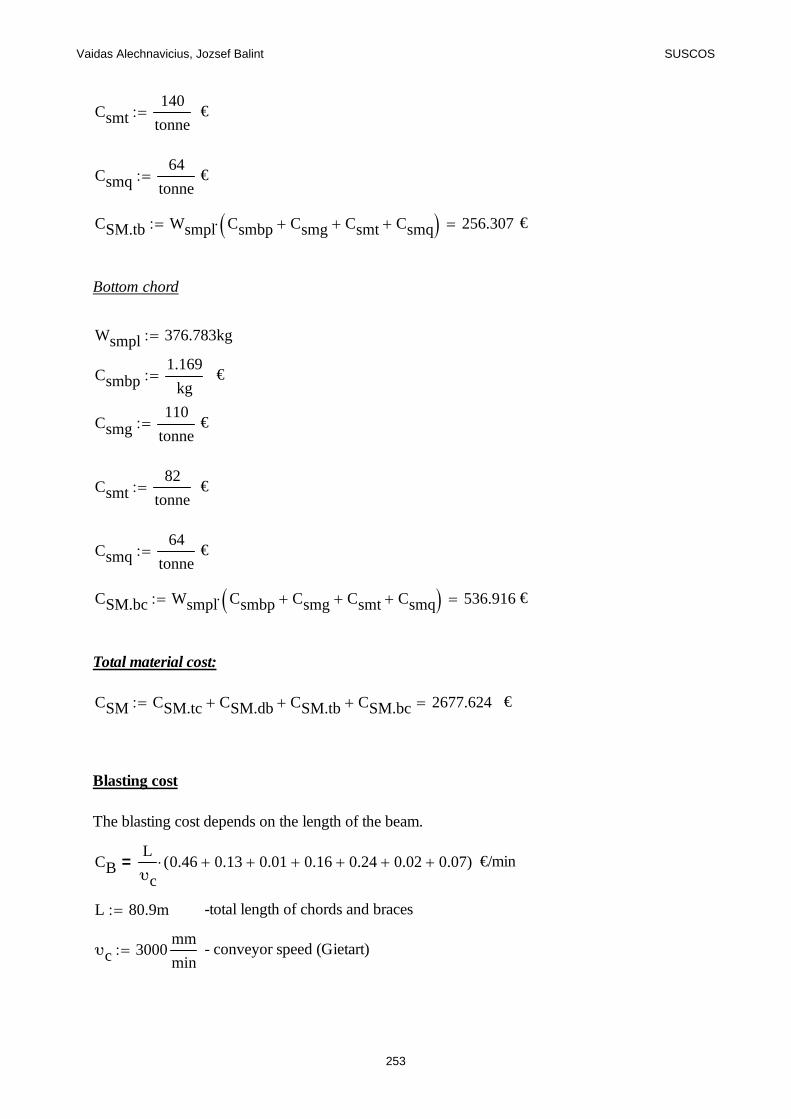
Vaidas Alechnavicius, Jozsef Balint SUSCOS
Csmt140
tonne €
Csmq64
tonne €
CSM.tb Wsmpl Csmbp Csmg Csmt Csmq 256.307 €
Bottom chord
Wsmpl 376.783kg
Csmbp1.169
kg €
Csmg110
tonne €
Csmt82
tonne €
Csmq64
tonne €
CSM.bc Wsmpl Csmbp Csmg Csmt Csmq 536.916 €
Total material cost:
CSM CSM.tc CSM.db CSM.tb CSM.bc 2677.624 €
Blasting cost
The blasting cost depends on the length of the beam.
CBL
υc0.46 0.13 0.01 0.16 0.24 0.02 0.07( )= €/min
L 80.9m -total length of chords and braces
υc 3000mm
min - conveyor speed (Gietart)
253
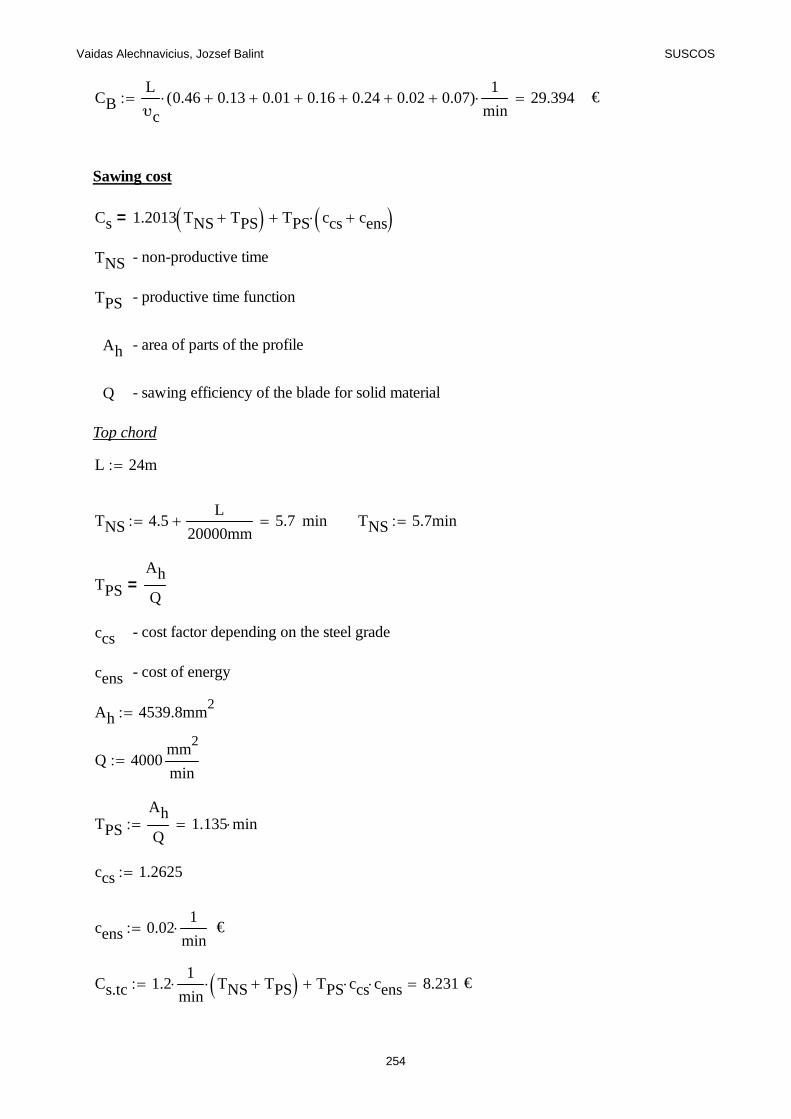
Vaidas Alechnavicius, Jozsef Balint SUSCOS
CBL
υc0.46 0.13 0.01 0.16 0.24 0.02 0.07( )
1
min 29.394 €
Sawing cost
Cs 1.2013 TNS TPS TPS ccs cens =
TNS - non-productive time
TPS - productive time function
Ah - area of parts of the profile
Q - sawing efficiency of the blade for solid material
Top chord
L 24m
TNS 4.5L
20000mm 5.7 min TNS 5.7min
TPS
Ah
Q=
ccs - cost factor depending on the steel grade
cens - cost of energy
Ah 4539.8mm2
Q 4000mm
2
min
TPS
Ah
Q1.135 min
ccs 1.2625
cens 0.021
min €
Cs.tc 1.21
min TNS TPS TPS ccs cens 8.231 €
254
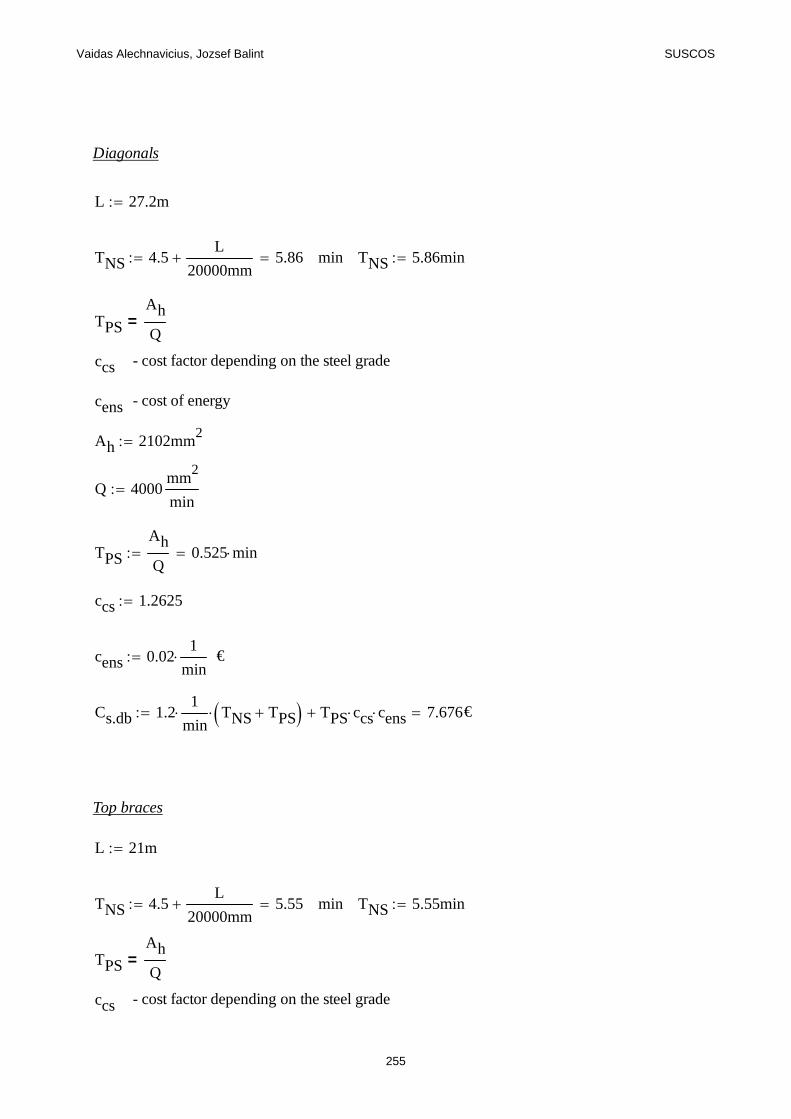
Vaidas Alechnavicius, Jozsef Balint SUSCOS
Diagonals
L 27.2m
TNS 4.5L
20000mm 5.86 min TNS 5.86min
TPS
Ah
Q=
ccs - cost factor depending on the steel grade
cens - cost of energy
Ah 2102mm2
Q 4000mm
2
min
TPS
Ah
Q0.525 min
ccs 1.2625
cens 0.021
min €
Cs.db 1.21
min TNS TPS TPS ccs cens 7.676 €
Top braces
L 21m
TNS 4.5L
20000mm 5.55 min TNS 5.55min
TPS
Ah
Q=
ccs - cost factor depending on the steel grade
255
Vaidas Alechnavicius, Jozsef Balint SUSCOS
cens - cost of energy
Ah 1049mm2
Q 4000mm
2
min
TPS
Ah
Q0.262 min
ccs 1.2625
cens 0.021
min €
Cs.tb 1.21
min TNS TPS TPS ccs cens 6.981 €
Bottom chord
L 8.7m
TNS 4.5L
20000mm 4.935 min TNS 4.935min
TPS
Ah
Q=
ccs - cost factor depending on the steel grade
cens - cost of energy
Ah 5516.73mm2
Q 4000mm
2
min
TPS
Ah
Q1.379 min
ccs 1.2625
256
Vaidas Alechnavicius, Jozsef Balint SUSCOS
cens 0.021
min €
Cs.bc 1.21
min TNS TPS TPS ccs cens 7.612 €
Total sawing cost:
Cs Cs.tc Cs.db Cs.tb Cs.bc 30.5 €
Painting cost (including drying)
Cp 4.17 106 L Au 0.36L 10
3 WAmin 103=
A - painted area per unit length
WAmin - smallest dimension of beam
Top chord
L 24m
Au 618mm
WAmin 200mm
Cp.tc4.17
mm2
106 L Au
0.36
mm2
L 103 WAmin 10
3 63.577 €
Diagonals
L 27.52m
Au 432.62mm
WAmin 140mm
Cp.db4.17
mm2
106 L Au
0.36
mm2
L 103 WAmin 10
3 51.034 €
257
Vaidas Alechnavicius, Jozsef Balint SUSCOS
Top bracings
L 19.6m
r 57.15mm
Au 2π r 359.084 mm
WAmin 114.3mm
Cp.tb4.17
mm2
106 L Au
0.36
mm2
L 103 WAmin 10
3 30.155 €
Bottom chord
L 8.70m
Au 1854.72mm
WAmin 249mm
Cp.bc4.17
mm2
106 L Au
0.36
mm2
L 103 WAmin 10
3 68.067 €
Total painting cost:
Cp Cp.tc Cp.db Cp.tb Cp.bc 212.834 €
Transportation cost
Ct V 0.0106dws 1.2729 W
V264
kg
m3
if
W 4 105 dws 4.8 10
3
otherwise
=
V - the volume occupied by the beam
W - weight of the beam
dws -distance between workshop and site [km]
258
Vaidas Alechnavicius, Jozsef Balint SUSCOS
We assume that the distance between the workshop and the site isdws 100km
Top chord
L 24m
Au 29389.26mm2
V L Au 0.705 m3
W 855.29kg
W
V1212.589
kg
m3
Ct.tc W4 10
5km kg
dws4.8 10
3kg
7.527 €
Diagonals
L 27.2m
Au 14400.73mm2
V L Au 0.392 m3
W 448.82kg
W
V1145.826
kg
m3
Ct.db W4 10
5km kg
dws4.8 10
3kg
3.95 €
Top bracings
L 21m
r 57.15mm
Au π r2 1.026 10
4 mm2
V L Au 0.215 m3
W 172.83kg
259
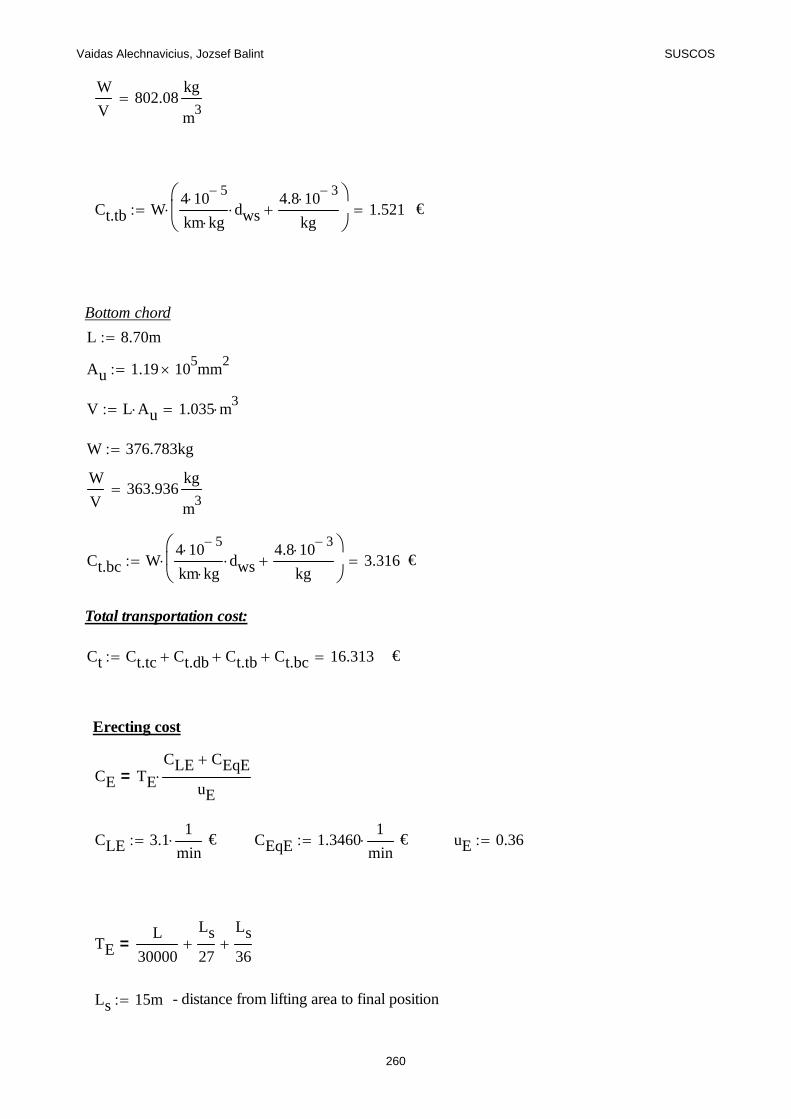
Vaidas Alechnavicius, Jozsef Balint SUSCOS
W
V802.08
kg
m3
Ct.tb W4 10
5km kg
dws4.8 10
3kg
1.521 €
Bottom chord
L 8.70m
Au 1.19 105 mm
2
V L Au 1.035 m3
W 376.783kg
W
V363.936
kg
m3
Ct.bc W4 10
5km kg
dws4.8 10
3kg
3.316 €
Total transportation cost:
Ct Ct.tc Ct.db Ct.tb Ct.bc 16.313 €
Erecting cost
CE TE
CLE CEqE
uE=
CLE 3.11
min € CEqE 1.3460
1
min € uE 0.36
TEL
30000
Ls
27
Ls
36=
Ls 15m - distance from lifting area to final position
260
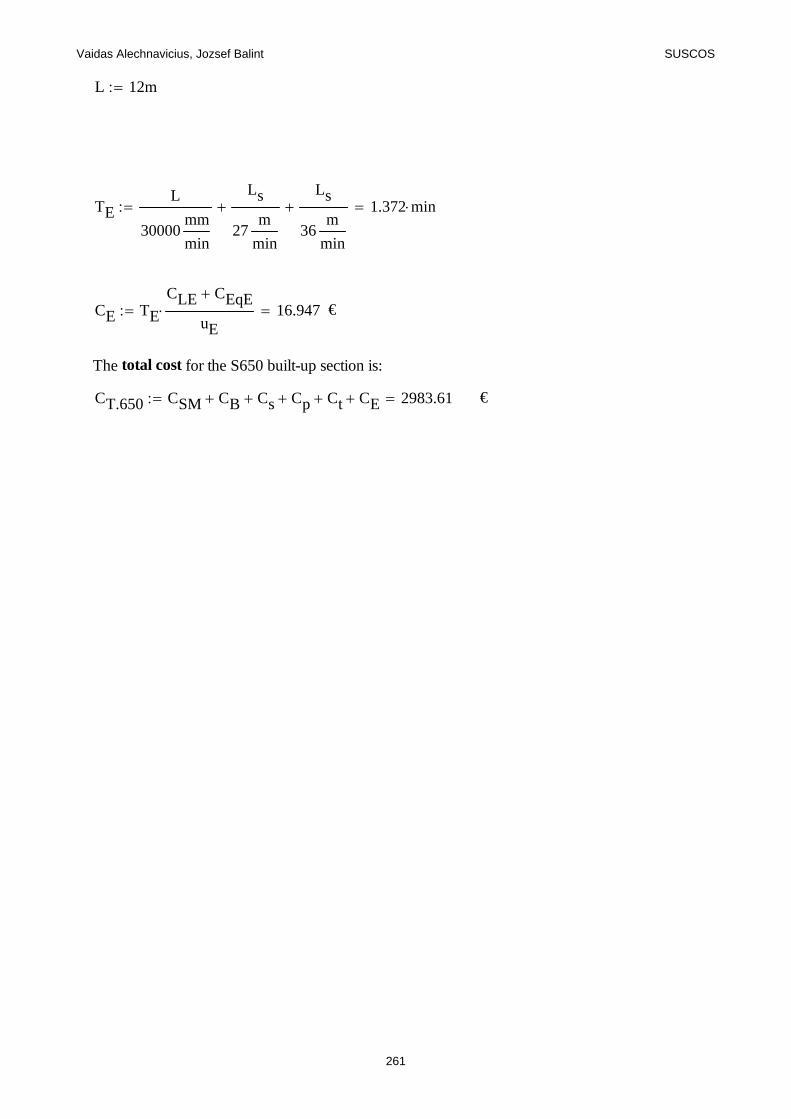
Vaidas Alechnavicius, Jozsef Balint SUSCOS
L 12m
TEL
30000mm
min
Ls
27m
min
Ls
36m
min
1.372 min
CE TE
CLE CEqE
uE 16.947 €
The total cost for the S650 built-up section is:
CT.650 CSM CB Cs Cp Ct CE 2983.61 €
261
Vaidas Alechnavicius, Jozsef Balint SUSCOS
Determination of the total cost of S500 polygonal truss
Total cost is determined by:
CT CSM CB Cs CP Ct CE=
where:
CT -total cost
CSM - material cost
CB - blasting cost
Cs - sawing cost
CP - painting cost
Ct - tranporting cost
CE - erecting cost
All prices are expressed in euro.
Material cost
The material cost will be calculated according to Haapio (2012) with the following formula:
CSM Wsmpl Csmbp Csmg Csmt Csmq =
Wsmpl -weight of the plate [kg]
262
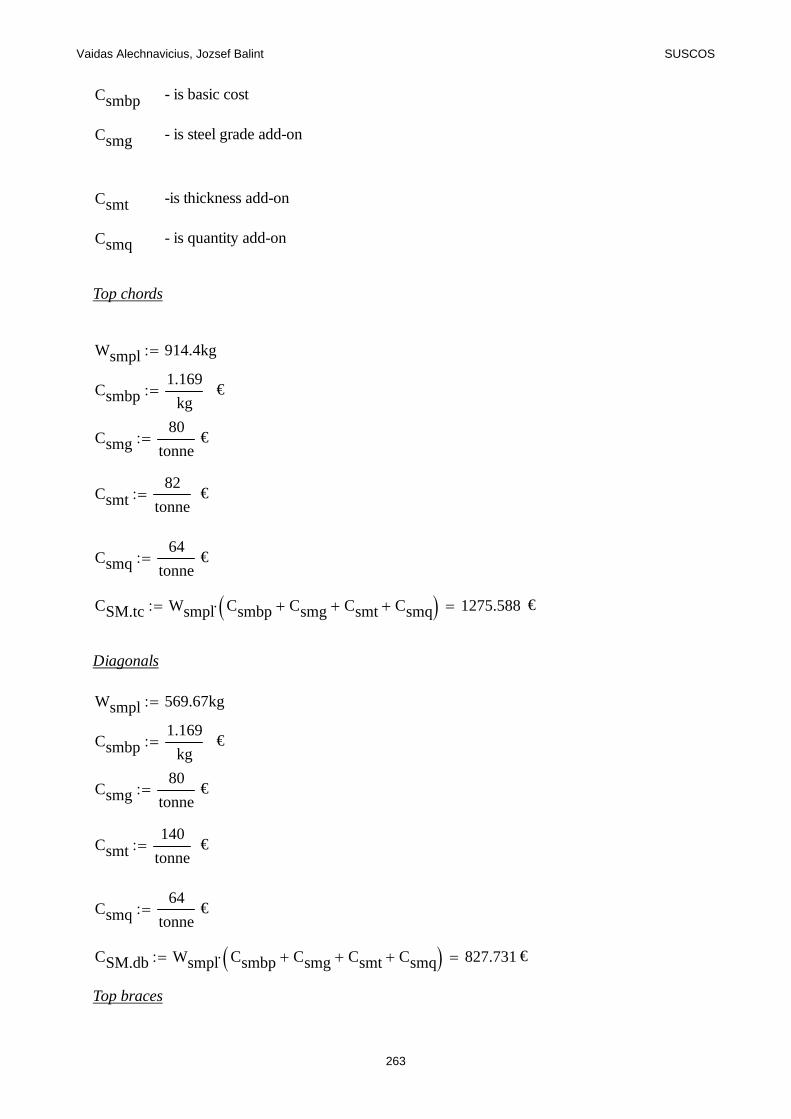
Vaidas Alechnavicius, Jozsef Balint SUSCOS
Csmbp - is basic cost
Csmg - is steel grade add-on
Csmt -is thickness add-on
Csmq - is quantity add-on
Top chords
Wsmpl 914.4kg
Csmbp1.169
kg €
Csmg80
tonne €
Csmt82
tonne €
Csmq64
tonne €
CSM.tc Wsmpl Csmbp Csmg Csmt Csmq 1275.588 €
Diagonals
Wsmpl 569.67kg
Csmbp1.169
kg €
Csmg80
tonne €
Csmt140
tonne €
Csmq64
tonne €
CSM.db Wsmpl Csmbp Csmg Csmt Csmq 827.731 €
Top braces
263
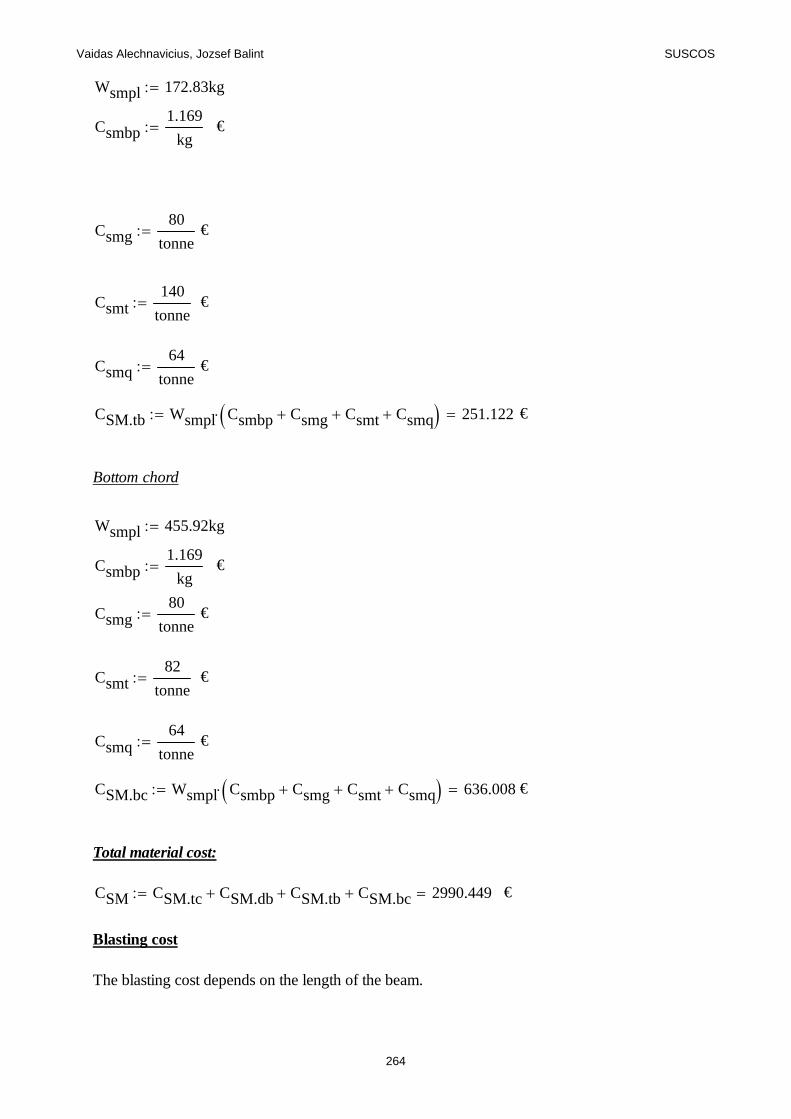
Vaidas Alechnavicius, Jozsef Balint SUSCOS
Wsmpl 172.83kg
Csmbp1.169
kg €
Csmg80
tonne €
Csmt140
tonne €
Csmq64
tonne €
CSM.tb Wsmpl Csmbp Csmg Csmt Csmq 251.122 €
Bottom chord
Wsmpl 455.92kg
Csmbp1.169
kg €
Csmg80
tonne €
Csmt82
tonne €
Csmq64
tonne €
CSM.bc Wsmpl Csmbp Csmg Csmt Csmq 636.008 €
Total material cost:
CSM CSM.tc CSM.db CSM.tb CSM.bc 2990.449 €
Blasting cost
The blasting cost depends on the length of the beam.
264
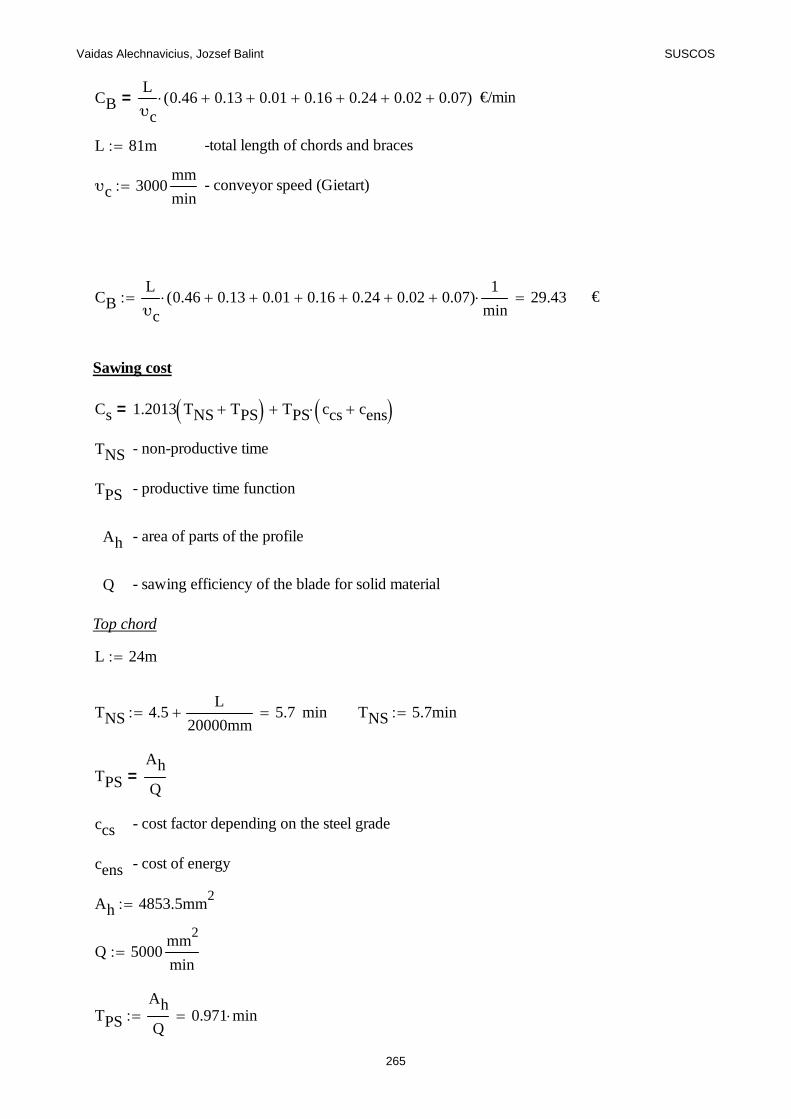
Vaidas Alechnavicius, Jozsef Balint SUSCOS
CBL
υc0.46 0.13 0.01 0.16 0.24 0.02 0.07( )= €/min
L 81m -total length of chords and braces
υc 3000mm
min - conveyor speed (Gietart)
CBL
υc0.46 0.13 0.01 0.16 0.24 0.02 0.07( )
1
min 29.43 €
Sawing cost
Cs 1.2013 TNS TPS TPS ccs cens =
TNS - non-productive time
TPS - productive time function
Ah - area of parts of the profile
Q - sawing efficiency of the blade for solid material
Top chord
L 24m
TNS 4.5L
20000mm 5.7 min TNS 5.7min
TPS
Ah
Q=
ccs - cost factor depending on the steel grade
cens - cost of energy
Ah 4853.5mm2
Q 5000mm
2
min
TPS
Ah
Q0.971 min
265
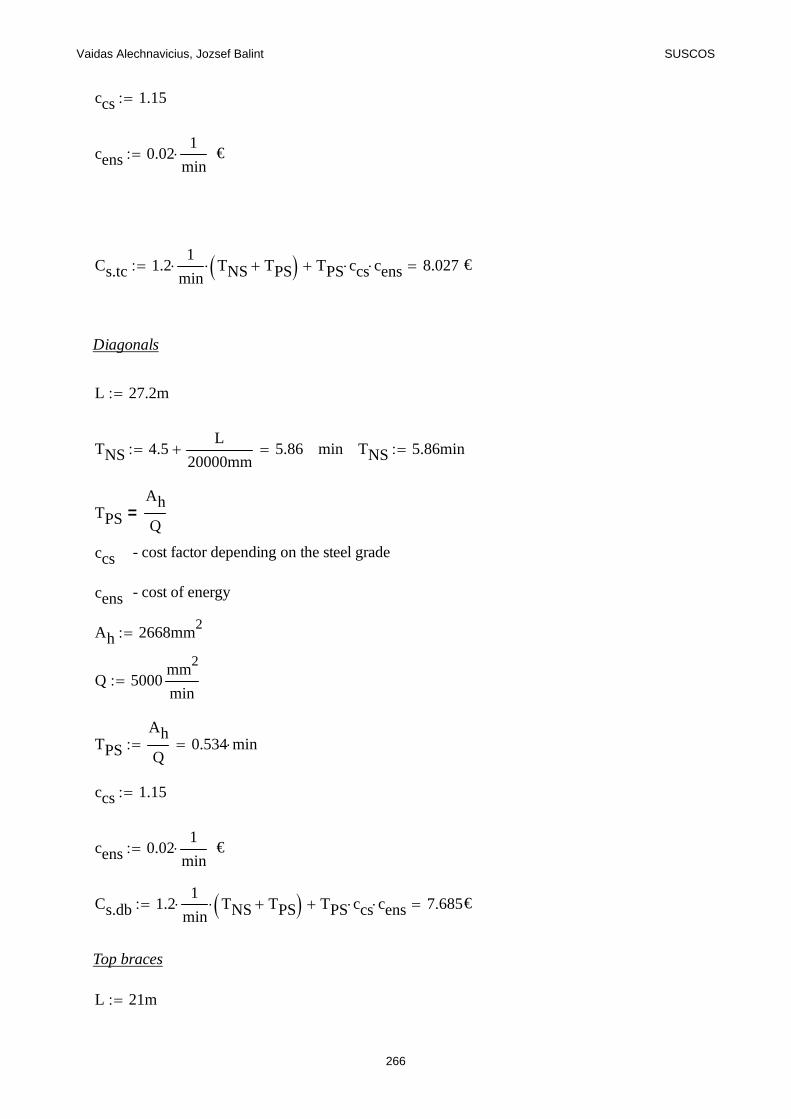
Vaidas Alechnavicius, Jozsef Balint SUSCOS
ccs 1.15
cens 0.021
min €
Cs.tc 1.21
min TNS TPS TPS ccs cens 8.027 €
Diagonals
L 27.2m
TNS 4.5L
20000mm 5.86 min TNS 5.86min
TPS
Ah
Q=
ccs - cost factor depending on the steel grade
cens - cost of energy
Ah 2668mm2
Q 5000mm
2
min
TPS
Ah
Q0.534 min
ccs 1.15
cens 0.021
min €
Cs.db 1.21
min TNS TPS TPS ccs cens 7.685 €
Top braces
L 21m
266
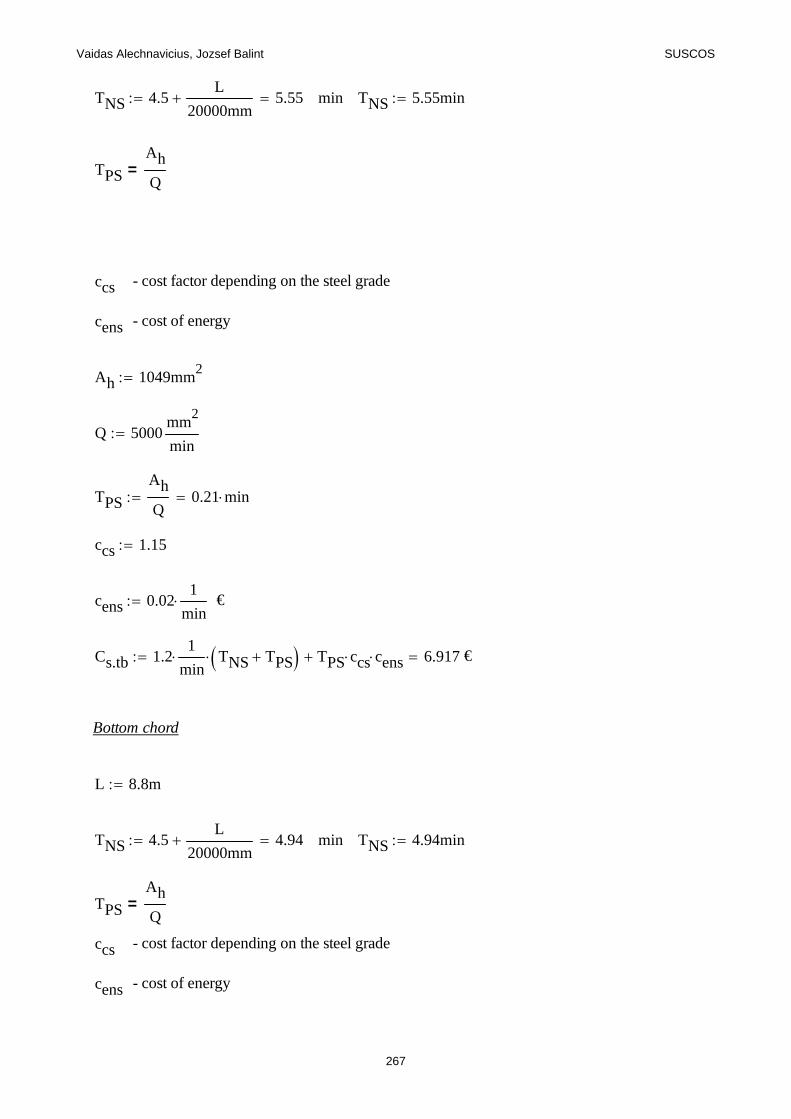
Vaidas Alechnavicius, Jozsef Balint SUSCOS
TNS 4.5L
20000mm 5.55 min TNS 5.55min
TPS
Ah
Q=
ccs - cost factor depending on the steel grade
cens - cost of energy
Ah 1049mm2
Q 5000mm
2
min
TPS
Ah
Q0.21 min
ccs 1.15
cens 0.021
min €
Cs.tb 1.21
min TNS TPS TPS ccs cens 6.917 €
Bottom chord
L 8.8m
TNS 4.5L
20000mm 4.94 min TNS 4.94min
TPS
Ah
Q=
ccs - cost factor depending on the steel grade
cens - cost of energy
267
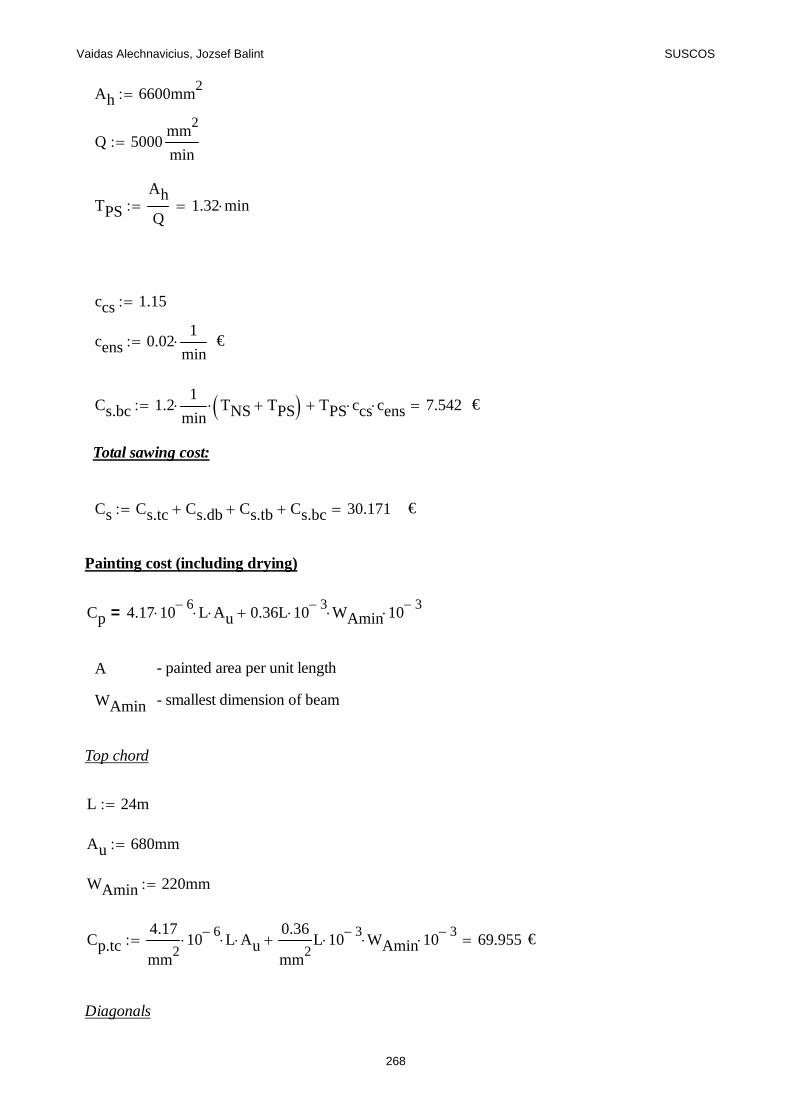
Vaidas Alechnavicius, Jozsef Balint SUSCOS
Ah 6600mm2
Q 5000mm
2
min
TPS
Ah
Q1.32 min
ccs 1.15
cens 0.021
min €
Cs.bc 1.21
min TNS TPS TPS ccs cens 7.542 €
Total sawing cost:
Cs Cs.tc Cs.db Cs.tb Cs.bc 30.171 €
Painting cost (including drying)
Cp 4.17 106 L Au 0.36L 10
3 WAmin 103=
A - painted area per unit length
WAmin - smallest dimension of beam
Top chord
L 24m
Au 680mm
WAmin 220mm
Cp.tc4.17
mm2
106 L Au
0.36
mm2
L 103 WAmin 10
3 69.955 €
Diagonals
268
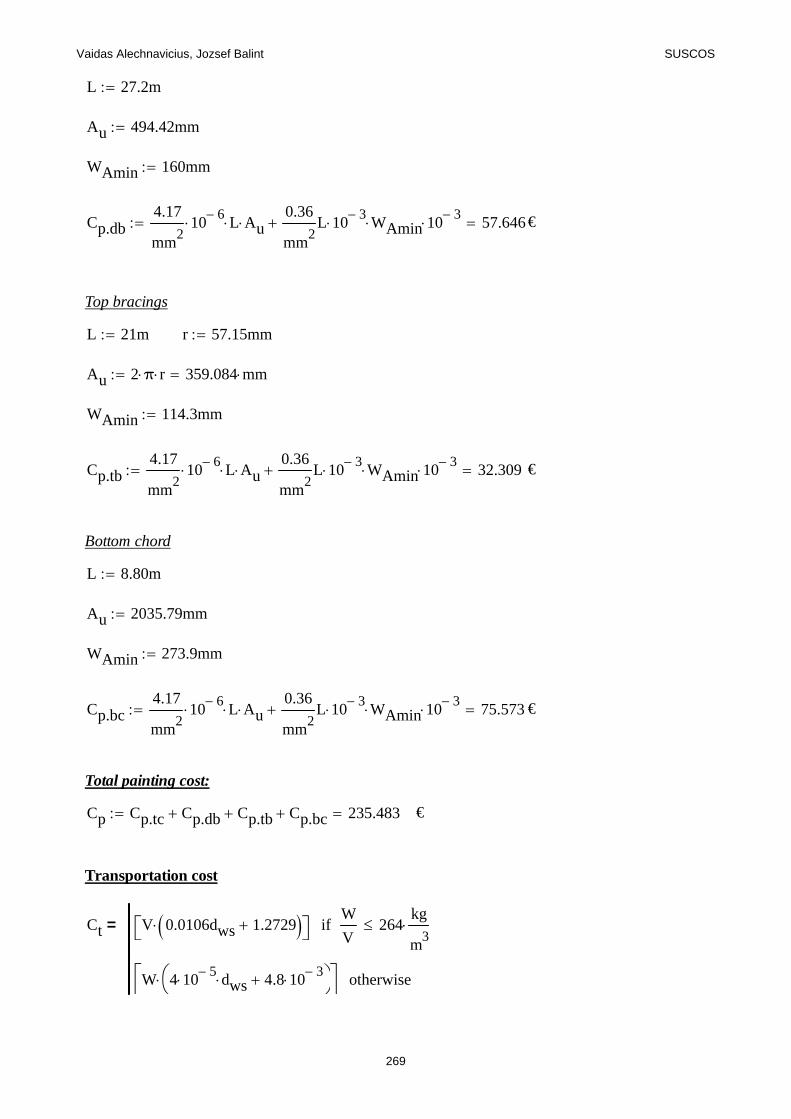
Vaidas Alechnavicius, Jozsef Balint SUSCOS
L 27.2m
Au 494.42mm
WAmin 160mm
Cp.db4.17
mm2
106 L Au
0.36
mm2
L 103 WAmin 10
3 57.646 €
Top bracings
L 21m r 57.15mm
Au 2 π r 359.084 mm
WAmin 114.3mm
Cp.tb4.17
mm2
106 L Au
0.36
mm2
L 103 WAmin 10
3 32.309 €
Bottom chord
L 8.80m
Au 2035.79mm
WAmin 273.9mm
Cp.bc4.17
mm2
106 L Au
0.36
mm2
L 103 WAmin 10
3 75.573 €
Total painting cost:
Cp Cp.tc Cp.db Cp.tb Cp.bc 235.483 €
Transportation cost
Ct V 0.0106dws 1.2729 W
V264
kg
m3
if
W 4 105 dws 4.8 10
3
otherwise
=
269
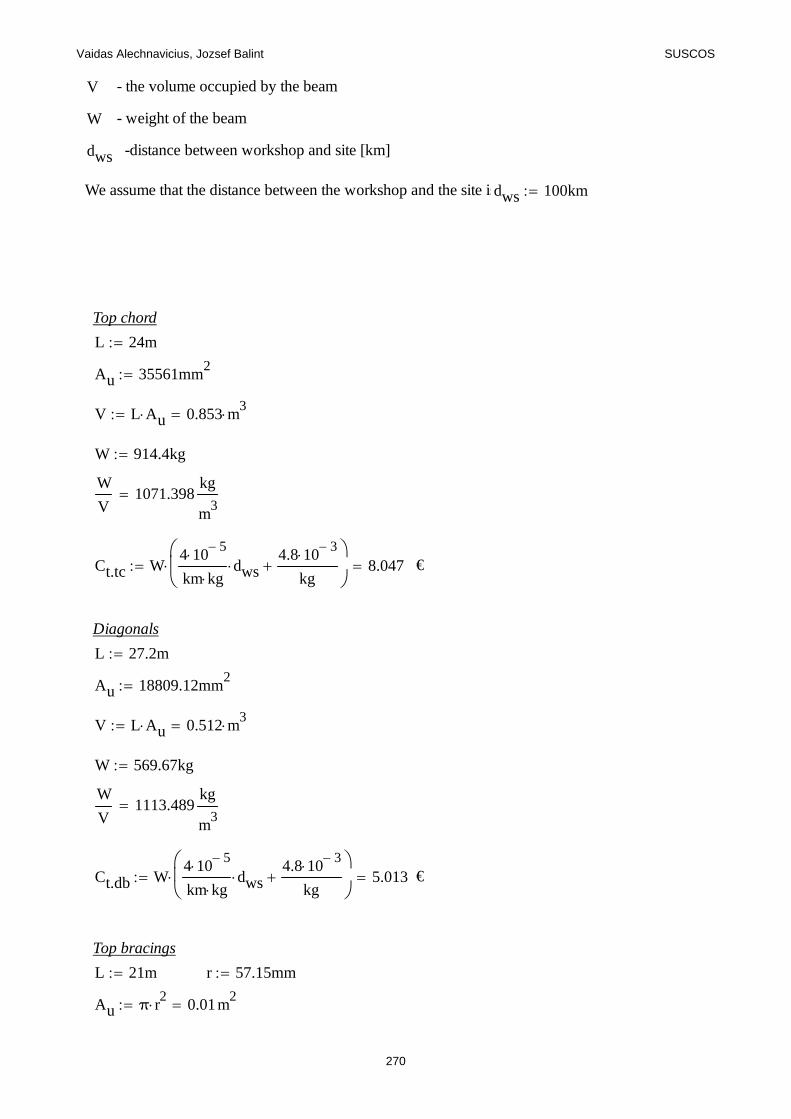
Vaidas Alechnavicius, Jozsef Balint SUSCOS
V - the volume occupied by the beam
W - weight of the beam
dws -distance between workshop and site [km]
We assume that the distance between the workshop and the site isdws 100km
Top chord
L 24m
Au 35561mm2
V L Au 0.853 m3
W 914.4kg
W
V1071.398
kg
m3
Ct.tc W4 10
5km kg
dws4.8 10
3kg
8.047 €
Diagonals
L 27.2m
Au 18809.12mm2
V L Au 0.512 m3
W 569.67kg
W
V1113.489
kg
m3
Ct.db W4 10
5km kg
dws4.8 10
3kg
5.013 €
Top bracings
L 21m r 57.15mm
Au π r2 0.01m
2
270
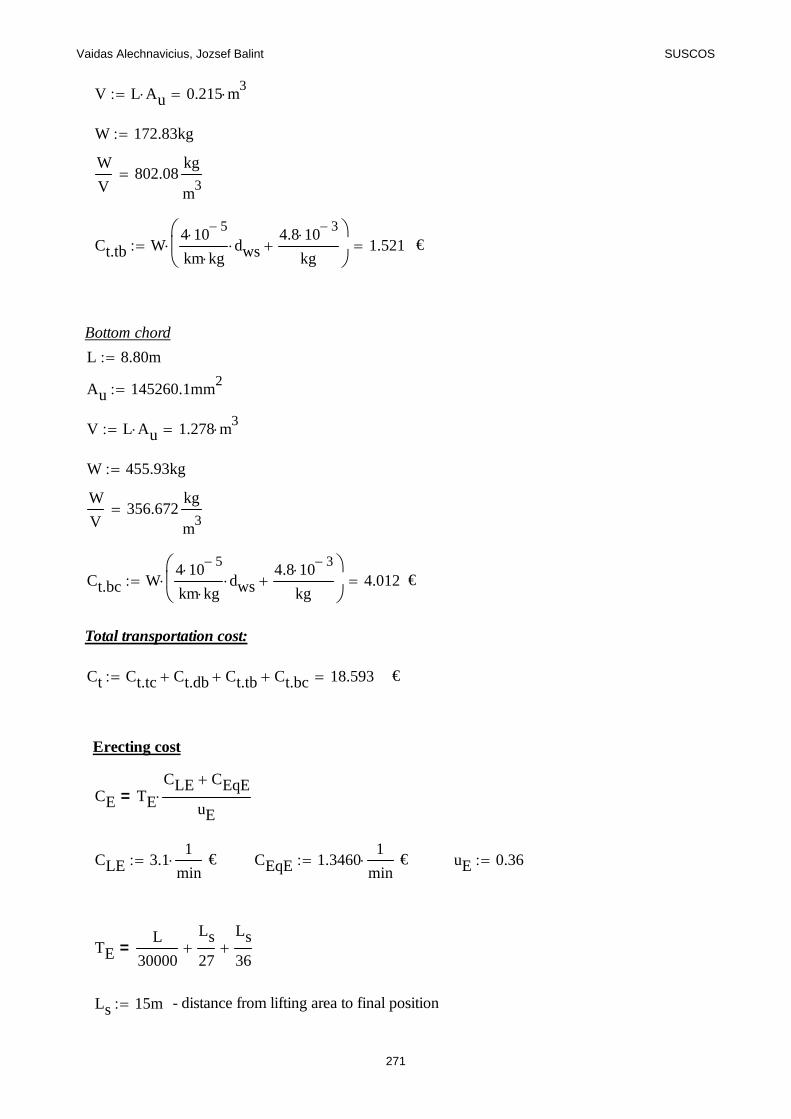
Vaidas Alechnavicius, Jozsef Balint SUSCOS
V L Au 0.215 m3
W 172.83kg
W
V802.08
kg
m3
Ct.tb W4 10
5km kg
dws4.8 10
3kg
1.521 €
Bottom chord
L 8.80m
Au 145260.1mm2
V L Au 1.278 m3
W 455.93kg
W
V356.672
kg
m3
Ct.bc W4 10
5km kg
dws4.8 10
3kg
4.012 €
Total transportation cost:
Ct Ct.tc Ct.db Ct.tb Ct.bc 18.593 €
Erecting cost
CE TE
CLE CEqE
uE=
CLE 3.11
min € CEqE 1.3460
1
min € uE 0.36
TEL
30000
Ls
27
Ls
36=
Ls 15m - distance from lifting area to final position
271
Vaidas Alechnavicius, Jozsef Balint SUSCOS
L 12m
TEL
30000mm
min
Ls
27m
min
Ls
36m
min
1.372 min
CE TE
CLE CEqE
uE 16.947 €
The total cost for the S500 built-up section is:
CT.500 CSM CB Cs Cp Ct CE 3321.073 €
272
Vaidas Alechnavicius, Jozsef Balint SUSCOS
Determination of the total cost of S355 polygonal truss
Total cost is determined by:
CT CSM CB Cs CP Ct CE=
where:
CT -total cost
CSM - material cost
CB - blasting cost
Cs - sawing cost
CP - painting cost
Ct - tranporting cost
CE - erecting cost
All prices are expressed in euro.
Material cost
The material cost will be calculated according to Haapio (2012) with the following formula:
CSM Wsmpl Csmbp Csmg Csmt Csmq =
Wsmpl -weight of the plate [kg]
273
Vaidas Alechnavicius, Jozsef Balint SUSCOS
Csmbp - is basic cost
Csmg - is steel grade add-on
Csmt -is thickness add-on
Csmq - is quantity add-on
Top chords
Wsmpl 973.09kg
Csmbp1.169
kg €
Csmg35
tonne €
Csmt82
tonne €
Csmq64
tonne €
CSM.tc Wsmpl Csmbp Csmg Csmt Csmq 1313.672 €
Diagonals
Wsmpl 626.96kg
Csmbp1.169
kg €
Csmg35
tonne €
Csmt140
tonne €
Csmq64
tonne €
CSM.db Wsmpl Csmbp Csmg Csmt Csmq 882.76 €
274
Vaidas Alechnavicius, Jozsef Balint SUSCOS
Top braces
Wsmpl 216.3kg
Csmbp1.169
kg €
Csmg35
tonne €
Csmt140
tonne €
Csmq64
tonne €
CSM.tb Wsmpl Csmbp Csmg Csmt Csmq 304.55 €
Bottom chord
Wsmpl 657kg
Csmbp1.169
kg €
Csmg35
tonne €
Csmt23
tonne €
Csmq82
tonne €
CSM.bc Wsmpl Csmbp Csmg Csmt Csmq 860.013 €
Total material cost:
CSM CSM.tc CSM.db CSM.tb CSM.bc 3360.995 €
Blasting cost
275
Vaidas Alechnavicius, Jozsef Balint SUSCOS
The blasting cost depends on the length of the beam.
CBL
υc0.46 0.13 0.01 0.16 0.24 0.02 0.07( )= €/min
L 80.74m -total length of chords and braces
υc 3000mm
min - conveyor speed (Gietart)
CBL
υc0.46 0.13 0.01 0.16 0.24 0.02 0.07( )
1
min 29.336 €
Sawing cost
Cs 1.2013 TNS TPS TPS ccs cens =
TNS - non-productive time
TPS - productive time function
Ah - area of parts of the profile
Q - sawing efficiency of the blade for solid material
Top chord
L 24m
TNS 4.5L
20000mm 5.7 min TNS 5.7min
TPS
Ah
Q=
ccs - cost factor depending on the steel grade
cens - cost of energy
Ah 5165mm2
Q 8800mm
2
min
TPS
Ah
Q0.587 min
276
Vaidas Alechnavicius, Jozsef Balint SUSCOS
ccs 1
cens 0.021
min €
Cs.tc 1.21
min TNS TPS TPS ccs cens 7.556 €
Diagonals
L 26.74m
TNS 4.5L
20000mm 5.837 min TNS 5.837min
TPS
Ah
Q=
ccs - cost factor depending on the steel grade
cens - cost of energy
Ah 2986.86mm2
Q 8800mm
2
min
TPS
Ah
Q0.339 min
ccs 1
cens 0.021
min €
Cs.db 1.21
min TNS TPS TPS ccs cens 7.418 €
Top braces
L 21m
277
Vaidas Alechnavicius, Jozsef Balint SUSCOS
TNS 4.5L
20000mm 5.55 min TNS 5.55min
TPS
Ah
Q=
ccs - cost factor depending on the steel grade
cens - cost of energy
Ah 1307mm2
Q 8800mm
2
min
TPS
Ah
Q0.149 min
ccs 1
cens 0.021
min €
Cs.tb 1.21
min TNS TPS TPS ccs cens 6.841 €
Bottom chord
L 9m
TNS 4.5L
20000mm 4.95 min TNS 4.95min
TPS
Ah
Q=
ccs - cost factor depending on the steel grade
cens - cost of energy
Ah 9300mm2
278
Vaidas Alechnavicius, Jozsef Balint SUSCOS
Q 8800mm
2
min
TPS
Ah
Q1.057 min
ccs 1
cens 0.021
min €
Cs.bc 1.21
min TNS TPS TPS ccs cens 7.229 €
Total sawing cost:
Cs Cs.tc Cs.db Cs.tb Cs.bc 29.045 €
Painting cost (including drying)
Cp 4.17 106 L Au 0.36L 10
3 WAmin 103=
A - painted area per unit length
WAmin - smallest dimension of beam
Top chord
L 24m
Au 741.64mm
WAmin 240mm
Cp.tc4.17
mm2
106 L Au
0.36
mm2
L 103 WAmin 10
3 76.297 €
Diagonals
L 26.74m
279
Vaidas Alechnavicius, Jozsef Balint SUSCOS
Au 587.13mm
WAmin 190mm
Cp.db4.17
mm2
106 L Au
0.36
mm2
L 103 WAmin 10
3 67.297 €
Top bracings
L 21m r 54mm
Au 2 π r 339.292 mm
WAmin 108mm
Cp.tb4.17
mm2
106 L Au
0.36
mm2
L 103 WAmin 10
3 30.528 €
Bottom chord
L 9m
Au 2414.34mm
WAmin 325mm
Cp.bc4.17
mm2
106 L Au
0.36
mm2
L 103 WAmin 10
3 91.663 €
Total painting cost:
Cp Cp.tc Cp.db Cp.tb Cp.bc 265.786 €
Transportation cost
280
Vaidas Alechnavicius, Jozsef Balint SUSCOS
Ct V 0.0106dws 1.2729 W
V264
kg
m3
if
W 4 105 dws 4.8 10
3
otherwise
=
V - the volume occupied by the beam
W - weight of the beam
dws -distance between workshop and site [km]
We assume that the distance between the workshop and the site isdws 100km
Top chord
L 24m
Au 42320.54mm2
V L Au 1.016 m3
W 973.08kg
W
V958.045
kg
m3
Ct.tc W4 10
5km kg
dws4.8 10
3kg
8.563 €
Diagonals
L 26.74m
Au 26523.8mm2
V L Au 0.709 m3
W 626.97kg
W
V883.995
kg
m3
Ct.db W4 10
5km kg
dws4.8 10
3kg
5.517 €
281
Vaidas Alechnavicius, Jozsef Balint SUSCOS
Top bracings
L 21m r 54mm
Au π r2 0.009m
2
V L Au 0.192 m3
W 159.57kg
W
V829.458
kg
m3
Ct.tb W4 10
5km kg
dws4.8 10
3kg
1.404 €
Bottom chord
L 9m
Au 202554.2mm2
V L Au 1.823 m3
W 657.045kg
W
V360.422
kg
m3
Ct.bc W4 10
5km kg
dws4.8 10
3kg
5.782 €
Total transportation cost:
Ct Ct.tc Ct.db Ct.tb Ct.bc 21.267 €
Erecting cost
CE TE
CLE CEqE
uE=
CLE 3.11
min € CEqE 1.3460
1
min € uE 0.36
282
Vaidas Alechnavicius, Jozsef Balint SUSCOS
TEL
30000
Ls
27
Ls
36=
Ls 15m - distance from lifting area to final position
L 12m
TEL
30000mm
min
Ls
27m
min
Ls
36m
min
1.372 min
CE TE
CLE CEqE
uE 16.947 €
The total cost for the S355 built-up section is:
CT.355 CSM CB Cs Cp Ct CE 3723.375 €
283

Vaidas Alechnavicius, Jozsef Balit SUSCOS
ANNEX E
CO 2 emissions for the S650 CHS truss
Steel production
m650 2201.55kg - total mass of the steel
The amount of CO2 emissions is converted to a higher strength steel with the following formula,
presented in "Jan-Olof steel eco-cycle":
co2.emiss.650 0.00018 650 355( )1070
1000
1000 1123.1
co2.emiss.6501123.1gm
kg
co2.steel m650 co2.emiss.650 2472560.805 gm CO2
Painting
Acrylic paint will be used for the truss elements.
macryl 2.5kg
L -amount of CO2 emission according to JouCO2&COSTi
tpaint 1.5mm - thickness of paint applied to the truss elements
Apaint 38.611 m2 - painted area
Vpaint Apaint tpaint 57.916L -volume of paint needed
co2.acryl macryl Vpaint 144791.25 gm CO2
co2.paint co2.acryl 144791.25 gm CO2
284
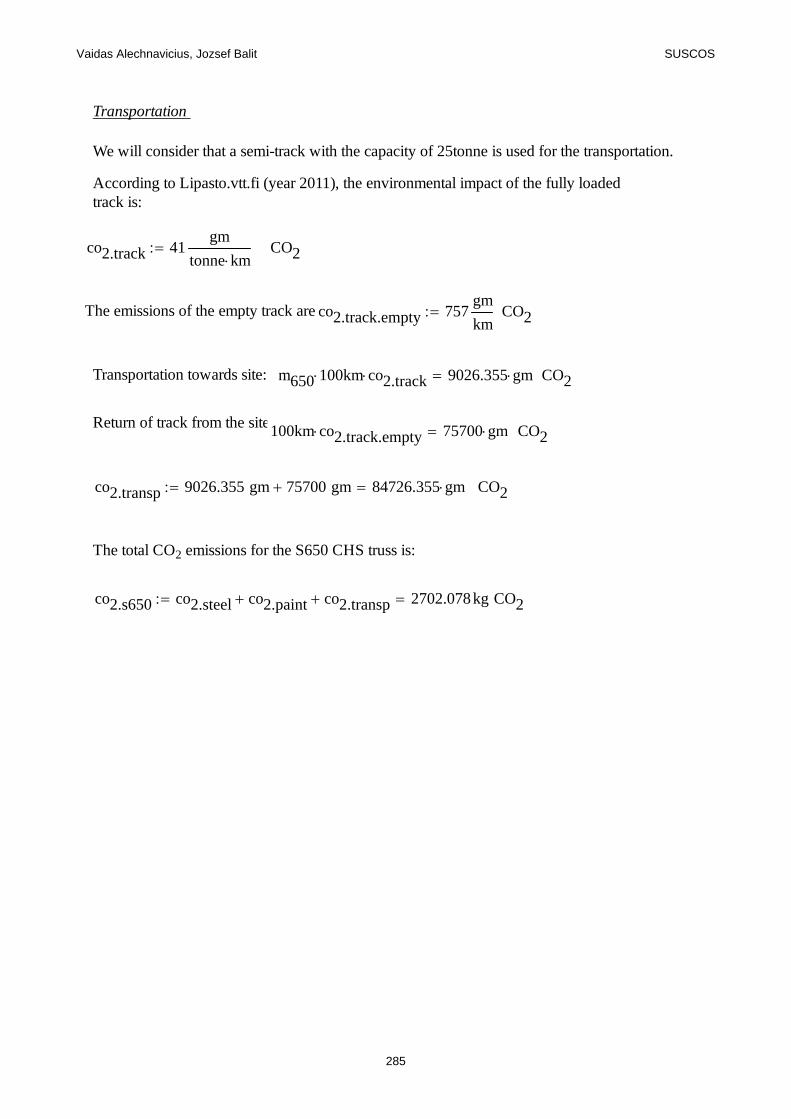
Vaidas Alechnavicius, Jozsef Balit SUSCOS
Transportation
We will consider that a semi-track with the capacity of 25tonne is used for the transportation.
According to Lipasto.vtt.fi (year 2011), the environmental impact of the fully loadedtrack is:
co2.track 41gm
tonne km CO2
The emissions of the empty track are:co2.track.empty 757gm
km CO2
Transportation towards site: m650 100 km co2.track 9026.355 gm CO2
Return of track from the site:100km co2.track.empty 75700 gm CO2
co2.transp 9026.355 gm 75700 gm 84726.355 gm CO2
The total CO2 emissions for the S650 CHS truss is:
co2.s650 co2.steel co2.paint co2.transp 2702.078kg CO2
285
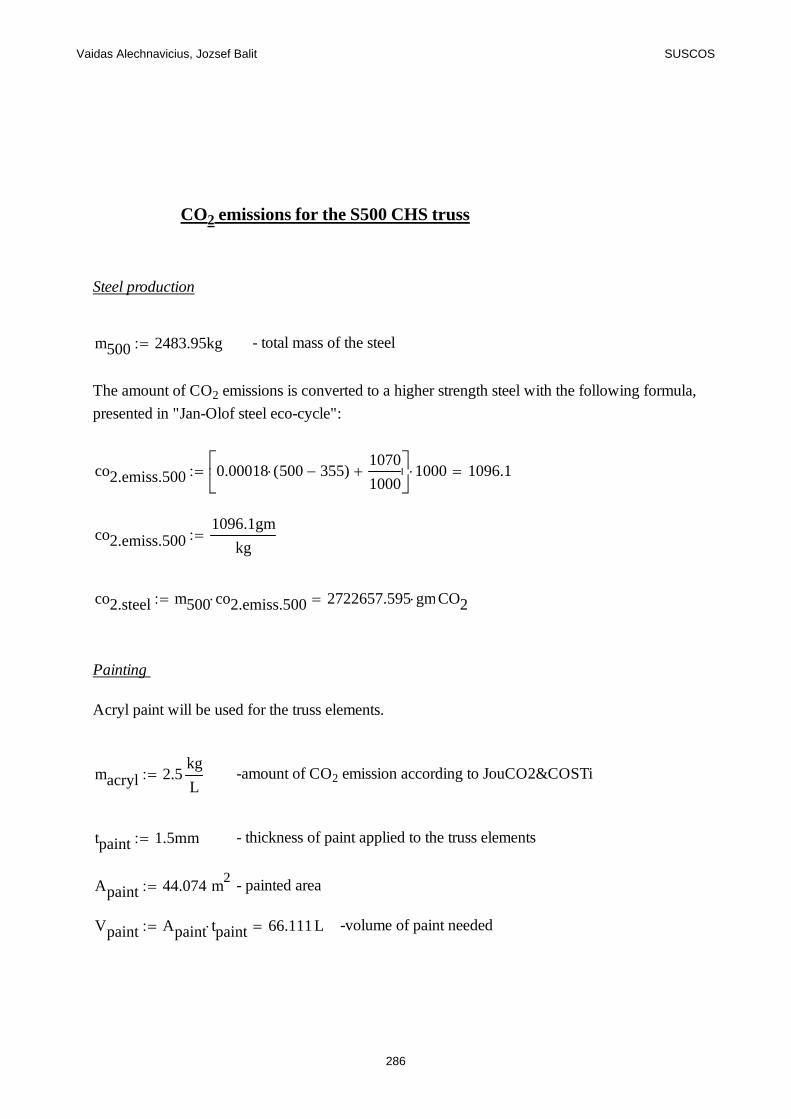
Vaidas Alechnavicius, Jozsef Balit SUSCOS
CO 2 emissions for the S500 CHS truss
Steel production
m500 2483.95kg - total mass of the steel
The amount of CO2 emissions is converted to a higher strength steel with the following formula,
presented in "Jan-Olof steel eco-cycle":
co2.emiss.500 0.00018 500 355( )1070
1000
1000 1096.1
co2.emiss.5001096.1gm
kg
co2.steel m500 co2.emiss.500 2722657.595 gm CO2
Painting
Acryl paint will be used for the truss elements.
macryl 2.5kg
L -amount of CO2 emission according to JouCO2&COSTi
tpaint 1.5mm - thickness of paint applied to the truss elements
Apaint 44.074 m2 - painted area
Vpaint Apaint tpaint 66.111L -volume of paint needed
286
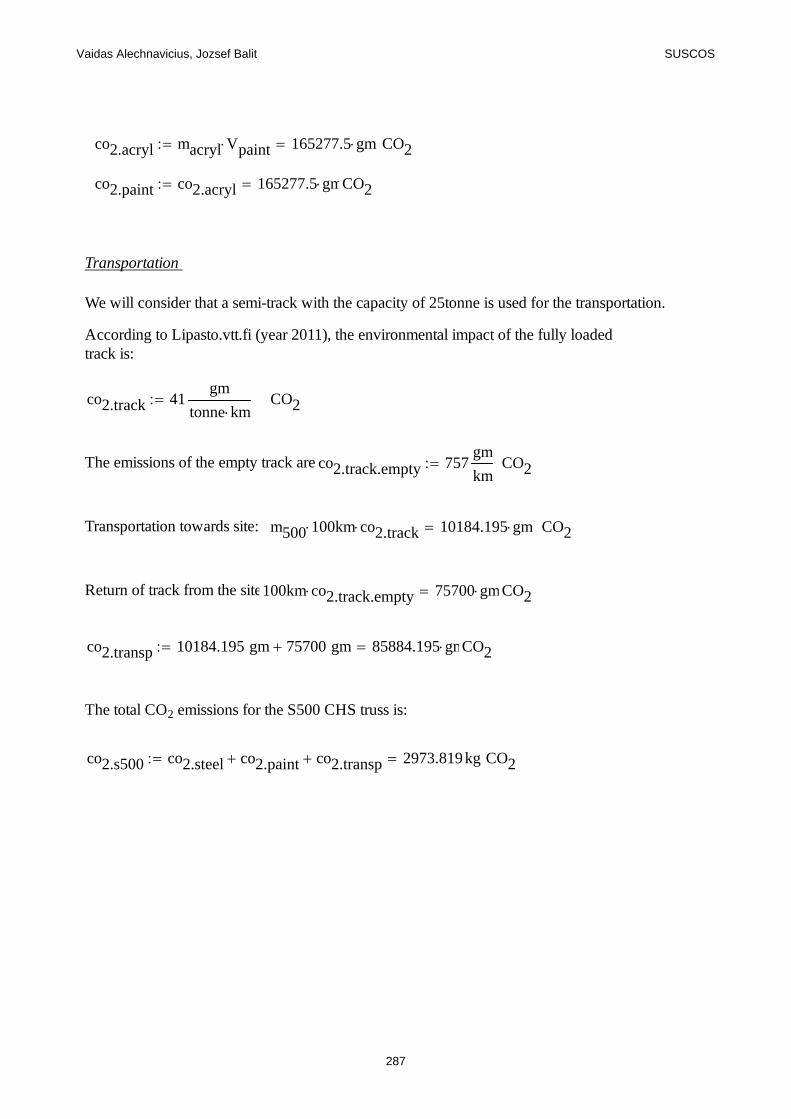
Vaidas Alechnavicius, Jozsef Balit SUSCOS
co2.acryl macryl Vpaint 165277.5 gm CO2
co2.paint co2.acryl 165277.5 gm CO2
Transportation
We will consider that a semi-track with the capacity of 25tonne is used for the transportation.
According to Lipasto.vtt.fi (year 2011), the environmental impact of the fully loadedtrack is:
co2.track 41gm
tonne km CO2
The emissions of the empty track are:co2.track.empty 757gm
km CO2
Transportation towards site: m500 100 km co2.track 10184.195 gm CO2
Return of track from the site:100km co2.track.empty 75700 gm CO2
co2.transp 10184.195 gm 75700 gm 85884.195 gm CO2
The total CO2 emissions for the S500 CHS truss is:
co2.s500 co2.steel co2.paint co2.transp 2973.819kg CO2
287
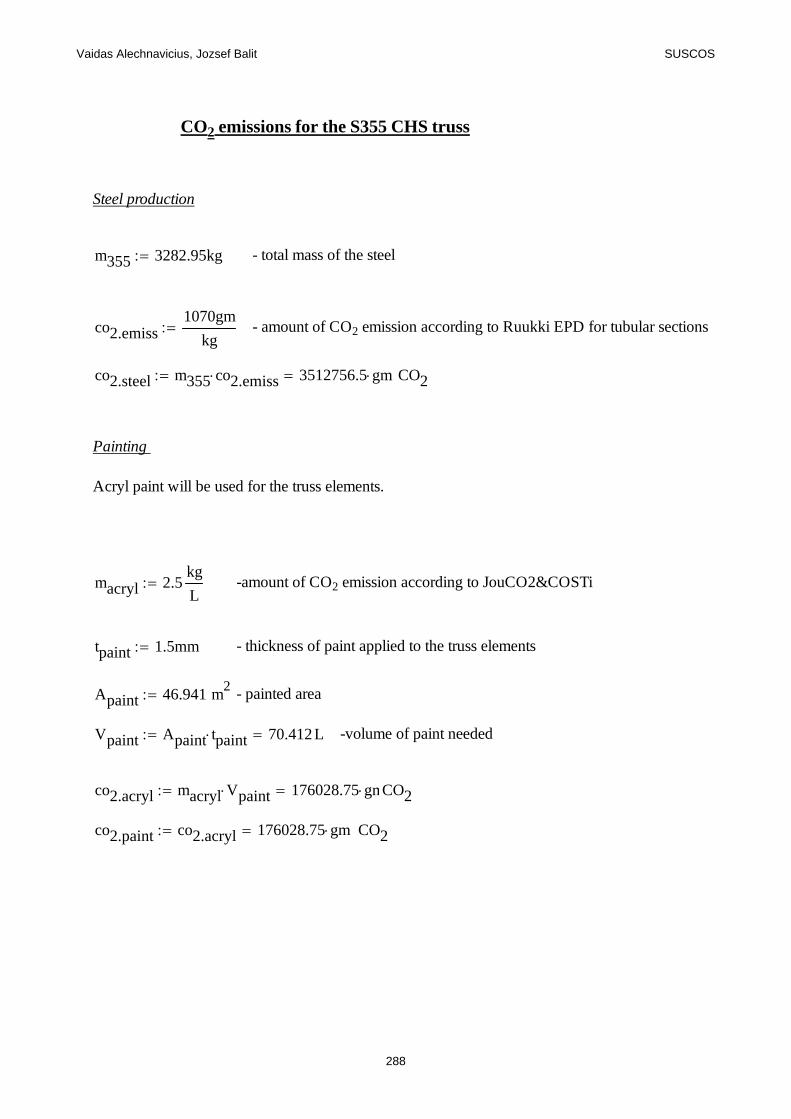
Vaidas Alechnavicius, Jozsef Balit SUSCOS
CO 2 emissions for the S355 CHS truss
Steel production
m355 3282.95kg - total mass of the steel
co2.emiss1070gm
kg - amount of CO2 emission according to Ruukki EPD for tubular sections
co2.steel m355 co2.emiss 3512756.5 gm CO2
Painting
Acryl paint will be used for the truss elements.
macryl 2.5kg
L -amount of CO2 emission according to JouCO2&COSTi
tpaint 1.5mm - thickness of paint applied to the truss elements
Apaint 46.941 m2 - painted area
Vpaint Apaint tpaint 70.412L -volume of paint needed
co2.acryl macryl Vpaint 176028.75 gm CO2
co2.paint co2.acryl 176028.75 gm CO2
288
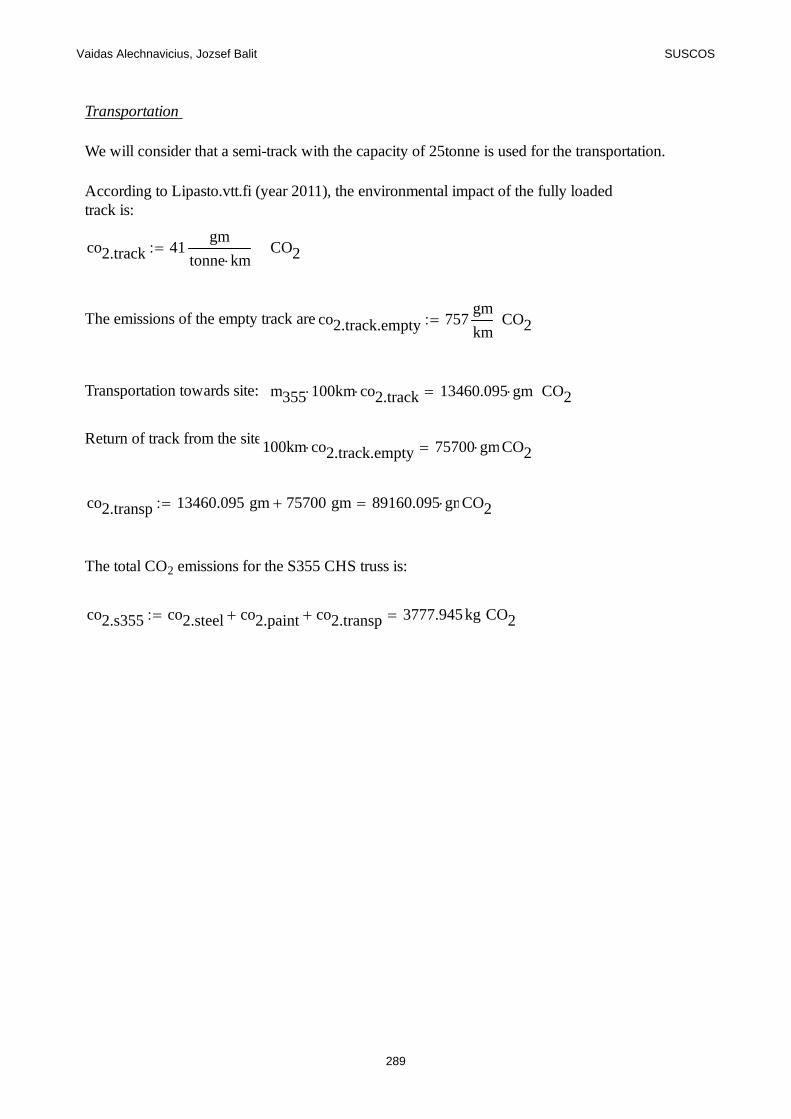
Vaidas Alechnavicius, Jozsef Balit SUSCOS
Transportation
We will consider that a semi-track with the capacity of 25tonne is used for the transportation.
According to Lipasto.vtt.fi (year 2011), the environmental impact of the fully loadedtrack is:
co2.track 41gm
tonne km CO2
The emissions of the empty track are:co2.track.empty 757gm
km CO2
Transportation towards site: m355 100 km co2.track 13460.095 gm CO2
Return of track from the site:100km co2.track.empty 75700 gm CO2
co2.transp 13460.095 gm 75700 gm 89160.095 gm CO2
The total CO2 emissions for the S355 CHS truss is:
co2.s355 co2.steel co2.paint co2.transp 3777.945kg CO2
289
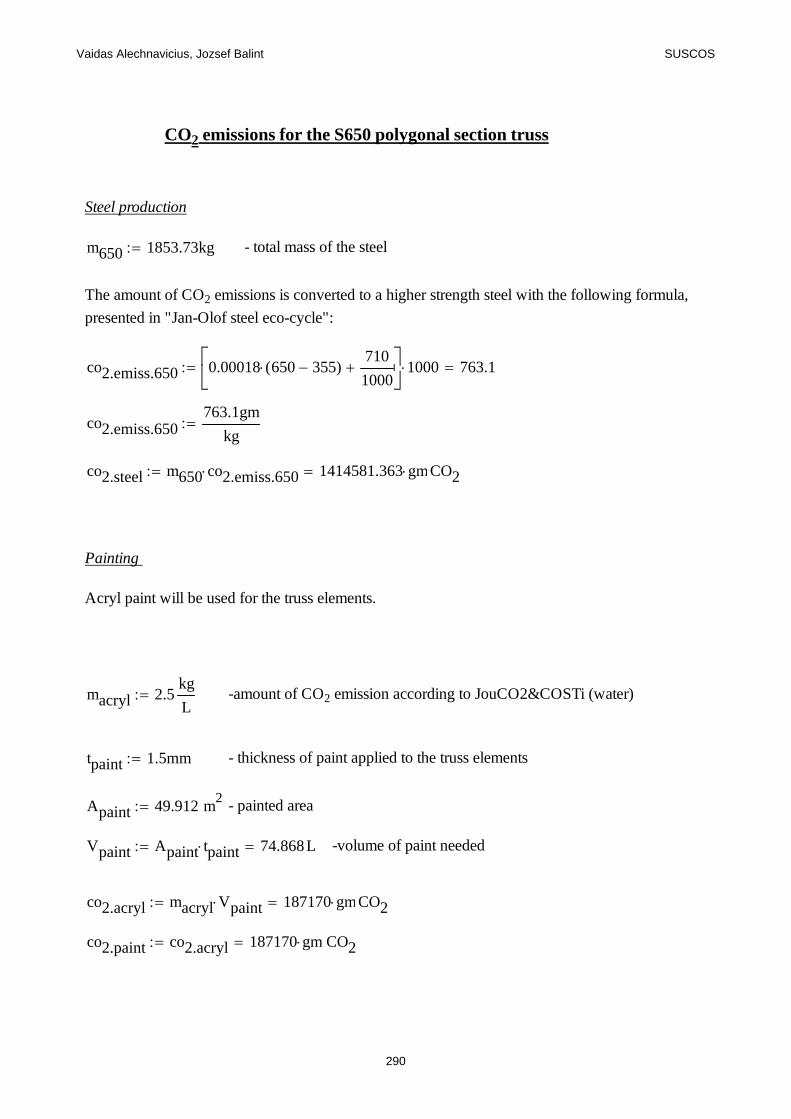
Vaidas Alechnavicius, Jozsef Balint SUSCOS
CO 2 emissions for the S650 polygonal section truss
Steel production
m650 1853.73kg - total mass of the steel
The amount of CO2 emissions is converted to a higher strength steel with the following formula,
presented in "Jan-Olof steel eco-cycle":
co2.emiss.650 0.00018 650 355( )710
1000
1000 763.1
co2.emiss.650763.1gm
kg
co2.steel m650 co2.emiss.650 1414581.363 gm CO2
Painting
Acryl paint will be used for the truss elements.
macryl 2.5kg
L -amount of CO2 emission according to JouCO2&COSTi (water)
tpaint 1.5mm - thickness of paint applied to the truss elements
Apaint 49.912 m2 - painted area
Vpaint Apaint tpaint 74.868L -volume of paint needed
co2.acryl macryl Vpaint 187170 gm CO2
co2.paint co2.acryl 187170 gm CO2
290
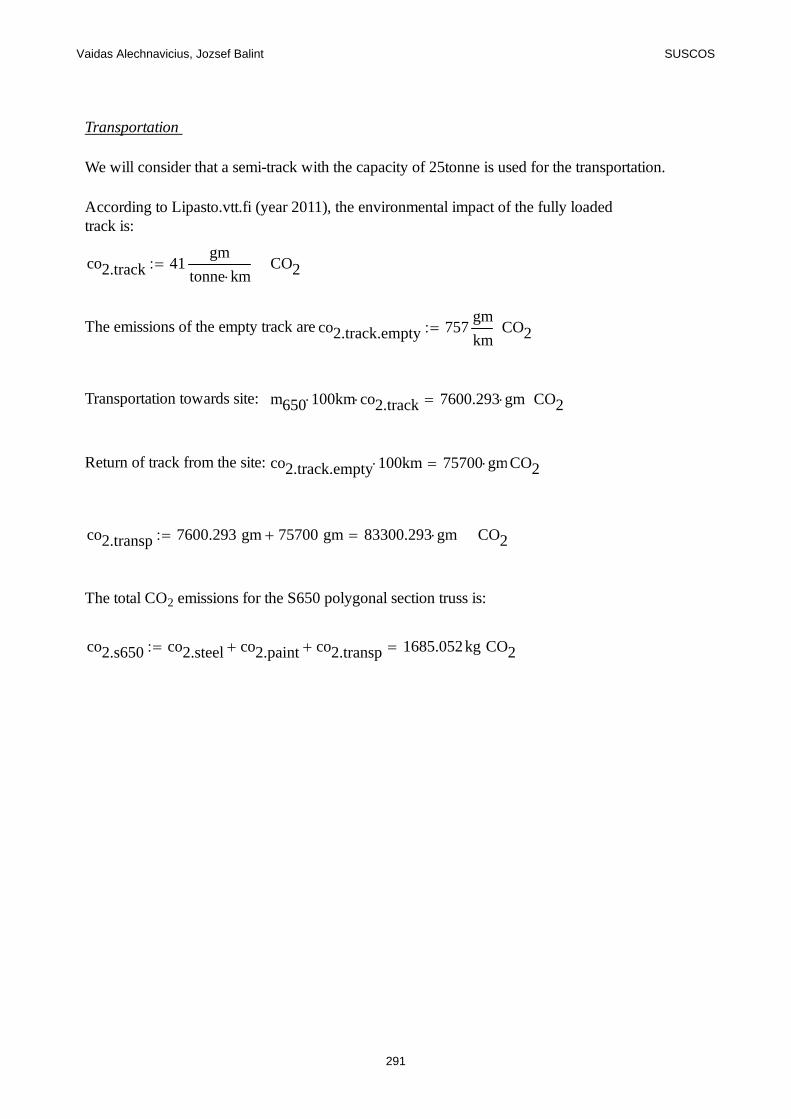
Vaidas Alechnavicius, Jozsef Balint SUSCOS
Transportation
We will consider that a semi-track with the capacity of 25tonne is used for the transportation.
According to Lipasto.vtt.fi (year 2011), the environmental impact of the fully loadedtrack is:
co2.track 41gm
tonne km CO2
The emissions of the empty track are:co2.track.empty 757gm
km CO2
Transportation towards site: m650 100 km co2.track 7600.293 gm CO2
Return of track from the site: co2.track.empty 100 km 75700 gm CO2
co2.transp 7600.293 gm 75700 gm 83300.293 gm CO2
The total CO2 emissions for the S650 polygonal section truss is:
co2.s650 co2.steel co2.paint co2.transp 1685.052kg CO2
291
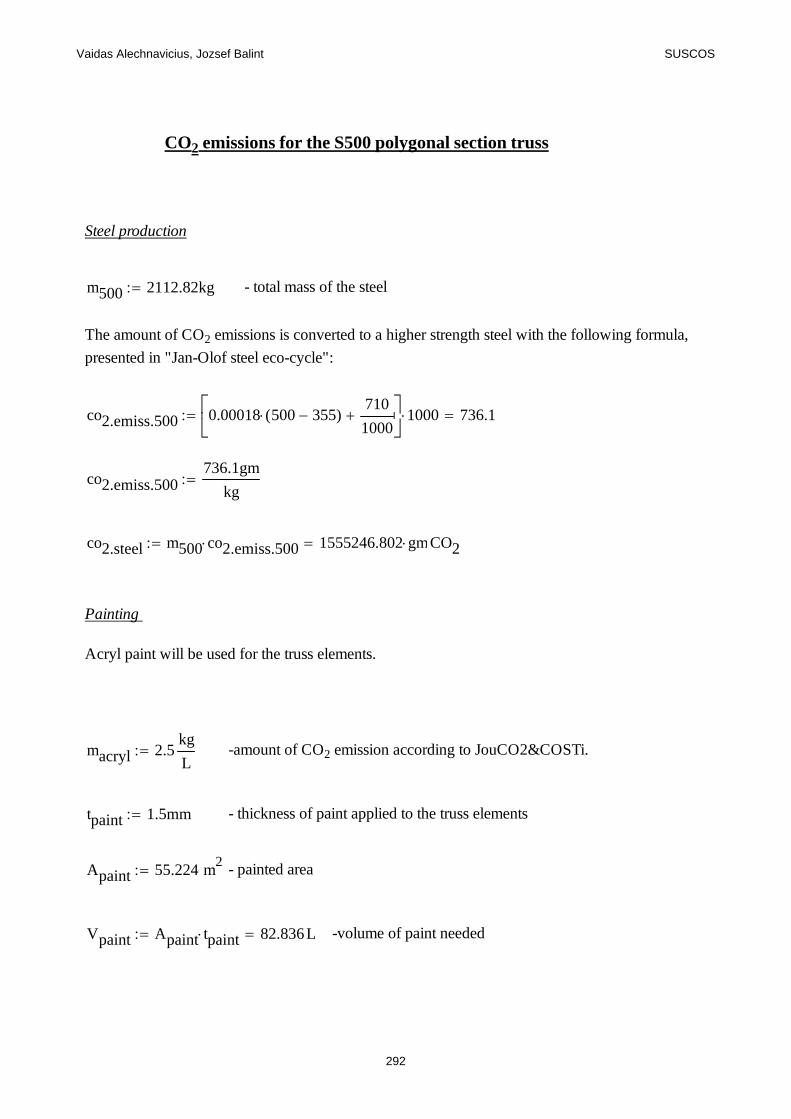
Vaidas Alechnavicius, Jozsef Balint SUSCOS
CO 2 emissions for the S500 polygonal section truss
Steel production
m500 2112.82kg - total mass of the steel
The amount of CO2 emissions is converted to a higher strength steel with the following formula,
presented in "Jan-Olof steel eco-cycle":
co2.emiss.500 0.00018 500 355( )710
1000
1000 736.1
co2.emiss.500736.1gm
kg
co2.steel m500 co2.emiss.500 1555246.802 gm CO2
Painting
Acryl paint will be used for the truss elements.
macryl 2.5kg
L -amount of CO2 emission according to JouCO2&COSTi.
tpaint 1.5mm - thickness of paint applied to the truss elements
Apaint 55.224 m2 - painted area
Vpaint Apaint tpaint 82.836L -volume of paint needed
292
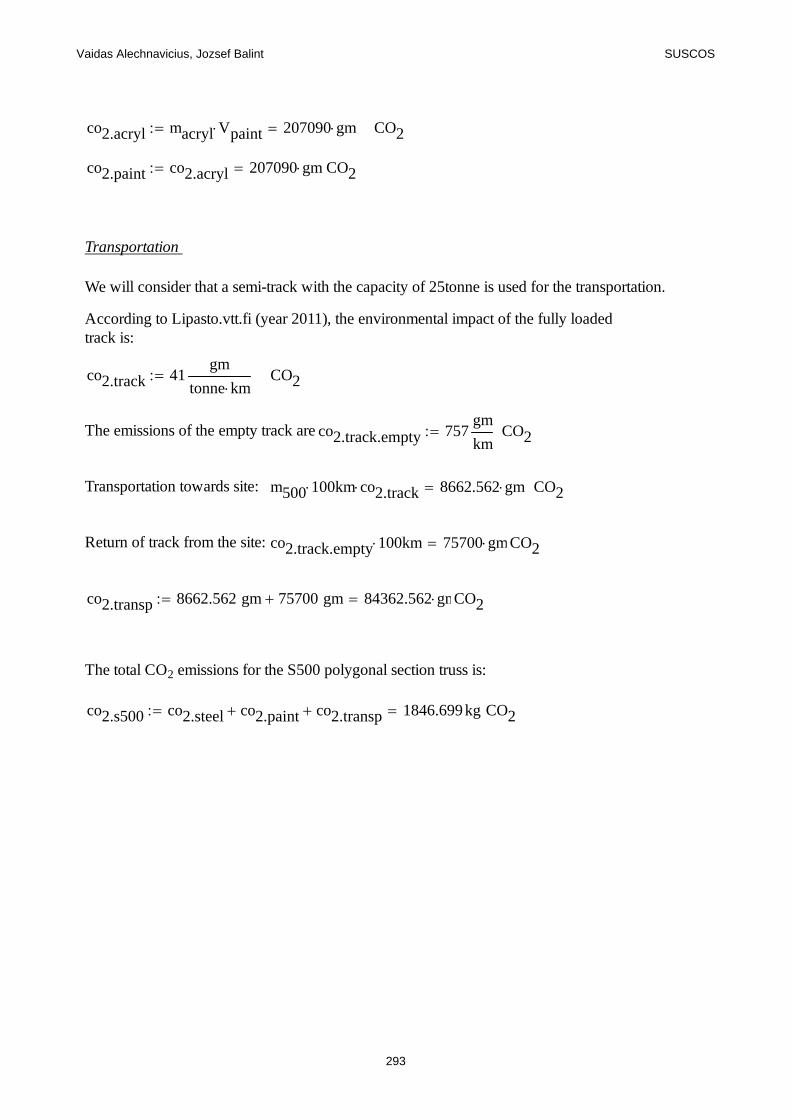
Vaidas Alechnavicius, Jozsef Balint SUSCOS
co2.acryl macryl Vpaint 207090 gm CO2
co2.paint co2.acryl 207090 gm CO2
Transportation
We will consider that a semi-track with the capacity of 25tonne is used for the transportation.
According to Lipasto.vtt.fi (year 2011), the environmental impact of the fully loadedtrack is:
co2.track 41gm
tonne km CO2
The emissions of the empty track are:co2.track.empty 757gm
km CO2
Transportation towards site: m500 100 km co2.track 8662.562 gm CO2
Return of track from the site: co2.track.empty 100 km 75700 gm CO2
co2.transp 8662.562 gm 75700 gm 84362.562 gm CO2
The total CO2 emissions for the S500 polygonal section truss is:
co2.s500 co2.steel co2.paint co2.transp 1846.699kg CO2
293
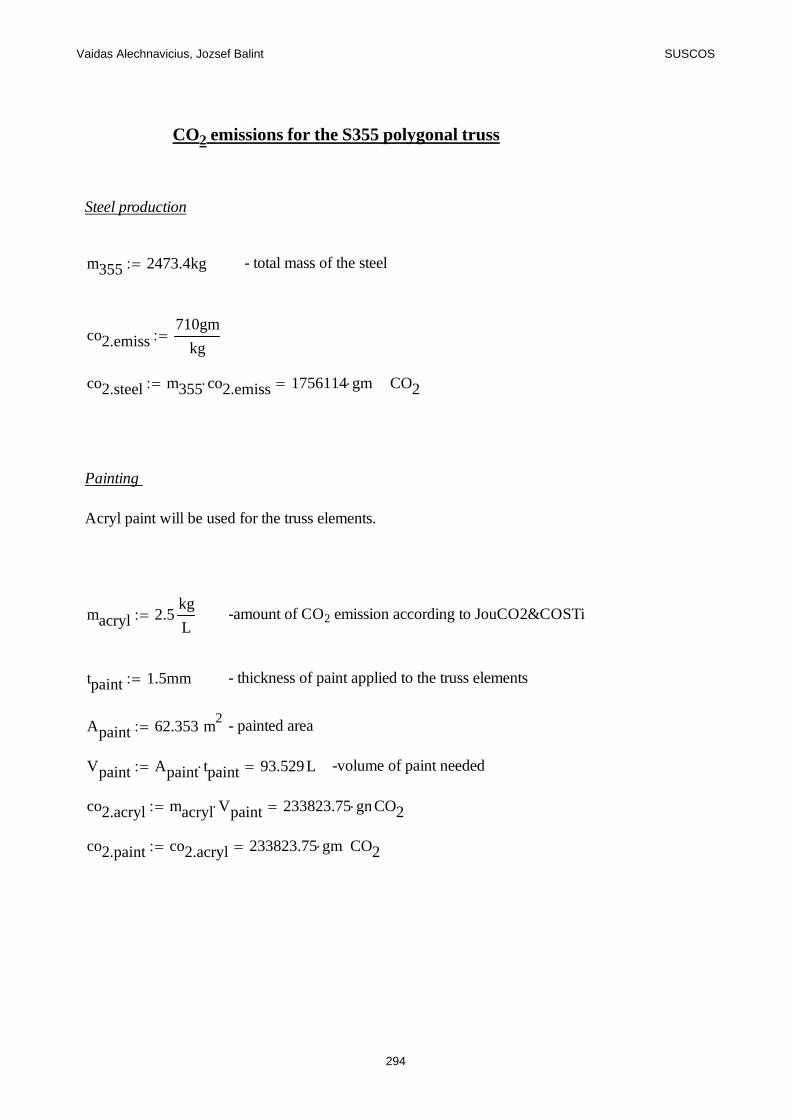
Vaidas Alechnavicius, Jozsef Balint SUSCOS
CO 2 emissions for the S355 polygonal truss
Steel production
m355 2473.4kg - total mass of the steel
co2.emiss710gm
kg
co2.steel m355 co2.emiss 1756114 gm CO2
Painting
Acryl paint will be used for the truss elements.
macryl 2.5kg
L -amount of CO2 emission according to JouCO2&COSTi
tpaint 1.5mm - thickness of paint applied to the truss elements
Apaint 62.353 m2 - painted area
Vpaint Apaint tpaint 93.529L -volume of paint needed
co2.acryl macryl Vpaint 233823.75 gm CO2
co2.paint co2.acryl 233823.75 gm CO2
294
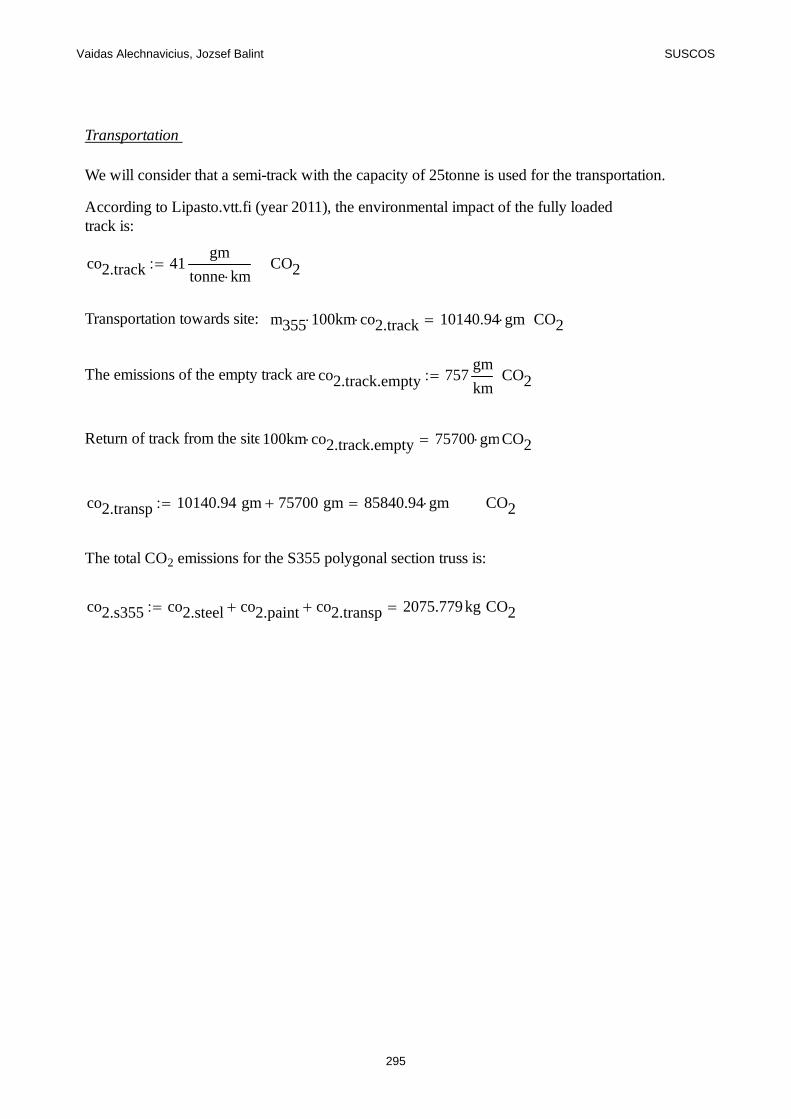
Vaidas Alechnavicius, Jozsef Balint SUSCOS
Transportation
We will consider that a semi-track with the capacity of 25tonne is used for the transportation.
According to Lipasto.vtt.fi (year 2011), the environmental impact of the fully loadedtrack is:
co2.track 41gm
tonne km CO2
Transportation towards site: m355 100 km co2.track 10140.94 gm CO2
The emissions of the empty track are:co2.track.empty 757gm
km CO2
Return of track from the site:100km co2.track.empty 75700 gm CO2
co2.transp 10140.94 gm 75700 gm 85840.94 gm CO2
The total CO2 emissions for the S355 polygonal section truss is:
co2.s355 co2.steel co2.paint co2.transp 2075.779kg CO2
295