lok sabha starred question no. 27 to be
TRANSCRIPT
GOVERNMENT OF INDIA MINISTRY OF COMMERCE & INDUSTRY
(DEPARTMENT OF COMMERCE)
LOK SABHA STARRED QUESTION NO. 27
TO BE ANSWERED ON 18th DECEMBER, 2017
DEVELOPMENTAL ACTIVITIES UNDERTAKEN BY COFFEE AND TEA BOARDS
*27. SHRI B.S. YEDIYURAPPA: Will the Minister of COMMERCE & INDUSTRY (वा ण य एव ंउ योग मं ी ) be
pleased to state:
(a) the details of the developmental activities undertaken by the Coffee Board and the Tea Board during the last three years and the impact thereof on enhancing productivity as well as improving the quality of tea and coffee in the country;
(b) the details of the steps taken by these Boards for improving their position in the world as well as in the domestic market;
(c) whether these Boards have been able to discharge their basic regulatory role effectively; and
(d) if so, the details thereof and if not, the reasons therefor along with the corrective measures taken by the Government in this regard?
ANSWER
okf.kT; ,oa m|ksx ea=ky; esa jkT; ea=h ¼Jh lh- vkj- pkS/kjh½
THE MINISTER OF STATE IN THE MINISTRY OF COMMERCE AND INDUSTRY (SHRI C. R. CHAUDHARY)
a) to d): A Statement is laid on the Table of the House.
*****
STATEMENT REFERRED TO IN REPLY TO PARTS (a) TO (d) OF LOK SABHA STARRED QUESTION NO. 27 FOR ANSWER ON 18TH DECEMBER, 2017 REGARDING “DEVELOPMENTAL ACTIVITIES UNDERTAKEN BY COFFEE AND TEA BOARDS”.
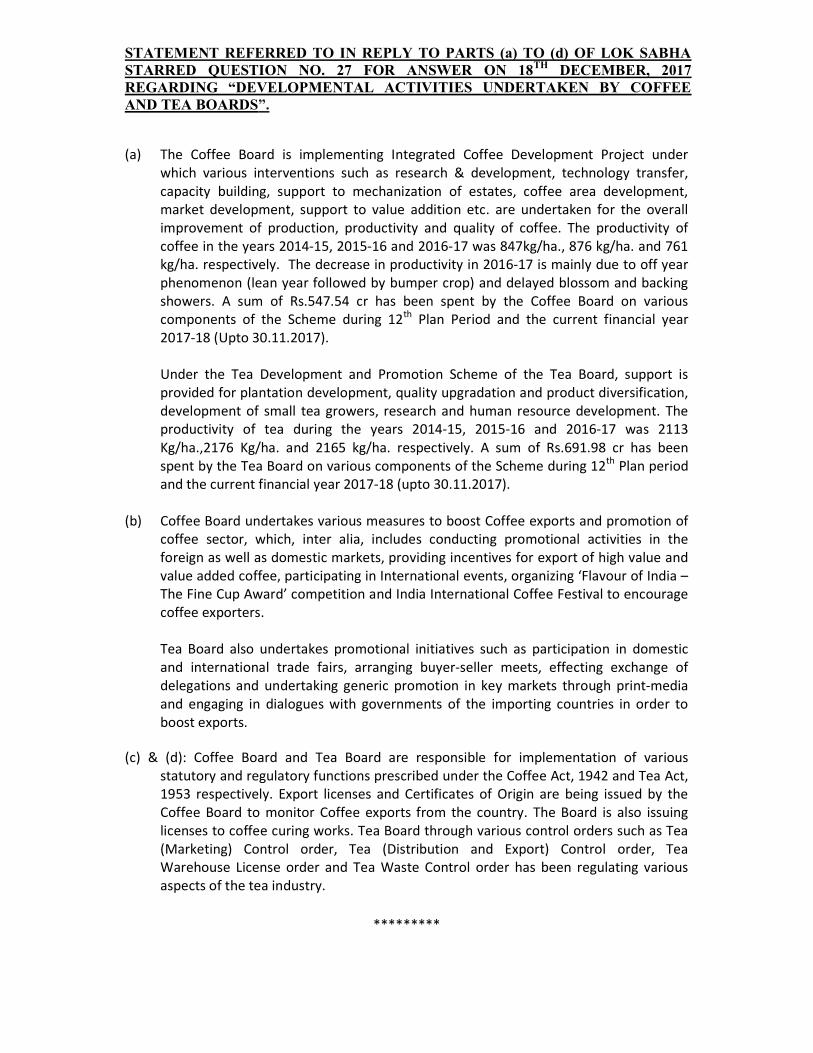
(a) The Coffee Board is implementing Integrated Coffee Development Project under which various interventions such as research & development, technology transfer, capacity building, support to mechanization of estates, coffee area development, market development, support to value addition etc. are undertaken for the overall improvement of production, productivity and quality of coffee. The productivity of coffee in the years 2014-15, 2015-16 and 2016-17 was 847kg/ha., 876 kg/ha. and 761 kg/ha. respectively. The decrease in productivity in 2016-17 is mainly due to off year phenomenon (lean year followed by bumper crop) and delayed blossom and backing showers. A sum of Rs.547.54 cr has been spent by the Coffee Board on various components of the Scheme during 12th Plan Period and the current financial year 2017-18 (Upto 30.11.2017).
Under the Tea Development and Promotion Scheme of the Tea Board, support is
provided for plantation development, quality upgradation and product diversification, development of small tea growers, research and human resource development. The productivity of tea during the years 2014-15, 2015-16 and 2016-17 was 2113 Kg/ha.,2176 Kg/ha. and 2165 kg/ha. respectively. A sum of Rs.691.98 cr has been spent by the Tea Board on various components of the Scheme during 12th Plan period and the current financial year 2017-18 (upto 30.11.2017).
(b) Coffee Board undertakes various measures to boost Coffee exports and promotion of
coffee sector, which, inter alia, includes conducting promotional activities in the foreign as well as domestic markets, providing incentives for export of high value and value added coffee, participating in International events, organizing ‘Flavour of India –The Fine Cup Award’ competition and India International Coffee Festival to encourage coffee exporters.
Tea Board also undertakes promotional initiatives such as participation in domestic
and international trade fairs, arranging buyer-seller meets, effecting exchange of delegations and undertaking generic promotion in key markets through print-media and engaging in dialogues with governments of the importing countries in order to boost exports.
(c) & (d): Coffee Board and Tea Board are responsible for implementation of various
statutory and regulatory functions prescribed under the Coffee Act, 1942 and Tea Act, 1953 respectively. Export licenses and Certificates of Origin are being issued by the Coffee Board to monitor Coffee exports from the country. The Board is also issuing licenses to coffee curing works. Tea Board through various control orders such as Tea (Marketing) Control order, Tea (Distribution and Export) Control order, Tea Warehouse License order and Tea Waste Control order has been regulating various aspects of the tea industry.
*********
GOVERNMENT OF INDIA
MINISTRY OF COMMERCE & INDUSTRY (DEPARTMENT OF COMMERCE)
LOK SABHA STARRED QUESTION NO. 39
TO BE ANSWERED ON 18th DECEMBER, 2017
IMPORT PRICE OF ARECA NUTS *39. ADV. NARENDRA KESHAV SAWAIKAR:
Will the Minister of COMMERCE & INDUSTRY (वा ण य एव ंउ योग मं ी ) be
pleased to state:
(a) whether the Government has recently enhanced the base import price of Areca nuts; (b) if so, the details thereof; (c) whether the said increase in import price of Areca nuts has not given the desired
benefits to the Areca nut farmers; and (d) if so, the reasons therefor along with the measures being contemplated by the
Government to help the Areca nut growers?
ANSWER
okf.kT; ,oa m|ksx ea=ky; esa jkT; ea=h ¼Jh lh- vkj- pkS/kjh½
THE MINISTER OF STATE IN THE MINISTRY OF COMMERCE AND INDUSTRY (SHRI C. R. CHAUDHARY)
a) to d): A Statement is laid on the Table of the House.
*****
STATEMENT REFERRED TO IN REPLY TO PARTS (a) TO (d) OF LOK SABHA STARRED QUESTION NO. 39 FOR ANSWER ON 18th DECEMBER, 2017
REGARDING “IMPORT PRICE OF ARECA NUTS”
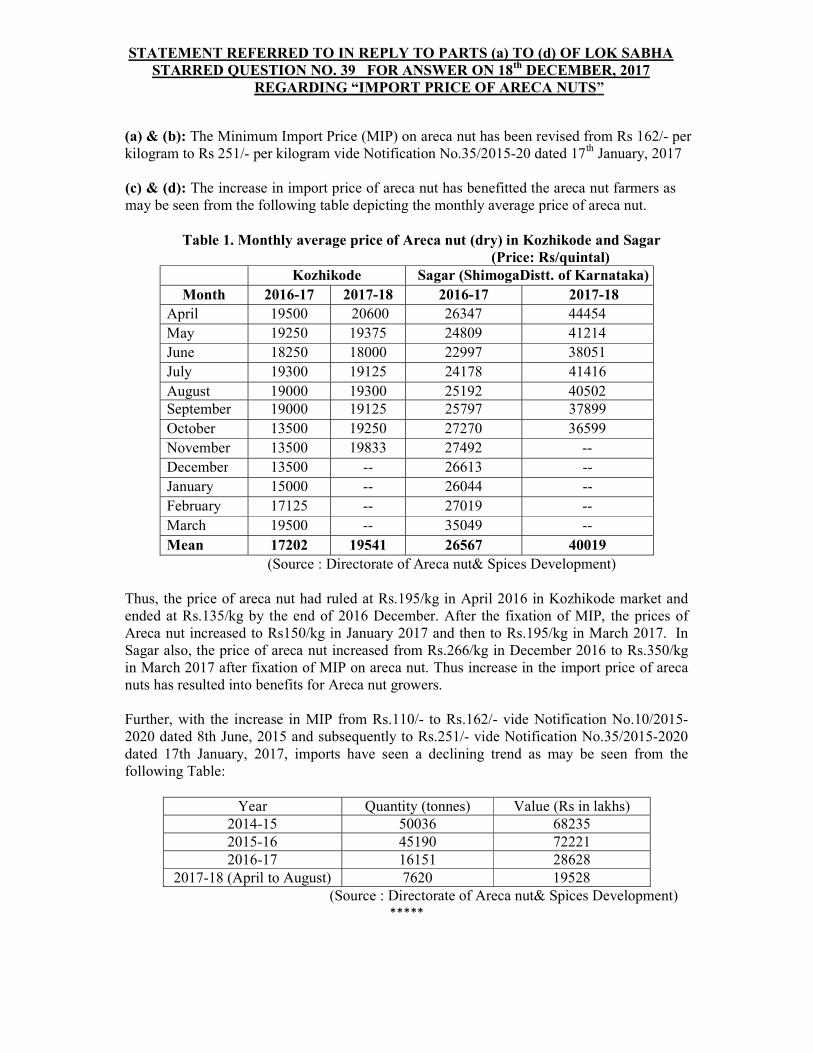
(a) & (b): The Minimum Import Price (MIP) on areca nut has been revised from Rs 162/- per kilogram to Rs 251/- per kilogram vide Notification No.35/2015-20 dated 17th January, 2017 (c) & (d): The increase in import price of areca nut has benefitted the areca nut farmers as may be seen from the following table depicting the monthly average price of areca nut.
Table 1. Monthly average price of Areca nut (dry) in Kozhikode and Sagar (Price: Rs/quintal)
Kozhikode Sagar (ShimogaDistt. of Karnataka) Month 2016-17 2017-18 2016-17 2017-18
April 19500 20600 26347 44454 May 19250 19375 24809 41214 June 18250 18000 22997 38051 July 19300 19125 24178 41416 August 19000 19300 25192 40502 September 19000 19125 25797 37899 October 13500 19250 27270 36599 November 13500 19833 27492 -- December 13500 -- 26613 -- January 15000 -- 26044 -- February 17125 -- 27019 -- March 19500 -- 35049 -- Mean 17202 19541 26567 40019
(Source : Directorate of Areca nut& Spices Development)
Thus, the price of areca nut had ruled at Rs.195/kg in April 2016 in Kozhikode market and ended at Rs.135/kg by the end of 2016 December. After the fixation of MIP, the prices of Areca nut increased to Rs150/kg in January 2017 and then to Rs.195/kg in March 2017. In Sagar also, the price of areca nut increased from Rs.266/kg in December 2016 to Rs.350/kg in March 2017 after fixation of MIP on areca nut. Thus increase in the import price of areca nuts has resulted into benefits for Areca nut growers. Further, with the increase in MIP from Rs.110/- to Rs.162/- vide Notification No.10/2015-2020 dated 8th June, 2015 and subsequently to Rs.251/- vide Notification No.35/2015-2020 dated 17th January, 2017, imports have seen a declining trend as may be seen from the following Table:
Year Quantity (tonnes) Value (Rs in lakhs) 2014-15 50036 68235 2015-16 45190 72221 2016-17 16151 28628
2017-18 (April to August) 7620 19528 (Source : Directorate of Areca nut& Spices Development)
*****
GOVERNMENT OF INDIA MINISTRY OF COMMERCE & INDUSTRY
(DEPARTMENT OF COMMERCE)
LOK SABHA UNSTARRED QUESTION NO. 246
TO BE ANSWERED ON 18th DECEMBER, 2017
TRADE INFRASTRUCTURE FOR EXPORT SCHEME 246. SHRIMATI KIRRON KHER:
Will the Minister of COMMERCE & INDUSTRY (वा ण य एव ंउ योग मं ी ) be
pleased to state:
(a) the number of projects approved under the Trade Infrastructure for Export Scheme (TIES), State-wise along with the details of grant-in-aid sanctioned to them under the scheme;
(b) the details of total increase in exports since implementation of TIES, State-wise along with the overview of the projects sanctioned under the scheme;
(c) the manner in which TIES has bridged infrastructural gaps in exports so far along with the details and the number of projects approved under TIES which have had funding from other sources such as bank financing;
(d) the details of major problems faced in implementation of the scheme along with the measures taken by the Government in this regard; and
(e) whether the Government has any plan on easing the 20 crore per project cap to promote infrastructure building in certain export sectors and if so, the details thereof?
ANSWER
okf.kT; ,oa m|ksx ea=ky; esa jkT; ea=h ¼Jh lh- vkj- pkS/kjh½
THE MINISTER OF STATE IN THE MINISTRY OF COMMERCE AND INDUSTRY (SHRI C. R. CHAUDHARY)
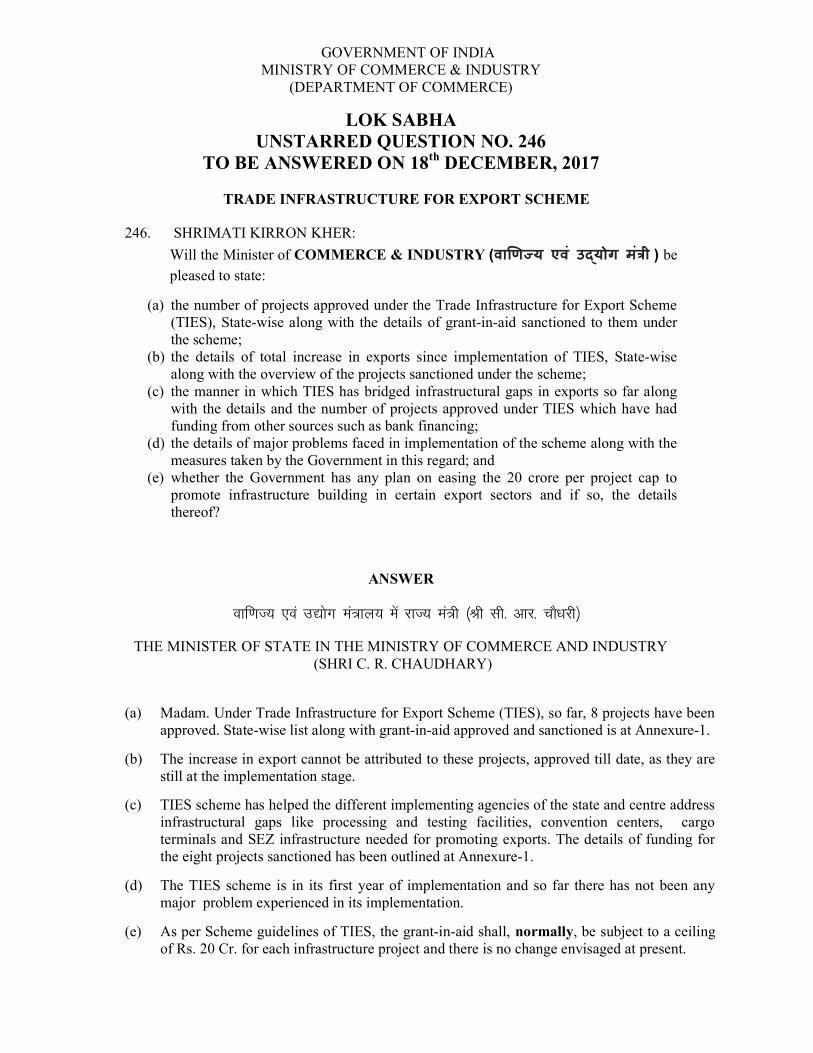
(a) Madam. Under Trade Infrastructure for Export Scheme (TIES), so far, 8 projects have been approved. State-wise list along with grant-in-aid approved and sanctioned is at Annexure-1.
(b) The increase in export cannot be attributed to these projects, approved till date, as they are still at the implementation stage.
(c) TIES scheme has helped the different implementing agencies of the state and centre address infrastructural gaps like processing and testing facilities, convention centers, cargo terminals and SEZ infrastructure needed for promoting exports. The details of funding for the eight projects sanctioned has been outlined at Annexure-1.
(d) The TIES scheme is in its first year of implementation and so far there has not been any major problem experienced in its implementation.
(e) As per Scheme guidelines of TIES, the grant-in-aid shall, normally, be subject to a ceiling of Rs. 20 Cr. for each infrastructure project and there is no change envisaged at present.
Annexure-1
Details of projects approved under TIES
( Rs. in Crore)
S. No.
Name of State
Name of Project Financial Details TIES fund approved
1st instalment released/ Sanctioned
1. Karnataka Modernization of infrastructure facility for Marine Exports at Tadadi, Kumta Taluk, Uttara Kannada District, Karnataka
Total cost: Rs. 13.34 Cr TIES share:- Rs.5.00 cr. Govt. of Karnataka – Rs.5.00 cr. KFDC – Rs. 3.344 cr.
5.00 2.00
2. Karnataka Establishment of ‘Coastal Cashew Research & Development Foundation, Kumta”, District Uttara Kannada, Karnataka
Total Cost: Rs. 9.55 Cr. TIES Share: 3.31 Cr Govt. of Karnataka – Rs. 6.24 Cr.
3.31 1.00
3. Kerala Construction of Standard Design Factory Building at Cochin SEZ, Kerala
Total cost: Rs. 61.63 Cr TIES share requested:- Rs.20.00cr CSEZA fund –Rs. 21.63 cr. Borrowing from bank – Rs.20.00 cr.
20.00 6.50
4. Manipur Establishment of Integrated Cargo Terminal (ICT) at Imphal International Airport, Imphal, Manipur
Total cost: Rs. 16.20 Cr TIES share requested:- Rs.12.96 cr AAI – Rs. 3.24 cr.
11.92 6.00
5. Andhra Pradesh
Common Scientific Facilities in Andhra Pradesh Medi-Tech Zone, Andhra Pradesh
Total cost: Rs. 168.87 Cr TIES share requested:- Rs.72.18 cr AMTZ: 79.80 cr. Debt financing – Rs. 16.89 cr.
40.00 4.00
6. Tamilnadu Setting up of EMI/EMC Lab for Medical Technology at Chengalpattu, Tamil Nadu
Total project cost - Rs. 21.07 Cr TIES share requested - Rs. 10.55 Cr Loan– Rs. 10.52. Cr
9.56 4.78
7. Tamilnadu Expansion of Chennai Trade Centre Tamil Nadu
Total project cost - Rs. 288.16 Cr TIES share requested - Rs. 20.00 Cr. TNTPO (own resources) – Rs. 85.00 Cr. Term Loan from SBI – Rs.183.16 Cr.
20.00 10.00
8. Madhya Pradesh
‘Establishment of Trade Promotion Centre at Minto Hall, Bhopal’ Madhya Pradesh
Total project cost - Rs. 49.39 Cr TIES share requested - Rs. 20 Cr Government of Madhya Pradesh – Rs. 29.39 Cr
17.67 9.00
TOTAL 43.28 *****
GOVERNMENT OF INDIA
MINISTRY OF COMMERCE & INDUSTRY (DEPARTMENT OF COMMERCE)
LOK SABHA UNSTARRED QUESTION NO. 260
TO BE ANSWERED ON 18th DECEMBER, 2017
ANTI-DUMPING DUTY ON CHINESE PRODUCTS 260. SHRI M.I. SHANAVAS:
Will the Minister of COMMERCE & INDUSTRY (वा ण य एव ंउ योग मं ी ) be
pleased to state:
(a) the details of products imported from China on which anti-dumping duty is in force; (b) Whether there has been a surge in such products imported from China in the last
four quarters of the financial year and if so, the details thereof; (c) whether such items include food items and consumer goods; and (d) if so, the details thereof along with the details of initiatives taken by the
Government to prevent dumping, specifically from China?
ANSWER
okf.kT; ,oa m|ksx ea=ky; esa jkT; ea=h ¼Jh lh- vkj- pkS/kjh½
THE MINISTER OF STATE IN THE MINISTRY OF COMMERCE AND INDUSTRY (SHRI C. R. CHAUDHARY)
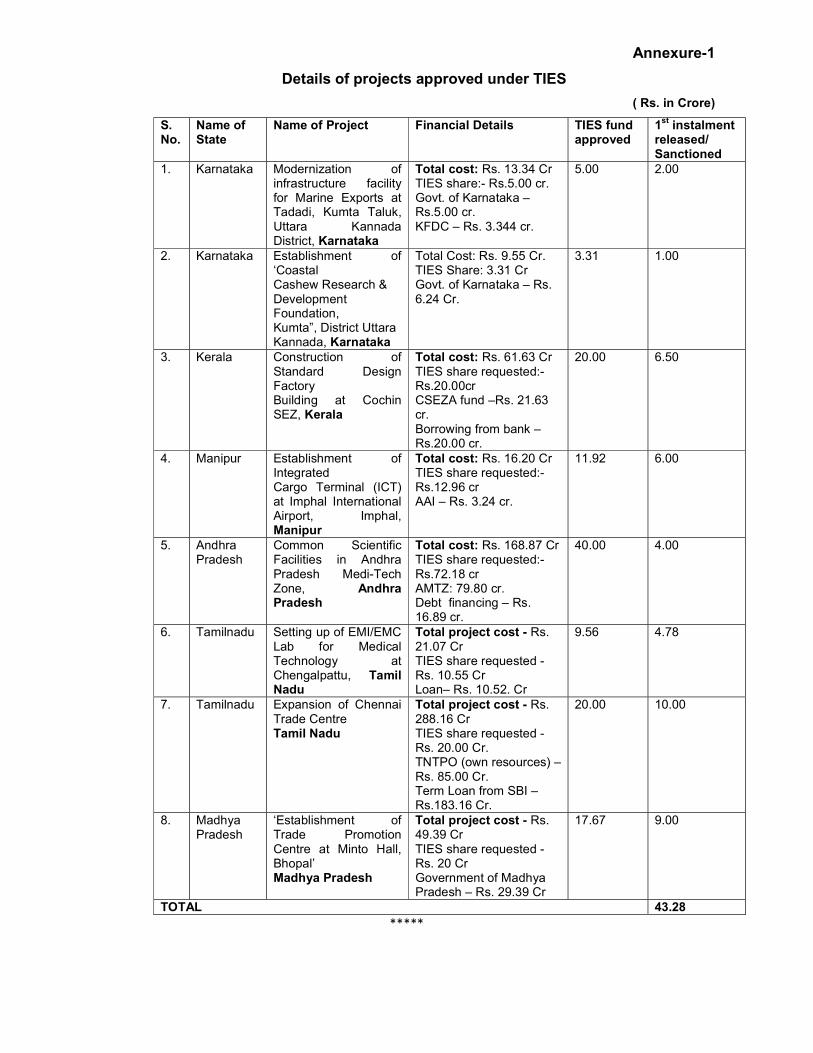
(a) : Currently, anti-dumping duty is in force on 100 products imported from China. The product category wise details of cases is given below:
(as on 12.12.2017)
S.No. Product Category No. of cases in which duty is in force
1. Chemical and Petrochemicals
41
2. Electrical and electronic items and accessories
7
3. Fibre Boards 2 4. Fibres and Yarn 9 5. Glass and Glassware 8 6. Machinery Items 5 7. Pharmaceutical 2 8. Rubber or Plastic products 1 9. Steel and other metals 10 10. Other Products 15
Total 100
(b) : There has been no such surge in imports of the above products from China.
(c) & (d): From time to time, DGAD receives applications from domestic producers for imposition of anti-dumping duty on various products. After detailed investigations, preliminary/final findings are issued by DGAD based on which, Department of Revenue imposes provisional/definitive anti-dumping duties.
********
GOVERNMENT OF INDIA MINISTRY OF COMMERCE & INDUSTRY
(DEPARTMENT OF COMMERCE)
LOK SABHA UNSTARRED QUESTION NO. 281
TO BE ANSWERED ON 18th DECEMBER, 2017
ONION EXPORT 281. DR. GOKARAJU GANGA RAJU:
Will the Minister of COMMERCE & INDUSTRY (वा ण य एव ंउ योग मं ी ) be
pleased to state:
(a) whether onion exports have declined in the current fiscal and if so, the details thereof indicating the percentage of decline;
(b) whether it is true that on the one hand the end users/consumers are purchasing onions at exorbitant price and on the other hand farmers are not getting remunerative price for onion due to its non export; and
(c) if so, the details thereof along with the steps taken by the Government to increase onion export?
ANSWER
okf.kT; ,oa m|ksx ea=ky; esa jkT; ea=h ¼Jh lh- vkj- pkS/kjh½
THE MINISTER OF STATE IN THE MINISTRY OF COMMERCE AND INDUSTRY (SHRI C. R. CHAUDHARY)
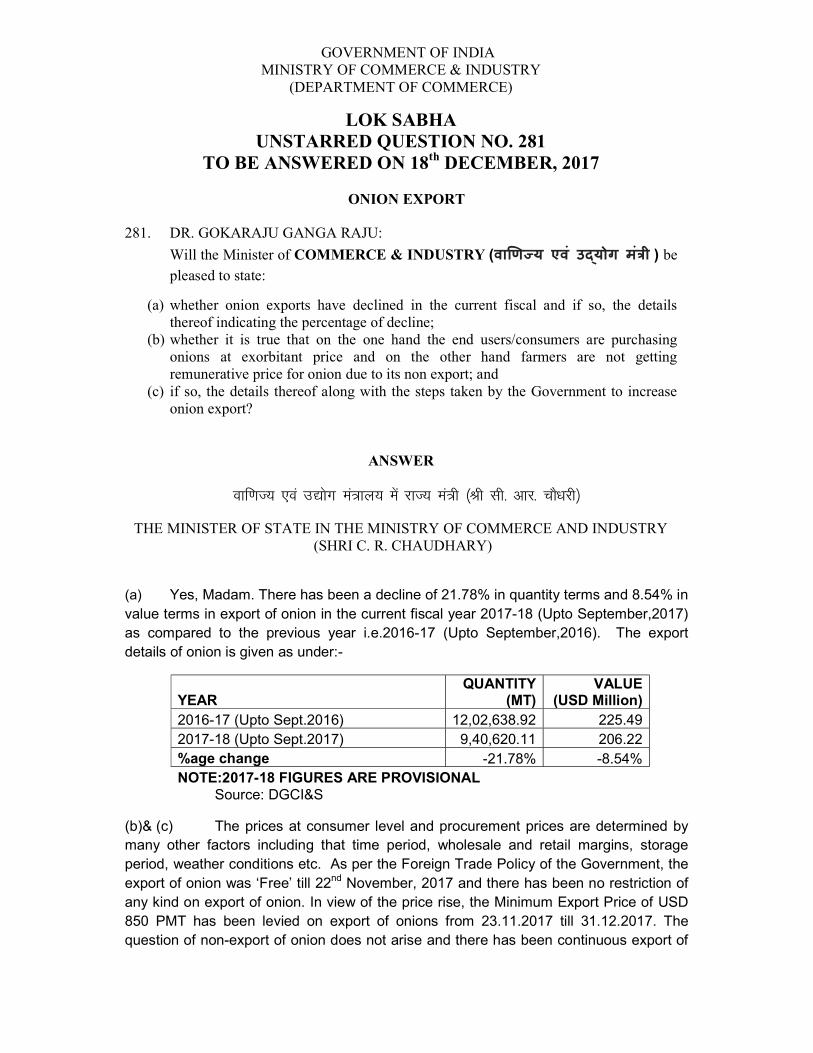
(a) Yes, Madam. There has been a decline of 21.78% in quantity terms and 8.54% in value terms in export of onion in the current fiscal year 2017-18 (Upto September,2017) as compared to the previous year i.e.2016-17 (Upto September,2016). The export details of onion is given as under:-
YEAR QUANTITY
(MT) VALUE
(USD Million) 2016-17 (Upto Sept.2016) 12,02,638.92 225.49 2017-18 (Upto Sept.2017) 9,40,620.11 206.22 %age change -21.78% -8.54% NOTE:2017-18 FIGURES ARE PROVISIONAL
Source: DGCI&S
(b)& (c) The prices at consumer level and procurement prices are determined by many other factors including that time period, wholesale and retail margins, storage period, weather conditions etc. As per the Foreign Trade Policy of the Government, the export of onion was ‘Free’ till 22nd November, 2017 and there has been no restriction of any kind on export of onion. In view of the price rise, the Minimum Export Price of USD 850 PMT has been levied on export of onions from 23.11.2017 till 31.12.2017. The question of non-export of onion does not arise and there has been continuous export of
onion during the current year. In order to boost export of onion, the Government has covered onion under “Merchandize Exports from India (MEIS)” under Foreign Trade Policy 2015-20 which was continued till 30.09.2017. In addition, the Ministry of Commerce & Industry has put in place various schemes namely Market Development Assistance (MDA), Market Assistance Initiative (MAI), Trade Infrastructure for Export Scheme (TIES) etc. to boost export of agri products which includes onions also.
*****
GOVERNMENT OF INDIA MINISTRY OF COMMERCE & INDUSTRY
(DEPARTMENT OF COMMERCE)
LOK SABHA UNSTARRED QUESTION NO. 283
TO BE ANSWERED ON 18th DECEMBER, 2017
SPONSORING OF EVENTS THROUGH NGOs 283. ADV. CHINTAMAN NAVASHA WANAGA:
Will the Minister of COMMERCE & INDUSTRY (वा ण य एव ंउ योग मं ी ) be
pleased to state:
(a) whether the Ministry has sponsored or sponsoring some events through Non-Governmental Organisations (NGOs);
(b) if so, the details thereof along with the details of the said NGOs including its Chairman; and
(c) if not, the reasons therefor?
ANSWER
okf.kT; ,oa m|ksx ea=ky; esa jkT; ea=h ¼Jh lh- vkj- pkS/kjh½
THE MINISTER OF STATE IN THE MINISTRY OF COMMERCE AND INDUSTRY (SHRI C. R. CHAUDHARY)
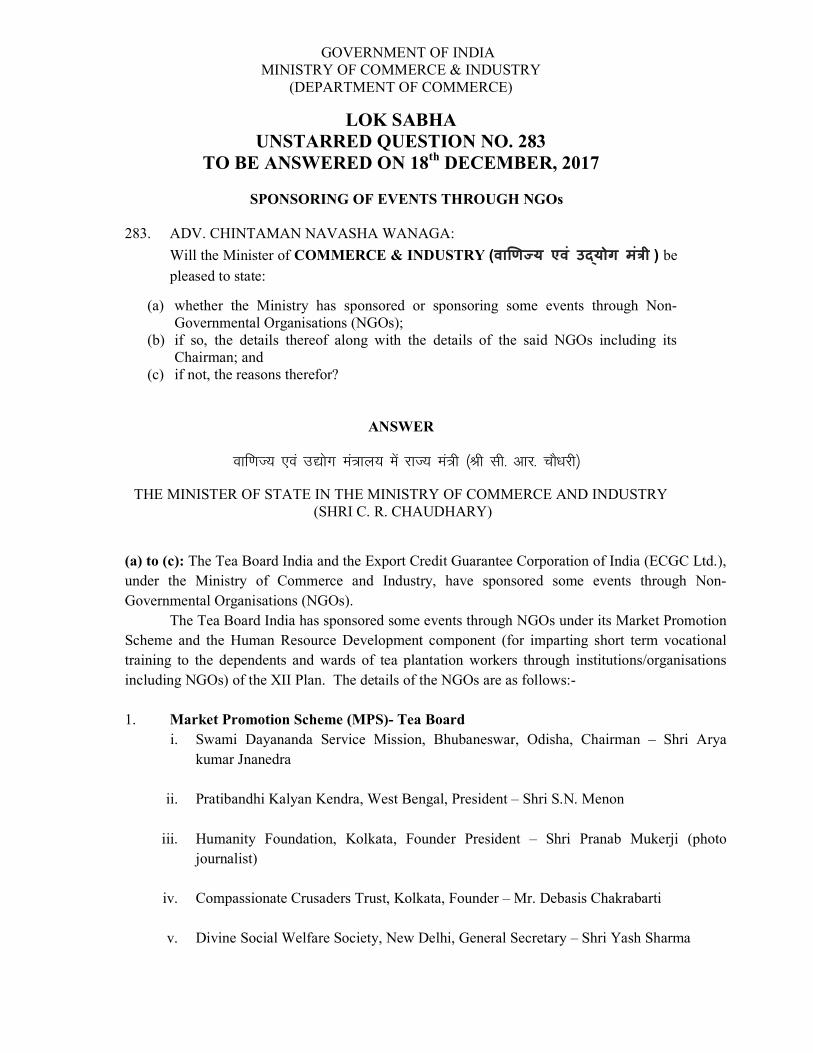
(a) to (c): The Tea Board India and the Export Credit Guarantee Corporation of India (ECGC Ltd.), under the Ministry of Commerce and Industry, have sponsored some events through Non-Governmental Organisations (NGOs).
The Tea Board India has sponsored some events through NGOs under its Market Promotion Scheme and the Human Resource Development component (for imparting short term vocational training to the dependents and wards of tea plantation workers through institutions/organisations including NGOs) of the XII Plan. The details of the NGOs are as follows:-
1. Market Promotion Scheme (MPS)- Tea Board
i. Swami Dayananda Service Mission, Bhubaneswar, Odisha, Chairman – Shri Arya kumar Jnanedra
ii. Pratibandhi Kalyan Kendra, West Bengal, President – Shri S.N. Menon
iii. Humanity Foundation, Kolkata, Founder President – Shri Pranab Mukerji (photo journalist)
iv. Compassionate Crusaders Trust, Kolkata, Founder – Mr. Debasis Chakrabarti
v. Divine Social Welfare Society, New Delhi, General Secretary – Shri Yash Sharma
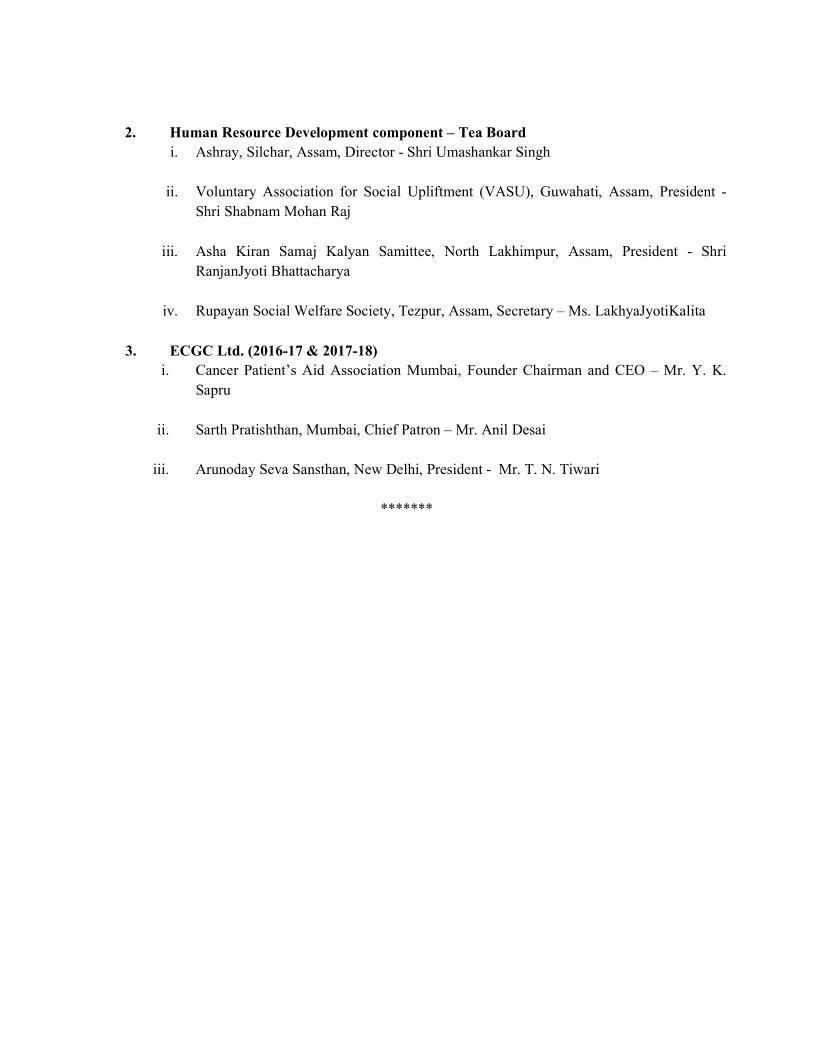
2. Human Resource Development component – Tea Board
i. Ashray, Silchar, Assam, Director - Shri Umashankar Singh
ii. Voluntary Association for Social Upliftment (VASU), Guwahati, Assam, President - Shri Shabnam Mohan Raj
iii. Asha Kiran Samaj Kalyan Samittee, North Lakhimpur, Assam, President - Shri
RanjanJyoti Bhattacharya
iv. Rupayan Social Welfare Society, Tezpur, Assam, Secretary – Ms. LakhyaJyotiKalita 3. ECGC Ltd. (2016-17 & 2017-18)
i. Cancer Patient’s Aid Association Mumbai, Founder Chairman and CEO – Mr. Y. K. Sapru
ii. Sarth Pratishthan, Mumbai, Chief Patron – Mr. Anil Desai
iii. Arunoday Seva Sansthan, New Delhi, President - Mr. T. N. Tiwari
*******
GOVERNMENT OF INDIA MINISTRY OF COMMERCE & INDUSTRY
(DEPARTMENT OF COMMERCE)
LOK SABHA UNSTARRED QUESTION NO.285
TO BE ANSWERED ON 18th DECEMBER, 2017
PRODUCTION AND EXPORT OF GEMS AND JEWELLERY 285(H). SHRIMATI JAYSHREEBEN PATEL:
Will the Minister of COMMERCE & INDUSTRY (वा ण य एव ंउ योग मं ी ) be
pleased to state:
(a) the total production of gems, jewellery and diamond in India during the last three years and the current year along with the total quantity and value of their exports during the said period;
(b) whether there has been an increase/ decrease in the trade of old gold jewellery, diamond and pearls during the said period; and
(c) if so, the details thereof along with the reasons therefor?
ANSWER
okf.kT; ,oa m|ksx ea=ky; esa jkT; ea=h ¼Jh lh- vkj- pkS/kjh½
THE MINISTER OF STATE IN THE MINISTRY OF COMMERCE AND INDUSTRY (SHRI C. R. CHAUDHARY)
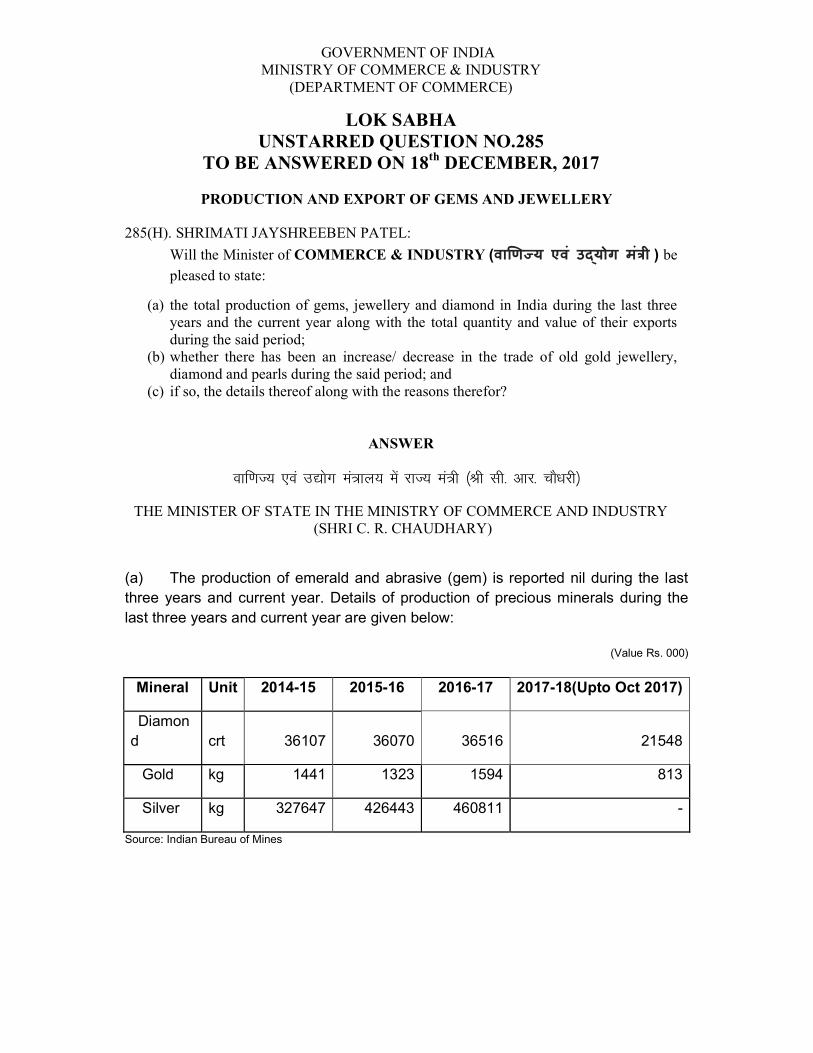
(a) The production of emerald and abrasive (gem) is reported nil during the last three years and current year. Details of production of precious minerals during the last three years and current year are given below:
(Value Rs. 000)
Mineral Unit 2014-15 2015-16 2016-17 2017-18(Upto Oct 2017)
Diamond crt 36107 36070 36516 21548
Gold kg 1441 1323 1594 813
Silver kg 327647 426443 460811 -
Source: Indian Bureau of Mines
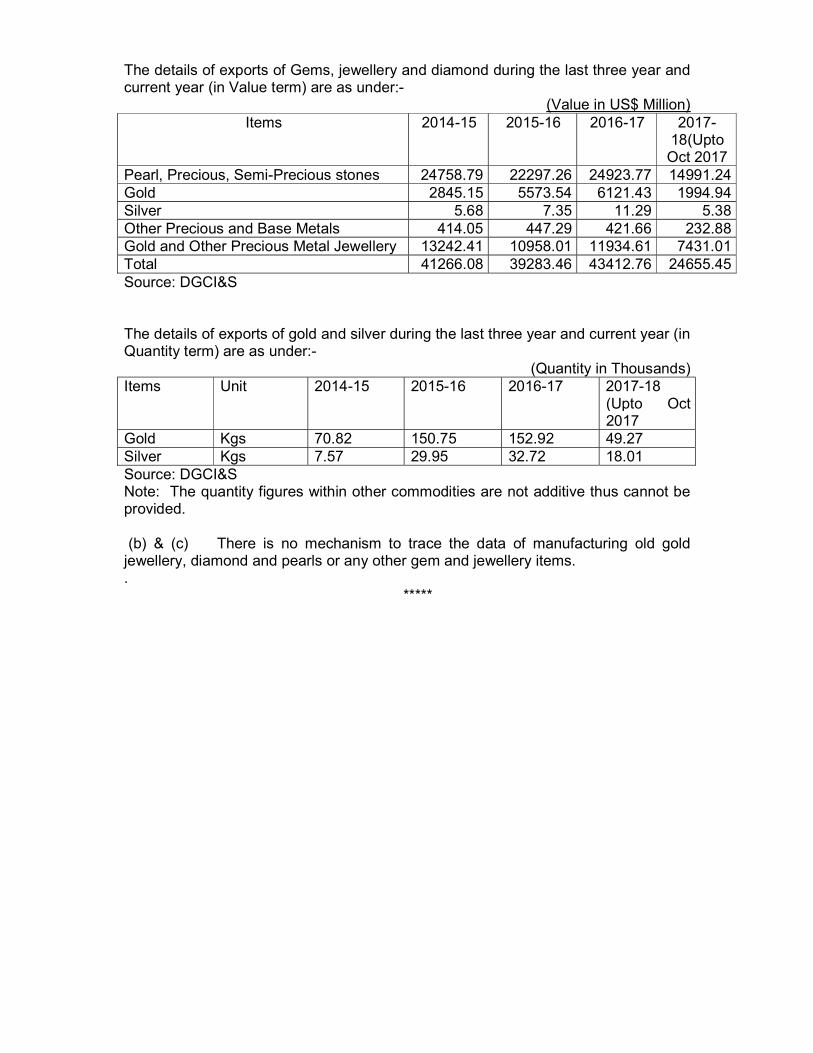
The details of exports of Gems, jewellery and diamond during the last three year and current year (in Value term) are as under:-
(Value in US$ Million) Items 2014-15 2015-16 2016-17 2017-
18(Upto Oct 2017
Pearl, Precious, Semi-Precious stones 24758.79 22297.26 24923.77 14991.24 Gold 2845.15 5573.54 6121.43 1994.94 Silver 5.68 7.35 11.29 5.38 Other Precious and Base Metals 414.05 447.29 421.66 232.88 Gold and Other Precious Metal Jewellery 13242.41 10958.01 11934.61 7431.01 Total 41266.08 39283.46 43412.76 24655.45 Source: DGCI&S The details of exports of gold and silver during the last three year and current year (in Quantity term) are as under:-
(Quantity in Thousands) Items Unit 2014-15 2015-16 2016-17 2017-18
(Upto Oct 2017
Gold Kgs 70.82 150.75 152.92 49.27 Silver Kgs 7.57 29.95 32.72 18.01 Source: DGCI&S Note: The quantity figures within other commodities are not additive thus cannot be provided. (b) & (c) There is no mechanism to trace the data of manufacturing old gold jewellery, diamond and pearls or any other gem and jewellery items. .
*****
GOVERNMENT OF INDIA MINISTRY OF COMMERCE & INDUSTRY
(DEPARTMENT OF COMMERCE)
LOK SABHA UNSTARRED QUESTION NO. 290
TO BE ANSWERED ON 18th DECEMBER, 2017
EXPORT GROWTH 290. SHRI M.B. RAJESH:
Will the Minister of COMMERCE & INDUSTRY (वा ण य एव ंउ योग मं ी ) be
pleased to state:
(a) whether export growth of major items like Gems and Jewellery, Textiles, Dairy, Meat and Poultry and Leather have slowed down in the current financial year and if so, the details thereof and the reasons therefor;
(b) the details of export performance of these items during the last five years along with the reasons for slow growth;
(c) whether the restriction of cattle trade for slaughter has been a reason for slow growth of meat products and if so, the details thereof; and
(d) the measures taken or proposed to be taken by the Government to enhance export growth of these major items?
ANSWER
okf.kT; ,oa m|ksx ea=ky; esa jkT; ea=h ¼Jh lh- vkj- pkS/kjh½
THE MINISTER OF STATE IN THE MINISTRY OF COMMERCE AND INDUSTRY (SHRI C. R. CHAUDHARY)
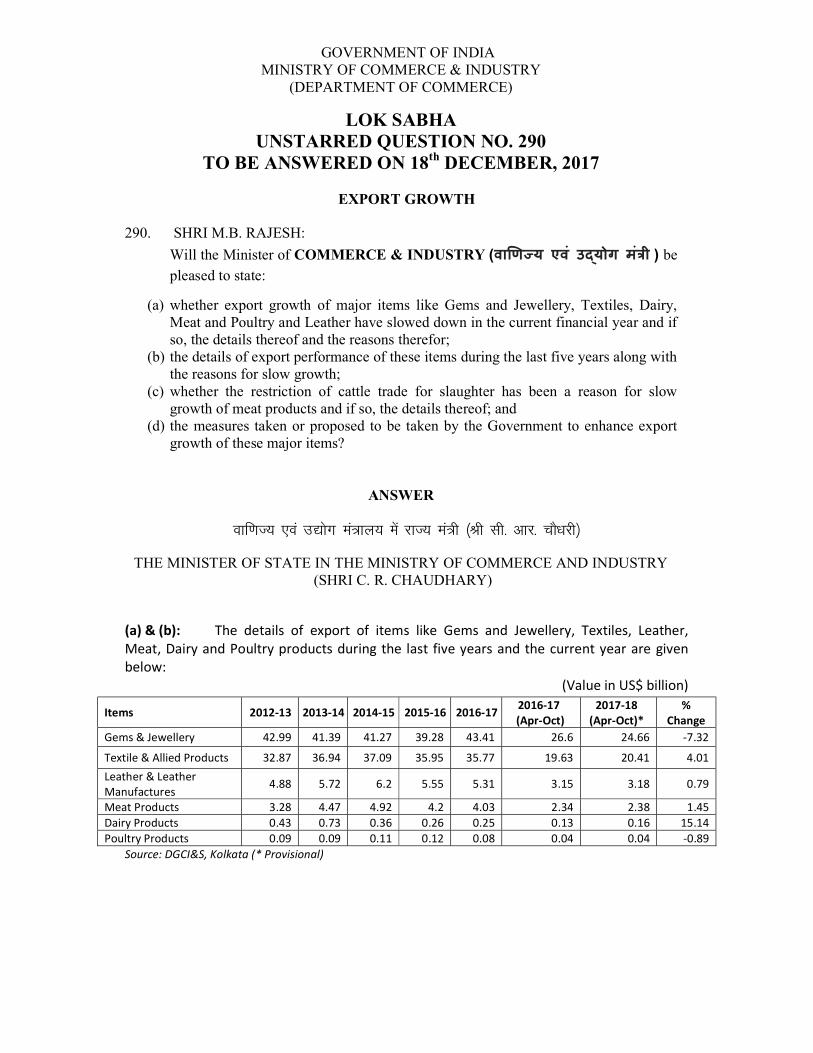
(a) & (b): The details of export of items like Gems and Jewellery, Textiles, Leather, Meat, Dairy and Poultry products during the last five years and the current year are given below:
(Value in US$ billion)
Items 2012-13 2013-14 2014-15 2015-16 2016-17 2016-17 (Apr-Oct)
2017-18 (Apr-Oct)*
% Change
Gems & Jewellery 42.99 41.39 41.27 39.28 43.41 26.6 24.66 -7.32
Textile & Allied Products 32.87 36.94 37.09 35.95 35.77 19.63 20.41 4.01 Leather & Leather Manufactures
4.88 5.72 6.2 5.55 5.31 3.15 3.18 0.79
Meat Products 3.28 4.47 4.92 4.2 4.03 2.34 2.38 1.45 Dairy Products 0.43 0.73 0.36 0.26 0.25 0.13 0.16 15.14 Poultry Products 0.09 0.09 0.11 0.12 0.08 0.04 0.04 -0.89
Source: DGCI&S, Kolkata (* Provisional)
The above table reveals that the items gems & jewellery and poultry products registered a negative growth during the current year as compared to the corresponding period of the previous year. Exports depend upon many global and domestic factors including demand in international markets, currency fluctuations, cost of credit, logistics costs, etc.
(c): There has been a positive growth of 1.45% in exports of meat products during the current year.
(d): The Government announced a major relief package for exporters in October 2017 by extending the Advance Authorization (AA) / Export Promotion Capital Goods (EPCG) / 100% EOU schemes to sourcing inputs etc. from abroad as well as domestic suppliers. Holders of AA / EPCG and EOUs would not have to pay Integrated Goods and Services Tax (IGST), Cess etc. on imports. Also, domestic supplies to holders of AA / EPCG and EOUs would be treated as deemed exports. During the mid-term review of Foreign Trade Policy in December, 2017, export incentives under Merchandise Exports from India (MEIS) have been increased by 2% across the board for labour intensive MSME sectors leading to additional annual incentive of Rs 4,567 cr. This was in addition to already announced increase in MEIS incentives from 2% to 4% for Ready-made Garments and Made Ups in the labour intensive Textiles Sector with an additional annual incentive of Rs 2,743 cr. For Leather and Footwear Articles, an additional benefit of Rs. 749 crore is part of the relief package. Further, incentives under Services Exports from India Scheme (SEIS) have also been increased by 2% leading to additional annual incentive of Rs 1,140 cr.
***
GOVERNMENT OF INDIA MINISTRY OF COMMERCE & INDUSTRY
(DEPARTMENT OF COMMERCE)
LOK SABHA UNSTARRED QUESTION NO. 299
TO BE ANSWERED ON 18th DECEMBER, 2017
IMPACT OF DEMONETISATION AND GST ON COMMERCE AND INDUSTRY SECTOR
299. SHRI ANTO ANTONY
Will the Minister of COMMERCE & INDUSTRY (वा ण य एव ंउ योग मं ी ) be
pleased to state:
(a) whether the demonetisation and the implementation of Goods and Services Tax have badly affected key sectors like manufacturing sector, export, import and construction industry in the country;
(b) if so, the details thereof; (c) whether the Government has any statistics regarding revenue generation from these
sectors in the country; and (d) if so, the details of revenue generation during the last 12 months, month-wise?
ANSWER
okf.kT; ,oa m|ksx ea=ky; esa jkT; ea=h ¼Jh lh- vkj- pkS/kjh½
THE MINISTER OF STATE IN THE MINISTRY OF COMMERCE AND INDUSTRY (SHRI C. R. CHAUDHARY)
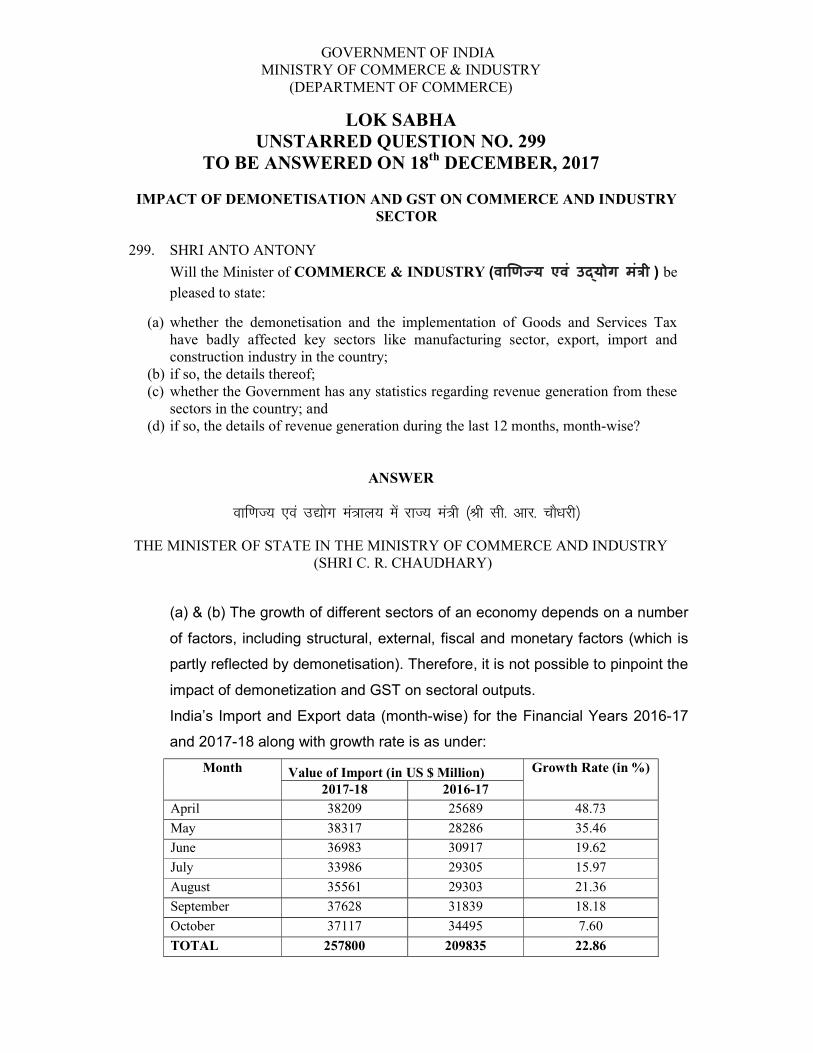
(a) & (b) The growth of different sectors of an economy depends on a number
of factors, including structural, external, fiscal and monetary factors (which is
partly reflected by demonetisation). Therefore, it is not possible to pinpoint the
impact of demonetization and GST on sectoral outputs.
India’s Import and Export data (month-wise) for the Financial Years 2016-17
and 2017-18 along with growth rate is as under:
Month Value of Import (in US $ Million) Growth Rate (in %)
2017-18 2016-17
April 38209 25689 48.73
May 38317 28286 35.46
June 36983 30917 19.62
July 33986 29305 15.97
August 35561 29303 21.36
September 37628 31839 18.18
October 37117 34495 7.60
TOTAL 257800 209835 22.86
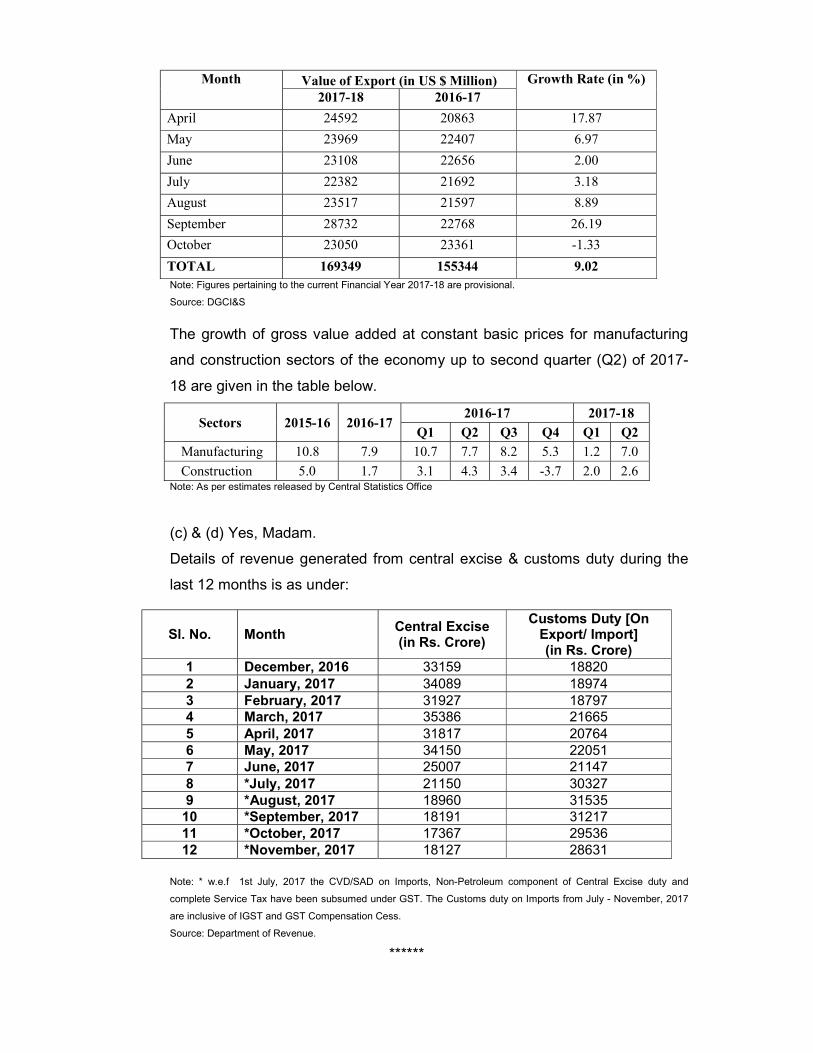
Month Value of Export (in US $ Million) Growth Rate (in %) 2017-18 2016-17
April 24592 20863 17.87
May 23969 22407 6.97
June 23108 22656 2.00
July 22382 21692 3.18
August 23517 21597 8.89
September 28732 22768 26.19
October 23050 23361 -1.33
TOTAL 169349 155344 9.02 Note: Figures pertaining to the current Financial Year 2017-18 are provisional.
Source: DGCI&S
The growth of gross value added at constant basic prices for manufacturing
and construction sectors of the economy up to second quarter (Q2) of 2017-
18 are given in the table below.
Sectors 2015-16 2016-17 2016-17 2017-18
Q1 Q2 Q3 Q4 Q1 Q2
Manufacturing 10.8 7.9 10.7 7.7 8.2 5.3 1.2 7.0
Construction 5.0 1.7 3.1 4.3 3.4 -3.7 2.0 2.6 Note: As per estimates released by Central Statistics Office
(c) & (d) Yes, Madam.
Details of revenue generated from central excise & customs duty during the
last 12 months is as under:
Note: * w.e.f 1st July, 2017 the CVD/SAD on Imports, Non-Petroleum component of Central Excise duty and
complete Service Tax have been subsumed under GST. The Customs duty on Imports from July - November, 2017
are inclusive of IGST and GST Compensation Cess.
Source: Department of Revenue.
******
Sl. No. Month Central Excise (in Rs. Crore)
Customs Duty [On Export/ Import] (in Rs. Crore)
1 December, 2016 33159 18820 2 January, 2017 34089 18974 3 February, 2017 31927 18797 4 March, 2017 35386 21665 5 April, 2017 31817 20764 6 May, 2017 34150 22051 7 June, 2017 25007 21147 8 *July, 2017 21150 30327 9 *August, 2017 18960 31535
10 *September, 2017 18191 31217 11 *October, 2017 17367 29536 12 *November, 2017 18127 28631
GOVERNMENT OF INDIA MINISTRY OF COMMERCE & INDUSTRY
(DEPARTMENT OF COMMERCE)
LOK SABHA UNSTARRED QUESTION NO. 324
TO BE ANSWERED ON 18th DECEMBER, 2017
FREE TRADE AGREEMENTS 324. SHRI KALIKESH N. SINGH DEO:
Will the Minister of COMMERCE & INDUSTRY (वा ण य एव ंउ योग मं ी ) be
pleased to state:
(a) the details of Free Trade Agreements (FTAs) signed/proposed to be signed by India with other countries including those signed or proposed to be signed with Asian countries/Eurasian Economic Union along with their present status;
(b) whether the Government has assessed the impact of these FTAs on steel, agriculture and domestic industries and if so, the details thereof along with benefits/ net inflow of foreign investment and the steps taken to protect the agricultural sector from the negative effect of FTAs;
(c) the details of the export and import made with the countries India has entered into FTAs/Extensive Economic Participation Agreement during the last three years, region/ quantity/price-wise; and
(d) whether the Government is in talks with many foreign countries to sign new FTA agreements and if so, the norms being followed and the action plan formulated and priority areas identified in this regard along with the progress made with regard to implementation of these agreements, country-wise?
ANSWER
okf.kT; ,oa m|ksx ea=ky; esa jkT; ea=h ¼Jh lh- vkj- pkS/kjh½
THE MINISTER OF STATE IN THE MINISTRY OF COMMERCE AND INDUSTRY (SHRI C. R. CHAUDHARY)
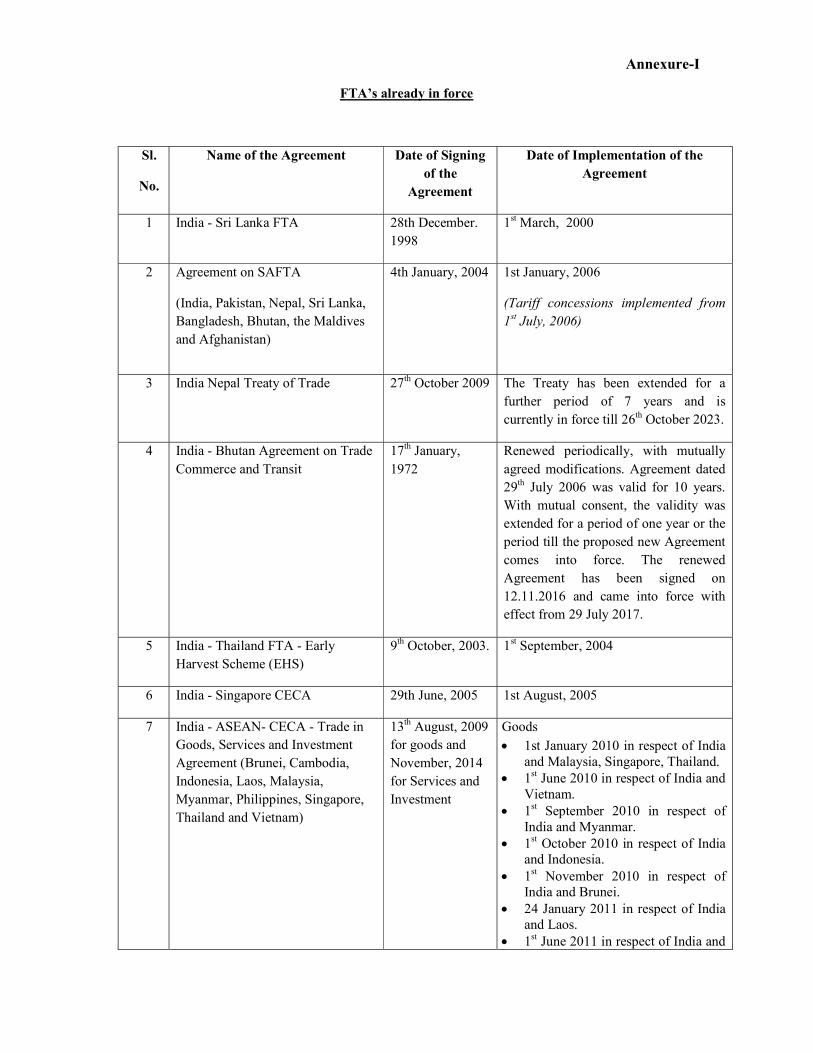
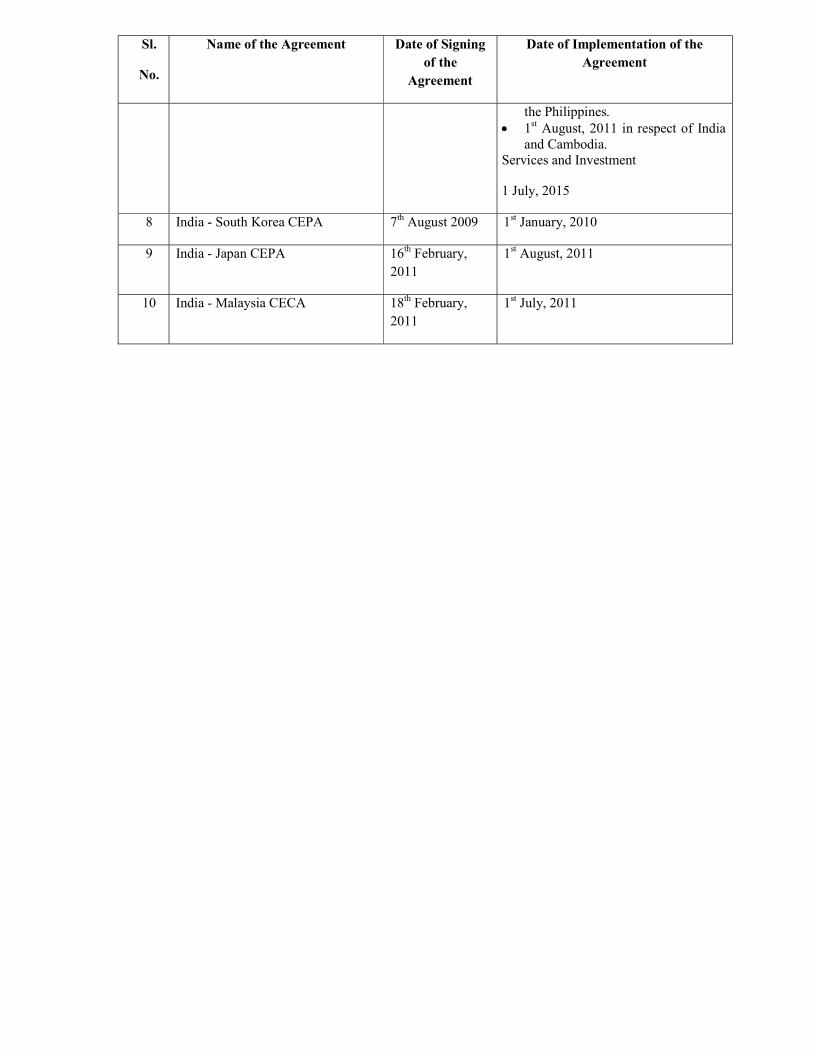
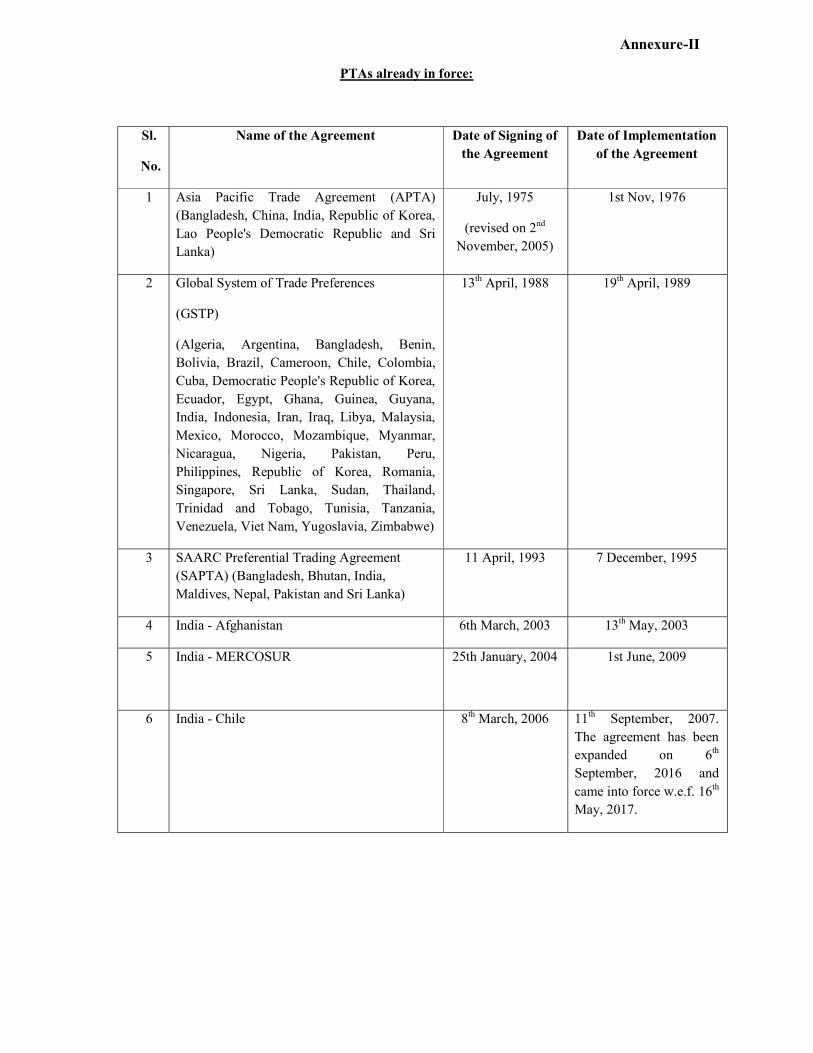
(a) The details of the Free Trade Agreements (FTAs)/Comprehensive Economic
Cooperation Agreements(CECAs)/Comprehensive Economic Partnership
Agreements(CEPA) and Preferential Trade Agreements(PTAs) entered into by India
is given in Annexure-I and Annexure-II respectively. The list of the FTAs/PTAs
currently being negotiated is given in Annexure-III. As regards an FTA with
Eurasian Economic Union, a joint statement to launch negotiations for FTA between
India and the Union has been signed on 3 June, 2017.
.
(b) Assessment evaluation of FTAs is a continuous process including on sectors such as
steel and agriculture. Before entering into negotiations with its trading partners,
studies are undertaken internally, as well as through the Joint Study Group (JSG) to
study the feasibility of the proposed FTAs, including their impact on the domestic
stakeholders including the Apex Chambers of Commerce and Industry, Industry
Associations as well as the Administrative Ministries and Departments. In order to
protect the interest of the domestic industry and agriculture sector, these agreements
provide for maintaining sensitive/negative lists of items on which limited or no tariff
concessions are granted under the FTA. The Government has largely adopted a
conservative policy on agricultural products by maintaining a large number of them in
the negative list of FTAs. In addition, in case of a surge in imports and injury to the
domestic industry, a country is allowed to take recourse to the measures such as anti-
dumping and safeguards.
(c) The Question does not arise as India has not entered into any new FTA or Preferential
Trade Agreement (PTA) during the last three years. However, India expanded the
scope of the India-ASEAN Trade in Goods (TIG) Agreement in November, 2014 to
cover both Services and Investment with its date of implementation being 1 July,
2015.
(d) The Department of Commerce is negotiating/reviewing 21 trade agreements with
various countries and trading blocs. The details of these agreements under negotiation
or review are at Annexure-III. The FTA negotiations are a continuous process and it is
difficult to predict a time-line for conclusion.
Annexure-I
FTA’s already in force
Sl.
No.
Name of the Agreement Date of Signing of the
Agreement
Date of Implementation of the Agreement
1 India - Sri Lanka FTA 28th December. 1998
1st March, 2000
2 Agreement on SAFTA
(India, Pakistan, Nepal, Sri Lanka, Bangladesh, Bhutan, the Maldives and Afghanistan)
4th January, 2004 1st January, 2006
(Tariff concessions implemented from 1st July, 2006)
3 India Nepal Treaty of Trade 27th October 2009 The Treaty has been extended for a further period of 7 years and is currently in force till 26th October 2023.
4 India - Bhutan Agreement on Trade Commerce and Transit
17th January, 1972
Renewed periodically, with mutually agreed modifications. Agreement dated 29th July 2006 was valid for 10 years. With mutual consent, the validity was extended for a period of one year or the period till the proposed new Agreement comes into force. The renewed Agreement has been signed on 12.11.2016 and came into force with effect from 29 July 2017.
5 India - Thailand FTA - Early Harvest Scheme (EHS)
9th October, 2003. 1st September, 2004
6 India - Singapore CECA 29th June, 2005 1st August, 2005
7 India - ASEAN- CECA - Trade in Goods, Services and Investment Agreement (Brunei, Cambodia, Indonesia, Laos, Malaysia, Myanmar, Philippines, Singapore, Thailand and Vietnam)
13th August, 2009 for goods and November, 2014 for Services and Investment
Goods 1st January 2010 in respect of India
and Malaysia, Singapore, Thailand. 1st June 2010 in respect of India and
Vietnam. 1st September 2010 in respect of
India and Myanmar. 1st October 2010 in respect of India
and Indonesia. 1st November 2010 in respect of
India and Brunei. 24 January 2011 in respect of India
and Laos. 1st June 2011 in respect of India and
Sl.
No.
Name of the Agreement Date of Signing of the
Agreement
Date of Implementation of the Agreement
the Philippines. 1st August, 2011 in respect of India
and Cambodia. Services and Investment
1 July, 2015
8 India - South Korea CEPA 7th August 2009 1st January, 2010
9 India - Japan CEPA 16th February, 2011
1st August, 2011
10 India - Malaysia CECA 18th February, 2011
1st July, 2011
Annexure-II
PTAs already in force:
Sl.
No.
Name of the Agreement Date of Signing of the Agreement
Date of Implementation of the Agreement
1 Asia Pacific Trade Agreement (APTA) (Bangladesh, China, India, Republic of Korea, Lao People's Democratic Republic and Sri Lanka)
July, 1975
(revised on 2nd November, 2005)
1st Nov, 1976
2 Global System of Trade Preferences
(GSTP)
(Algeria, Argentina, Bangladesh, Benin, Bolivia, Brazil, Cameroon, Chile, Colombia, Cuba, Democratic People's Republic of Korea, Ecuador, Egypt, Ghana, Guinea, Guyana, India, Indonesia, Iran, Iraq, Libya, Malaysia, Mexico, Morocco, Mozambique, Myanmar, Nicaragua, Nigeria, Pakistan, Peru, Philippines, Republic of Korea, Romania, Singapore, Sri Lanka, Sudan, Thailand, Trinidad and Tobago, Tunisia, Tanzania, Venezuela, Viet Nam, Yugoslavia, Zimbabwe)
13th April, 1988 19th April, 1989
3 SAARC Preferential Trading Agreement (SAPTA) (Bangladesh, Bhutan, India, Maldives, Nepal, Pakistan and Sri Lanka)
11 April, 1993 7 December, 1995
4 India - Afghanistan 6th March, 2003 13th May, 2003
5 India - MERCOSUR 25th January, 2004 1st June, 2009
6 India - Chile 8th March, 2006 11th September, 2007. The agreement has been expanded on 6th September, 2016 and came into force w.e.f. 16th May, 2017.
Annexure-III
FTAs/PTAs under Negotiation/Review:
Sl.
No.
Name of the Agreement Status
1 India - EU BTIA
(Austria, Belgium, Bulgaria, Croatia, Cyprus, Czech Republic, Denmark, Estonia ,Finland, France, Germany, Greece, Hungary, Ireland, Italy, Latvia, Lithuania, Luxembourg, Malta, Netherlands, Poland, Portugal, Romania, Slovakia, Slovenia, Spain, Sweden, United Kingdom)
Negotiations launched on 28th June 2007 in the areas of Goods, Services, Investment, Sanitary and Phyto-sanitary Measures, Technical Barriers to Trade, Trade Facilitation and Customs Cooperation, Competition, IPR & GIs. Etc. Sixteen rounds of negotiations and a number of inter-sessional and Chief Negotiator level meetings have been held till date. A Ministerial review meeting between Commerce & Industry Minister and EU’s Trade Commissioner was held on 15th April, 2013 at Brussels. After a period of lull, several attempts were made in 2016 to revive the negotiations through stocktaking meetings at the Chief Negotiators level. The 5th meeting took place in New Delhi on 14-15 November, 2017.
2 India – Sri Lanka Economic and Technical Cooperation Agreements (ETCA)
The negotiations on the text of the proposed Agreement are being carried out with Sri Lanka. Five rounds of negotiations have been held so far. The 5th round of negotiations of the ETCA was held on 16-18 August, 2017 in Colombo.
3 India - Thailand CECA Early Harvest Scheme on 82 items implemented. So far 30 rounds of India-Thailand Trade Negotiation committee (ITTNC) meetings have been held. The 30th round was held on 13-14 July, 2016 in New Delhi.
4 India - Mauritius Comprehensive Economic Cooperation and Partnership Agreement (CECPA)
Ten rounds of negotiations on India-Mauritius CECPA have been held between the two sides so far, the last round was held on 23–24 October, 2006. Although the CECPA negotiations had been formally put on hold, they were revived in March, 2016 during the visit of the Hon’ble Prime Minister to Mauritius. After resumption, the first meeting of the India-Mauritius was held on 12-13 September, 2016 in Mauritius. The 2nd meeting of the India-Mauritius was held on 27-28 September, 2017 at New Delhi to finalise the JSG Report.
5 India EFTA TEPA (Iceland, Norway, Liechtenstein and Switzerland)
The India-EFTA TEPA (Trade and Economic Partnership Agreement) was launched in January 2008 (then known as BTIA). The first round was held in New Delhi during 6-8 October, 2008. The Chapters covered are Trade in Goods, Services, Investment, Sanitary and Phyto-sanitary Measures (SPS), Technical Barriers to Trade(TBT), Trade Facilitation and Customs Cooperation, Competition, Intellectual Property Rights (IPR), Government
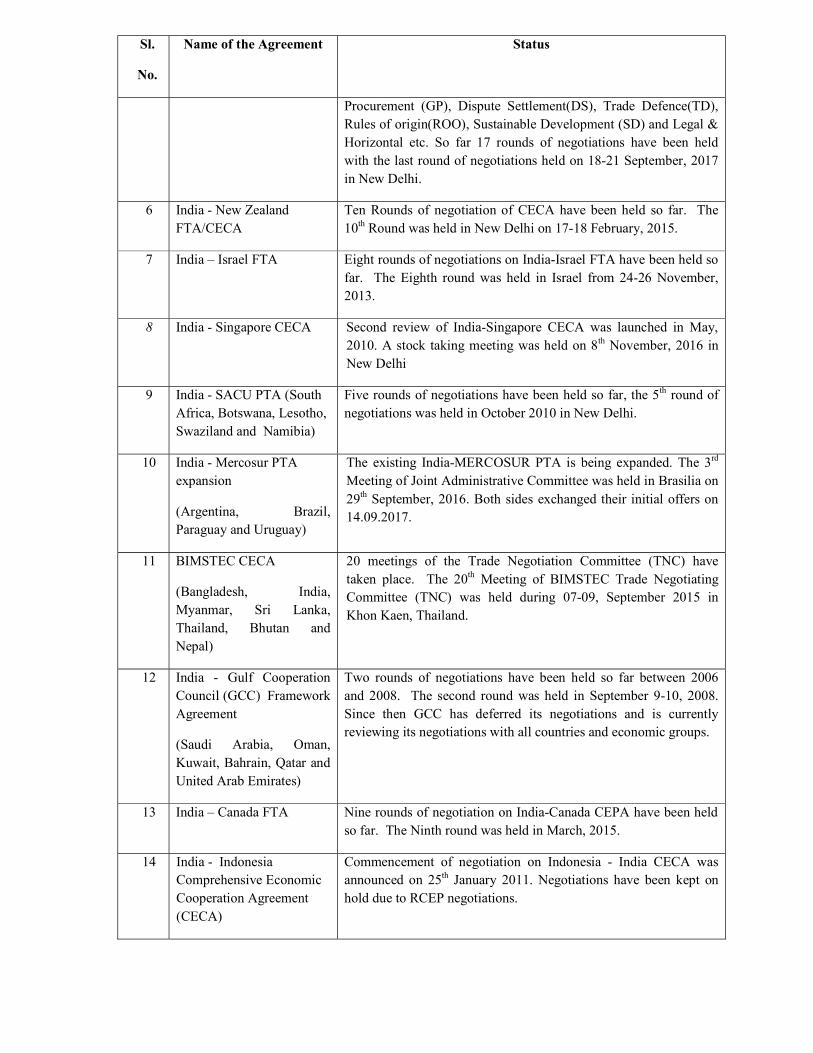
Sl.
No.
Name of the Agreement Status
Procurement (GP), Dispute Settlement(DS), Trade Defence(TD), Rules of origin(ROO), Sustainable Development (SD) and Legal & Horizontal etc. So far 17 rounds of negotiations have been held with the last round of negotiations held on 18-21 September, 2017 in New Delhi.
6 India - New Zealand FTA/CECA
Ten Rounds of negotiation of CECA have been held so far. The 10th Round was held in New Delhi on 17-18 February, 2015.
7 India – Israel FTA Eight rounds of negotiations on India-Israel FTA have been held so far. The Eighth round was held in Israel from 24-26 November, 2013.
8 India - Singapore CECA Second review of India-Singapore CECA was launched in May, 2010. A stock taking meeting was held on 8th November, 2016 in New Delhi
9 India - SACU PTA (South Africa, Botswana, Lesotho, Swaziland and Namibia)
Five rounds of negotiations have been held so far, the 5th round of negotiations was held in October 2010 in New Delhi.
10 India - Mercosur PTA expansion
(Argentina, Brazil, Paraguay and Uruguay)
The existing India-MERCOSUR PTA is being expanded. The 3rd Meeting of Joint Administrative Committee was held in Brasilia on 29th September, 2016. Both sides exchanged their initial offers on 14.09.2017.
11 BIMSTEC CECA
(Bangladesh, India, Myanmar, Sri Lanka, Thailand, Bhutan and Nepal)
20 meetings of the Trade Negotiation Committee (TNC) have taken place. The 20th Meeting of BIMSTEC Trade Negotiating Committee (TNC) was held during 07-09, September 2015 in Khon Kaen, Thailand.
12 India - Gulf Cooperation Council (GCC) Framework Agreement
(Saudi Arabia, Oman, Kuwait, Bahrain, Qatar and United Arab Emirates)
Two rounds of negotiations have been held so far between 2006 and 2008. The second round was held in September 9-10, 2008. Since then GCC has deferred its negotiations and is currently reviewing its negotiations with all countries and economic groups.
13 India – Canada FTA Nine rounds of negotiation on India-Canada CEPA have been held so far. The Ninth round was held in March, 2015.
14 India - Indonesia Comprehensive Economic Cooperation Agreement (CECA)
Commencement of negotiation on Indonesia - India CECA was announced on 25th January 2011. Negotiations have been kept on hold due to RCEP negotiations.
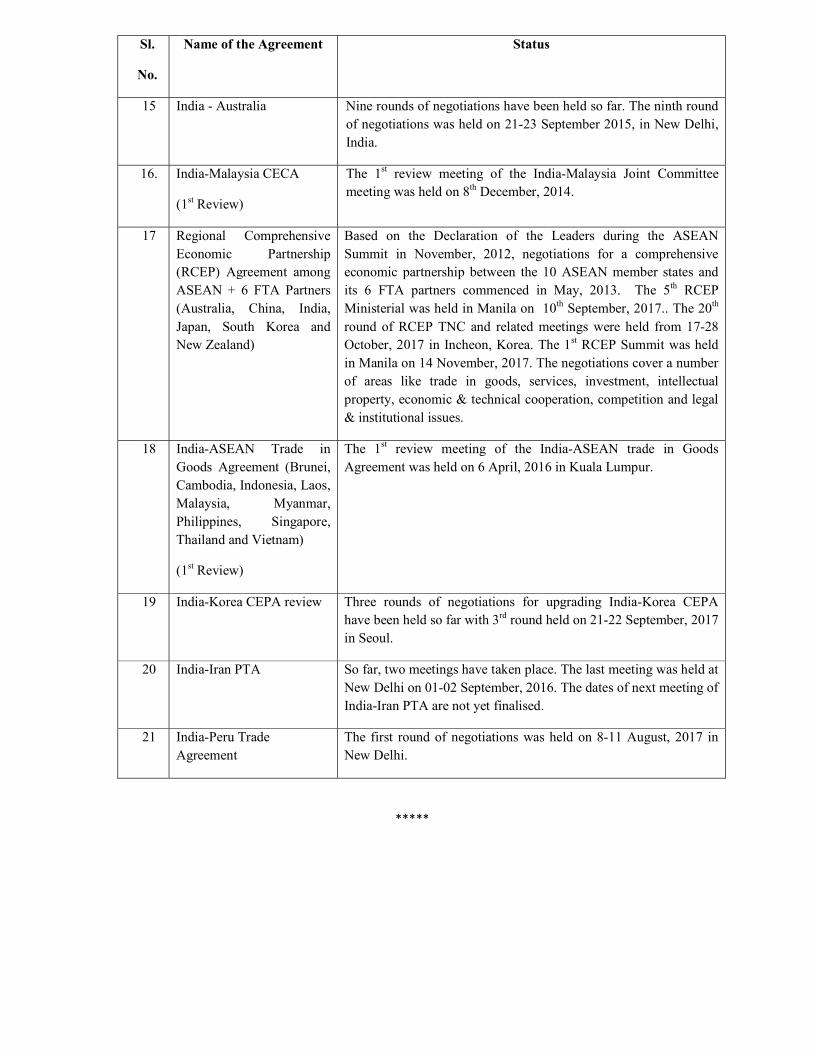
Sl.
No.
Name of the Agreement Status
15 India - Australia Nine rounds of negotiations have been held so far. The ninth round of negotiations was held on 21-23 September 2015, in New Delhi, India.
16. India-Malaysia CECA
(1st Review)
The 1st review meeting of the India-Malaysia Joint Committee meeting was held on 8th December, 2014.
17 Regional Comprehensive Economic Partnership (RCEP) Agreement among ASEAN + 6 FTA Partners (Australia, China, India, Japan, South Korea and New Zealand)
Based on the Declaration of the Leaders during the ASEAN Summit in November, 2012, negotiations for a comprehensive economic partnership between the 10 ASEAN member states and its 6 FTA partners commenced in May, 2013. The 5th RCEP Ministerial was held in Manila on 10th September, 2017.. The 20th round of RCEP TNC and related meetings were held from 17-28 October, 2017 in Incheon, Korea. The 1st RCEP Summit was held in Manila on 14 November, 2017. The negotiations cover a number of areas like trade in goods, services, investment, intellectual property, economic & technical cooperation, competition and legal & institutional issues.
18 India-ASEAN Trade in Goods Agreement (Brunei, Cambodia, Indonesia, Laos, Malaysia, Myanmar, Philippines, Singapore, Thailand and Vietnam)
(1st Review)
The 1st review meeting of the India-ASEAN trade in Goods Agreement was held on 6 April, 2016 in Kuala Lumpur.
19 India-Korea CEPA review Three rounds of negotiations for upgrading India-Korea CEPA have been held so far with 3rd round held on 21-22 September, 2017 in Seoul.
20 India-Iran PTA So far, two meetings have taken place. The last meeting was held at New Delhi on 01-02 September, 2016. The dates of next meeting of India-Iran PTA are not yet finalised.
21 India-Peru Trade Agreement
The first round of negotiations was held on 8-11 August, 2017 in New Delhi.
*****
GOVERNMENT OF INDIA MINISTRY OF COMMERCE & INDUSTRY
(DEPARTMENT OF COMMERCE)
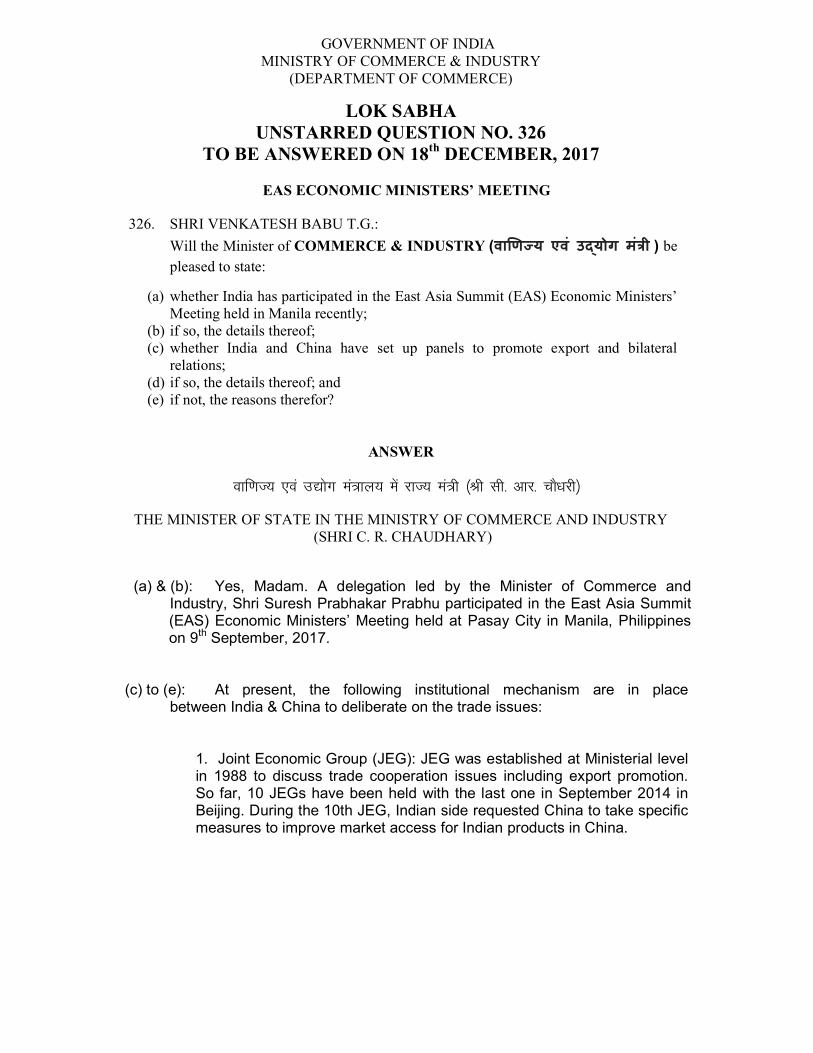
LOK SABHA UNSTARRED QUESTION NO. 326
TO BE ANSWERED ON 18th DECEMBER, 2017
EAS ECONOMIC MINISTERS’ MEETING 326. SHRI VENKATESH BABU T.G.:
Will the Minister of COMMERCE & INDUSTRY (वा ण य एव ंउ योग मं ी ) be pleased to state:
(a) whether India has participated in the East Asia Summit (EAS) Economic Ministers’ Meeting held in Manila recently;
(b) if so, the details thereof; (c) whether India and China have set up panels to promote export and bilateral
relations; (d) if so, the details thereof; and (e) if not, the reasons therefor?
ANSWER
okf.kT; ,oa m|ksx ea=ky; esa jkT; ea=h ¼Jh lh- vkj- pkS/kjh½
THE MINISTER OF STATE IN THE MINISTRY OF COMMERCE AND INDUSTRY (SHRI C. R. CHAUDHARY)
(a) & (b): Yes, Madam. A delegation led by the Minister of Commerce and Industry, Shri Suresh Prabhakar Prabhu participated in the East Asia Summit (EAS) Economic Ministers’ Meeting held at Pasay City in Manila, Philippines on 9th September, 2017.
(c) to (e): At present, the following institutional mechanism are in place between India & China to deliberate on the trade issues:
1. Joint Economic Group (JEG): JEG was established at Ministerial level in 1988 to discuss trade cooperation issues including export promotion. So far, 10 JEGs have been held with the last one in September 2014 in Beijing. During the 10th JEG, Indian side requested China to take specific measures to improve market access for Indian products in China.
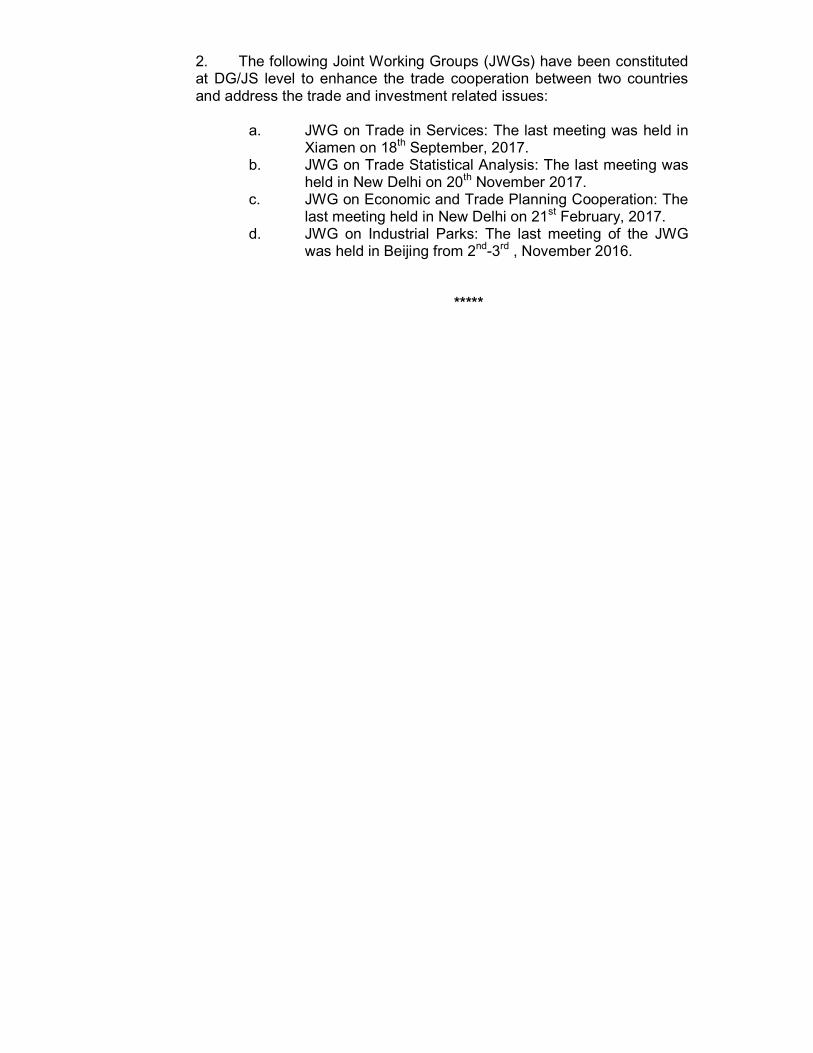
2. The following Joint Working Groups (JWGs) have been constituted at DG/JS level to enhance the trade cooperation between two countries and address the trade and investment related issues:
a. JWG on Trade in Services: The last meeting was held in Xiamen on 18th September, 2017. b. JWG on Trade Statistical Analysis: The last meeting was held in New Delhi on 20th November 2017. c. JWG on Economic and Trade Planning Cooperation: The last meeting held in New Delhi on 21st February, 2017. d. JWG on Industrial Parks: The last meeting of the JWG was held in Beijing from 2nd-3rd , November 2016.
*****
GOVERNMENT OF INDIA MINISTRY OF COMMERCE & INDUSTRY
(DEPARTMENT OF COMMERCE)
LOK SABHA UNSTARRED QUESTION NO.333
TO BE ANSWERED ON 18th DECEMBER, 2017
IMPORT OF ARTIFICIAL DIAMONDS FROM CHINA 333. SHRI G.M. SIDDESHWARA
Will the Minister of COMMERCE & INDUSTRY (वा ण य एव ंउ योग मं ी ) be
pleased to state:
(a) whether the Government is aware that artificial diamonds are being imported from China in large numbers which look like real ones but have no resale value;
(b) if so, the reaction of the Government thereto; (c) whether the Government is also aware that Indian consumers are being cheated due
to lack of identification of genuineness of imported diamonds from China; and (d) if so, the steps taken by Government to save the Indian consumers from being
cheated?
ANSWER
okf.kT; ,oa m|ksx ea=ky; esa jkT; ea=h ¼Jh lh- vkj- pkS/kjh½
THE MINISTER OF STATE IN THE MINISTRY OF COMMERCE AND INDUSTRY (SHRI C. R. CHAUDHARY)
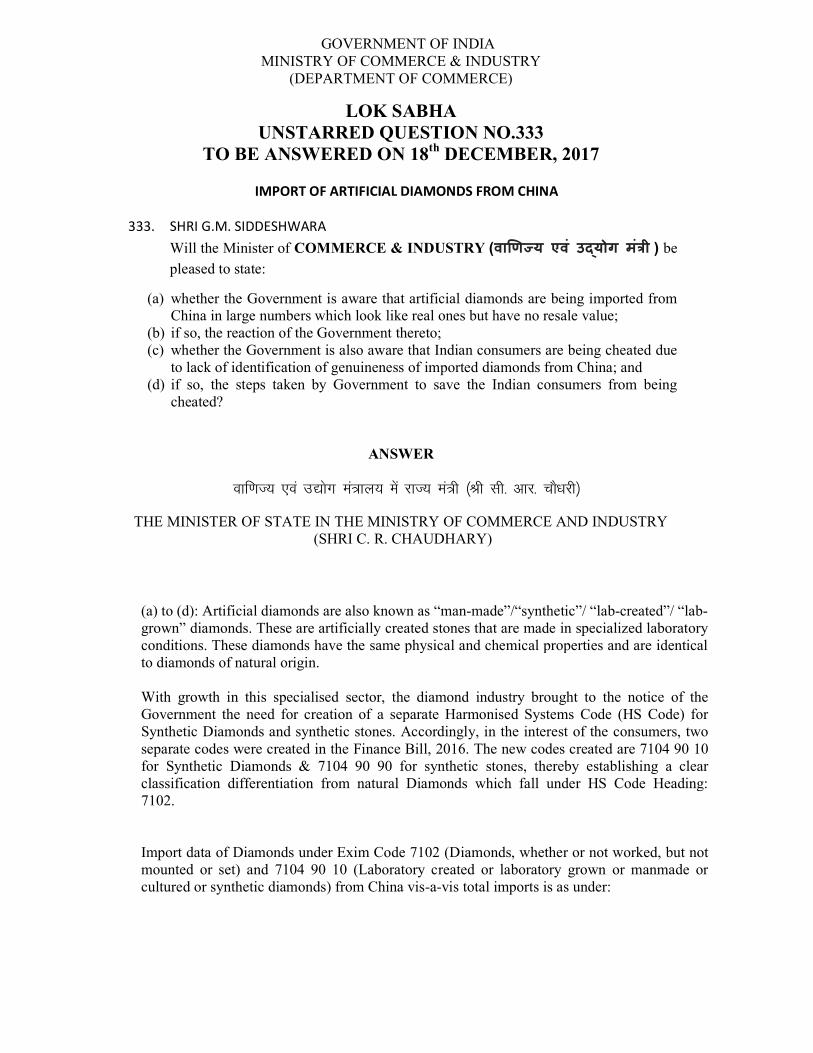
(a) to (d): Artificial diamonds are also known as “man-made”/“synthetic”/ “lab-created”/ “lab-grown” diamonds. These are artificially created stones that are made in specialized laboratory conditions. These diamonds have the same physical and chemical properties and are identical to diamonds of natural origin. With growth in this specialised sector, the diamond industry brought to the notice of the Government the need for creation of a separate Harmonised Systems Code (HS Code) for Synthetic Diamonds and synthetic stones. Accordingly, in the interest of the consumers, two separate codes were created in the Finance Bill, 2016. The new codes created are 7104 90 10 for Synthetic Diamonds & 7104 90 90 for synthetic stones, thereby establishing a clear classification differentiation from natural Diamonds which fall under HS Code Heading: 7102. Import data of Diamonds under Exim Code 7102 (Diamonds, whether or not worked, but not mounted or set) and 7104 90 10 (Laboratory created or laboratory grown or manmade or cultured or synthetic diamonds) from China vis-a-vis total imports is as under:
Table:1
Import of diamonds (HS code 7102)
Values in US $ Million
Year Total Imports
Imports from China
2014-15 20,495.36 1. 30 2015-16 16,865.96 6.21 2016-17 19,332.14 1.31 2017-18 (APR TO SEP) 15,091.34* 0.17*
* provisional.
Table: 2
Import under HS Code 71049010 (Lab grown Diamonds) Values in US $ Mill
Year Total Imports Imports from China
2017-18 (APR TO SEP) 160.33* 1.35* * provisional. From the above, it may be seen that imports from China is miniscule compared to our total import.
***
GOVERNMENT OF INDIA MINISTRY OF COMMERCE & INDUSTRY
(DEPARTMENT OF COMMERCE)
LOK SABHA UNSTARRED QUESTION NO.355
TO BE ANSWERED ON 18th DECEMBER, 2017
TRADE DEFICIT 355. SHRI GAURAV GOGOI:
SHRI JYOTIRADITYA M. SCINDIA: SHRI KRUPAL BALAJI TUMANE:
Will the Minister of COMMERCE & INDUSTRY (वा ण य एव ंउ योग मं ी ) be
pleased to state:
(a) whether it is a fact that India’s exports and imports have registered growth in the last quarter and if so, the details thereof;
(b) whether the country’s trade deficit jumped to three years high in October this year which may further widen current account deficit;
(c) if so, the factors responsible for country’s increase in trade deficit; (d) whether the Government has taken any concrete steps to resolve the grievances of
exporters to overcome widening of trade deficit; and (e) if so, the details thereof?
ANSWER
okf.kT; ,oa m|ksx ea=ky; esa jkT; ea=h ¼Jh lh- vkj- pkS/kjh½
THE MINISTER OF STATE IN THE MINISTRY OF COMMERCE AND INDUSTRY (SHRI C. R. CHAUDHARY)
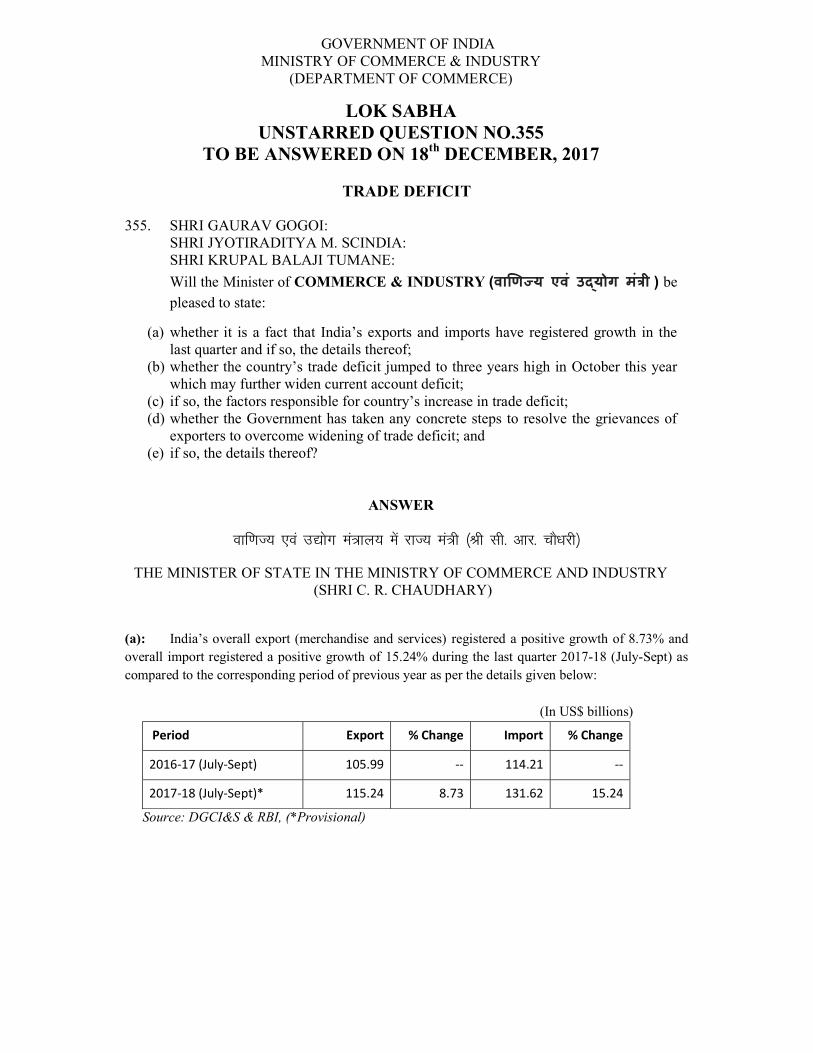
(a): India’s overall export (merchandise and services) registered a positive growth of 8.73% and overall import registered a positive growth of 15.24% during the last quarter 2017-18 (July-Sept) as compared to the corresponding period of previous year as per the details given below:
(In US$ billions)
Period Export % Change Import % Change
2016-17 (July-Sept) 105.99 -- 114.21 --
2017-18 (July-Sept)* 115.24 8.73 131.62 15.24
Source: DGCI&S & RBI, (*Provisional)
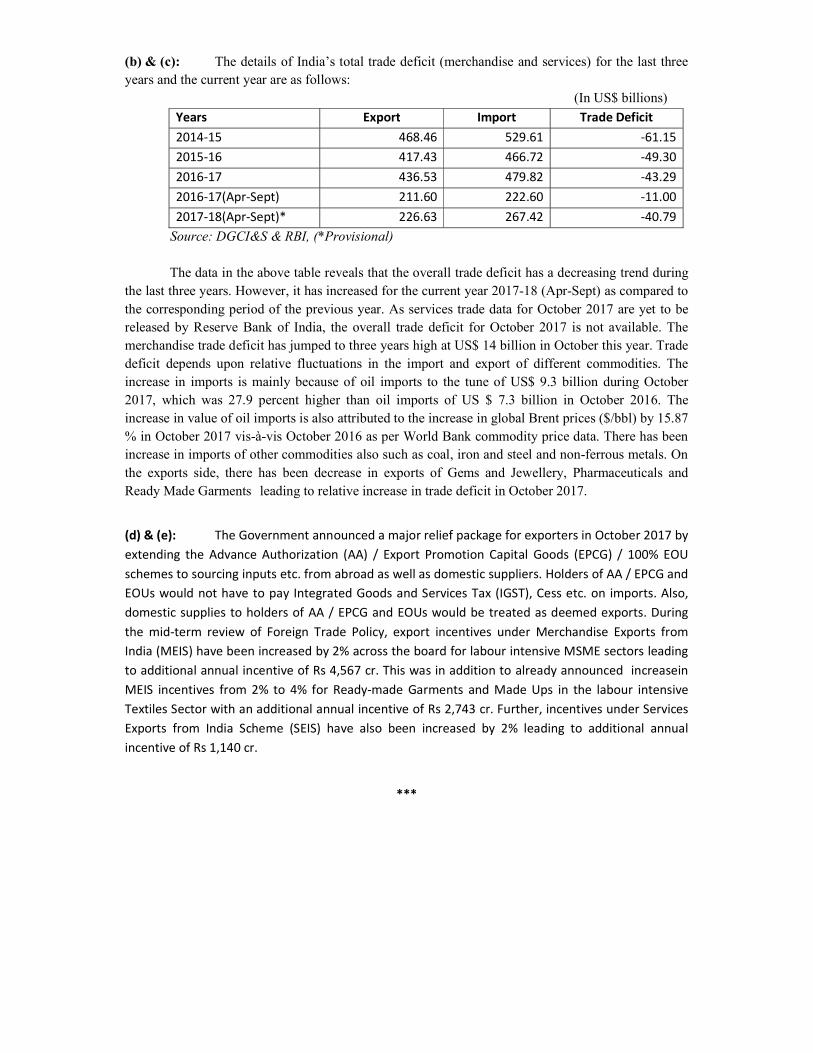
(b) & (c): The details of India’s total trade deficit (merchandise and services) for the last three years and the current year are as follows:
(In US$ billions)
Years Export Import Trade Deficit 2014-15 468.46 529.61 -61.15 2015-16 417.43 466.72 -49.30 2016-17 436.53 479.82 -43.29 2016-17(Apr-Sept) 211.60 222.60 -11.00 2017-18(Apr-Sept)* 226.63 267.42 -40.79
Source: DGCI&S & RBI, (*Provisional)
The data in the above table reveals that the overall trade deficit has a decreasing trend during the last three years. However, it has increased for the current year 2017-18 (Apr-Sept) as compared to the corresponding period of the previous year. As services trade data for October 2017 are yet to be released by Reserve Bank of India, the overall trade deficit for October 2017 is not available. The merchandise trade deficit has jumped to three years high at US$ 14 billion in October this year. Trade deficit depends upon relative fluctuations in the import and export of different commodities. The increase in imports is mainly because of oil imports to the tune of US$ 9.3 billion during October 2017, which was 27.9 percent higher than oil imports of US $ 7.3 billion in October 2016. The increase in value of oil imports is also attributed to the increase in global Brent prices ($/bbl) by 15.87 % in October 2017 vis-à-vis October 2016 as per World Bank commodity price data. There has been increase in imports of other commodities also such as coal, iron and steel and non-ferrous metals. On the exports side, there has been decrease in exports of Gems and Jewellery, Pharmaceuticals and Ready Made Garments leading to relative increase in trade deficit in October 2017.
(d) & (e): The Government announced a major relief package for exporters in October 2017 by extending the Advance Authorization (AA) / Export Promotion Capital Goods (EPCG) / 100% EOU schemes to sourcing inputs etc. from abroad as well as domestic suppliers. Holders of AA / EPCG and EOUs would not have to pay Integrated Goods and Services Tax (IGST), Cess etc. on imports. Also, domestic supplies to holders of AA / EPCG and EOUs would be treated as deemed exports. During the mid-term review of Foreign Trade Policy, export incentives under Merchandise Exports from India (MEIS) have been increased by 2% across the board for labour intensive MSME sectors leading to additional annual incentive of Rs 4,567 cr. This was in addition to already announced increasein MEIS incentives from 2% to 4% for Ready-made Garments and Made Ups in the labour intensive Textiles Sector with an additional annual incentive of Rs 2,743 cr. Further, incentives under Services Exports from India Scheme (SEIS) have also been increased by 2% leading to additional annual incentive of Rs 1,140 cr.
***
GOVERNMENT OF INDIA MINISTRY OF COMMERCE & INDUSTRY
(DEPARTMENT OF COMMERCE)
LOK SABHA UNSTARRED QUESTION NO. 361
TO BE ANSWERED ON 18th DECEMBER, 2017
TRADE FACILITATION AGREEMENT OF WTO 361(H). SHRI HARI MANJHI:
Will the Minister of COMMERCE & INDUSTRY (वा ण य एव ंउ योग मं ी ) be
pleased to state:
(a) the salient features of Trade Facilitation Agreement (TFA) of World Trade Organisation (WTO) along with the status of ratification of the said TFA;
(b) whether there is a possibility of ratification of WTO’s TFA by India very soon and if so, the details thereof along with the benefits likely to accrue as a result thereof;
(c) whether there is a possibility of withdrawal of Free Trade Agreement between India and European Union in near future; and
(d) if so, the details thereof?
ANSWER
okf.kT; ,oa m|ksx ea=ky; esa jkT; ea=h ¼Jh lh- vkj- pkS/kjh½
THE MINISTER OF STATE IN THE MINISTRY OF COMMERCE AND INDUSTRY (SHRI C. R. CHAUDHARY)
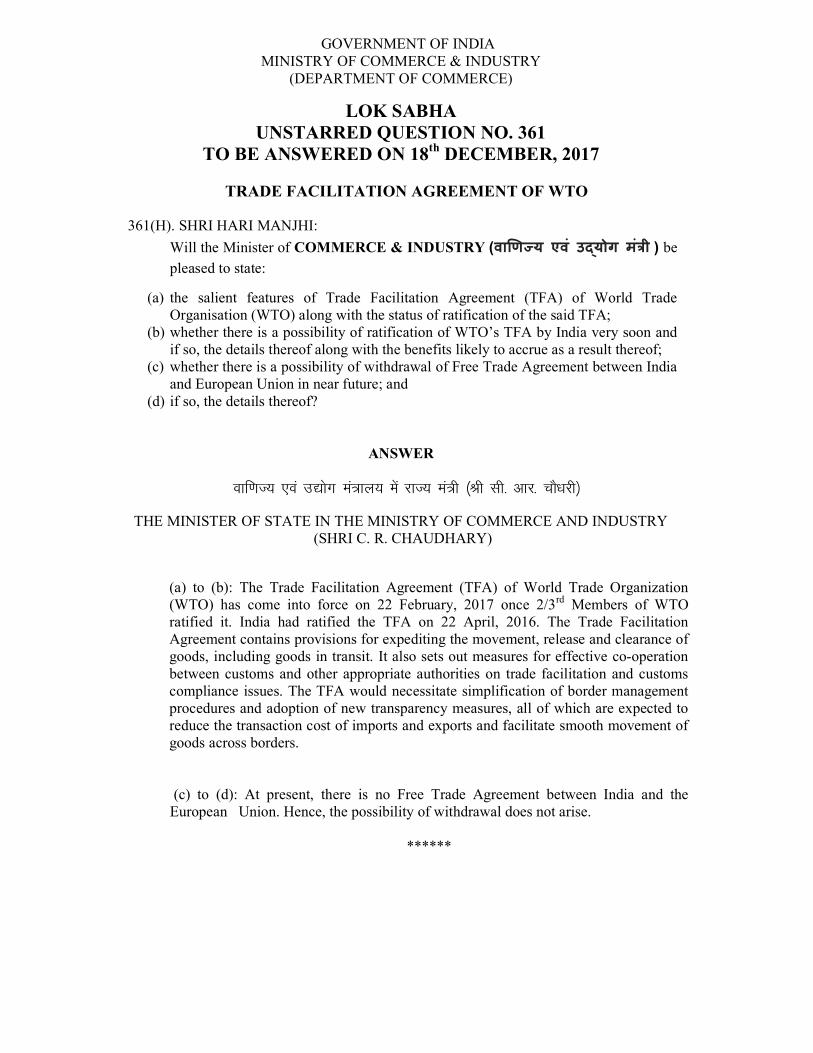
(a) to (b): The Trade Facilitation Agreement (TFA) of World Trade Organization (WTO) has come into force on 22 February, 2017 once 2/3rd Members of WTO ratified it. India had ratified the TFA on 22 April, 2016. The Trade Facilitation Agreement contains provisions for expediting the movement, release and clearance of goods, including goods in transit. It also sets out measures for effective co-operation between customs and other appropriate authorities on trade facilitation and customs compliance issues. The TFA would necessitate simplification of border management procedures and adoption of new transparency measures, all of which are expected to reduce the transaction cost of imports and exports and facilitate smooth movement of goods across borders. (c) to (d): At present, there is no Free Trade Agreement between India and the European Union. Hence, the possibility of withdrawal does not arise.
******
GOVERNMENT OF INDIA MINISTRY OF COMMERCE & INDUSTRY
(DEPARTMENT OF COMMERCE)
LOK SABHA UNSTARRED QUESTION NO. 373
TO BE ANSWERED ON 18th DECEMBER, 2017
IMPORT OF CHEAP QUALITY PEPPER
373. SHRI PINAKI MISRA:
Will the Minister of COMMERCE & INDUSTRY (वा ण य एव ंउ योग मं ी ) be
pleased to state:
(a) whether the prices of superior quality pepper have fallen due to increase in its production and if so, the details thereof;
(b) whether it is a fact that the cheap and low quality Vietnamese pepper is finding its way into India through Sri Lanka under the South Asia Free Trade Area Agreement which is severely impacting the pepper growers in the South Indian States, particularly Kerala and Karnataka; and
(c) if so, the measures proposed to be taken by the Government to stop the unethical inflow of inferior quality of pepper of Vietnam through Sri Lanka so that the prices of pepper get stabilized and its growers are protected?
ANSWER
okf.kT; ,oa m|ksx ea=ky; esa jkT; ea=h ¼Jh lh- vkj- pkS/kjh½
THE MINISTER OF STATE IN THE MINISTRY OF COMMERCE AND INDUSTRY (SHRI C. R. CHAUDHARY)
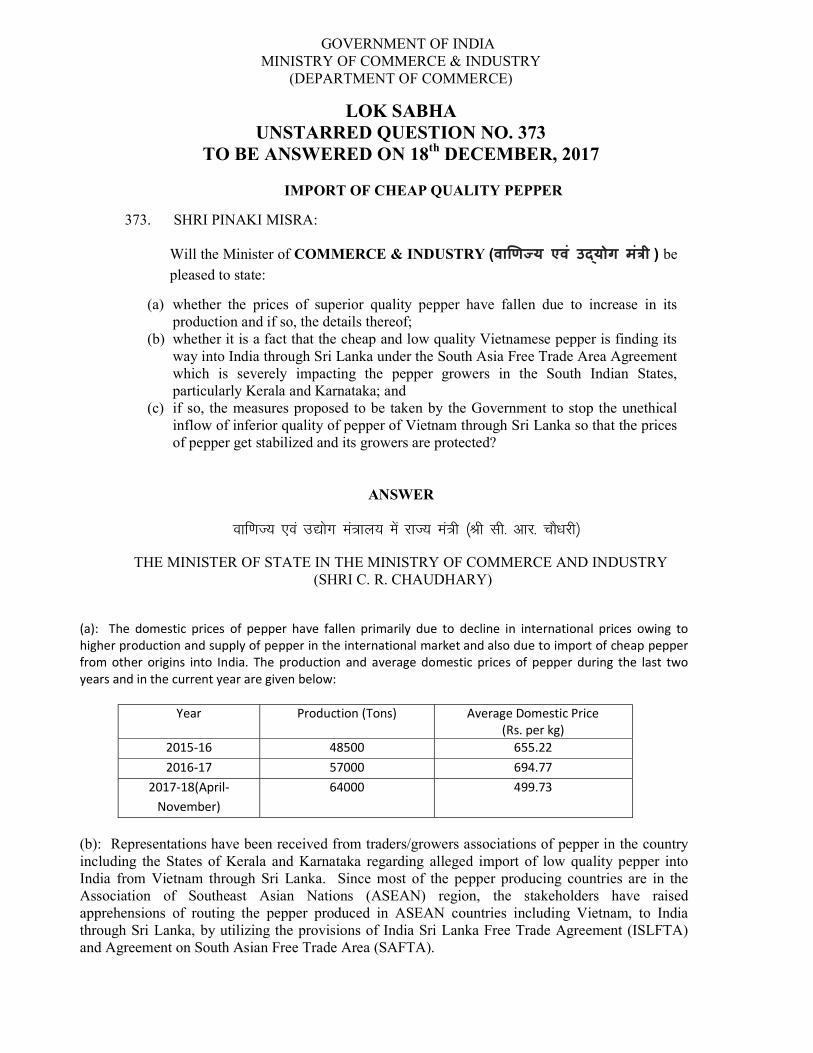
(a): The domestic prices of pepper have fallen primarily due to decline in international prices owing to higher production and supply of pepper in the international market and also due to import of cheap pepper from other origins into India. The production and average domestic prices of pepper during the last two years and in the current year are given below:
Year Production (Tons) Average Domestic Price (Rs. per kg)
2015-16 48500 655.22 2016-17 57000 694.77
2017-18(April-November)
64000 499.73
(b): Representations have been received from traders/growers associations of pepper in the country including the States of Kerala and Karnataka regarding alleged import of low quality pepper into India from Vietnam through Sri Lanka. Since most of the pepper producing countries are in the Association of Southeast Asian Nations (ASEAN) region, the stakeholders have raised apprehensions of routing the pepper produced in ASEAN countries including Vietnam, to India through Sri Lanka, by utilizing the provisions of India Sri Lanka Free Trade Agreement (ISLFTA) and Agreement on South Asian Free Trade Area (SAFTA).
(c): In order to stop the possibility of inferior quality pepper of other countries entering into India through Sri Lanka to take duty advantage and to stabilize the domestic prices of pepper, Government has fixed the CIF value of Rs.500/- per kg as Minimum Import Price for Black Pepper vide DGFT Notification dated 6/12/2017.
Sri Lankan Authorities have been requested to exercise extreme care and diligence in issuing the Certificates of Origin under ISLFTA and SAFTA. Government of Sri Lanka has informed that Sri Lanka Customs along with Ministry of Primary Industries and National Quarantine Service have introduced a new procedure with the aim of preventing Sri Lankan exporters from obtaining SAFTA or ISLFTA Certificates of Origin issued by the Department for third-country black pepper shipments destined to India.
****
GOVERNMENT OF INDIA MINISTRY OF COMMERCE & INDUSTRY
(DEPARTMENT OF COMMERCE)
LOK SABHA UNSTARRED QUESTION NO. 377
TO BE ANSWERED ON 18th DECEMBER, 2017
EVALUATION OF FTAs 377. SHRI RAMESH CHANDER KAUSHIK:
Will the Minister of COMMERCE & INDUSTRY (वा ण य एव ंउ योग मं ी ) be
pleased to state:
(a) whether the Government/any other Government department or office carries out any evaluation of Free Trade Agreements (FTAs) signed by India with Japan, South Korea, Malaysia, Thailand and ASEAN;
(b) if so, the details thereof indicating the deficit or surplus with these countries during the last five years;
(c) the details of main sectors wherein India is facing trade deficit and enjoying trade surplus with these countries; and
(d) whether the Government has any plan to review these FTAs and if so, the details thereof?
ANSWER
okf.kT; ,oa m|ksx ea=ky; esa jkT; ea=h ¼Jh lh- vkj- pkS/kjh½
THE MINISTER OF STATE IN THE MINISTRY OF COMMERCE AND INDUSTRY (SHRI C. R. CHAUDHARY)
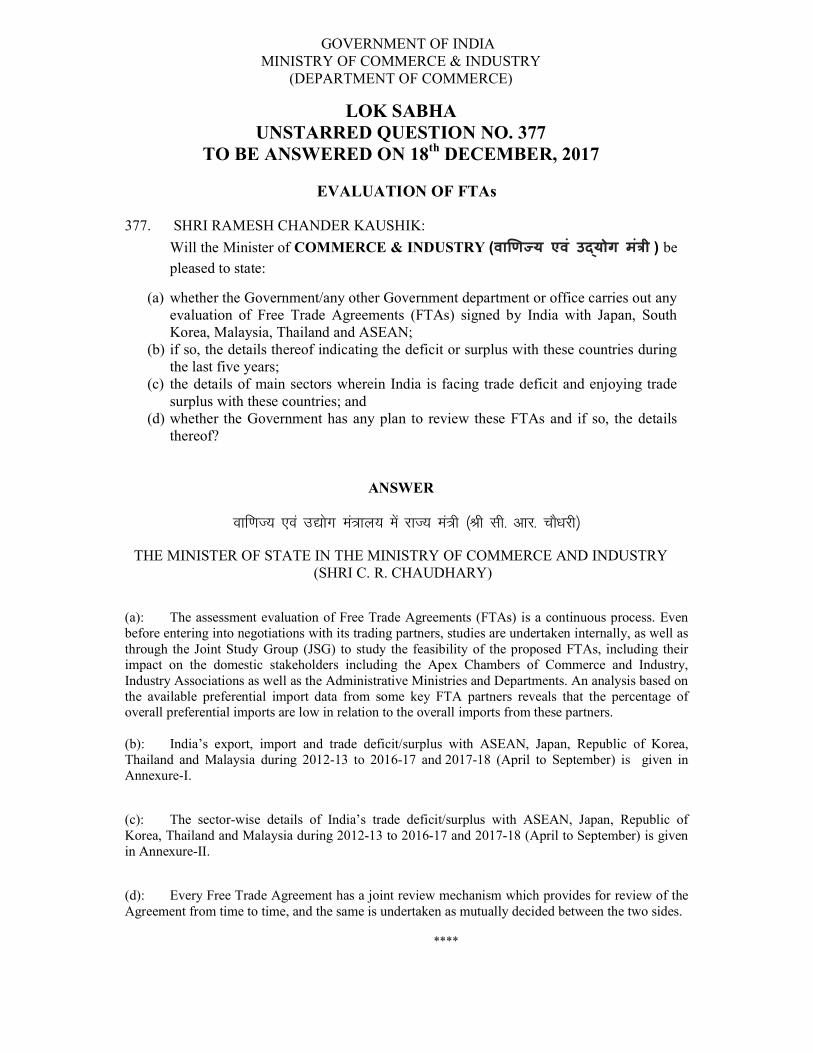
(a): The assessment evaluation of Free Trade Agreements (FTAs) is a continuous process. Even before entering into negotiations with its trading partners, studies are undertaken internally, as well as through the Joint Study Group (JSG) to study the feasibility of the proposed FTAs, including their impact on the domestic stakeholders including the Apex Chambers of Commerce and Industry, Industry Associations as well as the Administrative Ministries and Departments. An analysis based on the available preferential import data from some key FTA partners reveals that the percentage of overall preferential imports are low in relation to the overall imports from these partners. (b): India’s export, import and trade deficit/surplus with ASEAN, Japan, Republic of Korea, Thailand and Malaysia during 2012-13 to 2016-17 and 2017-18 (April to September) is given in Annexure-I.
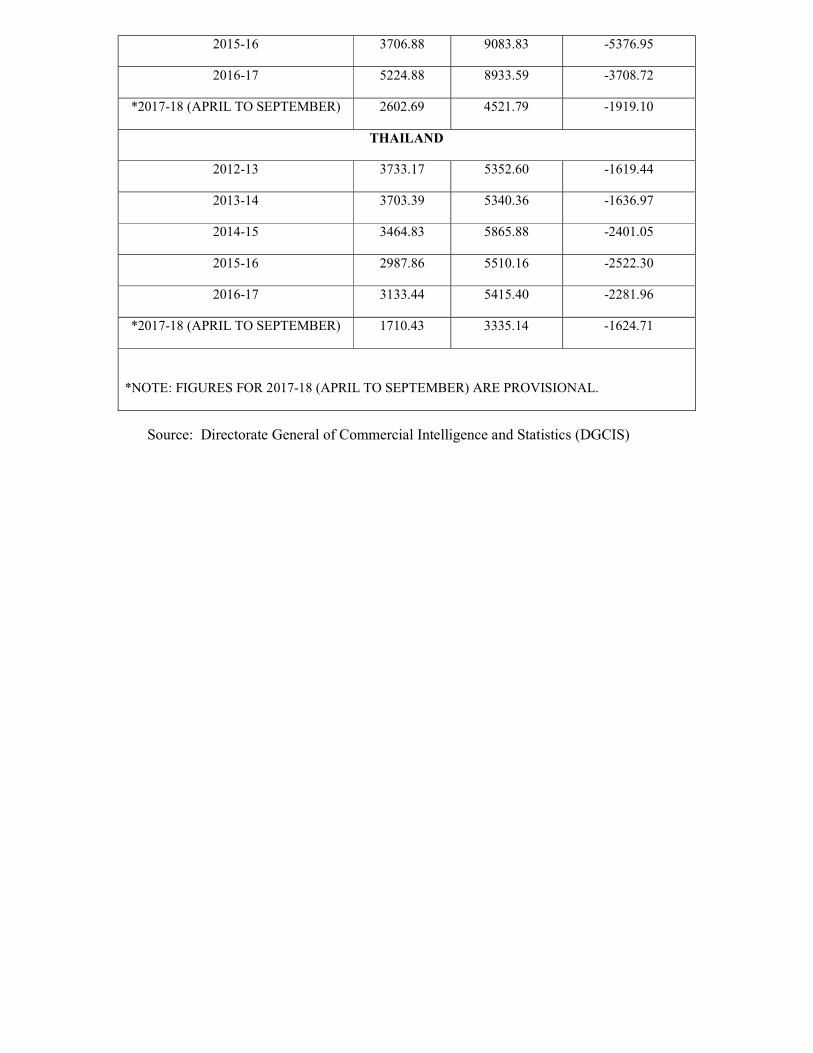
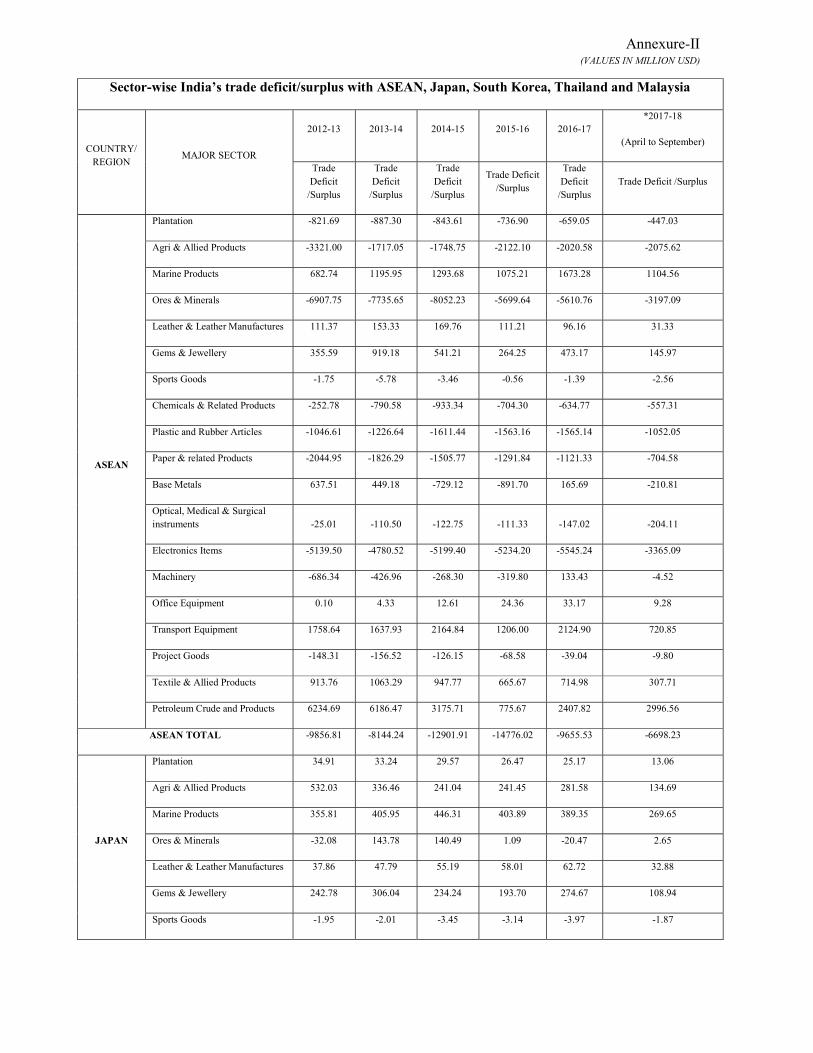
(c): The sector-wise details of India’s trade deficit/surplus with ASEAN, Japan, Republic of Korea, Thailand and Malaysia during 2012-13 to 2016-17 and 2017-18 (April to September) is given in Annexure-II.
(d): Every Free Trade Agreement has a joint review mechanism which provides for review of the Agreement from time to time, and the same is undertaken as mutually decided between the two sides.
****
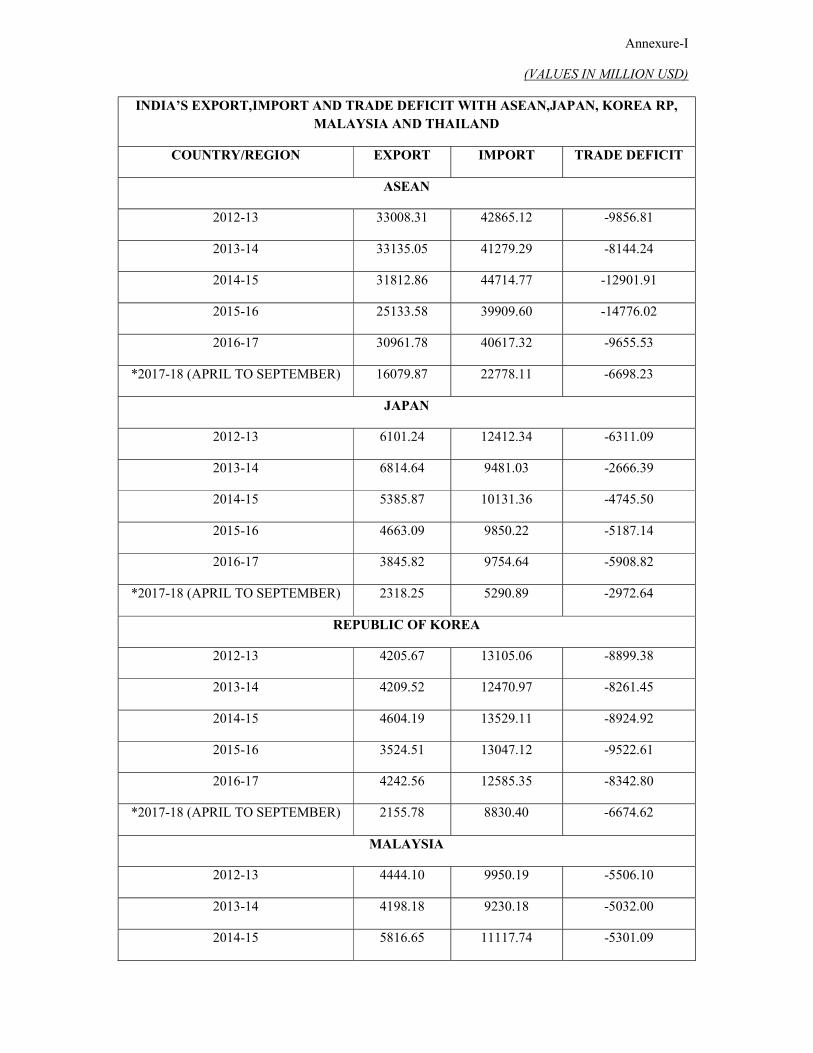
Annexure-I
(VALUES IN MILLION USD)
INDIA’S EXPORT,IMPORT AND TRADE DEFICIT WITH ASEAN,JAPAN, KOREA RP, MALAYSIA AND THAILAND
COUNTRY/REGION EXPORT IMPORT TRADE DEFICIT
ASEAN
2012-13 33008.31 42865.12 -9856.81
2013-14 33135.05 41279.29 -8144.24
2014-15 31812.86 44714.77 -12901.91
2015-16 25133.58 39909.60 -14776.02
2016-17 30961.78 40617.32 -9655.53
*2017-18 (APRIL TO SEPTEMBER) 16079.87 22778.11 -6698.23
JAPAN
2012-13 6101.24 12412.34 -6311.09
2013-14 6814.64 9481.03 -2666.39
2014-15 5385.87 10131.36 -4745.50
2015-16 4663.09 9850.22 -5187.14
2016-17 3845.82 9754.64 -5908.82
*2017-18 (APRIL TO SEPTEMBER) 2318.25 5290.89 -2972.64
REPUBLIC OF KOREA
2012-13 4205.67 13105.06 -8899.38
2013-14 4209.52 12470.97 -8261.45
2014-15 4604.19 13529.11 -8924.92
2015-16 3524.51 13047.12 -9522.61
2016-17 4242.56 12585.35 -8342.80
*2017-18 (APRIL TO SEPTEMBER) 2155.78 8830.40 -6674.62
MALAYSIA
2012-13 4444.10 9950.19 -5506.10
2013-14 4198.18 9230.18 -5032.00
2014-15 5816.65 11117.74 -5301.09
2015-16 3706.88 9083.83 -5376.95
2016-17 5224.88 8933.59 -3708.72
*2017-18 (APRIL TO SEPTEMBER) 2602.69 4521.79 -1919.10
THAILAND
2012-13 3733.17 5352.60 -1619.44
2013-14 3703.39 5340.36 -1636.97
2014-15 3464.83 5865.88 -2401.05
2015-16 2987.86 5510.16 -2522.30
2016-17 3133.44 5415.40 -2281.96
*2017-18 (APRIL TO SEPTEMBER) 1710.43 3335.14 -1624.71
*NOTE: FIGURES FOR 2017-18 (APRIL TO SEPTEMBER) ARE PROVISIONAL.
Source: Directorate General of Commercial Intelligence and Statistics (DGCIS)
Annexure-II (VALUES IN MILLION USD)
Sector-wise India’s trade deficit/surplus with ASEAN, Japan, South Korea, Thailand and Malaysia
COUNTRY/ REGION
MAJOR SECTOR
2012-13 2013-14 2014-15 2015-16 2016-17 *2017-18
(April to September)
Trade Deficit
/Surplus
Trade Deficit
/Surplus
Trade Deficit
/Surplus
Trade Deficit /Surplus
Trade Deficit
/Surplus Trade Deficit /Surplus
ASEAN
Plantation -821.69 -887.30 -843.61 -736.90 -659.05 -447.03
Agri & Allied Products -3321.00 -1717.05 -1748.75 -2122.10 -2020.58 -2075.62
Marine Products 682.74 1195.95 1293.68 1075.21 1673.28 1104.56
Ores & Minerals -6907.75 -7735.65 -8052.23 -5699.64 -5610.76 -3197.09
Leather & Leather Manufactures 111.37 153.33 169.76 111.21 96.16 31.33
Gems & Jewellery 355.59 919.18 541.21 264.25 473.17 145.97
Sports Goods -1.75 -5.78 -3.46 -0.56 -1.39 -2.56
Chemicals & Related Products -252.78 -790.58 -933.34 -704.30 -634.77 -557.31
Plastic and Rubber Articles -1046.61 -1226.64 -1611.44 -1563.16 -1565.14 -1052.05
Paper & related Products -2044.95 -1826.29 -1505.77 -1291.84 -1121.33 -704.58
Base Metals 637.51 449.18 -729.12 -891.70 165.69 -210.81
Optical, Medical & Surgical instruments -25.01 -110.50 -122.75 -111.33 -147.02 -204.11
Electronics Items -5139.50 -4780.52 -5199.40 -5234.20 -5545.24 -3365.09
Machinery -686.34 -426.96 -268.30 -319.80 133.43 -4.52
Office Equipment 0.10 4.33 12.61 24.36 33.17 9.28
Transport Equipment 1758.64 1637.93 2164.84 1206.00 2124.90 720.85
Project Goods -148.31 -156.52 -126.15 -68.58 -39.04 -9.80
Textile & Allied Products 913.76 1063.29 947.77 665.67 714.98 307.71
Petroleum Crude and Products 6234.69 6186.47 3175.71 775.67 2407.82 2996.56
ASEAN TOTAL -9856.81 -8144.24 -12901.91 -14776.02 -9655.53 -6698.23
JAPAN
Plantation 34.91 33.24 29.57 26.47 25.17 13.06
Agri & Allied Products 532.03 336.46 241.04 241.45 281.58 134.69
Marine Products 355.81 405.95 446.31 403.89 389.35 269.65
Ores & Minerals -32.08 143.78 140.49 1.09 -20.47 2.65
Leather & Leather Manufactures 37.86 47.79 55.19 58.01 62.72 32.88
Gems & Jewellery 242.78 306.04 234.24 193.70 274.67 108.94
Sports Goods -1.95 -2.01 -3.45 -3.14 -3.97 -1.87
Sector-wise India’s trade deficit/surplus with ASEAN, Japan, South Korea, Thailand and Malaysia
COUNTRY/ REGION
MAJOR SECTOR
2012-13 2013-14 2014-15 2015-16 2016-17 *2017-18
(April to September)
Trade Deficit
/Surplus
Trade Deficit
/Surplus
Trade Deficit
/Surplus
Trade Deficit /Surplus
Trade Deficit
/Surplus Trade Deficit /Surplus
Chemicals & Related Products -264.73 -180.12 -258.34 -283.00 -228.62 -166.33
Plastic and Rubber Articles -693.02 -579.70 -648.79 -792.05 -898.09 -517.59
Paper & related Products -53.14 -46.96 -41.73 -43.23 -49.43 -34.20
Base Metals -1896.60 -1446.23 -1739.07 -1807.44 -1173.94 -689.16
Optical, Medical & Surgical instruments -398.19 -335.26 -351.89 -356.11 -392.31 -196.03
Electronics Items -1017.89 -837.27 -791.00 -948.01 -987.61 -543.86
Machinery -3928.09 -2775.31 -2562.20 -2442.81 -2884.02 -1343.08
Office Equipment -6.04 -5.16 -8.19 -4.20 -3.32 -0.19
Transport Equipment -1580.92 -896.53 -1369.73 -474.77 -880.92 -417.50
Project Goods -384.26 -140.20 -285.42 -243.41 -162.56 -138.17
Textile & Allied Products 276.14 291.05 265.11 242.05 244.77 115.18
Petroleum Crude and Products 2427.96 2896.89 1777.51 1047.59 543.74 448.44
JAPAN TOTAL -6311.09 -2666.39 -4745.50 -5187.14 -5908.82 -2972.64
REPUBLIC OF KOREA
Plantation 1.98 6.07 15.56 10.28 10.57 5.96
Agri & Allied Products 773.01 670.20 406.46 331.79 254.99 122.90
Marine Products 20.70 32.00 35.24 23.96 26.16 11.21
Ores & Minerals 47.87 72.77 78.61 35.42 71.10 68.35
Leather & Leather Manufactures 35.71 48.35 55.98 69.94 60.70 26.47
Gems & Jewellery -202.70 -297.69 -327.63 -237.01 -229.96 -1409.41
Sports Goods -1.56 2.53 -0.25 -0.78 -1.41 -0.53
Chemicals & Related Products -872.97 -1117.38 -899.17 -493.19 -583.39 -435.18
Plastic and Rubber Articles -1539.84 -1614.81 -1772.87 -1544.79 -1472.02 -931.37
Paper & related Products -165.94 -201.14 -274.44 -279.93 -307.24 -141.32
Base Metals -1511.36 -1120.43 -1553.04 -1677.77 -1130.93 -999.45
Optical, Medical & Surgical instruments -132.30 -151.21 -156.17 -141.26 -157.14 -85.70
Electronics Items -1174.98 -1656.21 -1954.86 -2449.33 -2457.83 -1458.04
Machinery -2392.27 -1979.67 -2240.98 -1967.85 -1874.34 -936.00
Office Equipment -6.81 -48.29 -44.00 -24.36 -14.66 -3.82
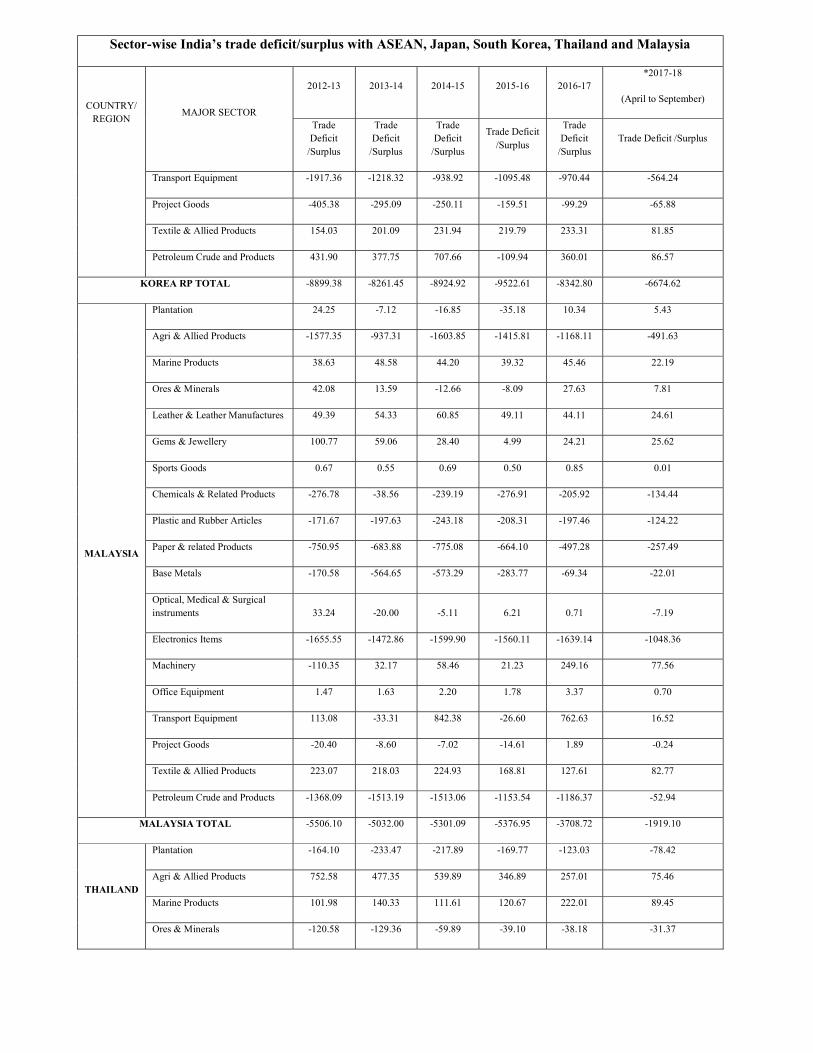
Sector-wise India’s trade deficit/surplus with ASEAN, Japan, South Korea, Thailand and Malaysia
COUNTRY/ REGION
MAJOR SECTOR
2012-13 2013-14 2014-15 2015-16 2016-17 *2017-18
(April to September)
Trade Deficit
/Surplus
Trade Deficit
/Surplus
Trade Deficit
/Surplus
Trade Deficit /Surplus
Trade Deficit
/Surplus Trade Deficit /Surplus
Transport Equipment -1917.36 -1218.32 -938.92 -1095.48 -970.44 -564.24
Project Goods -405.38 -295.09 -250.11 -159.51 -99.29 -65.88
Textile & Allied Products 154.03 201.09 231.94 219.79 233.31 81.85
Petroleum Crude and Products 431.90 377.75 707.66 -109.94 360.01 86.57
KOREA RP TOTAL -8899.38 -8261.45 -8924.92 -9522.61 -8342.80 -6674.62
MALAYSIA
Plantation 24.25 -7.12 -16.85 -35.18 10.34 5.43
Agri & Allied Products -1577.35 -937.31 -1603.85 -1415.81 -1168.11 -491.63
Marine Products 38.63 48.58 44.20 39.32 45.46 22.19
Ores & Minerals 42.08 13.59 -12.66 -8.09 27.63 7.81
Leather & Leather Manufactures 49.39 54.33 60.85 49.11 44.11 24.61
Gems & Jewellery 100.77 59.06 28.40 4.99 24.21 25.62
Sports Goods 0.67 0.55 0.69 0.50 0.85 0.01
Chemicals & Related Products -276.78 -38.56 -239.19 -276.91 -205.92 -134.44
Plastic and Rubber Articles -171.67 -197.63 -243.18 -208.31 -197.46 -124.22
Paper & related Products -750.95 -683.88 -775.08 -664.10 -497.28 -257.49
Base Metals -170.58 -564.65 -573.29 -283.77 -69.34 -22.01
Optical, Medical & Surgical instruments 33.24 -20.00 -5.11 6.21 0.71 -7.19
Electronics Items -1655.55 -1472.86 -1599.90 -1560.11 -1639.14 -1048.36
Machinery -110.35 32.17 58.46 21.23 249.16 77.56
Office Equipment 1.47 1.63 2.20 1.78 3.37 0.70
Transport Equipment 113.08 -33.31 842.38 -26.60 762.63 16.52
Project Goods -20.40 -8.60 -7.02 -14.61 1.89 -0.24
Textile & Allied Products 223.07 218.03 224.93 168.81 127.61 82.77
Petroleum Crude and Products -1368.09 -1513.19 -1513.06 -1153.54 -1186.37 -52.94
MALAYSIA TOTAL -5506.10 -5032.00 -5301.09 -5376.95 -3708.72 -1919.10
THAILAND
Plantation -164.10 -233.47 -217.89 -169.77 -123.03 -78.42
Agri & Allied Products 752.58 477.35 539.89 346.89 257.01 75.46
Marine Products 101.98 140.33 111.61 120.67 222.01 89.45
Ores & Minerals -120.58 -129.36 -59.89 -39.10 -38.18 -31.37
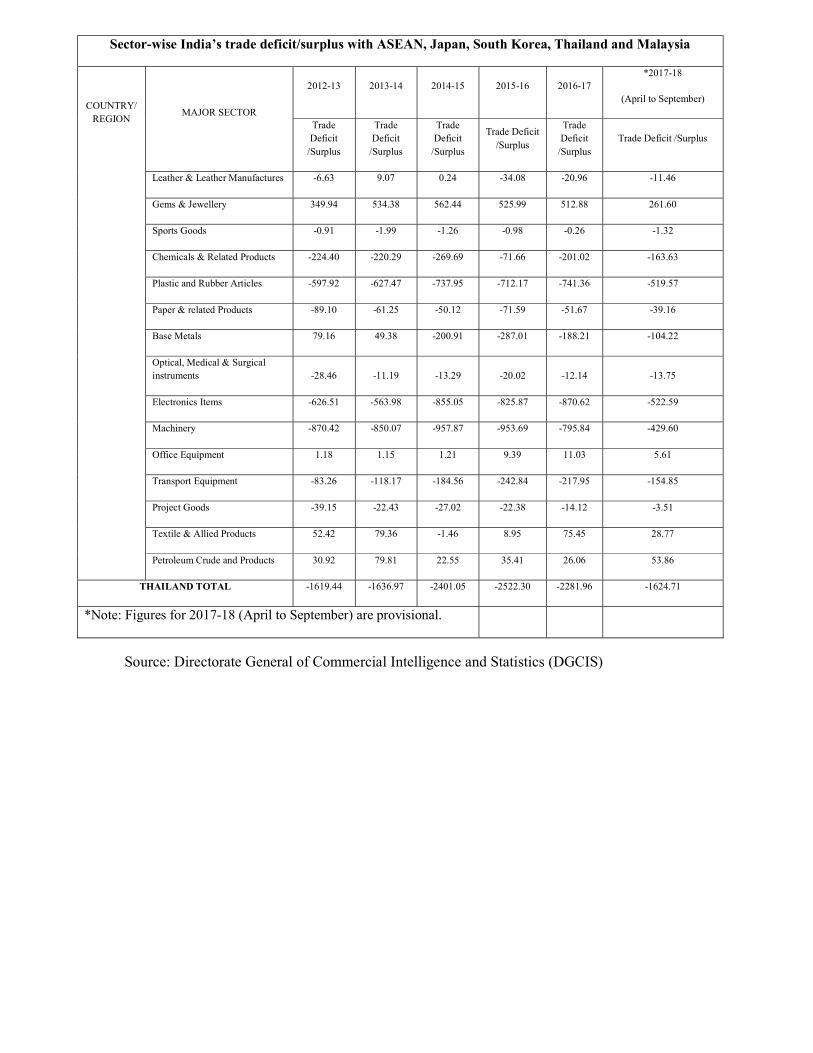
Sector-wise India’s trade deficit/surplus with ASEAN, Japan, South Korea, Thailand and Malaysia
COUNTRY/ REGION
MAJOR SECTOR
2012-13 2013-14 2014-15 2015-16 2016-17 *2017-18
(April to September)
Trade Deficit
/Surplus
Trade Deficit
/Surplus
Trade Deficit
/Surplus
Trade Deficit /Surplus
Trade Deficit
/Surplus Trade Deficit /Surplus
Leather & Leather Manufactures -6.63 9.07 0.24 -34.08 -20.96 -11.46
Gems & Jewellery 349.94 534.38 562.44 525.99 512.88 261.60
Sports Goods -0.91 -1.99 -1.26 -0.98 -0.26 -1.32
Chemicals & Related Products -224.40 -220.29 -269.69 -71.66 -201.02 -163.63
Plastic and Rubber Articles -597.92 -627.47 -737.95 -712.17 -741.36 -519.57
Paper & related Products -89.10 -61.25 -50.12 -71.59 -51.67 -39.16
Base Metals 79.16 49.38 -200.91 -287.01 -188.21 -104.22
Optical, Medical & Surgical instruments -28.46 -11.19 -13.29 -20.02 -12.14 -13.75
Electronics Items -626.51 -563.98 -855.05 -825.87 -870.62 -522.59
Machinery -870.42 -850.07 -957.87 -953.69 -795.84 -429.60
Office Equipment 1.18 1.15 1.21 9.39 11.03 5.61
Transport Equipment -83.26 -118.17 -184.56 -242.84 -217.95 -154.85
Project Goods -39.15 -22.43 -27.02 -22.38 -14.12 -3.51
Textile & Allied Products 52.42 79.36 -1.46 8.95 75.45 28.77
Petroleum Crude and Products 30.92 79.81 22.55 35.41 26.06 53.86
THAILAND TOTAL -1619.44 -1636.97 -2401.05 -2522.30 -2281.96 -1624.71
*Note: Figures for 2017-18 (April to September) are provisional.
Source: Directorate General of Commercial Intelligence and Statistics (DGCIS)
GOVERNMENT OF INDIA MINISTRY OF COMMERCE & INDUSTRY
(DEPARTMENT OF COMMERCE)
LOK SABHA UNSTARRED QUESTION NO.389
TO BE ANSWERED ON 18th DECEMBER, 2017
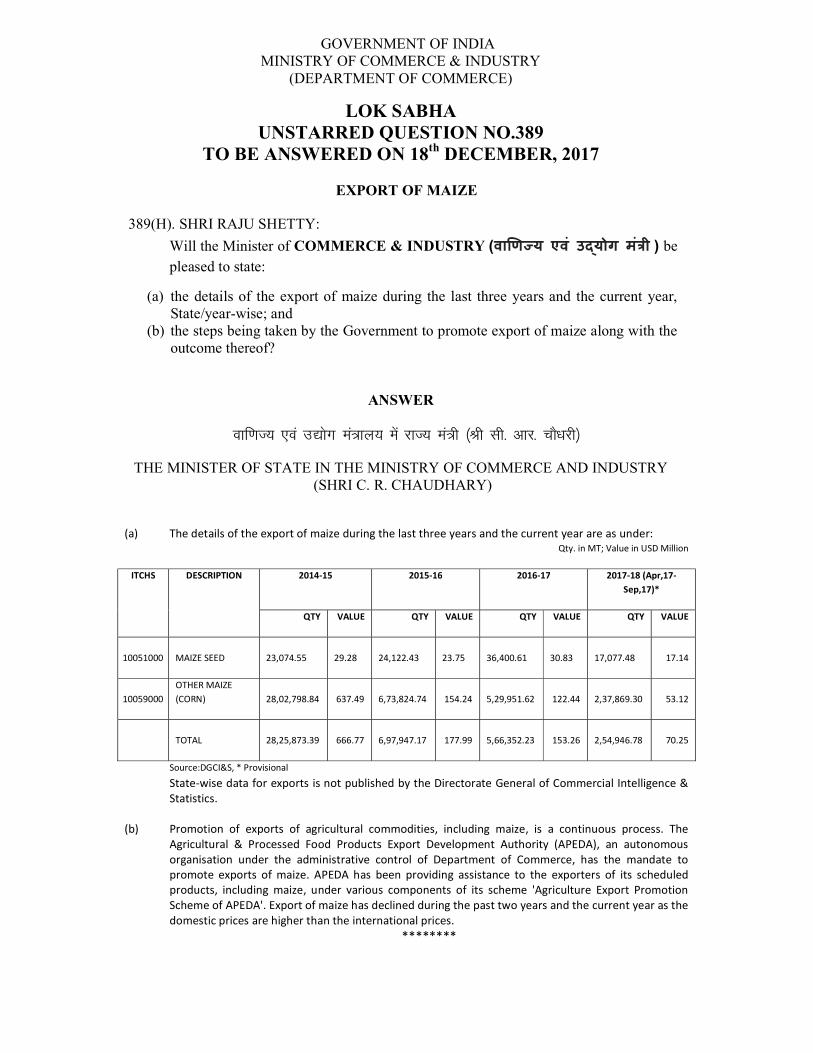
EXPORT OF MAIZE 389(H). SHRI RAJU SHETTY:
Will the Minister of COMMERCE & INDUSTRY (वा ण य एव ंउ योग मं ी ) be pleased to state:
(a) the details of the export of maize during the last three years and the current year, State/year-wise; and
(b) the steps being taken by the Government to promote export of maize along with the outcome thereof?
ANSWER
okf.kT; ,oa m|ksx ea=ky; esa jkT; ea=h ¼Jh lh- vkj- pkS/kjh½
THE MINISTER OF STATE IN THE MINISTRY OF COMMERCE AND INDUSTRY (SHRI C. R. CHAUDHARY)
(a) The details of the export of maize during the last three years and the current year are as under: Qty. in MT; Value in USD Million
ITCHS DESCRIPTION 2014-15 2015-16 2016-17 2017-18 (Apr,17-Sep,17)*
QTY VALUE QTY VALUE QTY VALUE QTY VALUE
10051000 MAIZE SEED 23,074.55
29.28
24,122.43
23.75
36,400.61
30.83
17,077.48
17.14
10059000 OTHER MAIZE (CORN)
28,02,798.84 637.49
6,73,824.74 154.24
5,29,951.62 122.44
2,37,869.30
53.12
TOTAL 28,25,873.39 666.77
6,97,947.17 177.99
5,66,352.23 153.26
2,54,946.78
70.25
Source:DGCI&S, * Provisional State-wise data for exports is not published by the Directorate General of Commercial Intelligence & Statistics.
(b) Promotion of exports of agricultural commodities, including maize, is a continuous process. The Agricultural & Processed Food Products Export Development Authority (APEDA), an autonomous organisation under the administrative control of Department of Commerce, has the mandate to promote exports of maize. APEDA has been providing assistance to the exporters of its scheduled products, including maize, under various components of its scheme 'Agriculture Export Promotion Scheme of APEDA'. Export of maize has declined during the past two years and the current year as the domestic prices are higher than the international prices.
********
GOVERNMENT OF INDIA MINISTRY OF COMMERCE & INDUSTRY
(DEPARTMENT OF COMMERCE)
LOK SABHA UNSTARRED QUESTION NO. 424
TO BE ANSWERED ON 18th DECEMBER, 2017
FARM EXPORTS
424. SHRI GUTHA SUKENDER REDDY:
SHRI JOSE K. MANI:
Will the Minister of COMMERCE & INDUSTRY (वा ण य एव ंउ योग मं ी ) be pleased to state:
(a) whether despite being one of the world’s largest producers of numerous agricultural commodities, India has minuscule share in the global agricultural trade;
(b) if so, the reasons therefor along with the measures taken by the Government to boost export of farm products without affecting the domestic demand/price and improve competitiveness of Indian products in the international market in terms of prices and variety of goods;
(c) whether the Government is also planning to roll out a comprehensive policy to boost the farm exports and if so, the details thereof; and
(d) the details of the sops and incentives being offered to the farmers to enable them come forward for exports?
ANSWER
okf.kT; ,oa m|ksx ea=ky; esa jkT; ea=h ¼Jh lh- vkj- pkS/kjh½
THE MINISTER OF STATE IN THE MINISTRY OF COMMERCE AND INDUSTRY (SHRI C. R. CHAUDHARY)
(a) As per World Trade Organization (WTO) International Trade Statistics, 2017 (based on trade in 2016), India is the 10th largest exporter of agricultural products in the world with a share of 2.1%. Shares of the other leading agricultural exporting countries, from 6th to 9th position, are in the same range as that of India i.e. 2.1 % - 2.4%. Hence, India’s share in the world agriculture trade cannot be termed as low as India also has a large domestic consumption base for agricultural products.
(b) Promotion of exports of agricultural commodities is a continuous process. The Department of Commerce has several schemes to promote exports, including exports of agricultural products, viz. Trade Infrastructure for Export Scheme (TIES), Market Access Initiatives (MAI) Scheme, Merchandise Exports from India Scheme (MEIS) etc. In addition, assistance to the exporters of agricultural products is also available under the Export Promotion Schemes of Agricultural & Processed Food Products Export Development Authority (APEDA), Marine Products Export Development Authority (MPEDA), Tea Board, Coffee Board and Spices Board.
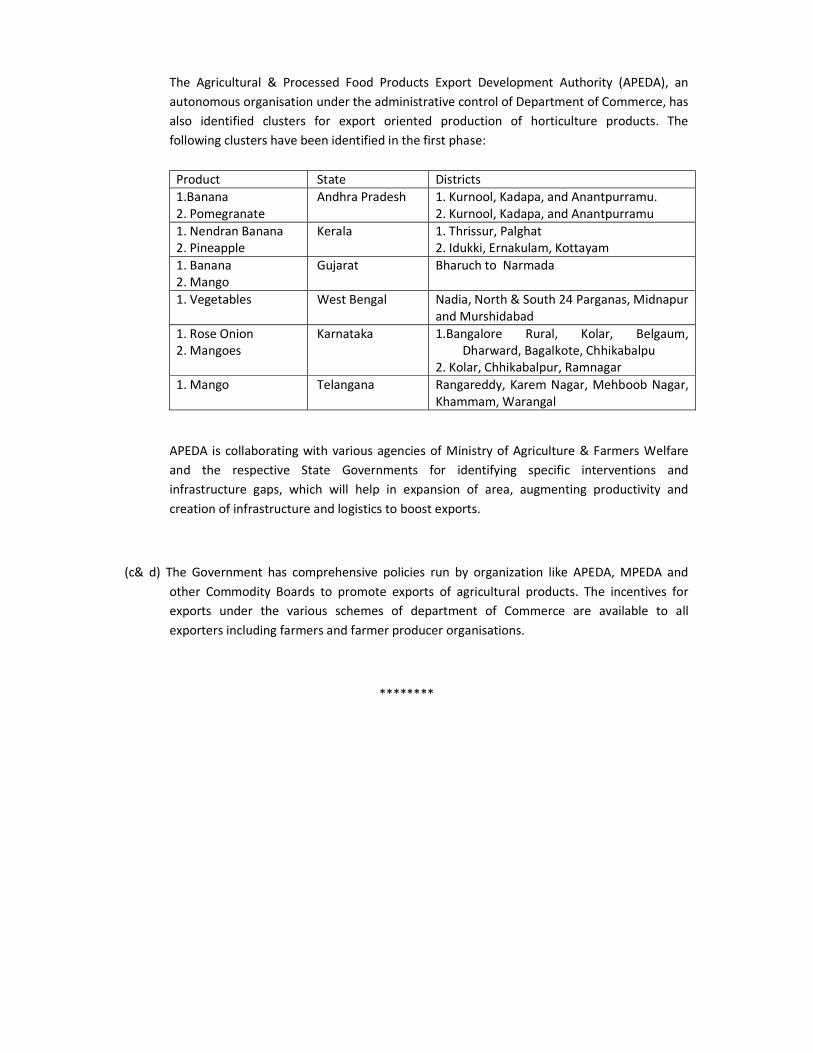
The Agricultural & Processed Food Products Export Development Authority (APEDA), an autonomous organisation under the administrative control of Department of Commerce, has also identified clusters for export oriented production of horticulture products. The following clusters have been identified in the first phase:
Product State Districts 1.Banana 2. Pomegranate
Andhra Pradesh 1. Kurnool, Kadapa, and Anantpurramu. 2. Kurnool, Kadapa, and Anantpurramu
1. Nendran Banana 2. Pineapple
Kerala 1. Thrissur, Palghat 2. Idukki, Ernakulam, Kottayam
1. Banana 2. Mango
Gujarat Bharuch to Narmada
1. Vegetables West Bengal Nadia, North & South 24 Parganas, Midnapur and Murshidabad
1. Rose Onion 2. Mangoes
Karnataka 1.Bangalore Rural, Kolar, Belgaum, Dharward, Bagalkote, Chhikabalpu
2. Kolar, Chhikabalpur, Ramnagar 1. Mango Telangana Rangareddy, Karem Nagar, Mehboob Nagar,
Khammam, Warangal
APEDA is collaborating with various agencies of Ministry of Agriculture & Farmers Welfare and the respective State Governments for identifying specific interventions and infrastructure gaps, which will help in expansion of area, augmenting productivity and creation of infrastructure and logistics to boost exports.
(c& d) The Government has comprehensive policies run by organization like APEDA, MPEDA and other Commodity Boards to promote exports of agricultural products. The incentives for exports under the various schemes of department of Commerce are available to all exporters including farmers and farmer producer organisations.
********
GOVERNMENT OF INDIA MINISTRY OF COMMERCE & INDUSTRY
(DEPARTMENT OF COMMERCE)
LOK SABHA UNSTARRED QUESTION NO. 425
TO BE ANSWERED ON 18th DECEMBER, 2017
PACKAGING STANDARDS FOR EXPORTS 425. SHRI ASHOK SHANKARRAO CHAVAN:
SHRI SUDHEER GUPTA: SHRI T. RADHAKRISHNAN: SHRI GAJANAN KIRTIKAR: KUNWAR HARIBANSH SINGH:
Will the Minister of COMMERCE & INDUSTRY (वा ण य एव ंउ योग मं ी ) be
pleased to state:
(a) whether absence of proper packaging has resulted in a large amount of Indian food items getting rejected in developing market;
(b) if so, the details thereof and the reasons therefor; (c) the names of the countries which have imposed ban on import of Indian food
products on ground of contamination; (d) whether the Government proposes new packaging norms for export of food items to
address concerns over food Safety and health standards and if so, the details thereof; (e) whether the Ministry has also constituted a committee to formulate packaging
standards for export; and (f) if so, the details thereof and the time by which the said Committee is likely to
submit its report to the Government?
ANSWER
okf.kT; ,oa m|ksx ea=ky; esa jkT; ea=h ¼Jh lh- vkj- pkS/kjh½
THE MINISTER OF STATE IN THE MINISTRY OF COMMERCE AND INDUSTRY (SHRI C. R. CHAUDHARY)
(a& b) All importing countries food products have concerns relating to human, animal and plant health and hygiene and safety of food consumed by its citizens. As a measure of protection, importing countries often resort to rejections of individual consignments for non-compliance with their prescribed norms/safety standards/rules/regulations. The Government does not maintain any data on rejections of individual consignments.
(c) At present, there is no instance of a formal country-specific ban on import of food products from India on grounds of contamination.
(d) The packaging of food products, for exports as well as the domestic market, is regulated under the Food Safety and Standards (Packaging and labelling) Regulations, 2011 of the Food Safety and Standards Authority of India (FSSAI).
(e) The Government of India has constituted a Packaging Standards Committee under the Chairmanship of the Additional Secretary, Department of Commerce to discuss challenges to India’s exports and how improved packaging can help to boost exports.
(f) The Committee comprises of representatives from Department of Commerce, Department of Consumer Affairs, Bureau of Indian Standards, FSSAI, Agricultural & Processed Food Products Export Development Authority (APEDA), Marine Products Export Development Authority (MPEDA), Tea Board, Coffee Board, Tobacco Board, Spices Board and Indian Institute of Packaging (IIP). The Committee has been mandated to identify various products (preferably with an export oriented focus) for developing packaging standards in line with or benchmarked to international standards. IIP has already designed and developed packaging standards and specifications for 28 varieties of fruits and vegetables for unit as well as bulk packaging and the report has been submitted to APEDA. APEDA has hosted the packaging standards on its website for the benefit of exporters.
*********
GOVERNMENT OF INDIA MINISTRY OF COMMERCE & INDUSTRY
(DEPARTMENT OF COMMERCE)
LOK SABHA UNSTARRED QUESTION NO. 426
TO BE ANSWERED ON 18th DECEMBER, 2017
GRANTS UNDER MDA SCHEME 426. SHRI SUMEDHANAND SARSWATI:
Will the Minister of COMMERCE & INDUSTRY (वा ण य एव ंउ योग मं ी ) be pleased to state:
(a) whether the Government is providing grants/financial assistance under the Market Development Assistance (MDA) scheme;
(b) if so, the details thereof; (c) whether the Government has approved any proposals in this regard during the last
three years and the current year; and (d) if so, the details thereof and if not the reasons therefor?
ANSWER
okf.kT; ,oa m|ksx ea=ky; esa jkT; ea=h ¼Jh lh- vkj- pkS/kjh½
THE MINISTER OF STATE IN THE MINISTRY OF COMMERCE AND INDUSTRY (SHRI C. R. CHAUDHARY)
(a) to (d): Yes, Madam. Under the Marketing Development Assistance (MDA) Scheme, lumpsum
assistance was provided to Export Promotion Councils/Trade Promotion Organizations for the
following:
(i) to assist exporters with a f.o.b. value of exports of uptoRs. 30 crore [relaxed in the
case of events in the Latin American and Caribbean (LAC) Region], for participation
in approved export promotion events abroad including reimbursement of airfares
and cost of rented space.
(ii) to assist Export Promotion Councils/Trade Promotion Organizations to undertake
export promotion activities for their product(s) and commodities in India and abroad.
The funds released to the eligible agencies under the MDA Scheme during the last three years are
as under:
Year Financial Assistance provided
2014-15 ₹50.00 crore 2015-16 ₹48.74 crore 2016-17 ₹45.93 crore
The Scheme now stands merged with the Market Access Initiative (MAI) Scheme.
****
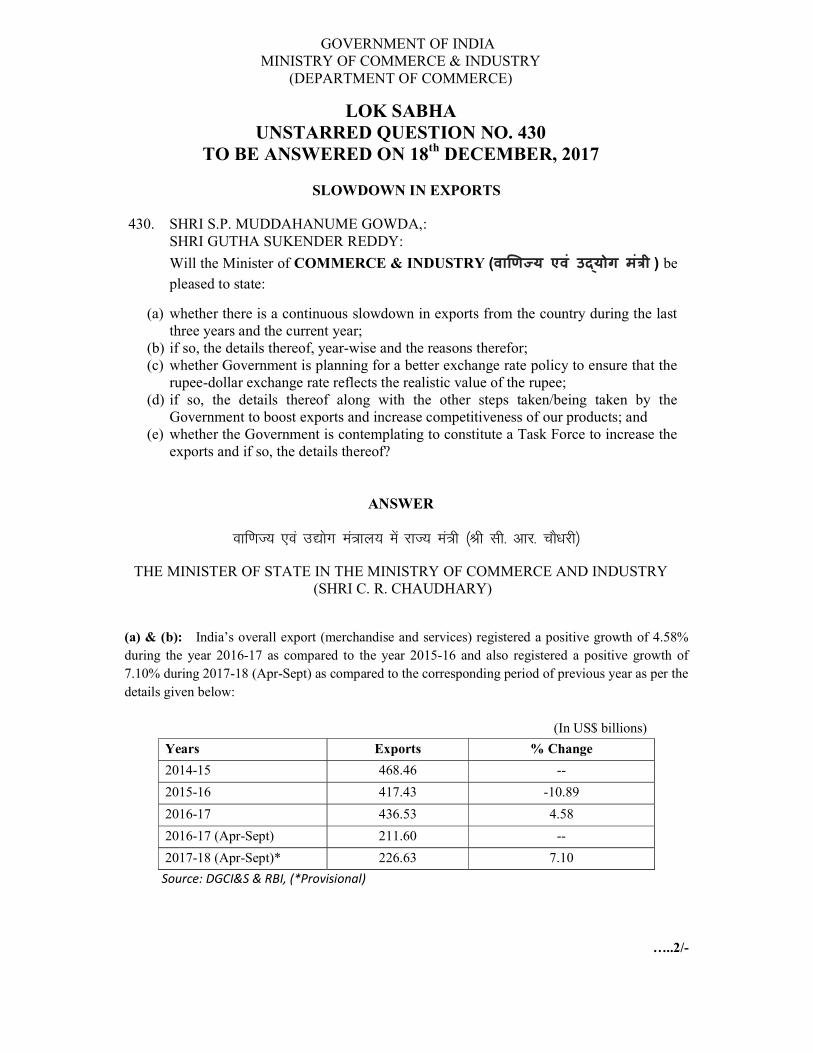
GOVERNMENT OF INDIA MINISTRY OF COMMERCE & INDUSTRY
(DEPARTMENT OF COMMERCE)
LOK SABHA UNSTARRED QUESTION NO. 430
TO BE ANSWERED ON 18th DECEMBER, 2017
SLOWDOWN IN EXPORTS 430. SHRI S.P. MUDDAHANUME GOWDA,:
SHRI GUTHA SUKENDER REDDY:
Will the Minister of COMMERCE & INDUSTRY (वा ण य एव ंउ योग मं ी ) be pleased to state:
(a) whether there is a continuous slowdown in exports from the country during the last three years and the current year;
(b) if so, the details thereof, year-wise and the reasons therefor; (c) whether Government is planning for a better exchange rate policy to ensure that the
rupee-dollar exchange rate reflects the realistic value of the rupee; (d) if so, the details thereof along with the other steps taken/being taken by the
Government to boost exports and increase competitiveness of our products; and (e) whether the Government is contemplating to constitute a Task Force to increase the
exports and if so, the details thereof?
ANSWER
okf.kT; ,oa m|ksx ea=ky; esa jkT; ea=h ¼Jh lh- vkj- pkS/kjh½
THE MINISTER OF STATE IN THE MINISTRY OF COMMERCE AND INDUSTRY (SHRI C. R. CHAUDHARY)
(a) & (b): India’s overall export (merchandise and services) registered a positive growth of 4.58% during the year 2016-17 as compared to the year 2015-16 and also registered a positive growth of 7.10% during 2017-18 (Apr-Sept) as compared to the corresponding period of previous year as per the details given below:
(In US$ billions)
Years Exports % Change
2014-15 468.46 --
2015-16 417.43 -10.89
2016-17 436.53 4.58
2016-17 (Apr-Sept) 211.60 --
2017-18 (Apr-Sept)* 226.63 7.10
Source: DGCI&S & RBI, (*Provisional)
…..2/-
-2-
(c) & (d): Since the initiation of reforms in the 1990s, India has adopted a market determined exchange rate system. Accordingly, the exchange rate of the rupee is determined by the forces of demand and supply in the domestic foreign exchange market.
Under the extant exchange rate policy, the primary objective of the RBI is maintenance of orderly conditions in the forex market by meeting temporary demand-supply gaps, which may arise due to uncertainties or other reasons and curbing destabilizing and self-fulfilling speculative activities. The RBI does not have any fixed target or band for the exchange rate. The overall objective is to curb excessive volatility in the forex market and to ensure that the exchange rate movements are broadly in line with the country’s economic fundamentals. Thus, market forces play a predominant role in determining the exchange rate of the rupee. During the current fiscal year 2017-18 so far (upto December 11), the rupee has been relatively stable, trading in the range of Rs.63.58 to 65.70 per US dollar.
In order to boost exports and increase competitiveness of our products, the Government has launched various schemes under the Foreign Trade policy (2015-20) such as Merchandise Exports from India Scheme (MEIS), Services Exports from India Scheme (SEIS), Duty Drawback scheme, Advance Authorisation scheme, Export Promotion Capital Goods Scheme, Interest Equalisation Scheme and Self Ratification Scheme.
(e): An Expert Task Force on Employment and Exports was constituted by Government on 6th September 2017 under the Chairmanship of Vice Chairman, NITI Aayog with the objective of providing major thrust to job creation by enhancing India’s exports. Members of the Task force include CEO, NITI Aayog, Secretary, Department of Commerce, Secretary, Department of Industrial Policy and Promotion, Secretary, Department of Economic Affairs, Secretary, Ministry of Textiles, leading economists and industry experts. The Task Force has submitted its recommendations to the Government in December, 2017.
***
GOVERNMENT OF INDIA MINISTRY OF COMMERCE & INDUSTRY
(DEPARTMENT OF COMMERCE)
LOK SABHA UNSTARRED QUESTION NO. 450
TO BE ANSWERED ON 18th DECEMBER, 2017
TRADE BETWEEN INDIA AND CHINA 450. KUNWAR HARIBANSH SINGH:
SHRI NARANBHAI KACHHADIYA: SHRI BIDYUT BARAN MAHATO: SHRI KALIKESH N. SINGH DEO: SHRI BHARATHI MOHAN R.K.: SHRI GAJANAN KIRTIKAR: SHRIMATI V. SATHYA BAMA:
SHRI MANSHANKAR NINAMA: SHRI K.N. RAMACHANDRAN: SHRI ASHOK SHANKARRAO CHAVAN: SHRI SUDHEER GUPTA: SHRI KANWAR SINGH TANWAR: DR. P.K. BIJU: SHRI T. RADHAKRISHNAN: SHRI S.R. VIJAYAKUMAR:
Will the Minister of COMMERCE & INDUSTRY (वा ण य एवं उ योग मं ी ) be pleased
to state:
(a) the details of the imports and exports carried out between India and China during the last three years and the current year, product/quantity/value and year-wise indicating the list of such Chinese products, raw and finished goods dominated in the domestic markets;
(b) whether India’s trade deficit with China has increased during the said period and if so, the details thereof and the reasons therefor along with the steps taken by the Government to reduce the same and promote exports to China;
(c) whether India and China have also agreed to set up industry specific working groups for increasing exports with a view to bridge trade deficit with China and if so, the details thereof along with the time by which the said working groups are likely to start functioning;
(d) whether China has shown interest in making investments in various sectors of the country and if so, the details thereof along with the details of investment made by Chinese companies in India so far; and
(e) whether the Government has chalked out any plans to provide adequate policy support and facilitation to indigenous industries to combat the over dumping of Chinese products in Indian domestic market and if so, the details thereof along with the plan of the Government, if any, to introduce anti-dumping duty on Chinese imports?
ANSWER
okf.kT; ,oa m|ksx ea=ky; esa jkT; ea=h ¼Jh lh- vkj- pkS/kjh½
THE MINISTER OF STATE IN THE MINISTRY OF COMMERCE AND INDUSTRY (SHRI C. R. CHAUDHARY)
(a)& (b): Details of the imports and exports between India and China during the last three years and
current year are given below: -
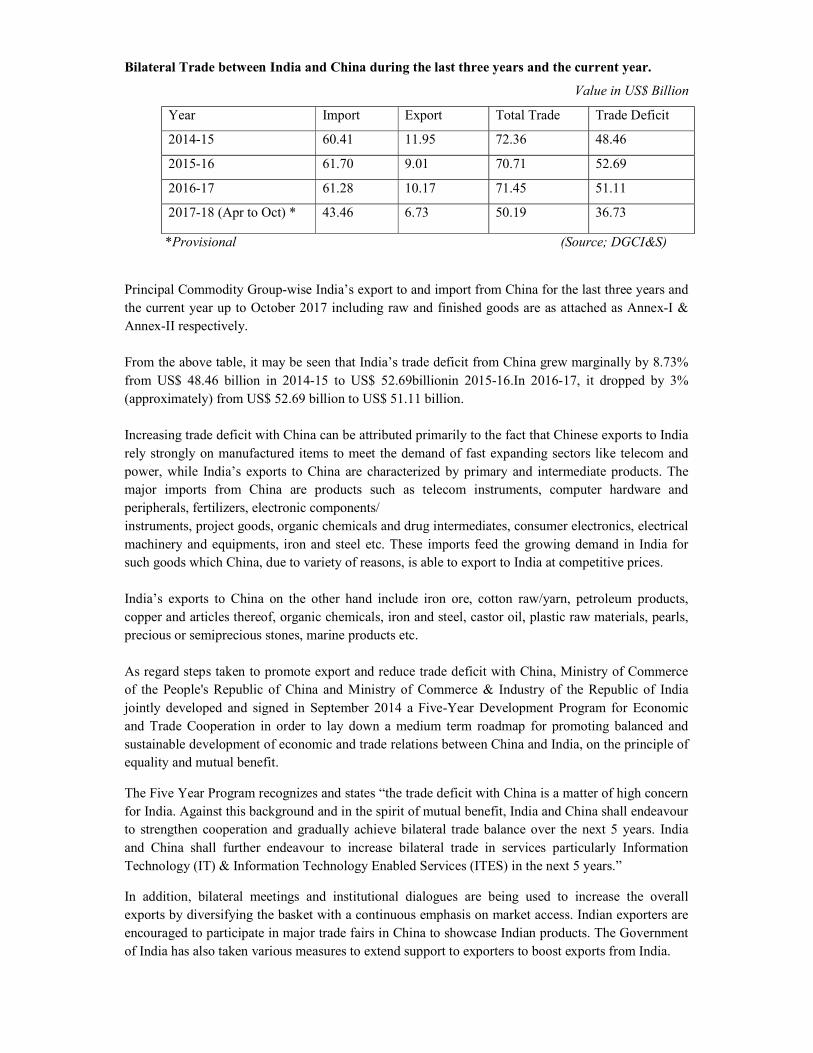
Bilateral Trade between India and China during the last three years and the current year.
Value in US$ Billion
Year Import Export Total Trade Trade Deficit
2014-15 60.41 11.95 72.36 48.46
2015-16 61.70 9.01 70.71 52.69
2016-17 61.28 10.17 71.45 51.11
2017-18 (Apr to Oct) * 43.46 6.73 50.19 36.73
*Provisional (Source; DGCI&S)
Principal Commodity Group-wise India’s export to and import from China for the last three years and the current year up to October 2017 including raw and finished goods are as attached as Annex-I & Annex-II respectively. From the above table, it may be seen that India’s trade deficit from China grew marginally by 8.73% from US$ 48.46 billion in 2014-15 to US$ 52.69billionin 2015-16.In 2016-17, it dropped by 3% (approximately) from US$ 52.69 billion to US$ 51.11 billion. Increasing trade deficit with China can be attributed primarily to the fact that Chinese exports to India rely strongly on manufactured items to meet the demand of fast expanding sectors like telecom and power, while India’s exports to China are characterized by primary and intermediate products. The major imports from China are products such as telecom instruments, computer hardware and peripherals, fertilizers, electronic components/ instruments, project goods, organic chemicals and drug intermediates, consumer electronics, electrical machinery and equipments, iron and steel etc. These imports feed the growing demand in India for such goods which China, due to variety of reasons, is able to export to India at competitive prices. India’s exports to China on the other hand include iron ore, cotton raw/yarn, petroleum products, copper and articles thereof, organic chemicals, iron and steel, castor oil, plastic raw materials, pearls, precious or semiprecious stones, marine products etc. As regard steps taken to promote export and reduce trade deficit with China, Ministry of Commerce of the People's Republic of China and Ministry of Commerce & Industry of the Republic of India jointly developed and signed in September 2014 a Five-Year Development Program for Economic and Trade Cooperation in order to lay down a medium term roadmap for promoting balanced and sustainable development of economic and trade relations between China and India, on the principle of equality and mutual benefit.
The Five Year Program recognizes and states “the trade deficit with China is a matter of high concern for India. Against this background and in the spirit of mutual benefit, India and China shall endeavour to strengthen cooperation and gradually achieve bilateral trade balance over the next 5 years. India and China shall further endeavour to increase bilateral trade in services particularly Information Technology (IT) & Information Technology Enabled Services (ITES) in the next 5 years.”
In addition, bilateral meetings and institutional dialogues are being used to increase the overall exports by diversifying the basket with a continuous emphasis on market access. Indian exporters are encouraged to participate in major trade fairs in China to showcase Indian products. The Government of India has also taken various measures to extend support to exporters to boost exports from India.
(c): Following Joint Working Groups (JWGs) are in place between India and China to enhance the trade cooperation between two countries and address the trade and investment related issues:
a. JWG on Trade in Services: The last meeting was held in Xiamen on 18th September 2017. b. JWG on Trade Statistical Analysis: The last meeting was held in Delhi on 20th November
2017. c. JWG on Economic and Trade Planning Cooperation: The last meeting held in New Delhi on
21st February,2014. d. JWG on Industrial Parks: The last meeting of the JWG was held in Beijing from 2-3
November 2016. e. JWG on Hitech Co-operation : The last meeting of the JWG was held on 15-16 December,
2014 f. JWG on cooperation with Ministry of Agriculture : The last meeting of the JWG was held in
2008
The working of various groups and their constitution is reviewed from time to time based on the requirements and mutual agreement on both the sides.
(d) As per the FDI Data maintained by DIPP/RBI, the Chinese FDI in India, though growing, has been insignificant compared to China's total FDI overseas. China presently ranks 17th in terms of FDI equity inflows into India. The cumulative FDI equity inflows from China since April 2000 to September 2017are to the tune of US$ 1.73 billion only, which is about 0.49 per cent of the overall FDI equity inflows into India. The major sectors in which the investment has come from China are:
Automobile Industry (53.79 %)
Metallurgical Industries (10.49 %)
Services (7.54%)
Electrical Equipment (6.70 %)
Industrial machinery (3.99 %)
Prominent investments from China into India include Huawei (telecom), ZTE (telecom), SANY (concrete, road & excavating machinery), YAPP Motors (plastic fuel tanks), Xindia Steel (steel), TBEA (high-voltage transformers), BTW (high-voltage transformers), Lenovo (computers), Liu Gong (wheel loaders, excavators & bull dozers), Haier (consumer electronics), Shanghai Automotive Industrial Corporation (automobiles), High (Compressors) etc. Several smart phone manufacturers from China such as Xiomi, LeEco, Gionee, Vivo, Lenovo, OPPO and ONEPLUS have presence in India. (e) All goods imported into India are subject to domestic laws, rules, orders, regulations, technical specifications, environment and safety norms that are notified from time to time. The Government takes appropriate action in case goods imported from any source are found to violate these regulations and threaten human, animal or plant life or health. In addition, trade defence measures like anti-dumping duty and countervailing duty are available to industries to seek remedies under the prescribed WTO provisions. Directorate General of Anti-Dumping and Allied Duties (DGAD) receives applications from domestic producers for imposition of anti-dumping duty on various products from time to time. After detailed investigations, preliminary/final findings are issued by DGAD based on which, Department of Revenue imposes provisional/definitive anti-dumping duties. As on 12.12.2017, anti-dumping duty is in force on 100 products being imported from China.
*****
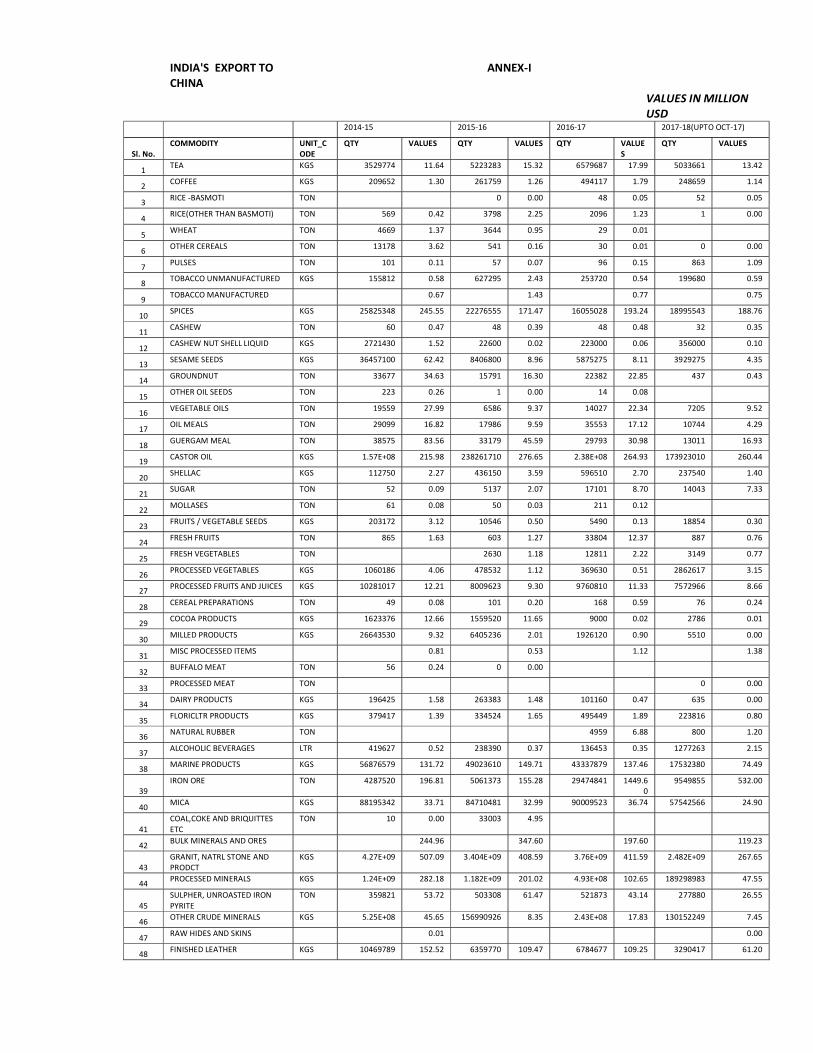
INDIA'S EXPORT TO CHINA
ANNEX-I
VALUES IN MILLION USD
2014-15 2015-16 2016-17 2017-18(UPTO OCT-17)
Sl. No. COMMODITY UNIT_C
ODE QTY VALUES QTY VALUES QTY VALUE
S QTY VALUES
1 TEA KGS 3529774 11.64 5223283 15.32 6579687 17.99 5033661 13.42
2 COFFEE KGS 209652 1.30 261759 1.26 494117 1.79 248659 1.14
3 RICE -BASMOTI TON 0 0.00 48 0.05 52 0.05
4 RICE(OTHER THAN BASMOTI) TON 569 0.42 3798 2.25 2096 1.23 1 0.00
5 WHEAT TON 4669 1.37 3644 0.95 29 0.01
6 OTHER CEREALS TON 13178 3.62 541 0.16 30 0.01 0 0.00
7 PULSES TON 101 0.11 57 0.07 96 0.15 863 1.09
8 TOBACCO UNMANUFACTURED KGS 155812 0.58 627295 2.43 253720 0.54 199680 0.59
9 TOBACCO MANUFACTURED 0.67 1.43 0.77 0.75
10 SPICES KGS 25825348 245.55 22276555 171.47 16055028 193.24 18995543 188.76
11 CASHEW TON 60 0.47 48 0.39 48 0.48 32 0.35
12 CASHEW NUT SHELL LIQUID KGS 2721430 1.52 22600 0.02 223000 0.06 356000 0.10
13 SESAME SEEDS KGS 36457100 62.42 8406800 8.96 5875275 8.11 3929275 4.35
14 GROUNDNUT TON 33677 34.63 15791 16.30 22382 22.85 437 0.43
15 OTHER OIL SEEDS TON 223 0.26 1 0.00 14 0.08
16 VEGETABLE OILS TON 19559 27.99 6586 9.37 14027 22.34 7205 9.52
17 OIL MEALS TON 29099 16.82 17986 9.59 35553 17.12 10744 4.29
18 GUERGAM MEAL TON 38575 83.56 33179 45.59 29793 30.98 13011 16.93
19 CASTOR OIL KGS 1.57E+08 215.98 238261710 276.65 2.38E+08 264.93 173923010 260.44
20 SHELLAC KGS 112750 2.27 436150 3.59 596510 2.70 237540 1.40
21 SUGAR TON 52 0.09 5137 2.07 17101 8.70 14043 7.33
22 MOLLASES TON 61 0.08 50 0.03 211 0.12
23 FRUITS / VEGETABLE SEEDS KGS 203172 3.12 10546 0.50 5490 0.13 18854 0.30
24 FRESH FRUITS TON 865 1.63 603 1.27 33804 12.37 887 0.76
25 FRESH VEGETABLES TON 2630 1.18 12811 2.22 3149 0.77
26 PROCESSED VEGETABLES KGS 1060186 4.06 478532 1.12 369630 0.51 2862617 3.15
27 PROCESSED FRUITS AND JUICES KGS 10281017 12.21 8009623 9.30 9760810 11.33 7572966 8.66
28 CEREAL PREPARATIONS TON 49 0.08 101 0.20 168 0.59 76 0.24
29 COCOA PRODUCTS KGS 1623376 12.66 1559520 11.65 9000 0.02 2786 0.01
30 MILLED PRODUCTS KGS 26643530 9.32 6405236 2.01 1926120 0.90 5510 0.00
31 MISC PROCESSED ITEMS 0.81 0.53 1.12 1.38
32 BUFFALO MEAT TON 56 0.24 0 0.00
33 PROCESSED MEAT TON 0 0.00
34 DAIRY PRODUCTS KGS 196425 1.58 263383 1.48 101160 0.47 635 0.00
35 FLORICLTR PRODUCTS KGS 379417 1.39 334524 1.65 495449 1.89 223816 0.80
36 NATURAL RUBBER TON 4959 6.88 800 1.20
37 ALCOHOLIC BEVERAGES LTR 419627 0.52 238390 0.37 136453 0.35 1277263 2.15
38 MARINE PRODUCTS KGS 56876579 131.72 49023610 149.71 43337879 137.46 17532380 74.49
39 IRON ORE TON 4287520 196.81 5061373 155.28 29474841 1449.6
0 9549855 532.00
40 MICA KGS 88195342 33.71 84710481 32.99 90009523 36.74 57542566 24.90
41 COAL,COKE AND BRIQUITTES ETC
TON 10 0.00 33003 4.95
42 BULK MINERALS AND ORES 244.96 347.60 197.60 119.23
43 GRANIT, NATRL STONE AND PRODCT
KGS 4.27E+09 507.09 3.404E+09 408.59 3.76E+09 411.59 2.482E+09 267.65
44 PROCESSED MINERALS KGS 1.24E+09 282.18 1.182E+09 201.02 4.93E+08 102.65 189298983 47.55
45 SULPHER, UNROASTED IRON PYRITE
TON 359821 53.72 503308 61.47 521873 43.14 277880 26.55
46 OTHER CRUDE MINERALS KGS 5.25E+08 45.65 156990926 8.35 2.43E+08 17.83 130152249 7.45
47 RAW HIDES AND SKINS 0.01 0.00
48 FINISHED LEATHER KGS 10469789 152.52 6359770 109.47 6784677 109.25 3290417 61.20
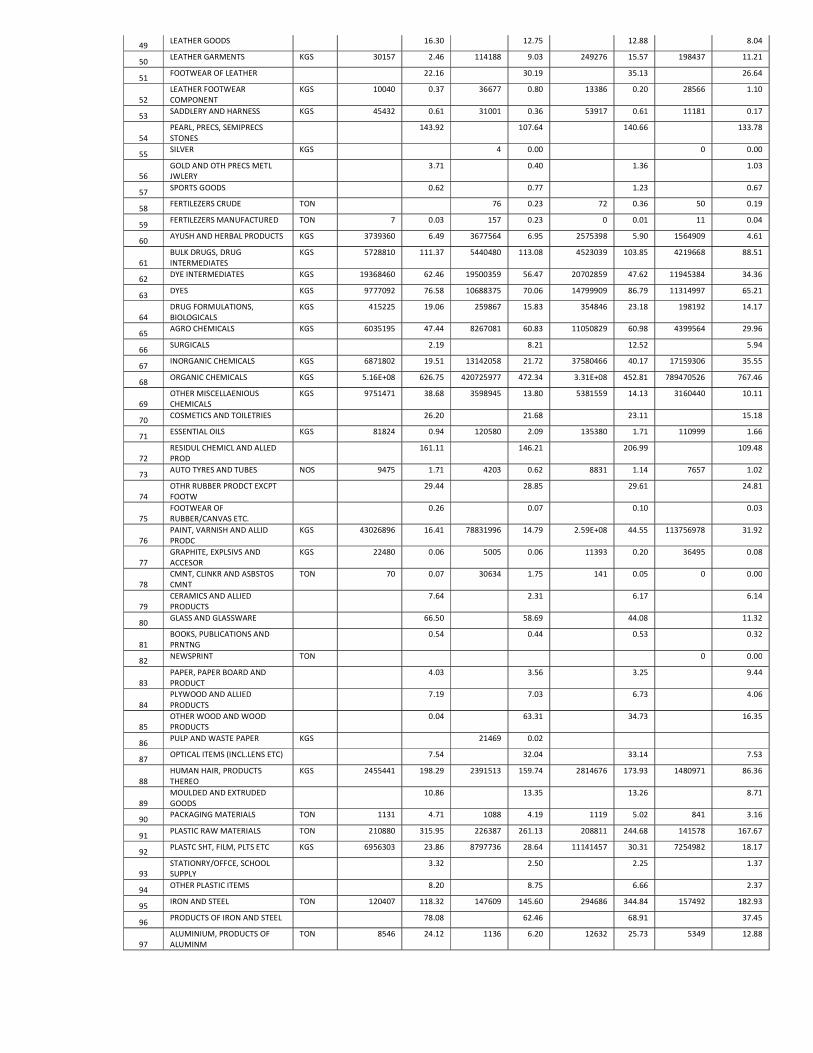
49 LEATHER GOODS 16.30 12.75 12.88 8.04
50 LEATHER GARMENTS KGS 30157 2.46 114188 9.03 249276 15.57 198437 11.21
51 FOOTWEAR OF LEATHER 22.16 30.19 35.13 26.64
52 LEATHER FOOTWEAR COMPONENT
KGS 10040 0.37 36677 0.80 13386 0.20 28566 1.10
53 SADDLERY AND HARNESS KGS 45432 0.61 31001 0.36 53917 0.61 11181 0.17
54 PEARL, PRECS, SEMIPRECS STONES
143.92 107.64 140.66 133.78
55 SILVER KGS 4 0.00 0 0.00
56 GOLD AND OTH PRECS METL JWLERY
3.71 0.40 1.36 1.03
57 SPORTS GOODS 0.62 0.77 1.23 0.67
58 FERTILEZERS CRUDE TON 76 0.23 72 0.36 50 0.19
59 FERTILEZERS MANUFACTURED TON 7 0.03 157 0.23 0 0.01 11 0.04
60 AYUSH AND HERBAL PRODUCTS KGS 3739360 6.49 3677564 6.95 2575398 5.90 1564909 4.61
61 BULK DRUGS, DRUG INTERMEDIATES
KGS 5728810 111.37 5440480 113.08 4523039 103.85 4219668 88.51
62 DYE INTERMEDIATES KGS 19368460 62.46 19500359 56.47 20702859 47.62 11945384 34.36
63 DYES KGS 9777092 76.58 10688375 70.06 14799909 86.79 11314997 65.21
64 DRUG FORMULATIONS, BIOLOGICALS
KGS 415225 19.06 259867 15.83 354846 23.18 198192 14.17
65 AGRO CHEMICALS KGS 6035195 47.44 8267081 60.83 11050829 60.98 4399564 29.96
66 SURGICALS 2.19 8.21 12.52 5.94
67 INORGANIC CHEMICALS KGS 6871802 19.51 13142058 21.72 37580466 40.17 17159306 35.55
68 ORGANIC CHEMICALS KGS 5.16E+08 626.75 420725977 472.34 3.31E+08 452.81 789470526 767.46
69 OTHER MISCELLAENIOUS CHEMICALS
KGS 9751471 38.68 3598945 13.80 5381559 14.13 3160440 10.11
70 COSMETICS AND TOILETRIES 26.20 21.68 23.11 15.18
71 ESSENTIAL OILS KGS 81824 0.94 120580 2.09 135380 1.71 110999 1.66
72 RESIDUL CHEMICL AND ALLED PROD
161.11 146.21 206.99 109.48
73 AUTO TYRES AND TUBES NOS 9475 1.71 4203 0.62 8831 1.14 7657 1.02
74 OTHR RUBBER PRODCT EXCPT FOOTW
29.44 28.85 29.61 24.81
75 FOOTWEAR OF RUBBER/CANVAS ETC.
0.26 0.07 0.10 0.03
76 PAINT, VARNISH AND ALLID PRODC
KGS 43026896 16.41 78831996 14.79 2.59E+08 44.55 113756978 31.92
77 GRAPHITE, EXPLSIVS AND ACCESOR
KGS 22480 0.06 5005 0.06 11393 0.20 36495 0.08
78 CMNT, CLINKR AND ASBSTOS CMNT
TON 70 0.07 30634 1.75 141 0.05 0 0.00
79 CERAMICS AND ALLIED PRODUCTS
7.64 2.31 6.17 6.14
80 GLASS AND GLASSWARE 66.50 58.69 44.08 11.32
81 BOOKS, PUBLICATIONS AND PRNTNG
0.54 0.44 0.53 0.32
82 NEWSPRINT TON 0 0.00
83 PAPER, PAPER BOARD AND PRODUCT
4.03 3.56 3.25 9.44
84 PLYWOOD AND ALLIED PRODUCTS
7.19 7.03 6.73 4.06
85 OTHER WOOD AND WOOD PRODUCTS
0.04 63.31 34.73 16.35
86 PULP AND WASTE PAPER KGS 21469 0.02
87 OPTICAL ITEMS (INCL.LENS ETC) 7.54 32.04 33.14 7.53
88 HUMAN HAIR, PRODUCTS THEREO
KGS 2455441 198.29 2391513 159.74 2814676 173.93 1480971 86.36
89 MOULDED AND EXTRUDED GOODS
10.86 13.35 13.26 8.71
90 PACKAGING MATERIALS TON 1131 4.71 1088 4.19 1119 5.02 841 3.16
91 PLASTIC RAW MATERIALS TON 210880 315.95 226387 261.13 208811 244.68 141578 167.67
92 PLASTC SHT, FILM, PLTS ETC KGS 6956303 23.86 8797736 28.64 11141457 30.31 7254982 18.17
93 STATIONRY/OFFCE, SCHOOL SUPPLY
3.32 2.50 2.25 1.37
94 OTHER PLASTIC ITEMS 8.20 8.75 6.66 2.37
95 IRON AND STEEL TON 120407 118.32 147609 145.60 294686 344.84 157492 182.93
96 PRODUCTS OF IRON AND STEEL 78.08 62.46 68.91 37.45
97 ALUMINIUM, PRODUCTS OF ALUMINM
TON 8546 24.12 1136 6.20 12632 25.73 5349 12.88
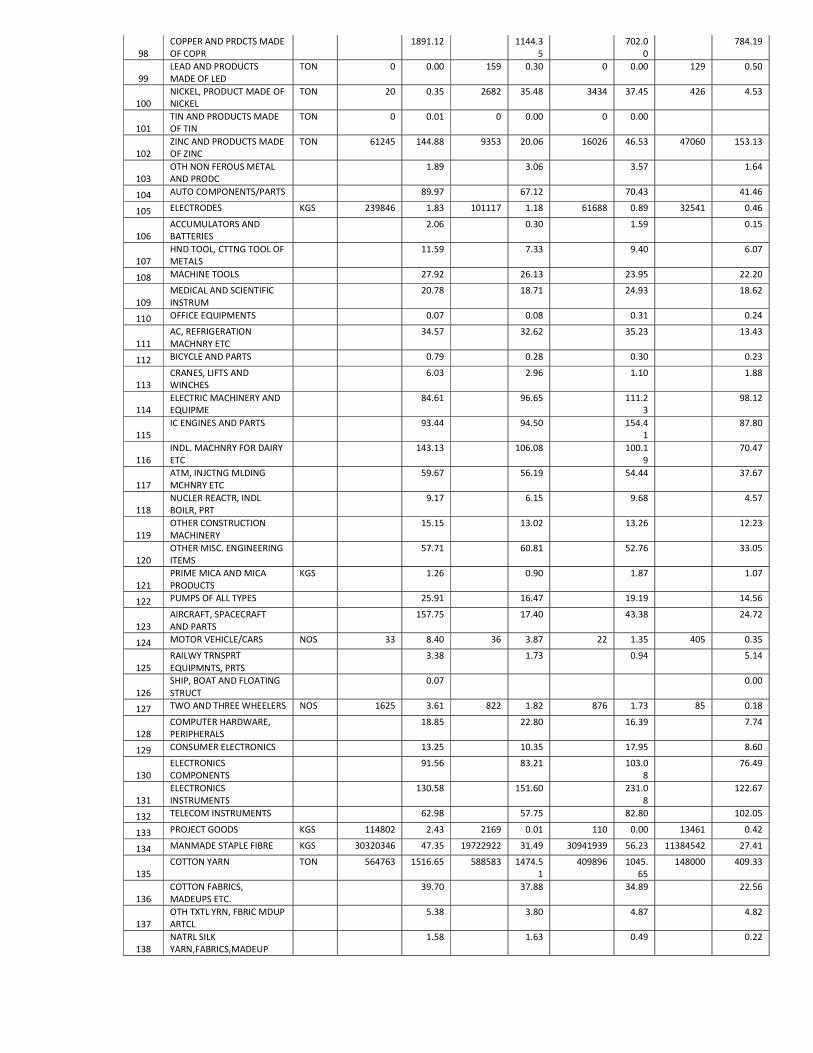
98 COPPER AND PRDCTS MADE OF COPR
1891.12 1144.35
702.00
784.19
99 LEAD AND PRODUCTS MADE OF LED
TON 0 0.00 159 0.30 0 0.00 129 0.50
100 NICKEL, PRODUCT MADE OF NICKEL
TON 20 0.35 2682 35.48 3434 37.45 426 4.53
101 TIN AND PRODUCTS MADE OF TIN
TON 0 0.01 0 0.00 0 0.00
102 ZINC AND PRODUCTS MADE OF ZINC
TON 61245 144.88 9353 20.06 16026 46.53 47060 153.13
103 OTH NON FEROUS METAL AND PRODC
1.89 3.06 3.57 1.64
104 AUTO COMPONENTS/PARTS 89.97 67.12 70.43 41.46
105 ELECTRODES KGS 239846 1.83 101117 1.18 61688 0.89 32541 0.46
106 ACCUMULATORS AND BATTERIES
2.06 0.30 1.59 0.15
107 HND TOOL, CTTNG TOOL OF METALS
11.59 7.33 9.40 6.07
108 MACHINE TOOLS 27.92 26.13 23.95 22.20
109 MEDICAL AND SCIENTIFIC INSTRUM
20.78 18.71 24.93 18.62
110 OFFICE EQUIPMENTS 0.07 0.08 0.31 0.24
111 AC, REFRIGERATION MACHNRY ETC
34.57 32.62 35.23 13.43
112 BICYCLE AND PARTS 0.79 0.28 0.30 0.23
113 CRANES, LIFTS AND WINCHES
6.03 2.96 1.10 1.88
114 ELECTRIC MACHINERY AND EQUIPME
84.61 96.65 111.23
98.12
115 IC ENGINES AND PARTS 93.44 94.50 154.4
1 87.80
116 INDL. MACHNRY FOR DAIRY ETC
143.13 106.08 100.19
70.47
117 ATM, INJCTNG MLDING MCHNRY ETC
59.67 56.19 54.44 37.67
118 NUCLER REACTR, INDL BOILR, PRT
9.17 6.15 9.68 4.57
119 OTHER CONSTRUCTION MACHINERY
15.15 13.02 13.26 12.23
120 OTHER MISC. ENGINEERING ITEMS
57.71 60.81 52.76 33.05
121 PRIME MICA AND MICA PRODUCTS
KGS 1.26 0.90 1.87 1.07
122 PUMPS OF ALL TYPES 25.91 16.47 19.19 14.56
123 AIRCRAFT, SPACECRAFT AND PARTS
157.75 17.40 43.38 24.72
124 MOTOR VEHICLE/CARS NOS 33 8.40 36 3.87 22 1.35 405 0.35
125 RAILWY TRNSPRT EQUIPMNTS, PRTS
3.38 1.73 0.94 5.14
126 SHIP, BOAT AND FLOATING STRUCT
0.07 0.00
127 TWO AND THREE WHEELERS NOS 1625 3.61 822 1.82 876 1.73 85 0.18
128 COMPUTER HARDWARE, PERIPHERALS
18.85 22.80 16.39 7.74
129 CONSUMER ELECTRONICS 13.25 10.35 17.95 8.60
130 ELECTRONICS COMPONENTS
91.56 83.21 103.08
76.49
131 ELECTRONICS INSTRUMENTS
130.58 151.60 231.08
122.67
132 TELECOM INSTRUMENTS 62.98 57.75 82.80 102.05
133 PROJECT GOODS KGS 114802 2.43 2169 0.01 110 0.00 13461 0.42
134 MANMADE STAPLE FIBRE KGS 30320346 47.35 19722922 31.49 30941939 56.23 11384542 27.41
135 COTTON YARN TON 564763 1516.65 588583 1474.5
1 409896 1045.
65 148000 409.33
136 COTTON FABRICS, MADEUPS ETC.
39.70 37.88 34.89 22.56
137 OTH TXTL YRN, FBRIC MDUP ARTCL
5.38 3.80 4.87 4.82
138 NATRL SILK YARN,FABRICS,MADEUP
1.58 1.63 0.49 0.22
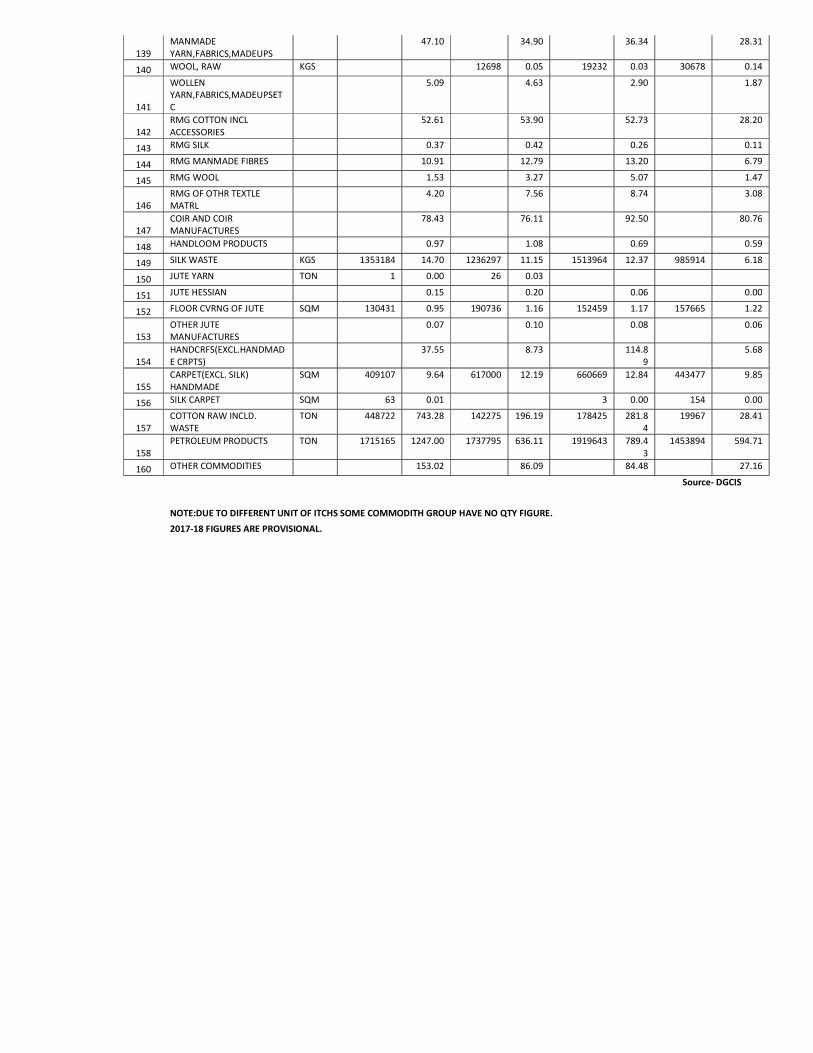
139 MANMADE YARN,FABRICS,MADEUPS
47.10 34.90 36.34 28.31
140 WOOL, RAW KGS 12698 0.05 19232 0.03 30678 0.14
141
WOLLEN YARN,FABRICS,MADEUPSETC
5.09 4.63 2.90 1.87
142 RMG COTTON INCL ACCESSORIES
52.61 53.90 52.73 28.20
143 RMG SILK 0.37 0.42 0.26 0.11
144 RMG MANMADE FIBRES 10.91 12.79 13.20 6.79
145 RMG WOOL 1.53 3.27 5.07 1.47
146 RMG OF OTHR TEXTLE MATRL
4.20 7.56 8.74 3.08
147 COIR AND COIR MANUFACTURES
78.43 76.11 92.50 80.76
148 HANDLOOM PRODUCTS 0.97 1.08 0.69 0.59
149 SILK WASTE KGS 1353184 14.70 1236297 11.15 1513964 12.37 985914 6.18
150 JUTE YARN TON 1 0.00 26 0.03
151 JUTE HESSIAN 0.15 0.20 0.06 0.00
152 FLOOR CVRNG OF JUTE SQM 130431 0.95 190736 1.16 152459 1.17 157665 1.22
153 OTHER JUTE MANUFACTURES
0.07 0.10 0.08 0.06
154 HANDCRFS(EXCL.HANDMADE CRPTS)
37.55 8.73 114.89
5.68
155 CARPET(EXCL. SILK) HANDMADE
SQM 409107 9.64 617000 12.19 660669 12.84 443477 9.85
156 SILK CARPET SQM 63 0.01 3 0.00 154 0.00
157 COTTON RAW INCLD. WASTE
TON 448722 743.28 142275 196.19 178425 281.84
19967 28.41
158 PETROLEUM PRODUCTS TON 1715165 1247.00 1737795 636.11 1919643 789.4
3 1453894 594.71
160 OTHER COMMODITIES 153.02 86.09 84.48 27.16
Source- DGCIS
NOTE:DUE TO DIFFERENT UNIT OF ITCHS SOME COMMODITH GROUP HAVE NO QTY FIGURE.
2017-18 FIGURES ARE PROVISIONAL.
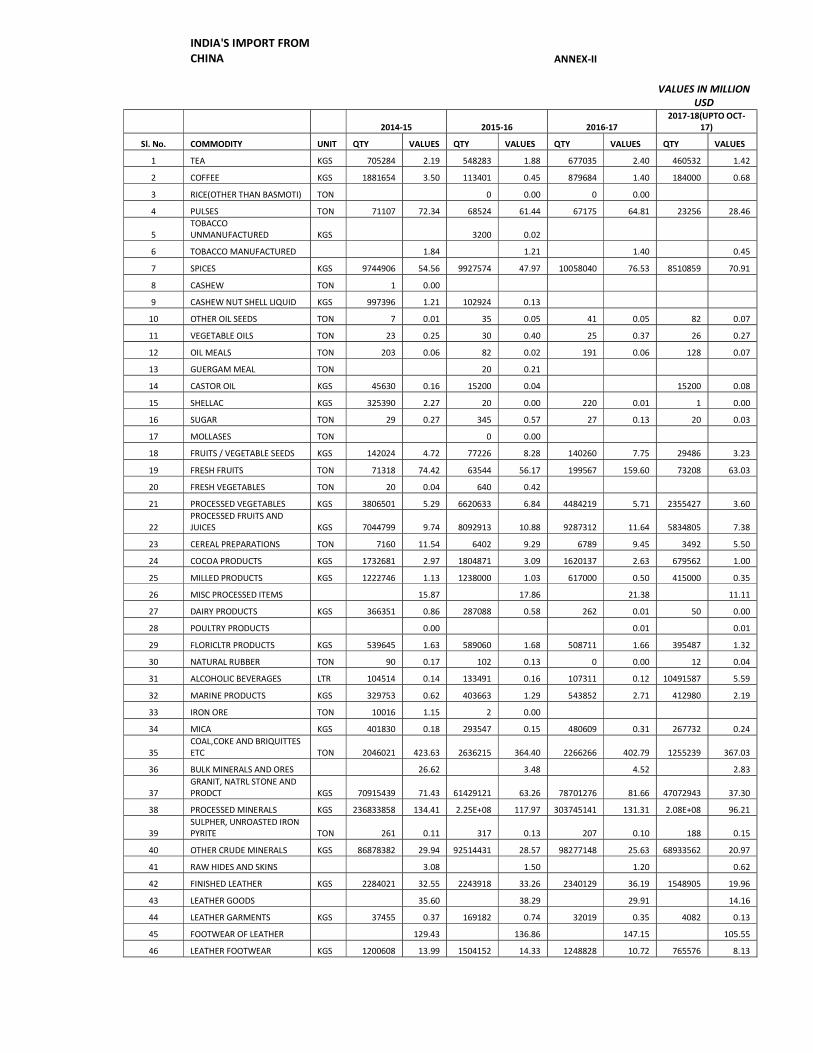
INDIA'S IMPORT FROM CHINA
ANNEX-II
VALUES IN MILLION USD
2014-15 2015-16 2016-17 2017-18(UPTO OCT-
17) Sl. No. COMMODITY UNIT QTY VALUES QTY VALUES QTY VALUES QTY VALUES 1 TEA KGS 705284 2.19 548283 1.88 677035 2.40 460532 1.42
2 COFFEE KGS 1881654 3.50 113401 0.45 879684 1.40 184000 0.68 3 RICE(OTHER THAN BASMOTI) TON 0 0.00 0 0.00 4 PULSES TON 71107 72.34 68524 61.44 67175 64.81 23256 28.46
5 TOBACCO UNMANUFACTURED KGS 3200 0.02
6 TOBACCO MANUFACTURED 1.84 1.21 1.40 0.45 7 SPICES KGS 9744906 54.56 9927574 47.97 10058040 76.53 8510859 70.91
8 CASHEW TON 1 0.00 9 CASHEW NUT SHELL LIQUID KGS 997396 1.21 102924 0.13 10 OTHER OIL SEEDS TON 7 0.01 35 0.05 41 0.05 82 0.07
11 VEGETABLE OILS TON 23 0.25 30 0.40 25 0.37 26 0.27
12 OIL MEALS TON 203 0.06 82 0.02 191 0.06 128 0.07 13 GUERGAM MEAL TON 20 0.21 14 CASTOR OIL KGS 45630 0.16 15200 0.04 15200 0.08
15 SHELLAC KGS 325390 2.27 20 0.00 220 0.01 1 0.00 16 SUGAR TON 29 0.27 345 0.57 27 0.13 20 0.03 17 MOLLASES TON 0 0.00 18 FRUITS / VEGETABLE SEEDS KGS 142024 4.72 77226 8.28 140260 7.75 29486 3.23
19 FRESH FRUITS TON 71318 74.42 63544 56.17 199567 159.60 73208 63.03 20 FRESH VEGETABLES TON 20 0.04 640 0.42 21 PROCESSED VEGETABLES KGS 3806501 5.29 6620633 6.84 4484219 5.71 2355427 3.60
22 PROCESSED FRUITS AND JUICES KGS 7044799 9.74 8092913 10.88 9287312 11.64 5834805 7.38
23 CEREAL PREPARATIONS TON 7160 11.54 6402 9.29 6789 9.45 3492 5.50 24 COCOA PRODUCTS KGS 1732681 2.97 1804871 3.09 1620137 2.63 679562 1.00
25 MILLED PRODUCTS KGS 1222746 1.13 1238000 1.03 617000 0.50 415000 0.35 26 MISC PROCESSED ITEMS 15.87 17.86 21.38 11.11 27 DAIRY PRODUCTS KGS 366351 0.86 287088 0.58 262 0.01 50 0.00
28 POULTRY PRODUCTS 0.00 0.01 0.01
29 FLORICLTR PRODUCTS KGS 539645 1.63 589060 1.68 508711 1.66 395487 1.32 30 NATURAL RUBBER TON 90 0.17 102 0.13 0 0.00 12 0.04 31 ALCOHOLIC BEVERAGES LTR 104514 0.14 133491 0.16 107311 0.12 10491587 5.59
32 MARINE PRODUCTS KGS 329753 0.62 403663 1.29 543852 2.71 412980 2.19
33 IRON ORE TON 10016 1.15 2 0.00 34 MICA KGS 401830 0.18 293547 0.15 480609 0.31 267732 0.24
35 COAL,COKE AND BRIQUITTES ETC TON 2046021 423.63 2636215 364.40 2266266 402.79 1255239 367.03
36 BULK MINERALS AND ORES 26.62 3.48 4.52 2.83
37 GRANIT, NATRL STONE AND PRODCT KGS 70915439 71.43 61429121 63.26 78701276 81.66 47072943 37.30
38 PROCESSED MINERALS KGS 236833858 134.41 2.25E+08 117.97 303745141 131.31 2.08E+08 96.21
39 SULPHER, UNROASTED IRON PYRITE TON 261 0.11 317 0.13 207 0.10 188 0.15
40 OTHER CRUDE MINERALS KGS 86878382 29.94 92514431 28.57 98277148 25.63 68933562 20.97 41 RAW HIDES AND SKINS 3.08 1.50 1.20 0.62 42 FINISHED LEATHER KGS 2284021 32.55 2243918 33.26 2340129 36.19 1548905 19.96
43 LEATHER GOODS 35.60 38.29 29.91 14.16 44 LEATHER GARMENTS KGS 37455 0.37 169182 0.74 32019 0.35 4082 0.13 45 FOOTWEAR OF LEATHER 129.43 136.86 147.15 105.55 46 LEATHER FOOTWEAR KGS 1200608 13.99 1504152 14.33 1248828 10.72 765576 8.13
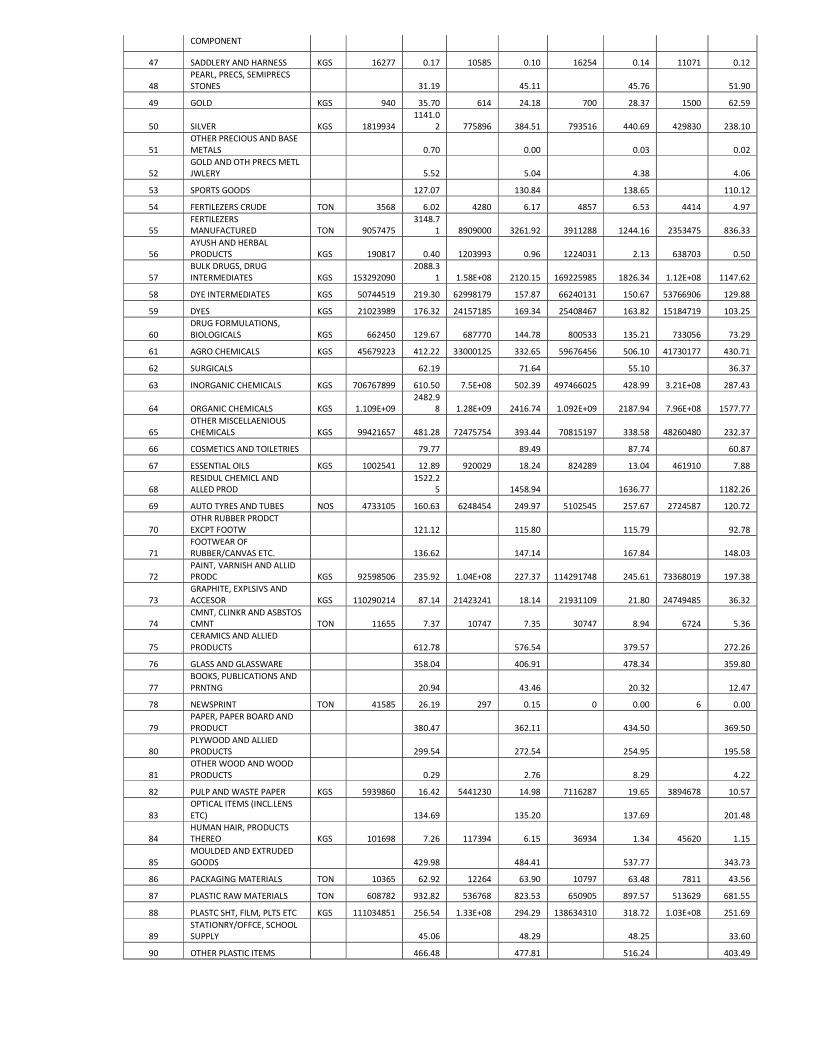
COMPONENT
47 SADDLERY AND HARNESS KGS 16277 0.17 10585 0.10 16254 0.14 11071 0.12
48 PEARL, PRECS, SEMIPRECS STONES 31.19 45.11 45.76 51.90
49 GOLD KGS 940 35.70 614 24.18 700 28.37 1500 62.59
50 SILVER KGS 1819934 1141.0
2 775896 384.51 793516 440.69 429830 238.10
51 OTHER PRECIOUS AND BASE METALS 0.70 0.00 0.03 0.02
52
GOLD AND OTH PRECS METL JWLERY 5.52 5.04 4.38 4.06
53 SPORTS GOODS 127.07 130.84 138.65 110.12 54 FERTILEZERS CRUDE TON 3568 6.02 4280 6.17 4857 6.53 4414 4.97
55 FERTILEZERS MANUFACTURED TON 9057475
3148.71 8909000 3261.92 3911288 1244.16 2353475 836.33
56 AYUSH AND HERBAL PRODUCTS KGS 190817 0.40 1203993 0.96 1224031 2.13 638703 0.50
57 BULK DRUGS, DRUG INTERMEDIATES KGS 153292090
2088.31 1.58E+08 2120.15 169225985 1826.34 1.12E+08 1147.62
58 DYE INTERMEDIATES KGS 50744519 219.30 62998179 157.87 66240131 150.67 53766906 129.88 59 DYES KGS 21023989 176.32 24157185 169.34 25408467 163.82 15184719 103.25
60 DRUG FORMULATIONS, BIOLOGICALS KGS 662450 129.67 687770 144.78 800533 135.21 733056 73.29
61 AGRO CHEMICALS KGS 45679223 412.22 33000125 332.65 59676456 506.10 41730177 430.71
62 SURGICALS 62.19 71.64 55.10 36.37
63 INORGANIC CHEMICALS KGS 706767899 610.50 7.5E+08 502.39 497466025 428.99 3.21E+08 287.43
64 ORGANIC CHEMICALS KGS 1.109E+09 2482.9
8 1.28E+09 2416.74 1.092E+09 2187.94 7.96E+08 1577.77
65 OTHER MISCELLAENIOUS CHEMICALS KGS 99421657 481.28 72475754 393.44 70815197 338.58 48260480 232.37
66 COSMETICS AND TOILETRIES 79.77 89.49 87.74 60.87
67 ESSENTIAL OILS KGS 1002541 12.89 920029 18.24 824289 13.04 461910 7.88
68 RESIDUL CHEMICL AND ALLED PROD
1522.25 1458.94 1636.77 1182.26
69 AUTO TYRES AND TUBES NOS 4733105 160.63 6248454 249.97 5102545 257.67 2724587 120.72
70 OTHR RUBBER PRODCT EXCPT FOOTW 121.12 115.80 115.79 92.78
71
FOOTWEAR OF RUBBER/CANVAS ETC. 136.62 147.14 167.84 148.03
72 PAINT, VARNISH AND ALLID PRODC KGS 92598506 235.92 1.04E+08 227.37 114291748 245.61 73368019 197.38
73
GRAPHITE, EXPLSIVS AND ACCESOR KGS 110290214 87.14 21423241 18.14 21931109 21.80 24749485 36.32
74
CMNT, CLINKR AND ASBSTOS CMNT TON 11655 7.37 10747 7.35 30747 8.94 6724 5.36
75 CERAMICS AND ALLIED PRODUCTS 612.78 576.54 379.57 272.26
76 GLASS AND GLASSWARE 358.04 406.91 478.34 359.80
77 BOOKS, PUBLICATIONS AND PRNTNG 20.94 43.46 20.32 12.47
78 NEWSPRINT TON 41585 26.19 297 0.15 0 0.00 6 0.00
79 PAPER, PAPER BOARD AND PRODUCT 380.47 362.11 434.50 369.50
80
PLYWOOD AND ALLIED PRODUCTS 299.54 272.54 254.95 195.58
81 OTHER WOOD AND WOOD PRODUCTS 0.29 2.76 8.29 4.22
82 PULP AND WASTE PAPER KGS 5939860 16.42 5441230 14.98 7116287 19.65 3894678 10.57
83 OPTICAL ITEMS (INCL.LENS ETC) 134.69 135.20 137.69 201.48
84
HUMAN HAIR, PRODUCTS THEREO KGS 101698 7.26 117394 6.15 36934 1.34 45620 1.15
85 MOULDED AND EXTRUDED GOODS 429.98 484.41 537.77 343.73
86 PACKAGING MATERIALS TON 10365 62.92 12264 63.90 10797 63.48 7811 43.56 87 PLASTIC RAW MATERIALS TON 608782 932.82 536768 823.53 650905 897.57 513629 681.55
88 PLASTC SHT, FILM, PLTS ETC KGS 111034851 256.54 1.33E+08 294.29 138634310 318.72 1.03E+08 251.69
89 STATIONRY/OFFCE, SCHOOL SUPPLY 45.06 48.29 48.25 33.60
90 OTHER PLASTIC ITEMS 466.48 477.81 516.24 403.49
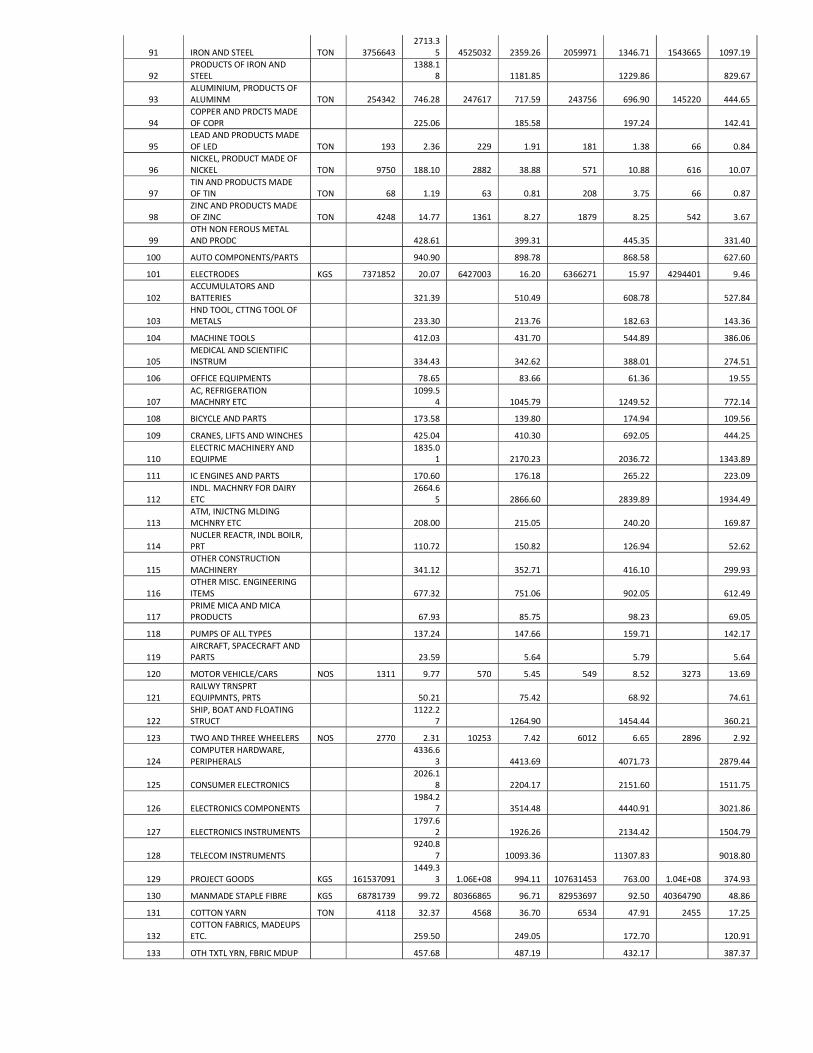
91 IRON AND STEEL TON 3756643 2713.3
5 4525032 2359.26 2059971 1346.71 1543665 1097.19
92 PRODUCTS OF IRON AND STEEL
1388.18 1181.85 1229.86 829.67
93 ALUMINIUM, PRODUCTS OF ALUMINM TON 254342 746.28 247617 717.59 243756 696.90 145220 444.65
94
COPPER AND PRDCTS MADE OF COPR 225.06 185.58 197.24 142.41
95 LEAD AND PRODUCTS MADE OF LED TON 193 2.36 229 1.91 181 1.38 66 0.84
96 NICKEL, PRODUCT MADE OF NICKEL TON 9750 188.10 2882 38.88 571 10.88 616 10.07
97
TIN AND PRODUCTS MADE OF TIN TON 68 1.19 63 0.81 208 3.75 66 0.87
98 ZINC AND PRODUCTS MADE OF ZINC TON 4248 14.77 1361 8.27 1879 8.25 542 3.67
99
OTH NON FEROUS METAL AND PRODC 428.61 399.31 445.35 331.40
100 AUTO COMPONENTS/PARTS 940.90 898.78 868.58 627.60 101 ELECTRODES KGS 7371852 20.07 6427003 16.20 6366271 15.97 4294401 9.46
102 ACCUMULATORS AND BATTERIES 321.39 510.49 608.78 527.84
103
HND TOOL, CTTNG TOOL OF METALS 233.30 213.76 182.63 143.36
104 MACHINE TOOLS 412.03 431.70 544.89 386.06
105 MEDICAL AND SCIENTIFIC INSTRUM 334.43 342.62 388.01 274.51
106 OFFICE EQUIPMENTS 78.65 83.66 61.36 19.55
107 AC, REFRIGERATION MACHNRY ETC
1099.54 1045.79 1249.52 772.14
108 BICYCLE AND PARTS 173.58 139.80 174.94 109.56
109 CRANES, LIFTS AND WINCHES 425.04 410.30 692.05 444.25
110 ELECTRIC MACHINERY AND EQUIPME
1835.01 2170.23 2036.72 1343.89
111 IC ENGINES AND PARTS 170.60 176.18 265.22 223.09
112 INDL. MACHNRY FOR DAIRY ETC
2664.65 2866.60 2839.89 1934.49
113
ATM, INJCTNG MLDING MCHNRY ETC 208.00 215.05 240.20 169.87
114
NUCLER REACTR, INDL BOILR, PRT 110.72 150.82 126.94 52.62
115 OTHER CONSTRUCTION MACHINERY 341.12 352.71 416.10 299.93
116
OTHER MISC. ENGINEERING ITEMS 677.32 751.06 902.05 612.49
117 PRIME MICA AND MICA PRODUCTS 67.93 85.75 98.23 69.05
118 PUMPS OF ALL TYPES 137.24 147.66 159.71 142.17
119 AIRCRAFT, SPACECRAFT AND PARTS 23.59 5.64 5.79 5.64
120 MOTOR VEHICLE/CARS NOS 1311 9.77 570 5.45 549 8.52 3273 13.69
121 RAILWY TRNSPRT EQUIPMNTS, PRTS 50.21 75.42 68.92 74.61
122
SHIP, BOAT AND FLOATING STRUCT
1122.27 1264.90 1454.44 360.21
123 TWO AND THREE WHEELERS NOS 2770 2.31 10253 7.42 6012 6.65 2896 2.92
124 COMPUTER HARDWARE, PERIPHERALS
4336.63 4413.69 4071.73 2879.44
125 CONSUMER ELECTRONICS 2026.1
8 2204.17 2151.60 1511.75
126 ELECTRONICS COMPONENTS 1984.2
7 3514.48 4440.91 3021.86
127 ELECTRONICS INSTRUMENTS 1797.6
2 1926.26 2134.42 1504.79
128 TELECOM INSTRUMENTS 9240.8
7 10093.36 11307.83 9018.80
129 PROJECT GOODS KGS 161537091 1449.3
3 1.06E+08 994.11 107631453 763.00 1.04E+08 374.93
130 MANMADE STAPLE FIBRE KGS 68781739 99.72 80366865 96.71 82953697 92.50 40364790 48.86
131 COTTON YARN TON 4118 32.37 4568 36.70 6534 47.91 2455 17.25
132 COTTON FABRICS, MADEUPS ETC. 259.50 249.05 172.70 120.91
133 OTH TXTL YRN, FBRIC MDUP 457.68 487.19 432.17 387.37
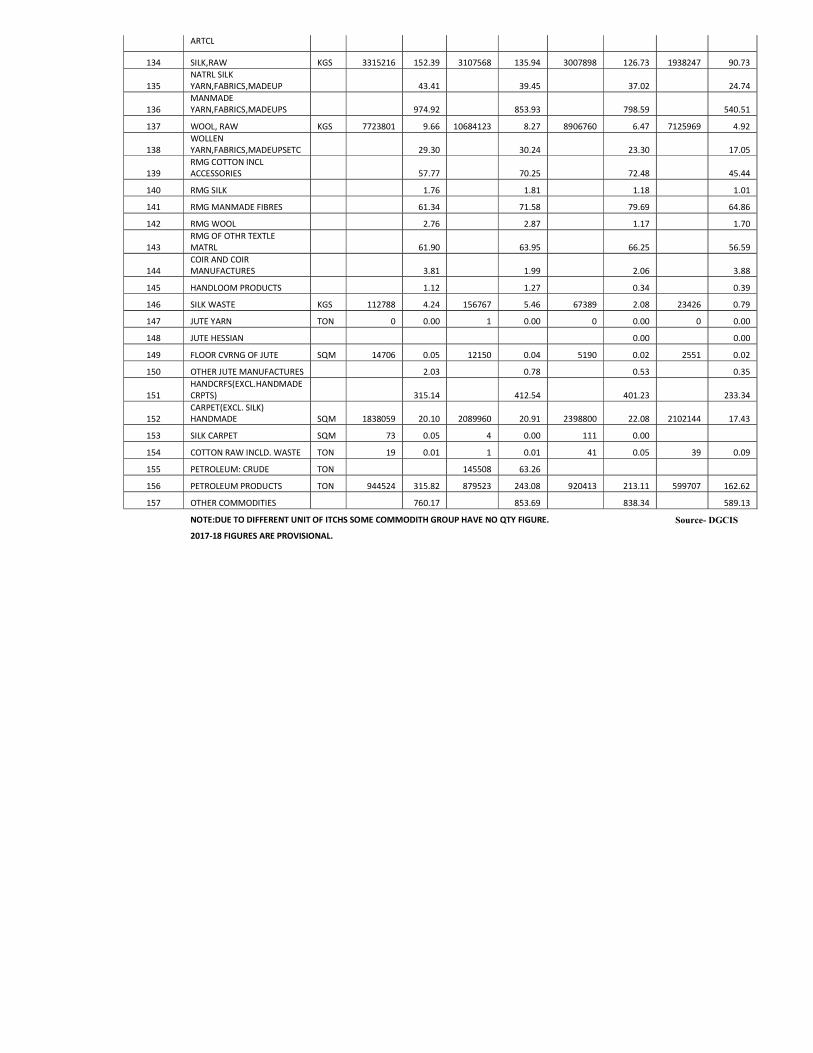
ARTCL
134 SILK,RAW KGS 3315216 152.39 3107568 135.94 3007898 126.73 1938247 90.73
135 NATRL SILK YARN,FABRICS,MADEUP 43.41 39.45 37.02 24.74
136 MANMADE YARN,FABRICS,MADEUPS 974.92 853.93 798.59 540.51
137 WOOL, RAW KGS 7723801 9.66 10684123 8.27 8906760 6.47 7125969 4.92
138 WOLLEN YARN,FABRICS,MADEUPSETC 29.30 30.24 23.30 17.05
139
RMG COTTON INCL ACCESSORIES 57.77 70.25 72.48 45.44
140 RMG SILK 1.76 1.81 1.18 1.01 141 RMG MANMADE FIBRES 61.34 71.58 79.69 64.86 142 RMG WOOL 2.76 2.87 1.17 1.70
143 RMG OF OTHR TEXTLE MATRL 61.90 63.95 66.25 56.59
144
COIR AND COIR MANUFACTURES 3.81 1.99 2.06 3.88
145 HANDLOOM PRODUCTS 1.12 1.27 0.34 0.39 146 SILK WASTE KGS 112788 4.24 156767 5.46 67389 2.08 23426 0.79 147 JUTE YARN TON 0 0.00 1 0.00 0 0.00 0 0.00
148 JUTE HESSIAN 0.00 0.00
149 FLOOR CVRNG OF JUTE SQM 14706 0.05 12150 0.04 5190 0.02 2551 0.02 150 OTHER JUTE MANUFACTURES 2.03 0.78 0.53 0.35
151 HANDCRFS(EXCL.HANDMADE CRPTS) 315.14 412.54 401.23 233.34
152
CARPET(EXCL. SILK) HANDMADE SQM 1838059 20.10 2089960 20.91 2398800 22.08 2102144 17.43
153 SILK CARPET SQM 73 0.05 4 0.00 111 0.00
154 COTTON RAW INCLD. WASTE TON 19 0.01 1 0.01 41 0.05 39 0.09 155 PETROLEUM: CRUDE TON 145508 63.26 156 PETROLEUM PRODUCTS TON 944524 315.82 879523 243.08 920413 213.11 599707 162.62
157 OTHER COMMODITIES 760.17 853.69 838.34 589.13
NOTE:DUE TO DIFFERENT UNIT OF ITCHS SOME COMMODITH GROUP HAVE NO QTY FIGURE. Source- DGCIS
2017-18 FIGURES ARE PROVISIONAL.