lifelong heterogeneity in fecundity is insufficient to explain late-life fecundity plateaus in...
TRANSCRIPT
Lifelong heterogeneity in fecundity is insufficient to explain
late-life fecundity plateaus in Drosophila melanogaster
Casandra L. Rauser1, Yasmine Abdel-Aal, Jonathan A. Shieh, Christine W. Suen,
Laurence D. Mueller, Michael R. Rose*
Department of Ecology and Evolutionary Biology, University of California, 321 Steinhaus Hall, Irvine, CA 92697-2525, USA
Received 14 March 2005; received in revised form 25 June 2005; accepted 28 June 2005
Available online 8 August 2005
Abstract
Previous studies have demonstrated that fecundity, like mortality, plateaus at late ages in cohorts of Drosophila melanogaster. Although
evolutionary theory can explain the decline and plateau in cohort fecundity at late ages, it is conceivable that lifelong heterogeneity in
individual female fecundity is producing these plateaus. For example, consistently more fecund females may die at earlier ages, leaving only
females that always laid a low number of eggs preponderant at later ages. We simulated fecundity within a cohort, assuming the two
phenotypes described above, and tested these predictions by measuring age of death and age-specific fecundity for individual females from
three large cohorts. We statistically tested whether there was enough lifelong heterogeneity in fecundity to produce a late-life plateau by
testing whether early female fecundity could predict whether that female would live to lay eggs after the onset of the population fecundity
plateau. Our results indicate that heterogeneity in fecundity is not lifelong and thus not likely to cause late-life fecundity plateaus. Because
lifelong heterogeneity models for fecundity are based on the same underlying assumptions as heterogeneity models for late-life mortality
rates, our test of this hypothesis is also an experimental test of lifelong heterogeneity models of late life generally.
q 2005 Elsevier Inc. All rights reserved.
Keywords: Fecundity; Heterogeneity; Fecundity plateau; Mortality-rate plateau; Aging; Late life
1. Introduction
Previous studies have found that fecundity, like
mortality-rates, plateaus at late ages in several cohorts of
Drosophila melanogaster (Rauser et al., 2003, 2005, in
press). Although evolutionary theory based on the age-
specific decline in the force of natural selection can explain
the decline and plateau in fecundity at late ages (Hamilton,
1966; Rauser et al., in press), it is conceivable that life-long
heterogeneity in individual female fecundity is causing a
spurious plateau in average late-life fecundity. There are
two obvious ways in which this might occur, among others.
First, some females within a cohort may be more fecund
0531-5565/$ - see front matter q 2005 Elsevier Inc. All rights reserved.
doi:10.1016/j.exger.2005.06.006
* Corresponding author. Tel.: C1 949 824 8121; fax: C1 949 824 2181.
E-mail address: [email protected] (M.R. Rose).1 Present address: Eukaryotic Genome Maintenance Unit, Laboratory of
Molecular Cell Biology, National Cancer Institute, Building 37, Room
6056D, Bethesda, MD 20892, USA.
than other females, but die at earlier ages, leaving a subset of
females at later ages that always laid fewer eggs. Second, in
complete contrast with the first possibility, some females
may be generally more robust and capable of sustaining
egg-laying indefinitely at later ages. The first hypothesis is
implicitly based on a trade-off between egg-laying and
lifelong robustness, while the second is a generalization of
the Vaupelian lifelong-robustness theory from mortality
to all age-specific life-history characters (cf. Vaupel et al.,
1979). Many other variations on these themes are
conceivable.
All lifelong heterogeneity in fecundity hypotheses have
in common the ability to infer late-life fecundity patterns
from attributes of young individuals in a cohort, just as
demographic theories of late-life mortality hypothesize that
mortality rates plateau because of individual heterogeneity
effects that are present throughout life (vid. Vaupel et al.,
1998). To be specific, lifelong heterogeneity theories
assume that individuals are imbued with life-long consistent
levels of robustness that define their mortality rates. As a
result, individuals within a cohort that are less robust
Experimental Gerontology 40 (2005) 660–670
www.elsevier.com/locate/expgero
C.L. Rauser et al. / Experimental Gerontology 40 (2005) 660–670 661
throughout life die at earlier ages, leaving individuals with
lifelong superiority in robustness predominant in the cohort
at late ages, causing a slowing of mortality rates (Vaupel
et al., 1979; Vaupel, 1988, 1990; Pletcher and Curtsinger,
2000). Note that this demographic heterogeneity is not the
same as mere genetic or environmental variation within a
population (cf. Carnes and Olshansky, 2001).
Mortality-rate plateaus only result when heterogeneity in
robustness levels is extreme and sustained throughout life
(Service, 2000a). Heterogeneity this extreme and this
consistent has yet to be found experimentally (Curtsinger
et al., 1992; Fukui et al., 1996; Brooks et al., 1994; Vaupel
et al., 1994; Khazaeli et al., 1998; Drapeau et al., 2000;
Arking and Giroux, 2001; see also Service, 2000b; Mueller
et al., 2000, 2003). In addition, analyses of the statistical
properties of lifelong heterogeneity theory are conflicting
(Service, 2000a, 2004; Pletcher and Curtsinger, 2000;
Mueller et al., 2003; Steinsaltz, 2005). A major problem
with testing the heterogeneity theory with regards to
mortality is that an individual’s rate of aging with respect
to mortality cannot be measured readily, so lifelong
heterogeneity for robustness has only been studied
indirectly. However, with fecundity this is not a difficulty,
as individual age-specific fecundity over a lifetime can
easily be measured within a cohort. Therefore, fecundity can
be used to test the general concept of lifelong demographic
heterogeneity because average population fecundity shows
the same plateauing pattern at late ages as mortality rates.
Such tests can be based on lifetime heterogeneity in
fecundity with differential loss of more fecund females,
for example.
Other studies of individual fecundity trajectories help
motivate the present experimental strategy. Muller et al.
(2001) looked at fecundity and death patterns in Medflies
and found no apparent trade-off between reproductive
output and lifespan. This is preliminary evidence against
one version of the lifelong fecundity-heterogeneity theory,
specifically the hypothesis that females that lay a high
number of eggs should die at earlier ages. Novoseltsev et al.
(2004) have shown that flies with short lifespans do not have
higher mean fecundity during their midlife ‘plateau’
compared to flies that live a medium number of days. This
is also not consistent with the predictions of the first type of
heterogeneity theory for fecundity adduced above. How-
ever, they did show that the longest lived flies had a lower
mean fecundity than the medium and short lived flies,
though this difference was not always significant. Overall, it
is not clear from the published literature whether or not any
type of lifelong fecundity-heterogeneity theory is likely to
be correct.
In the present study, we use computer simulations of a
population having various levels of robustness in fecundity
and mortality to demonstrate the a priori feasibility of the
first type of lifelong heterogeneity, that based on trade-offs
between reproduction and survival. We then test whether
observable lifelong heterogeneity in fecundity can be used
to predict the properties of the late life of individual flies,
including the survival of individual flies to the late-life
period. We do this by measuring daily fecundity over the
entire lifetime and age of death for 2828 individuals, then
testing whether the age-specific fecundity of females that
live to lay eggs at late ages differ significantly throughout
life from the age-specific fecundity of females that die
before the onset of the cohort’s plateau in fecundity.
2. Materials and methods
2.1. Simulations of lifelong fecundity effects on cohort
composition
We examined the consequences for average population
fecundity of a cohort with two levels of robustness in
fecundity and mortality. We assumed that a phenotype with
high fecundity was coupled with high mortality (H:H), and a
phenotype with low fecundity was coupled with low
mortality (L:L). A population consisting of just these two
phenotypes is the simplest example of the trade-off version
of a lifelong heterogeneity theory for fecundity. Specifi-
cally, we assume that more fecund individuals die earlier,
leaving the less fecund individuals at later ages. We do not
offer this example because we think that it is the only
possible example of a theory of this kind. We are merely
illustrating what the features of such theories are when they
are formally explicit, in one case. Many models of this type
can be invented.
We assumed that the H:H phenotype initially occurs at
a frequency p, and thus L:L females are at a frequency of
1Kp. We modeled adult survival with the Gompertz
equation. The probability of survival to ageKt, lt, is
expAð1KexpðatÞÞ
a
� �;
where A is the age-independent mortality parameter and a is
the age-dependent parameter. If we let the age-specific
survival and fecundity of H:H females be lt and mt,
respectively, and for L:L females ~lt and ~mt, then the average
fecundity of a cohort aged t days is
pltmt C ð1KpÞ~lt ~mt
plt C ð1KpÞ~lt
: (1)
2.2. Experimental population
This study used an outbred laboratory-selected popu-
lation of Drosophila melanogaster selected for mid-life
reproduction. The CO population employed is one of the
five replicate CO populations derived in 1989 from five
corresponding O populations (Rose, 1984). These popu-
lations are cultured using females 28 days of age (Rose
et al., 1992) and had been maintained at effective population
sizes of at least 1000 individuals for at least 170 generations
C.L. Rauser et al. / Experimental Gerontology 40 (2005) 660–670662
at the time of this study. Late-life mortality-rate plateaus
and late-life fecundity plateaus have been observed in the
CO populations (Rose et al., 2002; Rauser et al., in press). A
large cohort of flies from the CO1 replicate population was
used in each of the three assays.
2.3. Culture and assay methods
Flies used in the assays were raised for two generations
as larvae in 5 mL of standard banana-molasses food at
25 8C, constant light, and densities between 60 and 80 eggs
per 8-dram vial. During this controlled density rearing, flies
were kept on a 2-week generation time.
For each replicate assay, individual females were housed
with two males in vials containing charcoal-colored
medium and 5 mg of yeast. Fecundity was first measured
at age 12 days from egg (all ages reported are in days from
egg). Assays one and two started with 1111 females and
twice as many males, to insure that all females were mated,
while assay three started with 606 females and twice as
many males. The three replicate assays were temporally
staggered to reduce the large amount of work required in
measuring daily fecundity for such a large number of
females. Over all three cohorts, we collected lifetime daily
fecundity data for 2828 females, with 3,169,101 eggs
counted in total.
During the assays, we transferred flies to fresh yeasted
vials daily and counted the number of eggs laid for each
female until she died. Male flies were recombined between
vials as they died, to ensure a supply of mates for females.
We wanted to measure lifetime individual female fecundity
for all females in each cohort and compare the lifelong age-
specific fecundity of females that died before the onset of
the late-life fecundity plateau with those females that live to
lay eggs at very late ages. If lifelong heterogeneity in
fecundity is sufficient to produce late-life plateaus in
fecundity, then the observed fecundity at early ages should
be sufficient to predict which females will survive and
contribute to the eggs laid during the late-life fecundity
plateau. Specifically, we expect females that live to, and lay
eggs during, the plateau to lay significantly fewer eggs
earlier in life compared to females that die before the onset
of the plateau, if lifelong demographic heterogeneity based
on trade-offs between reproduction and survival determines
late-life fecundity patterns.
2.4. Statistical analysis of heterogeneity in fecundity
2.4.1. Choice of statistical model
We used our observations of individual female fecundity
to classify females as either ‘plateau’ or ‘non-plateau’
females. If plateau females always lay fewer eggs,
compared to non-plateau females, then we ought to be
able to examine the age-specific patterns of fecundity early
in life and predict whether a female will make it to the
plateau, or not. That is, statistically we ask if we can
correctly make this prediction, given the longitudinal
fecundity data, significantly more often than 50% of the
time.
To properly classify each female into one of the two
groups, we first determined the age at which average
population fecundity stopped declining and plateaued in
each of the three cohorts. The start of the fecundity plateau
was determined in each cohort independently by fitting a
3-parameter, two-stage linear model, having a second stage
slope of zero, to mid- and late-life population fecundity data
(starting at age 30 days). Note that this model was not
chosen to describe lifetime fecundity patterns of individuals
or the population, but simply to determine at what age
fecundity stops declining and plateaus at late ages. This
model was previously used to test whether fecundity
plateaus late in life in experimental Drosophila cohorts
(Rauser et al., 2005, in press). Under the two-stage model
the fecundity at age t days is
41 C42t; if t!43;
41 C4243; if tR43:
((2)
This model was fit to the data using the non-linear least-
squares package in the R-project for statistical computing
(www.R-project.org). We wrote a self-starting R-function
for the two-stage linear model that provided initial estimates
for the parameter values as well as the predicted fecundity
from Eq. (2).
From this model we determined the starting age of the
fecundity plateau (f3), which we call ‘the breakday’, for
each of the three cohorts. All females that died before the
breakday were classified as ‘non-plateau’ females (individ-
uals whose age of death is before f3), and females that died
on or after the breakday were classified as ‘plateau’ females
(individuals whose age of death is Sf3).
Steinsaltz (2005) has shown that search routines for
maximum likelihood estimates of the Gompertz mortality
functions with a plateau do not always find the best
estimates. We have explored this potential problem with
model (2) and the non-linear regression package of R by
doing extensive grid searches about the least squares
estimates to determine if there were nearby parameter
combinations which further reduced the sum of squares. We
found that the nls routine of R almost always identified the
best parameter estimates and in the single instance where a
better combination was found it was for a combination of
parameter values that were very close to the nls least squares
estimates.
There are of course other ways in which age-specific
fecundity cohort data could be fit statistically. Thus, we
have compared the two-stage linear model with two other
possible models. We believe this comparison illustrates
additional advantages of the two-stage linear model,
advantages that go beyond its primary purpose of estimating
the age at which fecundity transitions from a rapid decline
to a slow decline or plateau.
C.L. Rauser et al. / Experimental Gerontology 40 (2005) 660–670 663
We have compared three models, each with three
parameters, that predict the fecundity of a female aged t
days. The first is the two-stage linear model already
introduced as Eq. (2).
The second model we will call the ‘exponential model’
41 C42 expð43tÞ: (3)
The third model has the shape of the right half of a
normal distribution, so we will call it the Gaussian model
41 expðKð42 C43tÞ2Þ: (4)
We analyzed data from 19 different CO cohorts with
respect to their ‘fit’ with all three of these statistical models.
This sample included all five independent CO populations
(cf. Rose et al., 2002; Rose et al., 2004; Rauser et al., in
press) with at least two replicate cohorts sampled from each
of the five populations. The entire data set contained
116,393 measurements of age-specific fecundity. We fit
each model to the entire set of data assuming each
population differs due to random variation using the non-
linear mixed effects package of R (version 2.01). Goodness
of fit was assessed by the Akaike information criterion
(AIC) and the Bayesian information criterion (BIC).
The results of this model-fitting comparison were
qualitatively the same for AIC and BIC. The exponential
model showed a 0.3% improvement in AIC relative to the
two-stage linear model. The Gaussian model showed a 0.4%
improvement relative to the two-stage model. These are
modest improvements in statistical fit.
Therefore, the specific features of the three statistical
models become of greater interest in choosing among them.
Many females in this data set survived beyond 60 days, yet
the exponential model fitting predicts negative fecundity
values above this age. This property renders the exponential
model essentially worthless.
The problems with the Gaussian statistical model are also
profound. From the overall fitting of the three models, t-tests
with 116,372 degrees of freedom can be used to determine
if each parameter of each model is significantly different
from zero. Table 1 shows that all three parameters are
significantly different from zero for the two-stage and
Table 1
The top half of the table shows the P-value for the t-test of each model
parameter for the three different statistical models fit to population-level
age-specific fecundity data
P-value
Model f1 f2 f3
Two stage 2.4!10K106 8.0!10K75 !10K300
Exponential 4.8!10K8 6.4!10K15 3.8!10K46
Gaussian 0.93 0.79 4.1!10K08
Range of parameter variation (largest to smallest)
Two stage !3.6 !4.2 !1.5
Gaussian !1805 K3.4 to 2.09 !4.5
The bottom half of the table shows the range that the parameter estimates
vary over the 19 different CO populations.
exponential models. However, only one of the three
parameters is significantly different from zero for the
Gaussian model. This is due to the very large variation in
parameter estimates across these 19 populations for the
Gaussian model (Table 1). For instance, the f1 parameter
shows an 1800-fold range of variation over the 19 CO
populations, while the f2 parameter changes sign from one
population to the next.
Consequently, we conclude that the values of at least
two of the parameters in the Gaussian model are
extremely sensitive to slight biological changes from
replicate to replicate. The Gaussian model cannot be
rehabilitated by simply removing the f1 and f2
parameters, since the resulting model then predicts age-
specific fecundities no larger that exp(0) or 1. These
difficulties clearly render the Gaussian statistical model a
poor choice for data analysis.
In conclusion the two-stage model gives us the ability to
objectively determine an age at which there is a substantial
departure from the decline in fecundity that is apparent
through much of mid-life in the age-specific fecundity data.
In addition, our preferred statistical model has parameters
that have simple interpretations in terms of evolutionary
models, while avoiding the biological paradoxes exhibited
by statistical models like the exponential and Gaussian.
However, we cannot claim that there are not other
conceivable statistical models that might do an even better
job than our two-stage linear model does at data-fitting with
only three parameters, and invite our colleagues to develop
such models for future use.
2.4.2. Discriminant analysis
One way to test whether the age-specific fecundity
patterns at earlier ages allow us to predict which females
will be plateau females is with linear discriminant analysis
on the age-specific fecundity of individual females. Let the
number of eggs laid by the ith female, aged t days, be yit.
Suppose we have these data for k-consecutive days from
females belonging to two groups: plateau females and non-
plateau females. Using log transformed fecundity,
~yit Z lnðyitÞ, we assumed a common k!k covariance matrix
for ~y in plateau and non-plateau females, S. Note that the
mean vectors for plateau females, Yp, may be different from
the mean vector for non-plateau females, Yn.
Given the age-specific fecundity for the ith female,~YiZ ð ~yi;1; ~yi;2;.; ~yi;kÞ
T, we compute the Wald-Anderson
classification statistic (Morrison, 1976, p. 232)
W Z ~YiSK1ðYn KYpÞK
1
2ðYn CYpÞ
TSK1ðYnKYpÞ:
If WO0, we classified the female as a non-plateau
female, otherwise she was classified as a plateau female.
The difficult aspect of using this statistic is to determine
how much better than 50% our predictive power must be in
order to be considered statistically significant. We addressed
this problem by using computer re-sampling to determine
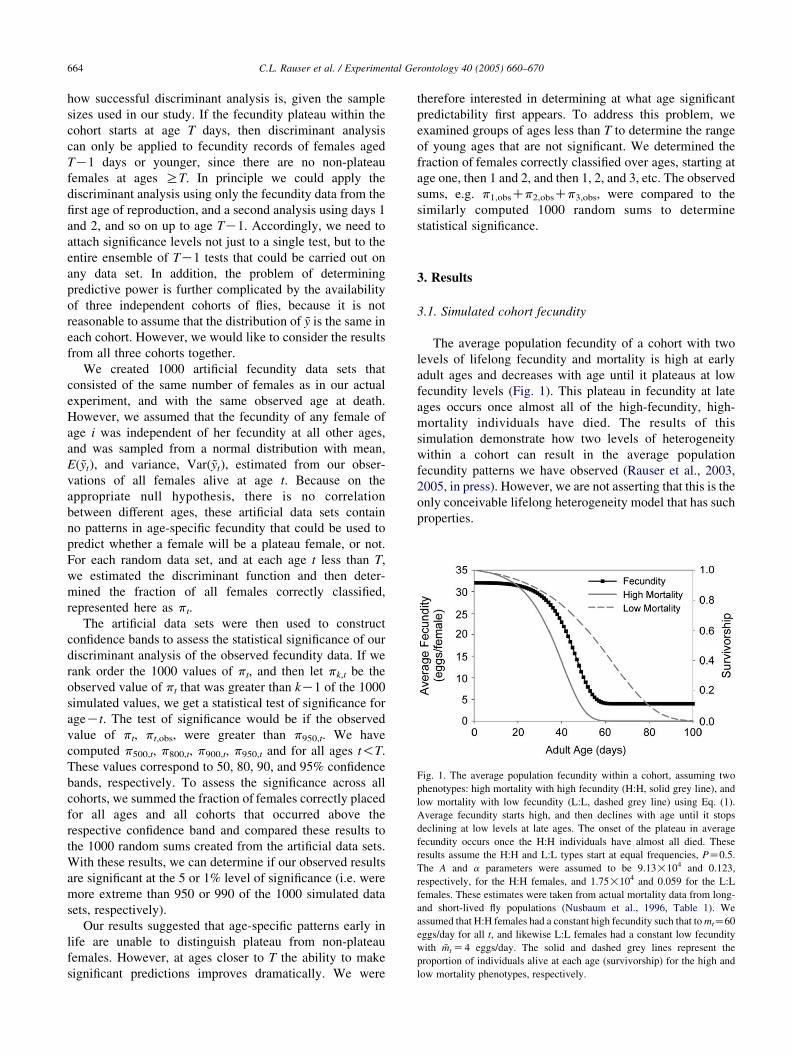
Fig. 1. The average population fecundity within a cohort, assuming two
phenotypes: high mortality with high fecundity (H:H, solid grey line), and
low mortality with low fecundity (L:L, dashed grey line) using Eq. (1).
Average fecundity starts high, and then declines with age until it stops
declining at low levels at late ages. The onset of the plateau in average
fecundity occurs once the H:H individuals have almost all died. These
results assume the H:H and L:L types start at equal frequencies, PZ0.5.
The A and a parameters were assumed to be 9.13!104 and 0.123,
respectively, for the H:H females, and 1.75!104 and 0.059 for the L:L
females. These estimates were taken from actual mortality data from long-
and short-lived fly populations (Nusbaum et al., 1996, Table 1). We
assumed that H:H females had a constant high fecundity such that to mtZ60
eggs/day for all t, and likewise L:L females had a constant low fecundity
with ~mt Z4 eggs/day. The solid and dashed grey lines represent the
proportion of individuals alive at each age (survivorship) for the high and
low mortality phenotypes, respectively.
C.L. Rauser et al. / Experimental Gerontology 40 (2005) 660–670664
how successful discriminant analysis is, given the sample
sizes used in our study. If the fecundity plateau within the
cohort starts at age T days, then discriminant analysis
can only be applied to fecundity records of females aged
TK1 days or younger, since there are no non-plateau
females at ages RT. In principle we could apply the
discriminant analysis using only the fecundity data from the
first age of reproduction, and a second analysis using days 1
and 2, and so on up to age TK1. Accordingly, we need to
attach significance levels not just to a single test, but to the
entire ensemble of TK1 tests that could be carried out on
any data set. In addition, the problem of determining
predictive power is further complicated by the availability
of three independent cohorts of flies, because it is not
reasonable to assume that the distribution of ~y is the same in
each cohort. However, we would like to consider the results
from all three cohorts together.
We created 1000 artificial fecundity data sets that
consisted of the same number of females as in our actual
experiment, and with the same observed age at death.
However, we assumed that the fecundity of any female of
age i was independent of her fecundity at all other ages,
and was sampled from a normal distribution with mean,
Eð ~ytÞ, and variance, Varð ~ytÞ, estimated from our obser-
vations of all females alive at age t. Because on the
appropriate null hypothesis, there is no correlation
between different ages, these artificial data sets contain
no patterns in age-specific fecundity that could be used to
predict whether a female will be a plateau female, or not.
For each random data set, and at each age t less than T,
we estimated the discriminant function and then deter-
mined the fraction of all females correctly classified,
represented here as pt.
The artificial data sets were then used to construct
confidence bands to assess the statistical significance of our
discriminant analysis of the observed fecundity data. If we
rank order the 1000 values of pt, and then let pk,t be the
observed value of pt that was greater than kK1 of the 1000
simulated values, we get a statistical test of significance for
ageKt. The test of significance would be if the observed
value of pt, pt,obs, were greater than p950,t. We have
computed p500,t, p800,t, p900,t, p950,t and for all ages t!T.
These values correspond to 50, 80, 90, and 95% confidence
bands, respectively. To assess the significance across all
cohorts, we summed the fraction of females correctly placed
for all ages and all cohorts that occurred above the
respective confidence band and compared these results to
the 1000 random sums created from the artificial data sets.
With these results, we can determine if our observed results
are significant at the 5 or 1% level of significance (i.e. were
more extreme than 950 or 990 of the 1000 simulated data
sets, respectively).
Our results suggested that age-specific patterns early in
life are unable to distinguish plateau from non-plateau
females. However, at ages closer to T the ability to make
significant predictions improves dramatically. We were
therefore interested in determining at what age significant
predictability first appears. To address this problem, we
examined groups of ages less than T to determine the range
of young ages that are not significant. We determined the
fraction of females correctly classified over ages, starting at
age one, then 1 and 2, and then 1, 2, and 3, etc. The observed
sums, e.g. p1,obsCp2,obsCp3,obs, were compared to the
similarly computed 1000 random sums to determine
statistical significance.
3. Results
3.1. Simulated cohort fecundity
The average population fecundity of a cohort with two
levels of lifelong fecundity and mortality is high at early
adult ages and decreases with age until it plateaus at low
fecundity levels (Fig. 1). This plateau in fecundity at late
ages occurs once almost all of the high-fecundity, high-
mortality individuals have died. The results of this
simulation demonstrate how two levels of heterogeneity
within a cohort can result in the average population
fecundity patterns we have observed (Rauser et al., 2003,
2005, in press). However, we are not asserting that this is the
only conceivable lifelong heterogeneity model that has such
properties.
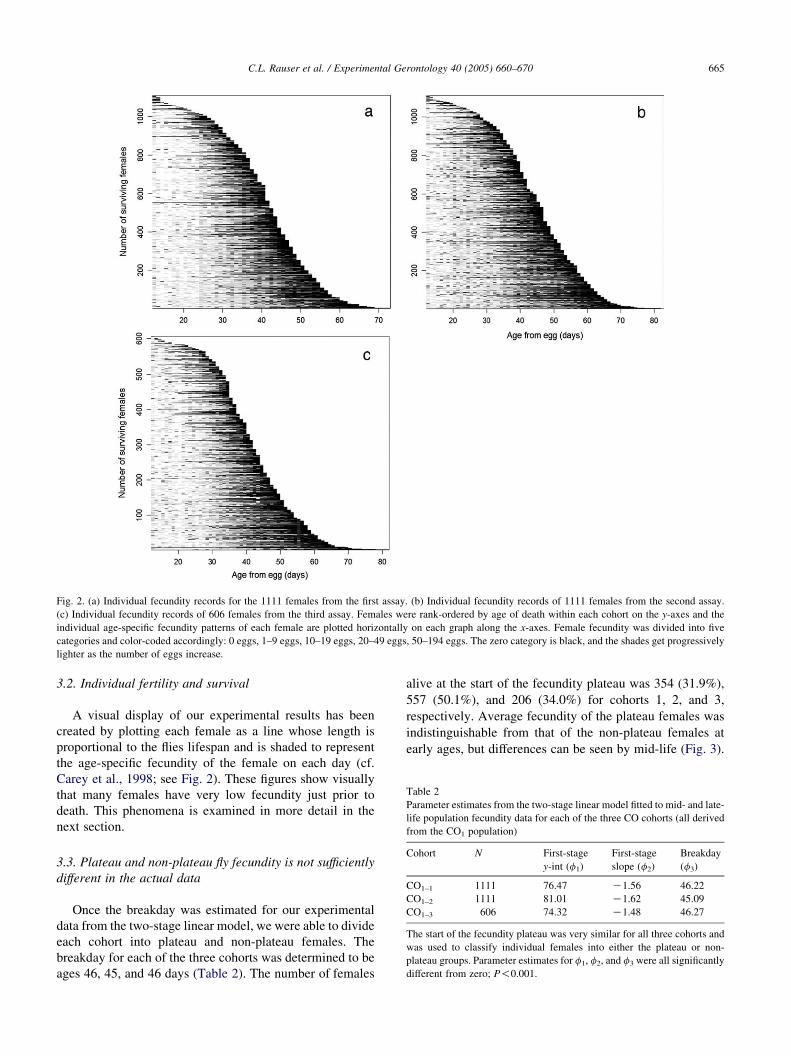
Fig. 2. (a) Individual fecundity records for the 1111 females from the first assay. (b) Individual fecundity records of 1111 females from the second assay.
(c) Individual fecundity records of 606 females from the third assay. Females were rank-ordered by age of death within each cohort on the y-axes and the
individual age-specific fecundity patterns of each female are plotted horizontally on each graph along the x-axes. Female fecundity was divided into five
categories and color-coded accordingly: 0 eggs, 1–9 eggs, 10–19 eggs, 20–49 eggs, 50–194 eggs. The zero category is black, and the shades get progressively
lighter as the number of eggs increase.
Table 2
Parameter estimates from the two-stage linear model fitted to mid- and late-
life population fecundity data for each of the three CO cohorts (all derived
from the CO1 population)
C.L. Rauser et al. / Experimental Gerontology 40 (2005) 660–670 665
3.2. Individual fertility and survival
A visual display of our experimental results has been
created by plotting each female as a line whose length is
proportional to the flies lifespan and is shaded to represent
the age-specific fecundity of the female on each day (cf.
Carey et al., 1998; see Fig. 2). These figures show visually
that many females have very low fecundity just prior to
death. This phenomena is examined in more detail in the
next section.
Cohort N First-stage
y-int (f1)
First-stage
slope (f2)
Breakday
(f3)
CO1–1 1111 76.47 K1.56 46.22
CO1–2 1111 81.01 K1.62 45.09
CO1–3 606 74.32 K1.48 46.27
The start of the fecundity plateau was very similar for all three cohorts and
was used to classify individual females into either the plateau or non-
plateau groups. Parameter estimates for f1, f2, and f3 were all significantly
different from zero; P!0.001.
3.3. Plateau and non-plateau fly fecundity is not sufficiently
different in the actual data
Once the breakday was estimated for our experimental
data from the two-stage linear model, we were able to divide
each cohort into plateau and non-plateau females. The
breakday for each of the three cohorts was determined to be
ages 46, 45, and 46 days (Table 2). The number of females
alive at the start of the fecundity plateau was 354 (31.9%),
557 (50.1%), and 206 (34.0%) for cohorts 1, 2, and 3,
respectively. Average fecundity of the plateau females was
indistinguishable from that of the non-plateau females at
early ages, but differences can be seen by mid-life (Fig. 3).
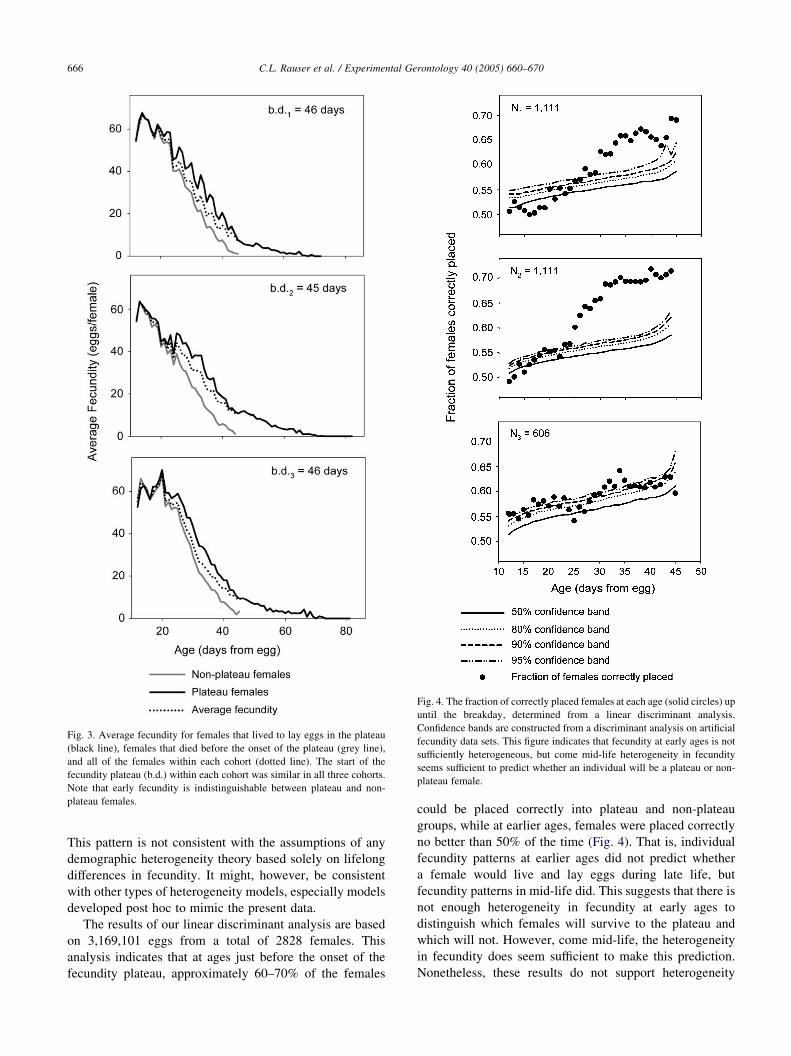
Fig. 3. Average fecundity for females that lived to lay eggs in the plateau
(black line), females that died before the onset of the plateau (grey line),
and all of the females within each cohort (dotted line). The start of the
fecundity plateau (b.d.) within each cohort was similar in all three cohorts.
Note that early fecundity is indistinguishable between plateau and non-
plateau females.
Fig. 4. The fraction of correctly placed females at each age (solid circles) up
until the breakday, determined from a linear discriminant analysis.
Confidence bands are constructed from a discriminant analysis on artificial
fecundity data sets. This figure indicates that fecundity at early ages is not
sufficiently heterogeneous, but come mid-life heterogeneity in fecundity
seems sufficient to predict whether an individual will be a plateau or non-
plateau female.
C.L. Rauser et al. / Experimental Gerontology 40 (2005) 660–670666
This pattern is not consistent with the assumptions of any
demographic heterogeneity theory based solely on lifelong
differences in fecundity. It might, however, be consistent
with other types of heterogeneity models, especially models
developed post hoc to mimic the present data.
The results of our linear discriminant analysis are based
on 3,169,101 eggs from a total of 2828 females. This
analysis indicates that at ages just before the onset of the
fecundity plateau, approximately 60–70% of the females
could be placed correctly into plateau and non-plateau
groups, while at earlier ages, females were placed correctly
no better than 50% of the time (Fig. 4). That is, individual
fecundity patterns at earlier ages did not predict whether
a female would live and lay eggs during late life, but
fecundity patterns in mid-life did. This suggests that there is
not enough heterogeneity in fecundity at early ages to
distinguish which females will survive to the plateau and
which will not. However, come mid-life, the heterogeneity
in fecundity does seem sufficient to make this prediction.
Nonetheless, these results do not support heterogeneity
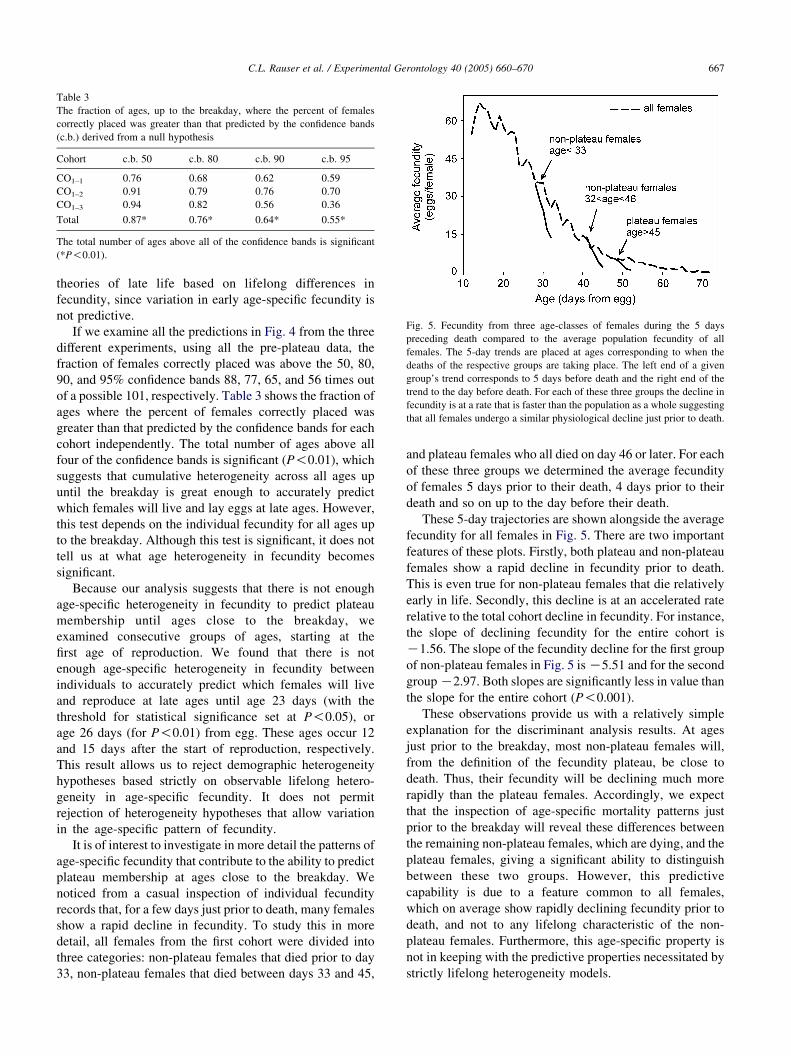
Table 3
The fraction of ages, up to the breakday, where the percent of females
correctly placed was greater than that predicted by the confidence bands
(c.b.) derived from a null hypothesis
Cohort c.b. 50 c.b. 80 c.b. 90 c.b. 95
CO1–1 0.76 0.68 0.62 0.59
CO1–2 0.91 0.79 0.76 0.70
CO1–3 0.94 0.82 0.56 0.36
Total 0.87* 0.76* 0.64* 0.55*
The total number of ages above all of the confidence bands is significant
(*P!0.01).
Fig. 5. Fecundity from three age-classes of females during the 5 days
preceding death compared to the average population fecundity of all
females. The 5-day trends are placed at ages corresponding to when the
deaths of the respective groups are taking place. The left end of a given
group’s trend corresponds to 5 days before death and the right end of the
trend to the day before death. For each of these three groups the decline in
fecundity is at a rate that is faster than the population as a whole suggesting
that all females undergo a similar physiological decline just prior to death.
C.L. Rauser et al. / Experimental Gerontology 40 (2005) 660–670 667
theories of late life based on lifelong differences in
fecundity, since variation in early age-specific fecundity is
not predictive.
If we examine all the predictions in Fig. 4 from the three
different experiments, using all the pre-plateau data, the
fraction of females correctly placed was above the 50, 80,
90, and 95% confidence bands 88, 77, 65, and 56 times out
of a possible 101, respectively. Table 3 shows the fraction of
ages where the percent of females correctly placed was
greater than that predicted by the confidence bands for each
cohort independently. The total number of ages above all
four of the confidence bands is significant (P!0.01), which
suggests that cumulative heterogeneity across all ages up
until the breakday is great enough to accurately predict
which females will live and lay eggs at late ages. However,
this test depends on the individual fecundity for all ages up
to the breakday. Although this test is significant, it does not
tell us at what age heterogeneity in fecundity becomes
significant.
Because our analysis suggests that there is not enough
age-specific heterogeneity in fecundity to predict plateau
membership until ages close to the breakday, we
examined consecutive groups of ages, starting at the
first age of reproduction. We found that there is not
enough age-specific heterogeneity in fecundity between
individuals to accurately predict which females will live
and reproduce at late ages until age 23 days (with the
threshold for statistical significance set at P!0.05), or
age 26 days (for P!0.01) from egg. These ages occur 12
and 15 days after the start of reproduction, respectively.
This result allows us to reject demographic heterogeneity
hypotheses based strictly on observable lifelong hetero-
geneity in age-specific fecundity. It does not permit
rejection of heterogeneity hypotheses that allow variation
in the age-specific pattern of fecundity.
It is of interest to investigate in more detail the patterns of
age-specific fecundity that contribute to the ability to predict
plateau membership at ages close to the breakday. We
noticed from a casual inspection of individual fecundity
records that, for a few days just prior to death, many females
show a rapid decline in fecundity. To study this in more
detail, all females from the first cohort were divided into
three categories: non-plateau females that died prior to day
33, non-plateau females that died between days 33 and 45,
and plateau females who all died on day 46 or later. For each
of these three groups we determined the average fecundity
of females 5 days prior to their death, 4 days prior to their
death and so on up to the day before their death.
These 5-day trajectories are shown alongside the average
fecundity for all females in Fig. 5. There are two important
features of these plots. Firstly, both plateau and non-plateau
females show a rapid decline in fecundity prior to death.
This is even true for non-plateau females that die relatively
early in life. Secondly, this decline is at an accelerated rate
relative to the total cohort decline in fecundity. For instance,
the slope of declining fecundity for the entire cohort is
K1.56. The slope of the fecundity decline for the first group
of non-plateau females in Fig. 5 is K5.51 and for the second
group K2.97. Both slopes are significantly less in value than
the slope for the entire cohort (P!0.001).
These observations provide us with a relatively simple
explanation for the discriminant analysis results. At ages
just prior to the breakday, most non-plateau females will,
from the definition of the fecundity plateau, be close to
death. Thus, their fecundity will be declining much more
rapidly than the plateau females. Accordingly, we expect
that the inspection of age-specific mortality patterns just
prior to the breakday will reveal these differences between
the remaining non-plateau females, which are dying, and the
plateau females, giving a significant ability to distinguish
between these two groups. However, this predictive
capability is due to a feature common to all females,
which on average show rapidly declining fecundity prior to
death, and not to any lifelong characteristic of the non-
plateau females. Furthermore, this age-specific property is
not in keeping with the predictive properties necessitated by
strictly lifelong heterogeneity models.
C.L. Rauser et al. / Experimental Gerontology 40 (2005) 660–670668
4. Discussion
If lifelong observable heterogeneity in fecundity causes
late-life fecundity plateaus in experimental cohorts, it
should be detectable from differences in egg laying between
individual females at every phase of adult life, including
early adulthood. For example, a cohort that shows life-long
heterogeneity in egg laying with strong trade-offs between
reproduction and survival should have females that
consistently lay more eggs quickly and then die at earlier
ages, leaving only females who have always laid eggs at a
low rate preponderant among late ages. Alternatively, a
cohort that has some members which show lifelong
superiority with respect to all adult life-history characters,
including all age-specific survival probabilities and all age-
specific fecundities, should allow us to predict survival to
late life from early fecundity data. But our analysis shows
that neither of these hypotheses are likely to be correct,
because early life fecundity does not predict late-life
characteristics, as we will now explain.
We used the age of death and age-specific fecundity for
individuals within three cohorts to test the predictions of
lifelong fecundity-heterogeneity hypotheses. Our data
suggest that there is a significant amount of age-specific
variation in fecundity, but it has no predictive value until
12–15 days after the start of reproduction (Fig. 4). There-
fore, we conclude that there is not enough heterogeneity in
fecundity at early ages to distinguish which females will
survive to lay eggs in the fecundity plateau and which will
not. Therefore, we reject lifelong heterogeneity theories for
fecundity. This result does NOT show that heterogeneity
theories that allow age-specificity are incorrect; the
evolutionary theory of late life based on the force of natural
selection (vid. Mueller and Rose, 1996; Charlesworth,
2001) is just such a theory, and other theories of this general
class are conceivable and unchallenged by our present
results.
It was not until ages just prior to the onset of the plateau
that we were able to accurately predict which females would
be plateau and non-plateau females. This observation makes
sense because the general pattern of fecundity right before
death is the same regardless of whether that female is a
plateau or non-plateau female. For both groups, individual
female fecundity steeply declines to zero just prior to death
(Fig. 5). This pattern of declining female fecundity just
before death has been observed in both Medflies and
Drosophila (Muller et al., 2001; Novoseltsev et al., 2003,
2004). Therefore, our increased ability to correctly place
females within demographic categories using fecundity at
ages just before the plateau probably arises simply from this
dramatic decline in fecundity right before death. This idea is
supported by the fact that plateau females have a three-fold
greater fecundity compared to non-plateau females 5 days
before the start of the fecundity plateau.
Further analysis of individual fecundity patterns for
females at ages prior to the onset of the fecundity plateau
show that fecundity declines much faster for females about
to die, compared to the population of females alive at these
same ages. Therefore, it is apparent that our ability to
correctly sort out plateau and non-plateau females increases
when we examine age-specific fecundity data just before the
breakday because the only non-plateau females alive at
these ages are those about to die, and thus undergoing a
rapid decline in fecundity.
Many heterogeneity theories proposed to explain the
slowing of mortality rates at late ages assume that
individuals within a cohort are still aging according to
Gompertz’ law, but that the differences between individual
Gompertz functions is large (Vaupel, 1990; Kowald and
Kirkwood, 1993). However, Abrams and Ludwig (1995)
point out that the amount of heterogeneity assumed to make
these models fit population mortality-rate data is extremely
large, without precedent in actual data. In fact, the
difference between the constant and exponential Gompertz
parameters in our long and short-lived fly populations
(Nusbaum et al., 1996) does not come close to the
magnitude of heterogeneity required within a population
to make heterogeneity models fit the data (Vaupel and
Carey, 1993; Kowald and Kirkwood, 1993). Furthermore,
we know that the demographic patterns of short-lived
populations do not indicate the presence of individuals as
long-lived as the typical member of the long-lived
population. Similarly, our simple model for heterogeneity
in fecundity required a 15-fold difference in fecundity
between the high and low egg-layers in order to simulate
accurately our observed cohort fecundity values. It would be
interesting to see if average cohort fecundity plateaus at late
ages in genetically homogenous cohorts. A plateau in
fecundity under these circumstances would indicate whether
age-specific, though not lifelong, genetic heterogeneity
plays a role in late-life fecundity patterns, because it would
not eliminate the contribution of age-specific environmental
heterogeneity. However, it is unlikely that exogenous
environmental heterogeneity has much of an effect on the
existence of fecundity plateaus, as we have observed
plateaus under both constant and varying environmental
conditions (Rauser et al., 2005, in press).
Other studies of the fecundity trajectories of individual
flies generally support our experimental findings, and do not
specifically support the predictions of lifelong heterogeneity
models for fecundity. Muller et al. (2001) looked at
fecundity and death patterns in Medflies and found no
apparent trade-off between reproductive output and life-
span, which is additional evidence against the type of model
that we simulate here. A lifelong heterogeneity model for
fecundity with strong trade-offs between reproduction and
survival predicts just the opposite: females that lay a high
number of eggs should die at earlier ages, which is
equivalent to a trade-off between reproduction and lifespan.
Analysis of the phenotypic relationship between lifetime
reproduction and lifespan in our flies indicates that long life
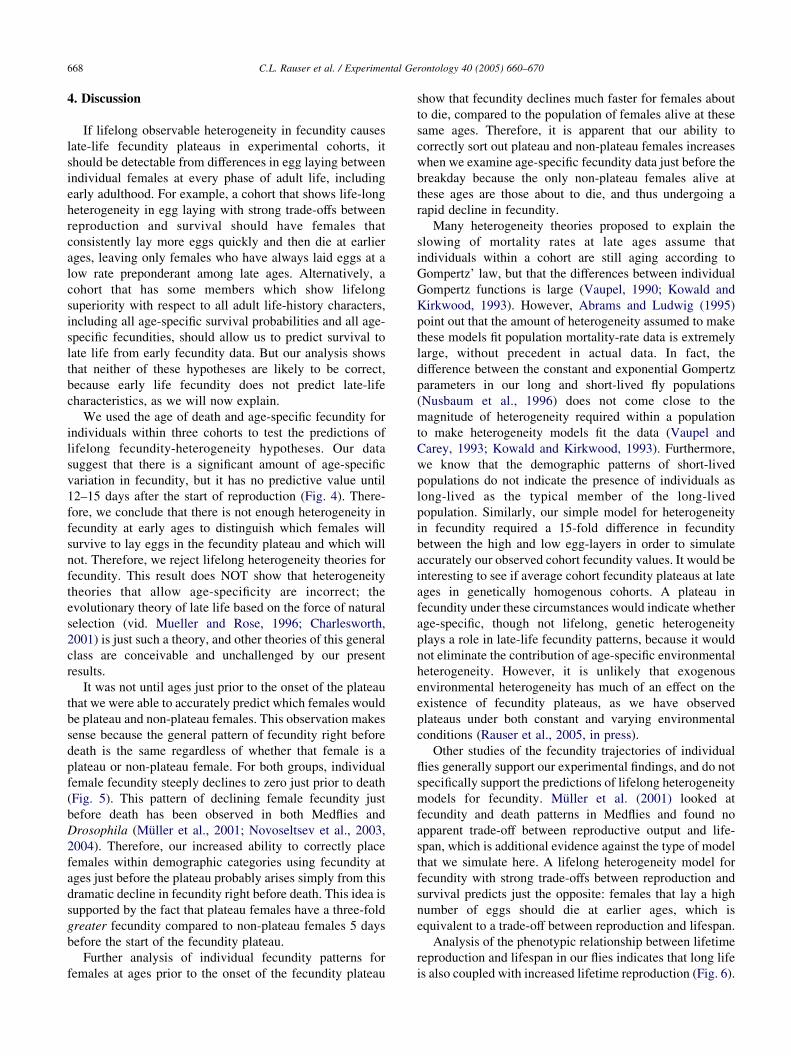
is also coupled with increased lifetime reproduction (Fig. 6).
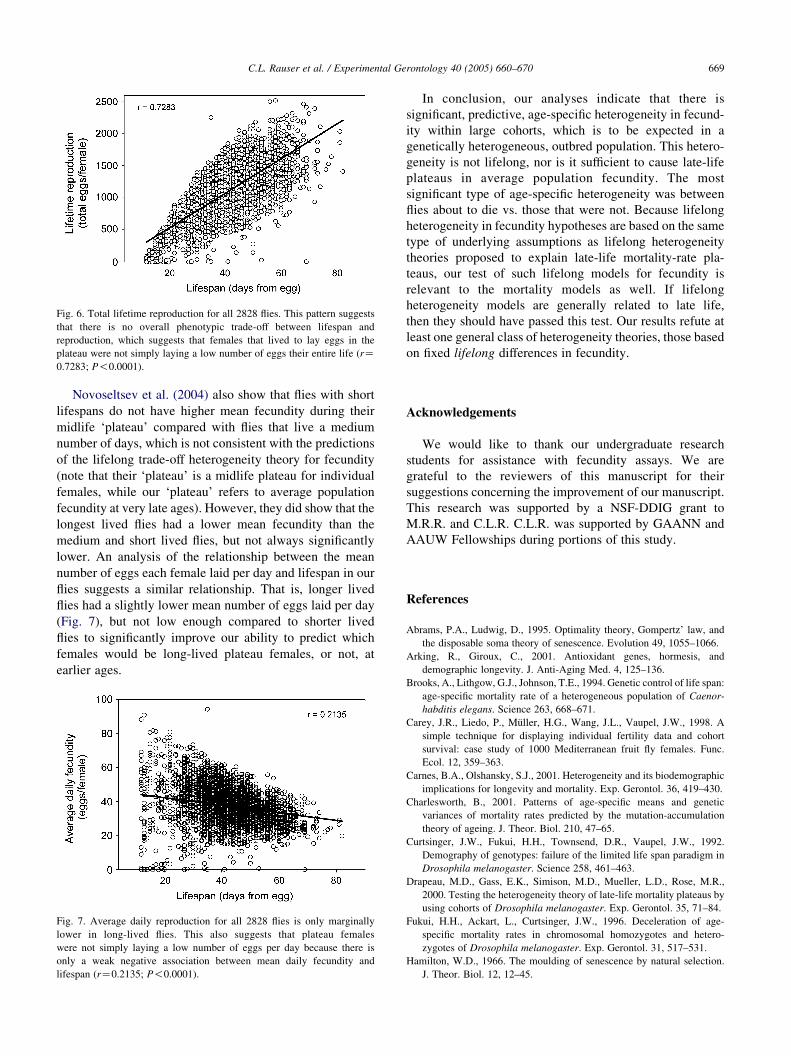
Fig. 6. Total lifetime reproduction for all 2828 flies. This pattern suggests
that there is no overall phenotypic trade-off between lifespan and
reproduction, which suggests that females that lived to lay eggs in the
plateau were not simply laying a low number of eggs their entire life (rZ0.7283; P!0.0001).
C.L. Rauser et al. / Experimental Gerontology 40 (2005) 660–670 669
Novoseltsev et al. (2004) also show that flies with short
lifespans do not have higher mean fecundity during their
midlife ‘plateau’ compared with flies that live a medium
number of days, which is not consistent with the predictions
of the lifelong trade-off heterogeneity theory for fecundity
(note that their ‘plateau’ is a midlife plateau for individual
females, while our ‘plateau’ refers to average population
fecundity at very late ages). However, they did show that the
longest lived flies had a lower mean fecundity than the
medium and short lived flies, but not always significantly
lower. An analysis of the relationship between the mean
number of eggs each female laid per day and lifespan in our
flies suggests a similar relationship. That is, longer lived
flies had a slightly lower mean number of eggs laid per day
(Fig. 7), but not low enough compared to shorter lived
flies to significantly improve our ability to predict which
females would be long-lived plateau females, or not, at
earlier ages.
Fig. 7. Average daily reproduction for all 2828 flies is only marginally
lower in long-lived flies. This also suggests that plateau females
were not simply laying a low number of eggs per day because there is
only a weak negative association between mean daily fecundity and
lifespan (rZ0.2135; P!0.0001).
In conclusion, our analyses indicate that there is
significant, predictive, age-specific heterogeneity in fecund-
ity within large cohorts, which is to be expected in a
genetically heterogeneous, outbred population. This hetero-
geneity is not lifelong, nor is it sufficient to cause late-life
plateaus in average population fecundity. The most
significant type of age-specific heterogeneity was between
flies about to die vs. those that were not. Because lifelong
heterogeneity in fecundity hypotheses are based on the same
type of underlying assumptions as lifelong heterogeneity
theories proposed to explain late-life mortality-rate pla-
teaus, our test of such lifelong models for fecundity is
relevant to the mortality models as well. If lifelong
heterogeneity models are generally related to late life,
then they should have passed this test. Our results refute at
least one general class of heterogeneity theories, those based
on fixed lifelong differences in fecundity.
Acknowledgements
We would like to thank our undergraduate research
students for assistance with fecundity assays. We are
grateful to the reviewers of this manuscript for their
suggestions concerning the improvement of our manuscript.
This research was supported by a NSF-DDIG grant to
M.R.R. and C.L.R. C.L.R. was supported by GAANN and
AAUW Fellowships during portions of this study.
References
Abrams, P.A., Ludwig, D., 1995. Optimality theory, Gompertz’ law, and
the disposable soma theory of senescence. Evolution 49, 1055–1066.
Arking, R., Giroux, C., 2001. Antioxidant genes, hormesis, and
demographic longevity. J. Anti-Aging Med. 4, 125–136.
Brooks, A., Lithgow, G.J., Johnson, T.E., 1994. Genetic control of life span:
age-specific mortality rate of a heterogeneous population of Caenor-
habditis elegans. Science 263, 668–671.
Carey, J.R., Liedo, P., Muller, H.G., Wang, J.L., Vaupel, J.W., 1998. A
simple technique for displaying individual fertility data and cohort
survival: case study of 1000 Mediterranean fruit fly females. Func.
Ecol. 12, 359–363.
Carnes, B.A., Olshansky, S.J., 2001. Heterogeneity and its biodemographic
implications for longevity and mortality. Exp. Gerontol. 36, 419–430.
Charlesworth, B., 2001. Patterns of age-specific means and genetic
variances of mortality rates predicted by the mutation-accumulation
theory of ageing. J. Theor. Biol. 210, 47–65.
Curtsinger, J.W., Fukui, H.H., Townsend, D.R., Vaupel, J.W., 1992.
Demography of genotypes: failure of the limited life span paradigm in
Drosophila melanogaster. Science 258, 461–463.
Drapeau, M.D., Gass, E.K., Simison, M.D., Mueller, L.D., Rose, M.R.,
2000. Testing the heterogeneity theory of late-life mortality plateaus by
using cohorts of Drosophila melanogaster. Exp. Gerontol. 35, 71–84.
Fukui, H.H., Ackart, L., Curtsinger, J.W., 1996. Deceleration of age-
specific mortality rates in chromosomal homozygotes and hetero-
zygotes of Drosophila melanogaster. Exp. Gerontol. 31, 517–531.
Hamilton, W.D., 1966. The moulding of senescence by natural selection.
J. Theor. Biol. 12, 12–45.
C.L. Rauser et al. / Experimental Gerontology 40 (2005) 660–670670
Khazaeli, A.A., Pletcher, S.D., Curtsinger, J.W., 1998. The fractionation
experiment: reducing heterogeneity to investigate age-specific mor-
tality in Drosophila. Mech. Ageing Dev. 105, 301–317.
Kowald, A., Kirkwood, T.B.L., 1993. Explaining fruit fly longevity.
Science 260, 1664–1665.
Morrison, D.F., 1976. Multivariate Statistical Methods, second ed.
McGraw-Hill, New York, NY.
Mueller, L.D., Rose, M.R., 1996. Evolutionary theory predicts late-life
mortality plateaus. Proc. Natl. Acad. Sci. U.S.A. 93, 15249–15253.
Mueller, L.D., Drapeau, M.D., Rose, M.R., 2000. Stress resistance,
heterogeneity, and mortality plateaus: response by the authors. Exp.
Gerontol. 35, 1089–1091.
Muller, H.G., Carey, J.R., Wu, D., Liedo, P., Vaupel, J.W., 2001.
Reproductive potential predicts longevity of female Mediterranean
fruitflies. Proc. R. Soc. Lond. B. 268, 445–450.
Mueller, L.D., Drapeau, M.D., Adams, C.S., Hammerle, C.W., Doyal,
K.M., Jazayeri, A.J., Ly, T., Beguwala, S.A., Mamidi, A.R., Rose,
M.R., 2003. Statistical tests of demographic heterogeneity theories.
Exp. Gerontol. 38, 373–386.
Novoseltsev, V.N., Novoseltseva, J.A., Yashin, A.I., 2003. What does a
fly’s individual fecundity pattern look like? The dynamics of resource
allocation in reproduction and ageing. Mech. Ageing Dev. 124,
605–617.
Novoseltsev, V.N., Carey, J.R., Novoseltseva, J.A., Papadopoulos, N.T.,
Blay, S., Yashin, A.I., 2004. Systemic mechanisms of individual
reproductive life history in female Medflies. Mech. Ageing Dev. 125,
77–87.
Nusbaum, T.J., Mueller, L.D., Rose, M.R., 1996. Evolutionary patterns
among measures of aging. Exp. Gerontol. 31, 507–516.
Pletcher, S.D., Curtsinger, J.W., 2000. The influence of environmentally
induced heterogeneity on age-specific genetic variance for mortality
rates. Genet. Res. 75, 321–329.
Rauser, C.L., Mueller, L.D., Rose, M.R., 2003. Aging, fertility and
immortality. Exp. Gerontol. 38, 27–33.
Rauser, C.L., Hong, J.S., Cung, M.B., Pham, K.M., Mueller, L.D., Rose,
M.R., 2005. Testing whether male age or high nutrition causes the
cessation of reproductive aging in female Drosophila melanogaster
populations. Rejuv. Res 8, 86–95.
Rauser, C.L., Tierney, J.J., Gunion, S.M., Covarrubias, G.M., Mueller,
L.D., Rose, M.R., in press. Evolution of late-life fecundity in
Drosophila melanogaster. J. Evol. Biol.
Rose, M.R., 1984. Laboratory evolution of postponed senescence in
Drosophila melanogaster. Evolution 38, 1004–1010.
Rose, M.R., Passananti, H.K., Matos, M., Eds, 2004. Methuselah Files: A
Case Study in the Evolution of Aging. World Scientific Publishing,
Singapore.
Rose, M.R., Vu, L.N., Park, S.U., Graves Jr., J.L., 1992. Selection on stress
resistance increases longevity in Drosophila melanogaster. Exp.
Gerontol. 27, 241–250.
Rose, M.R., Drapeau, M.D., Yazdi, P.G., Shah, K.H., Moise, D.B., Thakar,
R.R., Rauser, C.L., Mueller, L.D., 2002. Evolution of late-life mortality
in Drosophila melanogaster. Evolution 56, 1982–1991.
Service, P.M., 2000a. Heterogeneity in individual mortality risk and its
importance for evolutionary studies of senescence. Am. Nat. 156, 1–13.
Service, P.M., et al., 2000b. Stress resistance, heterogeneity, and mortality
plateaus: a comment on Drapeau et al.. Exp. Gerontol. 35, 1085–1087.
Service, P.M., 2004. Demographic heterogeneity explains age-specific
patterns of genetic variance in mortality rates. Exp. Gerontol. 39,
25–30.
Steinsaltz, D., 2005. Re-evaluating a test of the heterogeneity explanation
for mortality plateaus. Exp. Gerontol. 40, 101–113.
Vaupel, J.W., 1988. Inherited frailty and longevity. Demography 25,
277–287.
Vaupel, J.W., 1990. Relatives’ risks: frailty models of life history data.
Theor. Pop. Biol. 37, 220–234.
Vaupel, J.W., Carey, J.R., 1993. Compositional interpretations of medfly
mortality. Science 260, 1666–1667.
Vaupel, J.W., Manton, K.G., Stallard, E., 1979. The impact of
heterogeneity in individual frailty on the dynamics of mortality.
Demography 16, 439–454.
Vaupel, J.W., Johnson, T.E., Lithgow, G.J., 1994. Rates of mortality in
populations of Caenorhabditis elegans (Technical Comment). Science
266, 826.
Vaupel, J.W., Carey, J.R., Christensen, K., Johnson, T.E., Yashin, A.I.,
Holm, N.V., Iachine, I.A., Kannisto, V., Khazaeli, A.A., Liedo, P.,
Longo, V.D., Zeng, Y., Manton, K.G., Curtsinger, J.W., 1998.
Biodemographic trajectories of longevity. Science 280, 855–860.