lca biofuels bioelectricity
TRANSCRIPT
Bioresource Technology 102 (2011) 437–451
Contents lists available at ScienceDirect
Bioresource Technology
journal homepage: www.elsevier .com/locate /bior tech
Review
Life cycle assessment of bioenergy systems: State of the art and future challenges
Francesco Cherubini ⇑, Anders Hammer StrømmanDepartment of Energy and Process Engineering, Norwegian University of Science and Technology (NTNU), NO-7491 Trondheim, Norway
a r t i c l e i n f o a b s t r a c t
Article history:Received 14 May 2010Received in revised form 30 July 2010Accepted 2 August 2010Available online 6 August 2010
Keywords:BioenergyLCABiofuelsBioelectricityBioheat
0960-8524/$ - see front matter � 2010 Elsevier Ltd. Adoi:10.1016/j.biortech.2010.08.010
⇑ Corresponding author. Tel.: + 47 73598942.E-mail address: [email protected] (F. C
The use of different input data, functional units, allocation methods, reference systems and otherassumptions complicates comparisons of LCA bioenergy studies. In addition, uncertainties and use of spe-cific local factors for indirect effects (like land-use change and N-based soil emissions) may give rise towide ranges of final results. In order to investigate how these key issues have been addressed so far, thiswork performs a review of the recent bioenergy LCA literature. The abundance of studies dealing with thedifferent biomass resources, conversion technologies, products and environmental impact categories issummarized and discussed. Afterwards, a qualitative interpretation of the LCA results is depicted, focus-ing on energy balance, GHG balance and other impact categories. With the exception of a few studies,most LCAs found a significant net reduction in GHG emissions and fossil energy consumption when bio-energy replaces fossil energy.
� 2010 Elsevier Ltd. All rights reserved.
1. Introduction and background
With the current energy policies and management, world mar-ket energy consumption is projected to increase by 44% from 2006(497 EJ) to 2030 (715 EJ) (IEO, 2009). As highlighted by the FourthAssessment Report of The Intergovernmental Panel on ClimateChange (IPCC), this growing fossil fuel consumption, in conjunctionwith the world’s growing population, is leading to the rapid in-crease in greenhouse gas (GHG) emissions (IPCC, 2007). CO2 emis-sions are projected to rise from 29 billion tons in 2006 to 33.1billion tons in 2015 and 40.4 billion tons in 2030 (correspondingto an increase of 39%) (IEO, 2009).
In addition to the sustainability aspects related to fossil fuel use,this background raising fossil energy demand will face issues ofsupply, because of the progressive depletion of fossil resources,which makes the availability of conventional oil and naturalgas geographically restricted (Bentley et al., 2007; Hanlon andMcCartney, 2008). Alternative options able to simultaneouslymitigate climate change and reduce the dependence on fossilsources are already in development. The use of biomass for energy(i.e. bioenergy) is deemed to be one of the most promisingrenewable energy alternatives. In particular, modern biomassapplications are becoming increasingly important to countries asa low-carbon, distributed, renewable component of nationalenergy sources. There is a growing interest in bioenergy at anational and global level, as proven by recent policy documents
ll rights reserved.
herubini).
approved by the US congress (see for instance the American CleanEnergy and Security Act, either called the Waxman–Markey Bill)and by the European Parliament (Directive 2009/28/EC on the pro-motion of the use of energy from renewable sources). Despite theseregulations promoting biofuels, questions about sustainability ofbioenergy pathways were raised (Dickie 2007; Petrou and Pappis,2009; Sheehan 2009). The conversion of biomass to bioenergyhas input and output flows which may affect its overall environ-mental performances. In addition, indirect effects like land-usechange and N-based soil emissions may contribute to complicatethe overall picture. This paper elaborates on these topics by per-forming a thorough review of LCA bioenergy studies, followed bya specific assessment of the key methodological issues and indirecteffects, according to the aims and objectives explained in the fol-lowing section.
2. Aim and scope
This paper performs a review of a large portion of the existingscientific literature that explicitly used life cycle assessment(LCA) methodology, or a life-cycle approach, to estimate the envi-ronmental impacts of biomass energy uses. Authors of this paperassume that the reader already has a basic knowledge of LCA andbioenergy production chains, so that general information on theseaspects is not provided here.
The main purpose of this work is to discuss and synthesize thekey issues and striking features emerged from a review process ofthe wide scientific literature available, and analyzing the ap-proaches used by the different authors to face these issues, thus
438 F. Cherubini, A.H. Strømman / Bioresource Technology 102 (2011) 437–451
reporting the current state of the art. Contrarily to other bioenergyreview studies (Gnansounou et al., 2009; Larson, 2006; von Blott-nitz and Curran, 2007), in this paper there is not an attempt toharmonize results across studies and report them in bars withwide ranges (usually estimated by gathering data from papers lo-cated in different areas and based on different data sources andassumptions), but qualitative results will be rather discussed.Qualitative results for energy balance, GHG balance and other envi-ronmental impact categories are each described in specific sec-tions. References to studies showing quantitative results aregiven in the text and specific figures and examples from reliablestudies are sometimes reported across this paper to reinforce andenrich the results and the following discussion. Then, existingmethodological constraints and bottlenecks are described and dis-cussed in relation with policy maker’s requirements and normativeframeworks, so identifying existing shortcomings and future re-search challenges.
This review covers a time period of approximately fifteen years,in which a large numbers of studies have been published. In orderto narrow down the number of studies and focus the discussion onthe recent and future trends in LCA of bioenergy systems, but atsame time without disregarding older contributions, the literaturesearch was mainly based on the following criteria: before 2006,only review papers and relevant case studies were included; from2006 till date, both reviews and original research papers wereconsidered.
Only studies with a clear claim to be based on a life-cycle ap-proach to estimate environmental impacts are included. In addi-tion, only papers written in English and with good and reliablesupporting data and references were selected. Cost analysis andeconomic assessments are out of the scope of this paper. The totalnumber of reviewed studies is 94, most of which (74) are paperspublished in scientific journals and the remaining (20) are grey lit-erature. This set of studies does not include the complete literatureon LCA of bioenergy, but it does represent a thorough cross sectionof public available papers. In the Appendix, detailed informationfor each of the reviewed studies can be found in Tables A1 andA2. All the results described in the following section are derivedfrom an interpretation and critical assessment of these tables.
43
20
53
13
0
5
10
15
20
25
30
35
40
45
50
Europe North America
South America
Oceania Asia A
Location
Num
ber
of st
udie
s
Fig. 1. Location and
3. Results
3.1. Outcomes of the review process
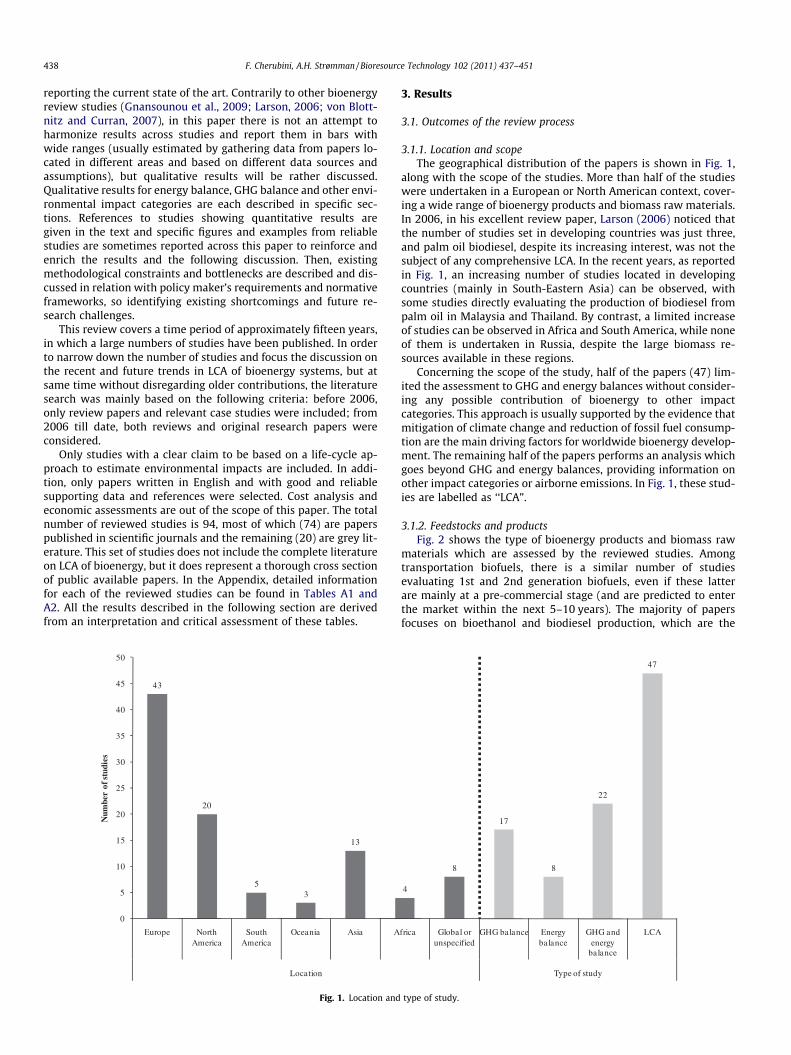
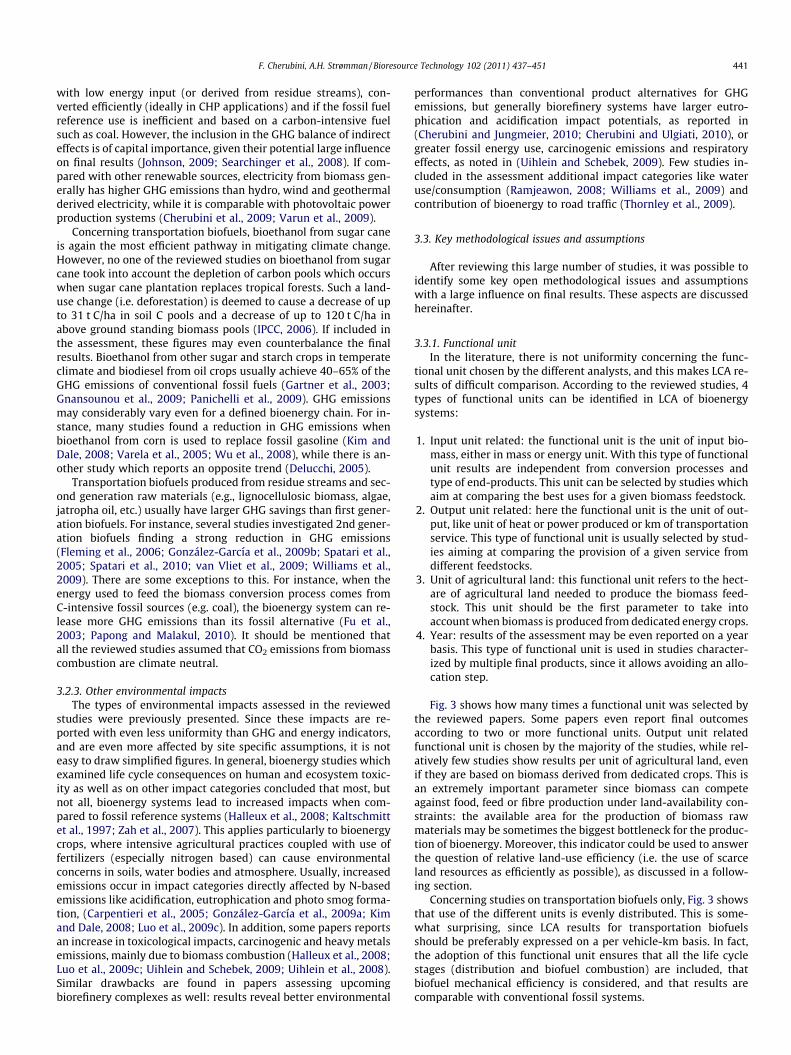
3.1.1. Location and scopeThe geographical distribution of the papers is shown in Fig. 1,
along with the scope of the studies. More than half of the studieswere undertaken in a European or North American context, cover-ing a wide range of bioenergy products and biomass raw materials.In 2006, in his excellent review paper, Larson (2006) noticed thatthe number of studies set in developing countries was just three,and palm oil biodiesel, despite its increasing interest, was not thesubject of any comprehensive LCA. In the recent years, as reportedin Fig. 1, an increasing number of studies located in developingcountries (mainly in South-Eastern Asia) can be observed, withsome studies directly evaluating the production of biodiesel frompalm oil in Malaysia and Thailand. By contrast, a limited increaseof studies can be observed in Africa and South America, while noneof them is undertaken in Russia, despite the large biomass re-sources available in these regions.
Concerning the scope of the study, half of the papers (47) lim-ited the assessment to GHG and energy balances without consider-ing any possible contribution of bioenergy to other impactcategories. This approach is usually supported by the evidence thatmitigation of climate change and reduction of fossil fuel consump-tion are the main driving factors for worldwide bioenergy develop-ment. The remaining half of the papers performs an analysis whichgoes beyond GHG and energy balances, providing information onother impact categories or airborne emissions. In Fig. 1, these stud-ies are labelled as ‘‘LCA”.
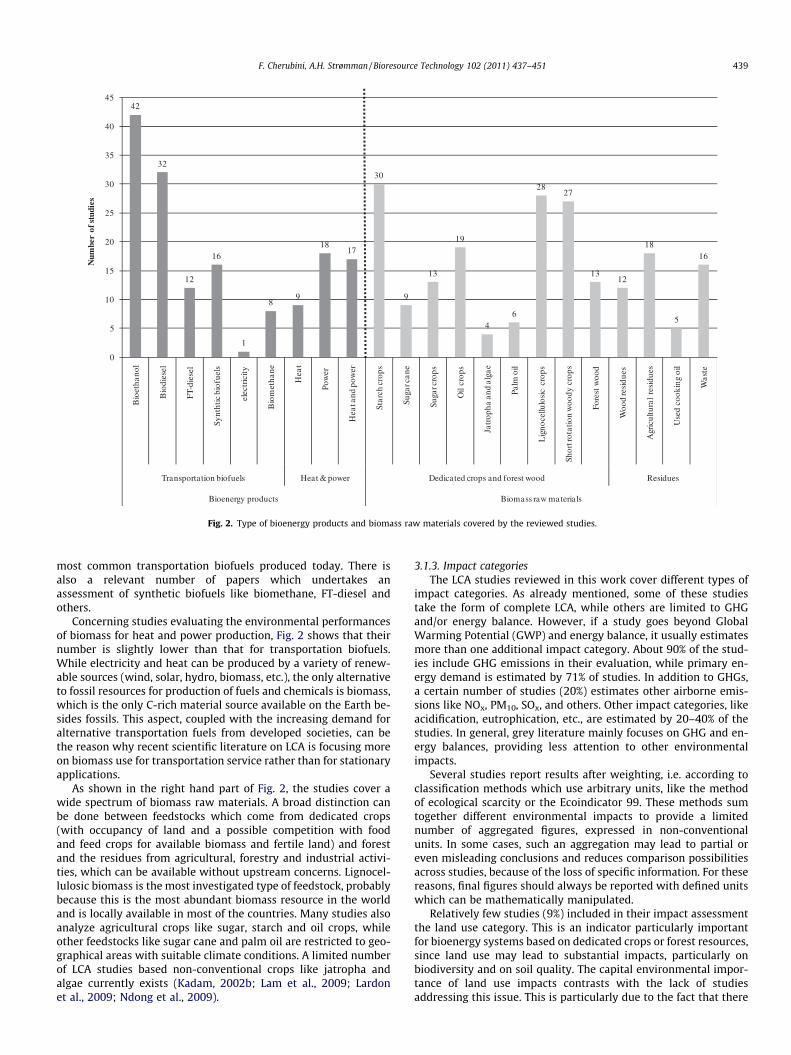
3.1.2. Feedstocks and productsFig. 2 shows the type of bioenergy products and biomass raw
materials which are assessed by the reviewed studies. Amongtransportation biofuels, there is a similar number of studiesevaluating 1st and 2nd generation biofuels, even if these latterare mainly at a pre-commercial stage (and are predicted to enterthe market within the next 5–10 years). The majority of papersfocuses on bioethanol and biodiesel production, which are the
4
8
17
8
22
47
frica Global or unspecified
GHG balance Energy balance
GHG and energy
balance
LCA
Type of study
type of study.
42
32
12
16
1
89
1817
30
9
13
19
46
2827
1312
18
5
16
0
5
10
15
20
25
30
35
40
45
Bio
etha
nol
Bio
dies
el
FT-d
iese
l
Synt
htic
bio
fuel
s
elec
tric
ity
Bio
met
hane
Hea
t
Pow
er
Hea
t and
pow
er
Star
ch c
rops
Suga
r can
e
Suga
r cro
ps
Oil
crop
s
Jatr
opha
and
alg
ae
Palm
oil
Lig
noce
llulo
sic
crop
s
Shor
t rot
atio
n w
oody
cro
ps
Fore
st w
ood
Woo
d re
sidu
es
Agr
icul
tura
l re
sidu
es
Use
d co
okin
g oi
l
Was
te
Transportation biofuels Heat & power Dedicated crops and forest wood Residues
Bioenergy products Biomass raw materials
Num
ber
of st
udie
s
Fig. 2. Type of bioenergy products and biomass raw materials covered by the reviewed studies.
F. Cherubini, A.H. Strømman / Bioresource Technology 102 (2011) 437–451 439
most common transportation biofuels produced today. There isalso a relevant number of papers which undertakes anassessment of synthetic biofuels like biomethane, FT-diesel andothers.
Concerning studies evaluating the environmental performancesof biomass for heat and power production, Fig. 2 shows that theirnumber is slightly lower than that for transportation biofuels.While electricity and heat can be produced by a variety of renew-able sources (wind, solar, hydro, biomass, etc.), the only alternativeto fossil resources for production of fuels and chemicals is biomass,which is the only C-rich material source available on the Earth be-sides fossils. This aspect, coupled with the increasing demand foralternative transportation fuels from developed societies, can bethe reason why recent scientific literature on LCA is focusing moreon biomass use for transportation service rather than for stationaryapplications.
As shown in the right hand part of Fig. 2, the studies cover awide spectrum of biomass raw materials. A broad distinction canbe done between feedstocks which come from dedicated crops(with occupancy of land and a possible competition with foodand feed crops for available biomass and fertile land) and forestand the residues from agricultural, forestry and industrial activi-ties, which can be available without upstream concerns. Lignocel-lulosic biomass is the most investigated type of feedstock, probablybecause this is the most abundant biomass resource in the worldand is locally available in most of the countries. Many studies alsoanalyze agricultural crops like sugar, starch and oil crops, whileother feedstocks like sugar cane and palm oil are restricted to geo-graphical areas with suitable climate conditions. A limited numberof LCA studies based non-conventional crops like jatropha andalgae currently exists (Kadam, 2002b; Lam et al., 2009; Lardonet al., 2009; Ndong et al., 2009).
3.1.3. Impact categoriesThe LCA studies reviewed in this work cover different types of
impact categories. As already mentioned, some of these studiestake the form of complete LCA, while others are limited to GHGand/or energy balance. However, if a study goes beyond GlobalWarming Potential (GWP) and energy balance, it usually estimatesmore than one additional impact category. About 90% of the stud-ies include GHG emissions in their evaluation, while primary en-ergy demand is estimated by 71% of studies. In addition to GHGs,a certain number of studies (20%) estimates other airborne emis-sions like NOx, PM10, SOx, and others. Other impact categories, likeacidification, eutrophication, etc., are estimated by 20–40% of thestudies. In general, grey literature mainly focuses on GHG and en-ergy balances, providing less attention to other environmentalimpacts.
Several studies report results after weighting, i.e. according toclassification methods which use arbitrary units, like the methodof ecological scarcity or the Ecoindicator 99. These methods sumtogether different environmental impacts to provide a limitednumber of aggregated figures, expressed in non-conventionalunits. In some cases, such an aggregation may lead to partial oreven misleading conclusions and reduces comparison possibilitiesacross studies, because of the loss of specific information. For thesereasons, final figures should always be reported with defined unitswhich can be mathematically manipulated.
Relatively few studies (9%) included in their impact assessmentthe land use category. This is an indicator particularly importantfor bioenergy systems based on dedicated crops or forest resources,since land use may lead to substantial impacts, particularly onbiodiversity and on soil quality. The capital environmental impor-tance of land use impacts contrasts with the lack of studiesaddressing this issue. This is particularly due to the fact that there
440 F. Cherubini, A.H. Strømman / Bioresource Technology 102 (2011) 437–451
is no widely accepted methodology for including land use impactsin LCA, despite some recent efforts (Dubreuil et al., 2007; Koellnerand Scholz, 2008; Scholz, 2007). For the same reason, none of thereviewed studies included in the assessment the potential impactof bioenergy on biodiversity, despite an existing accurate method-ology (Michelsen, 2008).
Another indicator which received little attention in the litera-ture is the share of urban/local emissions in the life cycle of trans-portation biofuels, e.g., the urban tailpipe emissions from biofuelcombustion in road vehicles. In most circumstances, studies ne-glect vehicle emissions from biofuel combustion, while others esti-mate only GHG emissions (N2O and CH4). Very few studiesconsider other gas species like SO2, PM10 and NOx, and includethem in the overall final assessment. With the exception of fewstudies, information about urban or local emissions is not usuallyprovided. For bioethanol, results reveal that ethanol combustionin cars usually reduce airborne emissions when compared to gaso-line (Brinkman et al., 2005; Wu et al., 2008). When biodiesel isused to replace conventional diesel in road vehicle, marginalreductions in CO, uncombusted hydrocarbons and particulateemissions are observed, while SO2 emissions are effectively elimi-nated; by contrast, NOx emissions are slightly higher (Mortimeret al., 2003).
3.2. Qualitative interpretation of results
LCA results of the reviewed studies can be grouped in threebroad categories: energy balance, GHG balance and other life-cycleimpact categories. All the papers have different goal, scope andobjectives. This implies that when comparing LCA results reportedby different authors and sources, a wide range of final outcomescan be observed, even for apparently similar bioenergy chains. Thisvariance can be attributable to differing data sources and ages, keyinput parameter values, agricultural managements, and otherintrinsic factors. In addition to them, methodological issues likedefinition of system boundaries, allocation procedure, referencesystems, and other indirect effects such as land-use change andN soil emissions can contribute to widen the range of final resultsand their uncertainty. In order to completely understand this widevariation, investigation into numerical input assumptions is alwaysrequired as well as into the calculation methodologies that wereused to generate the results. As already mentioned before, this pa-per focuses on a qualitative interpretation of the results, supportedby selected examples and references. Unit based ranges for bioen-ergy chains are already available in many papers, as will be re-ferred to in the following paragraphs.
3.2.1. Energy balanceMany bioenergy LCA studies include primary energy analysis in
their assessment, in order to quantify the possible non-renewableenergy savings of the bioenergy system. In particular, there areeight reviewed studies that only focus on energy analysis.
Different indicators can be used for this purpose, and the energyanalysis approach usually evaluates all the energy inputs along thefull chain, from agricultural cultivation, transportation, processingand final distribution. The resulting cumulative primary energy de-mand is sometimes used to calculate the EROI (Energy Return onInvestment) index (Hammerschlag, 2006); this index is the ratiobetween energy out (i.e., the energy content of the biofuel) andthe non-renewable energy in required along the full life cycle.The cumulative energy demand can be even divided into fossiland renewable. The energy balances and savings of the most com-mon biofuel systems can be found in (Quirin et al., 2004; Shapouriet al., 2002), while ranges on biomass for heat and power produc-tion are available in (Cherubini et al., 2009).
In general, because of lower conversion efficiencies, bioenergysystems are affected by a larger cumulative primary energydemand than conventional/fossil energy systems, but it is mainlyconstituted by the renewable energy fraction of the feedstock,while the fossil energy consumption is significantly smaller(Cherubini and Jungmeier, 2010; Cherubini and Ulgiati, 2010). Inbioenergy systems, the fossil energy demand is predominantly af-fected by fossil fuel energy inputs during cultivation or processing.Among transportation biofuels, bioethanol from sugar cane is themost efficient option for replacing fossil energy, thanks to boththe high yields and the possibility to use its residues (i.e. bagasse)to run the processing plant. Transportation biofuels produced intemperate regions replace much less fossil energy. Most of the re-viewed studies concluded that bioenergy saves fossil energy, be-sides two exceptions. A study located in the US states thatenergy outputs from ethanol produced using corn, switchgrass,and wood biomass were each less than the respective fossil energyinputs; within the same paper, a similar result was achieved in theproduction of biodiesel from soybeans and sunflower (Pimenteland Patzek, 2005). In this case, our understanding is that the cumu-lative energy demand is not allocated among the co-products. Sim-ilarly, another study focusing on bioethanol production fromcassava in Thailand shows that, when an allocation step is notundertaken and coal is used to feed the conversion plant, the bio-fuel production consumes more fossil energy than it substitutes(Papong and Malakul, 2010).
In general, the fossil energy input is higher for production oftransportation biofuels from oil or starch crops than for biomass-derived electricity/heat generation (usually produced from woodcombustion). The reason is twofold: oil and starch crops need high-er cultivation inputs than woody crops (Kim and Dale, 2008; Zahet al., 2007), and the production of transportation biofuels usuallyinvolves more energy intensive stages (Botha and von Blottnitz,2006; Cherubini et al., 2009).
3.2.2. GHG balanceAbout 90% of the reviewed studies accounted for GHG emis-
sions along the entire bioenergy chain to estimate its GWP. Thereis clear scientific evidence that emissions of greenhouse gasses,such as carbon dioxide (CO2), methane (CH4), and nitrous oxide(N2O), arising from fossil fuel combustion and land-use change asa result of human activities, are perturbing the Earth’s climate.Mitigation of climate change is therefore one of the main drivingforces for development and deployment of bioenergy systems.LCA studies report results with different indices and indicators, of-ten based on different functional units, and use different referencesystems to estimate GHG emission savings. This means that out-comes are often not immediately comparable and of difficult inter-pretation. Moreover, there is a wide variation on the methodologyused to estimate GHG emissions, mainly due to the selection ofsystem boundaries, allocation procedures, inclusion of land-usechange effects and others. As a consequence, this indicator has ahigher degree of divergence across studies than the energy analy-sis; this is why regulatory agencies and organizations recently pro-posed methodological standards for calculating the C footprint ofproducts (EU, 2009; ISO, 2009; PAS2050, 2008). Wide ranges sum-marizing GHG balances from published studies for transportationbiofuels are available in (Hossain and Davies, 2010; Quirin et al.,2004), while for heat and/or power production see (Cherubiniet al., 2009; Varun et al., 2009).
Bioenergy systems generally ensure GHG emission savingswhen compared to conventional fossil reference systems. Forexample, net GHG emissions from generation of a unit of electricityfrom biomass are usually 5–10% of those from fossil fuel-basedelectricity generation (Cherubini et al., 2009; Varun et al., 2009).The ratio will be more favourable (lower), if biomass is produced
F. Cherubini, A.H. Strømman / Bioresource Technology 102 (2011) 437–451 441
with low energy input (or derived from residue streams), con-verted efficiently (ideally in CHP applications) and if the fossil fuelreference use is inefficient and based on a carbon-intensive fuelsuch as coal. However, the inclusion in the GHG balance of indirecteffects is of capital importance, given their potential large influenceon final results (Johnson, 2009; Searchinger et al., 2008). If com-pared with other renewable sources, electricity from biomass gen-erally has higher GHG emissions than hydro, wind and geothermalderived electricity, while it is comparable with photovoltaic powerproduction systems (Cherubini et al., 2009; Varun et al., 2009).
Concerning transportation biofuels, bioethanol from sugar caneis again the most efficient pathway in mitigating climate change.However, no one of the reviewed studies on bioethanol from sugarcane took into account the depletion of carbon pools which occurswhen sugar cane plantation replaces tropical forests. Such a land-use change (i.e. deforestation) is deemed to cause a decrease of upto 31 t C/ha in soil C pools and a decrease of up to 120 t C/ha inabove ground standing biomass pools (IPCC, 2006). If included inthe assessment, these figures may even counterbalance the finalresults. Bioethanol from other sugar and starch crops in temperateclimate and biodiesel from oil crops usually achieve 40–65% of theGHG emissions of conventional fossil fuels (Gartner et al., 2003;Gnansounou et al., 2009; Panichelli et al., 2009). GHG emissionsmay considerably vary even for a defined bioenergy chain. For in-stance, many studies found a reduction in GHG emissions whenbioethanol from corn is used to replace fossil gasoline (Kim andDale, 2008; Varela et al., 2005; Wu et al., 2008), while there is an-other study which reports an opposite trend (Delucchi, 2005).
Transportation biofuels produced from residue streams and sec-ond generation raw materials (e.g., lignocellulosic biomass, algae,jatropha oil, etc.) usually have larger GHG savings than first gener-ation biofuels. For instance, several studies investigated 2nd gener-ation biofuels finding a strong reduction in GHG emissions(Fleming et al., 2006; González-García et al., 2009b; Spatari et al.,2005; Spatari et al., 2010; van Vliet et al., 2009; Williams et al.,2009). There are some exceptions to this. For instance, when theenergy used to feed the biomass conversion process comes fromC-intensive fossil sources (e.g. coal), the bioenergy system can re-lease more GHG emissions than its fossil alternative (Fu et al.,2003; Papong and Malakul, 2010). It should be mentioned thatall the reviewed studies assumed that CO2 emissions from biomasscombustion are climate neutral.
3.2.3. Other environmental impactsThe types of environmental impacts assessed in the reviewed
studies were previously presented. Since these impacts are re-ported with even less uniformity than GHG and energy indicators,and are even more affected by site specific assumptions, it is noteasy to draw simplified figures. In general, bioenergy studies whichexamined life cycle consequences on human and ecosystem toxic-ity as well as on other impact categories concluded that most, butnot all, bioenergy systems lead to increased impacts when com-pared to fossil reference systems (Halleux et al., 2008; Kaltschmittet al., 1997; Zah et al., 2007). This applies particularly to bioenergycrops, where intensive agricultural practices coupled with use offertilizers (especially nitrogen based) can cause environmentalconcerns in soils, water bodies and atmosphere. Usually, increasedemissions occur in impact categories directly affected by N-basedemissions like acidification, eutrophication and photo smog forma-tion, (Carpentieri et al., 2005; González-García et al., 2009a; Kimand Dale, 2008; Luo et al., 2009c). In addition, some papers reportsan increase in toxicological impacts, carcinogenic and heavy metalsemissions, mainly due to biomass combustion (Halleux et al., 2008;Luo et al., 2009c; Uihlein and Schebek, 2009; Uihlein et al., 2008).Similar drawbacks are found in papers assessing upcomingbiorefinery complexes as well: results reveal better environmental
performances than conventional product alternatives for GHGemissions, but generally biorefinery systems have larger eutro-phication and acidification impact potentials, as reported in(Cherubini and Jungmeier, 2010; Cherubini and Ulgiati, 2010), orgreater fossil energy use, carcinogenic emissions and respiratoryeffects, as noted in (Uihlein and Schebek, 2009). Few studies in-cluded in the assessment additional impact categories like wateruse/consumption (Ramjeawon, 2008; Williams et al., 2009) andcontribution of bioenergy to road traffic (Thornley et al., 2009).
3.3. Key methodological issues and assumptions
After reviewing this large number of studies, it was possible toidentify some key open methodological issues and assumptionswith a large influence on final results. These aspects are discussedhereinafter.
3.3.1. Functional unitIn the literature, there is not uniformity concerning the func-
tional unit chosen by the different analysts, and this makes LCA re-sults of difficult comparison. According to the reviewed studies, 4types of functional units can be identified in LCA of bioenergysystems:
1. Input unit related: the functional unit is the unit of input bio-mass, either in mass or energy unit. With this type of functionalunit results are independent from conversion processes andtype of end-products. This unit can be selected by studies whichaim at comparing the best uses for a given biomass feedstock.
2. Output unit related: here the functional unit is the unit of out-put, like unit of heat or power produced or km of transportationservice. This type of functional unit is usually selected by stud-ies aiming at comparing the provision of a given service fromdifferent feedstocks.
3. Unit of agricultural land: this functional unit refers to the hect-are of agricultural land needed to produce the biomass feed-stock. This unit should be the first parameter to take intoaccount when biomass is produced from dedicated energy crops.
4. Year: results of the assessment may be even reported on a yearbasis. This type of functional unit is used in studies character-ized by multiple final products, since it allows avoiding an allo-cation step.
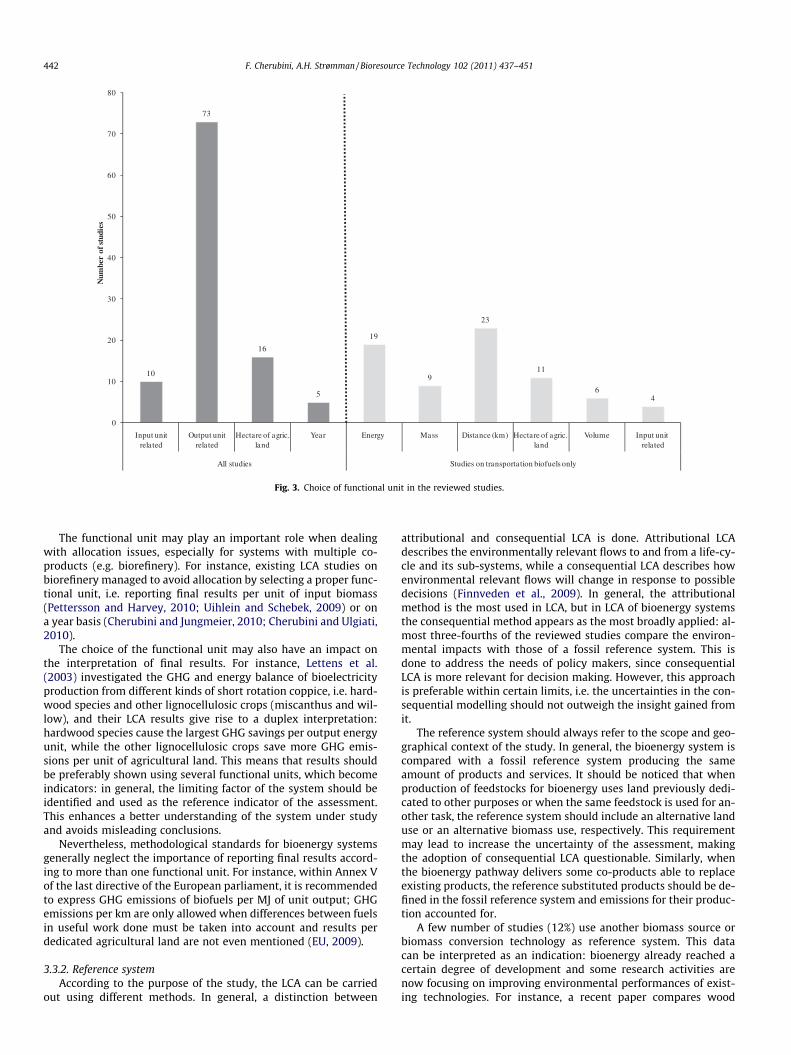
Fig. 3 shows how many times a functional unit was selected bythe reviewed papers. Some papers even report final outcomesaccording to two or more functional units. Output unit relatedfunctional unit is chosen by the majority of the studies, while rel-atively few studies show results per unit of agricultural land, evenif they are based on biomass derived from dedicated crops. This isan extremely important parameter since biomass can competeagainst food, feed or fibre production under land-availability con-straints: the available area for the production of biomass rawmaterials may be sometimes the biggest bottleneck for the produc-tion of bioenergy. Moreover, this indicator could be used to answerthe question of relative land-use efficiency (i.e. the use of scarceland resources as efficiently as possible), as discussed in a follow-ing section.
Concerning studies on transportation biofuels only, Fig. 3 showsthat use of the different units is evenly distributed. This is some-what surprising, since LCA results for transportation biofuelsshould be preferably expressed on a per vehicle-km basis. In fact,the adoption of this functional unit ensures that all the life cyclestages (distribution and biofuel combustion) are included, thatbiofuel mechanical efficiency is considered, and that results arecomparable with conventional fossil systems.
10
73
16
5
19
9
23
11
64
0
10
20
30
40
50
60
70
80
Input unit related
Output unit related
Hectare of agric. land
Year Energy Mass Distance (km) Hectare of agric. land
Volume Input unit related
ylnosleufoibnoitatropsnartnoseidutSseidutsllA
Num
ber
of st
udie
s
Fig. 3. Choice of functional unit in the reviewed studies.
442 F. Cherubini, A.H. Strømman / Bioresource Technology 102 (2011) 437–451
The functional unit may play an important role when dealingwith allocation issues, especially for systems with multiple co-products (e.g. biorefinery). For instance, existing LCA studies onbiorefinery managed to avoid allocation by selecting a proper func-tional unit, i.e. reporting final results per unit of input biomass(Pettersson and Harvey, 2010; Uihlein and Schebek, 2009) or ona year basis (Cherubini and Jungmeier, 2010; Cherubini and Ulgiati,2010).
The choice of the functional unit may also have an impact onthe interpretation of final results. For instance, Lettens et al.(2003) investigated the GHG and energy balance of bioelectricityproduction from different kinds of short rotation coppice, i.e. hard-wood species and other lignocellulosic crops (miscanthus and wil-low), and their LCA results give rise to a duplex interpretation:hardwood species cause the largest GHG savings per output energyunit, while the other lignocellulosic crops save more GHG emis-sions per unit of agricultural land. This means that results shouldbe preferably shown using several functional units, which becomeindicators: in general, the limiting factor of the system should beidentified and used as the reference indicator of the assessment.This enhances a better understanding of the system under studyand avoids misleading conclusions.
Nevertheless, methodological standards for bioenergy systemsgenerally neglect the importance of reporting final results accord-ing to more than one functional unit. For instance, within Annex Vof the last directive of the European parliament, it is recommendedto express GHG emissions of biofuels per MJ of unit output; GHGemissions per km are only allowed when differences between fuelsin useful work done must be taken into account and results perdedicated agricultural land are not even mentioned (EU, 2009).
3.3.2. Reference systemAccording to the purpose of the study, the LCA can be carried
out using different methods. In general, a distinction between
attributional and consequential LCA is done. Attributional LCAdescribes the environmentally relevant flows to and from a life-cy-cle and its sub-systems, while a consequential LCA describes howenvironmental relevant flows will change in response to possibledecisions (Finnveden et al., 2009). In general, the attributionalmethod is the most used in LCA, but in LCA of bioenergy systemsthe consequential method appears as the most broadly applied: al-most three-fourths of the reviewed studies compare the environ-mental impacts with those of a fossil reference system. This isdone to address the needs of policy makers, since consequentialLCA is more relevant for decision making. However, this approachis preferable within certain limits, i.e. the uncertainties in the con-sequential modelling should not outweigh the insight gained fromit.
The reference system should always refer to the scope and geo-graphical context of the study. In general, the bioenergy system iscompared with a fossil reference system producing the sameamount of products and services. It should be noticed that whenproduction of feedstocks for bioenergy uses land previously dedi-cated to other purposes or when the same feedstock is used for an-other task, the reference system should include an alternative landuse or an alternative biomass use, respectively. This requirementmay lead to increase the uncertainty of the assessment, makingthe adoption of consequential LCA questionable. Similarly, whenthe bioenergy pathway delivers some co-products able to replaceexisting products, the reference substituted products should be de-fined in the fossil reference system and emissions for their produc-tion accounted for.
A few number of studies (12%) use another biomass source orbiomass conversion technology as reference system. This datacan be interpreted as an indication: bioenergy already reached acertain degree of development and some research activities arenow focusing on improving environmental performances of exist-ing technologies. For instance, a recent paper compares wood
F. Cherubini, A.H. Strømman / Bioresource Technology 102 (2011) 437–451 443
combustion in new stoves for space heating with old stoves (Solliet al., 2009), while second generation bioethanol production fromlignocellulosic sources are compared with first generation bioeth-anol from corn (Luo et al., 2009b; Williams et al., 2009). Some stud-ies (13%) do not include a reference system in their assessment atall.
The definition of the reference system may also play a key rolein the estimation of the environmental impact savings of the bio-energy chain. According to the assumptions made, results canwidely differ. In fact, fossil-derived electricity can be assumed tobe produced from oil, natural gas, coal or other sources, all ofwhich having different GHG emission factors. An example can befound in a recent paper, where GHG emission savings of bioelec-tricity production from black liquor are estimated using electricitycoming from different fossil sources as reference (Pettersson andHarvey, 2010). Clearly, savings are much larger if coal electricityis displaced rather than natural gas electricity.
The definition of a fossil reference system is particularly used bylegislations and acts, which usually set specific fraction of GHGemission savings which bioenergy systems must achieve (see forinstance the EU directive and the US Energy Independence andSecurity Act).
3.3.3. Change in carbon pools and land-use changesGenerally, organic C is stored in five different pools: above
ground vegetation, below ground vegetation, dead wood, litterand soil. When changing land utilization, these storage pools canchange until a new equilibrium is reached. This is an important as-pect because of the large quantities of these storage pools, espe-cially soil organic carbon (SOC): this stock of carbon is so largethat even relatively small percentage increases or decreases intheir size can have relevance in the GHG balance. Land-use changes(LUC) are therefore deemed especially important, and their effectscan consistently reduce GHG savings of bioenergy systems basedon dedicated crops or agricultural and forest residues, dependingon the nature of the changes and the period of time assumed. A dis-tinction is generally done between direct and indirect LUC.
Direct LUC: Direct LUC occurs when new agricultural land is ta-ken into production and feedstock for biofuel purposes displaces aprior land use (e.g. conversion of forest land to sugarcane planta-tions), thereby generating possible changes to the carbon stock ofthat land. Among the reviewed studies, land-use change effectswere addressed in 22 circumstances (about 23% of the studies).These papers estimate changes in C pools, while three papers in-cluded in the assessment other LUC-induced aspects besides Cpools, such as the variation in N2O soil emissions and other effectslike additional fertilizer manufacture, honey production, etc. (Cher-ubini and Ulgiati, 2010; Gabrielle and Gagnaire, 2008; Gartneret al., 2003).
Depending on the earlier use of the land and the crop to beestablished, the reviewed studies reveal that LUC can be a benefitor a disadvantage:
� When a forest is converted to agricultural land for biofuel pro-duction a loss of carbon stocks, in addition to a decrease in bio-diversity, is expected; this loss of C affects the whole GHGbalance and may even make the bioenergy system worse thanits respective fossil reference. Some examples are (Panichelliet al., 2009; Reijnders and Huijbregts, 2008b).� When set-aside land is taken into production, or perennial her-
baceous crops replace annual row crops, the carbon stock mayincrease; this means that atmospheric CO2 is sequestered fromthe atmosphere and stored into soil organic carbon, with apositive effect on the GHG balance of the bioenergy system(Cherubini and Jungmeier, 2010; Spatari et al., 2010; Stylesand Jones, 2007; Wang et al., 1999; Wu et al., 2008).
The changes of carbon in soil and other pools are very site-specificand highly dependent on former and current agronomic practices,climate, and soil characteristics. The approach generally used inthe literature to estimate LUC effects is to quantify the increase or de-crease of a carbon pool (both above and below ground) for a certainperiod of time, and then include this C loss as CO2 emissions in accor-dance to the selected functional unit. This means that LUC effects areamortized over an assumed time horizon, spreading out an emissionthat mainly occurs in a short period of time over a longer time frame.This approach underestimates the true climate change effects ofLUC, since the effect of a GHG increases with the time it remains inthe atmosphere. Efforts to overcome this inconsistency can be recog-nized both in the recent literature (Kendall et al., 2009; O’Hare et al.,2009) and methodological standards (ISO, 2009). Changes in carbonpools are usually estimated by means of literature references or soft-ware tools able to model soil carbon dynamics. In addition, IPCC pro-vides default values by which it is possible to estimate the annualeffect of direct LUC (IPCC, 2006). The use of IPCC default values is rec-ommended by most of the methodological standards, which suggestthe use of annualized emissions over an arbitrary time frame, usually20 years (EU, 2009; PAS2050, 2008). In particular, PAS2050 providestables for conversion of forest land and grassland to agriculturalland, disregarding SOC changes for agricultural soils, while the ISOGHG protocol stresses the importance of defining proper timeboundaries for the assessment, in order to include future emissions(ISO, 2009). The EU directive has a specific land use section, whichprovides guidelines to estimate GHG emissions induced by LUC,which are straight-line amortized over 20 years (EU, 2009).
Indirect LUC: Indirect LUC (or leakage) occurs when land cur-rently used for feed or food crops is changed into bioenergy feed-stock production and the demand for the previous land use (i.e.feed, food) remains, the displaced agricultural production willmove to other places (for instance, expansion of agricultural landafter deforestation) (Gnansonou et al., 2008). When bioenergycrops are cultivated on fallow, marginal or degraded land wherepreviously no conventional crops were grown, and proper manage-ment strategies are implemented, no indirect LUC occurs and theGHG balance can even turn favourably, as in the case of perennialgrasses discussed above. Even if none of the reviewed studies ad-dressed this issue and no methodological standards exist, GHGemissions from indirect LUC are deemed to be even more impor-tant than emissions from direct LUC. Some authors elaborated arange of values to show the magnitude of this effect (Fargioneet al., 2008; Fritsche, 2008; Searchinger et al., 2008). However,these models likely estimate GHG emissions from LUC with signif-icant inaccuracy, and further research is needed before we can bereasonably sure of the indirect effects of biofuels (Liska and Perrin,2009).
3.3.4. Non-CO2 emissions from soilsThe contribution to net GHG emissions of N2O, which evolves
from nitrogen fertiliser application and organic matter decomposi-tion in soil, emerges as an important variable in LCA studies. Emis-sions from fields vary depending on soil type, climate, crop, tillagemethod, and fertiliser and manure application rates. The uncertain-ties in actual emissions are magnified by the high global warmingpotential of N2O, 298 times greater than CO2. The impacts of N2Oemissions are especially significant for annual biofuel crops, sincefertilisation rates are larger for these than for perennial energy crops.Crops grown in high rainfall environments or under flood irrigationhave the highest N2O emissions, as denitrification, the major processleading to N2O production, is favoured under moist soil conditionswhere oxygen availability is low (Wrage et al., 2005). Almost thetotality of the reviewed studies based on agricultural crops includedestimations of N2O soil emissions in their assessments, and most of
444 F. Cherubini, A.H. Strømman / Bioresource Technology 102 (2011) 437–451
them show their relevant contributions to the final GHG balance(CONCAWE, 2006; Kim and Dale, 2008; Lettens et al., 2003; Panich-elli et al., 2009; Reijnders and Huijbregts, 2008b). These emissionsare generally quantified as a fraction of fertilizer nitrogen contentand are based on literature references such as IPCC default factors(IPCC, 2006). Utilization of these factors is also recommended byPAS2050, while the other methodological standards, including theEU directive, do not explicitly mention N-based soil emissions. IPCCdata estimate that about 1.0–1.5% of N in synthetic fertilizer is emit-ted as N in N2O in temperate regions. A recent paper, which used adifferent procedure for estimating this emission, proposes a valueof 3–5% (Crutzen et al., 2007). If this ‘‘extra” N2O emission is includedin GHG balances of biomass systems, Crutzen et al. (2007) state thatthe global warming benefits of most first generation biofuels arecompletely annulled. As a consequence, this study is frequently citedas evidence against the use of biofuels as an effective means for mit-igating climate change; by contrast, other studies claim that Crutzenet al. (2007) apply an uncertain approach, questionable assumptionsand inappropriate, selective comparisons to reach their conclusions(North-Energy, 2008; RFA, 2008). Application of fertilizers also af-fects other environmental impacts besides GHG emissions, like acid-ification and eutrophication. In fact, N-based fertilizers enhancevolatilization of ammonia from soils and leaching of nitrates togroundwater. These indirect emissions are responsible for the higherimpacts which bioenergy systems usually have in these categorieswhen they are compared to fossil reference systems (Cherubiniand Jungmeier, 2010; Gasol et al., 2009; Kim and Dale, 2008).
Concerning CH4 emissions, cultivation of agricultural and en-ergy crops can reduce the oxidation of methane in aerobic soils,and thereby increase the concentration of methane in the atmo-sphere. However, this effect usually has a small contribution to lifecycle GHG emissions of the bioenergy chain (Delucchi, 2003).
3.3.5. Effects of agricultural residue removalThere is an ongoing debate on the actual possibilities of crop res-
idue removal from agricultural cropping systems for bioenergy pro-duction (Lal, 2005; Wilhelm et al., 2004). In order to estimatepossible effects, a reference use for agricultural residues must befirstly defined: crop residues can be mainly used as fodder for ani-mals or ploughed back to the field to maintain soil quality. In thiscase, current experimental evidences on the effect of residue re-moval on processes like soil organic turnover, soil erosion or cropyields are not consistent because of the strong influence of local con-ditions (climate, soil type and crop management). In addition, the re-moval of crop residues for bioenergy production may influencemany environmental aspects like N2O soil emissions, leaching of ni-trate and changes in soil carbon pools. There are few references onthese effects in the scientific literature, and the patterns are not con-sistent across references. The use of agricultural residues for bioen-ergy purposes was investigated by 18 of the reviewed studies, butmost of them ignored environmental impact consequences of resi-due removal, except three studies: one of them assumes that 50%of the residues are left on the field to maintain SOC levels (Spatariet al., 2010), while the others extend the investigation to other as-pects, like effects on grain yields, SOC, and N cycle (Cherubini andUlgiati, 2010; Gabrielle and Gagnaire, 2008).
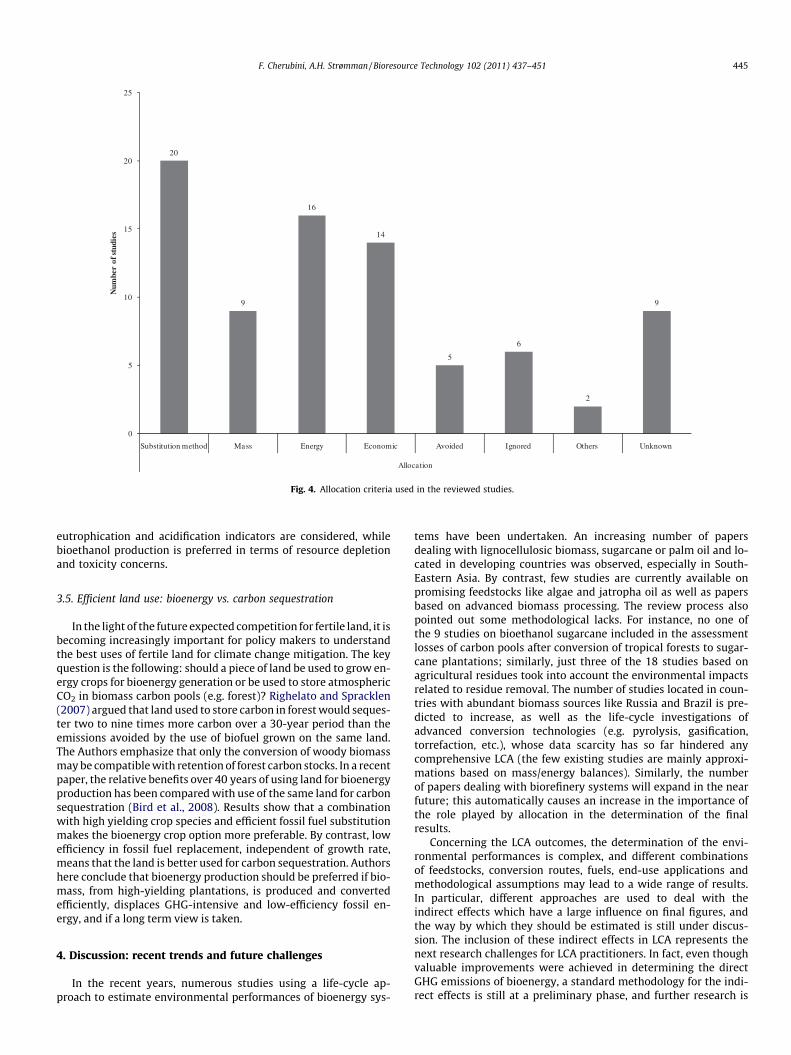
3.3.6. AllocationAllocation in LCA is carried out to attribute shares of the total
environmental impact to the different products of a system. Thisconcept is extremely important for bioenergy systems, which areusually characterized by multiple products (e.g. electricity andheat from CHP application, rape-cake and glycerine from biodieselproduction), and has a large influence on final results. A detaileddiscussion of the possible allocation methods, with their advanta-ges and disadvantages, is out of the scope of this paper and can be
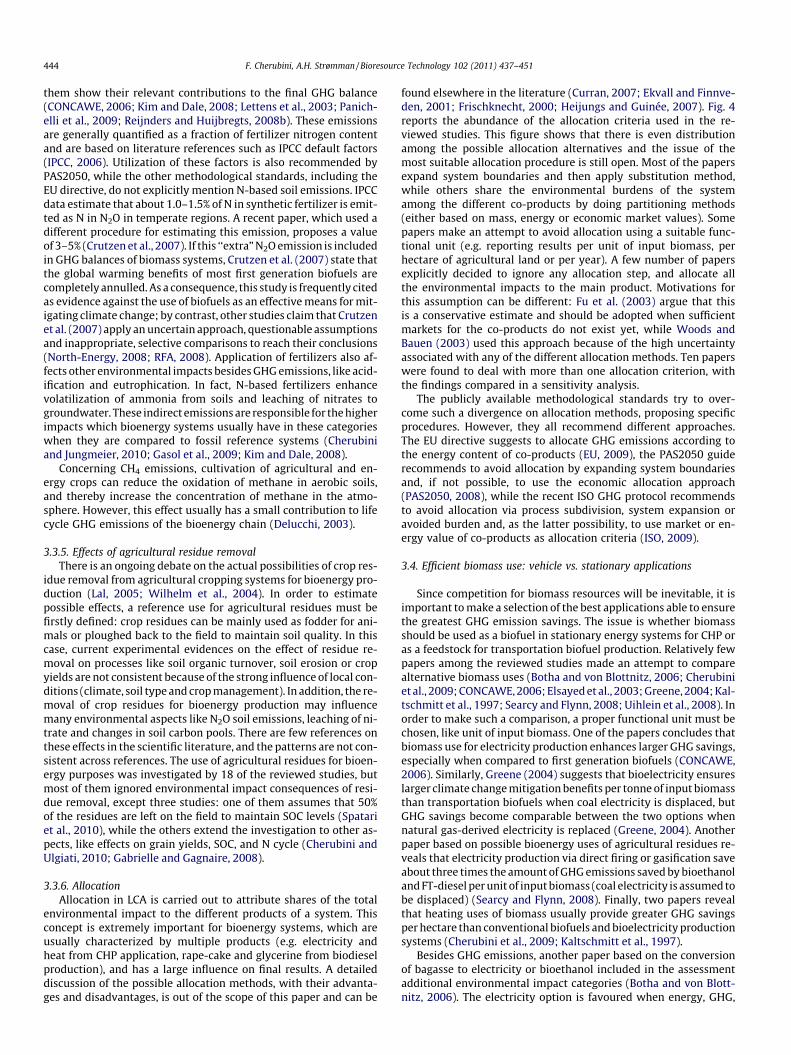
found elsewhere in the literature (Curran, 2007; Ekvall and Finnve-den, 2001; Frischknecht, 2000; Heijungs and Guinée, 2007). Fig. 4reports the abundance of the allocation criteria used in the re-viewed studies. This figure shows that there is even distributionamong the possible allocation alternatives and the issue of themost suitable allocation procedure is still open. Most of the papersexpand system boundaries and then apply substitution method,while others share the environmental burdens of the systemamong the different co-products by doing partitioning methods(either based on mass, energy or economic market values). Somepapers make an attempt to avoid allocation using a suitable func-tional unit (e.g. reporting results per unit of input biomass, perhectare of agricultural land or per year). A few number of papersexplicitly decided to ignore any allocation step, and allocate allthe environmental impacts to the main product. Motivations forthis assumption can be different: Fu et al. (2003) argue that thisis a conservative estimate and should be adopted when sufficientmarkets for the co-products do not exist yet, while Woods andBauen (2003) used this approach because of the high uncertaintyassociated with any of the different allocation methods. Ten paperswere found to deal with more than one allocation criterion, withthe findings compared in a sensitivity analysis.
The publicly available methodological standards try to over-come such a divergence on allocation methods, proposing specificprocedures. However, they all recommend different approaches.The EU directive suggests to allocate GHG emissions according tothe energy content of co-products (EU, 2009), the PAS2050 guiderecommends to avoid allocation by expanding system boundariesand, if not possible, to use the economic allocation approach(PAS2050, 2008), while the recent ISO GHG protocol recommendsto avoid allocation via process subdivision, system expansion oravoided burden and, as the latter possibility, to use market or en-ergy value of co-products as allocation criteria (ISO, 2009).
3.4. Efficient biomass use: vehicle vs. stationary applications
Since competition for biomass resources will be inevitable, it isimportant to make a selection of the best applications able to ensurethe greatest GHG emission savings. The issue is whether biomassshould be used as a biofuel in stationary energy systems for CHP oras a feedstock for transportation biofuel production. Relatively fewpapers among the reviewed studies made an attempt to comparealternative biomass uses (Botha and von Blottnitz, 2006; Cherubiniet al., 2009; CONCAWE, 2006; Elsayed et al., 2003; Greene, 2004; Kal-tschmitt et al., 1997; Searcy and Flynn, 2008; Uihlein et al., 2008). Inorder to make such a comparison, a proper functional unit must bechosen, like unit of input biomass. One of the papers concludes thatbiomass use for electricity production enhances larger GHG savings,especially when compared to first generation biofuels (CONCAWE,2006). Similarly, Greene (2004) suggests that bioelectricity ensureslarger climate change mitigation benefits per tonne of input biomassthan transportation biofuels when coal electricity is displaced, butGHG savings become comparable between the two options whennatural gas-derived electricity is replaced (Greene, 2004). Anotherpaper based on possible bioenergy uses of agricultural residues re-veals that electricity production via direct firing or gasification saveabout three times the amount of GHG emissions saved by bioethanoland FT-diesel per unit of input biomass (coal electricity is assumed tobe displaced) (Searcy and Flynn, 2008). Finally, two papers revealthat heating uses of biomass usually provide greater GHG savingsper hectare than conventional biofuels and bioelectricity productionsystems (Cherubini et al., 2009; Kaltschmitt et al., 1997).
Besides GHG emissions, another paper based on the conversionof bagasse to electricity or bioethanol included in the assessmentadditional environmental impact categories (Botha and von Blott-nitz, 2006). The electricity option is favoured when energy, GHG,
20
9
16
14
5
6
2
9
0
5
10
15
20
25
Substitution method Mass Energy Economic Avoided Ignored Others Unknown
Allocation
Num
ber
of st
udie
s
Fig. 4. Allocation criteria used in the reviewed studies.
F. Cherubini, A.H. Strømman / Bioresource Technology 102 (2011) 437–451 445
eutrophication and acidification indicators are considered, whilebioethanol production is preferred in terms of resource depletionand toxicity concerns.
3.5. Efficient land use: bioenergy vs. carbon sequestration
In the light of the future expected competition for fertile land, it isbecoming increasingly important for policy makers to understandthe best uses of fertile land for climate change mitigation. The keyquestion is the following: should a piece of land be used to grow en-ergy crops for bioenergy generation or be used to store atmosphericCO2 in biomass carbon pools (e.g. forest)? Righelato and Spracklen(2007) argued that land used to store carbon in forest would seques-ter two to nine times more carbon over a 30-year period than theemissions avoided by the use of biofuel grown on the same land.The Authors emphasize that only the conversion of woody biomassmay be compatible with retention of forest carbon stocks. In a recentpaper, the relative benefits over 40 years of using land for bioenergyproduction has been compared with use of the same land for carbonsequestration (Bird et al., 2008). Results show that a combinationwith high yielding crop species and efficient fossil fuel substitutionmakes the bioenergy crop option more preferable. By contrast, lowefficiency in fossil fuel replacement, independent of growth rate,means that the land is better used for carbon sequestration. Authorshere conclude that bioenergy production should be preferred if bio-mass, from high-yielding plantations, is produced and convertedefficiently, displaces GHG-intensive and low-efficiency fossil en-ergy, and if a long term view is taken.
4. Discussion: recent trends and future challenges
In the recent years, numerous studies using a life-cycle ap-proach to estimate environmental performances of bioenergy sys-
tems have been undertaken. An increasing number of papersdealing with lignocellulosic biomass, sugarcane or palm oil and lo-cated in developing countries was observed, especially in South-Eastern Asia. By contrast, few studies are currently available onpromising feedstocks like algae and jatropha oil as well as papersbased on advanced biomass processing. The review process alsopointed out some methodological lacks. For instance, no one ofthe 9 studies on bioethanol sugarcane included in the assessmentlosses of carbon pools after conversion of tropical forests to sugar-cane plantations; similarly, just three of the 18 studies based onagricultural residues took into account the environmental impactsrelated to residue removal. The number of studies located in coun-tries with abundant biomass sources like Russia and Brazil is pre-dicted to increase, as well as the life-cycle investigations ofadvanced conversion technologies (e.g. pyrolysis, gasification,torrefaction, etc.), whose data scarcity has so far hindered anycomprehensive LCA (the few existing studies are mainly approxi-mations based on mass/energy balances). Similarly, the numberof papers dealing with biorefinery systems will expand in the nearfuture; this automatically causes an increase in the importance ofthe role played by allocation in the determination of the finalresults.
Concerning the LCA outcomes, the determination of the envi-ronmental performances is complex, and different combinationsof feedstocks, conversion routes, fuels, end-use applications andmethodological assumptions may lead to a wide range of results.In particular, different approaches are used to deal with theindirect effects which have a large influence on final figures, andthe way by which they should be estimated is still under discus-sion. The inclusion of these indirect effects in LCA represents thenext research challenges for LCA practitioners. In fact, even thoughvaluable improvements were achieved in determining the directGHG emissions of bioenergy, a standard methodology for the indi-rect effects is still at a preliminary phase, and further research is
Table A1Explanations of the acronyms and abbreviations used in Tables A2 and A3.
Acronym orAbbreviation
Explanation
Scope of the studyGW Global warming potentialEn Energy analysisOG Other gases besides GHGs (e.g., PM10, SOx, NOx,
NH3, etc.)U/L Emissions or impacts at local or urban scaleAD Abiotic depletion potentialAP Acidification potentialEP Eutrophication potentialOD Ozone layer depletion potentialPS Photochemical smog formation potentialLU Land useTP Toxicity potential (including heavy metals,
carcinogenics, and others)Type of productsFT Fischer–Tropsch fuelsSVO Straight Vegetable OilSynthetic biofuel This group includes methanol, DME, ETBE, H2, SNG
and othersCHP Combined Heat and PowerFunctional unitHA Hectare of agricultural landOU Output unitIU Input unitYR Yearkm Distance (km or mi)Reference systemFF Fossil fuel(s)BD BiodieselBE BioethanolBG Bioenergy (generic, CHP)RE Renewable energy (except biomass)Land-use changeLUC Land-use change (including changes in C pools and
other effects)AllocationMA MassEN EnergyEC EconomicSM Substitution method (or system expansion)AV AvoidedIG IgnoredType of feedstocksStarch crops Conventional starch crops (corn, wheat, barley, etc.)Sugar crops, oil crops Conventional crops (where not specified) like sugar
beet, rapeseed, soya, etc.
446 F. Cherubini, A.H. Strømman / Bioresource Technology 102 (2011) 437–451
needed. It is therefore predictable that future LCA studies will focuson reducing the uncertainties of these current key open issues, e.g.:inclusion in the assessment of indirect LUC effects and their amor-tization over time, estimation of bioenergy impacts on biodiversity,better determination of fertilizer induced N emissions, and others.However, standardization in GHG balance accounting (either calledcarbon footprint) of products is particularly perceived as urgent bypolicy makers, and the methodological standards provided by con-sultants and stakeholders try to address this need. A variety of pol-icy objectives have motivated governments around the world topromote bioenergy and biofuels, on condition that a certainamount of GHG emission savings is achieved. This means that leg-islation requires a standardized GHG accounting procedure,encompassing the inclusion of indirect emissions in the life cycleof bioenergy, even if this topic is still in its scientific infancy. In or-der to cover this gap, several methodological standards have beenproposed, as previously mentioned. In most of the cases, theseguidelines tend to simplify or overlook concepts and issues of par-amount importance, like indirect LUC effects and carbon storage inproducts. In addition, methodological standards usually limit theassessment to a very limited number of indices and indicators.On one hand, these simplifications can make the overall assess-ment and interpretation of final results easier, but on the otherhand approximation and fixed approaches may have the drawbackof misleading and inaccurate conclusions. Therefore, the formula-tion of regulatory standards in the presence of scientificuncertainty may lead to inefficient or counterproductive method-ologies. Finding a compromise is challenging, because a certain de-gree of simplicity and standardization in sustainability assessmentof bioenergy systems is highly desirable nowadays, especially at agovernmental and political level, where the best strategies for cli-mate change mitigation should be put into practice as soon as pos-sible. An example of this quandary can be found in the currentsituation for the Clean Development Mechanism (CDM), a tradingframework established by the Kyoto Protocol that allows emis-sion-reducing projects in developing countries to earn and sell car-bon credits. Despite the high growth in transportation biofuelinvestment and research in recent years, not a single project ontransportation biofuels has been successfully registered underthe CDM (Bird et al., 2008). One of the most important reasonsfor such an astonishing result is the lack of standard methodologiesfor assessing GHG balance from agricultural and forest land. In fact,while the CDM focuses on the effects of individual projects, theland use issues discussed in this paper can hardly be attributedto a single activity but tend to be the results of macroeconomicdevelopments. Standardization in the inclusion of indirect effectsin LCA may also give the possibility to establish LUC policies aim-ing at mitigating climate change. In fact, while deforestation anddecrease of SOC are threatens for climate change, suitable landuse policies may even lead to the opposite effect, given the largepotential of GHG mitigation provided by CO2 sequestration in ter-restrial and vegetation carbon pools (UN-REDD, 2008; UNFCCC,2005).
SC Sugar canePO Palm oilJO Jatropha oilAL AlgaeSRC Short rotation coppice (willow, poplar, etc.)WR Wood residuesFW Forest woodLC Lignocellulosic crops (switchgrass, miscanthus, etc.)AR Agricultural residues (corn stover, wheat and rice
straw, etc.)BL Black liquorMSW Municipal solid wasteUCO Used cooking oilMN ManureBG Bagasse
5. Conclusions
This work points out and discuss the key issues and methodo-logical assumptions responsible for wide ranges and uncertaintiesin bioenergy LCA. These aspects do not make possible to provideonce for ever an exact quantification of the environmental impactsof bioenergy, because too many variables are involved. Some of thekey parameters (such as indirect effects) are not well known andstrongly depend on local and climate conditions. Although policymakers are claiming for methodological standards, scientific re-search for estimating indirect effects is still at a preliminary stage.
A right balance between simplicity and accuracy should thereforebe purpursued.
Acknowledgements
The authors would like to thank the Norwegian research councilfor funding this work through the Bio-energy Innovation Centre(CenBio).
Tabl
eA
2O
verv
iew
ofth
ere
view
edst
udie
s(I
).
Pape
rSc
ope
ofth
est
udy
Type
ofpr
odu
cts
Met
hod
olog
yTy
peof
feed
stoc
ks
Tran
spor
tati
onbi
ofu
els
Hea
t&
/or
pow
er
Loca
tion
GW
EnO
GU
/LA
DA
PEP
OD
PSLU
TPB
ioet
han
olB
io-
dies
elFT
SVO
Syn
thet
icbi
ofu
els
Bio
gas
Hea
tPo
wer
CH
PFu
nct
ion
alu
nit
Ref
er.
syte
mLU
CA
lloc
atio
nSt
arch
crop
sSu
gar
crop
sO
ilcr
ops
Lign
ocel
lulo
sic
biom
ass
Was
te/
oth
er
Kal
tsch
mit
tet
al.(
1997
))G
erm
any
xx
xx
xx
xx
HA
,OU
FFSM
xx
xx
Car
pen
tier
iet
al.(
2005
)U
nsp
ecifi
edx
xx
xx
xx
xO
UFF
SRC
Hel
ler
etal
.(20
04)
USA
xx
xx
OU
FFx
WR
,SR
CPi
men
tel
and
Patz
ek(2
005)
USA
xx
xH
AIG
xx
FW,L
CLu
oet
al.(
2009
b)U
nsp
ecifi
edx
HA
BE
IGA
RM
alça
and
Frei
re(2
006)
Fran
cex
xx
OU
FF5
met
hod
sx
xY
áñez
An
gari
taet
al.(
2009
)B
razi
l,C
olom
bia
xx
OU
ENPO
Kh
atiw
ada
and
Silv
eira
(200
9)N
epal
xx
HA
,OU
EN,E
CSC
Smyt
het
al.(
2009
)Ir
elan
dx
xH
ALC
Plea
nja
ian
dG
hee
wal
a(2
009)
Thai
lan
dx
xH
AB
DPO
Pett
erss
onan
dH
arve
y(2
010)
Scan
din
avia
xx
xx
IUFF
BL
Stic
hn
oth
ean
dA
zapa
gic,
(200
9)U
Kx
xO
UFF
MSW
Rei
jnde
rsan
dH
uij
breg
ts(2
008a
)So
uth
Asi
ax
xIU
FFx
POPl
ean
jai
etal
.(20
09)
Thai
lan
dx
xkm
FFM
AU
CO
Rei
jnde
rsan
dH
uij
breg
ts(2
008b
)EU
,Bra
zil
xx
HA
,OU
FFx
ECx
Hig
oan
dD
owak
i,20
10)
Japa
n,P
apu
aN
.G.
xx
OU
WR
,SR
CFl
emin
get
al.(
2006
)G
loba
lx
xx
xkm
FFW
R,S
RC
,LC
Bör
jess
onan
dM
atti
asso
n(2
008)
Swed
enx
xx
HA
,OU
FFEN
xM
NN
don
get
al.(
2009
)Iv
ory
Cos
tx
xx
OU
FFx
ENJO
Lam
etal
.(20
09)
Mal
aysi
ax
xx
xO
UIG
JO,P
OK
aln
eset
al.(
2009
)U
SAx
xx
xx
OU
MA
,SM
xC
hes
ter
and
Mar
tin
(200
9)U
SAx
xO
UFF
MSW
van
Vli
etet
al.(
2009
)G
loba
lx
xx
kmFF
n.a
.SR
CY
eeet
al.(
2009
)M
alay
sia
xx
xO
UFF
,BD
xEN
POH
uo
etal
.(20
08)
USA
xx
xx
OU
FF5
met
hod
sx
Ch
eru
bin
iet
al.(
2009
)G
loba
lx
xx
xx
xx
xx
HA
,km
FFx
SMx
x,SC
xLC
,SR
CM
NK
adam
,200
2a)
Indi
ax
xx
xx
xx
xIU
FF,B
Gn
.a.
BG
Lard
onet
al.(
2009
)EU
xx
xx
xx
xx
xx
OU
FF,B
DEN
AL
Spat
ari
etal
.(20
05)
Can
ada
xx
xx
kmFF
n.a
.A
R,L
CW
illia
ms
etal
.(20
09)
USA
xx
xx
xO
UB
EFW
,AR
,LC
Lute
rbac
her
etal
.(20
09)
Swit
zerl
and
xx
xx
OU
SMW
RM
NLu
oet
al.(
2009
a)B
razi
lx
xx
xx
xx
xx
kmFF
ECSC
Papo
ng
and
Mal
aku
l(2
010)
Thai
lan
dx
xx
xx
xx
xx
xO
UIG
,EN
LCB
ern
esso
net
al.(
2006
)Sw
eden
xx
xx
xx
xO
USM
,EC
,EN
xTa
len
sPe
iró
etal
.(20
10)
Spai
nx
xx
xx
xx
xO
Un
.a.
UC
OG
onzá
lez-
Gar
cía
etal
.(20
09)
Spai
nx
xx
xx
xx
xx
kmFF
MA
,EC
LCB
oth
aan
dvo
nB
lott
nit
z(2
006)
Sou
thA
fric
ax
xx
xx
xx
IUSu
gar
BG
Gon
zále
z-G
arcí
aet
al.(
2009
b)Sp
ain
xx
xx
xx
kmFF
AV
LCK
iman
dD
ale
(200
8)U
SAx
xx
xx
xx
OU
FFx
SMx
Spat
ari
etal
.(20
10)
USA
xx
xx
OU
FFx
SMA
R,L
CX
iao
etal
.(20
09)
Ch
ina
xx
xx
xx
xx
OU
FWFu
etal
.(20
03)
Can
ada
xx
xx
xx
xx
kmFF
IGLC
Hal
leu
xet
al.(
2008
)B
elgi
um
xx
xx
xx
xkm
FFSM
xx
Luo
etal
.(20
09c)
USA
xx
xx
xx
xx
kmFF
x4
met
hod
sA
RSe
arcy
and
Flyn
n(2
008)
Can
ada
xx
xx
OU
FFSM
AR
Pan
ich
elli
etal
.(20
09)
Arg
enti
na
xx
xx
xx
xkm
FF,B
Dx
ECx
Har
din
get
al.(
2008
)So
uth
Afr
ica
xx
xx
xx
xx
OU
BD
MA
xH
uet
al.(
2008
)C
hin
ax
xx
xO
UFF
MA
x
F. Cherubini, A.H. Strømman / Bioresource Technology 102 (2011) 437–451 447
Tabl
eA
3O
verv
iew
ofth
ere
view
edst
udie
s(I
I).
Pape
rSc
ope
ofth
est
udy
Type
ofpr
odu
cts
Met
hod
olog
yTy
peof
feed
stoc
k
Tran
spor
tati
onbi
ofu
els
Hea
t&
/or
pow
er
Loca
tion
GW
EnO
GU
/L
AD
AP
EPO
DPS
LUTP
Bio
eth
anol
Bio
-di
esel
FTSV
OSy
nth
etic
biof
uel
sB
ioga
sH
eat
Pow
erC
HP
Fun
ctio
nal
un
itR
efer
.sy
tem
LUC
All
ocat
ion
Star
chcr
ops
Suga
rcr
ops
Oil
crop
sLi
gnoc
ellu
losi
cbi
omas
sW
aste
/ot
her
Hos
sain
and
Dav
ies
(201
0)U
SAx
xx
xx
OU
FF,B
Dx
Ch
eru
bin
ian
dU
lgia
ti(2
010)
Au
stri
ax
xx
xx
xx
xx
xY
RFF
xA
VA
RC
her
ubi
ni
and
Jun
gmei
er(2
010)
Au
stri
ax
xx
xx
xx
xx
xY
RFF
AV
LCU
ihle
inan
dSc
heb
ek(2
009)
Ger
man
yx
xx
xx
xx
xx
IUFF
AV
AR
Cor
tian
dLo
mba
rdi
(200
4)It
aly
xx
OU
FFSR
CV
aru
net
al.(
2009
)G
loba
lx
xO
UFF
,RE
AR
,SR
CM
NPe
ters
enR
aym
er(2
006)
Nor
way
xx
IUFF
WR
,FR
Jun
gmei
eran
dSp
itze
r(2
001)
Au
stri
ax
xx
OU
FFA
Vx
xA
R,L
C,S
RC
Ish
ikaw
aet
al.(
2006
)Ja
pan
xx
xY
RM
NEr
ikss
onet
al.(
2007
)Sw
eden
xx
xx
OU
FF,R
ESM
FWG
ogli
oan
dO
wen
de(2
009)
Irel
and
xx
xH
AB
GEN
SRC
Lett
ens
etal
.(20
03)
Bel
giu
mx
xx
OU
,HA
FFx
LC,S
RC
Styl
esan
dJo
nes
(200
7)Ir
elan
dx
xO
U,H
AFF
xLC
,SR
CU
ihle
inet
al.(
2008
)G
erm
any
xx
xx
xx
xx
xO
UFF
SMLC
Feld
eran
dD
ones
(200
7)Sw
itze
rlan
dx
xx
xx
xx
xx
OU
,km
FFFW
Man
nan
dSp
ath
(199
7)U
SAx
xx
xO
Ux
SRC
Thor
nle
yet
al.(
2009
)U
Kx
xx
xx
OU
,HA
AR
,LC
,SR
CG
asol
etal
.(20
09)
Spai
nx
xx
xx
xx
xx
IUFF
,BG
SRC
Har
tman
nan
dK
alts
chm
itt
(199
9)G
erm
any
xx
xx
xO
UFF
FW,A
R
Kad
am(2
002b
)U
SAx
xx
xx
OU
FFA
LR
amje
awon
(200
8)M
auri
tiu
sx
xx
xx
xx
xx
OU
FFEC
BG
Raf
asch
ieri
etal
.(19
99)
Ital
yx
xx
xx
xx
xO
UFF
SRC
Ch
eval
ier
and
Meu
nie
r(2
005)
3co
un
trie
sx
xx
xx
YR
FFA
RSo
lli
etal
.(20
09)
Nor
way
xx
xx
xx
xx
OU
BG
FWvo
nB
lott
nit
zan
dC
urr
an(2
007)
Glo
bal
xx
xx
xx
xx
xH
A,k
mFF
xx,
SCx
LC,S
RC
Gab
riel
lean
dG
agn
aire
(200
8)Fr
ance
xx
xx
xx
OU
xM
AA
RG
rey
liter
atur
eEl
saye
det
al.(
2003
)U
Kx
xx
xx
xx
xO
UFF
SM,E
Cx
xx
FW,A
R,L
CM
NC
ON
CA
WE
(200
6)EU
xx
xx
xx
xO
U,k
mFF
xSM
xx,
SCx
WR
,AR
,SR
CM
NG
Met
al.(
2002
)EU
xx
xx
xx
kmFF
n.a
.x
WR
Qu
irin
etal
.(20
04)
Glo
bal
xx
xx
xx
xH
A,k
mFF
SMx
x,SC
xW
R,F
W,L
CB
rin
kman
etal
.(20
05)
USA
xx
xx
xkm
FFn
.a.
xLC
den
Uil
etal
.(20
03)
Net
her
lan
dx
xx
xx
xx
%FF
n.a
.W
R,F
W,S
RC
Var
ela
etal
.(20
05)
EUx
xx
xx
xx
kmFF
SMx
xx
WR
,LC
UC
O,
MN
Wu
etal
.(20
08)
USA
xx
xx
xkm
FFx
ENx
LCG
reen
e(2
004)
USA
xx
xx
xIU
FFEN
LCIE
A(2
005)
Glo
bal
xx
x%
FFn
.a.
xx,
SCx
LCW
ang
etal
.(19
99)
USA
xx
xkm
FFx
ENx
LC,S
RC
Woo
dsan
dB
auen
(200
3)U
Kx
xx
xx
xO
UFF
IGx
xA
R,S
RC
Del
ucc
hi
(200
5)4
cou
ntr
ies
xx
xx
xx
kmFF
xSM
xLC
,SR
CM
orti
mer
etal
.(20
03)
UK
xx
xO
UFF
ECx
Gar
tner
etal
.(20
03)
Ger
man
yx
xx
xx
xx
OU
FFx
Zah
etal
.(20
07)
Swit
zerl
and
xx
xx
xx
xx
xx
xkm
FFx
ECx
x,SC
x,PO
SRC
,LC
UC
O,
MN
Shap
ouri
etal
.(20
02)
USA
xx
OU
4 met
hod
sx
Mac
edo
etal
.(20
04)
Bra
zil
xx
IUFF
n.a
.SC
Cow
ie(2
005)
Au
stra
lia
xx
HA
,IU
,OU
FFx
FW,S
RC
Rob
erts
on(2
004)
New
Zeal
and
xx
YR
FFW
R
448 F. Cherubini, A.H. Strømman / Bioresource Technology 102 (2011) 437–451
F. Cherubini, A.H. Strømman / Bioresource Technology 102 (2011) 437–451 449
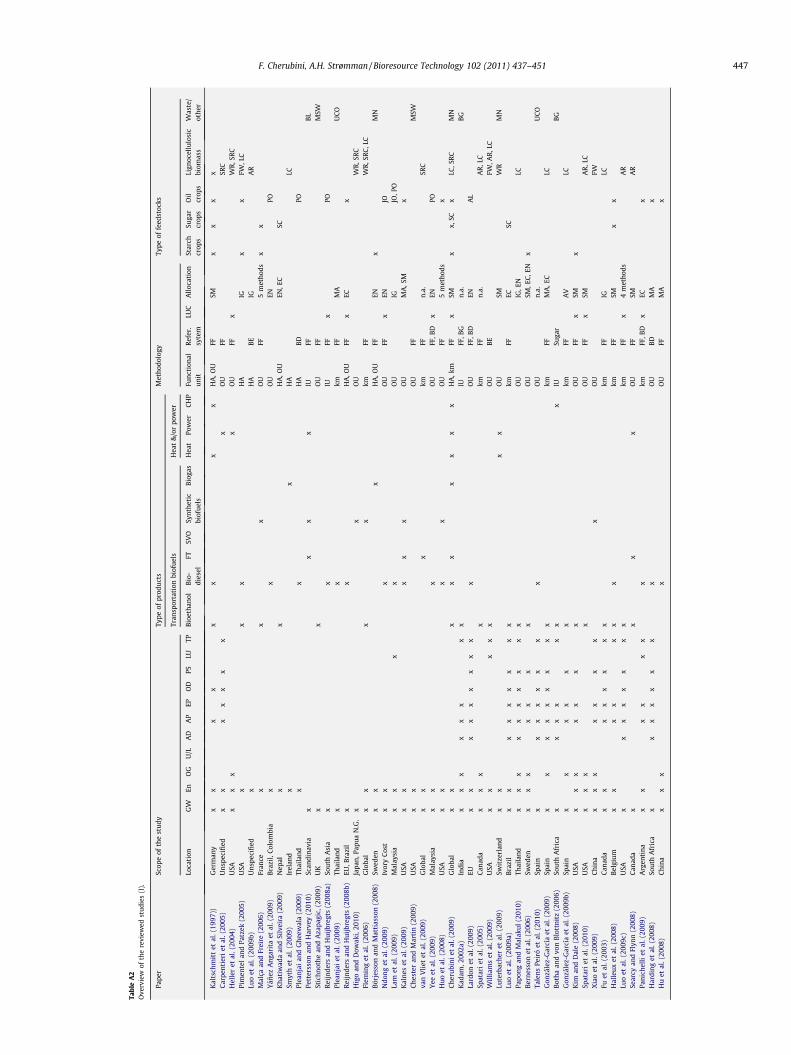
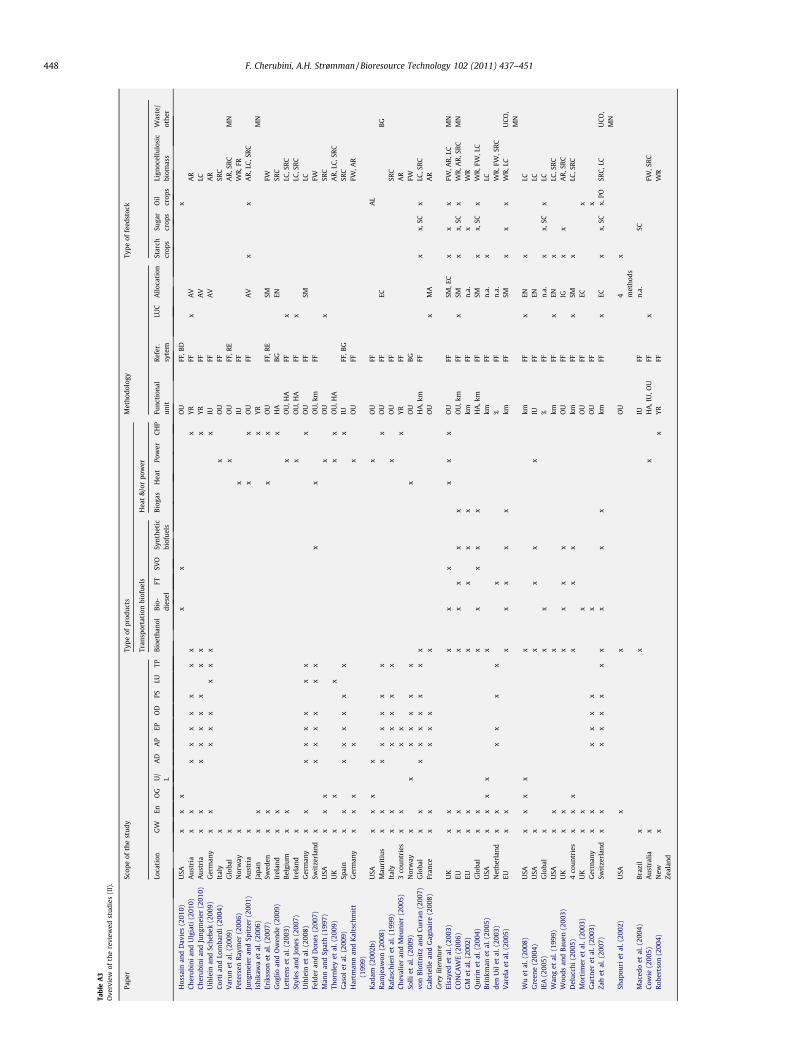
Appendix A. Overview of the studies
This appendix reports information on each of the reviewedstudies. In Table A1, the explanations of the acronyms or abbrevi-ations used in the following tables are shown. Features of the re-viewed LCA bioenergy studies are summarized in Tables A2 and A3.
References
Bentley, R.W., Mannan, S.A., Wheeler, S.J., 2007. Assessing the date of the global oilpeak: the need to use 2P reserves. Energy Policy 35, 6364–6382.
Bernesson, S., Nilsson, D., Hansson, P.-A., 2006. A limited LCA comparing large- andsmall-scale production of ethanol for heavy engines under Swedish conditions.Biomass and Bioenergy 30, 46–57.
Bird, N.D., Cherubini, F., Cowie, A., Fijan-Parlov, S., Moellersten, K., Pingoud, K.,Rueter, S., Schlamadinger, B., Soimakallio, S., Van Stappen, F., Woess-Gallasch, S.,2008. Bioenergy: the relationship with greenhouse gases in agriculture andforestry, 16th European Biomass Conference & Exhibition Valencia, Spain. pp.2465-2569.
Börjesson, P., Mattiasson, B., 2008. Biogas as a resource-efficient vehicle fuel. Trendsin Biotechnology 26, 7–13.
Botha, T., von Blottnitz, H., 2006. A comparison of the environmental benefits ofbagasse-derived electricity and fuel ethanol on a life-cycle basis. Energy Policy34, 2654–2661.
Brinkman, N., Wang, M., Weber, T., Darlington, T., 2005. Well-to-wheels analysis ofadvanced fuel/vehicle systems — a North American study of energy use. In:Laboratory, A.N. (Ed.), Greenhouse Gas Emissions, and Criteria PollutantEmissions. Argonne, USA, p. 238.
Carpentieri, M., Corti, A., Lombardi, L., 2005. Life cycle assessment (LCA) of anintegrated biomass gasification combined cycle (IBGCC) with CO2 removal.Energy Conversion and Management 46, 1790–1808.
Cherubini, F., Jungmeier, G., 2010. LCA of a biorefinery concept producingbioethanol, bioenergy, and chemicals from switchgrass. The InternationalJournal of Life Cycle Assessment 15, 53–66.
Cherubini, F., Ulgiati, S., 2010. Crop residues as raw materials for biorefinerysystems – A LCA case study. Applied Energy 87, 47–57.
Cherubini, F., Bird, N.D., Cowie, A., Jungmeier, G., Schlamadinger, B., Woess-Gallasch,S., 2009. Energy- and greenhouse gas-based LCA of biofuel and bioenergysystems: key issues, ranges and recommendations. Resources Conservation andRecycling 53, 434–447.
Chester, M., Martin, E., 2009. Cellulosic ethanol from municipal solid waste: a casestudy of the economic, energy, and greenhouse gas impacts in California.Environmental Science & Technology 43, 5183–5189.
Chevalier, C., Meunier, F., 2005. Environmental assessment of biogas co- or tri-generation units by life cycle analysis methodology. Applied ThermalEngineering 25, 3025–3041.
CONCAWE, 2006. Well-to-Wheels Analysis of Future Automotive Fuels andPowertrains in the European Context, Summary Report, Joint Research Centreof the EU Commission, and European Council for Automotive R&D.
Corti, A., Lombardi, L., 2004. Biomass integrated gasification combined cycle withreduced CO2 emissions: performance analysis and life cycle assessment (LCA).Energy 29, 2109–2124.
Cowie, A., 2005. Greenhouse Gas Balance Of Bioenergy Systems Based On IntegratedPlantation Forestry in North East New South Wales, Australia, IEA BioenergyTask 38 – Case study.
Crutzen, P.J., Mosier, A.R., Smith, K.A., Winiwarter, W., 2007. N2O release from agro-biofuel production negates global warming reduction by replacing fossil fuels.Atmospheric Chemistry and Physics Discuss 7, 11191–11205.
Curran, M.A., 2007. Co-product and input allocation approaches for creating lifecycle inventory data: a literature review. International Journal of Life CycleAssessment Special Issue, 65–78.
Delucchi M.A., 2003. A Lifecycle Emissions Model (LEM): Lifecycle Emissions fromTransportation Fuels, Motor Vehicles, Transportation Modes, Electricity Use,Heating and Cooking Fuels, and Materials, Main Report, Institute ofTransportation Studies, UC Davis, USA.
Delucchi, M.A., 2005. A Multi-Country Analysis of Lifecycle Emissions fromTransportation Fuels and Motor Vehicles. University of California, Davis, USA.
den Uil H., Bakker R.R., Deurwaarder E.P., Elbersen H.W., Weismann M. (2003)Conventional bio-transportation fuels: an update, Report 2 GAVE-03.10,Netherlads Agency for Energy and Environment, Utrecht, pp. 48.
Dickie, A., 2007. Biofuels sustainability: a UK perspective. Renewable Energy Focus8, 59–61.
Dubreuil A., Gaillard G., Müller-Wenk R., 2007. Key Elements in a Framework forLand Use Impact Assessment Within LCA (11 pp). The International Journal ofLife Cycle Assessment 12, 5-15.
Ekvall, T., Finnveden, G., 2001. Allocation in ISO 14041 – a critical review. Journal ofCleaner Production 9, 197–208.
Elsayed, M.A., Matthews, R., Mortimer, N.D., 2003. Carbon and Energy Balances for aRange of Biofuel Options. In: R. R. Unit (Ed.), Sheffield Hallam University, UK,Sheffield. p. 71.
Eriksson, O., Finnveden, G., Ekvall, T., Björklund, A., 2007. Life cycle assessment offuels for district heating: a comparison of waste incineration, biomass- andnatural gas combustion. Energy Policy 35, 1346–1362.
EU, 2009. Directives on the promotion of the use of energy from renewable sources,European Parliament, Directive 2009/28/EC, 23 April 2009.
Fargione, J., Hill, J., Tilman, D., Polasky, S., Hawthorne, P., 2008. Land clearing and thebiofuel carbon debt. Science 319, 1235–1238.
Felder, R., Dones, R., 2007. Evaluation of ecological impacts of synthetic natural gasfrom wood used in current heating and car systems. Biomass and Bioenergy 31,403–415.
Finnveden, G., Hauschild, M.Z., Ekvall, T., Guinée, J., Heijungs, R., Hellweg, S.,Koehler, A., Pennington, D., Suh, S., 2009. Recent developments in life cycleassessment. Journal of Environmental Management 91, 1–21.
Fleming, J.S., Habibi, S., MacLean, H.L., 2006. Investigating the sustainability oflignocellulose-derived fuels for light-duty vehicles. Transportation ResearchPart D: Transport and Environment 11, 146–159.
Frischknecht, R., 2000. Allocation in life cycle inventory analysis for jointproduction. The International Journal of Life Cycle Assessment 5, 85–95.
Fritsche U.R., 2008. The ‘‘iLUC Factor” as a Means to Hedge Risks of GHG Emissionsfrom Indirect Land-Use Change Associated with Bioenergy Feedstock Provision,Working paper prepared for BMU, Oeko-Institut, Darmstadt – Germany.
Fu, G., Chan, A., Minns, D., 2003. Life cycle assessment of bio-ethanol derived fromcellulose. The International Journal of Life Cycle Assessment 8, 137–141.
Gabrielle, B., Gagnaire, N., 2008. Life-cycle assessment of straw use in bio-ethanolproduction: a case study based on biophysical modelling. Biomass andBioenergy 32, 431–441.
Gartner, S.O., Reinhardt, G.A., Braschkat, J., 2003. Life Cycle Assessment of Biodiesel:Update and New Aspects, Institute for Energy and Environmental Research.Heidelberg, Germany. p. 24.
Gasol, C.M., Gabarrell, X., Anton, A., Rigola, M., Carrasco, J., Ciria, P., Rieradevall, J.,2009. LCA of poplar bioenergy system compared with Brassica carinata energycrop and natural gas in regional scenario. Biomass and Bioenergy 33, 119–129.
GM, BP, ExxonMobil, Shell, Totalfinaelf, 2002. GM Well-to-Wheel Analysis of EnergyUse and Greenhouse Gas Emissions of Advanced Fuel/Vehicle Systems – AEuropean Study. In: L.-B. GmbH (Ed.), Ottobrunn, Germany, pp. 138.
Gnansonou E., Panichelli L., Dauriat A., Villegas J.D., 2008. Accounting for indirectland use changes in GHG balances of biofuels – Review of current approaches,Working paper REF. 437.101, Ecole Poytechnique Federale de Lausanne.
Gnansounou, E., Dauriat, A., Villegas, J., Panichelli, L., 2009. Life cycle assessment ofbiofuels: energy and greenhouse gas balances. Bioresource Technology 100,4919–4930.
Goglio, P., Owende, P.M.O., 2009. A screening LCA of short rotation coppice willow(Salix sp.) feedstock production system for small-scale electricity generation..Biosystems Engineering 103, 389–394.
González-García, S., Luo, L., Moreira, M.T., Feijoo, G., Huppes, G., 2009a. Life cycleassessment of flax shives derived second generation ethanol fueled automobilesin Spain. Renewable and Sustainable Energy Reviews 13, 1922–1933.
González-García, S., Gasol, C.M., Gabarrell, X., Rieradevall, J., Moreira, M.T., Feijoo, G.,2009b. Environmental aspects of ethanol-based fuels from Brassica carinata: acase study of second generation ethanol. Renewable and Sustainable EnergyReviews 13, 2613–2620.
Greene N., 2004. Growing Energy: How Biofuels Can Help End America’s OilDependence. In: N.R.D. Council (Ed.), New York, USA, pp. 78.
Halleux, H., Lassaux, S., Renzoni, R., Germain, A., 2008. Comparative life cycleassessment of two biofuels ethanol from sugar beet and rapeseed methyl ester.The International Journal of Life Cycle Assessment 13, 184–190.
Hammerschlag, R., 2006. Ethanol’s energy return on investment: a survey of theliterature 1990 � present. Environmental Science & Technology 40, 1744–1750.
Hanlon, P., McCartney, G., 2008. Peak oil: will it be public health’s greatestchallenge. Public Health 122, 647–652.
Harding, K.G., Dennis, J.S., von Blottnitz, H., Harrison, S.T.L., 2008. A life-cyclecomparison between inorganic and biological catalysis for the production ofbiodiesel. Journal of Cleaner Production 16, 1368–1378.
Hartmann, D., Kaltschmitt, M., 1999. Electricity generation from solid biomass viaco-combustion with coal: energy and emission balances from a German casestudy. Biomass and Bioenergy 16, 397–406.
Heijungs, R., Guinée, J.B., 2007. Allocation and ‘what-if’ scenarios in life cycleassessment of waste management systems. Waste Management 27, 997–1005.
Heller, M.C., Keoleian, G.A., Mann, M.K., Volk, T.A., 2004. Life cycle energy andenvironmental benefits of generating electricity from willow biomass.Renewable Energy 29, 1023–1042.
Higo, M., Dowaki, K., 2010. A life cycle analysis on a Bio-DME production systemconsidering the species of biomass feedstock in Japan and Papua New Guinea.Applied Energy 87, 58–67.
Hossain, A.K., Davies, P.A., 2010. Plant oils as fuels for compression ignition engines:a technical review and life-cycle analysis. Renewable Energy 35, 1–13.
Hu, Z., Tan, P., Yan, X., Lou, D., 2008. Life cycle energy, environment and economicassessment of soybean-based biodiesel as an alternative automotive fuel inChina. Energy 33, 1654–1658.
Huo, H., Wang, M., Bloyd, C., Putsche, V., 2008. Life-cycle assessment of energy useand greenhouse gas emissions of soybean-derived biodiesel and renewablefuels. Environmental Science & Technology 43, 750–756.
IEA, 2005. Biofuels for Transport: An International Perspective, International EnergyAgency, Paris, France, pp. 215.
IEO, 2009. International Energy Outlook, Energy Information Administration, Officeof Integrated Analysis and Forecasting, US Department of Energy, Washington,DC, p. 284.
IPCC, 2006. Guidelines for national greenhouse gas inventories, Vol. 4 – Agriculture,forestry and other land use, Intergovernmental Panel on Climate Change.
450 F. Cherubini, A.H. Strømman / Bioresource Technology 102 (2011) 437–451
IPCC, 2007. Climate change 2007: mitigation. In: Metz, B., et al. (Eds.), Contributionof working group 3 to the Fourth Assessment Report of the IntergovernmentalPanel on Climate Change, Cambridge, United Kingdom and New York, USA.
Ishikawa, S., Hoshiba, S., Hinata, T., Hishinuma, T., Morita, S., 2006. Evaluation of abiogas plant from life cycle assessment (LCA). International Congress Series1293, 230–233.
ISO, 2009. Carbon footprint of products – Part 2: communications, GHGmanagement in the value or supply chain.
Johnson, E., 2009. Goodbye to carbon neutral: getting biomass footprints right.Environmental Impact Assessment Review 29, 165–168.
Jungmeier, G., Spitzer, J., 2001. Greenhouse gas emissions of bioenergy fromagriculture compared to fossil energy for heat and electricity supply. NutrientCycling in Agroecosystems 60, 267–273.
Kadam, K.L., 2002a. Environmental benefits on a life cycle basis of using bagasse-derived ethanol as a gasoline oxygenate in India. Energy Policy 30, 371–384.
Kadam, K.L., 2002b. Environmental implications of power generation via coal-microalgae cofiring. Energy 27, 905–922.
Kalnes, T.N., Koers, K.P., Marker, T., Shonnard, D.R., 2009. A technoeconomic andenvironmental life cycle comparison of green diesel to biodiesel and syndiesel.Environmental Progress & Sustainable Energy 28, 111–120.
Kaltschmitt, M., Reinhardt, G.A., Stelzer, T., 1997. Life cycle analysis of biofuelsunder different environmental aspects. Biomass & Bioenergy 12, 121–134.
Kendall, A., Chang, B., Sharpe, B., 2009. Accounting for time-dependent effects inbiofuel life cycle greenhouse gas emissions calculations. Environmental Science& Technology 43, 7142–7147.
Khatiwada, D., Silveira, S., 2009. Net energy balance of molasses based ethanol: thecase of Nepal. Renewable and Sustainable Energy Reviews 13, 2515–2524.
Kim, S., Dale, B.E., 2008. Life cycle assessment of fuel ethanol derived from corngrain via dry milling. Bioresource Technology 99, 5250–5260.
Koellner, T., Scholz, R., 2008. Assessment of land use impacts on the naturalenvironment. The International Journal of Life Cycle Assessment 13, 32–48.
Lal, R., 2005. World crop residues production and implications of its use as a biofuel.Environment International 31, 575–584.
Lam, M.K., Lee, K.T., Mohamed, A.R., 2009. Life cycle assessment for the productionof biodiesel: a case study in Malaysia for palm oil versus jatropha oil. Biofuels,Bioproducts and Biorefining 3, 601–612.
Lardon, L., Helias, A., Sialve, B., Steyer, J.-P., Bernard, O., 2009. Life-cycle assessmentof biodiesel production from microalgae. Environmental Science & Technology43, 6475–6481.
Larson, E.D., 2006. A review of life-cycle analysis studies on liquid biofuel systemsfor the transport sector. Energy for Sustainable Development 10, 109–126.
Lettens, S., Muys, B., Ceulemans, R., Moons, E., Garcia, J., Coppin, P., 2003. Energybudget and greenhouse gas balance evaluation of sustainable coppice systemsfor electricity production. Biomass and Bioenergy 24, 179–197.
Liska, A.J., Perrin, R.K., 2009. Indirect land use emissions in the life cycle of biofuels:regulations vs science. Biofuels, Bioproducts and Biorefining 3, 318–328.
Luo, L., van der Voet, E., Huppes, G., 2009a. Life cycle assessment and life cyclecosting of bioethanol from sugarcane in Brazil. Renewable and SustainableEnergy Reviews 13, 1613–1619.
Luo, L., van der Voet, E., Huppes, G., 2009b. An energy analysis of ethanol fromcellulosic feedstock-corn stover. Renewable and Sustainable Energy Reviews 13,2003–2011.
Luo, L., van der Voet, E., Huppes, G., Udo de Haes, H., 2009c. Allocation issues in LCAmethodology: a case study of corn stover-based fuel ethanol. The InternationalJournal of Life Cycle Assessment 14, 529–539.
Luterbacher, J.S., Fróling, M., Vogel, F.d.r., Marechal, F.o., Tester, J.W., 2009.Hydrothermal gasification of waste biomass: process design and life cycleasessment. Environmental Science & Technology 43, 1578–1583.
Macedo, I.C., Leal, M.R.L.V., da Silva, J.E.A.R., 2004. Assessment of greenhouse gasemissions in the production and use of fuel ethanol in Brazil. Sao Paulo StateSecretariat of the Environment. Sao Paulo, Brazil. pp. 37.
Malça, J., Freire, F., 2006. Renewability and life-cycle energy efficiency of bioethanoland bio-ethyl tertiary butyl ether (bioETBE): assessing the implications ofallocation. Energy 31, 3362–3380.
Mann, M.K., Spath, P.L., 1997. Life cycle assessment of a biomass gasificationcombined-cycle system. National Renewable Energy Laboratory.
Michelsen, O., 2008. Assessment of land use impact on biodiversity. TheInternational Journal of Life Cycle Assessment 13, 22–31.
Mortimer N.D., Cormack P., Elsayed M.A., Home R.E., 2003. Evaluation of theComparative Energy, Global Warming, and Socio-Economic Costs and Benefitsof Biodiesel, Resources Research Unit, School of Environment and Development,Sheffield Hallam University, UK, p. 132.
Ndong, R., Montrejaud-Vignoles, M., Saint-Girons, O., Gabrielle, B., Pirot, R.,Domergue, M., Sablayrolles, C., 2009. Life cycle assessment of biofuels fromJatropha curcas in West Africa: a field study. GCB Bioenergy 1, 197–210.
North-Energy, 2008. Report to AEA for the RFA review of indirect effects of biofuels.O’Hare, M., Plevin, A., Martin, A., Jones, A., Kendall, A., Hopson, A., 2009. Proper
accounting for time increases crop-based biofuels & rsquo; greenhouse gasdeficit versus petroleum. Environmental Research Letters 4, 7.
Panichelli, L., Dauriat, A., Gnansounou, E., 2009. Life cycle assessment of soybean-based biodiesel in Argentina for export. The International Journal of Life CycleAssessment 14, 144–159.
Papong, S., Malakul, P., 2010. Life-cycle energy and environmental analysis ofbioethanol production from cassava in Thailand. Bioresource Technology 101,S112–S118.
PAS2050, 2008. How to assess the carbon footprint of goods and services, Crownand Carbon Trust, London, UK. p. 58.
Petersen Raymer, A.K., 2006. A comparison of avoided greenhouse gas emissionswhen using different kinds of wood energy. Biomass and Bioenergy 30, 605–617.
Petrou, E.C., Pappis, C.P., 2009. Biofuels: a survey on pros and cons. Energy & Fuels23, 1055–1066.
Pettersson, K., Harvey, S., 2010. CO2 emission balances for different black liquorgasification biorefinery concepts for production of electricity or second-generation liquid biofuels. Energy 35, 1101–1106.
Pimentel, D., Patzek, T.W., 2005. Ethanol production using corn, switchgrass, andwood; biodiesel production using soybean and sunflower. Natural ResourcesResearch 14, 65–76.
Pleanjai, S., Gheewala, S.H., 2009. Full chain energy analysis of biodiesel productionfrom palm oil in Thailand. Applied Energy 86, S209–S214.
Pleanjai, S., Gheewala, S.H., Garivait, S., 2009. Greenhouse gas emissions fromproduction and use of used cooking oil methyl ester as transport fuel inThailand. Journal of Cleaner Production 17, 873–876.
Quirin M., Gartner S.O., Pehnt M., Reinhardt G.A., 2004. CO2 Mitigation ThroughBiofuels in the Transport Sector: Status and Perspectives. In: I. f. E. a. E. R. (IFEU)(Ed.), Main Report, Heidelberg, Germany, p. 57.
Rafaschieri, A., Rapaccini, M., Manfrida, G., 1999. Life cycle assessment of electricityproduction from poplar energy crops compared with conventional fossil fuels.Energy Conversion and Management 40, 1477–1493.
Ramjeawon, T., 2008. Life cycle assessment of electricity generation from bagasse inMauritius. Journal of Cleaner Production 16, 1727–1734.
Reijnders, L., Huijbregts, M.A.J., 2008a. Palm oil and the emission of carbon-basedgreenhouse gases. Journal of Cleaner Production 16, 477–482.
Reijnders, L., Huijbregts, M.A.J., 2008b. Biogenic greenhouse gas emissions linked tothe life cycles of biodiesel derived from European rapeseed and Braziliansoybeans. Journal of Cleaner Production 16, 1943–1948.
RFA, 2008. The Gallagher Review of the indirect effects of biofuels production,Renewable Fuels Agency.
Righelato, R., Spracklen, D.V., 2007. ENVIRONMENT: carbon mitigation by biofuelsor by saving and restoring forests. Science 317, 902. doi:10.1126/science.1141361.
Robertson K., 2004. Greenhouse Gas Benefits of a Combined Heat and PowerBioenergy System in New Zealand, IEA Bioenergy Task 38 – Case study.
Scholz, R., 2007. Assessment of Land Use Impacts on the Natural Environment. Part1: an Analytical Framework for Pure Land Occupation and Land Use Change (8pp). The International Journal of Life Cycle Assessment 12, 16–23.
Searchinger, T., Heimlich, R., Houghton, R., Dong, F., Elobeid, A., Fabiosa, J., Tokgoz,S., Hayes, D., Yu, T., 2008. Use of US croplands for biofuels increases greenhousegases through emissions from land use change. Science 319, 1238–1240.
Searcy, E., Flynn, P.C., 2008. Processing of straw/corn stover: comparison of life cycleemissions. International Journal of Green Energy 5, 423–437.
Shapouri H., Duffield J.A., Wang M., 2002. The Energy Balance of Corn Ethanol: AnUpdate, Agricultural Economic Report 813, US Dept. of Agriculture, Washington,DC.
Sheehan, J.J., 2009. Biofuels and the conundrum of sustainability. Current Opinion inBiotechnology 20, 318–324.
Smyth, B.M., Murphy, J.D., O’Brien, C.M., 2009. What is the energy balance of grassbiomethane in Ireland and other temperate northern European climates.Renewable and Sustainable Energy Reviews 13, 2349–2360.
Solli, C., Reenaas, M., Strømman, A., Hertwich, E., 2009. Life cycle assessment ofwood-based heating in Norway. The International Journal of Life CycleAssessment 14, 517–528.
Spatari, S., Zhang, Y., MacLean, H.L., 2005. Life cycle assessment of switchgrass- andcorn stover-derived ethanol-fueled automobiles. Environmental Science &Technology 39, 9750–9758.
Spatari, S., Bagley, D.M., MacLean, H.L., 2010. Life cycle evaluation of emerginglignocellulosic ethanol conversion technologies. Bioresource Technology 101,654–667.
Stichnothe, H., Azapagic, A., 2009. Bioethanol from waste: life cycle estimation ofthe greenhouse gas saving potential. Resources, Conservation and Recycling 53,624–630.
Styles, D., Jones, M.B., 2007. Energy crops in Ireland: quantifying the potential life-cycle greenhouse gas reductions of energy-crop electricity. Biomass andBioenergy 31, 759–772.
Talens Peiró, L., Lombardi, L., Villalba Méndez, G., Gabarrell i Durany, X., 2010. Lifecycle assessment (LCA) and exergetic life cycle assessment (ELCA) of theproduction of biodiesel from used cooking oil (UCO). Energy 35, 889–893.
Thornley, P., Upham, P., Huang, Y., Rezvani, S., Brammer, J., Rogers, J., 2009.Integrated assessment of bioelectricity technology options. Energy Policy 37,890–903.
Uihlein, A., Schebek, L., 2009. Environmental impacts of a lignocellulose feedstockbiorefinery system: an assessment. Biomass and Bioenergy 33, 793–802.
Uihlein, A., Ehrenberger, S., Schebek, L., 2008. Utilisation options of renewableresources: a life cycle assessment of selected products. Journal of CleanerProduction 16, 1306–1320.
UN-REDD, 2008. UN Collaborative Programme on Reducing Emissions fromDeforestation and Forest Degradation in Developing Countries, FrameworkDocument. p. 27.
UNFCCC, 2005. Modalities and procedures for afforestation and reforestationproject activities under the clean development mechanism in the firstcommitment period of the Kyoto Protocol, FCCC/KP/CMP/2005/8/Add.1,
F. Cherubini, A.H. Strømman / Bioresource Technology 102 (2011) 437–451 451
United Nations Framework Convention on Climate Change, Decision 5/CMP.1. p.62.
van Vliet, O.P.R., Faaij, A.P.C., Turkenburg, W.C., 2009. Fischer-Tropsch dieselproduction in a well-to-wheel perspective: a carbon, energy flow and costanalysis. Energy Conversion and Management 50, 855–876.
Varela, M., Lago, C., Jungmeier, G., Koenighofer, K., 2005. Environmental andEconomic Performance of Biofuels – Volume I, Main Report, in: SenterNovem(Ed.), VIEWLS (Clear Views on Clean Fuels) Project, Utrecht, the Netherlands. p.242.
Varun, Bhat, I.K., Prakash, R., 2009. LCA of renewable energy for electricitygeneration systems – A review. Renewable and Sustainable Energy Reviews13, 1067–1073.
von Blottnitz, H., Curran, M.A., 2007. A review of assessments conducted on bio-ethanol as a transportation fuel from a net energy, greenhouse gas, andenvironmental life cycle perspective. Journal of Cleaner Production 15, 607–619.
Wang, M., C. Saricks, Santini, D., 1999. Effects of fuel ethanol use on fuel-cycleenergy and greenhouse gas emissions, Argonne National Laboratory, Argonne,USA. p. 39.
Wilhelm, W.W., Johnson, J.M.F., Hatfield, J.L., Voorhees, W.B., Linden, D.R., 2004.Crop and soil productivity response to corn residue removal: a literaturereview. Agron J 96, 1–17.
Williams, P.R.D., Inman, D., Aden, A., Heath, G.A., 2009. Environmental andSustainability factors associated with next-generation biofuels in the US.:
what do we really know. Environmental Science & Technology 43, 4763–4775.doi:10.1021/es900250.
Woods J., Bauen A., 2003. Technology Status Review and Carbon AbatementPotential of Renewable Transport Fuels in the UK, New and Renewable EnergyProgram, Department of Trade and Industry, London, UK.
Wrage, N., Groenigen, J.W.v., Oenema, O., Baggs, E.M., 2005. A novel dual-isotopelabelling method for distinguishing between soil sources of N2O. RapidCommunications in Mass Spectrometry 19, 3298–3306.
Wu M., Wu Y., Wang M., 2008. Mobility Chain Analysis of Technologies for PassengerCars and Light-Duty Vehicles Fueled with Biofuels: Application of the GREETModel to the Role of Biomass in America’s Energy Future (RBAEF) Project. In: A.N.Laboratory (Ed.), Center for Transportation Research, United States, p. 66.
Xiao, J., Shen, L., Zhang, Y., Gu, J., 2009. Integrated analysis of energy, economic, andenvironmental performance of biomethanol from rice straw in China. Industrial& Engineering Chemistry Research..
Yáñez Angarita, E.E., Silva Lora, E.E., da Costa, R.E., Torres, E.A., 2009. The energybalance in the palm oil-derived methyl ester (PME) life cycle for the cases inBrazil and Colombia. Renewable Energy 34, 2905–2913.
Yee, K.F., Tan, K.T., Abdullah, A.Z., Lee, K.T., 2009. Life cycle assessment of palmbiodiesel: revealing facts and benefits for sustainability. Applied Energy 86,S189–S196.
Zah R., Böni H., Gauch M., Hischier R., Lehmann M., P. W., 2007. Life CycleAssessment of Energy Products: Environmental Assessment of Biofuels, EMPA,Bern, Switzerland.