lc-ms identification of derivatized free fatty acids from adipocere in soil samples
TRANSCRIPT
Research Article
LC-MS identification of derivatized free fattyacids from adipocere in soil samples
Free fatty acids were derivatized as amides (DFFA) by reaction with (R)-(1)-1-phenyl-
ethylamine, using a simple, fast and robust reaction scheme. A HPLC method with diode
array and ESI MS detection was developed for the analysis of the derivatized substances.
Six fatty acids were used in the method development: myristic, linoleic, palmitic, oleic,
margaric and stearic acids. Under these conditions the elution of the DFFA are well
resolved with retention times raging from 6.9 to 16.0 min. Fatty acids were extracted from
cemetery soil and from adipocere formation experimental soils using a Soxhlet extraction,
using as solvent ether/dichloromethane (1:1). Each DFFA is characterized by three m/zpeaks: molecular weight of the substance; molecular weight of a dimer of the substance;
the molecular weight of the dimer plus the atomic mass of sodium. The analysis of soil
samples detected the six fatty acids used in the method developed plus palmitoleic and
pentadecanoic. Beside this set of eight fatty acids other 13 fatty acids were detected in trace
quantities or only in some soils and some were tentatively assigned as: 10-hydroxystearic,
myristoleic, heptadecenoic and arachidic acids.
Keywords: Adipocere / Fatty acid derivatization / LC-MS / Soils extractionDOI 10.1002/jssc.200900614
1 Introduction
The major constituents of adipocere, defined as a late-stage
post-mortem decomposition product consists of a mixture of
free fatty acids (FFAs). It is produced when triacylglycerides
in the adipose tissue are converted enzymatically to
unsaturated and saturated fatty acids, the former being
reduced further to saturated acids [1, 2]. In a forensic
context, its characterization yields important information
about a body decomposition rate [3, 4]. Due to their
continued interest, an increased attention has received and
a wide research work is performed to characterize the
chemistry of adipocere. In particular, gas chromatography
has provided useful information about the lipid composition
of adipocere in a number of studies [5–10]. The major fatty
acids present in order of abundance are palmitic (C16:0),
stearic (C18:0) and myristic (C14:0) acids [11]. Depending on
the environmental conditions, oxygenated FFAs are recog-
nized as hydroxyl [12, 13] and oxo derivates at trace level [7,
14]. The literature reports showed that adipocere formation
and FFA composition may be a function of the soil
characteristics, burial environment, soil pH, temperature,
moisture and oxygen content [7, 15–17].
LC analysis of the adipocere composition is mainly
focussed in the determination of FFA composition, tagging
derivatized compounds with reagents that afford chromo-
phores having UV and/or Vis absorption bands. Among
those reagents, phenyl and substituted phenyl bromide are
widely used [18–21]. To improve the detection, a-bromo-20-
acetonaphthone [22] and 2-nitrophenylhydrazine [23, 24]
were proposed. Analyses of FFAs as their hydroxamic acids
[25] and monoalkanoylamides [26] have been also reported.
To simplify the separation process, polymeric derivatizing
reagents have been developed for the analysis of FFAs [27].
LC-MS methodologies, coupled to specific extraction tech-
niques, have been proposed for the analysis of FFA for
chocolate quality control [28] and in the inhibition effect of
sterculic acid in the D9-desaturase activity [29].
In this article, a new synthetic route for the reaction of
(R)-(1)-1-phenylethylamine (R-PEA) with FFA is proposed,
allowing a simple, fast and robust derivatization of FFA to
chiral amides (DFFA). DFFA were prepared using a multi-
step procedure that involves a key step, the functionalization
of the corresponding fatty acid via an acylation using a
carboxylic–carbonic anhydride intermediate. The prepara-
tion of carboxylic–carbonic anhydride intermediates from
the corresponding carboxylic acids and alkyl haloformates is
a convenient method in chiral amide synthesis using soft
conditions leading to high product yields without loss of
optical activity. Moreover, a LC method with MS detection
Manuel Algarra1
Jose E. Rodrıguez-Borges2
Joaquim C. G. Esteves daSilva2
1Centro de Geologia do Porto,Faculdade de Ciencias daUniversidade do Porto, Porto,Portugal
2Centro de Investigac- ao emQuımica, Departamento deQuımica, Faculdade de Cienciasda Universidade do Porto, Porto,Portugal
Received September 22, 2009Revised November 1, 2009Accepted November 2, 2009
Abbreviations: DFFA, derivatized FFA; FFA, free fatty acid;
R-PEA, (R)-(1)-1-phenylethylamine; RT, retention times
Correspondence: Professor J. C. G. Esteves da Silva, Centro deInvestigac- ao em Quımica, Departamento de Quımica, Faculdadede Ciencias da Universidade do Porto, R. Campo Alegre 687,4169-007 Porto, PortugalE-mail: [email protected]: 1351-220-402-659
& 2009 WILEY-VCH Verlag GmbH & Co. KGaA, Weinheim www.jss-journal.com
J. Sep. Sci. 2010, 33, 143–154 143

(LC-MS) was developed for the identification of FFA after
extraction from soils. The objective of this study was to
develop a forensic methodology for the identification of the
fatty acid composition that resulted in soil as consequence
of adipocere formation. Besides the fundamental extraction
and detection steps, and taking into consideration the
complexity of the samples under investigation, that are
characterized by quite complex trace level mixtures of
Scheme 1. DFFA derivatization reaction.
RT:A
B
0 2 4 6 8 10 12 14 16 18 20 22 24Time (min)
0
500
1000
1500
2000
2500
3000
3500
4000
4500
5000
5500
6000
6500
uAU
2.87
2.80
3.113.67 6.77
8.1010.59
4.19
9.93
15.8712.45
22.065.68
22.30 23.2 6
C:\Xcalibur\...\JESMistura_090602111556 02-06-2009 11:15:56
RT:0.00 - 24.99
0 2 4 6 8 10 12 14 16 18 20 22 24
Time (min)
0
5
10
15
20
25
30
35
40
45
50
55
60
65
70
75
80
85
90
95
100
Rel
ativ
e A
bund
ance
10.716.93 8.218.25
10.8210.5910.52
6.85 8.308.10
16.0212.51
12.599.8316.1512.42 12.64
15.8016.21
12.8515.73
9.76
12.90 15.65 16.41
16.5415.58
22.1415.52 16.67
16.99 22.2520.6013.37 19.446.465.8422.42
0.21 24.894.721.21 3.17
0.00 - 25.00
Figure 1. Typical chromatogramsof the six DFFA with diode array(total scan) (A) and mass (TIC) (B)detection.
J. Sep. Sci. 2010, 33, 143–154144 M. Algarra et al.
& 2009 WILEY-VCH Verlag GmbH & Co. KGaA, Weinheim www.jss-journal.com
FFA in a complex background, the proposed methodology
for forensic applications includes a derivatization reaction
because: (i) when UV-Vis detection is used LC resolution
and detection limits of FFA can be improved
because underivatized FFA show absorption in the UV and
relatively small extinction coefficients; (ii) less mild
chromatographic conditions can be employed for the reso-
lution of derivatized FFA without the necessity of complex
chromatographic eluents and gradients and relatively high
column temperatures; (iii) LC-MS detection of a large
number of FFA derivatives in the same sample is feasible
and unequivocal.
225 230 235 240 245 250 255 260 265 270 275 280 285 290 295
wavelength (nm)
0100020003000400050006000700080009000
10000110001200013000140001500016000170001800019000200002100022000
uAU
259.00
280.00
RT:0.00 - 25.00
0 2 4 6 8 10 12 14 16 18 20 22 24Time (min)
0
2000
4000
6000
8000
10000
12000
14000
16000
18000
20000
22000
24000
26000
uAU
2.93
3.10
8.09
6.77
10.59
9.92
15.8712.43
3.58
4.21
2.59 5.78
A
B
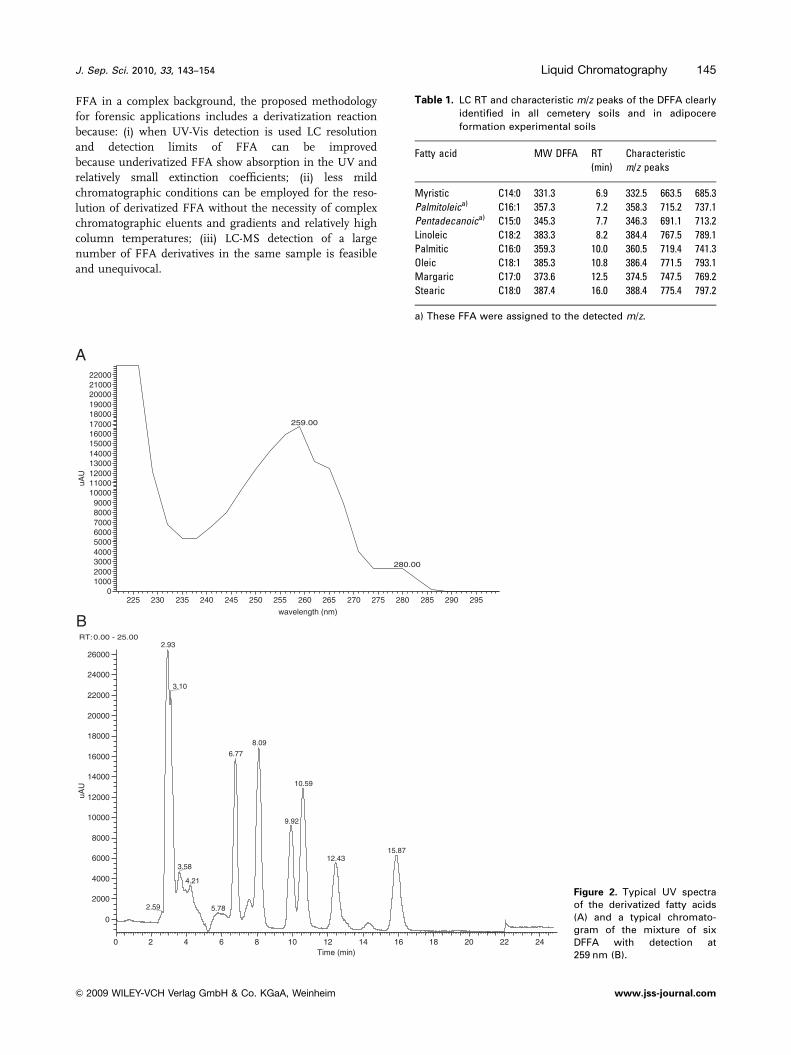
Figure 2. Typical UV spectraof the derivatized fatty acids(A) and a typical chromato-gram of the mixture of sixDFFA with detection at259 nm (B).
Table 1. LC RT and characteristic m/z peaks of the DFFA clearly
identified in all cemetery soils and in adipocere
formation experimental soils
Fatty acid MW DFFA RT
(min)
Characteristic
m/z peaks
Myristic C14:0 331.3 6.9 332.5 663.5 685.3
Palmitoleica) C16:1 357.3 7.2 358.3 715.2 737.1
Pentadecanoica) C15:0 345.3 7.7 346.3 691.1 713.2
Linoleic C18:2 383.3 8.2 384.4 767.5 789.1
Palmitic C16:0 359.3 10.0 360.5 719.4 741.3
Oleic C18:1 385.3 10.8 386.4 771.5 793.1
Margaric C17:0 373.6 12.5 374.5 747.5 769.2
Stearic C18:0 387.4 16.0 388.4 775.4 797.2
a) These FFA were assigned to the detected m/z.
J. Sep. Sci. 2010, 33, 143–154 Liquid Chromatography 145
& 2009 WILEY-VCH Verlag GmbH & Co. KGaA, Weinheim www.jss-journal.com
2 Materials and methods
2.1 Chemical and reagents
FFAs standards (linoleic, margaric, myristic, oleic, palmitic,
stearic and acid) were supplied by Sigma-Aldrich Quımica
SA (Spain). The derivatizing chiral agent, R-PEA, dichlor-
omethane, methanol (HPLC grade) and ethylic ether were
purchased from Merck (Darmstadt, Germany) and Panreac
(Barcelona, Spain), respectively. All compounds were
analytical-reagent grade and the purities were stated to be
higher than 99%. Methanol stock standard solutions for
HPLC measurements were used. Deionised water was
employed in all of the experiments.
2.2 Soil samples
Some samples of soils from Agramonte and Prado Repouso
cemeteries (Municipal cemeteries of Porto, Portugal) with
known episodes of unskeletalized corpses were analysed.
Soil samples were collected in the soil adjacent to the grave.
JESMistura_090602111556A
B
#551 RT: 10.84 AV: 1 NL: 3.26E8T: + p ESI Full ms [ 250.00-1500.00]
300 350 400 450 500 550 600 650 700 750 800 850m/z
m/z
0
20000000
40000000
60000000
80000000
100000000
120000000
140000000
160000000
180000000
200000000
220000000
240000000
260000000
280000000
300000000
320000000
Inte
nsity
793.13
771.47
386.40
408.53431.20 809.00671.20 748.27 876.60611.87476.27 521.20 562.93266.67 359.80301.33
JESMistura_090602111556 #647 RT: 12.62 AV: 1 NL: 2.52E8T: + p ESI Full ms [ 250.00-1500.00]
300 350 400 450 500 550 600 650 700 750 800 8500
20000000
40000000
60000000
80000000
100000000
120000000
140000000
160000000
180000000
200000000
220000000
240000000
Inte
nsity
769.20
747.47
374.47
396.40784.73433.47 473.13 39.14874.476 895.07708.33612.27552.73270.47 364.27
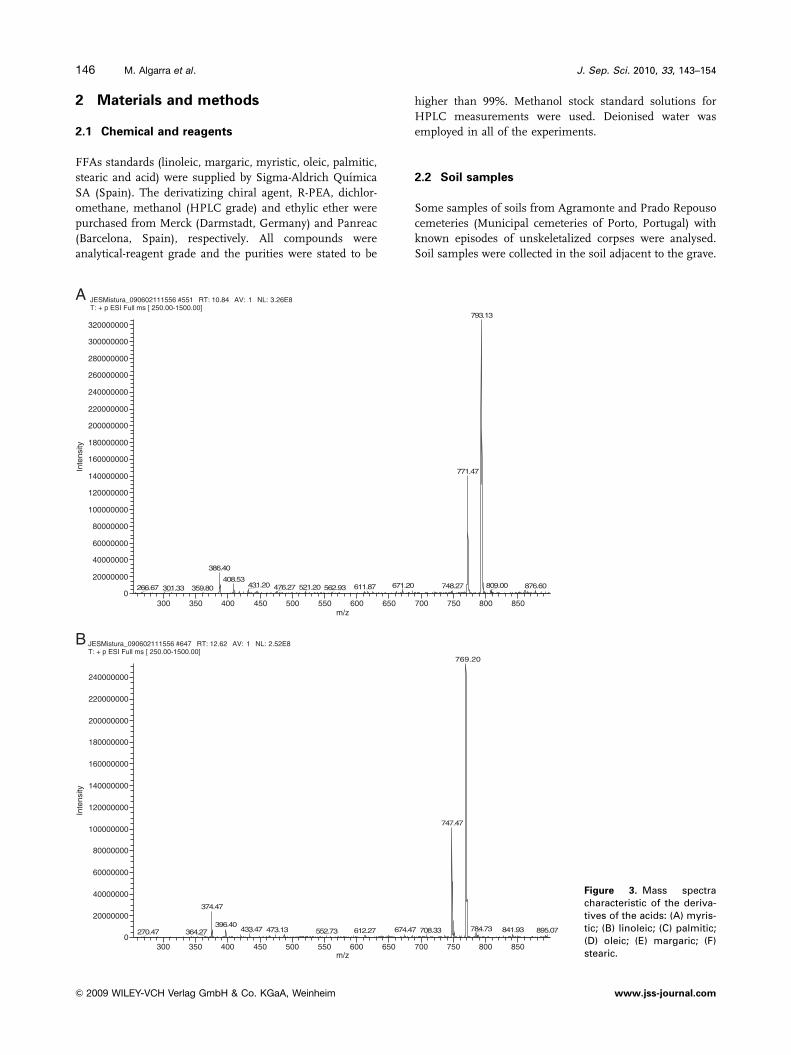
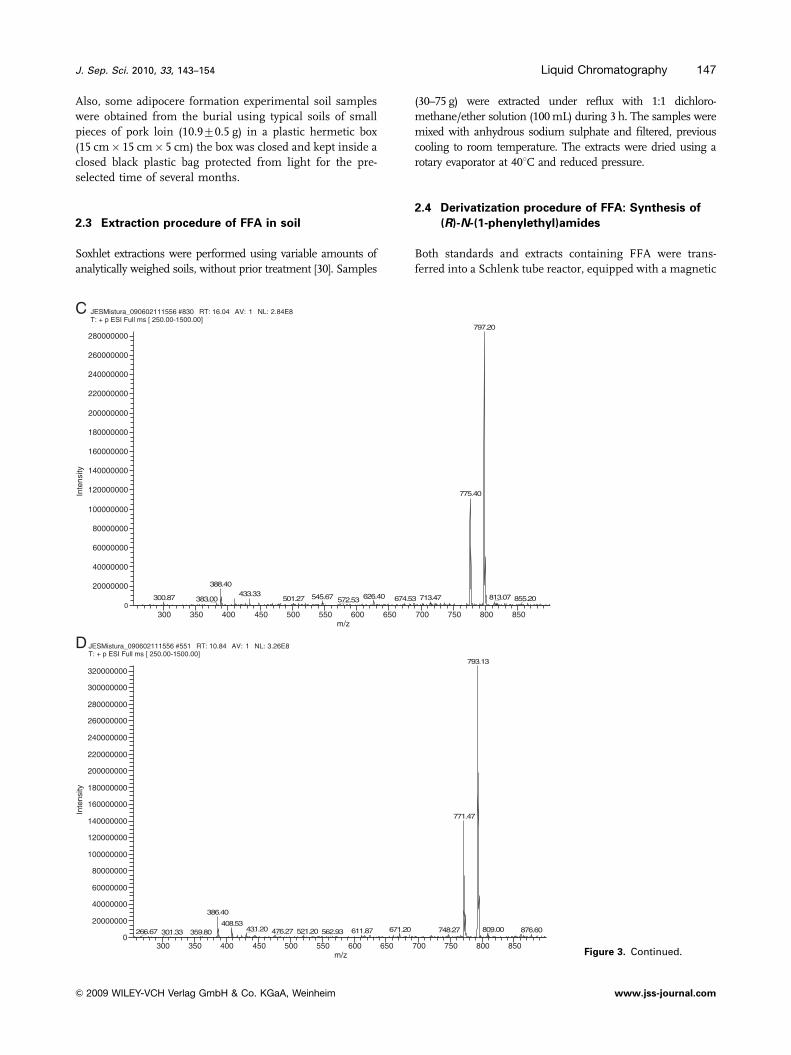
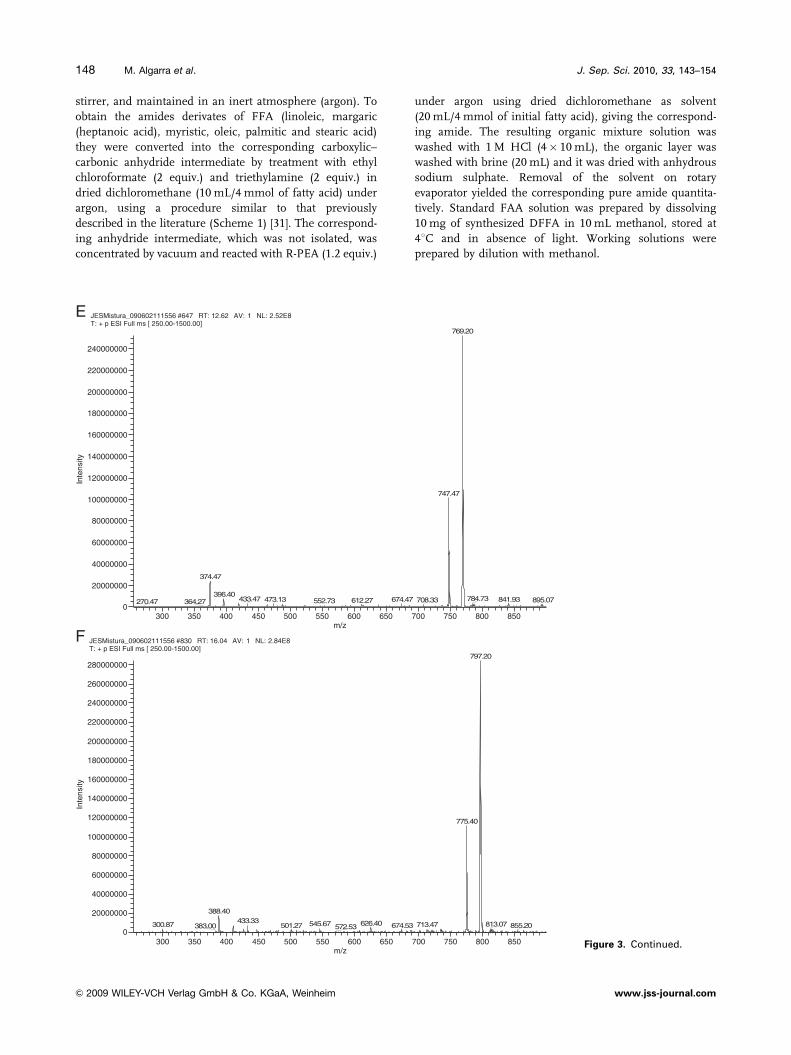
Figure 3. Mass spectracharacteristic of the deriva-tives of the acids: (A) myris-tic; (B) linoleic; (C) palmitic;(D) oleic; (E) margaric; (F)stearic.
J. Sep. Sci. 2010, 33, 143–154146 M. Algarra et al.
& 2009 WILEY-VCH Verlag GmbH & Co. KGaA, Weinheim www.jss-journal.com
Also, some adipocere formation experimental soil samples
were obtained from the burial using typical soils of small
pieces of pork loin (10.970.5 g) in a plastic hermetic box
(15 cm� 15 cm� 5 cm) the box was closed and kept inside a
closed black plastic bag protected from light for the pre-
selected time of several months.
2.3 Extraction procedure of FFA in soil
Soxhlet extractions were performed using variable amounts of
analytically weighed soils, without prior treatment [30]. Samples
(30–75 g) were extracted under reflux with 1:1 dichloro-
methane/ether solution (100 mL) during 3 h. The samples were
mixed with anhydrous sodium sulphate and filtered, previous
cooling to room temperature. The extracts were dried using a
rotary evaporator at 401C and reduced pressure.
2.4 Derivatization procedure of FFA: Synthesis of
(R)-N-(1-phenylethyl)amides
Both standards and extracts containing FFA were trans-
ferred into a Schlenk tube reactor, equipped with a magnetic
JESMistura_090602111556 #551 RT: 10.84 AV: 1 NL: 3.26E8T: + p ESI Full ms [ 250.00-1500.00]
300 350 400 450 500 550 600 650 700 750 800 850m/z
0
20000000
40000000
60000000
80000000
100000000
120000000
140000000
160000000
180000000
200000000
220000000
240000000
260000000
280000000
300000000
320000000
Inte
nsity
793.13
771.47
386.40
408.53431.20 809.00671.20 748.27 876.60611.87476.27 521.20 562.93266.67 359.80301.33
C
D
JESMistura_090602111556 #830 RT: 16.04 AV: 1 NL: 2.84E8T: + p ESI Full ms [ 250.00-1500.00]
300 350 400 450 500 550 600 650 700 750 800 850m/z
0
20000000
40000000
60000000
80000000
100000000
120000000
140000000
160000000
180000000
200000000
220000000
240000000
260000000
280000000
Inte
nsity
797.20
775.40
388.40433.33 626.40545.67 813.0774.31778.003 855.2035.47672.105383.00 572.53
Figure 3. Continued.
J. Sep. Sci. 2010, 33, 143–154 Liquid Chromatography 147
& 2009 WILEY-VCH Verlag GmbH & Co. KGaA, Weinheim www.jss-journal.com
stirrer, and maintained in an inert atmosphere (argon). To
obtain the amides derivates of FFA (linoleic, margaric
(heptanoic acid), myristic, oleic, palmitic and stearic acid)
they were converted into the corresponding carboxylic–
carbonic anhydride intermediate by treatment with ethyl
chloroformate (2 equiv.) and triethylamine (2 equiv.) in
dried dichloromethane (10 mL/4 mmol of fatty acid) under
argon, using a procedure similar to that previously
described in the literature (Scheme 1) [31]. The correspond-
ing anhydride intermediate, which was not isolated, was
concentrated by vacuum and reacted with R-PEA (1.2 equiv.)
under argon using dried dichloromethane as solvent
(20 mL/4 mmol of initial fatty acid), giving the correspond-
ing amide. The resulting organic mixture solution was
washed with 1 M HCl (4� 10 mL), the organic layer was
washed with brine (20 mL) and it was dried with anhydrous
sodium sulphate. Removal of the solvent on rotary
evaporator yielded the corresponding pure amide quantita-
tively. Standard FAA solution was prepared by dissolving
10 mg of synthesized DFFA in 10 mL methanol, stored at
41C and in absence of light. Working solutions were
prepared by dilution with methanol.
JESMistura_090602111556 #647 RT: 12.62 AV: 1 NL: 2.52E8T: + p ESI Full ms [ 250.00-1500.00]
300 350 400 450 500 550 600 650 700 750 800 850m/z
0
20000000
40000000
60000000
80000000
100000000
120000000
140000000
160000000
180000000
200000000
220000000
240000000
Inte
nsity
769.20
747.47
374.47
396.40784.73433.47 473.13 39.14874.476 895.07708.33612.27552.73270.47 364.27
JESMistura_090602111556 #830 RT: 16.04 AV: 1 NL: 2.84E8T: + p ESI Full ms [ 250.00-1500.00]
300 350 400 450 500 550 600 650 700 750 800 850m/z
0
20000000
40000000
60000000
80000000
100000000
120000000
140000000
160000000
180000000
200000000
220000000
240000000
260000000
280000000
Inte
nsity
797.20
775.40
388.40433.33 626.40545.67 813.0774.31778.003 855.2035.47672.105383.00 572.53
E
F
Figure 3. Continued.
J. Sep. Sci. 2010, 33, 143–154148 M. Algarra et al.
& 2009 WILEY-VCH Verlag GmbH & Co. KGaA, Weinheim www.jss-journal.com
The synthesized DFFA were characterized by 1H-NMR
spectrometry (400 MHz, CDCl3) (see Supporting Informa-
tion).
For the soils extracts the same derivatization procedure
was carried out, using dichloromethane (2 mL/50 mg of
isolated sample), ethyl chloroformate (40 mL/50 mg of
sample) and triethylamine (50 mL/50 mg of sample), for 3 h
at room temperature. After that, a gentle vacuum was
applied, to evaporate all solvents and excess of reactants. R-
PEA was added (30 mL/50 mg of sample) in anhydrous
dichloromethane (2 mL/50 mg of isolated sample) to form
DFFA, left overnight. Extracted with dichloromethane and
washed with HCl and brine, as previously described in the
standard FFA. Extracts were dissolved in 4 mL of methanol
and transferred into injection vials for LC analysis.
2.5 LC method
The analysis was performed using a LC-DAD-MS system
with a Finnigan Surveyor series liquid chromatograph
equipped with Finnigan Surveyor autosampler. Double-
online detection was done by a photodiode spectrophot-
ometer and MS. The mass detector was a Finnigan LCQ
RT: 0.00 - 25.00
0 2 4 6 8 10 12 14 16 18 20 22 24Time (min)
0
5000
10000
15000
20000
25000
30000
35000
40000
45000
50000
55000
60000
65000
70000
75000
80000
85000
90000
uAU
3.22 3.854.89
5.33 11.09
5.70
6.15
9.947.47
8.36
12.41 16.1013.28
16.95 22.9619.13 19.67 20.53
RT: 0.00 - 25.00
0 2 4 6 8 10 12 14 16 18 20 22 24
Time (min)
0
5000
10000
15000
20000
25000
30000
35000
40000
45000
50000
55000
60000
65000
70000
75000
uAU
3.25 3.85 5.66
9.83
4.63
6.13
6.80 7.47
8.2312.31
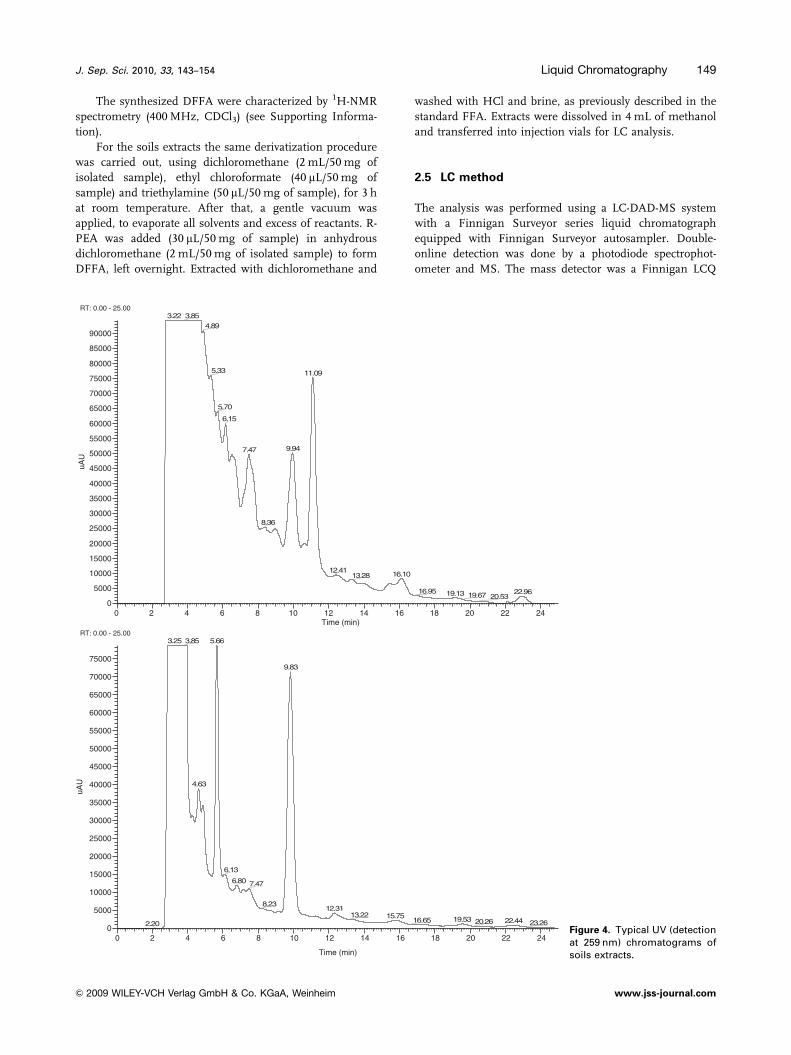
13.22 15.75 19.5316.65 22.4420.26 23.262.20Figure 4. Typical UV (detectionat 259 nm) chromatograms ofsoils extracts.
J. Sep. Sci. 2010, 33, 143–154 Liquid Chromatography 149
& 2009 WILEY-VCH Verlag GmbH & Co. KGaA, Weinheim www.jss-journal.com
DECA XP MAX (Finnigan, San Jose, CA) quadrupole IT
equipped with API source, using ESI interface. The
vaporizer and the capillary voltages were 5 and 4 V,
respectively. The capillary temperature was set at 3001C.
Nitrogen was used as both sheath and auxiliary gas at flow
rates of 60 and 15, respectively (in arbitrary units). Spectra
were recorded in positive ion mode between m/z 250 and
1500. Chromatographic data analysis was done with
Xcalibur 1.4 software from Thermo Electron.
The separation was done with a chromolith RP-18
column (125� 4.6 mm) from Merck KGaA thermostated at
251C. A mobile phase constituted by a mixture of methanol/
water (90:10) with a flow rate of 0.5 mL/min was used and
the injection volume was 25 mL. For the preparation of the
mobile phases, the solvents were filtered through 0.2 mm
nylon membrane filters and degassed during, at least, 1 h.
3 Results and discussion
3.1 Standard FFAs analysis
Figure 1 shows the UV–Vis chromatogram (total scan DAD
in the range 220–750 nm) and MS chromatogram (total ion
count (TIC) in the range m/z 250–1500 Da) of a mixture of
the six known DFFA. The analysis of the chromatograms in
Fig. 1 show that the peaks corresponding to the six DFFA
are well resolved but those due to palmitic and oleic acids
partially overlap.
Table 1 presents the retention times (RT) of the six
DFFAs. As expected, the general trend is the increasing of
RT with the increasing of the FFA chain length but the
degree of unsaturation and position of the terminal double
bound changes that trend [32].
RT:0.00 - 24.98
0 2 4 6 8 10 12 14 16 18 20 22 24
Time (min)
0
5
10
15
20
25
30
35
40
45
50
55
60
65
70
75
80
85
90
95
100
Rel
ativ
e A
bund
ance
10.0410.15
10.23
9.89 10.69
10.777.317.26 7.467.59
10.907.72 22.20
9.2610.97
22.139.195.149.107.14
11.089.06 16.31 16.416.875.08 16.115.23 11.458.206.6816.4811.715.56 16.00
11.79 14.13 22.3716.6515.92 21.0715.85 16.76 20.92
22.4217.67 20.5122.52
22.8023.14
4.352.861.810.25
RT:0.00 - 24.99
0 2 4 6 8 10 12 14 16 18 20 22 24
Time (min)
0
5
10
15
20
25
30
35
40
45
50
55
60
65
70
75
80
85
90
95
100
Rel
ativ
e A
bund
ance
10.11
10.26
10.325.4112.7710.847.03 10.04 12.695.75 13.07
11.026.06 9.957.07 13.165.38 7.16 12.64 13.255.23
7.31 9.89 13.2912.6011.32 16.265.13 13.38 16.457.38
16.548.295.1021.1016.1314.079.82 21.19
21.4116.6514.169.70 21.0121.47
16.088.77 22.1416.7622.2017.90 20.86
18.0714.48 20.7718.38 22.2919.20
22.33
22.42
22.6122.79 24.97
1.68 4.261.11 2.33
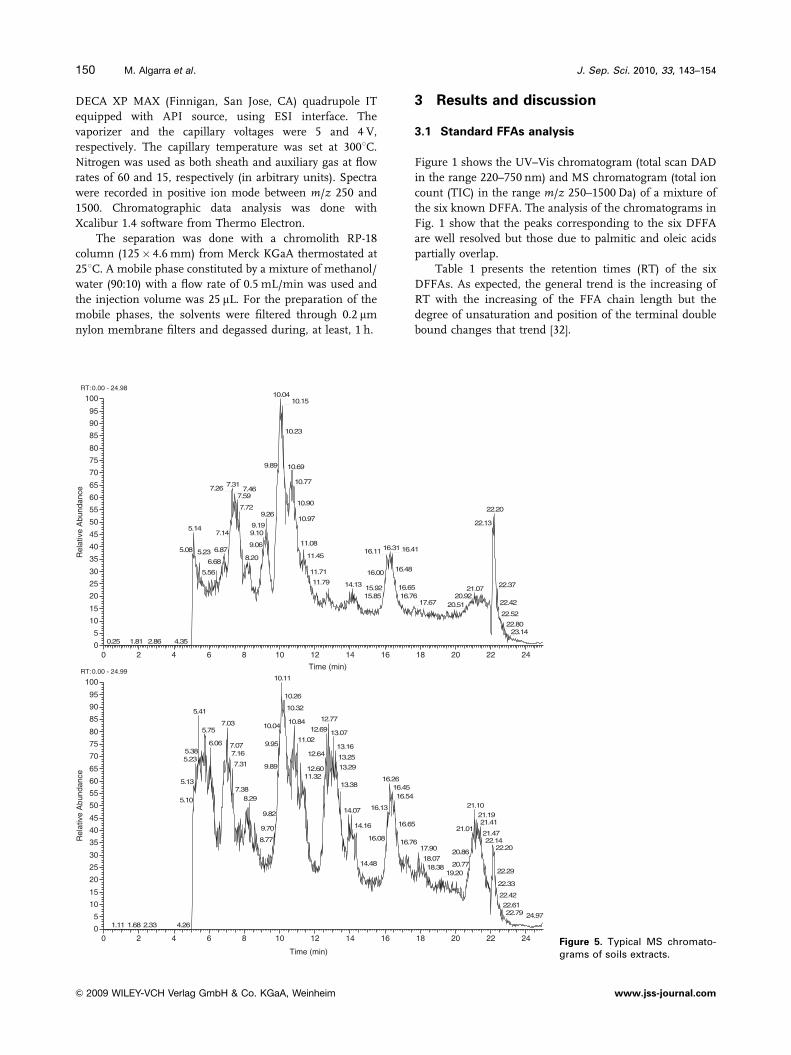
Figure 5. Typical MS chromato-grams of soils extracts.
J. Sep. Sci. 2010, 33, 143–154150 M. Algarra et al.
& 2009 WILEY-VCH Verlag GmbH & Co. KGaA, Weinheim www.jss-journal.com
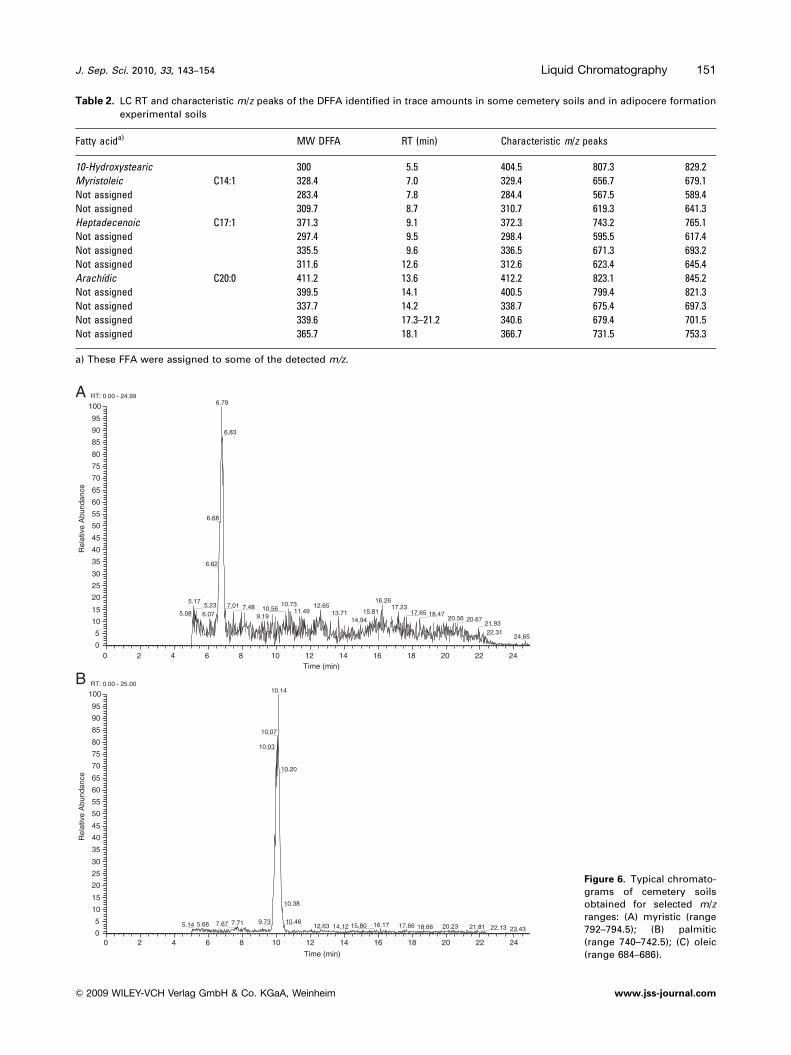
Table 2. LC RT and characteristic m/z peaks of the DFFA identified in trace amounts in some cemetery soils and in adipocere formation
experimental soils
Fatty acida) MW DFFA RT (min) Characteristic m/z peaks
10-Hydroxystearic 300 5.5 404.5 807.3 829.2
Myristoleic C14:1 328.4 7.0 329.4 656.7 679.1
Not assigned 283.4 7.8 284.4 567.5 589.4
Not assigned 309.7 8.7 310.7 619.3 641.3
Heptadecenoic C17:1 371.3 9.1 372.3 743.2 765.1
Not assigned 297.4 9.5 298.4 595.5 617.4
Not assigned 335.5 9.6 336.5 671.3 693.2
Not assigned 311.6 12.6 312.6 623.4 645.4
Arachıdic C20:0 411.2 13.6 412.2 823.1 845.2
Not assigned 399.5 14.1 400.5 799.4 821.3
Not assigned 337.7 14.2 338.7 675.4 697.3
Not assigned 339.6 17.3–21.2 340.6 679.4 701.5
Not assigned 365.7 18.1 366.7 731.5 753.3
a) These FFA were assigned to some of the detected m/z.
RT: 0.00 - 24.99A
B
0 2 4 6 8 10 12 14 16 18 20 22 24Time (min)
0
5
10
15
20
25
30
35
40
45
50
55
60
65
70
75
80
85
90
95
100
Rel
ativ
e A
bund
ance
6.79
6.83
6.68
6.62
16.265.17 10.735.23 7.01 12.65 17.237.48 10.56 11.49 15.81 17.6513.715.08 6.07 18.479.19 20.56 20.6714.94 21.9322.31
24.65
RT: 0.00 - 25.00
0 2 4 6 8 10 12 14 16 18 20 22 24
Time (min)
0
5
10
15
20
25
30
35
40
45
50
55
60
65
70
75
80
85
90
95
100
Rel
ativ
e A
bund
ance
10.14
10.07
10.03
10.20
10.38
9.73 10.467.717.675.665.14 16.1715.80 17.6612.63 20.2314.12 18.66 21.81 22.13 23.43
Figure 6. Typical chromato-grams of cemetery soilsobtained for selected m/zranges: (A) myristic (range792–794.5); (B) palmitic(range 740–742.5); (C) oleic(range 684–686).
J. Sep. Sci. 2010, 33, 143–154 Liquid Chromatography 151
& 2009 WILEY-VCH Verlag GmbH & Co. KGaA, Weinheim www.jss-journal.com
The UV spectra of all the DFFA are similar with a
maximum wavelength at 259 nm (Fig. 2A). By selecting a
UV detection at 259 nm the chromatogram becomes
simpler (Fig. 2B). However, some overlap of the palmitic
and oleic acids derivatives is still observed that does not
compromise a quantitative analysis.
As shown in Fig. 3, the mass spectra of the six known
DFFA were easily detected confirming that the derivatization
reaction proceeded as expected and the amides of the FFA
were indeed obtained. Besides that m/z of the DFFA mole-
cule, two more characteristic m/z values of each DFFA were
detected with higher sensitivity: the dimer of the DFFA and
the dimer plus sodium ion. Figure 3 and Table 1 shows and
summarizes the characteristic m/z peaks of each DFFA.
The analysis of the results obtained for the six DFFA
shows that the proposed chromatographic methodology allows
the unequivocal separation and identification of FFA based on
RT and MS of the corresponding derivative. Also, at least for
pure FFA solutions, the quantification of the six studied FFAs
is apparently possible using a UV detection at 259 nm.
3.2 Soil samples analysis
In order to assess the perforce of the proposed methodology
in real samples, 24 samples of soils were studied (extracted,
derivatized and analysed).
Figure 4 shows some examples of UV (detection at
259 nm) chromatogram of soil samples. These chromato-
grams are usually characterized by some intense peaks with
RT close to the previously detected DFFA but with incom-
patible UV spectra. This observation shows that the possibility
of a quantitative analysis of the DFFA using a simple UV
detector should be done with caution. Nevertheless, the DFFA
are chiral molecules and, if further confirmatory qualitative
and/or quantitative analysis is required, chiral columns
coupled to chiral and/or MS detector can be used [33, 34].
Figure 5 shows some examples of MS chromatogram of
the soil samples. A preliminary analysis of these chromato-
grams shows, as expected from the analysis of the UV
chromatogram, that they are more complex, with other m/zpeaks, besides those observed for the six known DFFA.
However, from the analysis of the characteristic m/z values
at the expected RT, the derivatives of myristic, linoleic,
palmitic, oleic, margaric and stearic, plus two other DFFA,
were identified in almost all studied soil samples. These
new DFFA were identified as corresponding to the deriva-
tives of palmitoleic (C15:0) and pentadecanoic acids (C16:1)
(Table 1).
Besides this set of eight DFFA that are present in almost
all soil samples, there are a set of 12 DFFA that are detected
in some samples or are only present in trace quantities. As
shown in Table 2 all the DFFA show the characteristic three
m/z values. Some of these new peaks can be tentatively
assigned (comparing the expected m/z values) to a DFFA [5,
35]: myristoleic, heptadecenoic and arachidic acids.
Although some samples show overlapping of the DFFA
when the TIC detection is used, the extracted ion chromato-
grams using one of the characteristic DFFA m/z are highly
improved. Because the mass of the DFFA corresponding to
the dimer plus sodium show the highest sensitivity, it was
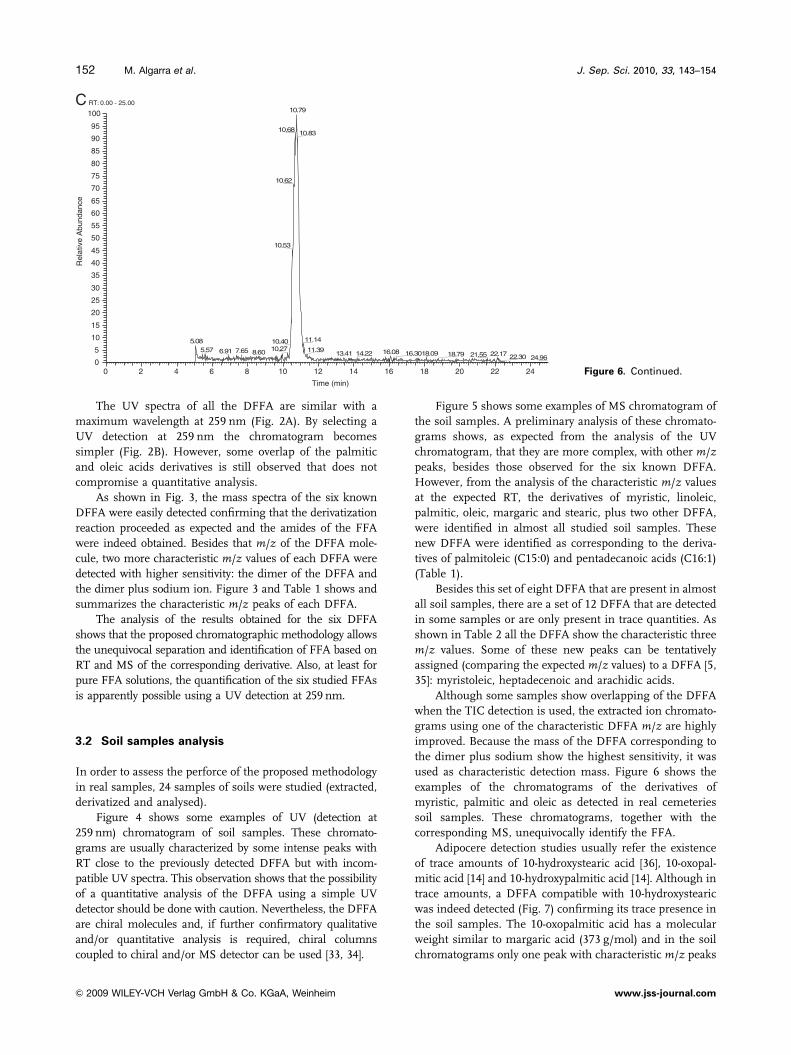
used as characteristic detection mass. Figure 6 shows the
examples of the chromatograms of the derivatives of
myristic, palmitic and oleic as detected in real cemeteries
soil samples. These chromatograms, together with the
corresponding MS, unequivocally identify the FFA.
Adipocere detection studies usually refer the existence
of trace amounts of 10-hydroxystearic acid [36], 10-oxopal-
mitic acid [14] and 10-hydroxypalmitic acid [14]. Although in
trace amounts, a DFFA compatible with 10-hydroxystearic
was indeed detected (Fig. 7) confirming its trace presence in
the soil samples. The 10-oxopalmitic acid has a molecular
weight similar to margaric acid (373 g/mol) and in the soil
chromatograms only one peak with characteristic m/z peaks
C RT: 0.00 - 25.00
0 2 4 6 8 10 12 14 16 18 20 22 24
Time (min)
0
5
10
15
20
25
30
35
40
45
50
55
60
65
70
75
80
85
90
95
100
Rel
ativ
e A
bund
ance
10.79
10.68 10.83
10.62
10.53
11.145.08 10.4010.27 11.395.57 7.656.91 16.088.60 13.41 16.3014.22 18.09 22.1718.79 21.55 22.30 24.96
Figure 6. Continued.
J. Sep. Sci. 2010, 33, 143–154152 M. Algarra et al.
& 2009 WILEY-VCH Verlag GmbH & Co. KGaA, Weinheim www.jss-journal.com
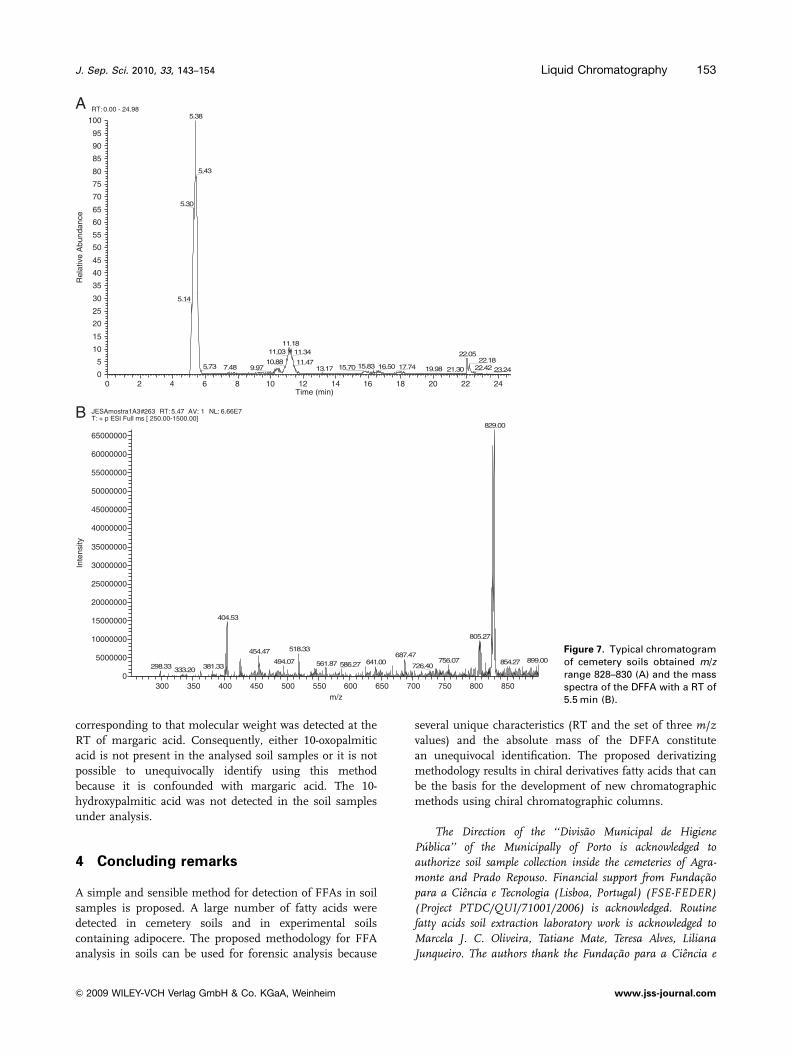
corresponding to that molecular weight was detected at the
RT of margaric acid. Consequently, either 10-oxopalmitic
acid is not present in the analysed soil samples or it is not
possible to unequivocally identify using this method
because it is confounded with margaric acid. The 10-
hydroxypalmitic acid was not detected in the soil samples
under analysis.
4 Concluding remarks
A simple and sensible method for detection of FFAs in soil
samples is proposed. A large number of fatty acids were
detected in cemetery soils and in experimental soils
containing adipocere. The proposed methodology for FFA
analysis in soils can be used for forensic analysis because
several unique characteristics (RT and the set of three m/zvalues) and the absolute mass of the DFFA constitute
an unequivocal identification. The proposed derivatizing
methodology results in chiral derivatives fatty acids that can
be the basis for the development of new chromatographic
methods using chiral chromatographic columns.
The Direction of the ‘‘Divisao Municipal de HigienePublica’’ of the Municipally of Porto is acknowledged toauthorize soil sample collection inside the cemeteries of Agra-monte and Prado Repouso. Financial support from Fundac- aopara a Ciencia e Tecnologia (Lisboa, Portugal) (FSE-FEDER)(Project PTDC/QUI/71001/2006) is acknowledged. Routinefatty acids soil extraction laboratory work is acknowledged toMarcela J. C. Oliveira, Tatiane Mate, Teresa Alves, LilianaJunqueiro. The authors thank the Fundac- ao para a Ciencia e
RT:A
B
0.00 - 24.98
0 2 4 6 8 10 12 14 16 18 20 22 24Time (min)
0
5
10
15
20
25
30
35
40
45
50
55
60
65
70
75
80
85
90
95
100
Rel
ativ
e A
bund
ance
5.38
5.43
5.30
5.14
11.1811.03 11.34 22.05
22.1810.88 11.4715.835.73 16.50 17.7415.707.48 22.429.97 13.17 19.98 21.30 23.24
JESAmostra1A3#263 RT: 5.47 AV: 1 NL: 6.66E7T: + p ESI Full ms [ 250.00-1500.00]
300 350 400 450 500 550 600 650 700 750 800 850m/z
0
5000000
10000000
15000000
20000000
25000000
30000000
35000000
40000000
45000000
50000000
55000000
60000000
65000000
Inte
nsity
829.00
404.53
805.27
518.33454.47 687.47899.00756.07494.07 72.45800.146561.87 586.27 726.40381.33298.33 333.20
Figure 7. Typical chromatogramof cemetery soils obtained m/zrange 828–830 (A) and the massspectra of the DFFA with a RT of5.5 min (B).
J. Sep. Sci. 2010, 33, 143–154 Liquid Chromatography 153
& 2009 WILEY-VCH Verlag GmbH & Co. KGaA, Weinheim www.jss-journal.com
Tecnologia (Lisboa, Portugal) under the frame of the Ciencia2007 program.
The authors have declared no conflict of interest.
5 References
[1] Den Dooren de Jong, L. E., Antonie van LeeuwenhoekJ. Microb. Ser. 1961, 27, 337–361.
[2] Rosenfeld, L., Clin. Chem. 2002, 48, 186–197.
[3] Dent, B. B., Forbes, S. L., Stuart, B. H., Environ. Geol.2004, 45, 576–585.
[4] Forbes, S. L., Stuart, B. H., Dadour, I. R., Dent, B. B.,J. Forensic Sci. 2004, 49, 566–574.
[5] Notter, S. J., Stuart, B. H., Dent, B. B., Keegan, J., Eur. J.Lipid Sci. Tech. 2008, 110 73–80.
[6] Nushida, H., Adachi, J., Takeuchi, A., Asano, M., Ueno,Y., Forensic Sci. Int. 2008, 175, 160–165.
[7] Forbes, S. L., Stuart, B. H., Dent, B. B., Forensic Sci. Int.2002, 127, 225–230.
[8] Adachi, J., Ueno, Y., Miwa, A., Asano, M., Nishimura,A., Tatsuno, Y., Lipids 1997, 32, 1155–1160.
[9] Yamaoka, A., Forensic Sci. 1977, 9, 63–73.
[10] Takatori, T., Forensic Sci. Int. 1996, 80, 49–61.
[11] Vane, C. H., Trick, J. K., Forensic Sci. Int. 2005, 154,19–23.
[12] Takatori, T., Terazawa, K., Nakano, K., Matsumiya, H.,Forensic Sci. Int. 1983, 23, 117–122.
[13] Takatori, T., Forensic Sci. Int. 1996, 80, 49–61.
[14] Takatori, T., Leg. Med. 2001, 3, 193–204.
[15] Forbes, S. L., Dent, B. B., Stuart, B. H., Forensic Sci. Int.2005, 154, 35–43.
[16] Fiedler, S., Schneckenberger, K., Graw, M., Arch.Environ. Contam. Toxicol. 2004, 47, 561–568.
[17] Forbes, S. L., Stuart, B. H., Dent, B. B., Forensic Sci. Int.2005, 154, 24–34.
[18] Wood, R., Lee, T., J. Chrom. 1983, 254, 237–246.
[19] Silva, F. O., Ferraz, V., Talanta 2006, 68, 643–645.
[20] Amet, Y., Adas, F., Berthou, F., Anal. Chim. Acta 2002,465, 193–198.
[21] Yang, W. C., Adamec, J., Regnier, F. E., Anal. Chem.2007, 79, 5150–5157.
[22] Zoutendam, P. H., Bowman, P. B., Rumph, J. L., Ryan, T.M., J. Chrom. 1984, 283, 281–287.
[23] Miwa, H., Yamamoto, M., J. Chrom. 1986, 351, 275–282.
[24] Miwa, H., Yamamoto, M., J. Chrom. 1987, 421, 33–41.
[25] Gutnikov, G., Streng, J. R., J. Chrom. 1991, 587, 292–296.
[26] Ben-Bassat, A. A., Wasserman, T., J. Liq. Chrom. Rel.Tech. 1987, 10, 2939–2950.
[27] Yasaka, Y., Tanaka, M., Matsumoto, T., Funazo, K.,Shono, T., Anal. Sci. 1989, 5, 611–612.
[28] Perret, D., Gentili, A., Marchese, S., Sergi, M., Capor-ossi, L., Rapid Commun. Mass Spectrom. 2004, 18,1989–1994.
[29] Dillon, R., Greig, M., Bhat, B., Anal. Chim. Acta 2008,627, 99–104.
[30] Vane, C. H., Trick, J. K., Forensic Sci. Int. 2000, 154,19–23.
[31] Andrade, M., Sousa, C., Borges, J. E., Freire, C., J. Phys.Org. Chem. 2005, 18, 935–940.
[32] Chen, S. H., Chuang, Y. J., Anal. Chim. Acta 2002, 465,145–155.
[33] Kazuaki, A., Ryuta, S., Seiya, S., Hiroshi, O., Chroma-tography 1999, 20, 308–309.
[34] Lingeman, H., in: Detection-Oriented DerivatizationTechniques in Liquid Chromatography, 1st Edn., CRCPress, Boca Raton 1990.
[35] Frund, H., Schoenen, D., Forensic Sci. Int. 2009, 188,18–22.
[36] Saito, K., J. Biochem. 1966, 59, 487–494.
J. Sep. Sci. 2010, 33, 143–154154 M. Algarra et al.
& 2009 WILEY-VCH Verlag GmbH & Co. KGaA, Weinheim www.jss-journal.com