las opiniones y los contenidos de los trabajos publicados son
TRANSCRIPT
Red Internacional de Investigadores en Competitividad XIV Congreso
ISBN 978-607-96203-0-9
Las opiniones y los contenidos de los trabajos publicados son responsabilidad de los autores, por
tanto, no necesariamente coinciden con los de la Red Internacional de Investigadores en
Competitividad.
Esta obra por la Red Internacional de Investigadores en Competitividad se encuentra bajo una
Licencia Creative Commons Atribución-NoComercial-SinDerivadas 3.0 Unported. Basada en una
obra en riico.net.
ISBN 978-607-96203-0-9 XIV Congreso de la Red Internacional de Investigadores en Competitividad
Use of mobile applications in individual public transportation in Mexico
Claudia Leticia Preciado-Ortiz1
Abstract
Objective: The main objective of this research work was to analyze the factors that influence
satisfaction and the intention to continue with the use of transport mobile applications among young
university students from Guadalajara, Jalisco, Mexico.
Design / Methodology / Approach: The approach was quantitative. 144 valid responses were used
and data analysis is performed by multiple regression.
Results: The results indicate that information quality, system quality and perceived risk are
influential predictors of satisfaction. At the same time, satisfaction and design quality were
predictors for the continuity of the use of the app.
Originality / Value: Companies that offer individual passenger transport through a mobile
application have increased in recent years, generating intense competition both between existing
brands and with established traditional taxis. This study provides new and recent information for
marketing managers and academics on application user behavior in the transportation industry.
Keywords: mobile app, public transport, satisfaction, intention to continue use.
Resumen
Objetivo: El presente trabajo de investigación tuvo como principal objetivo analizar los factores
que influyen en la satisfacción y la intención de continuar con el uso de aplicaciones móviles para
las empresas en red de transporte particular entre los jóvenes universitarios de Guadalajara, Jalisco.
Diseño / Metodología / Enfoque: El enfoque fue cuantitativo. Se utilizaron 144 respuestas válidas
y el análisis de los datos se realize mediante regresión múltiple.
Resultados: Los resultados indican que la calidad de la información, calidad del sistema y riesgo
percibido son predictores influyentes en la satisfacción. Mientras que la satisfacción y la calidad del
diseño fueron predictores para la continuidad del uso de la app.
Originalidad / Valor: Las empresas que ofrecen transporte individual de pasajeros mediante una
app móvil han aumentado en los últimos años generando una fuerte competencia tanto entre las
marcas existentes como con los taxis tradicionales establecidos. Este estudio aporta información
nueva y reciente para los directores de marketing y académicos sobre el comportamiento del usuario
de apps en la industria del transporte.
Palabras clave: app móviles, transporte público, satisfacción, intención de continuar el uso.
1 Doctorado en Ciencias Administrativas – CONACYT. Universidad de Guadalajara
ISBN 978-607-96203-0-9 XIV Congreso de la Red Internacional de Investigadores en Competitividad
Introduction Mobile applications (apps) currently occupy an important place in daily life (Jain, Kumar and
Singla, 2014), even becoming indispensable in daily activities (Soemantadiredia, Vitayala &
Hermadi, 2015), and changing the ways of life of many ways (Chan, Chang, Lau, Law & Lei,
2016). o mention an example are the applications to stay related to other people in the personal or
work environment (Whatsapp, Facebook, Messenger, Zoom, Google Meet, among others), or to
communicate and perform basic activities (such as remembering the time to wake up, take medicine
or a meeting) or even applications that are in the form of financial services, airline reservation
services, shopping, games, health applications, food and fitness and a new service in ordering taxis
(Keong, 2016).
The taxi sector has recently had a phase of disruption generated by social, cultural and economic
changes through the introduction of the internet and new technologies (Akbulaev, 2020). Emerging
mobile transport based on complementary or independent technological platforms that act as
intermediaries between passengers and drivers, through the use of applications appearing in
countries around the world (Agyeman, Kwarteng, & Zurkalnaine, 2019). This new taxi ordering
service is called Mobile Booking Taxi Application (MBTA) (Kanti, Anandya & Rahardja, 2018),
where the user makes the point-to-point service request from a mobile device at any time and from
anywhere (Harding, Kandlikar, & Gulati, 2016; Kanti et al. 2018; Mohamed, Rye, & Fonzone,
2020). For example, Uber, Hailo, Curb and Lyft in the USA, Uber and Cabify in Europe and Latin
America, App Chiflea in Ecuador, Easy taxi and 99 taxis in Brazil, Little and Mondo in Africa, or
Grab, Go-Jek, Didache, Kuaidi Dache, Didi, Meru, Ola, and Hailing in Asia. This innovation has
generated new direct competition to taxis, since in the beginning the absence of legislation to
operate in this sector, previously exclusively for taxis, caused problems in public transport policies,
such as monopoly or protests in different countries, especially the poorest, that they were not
prepared for this (Harding et al. 2016; Akimova, Arana-Landín, & Heras-Saizarbitoria, 2020; Cetin
& Deakin, 2017; Paronda, Regido, & Napalang, 2016; Ye, Cen, Chen, & Zhen, 2018; Contreras &
Paz, 2018; Agyeman et al. 2019; Mohamed et al. 2020; Sánchez-Torres, Correa & Gómez, 2020).
In various parts of the world, the individual public passenger service (taxis) had been presenting
problems related to asymmetries of information and coordination between client and driver, as it
was not known precisely where to take a taxi, service hours, and driver reliability, safety,
cleanliness and vehicle quality, knowledge of the city by the driver and the price to pay for the
service offered, among others, reflecting on uncomfortable trips for the consumer (Balachandran &
ISBN 978-607-96203-0-9 XIV Congreso de la Red Internacional de Investigadores en Competitividad
Bin, 2017). To address these problems, different work schemes and their regulation have been
adopted with varying degrees of success, implementing the MTBAs to provide better quality
services to passengers and entirely in tune with market changes (Hamzah et al. 2018; Weng,
Zailani, Iranmanesh, & Hyun, 2017) being proposed for their applicability in taxis in many
countries (Ge et al. 2020; Nguyen-Phuoc, Su, Tran, Le, & Johnson, 2020; Wang, He, Yang, &
Oliver Gao, 2016; Ye et al. 2018; Zhang, Honnappa, & Ukkusuri, 2020). The advantages it provides
is that by using the MTBAs users keep informed at all times about the time, price, route and driver
data of the vehicle (Weng et al. 2017). Users can fix the departure and destination location by GPS
or by typing the location that drivers can easily reach (Chan et al. 2016). This type of application
motivates the user to change their habit of using private transport to public transport (Kanti et al.
2018). In the literature, some research can be found on the factors that influence the intention to use,
consumer satisfaction, quality of service, loyalty, among other aspects regarding public or private
transport in different countries of the world, such as in Indonesia (Sumaedi, Bakti & Yarmen,
2012); South Africa (Govender, 2014); United States (Rayle, 2014 and Hong & Zhang, 2017);
Vietnam (Khuong & Dai, 2016); and Malaysia (Balachandran & Bin, 2017), however, it can be
identified by the recentness of the subject, that there is still a significant gap in the literature
regarding the taxi industry, the use of apps in this sector and the consumer. In light of the foregoing,
the purpose of this document is to identify what factors affect satisfaction and the intention to
continue using the apps of the so-called transportation network companies or ERT.
Mobile applications in individual public transport
Based on the development of smartphone technologies and global positioning systems, various
companies have emerged dedicated to mediating the agreement between users and providers of
individual public transport services through downloadable applications on mobile devices, which
makes, on the one hand, the user demands point-to-point transport services and, on the other hand, a
group of private drivers offers the service by using the same application and their vehicles. These
companies "are called Transport Network Companies or ERT" (Federal Commission of Economic
Competition, 2015, p. 2). According to the Mexican Institute of Transportation (IMT, 2007), the
transportation service is classified as private and public, subdividing the latter into "collective
public transportation and individual public transportation (point-to-point taxi and route or subject to
itinerary)” (Federal Commission for Economic Competition, 2015, p. 1). Within the individual
public transport of passengers, the traditional taxi, ridesharing and ERT can be identified.
“Traditional taxis are subject to specific regulation of passenger transport and imply the provision
of public service in exchange for a regulated charge. Ridesharing consists of sharing a car without
ISBN 978-607-96203-0-9 XIV Congreso de la Red Internacional de Investigadores en Competitividad
an economic transaction involved and, it usually occurs between people who know each other.
ERTs use technological platforms to communicate passengers with independent drivers” (Federal
Commission of Economic Competition, 2015, p. 2).
ERTs have taken two different forms:
- Complementary platforms are those that connect consumers of point-to-point transport services
with taxi drivers registered in the public service modality. In Mexico, an example of these systems
is Easytaxi and Yaxi.
- Independent platforms, which are those that through an application connect drivers who offer
particular services to consumers. Examples of these platforms are Uber and Cabify (Federal
Commission for Economic Competition, 2015, p. 2 - 3).
According to the Global Mobile Consumer Survey (GMCS) 2017 Mexico chapter, on average there
are 14 applications installed on most mobile devices, and that in terms of payments shows that
paying for a taxi (54%) is the most performed activity by users through the use of smartphones.
According to Statista eTravel Report 2019, it is observed that the number of users of mobility apps
in the world to request a driver service (taxi, uber, cabify), rent a car or bicycle for short trips or
share vehicles is considerable. Of the 43,034 respondents from 52 countries, China, Russia, Spain
and the US occupy the first positions (51%, 38%, 35% and 35%, respectively), followed by Brazil
(33%), the United Kingdom (30 %), France (26%), India (23%), Italy (21%) and Germany (20%).
Although Mexico is not among the ten countries with the most users of this type of application, it
has taken significant steps in this industry. According to The Competitive Intelligence Unit (CIU)
(January 20, 2020), transportation platforms have increased their preference among consumers over
traditional alternatives. In 2019, 59.6 million (71%) of Internet users in Mexico made payments
through an app or website. Of this percentage, 16.2% corresponds to transport applications, only
below the payment of audiovisual content platform services (22.1%) and the sale of electronic
products (17.8%). Within the transport service, the five leading players are Uber (80%), Cabify
(14%), DiDi (4%), Easy Taxi (1%) and Beat (1%).
It is important to mention that its growth in the market will depend on the standards of service
quality, reputation and price level perceived by users in its horizontal comparison and compared to
traditional substitutes. In the same way, the increase in payment options and greater security in the
provision of the service.
Theoretical model and development of hypotheses
Mobile commerce is one of the most favored areas for companies that have been able to adapt.
According to Rojas (2019), applications give the consumer the impression that the service is tailor-
ISBN 978-607-96203-0-9 XIV Congreso de la Red Internacional de Investigadores en Competitividad
made for them, which encourages brand identification. In this way, the company can take the user
by the hand throughout the purchase process, facilitate the transaction and knowledge or exploration
of the product or service offered in a close and immediate language.
Intention to continue use
Behavioral intentions can be seen as the signals shown if the client continues to use the services of
one company or switch to a different provider (Zeithaml et al. 1988). Therefore, through a better
understanding of passenger involvement, more appropriate marketing strategies can be developed
and adapted to services (Lai & Chen, 2011).
Satisfaction
Satisfaction can be defined as the consumer's feeling that the consumption of a product delivers
results against a standard of pleasure or displeasure. This definition mirrors on one side,
satisfactions cognitive nature, i.e. comparison between expectations and performance while on the
other side, it mirrors on the afective nature which is the related pleasure feeling (Moliner, Sánchez,
Rodríguez & Callarisa, 2007 cited in Olubusola, 2015, p. 2).
Mobile consumer user satisfaction (MCUS) can be defined as ''a summary affective response of
varying intensity that follows mobile commerce activities and is stimulated by several focal aspects,
such as information quality, system quality, and service quality'' (Wang & Liao, 2007, p. 384). The
more satisfied the users are, then the higher the probability that the users will continue to use the
current application (Oghuma et al., 2016; Kanti et al. 2018). In the same time, the results of several
studies on satisfaction and intention to continue are positively accepted (Lai & Chen, 2011; Lee and
Kwon, 2011; Kanti et al. 2018) including public transport services (Joewono and Kubota, 2007;
Nathanail, 2008; Lai & Chen, 2011).
Perceived risk
The perceived risk was evaluated as an uncertainty about the possible negative effect of the use of
products or services (Srivastava & Sharma, 2011) or also the degree of uncertainty of the consumer
regarding the result of a purchase decision (Keong, 2016). The perceived risk plays an important
role in the use or purchase online since it is related to the perceptions of the users (Currás-Pérez et
al. 2013). In this context it is defined as the “uncertainty about the result of the use of innovation”
(Ram and Sheth 1989; Miyazaki & Fernandez, 2001; Gerrard and Cunningham, 2003; Cruz,
Barreto, Muñoz-Gallego & Laukkanen, 2010).
ISBN 978-607-96203-0-9 XIV Congreso de la Red Internacional de Investigadores en Competitividad
Research on technology adoption provides evidence that an individual's perception of risk is
important when considering the acquisition of a new technology or service (Laforet and Li 2005,
Yang 2005; Im et al. 2007; Sohail & Al-Jabri, 2014; Kanti et al. 2018).
In the context of mobile apps, the perception of risk is even more important due to the threat of
privacy and security concerns (Luarn and Lin 2005; Reid & Levy, 2008). For example, fear of
losing confidential information (Kuisma et al. 2007), hackers who can access your bank account by
making unauthorized charges (Poon 2008), or fear to the loss or theft of a mobile device with stored
data (Coursaris et al. 2003; Kwame, 2013).
System quality
Degree to wich individuals perceive that the system is satisfying, in terms of transfer speed and
reliability (Kleijnen, et al., 2004 cited in Kumar & Ravindran, 2012).
Quality information
Ding and Straub (2008) define information quality as “the ability to provide information to benefit
users in terms of accuracy, completeness and up-to-date” (Kumar & Ravindran, 2012).
Information is one of the important aspects for the client when making the decision to use and pay
for a service. In matters of mobile apps, it is not the exception, and it could be said that the quality
of the information presented acquires major importance. Having sufficient information guides
consumers to make better decisions and allows them to more easily accept and continue using a
product or service (Sripalawat et al. 2011).
Information is essential in any innovation diffusion process (Cruz et al. 2010) and plays a crucial
role in reducing consumer resistance (Jun and Cai, 2001; Rogers, 2003; Cruz et al., 2010; Kwame,
2013).
Design quality
The quality of the design of the transport mobile app is another important aspect to consider. Some
authors associate this characteristic as the device barrier, inappropriate device (Cruz et al. 2010;
Sripalawat et al. 2011), design (Lee and Chung, 2009; Poey and Arffin, 2015) or interface design
(Yu and Fang, 2009). In the mobile context, it can be defined as “the relative importance in the
attributes of the services (screen size, keyboard, location, response time” (Laukkanen, 2007; Yang,
2009).
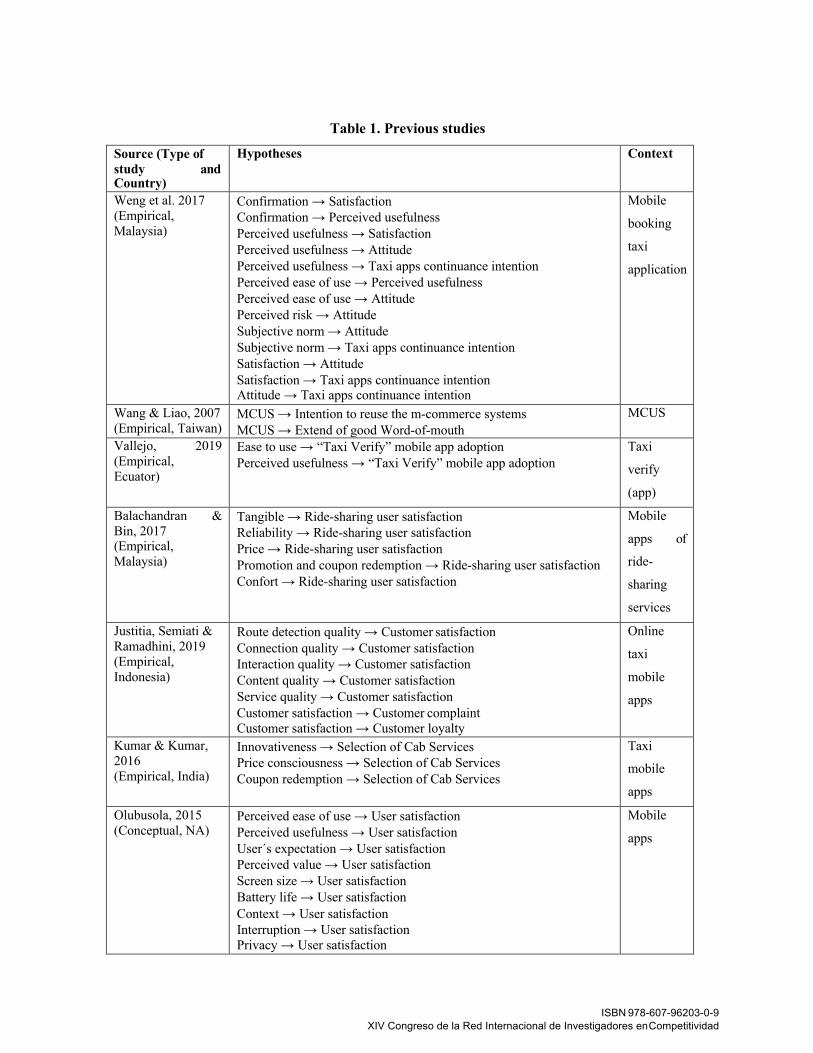
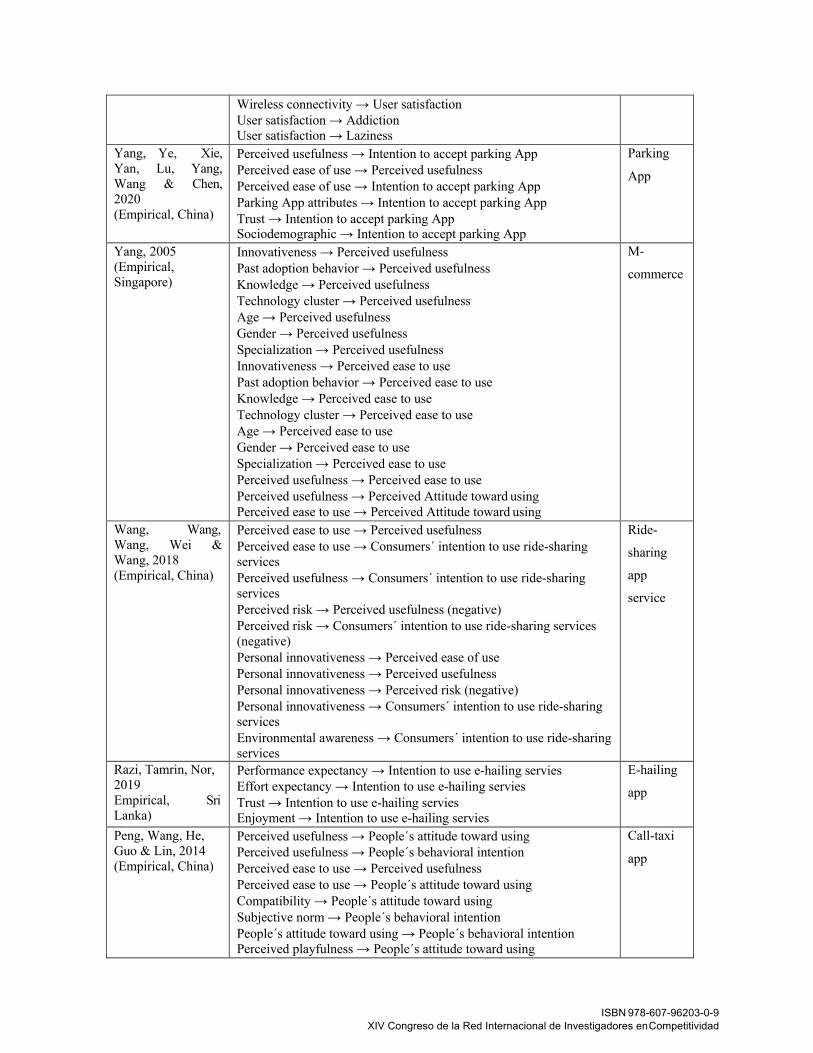
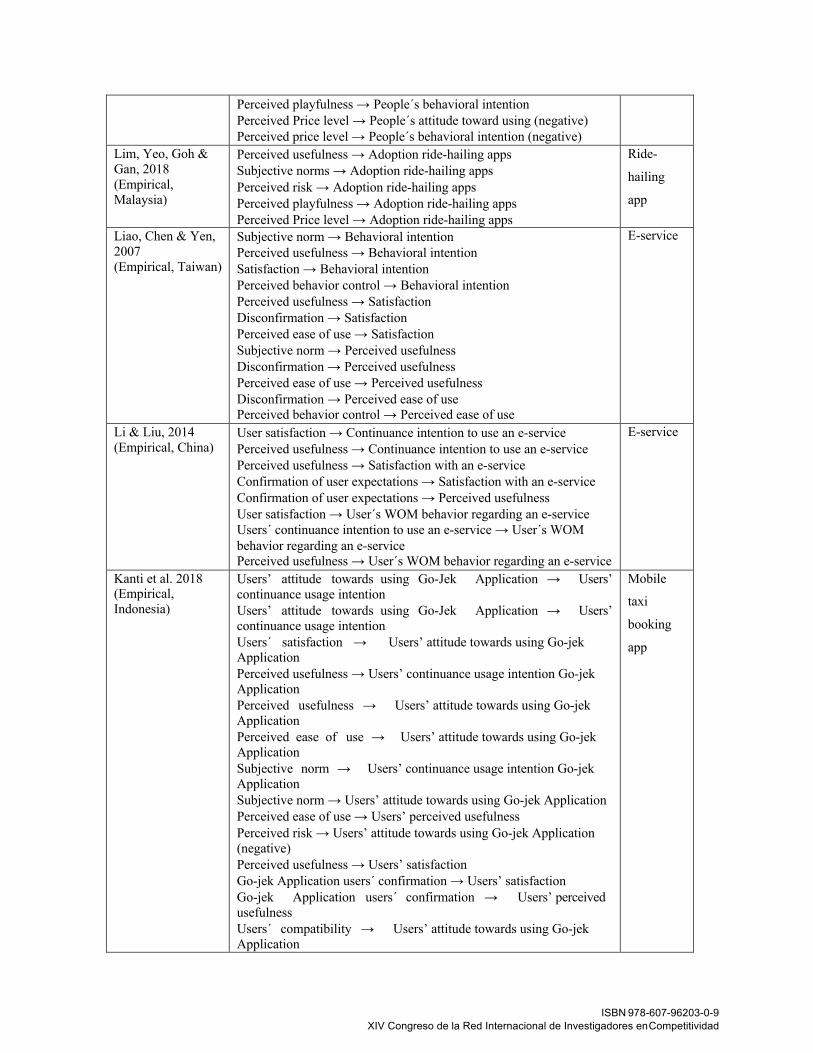
Table 1 shows some studies that have been carried out in the mobile context, specifying authors,
hypotheses, context and country in which the study was carried out.
ISBN 978-607-96203-0-9 XIV Congreso de la Red Internacional de Investigadores en Competitividad
Table 1. Previous studies
Source (Type of study and Country)
Hypotheses Context
Weng et al. 2017 (Empirical, Malaysia)
Confirmation → Satisfaction Confirmation → Perceived usefulness Perceived usefulness → Satisfaction Perceived usefulness → Attitude Perceived usefulness → Taxi apps continuance intention Perceived ease of use → Perceived usefulness Perceived ease of use → Attitude Perceived risk → Attitude Subjective norm → Attitude Subjective norm → Taxi apps continuance intention Satisfaction → Attitude Satisfaction → Taxi apps continuance intention Attitude → Taxi apps continuance intention
Mobile
booking
taxi
application
Wang & Liao, 2007 (Empirical, Taiwan)
MCUS → Intention to reuse the m-commerce systems MCUS → Extend of good Word-of-mouth
MCUS
Vallejo, 2019 (Empirical, Ecuator)
Ease to use → “Taxi Verify” mobile app adoption Perceived usefulness → “Taxi Verify” mobile app adoption
Taxi
verify
(app)
Balachandran & Bin, 2017 (Empirical, Malaysia)
Tangible → Ride-sharing user satisfaction Reliability → Ride-sharing user satisfaction Price → Ride-sharing user satisfaction Promotion and coupon redemption → Ride-sharing user satisfaction Confort → Ride-sharing user satisfaction
Mobile
apps of
ride-
sharing
services
Justitia, Semiati & Ramadhini, 2019 (Empirical, Indonesia)
Route detection quality → Customer satisfaction Connection quality → Customer satisfaction Interaction quality → Customer satisfaction Content quality → Customer satisfaction Service quality → Customer satisfaction Customer satisfaction → Customer complaint Customer satisfaction → Customer loyalty
Online
taxi
mobile
apps
Kumar & Kumar, 2016 (Empirical, India)
Innovativeness → Selection of Cab Services Price consciousness → Selection of Cab Services Coupon redemption → Selection of Cab Services
Taxi
mobile
apps
Olubusola, 2015 (Conceptual, NA)
Perceived ease of use → User satisfaction Perceived usefulness → User satisfaction User´s expectation → User satisfaction Perceived value → User satisfaction Screen size → User satisfaction Battery life → User satisfaction Context → User satisfaction Interruption → User satisfaction Privacy → User satisfaction
Mobile
apps
ISBN 978-607-96203-0-9 XIV Congreso de la Red Internacional de Investigadores en Competitividad
Wireless connectivity → User satisfaction User satisfaction → Addiction User satisfaction → Laziness
Yang, Ye, Xie, Yan, Lu, Yang, Wang & Chen, 2020 (Empirical, China)
Perceived usefulness → Intention to accept parking App Perceived ease of use → Perceived usefulness Perceived ease of use → Intention to accept parking App Parking App attributes → Intention to accept parking App Trust → Intention to accept parking App Sociodemographic → Intention to accept parking App
Parking
App
Yang, 2005 (Empirical, Singapore)
Innovativeness → Perceived usefulness Past adoption behavior → Perceived usefulness Knowledge → Perceived usefulness Technology cluster → Perceived usefulness Age → Perceived usefulness Gender → Perceived usefulness Specialization → Perceived usefulness Innovativeness → Perceived ease to use Past adoption behavior → Perceived ease to use Knowledge → Perceived ease to use Technology cluster → Perceived ease to use Age → Perceived ease to use Gender → Perceived ease to use Specialization → Perceived ease to use Perceived usefulness → Perceived ease to use Perceived usefulness → Perceived Attitude toward using Perceived ease to use → Perceived Attitude toward using
M-
commerce
Wang, Wang, Wang, Wei & Wang, 2018 (Empirical, China)
Perceived ease to use → Perceived usefulness Perceived ease to use → Consumers´ intention to use ride-sharing services Perceived usefulness → Consumers´ intention to use ride-sharing services Perceived risk → Perceived usefulness (negative) Perceived risk → Consumers´ intention to use ride-sharing services (negative) Personal innovativeness → Perceived ease of use Personal innovativeness → Perceived usefulness Personal innovativeness → Perceived risk (negative) Personal innovativeness → Consumers´ intention to use ride-sharing services Environmental awareness → Consumers´ intention to use ride-sharing services
Ride-
sharing
app
service
Razi, Tamrin, Nor, 2019 Empirical, Sri Lanka)
Performance expectancy → Intention to use e-hailing servies Effort expectancy → Intention to use e-hailing servies Trust → Intention to use e-hailing servies Enjoyment → Intention to use e-hailing servies
E-hailing
app
Peng, Wang, He, Guo & Lin, 2014 (Empirical, China)
Perceived usefulness → People´s attitude toward using Perceived usefulness → People´s behavioral intention Perceived ease to use → Perceived usefulness Perceived ease to use → People´s attitude toward using Compatibility → People´s attitude toward using Subjective norm → People´s behavioral intention People´s attitude toward using → People´s behavioral intention Perceived playfulness → People´s attitude toward using
Call-taxi
app
ISBN 978-607-96203-0-9 XIV Congreso de la Red Internacional de Investigadores en Competitividad
Perceived playfulness → People´s behavioral intention Perceived Price level → People´s attitude toward using (negative) Perceived price level → People´s behavioral intention (negative)
Lim, Yeo, Goh & Gan, 2018 (Empirical, Malaysia)
Perceived usefulness → Adoption ride-hailing apps Subjective norms → Adoption ride-hailing apps Perceived risk → Adoption ride-hailing apps Perceived playfulness → Adoption ride-hailing apps Perceived Price level → Adoption ride-hailing apps
Ride-
hailing
app
Liao, Chen & Yen, 2007 (Empirical, Taiwan)
Subjective norm → Behavioral intention Perceived usefulness → Behavioral intention Satisfaction → Behavioral intention Perceived behavior control → Behavioral intention Perceived usefulness → Satisfaction Disconfirmation → Satisfaction Perceived ease of use → Satisfaction Subjective norm → Perceived usefulness Disconfirmation → Perceived usefulness Perceived ease of use → Perceived usefulness Disconfirmation → Perceived ease of use Perceived behavior control → Perceived ease of use
E-service
Li & Liu, 2014 (Empirical, China)
User satisfaction → Continuance intention to use an e-service Perceived usefulness → Continuance intention to use an e-service Perceived usefulness → Satisfaction with an e-service Confirmation of user expectations → Satisfaction with an e-service Confirmation of user expectations → Perceived usefulness User satisfaction → User´s WOM behavior regarding an e-service Users´ continuance intention to use an e-service → User´s WOM behavior regarding an e-service Perceived usefulness → User´s WOM behavior regarding an e-service
E-service
Kanti et al. 2018 (Empirical, Indonesia)
Users’ attitude towards using Go-Jek Application → Users’ continuance usage intention Users’ attitude towards using Go-Jek Application → Users’ continuance usage intention Users´ satisfaction → Users’ attitude towards using Go-jek Application Perceived usefulness → Users’ continuance usage intention Go-jek Application Perceived usefulness → Users’ attitude towards using Go-jek Application Perceived ease of use → Users’ attitude towards using Go-jek Application Subjective norm → Users’ continuance usage intention Go-jek Application Subjective norm → Users’ attitude towards using Go-jek Application Perceived ease of use → Users’ perceived usefulness Perceived risk → Users’ attitude towards using Go-jek Application (negative) Perceived usefulness → Users’ satisfaction Go-jek Application users´ confirmation → Users’ satisfaction Go-jek Application users´ confirmation → Users’ perceived usefulness Users´ compatibility → Users’ attitude towards using Go-jek Application
Mobile
taxi
booking
app
ISBN 978-607-96203-0-9 XIV Congreso de la Red Internacional de Investigadores en Competitividad
Perceived playfulness → Users’ attitude towards using Go-jek Application
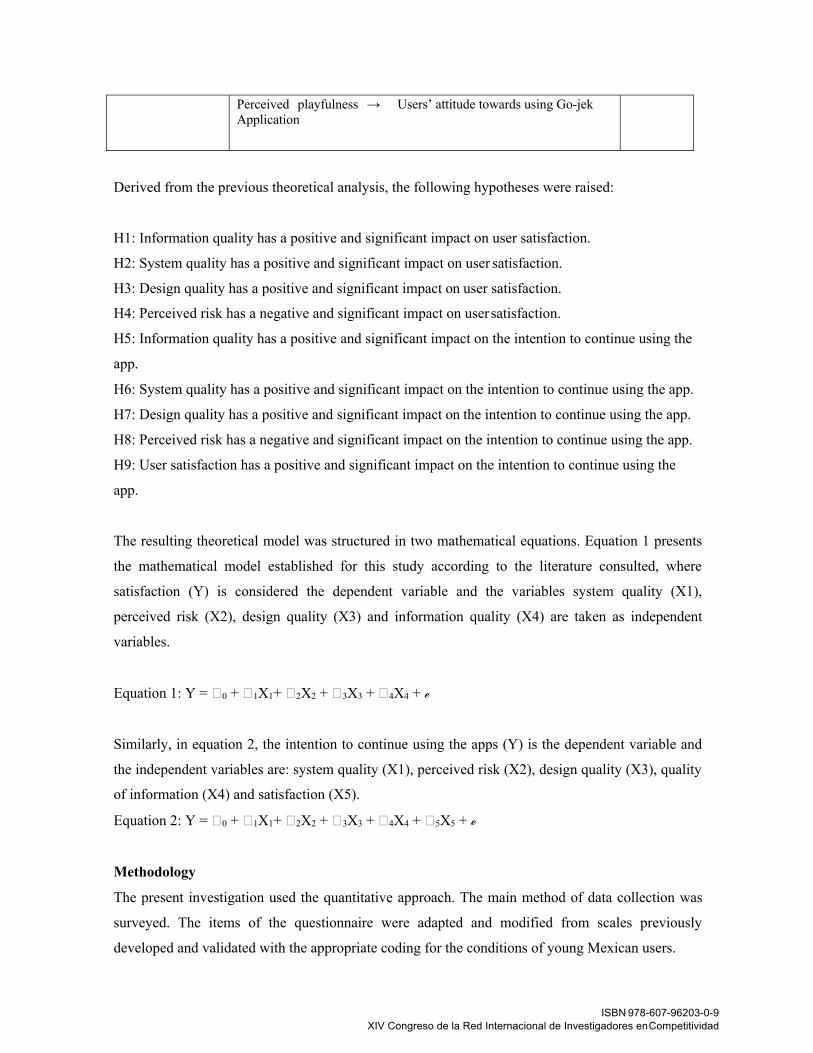
Derived from the previous theoretical analysis, the following hypotheses were raised:
H1: Information quality has a positive and significant impact on user satisfaction.
H2: System quality has a positive and significant impact on user satisfaction.
H3: Design quality has a positive and significant impact on user satisfaction.
H4: Perceived risk has a negative and significant impact on user satisfaction.
H5: Information quality has a positive and significant impact on the intention to continue using the
app.
H6: System quality has a positive and significant impact on the intention to continue using the app.
H7: Design quality has a positive and significant impact on the intention to continue using the app.
H8: Perceived risk has a negative and significant impact on the intention to continue using the app.
H9: User satisfaction has a positive and significant impact on the intention to continue using the
app.
The resulting theoretical model was structured in two mathematical equations. Equation 1 presents
the mathematical model established for this study according to the literature consulted, where
satisfaction (Y) is considered the dependent variable and the variables system quality (X1),
perceived risk (X2), design quality (X3) and information quality (X4) are taken as independent
variables.
Equation 1: Y = �0 + �1X1+ �2X2 + �3X3 + �4X4 + ℯ
Similarly, in equation 2, the intention to continue using the apps (Y) is the dependent variable and
the independent variables are: system quality (X1), perceived risk (X2), design quality (X3), quality
of information (X4) and satisfaction (X5).
Equation 2: Y = �0 + �1X1+ �2X2 + �3X3 + �4X4 + �5X5 + ℯ
Methodology
The present investigation used the quantitative approach. The main method of data collection was
surveyed. The items of the questionnaire were adapted and modified from scales previously
developed and validated with the appropriate coding for the conditions of young Mexican users.
ISBN 978-607-96203-0-9 XIV Congreso de la Red Internacional de Investigadores en Competitividad
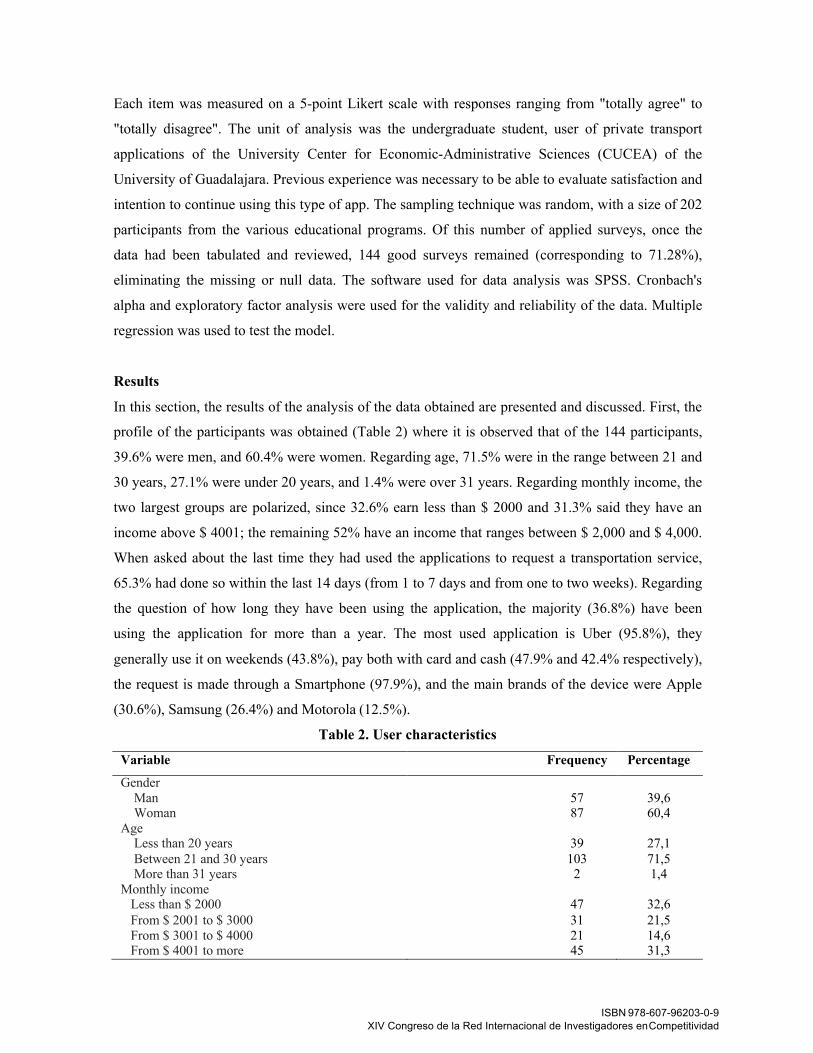
Each item was measured on a 5-point Likert scale with responses ranging from "totally agree" to
"totally disagree". The unit of analysis was the undergraduate student, user of private transport
applications of the University Center for Economic-Administrative Sciences (CUCEA) of the
University of Guadalajara. Previous experience was necessary to be able to evaluate satisfaction and
intention to continue using this type of app. The sampling technique was random, with a size of 202
participants from the various educational programs. Of this number of applied surveys, once the
data had been tabulated and reviewed, 144 good surveys remained (corresponding to 71.28%),
eliminating the missing or null data. The software used for data analysis was SPSS. Cronbach's
alpha and exploratory factor analysis were used for the validity and reliability of the data. Multiple
regression was used to test the model.
Results
In this section, the results of the analysis of the data obtained are presented and discussed. First, the
profile of the participants was obtained (Table 2) where it is observed that of the 144 participants,
39.6% were men, and 60.4% were women. Regarding age, 71.5% were in the range between 21 and
30 years, 27.1% were under 20 years, and 1.4% were over 31 years. Regarding monthly income, the
two largest groups are polarized, since 32.6% earn less than $ 2000 and 31.3% said they have an
income above $ 4001; the remaining 52% have an income that ranges between $ 2,000 and $ 4,000.
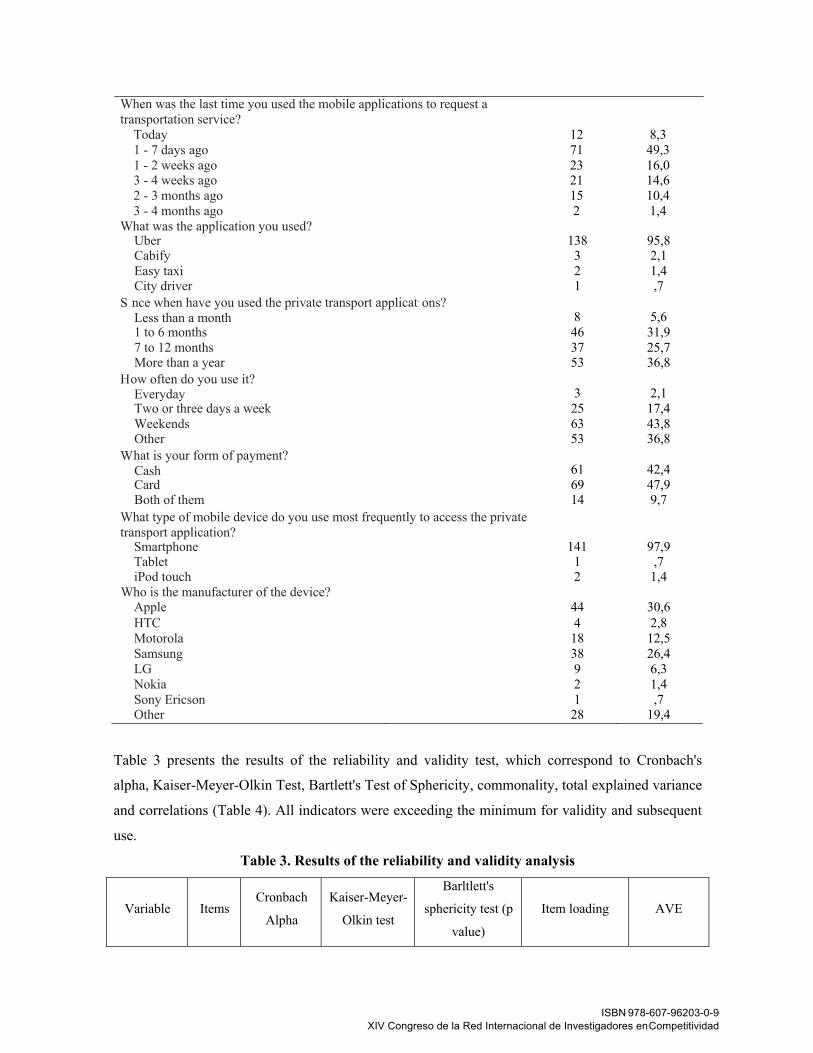
When asked about the last time they had used the applications to request a transportation service,
65.3% had done so within the last 14 days (from 1 to 7 days and from one to two weeks). Regarding
the question of how long they have been using the application, the majority (36.8%) have been
using the application for more than a year. The most used application is Uber (95.8%), they
generally use it on weekends (43.8%), pay both with card and cash (47.9% and 42.4% respectively),
the request is made through a Smartphone (97.9%), and the main brands of the device were Apple
(30.6%), Samsung (26.4%) and Motorola (12.5%).
Table 2. User characteristics
Variable Frequency Percentage
Gender Man 57 39,6 Woman 87 60,4
Age Less than 20 years 39 27,1 Between 21 and 30 years 103 71,5 More than 31 years 2 1,4
Monthly income Less than $ 2000 47 32,6 From $ 2001 to $ 3000 31 21,5 From $ 3001 to $ 4000 21 14,6 From $ 4001 to more 45 31,3
ISBN 978-607-96203-0-9 XIV Congreso de la Red Internacional de Investigadores en Competitividad
When was the last time you used the mobile applications to request a transportation service?
Today 12 8,3 1 - 7 days ago 71 49,3 1 - 2 weeks ago 23 16,0 3 - 4 weeks ago 21 14,6 2 - 3 months ago 15 10,4 3 - 4 months ago 2 1,4
What was the application you used?
S
H
W
What type of mobile device do you use most frequently to access the private transport application?
Smartphone 141 97,9 Tablet 1 ,7 iPod touch 2 1,4
Who is the manufacturer of the device? Apple 44 30,6 HTC 4 2,8 Motorola 18 12,5 Samsung 38 26,4 LG 9 6,3 Nokia 2 1,4 Sony Ericson 1 ,7 Other 28 19,4
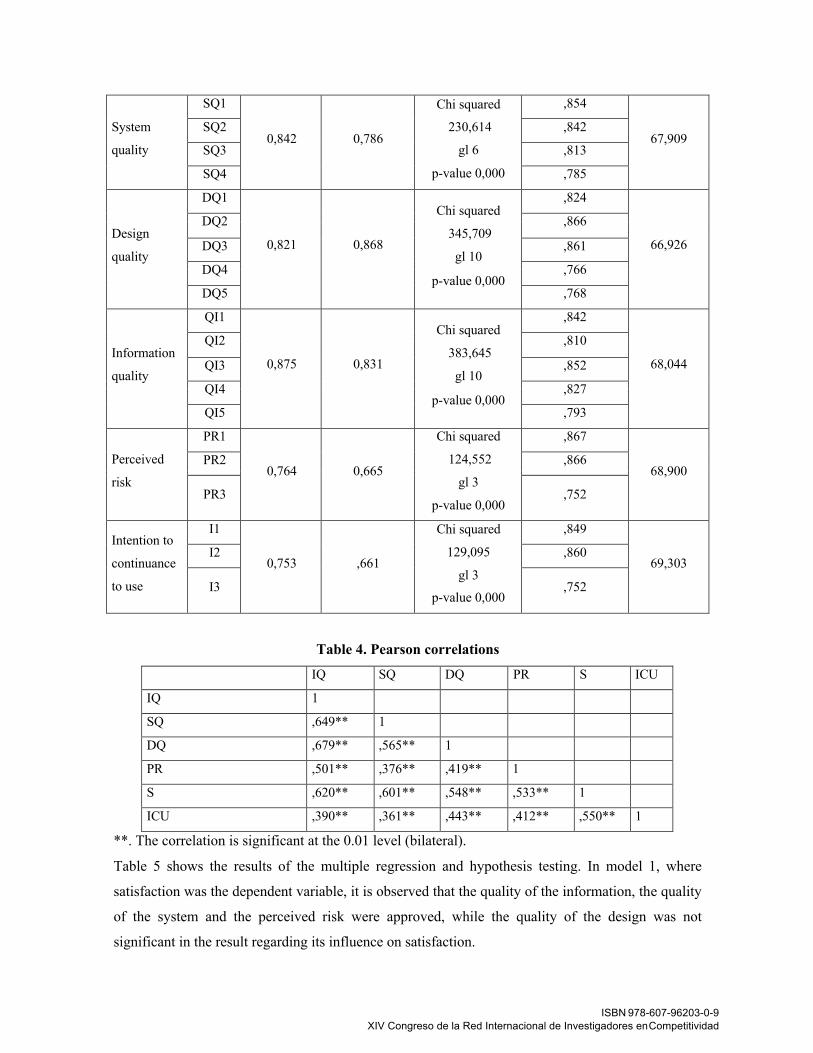
Table 3 presents the results of the reliability and validity test, which correspond to Cronbach's
alpha, Kaiser-Meyer-Olkin Test, Bartlett's Test of Sphericity, commonality, total explained variance
and correlations (Table 4). All indicators were exceeding the minimum for validity and subsequent
use.
Table 3. Results of the reliability and validity analysis
Variable
Items
Cronbach
Alpha
Kaiser-Meyer-
Olkin test
Barltlett's
sphericity test (p
value)
Item loading
AVE
Uber 138 95,8 Cabify 3 2,1 Easy taxi 2 1,4 City driver 1 ,7
ince when have you used the private transport applicati Less than a month
ons? 8
5,6
1 to 6 months 46 31,9 7 to 12 months 37 25,7 More than a year 53 36,8
ow often do you use it? Everyday
3
2,1
Two or three days a week 25 17,4 Weekends 63 43,8 Other 53 36,8 hat is your form of payment? Cash
61
42,4
Card 69 47,9 Both of them 14 9,7
ISBN 978-607-96203-0-9 XIV Congreso de la Red Internacional de Investigadores en Competitividad
SQ1 Chi squared ,854
System
quality
SQ2 0,842 0,786
230,614
gl 6
,842 67,909
SQ3 ,813
SQ4 p-value 0,000 ,785
DQ1 Chi squared
,824
DQ2 ,866 Design
quality
0,821
0,868 345,709
gl 10
66,926 DQ3 ,861
DQ4 ,766 p-value 0,000 DQ5 ,768
QI1 Chi squared
,842
QI2 ,810 Information
quality
0,875
0,831 383,645
gl 10
68,044 QI3 ,852
QI4 ,827 p-value 0,000 QI5 ,793
PR1
0,764
0,665
Chi squared ,867
68,900 Perceived PR2 124,552 ,866
risk PR3
gl 3
p-value 0,000 ,752
Intention to
continuance
to use
I1
0,753
,661
Chi squared
129,095
gl 3 p-value 0,000
,849
69,303 I2 ,860
I3 ,752
Table 4. Pearson correlations
IQ SQ DQ PR S ICU
IQ 1
SQ ,649** 1
DQ ,679** ,565** 1
PR ,501** ,376** ,419** 1
S ,620** ,601** ,548** ,533** 1
ICU ,390** ,361** ,443** ,412** ,550** 1
**. The correlation is significant at the 0.01 level (bilateral).
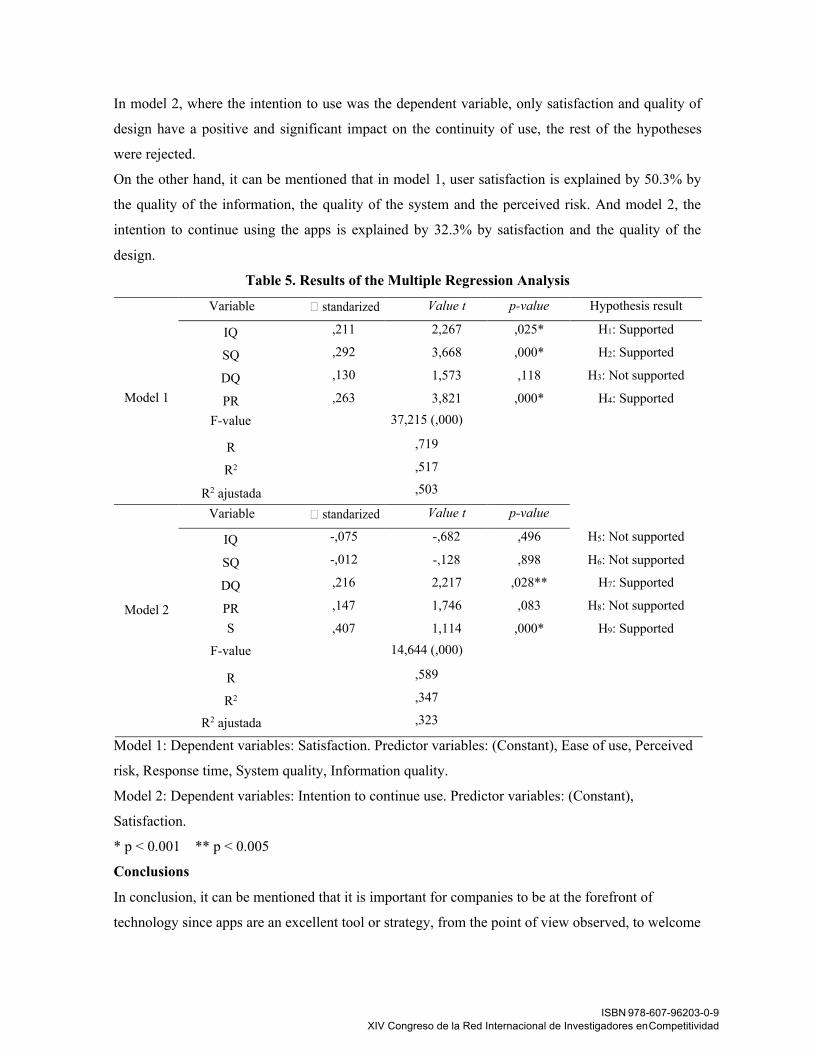
Table 5 shows the results of the multiple regression and hypothesis testing. In model 1, where
satisfaction was the dependent variable, it is observed that the quality of the information, the quality
of the system and the perceived risk were approved, while the quality of the design was not
significant in the result regarding its influence on satisfaction.
ISBN 978-607-96203-0-9 XIV Congreso de la Red Internacional de Investigadores en Competitividad
In model 2, where the intention to use was the dependent variable, only satisfaction and quality of
design have a positive and significant impact on the continuity of use, the rest of the hypotheses
were rejected.
On the other hand, it can be mentioned that in model 1, user satisfaction is explained by 50.3% by
the quality of the information, the quality of the system and the perceived risk. And model 2, the
intention to continue using the apps is explained by 32.3% by satisfaction and the quality of the
design.
Table 5. Results of the Multiple Regression Analysis
Variable � standarized Value t p-value Hypothesis result
IQ ,211 2,267 ,025* H1: Supported
SQ ,292 3,668 ,000* H2: Supported
DQ ,130 1,573 ,118 H3: Not supported Model 1 PR ,263 3,821 ,000* H4: Supported
F-value 37,215 (,000)
R ,719
R2 ,517 R2 ajustada ,503
Variable � standarized Value t p-value
IQ -,075 -,682 ,496 H5: Not supported SQ -,012 -,128 ,898 H6: Not supported DQ ,216 2,217 ,028** H7: Supported Model 2 PR ,147 1,746 ,083 H8: Not supported S ,407 1,114 ,000* H9: Supported F-value 14,644 (,000)
R
R2
,589
,347 R2 ajustada ,323
Model 1: Dependent variables: Satisfaction. Predictor variables: (Constant), Ease of use, Perceived
risk, Response time, System quality, Information quality.
Model 2: Dependent variables: Intention to continue use. Predictor variables: (Constant),
Satisfaction.
* p < 0.001 ** p < 0.005
Conclusions
In conclusion, it can be mentioned that it is important for companies to be at the forefront of
technology since apps are an excellent tool or strategy, from the point of view observed, to welcome
ISBN 978-607-96203-0-9 XIV Congreso de la Red Internacional de Investigadores en Competitividad
the market, position themselves and facilitate the purchase processes between the company and the
customers.
With mobile devices, companies can adopt a business mobility strategy, saving costs, gaining
flexibility and being able to optimize processes due to obtaining customer information in real-time
and improving corporate communications. Similarly, through the use of mobile marketing, the
interaction between the company and its customers is promoted, facilitates the dissemination of
offers and promotions, encourages purchases, improves customer loyalty and favors the image of
the brand. All this was influencing the future of business around the world.
Given this, the transport network companies are here to stay and satisfy the needs of the consumer
regarding individual public transport, emphasizing that a better knowledge of the user will lead to
improving the service offered and with it the loyalty, continuity of use and promotion of Word of
mouth from the user, reflecting in higher sales and therefore profits for companies.
References
Agyeman, S., Kwarteng, R. A., & Zurkalnaine, S. (2019). Principal component analysis of driver
challenges in the shared taxi market in Ghana. Case Studies on Transport Policy, 7(1), 73–86.
https://doi.org/10.1016/j.cstp.2018.12.001.
Akbulaev, N. (2020). The impact of the taxi service mobile applications on the financial condition
of taxi companies. International Journal of Scientific and Technology Research, 9(2), 2144–2150.
Akimova, T., Arana-Landín, G., & Heras-Saizarbitoria, I. (2020). The economic impact of
transportation network companies on the traditional taxi sector: An empirical study in Spain. Case
Studies on Transport Policy. 0–1. https://doi.org/10.1016/j.cstp.2020.02.002 February.
Balachandran, I. & Bin, H. I. (2017). The influence of customer satisfaction on ride-sharing services
in Malaysia. International Journal of Accounting & Business Management. 5 (2).
24924/ijabm/2017.11/v5.iss2/184.196
Cetin, T., & Deakin, E. (2017). Regulation of taxis and the rise of ridesharing. Transport Policy,
76(September), 149–158. https://doi.org/10.1016/j.tranpol.2017.09.002.
Contreras, S. D., & Paz, A. (2018). The effects of ride-hailing companies on the taxicab industry in
Las Vegas, Nevada. Transportation Research Part A: Policy and Practice, 115(November 2017),
63–70. https://doi.org/10.1016/j.tra.2017.11.008.
Cruz, P., Barreto, F. N. L., Muñoz-Gallego, P., & Laukkanen, T. (2010). Mobile banking rollout in
emerging markets: Evidence from Brazil. International Journal of Bank Marketing, 28(5), 342-371.
Chan, J. W., Chang, V. L., Lau, W. K., Law, L. K., & Lei, C. J. (2016). Taxi App Market Analysis
in Hongkong. Journal Economy Business Management, 4 (3), 239-242.
ISBN 978-607-96203-0-9 XIV Congreso de la Red Internacional de Investigadores en Competitividad
Coursaris, C., K. Hassanein, K. and Head, M. (2003). M-Commerce in Canada: An Interaction
Framework for Wireless Privacy, Canadian Journal of Administrative Sciences, 20 (1), 54-73.
Currás-Pérez, R., Ruiz-Mafé, C., & Sanz-Blas, S. (2013). Social Network Loyalty: Evaluating the
Role of Attitude, Perceived Risk, and Satisfaction. Online Information Review, 37 (1), 61-82.
Deloitte Insights. Estudio: Hábitos de los consumidores móviles en México, 2019. Consultado el 10
de agosto de 2020 de:
https://www2.deloitte.com/content/dam/Deloitte/mx/Documents/technology/Global-Mobile-
Consumer-Survey.pdf
Federal Commission for Economic Competition (2015). Opinión OPN-008-2015. Retreived August 12, 2020. From:
https://www.cofece.mx/CFCResoluciones/docs/Mercados%20Regulados/V6/16/2042252.pdf
Ge, W., Shao, D., Xue, M., Zhu, H., Zhao, X., & Cheng, J. (2020). Urban taxi ridership analysis in
the emerging metropolis: Case study in Shanghai. Case Studies on Transport Policy, 8(1), 173–179.
https://doi.org/10.1016/j.cstp.2018.09.006.
Gerrard, P. and Cunningham, J.B. (2003). The impact of perceived risks on banking managers
intention to outsource business processes – a study of the German banking and finance industry,
International Journal of Bank Marketing, 21 (1), 16-28.
Govender, K. (2014). Public Transport Service Quality in South Africa: A Case Study of Bus and
Min Bus Services in Johannesburg. African Journal of Business Management. 8(10) 317-326.
Harding, S., Kandlikar, M., & Gulati, S. (2016). Taxi apps, regulation, and the market for taxi
journeys. Transportation Research Part A: Policy and Practice, 88 (December 2014), 15–25.
https://doi.org/10.1016/j.tra.2016.03.009.
Hong Z.L.Y. & Zhang Z. (2017). An Empirical Analysis Of On Demand Ride-Sharing And Traffic
Congestion: Proceedings Of The 50th Hawaii International Conference On System Sciences.
Im, S., Mason, C.H., and Houston, M.B. (2007). Does innate consumer innovativeness relate to new
product/service adoption behavior? The intervening role of social learning via vicarious
innovativeness. Journal of the Academy of Marketing Science, 35 (1), 63–75.
Jain, L., Kumar, H., & Singla, R. K. (2014). Assesing Mobile Technology Usage for Knowledge
Dissemination among Farmers in Punjab. Information Technology for Development, 21 (4), 1-9.
Joewono, T.B. & Kubota,H., (2007). User satisfaction with paratransit in competition with
motorization in Indonesia: anticipation of future implications. Transportation 34, 337–354.
Jun, M. and Cai, S. (2001). The key determinants of internet banking service quality: a content
Analysis, International Journal of Bank Marketing, Vol. 19 No. (7), 276-91.
ISBN 978-607-96203-0-9 XIV Congreso de la Red Internacional de Investigadores en Competitividad
Justitia, A. Semiati, R. & Ramadhini, A. N. (2019). Customer Satisfaction analysis of online taxi
mobile apps. Journal of information systems engineering and business intelligence. 5 (1).
http://dx.doi.org/10.20473/jisebi.5.1.85-92
Kanti, M. W., Anandya, D. & Rahardja, C. (2018). Continuance Usage Intention of Gojek
Application in Surabaya. ICEMAB 2018. 10.4108/eai.8-10-2018.2288664
Keong, W. Y. (2016). Factors Influencing Passengers' Attitude and Adoption Intention of Mobile
Taxi Booking. The Social Science, 11 (11), 2769-2776.
Kwame, R. (2013). Banking Innovation in Ghana: Insight of Students’ Adoption and Diffusion.
Journal of Internet Banking and Commerce, 18 (3).
Kumar, R. & Ravindran, S. (2012). An empirical study on service quality perceptions and
continuance intention in mobile banking context in India. Journal of internet banking and
commerce. 17(1).
Khuong M. N., & Dai N. Q. (2016). The Factors Affecting Customer Satisfaction And Customer
Loyalty — A Study Of Local Taxi Companies In Ho Chi Minh City, Vietnam. International
Journal Of Innovation, Management And Technology, 7 (5).
Kleijnen, M., Wetzels, M., & Ruyter, K. (2004). Consumer acceptance of wireless finance. Journal
of Financial Services Marketing, 8(3), 205-217.
Laforet, S. and Li, X., (2005). Consumers’ attitudes towards online and mobile banking in China.
International Journal of Bank Marketing, 23 (5), 362–380.
Lai, W-T. & Chen, C.-F. (2011). Behavioral intentions of public transit passengers — The roles of
service quality, perceived value, satisfaction and involvement. Transport Policy. 18, 318 – 325.
10.1016/j.tranpol.2010.09.003
Laukkanen, T. (2007). Internet vs mobile banking: comparing customer value perceptions, Business
Process Management Journal, 13 (6), 788-797, https://doi.org/10.1108/14637150710834550
Lee, K.C. & Chung, N. (2009). Understanding factors affecting trust in and satisfaction with mobile
banking in Korea: A modified DeLone and McLean’s model perspective. Interacting with
Computers, 21, 385 - 392.
Lee, Y. & Kwon, O. (2011). Intimacy, familiarity and continuance intention: An extended
expectation–confirmation model in web-based services. Electron. Commer. Res. Appl., 10, 342–
357.
Li, H. & Liu, Y. (2014). Understanding post-adoption behaviors of e-service users in the context of
online travel services. Information & Management. http://dx.doi.org/10.1016/j.im.2014.07.004
ISBN 978-607-96203-0-9 XIV Congreso de la Red Internacional de Investigadores en Competitividad
Liao, C., Chen, J-L. & Yen, D. (2007). Theory of planning behavior (TPB) and customer
satisfaction in the continued use of e-service: An integrated model. Computers in Human Behavior.
23, 2804–2822. 10.1016/j.chb.2006.05.006
Lim, K. B., Yeo, S.F., Goh, M. L. & Gan, A. X. (2018). Journal of Fundamental and Applied
Sciences. 10(6S), 1132-1142. http://dx.doi.org/10.4314/jfas.v10i6s.74
Luarn, P., & Lin, H. (2005). Toward an understanding of the behavioral intention to use mobile
banking. Computer in Human Behavior, 21, 873-891.
Mexican Institute of Transportation (IMT, 2017). Análisis de los Sistemas de Transporte. Retreived
August 01, 2020. https://www.gob.mx/imt
Miyazaki, A., & Fernandez, A. (2001). Consumer perceptions of privacy and security risk for online
shopping, The Journal of Consumer Affair, 35, 27–44.
Mohamed, M. J., Rye, T., & Fonzone, A. (2020). The utilisation and user characteristics of Uber
services in London. Transportation Planning and Technology, 0(0), 1–18. https://
doi.org/10.1080/03081060.2020.1747205.
Nathanail, E., (2008). Measuring the quality of service for messengers on the Hellenic railways.
Transp.Res. Part A 42, 48–66.
Nguyen-Phuoc, D. Q., Su, D. N., Tran, P. T. K., Le, D. T. T., & Johnson, L. W. (2020). Factors
influencing customer's loyalty towards ride-hailing taxi services – A case study of Vietnam.
Transportation Research Part A: Policy and Practice, 134 (March 2019), 96–112.
https://doi.org/10.1016/j.tra.2020.02.008.
Oghuma, A. P., Libaque-Saenz, C. F., Wong, S. F., & Chang, Y. (2016). An Expectation-
Confirmation Model of Continuance Intention to Use Mobile Instant Messaging. Telematics and
Informatics, 33 (1), 34-47.
Olubusola, A. O. (2015). User Satisfaction in Mobile Applications, Research Paper at School of
Computer Science University of Birmingham. Retrieved from, 2015, [online] Available:
http://www.cs.bham.ac.uk/~rjh/courses/Research/TopicslnHCi/2014-15/Submissions/ajayi-
oluwande.pdf.
Paronda, A. G. A., Regido, J. R. F., & Napalang, M. S. G. (2016). Comparative analysis of
transportation network companies (TNCs) and conventional taxi Services in Metro Manila. 23rd
Annual Conference of the Transportation (pp. 1–12). . August
https://s3.amazonaws.com/academia.edu.documents/54055483/Comparative_Analysis_Uber_Grab_
Taxi_Paper_Paronda_2_FINALrev06302016.pdf?AWSAccessKeyId=AKIAIWOWYYGZ2Y53UL
3A&Expires=1517457700&Signature=KVlw86klvqMeM34kwPCSdDj0xLc%3D&response-
content-dispositio.
ISBN 978-607-96203-0-9 XIV Congreso de la Red Internacional de Investigadores en Competitividad
Peng, L., Wang, H., He, X., Guo, D. & Lin, Y. (2014). Exploring Factors Affecting the User
Adoption of Call-taxi App. 25th Australasian Conference on Information Systems. 8th -10th Dec
2014, Auckland, New Zealand.
Poey, L. & Arffin, Z. (2015). Consumers’ Intention to Use a Single Platform E-Payment System: A
Study Among Malaysian Internet and Mobile Banking Users. Journal of Internet Banking and
Commerce, 20(1). http://www.arraydev.com/commerce/jibc/
Poon, W. C., (2008). Users’ adoption of e-banking services: the Malaysian perspective, Journal of
Business and Industrial Marketing, 23 (1), 59-69.
Ram, S. and Sheth, J.N. (1989). Consumer resistance to innovations: the marketing problem and its
solutions, Journal of Consumer Marketing, 6 (2), 5-14.
Rayle L. (2014). App-Based, On-Demand Ride Services: Comparing Taxi And Ridesourcing Trips
And User Characteristics In San Francisco; A Survey.
Razi, M., Tamrin, M. & Nor, R. (2019). Adopting e-hailing Application Among Malaysian
Millennials. The 7th International Conference on Cyber and IT Service Management (CITSM
2019).
Reid, M., & Levy, Y. (2008). Integrating trust and computer self-efficacy with TAM: An empirical
assessment of customers' acceptance of banking information systems (BIS) in Jamaica. Journal of
Internet Banking and Commerce, 13(3), 1-18.
Rogers, E. (2003). Diffusion of Innovations, New York, Free Press.
Rojas, M. Q. (12 de Junio de 2019). La importancia de las apps móviles en las empresas. Obtenido
de https://economiatic.com/importancia-apps-moviles-empresas/
Sánchez-Torres, J.A., Correa, H. S. & Gómez, I.C. (2020). Assessment of mobile taxi booking
apps: An empirical study of adoption by taxi drivers in Medellín-Colombia. Research in
Transportation Business & Management, https://doi.org/10.1016/j.rtbm.2020.100500
Sohail, S. & Al-Jabri, I. (2014). Attitudes towards mobile banking: are there any differences
between users and non-users?. Behaviour & Information Technology. 3(4), 335-344.
Soemantadiredja, A., Vitayala, A., & Hermadi, I. (2015). Analysis Adoption of Innovation Go-jek
Application. International Journal of Science and Research, 6 (3), 936-940.
Sripalawat, J., Thongmak, M., & Ngramyarn, A. (2011). M-banking in Metropolitan Bangkok and a
comparison with other countries. The Journal of Computer Information Systems, 51(3), 67-76.
Srivastava, K., & Sharma, N. K. (2011). Exploring the Multidimensional Role of Involvement and
Perceived Risk in Brand Extension. International Journal of Commerce and Management, 21 (4),
410-427.
ISBN 978-607-96203-0-9 XIV Congreso de la Red Internacional de Investigadores en Competitividad
Statista eTravel Report 2019. Retreived August 10, 2020.
https://de.statista.com/statistik/studie/id/42170/dokument/etravel-report/
Sumaedi S.I, Bakti G. M. Y., & Yarmen M. (2012). The Empirical Study Of Public Transport
Passengers’ Behavioral Intentions: The Roles Of Service Quality, Perceived Sacrifice, Perceived
Value, And Satisfaction (Case Study: Paratransit Passengers In Jakarta, Indonesia), International
Journal For Traffic And Transport Engineering, 2(1), 83 – 97.
The Competitive Intelligence Unit (CIU) (January, 20, 2020), Consultado el 11 de agosto de 2020
desde https://www.theciu.com/publicaciones-2/2020/1/20/plataformas-de-transporte-y-comida-
adopcin-y-preferencia
Vallejo, G. A. (2019). Aplicativo móvil para la utilización de taxis seguros en la Ciudad de Ambato.
Trabajo de graduación. Modalidad: Proyecto de Investigación presentado previo la obtención del
título Ingeniero en Sistemas Computacionales e Informáticos. Universidad Técnica de Ambato,
Ambato, Ecuador.
Wang, Y-S. & Liao, Y-W. (2007). The conceptualization and measurement of m-commerce user
satisfaction. Computers in Human Behavior, 23, 381 – 398. 10.1016/j.chb.2004.10.017
Wang, X., He, F., Yang, H., & Oliver Gao, H. (2016). Pricing strategies for a taxi-hailing platform.
Transportation Research Part E: Logistics and Transportation Review, 93, 212–231.
https://doi.org/10.1016/j.tre.2016.05.011.
Wang, Y., Wang, S., Wang, J., Wei, J. & Wang, C. (2018). An empirical study of consumers’
intention to use ride‑sharing services: using an extended technology acceptance model.
Transportation. https://doi.org/10.1007/s11116-018-9893-4
Weng, G. S., Zailani, S., Iranmanesh, M., & Hyun, S. S. (2017). Mobile taxi booking application
service's continuance usage intention by users. Transportation Research Part D: Transport and
Environment, 57(October), 207–216. https://doi.org/10.1016/j.trd.2017.07.023.
Yang, K.C., (2005). Exploring factors affecting the adoption of mobile commerce in Singapore.
Telematics and Informatics, 22 (3), 257–277.
Yang, A.S., (2009). Exploring adoption difficulties in mobile banking services. Canadian Journal
of Administrative Sciences. 26 (2), 136–149. 10.1002/CJAS.102
Yang, C., Ye, Xiaofei, Y., Xie, J., Yan, X., Lu, L., Yang, Z., Wang, T. & Chen, J. (2020).
Analyzing Drivers’ Intention to Accept Parking App by Structural Equation Model. Journal of
Advanced Transportation. https://doi.org/10.1155/2020/3051283
Ye, Q., Cen, J., Chen, X., & Zhen, H. (2018). How taxi operation change in the development of e-
hailing APPs: A case study in Shanghai, China. CICTP 2017: Transportation reform and change -
equity, inclusiveness, sharing, and innovation – proceedings of the 17th COTA international
ISBN 978-607-96203-0-9 XIV Congreso de la Red Internacional de Investigadores en Competitividad
conference of transportation professionals, 2018-January (pp. 2167–2177).
https://doi.org/10.1061/9780784480915.229.
Yu, T. K. & Fang, K. (2009). Measuring the Post-Adoption Customer Perception of Mobile
Banking Services. CyberPsychology & Behavior. 12(1). 10.1089/cpb.2007.0209
Zhang, W., Honnappa, H., & Ukkusuri, S. V. (2020). Modeling urban taxi services with ehailings:
A queueing network approach. Transportation Research Part C: Emerging Technologies, 113
(November 2018), 332–349. https://doi.org/10.1016/j.trc.2019.05.036.
Zeithaml, V., Varadarajan, P. and Zeithaml, C. (1988), The contingency approach: its foundations
and relevancy to theory building and research in marketing, European Journal of Marketing, 22 (7),
37-64.