large deflections in thin rectangular plates ... - university of bath
TRANSCRIPT

Large Deflections in Thin Rectangular Plates Subjected to Uniform Load:Pitfalls in the Application of Analytical Methods
Adam D. Leea,b,∗, Paul Shepherda, Mark C. Everndena
aDepartment of Architecture and Civil Engineering, University of Bath, Claverton Down, Bath, BA2 7AY, U.K.bPTCC Facade Design, Telecom Plaza, 316 Senator Gil Puyat Ave., Makati City, Metro Manila, 1200, Philippines.
Abstract
Thin, rectangular structural plates are used in a wide range of applications, including architectural
sheet metal cladding, in which the magnitude of lateral deflection is much larger the material’s thickness.
This study compares new experimental data with established algebraic models and assesses the influence
of practicalities such as geometric tolerances and partial fixity of connections.
Errors and anomalies are identified in existing analytical formulas. It is also shown that standardised
test methods measure only part of an imperfectly-flat plate’s lateral movement, and that the actual
displacement of plates in real structures can be several times greater than that inferred by a naive
application of non-linear plate theory.
Findings are presented as set of guidelines to help practising engineers create economical structures
that will not deflect excessively when load is applied.
Keywords: large deflection, facade engineering, cladding, sheet metal, Foppl membrane, von Karman
plate
1. Introduction
Thin, flat, rectangular sheets of metal, and other materials, are widely used to resist uniform pressure
acting in the direction normal to the plane – in windows, storage tanks, floors, decks and so forth – and a
mathematical model of their structural behaviour, first published by Foppl [1] and later by von Karman [2,
p. 350], is well known and is generally accepted to be reliable. In this model, however, the plate’s stress
field and deflection are described by a pair of differential equations, which are renowned because their
solution is a formidable mathematical challenge. Precise deflection solutions – algebraic descriptions of
a plate’s displaced shape – have been found for only a small number of combinations of edge support
condition and load distribution. Nonetheless, approximate algebraic solutions, sufficiently accurate for
many engineering purposes, have been documented by various parties, including Scholes [3], who surveyed
the seminal papers, and Szilard [4, Part. IV], who lists modern methods.
In the field of solid mechanics, any thin, flat body is a “plate”, but in practical settings, the term
“sheet” is often used. According to ASTM A480 [5], to be classified as plate, the material must be at least
∗Corresponding AuthorEmail addresses: [email protected] (Adam D. Lee), [email protected] (Paul Shepherd),
[email protected] (Mark C. Evernden)
Preprint submitted to Structures June 13, 2020

5 mm in thickness. If the Aluminum Association’s guidelines [6, p. 87] are followed then the minimum
thickness is 1/4 inch (6.4 mm). In this paper the two terms, sheet and plate, are used interchangeably.
At its outset, the aim of this study was simply to identify one of the existing algebraic models –
preferably a short, closed form expression – with which to predict, approximately, the deflections that
occur when uniform wind pressure acts upon the sheet materials that are used in architectural cladding
for building facades. The topic had attracted attention because the authors had observed that, when
a sheet metal component is analyzed by more than one professional facade designer, the individuals’
contrasting modelling assumptions can lead to widely differing deflection predictions. Further, an ini-
tial comparison of the literature’s non-linear analysis formulas revealed, for a given plate configuration,
apparent inconsistencies between the various theoretical deflections. The large disparities could not be
attributed solely to the methods’ inherent approximate nature.
Various different plate deflection models are summarised in this paper’s Section 2. In order to see
which of the methods best simulates the behaviour of plates that are attached to their frames by fixing
methods that are commonly used in construction, in Section 3.3 new laboratory test results have been
plotted alongside the theoretical predictions. The findings are discussed in Section 4, with comments on
the extent to which a plate’s deflection is affected by changes in its edge support conditions, Poisson’s
ratio, thickness and initial flatness. It is hoped that the conclusions, summarised in Section 5, will help
practising designers of plate structures – not just those working in the architectural facade industry –
to make appropriate modelling assumptions, to avoid published formulas containing errors, and hence
obtain realistic deflection estimates. It is important that deflection estimates are realistic because, on the
one hand, if a plate’s movement is excessive then it may damage adjacent connections and seals, while,
on the other hand, if inaccurate analysis produces unnecessarily stiff plates, then the resulting designs
will be uneconomical.
2. Mathematical Models
A simple mathematical formula with which to estimate deflections in edge-supported rectangular
plates subject to uniform out-of-plane pressure – a method that does not rely upon computationally
intensive numerical methods – is of value to structural designers working in many different engineering
fields. For greatest practical utility, the algebraic model needs to address not just cases in which deflection
is small in comparison with the thickness of the plate, when bending stresses predominate, but also the
larger deflection situations in which membrane effects become significant. The particular techniques
presented below have been selected from the greater set of known large deflection analysis methods,
primarily because of their relative simplicity.
Within these published papers, individual authors used their own terms to describe the various types
of plate edge support. Those terms, and the corresponding support idealisations, are listed in Table 1.
For the sake of consistency within this paper, some of the variable names used in the original publi-
cations have been modified so that, here, t is the thickness of the plate, a and b are the lengths of the
plate’s short and long sides respectively, q is the applied out-of-plane pressure, and wc is the out-of-plane
2

deflection at the plate’s centre. The plate’s orientation in Cartesian space is shown in Figure 1. Some of
the published formulas have been rearranged and, in order to obtain expressions for deflection, roots of
several of the original functions have been determined.
Figure 1: Coordinate axes and dimensions used in the analysis of thin rectangular plate subjected to uniformly distributedload.
Table 1: Idealisation of plate edge support conditions. The material drawn with a speckled hatch pattern is inelastic.
Case Terms Usedin OriginalLiterature
DiagrammaticRepresentation
Description
A Fixed.Clamped.
Resists moments acting about theaxis of the plate’s edge, as well asforces in and out of the plane of theplate.
B Restrained.Held.
Resists forces in and out of theplane of the plate, but not momentsabout the axis of the plate’s edge.
C Simply supported.Knife-edge.Stress free.
Resists only forces normal to theplane of the plate.
D Straight. As for Case C, above. In addition,the plate is constrained so that itsedge remains straight.
3
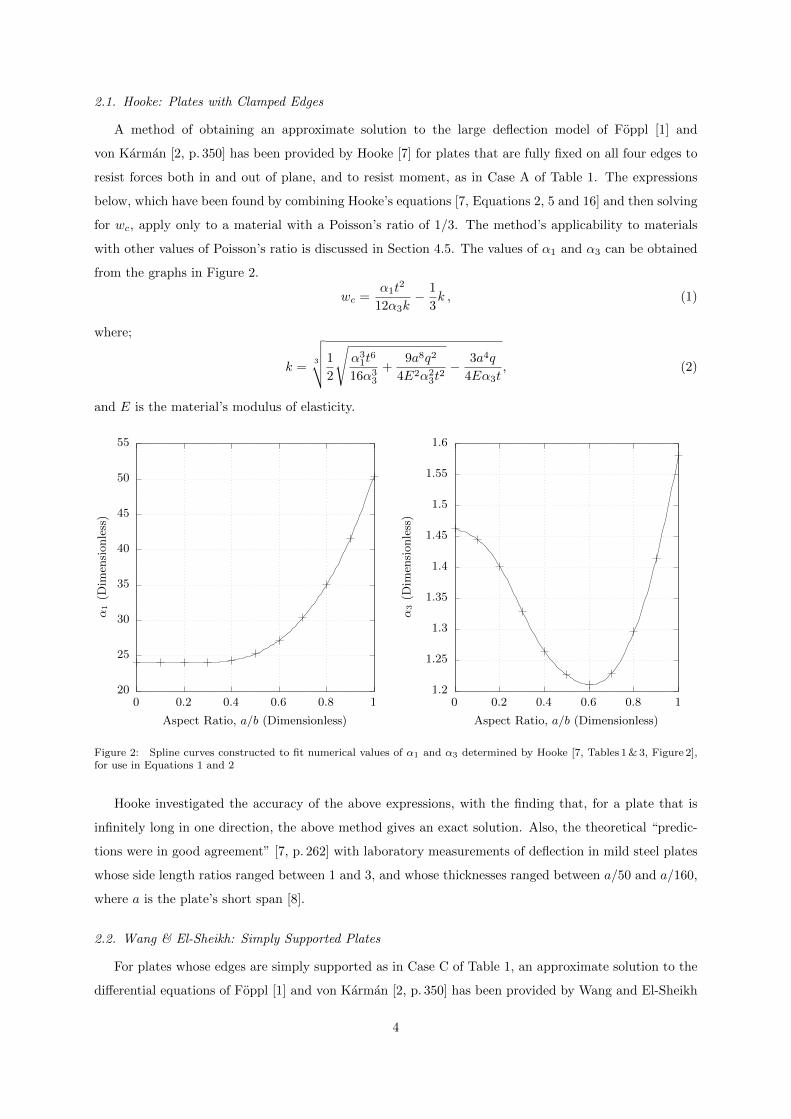
2.1. Hooke: Plates with Clamped Edges
A method of obtaining an approximate solution to the large deflection model of Foppl [1] and
von Karman [2, p. 350] has been provided by Hooke [7] for plates that are fully fixed on all four edges to
resist forces both in and out of plane, and to resist moment, as in Case A of Table 1. The expressions
below, which have been found by combining Hooke’s equations [7, Equations 2, 5 and 16] and then solving
for wc, apply only to a material with a Poisson’s ratio of 1/3. The method’s applicability to materials
with other values of Poisson’s ratio is discussed in Section 4.5. The values of α1 and α3 can be obtained
from the graphs in Figure 2.
wc =α1t
2
12α3k− 1
3k , (1)
where;
k =3
√√√√1
2
√α31t
6
16α33
+9a8q2
4E2α23t
2− 3a4q
4Eα3t, (2)
and E is the material’s modulus of elasticity.
20
25
30
35
40
45
50
55
0 0.2 0.4 0.6 0.8 1
α1
(Dim
ensi
onle
ss)
Aspect Ratio, a/b (Dimensionless)
1.2
1.25
1.3
1.35
1.4
1.45
1.5
1.55
1.6
0 0.2 0.4 0.6 0.8 1
α3
(Dim
ensi
onle
ss)
Aspect Ratio, a/b (Dimensionless)
Figure 2: Spline curves constructed to fit numerical values of α1 and α3 determined by Hooke [7, Tables 1 & 3, Figure 2],for use in Equations 1 and 2
Hooke investigated the accuracy of the above expressions, with the finding that, for a plate that is
infinitely long in one direction, the above method gives an exact solution. Also, the theoretical “predic-
tions were in good agreement” [7, p. 262] with laboratory measurements of deflection in mild steel plates
whose side length ratios ranged between 1 and 3, and whose thicknesses ranged between a/50 and a/160,
where a is the plate’s short span [8].
2.2. Wang & El-Sheikh: Simply Supported Plates
For plates whose edges are simply supported as in Case C of Table 1, an approximate solution to the
differential equations of Foppl [1] and von Karman [2, p. 350] has been provided by Wang and El-Sheikh
4

[9, Equation 35]. After solving for deflection, the published formulation can be shown to be equivalent
to the following expressions:
wc =−4a4t2 − 8a2b2t2 − 4b4t2 + k21
(−a4ν2 + a4 − b4ν2 + b4
)3k1 (a4ν2 − a4 + b4ν2 − b4)
, (3)
where ν is Poisson’s ratio and where;
k1 =2
π2
3
√√√√− 432a4b4q
Ea4t+ Eb4t+
√− π
12t6 (a4 + 2a2b2 + b4)3
(a4ν2 − a4 + b4ν2 − b4)3 +
186624a8b8q2
E2t2 (a4 + b4)2 . (4)
Wang and El-Sheikh validated their own method [9, p. 817] by using it to compute a square plate’s
deflection. The result was compared with a known, exact solution [10], and the error was found to be
4.7 %.
Those interested in applying Wang and El-Sheikh’s method of analyzing plates with simply supported
edges should first read the comments in Sections 4.9 and 5.
2.3. Wang & El-Sheikh: Plates with Held Edges
For a plate whose four edges are held, as in Case B of Table 1, an expression provided by Wang and
El-Sheikh [9, Equation 38] can be solved for deflection and rewritten as:
wc =
3√
2(
8k6t2 − k5 3
√2(ν2 − 1
) (2k4 +
√k2 + k3
) 23
)6k5 (ν2 − 1)
3
√2k4 +
√k2 + k3
, (5)
where;
k2 =51.69a8b8q2
(ν2 − 1
)2E2k25t
2, k3 =
256k36t6
k35 (ν2 − 1)3 , k4 =
3456a4b4q(ν2 − 1
)π6Ek5t
, (6)
k5 = −a4ν2 + 2a4ν + a4 + 4a2b2 − b4ν2 + 2b4ν + b4, (7)
and,
k6 = a4ν2 − a4 + 2a2b2ν2 − 2a2b2 + b4ν2 − b4. (8)
The method has been validated [9, p. 817] by comparison with a known, exact deflection solution for
a square plate [10]. The theoretical deflection given by the approximate method was 7.9 % greater than
the exact solution.
In the same published paper, simultaneous equations were provided for a more accurate analysis of
deflection in plates whose edges are held as shown in Case B, Table 1. However, two of the expressions
[9, Equations 42b and 42c] are dimensionally inconsistent and therefore apparently in error.
2.4. Bakker, Rosmanit and Hofmeyer: Plates Supported in Various Ways
Another approximate algebraic solution to the Foppl and von Karman equation system was found by
Bakker, Rosmanit and Hofmeyer, and the expressions below follow from their method [derived from 11,
5

Equations 4, 32, 37, 38, 48];
q =(a2 + b2)2Et3π4
48a3b3(1− ν2)(wc − w0) +AQwc(w
2c − w2
0), (9)
where, w0 is the deflection of the plate when no pressure is applied. If all four sides are “restrained”, as
in Case B of Table 1:
AQ =π4Et
64a3b3 (ν2 − 1)
(a4ν2 − 3a4 − 4a2b2ν + a4ν2 − 3b4
). (10)
If all four sides are free to rotate about the axis of the edge, while the edges are constrained to remain
straight, as depicted diagrammatically in Case D, Table 1:
AQ =π4Et
(a4 + b4
)64a3b3
. (11)
However, if the plate’s two short sides are straight and its long sides are “stress free”, meaning simply
supported as shown in Case C, Table 1, then:
AQ =π4aEt
(4.659a3 + 3.151b3
)64b3 (4.659a3 + b3)
. (12)
The assumption that two sides of the plate remain straight is helpful because, with such boundary
conditions, it is mathematically easier to deduce closed-form expressions for the deflected shape. However,
such conditions are not commonly encountered in engineering design. It is therefore worth commenting
that the behaviour of this sort of plate – with long sides simply supported and short sides forced to
remain straight – can be expected to resemble that of a simply supported plate, but the magnitude of
deflection will be somewhat reduced because of the additional constraint on the short sides.
Substituting the expression for AQ, from Equation 12, in Equation 9, then setting the initial deflection,
w0, to zero, and solving for deflection:
wc =3
√√√√− K1
2K2+
√K2
1
4K22
+K3
3
27K34
− K3
33
√√√√− K1
2K2+
√K2
1
4K22
+K3
3
27K34
K4
(13)
where;
K1 = −1192704b4a3q − 256000b7q, K2 =4304426875E
961a3t+
581632771E
192b3t, (14)
K3 = t2(−18636a7 − 37272a5b2 − 4000a4b3 − 18636a3b4 − 8000a2b5 − 4000b7), (15)
and,
K4 = −13977a7 + 13977a7ν2 − 9453a4b3 + 9453a4b3ν2. (16)
Bakker and coauthors calculated deflections for various combinations of aspect ratio and support con-
6

dition, using their method, and compared the results to deflections that had been determined numerically,
by finite difference or finite element techniques. The numerical simulations were taken to be reliably rep-
resentative of real plate behaviour. They found that the accuracy of their predicted deflections decreased
as side lengths diverged, but for plates with one edge twice the length of the other, in the worst case,
“the errors in the analytical displacements are slightly larger than 10 %” [11, p. 1232].
2.5. ASTM E1300: Simply Supported Plates
The architectural glass design standard that is observed in the USA, ASTM E1300, provides the
following algebraic expressions for estimating the central deflection of a pane of glass under uniform wind
pressure [12, Appendix X1]. This code indicates that the method is applicable to thin glass plates, when
the magnitude of deflection exceeds the thickness of the pane.
wc = te(r0 + r1x+ r2x2), (17)
where,
r0 = −0.0969(b/a)3 + 1.11(b/a)2 − 3.83(b/a) + 0.553, (18)
r1 = +0.2067(b/a)3 − 2.17(b/a)2 + 5.83(b/a)− 2.29, (19)
r2 = −0.0822(b/a)3 + 0.815(b/a)2 − 1.908(b/a) + 1.485, (20)
with the qualification that b/a = 5 for aspect ratios of five or more, and;
x = ln
(ln
(q(ab)2
Et4
)). (21)
It is known that this analytical method appeared, without attribution, in a now-obsolete Canadian
standard, CGSB-12.20-M89 [13, Appendix E]. The calculation procedure was subsequently incorporated
in ASTM E1300 with a note that the polynomials are “by Dalgliesh for a curve fit to the Beason and
Morgan data”. Dalgliesh was a member of the technical committee responsible for CGSB-12.20-M89: his
commentary on the use of that code [14, p. 15 & 16] is a practical guide, but the origin of the mathematical
model is not indicated. Similarly, the data presented in the journal paper by Beason and Morgan [15],
which is cited in ASTM E1300 [12, Appendix X1], relate to the ultimate strength of glass plates, not to
glass deflection. There is however a reaffirmation [15, p. 198] of a conclusion reached by Beason in prior
research [16, Figures 14-17], that deflections in a glass pane whose edges are simply supported, as shown
in Case C, Table 1, are in reasonably accurate agreement with the Foppl [1] and von Karman [2, p. 350]
model.
The present authors are therefore unsure of the assumptions that underpin Equations 17 to 21. For
example, it is unclear how the empirical relationships, based on measured deflections in glass plates, have
been converted to functions of Young’s modulus. Nonetheless, even if the method’s derivation is obscure,
its formulation permits the calculation of deflections in materials other than glass: its applicability to
7

other materials is considered in Section 4.5. It is also worth noting that, because this approach is
documented in an established construction standard, it is already familiar to the practising engineers in
at least one industry.
Some idea of the accuracy of the ASTM’s approximations may be obtained by inspecting Beason’s
graphs [16, Figures 14-17], in which the maximum deviation between the measured deflection and the clas-
sical prediction is around 16 %. The now-superseded Canadian code CGSB-12.20-M89 [13, Section E4.1]
states that, for glass panes, “measured deflections should be, on average, within 10 % of those calculated”
by Equations 17 to 21 above.
2.6. Aalami & Williams: Simply Supported Plates
For plates with a range of different aspect ratios, each subjected to a range of non-dimensionalised
loads, Aalami and Williams [17] used finite difference expressions to determine deflections and stresses.
In their calculations, Poisson’s ratio was assumed to be 0.3. In the instances that Aalami and Williams’
tabular data for simply supported plates [17, Table A1] apply to this present study’s laboratory conditions,
values found by bivariate spline interpolation have been plotted in the graphs presented in Section 3.3.
2.7. Seide: Membranes Held at Edges
It is often assumed [e.g. 18, Page 418] that, if a plate’s deflection is many times greater than its
thickness, is can be modelled as a membrane. The deflection of a laterally-loaded rectangular membrane
– that is to say, an elastic plate capable of carrying in-plane loads in tension, but having no resistance
to bending – is described by Foppl’s differential equations [19]. Seide [20] provides means to obtain an
approximate solution to Foppl’s model, for a material with Poisson’s ratio of 0.3;
wc = ηt3
√q
E
(at
)4, (22)
where η varies with membrane’s aspect ratio as shown graphically in Figure 3.
Seide compared this method’s deflections with estimates obtained by other researchers, and found
them to be in close agreement. For example, for a square membrane, deflection was approximately 0.9 %
greater than that from finite difference analysis.
2.8. Jain & Mazumdar: Simply Supported, Elastic-Plastic Plates
The plate dimensions and pressure ranges considered in this present study lie within the ranges that
are commonly encountered by facade designers. Amongst the conditions studied are cases in which a
plate’s central deflection reaches ten or more times its thickness, and in which plastic deformation may
occur in small areas. For structural engineers, it is therefore desirable to find a simple method – without
the need for numerical modelling with a computer – to estimate the deflections that will occur, even if a
small region of the plate is deforming plastically.
Jain & Mazumdar [21] considered a simply supported rectangular plate with a Poisson’s ratio of 0.5.
By pre-supposing the pattern of contour lines in the deflected shape, and by assessing stored energy,
8

graphs of non-dimensional deflection with respect to non-dimensional load were created for plates of
various different aspect ratios. The findings were validated by plotting the curve of predicted deflection
with respect to load for a plate with aspect ratio of 1.5, within its elastic range, and comparing the result
with a known exact solution. It was claimed that differences between the estimated and exact solutions
were “hardly noticeable”.
Those interested in using Jain & Mazumdar’s graph [21, Figure 2] to predict purely elastic or elastic-
plastic deflections in plates with simply supported edges should first read the comments in Section 4.7.
3. Laboratory Investigation
Usually, in real structures, the connections at the perimeter of a plate offer only partial resistance to
forces and moments, and therefore they differ from the connections idealised in Table 1. In addition, the
thickness and flatness of a real plate may vary within an allowable range, and such deviations from the
theoretical geometry will affect behaviour when load is applied. Because of these practical considerations,
it may be difficult for a structural designer to select an appropriate model, and therefore new experimental
data has been collected for comparison with the analytical models listed in Section 2.
Physical tests have been carried out to measure deflections in aluminium plates whose sizes and
thicknesses make them representative of the face sheets that often are used at the visible, exterior side of
building envelopes, in cladding and curtain walls. In addition, this new laboratory study has investigated
the deflection of steel plate samples whose fixing details, sizes and thicknesses make them representative
of the concealed interior barriers or “backpans” frequently found inside building facade systems. The
results will however be of general interest, because the simple, screw-fastened edge details are employed
in many and varied construction applications.
The size of the specimens matches those that were tested in a previous study, carried out by Enclos
0.28
0.29
0.3
0.31
0.32
0.33
0.34
0.35
1 1.5 2 2.5 3 3.5 4 4.5 5
η(D
imen
sionle
ss)
Aspect Ratio, a/b (Dimensionless)
Figure 3: Spline curves constructed to fit values of η tabulated by Seide [20, Table 1] for use in Equation 22.
9

[22]. However, in this new work, several aspects of Enclos’ experimental procedure have been modified.
In particular, the magnitudes of the applied loads have been chosen to ensure that, in localised areas of
the thinner plates, stresses exceed the material’s yield strength.
3.1. Experimental Method
In turn, four flat aluminium sheets with nominal thicknesses of 2.38 mm (3/32”), 3.18 mm (1/8”),
4.76 mm (3/16”) and 6.35 mm (1/4”), and two flat steel sheets with mean measured thicknesses of 0.72 mm
and 0.78 mm, were fastened on all four edges, using 9.5 mm (3/8”) diameter fasteners spaced at 305 mm
(12”), to the rectangular wooden frame surrounding an opening in an airtight chamber. As shown in
Figure 4, the frame’s overall dimensions were 914× 1524 mm (36× 60 inch) if measured to the outer edge
of the timber members, or 813× 1422 mm (32× 56 inch) clear span between the frame’s inner edges. The
sketch on the left hand side of Figure 5 details the connection between each plate and the chamber.
Figure 4: Experimental apparatus [22]. In this diagram the corner of the plate specimen has been cut away to reveal thewooden frame and chamber bracing. Plate edges are ‘folded and fastened’: details of other types of edge connection areprovided in Figure 5 and the left diagram in Figure 6.
The test chamber was pressurised and depressurised using a 180 W electric vortex blower. In this
way, each specimen was subjected to uniformly distributed loads at intervals of 239 Pa (5 lbf/ft2) in
the range from 0 to 5.75 kPa (120 lbf/ft2), and also in the range from 0 to -5.75 kPa (-120 lbf/ft2), the
pressure difference being positive when the plate is drawn toward or into the chamber. Pressures were
measured using a vertical U-tube water-filled manometer accurate to within 3 % of the highest recorded
pressure. The metal sheets’ central deflections were measured using digital displacement transducers with
a resolution of 0.01 mm.
In order to create an effective air seal at the perimeter of the sample, a low-modulus silicone sealant
[23] was used to fill the gap between the pressure chamber’s wooden members and the edge of the metal
10

plate, as shown in the diagram at the right side of Figure 6. The sealant chosen for this application was
one that had been rated, by its manufacturer, to be capable of extending in service to twice its original,
unstretched, length.
After recording deflections, the actual thickness of each plate specimen was measured at 9 locations.
Nominal, minimum, mean and maximum thicknesses are listed in Table 2.
Three coupons of steel plate, each 50 mm long and 12.5 mm wide, were cut from the same sheets as the
deflection test specimens. Their yield strengths in tension were found to be 212, 242 and 285 MPa. The
yield strengths of three aluminium plate coupons, each 60 mm long and 12.5 mm wide, cut from the same
sheets as the deflection test specimens, measured at 0.2 % plastic strain, were 101, 102 and 120 MPa.
Before testing, each specimen’s deviation from the flat plane was recorded while it was supported
as shown in Figure 4, and while no load was applied. In this, vertical orientation, the plate’s weight
does not cause lateral displacement. In all of the aluminium samples, initial deviation from the flat
plane was less than 2 mm. In the 0.78 mm and 0.72 mm thick steel sheets, that deviation was 9.5 mm
and 7.5 mm respectively. In general, the thinner the plate, the wider the flatness tolerance permitted
Figure 5: Details of the ‘flat fastened’ (left) and ‘folded and fastened’ [22] (right) plate edge connections.
Figure 6: (Left Diagram) Flat, unfolded plates tested during this present study were secured at their edges in a mannersimilar to that used by Enclos [22]. A low modulus sealant was applied between the perimeter of the specimen and thepressure chamber. (Right Diagram) A structural silicone adhesive connection.
11

by the manufacturing standards [e.g 5, Table A2.20]. Similarly, the permissible tolerance is greater for
plates having higher yield strength. It is therefore unsurprising that, while without load, the steel plates
examined in this study were less flat than the thicker aluminium specimens.
3.2. Enclos’ Tests
Enclos [22] published plate deflection measurements, found using apparatus and procedures similar to
those described above, although only for pressures in the range between -3.83 and 3.83 kPa (±80 lbf/ft2).
The size of the opening in Enclos’ pressure chamber was the same as that shown in Figure 4. Enclos
carried out one set of tests on flat plate specimens attached to the chamber with screw fasteners, in the
manner detailed on the left hand side of Figure 5, other specimens were folded and screw fastened as
shown on the right hand side of Figure 5, and, in a third set of tests, plates were bonded to the chamber’s
frame using a structural silicone adhesive. The dimensions of the sealant joint used in Enclos’ tests is
not known, but a joint compliant with the guidelines set out in ASTM C1401 [24] is shown on the left
hand side of Figure 6.
3.3. Results
After carrying out the experimental procedure – the application and then removal of pressure – each
specimen exhibited a small residual deflection, ws. This change in shape is attributable, in part, to
in-plane movements of the plate’s edges with respect to the fasteners, that occur while the magnitude of
pressure increases, but which are not reversed when the load is removed. It might be said that this is
the process of “bedding in” or “taking up slack”. In addition, in the thinner plates, residual deflection
was caused by localised plastic deformation within the plate. Because of these effects, if the deflections
recorded during the phases of increasing and decreasing load are measured with respect to the initial
position of the centre of the plate, then the result is as shown in the left hand plot in Figure 7. In the
right hand plot, which shows the same data, the deflections recorded during the increasing load phase
are measured with respect to the plate’s initial position, while those deflections recorded while load was
being reduced are measured with respect to the plate’s final position.
Table 2: Measured thicknesses of this present study’s plate specimens.
Nominal Thickness Material Measured Thickness
mm Imp. Min. (mm) Mean (mm) Max. (mm)
2.381 3/32” Aluminium 2.185 2.268 2.330
3.175 1/8” Aluminium 2.720 2.834 2.940
4.763 3/16” Aluminium 4.175 4.331 4.505
6.350 1/4” Aluminium 5.505 5.728 5.980
– – Steel 0.700 0.780 0.835
– – Steel 0.650 0.723 0.815
12

−40
−30
−20
−10
0
10
20
30
40
−6 −4 −2 0 2 4 6
ws
≈ −ws
3/32” Aluminium Plate
Defl
ecti
on
(mm
)
Pressure (kPa)
−40
−30
−20
−10
0
10
20
30
40
−6 −4 −2 0 2 4 6
≈ −ws
ws
3/32” Aluminium Plate
Defl
ecti
on
(mm
)
Pressure (kPa)
Figure 7: Both graphs show residual deflection, ws, caused by the application of test pressure. In the left hand graph,all deflections are measured with respect to the initial position of the plate’s centre. In the right hand graph, deflectionsmeasured during the increasing pressure phase are with respect to the initial unloaded deflection, while those recordedduring the decreasing pressure phase are with respect to the final unloaded deflection. The format of the right hand graphhas been applied to the laboratory test results in Figures 8 to 10.
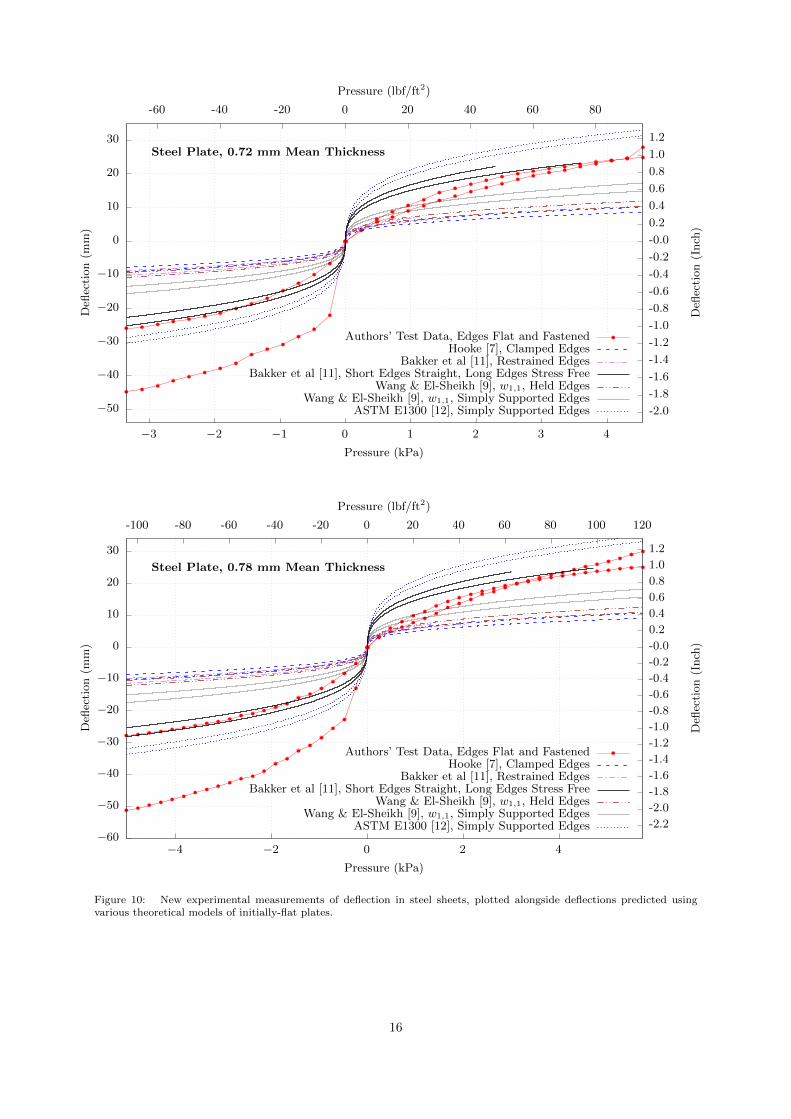
This present study’s experimental results, which are shown graphically in Figures 8 to 10, have been
presented in the same format as the right hand graph in Figure 7 and, for the reason given above, it
is always the curve recorded during the increasing pressure phase that has the greater magnitude. The
analytical methods described in Section 2 – including those modelling plate edge support conditions that
differ from those tested in the laboratory – have been used to create deflection curves for two different sizes
of plate, one with the dimensions of the interior of the perimeter frame, and one with the dimensions
of the frame’s exterior. Theoretical deflections for simply supported plates, obtained by interpolation
of Aalami and Williams’ results [17, Table A1], are shown on graphs for thicker plates but, without
unreasonable extrapolation, this reference dataset cannot be applied to the thinner test specimens. The
experimental results are compared with the theoretical deflection of a membrane in a separate discussion,
in Section 4.1.
The holes at the perimeter of the flat, screw-fastened specimens were examined after load had been
applied. Although the theoretical bearing stresses in the areas of contact between fastener shanks and the
thinner plates, assuming membrane behaviour, was well above yield, plastic deformation occurred only
in the thinner specimens, and was slight. Permanent changes in shape were greatest at the perimeter
of holes on the long sides of the 0.72 mm specimen, one of which is pictured in Figure 11, where the
maximum magnitude of the permanent distortion was approximately 1 mm.
13

−40
−30
−20
−10
0
10
20
30
−4 −2 0 2 4
-1.6
-1.4
-1.2
-1.0
-0.8
-0.6
-0.4
-0.2
-0.0
0.2
0.4
0.6
0.8
1.0
1.2
1.4
-120 -100 -80 -60 -40 -20 0 20 40 60 80 100 120
Aluminium Plate, 3/32” Nominal Thickness
Defl
ecti
on
(mm
)
Defl
ecti
on
(Inch
)
Pressure (kPa)
Pressure (lbf/ft2)
Authors’ Test Data, Edges Flat and FastenedHooke [7], Clamped Edges
Bakker et al [11], Restrained EdgesBakker et al [11], Short Edges Straight, Long Edges Stress Free
Wang & El-Sheikh [9], w1,1, Held EdgesWang & El-Sheikh [9], w1,1, Simply Supported Edges
ASTM E1300 [12], Simply Supported Edges
−40
−30
−20
−10
0
10
20
30
−4 −2 0 2 4
-1.6
-1.4
-1.2
-1.0
-0.8
-0.6
-0.4
-0.2
-0.0
0.2
0.4
0.6
0.8
1.0
1.2
-120 -100 -80 -60 -40 -20 0 20 40 60 80 100 120
Aluminium Plate, 1/8” Nominal Thickness
Defl
ecti
on
(mm
)
Defl
ecti
on
(Inch
)
Pressure (kPa)
Pressure (lbf/ft2)
Authors’ Test Data, Edges Flat and FastenedAalami & Williams [17], Simply Supported Edges
Hooke [7], Clamped EdgesBakker et al [11], Restrained Edges
Bakker et al [11], Short Edges Straight, Long Edges Stress FreeWang & El-Sheikh [9], w1,1, Held Edges
Wang & El-Sheikh [9], w1,1, Simply Supported EdgesASTM E1300 [12], Simply Supported Edges
Figure 8: New experimental measurements of deflection in 3/32” and 1/8” aluminium plates, plotted alongside deflectionspredicted using various theoretical models.
14

−30
−20
−10
0
10
20
−4 −2 0 2 4
-1.0
-0.8
-0.6
-0.4
-0.2
-0.0
0.2
0.4
0.6
0.8
-120 -100 -80 -60 -40 -20 0 20 40 60 80 100 120
Aluminium Plate, 3/16” Nominal Thickness
Defl
ecti
on
(mm
)
Defl
ecti
on
(Inch
)
Pressure (kPa)
Pressure (lbf/ft2)
Authors’ Test Data, Edges Flat and FastenedAalami & Williams [17], Simply Supported Edges
Hooke [7], Clamped EdgesBakker et al [11], Restrained Edges
Bakker et al [11], Short Edges Straight, Long Edges Stress FreeWang & El-Sheikh [9], w1,1, Held Edges
Wang & El-Sheikh [9], w1,1, Simply Supported EdgesASTM E1300 [12], Simply Supported Edges
−20
−15
−10
−5
0
5
10
15
−4 −2 0 2 4
-0.6
-0.4
-0.2
-0.0
0.2
0.4
0.6
-120 -100 -80 -60 -40 -20 0 20 40 60 80 100 120
Aluminium Plate, 1/4” Nominal Thickness
Defl
ecti
on
(mm
)
Defl
ecti
on
(Inch
)
Pressure (kPa)
Pressure (lbf/ft2)
Authors’ Test Data, Edges Flat and FastenedAalami & Williams [17], Simply Supported Edges
Hooke [7], Clamped EdgesBakker et al [11], Restrained Edges
Bakker et al [11], Short Edges Straight, Long Edges Stress FreeWang & El-Sheikh [9], w1,1, Held Edges
Wang & El-Sheikh [9], w1,1, Simply Supported EdgesASTM E1300 [12], Simply Supported Edges
Figure 9: New experimental measurements of deflection in 3/16” and 1/4” aluminium plates, plotted alongside deflectionspredicted using various theoretical models.
15
−50
−40
−30
−20
−10
0
10
20
30
−3 −2 −1 0 1 2 3 4
-2.0
-1.8
-1.6
-1.4
-1.2
-1.0
-0.8
-0.6
-0.4
-0.2
-0.0
0.2
0.4
0.6
0.8
1.0
1.2
-60 -40 -20 0 20 40 60 80
Steel Plate, 0.72 mm Mean Thickness
Defl
ecti
on
(mm
)
Defl
ecti
on
(Inch
)
Pressure (kPa)
Pressure (lbf/ft2)
Authors’ Test Data, Edges Flat and FastenedHooke [7], Clamped Edges
Bakker et al [11], Restrained EdgesBakker et al [11], Short Edges Straight, Long Edges Stress Free
Wang & El-Sheikh [9], w1,1, Held EdgesWang & El-Sheikh [9], w1,1, Simply Supported Edges
ASTM E1300 [12], Simply Supported Edges
−60
−50
−40
−30
−20
−10
0
10
20
30
−4 −2 0 2 4
-2.2
-2.0
-1.8
-1.6
-1.4
-1.2
-1.0
-0.8
-0.6
-0.4
-0.2
-0.0
0.2
0.4
0.6
0.8
1.0
1.2
-100 -80 -60 -40 -20 0 20 40 60 80 100 120
Steel Plate, 0.78 mm Mean Thickness
Defl
ecti
on
(mm
)
Defl
ecti
on
(Inch
)
Pressure (kPa)
Pressure (lbf/ft2)
Authors’ Test Data, Edges Flat and FastenedHooke [7], Clamped Edges
Bakker et al [11], Restrained EdgesBakker et al [11], Short Edges Straight, Long Edges Stress Free
Wang & El-Sheikh [9], w1,1, Held EdgesWang & El-Sheikh [9], w1,1, Simply Supported Edges
ASTM E1300 [12], Simply Supported Edges
Figure 10: New experimental measurements of deflection in steel sheets, plotted alongside deflections predicted usingvarious theoretical models of initially-flat plates.
16

4. Discussion
Theoretical plate deflections derived by the methods listed in Section 2 have been compared with the
new experimental data in Section 3.3, as well as the published test results [22], and noteworthy points
are summarised in the observations below.
4.1. Modelling Thin Plates as Membranes
Structural engineers are usually taught that, when deflection is large in comparison with thickness,
plates can be modelled as membranes. Quoting Timoshenko and Woinowsky-Krieger; “In the case of
very thin plates, which may have deflection many times larger than their thickness, the resistance of the
plate to bending can be neglected; i.e. the flexural rigidity D can be taken equal to zero, and the problem
reduced to that of finding the deflection of a flexible membrane” [18, Page 418].
It might be expected that, because a membrane model ignores bending resistance, it will overestimate
deflection of materials which, in reality, have some stiffness. For each of the plate materials and geometries
tested in this study, a corresponding membrane analysis has been carried out using Seide’s method [20],
which is summarised in Section 2.7. The results are tabulated in Table 3.
A review of the tabulated data shows that in practice, for plates secured at their edges by screw
fixings, theoretical deflections can be substantially less than the actual deflections of a membrane, and
the magnitude of the difference becomes more pronounced with increasing pressure and with decreasing
plate thickness. This observation can be explained by the imperfect restraint provided by the screw fixings
at the plate’s perimeter. Just a small displacement at an edge can cause significant central deflection. For
example, if a is the width of the plate then, even if there is no in-plane strain, an in-plane displacement
of a/2918 at each side of the plate will result in an out-of-plane deflection of approximately a/60 at the
plate’s centre [25, Page 669].
Engineers who wish to use thin plates that will be secured at their edges in ways that are common in
construction and other industries – using screw fasteners or low-modulus structural adhesives – should be
Figure 11: Testing caused plastic deformation only adjacent to holes in the thinner sheets. The greatest permanent move-ment of material, shown here, which occurred at holes on the long sides of the 0.72 mm steel specimen, was approximately1 mm. In the picture, the numbers on the scale are centimeters.
17

aware that these fixings will not completely prevent movement in the plane of the sheet. For this reason,
the standard membrane model may underestimate, substantially, the deflections that will actually occur.
4.2. Influence of Edge Connection Detail
Others [e.g 8] have found that the edge of a plate must be secured by stout clamps if its structural
behaviour is to resemble that of a fully fixed connection, as in Case A of Table 1. It is therefore to be
expected that the actual deflections of plates whose edges are held only by screw fasteners, as shown in
Figure 5, or attached by structural silicone sealant, as in the left hand diagram in Figure 6, should be
greater than the deflections predicted by Hooke’s method, described in Section 2.1, for plates that are
rigidly fixed at their edges. In this respect, the test results are consistent with theory.
The silicone rubber used in a structural adhesive joint of the sort shown at the left side of Figure 6 has
a low modulus of elasticity. Values around 1 MPa are typical [26], and a previous study by the authors
[27] has demonstrated that such joints offer little resistance to a plate’s edge rotation. It follows that
deflections in a plate secured at its perimeter with structural silicone will be similar to those of a simply
supported plate. That is indeed the case: deflections of silicone bonded specimens, measured by Enclos
[22], are broadly in agreement with those suggested by the simply supported plate models of ASTM
E1300 [12, Appendix X1] and of Aalami and Williams [17, Table A1].
The measured deflections of aluminium and steel specimens, presented in Figures 8 to 10, indicate
that a plate attached to its frame by screw fasteners will deflect less than a plate attached by structural
silicone adhesive. Because the silicone adhesive’s elastic modulus is low, this outcome is consistent with
logical expectations. However, the difference is small. For the engineering design purposes, it is reasonable
to model each of these connections as a simple support, as idealised in Case C of Table 1.
Table 3: Theoretical deflections of 813 × 1422 mm membranes, given in mm and (in italics) as a percentage of theexperimentally-determined deflection of the corresponding plate specimens, which are shown in Section 3.3. Cases inwhich the theoretical membrane deflection exceeds the measured deflection are typeset in bold font.
Thickness Thickness Material Theoretical Membrane Deflection
(Mean) (Nominal) (mm and theoretical deflection as % of measured deflection)
(See Figures 8 to 10)
1 kPa 2 kPa 3 kPa 4 kPa
mm Inch mm % mm % mm % mm %
5.728 1/4” Aluminium 7.4 282 9.3 174 10.7 139 11.8 122
4.331 3/16” Aluminium 8.1 138 10.2 106 11.7 95 12.9 90
2.834 1/8” Aluminium 9.4 106 11.8 78 13.5 80 14.9 77
2.268 3/32” Aluminium 10.1 82 12.7 75 14.5 71 16.0 70
0.780 – Steel 10.1 129 12.8 90 14.6 76 16.1 73
0.723 – Steel 10.4 112 13.1 87 15.0 75 16.5 70
18

4.3. Thickness Tolerances
For each of the four thickness of aluminium sheet used in the laboratory tests, the Aluminum Asso-
ciation’s thickness tolerances [6, Table 7.7] are listed in Table 4. It can be seen that, to comply with the
standard, the thickness of the manufactured product must lie within a few percent of the nominal value.
Table 4: Standard thickness tolerances for aluminium sheet up to 1 m in width [6, Table 7.7], and flatness tolerances for3003 alloy aluminium sheet for undulations with wavelength between 4’ (1.22 m) and 6’ (1.83 m) [6, Table 7.17].
Nominal Thickness Thickness Tolerance Thickness Tolerance ÷ Flatness Tolerance
[6, Table 7.7] Nominal Thickness [6, Table 7.17]
2.381 mm 3/32” ±0.0889 mm 3.73 % ±9.525 mm
3.175 mm 1/8” ±0.1143 mm 3.60 % ±9.525 mm
4.763 mm 3/16” ±0.1778 mm 3.73 % ±9.525 mm
6.350 mm 1/4” ±0.3048 mm 4.80 % ±9.525 mm
Variations in thickness have greater influence upon bending stresses than upon membrane stresses. If
a plate’s thickness to span ratio, t/a, is small, say is 1/300 or less, in many engineering contexts it will
be reasonable to ignore manufacturing thickness tolerances when modelling large deflections.
4.4. Flatness Tolerances and the “Pop-Through” Effect
The theoretical deflections that are shown graphically in Figures 8 to 10 apply to sheets that are geo-
metrically perfect. In practice however, even before load is applied, thin plates may not be absolutely flat.
For each of the thicknesses of aluminium sheet used in the laboratory tests, the Aluminum Association’s
standard flatness tolerances [6, Table 7.17] are listed in Table 4.
In Figure 12 the theoretical deflection occurring in an initially flat, rectangular, aluminium plate,
measuring 914 mm by 1524 mm, whose long sides are simply supported as shown diagrammatically in
Table 1 Case C, and whose short sides remain straight as shown in Table 1 Case D, is compared with
that of an otherwise equivalent plate having an initial deflection that is the maximum allowable in
commercial sheet metal. With these boundary conditions, deflections in both the initially flat plate and
in the initially dished plate will be slightly less than the deflections that would occur if their edges were
simply supported. The two examples presented in the graphs in Figure 12 are for plates with thicknesses
of 3.175 mm and 6.35 mm, and with initial deflections of 0 and 9.53 mm.
When analysing the lateral movement of the centre of a sheet that is, without applied load, perfectly
planar, the term “deflection” can be used without ambiguity. However, when describing the lateral
movement of a sheet that is initially not flat, additional care is needed. For some applications the
designer will want to know how far the centre of the sheet can move from the plane of the perimeter. In
other instances the distance of interest may be that through which the centre of the sheet moves when
load is applied. In this second case, as illustrated in Figure 13, the magnitude of movement will depend
upon the polarity of the applied pressure. Because of the “pop-through” effect, large lateral movement
can occur when a small load acts toward the convex side.
19

If a plate’s initial deflection is ignored in deflection analysis then the size of the resulting error depends
upon the measurement of interest to the designer. In some circumstances – if, say, there is a need to avoid
interference with an adjacent mechanism – the relevant dimension is the maximum distance between the
centre of the sheet and the plane of its perimeter. In other cases – for example, if the plate will be
bonded to an elastomeric seal with limited movement capacity – it will be more important to determine
the maximum distance through which the plate travels. The example values that follow have been taken
from the left hand graph of Figure 12, at a pressure of 1 kPa. If the distance of interest is that between the
centre of the loaded plate and its perimeter plane, then a deflection calculation based on the assumption
that the plate is initially flat will underestimate the true value by 28 %. The error is labelled δ1 in
Figure 12. If applied load acts toward the concave side of the plate, and if the designer is interested in
displacement relative to the unloaded position, then the initially-flat model will overestimate the actual
displacement by 99 %. On the other hand, if load is applied toward the plate’s convex side, causing
it to “pop through” as shown in Figure 13, then the actual movement will be 205 % of the theoretical
deflection. In any one of these three circumstances, but particularly when pop-through occurs, the scale
of the error will be a practical concern.
Therefore, analytical procedures should not disregard a plate’s initial deviation from the flat plane,
even if that initial deflection is within the tolerances that common production standards permit.
0
5
10
15
20
25
0 0.5 1 1.5 2 2.5 3 3.5
δ1
Defl
ecti
on
(mm
)
Pressure (kPa)
t = 3.175 mm, w0 = 9.53 mmt = 3.175 mm, w0 = 0.00 mm
0
5
10
15
20
25
0 0.5 1 1.5 2 2.5 3 3.5
Defl
ecti
on
(mm
)
Pressure (kPa)
t = 6.350 mm, w0 = 9.53 mmt = 6.350 mm, w0 = 0.00 mm
Figure 12: Lateral deflection of centre of 1524 mm by 914 mm aluminium sheets with thickness t and initial deflection w0,measured with respect to the plane of the supporting frame. The measurement δ1 is discussed in Section 4.4.
20

4.5. Poisson’s Ratio
The materials from which structural plates are commonly made, and the values of their Possion’s
ratios, are listed in Table 5. Because deflections found using Hooke’s procedure (Section 2.1) or the
ASTM E1300 procedure (Section 2.5) are valid only for one particular value of Poisson’s ratio, it is of
interest to estimate the extent to which accuracy is affected when these methods are applied to materials
with other values of Poisson’s ratio.
Table 5: Possion’s ratio for selected structural plate materials.
Material Poisson’s Ratio, ν
(Dimensionless)
Aluminium 0.33
Stainless Steel 0.30
Mild Steel 0.26
Glass 0.22
Equation 23, below [from 4, p. 999], is known to describe the effect that changes in Poisson’s ratio
have upon deflections in the linear, or small deflection, range. If the deflection and Poisson’s ratio of a
a b c d
Figure 13: In engineering calculations it is often assumed that plates are perfectly flat, as in a. By applying and removinglight pressure on the convex side of b, which has an initial bow of magnitude −w0, its shape can be changed to that shownin c, with an initial deflection of approximately w0. A uniform pressure results in a central deflection of wc, shown in d.
21

plate are known to be w1 and ν1, then;
w2 = w11− ν221− ν21
, (23)
where w2 is the deflection that would occur if Poisson’s ratio were ν2. The implication is that a deflection
analysis method that takes into consideration the Young’s modulus of the plate material, but assumes
that every material has the same Poisson’s ratio as glass, with ν = 0.22, will be in error by 2.0 % when
applied to a grade A36 steel plate, with ν = 0.26, and in error by 6.4 % when applied to an aluminium
plate, with ν = 0.33.
However, Poisson’s ratio has greatest influence upon deflection while stresses in the plate are flexural:
that is to say, while the magnitude of deflection is small. When membrane effects dominate, for a given
value of Young’s modulus, changing Poisson’s ratio has little effect. Using Equations 13 to 16 it can be
shown, for example, that if the Poisson’s ratio of the 3.175 mm thick plate considered in this study were
to decrease by a third, from 0.33 to 0.22, then deflection at 3.83 kPa would increase from 21.35 mm to
21.44 mm – a change of less than half of one percent.
It can be seen that large deflections are only weakly influenced by Poisson’s ratio (Section 4.5),
and in the engineering analysis of large lateral deflections, it will generally be reasonable to ignore any
inconsistency between a plate’s actual and modelled Poisson’s ratio.
4.6. Frame Width Effects
This study’s laboratory results, and also the test data collected by Enclos [22], show that the magni-
tude of a plate’s deflection depends upon the polarity of the applied pressure. For each of the different
edge connection details, which are shown in Figures 5 and 6, deflections are greater when pressure acts
away from the plate’s supporting frame. This phenomenon is the result of a change in the position of the
plate’s supports, indicated in Figure 14, occurring when the polarity of the deflection is reversed. The size
of the difference in deflections is sufficient to concern a structural designer, particularly if the members
in the supporting frame are wide, and if the movement of the centre of the plate is large in comparison
with its thickness. For example, the test results in Figures 10 show that, in the large deflection range,
deflection of the steel plates toward the chamber, under positive pressure, is approximately 15 % less than
the deflection caused by the equivalent negative pressure. Similarly, Figure 9 shows that, for the 3/16”
aluminium specimen, the difference is sheet approximately 8 %.
In the analysis of deflection, this point should therefore be taken into consideration.
4.7. Elastic-Plastic Behaviour
There are many practical applications in which a plate can deform plastically while still fulfilling its
functional purpose. Structures that are designed to deform plastically can be constructed from plates
that are thinner than those that would be required if yield-limited design rules were to be observed.
Because of the potential to achieve material savings – hence, cost savings and environmental benefits
22

– there is good reason to look for simple plate analysis techniques that will allow designers to predict,
without finite element models, deflections in the elastic-plastic range.
Upon initial review, the graph provided by Jain and Mazumdar [21, Figure 2] appears to meet this
requirement. A non-dimensionalised graph of deflection with respect to load can, ostensibly, be used to
estimate deflections in simply supported plates, throughout the elastic, elastic-plastic and fully-plastic
phases. However, at least for some plate geometries, deflections estimated in this way are wildly at odds
with those found by other methods.
In comparison with the new experimental data, deflections obtained from Jain and Mazumdar’s graph
[21, Figure 2] are overestimates, and the degree of overestimation increases as plate thickness decreases.
For simply supported plates with geometry matching that of the thinnest specimens tested in this present
study, deflections estimated by Jain and Mazumdar’s method are up to two orders of magnitude greater
than the deflections estimated by the other analytical methods described herein. These comments apply
not just to conditions in which the plate is deforming plastically, but throughout the range of pressure
considered in this study, even though this particular analytical method was published with the statement
that it is in close agreement with exact solutions of the elastic model.
For many of the practical situations in which plastic deformation might be tolerated, such as in an
exterior facade’s concealed backpans, or in the sheet metal enclosing a fluid storage tank, the deflection
response found using Jain and Mazumdar will be greatly misleading.
METAL PLATE SPECIMEN
SCREW FASTENER
RUBBER SEPARATOR
FRAME OF PRESSURECHAMBER
Figure 14: Folded and fastened edges of plate specimens tested by Enclos [22]. The location of the support depends uponthe polarity of the applied pressure, which is negative in the condition shown on the left, and positive in the right handdiagram.
23

4.8. Limitations of Industrial Test Procedures
The standardised structural test methods used in some industries, for example ASTM E330 [28],
do not measure the full extent of the displacement or movement of an initially bowed plate. Such test
procedures require that a “pre-load” is applied to, and then removed from, the specimen before the
displacement measuring instruments are set to zero. Hence the distance through which the centre of
the plate can move during pre-loading – which may be twice the initial deflection, 2w0, as indicated in
Figures 13-b and 13-d – is not included in the deflection measurement. What is actually measured is the
distance between the centre of the loaded specimen and the neutral plane, less the initial deflection; that
is to say, |wc|−|w0|.
If analytical methods and industrial test procedures systematically underestimate the magnitude of
the total displacement that occurs when load is applied to a plate, then the plate’s real movements in
service are likely to exceed the range anticipated by the structural designer. The practical consequence is
that components attached or adjacent to the surfaces of the plate, such as elastomeric seals or flashings,
may fail when stretched beyond their capacity.
4.9. Comparison of Simply-Supported Plate Models
In comparison with simply supported plate deflections calculated by the ASTM E1300 method (Sec-
tion 2.5) or based upon the data of Aalami and Williams (Section 2.6), Wang and El-Sheikh’s mathe-
matical model, in Equations 3 and 4, gives deflection estimates that are much smaller: they are in the
range between one half and three quarters of the values obtained from the other models. It is difficult
to explain this degree of divergence, and therefore it is possible that the method of Wang and El-Sheikh
contains an error.
For the initially-flat, screw-fixed plates tested in this study (Figures 8 and 9), the measured large
deflections are broadly in agreement with the approximate solutions to the model of Foppl [1], and of
von Karman [2, p. 350]. Those solutions have been calculated using the method developed by Bakker
et al. [11], for plates that are simply supported on their long sides (Table 1, Case C), and straight on
their short sides (Table 1, Case D). Bakker’s method has practical merits. Firstly, it is fairly simple:
the equations provided can be rearranged to create a single, closed form expression for deflection. Also,
of the analysis methods that have been examined in this study, this is the only one that allows initial
deflections to be modelled.
Another mathematical model of large deflection in rectangular plates, developed for the architectural
glazing industry, appears in ASTM E1300 [12, Appendix X1]. The formulas for deflection are functions
of Young’s modulus, but they are independent of Poisson’s ratio. Calculations in Section 4.5 have
demonstrated that, in the large deflection range, changes in Poisson’s ratio do not greatly influence
deflection, and so, in this present study, the glass analysis method has been applied to plates made of
metal. Although it is unclear how its expressions were derived, the ASTM E1300 predictions of large
deflections are in fair agreement with the new experimental results (Figures 8 and 9). For small deflections
– those that are less than the thickness of the material – accuracy is poor. Nonetheless, the calculation
process is straightforward, and it is already a part of an established construction industry standard.
24

4.10. Reliability of the Existing Literature
Within one of the published models of a plate that is held or restrained at its edges, as shown in
Case B of Table 1, two of the algebraic expressions have been found to contain errors [9, Equations 42b
and 42c]. The non-dimensionalised graph in another technical paper [21, Figure 2] indicates a deflec-
tion that is, for the thinnest of the plates investigated during this research, of the order of one hundred
times too great. Simply-supported plate deflection predictions based on another of the existing meth-
ods [9, Equation 35], are roughly half the magnitude of the theoretical deflections determined in other
ways. Practising designers should therefore remain aware that errors and anomalies exist in the technical
documentation.
5. Conclusions
Thin, edge supported, rectangular plates are widely used in practical settings. In the exterior walls
of modern buildings, to give just one field of application, thin metal cladding is a common feature of the
exposed architecture, while concealed sheet metal backpans and flashings make a building’s enclosure
weathertight.
In construction drawings of engineering structures, thin plate elements are invariably shown to be
perfectly flat, and it might appear that the mechanical fixings and adhesive joints used at their edges
would be capable of resisting moments and in-plane displacements. This study has shown that, if naive
modelling assumptions of this sort are the basis for analysis of the plate’s response to lateral load, then
the deflections that occur in practice can be greater – in some cases, many times greater – than the
theoretical predictions. By taking into consideration the factors set out in Section 4, structural designers
will be able to estimate the magnitudes of large deflections with greater accuracy, and in this way the
problems that can be caused by excessive lateral displacement of a plate in service, such as the failure of
adjacent joints and seals, can be avoided.
6. Acknowledgements
The authors are grateful for the assistance given by members of the staff of PTCC Facade Design:
Engineers Warren Tan and Jenalynn Nolasco reviewed an early draft of the manuscript and made valuable
comments; Mr. Jhun Fabrero and Architect Jerico Sesno converted hand-drawn sketches into presentable
figures; Mr. Rene Ramiscal and Engineer Marc Dela Cruz provided support during the commissioning of
test apparatus and collection of laboratory data.
References
[1] A. Foppl, Vorlesungen Uber Technische Mechanik, Druck und Verlag von B.G. Teubner, 1907.
URL https://archive.org/details/vorlesungenbert25fpgoog
25

[2] T. von Karman, Festigkeitsprobleme im maschinenbau, in: F. Klein, C. Muller (Eds.), Encyklopadie
der Mathematischen Wissenschaften, Druck und Verlag von B.G. Teubner, 1910, pp. 311–385, 1907-
1914 Edition.
URL https://archive.org/details/p4encyklopdieder04akaduoft
[3] A. Scholes, E. L. Bernstein, Bending of normally loaded simply supported rectangular plates
in the large-deflection range, Journal of Strain Analysis 4 (3) (1969) 190–198. doi:10.1243/
03093247v043190.
[4] R. Szilard, Theories and Applications of Plate Analysis: Classical, Numerical and Engineering Meth-
ods, John Wiley and Sons, 2004.
[5] ASTM International, Standard Specification for General Requirements for Flat-Rolled Stainless and
Heat-Resisting Steel Plate, Sheet, and Strip (2014). doi:10.1520/A0480_A0480M-14B.
[6] Aluminum Association, Aluminum Standards and Data (1993).
URL www.aluminum.org/bookstore
[7] R. Hooke, Approximate analysis of the large deflection elastic behaviour of clamped, uniformly
loaded, rectangular plates, Journal of Mechanical Engineering Science 11 (3) (1969) 256–268. doi:
10.1243/jmes_jour_1969_011_033_02.
[8] R. Hooke, B. Rawlings, An experimental investigation of the behaiour of clamped, rectangular,
mild steel plates subjected to uniform transverse pressure, Proceedings of the Institution of Civil
Engineers 42 (1969) 75–103. doi:10.1680/iicep.1969.7545.
[9] D. Wang, A. I. El-Sheikh, Large deflection mathematical analysis of rectangular plates, Journal of
Engineering Mechanics 131 (2005) 809–821. doi:10.1061/(ASCE)0733-9399(2005)131:8(809).
[10] S. Levy, Bending of Rectangular Plates with Large Deflections, NACA Technical Note 846 (1942).
URL https://ntrs.nasa.gov/search.jsp?R=19930081641
[11] M. C. M. Bakker, M. Rosmanit, H. Hofmeyer, Approximate large-deflection analysis of simply sup-
ported rectangular plates under transverse loading using plate post-buckling solutions, Thin Walled
Structures 46 (2008) 1224–1235. doi:10.1016/j.tws.2008.02.003.
[12] ASTM E1300, Standard Practice for Determining Load Resistance of Glass in Buildings (2004).
doi:10.1520/E1300-04.
[13] CAN/CGSB-12.20-M89, Structural Design of Glass for Buildings (1989).
[14] A. Dalgliesh, Structural Design of Glass for Curtain Walls: An Introduction to National Standard
CAN/CGSB-12.20-M89, in: Proceedings of the Update on Contemporary Curtain Wall, Ontario
Building Envelope Council, 1990.
URL https://www.researchgate.net/publication/44076943
26

[15] W. L. Beason, J. R. Morgan, Glass failure prediction model, Journal of Structural Engineering
110 (2) (1984) 197–212. doi:10.1061/(ASCE)0733-9445(1983)109:2(489).
[16] W. L. Beason, A Failure Prediction Model for Window Glass, PhD Thesis, Texas Tech University
(1980).
URL https://ttu-ir.tdl.org/ttu-ir/handle/2346/10495
[17] B. Aalami, D. G. Williams, Thin Plate Design for Transverse Loading, John Wiley and Sons, 1975.
[18] S. Timoshenko, S. Woinowsky-Krieger, Theory of Plates and Shells, 2nd Edition, McGraw-Hill, 1959.
URL https://archive.org/download/TheoryOfPlatesAndShells/TheoryOfPlatesAndShellsS.
timoshenko2ndEdition.pdf
[19] A. Foppl, Die wichtigsten lehren der hoheren elastizitatstheorie, Vorlesungen uber Technische
Mechanik 5 (1907) 132.
[20] P. Seide, Large deflections of rectangular membranes under uniform pressure, International Journal
of Non-Linear Mechanics 12 (1977) 397–406. doi:10.1016/0020-7462(77)90040-3.
[21] R. K. Jain, J. Mazumdar, Research note on the elastic-plastic bending of rectangular plates: A new
approach, International Journal of Plasticity 10 (7) (1994) 749–759. doi:10.1016/0749-6419(94)
90044-2.
[22] Enclos, Light-gage metal panel deflection, in: Insight 01, Advanced Technology Studio of Enclos,
2010.
URL http://www.enclos.com/library/publications/insight-01
[23] Dow Chemical Company, Product Information: Dowsil 790 Silicone Building Sealant, Dow Chemical
Company Form Number: 61-884-01 Q (2017).
[24] ASTM C1401, Standard Guide for Structural Silicone Sealant Glazing (2014). doi:10.1520/
C1401-14.
[25] A. D. Lee, J. A. Alimanza, P. Shepherd, M. C. Evernden, Axial rotation and lateral torsional
buckling of extruded aluminium mullions in curtain wall facades, Structures 20 (2019) 658–675.
doi:https://doi.org/10.1016/j.istruc.2019.05.010.
[26] Dow Corning Corporation, Silicone Structural Glazing Manual, DC Form Number: 62-0979H-01
(2011).
URL https://www.dowcorning.com/content/publishedlit/62-0979c-01.pdfumber
[27] A. D. Lee, P. Shepherd, M. C. Evernden, D. Metcalfe, Measuring the effective young’s modulus of
structural silicone sealant in moment-resisting glazing joints, Construction and Building Materials
181 (2018) 510–256. doi:10.1016/j.conbuildmat.2018.06.038.
[28] ASTM E330, Standard Test Method for Structural Performance of Exterior Windows, Doors, Sky-
lights and Curtain Walls by Uniform Static Air Pressure Difference (2014).
27