large combustion plants - greenpeace
TRANSCRIPT
Best Available Techniques (BAT) Reference Document for
Large Combustion Plants
Industrial Emissions Directive 2010/75/EU
(Integrated Pollution Prevention and Control)
JOINT RESEARCH CENTRE
Institute for Prospective Technological Studies
Sustainable Production and Consumption Unit
European IPPC Bureau
Final Draft (June 2016)
WORKIN
G DRAFT IN
PROGRESS

WORKIN
G DRAFT IN
PROGRESS
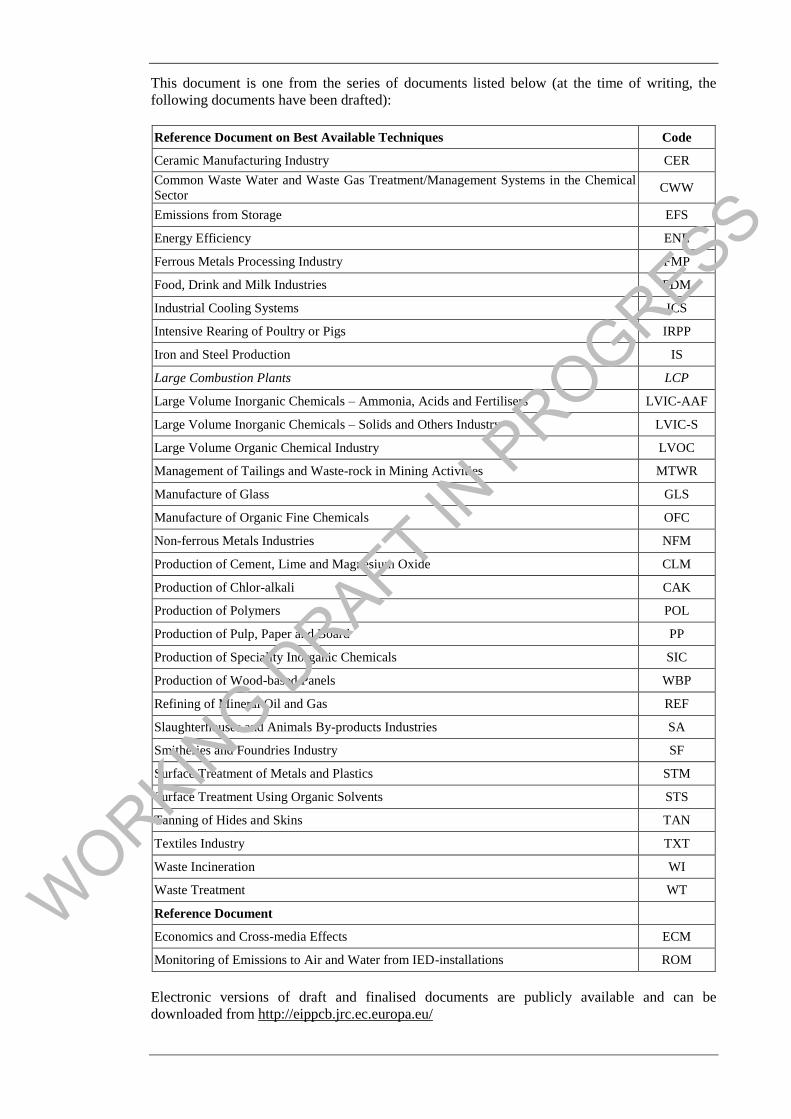
This document is one from the series of documents listed below (at the time of writing, the
following documents have been drafted):
Reference Document on Best Available Techniques Code
Ceramic Manufacturing Industry CER
Common Waste Water and Waste Gas Treatment/Management Systems in the Chemical
Sector CWW
Emissions from Storage EFS
Energy Efficiency ENE
Ferrous Metals Processing Industry FMP
Food, Drink and Milk Industries FDM
Industrial Cooling Systems ICS
Intensive Rearing of Poultry or Pigs IRPP
Iron and Steel Production IS
Large Combustion Plants LCP
Large Volume Inorganic Chemicals – Ammonia, Acids and Fertilisers LVIC-AAF
Large Volume Inorganic Chemicals – Solids and Others Industry LVIC-S
Large Volume Organic Chemical Industry LVOC
Management of Tailings and Waste-rock in Mining Activities MTWR
Manufacture of Glass GLS
Manufacture of Organic Fine Chemicals OFC
Non-ferrous Metals Industries NFM
Production of Cement, Lime and Magnesium Oxide CLM
Production of Chlor-alkali CAK
Production of Polymers POL
Production of Pulp, Paper and Board PP
Production of Speciality Inorganic Chemicals SIC
Production of Wood-based Panels WBP
Refining of Mineral Oil and Gas REF
Slaughterhouses and Animals By-products Industries SA
Smitheries and Foundries Industry SF
Surface Treatment of Metals and Plastics STM
Surface Treatment Using Organic Solvents STS
Tanning of Hides and Skins TAN
Textiles Industry TXT
Waste Incineration WI
Waste Treatment WT
Reference Document
Economics and Cross-media Effects ECM
Monitoring of Emissions to Air and Water from IED-installations ROM
Electronic versions of draft and finalised documents are publicly available and can be
downloaded from http://eippcb.jrc.ec.europa.eu/
WORKIN
G DRAFT IN
PROGRESS

WORKIN
G DRAFT IN
PROGRESS

Preface
TL/JFF/FN/EIPPCB/LCP_Final Draft June 2016 i
PREFACE
1. Status of this document
Unless otherwise stated, references to ‘the Directive’ in this document refer to Directive
2010/75/EU of the European Parliament and the Council on industrial emissions (integrated
pollution prevention and control) (Recast).
This document is a working draft of the European IPPC Bureau (of the Commission's Joint
Research Centre). It is not an official publication of the European Union and does not
necessarily reflect the position of the European Commission.
2. Participants in the information exchange
As required in Article 13(3) of the Directive, the Commission has established a forum to
promote the exchange of information, which is composed of representatives from Member
States, the industries concerned and non-governmental organisations promoting environmental
protection (Commission Decision of 16 May 2011 establishing a forum for the exchange of
information pursuant to Article 13 of the Directive 2010/75/EU on industrial emissions (2011/C
146/03), OJ C 146, 17.05.2011, p. 3).
Forum members have nominated technical experts constituting the technical working group
(TWG) that was the main source of information for drafting this document. The work of the
TWG was led by the European IPPC Bureau (of the Commission's Joint Research Centre).
3. Structure and contents of this document
Chapters 1 and 2 provide general information on the Large Combustion Plants industrial sector
and on the industrial processes used within this sector. These are horizontal matters or specific
activities that do not relate to one specific combustion activity.
Chapter 3 provides data and general information concerning the environmental performance of
installations within the sector, and in operation at the time of writing, in terms of water
consumption, the generation of waste and general techniques used within this sector. It also
describes in more detail the general techniques to prevent or, where this is not practicable, to
reduce the environmental impact of installations in this sector that were considered in
determining the BAT.
Chapters 4 to 9 provide the following information given below on specific combustion
processes (gasification, combustion of solid fuel, combustion of liquid fuel, combustion of
gaseous fuel, multi-fuel combustion and waste co incineration). For each combustion process (X
is the chapter or section number):
Section X.1 provides information on applied processes and techniques.
Section X.2 provides data and information concerning the environmental performance of
installations within the sector, and in operation at the time of writing, in terms of current
emissions, consumption and nature of raw materials, and use of energy.
Section X.3 describes in more detail the techniques to prevent or, where this is not
practicable, to reduce the environmental impact of operating installations in this sector that
were considered in determining the BAT. This information includes, where relevant, the
environmental performance levels (e.g. emission and consumption levels) which can be
achieved by using the techniques, the associated monitoring, the costs and the cross-media
issues associated with the techniques.
Chapter 10 presents the BAT conclusions as defined in Article 3(12) of the Directive.
WORKIN
G DRAFT IN
PROGRESS
Preface
ii June 2016 TL/JFF/FN/EIPPCB/LCP_Final Draft
Chapter 11 presents information on 'emerging techniques' as defined in Article 3(14) of the
Directive.
Concluding remarks and recommendations for future work are presented in Chapter 12.
4. Information sources and the derivation of BAT
This document is based on information collected from a number of sources, in particular
through the TWG that was established specifically for the exchange of information under
Article 13 of the Directive. The information has been collated and assessed by the European
IPPC Bureau (of the Commission's Joint Research Centre) who led the work on determining
BAT, guided by the principles of technical expertise, transparency and neutrality. The work of
the TWG and all other contributors is gratefully acknowledged.
The BAT conclusions have been established through an iterative process involving the
following steps:
identification of the key environmental issues for the Large Combustion Plants sector;
examination of the techniques most relevant to address these key issues;
identification of the best environmental performance levels, on the basis of the available
data in the European Union and worldwide;
examination of the conditions under which these environmental performance levels were
achieved, such as costs, cross-media effects, and the main driving forces involved in the
implementation of the techniques;
selection of the best available techniques (BAT), their associated emission levels (and
other environmental performance levels) and the associated monitoring for this sector
according to Article 3(10) of, and Annex III to, the Directive.
Expert judgement by the European IPPC Bureau and the TWG has played a key role in each of
these steps and the way in which the information is presented here.
Where available, economic data have been given together with the descriptions of the
techniques presented in Chapter 4 to 9. These data give a rough indication of the magnitude of
the costs and benefits. However, the actual costs and benefits of applying a technique may
depend strongly on the specific situation of the installation concerned, which cannot be
evaluated fully in this document. In the absence of data concerning costs, conclusions on the
economic viability of techniques are drawn from observations on existing installations.
5. Review of BAT reference documents (BREFs)
BAT is a dynamic concept and so the review of BREFs is a continuing process. For example,
new measures and techniques may emerge, science and technologies are continuously
developing and new or emerging processes are being successfully introduced into the industries.
In order to reflect such changes and their consequences for BAT, this document will be
periodically reviewed and, if necessary, updated accordingly.
6. Contact information
All comments and suggestions should be made to the European IPPC Bureau at the Institute for
Prospective Technological Studies at the following address:
WORKIN
G DRAFT IN
PROGRESS

Preface
TL/JFF/FN/EIPPCB/LCP_Final Draft June 2016 i
European Commission
Institute for Prospective Technological Studies
European IPPC Bureau
Edificio Expo
c/ Inca Garcilaso, 3
E-41092 Seville, Spain
Telephone: +34 95 4488 284
Fax: +34 95 4488 426
E-mail: [email protected]
Internet: http://eippcb.jrc.ec.europa.eu
WORKIN
G DRAFT IN
PROGRESS
ii June 2016 TL/JFF/FN/EIPPCB/LCP_Final Draft
Reference Document on Best Available Techniques for Large Combustion Plants
PREFACE ........................................................................................................................ I
SCOPE ..................................................................................................................... XXIX
1 GENERAL INFORMATION ON THE STRUCTURE OF THE SECTOR ..... 1
1.1 INDUSTRY OVERVIEW .................................................................................................... 1
1.2 ECONOMIC SITUATION................................................................................................. 12
1.3 KEY ENVIRONMENTAL ISSUES ..................................................................................... 17
1.3.1 Energy efficiency ............................................................................................... 18
1.3.2 Emissions to air .................................................................................................. 19
1.3.2.1 Sulphur oxides (SOX) .............................................................................................. 20 1.3.2.2 Nitrogen oxides (NOX) ........................................................................................... 21 1.3.2.3 Dust ......................................................................................................................... 23 1.3.2.4 Metals ..................................................................................................................... 25 1.3.2.5 Carbon monoxide (CO) .......................................................................................... 27 1.3.2.6 Greenhouse gases.................................................................................................... 29 1.3.2.7 Hydrogen chloride (HCl) ........................................................................................ 31 1.3.2.8 Hydrogen fluoride (HF) .......................................................................................... 32 1.3.2.9 Ammonia (NH3)...................................................................................................... 33 1.3.2.10 Volatile organic compounds (VOCs)...................................................................... 33 1.3.2.11 Persistent organic pollutants (POPs): polycyclic aromatic hydrocarbons
(PAHs), dioxins and furans ..................................................................................... 34
1.3.3 Emissions to water ............................................................................................. 35
1.3.4 Combustion residues .......................................................................................... 37
1.3.5 Noise and vibration emissions ........................................................................... 39
1.3.6 Emission of radioactive substances ................................................................... 39
1.3.7 Mitigation of environmental impacts ................................................................. 40
1.3.8 An introduction to the integrated approach of protecting the environment as
a whole ............................................................................................................... 40
1.3.9 Plant-specific data collection for the LCP sector ............................................... 41
2 PROCESSES FOR ENERGY GENERATION .................................................. 43
2.1 COMBUSTION PRINCIPLES ........................................................................................... 43
2.2 COMMON TECHNICAL COMBUSTION PROCESSES ......................................................... 44
2.2.1 General fuel heat conversion ............................................................................. 44
2.2.2 Pulverised and atomised firing .......................................................................... 44
2.2.3 Fluidised bed combustion furnace ..................................................................... 47 2.2.3.1 Bubbling fluidised bed combustion (BFBC) .......................................................... 48 2.2.3.2 Circulating fluidised bed combustion (CFBC) ....................................................... 49 2.2.3.3 Pressurised fluidised bed combustion (PFBC) ....................................................... 51 2.2.3.4 NOX and N2O control in fluidised bed combustion ................................................ 52
2.2.4 Grate firing of solid fuels ................................................................................... 52
2.3 DIRECT CONVERSION .................................................................................................. 55
2.3.1 General ............................................................................................................... 55
2.3.2 Combustion engines ........................................................................................... 55 2.3.2.1 Diesel engines ......................................................................................................... 56 2.3.2.2 Spark-ignited (SG-type) engines ............................................................................ 56 2.3.2.3 Low-pressure dual fuel (DF-type) engines ............................................................. 56 2.3.2.4 High-pressure gas diesel (GD-type) engines .......................................................... 57
2.3.3 Gas turbines ....................................................................................................... 57
2.4 STEAM PROCESSES ...................................................................................................... 63
WORKIN
G DRAFT IN
PROGRESS
TL/JFF/FN/EIPPCB/LCP_Final Draft June 2016 iii
2.4.1 General .............................................................................................................. 63
2.4.1.1 Typical elements of a steam cycle .......................................................................... 63 2.4.1.1.1 The boiler ....................................................................................................... 65 2.4.1.1.2 Steam turbine.................................................................................................. 66 2.4.1.1.3 Condenser ....................................................................................................... 66 2.4.1.1.4 Cooling system ............................................................................................... 67
2.4.2 Vacuum condensing power plant ...................................................................... 67
2.4.3 Cogeneration/combined heat and power (CHP) ................................................ 67
2.4.4 Combined cycle ................................................................................................. 68
2.4.5 General .............................................................................................................. 68
2.4.6 Supplementary firing of combined cycle gas turbines ...................................... 69
2.4.7 Repowering of existing power plants ................................................................ 69
2.5 COGENERATION OR COMBINED HEAT AND POWER (CHP) .......................................... 70
2.6 INTEGRATED GASIFICATION COMBINED CYCLE .......................................................... 76
2.7 ENERGY EFFICIENCY ................................................................................................... 77
2.7.1 Carnot efficiency ............................................................................................... 78
2.7.2 Thermal efficiency ............................................................................................ 78
2.7.3 Electrical efficiency........................................................................................... 79
2.7.4 Mechanical efficiency ....................................................................................... 81
2.7.5 Operating (annual) energy efficiency ................................................................ 81
2.7.6 Total fuel utilisation .......................................................................................... 82
2.7.7 Unit efficiency for steam withdrawal ................................................................ 83
2.7.8 Exergy concept and exergy efficiency .............................................................. 83
2.7.9 Influence of climate conditions on efficiency ................................................... 86
2.7.10 Relationship between energy efficiency and environmental issues .................. 88 2.7.10.1 Impact of the abatement techniques on plant energy efficiency ............................. 88 2.7.10.2 Effect of increasing the plant energy efficiency on emission levels....................... 88
2.7.11 Losses of efficiency in combustion plants ........................................................ 89
2.7.12 General technical measures to improve LCP efficiency ................................... 90
2.8 UNLOADING, STORAGE AND HANDLING OF FUEL AND ADDITIVES ............................. 92
2.8.1.1 Unloading, storage and handling of solid fuels and additives ................................ 92 2.8.1.2 Unloading, storage and handling of liquid fuels .................................................... 95 2.8.1.3 Unloading, storage and handling of gaseous fuels ................................................. 96
3 GENERAL TECHNIQUES TO PREVENT AND/OR REDUCE
EMISSIONS AND CONSUMPTION .................................................................. 99
3.1 APPLIED COMMON TECHNIQUES ................................................................................. 99
3.1.1 General primary techniques to reduce emissions/consumption ........................ 99
3.1.1.1 Cogeneration or combined heat and power (CHP) ................................................. 99 3.1.1.2 Integrated gasification combined cycle .................................................................. 99 3.1.1.3 Combined-cycle combustion .................................................................................. 99 3.1.1.4 Fuel switch or choice ............................................................................................. 99 3.1.1.5 Combustion modifications (process control)........................................................ 100
3.1.2 Techniques to prevent and/or reduce dust emissions ...................................... 102
3.1.3 Techniques to prevent and/or reduce sulphur oxide emissions ....................... 103 3.1.3.1 Wet scrubbers ....................................................................................................... 104 3.1.3.2 Semi-dry scrubbers ............................................................................................... 105 3.1.3.3 Sorbent injection .................................................................................................. 105
3.1.4 Techniques to prevent and/or reduce nitrogen oxide emissions ...................... 106
3.1.4.1 Primary techniques to reduce NOX emissions ...................................................... 107 3.1.4.2 Secondary techniques to reduce NOX emissions .................................................. 108
WORKIN
G DRAFT IN
PROGRESS

iv June 2016 TL/JFF/FN/EIPPCB/LCP_Final Draft
3.1.4.2.1 Trade-offs between NOX abatement, CO/dust emissions and/or energy
consumption .................................................................................................. 109
3.1.5 Combined techniques to prevent and/or reduce sulphur oxide and nitrogen
oxide emissions ................................................................................................ 109 3.1.5.1 Solid adsorption/regeneration ............................................................................... 110
3.1.5.1.1 Activated carbon process .............................................................................. 110 3.1.5.1.2 Other solid adsorption/regenerative processes .............................................. 111
3.1.5.2 Gas/solid catalytic processes ................................................................................ 111
3.1.6 Techniques to prevent and/or reduce metal emissions..................................... 112
3.1.7 Techniques to prevent and/or reduce emissions of CO and unburnt
hydrocarbons .................................................................................................... 113
3.1.8 Techniques to prevent and/or reduce halide emissions .................................... 113
3.1.9 Techniques to reduce greenhouse gas (GHG) emissions from large
combustion plants ............................................................................................ 113
3.1.10 Water usage and techniques to reduce emissions to water .............................. 114
3.1.10.1 Waste water from raw water treatment plants ...................................................... 116 3.1.10.2 Waste water from cooling circuit systems ............................................................ 116 3.1.10.3 Waste water from steam generation processes ..................................................... 116 3.1.10.4 Waste water from flue-gas treatment systems ...................................................... 117 3.1.10.5 Acid washing water .............................................................................................. 121 3.1.10.6 Sanitary waste water ............................................................................................. 122 3.1.10.7 Other waste waters ................................................................................................ 122
3.1.11 Techniques to control releases to land/soils and for residues management ..... 122
3.1.12 Measures to control noise emissions................................................................ 123
3.1.13 Cooling techniques .......................................................................................... 125
3.1.14 Emission monitoring and reporting ................................................................. 125
3.1.14.1 Emission components ........................................................................................... 125 3.1.14.2 Reference conditions and parameters ................................................................... 126 3.1.14.3 Sampling points .................................................................................................... 126 3.1.14.4 Monitoring of emissions ....................................................................................... 127
3.1.14.4.1 Continuous monitoring ................................................................................. 127 3.1.14.4.2 Periodic monitoring ...................................................................................... 127 3.1.14.4.3 Indirect monitoring using surrogate parameters ........................................... 128
3.1.15 Influence of load factors and modes on environmental performances ............ 128
3.1.16 Other than normal operating conditions (OTNOC) ......................................... 130
3.2 TECHNIQUES TO CONSIDER IN THE DETERMINATION OF GENERAL BAT FOR THE
LCP SECTOR .............................................................................................................. 132
3.2.1 Environmental management systems ............................................................... 135
3.2.2 Techniques for the prevention and control of channelled emissions to air ...... 139 3.2.2.1 Techniques for the prevention and control of dust emissions ............................... 139
3.2.2.1.1 Electrostatic precipitators (ESPs) ................................................................. 139 3.2.2.1.2 Bag filters ...................................................................................................... 143 3.2.2.1.3 Centrifugal precipitation (cyclones).............................................................. 148 3.2.2.1.4 Wet scrubbers ............................................................................................... 150
3.2.2.2 Techniques for the prevention and control of SOX emissions .............................. 153 3.2.2.2.1 Wet lime/limestone scrubbers ....................................................................... 153 3.2.2.2.2 Seawater scrubber ......................................................................................... 163 3.2.2.2.3 Magnesium wet scrubber .............................................................................. 166 3.2.2.2.4 Ammonia wet scrubber ................................................................................. 167 3.2.2.2.5 Lye wet scrubber ........................................................................................... 168 3.2.2.2.6 Spray dry scrubber/absorber ......................................................................... 169 3.2.2.2.7 Circulating fluidised bed (CFB) dry scrubber ............................................... 174 3.2.2.2.8 Duct sorbent injection ................................................................................... 177 3.2.2.2.9 Use of sorbents in fluidised bed combustion systems ................................... 180 3.2.2.2.10 Furnace sorbent injection in pulverised combustion boilers ......................... 182
WORKIN
G DRAFT IN
PROGRESS
TL/JFF/FN/EIPPCB/LCP_Final Draft June 2016 v
3.2.2.2.11 Hybrid sorbent injection ............................................................................... 185 3.2.2.2.12 Magnesium oxide process ............................................................................ 186
3.2.2.3 Techniques for the prevention and control of NOX emissions ............................. 187 3.2.2.3.1 Low excess air firing .................................................................................... 187 3.2.2.3.2 Air staging .................................................................................................... 189 3.2.2.3.3 Flue-gas recirculation (FGR) or exhaust gas recirculation (EGR) ............... 192 3.2.2.3.4 Reduction of combustion air temperature .................................................... 195 3.2.2.3.5 Low-NOX burners ......................................................................................... 196 3.2.2.3.6 Fuel staging (reburning) ............................................................................... 201 3.2.2.3.7 Dry low-NOX burners (DLN) ....................................................................... 205 3.2.2.3.8 Low-NOX combustion concept in engines ................................................... 207 3.2.2.3.9 Lean-burn concept ........................................................................................ 209 3.2.2.3.10 Water/steam addition .................................................................................... 211 3.2.2.3.11 Selective catalytic reduction (SCR) .............................................................. 215 3.2.2.3.12 Selective non-catalytic reduction (SNCR) ................................................... 227 3.2.2.3.13 Ammonia-related issues when using SCR/SNCR techniques ...................... 231
3.2.2.4 Combined techniques for the prevention and control of SOX, NOX and other
pollutant emissions ............................................................................................... 232 3.2.2.4.1 Activated carbon process .............................................................................. 232 3.2.2.4.2 WSA-SNOX process ..................................................................................... 234 3.2.2.4.3 DeSONOX process ....................................................................................... 237
3.2.2.5 Techniques for the prevention and control of metal emissions ............................ 238 3.2.2.5.1 Reduction of metal emissions in dust abatement systems ............................ 239 3.2.2.5.2 Reduction of metal emissions in FGD systems ............................................ 241 3.2.2.5.3 Reduction of metal emissions in NOX control systems ................................ 243 3.2.2.5.4 Reduction of metal emissions by specifically designed systems .................. 244 3.2.2.5.5 Reduction of metal emissions by use of a metal separator in the fuel
supply line .................................................................................................... 245 3.2.2.6 Techniques for the prevention and control of HCl and HF emissions.................. 246
3.2.2.6.1 Co-benefit of techniques designed for other pollutants ................................ 246 3.2.2.6.2 Wet scrubbing .............................................................................................. 247
3.2.2.7 Techniques to reduce unburnt carbon .................................................................. 249 3.2.2.7.1 Combustion optimisation ............................................................................. 249 3.2.2.7.2 Oxidation catalyst ......................................................................................... 249
3.2.3 Techniques to increase energy efficiency ....................................................... 251 3.2.3.1 Heat recovery techniques ..................................................................................... 251 3.2.3.2 Cogeneration or combined heat and power (CHP) ............................................... 251 3.2.3.3 Cheng Cycle ......................................................................................................... 255 3.2.3.4 Combustion air preheating ................................................................................... 258 3.2.3.5 Advanced material use ......................................................................................... 259 3.2.3.6 Steam double reheating ........................................................................................ 260 3.2.3.7 Feed-water preheating using recovered heat ........................................................ 260 3.2.3.8 Advanced control system ..................................................................................... 262 3.2.3.9 Heat accumulation (heat storage) in CHP or heat-only mode .............................. 265 3.2.3.10 Integrated gasification combined cycle (IGCC) ................................................... 266 3.2.3.11 Combined-cycle combustion ................................................................................ 266 3.2.3.12 Topping cycle ....................................................................................................... 268 3.2.3.13 Steam turbine and other component upgrades ...................................................... 270 3.2.3.14 (Ultra-) Supercritical steam parameters ............................................................... 272 3.2.3.15 Flue-gas condenser ............................................................................................... 274 3.2.3.16 Cooling tower air emission discharge .................................................................. 275 3.2.3.17 Wet stack .............................................................................................................. 276 3.2.3.18 Fuel preheating/drying ......................................................................................... 277 3.2.3.19 Cooling system ..................................................................................................... 278
3.2.4 Techniques for the prevention and control of emissions to water ................... 278
3.2.4.1 Filtration ............................................................................................................... 279 3.2.4.2 Coagulation, flocculation, sedimentation and precipitation ................................. 280 3.2.4.3 Flotation ............................................................................................................... 282
WORKIN
G DRAFT IN
PROGRESS
vi June 2016 TL/JFF/FN/EIPPCB/LCP_Final Draft
3.2.4.4 Oil-water separation.............................................................................................. 282 3.2.4.5 Crystallisation ....................................................................................................... 283 3.2.4.6 Evaporation ........................................................................................................... 284 3.2.4.7 Air stripping .......................................................................................................... 285 3.2.4.8 Ion exchange ......................................................................................................... 286 3.2.4.9 Biological treatment.............................................................................................. 287 3.2.4.10 Techniques to consider for plants equipped with flue-gas treatment with
emissions to water (Wet FGD, FG condenser) ..................................................... 288
3.2.5 Techniques for the management of residues .................................................... 302
3.2.5.1 Optimisation of gypsum quality ........................................................................... 302 3.2.5.2 Optimisation of bottom ash quality ...................................................................... 303
3.2.6 Techniques for the prevention of emissions to soil and groundwater .............. 304
3.2.7 Techniques to reduce noise emissions ............................................................. 304 3.2.7.1 Strategic planning of the location of equipment, units and buildings ................... 304 3.2.7.2 Primary techniques: noise reduction at source ...................................................... 305 3.2.7.3 Secondary techniques: noise abatement ................................................................ 307
4 GASIFICATION .................................................................................................. 309
4.1 APPLIED PROCESSES AND TECHNIQUES ..................................................................... 312
4.1.1 IGCC (Integrated gasification combined cycle) plants .................................... 313
4.1.2 Biomass gasifiers ............................................................................................. 322
4.1.3 Plasma gasification of waste material .............................................................. 326
4.2 CURRENT EMISSIONS AND CONSUMPTION LEVELS .................................................... 327
4.2.1 Residues ........................................................................................................... 332
4.2.2 Consumption of water, chemicals and energy ................................................. 333
4.2.3 Emissions to land/soil ...................................................................................... 334
4.3 TECHNIQUES TO CONSIDER IN THE DETERMINATION OF BAT .................................. 335
4.3.1 Gasification integrated with the combustion process ...................................... 335 4.3.1.1 Prevention of emissions and efficient energy use in coal- and multi-fuel-based
integrated gasification combined cycle (IGCC) plants ......................................... 335 4.3.1.2 Reduction of emissions from a gasifier connected to an existing coal boiler ....... 342 4.3.1.3 Biomass gasification connected to engine plants with prior wet gas cleaning ..... 346
4.3.2 Techniques for the prevention and control of water pollution from the
gasification process .......................................................................................... 348
4.3.3 Techniques for the handling of residues from the gasification process ........... 349
4.3.4 Techniques to increase the energy efficiency of the gasification process ....... 350
4.3.4.1 High-temperature and -pressure gasification ........................................................ 350 4.3.4.2 Dry feedstock feeding system ............................................................................... 351 4.3.4.3 Use of recovered heat from the gasification process ............................................ 351 4.3.4.4 Full integration of the air supply unit (ASU) with the gas turbine in IGCC
plants ..................................................................................................................... 352
5 COMBUSTION OF SOLID FUELS .................................................................. 355
5.1 COMBUSTION OF COAL AND/OR LIGNITE ................................................................... 355
5.1.1 Applied processes and techniques ................................................................... 357 5.1.1.1 Fuel characterisation ............................................................................................. 358 5.1.1.2 Pretreatment and preparation of coal and lignite .................................................. 363 5.1.1.3 Energy efficiency of coal- and/or lignite-fired LCP boilers ................................. 365 5.1.1.4 Control of emissions to air from coal- and/or lignite-fired LCPs ......................... 366
5.1.1.4.1 Control of emissions from pulverised fuel combustion ................................ 366 5.1.1.4.2 Control of emissions from fluidised bed combustion ................................... 370 5.1.1.4.3 Control of emissions from grate firing .......................................................... 371 5.1.1.4.4 Control of mercury (Hg) emissions from coal- and/or lignite-fired LCPs .... 371
5.1.1.5 Water and waste water treatment .......................................................................... 374 5.1.1.6 Treatment of combustion residues ........................................................................ 374
WORKIN
G DRAFT IN
PROGRESS

TL/JFF/FN/EIPPCB/LCP_Final Draft June 2016 vii
5.1.2 Current consumption and emission levels ....................................................... 377
5.1.2.1 Coal and lignite used in LCPs .............................................................................. 377 5.1.2.2 The efficiency of coal- and lignite-fired combustion plants ................................. 380 5.1.2.3 Emissions to air (coal/lignite) .............................................................................. 384 5.1.2.4 Combustion residues ............................................................................................ 393
5.1.3 Techniques to consider in the determination of BAT for the combustion of
coal and/or lignite ............................................................................................ 398 5.1.3.1 Techniques for the control of diffuse emissions from the unloading, storage and
handling of fuel/additives ..................................................................................... 399 5.1.3.2 Techniques to improve the general environmental performance ......................... 402 5.1.3.3 Techniques to increase energy efficiency and fuel utilisation .............................. 406 5.1.3.4 Techniques for the prevention and control of dust and metal emissions .............. 412
5.1.3.4.1 General techniques for the prevention and control of dust and particle-
bound metal emissions ................................................................................. 412 5.1.3.4.2 General techniques for the prevention and control of mercury emissions .... 417 5.1.3.4.3 Specific techniques for the prevention and control of mercury emissions ... 421
5.1.3.4.3.1 Fuel pretreatment ................................................................................. 421 5.1.3.4.3.2 Carbon sorbent injection...................................................................... 423 5.1.3.4.3.3 Use of halideated additives (e.g. bromide) .......................................... 427 5.1.3.4.3.4 Other specific techniques for the prevention and control of gaseous
mercury................................................................................................ 429 5.1.3.5 Techniques for the prevention and control of SOX, HCl and HF emissions ......... 432
5.1.3.5.1 General techniques for the prevention and control of SOX, HCl and HF
emissions ...................................................................................................... 432 5.1.3.5.2 Replacement of the gas-gas heater located downstream of the wet FGD ..... 440
5.1.3.6 Techniques for the prevention and control of NOX, CO and N2O emissions ....... 442 5.1.3.6.1 General techniques for the prevention and control of NOX, CO and N2O
emissions ...................................................................................................... 442 5.1.3.6.2 Thermal input biasing and dynamic classifiers for the prevention and
control of NOX at downshot boilers combusting low volatile coals ............. 449
5.2 COMBUSTION OF BIOMASS AND PEAT ....................................................................... 451
5.2.1 Applied processes and techniques ................................................................... 451 5.2.1.1 Fuel characterisation of biomass and/or peat ....................................................... 451 5.2.1.2 Fuel pretreatment and preparation ........................................................................ 451 5.2.1.3 Combustion technologies specific to biomass and/or peat firing ......................... 452
5.2.1.3.1 Grate firing ................................................................................................... 452 5.2.1.3.2 Fluidised bed combustion ............................................................................. 454 5.2.1.3.3 Pulverised peat and/or biomass firing .......................................................... 455
5.2.1.4 Technique to increase efficiency .......................................................................... 456 5.2.1.5 Control of emissions to air from biomass- and/or peat-fired plants ..................... 457
5.2.1.5.1.1 Control of nitrogen oxides emissions .................................................. 457 5.2.1.5.1.2 Control of SOX emissions .................................................................... 458 5.2.1.5.1.3 Dust control ......................................................................................... 458
5.2.1.6 Water and waste water treatment ......................................................................... 460 5.2.1.7 Handling of combustion residues ......................................................................... 460
5.2.2 Current emission and consumption levels ....................................................... 461 5.2.2.1 Biomass and peat used in large combustion plants .............................................. 461 5.2.2.2 Energy efficiency of biomass- and peat-fired combustion plants ........................ 464 5.2.2.3 Emissions to air from biomass- and/or peat-fired combustion plants .................. 465 5.2.2.4 Combustion and other plant residues ................................................................... 468
5.2.3 Techniques to consider in the determination of BAT for the combustion of
biomass and/or peat ......................................................................................... 469
5.2.3.1 Techniques to reduce diffuse/fugitive emissions to air ........................................ 469 5.2.3.2 Techniques to improve the general environmental performance ......................... 471 5.2.3.3 Techniques to increase energy efficiency............................................................. 473 5.2.3.4 Techniques for the prevention and control of NOX, N2O and CO emissions ....... 476 5.2.3.5 Techniques for the prevention and control of SOX, HCl and HF emissions ......... 481
WORKIN
G DRAFT IN
PROGRESS
viii June 2016 TL/JFF/FN/EIPPCB/LCP_Final Draft
5.2.3.6 Techniques for the prevention and control of dust and particulate-bound metal
emissions .............................................................................................................. 488 5.2.3.7 Techniques for the prevention and control of mercury (Hg) ................................ 492 5.2.3.8 Techniques for the reduction and reuse of combustion residues .......................... 495
6 COMBUSTION OF LIQUID FUELS ................................................................ 497
6.1 APPLIED PROCESSES AND TECHNIQUES ..................................................................... 497
6.1.1 Fuel characterisation ........................................................................................ 497
6.1.2 Pretreatment and preparation of fuels .............................................................. 497 6.1.2.1 Pretreatment of fuels used in conventional boilers ............................................... 497 6.1.2.2 Pretreatment of fuels used in diesel engines ......................................................... 497 6.1.2.3 Pretreatment of fuels for gas turbines ................................................................... 498
6.1.3 Combustion technologies ................................................................................. 498
6.1.3.1 Design of oil-fired boilers ..................................................................................... 498 6.1.3.2 Compression ignition (diesel) engines .................................................................. 499 6.1.3.3 Liquid-fuel-fired gas turbines ............................................................................... 499
6.1.4 Control of emissions to air ............................................................................... 499
6.1.4.1 Primary control techniques for emissions to air from boilers ............................... 501 6.1.4.2 Primary control techniques for emissions to air from engines .............................. 502 6.1.4.3 Primary control techniques for emissions to air from gas turbines ....................... 503 6.1.4.4 End-of-pipe techniques to control emissions to air ............................................... 503
6.1.4.4.1 Control of dust emissions.............................................................................. 503 6.1.4.4.2 Control of SOX emissions ............................................................................. 503 6.1.4.4.3 Control of NOX emissions............................................................................. 504
6.1.5 Water consumption and waste water treatment ............................................... 505
6.1.6 Combustion residues treatment ........................................................................ 506
6.2 CURRENT CONSUMPTION AND EMISSION LEVELS IN THE COMBUSTION OF LIQUID
FUELS ......................................................................................................................... 507
6.2.1 Liquid fuels used in large combustion plants .................................................. 507
6.2.2 Efficiency of combustion plants firing HFO and/or gas oil ............................. 509
6.2.3 Emissions to air from liquid-fuel-fired combustion plants .............................. 509
6.3 TECHNIQUES TO CONSIDER IN THE DETERMINATION OF BAT FOR THE
COMBUSTION OF LIQUID FUELS ................................................................................. 511
6.3.1 Techniques for the prevention of emissions to soil and groundwater .............. 511
6.3.2 Techniques to consider in the determination of BAT for the combustion of
HFO and/or gas oil in boilers ........................................................................... 513
6.3.2.1 Techniques to improve the general performance .................................................. 513 6.3.2.2 Techniques to increase energy efficiency ............................................................. 515 6.3.2.3 Techniques for the prevention and control of NOX and CO emissions ................. 518 6.3.2.4 Techniques for the prevention and control of SOX emissions .............................. 522 6.3.2.5 Techniques for the prevention and control of dust and particulate-bound metals
emissions .............................................................................................................. 527
6.3.3 Techniques to consider in the determination of BAT for the combustion of
HFO and/or gas oil in engines ......................................................................... 530
6.3.3.1 Techniques to increase energy efficiency ............................................................. 530 6.3.3.2 Techniques for the prevention and control of NOX and CO emissions ................. 533 6.3.3.3 Techniques for the prevention and control of SOX emissions .............................. 538 6.3.3.4 Techniques for the prevention and control of dust and particulate-bound metals
emissions .............................................................................................................. 541
6.3.4 Techniques to consider in the determination of BAT for the combustion of
gas oil in gas turbines....................................................................................... 544 6.3.4.1 Techniques to increase energy efficiency ............................................................. 544 6.3.4.2 Techniques for the prevention and control of NOX and CO emissions ................. 547 6.3.4.3 Techniques for the prevention and control of SOX emissions .............................. 549
WORKIN
G DRAFT IN
PROGRESS
TL/JFF/FN/EIPPCB/LCP_Final Draft June 2016 ix
6.3.4.4 Techniques for the prevention and control of dust and particulate-bound metals
emissions .............................................................................................................. 550
7 COMBUSTION OF GASEOUS FUELS ........................................................... 553
7.1 COMBUSTION OF NATURAL GAS ............................................................................... 553
7.1.1 Specific applied processes and techniques ...................................................... 553
7.1.1.1 Fuel characterisation ............................................................................................ 554 7.1.1.2 Control of emissions to air ................................................................................... 555
7.1.1.2.1 Control of NOX emissions to air from boilers .............................................. 555 7.1.1.2.2 Control of NOX emissions to air from engines ............................................. 555 7.1.1.2.3 Control of NOX emissions to air from turbines ............................................ 556
7.1.1.3 Water and waste water treatment ......................................................................... 558
7.1.2 Current consumption and emission levels ....................................................... 559
7.1.2.1 Energy efficiency of natural gas combustion plants ............................................. 559 7.1.2.2 Emissions to air .................................................................................................... 564 7.1.2.3 Emissions to water ............................................................................................... 572 7.1.2.4 Combustion and other plant residues ................................................................... 572
7.1.3 Techniques to consider in the determination of BAT for the combustion of
natural gas in boilers / engines / gas turbines .................................................. 573 7.1.3.1 Techniques to increase the energy efficiency of natural-gas-fired plants ............ 574
7.1.3.1.1 General techniques to increase the energy efficiency of natural-gas-fired
units .............................................................................................................. 574 7.1.3.1.2 Specific techniques to increase the energy efficiency of the fuel supply and
handling activities ........................................................................................ 584 7.1.3.1.2.1 Use of expansion turbine ..................................................................... 584
7.1.3.1.3 Specific techniques to increase the energy efficiency of natural-gas-fired
turbines ......................................................................................................... 585 7.1.3.1.3.1 CHP readiness ..................................................................................... 585 7.1.3.1.3.2 Flow path optimisation ........................................................................ 587 7.1.3.1.3.3 Inlet combustion air cooling ................................................................ 588 7.1.3.1.3.4 Recuperative gas turbine cycle ............................................................ 590
7.1.3.2 Techniques for the prevention and control of NOX and CO emissions ................ 591 7.1.3.2.1 General techniques for the prevention and control of NOX and CO
emissions from natural-gas-fired boilers ...................................................... 591 7.1.3.2.2 General techniques for the prevention and control of NOX and CO
emissions from natural-gas-fired turbines .................................................... 596 7.1.3.2.3 Specific techniques for the prevention and control of NOX and CO
emissions from natural-gas-fired turbines – Catalytic pollution control
SCONOXTM
system ...................................................................................... 605 7.1.3.2.4 Prevention and control of NOX and CO emissions from natural-gas-fired
turbines at low load ...................................................................................... 607 7.1.3.2.4.1 Low-load operation point (LLOP) ....................................................... 607 7.1.3.2.4.2 Airflow control with improved inlet guided vanes (IGV) ................... 609 7.1.3.2.4.3 Gas turbine inlet excess air management via a bleed valve discharge. 610
7.1.3.2.5 General techniques for the prevention and control of NOX and unburnt
carbon emissions from natural-gas-fired engines ......................................... 611 7.1.3.3 Techniques for the prevention of emissions to soil .............................................. 616
7.2 COMBUSTION OF BIOGAS .......................................................................................... 618
7.3 COMBUSTION OF PROCESS GASES FROM THE IRON AND STEEL INDUSTRY ............... 619
7.3.1 Specific applied processes and techniques ...................................................... 619 7.3.1.1 Fuel characterisation and preparation/pretreatment ............................................. 621 7.3.1.2 Control of emissions to air from boilers ............................................................... 626 7.3.1.3 Control of emissions to air from gas turbines ...................................................... 627 7.3.1.4 Water and waste water treatment ......................................................................... 628
7.3.2 Current consumption and emission levels ....................................................... 629 7.3.2.1 Iron and steel process gases used in large combustion plants .............................. 629 7.3.2.2 Energy efficiency of iron and steel process-gas-fired combustion plants ............ 629
WORKIN
G DRAFT IN
PROGRESS

x June 2016 TL/JFF/FN/EIPPCB/LCP_Final Draft
7.3.2.3 Emissions to air .................................................................................................... 633
7.3.3 Techniques to consider in the determination of BAT for the combustion of
iron and steel process gases ............................................................................. 642 7.3.3.1 Techniques to increase energy efficiency ............................................................. 643
7.3.3.1.1 General techniques to increase energy efficiency ......................................... 643 7.3.3.1.2 Process gas management system .................................................................. 646
7.3.3.2 Techniques for the prevention and control of NOX and CO emissions ................. 647 7.3.3.2.1 General techniques for the prevention and control of NOX and CO
emissions when firing iron and steel process gases ...................................... 647 7.3.3.2.2 Specially designed low-NOX burners in multiple rows per type of fuel or
including specific features for multi-fuel firing ............................................ 651 7.3.3.3 Techniques for the prevention and control of SOX emissions ............................... 652 7.3.3.4 Techniques for the prevention and control of dust emissions ............................... 655
7.4 COMBUSTION OF GAS ON OFFSHORE PLATFORMS ..................................................... 658
7.4.1 Specific applied processes and techniques ...................................................... 658 7.4.1.1 Offshore combustion installations ........................................................................ 658 7.4.1.2 Control of emissions to air .................................................................................... 660
7.4.2 Current consumption and emission levels ....................................................... 661
7.4.2.1 Non-conventional gaseous fuels combusted ......................................................... 661 7.4.2.2 Efficiency of non-conventional gaseous fuels combustion in offshore gas
turbines ................................................................................................................. 661
7.4.3 Techniques to consider in the determination of BAT ...................................... 662 7.4.3.1 Techniques to improve the environmental performance of combustion plants
used on offshore platforms ................................................................................... 662 7.4.3.2 Techniques to increase energy efficiency ............................................................. 663 7.4.3.3 Techniques for the prevention and control of NOX and CO emissions ................. 665
8 MULTI-FUEL COMBUSTION ......................................................................... 671
8.1 SOLID MULTI-FUEL COMBUSTION .............................................................................. 671
8.1.1 Applied processes and techniques used in solid multi-fuel combustion in
LCPs ................................................................................................................ 671 8.1.1.1 Unloading, storage and handling .......................................................................... 671 8.1.1.2 Fuels characterisation and pretreatment................................................................ 671 8.1.1.3 Techniques to introduce the different fuels into the combustion process ............. 672
8.1.1.3.1 Mixing with the main fuel............................................................................. 672 8.1.1.3.2 Dedicated burners ......................................................................................... 672
8.1.1.4 Solid multi-fuel combustion processes ................................................................. 673 8.1.1.4.1 Co-firing of biomass and fossil fuels ............................................................ 673
8.1.1.5 Control of emissions to air in solid multi-fuel combustion LCPs ......................... 675
8.1.2 Current consumption and emission levels in solid multi-fuel-combustion in
LCPs ................................................................................................................ 677 8.1.2.1 Degree of solid multi-fuel firing in LCPs ............................................................. 677 8.1.2.2 Effects of solid multi-fuel combustion on plant performance and efficiency ....... 677 8.1.2.3 Effects of solid multi-fuel combustion on emissions to air ................................... 678 8.1.2.4 Effects of solid multi-fuel combustion on the quality of combustion residues ..... 678
8.1.3 Techniques to consider in the determination of BAT in solid multi-fuel
combustion in LCPs ......................................................................................... 679
8.2 COMBUSTION OF LIQUID AND GASEOUS PROCESS FUELS FROM THE CHEMICAL
INDUSTRY .................................................................................................................. 680
8.2.1 Applied processes and techniques for combustion plants in the chemical
industry ............................................................................................................ 680 8.2.1.1 Operating conditions ............................................................................................. 681 8.2.1.2 Control of NOX, NH3 and CO ............................................................................... 681 8.2.1.3 Control of other pollutants .................................................................................... 681
8.2.2 Current emission and consumption levels ....................................................... 682
WORKIN
G DRAFT IN
PROGRESS

TL/JFF/FN/EIPPCB/LCP_Final Draft June 2016 xi
8.2.2.1 Consumption of gaseous and liquid process fuels from the chemical industry .... 682 8.2.2.1.1 Energy efficiency ......................................................................................... 682
8.2.2.2 Emissions ............................................................................................................. 683 8.2.2.2.1 NOX emissions variability ............................................................................ 685
8.2.3 Techniques to consider in the determination of BAT for the combustion of
process fuels from the chemical industry ........................................................ 687 8.2.3.1 Techniques for the prevention and control of NOX, CO and NH3 emissions ....... 687 8.2.3.2 Techniques for the prevention and control of other pollutants ............................. 693
9 WASTE CO-INCINERATION .......................................................................... 697
9.1 APPLIED PROCESSES AND TECHNIQUES USED IN THE WASTE CO-INCINERATION IN
LCPS ......................................................................................................................... 698
9.1.1 Acceptance and pre-acceptance procedures .................................................... 698
9.1.2 Unloading, storage and handling ..................................................................... 698
9.1.3 Characterisation and pretreatment of waste streams ....................................... 698 9.1.3.1 Milling .................................................................................................................. 699 9.1.3.2 Drying .................................................................................................................. 699 9.1.3.3 Pyrolysis ............................................................................................................... 699 9.1.3.4 Gasification .......................................................................................................... 700 9.1.3.5 Methanisation ....................................................................................................... 700
9.1.4 Techniques to introduce waste into the combustion process........................... 700 9.1.4.1 Mixing with the main fuel .................................................................................... 700 9.1.4.2 Separate lances or modified existing burners ....................................................... 701 9.1.4.3 Special grates ....................................................................................................... 702 9.1.4.4 Feeding wastes into a fluidised bed boiler ........................................................... 702
9.1.5 Control of emissions to air from waste co-incineration .................................. 703
9.1.6 Water and waste water treatment .................................................................... 703
9.1.7 Handling of combustion residues .................................................................... 703
9.2 CURRENT CONSUMPTION AND EMISSION LEVELS IN WASTE CO-INCINERATION
LCPS ......................................................................................................................... 705
9.2.1 Overview of the waste co-incinerated in LCPs ............................................... 705
9.2.2 The degree of waste co-incinerated in LCPs ................................................... 707
9.2.3 Effects of waste co-incineration on plant energy efficiency ........................... 711
9.2.4 General effects of waste co-incineration in LCPs ........................................... 711
9.2.5 Effect of waste co-incineration on plant performance .................................... 712
9.2.6 Effects of waste co-incineration on emissions to air ....................................... 713
9.2.6.1 Dust ...................................................................................................................... 713 9.2.6.2 Acid gases ............................................................................................................ 713 9.2.6.3 Carbon oxides ...................................................................................................... 713 9.2.6.4 Halides ................................................................................................................. 713 9.2.6.5 Nitrogen oxides .................................................................................................... 714 9.2.6.6 Sulphur oxides ...................................................................................................... 714 9.2.6.7 TOC, VOCs and dioxins ...................................................................................... 714 9.2.6.8 Metals (Cd+Tl; Hg; Sb+As+Pb+Cr+Co+Cu+Mn+Ni+V) ................................... 714 9.2.6.9 Plume ................................................................................................................... 715 9.2.6.10 Odour ................................................................................................................... 715
9.2.7 Effects of waste co-incineration on emissions to water .................................. 715
9.2.8 Effects of waste co-incineration on the quality of combustion residues ......... 716
9.3 TECHNIQUES TO CONSIDER IN THE DETERMINATION OF BAT FOR WASTE CO-
INCINERATION ........................................................................................................... 718
9.3.1 Techniques for the control of diffuse emissions and odours from the storage
and handling of dusty and odorous waste ....................................................... 718
9.3.2 Techniques for the pretreatment of waste ....................................................... 720
9.3.3 Techniques to introduce waste into the combustion process........................... 721
WORKIN
G DRAFT IN
PROGRESS

xii June 2016 TL/JFF/FN/EIPPCB/LCP_Final Draft
9.3.4 Techniques for the prevention and control of emissions to air from waste co-
incineration in LCPs ........................................................................................ 722
9.3.5 Techniques to reduce the impact of waste co-incineration on the residues
generated .......................................................................................................... 738
10 BEST AVAILABLE TECHNIQUES (BAT) CONCLUSIONS ....................... 739
10.1 GENERAL BAT CONCLUSIONS .................................................................................. 748
10.1.1 Environmental management systems ............................................................... 748
10.1.2 Monitoring ....................................................................................................... 750
10.1.3 General environmental and combustion performance ..................................... 756
10.1.4 Energy efficiency ............................................................................................. 759
10.1.5 Removed .......................................................................................................... 761
10.1.6 Water usage and emissions to water ................................................................ 761
10.1.7 Waste management .......................................................................................... 764
10.1.8 Noise emissions ............................................................................................... 765
10.1.9 Removed .......................................................................................................... 765
10.1.10 Removed .......................................................................................................... 765
10.2 BAT CONCLUSIONS FOR THE COMBUSTION OF SOLID FUELS .................................... 766
10.2.1 BAT conclusions for the combustion of coal and/or lignite ............................ 766 10.2.1.1 General environmental performance ..................................................................... 766 10.2.1.2 Energy efficiency .................................................................................................. 766 10.2.1.3 NOX, N2O and CO emissions to air ...................................................................... 768 10.2.1.4 SOX, HCl and HF emissions to air ........................................................................ 770 10.2.1.5 Dust and particulate-bound metal emissions to air ............................................... 772 10.2.1.6 Mercury emissions to air ...................................................................................... 773
10.2.2 BAT conclusions for the combustion of solid biomass and/or peat ................ 774 10.2.2.1 Removed ............................................................................................................... 774 10.2.2.2 Energy efficiency .................................................................................................. 774 10.2.2.3 NOX, N2O and CO emissions to air ...................................................................... 775 10.2.2.4 SOX, HCl and HF emissions to air ........................................................................ 776 10.2.2.5 Dust and particulate-bound metal emissions to air ............................................... 777 10.2.2.6 Mercury emissions to air ...................................................................................... 778
10.3 BAT CONCLUSIONS FOR THE COMBUSTION OF LIQUID FUELS .................................. 779
10.3.1 HFO- and/or gas-oil-fired boilers .................................................................... 779
10.3.1.1 Energy efficiency .................................................................................................. 779 10.3.1.2 NOX and CO emissions to air ............................................................................... 780 10.3.1.3 SOX, HCl and HF emissions to air ........................................................................ 782 10.3.1.4 Dust and particulate-bound metal emissions to air ............................................... 783
10.3.2 HFO- and/or gas-oil-fired engines ................................................................... 783
10.3.2.1 Energy efficiency .................................................................................................. 784 10.3.2.2 NOX, CO and volatile organic compound emissions to air ................................... 785 10.3.2.3 SOX, HCl and HF emissions to air ........................................................................ 786 10.3.2.4 Dust and particulate-bound metal emissions to air ............................................... 786
10.3.3 Gas-oil-fired gas turbines ................................................................................. 787
10.3.3.1 Energy efficiency .................................................................................................. 787 10.3.3.2 NOX and CO emissions to air ............................................................................... 788 10.3.3.3 SOX and dust emissions to air ............................................................................... 789
10.4 BAT CONCLUSIONS FOR THE COMBUSTION OF GASEOUS FUELS ............................... 790
10.4.1 BAT conclusions for the combustion of natural gas ........................................ 790
10.4.1.1 Energy efficiency .................................................................................................. 790 10.4.1.2 NOX, CO, NMVOC and CH4 emissions to air ...................................................... 792
10.4.2 BAT conclusions for the combustion of iron and steel process gases ............. 796 10.4.2.1 Energy efficiency .................................................................................................. 796
WORKIN
G DRAFT IN
PROGRESS
TL/JFF/FN/EIPPCB/LCP_Final Draft June 2016 xiii
10.4.2.2 NOX and CO emissions to air ............................................................................... 797 10.4.2.3 SOX emissions to air ............................................................................................. 800 10.4.2.4 Dust emissions to air ............................................................................................ 800
10.4.3 BAT conclusions for the combustion of gaseous and/or liquid fuels on
offshore platforms ........................................................................................... 802
10.5 BAT CONCLUSIONS FOR MULTI-FUEL-FIRED PLANTS ............................................... 804
10.5.1 BAT conclusions for the combustion of process fuels from the chemical
industry ............................................................................................................ 804 10.5.1.1 General environmental performance .................................................................... 804 10.5.1.2 Energy efficiency ................................................................................................. 804 10.5.1.3 NOX and CO emissions to air ............................................................................... 805 10.5.1.4 SOX, HCl and HF emissions to air ....................................................................... 806 10.5.1.5 Dust and particulate-bound metal emissions to air ............................................... 807 10.5.1.6 Removed .............................................................................................................. 807 10.5.1.7 Emissions of volatile organic compounds and polychlorinated dibenzo-dioxins
and -furans to air .................................................................................................. 808
10.6 BAT CONCLUSIONS FOR THE CO-INCINERATION OF WASTE ..................................... 809
10.6.1.1 General environmental performance .................................................................... 809 10.6.1.2 Energy efficiency ................................................................................................. 810 10.6.1.3 NOX and CO emissions to air ............................................................................... 810 10.6.1.4 SOX, HCl and HF emissions to air ....................................................................... 811 10.6.1.5 Dust and particulate-bound metal emissions to air ............................................... 811 10.6.1.6 Mercury emissions to air ...................................................................................... 812 10.6.1.7 Emissions of volatile organic compounds and polychlorinated dibenzo-dioxins
and -furans to air .................................................................................................. 812
10.7 BAT CONCLUSIONS FOR GASIFICATION .................................................................... 813
10.7.1.1 Energy efficiency ................................................................................................. 813 10.7.1.2 NOX and CO emissions to air ............................................................................... 814 10.7.1.3 SOX emissions to air ............................................................................................. 815 10.7.1.4 Dust, particulate-bound metal, ammonia and halogen emissions to air ............... 816
10.8 DESCRIPTION OF TECHNIQUES .................................................................................. 817
10.8.1 General techniques .......................................................................................... 817
10.8.2 Techniques to increase energy efficiency ....................................................... 817
10.8.3 Techniques to reduce emissions of NOX and/or CO to air .............................. 818
10.8.4 Techniques to reduce emissions of SOX, HCl and/or HF to air ...................... 820
10.8.5 Techniques to reduce emissions of dust, and/or metals including mercury to
air..................................................................................................................... 821
10.8.6 Techniques to reduce emissions to water ........................................................ 821
11 EMERGING TECHNIQUES ............................................................................. 823
11.1 COMMON PROCESSES AND TECHNIQUES FOR ENERGY GENERATION........................ 823
11.1.1 High-temperature and -pressure super critical coal plant ................................ 823
11.2 COMMON TECHNICAL COMBUSTION PROCESSES ...................................................... 824
11.2.1 Techniques to reduce sulphur oxide emissions ............................................... 824
11.2.1.1 Bubbling technology ............................................................................................ 824
11.2.2 Combined techniques to reduce sulphur oxide and nitrogen oxide emissions 824
11.2.2.1 Emerging gas/solid catalytic processes ................................................................ 824 11.2.2.2 Alkali injection ..................................................................................................... 824 11.2.2.3 Wet scrubber with additives to achieve NOX removal ......................................... 824
11.2.3 Techniques to reduce metal emissions ............................................................ 825 11.2.3.1 Membrane filtration to reduce metals in scrubber waste water ............................ 825
11.2.4 CO2 capture processes ..................................................................................... 827
11.2.4.1 Post-combustion CO2 capture processes .............................................................. 828 11.2.4.1.1 Amine Process .............................................................................................. 828
WORKIN
G DRAFT IN
PROGRESS
xiv June 2016 TL/JFF/FN/EIPPCB/LCP_Final Draft
11.2.4.1.2 Chilled Ammonia Process............................................................................. 831 11.2.4.1.3 Biocatalysis techniques to remove CO2 from flue-gases .............................. 833
11.2.4.2 Oxy-fuel combustion ............................................................................................ 834 11.2.4.3 Carbon Capture Readiness .................................................................................... 837
11.2.4.3.1 Plant space and access requirements ............................................................. 837 11.2.4.3.2 Power plant CCR pre-investments ................................................................ 837
11.3 GASIFICATION / LIQUEFACTION / PYROLYSIS OF FUELS ........................................... 839
11.3.1 IGCC (Integrated gasification combined cycle) .............................................. 844
11.3.2 Underground coal gasification ......................................................................... 844
11.4 COMBUSTION OF SOLID FUELS .................................................................................. 846
11.4.1 Combustion of coal and/or lignite.................................................................... 846 11.4.1.1 Pre-drying of lignite with low-temperature heat ................................................... 846 11.4.1.2 Mercury emissions reduction ................................................................................ 847
11.4.1.2.1 Coal beneficiation ......................................................................................... 847 11.4.1.2.2 Oxidation catalysts ........................................................................................ 848 11.4.1.2.3 Other novel control technologies .................................................................. 848 11.4.1.2.4 Photochemical oxidation process .................................................................. 849
11.4.1.3 Multi-pollutant control technologies..................................................................... 849
11.5 COMBUSTION OF LIQUID FUELS ................................................................................. 850
11.5.1 Combustion of liquid petroleum commercial fuels in boilers / engines /
turbines ............................................................................................................ 850 11.5.1.1 Two-stage turbocharging for large internal combustion engines .......................... 850
11.5.2 Fuel cell applications ....................................................................................... 850
11.6 COMBUSTION OF GASEOUS FUELS ............................................................................. 851
11.6.1 Combustion of natural gas in boilers / engines / turbines ................................ 851
11.6.1.1 Miller cycle and two-stage turbocharging in lean-burn gas engines ..................... 851 11.6.1.2 Contol of methane slip from gas-fired lean-burn engines ..................................... 851
11.6.1.2.1 Oxidation catalyst ......................................................................................... 851 11.6.1.2.2 Recuperative oxidiser ................................................................................... 852
11.6.1.3 Oxy-combustion ................................................................................................... 852 11.6.1.4 Catalytic combustion ............................................................................................ 852 11.6.1.5 Flameless combustion ........................................................................................... 853 11.6.1.6 Closed-loop steam cooling.................................................................................... 855 11.6.1.7 Further development potential .............................................................................. 856 11.6.1.8 Recuperative options ............................................................................................ 856
11.6.1.8.1 Intercooled recuperated gas turbine .............................................................. 856 11.6.1.8.2 HAT cycle ..................................................................................................... 856 11.6.1.8.3 TOPHAT process .......................................................................................... 857 11.6.1.8.4 CHAT cycle .................................................................................................. 857
11.6.1.9 Advanced lean-burn approach for gas engines ..................................................... 857
11.6.2 Fuel cell applications ....................................................................................... 857
12 CONCLUDING REMARKS AND RECOMMENDATIONS FOR FUTURE
WORK .................................................................................................................. 859
13 ANNEXES ............................................................................................................ 875
13.1 ANNEX I - LIST OF EUROPEAN PLANTS THAT TOOK PART IN THE DATA COLLECTION
EXERCISE IN 2012 ...................................................................................................... 875
13.2 ANNEX II - LIST OF WASTE CO-INCINERATED ........................................................... 920
13.3 ANNEX III - EXAMPLE TOOL FOR CONVERTING EMISSION LEVELS TO DIFFERENT
AVERAGING PERIODS ................................................................................................. 922
13.4 ANNEX IV - MEASUREMENT UNCERTAINTIES REPORTED BY THE PLANTS THAT
PARTICIPATED IN THE 2012 DATA COLLECTION ........................................................ 924
GLOSSARY ................................................................................................................. 927
WORKIN
G DRAFT IN
PROGRESS

TL/JFF/FN/EIPPCB/LCP_Final Draft June 2016 xv
I. ISO COUNTRY CODES ............................................................................................... 928
II. MONETARY UNITS .................................................................................................... 928
III. UNIT PREFIXES, NUMBER SEPARATORS AND NOTATIONS ......................................... 929
IV. UNITS AND MEASURES .............................................................................................. 930
V. CHEMICAL ELEMENTS ............................................................................................... 932
VI. ACRONYMS AND DEFINITIONS .................................................................................. 933
REFERENCES ............................................................................................................ 939
WORKIN
G DRAFT IN
PROGRESS
xvi June 2016 TL/JFF/FN/EIPPCB/LCP_Final Draft
List of Tables Table 1.1: Area and population worldwide, 2011 ................................................................................... 1 Table 1.2: Maximum electrical capacity in the EU-28 (MW), 1990-2013 .............................................. 5 Table 1.3: LCP in the EU (2013)............................................................................................................ 7 Table 1.4: Potential emission pathways by source type and substance ................................................. 18 Table 1.5: Air emissions of European large combustion plants (2013) ................................................ 20 Table 1.6: Fuel-bound nitrogen ............................................................................................................. 22 Table 1.7: List of water pollutants from LCPs ...................................................................................... 36 Table 2.1: Heat and electricity generated by CHP plants in European countries in 2013 ..................... 72 Table 2.2: Typical efficiencies at the output shaft of gas turbines in relation to their thermal power ... 81 Table 2.3: Commonly applicable efficiency improvement techniques at combustion plants ................ 82 Table 2.4: Examples of energetic and exergetic efficiencies of different types of combustion plants .. 85 Table 2.5: Examples of effect of climatic conditions in Europe on the loss of efficiency of power
plants .................................................................................................................................... 87 Table 2.6: Typical energy consumption of secondary abatement techniques........................................ 88 Table 3.1: Description of primary techniques for emission control .................................................... 101 Table 3.2: Indicative DeNOX (secondary measures only) at large combustion plants in the EU-28 ... 107 Table 3.3: Yearly emissions to water .................................................................................................. 121 Table 3.4: Information for each technique described in this chapter ................................................... 133 Table 3.5: General performance of an ESP ......................................................................................... 142 Table 3.6: General performance of bag filters ..................................................................................... 147 Table 3.7: General performance of dust cleaning devices ................................................................... 149 Table 3.8: General performance of wet scrubbers ............................................................................... 152 Table 3.9: Comparison between forced and natural oxidation ............................................................ 155 Table 3.10: Performance of the wet lime/limestone scrubber technique for reducing sulphur oxide
emissions ............................................................................................................................ 161 Table 3.11: Potential performance improvement options ...................................................................... 162 Table 3.12: Performance of the seawater scrubber technique for reducing sulphur oxide emissions ... 165 Table 3.13: Performance of the spray dry scrubber technique for reducing sulphur oxide emissions .. 172 Table 3.14: Performance of the CFB dry scrubber technique for reducing sulphur oxide emissions ... 176 Table 3.15: Performance of the duct sorbent injection technique for reducing sulphur oxide
emissions ............................................................................................................................ 179 Table 3.16: Performance of the furnace sorbent injection technique for reducing sulphur oxide
emissions ............................................................................................................................ 184 Table 3.17: Performance of the hybrid sorbent injection technique for reducing sulphur oxide
emissions ............................................................................................................................ 185 Table 3.18: Performance of the air staging technique for reducing nitrogen oxide emissions .............. 191 Table 3.19: Performance of the flue-gas recirculation technique for reducing nitrogen oxide
emissions ............................................................................................................................ 194 Table 3.20: Performance of the low-NOX burner technique for reducing nitrogen oxide emissions .... 199 Table 3.21: Performance of the fuel staging (reburning) technique for reducing nitrogen oxide
emissions ............................................................................................................................ 203 Table 3.22: Trade-offs between control of NOX emissions and efficiency ........................................... 210 Table 3.23: NOX and CO emissions from applying water or steam injection to example gas turbines . 214 Table 3.24: Typical SCR efficiencies for different combustion processes (dependent on SCR design
and injected reagent amount) ............................................................................................. 222 Table 3.25: Performance of the SCR technique for reducing nitrogen oxide emissions ....................... 223 Table 3.26: Cost estimations for an SCR unit as a function of the flue-gas volume for a coal-fired
boiler .................................................................................................................................. 226 Table 3.27: Performance of the SNCR technique for reducing nitrogen oxide emissions .................... 230 Table 3.28: Performance of the activated carbon technique for reducing sulphur oxide/nitrogen
oxide/mercury emissions .................................................................................................... 234 Table 3.29: Performance of the WSA-SNOX technique for reducing sulphur oxide/nitrogen oxides
emissions ............................................................................................................................ 236 Table 3.30: Main features of the plant taken as an example for the operating costs of the WSA-
SNOX technique in Table 3.31 ........................................................................................... 236 Table 3.31: Operating costs of the WSA-SNOX technique at the example plant described in Table
3.30 operated 8000 h/yr ...................................................................................................... 236 Table 3.32: Performance of the DeSONOX technique for reducing sulphur oxide/nitrogen oxides
emissions ............................................................................................................................ 238 Table 3.33: Metal reduction efficiencies (%) achieved in a conventional pulverised-coal-fired plant.. 240 Table 3.34: Metal reduction efficiencies (%) achieved in a conventional pulverised-coal-fired plant.. 242
WORKIN
G DRAFT IN
PROGRESS

TL/JFF/FN/EIPPCB/LCP_Final Draft June 2016 xvii
Table 3.35: Plant data of HCl scrubbers implemented at waste incineration facilities ......................... 248 Table 3.36: Indicative comparison of cogeneration with separate power and heat generation ............. 253 Table 3.37: Achieved NOX emissions and thermal efficiencies for conventional combustor turbines
with modified fuel nozzles ................................................................................................. 257 Table 3.38: Costs and weight for a Cheng steam injection cycle on a GE LM 2500 package .............. 258 Table 3.39: Environmental results of a combustion optimiser (Metso advanced process control
solution) ............................................................................................................................. 265 Table 3.40: Impact on plant efficiency of component refurbishments and upgrades............................ 271 Table 3.41: Techniques for the prevention and control of water pollution from plants operating flue-
gas treatment with emissions to water ............................................................................... 289 Table 3.42: Plant emissions included in the plant codes shown in Figure 3.58 to Figure 3.72 ............. 291 Table 4.1: Syngas compositions from fluidised bed and fixed-bed gasifiers (typical bituminous
coal) ................................................................................................................................... 315 Table 4.2: Syngas compositions from entrained-flow coal gasification processes (typical
bituminous coal) ................................................................................................................ 317 Table 4.3: Syngas compositions for air-blown KBR and MHI gasification processes ....................... 317 Table 4.4: Typical syngas compositions for BFB and CFB biomass gasifiers (range) ....................... 323 Table 4.5: General information on efficiency and emissions to air of European IGCC plants ........... 327 Table 4.6: Comparison of the boiler gas emission measurement results from 100 % coal firing
(1997) and from co-firing of gasifier gas and coal (2001) ................................................. 328 Table 4.7: Emission per MWh produced (heat and electricity) over 2007–2012 ............................... 328 Table 4.8: Waste water emissions from the WAC Buggenum IGCC power plant, the Netherlands .. 331 Table 4.9: Waste water emissions from the ELCOGAS IGCC plant, Puertollano, Spain .................. 331 Table 4.10: Solid by-products, residues and waste from the WAC Buggenum IGCC power plant, the
Netherlands ........................................................................................................................ 332 Table 4.11: Solid by-products, residues and waste from the ELCOGAS IGCC plant, Puertollano,
Spain .................................................................................................................................. 332 Table 4.12: Solid by-products, residues and waste from the Kymijärvi I plant, Lahti, Finland ........... 333 Table 4.13: Consumption data from the WAC Buggenum IGCC power plant, the Netherlands.......... 333 Table 4.14: Consumption data from the ELCOGAS IGCC plant, Puertollano, Spain.......................... 333 Table 4.15: Consumption data from the Kymijärvi I plant, Lahti, Finland .......................................... 333 Table 4.16: Consumption levels per MWh produced (heat and electricity) over 2007–2012 for the
Skive CHP plant ................................................................................................................ 334 Table 4.17: Data of the Tampa IGCC power plant (Florida, US) ......................................................... 338 Table 4.18: Data of the Nuon IGCC power plant in Buggenum (the Netherlands) .............................. 338 Table 4.19: Data of the Wabash River IGCC power plant (Indiana, US) ............................................. 338 Table 4.20: Data of the IGCC power plant project in Nakoso (Japan) ................................................. 338 Table 4.21: Data of the Puertollano IGCC power plant (Spain) ........................................................... 339 Table 4.22: Data of Italian IGCC plants gasifying refinery residues .................................................... 339 Table 5.1: Indicative analyses of typical coals and lignites (general practice) ................................... 360 Table 5.2: Indicative concentrations of metals and trace elements in coals from different regions .... 361 Table 5.3: Typical monitoring of fuel characteristics in European coal- and/or lignite-fired plants .. 362 Table 5.4: Types of mills using different coal qualities ...................................................................... 364 Table 5.5: Example mercury removal efficiency for US coal-fired plants fitted with different
combinations of techniques ............................................................................................... 373 Table 5.6: Examples of marketing and removal of residues from coal and lignite combustion ......... 376 Table 5.7: Output of German lignite in 2012 by region ...................................................................... 378 Table 5.8: Key characteristics of German lignite................................................................................ 378 Table 5.9: Mercury content in coal from different origins .................................................................. 379 Table 5.10: Typical design net electrical efficiencies (LHV) for different LCP technologies.............. 382 Table 5.11: Effect of the steam characteristics on design efficiencies for different combustion
processes ............................................................................................................................ 382 Table 5.12: Example of emissions (in concentration – yearly averages) to air from coal-fired
combustion plants .............................................................................................................. 385 Table 5.13: Example of emissions (in concentration – yearly averages) to air from lignite-fired
combustion plants .............................................................................................................. 387 Table 5.14: Level of NOX emissions for existing plants without secondary techniques ....................... 388 Table 5.15: Pathways of metals in three example coal-fired combustion plants .................................. 389 Table 5.16: Metals content in flue-gases at stack level from example European plants ....................... 389 Table 5.17: Mercury content in flue-gases at stack level from example European plants .................... 390 Table 5.18: Measured N2O emission levels taken from different literature sources ............................. 391 Table 5.19: N2O emissions from example European circulating fluidised bed boilers ......................... 391
WORKIN
G DRAFT IN
PROGRESS
xviii June 2016 TL/JFF/FN/EIPPCB/LCP_Final Draft
Table 5.20: Example of HCl and HF emission levels from plants with and without secondary
techniques ........................................................................................................................... 392 Table 5.21: Example of dioxins and PAHs emission levels from the combustion of different fuels .... 392 Table 5.22: Production of CCPs in the EU-15 in 2010 ......................................................................... 395 Table 5.23: Metal content of coal and some coal combustion residues ................................................. 397 Table 5.24: Input and output of metals in some coal-fired combustion plants ...................................... 398 Table 5.25: General techniques to be considered for the control of diffuse emissions from the
unloading, storage and handling of fuel and additives ....................................................... 400 Table 5.26: Techniques to be considered for improving the general environmental performance of
coal- and/or lignite-fired plants .......................................................................................... 403 Table 5.27: General techniques to be considered to increase energy efficiency and fuel utilisation ..... 407 Table 5.28: General techniques to be considered to increase energy efficiency ................................... 409 Table 5.29: Net design electrical efficiency (%) achieved by example power combustion plants in
the EU ................................................................................................................................ 411 Table 5.30: Net design total fuel utilisation (%) achieved by example CHP combustion plants in the
EU ...................................................................................................................................... 411 Table 5.31: General techniques to be considered for the prevention and control of dust and metal
emissions ............................................................................................................................ 413 Table 5.32: Co-benefit removal of mercury by techniques applied for other pollutants ....................... 418 Table 5.33: Example of capital costs for implementing a sorbent injection system for mercury
reduction ............................................................................................................................. 426 Table 5.34: Example US plants operating brominated activated carbon injection systems .................. 427 Table 5.35: Other specific techniques to consider for the prevention and control of gaseous mercury
emissions ............................................................................................................................ 430 Table 5.36: General techniques to consider for the prevention and control of SOX, HCl and HF
emissions ............................................................................................................................ 433 Table 5.37: General primary techniques to consider for the prevention and control of NOX and N2O
emissions ............................................................................................................................ 443 Table 5.38: General secondary techniques to consider for the prevention and control of NOX and
N2O emissions .................................................................................................................... 446 Table 5.39: Comparison of biomass fuels and milled peat with fossil fuels normally used in LCPs .... 463 Table 5.40: Specific emissions to air from biomass- and/or peat-fired combustion plants ................... 466 Table 5.41: Composition of minerals/nutrients in ash from the combustion of a typical wood pellet .. 468 Table 5.42: Techniques to reduce diffuse/fugitive emissions to air ...................................................... 470 Table 5.43: Techniques to improve the general environmental performance ....................................... 472 Table 5.44: Techniques to increase energy efficiency ........................................................................... 474 Table 5.45: Techniques for the prevention and control of NOX, CO and N2O emissions ...................... 477 Table 5.46: Techniques for the prevention and control of SOX, HCl and HF emissions ....................... 482 Table 5.47: Techniques for the prevention and control of dust and metal emissions ............................ 489 Table 5.48: Techniques for the prevention and control of mercury ...................................................... 493 Table 5.49: Techniques for handling, reduction, and recycling or recovery of combustion residues ... 495 Table 6.1: General characteristics of liquid fuels ................................................................................ 507 Table 6.2: Chemical properties of several typical heavy fuel oils ....................................................... 508 Table 6.3: Properties of Orimulsion .................................................................................................... 508 Table 6.4: Range of yearly emissions to air from HFO- and/or gas-oil- fired combustion plants ....... 510 Table 6.5: Techniques for the prevention of emissions to soil and groundwater ................................ 512 Table 6.6: Techniques to improve the general environmental performance of HFO- and/or gas oil
fired boilers ........................................................................................................................ 514 Table 6.7: Techniques to increase the energy efficiency of HFO- and/or gas-oil-fired boilers ........... 516 Table 6.8: Techniques for the prevention and control of NOX and N2O emissions from
HFO- and/or gas-oil-fired boilers ....................................................................................... 519 Table 6.9: Techniques for the prevention and control of SOX emissions from HFO- and/or gas-oil-
fired boilers ........................................................................................................................ 523 Table 6.10: Techniques for the prevention and control of dust and particulate-bound metals
emissions from HFO- and/or gas-oil-fired boilers ............................................................. 528 Table 6.11: Techniques to increase the efficiency of HFO- and/or gas-oil-fired engines ..................... 532 Table 6.12: Techniques for the prevention and control of NOX and CO emissions from HFO- and/or
gas-oil-fired engines ........................................................................................................... 534 Table 6.13: Techniques for the prevention and control of SOX emissions from HFO- and/or gas-
oil-fired engines ................................................................................................................. 539 Table 6.14: Techniques for the prevention and control of dust and particulate-bound metals
emissions from HFO- and/or gas-oil-fired engines ............................................................ 542 Table 6.15: Techniques to increase the energy efficiency of gas-oil-fired gas turbines ........................ 546
WORKIN
G DRAFT IN
PROGRESS
TL/JFF/FN/EIPPCB/LCP_Final Draft June 2016 xix
Table 6.16: Techniques for the prevention and control of NOX and CO emissions from gas-oil-fired
turbines .............................................................................................................................. 548 Table 6.17: Techniques for the prevention and control of SOX emissions from gas-oil-fired gas
turbines .............................................................................................................................. 549 Table 6.18: Techniques for the prevention and control of dust and particulate-bound metal
emissions from gas-oil-fired gas turbines .......................................................................... 550 Table 7.1: Typical characteristics of NG fired in large combustion plants in Europe ........................ 554 Table 7.2: Overview of typical ISO efficiencies of natural-gas-fired combustion units ..................... 560 Table 7.3: Overview of operating energy efficiencies (yearly averages) of European natural-gas-
fired combustion units ....................................................................................................... 560 Table 7.4: Calculated specific NOX emissions with emission levels of 50 mg/Nm
3 .......................... 567
Table 7.5: Example of emissions to air from natural-gas-fired turbines in 2010 ................................ 569 Table 7.6: Examples of NOX emissions for steady-state full engine load (15 % O2) .......................... 570 Table 7.7: Example emissions of NMVOC, CO and CH4 reported by European natural-gas-fired
engines (15 % O2) .............................................................................................................. 571 Table 7.8: Example of emissions to air from natural gas fired-boilers in 2010 .................................. 572 Table 7.9: General techniques to increase the energy efficiency of natural-gas-fired boilers, gas
turbines and engines .......................................................................................................... 575 Table 7.10: General techniques for the prevention and control of NOX and CO emissions from
natural-gas-fired boilers ..................................................................................................... 592 Table 7.11: General techniques for the prevention and control of NOX and CO emissions from
natural-gas-fired turbines ................................................................................................... 597 Table 7.12: Typical cost components for applying SCR at a gas turbine ............................................. 599 Table 7.13: Typical cost figures for applying SCR at a gas turbine ..................................................... 599 Table 7.14: SCR retrofit costs for a 375 MWe combined-cycle gas turbine ......................................... 600 Table 7.15: General techniques for the prevention and control of NOX and unburnt carbon emissions
from natural-gas-fired stationary engines .......................................................................... 612 Table 7.16: Emission levels of two gas-fired engine power plants equipped with SCR ....................... 614 Table 7.17: Costs of installing SCR for gas engines operating 4000 h/yr ............................................ 616 Table 7.18: Techniques for the prevention of emissions to soil ............................................................ 617 Table 7.19: Overview of efficiencies of a biogas-fired gas turbine ...................................................... 618 Table 7.20: Cleaned COG characteristics ............................................................................................. 622 Table 7.21: Cleaned BF gas characteristics (average annual data) ....................................................... 623 Table 7.22: Cleaned BOF gas characteristics (average annual data) .................................................... 624 Table 7.23: Comparison of the average LHV and Wobbe index values for BF gas, BOF gas and
mixed BF + BOF gas ......................................................................................................... 625 Table 7.24: Composition of natural gas used in combustion plants firing iron and steel process fuels 626 Table 7.25: Gas volumes, additional fuel tonnages and thermal inputs per 24 hours for combustion
plants firing iron and steel process gases ........................................................................... 629 Table 7.26: An example composition of crude natural gas from an oilfield in the North Sea .............. 661 Table 7.27: Techniques to consider in the determination of BAT to increase energy efficiency for
offshore installations .......................................................................................................... 664 Table 7.28: Techniques to consider in the determination of BAT to prevent and / or reduce NOX and
CO emissions for offshore installations ............................................................................. 666 Table 8.1: Ranges of reported emissions to air from boilers firing process fuels from the chemical
industry .............................................................................................................................. 684 Table 8.2: Techniques for the prevention and control of NOX emissions ........................................... 688 Table 9.1: Example of coal/lignite and some typical sewage sludge compositions ............................ 706 Table 9.2: Example compositions of waste wood types used in LCPs ............................................... 707 Table 9.3: Variation of impurities in different wood – waste mixtures .............................................. 707 Table 9.4: Experience with waste co-incineration in some LCPs in some EU Member States .......... 709 Table 9.5: Effect of co-incineration on combustion residues (dry sorption residue) .......................... 717 Table 9.6: Effect of co-incineration on combustion residues (coarse ash) ......................................... 717 Table 9.7: General techniques for the storage and handling of waste to be co-incinerated ................ 719 Table 9.8: General techniques for the pretreatment of waste to be co-incinerated ............................. 720 Table 9.9: General techniques to introduce waste into the combustion process ................................. 722 Table 9.10: General techniques for the prevention and control of emissions to air from waste co-
incineration in combustion plants ...................................................................................... 723 Table 9.11: Specific techniques for the prevention and control of emissions to air from waste co-
incineration in combustion plants ...................................................................................... 725 Table 9.12: Co-incineration degree and achieved HCl emissions in well-performing coal- and/or
lignite-fired plants of more than 100 MWth (see Figure 5.34) ........................................... 727
WORKIN
G DRAFT IN
PROGRESS
xx June 2016 TL/JFF/FN/EIPPCB/LCP_Final Draft
Table 9.13: Co-incineration degree and achieved annual average HF emissions in well-performing
coal- and/or lignite-fired plants of more than 100 MWth (see Figure 5.35) ........................ 728 Table 9.14: General techniques to reduce the impact of waste co-incineration on the residues
generated ............................................................................................................................ 738 Table 10.1: BAT-AELs for direct discharges to a receiving water body from flue-gas treatment ........ 763 Table 10.2: BAT-associated energy efficiency levels (BAT-AEELs) for coal and/or lignite
combustion ......................................................................................................................... 767 Table 10.3: BAT-associated emission levels (BAT-AELs) for NOX emissions to air from the
combustion of coal and/or lignite ....................................................................................... 769 Table 10.4: Removed ............................................................................................................................ 769 Table 10.5: BAT-associated emission levels (BAT-AELs) for SO2 emissions to air from the
combustion of coal and/or lignite ....................................................................................... 771 Table 10.6: BAT-associated emission levels (BAT-AELs) for HCl and HF emissions to air from the
combustion of coal and/or lignite ....................................................................................... 772 Table 10.7: BAT-associated emission levels (BAT-AELs) for dust emissions to air from the
combustion of coal and/or lignite ....................................................................................... 772 Table 10.8: BAT-associated emission levels (BAT-AELs) for mercury emissions to air from the
combustion of coal ............................................................................................................. 774 Table 10.9: BAT-associated emission levels (BAT-AELs) for mercury emissions to air from the
combustion of lignite .......................................................................................................... 774 Table 10.10: BAT-associated energy efficiency levels (BAT-AEELs) for the combustion of solid
biomass and/or peat ............................................................................................................ 774 Table 10.11: BAT-associated emission levels (BAT-AELs) for NOX emissions to air from the
combustion of solid biomass and/or peat ........................................................................... 775 Table 10.12: BAT-associated emission levels (BAT-AELs) for SO2 emissions to air from the
combustion of solid biomass and/or peat ........................................................................... 777 Table 10.13: BAT-associated emission levels (BAT-AELs) for dust emissions to air from the
combustion of solid biomass and/or peat ........................................................................... 778 Table 10.14: BAT-associated emission levels (BAT-AELs) for mercury emissions to air from the
combustion of solid biomass and/or peat ........................................................................... 778 Table 10.15: BAT-associated energy efficiency levels (BAT-AEELs) for HFO and/or gas oil
combustion in boilers ......................................................................................................... 779 Table 10.16: BAT-associated emission levels (BAT-AELs) for NOX emissions to air from the
combustion of HFO and/or gas oil in boilers ..................................................................... 781 Table 10.17: BAT-associated emission levels (BAT-AELs) for SO2 emissions to air from the
combustion of HFO and/or gas oil in boilers ..................................................................... 782 Table 10.18: BAT-associated emission levels (BAT-AELs) for dust emissions to air from the
combustion of HFO and/or gas oil in boilers ..................................................................... 783 Table 10.19: BAT-associated energy efficiency levels (BAT-AEELs) for the combustion of HFO
and/or gas oil in reciprocating engines ............................................................................... 784 Table 10.20: BAT-associated emission levels (BAT-AELs) for NOX emissions to air from the
combustion of HFO and/or gas oil in reciprocating engines .............................................. 785 Table 10.21: BAT-associated emission levels (BAT-AELs) for SO2 emissions to air from the
combustion of HFO and/or gas oil in reciprocating engines .............................................. 786 Table 10.22: BAT-associated emission levels (BAT-AELs) for dust emissions to air from the
combustion of HFO and/or gas oil in reciprocating engines .............................................. 787 Table 10.23: BAT-associated energy efficiency levels (BAT-AEELs) for gas-oil-fired gas turbines .... 787 Table 10.24: Indicative emission levels for NOX emissions to air from the combustion of gas oil in
dual fuel gas turbines.......................................................................................................... 788 Table 10.25: BAT-associated emission levels for SO2 and dust emissions to air from the combustion
of gas oil in gas turbines, including dual fuel gas turbines ................................................. 789 Table 10.26: BAT-associated energy efficiency levels (BAT-AEELs) for the combustion of natural
gas ...................................................................................................................................... 791 Table 10.27: BAT-associated emission levels (BAT-AELs) for NOX emissions to air from the
combustion of natural gas in gas turbines .......................................................................... 794 Table 10.28: BAT-associated emission levels (BAT-AELs) for NOX emissions to air from the
combustion of natural gas in boilers and engines ............................................................... 795 Table 10.29: BAT-associated emission levels (BAT-AELs) for formaldehyde and CH4 emissions to
air from the combustion of natural gas in a spark-ignited lean-burn gas engine ................ 796 Table 10.30: BAT-associated energy efficiency levels (BAT-AEELs) for the combustion of iron and
steel process gases in boilers .............................................................................................. 796 Table 10.31: BAT-associated energy efficiency levels (BAT-AEELs) for the combustion of iron and
steel process gases in CCGTs ............................................................................................. 797
WORKIN
G DRAFT IN
PROGRESS

TL/JFF/FN/EIPPCB/LCP_Final Draft June 2016 xxi
Table 10.32: BAT-associated emission levels (BAT-AELs) for NOX emissions to air from the
combustion of 100 % iron and steel process gases ............................................................ 799 Table 10.33: Removed ............................................................................................................................ 799 Table 10.34: BAT-associated emission levels (BAT-AELs) for SO2 emissions to air from the
combustion of 100 % iron and steel process gases ............................................................ 800 Table 10.35: Removed ............................................................................................................................ 800 Table 10.36: BAT-associated emission levels (BAT-AELs) for dust emissions to air from the
combustion of 100 % iron and steel process gases ............................................................ 801 Table 10.37: BAT-associated emission levels (BAT-AELs) for NOX emissions to air from the
combustion of gaseous fuels in open-cycle gas turbines on offshore platforms ................ 803 Table 10.38: BAT-associated energy efficiency levels (BAT-AEELs) for the combustion of process
fuels from the chemical industry in boilers ........................................................................ 804 Table 10.39: BAT-associated emission levels (BAT-AELs) for NOX emissions to air from the
combustion of 100 % process fuels from the chemical industry in boilers ........................ 806 Table 10.40: BAT-associated emission levels (BAT-AELs) for SO2 emissions to air from the
combustion of 100 % process fuels from the chemical industry in boilers ........................ 806 Table 10.41: BAT-associated emission levels (BAT-AELs) for HCl and HF emissions to air from the
combustion of process fuels from the chemical industry in boilers ................................... 807 Table 10.42: BAT-associated emission levels (BAT-AELs) for dust emissions to air from the
combustion of mixtures of gases and liquids composed of 100 % process fuels from the
chemical industry in boilers ............................................................................................... 807 Table 10.43: Removed ............................................................................................................................ 807 Table 10.44: Removed ............................................................................................................................ 807 Table 10.45: BAT-associated emission levels (BAT-AELs) for PCDD/F and TVOC emissions to air
from the combustion of 100 % process fuels from the chemical industry in boilers ......... 808 Table 10.46: Removed ............................................................................................................................ 810 Table 10.47: Removed ........................................................................................................................... 810 Table 10.48: Removed ............................................................................................................................ 811 Table 10.49: Removed ............................................................................................................................ 811 Table 10.50: Removed ............................................................................................................................ 811 Table 10.51: BAT-associated emission levels (BAT-AELs) for metal emissions to air from the co-
incineration of waste with coal and/or lignite .................................................................... 811 Table 10.52: BAT-associated emission levels (BAT-AELs) for metal emissions to air from the co-
incineration of waste with biomass and/or peat ................................................................. 811 Table 10.53: Removed ............................................................................................................................ 812 Table 10.54: BAT-associated emission levels (BAT-AELs) for PCDD/F and TVOC emissions to air
from the co-incineration of waste with biomass, peat, coal and/or lignite ......................... 812 Table 10.55: BAT-associated energy efficiency levels (BAT-AEELs) for gasification and IGCC units 814 Table 10.56: BAT-associated emission levels (BAT-AELs) for NOX emissions to air from IGCC
plants .................................................................................................................................. 815 Table 10.57: BAT-associated emission levels (BAT-AELs) for dust and particulate-bound metal
emissions to air from IGCC plants .................................................................................... 816 Table 11.1: Removal of heavy metals and other pollutants from scrubber waste water ....................... 826 Table 11.2: Economic parameters for an example SiC membrane ultrafiltration plant ........................ 826 Table 11.3: Gasification technologies ................................................................................................... 839 Table 12.1: Key milestones in the review of the BREF for Large Combustion Plants ............................ 859 Table 12.2: Dissenting views expressed ................................................................................................... 861 Table 13.1: List of European plants that took part in the data collection exercise in 2012 ................... 876 Table 13.2: Example of monthly average levels calculated using the NL/Eurelectric tool ...................... 923
WORKIN
G DRAFT IN
PROGRESS
Scope
xxii June 2016 TL/JFF/FN/EIPPCB/LCP_Final Draft
List of Figures Figure 1.1: Population index worldwide. (1995 = 100) ............................................................................ 1 Figure 1.2: World electricity generation from 1971 to 2012 by fuel (TWh) ............................................ 2 Figure 1.3: World electricity generation fuel shares in 1973 and 2012 .................................................... 2 Figure 1.4: World electricity generation from 1971 to 2012 by region (TWh) ........................................ 3 Figure 1.5: Net electricity generation, EU-28, 2013 (% of total, based on GWh) .................................... 3 Figure 1.6: Gross electricity generation by fuel, GWh, EU-28, 1990-2013 ............................................. 4 Figure 1.7: Fuel mix of electricity generated in 2011 in the EU-28 ......................................................... 5 Figure 1.8: Total net electricity consumption in the EU-28 (TWh) in 2011 ............................................. 6 Figure 1.9: Location of Large Combustion Plants in Europe .................................................................. 8 Figure 1.10: Electricity generation by fuel – EU-28 trends to 2050. EU Reference scenario 2013 ........... 9 Figure 1.11: Fuel input for steam generation in DH and boilers – EU-28 trends to 2050 ........................ 10 Figure 1.12: Mechanical drive engines and turbines for transport and storage - 2009 ............................. 11 Figure 1.13: Example of annualised cost of removal per unit generated as a function of load factor ...... 15 Figure 1.14: Example of annualised cost of removal per unit generated as a function of economic life .. 16 Figure 1.15: Generalised flow diagram of a combustion plant and its associated operations ................... 17 Figure 1.16 Emissions of SOX/SO2 to air by industry sector/activity in the EU-28 in 2014 ................... 21 Figure 1.17 Emissions of NOX/NO2 to air by industry sector/activity in the EU-28 in 2014 .................. 23 Figure 1.18 Emissions of PM10 to air by industry sector/activity in the EU-28 in 2014 ......................... 25 Figure 1.19: Partitioning of metals during coal combustion ..................................................................... 26 Figure 1.20 Emissions of Hg to air by industry sector/activity in the EU-28 in 2014 ............................. 27 Figure 1.21 Emissions of CO to air by industry sector/activity in the EU-28 in 2014 ............................ 28 Figure 1.22: Emissions of CO2 to air by industry sector/activity in the EU-28 in 2014 ........................... 29 Figure 1.23: Emissions of N2O to air by industry sector/activity in the EU-28 in 2014 ........................... 30 Figure 1.24: Emissions of SF6 to air by industry sector/activity in the EU-28 in 2014 ............................ 30 Figure 1.25: Emissions of CH4 to air by industry sector/activity in the EU-28 in 2014 ........................... 31 Figure 1.26 Emissions of chlorine and inorganic compounds (as HCl) to air by industry
sector/activity in the EU-28 in 2014 ..................................................................................... 32 Figure 1.27: Emissions of HF to air by industry sector/activity in the EU-28 in 2014 ............................. 32 Figure 1.28: Emissions of NMVOC to air by industry sector/activity in the EU-28 in 2014 ................... 34 Figure 1.29: Effluents from fossil-fuel-fired large combustion plants...................................................... 35 Figure 2.1: Different coal burner configurations (main systems applied) .............................................. 45 Figure 2.2: Tangential-fired combustion chamber .................................................................................. 45 Figure 2.3: Heavy fuel oil boiler ............................................................................................................. 46 Figure 2.4: Schematic of the bubbling fluidised bed boiler and the circulating fluidised bed boiler...... 47 Figure 2.5: BFBC boiler (left) and CFBC boiler (right) schemes ........................................................... 49 Figure 2.6: CFBC plant for high efficiency (Lagisza, 966 MWth, 361/306 kg/s, 275/50 bar,
560/580 °C) .......................................................................................................................... 50 Figure 2.7: CFBC plant for low quality lignite (Turow, 3 x 557 MWth, 195/181 kg/s,
170/39 bar, 568/568 °C) ..................................................................................................... 50 Figure 2.8: Schematic drawing of a bubbling bed PFBC system ........................................................... 51 Figure 2.9: Travelling grate firing for coal combustion .......................................................................... 53 Figure 2.10: Spreader stoker grate firing for solid fuels ........................................................................... 54 Figure 2.11: Natural gas-fired engine ....................................................................................................... 57 Figure 2.12: Heavy-duty gas turbine electricity-generating units from different manufacturers .............. 58 Figure 2.13: Scheme of a gas turbine process with sequential combustion .............................................. 59 Figure 2.14: Combined cycle power plant cogeneration principle 1+1 system ........................................ 60 Figure 2.15: Gas turbine (159 MW) with a silo combustion chamber ...................................................... 61 Figure 2.16: Recently built gas turbine combined cycle power plant in Belgium .................................... 62 Figure 2.17: Steam turbine of a coal-fired power plant ............................................................................ 63 Figure 2.18: Schematic of an ideal combustion Rankine steam cycle ...................................................... 64 Figure 2.19: The natural circulation and once-through boiler concepts ................................................... 65 Figure 2.20: Gas turbine combined-cycle power plant ............................................................................. 68 Figure 2.21: CHP based on combined cycle where the steam turbine condenser cooling for the steam
cycle is provided by a district heating network .................................................................... 69 Figure 2.22: Duration curve of the district heating operation in the Helsinki region in 2003 .................. 71 Figure 2.23: Main features of an oxygen-blown IGCC ............................................................................ 76 Figure 2.24: Ideal (Carnot) efficiency compared to the efficiencies actually achieved by the thermal
energy generation techniques currently in use ..................................................................... 78 Figure 2.25: System boundaries for efficiency definition ........................................................................ 79 Figure 2.26: Relative deviation of electrical efficiency depending on load for a coal-fired power plant . 80 Figure 2.27: Example demonstrating the methodology for calculating the exergetic efficiency .............. 84
WORKIN
G DRAFT IN
PROGRESS
Scope
TL/JFF/FN/EIPPCB/LCP_Final Draft June 2016 xxiii
Figure 2.28: Improvements in the efficiency of power plants between 1993 and 2000 ........................... 91 Figure 2.29: Peat, wood and coal handling system .................................................................................. 94 Figure 2.30: European natural gas network in 2011 ................................................................................. 97 Figure 3.1: Overview of dust control devices ...................................................................................... 102 Figure 3.2: Overview of secondary techniques used to reduce sulphur oxide emissions ..................... 104 Figure 3.3: Overview of combustion modifications for reducing nitrogen oxide emissions ................ 108 Figure 3.4 The activated carbon process ............................................................................................. 111 Figure 3.5: Mass balance of metals, fluoride and chloride in coal-fired combustion plants ................ 112 Figure 3.6: FGD waste water treatment plant ...................................................................................... 118 Figure 3.7: Two-stage waste water treatment plant .............................................................................. 119 Figure 3.8: Yearly sulphate concentration in the direct emission of the plants – Comparison of
plants with a wet abatement system for air pollutants and plants without ......................... 120 Figure 3.9: Yearly mercury concentration (> 0.0008 mg/l) in the direct emission of the plants –
Comparison of plants with a wet abatement system for air pollutants and plants without 120 Figure 3.10: Impact of load factor variation on NOX emissions at a GDF Suez natural gas combined-
cycle plant, including five units of 385 MWe .................................................................... 129 Figure 3.11: Example of NOX (left) (mg/Nm
3) and O2 (right) (%) (y axis) for different load factors (x
axis) at a BFB boiler in Sweden ........................................................................................ 129 Figure 3.12: Continuous improvement in an EMS model ...................................................................... 136 Figure 3.13: Typical schematic arrangement of an ESP ........................................................................ 140 Figure 3.14: General arrangement of a bag filter (with one compartment in the cleaning cycle) .......... 144 Figure 3.15: Low-pressure pulse-jet bag filter ....................................................................................... 145 Figure 3.16: Typical flow diagram of a venturi system ......................................................................... 150 Figure 3.17: Moving-bed scrubber ......................................................................................................... 151 Figure 3.18: Schematic flow diagram of a lime/limestone wet scrubber FGD process ......................... 154 Figure 3.19: Different types of lime/limestone wet scrubbers ............................................................... 156 Figure 3.20: Different absorber types .................................................................................................... 158 Figure 3.21: Example of a co-current and counter-current wet FGD system ......................................... 159 Figure 3.22: Seawater scrubbing process ............................................................................................... 164 Figure 3.23: The ammonia wet scrubber ................................................................................................ 167 Figure 3.24: Flowsheet of a spray dry scrubber process ........................................................................ 170 Figure 3.25: Schematic of a CFB scrubber process flow ....................................................................... 174 Figure 3.26: Duct sorbent injection ........................................................................................................ 177 Figure 3.27: 'Modified dry FGD' process ............................................................................................... 178 Figure 3.28: Furnace sorbent injection ................................................................................................... 182 Figure 3.29: SO2 removal reactions in furnace sorbent injection ........................................................... 183 Figure 3.30: The relationship between NOX, CO and excess air at various sections in a 150 MWe
lignite-fired boiler .............................................................................................................. 188 Figure 3.31: NOX formation in a tangentially coal-fired boiler (with and without a rotating opposed
fired air (ROFA) system) ................................................................................................... 190 Figure 3.32: Flue-gas recirculation in a boiler ....................................................................................... 193 Figure 3.33: Comparison of conventional air-staged and advanced air-staged low-NOX burners ......... 197 Figure 3.34: Flue-gas recirculation low-NOX burners ............................................................................ 197 Figure 3.35: Fuel staging at the burner .................................................................................................. 198 Figure 3.36: The three combustion zones and relevant parameters in a reburning process ................... 201 Figure 3.37: Comparison of coal, oil and natural gas as reburning fuel ................................................. 202 Figure 3.38: Denitrification rate as a function of the reburning rate ...................................................... 204 Figure 3.39: Schematic of a DLN (premix) combustion chamber ......................................................... 206 Figure 3.40: NOX reduction by steam or water injection ....................................................................... 213 Figure 3.41: Different types of catalysts ................................................................................................ 216 Figure 3.42: Configuration of catalyst reactor ....................................................................................... 217 Figure 3.43: Existing configurations of SCR NOX abatement techniques ............................................. 218 Figure 3.44: Example of a high-dust SCR catalyst ................................................................................ 220 Figure 3.45: SCR system applied to a stationary combustion engine .................................................... 222 Figure 3.46: Investment costs for an SCR process at a combustion plant .............................................. 225 Figure 3.47: The SNCR process ............................................................................................................. 228 Figure 3.48: The activated carbon process ............................................................................................. 233 Figure 3.49: The WSA-SNOX process ................................................................................................... 235 Figure 3.50 The DeSONOX process ...................................................................................................... 237 Figure 3.51: Influence of heat production on utilisation efficiency in a CHP plant ............................... 254 Figure 3.52: Principle sketch of the Cheng Steam Injection Cycle ........................................................ 256 Figure 3.53: NOX and CO emission as a function of steam ratio ........................................................... 257 Figure 3.54: Feed-water preheating ....................................................................................................... 261
WORKIN
G DRAFT IN
PROGRESS
Scope
xxiv June 2016 TL/JFF/FN/EIPPCB/LCP_Final Draft
Figure 3.55: Advanced control system applied at the Billerud AB Karlsborg plant, Sweden ................ 264 Figure 3.56: Schematic of a combined-cycle power plant with a heat recovery steam generator
(HRSG) .............................................................................................................................. 267 Figure 3.57: Schematic of a topping cycle in a power plant ................................................................... 269 Figure 3.58: Total suspended solids (TSS) emissions in direct discharges to a receiving water body ... 292 Figure 3.59: Total organic carbon (TOC) emissions in direct discharges to a receiving water body ..... 293 Figure 3.60: Chemical oxygen demand (COD) emissions in direct discharges to a receiving water
body .................................................................................................................................... 294 Figure 3.61: Fuoride (F
-) emissions in direct discharges to a receiving water body ............................... 295
Figure 3.62: Sulphate (SO42-
) emissions in direct discharges to a receiving water body ........................ 296 Figure 3.63: Sulphide (S
2-) emissions in direct discharges to a receiving water body ............................ 297
Figure 3.64: Sulphite (SO32-
) emissions in direct discharges to a receiving water body ........................ 297 Figure 3.65: Arsenic (As) emissions in direct discharges to a receiving water body ............................. 298 Figure 3.66: Cadmium (Cd) emissions in direct discharges to a receiving water body .......................... 298 Figure 3.67: Chromium (Cr) emissions in direct discharges to a receiving water body ......................... 299 Figure 3.68: Copper (Cu) emissions in direct discharges to a receiving water body .............................. 299 Figure 3.69: Mercury (Hg) emissions in direct discharges to a receiving water body ............................ 300 Figure 3.70: Nickel (Ni) emissions in direct discharges to a receiving water body ................................ 300 Figure 3.71: Lead (Pb) emissions in direct discharges to a receiving water body .................................. 301 Figure 3.72: Zinc (Zn) emissions in direct discharges to a receiving water body .................................. 301 Figure 4.1: Block diagram and integration options for an IGCC plant ................................................. 314 Figure 4.2: General Electric single-stage entrained-flow gasifier......................................................... 316 Figure 4.3: Syngas composition as a function of the O2 to coal feed ratio ........................................... 318 Figure 4.4: Block diagram of the Tampa IGCC plant process .............................................................. 319 Figure 4.5: Block diagram of the Nuon IGCC plant process ................................................................ 320 Figure 4.6: Block diagram of the Wabash River IGCC repowering project ......................................... 320 Figure 4.7: Block diagram of the ELCOGAS IGCC plant process ...................................................... 321 Figure 4.8: Foster and Wheeler atmospheric CFB gasifier ................................................................... 324 Figure 4.9: ANDRITZ Carbona air-blown pressurised BFB gasifier ................................................... 325 Figure 4.10: Different principal options for CFB/BFB gasifier connections to boilers .......................... 326 Figure 4.11: SO2 emissions of currently feasible coal-to-electricity technology options without CO2
capture ................................................................................................................................ 329 Figure 4.12: NOX emissions of currently feasible coal-to-electricity technology options without CO2
capture ................................................................................................................................ 329 Figure 4.13: Particulate emissions of currently feasible coal-to-electricity technology options without
CO2 capture ........................................................................................................................ 330 Figure 4.14: Availability statistics for IGCC first-of-a-kind plants ........................................................ 340 Figure 4.15: Kymijärvi CFB gasifier ...................................................................................................... 343 Figure 4.16: Vaskiluoto gasification plant .............................................................................................. 343 Figure 4.17: The Skive CHP flowsheet (Salo, 2010) .............................................................................. 346 Figure 5.1: Capacities of coal- and/or lignite-fired power plants in EU-27 countries in 2011 ............. 355 Figure 5.2: Capacity, age and number of units of coal- and/or lignite-fired power plants in EU-27
countries in 2011 ................................................................................................................ 356 Figure 5.3: Age and number of units of coal- and/or lignite-fired power plants in EU-27 countries in
2011 .................................................................................................................................... 356 Figure 5.4: Capacity-weighted average age of coal- and/or lignite-fired power plants in EU-27
countries ............................................................................................................................. 357 Figure 5.5: Example large lignite-fired power plant with cooling tower discharge .............................. 358 Figure 5.6: Influence of coal quality on the performance of the combustion plant .............................. 362 Figure 5.7: Wet FGD process with a spray tower ................................................................................. 368 Figure 5.8: Closed gypsum storage facilities ........................................................................................ 375 Figure 5.9: Coal in Europe in 2012 - Lignite production, coal production and imports ....................... 377 Figure 5.10: Europe's most important lignite mining countries, 2000 (in million tonnes) ..................... 378 Figure 5.11: Sulphur and ash content in EU lignites ([wt-%], cross in medians) ................................... 379 Figure 5.12: Efficiency impact of the power plant capacity (MWth) based on design values ................. 380 Figure 5.13: Efficiency of coal-fired power plants in Europe in relation to the commissioning year
based on design values ....................................................................................................... 380 Figure 5.14: Efficiency impact of the power plant capacity based on operating yearly average energy
efficiency values ................................................................................................................. 381 Figure 5.15: Efficiency of coal- and/or lignite-fired power plants in Europe in relation to the
commissioning year based on operating yearly average energy efficiency values............. 381 Figure 5.16: Increased efficiency of a coal-fired power plant – individual measures ............................ 383 Figure 5.17: Increased efficiency of a coal-fired power plant – development of materials .................... 383
WORKIN
G DRAFT IN
PROGRESS
Scope
TL/JFF/FN/EIPPCB/LCP_Final Draft June 2016 xxv
Figure 5.18: Impact of the equivalent full load factor on N2O emissions at Plant 387 (Lagisza, PL) ... 392 Figure 5.19: Annual production of CCPs in a 450 MWe coal-fired power plant at 6000 hours full load
(total production of CCPs = 187 000 tonnes) .................................................................... 394 Figure 5.20: Production of CCPs in the EU-15 in 2010 ......................................................................... 394 Figure 5.21: Development of CCP production in the EU-15 from 1993 to 2010................................... 395 Figure 5.22: Utilisation and disposal of CCPs in the EU-15 in 2010 ..................................................... 396 Figure 5.23: Utilisation and disposal of CCPs in the EU-15 in 2010 ..................................................... 397 Figure 5.24: Operating energy efficiencies of European coal- and/or lignite-fired plants of > 1000
MWth ................................................................................................................................. 410 Figure 5.25: Operating energy efficiencies from European coal- and/or lignite-fired plants of
< 1000 MWth ...................................................................................................................... 411 Figure 5.26: Dust emissions from well-performing coal- and/or lignite-fired plants of less
than 100 MWth ................................................................................................................... 414 Figure 5.27: Yearly average dust emissions from well-performing coal- and/or lignite-fired plants
sized between 100 MWth and 300 MWth............................................................................ 415 Figure 5.28: Dust emissions from well-performing coal- and/or lignite-fired plants sized between
300 MWth and 1000 MWth ................................................................................................. 416 Figure 5.29: Dust emissions from well-performing coal- and/or lignite-fired plants of more than
1000 MWth ......................................................................................................................... 417 Figure 5.30: Mercury emissions from well-performing coal fired plants .............................................. 419 Figure 5.31: Mercury emissions from well-performing lignite-fired plants ........................................... 420 Figure 5.32: SO2 emissions from well-performing coal- and/or lignite-fired combustion plants of
more than 300 MWth burning coal and/or non-indigenous lignite ..................................... 437 Figure 5.33: SO2 emissions from example plants of more than 300 MWth burning indigenous lignite . 438 Figure 5.34: HCl emissions from well-performing coal- and/or lignite-fired plants of > 100 MWth ..... 439 Figure 5.35: HF emissions from well-performing coal- and/or lignite-fired plants of > 100 MWth ...... 440 Figure 5.36: Heat displacement around the FGD unit ............................................................................ 441 Figure 5.37: NOX emissions from well-performing pulverised coal boilers of more than 300 MWth .... 447 Figure 5.38: NOX emissions from well-performing pulverised lignite boilers and coal or lignite
fluidised bed boilers of more than 300 MWth .................................................................... 448 Figure 5.39: Water-cooled vibrating moving grate system with sloped grate boiler for biomass
combustion......................................................................................................................... 453 Figure 5.40: Straw-firing combustion plant ........................................................................................... 454 Figure 5.41: Biomass-fired circulating fluidised bed boiler ................................................................... 455 Figure 5.42: Fuel and bed material flow in a biomass-fired CFBC boiler ............................................. 460 Figure 5.43: Example of the mass flow balance stream of a peat-fired CFBC boiler ............................ 464 Figure 5.44 Operating energy efficiencies of European biomass- and/or peat-fired combustion plants473 Figure 5.45: NOX emissions from well-performing biomass- and/or peat-fired plants of < 100 MWth . 479 Figure 5.46: NOX s from well-performing biomass- and/or peat-fired plants between 100 MWth
and 300 MWth .................................................................................................................... 480 Figure 5.47: NOX s from well-performing biomass- and/or peat-fired plants of ≥ 300 MWth ............... 480 Figure 5.48: SO2 emissions from well-performing biomass- and/or peat-fired plants of < 100 MWth .. 484 Figure 5.49: SO2 emissions from well-performing biomass- and/or peat-fired plants between
≥ 100 MWth and < 300 MWth ............................................................................................ 485 Figure 5.50: SO2 emissions from well-performing biomass- and/or peat-fired plants of ≥ 300 MWth .. 485 Figure 5.51: HCl emissions from well-performing biomass- and/or peat-fired plants of < 100 MWth .. 486 Figure 5.52: HCl emissions from well-performing biomass- and/or peat-fired plants between
≥ 100 MWth and < 300 MWth ............................................................................................ 487 Figure 5.53: HF emissions from well-performing biomass- and/or peat-fired plants of < 100 MWth.... 487 Figure 5.54: HF emissions from well-performing biomass- and/or peat-fired plants between
≥ 100 MWth and < 300 MWth ............................................................................................ 488 Figure 5.55: Dust emissions from well-performing biomass- and/or peat-fired plants of < 100 MWth . 490 Figure 5.56: Dust emissions from well-performing biomass- and/or peat-fired plants between
100 MWth and 300 MWth ................................................................................................... 491 Figure 5.57: Dust emissions from well-performing biomass- and/or peat-fired plants of ≥ 300 MWth . 491 Figure 5.58: Mercury emissions from well-performing biomass- and/or peat-fired plants .................... 495 Figure 6.1: Operating energy efficiencies of European HFO- and/or gas-oil-fired combustion units . 515 Figure 6.2: NOX emissions from well-performing HFO- and/or gas-oil-fired boilers of < 100 MWth . 521 Figure 6.3: NOX emissions from well-performing HFO- and/or gas-oil-fired boilers of ≥ 100 MWth . 522 Figure 6.4: Wet FGD process applied to a HFO-fired boiler ............................................................... 525 Figure 6.5: SO2 emissions from well-performing HFO- and/or gas-oil-fired boilers of < 300 MWth .. 526 Figure 6.6: SO2 emissions from well-performing HFO- and/or gas-oil-fired boilers of ≥ 300 MWth .. 526 Figure 6.7: Dust emissions from well-performing HFO- and/or gas-oil-fired boilers of < 300 MWth . 529
WORKIN
G DRAFT IN
PROGRESS

Scope
xxvi June 2016 TL/JFF/FN/EIPPCB/LCP_Final Draft
Figure 6.8: Dust emissions from well-performing HFO- and/or gas-oil-fired boilers of ≥ 300 MWth . 530 Figure 6.9: Operating energy efficiencies of European HFO- and/or gas-oil-fired combustion
engines ............................................................................................................................... 531 Figure 6.10: Typical costs of SCR as a function of the NOX reduction rate at a HFO-fired
medium-speed diesel engine power plant ........................................................................... 537 Figure 6.11: Yearly NOX emissions from HFO- and/or gas-oil-fired engines fitted with SCR and/or
primary techniques ............................................................................................................. 538 Figure 6.12: SO2 emissions from well-performing HFO- and/or gas-oil-fired engines .......................... 541 Figure 6.13: Dust emissions from well-performing HFO- and/or gas-oil-fired engines ......................... 543 Figure 6.14: Configuration of an engine combustion plant fitted with SCR, recovery boiler, DSI and
a bag filter .......................................................................................................................... 544 Figure 6.15: Operating energy efficiencies of European gas-oil-fired gas turbines ............................... 545 Figure 6.16: SO2 emissions from well-performing gas-oil-fired gas turbines ........................................ 550 Figure 6.17: Dust emissions from well-performing gas-oil-fired gas turbines ....................................... 551 Figure 7.1: Physical properties of European and worldwide pipeline gas and LNG ............................ 554 Figure 7.2: HRSG design and SCR installation .................................................................................... 557 Figure 7.3: SCR installation with vertical flow .................................................................................... 558 Figure 7.4: Grassmann diagram of a gas turbine with HRSG............................................................... 559 Figure 7.5: Net operating electrical efficiencies of CCGTs in Europe in 2010 .................................... 561 Figure 7.6: Net operating electrical efficiencies of CCGTs with supplementary firing in 2010 .......... 562 Figure 7.7: Net operating electrical efficiencies of CCGTs without supplementary firing in 2010 ..... 562 Figure 7.8: Net operating electrical efficiencies of CCGTs producing only power operated
≥ 4000 hours in 2010 .......................................................................................................... 563 Figure 7.9: Net operating electrical efficiencies of CCGTs producing only power operated
< 4000 hours in 2010 .......................................................................................................... 563 Figure 7.10: Net operating electrical efficiencies and total fuel utilisation in 2010 of natural-gas-fired
boilers ................................................................................................................................. 564 Figure 7.11: NOX emissions from European natural-gas-fired turbines in 2010 .................................... 565 Figure 7.12: NO emissions as a function of the pressure with various combustion temperatures and a
residence time in the reaction zone of 30 ms ..................................................................... 566 Figure 7.13: Example of CCGTs achieving low NOX emissions and high operating electrical
efficiencies ......................................................................................................................... 567 Figure 7.14: NOX emissions (yearly averages) from CCGTs fitted with supplementary firing at the
HRSG level ........................................................................................................................ 568 Figure 7.15: NOX emissions (yearly averages) from CCGTs without supplementary firing at the
HRSG level ........................................................................................................................ 569 Figure 7.16: NOX emissions (yearly averages) from European natural gas boilers in 2010 ................... 571 Figure 7.17: Typical net operating electrical efficiencies in 2010 of European natural gas-fired open-
cycle gas turbines ............................................................................................................... 579 Figure 7.18: Typical net operating energy efficiencies in 2010 of European natural-gas-fired
combined-cycle gas turbines producing heat and power (plants from 50 MWth to
600 MWth) .......................................................................................................................... 580 Figure 7.19: Typical net operating energy efficiencies in 2010 of European natural-gas-fired
combined-cycle gas turbines producing heat and power (plants of > 600 MWth) .............. 581 Figure 7.20: Typical net operating electrical efficiencies in 2010 of European natural-gas-fired
combined-cycle gas turbines producing power only .......................................................... 582 Figure 7.21: Typical operating net total fuel utilisation in 2010 of European natural-gas-fired boilers . 583 Figure 7.22: Typical net operating energy efficiencies in 2010 of European natural-gas-fired engines. 583 Figure 7.23: Effect of ambient intake temperature on the gas turbine thermal efficiency using
evaporative and absorption chiller cooling ......................................................................... 589 Figure 7.24: NOX emissions to air in 2010 from well-performing European boilers ............................. 595 Figure 7.25: NOX and CO emissions to air in 2010 from well-performing European CCGTs of
≥ 600 MWth ........................................................................................................................ 601 Figure 7.26: NOX and CO emissions to air in 2010 from well-performing European CCGTs of 50–
600 MWth with a net total fuel utilisation of < 75 % .......................................................... 602 Figure 7.27: NOX and CO emissions to air in 2010 from well-performing European CCGTs of 50–
600 MWth with a net total fuel utilisation of ≥ 75 % .......................................................... 602 Figure 7.28: NOX and CO emissions to air in 2010 from European open-cycle gas turbines with the
exception of mechanical drive turbines .............................................................................. 603 Figure 7.29: NOX and CO emissions to air in 2010 from well-performing European open-cycle gas
turbines operated ≥ 500 h/yr for mechanical drive turbines ............................................... 604 Figure 7.30: NOX and CO emissions to air in 2010 from well-performing European gas turbines
operated < 500 h/yr ............................................................................................................ 605
WORKIN
G DRAFT IN
PROGRESS
Scope
TL/JFF/FN/EIPPCB/LCP_Final Draft June 2016 xxvii
Figure 7.31: Schematic representation of the catalyst pollution control SCONOXTM
system ................ 606 Figure 7.32: Example of energy flows in an integrated steelworks ....................................................... 620 Figure 7.33: Comparison of iron and steel process gases and natural gas ............................................. 621 Figure 7.34: Hourly average data for the thermal input to a boiler using BF gas, COG and HFO over
a period of three months .................................................................................................... 630 Figure 7.35: Hourly average inputs of BF gas and COG to a boiler over a two-week period ................ 631 Figure 7.36: Hourly average thermal inputs of BF gas, COG and HFO to a boiler over a two-week
period ................................................................................................................................. 632 Figure 7.37: Daily average thermal inputs of BFG, COG and BOF gas plus NG auxiliary fuel to a
CCGT in 2010 ................................................................................................................... 633 Figure 7.38: Hourly average thermal inputs of BF gas, COG and HFO to a boiler over a two-week
period ................................................................................................................................. 634 Figure 7.39: Hourly average emissions of dust, NOX, SOX and CO (reference 3 % O2) from a boiler
fired on BF gas and COG with a HFO addition as required over a two-week period ........ 634 Figure 7.40: Half-hourly average thermal inputs of BFG and COG and total thermal input to the
boiler over a 25-day period in November 2010 ................................................................. 635 Figure 7.41: Half-hourly average emissions of NOX and SO2 (reference 3 % O2) from a boiler fired
on BFG and COG over a 25-day period in November 2010, as per Figure 7.40 ............... 635 Figure 7.42: Daily average thermal inputs of I&S process gases plus NG and total thermal input to a
CCGT over a 50-day period............................................................................................... 636 Figure 7.43: Daily average emissions from a CCGT over a 50-day period, as per Figure 7.42 ............. 636 Figure 7.44: Relationship between NOX emissions and the relative thermal inputs to the boiler of
BFG and COG using hourly average data over a three-month period ............................... 638 Figure 7.45: NOX emissions (mg/Nm
3) against the gas flows (m
3/h) for a boiler using three different
base gas mixes ................................................................................................................... 639 Figure 7.46: NOX emissions and relative thermal input for a combination of three CCGTs
combusting COG, using daily average data for 2010 ........................................................ 640 Figure 7.47: Relationship between SO2 emissions and the relative thermal inputs to the boiler of
BFG and COG using hourly average data over a three-month period ............................... 641 Figure 7.48: Relationship between SO2 emissions and the inputs to 3 CCGTs from COG using daily
average data for 2010 ......................................................................................................... 642 Figure 7.49: Operating energy efficiencies of boilers firing iron and steel process gases in
combination with other gaseous/liquid fuels for 2012 ....................................................... 645 Figure 7.50: Operating energy efficiencies of CCGTs firing iron and steel process gases in
combination with other gaseous fuels for 2012 ................................................................. 645 Figure 7.51: NOX emissions from well-performing gas boilers combusting iron and steel process
gases .................................................................................................................................. 648 Figure 7.52: NOX emissions from well-performing CCGTs combusting iron and steel process gases .. 649 Figure 7.53: Relationship between the NOX emission and COG thermal input (%) for LCPs utilising
iron and steel process gases ............................................................................................... 650 Figure 7.54: SO2 emissions from well-performing boilers combusting iron and steel process gases .... 653 Figure 7.55: Relationship between the daily average SO2 emission and COG thermal input (%) for
boilers using iron and steel process gases (thermal input from auxiliary fuels < 5 %) ...... 654 Figure 7.56: SO2 emissions from well-performing CCGTs combusting iron and steel process gases ... 655 Figure 7.57: Dust emissions from well-performing boilers combusting iron and steel process gases ... 656 Figure 7.58: Dust emissions from well-performing CCGTs combusting iron and steel process gases .. 657 Figure 7.59: North Sea oil platform ....................................................................................................... 658 Figure 8.1: Industrial CFB boiler with multi-inlet cyclone applied for multi-fuel firing ..................... 674 Figure 8.2: The effect of biomass multi-fuel firing on SO2 emissions ................................................. 676 Figure 8.3: Utility boilers in chemical installations ............................................................................. 680 Figure 8.4: NOX emissions pattern as a function of the daily operation of a utility boiler not fitted
with end-of-pipe measures (values are not taken from real installations) .......................... 685 Figure 8.5: NOX concentration pattern in raw flue-gas as a function of the fuel blend at nominal
load .................................................................................................................................... 686 Figure 8.6: NOX and CO emissions from example boilers firing mixtures of gaseous and liquid
process fuels from the chemical industry ........................................................................... 691 Figure 8.7: NOX and CO emissions from example boilers firing gaseous process fuels from the
chemical industry ............................................................................................................... 692 Figure 8.8: NOX and CO emissions from example gas turbines firing process fuels from the
chemical industry ............................................................................................................... 692 Figure 8.9: Overfire air technique retrofitted in a boiler at a chemical installation.............................. 693 Figure 8.10: SO2, HCl and HF emissions from example plants firing mixtures of process gaseous and
liquid fuels from the chemical industry ............................................................................. 694
WORKIN
G DRAFT IN
PROGRESS

Scope
xxviii June 2016 TL/JFF/FN/EIPPCB/LCP_Final Draft
Figure 8.11: Dust emissions from example plants firing mixtures of process gaseous and liquid fuels
from the chemical industry ................................................................................................. 695 Figure 9.1: Co-incineration combustion of coal and sewage sludge..................................................... 701 Figure 9.2: Internal grates in a pulverised coal-fired boiler .................................................................. 702 Figure 9.3: Sb+As+Pb+Cr+Co+Cu+Mn+Ni+V emissions from well-performing coal- and/or
lignite-fired plants of more than 300 MWth, including plants co-incinerating waste ......... 730 Figure 9.4: Cd+Tl emissions from well-performing coal- and lignite-fired plants of more than
300 MWth, including plants co-incinerating waste (averages over the year) ...................... 731 Figure 9.5: TVOC emissions from well-performing coal- and lignite-fired plants, including plants
co-incinerating waste.......................................................................................................... 732 Figure 9.6: PCDD/F emissions from well-performing coal- and/or lignite-fired plants of more than
300 MWth, including plants co-incinerating waste ............................................................. 733 Figure 9.7: Sb+As+Pb+Cr+Co+Cu+Mn+Ni+V emissions from well-performing biomass- and/or
peat-fired plants, including plants co-incinerating waste ................................................... 735 Figure 9.8: Cd+Tl emissions from well-performing biomass- and/or peat-fired plants, including
plants co-incinerating waste ............................................................................................... 736 Figure 9.9: TVOC emissions from well-performing biomass- and/or peat-fired plants, including
plants co-incinerating waste ............................................................................................... 737 Figure 9.10: PCDD/F emissions from well-performing biomass- and/or peat-fired plants, including
plants co-incinerating waste ............................................................................................... 738 Figure 11.1: Amine Process using UCARSOL
TM FGC 3000 (Alstom and Dow Chemical) .................. 829
Figure 11.2: Simplified flow diagram of a power plant with post-combustion CO2 capture .................. 830 Figure 11.3: Chilled Ammonia Process flow diagram ............................................................................ 832 Figure 11.4: Simplified flow diagram of an oxy-fuel power plant ......................................................... 834 Figure 11.5: Pilot plant for lignite dying ................................................................................................ 846 Figure 11.6: Presentation of the coal beneficiation K-Fuel process ....................................................... 847 Figure 11.7: Typical picture of combustion occurring from a flameless burner ..................................... 853 Figure 13.1: Measurement uncertainties reported for NOX emissions .................................................... 924 Figure 13.2: Measurement uncertainties reported for SO2 emissions ..................................................... 925 Figure 13.3: Measurement uncertainties reported for dust emissions ..................................................... 926
WORKIN
G DRAFT IN
PROGRESS

Scope
TL/JFF/FN/EIPPCB/LCP_Final Draft June 2016 xxix
SCOPE
This BREF for the Large Combustion Plants sector covers the following activities specified in
Annex I to Directive 2010/75/EU:
1.1: Combustion of fuels in installations with a total rated thermal input of 50 MW
or more, only when this activity takes place in combustion plants with a total rated
thermal input of 50 MW or more.
1.4: Gasification of coal or other fuels in installations with a total rated thermal
input of 20 MW or more, only when this activity is directly associated to a
combustion process.
5.2: Disposal or recovery of waste in waste co-incineration plants for non-
hazardous waste with a capacity exceeding 3 tonnes per hour or for hazardous waste
with a capacity exceeding 10 tonnes per day, only when this activity takes place in
combustion plants covered under 1.1 above.
In particular, this document covers upstream and downstream activities directly associated to
the aforementioned activities including the emission prevention and control techniques applied.
The fuels considered in this document are any solid, liquid and/or gaseous combustible material
including:
solid fuels (e.g. coal, lignite, peat);
biomass (as defined in Article 3(31) of Directive 2010/75/EU);
liquid fuels (e.g. heavy fuel oil and gas oil);
gaseous fuels (e.g. natural gas, hydrogen-containing gas and syngas);
industry-specific fuels (e.g. by-products from chemical and iron and steel industries);
waste except mixed municipal waste as defined in Article 3(39) and except other waste
listed in Article 42(2)(a)(ii) and (iii) of Directive 2010/75/EU.
This document does not address the following:
gasification of fuels, when not directly associated to the combustion of the resulting
syngas;
gasification of fuels and subsequent combustion of syngas when directly associated to
the refining of mineral oil and gas;
the upstream and downstream activities not directly associated to combustion or
gasification activities;
combustion in process furnaces or heaters;
combustion in post-combustion plants;
flaring;
WORKIN
G DRAFT IN
PROGRESS
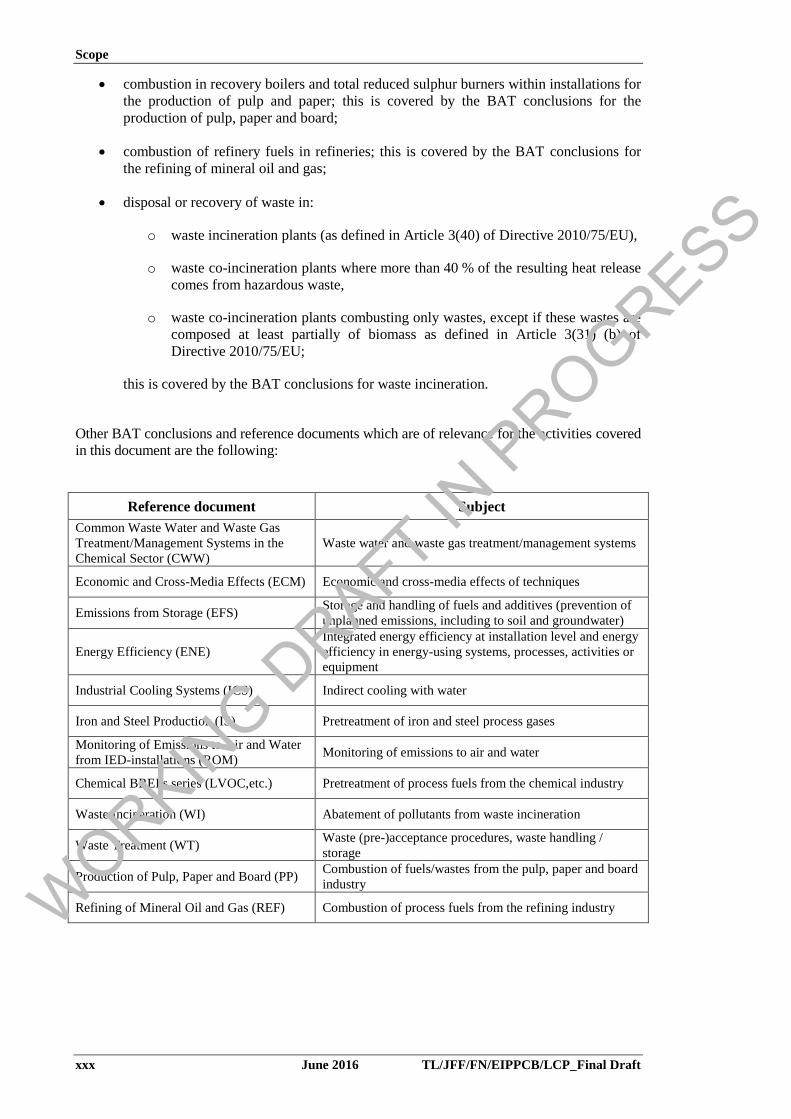
Scope
xxx June 2016 TL/JFF/FN/EIPPCB/LCP_Final Draft
combustion in recovery boilers and total reduced sulphur burners within installations for
the production of pulp and paper; this is covered by the BAT conclusions for the
production of pulp, paper and board;
combustion of refinery fuels in refineries; this is covered by the BAT conclusions for
the refining of mineral oil and gas;
disposal or recovery of waste in:
o waste incineration plants (as defined in Article 3(40) of Directive 2010/75/EU),
o waste co-incineration plants where more than 40 % of the resulting heat release
comes from hazardous waste,
o waste co-incineration plants combusting only wastes, except if these wastes are
composed at least partially of biomass as defined in Article 3(31) (b) of
Directive 2010/75/EU;
this is covered by the BAT conclusions for waste incineration.
Other BAT conclusions and reference documents which are of relevance for the activities covered
in this document are the following:
Reference document Subject
Common Waste Water and Waste Gas
Treatment/Management Systems in the
Chemical Sector (CWW)
Waste water and waste gas treatment/management systems
Economic and Cross-Media Effects (ECM) Economic and cross-media effects of techniques
Emissions from Storage (EFS) Storage and handling of fuels and additives (prevention of
unplanned emissions, including to soil and groundwater)
Energy Efficiency (ENE)
Integrated energy efficiency at installation level and energy
efficiency in energy-using systems, processes, activities or
equipment
Industrial Cooling Systems (ICS) Indirect cooling with water
Iron and Steel Production (IS) Pretreatment of iron and steel process gases
Monitoring of Emissions to Air and Water
from IED-installations (ROM) Monitoring of emissions to air and water
Chemical BREFs series (LVOC,etc.) Pretreatment of process fuels from the chemical industry
Waste Incineration (WI) Abatement of pollutants from waste incineration
Waste Treatment (WT) Waste (pre-)acceptance procedures, waste handling /
storage
Production of Pulp, Paper and Board (PP) Combustion of fuels/wastes from the pulp, paper and board
industry
Refining of Mineral Oil and Gas (REF) Combustion of process fuels from the refining industry
WORKIN
G DRAFT IN
PROGRESS
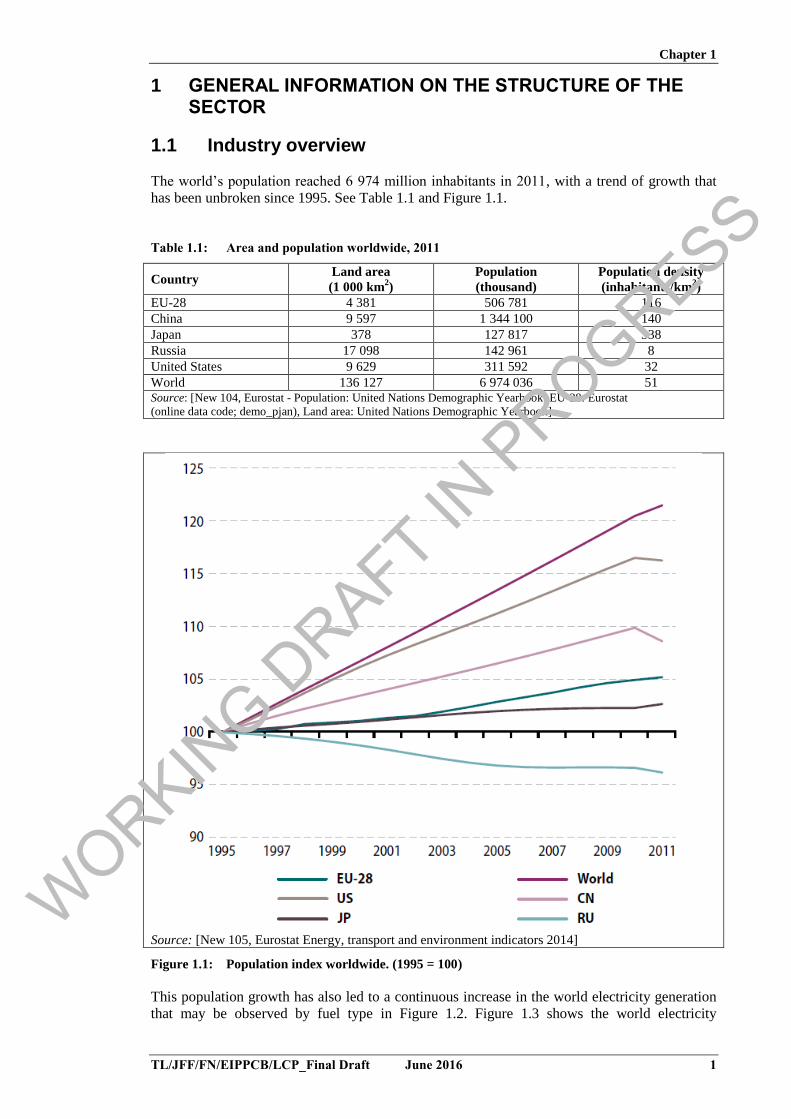
Chapter 1
TL/JFF/FN/EIPPCB/LCP_Final Draft June 2016 1
1 GENERAL INFORMATION ON THE STRUCTURE OF THE SECTOR
1.1 Industry overview
The world’s population reached 6 974 million inhabitants in 2011, with a trend of growth that
has been unbroken since 1995. See Table 1.1 and Figure 1.1.
Table 1.1: Area and population worldwide, 2011
Country Land area
(1 000 km2)
Population
(thousand)
Population density
(inhabitants/km2)
EU-28 4 381 506 781 116
China 9 597 1 344 100 140
Japan 378 127 817 338
Russia 17 098 142 961 8
United States 9 629 311 592 32
World 136 127 6 974 036 51 Source: [New 104, Eurostat - Population: United Nations Demographic Yearbook; EU-28: Eurostat
(online data code; demo_pjan), Land area: United Nations Demographic Yearbook].
Source: [New 105, Eurostat Energy, transport and environment indicators 2014]
Figure 1.1: Population index worldwide. (1995 = 100)
This population growth has also led to a continuous increase in the world electricity generation
that may be observed by fuel type in Figure 1.2. Figure 1.3 shows the world electricity
WORKIN
G DRAFT IN
PROGRESS
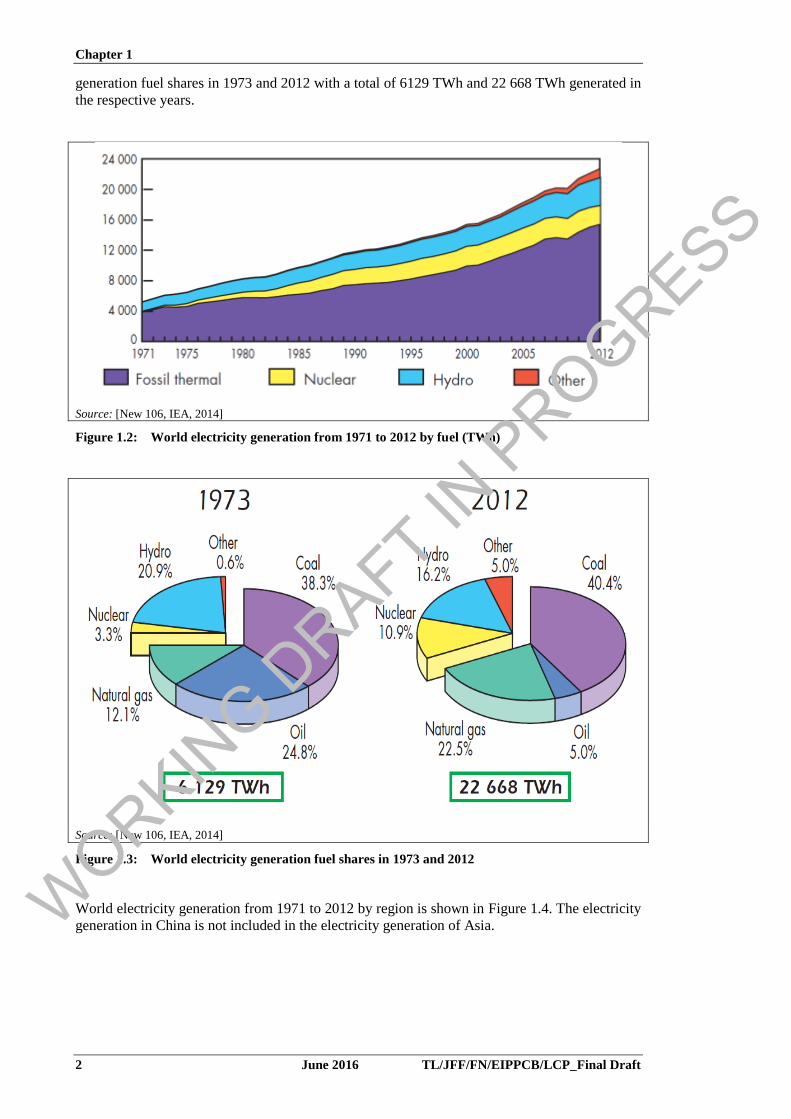
Chapter 1
2 June 2016 TL/JFF/FN/EIPPCB/LCP_Final Draft
generation fuel shares in 1973 and 2012 with a total of 6129 TWh and 22 668 TWh generated in
the respective years.
Source: [New 106, IEA, 2014]
Figure 1.2: World electricity generation from 1971 to 2012 by fuel (TWh)
Source: [New 106, IEA, 2014]
Figure 1.3: World electricity generation fuel shares in 1973 and 2012
World electricity generation from 1971 to 2012 by region is shown in Figure 1.4. The electricity
generation in China is not included in the electricity generation of Asia.
WORKIN
G DRAFT IN
PROGRESS
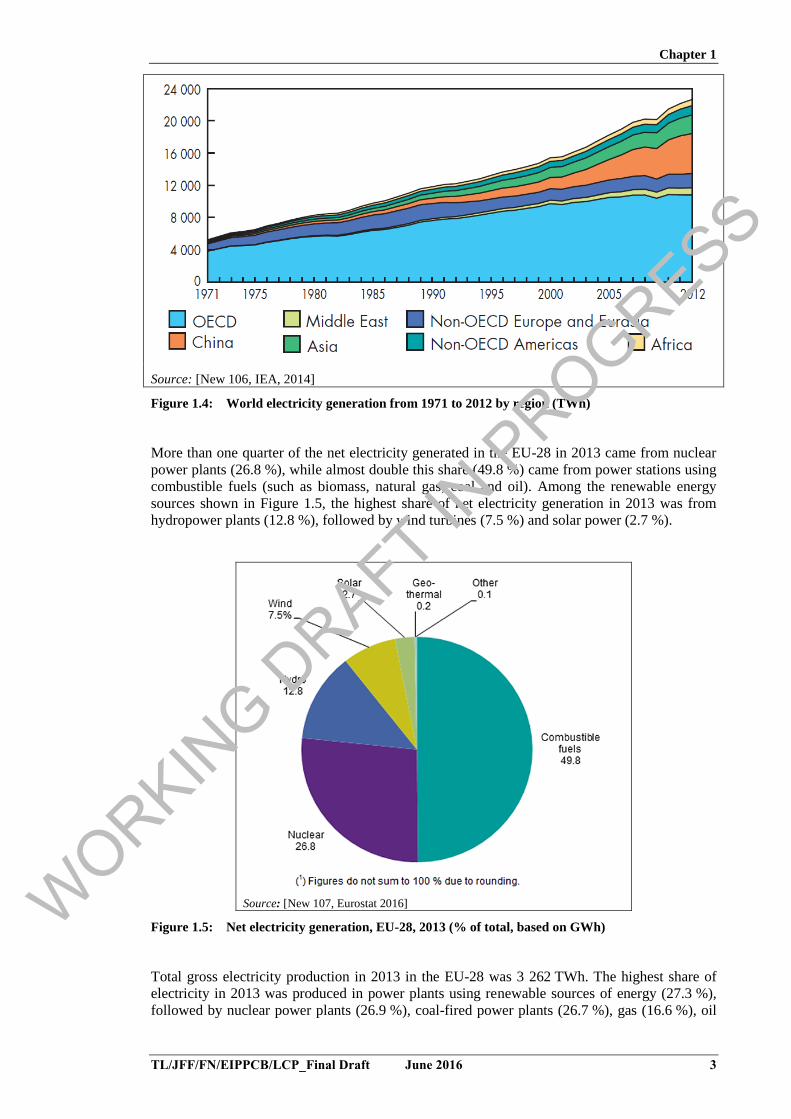
Chapter 1
TL/JFF/FN/EIPPCB/LCP_Final Draft June 2016 3
Source: [New 106, IEA, 2014]
Figure 1.4: World electricity generation from 1971 to 2012 by region (TWh)
More than one quarter of the net electricity generated in the EU-28 in 2013 came from nuclear
power plants (26.8 %), while almost double this share (49.8 %) came from power stations using
combustible fuels (such as biomass, natural gas, coal and oil). Among the renewable energy
sources shown in Figure 1.5, the highest share of net electricity generation in 2013 was from
hydropower plants (12.8 %), followed by wind turbines (7.5 %) and solar power (2.7 %).
Source: [New 107, Eurostat 2016]
Figure 1.5: Net electricity generation, EU-28, 2013 (% of total, based on GWh)
Total gross electricity production in 2013 in the EU-28 was 3 262 TWh. The highest share of
electricity in 2013 was produced in power plants using renewable sources of energy (27.3 %),
followed by nuclear power plants (26.9 %), coal-fired power plants (26.7 %), gas (16.6 %), oil
WORKIN
G DRAFT IN
PROGRESS
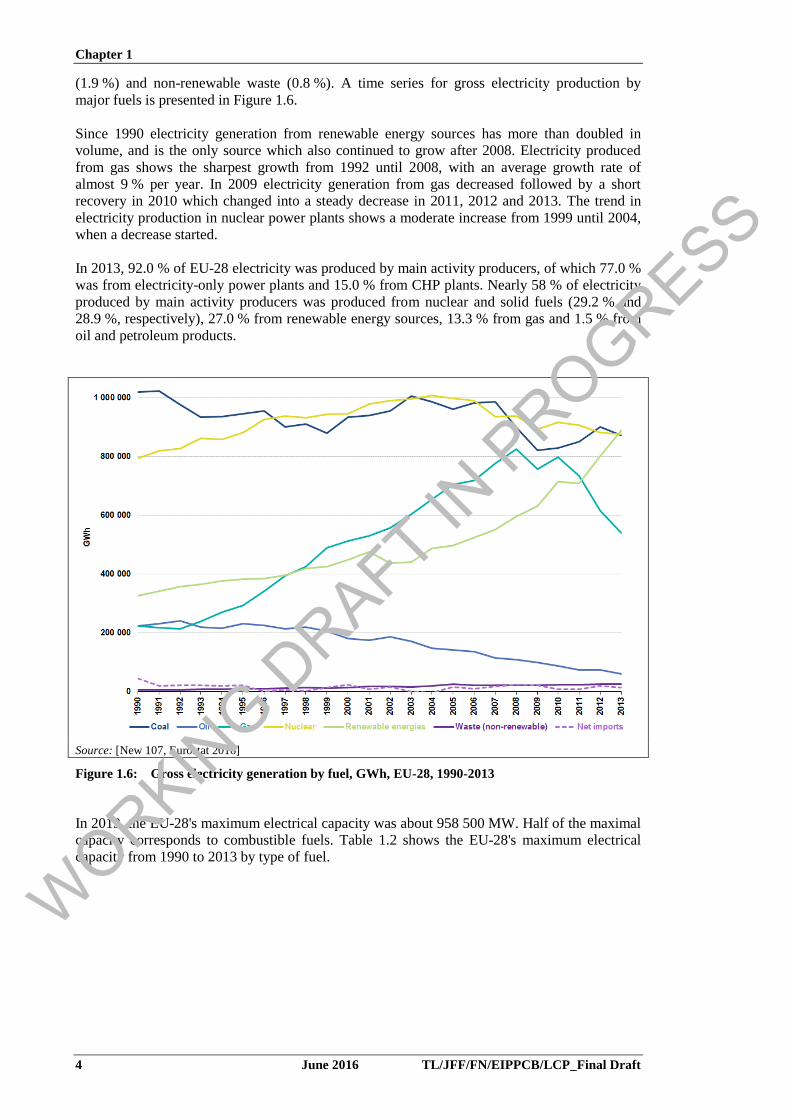
Chapter 1
4 June 2016 TL/JFF/FN/EIPPCB/LCP_Final Draft
(1.9 %) and non-renewable waste (0.8 %). A time series for gross electricity production by
major fuels is presented in Figure 1.6.
Since 1990 electricity generation from renewable energy sources has more than doubled in
volume, and is the only source which also continued to grow after 2008. Electricity produced
from gas shows the sharpest growth from 1992 until 2008, with an average growth rate of
almost 9 % per year. In 2009 electricity generation from gas decreased followed by a short
recovery in 2010 which changed into a steady decrease in 2011, 2012 and 2013. The trend in
electricity production in nuclear power plants shows a moderate increase from 1999 until 2004,
when a decrease started.
In 2013, 92.0 % of EU-28 electricity was produced by main activity producers, of which 77.0 %
was from electricity-only power plants and 15.0 % from CHP plants. Nearly 58 % of electricity
produced by main activity producers was produced from nuclear and solid fuels (29.2 % and
28.9 %, respectively), 27.0 % from renewable energy sources, 13.3 % from gas and 1.5 % from
oil and petroleum products.
Source: [New 107, Eurostat 2016]
Figure 1.6: Gross electricity generation by fuel, GWh, EU-28, 1990-2013
In 2013, the EU-28's maximum electrical capacity was about 958 500 MW. Half of the maximal
capacity corresponds to combustible fuels. Table 1.2 shows the EU-28's maximum electrical
capacity from 1990 to 2013 by type of fuel.
WORKIN
G DRAFT IN
PROGRESS

Chapter 1
TL/JFF/FN/EIPPCB/LCP_Final Draft June 2016 5
Table 1.2: Maximum electrical capacity in the EU-28 (MW), 1990-2013
1990 1995 2000 2005 2010 2011 2012 2013
Nuclear 121 070 128
435
136
637
134
994
131
731 132 087 123 183 122 971
Hydro 119 652 127
466
132
866
143
363
147
516 148 687 148 687 150 145
Geothermal 499 480 604 687 762 764 768 781
Solar 10 49 180 2 297 30 131 52 463 70 789 81 876 Tide, wave
and ocean 240 240 241 240 241 241 243 243
Wind 471 2 447 12 711 40 568 84 624 94 290 105 421 117 936
Combustible
Fuels 321 479
353
250
391
490
435
137
487
854 490 982 494 100 482 464
Industrial
wastes 420 682 1 063 514 1 820 1 866 2 020 1 879
Municipal
wastes 968 1 418 2 488 4 426 6 029 6 095 6 080 6 959
Solid
biofuels 2 988 3 862 5 329 10 019 14 195 15 829 16 639 16 465
Biogases 260 509 1 243 3 088 5 934 7 031 8 279 8 660 Liquid
biofuels 0 0 0 704 1 068 1 141 1 842 1 864
Other sources 10 142 229 905 883 2 162 2 044 2 111 Source: [New 108, Eurostat (nrg_113a)]
In the European Union, all available types of energy sources are used for electric and thermal
power generation. The type of fuel used for energy generation in each EU Member State (MS)
is largely influenced by national fuel resources, such as the local or national availability of coal,
lignite, natural gas, or oil. For example, in Greece and in parts of Germany and Poland,
significant lignite resources are available for energy generation. In Finland and Ireland, for
instance, peat is an important domestic energy source and, therefore, an important cornerstone
of the national energy policy. In France, where nuclear power stations provide the majority of
the nation's energy demand, the use of fossil fuel is mainly restricted to a small number of peak
load plants. In Sweden and Finland, for instance, biomass is an important domestic energy
source. The fuel mix of electricity generated in 2011 by each MS (%) is shown in Figure 1.7.
Source: [New 109, Eurostat submitted by PL ]
Figure 1.7: Fuel mix of electricity generated in 2011 in the EU-28
Combustion plants are used in the EU according to their demands and requirements, either as
large utility plants or as industrial combustion plants that provide electricity, steam, or heat to
WORKIN
G DRAFT IN
PROGRESS
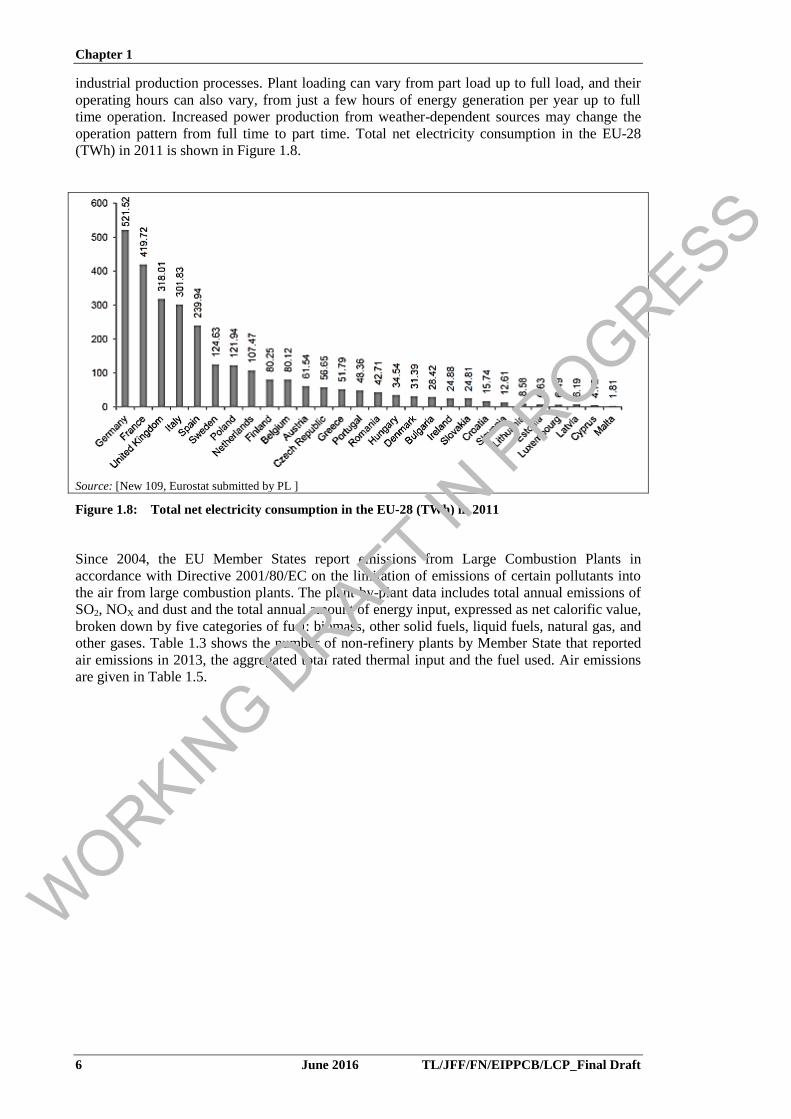
Chapter 1
6 June 2016 TL/JFF/FN/EIPPCB/LCP_Final Draft
industrial production processes. Plant loading can vary from part load up to full load, and their
operating hours can also vary, from just a few hours of energy generation per year up to full
time operation. Increased power production from weather-dependent sources may change the
operation pattern from full time to part time. Total net electricity consumption in the EU-28
(TWh) in 2011 is shown in Figure 1.8.
Source: [New 109, Eurostat submitted by PL ]
Figure 1.8: Total net electricity consumption in the EU-28 (TWh) in 2011
Since 2004, the EU Member States report emissions from Large Combustion Plants in
accordance with Directive 2001/80/EC on the limitation of emissions of certain pollutants into
the air from large combustion plants. The plant-by-plant data includes total annual emissions of
SO2, NOX and dust and the total annual amount of energy input, expressed as net calorific value,
broken down by five categories of fuel: biomass, other solid fuels, liquid fuels, natural gas, and
other gases. Table 1.3 shows the number of non-refinery plants by Member State that reported
air emissions in 2013, the aggregated total rated thermal input and the fuel used. Air emissions
are given in Table 1.5.
WORKIN
G DRAFT IN
PROGRESS

Chapter 1
TL/JFF/FN/EIPPCB/LCP_Final Draft June 2016 7
Table 1.3: LCP in the EU (2013)
Number of
plants MWth
Biomass
(TJ)
Other solid
fuels (TJ)
Liquid
fuels (TJ)
Natural gas
(TJ)
Other
gases (TJ)
AT 90 19709 9812 47331 1195 75728 24293
BE 86 20367 36553 29460 3556 124245 25469
BG 24 23601 5533 234164 0 33935 676
CY 16 3864 0 0 32534 0 0
CZ 101 43639 10588 504010 3690 22218 34076
DE 560 272785 48196 2681498 57173 685006 239077
DK 73 16481 36221 131095 4521 24407 154
EE 20 10300 7020 125652 643 6110 5970
EL 50 24613 0 282023 17113 92904 0
ES 144 77686 5517 408664 68303 216257 55993
FI 159 30493 86336 160433 2271 57355 6271
FR 235 79595 22456 256303 52297 136131 52485
HR 13 4617 0 23290 1395 12434 483
HU 42 17665 17132 75074 753 47257 5129
IE 27 13973 1969 61456 5268 96011 2
IT 342 136366 19704 425569 39777 732406 134531
LT 21 12488 4620 0 5265 30102 974
LU 1 730 0 0 0 7218 0
LV 20 5711 667 42 2 23866 0
MT 9 1745 0 0 21603 0 0
NL 146 50529 20108 221556 8442 266803 143734
PL 96 104409 81946 1446819 6909 33630 33531
PT 26 12387 6516 106016 849 33592 1869
RO 85 36459 128 205722 1752 98273 278
SE 128 28340 96157 17760 7330 14577 10943
SI 16 4653 1009 55791 132 1950 0
SK 63 11286 7443 51228 342 29595 12603
UK 248 152905 83805 1137287 10249 765457 48500
Source: [New 113, EEA]
Figure 1.9 shows the location of the large combustion plants in Europe (northern Sweden,
northern Finland, the Canary Islands and other remote European islands are not represented on
the map).
WORKIN
G DRAFT IN
PROGRESS
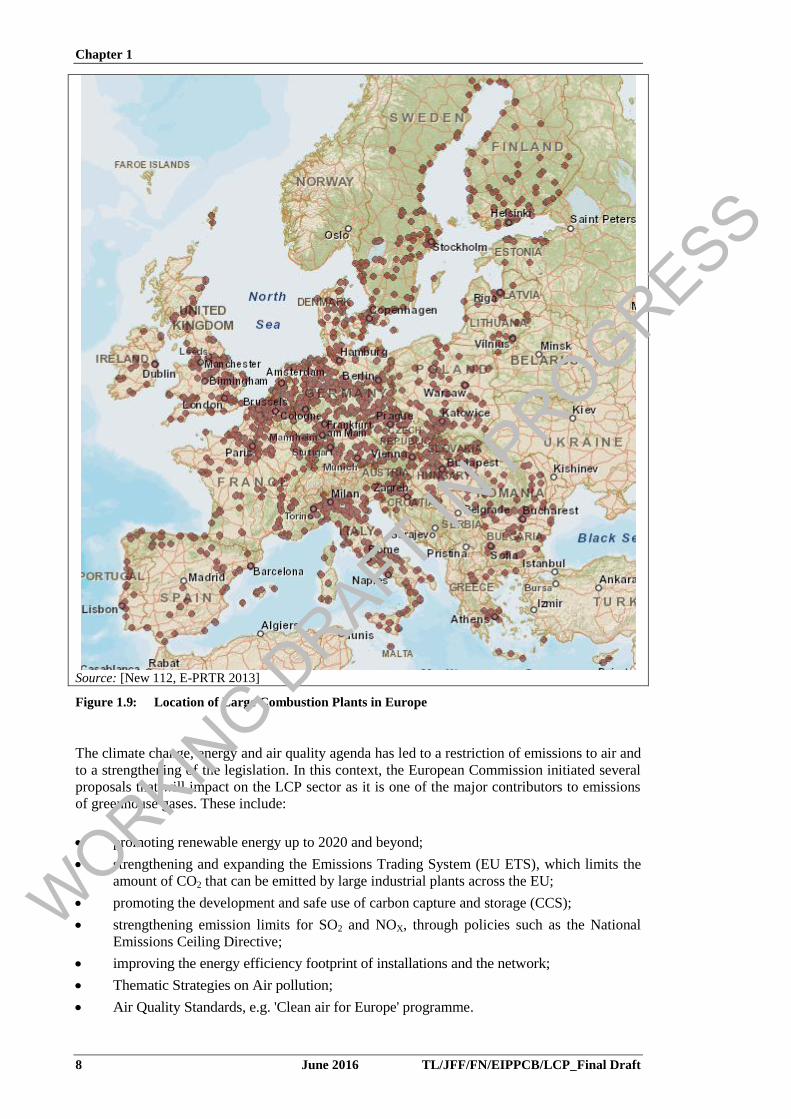
Chapter 1
8 June 2016 TL/JFF/FN/EIPPCB/LCP_Final Draft
Source: [New 112, E-PRTR 2013]
Figure 1.9: Location of Large Combustion Plants in Europe
The climate change, energy and air quality agenda has led to a restriction of emissions to air and
to a strengthening of the legislation. In this context, the European Commission initiated several
proposals that will impact on the LCP sector as it is one of the major contributors to emissions
of greenhouse gases. These include:
promoting renewable energy up to 2020 and beyond;
strengthening and expanding the Emissions Trading System (EU ETS), which limits the
amount of CO2 that can be emitted by large industrial plants across the EU;
promoting the development and safe use of carbon capture and storage (CCS);
strengthening emission limits for SO2 and NOX, through policies such as the National
Emissions Ceiling Directive;
improving the energy efficiency footprint of installations and the network;
Thematic Strategies on Air pollution;
Air Quality Standards, e.g. 'Clean air for Europe' programme.
WORKIN
G DRAFT IN
PROGRESS
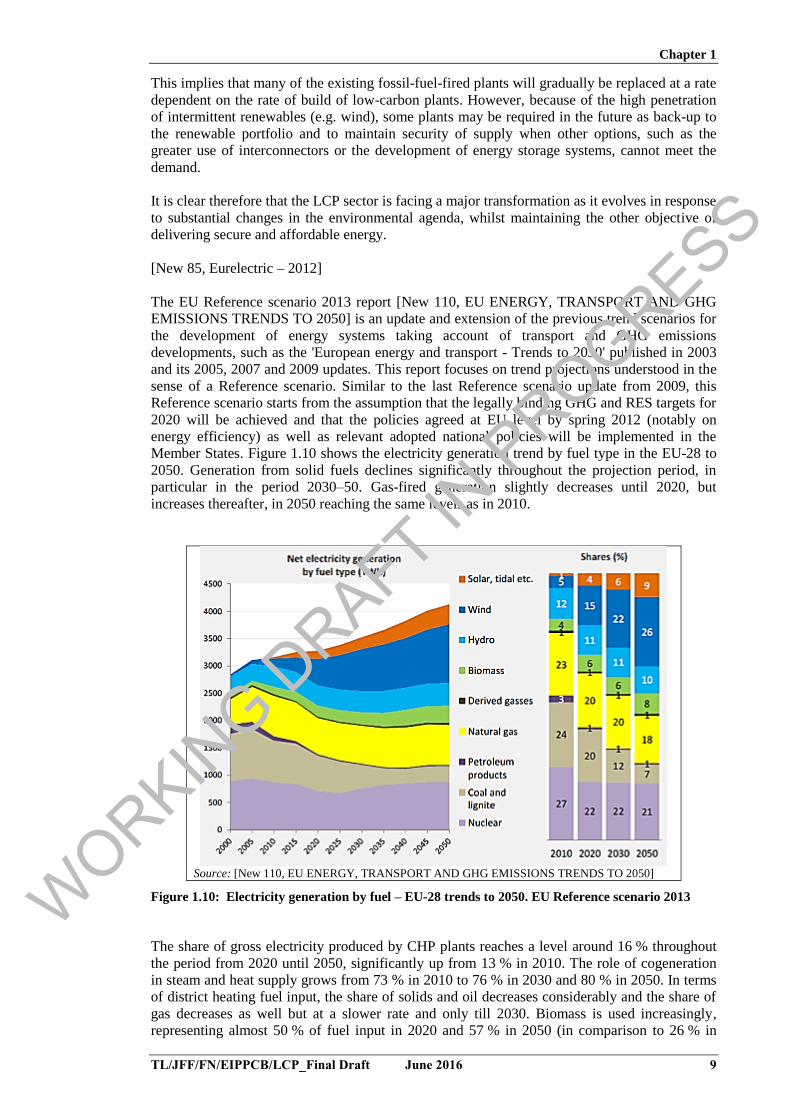
Chapter 1
TL/JFF/FN/EIPPCB/LCP_Final Draft June 2016 9
This implies that many of the existing fossil-fuel-fired plants will gradually be replaced at a rate
dependent on the rate of build of low-carbon plants. However, because of the high penetration
of intermittent renewables (e.g. wind), some plants may be required in the future as back-up to
the renewable portfolio and to maintain security of supply when other options, such as the
greater use of interconnectors or the development of energy storage systems, cannot meet the
demand.
It is clear therefore that the LCP sector is facing a major transformation as it evolves in response
to substantial changes in the environmental agenda, whilst maintaining the other objective of
delivering secure and affordable energy.
[New 85, Eurelectric – 2012]
The EU Reference scenario 2013 report [New 110, EU ENERGY, TRANSPORT AND GHG
EMISSIONS TRENDS TO 2050] is an update and extension of the previous trend scenarios for
the development of energy systems taking account of transport and GHG emissions
developments, such as the 'European energy and transport - Trends to 2030' published in 2003
and its 2005, 2007 and 2009 updates. This report focuses on trend projections understood in the
sense of a Reference scenario. Similar to the last Reference scenario update from 2009, this
Reference scenario starts from the assumption that the legally binding GHG and RES targets for
2020 will be achieved and that the policies agreed at EU level by spring 2012 (notably on
energy efficiency) as well as relevant adopted national policies will be implemented in the
Member States. Figure 1.10 shows the electricity generation trend by fuel type in the EU-28 to
2050. Generation from solid fuels declines significantly throughout the projection period, in
particular in the period 2030–50. Gas-fired generation slightly decreases until 2020, but
increases thereafter, in 2050 reaching the same levels as in 2010.
Source: [New 110, EU ENERGY, TRANSPORT AND GHG EMISSIONS TRENDS TO 2050]
Figure 1.10: Electricity generation by fuel – EU-28 trends to 2050. EU Reference scenario 2013
The share of gross electricity produced by CHP plants reaches a level around 16 % throughout
the period from 2020 until 2050, significantly up from 13 % in 2010. The role of cogeneration
in steam and heat supply grows from 73 % in 2010 to 76 % in 2030 and 80 % in 2050. In terms
of district heating fuel input, the share of solids and oil decreases considerably and the share of
gas decreases as well but at a slower rate and only till 2030. Biomass is used increasingly,
representing almost 50 % of fuel input in 2020 and 57 % in 2050 (in comparison to 26 % in
WORKIN
G DRAFT IN
PROGRESS
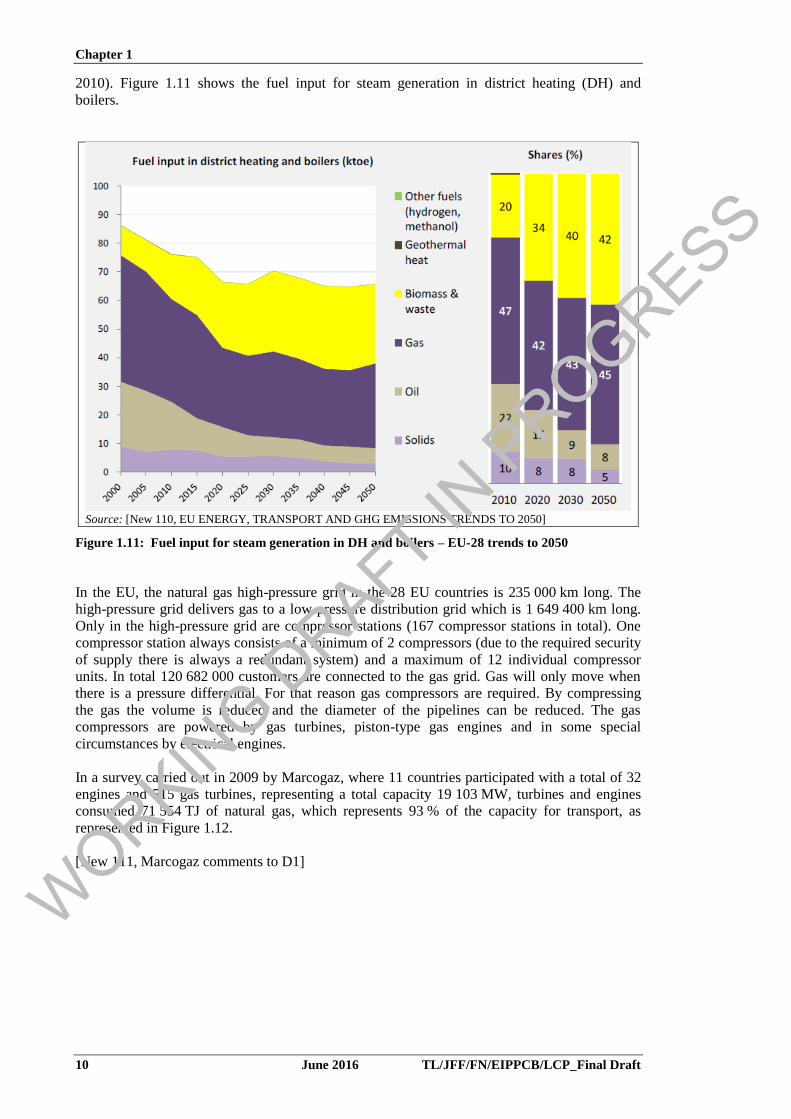
Chapter 1
10 June 2016 TL/JFF/FN/EIPPCB/LCP_Final Draft
2010). Figure 1.11 shows the fuel input for steam generation in district heating (DH) and
boilers.
Source: [New 110, EU ENERGY, TRANSPORT AND GHG EMISSIONS TRENDS TO 2050]
Figure 1.11: Fuel input for steam generation in DH and boilers – EU-28 trends to 2050
In the EU, the natural gas high-pressure grid in the 28 EU countries is 235 000 km long. The
high-pressure grid delivers gas to a low-pressure distribution grid which is 1 649 400 km long.
Only in the high-pressure grid are compressor stations (167 compressor stations in total). One
compressor station always consists of a minimum of 2 compressors (due to the required security
of supply there is always a redundant system) and a maximum of 12 individual compressor
units. In total 120 682 000 customers are connected to the gas grid. Gas will only move when
there is a pressure differential. For that reason gas compressors are required. By compressing
the gas the volume is reduced and the diameter of the pipelines can be reduced. The gas
compressors are powered by gas turbines, piston-type gas engines and in some special
circumstances by electrical engines.
In a survey carried out in 2009 by Marcogaz, where 11 countries participated with a total of 32
engines and 515 gas turbines, representing a total capacity 19 103 MW, turbines and engines
consumed 71 554 TJ of natural gas, which represents 93 % of the capacity for transport, as
represented in Figure 1.12.
[New 111, Marcogaz comments to D1]
WORKIN
G DRAFT IN
PROGRESS

Chapter 1
TL/JFF/FN/EIPPCB/LCP_Final Draft June 2016 11
Source: [New 111, Marcogaz comments to D1]
Figure 1.12: Mechanical drive engines and turbines for transport and storage - 2009
WORKIN
G DRAFT IN
PROGRESS
Chapter 1
12 June 2016 TL/JFF/FN/EIPPCB/LCP_Final Draft
1.2 Economic situation
The opening up of electricity markets is an ongoing worldwide process. The principle objective
is to increase competition across the sector and thereby encourage the reduction of generation,
transmission, distribution and supply costs to the benefit of both industrial and domestic
consumers.
In parallel with the liberalisation of the electricity market, there is a move towards the use of
economic instruments to achieve national and international energy and environmental policy
objectives. These instruments take various forms including taxes, incentives and market-based
trading opportunities.
In 1996, the European Union introduced the Internal Electricity Market (IEM) Directive
(96/92/EC), repealed by Directive 2009/72/2009, which required MS to open up up to 25 % of
their markets to competition, although they remained free to take their market opening-up
process even further. The degree of actual market opening varies throughout the EU, from a full
open market in some countries to a partially open market in others.
As markets open up to competition, this can have a significant impact on a range of factors
relating to the operation and regulation of LCPs, and which may be taken into account in
determining the appropriateness of particular techniques to reduce emissions to air, water and
land. The need for some plants to manage specific customer requirements including auxiliary
services, such as maintaining voltage and frequency, leads to load following, peak load
production and black start capability. These include, but are not limited to, the following [New
123, 58, Eurelectric, 2001]:
Security of the energy supply. This can affect the levels of excess capacity in a system
and the extent of fuel diversity, although the capacity is itself influenced by the need for
spinning reserve and the availability of fuel storage.
Cost and availability of fuel.
Cost and availability of allowances provided under the EU Emissions Trading System
(ETS).
The level of system security that is required by any given market can significantly
influence factors such as the redundancy in plant design, with a direct influence on
investment costs and the level of electricity price required to pay back investment.
The impact of the market shape (i.e. load duration curves), which, together with factors
such as the marginal cost of generation, can influence the level of utilisation of particular
types of plant, availability requirements and the level of excess capacity.
Remuneration structures within particular markets, including whether they operate
contract markets, balancing markets, trading via an electricity pool, capacity payments,
etc.
The level of the forward price within the market and the structure of price in relation to
plant utilisation and generation costs, which may influence the ability of a given market
to pay back investments.
The extent to which tariffs in a particular market are fixed to control the supply or
consumption of electricity produced by a given technique or sourced from a particular
fuel, so as to support an individual MS' energy policy requirements. Other instruments are
also used by MS to achieve these objectives, including carbon, energy, and pollutant
taxes.
The extent of preferential feed in capacity from renewable sources.
The need for a particular plant to manage specific customer interface requirements,
including ancillary services such as maintaining system voltage and frequency, load-
following and load structure, black start capability and the specific need to meet local grid
WORKIN
G DRAFT IN
PROGRESS

Chapter 1
TL/JFF/FN/EIPPCB/LCP_Final Draft June 2016 13
constraints, all of which can have a marked impact on the operational characteristics of
such a plant.
The interaction of connected markets, such as in systems where gas and electricity grids
create the opportunity for hedging between gas supply and electricity generation based on
fuel price differentials, which can also be driven by short-term demand.
Grid infrastructure and the particular charging structure within a specific market can have
plant-specific implications, e.g. transmission loss, grid access and the use of system
charges, together with the extent of constrained on or off running.
Regulatory incentives within particular markets to encourage embedded and distributed
generation. These can also have an influence on the level of renewable generation, where
national targets can be achieved through additional support mechanisms, including
supplier obligations or subsidies.
Location of combustion installations
It is general practice throughout Europe to locate fossil fuel-burning power plants in locations
that incur the minimum costs for installation and operation, allowing also for a number of
contributing factors related to the area where the plant is located and the infrastructure to
support its operation. Each of these factors varies in significance according to local and national
considerations, but in many cases the availability of a connection to the electricity
transmission/distribution system, the proximity of the electrical demand, and the availability of
water for the cooling systems, and the proximity of mining zones/seaports have often been
predominant factors in selecting the location for LCPs. In the past, forecasts of future power
demands for individual countries, and the optimum long-term costs for the preferred type of
plant, have determined the chosen size and location of power plants.
Since there is a substantial reduction of specific investment cost between small units
(< 300 MWth) and large units (> 300 MWth) and hence a reduction in the costs of the electricity
produced, the capacity of individual units has increased in the last few decades. Nonetheless,
whilst this is the driver on the mainland, island generators may face specific challenges. The
size of generators installed on islands is a compromise between the use of the larger power units
for enhanced efficiency, whilst maintaining an adequate level of redundancy in case of failure of
units. Island generators do not benefit from economies of scale. Flexibility is key when selecting
island generators since they need to be operated with high variations of duty cycle resulting
from daily and seasonal variations in the island’s electricity demand.
Gas compressor stations are situated at fixed distances alongside the transport pipe, and storage
plants are located depending on the geological site. Small and reductant compressors may be
needed to guarantee optimal gas flow and security of supply.
Other factors are often of less importance when selecting the location of a LCP. The availability
of suitable land, the visual and air quality impact on the local environment, and the access for
the delivery and storage of fuels are often factors that influence the design and positioning of a
power plant. However, these factors are often considered in detail only when the general
location has been determined, and do not usually override the decision to proceed with the plant
installation.
With the widespread expansion of energy infrastructure taking place in Europe, there are also
changes in the relative influence of each of the factors used when selecting the location of the
power plant. It is now easier to bring the fuel and power connections to the right location for the
plant, rather than to choose the location according to the existing infrastructure. The significant
increase in the use of natural gas as a fuel has now resulted in a greater level of gas supply
infrastructure, making gas more widely available at the pressure and quantity required for the
operation of the gas engines and turbines for power generation, with low transportation costs
and no site fuel storage requirements. The expansion of the integrated electricity distribution
system has widened the options for achieving good connections for the power-generating plant
WORKIN
G DRAFT IN
PROGRESS
Chapter 1
14 June 2016 TL/JFF/FN/EIPPCB/LCP_Final Draft
to supply power into the system. New switchgear and control systems are also enabling more
safe and effective connections.
The LCP sector imports a large amount of fuel (including coal and gas) from outside the EU and
hence security of supply is an important driver in the design, the technology and in the location
of plants. Indigenous supplies will increasingly play a role in maintaining diversity and security
of supply, whilst coal plants often seek opportunities to widen their capability to diversify fuels
by also burning biomass, wastes and petroleum coke. LCPs may, in the future, need to be more
flexible in fuelling, as well as in operation, due to the increase in intermittent renewable energy.
There is a decreasing availability of locations that meet the main requirements for power
plants and this may become more important in the future as the increased use of carbon
capture and storage (CCS) may influence the siting of new fossil plants to maintain access to
CO2 storage sites.
[New 85, Eurelectric – 2012]
At the same time, changes in power generation and abatement techniques have significantly
increased the efficiency of power generation, as well as providing far cleaner flue-gases than
earlier plants burning fossil fuels. The use of gas turbines for power generation, and the
development of new combustion plants and flue-gas treatments have resulted in power plants
that can use a range of gaseous, liquid or solid fuels, all emitting far less pollutants per unit of
power generated than previously. The overall impact that new plants have on their local
environment is significantly less compared to older plants.
In some countries, an area´s residential and commercial heat load is an important parameter in
locating district heating or combined heat and power (CHP) plants. For district heating, the
economically optimised situation leads to calls for peak load production in the same area. In a
high load situation, peak load boilers are in constant co-operation with CHP plants. This means
that each plant feeds the nearby area with a relatively small distance between the consumers and
the plant. Connecting CHP and peak load plants to a district heating grid must thus follow
certain rules.
Newer plants have higher energy efficiencies, which result, inter alia, in a reduced production
of emissions (to water and air) per unit of power generated. Future increases of plant efficiency
will ultimately be limited because of:
the laws of thermodynamics;
the diminishing returns from increasing development costs;
increasing capital costs resulting in higher generation costs;
CO2 capture and storage measures;
plants not using their full capacity.
The influence of remaining plant life and plant operation
Economic viability for implementing new environmental techniques is relevant since
decarbonising electricity generation will require a new tranche of technology and hence a
transition from existing to new technology. Future expected lifetime and operating regimes,
particularly for existing plants, may well be very different from current ones. Low levels of
operation and a limited remaining life are key parameters to consider when assessing the ability
to recover further investments in an existing plant. The dependence of costs as a function of
remaining plant life and load factor can be assessed on a case-by-case basis (for given
assumptions on capital and operating costs, discount rate, and economic lifetime). The level of
operation is represented by the plant annual load factor, or equivalent load factor.
In the example below, it is assumed that SCR is retrofitted to a 500 MWth coal-fired unit with an
annual operating period of 6000 hours at a cost of EUR 60 million. It is also assumed that the
WORKIN
G DRAFT IN
PROGRESS
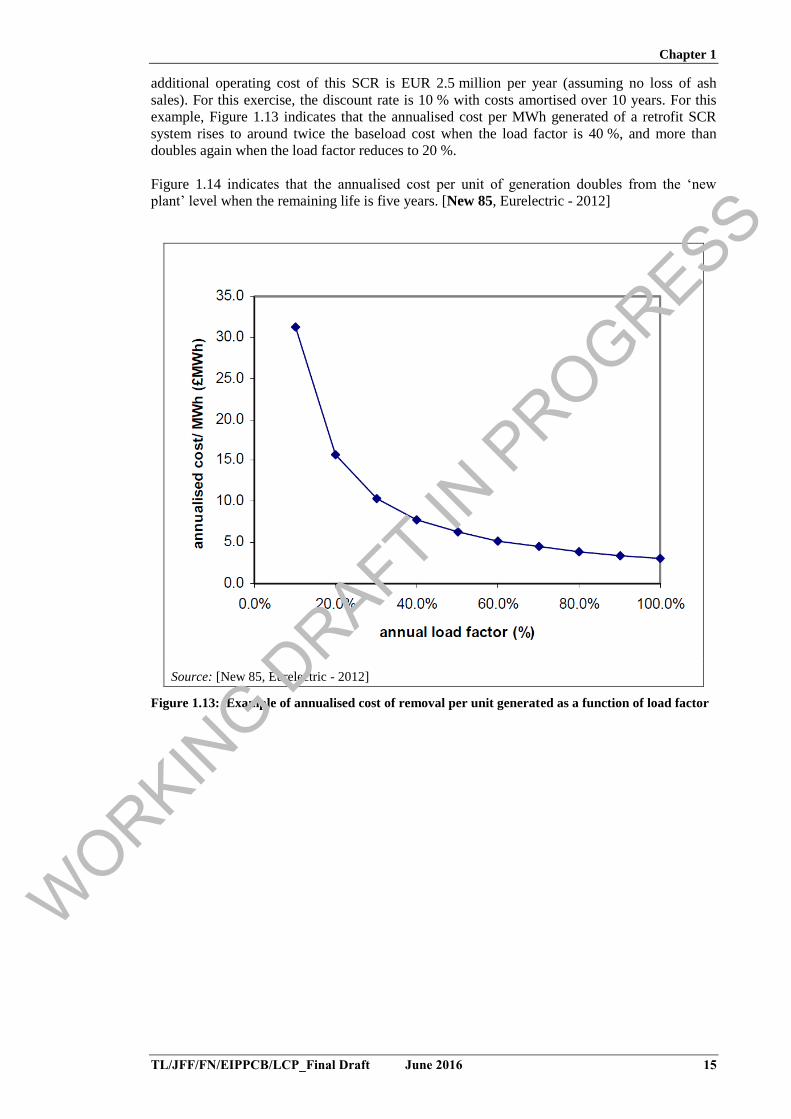
Chapter 1
TL/JFF/FN/EIPPCB/LCP_Final Draft June 2016 15
additional operating cost of this SCR is EUR 2.5 million per year (assuming no loss of ash
sales). For this exercise, the discount rate is 10 % with costs amortised over 10 years. For this
example, Figure 1.13 indicates that the annualised cost per MWh generated of a retrofit SCR
system rises to around twice the baseload cost when the load factor is 40 %, and more than
doubles again when the load factor reduces to 20 %.
Figure 1.14 indicates that the annualised cost per unit of generation doubles from the ‘new
plant’ level when the remaining life is five years. [New 85, Eurelectric - 2012]
Source: [New 85, Eurelectric - 2012]
Figure 1.13: Example of annualised cost of removal per unit generated as a function of load factor
WORKIN
G DRAFT IN
PROGRESS
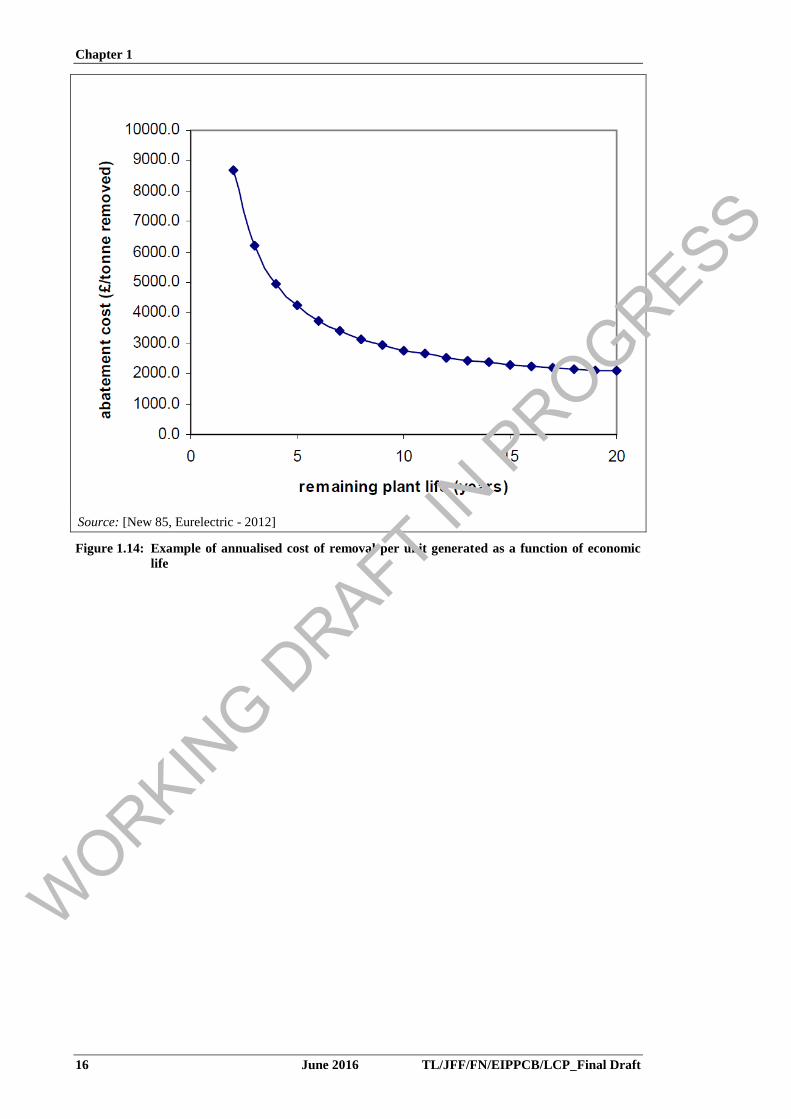
Chapter 1
16 June 2016 TL/JFF/FN/EIPPCB/LCP_Final Draft
Source: [New 85, Eurelectric - 2012]
Figure 1.14: Example of annualised cost of removal per unit generated as a function of economic
life
WORKIN
G DRAFT IN
PROGRESS

Chapter 1
TL/JFF/FN/EIPPCB/LCP_Final Draft June 2016 17
1.3 Key environmental issues
The operation of combustion installations to generate electrical energy and/or heat, and in
particular the electricity-generating industry due to its large centralised power plants, is a very
important cornerstone of our modern society and of the European economy. On the other hand,
combustion installations use large amounts of combustible fuels and other raw materials taken
from the earth’s natural resources, converting them into useful energy. These plants generate a
number of residues, wastes and large amounts of emissions to all environmental media. To give
an overview of the different mass streams, a generalised flow diagram of a combustion plant
and its associated operations is presented in Figure 1.15.
Source: [New 124] [5, HMIP, 1995]
Figure 1.15: Generalised flow diagram of a combustion plant and its associated operations
Combustible fuels are the principal energy source used today. However, their burning results in
a relevant and at times significant impact on the environment as a whole. The combustion
process leads to the generation of emissions to air, water and soil, of which emissions to the
atmosphere are considered to be one of the main environmental concerns. The following
sections give general information about the main substances emitted. An overview of the
substances emitted, their sources and their influence on the different environmental media is
given in Table 1.4.
WORKIN
G DRAFT IN
PROGRESS
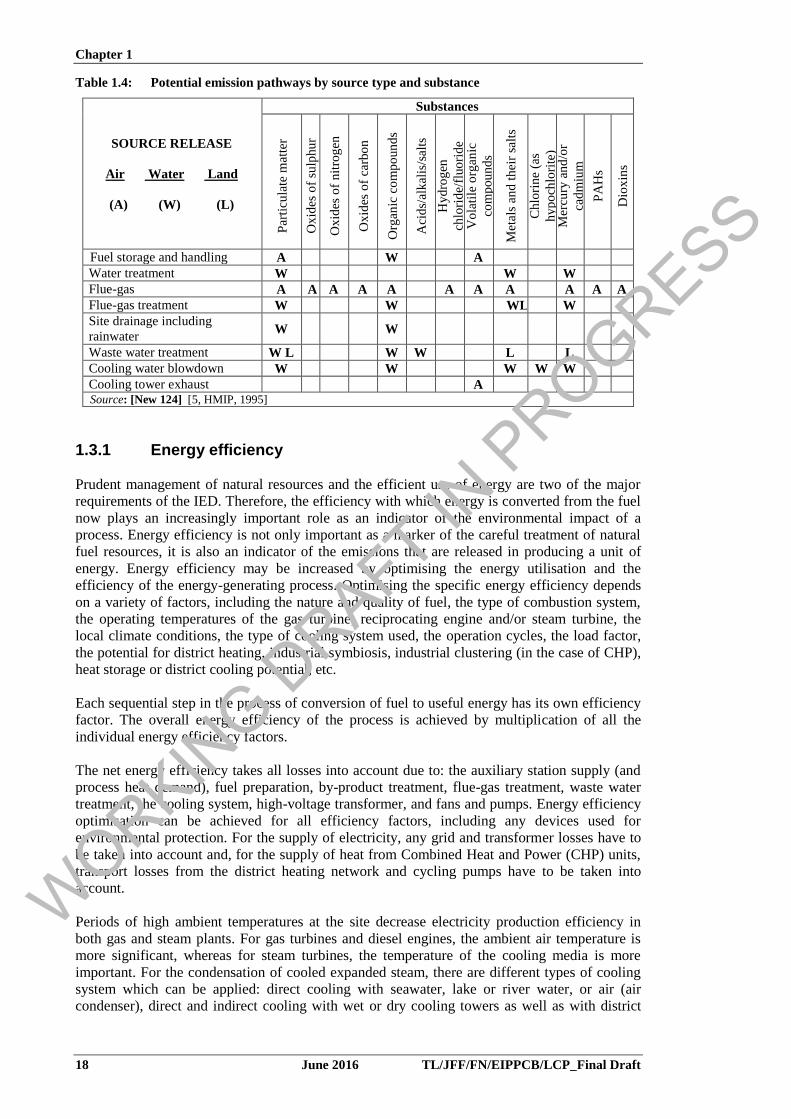
Chapter 1
18 June 2016 TL/JFF/FN/EIPPCB/LCP_Final Draft
Table 1.4: Potential emission pathways by source type and substance
SOURCE RELEASE
Air Water Land
(A) (W) (L)
Substances
Par
ticu
late
mat
ter
Ox
ides
of
sulp
hu
r
Ox
ides
of
nit
rog
en
Ox
ides
of
carb
on
Org
anic
co
mp
oun
ds
Aci
ds/
alk
alis
/sal
ts
Hy
dro
gen
chlo
rid
e/fl
uo
rid
e V
ola
tile
org
anic
com
pou
nd
s
Met
als
and
th
eir
salt
s
Ch
lori
ne
(as
hy
po
chlo
rite
) M
ercu
ry a
nd
/or
cad
miu
m
PA
Hs
Dio
xin
s
Fuel storage and handling A W A
Water treatment W W W
Flue-gas A A A A A A A A A A A
Flue-gas treatment W W WL W
Site drainage including
rainwater W W
Waste water treatment W L W W L L
Cooling water blowdown W W W W W
Cooling tower exhaust A Source: [New 124] [5, HMIP, 1995]
1.3.1 Energy efficiency
Prudent management of natural resources and the efficient use of energy are two of the major
requirements of the IED. Therefore, the efficiency with which energy is converted from the fuel
now plays an increasingly important role as an indicator of the environmental impact of a
process. Energy efficiency is not only important as a marker of the careful treatment of natural
fuel resources, it is also an indicator of the emissions that are released in producing a unit of
energy. Energy efficiency may be increased by optimising the energy utilisation and the
efficiency of the energy-generating process. Optimising the specific energy efficiency depends
on a variety of factors, including the nature and quality of fuel, the type of combustion system,
the operating temperatures of the gas turbine, reciprocating engine and/or steam turbine, the
local climate conditions, the type of cooling system used, the operation cycles, the load factor,
the potential for district heating, industrial symbiosis, industrial clustering (in the case of CHP),
heat storage or district cooling potential, etc.
Each sequential step in the process of conversion of fuel to useful energy has its own efficiency
factor. The overall energy efficiency of the process is achieved by multiplication of all the
individual energy efficiency factors.
The net energy efficiency takes all losses into account due to: the auxiliary station supply (and
process heat demand), fuel preparation, by-product treatment, flue-gas treatment, waste water
treatment, the cooling system, high-voltage transformer, and fans and pumps. Energy efficiency
optimisation can be achieved for all efficiency factors, including any devices used for
environmental protection. For the supply of electricity, any grid and transformer losses have to
be taken into account and, for the supply of heat from Combined Heat and Power (CHP) units,
transport losses from the district heating network and cycling pumps have to be taken into
account.
Periods of high ambient temperatures at the site decrease electricity production efficiency in
both gas and steam plants. For gas turbines and diesel engines, the ambient air temperature is
more significant, whereas for steam turbines, the temperature of the cooling media is more
important. For the condensation of cooled expanded steam, there are different types of cooling
system which can be applied: direct cooling with seawater, lake or river water, or air (air
condenser), direct and indirect cooling with wet or dry cooling towers as well as with district
WORKIN
G DRAFT IN
PROGRESS
Chapter 1
TL/JFF/FN/EIPPCB/LCP_Final Draft June 2016 19
heating water or with industrial process water. Each has different influences on energy
efficiency. For more information, refer to the ‘Industrial Cooling Systems’ BREF.
Energy efficiency and emissions
Even the most efficient condensing power plants may be passing a significant amount of their
total energy input to the environment in the form of rejected heat. This heat may be absorbed in
the local atmosphere or watercourses with relatively little harm to the local environment, but
every unit of energy consumed represents additional emissions passed into the environment. At
the present time, the most effective way to improve the energy efficiency of power generation is
to maximise the use of the heat produced, and not to waste it.
For waste heat utilisation, several thermodynamic, technical, and economical criteria need to be
taken into account. Thermodynamic criteria involve, on one hand, the temperature and, on the
other hand, the resulting exergy content of waste heat. The temperature has to be taken into
account if the waste heat is to be used for heating. The exergy content has to be taken into
account if the waste heat is to be utilised for the production of electricity and power. The
technical criteria depend on individual site conditions.
By reducing and utilising waste heat, energy can often be saved, emissions can be reduced and
resources can be preserved. There are a wide range of processes that require continuous supplies
of heat in the form of steam, hot water, or hot air as inputs to their production and operating
facilities. This technique is known as cogeneration or combined heat and power production
(CHP). Its associated fuel consumption is usually lower in comparison to the separate
production of heat and power. The benefits of increased energy utilisation can result in a
reduced rate of emissions of CO2, nitrogen oxides (NOX), and other pollutants, depending on
the annual utilisation of the CHP process, the fuel substituted, and the potential for
replacing small combustion plants with heat from an adjacent power station. However, the
magnitude of the beneficial effect of lower overall fuel consumption with CHP is often site-
specific and depends on maintaining a high annual utilisation rate, particularly during
summertime when the heat load is at its minimum.
Effect of load on plant energy efficiency
At the time of construction, some LCPs are designed for operation at full load or baseload and
some other LCPs are designed for operation at fluctuating loads. After a period of operation,
other, more efficient or less costly, plants may be constructed forcing older plants to operate at
lower and lower loads, before finally being closed. However, it is anticipated that existing
fossil-fuel-fired plants will increasingly be required to operate at lower loads and varying loads
in the future, as more, intermittent, renewable plants are built. The cost of implementation of
retrofitting environmental abatement equipment may also contribute to the decision to operate at
lower loads before eventual closure.
Similarly, a plant operating with frequent shutdown and start-up periods is significantly less
efficient than if operated at a steady output.
[New 85, Eurelectric – 2012]
Banked boilers (boilers that are kept warm for scheduled or emergency use) and intermittently
used plants often lead to poor system efficiencies.
1.3.2 Emissions to air
The most important emissions to air from the combustion of combustible fuels are SO2, NOX,
CO, particulate matter (dust) and greenhouse gases, such as CO2. Other substances, such as
heavy metals, hydrogen fluoride, hydrogen chloride, unburnt hydrocarbons, non-methane
volatile organic compounds (NMVOCs) and dioxins, are emitted in smaller quantities but may
have a significant influence on the environment due to their toxicity or their persistence.
WORKIN
G DRAFT IN
PROGRESS
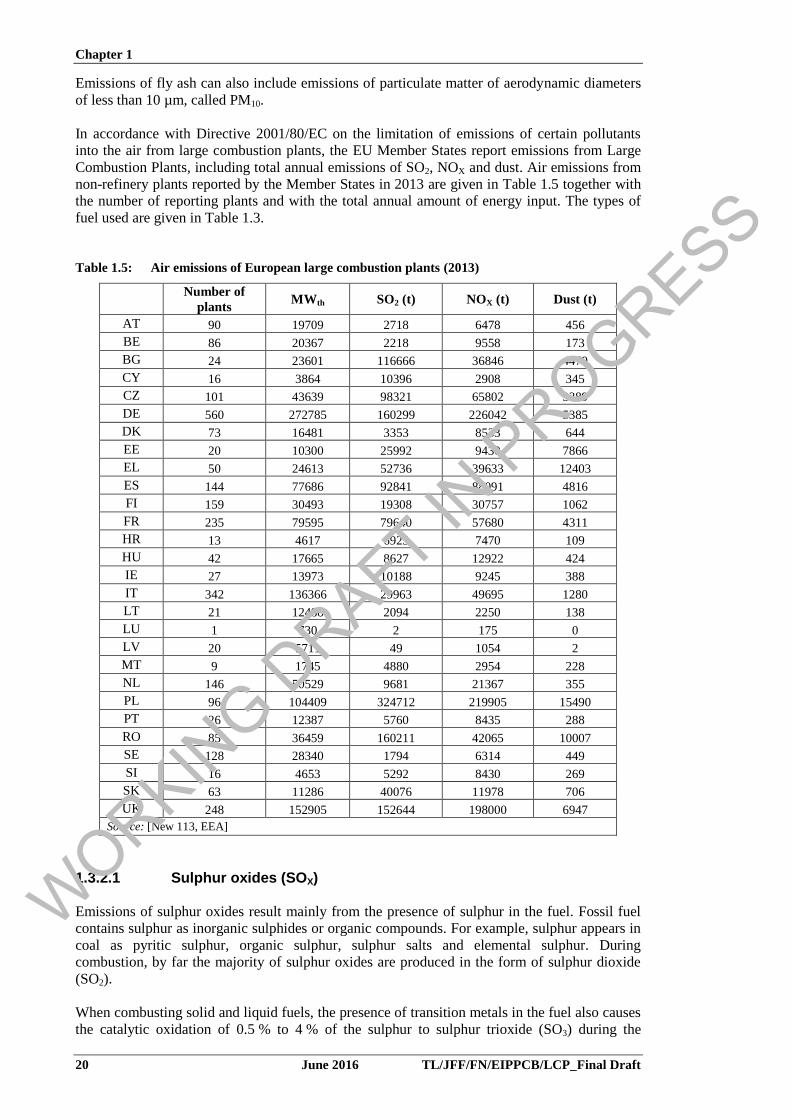
Chapter 1
20 June 2016 TL/JFF/FN/EIPPCB/LCP_Final Draft
Emissions of fly ash can also include emissions of particulate matter of aerodynamic diameters
of less than 10 µm, called PM10.
In accordance with Directive 2001/80/EC on the limitation of emissions of certain pollutants
into the air from large combustion plants, the EU Member States report emissions from Large
Combustion Plants, including total annual emissions of SO2, NOX and dust. Air emissions from
non-refinery plants reported by the Member States in 2013 are given in Table 1.5 together with
the number of reporting plants and with the total annual amount of energy input. The types of
fuel used are given in Table 1.3.
Table 1.5: Air emissions of European large combustion plants (2013)
Number of
plants MWth SO2 (t) NOX (t) Dust (t)
AT 90 19709 2718 6478 456
BE 86 20367 2218 9558 173
BG 24 23601 116666 36846 4479
CY 16 3864 10396 2908 345
CZ 101 43639 98321 65802 3389
DE 560 272785 160299 226042 5385
DK 73 16481 3353 8533 644
EE 20 10300 25992 9430 7866
EL 50 24613 52736 39633 12403
ES 144 77686 92841 88091 4816
FI 159 30493 19308 30757 1062
FR 235 79595 79640 57680 4311
HR 13 4617 6925 7470 109
HU 42 17665 8627 12922 424
IE 27 13973 10188 9245 388
IT 342 136366 29963 49695 1280
LT 21 12488 2094 2250 138
LU 1 730 2 175 0
LV 20 5711 49 1054 2
MT 9 1745 4880 2954 228
NL 146 50529 9681 21367 355
PL 96 104409 324712 219905 15490
PT 26 12387 5760 8435 288
RO 85 36459 160211 42065 10007
SE 128 28340 1794 6314 449
SI 16 4653 5292 8430 269
SK 63 11286 40076 11978 706
UK 248 152905 152644 198000 6947
Source: [New 113, EEA]
1.3.2.1 Sulphur oxides (SOX)
Emissions of sulphur oxides result mainly from the presence of sulphur in the fuel. Fossil fuel
contains sulphur as inorganic sulphides or organic compounds. For example, sulphur appears in
coal as pyritic sulphur, organic sulphur, sulphur salts and elemental sulphur. During
combustion, by far the majority of sulphur oxides are produced in the form of sulphur dioxide
(SO2).
When combusting solid and liquid fuels, the presence of transition metals in the fuel also causes
the catalytic oxidation of 0.5 % to 4 % of the sulphur to sulphur trioxide (SO3) during the
WORKIN
G DRAFT IN
PROGRESS
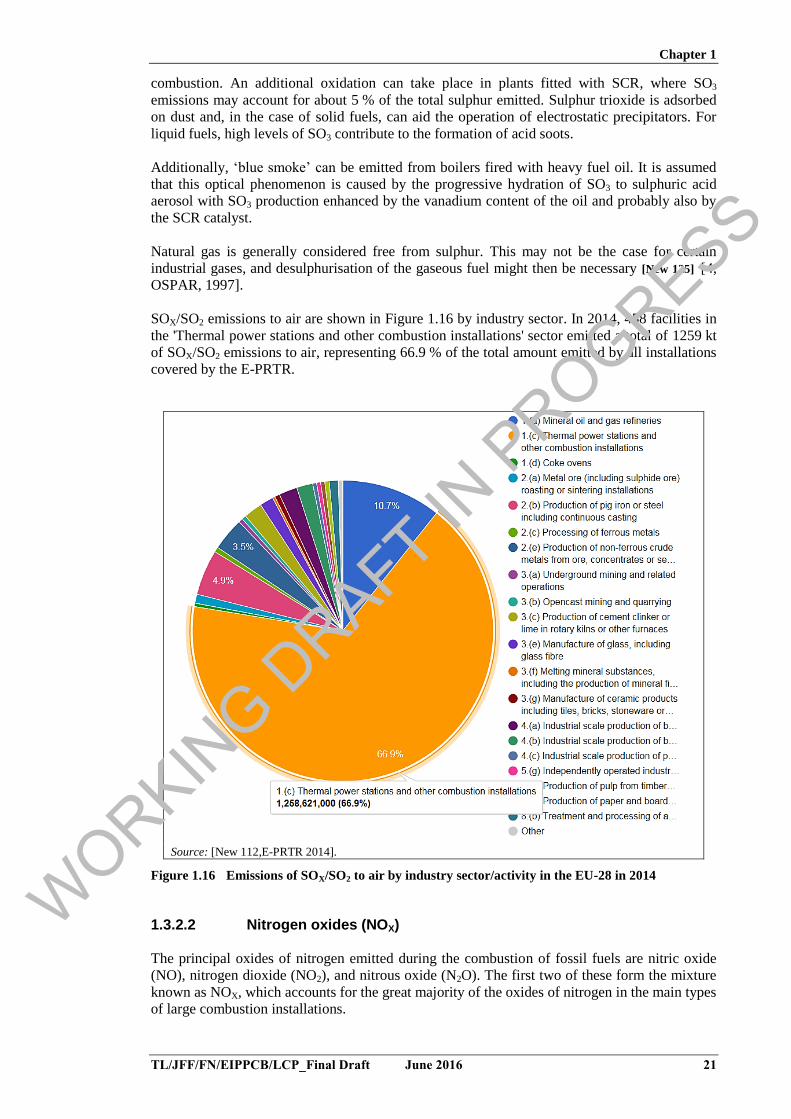
Chapter 1
TL/JFF/FN/EIPPCB/LCP_Final Draft June 2016 21
combustion. An additional oxidation can take place in plants fitted with SCR, where SO3
emissions may account for about 5 % of the total sulphur emitted. Sulphur trioxide is adsorbed
on dust and, in the case of solid fuels, can aid the operation of electrostatic precipitators. For
liquid fuels, high levels of SO3 contribute to the formation of acid soots.
Additionally, ‘blue smoke’ can be emitted from boilers fired with heavy fuel oil. It is assumed
that this optical phenomenon is caused by the progressive hydration of SO3 to sulphuric acid
aerosol with SO3 production enhanced by the vanadium content of the oil and probably also by
the SCR catalyst.
Natural gas is generally considered free from sulphur. This may not be the case for certain
industrial gases, and desulphurisation of the gaseous fuel might then be necessary [New 125] [4,
OSPAR, 1997].
SOX/SO2 emissions to air are shown in Figure 1.16 by industry sector. In 2014, 458 facilities in
the 'Thermal power stations and other combustion installations' sector emitted a total of 1259 kt
of SOX/SO2 emissions to air, representing 66.9 % of the total amount emitted by all installations
covered by the E-PRTR.
Source: [New 112,E-PRTR 2014].
Figure 1.16 Emissions of SOX/SO2 to air by industry sector/activity in the EU-28 in 2014
1.3.2.2 Nitrogen oxides (NOX)
The principal oxides of nitrogen emitted during the combustion of fossil fuels are nitric oxide
(NO), nitrogen dioxide (NO2), and nitrous oxide (N2O). The first two of these form the mixture
known as NOX, which accounts for the great majority of the oxides of nitrogen in the main types
of large combustion installations.
WORKIN
G DRAFT IN
PROGRESS
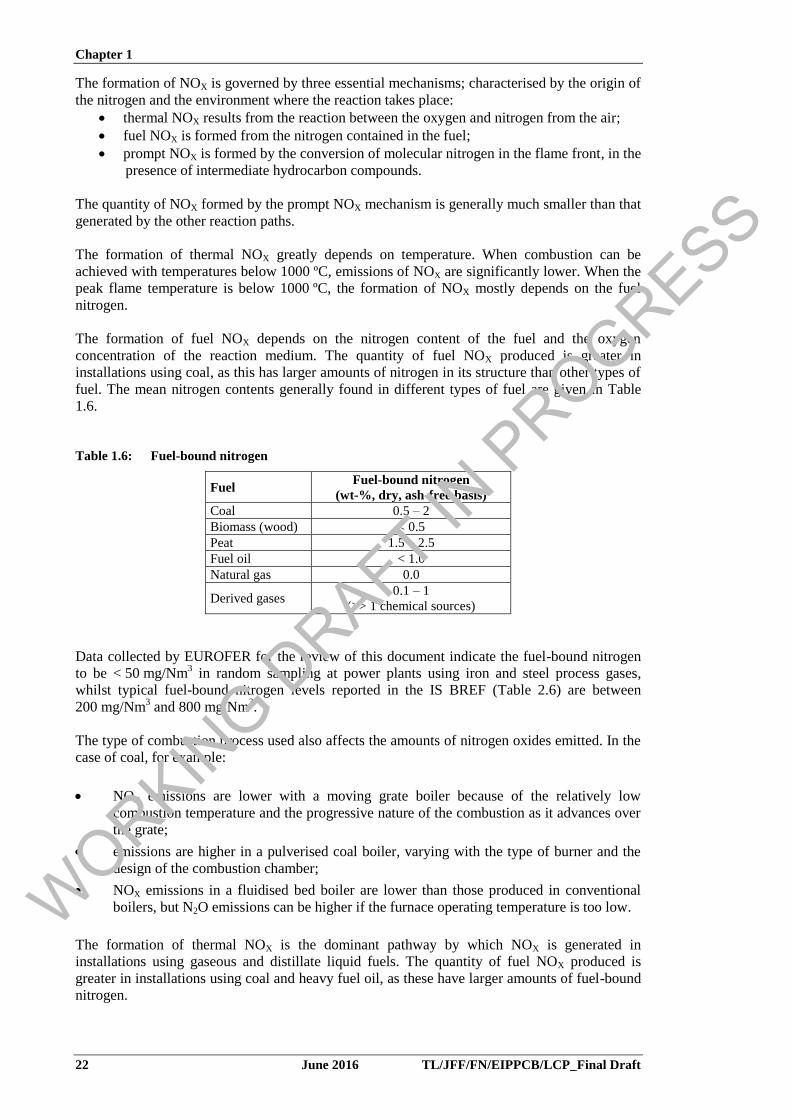
Chapter 1
22 June 2016 TL/JFF/FN/EIPPCB/LCP_Final Draft
The formation of NOX is governed by three essential mechanisms; characterised by the origin of
the nitrogen and the environment where the reaction takes place:
thermal NOX results from the reaction between the oxygen and nitrogen from the air;
fuel NOX is formed from the nitrogen contained in the fuel;
prompt NOX is formed by the conversion of molecular nitrogen in the flame front, in the
presence of intermediate hydrocarbon compounds.
The quantity of NOX formed by the prompt NOX mechanism is generally much smaller than that
generated by the other reaction paths.
The formation of thermal NOX greatly depends on temperature. When combustion can be
achieved with temperatures below 1000 ºC, emissions of NOX are significantly lower. When the
peak flame temperature is below 1000 ºC, the formation of NOX mostly depends on the fuel
nitrogen.
The formation of fuel NOX depends on the nitrogen content of the fuel and the oxygen
concentration of the reaction medium. The quantity of fuel NOX produced is greater in
installations using coal, as this has larger amounts of nitrogen in its structure than other types of
fuel. The mean nitrogen contents generally found in different types of fuel are given in Table
1.6.
Table 1.6: Fuel-bound nitrogen
Fuel Fuel-bound nitrogen
(wt-%, dry, ash-free basis)
Coal 0.5 – 2
Biomass (wood) < 0.5
Peat 1.5 – 2.5
Fuel oil < 1.0
Natural gas 0.0
Derived gases 0.1 – 1
(>> 1 chemical sources)
Data collected by EUROFER for the review of this document indicate the fuel-bound nitrogen
to be < 50 mg/Nm3 in random sampling at power plants using iron and steel process gases,
whilst typical fuel-bound nitrogen levels reported in the IS BREF (Table 2.6) are between
200 mg/Nm3 and 800 mg/Nm
3.
The type of combustion process used also affects the amounts of nitrogen oxides emitted. In the
case of coal, for example:
NOX emissions are lower with a moving grate boiler because of the relatively low
combustion temperature and the progressive nature of the combustion as it advances over
the grate;
emissions are higher in a pulverised coal boiler, varying with the type of burner and the
design of the combustion chamber;
NOX emissions in a fluidised bed boiler are lower than those produced in conventional
boilers, but N2O emissions can be higher if the furnace operating temperature is too low.
The formation of thermal NOX is the dominant pathway by which NOX is generated in
installations using gaseous and distillate liquid fuels. The quantity of fuel NOX produced is
greater in installations using coal and heavy fuel oil, as these have larger amounts of fuel-bound
nitrogen.
WORKIN
G DRAFT IN
PROGRESS
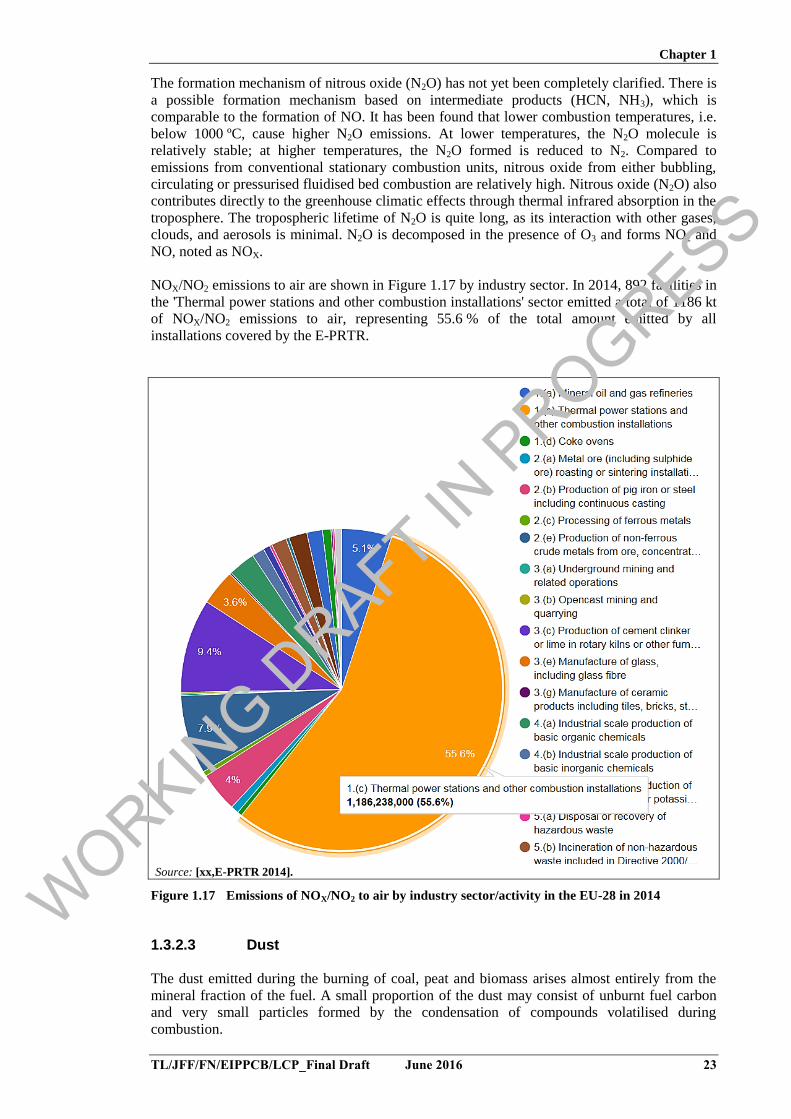
Chapter 1
TL/JFF/FN/EIPPCB/LCP_Final Draft June 2016 23
The formation mechanism of nitrous oxide (N2O) has not yet been completely clarified. There is
a possible formation mechanism based on intermediate products (HCN, NH3), which is
comparable to the formation of NO. It has been found that lower combustion temperatures, i.e.
below 1000 ºC, cause higher N2O emissions. At lower temperatures, the N2O molecule is
relatively stable; at higher temperatures, the N2O formed is reduced to N2. Compared to
emissions from conventional stationary combustion units, nitrous oxide from either bubbling,
circulating or pressurised fluidised bed combustion are relatively high. Nitrous oxide (N2O) also
contributes directly to the greenhouse climatic effects through thermal infrared absorption in the
troposphere. The tropospheric lifetime of N2O is quite long, as its interaction with other gases,
clouds, and aerosols is minimal. N2O is decomposed in the presence of O3 and forms NO2 and
NO, noted as NOX.
NOX/NO2 emissions to air are shown in Figure 1.17 by industry sector. In 2014, 892 facilities in
the 'Thermal power stations and other combustion installations' sector emitted a total of 1186 kt
of NOX/NO2 emissions to air, representing 55.6 % of the total amount emitted by all
installations covered by the E-PRTR.
Source: [xx,E-PRTR 2014].
Figure 1.17 Emissions of NOX/NO2 to air by industry sector/activity in the EU-28 in 2014
1.3.2.3 Dust
The dust emitted during the burning of coal, peat and biomass arises almost entirely from the
mineral fraction of the fuel. A small proportion of the dust may consist of unburnt fuel carbon
and very small particles formed by the condensation of compounds volatilised during
combustion.
WORKIN
G DRAFT IN
PROGRESS

Chapter 1
24 June 2016 TL/JFF/FN/EIPPCB/LCP_Final Draft
The type of combustion process has a considerable effect on the proportion of ash entrained in
the flue-gas emissions from boilers. For example, moving grate boilers produce a relatively
small amount of fly ash (20–40 % of total ash), whereas pulverised coal boilers produce an
appreciable amount (80–90 %).
The combustion of liquid fuels is also a source of particulate emissions, although to a lesser
extent than coal. In particular, poor combustion conditions lead to the formation of soot, which
is liable to produce acidic agglomerates with corrosive properties in the presence of sulphur
trioxide.
The combustion of natural gas is not a significant source of dust emissions. On the other hand,
some industrial gases may contain particles which are filtered out in the production process or,
failing that, before combustion.
For many installations, there are also potential diffuse emissions (open-air handling and storage
of coal, the crushing of the coal used in pulverised coal boilers, the handling of ash, etc.). [New
125] [4, OSPAR, 1997].
Environmental problems, in particular health impacts, are especially associated with particles
less than 2.5 µm in diameter, which can remain suspended in the atmosphere for days or even
weeks. Environmental problems can also occur by long-term accumulation of persistent
compounds after deposition on the soil or by solution and transfer to water bodies. The distance
that particles travel before they are removed from the air by settling or by precipitation depends
on their physical characteristics and on the weather conditions. The size, density and shape
influence the rate at which particles settle. Particles larger than 10 µm in diameter settle fairly
rapidly. Their impact is primarily near the source. Smaller particles of less than 10 µm and
especially those less than 2.5 µm can travel over hundreds of kilometres before settling.
Aerosols often function as condensation nuclei for cloud formation and are washed out with
rain.
Industrial emission control techniques for particulate matter (PM) are very efficient, achieving
more than 99.8 % by weight removal from the raw gas input. Achievable reduction rates depend
on the secondary abatement technology used and might for some other fuels, such as oil, be
lower due to the different particulate composition and sizes. Only for small particles, such as for
PM10 and below, does the removal efficiency decrease to between 95 % and 98 %. For this
reason, the majority of particles from LCPs still emitted to the air are in the 0.1 µm to 10 µm
diameter range.
PM10 emissions to air are shown in Figure 1.18 by industry sector. In 2014, 165 facilities in the
'Thermal power stations and other combustion installations' sector emitted a total of 49 kt of
PM10 emissions to air, representing 48.1 % of the total amount emitted by all installations
covered by the E-PRTR.
WORKIN
G DRAFT IN
PROGRESS
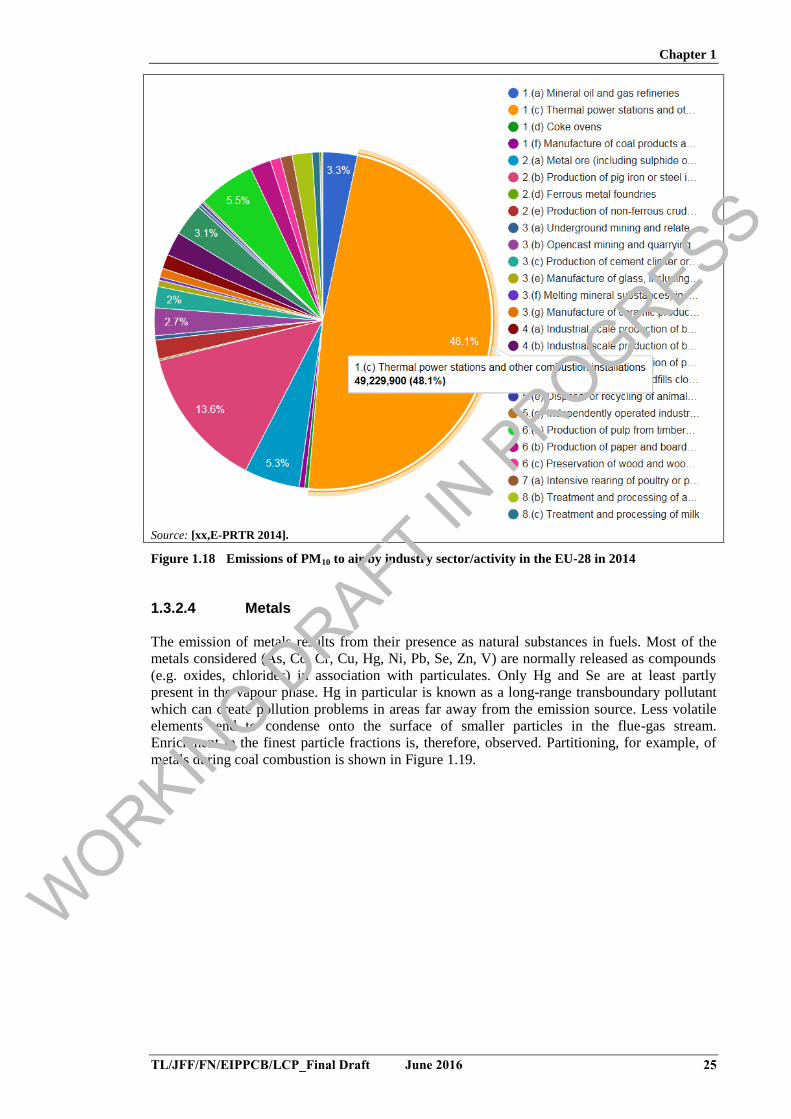
Chapter 1
TL/JFF/FN/EIPPCB/LCP_Final Draft June 2016 25
Source: [xx,E-PRTR 2014].
Figure 1.18 Emissions of PM10 to air by industry sector/activity in the EU-28 in 2014
1.3.2.4 Metals
The emission of metals results from their presence as natural substances in fuels. Most of the
metals considered (As, Cd, Cr, Cu, Hg, Ni, Pb, Se, Zn, V) are normally released as compounds
(e.g. oxides, chlorides) in association with particulates. Only Hg and Se are at least partly
present in the vapour phase. Hg in particular is known as a long-range transboundary pollutant
which can create pollution problems in areas far away from the emission source. Less volatile
elements tend to condense onto the surface of smaller particles in the flue-gas stream.
Enrichment in the finest particle fractions is, therefore, observed. Partitioning, for example, of
metals during coal combustion is shown in Figure 1.19.
WORKIN
G DRAFT IN
PROGRESS

Chapter 1
26 June 2016 TL/JFF/FN/EIPPCB/LCP_Final Draft
[New 126] [107, Davidson, 2000]
Figure 1.19: Partitioning of metals during coal combustion
The content of metals in coal is normally several orders of magnitude higher than in oil (except
occasionally for Ni and V in heavy fuel oil) or natural gas. Many of the metals are chemically
bound in compounds, like oxides, sulphates, aluminosilicates, and minerals, such as anhydrites
and gypsum. The release of the elements depends on the nature and particle size of the
compound. During the combustion of coal, for example, particles undergo complex changes
which lead to vaporisation of volatile elements. The rate of volatilisation of metal compounds
depends on the fuel characteristics (e.g. concentrations in coal, fraction of inorganic compounds
such as calcium) and the characteristics of the technology applied (e.g. type of boiler, operating
mode).
As a consequence, different metals are found in different proportions in fly ashes and bottom
ashes. For example, manganese and iron have similar enrichment in fly ash and bottom ash, and
their level is low in stack particulate emissions. By contrast, up to 80 % of cadmium, tin, zinc,
lead, antimony and copper are retained in the fly ash and about 5–10 % are retained in the
bottom ash. However, only 15 % of selenium and 2 % of arsenic is retained within the solid
particles, and only about 5 % of these elements is retained in the bottom ash. A similarly high
proportion of Mercury is released in the atmosphere -- up to 85 % of mercury is either emitted
in the atmosphere or captured in solid fly ash particles, and a negligible amount is retained in
the bottom ash.
Coal combustion releases mercury in oxidised (Hg2+
), elemental (Hg0) or particulate-bound
(Hgp) form. Mercury is present in the coal in trace amounts, and the combustion process
releases this into the exhaust gas as elemental mercury. This may then be oxidised via
homogeneous (gas-gas) or heterogeneous (gas-solid) reactions. The primary homogeneous
oxidation mechanism is the reaction with gas-phase chlorine to form HgCl2, whilst
heterogeneous oxidation reactions are believed to occur on the surface of the fly ash and
unburnt carbon (UBC). The mercury which is adsorbed onto solid surfaces is known as
particulate-bound mercury.
Oxidised mercury is prevalent in the flue-gas from coal combustion, and, being water-soluble, is
relatively easy to capture using SO2 controls such as wet limestone scrubbers. The concentration
of halides (i.e. chloride) in the flue-gas is relevant as they promote the oxidation of mercury.
Particulate-bound mercury is also relatively easy to capture in existing particulate control
devices. Elemental mercury, present in higher concentrations in the flue-gases of lignite
combustion, is more difficult to capture with the existing pollution controls prevalent in lignite-
fired plants (i.e. without SCR). This combines with lower levels of fly ash carbon content to
WORKIN
G DRAFT IN
PROGRESS
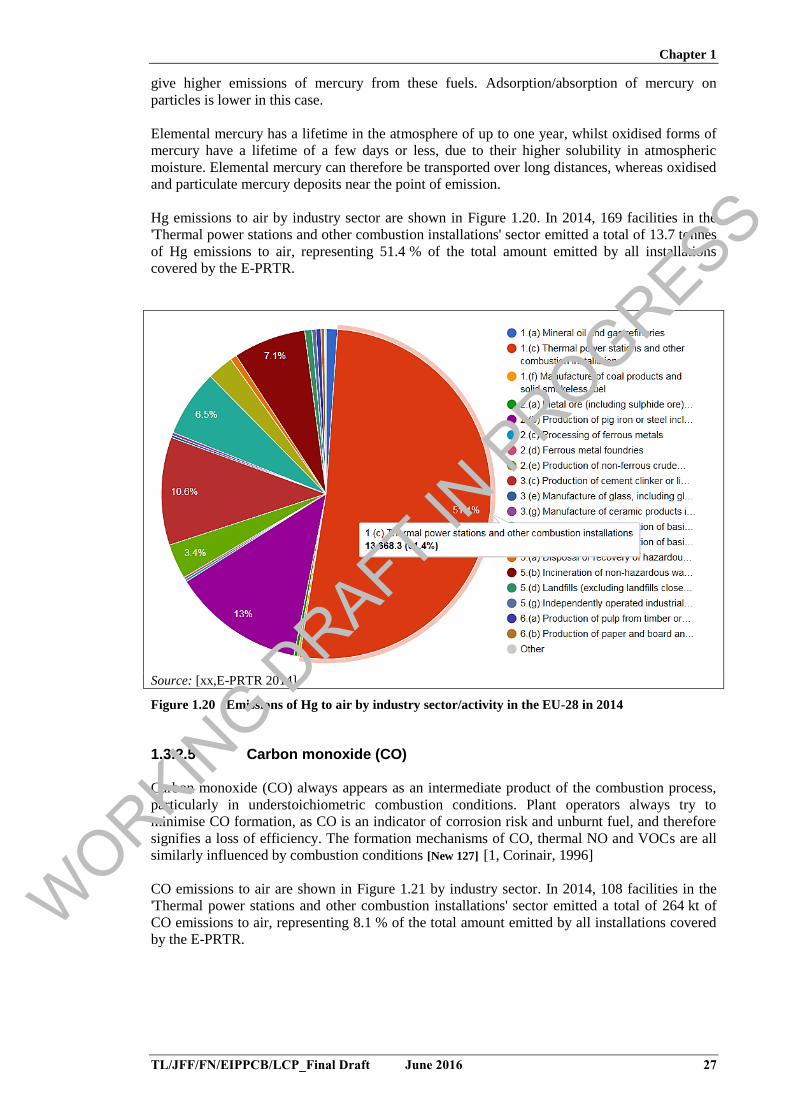
Chapter 1
TL/JFF/FN/EIPPCB/LCP_Final Draft June 2016 27
give higher emissions of mercury from these fuels. Adsorption/absorption of mercury on
particles is lower in this case.
Elemental mercury has a lifetime in the atmosphere of up to one year, whilst oxidised forms of
mercury have a lifetime of a few days or less, due to their higher solubility in atmospheric
moisture. Elemental mercury can therefore be transported over long distances, whereas oxidised
and particulate mercury deposits near the point of emission.
Hg emissions to air by industry sector are shown in Figure 1.20. In 2014, 169 facilities in the
'Thermal power stations and other combustion installations' sector emitted a total of 13.7 tonnes
of Hg emissions to air, representing 51.4 % of the total amount emitted by all installations
covered by the E-PRTR.
Source: [xx,E-PRTR 2014].
Figure 1.20 Emissions of Hg to air by industry sector/activity in the EU-28 in 2014
1.3.2.5 Carbon monoxide (CO)
Carbon monoxide (CO) always appears as an intermediate product of the combustion process,
particularly in understoichiometric combustion conditions. Plant operators always try to
minimise CO formation, as CO is an indicator of corrosion risk and unburnt fuel, and therefore
signifies a loss of efficiency. The formation mechanisms of CO, thermal NO and VOCs are all
similarly influenced by combustion conditions [New 127] [1, Corinair, 1996]
CO emissions to air are shown in Figure 1.21 by industry sector. In 2014, 108 facilities in the
'Thermal power stations and other combustion installations' sector emitted a total of 264 kt of
CO emissions to air, representing 8.1 % of the total amount emitted by all installations covered
by the E-PRTR.
WORKIN
G DRAFT IN
PROGRESS

Chapter 1
28 June 2016 TL/JFF/FN/EIPPCB/LCP_Final Draft
Source: [xx,E-PRTR 2014].
Figure 1.21 Emissions of CO to air by industry sector/activity in the EU-28 in 2014
WORKIN
G DRAFT IN
PROGRESS

Chapter 1
TL/JFF/FN/EIPPCB/LCP_Final Draft June 2016 29
1.3.2.6 Greenhouse gases
Greenhouse gases have an effect on global warming in relation to their potential for trapping
heat in the atmosphere. Carbon dioxide (CO2), nitrous oxide (N2O), sulphur hexafluoride (SF6),
and methane (CH4) are the most important greenhouse gases associated with LCPs. Emissions
of CO2, N2O, SF6 and CH4 to air in the EU-28 in 2014 are shown by industry sector/activity in
Figure 1.22, Figure 1.23, Figure 1.24 and Figure 1.25.
Source: [xx,E-PRTR 2014].
Figure 1.22: Emissions of CO2 to air by industry sector/activity in the EU-28 in 2014
WORKIN
G DRAFT IN
PROGRESS

Chapter 1
30 June 2016 TL/JFF/FN/EIPPCB/LCP_Final Draft
Source: [xx,E-PRTR 2014].
Figure 1.23: Emissions of N2O to air by industry sector/activity in the EU-28 in 2014
Source: [xx,E-PRTR 2014].
Figure 1.24: Emissions of SF6 to air by industry sector/activity in the EU-28 in 2014
WORKIN
G DRAFT IN
PROGRESS
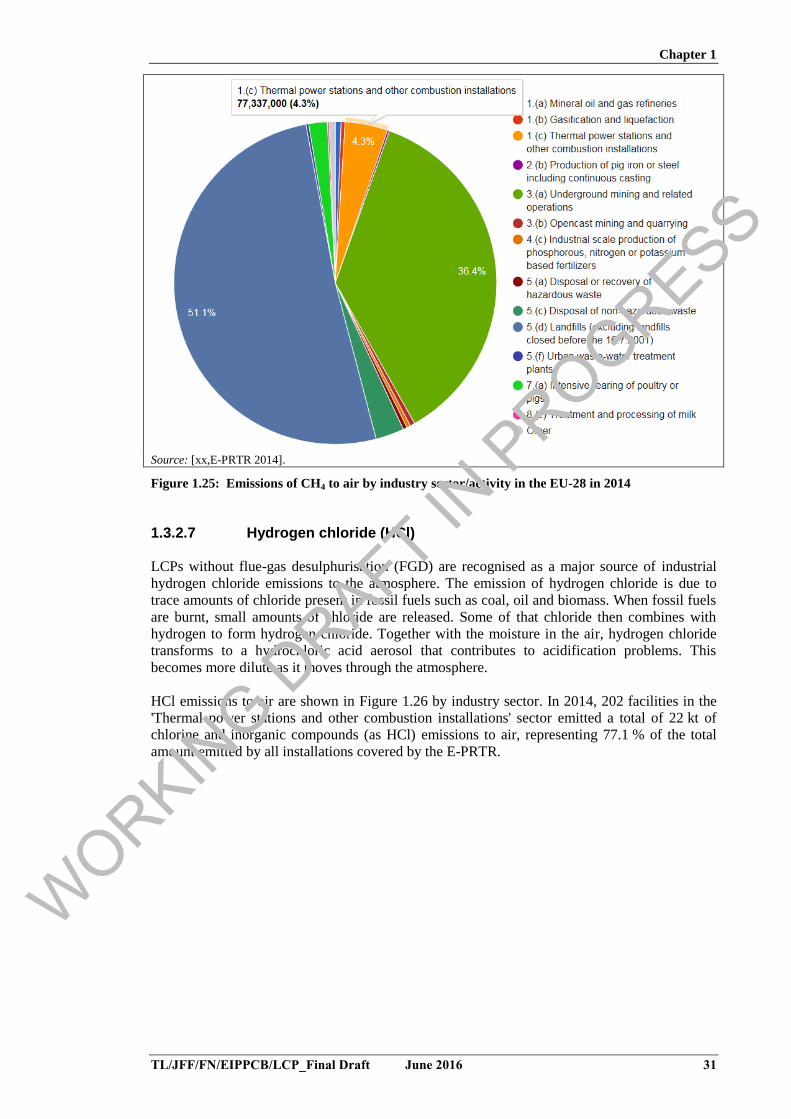
Chapter 1
TL/JFF/FN/EIPPCB/LCP_Final Draft June 2016 31
Source: [xx,E-PRTR 2014].
Figure 1.25: Emissions of CH4 to air by industry sector/activity in the EU-28 in 2014
1.3.2.7 Hydrogen chloride (HCl)
LCPs without flue-gas desulphurisation (FGD) are recognised as a major source of industrial
hydrogen chloride emissions to the atmosphere. The emission of hydrogen chloride is due to
trace amounts of chloride present in fossil fuels such as coal, oil and biomass. When fossil fuels
are burnt, small amounts of chloride are released. Some of that chloride then combines with
hydrogen to form hydrogen chloride. Together with the moisture in the air, hydrogen chloride
transforms to a hydrochloric acid aerosol that contributes to acidification problems. This
becomes more dilute as it moves through the atmosphere.
HCl emissions to air are shown in Figure 1.26 by industry sector. In 2014, 202 facilities in the
'Thermal power stations and other combustion installations' sector emitted a total of 22 kt of
chlorine and inorganic compounds (as HCl) emissions to air, representing 77.1 % of the total
amount emitted by all installations covered by the E-PRTR.
WORKIN
G DRAFT IN
PROGRESS

Chapter 1
32 June 2016 TL/JFF/FN/EIPPCB/LCP_Final Draft
Source: [xx,E-PRTR 2014].
Figure 1.26 Emissions of chlorine and inorganic compounds (as HCl) to air by industry
sector/activity in the EU-28 in 2014
1.3.2.8 Hydrogen fluoride (HF)
Like chloride, fluoride is also a natural element present in fossil fuels and biomass. When using
such fuels such as coal for generating energy, without using FGD, fluoride is liberated and
released to the flue-gas. It then combines with hydrogen to form hydrogen fluoride, and with the
moisture of the ambient air to form hydrofluoric acid.
HF emissions to air are shown in Figure 1.27 by industry sector. In 2014, 110 facilities in the
'Thermal power stations and other combustion installations' sector emitted a total of 3.57 kt of
fluorine and inorganic compounds (as HF) to air, representing 71.9 % of the total amount
emitted by all installations covered by the E-PRTR.
Source: [xx,E-PRTR 2014].
Figure 1.27: Emissions of HF to air by industry sector/activity in the EU-28 in 2014
WORKIN
G DRAFT IN
PROGRESS
Chapter 1
TL/JFF/FN/EIPPCB/LCP_Final Draft June 2016 33
1.3.2.9 Ammonia (NH3)
The emission of ammonia (NH3) does not result from the combustion of fossil fuels, but rather
as a consequence of the incomplete reaction of ammonia in the DeNOX process. Ammonia is
used as reagent, as pure ammonia, or in water solution in SCR and SNCR units. Ammonia
chemically reacts to form NH4HSO4 and is removed together with the fly ash from the system
and also, being a soluble gas, via a wet FGD scrubber. With no dust removal or FGD
downstream (DeNOX tail-end configuration), the ‘ammonia slip’ is then emitted along with the
flue-gas to the atmosphere. The ammonia slip at SCR and SNCR installations increases with an
increasing NH3 to NOX ratio, but also, with SCR, with decreasing catalyst activity. A low
amount of NH3 in by-products can be guaranteed by proper maintenance of the catalyst system.
The US EPA identified ammonia as the single largest precursor of fine particulate (2.5 microns
in size and smaller) air pollution in the country. [New 128, Heide 2011, Fact sheet SNCR –
Yara]
In 2014, 33 facilities in the 'Thermal power stations and other combustion installations' sector
emitted a total of 997 tonnes of NH3 emissions to air, representing 0.5 % of the total amount
emitted by all installations covered by the E-PRTR (the bulk of ammonia emissions is
associated with the rearing of pigs and poultry). [New 112,E-PRTR 2014].
1.3.2.10 Volatile organic compounds (VOCs)
The emission sources of volatile organic compounds due to industrial activities are numerous,
but the combustion of fuels is one of the most significant.
Non-methane volatile organic compounds (NMVOC) emissions to air are shown in Figure 1.28
by industry sector. In 2014, 95 facilities in the 'Thermal power stations and other combustion
installations' sector emitted a total of 40.24 kt of NMVOC to air, representing 10.4 % of the
total amount emitted by all installations covered by the E-PRTR.
WORKIN
G DRAFT IN
PROGRESS
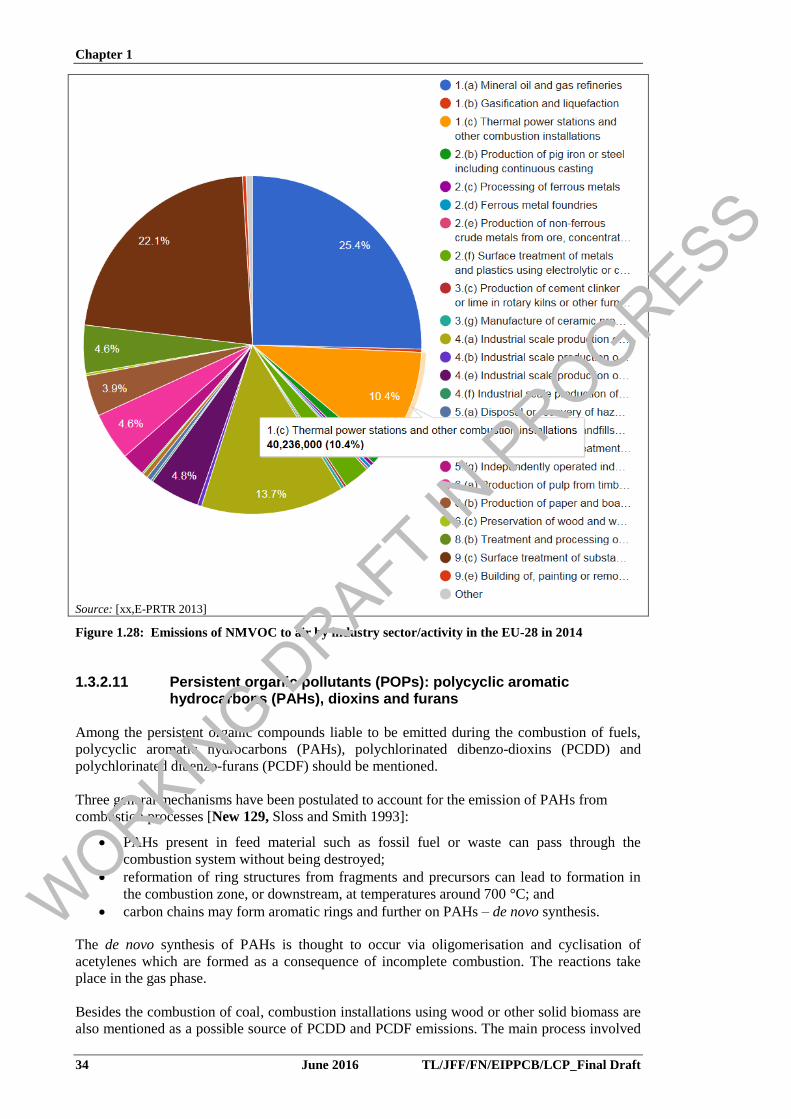
Chapter 1
34 June 2016 TL/JFF/FN/EIPPCB/LCP_Final Draft
Source: [xx,E-PRTR 2013]
Figure 1.28: Emissions of NMVOC to air by industry sector/activity in the EU-28 in 2014
1.3.2.11 Persistent organic pollutants (POPs): polycyclic aromatic hydrocarbons (PAHs), dioxins and furans
Among the persistent organic compounds liable to be emitted during the combustion of fuels,
polycyclic aromatic hydrocarbons (PAHs), polychlorinated dibenzo-dioxins (PCDD) and
polychlorinated dibenzo-furans (PCDF) should be mentioned.
Three general mechanisms have been postulated to account for the emission of PAHs from
combustion processes [New 129, Sloss and Smith 1993]:
PAHs present in feed material such as fossil fuel or waste can pass through the
combustion system without being destroyed;
reformation of ring structures from fragments and precursors can lead to formation in
the combustion zone, or downstream, at temperatures around 700 °C; and
carbon chains may form aromatic rings and further on PAHs – de novo synthesis.
The de novo synthesis of PAHs is thought to occur via oligomerisation and cyclisation of
acetylenes which are formed as a consequence of incomplete combustion. The reactions take
place in the gas phase.
Besides the combustion of coal, combustion installations using wood or other solid biomass are
also mentioned as a possible source of PCDD and PCDF emissions. The main process involved
WORKIN
G DRAFT IN
PROGRESS
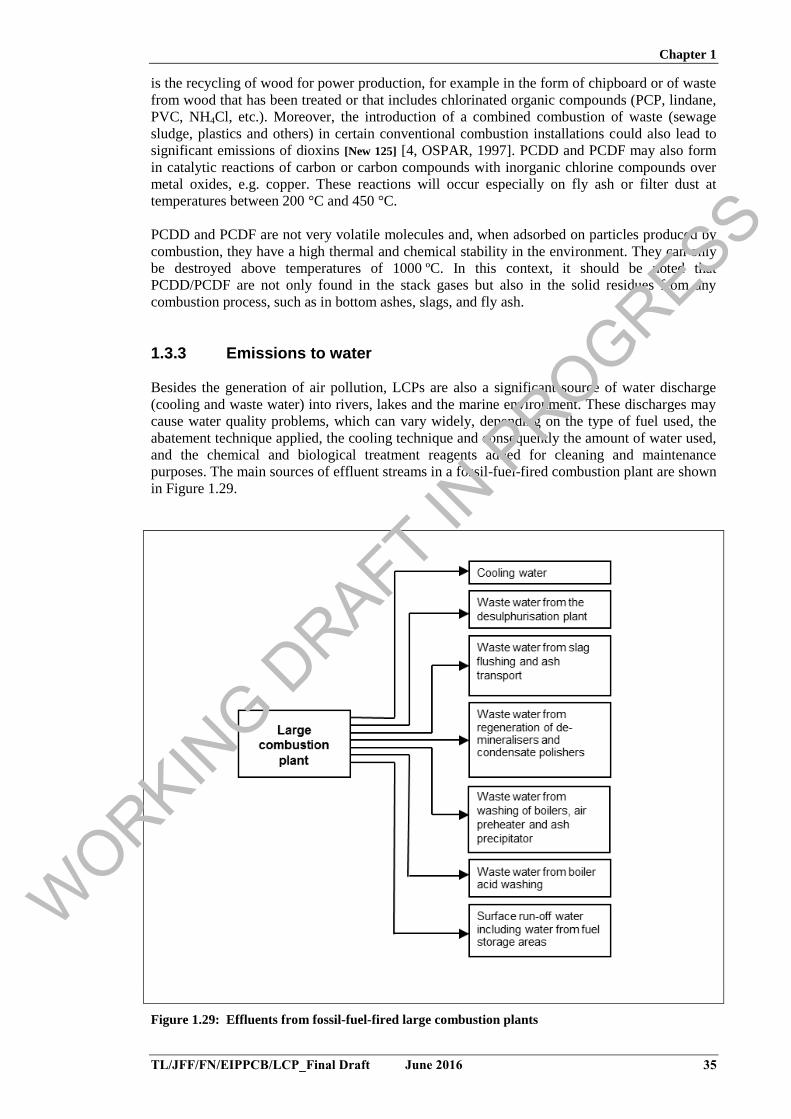
Chapter 1
TL/JFF/FN/EIPPCB/LCP_Final Draft June 2016 35
is the recycling of wood for power production, for example in the form of chipboard or of waste
from wood that has been treated or that includes chlorinated organic compounds (PCP, lindane,
PVC, NH4Cl, etc.). Moreover, the introduction of a combined combustion of waste (sewage
sludge, plastics and others) in certain conventional combustion installations could also lead to
significant emissions of dioxins [New 125] [4, OSPAR, 1997]. PCDD and PCDF may also form
in catalytic reactions of carbon or carbon compounds with inorganic chlorine compounds over
metal oxides, e.g. copper. These reactions will occur especially on fly ash or filter dust at
temperatures between 200 °C and 450 °C.
PCDD and PCDF are not very volatile molecules and, when adsorbed on particles produced by
combustion, they have a high thermal and chemical stability in the environment. They can only
be destroyed above temperatures of 1000 ºC. In this context, it should be noted that
PCDD/PCDF are not only found in the stack gases but also in the solid residues from any
combustion process, such as in bottom ashes, slags, and fly ash.
1.3.3 Emissions to water
Besides the generation of air pollution, LCPs are also a significant source of water discharge
(cooling and waste water) into rivers, lakes and the marine environment. These discharges may
cause water quality problems, which can vary widely, depending on the type of fuel used, the
abatement technique applied, the cooling technique and consequently the amount of water used,
and the chemical and biological treatment reagents added for cleaning and maintenance
purposes. The main sources of effluent streams in a fossil-fuel-fired combustion plant are shown
in Figure 1.29.
Figure 1.29: Effluents from fossil-fuel-fired large combustion plants
WORKIN
G DRAFT IN
PROGRESS
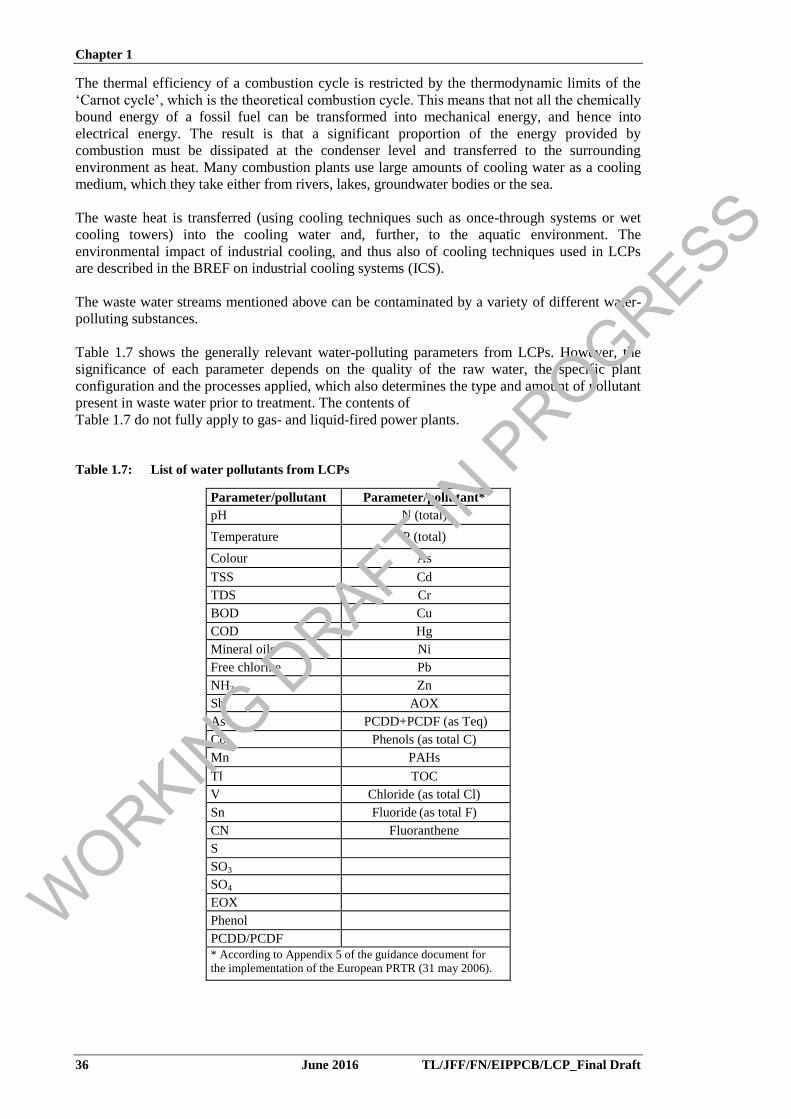
Chapter 1
36 June 2016 TL/JFF/FN/EIPPCB/LCP_Final Draft
The thermal efficiency of a combustion cycle is restricted by the thermodynamic limits of the
‘Carnot cycle’, which is the theoretical combustion cycle. This means that not all the chemically
bound energy of a fossil fuel can be transformed into mechanical energy, and hence into
electrical energy. The result is that a significant proportion of the energy provided by
combustion must be dissipated at the condenser level and transferred to the surrounding
environment as heat. Many combustion plants use large amounts of cooling water as a cooling
medium, which they take either from rivers, lakes, groundwater bodies or the sea.
The waste heat is transferred (using cooling techniques such as once-through systems or wet
cooling towers) into the cooling water and, further, to the aquatic environment. The
environmental impact of industrial cooling, and thus also of cooling techniques used in LCPs
are described in the BREF on industrial cooling systems (ICS).
The waste water streams mentioned above can be contaminated by a variety of different water-
polluting substances.
Table 1.7 shows the generally relevant water-polluting parameters from LCPs. However, the
significance of each parameter depends on the quality of the raw water, the specific plant
configuration and the processes applied, which also determines the type and amount of pollutant
present in waste water prior to treatment. The contents of
Table 1.7 do not fully apply to gas- and liquid-fired power plants.
Table 1.7: List of water pollutants from LCPs
Parameter/pollutant Parameter/pollutant*
pH N (total)
Temperature P (total)
Colour As
TSS Cd
TDS Cr
BOD Cu
COD Hg
Mineral oils Ni
Free chlorine Pb
NH3 Zn
Sb AOX
As PCDD+PCDF (as Teq)
Co Phenols (as total C)
Mn PAHs
Tl TOC
V Chloride (as total Cl)
Sn Fluoride (as total F)
CN Fluoranthene
S
SO3
SO4
EOX
Phenol
PCDD/PCDF
* According to Appendix 5 of the guidance document for
the implementation of the European PRTR (31 may 2006).
WORKIN
G DRAFT IN
PROGRESS
Chapter 1
TL/JFF/FN/EIPPCB/LCP_Final Draft June 2016 37
Because of their chemical, biological and/or physical behaviour, such compounds may have a
high impact on the aquatic environment. These substances can cause changes in the receiving
water, such as increasing its acidity or alkalinity thereby changing its pH value, salinity, or
reducing its oxygen content and increasing plant growth due to the emission of plant nutrients.
For instance, water from slag flushing and ash transport has an alkaline character due to the
composition of the ash, whereas water from boiler washing is acidic. Waste water from the wet
desulphurisation plant contains salts such as chlorides and sulphates.
1.3.4 Combustion residues
The combustion of fuels is associated with the generation of a variety of residues (wastes and/or
by-products). Substances or objects resulting from a production process, the primary aim of
which is not the production of that item, may be regarded as not waste but as by-products if the
proper requirements for them to be sold on the market are met (e.g. fly ash, gypsum from flue-
gas desulphurisation). According to their origin, residues from a combustion plant can be
divided into those directly related to the process of combustion or those generated by the
operation of the plant and its equipment, such as coal mills or water treatment facilities.
Residues directly related to the combustion of fuels are ashes (fly and bottom ash) and residues
that are generated by the desulphurisation of flue-gases. Within the EU (EU-15) about 48 300 kt
of residues were produced from coal combustion in 2010, of which about 25 290 kt were
utilised in construction (51.7 %), 19 500 kt in reclamation (40 %) and about 1000 kt was
disposed of (6.4 %). [New 64, ECOBA Statistics 2010; www.ecoba.org]
The main residues generated by LCPs are as follows:
Bottom ash and/or boiler slag: Bottom ash is a non-combustible material that settles to
the bottom of the boiler and remains in the form of unconsolidated ash. If combustion
temperatures exceed the ash fusion temperature, the ash remains as slag in a molten state
until it is drained from the bottom of the boiler as boiler slag.
Fluidised bed ash: The operation of a fluidised bed combustion installation with a solid
fuel, such as coal, lignite, biomass or peat, results in the generation of ash, which is a
composition of spent bed material and fuel ash. Bed ash is removed from the bottom of
the fluidised bed combustion chamber.
Fly ash: Fly ash represents the part of the non-combustible material that is carried out of
the boiler along with the flue-gas. Fly ash is collected from the particulate control
equipment, such as from the electrostatic precipitator or bag filter, and also from different
parts of the boiler, such as the economiser and the air preheater. The largest amount of
ash is generated by the combustion of coal and lignite, followed by the combustion of
peat and biomass, whereas gas-fired facilities generate very low quantities of ash. The
amount of ash generated from a liquid-fuel-fired facility is much higher than from a gas-
fired boiler, but, compared with the amount of ash from coal combustion, the quantities
are relatively small.
Flue-gas desulphurisation residues: Fuels such as coal, peat and oil contain varying
amounts of sulphur. To avoid high emissions of sulphur dioxide to the atmosphere, LCPs
(in particular plants over 100 MWth) are usually equipped with flue-gas desulphurisation
(FGD) systems. The different desulphurisation techniques currently in use result in the
generation of a number of residues. Wet lime/limestone scrubbers, for instance, generate
gypsum as a by-product, whereas dry scrubber systems generate a mixture of unreacted
sorbent (e.g. lime, limestone, sodium carbonates, calcium carbonates), sulphur salts and
fly ash as residue.
Ash and flue-gas desulphurisation residues are by far the largest quantities of residues from
LCPs. These residues may be disposed of as wastes to a landfill or can be used as by-products
for different purposes, such as in cement and concrete production; as aggregate in concrete and
WORKIN
G DRAFT IN
PROGRESS

Chapter 1
38 June 2016 TL/JFF/FN/EIPPCB/LCP_Final Draft
asphalt, for mine reclamation or waste stabilisation; and as an ingredient in many other
products.
Gypsum, a by-product from the desulphurisation plant, is widely used in the cement and
gypsum industry, e.g. for the production of plasterboard, and makes a significant and increasing
contribution to meeting the demand for gypsum.
Beside the residues that are directly related to the combustion process and which arise in large
volumes, lower volume residues are generated as a result of the plant and equipment operation.
Typical examples of such residues are as follows:
Residues from boiler cleaning: Residues generated during the maintenance of the gas
and water sides of the boiler, including the air preheater, economiser, superheater, stack,
condenser and ancillary equipment. On the gas side, combustion residues such as soot and
fly ash build up on the surface of the equipment and must be removed periodically. On
the water side, scale and corrosion products build up in the boiler and need to be removed
from time to time, using acid or alkaline solutions.
Rejects from solid fuel milling: Solid fuels such as coal and lignite are normally reduced
in size in order to be able to blow them into the boiler. During the milling of coal, any
rocks and pyrites (an iron-based mineral) need to be separated from the fuel stream. This
solid residue may be discharged together with the bottom ash.
Make-up water treatment sludge: Residues resulting from the treatment of make-up
water for the steam cycle. The treatment of boiler make-up water may include different
processes such as settling, flocculation, softening, filtration and osmosis. These treatment
methods result in the generation of a treatment sludge.
Spent ion exchange resins: Ion exchange resins are used for the treatment of boiler
make-up water.
Spent catalysts from SCR processes: SCR catalysts are used to reduce nitrogen oxide
emissions to the atmosphere. Due to deactivation, these catalysts have to be replaced
periodically (after several years of service). Today, different processes exist for the
regeneration of such catalytic materials. Used catalyst elements are usually sent back to
the catalyst manufacturer for preparation for their reuse.
Waste water treatment sludge: Sludge generated by treating the different waste water
streams from a LCP.
Laboratory waste: Small amounts of waste generated in the laboratory, for instance by
analysing fuel samples, intake water, by-products, residues, etc.
Other residues: Other residues include those resulting from the purging of plant
equipment for maintenance, used oil and equipment containing oil, equipment containing
PCBs, and waste from the treatment of fuel (e.g. coal washing).
Most of the above-mentioned residues, from both the combustion process (e.g. ash) and from
the desulphurisation process (e.g. gypsum), and any other residue from the combustion plant
may represent a potential environmental risk. Ash from a coal-fired boiler, for instance, contains
elements such as silicon, aluminium, iron, calcium, magnesium, potassium, sodium and
titanium, as well as metals such as antimony, arsenic, barium, cadmium, chromium, lead,
mercury, selenium, strontium, zinc and others.
Current EU legislation regards many of the above-mentioned residues from combustion plants
as wastes. However, for many decades, industry has put great effort into developing ways to
minimise the generation of residues and/or to reuse them in various industrial sectors, such as in
the cement and construction industry, such that the quantities of waste disposed of to landfill
have actually been reduced. According to Directive 2008/98/EC of the European Parliament and
of the Council, this is beneficial to the environment because the utilisation of residues as raw
materials helps to conserve natural resources and to minimise the total amount of wastes to be
WORKIN
G DRAFT IN
PROGRESS
Chapter 1
TL/JFF/FN/EIPPCB/LCP_Final Draft June 2016 39
landfilled. As an example, the use of coal ash has been shown to reduce the overall amount of
CO2 emitted in the production of cement, due to the reduced amount of limestone to be
calcined. [New 85, Eurelectric – 2012]
With respect to bottom and fly ash from coal combustion, both are composed of various
elements from soil associated with the coal. One of their most distinctive characteristics is that
the bulk of this material is in a powdered or sintered state, with most of the elements contained
within a glassy matrix, and this basically determines their legal classification in national and
international waste lists as an inert, inactive or non-hazardous residue (e.g. non-hazardous
wastes in the European list of wastes - Decision 2001/118/EC amending Decision 2000/532/EC,
and also in the ‘green’ list of the OECD Decision C (92)39/final).
It is also well known that some by-products, such as gypsum from the desulphurisation plant,
have a strong commercial share of the gypsum market and are used as the most important raw
material in the production of gypsum boards. These efforts made by industry help to reduce
cross-media effects and the risk of environmental damage as well as reducing the need to mine
natural gypsum.
1.3.5 Noise and vibration emissions
Noise and vibration are common issues arising from the operation of LCPs; turbines in
particular have the potential for high noise emissions. Process noise emitted from an installation
into the surrounding environment is a factor that has caused many complaints in the past and
some information needs to be given about causes and approaches to prevent and minimise noise
and vibration.
The most significant sources of noise are from the transport and handling of fuels and residues
(waste and by-products); the use of large pumps and fans; safety valves; the cooling technique;
and from boilers, steam and gas turbines or other stationary engines. Noise and vibration can be
measured in a number of ways, but often the specific method is site-specific and takes account
of the frequency of the sound and the location of residential areas (sensitive receptors).
The impact of noise emitted from a combustion plant is limited to a relatively small area
surrounding the installation. Accordingly, the most frequent problem, especially at night, can be
noise nuisance for people living in the area close to the plant. For this reason, in some countries,
plants are subject to more stringent permissible noise levels at night than during the day.
1.3.6 Emission of radioactive substances
Natural radioactive substances are not covered by the IED, according to IED Article 3.1 (a).
However, it has been agreed within the technical working group on LCPs to include some
information on the emission of natural radioactive substances released by the combustion of
fossil fuels in the general part of this document.
Emissions of radioactive substances naturally present in most fossil fuels are not considered to
be a key environmental issue LCPs. Over recent years, European society (especially people
living close to LCPs) has become increasingly wary of radiation releases from the utilisation of
fossil fuels, in particular the combustion of large amounts of coal. In practice, emissions to air
of radioactive substances from a particular power plant or stack have been found to be close to
undetectable in comparison with natural background radiation.
An examination of the radioactivity of solid material passing through power plants has shown
that more than 90 % of the radioactivity in coal is retained in the ash. Only a small percentage of
the radioactivity can be found in flue-gas desulphurisation products such as FGD gypsum.
Radionuclide concentration in ash is determined by the radionuclide concentration of the coal,
WORKIN
G DRAFT IN
PROGRESS
Chapter 1
40 June 2016 TL/JFF/FN/EIPPCB/LCP_Final Draft
the ash content of the coal and the conditions at the power station. Because of the ash content,
natural radioactive nuclide concentrations in fly ash exceed those in coal by a factor of 2 to 15.
International measurement results of radioactivity in the fly ash generated by coal burning range
between 60 Bq/kg and 1000 Bq/kg. Mean data values range from 90 Bq/kg to 180 Bq/kg, with
peak values of up to 1000 Bq/kg for the uranium series, and from 70 Bq/kg to 150 Bq/kg, with
peak values of up to 290 Bq/kg for the thorium series.
Peat ash is used as a landfill, for landscaping, in concrete, and as a bulk material for road
construction. It may also be taken to dumps or mounded. The radiation exposure from the
handling and utilisation of peat ash has been estimated with activity indices. In peat ash, the
activity concentrations of radionuclides are 20–25 times higher than in peat itself. The
concentrations of radium and thorium are of the same magnitude as those in soil and rock. The
concentration of uranium (up to 1000 Bq/kg) is on average about 25 times higher than that in
sand and gravel.
1.3.7 Mitigation of environmental impacts
The preceding sections set out the range and magnitude of the potential environmental impacts
from LCPs if abatement techniques are not applied.
The actual impacts can be managed by the selection of appropriate techniques according to the
principles of BAT. The following chapters of this document set out the techniques that are
available to mitigate the potential environmental impacts.
Consequently, the actual impacts of a given LCP will depend on the total package of mitigating
measures that are applied during the plant design, operation, and decommissioning.
1.3.8 An introduction to the integrated approach of protecting the environment as a whole
Below, the integrated approach is discussed from three points of view [New 130, 59, Finnish
LCP WG, 2000]:
mutual influence of the emission reduction techniques for different pollutants through the
inherent characteristics of the LCP process in question;
dependence on the performance of a given pollutant emission abatement technique on other
environmental aspects and on the use of energy and consumables as well as on economics;
the need to find an appropriate balance between environmental benefits (reduction of
different pollutant emissions), cross-media effects and economics.
An example of mutual influence in LCP pollution is the interdependence between the emissions
of NOX from a low-NOX burner, the unburnt carbon, CO and hydrocarbons. Attempts to
minimise the NOX formation at some point cause the unburnt fraction of the fuel to increase
rapidly. This not only reduces combustion efficiency, but also creates new pollutants, CO and
unburnt hydrocarbons. Furthermore, EN 197-1 defines a limit for loss on ignition (method to
measure unburnt carbon, determined in accordance with EN 197-2) of the fly ash, beyond which
the fly ash is no longer recyclable in cement or in the construction industry, creating the need
for fly ash disposal in landfill.
Another example is the dependence of NOX and N2O formation on the fluidised bed combustion
temperature. NOX formation can be minimised by decreasing the bed temperature of the FBC
boiler, but, at some point, the rate of N2O formation starts to increase. A compromise has to be
found between combustion temperatures and a judgement on which one will achieve the best
overall balance. In addition to the oxides of nitrogen, sulphur capture in the bed of a FBC boiler
by limestone addition is also influenced by the bed temperature.
WORKIN
G DRAFT IN
PROGRESS
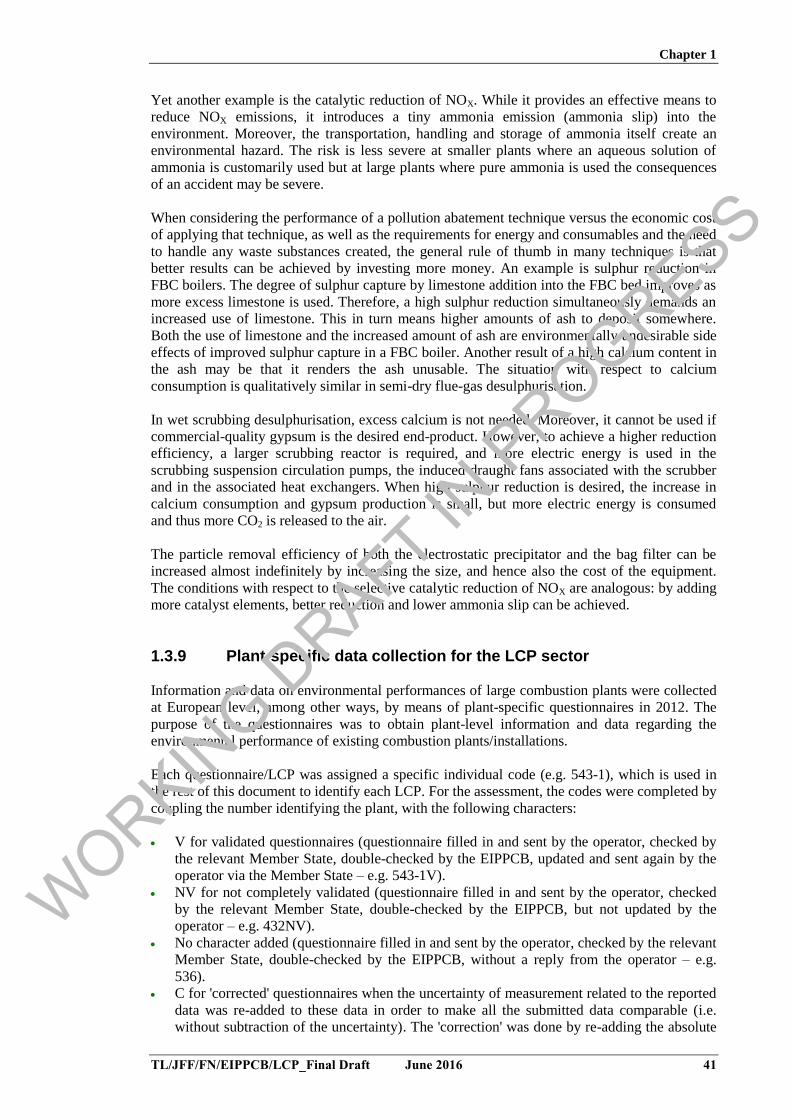
Chapter 1
TL/JFF/FN/EIPPCB/LCP_Final Draft June 2016 41
Yet another example is the catalytic reduction of NOX. While it provides an effective means to
reduce NOX emissions, it introduces a tiny ammonia emission (ammonia slip) into the
environment. Moreover, the transportation, handling and storage of ammonia itself create an
environmental hazard. The risk is less severe at smaller plants where an aqueous solution of
ammonia is customarily used but at large plants where pure ammonia is used the consequences
of an accident may be severe.
When considering the performance of a pollution abatement technique versus the economic cost
of applying that technique, as well as the requirements for energy and consumables and the need
to handle any waste substances created, the general rule of thumb in many techniques is that
better results can be achieved by investing more money. An example is sulphur reduction in
FBC boilers. The degree of sulphur capture by limestone addition into the FBC bed improves as
more excess limestone is used. Therefore, a high sulphur reduction simultaneously demands an
increased use of limestone. This in turn means higher amounts of ash to deposit somewhere.
Both the use of limestone and the increased amount of ash are environmentally undesirable side
effects of improved sulphur capture in a FBC boiler. Another result of a high calcium content in
the ash may be that it renders the ash unusable. The situation with respect to calcium
consumption is qualitatively similar in semi-dry flue-gas desulphurisation.
In wet scrubbing desulphurisation, excess calcium is not needed. Moreover, it cannot be used if
commercial-quality gypsum is the desired end-product. However, to achieve a higher reduction
efficiency, a larger scrubbing reactor is required, and more electric energy is used in the
scrubbing suspension circulation pumps, the induced draught fans associated with the scrubber
and in the associated heat exchangers. When high sulphur reduction is desired, the increase in
calcium consumption and gypsum production is small, but more electric energy is consumed
and thus more CO2 is released to the air.
The particle removal efficiency of both the electrostatic precipitator and the bag filter can be
increased almost indefinitely by increasing the size, and hence also the cost of the equipment.
The conditions with respect to the selective catalytic reduction of NOX are analogous: by adding
more catalyst elements, better reduction and lower ammonia slip can be achieved.
1.3.9 Plant-specific data collection for the LCP sector
Information and data on environmental performances of large combustion plants were collected
at European level, among other ways, by means of plant-specific questionnaires in 2012. The
purpose of the questionnaires was to obtain plant-level information and data regarding the
environmental performance of existing combustion plants/installations.
Each questionnaire/LCP was assigned a specific individual code (e.g. 543-1), which is used in
the rest of this document to identify each LCP. For the assessment, the codes were completed by
coupling the number identifying the plant, with the following characters:
V for validated questionnaires (questionnaire filled in and sent by the operator, checked by
the relevant Member State, double-checked by the EIPPCB, updated and sent again by the
operator via the Member State – e.g. 543-1V).
NV for not completely validated (questionnaire filled in and sent by the operator, checked
by the relevant Member State, double-checked by the EIPPCB, but not updated by the
operator – e.g. 432NV).
No character added (questionnaire filled in and sent by the operator, checked by the relevant
Member State, double-checked by the EIPPCB, without a reply from the operator – e.g.
536).
C for 'corrected' questionnaires when the uncertainty of measurement related to the reported
data was re-added to these data in order to make all the submitted data comparable (i.e.
without subtraction of the uncertainty). The 'correction' was done by re-adding the absolute
WORKIN
G DRAFT IN
PROGRESS

Chapter 1
42 June 2016 TL/JFF/FN/EIPPCB/LCP_Final Draft
value, or a percentage, depending on the type of information provided in the questionnaire.
Where no information on uncertainty was provided, a 'by-default' uncertainty corresponding
to 2 % for CO emissions, 3 % for NOX and SOX emissions, and 4 % for dust emissions was
re-added.
The collected data and information have been extensively used in the BREF and the combustion
plants' performances shown in tables or graphs are flagged by means of the above-mentioned
codes. In the case of graphs for emissions to water, there is no correction of the uncertainty. The
list of codes and plant names can be found in Annex I [ 3, LCP TWG 2012 ].
The reported air emission data used for the analysis are without subtraction of the measurement
uncertainty. Information on the averaged uncertainty assigned to measured results from
European combustion plants, derived from data collected at plant level through the
questionnaires is given in Annex IV.
WORKIN
G DRAFT IN
PROGRESS

Chapter 2
TL/JFF/FN/EIPPCB/LCP_Final Draft June 2016 43
2 PROCESSES FOR ENERGY GENERATION
2.1 Combustion principles
A boiler requires a source of heat at a sufficient temperature to produce steam. Fuels, when used
for the generation of steam, are generally burnt in the furnace or combustion chamber of the
boiler. Steam generators might also use thermal energy in the form of waste heat from another
process.
Combustion can be defined as the rapid chemical combination of oxygen with the combustible
elements of a fuel. There are just three combustible chemical elements of significance: carbon,
hydrogen and sulphur. Sulphur is usually of minor significance as a source of heat.
Carbon and hydrogen, when burnt to completion with oxygen, are transformed to CO2 and H2O
according to the following reactions:
C + O2 CO2
2H2 + O2 2H2O
Air is the usual source of oxygen for boiler furnaces. These combustion reactions are
exothermic and the heat released is about 32 800 kJ/kg of carbon burnt and 142 700 kJ/kg of
hydrogen burnt. The energy of fuels cannot be calculated by the sum of energy from the
hydrogen and carbon content alone, as the chemical energy of molecular formation also needs to
be taken into account. Also sulphur and other elements in the fuels contribute to the energy
release. As water is released in a gaseous form during combustion, the heat transferable to the
steam generator is the theoretical heat of combustion minus the latent heat of the water vapour
of the flue-gas. This energy is expressed as the ‘lower heating value’ (LHV) or 'net calorific
value'. The LHV can be compared to the ‘higher heating value’ (HHV) or 'gross calorific value',
which is defined for all the combustion products at environmental conditions (1 bar, 25 °C) and
takes into account the latent heat of vaporisation of water in the combustion. Most of the
additional energy is only available with the condensation of gaseous H2O from the flue-gas to
liquid H2O at temperatures below the water dew point.
The objective of good combustion is to release all of this heat, whilst minimising losses from
combustion imperfections and superfluous airflows. Proper combustion requires a temperature
high enough to ignite the constituents, good mixing or turbulence, and sufficient time for
complete combustion.
In a boiler furnace (where no mechanical work is carried out), the heat energy derived from the
reaction of the combustible elements with oxygen depends on the ultimate products of
combustion and not on any intermediate combinations that may occur in reaching the final
result.
A simple demonstration of this law is the reaction of 1 kg of carbon with oxygen to produce a
specific amount of heat. The reaction may occur in just one step to form CO2 or, under certain
conditions, it may occur in two steps: firstly forming CO, which produces a much smaller
amount of heat, and secondly through the reaction of the CO to form CO2. However, the sum of
the heat released in the two steps is the same as the 32 800 kJ/kg generated when carbon is burnt
in the single step to form CO2.
The fact that carbon can react in these two ways with oxygen is of the utmost importance in the
design of combustion equipment. Firing methods must assure complete mixture of the fuel and
oxygen to be certain that all of the carbon burns to CO2 and not to CO. Failure to meet this
requirement will result in appreciable losses in combustion efficiency and in the amount of heat
released by the fuel, since only about 28 % of the available heat in the carbon is released if CO
is formed rather than CO2.
WORKIN
G DRAFT IN
PROGRESS

Chapter 2
44 June 2016 TL/JFF/FN/EIPPCB/LCP_Final Draft
2.2 Common technical combustion processes
The chapter is intended for those interested in gaining a general understanding of the industry
and for those interested in the interrelationship between industrial processes and the topics
described in subsequent sections.
2.2.1 General fuel heat conversion
In this section, information is only given as a summary to provide an overview of different
combustion techniques. Where necessary, the specific combustion processes are given in more
detail in the relevant fuel chapters. Combustion techniques are generally applied at about
atmospheric pressure, but can be developed for higher pressure. In all combustion systems,
almost 100 % of fuel energy is converted to heat. This conversion efficiency is called ‘fuel
utilisation’.
Generally in most applications, this released net fuel heat is transferred to, and applied in, steam
processes, gas turbines or reciprocating engines. The unburnt carbon-in-ash, CO, and VOCs
contains the losses of fuel energy during the combustion process.
In gasification processes for solid or liquid fuels, heat is released in two steps: in a first step
when the fuel is gasified, and in a second step when the product gas is burnt.
The choice of system employed at a facility is based on the loads, the availability of the fuels,
and the energy requirements. Facilities using these systems also need other ancillary processes.
These ancillary processes include supporting operations such as coal processing and pollution
control. [New 131] [21, US EPA, 1997].
2.2.2 Pulverised and atomised firing
Boiler types
There are two types of furnaces/boilers where the solid fuels are pulverised or the liquid fuels
are atomised before combustion:
Dry bottom ash furnace/dry-bottom boiler (DBB): This type of boiler is operated at
temperatures far below the melting point of the ash. To avoid slagging, the ash
temperature is low enough not to stick to the walls, and ash collected at the bottom is
solid. In the centre of the flame, temperatures are often higher than the melting point of
the ash particles and the temperature at the furnace outlets is much lower compared to the
flame temperature, ensuring a solid, non-sticky state of the particles. From 0 % to 20 % of
the ash is transferred to the dry-bottom of the boiler and is extracted as bottom ash, the
remaining 80–100 % of the ash is transported with the flue-gas and then removed
downstream. The DBB technique has the highest installed capacity of coal combustion in
the world. New plants using this technique with single unit capacities of up to 1100 MWe
are in operation for lignite combustion in Europe. In the US and Japan, units have been
built with even higher capacities for coal combustion.
Slag tap furnace/wet-bottom boiler (WBB): This type of boiler is operated at
temperatures above the melting point of the ash to ensure a liquid ash with sufficient
fluidity to flow down the protected walls. The liquid ash is quenched in a water-filled
collector. These furnaces need special ceramic lining to withstand the molten ash
temperatures and high-temperature chemical attack. A large amount of ash is transported
to the walls and flows in a liquid form down the walls and through the bottom outlet. Fly
ash in this type of combustion system can be recycled to the combustion chamber to
produce boiler slag as a residue instead of fly ash. The wet-bottom boiler is mainly used
for the combustion of coal (e.g. anthracite), where the amount of volatiles is relatively
low. Waste co-incineration is often relatively easy in slag tap furnaces.
WORKIN
G DRAFT IN
PROGRESS
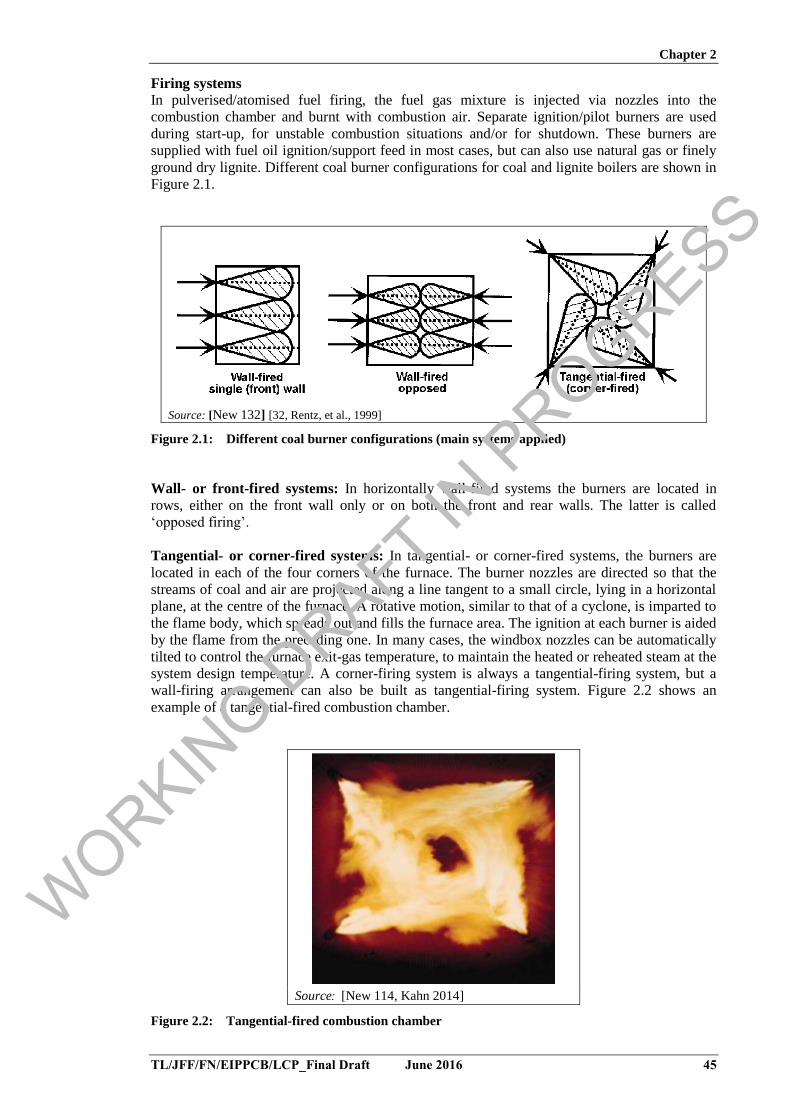
Chapter 2
TL/JFF/FN/EIPPCB/LCP_Final Draft June 2016 45
Firing systems
In pulverised/atomised fuel firing, the fuel gas mixture is injected via nozzles into the
combustion chamber and burnt with combustion air. Separate ignition/pilot burners are used
during start-up, for unstable combustion situations and/or for shutdown. These burners are
supplied with fuel oil ignition/support feed in most cases, but can also use natural gas or finely
ground dry lignite. Different coal burner configurations for coal and lignite boilers are shown in
Figure 2.1.
Source: [New 132] [32, Rentz, et al., 1999]
Figure 2.1: Different coal burner configurations (main systems applied)
Wall- or front-fired systems: In horizontally wall-fired systems the burners are located in
rows, either on the front wall only or on both the front and rear walls. The latter is called
‘opposed firing’.
Tangential- or corner-fired systems: In tangential- or corner-fired systems, the burners are
located in each of the four corners of the furnace. The burner nozzles are directed so that the
streams of coal and air are projected along a line tangent to a small circle, lying in a horizontal
plane, at the centre of the furnace. A rotative motion, similar to that of a cyclone, is imparted to
the flame body, which spreads out and fills the furnace area. The ignition at each burner is aided
by the flame from the preceding one. In many cases, the windbox nozzles can be automatically
tilted to control the furnace exit-gas temperature, to maintain the heated or reheated steam at the
system design temperature. A corner-firing system is always a tangential-firing system, but a
wall-firing arrangement can also be built as tangential-firing system. Figure 2.2 shows an
example of a tangential-fired combustion chamber.
Source: [New 114, Kahn 2014]
Figure 2.2: Tangential-fired combustion chamber
WORKIN
G DRAFT IN
PROGRESS

Chapter 2
46 June 2016 TL/JFF/FN/EIPPCB/LCP_Final Draft
Vertically fired systems: The first pulverised coal systems had a configuration called vertical
or arch. They are now principally used to fire coals with volatile matter of between 8 % and
15 % (dry basis). The firing system produces a long, looping flame in the lower furnace with the
hot gases discharging up the centre.
Boilers designed for burning liquid and gaseous fuels are very similar to boilers that are used
for the combustion of coal. While gaseous fuel is directly combusted with air, liquid fuels are
sprayed into the furnace via nozzles, generating very small droplets atomised by high-pressure
steam or air and producing a high amount of volatiles. Only heavy fuel oils produce significant
amounts of ash. All clean gaseous and liquid fuels can be fired by burners at the bottom of the
furnace.
A typical heavy fuel oil boiler is shown in Figure 2.3.
Source: [New 133] [43, Wienstrom, 2001]
Figure 2.3: Heavy fuel oil boiler
All burner designs are supplied directly with air.
When designed for gas burning only, the combustion chamber is slightly smaller but, in most
cases, these boilers are designed for burning liquid fuel too, in emergency situations or for
multi-fuel firing.
WORKIN
G DRAFT IN
PROGRESS
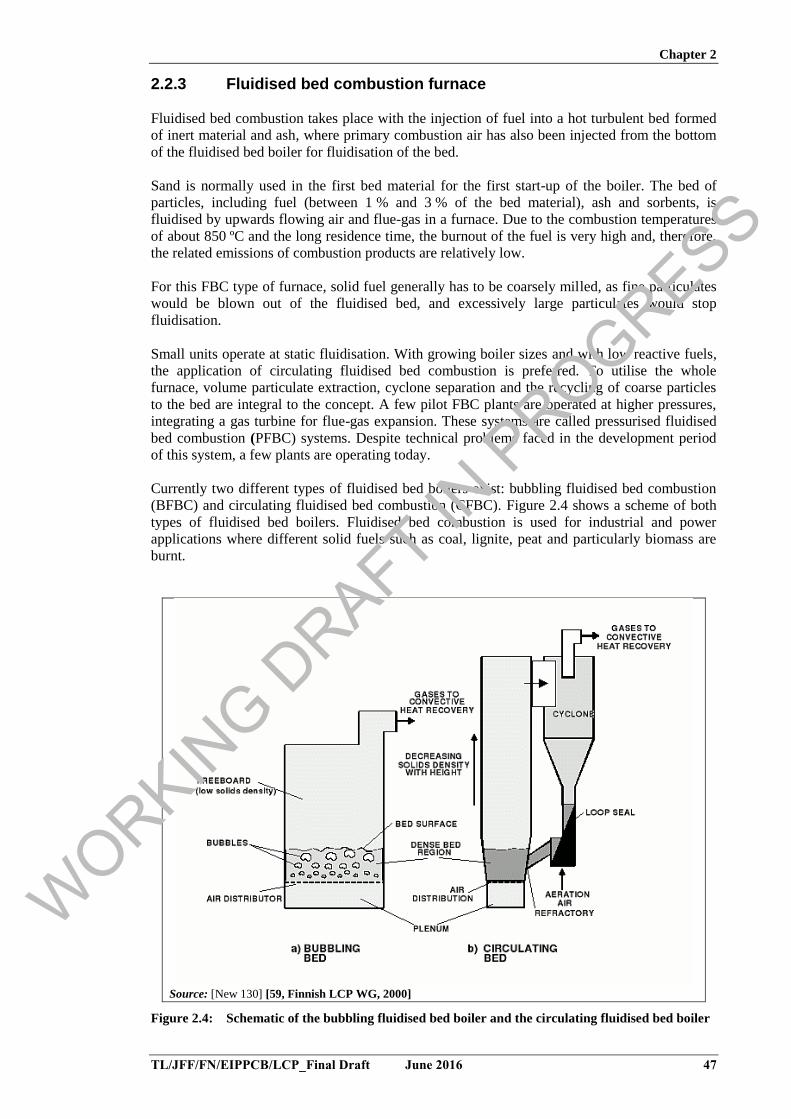
Chapter 2
TL/JFF/FN/EIPPCB/LCP_Final Draft June 2016 47
2.2.3 Fluidised bed combustion furnace
Fluidised bed combustion takes place with the injection of fuel into a hot turbulent bed formed
of inert material and ash, where primary combustion air has also been injected from the bottom
of the fluidised bed boiler for fluidisation of the bed.
Sand is normally used in the first bed material for the first start-up of the boiler. The bed of
particles, including fuel (between 1 % and 3 % of the bed material), ash and sorbents, is
fluidised by upwards flowing air and flue-gas in a furnace. Due to the combustion temperatures
of about 850 ºC and the long residence time, the burnout of the fuel is very high and, therefore,
the related emissions of combustion products are relatively low.
For this FBC type of furnace, solid fuel generally has to be coarsely milled, as fine particulates
would be blown out of the fluidised bed, and excessively large particulates would stop
fluidisation.
Small units operate at static fluidisation. With growing boiler sizes and with low reactive fuels,
the application of circulating fluidised bed combustion is preferred. To utilise the whole
furnace, volume particulate extraction, cyclone separation and the recycling of coarse particles
to the bed are integral to the concept. A few pilot FBC plants are operated at higher pressures,
integrating a gas turbine for flue-gas expansion. These systems are called pressurised fluidised
bed combustion (PFBC) systems. Despite technical problems faced in the development period
of this system, a few plants are operating today.
Currently two different types of fluidised bed boilers exist: bubbling fluidised bed combustion
(BFBC) and circulating fluidised bed combustion (CFBC). Figure 2.4 shows a scheme of both
types of fluidised bed boilers. Fluidised bed combustion is used for industrial and power
applications where different solid fuels such as coal, lignite, peat and particularly biomass are
burnt.
Source: [New 130] [59, Finnish LCP WG, 2000]
Figure 2.4: Schematic of the bubbling fluidised bed boiler and the circulating fluidised bed boiler
WORKIN
G DRAFT IN
PROGRESS

Chapter 2
48 June 2016 TL/JFF/FN/EIPPCB/LCP_Final Draft
Fluidised bed combustion is not very different from other combustion techniques. Bubbling
fluidised bed combustion resembles spreader stoker grate firing in many respects. The main
benefit for combustion is the better temperature control. Circulating fluidised bed combustion
resembles pulverised fuel combustion or burner combustion. One difference though is the
comprehensive temperature control of the furnace, which ensures ignition of the fuel without the
need for a high-temperature flame.
The temperature of a fluidised bed is typically 750–950 ºC. The lower limit comes from the
combustion reactivity of the fuels, and the upper limit from the starting point of the fuel ash
sintering.
Fuel does not need to be pulverised or dried for use in fluidised bed boilers. Mechanical
crushing of the fuel is sufficient to facilitate its feeding into the bed. Fluidised beds can tolerate
high moisture content because of the stabilising effect of the bed. Some size limitations are
connected with the rotary fuel feeders. On the other hand, the pre-processing of reactive fuels is
safer if they contain a moderate amount of moisture. The risks of explosive dust formation and
fires in fuel processing and transportation are normally controlled by keeping the fuel moisture
content above 40 %.
As far as environmental considerations are concerned, FBC systems are able to reduce SO2
emissions by limestone injection and can achieve a relatively low level of thermal NOX
formation because of the low combustion temperature. This is one of the reasons why this
combustion technique is being intensively developed more and more nowadays. Moreover, a
wide range of fuels can be combusted in the same facility because these boilers are not very
sensitive to the fuel specifications.
In the bubbling bed freeboard above the bed itself, the combustion of the pyrolysis gases can
produce temperatures in excess of 1200 °C and this can promote the formation of thermal NOX.
As a general rule, NOX formation in a properly designed fluidised bed can be kept below the
NOX formation in PC boilers.
The fluidised bed combustion option is a balancing act between the partially conflicting
requirements of NOX, N2O, and SO2 control, and the control of unburnt hydrocarbons, CO, and
char.
Fuels with a low ash melting point cannot be burnt in a fluidised bed, because the fluidisation
will be disturbed quite rapidly by the accumulation of melted ash. Heavy physical impurities
such as metal particles in domestic waste cannot be fluidised either, as they sink onto the air
distribution plate, disturb the fluidisation, and are difficult to remove from the furnace.
However, new solutions for keeping the bed operational with these fuels have been successfully
implemented.
2.2.3.1 Bubbling fluidised bed combustion (BFBC)
Bubbling fluidised bed combustion (BFBC) is a modern combustion technology, especially
suited for burning inhomogeneous biofuels. In BFBC, the fuel is fed into the bed. Biofuels
pyrolyse instantly once in contact with the hot bed. Of the combustion air, 30–40 % is used as
the fluidising air and the rest is used for the combustion of pyrolysis gases in the so-called
freeboard above the bubbling bed. Most of the finest particles also burn in the freeboard. The
combustion temperature in the freeboard can be up to 1100–1200 ºC, or even higher locally.
The bubbling bed actually operates as an adiabatic combustor of fuel, and the low combustion
temperature is a result of using a substoichiometric air ratio in the primary combustion zone.
BFBC consists of a 0.5–1.5 m high bed on a fluidising air distribution plate. The fluidising
velocity is about 1 m/s. The density of the bubbling bed is about 1000 kg/m3. Typical bed
materials used are sand, fuel ash, dolomite, limestone, etc. The particle size distribution in the
WORKIN
G DRAFT IN
PROGRESS

Chapter 2
TL/JFF/FN/EIPPCB/LCP_Final Draft June 2016 49
fluidising bed material is typically within 0.5–1.5 mm, as smaller particles are carried out with
the fluidising gas flow, and larger particles sink onto the distribution plate. The left of Figure
2.5 shows how the furnace of a BFB boiler, marked light blue, with the fluidised bed at the
bottom, is wide to keep the gas velocities low enough for the fluidised material to stay in the
furnace.
In the freeboard of the BFBC furnace, other burners can be located and operated simultaneously
with the bed. For example gas, oil and coal burners have been used.
2.2.3.2 Circulating fluidised bed combustion (CFBC)
Circulating fluidised bed combustion (CFBC) differs from BFBC in two ways. The bed material
particle size is smaller, i.e. 0.1–0.6 mm, and the fluidising velocity is faster, i.e. 4–6 m/s. These
changes affect the fluidising conditions so that part of the bed material is carried out from the
bed, transiting through the furnace to the second pass of the boiler. These particles are separated
from the flue-gas flow by a cyclone or by other separation methods and recirculated back to the
fluidised bed. The separation can be carried out in the middle of the second pass and, in part, at
the outlet of the boiler pass, where electrostatic precipitators and bag filters can also be used.
In CFBC, air is blown into the bottom of the furnace, partly as primary air injected through a
grid and partly as secondary air some metres above the grid. The velocity of the air is high
enough to carry the bed solids along with it, thereby filling the entire combustion chamber. The
hot combustion gases carry the particles to the top of the combustion systems and into heavy-
duty cyclones or other separation units, where they are separated and recirculated back into the
bottom of the main combustion chamber as is represented on the right side of Figure 2.5. To
enable SO2 removal, crushed limestone or dolomite is added to the bed. The circulating bed
systems increase the reaction time and the level of gas mixing, therefore generally leading to a
more efficient combustion and fixation of sulphur.
Source:[New 115, NOVOX 2013]
Figure 2.5: BFBC boiler (left) and CFBC boiler (right) schemes
CFBC includes a bubbling fluidised bed at the bottom of the furnace. The suspension density
above the bed decreases with furnace height, as the bed material is recycled in the furnace along
the furnace walls. This high share of circulating inert material smoothes the temperature profile
throughout the furnace. The heat transfer surfaces therefore can be located at different places in
WORKIN
G DRAFT IN
PROGRESS
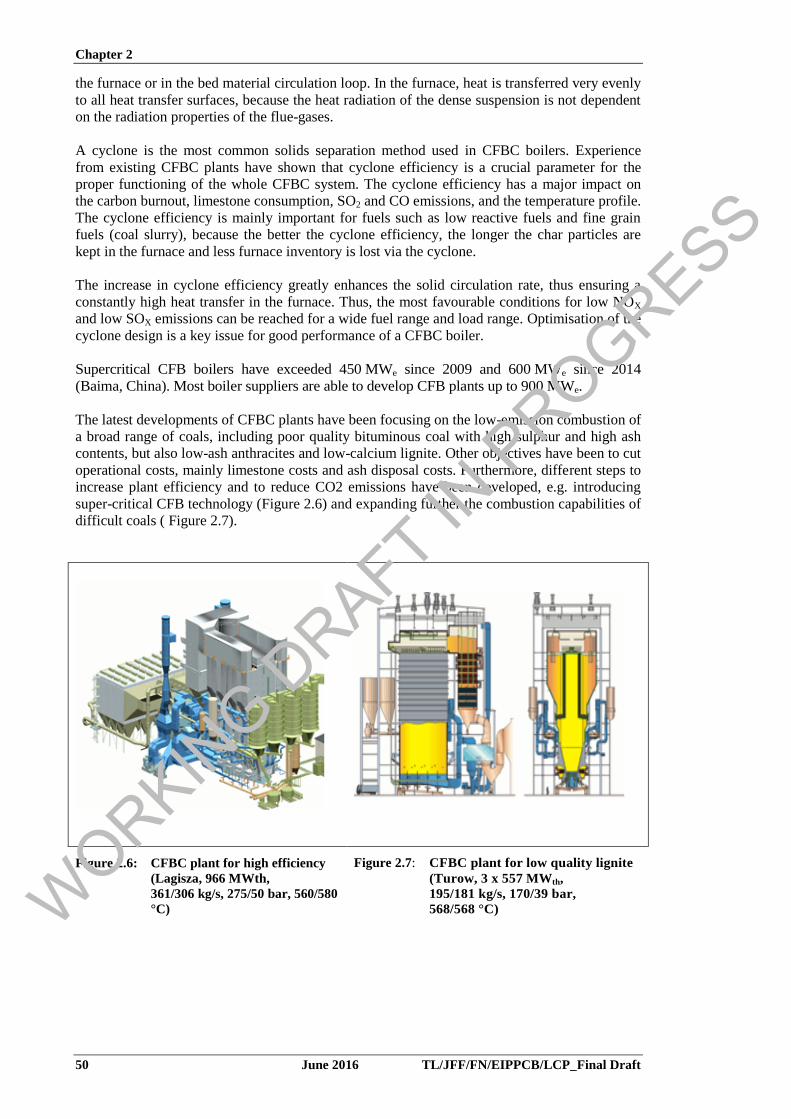
Chapter 2
50 June 2016 TL/JFF/FN/EIPPCB/LCP_Final Draft
the furnace or in the bed material circulation loop. In the furnace, heat is transferred very evenly
to all heat transfer surfaces, because the heat radiation of the dense suspension is not dependent
on the radiation properties of the flue-gases.
A cyclone is the most common solids separation method used in CFBC boilers. Experience
from existing CFBC plants have shown that cyclone efficiency is a crucial parameter for the
proper functioning of the whole CFBC system. The cyclone efficiency has a major impact on
the carbon burnout, limestone consumption, SO2 and CO emissions, and the temperature profile.
The cyclone efficiency is mainly important for fuels such as low reactive fuels and fine grain
fuels (coal slurry), because the better the cyclone efficiency, the longer the char particles are
kept in the furnace and less furnace inventory is lost via the cyclone.
The increase in cyclone efficiency greatly enhances the solid circulation rate, thus ensuring a
constantly high heat transfer in the furnace. Thus, the most favourable conditions for low NOX
and low SOX emissions can be reached for a wide fuel range and load range. Optimisation of the
cyclone design is a key issue for good performance of a CFBC boiler.
Supercritical CFB boilers have exceeded 450 MWe since 2009 and 600 MWe since 2014
(Baima, China). Most boiler suppliers are able to develop CFB plants up to 900 MWe.
The latest developments of CFBC plants have been focusing on the low-emission combustion of
a broad range of coals, including poor quality bituminous coal with high sulphur and high ash
contents, but also low-ash anthracites and low-calcium lignite. Other objectives have been to cut
operational costs, mainly limestone costs and ash disposal costs. Furthermore, different steps to
increase plant efficiency and to reduce CO2 emissions have been developed, e.g. introducing
super-critical CFB technology (Figure 2.6) and expanding further the combustion capabilities of
difficult coals ( Figure 2.7).
Figure 2.6: CFBC plant for high efficiency
(Lagisza, 966 MWth,
361/306 kg/s, 275/50 bar, 560/580
°C)
Figure 2.7: CFBC plant for low quality lignite
(Turow, 3 x 557 MWth,
195/181 kg/s, 170/39 bar,
568/568 °C)
WORKIN
G DRAFT IN
PROGRESS

Chapter 2
TL/JFF/FN/EIPPCB/LCP_Final Draft June 2016 51
2.2.3.3 Pressurised fluidised bed combustion (PFBC)
Based on the experience gathered with atmospheric fluidised bed combustion systems, the
development of pressurised fluidised combustion (PFBC) started in the mid-1970s. The
technology is a combination of the Rankine steam cycle and Brayton gas turbine cycle. PFBC
systems offer the advantage of smaller plant sizes than conventional FBC plants for the same
output. Because of the low combustion temperature, no thermal NOX is formed, and fuel NOX
can be reduced during combustion by the introduction of ammonia into the freeboard or into the
flue-gas duct. As in the case of atmospheric FBC, it is possible to differentiate between
bubbling and circulating bed systems. PFBC plants were commissioned in the 1990s and the
early 2000s.
The main parts of a PFBC system are: the fuel preparation and handling section; the pressurised
bubbling or fluidised bed boiler; the flue-gas clean-up section; the gas turbine (including the gas
turbine expander and the air compressor); and the steam/water circuit of the steam turbine.
Figure 2.8 shows a schematic drawing of a bubbling bed PFBC system.
Source: [New 132] [32, Rentz, et al., 1999]
Figure 2.8: Schematic drawing of a bubbling bed PFBC system
In the scheme shown in Figure 2.8, coal is crushed and then mixed with limestone (dolomite).
The mixture is fed via a pneumatic conveying system or a slurry feed pump across the pressure
boundary and is then injected into the combustor from a series of feed points. Combustion air is
first pressurised using a suitable gas turbine compressor and routed to the combustor
containment vessel through the outer annulus of a coaxial duct, while hot combustion gases
return to the turbine through the central passage. Combustion takes place inside the pressure
vessel at a temperature of 850 °C to 900 °C and a pressure of approximately 1.6 MPa. The
combustion chamber is equipped with immersed heat exchangers, which allow for a constant
combustion temperature and which produce high-pressure steam, which is utilised in the steam
turbine. The hot flue-gases are first cleaned using ceramic candle filters or cyclones and then
expanded through a gas turbine connected to the air compressor and a generator. A Brayton
cycle gas turbine expander drives the air compressor supplying air required for the combustion
process. Turbine exhaust gases are fed to a heat recovery steam generator and are used for boiler
WORKIN
G DRAFT IN
PROGRESS
Chapter 2
52 June 2016 TL/JFF/FN/EIPPCB/LCP_Final Draft
feed-water preheating and steam generation. The steam turbine produces about 80 % of the total
electricity produced by the utility.
Currently, PFBC systems are able to achieve thermal efficiencies of up to 45 %. Further
improvements are limited because of the comparatively low gas turbine inlet temperature, which
is determined by the combustion temperature in the fluidised bed boiler. Several process
schemes to increase the gas turbine inlet temperature, e.g. by an additional firing using natural
gas or fuel oil, or by partial gasification of the feed coal prior to combustion and utilising the
fuel gas in the gas turbine, have been proposed and are being investigated. These process
configurations offer considerably higher efficiency values, but no pilot or demonstration plant
has yet been built. As mentioned earlier, inherent emission control is one of the main features of
PFBC technology [New 132] [32, Rentz, et al., 1999].
2.2.3.4 NOX and N2O control in fluidised bed combustion
The formation of thermal NOX is low in fluidised bed combustion because of the low
combustion temperature. Most NOX formed in FBC boilers is generated from the nitrogen
content of the fuel, and is efficiently controlled by staging the combustion air. The staging in
CFBC is always quite strong because of the poor horizontal mixing of gases over a dense
suspension area. The dense suspension suppresses the turbulence, and the combustion zone of
volatile fuel components spreads upwards from the feeding point. Staging of combustion air can
also be implemented in BFBC.
Fuel nitrogen can also form nitrous oxide (N2O). N2O emissions are higher from FBC boilers
than from PC boilers. The share of fuel nitrogen that forms nitrous oxide decreases to an
insignificant value if the bed temperature is increased to over 950 ºC. On the other hand, a high
combustion temperature can cause an increase in the emissions of nitrogen oxides (NO and
NO2). In BFBC, the risk of nitrous oxide emissions can be more easily avoided, as the
temperature in the freeboard can be kept much higher than 950 ºC.
2.2.4 Grate firing of solid fuels
Grate firing is the oldest firing principle used in boilers. Today grate-firing systems are highly
developed and moving grates are typically used in these systems. Depending on the particular
fuel characteristics, moving grates are arranged in a horizontal position (e.g. travelling grate
systems) or in a sloped position (e.g. pusher-type grate systems or vibrating grates). Moving
grate systems burn solid fuels on the grates with air passing through the system floor. Normally
there is only limited fuel preparation needed. Large pieces of solid fuel may be reduced in size
in order to supply a more or less homogeneous particle size distribution into the combustion
chamber for burning on the grate. The maximum size of the fuel particles is often determined by
the feed systems for the combustion chamber and depending on the technical conditions of the
grate.
Grate or spreader stoker combustion systems burn solid fuels on the grate or stoker system with
air passing through the system floor (see Figure 2.9). Most coarse solid fuels can be burnt in
these systems. On a mass-burn grate, the fuel is initially dried and then pyrolysed as it moves
along the grate and finally the char is burnt and the ash is discharged at the end of the grate. In
spreader stoker firing, part of the fuel burns in suspension. The heavier fuel particles land on the
grate and burn more or less uniformly across the grate surface.
The combustion process in grate firing is not as well controlled as it is in pulverised fuel burners
or in fluidised beds. The combustion chemistry and the temperature can vary even for the same
kind of fuel particles, depending on their location on the grate. On a grate, all fuels will first be
dried, then pyrolysed and, finally, the char is burnt on the grate. The pyrolysing share of fuel
WORKIN
G DRAFT IN
PROGRESS

Chapter 2
TL/JFF/FN/EIPPCB/LCP_Final Draft June 2016 53
energy can be about 80 % with biofuels. Modern grate-firing control enables an optimal burning
air supply and, therefore, a low content of unburnt compounds in the flue-gases.
Practice shows that fuel can be fed as a mixed size grading, usually from 30 mm downwards,
including very fine particles. Grate combustion systems work with a steady reservoir of fuel in
the combustion chamber, but the fuel can be left on the grate without the fans running, and can
be rekindled quickly in the event of sudden demand for steam. If problems arise with the air
supply, a bypass operation is necessary. Grate firing is a technology applied for coal- and
biomass-fired boilers used for heat inputs up to 150 MW, mainly applied in industrial and local
district heating plants.
Source: [New 134] [79, Bell and Chiu, 2000]
Figure 2.9: Travelling grate firing for coal combustion
In the spreader stoker system, the fuel can also be fed onto the grate by a so-called spreader
located on the furnace wall (see Figure 2.10). The spreader throws the fuel on the grate against
the direction of the grate movement. Thus, the longest burning time can be achieved for the
largest particles, as they are thrown furthest from the ash discharge.
WORKIN
G DRAFT IN
PROGRESS
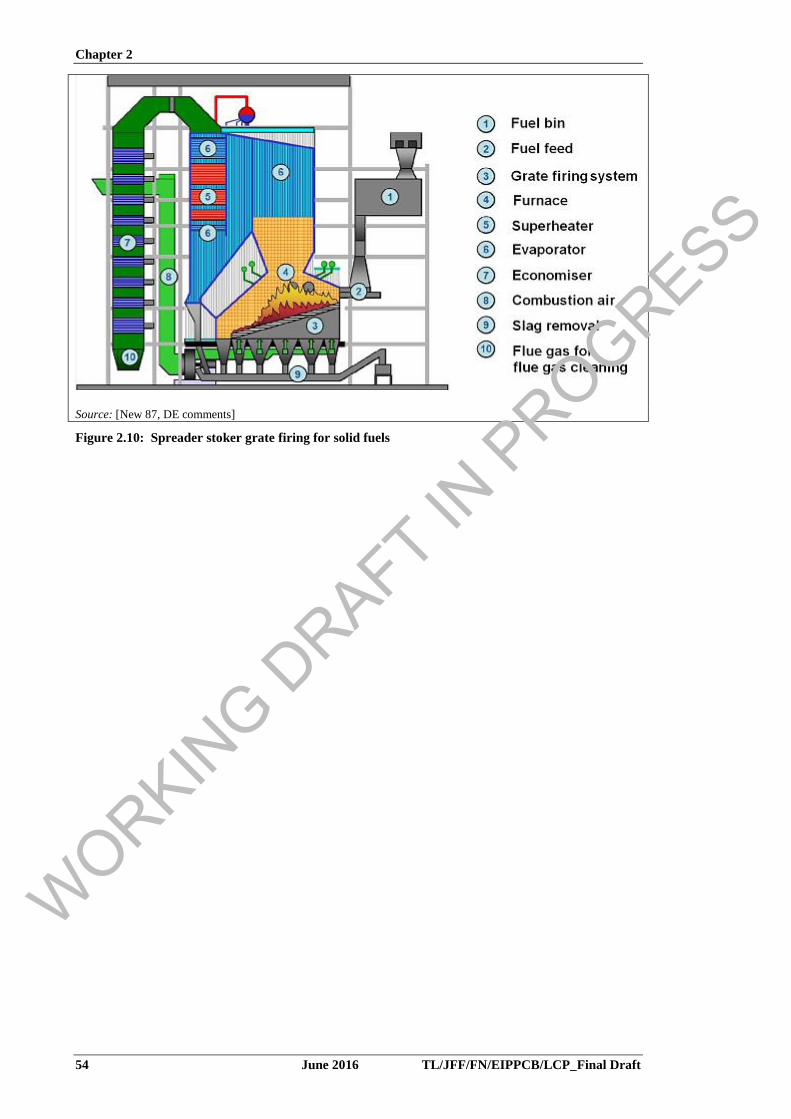
Chapter 2
54 June 2016 TL/JFF/FN/EIPPCB/LCP_Final Draft
Source: [New 87, DE comments]
Figure 2.10: Spreader stoker grate firing for solid fuels
WORKIN
G DRAFT IN
PROGRESS
Chapter 2
TL/JFF/FN/EIPPCB/LCP_Final Draft June 2016 55
2.3 Direct conversion
2.3.1 General
The expansion of hot pressurised (flue-) gas in gas turbines and in internal combustion engines
allows the generation of mechanical and, subsequently, electrical energy. Such systems have
been developed from mobile systems and are often applied in remote sites, like islands, or in gas
transmission networks. The transfer of combustion heat at a high temperature to steam with
exergetic losses caused by temperature limitations is avoided in these processes. For this reason,
interest in direct expansion methods is increasing. These systems can be started very quickly
and so can meet peak demands. Additionally, these technologies do not necessarily need water
for cooling. Nonetheless, they can be coupled to steam processes to increase the overall
efficiency, i.e. in a combined cycle.
2.3.2 Combustion engines
Combustion or reciprocating engines have one or more cylinders in which fuel combustion
occurs. Engines convert the chemical energy of fuels into mechanical energy, in a design similar
to a marine engine (HFO and/or gas oil engine type) or automotive Otto (lean-burn gas engine
type) engine. To produce electricity, the moving piston transfers the energy from the
combustion to a generator connected to the rotating engine shaft.
Reciprocating engines for power plants are typically designed to operate on either four- or two-
stroke cycles. Both larger baseload engine-driven power plants with an output of up to about
600 MWe (formed by a number of single engines) and decentralised smaller simultaneous heat
and power (CHP) production plants are common worldwide. High-efficiency medium- and low-
speed engines are suitable for baseload operation. Medium-speed diesel engine units with a fuel
input of up to 50 MWth or more and gas diesel engines (‘high pressure’ and ‘low pressure (dual
fuel)’ types) with a fuel input of up to 40 MWth, are available on the market. Low-speed diesel
engine units have a fuel input of 130 MWth or more. Four-stroke spark-ignited lean-burn gas-
type engine units have a fuel input of up to about 45 MWth. [New 135] [63, Wärtsilä, 2000]
Compared to gas turbines, combustion in reciprocating engines is not continuous and takes
place in closed combustion chambers. During combustion, the pressure and temperature
increase is very high and this allows a high conversion efficiency for small units. Most systems
use gas oil or heavy fuel oil as liquid fuel, but gaseous fuel use is also possible. Often special
measures are necessary to reach current emission standards.
In Europe, few such plants exist in interconnected systems for power generation with liquid
fuels. The applications with liquids are mainly limited to isolated systems (e.g. operated on
islands) where a natural gas grid is not available. Gas-fired stationary engine plants are common
today, such as medium-sized CHP plants and large peaking plants for grid stabilisation.
The advantages of the reciprocating engine for this kind of application are many, e.g. high
thermal efficiency (low fuel consumption), optimum set-up for matching different load
demands, short construction time, easy maintenance and robust design. The best electrical
efficiencies (at alternator terminals) range from about 38 % to 48 % (depending on the engine
size, and depending on whether it is a new engine and/or whether it is single or combined
cycle), calculated on the lower heating value of the fuel.
Other attractive advantages of the engine-driven combustion plant are that these combustion
plants can be located in urban areas or in industrial areas close to the consumers of the heat and
electricity. Less transmission lines are then needed and the associated energy losses and land
demand can be minimised. Engine-driven CHP plants are well suited for industrial applications,
local utility companies, residential and commercial buildings, etc. Heat can be recovered as
steam, hot water, hot air, etc. Possible options for using the recovered heat include:
WORKIN
G DRAFT IN
PROGRESS

Chapter 2
56 June 2016 TL/JFF/FN/EIPPCB/LCP_Final Draft
district heating/cooling;
desalination processes;
air preheating for some processes.
2.3.2.1 Diesel engines
Diesel engines are flexible in terms of fuel and can use fuels such as gas oil, heavy fuel oil, gas,
crude oil, biofuels and, in a few cases, even emulsified fuels. In a diesel engine, air is forced
into the cylinder and is compressed by the piston. Fuel is injected into the cylinder and is ignited
by the heat of the air compression.
The optimum heat to power ratio for a reciprocating engine plant is typically about one (in a
high-grade heat plant), compared to a low-grade heat system which typically has a heat to power
ratio of 3/2 or higher.
Liquid fuel pressure can be boosted to about 1100–1800 bar (dependent on engine type) to
achieve a droplet distribution small enough for fast and complete combustion. The nozzle
design for the fuel inlet is one of the key factors for the combustion process. Combustion is
realised partially at constant volume with an increase in the pressure, with the main combustion
process occurring at constant pressure. Combustion is not continuous but occurs only during
one part of the cycle. End-of-compression pressure and temperature are important parameters to
ensure good combustion. The maximum pressure must be limited to prevent damage. The
engine materials can bear temperatures of about 1200 °C, which allows a maximum cycle
temperature of 2500 °C. Thus the efficiency of this kind of engine is around 40–50 %.
2.3.2.2 Spark-ignited (SG-type) engines
A spark-ignited gas Otto engine often works according to the lean-burn concept. The expression
‘lean-burn’ describes the ratio of air-combustion/fuel in the cylinder, which is a lean mixture,
i.e. there is more air present in the cylinder than needed for combustion. In order to stabilise the
ignition and combustion of the lean mixture, in larger engine types, a pre-chamber with a richer
air/fuel mixture is used. The ignition is initiated with a spark plug located in the pre-chamber,
resulting in a high-energy ignition source for the main fuel charge in the cylinder. This engine
type is designed for use with low-pressure gas as a fuel. Spark-ignited engines with a fuel input
of up to 40 MWth are on the market.
2.3.2.3 Low-pressure dual fuel (DF-type) engines
The dual fuel (DF) engine is an engine type that recently became available on the market,
developed for countries where natural gas is available. This engine type is versatile with regards
to fuel, it can be run on low-pressure natural gas or liquid fuels such as gas oil, heavy fuel oil,
bio oils, etc., and it can operate at full load in both fuel modes. In the gas mode, the engine is
operated according to the lean-burn principle, i.e. there is about twice as much air in the
cylinder compared to the minimum needed for complete combustion of the gas. This allows a
controlled combustion and a high specific cylinder output without immediate risk of knocking
or self-ignition when the process is well controlled. In gas engines, the compression of the
air/gas mixture with the piston does not heat the gas enough to start the combustion process, and
therefore some additional energy needs to be added, which is done by injecting a small pilot fuel
stream (e.g. gas oil). A liquid fuel such as gas oil has a lower self-ignition temperature than
natural gas and the heat in the cylinder close to the top position is enough to ignite the liquid
fuel, which in turn creates enough heat to cause the air/gas mixture to burn. The amount of pilot
fuel ranges from 1 % to 2 % of the total fuel consumption at full load. The engine works
according to the diesel process, in the liquid fuel mode, and according to the Otto process in the
gas mode. [New 136] [88, Euromot, 2001]. In view of the different thermodynamic cycles when
WORKIN
G DRAFT IN
PROGRESS

Chapter 2
TL/JFF/FN/EIPPCB/LCP_Final Draft June 2016 57
operating a dual fuel engine, the engine cannot be optimised for each fuel and a level of
compromise is inherent. The DF engine is primarily optimised for gas operation. Thus the
compression ratio possible for a DF engine will be lower than for a modern diesel engine and, as
a consequence, the NOX emission is higher for the DF-type engine in liquid mode than for a
modern optimised diesel engine if there is no NOX abatement technique.
Source: [149, Wärtsilä NSD, 2001]
Figure 2.11: Natural gas-fired engine
2.3.2.4 High-pressure gas diesel (GD-type) engines
High-pressure gas injection engines operate according to the diesel process in both liquid and
gas fuel modes. In the gas mode, a pilot fuel oil (e.g. HFO) (typically 3–5 % of the total fuel
heat input) and a high-pressure gas at about 350–400 bar pressure are needed. The engine can
operate at full load, both in liquid and gas fuel modes. High-pressure gas diesel engines up to
about 40 MWth or 20 MWe are available on the market.
2.3.3 Gas turbines
Gas turbines are used for the transformation of chemically bound fuel energy into mechanical
energy. They are applied for the production of electrical energy and to drive pumps and
compressors. The number of gas turbines used worldwide has grown significantly over the last
decades, and nowadays gas turbines are increasingly used for electricity production in base and
intermediate loads, and can also be used for emergency and peak demand, in large grids. In the
case of islands, gas turbines operate with liquid fuel, mainly gas oil in medium or baseload
operation. This increase may be explained by the abundant supply of natural gas at a favourable
price in the past and by the development of a new generation of gas turbines with higher output,
efficiency, and reliability.
Stationary gas turbines are classified into three groups according to their design characteristics
and thermodynamic parameters:
heavy-duty gas turbines;
aero-derivatives (gas turbines derived from aircraft engines);
small and micro-gas turbines for a decentralised power supply.
[ 1, Eurelectric 2012 ]
Gas turbines are used within a wide range of thermal capacities, from small gas turbines at
about 100 kWe, up to large gas turbines of 380 MWe. Gas turbines can be fuelled with various
WORKIN
G DRAFT IN
PROGRESS

Chapter 2
58 June 2016 TL/JFF/FN/EIPPCB/LCP_Final Draft
gaseous fuels and liquid fuels. Natural gas is the usual gaseous fuel for gas turbines, but gases
with low or medium calorific value are also applied, such as coal gas from coal gasification
units, gas from blast furnaces, and gas from biomass gasification units. Heavy-duty gas turbines
are capable of burning a variety of liquid fuels, from naphthas to residuals. Operating with ash-
forming fuels, such as crude and residual oils, requires comprehensive treatment systems (e.g.
desalting or particulates removal). The oil is raised to the necessary input pressure before
combustion in the gas turbine.
Gas turbines are installed in different types of combustion plants, such as combined cycle units,
cogeneration plants, and integrated coal gasification units (IGCC). Aeroderivative gas turbines
are available up to 100 MWe, with efficiencies of up to 42 %. They are also largely used on
offshore platforms. Heavy-duty gas turbines with power outputs from 150 MWe to 380 MWe
can reach efficiencies of up to 39 % (open cycle). Figure 2.12 shows examples of heavy-duty
gas turbines from different manufacturers.
Source: [New 116, EUTurbines comments],
Figure 2.12: Heavy-duty gas turbine electricity-generating units from different manufacturers
Sequential combustion, as shown in Figure 2.13, allows for a significant enhancement in heavy-
duty gas turbines used in the simple cycle mode without a combined steam cycle. One
advantage of these gas turbines is that the efficiency can be improved without constantly
increasing the turbine inlet temperature, while the classical heavy-duty gas turbine process with
high turbine inlet temperatures increases the complexity of the design of the downstream
process, due to the high exhaust gas temperature.
WORKIN
G DRAFT IN
PROGRESS
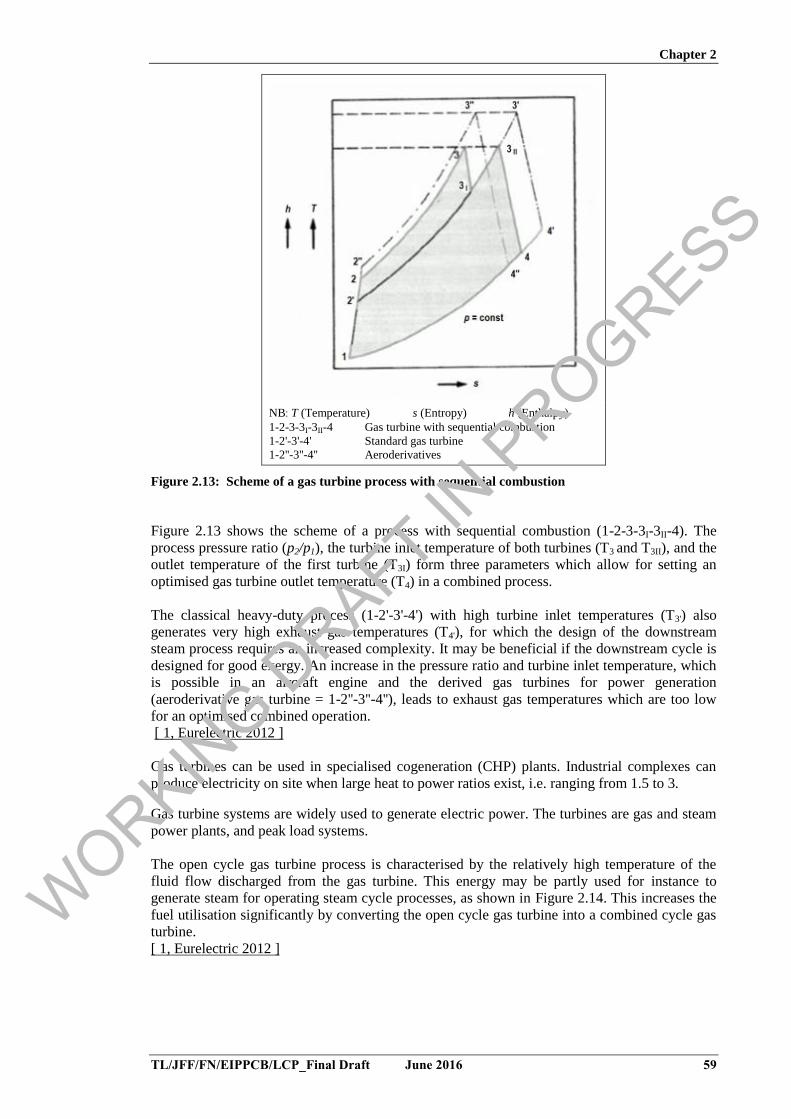
Chapter 2
TL/JFF/FN/EIPPCB/LCP_Final Draft June 2016 59
NB: T (Temperature) s (Entropy) h (Enthalpy)
1-2-3-3I-3II-4 Gas turbine with sequential combustion
1-2'-3'-4' Standard gas turbine
1-2''-3''-4'' Aeroderivatives
Figure 2.13: Scheme of a gas turbine process with sequential combustion
Figure 2.13 shows the scheme of a process with sequential combustion (1-2-3-3I-3II-4). The
process pressure ratio (p2/p1), the turbine inlet temperature of both turbines (T3 and T3II), and the
outlet temperature of the first turbine (T3I) form three parameters which allow for setting an
optimised gas turbine outlet temperature (T4) in a combined process.
The classical heavy-duty process (1-2'-3'-4') with high turbine inlet temperatures (T3') also
generates very high exhaust gas temperatures (T4'), for which the design of the downstream
steam process requires an increased complexity. It may be beneficial if the downstream cycle is
designed for good exergy. An increase in the pressure ratio and turbine inlet temperature, which
is possible in an aircraft engine and the derived gas turbines for power generation
(aeroderivative gas turbine = 1-2''-3''-4''), leads to exhaust gas temperatures which are too low
for an optimised combined operation.
[ 1, Eurelectric 2012 ]
Gas turbines can be used in specialised cogeneration (CHP) plants. Industrial complexes can
produce electricity on site when large heat to power ratios exist, i.e. ranging from 1.5 to 3.
Gas turbine systems are widely used to generate electric power. The turbines are gas and steam
power plants, and peak load systems.
The open cycle gas turbine process is characterised by the relatively high temperature of the
fluid flow discharged from the gas turbine. This energy may be partly used for instance to
generate steam for operating steam cycle processes, as shown in Figure 2.14. This increases the
fuel utilisation significantly by converting the open cycle gas turbine into a combined cycle gas
turbine.
[ 1, Eurelectric 2012 ]
WORKIN
G DRAFT IN
PROGRESS
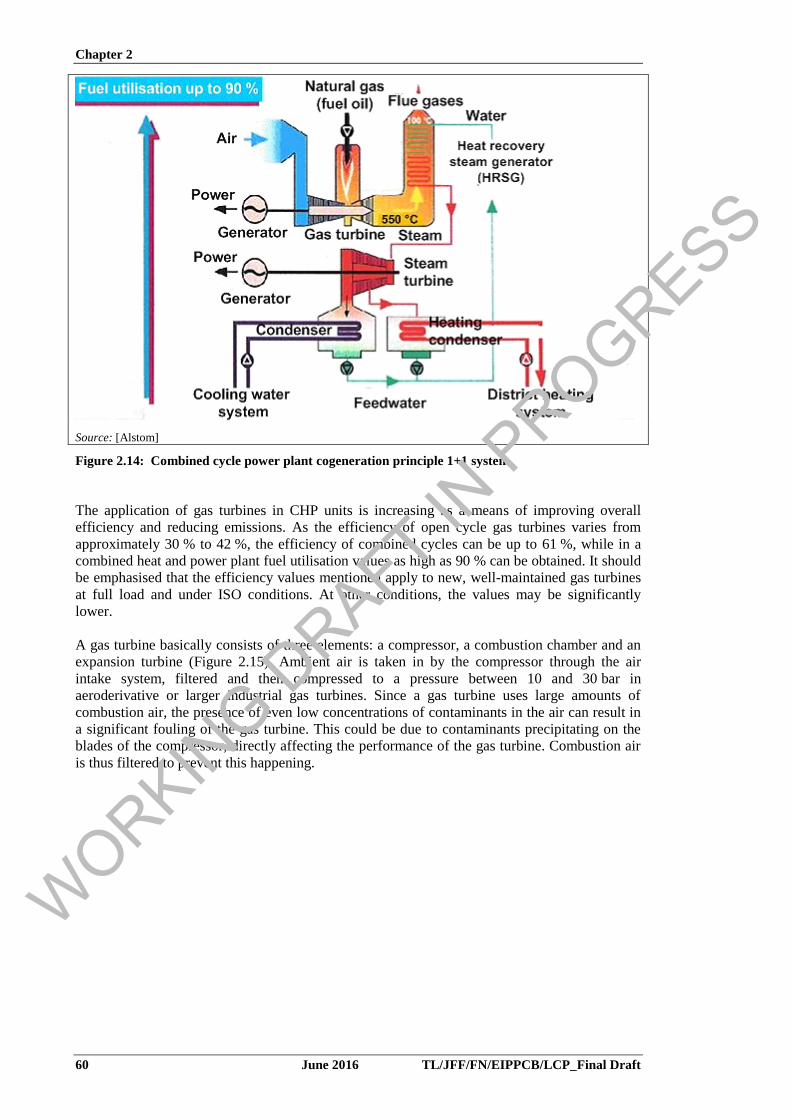
Chapter 2
60 June 2016 TL/JFF/FN/EIPPCB/LCP_Final Draft
Source: [Alstom]
Figure 2.14: Combined cycle power plant cogeneration principle 1+1 system
The application of gas turbines in CHP units is increasing as a means of improving overall
efficiency and reducing emissions. As the efficiency of open cycle gas turbines varies from
approximately 30 % to 42 %, the efficiency of combined cycles can be up to 61 %, while in a
combined heat and power plant fuel utilisation values as high as 90 % can be obtained. It should
be emphasised that the efficiency values mentioned apply to new, well-maintained gas turbines
at full load and under ISO conditions. At other conditions, the values may be significantly
lower.
A gas turbine basically consists of three elements: a compressor, a combustion chamber and an
expansion turbine (Figure 2.15). Ambient air is taken in by the compressor through the air
intake system, filtered and then compressed to a pressure between 10 and 30 bar in
aeroderivative or larger industrial gas turbines. Since a gas turbine uses large amounts of
combustion air, the presence of even low concentrations of contaminants in the air can result in
a significant fouling of the gas turbine. This could be due to contaminants precipitating on the
blades of the compressor, directly affecting the performance of the gas turbine. Combustion air
is thus filtered to prevent this happening.
WORKIN
G DRAFT IN
PROGRESS

Chapter 2
TL/JFF/FN/EIPPCB/LCP_Final Draft June 2016 61
Figure 2.15: Gas turbine (159 MW) with a silo combustion chamber
In the combustion chamber(s), fuel and compressed air are burnt at temperatures of between
1000 ºC and 1450 ºC. After the combustion process, the gas expands through the turbine and
generates electric power in the generator, drawing off the power needed to drive the
compressors, or the shaft transferring mechanical power in the case of mechanical drive
systems.
Gas turbines are designed with one or two shafts. Single-shaft gas turbines are configured with
one continuous shaft and, therefore, all stages operate at the same speed. These units are most
suited to generator drive applications, where a significant speed variation is not required or is
even not wanted. In some cases, a reduction gear is applied between the gas turbine and the
generator.
In a multi-shaft gas turbine, the low-pressure part of the turbine (the power turbine) is separated
from the high-pressure part, which drives the compressor. The low-pressure turbine is able to
operate at a wide range of speeds, which makes it ideally suited to variable speed applications.
However, this feature is less important for application in power plants, because the driven
equipment (i.e. the generator) is operated at a constant speed during normal operation, related to
the grid frequency.
The materials applied in stationary gas turbines can be classified into three main groups:
stainless steel (iron-based), nickel-based alloys, and cobalt-based alloys. In general, the
materials adopted for compressors are the same as those applied in the high-pressure parts of the
steam turbines. Nickel-based materials are usually applied for combustor parts. For gas turbine
blades, nickel-based superalloys are applied because of their good mechanical properties at high
temperatures.
Source:[New 137] [104, Siemens, 2001]
WORKIN
G DRAFT IN
PROGRESS
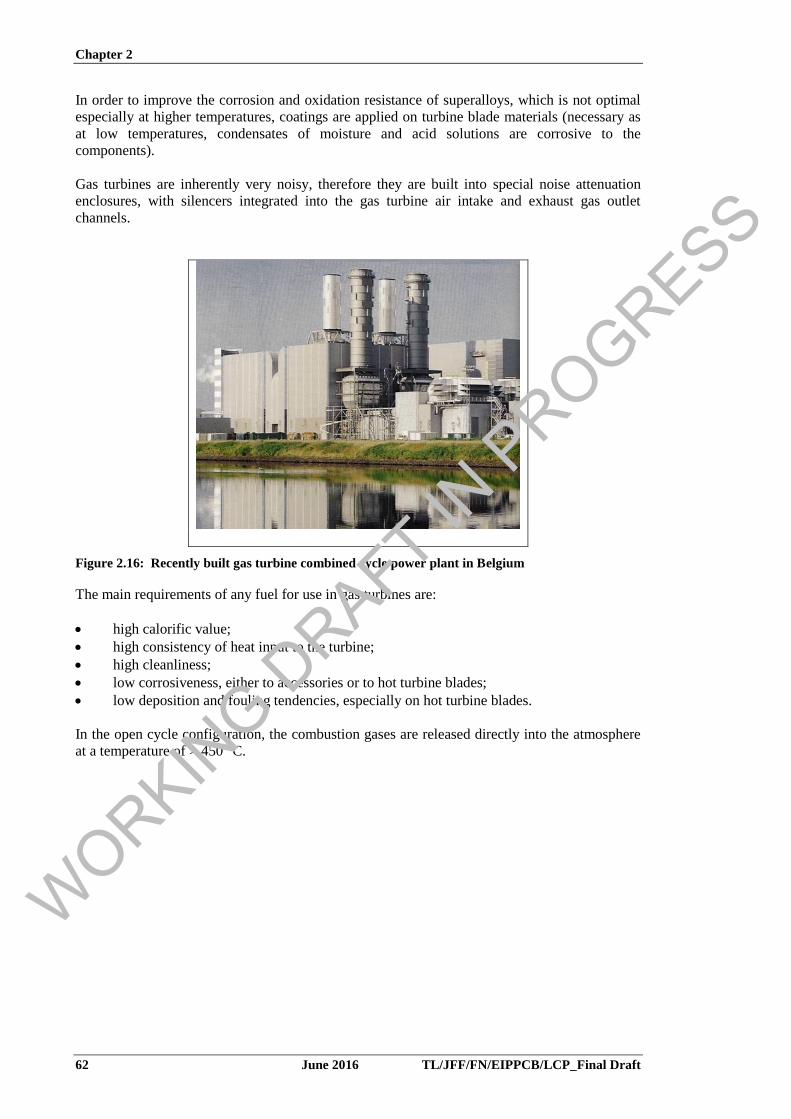
Chapter 2
62 June 2016 TL/JFF/FN/EIPPCB/LCP_Final Draft
In order to improve the corrosion and oxidation resistance of superalloys, which is not optimal
especially at higher temperatures, coatings are applied on turbine blade materials (necessary as
at low temperatures, condensates of moisture and acid solutions are corrosive to the
components).
Gas turbines are inherently very noisy, therefore they are built into special noise attenuation
enclosures, with silencers integrated into the gas turbine air intake and exhaust gas outlet
channels.
Figure 2.16: Recently built gas turbine combined cycle power plant in Belgium
The main requirements of any fuel for use in gas turbines are:
high calorific value;
high consistency of heat input to the turbine;
high cleanliness;
low corrosiveness, either to accessories or to hot turbine blades;
low deposition and fouling tendencies, especially on hot turbine blades.
In the open cycle configuration, the combustion gases are released directly into the atmosphere
at a temperature of > 450 °C.
WORKIN
G DRAFT IN
PROGRESS
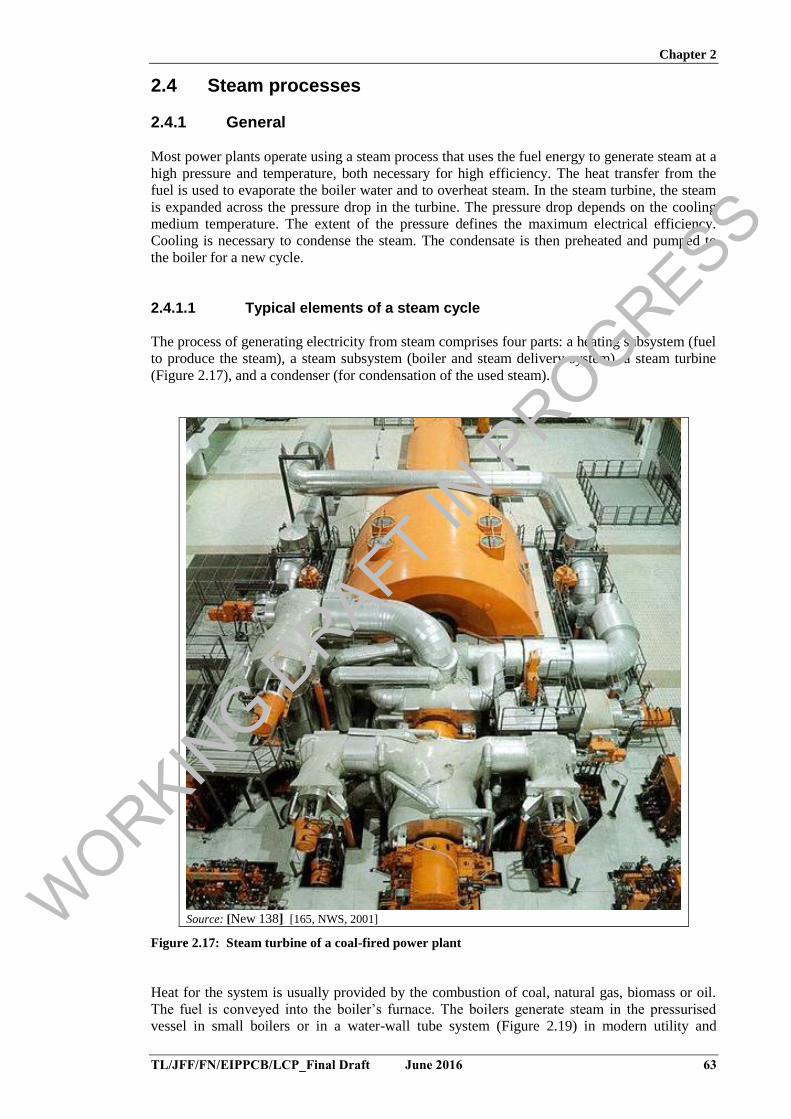
Chapter 2
TL/JFF/FN/EIPPCB/LCP_Final Draft June 2016 63
2.4 Steam processes
2.4.1 General
Most power plants operate using a steam process that uses the fuel energy to generate steam at a
high pressure and temperature, both necessary for high efficiency. The heat transfer from the
fuel is used to evaporate the boiler water and to overheat steam. In the steam turbine, the steam
is expanded across the pressure drop in the turbine. The pressure drop depends on the cooling
medium temperature. The extent of the pressure defines the maximum electrical efficiency.
Cooling is necessary to condense the steam. The condensate is then preheated and pumped to
the boiler for a new cycle.
2.4.1.1 Typical elements of a steam cycle
The process of generating electricity from steam comprises four parts: a heating subsystem (fuel
to produce the steam), a steam subsystem (boiler and steam delivery system), a steam turbine
(Figure 2.17), and a condenser (for condensation of the used steam).
Source: [New 138] [165, NWS, 2001]
Figure 2.17: Steam turbine of a coal-fired power plant
Heat for the system is usually provided by the combustion of coal, natural gas, biomass or oil.
The fuel is conveyed into the boiler’s furnace. The boilers generate steam in the pressurised
vessel in small boilers or in a water-wall tube system (Figure 2.19) in modern utility and
WORKIN
G DRAFT IN
PROGRESS

Chapter 2
64 June 2016 TL/JFF/FN/EIPPCB/LCP_Final Draft
industrial boilers. Additional elements within or associated with the boiler, such as a
superheater, reheater, economiser and air heater, improve the boiler efficiency.
Residues from the combustion process include flue-gases and, when coal, biomass or oil is used
as fuel, ash.
High-temperature, high-pressure steam is generated in the boiler and then enters the steam
turbine, as shown schematically in Figure 2.18. At the other end of the steam turbine is the
condenser, which is kept at a low temperature and pressure. Steam flowing from the high-
pressure boiler to the low-pressure condenser drives the turbine blades, which powers the
electric generator.
Source: [New 139] [54, Cortés and Plumed, 2000]
Figure 2.18: Schematic of an ideal combustion Rankine steam cycle
Steam expands as it works, hence the turbine is wider at the end where the steam exits. The
theoretical thermal efficiency of the unit depends on the gradient between the high pressure and
temperature in the boiler and the low temperature and pressure in the condenser.
Low-pressure steam exiting the turbine enters the condenser shell and is condensed on the
condenser tubes. The condenser tubes are maintained at a low temperature by the flow of
cooling medium. The condenser is necessary for efficient operation by providing a low-pressure
sink for the exhausted steam. As the steam is cooled to condensate, the condensate is
transported by the boiler feed-water system back to the boiler, where it is reused. Being a low-
volume incompressible liquid, the condensate water can be efficiently pumped back into the
high-pressure boiler.
A constant sufficient flow of low-temperature cooling medium in the condenser tubes is
required to keep the condenser shell (steam side) at a proper pressure to ensure efficient
electricity generation. Through the condensing process, the cooling medium is warmed. If the
cooling system is an open or a once-through system, this warm water is released back to the
source water body. In a closed system, the warm medium is cooled by recirculation through
cooling towers, lakes or ponds, where the heat is released into the air by evaporation and/or
sensible heat transfer. If a recirculating cooling system is used, only a small amount of make-up
water is required to offset losses by evaporation and the cooling tower blowdown, which must
be discharged periodically to control the build-up of solids. Compared to a once-through
WORKIN
G DRAFT IN
PROGRESS
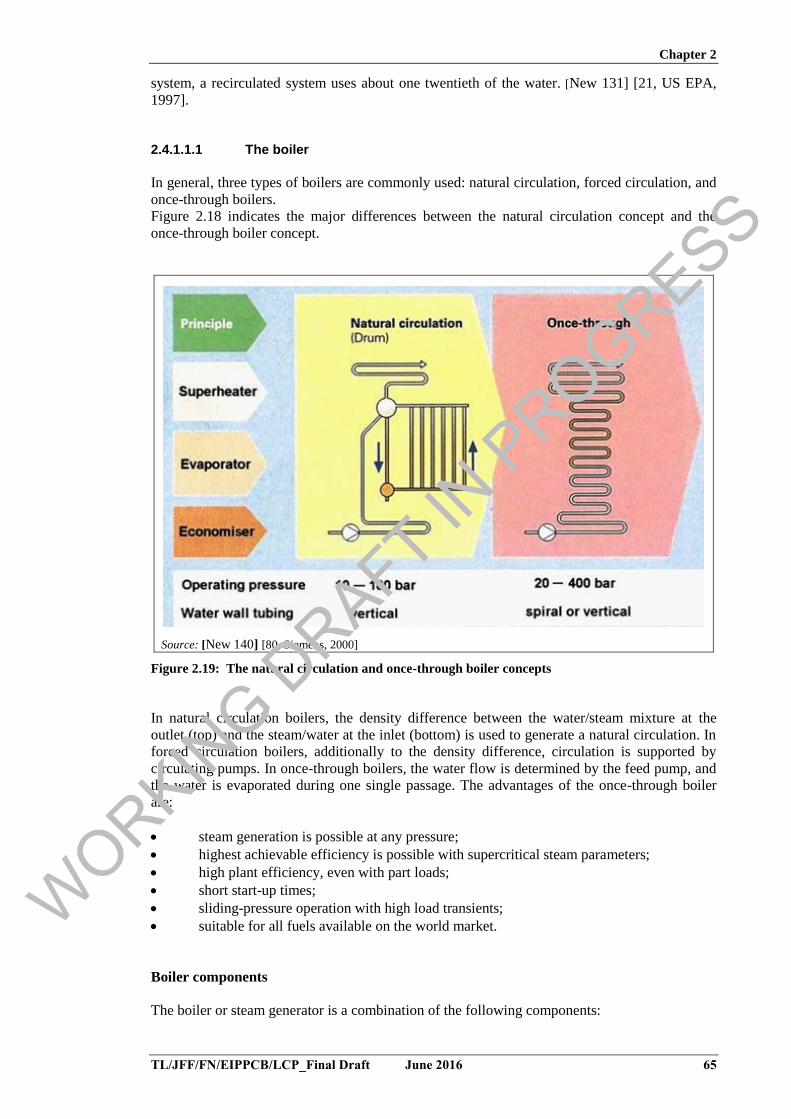
Chapter 2
TL/JFF/FN/EIPPCB/LCP_Final Draft June 2016 65
system, a recirculated system uses about one twentieth of the water. [New 131] [21, US EPA,
1997].
2.4.1.1.1 The boiler
In general, three types of boilers are commonly used: natural circulation, forced circulation, and
once-through boilers.
Figure 2.18 indicates the major differences between the natural circulation concept and the
once-through boiler concept.
Source: [New 140] [80, Siemens, 2000]
Figure 2.19: The natural circulation and once-through boiler concepts
In natural circulation boilers, the density difference between the water/steam mixture at the
outlet (top) and the steam/water at the inlet (bottom) is used to generate a natural circulation. In
forced circulation boilers, additionally to the density difference, circulation is supported by
circulating pumps. In once-through boilers, the water flow is determined by the feed pump, and
the water is evaporated during one single passage. The advantages of the once-through boiler
are:
steam generation is possible at any pressure;
highest achievable efficiency is possible with supercritical steam parameters;
high plant efficiency, even with part loads;
short start-up times;
sliding-pressure operation with high load transients;
suitable for all fuels available on the world market.
Boiler components
The boiler or steam generator is a combination of the following components:
WORKIN
G DRAFT IN
PROGRESS
Chapter 2
66 June 2016 TL/JFF/FN/EIPPCB/LCP_Final Draft
Economiser: The feed water is heated in the economiser to a temperature 10 ºC below
the saturation point. The economiser is the first heat exchanger of the boiler collecting heat from
the lower temperature flue-gas at the exit of the boiler.
Evaporator: In the combustion chamber, the energy of the fuel is released and
transferred across the boiler and heat-exchanger walls to the water/steam circuit. The heated
water is then evaporated in the boiler evaporator to at least saturated steam for subcritical
pressure water/steam conditions, or to superheated steam for supercritical conditions. Usually
the evaporator tubes constitute the combustion chamber walls and are aligned in a vertical or a
spiral arrangement. Modern plants work with supercritical water/steam pressure, i.e. a pressure
above the critical point in the water-steam diagram. At supercritical pressure, the conversion
occurs without a phase transition, so the evaporation energy is zero and only a peak in heat
capacity represents the change in the continuous fluid.
Superheater: The superheater uses the highest temperature flue-gas area of the boiler to
produce superheated steam. Usually the superheater stage consists of several heat exchangers
with an injection in between. This injection controls the live steam temperature. Live steam
temperatures are in the range of 540–570 ºC for supercritical units and in the range of about 600
ºC for ultra-supercritical units. Superheated steam has a temperature significantly above the
pressure-dependent condensation temperature. Such temperatures are necessary to facilitate the
high pressure drop in the steam turbine and thus avoid condensation during the expansion of
steam in the high-pressure steam turbine. Part of this expanded steam is bled off and used to
transfer heat to the feed water.
Reheater: The bulk of the steam is reheated by the flue-gas in the reheater systems to
extract further work and to achieve a higher efficiency in the subsequent medium-pressure
steam turbine. The hot reheat steam temperature is controlled, e.g. by means of water injection
or burner tilt. Reheating is typically used at large power plants. Very large units can also have
another superheating stage to further enhance power output.
2.4.1.1.2 Steam turbine
In the steam turbine, the thermal energy of the steam is converted to mechanical work (i.e.
turbine shaft rotation). This occurs between the steam inlet point and the condenser, with the
steam expansion being used as the driving force. The steam expansion is coupled with a
pressure drop and with an adiabatic decrease of the steam temperature. During this adiabatic
steam expansion, the temperature of the steam decreases in association with a pressure drop
from about 180–300 bar to 0.03 bar for modern LCPs. For larger plants, due to the large
difference in pressure, steam expansion is normally effected in three stages: high-pressure (HP),
intermediate-pressure (IP) and low-pressure (LP) stages of steam turbines. In most cases, these
steps allow the steam to be reheated in reheaters before re-entering the next lowest pressure
steps in the steam turbine. For smaller plants, two stages are applied (IP and LP).
2.4.1.1.3 Condenser
Finally, in the condenser located downstream of the low-pressure section of the turbine, steam is
condensed back to water (condensate). After expansion in the steam turbine, some condensation
and kinetic energy remains in the steam and is not transferable to mechanical energy. Efficient
condensation systems allow a reduction in the pressure of the steam turbine to well below
atmospheric pressure (vacuum of down to 0.03 bar, depending on the cooling medium
temperature and the cooling water mass flow), which is desirable to extract the maximum
amount of mechanical energy. This maximises the extraction of mechanical energy from the
expansion of steam in the turbine. At CHP plants the condenser can be cooled with district
heating water. With this application the condensing pressure is higher but the steam condensing
heat can be utilised for the heating of buildings or industrial processes.
WORKIN
G DRAFT IN
PROGRESS

Chapter 2
TL/JFF/FN/EIPPCB/LCP_Final Draft June 2016 67
2.4.1.1.4 Cooling system
Cooling techniques are applied to remove the condensation energy from the steam, i.e. the
thermodynamically unusable energy of the process. For some detailed information on cooling
techniques, refer to the ICS BREF.
The effect of choice of cooling technology on overall plant efficiency is of importance at
combustion plants. This leads to the following ordering of cooling system technologies: once-
through cooling, natural draught tower-cooled recirculating systems, mechanical draught tower-
cooled recirculating systems (including hybrid systems) and dry cooling systems, e.g. air-cooled
condensers. Where sufficient volumes of water are available, wet cooling systems result in the
highest plant efficiency and electrical output under nearly all conditions. In this case, the
environmental impacts of water discharged to the receiving water body have to be considered.
Recirculating tower-cooled systems offer slightly lower thermal efficiencies than those
achievable with once-through cooling but may be used at locations where water availability is
limited or the impact of entrainment and impingement and thermal discharges needs to be
reduced. Dry cooling technologies are limited to developments at locations with very restricted
water resources or with particular environmental concerns related to water use.
2.4.2 Vacuum condensing power plant
So-called condensing power plants use ambient cooling sources to condense the steam at the
lowest available temperature and under vacuum conditions.
Low-temperature cooling water from the sea, a river or lake enables the highest efficiency,
followed by warm, summertime temperature water from the same sources. Cooling using an
intermediate cooling cycle or cooling towers is generally the least effective technique, due to the
higher temperatures of the cooling medium. A temperature gradient between the steam and the
cooling medium, and the environment is always needed. As electrical efficiency varies with the
ambient temperature, reference data are calculated for standard ISO conditions.
2.4.3 Cogeneration/combined heat and power (CHP)
See Section 2.5.See Section 2.5.
WORKIN
G DRAFT IN
PROGRESS
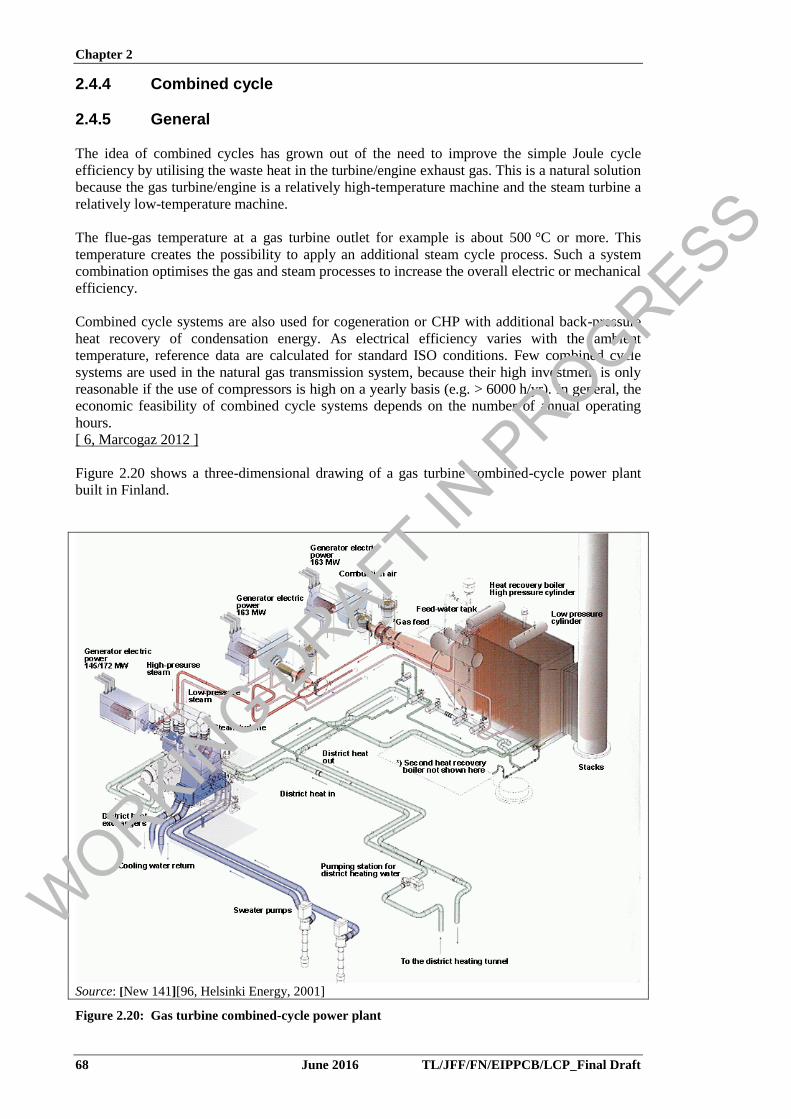
Chapter 2
68 June 2016 TL/JFF/FN/EIPPCB/LCP_Final Draft
2.4.4 Combined cycle
2.4.5 General
The idea of combined cycles has grown out of the need to improve the simple Joule cycle
efficiency by utilising the waste heat in the turbine/engine exhaust gas. This is a natural solution
because the gas turbine/engine is a relatively high-temperature machine and the steam turbine a
relatively low-temperature machine.
The flue-gas temperature at a gas turbine outlet for example is about 500 °C or more. This
temperature creates the possibility to apply an additional steam cycle process. Such a system
combination optimises the gas and steam processes to increase the overall electric or mechanical
efficiency.
Combined cycle systems are also used for cogeneration or CHP with additional back-pressure
heat recovery of condensation energy. As electrical efficiency varies with the ambient
temperature, reference data are calculated for standard ISO conditions. Few combined cycle
systems are used in the natural gas transmission system, because their high investment is only
reasonable if the use of compressors is high on a yearly basis (e.g. > 6000 h/yr). In general, the
economic feasibility of combined cycle systems depends on the number of annual operating
hours.
[ 6, Marcogaz 2012 ]
Figure 2.20 shows a three-dimensional drawing of a gas turbine combined-cycle power plant
built in Finland.
Source: [New 141][96, Helsinki Energy, 2001]
Figure 2.20: Gas turbine combined-cycle power plant
WORKIN
G DRAFT IN
PROGRESS
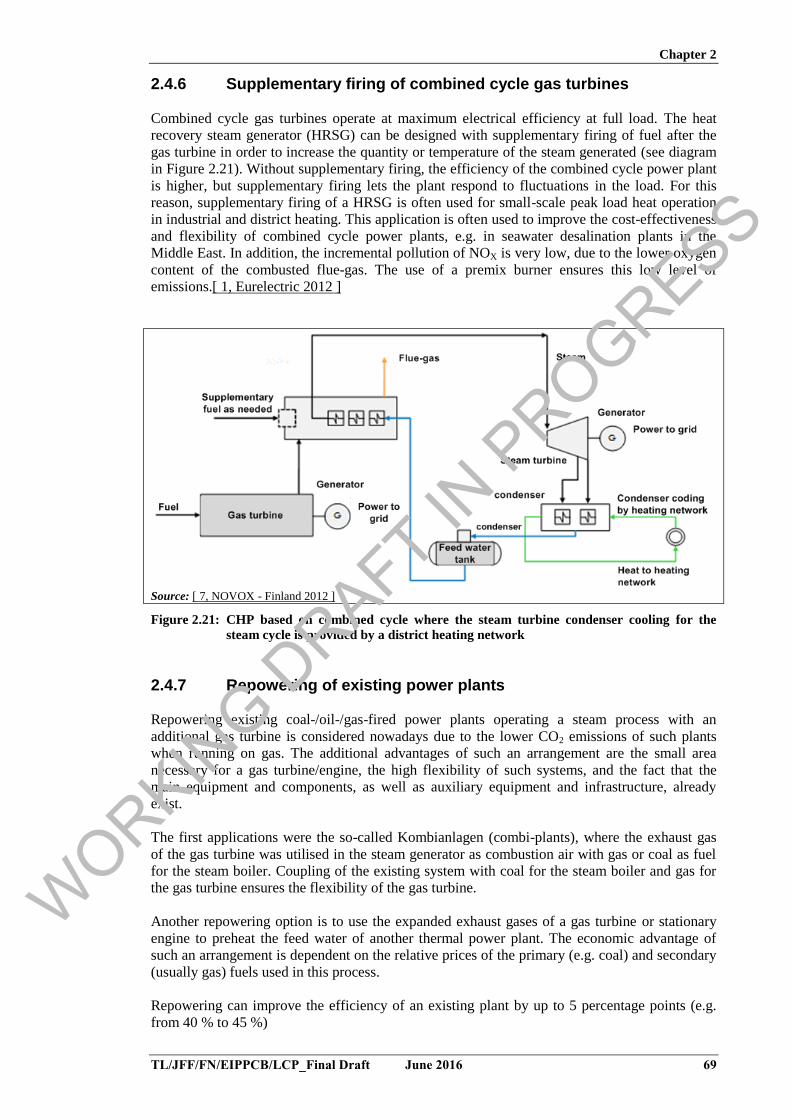
Chapter 2
TL/JFF/FN/EIPPCB/LCP_Final Draft June 2016 69
2.4.6 Supplementary firing of combined cycle gas turbines
Combined cycle gas turbines operate at maximum electrical efficiency at full load. The heat
recovery steam generator (HRSG) can be designed with supplementary firing of fuel after the
gas turbine in order to increase the quantity or temperature of the steam generated (see diagram
in Figure 2.21). Without supplementary firing, the efficiency of the combined cycle power plant
is higher, but supplementary firing lets the plant respond to fluctuations in the load. For this
reason, supplementary firing of a HRSG is often used for small-scale peak load heat operation
in industrial and district heating. This application is often used to improve the cost-effectiveness
and flexibility of combined cycle power plants, e.g. in seawater desalination plants in the
Middle East. In addition, the incremental pollution of NOX is very low, due to the lower oxygen
content of the combusted flue-gas. The use of a premix burner ensures this low level of
emissions.[ 1, Eurelectric 2012 ]
Source: [ 7, NOVOX - Finland 2012 ]
Figure 2.21: CHP based on combined cycle where the steam turbine condenser cooling for the
steam cycle is provided by a district heating network
2.4.7 Repowering of existing power plants
Repowering existing coal-/oil-/gas-fired power plants operating a steam process with an
additional gas turbine is considered nowadays due to the lower CO2 emissions of such plants
when running on gas. The additional advantages of such an arrangement are the small area
necessary for a gas turbine/engine, the high flexibility of such systems, and the fact that the
main equipment and components, as well as auxiliary equipment and infrastructure, already
exist.
The first applications were the so-called Kombianlagen (combi-plants), where the exhaust gas
of the gas turbine was utilised in the steam generator as combustion air with gas or coal as fuel
for the steam boiler. Coupling of the existing system with coal for the steam boiler and gas for
the gas turbine ensures the flexibility of the gas turbine.
Another repowering option is to use the expanded exhaust gases of a gas turbine or stationary
engine to preheat the feed water of another thermal power plant. The economic advantage of
such an arrangement is dependent on the relative prices of the primary (e.g. coal) and secondary
(usually gas) fuels used in this process.
Repowering can improve the efficiency of an existing plant by up to 5 percentage points (e.g.
from 40 % to 45 %)
WORKIN
G DRAFT IN
PROGRESS
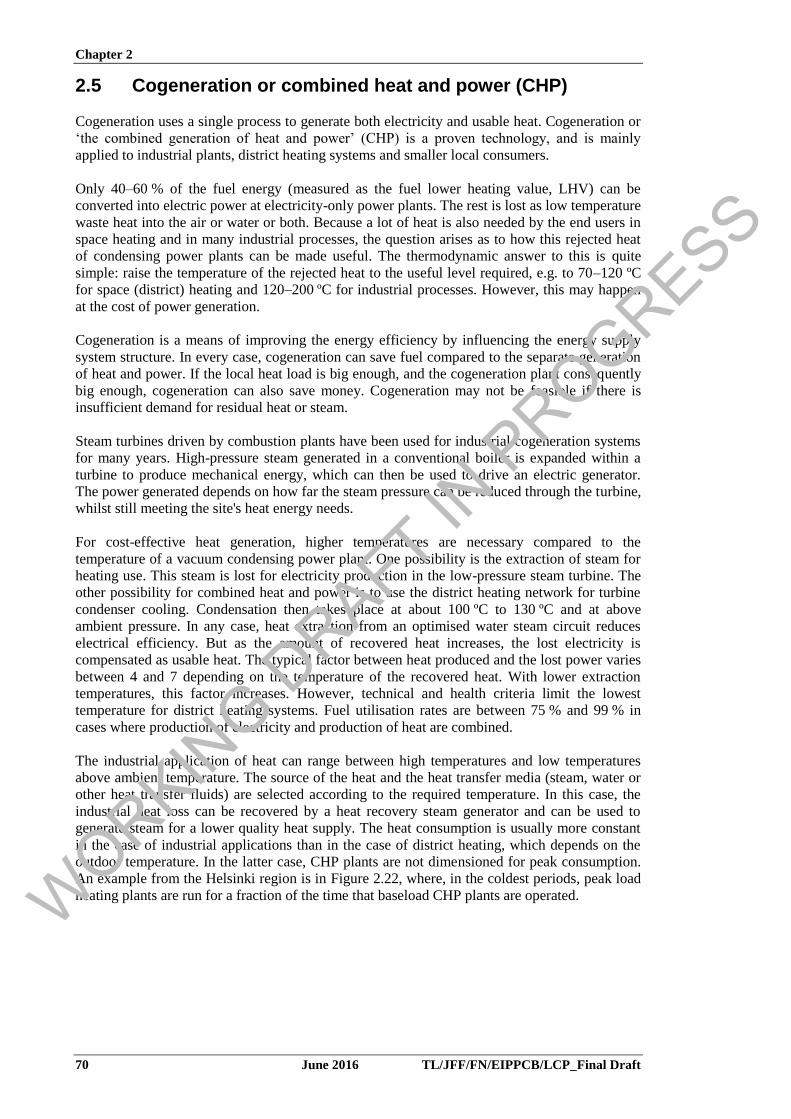
Chapter 2
70 June 2016 TL/JFF/FN/EIPPCB/LCP_Final Draft
2.5 Cogeneration or combined heat and power (CHP)
Cogeneration uses a single process to generate both electricity and usable heat. Cogeneration or
‘the combined generation of heat and power’ (CHP) is a proven technology, and is mainly
applied to industrial plants, district heating systems and smaller local consumers.
Only 40–60 % of the fuel energy (measured as the fuel lower heating value, LHV) can be
converted into electric power at electricity-only power plants. The rest is lost as low temperature
waste heat into the air or water or both. Because a lot of heat is also needed by the end users in
space heating and in many industrial processes, the question arises as to how this rejected heat
of condensing power plants can be made useful. The thermodynamic answer to this is quite
simple: raise the temperature of the rejected heat to the useful level required, e.g. to 70–120 ºC
for space (district) heating and 120–200 ºC for industrial processes. However, this may happen
at the cost of power generation.
Cogeneration is a means of improving the energy efficiency by influencing the energy supply
system structure. In every case, cogeneration can save fuel compared to the separate generation
of heat and power. If the local heat load is big enough, and the cogeneration plant consequently
big enough, cogeneration can also save money. Cogeneration may not be feasible if there is
insufficient demand for residual heat or steam.
Steam turbines driven by combustion plants have been used for industrial cogeneration systems
for many years. High-pressure steam generated in a conventional boiler is expanded within a
turbine to produce mechanical energy, which can then be used to drive an electric generator.
The power generated depends on how far the steam pressure can be reduced through the turbine,
whilst still meeting the site's heat energy needs.
For cost-effective heat generation, higher temperatures are necessary compared to the
temperature of a vacuum condensing power plant. One possibility is the extraction of steam for
heating use. This steam is lost for electricity production in the low-pressure steam turbine. The
other possibility for combined heat and power is to use the district heating network for turbine
condenser cooling. Condensation then takes place at about 100 ºC to 130 ºC and at above
ambient pressure. In any case, heat extraction from an optimised water steam circuit reduces
electrical efficiency. But as the amount of recovered heat increases, the lost electricity is
compensated as usable heat. The typical factor between heat produced and the lost power varies
between 4 and 7 depending on the temperature of the recovered heat. With lower extraction
temperatures, this factor increases. However, technical and health criteria limit the lowest
temperature for district heating systems. Fuel utilisation rates are between 75 % and 99 % in
cases where production of electricity and production of heat are combined.
The industrial application of heat can range between high temperatures and low temperatures
above ambient temperature. The source of the heat and the heat transfer media (steam, water or
other heat transfer fluids) are selected according to the required temperature. In this case, the
industrial heat loss can be recovered by a heat recovery steam generator and can be used to
generate steam for a lower quality heat supply. The heat consumption is usually more constant
in the case of industrial applications than in the case of district heating, which depends on the
outdoor temperature. In the latter case, CHP plants are not dimensioned for peak consumption.
An example from the Helsinki region is in Figure 2.22, where, in the coldest periods, peak load
heating plants are run for a fraction of the time that baseload CHP plants are operated.
WORKIN
G DRAFT IN
PROGRESS
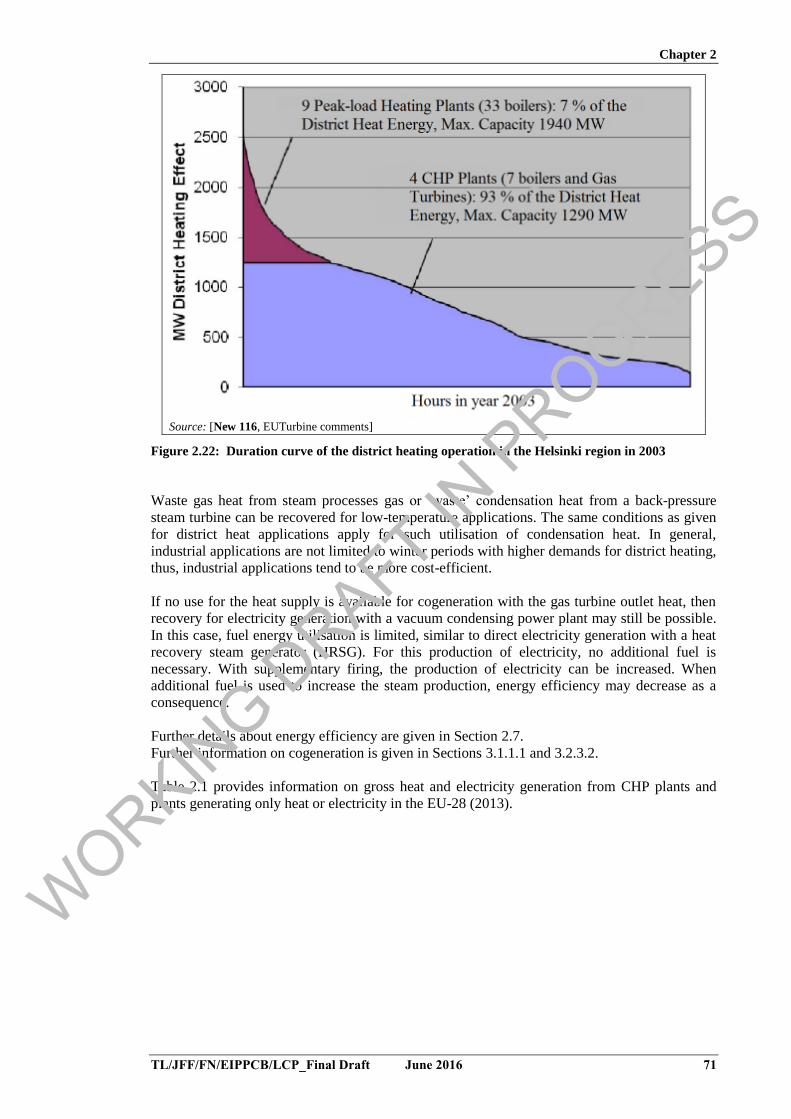
Chapter 2
TL/JFF/FN/EIPPCB/LCP_Final Draft June 2016 71
Source: [New 116, EUTurbine comments]
Figure 2.22: Duration curve of the district heating operation in the Helsinki region in 2003
Waste gas heat from steam processes gas or ‘waste’ condensation heat from a back-pressure
steam turbine can be recovered for low-temperature applications. The same conditions as given
for district heat applications apply for such utilisation of condensation heat. In general,
industrial applications are not limited to winter periods with higher demands for district heating,
thus, industrial applications tend to be more cost-efficient.
If no use for the heat supply is available for cogeneration with the gas turbine outlet heat, then
recovery for electricity generation with a vacuum condensing power plant may still be possible.
In this case, fuel energy utilisation is limited, similar to direct electricity generation with a heat
recovery steam generator (HRSG). For this production of electricity, no additional fuel is
necessary. With supplementary firing, the production of electricity can be increased. When
additional fuel is used to increase the steam production, energy efficiency may decrease as a
consequence.
Further details about energy efficiency are given in Section 2.7.
Further information on cogeneration is given in Sections 3.1.1.1 and 3.2.3.2.
Table 2.1 provides information on gross heat and electricity generation from CHP plants and
plants generating only heat or electricity in the EU-28 (2013).
WORKIN
G DRAFT IN
PROGRESS
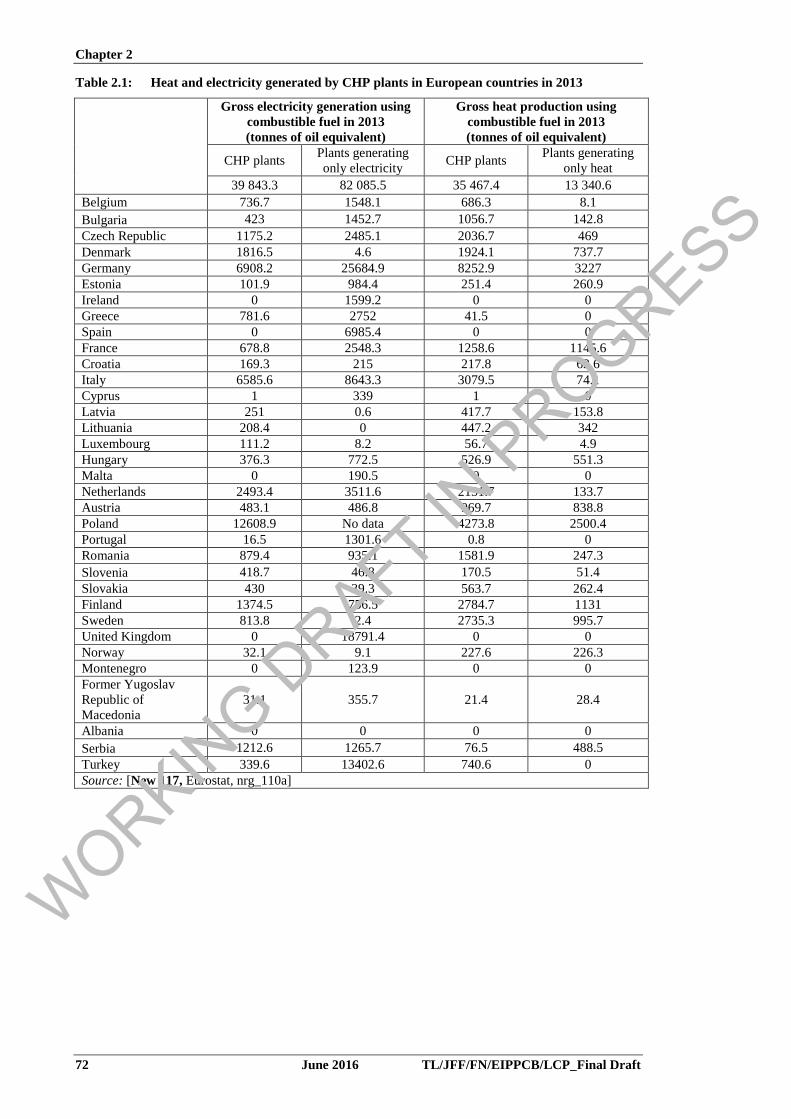
Chapter 2
72 June 2016 TL/JFF/FN/EIPPCB/LCP_Final Draft
Table 2.1: Heat and electricity generated by CHP plants in European countries in 2013
Gross electricity generation using
combustible fuel in 2013
(tonnes of oil equivalent)
Gross heat production using
combustible fuel in 2013
(tonnes of oil equivalent)
CHP plants Plants generating
only electricity CHP plants
Plants generating
only heat
39 843.3 82 085.5 35 467.4 13 340.6
Belgium 736.7 1548.1 686.3 8.1
Bulgaria 423 1452.7 1056.7 142.8
Czech Republic 1175.2 2485.1 2036.7 469
Denmark 1816.5 4.6 1924.1 737.7
Germany 6908.2 25684.9 8252.9 3227
Estonia 101.9 984.4 251.4 260.9
Ireland 0 1599.2 0 0
Greece 781.6 2752 41.5 0
Spain 0 6985.4 0 0
France 678.8 2548.3 1258.6 1145.6
Croatia 169.3 215 217.8 62.6
Italy 6585.6 8643.3 3079.5 74.1
Cyprus 1 339 1 0
Latvia 251 0.6 417.7 153.8
Lithuania 208.4 0 447.2 342
Luxembourg 111.2 8.2 56.7 4.9
Hungary 376.3 772.5 526.9 551.3
Malta 0 190.5 0 0
Netherlands 2493.4 3511.6 2131.7 133.7
Austria 483.1 486.8 969.7 838.8
Poland 12608.9 No data 4273.8 2500.4
Portugal 16.5 1301.6 0.8 0
Romania 879.4 935.1 1581.9 247.3
Slovenia 418.7 46.8 170.5 51.4
Slovakia 430 39.3 563.7 262.4
Finland 1374.5 756.5 2784.7 1131
Sweden 813.8 2.4 2735.3 995.7
United Kingdom 0 18791.4 0 0
Norway 32.1 9.1 227.6 226.3
Montenegro 0 123.9 0 0
Former Yugoslav
Republic of
Macedonia
31.1 355.7 21.4 28.4
Albania 0 0 0 0
Serbia 1212.6 1265.7 76.5 488.5
Turkey 339.6 13402.6 740.6 0
Source: [New 117, Eurostat, nrg_110a]
WORKIN
G DRAFT IN
PROGRESS

Chapter 2
TL/JFF/FN/EIPPCB/LCP_Final Draft June 2016 73
District heating networks
Combined heat and power production (CHP) plants have a very high level of total fuel
utilisation, achieved by integration and connection of a district heating network with power
production. In cases where the heat demand is steady, the CHP plant is dimensioned to fulfil the
demand of heat, and the power production process is dimensioned to fit into this heat
production.
CHP is widely utilised in cold climate regions of the EU. Cold climate means in this context
climate with long periods of sub-zero Celsius temperatures and peak low temperatures down to
minus 30˚C. In these conditions, the system reliability and security of supply are very important.
To achieve the required high level of supply security, the network consists of one or more main
CHP plants, and peak and reserve boiler plants. The heat demand typically varies, along with
ambient temperature, hot water consumption and wind. In summer there is only a low demand
of heat, mainly for hot water production. The heat demand of the network typically starts to
increase when the ambient temperature falls below about +15 ˚C.
[ 7, NOVOX - Finland 2012 ]
With regard to district heating boilers, which are typically located within or close to populated
areas, district heating may be beneficial on the local air quality. A few large and well
maintained boilers with flue-gas cleaning and with high stacks can replace a large number of
individual heating installations with low stacks and possibly less controlled combustion. As a
result, the total emissions can be considerably reduced. The effect of this is that local air quality
in the cities, towns and villages heated with district heating boilers may be far better than it
would be if individual heating alone was used.
Industrial CHP
The need for steam at industrial plants varies with the production cycles of the plants. The
variation is sometimes rapid and unpredictable because of disturbances in the steam consuming
processes. This causes variation and rapid changes in the combustion process of the CHP-plant
delivering steam to this type of steam client.
Supply of steam to the industrial users is typically secured by reserve boilers connected to the
steam network and usually is not participating to electricity production. A reserve boiler is
usually gas or fuel oil fired boiler with fast start up during the failure of the main boiler as
industrial plants usually should be secured at least for fast heat supply. Typically reserve boilers
annual operating hours are very low, only operating during main boiler annual planned
shutdown or unexpected disturbance situations. Some systems are equipped also with steam
accumulator vessels, to secure the steam pressure and delivery during quick load changes.
The reserve steam supply units connected to industrial steam networks are typically existing
boiler plants which are no longer economical to operate continuously.
[ 8, NOVOX - Finland 2012 ]
Industrial complexes can produce electricity on site when large heat to power ratios exist, i.e.
ranging from 1.5 to 3.
Cogeneration using gas turbines
Gas turbines can be used in industrial CHP plants. Obtaining a supply of heat from a CCGT
plant is most likely to be achieved by extracting steam from the plant’s steam turbine system.
For a district heating scheme, this is likely to be low-pressure steam which is passed through an
on-site heat exchanger to produce hot water which is then piped off-site. For industrial
applications this may be steam at higher pressures which is piped directly to the customer. In
practice, however, the waste heat from the plant’s condensers is unlikely to be of any use due to
the low temperature (around 25 °C) although there are some exceptions, such as use of
condenser water at a slightly higher temperature for liquid natural gas re-gasification.
Cogeneration using engines
WORKIN
G DRAFT IN
PROGRESS
Chapter 2
74 June 2016 TL/JFF/FN/EIPPCB/LCP_Final Draft
Stationary engines are well suited and commonly popular for cogeneration i.e. for hot water
production, steam generation (sometimes with an additional steam turbine for enhanced
electrical efficiency), desalination of seawater, district cooling systems and for heating air. The
total fuel efficiency of this kind of installation is very high, up to 90 % in some applications.
The heat to power ratios for engine CHP applications are typically from 0.5 to 1.3. [New 136]
[88, Euromot, 2001].
A common heat recovery application for CHP plants with engines is to generate low pressure
steam for industrial purposes. The pressure range is usually from 3 bar to 16 bar, but higher
steam pressure and extended steam production can be achieved with supplementary firing or
auxiliary fired boilers. Steam at 8 bar is well suited for desalination and absorption chillers,
while certain industrial processes might require higher steam pressures.
The second solution for boosting the steam generating capacity is to equip the HRSG with
supplementary firing. For larger spark-ignited gas engines, the oxygen content is typically 11 to
12 vol-% and for a high pressure gas diesel engine, often higher. This oxygen can be used as the
main combustion air for supplementary firing. The system also makes it possible to generate
high-pressure steam and it has a good thermal efficiency for the additional fuel for the
supplementary firing. So far, there are only a few reciprocating engines which exist equipped
with supplementary firing, due to the challenges of combining the combustion flame with the
pulsing of the engine flue-gas and the relatively low oxygen content of the flue-gas [New 135]
[63, Wärtsilä, 2000].
An interesting CHP concept is the feed-water preheating, where the waste heat from the engine
flue-gas and cooling circuits are used for increasing the efficiency of an existing, e.g. steam
boiler plant. The electrical efficiency of a gas engine plant can be raised by equipping the plant
with a steam turbine. Steam turbines most used in this application are single stage condensing
turbines and the steam pressure typically applied is 12 bar to 20 bar. In this case, the electrical
yield from the plant is increased typically by 8–10 percentage points depending on the engine
type used and on the condensing cooling temperature.
Cogeneration using coal- and/or lignite-fired plants
Steam turbines driven by fossil-fuel-fired boilers have been used for industrial cogeneration
systems for many years. High-pressure steam raised in a conventional coal- or lignite-fired
boiler is expanded within a turbine to generate mechanical energy, which can then be used to
drive an electric generator. The amount of power generated depends on how much the steam
pressure can be reduced though the turbine whilst still being able to meet the site heat energy
needs. In some cases, the turbine is equipped with a separate or integrated low pressure cylinder,
which enables electricity production independent of the heat supply
CHP readiness of combustion plants
Given the advantages of cogeneration in terms of general energy efficiency and overall pollutant
emissions, the question of the CHP readiness is raised. In the UK, it is recommended that new
built combined-cycle gas turbines (CCGT) are 'CHP-ready' (CHPR) and that the 'CHP-lockout'
(where the design of a power plant precludes the later take off of heat) is avoided. The degree to
which any new CCGT power plant is CHPR is location-specific, based on the current and
potential future heat supply opportunities in that particular area. The same principles of CHPR
for new biomass power plants are under assessment.
A CHP plant is ideally built to supply both heat and power right from the start, with a known
heat load size and profile used to produce an optimum design. In contrast, a CCGT plant which
is CHPR is initially built to supply power only, with varying degrees of uncertainty at the design
stage over the type and quantity of future heat it may need to supply, if any.
In general terms, it is likely to be easier to retrofit greater quantities of low pressure steam take-
off from a lateral exhaust steam turbine than from an axial exhaust steam turbine. This may
therefore influence the choice of turbine if there is a significant chance of a new CCGT being
WORKIN
G DRAFT IN
PROGRESS

Chapter 2
TL/JFF/FN/EIPPCB/LCP_Final Draft June 2016 75
required to supply CHP in the future. Otherwise, the need to be CHPR is likely to have little
influence on the choice of steam turbine, due to the range of other options, such as the use of
cold reheat.
Location specific CHP-readiness
When existing old boilers come to the end of their working lives, they may be replaced with
CCGT power plants built on the same site, due to the ease of electricity grid connection and
access to cooling. Because the locations of these sites tend to be away from population centres,
new CCGT power plants are not usually built as CHP plants due, to the absence of heat
customers in the immediate vicinity. However, this will not always be the case, and where there
is a realistic potential for future CHP opportunities in the vicinity of a CCGT power plant, this
is taken into account when considering design options.
[ 9, UK-TWG 2012 ]
Cheng Cycle
The Cheng Cycle is a CHP technology applied to existing or new gas turbines, linked with a
steam cycle applied at the gas turbine but not with a combined cycle system. Heat is recovered
from the flue-gas through a heat recovery steam generator (boiler) (HRSG), allowing the
generation of steam or water for industrial purposes or district heating. But instead of
associating a steam turbine to the HRSG to produce electricity out of the remaining heat/steam,
the Cheng Cycle redirects the steam to the gas turbine to produce additional electricity and, at
the same time, to reduce NOX emissions.
Applying such a technique to a simple gas turbine improves the overall energy efficiency by
allowing recovery of the flue-gas heat. It is an option for variable load demands from both
clients: steam and electricity users. Around 300 plants with such a system are reported to be in
operation worldwide [ 4, deBiasi 2013 ].
WORKIN
G DRAFT IN
PROGRESS
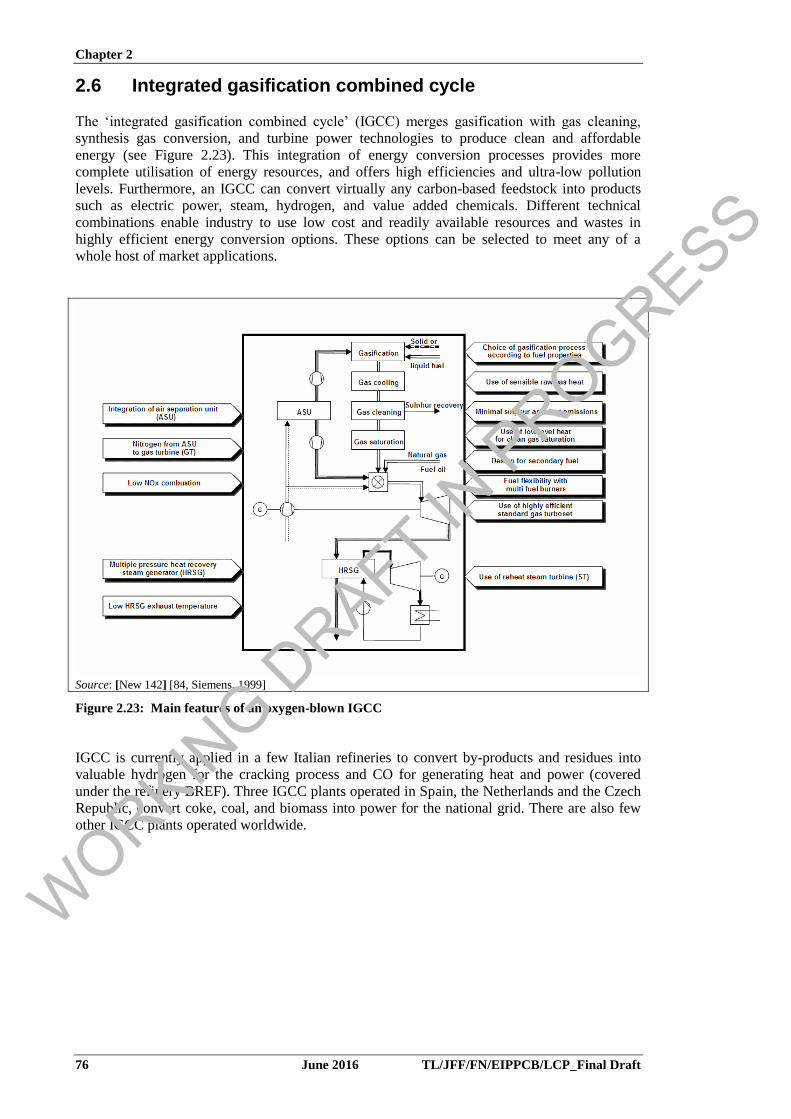
Chapter 2
76 June 2016 TL/JFF/FN/EIPPCB/LCP_Final Draft
2.6 Integrated gasification combined cycle
The ‘integrated gasification combined cycle’ (IGCC) merges gasification with gas cleaning,
synthesis gas conversion, and turbine power technologies to produce clean and affordable
energy (see Figure 2.23). This integration of energy conversion processes provides more
complete utilisation of energy resources, and offers high efficiencies and ultra-low pollution
levels. Furthermore, an IGCC can convert virtually any carbon-based feedstock into products
such as electric power, steam, hydrogen, and value added chemicals. Different technical
combinations enable industry to use low cost and readily available resources and wastes in
highly efficient energy conversion options. These options can be selected to meet any of a
whole host of market applications.
Source: [New 142] [84, Siemens, 1999]
Figure 2.23: Main features of an oxygen-blown IGCC
IGCC is currently applied in a few Italian refineries to convert by-products and residues into
valuable hydrogen for the cracking process and CO for generating heat and power (covered
under the refinery BREF). Three IGCC plants operated in Spain, the Netherlands and the Czech
Republic, convert coke, coal, and biomass into power for the national grid. There are also few
other IGCC plants operated worldwide.
WORKIN
G DRAFT IN
PROGRESS
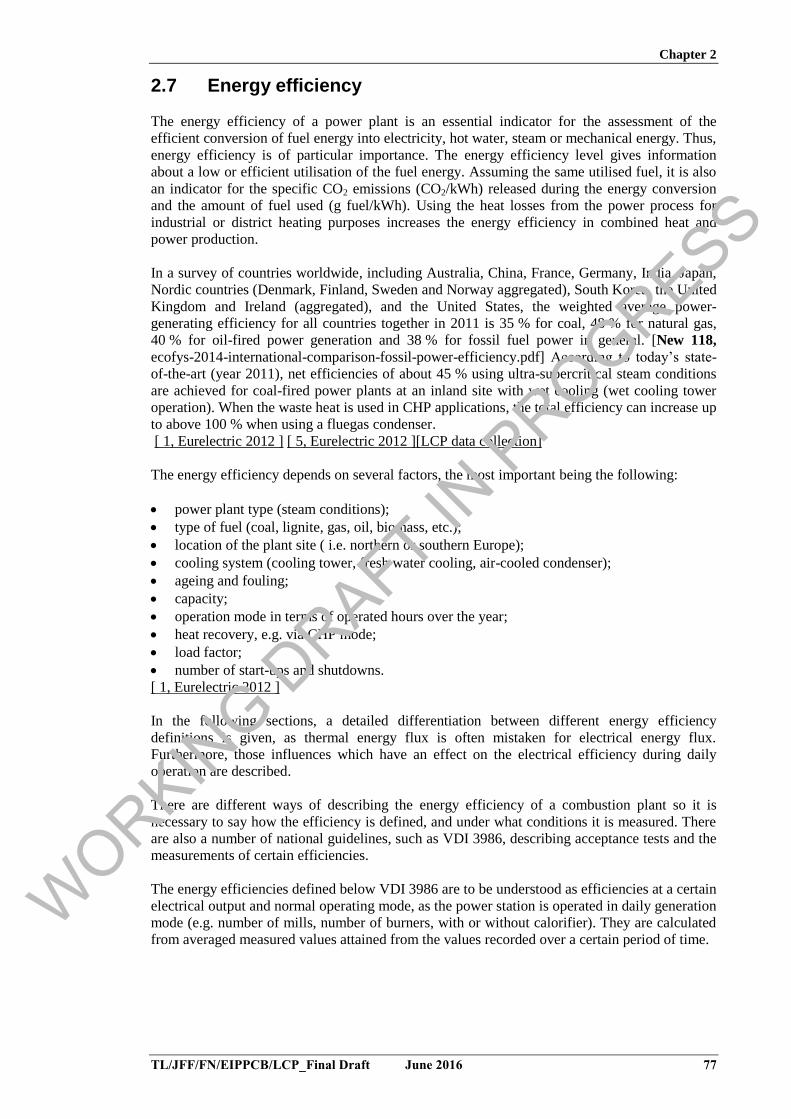
Chapter 2
TL/JFF/FN/EIPPCB/LCP_Final Draft June 2016 77
2.7 Energy efficiency
The energy efficiency of a power plant is an essential indicator for the assessment of the
efficient conversion of fuel energy into electricity, hot water, steam or mechanical energy. Thus,
energy efficiency is of particular importance. The energy efficiency level gives information
about a low or efficient utilisation of the fuel energy. Assuming the same utilised fuel, it is also
an indicator for the specific CO2 emissions (CO2/kWh) released during the energy conversion
and the amount of fuel used (g fuel/kWh). Using the heat losses from the power process for
industrial or district heating purposes increases the energy efficiency in combined heat and
power production.
In a survey of countries worldwide, including Australia, China, France, Germany, India, Japan,
Nordic countries (Denmark, Finland, Sweden and Norway aggregated), South Korea, the United
Kingdom and Ireland (aggregated), and the United States, the weighted average power-
generating efficiency for all countries together in 2011 is 35 % for coal, 48 % for natural gas,
40 % for oil-fired power generation and 38 % for fossil fuel power in general. [New 118,
ecofys-2014-international-comparison-fossil-power-efficiency.pdf] According to today’s state-
of-the-art (year 2011), net efficiencies of about 45 % using ultra-supercritical steam conditions
are achieved for coal-fired power plants at an inland site with wet cooling (wet cooling tower
operation). When the waste heat is used in CHP applications, the total efficiency can increase up
to above 100 % when using a fluegas condenser.
[ 1, Eurelectric 2012 ] [ 5, Eurelectric 2012 ][LCP data collection]
The energy efficiency depends on several factors, the most important being the following:
power plant type (steam conditions);
type of fuel (coal, lignite, gas, oil, biomass, etc.);
location of the plant site ( i.e. northern or southern Europe);
cooling system (cooling tower, fresh water cooling, air-cooled condenser);
ageing and fouling;
capacity;
operation mode in terms of operated hours over the year;
heat recovery, e.g. via CHP mode;
load factor;
number of start-ups and shutdowns.
[ 1, Eurelectric 2012 ]
In the following sections, a detailed differentiation between different energy efficiency
definitions is given, as thermal energy flux is often mistaken for electrical energy flux.
Furthermore, those influences which have an effect on the electrical efficiency during daily
operation are described.
There are different ways of describing the energy efficiency of a combustion plant so it is
necessary to say how the efficiency is defined, and under what conditions it is measured. There
are also a number of national guidelines, such as VDI 3986, describing acceptance tests and the
measurements of certain efficiencies.
The energy efficiencies defined below VDI 3986 are to be understood as efficiencies at a certain
electrical output and normal operating mode, as the power station is operated in daily generation
mode (e.g. number of mills, number of burners, with or without calorifier). They are calculated
from averaged measured values attained from the values recorded over a certain period of time. W
ORKING D
RAFT IN P
ROGRESS
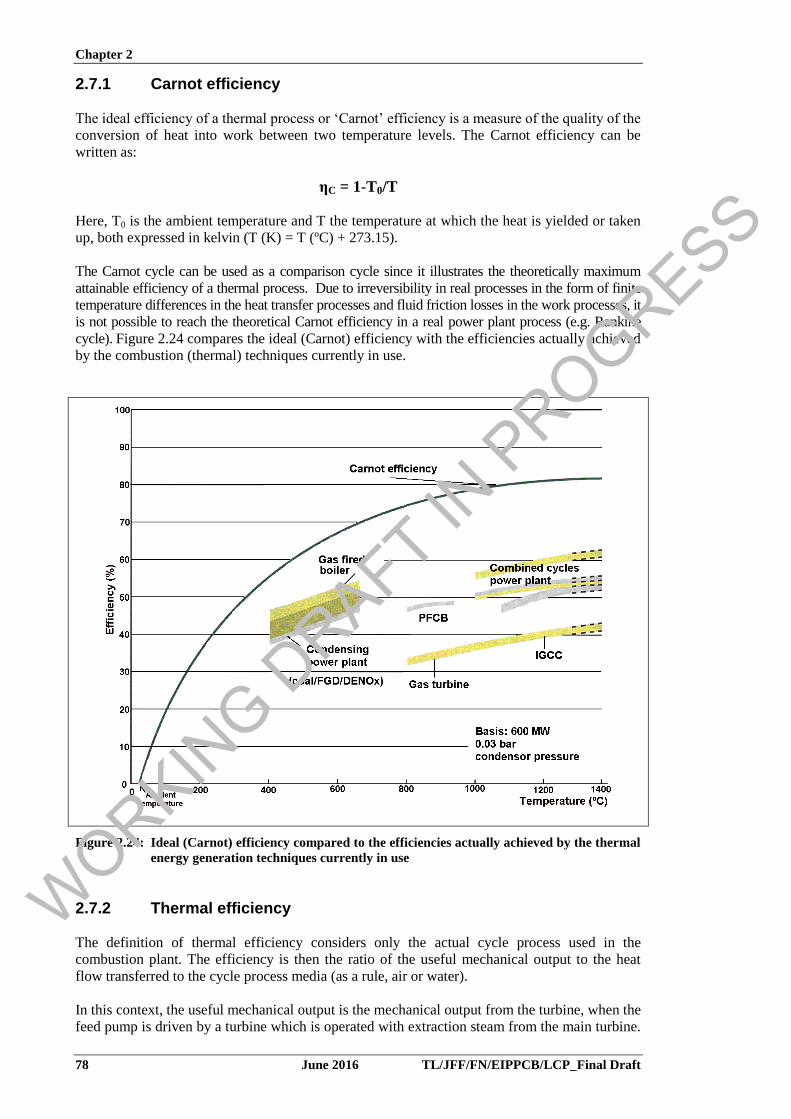
Chapter 2
78 June 2016 TL/JFF/FN/EIPPCB/LCP_Final Draft
2.7.1 Carnot efficiency
The ideal efficiency of a thermal process or ‘Carnot’ efficiency is a measure of the quality of the
conversion of heat into work between two temperature levels. The Carnot efficiency can be
written as:
ηC = 1-T0/T
Here, T0 is the ambient temperature and T the temperature at which the heat is yielded or taken
up, both expressed in kelvin (T (K) = T (ºC) + 273.15).
The Carnot cycle can be used as a comparison cycle since it illustrates the theoretically maximum
attainable efficiency of a thermal process. Due to irreversibility in real processes in the form of finite
temperature differences in the heat transfer processes and fluid friction losses in the work processes, it
is not possible to reach the theoretical Carnot efficiency in a real power plant process (e.g. Rankine
cycle). Figure 2.24 compares the ideal (Carnot) efficiency with the efficiencies actually achieved
by the combustion (thermal) techniques currently in use.
Figure 2.24: Ideal (Carnot) efficiency compared to the efficiencies actually achieved by the thermal
energy generation techniques currently in use
2.7.2 Thermal efficiency
The definition of thermal efficiency considers only the actual cycle process used in the
combustion plant. The efficiency is then the ratio of the useful mechanical output to the heat
flow transferred to the cycle process media (as a rule, air or water).
In this context, the useful mechanical output is the mechanical output from the turbine, when the
feed pump is driven by a turbine which is operated with extraction steam from the main turbine.
WORKIN
G DRAFT IN
PROGRESS

Chapter 2
TL/JFF/FN/EIPPCB/LCP_Final Draft June 2016 79
As the condensate pump also contributes to raising the pressure, it is considered to be part of the
feed pump, from a thermodynamic point of view. Its mechanical output must therefore be
subtracted from the mechanical output of the turbine. The mechanical output of the turbine, in a
thermodynamic sense, is in this case the output resulting from the steam mass flow and the
enthalpy difference. If the feed pump is driven by an electric motor, then the useful mechanical
output is equal to the difference between the mechanical output of the turbine minus the drive
outputs of the feed pump plus the condensate pump. This also applies when the feed pump is
driven directly by the turbine shaft. The heat flow transferred to the process is that heat flow
transferred to the water/steam cycle.
In the case of a combined gas/steam turbine process, the useful mechanical output is the
mechanical output of the steam turbine plus the mechanical output of the gas turbine, when the
feed pump is driven by a turbine which operates with extracted steam. However, the output of a
condensate pump has to be subtracted from this. If the feed pump is driven by an electric motor,
then the useful mechanical output is equal to the difference between the mechanical output of
the turbine and the drive output of the feed pump plus the condensate pump. The heat flow
transferred to the circuit process in a gas/steam turbine process is equal to the heat flow
transferred to air in the combustion chamber of the gas turbine, plus the heat flow transferred to
the water/steam cycle in the steam generator by combustion. In a pure heat recovery steam
generator, the heat flow transferred to the water steam cycle is zero [New 147][48, VDI, 1998].
2.7.3 Electrical efficiency
For the definition of electrical efficiency it is important that the system boundaries are defined
carefully. A simplified scheme is shown in Figure 2.25. All components within the system
boundaries can have an impact on the auxiliary power and therefore an impact to the net values.
Figure 2.25: System boundaries for efficiency definition
WORKIN
G DRAFT IN
PROGRESS
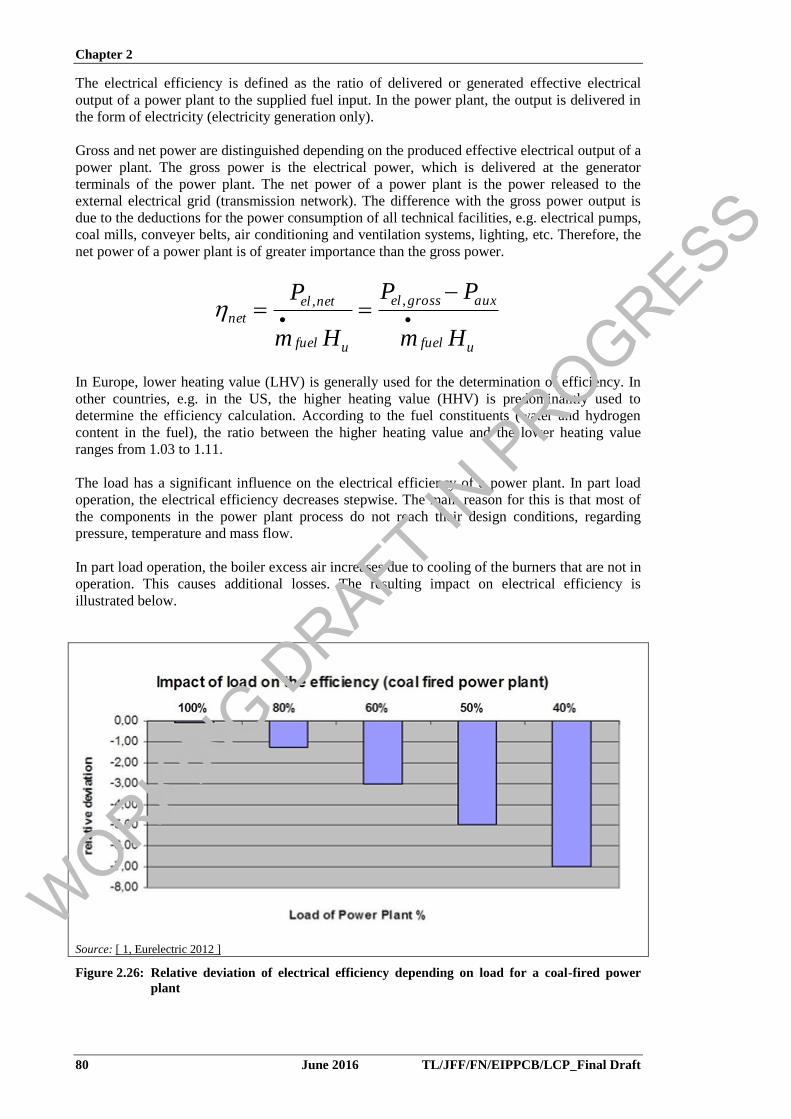
Chapter 2
80 June 2016 TL/JFF/FN/EIPPCB/LCP_Final Draft
The electrical efficiency is defined as the ratio of delivered or generated effective electrical
output of a power plant to the supplied fuel input. In the power plant, the output is delivered in
the form of electricity (electricity generation only).
Gross and net power are distinguished depending on the produced effective electrical output of a
power plant. The gross power is the electrical power, which is delivered at the generator
terminals of the power plant. The net power of a power plant is the power released to the
external electrical grid (transmission network). The difference with the gross power output is
due to the deductions for the power consumption of all technical facilities, e.g. electrical pumps,
coal mills, conveyer belts, air conditioning and ventilation systems, lighting, etc. Therefore, the
net power of a power plant is of greater importance than the gross power.
ufuel
auxgrossel
ufuel
netel
net
Hm
PP
Hm
P
,,
In Europe, lower heating value (LHV) is generally used for the determination of efficiency. In
other countries, e.g. in the US, the higher heating value (HHV) is predominantly used to
determine the efficiency calculation. According to the fuel constituents (water and hydrogen
content in the fuel), the ratio between the higher heating value and the lower heating value
ranges from 1.03 to 1.11.
The load has a significant influence on the electrical efficiency of a power plant. In part load
operation, the electrical efficiency decreases stepwise. The main reason for this is that most of
the components in the power plant process do not reach their design conditions, regarding
pressure, temperature and mass flow.
In part load operation, the boiler excess air increases due to cooling of the burners that are not in
operation. This causes additional losses. The resulting impact on electrical efficiency is
illustrated below.
Source: [ 1, Eurelectric 2012 ]
Figure 2.26: Relative deviation of electrical efficiency depending on load for a coal-fired power
plant
WORKIN
G DRAFT IN
PROGRESS

Chapter 2
TL/JFF/FN/EIPPCB/LCP_Final Draft June 2016 81
2.7.4 Mechanical efficiency
For the production of mechanical energy, e.g. to drive natural gas compressors in the gas
transmission network, the efficiency is simply equal to the efficiency of the machine itself, as
there are no internal uses reducing the product at the shaft of the gas turbine or gas engine. The
efficiency of machines for mechanical drive has improved over time, and continues to do so.
Older gas turbines have lower efficiencies compared to new ones. The size of the machine is
also relevant, smaller ones having lower efficiencies than large ones. This effect can be seen in
Table 2.2.
Table 2.2: Typical efficiencies at the output shaft of gas turbines in relation to their thermal
power
Plant type Efficiency (%) ISO conditions
Remarks New plants Existing plants
Gas turbine 15–50 MW 30–35 27–35 For existing plants
depending on their age
Gas turbine 50–100 MW 36–40 27–38 For existing plants
depending on their age
Gas turbine > 100 MW 36–40 32–38
Source: [ 6, Marcogaz 2012 ]
2.7.5 Operating (annual) energy efficiency
Even today, electricity cannot be stored in large quantities in the electric grid, so operators have
to permanently carry out load adaptations. That means that the power plants may run in
frequency support load (part-load operation).
Besides the load fluctuations caused by electricity/industrial consumers, load fluctuations are
also increased due to the priority grid access for renewable power plants (e.g. wind power
plants, photovoltaic plants, etc.), feeding electricity into the grid often intermittently.
The fluctuating feeding of electricity leads thermal power plants to adapt their load operation,
i.e. running in less efficient part-load operation when necessary, or even to be put out of
operation.
In addition, it has to be taken into account that the net efficiency of a power plant is only
reached with so-called 'delivery terms'. The delivery terms correspond to a theoretical ideal
value if the external operating conditions of a power plant are optimal. Besides the load
fluctuations mentioned above, external conditions, over which the operator has no control,
include ambient air temperature and ambient air pressure.
Operating conditions strongly influence the mean efficiency. The measured efficiency of the
plant is different from the design efficiency, as real operation rarely complies with ideal
conditions (due to fouling, slagging, de-superheating, non-ideal condenser conditions,
blowdown, etc.), due to start-ups and shutdowns, and as the characteristics of the fuel used
rarely comply exactly with the characteristics of the design fuel (calorific value, water content,
ash content, etc.). The ageing of a normally maintained plant (fouling, slagging, erosion, leaks,
etc.) also leads to efficiency deteriorating over time. This can be offset by component
refurbishments and upgrades, as shown in Table 2.3 below.
[ 1, Eurelectric 2012 ]
WORKIN
G DRAFT IN
PROGRESS
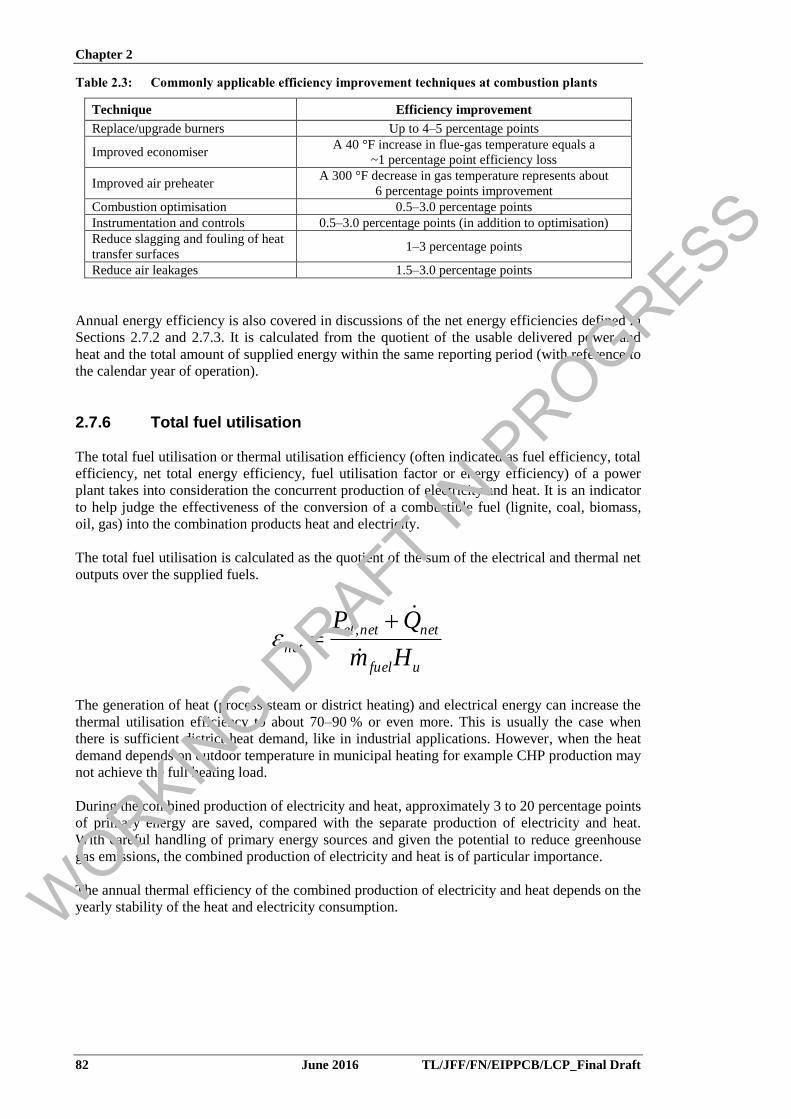
Chapter 2
82 June 2016 TL/JFF/FN/EIPPCB/LCP_Final Draft
Table 2.3: Commonly applicable efficiency improvement techniques at combustion plants
Technique Efficiency improvement
Replace/upgrade burners Up to 4–5 percentage points
Improved economiser A 40 °F increase in flue-gas temperature equals a
~1 percentage point efficiency loss
Improved air preheater A 300 °F decrease in gas temperature represents about
6 percentage points improvement
Combustion optimisation 0.5–3.0 percentage points
Instrumentation and controls 0.5–3.0 percentage points (in addition to optimisation)
Reduce slagging and fouling of heat
transfer surfaces 1–3 percentage points
Reduce air leakages 1.5–3.0 percentage points
Annual energy efficiency is also covered in discussions of the net energy efficiencies defined in
Sections 2.7.2 and 2.7.3. It is calculated from the quotient of the usable delivered power and
heat and the total amount of supplied energy within the same reporting period (with reference to
the calendar year of operation).
2.7.6 Total fuel utilisation
The total fuel utilisation or thermal utilisation efficiency (often indicated as fuel efficiency, total
efficiency, net total energy efficiency, fuel utilisation factor or energy efficiency) of a power
plant takes into consideration the concurrent production of electricity and heat. It is an indicator
to help judge the effectiveness of the conversion of a combustible fuel (lignite, coal, biomass,
oil, gas) into the combination products heat and electricity.
The total fuel utilisation is calculated as the quotient of the sum of the electrical and thermal net
outputs over the supplied fuels.
ufuel
netnetel
netHm
QP
,
The generation of heat (process steam or district heating) and electrical energy can increase the
thermal utilisation efficiency to about 70–90 % or even more. This is usually the case when
there is sufficient district heat demand, like in industrial applications. However, when the heat
demand depends on outdoor temperature in municipal heating for example CHP production may
not achieve the full heating load.
During the combined production of electricity and heat, approximately 3 to 20 percentage points
of primary energy are saved, compared with the separate production of electricity and heat.
With careful handling of primary energy sources and given the potential to reduce greenhouse
gas emissions, the combined production of electricity and heat is of particular importance.
The annual thermal efficiency of the combined production of electricity and heat depends on the
yearly stability of the heat and electricity consumption.
WORKIN
G DRAFT IN
PROGRESS
Chapter 2
TL/JFF/FN/EIPPCB/LCP_Final Draft June 2016 83
2.7.7 Unit efficiency for steam withdrawal
In a power plant unit, steam extracted for heating or process purposes is no longer available for
power generation. In this case, in order to be able to compare the unit efficiency with the
efficiency of pure power generation, the electrical output which could be obtained from the
extracted heating steam if it were to expand to the condenser pressure has to be added to the
electrical output.
For the extraction of heating steam, a correction for the power loss is used as shown in the
diagrams presented in VDI 3986. In these diagrams, the power loss characteristic depends on
the flow temperature, with the return temperature as an important parameter for single-stage,
double-stage and triple-stage heating. The diagrams apply to condenser pressures of 30, 40, 70
and 80 mbar.
In the case of process steam extraction, the condensate can be returned to the circuit. The
influence of the returned condensate can be separated from the influence of the extracted steam.
The correction for process steam extraction is also shown in the diagrams presented in VDI
3986.
2.7.8 Exergy concept and exergy efficiency
Since electricity can be converted into heat but the reverse process is not completely possible,
electricity then has a higher value than heat. As heat contains a greater share of convertible
energy at higher temperatures than it does at lower temperatures, the quality of heat at higher
temperatures is higher than at lower temperatures. These issues are covered by the concept of
exergy, which expresses the convertibility of energy in qualitative terms. This can be achieved
by using quality factors (QF), which give the fraction of exergy in a total quantity of energy.
The quality factor of electricity and mechanical energy is 1 (electricity is pure exergy). The
quality factor of heat, however, depends on the temperature at which the heat is available. The
expression for converting one unit of heat at temperature T into work has long been known. It is
called the ‘Carnot factor’, and has been discussed in Section 2.7.1. The Carnot factor is, quite
simply, the quality factor for heat. This factor is always less than 1, becoming 0 at ambient
temperature [New 143][49, Electrabel, 1996].
By applying such simple quality factors to the energy input (Enenergy input) and the useful energy
output (Enuseful energy output) of a process, the exergetic efficiency of a combustion process can be
calculated and compared to the fuel efficiency. The exergetic efficiency (ηex) can then be
expressed as follows:
ηex = ∑(QF · Enuseful energy output)/∑(QF · Enenergy input)
By using this methodology, a comparison of the energetic and exergetic efficiencies can be
made, as shown in Figure 2.27.
WORKIN
G DRAFT IN
PROGRESS
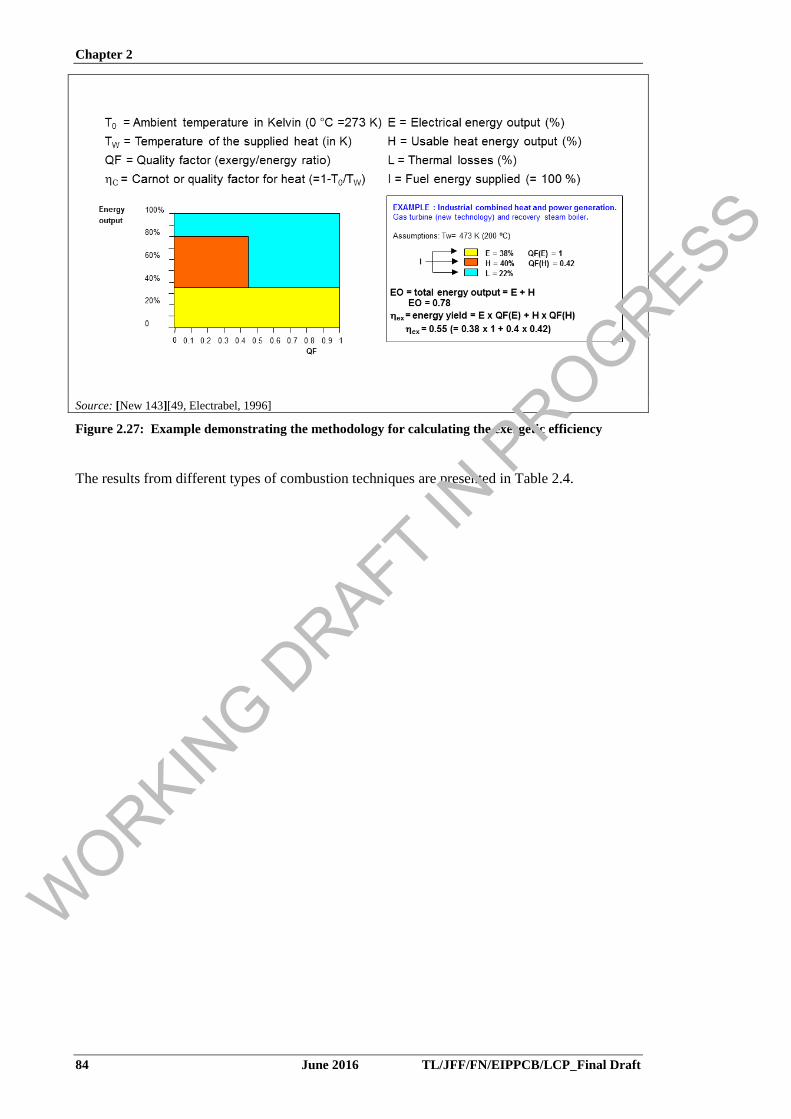
Chapter 2
84 June 2016 TL/JFF/FN/EIPPCB/LCP_Final Draft
Source: [New 143][49, Electrabel, 1996]
Figure 2.27: Example demonstrating the methodology for calculating the exergetic efficiency
The results from different types of combustion techniques are presented in Table 2.4.
WORKIN
G DRAFT IN
PROGRESS

Chapter 2
TL/JFF/FN/EIPPCB/LCP_Final Draft June 2016 85
Table 2.4: Examples of energetic and exergetic efficiencies of different types of combustion plants
Combustion technique
Fuel
energy
supplied
(= 100 %)
Electrical
energy
output
(%)
Usable
heat
energy
output
(%)
External
losses
(%)
TW
Temperature
of supplied
heat
(K)
Quality factor
of heat
(QF = 1-T0/T)
Quality
factor of
electricity
Total energy
output EO
(fuel
efficiency)
Exergetic
efficiency
(ηex)
Heat generation
Type: heating boiler for space heating,
where TW = 70 ºC (343 K)
100 0 90 10 343 0.2 NA 0.90 0.18
Electricity generation
Type: combined cycle (recent high-yield
combined cycle technology)
100 55 0 45 NA NA 1 0.55 0.55
Industrial CHP plant
Type: steam boiler + back-pressure steam
turbine, (where TW = 200 ºC (473 K)
steam for industrial process)
100 20 60 20 473 0.42 1 0.80 0.45
Industrial CHP plant
Type: combined cycle with steam tapping,
where TW = 200 ºC (473 K) (steam for
industrial process)
100 50 12 38 473 0.42 1 0.62 0.55
Industrial CHP plant
Type: gas turbine (new technology) with
recovery steam boiler, where TW = 200 ºC
(473 K)
100 38 40 22 473 0.42 1 0.78 0.55
Industrial CHP plant
Type: gas turbine with recovery steam
boiler, where TW = 200 ºC (473 K)
100 32 48 20 473 0.42 1 0.80 0.52
Industrial CHP plant
Type: gas turbine with recovery steam
boiler with back pressure steam turbine
where TW = 200 ºC (473 K)
100 35 45 20 473 0.42 1 0.80 0.54
Small scale CHP plant
Type: gas engine with heat exchanger
where TW = 70 ºC (343 K) (for space
heating and small-scale industrial
applications)
100 35 55 10 343 0.20 1 0.90 0.46
NB:
NA: Not available
Source: [New 143][49, Electrabel, 1996]
WORKIN
G DRAFT IN
PROGRESS

Chapter 2
86 June 2016 TL/JFF/FN/EIPPCB/LCP_Final Draft
2.7.9 Influence of climate conditions on efficiency
The climate expressed in terms of wet- and dry-bulb temperatures is an extremely important
site-specific condition. It influences both the choice of cooling and the possible end temperature
of the process. The contradiction of cooling with air and/or water is that when the cooling
demand is high it becomes more difficult to achieve the requirements, particularly in areas
where high air temperatures and high water temperatures coincide with lower water availability
during part of the year. A certain operational flexibility of the cooling system can then be very
important and may be achieved by combining water and air cooling. Sometimes, however, a
certain loss of efficiency has to be accepted.
To reach the required end temperature, the cooling medium must have a lower temperature than
the medium to be cooled, but this depends on the dry- and wet-bulb temperatures. A wet-bulb
temperature is always lower than a dry-bulb temperature. The wet-bulb temperature depends on
the measured temperature of the atmosphere, the humidity, and the air pressure. For latent
(evaporative) heat transfer, wet-bulb temperature is the relevant temperature. It is theoretically
the lowest temperature to which water can be cooled by evaporation. For sensible heat transfer,
dry-bulb (dry air) temperature is relevant, where air is the coolant.
For the selection of the type and design of the cooling system, the design temperature is
important and usually relates to summer levels of the wet-bulb and dry-bulb temperatures. The
greater the difference between these temperatures and the higher the dry bulb temperatures, the
more difficult it will be to reach low end temperatures with dry air-cooled systems. As
mentioned earlier, this can lead to efficiency losses. Measures can be taken to overcome this
loss, but they require a certain investment.
As an example, Table 2.5 shows how, for different climate conditions in Europe, the choice of
a dry or a wet cooling system can affect process efficiency losses due to the Carnot cycle. In the
example, the approach for wet cooling is considered to be 4 K and this has to be added to the
wet-bulb temperature to get the minimum end temperature of the coolant. The approach for dry
cooling is set at 12 K to be added to the dry-bulb temperature. The larger the difference between
the wet and the dry end temperatures, the higher the loss of efficiency (in this example), where
losses of 0.35 % per kelvin on average occur. At the same time, for example, with a 5 %
efficiency loss, the efficiency of a conventional power plant would be 38.6 % instead of 40 %.
WORKIN
G DRAFT IN
PROGRESS

Chapter 2
TL/JFF/FN/EIPPCB/LCP_Final Draft June 2016 87
Table 2.5: Examples of effect of climatic conditions in Europe on the loss of efficiency of power plants
Country and station (1)
Parameter
Dry-bulb temp.
(1 %) (2)
(°C)
Wet-bulb temp.
(1 %) (2)
(°C)
Temperature
difference
(K)
End temp.
dry system (3)
(°C)
End temp.
wet system (4)
(°C)
ΔT wet-dry
(K)
Efficiency loss
(5)
(%)
Greece Athens 36 22 14 48 26 22 7.7
Spain Madrid 34 22 12 46 26 20 7.0
France Paris 32 21 11 44 25 19 6.7
Italy Rome 34 23 11 46 27 19 6.7
Austria Vienna 31 22 9 43 26 17 6.0
Germany Berlin 29 20 9 41 24 17 6.0
Netherlands Amsterdam 26 18 8 38 22 16 5.6
France Nice 31 23 8 43 27 16 5.6
UK London 28 20 8 40 24 16 5.6
Germany Hamburg 27 20 7 39 24 15 5.3
Norway Oslo 26 19 7 38 23 15 5.3
Belgium Brussels 28 21 7 40 25 15 5.3
Spain Barcelona 31 24 7 43 28 15 5.3
Finland Helsinki 25 19 6 37 23 14 4.9
Denmark Copenhagen 26 20 6 38 24 14 4.9
Portugal Lisbon 32 27 5 44 31 13 4.6
UK Glasgow 23 18 5 35 22 13 4.6
Ireland Dublin 23 18 5 35 22 13 4.6
(1) The given data in the table are illustrative of the variation of the climate in Europe. Other references may provide slightly different data. The exact data of a site can be analysed
by a meteorological institute.
(2) Statistically only 1 % of the maximum temperatures are above this data.
(3) Approach 12 K.
(4) Approach for wet system: 4K.
(5) Loss of efficiency 0.35 % per ΔT K on average.
Source: [New 144][45, Eurovent, 1998]
WORKIN
G DRAFT IN
PROGRESS

Chapter2
88 June 2016 TL/JFF/FN/EIPPCB/LCP_Final Draft
2.7.10 Relationship between energy efficiency and environmental issues
2.7.10.1 Impact of the abatement techniques on plant energy efficiency
The operation of the abatement techniques installed to prevent or reduce the emission of
pollutants usually requires the use of additional electricity and/or heat. This is associated with a
number of energy-consuming processes, including the following operations:
additional flue-gas fans to compensate for pressure drops;
pumps for the recirculation of liquids and slurries;
mechanical shaking or pressurised air blowing for filter cake removal;
high-voltage fields in ESPs;
flue-gas reheating e.g. in the case of tail-end SCR.
The main techniques used in LCPs for the reduction of channelled emissions to air are described
in Section 3.2.2. Table 2.6 provides a summary of the typical values for energy consumption of
secondary abatement techniques. Primary techniques, such as the use of fuels with low sulphur
contents or of low-NOX burners, usually have no or minimal direct energy consumption.
However, some primary techniques, for instance certain techniques to reduce NOX emissions,
may affect the parameters of the thermodynamic cycle and thus may present some trade-offs
with energy efficiency, as also described in Section 1.3.8. The extent to which these effects
occur is fuel- and process-specific and is described in the fuel-specific sections where
information is available.
Table 2.6: Typical energy consumption of secondary abatement techniques
Main pollutant
addressed Technique
Energy consumption as % of
gross electrical output
Reference Section in
this BREF
Dust
ESP 0.32 % 3.2.2.1.1
Bag filters Up to 0.6 % 3.2.2.1.2
Wet scrubbers Up to 3 % 3.2.2.1.4
SOX
Wet FGD 1–3 % 3.2.2.2.1
Seawater scrubber 0.8–1.6 % 3.2.2.2.2
Spray dry
absorber/scrubber 0.5–1 % 3.2.2.2.6
CFB dry scrubber 0.3–1 % 3.2.2.2.7
DSI 0.2 % 3.2.2.2.8
In-furnace sorbent
injection 0.01–0.2 % 3.2.2.2.9, 3.2.2.2.10
NOX SNCR 0.1–0.3 % 3.2.2.3.12
SCR - 3.2.2.3.11
SOX NOX DeSONOX 2 % 3.2.2.4.3
SOX NOX metals Activated carbon 1.2–3.3 % 3.2.2.4.1 List of acronyms:
CFB: Circulating fluidised bed; DSI: Duct sorbent injection; ESP: Electrostatic precipitator; SCR: Selective catalytic
reduction; SNCR: Selective non-catalytic reduction; FGD: Flue-gas desulphurisation.
2.7.10.2 Effect of increasing the plant energy efficiency on emission levels
According to [New 145] [64, UBA, 2000], increases in efficiency have the following effects on
fuel consumption, waste heat and emissions.
WORKIN
G DRAFT IN
PROGRESS

Chapter 2
TL/JFF/FN/EIPPCB/LCP_Final Draft June 2016 89
Savings in fuel 2
1
η
η-1=eΔ
Reductions in waste heat 1η-1
eΔ=aΔ
Reductions of CO2 emissions 2
1
η
η-1=CΔ
Reductions in pollutant gas emissions )1
-1
(6.3
21
u
R
H
xV (mg/kWh)
Variables:
1 efficiency before improvement
2 efficiency after improvement
VR volume of flue-gas/kg fuel (m3/kg)
x emission concentration (mg/m3)
Hu lower calorific value (MJ/kg)
2.7.11 Losses of efficiency in combustion plants
The heat energy resulting from the combustion of fuels is transferred to the working medium
(steam). During this process, part of the energy is lost. The operation of the steam generator
requires continuous surveillance. The heat losses from the steam generator can be categorised as
follows:
Losses via the flue-gas. These depend on the flue-gas temperature, air mix, fuel
composition and the level of fouling of the boiler.
Losses through unburnt fuel, the chemical energy of which is not converted. Incomplete
combustion causes CO and hydrocarbons to occur in the flue-gas.
Losses through unburnt material in the residues, such as carbon in bottom and fly ash.
Losses via the bottom and fly ash from a DBB and the slag and fly ash from a WBB.
Losses through conduction and radiation. These mainly depend on the quality of
insulation of the steam generator.
In addition to the heat losses, the energy consumption needed for the operation of auxiliary
machinery (fuel transport equipment, coal mills, pumps and fans, ash removal systems,
cleaning of the heating surfaces, etc.) also has to be taken into consideration.
Poor combustion lowers the economic viability, increases the environmental impacts and is
detrimental to the safety of the plant. The following parameters affect the viability of the plant
and may, therefore, be monitored to keep the plant’s efficiency as high as possible:
fuel composition;
fineness of grind;
flue-gas composition (O2, CO2, CO);
air mix and flue-gas volume flow;
air leaking into the combustor;
boiler fouling;
temperatures of the combustion air and flue-gases;
temperature behaviour within the heating surfaces;
reduction of draught;
flame profile;
WORKIN
G DRAFT IN
PROGRESS

Chapter2
90 June 2016 TL/JFF/FN/EIPPCB/LCP_Final Draft
combustible proportion of residue (annealing loss).
The operation mode in terms of operated hours over the year, load factor and number of start-
ups and shutdowns may influence the efficiency of the combustion plant.
2.7.12 General technical measures to improve LCP efficiency
Cogeneration (CHP)
The generation of heat (process steam or district heating) and electrical energy increases the fuel
efficiency (fuel utilisation) to about 70–90 % or even more. Cogeneration (CHP) is also
regulated by other directives (Energy Efficiency Directive, 2012/27/EC, and Cogeneration
Directive, 2004/8/EC) and is dependent on local conditions.
Combustion
The fuel is mixed with air and burnt in the boiler. It is not possible to obtain an ideal mix
between the fuel and air, and therefore more air than is necessary for stoichiometric combustion
is supplied to the boiler. Furthermore, a small percentage of the fuel does not fully combust. The
flue-gas temperature must be kept high enough to prevent condensation of acid substances on
the heating surfaces.
Unburnt carbon-in-ash Optimisation of the combustion leads to less unburnt carbon-in-ash. It should be noted that NOX
abatement techniques using combustion modification (primary measures) show a tendency of
increased unburnt carbon. Increased unburnt carbon could also worsen and harm the quality of
the coal fly ash and make difficult, or even prevent, their utilisation for certain applications,
with the risk that they may not comply with the specifications and requirements laid down in
relevant national and European standards.
Air excess The amount of excess air used depends on the type of boiler and on the nature of the fuel.
Typically, 12–20 % excess air is used for a pulverised coal-fired boiler with a dry-bottom. For
reasons of combustion quality (related to CO and unburnt carbon formation) and for corrosion
and safety reasons (e.g. risk of explosion in the boiler, if there is a flameout due to a low excess
of air and then reignition where there is sufficient excess air), it is often not possible to reduce
the excess air levels further.
Steam
The most important factors in increasing efficiency are the highest possible temperature and
pressure of the working medium. In modern plants, the partially expended steam is reheated by
one or more reheating stages.
Flue-gas temperature The flue-gas temperature leaving the clean boiler (depends on the fuel type) is traditionally
between 120 °C and 170 °C, kept high enough to minimise risks of acid corrosion by the
condensation of sulphuric acid. However, some designs sometimes incorporate a second stage
of air heaters or a flue-gas heat recovery system to lower this temperature below 100 °C, but
with special claddings on the air heater and the stack which makes this reduction economically
unprofitable.
Vacuum in the condenser
After leaving the low-pressure section of the steam turbine, the steam is condensed in
condensers and the heat released into the cooling water. In order to ensure the maximum
pressure drop over the steam turbines, it is desirable to reduce the vacuum to a minimum. In
general, the vacuum is dictated by the temperature of the cooling water, which is lower with
once-through cooling systems than with a cooling tower. The best electrical efficiency is
WORKIN
G DRAFT IN
PROGRESS
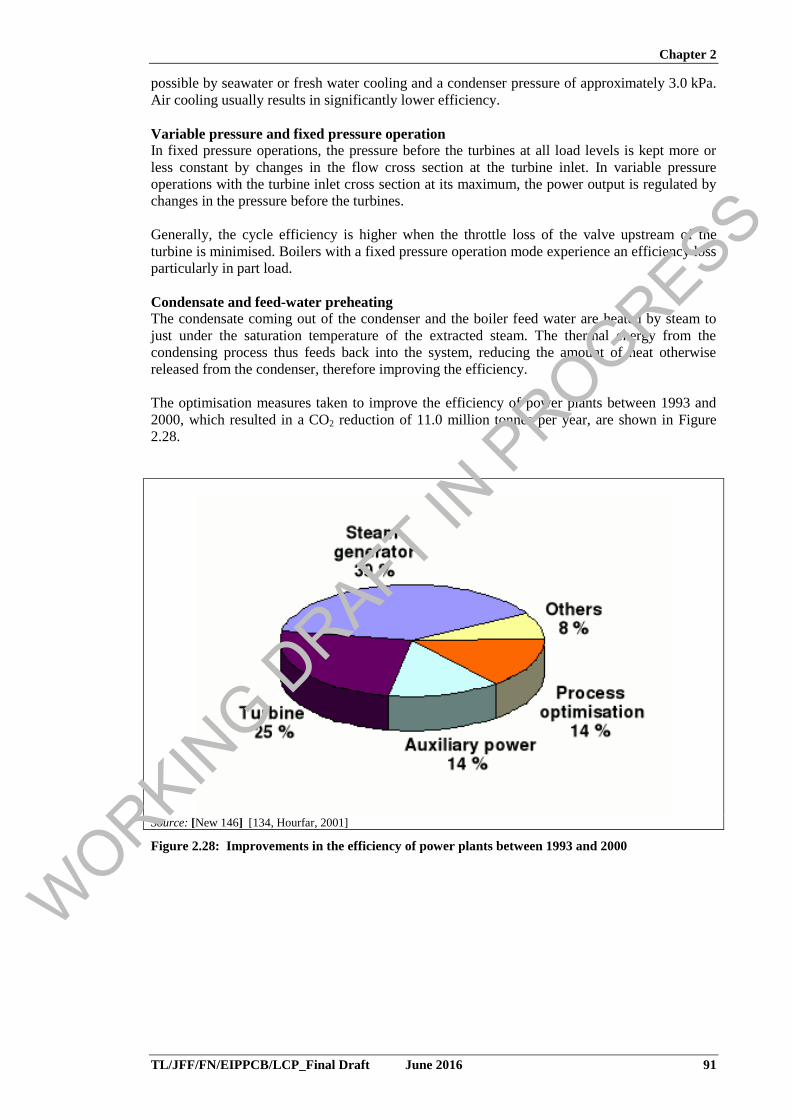
Chapter 2
TL/JFF/FN/EIPPCB/LCP_Final Draft June 2016 91
possible by seawater or fresh water cooling and a condenser pressure of approximately 3.0 kPa.
Air cooling usually results in significantly lower efficiency.
Variable pressure and fixed pressure operation
In fixed pressure operations, the pressure before the turbines at all load levels is kept more or
less constant by changes in the flow cross section at the turbine inlet. In variable pressure
operations with the turbine inlet cross section at its maximum, the power output is regulated by
changes in the pressure before the turbines.
Generally, the cycle efficiency is higher when the throttle loss of the valve upstream of the
turbine is minimised. Boilers with a fixed pressure operation mode experience an efficiency loss
particularly in part load.
Condensate and feed-water preheating
The condensate coming out of the condenser and the boiler feed water are heated by steam to
just under the saturation temperature of the extracted steam. The thermal energy from the
condensing process thus feeds back into the system, reducing the amount of heat otherwise
released from the condenser, therefore improving the efficiency.
The optimisation measures taken to improve the efficiency of power plants between 1993 and
2000, which resulted in a CO2 reduction of 11.0 million tonnes per year, are shown in Figure
2.28.
Source: [New 146] [134, Hourfar, 2001]
Figure 2.28: Improvements in the efficiency of power plants between 1993 and 2000
WORKIN
G DRAFT IN
PROGRESS
Chapter 2
92 June 2016 TL/JFF/FN/EIPPCB/LCP_Final Draft
2.8 Unloading, storage and handling of fuel and additives
2.8.1.1 Unloading, storage and handling of solid fuels and additives
Fuels
Solid fuels such as coal and lignite are supplied by ships, trains and lorries, depending on the
transport distance involved and what transport systems are available at mines and LCP sites.
Unloading normally takes place with belt conveyors. LCPs near mines or harbours may also be
supplied with fuel directly from the mine or harbour by belt conveyors.
Coal and lignite are normally stored in open stockpiles (coal yards) with a storage capacity from
a few days up to three month use, and in several cases even enough supply for up to one year of
operation. This additional storage capacity helps fuel supply security, as it lessens the
dependence on transport logistics. The capacity of the storage facility depends on various
parameters, such as, for example, fuel prices and availability, the company’s stock policy,
security of the supply and on weather conditions. For newbuild plants, layout considerations and
availability footprint will also be considerations. Fuel is normally transferred from the stockpile
to the plant using belt conveyors. A buffer storage (e.g. coal bunkers with a capacity for a few
hours operation, usually from 4 to 24 hours) exists within the LCP to cover periods when
delivery from the coal yard is not possible.
The storage and transport of fuel can cause dust formation. For this reason, open stockpiles may
be sprayed with water to control fine dust particle emissions, unless the fuel’s moisture is
already high enough that spraying is not necessary. During open loading and unloading of the
stockpile, the height of the fuel drop onto the stockpile or between belt conveyors has to be as
low as possible to avoid fugitive dust emissions. In urban regions, transport systems are often
closed systems and operated with pressures below atmospheric pressure to minimise fugitive
emissions. Bag filters are often used to clean the collected air of dispersed fuel particles.
A sealed surface with drainage systems is an option to prevent soil and groundwater
contamination from coal storage. It is not however a technique applied within the industry in
Europe. Experiments on a plant in Denmark have shown that precipitation on a pile of coal
penetrates the stack by 75 cm over a year. Normally the free void in stored coal is
approximately 30 %, implying 1 m3 coal can contain 0.3 m
3 water. Coal in working storage will
therefore be removed and fired before the precipitation has penetrated the stored volume and
leached to the subsurface. In long-term storage areas, secondary techniques such as dozing the
coal yard in order to compress the coal storage are generally used. This also prevents self-
ignition and reduces fugitive dust emissions.
For certain solid fuels, full enclosure during both transport and storage is now being specified.
This is, for instance, the case with petroleum coke, where fine dust enriched with higher levels
of nickel, vanadium and PAHs can be released by transport and storage unless specific
mitigating actions are taken.
The approach to fuel transportation, unloading, storing, and the handling of biomass and peat is
different to that of coal. In particular, these fuels are prone to self-heating and ignition. Short
storage times are preferred where feasible.
Peat in particular is reactive and can self-heat/self-ignite or decompose slowly if kept in storage
for a long time. Typically, only a few days' consumption of peat is actually stored at the power
plant site. Peat is usually stored, even for periods of years, in stockpiles in the production area.
Likewise, biomass is also prone to smouldering; therefore an effective monitoring system may
be put in place to mitigate uncontrollable outbreaks of fire.
To minimise the risk of self-ignition, fuel mixing and downsizing before storage are taken into
consideration.
WORKIN
G DRAFT IN
PROGRESS

Chapter 2
TL/JFF/FN/EIPPCB/LCP_Final Draft June 2016 93
[New 86, Eurelectric comments ]
Peat and/or biomass are transported by articulated lorries, trailers, rail, ships and barges or, for even
shorter distances, by tractor-trailers.
Peat has many characteristics that put special demands on the handling and transportation
equipment. These include:
relatively low calorific value because of the rather high moisture content (40–50 wt-%);
low density;
tendency to freeze (due to the high moisture content);
risk of self-heating/self-ignition;
bridging;
dust-raising propensity;
frequent considerable amount of mechanical impurities like wood and stones, or, in
wintertime, frozen peat.
The impact of peat transportation depends on the method of transport and the distance. The
environmental impact from rail transportation is of minor importance as only some noise will be
generated. Road transportation causes noise and results in vehicle emissions. Life cycle analyses
carried out, however, show that the emissions from peat production and transportation are of minor
importance compared to the emissions from combustion.
In some countries, biomass and peat are usually local fuels and as they are collected near the
combustion plant the impact of the transportation is low. In industrial plants, biomass may come as
a by-product from the mill.
Choice of fuel-receiving station, storage facilities, transportation to the boiler, etc. depend largely
on the type of fuel. Some plants are, due to fuel quality, equipped with screens where large stones
and pieces of biomass (i.e. wood) are removed. At some sites the larger pieces of wood are added
back to the fuel after they have been crushed. Depending on the fuel and operating conditions,
some biomasses are shredded and possibly mixed with other types of fuel. This may be carried out
when receiving the fuel or just before transport to the boiler. A typical fuel-handling system (co-
combustion of peat, wood, and coal) is presented in Figure 2.29.
WORKIN
G DRAFT IN
PROGRESS

Chapter 2
94 June 2016 TL/JFF/FN/EIPPCB/LCP_Final Draft
Source: [ New 123, 58, Eurelectric, 2001]
Figure 2.29: Peat, wood and coal handling system
Closed silos and storage areas with dedusting devices are necessary when storing fine dusty
biomass. Chips and bark are stored for longer periods in open stockpiles, with covered storage
reserved for the screened and crushed fuel that is to be used for daily use.
Fuel is normally transferred from the stockpile/receiving station/silos to the boiler using belt
conveyors. Dust generated during peat unloading and handling can cause local harm in the plant
area. Closed conveyors can be used to reduce the impact of any dusty material.
A major hazard of peat-fired power plants is the risk of fire and explosion. Dry peat ignites by
sparks or hot surfaces like bearings very easily, and also dry, fine dust may explode even before
it reaches the boiler; either on the peat conveyors, or even in the articulated lorry transporting
the peat. It is, therefore, a general safety rule that the moisture content of milled fuel peat be at
least 40 % during transport to the plant and 38 % when received in the plant. This reduces the
risk of dust explosion and of the spreading of fire in cases of self-ignition and also eliminates
the raising of fugitive dust out of the fuel.
Peat/biomass handling operations are among the major noise sources at the peat/biomass-fired
power plant.
The approach to the transportation, unloading and storage of straw is different to that of coal,
other types of biomass and peat. The handling of straw for large CHP plants is almost solely
based on bales, each weighing approximately 400–700 kg. Trucks carrying 20 or 24 bales
transport the bales from the fields or farmers’ storage area to the plant. The trucks are unloaded
by a specialised overhead crane, whilst a quality check (weight and moisture) of the straw is
simultaneously performed. The data from the quality checks are stored on a central logistics
computer. The straw batches (10 or 12 bales per batch) are transferred either to a vacant position
WORKIN
G DRAFT IN
PROGRESS
Chapter 2
TL/JFF/FN/EIPPCB/LCP_Final Draft June 2016 95
in the straw storage area or directly to the processing equipment. The storage is mostly fully
automated and designed to hold about two to three days' full load capacity of the boiler.
The pelletised biomass used in Europe is generally wood, which has a lower calorific value and
lower density than coal. It is also dusty and must be handled correctly in order to control
fugitive dust emissions and manage or eliminate fire, explosion and health risks. Handling of
wood pellets can result in significant dust emissions if appropriate measures are not
incorporated into the design. Ignition sources are eliminated and biomass self-ignition is
prevented by elimination of moisture and minimising storage and handling times. Biomass
pellets can be reactive, especially if wet, and must be kept in a dry store. Generally biomass
pellets are stored in dedicated silos or storage buildings where their temperature and any
decomposition can be monitored.
Biomass pellets is one of the preferred biomass types when transporting long distances because
of compaction, easier handling, reduction in moisture and avoidance of the need for
phytosanitary treatment among others. Large volumes of wood pellets are transported by rail or
ship directly to the LCP or to a harbour close to it.
[New 85, Eurelectric comments to D1]
Additives
Additives and chemical treatment reagents are often used for a variety of purposes in a
combustion plant. They may be used in abatement equipment, such as desulphurisation plants,
and for reducing nitrogen oxides, as well as in water and waste water treatment plants. For
instance, chemical reagents are used as additives for boiler make-up water and biocides are used
in cooling systems.
The supplier or employer specifies the appropriate storage of these materials. As reagents can
react together, the storage and handling methods applied usually involve segregating any
reactive materials. Liquids are usually stored in drums or tanks in open or enclosed bunded
areas, and acid- or chemical-resistant coatings are also used. Fine pulverised solids such as lime
are generally stored indoors in silos, in drums or bags and with isolated drainage systems.
Coarse structured solid raw materials are often stored in open storage areas. Pneumatic or
mechanical (e.g. screw conveyors, bucket elevators) transportation systems are used to transport
the materials.
The distribution of gases within the site is normally carried out inside pipelines, which are
situated overhead, and which include good damage protection systems. Health and safety
regulations govern the storage, handling and distribution of liquid or gaseous ammonia, which
are used in SCR and SNCR plants to reduce NOX emissions.
2.8.1.2 Unloading, storage and handling of liquid fuels
Liquid fuels are supplied by pipeline, ship, train or lorry, depending on the availability of
transport systems at the oil well, refinery and LCP site. Liquid fuels are processed in refineries
for direct use in engines, domestic combustion systems and LCPs. Unloading is normally
carried out with pipelines.
Fuel oil is stored in vertical steel cylindrical (vented or floating roof) storage tanks. The tank
capacity varies from 1000 m3 to 100 000 m
3, depending on the number of tanks and the size of
the station. The tanks are generally grouped inside a bund (retention basin), which can hold all
or a part of the volume in the event of a leak or other damage to the tanks (e.g. fire, explosion,
pipe breakage); the actual capacity of the bund depends on national regulations and oil quality.
For example, the bund capacity may be 50–75 % of the overall maximum capacity of all the
tanks and at least equal to the maximum volume of the largest one. The bund must be perfectly
sealed and should incorporate oil interceptors to prevent the discharge of oil into site run-off
water.
WORKIN
G DRAFT IN
PROGRESS
Chapter 2
96 June 2016 TL/JFF/FN/EIPPCB/LCP_Final Draft
Depending on climatic conditions at the site and the type of fuel oil stored, storage tanks may
need to be equipped with heating systems to bring the fuel oil (in particular heavy fuel oil) up to
the appropriate temperature for its transfer and in order to ensure correct atomisation in the
burner, which is an important pollution control technique. In such cases, the tanks have to be
properly insulated. There are two types of heating systems which can be generally used to warm
up the fuel oil: ‘bottom’ heaters, which warm up the entire volume of fuel oil; or ‘recovery’
heaters, which are located just before the suction piping and heat up the fuel oil only as it is
leaving the storage tank. Light distillate oil does not need to be heated for pumping or for
atomisation.
Regular checks of the tank contents to identify leaks and to check the fill level are common
practice. Automatic systems, incorporating alarms, are used to check the fill level. Inertised
atmospheres are occasionally used. Regular checks of the storage facilities and piping are
common practice and part of good plant management.
Pipelines used for liquid fuel delivery incorporate intermediate tank storage. Fuel distribution
from the site storage tanks to the burners is usually by overhead pipelines or by service trenches,
or less commonly by buried pipeline. Barriers are used to protect overhead pipelines against
damage. When using underground pipes, state of the art is to use double-walled pipes with
automatic control of the spacing and special constructions (e.g. steel pipes, welded connections
with no valves in the underground section).
If there is a risk of groundwater contamination, the storage area should be impermeable and
resistant to the fuel stored. Depending on the flashpoint of the liquid fuel, there may be a risk of
explosion.
2.8.1.3 Unloading, storage and handling of gaseous fuels
Gaseous fuels are delivered to LCPs via pipeline, either from the gas well or from liquefied
natural gas (LNG) decompression and storage facilities. Natural gas from different wells varies
in quality. Often gas clean-up may occur at the production site to reduce transport problems in
pipelines.
The natural gas high-pressure grid in the EU-27 is approximately 235 000 km long. Figure 2.30
shows the European natural gas network in 2011. The high-pressure grid delivers gas to a low-
pressure distribution grid which is 1 649 400 km long. Compressor stations (167 in total) are
only used in the high-pressure grid. The purpose of a compressor station is to restore the
pipeline pressure to the desired level if it is decreased too much in the pipeline. The pressure
loss depends on the distance from the previous compressor station, but also on the flow rate. To
ensure the contracted gas flow the pipeline, pressure has to be raised again after 100 km to
250 km depending on the local and technical situation.
WORKIN
G DRAFT IN
PROGRESS

Chapter 2
TL/JFF/FN/EIPPCB/LCP_Final Draft June 2016 97
Source: [New 111, Marcogaz comments], [New 119, Italy comments]
Figure 2.30: European natural gas network in 2011
A range of gases may be used in gas combustion plants. If the pressure of the supply pipeline
exceeds the required input pressure of the LCP, the gas pressure needs to be regulated. This may
take place in an expansion turbine in order to recover some of the energy used for compression.
Heat from the power plant can be used to heat up the gas and thus to increase electricity output.
Fuel gas is then transported in pipes to the LCP.
Gas turbines only use clean gases for direct firing. Here also, natural gas may have to be
decompressed, if the pressure of the pipeline exceeds the required input pressure of the gas
turbine. Adiabatic cooling of the expanded gas can be used to cool the fresh air entering the gas
turbine’s compressor. Fuel gases at atmospheric pressure from other sources have to be
pressurised to the necessary input pressure of the combustion chamber of the particular gas
turbine. Fuel gas may be also preheated.
Natural gas storage is an industrial process where gas is generally injected into an underground
porous rock system or salt cavern, which can store the accumulation and then supply the gas to
meet the market demand, in terms of hourly and daily flow rate. The storage gas stations include
gas compression plants and processing plants.
WORKIN
G DRAFT IN
PROGRESS

Chapter 2
98 June 2016 TL/JFF/FN/EIPPCB/LCP_Final Draft
In order to be transported by LNG carriers, natural gas is subject to the liquefaction process. The
liquefaction temperature of natural gas is -162 °C at atmospheric pressure. The natural gas is
liquefied and stored in tanks in the producing country before being loaded into an LNG vessel.
The LNG-receiving area of the plant has, in general, a berthing area for the LNG carriers,
unloading arms and a transfer line to the tanks. The LNG is unloaded from carriers and sent
through a pipeline. The storage area consists of tanks where submerged pumps are placed for
the movement of LNG.
The regasification area is made up of pumps for the movement and pressurisation of the LNG
and of the submerged combustion and/or seawater vaporisers. The liquefied natural gas is drawn
from the tanks and sent through the pipeline to the vaporisation units where the LNG is heated
to reach its gaseous state. The natural gas is then injected into the transmission network which
transports it to end users.
WORKIN
G DRAFT IN
PROGRESS
Chapter 3
TL/JFF/FN/EIPPCB/LCP_Final Draft June 2016 99
3 GENERAL TECHNIQUES TO PREVENT AND/OR REDUCE EMISSIONS AND CONSUMPTION
3.1 Applied common techniques
Techniques are described in this section if they apply to more than one combustion process or
type of fuel firing described in Chapters 4 to 9. Further details are provided in Chapters 4 to 9 if
the techniques apply to a specific process or to the combustion of a specific fuel perform in a
specific manner.
3.1.1 General primary techniques to reduce emissions/consumption
Some techniques have a general positive and global impact on emissions and/or consumption
due to their better energy efficiency or to their full integration into the combustion process.
3.1.1.1 Cogeneration or combined heat and power (CHP)
See Section 2.5
3.1.1.2 Integrated gasification combined cycle
See Section 2.6.
3.1.1.3 Combined-cycle combustion
See Section 2.4.4.
3.1.1.4 Fuel switch or choice
The possibility of choosing a fuel or switching fuel from solid to liquid or gas, or from liquid to
gas, is considered 'subject to conditions' in this document, as the technical, economic and
political feasibility of a fuel switch or choice is largely determined by local circumstances. The
possibility to change the fuel is also subject to a strategic evaluation of the fuel policy at a
national level and to market availability.
In general, the use of fuels with a lower content of ash, sulphur, nitrogen, carbon, mercury, etc.
is an option to consider.
Choosing or switching to low-sulphur fuel, keeping the other basic fuel parameters (e.g. lower
heating value, ash and moisture content) within the boiler design fuel range, is a measure which
can significantly reduce SO2 emissions. In cases where supply is available, a choice or change
of fuel may be a viable option. This may include fuels with high internal desulphurisation due to
the limestone (or other active compounds) content of the fuel ash. For coal, 5 % limestone
content is typical. For lignite and peat, desulphurisation effects may be higher than for coal,
even up to 80 %, depending on the fuel and the combustion system. Also, biomass can be used
for multi-fuel firing, contributing to SOX emissions prevention. However, this measure greatly
depends on the type of fuel and the abatement technique used, and therefore is discussed in
Chapters 4 to 9.
Natural desulphurisation can reduce SO2 emissions by as much as 90 %, e.g. by burning some
low-quality lignites and peat with a low sulphur and a high alkaline ash content, resulting in
very low SO2 emissions, comparable to those achieved by the application of common secondary
techniques.
WORKIN
G DRAFT IN
PROGRESS

Chapter 3
100 June 2016 TL/JFF/FN/EIPPCB/LCP_Final Draft
Combustion plants located in iron and steel facilities aim at using the available process gases as
much as possible.
3.1.1.5 Combustion modifications (process control)
Combustion-related techniques (process control) involve combustion modifications, including:
capacity derating;
burner modifications;
in-furnace combustion modifications;
air and fuel modifications (e.g. flue-gas recycling, fuel air premixing, the use of additives,
fuel mixing, drying, finer grinding, gasification, pyrolysis).
Additives introduced into the combustion system support complete combustion, but can also be
used as primary techniques to reduce emissions of dust, SO2, NOX and fuel-specific metals.
Possible techniques related to combustion modifications are given in Table 3.1. Details for these
primary techniques are very specific to the fuel and combustion system applied and are given in
Chapters 4 to 9. Reciprocating engine primary techniques are described in Chapters 6 and 7.
WORKIN
G DRAFT IN
PROGRESS

Chapter 3
TL/JFF/FN/EIPPCB/LCP_Final Draft June 2016 101
Table 3.1: Description of primary techniques for emission control
Fuels/parameters
Combustion modifications
Capacity
derating
Air and fuel
modifications
Burner
modifications
In-furnace
combustion
modifications
Solid fuels/dust
Lower volume
flow and higher
oxygen surplus
reduce
temperature
Gasification, pyrolysis
of fuel, fuel additives,
i.e. low melting
additives for slag tap
furnace with liquid ash
removal
Liquid ash
removal, cyclone
burner in slag tap
furnace
Liquid ash removal
in slag tap furnace;
coarse ash control
in circulating
fluidised bed
combustion
Solid fuels/SO2
Reduced
temperature
reduces sulphur
volatilisation
Use of low-sulphur fuel
and sorbent fuel
additives, i.e. lime and
limestone for fluidised
bed combustion
Burner with
separate additive
injection
Injection of
absorbents, i.e.
limestone
Solid fuels/NOX
Reduced
temperature
reduces thermal
NOX
Mixing and finer
grinding of fuel and
flue-gas recycling
reduce NOX production
Low-NOX
burners
Staged combustion
and reburning
Liquid fuel/dust
Reduced
temperature
reduces slagging
Gasification, pyrolysis
of fuel, additives for
low soot combustion
NA Optimised
combustion
Liquid fuel/SO2 NA
Use of low-sulphur fuel
and additives for
absorption
NA NA
Liquid fuel/NOX
Reduced
temperature
reduces thermal
NOX
Flue-gas recycling
reduces thermal and
fuel-bound NOX
Low-NOX
burners
Staged
combustion*,
reburning.
Water and steam
addition
Gaseous fuel/NOX
Reduced
temperature
reduces thermal
NOX
Flue-gas recycling,
fuel air premixing**
Low-NOX
burners
Staged
combustion* **.
Reburning, water
and steam addition
NB:
* Not applicable to existing gas turbines.
** Staged combustion is applied differently in gas turbines and furnaces.
NA: Not available
Source: [ New 123, 58, Eurelectric, 2001]
The use of additives to the fuel can be a fuel supply measure for small combustion systems or a
primary combustion technique at LCP sites. LCP-integrated fuel modification techniques
necessary for optimised combustion, such as fuel mixing, fuel additives, crushing, and grinding
of solid fuels, are dealt with in Chapters 4, 5, 6, and 8 when applicable. Some LCP-integrated
fuel-side measures currently under development are special integrated fuel preparation
techniques. This includes techniques to enhance efficiency, such as the pre-drying of solid fuels,
and gasification or pyrolysis of solid or liquid fuels, with the necessary syngas cleaning for
combined-cycle applications (see Chapter 4). W
ORKING D
RAFT IN P
ROGRESS
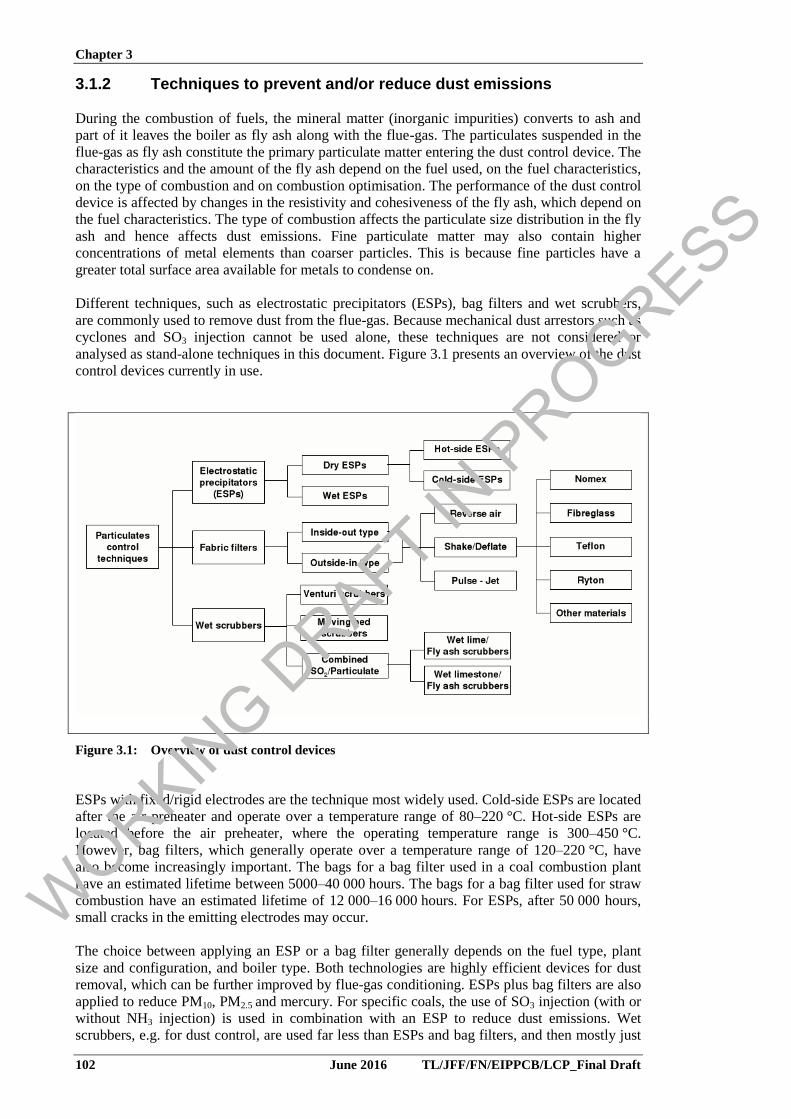
Chapter 3
102 June 2016 TL/JFF/FN/EIPPCB/LCP_Final Draft
3.1.2 Techniques to prevent and/or reduce dust emissions
During the combustion of fuels, the mineral matter (inorganic impurities) converts to ash and
part of it leaves the boiler as fly ash along with the flue-gas. The particulates suspended in the
flue-gas as fly ash constitute the primary particulate matter entering the dust control device. The
characteristics and the amount of the fly ash depend on the fuel used, on the fuel characteristics,
on the type of combustion and on combustion optimisation. The performance of the dust control
device is affected by changes in the resistivity and cohesiveness of the fly ash, which depend on
the fuel characteristics. The type of combustion affects the particulate size distribution in the fly
ash and hence affects dust emissions. Fine particulate matter may also contain higher
concentrations of metal elements than coarser particles. This is because fine particles have a
greater total surface area available for metals to condense on.
Different techniques, such as electrostatic precipitators (ESPs), bag filters and wet scrubbers,
are commonly used to remove dust from the flue-gas. Because mechanical dust arrestors such as
cyclones and SO3 injection cannot be used alone, these techniques are not considered or
analysed as stand-alone techniques in this document. Figure 3.1 presents an overview of the dust
control devices currently in use.
Figure 3.1: Overview of dust control devices
ESPs with fixed/rigid electrodes are the technique most widely used. Cold-side ESPs are located
after the air preheater and operate over a temperature range of 80–220 °C. Hot-side ESPs are
located before the air preheater, where the operating temperature range is 300–450 °C.
However, bag filters, which generally operate over a temperature range of 120–220 °C, have
also become increasingly important. The bags for a bag filter used in a coal combustion plant
have an estimated lifetime between 5000–40 000 hours. The bags for a bag filter used for straw
combustion have an estimated lifetime of 12 000–16 000 hours. For ESPs, after 50 000 hours,
small cracks in the emitting electrodes may occur.
The choice between applying an ESP or a bag filter generally depends on the fuel type, plant
size and configuration, and boiler type. Both technologies are highly efficient devices for dust
removal, which can be further improved by flue-gas conditioning. ESPs plus bag filters are also
applied to reduce PM10, PM2.5 and mercury. For specific coals, the use of SO3 injection (with or
without NH3 injection) is used in combination with an ESP to reduce dust emissions. Wet
scrubbers, e.g. for dust control, are used far less than ESPs and bag filters, and then mostly just
WORKIN
G DRAFT IN
PROGRESS

Chapter 3
TL/JFF/FN/EIPPCB/LCP_Final Draft June 2016 103
in the US. They can have high power consumption and generally achieve lower particulate
removal efficiencies, especially of fine particles, compared to ESPs and bag filters. This is not
the case for wet scrubbers used for desulphurisation, which have an additional reduction impact
on dust emissions.
According to the global inventory of electric power-generating plants "UDI World Electric
Power Plants Data Base" (WEPP) 2014, there are around 630 power plants that use bag filter
alone or in combination with other dust abatement techniques. 48 % of them are located in
North America, 23 % in European countries, 14 % in Asia, 7 % in Africa, 6 % in Australia/New
Zeeland and about 2 % in Latin America. The same source reports about 4800 power plants
using ESP alone or in combination with other dust abatement techniques. 53 % of them are
located in Asia, 19 % in European countries, 18 % in North America, 4 % in Russia and CIS
countries, 2 % in Africa, 2 % in Latin America, 2 % in the Middle East and 1 % in
Australia/New Zeeland.
3.1.3 Techniques to prevent and/or reduce sulphur oxide emissions
Sulphur oxides are emitted through oxidation of the sulphur contained in the fuel. Measures to
remove sulphur oxides, mainly SO2, from flue-gases during or after combustion have been used
since the early 1970s, first in the US and Japan and then, in the early 1980s, in Europe.
Nowadays there are many different ways of reducing the SO2 emissions generated by the
combustion of fossil fuels.
The investment cost for a DeSOX plant varies a lot, according to the method chosen. The
operating cost mainly depends on the amount and type of reagent, water and electricity
consumption, maintenance, and residues disposal costs if not reused. The DeSOX system needs
proper maintenance in order to work optimally. In addition, it is bulky and consequently
additional space is needed for the combustion plant.
Flue-gas desulphurisation (FGD) techniques can be classified as shown in Figure 3.2.
WORKIN
G DRAFT IN
PROGRESS

Chapter 3
104 June 2016 TL/JFF/FN/EIPPCB/LCP_Final Draft
Figure 3.2: Overview of secondary techniques used to reduce sulphur oxide emissions
3.1.3.1 Wet scrubbers
Wet scrubbers, especially in limestone-gypsum processes, are the leading FGD techniques.
They have about 80 % of the market share and are used in large utility boilers. This is due to
their high SO2 removal efficiency and their high reliability. Limestone is used in most cases as
the sorbent, as it is available in large amounts in many countries and is cheaper to process than
other sorbents. By-products are either gypsum or a mixture of calcium sulphate/sulphite,
depending on the oxidation mode. If the gypsum can be sold, the total overall operating costs
may be reduced.
The first successful wet limestone scrubber plant was constructed in 1972 by Mitsui Miike
Engineering Company (MIMC) at the Omuta coal-fired plant of Mitsui Aluminium in Japan.
The plant used lime slurry and produced sludge of calcium sulphite/sulphate and fly ash, which
was disposed of in a pond. Since then, wet limestone scrubbers have become popular in the US.
The penetration of this technique has taken more time in other countries, mainly because of the
large land requirements for sludge disposal. The first wet limestone scrubber plant producing
gypsum for a coal-fired utility boiler was constructed at the Takasago power plant of EPDC
(Electric Power Development Company), which began operation in 1975. Initially the plant had
start-up problems but the reliability of the operation has exceeded 99 % since 1977.
Sodium scrubbing was popular in the late 1960s in Japan. The by-product, sodium sulphite, was
sold to the paper industry. The sodium scrubbing process is simple and was applied to a large
WORKIN
G DRAFT IN
PROGRESS
Chapter 3
TL/JFF/FN/EIPPCB/LCP_Final Draft June 2016 105
number of small oil-fired boilers. Several magnesium scrubbing systems are also used in
relatively small industrial boilers, mainly due to the low capital costs involved. In magnesium
scrubbing systems, waste water containing magnesium sulphate can be discharged into the sea,
after the removal of dust and dust-absorbed metals, as magnesium sulphate is already a
constituent of seawater. The process, therefore, has an advantage over other systems if a plant is
located near the coast. The by-product of wet ammonia scrubbers can be used as an agricultural
fertiliser.
Dual alkali processes have been in commercial operation in the US since the mid-1970s. Wet
limestone scrubbers suffered from gypsum scaling problems during their development, in the
1970s to the early 1980s, due to the lack of understanding of the scrubber chemistry and the
process design requirements. Dual alkali processes were used while system manufacturers and
plant operators solved the scaling problems. Recent developments in dual alkali processes,
enabling the use of limestone instead of the more expensive lime sorbent, and the production of
gypsum, may revive the use of this system.
The reagent in magnesium scrubbing is magnesium hydroxide, which is produced by adding
slaked lime to seawater in order to enhance alkalinity, taking care to avoid significant increases
of other trace elements associated with the slaked lime. The process has become popular since
the early 1980s, replacing sodium scrubbing, because magnesium hydroxide has become less
costly than sodium hydroxide or carbonate as the reagent.
In the ammonia wet scrubber, SO2 is absorbed by aqueous ammonia, resulting in ammonium
sulphate, a by-product which can be used as fertiliser.
3.1.3.2 Semi-dry scrubbers
There are two main semi-dry scrubber types: the spray dry scrubber or absorber and the
circulating fluidised bed scrubber.
The spray dry scrubber or absorber (SDA) is a FGD technique, developed in the US and in
Europe in the early to mid-1970s. The first commercial use in combustion plants started in the
US in 1980, where the technique was applied to a coal-fired boiler. In the worldwide hierarchy
of applied FGD systems, SDA are second behind wet scrubbers. The SDA process is well
established as a commercially available technique.
The circulating fluidised bed (CFB) process has been in commercial operation in over twenty
coal- and/or lignite-fired utility boilers in Germany since 1987. Since the year 2000, this
technique has seen significant development as a semi-dry process for LCPs in Europe, with
more than 10 plants (from 100 MWth up to 1000 MWth) equipped.
3.1.3.3 Sorbent injection
Boiler sorbent injection involves the direct injection of a dry sorbent into the gas stream of the
boiler. Typical sorbents include: pulverised limestone (CaCO3) and dolomite (CaCO3·MgCO3).
In the furnace, the addition of heat results in the calcination of the sorbent to produce reactive
CaO particles. The surface of these particles reacts with the SO2 in the flue-gas to form calcium
sulphite (CaSO3) and calcium sulphate (CaSO4). These reaction products are then captured
along with the fly ash by the dust control device, typically an ESP or bag filter. The SO2 capture
process continues into the precipitator, and into the filter cake of the bag filter. The residues are
disposed of, for example, as landfill, although careful control is needed because they include
active lime and calcium sulphite. Possible uses of these residues are under investigation.
The use of adsorbents in fluidised bed combustion systems is mainly in coal-fired plants.
WORKIN
G DRAFT IN
PROGRESS
Chapter 3
106 June 2016 TL/JFF/FN/EIPPCB/LCP_Final Draft
Duct sorbent injection means injection of a calcium- or sodium-based sorbent into the flue-gas.
The most common types of duct sorbent injection are:
dry hydrated lime, for which the sulphur capture can be improved by humidification in
some cases (depending on the flue-gas composition);
dry sodium bicarbonate injection, which does not require humidification but may require
on-site milling for improved capture;
lime slurry injection or in-duct scrubbing, which does not require a separate
humidification step.
Hybrid sorbent injection is a combination of boiler sorbent injection and duct sorbent injection
to improve the SOX removal efficiency.
SOX control in fluidised bed combustion
When a fuel containing sulphur is combusted, sulphur dioxide and sulphur trioxide are
generated. In a circulating fluidised bed, sulphur oxides can be captured by using dolomite or
limestone as a bed material. Dolomite, or limestone, is calcined in the bed by the influence of
heat, and the calcined lime then reacts with sulphur oxides to form calcium sulphate. The
temperature of the CFB (850 ºC) is optimal for calcium-based sulphur recovery.
In a bubbling bed, the combustion of gases released from the fuel mainly occurs in the freeboard
zone, and the dense suspension only exists in the bubbling bed. Therefore, the efficiency of
sulphur recovery is much lower in BFBC than in CFBC.
3.1.4 Techniques to prevent and/or reduce nitrogen oxide emissions
Techniques that are generally used to prevent and/or reduce emissions of nitrogen oxides are
divided into primary and secondary techniques. Primary techniques allow the control of NOX
formation and/or reduction in the combustion chamber, whereas secondary techniques are end-
of-pipe techniques to reduce NOX emissions.
Nitrogen oxides (NOX) formed during the combustion of fossil fuels are mainly NO and NO2.
NO contributes to over 90 % of the total NOX in most types of combustion; this ratio may be
lower when primary techniques are applied to reduce NOX emissions. As already mentioned in
Chapter 1, there are three different formation mechanisms for NOX: thermal NOX formation;
prompt NOX; and the formation of NOX from nitrogen as a component of the fuel. A number of
primary techniques are currently used in LCPs in order to minimise the formation of NOX by
these mechanisms.
With data collected by EURELECTRIC, VDEW and VGB up to 1996, and updated by EEB in
2012, an indicative overview of denitrification in Europe is presented in Table 3.2.
WORKIN
G DRAFT IN
PROGRESS

Chapter 3
TL/JFF/FN/EIPPCB/LCP_Final Draft June 2016 107
Table 3.2: Indicative DeNOX (secondary measures only) at large combustion plants in the EU-28
Country
Number of sites and
electrical power
Plants with DeNOX and controlled
electrical power
No of sites MWe
No of sites
(1)
Electrical power (MWe)
Austria 18 4852 13 3187
Belgium 31 5867 3 1220
Bulgaria NA NA NA 505
Czech Republic NA NA NA 380
Denmark 13 8447 10 3224
Germany 960 (2) 91 090 150 40 800
Greece 10 6138 NA NA
Hungary NA NA NA NA
Finland 30 5054 2 600
France 17 18 218 6 1850
Ireland 10 2955 NA NA
Italy 79 41 873 19 19 990
Luxembourg NA NA NA NA
Netherlands 15 9632 10 8650
Poland NA NA NA 1598
Portugal 6 4514 2 1856
Romania NA NA NA 2290
Spain 41 19 357 NA NA
Sweden 41 5303 11 2534
United Kingdom 26 37 718 3 4458
EU-28 (2012) 1297 26 1018 229 93 142
(1) Including fluidised bed combustion.
(2) Including German industrial power plants of > 50 MWth.
NB:
NA: Not available.
Source: [ New 123, 58, Eurelectric, 2001][New 120, EEB 2013]
3.1.4.1 Primary techniques to reduce NOX emissions
There are a wide variety of primary emission reduction techniques to prevent nitrogen oxides
formation in combustion plants. All these techniques aim to modify operational or design
parameters of combustion plants in such a way that the formation of nitrogen oxides is reduced
or so that nitrogen oxides already formed are converted inside the boiler/engine/gas turbine
prior to their release. Figure 3.3 summarises the primary techniques regarding combustion
modifications.
WORKIN
G DRAFT IN
PROGRESS
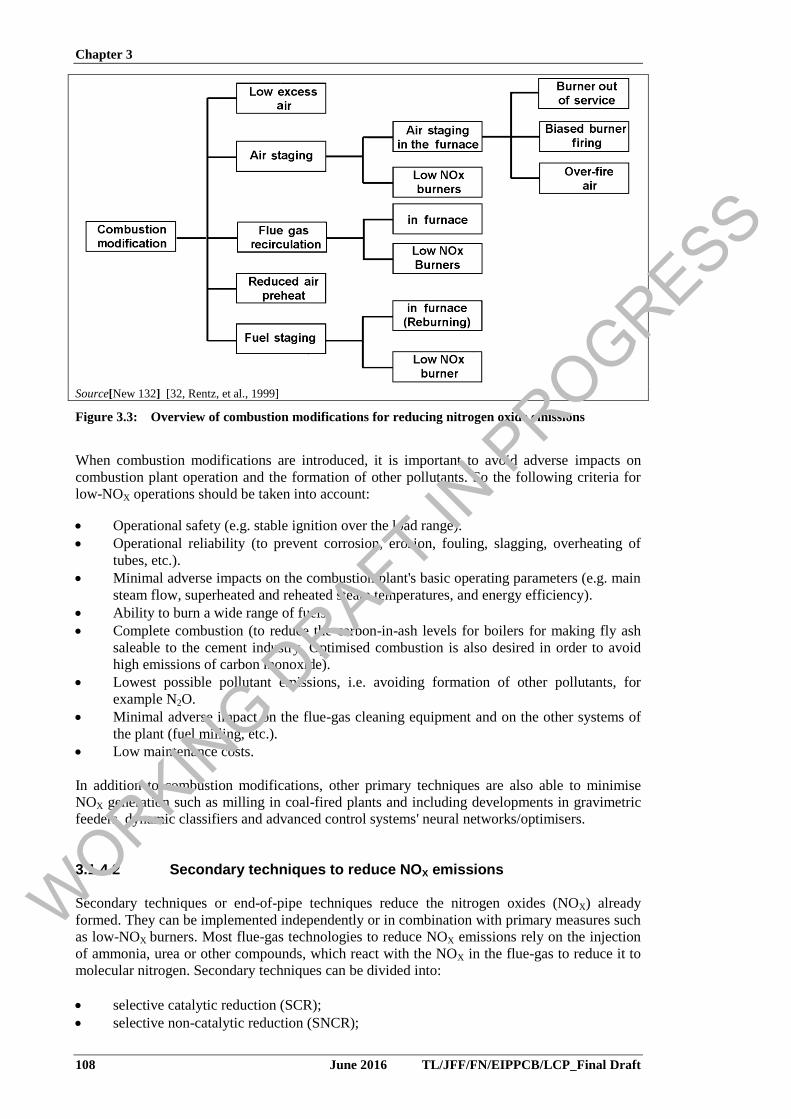
Chapter 3
108 June 2016 TL/JFF/FN/EIPPCB/LCP_Final Draft
Source[New 132] [32, Rentz, et al., 1999]
Figure 3.3: Overview of combustion modifications for reducing nitrogen oxide emissions
When combustion modifications are introduced, it is important to avoid adverse impacts on
combustion plant operation and the formation of other pollutants. So the following criteria for
low-NOX operations should be taken into account:
Operational safety (e.g. stable ignition over the load range).
Operational reliability (to prevent corrosion, erosion, fouling, slagging, overheating of
tubes, etc.).
Minimal adverse impacts on the combustion plant's basic operating parameters (e.g. main
steam flow, superheated and reheated steam temperatures, and energy efficiency).
Ability to burn a wide range of fuels.
Complete combustion (to reduce the carbon-in-ash levels for boilers for making fly ash
saleable to the cement industry. Optimised combustion is also desired in order to avoid
high emissions of carbon monoxide).
Lowest possible pollutant emissions, i.e. avoiding formation of other pollutants, for
example N2O.
Minimal adverse impact on the flue-gas cleaning equipment and on the other systems of
the plant (fuel milling, etc.).
Low maintenance costs.
In addition to combustion modifications, other primary techniques are also able to minimise
NOX generation such as milling in coal-fired plants and including developments in gravimetric
feeders, dynamic classifiers and advanced control systems' neural networks/optimisers.
3.1.4.2 Secondary techniques to reduce NOX emissions
Secondary techniques or end-of-pipe techniques reduce the nitrogen oxides (NOX) already
formed. They can be implemented independently or in combination with primary measures such
as low-NOX burners. Most flue-gas technologies to reduce NOX emissions rely on the injection
of ammonia, urea or other compounds, which react with the NOX in the flue-gas to reduce it to
molecular nitrogen. Secondary techniques can be divided into:
selective catalytic reduction (SCR);
selective non-catalytic reduction (SNCR);
WORKIN
G DRAFT IN
PROGRESS

Chapter 3
TL/JFF/FN/EIPPCB/LCP_Final Draft June 2016 109
a combination of the two.
The selective catalytic reduction (SCR) technique is widely applied for the reduction of nitrogen
oxides in flue-gases from large combustion plants in Europe and in other countries throughout
the world, such as Japan and the US.
The selective non-catalytic reduction (SNCR) technique is another secondary technique to
reduce nitrogen oxides already formed in the flue-gas of a combustion plant. It is operated
without a catalyst within a temperature window which greatly depends on the reagent used
(aqueous ammonia, urea or anhydrous ammonia).
The combination of both techniques is also increasingly applied with a compact catalyst system
installed at the boiler outlet, after an SNCR system, in order to further complete the NOX
reduction and to limit the NH3 slip.
According to the global inventory of electric power-generating plants 'UDI World Electric
Power Plants Data Base' (WEPP) 2014, there are around 1430 power plants that use SCR alone
or in combination with other NOX abatement techniques. Of these, 52 % are plants located in
North America, 32 % in Asia and 13 % in European countries. The same source reports about
230 power plants using SNCR alone or in combination with other NOX abatement techniques.
Almost 63 % of them are located in North America, about 28 % in European countries and 7 %
in Asia.
3.1.4.2.1 Trade-offs between NOX abatement, CO/dust emissions and/or energy
consumption
Examples of trade-offs between NOX abatement, CO/dust emissions and/or energy consumption
are given in Section 1.3.8. These trade-offs are very dependent on the techniques/fuel used and
on the plant configuration. More generally, when comparing the data for assessing the BAT
candidate techniques in this document, correlations and cross-impacts between these parameters
subject to potential trade-offs have been considered for deriving the conclusions and setting the
associated emission levels.
3.1.5 Combined techniques to prevent and/or reduce sulphur oxide and nitrogen oxide emissions
Combined SOX/NOX abatement techniques have been developed with the aim of replacing
conventional FGD/SCR techniques. Some of the combined SOX/NOX abatement techniques
have only been applied in a very small number of units or exist more or less only as
demonstration plants and have not yet found a market penetration for commercial (cost) reasons.
Each of these techniques employs a unique chemical reaction to remove SOX and NOX
simultaneously. The development of combined techniques has been triggered by a major
problem of conventional SCR followed by the FGD technique, which is related to the oxidation
of SO2 in the SCR reactor. Usually 0.2–2 % of the SO2 is oxidised to SO3. This has various
effects on the flue-gas cleaning system. For low-sulphur coal for instance, SO3 may improve the
removal efficiency of a cold-side ESP. However, SO3 usually increases the deposits and
corrosion in the air preheater and gas-gas heat exchanger.
Combined SOX/NOX abatement techniques can generally be divided into the following
categories:
solid adsorption/regeneration (desorption);
gas/solid catalytic operation;
electron beam irradiation;
alkali injection;
WORKIN
G DRAFT IN
PROGRESS

Chapter 3
110 June 2016 TL/JFF/FN/EIPPCB/LCP_Final Draft
wet scrubbing.
Within these categories several processes are still under development, whereas other techniques
are already commercially available and in operation in a number of plants.
3.1.5.1 Solid adsorption/regeneration
This type of process employs a solid sorbent or catalyst, which adsorbs or reacts with SOX and
NOX in the flue-gas. The sorbent or catalyst is regenerated for reuse. Sulphur or nitrogen species
are liberated from the sorbent in the regeneration step, which generally requires a high
temperature or reducing the gas for a sufficient residence time. The recovered sulphur species
are processed, for example in a ‘Claus’ plant, to produce elemental sulphur, a saleable by-
product. The nitrogen species are decomposed into N2 and water by injection of ammonia or by
recycling to the boiler. In other processes such as the activated carbon process, copper oxide,
zinc oxide and magnesium oxide-vermiculite are involved in solid adsorption/regeneration.
3.1.5.1.1 Activated carbon process
As activated carbon has a very large specific surface area, it has been widely used as an air
cleaning and waste water treatment agent since the nineteenth century. It has also long been
known that activated carbon adsorbs SO2, oxygen and water to produce sulphuric acid.
Simultaneous SO2 and NOX removal becomes possible by adding ammonia.
The flue-gas from the boiler is first dedusted, passed through a heat exchanger where heat is
extracted for activated carbon regeneration, and then cooled in a water pre-scrubber. The gas
enters the first stage of the activated carbon (dry porous charcoal) bed at a temperature of 90–
150 ºC. The sulphur dioxide reacts with oxygen and water vapour in the flue-gases (through
catalytic oxidation) to form sulphuric acid, which is adsorbed on the activated carbon.
Prior to entering the second-stage adsorber, ammonia is injected into the flue-gases in a mixing
chamber. Nitrogen oxides react catalytically with the ammonia in the second stage to form
nitrogen gas (N2) and water. The cleaned flue-gases and liberated nitrogen and moisture pass to
the stack for discharge. The reduction process takes place in an adsorber, where the activated
carbon pellets are transported from the top to the bottom in the form of a moving bed. The gas
flows across the layers, first entering the lowest part of the bed.
The sulphur-laden activated carbon passes to a regenerator where desorption is performed
thermally, by indirect heating using heat extracted earlier from the flue-gases, at a temperature
of about 400 – 450 ºC. Carbon dust is removed and make-up pellets added, prior to recycling
them back to the absorber. As a result of the regeneration, enriched SO2 gas is generated from
the desorber. The enriched gas is converted, using a Claus or another process, to elemental
sulphur, or sulphuric acid that can be sold as a by-product. Figure 3.4 shows a schematic
diagram of the activated carbon process.
WORKIN
G DRAFT IN
PROGRESS
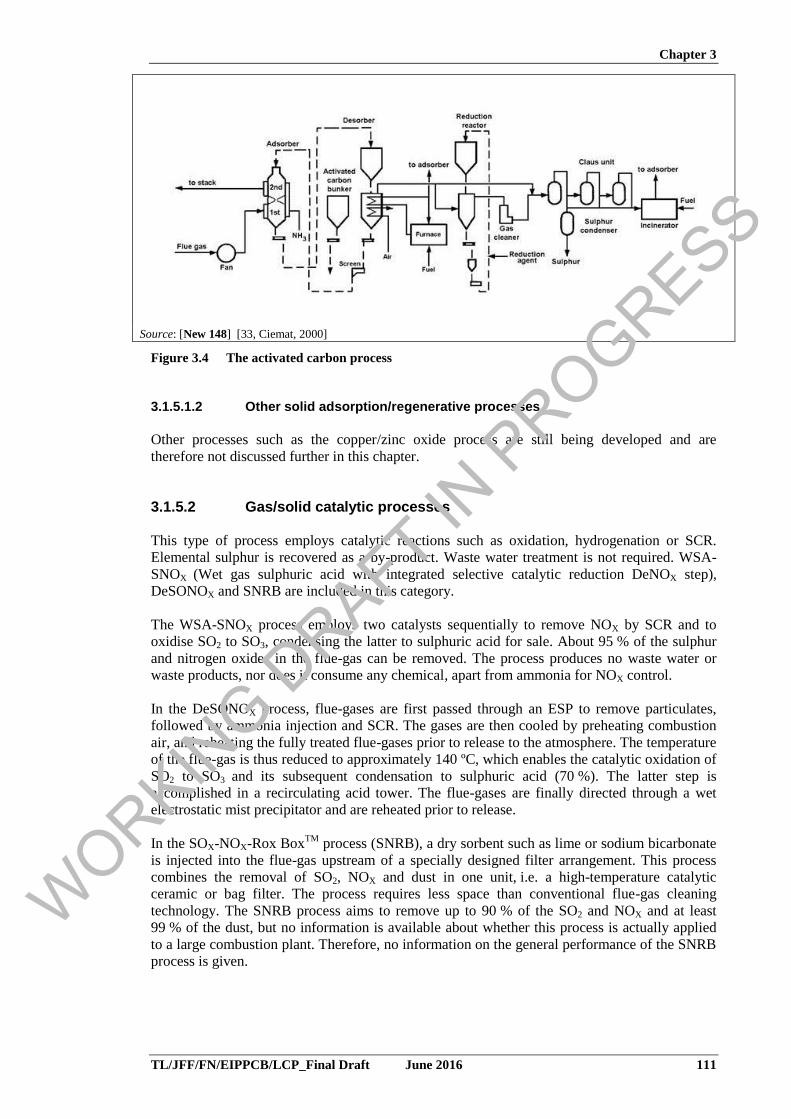
Chapter 3
TL/JFF/FN/EIPPCB/LCP_Final Draft June 2016 111
Source: [New 148] [33, Ciemat, 2000]
Figure 3.4 The activated carbon process
3.1.5.1.2 Other solid adsorption/regenerative processes
Other processes such as the copper/zinc oxide process are still being developed and are
therefore not discussed further in this chapter.
3.1.5.2 Gas/solid catalytic processes
This type of process employs catalytic reactions such as oxidation, hydrogenation or SCR.
Elemental sulphur is recovered as a by-product. Waste water treatment is not required. WSA-
SNOX (Wet gas sulphuric acid with integrated selective catalytic reduction DeNOX step),
DeSONOX and SNRB are included in this category.
The WSA-SNOX process employs two catalysts sequentially to remove NOX by SCR and to
oxidise SO2 to SO3, condensing the latter to sulphuric acid for sale. About 95 % of the sulphur
and nitrogen oxides in the flue-gas can be removed. The process produces no waste water or
waste products, nor does it consume any chemical, apart from ammonia for NOX control.
In the DeSONOX process, flue-gases are first passed through an ESP to remove particulates,
followed by ammonia injection and SCR. The gases are then cooled by preheating combustion
air, and reheating the fully treated flue-gases prior to release to the atmosphere. The temperature
of the flue-gas is thus reduced to approximately 140 ºC, which enables the catalytic oxidation of
SO2 to SO3 and its subsequent condensation to sulphuric acid (70 %). The latter step is
accomplished in a recirculating acid tower. The flue-gases are finally directed through a wet
electrostatic mist precipitator and are reheated prior to release.
In the SOX-NOX-Rox BoxTM
process (SNRB), a dry sorbent such as lime or sodium bicarbonate
is injected into the flue-gas upstream of a specially designed filter arrangement. This process
combines the removal of SO2, NOX and dust in one unit, i.e. a high-temperature catalytic
ceramic or bag filter. The process requires less space than conventional flue-gas cleaning
technology. The SNRB process aims to remove up to 90 % of the SO2 and NOX and at least
99 % of the dust, but no information is available about whether this process is actually applied
to a large combustion plant. Therefore, no information on the general performance of the SNRB
process is given.
WORKIN
G DRAFT IN
PROGRESS
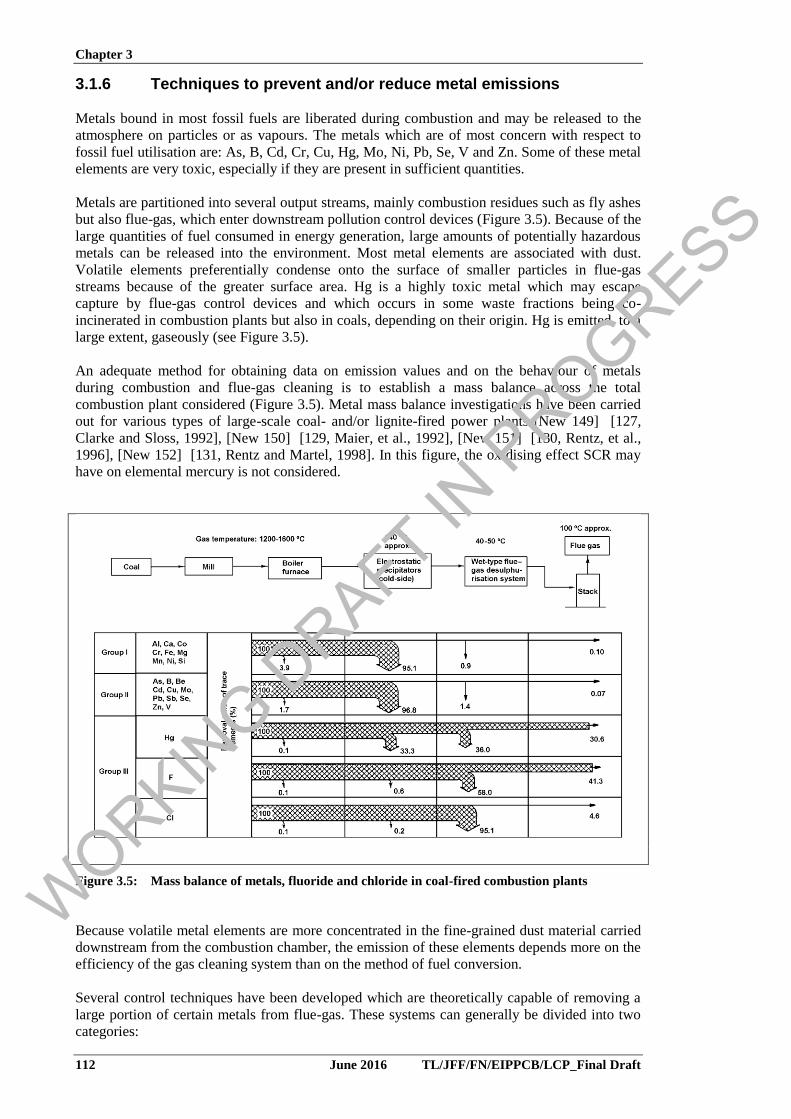
Chapter 3
112 June 2016 TL/JFF/FN/EIPPCB/LCP_Final Draft
3.1.6 Techniques to prevent and/or reduce metal emissions
Metals bound in most fossil fuels are liberated during combustion and may be released to the
atmosphere on particles or as vapours. The metals which are of most concern with respect to
fossil fuel utilisation are: As, B, Cd, Cr, Cu, Hg, Mo, Ni, Pb, Se, V and Zn. Some of these metal
elements are very toxic, especially if they are present in sufficient quantities.
Metals are partitioned into several output streams, mainly combustion residues such as fly ashes
but also flue-gas, which enter downstream pollution control devices (Figure 3.5). Because of the
large quantities of fuel consumed in energy generation, large amounts of potentially hazardous
metals can be released into the environment. Most metal elements are associated with dust.
Volatile elements preferentially condense onto the surface of smaller particles in flue-gas
streams because of the greater surface area. Hg is a highly toxic metal which may escape
capture by flue-gas control devices and which occurs in some waste fractions being co-
incinerated in combustion plants but also in coals, depending on their origin. Hg is emitted, to a
large extent, gaseously (see Figure 3.5).
An adequate method for obtaining data on emission values and on the behaviour of metals
during combustion and flue-gas cleaning is to establish a mass balance across the total
combustion plant considered (Figure 3.5). Metal mass balance investigations have been carried
out for various types of large-scale coal- and/or lignite-fired power plants [New 149] [127,
Clarke and Sloss, 1992], [New 150] [129, Maier, et al., 1992], [New 151] [130, Rentz, et al.,
1996], [New 152] [131, Rentz and Martel, 1998]. In this figure, the oxidising effect SCR may
have on elemental mercury is not considered.
Figure 3.5: Mass balance of metals, fluoride and chloride in coal-fired combustion plants
Because volatile metal elements are more concentrated in the fine-grained dust material carried
downstream from the combustion chamber, the emission of these elements depends more on the
efficiency of the gas cleaning system than on the method of fuel conversion.
Several control techniques have been developed which are theoretically capable of removing a
large portion of certain metals from flue-gas. These systems can generally be divided into two
categories:
WORKIN
G DRAFT IN
PROGRESS
Chapter 3
TL/JFF/FN/EIPPCB/LCP_Final Draft June 2016 113
techniques that are commonly used to remove dust, SOX and/or NOX emissions;
techniques that have been developed expressly to remove trace elements from the flue-
gas.
3.1.7 Techniques to prevent and/or reduce emissions of CO and unburnt hydrocarbons
The emissions of unburnt gases, which can be divided into two main groups: carbon monoxide
(CO) and hydrocarbons (CxHy), can be prevented/reduced by advanced combustion techniques.
Emissions of CO and unburnt hydrocarbons are a consequence of incomplete combustion and
can be caused by excessively low combustion temperatures; too short a residence time in the
combustion zone; or by an inefficient mixing of the fuel and combustion air, leading to local
areas of oxygen deficiency and relatively uneven fuel particle size distribution.
Carbon monoxide is the most important unburnt gas. It is a stable compound even at high
temperatures if there is no oxygen present. Hydrocarbons, on the other hand, can be
decomposed and form soot at high temperatures in an oxygen-poor atmosphere. In general, it is
possible that emissions of unburnt hydrocarbons may be generated when a low combustion zone
temperature and inefficient mixing of fuel and air occur together.
3.1.8 Techniques to prevent and/or reduce halide emissions
Natural sources, the sea in particular, are the major source of chlorine, bromine and iodine in the
atmosphere. Human activities, especially industrial sources such as aluminium manufacture, are
the major global source of fluorine emissions. In many countries, the combustion of fossil fuels
is the largest source of chlorine (as HCl) from human activities and may also be a predominant
source of fluorine (as HF). Emissions of halides from combustion are in the form of highly
soluble acidic gases, which can contribute to acid rain.
The emission of halides depends on a number of factors: the initial halogens content of the fuel
and the form in which they are present, the combustion conditions (temperature, residence time,
etc.), and the use of various pollution control techniques. Those techniques originally designed,
for instance, to control emissions of SOX, such as limestone addition to the boiler and FGD, can
be especially effective in reducing emissions of the acidic halide gases. With rotating gas heat
exchangers, HF bypasses FGD systems at a rate of ~50 %.
3.1.9 Techniques to reduce greenhouse gas (GHG) emissions from large combustion plants
Various methods, processes and technologies to reduce greenhouse gas emissions from fossil-
fuel-fired combustion plants, especially for the reduction of CO2 emissions, are the focus of
many projects linked to the implementation of stringent climate change policies. Article 36 of
the IED establishes for all plants of > 300 MWe a legal requirement to assess certain conditions
related to the future feasibility of carbon capture and storage, and, in the event of a positive
assessment, to ensure the retrofittability to meet the necessary conditions for CO2 capture.
CO2 emissions reduction in large combustion plants is regulated in Europe through the EU
Emissions Trading System (EU ETS).
Some GHG of less global importance but still relevant for the combustion sector, such as N2O,
can be generated at FBC boilers. The combustion of older fuels leads to higher levels of
emissions (e.g. N2O emission levels from anthracite combustion are higher than N2O emission
levels from lignite combustion, which are higher than N2O emission levels from biomass
WORKIN
G DRAFT IN
PROGRESS

Chapter 3
114 June 2016 TL/JFF/FN/EIPPCB/LCP_Final Draft
combustion). The techniques to prevent or reduce such emissions are described in Section
5.1.3.6.
3.1.10 Water usage and techniques to reduce emissions to water
A large combustion plant requires considerable water for producing process water and technical
water, cooling, energy generation, waste water treatment, and sanitary purposes. Water
consumption varies depending on the processes involved.
The water used may be obtained from the sea, rivers, lakes, etc. and it is possible to use both
seawater and water of a reduced quality for many of the processes. The feed water for the steam
cycle needs to undergo water treatment to reach the quality needed for deionised water.
Seawater can be used for feed water, cooling water or even for desulphurisation. Initiatives to
reduce water consumption largely depend on the source of the water. The technical water and
waste water from water treatment may be reused for the desulphurisation plant.
It is possible in coastal areas to use seawater that has been desalinated by reverse osmosis. The
process is normally based on the following process:
seawater intake;
filtering by self-rinsing filter;
filtering by sand filters;
filtering by cartridge filters;
reverse osmosis and recovery of energy from the concentrate.
[New 88, DK comments to D1]
Section 1.3.3 gives an overview of the different sources of waste water that can be found in a
large combustion plant. The waste water encountered in combustion plants is composed of
polluted water arising from the various LCP processes and rainwater from the site. This water
may have to be treated in waste water treatment plants, where a reduction of pollutant
concentrations is achieved. This section outlines the techniques that are normally used to treat
the contaminated waste water streams before they can be discharged to the aquatic environment.
The amount and the quality of the waste water and, correspondingly, the configuration of the
waste water treatment plant which is appropriate for the needs of a particular LCP’s effluents
are site-specific and depend on many parameters, including the:
type and composition of fuel;
type of storage facilities for fuel and chemicals;
type of fuel preparation;
type of combustion processes;
type of cooling systems;
type of chemical conditioning applied for boiler water and cooling water;
quality of raw water available;
type of water treatment systems;
type of flue-gas treatment systems;
nature of combustion by-products (fly ash, wet ash, FGD gypsum, etc.); and
management practices (disposal, sale).
The individual waste water streams generated by the various operations in an LCP include:
process waste water, in particular waste water from the FGD unit;
collected rainwater run-off and firefighting water;
sanitary waste water.
WORKIN
G DRAFT IN
PROGRESS

Chapter 3
TL/JFF/FN/EIPPCB/LCP_Final Draft June 2016 115
Due to their different compositions and quality (pollutants' characteristics and concentration),
the above-mentioned streams are usually collected by separate drainage systems and are
directed to separate destinations for further treatment in dedicated waste water treatment plants
(sanitary waste water in biological waste water treatment plants, and process waste water and
contaminated rainwater run-off in industrial waste water treatment plants).
The clean collected rainwater does not need to be treated and can be discharged directly to the
receiving water or used as fresh water for the plant's needs.
[ New 121, Eurelectric 2012 ]
The design of the LCP site's drainage systems is very important, as by employing well-designed
drainage systems the waste water management is optimised, achieving economies in water
consumption and in the design and operation of the waste water treatment plant.
Waste water is designed to flow, as far as possible, by gravity through the drainage systems to
the various components of the waste water treatment plant, in order to avoid intermediate
pumping and the associated energy consumption.
Waste water streams vary greatly in flow rate. Depending on their origin, the waste water
streams contain different substances:
solid substances (e.g. suspended solids);
fluid substances (e.g. oils, oil-water emulsions);
water-soluble substances (organic, inorganic).
The waste water streams encountered most often in an LCP are listed below:
waste water from raw water treatment plants;
waste water from the cooling circuit systems;
waste water from other sources in the steam generation process;
waste water from flue-gas cleaning systems;
acid washing water;
sanitary waste water.
Inventory management tools give detailed information on the location, production,
environmental circumstances, emissions, etc. of the installation and thereby help detect
emissions that can be prevented or reduced.
Relevant basic data on the composition and quantity of waste water are compiled in a stream
inventory. The emitted streams are listed respective to their source, i.e. the production process
from which they originate. This is a key element in assessing their degree of contamination and
the nature of the contaminants, as well as the possibilities of reduction at the source. Stream
inventories may be the basis for waste water segregation and water treatment strategies. Waste
water streams that are typically segregated include surface water run-off, cooling water, and
waste water from flue-gas treatment.
Relatively uncontaminated water (e.g. from cooling water blowdown) can often be reused for
other purposes requiring water of lower quality (e.g. for cleaning or flue-gas treatment). The
recycling is limited by the quality requirements of the recipient stream and the water balance of
the plant. Some waste water streams are usually not recycled (e.g. seawater used in cooling
systems). The optimum choice of the cooling system depends on the local conditions. Waste
water from wet FGD is sometimes recycled after treatment (US EPA 2013). Water recycling is
not applicable to waste water from cooling systems when water treatment chemicals and/or high
concentrations of salts from seawater are present.
A technique to reduce water usage and the volume of contaminated waste water discharged is
the handling of bottom ash from the boilers. Dry hot bottom ash falls from the furnace onto a
WORKIN
G DRAFT IN
PROGRESS
Chapter 3
116 June 2016 TL/JFF/FN/EIPPCB/LCP_Final Draft
mechanical conveyor system and is cooled down by air or water in a closed cycle. No water is
used in direct contact with the ash for cooling or transportation. Dry ash handling is a technique
also described in Section 3.2.5 (Optimisation of bottom ash quality) and proposed as a new
source performance standard by the US EPA.
3.1.10.1 Waste water from raw water treatment plants
Typically, raw water is pretreated before being used in different areas of the LCP. The types of
pretreatment carried out are softening and demineralisation. These pretreatments typically
generate the following waste waters.
The waste waters from softening plants are:
spray water from belt strainers (cleaning of surface water);
filtrate from sludge draining (without chemical additions);
filtrate from sludge draining (after flocculation and precipitation);
back flushing water from sand filters.
The waste waters arising from various parts of the softening plant are usually recycled back into
the process.
The waste waters from demineralisation plants are:
ion exchange (resins) regeneration effluents;
reverse osmosis concentrates;
ultrafiltration concentrates.
3.1.10.2 Waste water from cooling circuit systems
The waste water from cooling circuit systems mainly results from the blowdown of wet cooling
towers and the occasional drainage from the evacuation of the cooling towers basin. In once-
through cooling systems' inlet filter screen washings, cooling water discharge temperatures and
the concentration of biocides or other additives are considered.
Emissions from all types of cooling systems, including LCPs, to the environment are dealt with
in detail in the Industrial Cooling Systems BREF and are not included in the scope of this
document.
3.1.10.3 Waste water from steam generation processes
The waste water from steam generation processes mainly includes:
blowdowns from drum-type steam generators;
laboratory waste water and sampling;
discharges from the water-steam cycle;
discharges from district heating systems;
condensate polishing plant regeneration effluents;
ash and slag handling and removal systems' effluents;
boiler chemical cleaning effluents;
boiler wet conservation effluents;
wash water of steam generators, air heaters, gas heaters, ESPs, DeNOX, FGD plants and
various other equipment;
WORKIN
G DRAFT IN
PROGRESS
Chapter 3
TL/JFF/FN/EIPPCB/LCP_Final Draft June 2016 117
oily effluents (dewatering of fuel oil storage and daily tanks, run-off from heavy fuel oil
and/or gas oil treatment systems, turbine or diesel engine houses, transformer areas, etc.).
3.1.10.4 Waste water from flue-gas treatment systems
All wet-type flue-gas cleaning systems produce waste water that, due to the fuel and materials
used, contains metals among other components. One of the main sources of waste water in this
context is the wet limestone scrubber that is used in a large number of combustion plants for
desulphurisation of the flue-gas, although this water volume can be reduced by using fuels with
a lower chlorine content and by designing the absorber to operate at a higher chloride
concentration. This results in a reduction in the purge to the waste water treatment plant, which
in turn reduces emissions to water. An example of a conventional waste water treatment system
is presented in Figure 3.6, but it is noted that there are many different types of systems,
depending on the different national regulations, the type of fuel and site-specific factors.
The pH value of FGD waste water is increased in order to precipitate metals. This is generally
achieved using either lime milk or caustic soda, causing the formation of metal hydroxides. By
adding flocculants (iron(III) chloride), flakes are formed. The addition of coagulation aids
(polyelectrolytes) allows the agglomeration of individual flakes, so that a greater flake
formation ensues. The sludge is then pre-sedimented, drained and disposed of or co-combusted
in the case of slag tap combustion. Part of the ‘thin’ sludge is recycled to the flocculation stage
where the sludge particles serve as initial crystallisation nuclei promoting more rapid
flocculation.
The treated waste water from the pre-sedimentation stage can be supplied to a baffle plate
thickener for further sedimentation. The suspended micro-particles deposit on the inclined baffle
plates. The sludge falling off the plates is gathered at the lower point of the baffle plate
thickener and can also be recycled. The cleaned waste water is fed to the drain via the overflow
of the baffle plate thickener, provided the regulatory limit values are met. In addition, if the pH
value is required to be between 6 and 9.5, the water is neutralised. Although it is generally not
necessary, the content of ammonia in the waste water may lead to it first being fed to an
ammonia stripping plant before it is discharged to the drains. In some processes, e.g. with a
higher input of Hg from the co-combustion of wastes, it is customary to also add (organic)
sulphide after the addition of lime milk, thereby precipitating the metals as sulphides, which is
more effective than using hydroxide. The disadvantage is that the metal sulphides (greater
quantities) need to be disposed of, as by co-combusting these residues the sulphur would be
released as sulphur dioxide and Hg would be released again.
Various plants treat FGD waste waters differently. While some of them use flocculants and
flocculation aids for example, others use only flocculation auxiliaries and organic sulphide.
There are, however, also operators who use flocculants, flocculation auxiliaries and organic
sulphide.
In the example shown in Figure 3.6, FGD waste water is pre-neutralised in an agitator with the
aid of lime slurry. The pH is further increased by additional dosing of lime slurry in the second
reactor. Initial flocculation and settling of heavy metal hydroxides occur in the circular
concentration reactor tank. Polyelectrolytic solution is fed into the supply line to the
concentration reactor tank, in order to avoid repulsion between hydroxide particles and to
accelerate sedimentation.
The treated water, with a pH of 6 to 9, may be transferred from the upper zone of the circular
concentration reactor tank to the main water inlet. If the pH is above 9, it is corrected with an
acid additive, e.g. hydrochloric acid. Part of the slurry withdrawn from the concentration tank is
fed as contact slurry to support flocculation in the first agitator. This slurry acts as an accelerator
for the precipitation of the hydroxides. Most of the slurry from the agitator is temporarily stored
in a slurry container, dewatered in a filter press and finally stored in a bunker prior to disposal.
WORKIN
G DRAFT IN
PROGRESS

Chapter 3
118 June 2016 TL/JFF/FN/EIPPCB/LCP_Final Draft
Source: [ New 123, 58, Eurelectric, 2001]
Figure 3.6: FGD waste water treatment plant
Two-stage precipitation processes (see Figure 3.7) are widespread in FGD waste water
treatment. Waste water from FGD first reaches an oxidation stage, in which conversion is
generally accomplished with sodium hypochlorite (NaOCl), particularly mercury dissolved into
Hg(II). This is followed by the gypsum desaturation stage. Here, by the addition of calcium
hydroxide (Ca (OH)2), the pH of the waste water is raised and iron(III) chloride (FeCl3) may be
added for flocculation. With the addition of a flocculant, a sedimenting sludge is formed, which
is then deposited in a first sedimentation stage. A portion of this sludge from the sedimentation
is recirculated to improve sedimentation capability. This step can, for example, be a circular
clarifier whose efficiency can be increased if necessary by the incorporation of lamellae. The
deposited slurry (about 99 % of the total sludge accumulation) consists mainly of calcium
sulphate and can therefore be used further as a resource.
The clear effluent of the first sedimentation stage then enters the metal removal stage. Here, by
the addition of organic sulphides, the metals are precipitated as sulphides, and the pH may be
further increased by the addition of calcium hydroxide.
The sedimentation capability of the metal sulphides is improved by contact between the sludge
and the polymers. In the second stage of the two-stage procedure only a small amount of sludge
is accumulated (about 1 %), which must be disposed of. The same construction of both
sedimentation stages offers the advantage that the system can also be operated as a single stage,
for example during times of revision. Another advantage of a two-stage procedure is that the
gypsum sludge and the mercury sludge accumulate separately.
WORKIN
G DRAFT IN
PROGRESS

Chapter 3
TL/JFF/FN/EIPPCB/LCP_Final Draft June 2016 119
Figure 3.7: Two-stage waste water treatment plant
ZLD (zero liquid discharge) is a combination of techniques that results in no waste water
discharges. Depending on plant-specific conditions, ZLD may be achieved for different waste
water streams and by using different combinations of techniques. After the neutralisation and
sedimentation unit (pH adjustment, ferric co-precipitation, flocculation, clarification, etc.), a
Softening-Evaporation-Crystallisation (SEC) system can be installed. The products of this
system are high-quality water, to be recycled, and salts, to be disposed of. Evaporation allows
plants to recover clean water for reuse, thereby reducing water usage. A few plants worldwide
use evaporation, including larger plants (e.g. Plants 211/212 (418+433 MWth) and Plant 253
(1420 MWth)). However, evaporation is energy-intensive, which may offset the environmental
benefits. For new FGD applications, the design can be optimised for the ZLD concept, taking
into account the possible additional cost and decrease in energy efficiency, by reducing the FGD
purge flow rate.
Figure 3.8 and Figure 3.9 show that, for sulphate and mercury emissions to water for example,
there is differentiation between plants operating with a wet abatement system for air pollutants
(wet FGD, FG condenser) and those operating without.
WORKIN
G DRAFT IN
PROGRESS

Chapter 3
120 June 2016 TL/JFF/FN/EIPPCB/LCP_Final Draft
Source: [EIPPCB–Data collection 2010], [ 3, LCP TWG 2012 ]
Figure 3.8: Yearly sulphate concentration in the direct emission of the plants – Comparison of
plants with a wet abatement system for air pollutants and plants without
Source: [ 3, LCP TWG 2012 ]
Figure 3.9: Yearly mercury concentration (> 0.0008 mg/l) in the direct emission of the plants –
Comparison of plants with a wet abatement system for air pollutants and plants
without
The reported average levels of the direct emissions to water for each category of plant (i.e. those
fitted with a wet abatement system for air pollutants and those without) from a set of plants
operated in Europe are given in Table 3.3. In this table, no distinction is made concerning the
WORKIN
G DRAFT IN
PROGRESS
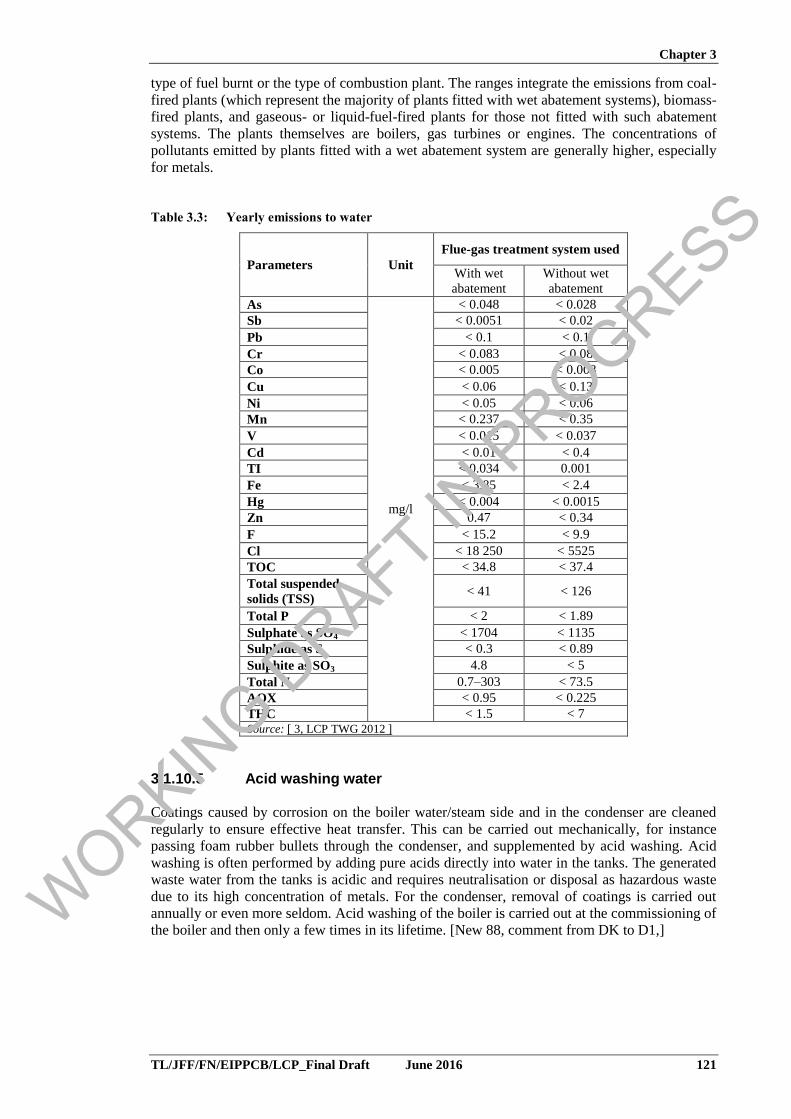
Chapter 3
TL/JFF/FN/EIPPCB/LCP_Final Draft June 2016 121
type of fuel burnt or the type of combustion plant. The ranges integrate the emissions from coal-
fired plants (which represent the majority of plants fitted with wet abatement systems), biomass-
fired plants, and gaseous- or liquid-fuel-fired plants for those not fitted with such abatement
systems. The plants themselves are boilers, gas turbines or engines. The concentrations of
pollutants emitted by plants fitted with a wet abatement system are generally higher, especially
for metals.
Table 3.3: Yearly emissions to water
Parameters Unit
Flue-gas treatment system used
With wet
abatement
Without wet
abatement
As
mg/l
< 0.048 < 0.028
Sb < 0.0051 < 0.02
Pb < 0.1 < 0.1
Cr < 0.083 < 0.08
Co < 0.005 < 0.008
Cu < 0.06 < 0.13
Ni < 0.05 < 0.06
Mn < 0.237 < 0.35
V < 0.015 < 0.037
Cd < 0.01 < 0.4
TI < 0.034 0.001
Fe < 3.85 < 2.4
Hg < 0.004 < 0.0015
Zn 0.47 < 0.34
F < 15.2 < 9.9
Cl < 18 250 < 5525
TOC < 34.8 < 37.4
Total suspended
solids (TSS) < 41 < 126
Total P < 2 < 1.89
Sulphate as SO4 < 1704 < 1135
Sulphide as S < 0.3 < 0.89
Sulphite as SO3 4.8 < 5
Total N 0.7–303 < 73.5
AOX < 0.95 < 0.225
THC < 1.5 < 7 Source: [ 3, LCP TWG 2012 ]
3.1.10.5 Acid washing water
Coatings caused by corrosion on the boiler water/steam side and in the condenser are cleaned
regularly to ensure effective heat transfer. This can be carried out mechanically, for instance
passing foam rubber bullets through the condenser, and supplemented by acid washing. Acid
washing is often performed by adding pure acids directly into water in the tanks. The generated
waste water from the tanks is acidic and requires neutralisation or disposal as hazardous waste
due to its high concentration of metals. For the condenser, removal of coatings is carried out
annually or even more seldom. Acid washing of the boiler is carried out at the commissioning of
the boiler and then only a few times in its lifetime. [New 88, comment from DK to D1,]
WORKIN
G DRAFT IN
PROGRESS

Chapter 3
122 June 2016 TL/JFF/FN/EIPPCB/LCP_Final Draft
3.1.10.6 Sanitary waste water
Sanitary waste water includes waste waters originating from toilets and canteens. Current flows
are usually estimated at approximately 75 l/person/day. Emissions are characterised by a high
organic content.
3.1.10.7 Other waste waters
Surface run-off water arises from the contamination of rainwater collected from building roofs,
paved areas and fuel storage areas (e.g. coal stockpiles). The contamination of rainwater occurs
when materials such as dust (coal particulates) from fuel storage, surface deposition, etc. or oils
are washed into the drainage system. The contamination of surface water can be prevented or
minimised by the use of sedimentation basins and good practice in the storage of fuel and other
raw materials, as well as by good maintenance and cleaning of the whole plant.
Surface run-off water may be collected separately. After a sedimentation step or chemical
treatment, it may be reused for other purposes in the production process, for instance in water
sprays to prevent dust formation from the storage of solid fuels.
In combustion plants, there are many other sources of waste water. Examples are: liquid
effluents from the cleaning stations for trucks delivering fuel (e.g. trucks transporting peat) and
other raw material; sealing water from pumps; and waste water from general operations,
including the cleaning of equipment, floors, etc. These liquid effluents are normally collected
and treated. Water from the sanitary system is normally discharged to the public sewerage
system.
To reduce the concentration of water pollutants, end-of-pipe techniques such as neutralisation,
flocculation, sedimentation and filtration may be used. These techniques are normally used
together in a final or central on-site waste water treatment plant.
3.1.11 Techniques to control releases to land/soils and for residues management
When sludges and solid residues from flue-gas and waste water cleaning in LCPs cannot be
utilised, or whenever the current production exceeds demand, the surplus has to be disposed of
in an environmentally responsible and sound way (e.g. by applying the results of the
Environmental Impact Assessment (EIA) studies conducted). Acting in this way, the appropriate
choice of site, disposal method and monitoring ensures that this surplus can be deposited
without detriment to the environment. In common with other powdered materials, guidelines for
the manipulation (including transport) of ash ensure the efficient protection against accidental
exposure to dust. The aim is always to obtain by-products from the residues that can be used in
other industrial sectors, for example as building material.
The sludges and other residues from LCPs can be subdivided into sludge from water and waste
water treatment and residues from flue-gas desulphurisation and flue-gas dust precipitation.
Another generated residue consists of matter screened from surface waters that is encountered
on the rakes and screening facilities for the drawing-off of water.
The organic matter collected at the cooling water intake can be used as an energy source or
composted and used afterwards to improve soil quality. Residual matter must be deposited.
Sludges from the treatment of waste waters from FGD plants can possibly be reused as reaction
agents in the FGD plant, due to the calcium components. They are also used as additives in
coal-fired combustion plants to improve the ash melting behaviour.
WORKIN
G DRAFT IN
PROGRESS

Chapter 3
TL/JFF/FN/EIPPCB/LCP_Final Draft June 2016 123
Sludges from the treatment of raw waters, such as surface water, are decarbonised and thus have
a high content of calcium carbonate (e.g. 30 % or more). Besides the above-mentioned
implementation in flue-gas desulphurisation and as an additive in coal boilers or other areas
where calcium additives are used, these sludges can be useful as calcium fertiliser and for soil
improvement in agriculture.
Residues from flue-gas desulphurisation, such as FGD gypsum and ammonium sulphates,
contain calcium and sulphur, which are used for fertilisation and in soil improvers in agriculture,
among other uses (e.g. construction sector). Only 0.1 % of residues from SDA are currently
used as fertiliser (see data from ECOBA), mainly due to metals (e.g. Cd, Hg). SDA products are
also used specifically as an underground filler, e.g. to stabilise underground mines. Other
desulphurisation products, such as sulphur or sulphuric acid, are only produced in small
quantities and are used exclusively in the chemical industry.
Residues from flue-gas dust removal are typically ashes, such as boiler slag from wet-bottom
furnaces; bottom ash from dry-bottom furnaces; and fly ash from coal-fired and lignite-fired
power plants. In fact, the utilisation of coal ash as a replacement for minerals or manufactured
products saves the extraction of raw materials, while preserving and conserving natural
resources, as well as reducing energy consumption and the emission of carbon dioxide (to the
extent that one tonne of fly ash replacing cement saves approximately 600 kg of CO2).
Owing to its good filtering properties, about 60 % of the bottom ash is used in road construction
and other surfacing and landscaping work. About 70 % of fly ash is used in the manufacture of
cement, concrete and concrete products, in which it is valued for its building properties. It is
also used in the production of mortar, bricks, masonry blocks, paving and mining mortar.
Ashes from lignite-fired power plants are mostly used as a leach-free stabiliser mixed with
waste water from FGD plants for the filling of exhausted open-pit mines. Part of the ash is used
for recultivation and surface covering. Certain qualities of lignite fly ash make it suitable for use
in concrete manufacture. There are also many other possible uses for ashes and for ashes from
fluidised bed combustion plants.
In summary, techniques to control releases to soil cover flue-gas and waste water cleaning
techniques, as well as techniques for residue and by-product utilisation, which result in a
reduction in the amounts of waste that would otherwise have to be disposed of in landfills. With
the increasing degree of utilisation, the quantity of waste that has to be disposed of is reduced,
which means the consumption of landfill volume becomes lower. The utilisation of by-products
may thus serve for soil protection and to conserve resources. However, care should be taken on
critical parameters which may need monitoring, such as long-term leaching behaviour, stability
of residues and monitoring and reporting of the quality of the residues. Therefore, unavoidable
and non-utilisable mineral residual waste may still be disposed of to landfill.
3.1.12 Measures to control noise emissions
Most EU countries have their own environmental noise regulations.
Typically, the noise criteria are based on different area types or specific environments
(residential, commercial, industrial, etc.). These levels usually differ depending on the affected
area (residential or business) and the time of day (daytime, typically 7.00 to 22.00, or night-
time, typically an eight-hour period between 22.00 and 7.00, e.g. 22.00 to 6.00 or 23.00 to 7.00).
The operator of a plant usually has to give information on noise dissemination and measures
taken for noise abatement. Since most plants operate continuously all day and night, the target
noise levels during the night will determine the techniques for the whole site. In case of impulse
noise, it is a common practice to add 5 dB(A).
WORKIN
G DRAFT IN
PROGRESS
Chapter 3
124 June 2016 TL/JFF/FN/EIPPCB/LCP_Final Draft
The environmental noise requirement is defined with a noise receptor outside the project
property boundary line. Also, existing background noise must be taken into account when
defining the noise impact of a new combustion plant.
The main noise sources of thermal power plants are: fans (including inlets, outlets, stacks and
enclosures), pumps, turbines, engines, steam systems, buildings (including windows and
ventilation systems), cooling towers and transformers.
Effective reduction of noise emissions is achieved by strategic planning of plants and sites, by
good device design and by applying primary techniques which reduce noise at source or by
means of secondary techniques which reduce noise propagation where needed.
The most effective combination of techniques has to be identified individually for each plant or
production site and does not necessarily include noise reduction techniques at the source with
the highest emission, but with the highest impact value. Therefore, a combination of techniques
used at noise sources close to the affected areas may be the most efficient way to reduce
environmental noise [ 150, COM 2011 ].
The noise emissions in LCPs are usually technically manageable. Since increased distance from
the source lowers noise, planning of land used both on a community level and within a specific
industrial site is perhaps the best preventive measure to avoid noise problems. Inside the
building, the same principle applies, i.e. the layout design should separate the working areas
from noisy equipment.
Some common noise control techniques are:
careful orientation and location of noise-emitting machinery, also taking into
consideration the change of frequency of the sound;
enclosure of noisy plant components (e.g. gas turbines, steam turbines and generators) in
sound-absorbing structures;
use of anti-vibration supports and interconnections for equipment;
ventilation of enclosures with low-noise fans;
addition of cladding to the support structure of noisy equipment;
fitting of high-level flue-gas silencers;
location of boiler feed pumps in enclosures;
building of a pump house around the pumps for circulating the cooling water;
operation of low-noise fans in the cooling towers (it should be noted that the noise
emissions from once-through cooling water systems are less than from cooling towers);
use of embankments or other noise barriers to screen the source of the noise.
Requirements stipulated by the authorities can encourage manufacturers to reduce the noise
generated by equipment and thus to create a competitive advantage.
In recent years, interest in noise has increased and has led to a series of noise regulations. The
objectives of such regulations are to ensure appropriate and sufficient protection for the
environment from plant noise and to provide planning security for the planners and future
operators of new plants with respect to compliance with the regulations. To achieve these
objectives, it may be practical to specify values, i.e. at receiver points (noise-sensitive receptors,
NSRs) in the neighbourhood and, at these points, sound levels for the noise emitted by the plant.
Based on these target values and the noise-relevant plant characteristics, a noise study may be
an indispensable part of the permitting phase. In such a study, an acoustic planning concept
should be worked out and sound propagation calculations applied to ensure and demonstrate
that the target values can be complied with. Periodically (e.g. three times per year), the operator
should assess whether any new noise sources exist.
WORKIN
G DRAFT IN
PROGRESS

Chapter 3
TL/JFF/FN/EIPPCB/LCP_Final Draft June 2016 125
3.1.13 Cooling techniques
The operation of large combustion plants is governed by ‘Carnot’s principle’. The heat source,
i.e. the boiler, provides the energy required for the water vaporisation. The cold source, i.e. the
condenser, condenses the steam coming out of the low-pressure turbine. The condenser and the
cooling system are, therefore, the key parts of the facility. Regardless of the mode of cooling
adopted, it is in fact one of the main interfaces between the combustion plant and the
surrounding environment. The efficiency and availability of a power plant depend, to a great
extent, on the integrity and cleanness of the condenser and the cooling system.
A variety of applications can be found, all aimed at meeting process, site, environmental and
economic requirements. The environmental impact of cooling techniques used in large
combustion plants is described in the BREF on industrial cooling systems.
Each cooling system is designed to provide cold water suitable for maintaining turbine
operation at the optimum design point. But the cooling systems are not equivalent in their
capacity to take into account the daily and seasonal variations in source water and
meteorological conditions. Greater sensitivity of dry cooling systems to ambient conditions is to
be noted, entailing a greater impact on plant operating efficiency.
[ New 121, Eurelectric 2012 ]
Most plants in the 2012 data collection report the use of a direct once-through system for
cooling, where the coolant (i.e. water) is pumped from a source (e.g. river, sea, lake), it passes
through a heat exchanger (where the heat is transferred from the process to the coolant through a
partition wall) and finally it is discharged back to the receiving water. In many of those cases
the coolant passes through a cooling tower before it is discharged back to the receiving water. A
number of plants also report the use of an indirect once-through system. In this case, the primary
coolant (i.e. water) is pumped from a source, it passes through a heat exchanger (the heat is
transferred in the heat exchanger from the secondary cooling circuit to the primary coolant
through a partition wall) and finally it is discharged back to the receiving water. In the
secondary circuit, there is another heat exchanger where the heat is transferred from the process
to the secondary coolant through a partition wall. In some cases the primary coolant passes
through a cooling tower before it is discharged back to the receiving water. Open recirculating
wet cooling systems are also reported in the 2012 data collection, as well as closed circuit
systems. Few examples of hybrid (wet/dry) cooling systems are reported.
3.1.14 Emission monitoring and reporting
This section is intended to give general information on the monitoring and reporting of
emissions from combustion plants. The methods and instruments used for the monitoring of
emissions are the relevant national or international methods (e.g. European Committee for
Standardisation (CEN); ISO; VDI Richtlinien; Netherlands Emission Regulations; UK
Guidance Notes: British Standards, etc.). For more detailed information on general monitoring
issues, reference is made to the JRC Reference Report on Monitoring of emissions to air and
water from IED installations.
3.1.14.1 Emission components
The most common emission components to air that are measured at LCPs or that are calculated
using emission factors and other methods are:
diffuse dust emissions, e.g. from the unloading, storage (short- and long-term) and
handling of fuel;
dust as stack emissions (including PM10 and PM2.5);
sulphur oxides (SOX);
WORKIN
G DRAFT IN
PROGRESS

Chapter 3
126 June 2016 TL/JFF/FN/EIPPCB/LCP_Final Draft
nitrogen oxides (NOX);
nitrous oxide (N2O);
metals;
carbon monoxide (CO);
carbon dioxide (CO2);
hydrogen fluoride (HF);
hydrogen chloride (HCl);
ammonia (NH3);
hydrocarbons (as unburnt hydrocarbons, UHC);
volatile organic compounds (VOCs);
dioxins and/or POPs.
For water pollution, the following parameters can be monitored:
suspended solids;
metals;
salts (chloride and sulphate);
organic halides;
biocides;
phosphate;
altered pH values.
The pH value and the other components are reported as a whole or partly in the fuel-specific
chapters, depending on the fuel used and the availability of data. Methods of analysis are given
in relevant national and international guidelines on monitoring and analysis.
3.1.14.2 Reference conditions and parameters
For emissions to air, the following flue-gas parameters are determined to convert the emission
concentrations obtained to standard conditions, i.e. 273 K, 101.3 kPa, reference oxygen level
and dry gas:
the volumetric flue-gas flow (in order to calculate the concentration and emission mass
flow);
the flue-gas temperature;
the water vapour content of the flue-gas;
the static pressure in the flue-gas duct;
the atmospheric pressure;
the monitoring period/averaging period;
the oxygen content.
In addition to the above-mentioned parameters, for good operation of the combustion plant and
the flue-gas cleaning system, additional measurements of certain parameters (such as voltage
and electricity (electrostatic precipitators), pressure drop (bag filters), pH of scrubbing fluid
(scrubbers)) and pollutant concentrations at various sites within the flue-gas ducts may be
necessary.
3.1.14.3 Sampling points
The sampling points meet the requirements of EN standards (i.e. EN 15259).
The sampling points need to be situated in a section of the flue-gas duct where representative and
homogeneous flow conditions and concentrations of pollutants are expected.
WORKIN
G DRAFT IN
PROGRESS
Chapter 3
TL/JFF/FN/EIPPCB/LCP_Final Draft June 2016 127
The measurement sites allow access to the sampling plane for typical sampling equipment
consisting of structures and technical equipment, for example working platforms, measurement
ports and energy supply.
3.1.14.4 Monitoring of emissions
The monitoring of emissions is carried out to determine the substances in the flue-gas or waste
water in order to check the compliance with the emission limit values of the permit, to report to
the authorities (e.g. to the E-PRTR), to control the combustion process or abatement system,
and/or to predict the environmental impact of the plant or process.
Monitoring analysis during normal operating conditions and OTNOC can be carried out by
direct measurements (i.e. direct source testing) or by using surrogate parameters. Direct
measurements can be continuous or periodic.
The minimum monitoring frequency depends on the type of pollutant, the fuel combusted, the
plant size, the monitoring practices and the implemented abatement techniques.
3.1.14.4.1 Continuous monitoring
In general, continuous direct measurements are the most accurate and preferred method of
monitoring emissions. Continuous emission monitoring of a number of components in gases or
in waste water is possible, and, in several cases, accurate concentrations (mg/Nm3, ppm or mg/l)
can be reported continuously or as mean values over agreed time periods (half-hourly, daily,
etc.). However, conditions for this are that the existing infrastructure is good and trained
personnel are available to operate the equipment (for calibration procedures, etc.). Prime mover
differences such as over/underpressures in the flue-gas, pressure fluctuations, flue-gas
temperature, etc. are to be taken into account in the choice of the equipment. In these cases,
discontinuous measurements, e.g. annual/six-monthly measurements, where practical, are
preferred.
Continuous monitoring and associated software allows the reporting of concentration values for
the main released pollutants in the required averaged standard (from half an hour to a month).
[ 10, METSO 2012 ]
In EN 14181:2014, a quality assurance system, based on different Quality Assurance Levels
(QAL1, QAL2, QAL3) for automated measuring systems (AMSs) is defined for emissions to
air. This standard is applicable to AMSs installed at emission sources for the determination of
the flue-gas components and other flue-gas parameters. In EN 15267 Parts 1 to 3, the Quality
Assurance Level QAL1 and the procedures for achieving the required certifications are defined,
and these are applied before the AMS is installed at the emission source.
The EN ISO 5667-1:2006 standard gives some guidance on measurement and sampling for
emissions to water, distinguishing between continuous and periodic measurements, between
continuous and periodic sampling, and between composite and spot samples.
3.1.14.4.2 Periodic monitoring
Periodic measurements are the determination of a measurand at specified time intervals in the
case of emissions to air. For these measurements, the flue-gas sample is extracted from the
channelled emission and the pollutant is analysed instantly with portable measuring systems or
afterwards in the laboratory.
WORKIN
G DRAFT IN
PROGRESS
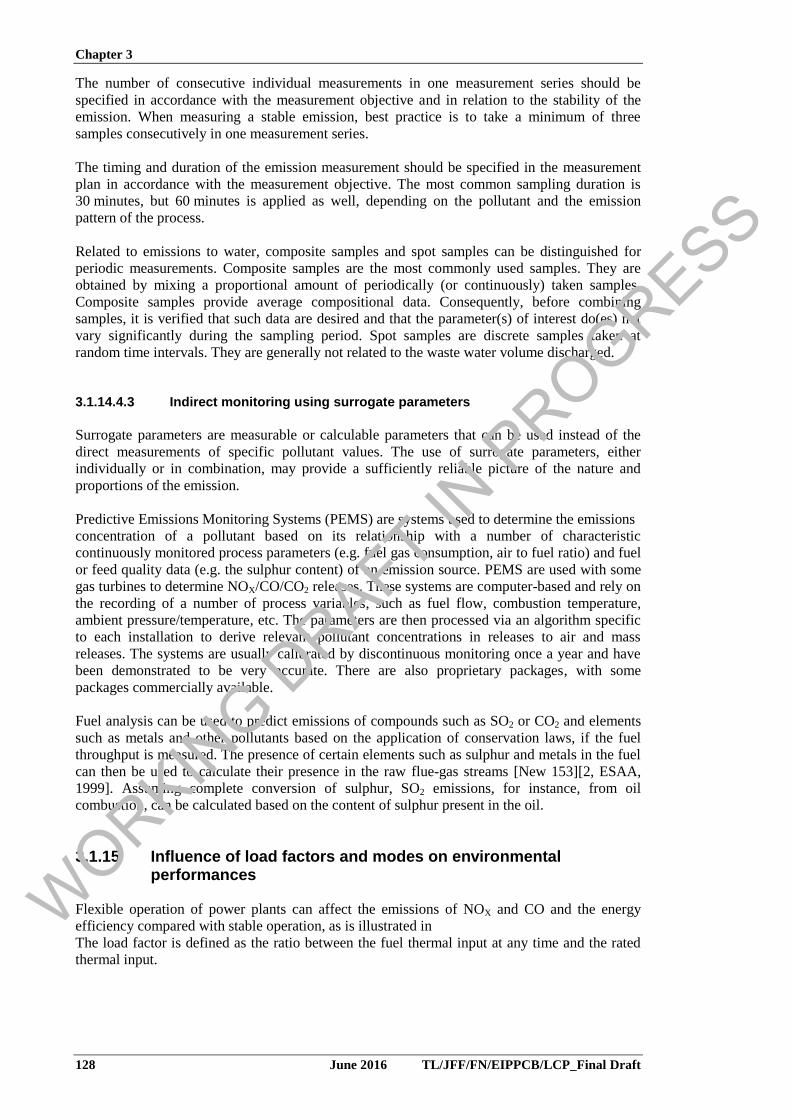
Chapter 3
128 June 2016 TL/JFF/FN/EIPPCB/LCP_Final Draft
The number of consecutive individual measurements in one measurement series should be
specified in accordance with the measurement objective and in relation to the stability of the
emission. When measuring a stable emission, best practice is to take a minimum of three
samples consecutively in one measurement series.
The timing and duration of the emission measurement should be specified in the measurement
plan in accordance with the measurement objective. The most common sampling duration is
30 minutes, but 60 minutes is applied as well, depending on the pollutant and the emission
pattern of the process.
Related to emissions to water, composite samples and spot samples can be distinguished for
periodic measurements. Composite samples are the most commonly used samples. They are
obtained by mixing a proportional amount of periodically (or continuously) taken samples.
Composite samples provide average compositional data. Consequently, before combining
samples, it is verified that such data are desired and that the parameter(s) of interest do(es) not
vary significantly during the sampling period. Spot samples are discrete samples taken at
random time intervals. They are generally not related to the waste water volume discharged.
3.1.14.4.3 Indirect monitoring using surrogate parameters
Surrogate parameters are measurable or calculable parameters that can be used instead of the
direct measurements of specific pollutant values. The use of surrogate parameters, either
individually or in combination, may provide a sufficiently reliable picture of the nature and
proportions of the emission.
Predictive Emissions Monitoring Systems (PEMS) are systems used to determine the emissions
concentration of a pollutant based on its relationship with a number of characteristic
continuously monitored process parameters (e.g. fuel gas consumption, air to fuel ratio) and fuel
or feed quality data (e.g. the sulphur content) of an emission source. PEMS are used with some
gas turbines to determine NOX/CO/CO2 releases. These systems are computer-based and rely on
the recording of a number of process variables, such as fuel flow, combustion temperature,
ambient pressure/temperature, etc. The parameters are then processed via an algorithm specific
to each installation to derive relevant pollutant concentrations in releases to air and mass
releases. The systems are usually calibrated by discontinuous monitoring once a year and have
been demonstrated to be very accurate. There are also proprietary packages, with some
packages commercially available.
Fuel analysis can be used to predict emissions of compounds such as SO2 or CO2 and elements
such as metals and other pollutants based on the application of conservation laws, if the fuel
throughput is measured. The presence of certain elements such as sulphur and metals in the fuel
can then be used to calculate their presence in the raw flue-gas streams [New 153][2, ESAA,
1999]. Assuming complete conversion of sulphur, SO2 emissions, for instance, from oil
combustion, can be calculated based on the content of sulphur present in the oil.
3.1.15 Influence of load factors and modes on environmental performances
Flexible operation of power plants can affect the emissions of NOX and CO and the energy
efficiency compared with stable operation, as is illustrated in
The load factor is defined as the ratio between the fuel thermal input at any time and the rated
thermal input.
WORKIN
G DRAFT IN
PROGRESS
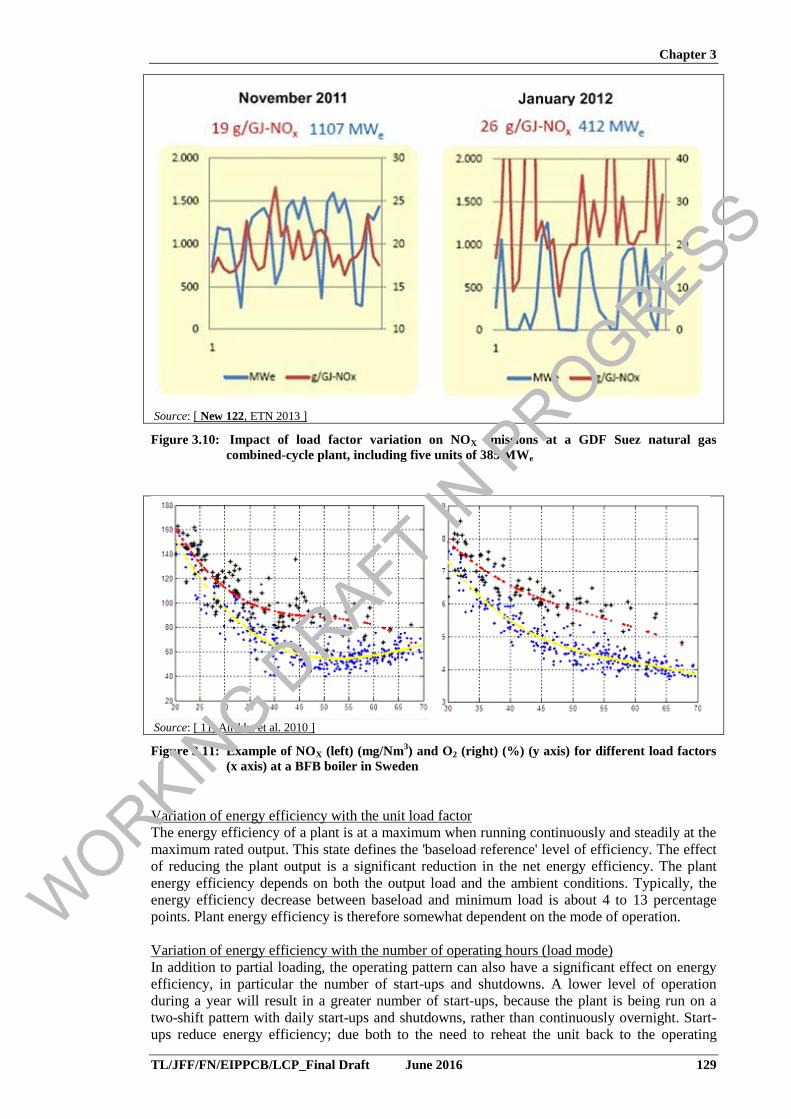
Chapter 3
TL/JFF/FN/EIPPCB/LCP_Final Draft June 2016 129
Source: [ New 122, ETN 2013 ]
Figure 3.10: Impact of load factor variation on NOX emissions at a GDF Suez natural gas
combined-cycle plant, including five units of 385 MWe
Source: [ 11, Airikka et al. 2010 ]
Figure 3.11: Example of NOX (left) (mg/Nm3) and O2 (right) (%) (y axis) for different load factors
(x axis) at a BFB boiler in Sweden
Variation of energy efficiency with the unit load factor
The energy efficiency of a plant is at a maximum when running continuously and steadily at the
maximum rated output. This state defines the 'baseload reference' level of efficiency. The effect
of reducing the plant output is a significant reduction in the net energy efficiency. The plant
energy efficiency depends on both the output load and the ambient conditions. Typically, the
energy efficiency decrease between baseload and minimum load is about 4 to 13 percentage
points. Plant energy efficiency is therefore somewhat dependent on the mode of operation.
Variation of energy efficiency with the number of operating hours (load mode)
In addition to partial loading, the operating pattern can also have a significant effect on energy
efficiency, in particular the number of start-ups and shutdowns. A lower level of operation
during a year will result in a greater number of start-ups, because the plant is being run on a
two-shift pattern with daily start-ups and shutdowns, rather than continuously overnight. Start-
ups reduce energy efficiency; due both to the need to reheat the unit back to the operating
WORKIN
G DRAFT IN
PROGRESS
Chapter 3
130 June 2016 TL/JFF/FN/EIPPCB/LCP_Final Draft
temperature and to the lower energy efficiency at lower loads while the output is progressively
increased. Shutdowns have a similar effect. Variations in ambient conditions and general
operation give rise to in-year baseload efficiency variations of typically about two percentage
points.
Influence of load modes and load factors on the environmental performance of
combustion plants
For the purpose of this BREF, data related to the number of hours operated yearly (load mode)
and to the way the plant is operated compared with its full capacity (load factor) have been
collected and assessed together with the environmental parameters (emissions, consumption,
efficiencies) and have been considered when setting the BAT-AELs.
[ 12, UK-TWG 2012 ]
[ 3, LCP TWG 2012 – Plant 506]
3.1.16 Other than normal operating conditions (OTNOC)
To reduce emissions during other than normal operating conditions (OTNOC), a management
plan may be set up and implemented as part of the environmental management system, along
with the implementation of traceable concrete measures commensurate with the type of possible
OTNOC. These measures include:
appropriate design of systems considered to cause OTNOC and that may have an
impact on emissions (e.g. low load design concepts for reducing the minimum start-up
and shutdown loads for stable generation in gas turbines);
drawing up of specific preventive maintenance plans for these relevant systems, where
needed;
review and recording of emissions caused by OTNOC;
implementation of corrective actions to return to normal operating conditions (NOC);
periodic assessment of overall emissions during OTNOC (e.g. frequency of events,
duration, emissions quantification/estimation) and implementation of corrective actions
if necessary.
Monitoring of emissions during OTNOC is important as high pollutant emissions may occur
during these periods. Some countries include emissions monitoring provisions in environmental
permits.
There may be cases in which alternative monitoring is more precise than direct emissions
measurement, e.g. monitoring based on surrogate parameters if the monitoring device is not well
calibrated in the range of emissions. Using emissions arising from a typical OTNOC as the basis
for assessing the emissions of each OTNOC is also a possibility as long as these OTNOC can be
linked by quantifiable parameter(s).
Start-ups and shutdowns
Commission Implementing Decision 2012/249/EU refers to the determination of start-up and
shutdown periods for combustion plants for the purposes of the IED.
During start-ups and shutdowns, plant emission levels may vary significantly and it is therefore
important to control these phases as much as possible, e.g. by limiting their duration or using a
less polluting fuel, hence limiting the amount of emissions. There are tools for monitoring and
analysing the start-ups, whether the plant is started manually or automatically using a sequence,
and the manufacturer start-up curves are taken into account at all times. Special automated
solutions enable the tracking of start-ups, comparisons to manufacturer curves and comparisons
of actual start-ups to each other. This helps the plant staff to find the best possible start-up
practices.[ 13, METSO 2012 ]
WORKIN
G DRAFT IN
PROGRESS

Chapter 3
TL/JFF/FN/EIPPCB/LCP_Final Draft June 2016 131
Other OTNOC
It is important to identify other than normal operating conditions as they may affect the level of
emissions or consumption of the combustion plant. The following situations are examples of
conditions that may be considered OTNOC:
periods related to malfunction or breakdown of the abatement techniques;
testing periods (e.g. commissioning periods, periods after modifications to the combustion
chamber, or testing periods of new/repaired abatement techniques or of the combustion of a
new fuel);
periods corresponding to the use of emergency fuels for a very short period due to the lack
of availability of normally used fuels (serious shortage or sudden interruption) or to
disturbances in fuel feeding;
periods of exceptional low-load operations due to unplanned malfunction of plant system(s);
periods related to sudden major combustion failures;
periods related to malfunction of the auxiliary or monitoring systems (e.g. malfunctioning
of the analysis instrument or data transfer related to the process control);
periods of calibration of monitoring systems requiring measurement points outside the range
corresponding to normal operating conditions;
extraordinary/unforeseeable variations in fuel quality whereby the installation/equipment
performance cannot be guaranteed by the manufacturer (outside design specifications)
and/or where there is a failure in the application of the fuel quality check procedures;
in the case of bypass of control equipment or a process, when the bypass is unavoidable,
e.g. to prevent loss of life or personal injury.
WORKIN
G DRAFT IN
PROGRESS

Chapter 3
132 June 2016 TL/JFF/FN/EIPPCB/LCP_Final Draft
3.2 Techniques to consider in the determination of general BAT for the LCP sector
This section describes techniques (or combinations thereof), and associated monitoring,
considered to have the potential for achieving a high level of environmental protection in the
activities within the scope of this document. The techniques described will include both the
technology used and the way in which the installations are designed, built, maintained, operated
and decommissioned.
It covers environmental management systems, general process-integrated techniques and general
end-of-pipe techniques. Waste prevention and management, including waste minimisation and
recycling procedures, are also considered, as well as techniques that reduce the consumption of
raw materials, water and energy by optimising use and reuse. The techniques described also
cover measures used to prevent or to limit the environmental consequences of accidents and
incidents, as well as site remediation measures. They also cover measures taken to prevent or
reduce emissions under other than normal operating conditions (such as start-up and shutdown
operations, leaks, malfunctions, momentary stoppages and the definitive cessation of
operations).
Annex III to the Directive lists a number of criteria for determining BAT, and the information
within this chapter addresses these considerations. As far as possible, the standard structure in
Table 3.4 is used to outline the information on each technique, to enable a comparison of
techniques and the assessment against the definition of BAT in the Directive.
This chapter does not necessarily provide an exhaustive list of techniques which could be
applied in the sector. Other techniques may exist, or may be developed, which could be
considered in the determination of BAT for an individual installation.
WORKIN
G DRAFT IN
PROGRESS

Chapter 3
TL/JFF/FN/EIPPCB/LCP_Final Draft June 2016 133
Table 3.4: Information for each technique described in this chapter
Heading within the sections Type of information included
Description A brief description of the technique with a view to being used in the BAT
conclusions.
Technical description
A more detailed and yet concise technical description using, as
appropriate, chemical or other equations, pictures, diagrams and flow
charts.
Achieved environmental
benefits
The main potential environmental benefits to be gained through
implementing the technique (including reduced consumption of energy;
reduced emissions to water, air and land; raw material savings; as well as
production yield increases, reduced waste, etc.).
Environmental performance
and operational data
Actual and plant-specific performance data (including emission levels,
consumption levels – of raw materials, water, energy – and amounts of
residues/wastes generated) from well-performing installations/plants
(with respect to the environment taken as a whole) applying the technique
accompanied by the relevant contextual information.
Any other useful information on the following items:
how to design, operate, maintain, control and decommission the
technique
emission monitoring issues related to the use of the technique
sensitivity and durability of the technique
issues regarding accident prevention.
Links between inputs (e.g. nature and quantity of raw material and fuel,
energy, water) and outputs (emissions, residues/wastes, products) are
highlighted, in particular where relevant to enhancing an understanding of
different environmental impacts and their interaction, for example where
trade-offs have been made between different outputs such that certain
environmental performance levels cannot be achieved at the same time.
Emission and consumption data are qualified as far as possible with
details of relevant operating conditions (e.g. percentage of full capacity,
fuel composition, bypassing of the (abatement) technique, inclusion or
exclusion of other than normal operating conditions, reference
conditions), sampling and analytical methods, and statistical presentation
(e.g. short and long-term averages, maxima, ranges and distributions).
Information on conditions/circumstances hampering the use of the
(abatement) technique at full capacity and/or necessitating full or partial
bypassing of the (abatement) technique and measures taken to restore full
(abatement) capacity.
Cross-media effects
Relevant negative effects on the environment due to implementing the
technique, allowing a comparison between techniques in order to assess
the impact on the environment as a whole. This may include issues such
as:
consumption and nature of raw materials and water;
energy consumption and contribution to climate change;
stratospheric ozone depletion potential;
photochemical ozone creation potential;
acidification resulting from emissions to air;
presence of particulate matter in ambient air (including
microparticles and metals);
eutrophication of land and waters resulting from emissions to air or
water;
oxygen depletion potential in water;
persistent/toxic/bioaccumulable components (including metals);
generation of residues/waste;
WORKIN
G DRAFT IN
PROGRESS

Chapter 3
134 June 2016 TL/JFF/FN/EIPPCB/LCP_Final Draft
limitation of the ability to reuse or recycle residues/waste;
generation of noise and/or odour;
increased risk of accidents.
The Reference Document on Economics and Cross-media Effects (ECM)
should be taken into account.
Technical considerations
relevant to applicability
It is indicated whether the technique can be applied throughout the sector.
Otherwise, the main general technical restrictions on the use of the
technique within the sector are indicated. These may be:
an indication of the type of plants or processes within the sector to
which the technique cannot be applied;
constraints to implementation in certain generic cases, considering,
e.g.:
whether it concerns a new or an existing plant, taking into
account factors involved in retrofitting (e.g. space
availability) and interactions with techniques already
installed
plant size, capacity or load factor
quantity, type or quality of product manufactured
type of fuel or raw material used
animal welfare
climatic conditions.
These restrictions are indicated together with the reasons for them.
These restrictions are not meant to be a list of the possible local
conditions that could affect the applicability of the technique for an
individual plant.
Economics
Information on the costs (capital/investment, operating and maintenance
including details on how these costs have been calculated/estimated) and
any possible savings (e.g. reduced raw material or energy consumption,
waste charges, reduced payback time compared to other techniques), or
revenues or other benefits including details on how these have been
calculated/estimated.
Cost data are preferably given in euro (EUR). If a conversion is made
from another currency, the data in the original currency and the year when
the data were collected is indicated. The price/cost of the equipment or
service is accompanied by the year it was purchased.
Information on the market for the sector in order to put costs of techniques
into context.
Information relevant to both newly built, retrofitted and existing plants.
This should allow assessment, where possible, of the economic viability
of the technique for the sector concerned.
Information on the cost-effectiveness of the technique (e.g. in EUR per
mass of pollutant abated) and related assumptions for their calculation can
be reported.
The Reference Document on Economics and Cross-media Effects (ECM)
and the Reference Document on the General Principles of Monitoring
(MON) are taken into account with regard to economic aspects and
monitoring costs, respectively.
Driving force for
implementation
Where applicable, specific local conditions, requirements (e.g. legislation,
safety measures) or non-environmental triggers (e.g. increased yield,
WORKIN
G DRAFT IN
PROGRESS
Chapter 3
TL/JFF/FN/EIPPCB/LCP_Final Draft June 2016 135
improved product quality, economic incentives – e.g. subsidies, tax
breaks) which have driven or stimulated the implementation of the
technique to date.
This subsection should be very short using bullet point lists.
Example plants
Reference to a plant(s) where the technique has been implemented and
from which information has been collected and used in writing the section.
An indication of the degree to which the technique is in use in the EU or
worldwide.
Reference literature
Literature or other reference material (e.g. books, reports, studies) that
was used in writing the section and that contains more detailed
information on the technique. When the reference material consists of a
large number of pages, reference will be made to the relevant page(s) or
section(s).
3.2.1 Environmental management systems Description
A formal system to demonstrate compliance with environmental objectives.
Technical description
The Directive defines ‘techniques’ (under the definition of 'best available techniques') as ‘both
the technology used and the way in which the installation is designed, built, maintained,
operated and decommissioned’.
In this respect, an environmental management system (EMS) is a technique allowing operators
of installations to address environmental issues in a systematic and demonstrable way. EMSs
are most effective and efficient where they form an inherent part of the overall management and
operation of an installation.
An EMS focuses the attention of the operator on the environmental performance of the
installation; in particular through the application of clear operating procedures for both normal
and other than normal operating conditions, and by setting out the associated lines of
responsibility.
All effective EMSs incorporate the concept of continuous improvement, meaning that
environmental management is an ongoing process, not a project which eventually comes to an
end. There are various process designs, but most EMSs are based on the plan-do-check-act cycle
(which is widely used in other company management contexts). The cycle is an iterative
dynamic model, where the completion of one cycle flows into the beginning of the next (see
Figure 3.12).
WORKIN
G DRAFT IN
PROGRESS
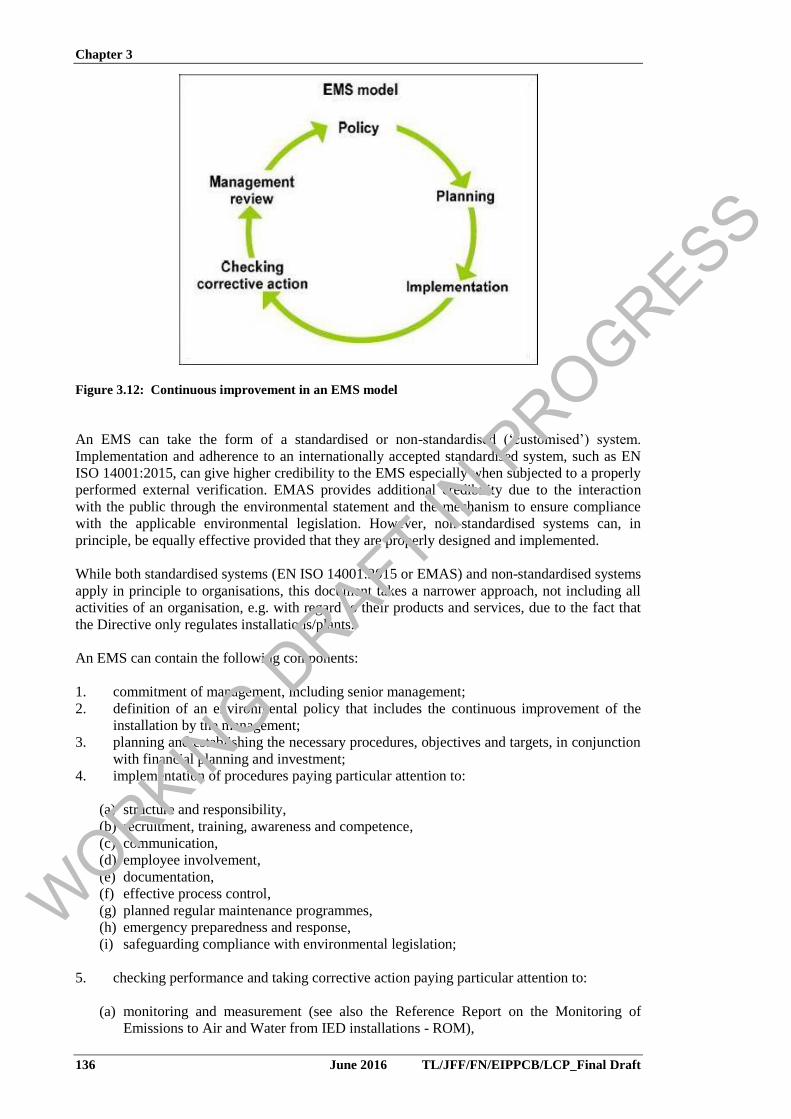
Chapter 3
136 June 2016 TL/JFF/FN/EIPPCB/LCP_Final Draft
Figure 3.12: Continuous improvement in an EMS model
An EMS can take the form of a standardised or non-standardised (‘customised’) system.
Implementation and adherence to an internationally accepted standardised system, such as EN
ISO 14001:2015, can give higher credibility to the EMS especially when subjected to a properly
performed external verification. EMAS provides additional credibility due to the interaction
with the public through the environmental statement and the mechanism to ensure compliance
with the applicable environmental legislation. However, non-standardised systems can, in
principle, be equally effective provided that they are properly designed and implemented.
While both standardised systems (EN ISO 14001:2015 or EMAS) and non-standardised systems
apply in principle to organisations, this document takes a narrower approach, not including all
activities of an organisation, e.g. with regard to their products and services, due to the fact that
the Directive only regulates installations/plants.
An EMS can contain the following components:
1. commitment of management, including senior management;
2. definition of an environmental policy that includes the continuous improvement of the
installation by the management;
3. planning and establishing the necessary procedures, objectives and targets, in conjunction
with financial planning and investment;
4. implementation of procedures paying particular attention to:
(a) structure and responsibility,
(b) recruitment, training, awareness and competence,
(c) communication,
(d) employee involvement,
(e) documentation,
(f) effective process control,
(g) planned regular maintenance programmes,
(h) emergency preparedness and response,
(i) safeguarding compliance with environmental legislation;
5. checking performance and taking corrective action paying particular attention to:
(a) monitoring and measurement (see also the Reference Report on the Monitoring of
Emissions to Air and Water from IED installations - ROM),
WORKIN
G DRAFT IN
PROGRESS

Chapter 3
TL/JFF/FN/EIPPCB/LCP_Final Draft June 2016 137
(b) corrective and preventive action,
(c) maintenance of records,
(d) independent (where practicable) internal and external auditing in order to determine
whether or not the EMS conforms to planned arrangements and has been properly
implemented and maintained;
6. review of the EMS and its continuing suitability, adequacy and effectiveness by senior
management;
7. preparation of a regular environmental statement;
8. validation by a certification body or an external EMS verifier;
9. following the development of cleaner technologies;
10. consideration for the environmental impacts from the eventual decommissioning of the
installation at the stage of designing a new plant, and throughout its operating life
including:
(a) avoiding underground structures,
(b) incorporating features that facilitate dismantling,
(c) choosing surface finishes that are easily decontaminated,
(d) using an equipment configuration that minimises trapped chemicals and facilitates
drainage or cleaning,
(e) designing flexible, self-contained equipment that enables phased closure,
(f) using biodegradable and recyclable materials where possible;
11. application of sectoral benchmarking on a regular basis.
Specifically for this sector, it is also important to consider the following potential features of the
EMS:
12. quality assurance/quality control programmes to ensure that the characteristics of all fuels
are fully determined and controlled;
13. a management plan in order to reduce emissions to air and/or water during other than
normal operating conditions, including start-up and shutdown periods.
14. a waste management plan to ensure that, in order of priority, waste is avoided, prepared
for reuse, recycled or otherwise recovered;
15. a process quality optimisation system in order to identify and implement improvements to
increase energy efficiency and fuel utilisation;
16. an environmental and safety management system to identify and plan to prevent and deal
with uncontrolled and/or unplanned emissions to the environment, in particular:
(a) emissions to soil and groundwater from the handling and storage of fuels, additives, by-
products and wastes,
(b) due to the risk of self-heating and/or self-ignition of fuel in the storage and handling
activities;
17. a dust management plan to prevent or, where this is not practicable, to reduce diffuse
emissions from loading, unloading, storage and/or handling of fuels, residues and
additives;
18. a noise management plan where a noise nuisance at sensitive receptors is expected or
sustained, including:
(a) a protocol for conducting noise monitoring at the plant boundary,
(b) a noise reduction programme,
(c) a protocol for response to noise incidents containing appropriate actions and timelines,
(d) a review of historic noise incidents, corrective actions and dissemination of noise
incident knowledge to the affected parties;
WORKIN
G DRAFT IN
PROGRESS

Chapter 3
138 June 2016 TL/JFF/FN/EIPPCB/LCP_Final Draft
19. for the combustion, gasification or co-incineration of malodourous substances, an odour
management plan including:
(a) a protocol for conducting odour monitoring,
(b) where necessary, an odour elimination programme to identify and eliminate or reduce
the odour emissions,
(c) a protocol to record odour incidents and the appropriate actions and timelines,
(d) a review of historic odour incidents, corrective actions and the dissemination to the
affected parties.
Achieved environmental benefits
An EMS promotes and supports the continuous improvement of the environmental performance
of the installation. If the installation already has a good overall environmental performance, an
EMS helps the operator to maintain the high performance level.
Environmental performance and operational data
No information provided.
Cross-media effects
None reported. The systematic analysis of the initial environmental impacts and scope for
improvements in the context of the EMS sets the basis for assessing the best solutions for all
environmental media.
Technical considerations relevant to applicability
The components described above can typically be applied to all installations within the scope of
this document. The scope (e.g. level of detail) and nature of the EMS (e.g. standardised or non-
standardised) will be related to the nature, scale and complexity of the installation, and the range
of environmental impacts it may have.
Economics
It is difficult to determine accurately the costs and economic benefits of introducing and
maintaining a good EMS. There are also economic benefits that are the result of using an EMS
and these vary widely from sector to sector.
External costs relating to verification of the system can be estimated from guidance issued by
the International Accreditation Forum [the website is already lodged in BATIS with ID number
10152; a reference will be inserted here].
Driving force for implementation
The driving forces for the implementation of an EMS include:
improved environmental performance;
improved insight into the environmental aspects of the company which can be used to
fulfil the environmental requirements of customers, regulatory authorities, banks,
insurance companies or other stakeholders (e.g. people living or working in the vicinity of
the installation);
improved basis for decision-making;
improved motivation of personnel (e.g. managers can have confidence that environmental
impacts are controlled and employees can feel that they are working for an
environmentally responsible company);
additional opportunities for operational cost reduction and product quality improvement
improved company image;
reduced liability, insurance and non-compliance costs.
Example plants
EMSs are applied in a number of installations throughout the EU.
Reference literature
WORKIN
G DRAFT IN
PROGRESS
Chapter 3
TL/JFF/FN/EIPPCB/LCP_Final Draft June 2016 139
EMAS Regulation (EC) No 1221/2009 [already in BATIS; to be inserted here]
DG Environment EMAS website. [TWG: the website is already lodged in BATIS with ID
number 10149; a reference will be inserted here]
EN ISO 14001:2015
ISO 14000 family of standards website. [TWG: the website is already lodged in BATIS with ID
number 10150; a reference will be inserted here]
ISO 14000 technical committee. [ TWG: the website is already lodged in BATIS with ID number
10151; a reference will be inserted here]
3.2.2 Techniques for the prevention and control of channelled emissions to air
3.2.2.1 Techniques for the prevention and control of dust emissions 3.2.2.1.1 Electrostatic precipitators (ESPs)
Description
Electrostatic precipitators (ESPs) operate such that particles are charged and separated under the
influence of an electrical field. Electrostatic precipitators are capable of operating over a wide
range of conditions.
The abatement efficiency may depend on the number of fields, residence time (size), and
upstream particle removal devices. They generally include between two and five fields. The
most modern (high-performance) ESPs have up to seven fields.
Technical description
There are both wet and dry ESP types. Corrosion and abrasion resistance are built into both the
wet and dry designs [27, Theodore and Buonicore, 1992], [28, Soud, 1993], [29, Soud, 1995],
[30, VDI, 1998], [New 148] [33, Ciemat, 2000]. A typical arrangement of an ESP is shown in
Figure 3.13.
WORKIN
G DRAFT IN
PROGRESS

Chapter 3
140 June 2016 TL/JFF/FN/EIPPCB/LCP_Final Draft
NB: Only two fields are shown but, in LCPs, ESPs are commonly applied with three to six or even seven fields,
depending on the fuel characteristics.
Source: [36, Lurgi, 1999]
Figure 3.13: Typical schematic arrangement of an ESP
An ESP consists of a hopper-bottomed box containing rows of plates forming passages through
which the flue-gas flows. Centrally located in each passage are emitting electrodes energised
with high-voltage direct current, which is provided by a transformer/rectifier (T/R) set. The
electrical field is applied across the electrodes by a small direct current at high voltage (60–
120 kV). The voltage applied is high enough to ionise the gas molecules close to the electrodes,
resulting in a visible corona. The flow of gas ions from the emitting electrodes across the gas
passages to the grounded collecting plates constitutes what is called the corona current.
When passing through the flue-gas, the charged ions collide with, and attach themselves to, fly
ash particles suspended in the gas. The electrical field forces the charged particles out of the gas
stream towards the grounded plates, where they collect in a layer. The plates are periodically
cleaned by a rapping system to release the layer into the ash hoppers as an agglomerated mass.
In practice, an ESP is divided into a number of discrete zones (up to six zones are commonly
used). In most cases, the ESP is located after the air heater or economiser and referred to as a
cold-side installation. In special cases, it is located before the air heater to take advantage of the
higher temperature. In this case, it is called a hot-side installation.
Particles are removed from the gas stream in four stages:
through application of an electrical charge to the dust;
through placement of the charged dust in an electrical field;
by capture (agglomeration) of the dust onto the collecting electrode;
by removal of the dust from the surface of the electrode.
Good rectifier design is used, which includes the use of separate rectifier sections for each field
or portion of a field of the ESP. This allows the applied voltage to be varied in the inlet and
outlet zones to take account of the reduced dust load towards the outlet and the fields to be
operated at progressively higher voltages without sparking. Good design also involves the use of
WORKIN
G DRAFT IN
PROGRESS
Chapter 3
TL/JFF/FN/EIPPCB/LCP_Final Draft June 2016 141
automatic control systems. They maintain the optimum high voltage (HV) applied to the
electrodes in a particular zone without sparking. An automatic monitor is used to apply the
maximum voltage without sparking and constantly varies the HV. Fixed HV power supplies are
unlikely to provide optimal collection efficiencies.
The resistivity (the inverse of the conductivity) of the dust is particularly important. If it is too
low, the particles reaching the collector electrode lose their charge easily and dust re-
entrainment can occur. When the dust has too high a resistivity, an insulating layer is formed on
the electrode, which hinders normal corona discharge and leads to a reduction of the collection
efficiency (back corona effect). It is now common practice with highly resistive ashes (e.g. the
ones coming generally from low-sulphur fuels) to condition the flue-gas to reduce the resistivity
of the ash, e.g. by injecting SO3 into the flue-gas upstream of the ESP to form sulphuric acid.
This is efficiently absorbed onto the particles and thus reduces the ash surface resistivity. The
presence of an SCR system upstream of the ESP may also change the flue-gas conditions by
oxidising part of the SO2 into SO3, leading to the same flue-gas conditioning effect as
mentioned before.
The particle size distribution affects the particle migration velocity. For particles of > 1 µm, the
migration velocity is inversely proportional to the particle diameter, becoming independent of
particle size for particles of < 1 µm. In addition, a high load of fine particles can cause a
substantial change in the electrical conditions in an ESP. Within the ESP, the dust in the flue-
gas is charged in an ionic space charge cloud. The nature of the space charge changes with the
particle size distribution and the flue-gas loading. The particulate space charge increases with
the number of particles per cubic metre of flue-gas entering the ESP. An increase in fine
particles and a relatively high particle migration velocity in the higher flue-gas load can result in
an increase in the space charge, and can subsequently cause an electrical short circuit. The
corona current at the inlet field can be suppressed by the increased space charge. A much higher
space charge can result in the corona current being suppressed throughout the ESP.
Rapping, used to dislodge the fly ash (dust cake) layer off the collection electrode into hoppers,
may also cause re-entrainment. Particles are separated from the fly ash layer and re-entrained
into the flue-gas. Re-entrainment can reduce the efficiency significantly. In effect, the ESP
efficiency strongly depends on the unit size. An increase in efficiency incurs higher costs.
A moderate sulphur content in the flue-gas decreases the resistivity of particles and enables
better particle reduction. However, uneven gas distribution in the precipitator may lead to there
being cooler parts inside the device. Also, the higher the sulphur content of the fuel, the higher
the possible dew point. If these two conditions occur simultaneously, i.e. an uneven temperature
distribution and a higher dew point of sulphuric acid, there is a higher risk of material damage
and hence a higher risk of the device breaking down.
Problems may also occur while burning fuels which form volatiles, as the volatiles can coat the
particles and hamper their effective precipitation. This is possible with low calorific value fuels,
and when the boiler process is unstable.
Wet electrostatic precipitators (WESPs) operate on the same principles as ESPs. In this case, the
collected dust is removed from the collector plates by flushing with a suitable liquid, usually
water, either intermittently or by continuous spray irrigation. This offers advantages for certain
dusts that adhere to conventional plates or when other components in the gas stream interfere
with the operation, for example in the case of a cool, damp gas.
Achieved environmental benefits
Reduction of dust, aerosol and metal emissions to air.
Environmental performance and operational data
ESPs are used extensively in large combustion plants and are capable of operating over a wide
range of temperatures, pressures and dust burden conditions.
WORKIN
G DRAFT IN
PROGRESS
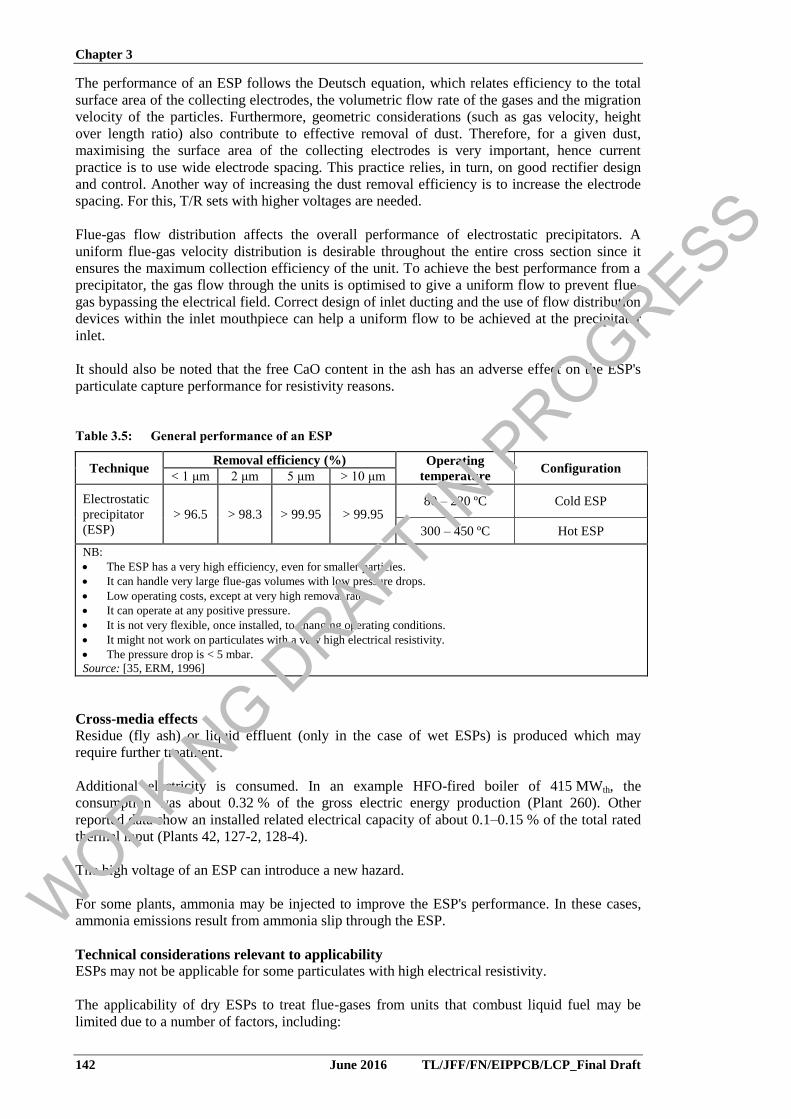
Chapter 3
142 June 2016 TL/JFF/FN/EIPPCB/LCP_Final Draft
The performance of an ESP follows the Deutsch equation, which relates efficiency to the total
surface area of the collecting electrodes, the volumetric flow rate of the gases and the migration
velocity of the particles. Furthermore, geometric considerations (such as gas velocity, height
over length ratio) also contribute to effective removal of dust. Therefore, for a given dust,
maximising the surface area of the collecting electrodes is very important, hence current
practice is to use wide electrode spacing. This practice relies, in turn, on good rectifier design
and control. Another way of increasing the dust removal efficiency is to increase the electrode
spacing. For this, T/R sets with higher voltages are needed.
Flue-gas flow distribution affects the overall performance of electrostatic precipitators. A
uniform flue-gas velocity distribution is desirable throughout the entire cross section since it
ensures the maximum collection efficiency of the unit. To achieve the best performance from a
precipitator, the gas flow through the units is optimised to give a uniform flow to prevent flue-
gas bypassing the electrical field. Correct design of inlet ducting and the use of flow distribution
devices within the inlet mouthpiece can help a uniform flow to be achieved at the precipitator
inlet.
It should also be noted that the free CaO content in the ash has an adverse effect on the ESP's
particulate capture performance for resistivity reasons.
Table 3.5: General performance of an ESP
Technique Removal efficiency (%) Operating
temperature Configuration
< 1 μm 2 μm 5 μm > 10 μm
Electrostatic
precipitator
(ESP)
> 96.5 > 98.3 > 99.95 > 99.95 80 – 220 ºC Cold ESP
300 – 450 ºC Hot ESP
NB:
The ESP has a very high efficiency, even for smaller particles.
It can handle very large flue-gas volumes with low pressure drops.
Low operating costs, except at very high removal rates.
It can operate at any positive pressure.
It is not very flexible, once installed, to changing operating conditions.
It might not work on particulates with a very high electrical resistivity.
The pressure drop is < 5 mbar.
Source: [35, ERM, 1996]
Cross-media effects
Residue (fly ash) or liquid effluent (only in the case of wet ESPs) is produced which may
require further treatment.
Additional electricity is consumed. In an example HFO-fired boiler of 415 MWth, the
consumption was about 0.32 % of the gross electric energy production (Plant 260). Other
reported data show an installed related electrical capacity of about 0.1–0.15 % of the total rated
thermal input (Plants 42, 127-2, 128-4).
The high voltage of an ESP can introduce a new hazard.
For some plants, ammonia may be injected to improve the ESP's performance. In these cases,
ammonia emissions result from ammonia slip through the ESP.
Technical considerations relevant to applicability
ESPs may not be applicable for some particulates with high electrical resistivity.
The applicability of dry ESPs to treat flue-gases from units that combust liquid fuel may be
limited due to a number of factors, including:
WORKIN
G DRAFT IN
PROGRESS

Chapter 3
TL/JFF/FN/EIPPCB/LCP_Final Draft June 2016 143
the very low particle resistivity;
the type of particles (e.g. high cenosphere content);
the unfavourable flue-gas composition.
However, several example plants (175, 225, 258 to 263, 454, 472) combusting liquid fuels and
fitted with ESPs achieve levels of dust emissions to air below 10 mg/Nm3 as a yearly average.
Economics
The cost of electrostatic precipitators includes costs due to electricity consumption, maintenance
expenses (very dependent on the boiler process and fuel properties) and the transfer of the
precipitated ash, but generally they are cost-effective devices for reducing dust emissions.
The initial investment costs may be higher or lower, depending on the applied fuel, than for
other available techniques such as bag filters. However, operational costs are lower than the
corresponding costs of the other techniques, and the use of modern control systems reduces
these expenses even more. Operational costs can vary widely, depending on the different
properties of fly ashes. Maintenance costs are normally very reasonable when processing
ordinary fly ash. These devices are competitive at power plants which have a wide range of
power equipment and a variety of boiler processes.
The UK has established indicative capital costs for ESPs of GBP 25/kWe (1999 prices) and
indicative operating costs of GBP 0.0003/kWe (1999 prices) across all capacity ranges. [EEB_2]
The ESP has generally been the preferred economic solution, especially for larger plants.
However, nowadays more and more bag filters are being installed, as they are considered a
better economic solution for taking into consideration fuel flexibility issues and performance
requirements.
Driving force for implementation
The legislative demands for reduced emissions of fine particulate matter have led to various
research projects aimed at improving the efficiency of this technology.
Example plants
About 145 of the plants that submitted a questionnaire in 2012 for the review of this BREF are
fitted with a dry ESP.
See each fuel section for further details.
Plant 139 uses an ESP with SO3 conditioning.
Reference literature
No information provided.
3.2.2.1.2 Bag filters
Description
Bag or fabric filters are constructed from porous woven or felted fabric through which gases
flow to remove dust. The use of a bag filter requires the selection of a fabric material suitable
for the characteristics of the flue-gas and the maximum operating temperature.
Technical description
Fabric filtration is a method to remove particles (especially fly ash) from the flue-gas of
industrial combustion plants. In addition to collecting fly ash, there have been a number of
applications where bag filters have been used together with the injection of slurried or powdered
sulphur dioxide absorbent (such as lime or sodium bicarbonate) to simultaneously control both
sulphur dioxide and fly ash emissions.
WORKIN
G DRAFT IN
PROGRESS

Chapter 3
144 June 2016 TL/JFF/FN/EIPPCB/LCP_Final Draft
A bag filter unit consists of one or more isolated compartments containing rows of bag filter
bags or tubes. Dust-laden gas passes up (usually) along the surface of the bags then radially
through the fabric. Particles are retained on the upstream face of the bags, while the now
cleaned gas stream is vented to the atmosphere. The filter is operated cyclically, alternating
between relatively long periods of filtering and short periods of cleaning. During cleaning, dust
that has accumulated on the bags is removed from the fabric surface and deposited in a hopper
for subsequent disposal. The major operating feature of bag filters that distinguishes them from
other gas filters is the opportunity to check the filtering surface periodically when cleaning.
Source: [36, Lurgi, 1999]
Figure 3.14: General arrangement of a bag filter (with one compartment in the cleaning cycle)
Regular dust removal from the fabric is important in order to maintain an effective extraction
efficiency, but it also influences the operating life of the fabric. Bag filters are normally
classified according to the method by which the filter media are cleaned. The most common
cleaning method consists of compressed air pulsing. Other methods include reverse airflow,
mechanical shaking/deflating and vibration. Acoustic horns are also used for the cleaning of
bags. The normal cleaning mechanisms do not result in the fabric returning to pristine condition,
but the particles deposited within the depth of the cloth help reduce the pore size between the
fibres, resulting in high filtering efficiencies for submicron particles.
WORKIN
G DRAFT IN
PROGRESS

Chapter 3
TL/JFF/FN/EIPPCB/LCP_Final Draft June 2016 145
Source: [36, Lurgi, 1999]
Figure 3.15: Low-pressure pulse-jet bag filter
Fabric selection takes into account the composition of the gases, the nature and particle size of
the dust, the method of cleaning to be employed, the required efficiency and economics. The gas
temperature also needs to be considered, together with the method of gas cooling, if any, and the
resultant water vapour and acid dew point.
Wear of the filter bags results in a gradual but measurable reduction in performance. There may
also be a risk of damage or catastrophic failure of several bags if corrosion occurs, when
abrasive material is filtered or when there is the risk of fire. Simple online monitoring systems,
such as pressure drop indicators or dust tell-tale devices, give only a rough indication of
performance.
Triboelectric or optical devices are used to measure trends in the dust emissions from the bag
filter to identify possible failure. They can also be used to detect dust peaks during a cleaning
cycle. When these measurements are integrated with a zoned cleaning system, any zone that
contains damaged bags can be identified and local repairs can then be made [37, Robson, 1998].
Synthetic filter cloths such as Gore-Tex® and Tefaire
® (teflon/fibreglass) have enabled bag
filters to be used in a wide range of applications and have led to extended filter lives. The
performance of modern filter materials, even in high temperatures or abrasive conditions, has
improved. Cloth manufacturers can recommend the materials that are most suitable for specific
applications.
WORKIN
G DRAFT IN
PROGRESS

Chapter 3
146 June 2016 TL/JFF/FN/EIPPCB/LCP_Final Draft
New methods to increase the air to cloth ratio and to reduce the pressure drop are continually
being investigated. Flue-gas inlet and outlet modifications aim to improve the capture of the fly
ash which is essential for optimal design and the high PM removal efficiency of the equipment.
Pulse-jet technology has become the preferred bag filter system as the primary particulate
control device for utility and industrial boilers. Research is continuing to improve the
understanding and hence performance of the system.
As there are many different filter materials on the market, the operator chooses the best one for
their own needs. The filter material has to be selected with particular care to avoid possible
problems being caused if the process parameters change.
Achieved environmental benefits
Reduction of dust, metal and aerosol emissions to air.
Environmental performance and operational data
Some fuels may cause clogging problems, which complicates the process operation. Clogging
problems may occur, e.g. during start-ups, when oil is burnt. The filter material is usually quite
sensitive to the temperature of the ash and flue-gases, so unburnt carbon and hot fly ash
agglomerations may damage the filter material. Precoating of the filter fabric with available fly
ash, lime material or other materials can reduce the risk of bag damage during the start-up of the
filter. In applications where the ash has a high amount of unburnt matter, and there is a risk of
sparks or glowing particles reaching the bag filter, a pre-collector upstream of the bag filter is
recommended to reduce the risk of hopper fires and bag damage. Biomass-fired power plants
are a typical example. [EEB_4]
Also, cracks may form in the fabric material. These are difficult to detect during operation.
These cracks increase the emissions of particles. If the baghouse is of a modular design and
modules are isolated, then maintenance work may be possible without shutting down the
process.
The bag filter operating temperature should be kept above the water and acid dew point of the
flue-gas, in order to avoid chemical attack on the filter bags, dust-handling problems and
corrosion. [EEB_5]
WORKIN
G DRAFT IN
PROGRESS
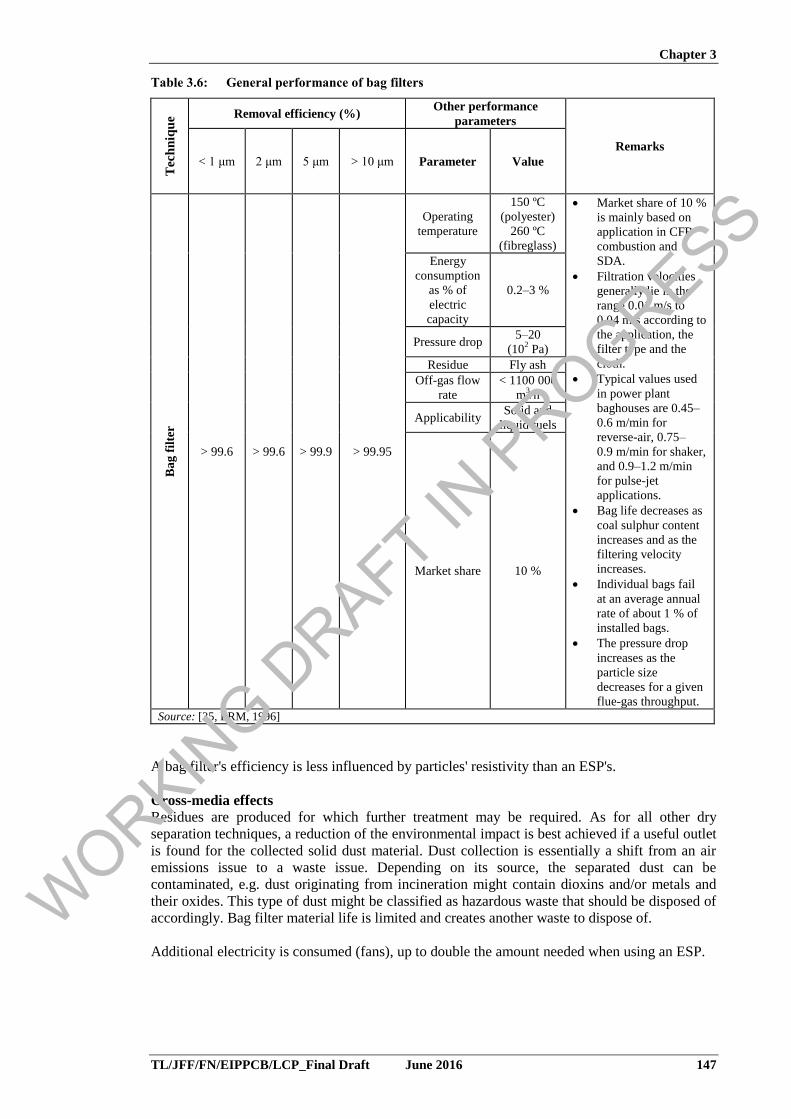
Chapter 3
TL/JFF/FN/EIPPCB/LCP_Final Draft June 2016 147
Table 3.6: General performance of bag filters
Tec
hn
iqu
e Removal efficiency (%)
Other performance
parameters
Remarks
< 1 μm 2 μm 5 μm > 10 μm Parameter Value B
ag
fil
ter
> 99.6 > 99.6 > 99.9 > 99.95
Operating
temperature
150 ºC
(polyester)
260 ºC
(fibreglass)
Market share of 10 %
is mainly based on
application in CFB
combustion and
SDA.
Filtration velocities
generally lie in the
range 0.01 m/s to
0.04 m/s according to
the application, the
filter type and the
cloth.
Typical values used
in power plant
baghouses are 0.45–
0.6 m/min for
reverse-air, 0.75–
0.9 m/min for shaker,
and 0.9–1.2 m/min
for pulse-jet
applications.
Bag life decreases as
coal sulphur content
increases and as the
filtering velocity
increases.
Individual bags fail
at an average annual
rate of about 1 % of
installed bags.
The pressure drop
increases as the
particle size
decreases for a given
flue-gas throughput.
Energy
consumption
as % of
electric
capacity
0.2–3 %
Pressure drop 5–20
(102 Pa)
Residue Fly ash
Off-gas flow
rate
< 1100 000
m3/h
Applicability Solid and
liquid fuels
Market share 10 %
Source: [35, ERM, 1996]
A bag filter's efficiency is less influenced by particles' resistivity than an ESP's.
Cross-media effects
Residues are produced for which further treatment may be required. As for all other dry
separation techniques, a reduction of the environmental impact is best achieved if a useful outlet
is found for the collected solid dust material. Dust collection is essentially a shift from an air
emissions issue to a waste issue. Depending on its source, the separated dust can be
contaminated, e.g. dust originating from incineration might contain dioxins and/or metals and
their oxides. This type of dust might be classified as hazardous waste that should be disposed of
accordingly. Bag filter material life is limited and creates another waste to dispose of.
Additional electricity is consumed (fans), up to double the amount needed when using an ESP.
WORKIN
G DRAFT IN
PROGRESS

Chapter 3
148 June 2016 TL/JFF/FN/EIPPCB/LCP_Final Draft
Technical considerations relevant to applicability
Bag filters are applicable for solid-fuel-fired power plants (coal, lignite, pet coke, biomass, peat)
of all sizes and combustion techniques, with and without sorbent injection upstream of the filter.
They are also applicable for oil-, diesel-, oil residues- and Orimulsion-fired boilers provided that
a sorbent (e.g. Ca(OH)2, NaHCO3) is injected upstream of the filter. The sorbent dilutes the
potentially sticky ash/soot from oil firing which might otherwise cause a high pressure drop
over the bags.
Bag filters may be less effective in applications with flue-gas temperatures over 240 °C.
Depending on the flow rate design parameters, they can reach significant volumes and require
considerable space.
Bag filters are well adapted for processes likely to deliver variable flue-gas flows and dust
concentrations. The high ratio type of filter (where the dust is collected on the outside of the
bag) is particularly suited to FBC boilers, as its ability to perform well for varying ash
compositions is suited to the inherent fuel flexibility of this type of boiler. The high ratio design
is also particularly suited to use with an ESP that does not meet new standards, and where an
extension of the ESP is difficult or not cost-effective. In these instances, the filter bags and
associated bag-cleaning devices can often be installed in the precipitator casing, keeping
investment to a minimum.
Bag filters are useful for collecting particulate matter with electrical resistivities either too low
or too high for ESPs.
[CEFIC_34][EEB_6]
Economics
UK indicative capital costs (1999 prices) are GBP 10/kWe for bag filters. The operating costs
(1999 prices) are GBP 0.0011/kWe. [EEB_3]
Although capital costs of bag filters are quite low, maintenance costs are high, as the filter
material has to be changed every two to five years. The minimum expense of the filter change is
approximately 10 % of the investment cost. Precipitated material is easy to recycle, and, for
example, unreacted sorbent can be returned to the process and has some economic value.
Driving force for implementation
Legislation is the main driving force. However, for those plants where the separated ash can be
sold, economics is also a driver. Another is the possibility to burn a wide range of fuels/wastes.
Example plants
More than 40 plants that submitted a questionnaire in 2012 for the review of this BREF are
fitted with a bag filter.
See each fuel section for further details.
Reference literature
No information provided.
3.2.2.1.3 Centrifugal precipitation (cyclones)
Description
Dust control system based on centrifugal force, whereby particles are separated from the carrier
gas.
Technical description
This type of dust control system utilises centrifugal forces and can process all types of flue-
gases, in dry conditions.
WORKIN
G DRAFT IN
PROGRESS
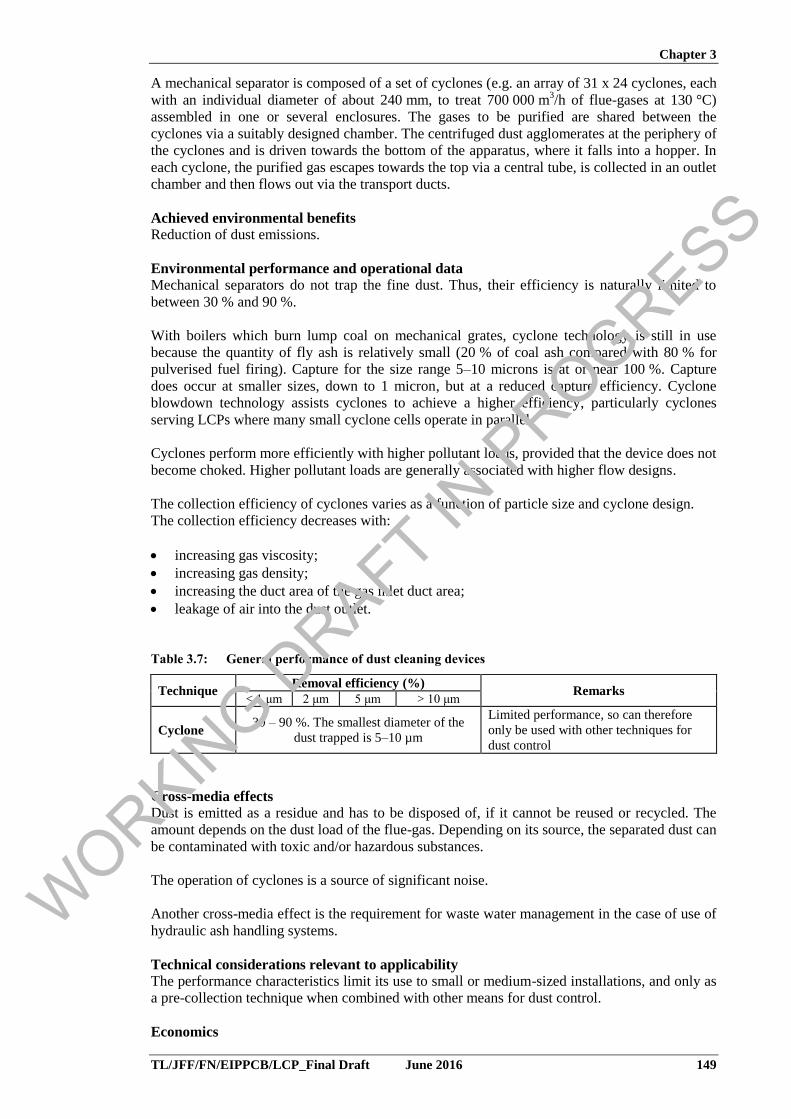
Chapter 3
TL/JFF/FN/EIPPCB/LCP_Final Draft June 2016 149
A mechanical separator is composed of a set of cyclones (e.g. an array of 31 x 24 cyclones, each
with an individual diameter of about 240 mm, to treat 700 000 m3/h of flue-gases at 130 °C)
assembled in one or several enclosures. The gases to be purified are shared between the
cyclones via a suitably designed chamber. The centrifuged dust agglomerates at the periphery of
the cyclones and is driven towards the bottom of the apparatus, where it falls into a hopper. In
each cyclone, the purified gas escapes towards the top via a central tube, is collected in an outlet
chamber and then flows out via the transport ducts.
Achieved environmental benefits
Reduction of dust emissions.
Environmental performance and operational data
Mechanical separators do not trap the fine dust. Thus, their efficiency is naturally limited to
between 30 % and 90 %.
With boilers which burn lump coal on mechanical grates, cyclone technology is still in use
because the quantity of fly ash is relatively small (20 % of coal ash compared with 80 % for
pulverised fuel firing). Capture for the size range 5–10 microns is at or near 100 %. Capture
does occur at smaller sizes, down to 1 micron, but at a reduced capture efficiency. Cyclone
blowdown technology assists cyclones to achieve a higher efficiency, particularly cyclones
serving LCPs where many small cyclone cells operate in parallel.
Cyclones perform more efficiently with higher pollutant loads, provided that the device does not
become choked. Higher pollutant loads are generally associated with higher flow designs.
The collection efficiency of cyclones varies as a function of particle size and cyclone design.
The collection efficiency decreases with:
increasing gas viscosity;
increasing gas density;
increasing the duct area of the gas inlet duct area;
leakage of air into the dust outlet.
Table 3.7: General performance of dust cleaning devices
Technique Removal efficiency (%)
Remarks < 1 μm 2 μm 5 μm > 10 μm
Cyclone 30 – 90 %. The smallest diameter of the
dust trapped is 5–10 µm
Limited performance, so can therefore
only be used with other techniques for
dust control
Cross-media effects
Dust is emitted as a residue and has to be disposed of, if it cannot be reused or recycled. The
amount depends on the dust load of the flue-gas. Depending on its source, the separated dust can
be contaminated with toxic and/or hazardous substances.
The operation of cyclones is a source of significant noise.
Another cross-media effect is the requirement for waste water management in the case of use of
hydraulic ash handling systems.
Technical considerations relevant to applicability
The performance characteristics limit its use to small or medium-sized installations, and only as
a pre-collection technique when combined with other means for dust control.
Economics
WORKIN
G DRAFT IN
PROGRESS
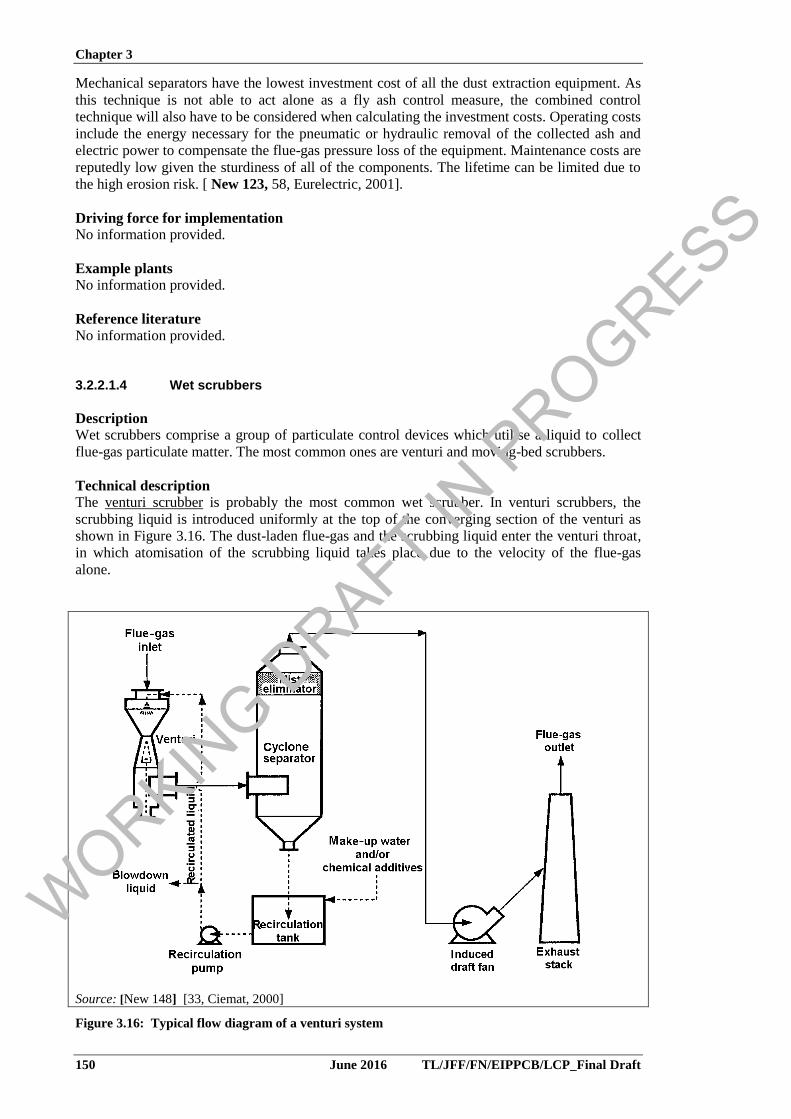
Chapter 3
150 June 2016 TL/JFF/FN/EIPPCB/LCP_Final Draft
Mechanical separators have the lowest investment cost of all the dust extraction equipment. As
this technique is not able to act alone as a fly ash control measure, the combined control
technique will also have to be considered when calculating the investment costs. Operating costs
include the energy necessary for the pneumatic or hydraulic removal of the collected ash and
electric power to compensate the flue-gas pressure loss of the equipment. Maintenance costs are
reputedly low given the sturdiness of all of the components. The lifetime can be limited due to
the high erosion risk. [ New 123, 58, Eurelectric, 2001].
Driving force for implementation
No information provided.
Example plants
No information provided.
Reference literature
No information provided.
3.2.2.1.4 Wet scrubbers
Description
Wet scrubbers comprise a group of particulate control devices which utilise a liquid to collect
flue-gas particulate matter. The most common ones are venturi and moving-bed scrubbers.
Technical description
The venturi scrubber is probably the most common wet scrubber. In venturi scrubbers, the
scrubbing liquid is introduced uniformly at the top of the converging section of the venturi as
shown in Figure 3.16. The dust-laden flue-gas and the scrubbing liquid enter the venturi throat,
in which atomisation of the scrubbing liquid takes place due to the velocity of the flue-gas
alone.
Source: [New 148] [33, Ciemat, 2000]
Figure 3.16: Typical flow diagram of a venturi system
WORKIN
G DRAFT IN
PROGRESS

Chapter 3
TL/JFF/FN/EIPPCB/LCP_Final Draft June 2016 151
Wetting of the flue-gas in this way leads to the collection of small particles into larger heavier
droplets, which are captured more easily in the separator. This overcomes the difficulties
experienced in removing fine particles by inertial methods. A high initial relative velocity
between the droplets and the particulates is required to ensure that the captured particles are
retained on the droplets when the droplets have accelerated to their terminal velocity. The
scrubbed gas and entrained droplets containing trapped particulates enter the diverging section
where further collision and agglomeration take place.
Moving-bed scrubbers for particulate collection are packed with low-density plastic spheres,
which are free to move within the packing retainers, as shown in Figure 3.17. Particulate
collection may be enhanced by using several moving-bed stages in series. Moving-bed
scrubbers commonly employ countercurrent flows. The packing is kept in constant motion by
the flue-gas and the scrubbing liquid. Hence, the continued motion of the packing considerably
reduces any tendency for the bed to plug.
Source: [New 148] [33, Ciemat, 2000]
Figure 3.17: Moving-bed scrubber
WORKIN
G DRAFT IN
PROGRESS

Chapter 3
152 June 2016 TL/JFF/FN/EIPPCB/LCP_Final Draft
Achieved environmental benefits
Reduction of dust emissions.
Environmental performance and operational data
Many of these scrubbers are designed for combined particulate removal and control of sulphur
dioxide emissions, utilising the alkaline fly ash as sorbent. Lime is frequently added to boost
SO2 removal efficiencies.
The pressure drop and venturi performance are largely dependent on the gas velocity through
the venturi. In order to accommodate efficient operation at reduced boiler loads, some venturis
are designed with variable throats, which can be operated close to a constant pressure drop,
independent of the flue-gas flow rate (boiler load). The venturi itself is followed by a separating
section for the elimination of entrained droplets.
The separation efficiency of moving-bed scrubbers is good when processing moderate dust
loads. However, this technique is not very suitable for high ash content fuels.
Table 3.8: General performance of wet scrubbers
Tec
hn
iqu
e Removal efficiency (%) Other performance parameters
< 1 μm 2 μm 5 μm > 10 μm Parameter Value
Wet
scrubber
(high-
energy
venturi)
98.5 99.5 99.9 > 99.9
Energy
consumption
as % of electric
capacity
Up to 3 %
(5 – 15 (kWh/1000 m3))
Liquid to gas
ratio 0.8 – 2.0 l/m
3
Pressure drop 30 – 200 (102 Pa)
Residue Fly ash sludge/slurry
Residue Fly ash sludge/slurry
Cross-media effects
Waste waters are produced for which further treatment and discharge may be required.
If the mist eliminators do not work properly, there is a possibility that small water particles,
including fly ash, may remain in the flue-gases even after the scrubbing. Large dust loads may
cause clogging and can affect the operational availability and effectiveness of the scrubber unit.
Technical considerations relevant to applicability
The use of wet scrubbers is not commonly applied for the control of particulate emissions.
However, wet scrubbers have been used in some high-temperature and -pressure combustion
applications, such as integrated gasification combined cycle (IGCC) and pressurised fluidised
bed combustion (PFBC). Here, the pressure drop experienced is less significant in relation to the
operating pressure, and in IGCC the problem of reheating is overcome as the gas is
subsequently heated by combustion.
Economics
Investment costs include the reactor, a possible sorbent injection system, and a waste water
treatment plant. Operating costs are mainly related to water consumption and energy costs.
Condensing scrubbers cool the flue-gases, and the absorbed heat can be used, for example, for
district heating. This improves the economics of the technique.
WORKIN
G DRAFT IN
PROGRESS

Chapter 3
TL/JFF/FN/EIPPCB/LCP_Final Draft June 2016 153
The capital cost of wet scrubbers is generally lower than for ESPs and bag filters, which make
them potentially attractive for industrial-scale use. However, this may be offset by a relatively
high pressure drop and operating costs and also other additional costs that may be linked to the
possible need for a water treatment plant, bigger fan and flue-gas bypass if the plant cannot be
stopped in case of a problem with the cooling system. The flue-gas is cooled during wet
scrubbing and requires reheating prior to emission to the atmosphere; this incurs higher energy
costs.
The majority of wet scrubbers for collecting fly ash from coal-fired boilers (industrial or utility)
are installed in the US. The greatest concentration of these units is in the western US, where fly
ash from the available low-sulphur coal is so highly resistive that ESPs are less economically
attractive.
Driving force for implementation
No information provided.
Example plants
No information provided.
Reference literature
No information provided.
3.2.2.2 Techniques for the prevention and control of SOX emissions 3.2.2.2.1 Wet lime/limestone scrubbers
Description
Scrubbing technique where sulphur is removed from flue-gases through injection of a slurry of
lime/limestone sorbent (liquid solution) into the scrubbing suspension to capture SO2 and
transform it into gypsum. In the wet scrubbing process, gaseous compounds are dissolved in a
suitable liquid (water or alkaline solution). Simultaneous removal of solid and gaseous
compounds may be achieved. Downstream of the wet scrubber, the flue-gases are saturated with
water and separation of the droplets is required before discharging the flue-gases. The resulting
liquid has to be treated by a waste water process and the insoluble matter is collected by
sedimentation or filtration.
Technical description
Figure 3.18 shows a typical flow diagram of a type of wet lime/limestone FGD system.
Limestone is commonly used as a reagent because it is present in large amounts in many
countries and is usually much cheaper than other reagents. Lime was commonly used as a
reagent in earlier plants because of its better reactivity with SO2. However, lime has been
replaced by limestone to reduce the risk of lime calcination, which is energy-intensive, costly,
and time-consuming to repair. Nevertheless, in some cases, lime has to be used instead of
limestone due to the whiteness requirements of the FGD gypsum users. In any case, FGD using
limestone can achieve almost the same SO2 removal as lime. The reactivity of limestone has an
important influence on the efficiency of a FGD system; however, at present there is no standard
or normalised method to test reactivities. Other reagents, such as magnesium-enhanced lime, are
also used.
WORKIN
G DRAFT IN
PROGRESS

Chapter 3
154 June 2016 TL/JFF/FN/EIPPCB/LCP_Final Draft
Figure 3.18: Schematic flow diagram of a lime/limestone wet scrubber FGD process
The flue-gas leaving the particulate control system usually passes through a heat exchanger and
enters the FGD absorber, in which SO2 is removed by direct contact with an aqueous suspension
of finely ground limestone, where the CaCO3 content of the limestone should be more than
95 % CaCO3. Fresh limestone slurry is continuously charged into the absorber. The scrubbed
flue-gas passes through the mist eliminator and is emitted to the atmosphere from a stack or a
cooling tower. Reaction products are withdrawn from the absorber and sent for dewatering and
further processing.
Wet limestone scrubbers are generally divided into two categories according to the type of
oxidation: forced oxidation and natural oxidation. The mode of oxidation is determined by the
chemical reactions, the pH of the reagent slurry and the resulting by-product. In forced
oxidation mode with a pH range of 5 to 6, which is common in wet limestone scrubbers, the
chemical reactions are as follows:
SO2 + H2O → H2SO3 (1)
CaCO3 + H2SO3 → CaSO3 + CO2 + H2O (2)
CaSO3 + ½O2 + 2H2O → CaSO4 • 2H2O (3)
CaCO3 + SO2 + ½O 2 + 2H2O → CaSO4 • 2H2O + CO2 (4)
CaSO3 + ½H2O → CaSO3 • ½H2O (5)
Reactions (1) and (2) are common to all wet FGD systems. Reaction (3) shows the forced
oxidation of calcium sulphite by air and the formation (crystallisation) of calcium sulphate
dihydrate or gypsum in the oxidation mode. In forced oxidation mode, air is introduced into the
bottom of the absorber to oxidise calcium sulphite to calcium sulphate, achieving over 99 %
oxidation.
WORKIN
G DRAFT IN
PROGRESS
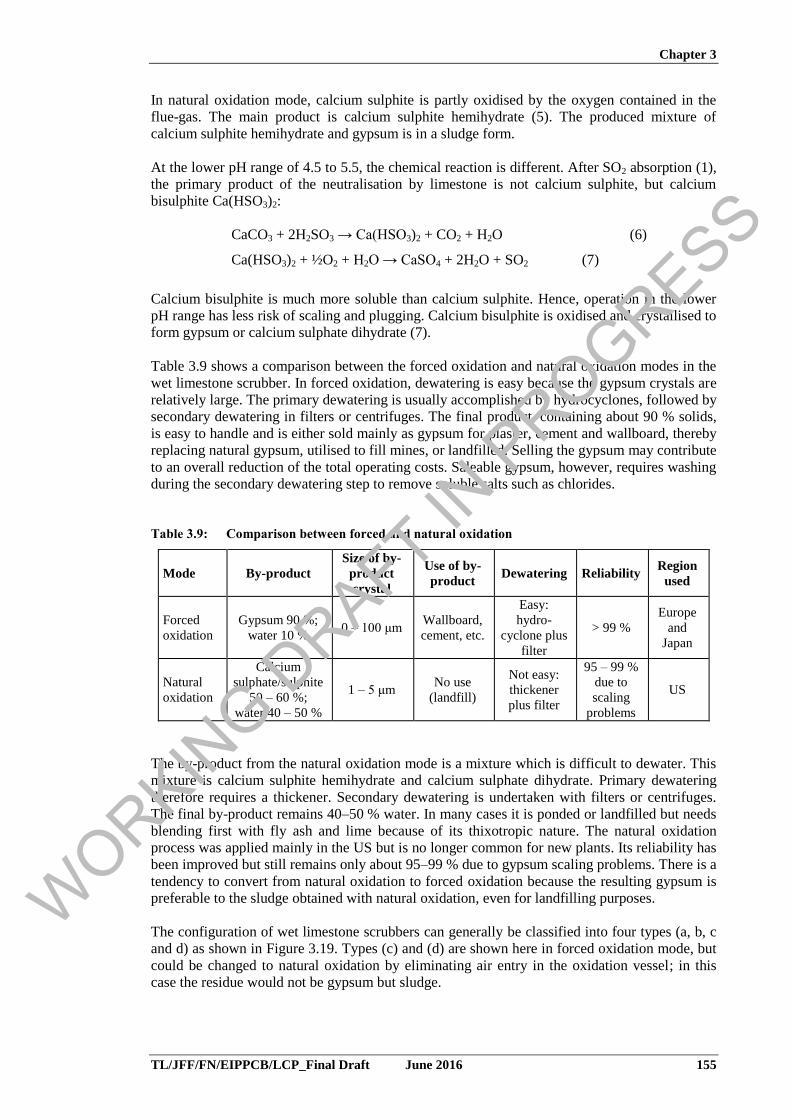
Chapter 3
TL/JFF/FN/EIPPCB/LCP_Final Draft June 2016 155
In natural oxidation mode, calcium sulphite is partly oxidised by the oxygen contained in the
flue-gas. The main product is calcium sulphite hemihydrate (5). The produced mixture of
calcium sulphite hemihydrate and gypsum is in a sludge form.
At the lower pH range of 4.5 to 5.5, the chemical reaction is different. After SO2 absorption (1),
the primary product of the neutralisation by limestone is not calcium sulphite, but calcium
bisulphite Ca(HSO3)2:
CaCO3 + 2H2SO3 → Ca(HSO3)2 + CO2 + H2O (6)
Ca(HSO3)2 + ½O2 + H2O → CaSO4 + 2H2O + SO2 (7)
Calcium bisulphite is much more soluble than calcium sulphite. Hence, operation in the lower
pH range has less risk of scaling and plugging. Calcium bisulphite is oxidised and crystallised to
form gypsum or calcium sulphate dihydrate (7).
Table 3.9 shows a comparison between the forced oxidation and natural oxidation modes in the
wet limestone scrubber. In forced oxidation, dewatering is easy because the gypsum crystals are
relatively large. The primary dewatering is usually accomplished by hydrocyclones, followed by
secondary dewatering in filters or centrifuges. The final product, containing about 90 % solids,
is easy to handle and is either sold mainly as gypsum for plaster, cement and wallboard, thereby
replacing natural gypsum, utilised to fill mines, or landfilled. Selling the gypsum may contribute
to an overall reduction of the total operating costs. Saleable gypsum, however, requires washing
during the secondary dewatering step to remove soluble salts such as chlorides.
Table 3.9: Comparison between forced and natural oxidation
Mode By-product
Size of by-
product
crystal
Use of by-
product Dewatering Reliability
Region
used
Forced
oxidation
Gypsum 90 %;
water 10 % 0 – 100 μm
Wallboard,
cement, etc.
Easy:
hydro-
cyclone plus
filter
> 99 %
Europe
and
Japan
Natural
oxidation
Calcium
sulphate/sulphite
50 – 60 %;
water 40 – 50 %
1 – 5 μm No use
(landfill)
Not easy:
thickener
plus filter
95 – 99 %
due to
scaling
problems
US
The by-product from the natural oxidation mode is a mixture which is difficult to dewater. This
mixture is calcium sulphite hemihydrate and calcium sulphate dihydrate. Primary dewatering
therefore requires a thickener. Secondary dewatering is undertaken with filters or centrifuges.
The final by-product remains 40–50 % water. In many cases it is ponded or landfilled but needs
blending first with fly ash and lime because of its thixotropic nature. The natural oxidation
process was applied mainly in the US but is no longer common for new plants. Its reliability has
been improved but still remains only about 95–99 % due to gypsum scaling problems. There is a
tendency to convert from natural oxidation to forced oxidation because the resulting gypsum is
preferable to the sludge obtained with natural oxidation, even for landfilling purposes.
The configuration of wet limestone scrubbers can generally be classified into four types (a, b, c
and d) as shown in Figure 3.19. Types (c) and (d) are shown here in forced oxidation mode, but
could be changed to natural oxidation by eliminating air entry in the oxidation vessel; in this
case the residue would not be gypsum but sludge.
WORKIN
G DRAFT IN
PROGRESS

Chapter 3
156 June 2016 TL/JFF/FN/EIPPCB/LCP_Final Draft
Source: [38, Soud, 2000]
Figure 3.19: Different types of lime/limestone wet scrubbers
WORKIN
G DRAFT IN
PROGRESS
Chapter 3
TL/JFF/FN/EIPPCB/LCP_Final Draft June 2016 157
Type (a) and type (b) use an additional oxidation vessel and are not presented and discussed
here, because oxidation vessels have only been used in research.
Type (c) does not have a separate oxidation vessel. Here, the oxidation air is purged into the
bottom of the absorber to form gypsum. This oxidation method is usually called in situ
oxidation and is now the most common method. When oxidation occurs in an oxidation vessel,
such as with types (a) and (b), the process is called ex situ oxidation. Although the pre-scrubber
is primarily used to remove HCI and HF, a low-pH pre-scrubber also removes more mercury, as
well as any fine particulates which may be carrying other trace elements. In Japan, many of the
new, large FGD plants have adopted type (c) because of the high-quality gypsum that results
and its high operational reliability, avoiding possible problems which may occur without the
pre-scrubber.
Eliminating the oxidation vessel or conversion from ex situ to in situ oxidation is a major
development in FGD technology. In situ oxidation has many advantages over ex situ oxidation:
First of all, in situ oxidation prevents scaling and plugging problems through complete
oxidation of the product in the absorber, resulting in a higher operational reliability.
Partial oxidation of the product, due to the oxygen in the flue-gas, causes gypsum scaling
in the absorber.
Secondly, in situ oxidation achieves a higher SO2 removal efficiency than ex situ
oxidation.
Thirdly, it is important to note that in situ oxidation promotes SO2 removal efficiency
even at low pH values because the H2SO4, which is produced by oxidation of H2SO3
through air injection, rapidly reacts with limestone. In addition, the utilisation of
limestone is higher than in ex situ oxidation because of the higher solubility of limestone
at low pH values. The Ca/S molar ratio ranges from 1.02 to 1.1.
A further advantage of in situ oxidation is that it is possible to reduce the formation of S2O3.
This is a by-product of the side reaction of SO2 oxidation and is one of the chemical oxygen
demand (COD) substances. Decreasing the COD to as low as one fifth to one tenth in the waste
water can reduce the requirement for waste water treatment. There is also no need to add H2SO4
for oxidation, unlike with types (a) and (b). The emergence of in situ forced oxidation has made
the wet limestone scrubber more attractive.
Type (d) is the simplest configuration in wet limestone scrubbers and has now become the
leading FGD system. All chemical reactions are operated in an integrated single absorber. This
can reduce the capital costs and the power consumption. Type (d) has achieved a high
operational reliability and has produced a reasonable quality of gypsum since the late 1980s. An
integrated single tower also requires less space, facilitating the retrofit to existing boilers. In
Germany, the most recent FGD installations are type (d). In the US, type (d) is also popular due
to its lower costs and high efficiency.
The design of the absorber is crucial in wet FGD systems. Figure 3.20 shows examples of
different types of absorbers where all FGD chemical reactions occur together.
WORKIN
G DRAFT IN
PROGRESS

Chapter 3
158 June 2016 TL/JFF/FN/EIPPCB/LCP_Final Draft
Source: [New 148] [33, Ciemat, 2000]
Figure 3.20: Different absorber types
Type 1 is the spray tower absorber and is the most commonly used in wet FGD systems
throughout the world. The spray tower normally has three to four spray heads with a number of
spray nozzles through which an aqueous suspension of gypsum slurry containing finely ground
limestone is atomised and sprayed with uniform distribution. The flue-gas introduced into the
absorber is in close contact with freely moving droplets, usually in a countercurrent
configuration with no devices restricting the gas flow. Liquid mists carried over are captured by
mist eliminators. This design was developed to cope with the scaling problems of the first
generation of FGD systems equipped with internally structured absorbers.
Type 2 is the packed tower absorber using plastic grid packing, originally developed in Japan.
The packed tower lengthens the residence time for gas-liquid contact, resulting in higher SO2
removal efficiencies. The packed tower is now operated without scaling problems, due to an
improved understanding of FGD processes. Moreover, the important feature of the high-velocity
co-current gas flow configuration is the compact design for the large-scale absorber.
Type 3 is known as the turbulent bubble bed or jet bubbling reactor. The flue-gas is injected
into slurry through numerous submerged pipes while limestone slurry is fed into the turbulent
bubble bed reactor and air for oxidation is blown into the slurry. The absorber type is a good
example of a simplified FGD process. It eliminates the need for recycle pumps, spray nozzles
and headers, separate oxidation tanks and thickeners, thereby minimising difficulties as well as
power consumption.
WORKIN
G DRAFT IN
PROGRESS
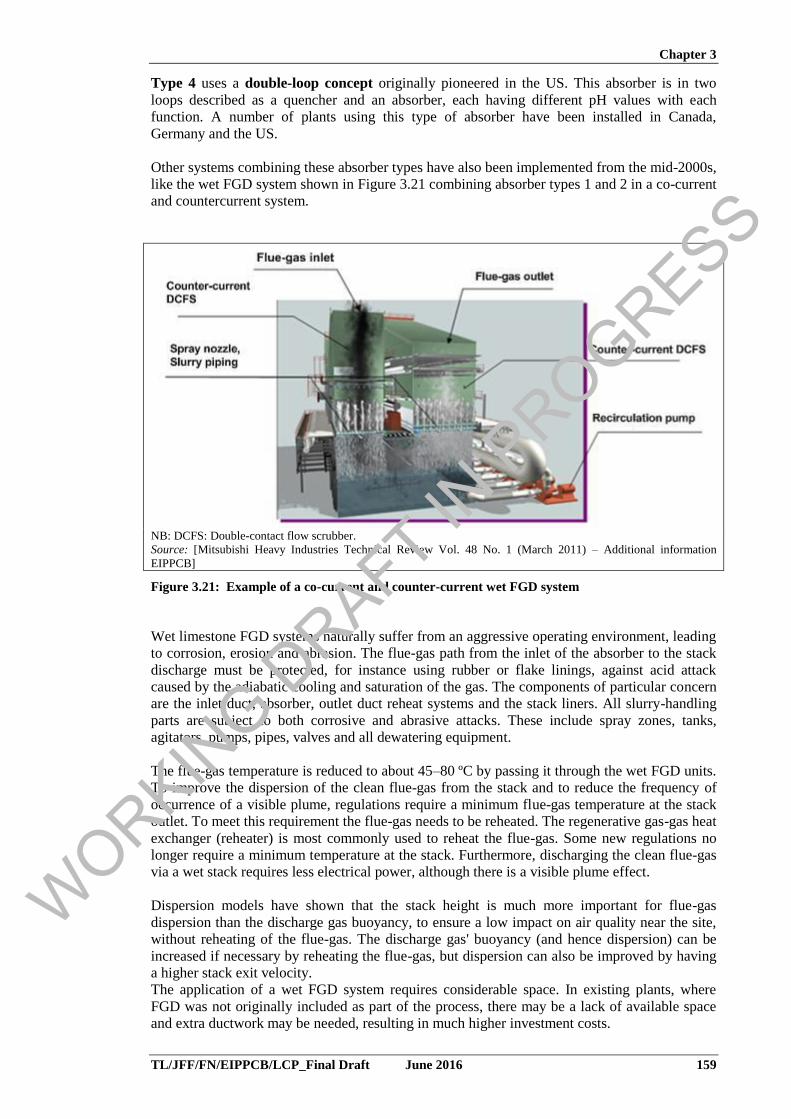
Chapter 3
TL/JFF/FN/EIPPCB/LCP_Final Draft June 2016 159
Type 4 uses a double-loop concept originally pioneered in the US. This absorber is in two
loops described as a quencher and an absorber, each having different pH values with each
function. A number of plants using this type of absorber have been installed in Canada,
Germany and the US.
Other systems combining these absorber types have also been implemented from the mid-2000s,
like the wet FGD system shown in Figure 3.21 combining absorber types 1 and 2 in a co-current
and countercurrent system.
NB: DCFS: Double-contact flow scrubber.
Source: [Mitsubishi Heavy Industries Technical Review Vol. 48 No. 1 (March 2011) – Additional information
EIPPCB]
Figure 3.21: Example of a co-current and counter-current wet FGD system
Wet limestone FGD systems naturally suffer from an aggressive operating environment, leading
to corrosion, erosion and abrasion. The flue-gas path from the inlet of the absorber to the stack
discharge must be protected, for instance using rubber or flake linings, against acid attack
caused by the adiabatic cooling and saturation of the gas. The components of particular concern
are the inlet duct, absorber, outlet duct reheat systems and the stack liners. All slurry-handling
parts are subject to both corrosive and abrasive attacks. These include spray zones, tanks,
agitators, pumps, pipes, valves and all dewatering equipment.
The flue-gas temperature is reduced to about 45–80 ºC by passing it through the wet FGD units.
To improve the dispersion of the clean flue-gas from the stack and to reduce the frequency of
occurrence of a visible plume, regulations require a minimum flue-gas temperature at the stack
outlet. To meet this requirement the flue-gas needs to be reheated. The regenerative gas-gas heat
exchanger (reheater) is most commonly used to reheat the flue-gas. Some new regulations no
longer require a minimum temperature at the stack. Furthermore, discharging the clean flue-gas
via a wet stack requires less electrical power, although there is a visible plume effect.
Dispersion models have shown that the stack height is much more important for flue-gas
dispersion than the discharge gas buoyancy, to ensure a low impact on air quality near the site,
without reheating of the flue-gas. The discharge gas' buoyancy (and hence dispersion) can be
increased if necessary by reheating the flue-gas, but dispersion can also be improved by having
a higher stack exit velocity.
The application of a wet FGD system requires considerable space. In existing plants, where
FGD was not originally included as part of the process, there may be a lack of available space
and extra ductwork may be needed, resulting in much higher investment costs.
WORKIN
G DRAFT IN
PROGRESS

Chapter 3
160 June 2016 TL/JFF/FN/EIPPCB/LCP_Final Draft
When implementing this process in an existing installation, a new stack may also need to be
built, because the exhaust gases from the FGD are much more corrosive (the dew point is
reached in the scrubber) than those from installations without FGD treatment, and the existing
stack may not be designed or suitable for this purpose. These new stacks can take advantage of
modern flue linings that both reduce acid condensate and improve dispersion by heating up
quickly during start-up. This is becoming increasingly important as developments in the
electricity market result in more plants being operated intermittently to adapt to the demand.
Wet scrubber processes have undergone considerable development in the last few decades,
leading to improved reliability and removal efficiencies, as well as reduced costs. Reliability is
normally over 99 % with forced oxidation, and 95 – 99 % with natural oxidation. The
applicability may be influenced by both scrubber components and auxiliary processes connected
to the absorber process.
A process involving hydroxide and sulphide precipitation, clarification and slurry dewatering
has been found to be a good measure for the waste water treatment after the FGD plant to
remove metals and suspended solids.
Achieved environmental benefits
Reduced SOX, HCl, HF, dust and particle-bound metal emissions to air.
Environmental performance and operational data
WORKIN
G DRAFT IN
PROGRESS

Chapter 3
TL/JFF/FN/EIPPCB/LCP_Final Draft June 2016 161
Table 3.10: Performance of the wet lime/limestone scrubber technique for reducing sulphur oxide
emissions
Technique General SO2
reduction rate
Other performance parameters
Parameter Value
Wet lime/
limestone
scrubber
92 % to > 99 %
(depending on the
absorber type)
Operating temperature 45 – 60 ºC
Sorbent Limestone, lime, chalk
Energy consumption as % of
electrical capacity 1 – 3 %
Pressure drop 20 – 30 (10
2 Pa)
(without gas-gas heater)
Ca/S molar ratio 1.02–1.1
Reliability 95–99 % (of operating time)
Residue/by-product Gypsum
Gypsum purity 90–95 %
Residence time < 5 – 10 s
Lifetime of rubber lining > 10 years (coal)
SO3 aerosol removal rate 50 %
HCl removal rate 90–99 %
HF removal rate 90 – 99 % in the absorber
Particulate
> 50 % (e.g. in the case of coal
combustion; for other fuels, it
depends on the particle size)
Raw water consumption
220 – 250 l/MWeh
In a diesel power plant without
heat recovery, about
1.1 m3/MWhe
NB:
The SO2 reduction rate for some existing FGD units starts at 85 %.
Of the total installed FGD capacity, 80 % are wet scrubbers, of which 72 % use limestone as the reagent,
16 % use lime and 12 % use other reagents.
The selection of limestone (high calcium carbonate content; low Al, F and Cl content) is important to
ensure a good SO2 removal rate.
The distance the limestone has to travel to the plant and the reactivity of the limestone are also two
important factors to take into account.
Sometimes organic buffers are used to maintain the pH value of the scrubbing solution, thus enhancing the
SO2 removal or limiting the lime/limestone needed for the reaction.
The operating temperature may be as high as 75 °C when using lignite with a low calorific value and high
moisture content.
Gypsum may be a saleable by-product.
The removal efficiency is a function of the downward liquid flow rate compared with the
upward flue-gas flow rate (the so-called liquid to gas ratio and the resulting contact time and
volume within the absorber. It depends also to some extent on the type of packing used, the
temperature of the water and the addition of chemicals. Limiting factors for removal efficiency
include the vessel size and pathways, pump capacities, pipework sizes and configurations and
sump size.
Within these limitations, in principle a number of options exist to improve the performance of
the FGD system. They generally fall into two categories, those that improve the contact of the
flue-gas with the liquor within the absorber tower, and those that improve the chemistry of the
process itself. Examples of the former include: wall rings, interspatial spray level, improved
header and nozzle, and tray.
An example of the latter is chemical dosing, such as the use of organic acids, to modify or
optimise the pH. Adding an organic acid (or organic buffer), such as adipic acid, to a limestone
FGD system increases the capacity of the slurry liquid to absorb SO2 by buffering the pH in the
absorber. The operating pH, optimally 5.0–5.1, permitted for an adipic-acid-enhanced system is
lower compared to the 5.1–5.5 pH usually required for an unenhanced limestone system. By this
WORKIN
G DRAFT IN
PROGRESS
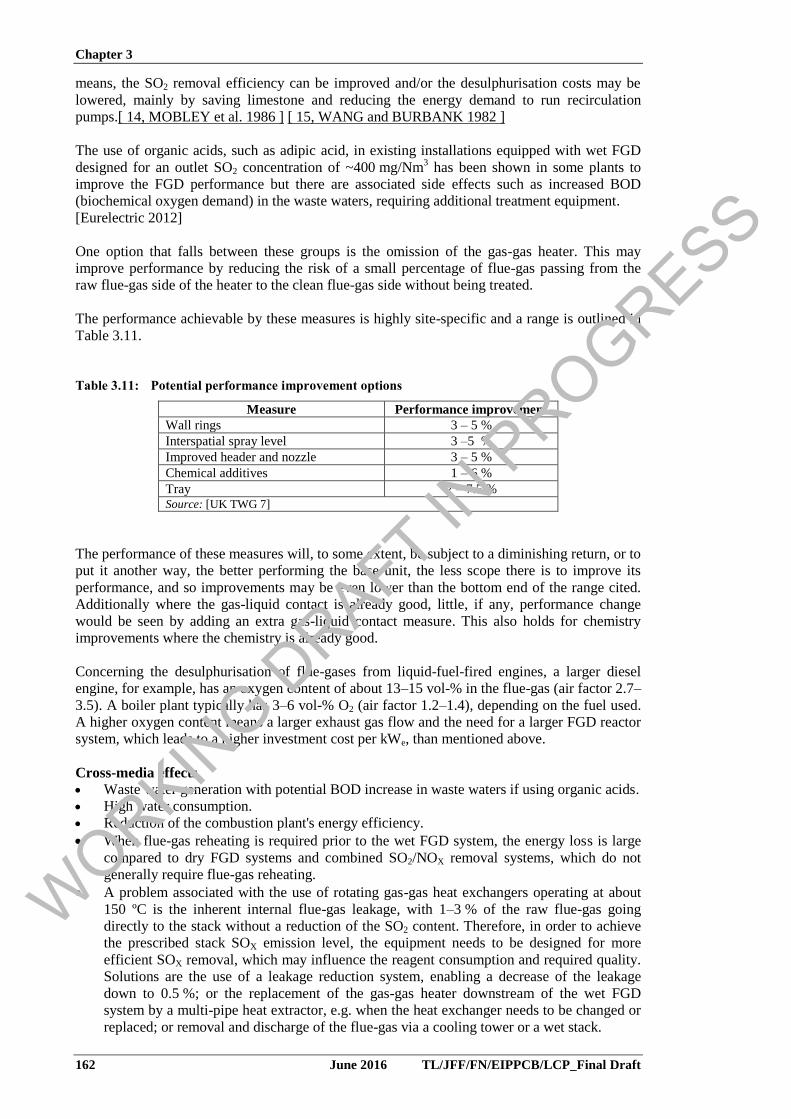
Chapter 3
162 June 2016 TL/JFF/FN/EIPPCB/LCP_Final Draft
means, the SO2 removal efficiency can be improved and/or the desulphurisation costs may be
lowered, mainly by saving limestone and reducing the energy demand to run recirculation
pumps.[ 14, MOBLEY et al. 1986 ] [ 15, WANG and BURBANK 1982 ]
The use of organic acids, such as adipic acid, in existing installations equipped with wet FGD
designed for an outlet SO2 concentration of ~400 mg/Nm3 has been shown in some plants to
improve the FGD performance but there are associated side effects such as increased BOD
(biochemical oxygen demand) in the waste waters, requiring additional treatment equipment.
[Eurelectric 2012]
One option that falls between these groups is the omission of the gas-gas heater. This may
improve performance by reducing the risk of a small percentage of flue-gas passing from the
raw flue-gas side of the heater to the clean flue-gas side without being treated.
The performance achievable by these measures is highly site-specific and a range is outlined in
Table 3.11.
Table 3.11: Potential performance improvement options
Measure Performance improvement
Wall rings 3 – 5 %
Interspatial spray level 3 –5 %
Improved header and nozzle 3 – 5 %
Chemical additives 1 – 6 %
Tray 2 – 7.5 % Source: [UK TWG 7]
The performance of these measures will, to some extent, be subject to a diminishing return, or to
put it another way, the better performing the base unit, the less scope there is to improve its
performance, and so improvements may be even lower than the bottom end of the range cited.
Additionally where the gas-liquid contact is already good, little, if any, performance change
would be seen by adding an extra gas-liquid contact measure. This also holds for chemistry
improvements where the chemistry is already good.
Concerning the desulphurisation of flue-gases from liquid-fuel-fired engines, a larger diesel
engine, for example, has an oxygen content of about 13–15 vol-% in the flue-gas (air factor 2.7–
3.5). A boiler plant typically has 3–6 vol-% O2 (air factor 1.2–1.4), depending on the fuel used.
A higher oxygen content means a larger exhaust gas flow and the need for a larger FGD reactor
system, which leads to a higher investment cost per kWe, than mentioned above.
Cross-media effects
Waste water generation with potential BOD increase in waste waters if using organic acids.
High water consumption.
Reduction of the combustion plant's energy efficiency.
When flue-gas reheating is required prior to the wet FGD system, the energy loss is large
compared to dry FGD systems and combined SO2/NOX removal systems, which do not
generally require flue-gas reheating.
A problem associated with the use of rotating gas-gas heat exchangers operating at about
150 ºC is the inherent internal flue-gas leakage, with 1–3 % of the raw flue-gas going
directly to the stack without a reduction of the SO2 content. Therefore, in order to achieve
the prescribed stack SOX emission level, the equipment needs to be designed for more
efficient SOX removal, which may influence the reagent consumption and required quality.
Solutions are the use of a leakage reduction system, enabling a decrease of the leakage
down to 0.5 %; or the replacement of the gas-gas heater downstream of the wet FGD
system by a multi-pipe heat extractor, e.g. when the heat exchanger needs to be changed or
replaced; or removal and discharge of the flue-gas via a cooling tower or a wet stack.
WORKIN
G DRAFT IN
PROGRESS
Chapter 3
TL/JFF/FN/EIPPCB/LCP_Final Draft June 2016 163
Technical considerations relevant to applicability
Retrofitting to existing plants may be difficult because of the space requirements for scrubbers
and ancillary equipment because of their size and/or complex modifications to existing flue-gas
piping systems.
Existing plants that have already applied a wet FGD system can reduce the SO2 emissions by
optimising the flow pattern in the absorber vessel.
Economics
The capital costs are relatively high for a wet limestone scrubber, but the operating costs are
moderate due to the advanced automation, the reliability, and the saleable by-product. The
capital costs can vary widely. They depend on the site specifications and technical and
economic conditions, such as plant size, SO2 inlet and outlet concentrations, the redundancy
strategy, annual operating hours, operating years, management of gypsum or residues, raw water
cost and quality, interest rates, number of units on site, FGD market situation, etc.
The capital cost for the wet lime/limestone scrubber process is mainly influenced by the flue-gas
flow rate and other site-specific factors such as plant layout, available space and necessary
modifications to existing plants. In some cases these factors might be expected to increase the
costs by some 50 %. FGD retrofit installations are much more expensive than greenfield
installations. The capital costs for a wet limestone scrubbing process fitted to a boiler varies
from EUR 35–50 per kWe for a new plant to EUR 60–300 per kWe in the case of retrofits.
Operation and maintenance costs are between EUR 0.4 and EUR 0.7 per MWh (energy input).
The typical SO2 removal costs are between EUR 750 and EUR 1150 per tonne of SO2 removed,
which corresponds to an impact of EUR 3–6 per MWh on the cost of electricity production.
[LCP TWG 2012]
Regarding the upgrade of existing wet FGD systems, a study performed for the UK EPA
identified a case where the extra cost for reducing SO2 from 800 mg/Nm3
to 400 mg/Nm3 in a
500 MW unit was about GBP 7.5 million. This required an extra slurry pump, an extra spray
level and an increase in the height of the absorber. Extra limestone was required which
necessitated larger limestone milling equipment and increases in size throughout the limestone-
handling system. Similarly there was an increase in equipment size for gypsum handling. The
study concluded that a reasonable estimate for the increase in capital costs for going from
200 mg/Nm3 to 100 mg/Nm
3 would be GBP 5 million. [UK TWG 7]
Driving force for implementation
Reduction of SOX, HCl, HF, dust and particle-bound metal emissions.
Example plants
See sections on coal, lignite, biomass, peat and oil combustion.
Reference literature
No information provided.
3.2.2.2.2 Seawater scrubber
Description
A specific non-regenerative type of scrubbing using seawater, due to its alkalinity, as a solvent
in locations where a large volume of seawater is available. WORKIN
G DRAFT IN
PROGRESS
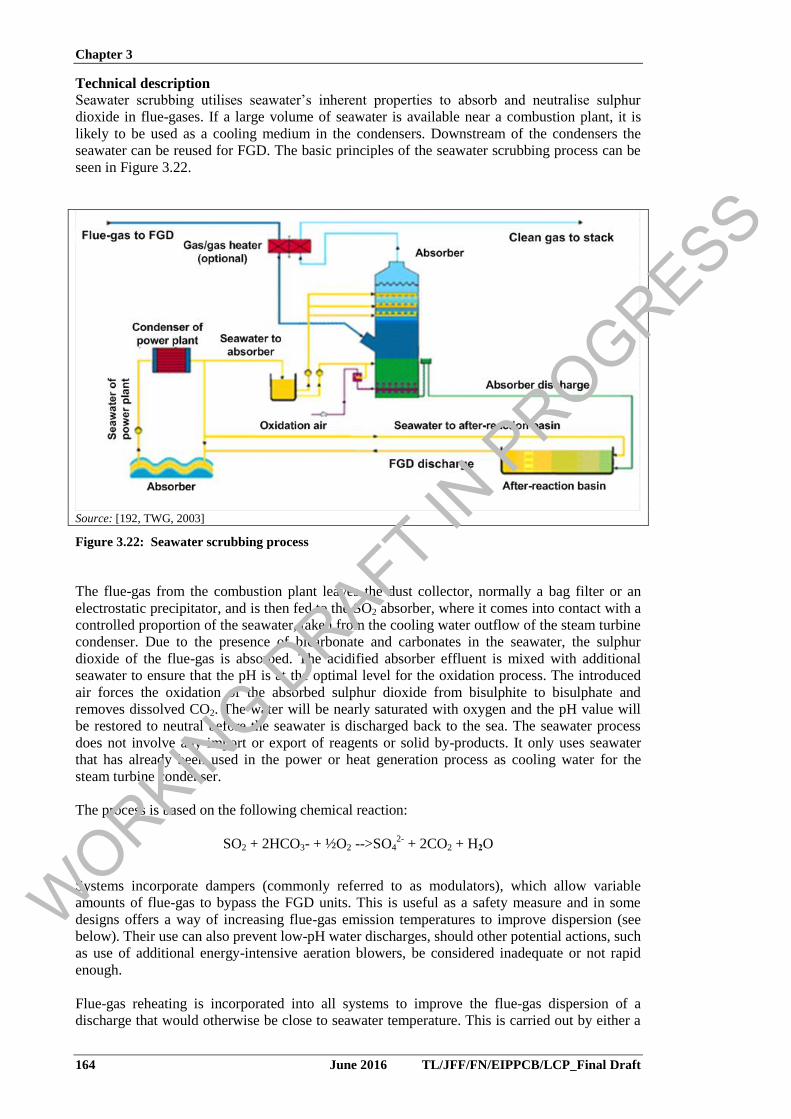
Chapter 3
164 June 2016 TL/JFF/FN/EIPPCB/LCP_Final Draft
Technical description
Seawater scrubbing utilises seawater’s inherent properties to absorb and neutralise sulphur
dioxide in flue-gases. If a large volume of seawater is available near a combustion plant, it is
likely to be used as a cooling medium in the condensers. Downstream of the condensers the
seawater can be reused for FGD. The basic principles of the seawater scrubbing process can be
seen in Figure 3.22.
Source: [192, TWG, 2003]
Figure 3.22: Seawater scrubbing process
The flue-gas from the combustion plant leaves the dust collector, normally a bag filter or an
electrostatic precipitator, and is then fed to the SO2 absorber, where it comes into contact with a
controlled proportion of the seawater, taken from the cooling water outflow of the steam turbine
condenser. Due to the presence of bicarbonate and carbonates in the seawater, the sulphur
dioxide of the flue-gas is absorbed. The acidified absorber effluent is mixed with additional
seawater to ensure that the pH is at the optimal level for the oxidation process. The introduced
air forces the oxidation of the absorbed sulphur dioxide from bisulphite to bisulphate and
removes dissolved CO2. The water will be nearly saturated with oxygen and the pH value will
be restored to neutral before the seawater is discharged back to the sea. The seawater process
does not involve any import or export of reagents or solid by-products. It only uses seawater
that has already been used in the power or heat generation process as cooling water for the
steam turbine condenser.
The process is based on the following chemical reaction:
SO2 + 2HCO3- + ½O2 -->SO42-
+ 2CO2 + H2O
Systems incorporate dampers (commonly referred to as modulators), which allow variable
amounts of flue-gas to bypass the FGD units. This is useful as a safety measure and in some
designs offers a way of increasing flue-gas emission temperatures to improve dispersion (see
below). Their use can also prevent low-pH water discharges, should other potential actions, such
as use of additional energy-intensive aeration blowers, be considered inadequate or not rapid
enough.
Flue-gas reheating is incorporated into all systems to improve the flue-gas dispersion of a
discharge that would otherwise be close to seawater temperature. This is carried out by either a
WORKIN
G DRAFT IN
PROGRESS
Chapter 3
TL/JFF/FN/EIPPCB/LCP_Final Draft June 2016 165
gas-gas reheater or by an untreated gas and hot bypass gas mixer. The seawater process removes
moisture from the flue-gas to a dew point close to seawater temperature, generally lower than
local atmospheric temperatures, such that a stack plume is not generally visible.
In some estuarine locations, an influx of fresh or brackish water, for example after long periods
of precipitation, can affect seawater's alkalinity and therefore its ability to remove SO2. At low
tide in estuarine locations, there may be recirculation between the cooling water outfall and
intake. This can in turn affect the efficiency of SO2 removal and the acidity of the discharged
cooling water, requiring the partial bypassing of one or more of the FGD absorbers using the
modulators mentioned above.
[UK 2013]
Achieved environmental benefits
SOX emissions reduction.
Simple process which does not require slurry handling and does not generate by-products.
Reduction of metal emissions to air.
Environmental performance and operational data
Table 3.12: Performance of the seawater scrubber technique for reducing sulphur oxide emissions
Technique General SO2
reduction rate
Other performance parameters
Parameter Value
Seawater
scrubbing 85 – 98 %
Operating temperature
(example)
145 ºC (example of flue-gas inlet)
30 – 40 °C
(= seawater outlet temperature)
Sorbent Seawater, air
Residence time of seawater in
aerator
15 min (example, residence time
depends on type of process)
Max. flue-gas flow per absorber No limitation in gas flow
Reliability 98 – 99 %
Residue/by-product None
Energy consumption as % of
electric capacity 0.8 – 1.6 %
HCl removal rate 95 – 99 %
HF removal rate 95 – 99 % (in the absorber)
Waste water
Discharged directly back to the
sea (sulphate ions dissolved in
seawater)
Pressure drop 10 – 20 (10² Pa)
NB: Unlike the limestone gypsum system that turns spray levels on and off to match performance to coal sulphur,
the seawater absorber only employs a controlled bypass that improves the reheat and reduces cross-media effects to
seawater when firing lower sulphur coals.
Cross-media effects
Local conditions such as seawater conditions, tidal flows, the marine (aquatic) environment
close to the scrubber water outlet, etc. need to be carefully examined in order to avoid any
negative environmental or ecological effects.
Effects may arise from the reduction of the pH level in the general vicinity of the combustion
plant, as well as from the input of remaining metals, in particular Hg, and fly ash. This is
especially relevant for plants situated in an estuary. Injection of activated carbon in the flue-gas
stream together with the use of a bag filter, upstream of the seawater FGD, enables the reduction
of mercury emissions to water. [UK 2013, EEB 2013] The discharge to water will contain
sulphate and chlorine ions, which are natural constituents of seawater.
WORKIN
G DRAFT IN
PROGRESS
Chapter 3
166 June 2016 TL/JFF/FN/EIPPCB/LCP_Final Draft
Another cross-media effect is the reduction of the combustion plant's energy efficiency.
Technical considerations relevant to applicability
Seawater must be available and already used as cooling water.
The applicability of seawater scrubbing is very high, as the process is simple and does not
require slurry handling. However, it is applicable only for low-sulphur fuel.
Because particulates (possibly including their metals content) are transferred to the
seawater, an efficient particulate abatement technique is necessary prior to the seawater
scrubbing.
Retrofitting to existing plants can be difficult because of the plot space requirement for
scrubbers and ancillary equipment because of their size and/or complex modifications to
existing flue-gas piping systems.
Economics
The capital and operating costs are low (no bulk chemicals required, although sometimes
magnesium hydroxide is used to enhance the alkalinity).
For a 300–500 MWe plant fitting a seawater FGD system to achieve a 90 % reduction in SO2, an
indicative capital cost of GBP 110/kWel, and operating costs of GBP 0.0011/kWel (1999 prices)
are given.
[EEB 2013]
Driving force for implementation
Reduction of SOX, HCl, HF, dust and particle-bound metal emissions.
Example plants
Aberthaw Power Station in Wales in the UK (Plant 493).
Kilroot Power Station in Northern Ireland in the UK.
Reference literature
No information provided.
3.2.2.2.3 Magnesium wet scrubber
Description
Scrubbing technique using seawater as a solvent and using magnesium hydroxide to enhance
alkalinity.
Technical description
The reagent in magnesium scrubbing is magnesium hydroxide, which is produced by adding
slaked lime to seawater in order to enhance alkalinity. It produces waste sulphate liquor. The
magnesium sulphate can be discharged into the sea because magnesium sulphate is a constituent
of seawater.
Achieved environmental benefits
Reduced SOX emissions to air.
Environmental performance and operational data
No information provided.
Cross-media effects
Local conditions such as seawater conditions, tidal flows, the marine (aquatic) environment
close to the scrubber water outlet, etc. need to be carefully examined in order to avoid any
negative environmental or ecological effects.
WORKIN
G DRAFT IN
PROGRESS

Chapter 3
TL/JFF/FN/EIPPCB/LCP_Final Draft June 2016 167
Effects may arise from the reduction of the pH level in the general vicinity of the power plant,
as well as from the input of remaining metals, in particular Hg, and fly ash. This is especially
relevant for plants situated in an estuary.
A further cross-media effect is the reduction of the combustion plant's energy efficiency.
Technical considerations relevant to applicability
This process is suitable only for plants located near the coast.
The magnesium wet scrubber has mainly been applied to smaller plants, i.e. less than 50 MW,
and is therefore not described further in this document.
Economics
The capital costs are low, but the operational costs are high.
Driving force for implementation
Reduction of SOX, HCl, HF, dust and particle-bound metal emissions.
Example plants
A number of units with this process have been constructed, mainly for industrial coal-fired
boilers.
Reference literature
No information provided.
3.2.2.2.4 Ammonia wet scrubber
Description
Scrubbing technique where sulphur is removed from flue-gases through injection of ammonia
sorbent for capturing SO2 and transforming it into ammonium sulphate.
Technical description
In the ammonia wet scrubber, as shown in Figure 3.23, SO2 is absorbed by aqueous ammonia,
resulting in ammonium sulphate as the by-product, which is used as fertiliser.
Source: [126, Lurgi Lentjes Bischoff, 2001]
Figure 3.23: The ammonia wet scrubber
WORKIN
G DRAFT IN
PROGRESS
Chapter 3
168 June 2016 TL/JFF/FN/EIPPCB/LCP_Final Draft
Achieved environmental benefits
Reduced SOX emissions to air.
Environmental performance and operational data
The technique has been operating reliably following improvements and the resolution of some
initial problems with the generation of aerosols, i.e. ammonia salt particles with a diameter of up
to 1 m. The process can achieve emission levels of less than 200 mg/Nm3.
Cross-media effects
The process does not generate solid by-products or liquid waste. If particulates with possible
metals content are present in the flue-gas they appear together with the product.
Another cross-media effect is the reduction of the combustion plant's energy efficiency.
Technical considerations relevant to applicability
No information provided.
Economics
No information provided.
Driving force for implementation
Besides the emissions reduction performance, the driving forces to apply the ammonia wet
scrubber are: the requirement for a saleable by-product; the requirement that no waste water
results (when local conditions do not allow discharge of waste water into the public
watercourse) or other materials that would require waste disposal; very limited space
availability; and economic constraints.
Example plants
The process has been operated in a coal-fired, wet-bottom boiler with a 191 MWe firing capacity
in Germany.
Reference literature
No information provided.
3.2.2.2.5 Lye wet scrubber
Description
Scrubbing technique where sulphur is removed from flue-gases through injection of a NaOH
sorbent for capturing SOX.
Technical description
Some wet scrubbers use a NaOH (about 50 wt-%) water solution (lye) as the reagent. The
flue-gas is washed with the reagent water solution and the SOX is removed. The main
components of the system are the reagent storage tank and transportation system, a scrubber
with recirculation pumps, and an oxidation tank.
Some of the technical drawbacks of a wet scrubber using a NaOH water solution as the reagent
are:
moderate reduction of flue-gas particles;
low exhaust gas temperature (detrimental for flue-gas dispersion);
high water consumption;
high discharge water flow (‘by-product’).
All DeSOX methods need a large amount of make-up water and produce a large amount of end
(by-)product, which has to be disposed of in an environmentally sound way. The disposal
WORKIN
G DRAFT IN
PROGRESS
Chapter 3
TL/JFF/FN/EIPPCB/LCP_Final Draft June 2016 169
options for the by-product depend on local and national standards and on the existing
infrastructure. Therefore, these are decided on a case-by-case basis.
Achieved environmental benefits
Reduced SOX emissions to air.
Environmental performance and operational data
No information provided.
Cross-media effects
High water consumption.
High discharge water flow (‘by-product’).
Reduction of the combustion plant's energy efficiency.
Technical considerations relevant to applicability
No information provided.
Economics
Lower investment costs compared to other DeSOX methods (residue treatment costs are not
considered, and neither is reheating (depends on the applicable legislation)).
Expensive reagent.
In larger power plants, other DeSOX methods are often more competitive than NaOH
DeSOX, due to lower operating costs (cheaper reagent, etc.).
Driving force for implementation
The driving forces are the lye wet scrubber's simplicity, reliability (no clogging risk) and good
SOX removal efficiency.
Example plants
No information provided.
Reference literature
No information provided.
3.2.2.2.6 Spray dry scrubber/absorber
Description
A suspension/solution of alkaline reagent is introduced and dispersed in the flue-gas stream. The
material reacts with the gaseous sulphur species to form a solid powder, which has to be
removed by filtration (bag filter or ESP).
Technical description
The spray dry scrubber process belongs to a group of semi-dry processes because it uses lime
slurry (mixture of lime and water), similar to the wet scrubber processes, and the residue is dry
powder, similar to the dry processes. Lime slurry is usually used to remove SOX from the flue-
gas in this type of FGD scrubbing technique. The process consists mainly of a spray dry
absorber; dust control, such as an ESP or a bag filter; and recycling disposal devices for the
reaction products. Several spray dry scrubber processes are currently commercially operated.
These processes are similar to each other in terms of the process configuration, constituents, and
the sorbent used, but one difference is the lime slurry dispersion system used in the spray dry
absorber (SDA).
Some installations use a dust control device before the spray dry scrubber for separate collection
of the fly ash.
WORKIN
G DRAFT IN
PROGRESS

Chapter 3
170 June 2016 TL/JFF/FN/EIPPCB/LCP_Final Draft
Source: [DK, 2013]
Figure 3.24: Flowsheet of a spray dry scrubber process
The sorbent for the SOX absorption is typically calcium hydroxide (Ca(OH)2). The calcium
hydroxide can be made from burnt lime (CaO) on site in the slaking process or bought as a
powder to be mixed with water to produce the lime slurry, which is also called lime milk. Lime
slurry is sprayed as a cloud of fine droplets in the spray dry absorber, where SOX is also
removed from the flue-gas. Water is evaporated by the heat of the flue-gas, usually with a
sufficient residence time (about 10 seconds) for the SO2 and other acid gases such as SO3 and
HCl to react simultaneously with hydrated lime to form calcium sulphite/sulphate and calcium
chloride. Waste water treatment is not required in these processes because all the water is
completely evaporated in the spray dry absorber. The spray dry scrubber may even be used to
eliminate the waste water stream from wet scrubbers and can thus be seen as an excellent zero
liquid discharge (ZLD) technique.
The process chemistry associated with SO2 removal from the flue-gas is a simple acid/base
absorption reaction between SO2 and hydrated lime as follows:
Ca(OH)2 + SO2 CaSO3 + H2O
CaSO3 +½O2 + ½H2O CaSO4 · ½H2O
The absorption chemistry is strongly affected by factors such as flue-gas temperature, gas
humidity, SO2 concentration in the flue-gas and atomised slurry droplet size. The by-product is
a dry mixture of calcium sulphite, calcium sulphate, fly ash and unreacted lime, which is
collected by either the ESP or the bag filter. As this residue contains some unreacted lime, part
of it is generally recycled and mixed with fresh lime slurry to enhance lime utilisation. If bag
filters are used to remove the solids after scrubbing, the flue-gas normally requires cooling,
either by heat exchanger or cooling air, to keep the temperature below 250 °C (except with
fabrics suitable for higher temperatures, such as ceramics or metal gauze/mesh).
The use of a pre-collector, which removes most of the fly ash before it enters the absorber, is a
common design feature of most European spray dry scrubber plants. It is installed between the
air heater and the absorber. The installation of a pre-collector has some advantages that can help
to balance its initial capital and operating costs, e.g.:
WORKIN
G DRAFT IN
PROGRESS

Chapter 3
TL/JFF/FN/EIPPCB/LCP_Final Draft June 2016 171
For a given desulphurisation yield, it can reduce the lime consumption (at a given T).
Although this requires the SD scrubber operating temperature to be increased (at a given
Ca/S ratio), this also reduces dust deposition risks.
It helps to achieve a greater ESP efficiency and, therefore, lower final emissions.
It stops erosion of the equipment downstream by the fly ash.
It reduces the volume of waste for disposal.
It collects a saleable product (fly ash), which is useful as the market for fly ash is well
established.
The pre-collector is normally a simple one-field ESP. However, in retrofits the existing
particulate control equipment is often used as a pre-collector.
Slurry or detention-type slakers are typically used in Europe and the US, followed by paste
slakers (used more commonly in the US). The simple tank slaker can be used for pulverised
quicklime.
The main part of the absorber is the lime slurry spray system. The spray system can be of the
rotary atomiser type or of the dual-fluid nozzle type. The first one is installed at the centre of the
roof and sprays fine droplets of hydrated lime. For large flue-gas flows (above 850 000 Nm3/hr),
the flue-gas stream is split prior to entering the absorber, so that approximately 60 % of the gas
enters the absorber through the roof gas disperser and the other 40 % through the central gas
disperser. Adjusting the two flows and correct positioning of the gas dispersal vanes help to
control the shape of the cloud of atomised droplets and provide an efficient mixing of the flue-
gas and sorbent in a narrow zone around the atomiser. The appropriate size of absorber for
treating the flue-gas from boilers with a 150–200 MWe capacity is usually 14–15 m (diameter) x
11–12 m (cylindrical height).
The spray nozzles of the slurry atomiser in the spray dry absorber have to conform to high
specifications to maintain a constant spraying quality. For example, the nozzles must be able to
resist flue-gas corrosion and lime erosion. In addition, they must have a low pressure drop and a
minimal risk of clogging. Many types of spray nozzle are used in the slurry atomiser, such as
the rotary atomiser and the stationary dual-fluid nozzle.
Sorbent utilisation in spray dry scrubbers is higher than in sorbent injection processes, but
unreacted lime constitutes about 10–40 % of the make-up lime and is discharged from the
system with calcium sulphite/sulphate. The sorbent utilisation is improved by strictly
controlling the sorbent to water ratio in slurry making, decreasing the approach-to-saturation
temperature in the absorber and by recirculating parts of the residue back to the absorber.
Achieved environmental benefits
Reduction of SOX emissions to air.
No waste water generated.
Investigation showed that about 35–85 % of the mercury present in the gas phase upstream
of the scrubber is removed.
Environmental performance and operational data
Spray dry absorbers usually operate at 20–30 K above the saturation temperature, where the
saturation temperature of flue-gas is between 45 °C and 55 °C. Thus, most plants do not require
the reheating of the clean flue-gas, unless the dew point can be reached, although the required
stack temperature must still somehow be met. General performance and operational parameters
of spray dry scrubbers are shown in Table 3.13.
The small amounts of SO3 always present in boiler flue-gas are absorbed in a spray dry
absorber. The alkaline calcium-based absorbent reacts with acidic SO3/H2SO4 to form sulphuric
salts. The SO3/H2SO4 removal is normally completed effectively by the alkaline cake layer
formed on the surface of bag filter bags, in addition to the common gas/solid neutralisation
reactions.
WORKIN
G DRAFT IN
PROGRESS

Chapter 3
172 June 2016 TL/JFF/FN/EIPPCB/LCP_Final Draft
Table 3.13: Performance of the spray dry scrubber technique for reducing sulphur oxide emissions
Technique General SO2
reduction rate
Other performance parameters Remarks
Parameter Value
Spray dry
scrubber 85 – 92 %
Operating temperature 120 – 200 ºC (flue-gas inlet)
65 – 80 ºC (flue-gas outlet) The use of tower mills for slaking can increase the reactivity of
the slaked lime.
As spray dry scrubbers can remove more SO3 than wet
scrubbers, there is likely to be less of a problem of H2SO4 in the
environment close to the plant than with wet scrubbers.
The overall power consumption for pollution control (including
NOX and dust control devices) is usually below 1.0 % in a plant
using a spray dry scrubber.
With sulphur contents exceeding 3 %, the removal efficiency
decreases slightly.
The spray dry scrubber efficiency very much depends on the
dedusting device used (e.g. bag filter or ESP), because
desulphurisation occurs to a certain extent, for instance, in the
filter cake of the bag filter.
Sorbent Lime, calcium hydroxide
Residence time Approx. 10 s
Ca/S molar ratio 1.1 – 1.4
Max. flue-gas flow per
absorber 3 300 000 m
3/h
Removal range of SO3 and
HCl 95 % to > 99 %
Recirculation rate of used
sorbent 0 – 75 %
Solid content in injected
liquid 10 – 45 %
Reliability 95 – 99 %
Residue/by-product
Mixture of fly ash,
unreacted additive and
CaSO3
Energy consumption as %
of electric capacity 0.5 – 1 %
Water consumption
20 – 40 l/1000 m3 flue-gas
(depends on gas
temperature)
Waste water None
Pressure drop of the spray
dryer without the
dedusting device
10 mbar (103Pa)
WORKIN
G DRAFT IN
PROGRESS

Chapter 3
TL/JFF/FN/EIPPCB/LCP_Final Draft June 2016 173
Cross-media effects
The residue is normally a mixture of the original sorbent, calcium sulphite, calcium sulphate and
fly ash, which is less attractive commercially. Most SDA residues being produced around the
world are used in the construction industry, in underground mining, for land reclamation
purposes, as fertiliser or as a reagent in a synergy process with a wet FGD system.
A common means of disposal and utilisation of the spray dry scrubber residue are stabilised
landfills. As the residue contains unreacted lime, it cannot be disposed of untreated, because it
produces dust and there may be a risk of an uncontrolled leaching of hazardous components.
Therefore, it is specially conditioned by mixing with water and fly ash to produce a disposable
fixed product. The residue is both an advantage and disadvantage to the system. Establishing a
use for the residue is a key aspect of the application of a spray dry scrubber. As it contains a
large amount of unreacted lime, the product is used as a solvent for wet FGD systems sited
nearby, providing the ash content is low enough. Research suggests a new field of application
for the residue product is as an additive to fertilisers where sulphur is required.
An additional cross-media effect is the reduction of the combustion plant's energy efficiency.
Technical considerations relevant to applicability
The spray dry scrubber is suitable for low- to moderate-sulphur fuels and for use in smaller
facilities. The equipment includes slurry preparation, handling and atomisation equipment, all of
which have to be able to withstand erosion by the slurry. The dry solid by-product can be used
in a range of different construction purposes.
Economics
Spray dry scrubbers are generally characterised by lower capital costs but have higher operating
costs than wet scrubbers, mainly due to the use of the more expensive lime sorbent. Spray dry
scrubbers are mostly used for relatively small to medium-sized capacity boilers using low- to
medium-sulphur (1.5 %) coal. For the same reason, they are preferable for retrofits and for peak
load operation.
The capital cost for the spray dry system mainly depends on the capacity of the plant and the
type and layout of the spray dry absorber and the injection system. Reported capital costs differ
significantly, depending on the type of power plant. The capital cost of a spray drying system is
approximately 30–50 % less than the capital cost of a wet limestone process for an LCP of the
same size, but the operating costs are higher due to the higher sorbent costs. The four to five
times higher cost of the lime sorbent used in spray dry scrubbers, compared to limestone for the
predominant wet scrubbers, is probably the greatest disadvantage of spray dry scrubbers. The
use of a single-module spray dryer is limited to units below 1500 MWth, with a 3.3 million m3/h
maximum flow rate, and to low- to moderate-sulphur fuels, in order to keep the operational
costs within reasonable limits. Spray dry systems are only cheaper for smaller units and low
operational loads.
Spray dry scrubber costs for a boiler have been estimated to be EUR 7–45 per kWth (fuel energy
input) in investment costs, and EUR 0.5–0.7 per MWh in operating and maintenance costs. The
cost of the reduced pollutant was EUR 600–800 per tonne of sulphur dioxide removed. The
effect on the price of electricity was approximately EUR 6 per MWh (electricity produced).
Higher peak prices correspond to smaller LCPs in comparison to wet FGD applications. A
larger diesel engine has an oxygen content of about 13–15 vol-% O2 in the flue-gas (air factor
2.7–3.5); and a boiler plant typically 3–6 vol-% O2 (air factor 1.2–1.4), depending on the fuel
used. A higher oxygen content means a greater exhaust gas flow and the need for a greater FGD
reactor system, which leads to a higher investment cost, etc.
Depending on the different possibilities for by-product utilisation, the by-product treatment and
disposal costs have to be taken into account for the spray dry processes when comparing the
costs of the different desulphurisation methods.
WORKIN
G DRAFT IN
PROGRESS

Chapter 3
174 June 2016 TL/JFF/FN/EIPPCB/LCP_Final Draft
Driving force for implementation
A spray dry scrubber/absorber is a simple, reliable and efficient desulphurisation system with
few control loops which is easy to control and which produces no waste water (zero liquid
discharge).
Example plants
Plants 213, 376, 443-1/2, 462 and 489.
Reference literature
[ 16, GEA Niro 2012 ]
3.2.2.2.7 Circulating fluidised bed (CFB) dry scrubber
Description
The circulating fluidised bed (CFB) process is a separate process to the spray dry scrubber and
the duct sorbent injection techniques. Flue-gas from the boiler air preheater enters the CFB
absorber at the bottom and flows vertically upwards through a venturi section where a solid
sorbent and water are injected separately into the flue-gas stream.
Technical description
The venturi is designed to achieve the proper flow distribution throughout the operating range of
the vessel. Inside the venturi, the gas is first accelerated, and then decelerated before entering
the cylindrical upper vessel. The height of the vessel is designed to accommodate the mass and
residence time of bed material required for the desired Ca and SO2 contact time. Sizing of the
equipment is mostly determined depending on the flue-gas flow. All external inputs, such as the
recirculating material, fresh reagent and gas-conditioning water, are introduced to the gas at the
diverging wall of the venturi. The vessel has no internal mechanical or structural components.
Control of the gas distribution, the sorbent flow rate, and the distribution and the amount of
humidifying water ensures the appropriate conditions for optimum SO2 removal efficiency.
Source: [EPPSA 2013]
Figure 3.25: Schematic of a CFB scrubber process flow
WORKIN
G DRAFT IN
PROGRESS
Chapter 3
TL/JFF/FN/EIPPCB/LCP_Final Draft June 2016 175
The treated exhaust gas flows to a dust collector (bag filter or electrostatic precipitator), where
dust is removed from the flue-gas. Outlet gases from the particulate collector are transported to
a stack by means of an induced draft fan. The majority of the solids collected are recycled back
to the absorber. The hopper level controls the extraction of powder to the by-product silo for
disposal [135, Alstom Power, 2002].
The process chemistry associated with acid gas removal from the flue-gas is a simple acid/base
absorption reaction between SO2, HCl, HF and hydrated lime as follows:
Ca(OH)2 + SO2 CaSO3 + H2O
CaSO3 +½O2 + ½H2O CaSO4 · ½H2O
Ca(OH)2 + SO3 CaSO4 + H2O
Ca(OH)2 + 2 HCl CaCaCl2 + 2 H2O
Ca(OH)2 + 2 HF CaF2 + 2 H2O
Ca(OH)2 + CO2 CaCO3 + H2O
The absorption chemistry is strongly affected by factors such as the flue-gas temperature, gas
humidity and SO2 concentration in the flue-gas. The by-product is a dry mixture of calcium
sulphite, calcium sulphate, fly ash and unreacted lime.
The use of a pre-collector that removes most of the fly ash before it enters the absorber is a
common design feature. It is installed between the air heater and the absorber. The installation
of a pre-collector has some advantages that can help to balance its initial capital and operating
costs, e.g.:
For a given desulphurisation yield, it can reduce the lime consumption (at a given T).
Although this requires the CFB scrubber operating temperature to be increased (at a given
Ca/S ratio), this also reduces dust deposition risks.
It helps to achieve a greater ESP efficiency and, therefore, lower final emissions.
It reduces the volume of waste for disposal.
It collects a saleable product (fly ash), which is useful as the market for fly ash is well
established.
The pre-collector is normally a simple one-field ESP. However, in retrofits the existing
particulate control equipment is often used as a pre-collector.
The process is not complicated to operate and is easy to maintain because it does not require
high-maintenance mechanical equipment such as grinding mills, abrasion-resistant slurry
pumps, agitators, rotary atomisers, and sludge dewatering devices. Furthermore, the increased
effective surface area of the circulating bed permits successful capture of virtually all of the SO3
and halides in the gas, eliminating the possibility of gas path corrosion from condensate SO3
aerosol mist.
Achieved environmental benefits
Reduced SOX and halides emissions to air.
Increased dust removal efficiency.
Environmental performance and operational data
WORKIN
G DRAFT IN
PROGRESS
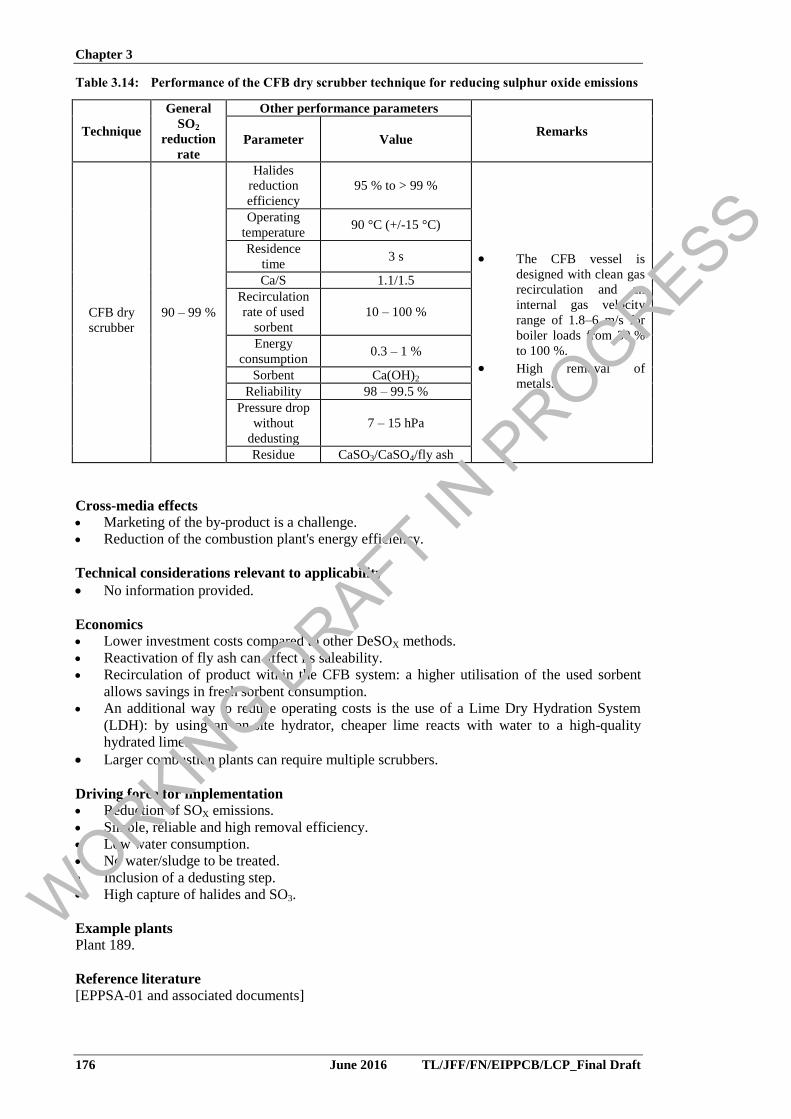
Chapter 3
176 June 2016 TL/JFF/FN/EIPPCB/LCP_Final Draft
Table 3.14: Performance of the CFB dry scrubber technique for reducing sulphur oxide emissions
Technique
General
SO2
reduction
rate
Other performance parameters
Remarks Parameter Value
CFB dry
scrubber
90 – 99 %
Halides
reduction
efficiency
95 % to > 99 %
The CFB vessel is
designed with clean gas
recirculation and an
internal gas velocity
range of 1.8–6 m/s for
boiler loads from 30 %
to 100 %.
High removal of
metals.
Operating
temperature 90 °C (+/-15 °C)
Residence
time 3 s
Ca/S 1.1/1.5
Recirculation
rate of used
sorbent
10 – 100 %
Energy
consumption 0.3 – 1 %
Sorbent Ca(OH)2
Reliability 98 – 99.5 %
Pressure drop
without
dedusting
7 – 15 hPa
Residue CaSO3/CaSO4/fly ash
Cross-media effects
Marketing of the by-product is a challenge.
Reduction of the combustion plant's energy efficiency.
Technical considerations relevant to applicability
No information provided.
Economics
Lower investment costs compared to other DeSOX methods.
Reactivation of fly ash can affect its saleability.
Recirculation of product within the CFB system: a higher utilisation of the used sorbent
allows savings in fresh sorbent consumption.
An additional way to reduce operating costs is the use of a Lime Dry Hydration System
(LDH): by using an on-site hydrator, cheaper lime reacts with water to a high-quality
hydrated lime.
Larger combustion plants can require multiple scrubbers.
Driving force for implementation
Reduction of SOX emissions.
Simple, reliable and high removal efficiency.
Low water consumption.
No water/sludge to be treated.
Inclusion of a dedusting step.
High capture of halides and SO3.
Example plants
Plant 189.
Reference literature
[EPPSA-01 and associated documents]
WORKIN
G DRAFT IN
PROGRESS

Chapter 3
TL/JFF/FN/EIPPCB/LCP_Final Draft June 2016 177
3.2.2.2.8 Duct sorbent injection
Description
Dry powder is introduced and dispersed in the flue-gas stream. The material reacts with the
gaseous sulphur species to form a solid, which has to be removed by filtration (bag filter or
electrostatic precipitator).
Technical description
Duct sorbent injection (DSI) means the injection of a calcium- or sodium-based sorbent into the
flue-gas, between the air heater and the ESP or bag filter, as shown in Figure 3.26.
Source: [New 148] [33, Ciemat, 2000]
Figure 3.26: Duct sorbent injection
The most common types of duct sorbent injection are:
dry hydrated lime, for which the sulphur capture can be improved by humidification in
some cases (depending on flue-gas composition);
dry sodium bicarbonate injection, which does not require humidification but requires on-
site milling for improved capture;
lime slurry injection or in-duct scrubbing, which does not require a separate
humidification step (also known as 'modified dry FGD' - see Figure 3.27).
The humidification water serves two purposes. First, it activates the sorbent to enhance SO2
removal and, secondly, it conditions the dust to maintain an efficient ESP performance.
However, when a bag filter is used, humidification needs to be carefully controlled in order to
avoid wet deposits on the filtering media.
Even though duct sorbent injection is an outwardly simple process, two of the key phenomena
to increase its control are a) the desulphurisation of flue-gas by calcium- or sodium-based
sorbent in the recycling of product with a high amount of unreacted absorbent, and b) the
coupling with an existing ESP to increase the efficiency, by reducing the temperature and by
having a higher humidity. An additional parameter is to humidify the recycled products in such
a way that the walls and ESP are not in direct contact with water, to avoid the risk of corrosion.
Recently, lime slurries have been improved to enhance SO3 and SO2 absorption (e.g. by
including additives (Mg and Na)).
WORKIN
G DRAFT IN
PROGRESS
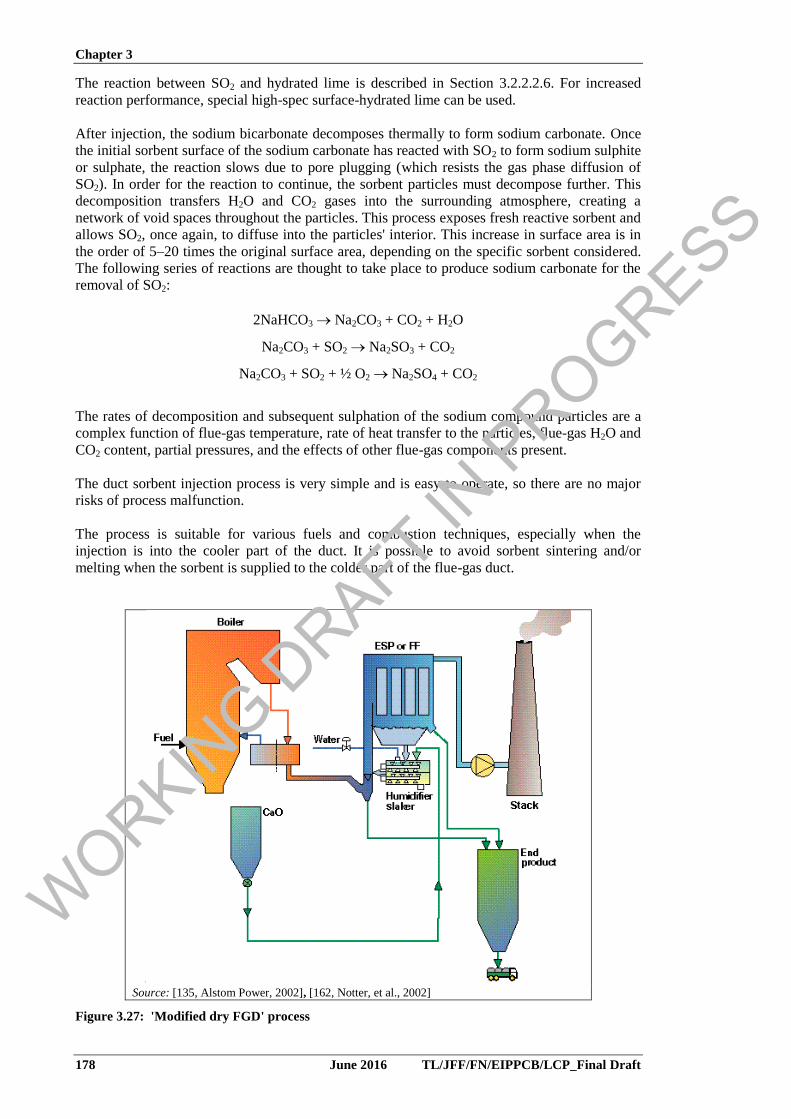
Chapter 3
178 June 2016 TL/JFF/FN/EIPPCB/LCP_Final Draft
The reaction between SO2 and hydrated lime is described in Section 3.2.2.2.6. For increased
reaction performance, special high-spec surface-hydrated lime can be used.
After injection, the sodium bicarbonate decomposes thermally to form sodium carbonate. Once
the initial sorbent surface of the sodium carbonate has reacted with SO2 to form sodium sulphite
or sulphate, the reaction slows due to pore plugging (which resists the gas phase diffusion of
SO2). In order for the reaction to continue, the sorbent particles must decompose further. This
decomposition transfers H2O and CO2 gases into the surrounding atmosphere, creating a
network of void spaces throughout the particles. This process exposes fresh reactive sorbent and
allows SO2, once again, to diffuse into the particles' interior. This increase in surface area is in
the order of 5–20 times the original surface area, depending on the specific sorbent considered.
The following series of reactions are thought to take place to produce sodium carbonate for the
removal of SO2:
2NaHCO3 Na2CO3 + CO2 + H2O
Na2CO3 + SO2 Na2SO3 + CO2
Na2CO3 + SO2 + ½ O2 Na2SO4 + CO2
The rates of decomposition and subsequent sulphation of the sodium compound particles are a
complex function of flue-gas temperature, rate of heat transfer to the particles, flue-gas H2O and
CO2 content, partial pressures, and the effects of other flue-gas components present.
The duct sorbent injection process is very simple and is easy to operate, so there are no major
risks of process malfunction.
The process is suitable for various fuels and combustion techniques, especially when the
injection is into the cooler part of the duct. It is possible to avoid sorbent sintering and/or
melting when the sorbent is supplied to the colder part of the flue-gas duct.
Source: [135, Alstom Power, 2002], [162, Notter, et al., 2002]
Figure 3.27: 'Modified dry FGD' process
WORKIN
G DRAFT IN
PROGRESS
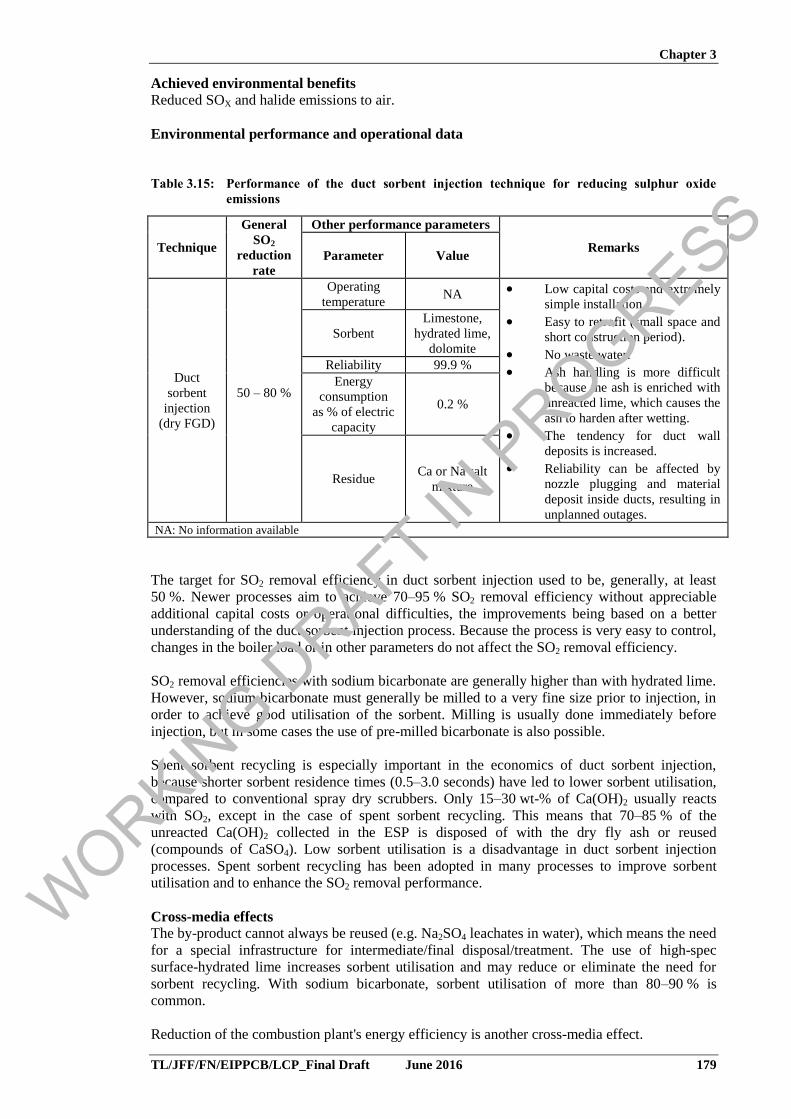
Chapter 3
TL/JFF/FN/EIPPCB/LCP_Final Draft June 2016 179
Achieved environmental benefits
Reduced SOX and halide emissions to air.
Environmental performance and operational data
Table 3.15: Performance of the duct sorbent injection technique for reducing sulphur oxide
emissions
Technique
General
SO2
reduction
rate
Other performance parameters
Remarks Parameter Value
Duct
sorbent
injection
(dry FGD)
50 – 80 %
Operating
temperature NA Low capital costs and extremely
simple installation.
Easy to retrofit (small space and
short construction period).
No waste water.
Ash handling is more difficult
because the ash is enriched with
unreacted lime, which causes the
ash to harden after wetting.
The tendency for duct wall
deposits is increased.
Reliability can be affected by
nozzle plugging and material
deposit inside ducts, resulting in
unplanned outages.
Sorbent
Limestone,
hydrated lime,
dolomite
Reliability 99.9 %
Energy
consumption
as % of electric
capacity
0.2 %
Residue Ca or Na salt
mixture
NA: No information available
The target for SO2 removal efficiency in duct sorbent injection used to be, generally, at least
50 %. Newer processes aim to achieve 70–95 % SO2 removal efficiency without appreciable
additional capital costs or operational difficulties, the improvements being based on a better
understanding of the duct sorbent injection process. Because the process is very easy to control,
changes in the boiler load or in other parameters do not affect the SO2 removal efficiency.
SO2 removal efficiencies with sodium bicarbonate are generally higher than with hydrated lime.
However, sodium bicarbonate must generally be milled to a very fine size prior to injection, in
order to achieve good utilisation of the sorbent. Milling is usually done immediately before
injection, but in some cases the use of pre-milled bicarbonate is also possible.
Spent sorbent recycling is especially important in the economics of duct sorbent injection,
because shorter sorbent residence times (0.5–3.0 seconds) have led to lower sorbent utilisation,
compared to conventional spray dry scrubbers. Only 15–30 wt-% of Ca(OH)2 usually reacts
with SO2, except in the case of spent sorbent recycling. This means that 70–85 % of the
unreacted Ca(OH)2 collected in the ESP is disposed of with the dry fly ash or reused
(compounds of CaSO4). Low sorbent utilisation is a disadvantage in duct sorbent injection
processes. Spent sorbent recycling has been adopted in many processes to improve sorbent
utilisation and to enhance the SO2 removal performance.
Cross-media effects
The by-product cannot always be reused (e.g. Na2SO4 leachates in water), which means the need
for a special infrastructure for intermediate/final disposal/treatment. The use of high-spec
surface-hydrated lime increases sorbent utilisation and may reduce or eliminate the need for
sorbent recycling. With sodium bicarbonate, sorbent utilisation of more than 80–90 % is
common.
Reduction of the combustion plant's energy efficiency is another cross-media effect.
WORKIN
G DRAFT IN
PROGRESS
Chapter 3
180 June 2016 TL/JFF/FN/EIPPCB/LCP_Final Draft
Technical considerations relevant to applicability
Duct sorbent injection has great potential for relatively old and small boilers.
Economics
The characteristics of duct sorbent injection technologies are low capital costs, the simplicity of
the process, and their adaptability to difficult retrofit situations. However, they have a relatively
low SO2 removal efficiency. They are economically competitive at small power plants.
In a sorbent recycling system, a portion of the collected solids can be recycled back to the duct
to provide another opportunity for the Ca(OH)2 to react with SO2. Recycling these solids
increases the total Ca(OH)2 content in the system without increasing the rate of fresh hydrated
lime addition. Therefore, any increase in SO2 removal is achieved without increasing fresh
sorbent costs.
The required reactants are more expensive than in the limestone processes, such as in in-furnace
injection. The cost of both sodium bicarbonate and high-spec surface-hydrated lime is usually
higher than that of ordinary hydrated lime. This means that the operating costs tend to be higher,
even though a smaller Ca/S molar ratio is possible.
The reduction rate of the process can be improved by increasing the Ca/S ratio, which means
increased sorbent costs and auxiliary power demand. With sodium bicarbonate and high-spec
surface-hydrated lime sorbent utilisation, the reduction efficiency is however markedly higher
and the resulting residue quantities are lower. Lower sorbent consumption and reduced disposal
costs may offset the higher cost of the sorbent.
The by-product cannot always be reused, which causes more expenses to the operator.
Driving force for implementation
Reduction of SOX emissions.
Low investment and operational costs, low energy consumption, and a stable process.
No emissions to water from waste water treatment.
Higher SOX removal efficiency than in-bed sorbent injection for bubbling fluidised bed
boilers.
Example plants
Plant 125 (modified dry FGD).
Plants 69 and 168 (pilot DSI) combine a DSI with an ESP.
More example plants combining a DSI and a bag filter can be found in the graphs representing
well-performing plants in the fuel-specific sections.
Reference literature
[LCP BREF 2006] [ 18, CaO Hellas - GREECE 2011 ]
3.2.2.2.9 Use of sorbents in fluidised bed combustion systems
Description
Sorbents in fluidised bed combustion (FBC) systems are integrated desulphurisation systems
where sulphur reacts with the alkaline calcium or magnesium compounds injected into the bed.
Technical description
The burning temperature in a FBC system is favourable for sulphur to react with the calcium or
magnesium compounds added into the bed. This limits the combustion temperature to about
850–870 °C. The sorbent utilised is typically CaCO3-based limestone. The reaction needs a
surplus of sorbent with a stoichiometric ratio (fuel/adsorbent) of 1.5 to 7, depending on the fuel.
The sorbent is supplied into the combustion chamber constantly. Its quantity depends on many
factors such as the amount of sulphur in the fuel, the temperature of the boiler bed and the
WORKIN
G DRAFT IN
PROGRESS

Chapter 3
TL/JFF/FN/EIPPCB/LCP_Final Draft June 2016 181
physical and chemical characteristics of the limestone sand. The ideal temperature range for the
reaction is between 840 °C and 900 °C. The reaction products, calcium sulphate and unreacted
limestone, are removed, partly from the bed together with bed ash and partly from the
electrostatic precipitator or bag filter together with the fly ash. Higher Ca/S ratios are needed in
fluidised bed combustion than in wet scrubbing or spray towers for a high reduction of sulphur.
Higher degrees of desulphurisation are achieved in circulating fluidised bed combustion
(CFBC) boilers than in bubbling fluidised bed combustion (BFBC) boilers.
Achieved environmental benefits
Reduced SOX emissions to air.
Environmental performance and operational data
Even with very high Ca/S ratios, FBC cannot achieve as high reduction rates as wet scrubbing.
For coal and lignite, removal efficiencies as high as 80–95 % are possible in CFBC boilers with
moderate Ca/S ratios (i.e. between 1.5 and 3). When the fuel sulphur content increases, the Ca/S
ratio decreases slightly for a certain sulphur removal (e.g. 90 % removal). However, the actual
mass flow rate of limestone needed increases, as well as the amount of residues generated.
Hence, the current trend for CFBC boilers firing high-sulphur (4–6 % S) fuels is to combine a)
in situ sulphur capture by limestone in the furnace, and b) cold-end sulphur capture.
In BFBC boilers, the corresponding removal efficiency is between 55 % and 65 %, with a
similar quality of coal or lignite and with a similar quality and consumption of limestone. In
BFBC boilers burning only coal, additional end-of-pipe techniques are needed.
The in-furnace desulphurisation rate is voluntarily limited when combusting high-chlorine fuels,
in order to maintain the favourable effect the remaining SO2 in the flue-gas has on mitigating
the corrosion in the boiler backpass.
Cross-media effects
Increase in limestone sand consumption.
Increase in generated waste (desulphurisation products are contained in bottom ash and fly
ash).
Increase in electricity consumption and reduction of the combustion plant's energy
efficiency.
Technical considerations relevant to applicability
The presence of lime/limestone in the bed changes the bed composition and the softening
temperature. It is thus critical to fix the injection level according to the bed's operating
parameters to avoid issues with its behaviour.
For high-sulphur fuel, when this technique is not sufficient to reach the targeted SOX emission
level, downstream polishing FGD can be installed, typically duct sorbent injection or the
circulating fluidised bed process.
Economics
Use of this technique is limited to fluidised bed boilers but it represents an in situ FGD process
without significant investment.
Limestone sorbent is cheap but this technique requires a higher dosage than a wet scrubbing
system. In an example 1 GWth CFB coal-fired boiler, the cost of sorbent for a removal
efficiency of 93 % was about EUR 0.25 per MWth (fuel energy input) in 2011.
Driving force for implementation
Reduction of SOX emissions.
Low construction costs.
Lack of waste water from the system.
WORKIN
G DRAFT IN
PROGRESS

Chapter 3
182 June 2016 TL/JFF/FN/EIPPCB/LCP_Final Draft
Example plants
This technique is commonly used throughout Europe for reducing SOX emissions.
See Plants: coke-/coal-/lignite-firing plants: 489-1/2, 387, 19, 81, 390-1/5, 224, 156, 377 (all
CFB boilers) and 69 (BFB boiler); and peat-/biomass-/waste-firing plants: 42, 190, 539 (CFB
boilers) and 188 (BFB boiler).
Reference literature
[EIPPCB additional information Alstom document]
3.2.2.2.10 Furnace sorbent injection in pulverised combustion boilers
Description
Furnace sorbent injection consists of the direct injection of a dry sorbent into the gas stream of
the boiler furnace. The surface of these particles reacts with the SO2 in the flue-gas.
Technical description
Typical sorbents include pulverised limestone (CaCO3) and dolomite (CaCO3·MgCO3). If the
reagent is injected into the economiser area, hydrated lime is typically used. In the furnace, the
heat results in the calcination of the sorbent to produce reactive CaO particles. The surface of
these particles reacts with the SO2 in the flue-gas to form calcium sulphite (CaSO3) and calcium
sulphate (CaSO4) (see Figure 3.28). These reaction products are then captured along with the fly
ash by the dust control device, typically an ESP or bag filter. The SO2 capture process continues
into the precipitator and into the filter cake of the bag filter. Using a bag filter is preferable
because the reaction can continue with the unreacted sorbent deposited on the filter media.
When an ESP is used, it may be preferable to inject the sorbent into a reactor to guarantee a
sufficient contact time of a few seconds between the sorbent and the waste gas before the ESP.
Due to its ability to work at relatively high temperatures and to its very high efficiency with
regard to SO2 abatement, the dry sodium bicarbonate process may be used upstream of an SCR
system, without reheating the flue-gas before it enters the SCR system. This creates energy and
cost savings which may be significant.
Source: [New 148] [33, Ciemat, 2000]
Figure 3.28: Furnace sorbent injection
WORKIN
G DRAFT IN
PROGRESS

Chapter 3
TL/JFF/FN/EIPPCB/LCP_Final Draft June 2016 183
The SO2 removal occurs in the following two steps, as illustrated in Figure 3.29:
CaCO3 + heat CaO + CO2 or Ca(OH)2 + heat CaO + H2O
CaO + SO2 +½ O2 CaSO4 + heat
Source: [New 148] [33, Ciemat, 2000]
Figure 3.29: SO2 removal reactions in furnace sorbent injection
Furnace sorbent injection provides the added benefit of removing SO3.
The critical temperature range for the limestone reaction in furnace sorbent injection is 980–
1230 °C. Once a reactive lime (CaO) is produced, it must have sufficient time (at least half a
second) in the critical temperature range. Hydrated lime has two reaction windows: 980–
1230 °C and around 540 °C. As a consequence, it is possible to use hydrated lime as reagent
injected into the economiser region.
Thermochemically, CaSO4 is not stable at temperatures above 1260 °C in an environment
typical of high-sulphur fossil-fuel-fired combustion products, e.g. 2000–4000 ppm SO2 for
firing coal. The lower temperature limit for the formation of CaSO4 depends on complex
interactions between sulphation kinetics, crystal growth and sintering, and the build-up of a
barrier layer of CaSO4 on the surface of the reactive CaO.
Achieved environmental benefits
Reduced SOX emissions to air.
Environmental performance and operational data
WORKIN
G DRAFT IN
PROGRESS

Chapter 3
184 June 2016 TL/JFF/FN/EIPPCB/LCP_Final Draft
Table 3.16: Performance of the furnace sorbent injection technique for reducing sulphur oxide
emissions
Technique General SO2
reduction rate
Other performance parameters
Parameter Value
Furnace
sorbent
injection
30 – 50 %
70 – 80 % by
recycling the
reaction product
Operating temperature
98 – 1230 °C
(upper furnace)
540ºC (economiser)
Sorbent Limestone, hydrated lime,
dolomite
Reliability 99.9 %
Boiler efficiency drop 2 %
Energy consumption as % of
electric capacity 0.01–0.2 %
Residue Ca salt mixture
The efficiency of SO2 control is primarily a function of the Ca/S molar ratio, the sorbent type,
the degree of humidification, the additives available, the injection point and the boiler load.
The SOX removal efficiency and limestone utilisation efficiency are lower than with other FGD
systems. There are several measures to improve SOX removal efficiency at a low capital cost,
for instance by adding some devices to the furnace sorbent injection unit. The simplest measure
is to spray water into the duct before the precipitator. This results in an improvement in the SOX
removal efficiency of about 10 %. Furthermore, in order to make better use of the lime
generated in the furnace area, it is possible to design an additional absorber (e.g. CFB scrubber)
where the excess reagent will have a long enough residence time to further react with the flue-
gas stream. In this case, the total efficiency of the SO2 removal can reach 98 % (see Section
3.2.2.2.7).
Recycling the reaction product is an effective alternative and has been investigated in order to
improve the efficiency of both SO2 reduction and limestone utilisation. The reaction product
collected by the particulate control device (ESP or bag filter) is reinjected into the furnace or
duct and circulated several times. In some processes, it is recycled after conditioning. These
measures are expected to achieve 70–80 % SO2 removal efficiency.
Cross-media effects
The residues are disposed of, for example, as landfill, although careful control is needed
because they include active lime and calcium sulphite. Possible utilisation of these residues is
under investigation.
Ash handling and disposal are complications in furnace sorbent injection, mostly due to the
sheer quantity of the reaction products to be processed. Operating at a Ca/S molar ratio of 2.0
with coal with an ash content of 10 % almost triples the rate at which the ash must be collected
by the particulate control device and then transferred to the ash disposal site. Some retrofitted
plants require improvements to the ESP to accommodate such amounts.
Although many research projects are in progress to utilise the reaction product, most utilities
equipping a furnace with sorbent injection must have a specially prepared disposal site, in
contrast to wet scrubbers which produce a saleable by-product, i.e. gypsum.
The process itself is relatively simple and therefore requires less operation and maintenance.
The process produces a dry solid residue, which needs no further treatment before being
discharged to a landfill or being used as a construction material.
Furnace sorbent injection can cause slagging and fouling of heat exchangers, so soot blowing
may have to be increased.
WORKIN
G DRAFT IN
PROGRESS
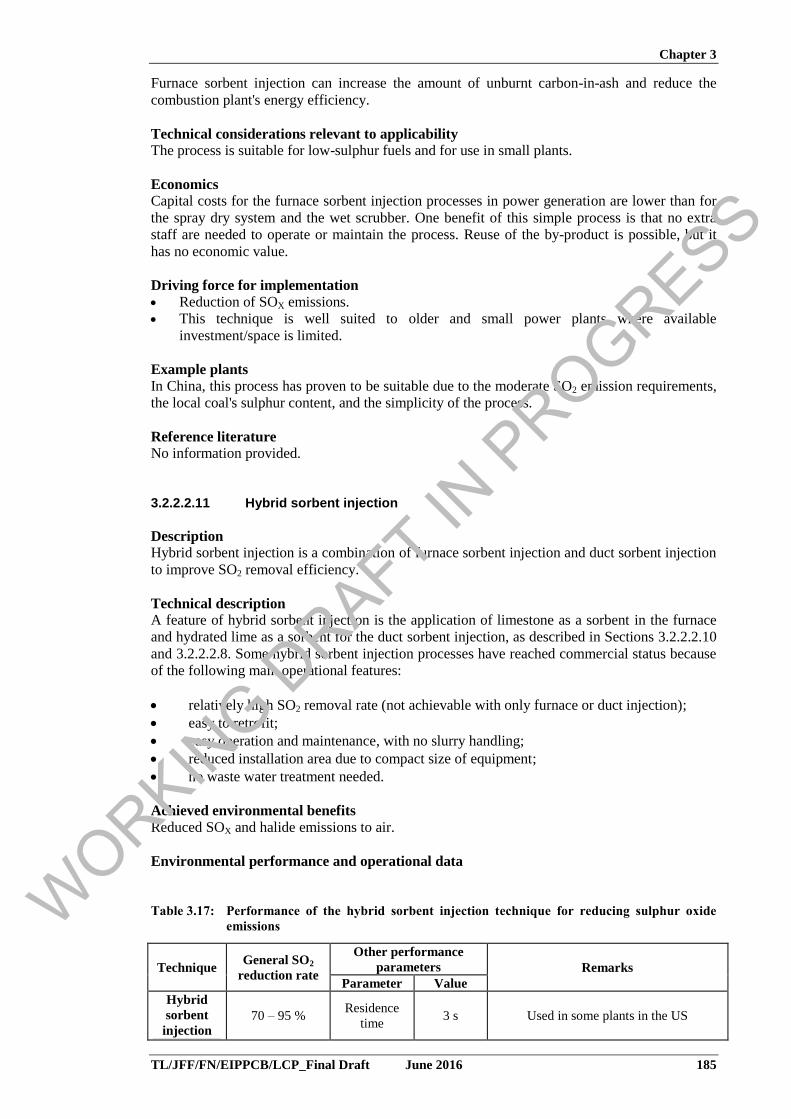
Chapter 3
TL/JFF/FN/EIPPCB/LCP_Final Draft June 2016 185
Furnace sorbent injection can increase the amount of unburnt carbon-in-ash and reduce the
combustion plant's energy efficiency.
Technical considerations relevant to applicability
The process is suitable for low-sulphur fuels and for use in small plants.
Economics
Capital costs for the furnace sorbent injection processes in power generation are lower than for
the spray dry system and the wet scrubber. One benefit of this simple process is that no extra
staff are needed to operate or maintain the process. Reuse of the by-product is possible, but it
has no economic value.
Driving force for implementation
Reduction of SOX emissions.
This technique is well suited to older and small power plants where available
investment/space is limited.
Example plants
In China, this process has proven to be suitable due to the moderate SO2 emission requirements,
the local coal's sulphur content, and the simplicity of the process.
Reference literature
No information provided.
3.2.2.2.11 Hybrid sorbent injection
Description
Hybrid sorbent injection is a combination of furnace sorbent injection and duct sorbent injection
to improve SO2 removal efficiency.
Technical description
A feature of hybrid sorbent injection is the application of limestone as a sorbent in the furnace
and hydrated lime as a sorbent for the duct sorbent injection, as described in Sections 3.2.2.2.10
and 3.2.2.2.8. Some hybrid sorbent injection processes have reached commercial status because
of the following main operational features:
relatively high SO2 removal rate (not achievable with only furnace or duct injection);
easy to retrofit;
easy operation and maintenance, with no slurry handling;
reduced installation area due to compact size of equipment;
no waste water treatment needed.
Achieved environmental benefits
Reduced SOX and halide emissions to air.
Environmental performance and operational data
Table 3.17: Performance of the hybrid sorbent injection technique for reducing sulphur oxide
emissions
Technique General SO2
reduction rate
Other performance
parameters Remarks
Parameter Value
Hybrid
sorbent
injection
70 – 95 % Residence
time 3 s Used in some plants in the US
WORKIN
G DRAFT IN
PROGRESS

Chapter 3
186 June 2016 TL/JFF/FN/EIPPCB/LCP_Final Draft
Cross-media effects
Influence of free lime on the combustion product (as described in Section 3.2.2.2.9 in the
case of non-recirculation.
Reduction of the combustion plant's energy efficiency.
Technical considerations relevant to applicability
This technique has great potential for older and smaller boilers to improve the reliability and
efficiency of SOX removal without appreciable additional capital costs or operational
difficulties, the improvements being based on a better understanding of the duct sorbent
injection process and spent sorbent recycling.
Economics
Limestone is cheaper than lime, which is generally used in spray dry scrubbers. The technique is
associated with low capital and operational costs.
Driving force for implementation
Reduction of SOX emissions.
No waste water generated.
Example plants
No information provided.
Reference literature
No information provided.
3.2.2.2.12 Magnesium oxide process
Description
The magnesium oxide process is a regenerable wet scrubbing process, which uses magnesium
hydroxide solution as sorbent.
Technical description
The technique is essentially the same as for the limestone wet scrubber except for the
regeneration step for the spent sorbent. HCl and HF in the flue-gas are removed in a pre-
scrubber, to avoid contamination of the magnesium salt after SO2 absorption. The flue-gas then
enters the scrubber, where the SO2 is absorbed by aqueous slurry of magnesium sulphate,
formed from the magnesium hydroxide sorbent:
MgSO3 + SO2 + H2O Mg(HSO3)2
Mg(HSO3)2 + Mg(OH)2 2MgSO3 + 2H2O
2MgSO3 + O2 2MgSO4
The reaction product, magnesium sulphite/sulphate, is bled continuously from the absorber and
dried in a dryer. The magnesium sulphite/sulphate is calcined at about 900 °C in the presence of
carbon, to regenerate magnesium oxide which is returned to the absorption system:
MgSO3 MgO + SO2
MgSO4 + C MgO + SO2 + CO
As a by-product, elemental sulphur, sulphuric acid or concentrated sulphur dioxide is obtained
in the process. These are saleable by-products, which can be sold to reduce overall operating
costs. Otherwise, regeneration of the magnesium oxide would require a large amount of thermal
energy.
WORKIN
G DRAFT IN
PROGRESS

Chapter 3
TL/JFF/FN/EIPPCB/LCP_Final Draft June 2016 187
Achieved environmental benefits
Reduced SOX emissions to air.
Environmental performance and operational data
No information provided.
Cross-media effects
No information provided.
Technical considerations relevant to applicability
No information provided.
Economics
No information provided.
Driving force for implementation
Reduction of SOX emissions.
Example plants
No information provided.
Reference literature
No information provided.
3.2.2.3 Techniques for the prevention and control of NOX emissions 3.2.2.3.1 Low excess air firing
Description
Reduction of the amount of oxygen available in the combustion zone to the minimum amount
needed for complete combustion and for minimising NOX generation. The technique is mainly
based on the minimisation of air leakages in the furnace, careful control of the air used for
combustion and a modified design of the furnace combustion chamber.
Technical description
Low excess air is a comparatively simple and easy-to-implement operational measure for the
reduction of nitrogen oxides emissions. By reducing the amount of oxygen available in the
combustion zone to the minimum amount needed for complete combustion, fuel-bound nitrogen
conversion and, to a lesser extent, thermal NOX formation are reduced. A considerable emission
reduction can be achieved with this technique, therefore it has been applied in many existing
large combustion installations. In general, new plants are equipped with extensive measuring
and control equipment that enables optimum adjustment of the combustion air supply.
No additional energy is required for low excess air firing (in fact less energy may be required as
air and flue-gas flows are reduced, which reduces fan power consumption and flue-gas heat
loss). If operated properly, no reduction in the availability of the power plant should result from
this primary emission reduction measure.
Another effect of this technique is that not only will NOX be reduced, but also SO3, which can
cause corrosion and fouling in the air preheater and the particulate control device.
Achieved environmental benefit
Reduced NOX, N2O and SO3 emissions to air.
WORKIN
G DRAFT IN
PROGRESS

Chapter 3
188 June 2016 TL/JFF/FN/EIPPCB/LCP_Final Draft
Environmental performance and operational data
The general NOX reduction rate is 10–44 %. NOX reduction strongly depends on the emission
level of the uncontrolled plant.
For existing old coal-fired boilers that have applied ‘low excess air’ as a primary measure, the
usual excess air is in the range of 5–7 % O2 (in the flue-gas). Newbuild low excess air
combustion systems are characterised by 3–4 % O2 (in the flue-gas). Also, residence time has
been identified as a key factor in the simultaneous control of NOX, CO and unburnt carbon. The
relationship between NOX, CO and excess air at various sections in a 150 MWe boiler is shown
in Figure 3.30.
Source: [108, Scott, 1997] [original source: EVT-Bericht 106/91, Reidick et al. See EPPSA comment 144]
Figure 3.30: The relationship between NOX, CO and excess air at various sections in a 150 MWe
lignite-fired boiler
Cross-media effects
As the oxygen level is reduced, combustion may become incomplete and the amount of unburnt
carbon-in-ash may increase.
Reducing the oxygen in the primary zones to very low amounts can also lead to high levels of
carbon monoxide. The result of these changes can be a reduction in the combustion plant's
efficiency, as well as slagging, corrosion and an overall adverse impact on the combustion
plant's performance.
WORKIN
G DRAFT IN
PROGRESS
Chapter 3
TL/JFF/FN/EIPPCB/LCP_Final Draft June 2016 189
These cross-media effects are usually overcome by implementing some form of overfire air
system as shown in Figure 3.30.
An additional cross-media effect is that the steam temperature may decrease.
Potential safety problems, which might result from the use of this technique without a strict
control system, include fires in air preheaters and ash hoppers, as well as increases in opacity
and in the rates of water-wall wastage.
Applicability considerations
Generally applicable to new and existing boilers, for all fuels.
Economics
This is a very inexpensive way of decreasing nitrogen oxide emissions.
Driving force for implementation
Reduction of NOX emissions.
Example plants
Plants 102 and 444.
Reference literature
No information provided.
3.2.2.3.2 Air staging
Description
Creation of several combustion zones in the combustion chamber with different oxygen contents
for reducing controlling NOX emissions and for ensuring an optimised complete combustion.
Technical description
NOX reduction by air staging is based on the creation of at least two divided combustion zones,
a primary combustion zone with a lack of oxygen and a secondary combustion zone with excess
oxygen in order to ensure complete burnout. Air staging reduces the amount of available oxygen
in the primary combustion zone as only part of the combustion air (the primary air) is supplied
to this zone. Primary air typically makes up 70–90 % of the total airflow for coal-fired boilers
and 40–60 % for biomass boilers. The substoichiometric conditions in the primary zone
suppress the conversion of fuel-bound nitrogen into NOX. Also, the formation of thermal NOX is
reduced to some extent by the resulting lower peak temperature. In the secondary zone, 10–
30 % (40–60 % in the case of biomass boilers) of the combustion air is injected above the
combustion zone. Combustion is completed at this increased flame volume. Hence, the
relatively low-temperature secondary stage limits the production of thermal NOX.
In boilers and furnaces, the following options exist for achieving air staging:
Biased burner firing (BBF): Biased burner firing is frequently used as a retrofit measure
at existing installations (only for vertical boilers), as it does not require a major alteration
of the combustion installation. The lower burners operate with excess fuel whereas upper
burners are supplied with excess air.
Burners out of service (BOOS): Since putting some burners out of service does not
require a major alteration of the combustion installation, this measure is frequently used
as a retrofit measure at existing vertical boilers. Here, the lower burners are operated
under fuel-rich conditions, whereas the upper burners are not in use, injecting only air.
The effect of this measure is similar to overfire air, but NOX emission reduction by BOOS
is not as efficient. Problems may arise with maintaining the fuel input because the same
amount of thermal energy has to be supplied to the furnace with fewer burners in
WORKIN
G DRAFT IN
PROGRESS
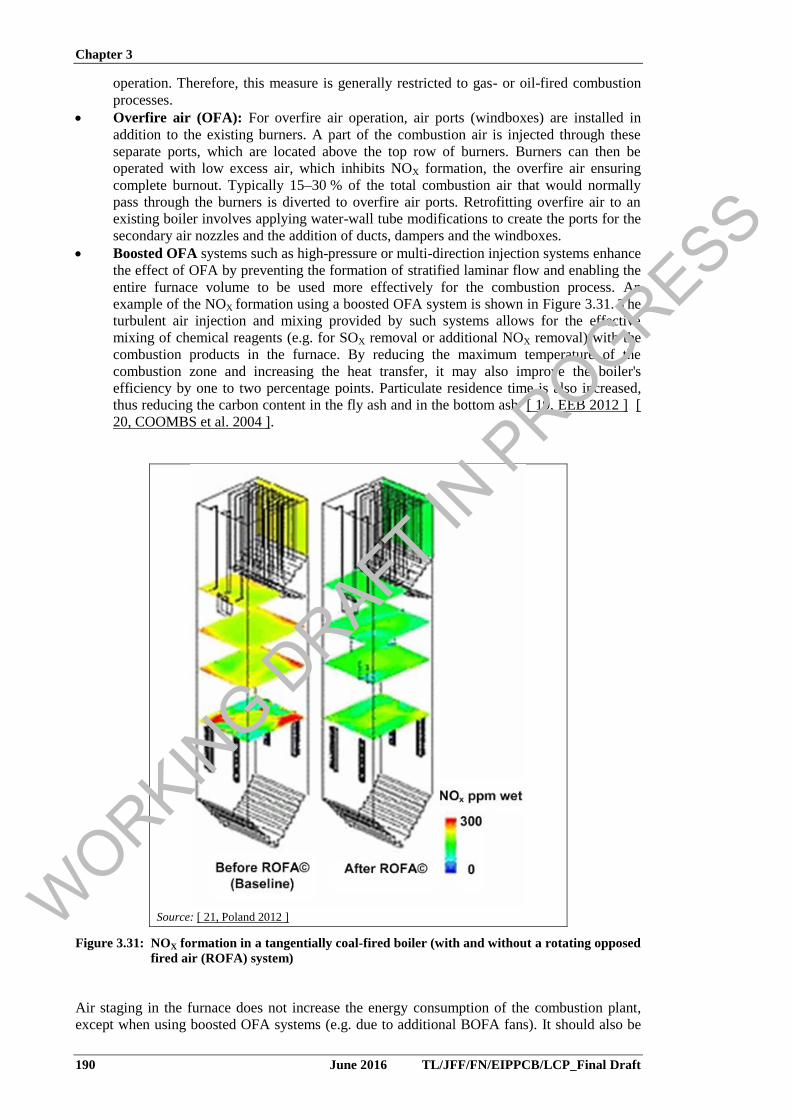
Chapter 3
190 June 2016 TL/JFF/FN/EIPPCB/LCP_Final Draft
operation. Therefore, this measure is generally restricted to gas- or oil-fired combustion
processes.
Overfire air (OFA): For overfire air operation, air ports (windboxes) are installed in
addition to the existing burners. A part of the combustion air is injected through these
separate ports, which are located above the top row of burners. Burners can then be
operated with low excess air, which inhibits NOX formation, the overfire air ensuring
complete burnout. Typically 15–30 % of the total combustion air that would normally
pass through the burners is diverted to overfire air ports. Retrofitting overfire air to an
existing boiler involves applying water-wall tube modifications to create the ports for the
secondary air nozzles and the addition of ducts, dampers and the windboxes.
Boosted OFA systems such as high-pressure or multi-direction injection systems enhance
the effect of OFA by preventing the formation of stratified laminar flow and enabling the
entire furnace volume to be used more effectively for the combustion process. An
example of the NOX formation using a boosted OFA system is shown in Figure 3.31. The
turbulent air injection and mixing provided by such systems allows for the effective
mixing of chemical reagents (e.g. for SOX removal or additional NOX removal) with the
combustion products in the furnace. By reducing the maximum temperature of the
combustion zone and increasing the heat transfer, it may also improve the boiler's
efficiency by one to two percentage points. Particulate residence time is also increased,
thus reducing the carbon content in the fly ash and in the bottom ash [ 19, EEB 2012 ] [
20, COOMBS et al. 2004 ].
Source: [ 21, Poland 2012 ]
Figure 3.31: NOX formation in a tangentially coal-fired boiler (with and without a rotating opposed
fired air (ROFA) system)
Air staging in the furnace does not increase the energy consumption of the combustion plant,
except when using boosted OFA systems (e.g. due to additional BOFA fans). It should also be
WORKIN
G DRAFT IN
PROGRESS
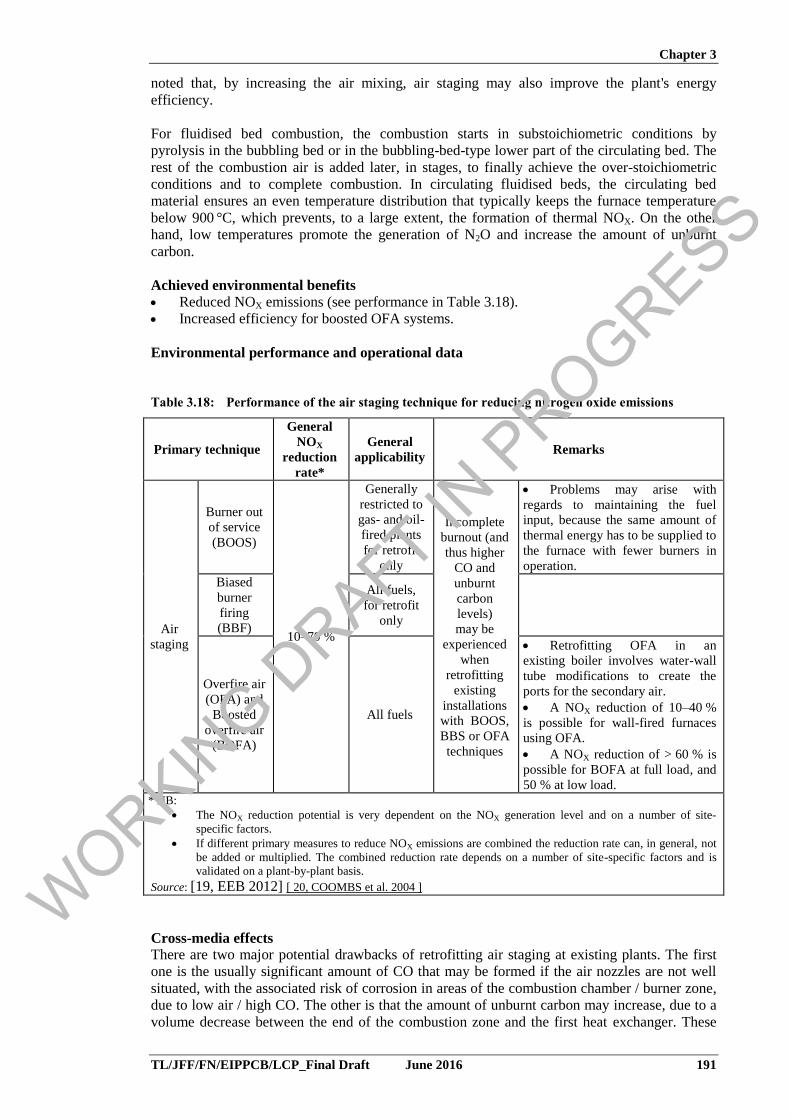
Chapter 3
TL/JFF/FN/EIPPCB/LCP_Final Draft June 2016 191
noted that, by increasing the air mixing, air staging may also improve the plant's energy
efficiency.
For fluidised bed combustion, the combustion starts in substoichiometric conditions by
pyrolysis in the bubbling bed or in the bubbling-bed-type lower part of the circulating bed. The
rest of the combustion air is added later, in stages, to finally achieve the over-stoichiometric
conditions and to complete combustion. In circulating fluidised beds, the circulating bed
material ensures an even temperature distribution that typically keeps the furnace temperature
below 900 °C, which prevents, to a large extent, the formation of thermal NOX. On the other
hand, low temperatures promote the generation of N2O and increase the amount of unburnt
carbon.
Achieved environmental benefits
Reduced NOX emissions (see performance in Table 3.18).
Increased efficiency for boosted OFA systems.
Environmental performance and operational data
Table 3.18: Performance of the air staging technique for reducing nitrogen oxide emissions
Primary technique
General
NOX
reduction
rate*
General
applicability Remarks
Air
staging
Burner out
of service
(BOOS)
10–70 %
Generally
restricted to
gas- and oil-
fired plants
for retrofit
only
Incomplete
burnout (and
thus higher
CO and
unburnt
carbon
levels)
may be
experienced
when
retrofitting
existing
installations
with BOOS,
BBS or OFA
techniques
Problems may arise with
regards to maintaining the fuel
input, because the same amount of
thermal energy has to be supplied to
the furnace with fewer burners in
operation.
Biased
burner
firing
(BBF)
All fuels,
for retrofit
only
Overfire air
(OFA) and
Boosted
overfire air
(BOFA)
All fuels
Retrofitting OFA in an
existing boiler involves water-wall
tube modifications to create the
ports for the secondary air.
A NOX reduction of 10–40 %
is possible for wall-fired furnaces
using OFA.
A NOX reduction of > 60 % is
possible for BOFA at full load, and
50 % at low load.
* NB:
The NOX reduction potential is very dependent on the NOX generation level and on a number of site-
specific factors.
If different primary measures to reduce NOX emissions are combined the reduction rate can, in general, not
be added or multiplied. The combined reduction rate depends on a number of site-specific factors and is
validated on a plant-by-plant basis.
Source: [19, EEB 2012] [ 20, COOMBS et al. 2004 ]
Cross-media effects
There are two major potential drawbacks of retrofitting air staging at existing plants. The first
one is the usually significant amount of CO that may be formed if the air nozzles are not well
situated, with the associated risk of corrosion in areas of the combustion chamber / burner zone,
due to low air / high CO. The other is that the amount of unburnt carbon may increase, due to a
volume decrease between the end of the combustion zone and the first heat exchanger. These
WORKIN
G DRAFT IN
PROGRESS
Chapter 3
192 June 2016 TL/JFF/FN/EIPPCB/LCP_Final Draft
drawbacks are limited in the case of boosted OFA systems, which enable intensive internal
recirculation of flue-gases between the different combustion zones.
Correctly designed OFA in new boilers will not result in high CO or high unburnt carbon.
[ 21, Poland 2012 ]
Air staging in the furnace may also increase the energy consumption of the combustion plant in
the case of boosted OFA which typically requires dedicated booster fans with the consequent
related power consumption.
Technical considerations relevant to applicability
The furnace height in old boilers is usually low and may prevent the installation of overfire air
(OFA) ports. Even if there is room for an OFA port, the residence time of the combustion gases
in the upper part of the furnace may not be long enough for complete combustion. Applying air
staging may thus require a reduction in unit capacity to allow the space for air staging. In boilers
built later when more was known about NOX formation, the furnace is usually larger and lower
NOX levels can thus be achieved. The best results are obtained when low-NOX combustion is
integrated into the boiler design.
Air staging is not applicable in gas turbines when there is not enough room for implementation.
Economics
This is a very inexpensive way of decreasing nitrogen oxide emissions. It is very often applied
with other primary measures such as low-NOX burners, so it is quite difficult to estimate the cost
effects of the air staging element alone. A rough estimate is that OFA costs are almost
EUR 1 million for a 250 MWth boiler, and the NOX reduction cost per tonne is typically
EUR 300–1000 [New 132] [32, Rentz, et al., 1999].
Driving force for implementation
Reduction of NOX emissions.
Example plants
About 160 plants that submitted a questionnaire in 2012 for the review of this document are
fitted with air staging.
See sections on coal, lignite and gaseous fuel combustion for further examples.
Reference literature
No information provided.
3.2.2.3.3 Flue-gas recirculation (FGR) or exhaust gas recirculation (EGR)
Description
Recirculation of part of the flue-gas to the combustion chamber to replace part of the fresh
combustion air, having the double effect of cooling the flame temperature and limiting the O2
content for nitrogen oxidation, thus limiting the NOX generation. It implies the supply of flue-
gas from the furnace into the flame to reduce the oxygen content and therefore the temperature
of the flame. The use of special burners or other provisions is based on the internal recirculation
of combustion gases which cool the root of the flames and reduce the oxygen content in the
hottest part of the flames.
Technical description
The recirculation of flue-gas results in the reduction of available oxygen in the combustion zone
and, as it directly cools the flame, in the decrease of the flame temperature: therefore, both fuel-
bound nitrogen conversion and thermal NOX formation are reduced. The recirculation of flue-
gas into the combustion air has proven to be a successful method for NOX abatement in high-
WORKIN
G DRAFT IN
PROGRESS
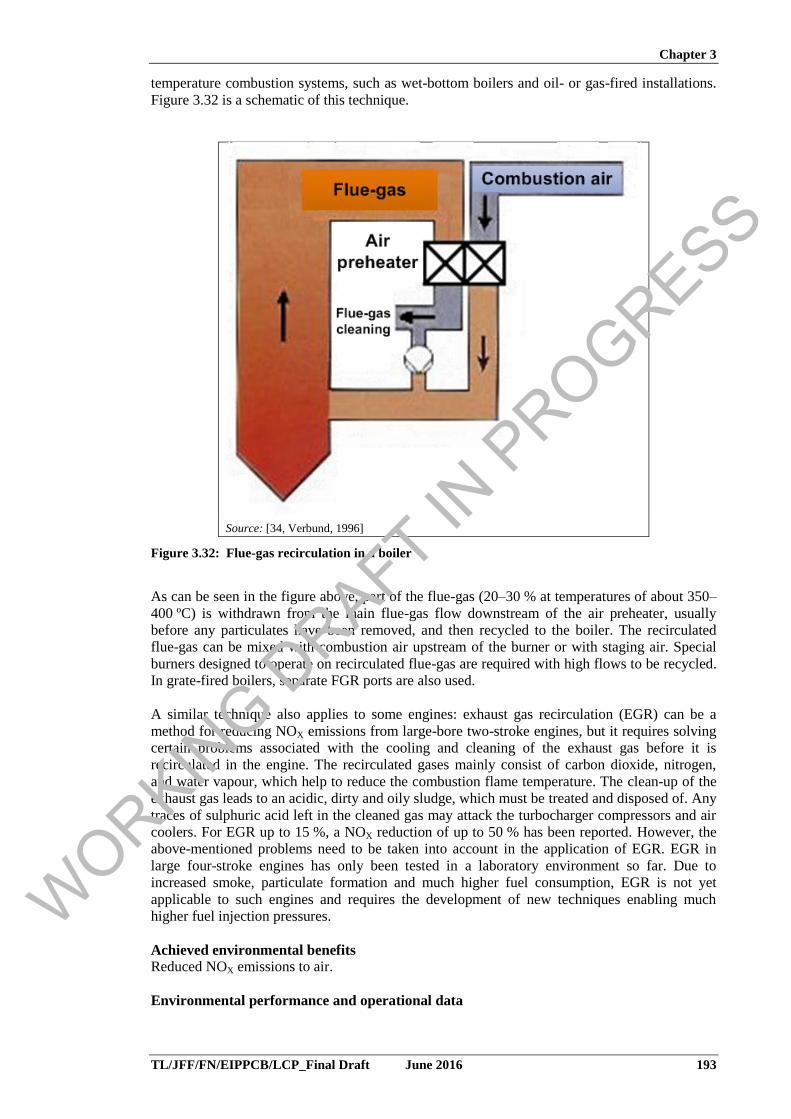
Chapter 3
TL/JFF/FN/EIPPCB/LCP_Final Draft June 2016 193
temperature combustion systems, such as wet-bottom boilers and oil- or gas-fired installations.
Figure 3.32 is a schematic of this technique.
Source: [34, Verbund, 1996]
Figure 3.32: Flue-gas recirculation in a boiler
As can be seen in the figure above, part of the flue-gas (20–30 % at temperatures of about 350–
400 ºC) is withdrawn from the main flue-gas flow downstream of the air preheater, usually
before any particulates have been removed, and then recycled to the boiler. The recirculated
flue-gas can be mixed with combustion air upstream of the burner or with staging air. Special
burners designed to operate on recirculated flue-gas are required with high flows to be recycled.
In grate-fired boilers, separate FGR ports are also used.
A similar technique also applies to some engines: exhaust gas recirculation (EGR) can be a
method for reducing NOX emissions from large-bore two-stroke engines, but it requires solving
certain problems associated with the cooling and cleaning of the exhaust gas before it is
recirculated in the engine. The recirculated gases mainly consist of carbon dioxide, nitrogen,
and water vapour, which help to reduce the combustion flame temperature. The clean-up of the
exhaust gas leads to an acidic, dirty and oily sludge, which must be treated and disposed of. Any
traces of sulphuric acid left in the cleaned gas may attack the turbocharger compressors and air
coolers. For EGR up to 15 %, a NOX reduction of up to 50 % has been reported. However, the
above-mentioned problems need to be taken into account in the application of EGR. EGR in
large four-stroke engines has only been tested in a laboratory environment so far. Due to
increased smoke, particulate formation and much higher fuel consumption, EGR is not yet
applicable to such engines and requires the development of new techniques enabling much
higher fuel injection pressures.
Achieved environmental benefits
Reduced NOX emissions to air.
Environmental performance and operational data
WORKIN
G DRAFT IN
PROGRESS
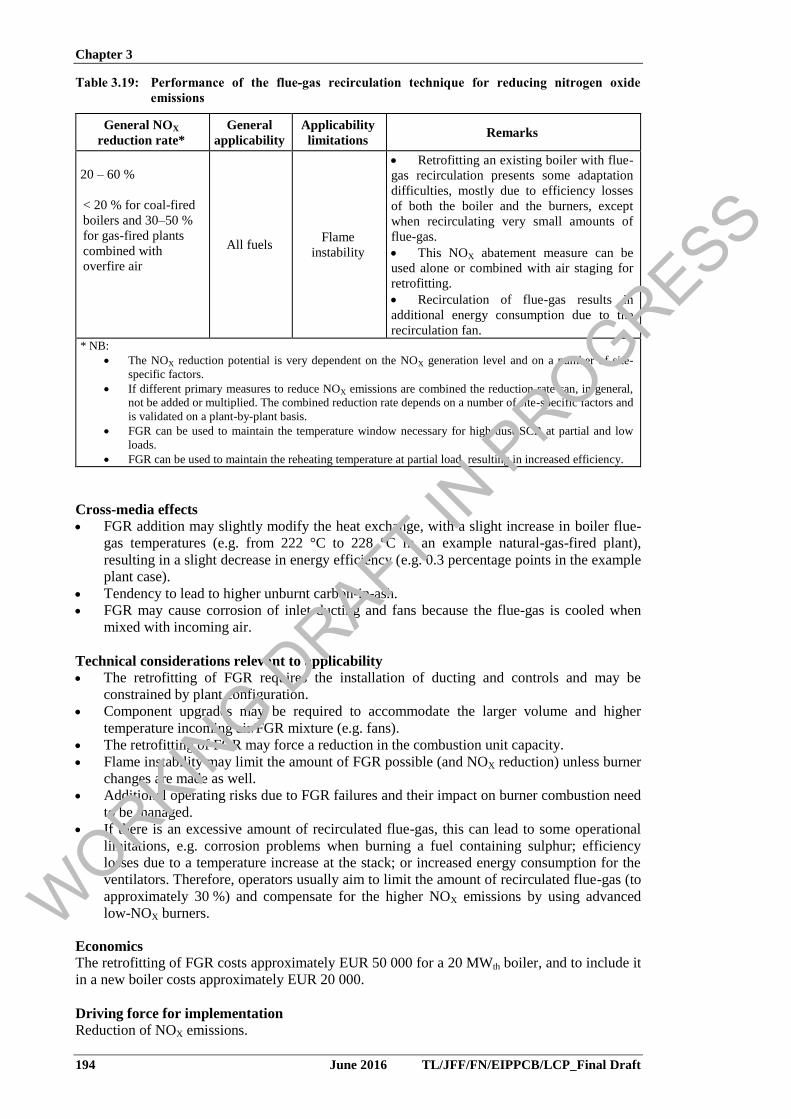
Chapter 3
194 June 2016 TL/JFF/FN/EIPPCB/LCP_Final Draft
Table 3.19: Performance of the flue-gas recirculation technique for reducing nitrogen oxide
emissions
General NOX
reduction rate*
General
applicability
Applicability
limitations Remarks
20 – 60 %
< 20 % for coal-fired
boilers and 30–50 %
for gas-fired plants
combined with
overfire air
All fuels Flame
instability
Retrofitting an existing boiler with flue-
gas recirculation presents some adaptation
difficulties, mostly due to efficiency losses
of both the boiler and the burners, except
when recirculating very small amounts of
flue-gas.
This NOX abatement measure can be
used alone or combined with air staging for
retrofitting.
Recirculation of flue-gas results in
additional energy consumption due to the
recirculation fan.
* NB:
The NOX reduction potential is very dependent on the NOX generation level and on a number of site-
specific factors.
If different primary measures to reduce NOX emissions are combined the reduction rate can, in general,
not be added or multiplied. The combined reduction rate depends on a number of site-specific factors and
is validated on a plant-by-plant basis.
FGR can be used to maintain the temperature window necessary for high-dust SCR at partial and low
loads.
FGR can be used to maintain the reheating temperature at partial load, resulting in increased efficiency.
Cross-media effects
FGR addition may slightly modify the heat exchange, with a slight increase in boiler flue-
gas temperatures (e.g. from 222 °C to 228 °C in an example natural-gas-fired plant),
resulting in a slight decrease in energy efficiency (e.g. 0.3 percentage points in the example
plant case).
Tendency to lead to higher unburnt carbon-in-ash.
FGR may cause corrosion of inlet ducting and fans because the flue-gas is cooled when
mixed with incoming air.
Technical considerations relevant to applicability
The retrofitting of FGR requires the installation of ducting and controls and may be
constrained by plant configuration.
Component upgrades may be required to accommodate the larger volume and higher
temperature incoming air/FGR mixture (e.g. fans).
The retrofitting of FGR may force a reduction in the combustion unit capacity.
Flame instability may limit the amount of FGR possible (and NOX reduction) unless burner
changes are made as well.
Additional operating risks due to FGR failures and their impact on burner combustion need
to be managed.
If there is an excessive amount of recirculated flue-gas, this can lead to some operational
limitations, e.g. corrosion problems when burning a fuel containing sulphur; efficiency
losses due to a temperature increase at the stack; or increased energy consumption for the
ventilators. Therefore, operators usually aim to limit the amount of recirculated flue-gas (to
approximately 30 %) and compensate for the higher NOX emissions by using advanced
low-NOX burners.
Economics
The retrofitting of FGR costs approximately EUR 50 000 for a 20 MWth boiler, and to include it
in a new boiler costs approximately EUR 20 000.
Driving force for implementation
Reduction of NOX emissions.
WORKIN
G DRAFT IN
PROGRESS

Chapter 3
TL/JFF/FN/EIPPCB/LCP_Final Draft June 2016 195
Example plants
About 100 plants that submitted a questionnaire in 2012 for the review of this document are
fitted with FGR.
Reference literature
No information provided.
3.2.2.3.4 Reduction of combustion air temperature
Description
Reduction of combustion air preheating to lower the combustion flame temperature and limit
the generation of thermal NOX.
Technical description
The combustion air preheat temperature has a significant impact on NOX formation, mainly for
gas- and oil-firing systems. For these fuels, the main part of NOX is caused by the thermal NO
mechanism, which depends on the combustion temperature. Reduction of the air preheat
temperature results in lower flame temperatures (peak temperatures) in the combustion zone.
Accordingly, a lower formation of thermal NOX results. For a small unit, removing the air
preheater may be the most justified action.
Achieved environmental benefit
Reduced NOX emissions.
Environmental performance and operational data
The general reduction rate is 20–30 %. The level of emission reduction achievable mainly
depends on the initial air preheat temperature and on the temperature that is achieved after this
measure has been implemented.
Cross-media effects
There are two major drawbacks of this technology. First, in several boilers, e.g. those burning
coal or wet biomass, high combustion temperatures are required and accordingly high air
preheat temperatures are essential for the proper functioning of the combustion installation.
Second, lowering the air preheat temperature results in higher fuel consumption, since a higher
portion of the thermal energy contained in the flue-gas cannot be utilised and ends up leaving
the plant via the stack. This can be counterbalanced by utilising certain energy conservation
methods, such as increasing the size of the economiser.
Technical considerations relevant to applicability
This technique is not suitable for coal-firing wet-bottom boilers and boilers firing wet biomass.
Economics
The cost of removing the combustion air preheater is plant-specific.
Osiris, the energy service company providing utilities in the Les Roches–Roussillon Chemical
Platform, calculated in 2012 that the cost of the retrofit of its 60 MWth natural-gas-fired boiler
would amount to EUR 3 300 000. This included:
removal of the rotary heat exchanger;
installation of a new energy recovery heat exchanger, with a sweep system for
emergency operation using fuel oil;
replacement of the combustion air fan as the air volume will be very different;
adaptation of the burners for operation at low temperature;
review of the settings of the burners;
installation of feed-water piping to supply the new economiser;
installation of steam piping for the sweeping of the economiser;
WORKIN
G DRAFT IN
PROGRESS

Chapter 3
196 June 2016 TL/JFF/FN/EIPPCB/LCP_Final Draft
update of the entire regulation system.
Driving force for implementation
Reduction of NOX emissions.
Example plants
No information provided.
Reference literature
[CEFIC info 05 on BATIS]
3.2.2.3.5 Low-NOX burners
Description
The technique (including ultra- or advanced- low-NOX burners) is based on the principles of
reducing peak flame temperatures; boiler burners are designed to delay but improve the
combustion and increase the length of the flames, allowing the heat radiated during combustion
to reduce peak temperatures. The air/fuel mixing reduces the availability of oxygen and reduces
the peak flame temperature, thus retarding the conversion of fuel-bound nitrogen to NOX and
the formation of thermal NOX, while maintaining high combustion efficiency. This may be
associated with a modified design of the furnace combustion chamber. The design of ultra-low-
NOX burners (ULNBs) includes combustion staging (air/fuel) and firebox gases' recirculation
(internal flue-gas recirculation).
Technical description
Low-NOX burners have reached a mature stage of development, but further improvements are
ongoing and a considerable amount of research work is still devoted to the enhancement of
existing low-NOX burner systems. Since design details of low-NOX burners differ significantly
from manufacturer to manufacturer, only the general principle is referred to here.
In a classical combustion installation, the combined fuel and air/oxygen mix is entirely injected
at the same place. The resulting flame is then composed of a hot and oxidising primary zone
located at the flame root and a colder secondary zone located at the flame end. The primary
zone generates most of the NO, which increases exponentially with temperature, whereas the
contribution of the secondary zone is rather modest.
Low-NOX burners (LNBs) modify the means of introducing air and fuel to delay the mixing,
reduce the availability of oxygen, and reduce the peak flame temperature.
According to the different principles to reduce the formation of NOX, low-NOX burners have
been developed as air-staged burners, flue-gas recirculation burners and fuel-staged burners.
Air-staged low-NOX burners
In the air-staging process, the primary air is mixed with the total quantity of fuel, producing a
fuel-rich flame, which is both relatively cool and deficient in oxygen; in these conditions the
formation of nitrogen oxides is inhibited. The fuel-air mixture and the secondary air as shown in
Figure 3.33 create a substoichiometric combustion zone (primary flame). An internal
recirculation zone is created due to the swirl of the secondary air and the conical opening of the
burner, which heats up the fuel rapidly. The swirl of the secondary flame is necessary for flame
stability. The volatile compounds are freed in the primary flame, together with the majority of
the nitrogen compounds. By operating a fuel-rich / air-lean mixture with a high concentration of
CO, the oxidation of the nitrogen compounds to NO is limited. With the secondary air, a
burnout zone is created, in which a slow combustion of the unburnt fuel takes place at relatively
low temperatures. The low O2 concentration provides for NOX control at this stage.
WORKIN
G DRAFT IN
PROGRESS
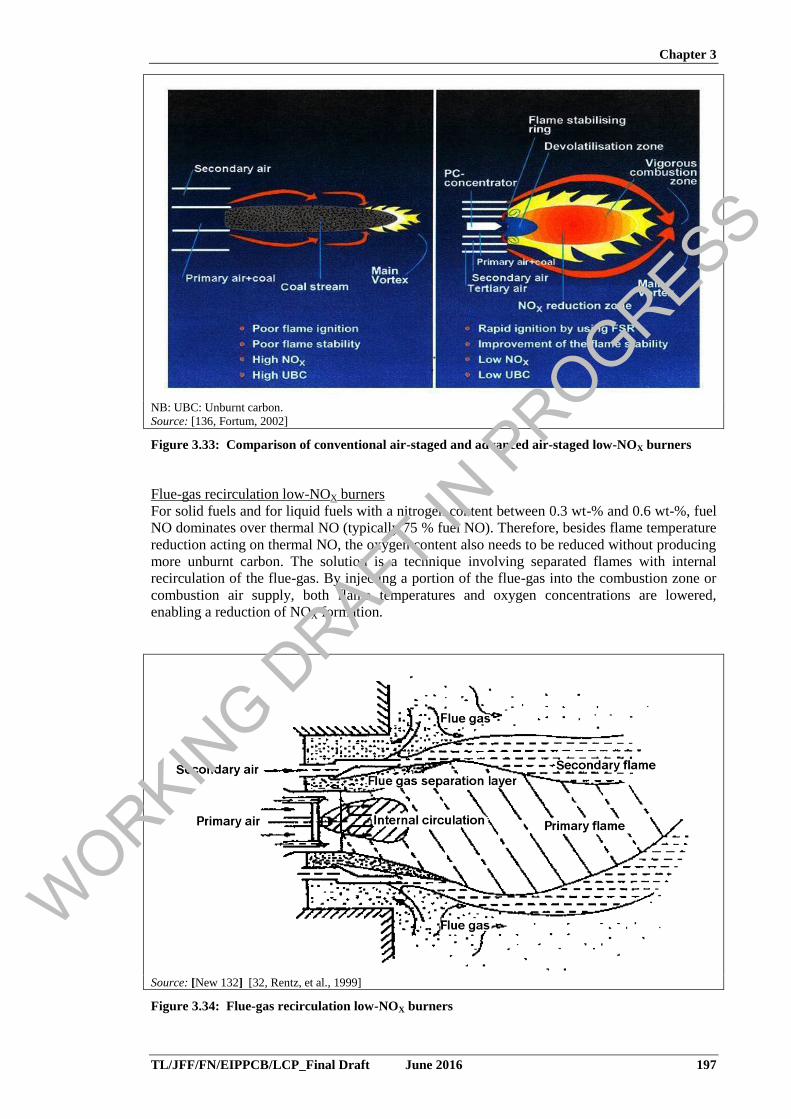
Chapter 3
TL/JFF/FN/EIPPCB/LCP_Final Draft June 2016 197
NB: UBC: Unburnt carbon.
Source: [136, Fortum, 2002]
Figure 3.33: Comparison of conventional air-staged and advanced air-staged low-NOX burners
Flue-gas recirculation low-NOX burners
For solid fuels and for liquid fuels with a nitrogen content between 0.3 wt-% and 0.6 wt-%, fuel
NO dominates over thermal NO (typically 75 % fuel NO). Therefore, besides flame temperature
reduction acting on thermal NO, the oxygen content also needs to be reduced without producing
more unburnt carbon. The solution is a technique involving separated flames with internal
recirculation of the flue-gas. By injecting a portion of the flue-gas into the combustion zone or
combustion air supply, both flame temperatures and oxygen concentrations are lowered,
enabling a reduction of NOX formation.
Source: [New 132] [32, Rentz, et al., 1999]
Figure 3.34: Flue-gas recirculation low-NOX burners
WORKIN
G DRAFT IN
PROGRESS

Chapter 3
198 June 2016 TL/JFF/FN/EIPPCB/LCP_Final Draft
The basic function is similar to that of the air-staged low-NOX burner, but the distances between
primary and secondary nozzles are larger, therefore a flue-gas layer develops. In these burners,
15–25 % of the hot flue-gas is internally recirculated, along with the combustion air, into the
burnout air. The flue-gas acts as a diluent, reducing the flame temperature and partial pressure
of oxygen, thus reducing NOX formation. Internal recirculation is generally operated in liquid
fuel firing and in the latest generation of combined gas and oil LNBs.
Fuel-staged low-NOX burners
The fuel-staged burner aims to reduce the NOX already formed by the addition of part of the fuel
in a second stage. Fuel-staged LNBs are mostly used for gas applications.
This technique begins with combustion of a portion of the fuel with high excess air, making
relatively low flame temperatures possible, which inhibit the formation of nitrogen oxides. The
internal recirculation zone and the near-stoichiometric combustion ensure flame stability. As the
combustion nears completion in the primary zone, additional fuel (optimum ratio between 20 %
and 30 %) is injected downstream of the primary flame to form the secondary flame, which is
extremely substoichiometric. An atmosphere is created in which the NOX already formed can be
reduced to N2 by NH3, HCN, and CO radicals. The burnout zone is formed in a third stage. The
flame of this type of burner is about 50 % longer than that of a standard gas burner.
Source: [New 132] [32, Rentz, et al., 1999]
Figure 3.35: Fuel staging at the burner
New generation of low-NOX burners
The most recent designs of LNBs (called ‘hybrid low-NOX burners’ or 'ultra-low-NOX burners')
use a combination of air staging, fuel staging and internal flue-gas recirculation along with new
techniques in order to enable ultra-low NOX emissions. Variable split fuel staging is also
employed or the use of lean premix combustion in the case of gas burners. A drawback of first-
generation low-NOX burners is the need for sufficient room to allow the flame separation: the
diameter of low-NOX flames is about 30–50 % larger than that of classical flames. Compared
WORKIN
G DRAFT IN
PROGRESS
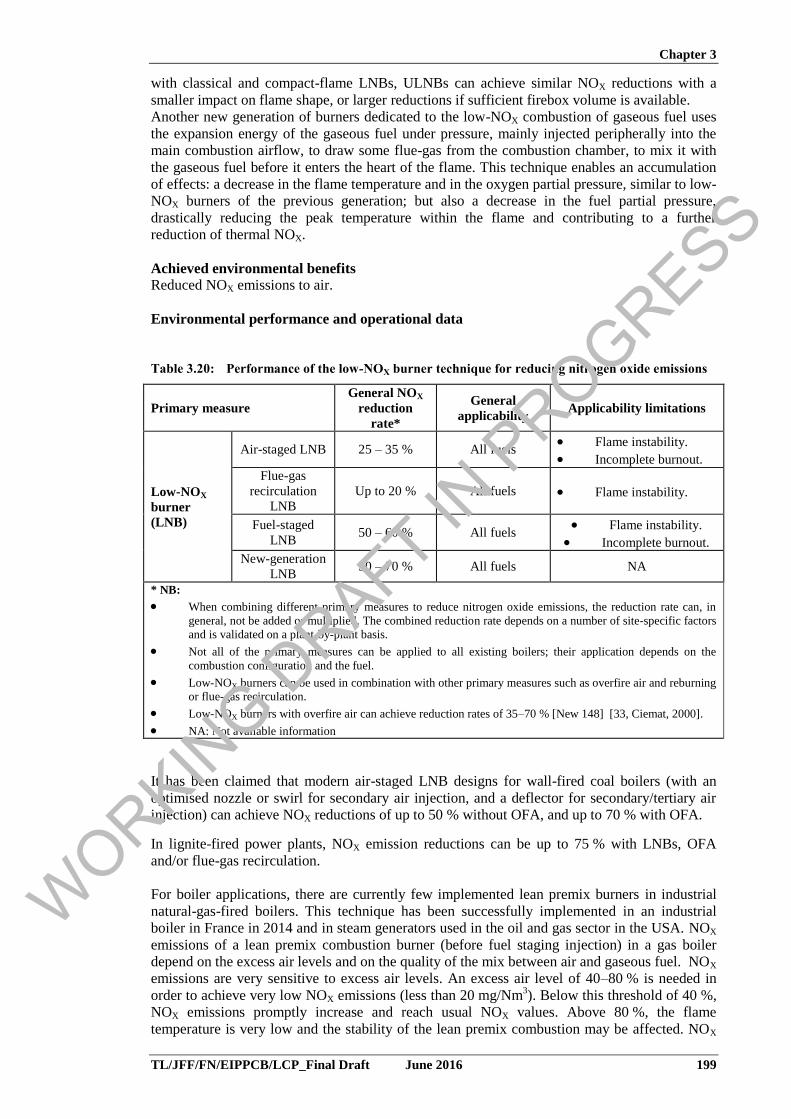
Chapter 3
TL/JFF/FN/EIPPCB/LCP_Final Draft June 2016 199
with classical and compact-flame LNBs, ULNBs can achieve similar NOX reductions with a
smaller impact on flame shape, or larger reductions if sufficient firebox volume is available.
Another new generation of burners dedicated to the low-NOX combustion of gaseous fuel uses
the expansion energy of the gaseous fuel under pressure, mainly injected peripherally into the
main combustion airflow, to draw some flue-gas from the combustion chamber, to mix it with
the gaseous fuel before it enters the heart of the flame. This technique enables an accumulation
of effects: a decrease in the flame temperature and in the oxygen partial pressure, similar to low-
NOX burners of the previous generation; but also a decrease in the fuel partial pressure,
drastically reducing the peak temperature within the flame and contributing to a further
reduction of thermal NOX.
Achieved environmental benefits
Reduced NOX emissions to air.
Environmental performance and operational data
Table 3.20: Performance of the low-NOX burner technique for reducing nitrogen oxide emissions
Primary measure
General NOX
reduction
rate*
General
applicability Applicability limitations
Low-NOX
burner
(LNB)
Air-staged LNB 25 – 35 % All fuels Flame instability.
Incomplete burnout.
Flue-gas
recirculation
LNB
Up to 20 % All fuels Flame instability.
Fuel-staged
LNB 50 – 60 % All fuels
Flame instability.
Incomplete burnout.
New-generation
LNB 50 – 70 % All fuels NA
* NB:
When combining different primary measures to reduce nitrogen oxide emissions, the reduction rate can, in
general, not be added or multiplied. The combined reduction rate depends on a number of site-specific factors
and is validated on a plant-by-plant basis.
Not all of the primary measures can be applied to all existing boilers; their application depends on the
combustion configuration and the fuel.
Low-NOX burners can be used in combination with other primary measures such as overfire air and reburning
or flue-gas recirculation.
Low-NOX burners with overfire air can achieve reduction rates of 35–70 % [New 148] [33, Ciemat, 2000].
NA: Not available information
It has been claimed that modern air-staged LNB designs for wall-fired coal boilers (with an
optimised nozzle or swirl for secondary air injection, and a deflector for secondary/tertiary air
injection) can achieve NOX reductions of up to 50 % without OFA, and up to 70 % with OFA.
In lignite-fired power plants, NOX emission reductions can be up to 75 % with LNBs, OFA
and/or flue-gas recirculation.
For boiler applications, there are currently few implemented lean premix burners in industrial
natural-gas-fired boilers. This technique has been successfully implemented in an industrial
boiler in France in 2014 and in steam generators used in the oil and gas sector in the USA. NOX
emissions of a lean premix combustion burner (before fuel staging injection) in a gas boiler
depend on the excess air levels and on the quality of the mix between air and gaseous fuel. NOX
emissions are very sensitive to excess air levels. An excess air level of 40–80 % is needed in
order to achieve very low NOX emissions (less than 20 mg/Nm3). Below this threshold of 40 %,
NOX emissions promptly increase and reach usual NOX values. Above 80 %, the flame
temperature is very low and the stability of the lean premix combustion may be affected. NOX
WORKIN
G DRAFT IN
PROGRESS
Chapter 3
200 June 2016 TL/JFF/FN/EIPPCB/LCP_Final Draft
levels below 50 mg/Nm3 are generally achieved with this technique. Tests carried out at a
demonstration-scale application have shown that NOX emission levels around 20–30 mg/Nm3
(at 3 % O2) are achievable when a lean premix burner is used in conjunction with external flue-
gas recirculation, at the expense of higher capex and opex.
Cross-media effects
As the pressure drop in air ducts increases in comparison with standard burners, it may result in
operational expenses. Coal pulverisation, for instance, must usually be improved, and that may
lead to higher operating and maintenance costs. There could also be some corrosion problems or
impacts on equipment safety and reliability due to lack of combustion stability, especially if the
process is not properly controlled.
There is no measurable effect of LNBs on the energy efficiency, waste gas temperatures and
steam production, in the case of natural-gas-fired plants.
The implementation of low-NOX burners may increase the level of carbon-in-ash, which should
be kept within a set limit so as not to jeopardise the management of these combustion residues.
The addition of classifiers to the coal mills, which improves the fineness of the pulverised coal,
is an efficient way to counterbalance this problem. Modern coal LNBs are efficiently designed
not to influence the carbon-in-ash level.
Low-NOX burners may also increase CO generation due to cooler, larger flames. This
generation will increase at low loads.
Technical considerations relevant to applicability
For the application of advanced low-NOX burners to existing boilers, it should be noted that in
older installations the furnaces will usually have been built as small as possible (designed for
high combustion intensity). Therefore, the furnace temperature, and thus the NOX generation,
can only be reduced to a limited extent. In addition, the furnace depth may only accommodate
slightly longer flames than it was originally designed for.
The applicability of lean premix burners for gas boilers with preheated air (> 150 °C) or process
gases with a high hydrogen content or variable compositions is not yet demonstrated.
Economics
The low-NOX burning technique requires, as a minimum, the burners to be changed and, often,
installation of an overfire air (OFA) system. If the existing burners are classical burners, then
changing the burners can almost always be done very cost-effectively. If the burners are
delayed-combustion low-NOX burners (old type), the benefits of retrofitting them into rapid-
injection low-NOX burners can be assessed only on a case-by-case basis.
Low-NOX burners with OFA for a 250 MWth solid fuel boiler cost approximately
EUR 1.7 million. In coal-fired boilers, the cost of NOX reduction is around EUR 500 per tonne
of NOX reduced.
For new installations, the additional investment for a low-NOX burner compared to a classical
burner can be considered negligible. For retrofits, possible modifications to the installation have
to be taken into account, which are very often plant-specific and thus not quantifiable in general
terms. The supplementary operating costs required to operate low-NOX burners are, to a large
extent, due to the additional energy consumption, which is necessary due to:
the need for larger fans, as larger pressure drops occur across the burners;
the need to ensure improved coal pulverisation, in order to attain efficient combustion
under the reduced air conditions experienced in the burners.
Driving force for implementation
WORKIN
G DRAFT IN
PROGRESS
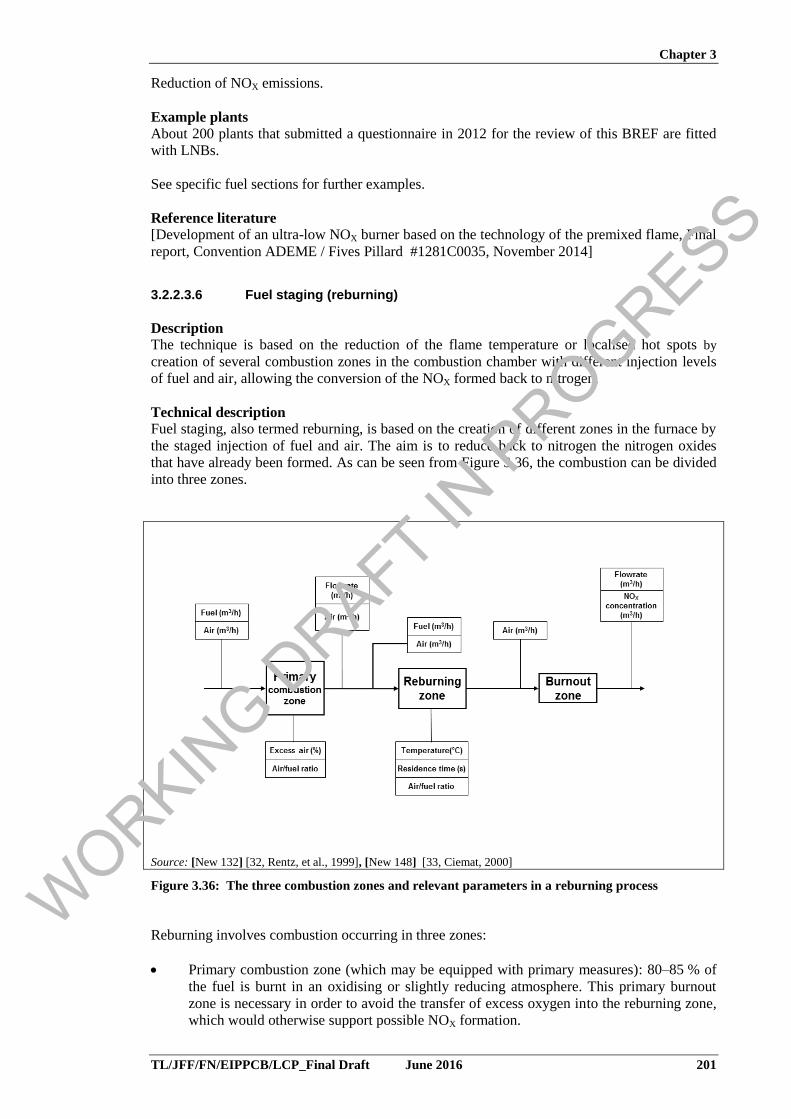
Chapter 3
TL/JFF/FN/EIPPCB/LCP_Final Draft June 2016 201
Reduction of NOX emissions.
Example plants
About 200 plants that submitted a questionnaire in 2012 for the review of this BREF are fitted
with LNBs.
See specific fuel sections for further examples.
Reference literature
[Development of an ultra-low NOX burner based on the technology of the premixed flame, Final
report, Convention ADEME / Fives Pillard #1281C0035, November 2014]
3.2.2.3.6 Fuel staging (reburning)
Description
The technique is based on the reduction of the flame temperature or localised hot spots by
creation of several combustion zones in the combustion chamber with different injection levels
of fuel and air, allowing the conversion of the NOX formed back to nitrogen.
Technical description
Fuel staging, also termed reburning, is based on the creation of different zones in the furnace by
the staged injection of fuel and air. The aim is to reduce back to nitrogen the nitrogen oxides
that have already been formed. As can be seen from Figure 3.36, the combustion can be divided
into three zones.
Source: [New 132] [32, Rentz, et al., 1999], [New 148] [33, Ciemat, 2000]
Figure 3.36: The three combustion zones and relevant parameters in a reburning process
Reburning involves combustion occurring in three zones:
Primary combustion zone (which may be equipped with primary measures): 80–85 % of
the fuel is burnt in an oxidising or slightly reducing atmosphere. This primary burnout
zone is necessary in order to avoid the transfer of excess oxygen into the reburning zone,
which would otherwise support possible NOX formation.
WORKIN
G DRAFT IN
PROGRESS
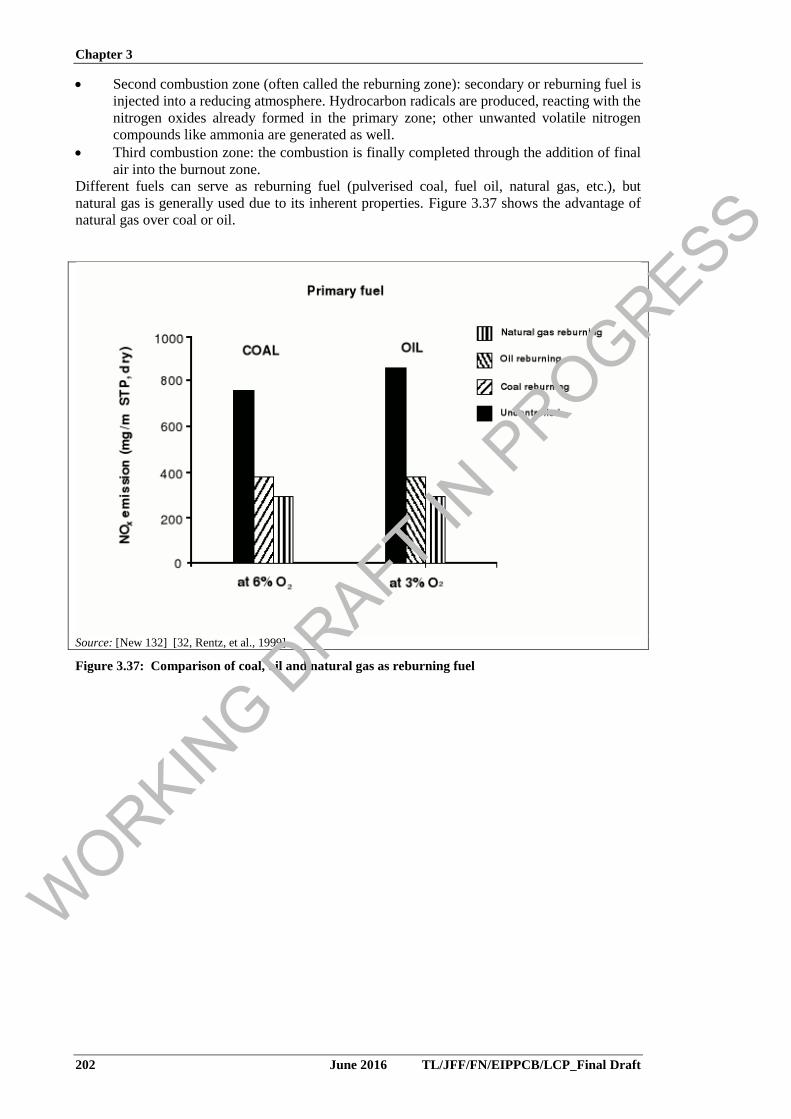
Chapter 3
202 June 2016 TL/JFF/FN/EIPPCB/LCP_Final Draft
Second combustion zone (often called the reburning zone): secondary or reburning fuel is
injected into a reducing atmosphere. Hydrocarbon radicals are produced, reacting with the
nitrogen oxides already formed in the primary zone; other unwanted volatile nitrogen
compounds like ammonia are generated as well.
Third combustion zone: the combustion is finally completed through the addition of final
air into the burnout zone.
Different fuels can serve as reburning fuel (pulverised coal, fuel oil, natural gas, etc.), but
natural gas is generally used due to its inherent properties. Figure 3.37 shows the advantage of
natural gas over coal or oil.
Source: [New 132] [32, Rentz, et al., 1999]
Figure 3.37: Comparison of coal, oil and natural gas as reburning fuel
WORKIN
G DRAFT IN
PROGRESS
Chapter 3
TL/JFF/FN/EIPPCB/LCP_Final Draft June 2016 203
Achieved environmental benefits
Reduced NOX and CO emissions to air.
Environmental performance and operational data
Table 3.21: Performance of the fuel staging (reburning) technique for reducing nitrogen oxide
emissions
General NOX
reduction rate*
General
applicability Remarks
50 – 60 %
(70 – 80 % of the
NOX formed in the
primary
combustion zone
can be reduced)
All fuels
Reburning offers some advantages, such as compatibility
with other primary NOX emission reduction measures,
simple installation of the technique, use of a standard fuel
as the reducing agent, and very small amounts of
additional energy. The additional energy consumption by
reburning 'coal over coal' can be higher than using natural
gas as a reburning fuel.
Combustion downstream of the primary zone also
produces nitrogen oxides.
When using natural gas as the reburning fuel, dust and SO2
are also reduced in direct proportion to the amount of coal
replaced. CO2 is reduced in proportion to the amount of
carbon replaced with hydrogen (in methane).
* NB:
The NOX reduction potential is very dependent on the NOX generation level and on a number of site-
specific factors.
If different primary measures to reduce NOX emissions are combined the reduction rate can, in general,
not be added or multiplied. The combined reduction rate depends on a number of site-specific factors and
is validated on a plant-by-plant basis.
The efficiency rate of reburning depends on several parameters, including the following:
Temperature: to obtain low NOX values, the temperature in the reburning zone should be
as high as possible (1200 °C). Figure 3.38 shows the denitrification rate as a function of
the reburning rate at different temperatures.
Residence time: increasing the residence time in the reburning zone favours NOX
reduction. An appropriate time is between 0.4 seconds and 1.5 seconds.
Aeration rate in the reburning zone: the stoichiometry should be in the range = 0.7–0.9.
Fuel type.
Quality of the mixing of the additional fuel and the flue-gas generated by the primary
combustion zone. Natural gas usually enables homogeneous combustion, resulting in a
very short residence time for burnout.
Excess air in the primary combustion zone: the stoichiometry is approximately = 1.1.
WORKIN
G DRAFT IN
PROGRESS

Chapter 3
204 June 2016 TL/JFF/FN/EIPPCB/LCP_Final Draft
Source: [New 132] [32, Rentz, et al., 1999]
Figure 3.38: Denitrification rate as a function of the reburning rate
Cross-media effects
When using coal or oil as reburning fuel, nitrogen is present in a certain quantity, leading
inevitably to NOX formation in the burnout zone. This drawback can be reduced or avoided by
using natural gas.
Technical considerations relevant to applicability
In principle, the reburning technique can be implemented in all types of fossil-fuel-fired boilers
and in combination with low-NOX combustion techniques (for the primary fuel). In practice,
reburning is not commonly used in existing utility boilers firing liquid or gaseous fuels as
primary fuels. This abatement technique, while very attractive for new boilers, necessitates large
chamber volumes if high amounts of unburnt carbon are to be avoided. Therefore, reburning
may be less appropriate for retrofits, due to possible space constraints in existing installations.
The retrofit may be less efficient in the case of smaller plants than in larger plants.
As mentioned earlier, major problems are caused by incomplete combustion. This measure best
suits boilers that have a long enough residence time and where proper reburning of fuel is
available at a reasonable price. Natural gas has proven to be the best reburning fuel, mostly
because it is easily flammable and does not contain particles or sulphur.
Coal over coal reburning requires an ultrafine pulverising system and associated milling plant,
cyclones and classifiers to achieve this fineness.
Economics
The costs of reburning depend on the structure of the boiler and on the fuel used. The use of
auxiliary fuel, such as natural gas, also incurs costs but, on the other hand, it releases heat to the
process and can therefore be considered a usable fuel. So the calculations should be made for
the whole power plant economy, including possible changes, e.g. in the boiler efficiency.
Experience shows that reburning is not as cost-effective as low-NOX burners with OFA, but it is
still an appropriate measure for reducing NOX emissions. One estimate gives reburning costs as
close to EUR 2.5 million for a 250 MWth boiler. The operating costs for reburning have also
been calculated as twice as high as the costs for low-NOX burners with OFA.
WORKIN
G DRAFT IN
PROGRESS

Chapter 3
TL/JFF/FN/EIPPCB/LCP_Final Draft June 2016 205
Driving force for implementation
Reduction of NOX emissions.
Example plants
Reburning has been installed at large power plants in the US, Japan, the Netherlands, Germany,
Italy and the UK. In Italy, reburning (with oil as a reducing agent) has been implemented
successfully in many large oil-fired units.
Reference literature
No information provided.
3.2.2.3.7 Dry low-NOX burners (DLN)
Description
Gas turbine burners that include the premixing of the air and fuel before entering the
combustion zone. By mixing air and fuel before combustion, a homogeneous temperature
distribution and a lower flame temperature are achieved, resulting in lower NOX emissions.
DLN is a generic name commonly used throughout the industry to represent a range of similar
technologies (DLN, DLE, SoLoNOX, etc.).
Technical description
The basic characteristic of dry low-NOX burners (see Figure 3.39) is that the mixing of the air
and fuel and the combustion both take place in two successive steps. Lean premix systems are
more dependent on the precision engineering than conventional diffusion flame systems as they
require a careful balance to minimise both NOX and CO emissions. By mixing combustion air
and fuel before combustion, a homogeneous temperature distribution and a lower flame
temperature are achieved, resulting in lower NOX emissions. A turbine includes between 30 and
75 premixers.
The primary burner DLN system has the following basic components: fuel/air injection system,
premixing zone, and flame stabilisation zone. The fuel/air injection system is designed to
promote rapid and uniform distribution of the fuel into the air using multiple (small) fuel
injection points. The mixing zone is designed to allow sufficient time to promote uniform
mixing and the aerodynamics of the flame. The stabilisation zone is designed to prevent flame
propagation into the mixing zone, known as flashback, which can cause severe damage to the
combustor.
Low-load flame stabilisation in the primary burners is achieved by use of a diffusion pilot
system that places the fuel directly in the flame stabilisation zone. This creates high localised
temperatures, so that the flame is not extinguished but leads to an increase in NOX when
compared with premix operation. Low-load operation therefore tends to generate increased NOX
levels. At the same time, CO emissions increase in the transitional time taken to reach the
minimum stable generation level, since the additional air causes quenching of the flame, which
results in a lower combustion efficiency. There may be a deterioration of performance observed
over time due to changes in air leakage paths within the turbine, for example. Thus the system
operates in distinct combustion modes to allow operation from start-up to baseload at minimum
NOX emission levels over the full operating range of the gas turbine.
DLN providers are still increasing the efficiency of the technique by means of slight
improvements, such as a special axial swirler which provides a better pilot gas/air distribution to
enhance the fuel/air mixing and therefore to reduce flame temperature peaks, in order to reduce
NOX emissions; or new technology that extends the gas/air premix, typically only in the main
burner, but also innovatively in the pilot burner.
WORKIN
G DRAFT IN
PROGRESS
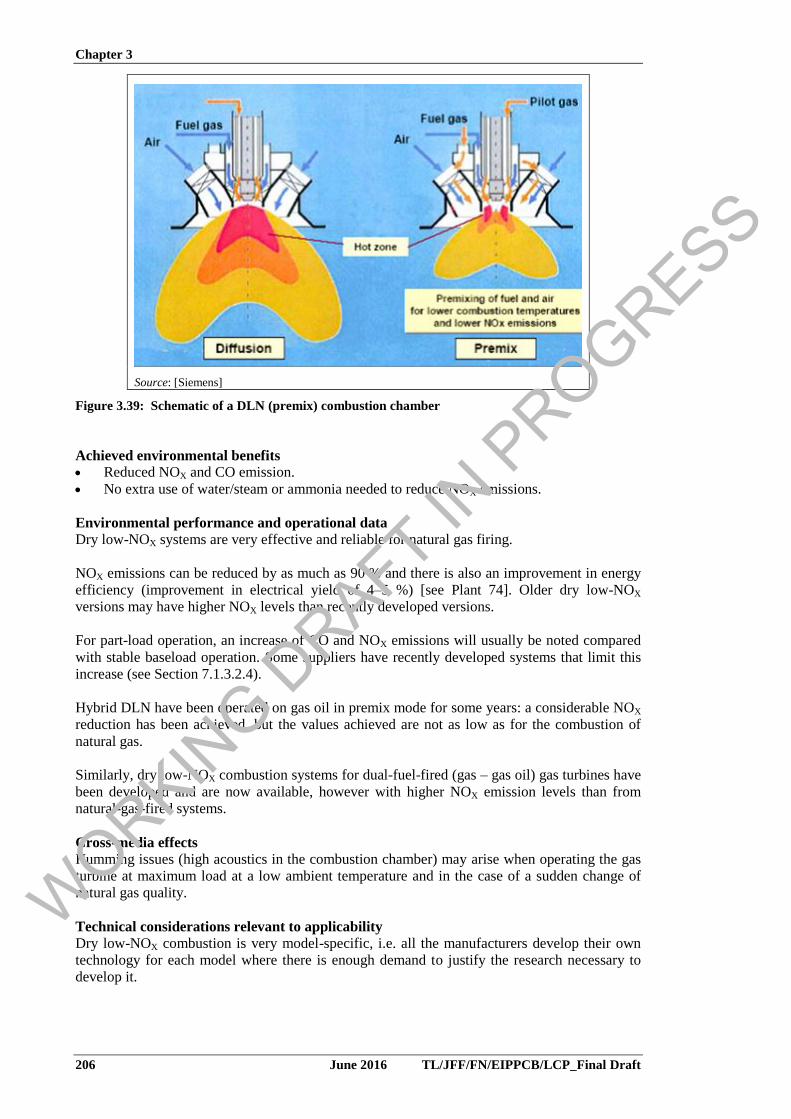
Chapter 3
206 June 2016 TL/JFF/FN/EIPPCB/LCP_Final Draft
Source: [Siemens]
Figure 3.39: Schematic of a DLN (premix) combustion chamber
Achieved environmental benefits
Reduced NOX and CO emission.
No extra use of water/steam or ammonia needed to reduce NOX emissions.
Environmental performance and operational data
Dry low-NOX systems are very effective and reliable for natural gas firing.
NOX emissions can be reduced by as much as 90 % and there is also an improvement in energy
efficiency (improvement in electrical yield of 4–5 %) [see Plant 74]. Older dry low-NOX
versions may have higher NOX levels than recently developed versions.
For part-load operation, an increase of CO and NOX emissions will usually be noted compared
with stable baseload operation. Some suppliers have recently developed systems that limit this
increase (see Section 7.1.3.2.4).
Hybrid DLN have been operated on gas oil in premix mode for some years: a considerable NOX
reduction has been achieved, but the values achieved are not as low as for the combustion of
natural gas.
Similarly, dry low-NOX combustion systems for dual-fuel-fired (gas – gas oil) gas turbines have
been developed and are now available, however with higher NOX emission levels than from
natural-gas-fired systems.
Cross-media effects
Humming issues (high acoustics in the combustion chamber) may arise when operating the gas
turbine at maximum load at a low ambient temperature and in the case of a sudden change of
natural gas quality.
Technical considerations relevant to applicability
Dry low-NOX combustion is very model-specific, i.e. all the manufacturers develop their own
technology for each model where there is enough demand to justify the research necessary to
develop it.
WORKIN
G DRAFT IN
PROGRESS
Chapter 3
TL/JFF/FN/EIPPCB/LCP_Final Draft June 2016 207
Thus DLN are applicable for all new natural-gas-fired turbines (single- or dual-fuel-fired), and
for most existing turbines as a retrofit package. For older models or models with low demand
for the technology, they may not be available.
Retrofitting the DLN technique in existing gas turbines with steam/water injection may not
always be technically feasible.
Further developments are necessary for gas turbines utilising fuel oils as, in these turbine
operations, not only does premixing of the air and fuel have to be carried out before combustion,
but so does evaporation of the liquid fuel. As the particle size has an impact on the evaporation
velocity, current research is focusing on developing more efficient atomiser systems.
Economics
The cost of DLN to be retrofitted can vary dramatically for the same size turbine offered by
different manufacturers. As an example, the incremental cost of a DLN combustor for a new gas
turbine from manufacturer A (5.2 MW) was approximately EUR 180 000, whereas the
incremental cost for a similar DLN combustor from manufacturer B (5.1 MW) was EUR
20 000. The cost discrepancy is related to performance capabilities, design complexity and
reliability/maintenance factors. Investment costs for retrofitting can be estimated as EUR 20–
40/kWe. Retrofits cost approximately from EUR 2 million to EUR 4 million for a 140 MWth gas
turbine for a modern dry low-NOX burner, depending on the original/final situations and on the
type of plant/retrofit, and the operation and maintenance cost is approximately EUR 500 000 per
year. Due to their high efficiency, new burners are very economical to operate, especially as
there are no great losses of energy from fuel losses, or in the form of hydrocarbons, etc. The
investment costs are approximately 15 % higher and maintenance costs about 40 % higher than
non-DLE gas turbines.
For new plants, it can be assumed that dry low-NOX combustors are nowadays no more
expensive than the former conventional combustors. Therefore, for new installations, the
additional costs for using dry low-NOX combustors can be considered negligible. A capex of
EUR 2.5 million has been reported for a newly built 700 MWth CCGT.
Due to the reduced heat load, the hot gas path components have a longer lifetime than when wet
emission controls are used, (e.g. a six-year lifespan compared with an approximate five-year
lifespan with a wet system in a reported example plant), resulting in a reduction in maintenance
costs.
Driving force for implementation
Low emission levels of NOX and CO.
Example plants
Today, almost all gas turbines in industrial use are equipped with dry low-NOX systems.
Reference literature
[New 132] [32, Rentz, et al., 1999], [44, Austrian Ministry of Environment, 2000], [182, OSEC,
1999].
3.2.2.3.8 Low-NOX combustion concept in engines
Description
The technique consists of a combination of internal engine modifications, e.g. combustion and
fuel injection optimisation (the very late fuel injection timing in combination with early inlet air
valve closing), turbocharging or Miller cycle.
Technical description
Retarding the start of the injection to reduce the firing pressure is a simple way of reducing NOX
emissions. It reduces the peak combustion temperature level and, in response, the combustion
WORKIN
G DRAFT IN
PROGRESS

Chapter 3
208 June 2016 TL/JFF/FN/EIPPCB/LCP_Final Draft
process progressively moves into the expansion process. In the injection retard method, the
burning temperature peak is lowered. Initially, the drawback of this method was the increased
specific fuel consumption, so, in order to re-establish low fuel consumption, the compression
ratio of the engine was increased as a countermeasure, resulting in lower NOX emissions and no
penalty in terms of fuel consumption.
Very late fuel injection timing in combination with a high compression ratio requires a
sophisticated modification of the injection rate, as well as costly development of a new
combustion chamber shape design. Sophisticated fuel injection equipment is consequently a key
element in this technique. The continuing technological development of the diesel components
has made it possible to further optimise the diesel cycle with the ‘Miller concept’,
corresponding to an early inlet valve closing. In this concept, some components have been
further developed, such as the turbocharger, fuel injection pumps, fuel injection nozzles and the
camshaft. Today the 'Miller concept' is a standard application for big four-stroke diesel
engines. Several Miller steps have been introduced since the first generation of low-NOX
systems at the end of 1990s. The bottleneck for implementation of the next generation has been
the turbochargers; considerable development efforts were needed on these and subsequent
proper testing before commercial introduction in different engine configurations. The Miller
concept is an inbuilt concept for big engines and has enabled compliance with the current
minimum global emission ruling for international projects [World Bank IFC EHS Guidelines].
Achieved environmental benefits
Reduced NOX emissions to air.
Environmental performance and operational data
By implementing the low-NOX combustion concept in combination with the Miller concept,
NOX emissions have been reduced by up to about 40 % in today’s engines compared to the same
engine type at the beginning of 1990s, whilst maintaining high efficiency. Feedback from the
industry on the Miller concept implementation suggests a typical NOX reduction closer to 30 %,
which is strongly dependent on the type of engine and on the performance of the
turbocompressor.
For a modern engine, the NOX reduction achieved by retarding the start of the injection might be
around 10 % (applicability dependent on engine type) but, due to the increased fuel
consumption, this technique is rarely used as the sole measure.
Cross-media effects
With late fuel injection timing, some negative side effects are still reported: an increase in both
unburnt hydrocarbons and solid particulate emissions, an increase in the fuel consumption (1 %
for every 4 – 5 % of NOX reduced) and in the CO2 emissions.
Technical considerations relevant to applicability
No information provided.
Economics
No information provided.
Driving force for implementation
Reduction of NOX emissions.
Example plants
No information provided.
Reference literature
No information provided.
WORKIN
G DRAFT IN
PROGRESS
Chapter 3
TL/JFF/FN/EIPPCB/LCP_Final Draft June 2016 209
3.2.2.3.9 Lean-burn concept
Description
The control of the peak flame temperature through lean-burn conditions is the primary
combustion approach to limiting NOX formation in gas engines. Lean-burn combustion
decreases the fuel to air ratio in the zones where NOX is generated, so that the peak flame
temperature is lower than the stoichiometric adiabatic flame temperature, therefore reducing
thermal NOX formation.
Technical description
Among natural gas engine options, lean-burn natural gas engines generate the lowest NOX
emissions directly from the engine. It is called 'advanced' when the system is tuned to achieve
NOX levels below 100 mg/Nm3 (15 % O2). The latter is possible with a spark plug or other
ignited-type engine but not for the low-pressure gas dual fuel-type engines.
Diesel engines produce higher combustion temperatures and more NOX than lean-burn gas
engines, even though the overall diesel engine air to fuel ratio may be very lean. There are three
reasons for this: (1) heterogeneous near-stoichiometric combustion, (2) the higher adiabatic
flame temperature of distillate fuel, and (3) fuel-bound nitrogen. The diesel fuel is atomised as it
is injected and dispersed in the combustion chamber. Combustion largely occurs at near-
stoichiometric conditions at the air droplet and air fuel vapour interfaces, resulting in maximum
temperatures and higher NOX. In contrast, lean premixed homogeneous combustion used in
lean-burn gas engines results in lower combustion temperatures and lower NOX production.
For any engine, there are generally trade-offs between low NOX emissions and high efficiency.
There are also trade-offs between low NOX emissions and emissions of the products of
incomplete combustion (CO and unburnt hydrocarbons). There are three main approaches to
these trade-offs that come into play depending on regulations and economics. One approach is
to aim for the lowest NOX emissions, accepting a fuel efficiency penalty and possibly higher CO
and hydrocarbon emissions. A second option is finding an optimal balance between emissions
and efficiency. A third option is to design for the highest efficiency and use post-combustion
exhaust treatment.
Control of the combustion temperature has been the principal focus of combustion process
control in gas engines. Combustion control requires trade-offs: high temperatures favour
complete burnout of the fuel and low residual hydrocarbons and CO, but promote NOX
formation. Lean-burn combustion dilutes the combustion process and reduces combustion
temperatures and NOX formation, and allows a higher compression ratio or peak firing
pressures, resulting in higher efficiency. However, if the mixture is too lean, misfiring and
incomplete combustion occur, increasing CO and VOC emissions.
Achieved environmental benefits
Reduced NOX emissions to air.
Environmental performance and operational data
Most lean-burn engines use turbocharging to supply excess air to the engine and produce the
homogeneous lean fuel-air mixtures. Lean-burn engines generally use around 100 % excess air
(over-stoichiometric). Typical NOX emission concentrations for lean-burn natural gas engines
are between 90 mg/Nm3 and 380 mg/Nm
3.
SG natural-gas-fired lean-burn engines used in 'optimised' gas mode (lowest fuel consumption,
lowest unburnt emissions, high flue-gas temperature) achieve NOX levels of 190 mg/Nm3 at
15 % O2, and lean-burn DF engines achieve levels of 380 mg/Nm3 at 15 % O2. SG engines and
DF engines (in gas mode) can be tuned to achieve NOX levels of respectively 95 mg/Nm3 and
190 mg/Nm3, with a higher fuel consumption and a lower flue-gas temperature as a
consequence. Recently commissioned lean-burn SG engines (30–40 MWth) in Italy, also fitted
with SCR, achieve yearly average NOX concentrations of 28 mg/Nm3. Furthermore, gas engines
WORKIN
G DRAFT IN
PROGRESS

Chapter 3
210 June 2016 TL/JFF/FN/EIPPCB/LCP_Final Draft
that reported data for the review of this document monitor their NOX and CO emissions
continuously.
An added performance advantage of lean-burn operation is the higher output and higher
efficiency if the mixture is not too lean. Optimised lean-burn operation requires sophisticated
engine controls to ensure that the combustion remains stable and that NOX reduction is
maximised, while minimising emissions of CO and VOCs.
Cross-media effects
Table 3.22 shows data for a large lean-burn natural gas engine that illustrates the trade-offs
between control of NOX emissions and efficiency. At the lowest achievable NOX levels (45–
50 ppmv), almost 1.5 percentage points are lost compared to full rated efficiency.
Table 3.22: Trade-offs between control of NOX emissions and efficiency
Engine characteristic * Low NOX High efficiency
Capacity (MW) 5.2 5.2
Speed (rpm) 720 720
Efficiency, LHV (present) 40.7 42.0
Emissions:
NOX (gm/KWh) 0.7 1.4
(ppmv at 15 % O2) 46 92
CO (gm/KWh) 3.2 2.0
(ppmv at 15 % O2) 361 227
NMHC (gm/KWh) 0.9 0.6
(ppmv at 15 % O2) 61 39
* Based on engine manufacturer’s data – Wartsila 18V34SG pre-chamber lean-burn SG-type gas engine.
NB:
NMHC: Non-methane hydrocarbons
Source: [New 144] [45, Eurovent, 1998]
A SG-type engine can be tuned to achieve NOX emissions of 100 mg/Nm3 (15 % O2), but this
will incur higher fuel consumption and corresponding higher CO2 emissions, as well as higher
CO, NMVOC and formaldehyde emissions.
Technical considerations relevant to applicability
Applicable to new plants.
Further developments to try to further decrease the NOX emissions based on this principle
(called 'advanced lean-burn') showed NOX reduction improvements but not yet for dual fuel
(DF) engines. The flame front is less developed in SG engines (no pilot fuel injection) compared
to DF engines (injection of pilot fuel) so, as a consequence, an SG engine can be more highly
tuned for low NOX than a DF engine. If an SG engine is tuned to burn too leanly, misfiring
might occur and other emissions such as CO and HC might increase, fuel consumption may
increase and the flue-gas temperature could drop (detrimental for CHP).
Economics
No information.
Driving force
Reduction of NOX emissions.
WORKIN
G DRAFT IN
PROGRESS

Chapter 3
TL/JFF/FN/EIPPCB/LCP_Final Draft June 2016 211
Example plants
Plants 353 and 354.
Reference literature
[ 22, US-EPA 2008 ] [ 23, Finland 2012 ]
3.2.2.3.10 Water/steam addition
Description
Water or steam is used as a diluent for reducing the combustion temperature in combustion
plants and the thermal NOX formation, either by being premixed with the fuel prior to its
combustion (fuel emulsion, humidification or saturation) or directly injected in the combustion
chamber (water/steam injection).
Technical description
Water/steam addition can be performed either by the injection of a mixture of fuel and water or
steam, or by the injection of water or steam through nozzles directly into the combustion
chamber of gas turbines, engines or boilers. The evaporation or superheating of steam requires
thermal energy, which is then not available to heat the flame. Thus, the flame temperature
decreases and NOX formation is also reduced.
Use in gas turbines
As can be seen from Figure 3.40, the emission reduction rate strongly depends on the amount of
water or steam used. In order to reach high emission reduction rates, large amounts of water or
steam are necessary; sometimes the amount of water or steam injected is higher than the amount
of fuel burnt. A higher emission reduction rate can be achieved with water than with steam (for
a given water/steam to fuel ratio), which can be explained by the fact that more energy is
required to evaporate the water (in practice, approximately twice as much steam is necessary to
achieve the same NOX emission reduction). The steam or water needs to be injected at high
pressures, usually 20 bar or greater.
A special variant of steam injection for gas turbines is the 'Cheng Cycle', described in
Section 3.2.3.3, which has the dual environmental benefit of NOX reduction and higher
efficiency.
Use in engines
In combustion engines, direct water injection may be applied as an alternative to emulsified
fuels. Depending on the engine type, up to about 40–50 % NOX reduction is achievable. Direct
water injection can only be applied in some liquid-fuel-fired engine types; this technique is used
in some shipping installations only. The fuel consumption increases and the amount of water
needed depends on the NOX reduction rate. This method requires greater modifications to the
engine design, due to the need for an additional water injection system and supervision of this
system. The amount of water that can be injected is independent of the fuel injection pumps,
allowing larger quantities of water to be injected. Corrosion can occur on cylinder heads and
pistons, thus increasing maintenance needs.
Injection of a fuel-water emulsion in engines: NOX reductions can be achieved by adding fresh
water to the fuel and emulsifying the mixture before supplying it to the engine. The fuel-water
emulsion is injected through the existing injection pump. The quantity of water injected depends
on the operating conditions. A programmed control unit manages the mixing procedure. This
method brings the water to exactly where it is needed and optimises the amount of water
injected. This amount is limited by the capacity of the engine’s injection device. The inert gas
effect of the water in the combustion chamber lowers the combustion temperature, which then
reduces NOX generation and the thermal load of the components in the exhaust gas flow. The
associated fuel consumption penalty ranges up to a 1 % increase for each 10 % of the water
injection (related to the fuel consumption). Different sources ([VGB Kraftwerkstechnik 70
WORKIN
G DRAFT IN
PROGRESS

Chapter 3
212 June 2016 TL/JFF/FN/EIPPCB/LCP_Final Draft
(1990)], [LCP BREF 2006]) report achievable NOX emission reductions of 20 % and up to 60 %
depending also on the water to oil ratio. This solution might also influence the remaining
harmful components in the diesel exhaust gas; reductions in unburnt emissions such as CO and
HC have been reported when operating on gas oil using this method. The quality of the
emulsion is important as vapour bubbles in the heavy fuel being reheated can damage the
injection system.
Humid air injection in engines: Humid air injection mainly consists of a heat exchanger and
humidification cell, which can possibly replace the intercooler in engines. Air which is
relatively hot and dry is fed into the unit, where the water partly evaporates, reducing the
scavenging air temperature. The air fed to the cylinder is nearly saturated in water vapour: the
quantity of water absorbed by the engine is controlled by the scavenging air temperature, which
depends mainly on the water temperature. With this method, a water quantity of about twice the
corresponding fuel consumption can be absorbed by the engine. The use of seawater instead of
treated water for such devices has been reported without negative effect, as regards the plant
reliability. This point is particularly interesting for plants located in coastal areas, as the
operating cost of such a system is reduced. According to experiences of using humid air
injection in engines in France, the maintenance costs decrease, the combustion chambers are
cleaner and the lubricating oil consumption decreases as well. A NOX emission reduction of
70 % has been reported for a medium-speed engine, but a range from 60 % up to 65 % is more
common according to industrial feedback.
A high NOX reduction leads to higher emissions of unburnt compounds (CO, HC, smoke, etc.).
Tests have shown that, in practical applications, NOX reductions of up to 50 % are reasonable in
order to have acceptable emissions of unburnt compounds. NOx reduction is also associated
with a beneficial temperature drop, the amount depending on the turbocharger pressure and on
the amount of water vapour added to the combustion air. The air mass passed through the
engine is slightly increased by the water vapour, but without any additional compression work
being needed. Corrosion can occur on valves, pistons and air receivers, thus increasing
maintenance needs and costs. Therefore, long-term tests are needed in order to estimate the
effects of corrosion and possible remediation options.
Achieved environmental benefits
Reduced NOX emissions to air.
Reduced unburnt compound emissions (injection of water-fuel emulsion).
Increased energy efficiency in the case of gas turbines (Cheng cycle).
Environmental performance and operational data
NOX emission reduction rates of between 60 % and 85 % can be achieved but without limiting
CO. When CO emissions are kept under control, NOX reduction rates of between 40 % and
60 % can be achieved.
NOX emissions can be reduced to approximately 45–125 mg/Nm3 (at 15 % O2) for a gas turbine
and to 100–400 mg/Nm3 for boilers depending on parameters such as the plant size, the
combusted fuel types and/or the combination of techniques implemented for NOX reduction.
The reduction rates by steam or water injection in the case of gas turbines are presented in
Figure 3.40.
WORKIN
G DRAFT IN
PROGRESS
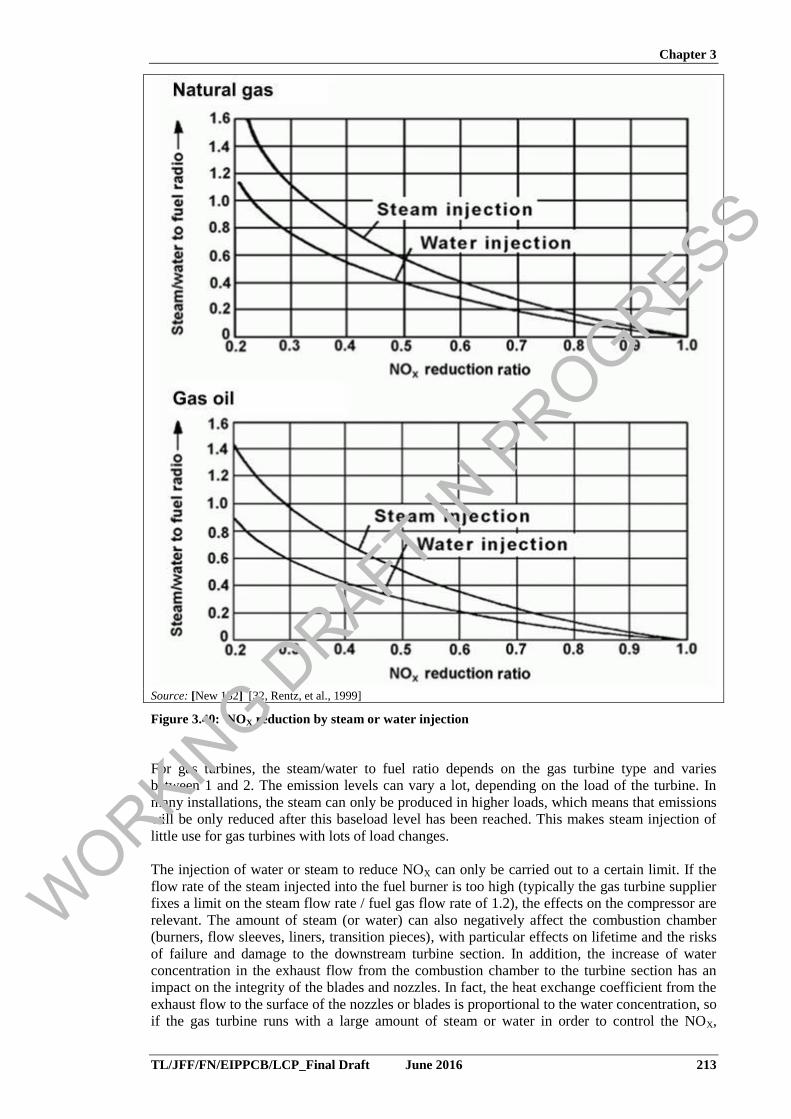
Chapter 3
TL/JFF/FN/EIPPCB/LCP_Final Draft June 2016 213
Source: [New 132] [32, Rentz, et al., 1999]
Figure 3.40: NOX reduction by steam or water injection
For gas turbines, the steam/water to fuel ratio depends on the gas turbine type and varies
between 1 and 2. The emission levels can vary a lot, depending on the load of the turbine. In
many installations, the steam can only be produced in higher loads, which means that emissions
will be only reduced after this baseload level has been reached. This makes steam injection of
little use for gas turbines with lots of load changes.
The injection of water or steam to reduce NOX can only be carried out to a certain limit. If the
flow rate of the steam injected into the fuel burner is too high (typically the gas turbine supplier
fixes a limit on the steam flow rate / fuel gas flow rate of 1.2), the effects on the compressor are
relevant. The amount of steam (or water) can also negatively affect the combustion chamber
(burners, flow sleeves, liners, transition pieces), with particular effects on lifetime and the risks
of failure and damage to the downstream turbine section. In addition, the increase of water
concentration in the exhaust flow from the combustion chamber to the turbine section has an
impact on the integrity of the blades and nozzles. In fact, the heat exchange coefficient from the
exhaust flow to the surface of the nozzles or blades is proportional to the water concentration, so
if the gas turbine runs with a large amount of steam or water in order to control the NOX,
WORKIN
G DRAFT IN
PROGRESS

Chapter 3
214 June 2016 TL/JFF/FN/EIPPCB/LCP_Final Draft
mechanical damage and an efficiency reduction may occur, increasing the maintenance costs
and the risk of failure.
Table 3.23 gives levels of NOX and CO emissions recorded for example European gas turbines
in 2011.
Table 3.23: NOX and CO emissions from applying water or steam injection to example gas
turbines
Measured emission values
(yearly average)
CO (mg/Nm3) 2 – 80
NOX (mg/Nm3) 45 – 125
Source: LCP TWG - 2012
Cross-media effects
Some major drawbacks of this NOX abatement technique are the increased emissions of CO and
hydrocarbons, a potential decrease in the thermal efficiency of the installation, and an increase
in fuel consumption. CO catalyst can be installed to oxidise the CO to CO2. Steam or water
injected into gas turbines needs to be of a very high purity, and therefore application of this
technique requires the use of a high-quality water treatment plant, which in turn may create a
liquid effluent requiring disposal. Steam injection causes a greater efficiency loss than water
injection (3–4 % for water injection). Furthermore, flame stability problems can be observed at
high water to fuel ratios and direct injection of water or steam results in a higher material stress
(small fissures can occur on the material surface due to temperature shock) than injection of a
fuel and water or steam mixture. As a consequence, the latter alternative is often preferred. [New
132] [32, Rentz, et al., 1999].
The use of steam or water injection may also reduce the life expectancy of a gas turbine.
Technical considerations relevant to applicability
This technique can be applied to new and existing gas turbines, or to boilers generally
combusting liquid fuels, alone or in combination with other techniques reducing NOX
emissions.
Water injection has often been used when steam was not available, e.g. in simple cycle
applications, whereas steam injection is usually preferred in natural-gas-fired combined cycles,
where steam is readily available from the exhaust heat recovery system.
Nowadays, new gas turbines are built with dry low-NOX combustors, and most existing plants
can be retrofitted with such combustors, providing a better performance than water/steam
injection. However, for certain small or existing turbines, water/steam injection may be a cost-
effective solution.
There may be technical constraints to retrofitting water/steam addition in existing old engines.
For the fuel-water emulsion technique, major modifications have to be made to the fuel
injection system (FIE) of an existing engine since the thermal input to the engine will be
reduced and thus higher mass flow rates of emulsions will be required.
The applicability may be limited in the case of engines where a retrofit package is not available.
The technique cannot be applied in areas with a shortage or lack of water since the water
consumption requirements are high.
WORKIN
G DRAFT IN
PROGRESS

Chapter 3
TL/JFF/FN/EIPPCB/LCP_Final Draft June 2016 215
Economics
The investment costs for retrofitting gas turbines with water or steam injection can vary widely.
These costs are mainly related to the water conditioning and injection devices used. The
additional operating costs incurred by the water/steam injection are due to increased fuel
consumption.
A steam injection retrofit for a 140 MWth gas turbine costs about EUR 1.7 million.
The injection of water or steam requires the preparation of the water used for the process. At
sites where steam or water is not used for other requirements, the investment and operational
costs are high. In the cases where gas compressor stations – with a size capacity of between
20 MWth and 250 MWth, with changing operating conditions and with low operating hours per
year – are situated at remote sites, the total costs are high. Furthermore, for existing gas
turbines, the conversion of the combustor of a gas turbine to a steam or water injection system
requires changes to the design and the layout of the gas turbine.
Driving force for implementation
Reduction of NOX emissions.
Example plants
Plants 70, 71, 102, 153-1/3, 174, 295, 296, 360, 375 and 488.
Reference literature
[44, Austrian Ministry of Environment, 2000], [New 132] [32, Rentz, et al., 1999], [182, OSEC,
1999].
3.2.2.3.11 Selective catalytic reduction (SCR)
Description
Selective reduction of nitrogen oxides with ammonia or urea in the presence of a catalyst. The
technique is based on the reduction of NOX to nitrogen in a catalytic bed by reaction with
ammonia (in general aqueous solution) at an optimum operating temperature of around 300–
450 °C. Several layers of catalyst may be applied. A higher NOX reduction is achieved with the
use of several layers of catalyst. The technique design can be modular; a special catalyst and/or
preheating can be used to cope with low loads or with a wide flue-gas temperature window.
Technical description
The reducing agent is injected into the flue-gas upstream of the catalyst. NOX conversion takes
place on the catalyst surface at a temperature usually between 300 °C and 450 °C, and
sometimes in wider range between 170 °C and 510 °C depending on the type of
catalyst/configuration used, by one of the main reactions below. Base metal oxide SCR catalysts
operating in the above-mentioned temperature range are available on the market and used in
numerous applications.
1. With ammonia as a reducing agent:
4 NO + 4 NH3 + O2 ↔ 4 N2 + 6 H2O
2 NO2 + 4 NH3 + O2 ↔ 3 N2 + 6 H2O
6 NO2 + 8 NH3 ↔ 7 N2 + 12 H2O
2. With urea as a reducing agent:
4 NO + 2 (NH2)2CO + 2 H2O + O2 ↔ 4 N2 + 6 H2O + 2 CO2
6 NO2 + 4 (NH2)2CO + 4 H2O ↔ 7 N2 + 12 H2O + 4 CO2
WORKIN
G DRAFT IN
PROGRESS

Chapter 3
216 June 2016 TL/JFF/FN/EIPPCB/LCP_Final Draft
When ammonia is used as the reducing agent, it is usually stored in vessels as an aqueous
solution or in a liquefied state (anhydrous ammonia) at a pressure greater than its vapour
pressure (about 17 bar) at the maximum temperature. In some smaller applications, i.e.
< 50 MWth, urea is used in the form of white crystal granules, which are dissolved in water
before being injected.
The number of installations using liquefied ammonia exceeds the number of installations using
other agents, because the cost per kg of ammonia is lower, thus allowing low operating costs.
Investment costs for ammonia storage, including safety measures, are also lower. Nevertheless,
its properties make handling more difficult compared to the relatively inert aqueous ammonia
solution.
To use, liquefied ammonia has to be evaporated to gaseous ammonia. This is achieved in an
evaporator heated electrically, by steam, or by hot water. The ammonia is subsequently diluted
with air before the mixture is injected into the exhaust gas. The injection takes place through a
system of nozzles to achieve a homogeneous mixing of ammonia with the flue-gas. A static
mixer can be placed in the exhaust gas channel to further improve mixing. In order to obtain a
high NOX removal efficiency and to minimise the NH3 slip, it is particularly important to
achieve a homogeneous NH3 to NOX ratio in the flue-gas. Even in the absence of specific
emission limit values for ammonia, a strong motivation for avoiding ammonia slip (over 2 ppm)
in coal-fired combustion plants is that otherwise the fly ash cannot be sold to the building
industry.
The degree of NOX removal depends on the catalyst used: at high NH3 to NOX ratios, a high
NOX removal efficiency can be obtained, but simultaneously the amount of unused ammonia
(NH3 slip) in the clean flue-gas increases considerably. The ammonia slip should be as low as
possible, in order to avoid the risk of NH3 reacting with SO3 in the flue-gas during cooling of
the flue-gas, which can lead to fouling and corrosion of the heating surfaces by the ammonium
bisulphates ((NH4)HSO4 or 'ABS') formed.
The catalysts used can have different geometrical forms such as the honeycomb, plate or
corrugated types shown in Figure 3.41. Pellets (especially for activated carbon) are also used in
some applications.
Source: [ 24, Evonik and Southern Company 2008 ]
Figure 3.41: Different types of catalysts
WORKIN
G DRAFT IN
PROGRESS
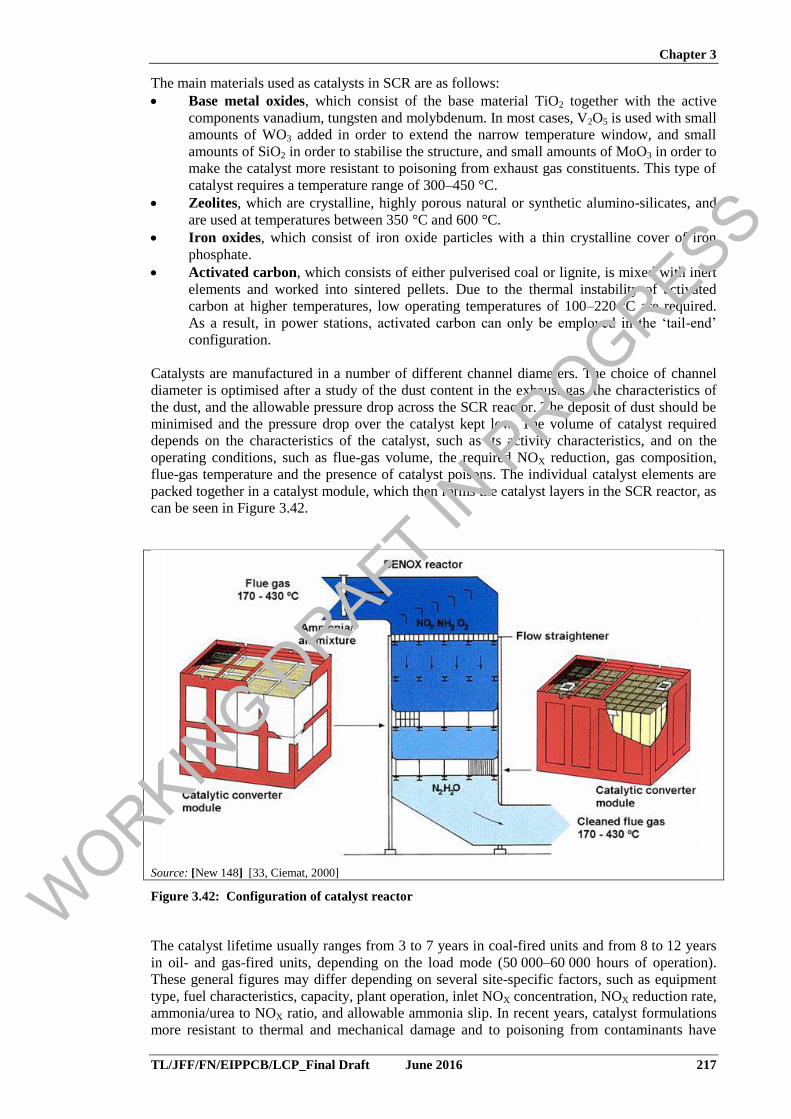
Chapter 3
TL/JFF/FN/EIPPCB/LCP_Final Draft June 2016 217
The main materials used as catalysts in SCR are as follows:
Base metal oxides, which consist of the base material TiO2 together with the active
components vanadium, tungsten and molybdenum. In most cases, V2O5 is used with small
amounts of WO3 added in order to extend the narrow temperature window, and small
amounts of SiO2 in order to stabilise the structure, and small amounts of MoO3 in order to
make the catalyst more resistant to poisoning from exhaust gas constituents. This type of
catalyst requires a temperature range of 300–450 °C.
Zeolites, which are crystalline, highly porous natural or synthetic alumino-silicates, and
are used at temperatures between 350 °C and 600 °C.
Iron oxides, which consist of iron oxide particles with a thin crystalline cover of iron
phosphate.
Activated carbon, which consists of either pulverised coal or lignite, is mixed with inert
elements and worked into sintered pellets. Due to the thermal instability of activated
carbon at higher temperatures, low operating temperatures of 100–220 °C are required.
As a result, in power stations, activated carbon can only be employed in the ‘tail-end’
configuration.
Catalysts are manufactured in a number of different channel diameters. The choice of channel
diameter is optimised after a study of the dust content in the exhaust gas, the characteristics of
the dust, and the allowable pressure drop across the SCR reactor. The deposit of dust should be
minimised and the pressure drop over the catalyst kept low. The volume of catalyst required
depends on the characteristics of the catalyst, such as its activity characteristics, and on the
operating conditions, such as flue-gas volume, the required NOX reduction, gas composition,
flue-gas temperature and the presence of catalyst poisons. The individual catalyst elements are
packed together in a catalyst module, which then forms the catalyst layers in the SCR reactor, as
can be seen in Figure 3.42.
Source: [New 148] [33, Ciemat, 2000]
Figure 3.42: Configuration of catalyst reactor
The catalyst lifetime usually ranges from 3 to 7 years in coal-fired units and from 8 to 12 years
in oil- and gas-fired units, depending on the load mode (50 000–60 000 hours of operation).
These general figures may differ depending on several site-specific factors, such as equipment
type, fuel characteristics, capacity, plant operation, inlet NOX concentration, NOX reduction rate,
ammonia/urea to NOX ratio, and allowable ammonia slip. In recent years, catalyst formulations
more resistant to thermal and mechanical damage and to poisoning from contaminants have
WORKIN
G DRAFT IN
PROGRESS
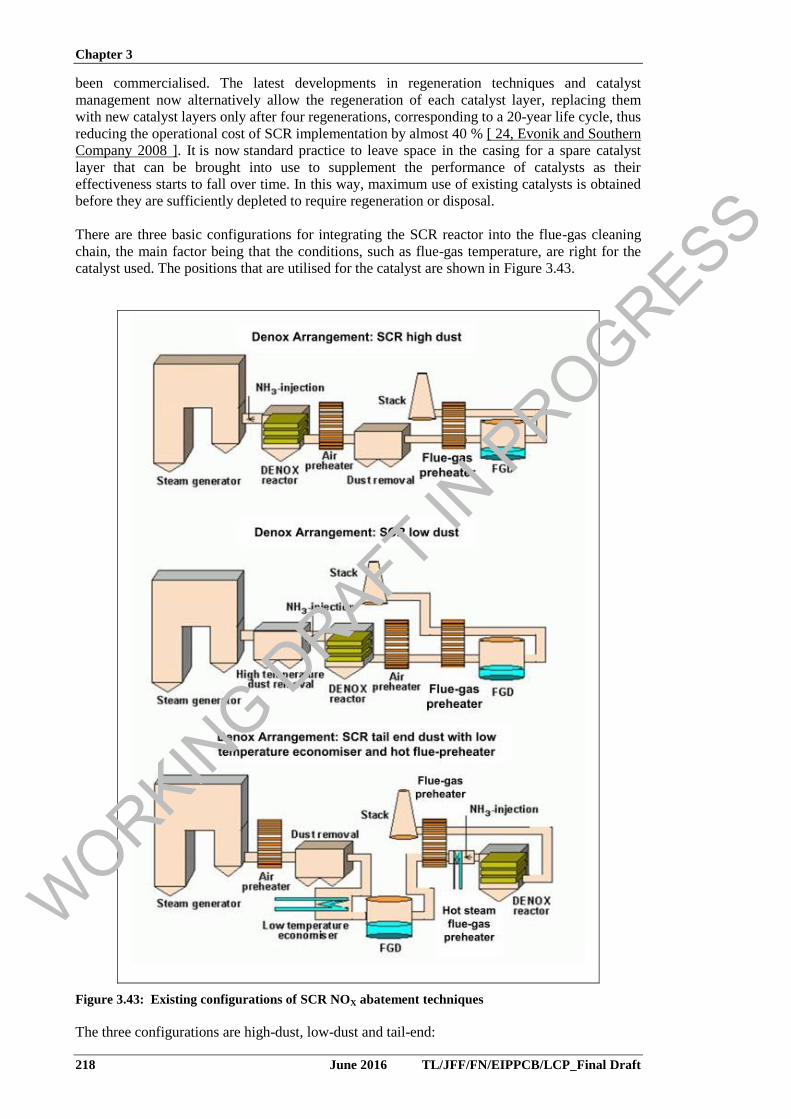
Chapter 3
218 June 2016 TL/JFF/FN/EIPPCB/LCP_Final Draft
been commercialised. The latest developments in regeneration techniques and catalyst
management now alternatively allow the regeneration of each catalyst layer, replacing them
with new catalyst layers only after four regenerations, corresponding to a 20-year life cycle, thus
reducing the operational cost of SCR implementation by almost 40 % [ 24, Evonik and Southern
Company 2008 ]. It is now standard practice to leave space in the casing for a spare catalyst
layer that can be brought into use to supplement the performance of catalysts as their
effectiveness starts to fall over time. In this way, maximum use of existing catalysts is obtained
before they are sufficiently depleted to require regeneration or disposal.
There are three basic configurations for integrating the SCR reactor into the flue-gas cleaning
chain, the main factor being that the conditions, such as flue-gas temperature, are right for the
catalyst used. The positions that are utilised for the catalyst are shown in Figure 3.43.
Figure 3.43: Existing configurations of SCR NOX abatement techniques
The three configurations are high-dust, low-dust and tail-end:
WORKIN
G DRAFT IN
PROGRESS

Chapter 3
TL/JFF/FN/EIPPCB/LCP_Final Draft June 2016 219
The high-dust arrangement is the most commonly implemented and avoids the flue-gas
reheating due to the high operating temperature of the catalyst (Figure 3.44). The lifetime
of the catalyst has been improved, as well as its resistance to abrasion. However, its use
has two drawbacks: first, the flue-gas may contain fly ash and catalyst poisons, which
results in catalyst deactivation, followed by a decrease in NOX reduction efficiency. This
may occur, for example, in slag tap furnaces, for specific fuels or in co-combustion
processes. Secondly, for retrofitting with SCR in the high-dust configuration, additional
space is required near the boiler. The high-dust arrangement is cost-effective for many
installations.
In-duct SNCR/SCR, also called slip, catalyst or hybrid SNCR/SCR, is a version of the
high-dust arrangement. These catalyst systems are combined with SNCR in order to
consume the remaining injected sorbent still present in the flue-gas at the boiler outlet in
order to add a NOX reduction stage. Such SCR requires much less catalyst than
conventional SCR, providing overall high removal efficiency and low ammonia slip at a
reduced capital cost.
The low-dust arrangement bypasses the drawbacks of the high-dust configuration. Its
major advantage is the lowered mechanical strain on the catalyst, which can be expected
to extend the catalyst’s lifetime. However, because the process operates without
supplementary heating, the installation of high-temperature dust precipitators is
necessary. Therefore, this configuration often proves to be uneconomical when
retrofitting old power plants. Moreover, the air heater is subject to the deposition of
ammonium bisulphate.
The tail-end arrangement is a favourable variant for existing plants, due to the reduced
exposure of the catalyst to abrasion, corrosion, and deactivation. Also, the catalyst
volume is smaller than for the high-dust configuration, because a catalyst with a smaller
pitch can be used. However, the incoming flue-gas has to be reheated by additional
burners that mainly use natural gas to reach the operating temperature of the catalyst. For
an activated coke catalyst, a heat exchange from the raw gas to the clean gas is usually
sufficient.
WORKIN
G DRAFT IN
PROGRESS
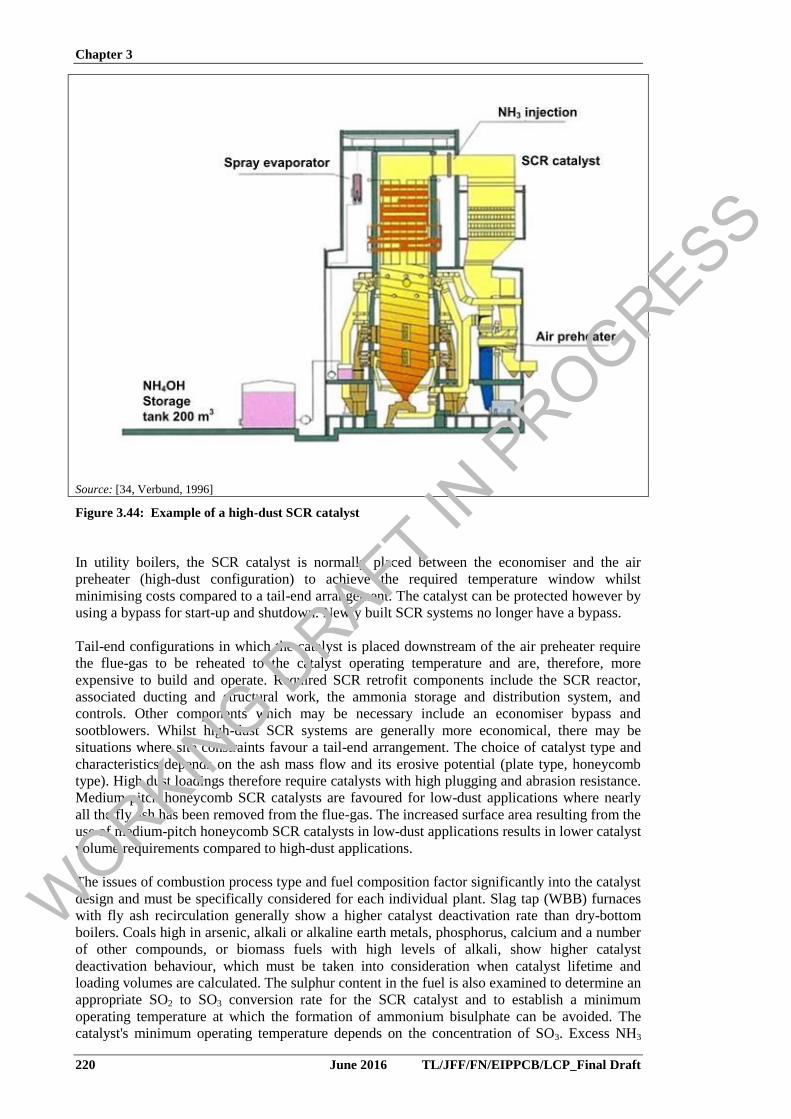
Chapter 3
220 June 2016 TL/JFF/FN/EIPPCB/LCP_Final Draft
Source: [34, Verbund, 1996]
Figure 3.44: Example of a high-dust SCR catalyst
In utility boilers, the SCR catalyst is normally placed between the economiser and the air
preheater (high-dust configuration) to achieve the required temperature window whilst
minimising costs compared to a tail-end arrangement. The catalyst can be protected however by
using a bypass for start-up and shutdown. Newly built SCR systems no longer have a bypass.
Tail-end configurations in which the catalyst is placed downstream of the air preheater require
the flue-gas to be reheated to the catalyst operating temperature and are, therefore, more
expensive to build and operate. Required SCR retrofit components include the SCR reactor,
associated ducting and structural work, the ammonia storage and distribution system, and
controls. Other components which may be necessary include an economiser bypass and
sootblowers. Whilst high-dust SCR systems are generally more economical, there may be
situations where site constraints favour a tail-end arrangement. The choice of catalyst type and
characteristics depends on the ash mass flow and its erosive potential (plate type, honeycomb
type). High dust loadings therefore require catalysts with high plugging and abrasion resistance.
Medium-pitch honeycomb SCR catalysts are favoured for low-dust applications where nearly
all the fly ash has been removed from the flue-gas. The increased surface area resulting from the
use of medium-pitch honeycomb SCR catalysts in low-dust applications results in lower catalyst
volume requirements compared to high-dust applications.
The issues of combustion process type and fuel composition factor significantly into the catalyst
design and must be specifically considered for each individual plant. Slag tap (WBB) furnaces
with fly ash recirculation generally show a higher catalyst deactivation rate than dry-bottom
boilers. Coals high in arsenic, alkali or alkaline earth metals, phosphorus, calcium and a number
of other compounds, or biomass fuels with high levels of alkali, show higher catalyst
deactivation behaviour, which must be taken into consideration when catalyst lifetime and
loading volumes are calculated. The sulphur content in the fuel is also examined to determine an
appropriate SO2 to SO3 conversion rate for the SCR catalyst and to establish a minimum
operating temperature at which the formation of ammonium bisulphate can be avoided. The
catalyst's minimum operating temperature depends on the concentration of SO3. Excess NH3
WORKIN
G DRAFT IN
PROGRESS
Chapter 3
TL/JFF/FN/EIPPCB/LCP_Final Draft June 2016 221
reacts with SO3, forming ammonium salts (NH4)2SO4 and NH4HSO4 that condensate and block
the catalyst openings. SCR catalysts exist for a lower temperature range (below 290 °C), but can
only be used when the SOX in the flue-gas is below 50 mg/Nm3. (It is generally estimated that
SO3 makes up roughly 3 – 5 % of total SOX) (see also the paragraphs below on SO2 to SO3
conversion and on ABS).
The catalyst lifetime can be optimised through proper maintenance, including the use of
appropriate soot blowing and by avoiding contact with moisture for catalysts exposed to fly ash.
System bypasses can be used when the unit is starting up or shutting down or if the economiser
temperature drops below the minimum catalyst operating temperature at low combustion plant
load. When using a conventional SCR system with a diesel engine, for example, the range of
load in operation is limited to approximately the upper third.
The main advantages of the SCR technology are:
the SCR process can be used for many of the fuels used in combustion processes, e.g.
natural gas and light oils, as well as process gases and coal;
the conversion of NOX does not create any secondary pollution components;
the emission of NOX can be reduced by 90 % or more;
the overall NOX reduction depends on SCR and primary measures;
to meet air quality requirements, SCR can be applied with adapted NH3 consumption to
reduce NH3 slip effects and to increase catalyst lifetime.
Achieved environmental benefit
Reduced NOX emissions to air.
Reduced mercury emissions to air due to greater oxidation of elemental mercury.
Environmental performance and operational data
There are no major problems in designing SCR for boilers and engines (see example in Figure
3.45) with 90 % or higher NOX reduction. For higher reduction rates, a more sophisticated
control system is needed in order to keep the SCR in the optimal working area. Fuel impurities
have a direct impact on achievable reduction rates; with clean fuels, higher NOX reduction rates
can be achieved. Special care is taken in the design of the NH3 injection system to ensure a
uniform NH3 to NOX ratio in the flue-gas. The increased NOX reduction requires 5 – 10 %
additional installed catalyst and a corresponding higher pressure drop. Also, a slightly higher
NH3 slip is expected due to the increased reagent injection needed at higher NOX reduction
rates.
In gas turbines, it is more difficult to obtain a very uniform NH3 to NOX ratio in the flue-gas.
However, a 95 % reduction rate may be obtained with 5–10 ppm NH3 slip [ 25, Haldor Topsoe
2012 ] [Euromot 2013- comment] [EPPSA 2013 - coment]. Retrofitting a CCGT requires a
catalyst volume of 0.2 m3/MWe (e.g. about 80 m
3 for a 400 MWe plant) [EUTurbines comment
to D1 – 2013].
WORKIN
G DRAFT IN
PROGRESS

Chapter 3
222 June 2016 TL/JFF/FN/EIPPCB/LCP_Final Draft
Source: [97, Euromot, 2000]
Figure 3.45: SCR system applied to a stationary combustion engine
The SCR system’s ability to respond to load changes depends not only on the control system but
also on the design of the catalyst implemented in the system. Older systems have a tendency to
emit excessive NH3 and NOX during load changes but modern catalyst types with lower mass
react faster to changes in operating conditions and enable rapid system start-up and achievement
of stable performance. [ 25, Haldor Topsoe 2012 ]
Catalyst bed pressure drop is monitored to detect any sign of fouling as catalyst fouling
increases back pressure and reduces activity. Fouling can occur from:
burning dirty fuel;
sulphate deposition;
excessive fuel-rich operation.
Operators report that catalyst plugging with solids is the most frequent operational issue. Solids
in the flue-gas duct from corrosion, duct insulation degradation, etc. plug the SCR catalyst
openings, causing excessive pressure drop and unit shutdown for cleaning.
Examples of typical emission data at a 100 % plant load are given in Table 3.24.
Table 3.24: Typical SCR efficiencies for different combustion processes (dependent on SCR
design and injected reagent amount)
Application NOX inlet (ppm) NOX outlet (ppm)
Power plant – coal-fired 500 40 – 50
Gas turbine 25 – 90 2 – 9
Diesel engine 1200 120
Source: Doc 15 DK see bulk info 3.1.4[CEFIC comment 108]
WORKIN
G DRAFT IN
PROGRESS
Chapter 3
TL/JFF/FN/EIPPCB/LCP_Final Draft June 2016 223
At lower loads, the NOX reduction rate is equal to or better than at 100 % load, due to the lower
flue-gas flow rate (higher relative amount of catalyst).
Table 3.25 presents the efficiency and operational parameters when applying SCR.
Table 3.25: Performance of the SCR technique for reducing nitrogen oxide emissions
General NOX
reduction rate Operating temperature Configuration/plant
80 – 95 %
350 – 450 ºC High-dust
170 – 300 ºC Tail-end
280 – 510 ºC Gas turbines
200 – 510 ºC Diesel engines
NB:
The life of the catalyst is 3–7 years for coal combustion, 8–12 years for oil combustion and more than
10 years for gas combustion. Catalyst regeneration allows a catalyst lifetime of about 20 years.
A catalyst lifetime of 40 000 – 80 000 operating hours can be reached by periodical washing. However,
it can be much shorter in aggressive conditions (e.g. with difficult biomasses, the chemical lifetime may
be as low as 8000 operating hours).
Operating temperatures are dependent on the fuel sulphur content.
The catalyst performance tends to deteriorate with time.
Cross-media effects
The ammonia slip increases with an increasing NH3 to NOX ratio, which may cause
problems, e.g. with an excessively high ammonia content in the fly ash. This is a problem
which can be solved by using a larger catalyst volume and/or by improving the mixing of
NH3 and NOX in the flue-gas.
Incomplete reaction of NH3 with NOX may result in the formation of ammonium
sulphates, which are deposited on downstream systems such as the catalyst and air
preheater; increased amounts of NH3 in flue-gas desulphurisation waste waters and the air
heater cleaning water; and an increased NH3 concentration in the fly ash. This incomplete
reaction only occurs in the very unlikely case of catastrophic failures of the whole SCR
system.
SO2 to SO3 conversion
As a result of the fossil fuel combustion process, SO2 and SO3 are generated due to the presence
of sulphur in the fuel. The use of SCR systems for NOX emission control can have a negative
impact on the concentration in the flue-gas at the air preheater and through the stack. This is
caused by the undesired oxidation side reaction:
SO2 + ½ O2 SO3
Higher levels of SO3 can cause operational issues related to air preheater fouling and/or
corrosion and may lead to more visible emissions due to sulphuric acid mist. SO3 stack
emissions below 5 vppm avoid visual emissions.
Catalyst manufacturers typically formulate their catalyst to achieve a low SO2 to SO3 oxidation
level. Therefore, the reaction is relatively slow compared to the NOX reduction reaction.
[ 27, ICAC 2009 ]
ABS formation
Operating at low load can cause problems with maintaining the minimum temperature, and
ammonium bisulphates ((NH4)HSO4 (ABS) may condense and form a sticky coating on the
catalyst and plume at the stack. ABS is a highly acidic and sticky substance that can deposit on
downstream equipment such as convection coils and air heaters, causing plugging and a
WORKIN
G DRAFT IN
PROGRESS

Chapter 3
224 June 2016 TL/JFF/FN/EIPPCB/LCP_Final Draft
deterioration in equipment performance. Fly ash will be caught and the canals in the catalyst can
be blocked. ABS can, because of the capillary effect, condense in the pores of the catalyst
approximately 28 °C above the temperature of condensation on the surface of the catalyst.
When the temperature rises again ABS will then evaporate, but if the SCR system is in
operation below the dew point of ABS for a longer period the catalyst will gradually deactivate,
with decreasing efficiency or ammonia slip as a consequence. Deposits can be minimised by
keeping ammonia slip low and monitoring the flue-gas temperature downstream. Deposits can
be cleaned on-line by water washing or by raising metal temperatures above the condensation
temperature to sublime deposits with suitably designed materials. In Denmark, coal-fired power
plants with SCR equipment have very different levels of ammonia injection for the minimum
load (approximately 20 % to 50 % of the maximum load), where the ammonia dosage is either
decreased or stopped.
Other effects
The flue-gas pressure drop through the catalyst can generally vary from 5 mbar to 15 mbar.
Additional energy may be needed to offset this pressure drop. Furthermore, in the tail-end
arrangement, reheating may be needed for the catalyst to reach the minimum operating
temperature.
This technique generates waste (spent catalyst).
Catalyst washing may generate effluents not typical of those expected at the installation and
may thus require the adaptation of the waste water treatment or washing on specialised
companies' premises.
Other cross-media effects are linked to the use of ammonia, through:
the release of NH3 to air in the case of inhomogeneous reactions between NOX and NH3;
safety issues related to ammonia storage.
(See further details in Section 3.2.2.3.13.)
Technical considerations relevant to applicability
The technique is applicable to new plants.
Retrofitting SCR to existing plants requires consideration of space, pressure and temperature
constraints. Higher operating temperatures reduce the catalyst size and costs but introduce
retrofit complexity. Lower operating temperatures increase the required catalyst volume and
costs but often allow for a simpler retrofit.
Load variations and frequent start-ups/shutdowns may limit the use of conventional SCR as
high variations of the load demand can make the flue-gas temperature very unstable and not
always compatible with the temperature window of available catalysts. This may require
specially designed catalysts and/or a preheating system.
Economics
The investment costs of an SCR device are considerable (Figure 3.46). The price per tonne of
NOX reduced varies between plant types. Tangentially fired boilers have higher costs per tonne
of NOX reduced than wall-fired boilers because they have lower original emission levels. The
reactant costs are relatively lower than in the SNCR plants.
WORKIN
G DRAFT IN
PROGRESS
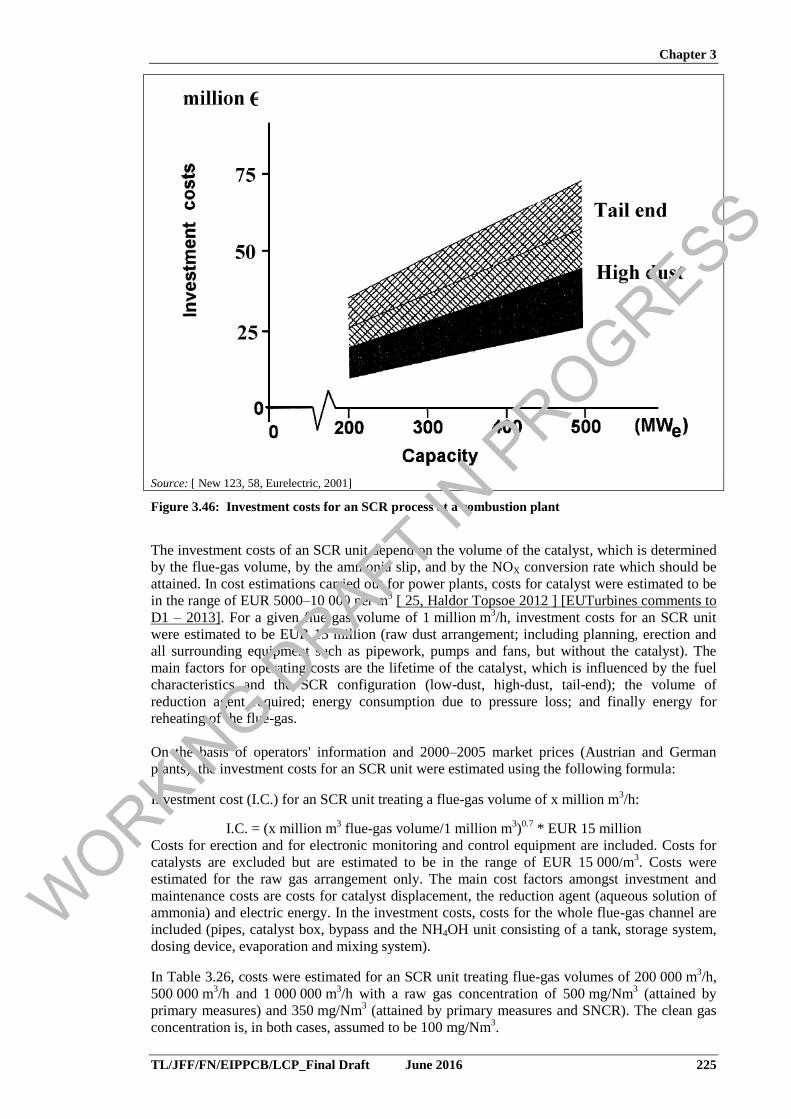
Chapter 3
TL/JFF/FN/EIPPCB/LCP_Final Draft June 2016 225
Source: [ New 123, 58, Eurelectric, 2001]
Figure 3.46: Investment costs for an SCR process at a combustion plant
The investment costs of an SCR unit depend on the volume of the catalyst, which is determined
by the flue-gas volume, by the ammonia slip, and by the NOX conversion rate which should be
attained. In cost estimations carried out for power plants, costs for catalyst were estimated to be
in the range of EUR 5000–10 000 per m3 [ 25, Haldor Topsoe 2012 ] [EUTurbines comments to
D1 – 2013]. For a given flue-gas volume of 1 million m3/h, investment costs for an SCR unit
were estimated to be EUR 15 million (raw dust arrangement; including planning, erection and
all surrounding equipment such as pipework, pumps and fans, but without the catalyst). The
main factors for operating costs are the lifetime of the catalyst, which is influenced by the fuel
characteristics and the SCR configuration (low-dust, high-dust, tail-end); the volume of
reduction agent required; energy consumption due to pressure loss; and finally energy for
reheating of the flue-gas.
On the basis of operators' information and 2000–2005 market prices (Austrian and German
plants), the investment costs for an SCR unit were estimated using the following formula:
Investment cost (I.C.) for an SCR unit treating a flue-gas volume of x million m3/h:
I.C. = (x million m3 flue-gas volume/1 million m
3)
0.7 * EUR 15 million
Costs for erection and for electronic monitoring and control equipment are included. Costs for
catalysts are excluded but are estimated to be in the range of EUR 15 000/m3. Costs were
estimated for the raw gas arrangement only. The main cost factors amongst investment and
maintenance costs are costs for catalyst displacement, the reduction agent (aqueous solution of
ammonia) and electric energy. In the investment costs, costs for the whole flue-gas channel are
included (pipes, catalyst box, bypass and the NH4OH unit consisting of a tank, storage system,
dosing device, evaporation and mixing system).
In Table 3.26, costs were estimated for an SCR unit treating flue-gas volumes of 200 000 m3/h,
500 000 m3/h and 1 000 000 m
3/h with a raw gas concentration of 500 mg/Nm
3 (attained by
primary measures) and 350 mg/Nm3 (attained by primary measures and SNCR). The clean gas
concentration is, in both cases, assumed to be 100 mg/Nm3.
WORKIN
G DRAFT IN
PROGRESS
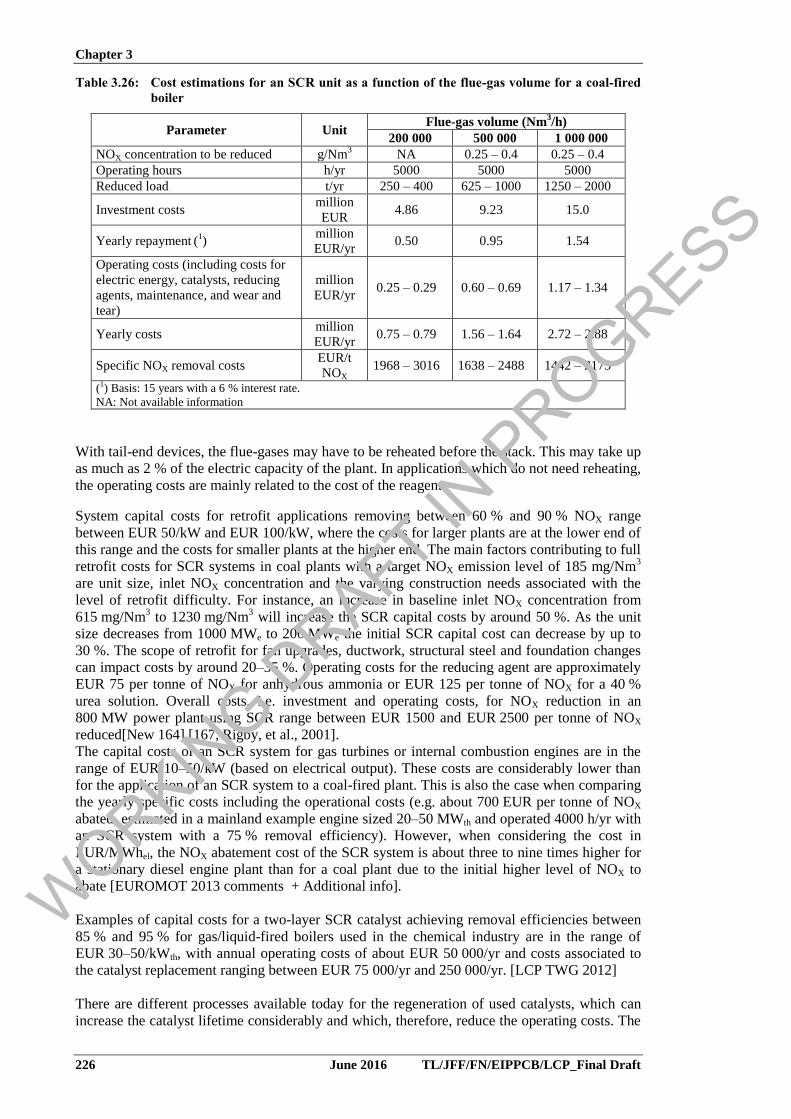
Chapter 3
226 June 2016 TL/JFF/FN/EIPPCB/LCP_Final Draft
Table 3.26: Cost estimations for an SCR unit as a function of the flue-gas volume for a coal-fired
boiler
Parameter Unit Flue-gas volume (Nm
3/h)
200 000 500 000 1 000 000
NOX concentration to be reduced g/Nm3 NA 0.25 – 0.4 0.25 – 0.4
Operating hours h/yr 5000 5000 5000
Reduced load t/yr 250 – 400 625 – 1000 1250 – 2000
Investment costs million
EUR 4.86 9.23 15.0
Yearly repayment (
1)
million
EUR/yr 0.50 0.95 1.54
Operating costs (including costs for
electric energy, catalysts, reducing
agents, maintenance, and wear and
tear)
million
EUR/yr 0.25 – 0.29 0.60 – 0.69 1.17 – 1.34
Yearly costs million
EUR/yr 0.75 – 0.79 1.56 – 1.64 2.72 – 2.88
Specific NOX removal costs EUR/t
NOX 1968 – 3016 1638 – 2488 1442 – 2175
(1) Basis: 15 years with a 6 % interest rate.
NA: Not available information
With tail-end devices, the flue-gases may have to be reheated before the stack. This may take up
as much as 2 % of the electric capacity of the plant. In applications which do not need reheating,
the operating costs are mainly related to the cost of the reagent.
System capital costs for retrofit applications removing between 60 % and 90 % NOX range
between EUR 50/kW and EUR 100/kW, where the costs for larger plants are at the lower end of
this range and the costs for smaller plants at the higher end. The main factors contributing to full
retrofit costs for SCR systems in coal plants with a target NOX emission level of 185 mg/Nm3
are unit size, inlet NOX concentration and the varying construction needs associated with the
level of retrofit difficulty. For instance, an increase in baseline inlet NOX concentration from
615 mg/Nm3 to 1230 mg/Nm
3 will increase the SCR capital costs by around 50 %. As the unit
size decreases from 1000 MWe to 200 MWe the initial SCR capital cost can decrease by up to
30 %. The scope of retrofit for fan upgrades, ductwork, structural steel and foundation changes
can impact costs by around 20–35 %. Operating costs for the reducing agent are approximately
EUR 75 per tonne of NOX for anhydrous ammonia or EUR 125 per tonne of NOX for a 40 %
urea solution. Overall costs, i.e. investment and operating costs, for NOX reduction in an
800 MW power plant using SCR range between EUR 1500 and EUR 2500 per tonne of NOX
reduced[New 164] [167, Rigby, et al., 2001].
The capital costs of an SCR system for gas turbines or internal combustion engines are in the
range of EUR 10–50/kW (based on electrical output). These costs are considerably lower than
for the application of an SCR system to a coal-fired plant. This is also the case when comparing
the yearly specific costs including the operational costs (e.g. about 700 EUR per tonne of NOX
abated, estimated in a mainland example engine sized 20–50 MWth and operated 4000 h/yr with
an SCR system with a 75 % removal efficiency). However, when considering the cost in
EUR/MWhel, the NOX abatement cost of the SCR system is about three to nine times higher for
a stationary diesel engine plant than for a coal plant due to the initial higher level of NOX to
abate [EUROMOT 2013 comments + Additional info].
Examples of capital costs for a two-layer SCR catalyst achieving removal efficiencies between
85 % and 95 % for gas/liquid-fired boilers used in the chemical industry are in the range of
EUR 30–50/kWth, with annual operating costs of about EUR 50 000/yr and costs associated to
the catalyst replacement ranging between EUR 75 000/yr and 250 000/yr. [LCP TWG 2012]
There are different processes available today for the regeneration of used catalysts, which can
increase the catalyst lifetime considerably and which, therefore, reduce the operating costs. The
WORKIN
G DRAFT IN
PROGRESS
Chapter 3
TL/JFF/FN/EIPPCB/LCP_Final Draft June 2016 227
price of regenerated SCR catalysts is up to half that of new catalysts. Without severe erosion
effects, the limited lifetime of deactivated high-dust SCR catalysts can be prolonged by
regeneration, with an impact on operation costs compared to new catalysts.
The hybrid SNCR/SCR solution can be a cost-effective solution at less than two thirds of the
cost of a full SCR system.
Driving force for implementation
Reduction of NOX emissions.
Possible NOX taxes. With SCR, much higher NOX conversions with very low NH3 slip can
be obtained compared to SNCR and primary measures. The NOX tax of DKK 25/kg in
Denmark and SEK 40/kg in Sweden are drivers for maximising the NOX conversion of
installed SCR units and thereby reduce tax.
Example plants
About 80 plants that submitted a questionnaire in 2012 for the review of this BREF are fitted
with an SCR system.
See specific fuel sections for further examples.
Reference literature
[New 132] [32, Rentz, et al., 1999], [57, Austrian Ministry of Environment, 2000], [183, Calepa,
1999] [VGB Power tech magazine 12-2013 – See additional info in CZ folder].
[ 27, ICAC 2009 ]
3.2.2.3.12 Selective non-catalytic reduction (SNCR)
Description
Selective reduction of nitrogen oxides with ammonia or urea without a catalyst. The technique
is based on the reduction of NOX to nitrogen by reaction with ammonia or urea at a high
temperature. The operating temperature window is maintained between 800 °C and 1100 °C for
optimal reaction.
Technical description
The temperature window strongly depends on the reagent used (ammonia, urea or caustic
ammonia).
Using ammonia as a reagent, the following chemical reactions take place more or less at the
same time. At the lower temperature, both reactions are too slow; at the higher temperature, the
unwanted by-reaction dominates with an increase in NOX emissions. Moreover, with load
changes, the required temperature window is subjected to fluctuations in the boiler. To adjust
the required temperature window with the ammonia injection, several levels of injection are
necessary.
Main reaction:
4 NO + 4 NH3 + O2 4 N2 + 6 H2O (reduction)
Unwanted by-reaction:
4 NH3 + 5 O2 4 NO + 6 H2O (oxidation)
An SNCR facility consists of the following operational units:
the reagent storage unit, for the storage, cooling, and evaporation of the reagent;
the SNCR unit itself, where the injection of the reagent and the reaction of nitrogen
oxides to nitrogen and water take place;
an automation system for controlling the reagent injection.
WORKIN
G DRAFT IN
PROGRESS

Chapter 3
228 June 2016 TL/JFF/FN/EIPPCB/LCP_Final Draft
The temperature window is of considerable importance as, above this, ammonia is oxidised and
so even more NOX is produced, and below this, the conversion rate is too low and ammonia can
be formed. The SNCR process with different injection levels of ammonia is shown in Figure
3.47.
Source: [34, Verbund, 1996]
Figure 3.47: The SNCR process
In order to achieve a high abatement rate and a low NH3 slip, the reagent and NOX in the flue-
gas must undergo sufficient mixing. Besides distribution and mixing, another relevant parameter
is the size of the reagent drops. Small drops would evaporate too quickly and react at
excessively high temperatures, inducing a reduced NOX abatement rate, whereas extremely
large drops would evaporate too slowly and react at excessively low temperatures, resulting in
increased NH3 slip.
Possible carriers for the reducing agent are pressurised air, steam or water. Primary measures,
such as overfire air or flue-gas recirculation, can be used as a reagent carrier for the SNCR
process.
Most problems with SNCR applications are related to non-uniform distribution of the reagent
within the combustion chamber and injection of ammonia at incorrect locations (where
oxidation rather than reduction or low reaction can occur, causing higher NOX and higher NH3
slip). Therefore, optimisation of the distribution system is required. Special distribution systems
are used to achieve the optimal distribution of ammonia and flue-gas. CFD modelling is used for
the design and then temperature control systems to precisely adjust the injection parameters.
The reaction of nitrogen oxides and ammonia/urea into water and nitrogen strongly depends on
the temperature and retention time within the required temperature range, as well as on the
ammonia to nitrogen oxides ratio. The temperature window for ammonia and caustic ammonia
is 850 °C to 1000 °C, with the optimum temperature being 870 °C. In comparison, the
temperature window when using urea is wider (800 °C to 1100 °C), with an optimal temperature
of 1000 °C.
The retention time within the required temperature window ranges from 0.2 to 0.5 seconds. This
contact time range is rather unstable, and therefore the ammonia to nitrogen oxides ratio must be
ammonia-rich rather than stoichiometric. Once more, optimisation is required as regards the
molar ratio of NH3 to NOX. The NOX removal rate is favoured by an increased ratio, but at the
same time the ammonia slip increases too, leading to increased pollution of subsequent units
WORKIN
G DRAFT IN
PROGRESS

Chapter 3
TL/JFF/FN/EIPPCB/LCP_Final Draft June 2016 229
(e.g. heat exchangers, flue-gas ducts). A NH3 to NOX ratio of between 1 and 2.5 is
representative of most installations, depending on the nature of the host process and the amount
of NOX to be removed.
The equipment for the SNCR process is quite easy to install and does not take up too much
space, even if, in almost every case, more than one injection level is needed. SNCR can be used
alone in boilers which already have quite low emission levels. It can also be useful in boilers
equipped with (a) primary reduction technique(s).
To ensure that the reagent is always injected in the upper range of the temperature window
under any operating conditions, i.e. in the range where NOX reduction is highest and NH3 slip is
lowest, acoustic gas temperature measurement systems (AGAM) are provided in plants where a
high performance is required. AGAM measures the real gas temperature and determines the
temperature profiles across the entire combustion chamber cross section. The temperature
profile is divided into sections and can be assigned to individual lances or groups of lances to
switch them to another level depending on the flue-gas temperature measured. This ensures that
the reagent gets to the locations which are most effective for the reaction even at rapidly varying
flue-gas temperatures. In a recent example 200 MWe coal-fired boiler fitted with SNCR, it was
decided that, due to the significant temperature differences between low load (20 %) and full
load as well as the extreme temperature imbalances, five injection levels would be installed
between 26 m and 51.8 m. The injectors were arranged in such a way that the right and the left
sides of the boiler could be controlled independently of each other. Each injection lance could
be individually activated or deactivated.
[Yara doc]
SNCR technique for larger boilers
The SNCR technique has increasingly been developed for larger boilers in recent years as the
injection technology and measurement and control of boiler cross section temperature systems
have improved to allow reduction rates above 40 %, compared to the 20 % that was reported in
the case of older plants. Special urea-based reagents have been developed for these boilers as
aqueous ammonia would evaporate too quickly whereas urea solutions require a first
evaporation step before the urea molecules become active, enabling deeper penetration.
[Additional info CZ-01]
Achieved environmental benefits
Reduced NOX emissions to air.
Environmental performance and operational data
WORKIN
G DRAFT IN
PROGRESS
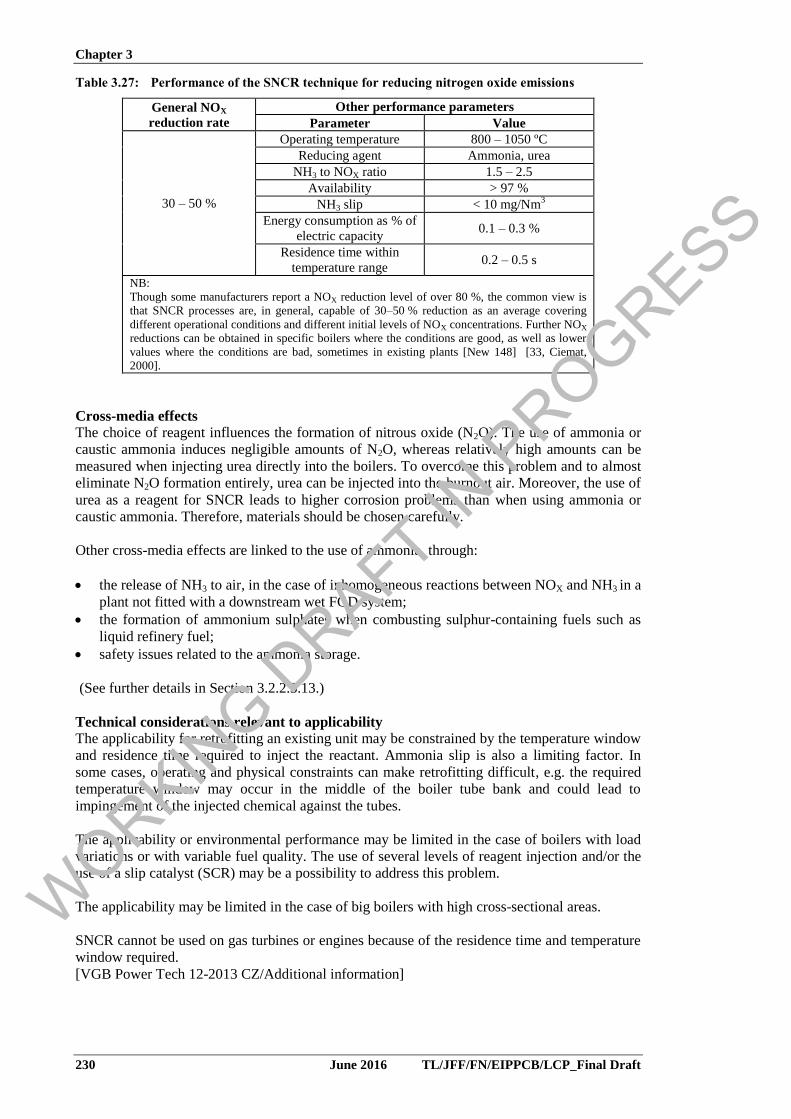
Chapter 3
230 June 2016 TL/JFF/FN/EIPPCB/LCP_Final Draft
Table 3.27: Performance of the SNCR technique for reducing nitrogen oxide emissions
General NOX
reduction rate
Other performance parameters
Parameter Value
30 – 50 %
Operating temperature 800 – 1050 ºC
Reducing agent Ammonia, urea
NH3 to NOX ratio 1.5 – 2.5
Availability > 97 %
NH3 slip < 10 mg/Nm3
Energy consumption as % of
electric capacity 0.1 – 0.3 %
Residence time within
temperature range 0.2 – 0.5 s
NB:
Though some manufacturers report a NOX reduction level of over 80 %, the common view is
that SNCR processes are, in general, capable of 30–50 % reduction as an average covering
different operational conditions and different initial levels of NOX concentrations. Further NOX
reductions can be obtained in specific boilers where the conditions are good, as well as lower
values where the conditions are bad, sometimes in existing plants [New 148] [33, Ciemat,
2000].
Cross-media effects
The choice of reagent influences the formation of nitrous oxide (N2O). The use of ammonia or
caustic ammonia induces negligible amounts of N2O, whereas relatively high amounts can be
measured when injecting urea directly into the boilers. To overcome this problem and to almost
eliminate N2O formation entirely, urea can be injected into the burnout air. Moreover, the use of
urea as a reagent for SNCR leads to higher corrosion problems than when using ammonia or
caustic ammonia. Therefore, materials should be chosen carefully.
Other cross-media effects are linked to the use of ammonia, through:
the release of NH3 to air, in the case of inhomogeneous reactions between NOX and NH3 in a
plant not fitted with a downstream wet FGD system;
the formation of ammonium sulphates when combusting sulphur-containing fuels such as
liquid refinery fuel;
safety issues related to the ammonia storage.
(See further details in Section 3.2.2.3.13.)
Technical considerations relevant to applicability
The applicability for retrofitting an existing unit may be constrained by the temperature window
and residence time required to inject the reactant. Ammonia slip is also a limiting factor. In
some cases, operating and physical constraints can make retrofitting difficult, e.g. the required
temperature window may occur in the middle of the boiler tube bank and could lead to
impingement of the injected chemical against the tubes.
The applicability or environmental performance may be limited in the case of boilers with load
variations or with variable fuel quality. The use of several levels of reagent injection and/or the
use of a slip catalyst (SCR) may be a possibility to address this problem.
The applicability may be limited in the case of big boilers with high cross-sectional areas.
SNCR cannot be used on gas turbines or engines because of the residence time and temperature
window required.
[VGB Power Tech 12-2013 CZ/Additional information]
WORKIN
G DRAFT IN
PROGRESS
Chapter 3
TL/JFF/FN/EIPPCB/LCP_Final Draft June 2016 231
Economics
The actual construction costs depend on the boiler and its operating profile. According to an
estimate from a European SNCR provider, the levelised costs are approximately EUR 430 per
tonne of NOX reduced in a coal-fired 250 MWth boiler operating for 4000 h/yr, assuming a
baseline NOX level of 400 mg/Nm3 and a NOX reduction of 50 %. Also taking into consideration
the reagent costs, loss of efficiency for the host plant and maintenance costs, the same European
SNCR and reagent supplier estimated a levelised cost for the 50 % NOX reduction to be
approximately EUR 1400 per tonne of NOX reduced if using 24.5 % aqueous ammonia as a
reagent. If using 40 % urea solution, the estimated costs of NOX removal is approximately
EUR 1500 per tonne of NOX reduced. A project life of 10 years has been assumed in the
calculations and a NH3 to NOX ratio of 1.2 (20 % higher for urea solution). [EEB comments +
Yara draft text paper] [EGTEI tool on cost estimation].
Driving force for implementation
Reduction of NOX emissions.
Lower capex than SCR.
No need for additional space, e.g. for structures, reactor and ductwork.
No catalyst pressure drop and no associated need to modify existing equipment (duct, ESP,
fans).
Example plants
Electrownia 'Rybnik' SA – 225 MWe coal-fired boiler.
About 30 plants that submitted a questionnaire in 2012 for the review of this BREF are fitted
with an SNCR system.
See specific fuel sections for further examples.
Reference literature
[VGB article –CZ]
[Yara doc Information on SNCR]
[NOx out SNCR 2008 - Yara file]
3.2.2.3.13 Ammonia-related issues when using SCR/SNCR techniques
One possible disadvantage of the SCR/SNCR techniques is related to the ammonia slip, which
is the emission of unreacted ammonia into the environment.
This occurs in the case of incomplete reaction of NH3 with NOX, when small amounts of NH3
leave the reactor / combustion chamber with the flue-gas, and may be due to catastrophic failure
of the whole SCR system or to an increase of the NH3 to NOX ratio when looking to increase the
SCR/SNCR system efficiency. This effect is known as ammonia slip (NH3 slip). High ammonia
slip (NH3 breakthrough) can lead to the following:
The formation of ammonium sulphates, which form deposits on downstream systems
such as the catalyst and air preheater and on surfaces below the NH4SO4 dewpoint
(235 °C or higher in the case of high level of SOX in the flue-gas), or can result in
increased dust emissions. Deposits can be minimised by keeping the ammonia slip low
and monitoring the downstream flue-gas temperature. Deposits can be cleaned on-line by
water washing or by raising metal temperatures above the condensation temperature to
sublime deposits with suitably designed materials.
NH3 in flue-gas desulphurisation waste waters and air heater cleaning water.
And an increased NH3 concentration in the fly ash, which may affect its disposal or sale.
When SCR is implemented, the ammonia slip increases with an increasing NH3 to NOX ratio
and with a decreasing catalyst activity.
WORKIN
G DRAFT IN
PROGRESS

Chapter 3
232 June 2016 TL/JFF/FN/EIPPCB/LCP_Final Draft
When SNCR is implemented, the ammonia slip increases with poor NH3 and flue-gas mixing
conditions, due to lack of residence time within the reaction temperature window, and with an
increasing NH3 to NOX ratio.
When a downstream wet flue-gas desulphurisation (WFGD) system is implemented, the NH3
slip is further dissolved in water.
In order to avoid problems with the utilisation of fly ash and possibly the smell of the flue-gas
in surrounding areas, the ammonia concentration associated with the use of SCR or SNCR is
usually kept below 10 mg/Nm3. When fuels with very low-ash content are used, ammonia slip
can also lead to ash that is too high in ammonia to handle safely.
Limiting the ammonia slip for SCR systems can be solved by using a larger catalyst volume
and/or by improving the mixing of NH3 and NOX in the flue-gas.
The ammonia slip is often the limiting factor in the utilisation of the SNCR technique. To avoid
ammonia slip with the SNCR technique, a low layer of SCR catalyst can be installed in the
economiser area of the boiler. As this catalyst reduces the ammonia slip, it also reduces the
corresponding amount of NOX.
Both SCR and SNCR techniques use ammonia or urea as a reducing agent. Urea is more
commonly used in combustion plants below 50 MWth than in large SCR or SNCR applications.
Health and safety risks related to the use of pure liquefied ammonia exist, e.g. for the handling
and storage of pure liquefied ammonia, pressure reservoirs may need to be double-walled and
located underground. No impact on health arises from solid urea storage. From a safety point of
view, the use of an ammonia-water solution is less risky than the storage and handling of pure
liquefied ammonia.
The most common form of ammonia used for SCR and SNCR is aqueous ammonia, normally
available in a 24.5 % concentration or lower. Aqueous ammonia is a non-flammable liquid, and
is classified as an irritant. Aqueous ammonia can be stored under atmospheric conditions. Pure
anhydrous ammonia is classified as a flammable, toxic and corrosive gas, and is combustible in
air concentrations between 15 % and 28 % and has to be stored under pressure (vapour pressure
of 7.6 bar at 20 °C).
Because of the high risk of ammonia to human health, ammonia transportation, handling and
storage need to be carried out very carefully to avoid any leakage. Monitoring systems are
installed for the detection of low ammonia concentrations around the ammonia storage and
handling area. Pressurised and hydrous ammonia are regulated under the Seveso III Directive
(2012/18/EU) and corresponding national regulations.
The stress corrosion risk for steel vessels requires regular monitoring of tank integrity and
quality control for traces of hydrogen or oxygen in the supplied liquid ammonia.
3.2.2.4 Combined techniques for the prevention and control of SOX, NOX and other pollutant emissions
3.2.2.4.1 Activated carbon process
Description
This process is based on the adsorption of pollutant molecules by the activated carbon. When
the surface has adsorbed as much as it can, the adsorbed content is desorbed as part of the
regeneration of the adsorbent.
WORKIN
G DRAFT IN
PROGRESS
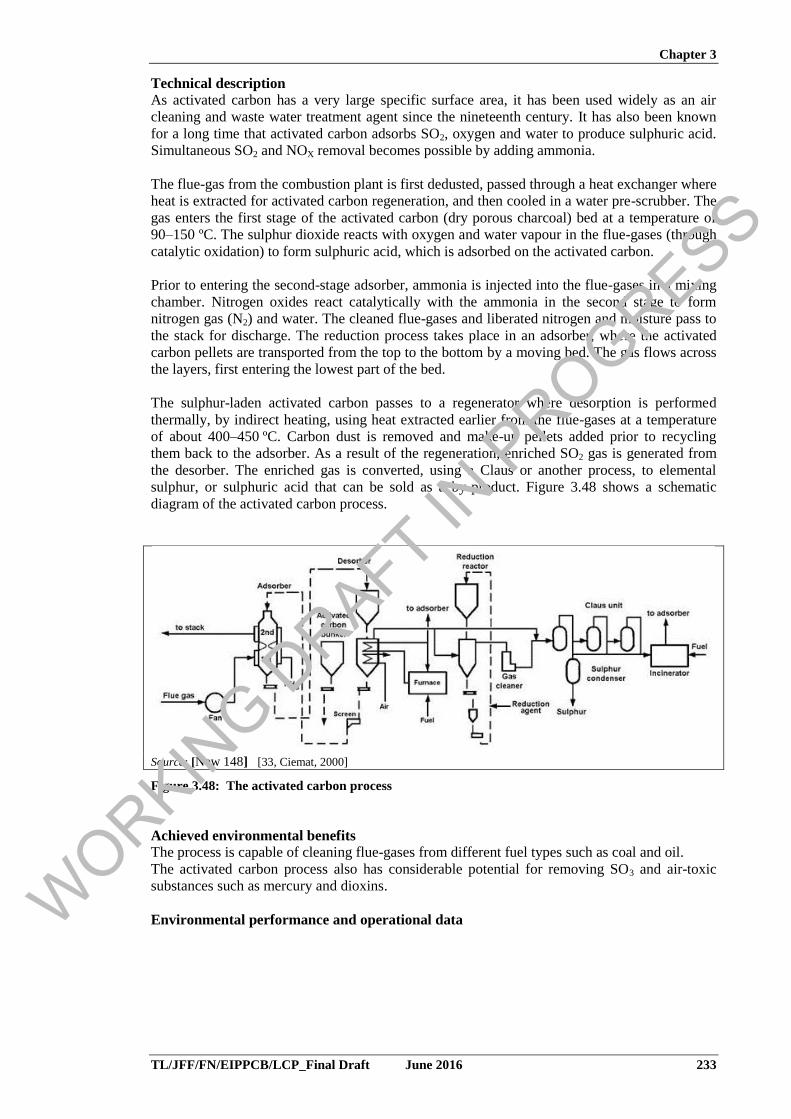
Chapter 3
TL/JFF/FN/EIPPCB/LCP_Final Draft June 2016 233
Technical description
As activated carbon has a very large specific surface area, it has been used widely as an air
cleaning and waste water treatment agent since the nineteenth century. It has also been known
for a long time that activated carbon adsorbs SO2, oxygen and water to produce sulphuric acid.
Simultaneous SO2 and NOX removal becomes possible by adding ammonia.
The flue-gas from the combustion plant is first dedusted, passed through a heat exchanger where
heat is extracted for activated carbon regeneration, and then cooled in a water pre-scrubber. The
gas enters the first stage of the activated carbon (dry porous charcoal) bed at a temperature of
90–150 ºC. The sulphur dioxide reacts with oxygen and water vapour in the flue-gases (through
catalytic oxidation) to form sulphuric acid, which is adsorbed on the activated carbon.
Prior to entering the second-stage adsorber, ammonia is injected into the flue-gases in a mixing
chamber. Nitrogen oxides react catalytically with the ammonia in the second stage to form
nitrogen gas (N2) and water. The cleaned flue-gases and liberated nitrogen and moisture pass to
the stack for discharge. The reduction process takes place in an adsorber, where the activated
carbon pellets are transported from the top to the bottom by a moving bed. The gas flows across
the layers, first entering the lowest part of the bed.
The sulphur-laden activated carbon passes to a regenerator where desorption is performed
thermally, by indirect heating, using heat extracted earlier from the flue-gases at a temperature
of about 400–450 ºC. Carbon dust is removed and make-up pellets added prior to recycling
them back to the adsorber. As a result of the regeneration, enriched SO2 gas is generated from
the desorber. The enriched gas is converted, using a Claus or another process, to elemental
sulphur, or sulphuric acid that can be sold as a by-product. Figure 3.48 shows a schematic
diagram of the activated carbon process.
Source: [New 148] [33, Ciemat, 2000]
Figure 3.48: The activated carbon process
Achieved environmental benefits
The process is capable of cleaning flue-gases from different fuel types such as coal and oil.
The activated carbon process also has considerable potential for removing SO3 and air-toxic
substances such as mercury and dioxins.
Environmental performance and operational data
W
ORKING D
RAFT IN P
ROGRESS
Chapter 3
234 June 2016 TL/JFF/FN/EIPPCB/LCP_Final Draft
Table 3.28: Performance of the activated carbon technique for reducing sulphur oxide/nitrogen
oxide/mercury emissions
Technique
General
SO2/NOX
reduction rate
General Hg
reduction rate
Other performance parameters
Parameter Value
Activated
carbon
process
98 % /
60 – 80 %
> 90 %
Operating temperature 90 – 150 ºC
Reagent Activated
carbon/ammonia
Reliability 98 %
Other substances
removed HCl, HF, dioxins
Energy consumption
as % of electric capacity 1.2 – 3.3 %
By-products Elemental sulphur or
sulphuric acid
Activated carbon techniques combined use only a fraction of the water used in conventional
abatement systems, e.g. at a Japanese plant, water use is as low as 1 % of the water used in wet
FGD.
Cross-media effects
Waste water is only produced in small amounts from the operation of the pre-scrubber.
Technical considerations relevant to applicability
No information provided.
Economics
No information provided.
Driving force for implementation
No information provided.
Example plants
Several commercial systems have been installed, mainly in Japan, e.g. J-Power Isogo Units 1
and 2 (2009) with: dust emission levels of < 10 mg/Nm3 for Unit 1 and < 5 mg/Nm
3 for Unit 2;
NOX emission levels of < 40 mg/Nm3 for Unit 1 and < 26 mg/Nm
3 for Unit 2; and SOX emission
levels of < 56 mg/Nm3 for Unit 1 and < 28 mg/Nm
3 for Unit 2.
Reference literature
[State –of-the-art USC coal fired power plant, Isogo repowering project, Shuzo Higa – EEB
submission 2012],
www.powermag.com/react-reduces-emissions-and-water-use
ReACT at Valmy
3.2.2.4.2 WSA-SNOX process
Description
WSA-SNOX process (Wet gas sulphuric acid with integrated selective catalytic reduction
DeNOX step) employs two catalysts sequentially to remove NOX by SCR and to oxidise SO2 to
SO3, condensing the latter as sulphuric acid for sale.
Technical description
About 98 % and 95 % of the sulphur and nitrogen oxides respectively in the flue-gas can be
removed. The process produces no waste water or waste products, nor does it consume any
chemical apart from ammonia for NOX control.
WORKIN
G DRAFT IN
PROGRESS
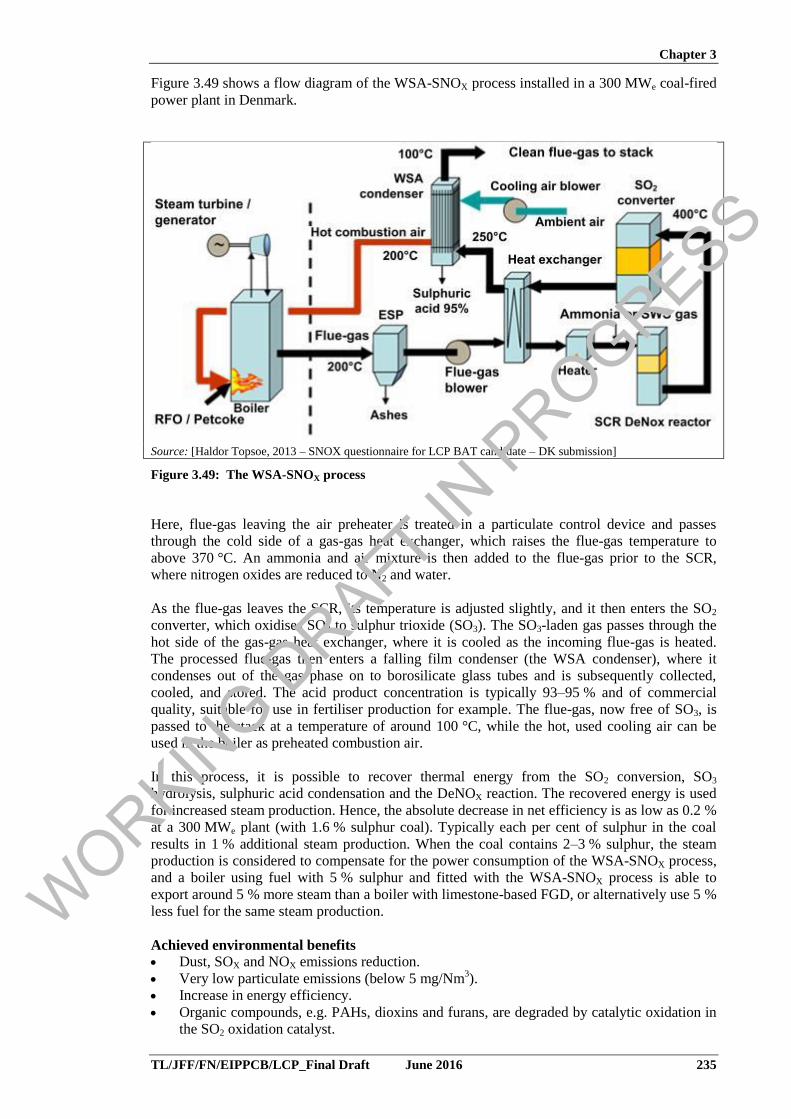
Chapter 3
TL/JFF/FN/EIPPCB/LCP_Final Draft June 2016 235
Figure 3.49 shows a flow diagram of the WSA-SNOX process installed in a 300 MWe coal-fired
power plant in Denmark.
Source: [Haldor Topsoe, 2013 – SNOX questionnaire for LCP BAT candidate – DK submission]
Figure 3.49: The WSA-SNOX process
Here, flue-gas leaving the air preheater is treated in a particulate control device and passes
through the cold side of a gas-gas heat exchanger, which raises the flue-gas temperature to
above 370 °C. An ammonia and air mixture is then added to the flue-gas prior to the SCR,
where nitrogen oxides are reduced to N2 and water.
As the flue-gas leaves the SCR, its temperature is adjusted slightly, and it then enters the SO2
converter, which oxidises SO2 to sulphur trioxide (SO3). The SO3-laden gas passes through the
hot side of the gas-gas heat exchanger, where it is cooled as the incoming flue-gas is heated.
The processed flue-gas then enters a falling film condenser (the WSA condenser), where it
condenses out of the gas phase on to borosilicate glass tubes and is subsequently collected,
cooled, and stored. The acid product concentration is typically 93–95 % and of commercial
quality, suitable for use in fertiliser production for example. The flue-gas, now free of SO3, is
passed to the stack at a temperature of around 100 °C, while the hot, used cooling air can be
used in the boiler as preheated combustion air.
In this process, it is possible to recover thermal energy from the SO2 conversion, SO3
hydrolysis, sulphuric acid condensation and the DeNOX reaction. The recovered energy is used
for increased steam production. Hence, the absolute decrease in net efficiency is as low as 0.2 %
at a 300 MWe plant (with 1.6 % sulphur coal). Typically each per cent of sulphur in the coal
results in 1 % additional steam production. When the coal contains 2–3 % sulphur, the steam
production is considered to compensate for the power consumption of the WSA-SNOX process,
and a boiler using fuel with 5 % sulphur and fitted with the WSA-SNOX process is able to
export around 5 % more steam than a boiler with limestone-based FGD, or alternatively use 5 %
less fuel for the same steam production.
Achieved environmental benefits
Dust, SOX and NOX emissions reduction.
Very low particulate emissions (below 5 mg/Nm3).
Increase in energy efficiency.
Organic compounds, e.g. PAHs, dioxins and furans, are degraded by catalytic oxidation in
the SO2 oxidation catalyst.
WORKIN
G DRAFT IN
PROGRESS
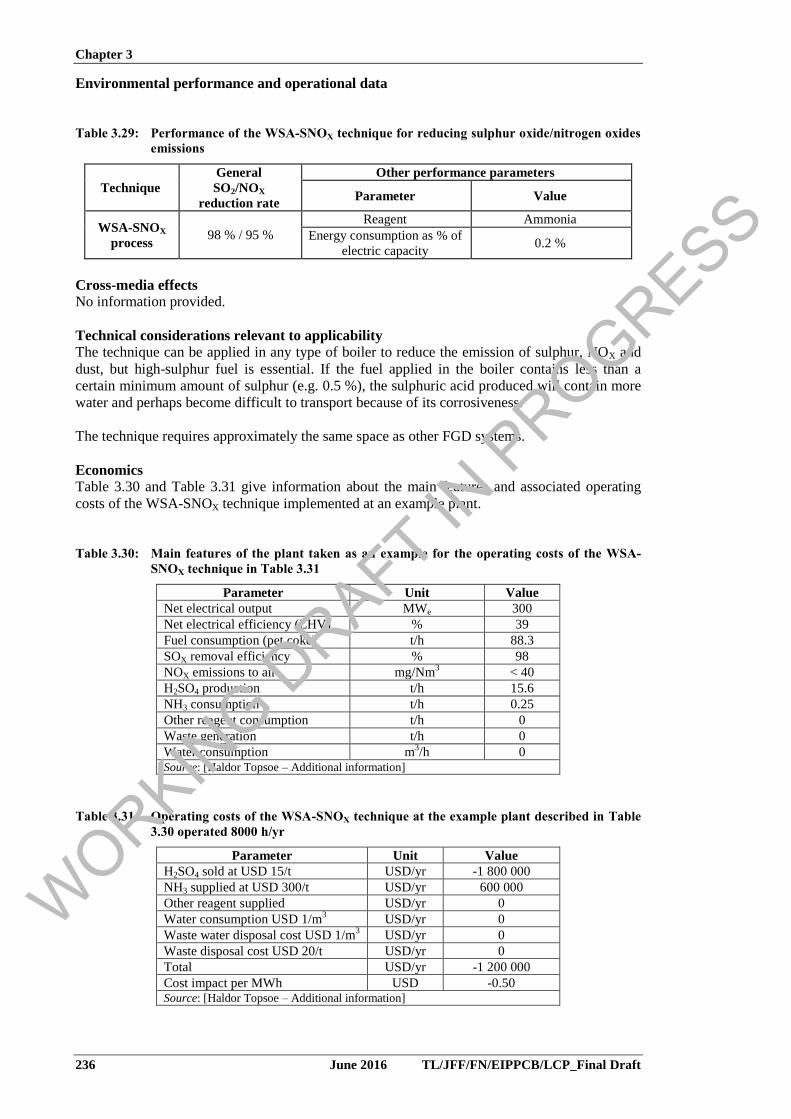
Chapter 3
236 June 2016 TL/JFF/FN/EIPPCB/LCP_Final Draft
Environmental performance and operational data
Table 3.29: Performance of the WSA-SNOX technique for reducing sulphur oxide/nitrogen oxides
emissions
Technique
General
SO2/NOX
reduction rate
Other performance parameters
Parameter Value
WSA-SNOX
process 98 % / 95 %
Reagent Ammonia
Energy consumption as % of
electric capacity 0.2 %
Cross-media effects
No information provided.
Technical considerations relevant to applicability
The technique can be applied in any type of boiler to reduce the emission of sulphur, NOX and
dust, but high-sulphur fuel is essential. If the fuel applied in the boiler contains less than a
certain minimum amount of sulphur (e.g. 0.5 %), the sulphuric acid produced will contain more
water and perhaps become difficult to transport because of its corrosiveness.
The technique requires approximately the same space as other FGD systems.
Economics
Table 3.30 and Table 3.31 give information about the main features and associated operating
costs of the WSA-SNOX technique implemented at an example plant.
Table 3.30: Main features of the plant taken as an example for the operating costs of the WSA-
SNOX technique in Table 3.31
Parameter Unit Value
Net electrical output MWe 300
Net electrical efficiency (LHV) % 39
Fuel consumption (pet coke) t/h 88.3
SOX removal efficiency % 98
NOX emissions to air mg/Nm3 < 40
H2SO4 production t/h 15.6
NH3 consumption t/h 0.25
Other reagent consumption t/h 0
Waste generation t/h 0
Water consumption m3/h 0
Source: [Haldor Topsoe – Additional information]
Table 3.31: Operating costs of the WSA-SNOX technique at the example plant described in Table
3.30 operated 8000 h/yr
Parameter Unit Value
H2SO4 sold at USD 15/t USD/yr -1 800 000
NH3 supplied at USD 300/t USD/yr 600 000
Other reagent supplied USD/yr 0
Water consumption USD 1/m3 USD/yr 0
Waste water disposal cost USD 1/m3 USD/yr 0
Waste disposal cost USD 20/t USD/yr 0
Total USD/yr -1 200 000
Cost impact per MWh USD -0.50 Source: [Haldor Topsoe – Additional information]
WORKIN
G DRAFT IN
PROGRESS
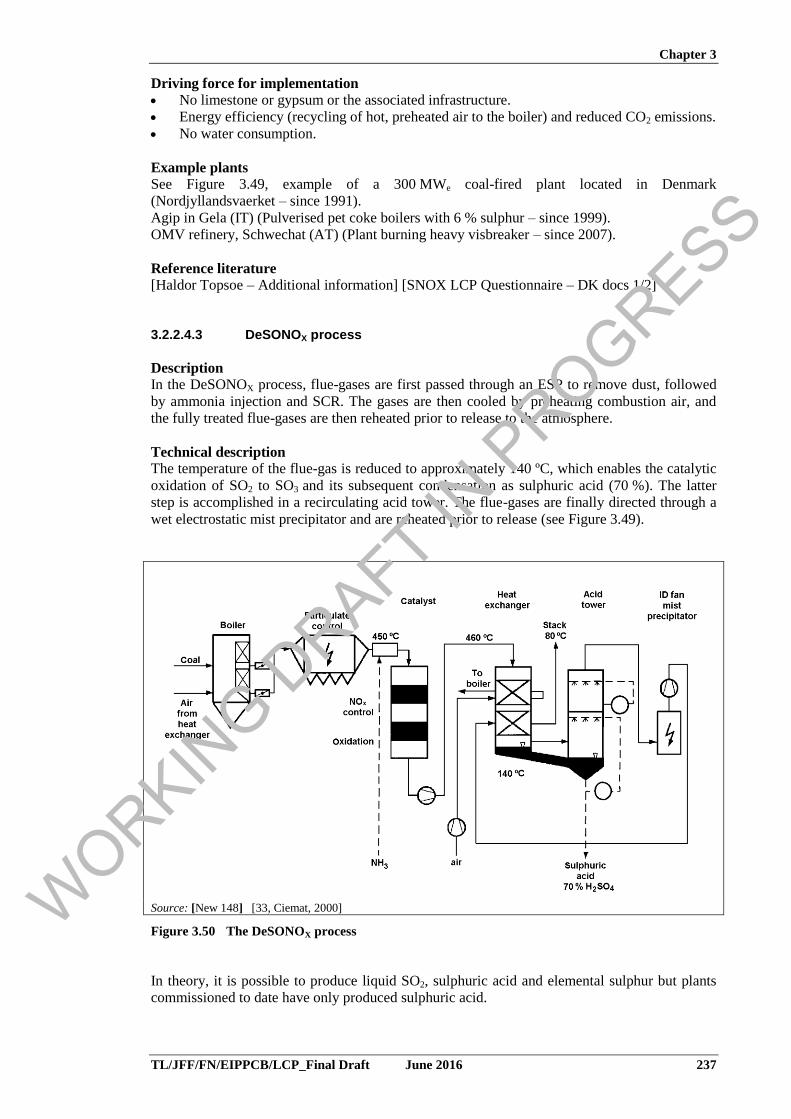
Chapter 3
TL/JFF/FN/EIPPCB/LCP_Final Draft June 2016 237
Driving force for implementation
No limestone or gypsum or the associated infrastructure.
Energy efficiency (recycling of hot, preheated air to the boiler) and reduced CO2 emissions.
No water consumption.
Example plants
See Figure 3.49, example of a 300 MWe coal-fired plant located in Denmark
(Nordjyllandsvaerket – since 1991).
Agip in Gela (IT) (Pulverised pet coke boilers with 6 % sulphur – since 1999).
OMV refinery, Schwechat (AT) (Plant burning heavy visbreaker – since 2007).
Reference literature
[Haldor Topsoe – Additional information] [SNOX LCP Questionnaire – DK docs 1/2]
3.2.2.4.3 DeSONOX process
Description
In the DeSONOX process, flue-gases are first passed through an ESP to remove dust, followed
by ammonia injection and SCR. The gases are then cooled by preheating combustion air, and
the fully treated flue-gases are then reheated prior to release to the atmosphere.
Technical description
The temperature of the flue-gas is reduced to approximately 140 ºC, which enables the catalytic
oxidation of SO2 to SO3 and its subsequent condensation as sulphuric acid (70 %). The latter
step is accomplished in a recirculating acid tower. The flue-gases are finally directed through a
wet electrostatic mist precipitator and are reheated prior to release (see Figure 3.49).
Source: [New 148] [33, Ciemat, 2000]
Figure 3.50 The DeSONOX process
In theory, it is possible to produce liquid SO2, sulphuric acid and elemental sulphur but plants
commissioned to date have only produced sulphuric acid.
WORKIN
G DRAFT IN
PROGRESS
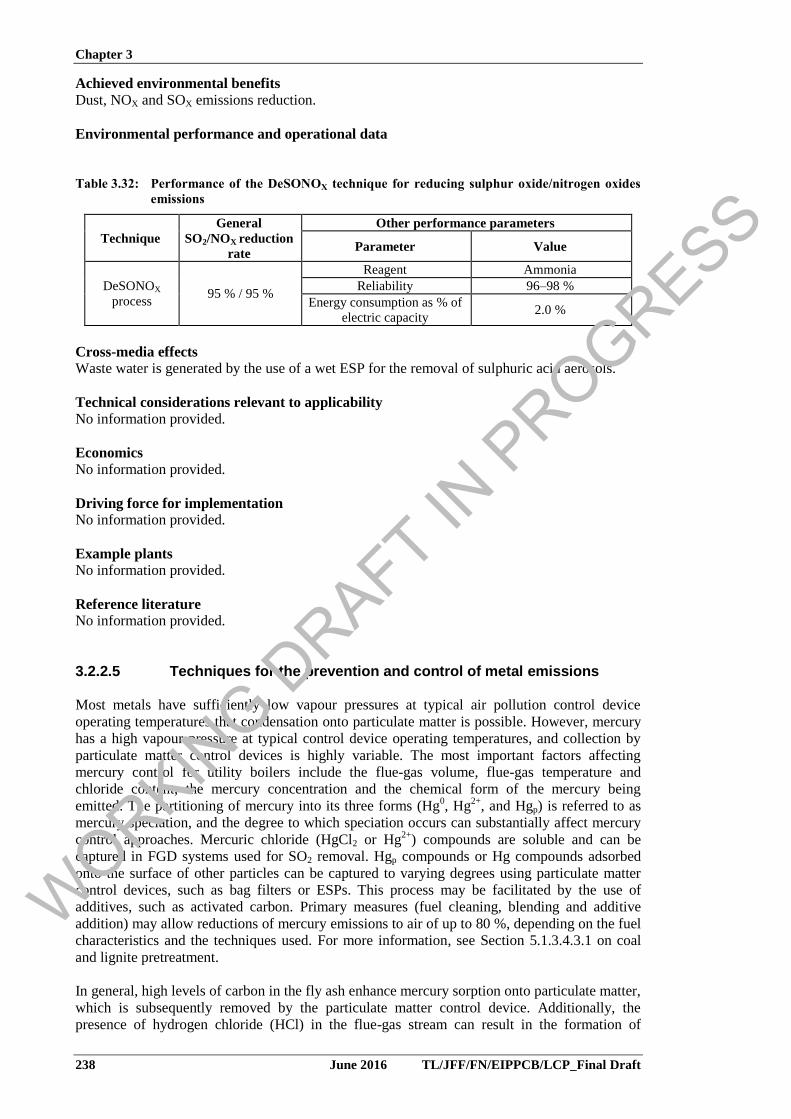
Chapter 3
238 June 2016 TL/JFF/FN/EIPPCB/LCP_Final Draft
Achieved environmental benefits
Dust, NOX and SOX emissions reduction.
Environmental performance and operational data
Table 3.32: Performance of the DeSONOX technique for reducing sulphur oxide/nitrogen oxides
emissions
Technique
General
SO2/NOX reduction
rate
Other performance parameters
Parameter Value
DeSONOX
process 95 % / 95 %
Reagent Ammonia
Reliability 96–98 %
Energy consumption as % of
electric capacity 2.0 %
Cross-media effects
Waste water is generated by the use of a wet ESP for the removal of sulphuric acid aerosols.
Technical considerations relevant to applicability
No information provided.
Economics
No information provided.
Driving force for implementation
No information provided.
Example plants
No information provided.
Reference literature
No information provided.
3.2.2.5 Techniques for the prevention and control of metal emissions
Most metals have sufficiently low vapour pressures at typical air pollution control device
operating temperatures that condensation onto particulate matter is possible. However, mercury
has a high vapour pressure at typical control device operating temperatures, and collection by
particulate matter control devices is highly variable. The most important factors affecting
mercury control for utility boilers include the flue-gas volume, flue-gas temperature and
chloride content, the mercury concentration and the chemical form of the mercury being
emitted. The partitioning of mercury into its three forms (Hg0, Hg
2+, and Hgp) is referred to as
mercury speciation, and the degree to which speciation occurs can substantially affect mercury
control approaches. Mercuric chloride (HgCl2 or Hg2+
) compounds are soluble and can be
captured in FGD systems used for SO2 removal. Hgp compounds or Hg compounds adsorbed
onto the surface of other particles can be captured to varying degrees using particulate matter
control devices, such as bag filters or ESPs. This process may be facilitated by the use of
additives, such as activated carbon. Primary measures (fuel cleaning, blending and additive
addition) may allow reductions of mercury emissions to air of up to 80 %, depending on the fuel
characteristics and the techniques used. For more information, see Section 5.1.3.4.3.1 on coal
and lignite pretreatment.
In general, high levels of carbon in the fly ash enhance mercury sorption onto particulate matter,
which is subsequently removed by the particulate matter control device. Additionally, the
presence of hydrogen chloride (HCl) in the flue-gas stream can result in the formation of
WORKIN
G DRAFT IN
PROGRESS

Chapter 3
TL/JFF/FN/EIPPCB/LCP_Final Draft June 2016 239
mercuric chloride, which is removed in the FGD system. Conversely, sulphur dioxide (SO2) in
flue-gas can act as a reducing agent to convert oxidised mercury to elemental mercury, which is
more difficult to collect.
Control technologies designed for controlling pollutants other than mercury (e.g. acid gases and
particulate matter) vary in their mercury removal capability, depending on fuel characteristics
and on the control technology configuration (see the example for coal-fired plants in Section
5.1.3.4.2).
[ 27, ICAC 2009 ]
3.2.2.5.1 Reduction of metal emissions in dust abatement systems
Description
The co-benefit capture, in dust abatement systems, of metals that have reacted with or formed
particulates.
Technical description
The particulate concentration in flue-gas is mainly affected by the ash content in the coal burnt.
Particles tend to be the adsorbents in flue-gas.
Electrostatic precipitators and bag filters are commonly used to remove dust from flue-gases
generated by combustion plants burning solid or liquid fuels. These systems can operate with an
overall particulate removal efficiency of > 99.9 %. However, the removal efficiency is generally
lower in the smaller particle size range, i.e. the size range in which particles enriched with metal
elements might be found.
ESPs are the most commonly used dedusting technique in coal-fired power plants. Particulate-
bound mercury and other metals are removed when the particles are captured by the ESP.
ESPs can capture nearly all Hgp. When the flue-gas flows through the charging electrode, all
particles are loaded with a negative charge. When the particles with a negative charge pass
through the collecting boards which have a positive charge, they are collected on the dust-
collecting electrode. Although gas-phase mercury is barely removed by ESPs, it does transform
continuously across the ducts and devices. Oxidised mercury, on the other hand, will move
forward along with the flue-gas. Therefore, Hg2+
is unlikely to be adsorbed onto particles to
transform to Hgp. However, some of the Hg0 will be adsorbed or oxidised into Hgp or Hg
2+ when
cooling to 400 °C, which explains the fact that the total gaseous mercury may decrease when
going through the ESP. [ 28, S.Wang et al. 2009 ]
Bag filters (BF) have a similar overall particulate removal efficiency to ESPs (i.e. greater than
99.9 %) but are better at abating fine particulate matter and less sensitive to particulate loading
and fly ash characteristics. The collection efficiency may be increased further still by using flue-
gas conditioning with small amounts of additives added to the gas flow upstream of the filters.
Regarding mercury, some elements may remain in the gas phase until the flue-gases have
cooled sufficiently for condensation to occur. By the time the flue-gases reach the BF, they have
cooled sufficiently to also allow some condensation of Hg, similar to a cold-side ESP. A BF can
be more effective than an ESP, especially with bituminous coals, because of the increased
contact with the flue-gas containing fly ash and unburnt carbon as they accumulate as a filter
cake on the BF. This filter cake contributes to greater heterogeneous oxidation and the
adsorption of mercury. For hot-side ESPs, this difference is accentuated because the capture of
mercury on fly ash is less effective at higher temperatures [ 2, EEB 2012 ]
The Hg removal efficiency in an ESP depends on the following factors:
temperature of the ESP;
WORKIN
G DRAFT IN
PROGRESS
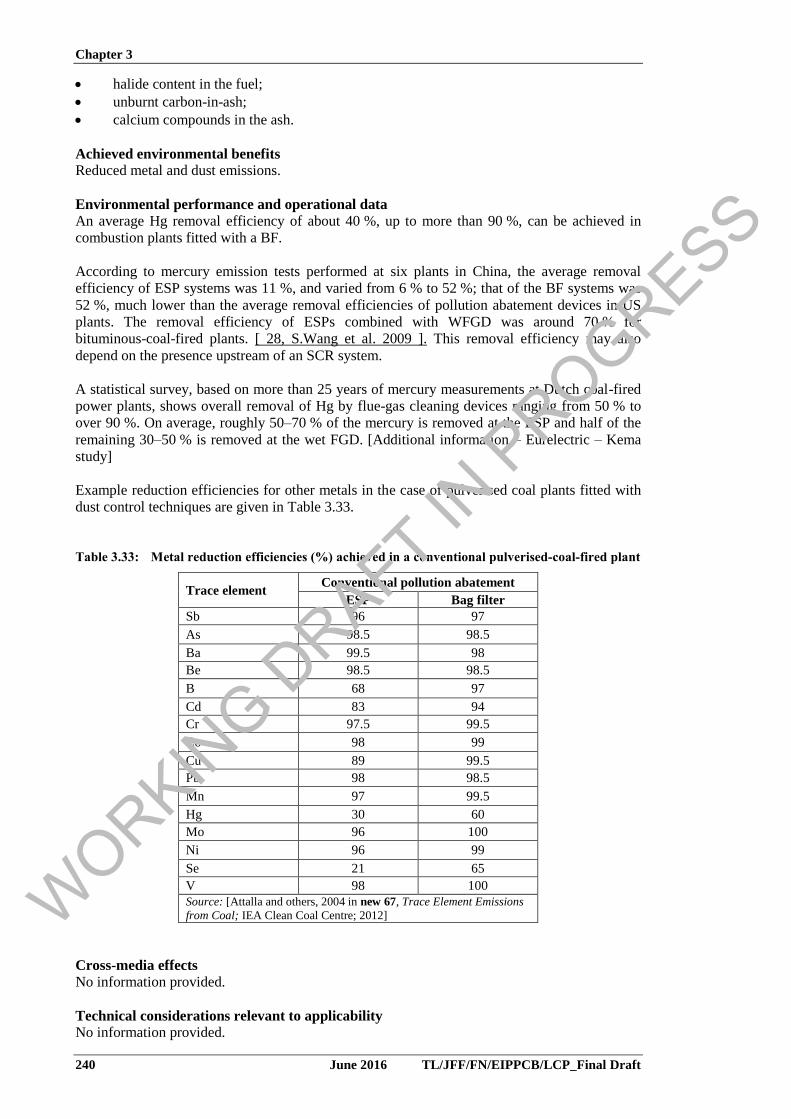
Chapter 3
240 June 2016 TL/JFF/FN/EIPPCB/LCP_Final Draft
halide content in the fuel;
unburnt carbon-in-ash;
calcium compounds in the ash.
Achieved environmental benefits
Reduced metal and dust emissions.
Environmental performance and operational data
An average Hg removal efficiency of about 40 %, up to more than 90 %, can be achieved in
combustion plants fitted with a BF.
According to mercury emission tests performed at six plants in China, the average removal
efficiency of ESP systems was 11 %, and varied from 6 % to 52 %; that of the BF systems was
52 %, much lower than the average removal efficiencies of pollution abatement devices in US
plants. The removal efficiency of ESPs combined with WFGD was around 70 % for
bituminous-coal-fired plants. [ 28, S.Wang et al. 2009 ]. This removal efficiency may also
depend on the presence upstream of an SCR system.
A statistical survey, based on more than 25 years of mercury measurements at Dutch coal-fired
power plants, shows overall removal of Hg by flue-gas cleaning devices ranging from 50 % to
over 90 %. On average, roughly 50–70 % of the mercury is removed at the ESP and half of the
remaining 30–50 % is removed at the wet FGD. [Additional information – Eurelectric – Kema
study]
Example reduction efficiencies for other metals in the case of pulverised coal plants fitted with
dust control techniques are given in Table 3.33.
Table 3.33: Metal reduction efficiencies (%) achieved in a conventional pulverised-coal-fired plant
Trace element Conventional pollution abatement
ESP Bag filter
Sb 96 97
As 98.5 98.5
Ba 99.5 98
Be 98.5 98.5
B 68 97
Cd 83 94
Cr 97.5 99.5
Co 98 99
Cu 89 99.5
Pb 98 98.5
Mn 97 99.5
Hg 30 60
Mo 96 100
Ni 96 99
Se 21 65
V 98 100
Source: [Attalla and others, 2004 in new 67, Trace Element Emissions
from Coal; IEA Clean Coal Centre; 2012]
Cross-media effects
No information provided.
Technical considerations relevant to applicability
No information provided.
WORKIN
G DRAFT IN
PROGRESS
Chapter 3
TL/JFF/FN/EIPPCB/LCP_Final Draft June 2016 241
Economics
See Sections 3.2.2.1.1 and 3.2.2.1.2.
Driving force for implementation
No information provided.
Example plants
See Sections 3.2.2.1.1 and 3.2.2.1.2.
Reference literature
No information provided.
3.2.2.5.2 Reduction of metal emissions in FGD systems
Description
Capture of metals in soluble or oxidised form using a desulphurisation system, as a co-benefit of
FGD.
Technical description
Wet scrubber FGD systems are an effective method for reducing emissions of certain metals.
This is mostly because the flue-gas temperature is reduced to about 50–60 ºC by passing
through the absorber, which allows many of the more volatile metals to condense from the
vapour phase, and allows them to be removed from the flue-gas. The condensed metals are then
mainly transferred to the waste water from the wet FGD system.
Spray dry absorbers configured with a particulate removal system before a spray dry scrubber
have high metal retention, so a large proportion of these elements (including volatile species)
are removed before the FGD unit. The highest particulate removal efficiencies, especially for
fine particles, are achieved by spray dry systems fitted with downstream bag filters. These
systems may also be expected to achieve the highest metal removal efficiencies.
Duct sorbent injection (DSI) with pre-humidification and a CFB scrubber have a similar
capability to reduce heavy metals, including mercury, as spray dry absorbers. The vaporisation
of water reduces the flue-gas temperature and this, in combination with a high-efficiency
particulate removal device, such as a bag filter, efficiently removes mercury and other metals.
The mercury removal is further enhanced if activated carbon is injected before the modified dry
scrubber.
Achieved environmental benefits
Reduced metal and SOX emissions.
Environmental performance and operational data
Various studies have given removal efficiencies from the flue-gas of 30–50 % for Hg and 60–
75 % for Se. However, the lime used in some systems may be an important source of As, Cd, Pb
and Zn, and so the concentrations of these elements can even increase downstream of the FGD.
Emissions from the scrubber depend on the specific process, operating conditions and specific
control technology configuration.
An average Hg removal efficiency of 96.6 % was achieved for instance by adding sodium
hypochlorite additives to the flue-gas from a waste incinerator in Japan. Sodium hypochlorite
stabilises the Hg in the flue-gas, allowing it to be captured in the scrubber water. The Hg can
then be removed from the waste water stream using reduction, volatilisation, condensation and
Hg separation processes. In another example related to six Chinese coal-fired plants, 67–98 %
of the Hg2+
was absorbed in the scrubber solution and retained in the FGD gypsum. A higher
concentration of Hg2+
in the flue-gas led to a higher removal efficiency in the wet FGD. The
reduction of Hg0 in the flue-gas in a wet FGD was less than 30 %. The removal efficiency of an
WORKIN
G DRAFT IN
PROGRESS

Chapter 3
242 June 2016 TL/JFF/FN/EIPPCB/LCP_Final Draft
ESP in combination with WFGD is around 70 % for bituminous-coal-fired plants. [ 28, S.Wang
et al. 2009 ]
The overall removal of Hg in various spray dry systems varies from about 35 % to 85 %. Plants
fitted with dust removal systems before the spray dry scrubber have Hg removal efficiencies up
to 70 %, even before entering the FGD unit.
Example reduction efficiencies for other metals in the case of a pulverised coal plant fitted with
FGD are given in Table 3.34.
Table 3.34: Metal reduction efficiencies (%) achieved in a conventional pulverised-coal-fired plant
Trace element
Flue-gas
desulphurisation
(Venturi scrubber)
Sb 99
As 98.5
Ba 99.5
Be 98.5
B 63
Cd 96
Cr 99.5
Co 99
Cu 99
Pb 99
Mn 99.5
Hg 20
Mo 99
Ni 99
Se 60
V 99.5 Source: [Attalla and others, 2004 in new 67, Trace
Element Emissions from Coal; IEA Clean Coal Centre;
2012]
Cross-media effects
There may be accumulation of metal concentrations in FGD gypsum which need to be avoided
not to jeopardize the use of FGD gypsum.
Under some conditions, oxidised mercury may be reduced to elemental mercury in wet FGD
units, and this could be re-emitted. When gaseous compounds of oxidised mercury (Hg2+
) are
absorbed in the liquid slurry of a wet FGD system, the dissolved species are believed to react
with dissolved sulphides from the flue-gas to form mercuric sulphide (HgS), which precipitates
from the liquid solution as sludge.
In the absence of a sufficient concentration of sulphides in the liquid solution, a competing
reaction with sulphites that reduces dissolved Hg2+
to elemental mercury (Hg0) is believed to
take place. Once this reduction occurs, the newly formed Hg0 is transferred to the flue-gas and
increases the concentration of Hg0 in the flue-gas passing through the wet FGD. Hg
2+ reduction
and subsequent Hg0 re-emission may be more significant in magnesium-enhanced limestone
scrubbers, which operate with a much higher sulphite concentration than limestone systems.
The wet FGD redox potential also plays an important role in the possible reduction of Hg2+
to
Hg0 and the consequent re-emission of Hg.
In some cases, the reduction of Hg2+
to Hg0 and subsequent re-emission are abated with the help
of sulphide-donating liquid reagent. In addition, transition metals in the slurry (originating from
WORKIN
G DRAFT IN
PROGRESS

Chapter 3
TL/JFF/FN/EIPPCB/LCP_Final Draft June 2016 243
fly ash in the flue-gas) are believed to play an active role in the conversion reaction, since they
can act as catalysts and/or reactants for reducing oxidised species. There also appears to be
increased potential for re-emission of mercury in wet FGD systems with appreciable
concentrations in the liquor phase.
Technical considerations relevant to applicability
No information provided.
Economics
No information provided.
Driving force for implementation
No information provided.
Example plants
No information provided.
Reference literature
No information provided.
3.2.2.5.3 Reduction of metal emissions in NOX control systems
Description
Conversion of mercury from an elemental form to a more easily capturable oxidised form,
through selective catalytic reduction.
Technical description
SCR systems can be enhanced by the addition of catalysts to specifically convert elemental
mercury to oxidised mercury, which can be subsequently captured by a wet FGD scrubber. For
low-halide fuels, the high-dust catalysts may require augmentation of the flue-gas chlorine or
bromine to be effective, whereas tail-end catalysts are effective without chlorine augmentation.
Beyond mercury, there is no evidence that NOX control systems have any significant influence
on trace element behaviour or removal.
Parameters affecting the degree of oxidation of elemental mercury include the halide content
(e.g. HF, HCl), flue-gas temperature, catalyst chemistry, catalyst age, and flue-gas constituents
from the combustion and concentration/distribution of NH3 in the flue-gas (increasing the NH3
concentration reduces the Hg oxidation). [ 29, Cormetech Inc. and Mitsubishi Heavy Industries
2010 ] [ 2, EEB 2012 ].
Achieved environmental benefits
Reduced Hg emissions when combined with an FGD system.
Reduced NOX emissions.
Environmental performance and operational data
Advanced catalysts used in selective catalytic reduction (SCR) can oxidise up to 95 % of the
vapour-phase mercury from an elemental form to a soluble ionic form, which can be readily
captured in a downstream wet FGD system. For bituminous-coal-firing boilers, an overall
mercury capture of 80 % to over 95 % has been observed in full-scale plant tests, where SCR
followed by wet FGD was used. Plant 123 has been undertaking long-term trials with such a
catalyst and the injection of precipitation additive into the scrubber to reduce mercury
emissions. Reported air emissions data show that 100 % of daily values in 2011 and 2012 were
< 5 µg/Nm3, and more than 90 % (2011) and 98 % (2012) of daily values were < 3 µg/Nm
3.
In a Chinese study related to mercury emissions and speciation in coal-fired power plants in
China, it was concluded that a conventional SCR system oxidised 13 % of the elemental
WORKIN
G DRAFT IN
PROGRESS

Chapter 3
244 June 2016 TL/JFF/FN/EIPPCB/LCP_Final Draft
mercury, and that ammonia injection before SCR might have a positive effect on the adsorption
of mercury onto particulate matter. [ 28, S.Wang et al. 2009 ]
Cross-media effects
See Section 3.2.2.3.11.
Technical considerations relevant to applicability
See Section 3.2.2.3.11.
Economics
See Section 3.2.2.3.11.
Driving force for implementation
See Section 3.2.2.3.11.
Example plants
See Section 3.2.2.3.11.
Reference literature
See Section 3.2.2.3.11.
3.2.2.5.4 Reduction of metal emissions by specifically designed systems
Description
Use of dedicated additive/sorbent, generally in addition to existing abatement equipment.
Technical description
Some systems have been developed expressly for the purpose of reducing certain metals from
flue-gas streams, mostly to reduce emissions of Hg and other toxic metals (such as As, Cd and
Pb) from waste incinerators. These systems include selenium filters, activated carbon filters and
various sorbents. They are only briefly discussed in this section.
Different sorbents such as silica, bauxite (alumina), kaolinite, emathlite and lime have been
investigated for their ability to remove metals from flue-gas. A detailed list of these and other
possible sorbents can be found in [New 148] [33, Ciemat, 2000] but some of the processes are
of limited practical use for large power stations because of the low operating temperatures,
harmful secondary effects and the high cost of some of the sorbents.
A long-term mercury control research and development programme was undertaken by the US
Department of Energy, which concluded, in 2008, that systems injecting sorbents into the flue-
gas from coal-fired power plants are ready for commercial deployment (see further details in
Section 5.1.3.4.3).
[ 2, EEB 2012 ]
Activated carbon or coke filter systems have been developed which can be used to remove
metals such as Cd, Hg and Pb from flue-gases. Information can be found in [New 148] [33,
Ciemat, 2000] regarding a lignite coke filter and catalyst system which, in addition to acid gas
removal, adsorbs metal elements. Tests carried out in a pilot-scale system, fitted to a municipal
waste incinerator, indicate that virtually all the Hg is removed from the flue-gases by the lignite
coke material. Activated carbon technology has also been applied in the US to increase Hg
removal in spray dry scrubber/ESP systems. See further details on carbon sorbent injection for
mercury reduction in Section 5.1.3.4.3.2.
The removal of Hg vapour from flue-gases using sulphur-impregnated adsorbents has been
studied using packed beds. The experimental results have shown that the impregnation of active
alumina and zeolite by sulphur increases the adsorption capacity by several orders of magnitude.
WORKIN
G DRAFT IN
PROGRESS

Chapter 3
TL/JFF/FN/EIPPCB/LCP_Final Draft June 2016 245
Although the sorbents have a high Hg adsorption capacity, they are unable to remove all the Hg
(as they already have an outlet concentration greater than zero for gases passing through the
filters, even at the start of gas breakthrough).
A system is available for Hg removal that uses a selenium-impregnated filter which may be
retrofitted to existing exhaust ducting after scrubbers. The filter relies on the strong affinity of
Hg to Se, with which it combines to form mercury selenide (HgSe), a highly stable compound.
Spent filters are returned to the manufacturer for recharging.
It is also possible to reduce Hg emissions using additives in other FGD systems, such as dry
injection systems. With regards to the additive, Sorbalit may be added for instance. This is a
sorbent that is composed of calcium hydroxide and various other organic and inorganic
constituents.
Achieved environmental benefits
Reduced specific metals emission.
Environmental performance and operational data
Environmental performances achieved when using activated carbon injection or halogenated
additives addition are given in Section 5.1.3.4.3.
Very low Hg concentrations in the flue-gases may be achieved using a bed of sulphur-
impregnated active alumina and zeolite adsorbents, followed by a second bed of sulphur-
impregnated activated carbon adsorbents.
Cross-media effects
See Section 5.1.3.4.3.
Technical considerations relevant to applicability
See Section 5.1.3.4.3.
Economics
See Section 5.1.3.4.3.
Driving force for implementation
See Section 5.1.3.4.3.
Example plants
See Section 5.1.3.4.3.
Reference literature
See Section 5.1.3.4.3.
3.2.2.5.5 Reduction of metal emissions by use of a metal separator in the fuel
supply line
Description
Removal of ferromagnetic matter contained in the fuel/waste before combustion.
Technical description
Before entering the boiler, ferromagnetic foreign matter is precipitated out of the fuel mixture
by means of a magnetic iron separator. In the metal separator, magnet technology is used to
remove magnetic metals before contaminants (large/heavy parts) are removed in the classifier
and then passed to a mill for recycling.
WORKIN
G DRAFT IN
PROGRESS
Chapter 3
246 June 2016 TL/JFF/FN/EIPPCB/LCP_Final Draft
Achieved environmental benefits
Reduced specific metals emission.
Environmental performance and operational data
The reduction in the metal input reduces the danger of malfunctions occurring in the
downstream plant sections and limits their associated environmental impacts.
Cross-media effects
Limited electrical consumption.
Technical considerations relevant to applicability
Plant-specific.
Economics
Limited capex and opex.
Metallic waste recovered can be sold for reuse.
Reduction in O&M expenditures due to reduced malfunctions in downstream processes.
In general, the metal separator is included in a dedicated feeding line for waste. In the case of
Plant 142, such a line represented an investment of about EUR 14.5 million (2003 price level)
and has a yearly O&M cost of about EUR 2.5 million (fixed costs, 2010 price level).
Driving force for implementation
Non-environmental triggers (maintenance/economic incentives).
Example plants.
Plants 121 and 142.
Reference literature
No information provided.
3.2.2.6 Techniques for the prevention and control of HCl and HF emissions 3.2.2.6.1 Co-benefit of techniques designed for other pollutants
This section discusses the halide removal efficiency of the various pollution control
technologies most commonly installed in LCPs (i.e. particulate and sulphur control equipment).
Description
Reduction of halide emissions as a co-benefit of abatement techniques designed for removing
other pollutants.
Technical description
Very little information is available regarding the capture of halides by electrostatic precipitators
(ESPs) and bag filters alone. Considering the nature of the gases, however, in the absence of a
sorbent, it is likely that they have little or no effect. The addition of a sorbent such as lime to the
combustion zone can result in the capture of halides on or in particles, which may then be
trapped by filtration systems. With dry sorbent injection in the combustion chamber, HCl and
HF reduction is limited as SO2 reduction releases HCl and HF from the sorbent at high
temperatures.
A common dry FGD system for both utility and industrial boilers is the spray dryer (semi-dry
system). The flue-gas comes into contact with an atomised lime slurry or sodium carbonate
solution. The hot flue-gases dry the droplets and precipitate the dissolved chemicals, which can
then be collected, along with any remaining boiler fly ash in a bag filter or ESP. Other dry
systems such as dry sorbent injection or the CFB scrubber can be used for reducing halide
WORKIN
G DRAFT IN
PROGRESS

Chapter 3
TL/JFF/FN/EIPPCB/LCP_Final Draft June 2016 247
emissions, for instance as a second abatement step for HCl and HF, including in a CFBC system
of > 300MWth.
In wet FGD systems, flue-gases can be initially washed in a pre-scrubber, which stops the
potential build-up of chlorides in the FGD absorber circulation loop. In the pre-scrubber, most
of the fly ash and soluble gases such as HCl and HF are captured and the effluent is removed to
a waste water treatment plant.
SCR and SNCR are technologies designed to remove NOX from flue-gases. In SNCR, the
ammonia used to reduce NOX can react with HCl and HF in the fly ash to produce ammonium
chloride and fluoride. It may be assumed that if an ESP or other particulate controls are in place,
the ammonia may still react with any HCl/HF in the flue-gas, although this effectively
neutralises the acidity of the HCl/HF.
Achieved environmental benefits
Reduced HCl and HF emissions.
Environmental performance and operational data
The actual halide removal efficiency of combustion plants using a wet FGD system varies
greatly. The chlorine (HCl) removal efficiency ranges from 87 % to 97 %, fluorine (HF) from
43 % to 97 %, bromine from 85 % to 96 % and iodine from 41 % to 97 %. When using a
rotating heat exchanger, the highest removal efficiencies cannot be reached due to the
adsorption/desorption of halides to/from the heat exchanger surface (material).
Chlorine and fluorine removal efficiencies in dry FGD systems are equivalent to those of wet
FGD systems [ New 148, 33, Ciemat, 2000].
Cross-media effects
When using SCR/SNCR techniques, the ammonium chloride produced can lead to visible
plumes at stack level.
Technical considerations relevant to applicability
See Section 3.2.2.2.
Economics
See sections on corresponding techniques.
Driving force for implementation
No information provided.
Example plants
See sections on corresponding techniques.
Reference literature
[New 148] [33, Ciemat, 2000]
3.2.2.6.2 Wet scrubbing
Description
Use of a liquid, typically water or a water-based solution, to capture the acidic gas by absorption
from the flue-gas.
Technical description
HCl/HF is scrubbed using either a venturi scrubber, with the mixing of liquid and gas streams
enabling the transfer of HCl/HF from the gas phase to the scrubbing liquid phase, or a
counter-current packed tower for achieving higher efficiencies.
WORKIN
G DRAFT IN
PROGRESS
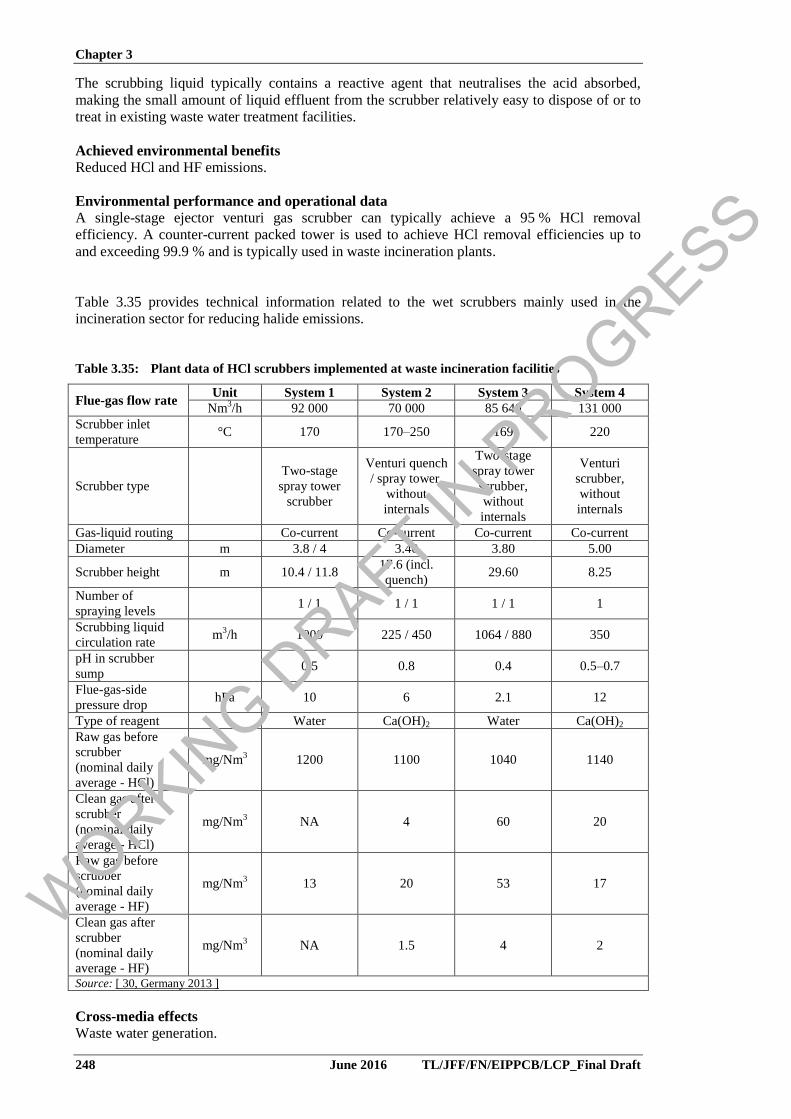
Chapter 3
248 June 2016 TL/JFF/FN/EIPPCB/LCP_Final Draft
The scrubbing liquid typically contains a reactive agent that neutralises the acid absorbed,
making the small amount of liquid effluent from the scrubber relatively easy to dispose of or to
treat in existing waste water treatment facilities.
Achieved environmental benefits
Reduced HCl and HF emissions.
Environmental performance and operational data
A single-stage ejector venturi gas scrubber can typically achieve a 95 % HCl removal
efficiency. A counter-current packed tower is used to achieve HCl removal efficiencies up to
and exceeding 99.9 % and is typically used in waste incineration plants.
Table 3.35 provides technical information related to the wet scrubbers mainly used in the
incineration sector for reducing halide emissions.
Table 3.35: Plant data of HCl scrubbers implemented at waste incineration facilities
Flue-gas flow rate Unit System 1 System 2 System 3 System 4
Nm3/h 92 000 70 000 85 640 131 000
Scrubber inlet
temperature °C 170 170–250 169 220
Scrubber type
Two-stage
spray tower
scrubber
Venturi quench
/ spray tower,
without
internals
Two-stage
spray tower
scrubber,
without
internals
Venturi
scrubber,
without
internals
Gas-liquid routing Co-current Co-current Co-current Co-current
Diameter m 3.8 / 4 3.40 3.80 5.00
Scrubber height m 10.4 / 11.8 17.6 (incl.
quench) 29.60 8.25
Number of
spraying levels 1 / 1 1 / 1 1 / 1 1
Scrubbing liquid
circulation rate m
3/h 1000 225 / 450 1064 / 880 350
pH in scrubber
sump 0.5 0.8 0.4 0.5–0.7
Flue-gas-side
pressure drop hPa 10 6 2.1 12
Type of reagent Water Ca(OH)2 Water Ca(OH)2
Raw gas before
scrubber
(nominal daily
average - HCl)
mg/Nm3 1200 1100 1040 1140
Clean gas after
scrubber
(nominal daily
average - HCl)
mg/Nm3 NA 4 60 20
Raw gas before
scrubber
(nominal daily
average - HF)
mg/Nm3 13 20 53 17
Clean gas after
scrubber
(nominal daily
average - HF)
mg/Nm3 NA 1.5 4 2
Source: [ 30, Germany 2013 ]
Cross-media effects
Waste water generation.
WORKIN
G DRAFT IN
PROGRESS
Chapter 3
TL/JFF/FN/EIPPCB/LCP_Final Draft June 2016 249
Technical considerations relevant to applicability
No information provided.
Economics
No information provided.
Driving force for implementation
No information provided.
Example plants
Plant 470V.
Reference literature
[ 30, Germany 2013 ] [ 31, CHIRONNA 2011 ]
3.2.2.7 Techniques to reduce unburnt carbon
3.2.2.7.1 Combustion optimisation
See also Section 3.1.7.
Description
Measures taken to maximise the efficiency of energy conversion, e.g. in the furnace/boiler,
while minimising emissions (in particular of CO). This is achieved by a combination of
techniques including good design of the combustion equipment, optimisation of the temperature
(e.g. efficient mixing of the fuel and combustion air) and the residence time in the combustion
zone, and/or use of an advanced control system.
Technical description
The technique includes the good design of the furnace, combustion chambers, burners and
associated devices and the regular planned maintenance of the combustion system according to
suppliers' recommendations.
Achieved environmental benefits
Reduction of NOX, N2O, NH3 (when SCR and/or SNCR are used), CO and other unburnt
emissions to air in a balanced way.
Technical considerations relevant to applicability
There are techno-economic limitations in the possibilities to improve the boiler design.
3.2.2.7.2 Oxidation catalyst
Description
Use of catalysts (that generally contain precious metals such as palladium or platinum) to
oxidise carbon monoxide (CO) and unburnt hydrocarbons (UHC) to form CO2 and water
vapour.
Technical description
The catalytic oxidation system can be installed in the gas turbine/engine exhaust.
The oxidation reaction between oxygen and carbon monoxide and unburnt hydrocarbons, which
is enhanced by the catalyst, occurs at 500 °C and above to form carbon dioxide. Oxidation
catalysts suitable for short chain alkanes (CH4, C2H6, C3H8,) are still in development stage for
gas engines, see Section 11.6.1.2.1 for more information.
WORKIN
G DRAFT IN
PROGRESS
Chapter 3
250 June 2016 TL/JFF/FN/EIPPCB/LCP_Final Draft
The principle of operation for the catalytic converter is a chemical reaction dependent only on
temperature and which requires no control instruments (the maximum exhaust temperature to be
considered is around 560 °C).
The oxidation catalyst is assembled in modules. Each module is formed by a special stainless
steel foil, corrugated and folded back and forth upon itself to make a honeycomb core. The core
is encased in a stainless steel enclosure measuring approximately 0.4 m2. The modules are fitted
into an internal support frame made of carbon steel. Expansion seals on the outside of the
internal support frame ensure that the exhaust passes through the catalyst. The expansion seals
also accommodate thermal expansion. The above-mentioned components are installed in an
external support structure which serves as a duct spool piece.
This catalyst structure is constructed of carbon steel with a stainless steel liner over the
insulation, and has an access point on one side wall. The access point is for installation and
removal of catalyst modules.
The converter duct spool is also equipped with a series of gas ports for access to measure total
and static pressures for developing a velocity profile. These ports can also be used to take
samples from the front and back of the converter, or to mount any customer-supplied
instruments.
Test catalyst cores or 'buttons' (cylinders of about 8 cm in diameter) are located in various
catalyst modules. The test catalyst buttons are mounted for easy replacement from time to time
for lab testing.
Achieved environmental benefits
CO and unburnt hydrocarbon reduction in emissions to air.
Environmental performance and operational data
At maximum load, in the case of a natural-gas-fired gas turbine/engine, the typical reduction
efficiency is about 90 %, being higher when the load decreases.
The typical useful lifetime is about 40 000 operating hours.
Cross-media effects
Waste generation when the catalyst has to be replaced.
Increase in CO2 emissions.
Technical considerations relevant to applicability
The oxidation catalyst needs a maximum upstream flow rate variation of about +/-15 %. For this
reason, perforated plates, guide vanes or straightening grids are necessary to uniform the flue-
gas velocity. Consequently the flue-gas duct should have the required space not only for the
catalyst module but also for the other devices.
The maximum flue-gas temperature is limited to about 560 °C.
Economics
No information provided.
Driving force for implementation
Regulation.
Example plants
Plant 162, 164, 195, 196, 295 and 296.
Reference literature
No information provided.
WORKIN
G DRAFT IN
PROGRESS
Chapter 3
TL/JFF/FN/EIPPCB/LCP_Final Draft June 2016 251
3.2.3 Techniques to increase energy efficiency
3.2.3.1 Heat recovery techniques
Description
Recovery of heat lost from all combustion and energy generation processes, to avoid such heat
being wasted and to efficiently use the fuel's energy content.
Technical description
Different techniques can be implemented to recover and use the heat, depending on the
combustion process, combusted fuel and/or configuration of the installation:
combined cycle combustion (see Section 3.2.3.11);
combined heat and power production (see Section 3.2.3.2);
feed-water preheating (see Section 3.2.3.7);
fuel drying/preheating (see Section 3.2.3.18);
combustion air preheating (see Section 3.2.3.4);
flue-gas temperature decrease;
flue-gas condenser (see Section 3.2.3.15);
cooling grate (see Sections 2.2.4 and 5.2.3.3);
heat recovery from recirculated bed materials.
Achieved environmental benefits
Increased energy efficiency.
Environmental performance and operational data
See related information in each specific section of this BREF.
Cross-media effects
See related information in each specific section of this BREF.
Technical considerations relevant to applicability
See related information in each specific section of this BREF.
Economics
See related information in each specific section of this BREF.
Driving force for implementation
See related information in each specific section of this BREF.
Example plants
See related information in each specific section of this BREF.
Reference literature
See related information in each specific section of this BREF.
3.2.3.2 Cogeneration or combined heat and power (CHP)
Description
Cogeneration is the recovery of heat (mainly from the steam system) for producing hot water /
steam to be used in industrial processes/activities or in district heating. Additional heat recovery
is possible from:
the flue-gas;
grate cooling;
WORKIN
G DRAFT IN
PROGRESS
Chapter 3
252 June 2016 TL/JFF/FN/EIPPCB/LCP_Final Draft
the circulating fluidised bed.
Technical description
Cogeneration is a means of improving the energy efficiency by influencing the energy supply
system structure.
The heat from the combustion plant (e.g. turbine, engine) flue-gases may be used for steam
production in a recovery boiler (also called heat recovery steam generator) or be extracted
partially (or sometimes fully) and used for steam supply to consumers, who can then use the
steam in their own processes or for other purposes such as district heating or seawater
desalination.
There are many possible configurations to meet the specific plant requirements. For example in
the case of gas turbines, depending on the demand for heat and power, the most common are the
following:
Gas turbine with a heat recovery steam generator and supply of all the generated steam to
steam consumers.
Gas turbine with a heat recovery steam generator with a back-pressure steam turbine, and
supply of all the generated heat to steam consumers.
Gas turbine with a heat recovery steam generator with steam extractions to consumers
and/or the use of extraction steam for other heating purposes and a vacuum steam
condenser. This design usually gives more flexibility in the power to heat ratio.
Steam-injected gas (STIG) cycles in which steam is also generated by the exhaust heat
but partly injected to the gas turbine. These are used primarily with aeroderivative gas
turbines without the application of a steam turbine. These cycles are mainly applied in
cogeneration applications with intermittent process steam demands.
An important measure of a cogeneration power plant is its power to heat output ratio. Because
electric power can be more economically valuable than heat, it is preferable to have as high a
power to heat ratio as possible, in combination with a low overall heat rate.
A CHP-ready plant includes the measures taken to allow the later export of a useful quantity of
heat to an off-site heat load in a way that will achieve at least a 10 % reduction in primary
energy usage when compared to the separate generation of the heat and power produced. This
includes identifying and retaining access to specific points in the steam system from which
steam can be extracted, as well as making sufficient space available to allow the later fitting of
items such as pipework, heat exchangers, extra water demineralisation capacity, standby boiler
plant and back-pressure turbines. Balance of Plant (BoP) systems and control/instrumentation
systems are suitable for upgrade. Later connection of back-pressure turbine(s) is also possible.
More information on CHP readiness is given in Section 7.1.3.1.3.1.
Further information on cogeneration is given in Sections 3.1.1.1 and 2.4.3.
Achieved environmental benefits
One benefit is energy efficiency improvement.
For baseload applications, cogeneration can save fuel compared to the separate generation of
heat and power from fossil fuels.
Advantages of a cogeneration system include [81, COGEN Europe, 1999]:
high overall energetic efficiency;
CO2 reduction possible in comparison to separate generation of heat and power.
WORKIN
G DRAFT IN
PROGRESS
Chapter 3
TL/JFF/FN/EIPPCB/LCP_Final Draft June 2016 253
Environmental performance and operational data
In cases where, for steam turbine-based power processes, the cooling of the steam turbine
condenser is provided by the district heating network, fuel utilisation rates of 75 % to 95 % can
be reached on a yearly basis, and a significant reduction of emissions of greenhouse gases, NOX,
SOX and particulates can be achieved, compared with the separate production of power and
heat. The fuel to electric power conversion rate is however somewhat lower in these plants than
at plants producing only power, because of the higher condensing temperature at the turbine
condenser, which in this case is the district heat exchanger. The high total efficiency achieved,
however, by far supersedes this lower electrical output.
At a condensing CCGT, two thirds of the power output comes from the gas turbine, and the
cogeneration-related power loss only occurs in the steam turbine producing the other third of the
output. The power to heat output ratio of a CCGT at nominal load can be 1.1 in district heating
applications and 0.9 in the pulp and paper industry, while the figures in steam-only cogeneration
are 0.6 and 0.3 respectively. The annual average figures are typically clearly lower, due to,
among others, part-load operation and start-up/shutdown cycles.
CHP plants can be optimised so that they can flexibly respond to changing heat and power
demands.
Table 3.36: Indicative comparison of cogeneration with separate power and heat generation
Power
generation
heat rate (1)
Power to
heat ratio
(2)
Total
cogeneration
system heat
rate (3)
Separated
system heat
rate;
coal (4)
Separated
system
heat rate;
CCGT (5)
Conventional coal
condensing 2.3 NA NA NA NA
CCGT condensing 1.8 NA NA NA NA
Industrial conventional
cogeneration (6)
5.0 0.28 1.1 1.36 1.25
Industrial CCGT
cogeneration 2.4 0.9 1.15 1.67 1.43
DH conventional
cogeneration 2.9 0.6 1.1 1.55 1.36
DH CCGT cogeneration 2.1 1.1 1.1 1.73 1.47
Heat only boilers/coal NA NA 1.1 NA NA
Heat-only boilers/HFO NA NA 1.1 NA NA
Heat-only boilers/gas NA NA 1.07 NA NA
(1) Fuel input (LHV)/Net power output.
(2) Net heat output/Net power output.
(3) Fuel input (LHV)/(Net power + heat output).
(4) Combined heat rate of producing separately in conventional coal condensing plants and heat-only boilers (HR =
1.1) the same amounts of power and heat as in the cogenerating system. To be compared with the HR indicated in row
3.
(5) Combined heat rate of producing separately in CCGT condensing plants and heat-only boilers (HR = 1.1) the same
amounts of power and heat as in the cogenerating system. To be compared with the HR indicated in row 3.
(6) Live steam 80 bar 480 °C; back-pressure 4 bar.
All figures refer to nominal full load operation.
NA: Information not available
Source: [New 130] [59, Finnish LCP WG, 2000]
In Figure 3.51, the total system heat rates (the final three columns on the right) are comparable
in each row. They indicate how much fuel is needed in a cogeneration system and in a system
with the same power and heat outputs but with heat and power generated separately. It can be
seen that, in each case, the separated system – whether conventional or CCGT-based – clearly
consumes more fuel than the cogeneration system providing the same energy service. When the
comparison basis is conventional condensing power, the reduction in fuel consumption by
WORKIN
G DRAFT IN
PROGRESS
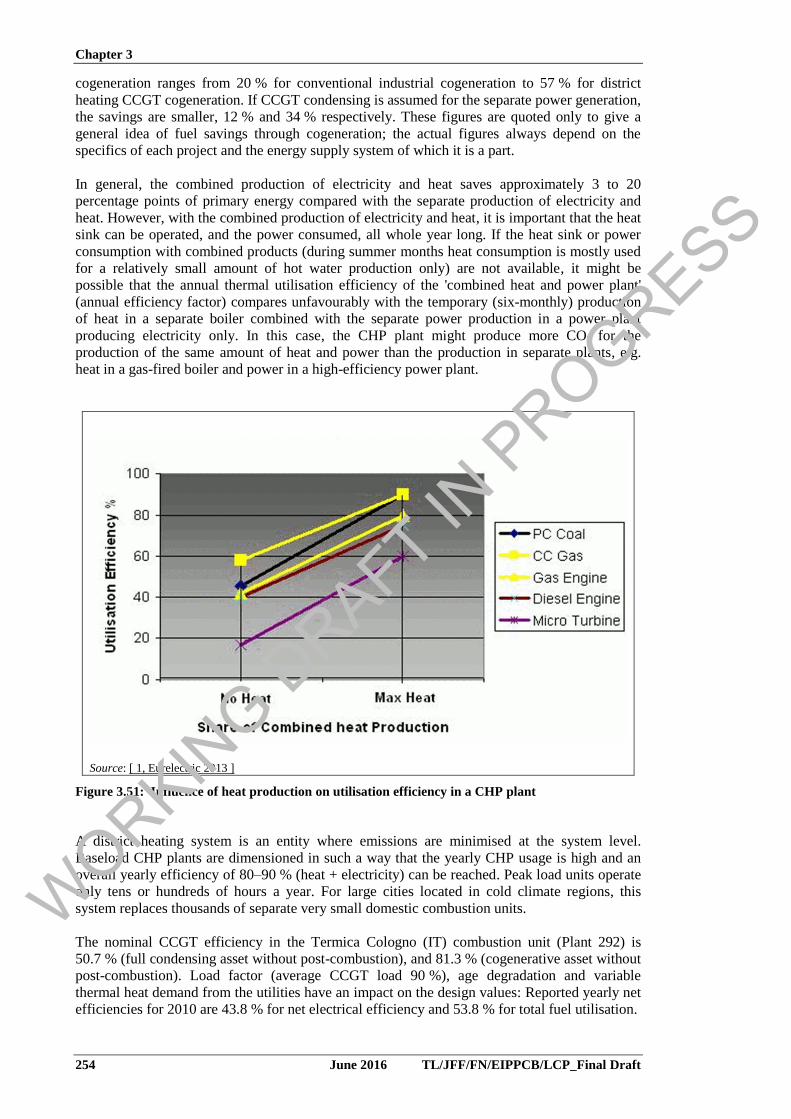
Chapter 3
254 June 2016 TL/JFF/FN/EIPPCB/LCP_Final Draft
cogeneration ranges from 20 % for conventional industrial cogeneration to 57 % for district
heating CCGT cogeneration. If CCGT condensing is assumed for the separate power generation,
the savings are smaller, 12 % and 34 % respectively. These figures are quoted only to give a
general idea of fuel savings through cogeneration; the actual figures always depend on the
specifics of each project and the energy supply system of which it is a part.
In general, the combined production of electricity and heat saves approximately 3 to 20
percentage points of primary energy compared with the separate production of electricity and
heat. However, with the combined production of electricity and heat, it is important that the heat
sink can be operated, and the power consumed, all whole year long. If the heat sink or power
consumption with combined products (during summer months heat consumption is mostly used
for a relatively small amount of hot water production only) are not available, it might be
possible that the annual thermal utilisation efficiency of the 'combined heat and power plant'
(annual efficiency factor) compares unfavourably with the temporary (six-monthly) production
of heat in a separate boiler combined with the separate power production in a power plant
producing electricity only. In this case, the CHP plant might produce more CO2 for the
production of the same amount of heat and power than the production in separate plants, e.g.
heat in a gas-fired boiler and power in a high-efficiency power plant.
Source: [ 1, Eurelectric 2013 ]
Figure 3.51: Influence of heat production on utilisation efficiency in a CHP plant
A district heating system is an entity where emissions are minimised at the system level.
Baseload CHP plants are dimensioned in such a way that the yearly CHP usage is high and an
overall yearly efficiency of 80–90 % (heat + electricity) can be reached. Peak load units operate
only tens or hundreds of hours a year. For large cities located in cold climate regions, this
system replaces thousands of separate very small domestic combustion units.
The nominal CCGT efficiency in the Termica Cologno (IT) combustion unit (Plant 292) is
50.7 % (full condensing asset without post-combustion), and 81.3 % (cogenerative asset without
post-combustion). Load factor (average CCGT load 90 %), age degradation and variable
thermal heat demand from the utilities have an impact on the design values: Reported yearly net
efficiencies for 2010 are 43.8 % for net electrical efficiency and 53.8 % for total fuel utilisation.
WORKIN
G DRAFT IN
PROGRESS

Chapter 3
TL/JFF/FN/EIPPCB/LCP_Final Draft June 2016 255
Cross-media effects
The disadvantages of a cogeneration system are [81, COGEN Europe, 1999]:
high heat to power ratio;
high cost.
Plant operation depends on the demand for electricity and hot water. Hot water production is
needed to supply the district heating networks. Therefore it may be necessary to change the
operating modes (full/partial load) in the short term. Short-term changes can move emission
values to a higher level.
For heat recovered from the flue-gas, care should be taken to consider corrosion issues (the flue-
gas temperature should be a minimum of 20 °C above the acid dew point).
Technical considerations relevant to applicability
This technique is generally applicable for new plants, with locations near a heat demand to be
favoured. It is also applicable for existing plants where there is an existing heat demand
available near the combustion plant.
In particular, district heating is applicable for areas where there is a demand for heating.
From the technical point of view, all combustion plants can be modified for cogeneration.
The applicability may be limited in the case of gas compressors with an unpredictable
operational heat profile.
Economics
For cogeneration to compete successfully in the market, a high electricity price and a sufficient
local heat demand are required. For a small heat demand, the plant size may be under the limit
of economic competitiveness. Big local industrial heat loads typically exist in the pulp and
paper industry, in refineries and in the chemical industry and, in some cases, in the food and
textile industries.
A relatively steady heat load is a prerequisite for effective and economical operation of a
combined heat and power plant. District heating can provide fairly steady heat loads for a large
part of the year in a cold climate.
Driving force for implementation
Replacement of old combustion plants / steam turbines by power plants with higher production
yields, when there is a possibility for a combined generation of electricity and steam/hot water
for process/heating purposes.
Example plants
Plants 49, 111 (district heating).
Plant 149-1 (CHP for chemical production and power plant).
Plant 292 (CHP for paper mill and district heating).
Plant 24 (retrofit to be included in a district heating network).
Reference literature
No information provided.
3.2.3.3 Cheng Cycle
Description
Steam is generated in gaseous-fuel-fired gas turbines by means of an open-cycle steam circuit,
by recovering heat losses from the flue-gas. The generated steam is then injected into the
WORKIN
G DRAFT IN
PROGRESS

Chapter 3
256 June 2016 TL/JFF/FN/EIPPCB/LCP_Final Draft
combustion chamber, to increase the turbine output and energy efficiency and to reduce NOX
emissions by cooling down the flame.
Technical description [ New 123, 58, Eurelectric, 2001]
In the ‘Cheng Cycle’, the heat of the exhaust gases from a gas turbine is used for steam
generation on one pressure level, which is fully injected into the gas turbine, increasing the
power output. As the steam will achieve the same pressure and temperature as the flue-gas in
the combustion chamber, the increase in power output will be greater than with a combined
cycle.
In practice the Cheng Cycle is applied in combined heat and power (CHP) units providing a
normal steam supply to users with a varying heat demand. In situations where no or less heat is
required, the generated steam can be used for electric power generation by injecting it directly
into the gas turbine, increasing the power output by 50–70 % in this mode, without a
supplementary steam turbine.
NB: Equipment/modifications required:
water production plant;
HRSG;
steam piping;
gas turbine modifications.
Figure 3.52: Principle sketch of the Cheng Steam Injection Cycle
Achieved environmental benefits
NOX reduction (up to 95 %).
No penalty in terms of increased CO associated with steam injection.
Higher steam to fuel ratio possible than other steam injection technologies.
Increase in thermal efficiency, up to 45 %, which reduces CO2 emissions per kWh
produced.
Contrary to other steam injection concepts, the Cheng Cycle also features a unique
control system that allows the power plant peak (maximum) thermal efficiency to follow
WORKIN
G DRAFT IN
PROGRESS
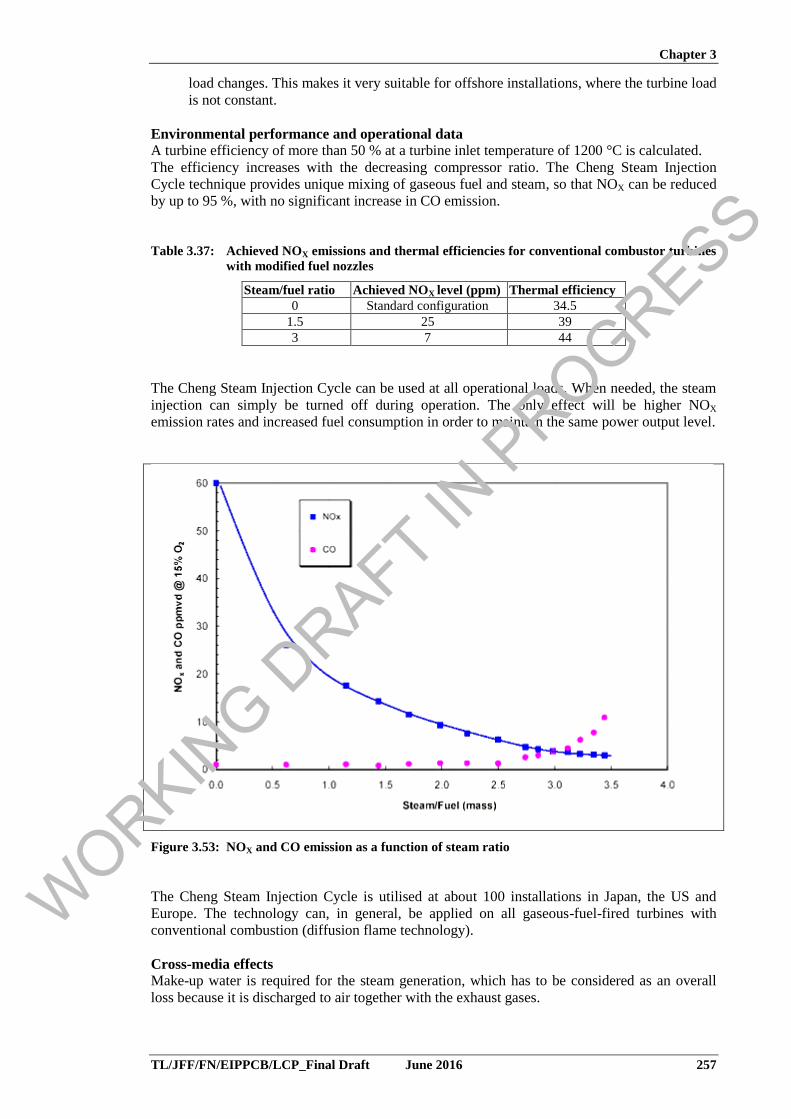
Chapter 3
TL/JFF/FN/EIPPCB/LCP_Final Draft June 2016 257
load changes. This makes it very suitable for offshore installations, where the turbine load
is not constant.
Environmental performance and operational data
A turbine efficiency of more than 50 % at a turbine inlet temperature of 1200 °C is calculated.
The efficiency increases with the decreasing compressor ratio. The Cheng Steam Injection
Cycle technique provides unique mixing of gaseous fuel and steam, so that NOX can be reduced
by up to 95 %, with no significant increase in CO emission.
Table 3.37: Achieved NOX emissions and thermal efficiencies for conventional combustor turbines
with modified fuel nozzles
Steam/fuel ratio Achieved NOX level (ppm) Thermal efficiency
0 Standard configuration 34.5
1.5 25 39
3 7 44
The Cheng Steam Injection Cycle can be used at all operational loads. When needed, the steam
injection can simply be turned off during operation. The only effect will be higher NOX
emission rates and increased fuel consumption in order to maintain the same power output level.
Figure 3.53: NOX and CO emission as a function of steam ratio
The Cheng Steam Injection Cycle is utilised at about 100 installations in Japan, the US and
Europe. The technology can, in general, be applied on all gaseous-fuel-fired turbines with
conventional combustion (diffusion flame technology).
Cross-media effects
Make-up water is required for the steam generation, which has to be considered as an overall
loss because it is discharged to air together with the exhaust gases.
WORKIN
G DRAFT IN
PROGRESS
Chapter 3
258 June 2016 TL/JFF/FN/EIPPCB/LCP_Final Draft
Technical considerations relevant to applicability
Generally applicable.
Economics
Less expensive than a dry low-NOX (DLN)/combined-cycle retrofit.
Calculation example:
installed power: 3 x 22 MW each, 66 MW total;
one HRSG installed in the exhaust duct of one gas turbine produces steam for three
turbines;
steam to fuel ratio of 2.5;
reduction of NOX to < 10 ppm;
additional costs for support structure for the installation on an offshore platform needs to
be taken into account.
Table 3.38: Costs and weight for a Cheng steam injection cycle on a GE LM 2500 package
Cost
(million NOK)
Weight
(t)
Gas turbine rebuild 30 ~1
HRSG 10 30
Desalination plant for water production 6 16
Driving force for implementation
Retrofit to the Cheng Cycle is possible for all gas turbines with conventional combustion
technology (diffusion flame combustor).
Little space is required in the gas turbine package for modification. Therefore, emission
levels lower than dry low-NOX emissions systems (DLE)/DLN can be achieved in
offshore installations that are not prepared for DLE/DLN turbines.
Retrofit and maintenance costs are lower than for the DLE/DLN available.
A conventional combustion system with Cheng steam injection has a higher availability
than DLE/DLN, hence it is more applicable to gas compression trains.
Emissions lower than DLE/DLN without CO/unburnt hydrocarbon trade-off.
Many offshore installations already have a HRSG, which lessens the need for
modifications and investment and results in lower installation costs.
Increased power output or reduced fuel consumption.
Example plants
No information provided.
Reference literature
[196, ASME, ], [197, ASME, ], [198, ASME, ], [199, Cheng, 1997]
3.2.3.4 Combustion air preheating
Description
Preheating of combustion air by heat recovered from the process/flue-gas.
Technical description
Preheating of combustion air by heat recovered from the process/flue-gas. This enables
transferring enthalpy to the combustion chamber, thus reducing the fuel consumption and
improving the energy efficiency.
WORKIN
G DRAFT IN
PROGRESS
Chapter 3
TL/JFF/FN/EIPPCB/LCP_Final Draft June 2016 259
Achieved environmental benefits
Increased energy efficiency.
Environmental performance and operational data
High operational experience.
Cross-media effects
Thermal NOX generation can be increased.
Technical considerations relevant to applicability
Applicable within the constraints associated with the NOX emissions control.
Economics
This technique is only economical if there is a good low-value heat source available (e.g.
process waste heat, vented low-pressure steam).
Driving force for implementation
No information provided.
Example plants
Plant 539.
Reference literature
No information provided.
3.2.3.5 Advanced material use
Description
Use of advanced materials able to operate at high temperatures for increased turbine (gas/steam)
efficiencies.
Technical description
In natural gas (NG) and integrated gasification combined-cycle (IGCC) power plants, the
combustion takes place with excess air, lowering the flame temperature from about 2000 °C to
~1400–1500 °C, so that it can be used in a Brayton cycle gas turbine. In conventional coal
plants, the heat is lowered to ~600°C, so it can be used in steam turbines. This downgrading of
the heat quality is counterintuitive to a major objective in the power industry, which is to raise
the hot-side temperature as much as possible so that the efficiency can be higher. The reason for
rejecting the highest heat quality is because of the lack of materials with high enough
mechanical strength and durability at such extreme temperatures to be used for turbo-machinery
components.
Achieved environmental benefits
Increased energy efficiency.
Environmental performance and operational data
Data are available for newly built plants; they are combustion process/fuel-specific.
For coal- and/or lignite-fired plants, using advanced materials enables steam pressures of up to
300 bar and steam temperatures of up to 600 C to be reached.
Cross-media effects
None.
Technical considerations relevant to applicability
Applicable for new plants.
WORKIN
G DRAFT IN
PROGRESS

Chapter 3
260 June 2016 TL/JFF/FN/EIPPCB/LCP_Final Draft
Economics
The main limitation of advanced materials is the high cost of such new materials.
Driving force for implementation
No information provided.
Example plants
No information provided.
Reference literature
No information provided.
3.2.3.6 Steam double reheating
Description
Improved plant performance is possible by a double, rather than single, steam reheat cycle.
Technical description
The benefit of using the double reheat cycle is further enhanced by the feasibility of using ultra-
supercritical pressures and temperatures.
Achieved environmental benefit
Increased thermal efficiency.
Environmental performance and operational data
No information provided.
Cross-media effects
No information provided.
Technical considerations relevant to applicability
Only applicable for new plants.
Economics
No information provided.
Driving force for implementation
No information provided.
Example plants
Plant 191.
Plant 34 (Nordjyllandsvaerket 3).
Reference literature
No information provided.
3.2.3.7 Feed-water preheating using recovered heat Description
Preheating water from the steam condenser with recovered heat before reusing it in the boiler.
Technical description
In steam power and CHP plants, the steam condensate stream that was cooled down by the
condenser is re-heated using either a steam stream extracted between the stages of the steam
turbines or heat extracted from the flue-gas downstream of the air preheater of the boiler. The
delivered heat remains, however, inside the system.
WORKIN
G DRAFT IN
PROGRESS

Chapter 3
TL/JFF/FN/EIPPCB/LCP_Final Draft June 2016 261
Source: [in General 2.7]
Figure 3.54: Feed-water preheating
Achieved environmental benefits
Increased thermal efficiency.
Environmental performance and operational data
Increase in electrical efficiency in turbines of 0.8–0.9 percentage points.
Feed-water preheating in coal- and/or lignite-fired plants can be made up of up to 10
stages, resulting in a feed-water temperature of about 300–320 C.
Plant 191 (GT) has a heat recovery steam generator with a triple pressure reheat design,
with a feed-water preheating circuit. This results in a low flue-gas temperature
(approximately 75 °C) at the stack and correspondingly less stack losses.
Cross-media effects
If heat is recovered from the flue-gas, there is a risk of corrosion due to the possible
condensation if the flue-gas temperature is too low. The latter should be kept at a minimum
of 20 °C above the acid dew point.
Technical considerations relevant to applicability
Only applicable to steam circuits and not to hot boilers.
Applicability to existing units may be limited due to constraints associated with the plant
configuration and the amount of recoverable heat.
Economics
No information provided.
Driving force for implementation
No information provided.
Example plants
Plant 191.
WORKIN
G DRAFT IN
PROGRESS
Chapter 3
262 June 2016 TL/JFF/FN/EIPPCB/LCP_Final Draft
Reference literature
No information provided.
3.2.3.8 Advanced control system
Description
Combustion efficiency can be improved by using computer-based automatic systems, which
includes the use of high-performance monitoring. This improvement minimises the heat loss
due to unburnt gases and to elements in solid wastes and residues from combustion, e.g. through
the slag. Boiler efficiency is optimised, and unburnt substances and NOX generation are
reduced.
Technical description
Varying combustion conditions and fuel quality, together with changing loads, upset
combustion. As a result, the boiler efficiency can decrease, and flue-gas emissions and oxygen
levels increase. Advanced computerised control systems improve the combustion efficiency,
acting on/considering the following variables:
combustion temperature;
inlet air excess;
temperature profile;
temperature at the combustion chamber outlet;
flue-gas oxygen content;
NOX/CO balance;
fuel feeding;
steam pressures in the whole steam network;
air to fuel ratio at each burner or row of burners.
Acting on and monitoring these parameters allows the combustion to be enhanced, thus
improving the thermal efficiency, reducing the unburnt carbon-in-ash, and reducing the CO and
NOX concentrations in the flue-gas.
The emissions of unburnt gases, which can be divided into two main groups: carbon monoxide
(CO) and hydrocarbons (CxHy), can be reduced by advanced combustion techniques. Emissions
of CO and unburnt hydrocarbons are a consequence of incomplete combustion and can be
caused by excessively low combustion temperatures; too short a residence time in the
combustion zone; or by inefficient mixing of the fuel and combustion air, leading to local areas
of oxygen deficiency.
Carbon monoxide is the most important unburnt gas. It is a stable compound even at high
temperatures if there is no oxygen present. Hydrocarbons, on the other hand, can be
decomposed and form soot at high temperatures in an oxygen-poor atmosphere. In general,
emissions of unburnt hydrocarbons may be generated when a low combustion temperature zone
and inefficient mixing of fuel and air occur together. However, such conditions are rare in large
modern combustion plants.
Engines and turbines may be equipped with catalytic converters (generally precious metals such
as palladium or platinum), where an oxidising reaction converts carbon monoxide (CO) and
unburnt hydrocarbons (UHC) to CO2 and water vapour, using the O2 contained in the flue-gas:
2CO + O2 → 2CO2
CxH2x + [(3x+1)/2]O2 → xCO2 + (x+1)H2O
A palladium-based catalyst is very sensitive to impurities in the flue-gas (thus natural gas or
clean distillate oil are prerequisites) and may deactivate fast. The NMVOC reduction rate
WORKIN
G DRAFT IN
PROGRESS
Chapter 3
TL/JFF/FN/EIPPCB/LCP_Final Draft June 2016 263
depends on the level of hydrocarbon compounds in the flue-gas. The shorter chain alkanes,
methane, ethane and propane, are stable molecules and difficult to oxidise (methane is the most
difficult, then ethane and then propane).
Emissions of unburnt gases are affected by several parameters. Typically, the emissions of
unburnt gases are highest when there are problems controlling the fuel to air ratio in the
combustion chamber or when the fuel quality is not homogeneous (as is the case with waste or
biomass). Coals with low reactivity and volatile content (anthracites) tend to increase the
emissions of unburnt gases. Higher emissions can also be a consequence of a low combustion
temperature, caused by using a low-rank fuel, partial loading, or through malfunction of the
burner.
Some measures to reduce NOX emissions, such as combustion with lower excess air or strong
air staging, can increase emissions of the unburnt gases. In these cases, the importance of
ensuring efficient mixing of air and fuel in the combustion system must be emphasised. NOX
reduction with the SNCR method can also cause higher CO emissions. CO emissions can be
decreased when limestone feeding is increased in fluidised bed combustion boilers.
Similarly to the costs of NOX reduction, it is impossible to separate the cost of these measures
from the total investment. If there are problems with unburnt gases in an existing power plant,
the case has to be assessed separately, and the possible expenses clearly set out in a feasibility
evaluation.
The use of primary measures, either for coal or lignite, tends to cause incomplete combustion,
resulting in a higher level of unburnt carbon in the fly ash and some carbon monoxide
emissions. With a good design and control of combustion, these negative impacts can mostly be
avoided. The amount of unburnt carbon-in-ash varies according to the fuel and is normally
somewhat higher than without primary measures. For most of the utilisation options for the fly
ash, the level of unburnt carbon-in-ash is below 5–10 %. Levels of unburnt carbon below 5 %
can normally be achieved, but with some coals only at the cost of somewhat higher NOX
emissions. Primary NOX reduction measures also have an impact on the total energy efficiency
of the process. If the combustion remains incomplete, the energy efficiency remains lower. A
normal rise in the amount of unburnt carbon due to low-NOX combustion has a negative impact
of approximately 0.1–0.3 percentage points on the unit efficiency.
The boiler efficiency and NOX generation depend largely on the correct distribution of fuel and
air in the combustion chamber. An efficient control system allows gas concentration
measurements to be taken in the interior areas of the combustion chamber, especially near the
burners.
Figure 3.55 shows the principles of an advanced control system applied to a 60 MWth biomass-
fired boiler.
WORKIN
G DRAFT IN
PROGRESS

Chapter 3
264 June 2016 TL/JFF/FN/EIPPCB/LCP_Final Draft
Source: [ 32, Airikka 2012 ]
Figure 3.55: Advanced control system applied at the Billerud AB Karlsborg plant, Sweden
Achieved environmental benefits
Increased thermal efficiency.
Air pollutant emission reduction (NOX, CO, TOC).
Low unburnt carbon-in-ash.
Lower risk of the formation of dioxins (and precursors), due to a more stable process in
the combustion chamber.
Environmental performance and operational data
High operational experience.
Generally, CO emissions from boilers burning international coals can be kept under 50 mg/Nm3
if the combustion is well controlled. Hydrocarbon emissions in modern power plant boilers are
negligible, typically below 5 mg/Nm3.
Table 3.39 presents achieved environmental benefits related to the implementation of advanced
process control systems.
WORKIN
G DRAFT IN
PROGRESS

Chapter 3
TL/JFF/FN/EIPPCB/LCP_Final Draft June 2016 265
Table 3.39: Environmental results of a combustion optimiser (Metso advanced process control
solution)
Year Customer Country Fuel Results
1996 Rovaniemi energy Finland Peat Reduced NOX and thermal flue-gas
loses
1998 SE Kaukopää Finland Biofuels
CO levels reduced by 67 %, NOX
emissions down by 18 %, and exit O2
reduced by 5 %
1999 SE Anjalankoski Finland Bio, RDF Excess NO CO- limited, NOX reduced
by 30 %
2003 MB Kemi Finland Biofuels
Thermal efficiency increase
1 percentage point; NOX emissions
down by 30 %
2004 SE Kemi Finland Biofuels Reduced NOX, CO and thermal flue-gas
losses
2005 E.ON Kemsley UK Refuse sludge Waste incineration increased by 10 %
2007 Toppila I Finland Peat Increased stability with low-quality
fuels
2008 Billerud Karlaborg Sweden Biofuels Reductions of NOX, CO2 and flue-gas
O2
2009 Dalkia Facture France Biofuels
Source: [ 32, Airikka 2012 ]
Cross-media effects
None.
Technical considerations relevant to applicability
The applicability to old combustion plants may be constrained by the need to retrofit the
combustion and/or control command system(s).
Economics
Plant-specific.
Driving force for implementation
No information provided.
Example plant
See Table 3.39.
Komati coal-fired power plant in South Africa and Irsching CCGT (Plant 136).
Coal fired-plants co-incinerating waste (Plants 121 and 142).
Reference literature
[ 3, LCP TWG 2012 ] [ 32, Airikka 2012 ] [ 23, Finland 2012 ]
3.2.3.9 Heat accumulation (heat storage) in CHP or heat-only mode
Description
Heat accumulation storage in CHP mode.
It is also possible to use it only in boilers.
Achieved environmental benefit
Reduced emissions.
For heat-only boilers, the use of peak load gas oil or HFO boilers may be avoided as well.
Environmental performance and operational data
No information provided.
WORKIN
G DRAFT IN
PROGRESS
Chapter 3
266 June 2016 TL/JFF/FN/EIPPCB/LCP_Final Draft
Cross-media effects
No information provided.
Applicability consideration
Applicable to new and existing plants. The applicability may be limited in the case of low heat
demand.
Economics
No information provided.
Driving force for implementation
The accumulator allows heat-only boilers (e.g. gas-oil-, HFO-, biomass-fired boilers) and CHP
plants (e.g. biomass-fired boilers) to keep emission levels low even with varying load demand.
Example plant
Plants in Sweden and Finland.
Reference literature
No information provided.
3.2.3.10 Integrated gasification combined cycle (IGCC)
See Chapter 4.
3.2.3.11 Combined-cycle combustion
Description
Combination of two or more thermodynamic cycles, e.g. a Brayton cycle (gas
turbine/combustion engine) with a Rankine cycle (steam turbine/boiler), to convert heat loss
from the flue-gas of the first cycle to useful energy by subsequent cycle(s).
Technical description
The gas turbine or engine exhaust gas typically has a temperature of 430 – 630 ºC, depending on
the turbine/engine type and on ambient conditions. This hot gas is led to a heat recovery steam
generator (HRSG), where it is used to generate steam, which then expands at a steam turbine
power plant, in principle, similar to a condensing power plant.
In today’s combined-cycle gas turbines (CCGTs), approximately two thirds of the output comes
from the gas turbine and the remaining third from the steam turbine.
The fuel generally used is natural gas or gas oil, but the use of coal in a gasification plant, which
will need to be installed upstream of the gas turbine, is also possible (see Chapter 4). A
schematic drawing of the combined cycle without supplementary firing (HRSG) technology is
given in Figure 3.56.
WORKIN
G DRAFT IN
PROGRESS

Chapter 3
TL/JFF/FN/EIPPCB/LCP_Final Draft June 2016 267
Source: [New 132] [32, Rentz, et al., 1999]
Figure 3.56: Schematic of a combined-cycle power plant with a heat recovery steam generator
(HRSG)
A multi-shaft configuration is applied, mostly in phased installations in which the gas turbines
are installed and operated prior to the steam cycle operation and where the intention is to
operate the gas turbines independently of the steam system. Multi-shaft combined-cycle systems
have one or more gas turbine generators and HRSGs that supply steam through a common
header to a separate single steam turbine generator unit.
Exhaust gas bypass systems, which are applied in multi-shaft combined-cycle systems to
provide fast start-up and shutdown and flexibility of operation, are not required with single-shaft
systems or with multi-shaft systems with one gas turbine and one steam turbine.
HRSGs are generally heat exchangers of the convection type, provided with fin tubes, and
which exchange the heat from the exhaust gases to the water steam cycle. The exhaust gases are
cooled down as much as possible to achieve the highest efficiency. The temperature is restricted
due to the risk of corrosion caused by the possible condensation of the acid (sulphur) products
from the exhaust gases. Exhaust temperatures of 100 °C are considered normal when
combusting natural gas.
HRSGs are constructed in horizontal and vertical configurations. The choice depends on the
space requirements and/or the client preferences. Both types are widely used.
Because both natural gas and gas oil are very clean fuels and allow almost complete combustion
in gas turbine combustors, there are no problems with ash, char or SO2 at CCGT plants. The
only problem is NOX, which, at modern plants, is controlled by using special low-NOX burners
and sometimes SCR added to the HRSG. In older burners, the NOX can be controlled by water
or steam sprays into the burners, but this is at the expense of the plant heat rate.
Because less than a third of the oxygen in the gas turbine inlet air is consumed for combustion
in the gas turbine combustor, supplementary firing of fuel in the gas turbine exhaust gas is
possible. Stationary engines can also apply supplementary firing. In modern CCGTs, this causes
a slight increase in the power generation heat rate. However, in industrial cogeneration, it is
frequently used as a means of controlling the HRSG's steam generation independently of the gas
turbine output. In cogeneration applications, supplementary firing also improves the overall
efficiency of heat and power generation.
WORKIN
G DRAFT IN
PROGRESS
Chapter 3
268 June 2016 TL/JFF/FN/EIPPCB/LCP_Final Draft
Achieved environmental benefits
Increased thermal efficiency.
Environmental performance and operational data
At combined-cycle power plants, gas turbines generate power at an efficiency of approximately
33–38 %. In the past 20 years, the heat rate of a CCGT plant has decreased from 2.2 to 1.7, i.e.
the LHV efficiency has grown from 45 % to 60 %. Gas turbines are currently still undergoing
rapid development, and a CCGT heat rate below 1.61 (efficiency over 62 %) should be possible
in the near future. However, commissioning experiences suggest that there are difficulties in
achieving the very high efficiencies forecast.
Cross-media effects
No information provided.
Applicability consideration
Generally applicable.
Economics
The great attractions of a CCGT plant are its low heat rate and its low investment cost, which
have made CCGTs competitive, despite the high cost of the natural gas fuel.
Driving force for implementation
No information provided.
Example plants
See Chapter 7.
Reference literature
No information provided.
3.2.3.12 Topping cycle
Description
In a topping cycle, the hot flue-gas from the gas turbine is used as combustion air in a
conventional power plant with coal- or gas-fired steam boilers. Several options for integrating
this cycle with a conventional power plant process are possible.
Technical description
Although this integration is feasible in new designs, topping cycles have typically been applied
in the past as repowering options to improve the efficiency of existing plants and/or to increase
the heat supply capability of cogeneration plants. The idea of combined cycles for repowering
coal-fired plants has grown out of the need to improve the simple ‘Brayton’ (Joule) cycle
efficiency by utilising the waste heat in the turbine exhaust gas. This is a natural solution
because the gas turbine is a relatively high-temperature machine and the boiler steam turbine a
relatively low-temperature machine. In the context of existing coal-fired combustion plants,
combined-cycle combustion is normally known as repowering.
The main objectives for repowering are to [82, Ciemat, 2000]:
increase the power output;
enhance the performance;
improve the use of installed plants;
obtain a greater operating flexibility;
increase the reliability and availability;
reduce the operating and maintenance costs;
extend the plant lifetime;
WORKIN
G DRAFT IN
PROGRESS
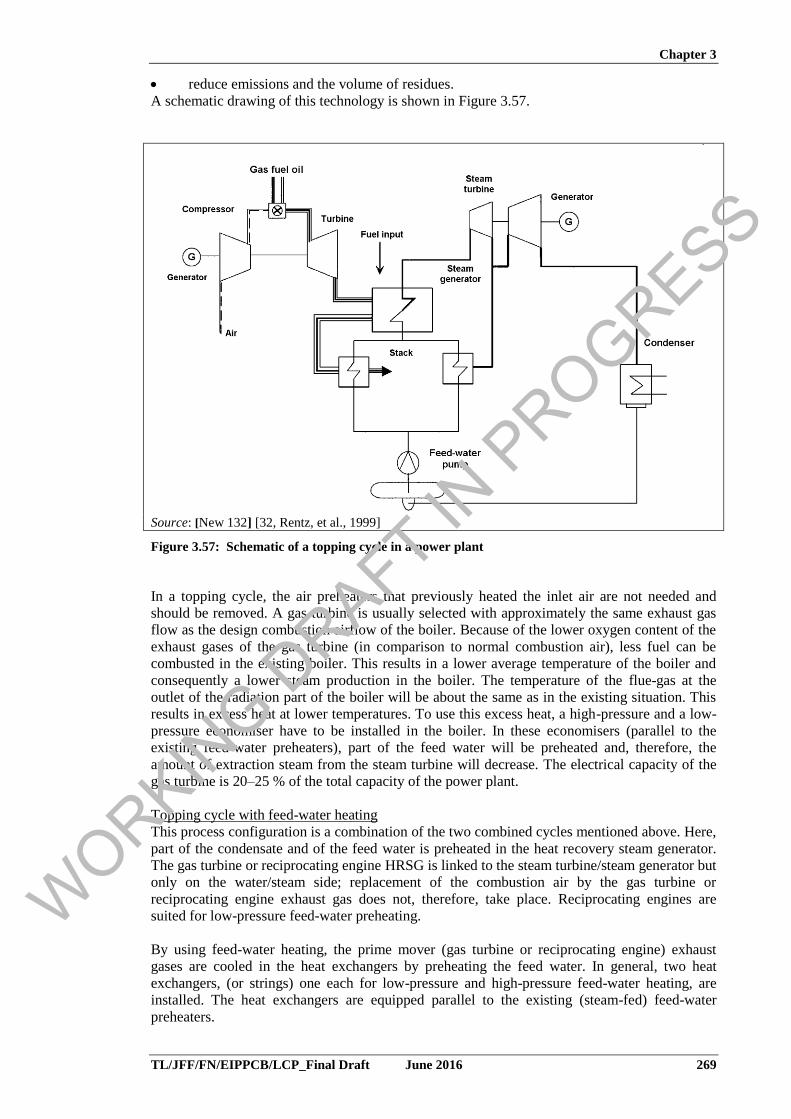
Chapter 3
TL/JFF/FN/EIPPCB/LCP_Final Draft June 2016 269
reduce emissions and the volume of residues.
A schematic drawing of this technology is shown in Figure 3.57.
Source: [New 132] [32, Rentz, et al., 1999]
Figure 3.57: Schematic of a topping cycle in a power plant
In a topping cycle, the air preheaters that previously heated the inlet air are not needed and
should be removed. A gas turbine is usually selected with approximately the same exhaust gas
flow as the design combustion airflow of the boiler. Because of the lower oxygen content of the
exhaust gases of the gas turbine (in comparison to normal combustion air), less fuel can be
combusted in the existing boiler. This results in a lower average temperature of the boiler and
consequently a lower steam production in the boiler. The temperature of the flue-gas at the
outlet of the radiation part of the boiler will be about the same as in the existing situation. This
results in excess heat at lower temperatures. To use this excess heat, a high-pressure and a low-
pressure economiser have to be installed in the boiler. In these economisers (parallel to the
existing feed-water preheaters), part of the feed water will be preheated and, therefore, the
amount of extraction steam from the steam turbine will decrease. The electrical capacity of the
gas turbine is 20–25 % of the total capacity of the power plant.
Topping cycle with feed-water heating
This process configuration is a combination of the two combined cycles mentioned above. Here,
part of the condensate and of the feed water is preheated in the heat recovery steam generator.
The gas turbine or reciprocating engine HRSG is linked to the steam turbine/steam generator but
only on the water/steam side; replacement of the combustion air by the gas turbine or
reciprocating engine exhaust gas does not, therefore, take place. Reciprocating engines are
suited for low-pressure feed-water preheating.
By using feed-water heating, the prime mover (gas turbine or reciprocating engine) exhaust
gases are cooled in the heat exchangers by preheating the feed water. In general, two heat
exchangers, (or strings) one each for low-pressure and high-pressure feed-water heating, are
installed. The heat exchangers are equipped parallel to the existing (steam-fed) feed-water
preheaters.
WORKIN
G DRAFT IN
PROGRESS
Chapter 3
270 June 2016 TL/JFF/FN/EIPPCB/LCP_Final Draft
Heat extractions from the prime mover can be eliminated or reduced, which thus results in an
increase in the electrical power output of the prime mover. This implies that the heat in the
exhaust gases of the prime mover contributes fully to the electrical power output and efficiency
of the unit. It appears that the best solution with feed-water heating will be obtained with a
prime mover with a high efficiency and enough heat capacity to achieve the complete feed-
water heating of the bottoming cycle.
The increase in power production is, however, limited by the flow capacity of the steam turbine
and by the power rating of the generator.
A comparison of the capacity of the preheating system of the unit with the heat available in the
gas turbine exhaust gases determines the number of prime movers required and the ultimate
increase in heat capacity.
The increased flexibility (electrical power versus thermal heat production) is an important
advantage gained by the modifications described. The steam plant can operate independently of
the prime mover. The flexibility, however, is limited by the maximum allowable flow through
the low-pressure steam turbine.
Achieved environmental benefits
Increased thermal efficiency.
Environmental performance and operational data
Various types of topping cycle gas turbines are in use in applications with outputs of up to
765 MWe (1600 MWth), and can achieve efficiencies of up to 48 %. A two-stage combustion
process can also be created by using exhaust gases from the gas turbine in the existing boiler,
resulting in a considerable reduction of NOX emissions. In one case, a reduction of NOX
emissions of 50 % has been achieved in the Netherlands.
The efficiency improvement with the feed-water heating option is about 2–5 %, dependent on
the prime mover and the existing steam turbine capacity. Because a topping cycle with feed-
water heating does not affect the combustion process of the boiler, the boiler emissions are also
unaffected. Total emissions are influenced by the contribution of the prime mover exhaust
gases.
Cross-media effects
No information provided.
Technical considerations relevant to applicability
Applicable to boilers.
Economics
No information provided.
Driving force for implementation
No information provided.
Example plants
No information provided.
Reference literature
No information provided.
3.2.3.13 Steam turbine and other component upgrades
Description
WORKIN
G DRAFT IN
PROGRESS
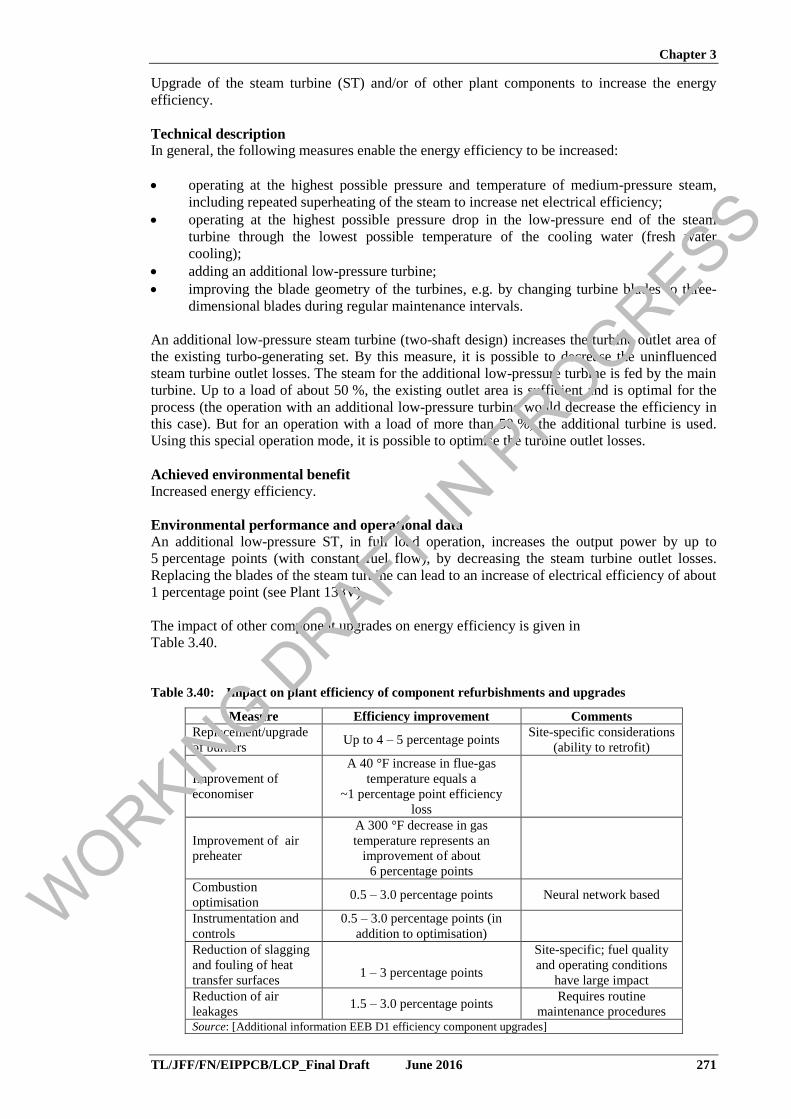
Chapter 3
TL/JFF/FN/EIPPCB/LCP_Final Draft June 2016 271
Upgrade of the steam turbine (ST) and/or of other plant components to increase the energy
efficiency.
Technical description
In general, the following measures enable the energy efficiency to be increased:
operating at the highest possible pressure and temperature of medium-pressure steam,
including repeated superheating of the steam to increase net electrical efficiency;
operating at the highest possible pressure drop in the low-pressure end of the steam
turbine through the lowest possible temperature of the cooling water (fresh water
cooling);
adding an additional low-pressure turbine;
improving the blade geometry of the turbines, e.g. by changing turbine blades to three-
dimensional blades during regular maintenance intervals.
An additional low-pressure steam turbine (two-shaft design) increases the turbine outlet area of
the existing turbo-generating set. By this measure, it is possible to decrease the uninfluenced
steam turbine outlet losses. The steam for the additional low-pressure turbine is fed by the main
turbine. Up to a load of about 50 %, the existing outlet area is sufficient and is optimal for the
process (the operation with an additional low-pressure turbine would decrease the efficiency in
this case). But for an operation with a load of more than 50 %, the additional turbine is used.
Using this special operation mode, it is possible to optimise the turbine outlet losses.
Achieved environmental benefit
Increased energy efficiency.
Environmental performance and operational data
An additional low-pressure ST, in full load operation, increases the output power by up to
5 percentage points (with constant fuel flow), by decreasing the steam turbine outlet losses.
Replacing the blades of the steam turbine can lead to an increase of electrical efficiency of about
1 percentage point (see Plant 138V).
The impact of other component upgrades on energy efficiency is given in
Table 3.40.
Table 3.40: Impact on plant efficiency of component refurbishments and upgrades
Measure Efficiency improvement Comments
Replacement/upgrade
of burners Up to 4 – 5 percentage points
Site-specific considerations
(ability to retrofit)
Improvement of
economiser
A 40 °F increase in flue-gas
temperature equals a
~1 percentage point efficiency
loss
Improvement of air
preheater
A 300 °F decrease in gas
temperature represents an
improvement of about
6 percentage points
Combustion
optimisation 0.5 – 3.0 percentage points Neural network based
Instrumentation and
controls
0.5 – 3.0 percentage points (in
addition to optimisation)
Reduction of slagging
and fouling of heat
transfer surfaces
1 – 3 percentage points
Site-specific; fuel quality
and operating conditions
have large impact
Reduction of air
leakages 1.5 – 3.0 percentage points
Requires routine
maintenance procedures Source: [Additional information EEB D1 efficiency component upgrades]
WORKIN
G DRAFT IN
PROGRESS
Chapter 3
272 June 2016 TL/JFF/FN/EIPPCB/LCP_Final Draft
Cross-media effects
No information provided.
Technical considerations relevant to applicability
Turbine blade upgrade is generally applicable to existing plants.
Addition of a low-pressure ST is applicable for steam turbines with very high exhaust losses;
sufficient space is required.
A key condition is the cooling available and the resulting condenser vacuum at the steam
turbine exhaust.
The applicability may be restricted by demand / steam conditions and/or limited plant lifetime.
Economics
No information provided.
Driving force for implementation
No information provided.
Example plant
Plant 138V (blade change).
Plant 131V (addition of low-pressure ST).
Plant 168 (ST upgrade).
Reference literature
No information provided.
3.2.3.14 (Ultra-) Supercritical steam parameters
Description
Operating with supercritical (SC) and ultra-supercritical (USC) steam parameters provides the
highest efficiency (which leads to the lowest possible fuel consumption and fuel costs, and
lowest overall emissions), by minimising energy fuel costs. SC steam parameters are: pressure
above 220.6 bar and temperature above 374 °C. USC steam parameters are not clearly defined.
The following levels are often used as a reference: pressure above 250–300 bar, and temperature
above 580–600 °C.
Technical description
Increasing steam parameters (SC steam) is another means to increase efficiency when CHP
mode is not possible. The technology includes a system for pulverising solid fuel to dust, and a
feeding system for combustion in low-NOX burners with a tangential or wall-firing arrangement
in a water-cooled furnace. The traditional fuel used is coal, which can be combined with NG,
HFO/gas oil or biomass.
A pressure of ~180 bar and superheated/reheated temperature of 540/565 °C, represent the
design limits in natural circulation drum-type boilers for steam pressure and temperature. At
these limits, the unit electrical efficiency can reach approximately 42 % (on an LHV basis).
Steam double reheating has been introduced in order to increase the efficiency. To further
increase the efficiency, SC steam conditions are required.
The 'critical point' of a substance is a well-defined thermodynamic parameter. For water, SC
conditions are obtained at the point where water is converted to steam without boiling and with
no latent heat addition.
Boilers have been supplied with sizes between 400 MWe and 1100 MWe.
WORKIN
G DRAFT IN
PROGRESS
Chapter 3
TL/JFF/FN/EIPPCB/LCP_Final Draft June 2016 273
Further development of the technology is ensured due to the continued development of new
high-temperature-resistant materials.
Achieved environmental benefits
Increased thermal efficiency.
Waste: compared to an SC or subcritical boiler, no new types of waste are generated, but
the higher efficiency results in a lower consumption of fuel and a lower production of
resulting by-products such as CO2 (flue-gas), FGD gypsum, NOX, slag, and ashes.
Environmental performance and operational data
By applying (ultra-) supercritical steam parameters to improve the efficiency, such as a double
reheat, and the most advanced high-temperature materials, coal- and/or lignite-fired condensing
power plants with a designed energy efficiency of 48 % have been built using direct water
cooling.
The heat rate and the efficiency level for recent coal- or lignite-fired condensing power plants
(pulverised coal or lignite combustion in DBB or WBB) with direct water cooling (with a
capacity of over 300 MWth) is between 2.3 and 2.2 (43 % and 47 %), using supercritical steam
parameters.
The highest efficiencies are achieved with the extremely high steam parameters used in
baseload plants. Peak load plants with frequent start-up cycles have to be designed with lower
steam parameters, resulting in lower efficiencies.
The use of a double reheat cycle increases the net electrical efficiency by about 0.8 percentage
points.
The achievable improvement in efficiency is around 1 % (relative) for each 20 °C rise in the
reheat temperature and 0.2 % (relative) for a 10 bar pressure increase.
Moving from subcritical to supercritical steam parameters will induce an increase in net cycle
efficiency from 38 % to 45–47 %, equivalent to a reduction in coal consumption of 16 % to
produce a unit of electricity. For a dedicated biomass application, a slightly lower efficiency
will be achieved, due to the restriction in steam data and other technical constraints.
The world's most efficient coal-fired unit (Nordjyllandsværket) has been in operation since 1998
with a documented net efficiency of 47 %, and an availability exceeding 98 %.
It is expected that, with the technology and materials currently available, up to 49 % efficiency
is achievable under the right circumstances.
Cross-media effects
An USC boiler compared to a SC or subcritical boiler presents no significant issues. The
technology and designs are well proven today, at least up to 305 bar and 610 °C.
Technical considerations relevant for applicability
Applicable to new units of ≥ 600 MWth operated > 4000 h/yr.
Not applicable when the purpose of the unit is to produce low steam temperatures and/or
pressures in process industries.
Not applicable to gas turbines and engines generating steam in CHP mode.
For units combusting biomass, the applicability may be constrained by high-temperature
corrosion in the case of certain biomasses.
Economics
In the event that the steam turbine sets are not adapted, a substantial increase of the investment
costs for the steam turbine is expected and therefore the retrofit with a double reheat cycle will
not necessarily be profitable at every site.
WORKIN
G DRAFT IN
PROGRESS
Chapter 3
274 June 2016 TL/JFF/FN/EIPPCB/LCP_Final Draft
The technology is mainly competitive for larger thermal power plant units, typically boilers with
steam production greater than 1000 t/h corresponding to approximately 350 MWe.
As USC boilers are for plants with larger output power requirements, coal is typically the most
cost-efficient primary fuel option.
Driving force for implementation
Efficiency and costs are generally the main drivers for investing in (ultra-) supercritical
technology.
Environment / Political / Clean coal technology: a substantial part of the world’s growth in
power generation is expected to be based on coal for at least the next 20–30 years. At the same
time, there is a requirement for the reduction of harmful emissions from coal-fired units and also
an increasing demand to limit greenhouse gas (CO2) emissions. The current approach for
addressing these requirements is called 'Clean Coal Technology'. The ultra-supercritical (USC)
power cycle is one of the most favoured solutions.
Example plants
Plant 27 (Avedore 2, DK)).
Plant 34 (Nordjyllandsværket, DK).
Plant 253 (Torrevaldaliga, IT).
Plant 116 (Niederaußem, DE).
Since 2011, several projects with superheated steam parameters of 27.2 MPa, 600 °C / 5.5 MPa,
605 °C and an efficiency of > 43 % have been put into operation in Europe: Walsum 10,
Boxberg R, Neurath BOA 2 and 3, Ledvice, etc. The first two experienced material problems
and had to change the T24 alliage to a more common one, reducing the achievable energy
efficiency. The latter two also experienced problems and delays in their commissioning but
were built using the T24 alliage. [CZ_9, E&P_9]
Reference literature
[ 3, LCP TWG 2012 ]
[Advantages of Ultra Super Critical (USC) Technology in power generation] ; [Experiences
with Coal fired USC Boilers in Denmark]; [Energy Technology Perspectives, Scenarios &
Technologies] ; [World Energy Outlook 2010] [Power Plants: Characteristics and Costs - US
Congress, November 2008] ; [Clean coal power generation technology Review: worldwide
experience and Implications for India]
3.2.3.15 Flue-gas condenser
Description
The flue-gas condenser is a heat exchanger where the return flow of district heating water is
preheated by the flue-gases before it is heated in the steam condensers. The vapour content in
the flue-gases thus condenses as it is cooled by the district heating water. A flue-gas condenser
is used both to increase the energy efficiency of the combustion unit and to clean the flue-gas.
Technical description
The warm (e.g. 180 °C) wet flue-gas is cooled down (e.g. by the return water from the district
heating system). The flue-gas temperature drops to 55 °C, and at the same time water is
condensed from the flue-gases. On the other side (district heating side) of the flue-gas
condenser, the return water from district heating is heated up to approximately 60 °C.
Approximately 20 % extra energy can be obtained from the flue-gas condenser (depending on
the moisture in the fuel), without increased fuel consumption. At the same time, the flue-gas is
cleaned of dust and other pollutants, such as acid gases.
WORKIN
G DRAFT IN
PROGRESS

Chapter 3
TL/JFF/FN/EIPPCB/LCP_Final Draft June 2016 275
The effectiveness of the flue-gas condenser is mainly dependent on the moisture content of the
fuel and on the temperature of the district heating water. Normally with a 90 MW boiler, the
condenser could provide up to 25–30 MW of heat energy at full load. However, the effect can
be reduced by bypassing the district heating water past the condenser, which is normally done
during summer when the district heating load goes below the minimum load for the boiler. This
action may also be called for during periods when the boiler operates above minimum load (but
below maximum load), e.g. when there is a preference for electricity production, as the
electricity production is otherwise limited by the district heating load (no other cooling
available).
Achieved environmental benefits
Increased overall energy efficiency.
Reduced specific fuel consumption.
Reduced dust, particulate-bound metals and SOX emissions.
Environmental performance and operational data
No information provided.
Cross-media effects
No information provided.
Technical considerations relevant to applicability
The technique is applicable to plants where there is a possibility of using large quantities of low-
temperature (< 60–65 °C) heat.
When the technique involves condensing the flue-gas below its dew point, it requires the use of
appropriate materials like corrosion-resistant stainless steel.
Economics
No information provided.
Driving force for implementation
No information provided.
Example plants
Plants 453, 454, 455, 456, 470, 472 and 473.
Reference literature
http://epubl.ltu.se/1402-1617/2006/141/LTU-EX-06141-SE.pdf
3.2.3.16 Cooling tower air emission discharge
Description
Air emission release through the cooling tower and not a dedicated stack.
Technical description
The purified flue-gas is discharged downstream of the flue-gas desulphurisation system via the
cooling tower. In this process, the clean gas is delivered to the cooling tower via a fibreglass-
reinforced duct above the distribution level and mixed completely with the cooling water cloud
in such a way that contact with the walls of the cooling tower is avoided. In recent plants, the
tower walls are made of acid-resistant concrete. In the interior of the cooling tower, the flue-gas
is distributed either via a distribution piece or a shutter system across the cooling tower cross
section.
WORKIN
G DRAFT IN
PROGRESS
Chapter 3
276 June 2016 TL/JFF/FN/EIPPCB/LCP_Final Draft
Achieved environmental benefits
Increased thermal efficiency: reheating of the flue-gas after the FGD plant is not
necessary.
No stack is needed.
Environmental performance and operational data
No information provided.
Cross-media effects
Potential for emission of liquid pollutants, especially acid aerosols.
Technical considerations relevant for applicability
Only applicable to units fitted with wet FGD where reheating of the flue-gas is necessary before
release, and where the unit cooling system is a cooling tower.
Economics
No information provided.
Driving force for implementation
No information provided.
Example plants
Plants 116V, 23, 130 (retrofit).
Reference literature
[Thomas Matthee papers]
3.2.3.17 Wet stack
Description
Design of the stack to enable water vapour condensation from the saturated flue-gas, and thus
avoid the need to use a gas-gas heater after the wet FGD.
Technical description
Many plants with wet FGD systems use reheated flue-gas to dry the saturated gases exiting the
wet FGD before they are sent to the stack.
New plants no longer use flue-gas reheating; this is also being removed from existing plants to
improve energy efficiency and when changing WFGD systems.
In the wet stack system, the water content of the flue-gas condenses on the walls of the absorber
outlet ducting and stack liner. This formed liquid is collected and drained. Condensates are
treated together with the FGD waste water, and the wet stack should be properly designed in
order to avoid the release from the stack of uncondensed liquid droplets.
Achieved environmental benefits
Increased thermal efficiency.
Prevention of potential emissions to air of SO2 and other pollutants such as Hg, due to the
leakage that can exist in the rotating heat exchanger after the wet FGD.
Environmental performance and operational data
No information provided.
Cross-media effects
Visible plume.
WORKIN
G DRAFT IN
PROGRESS
Chapter 3
TL/JFF/FN/EIPPCB/LCP_Final Draft June 2016 277
Stack liquid discharge (SLD) phenomenon, whereby entrained droplets in the flue-gas are
deposited near the plant before evaporating.
Technical considerations relevant for applicability
Applicable to boilers. Generally applicable to new and existing plants fitted with wet FGD.
Economics
Condensates drained from the stack need to be neutralised.
Driving force for implementation
No information provided.
Example plants
Plants 122aV and 122bV.
Reference literature
[EPRI guide]
3.2.3.18 Fuel preheating/drying
Description
Fuels are preheated or dried before entering the combustion chamber, often by recovering the
flue-gas energy content.
Technical description
With steam or flue-gas, low value heat can be recovered from power processes to increase the
fuel energy (e.g. by recovering the heat from the flue-gas). Many alternative technologies are
commercially available and new technical alternatives are under development (e.g. lignite pre-
drying with low-pressure superheated steam via heat exchanger, see Section 11.4.1.1).
Achieved environmental benefits
Increased thermal efficiency.
Environmental performance and operational data
No information provided.
Cross-media effects
Additional emissions to water and air are possible, depending on the configuration.
Drying/pressing of fuel requires additional auxiliary power, to be weighed against the expected
improvement in thermal efficiency.
Technical considerations relevant to applicability
Generally applicable to new gas-fired plants. The applicability may be limited for existing gas-
fired plants due to operation and maintenance constraints in the gas specification.
Drying is applicable to biomass, peat and lignite within the constraints associated with
spontaneous combustion risks (e.g. the moisture content of peat is kept above 40 % throughout
the delivery chain). Press drying is applied to bark fuel.
The retrofit of existing plants may be restricted by the extra calorific value that can be obtained
from the drying operation (e.g. some pelletised biomass) and by the limited retrofit possibilities
offered by some boiler designs or plant configurations.
Economics
WORKIN
G DRAFT IN
PROGRESS
Chapter 3
278 June 2016 TL/JFF/FN/EIPPCB/LCP_Final Draft
The investment cost and energy consumption of fuel dewatering equipment are generally
prohibitive except for very wet fuels.
Driving force for implementation
No information provided.
Example plants
Plant 191: a fuel gas efficiency preheater heats fuel gas to 150 °C via IP economiser feed-water
extraction.
Plant 116: prototype drying plant for lignite (WTA technique), offering potential for an
efficiency increase in the range of 4–6 percentage points for Rhenish lignite.
Rauma BFB boiler (FI): the combustion plant includes a fuel drying plant, where the bark and
sludge available from the neighbouring mill are dried, reducing the moisture from 55–60 % to
40–45 %. The drying is performed using the heat recovered from paper mill waste waters (55–
65 °C). The drying lasts about one hour on a 120 m long conveyor belt and at a temperature
between 55 °C and 65 °C.
Reference literature
No information provided.
3.2.3.19 Cooling system
For the different cooling system techniques, see the Industrial Cooling Systems (ICS) BREF.
3.2.4 Techniques for the prevention and control of emissions to water
In order to decide which are the best waste water management and treatment practices for a
specific LCP, a thorough assessment of the expected waste water streams is carried out. The
waste water is characterised regarding the nature and concentrations of the pollutants and the
pattern of the expected flows from the various sources. Waste water streams that are typically
segregated include surface water run-off, cooling water, and waste water from flue-gas
treatment. Then a decision is taken as to the configuration of the most appropriate waste water
treatment plant for each specific case. Figure 3.6 and Figure 3.7 show examples of waste water
from flue-gas treatment systems.
The removal of polluting substances from the waste water prior to discharge to the environment
is effected by the application of the appropriate combination of a wide range of physical,
chemical and biochemical processes, including:
filtration;
pH correction/neutralisation;
coagulation/flocculation/precipitation;
sedimentation/filtration/flotation;
dissolved hydrocarbon treatment;
oil-water separation systems;
biological treatment.
The selection of the appropriate treatment and/or management technique depends on the main
quality characteristics and volume of the waste water and the quality standards required by the
receiving waters of the treated effluents.
Thus, effluents containing high amounts of suspended solids, present in LCPs burning solid
fuels, are normally subjected to a primary settling stage for the removal of heavier suspended
solids. This is followed by flocculation, with coagulant and organic polymer dosing aided by pH
WORKIN
G DRAFT IN
PROGRESS
Chapter 3
TL/JFF/FN/EIPPCB/LCP_Final Draft June 2016 279
adjustment, before final settling and removal of the sludge. A final pH adjustment of the treated
effluent may be required before discharge to the receiving water.
Acid or alkali effluents (e.g. ion exchangers' regeneration effluents, boiler cleaning chemicals,
boiler blowdown) need to be neutralised before discharge.
Oily effluents arising from the fuel oil treatment systems, leakage or dewatering of fuel oil
storage facilities, unloading stations, transformer area, etc., may contain high amounts of oil.
Therefore, a primary oil separation stage is needed for the collection of these oils, normally
carried out in gravity separation tanks equipped with oil retention baffles. The residual waste waters, which may still contain small amounts of oil in oil-water emulsion
form, are treated in API or lamella separators equipped with oil skimmers or using air flotation.
Sanitary waste water may be treated in a municipal sewerage system, if one is available.
Otherwise, it may be either discharged to a septic tank or treated in an on-site biological unit,
normally of the extended aeration activated sludge type.
In certain cases, instead of being treated in the LCP waste water treatment plant along with
other effluents, special waste waters (e.g. water containing hydrocarbons used for analysis in the
laboratory) are collected separately and disposed of off site by an authorised contractor. The
management of firefighting water, which occurs only in emergency situations, depends on the
location of the fire. Such waters are collected by the drainage systems corresponding to the fire
location, retained in firewater retention ponds and treated, if necessary, before discharge.
Effluents from LCPs may be treated either separately by stream, or using combined treatment
techniques. Examples are given below.
The issue of water and waste water management is important within an LCP. By optimising the
recycling of the various intermediate discharges in the plant, a significant reduction in overall
water consumption can be achieved, as well as minimising the final liquid effluent quantities
that require further treatment. For example, in several cases it is possible to collect all waste
water from the various discharge points of the FGD plant and to reintroduce them into the
process (scrubber).
In addition, various waste water streams may be used for fly ash humidification instead of
service or raw water. Clean waste water downstream of the waste water treatment plant is
usually collected in retention ponds to supply water to points of consumption where the water
quality is adequate to the demand, e.g. limestone slurry preparation for FGD or for FGD
gypsum and fly ash mixture stabilisation prior to disposal in a landfill. However, it is not
possible to create a waste-water-free FGD system only by direct recirculation and circuitry in
the FGD system. If the chloride value increases, it is necessary to elutriate. The reduction of the
waste water and of the withdrawal rate is possible by recycling other streams like rainwater,
cooling water, etc. The alternative, evaporating this waste water, may require considerable
additional energy and waste disposal may offset the environmental benefits.
[ 1, Eurelectric 2013 ]
Another technique to reduce water usage and the volume of contaminated waste water
discharged is the handling of bottom ash from the boilers. Dry bottom ash handling is described
in Section 3.2.5.2.
3.2.4.1 Filtration
Description
Filtration is the separation of solids from waste water effluents passing through a porous
medium. It includes different types of techniques, e.g. sand filtration, microfiltration and
ultrafiltration. It is generally used in addition to coagulation and sedimentation or precipitation
softening for the removal of solids from surface water or waste water. Filtration does not
WORKIN
G DRAFT IN
PROGRESS

Chapter 3
280 June 2016 TL/JFF/FN/EIPPCB/LCP_Final Draft
remove dissolved solids. Filters typically require a cleaning operation – backwashing – with a
reverse flow of fresh water.
Technical description
Commonly used filter systems include:
granular-medium filter, or sand filter, which is widely used as a waste water treatment
device (the medium of sand filters need not be literally sand), mainly used for waters with a
low solids content;
gravity drum filter, used for sewage treatment and removal of activated sludge flocs; its
efficiency is dependent on the screen fabric;
rotary vacuum filter, well-suited to precoat filtration, which is used for oily sludge
dewatering and slop de-emulsification;
membrane filter;
belt filter press, which is largely used for sludge dewatering, but also for liquid-solid
separation operations;
filter press, which is usually used for sludge dewatering, but also for liquid-solid operations,
suitable for a high solids content.
Achieved environmental benefits
Reduction of suspended solids and metals in the waste water discharge.
Environmental performance and operational data
See the CWW BREF.
Cross-media effects
No information provided.
Technical considerations relevant to applicability
Generally applicable.
Economics
No information provided.
Driving force for implementation
No information provided.
Example plants
Plants 455 and 476.
Reference literature
CWW BREF.
Robinson, J. 2000. Water, Industrial Water Treatment. Kirk-Othmer Encyclopaedia of Chemical
Technology.
3.2.4.2 Coagulation, flocculation, sedimentation and precipitation
Description
Coagulation and flocculation are used to separate suspended solids from waste water and are
often carried out in successive steps. Coagulation is carried out by adding coagulants with
charges opposite to those of the suspended solids. Flocculation is carried out by adding
polymers, so that collisions of microfloc particles cause them to bond thereby producing larger
flocs.
Sedimentation is the separation of suspended solids by gravitational settling.
WORKIN
G DRAFT IN
PROGRESS

Chapter 3
TL/JFF/FN/EIPPCB/LCP_Final Draft June 2016 281
Precipitation is the conversion of dissolved pollutants into insoluble compounds by adding
chemical precipitants. The solid precipitates formed are subsequently separated by
sedimentation, flotation or filtration. If necessary, this may be followed by microfiltration or
ultrafiltration. Typical chemicals used for metal precipitation are lime, dolomite, sodium
hydroxide, sodium carbonate, sodium sulphide and organosulphides. Calcium salts (other than
lime) are used to precipitate sulphate or fluoride.
Technical description
When the particles cannot be separated by simple gravitational means, e.g. when they are too
small, their density is too close to that of water, or when they form colloids, special chemicals
are added to cause the solids to settle, e.g.:
aluminium sulphate (alum);
ferric sulphate;
ferric chloride;
lime;
polyaluminium chloride;
polyaluminium sulphate;
cationic organic polyelectrolytes;
non-ionic polyelectrolytes;
anionic polyelectrolytes;
(organo)sulphides.
These chemicals cause the destabilisation of colloidal and small suspended particles (e.g. clay,
silica, iron, heavy metals, dyes, organic solids, oil in waste water) and emulsions entrapping
solids (coagulation) and/or the agglomeration of these particles to flocs large enough to settle
(flocculation). In the case of flocculation, anionic and non-ionic polymers are also used. A
controlled pH range is essential to avoid poor clarification performance.
Achieved environmental benefits
Removal of fluoride, sulphate, metal, TOC and particulates.
Reduced waste water discharge from non-settleable material and metals.
Environmental performance and operational data
See the CWW BREF.
Cross-media effects
Sludge production. Sludge can be added to coal internally and in some cases sludge (e.g. from
decarbonisation) could be added in the FGD, or as a filling material in the mining industry.
Technical considerations relevant to applicability
Generally applicable.
Economics
No information provided.
Driving force for implementation
No information provided.
Example plants
Plants 662 and 464.
Reference literature
CWW BREF.
Robinson, J. 2000. Water, Industrial Water Treatment. Kirk-Othmer Encyclopaedia of Chemical
Technology.
WORKIN
G DRAFT IN
PROGRESS

Chapter 3
282 June 2016 TL/JFF/FN/EIPPCB/LCP_Final Draft
3.2.4.3 Flotation
Description
Flotation is a process whereby solid or liquid particles or particulates are separated from the
waste water phase by attaching to air bubbles. The buoyant particles accumulate at the water
surface and are collected with skimmers.
Technical description
There are three methods of flotation, distinguished by the way air is added:
vacuum flotation, where air is dissolved at atmospheric pressure, followed by a pressure
drop to allow the formation of bubbles;
induced air flotation (IAF), where fine bubbles are drawn into the waste water via an
induction device such as a venturi or orifice plate;
dissolved air flotation (DAF), where pressurised air (0.4–0.8 MPa, or 1.0–1.2 MPa for
aluminium compounds) is dissolved into the waste water, or a part of the total waste
water, and subsequently released to form small bubbles.
Flocculant additives, such as aluminium and ferric salts, activated silica and various organic
polymers, are commonly used to support the flotation process. Their function, besides
coagulation and flocculation, is to create a surface or a structure able to absorb or entrap the air
bubbles.
Achieved environmental benefits
Reduced non-settleable material and free oil from the waste water discharge.
Environmental performance and operational data
See the CWW BREF.
Cross-media effects
Sludge generation.
Technical considerations relevant to applicability
No information provided.
Economics
No information provided.
Driving force for implementation
No information provided.
Example plants
Plant 253.
Reference literature CWW BREF.
Robinson, J. 2000. Water, Industrial Water Treatment. Kirk-Othmer Encyclopaedia of Chemical
Technology.
3.2.4.4 Oil-water separation
Description The separation of oil and water and subsequent oil removal can be divided into:
gravity separation of free oil, using separation equipment;
emulsion breaking, using emulsion-breaking chemicals, e.g.:
WORKIN
G DRAFT IN
PROGRESS
Chapter 3
TL/JFF/FN/EIPPCB/LCP_Final Draft June 2016 283
o polyvalent metal salts such as alum, aluminium trichloride, ferrous chloride,
ferrous sulphate;
o mineral acids such as sulphuric acid, hydrochloric acid, nitric acid;
o adsorbents such as pulverised clay, lime;
o organic polymers such as polyamines, polyacrylates;
and subsequent separation of de-emulsified oil by coagulation/flocculation and air flotation.
Technical description The commonly used oil-water separators are the following:
American Petroleum Institute Separator (API), is the simplest type, consisting of an
open rectangular basin and a flight scraper, which moves the sludge to a collection pit and
the oil to the skimming device; able to intercept large slugs of oil.
Parallel Plate Interceptor (PPI), equipped with plates parallel to the current, which
enlarge the active surface area considerably, and an oil skimming device; not suitable for
intercepting large slugs.
Corrugated Plate Interceptor (CPI), equipped with corrugated plate packs placed
counter-current and an oil skimming device; not suitable for intercepting large slugs, but
with good separation efficiency.
Achieved environmental benefits
Reduced oil and solids from the waste water discharge.
Environmental performance and operational data
See the CWW BREF.
Cross-media effects
No information provided.
Technical considerations relevant for applicability
Generally applicable.
Economics
No information provided.
Driving force for implementation
No information provided.
Example plants
No information provided.
Reference literature
CWW BREF.
Robinson, J. 2000. Water, Industrial Water Treatment. Kirk-Othmer Encyclopaedia of Chemical
Technology.
3.2.4.5 Crystallisation
Description
The removal of ionic pollutants from waste water by crystallising them on a seed material such
as sand or minerals, working in a fluidised bed process.
Some combustion plants use crystallisation after evaporation.
Technical description
WORKIN
G DRAFT IN
PROGRESS
Chapter 3
284 June 2016 TL/JFF/FN/EIPPCB/LCP_Final Draft
The crystallisation device consists mainly of:
the cylindrical reactor with bottom influent and top effluent;
seed material, i.e. pellets of filter sand or minerals, kept in a fluidised bed condition;
the circulation system with a recirculation pump.
The principle of the circulation system is to mix the influent waste water with the circulation
stream with the lower anion or metal concentration. Because of the circulation system the
reactor can work more flexibly, e.g.:
fluctuations in the influent flow and composition are easily eliminated;
all kinds of waste water with concentrations in the range of 10–100 000 ppm can be
treated by simply adapting the circulation ratio (more highly concentrated waste water
requires a larger circulation ratio);
fluidisation of pellets is also maintained if no waste water is fed into the reactor.
Achieved environmental benefits
Reduction of metals and metalloids, sulphate (SO42-
) and fluoride (F-) in the waste water
discharge.
Environmental performance and operational data
No waste water is discharged.
Cross-media effects
Energy consumption.
Residues handling and disposal.
Technical considerations relevant to applicability
Generally applicable.
Economics
No information provided.
Driving force for implementation
No information provided.
Example plants
Plants 211 and 253.
Reference literature
CWW BREF.
Robinson, J. 2000. Water, Industrial Water Treatment. Kirk-Othmer Encyclopaedia of Chemical
Technology.
3.2.4.6 Evaporation
Description
Evaporation of waste water is a distillation process where water is the volatile substance,
leaving the concentrate as a bottom residue to be disposed of. The aim of this operation is to
reduce the volume of waste water or to concentrate mother liquors. The volatile steam is
collected in a condenser and the condensed water is, after subsequent treatment if necessary,
recycled.
Technical description
There are many types of evaporators. Their suitability depends on the individual requirements.
Examples of evaporators are:
WORKIN
G DRAFT IN
PROGRESS

Chapter 3
TL/JFF/FN/EIPPCB/LCP_Final Draft June 2016 285
natural-circulation evaporators, suitable for material that is not sensitive to heat;
short-tube vertical evaporators, suitable for non-corrosive or non-crystallising liquors;
basket-type evaporators, same application as short-tube evaporators;
falling film evaporators, used in the fertiliser industry to concentrate urea, phosphoric
acid, ammonium nitrate, etc.;
agitated thin film evaporators, used for concentrating, fractionating, deodorising and
stripping in the production of pharmaceuticals, polymers, organic and inorganic chemicals.
Evaporators are usually operated in series, where the condensation heat of one stage heats the
condensate (i.e. waste water) of the preceding stage. Operation under vacuum minimises the
energy demand. Normal operation conditions are 12–20 kPa and 50–60 °C.
Achieved environmental benefits
Reduction of the pollutants in the waste water discharge.
Environmental performance and operational data
No waste water is discharged.
Cross-media effects
Energy consumption.
Residues handling and disposal.
Technical considerations relevant to applicability
Generally applicable.
Economics
No information provided.
Driving force for implementation
No information provided.
Example plants
Plants 211 and 253.
Reference literature
CWW BREF.
Robinson, J. 2000. Water, Industrial Water Treatment. Kirk-Othmer Encyclopaedia of Chemical
Technology.
3.2.4.7 Air stripping
Description
Waste water stripping is an operation in which waste water is brought into contact with a high
flow of a gas current in order to transfer volatile pollutants from the water phase to the gas
phase. The pollutants are removed from the stripping gas so that it can be recycled into the
process and reused. Organic and inorganic volatile substances (e.g. ammonia) are transferred
from waste water to waste gas, greatly increasing the surface area of the contaminated water
exposed. Water evaporation, however, decreases the temperature of the waste water, thus
decreasing the volatility of the contaminants.
Technical description
The most common stripping facilities are:
packed tower stripper, with:
o spray nozzles at the top to distribute waste water over the packing, and the
stripping gas led counter-current through the packing;
WORKIN
G DRAFT IN
PROGRESS

Chapter 3
286 June 2016 TL/JFF/FN/EIPPCB/LCP_Final Draft
o a sump at the bottom to collect the decontaminated water, additionally equipped
with an air heater (for air stripping);
o an automated control system and air emission control system (GAC unit,
catalytic oxidiser or incinerator);
stripping tank, in which volatile compounds are stripped by bubbling gas (air, steam) into
a waste water ducting tank.
The equipment consists of:
a buffer tank for waste water;
a pretreatment tank for pH adjustment;
stripping column(s), operated counter-flow;
feed preheater, recovering heat from the subsequent stripping steam condenser;
condenser, air- or water-cooled;
downstream facilities for gas treatment.
Strippers can be operated continuously or batchwise, the latter ensuring consistent performance
and higher energy efficiency than continuously operated units.
Achieved environmental benefits
Reduced ammonia content in waste water.
Environmental performance and operational data
The ammonia content may be reduced by up to 90 % (Plant 464).
Cross-media effects
If the gases are not returned to the combustion unit, then transfer of ammonia from water to air.
Technical considerations relevant to applicability
Applicable in the case of a high ammonia content in waste water, e.g. due to SCR/SNCR use for
air pollution control.
Economics
No information provided.
Driving force for implementation
No information provided.
Example plants
Plants 473 and 464.
Reference literature
CWW BREF.
Robinson, J. 2000. Water, Industrial Water Treatment. Kirk-Othmer Encyclopaedia of Chemical
Technology.
3.2.4.8 Ion exchange
Description
Ion exchange is the removal of undesired or hazardous ionic constituents of waste water and
their replacement by more acceptable ions from an ion exchange resin, where they are
temporarily retained and afterwards released into a regeneration or backwashing liquid.
Technical description
The equipment of an ion exchanger usually consists of:
WORKIN
G DRAFT IN
PROGRESS

Chapter 3
TL/JFF/FN/EIPPCB/LCP_Final Draft June 2016 287
a vertical cylindrical pressure vessel with corrosion-resistant linings that contains the
resin, usually as a packed column with several possible configurations;
a control valve and piping system, directing the flows of waste water and regeneration
solution to the proper locations;
a system to regenerate the resin, consisting of salt-dissolving and dilution control
equipment.
An inlet distribution system is located at either the top or the bottom of the vessel and provides
an even distribution of the influent waste water, to avoid hollowing out flow channels in the
resin bed. It also acts as a collector for backwash water.
Ion exchangers commonly in use are macro-porous granule resins with cationic or anionic
functional groups. Some resins need acid and caustic for regeneration. If organics are present,
the resins may be subject to fouling. The regenerant streams will need to be neutralised.
Achieved environmental benefits
Reduced metal ions content in waste water.
Environmental performance and operational data
See the CWW BREF.
Cross-media effects
Production of sludge and brine to be treated or disposed of.
Technical considerations relevant to applicability
Generally applicable.
Economics
No information provided.
Driving force for implementation
No information provided.
Example plants
Plants 464 and 473.
Reference literature
CWW BREF.
3.2.4.9 Biological treatment
Description
Biological treatment is the degradation of dissolved organic substances with microorganisms
(i.e. bacteria) as oxidising agents.
Technical description
There are basically three types of metabolic processes: aerobic processes (using dissolved
oxygen), anoxic processes (using the biological reduction of oxygen donors) and anaerobic
processes (without an oxygen supply).
Some plants in the United States operate biological treatment systems to reduce biochemical
oxygen demand and some other coal-fired power plants use anoxic/anaerobic biological systems
to reduce certain pollutants (e.g. selenium, mercury, nitrates) more effectively than has been
possible with sedimentation, chemical precipitation or aerobic biological treatment processes.
Plants employing an anoxic/anaerobic biological treatment system operate a fixed-film
bioreactor that consists of an activated carbon bed, such as granular activated carbon or some
WORKIN
G DRAFT IN
PROGRESS

Chapter 3
288 June 2016 TL/JFF/FN/EIPPCB/LCP_Final Draft
other porous substrate that is inoculated with naturally occurring, beneficial microorganisms
that reduce selenium and other metals. [Steam-Electric_TDD_Proposed-rule_2013.pdf]
Untreated waste water can contain nitrogen in the form of organic nitrogen, ammonia (NH3-N),
nitrite (NO2-N) and nitrate (NO3-N). Biological nitrogen removal involves the initial conversion
of the nitrogen contained in the waste water to nitrate and, then, conversion of the NO3-N to
inert nitrogen (N2), which is released from the waste water to the atmosphere. More in detail,
biological treatment of waste water for the removal of nitrogen occurs in three steps:
ammonification (breakdown of organic N to NH3-N);
nitrification (oxidation of NH3-N to NO3-N);
denitrification (conversion of NO3-N to N2).
Achieved environmental benefits
Reduced organic content, nitrogen and metals in waste water.
Environmental performance and operational data
See Reference Literature below.
Cross-media effects
When the nitrification/denitrification stages are part of the central WWTP, they may contribute
to the release of odours and volatile substances.
Technical considerations relevant to applicability
Nitrification may not be applicable in the aerobic biological treatment of ammonium (NH4+) in
the case of high chloride concentrations (i.e. around 10 g/l). Studies of nitrogen removal from
waste water with high salinity (30 g/l) have been reported.
Economics
No information provided.
Driving force for implementation
No information provided.
Example plants
Duke Energy Carolinas' Allen Steam Station (USA).
Belews Creek Steam Station (USA).
Reference literature
EPA-821-R-13-002 [Steam-Electric_TDD_Proposed-rule_2013.pdf].
Biological nitrogen and phenol removal from saline industrial waste water by submerged fixed-
film reactor. [2006, A.F. Ramos et alter.]
[Duke Energy Carolina LLC's Strategy and Initial Experience of FGD Waste Water Treatment
Systems. International Water Conference, October 2008. iwc_08_32.pdf]
CWW BREF.
3.2.4.10 Techniques to consider for plants equipped with flue-gas treatment with emissions to water (Wet FGD, FG condenser)
WORKIN
G DRAFT IN
PROGRESS

Chapter 3
TL/JFF/FN/EIPPCB/LCP_Final Draft June 2016 289
Table 3.41: Techniques for the prevention and control of water pollution from plants operating flue-gas treatment with emissions to water
Technique Technical description
Achieved
environmental
benefits
Environmental
performance
and operational
data
Cross-media
effects
Technical
considerations relevant
to applicability
Economics Example plants
1 Mechanical treatment
Filtration
Separation of solids from
waste water effluents
passing through a porous
medium
Reduction of oil and
solids in the waste
water discharge NA
Sludge production Generally applicable Plant-
specific Plants 455, 476
Oil separation Separation of oil and water
by gravity
Reduction of oil in
the waste water
discharge
Sludge production Generally applicable Plant-
specific NA
2 Physico-chemical treatment
Flocculation, sedimentation,
precipitation, neutralisation
Addition of special
chemicals to cause solids
that cannot be separated by
simple gravitational
techniques to settle
Removal of
fluoride, metals,
TOC, suspended
solids
NA
Sludge production Generally applicable Plant-
specific Plants 662, 464
Softening, crystallisation,
evaporation
Crystallisation is closely
related to precipitation. In
contrast to it, the
precipitate is produced on
seed material such as sand
or minerals
Reduction of the
pollutants in the
waste water
discharge.
Avoidance of water
discharge
Concentrated waste
water or sludge
production.
Energy
consumption.
Applicable to ZLD (zero
liquid discharge) system
Plant-
specific Plants 211, 253
Stripping
Waste water is brought
into contact with a high
flow of a gas current in
order to transfer volatile
pollutants from the water
phase to the gas phase
Reduction of
ammonia content in
waste water
Transfer of
ammonia to air by
stripping
Applicable if high
ammonia content in
waste water because of
SCR/SNCR
Plant-
specific Plants 470, 464
WORKIN
G DRAFT IN
PROGRESS

Chapter 3
290 June 2016 TL/JFF/FN/EIPPCB/LCP_Final Draft
Technique Technical description
Achieved
environmental
benefits
Environmental
performance
and operational
data
Cross-media
effects
Technical
considerations relevant
to applicability
Economics Example plants
Ion exchange
Removal of undesired or
hazardous ionic
constituents of waste water
and their replacement by
more acceptable ions from
an ion exchange resin
Removal of ions
and ionisable
species from waste
water
Sludge and brine
production Generally applicable
Plant-
specific Plant 464
3 Reduction of waste water
Reuse of water
Mixing the waste water
from WFGD for ash
transport, by-products, etc.
Avoidance of water
discharge
NA
Stabilised material
can be used as
filling material in
opencast mines
Applicable to plants
close to opencast mines
Plant-
specific Plant 170
Water recycling Return of waste water to
the production process
Reduction of water
discharge
High salt content in
water discharged
Generally applicable.
Compulsory for soft
water used as make-up
water for WFGD
Plant-
specific Plants 547, 137
4 Biological treatment
Biological treatment
Degradation of dissolved
organic substances with
microorganisms (i.e.
bacteria) as oxidising
agents
Reduction of
organic content,
nitrogen and metals
in waste water
EPA-821-R-13-
002
It may contribute to
the release of
odours and volatile
substances
Nitrification may not be
applicable in the case of
high chloride
concentrations (i.e.
around 10 g/l)
Plant-
specific
Duke Energy
Carolinas' Allen
Steam Station
(USA), Belews
Creek Steam
Station (USA)
NB:
NA: No relevant specific information available.
WORKIN
G DRAFT IN
PROGRESS
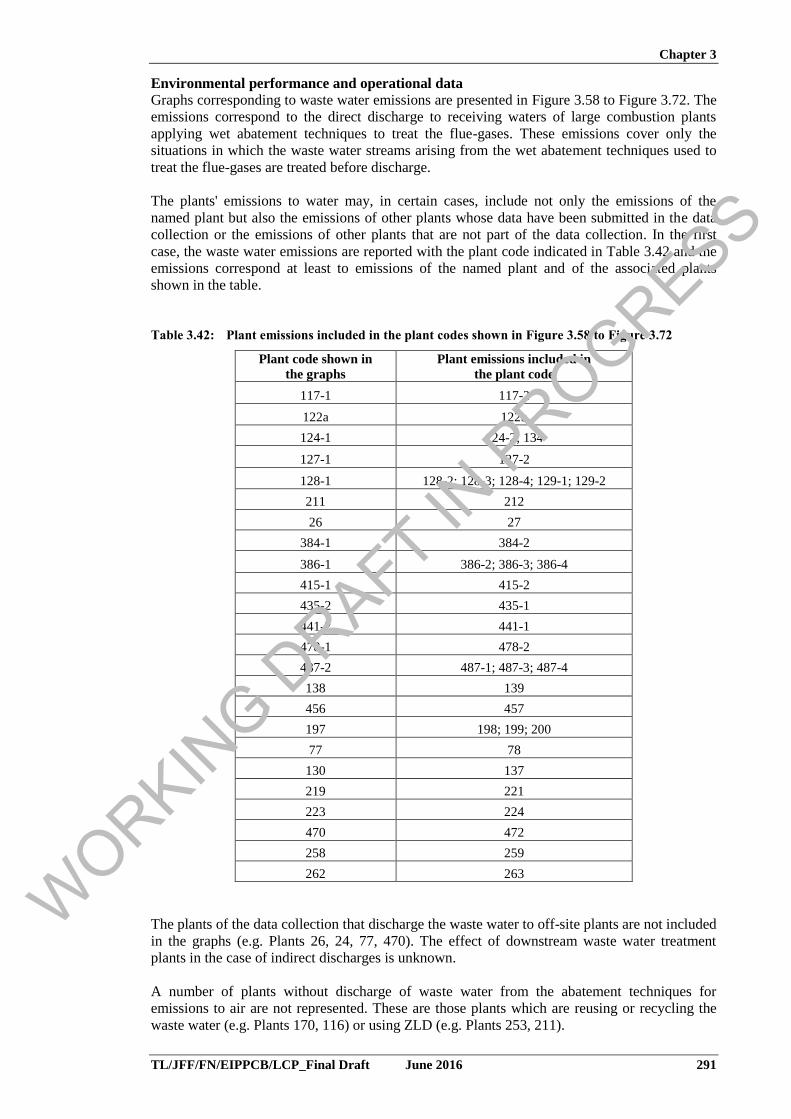
Chapter 3
TL/JFF/FN/EIPPCB/LCP_Final Draft June 2016 291
Environmental performance and operational data
Graphs corresponding to waste water emissions are presented in Figure 3.58 to Figure 3.72. The
emissions correspond to the direct discharge to receiving waters of large combustion plants
applying wet abatement techniques to treat the flue-gases. These emissions cover only the
situations in which the waste water streams arising from the wet abatement techniques used to
treat the flue-gases are treated before discharge.
The plants' emissions to water may, in certain cases, include not only the emissions of the
named plant but also the emissions of other plants whose data have been submitted in the data
collection or the emissions of other plants that are not part of the data collection. In the first
case, the waste water emissions are reported with the plant code indicated in Table 3.42 and the
emissions correspond at least to emissions of the named plant and of the associated plants
shown in the table.
Table 3.42: Plant emissions included in the plant codes shown in Figure 3.58 to Figure 3.72
Plant code shown in
the graphs
Plant emissions included in
the plant code
117-1 117-2
122a 122b
124-1 124-2; 134
127-1 127-2
128-1 128-2; 128-3; 128-4; 129-1; 129-2
211 212
26 27
384-1 384-2
386-1 386-2; 386-3; 386-4
415-1 415-2
435-2 435-1
441-2 441-1
478-1 478-2
487-2 487-1; 487-3; 487-4
138 139
456 457
197 198; 199; 200
77 78
130 137
219 221
223 224
470 472
258 259
262 263
The plants of the data collection that discharge the waste water to off-site plants are not included
in the graphs (e.g. Plants 26, 24, 77, 470). The effect of downstream waste water treatment
plants in the case of indirect discharges is unknown.
A number of plants without discharge of waste water from the abatement techniques for
emissions to air are not represented. These are those plants which are reusing or recycling the
waste water (e.g. Plants 170, 116) or using ZLD (e.g. Plants 253, 211).
WORKIN
G DRAFT IN
PROGRESS
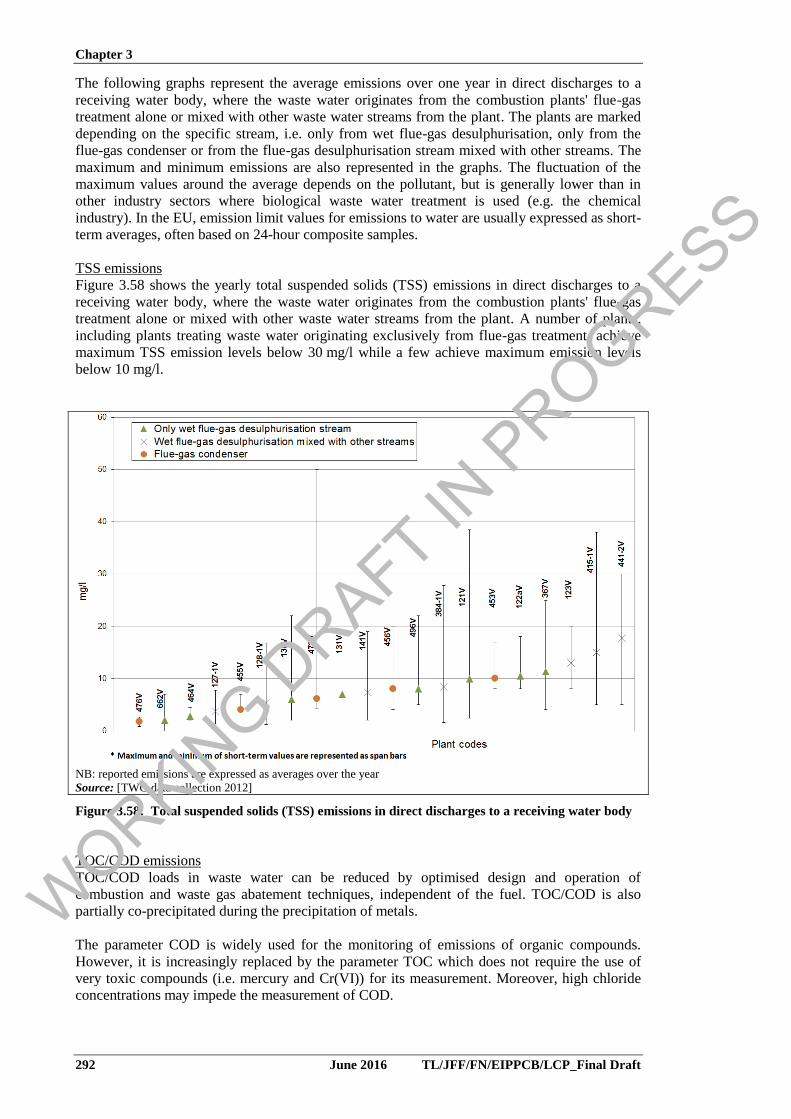
Chapter 3
292 June 2016 TL/JFF/FN/EIPPCB/LCP_Final Draft
The following graphs represent the average emissions over one year in direct discharges to a
receiving water body, where the waste water originates from the combustion plants' flue-gas
treatment alone or mixed with other waste water streams from the plant. The plants are marked
depending on the specific stream, i.e. only from wet flue-gas desulphurisation, only from the
flue-gas condenser or from the flue-gas desulphurisation stream mixed with other streams. The
maximum and minimum emissions are also represented in the graphs. The fluctuation of the
maximum values around the average depends on the pollutant, but is generally lower than in
other industry sectors where biological waste water treatment is used (e.g. the chemical
industry). In the EU, emission limit values for emissions to water are usually expressed as short-
term averages, often based on 24-hour composite samples.
TSS emissions
Figure 3.58 shows the yearly total suspended solids (TSS) emissions in direct discharges to a
receiving water body, where the waste water originates from the combustion plants' flue-gas
treatment alone or mixed with other waste water streams from the plant. A number of plants,
including plants treating waste water originating exclusively from flue-gas treatment, achieve
maximum TSS emission levels below 30 mg/l while a few achieve maximum emission levels
below 10 mg/l.
NB: reported emissions are expressed as averages over the year
Source: [TWG data collection 2012]
Figure 3.58: Total suspended solids (TSS) emissions in direct discharges to a receiving water body
TOC/COD emissions
TOC/COD loads in waste water can be reduced by optimised design and operation of
combustion and waste gas abatement techniques, independent of the fuel. TOC/COD is also
partially co-precipitated during the precipitation of metals.
The parameter COD is widely used for the monitoring of emissions of organic compounds.
However, it is increasingly replaced by the parameter TOC which does not require the use of
very toxic compounds (i.e. mercury and Cr(VI)) for its measurement. Moreover, high chloride
concentrations may impede the measurement of COD.
WORKIN
G DRAFT IN
PROGRESS
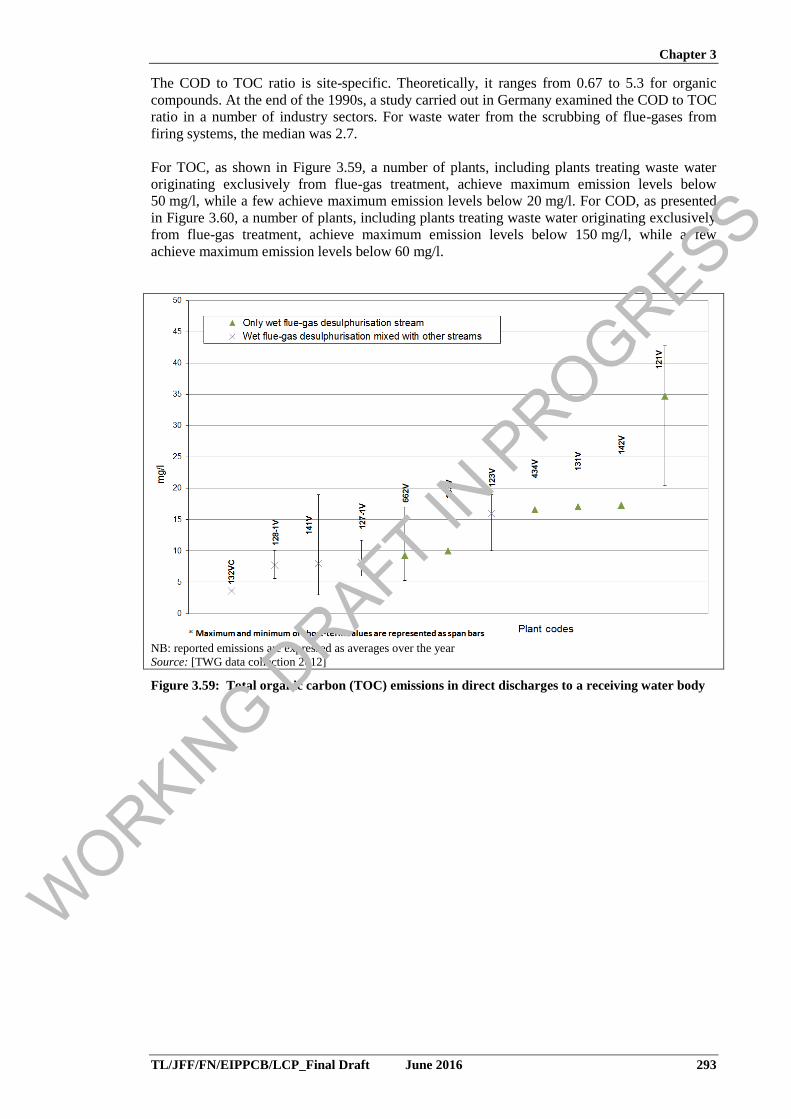
Chapter 3
TL/JFF/FN/EIPPCB/LCP_Final Draft June 2016 293
The COD to TOC ratio is site-specific. Theoretically, it ranges from 0.67 to 5.3 for organic
compounds. At the end of the 1990s, a study carried out in Germany examined the COD to TOC
ratio in a number of industry sectors. For waste water from the scrubbing of flue-gases from
firing systems, the median was 2.7.
For TOC, as shown in Figure 3.59, a number of plants, including plants treating waste water
originating exclusively from flue-gas treatment, achieve maximum emission levels below
50 mg/l, while a few achieve maximum emission levels below 20 mg/l. For COD, as presented
in Figure 3.60, a number of plants, including plants treating waste water originating exclusively
from flue-gas treatment, achieve maximum emission levels below 150 mg/l, while a few
achieve maximum emission levels below 60 mg/l.
NB: reported emissions are expressed as averages over the year
Source: [TWG data collection 2012]
Figure 3.59: Total organic carbon (TOC) emissions in direct discharges to a receiving water body
WORKIN
G DRAFT IN
PROGRESS
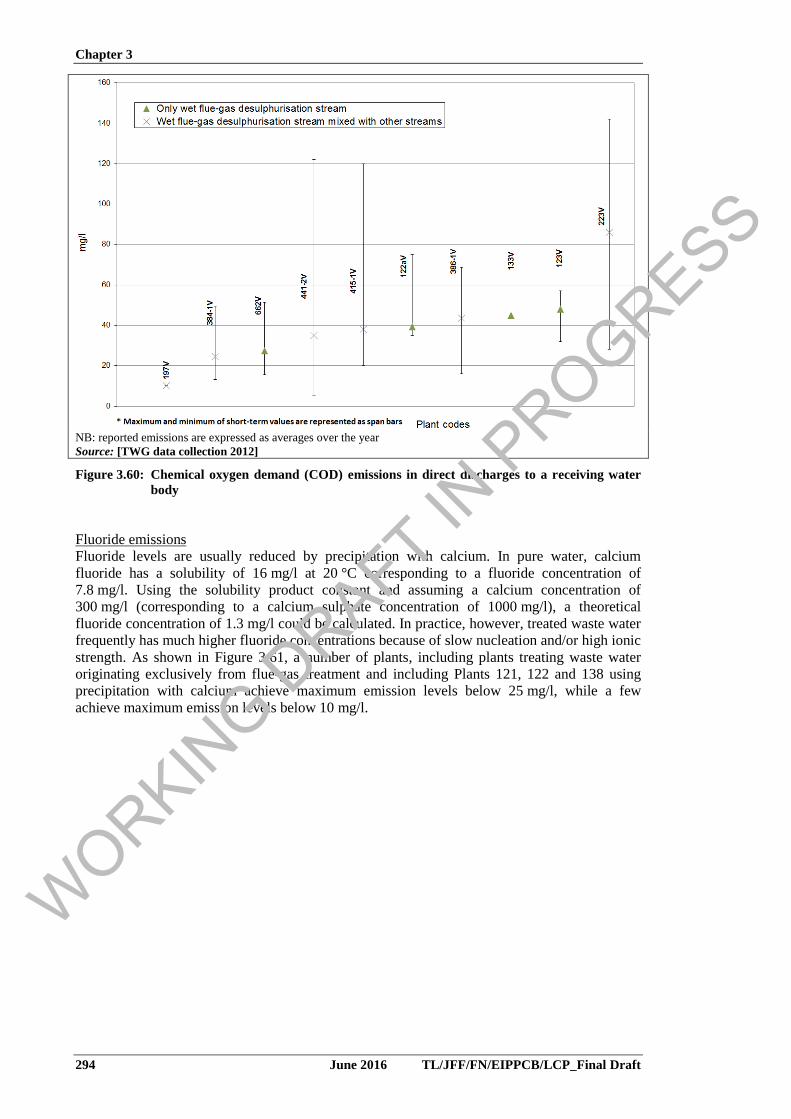
Chapter 3
294 June 2016 TL/JFF/FN/EIPPCB/LCP_Final Draft
NB: reported emissions are expressed as averages over the year
Source: [TWG data collection 2012]
Figure 3.60: Chemical oxygen demand (COD) emissions in direct discharges to a receiving water
body
Fluoride emissions
Fluoride levels are usually reduced by precipitation with calcium. In pure water, calcium
fluoride has a solubility of 16 mg/l at 20 °C corresponding to a fluoride concentration of
7.8 mg/l. Using the solubility product constant and assuming a calcium concentration of
300 mg/l (corresponding to a calcium sulphate concentration of 1000 mg/l), a theoretical
fluoride concentration of 1.3 mg/l could be calculated. In practice, however, treated waste water
frequently has much higher fluoride concentrations because of slow nucleation and/or high ionic
strength. As shown in Figure 3.61, a number of plants, including plants treating waste water
originating exclusively from flue-gas treatment and including Plants 121, 122 and 138 using
precipitation with calcium achieve maximum emission levels below 25 mg/l, while a few
achieve maximum emission levels below 10 mg/l.
WORKIN
G DRAFT IN
PROGRESS

Chapter 3
TL/JFF/FN/EIPPCB/LCP_Final Draft June 2016 295
NB: reported emissions are expressed as averages over the year
Source: [TWG data collection 2012]
Figure 3.61: Fuoride (F-) emissions in direct discharges to a receiving water body
Sulphate emissions
Figure 3.62 represents the yearly sulphate emissions in direct discharges to a receiving water
body, where the waste water originates from the combustion plants' flue-gas treatment alone or
mixed with other waste water streams from the plant. Sulphate levels in untreated waste water
from flue-gas treatment depend on the raw water quality, the fuel quality and the water
recycling rate. Sulphate levels are usually reduced by precipitation with calcium salts
(limestone/lime). Other techniques such as evaporation-crystallisation and precipitation with
barium are rarely used and imply cross-media effects. Residual sulphate levels thus depend on
the solubility of calcium sulphate, which increases with increasing temperatures and salinity
(e.g. chloride concentration). The chloride concentration is determined by the raw water quality
(e.g. seawater), the fuel quality and the water recycling rate in the flue-gas treatment system.
A number of plants, including plants treating waste water originating exclusively from flue-gas
treatment and including Plants 123 and 131 using precipitation with calcium achieve maximum
sulphate emission levels below 2 g/l, while a few achieve maximum emission levels below
1.3 g/l. The reported chloride concentrations are in all cases below 5 g/l. The concentration
range of 1.3–2 g/l corresponds to the solubility of calcium sulphate in low-salinity water.
Sulphate levels in waste water with chloride levels above 5 g/l were not reported, but the
literature indicates that the solubility of sulphate could increase up to 4 g/l and higher at chloride
levels of about 20 g/l, depending on the temperature.
WORKIN
G DRAFT IN
PROGRESS
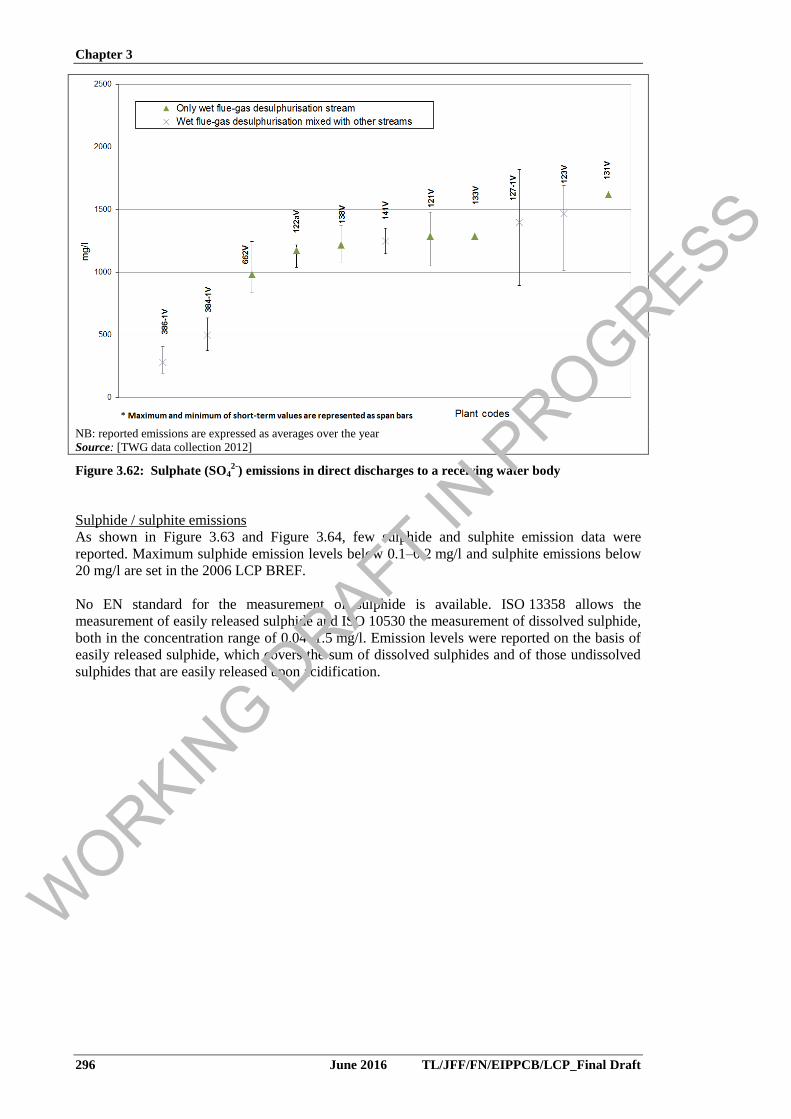
Chapter 3
296 June 2016 TL/JFF/FN/EIPPCB/LCP_Final Draft
NB: reported emissions are expressed as averages over the year
Source: [TWG data collection 2012]
Figure 3.62: Sulphate (SO42-
) emissions in direct discharges to a receiving water body
Sulphide / sulphite emissions
As shown in Figure 3.63 and Figure 3.64, few sulphide and sulphite emission data were
reported. Maximum sulphide emission levels below 0.1–0.2 mg/l and sulphite emissions below
20 mg/l are set in the 2006 LCP BREF.
No EN standard for the measurement of sulphide is available. ISO 13358 allows the
measurement of easily released sulphide and ISO 10530 the measurement of dissolved sulphide,
both in the concentration range of 0.04–1.5 mg/l. Emission levels were reported on the basis of
easily released sulphide, which covers the sum of dissolved sulphides and of those undissolved
sulphides that are easily released upon acidification.
WORKIN
G DRAFT IN
PROGRESS
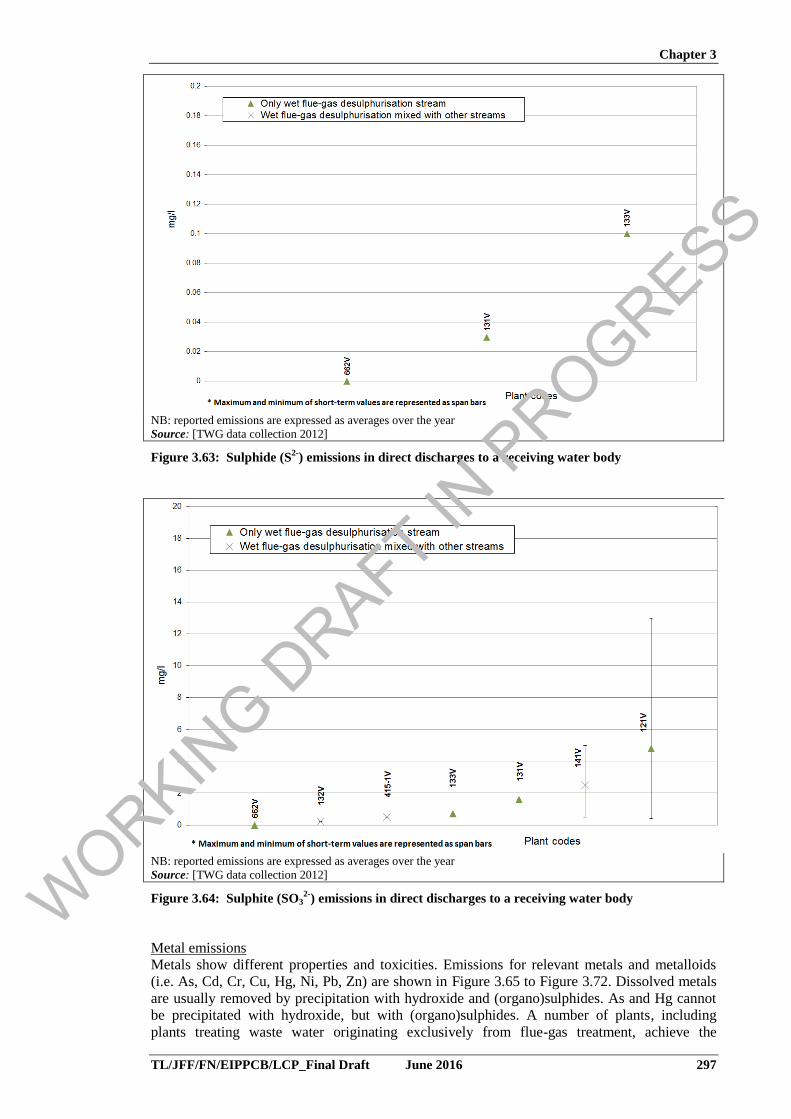
Chapter 3
TL/JFF/FN/EIPPCB/LCP_Final Draft June 2016 297
NB: reported emissions are expressed as averages over the year
Source: [TWG data collection 2012]
Figure 3.63: Sulphide (S2-
) emissions in direct discharges to a receiving water body
NB: reported emissions are expressed as averages over the year
Source: [TWG data collection 2012]
Figure 3.64: Sulphite (SO32-
) emissions in direct discharges to a receiving water body
Metal emissions
Metals show different properties and toxicities. Emissions for relevant metals and metalloids
(i.e. As, Cd, Cr, Cu, Hg, Ni, Pb, Zn) are shown in Figure 3.65 to Figure 3.72. Dissolved metals
are usually removed by precipitation with hydroxide and (organo)sulphides. As and Hg cannot
be precipitated with hydroxide, but with (organo)sulphides. A number of plants, including
plants treating waste water originating exclusively from flue-gas treatment, achieve the
WORKIN
G DRAFT IN
PROGRESS

Chapter 3
298 June 2016 TL/JFF/FN/EIPPCB/LCP_Final Draft
following maximum emission levels: As 50 µg/l, Cd 5 µg/l, Cr 50 µg/l, Cu 50 µg/l, Hg 3 µg/l,
Ni 50 µg/l, Pb 20 µg/l, and Zn 200 µg/l. A few plants achieve the following maximum emission
levels: As 10 µg/l, Cd 2 µg/l, Cr 10 µg/l, Cu 10 µg/l, Hg 0.2 µg/l, Ni 10 µg/l, Pb 10 µg/l, and Zn
50 µg/l.
NB: reported emissions are expressed as averages over the year
Source: [TWG data collection 2012]
Figure 3.65: Arsenic (As) emissions in direct discharges to a receiving water body
NB: reported emissions are expressed as averages over the year
Source: [TWG data collection 2012]
Figure 3.66: Cadmium (Cd) emissions in direct discharges to a receiving water body
WORKIN
G DRAFT IN
PROGRESS

Chapter 3
TL/JFF/FN/EIPPCB/LCP_Final Draft June 2016 299
NB: reported emissions are expressed as averages over the year
Source: [TWG data collection 2012]
Figure 3.67: Chromium (Cr) emissions in direct discharges to a receiving water body
NB: reported emissions are expressed as averages over the year
Source: [TWG data collection 2012]
Figure 3.68: Copper (Cu) emissions in direct discharges to a receiving water body
W
ORKING D
RAFT IN P
ROGRESS

Chapter 3
300 June 2016 TL/JFF/FN/EIPPCB/LCP_Final Draft
NB: reported emissions are expressed as averages over the year
Source: [TWG data collection 2012]
Figure 3.69: Mercury (Hg) emissions in direct discharges to a receiving water body
NB: reported emissions are expressed as averages over the year
Source: [TWG data collection 2012]
Figure 3.70: Nickel (Ni) emissions in direct discharges to a receiving water body
W
ORKING D
RAFT IN P
ROGRESS

Chapter 3
TL/JFF/FN/EIPPCB/LCP_Final Draft June 2016 301
NB: reported emissions are expressed as averages over the year
Source: [TWG data collection 2012]
Figure 3.71: Lead (Pb) emissions in direct discharges to a receiving water body
NB: reported emissions are expressed as averages over the year
Source: [TWG data collection 2012]
Figure 3.72: Zinc (Zn) emissions in direct discharges to a receiving water body
WORKIN
G DRAFT IN
PROGRESS

Chapter 3
302 June 2016 TL/JFF/FN/EIPPCB/LCP_Final Draft
3.2.5 Techniques for the management of residues
Details and information about the handling of residues are given in the EFS BREF.
To reduce the quantity of waste sent for disposal from combustion and/or abatement techniques,
it is important to organise operations in the following order of priority and take into account
life-cycle thinking:
a. waste prevention, e.g. maximise the proportion of residues which arise as by-products;
b. waste preparation for reuse, e.g. according to the specific requested quality criteria;
c. waste recycling;
d. other waste recovery (e.g. energy recovery).
Some techniques may be used for this purpose, i.e. the preparation of spent catalysts for reuse
(e.g. up to four times for SCR catalyst, depending on the mechanical condition of the catalyst
and on the required performance related to NOX and NH3 emissions), energy recovery by using
waste in the fuel mix (e.g. carbon-rich ash and sludges), generation of FGD gypsum as a by-
product and/or recycling or recovery of residues in the construction sector.
In relation to the generation of gypsum as a by-product, the quality of the calcium-based
reaction residues generated by wet FGD is optimised so that they can be used as a substitute for
mined gypsum (e.g. as raw material in the plasterboard industry). The quality of the limestone
used in wet FGD influences the purity of the gypsum produced.
The optimisation of the quality of the gypsum generated as a by-product in wet desulphurisation
systems may be carried out using a FGD pre-scrubber and a dehydration centrifuge.
Recovery or recycling of residues (e.g. from the semi-dry desulphurisation processes, fly ash,
bottom ash) as a construction material (e.g. in road-building; in concrete production, to replace
sand; or in the cement industry).
The optimisation of the quality of the bottom ash generated as a by-product of the combustion
may be carried out by means of dry de-ashing and afterburning.
3.2.5.1 Optimisation of gypsum quality
Description
Optimisation of the quality of the gypsum generated as a by-product in wet desulphurisation
systems using 2-stage dewatering systems including hydroclone and vacuum belt filter with
centrifuge, or more exceptionnaly a FGD pre-scrubber and a dehydration centrifuge.
Technical description
The 2-stage dewatering systems including hydroclone and vacuum belt filter with centrifuge
allow the separation of gypsum crystals by size to return small crystals into the srubber and to
remove large crystals for dewatering.
FGD pre-scrubbers can be used to reduce levels of acid-forming constituents (flue-dust, F, Cl),
thus improving the gypsum quality. In addition, the gypsum obtained is dehydrated by means of
a centrifuge.
Achieved environmental benefits
Increased level of gypsum reuse thanks to a reduction in chloride/fluoride levels in the gypsum
(saleable by-product).
Environmental performance and operational data
No information provided.
Cross-media effects
WORKIN
G DRAFT IN
PROGRESS

Chapter 3
TL/JFF/FN/EIPPCB/LCP_Final Draft June 2016 303
None.
Technical considerations relevant to applicability
Applicable to slag tap boilers fitted with wet desulphurisation systems.
Economics
Revenues from the gypsum sales.
Driving force for implementation
No information provided.
Example plants
Plant 121.
Reference literature
No information provided.
3.2.5.2 Optimisation of bottom ash quality
Description
Optimisation of the quality of the bottom ash generated as a by-product of the combustion, by
means of dry de-ashing and afterburning.
Technical description
Unburnt portions of fuel drop out of the boiler onto a conveyor belt (dry de-ashing), below the
boiler hopper, and are redirected to the boiler where they are reburnt (afterburning). Due to the
partial vacuum prevailing in the boiler, the flue-gases produced are passed into the flue-gas
conduit.
Dry de-ashing avoids the need for a separate effluent treatment plant (reduction in COD) and
increases the value of the ash by reducing the carbon content. At the same time, afterburning
also reduces the water content of the ash.
The air used to cool the ash re-enters the boiler, recovers a significant amount of energy and
increases the boiler efficiency.
Achieved environmental benefits
Reduced emissions to water and reduced waste generation: there is no generation of de-
ashing process effluent that would require separate treatment, thus avoiding COD emissions
from the combustion and ash treatment processes.
Improved energy efficiency.
Environmental performance and operational data
The boiler efficiency, compared with the use of a wet bottom ash handling system, is improved
by 0.1–0.2 percentage points for normal bituminous coals and by 0.5 percentage points for low-
rank coals.
Cross-media effects
Minimal additional emissions in the flue-gas stream as a result of the afterburning process.
Technical considerations relevant to applicability
Afterburning applicable to dry-bottom boilers.
Dry bottom ash handling only applicable to plants combusting solid fuels. There may be
technical restrictions that prevent retrofitting to existing combustion plants.
WORKIN
G DRAFT IN
PROGRESS
Chapter 3
304 June 2016 TL/JFF/FN/EIPPCB/LCP_Final Draft
Economics
Plant-specific.
In the example of Plant 142: capex about EUR 4.5 million and opex about EUR 170 000/yr
(2010 price levels).
Driving force for implementation
Reduction in emissions (effluent/COD).
Reduction in quantities of additional feedstocks (e.g. activated carbon, effluent treatment).
Improvement in ash quality.
Example plants
Plant 142.
Reference literature
[MagaldiNews ASME – EPPSA]
3.2.6 Techniques for the prevention of emissions to soil and groundwater
Soil and groundwater contamination is more widely related to uncontrolled and/or unplanned
(accidental) discharges. This contamination may be difficult and costly to mitigate. IED Article
14(1) (b) and (c) require permit conditions to include measures to protect soil and groundwater).
Measures to prevent or control soil/groundwater contamination may be included in the EMS.
3.2.7 Techniques to reduce noise emissions
3.2.7.1 Strategic planning of the location of equipment, units and buildings
Description
This technique consists of strategically planning the location of equipment, units and buildings
with the aim of increasing the distance between the emitter and the receiver and of using
buildings or other structures as noise screens.
Technical description
The low-noise design of plants and sites aims at minimising the resulting environmental noise at
the closest receptor premises. A simple, but in general effective, method is to increase the
distance between the emitter and the receiver. In addition, buildings can act as a noise screen for
other sources. In the case of existing plants, it may be possible to relocate specific units.
The basic options to reduce noise are to modify the noise source, to change the transmission
path of the noise or to make changes affecting the receiver. The first step that needs to be taken
in any noise assessment is to identify the principal sources and paths of noise. The prediction of
the levels of environmental noise at a certain distance from the source(s) may be based on ISO
9613-2. A noise management plan where a noise nuisance at sensitive receptors is expected or
sustained may be implemented. A method to decrease the level of noise is to increase the
distance between the receiver and the source.
Optimising the location of noisy equipment and of the whole plant is, therefore, perhaps the
most cost-effective means of avoiding noise problems. A straightforward method to remedy
noise effects is to modify the noise generation mechanism. Another alternative is to place the
noise source in an enclosure. Acoustic barriers are commonly used to modify the sound path.
Inside the buildings, the use of noise-absorptive material, particularly on the walls and ceiling,
is an effective method to decrease reflection or reverberation inside the building. If the internal
surfaces of the room are totally reflective, the noise theoretically approaches infinity. This is
WORKIN
G DRAFT IN
PROGRESS
Chapter 3
TL/JFF/FN/EIPPCB/LCP_Final Draft June 2016 305
why interior noise levels are, in some cases, controlled by adding absorptive material inside the
building.
Achieved environmental benefits
Reduction of noise emissions.
Environmental performance and operational data
No information provided.
Cross-media effects
In the case of existing plants, some raw materials and energy are consumed for the
relocation of equipment or production units.
Reduced accessibility for maintenance and inspections.
Technical considerations relevant to applicability
The technique is applicable to new plants. The relocation of equipment and production units in
existing plants is subject to space availability.
Economics
Optimising the layout of noisy equipment and of the whole plant/site is probably the most cost-
effective means of reducing noise emissions. In the case of existing plants, relocation may lead
to excessive costs.
Driving force for implementation
Environmental legislation.
Example plants
No information provided.
Reference literature
[ 57, EIPPCB 2012 ], [ 152, COM 2011 ], [ 153, COM 2010 ], [ 154, COM 2006 ], [ 155, COM
2001 ], [ 156, UK Environment Agency 2004 ]
3.2.7.2 Primary techniques: noise reduction at source
Description
Primary techniques aim at reducing noise at source. These include management, operational and
maintenance techniques as well as low-noise equipment and buildings.
Technical description
Primary techniques to reduce noise emissions at source include the following [ 57, EIPPCB
2011 ], [ 156, UK Environment Agency 2004 ]:
1. A noise-reduction programme, which may be part of the EMS, including the following
steps:
a) listing of all major sound sources and determination of their sound power
levels, in octave segments and including analysis of impulses;
b) determination of the affected areas such as housing areas;
c) computer-based calculation of the noise propagation (modelling of the site and
its surroundings) including checks of the real noise level in neighbouring areas
by direct measurements;
d) ranking of the noise sources according to their relevance for individually
affected areas (separately for day- and night-time);
e) evaluation of noise abatement techniques with regard to their relevance for the
noise level in affected areas and the estimated costs;
WORKIN
G DRAFT IN
PROGRESS
Chapter 3
306 June 2016 TL/JFF/FN/EIPPCB/LCP_Final Draft
f) identification of the most cost-effective combination of techniques that ensures
compliance with the legal requirements such as noise zoning;
g) Verification of the programme efficiency and monitoring of noise emissions at
regular intervals.
2. Operational and management techniques in buildings containing noisy equipment:
a) improved inspection and maintenance of equipment to prevent excessive wear
and failures leading to higher noise generation (e.g. in blowers and bearings);
b) closing of doors and windows of covered areas;
c) equipment operation by experienced staff;
d) avoidance of noisy activities at night-time;
e) provision for noise control during maintenance activities.
3. Use of low-noise equipment.
4. Installation of noise-reducers (e.g. mufflers, silencers) on equipment and ducts. For
noise reduction in blowing lines and safety valves, special mufflers are used based on
the ‘throttling principle’. Absorptive mufflers are suitable for reducing noise that covers
a wide frequency band. Typical examples are a lined duct, a silencer consisting of
parallel lined plates or a lined pressure chamber. Reactive mufflers are mainly based on
the geometry of the muffler. These mufflers are effective only at specific frequencies or
over a narrow frequency band. Expansion chambers or cavity resonators are typical
examples of reactive mufflers. The air in the cavity forms a spring that affects the
airflow directed through a neck to the cavity. The airflow acts as a mass, producing a
low-frequency tuning effect in a very limited frequency band. Commercial mufflers are
often combinations of the absorptive and the reactive types. In valves, the broadband
noise usually relates to the pressure drop, and noise can be reduced by arranging for the
pressure drop to occur in several stages. The use of mufflers or silencers, increased
pipe-wall thickness and the lining of piping with an absorptive or isolating material are
common solutions to noise problems at existing power plants.
5. Vibration insulation of machinery, good design and decoupled arrangement of noise
sources and potentially resonant components such as compressors and ducts. Rotating
machines such as turbines, generators, pumps, compressors, and electric motors are
important sources of vibration and noise in power plants. The noise is often caused by
machine vibration, which creates structure-borne noise. An effective method to limit the
spreading of structure-borne noise is the use of machine foundations supported by
vibration isolators such as specifically tuned springs or rubber elements. The principle
of isolators is that the natural frequency of the system resting on the isolators is much
lower than the principal running frequency of the machine. The isolated system
balances the excitation force by inertia. The greater the mass on isolators, the smaller
the vibrations of the system are, but, in any case, the isolators considerably decrease the
vibrations passing through them to the surrounding structures. If the machine is on an
isolated foundation, the connections from the machine to other structures, like pipes and
ducts, have to be flexible. This effectively prevents the spreading of structure-borne
noise to the ducts and piping. Expansion joints and bellows are examples used for such
isolation purposes. With respect to flow-generated noise, piping and ducts should be
designed for smooth uniform fluid flow. Sudden changes in geometry increase noise
that strongly depends on the flow velocity. In some cases, the noise is even
exponentially proportional to the fluid velocity, and the most effective method to reduce
the noise is thus to decrease the local fluid velocity. One practical method for doing this
is to provide piping with a sufficient diameter and the use of a large bending radius.
Piping noise is of two characteristic types: noise with a broad frequency range and noise
concentrated at discrete frequencies. Pumps, fans and blowers produce noise at their
blade passing frequencies. The latter depend on the number of blades around the
impeller. These discrete frequencies can sometimes be affected by a special design of
the machine.
6. Enclosure of noisy equipment (e.g. compressors) in separate structures such as
buildings or soundproofed cabinets with an internal lining made of absorbent material.
7. Soundproofing of buildings to shelter any noisy operations potentially including:
a) sound-absorbing materials in walls and ceilings;
WORKIN
G DRAFT IN
PROGRESS

Chapter 3
TL/JFF/FN/EIPPCB/LCP_Final Draft June 2016 307
b) sound-isolating doors;
c) double-glazed windows.
Achieved environmental benefits
Reduction of noise emissions.
Environmental performance and operational data
Target noise levels in permits are normally set at measurement points outside the site boundaries
and on a case-by-case basis. These levels usually differ depending on the affected area
(residential or business) and the time of day (daytime, typically 7.00–22.00, or night-time,
typically 22.00–7.00). The operator of a plant usually has to give information on noise
dissemination and measures taken for noise abatement. As most plants operate continuously all
day and night, the target noise levels during the night will determine the techniques for the
whole site. In the case of impulse noise, it is common practice to add 5 dB(A) to measurement
results when comparing to limit values.
Cross-media effects
Noise insulation may limit access for maintenance and inspections.
Technical considerations relevant to applicability
Technique 2.b) can be limited by heat accumulation, requiring forced removal of heat.
The applicability of noise control equipment may be restricted by lack of space.
Economics
Noise-reducing techniques lead to additional investment and operational costs which are
generally higher for existing plants than for new plants.
Driving force for implementation
Environmental legislation.
Health and safety legislation at the workplace.
Example plants
No information provided.
Reference literature
[57, EIPPCB 2012], [ 150, COM 2011 ], [ 152, COM 2011 ], [ 153, COM 2010 ], [ 154, COM
2006 ], [ 155, COM 2001 ], [ 156, UK Environment Agency 2004 ]
3.2.7.3 Secondary techniques: noise abatement
Description
Secondary techniques aim at reducing noise propagation by inserting appropriate obstacles such
as protection walls, embankments and buildings.
Technical description
If primary noise reduction techniques (see Section 3.2.7.2) are not sufficient to reach the
required noise target levels, secondary techniques may be considered appropriate.
In many cases, the noise may spread through the entire casing and may be difficult to correct by
changes in the machine or its connections. The solution then is to either line the machine with
an absorptive or isolating material or to use separate enclosures.
In order to screen the source of the noise, obstacles such as protection walls, embankments and
buildings are inserted between the emitter and the receiver [ 150, COM 2011 ], [ 153, COM
2010 ], [ 154, COM 2006 ], [ 156, UK Environment Agency 2004 ].
WORKIN
G DRAFT IN
PROGRESS

Chapter 3
308 June 2016 TL/JFF/FN/EIPPCB/LCP_Final Draft
Achieved environmental benefits
Reduction of noise emissions.
Environmental performance and operational data
No information provided.
Cross-media effects
Some raw materials and energy are consumed for erecting noise-absorbing obstacles.
Technical considerations relevant to applicability
The use of secondary techniques is subject to space availability.
Economics
No information provided.
Driving force for implementation
Environmental legislation.
Example plants
No information provided.
Reference literature
[ 151, COM 2011 ], [ 153, COM 2010 ], [ 154, COM 2006 ], [ 156, UK Environment Agency
2004 ]
WORKIN
G DRAFT IN
PROGRESS
Chapter 4
TL/JFF/FN/EIPPCB/LCP_Final Draft June 2016 309
4 GASIFICATION
The gasification technologies covered within this document include techniques linked to
combustion processes and with a minimum total rated thermal input of 20 MWth (i.e. 'fuel
pretreatment technology' for LCPs). While a number of different gasification technologies are
included in this definition, at the time of writing (2013), no dedicated pyrolysis or liquefaction
technologies with a size relevant for the purpose of this document have been identified.
Therefore, the technologies described in this document focus mainly on gasification processes.
Gasification is a partial oxidation process whereby a carbon source such as coal, pet coke, heavy
oil, biomass, heavy residues from a crude oil refinery process, or RDF, is converted, by means
of heat with a limited/controlled supply of oxygen, into carbon monoxide (CO) and hydrogen
(H2), plus carbon dioxide (CO2) and possibly hydrocarbon molecules such as methane (CH4),
and tar. This mix of gases is known as ‘producer gas’ or ‘synthesis gas’ (syngas); the precise
characteristics of the gas will depend on the gasification parameters, such as the temperature,
the type of feedstock fed to the gasification process, and the oxidiser used. The oxidiser may be
air, in which case the syngas will also contain nitrogen (N2), or steam or oxygen. The syngas
can be used in many different ways, e.g. to produce power, steam, hydrogen and basic
chemicals, such as methanol and ammonia.
Gasification is an efficient means of converting low-value fuels and residuals into a syngas, as it
can be applied to a variety of feedstocks: fossil fuels such as coal or oil, biomass (such as wood,
agricultural waste or various crops), manure, asphalt, sewage sludge, plastics and municipal
solid waste. In addition, gas cleaning techniques can be used to remove corrosive ash elements,
such as chloride and potassium, allowing clean gas production from otherwise problematic
fuels.
A number of factors contribute to a growing interest in gasification. The product and feedstock
flexibilities are two key reasons for the popularity of gasification in a market characterised by
volatile oil and natural gas prices. Furthermore, using the syngas is potentially more efficient
than direct combustion of the original fuel because it can be combusted at higher temperatures
or even in fuel cells. In addition, gasification syngas is much denser than combustion flue-gases
produced from the same fuel, and consequently the pollutants are at much higher
concentrations, making it easier to remove them more efficiently before final use. For this
reason, gasification systems generally offer environmental advantages over competing
combustion systems, due to the ability to achieve extremely low emissions, e.g. of sulphur
oxides and dust.
Gasification process
The following reactions are important in coal gasification:
Coal devolatilisation = CH4 + CO + CO2 + Oils + Tars + C (Char)
C + O2 = CO2 (exothermic – rapid)
C + 1/2O2 = CO (exothermic – rapid)
C + H2O = CO + H2 (endothermic – slower than oxidation)
C + CO2 = 2CO (endothermic – slower than oxidation)
CO + H2O = CO2 + H2 Shift Reaction (slightly exothermic – rapid)
CO + 3H2 = CH4 + H2O Methanation (exothermic)
C + 2H2 = CH4 Direct Methanation (exothermic)
High pressures and low temperatures favour the methanation reactions. However, in most cases
the methane content is higher than would be predicted by equilibrium alone, as methane is also
WORKIN
G DRAFT IN
PROGRESS
Chapter 4
310 June 2016 TL/JFF/FN/EIPPCB/LCP_Final Draft
formed during the primary devolatilisation (thermal decomposition of the coal's volatile
compounds) of the coal (this methane has sometimes been called 'prompt' methane).
Under the reducing conditions of gasification, the sulphur in the coal is converted primarily to
hydrogen sulphide (H2S), with ~3–10 % of the sulphur converting to carbonyl sulphide (COS).
This typically necessitates the use of a COS hydrolysis reactor to convert the COS to H2S, prior
to H2S removal by well-known solvent absorption processes widely used in the gas processing
and petroleum industries.
Gasification conditions favour the conversion of fuel-bound nitrogen to gaseous nitrogen and
ammonia (NH3). Higher temperatures favour the further destruction of ammonia to nitrogen and
hydrogen, so the ammonia content of the raw syngas is primarily a function of the gasifier outlet
temperature. Small amounts of HCN and other sour gases like ammonia, sulphur or halide
compounds are present too and can be treated in a wet scrubber system.
Tars, oils, and phenols survive in the lower temperature outlets of fixed-bed and fluidised bed
gasifiers and these species contain some of the fuel’s oxygen, nitrogen and sulphur as more
complex molecules.
In low-temperature gasifiers (fixed-bed and fluidised bed) and especially with high-volatile
fuels, such as biomass, municipal solid wastes and lignites, the devolatilisation stage and the
secondary cracking and reforming reactions of primary pyrolysis products have a significant
role on the overall gasification process performance. The presence of condensable organic
compounds, tars, is a special challenge of biomass and waste gasifiers and has a significant
effect on the overall gas cleaning process design.
Gasification processes associated with combustion processes
In principle, a gasification process can be connected to all types of combustion plants, as
described below.
If the gasification takes place at a relatively low temperature, such as 700–1000 ºC, the syngas
has a relatively high level of hydrocarbons compared with high-temperature gasification. As a
result it may be used directly, to be burnt in a boiler for heat or electricity generation via a steam
turbine with clean-up of the flue-gases to meet the same emission levels as for any combustion
process or, with suitable syngas clean-up before combustion, to run a gas turbine or an internal
combustion engine for electricity generation.
The combustion chamber for a simple boiler may be close-coupled with the gasifier, or the
syngas may be cleaned of longer chain hydrocarbons (tars), transported, stored and burnt
remotely. Syngas can also be converted into synthetic natural gas (SNG), which may be
transported to consumers via a natural gas network. Gas turbines can work with tars and other
liquid or gas hydrocarbons too in specific circumstances.
A gasification system may be closely integrated with a combined cycle gas turbine for
electricity generation (IGCC - integrated gasification combined cycle).
Higher temperature gasification (1200–1600 ºC) leads to very low concentrations of
hydrocarbons in the syngas, and a higher proportion of CO and H2, making the clean-up process
before the final use of syngas easier. This can be used to produce basic chemicals or to
synthesise longer chain hydrocarbons, using techniques such as Fischer-Tropsch (FT) synthesis.
Gasification for synthesis purposes only is not covered in this document.
Emissions/by-products generation
The emissions/by-products generated from gasification associated with combustion processes
include slag/bottom ash from the gasifier, and, depending on the level of syngas cleaning,
potentially also dry and/or wet gas cleaning residues, such as fly ash/filter dust from syngas
filtration, wet scrubber residues, recovered sulphur, waste water, and spent catalysts.
WORKIN
G DRAFT IN
PROGRESS

Chapter 4
TL/JFF/FN/EIPPCB/LCP_Final Draft June 2016 311
Because the syngas produced is used directly in the combustion plant, gasification processes
associated with combustion processes produce no direct emissions to air, except from possible
transport gas emissions, and incineration and flaring, e.g. from syngas cleaning during start-up
and shutdown periods. Diffuse emissions from fuel handling and pretreatment, such as dust and
VOCs, may be produced.
The characteristics of gasification ashes may be different to ashes produced by direct
combustion. Some gasification processes treat ash-containing heavy metals at very high
temperatures so that they are released in a glassy and chemically stable form. In this case, the
quality – and hence the reuse potential – of the gasification slags may be better than for the
corresponding combustion ashes.
For the fly ashes, the quality and reuse potential may vary significantly, depending on the
syngas cleaning technology used, the gasification technology and the quality of the original
feedstock. Some (coal gasification) fly ashes have a quality similar to coal combustion fly ash
and do not contain sorbents, and these ashes may be marketable. In other cases, the filter dust
from syngas filtration may contain a mixture of sorbents, unreacted carbon and all the impurities
of the original feedstock, and disposal is the only option.
WORKIN
G DRAFT IN
PROGRESS
Chapter 4
312 June 2016 TL/JFF/FN/EIPPCB/LCP_Final Draft
4.1 Applied processes and techniques
Many design variations of gasifiers are available for commercial use. Depending upon the type
of flow conditions present in the equipment, they all fall into one of the general categories:
fixed-bed (sometimes also called moving-bed), fluidised bed, entrained-flow, and plasma
reactor.
The air pollutants contained in the stack emissions from gasification associated with combustion
processes are essentially the same as those in the direct combustion systems, and are influenced
by the conversion technology employed, the nature of the fuel being processed, and especially
by the syngas cleaning processes applied.
If the gasifier is close-coupled with a boiler, the environmental clean-up (air emissions) relies
on the main boiler flue-gas cleaning techniques. On the other hand, the opportunity to clean the
syngas (upstream cleaning), instead of downstream flue-gas cleaning, presents some advantages
over dedicated combustion, e.g. with coal-based IGCC it is possible to achieve sulphur, NOX
and particulate emission values similar to those of CCGTs operating with natural gas.
Some air emission streams other than the one from the turbine stack may arise from IGCC
plants, such as tail gas from the Claus unit or streams from venting trains from the grinding and
drying of coal. These minor streams are treated with the aim of recovering any valuable material
(e.g. the tail gas from the ELCOGAS Claus unit is hydrogenated before being recycled to the
COS hydrolysis unit, allowing a higher total sulphur fuel recovery ratio and preventing a new
emission point to the atmosphere) or reducing the pollution emitted to air (e.g. the tail gas from
the Nuon Claus unit is hydrogenated and treated before discharge to the atmosphere through an
incinerator).
In refineries, an IGCC configuration may include the reburning in multiple-hearth furnaces of
the compressed sludge generated by the syngas water-scrubbing step. The related emissions to
air are covered by the Refining of mineral oil and gas BREF, in particular where multi-fuel
firing is dealt with.
Techniques for syngas filtration/cleaning
Syngas cleaning is generally not needed for immediate oxidation or co-firing in boilers, except
for removing corrosive compounds when their concentration is higher than can be accepted in
the boiler. However, cleaning is essential for direct firing in combustion engines or gas
turbines/IGCC plants. Cleaning of sour and sulphur compounds is advisable to avoid corrosion,
fouling or other effects in the boilers downstream of the combustion process, and, in the case of
combustion in gas turbines, the amount of dust has to be minimal to extend the life of the hot
components.
In coal-based IGCC plants, high-efficiency dust removal and desulphurisation of syngas is
carried out before direct combustion in gas turbines. This may be accomplished by commercial
dust removal and wet scrubbing technologies. Additional separation processes, necessary in
refineries, are not needed. The main efficiency penalty of gasification processes to obtain
syngas as a fuel in combustion processes is that syngas has to be cooled down enough to remove
particles and, mainly, sour and sulphur compounds. But this efficiency penalty is always lower
than the efficiency penalty when the cleaning is carried out on the flue-gas after combustion.
Syngas cooling and filtration can be seen as a mature technology, which has regularly been
applied in large-scale IGCC plants. Filtration of air-blown CFB gasification gases was
developed and thoroughly tested on a pilot scale in early 2000; the first commercial-scale
demonstration plant, the Kymijärvi plant, was in the commissioning phase in spring 2012 in
Lahti, Finland.
In biomass gasification, the occurrence of tars in the syngas is a specific challenge, and there are
two main strategies for dealing with them once they are present in the syngas: removal or in situ
WORKIN
G DRAFT IN
PROGRESS
Chapter 4
TL/JFF/FN/EIPPCB/LCP_Final Draft June 2016 313
conversion. Hot filtration, cyclones and wet scrubbing systems have been utilised for the
removal of tar, chlorides, ammonia, and alkaline compounds. Scrubbing cools the gas and
produces a waste water stream. An emerging technique is the removal of tars by catalytic
cracking, which could reduce or eliminate the waste water, avoid the loss of thermal energy in
scrubbing, and enhance gas quality and quantity. Another way to efficiently convert the tars is
to keep the gas temperature above the tar condensation temperature until the gas reaches the
burners firing the syngas. This technique is used for example at the following gasifiers:
Kymijärvi 1, Ruien, and Vaskiluoto. With this method, the high heating value of the tars is, in
practice, fully utilised in the boiler, but there may be a need for end-of-pipe cleaning techniques
and there may be potential corrosion and deposits on the boiler's heat exchanger surfaces.
As for combustion, most solid- and liquid-fed gasifiers produce solid by-products, primarily
bottom ash/slag, depending on the temperature of the gasification process, and fly ash/filter dust
from syngas filtration. Sulphur may also be recovered as a solid by-product.
4.1.1 IGCC (Integrated gasification combined cycle) plants
Integrated gasification combined cycle (IGGC) is a technique whose purpose is to produce
steam and electric power from a variety of low-grade fuel types with the highest conversion
efficiency possible. Impurities are removed from the syngas before it is combusted.
The primary feedstock in large-scale IGCC plants is often coal, petroleum coke, and/or heavy
oil or other heavy residues from crude oil refinery processes. These plants often use pure
oxygen for gasification (from an air separation unit, ASU), with a gas cleaning system (e.g.
Nuon Buggenum, ELCOGAS Puertollano and most large-scale IGCC plants). However, more
simple IGCC configurations with biomass also exist, although on a small scale and with
different emission levels in the flue-gas depending on the fuel used (e.g. Varnamo, Sweden).
Pressurised gasification is preferred for IGCC plants to avoid large auxiliary power losses in the
compression of the syngas to the gas turbine inlet pressure. In addition, since synthesis reactions
are generally improved by higher pressure, pressurised gasification is also favoured for the
synthesis application. The majority of, but not all, gasification processes currently in use or
planned for IGCC applications are oxygen-blown.
There are many variations in the basic layout of an IGCC plant, with the level of integration
between the units being the fundamental aspect of the design. Figure 4.1 shows the typical
configuration of an IGCC plant, and its integration possibilities.
Some methane is always produced by decomposition of the coal’s volatile matter and by
thermal reactions of the higher-molecular-weight primary devolatilisation products. At lower
gasifier outlet temperatures, more of the methane survives. As both fixed-bed gasifiers and
fluidised bed gasifiers have lower outlet temperatures (below the ash slagging temperatures)
than the single-stage entrained gasifiers, the syngas from these gasifiers has a much higher
methane content, representing typically 10–15 % of the coal’s carbon content at 28–35 barg. It
must also be noted that because of their operating temperatures, fluidised bed gasifiers also have
lower carbon conversion and their ash contains more carbon than the typical slag from slagging
gasifiers. Generally, fluidised bed gasifiers are more suited to highly volatile and highly reactive
fuels, such as lignites and biomass, than to bituminous coal, which requires high gasification
temperatures.
WORKIN
G DRAFT IN
PROGRESS
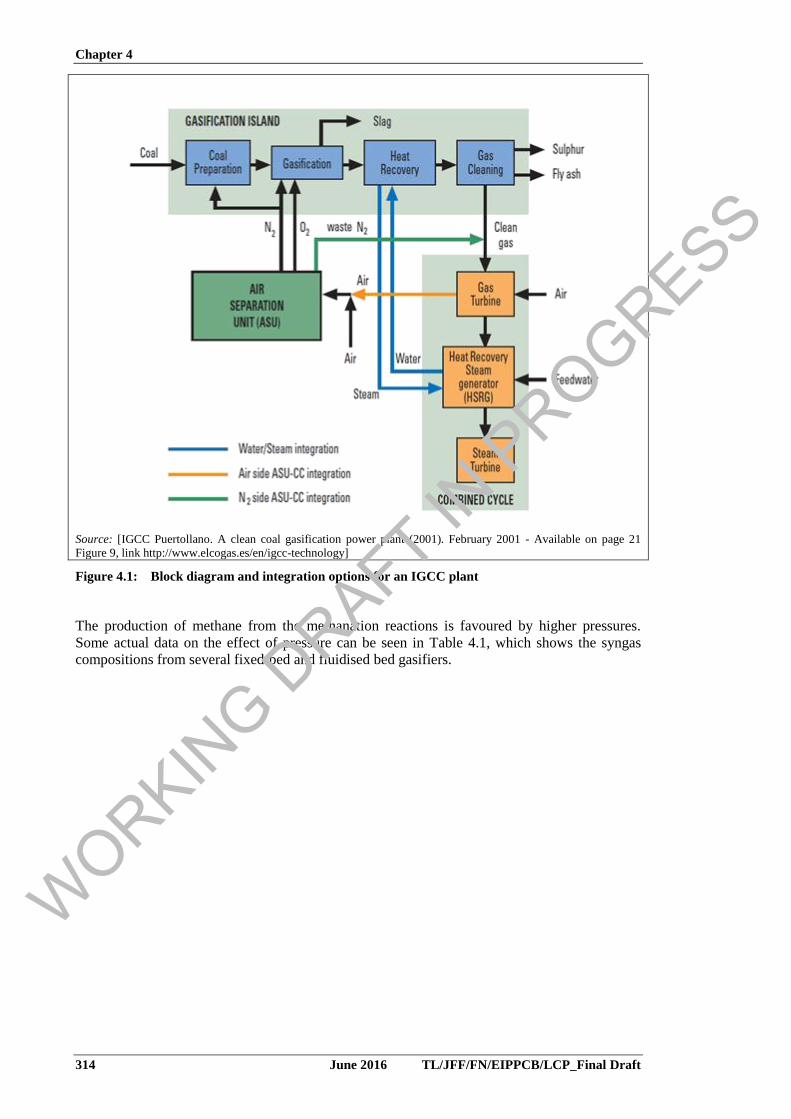
Chapter 4
314 June 2016 TL/JFF/FN/EIPPCB/LCP_Final Draft
Source: [IGCC Puertollano. A clean coal gasification power plant (2001). February 2001 - Available on page 21
Figure 9, link http://www.elcogas.es/en/igcc-technology]
Figure 4.1: Block diagram and integration options for an IGCC plant
The production of methane from the methanation reactions is favoured by higher pressures.
Some actual data on the effect of pressure can be seen in Table 4.1, which shows the syngas
compositions from several fixed-bed and fluidised bed gasifiers.
WORKIN
G DRAFT IN
PROGRESS
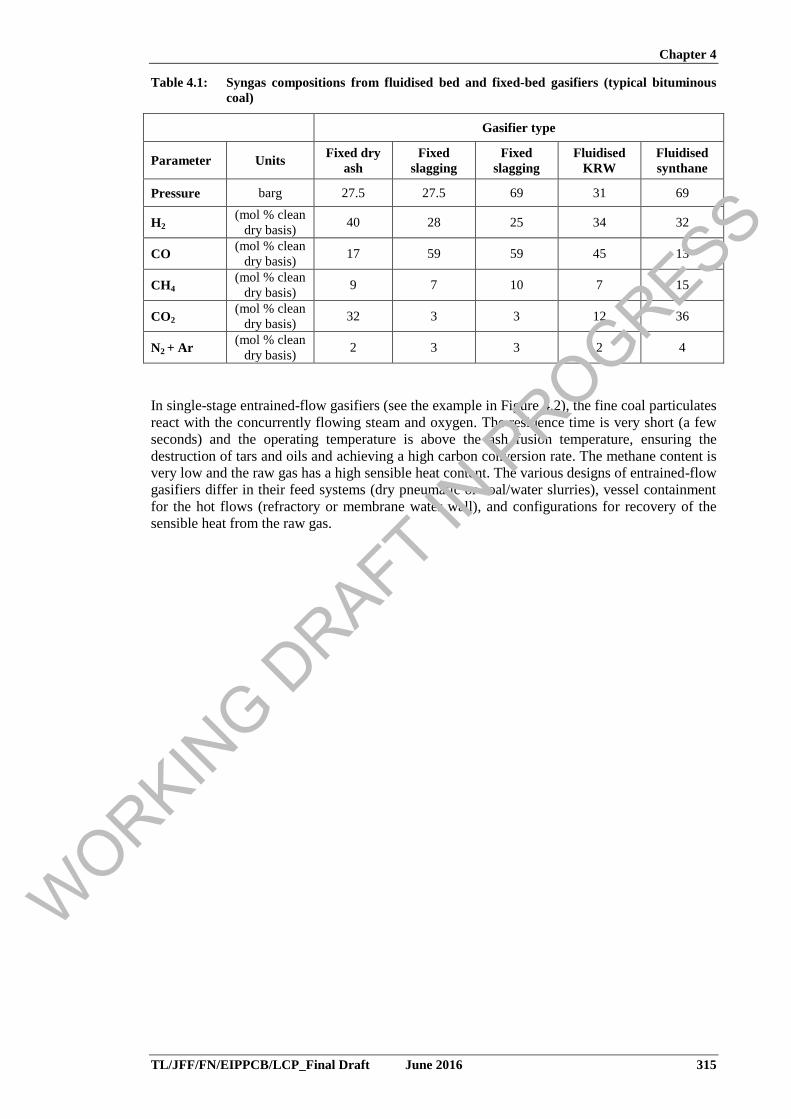
Chapter 4
TL/JFF/FN/EIPPCB/LCP_Final Draft June 2016 315
Table 4.1: Syngas compositions from fluidised bed and fixed-bed gasifiers (typical bituminous
coal)
Gasifier type
Parameter Units Fixed dry
ash
Fixed
slagging
Fixed
slagging
Fluidised
KRW
Fluidised
synthane
Pressure barg 27.5 27.5 69 31 69
H2 (mol % clean
dry basis) 40 28 25 34 32
CO (mol % clean
dry basis) 17 59 59 45 13
CH4 (mol % clean
dry basis) 9 7 10 7 15
CO2 (mol % clean
dry basis) 32 3 3 12 36
N2 + Ar (mol % clean
dry basis) 2 3 3 2 4
In single-stage entrained-flow gasifiers (see the example in Figure 4.2), the fine coal particulates
react with the concurrently flowing steam and oxygen. The residence time is very short (a few
seconds) and the operating temperature is above the ash fusion temperature, ensuring the
destruction of tars and oils and achieving a high carbon conversion rate. The methane content is
very low and the raw gas has a high sensible heat content. The various designs of entrained-flow
gasifiers differ in their feed systems (dry pneumatic or coal/water slurries), vessel containment
for the hot flows (refractory or membrane water wall), and configurations for recovery of the
sensible heat from the raw gas.
WORKIN
G DRAFT IN
PROGRESS
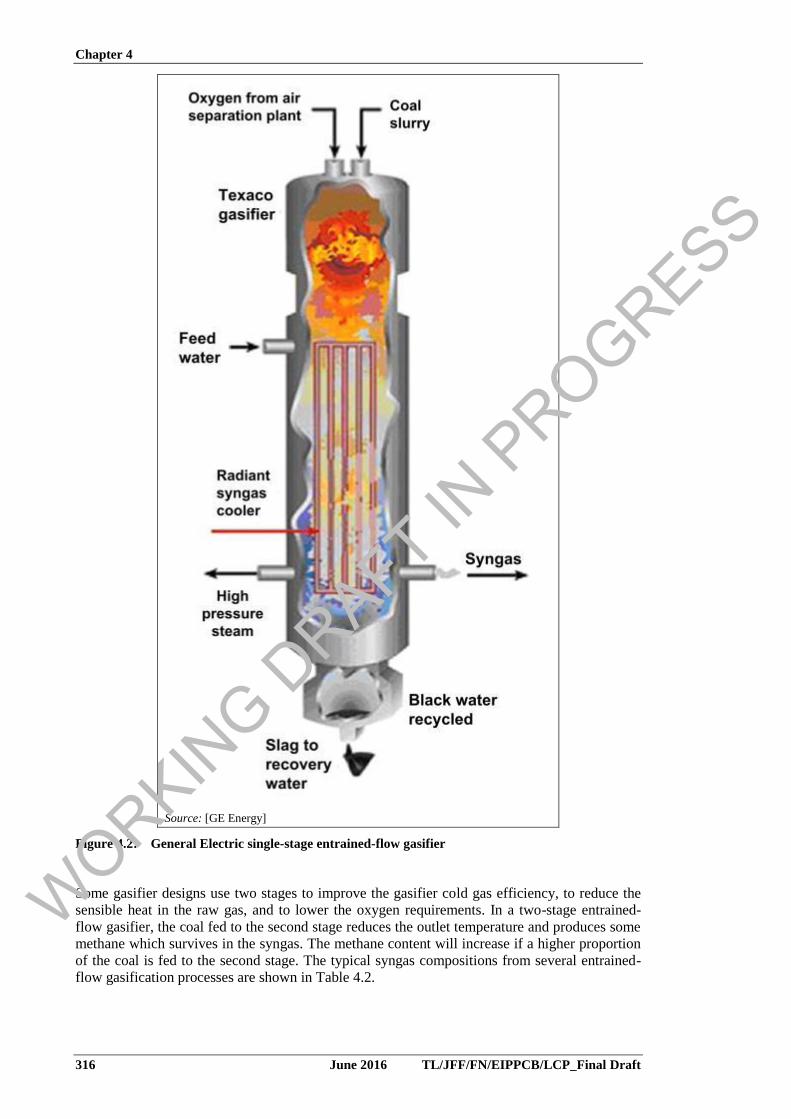
Chapter 4
316 June 2016 TL/JFF/FN/EIPPCB/LCP_Final Draft
Source: [GE Energy]
Figure 4.2: General Electric single-stage entrained-flow gasifier
Some gasifier designs use two stages to improve the gasifier cold gas efficiency, to reduce the
sensible heat in the raw gas, and to lower the oxygen requirements. In a two-stage entrained-
flow gasifier, the coal fed to the second stage reduces the outlet temperature and produces some
methane which survives in the syngas. The methane content will increase if a higher proportion
of the coal is fed to the second stage. The typical syngas compositions from several entrained-
flow gasification processes are shown in Table 4.2.
WORKIN
G DRAFT IN
PROGRESS
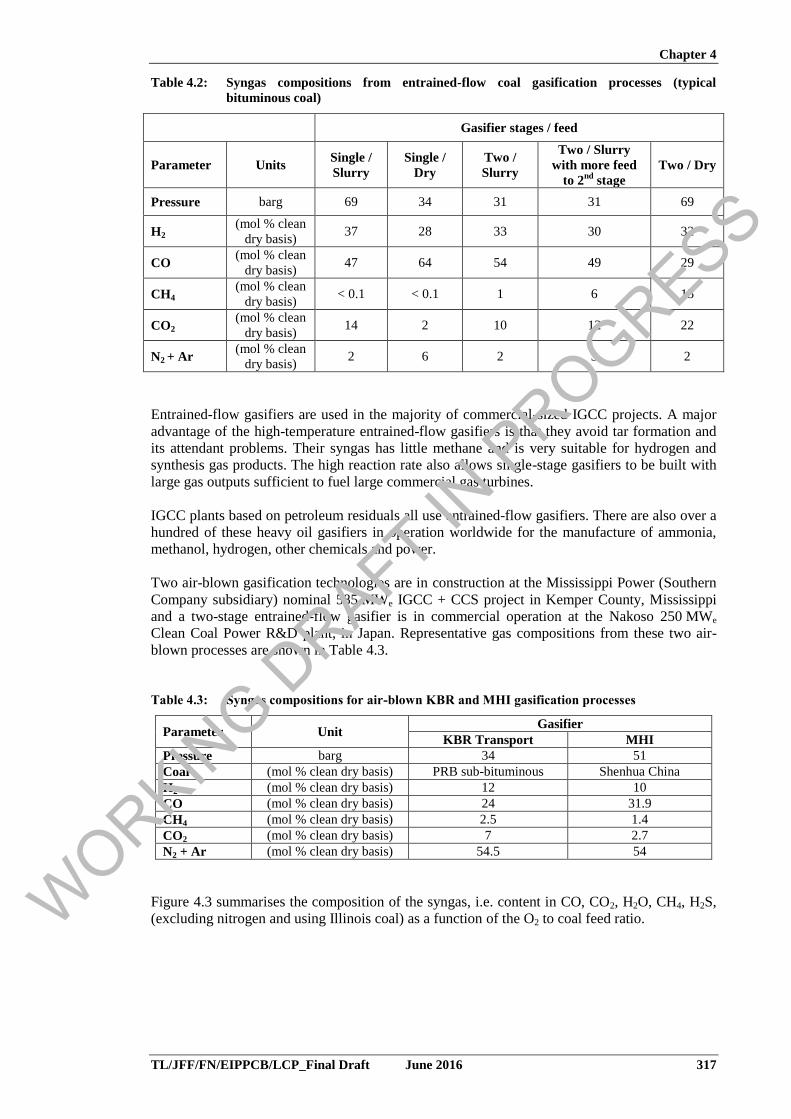
Chapter 4
TL/JFF/FN/EIPPCB/LCP_Final Draft June 2016 317
Table 4.2: Syngas compositions from entrained-flow coal gasification processes (typical
bituminous coal)
Gasifier stages / feed
Parameter Units Single /
Slurry
Single /
Dry
Two /
Slurry
Two / Slurry
with more feed
to 2nd
stage
Two / Dry
Pressure barg 69 34 31 31 69
H2 (mol % clean
dry basis) 37 28 33 30 32
CO (mol % clean
dry basis) 47 64 54 49 29
CH4 (mol % clean
dry basis) < 0.1 < 0.1 1 6 15
CO2 (mol % clean
dry basis) 14 2 10 12 22
N2 + Ar (mol % clean
dry basis) 2 6 2 3 2
Entrained-flow gasifiers are used in the majority of commercial-sized IGCC projects. A major
advantage of the high-temperature entrained-flow gasifiers is that they avoid tar formation and
its attendant problems. Their syngas has little methane and is very suitable for hydrogen and
synthesis gas products. The high reaction rate also allows single-stage gasifiers to be built with
large gas outputs sufficient to fuel large commercial gas turbines.
IGCC plants based on petroleum residuals all use entrained-flow gasifiers. There are also over a
hundred of these heavy oil gasifiers in operation worldwide for the manufacture of ammonia,
methanol, hydrogen, other chemicals and power.
Two air-blown gasification technologies are in construction at the Mississippi Power (Southern
Company subsidiary) nominal 585 MWe IGCC + CCS project in Kemper County, Mississippi
and a two-stage entrained-flow gasifier is in commercial operation at the Nakoso 250 MWe
Clean Coal Power R&D plant, in Japan. Representative gas compositions from these two air-
blown processes are shown in Table 4.3.
Table 4.3: Syngas compositions for air-blown KBR and MHI gasification processes
Parameter Unit Gasifier
KBR Transport MHI
Pressure barg 34 51
Coal (mol % clean dry basis) PRB sub-bituminous Shenhua China
H2 (mol % clean dry basis) 12 10
CO (mol % clean dry basis) 24 31.9
CH4 (mol % clean dry basis) 2.5 1.4
CO2 (mol % clean dry basis) 7 2.7
N2 + Ar (mol % clean dry basis) 54.5 54
Figure 4.3 summarises the composition of the syngas, i.e. content in CO, CO2, H2O, CH4, H2S,
(excluding nitrogen and using Illinois coal) as a function of the O2 to coal feed ratio.
W
ORKING D
RAFT IN P
ROGRESS

Chapter 4
318 June 2016 TL/JFF/FN/EIPPCB/LCP_Final Draft
[Source:
http://www.netl.doe.gov/technologies/coalpower/gasification/gasifipedia/4-gasifiers/index.html]
Figure 4.3: Syngas composition as a function of the O2 to coal feed ratio
Along with gasification, the power plant is a combined-cycle gas turbine and may be integrated
with a high-pressure air separation unit (ASU) for nitrogen and high-purity oxygen supply. The
air used by the ASU is supplied by the gas turbine compressor or not, depending on the level of
integration of the IGCC; the produced nitrogen not used in the gasification process or in
auxiliary systems may be injected into the combustion chamber to reduce NOX emissions.
Integration concept
There are many variations in the basic layout of an IGCC plant, with the level of integration
between the units being the fundamental aspect of the design (see also Figure 4.1):
In most plants, the combined cycle and the gasification island water/steam systems are fully
integrated. The gasification island feed water comes from the combined-cycle heat recovery
steam generator (HRSG). The steam produced in the gasifier waste heat boiler is exported to
the HRSG for superheating and then expanded in the steam turbine, generating additional
electricity. Part of the steam produced in the gasifier and in the HRSG is used for internal
consumption, e.g. to saturate syngas with water, in order to reduce NOX formation in the gas
turbine combustion chamber (also increasing the mass flow evolving in the gas turbine and
thus the power output), as an alternative method for nitrogen dilution.
Nitrogen-side integration of the ASU and the combined cycle. The residual nitrogen, a by-
product of the ASU, is compressed and mixed with the syngas to reduce NOX emissions and
to increase the capacity of the gas turbine.
Air-side integration of the ASU and the combined cycle. The compressed air required by the
ASU is partially or totally extracted from the gas turbine compressor. In this case it is it is
necessary to use all of the nitrogen in order to maintain the full capacity of the gas turbine.
If nitrogen dilution is desirable despite the ASU having its own feed air compressor, some
modifications to the gas turbine may be required (e.g. extra compressor blade rows).
Integration of the gasification island and the combined-cycle power production. Part of the
power production from the combined cycle is used to satisfy the power requirement of the
gasification island.
Various suppliers propose commercial IGCC solutions, and between 10 and 15 IGCC plants
were in operation worldwide in 2012.
A few examples of coal IGCC plants are presented in the block diagrams below.
WORKIN
G DRAFT IN
PROGRESS
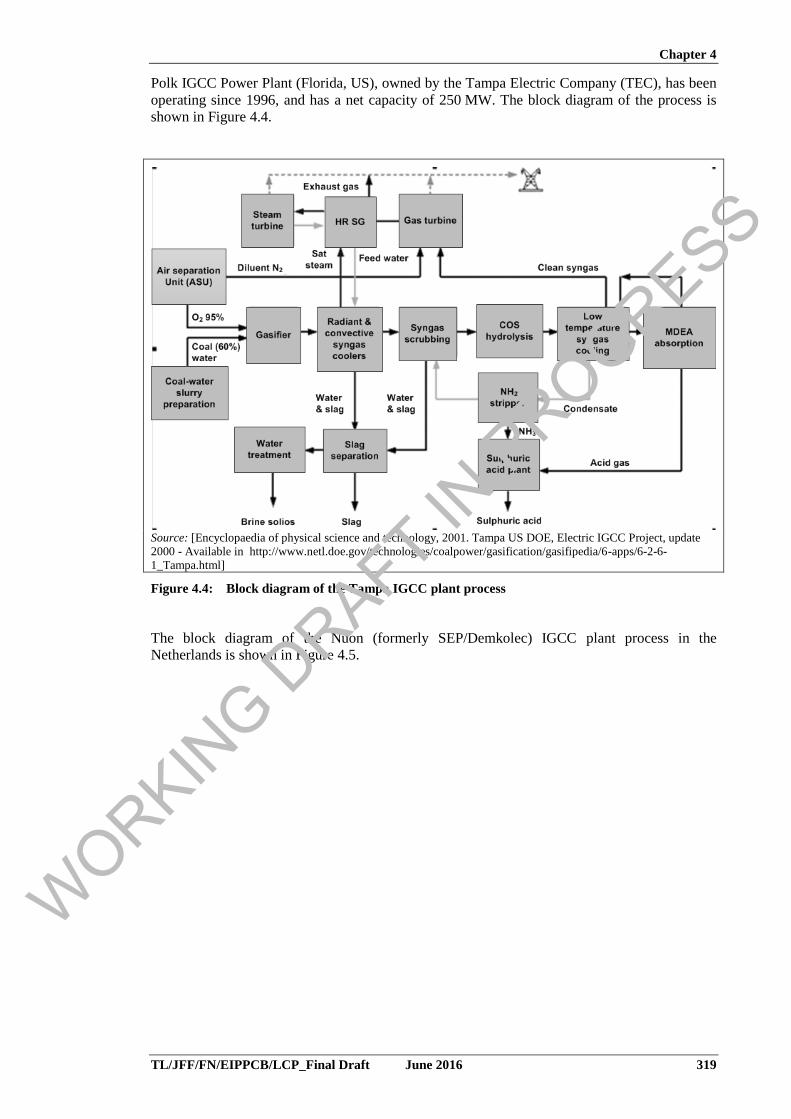
Chapter 4
TL/JFF/FN/EIPPCB/LCP_Final Draft June 2016 319
Polk IGCC Power Plant (Florida, US), owned by the Tampa Electric Company (TEC), has been
operating since 1996, and has a net capacity of 250 MW. The block diagram of the process is
shown in Figure 4.4.
Source: [Encyclopaedia of physical science and technology, 2001. Tampa US DOE, Electric IGCC Project, update
2000 - Available in http://www.netl.doe.gov/technologies/coalpower/gasification/gasifipedia/6-apps/6-2-6-
1_Tampa.html]
Figure 4.4: Block diagram of the Tampa IGCC plant process
The block diagram of the Nuon (formerly SEP/Demkolec) IGCC plant process in the
Netherlands is shown in Figure 4.5.
WORKIN
G DRAFT IN
PROGRESS
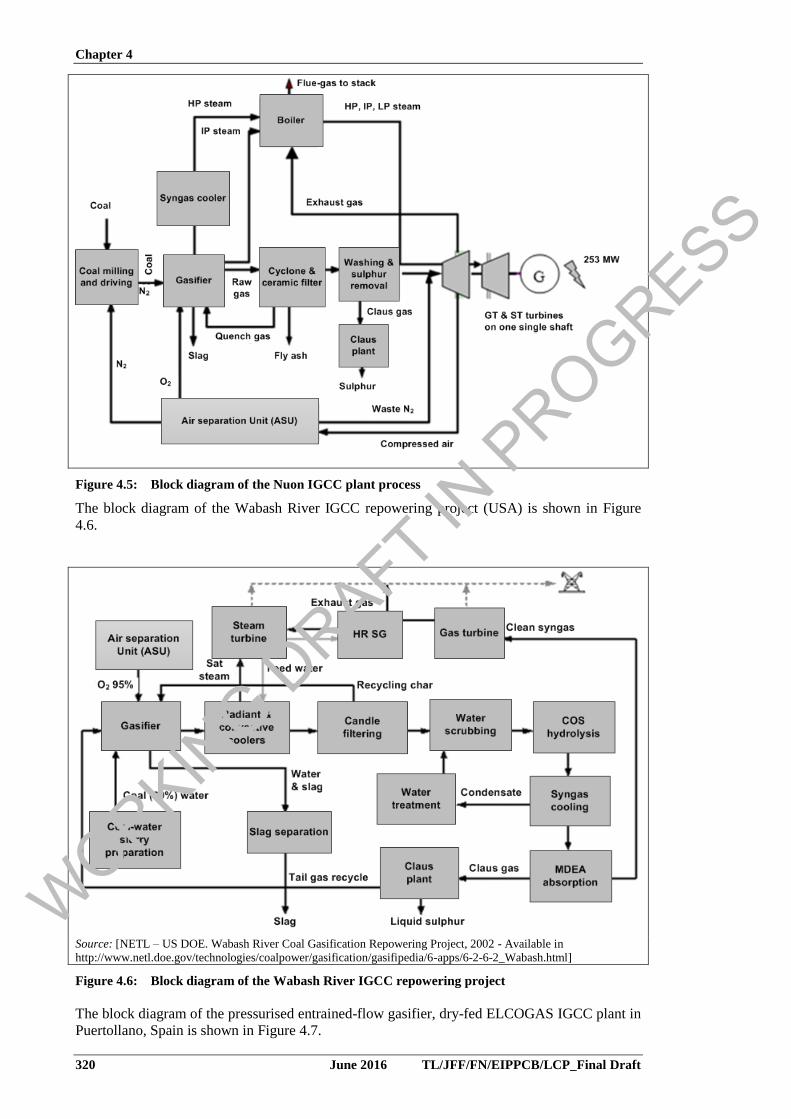
Chapter 4
320 June 2016 TL/JFF/FN/EIPPCB/LCP_Final Draft
Figure 4.5: Block diagram of the Nuon IGCC plant process
The block diagram of the Wabash River IGCC repowering project (USA) is shown in Figure
4.6.
Source: [NETL – US DOE. Wabash River Coal Gasification Repowering Project, 2002 - Available in
http://www.netl.doe.gov/technologies/coalpower/gasification/gasifipedia/6-apps/6-2-6-2_Wabash.html]
Figure 4.6: Block diagram of the Wabash River IGCC repowering project
The block diagram of the pressurised entrained-flow gasifier, dry-fed ELCOGAS IGCC plant in
Puertollano, Spain is shown in Figure 4.7.
WORKIN
G DRAFT IN
PROGRESS
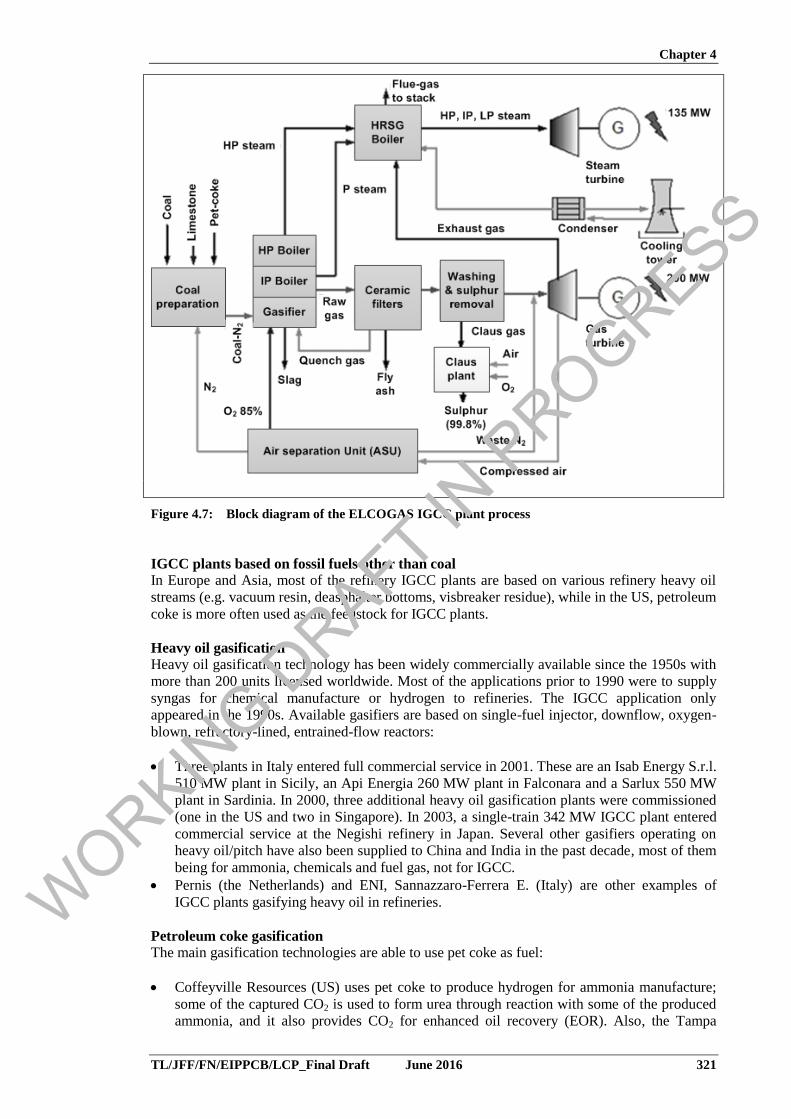
Chapter 4
TL/JFF/FN/EIPPCB/LCP_Final Draft June 2016 321
Figure 4.7: Block diagram of the ELCOGAS IGCC plant process
IGCC plants based on fossil fuels other than coal
In Europe and Asia, most of the refinery IGCC plants are based on various refinery heavy oil
streams (e.g. vacuum resin, deasphalter bottoms, visbreaker residue), while in the US, petroleum
coke is more often used as the feedstock for IGCC plants.
Heavy oil gasification
Heavy oil gasification technology has been widely commercially available since the 1950s with
more than 200 units licensed worldwide. Most of the applications prior to 1990 were to supply
syngas for chemical manufacture or hydrogen to refineries. The IGCC application only
appeared in the 1990s. Available gasifiers are based on single-fuel injector, downflow, oxygen-
blown, refractory-lined, entrained-flow reactors:
Three plants in Italy entered full commercial service in 2001. These are an Isab Energy S.r.l.
510 MW plant in Sicily, an Api Energia 260 MW plant in Falconara and a Sarlux 550 MW
plant in Sardinia. In 2000, three additional heavy oil gasification plants were commissioned
(one in the US and two in Singapore). In 2003, a single-train 342 MW IGCC plant entered
commercial service at the Negishi refinery in Japan. Several other gasifiers operating on
heavy oil/pitch have also been supplied to China and India in the past decade, most of them
being for ammonia, chemicals and fuel gas, not for IGCC.
Pernis (the Netherlands) and ENI, Sannazzaro-Ferrera E. (Italy) are other examples of
IGCC plants gasifying heavy oil in refineries.
Petroleum coke gasification
The main gasification technologies are able to use pet coke as fuel:
Coffeyville Resources (US) uses pet coke to produce hydrogen for ammonia manufacture;
some of the captured CO2 is used to form urea through reaction with some of the produced
ammonia, and it also provides CO2 for enhanced oil recovery (EOR). Also, the Tampa
WORKIN
G DRAFT IN
PROGRESS

Chapter 4
322 June 2016 TL/JFF/FN/EIPPCB/LCP_Final Draft
IGCC plant in Polk County, Florida usually runs on a mixture of 55 % petroleum coke and
45 % coal in order to reduce feedstock prices.
The ELCOGAS IGCC plant runs on a fifty-fifty mixture of petroleum coke and coal.
Since the conclusion of the DOE demonstration programme in January 2000, the Wabash
River plant has been running on 100 % petroleum coke.
4.1.2 Biomass gasifiers
The incentive for biomass gasification is generally attributed to the potential for a much higher
power generation efficiency with a biomass IGCC, or with the multi-fuel firing of biomass gas
in existing boilers, than can be accomplished with direct combustion boilers and steam turbines
in the smaller size range appropriate for dedicated biomass projects. Because of the nature of
biomass, and the economics and logistics of its gathering and supply, such projects are generally
considered in the much smaller 10–190 MWth size range than the larger 500 MWth coal-based
IGCC plants or other coal-fired units, so the main challenge for potential projects is the
diseconomy of scale. Because of the heightened concern over global warming, there is an
increased interest in renewable energy projects, including those associated with biomass.
The availability of biomass is a limiting factor for the commercialisation of biomass
gasification. However, the occurrence of tars in syngas is also a major problem that has to be
overcome in striving to commercialise biomass gasification processes for various purposes, and
efforts by vendors and research organisations to alleviate this problem are ongoing. The use of
entrained-flow gasifiers may eliminate tar problems, but these are mainly suited to large
industrial-scale gasification (> 100 MWth) and are therefore generally not relevant for most
biomass gasification applications [Brandin et al., 2011]. However, in coal-based IGCC plants
(Nuon Buggenum, the Netherlands and ELCOGAS Puertollano, Spain), the viability of biomass
co-gasification in small relative percentages, which still represents considerable biomass power
(5–30 % of biomass as fuel represents up to 30–200 MWth), has been demonstrated.
There are two main strategies for dealing with the tar once it is present in the syngas: removal or
in situ conversion. Removal includes wet/oil scrubbing systems; partial oxidation and catalytic
tar cracking are examples of in situ conversion methods [Brandin et al., 2011]. Another solution
for conversion is to keep the gas above the tar dew point and use the tar as a part of the gas to be
combusted in the boiler, which increases the energy efficiency by 5–10 %. [Power-Gen Europe
2012 - Vaskiluoto plant]
Fixed-bed (updraught and downdraught) and fluidised bed gasifiers are the three primary
varieties of biomass gasification technologies; they are mainly applicable on a small or medium
scale.
Updraught and downdraught fixed-bed designs are less complex than a fluidised bed, but
generate lower energy value syngas and are most suitable for small-scale biomass gasification
(in the range of a few hundred kWth). The market attractiveness of fixed-bed biomass gasifiers
of a scale relevant for this document (> 20 MWth rated input) is currently very limited.
Most of the larger biomass gasification projects in both the US and Europe are based on
fluidised bed gasification under either atmospheric or pressurised conditions.
Circulating and bubbling fluidised bed gasifiers
Fluidised bed gasifiers may be circulating (CFB) or bubbling (BFB), and are most useful for a
wide range of fuels, mainly because the feeding size requirement is not as strict as it is in
entrained-flow gasifiers. CFB/BFB fluidised bed gasifiers produce higher fuel value syngas and
accept a wider range of feedstocks, compared to updraught and downdraught fixed-bed
gasifiers. They are well suited for continuous operation and scalable to a wide range of sizes,
allowing for large-scale industrial plants. Hence, CFB/BFB fluidised bed gasifiers are state-of-
the-art technology for biomass gasification at the scale covered in this document (> 20 MWth).
WORKIN
G DRAFT IN
PROGRESS
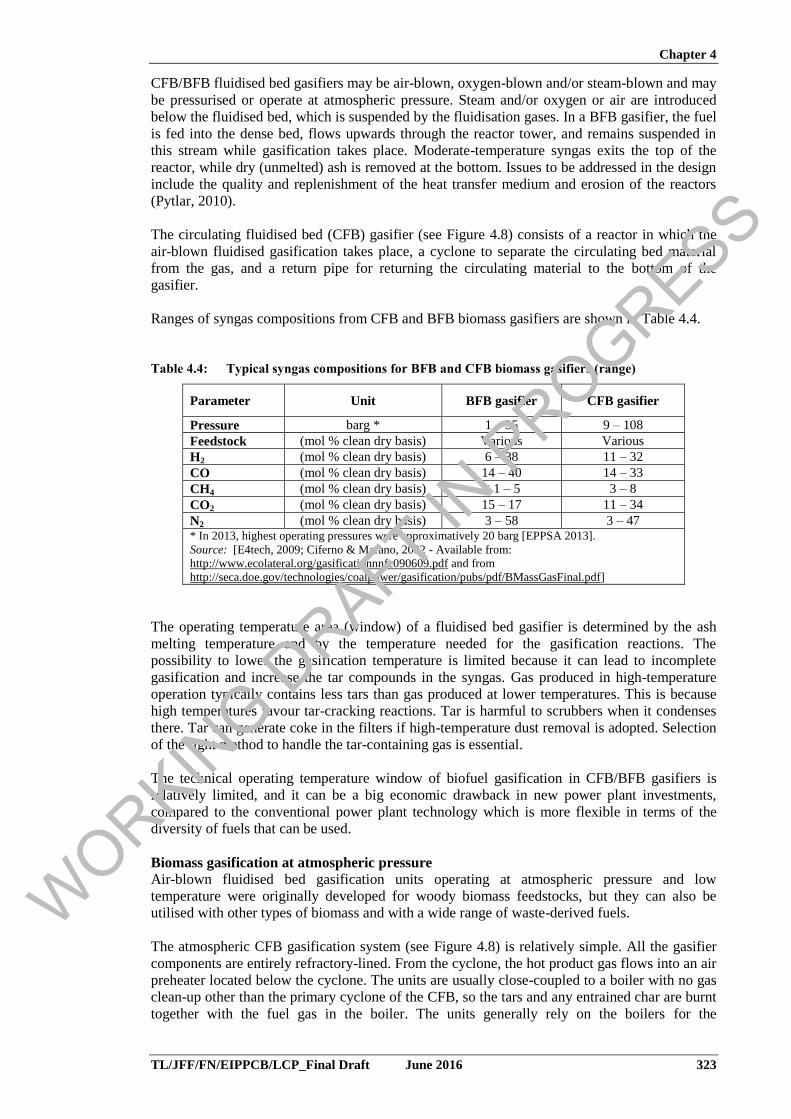
Chapter 4
TL/JFF/FN/EIPPCB/LCP_Final Draft June 2016 323
CFB/BFB fluidised bed gasifiers may be air-blown, oxygen-blown and/or steam-blown and may
be pressurised or operate at atmospheric pressure. Steam and/or oxygen or air are introduced
below the fluidised bed, which is suspended by the fluidisation gases. In a BFB gasifier, the fuel
is fed into the dense bed, flows upwards through the reactor tower, and remains suspended in
this stream while gasification takes place. Moderate-temperature syngas exits the top of the
reactor, while dry (unmelted) ash is removed at the bottom. Issues to be addressed in the design
include the quality and replenishment of the heat transfer medium and erosion of the reactors
(Pytlar, 2010).
The circulating fluidised bed (CFB) gasifier (see Figure 4.8) consists of a reactor in which the
air-blown fluidised gasification takes place, a cyclone to separate the circulating bed material
from the gas, and a return pipe for returning the circulating material to the bottom of the
gasifier.
Ranges of syngas compositions from CFB and BFB biomass gasifiers are shown in Table 4.4.
Table 4.4: Typical syngas compositions for BFB and CFB biomass gasifiers (range)
Parameter Unit BFB gasifier CFB gasifier
Pressure barg * 1 – 35 9 – 108
Feedstock (mol % clean dry basis) Various Various
H2 (mol % clean dry basis) 6 – 38 11 – 32
CO (mol % clean dry basis) 14 – 40 14 – 33
CH4 (mol % clean dry basis) < 1 – 5 3 – 8
CO2 (mol % clean dry basis) 15 – 17 11 – 34
N2 (mol % clean dry basis) 3 – 58 3 – 47 * In 2013, highest operating pressures were approximatively 20 barg [EPPSA 2013].
Source: [E4tech, 2009; Ciferno & Marano, 2002 - Available from:
http://www.ecolateral.org/gasificationnnfc090609.pdf and from
http://seca.doe.gov/technologies/coalpower/gasification/pubs/pdf/BMassGasFinal.pdf]
The operating temperature area (window) of a fluidised bed gasifier is determined by the ash
melting temperature and by the temperature needed for the gasification reactions. The
possibility to lower the gasification temperature is limited because it can lead to incomplete
gasification and increase the tar compounds in the syngas. Gas produced in high-temperature
operation typically contains less tars than gas produced at lower temperatures. This is because
high temperatures favour tar-cracking reactions. Tar is harmful to scrubbers when it condenses
there. Tar can generate coke in the filters if high-temperature dust removal is adopted. Selection
of the right method to handle the tar-containing gas is essential.
The technical operating temperature window of biofuel gasification in CFB/BFB gasifiers is
relatively limited, and it can be a big economic drawback in new power plant investments,
compared to the conventional power plant technology which is more flexible in terms of the
diversity of fuels that can be used.
Biomass gasification at atmospheric pressure
Air-blown fluidised bed gasification units operating at atmospheric pressure and low
temperature were originally developed for woody biomass feedstocks, but they can also be
utilised with other types of biomass and with a wide range of waste-derived fuels.
The atmospheric CFB gasification system (see Figure 4.8) is relatively simple. All the gasifier
components are entirely refractory-lined. From the cyclone, the hot product gas flows into an air
preheater located below the cyclone. The units are usually close-coupled to a boiler with no gas
clean-up other than the primary cyclone of the CFB, so the tars and any entrained char are burnt
together with the fuel gas in the boiler. The units generally rely on the boilers for the
WORKIN
G DRAFT IN
PROGRESS
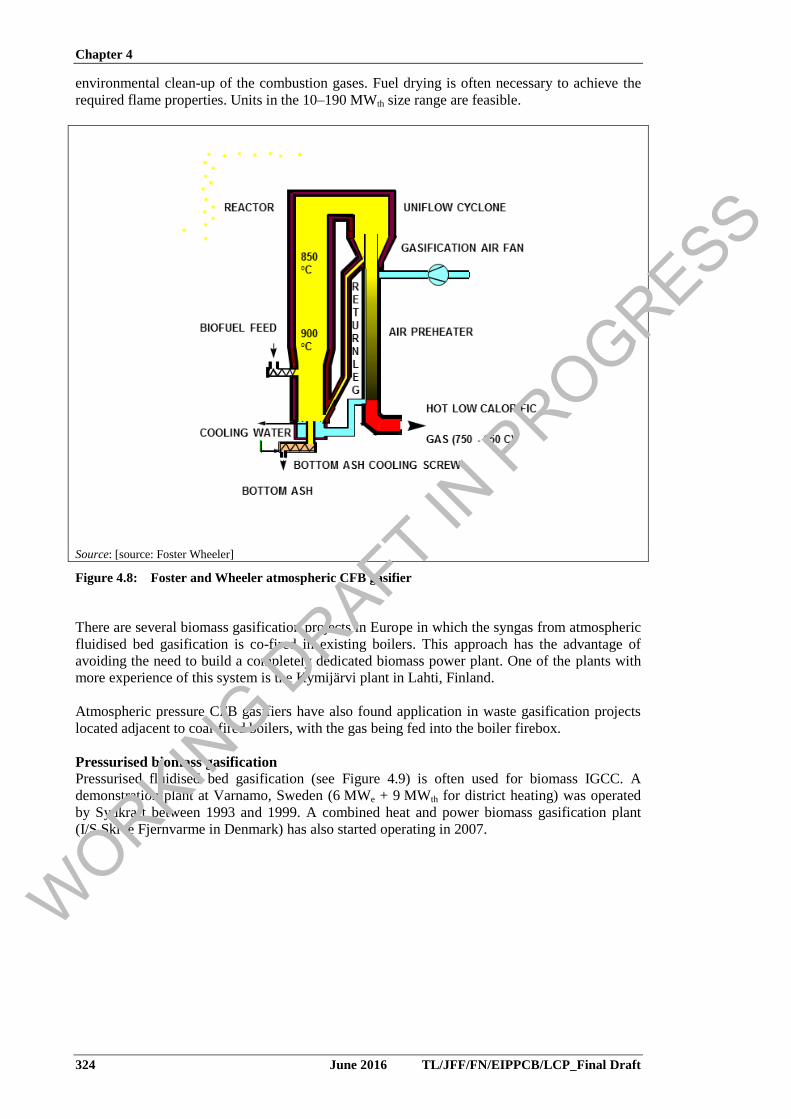
Chapter 4
324 June 2016 TL/JFF/FN/EIPPCB/LCP_Final Draft
environmental clean-up of the combustion gases. Fuel drying is often necessary to achieve the
required flame properties. Units in the 10–190 MWth size range are feasible.
Source: [source: Foster Wheeler]
Figure 4.8: Foster and Wheeler atmospheric CFB gasifier
There are several biomass gasification projects in Europe in which the syngas from atmospheric
fluidised bed gasification is co-fired in existing boilers. This approach has the advantage of
avoiding the need to build a completely dedicated biomass power plant. One of the plants with
more experience of this system is the Kymijärvi plant in Lahti, Finland.
Atmospheric pressure CFB gasifiers have also found application in waste gasification projects
located adjacent to coal-fired boilers, with the gas being fed into the boiler firebox.
Pressurised biomass gasification Pressurised fluidised bed gasification (see Figure 4.9) is often used for biomass IGCC. A
demonstration plant at Varnamo, Sweden (6 MWe + 9 MWth for district heating) was operated
by Sydkraft between 1993 and 1999. A combined heat and power biomass gasification plant
(I/S Skive Fjernvarme in Denmark) has also started operating in 2007.
WORKIN
G DRAFT IN
PROGRESS
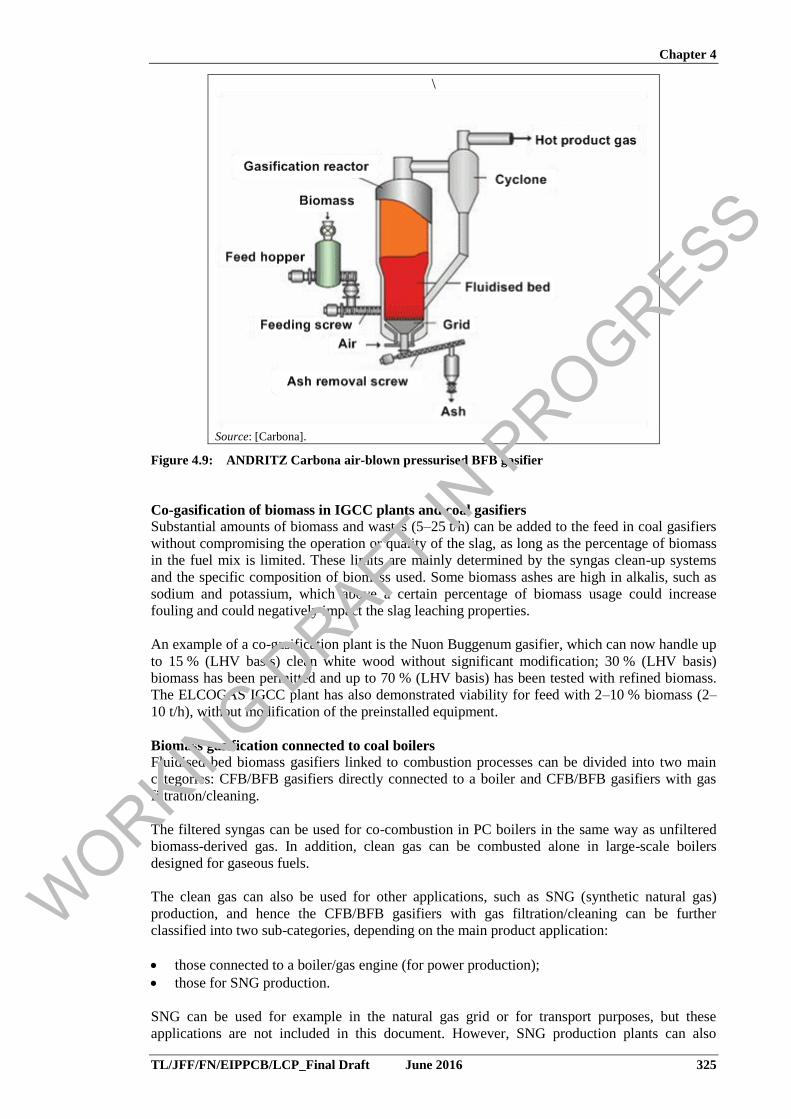
Chapter 4
TL/JFF/FN/EIPPCB/LCP_Final Draft June 2016 325
\
Source: [Carbona].
Figure 4.9: ANDRITZ Carbona air-blown pressurised BFB gasifier
Co-gasification of biomass in IGCC plants and coal gasifiers
Substantial amounts of biomass and wastes (5–25 t/h) can be added to the feed in coal gasifiers
without compromising the operation or quality of the slag, as long as the percentage of biomass
in the fuel mix is limited. These limits are mainly determined by the syngas clean-up systems
and the specific composition of biomass used. Some biomass ashes are high in alkalis, such as
sodium and potassium, which above a certain percentage of biomass usage could increase
fouling and could negatively impact the slag leaching properties.
An example of a co-gasification plant is the Nuon Buggenum gasifier, which can now handle up
to 15 % (LHV basis) clean white wood without significant modification; 30 % (LHV basis)
biomass has been permitted and up to 70 % (LHV basis) has been tested with refined biomass.
The ELCOGAS IGCC plant has also demonstrated viability for feed with 2–10 % biomass (2–
10 t/h), without modification of the preinstalled equipment.
Biomass gasification connected to coal boilers
Fluidised bed biomass gasifiers linked to combustion processes can be divided into two main
categories: CFB/BFB gasifiers directly connected to a boiler and CFB/BFB gasifiers with gas
filtration/cleaning.
The filtered syngas can be used for co-combustion in PC boilers in the same way as unfiltered
biomass-derived gas. In addition, clean gas can be combusted alone in large-scale boilers
designed for gaseous fuels.
The clean gas can also be used for other applications, such as SNG (synthetic natural gas)
production, and hence the CFB/BFB gasifiers with gas filtration/cleaning can be further
classified into two sub-categories, depending on the main product application:
those connected to a boiler/gas engine (for power production);
those for SNG production.
SNG can be used for example in the natural gas grid or for transport purposes, but these
applications are not included in this document. However, SNG production plants can also
WORKIN
G DRAFT IN
PROGRESS
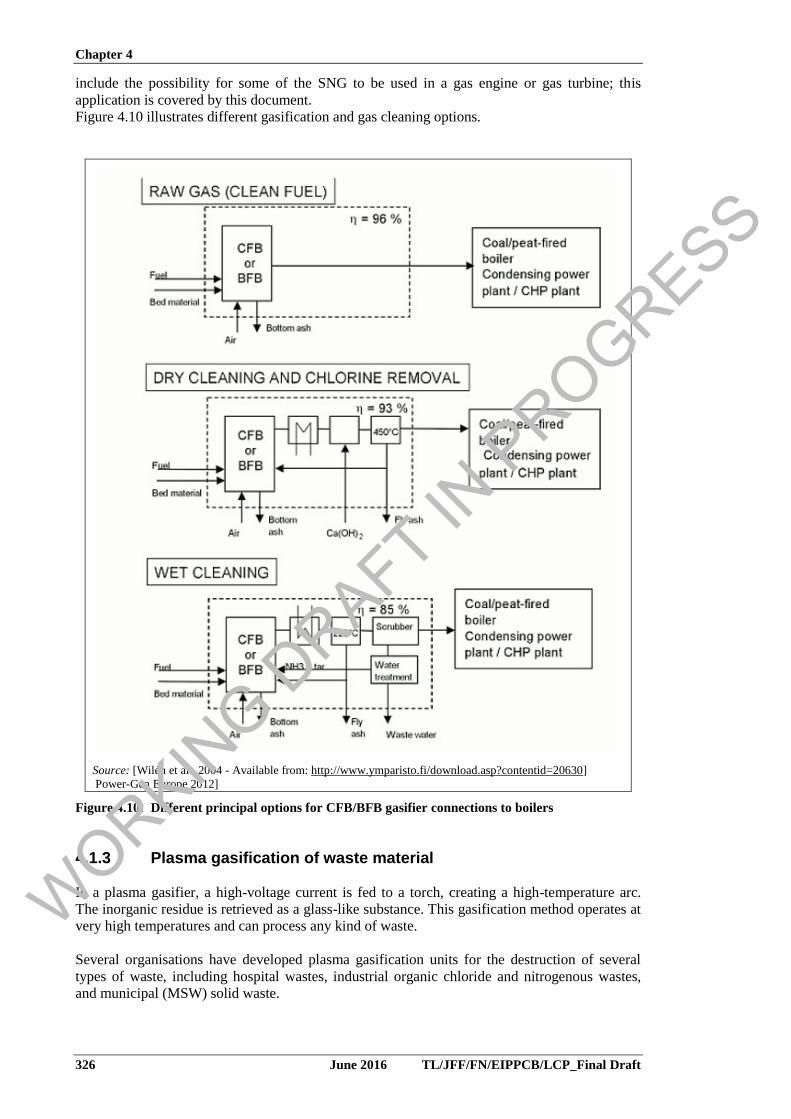
Chapter 4
326 June 2016 TL/JFF/FN/EIPPCB/LCP_Final Draft
include the possibility for some of the SNG to be used in a gas engine or gas turbine; this
application is covered by this document.
Figure 4.10 illustrates different gasification and gas cleaning options.
Source: [Wilén et al., 2004 - Available from: http://www.ymparisto.fi/download.asp?contentid=20630]
Power-Gen Europe 2012]
Figure 4.10: Different principal options for CFB/BFB gasifier connections to boilers
4.1.3 Plasma gasification of waste material
In a plasma gasifier, a high-voltage current is fed to a torch, creating a high-temperature arc.
The inorganic residue is retrieved as a glass-like substance. This gasification method operates at
very high temperatures and can process any kind of waste.
Several organisations have developed plasma gasification units for the destruction of several
types of waste, including hospital wastes, industrial organic chloride and nitrogenous wastes,
and municipal (MSW) solid waste.
WORKIN
G DRAFT IN
PROGRESS

Chapter 4
TL/JFF/FN/EIPPCB/LCP_Final Draft June 2016 327
4.2 Current emissions and consumption levels
The main environmental issues include:
waste water release (organic content, cyanides, sulphides, ammonia, heavy metals);
waste and by-product generation: slag, bottom/fly ash, sulphur/sulphuric acid from the
desulphurisation stage, used/saturated catalyst;
consumption of water, chemicals (solvent) and energy;
fuel handling and pretreatment (diffuse emissions such as dust, VOCs);
should the process be integrated with combustion: overall influence on energy
efficiency and on emissions to air/water, and synergies/drawbacks induced by the
integration.
Efficiency and emissions to air
Table 4.5 and Table 4.6 contain information on efficiency and emissions of pollutants to air of
European gasification plants (aggregation from submitted questionnaires and any additional
information available).
Table 4.5: General information on efficiency and emissions to air of European IGCC plants
Gasifier / size Feedstock
Syngas
output
efficiency
(%)
Emissions to air (mg/Nm3) – 15 % O2
NOX SOX Dust CO Hg
Buggenum
(NL) /
Entrained-flow /
585 MWth
Coal (90 %) –
Biomass
pellets (10 %)
77.1 15 3 < 1 6E-06
ELCOGAS
(ES) /
Entrained-flow /
726 MWth
Coal (50 %) –
Pet coke
(50 %)
74.1 45 15.5 0.4 2.8 1.8E-4
IGCC in
refineries (ENI
– ISAB –
SARAS (IT)) /
Entrained-flow /
2x272 – 2x663
– 3x530 MWth
Heavy
residual oils
(95 – 100 %) –
Heavy crude
oil (0–5 %)
74.1–88.2 12.2–42 3–15.8 0.7–2.5 < 1–18 5E-3 –
5E-4
Source: [ 3, LCP TWG 2012 ]
WORKIN
G DRAFT IN
PROGRESS
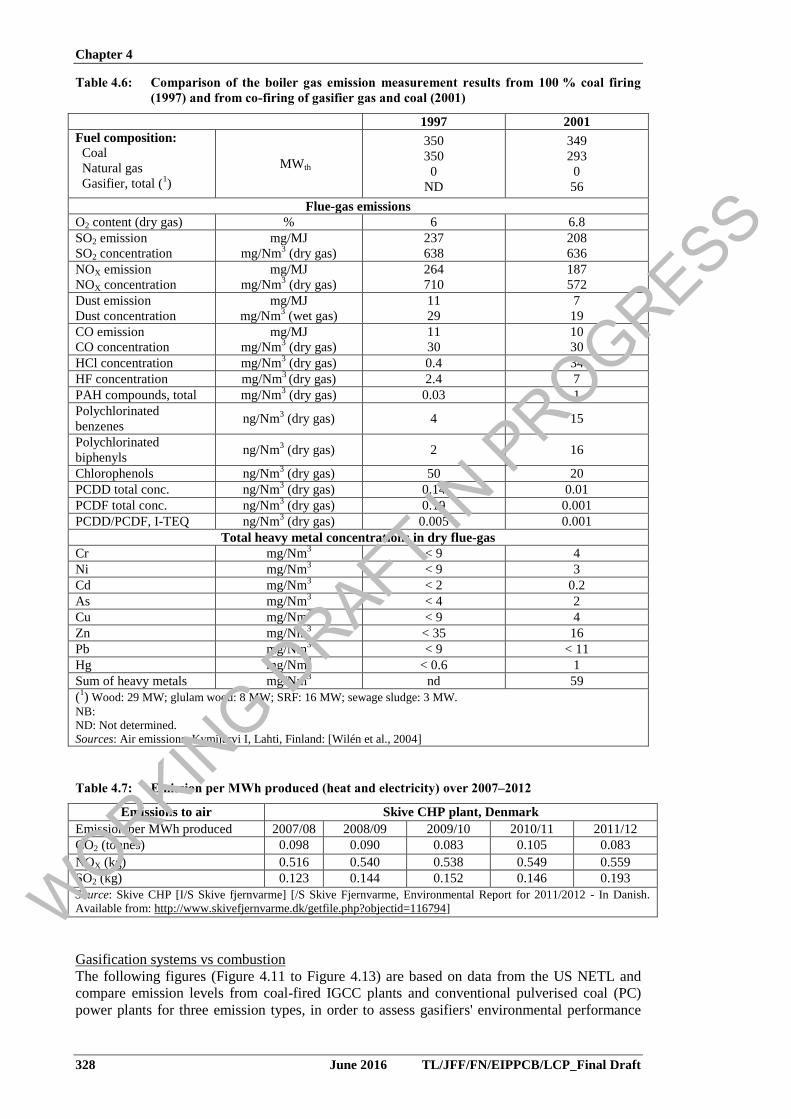
Chapter 4
328 June 2016 TL/JFF/FN/EIPPCB/LCP_Final Draft
Table 4.6: Comparison of the boiler gas emission measurement results from 100 % coal firing
(1997) and from co-firing of gasifier gas and coal (2001)
1997 2001
Fuel composition:
Coal
Natural gas
Gasifier, total (1)
MWth
350
350
0
ND
349
293
0
56
Flue-gas emissions
O2 content (dry gas) % 6 6.8
SO2 emission
SO2 concentration
mg/MJ
mg/Nm3 (dry gas)
237
638
208
636
NOX emission
NOX concentration
mg/MJ
mg/Nm3 (dry gas)
264
710
187
572
Dust emission
Dust concentration
mg/MJ
mg/Nm3 (wet gas)
11
29
7
19
CO emission
CO concentration
mg/MJ
mg/Nm3 (dry gas)
11
30
10
30
HCl concentration mg/Nm3 (dry gas) 0.4 34
HF concentration mg/Nm3 (dry gas) 2.4 7
PAH compounds, total mg/Nm3 (dry gas) 0.03 1
Polychlorinated
benzenes ng/Nm
3 (dry gas) 4 15
Polychlorinated
biphenyls ng/Nm
3 (dry gas) 2 16
Chlorophenols ng/Nm3 (dry gas) 50 20
PCDD total conc. ng/Nm3 (dry gas) 0.14 0.01
PCDF total conc. ng/Nm3 (dry gas) 0.19 0.001
PCDD/PCDF, I-TEQ ng/Nm3 (dry gas) 0.005 0.001
Total heavy metal concentrations in dry flue-gas
Cr mg/Nm3 < 9 4
Ni mg/Nm3 < 9 3
Cd mg/Nm3 < 2 0.2
As mg/Nm3 < 4 2
Cu mg/Nm3 < 9 4
Zn mg/Nm3 < 35 16
Pb mg/Nm3 < 9 < 11
Hg mg/Nm3 < 0.6 1
Sum of heavy metals mg/Nm3 nd 59
(1) Wood: 29 MW; glulam wood: 8 MW; SRF: 16 MW; sewage sludge: 3 MW.
NB:
ND: Not determined.
Sources: Air emissions, Kymijärvi I, Lahti, Finland: [Wilén et al., 2004]
Table 4.7: Emission per MWh produced (heat and electricity) over 2007–2012
Emissions to air Skive CHP plant, Denmark
Emission per MWh produced 2007/08 2008/09 2009/10 2010/11 2011/12
CO2 (tonnes) 0.098 0.090 0.083 0.105 0.083
NOX (kg) 0.516 0.540 0.538 0.549 0.559
SO2 (kg) 0.123 0.144 0.152 0.146 0.193
Source: Skive CHP [I/S Skive fjernvarme] [/S Skive Fjernvarme, Environmental Report for 2011/2012 - In Danish.
Available from: http://www.skivefjernvarme.dk/getfile.php?objectid=116794]
Gasification systems vs combustion
The following figures (Figure 4.11 to Figure 4.13) are based on data from the US NETL and
compare emission levels from coal-fired IGCC plants and conventional pulverised coal (PC)
power plants for three emission types, in order to assess gasifiers' environmental performance
WORKIN
G DRAFT IN
PROGRESS
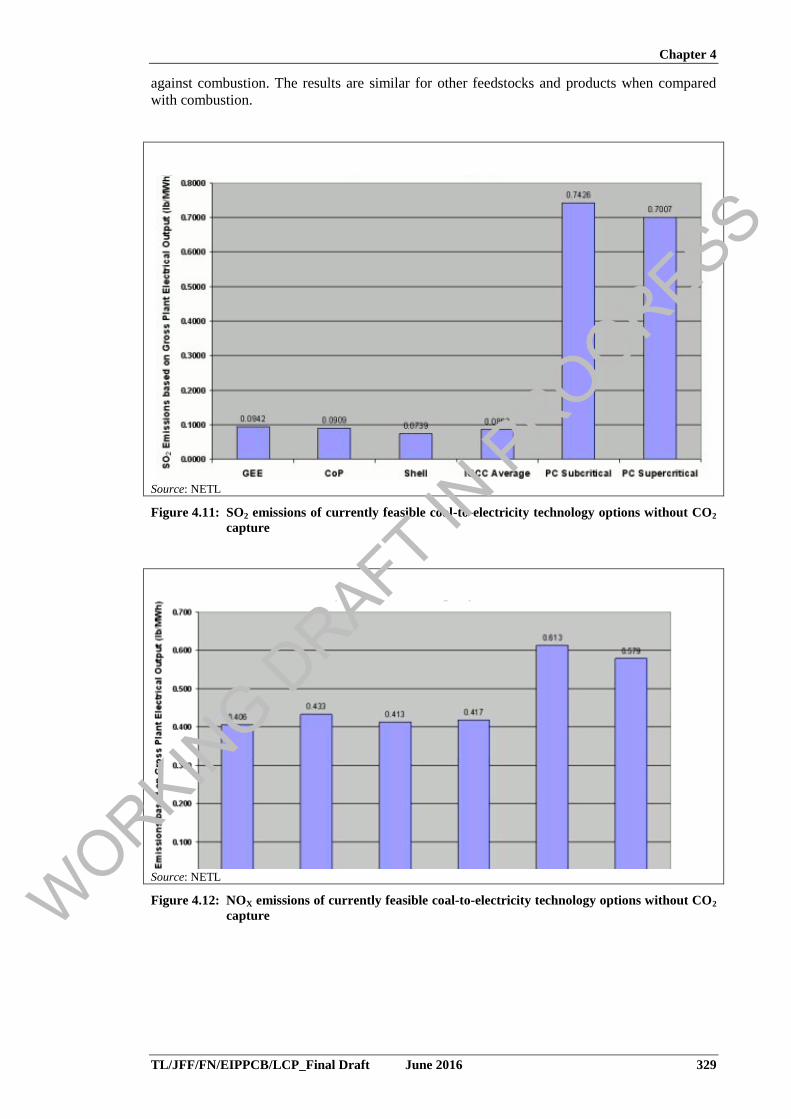
Chapter 4
TL/JFF/FN/EIPPCB/LCP_Final Draft June 2016 329
against combustion. The results are similar for other feedstocks and products when compared
with combustion.
Source: NETL
Figure 4.11: SO2 emissions of currently feasible coal-to-electricity technology options without CO2
capture
Source: NETL
Figure 4.12: NOX emissions of currently feasible coal-to-electricity technology options without CO2
capture
WORKIN
G DRAFT IN
PROGRESS

Chapter 4
330 June 2016 TL/JFF/FN/EIPPCB/LCP_Final Draft
Source: NETL
Figure 4.13: Particulate emissions of currently feasible coal-to-electricity technology options
without CO2 capture
Figure 4.11 shows that, other things being equal, the current IGCC technologies provide a SO2
emissions reduction of nearly one order of magnitude compared with their PC counterparts.
Figure 4.12 shows that known methods for controlling NOX formation keep these levels to a
minimum in IGCC processes and result in NOX emissions far below those associated with PC
firing. During gasification, most of the nitrogen in the coal is converted into nitrogen gas (N2).
Small levels of ammonia (NH3) and hydrogen cyanide (HCN) are produced, however, and can
be removed during the syngas cleaning process.
Figure 4.13 shows that gasification offers two main advantages for dust control over combustion
processes. First, gasification of coal provides the capability to remove most of the ash as slag or
bottom ash for disposal or sale as a by-product. Secondly, since the syngas leaving the gasifier
is much denser than combustion flue-gases, dust can be removed more easily with a proper gas
cleaning system, to achieve a syngas quality similar or better than natural gas, as required by the
final use, and allowing better optimisation of the environmental and efficiency performance.
Emissions to water
The water emissions correspond to the waste water released at specific release points and to the
WWT facilities of only the gasification plant and its auxiliary systems. Examples of emission
levels from the European IGCC plants gasifying coal are given in Table 4.8 and Table 4.9.
WORKIN
G DRAFT IN
PROGRESS
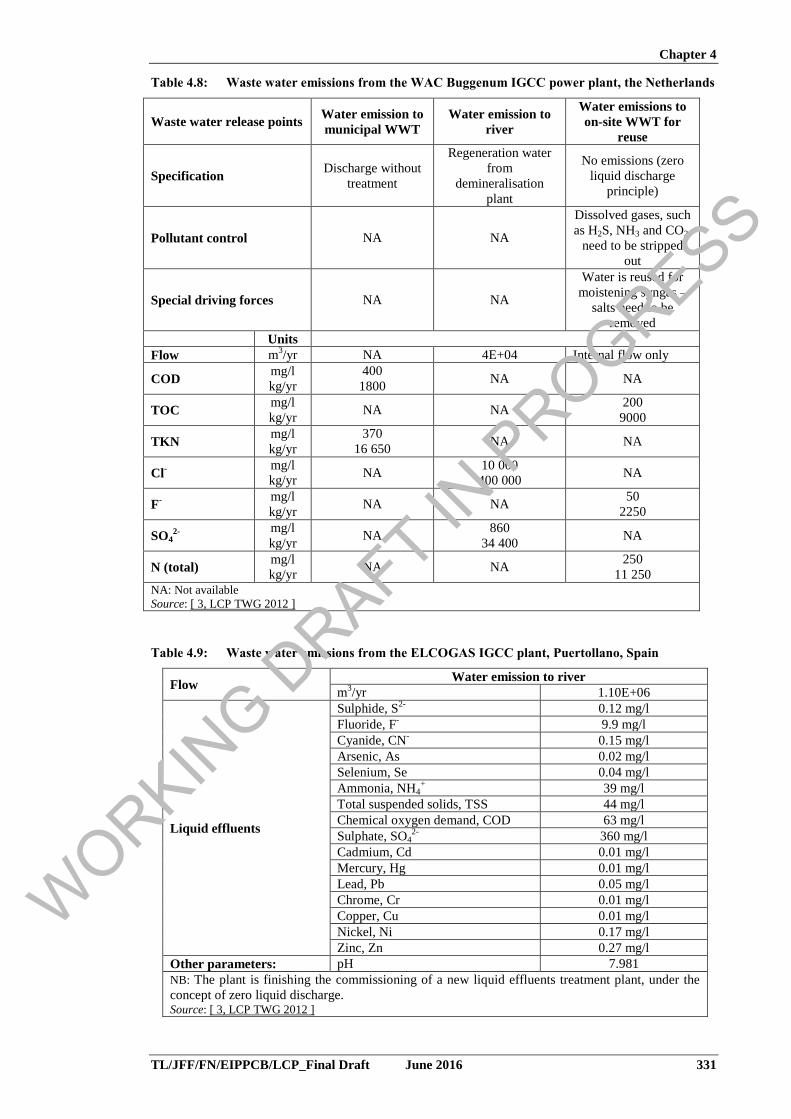
Chapter 4
TL/JFF/FN/EIPPCB/LCP_Final Draft June 2016 331
Table 4.8: Waste water emissions from the WAC Buggenum IGCC power plant, the Netherlands
Waste water release points Water emission to
municipal WWT
Water emission to
river
Water emissions to
on-site WWT for
reuse
Specification Discharge without
treatment
Regeneration water
from
demineralisation
plant
No emissions (zero
liquid discharge
principle)
Pollutant control NA NA
Dissolved gases, such
as H2S, NH3 and CO2,
need to be stripped
out
Special driving forces NA NA
Water is reused for
moistening syngas –
salts need to be
removed
Units
Flow m3/yr NA 4E+04 Internal flow only
COD mg/l
kg/yr
400
1800 NA NA
TOC mg/l
kg/yr NA NA
200
9000
TKN mg/l
kg/yr
370
16 650 NA NA
Cl-
mg/l
kg/yr NA
10 000
400 000 NA
F-
mg/l
kg/yr NA NA
50
2250
SO42-
mg/l
kg/yr NA
860
34 400 NA
N (total) mg/l
kg/yr NA NA
250
11 250 NA: Not available
Source: [ 3, LCP TWG 2012 ]
Table 4.9: Waste water emissions from the ELCOGAS IGCC plant, Puertollano, Spain
Flow Water emission to river
m3/yr 1.10E+06
Liquid effluents
Sulphide, S2-
0.12 mg/l
Fluoride, F-
9.9 mg/l
Cyanide, CN-
0.15 mg/l
Arsenic, As 0.02 mg/l
Selenium, Se 0.04 mg/l
Ammonia, NH4+ 39 mg/l
Total suspended solids, TSS 44 mg/l
Chemical oxygen demand, COD 63 mg/l
Sulphate, SO42-
360 mg/l
Cadmium, Cd 0.01 mg/l
Mercury, Hg 0.01 mg/l
Lead, Pb 0.05 mg/l
Chrome, Cr 0.01 mg/l
Copper, Cu 0.01 mg/l
Nickel, Ni 0.17 mg/l
Zinc, Zn 0.27 mg/l
Other parameters: pH 7.981
NB: The plant is finishing the commissioning of a new liquid effluents treatment plant, under the
concept of zero liquid discharge. Source: [ 3, LCP TWG 2012 ]
WORKIN
G DRAFT IN
PROGRESS

Chapter 4
332 June 2016 TL/JFF/FN/EIPPCB/LCP_Final Draft
4.2.1 Residues
Residues generated by gasification plants include fly ash, slag, elemental sulphur, waste from
the gas cleaning, spent catalysts, sludge from waste water treatment, and scrap.
Examples of emission levels from European plants gasifying coal or biomass are given in Table
4.10 to Table 4.12.
Table 4.10: Solid by-products, residues and waste from the WAC Buggenum IGCC power plant,
the Netherlands
Solid by-products,
residues and waste Source
Generation
during
reference
year (t)
Loss on
ignition (%)
Final
destination
Salt WWT facilities 298 NA Utilisation –
others
Sludge WWT facilities 110 NA Temporary
stockpile
Bottom ash Gasification process 37 324 0.5
Utilisation –
construction
industry
Fly ash Gasification process 10 647 0.5
Utilisation –
construction
industry
Sulphur Syngas cleaning
system 2 124 NA
Utilisation –
others NA : Not available
Source: [ 3, LCP TWG 2012 ]
Table 4.11: Solid by-products, residues and waste from the ELCOGAS IGCC plant, Puertollano,
Spain
Solid by-products,
residues and waste Source
Generation
during
reference year
(t)
Unburnt
carbon
(wt-%)
Final
destination
Fly ash Fuel pretreatment
facilities 14 320 1.75
Utilisation –
construction
industry
Vitrified slag Fuel pretreatment
facilities 58 207 3.6
Reclamation/
restoration of
open mines,
quarries and
pits
Elemental sulphur Fuel pretreatment
facilities 16 927 NC
Utilisation –
sulphuric
acid and
fertilisers
industry
MDEA waste (from coal
gas cleaning)
Fuel pretreatment
facilities 215 NC NA
Spent catalysts Fuel pretreatment
facilities 47 NC NA
Contaminated ceramic
material
Fuel pretreatment
facilities 18 NC NA
Sludge WWT facility 15 NC NA NA: not available
NC: not applicable
Source: [ 3, LCP TWG 2012 ]
WORKIN
G DRAFT IN
PROGRESS

Chapter 4
TL/JFF/FN/EIPPCB/LCP_Final Draft June 2016 333
Table 4.12: Solid by-products, residues and waste from the Kymijärvi I plant, Lahti, Finland
Solid by-products,
residues and waste Source
Generation during
reference year (t)
Unburnt
carbon
(wt-%)
Final
destination
Bottom ash (gasifier)
The only
direct solid
output is
gasifier
bottom ash
2 810 NA Landfilling
NA: not available
Source: [ 3, LCP TWG 2012 ]
4.2.2 Consumption of water, chemicals and energy
Examples of consumption levels from European plants gasifying coal or biomass are given in
Table 4.13 to Table 4.16.
Table 4.13: Consumption data from the WAC Buggenum IGCC power plant, the Netherlands
Consumption data
Parameter Unit Quantity
Fuel energy input (as LHV) MWth 2 815 717
Syngas energy output (as LHV) MWth 2 171 191
Recovered heat from the gasification MWth 418 748
Water:
Total inlet flow m3/yr 9.00E+04
Process water consumption m3/yr 9.00E+04
Water for cooling system m3/yr 2.79E+08
NB: Zero liquid discharge in the permit, most water (except cooling water) is recycled
Source:[ 3, LCP TWG 2012 ]
Table 4.14: Consumption data from the ELCOGAS IGCC plant, Puertollano, Spain
Consumption data
Parameter Unit Quantity
Fuel energy input (as LHV) MWth 3.28E+06
Syngas energy output (as LHV) MWth 2.43E+06
Recovered heat from the gasification MWth 560 000
Water:
Total inlet flow m3/yr 5.74E+05
Process water m3/yr 2.88E+05
Water for steam system m3/yr 2.35E+05
Water for cooling system m3/yr 1.82E+06
NB: Consumed water streams are lower than the inlet flow, as more raw water is needed to produce
demineralised water. Source:[ 3, LCP TWG 2012 ]
Table 4.15: Consumption data from the Kymijärvi I plant, Lahti, Finland
Consumption data
Parameter Unit Quantity
Fuel energy input (as LHV) MWth 3.20E+05
Syngas energy output (as LHV) MWth 3.13E+05
Water:
Total inlet flow m3/yr 0
Source: [ 3, LCP TWG 2012 ]
WORKIN
G DRAFT IN
PROGRESS

Chapter 4
334 June 2016 TL/JFF/FN/EIPPCB/LCP_Final Draft
Table 4.16: Consumption levels per MWh produced (heat and electricity) over 2007–2012 for the
Skive CHP plant
Consumption data
Parameters Quantity
Emission per MWh produced 2007/08 2008/09 2009/10 2010/11 2011/12
Water consumption (L) 236 279 146 176 201
Electricity consumption (kWh) 24 31 32 30 42 Source: [I/S Skive fjernvarme]
4.2.3 Emissions to land/soil
Emissions to soil/land from gasification facilities may include unexpected incidents, such as
leakages from waste water pipes.
WORKIN
G DRAFT IN
PROGRESS

Chapter 4
TL/JFF/FN/EIPPCB/LCP_Final Draft June 2016 335
4.3 Techniques to consider in the determination of BAT
4.3.1 Gasification integrated with the combustion process
This section presents relevant techniques to consider in the determination of BAT for
gasification processes associated with combustion processes and with a minimum total rated
thermal input of 20 MW. The gasification of refinery residues (e.g. heavy fuel oil) linked to
combustion is not covered by this document but is addressed in the Mineral Oil and Gas
Refineries BREF. However, as the techniques used are the same as those used when gasifying
coal or other feedstocks in an integrated way with combustion processes, information provided
by such plants gasifying refinery residues is used to further improve the description of the
techniques to consider in the determination of BAT.
4.3.1.1 Prevention of emissions and efficient energy use in coal- and multi-fuel-based integrated gasification combined cycle (IGCC) plants
Description
Coal/multi-fuel gasification prior to combustion of the produced syngas in a combined-cycle gas
turbine is an alternative to direct coal/multi-fuel combustion in a boiler and enables, by
implementing a set of appropriate techniques to clean the produced syngas, reduce pollutant
emissions and increase energy efficiency.
Technical description
All IGCC plants have demonstrated SO2 and NOX emissions comparable to or lower than those
from a coal-fired pulverised combustion (PC) plant or a combined-cycle plant using natural gas
(NGCC). Some pollutants, such as sulphur, can be turned into reusable by-products.
The plant is called integrated because (1) the syngas produced in the gasification section is used
as fuel for the gas turbine in the combined cycle, and (2) steam produced by the syngas coolers
in the gasification section is integrated into the normal steam cycle of the combined-cycle
process. In a normal combined cycle, so-called waste heat from the gas turbine flue-gas is used
in a heat recovery steam generator (HRSG) to make steam for the steam turbine cycle.
SOX emissions to air
Sulphur compounds from the feedstock of a gasification process are generally removed from the
syngas via an acid gas removal (AGR) process (e.g. including a (HCN/)COS hydrolysis reactor
and the absorption of H2S using a solvent such as MDEA or Sulfinol M Wash) as a concentrated
hydrogen sulphide (H2S) stream. Sulphur is then recovered as either liquid or solid elemental
sulphur (e.g. through a Claus unit), or as sulphuric acid, depending on market demands. In the
case of the Nuon plant (the Netherlands), the remaining H2S levels are below 20 ppm by
volume. In Nakoso (Japan), the H2S-rich gas is burnt and the flue-gases scrubbed with limestone
slurry to produce gypsum for sale, since there is very little market for elemental sulphur in
Japan.
NOX emissions to air
Due to the reducing atmosphere in which the gasification process takes place, the syngas does
not contain NOX, but ammonia (NH3) in low proportions, which is eliminated during the gas
cleaning process by water washing. In addition to dry low-NOX burners, other techniques are
used in the gas turbine, such as:
syngas saturation with hot water/steam recovered with low-level heat or intermediate-
pressure steam available in the plant (example plants: Nuon, ELCOGAS, and Wabash River,
as well as Isab Energy S.r.l., Sarlux Sarroch, ENI, Sannazzaro-Ferrera E. (which are Italian
IGCC plants gasifying refinery residues));
syngas mixture with nitrogen from the ASU (Nuon and ELCOGAS);
WORKIN
G DRAFT IN
PROGRESS
Chapter 4
336 June 2016 TL/JFF/FN/EIPPCB/LCP_Final Draft
direct injection of some intermediate pressure steam into the gas turbine combustors
(Wabash River);
SCR (Nakoso, Japan).
As an alternative to dry low-NOX burners, diffusion flame burners (should the H2 content be
> 15 %) or lean-premix burners in existing plants are used. Additionally, SCR may also be fitted
to reduce NOX emissions to air (example plants: Nakoso (Japan) and Isab Energy S.r.l. (Italy)).
Dust
Solid particulates are extracted from the syngas using filters and/or washing with water (e.g. at
the Polk plant in the US) prior to gas combustion, and, as a result, dust emissions are irrelevant.
The filters used are fly ash cyclones and/or candle filters to remove fly ash and unconverted
carbon (example plants: Nuon and ELCOGAS). In the case of a low syngas temperature
(1100 ºC), tars and ash with a high carbon content, generated in the raw syngas, are separated in
cyclones and recirculated to the gasifier.
Gas coolers, cyclones and high-temperature filters are standard equipment in syngas treatment.
Cyclones generally remove particulates from 1 mm down to 5 µm in size and work with dry
particulates. Cyclones can operate at actual gas temperatures (up to around 1000 °C) to avoid
chilling the gas [Brandin et al., 2011]. Cyclones can be used in series, in a multicyclone
installation, to remove successively smaller particulates, but this is still not enough to meet gas
turbine specifications [Pytlar, 2010].
A high-temperature ceramic filter can avoid thermal energy losses associated with gas cooling
and remove particulates.
[Pytlar, 2010 - Available from:
http://www.seas.columbia.edu/earth/wtert/sofos/nawtec/nawtec18/nawtec18-3521.pdf].
Candle filters consist of a porous metallic or ceramic filter material that allows gases to pass but
not the particulate matter. Candle filters can be operated at temperatures of up to 500 °C and can
effectively remove particulates in the 0.5–100 µm range. The filter is regenerated, either by
removing the filter cake or by back flushing with steam, dust-free syngas or nitrogen [Brandin
et al., 2011].
Conventional electrostatic precipitators may also theoretically be used for dust removal. These
can be operated at temperatures of up to around 400 °C and higher (if expensive special steels
are used).
Other pollutants: chlorides, ammonia, metals, HCN
Syngas passes through a water scrubber, HCN/COS converter and cooler where chlorides,
ammonia, particles, metals and halides are separated (example plants: Tampa, Nuon,
ELCOGAS and ENI). Dry feed gasifiers are reporting less mercury emissions that wet feeding
gasifiers.
Energy efficiency
Design improvements to existing gasifiers to increase the total fuel utilisation of IGCC plants
include:
geometric modification of the draught dip tube;
modification of the cooling system;
geometric modification of the neck and throat gasifier refractory;
installation of an expander to recover energy from the syngas pressure drop before
combustion;
hot gas cleaning, avoiding the need for gas cooling before cleaning and reheating before
feeding the gas turbine.
WORKIN
G DRAFT IN
PROGRESS
Chapter 4
TL/JFF/FN/EIPPCB/LCP_Final Draft June 2016 337
Excess heat from the primary combustion and syngas-fired heat generation is then passed to a
steam cycle, similar to a combined-cycle gas turbine. This may result in improved efficiency
compared to conventional pulverised coal combustion but comparable to ultra-supercritical PC
combustion. An IGCC plant improves the overall process efficiency by adding the higher
temperature steam produced by the gasification process to the steam turbine cycle. This steam is
then used in steam turbines to produce additional electrical power.
To achieve an even higher energy efficiency, the plant can be designed with full integration of
the air supply unit (ASU) and the gas turbine. All the air fed to the ASU is then supplied
(extracted) from the gas turbine compressor (example plant: ELCOGAS).
CO2 capture
CO2 capture in IGCC plants is favoured by the high pressure of the gasification process. By
means of the water-gas reaction CO + H2O CO2 + H2, the production of hydrogen can be
increased, and CO2 directly captured using commercial processes, such as MDEA or Selexol
absorption technologies, at a pressure that requires less auxiliary power for gas compression.
The high moisture content of quenched syngas enables the shift reaction to be conducted with
little or no additional steam from the steam cycle.
Achieved environmental benefits
Reduction in the emissions of SO2, NOX and particulates, compared to coal-fired power
plants.
High efficiency and energy security.
Ability to use lower-grade feedstock while keeping the same low emission levels. In
conventional units, low-grade fuels usually result in higher emissions.
Generation of marketable by-products.
Environmental performance and operational data
Desulphurisation scrubbing can be highly efficient, leading to very low sulphur emissions (e.g.
an IGCC unit in Tianjin has an abatement efficiency of > 99 %, and ELCOGAS, see Table 4.21,
has an abatement efficiency of 99.6 %).
If CO2 scrubbing is installed for subsequent sequestration or other uses, only H2 is combusted,
i.e. only water vapour is emitted by the IGCC process. Very low NOX emissions can be
achieved (according to General Electric, 2 ppmv with hydrogen-rich combustion gas) when in
IGCC CCS (carbon capture and storage) operation mode.
Particulate emissions are close to zero, as gas turbines require highly efficient particulate
abatement techniques, but levels of NOX emissions can be higher than from natural-gas-fired
turbines.
Table 4.17 to Table 4.22 give emission levels and energy efficiencies achieved by IGCC plants
fitted with the techniques described above.
WORKIN
G DRAFT IN
PROGRESS

Chapter 4
338 June 2016 TL/JFF/FN/EIPPCB/LCP_Final Draft
Table 4.17: Data of the Tampa IGCC power plant (Florida, US)
Net output 250 MW
Design net efficiency, LHV 41.2 %
Clean gas characteristics Higher heating value (HHV) 9 932 kJ/Nm3
Composition
(vol-%)
42.8 % CO 38.4 % H2 14.5 % CO2 3.3 % N2
0.9 % Ar 0.1 % CH4 200 ppmv S
NOX control Waste N2 to combustion chamber
Sulphur recovery 98 % sulphuric acid production plant
Emissions (design values), 6 % O2 40 mg/Nm3 SO2 100–- 125 mg/Nm
3 NOX
Source: [Holt, N. Gasification Technology Status, EPRI 2002. Tampa US DOE, Electric IGCC Project, update 2000]
Table 4.18: Data of the Nuon IGCC power plant in Buggenum (the Netherlands)
Net output 253 MW
Design net electrical efficiency, LHV 43.1 %
Net total fuel utilisation for the gasification block,
LHV %, yearly average 92 %
NOX control Gas saturation and mixing with nitrogen
Sulphur recovery Claus plant + SCOT plant for tail gas
Emissions (design values), 6 % O2 14 mg/Nm3 SO2 10 mg/Nm
3 NOX
Emissions (yearly averages – 2011), 6 % O2 3 mg/Nm3 SO2 15 mg/Nm
3 NOX
Emissions (yearly averages – 2011), 6 % O2 - 22 ng/Nm3 Hg
Source: [Holt, N. Gasification Technology Status, 2002]
Table 4.19: Data of the Wabash River IGCC power plant (Indiana, US)
Net output 262 MW
Design net electrical efficiency, LHV 39.2 %
Clean gas characteristics Higher heating value (HHV) 10 303 kJ/Nm3
Composition
(vol-%)
45.3 % CO 34.4 % H2 15.8 % CO2 1.9 % N2
0.6 % Ar 1.9 % CH4 < 100 ppmv S
NOX control Gas saturation + steam injection
Sulphur recovery Claus plant with tail gas recycle
Emissions (design values), 15 % O2 16 mg/Nm3 SO2 40–50 mg/Nm
3 NOX
Source: [Holt, N. Gasification Technology Status, EPRI 2002. NETL – US DOE. Wabash River Coal Gasification
Repowering Project, 2002]
Table 4.20: Data of the IGCC power plant project in Nakoso (Japan)
Net output 250 MW
Design net electrical efficiency, LHV
%
42.0 %
Gas heating value (LHV) 5000 kJ/Nm3 approx.
NOX control SCR
Sulphur recovery Gas washing with ash dilution
Expected emissions, 15 % O2 16 mg/Nm3 SO2 8 mg/Nm
3 NOx
WORKIN
G DRAFT IN
PROGRESS

Chapter 4
TL/JFF/FN/EIPPCB/LCP_Final Draft June 2016 339
Table 4.21: Data of the Puertollano IGCC power plant (Spain)
Net output 300 MW ISO (282.7 MW at site)
Design net electrical efficiency,
LHV 42.2 %
Yearly net electrical efficiency
(2011) 37.2 %
Net total fuel utilisation for the
gasification block, LHV, yearly
average
91.2 %
Clean gas characteristics
Higher heating value (HHV) 10 472 kJ/Nm3
Composition
(% vol.)
60.5 % CO 22.1 % H2 3.9 % CO2 12.5 % N2
1.0 % Ar 0.01 % CH4 < 25 ppmv S
NOX control Gas saturation and mixing with nitrogen
Sulphur recovery / SOX removal
efficiency (2011)
Claus plant + tail gas recycle / 99.6 % SOX removal efficiency
Emissions
(design values), 15 % O2 10 mg/Nm
3 SO2 60 mg/Nm
3 NOX
Emissions
(yearly averages – 2011), 15 % O2 15.5 mg/Nm
3 SO2 45 mg/Nm
3 NOX
Emissions, (yearly averages –
2011), 15 % O2 0.4 mg/Nm
3 dust 120 ng/Nm
3 Hg
*
* Below the detection limit of the analytical technique used.
Table 4.22: Data of Italian IGCC plants gasifying refinery residues
Emissions (yearly averages – 2011),
15 % O2 3–14.5 mg/Nm
3 SO2 12–42 mg/Nm
3 NOX
Emissions (yearly averages – 2011),
15 % O2 0.7–2.5 mg/Nm
3 dust
Yearly net electrical efficiency (2011) 36–46 %
Source: [ 3, LCP TWG 2012 ]
Availability
The availability of IGCC plants since their start-up is plotted in Figure 4.14. For most of the
coal-based plants, the early years had availabilities between 60 % and 80 %. Plants based on
petroleum residual oils have performed better, achieving over 90 % availability. The experience
accumulated over the past years allows projections to be made for new designs with a
significant improvement in the availability.
WORKIN
G DRAFT IN
PROGRESS
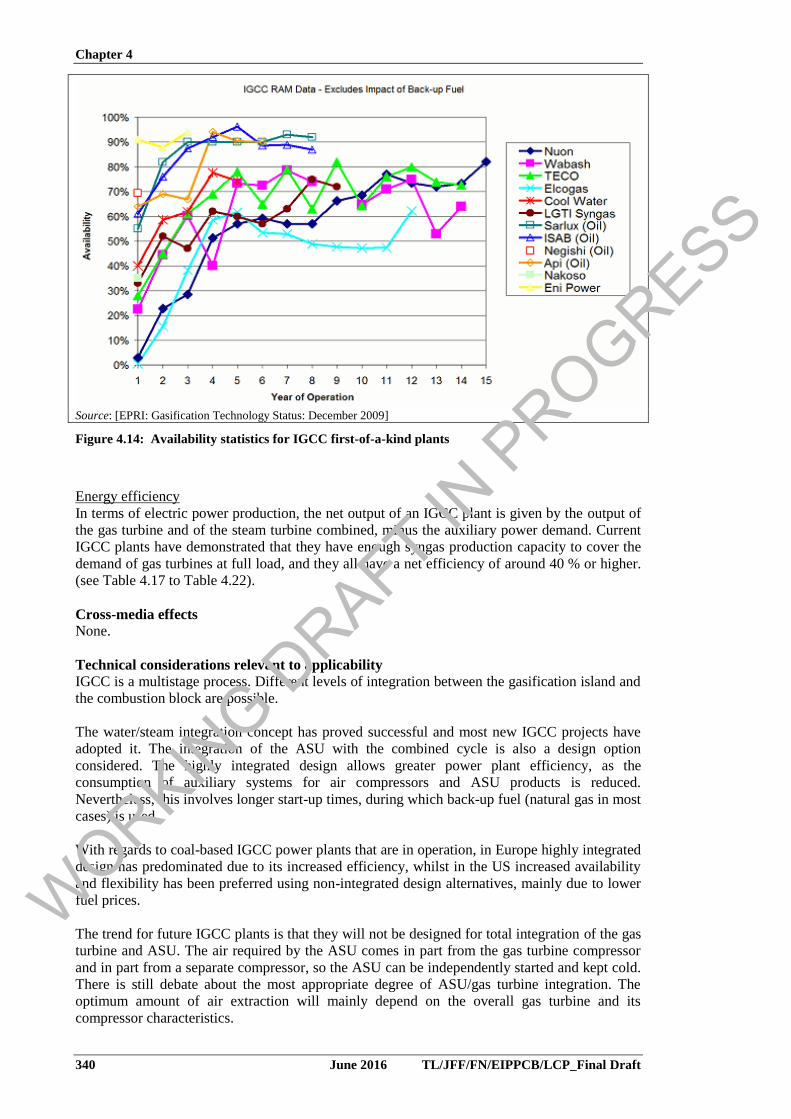
Chapter 4
340 June 2016 TL/JFF/FN/EIPPCB/LCP_Final Draft
Source: [EPRI: Gasification Technology Status: December 2009]
Figure 4.14: Availability statistics for IGCC first-of-a-kind plants
Energy efficiency
In terms of electric power production, the net output of an IGCC plant is given by the output of
the gas turbine and of the steam turbine combined, minus the auxiliary power demand. Current
IGCC plants have demonstrated that they have enough syngas production capacity to cover the
demand of gas turbines at full load, and they all have a net efficiency of around 40 % or higher.
(see Table 4.17 to Table 4.22).
Cross-media effects
None.
Technical considerations relevant to applicability
IGCC is a multistage process. Different levels of integration between the gasification island and
the combustion block are possible.
The water/steam integration concept has proved successful and most new IGCC projects have
adopted it. The integration of the ASU with the combined cycle is also a design option
considered. The highly integrated design allows greater power plant efficiency, as the
consumption of auxiliary systems for air compressors and ASU products is reduced.
Nevertheless, this involves longer start-up times, during which back-up fuel (natural gas in most
cases) is used.
With regards to coal-based IGCC power plants that are in operation, in Europe highly integrated
design has predominated due to its increased efficiency, whilst in the US increased availability
and flexibility has been preferred using non-integrated design alternatives, mainly due to lower
fuel prices.
The trend for future IGCC plants is that they will not be designed for total integration of the gas
turbine and ASU. The air required by the ASU comes in part from the gas turbine compressor
and in part from a separate compressor, so the ASU can be independently started and kept cold.
There is still debate about the most appropriate degree of ASU/gas turbine integration. The
optimum amount of air extraction will mainly depend on the overall gas turbine and its
compressor characteristics.
WORKIN
G DRAFT IN
PROGRESS

Chapter 4
TL/JFF/FN/EIPPCB/LCP_Final Draft June 2016 341
Regarding pollutant abatement techniques, they are all generally applicable. The selected
techniques depend on the raw fuel and on the required syngas characteristics.
Economics
Capital costs are higher, compared with combined cycles that use natural gas, due to fabrication,
cleaning and transport, or compared with combustion boilers with cleaning of the flue-gas. In
general, IGCC investment is expected to be higher than for a PC plant without CCS, but the
investment for IGCC+CCS is expected to be smaller than for PC+CCS.
Investment is estimated at between EUR 1 million and EUR 1.5 million/MWth (demonstration
plant). A study by the International Energy Agency considers that the specific investment for
IGCC is about 20 % higher than for pulverised coal combustion. However, there is more
uncertainty over IGCC costs as there are no recently built coal IGCC plants and the existing
ones were constructed as demonstration plants. Suppliers have plans to bring the capital costs to
within 10 % of those of pulverised coal combustion. The challenges are reliability, availability,
and investment. IGCC technologies could be commercially available by around 2020 with CCS.
[ 36, EGTEI 2012 ] [ 37, EGTEI 2012 ]
Driving force for implementation
High fuel and product flexibility.
High overall efficiency and very low emissions across all pollutants.
CO2 capture solution associated with IGCC seems an interesting concept.
Higher degree of public acceptance than for pulverised-coal-fired units.
Example plants
Coal/water slurry-fed IGCC plants
Polk IGCC power plant, Tampa, Florida, US (55 % petroleum coke/45 % coal).
Wabash River IGCC repowering project, US (petroleum coke).
Dry feed coal
Nuon IGCC power plant, the Netherlands.
ELCOGAS IGCC plant in Puertollano, Spain (fifty-fifty mixture of coal and petroleum coke).
Schwarze Pumpe, Germany.
Dry feed, enriched air-blown
IGCC plant in Nakoso, Japan.
Heavy oil gasification
Isab Energy S.r.l., Italy.
Api Energia, Falconara, Italy.
Sarlux, Sardinia.
Nigishi, Japan.
PERNIS, Netherlands.
ENI, Sannazzaro-Ferrera Erbognone, Italy.
Fujian Refinery Ethylene Project, China.
Biomass-fed IGCC plant
Varnamo IGCC, Sweden.
See also Section 4.1.1.
Reference literature
[ 36, EGTEI 2012 ] [ 37, EGTEI 2012 ]
WORKIN
G DRAFT IN
PROGRESS
Chapter 4
342 June 2016 TL/JFF/FN/EIPPCB/LCP_Final Draft
4.3.1.2 Reduction of emissions from a gasifier connected to an existing coal boiler
Description
Partial replacement of coal by syngas from biomass and/or other feedstocks, with or without
previous syngas cleaning, enables the environmental profile of coal-fired boilers to be
improved.
Technical description
The gasifier is connected to an existing coal boiler, either directly (see Figure 4.15) or with
intermediate syngas cleaning steps (see Figure 4.16). CFB/BFB gasification with dry gas
cleaning prior to the boiler (Figure 4.10 – dry cleaning and chlorine removal) makes it possible
to utilise biofuels with a high alkali content (such as straw), as well as SRF with higher chlorine
and heavy metal contents.
The gasifier may utilise different feedstocks (solid biofuels and refuse-derived fuels) from the
local area. The feedstock is gasified without drying, and the moisture content can be up to 60 %.
The capacity of the gasifier depends on the moisture content and on the heating value of the
input fuel. Biofuels and/or other feedstocks are gasified at atmospheric pressure at a temperature
of about 850 °C.
SOX emissions decrease due to the lower sulphur content of the syngas replacing the coal. NOX
emissions decrease as the syngas, which has quite a high moisture content due to the
gasification of biomass, has a cooling effect in the combustion chamber, allowing a reduction in
thermal NOX generation.
Direct connection gasifier–combustion plant
The hot flue-gas flows through the uniflow cyclone and is slightly cooled down in the air
preheater, before being fed into the main boiler. Simultaneously, the gasification air is heated up
in the air preheater before feeding it into the gasifier. The syngas is led directly from the gasifier
through the air preheater to some boiler burners, which are located below the coal burners in the
main boiler. This means that the environmental clean-up (emissions to air) relies on the main
boiler flue-gas cleaning installations. The gas can replace roughly 15 % of the coal
consumption. Figure 4.15 presents the configuration of the Finnish Kymijärvi plant. Figure 4.16
shows the configuration of the Finnish Vaskiluoto plant.
Connection gasifier–combustion via dry syngas cleaning
The method developed is based on gas filtration at 200–450 °C in a bag filter unit. With solid
refuse-derived fuels (SRF) and other fuels containing a lot of plastic material, the filtration
temperature has to be higher than 350 °C, in order to avoid tar condensation problems [Wilén et
al., 2004]. Ceramic (full or light) filter bags are used. Calcium hydroxide or other alkali sorbents
are injected into the gas before the filter unit, if necessary, to improve chlorine capture.
However, the inherent fuel alkali metals and the calcium-based bed material also react
efficiently with HCl during gas cooling and, especially, in the filter cake.
WORKIN
G DRAFT IN
PROGRESS
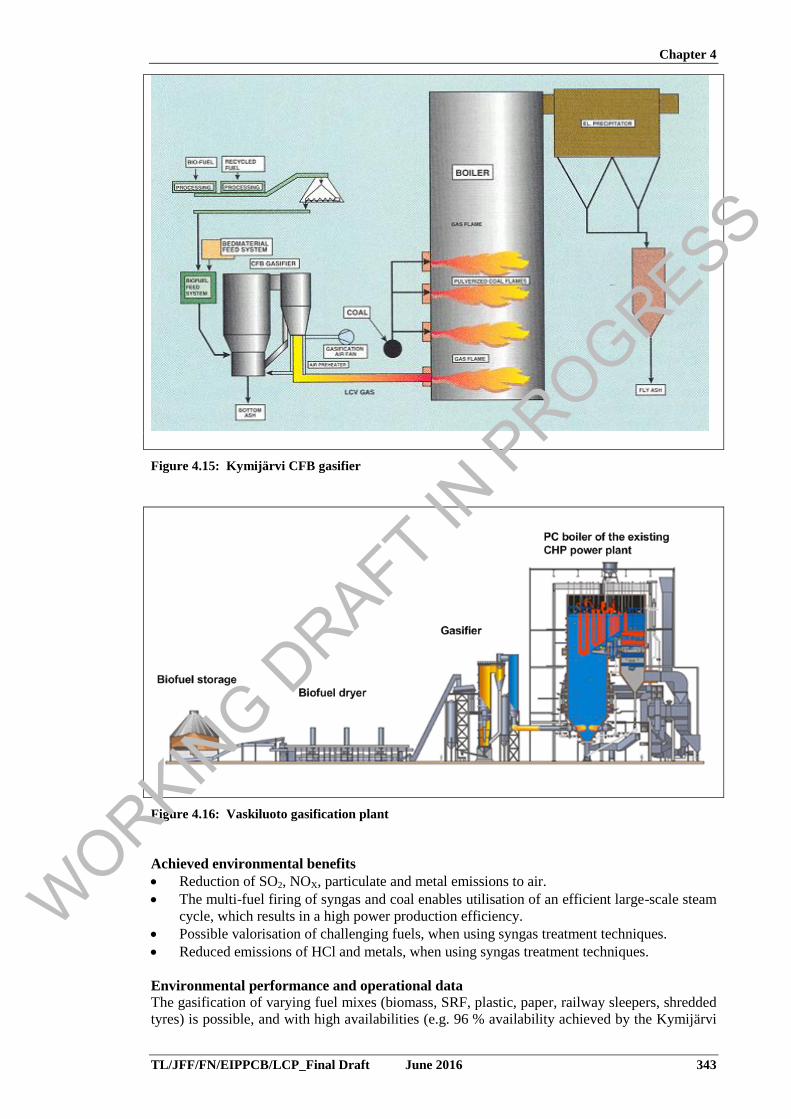
Chapter 4
TL/JFF/FN/EIPPCB/LCP_Final Draft June 2016 343
Figure 4.15: Kymijärvi CFB gasifier
Figure 4.16: Vaskiluoto gasification plant
Achieved environmental benefits
Reduction of SO2, NOX, particulate and metal emissions to air.
The multi-fuel firing of syngas and coal enables utilisation of an efficient large-scale steam
cycle, which results in a high power production efficiency.
Possible valorisation of challenging fuels, when using syngas treatment techniques.
Reduced emissions of HCl and metals, when using syngas treatment techniques.
Environmental performance and operational data
The gasification of varying fuel mixes (biomass, SRF, plastic, paper, railway sleepers, shredded
tyres) is possible, and with high availabilities (e.g. 96 % availability achieved by the Kymijärvi
WORKIN
G DRAFT IN
PROGRESS
Chapter 4
344 June 2016 TL/JFF/FN/EIPPCB/LCP_Final Draft
gasifier, Lahti, Finland). [Palonen et al., 2005; Palonen & Nieminem, 2001 - Available from:
http://www.fwc.com/publications/tech_papers/files/TP_GASFY_04_02.pdf].
Direct connection gasifier–combustion plant
A comprehensive one-year monitoring program in 1998 studying changes in the main boiler
emissions from the Kymijärvi gasifier (Lahti, Finland) demonstrated significantly decreased
emissions of CO2, NOX, SOX and particulates from the coal-fired boiler, while the emissions of
HCl and some metals increased depending on the quality of the gasified waste when the plant
was gasifying 40 % waste and 60 % biofuels. Boiler flue-gas emission measurements from co-
firing of syngas and coal in 2001 confirmed these effects [Wilén et al., 2004] (see Table 4.6).
While no changes were found in the emissions of CO, dioxins, furans, PAHs, benzenes and
phenols during monitoring in 1998 [Palonen et al., 2005, Palonen & Nieminen, 2001], the 2001
measurements indicated a slight increase in the boiler flue-gas emissions of total PAH
compounds, polychlorinated benzenes, and polychlorinated biphenyls, while the emissions of
chlorophenols and dioxins decreased, as compared to coal-only combustion data from 1997
[Wilén et al., 2004].
The most probable reason for the decrease in the dust content of the flue-gas is the increase in
the flue-gas moisture content, which enhances the operation of the ESP. The reasons for the
decrease in NOX emissions are, first, the reburning effect of ammonia and, second (and far more
importantly), the cooling effect of the low calorific, high-moisture syngas in the bottom part of
the boiler.
Because of the extremely low sulphur content of some biofuels, the main boiler's SOX emissions
decrease, while, in contrast, the HCl content of flue-gas increases, because of the higher
chlorine content of the SRF and shredded tyres in the gasifier, compared to the low-chlorine
coal in the main boiler [Palonen & Nieminen, 2001]. With regards to the emission of metals,
increases in some elements (e.g. Hg) can be seen, but, because of the very low baseline levels in
coal combustion, the changes that were measured were in practice very small.
Gasifier–combustion plant connection via syngas treatment techniques
In the case of waste-derived fuels, all heavy metals except mercury can be removed with over
99 % efficiency by filtration [Wilén et al., 2004]. However, final flue-gas cleaning after the
boiler may be necessary, in order to fulfil the emission requirements, especially with mercury-
containing waste fuels.
Residues
The only residue from the gasifier is bottom ash. In the case of the Kymijärvi gasifier (Lahti,
Finland), this consists mainly of sand and limestone. Furthermore, small amounts of solid
impurities, such as pieces of metal, concrete and glass may be found in the bottom ash if waste
is co-gasified. Typically, the carbon content in the bottom ash is less than 0.5 %. No signs of
chlorine are detected [Niemen, Kurkela and Palonen, 2004]. When shredded tyres are used as a
fuel in the gasifier, the zinc content in the gasifier bottom ash increases from a few hundred ppm
to 3000 ppm. All other analysed elements are in the range of a few or tens of ppms (As, Cd, Ni,
Pb and Hg), or in the range of hundreds of ppms (Cr and Cu) [Palonen & Nieminen, 2001].
In the case of direct connection of the gasifier to the boiler, the share of the gasifier fly ash of
the main coal-boiler total filter ash is small, only 3–5 %, and hence changes in the main boiler
filter ash quality caused by the gasifier are very small, even in the case of waste co-gasification
[Palonen & Nieminen, 2001]. The biggest change is seen in the zinc content when shredded
tyres are used as fuel in the gasifier [Palonen & Nieminen, 2001].
In the case of syngas pretreatment, a dry filter dust is produced, in addition to bottom ash from
the gasifier. The filter dust contains unconverted carbon (char), the finest fraction of the bed
material, inert matter from the feedstock, and chlorine removal sorbent.
Cross-media effects
WORKIN
G DRAFT IN
PROGRESS

Chapter 4
TL/JFF/FN/EIPPCB/LCP_Final Draft June 2016 345
Depending on the gasified feedstock (e.g. if waste is co-gasified with biomass), some pollutants
such as HCl and metals may be increased in emissions to air. For instance, the use of
contaminated materials (e.g. gluelam containing nitrogen and sodium in glue) increases the
concentration of ammonia, hydrogen cyanide and alkalis in the syngas [Palonen & Nieminen,
2001].
Technical considerations relevant to applicability
The most simple process configuration without gas cleaning (see Figure 4.10 – raw gas (clean
fuel)) is suitable for feedstocks which do not contain significant amounts of alkali and metals or
chlorine, as in this process a relatively large part of the biomass ash is led together with the
product gas into the coal boiler. Such feedstock includes wood chips, sawdust and bark, forest
residue chips and some clean plastic or paper wastes. This technology is available as a
commercial technology.
Due to the effective removal of chlorine, alkali metals and heavy metals, the configuration with
dry syngas pretreatment can also be applied for many challenging biomasses and waste-derived
fuels. For example straw, energy crops and different agricultural residues are fuels which often
require gas cleaning to lower the alkali and chlorine content before combustion in a boiler,
which involves high steam temperatures.
Economics
The gasifier–PC boiler process connection offers low investment and operating costs, thanks to
the utilisation of existing power plant capacity, with only small modifications to the main boiler.
The total costs of the 60 MWth gasification plant at the Kymijärvi power plant were about
EUR 12 million, including the fuel preparation plant, civil works, instrumentation and control,
as well as electrification works.
Driving force for implementation
Replacement of coal by almost CO2-neutral biomass-derived gas reduces fossil-fuel CO2
emissions. In PC boilers, the multi-fuel firing of gas with coal is significantly simpler than the
multi-fuel firing of solid biomass with coal.
Example plants
A pioneering plant for the configuration without gas cleaning has been in successful operation
in Lahti, Finland (Kymijärvi) since 1998. There the product gas from a 60 MWth gasifier
replaces 15 % of the coal input in a PC boiler. A larger unit of 140 MWth was recently put into
operation in Vaasa (Finland) to replace about 25 % of the coal in a PC boiler.
The first industrial gasification plant based on the dry syngas treatment was put into commercial
operation in 2012 in Lahti Finland (Kymijärvi II gasification plant with two 80 MW gasifiers
connected to a separate gas-fired boiler). Source-separated industrial and household wastes and
demolition wood are used as the feedstock at this plant.
Other plants:
Corenso Oy, Varkhaus, Finland.
Electrabel, Ruien, Belgium.
Essent, Amercentrale, Netherlands.
Biococomb, Austria.
Reference literature
[Kurkela, 2002 Available from:
http://www.ieatask33.org/app/webroot/files/file/publications/OPETReport4gasification.pdf;
Wilén et al., 2004]
WORKIN
G DRAFT IN
PROGRESS

Chapter 4
346 June 2016 TL/JFF/FN/EIPPCB/LCP_Final Draft
4.3.1.3 Biomass gasification connected to engine plants with prior wet gas cleaning
Technical description
Gasification with wet gas cleaning (Figure 4.10 – wet cleaning) is a process which can produce
a very clean gas for subsequent use, e.g. in gas engines. However, it produces a waste water
stream, and the waste water treatment may be difficult to design in a fully environmentally
acceptable manner [Wilén et al., 2004]. Problematic substances in the waste water from the gas
scrubber, which may be difficult to handle/eliminate, include benzene, naphthalene, PAHs and
phenol. [Waste Water Discharge Permission for Skive CHP, Skive Municipality, 2005]
A low-pressure biomass gasifier associated with a gas clean-up system has been developed for
use in gas-engine-based combined heat and power (CHP) plants. The first plant (Skive,
Denmark) produces 6 MWe and 12 MWth for district heating (Figure 4.17). The gasification
plant processes include an air-blown, low-pressure bubbling fluidised bed (BFB) gasifier with
limestone-based bed material, a catalytic tar reformer, gas cooling and filtration, and a gas
scrubber. The power plant processes include three gas engines with heat recovery (three 2 MWth
gas engines) and two optional gas boilers (two 10 MWth gas boilers).
Figure 4.17: The Skive CHP flowsheet (Salo, 2010)
The BFB gasifier is fed with wood pellets and chips and operated at a pressure of 0.5–2 bars.
The bed material is dolomite, giving the gasifier some tar cracking capability; the tar level after
the gasifier is claimed to be low. Dolomite is a naturally mixed calcium–magnesium carbonate;
when used for tar cracking, it is decomposed by heating into calcium–magnesium oxide, which
is the active component. However, if the CO2 partial pressure becomes too high, the oxide
reverts to carbonate at the gasification temperature. Other bed material has been or is being
tested to find a way to avoid this [Brandin et al., 2011].
Gas cleaning with catalytic tar reforming
The syngas enters the catalytic tar reformer, which operates at a temperature of 850–950 °C. As
the reforming reaction is endothermic, this might mean that the syngas enters at 950 °C and
WORKIN
G DRAFT IN
PROGRESS
Chapter 4
TL/JFF/FN/EIPPCB/LCP_Final Draft June 2016 347
leaves at 850 °C. No soot forms and the pressure drop is stable, but steam/nitrogen pulsing is
used to clean the catalyst bed.
The ammonia in the gas is decomposed by ammonia cracking over the reforming catalyst. As
the ammonia is very water-soluble, it follows the condensate and ends up in the scrubber water
and finally the waste water. The nitrogen level in the waste water is too high to be accepted at
municipal waste water plants. An activated carbon filter is also needed to treat the waste water
to reduce its organic content.
Achieved environmental benefits
High energy efficiency; high electrical efficiency of gas engines, even at small sizes.
[Brandin et al., 2011].
Overall air emission levels: according to the Environmental Approval for Skive CHP (Skive
Municipality, 2005), the most important emissions to air from the gas engines are NOX,
unburnt hydrocarbons, CO and formaldehyde, and, apart from CO, the emission limit values
in the legislation are the same as for natural-gas-fired engines.
Environmental performance and operational data
Such a gasification plant, when fully automated, can use all combinations of gas consumers (gas
engines and gas boilers), ensuring a large flexibility.
Achieved efficiencies at Skive CHP (Skive Fjernvarme, 2012) are:
total fuel utilisation: 86 %;
electrical efficiency: 30 %;
thermal efficiency (heat for district heating): 56 %.
The initial tar conversion over the catalyst was 90 %, but decreased to 70 %. However, no heavy
tars were found after the reformer completed 7500 hours of operation. The ammonia conversion
over the catalyst is low, and a maximum of 60 % is obtained.
The environmental performance (emissions and consumption levels) per MWh produced (heat
and electricity) over the 2007–2012 period are given in
Table 4.7 and Table 4.16.
Cross-media effects
Waste water produced from the gas scrubber contains sludge, organic compounds and inorganic
species. At the Skive plant, this is handled by a combination of mechanical treatment, activated
carbon filtering for removal of CxHy, and pH neutralisation by NaOH and CH2O2 before the
waste water from the scrubber is discharged to the municipal waste water plant. According to
the waste water discharge permit for Skive CHP (Skive Municipality, 2005), there are
potentially four problematic substances in the waste water from the gas scrubber which may
compromise the water quality of the recipient: benzene, naphthalene, PAHs and phenol.
The ammonia content of the condensate has also been mentioned as a problem, given the
emission regulation at the municipal water treatment plant at the Skive plant, despite the
catalytic reforming step for the tars [Brandin et al., 2011].
Another drawback of the system is the gas engine's exposure to corrosive combustion products,
resulting in short and expensive maintenance intervals [Brandin et al., 2011].
Technical considerations relevant to applicability
No information provided.
Economics
Investment costs are roughly 50 % higher than in the dry gas cleaning or directly connected
options [Wilén et al., 2004].
WORKIN
G DRAFT IN
PROGRESS
Chapter 4
348 June 2016 TL/JFF/FN/EIPPCB/LCP_Final Draft
Driving force for implementation
High electrical efficiencies of gas engines (even at small sizes), low cost, and reliability; they
also even work well at low loads [Brandin et al., 2011].
Example plants
Skive CHP, Denmark.
Reference literature
No information provided.
4.3.2 Techniques for the prevention and control of water pollution from the gasification process
Description
Waste water is recirculated after internal treatment in IGCC plants and gasification plants using
syngas wet cleaning techniques.
Technical description
Gasification plants may use a water scrubber, HCN/COS converter and cooler for removing
pollutants from the syngas, such as chlorides and other halides, ammonia or particulates. The
generated stream is sent to the water treatment unit prior to recirculation. Dissolved gases such
as H2S, NH3 and CO2 are stripped out.
Because the water is reused for moisturising the syngas before being combusted in gas turbines
or engines, the salt content of the water should be low. The water is evaporated to remove the
salts (mainly NaCl) and the condensate is also treated in a dedicated demineralisation plant to
achieve a low salt content (Cl < 0.05 mg/l).
Achieved environmental benefit
Reduced overall emissions to water.
Reduced water consumption.
Environmental performance and operational data
No information provided.
Cross-media effects
No information provided.
Technical considerations relevant to applicability
No information provided.
Economics
No information provided.
Driving force for implementation
Zero liquid discharge in the environmental permit.
Example plants
Nuon, ELCOGAS and Tampa.
Reference literature
No information provided.
WORKIN
G DRAFT IN
PROGRESS
Chapter 4
TL/JFF/FN/EIPPCB/LCP_Final Draft June 2016 349
4.3.3 Techniques for the handling of residues from the gasification process
Description
Residues reuse.
Technical description
The bottom ashes from gasification may either be removed dry, or as slag if the gasifier
operating temperature is well above the ash fusion temperature, which is often the case in
entrained-flow gasifiers for example. The gasifier slag is separated in a molten state through the
bottom of the gasifier, cooled in a bath of water and extracted using lock hoppers. Slag can be
removed continuously from the slag bath at the base of the gasifier via a let-down system, which
seems to show benefits in relation to lock hopper systems. The quality – and hence the reuse
potential – of the gasification slags may be better than that of the corresponding combustion
ashes due to their glassy and chemically stable form.
Sour gas is converted to solid sulphur in a Claus unit, and tail gas from the Claus unit is
hydrogenated before being recycled to the COS hydrolysis unit, allowing recovery of 98 % of
the total fuel sulphur content as elemental sulphur. Sulphur can also be recovered as gypsum,
e.g. by washing with a limestone solution. The plant includes a syngas cooler, hot gas filter and
cold gas clean-up using COS hydrolysis and MDEA for H2S removal. The H2S-rich gas is burnt
and the flue-gases scrubbed with limestone slurry to produce gypsum for sale. This technique
has been developed where there is very little market for elemental sulphur, like in Japan.
Depending on the market situation, slag and recovered sulphur are likely to be traded. The slag
can be used in the manufacturing of flooring tiles for example, and sulphur can be used in the
manufacture of fertilisers and sulphuric acid.
For the fly ashes, the quality and reuse potential may vary significantly, depending on the
syngas cleaning technology used, the gasification technology and the quality of the original
feedstock. In some cases, the fly ash will have a good quality and will not contain sorbents, and
these fly ashes may be marketed (example plants: Nuon and ELCOGAS IGCC plants).
If the gasification process is based on low temperatures (700–800 °C), and the fuel is biomass or
some waste fractions, it is possible to produce a fertiliser product from the fly ash and bottom
ash. The nutrients from the fuel (especially potassium and phosphorus) can thereby be returned
to the fields, and the heating value efficiently used for energy purposes. The process
temperature is kept low, to maintain a high availability of the nutrients in the fertiliser,
especially phosphorus. Carbon-in-ash has a beneficial effect on agricultural soil, where it
contributes to lower leaching of nutrients and an increased water-holding effect of the soil for
example. The carbon derived from a low-temperature gasification process is also stable in the
soil, while for instance when wheat straw is tilled into the soil, only a few per cent of the carbon
remains in the soil, and the rest is released as mainly CO2.
[www.Pyroneer.com].
Achieved environmental benefits
Reduced transfer of pollutants to the environment.
Environmental performance and operational data
See Section 4.2.1.
Cross-media effects
Without proper separation, slag may contain an intermediate size fraction with a high ash
content, which makes its sale difficult.
WORKIN
G DRAFT IN
PROGRESS

Chapter 4
350 June 2016 TL/JFF/FN/EIPPCB/LCP_Final Draft
Technical considerations relevant to applicability
Filter dust from syngas filtration may contain a mixture of sorbents, unreacted carbon, and all
the impurities of the original feedstock, and disposal may be the only option. The final disposal
methods of the filter dust must be designed on case-by-case basis, depending on the original
feedstock composition.
Economics
No information provided.
Driving force for implementation
No information provided.
Example plants
Tampa (US).
Nuon (the Netherlands).
Wabash River (proprietary slag removing system, US).
Nakoso (Japan).
ELCOGAS (Spain).
Reference literature
No information provided.
4.3.4 Techniques to increase the energy efficiency of the gasification process
4.3.4.1 High-temperature and -pressure gasification
Description
The use of a gasification technique with high-temperature and -pressure operating parameters
enables the maximum carbon conversion rate to be achieved.
Achieved environmental benefit
Reduced fuel consumption and increased energy efficiency.
Environmental performance and operational data
In the ELCOGAS plant (Spain), the gasification reaction takes place in the gasifier combustion
chamber at a high temperature, between 1600 °C and 1800 °C, and at a high pressure of 24 bar,
enabling a carbon conversion for the gasification of more than 98 %.
In Nakoso (Japan), a low syngas temperature of approximately 1100 ºC simplifies the cooling
system but means a lower conversion rate.
Technical considerations relevant to applicability
No information provided.
Cross-media effects
No information provided.
Economics
Pressurised systems significantly reduce the costs of syngas clean-up and overall capital costs.
Capital costs decrease largely due to the decreasing gas volume in the cleaning section. The
extra costs for air or oxygen compression are more than outweighed by smaller syngas clean-up
equipment and reduced compression costs downstream, and hence pressurised systems have a
lower total capital cost than atmospheric systems [E4tech, 2009].
WORKIN
G DRAFT IN
PROGRESS
Chapter 4
TL/JFF/FN/EIPPCB/LCP_Final Draft June 2016 351
Driving force for implementation
No information provided.
Example plants
ELCOGAS (Spain) and Nakoso (Japan).
Reference literature
No information provided.
4.3.4.2 Dry feedstock feeding system
Description
The use of a dry system for feeding the fuel to the gasifier enables improvements in the energy
efficiency of the gasification process.
Technical description
In entrained-flow gasification of coal, the fine coal can be fed to the gasifier in either a dry or
slurry form. The former uses a lock hopper system, while the latter relies on the use of high-
pressure slurry pumps. The slurry feed is a simpler operation, but it introduces water into the
reactor which needs to be evaporated. The result of this additional water is a syngas product
with a higher H2 to CO ratio, but with a lower gasifier thermal efficiency. The feed preparation
system needs to be evaluated, along with other process design alternatives.
Achieved environmental benefit
Reduced energy consumption and increased energy efficiency.
Environmental performance and operational data
In the Nuon plant (the Netherlands), the cooled syngas heating value typically contains ~80 %
of the heating value of the coal feed. This is higher than that achievable with the coal/water
slurry-fed systems.
Technical considerations relevant to applicability
No information provided.
Cross-media effects
No information provided.
Economics
No information provided.
Driving force for implementation
No information provided.
Example plants
Nuon (the Netherlands) and ELCOGAS (Spain).
Reference literature
No information provided.
4.3.4.3 Use of recovered heat from the gasification process
Description
The heat recovered from syngas cooling is reused internally to dry the fuel or produce additional
heat/power in order to reduce heat losses and to improve the process energy efficiency.
Technical description
WORKIN
G DRAFT IN
PROGRESS
Chapter 4
352 June 2016 TL/JFF/FN/EIPPCB/LCP_Final Draft
Biomass gasification systems differ from combustion systems as for gasification systems it is
usually necessary to dry the biomass prior to feeding it into the gasifier. The general
requirement for the moisture content in biomass is < 20 % moisture. However, some systems
can handle wet biomass with up to 60 % moisture (e.g. at the Kymijärvi plant, Lahti, Finland).
A variety of drying methods, including fluidised bed and rotary mechanisms, direct exposure to
flue-gas, or a thermal fluid, exist [Pytlar, 2010]. In order to avoid losing the energy used to drive
off water, heat recapture is favoured.
Achieved environmental benefit
Reduced energy consumption and increased energy efficiency.
Environmental performance and operational data
In the ELCOGAS plant (Spain), the raw syngas is quenched with recycled syngas to a
temperature of 800 °C upon leaving the combustion chamber. The syngas is then cooled in two
water-tube boilers down to 250 °C, generating a HP and IP steam that is superheated in the
HRSG of the power block and sent to the steam turbine. The recovered energy enables the
energy efficiency of the gasification process to be improved from 74.1 % to 91.2 % (yearly
average).
In the Nuon plant (the Netherlands), the raw syngas is quenched with recycled syngas to a
temperature of 800 °C upon leaving the gasifier reactor. The syngas is then cooled in a syngas
cooler down to 235 °C, generating HP and IP steam (which is superheated in the HRSG of the
power block and sent to the steam turbine) and LP steam for gasification and gas cleaning. The
recovered energy enables the energy efficiency of the gasification process to be improved from
77.1 % to 92 % (yearly average).
Technical considerations relevant to applicability
No information provided.
Cross-media effects
No information provided.
Economics
No information provided.
Driving force for implementation
No information provided.
Example plants
ELCOGAS (Spain) and Nuon (the Netherlands).
Reference literature
No information provided.
4.3.4.4 Full integration of the air supply unit (ASU) with the gas turbine in IGCC plants
Description
The air separation unit (ASU) and the gas turbine are fully integrated, meaning that the entire air
feed for the ASU is supplied (extracted) from the gas turbine compressor.
Achieved environmental benefit
Increased energy efficiency.
Environmental performance and operational data
No information provided.
WORKIN
G DRAFT IN
PROGRESS

Chapter 4
TL/JFF/FN/EIPPCB/LCP_Final Draft June 2016 353
Technical considerations relevant to applicability
No information provided.
Cross-media effects
No information provided.
Economics
No information provided.
Driving force for implementation
No information provided.
Example plants
ELCOGAS (Spain).
Reference literature
No information provided.
WORKIN
G DRAFT IN
PROGRESS

WORKIN
G DRAFT IN
PROGRESS
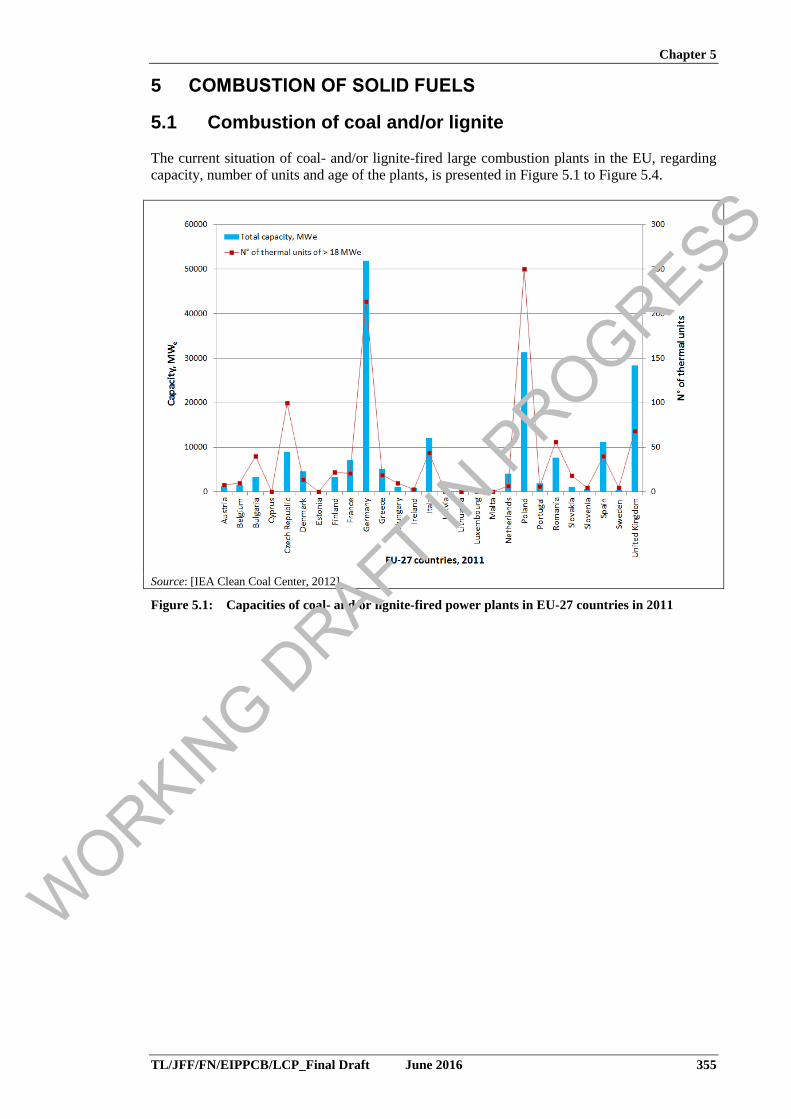
Chapter 5
TL/JFF/FN/EIPPCB/LCP_Final Draft June 2016 355
5 COMBUSTION OF SOLID FUELS
5.1 Combustion of coal and/or lignite
The current situation of coal- and/or lignite-fired large combustion plants in the EU, regarding
capacity, number of units and age of the plants, is presented in Figure 5.1 to Figure 5.4.
Source: [IEA Clean Coal Center, 2012]
Figure 5.1: Capacities of coal- and/or lignite-fired power plants in EU-27 countries in 2011
WORKIN
G DRAFT IN
PROGRESS
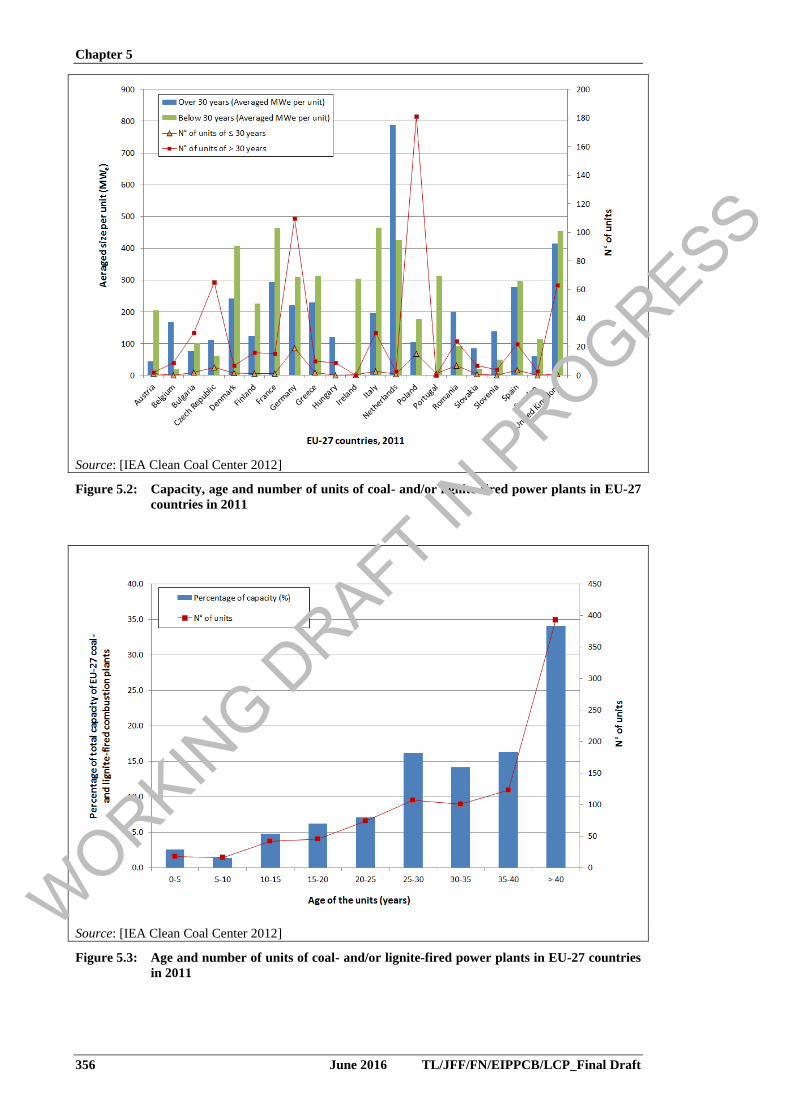
Chapter 5
356 June 2016 TL/JFF/FN/EIPPCB/LCP_Final Draft
Source: [IEA Clean Coal Center 2012]
Figure 5.2: Capacity, age and number of units of coal- and/or lignite-fired power plants in EU-27
countries in 2011
Source: [IEA Clean Coal Center 2012]
Figure 5.3: Age and number of units of coal- and/or lignite-fired power plants in EU-27 countries
in 2011
WORKIN
G DRAFT IN
PROGRESS
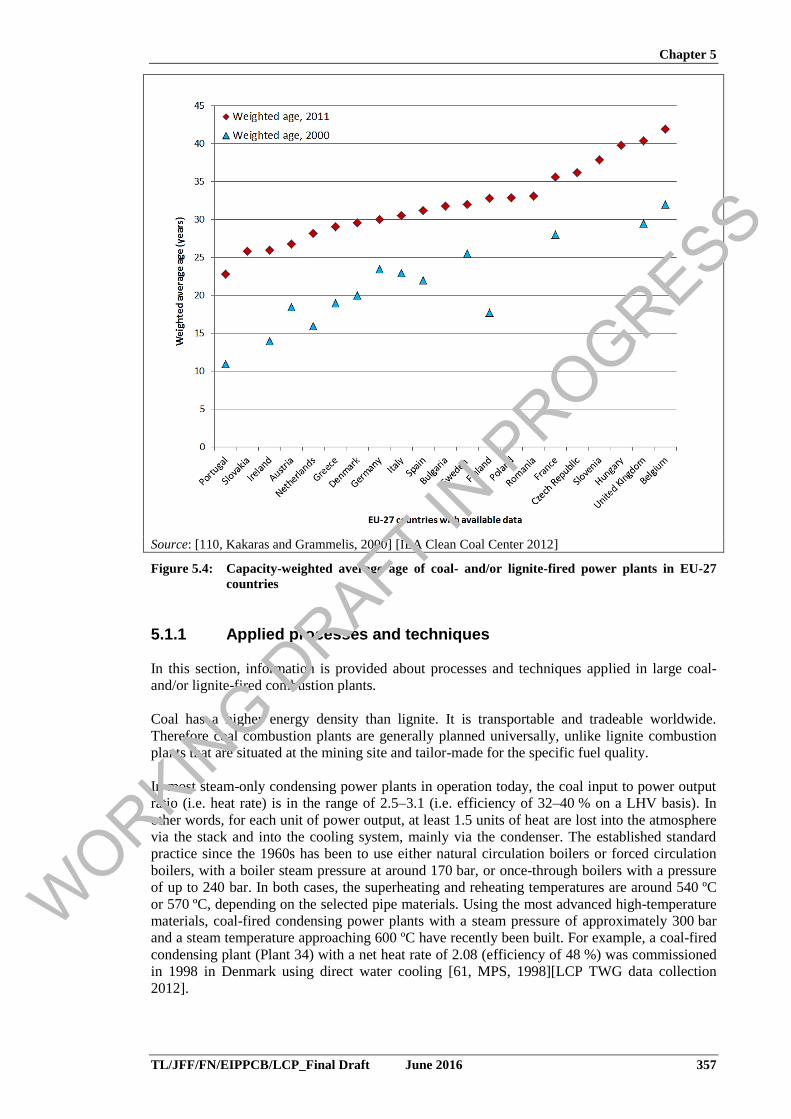
Chapter 5
TL/JFF/FN/EIPPCB/LCP_Final Draft June 2016 357
Source: [110, Kakaras and Grammelis, 2000] [IEA Clean Coal Center 2012]
Figure 5.4: Capacity-weighted average age of coal- and/or lignite-fired power plants in EU-27
countries
5.1.1 Applied processes and techniques
In this section, information is provided about processes and techniques applied in large coal-
and/or lignite-fired combustion plants.
Coal has a higher energy density than lignite. It is transportable and tradeable worldwide.
Therefore coal combustion plants are generally planned universally, unlike lignite combustion
plants that are situated at the mining site and tailor-made for the specific fuel quality.
In most steam-only condensing power plants in operation today, the coal input to power output
ratio (i.e. heat rate) is in the range of 2.5–3.1 (i.e. efficiency of 32–40 % on a LHV basis). In
other words, for each unit of power output, at least 1.5 units of heat are lost into the atmosphere
via the stack and into the cooling system, mainly via the condenser. The established standard
practice since the 1960s has been to use either natural circulation boilers or forced circulation
boilers, with a boiler steam pressure at around 170 bar, or once-through boilers with a pressure
of up to 240 bar. In both cases, the superheating and reheating temperatures are around 540 ºC
or 570 ºC, depending on the selected pipe materials. Using the most advanced high-temperature
materials, coal-fired condensing power plants with a steam pressure of approximately 300 bar
and a steam temperature approaching 600 ºC have recently been built. For example, a coal-fired
condensing plant (Plant 34) with a net heat rate of 2.08 (efficiency of 48 %) was commissioned
in 1998 in Denmark using direct water cooling [61, MPS, 1998][LCP TWG data collection
2012].
WORKIN
G DRAFT IN
PROGRESS
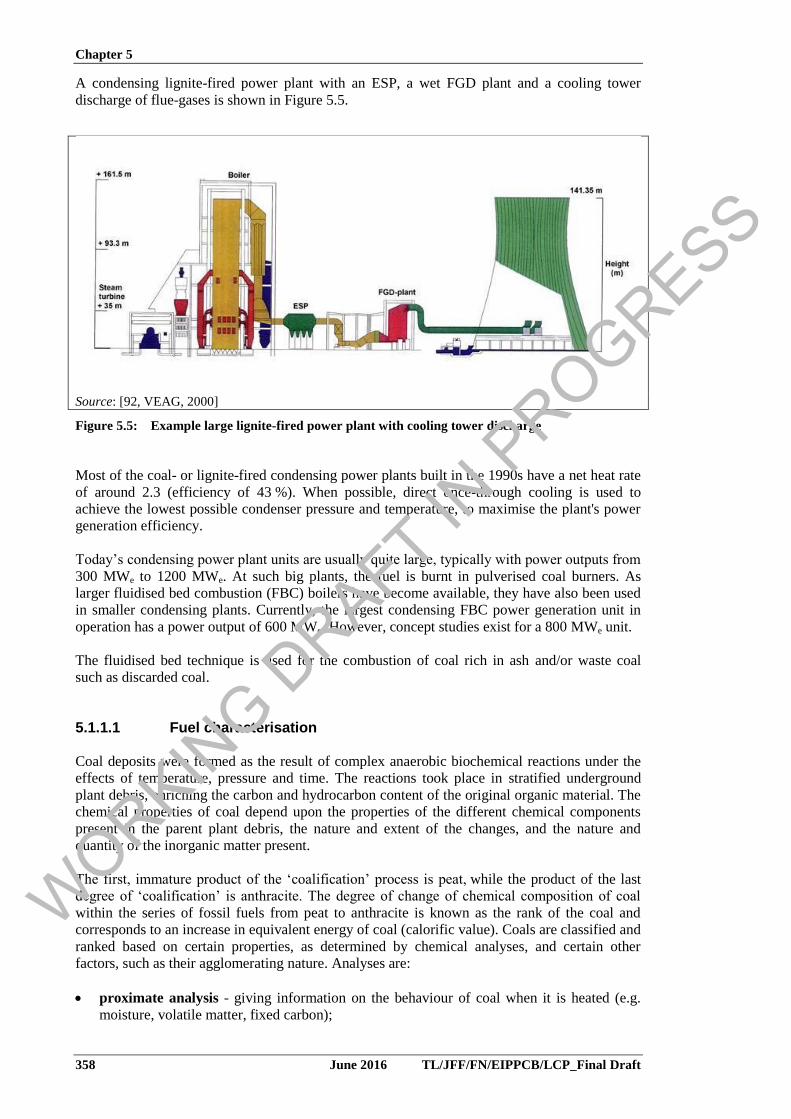
Chapter 5
358 June 2016 TL/JFF/FN/EIPPCB/LCP_Final Draft
A condensing lignite-fired power plant with an ESP, a wet FGD plant and a cooling tower
discharge of flue-gases is shown in Figure 5.5.
Source: [92, VEAG, 2000]
Figure 5.5: Example large lignite-fired power plant with cooling tower discharge
Most of the coal- or lignite-fired condensing power plants built in the 1990s have a net heat rate
of around 2.3 (efficiency of 43 %). When possible, direct once-through cooling is used to
achieve the lowest possible condenser pressure and temperature, to maximise the plant's power
generation efficiency.
Today’s condensing power plant units are usually quite large, typically with power outputs from
300 MWe to 1200 MWe. At such big plants, the fuel is burnt in pulverised coal burners. As
larger fluidised bed combustion (FBC) boilers have become available, they have also been used
in smaller condensing plants. Currently, the largest condensing FBC power generation unit in
operation has a power output of 600 MWe. However, concept studies exist for a 800 MWe unit.
The fluidised bed technique is used for the combustion of coal rich in ash and/or waste coal
such as discarded coal.
5.1.1.1 Fuel characterisation
Coal deposits were formed as the result of complex anaerobic biochemical reactions under the
effects of temperature, pressure and time. The reactions took place in stratified underground
plant debris, enriching the carbon and hydrocarbon content of the original organic material. The
chemical properties of coal depend upon the properties of the different chemical components
present in the parent plant debris, the nature and extent of the changes, and the nature and
quantity of the inorganic matter present.
The first, immature product of the ‘coalification’ process is peat, while the product of the last
degree of ‘coalification’ is anthracite. The degree of change of chemical composition of coal
within the series of fossil fuels from peat to anthracite is known as the rank of the coal and
corresponds to an increase in equivalent energy of coal (calorific value). Coals are classified and
ranked based on certain properties, as determined by chemical analyses, and certain other
factors, such as their agglomerating nature. Analyses are:
proximate analysis - giving information on the behaviour of coal when it is heated (e.g.
moisture, volatile matter, fixed carbon);
WORKIN
G DRAFT IN
PROGRESS

Chapter 5
TL/JFF/FN/EIPPCB/LCP_Final Draft June 2016 359
ultimate analysis - giving information to assist in the selection of coal for steam generation
(e.g. total carbon, hydrogen, nitrogen, oxygen, calorific value, ash fusion temperature,
grindability and sulphur content).
Three major classification systems have been developed based upon the proximate analysis of
coals:
ASTM classification, developed in the US
According to the ASTM classification, there are four classes of coal, based on fixed carbon and
volatile matter (on a dry, mineral matter-free basis) and calorific value (on a moist, mineral
matter-free basis):
anthracite,
bituminous,
sub-bituminous,
lignite.
FRB/NCB classification, developed in the UK
According to the FRB/NCB classification system, based upon volatile matter (on daf) and
burning properties (Gray-King Assay) there are four classes of coal:
anthracite,
low volatile steam coals,
medium volatile coals,
high volatile coals (consisting of six subclasses).
UN/ECE international classification system
According to the ‘International Codification System’ for medium and high rank coals and the
‘International Codification System’ for low rank coal utilisation, developed by the UN/ECE,
coals are defined as higher rank and lower rank coals, based upon their gross calorific value
(on a moist, ash-free basis) and vitrinite mean random reflectance in oil. These categories are
divided further into subcategories. The higher ranking coals are divided into medium and high
rank coals, while the lower ranking coals are divided into lignite and sub-bituminous coals.
For the purpose of this document, only the distinction between coal and lignite has been
considered, and 'coal' covers the different types of coal.
The composition of lignite and coal differs over a broad range, as shown in Table 5.1. This is
also true for the concentration of metals and trace elements in lignite and coal, as can be seen in
Table 5.2.
WORKIN
G DRAFT IN
PROGRESS
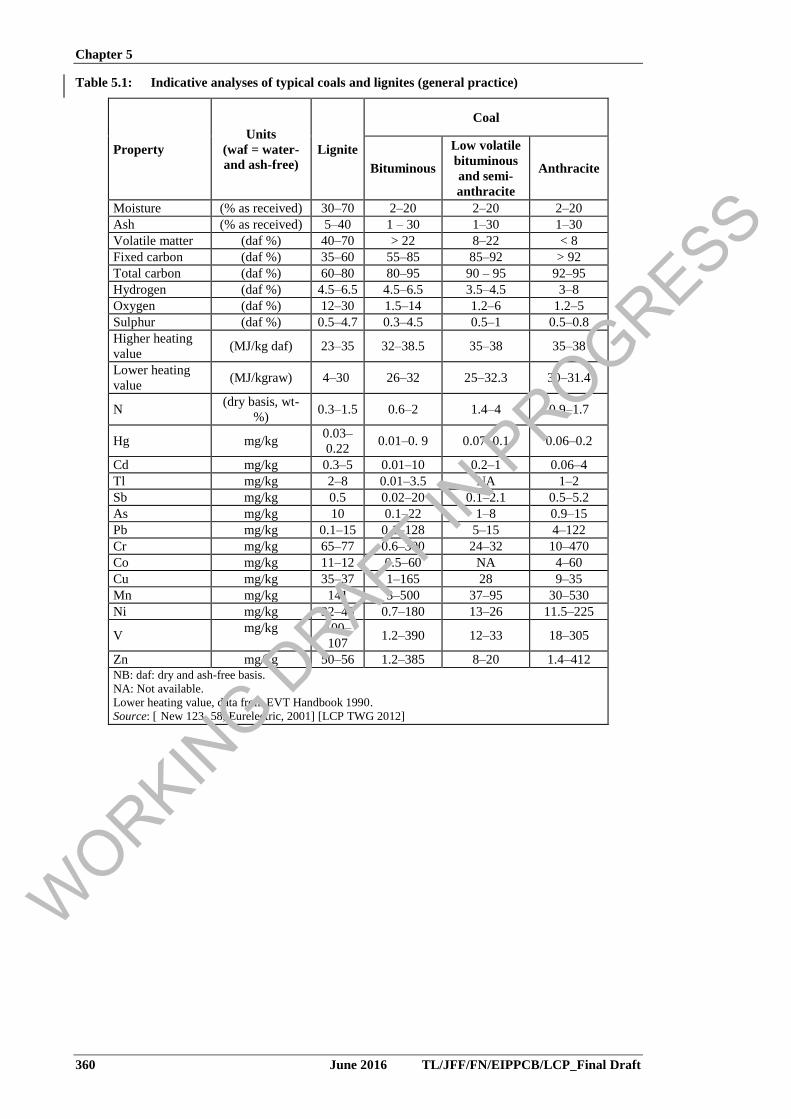
Chapter 5
360 June 2016 TL/JFF/FN/EIPPCB/LCP_Final Draft
Table 5.1: Indicative analyses of typical coals and lignites (general practice)
Property
Units
(waf = water-
and ash-free)
Lignite
Coal
Bituminous
Low volatile
bituminous
and semi-
anthracite
Anthracite
Moisture (% as received) 30–70 2–20 2–20 2–20
Ash (% as received) 5–40 1 – 30 1–30 1–30
Volatile matter (daf %) 40–70 > 22 8–22 < 8
Fixed carbon (daf %) 35–60 55–85 85–92 > 92
Total carbon (daf %) 60–80 80–95 90 – 95 92–95
Hydrogen (daf %) 4.5–6.5 4.5–6.5 3.5–4.5 3–8
Oxygen (daf %) 12–30 1.5–14 1.2–6 1.2–5
Sulphur (daf %) 0.5–4.7 0.3–4.5 0.5–1 0.5–0.8
Higher heating
value (MJ/kg daf) 23–35 32–38.5 35–38 35–38
Lower heating
value (MJ/kgraw) 4–30 26–32 25–32.3 30–31.4
N (dry basis, wt-
%) 0.3–1.5 0.6–2 1.4–4 0.9–1.7
Hg mg/kg 0.03–
0.22 0.01–0. 9 0.07–0.1 0.06–0.2
Cd mg/kg 0.3–5 0.01–10 0.2–1 0.06–4
Tl mg/kg 2–8 0.01–3.5 NA 1–2
Sb mg/kg 0.5 0.02–20 0.1–2.1 0.5–5.2
As mg/kg 10 0.1–22 1–8 0.9–15
Pb mg/kg 0.1–15 0.1–128 5–15 4–122
Cr mg/kg 65–77 0.6–300 24–32 10–470
Co mg/kg 11–12 0.5–60 NA 4–60
Cu mg/kg 35–37 1–165 28 9–35
Mn mg/kg 141 3–500 37–95 30–530
Ni mg/kg 32–40 0.7–180 13–26 11.5–225
V mg/kg 100–
107 1.2–390 12–33 18–305
Zn mg/kg 50–56 1.2–385 8–20 1.4–412
NB: daf: dry and ash-free basis.
NA: Not available.
Lower heating value, data from EVT Handbook 1990.
Source: [ New 123, 58, Eurelectric, 2001] [LCP TWG 2012]
WORKIN
G DRAFT IN
PROGRESS

Chapter 5
TL/JFF/FN/EIPPCB/LCP_Final Draft June 2016 361
Table 5.2: Indicative concentrations of metals and trace elements in coals from different regions
Values
in mg/kg
Australia Canada US Poland Russia and CIS Europe
Ash (%) 12.5 12.9 9.9 15.9 15.4 14.4
As 1.4 2.9 8.7 3.4 4 18.5
Ag NA NA 0.86 < 1.7 < 1.6 0.74
Ba NA NA 280 500 210 240
Be 1.4 0.8 1.9 1.6 0.7 2
B 12.3 58 46 NA NA NA
Cd 0.06 0.3 0.24 0.73 0.27 0.2
Cr 7.4 7.4 13.9 16.3 40 18.7
Cu 13.3 16.9 16.6 NA NA NA
Cl 300 300 800 NA NA NA
Co NA NA 6.2 5.3 3.2 6.2
Cs NA NA 1.92 3.3 0.9 1.3
F 62 82 55 NA NA NA
Hf NA NA 1.1 1.6 1.2 0.7
Hg 0.04 0.05 0.11 0.09 0.12 0.131
La NA NA 13.9 11.3 10.4 11.1
Mn 132 149 19 200 135 80
Mo 0.9 1.6 5.3 < 1.1 < 1.1 < 0.87
Ni 9.5 7.3 10.7 < 24 21 < 12.5
Pb 4.8 6.8 8.6 32 12.2 9.9
Rb NA NA 16.1 23 12.3 21
Sb NA NA 1.15 1.6 0.65 1.12
Sc NA NA 5.6 5.9 6.9 5.4
Sn NA NA < 26 < 62 <57 < 25
Se 0.8 1.1 3.9 NA NA NA
Th 2.3 3.3 4.2 4.1 3 3.5
Ti 0.15 0.1 0.5 NA NA NA
U 0.7 1.2 1.1 1.7 1.4 1.47
V 14.8 30 23.3 38 39 43
Zn 19 8.9 14.1 < 27 < 6.6 < 3.2
Zr NA NA 47 39 28 18.3
NB:
NA: Not available.
Source: [85, Itkonen and Jantunen, 1989]
It is important to know as much as possible about the properties of the solid fuel burnt, in order
to be able to appropriately design the LCP installations and equipment to achieve the best
performance. It is equally important to burn the correct fuel for which the LCP was designed, or
at least a fuel with similar properties. This ensures high efficiency in the long term, as well as
trouble-free operation and an optimal environmental performance.
The influence of the coal quality on the performance of the combustion plant is shown
schematically in Figure 5.6.
WORKIN
G DRAFT IN
PROGRESS
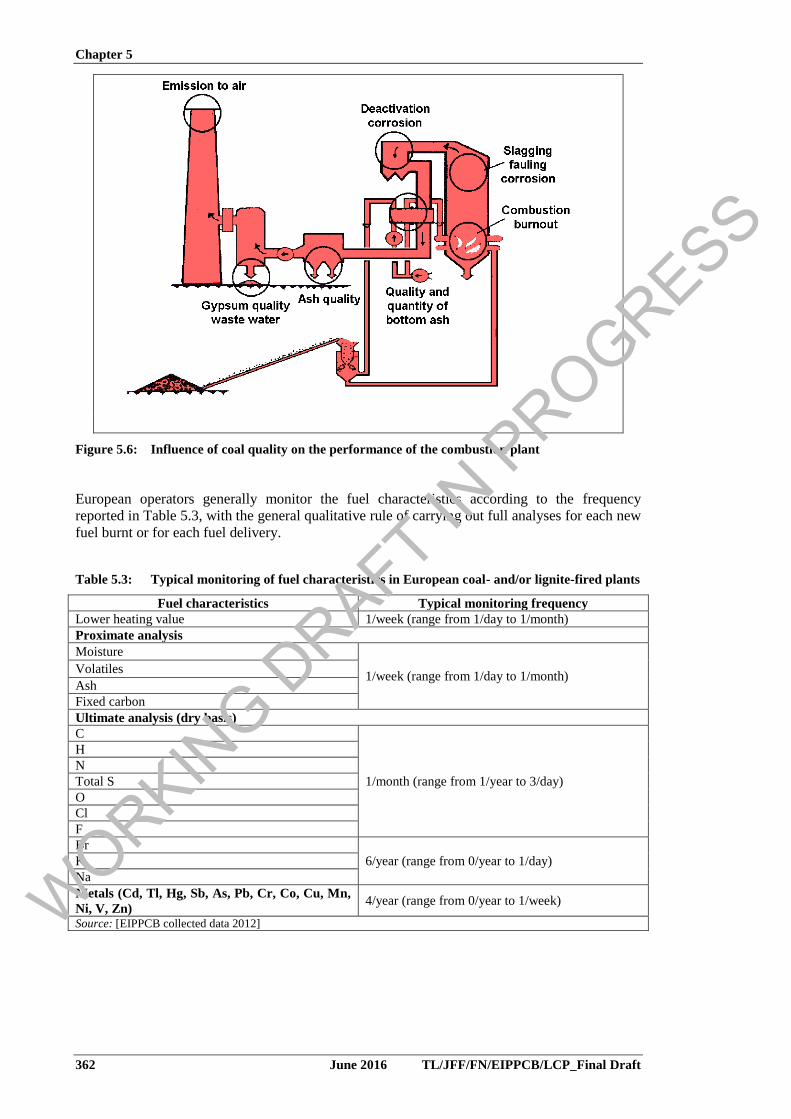
Chapter 5
362 June 2016 TL/JFF/FN/EIPPCB/LCP_Final Draft
Figure 5.6: Influence of coal quality on the performance of the combustion plant
European operators generally monitor the fuel characteristics according to the frequency
reported in Table 5.3, with the general qualitative rule of carrying out full analyses for each new
fuel burnt or for each fuel delivery.
Table 5.3: Typical monitoring of fuel characteristics in European coal- and/or lignite-fired plants
Fuel characteristics Typical monitoring frequency
Lower heating value 1/week (range from 1/day to 1/month)
Proximate analysis
Moisture
1/week (range from 1/day to 1/month) Volatiles
Ash
Fixed carbon
Ultimate analysis (dry basis)
C
1/month (range from 1/year to 3/day)
H
N
Total S
O
Cl
F
Br
6/year (range from 0/year to 1/day) K
Na
Metals (Cd, Tl, Hg, Sb, As, Pb, Cr, Co, Cu, Mn,
Ni, V, Zn) 4/year (range from 0/year to 1/week)
Source: [EIPPCB collected data 2012] WORKIN
G DRAFT IN
PROGRESS

Chapter 5
TL/JFF/FN/EIPPCB/LCP_Final Draft June 2016 363
5.1.1.2 Pretreatment and preparation of coal and lignite
Careful selection of the coal is an effective way of reducing emissions to air and water and of
reducing residues generation. However, possible restrictions related to the worldwide coal
market may limit the possibilities for switching coal. Low levels of sulphur, mercury and ash
are preferred when using commercially supplied or imported coal as a fuel. It is advantageous to
use fuels with a high energy content and which incur minimum transport and handling costs.
To achieve a constant fuel quality, which helps to optimise the combustion process, coal is
sometimes blended or mixed, depending on the specification range of the combustion plant.
This mixing can be simply achieved by picking coal from the stockpile in a different sequence
from the unloading sequence or by blending different types of coal in silos between the coal
yard and the raw-coal bunkers. In some cases, it may be possible to blend fuels at the port of
entry prior to transport to the power plant site.
Fuel blending or mixing may have different goals and effects as presented below.
Aim of a leaner fuel mix:
drop in combustion chamber temperature (dry-bottom furnace);
reduction in primary NOX in flue-gas (less NH3 consumption, longer operation period of
SCR);
reduction in CO content in combustion gas (less corrosion risk);
reduction of unburnt carbon in fly ash (utilisation quality of fly ash);
reduction in consumption of catalysts.
The effects of a leaner fuel mix:
CO2 content in flue-gas drops;
flow of air and flue-gas increases;
O2 content in flue-gas rises;
energy losses through flue-gas increases;
energy consumption from fans, and specific CO2 emission increase;
efficiency decreases.
Aim of a richer fuel mix:
increase in combustion chamber temperature (slag tap furnace, better ash extraction);
increased efficiency.
The effects of a richer fuel mix:
CO2 content in flue-gas rises;
flow of air and flue-gas drops;
O2 content in flue-gas decreases;
energy losses through flue-gas drops;
increase in unburnt carbon in fly ash;
energy consumption from fans, and specific CO2 emission decrease.
Qualifying conditions:
CO content in combustion gas should not increase;
no increase in unburnt carbon in fly ash;
acceptable risk regarding higher corrosion or higher ash recirculation.
Aim independent of a lean or rich fuel mix:
WORKIN
G DRAFT IN
PROGRESS
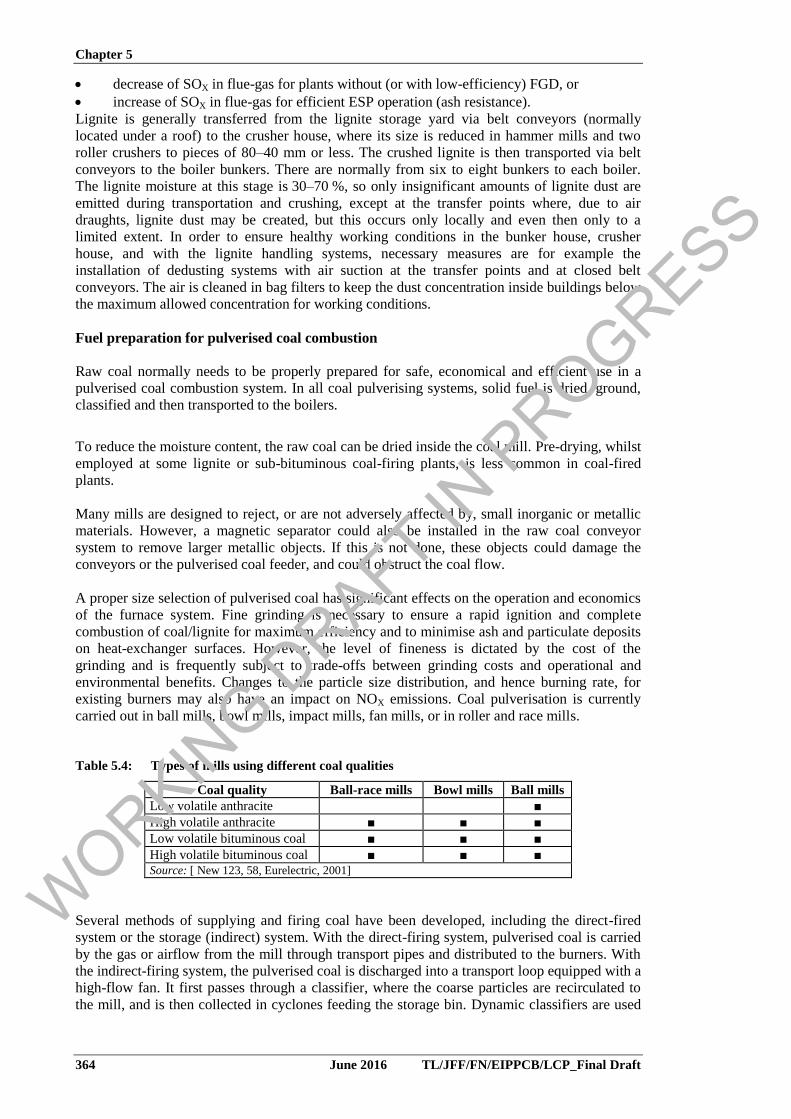
Chapter 5
364 June 2016 TL/JFF/FN/EIPPCB/LCP_Final Draft
decrease of SOX in flue-gas for plants without (or with low-efficiency) FGD, or
increase of SOX in flue-gas for efficient ESP operation (ash resistance).
Lignite is generally transferred from the lignite storage yard via belt conveyors (normally
located under a roof) to the crusher house, where its size is reduced in hammer mills and two
roller crushers to pieces of 80–40 mm or less. The crushed lignite is then transported via belt
conveyors to the boiler bunkers. There are normally from six to eight bunkers to each boiler.
The lignite moisture at this stage is 30–70 %, so only insignificant amounts of lignite dust are
emitted during transportation and crushing, except at the transfer points where, due to air
draughts, lignite dust may be created, but this occurs only locally and even then only to a
limited extent. In order to ensure healthy working conditions in the bunker house, crusher
house, and with the lignite handling systems, necessary measures are for example the
installation of dedusting systems with air suction at the transfer points and at closed belt
conveyors. The air is cleaned in bag filters to keep the dust concentration inside buildings below
the maximum allowed concentration for working conditions.
Fuel preparation for pulverised coal combustion
Raw coal normally needs to be properly prepared for safe, economical and efficient use in a
pulverised coal combustion system. In all coal pulverising systems, solid fuel is dried, ground,
classified and then transported to the boilers.
To reduce the moisture content, the raw coal can be dried inside the coal mill. Pre-drying, whilst
employed at some lignite or sub-bituminous coal-firing plants, is less common in coal-fired
plants.
Many mills are designed to reject, or are not adversely affected by, small inorganic or metallic
materials. However, a magnetic separator could also be installed in the raw coal conveyor
system to remove larger metallic objects. If this is not done, these objects could damage the
conveyors or the pulverised coal feeder, and could obstruct the coal flow.
A proper size selection of pulverised coal has significant effects on the operation and economics
of the furnace system. Fine grinding is necessary to ensure a rapid ignition and complete
combustion of coal/lignite for maximum efficiency and to minimise ash and particulate deposits
on heat-exchanger surfaces. However, the level of fineness is dictated by the cost of the
grinding and is frequently subject to trade-offs between grinding costs and operational and
environmental benefits. Changes to the particle size distribution, and hence burning rate, for
existing burners may also have an impact on NOX emissions. Coal pulverisation is currently
carried out in ball mills, bowl mills, impact mills, fan mills, or in roller and race mills.
Table 5.4: Types of mills using different coal qualities
Coal quality Ball-race mills Bowl mills Ball mills
Low volatile anthracite ■
High volatile anthracite ■ ■ ■
Low volatile bituminous coal ■ ■ ■
High volatile bituminous coal ■ ■ ■
Source: [ New 123, 58, Eurelectric, 2001]
Several methods of supplying and firing coal have been developed, including the direct-fired
system or the storage (indirect) system. With the direct-firing system, pulverised coal is carried
by the gas or airflow from the mill through transport pipes and distributed to the burners. With
the indirect-firing system, the pulverised coal is discharged into a transport loop equipped with a
high-flow fan. It first passes through a classifier, where the coarse particles are recirculated to
the mill, and is then collected in cyclones feeding the storage bin. Dynamic classifiers are used
WORKIN
G DRAFT IN
PROGRESS
Chapter 5
TL/JFF/FN/EIPPCB/LCP_Final Draft June 2016 365
to achieve optimum particle size distribution for vertically fired plants using low volatile semi-
anthracite. Direct-firing schemes are generally most common in pulverised coal-fired plants.
Fuel preparation for pulverised lignite combustion
The lignite is fed from the bunkers through closed feeders to the lignite mills. The mills are
specially designed (e.g. fan beater wheel type) for the type of local fuel utilised. They achieve
three objectives: they pulverise, dry, and then distribute the fuel to the combustion chamber.
Lignite pulverisation is aided by the presence of hot flue-gases, which are extracted from the
upper part of the furnace through recirculation ducting. The lignite particles are typically
reduced to less than 90 m (approximately 60 % through a 70-mesh screen). The flue-gas heat
reduces the lignite moisture content down from 30–70 % to 10–20 %, i.e. to the required level
for optimum combustion conditions. Finally, the mixture of lignite dust, flue-gases and moisture
is fed to the boiler burners. This mixture can also contain air and/or cold flue-gas, when fed to
the mills for mill temperature control.
For high moisture lignite one separator is built in the pulverised fuel discharge duct, where
moisture vapour is separated and directed to vapour burner; a pulverisation beater wheel mill
type is used.
Fuel preparation for fluidised bed combustion (FBC)
Fluidised bed combustion needs most solid fuels to be crushed. Depending on the fuel
properties, maximum grain sizes of between 3 mm and 20 mm are desired. The prepared fuel is
transferred directly to the fluidised bed in the combustion chamber, where the average bed
particle size is 1000 m for bubbling fluidised bed combustion (BFBC), and 100–1000 m for
circulating fluidised bed combustion (CFBC).
Fuel preparation for grate firing (GF)
If combustion is to be carried out on grates, then normally there is only limited fuel preparation
needed. Large pieces of solid fuel may be reduced in size in order to supply a more or less
homogeneous particle size distribution into the combustion chamber for burning on the grate.
The maximum size of the fuel particles is often determined by the feed systems for the
combustion chamber and depending on the technical conditions of the grate.
Fuel preparation for mercury removal
Coal cleaning is one option for removing mercury from the fuel prior to combustion. There are
many types of cleaning processes, all based on the principle that coal is less dense than the
pyritic sulphur, rock, clay, or other ash-producing impurities that are mixed or embedded in it.
5.1.1.3 Energy efficiency of coal- and/or lignite-fired LCP boilers
For a new boiler, design boiler energy efficiency levels around 85–95 % (LHV) are currently
recorded for solid fuels. The main losses are associated with flue-gas waste heat via the stack,
unburnt carbon, waste heat in ash, and radiation losses. The effect of fuel is important, assuming
boilers with identical performance (same ambient and flue-gas temperature, same excess air,
etc.), different boiler energy efficiencies are obtained depending on the nature of fuel, e.g. (LHV
basis):
international bituminous coal: up to 95 % efficiency;
lignite: 91 % efficiency;
low-grade lignite: 85 % efficiency.
WORKIN
G DRAFT IN
PROGRESS
Chapter 5
366 June 2016 TL/JFF/FN/EIPPCB/LCP_Final Draft
Techniques to increase the energy efficiency of coal- and/or lignite-fired boilers
The energy efficiency of a coal- and/or lignite-fired boiler is closely linked with the nature of
the fuel and the temperature of the ambient air. However, optimisation of some parameters is
possible:
Unburnt carbon-in-ash. Optimisation of combustion leads to less unburnt carbon-in-ash.
It should be noted that NOX abatement technologies by combustion modification show a
tendency to increase unburnt carbon. The target is to achieve the best burnout in order to
achieve the optimum efficiency or fuel utilisation. However, depending on technical and
fuel characteristics, in particular by burning anthracite coal, a higher content of unburnt
carbon-in-ash may occur.
Air excess. The amount of excess air is dependent on the type of boiler and on the nature
of the fuel. Typically, between 15 % and 20 % excess air is present in a pulverised coal-
fired dry-bottom boiler. To preserve combustion quality (CO and unburnt carbon
formation) and boiler integrity (air in-leakage), and to avoid corrosion and safety risks
(risk of thermal excursions in the boiler), it is often not possible to reduce the excess air
any further.
Flue-gas temperature. The temperature of the flue-gas leaving the boiler (depending on
fuel type) traditionally lies between 120 °C and 180 °C, so as to avoid the risk of acid
corrosion by the condensation of sulphuric acid. In the case of lignite-fired plants, the
corrosion effect may occur below 160 °C. Some designs incorporate a flue-gas heat
recovery system for second stage preheating or condensate preheating to lower the flue-
gas temperature even below 100 °C, but this requires special cladding or special materials
for ducting, for heaters and for the stack.
5.1.1.4 Control of emissions to air from coal- and/or lignite-fired LCPs
To control NOX emissions, special low-NOX burners and/or other primary NOX abatement
techniques are used. If these measures are not sufficient, selective catalytic reduction (SCR) or
selective non-catalytic reduction (SNCR) with urea or ammonia, or a combination of these
techniques, can be used to remove NOX from the flue-gas.
Flue-gas desulphurisation is typically performed with scrubbers fitted between the steam
generator and the flue-gas stack. If fluidised bed combustion is used, desulphurisation is best
achieved in the fluidised bed itself, e.g. by adding calcium carbonate into the bed. Another end-
of-pipe desulphurisation system may in that case not be needed.
The oldest environmental protection measure applied at conventional combustion plants is the
removal of ash and char particles from the flue-gas. The most widely used method to achieve
this is the electrostatic precipitator (ESP). Bag filters are also frequently used.
5.1.1.4.1 Control of emissions from pulverised fuel combustion
Fuel pretreatment
As a first step to minimise the generation of emissions, the raw materials used as fuels can be
improved, for instance by the following measures:
using a mixture of different coals with different characteristics and from different
countries;
using high quality coals, with respect to high heating value, low water content, low ash
content, low content of sulphur, mercury, chlorides and fluorides;
applying coal washing/cleaning;
applying coal gasification;
homogenising the coal to ensure the standard quality of the final fuel before combustion.
WORKIN
G DRAFT IN
PROGRESS
Chapter 5
TL/JFF/FN/EIPPCB/LCP_Final Draft June 2016 367
Fuel switch/choice
A choice of, or switch to, fossil fuels with a lower content of potential pollution-generating
compounds can lead to a significant reduction in pollution from combustion installations. This
technique is widely applied. Fuel switching options are limited by some adaptability restrictions
for specific combustion installations concerning the use of different fuels, and sometimes by
long-term contracts between power-producing companies and fuel suppliers. In the case of
lignite-fired power plants, the possibility of a fuel switch is also sometimes limited by the
quality of the available fuel deposits in nearby lignite mines. In general, the adaptability
depends on the burners installed, and usually a switch from one coal type to another one with a
better environmental profile (i.e. low sulphur content and low volatile material) or from coal to
heavy oil is often possible based on the burners installed. Switching from coal to gas, however,
normally requires a change of burners and the modification of the heat exchangers. Any
improvement in emission reduction depends on the characteristics of the initially used fuel and
of the new type of fuel [New 132] [32, Rentz, et al., 1999]. However, possible adverse impacts
of any new coal on emissions should be considered, e.g. poorer ESP performance due to
reduced sulphur content or poorer low-NOX burner performance with higher volatile coals.
Dust abatement
In pulverised coal combustion, the bulk of the ash is carried with the flue-gas out of the
combustion chamber. Only a small quantity (< 20 %) is collected as bottom ash in dry-bottom
boilers; 80 % of the ash leaves the furnace as fly ash and this fly ash must be collected in the
dust reduction equipment, such as an ESP or bag filter.
In wet-bottom boilers, ash is liquefied by the high combustion temperature. This liquid ash
flows with gravitational force to the slag tap. Even with a high velocity gas flow, most ash is
extracted as slag. Fly ash is often recirculated for this type of furnace, to extract almost all the
ash as slag.
Amongst dust removal techniques, the ESP is (by far) the most commonly used in Europe in
combustion plants using coal or lignite. Bag filters are also relatively common. ESPs collect fly
ash, generally in dry form, which can then be recycled for use in road-building or for
manufacturing products such as cement and concrete or for opencast mine restoration purposes
or, as a last solution, it can be landfilled. Fuels can be supplied from different sources in the
world, and ESP techniques, including sometimes a high voltage intermittent energising system,
are able to react to different fuel qualities, including those with a lower sulphur content. Further
developments are connected with high voltage peaking, which allows reducing the electricity
consumption of the ESP.
Cyclones are rarely used for dedusting in LCPs. Some plants with pre-extraction of dust using a
cyclone upstream of the ESP are operated in Europe.
Abatement of SOX emissions
For the reduction of SOX emissions from coal- and/or lignite-fired combustion plants, almost all
techniques described for the desulphurisation of flue-gases in Chapter 3 are currently applied.
The specific technique used depends on a variety of plant- and site-specific factors, such as the
location, the thermal capacity and the load factor of the particular plant, as well as on the fuel
and ash quality.
Dry and semi-dry techniques are generally more commonly applied to smaller plants
(< 100 MWth), whereas the wet FGD is the dominant technique used in various applications in
larger plants, i.e. over 300 MWth. Absorber towers are designed as spray, packed or double loop
towers. An example of a wet FGD plant using a spray tower applied to a large coal-fired plant in
the UK is presented in Figure 5.7.
WORKIN
G DRAFT IN
PROGRESS
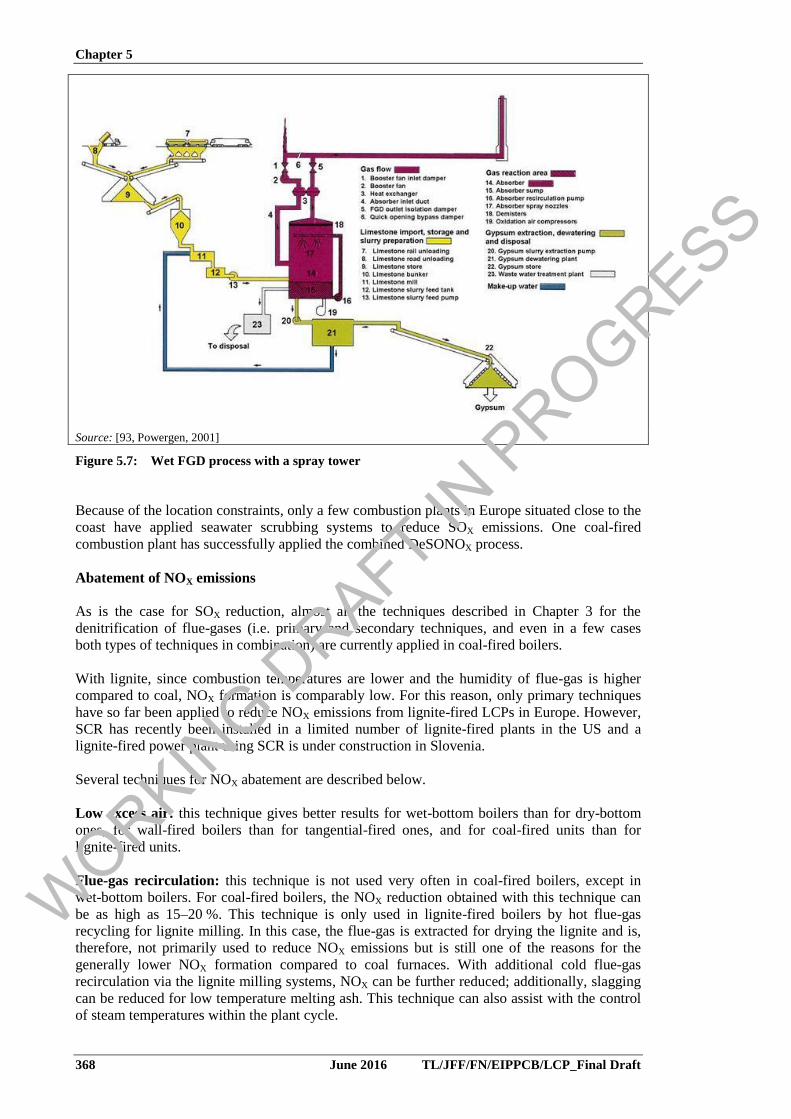
Chapter 5
368 June 2016 TL/JFF/FN/EIPPCB/LCP_Final Draft
Source: [93, Powergen, 2001]
Figure 5.7: Wet FGD process with a spray tower
Because of the location constraints, only a few combustion plants in Europe situated close to the
coast have applied seawater scrubbing systems to reduce SOX emissions. One coal-fired
combustion plant has successfully applied the combined DeSONOX process.
Abatement of NOX emissions
As is the case for SOX reduction, almost all the techniques described in Chapter 3 for the
denitrification of flue-gases (i.e. primary and secondary techniques, and even in a few cases
both types of techniques in combination) are currently applied in coal-fired boilers.
With lignite, since combustion temperatures are lower and the humidity of flue-gas is higher
compared to coal, NOX formation is comparably low. For this reason, only primary techniques
have so far been applied to reduce NOX emissions from lignite-fired LCPs in Europe. However,
SCR has recently been installed in a limited number of lignite-fired plants in the US and a
lignite-fired power plant using SCR is under construction in Slovenia.
Several techniques for NOX abatement are described below.
Low excess air: this technique gives better results for wet-bottom boilers than for dry-bottom
ones, for wall-fired boilers than for tangential-fired ones, and for coal-fired units than for
lignite-fired units.
Flue-gas recirculation: this technique is not used very often in coal-fired boilers, except in
wet-bottom boilers. For coal-fired boilers, the NOX reduction obtained with this technique can
be as high as 15–20 %. This technique is only used in lignite-fired boilers by hot flue-gas
recycling for lignite milling. In this case, the flue-gas is extracted for drying the lignite and is,
therefore, not primarily used to reduce NOX emissions but is still one of the reasons for the
generally lower NOX formation compared to coal furnaces. With additional cold flue-gas
recirculation via the lignite milling systems, NOX can be further reduced; additionally, slagging
can be reduced for low temperature melting ash. This technique can also assist with the control
of steam temperatures within the plant cycle.
WORKIN
G DRAFT IN
PROGRESS
Chapter 5
TL/JFF/FN/EIPPCB/LCP_Final Draft June 2016 369
Overfire air’ (OFA): this technique is the most commonly used primary technique in coal-fired
boilers, often in combination with a LNB. With modern OFA designs (optimised nozzle design,
separated and swirled airflow), NOX reductions of 40–50 % can be achieved in wall- or
tangentially fired boilers. OFA is a particularly efficient NOX reduction technique for
tangentially fired boilers, where it can be implemented as ‘close-coupled OFA’ (i.e. with the
addition of OFA ports just above the highest row of burners). Another option is ‘separated
OFA’ (i.e. with the addition of OFA ports above the main combustion zone, separated from the
burner rows). A recent development of this technique called either 'Boosted Overfire Air'
(BOFA) or 'Rotating Opposed Fired Air staging' (ROFA) has been applied in the UK, Poland
and other European countries at coal-fired plants. No references are available for lignite-fired
and/or tangential-fired boilers. The technique uses an additional fan to increase the velocity of
the OFA entering the furnace, thus allowing a greater degree of flexibility between NOX
reduction and char burnout.
Low-NOX burners (LNBs): for coal-fired boilers, the most often used are air-staged or fuel-
staged type burners, with NOX emission reductions of 25–35 % and 50–60 % respectively. Low-
NOX burners are the most common technique used to reduce NOX emissions in both new and
existing coal-fired boilers, often in combination with OFA. It is a mature technology with many
different designs currently available from worldwide suppliers, often specifically adapted to
each type and size of boiler.
LNBs are often used in combination with OFA, especially with tangentially fired boilers,
together with tilting or pulverised coal injectors and various OFA types.
Reburning in coal-fired boilers: this technique is implemented with coal – or far more
commonly – natural gas as reburning fuel. Reburning is easier to apply to new power plants but
it has also been successfully adapted to existing units.
Gas reburning has been implemented in several wall-, tangential-, or cyclone coal-fired boilers
in the US (from 33 MWe to 600 MWe). The gas reburning technique has only been installed in
units already equipped with low-NOX burners and/or OFA.
An ‘advanced gas reburn’ technique (AGR), mixing regular gas reburning with injection of a
nitrogen agent (ammonia or urea, see SNCR paragraph below for details), has also been
installed in one coal-fired boiler. This promising technique has been claimed to achieve a NOX
reduction of up to 85 % from the initial NOX level, but it is not yet a proven technique. Due in
part to the performance levels achieved by BOFA/ROFA (see above), reburning has not been
widely applied.
SNCR and SCR: these are secondary techniques that have largely been applied to coal-fired
combustion plants. In Europe, SCR systems are mainly applied in Austria, Germany, Italy,
Denmark, France, the Netherlands. Outside Europe, they are mostly applied in Japan and the
US. The SCR technique has proven to be successful for coal-fired combustion plants, but has
not yet been widely applied to lignite-fired plants. In a few cases where an SCR system has been
applied to lignite-fired power plants, concerns regarding the deactivation and damage to the
catalyst due to the characteristics of the ash were raised. However, SCR has been operated
successfully at several lignite-fired units worldwide. The fuel characteristics dictate the catalyst
and system design, and key issues for the design of SCR for lignite burning include its
heterogeneous quality, its high ash content, its high silica or alumina content, its high S and Ca
content and its high Na and K content. Lignite combustion is generally at a sufficiently low
furnace temperature to achieve emissions of 200 mg/Nm3 or even lower, without the need for
SCR when other primary techniques are applied and combined. NOX emissions of 80 mg/Nm3
were achieved at a lignite-fired plant in the US that was recently retrofitted with SCR.
WORKIN
G DRAFT IN
PROGRESS
Chapter 5
370 June 2016 TL/JFF/FN/EIPPCB/LCP_Final Draft
5.1.1.4.2 Control of emissions from fluidised bed combustion
For fluidised bed systems, fuel is used coarsely ground. In circulating fluidised bed combustion
systems (CFBC), the bed zone is expanded by higher airflow velocities and ash (necessary for
this type of combustion) has to be recirculated through a cyclone, which is an integral
component of CFBC to recover coarse particles.
Dust abatement
For dust abatement from fluidised bed combustion (FBC) boilers, both ESPs and bag filters are
currently applied.
Abatement of SOX emissions
FBC boilers can achieve SOX removal efficiencies of 80–90 % in BFBC boilers and more than
90–95 % in CFBC boilers, the abatement efficiency depending also on fuel sulphur content.
Lime or limestone is added directly to the fuel and injected into the fluidised bed. These
additives support the natural capability of alkaline ashes to capture SOX. Good desulphurisation
is achieved by adding limestone with a Ca/S ratio of 1.5 to 3.5. Besides the Ca/S ratio, the bed
temperature also plays an important role in ensuring effective SO2 reduction. Since the
calcination process begins at around 700 °C and improves with higher temperatures, the most
favourable combination of calcination and sulphation occurs at about 840 °C. This system is
simple to operate, as the feeding of the sorbent and removal of the reaction product are
incorporated into the combustion process.
To achieve more than 90 % SOX absorption, the mass of calcium hydroxide in the bed must be
in excess of stoichiometric conditions. This overdosing results in an increase of NOX emissions,
especially in CFBC boilers, because CaO catalyses the reactions of nitrogen compounds.
However, the greatest increase does not take place until the SOX concentration is very low.
Sorbent injection into the FBC boiler is an inexpensive method for sulphur capture. Investment
costs are low, because the desulphurisation is incorporated into the combustion process and
separate reactor equipment may not be needed. Secondary techniques for desulphurisation are
not yet very common, but have already been used occasionally in a few FBC plants.
The largest operating expenses are due to the consumption of sorbent and the handling of
combustion residues. The by-product of fluidised bed combustion is a mixture of ash, CaSO4,
unburnt fuel and unreacted sorbent. Relatively large amounts of sorbent are needed to achieve
sufficient SOX absorption; thus the volume of the solid waste from FBC is also large. Up until
now, disposal in landfills has been the most common means of handling ash from the FBC
boiler at power plants. Also, the ash can be used for construction purposes, such as in a road
base or as a structural fill, provided there is not too much calcium in the ash.
An increased dust load may result in the need to enlarge the dust precipitator.
Abatement of NOX emissions
The low combustion temperature (between 850 °C and 950 °C) of fluidised bed combustion
systems is advantageous for the suppression of NOX emissions. However, the FBC boilers may
generate a significant proportion of nitrogen emissions as N2O, which has a high global
warming potential. Other techniques such as SNCR are applied in some plants. However,
adding limestone to improve desulphurisation also promotes the conversion of NH3 to NOX
through catalysis by unreacted lime. This means that the more lime (for SOX control) is added to
the fluidised bed, the more NOX is formed.
Different types of fluidised bed combustion, usually BFBCs, are used in smaller capacity LCPs
and tend to have higher NOX emissions.
WORKIN
G DRAFT IN
PROGRESS
Chapter 5
TL/JFF/FN/EIPPCB/LCP_Final Draft June 2016 371
5.1.1.4.3 Control of emissions from grate firing
When burning coal or lignite in grate combustion systems, most of the ash is left on the grate
and collected as bottom ash. Only a small quantity of ash leaves the furnace as fly ash and is
collected in the dust reduction devices.
Dust abatement
For dust abatement from grate-fired combustion plants, both ESPs and bag filters are currently
applied.
Abatement of SOX emissions
For grate firing, which is mainly applied to smaller (< 100 MWth) industrial combustion plants,
low-sulphur fuel is mostly used for SOX control. Because the combustion temperature varies
between 850 °C and 950 °C, additives such as lime or limestone can also be added directly to
the fuel for SOX capture. These additives support the natural capability of alkaline ashes to
capture SOX. CaSO3 becomes unstable at temperatures greater than 850 °C, and CaO and SOX
coexist in chemical balance. For this reason, grate combustion is not as effective for the
abatement of SOX emissions as fluidised bed combustion.
Abatement of NOX emissions
The low combustion temperatures of grate systems are advantageous for the limitation of NOX
emissions. Grate systems (without additional control techniques) emit about 450 mg/Nm3 of
NOX, which is much less than from an uncontrolled Pulverised coal-burning combustion plant.
Overfire air is also sometimes used in addition, to reduce the generation of NOX emissions.
SNCR may also be used on grate-fired systems, but may not be necessary due to the inherently
low NOX levels generated through this combustion process.
5.1.1.4.4 Control of mercury (Hg) emissions from coal- and/or lignite-fired LCPs
In most cases in Europe, no specific systems for Hg removal have been applied at combustion
plants burning coal or lignite only. Indeed, bag filters and ESPs or wet scrubbers, which are
designed for dust and SOX, HCl and HF removal respectively, provide an additional side benefit
by also removing Hg emissions.
It should also be noted that, in recent years, systems have been put in place for mercury control
in many US plants including non-specific (like in Europe) and specific systems.
The abatement of Hg by non-specific flue-gas cleaning devices is based on Hg properties that
are different depending on its speciation:
Both gaseous elemental mercury (Hg0) and gaseous oxidised mercury (Hg
2+) are in the
vapour phase at flue-gas cleaning temperatures. Hg0 is hardly soluble in water and normally
cannot be captured in wet scrubbers. The predominant Hg2+
compounds in coal flue-gas are
weakly to strongly soluble, and the more soluble species can generally be captured in wet
FGD scrubbers.
Particle-bound mercury Hgp is attached to solids that can be readily captured in an ESP or
bag filter [171, UN ECE, 2002].
Native capture (i.e. mercury capture without additional mercury-specific techniques such as
activated carbon or sorbents) depends on the halide content in the coal and on the unburnt
carbon content in the fly ash, both of which contribute to higher levels of oxidised and
particulate mercury, which are easier to capture in existing air pollution control equipment than
elemental mercury. The halide content in the fuel and the unburnt carbon content in the fly ash
may be higher within bituminous coals than within sub-bituminous coals or within lignite.
WORKIN
G DRAFT IN
PROGRESS

Chapter 5
372 June 2016 TL/JFF/FN/EIPPCB/LCP_Final Draft
The Hg removal efficiency of these non-specific techniques varies significantly depending upon
the type of coal burnt and the specific control technique configuration. This is shown in Table
5.5, which displays the results of US field tests examining the co-benefit removal efficiency.
When using mercury-specific techniques, both Hg0 and Hg
2+ are partly adsorbed onto porous
solids such as fly ash, powdered activated carbon, or calcium-based acid gas sorbents for
subsequent collection in a dust control device. Alternatively, Hg may be captured in a packed
carbon bed. Hg2+
is generally easier to capture by adsorption than Hg0.
WORKIN
G DRAFT IN
PROGRESS

Chapter 5
TL/JFF/FN/EIPPCB/LCP_Final Draft June 2016 373
Table 5.5: Example mercury removal efficiency for US coal-fired plants fitted with different
combinations of techniques
System
Coal type
B=Bituminous
S=Sub-bituminous
L=Lignite
Native
capture
(%)
Range
of
capture
Number
of units
tested
Effect on mercury capture
CS-ESP
B
S
L
29
3
0
0–63
0–18
0–2
4
3
1
Good capture of particulate- or
sorbent-bound mercury; better
native capture for bituminous
coals than low rank coals
HS-ESP
B
S
L
11
0
None tested
0–48
0–27
3
4
Low native capture; probably
requires specially formulated
sorbents for high-temperature
mercury capture
BF
B
S
L
89
73
None tested
84–93
53–87
2
2
Good co-benefit. Elemental
mercury may be oxidised across
the BF
CS-ESP
+ wet
FGD
B
S
L
69
16
42
64–74
0–58
21–56
2
3
2
Good native capture for
bituminous coals because of
presence of soluble oxidised
mercury in the flue-gas;
relatively poor capture for low
rank coals
HS-ESP
+ wet
FGD
B
S
L
39
8
None tested
6–54
0–42
3
3
Moderate native capture for
bituminous coals; poor native
capture for low rank coals
BF +
dry
scrubber
B
S
L
None tested
Very high native capture
expected for bituminous coals;
less for low rank coals
BF +
wet
FGD
B
S
L
75
None tested
None tested
62–89
2
Good co-benefit capture for
bituminous coals; elemental
mercury may be oxidised across
the BF and captured in the wet
scrubber
SCR +
CS-ESP NA NA NA NA
Good capture of particulate- or
sorbent-bound mercury and
better native capture for
bituminous coals than low rank
coals are expected
SCR +
HS-ESP NA NA NA NA Low native capture is expected
SCR +
CS-ESP
+ wet
FGD
NA NA NA NA
Good capture of particulate- or
sorbent-bound mercury; better
native capture for bituminous
coals than low rank coals; SCR
will tend to enhance capture for
bituminous coals by oxidising
elemental mercury
SCR +
Spray
dryer +
BF
B
S
L
97
23
17
94–99
0–47
0–96
2
3
2
Very high native capture for
bituminous coals; less for low
rank coals; SCR may enhance
capture by oxidising elemental
mercury
SCR +
HS-ESP
+ wet
FGD
NA NA NA NA
Poor capture of particulate-
bound mercury in general and
total mercury for low rank coals;
SCR may enhance capture for
bituminous coals by oxidising
elemental mercury
SCR +
BF +
wet
NA NA NA NA
High level of mercury capture
would be expected for all coals.
SCR may enhance capture for
WORKIN
G DRAFT IN
PROGRESS

Chapter 5
374 June 2016 TL/JFF/FN/EIPPCB/LCP_Final Draft
FGD bituminous coals by oxidising
elemental mercury
NB:
NA: Not available.
CS-ESP: Cold-side electrostatic precipitator.
HS-ESP: Hot-side electrostatic precipitator.
BF: Bag filter.
Wet FGD: Wet flue-gas desulphurisation.
SCR: Selective catalytic reduction.
Source: [New 56 - US EPA Information request data; cited in Control of Mercury Emissions from Coal-
fired Electric Utility Boilers: Environmental Science and Technology; Ravi K Srivastava, Nick Hutson,
Blair Martin and Franck Princiotta, US EPA National Risk Management Research Laboratory; James
Staudt, Andover Technology Partners; March 1st 2006.]
5.1.1.5 Water and waste water treatment
A variety of waste water types (see Chapter 1) is generated from the operation of coal- and/or
lignite-fired combustion plants. The techniques described for waste water treatment in Chapter 3
(Sections 3.1.10 and 3.2.4 for more details) are applied to a large extent for the purification of
waste water from coal- and/or lignite-fired plants.
Managing the run-off water from coal/lignite yards, slag piles and by-product storage needs
special attention. Before discharging surplus water, it is safeguarded by treatment and
monitoring. Dilution, e.g. with fresh water, to meet the limits is not acceptable.
5.1.1.6 Treatment of combustion residues
When coal is burnt, most of the mineral matter is captured and removed as solid material at
various places in the system, such as at coal mills, at the bottom of the boiler, in the economiser
flue-gas cleaning system and in the stack. Bottom ash is recovered from all types of coal- and-
lignite-fired combustion plants, although the percentage of total ash it accounts for varies.
Because of the recycling of fly ash in wet-bottom boilers, 100 % is recovered as slag tap
granulate. Only when a certain amount of unburnt fuel remains in the fly ash is it recovered
separately and stored in a special silo. With circulating fluidised bed combustion, a cyclone
precipitator returns most of the ash to the furnace, where it agglomerates to bed material and is
recovered as bottom ash.
With lime/limestone-based wet FGD systems, gypsum is recovered with a definite crystalline
structure. This is necessary to separate gypsum from smaller undissolved limestone particulates
and to dry the recovered gypsum. Excessively small particulates increase the humidity of this
by-product, normally by about 10 %. When this by-product is washed, a high quality marketable
product (comparable to or better than natural gypsum) can be achieved, with only trace
impurities giving any indications of the fuel from which it is derived. Gypsum is usually stored
in closed stockpile (see Figure 5.8). When FGD systems started being retrofitted, in some plants
gypsum was further dried from 10 % down to 4 % or even 1 %, to reduce transport costs and to
increase product quality.
WORKIN
G DRAFT IN
PROGRESS
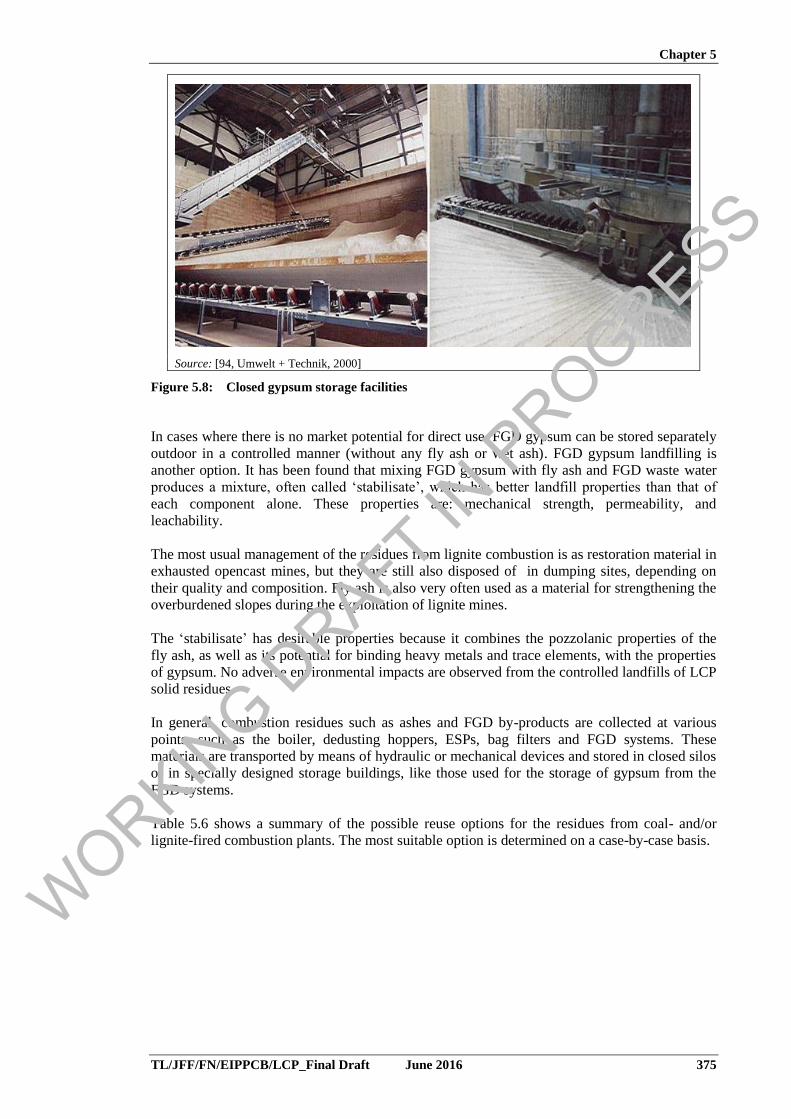
Chapter 5
TL/JFF/FN/EIPPCB/LCP_Final Draft June 2016 375
Source: [94, Umwelt + Technik, 2000]
Figure 5.8: Closed gypsum storage facilities
In cases where there is no market potential for direct use, FGD gypsum can be stored separately
outdoor in a controlled manner (without any fly ash or wet ash). FGD gypsum landfilling is
another option. It has been found that mixing FGD gypsum with fly ash and FGD waste water
produces a mixture, often called ‘stabilisate’, which has better landfill properties than that of
each component alone. These properties are: mechanical strength, permeability, and
leachability.
The most usual management of the residues from lignite combustion is as restoration material in
exhausted opencast mines, but they are still also disposed of in dumping sites, depending on
their quality and composition. Fly ash is also very often used as a material for strengthening the
overburdened slopes during the exploitation of lignite mines.
The ‘stabilisate’ has desirable properties because it combines the pozzolanic properties of the
fly ash, as well as its potential for binding heavy metals and trace elements, with the properties
of gypsum. No adverse environmental impacts are observed from the controlled landfills of LCP
solid residues.
In general, combustion residues such as ashes and FGD by-products are collected at various
points, such as the boiler, dedusting hoppers, ESPs, bag filters and FGD systems. These
materials are transported by means of hydraulic or mechanical devices and stored in closed silos
or in specially designed storage buildings, like those used for the storage of gypsum from the
FGD systems.
Table 5.6 shows a summary of the possible reuse options for the residues from coal- and/or
lignite-fired combustion plants. The most suitable option is determined on a case-by-case basis.
WORKIN
G DRAFT IN
PROGRESS

Chapter 5
376 June 2016 TL/JFF/FN/EIPPCB/LCP_Final Draft
Table 5.6: Examples of marketing and removal of residues from coal and lignite combustion
Fly
ash
Bo
tto
m a
sh
So
rpti
on
pro
cess
pro
du
cts
Gy
psu
m
Lig
nit
e
Co
al
Lig
nit
e
Co
al
Construction industry
Concrete additive x x
Lightweight aggregates for concrete x x x x
Foam mortar, porous concrete x x x
High-performance concrete x x
Blend additive in the cement industry x x
Raw meal constituent in the cement industry x x
Cement additive to delay setting x x
Isolation walls x x x
Construction gypsum x
Ceramic industry x x x x x
Road-building and landscaping x x x x
Dam construction with the RCC (roller-compacted concrete)
technique x x x x
Filler for bituminous surfacing, bonding layers and sub-base
binders x x
Ground stabilisation, loose building materials for earth work
and road construction x x x x x
Soundproofing x x x
Landfill technology, waste treatment x x x x
Landfill x x x x x
Hazardous substance immobilisation x x
Lining material for landfill bottom lining x x x
Surface filter for landfill sealing x x
Sewage sludge conditioning x
Base material for biological waste water cleaning x x
Filler for pipeline ditches
Stabilised ash cement mixture x x x
Ditch filling x x x
Other methods of utilisation x x x x
Reclamation material in mining x x x x
Zeolite production x x
Alpha- and beta-half hydrate production x
Filling material in the paper industry x x
Production of anhydrite x
Thermal recovery x x
Flue-gas desulphurisation x
Source: [New 145] [64, UBA, 2000]
WORKIN
G DRAFT IN
PROGRESS

Chapter 5
TL/JFF/FN/EIPPCB/LCP_Final Draft June 2016 377
5.1.2 Current consumption and emission levels
This section provides information on currently observed (measured) emission levels to air from
LCPs burning coal and/or lignite. Information is given about the fuels used in this sector, their
chemical and physical properties and the ranges of impurities that can generally be expected. As
far as available, the data include information about plant energy efficiencies and about any
residues that may arise in the different operations, and also reflect any options for recycling and
reuse of output streams within the whole process.
The extent of cross-media complexity is indicated where interdependency exists between
various inputs and outputs, for example where different parameters are dealt with
simultaneously or where some trade-off has been made such that certain levels cannot be
achieved at the same time.
Performance data are qualified as far as possible by including details of operating conditions
(e.g. equivalent full load factor), sampling and analytical methods, and on the statistical
presentation of figures (e.g. averages, maxima, ranges). Actual performance data may be
compared to relevant standards set in national or international legislation.
Current emission data in this document are normally reported as hourly, daily or yearly (when
stated) averages. Dilution is not considered acceptable. The standard conditions of 273 K, 101.3
kPa, 6 % level of oxygen content, and dry gases are used.
5.1.2.1 Coal and lignite used in LCPs
Coal and lignite are currently the dominant solid LCP fuels in the EU. Figure 5.9 presents the
lignite production, the coal production and imports in Europe in 2012.
Source: [57 New - TWG Domestic fuels initiative – 2014]
Figure 5.9: Coal in Europe in 2012 - Lignite production, coal production and imports
WORKIN
G DRAFT IN
PROGRESS
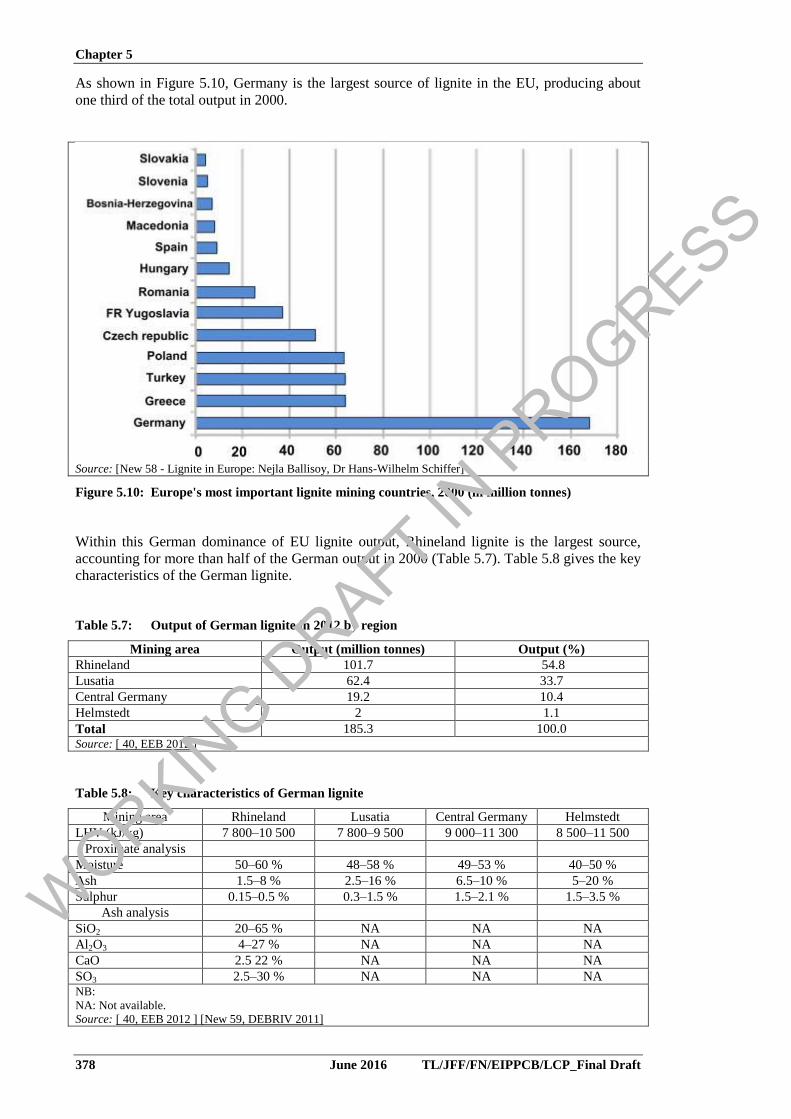
Chapter 5
378 June 2016 TL/JFF/FN/EIPPCB/LCP_Final Draft
As shown in Figure 5.10, Germany is the largest source of lignite in the EU, producing about
one third of the total output in 2000.
Source: [New 58 - Lignite in Europe: Nejla Ballisoy, Dr Hans-Wilhelm Schiffer]
Figure 5.10: Europe's most important lignite mining countries, 2000 (in million tonnes)
Within this German dominance of EU lignite output, Rhineland lignite is the largest source,
accounting for more than half of the German output in 2000 (Table 5.7). Table 5.8 gives the key
characteristics of the German lignite.
Table 5.7: Output of German lignite in 2012 by region
Mining area Output (million tonnes) Output (%)
Rhineland 101.7 54.8
Lusatia 62.4 33.7
Central Germany 19.2 10.4
Helmstedt 2 1.1
Total 185.3 100.0 Source: [ 40, EEB 2012 ]
Table 5.8: Key characteristics of German lignite
Mining area Rhineland Lusatia Central Germany Helmstedt
LHV (kJ/kg) 7 800–10 500 7 800–9 500 9 000–11 300 8 500–11 500
Proximate analysis
Moisture 50–60 % 48–58 % 49–53 % 40–50 %
Ash 1.5–8 % 2.5–16 % 6.5–10 % 5–20 %
Sulphur 0.15–0.5 % 0.3–1.5 % 1.5–2.1 % 1.5–3.5 %
Ash analysis
SiO2 20–65 % NA NA NA
Al2O3 4–27 % NA NA NA
CaO 2.5 22 % NA NA NA
SO3 2.5–30 % NA NA NA NB:
NA: Not available.
Source: [ 40, EEB 2012 ] [New 59, DEBRIV 2011]
WORKIN
G DRAFT IN
PROGRESS
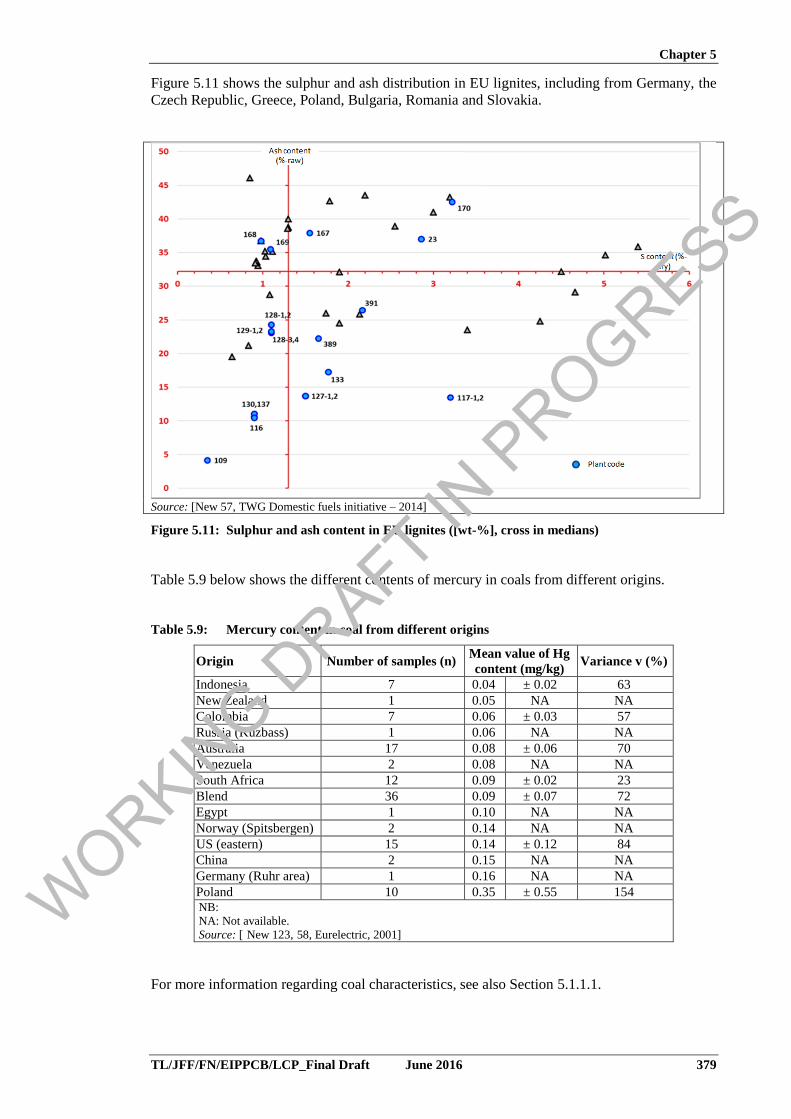
Chapter 5
TL/JFF/FN/EIPPCB/LCP_Final Draft June 2016 379
Figure 5.11 shows the sulphur and ash distribution in EU lignites, including from Germany, the
Czech Republic, Greece, Poland, Bulgaria, Romania and Slovakia.
Source: [New 57, TWG Domestic fuels initiative – 2014]
Figure 5.11: Sulphur and ash content in EU lignites ([wt-%], cross in medians)
Table 5.9 below shows the different contents of mercury in coals from different origins.
Table 5.9: Mercury content in coal from different origins
Origin Number of samples (n) Mean value of Hg
content (mg/kg) Variance v (%)
Indonesia 7 0.04 ± 0.02 63
New Zealand 1 0.05 NA NA
Colombia 7 0.06 ± 0.03 57
Russia (Kuzbass) 1 0.06 NA NA
Australia 17 0.08 ± 0.06 70
Venezuela 2 0.08 NA NA
South Africa 12 0.09 ± 0.02 23
Blend 36 0.09 ± 0.07 72
Egypt 1 0.10 NA NA
Norway (Spitsbergen) 2 0.14 NA NA
US (eastern) 15 0.14 ± 0.12 84
China 2 0.15 NA NA
Germany (Ruhr area) 1 0.16 NA NA
Poland 10 0.35 ± 0.55 154 NB:
NA: Not available.
Source: [ New 123, 58, Eurelectric, 2001]
For more information regarding coal characteristics, see also Section 5.1.1.1.
WORKIN
G DRAFT IN
PROGRESS
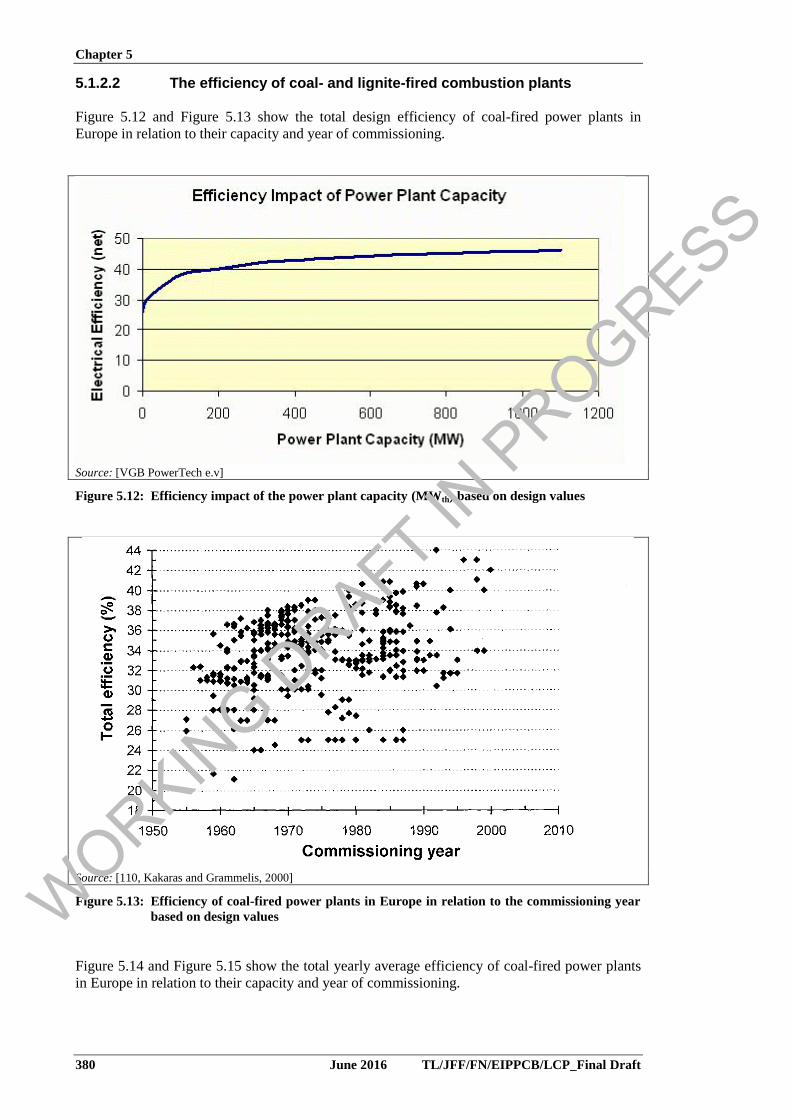
Chapter 5
380 June 2016 TL/JFF/FN/EIPPCB/LCP_Final Draft
5.1.2.2 The efficiency of coal- and lignite-fired combustion plants
Figure 5.12 and Figure 5.13 show the total design efficiency of coal-fired power plants in
Europe in relation to their capacity and year of commissioning.
Source: [VGB PowerTech e.v]
Figure 5.12: Efficiency impact of the power plant capacity (MWth) based on design values
Source: [110, Kakaras and Grammelis, 2000]
Figure 5.13: Efficiency of coal-fired power plants in Europe in relation to the commissioning year
based on design values
Figure 5.14 and Figure 5.15 show the total yearly average efficiency of coal-fired power plants
in Europe in relation to their capacity and year of commissioning.
WORKIN
G DRAFT IN
PROGRESS

Chapter 5
TL/JFF/FN/EIPPCB/LCP_Final Draft June 2016 381
Source: [LCP TWG 2012]
Figure 5.14: Efficiency impact of the power plant capacity based on operating yearly average
energy efficiency values
Source: [LCP TWG 2012]
Figure 5.15: Efficiency of coal- and/or lignite-fired power plants in Europe in relation to the
commissioning year based on operating yearly average energy efficiency values
WORKIN
G DRAFT IN
PROGRESS
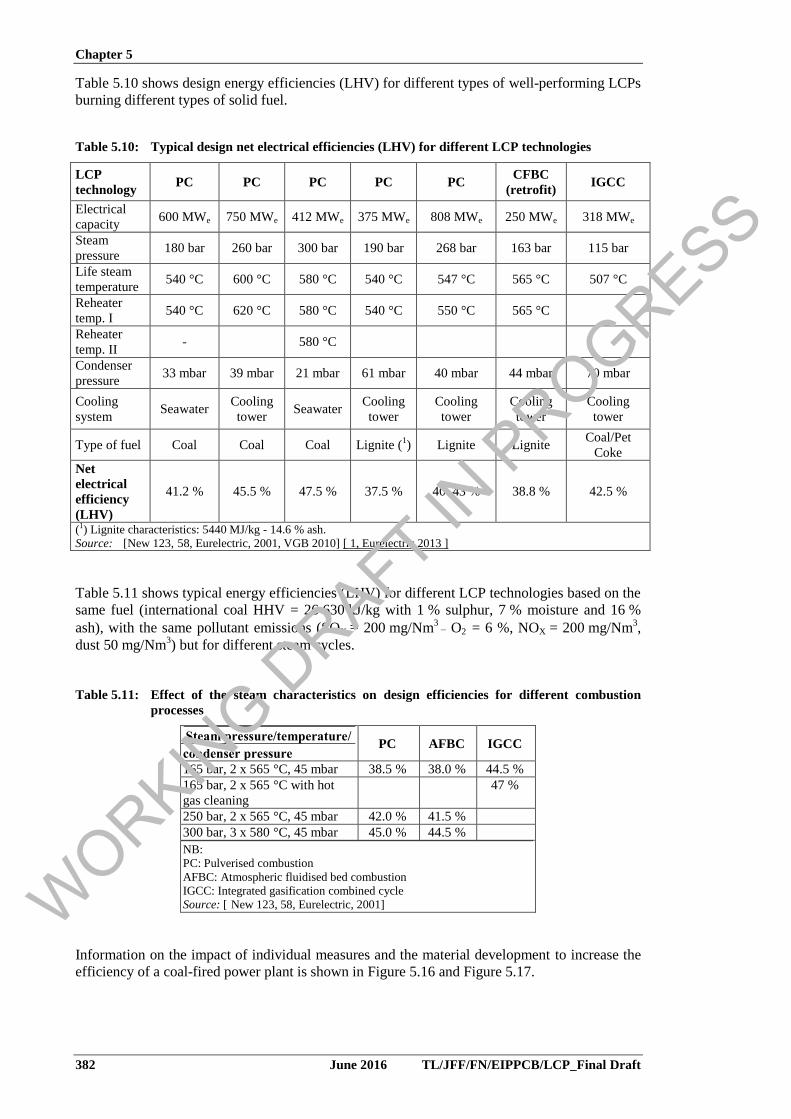
Chapter 5
382 June 2016 TL/JFF/FN/EIPPCB/LCP_Final Draft
Table 5.10 shows design energy efficiencies (LHV) for different types of well-performing LCPs
burning different types of solid fuel.
Table 5.10: Typical design net electrical efficiencies (LHV) for different LCP technologies
LCP
technology PC PC PC PC PC
CFBC
(retrofit) IGCC
Electrical
capacity 600 MWe 750 MWe 412 MWe 375 MWe 808 MWe 250 MWe 318 MWe
Steam
pressure 180 bar 260 bar 300 bar 190 bar 268 bar 163 bar 115 bar
Life steam
temperature 540 °C 600 °C 580 °C 540 °C 547 °C 565 °C 507 °C
Reheater
temp. I 540 °C 620 °C 580 °C 540 °C 550 °C 565 °C
Reheater
temp. II - 580 °C
Condenser
pressure 33 mbar 39 mbar 21 mbar 61 mbar 40 mbar 44 mbar 70 mbar
Cooling
system Seawater
Cooling
tower Seawater
Cooling
tower
Cooling
tower
Cooling
tower
Cooling
tower
Type of fuel Coal Coal Coal Lignite (1) Lignite Lignite
Coal/Pet
Coke
Net
electrical
efficiency
(LHV)
41.2 % 45.5 % 47.5 % 37.5 % 40–43 % 38.8 % 42.5 %
(1) Lignite characteristics: 5440 MJ/kg - 14.6 % ash.
Source: [New 123, 58, Eurelectric, 2001, VGB 2010] [ 1, Eurelectric 2013 ]
Table 5.11 shows typical energy efficiencies (LHV) for different LCP technologies based on the
same fuel (international coal HHV = 26 630 kJ/kg with 1 % sulphur, 7 % moisture and 16 %
ash), with the same pollutant emissions (SOX = 200 mg/Nm3 – O2 = 6 %, NOX = 200 mg/Nm
3,
dust 50 mg/Nm3) but for different steam cycles.
Table 5.11: Effect of the steam characteristics on design efficiencies for different combustion
processes
Steam pressure/temperature/
condenser pressure PC AFBC IGCC
165 bar, 2 x 565 °C, 45 mbar 38.5 % 38.0 % 44.5 %
165 bar, 2 x 565 °C with hot
gas cleaning
47 %
250 bar, 2 x 565 °C, 45 mbar 42.0 % 41.5 %
300 bar, 3 x 580 °C, 45 mbar 45.0 % 44.5 %
NB:
PC: Pulverised combustion
AFBC: Atmospheric fluidised bed combustion
IGCC: Integrated gasification combined cycle Source: [ New 123, 58, Eurelectric, 2001]
Information on the impact of individual measures and the material development to increase the
efficiency of a coal-fired power plant is shown in Figure 5.16 and Figure 5.17.
WORKIN
G DRAFT IN
PROGRESS
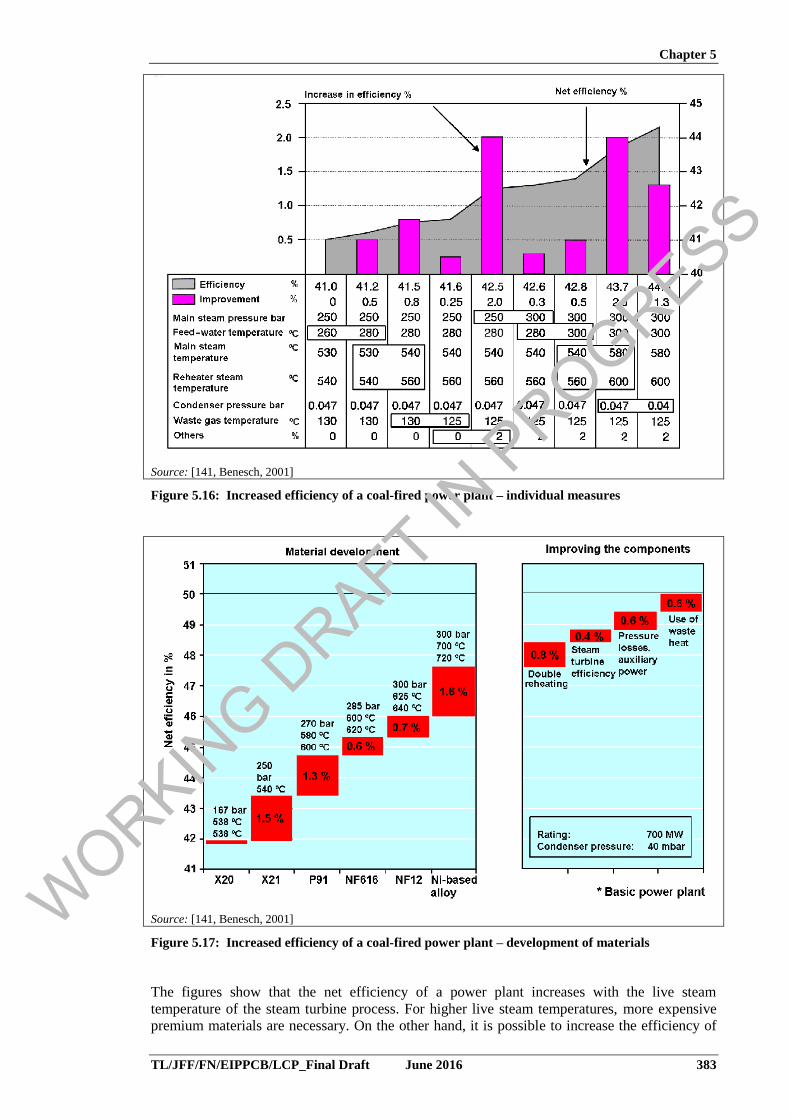
Chapter 5
TL/JFF/FN/EIPPCB/LCP_Final Draft June 2016 383
Source: [141, Benesch, 2001]
Figure 5.16: Increased efficiency of a coal-fired power plant – individual measures
Source: [141, Benesch, 2001]
Figure 5.17: Increased efficiency of a coal-fired power plant – development of materials
The figures show that the net efficiency of a power plant increases with the live steam
temperature of the steam turbine process. For higher live steam temperatures, more expensive
premium materials are necessary. On the other hand, it is possible to increase the efficiency of
WORKIN
G DRAFT IN
PROGRESS
Chapter 5
384 June 2016 TL/JFF/FN/EIPPCB/LCP_Final Draft
the power plant components. The use of a double reheat cycle for example increases the net
electrical efficiency by about 0.8 %. However, many standardised steam turbine sets are not
adapted for the implementation of a double reheat cycle. This can often result in a substantial
increase in the investment costs for the steam turbine and so this technique may not be
profitable at every site.
[ 1, Eurelectric 2013 ]
Other aspects that influence LCP efficiency are the following:
The technology used: an IGCC, for example, intrinsically consumes more auxiliary
energy (for the air separation unit, gas treatment and compressor) than a conventional
pulverised combustion boiler, even with flue-gas treatment, which consumes more than a
mechanical or spreader stoker grate system.
The level of pollution control: advanced FGD consumes more energy. Also, generally
pollution control measures have a detrimental effect on efficiency (see Section 2.7.10.1).
The design of the auxiliaries: boiler auxiliaries have to be over-dimensioned to withstand
all the variations in parameters compared to their design values (i.e. for possible leaks,
alternative fuels, start-up needs, redundant systems, etc.). This leads to changes in energy
consumption compared to that expected under optimal conditions and with the design fuel.
The integration of a CCS plant: this energy-consuming process reduces the net electrical
efficiency by about 8–12 percentage points.
The pre-drying of lignite: this reduces the flue-gas losses substantially. In general, a net
electrical efficiency enhancement of 4–6 percentage points is possible. The first pilot
plants are in operation. Commercial pre-drying plants for lignite are expected after 2015.
[ 1, Eurelectric 2013 ] [New 60 - Mission report to Germany – 2013]
Boiler efficiency: for a new boiler, an efficiency level of around 86–95 % (LHV) is
currently recorded for solid fuel and cannot easily be increased. The main losses stem from
flue-gas waste heat at the stack, unburnt carbon-in-ash, waste heat, and from heat radiation
losses. The effect of fuel is also important. Even assuming that the boilers have identical
performances (i.e. same ambient and flue-gas temperature, same excess air, etc.), different
boiler efficiencies are still achieved and these depend on the fuel, e.g. (LHV basis):
international coal: 95 % efficiency;
lignite: 91 % efficiency;
low-grade lignite: 85 % efficiency.
5.1.2.3 Emissions to air (coal/lignite)
Table 5.12 and Table 5.13 summarise the available information on measured air emission levels
(SO2, NOX, dust, CO, HF, HCl, and NH3) of about 90 European coal and lignite combustion
plants.
WORKIN
G DRAFT IN
PROGRESS

Chapter 5
TL/JFF/FN/EIPPCB/LCP_Final Draft June 2016 385
Emissions to air from coal-fired combustion plants
Table 5.12: Example of emissions (in concentration – yearly averages) to air from coal-fired combustion plants
Capacity
(MWth)
Comb.
Tech.
Example of applied emission reduction
techniques
Emission ranges of pollutants to air from example European coal-fired plants
(mg/Nm3)
SO2 NOX Dust SO2 NOX Dust CO HF HCl NH3
15–100
GF SS SDA
FGR / Air
staging /
SNCR
ESP / BF 300–1450 130–620 8–18 34–63 NA 0.5 6
GF MG NA Air staging ESP /
Cyclones 1130–1420 335 730 120–200 130–170 NA NA NA
PC NA
LNB /
Air/Fuel
staging
NA 600–1500 154–320 11–193 37–105 10 7 NA
AFBC Boiler sorbent
injection NA NA 195–500 180–470 1–18 9–83 1 0.5–16 AFBC
PFBC ESP 680–760 214–450 2 100–210 0.45 NA NA
100–300
GF SS NA NA NA 950 490 50 700 NA NA NA
GF MG DSI+BF SNCR /
FGR
Cyclones/
ESP 680–1040 170–360 6– 190 95–115 NA NA NA
PC SDA
LNB / Air
staging /
SCR
BF / ESP /
ESP + SO3
injection
190–1320 170–560 < 1–80 16–32 0.45–1 NA < 0.5
AFBC
Boiler sorbent
injection /
WFGD
SCR BF 350–555 100–260 < 1–14 30–230 0.05 2–17 NA
NB:
GF SS: Grate firing - spreader stoker GF MG: Grate firing - moving grate SDA: Spray dry absorber for desulphurisation
PC: Pulverised coal combustion AFBC: Atmospheric fluidised bed combustion BF: Bag filter
PFBC: Pressurised fluidised bed combustion WFGD: Wet flue-gas desulphurisation SNCR: Selective non-catalytic reduction of NOX
DSI: Duct sorbent injection for desulphurisation ESP: Electrostatic precipitator FGR: Flue-gas recirculation
CFB: Circulating fluidised bed SCR: Selective catalytic reduction of NOX NA: Not available
Source: [ 3, LCP TWG 2012 ][New 61 - LCP BREF 2006]
WORKIN
G DRAFT IN
PROGRESS

Chapter 5
386 June 2016 TL/JFF/FN/EIPPCB/LCP_Final Draft
Capacity
(MWth)
Comb.
Tech.
Example of applied emission reduction
techniques
Emission ranges of pollutants to air from example European coal-fired plants
(mg/Nm3)
SO2 NOX Dust SO2 NOX Dust CO HF HCl NH3
> 300
PC
Low-S coal /
WFGD / DSI /
SDA / CFB
dry scrubber
LNB / SCR/
(reburning
gas-coal) /
Air staging /
FGR
ESP /
BF+WFGD /
ESP + SO3
injection /
CFB dry
scrubber
9–1400 65–1020 < 1–105 1–240 0.01–6 0.2–40 < 3.4
AFBC Boiler sorbent
injection / DSI
Air staging /
SNCR ESP 170–590 100–310 2–12 32–145 NA 1 < 2.9
PFBC Boiler sorbent
injection NA ESP 485 150 35 75 NA NA NA
NB:
GF SS: Grate firing - spreader stoker GF MG: Grate firing - moving grate SDA: Spray dry absorber for desulphurisation
PC: Pulverised coal combustion AFBC: Atmospheric fluidised bed combustion BF: Bag filter
PFBC: Pressurised fluidised bed combustion WFGD: Wet flue-gas desulphurisation SNCR: Selective non-catalytic reduction of NOX
DSI: Duct sorbent injection for desulphurisation ESP: Electrostatic precipitator FGR: Flue-gas recirculation
CFB: Circulating fluidised bed SCR: Selective catalytic reduction of NOX NA: Not available
Source: [ 3, LCP TWG 2012 ][ New 61 - LCP BREF 2006]
WORKIN
G DRAFT IN
PROGRESS
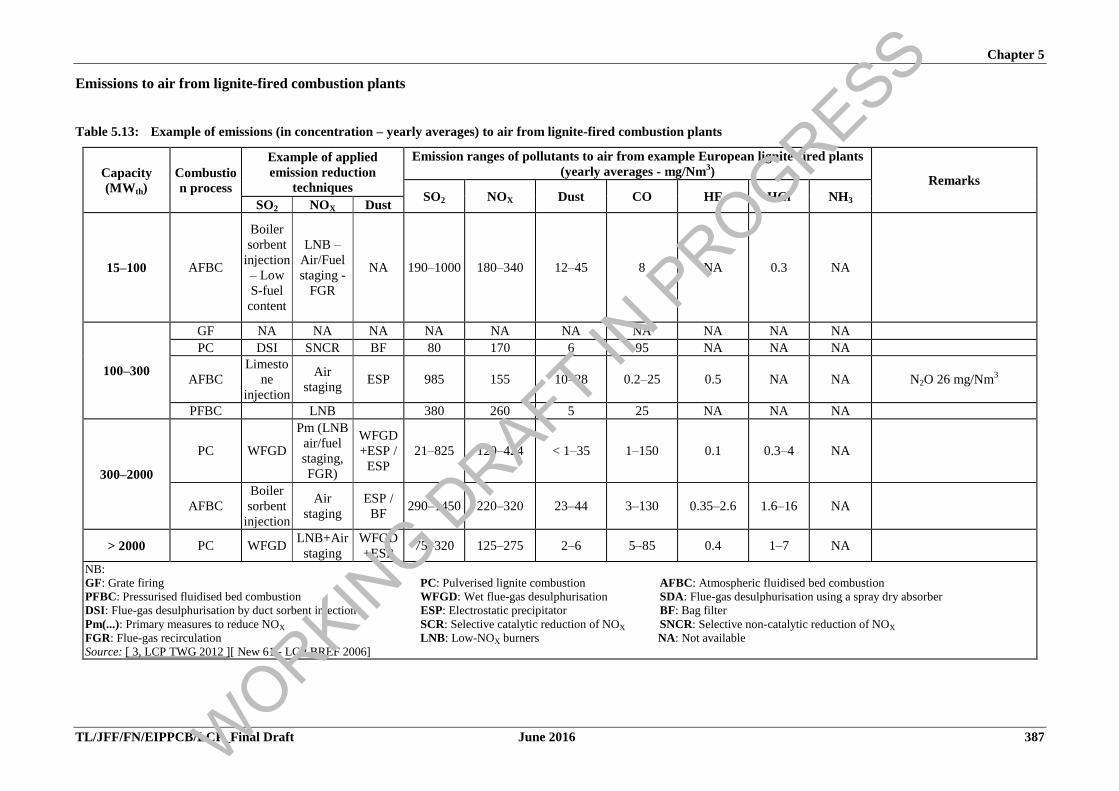
Chapter 5
TL/JFF/FN/EIPPCB/LCP_Final Draft June 2016 387
Emissions to air from lignite-fired combustion plants
Table 5.13: Example of emissions (in concentration – yearly averages) to air from lignite-fired combustion plants
Capacity
(MWth)
Combustio
n process
Example of applied
emission reduction
techniques
Emission ranges of pollutants to air from example European lignite-fired plants
(yearly averages - mg/Nm3)
Remarks
SO2 NOX Dust CO HF HCl NH3 SO2 NOX Dust
15–100 AFBC
Boiler
sorbent
injection
– Low
S-fuel
content
LNB –
Air/Fuel
staging -
FGR
NA 190–1000 180–340 12–45 8 NA 0.3 NA
100–300
GF NA NA NA NA NA NA NA NA NA NA
PC DSI SNCR BF 80 170 6 95 NA NA NA
AFBC
Limesto
ne
injection
Air
staging ESP 985 155 10–28 0.2–25 0.5 NA NA N2O 26 mg/Nm
3
PFBC LNB 380 260 5 25 NA NA NA
300–2000
PC WFGD
Pm (LNB
air/fuel
staging,
FGR)
WFGD
+ESP /
ESP
21–825 120–424 < 1–35 1–150 0.1 0.3–4 NA
AFBC
Boiler
sorbent
injection
Air
staging
ESP /
BF 290–1450 220–320 23–44 3–130 0.35–2.6 1.6–16 NA
> 2000 PC WFGD LNB+Air
staging
WFGD
+ESP 75–320 125–275 2–6 5–85 0.4 1–7 NA
NB:
GF: Grate firing PC: Pulverised lignite combustion AFBC: Atmospheric fluidised bed combustion
PFBC: Pressurised fluidised bed combustion WFGD: Wet flue-gas desulphurisation SDA: Flue-gas desulphurisation using a spray dry absorber
DSI: Flue-gas desulphurisation by duct sorbent injection ESP: Electrostatic precipitator BF: Bag filter
Pm(...): Primary measures to reduce NOX SCR: Selective catalytic reduction of NOX SNCR: Selective non-catalytic reduction of NOX
FGR: Flue-gas recirculation LNB: Low-NOX burners NA: Not available
Source: [ 3, LCP TWG 2012 ][ New 61 - LCP BREF 2006]
WORKIN
G DRAFT IN
PROGRESS

Chapter 5
388 June 2016 TL/JFF/FN/EIPPCB/LCP_Final Draft
Table 5.14 gives emission concentrations at the boiler outlet of example coal- and lignite-fired
plants.
Table 5.14: Level of NOX emissions for existing plants without secondary techniques
Coal
without NOX
abatement
(mg/Nm3)
Coal
with low-NOX
burner
(mg/Nm3)
Lignite
without NOX
abatement
(mg/Nm3)
Lignite
with
primary
techniques
(mg/Nm3)
DBB
Horizontal
firing system 1000–1500 500–650 NA NA
Tangential
firing system 600–900 400–650 400–700 200–500
Vertical firing
system 700–900 NA NA NA
Downshot firing
systems Up to 2000 1000–1200 NA NA
WBB Cyclone firing
system 1500–2500 1000–2000 NA NA
NB:
NA: Not available
DBB: Dry-bottom boiler
WBB: Wet-bottom boiler
Source: [ New 123, 58, Eurelectric, 2001][new 62 UKTWG19, 2012]
Metal emissions
During combustion, metals become volatile in metallic form, as well as in the form of chlorides,
oxides, sulphides, etc. A large proportion of these metals are condensed at temperatures of up to
300 °C and adsorbed onto the dust particles (fly ash).
It has been shown that systems designed for flue-gas dedusting and flue-gas desulphurisation
can also remove most of the metals from the flue-gases, i.e. those that are not retained in the
bottom ash or slag. Hence, particulate metal emissions in the scrubbed flue-gas are extremely
low in combustion plants equipped with flue-gas cleaning systems.
Experiments at a coal-fired dry-bottom boiler to evaluate the effects of different loads and the
combustion of different coals on the mass balance of metals gave the following results:
To a great extent, the amount of gaseous emissions of mercury via the flue-gas depends
on the chlorine and calcium content of the coal. Chlorine has two opposing effects. It
increases the share of gaseous mercury but it also improves the separation of mercury in
the wet FGD, as HgCl2, which can easily be washed out. Calcium improves the separation
of mercury in the ESP.
The integration of metals into the boiler ash does not depend on the chemical composition
of the coal.
The integration of metals into the fly ash does not depend on the chemical composition of
the coal, but it does depend on the load of the boiler, as the maximum level is reached at
full load.
With IGCC plants, the low volatility, high boiling point metals are captured and effectively
immobilised in the vitreous slag. Most higher volatility metals can be condensed and captured
by syngas scrubbing.
Table 5.15 gives a summary of metal measurements taken at three coal-fired power plants
which have applied an ESP and wet scrubber desulphurisation.
WORKIN
G DRAFT IN
PROGRESS

Chapter 5
TL/JFF/FN/EIPPCB/LCP_Final Draft June 2016 389
Table 5.15: Pathways of metals in three example coal-fired combustion plants
Amount of metals in different process outflows
(%) Emission (
1)
Removed with
bottom ash and
with fly ash
from ESP
Removed with FGD
end-product + filter
cake of waste water
treatment plant
Share released to
the air via stack
Concentration
in the emission
(g/Nm3)
Arsenic (As) 97–98.7 0.5–1.0 0.3–2 0–5
Cadmium (Cd) 95.2–97.6 0–1.1 2.4–3.6 (2) 0–5
Chromium (Cr) 97.9–99.9 0–0.9 0.1–0.5 0–5
Mercury (Hg) (3) 72.5–82 (
3) 0–16 5.1–13.6 (
3) 0–5
Manganese (Mn) 98–99.8 0.1–1.7 0.1 0–5
Nickel (Ni) 98.4–99.8 0.2–1.4 0.1–0.4 0–5
Lead (Pb) 97.2–99.9 0–0.8 0.1–1.8 0–5
Vanadium (V) 98.4–99.0 0.9–1.3 0.2–0.3 0–5
NB:
1 (1) The emissions are indicative values, including both gaseous and particulate emissions. With good particle
removal, the concentrations of all metals in emissions are typically below or around 1 g/Nm3. (2) The emission of cadmium was higher in these measurements than generally reported in the literature.
(32) The removal efficiency of mercury was higher and the emission lower in these measurements than
normally reported in the literature. In literature, it is reported that about 20–30 % of the mercury is released to
the air and only about 30– 40 % is removed with the ESP.
Source: [New 130] [59, Finnish LCP WG, 2000]
Table 5.16 below shows the metal contents in the flue-gas at the stack level from 27 European
plants combusting coal and/or lignite and up to 6 % waste, sized between 74 MWth and
2465 MWth. Most of the plants of ≥ 300 MWth are fitted with an ESP or bag filter and a wet
FGD, and plants of < 300 MWth are generally fitted only with an ESP or bag filter.
Table 5.16: Metals content in flue-gases at stack level from example European plants
Pollutants Combustion
plant type
Type of
monitoring
Frequency of
samples
Mean values
(μg/m3)
Sb+As+Pb+Cr+
Co+Cu+Mn+Ni+
V
< 300 MWth Periodic monitoring
for 5 plants 1/yr to 5/yr 2.1–540
≥ 300 MWth
Periodic monitoring
for 19 plants,
estimation for 3
plants
1/yr to 9/yr 0.1–156
Cd+Tl
< 300 MWth Periodic monitoring
for 5 plants 1/yr to 5/yr 0.4–5.5
≥ 300 MWth
Periodic monitoring
for 12 plants,
estimation for 5
plants
1/yr to 9/yr < 0.1–6
Source: [LCP TWG 2012]
Table 5.17 below shows the mercury content in the flue-gas at the stack level from 84 European
plants combusting coal or lignite and sized between 25 MWth and 3800 MWth. Most of the
plants of ≥ 300 MWth are fitted with a combination of SCR, ESP or bag filter and wet FGD, but
some plants are only fitted with an ESP or bag filter, and sometimes with dry FGD. Most of the
plants of < 300 MWth are fitted only with an ESP or bag filter.
WORKIN
G DRAFT IN
PROGRESS
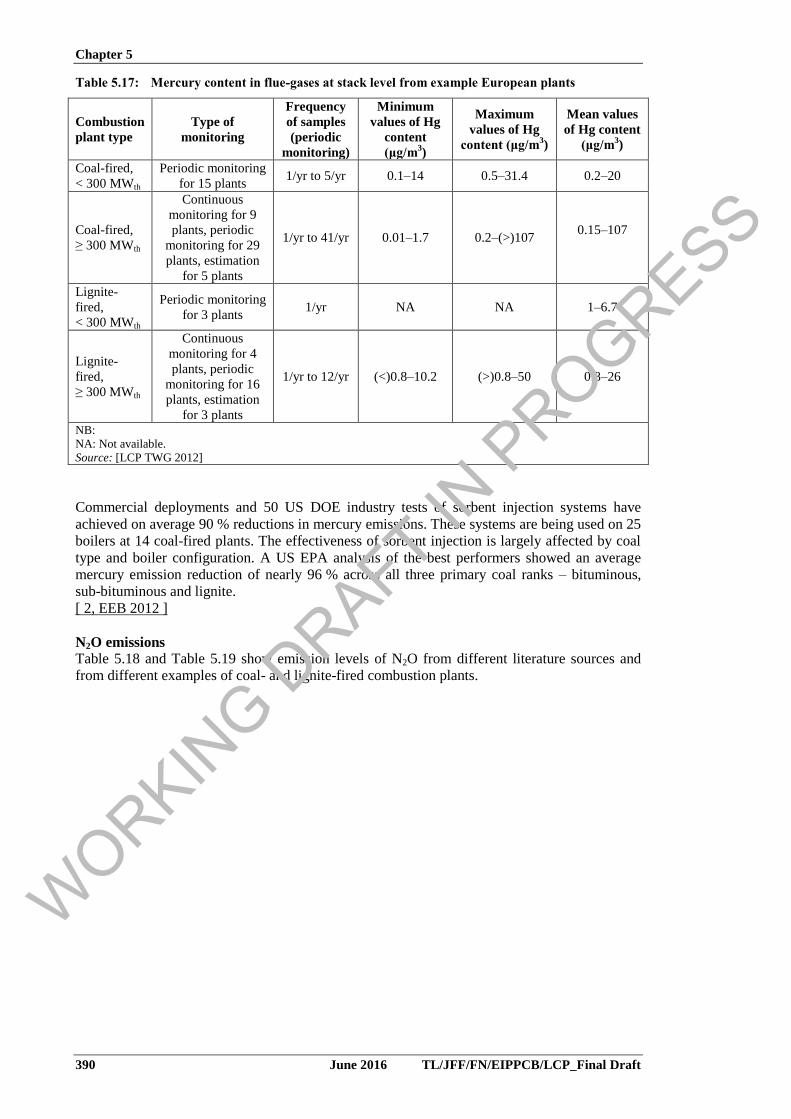
Chapter 5
390 June 2016 TL/JFF/FN/EIPPCB/LCP_Final Draft
Table 5.17: Mercury content in flue-gases at stack level from example European plants
Combustion
plant type
Type of
monitoring
Frequency
of samples
(periodic
monitoring)
Minimum
values of Hg
content
(μg/m3)
Maximum
values of Hg
content (μg/m3)
Mean values
of Hg content
(μg/m3)
Coal-fired,
< 300 MWth
Periodic monitoring
for 15 plants 1/yr to 5/yr 0.1–14 0.5–31.4 0.2–20
Coal-fired,
≥ 300 MWth
Continuous
monitoring for 9
plants, periodic
monitoring for 29
plants, estimation
for 5 plants
1/yr to 41/yr 0.01–1.7 0.2–(>)107 0.15–107
Lignite-
fired,
< 300 MWth
Periodic monitoring
for 3 plants 1/yr NA NA 1–6.7
Lignite-
fired,
≥ 300 MWth
Continuous
monitoring for 4
plants, periodic
monitoring for 16
plants, estimation
for 3 plants
1/yr to 12/yr (<)0.8–10.2 (>)0.8–50 0.8–26
NB:
NA: Not available.
Source: [LCP TWG 2012]
Commercial deployments and 50 US DOE industry tests of sorbent injection systems have
achieved on average 90 % reductions in mercury emissions. These systems are being used on 25
boilers at 14 coal-fired plants. The effectiveness of sorbent injection is largely affected by coal
type and boiler configuration. A US EPA analysis of the best performers showed an average
mercury emission reduction of nearly 96 % across all three primary coal ranks – bituminous,
sub-bituminous and lignite.
[ 2, EEB 2012 ]
N2O emissions
Table 5.18 and Table 5.19 show emission levels of N2O from different literature sources and
from different examples of coal- and lignite-fired combustion plants.
WORKIN
G DRAFT IN
PROGRESS

Chapter 5
TL/JFF/FN/EIPPCB/LCP_Final Draft June 2016 391
Table 5.18: Measured N2O emission levels taken from different literature sources
Fuel Comb.
Tech.
O2
(%)
N2O
(mg/Nm3)
N2O
(kg/TJ)
Kremer
1994 KEMA 1993
VGB
Power
Tech
1994
IEACR
1993 Braun 1993
IACR
1993
Peter
2001
Coal
PC
(DBB) 6 < 2
<4 (Without
staged
combustion)
<0.4–1.2 (With
staged
combustion)
NA 1–20 NA 0.4–1.4 2–5
PC
(WBB) 6 3.8–9 4–10 NA NA 0.4–1.4 2–5
Grate
firing 6 < 30 1–10 0.2–3 NA 0.4–1.4 2–5
CFBC 7
4–20
(Partial load)
40–700
(Full load)
16–170
(790–940 C) 30–160 60–140
50–120
(With peaks up
to 380)
36–72 20–45
BFBC 7
100–150
(Partial load)
140–480
(Full load)
NA NA NA NA NA NA
Lignite
PC
(DBB) 6 10–16 NA 13 1.5–6 NA 0.6–2.3 0.8–3.2
Grate
firing 6 < 30 NA 0.8–2.5 NA NA 0.8–3.5
FBC 7 < 30 NA 5–20 10–90 5–14
(With peaks up
to 30) 11–45 3–8
NB:
PC (DBB): Pulverised combustion (dry-bottom boiler)
PC (WBB): Pulverised combustion (wet-bottom boiler)
CFBC: Circulating fluidised bed combustion
BFBC: Bubbling fluidised bed combustion
FBC: Fluidised bed combustion
NA: Not available
Source: [98, DFIU, 2001] [New 61, LCP BREF 2006]
Table 5.19: N2O emissions from example European circulating fluidised bed boilers
Plant
number
Size
(MWth) Combusted fuel
Techniques for
NOX – N2O
NOX yearly
average
(mg/Nm3 at
6 % O2)
N2O
emissions
(mg/Nm3
at 6 % O2)
Equivalent
full load
factor (%)
470V 50
80 % Biomass
and Peat + 20 %
animal by-
products
FGR - SNCR 71 22 81.8
385V 400 90 % Coal +
10 % Biomass
Lighting up burners
- Air staging /
Planned retrofit for
NOX (Flue-gas
recirculation -
10 %)
265 21.1 92.3
377V 380
91 % Sub-
bituminous coal
+ 9 % Sludge
Air staging 149 119 86
NB:
FGR: Flue-gas recirculation SNCR: Selective non-catalytic reduction
Source: [ 3, LCP TWG 2012 ]
Figure 5.18 shows that N2O emissions strongly depend on the unit load.
WORKIN
G DRAFT IN
PROGRESS
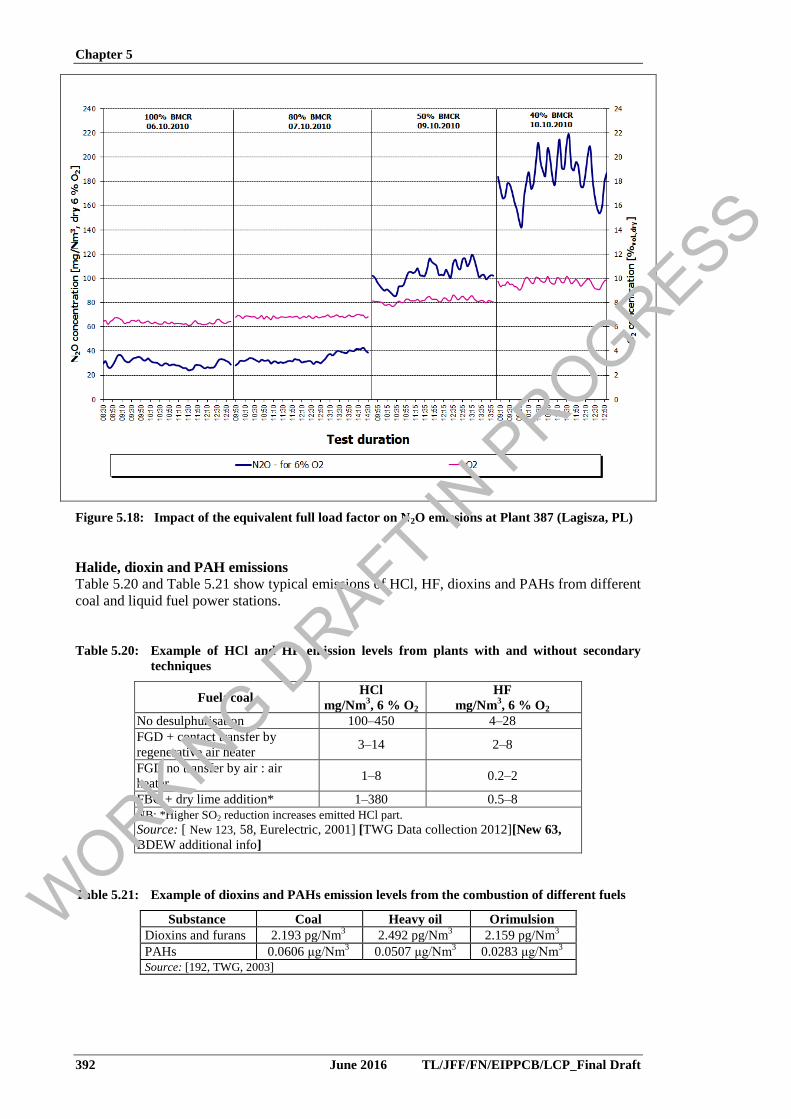
Chapter 5
392 June 2016 TL/JFF/FN/EIPPCB/LCP_Final Draft
Figure 5.18: Impact of the equivalent full load factor on N2O emissions at Plant 387 (Lagisza, PL)
Halide, dioxin and PAH emissions
Table 5.20 and Table 5.21 show typical emissions of HCl, HF, dioxins and PAHs from different
coal and liquid fuel power stations.
Table 5.20: Example of HCl and HF emission levels from plants with and without secondary
techniques
Fuel: coal HCl
mg/Nm3, 6 % O2
HF
mg/Nm3, 6 % O2
No desulphurisation 100–450 4–28
FGD + contact transfer by
regenerative air heater 3–14 2–8
FGD no transfer by air : air
heater 1–8 0.2–2
FBC + dry lime addition* 1–380 0.5–8
NB: *Higher SO2 reduction increases emitted HCl part.
Source: [ New 123, 58, Eurelectric, 2001] [TWG Data collection 2012][New 63,
BDEW additional info]
Table 5.21: Example of dioxins and PAHs emission levels from the combustion of different fuels
Substance Coal Heavy oil Orimulsion
Dioxins and furans 2.193 pg/Nm3 2.492 pg/Nm
3 2.159 pg/Nm
3
PAHs 0.0606 μg/Nm3 0.0507 μg/Nm
3 0.0283 μg/Nm
3
Source: [192, TWG, 2003]
WORKIN
G DRAFT IN
PROGRESS
Chapter 5
TL/JFF/FN/EIPPCB/LCP_Final Draft June 2016 393
5.1.2.4 Combustion residues
Large quantities of mineral substances are generated in every power plant. For a 450 MWe
power plant burning one million tonnes of coal with for example an ash content of 13 % and a
sulphur content of 1 %, some 187 000 tonnes of coal combustion products (CCPs) are yielded
annually.
In 2010, nearly 780 million tonnes of coal ashes (bottom ash and fly ash) were generated
worldwide. In many countries (for example, Austria and Canada) there is concern about the
metal content of these residues, which may adversely affect their potential recycling or
recovery.
The most common CCPs are:
Gypsum:
main component: calcium sulphate dehydrate. The concentration of trace elements is
limited by non-toxicity requirements.
critical parameters for use in the construction industry: crystal size, crystallography
and moisture content.
the quality criteria for FGD gypsum are described by an industry standard agreed between
Eurogypsum, ECOBA and VGB Power Tech e.V. [New 83].
Fly ash: contains the largest part of condensed metal:
critical parameters for use in concrete: ignition loss, Cl, free CaO;
critical parameters for use in cement: physical, chemical, mechanical parameters of
cement are specified (EN-197-1): ignition loss, sulphates, Cl.
Bottom ash: low metal content; use in the brick and cement industry.
Residue from spray dry absorption: mixture of gypsum, calcium sulphite and fly ash; the
majority is landfilled or used as a sealing material for landfills.
Only combustion and flue-gas treatment-related residues are mentioned here. It should however
be noted that waste water treatment (WWT)-related residues (e.g. sludges from FGD WWT)
may also be, in many cases, of significant importance.
Figure 5.19 gives an example of volumes of CCPs generated by a typical power plant.
WORKIN
G DRAFT IN
PROGRESS

Chapter 5
394 June 2016 TL/JFF/FN/EIPPCB/LCP_Final Draft
Source: [ z.B. Eck, Feuerborn, 2007, Eurocoalash]
Figure 5.19: Annual production of CCPs in a 450 MWe coal-fired power plant at 6000 hours full
load (total production of CCPs = 187 000 tonnes)
According to Ecoba [New 64 ECOBA stats 2010], the amount of CCPs generated in the EU-15
power plants totals 48 million tonnes, and totalled about 100 million tonnes in the EU-28 in
2011 when exact figures from all new Member States were not yet available to ECOBA.
Figure 5.20 shows the shares of the different CCPs generated in 2010. About 65 % of the total
CCPs are generated as fly ash. All combustion residues add up to 78.8 % and FGD residues up
to 21.2 % by mass.
Source: [New 64, ECOBA stat 2010]
Figure 5.20: Production of CCPs in the EU-15 in 2010
WORKIN
G DRAFT IN
PROGRESS
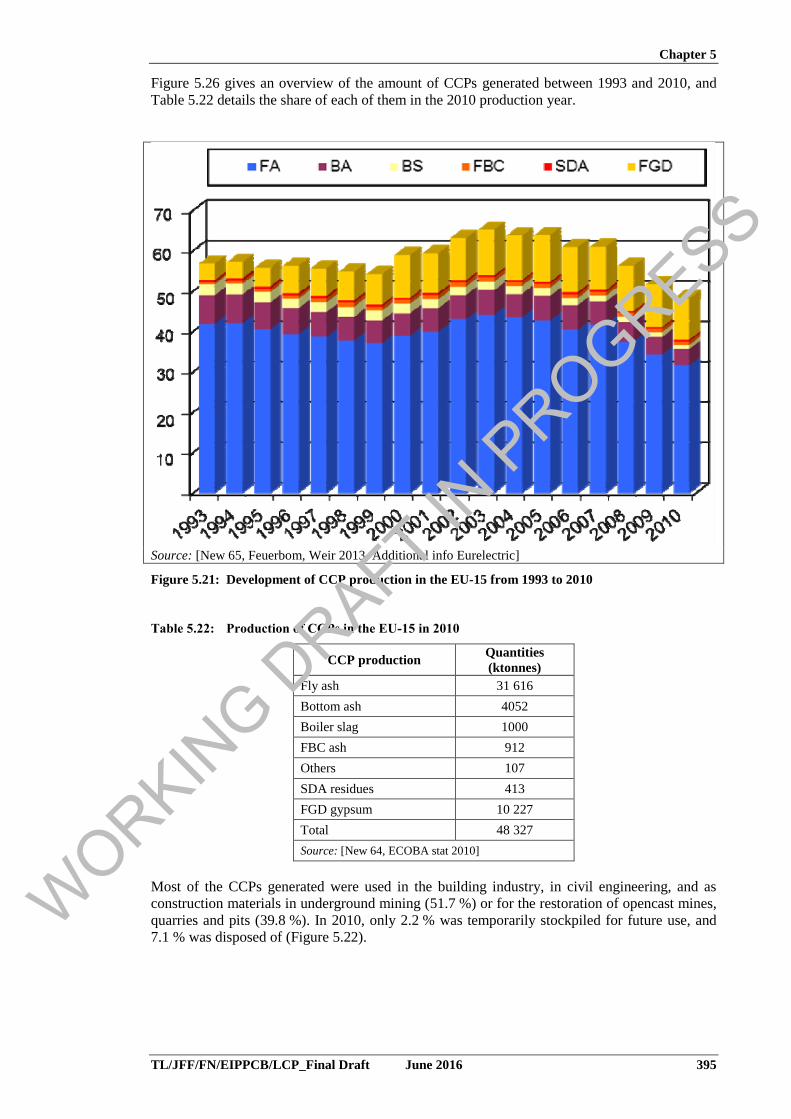
Chapter 5
TL/JFF/FN/EIPPCB/LCP_Final Draft June 2016 395
Figure 5.26 gives an overview of the amount of CCPs generated between 1993 and 2010, and
Table 5.22 details the share of each of them in the 2010 production year.
Source: [New 65, Feuerbom, Weir 2013, Additional info Eurelectric]
Figure 5.21: Development of CCP production in the EU-15 from 1993 to 2010
Table 5.22: Production of CCPs in the EU-15 in 2010
CCP production Quantities
(ktonnes)
Fly ash 31 616
Bottom ash 4052
Boiler slag 1000
FBC ash 912
Others 107
SDA residues 413
FGD gypsum 10 227
Total 48 327
Source: [New 64, ECOBA stat 2010]
Most of the CCPs generated were used in the building industry, in civil engineering, and as
construction materials in underground mining (51.7 %) or for the restoration of opencast mines,
quarries and pits (39.8 %). In 2010, only 2.2 % was temporarily stockpiled for future use, and
7.1 % was disposed of (Figure 5.22).
WORKIN
G DRAFT IN
PROGRESS
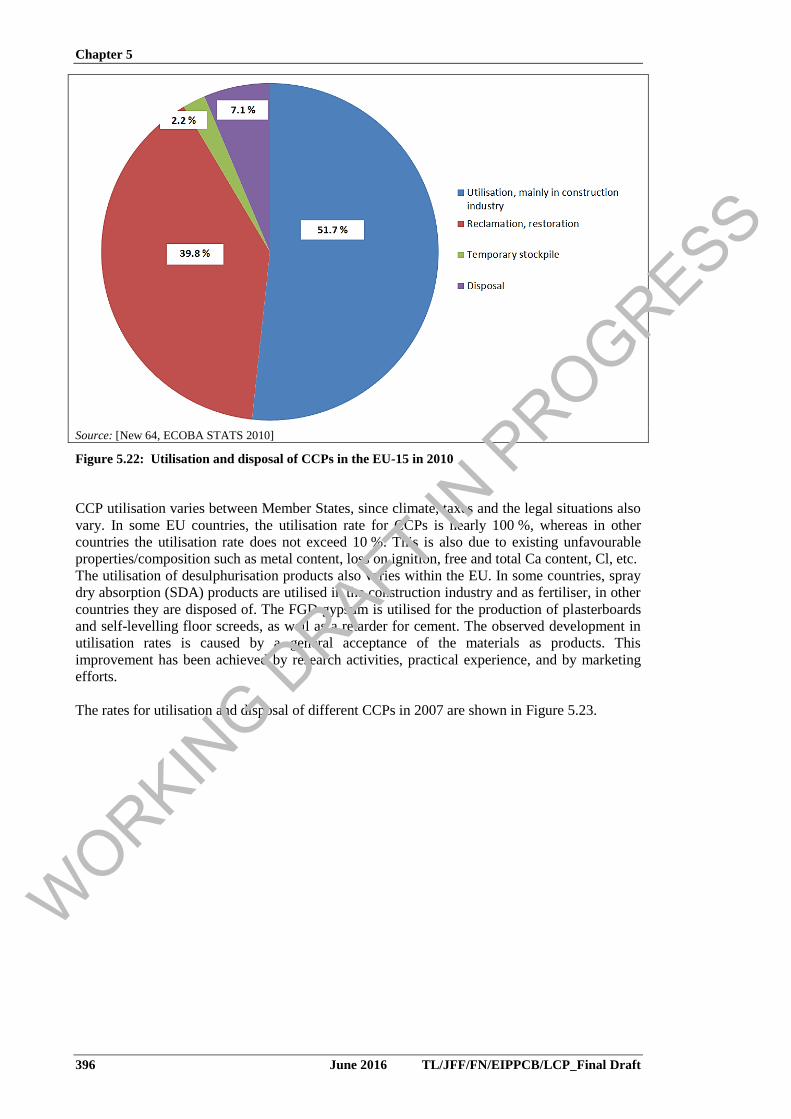
Chapter 5
396 June 2016 TL/JFF/FN/EIPPCB/LCP_Final Draft
Source: [New 64, ECOBA STATS 2010]
Figure 5.22: Utilisation and disposal of CCPs in the EU-15 in 2010
CCP utilisation varies between Member States, since climate, taxes and the legal situations also
vary. In some EU countries, the utilisation rate for CCPs is nearly 100 %, whereas in other
countries the utilisation rate does not exceed 10 %. This is also due to existing unfavourable
properties/composition such as metal content, loss on ignition, free and total Ca content, Cl, etc.
The utilisation of desulphurisation products also varies within the EU. In some countries, spray
dry absorption (SDA) products are utilised in the construction industry and as fertiliser, in other
countries they are disposed of. The FGD gypsum is utilised for the production of plasterboards
and self-levelling floor screeds, as well as a retarder for cement. The observed development in
utilisation rates is caused by a general acceptance of the materials as products. This
improvement has been achieved by research activities, practical experience, and by marketing
efforts.
The rates for utilisation and disposal of different CCPs in 2007 are shown in Figure 5.23.
WORKIN
G DRAFT IN
PROGRESS
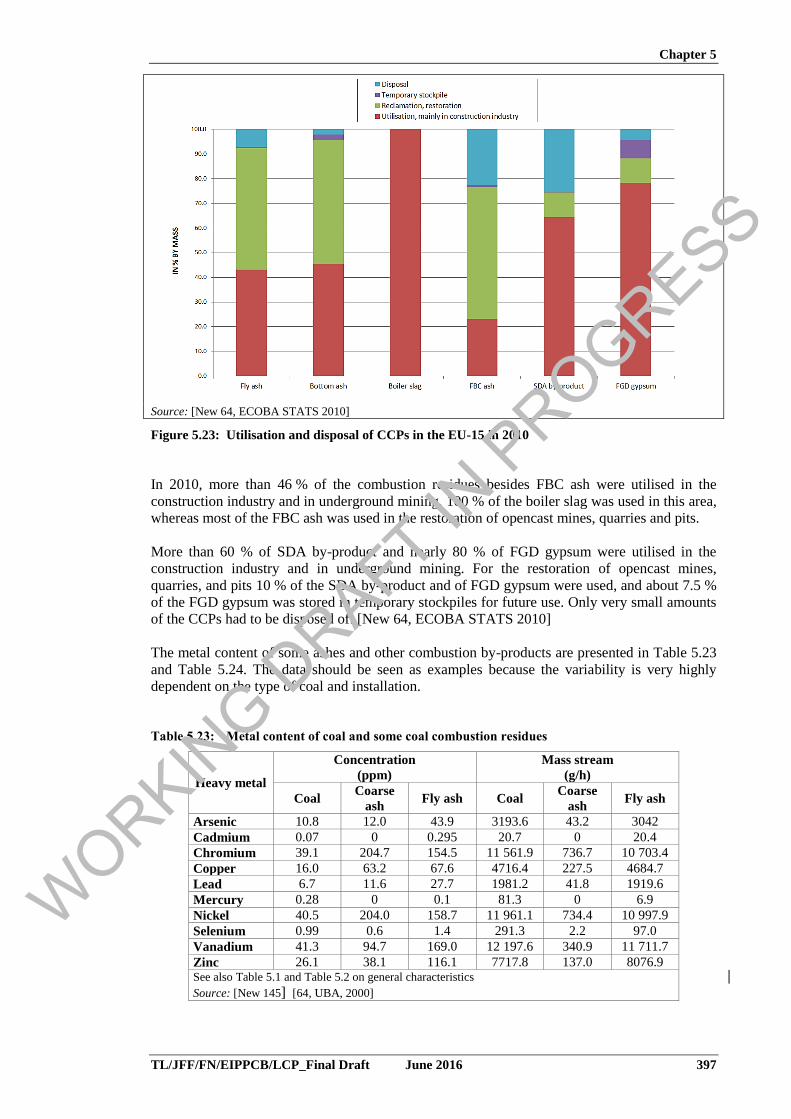
Chapter 5
TL/JFF/FN/EIPPCB/LCP_Final Draft June 2016 397
Source: [New 64, ECOBA STATS 2010]
Figure 5.23: Utilisation and disposal of CCPs in the EU-15 in 2010
In 2010, more than 46 % of the combustion residues besides FBC ash were utilised in the
construction industry and in underground mining. 100 % of the boiler slag was used in this area,
whereas most of the FBC ash was used in the restoration of opencast mines, quarries and pits.
More than 60 % of SDA by-product and nearly 80 % of FGD gypsum were utilised in the
construction industry and in underground mining. For the restoration of opencast mines,
quarries, and pits 10 % of the SDA by-product and of FGD gypsum were used, and about 7.5 %
of the FGD gypsum was stored in temporary stockpiles for future use. Only very small amounts
of the CCPs had to be disposed of. [New 64, ECOBA STATS 2010]
The metal content of some ashes and other combustion by-products are presented in Table 5.23
and Table 5.24. The data should be seen as examples because the variability is very highly
dependent on the type of coal and installation.
Table 5.23: Metal content of coal and some coal combustion residues
Heavy metal
Concentration
(ppm)
Mass stream
(g/h)
Coal Coarse
ash Fly ash Coal
Coarse
ash Fly ash
Arsenic 10.8 12.0 43.9 3193.6 43.2 3042
Cadmium 0.07 0 0.295 20.7 0 20.4
Chromium 39.1 204.7 154.5 11 561.9 736.7 10 703.4
Copper 16.0 63.2 67.6 4716.4 227.5 4684.7
Lead 6.7 11.6 27.7 1981.2 41.8 1919.6
Mercury 0.28 0 0.1 81.3 0 6.9
Nickel 40.5 204.0 158.7 11 961.1 734.4 10 997.9
Selenium 0.99 0.6 1.4 291.3 2.2 97.0
Vanadium 41.3 94.7 169.0 12 197.6 340.9 11 711.7
Zinc 26.1 38.1 116.1 7717.8 137.0 8076.9 See also Table 5.1 and Table 5.2 on general characteristics
Source: [New 145] [64, UBA, 2000]
WORKIN
G DRAFT IN
PROGRESS
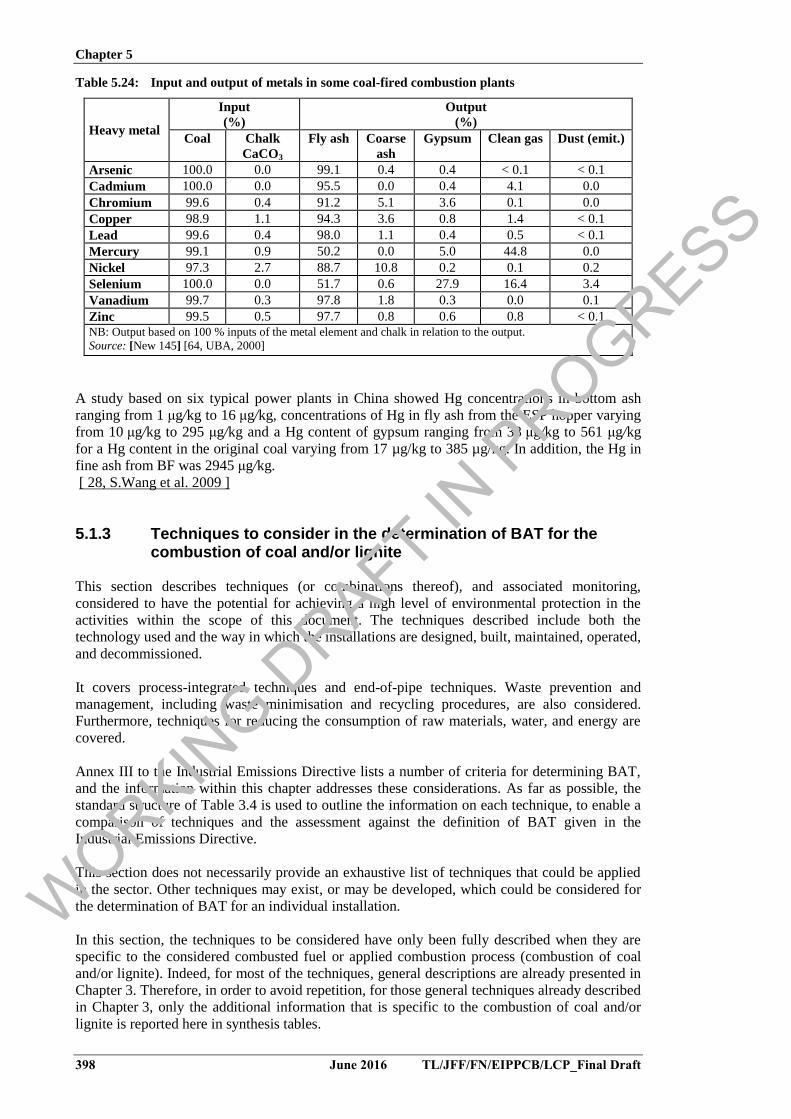
Chapter 5
398 June 2016 TL/JFF/FN/EIPPCB/LCP_Final Draft
Table 5.24: Input and output of metals in some coal-fired combustion plants
Heavy metal
Input
(%)
Output
(%)
Coal Chalk
CaCO3
Fly ash Coarse
ash
Gypsum Clean gas Dust (emit.)
Arsenic 100.0 0.0 99.1 0.4 0.4 < 0.1 < 0.1
Cadmium 100.0 0.0 95.5 0.0 0.4 4.1 0.0
Chromium 99.6 0.4 91.2 5.1 3.6 0.1 0.0
Copper 98.9 1.1 94.3 3.6 0.8 1.4 < 0.1
Lead 99.6 0.4 98.0 1.1 0.4 0.5 < 0.1
Mercury 99.1 0.9 50.2 0.0 5.0 44.8 0.0
Nickel 97.3 2.7 88.7 10.8 0.2 0.1 0.2
Selenium 100.0 0.0 51.7 0.6 27.9 16.4 3.4
Vanadium 99.7 0.3 97.8 1.8 0.3 0.0 0.1
Zinc 99.5 0.5 97.7 0.8 0.6 0.8 < 0.1
NB: Output based on 100 % inputs of the metal element and chalk in relation to the output.
Source: [New 145] [64, UBA, 2000]
A study based on six typical power plants in China showed Hg concentrations in bottom ash
ranging from 1 μg/kg to 16 μg/kg, concentrations of Hg in fly ash from the ESP hopper varying
from 10 μg/kg to 295 μg/kg and a Hg content of gypsum ranging from 38 μg/kg to 561 μg/kg
for a Hg content in the original coal varying from 17 µg/kg to 385 µg/kg. In addition, the Hg in
fine ash from BF was 2945 μg/kg.
[ 28, S.Wang et al. 2009 ]
5.1.3 Techniques to consider in the determination of BAT for the combustion of coal and/or lignite
This section describes techniques (or combinations thereof), and associated monitoring,
considered to have the potential for achieving a high level of environmental protection in the
activities within the scope of this document. The techniques described include both the
technology used and the way in which the installations are designed, built, maintained, operated,
and decommissioned.
It covers process-integrated techniques and end-of-pipe techniques. Waste prevention and
management, including waste minimisation and recycling procedures, are also considered.
Furthermore, techniques for reducing the consumption of raw materials, water, and energy are
covered.
Annex III to the Industrial Emissions Directive lists a number of criteria for determining BAT,
and the information within this chapter addresses these considerations. As far as possible, the
standard structure of Table 3.4 is used to outline the information on each technique, to enable a
comparison of techniques and the assessment against the definition of BAT given in the
Industrial Emissions Directive.
This section does not necessarily provide an exhaustive list of techniques that could be applied
in the sector. Other techniques may exist, or may be developed, which could be considered for
the determination of BAT for an individual installation.
In this section, the techniques to be considered have only been fully described when they are
specific to the considered combusted fuel or applied combustion process (combustion of coal
and/or lignite). Indeed, for most of the techniques, general descriptions are already presented in
Chapter 3. Therefore, in order to avoid repetition, for those general techniques already described
in Chapter 3, only the additional information that is specific to the combustion of coal and/or
lignite is reported here in synthesis tables.
WORKIN
G DRAFT IN
PROGRESS

Chapter 5
TL/JFF/FN/EIPPCB/LCP_Final Draft June 2016 399
5.1.3.1 Techniques for the control of diffuse emissions from the unloading, storage and handling of fuel/additives
Information on general techniques to reduce diffuse/fugitive air emissions is given in
Section 2.8. Table 5.25 gives additional information specific to lignite and/or coal firing.
WORKIN
G DRAFT IN
PROGRESS
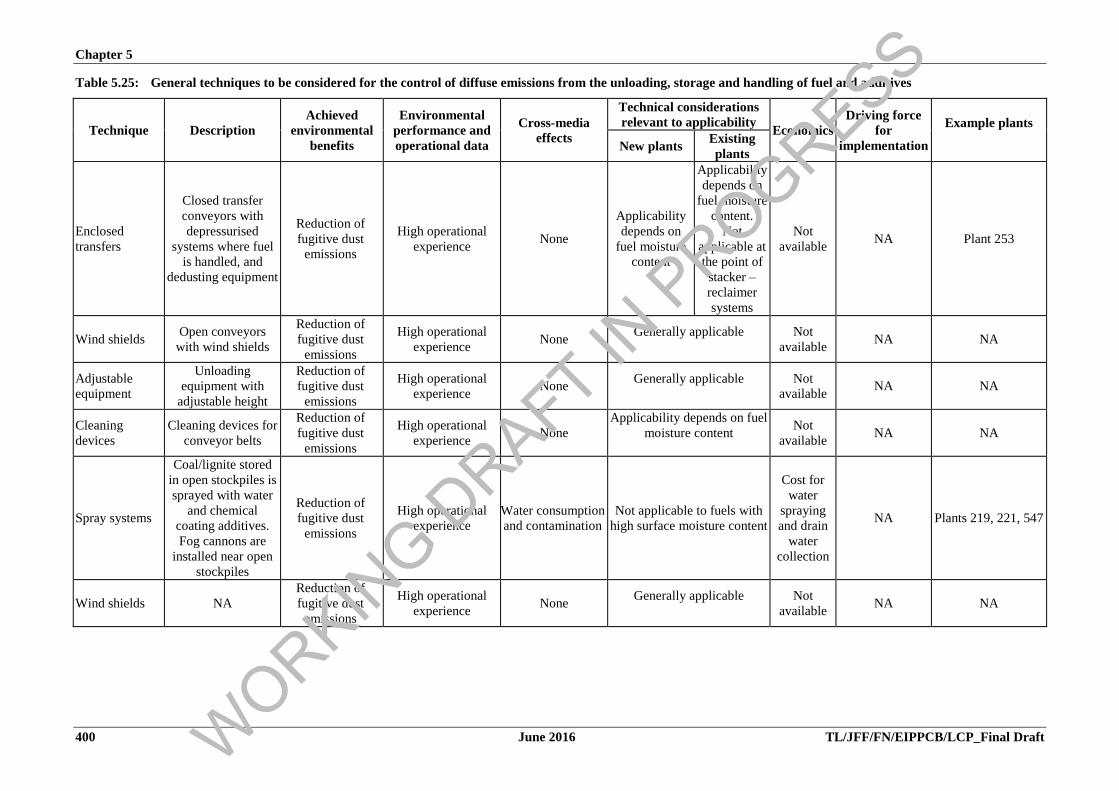
Chapter 5
400 June 2016 TL/JFF/FN/EIPPCB/LCP_Final Draft
Table 5.25: General techniques to be considered for the control of diffuse emissions from the unloading, storage and handling of fuel and additives
Technique Description
Achieved
environmental
benefits
Environmental
performance and
operational data
Cross-media
effects
Technical considerations
relevant to applicability Economics
Driving force
for
implementation
Example plants
New plants
Existing
plants
Enclosed
transfers
Closed transfer
conveyors with
depressurised
systems where fuel
is handled, and
dedusting equipment
Reduction of
fugitive dust
emissions
High operational
experience None
Applicability
depends on
fuel moisture
content
Applicability
depends on
fuel moisture
content.
Not
applicable at
the point of
stacker –
reclaimer
systems
Not
available NA Plant 253
Wind shields Open conveyors
with wind shields
Reduction of
fugitive dust
emissions
High operational
experience None
Generally applicable
Not
available NA NA
Adjustable
equipment
Unloading
equipment with
adjustable height
Reduction of
fugitive dust
emissions
High operational
experience None
Generally applicable
Not
available NA NA
Cleaning
devices
Cleaning devices for
conveyor belts
Reduction of
fugitive dust
emissions
High operational
experience None
Applicability depends on fuel
moisture content
Not
available NA NA
Spray systems
Coal/lignite stored
in open stockpiles is
sprayed with water
and chemical
coating additives.
Fog cannons are
installed near open
stockpiles
Reduction of
fugitive dust
emissions
High operational
experience
Water consumption
and contamination
Not applicable to fuels with
high surface moisture content
Cost for
water
spraying
and drain
water
collection
NA Plants 219, 221, 547
Wind shields NA
Reduction of
fugitive dust
emissions
High operational
experience None
Generally applicable
Not
available NA NA
WORKIN
G DRAFT IN
PROGRESS

Chapter 5
TL/JFF/FN/EIPPCB/LCP_Final Draft June 2016 401
Technique Description
Achieved
environmental
benefits
Environmental
performance and
operational data
Cross-media
effects
Technical considerations
relevant to applicability Economics
Driving force
for
implementation
Example plants
New plants
Existing
plants
Sealed surface
with drainage
systems
Sealing of the whole
storage surface may
not be needed as
long as the absence
of potential leachate
to the subsurface can
be demonstrated and
controlled
Prevention of soil
and groundwater
contamination
High operational
experience None Generally applicable
Cost for
waste water
treatment
NA NA
Enclosed
storage
Enclosed storage of
lime/limestone in
silos with dust
abatement
Reduction of fine
particles
High operational
experience None Generally applicable
Not
available NA NA
Enclosed storage of
coal
Reduction of
fugitive dust
emissions
NA NA Generally applicable
Local
environmental
quality standards
Plants 123, 253, 547
NA = No relevant specific information available
WORKIN
G DRAFT IN
PROGRESS

Chapter 5
402 June 2016 TL/JFF/FN/EIPPCB/LCP_Final Draft
5.1.3.2 Techniques to improve the general environmental performance
Information on general techniques to improve the general environmental performance of
combustion plants is given in Section 3.1.1.
Table 5.26 gives additional information specific to lignite and/or coal firing.
WORKIN
G DRAFT IN
PROGRESS

Chapter 5
TL/JFF/FN/EIPPCB/LCP_Final Draft June 2016 403
Table 5.26: Techniques to be considered for improving the general environmental performance of coal- and/or lignite-fired plants
Technique Description
Achieved
environmental
benefits
Environmental
performance and
operational data
Cross-media effects
Technical considerations relevant
to applicability Economics
Example
plants
New plants Existing plants
Fuel choice
Switching from the
combustion of one fuel
to a less harmful one in
terms of emissions (low
sulphur, low ash
content or better ash
quality) – see also
Section 3.1.1.4
Better environmental
profile, less
emissions
High operational
experience
Lower impurities in
the coal leads to
fewer emissions. Low
ash content involves
a PM emission
reduction and a
reduction of solid
wastes for
utilisation/disposal
Depends on the
design
characteristics of
the specific
boiler
Depends on the
design
characteristics of
the specific
boiler and
configuration of
the plant.
The fuel price
might be
higher
NA
The possibility of
changing the fuel may be
limited, at least temporarily (e.g.
because of multi-source imported
coal dependence and/or long-term
delivery contracts or full
dependence on local mines, etc.),
and may be constrained by the
availability of different types of
fuel with a better environmental
profile as a whole, which may be
impacted by the energy policy of
the Member States
Multi-fuel firing
Replacing part of the
lignite or coal with
another fuel such as
biomass or syngas from
biomass - see Chapter 8
and
Chapter 4
Better environmental
profile, less
emissions
High operational
experience for multi-
fuel firing with biomass
– Limited experience
for multi-fuel firing
with syngas
Potential increase in
pollutants such as Cl
to be considered
Generally applicable
May avoid
costly end-of-
pipe
techniques
NA
Fuel blending and
mixing
See also Section
5.1.3.4.3.1
Avoiding emission
peaks, stable
operation
High operational
experience NA
Generally applicable
Additional
costs for fuel
mixing and
blending
equipment
NA Best suited for boiler without
secondary emission control
WORKIN
G DRAFT IN
PROGRESS
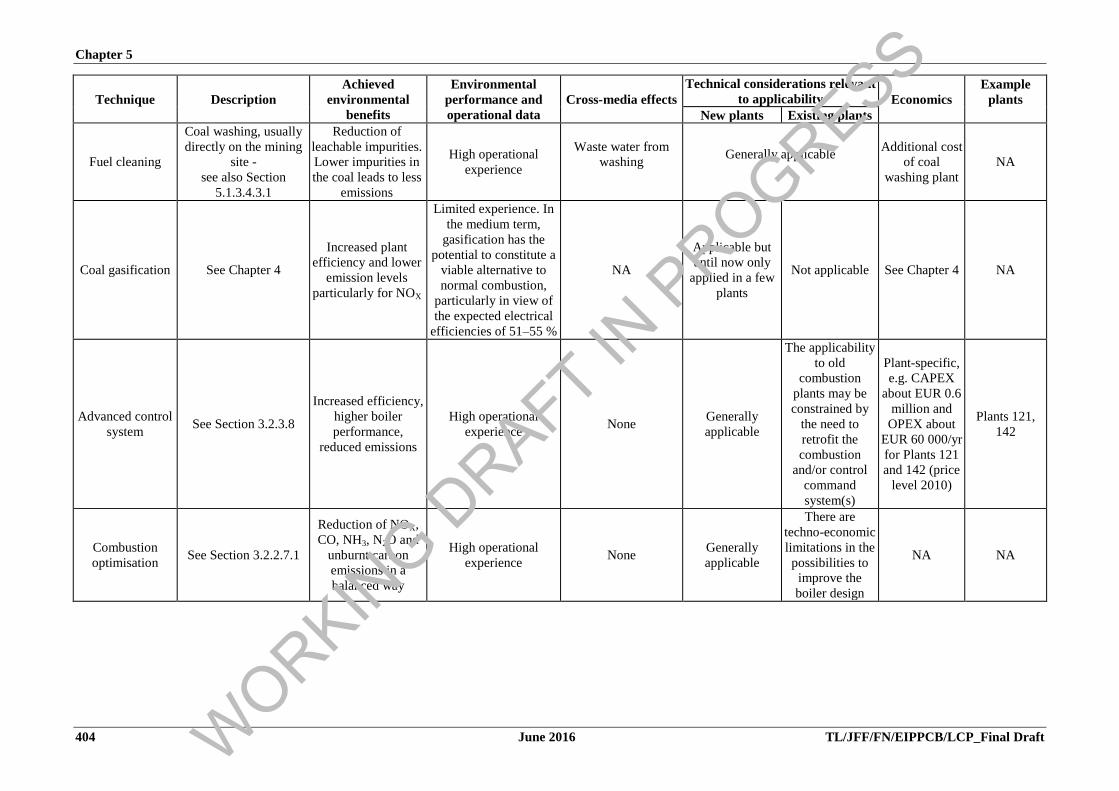
Chapter 5
404 June 2016 TL/JFF/FN/EIPPCB/LCP_Final Draft
Technique Description
Achieved
environmental
benefits
Environmental
performance and
operational data
Cross-media effects
Technical considerations relevant
to applicability Economics
Example
plants
New plants Existing plants
Fuel cleaning
Coal washing, usually
directly on the mining
site -
see also Section
5.1.3.4.3.1
Reduction of
leachable impurities.
Lower impurities in
the coal leads to less
emissions
High operational
experience
Waste water from
washing
Generally applicable
Additional cost
of coal
washing plant
NA
Coal gasification See Chapter 4
Increased plant
efficiency and lower
emission levels
particularly for NOX
Limited experience. In
the medium term,
gasification has the
potential to constitute a
viable alternative to
normal combustion,
particularly in view of
the expected electrical
efficiencies of 51–55 %
NA
Applicable but
until now only
applied in a few
plants
Not applicable See Chapter 4 NA
Advanced control
system See Section 3.2.3.8
Increased efficiency,
higher boiler
performance,
reduced emissions
High operational
experience None
Generally
applicable
The applicability
to old
combustion
plants may be
constrained by
the need to
retrofit the
combustion
and/or control
command
system(s)
Plant-specific,
e.g. CAPEX
about EUR 0.6
million and
OPEX about
EUR 60 000/yr
for Plants 121
and 142 (price
level 2010)
Plants 121,
142
Combustion
optimisation See Section 3.2.2.7.1
Reduction of NOX,
CO, NH3, N2O and
unburnt carbon
emissions in a
balanced way
High operational
experience None
Generally
applicable
There are
techno-economic
limitations in the
possibilities to
improve the
boiler design
NA NA
WORKIN
G DRAFT IN
PROGRESS

Chapter 5
TL/JFF/FN/EIPPCB/LCP_Final Draft June 2016 405
Technique Description
Achieved
environmental
benefits
Environmental
performance and
operational data
Cross-media effects
Technical considerations relevant
to applicability Economics
Example
plants
New plants Existing plants
Integrated
combustion
process
Ensure a high boiler
efficiency and include
primary techniques to
reduce NOX emissions,
such as air and fuel
staging, low-NOX
burners and/or
reburning.
See also Sections 3.1.1
and 3.2.3.8
Increased efficiency,
higher boiler
performance,
reduced emissions
High operational
experience None Generally applicable NA NA
NA = No relevant specific information available
WORKIN
G DRAFT IN
PROGRESS

Chapter 5
406 June 2016 TL/JFF/FN/EIPPCB/LCP_Final Draft
5.1.3.3 Techniques to increase energy efficiency and fuel utilisation
Information on general techniques to increase the energy efficiency of combustion plants is
given in Section 3.2.3.
Table 5.27 and Table 5.28 give additional information specific to lignite and/or coal firing.
Further details on related environmental performance and operational data are given after these
tables.
WORKIN
G DRAFT IN
PROGRESS
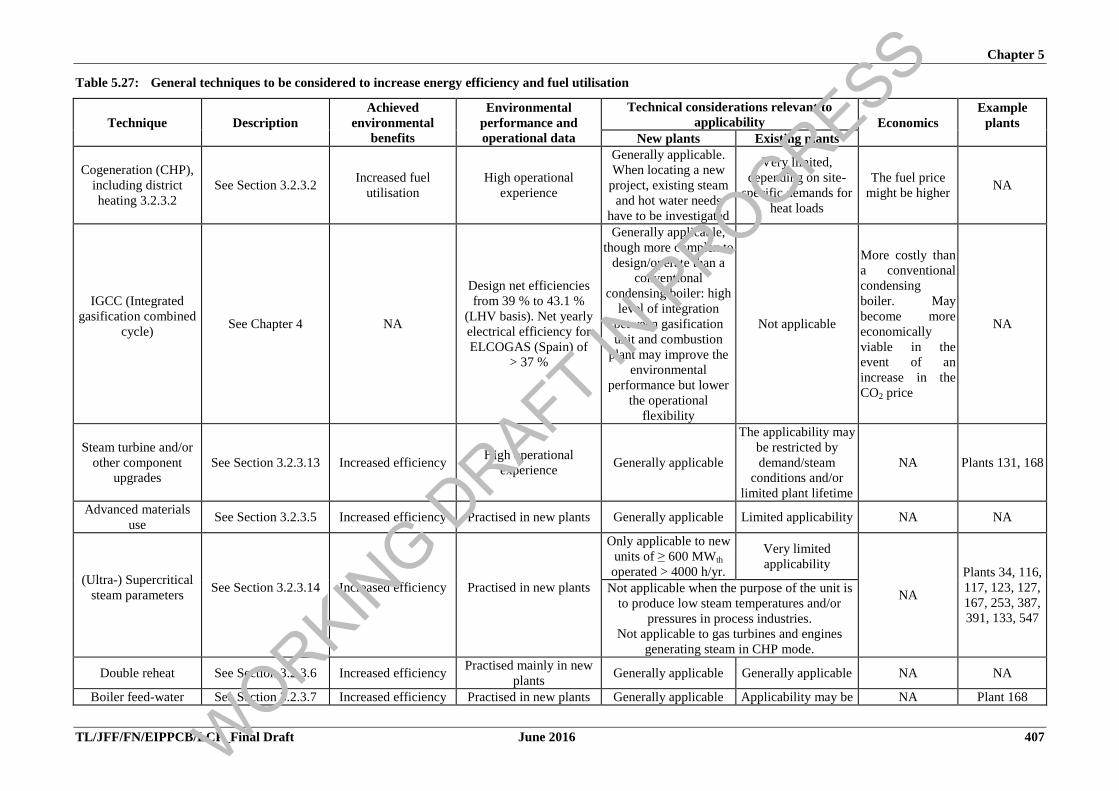
Chapter 5
TL/JFF/FN/EIPPCB/LCP_Final Draft June 2016 407
Table 5.27: General techniques to be considered to increase energy efficiency and fuel utilisation
Technique Description
Achieved
environmental
benefits
Environmental
performance and
operational data
Technical considerations relevant to
applicability Economics
Example
plants
New plants Existing plants
Cogeneration (CHP),
including district
heating 3.2.3.2
See Section 3.2.3.2 Increased fuel
utilisation
High operational
experience
Generally applicable.
When locating a new
project, existing steam
and hot water needs
have to be investigated
Very limited,
depending on site-
specific demands for
heat loads
The fuel price
might be higher NA
IGCC (Integrated
gasification combined
cycle)
See Chapter 4 NA
Design net efficiencies
from 39 % to 43.1 %
(LHV basis). Net yearly
electrical efficiency for
ELCOGAS (Spain) of
> 37 %
Generally applicable,
though more complex to
design/operate than a
conventional
condensing boiler: high
level of integration
between gasification
unit and combustion
plant may improve the
environmental
performance but lower
the operational
flexibility
Not applicable
More costly than
a conventional
condensing
boiler. May
become more
economically
viable in the
event of an
increase in the
CO2 price
NA
Steam turbine and/or
other component
upgrades
See Section 3.2.3.13 Increased efficiency High operational
experience Generally applicable
The applicability may
be restricted by
demand/steam
conditions and/or
limited plant lifetime
NA Plants 131, 168
Advanced materials
use See Section 3.2.3.5 Increased efficiency Practised in new plants Generally applicable Limited applicability NA NA
(Ultra-) Supercritical
steam parameters
See Section 3.2.3.14
Increased efficiency
Practised in new plants
Only applicable to new
units of ≥ 600 MWth operated > 4000 h/yr.
Very limited
applicability
NA
Plants 34, 116,
117, 123, 127,
167, 253, 387,
391, 133, 547
Not applicable when the purpose of the unit is
to produce low steam temperatures and/or
pressures in process industries.
Not applicable to gas turbines and engines
generating steam in CHP mode.
Double reheat See Section 3.2.3.6 Increased efficiency Practised mainly in new
plants Generally applicable Generally applicable NA NA
Boiler feed-water See Section 3.2.3.7 Increased efficiency Practised in new plants Generally applicable Applicability may be NA Plant 168
WORKIN
G DRAFT IN
PROGRESS

Chapter 5
408 June 2016 TL/JFF/FN/EIPPCB/LCP_Final Draft
temperature increase and some existing ones
limited due to
constraints associated
with the plant
configuration and the
amount of
recoverable heat
Only applicable to steam circuits and not to hot
boilers
Fuel drying
See Section 3.2.3.18
and Section 11.4.1.1
Increased efficiency
Limited experience, as
only applied at pilot plant.
Increased efficiency of
approximately 3–5
percentage points
Emerging
Additional cost
of lignite dryers
NA
The retrofit of existing plants may be restricted
by the extra calorific value that can be obtained
from the drying operation and by the limited
retrofit possibilities offered by some boiler
designs or plant configurations
NA
Dry bottom ash
handling See Section 3.2.5.2
Increased efficiency.
Reduction of water
usage
Practised at some new
plants and some existing
ones
There may be technical restrictions that
prevent retrofitting to existing combustion
plants
Plant-specific Plants 142,
219, 221, 253
NA = No relevant specific information available
WORKIN
G DRAFT IN
PROGRESS

Chapter 5
TL/JFF/FN/EIPPCB/LCP_Final Draft June 2016 409
Table 5.28: General techniques to be considered to increase energy efficiency
Technique Technical description
Achieved
environmental
benefit
Environmental
performance and
operational data
Cross-media effects
Technical considerations
relevant to applicability Economics
Example
plants
New plants Existing
plants
Air staging
Better repartition of the
air used for the
combustion - see
Section 3.2.2.3.2
Increased efficiency
and reduced NOX
and N2O emissions
High operational
experience
Can increase the tube
failure risk and the
amount of unburnt
fuel
Generally
applicable
Generally
applicable NA NA
Reduction in flue-
gas temperature
Reduce the flue-gas
temperature upstream
of FGD down to 80 °C
– see Section 3.2.3.1
Increased efficiency.
The extra heat can be
used only as
secondary heat
High operational
experience
Corrosion: Exhaust
gas temperature
should be 10–20 °C
above acid dew point.
Blocking of air
heater. Effective mists
separation in FGD
required to avoid SO3
carry-over.
Generally
applicable
Generally
applicable NA Plant 168
Cooling tower
discharge
Air emission release
through the cooling
tower and not a
dedicated stack – see
Section 3.2.3.16
Reheating of flue-gas
after the FGD plant is
not necessary. No
stack is needed
High operational
experience NA
Generally
applicable
Applicability
to be assessed
on a case-by-
case basis (e.g.
availability of
cooling tower
location and
construction
materials)
No additional
cost for
construction
and
maintenance of
a stack
Plants 116,
130, 137
Wet stack
technique See Section 3.2.3.17 NA
High operational
experience Visible plume
Generally applicable to new and
existing units fitted with wet FGD NA
Plants 122a,
122b
Various
techniques See Cooling BREF NA NA NA NA NA NA Plant 168
WORKIN
G DRAFT IN
PROGRESS

Chapter 5
410 June 2016 TL/JFF/FN/EIPPCB/LCP_Final Draft
Environmental performance and operational data for energy efficiency
Figure 5.24 shows the operating electrical efficiencies and total fuel utilisation of some
European coal- and/or lignite-fired plants of more than 1000 MWth, commissioned between
1967 and 2009, operated between 2400 h/yr and 8700 h/yr, with an equivalent full load factor
above 60 %. Plants with a yearly electrical efficiency below 35 % are quite old (generally
commissioned before 1985) or combust low-grade quality lignite (Plant 169V). Some plants are
CHP plants fitted with condensing or condensing/extraction steam turbines. Their main purpose
is, however, to produce electricity with a limited amount of additional heat.
Source: [TWG data collection 2012]
Figure 5.24: Operating energy efficiencies of European coal- and/or lignite-fired plants of > 1000
MWth
Figure 5.25 shows the operating electrical efficiencies and total fuel utilisation of some
European coal- and/or lignite-fired plants of less than 1000 MWth, (from 52 MWth to
1000 MWth) commissioned between 1969 and 2010, operated between 2000 h/yr and 8700 h/yr,
with an equivalent full load factor above 56 %. Condensing plants having a yearly electrical
efficiency below 34.5 % are quite old (generally commissioned before 1986). Some plants are
CHP plants. When their main purpose is to produce electricity, they are equipped with
condensing or condensing/extraction steam turbines and produce a limited amount of additional
heat, even if sometimes 20 % of the additional fuel utilisation can be achieved (Plants 34V,
662V). When their main purpose is to produce steam or hot water for industrial purposes or
district heating, they are equipped with a back-pressure or back-pressure/extraction steam
turbine and, despite lower electrical efficiencies, achieve high levels of fuel utilisation (Plants
109V, 376NV). Plants that produce only heat (Plants 20-2V, 69V, 93V) are utility boilers of
less than 75 MWth, with fuel utilisation above 80 %.
W
ORKING D
RAFT IN P
ROGRESS
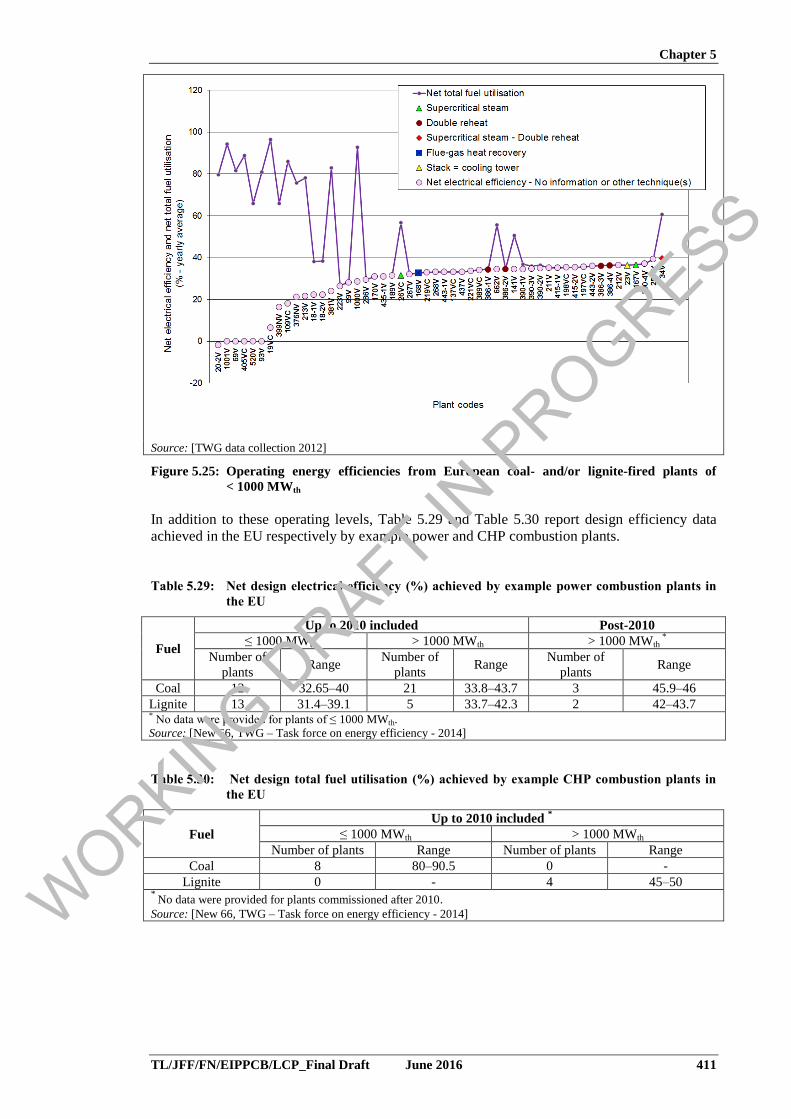
Chapter 5
TL/JFF/FN/EIPPCB/LCP_Final Draft June 2016 411
Source: [TWG data collection 2012]
Figure 5.25: Operating energy efficiencies from European coal- and/or lignite-fired plants of
< 1000 MWth
In addition to these operating levels, Table 5.29 and Table 5.30 report design efficiency data
achieved in the EU respectively by example power and CHP combustion plants.
Table 5.29: Net design electrical efficiency (%) achieved by example power combustion plants in
the EU
Fuel
Up to 2010 included Post-2010
≤ 1000 MWth > 1000 MWth > 1000 MWth *
Number of
plants Range
Number of
plants Range
Number of
plants Range
Coal 12 32.65–40 21 33.8–43.7 3 45.9–46
Lignite 13 31.4–39.1 5 33.7–42.3 2 42–43.7 * No data were provided for plants of ≤ 1000 MWth.
Source: [New 66, TWG – Task force on energy efficiency - 2014]
Table 5.30: Net design total fuel utilisation (%) achieved by example CHP combustion plants in
the EU
Fuel
Up to 2010 included *
≤ 1000 MWth > 1000 MWth
Number of plants Range Number of plants Range
Coal 8 80–90.5 0 -
Lignite 0 - 4 45–50 *
No data were provided for plants commissioned after 2010.
Source: [New 66, TWG – Task force on energy efficiency - 2014] WORKIN
G DRAFT IN
PROGRESS

Chapter 5
412 June 2016 TL/JFF/FN/EIPPCB/LCP_Final Draft
5.1.3.4 Techniques for the prevention and control of dust and metal emissions
5.1.3.4.1 General techniques for the prevention and control of dust and particle-
bound metal emissions
Information on general techniques to prevent and control dust and particle-bound metal
emissions from combustion plants is given in Section 3.2.2.
Table 5.31 gives additional information specific to lignite and/or coal firing. Further details on
related environmental performance and operational data are given after these tables.
WORKIN
G DRAFT IN
PROGRESS
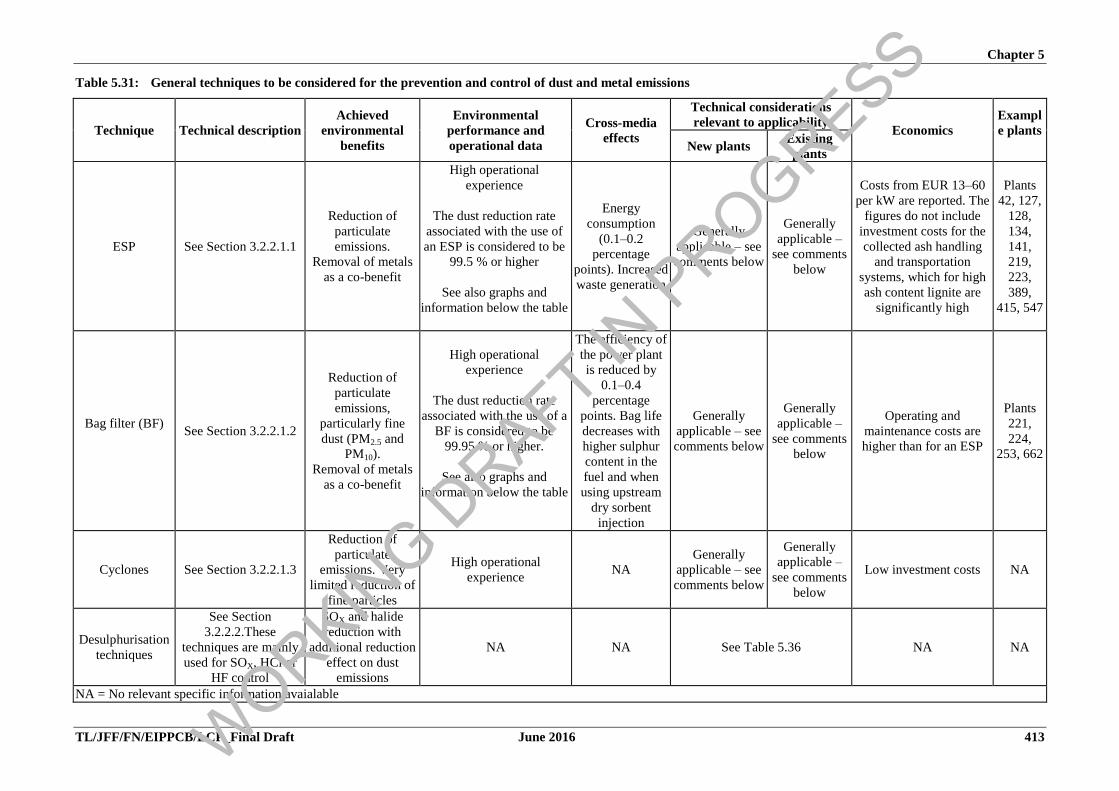
Chapter 5
TL/JFF/FN/EIPPCB/LCP_Final Draft June 2016 413
Table 5.31: General techniques to be considered for the prevention and control of dust and metal emissions
Technique Technical description
Achieved
environmental
benefits
Environmental
performance and
operational data
Cross-media
effects
Technical considerations
relevant to applicability Economics
Exampl
e plants
New plants Existing
plants
ESP
See Section 3.2.2.1.1
Reduction of
particulate
emissions.
Removal of metals
as a co-benefit
High operational
experience
The dust reduction rate
associated with the use of
an ESP is considered to be
99.5 % or higher
See also graphs and
information below the table
Energy
consumption
(0.1–0.2
percentage
points). Increased
waste generation
Generally
applicable – see
comments below
Generally
applicable –
see comments
below
Costs from EUR 13–60
per kW are reported. The
figures do not include
investment costs for the
collected ash handling
and transportation
systems, which for high
ash content lignite are
significantly high
Plants
42, 127,
128,
134,
141,
219,
223,
389,
415, 547
Bag filter (BF)
See Section 3.2.2.1.2
Reduction of
particulate
emissions,
particularly fine
dust (PM2.5 and
PM10).
Removal of metals
as a co-benefit
High operational
experience
The dust reduction rate
associated with the use of a
BF is considered to be
99.95 % or higher.
See also graphs and
information below the table
The efficiency of
the power plant
is reduced by
0.1–0.4
percentage
points. Bag life
decreases with
higher sulphur
content in the
fuel and when
using upstream
dry sorbent
injection
Generally
applicable – see
comments below
Generally
applicable –
see comments
below
Operating and
maintenance costs are
higher than for an ESP
Plants
221,
224,
253, 662
Cyclones See Section 3.2.2.1.3
Reduction of
particulate
emissions. Very
limited reduction of
fine particles
High operational
experience NA
Generally
applicable – see
comments below
Generally
applicable –
see comments
below
Low investment costs NA
Desulphurisation
techniques
See Section
3.2.2.2.These
techniques are mainly
used for SOX, HCl or
HF control
SOX and halide
reduction with
additional reduction
effect on dust
emissions
NA NA See Table 5.36 NA NA
NA = No relevant specific information avaialable
WORKIN
G DRAFT IN
PROGRESS

Chapter 5
414 June 2016 TL/JFF/FN/EIPPCB/LCP_Final Draft
Additional information on applicability
The ESP has been the better economic solution. In coal-fired combustion, plant bag filters
are mainly used downstream of dry and semi-dry techniques to reduce SOX emissions.
Mechanical cyclones are only used as a pre-deduster in combination with other techniques
such as an ESP or BF.
Particle-bound mercury is attached to solids, so it can be readily captured in an ESP or in a
BF. Where the removal of Hg is low due to the high alkalinity of the fly ash and low level
of HCl in the flue-gases, specific/additional techniques may be necessary (see Section
5.1.3.4.3).
A wet scrubber used for desulphurisation, which is commonly applied in plants above
300 MWth, also reduces dust.
Environmental performance and operational data for dust emissions from well-
performing plants based on data collected at European level for 2010
Reported yearly average concentrations from well-performing plants sized between 50 MWth
and 100 MWth including pulverised, fluidised bed and grate combustion, are between ≤ 2
mg/Nm3 and 18 mg/Nm
3 (see Figure 5.26), for plants operated between 2000 h/yr and 8000 h/yr
in different industrial sectors, such as power generation, district heating or the chemical
industry, with an equivalent full load factor above 60 %. These plants burn coal and/or lignite
and reduce dust emissions by means of an ESP containing at least two fields, sometimes co-
benefiting also from sorbent injection in the boiler used for sulphur reduction. They were
commissioned between 1974 and 2010 and generally monitor their dust emissions continuously.
The most recently built plant for which data were reported, an atmospheric CFB boiler
commissioned in 2010 with an ESP, achieves 12.5 mg/Nm3 dust emissions on a yearly basis.
NB: reported emissions are expressed as yearly averages
Source: [TWG data collection 2012]
Figure 5.26: Dust emissions from well-performing coal- and/or lignite-fired plants of less
than 100 MWth
WORKIN
G DRAFT IN
PROGRESS
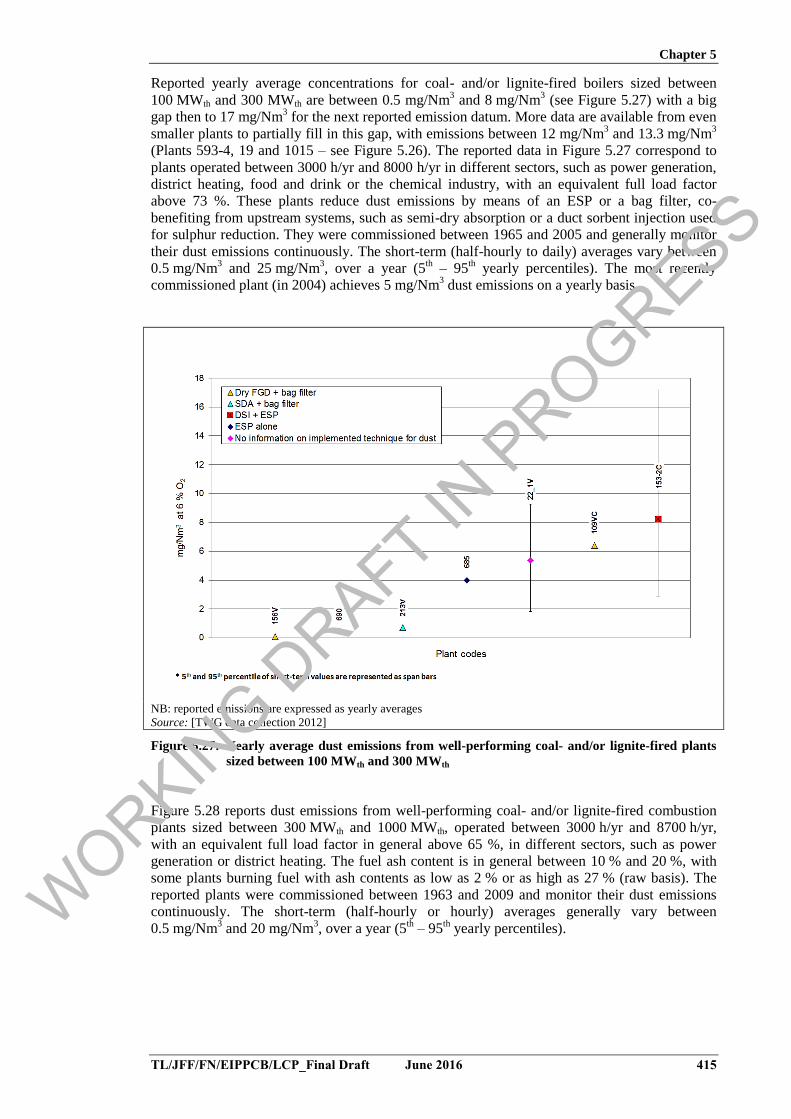
Chapter 5
TL/JFF/FN/EIPPCB/LCP_Final Draft June 2016 415
Reported yearly average concentrations for coal- and/or lignite-fired boilers sized between
100 MWth and 300 MWth are between 0.5 mg/Nm3 and 8 mg/Nm
3 (see Figure 5.27) with a big
gap then to 17 mg/Nm3 for the next reported emission datum. More data are available from even
smaller plants to partially fill in this gap, with emissions between 12 mg/Nm3 and 13.3 mg/Nm
3
(Plants 593-4, 19 and 1015 – see Figure 5.26). The reported data in Figure 5.27 correspond to
plants operated between 3000 h/yr and 8000 h/yr in different sectors, such as power generation,
district heating, food and drink or the chemical industry, with an equivalent full load factor
above 73 %. These plants reduce dust emissions by means of an ESP or a bag filter, co-
benefiting from upstream systems, such as semi-dry absorption or a duct sorbent injection used
for sulphur reduction. They were commissioned between 1965 and 2005 and generally monitor
their dust emissions continuously. The short-term (half-hourly to daily) averages vary between
0.5 mg/Nm3 and 25 mg/Nm
3, over a year (5
th – 95
th yearly percentiles). The most recently
commissioned plant (in 2004) achieves 5 mg/Nm3 dust emissions on a yearly basis.
NB: reported emissions are expressed as yearly averages
Source: [TWG data collection 2012]
Figure 5.27: Yearly average dust emissions from well-performing coal- and/or lignite-fired plants
sized between 100 MWth and 300 MWth
Figure 5.28 reports dust emissions from well-performing coal- and/or lignite-fired combustion
plants sized between 300 MWth and 1000 MWth, operated between 3000 h/yr and 8700 h/yr,
with an equivalent full load factor in general above 65 %, in different sectors, such as power
generation or district heating. The fuel ash content is in general between 10 % and 20 %, with
some plants burning fuel with ash contents as low as 2 % or as high as 27 % (raw basis). The
reported plants were commissioned between 1963 and 2009 and monitor their dust emissions
continuously. The short-term (half-hourly or hourly) averages generally vary between
0.5 mg/Nm3 and 20 mg/Nm
3, over a year (5
th – 95
th yearly percentiles).
WORKIN
G DRAFT IN
PROGRESS
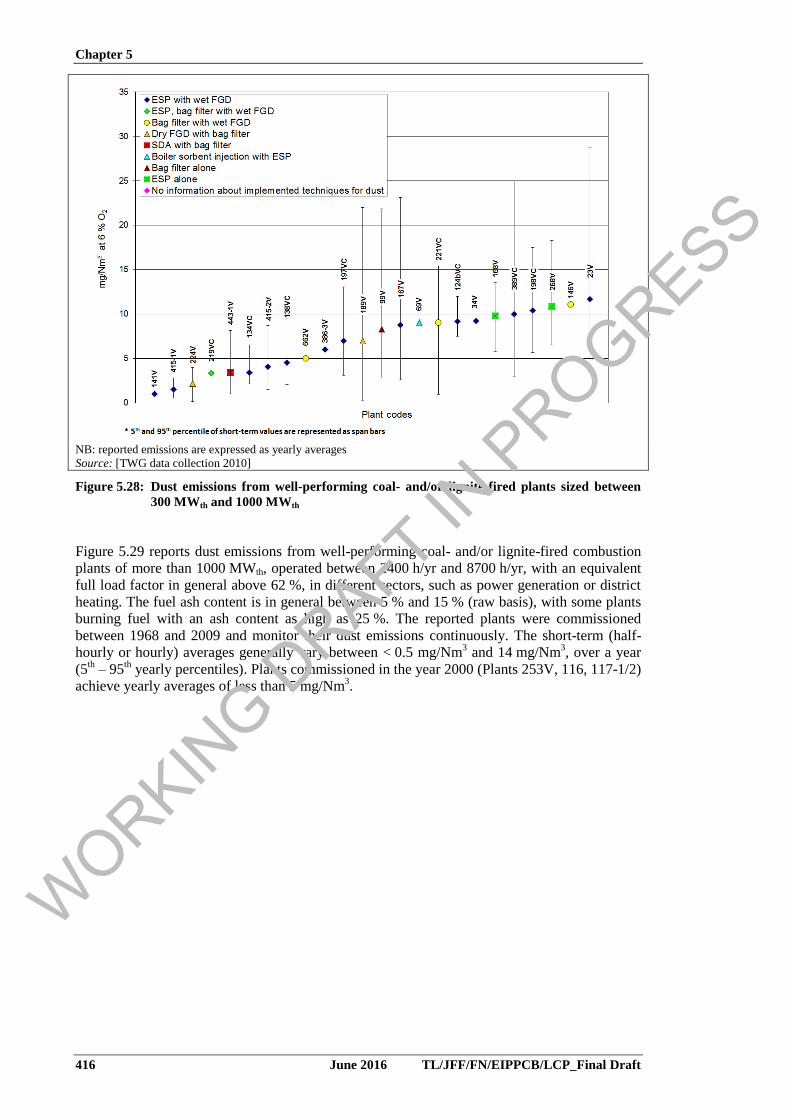
Chapter 5
416 June 2016 TL/JFF/FN/EIPPCB/LCP_Final Draft
NB: reported emissions are expressed as yearly averages
Source: [TWG data collection 2010]
Figure 5.28: Dust emissions from well-performing coal- and/or lignite-fired plants sized between
300 MWth and 1000 MWth
Figure 5.29 reports dust emissions from well-performing coal- and/or lignite-fired combustion
plants of more than 1000 MWth, operated between 2400 h/yr and 8700 h/yr, with an equivalent
full load factor in general above 62 %, in different sectors, such as power generation or district
heating. The fuel ash content is in general between 5 % and 15 % (raw basis), with some plants
burning fuel with an ash content as high as 25 %. The reported plants were commissioned
between 1968 and 2009 and monitor their dust emissions continuously. The short-term (half-
hourly or hourly) averages generally vary between < 0.5 mg/Nm3 and 14 mg/Nm
3, over a year
(5th – 95
th yearly percentiles). Plants commissioned in the year 2000 (Plants 253V, 116, 117-1/2)
achieve yearly averages of less than 5 mg/Nm3.
WORKIN
G DRAFT IN
PROGRESS
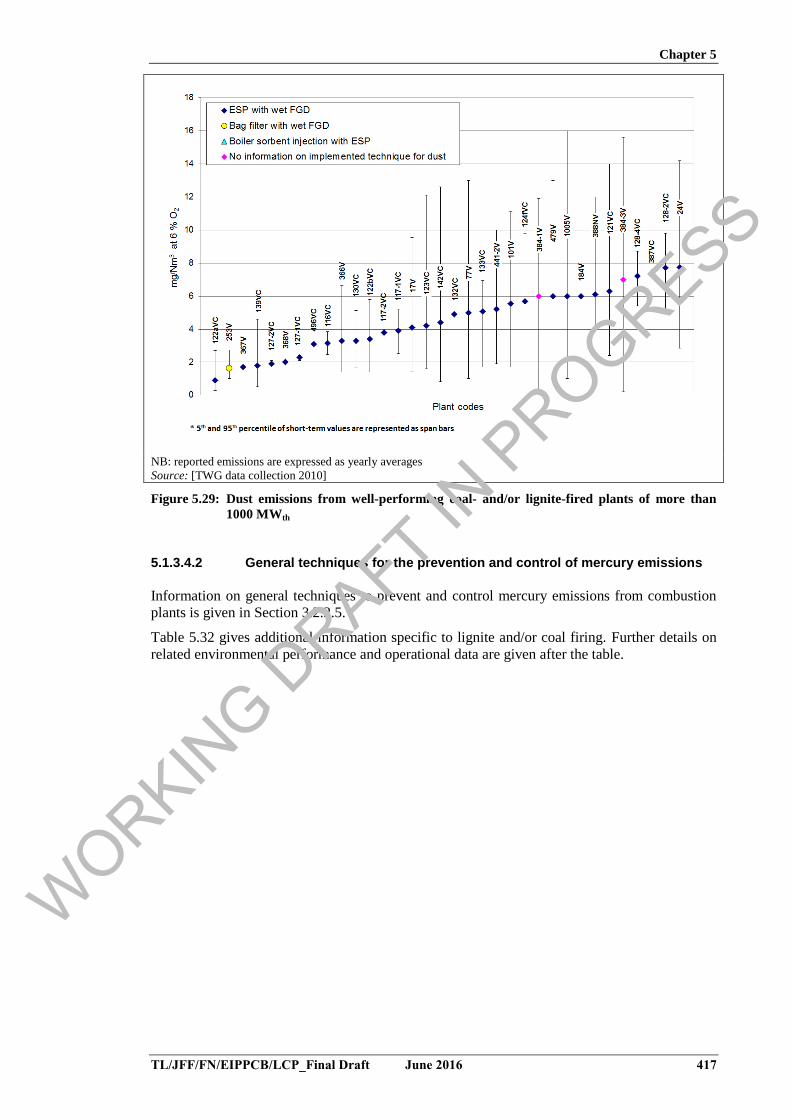
Chapter 5
TL/JFF/FN/EIPPCB/LCP_Final Draft June 2016 417
NB: reported emissions are expressed as yearly averages
Source: [TWG data collection 2010]
Figure 5.29: Dust emissions from well-performing coal- and/or lignite-fired plants of more than
1000 MWth
5.1.3.4.2 General techniques for the prevention and control of mercury emissions
Information on general techniques to prevent and control mercury emissions from combustion
plants is given in Section 3.2.2.5.
Table 5.32 gives additional information specific to lignite and/or coal firing. Further details on
related environmental performance and operational data are given after the table.
WORKIN
G DRAFT IN
PROGRESS

Chapter 5
418 June 2016 TL/JFF/FN/EIPPCB/LCP_Final Draft
Table 5.32: Co-benefit removal of mercury by techniques applied for other pollutants
Technique Technical description
Achieved
environmental
benefits
Environmental
performance and
operational data
Cross-media
effects
Technical considerations relevant to applicability
Economics New plants Existing plants
ESP
Co-benefit of dust
emissions reduction by
capture of particle-
bound mercury - see
Section 3.2.2.5.1
Reduction of
mercury
emissions
High operational
experience
See also graphs and
information below the
table
Energy
consumption
(0.1–0.2
percentage
points).
Generally applicable Generally applicable NA
Bag filter
(BF)
Co-benefit of dust
emissions reduction by
capture of particle-
bound mercury -
see Section 3.2.2.5.1
Reduction of
mercury
emissions
High operational
experience
See also graphs and
information below the
table
The efficiency of
the power plant
is reduced by
0.1 – 0.4
percentage
points
Generally applicable Generally applicable
Operating and
maintenance costs
are higher than for
an ESP
SCR
Co-benefit of NOX
emissions reduction by
enhancing the mercury
oxidation before capture
in a subsequent FGD
unit -
see Section 3.2.2.5.3
Improvement of
mercury
emissions
reduction
NA NA
Not applicable to plants of
< 300MWth operated
< 500 h/yr.
Not generally applicable to
combustion plants of
< 100MWth
Same considerations as for
new plants. Furthermore,
there may be technical and
economic restrictions for
retrofitting plants operated
between 500 h/yr and
1500 h/yr and for existing
plants of ≥ 300 MWth
operated < 500 h/yr
NA
FGD
Co-benefit of SOX
emissions reduction by
solubilising and
capturing the oxidised
mercury -
see Section 3.2.2.5.2
Reduction of
mercury
emissions
NA NA
Applicable when the
technique is mainly used for
SOX, HCl and or/HF
abatement. Wet FGD is not
applicable to plants operated
< 500 h/r.
There may be technical and
economic restrictions for
applying wet FGD to plants
of < 300MWth
Same considerations as for
new plants. Furthermore,
there may be technical and
economic restrictions for
retrofitting existing plants
operated between 500 h/yr
and 1500 h/yr
NA
NA = No relevant specific information available
WORKIN
G DRAFT IN
PROGRESS
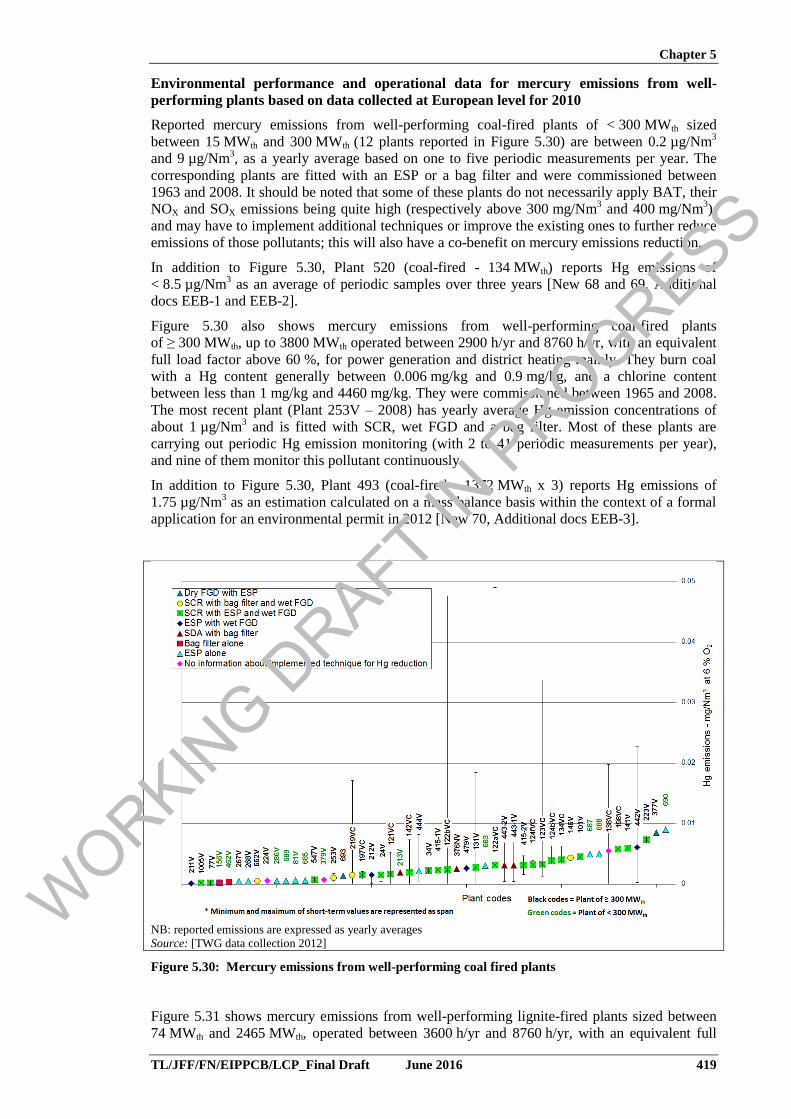
Chapter 5
TL/JFF/FN/EIPPCB/LCP_Final Draft June 2016 419
Environmental performance and operational data for mercury emissions from well-
performing plants based on data collected at European level for 2010
Reported mercury emissions from well-performing coal-fired plants of < 300 MWth sized
between 15 MWth and 300 MWth (12 plants reported in Figure 5.30) are between 0.2 µg/Nm3
and 9 µg/Nm3, as a yearly average based on one to five periodic measurements per year. The
corresponding plants are fitted with an ESP or a bag filter and were commissioned between
1963 and 2008. It should be noted that some of these plants do not necessarily apply BAT, their
NOX and SOX emissions being quite high (respectively above 300 mg/Nm3 and 400 mg/Nm
3),
and may have to implement additional techniques or improve the existing ones to further reduce
emissions of those pollutants; this will also have a co-benefit on mercury emissions reduction.
In addition to Figure 5.30, Plant 520 (coal-fired - 134 MWth) reports Hg emissions of
< 8.5 µg/Nm3 as an average of periodic samples over three years [New 68 and 69, Additional
docs EEB-1 and EEB-2].
Figure 5.30 also shows mercury emissions from well-performing coal-fired plants
of ≥ 300 MWth, up to 3800 MWth operated between 2900 h/yr and 8760 h/yr, with an equivalent
full load factor above 60 %, for power generation and district heating mainly. They burn coal
with a Hg content generally between 0.006 mg/kg and 0.9 mg/kg, and a chlorine content
between less than 1 mg/kg and 4460 mg/kg. They were commissioned between 1965 and 2008.
The most recent plant (Plant 253V – 2008) has yearly average Hg emission concentrations of
about 1 µg/Nm3 and is fitted with SCR, wet FGD and a bag filter. Most of these plants are
carrying out periodic Hg emission monitoring (with 2 to 41 periodic measurements per year),
and nine of them monitor this pollutant continuously.
In addition to Figure 5.30, Plant 493 (coal-fired - 1372 MWth x 3) reports Hg emissions of
1.75 µg/Nm3 as an estimation calculated on a mass balance basis within the context of a formal
application for an environmental permit in 2012 [New 70, Additional docs EEB-3].
NB: reported emissions are expressed as yearly averages
Source: [TWG data collection 2012]
Figure 5.30: Mercury emissions from well-performing coal fired plants
Figure 5.31 shows mercury emissions from well-performing lignite-fired plants sized between
74 MWth and 2465 MWth, operated between 3600 h/yr and 8760 h/yr, with an equivalent full
WORKIN
G DRAFT IN
PROGRESS

Chapter 5
420 June 2016 TL/JFF/FN/EIPPCB/LCP_Final Draft
load factor above 69 %, for power generation and district heating. Very little information has
been reported on the lignite characteristics with as examples levels of chlorine between
100 mg/kg and 210 mg/kg and levels of Hg of about 0.23 mg/kg. These plants were
commissioned between 1951 and 2010. The recently built plants (Plant 23V of 890 MWth and
Plant 19V of 74 MWth) have yearly average Hg emission concentrations lower than 3.5 µg/Nm3.
They do not apply any specific mercury abatement techniques which could further improve their
performance. Reported emission values are the result of continuous monitoring in one case, or
of periodic monitoring with a measurement frequency between once a year and 12 times a year
in the other cases.
NB: reported emissions are expressed as yearly averages
Source: [TWG data collection 2012]
Figure 5.31: Mercury emissions from well-performing lignite-fired plants
Monitoring issues
Monitoring Hg continuously or periodically several times a year permits a better knowledge of
the real performance of the plant as the behaviour of Hg throughout the plant is quite complex
and may vary substantially at the duct level. Sorbent trap monitoring is a cost-effective
alternative to continuous monitoring and has been used as a possible standardised method in the
US for mercury monitoring.
For periodic measurements of Hg, EN 13211 was validated in Europe for exhaust gases from
waste incineration plants in the range of 1–500 µg/m3. A limit of detection of 2.6 μg/m
3
(calculated for a sample gas volume of 50 l) is also given in the standard. For continuous
measurements of Hg, the certified automated measurement system with the lowest certification
range is reported to have a repeatability standard deviation at zero point of 0.2 % of the
certification range, corresponding to a limit of quantification of 0.08 µg/m3. Therefore, it seems
that Hg concentrations of < 1 µg/m3 can be measured in some cases, but that the measurement
uncertainty will be higher as such levels are close to the limit of detection/quantification.
Information on certification of continuous mercury monitors used in the US with levels of
accuracy ≤ 1 µg/Nm3 meeting the Performance certification 12A for mercury continuous
emission monitors (CEMS) has been reported [New 71 and 72, Additional EEB-04 and EEB-
05].
WORKIN
G DRAFT IN
PROGRESS

Chapter 5
TL/JFF/FN/EIPPCB/LCP_Final Draft June 2016 421
Examples of monitoring costs for mercury stack emissions are as follows:
For continuous monitoring, an investment cost of about EUR 80 000–100 000 with an
associated operational cost of about EUR 5000 per year (2010 price levels). The
corresponding EN standard is 14884. Calibration difficulties are reported below 5–
10 µg/Nm3.
For periodic monitoring, a cost of EUR 1500–3000 per sample was reported. The EN
standard 13211 is validated for the measurement range 1–500 µg/Nm3.
[New 60, Lecomte – 2013]
5.1.3.4.3 Specific techniques for the prevention and control of mercury emissions
US EPA data suggest that about a quarter of US installations may be achieving > 90 % Hg
reductions simply as a co-benefit of using other pollution abatement devices, such as flue-gas
desulphurisation, selective catalytic reduction and a bag filter. This technology control
configuration is largely implemented in Europe at coal-fired plants for controlling dust and acid
gases air emissions. However, these abatement techniques may not always be enough or
appropriate for reaching this performance level, due to the coal-lignite characteristics, and may
require additional/alternative solutions as described below, for mercury control.
5.1.3.4.3.1 Fuel pretreatment
Description
Pretreating the fuel before combustion can be used with or without additional co-benefit or Hg-
specific techniques to achieve good levels of reduction in mercury emissions to air. Pretreatment
can be: cleaning, blending with another fuel, and/or using additives.
Technical description
Coal cleaning
There are many types of cleaning processes, all based on the principle that coal is less dense
than the pyritic sulphur, rock, clay, or other ash-producing impurities that are mixed or
embedded in it. Mechanical devices using pulsating water or air currents can physically stratify
and remove impurities. Centrifugal force is sometimes combined with water and air currents to
aid in a further separation of coal from impurities. Another method is dense media washing,
which uses heavy liquid solutions usually consisting of magnetite (finely ground particles of
iron oxide) to separate coal from impurities. Smaller sized coal is sometimes cleaned using froth
flotation. This technique differs from the others because it focuses less on gravity and more on
chemical separation [168, US EPA, 1997].
These processes remove some of the mercury associated with the incombustible mineral
materials. However, they will not typically remove the mercury associated with the organic
carbon structure of the coal.
Furthermore, the effectiveness of mercury removal from coal during conventional coal cleaning
varies widely depending on the source of the coal and on the nature of the mercury within it.
Generally, mercury reduction in lower rank coals/lignite could be expected to be lower than in
bituminous coals, because in lower rank coals a greater fraction of mercury is likely to be bound
to the organic carbon structure and so will not be removed.
Coal blending/switching
In the context of mercury control, there are two objectives of coal blending:
to increase halide concentrations, thereby increasing the proportion of oxidised mercury,
which is water-soluble and can therefore be more easily captured by a flue-gas
desulphurisation scrubber;
WORKIN
G DRAFT IN
PROGRESS
Chapter 5
422 June 2016 TL/JFF/FN/EIPPCB/LCP_Final Draft
to reduce the amount of mercury to be removed by blending with or switching to low-
mercury coals.
Coal additives
The amount of mercury capture generally increases as the amount of halides in coal and unburnt
carbon increases. Therefore, mercury capture can be increased in coals with a low halide content
by adding halides, particularly bromide. Alternatively, hydrogen chloride or ammonium
chloride may be added. Bromine is thought to have an advantage over chlorine as its Deacon-
type reactions are more favourable and it is consumed by SO2 to a lower degree than chlorine,
thus requiring the use of a smaller amount of additive.
With the main application of this technique, i.e. bromide addition, coal additives basically form
a subset of the Br addition technique examined in more detail in Section 5.1.3.4.3.3. Addition
before the boiler is one of several possible options for adding bromide to the fuel, and this will
be discussed in more detail in that section.
Achieved environmental benefit
Reduction of mercury in emissions to air.
Reduction of fuel ash (from about 40 % to 20–30 %) and sulphur contents.
Fuel heating value increase.
Environmental performance and operational data
Due to variations in the source of the coal and the nature of the mercury within it, the
effectiveness of coal cleaning for mercury removal varies widely. In one analysis of 26 US
bituminous coal samples, 5 showed no mercury removal with conventional coal cleaning, whilst
the remaining 21 samples had mercury reductions ranging from 3 % to 64 %, with the average
of all samples being approximately 21 %. However, another study of 24 samples of bituminous
coal showed an average mercury reduction of 37 % on an energy basis, with values ranging
from 12 % to 78 %.
By increasing the proportion of oxidised mercury, coal blending has the potential to increase
mercury capture by the FGD scrubber by up to 80 %.
Cross-media effects
Transfer of mercury to waste waters in the case of using wet cleaning techniques. The dissolved
mercury can be precipitated with sulphides like a usual FGD waste water technique, but
dissolved organic carbon (DOC) will not be reduced with the usual techniques of the power
plant.
Regarding the cross-media effects of coal additives or coal blending/switching, see also Section
5.1.3.4.3.3 on the use of halideated additives.
Technical considerations relevant to applicability
Given the variability depending on the source of the coal and on the nature of the mercury
contained, pretreatment techniques such as coal cleaning need to be tested to determine how
much mercury could be removed from a given coal.
With the use of coal additives, it is very important to achieve an even distribution of the
additives across the fuel to achieve effective mercury reduction.
Economics
For coal additives, see Section 5.1.3.4.3.3.
Driving force for implementation
No information provided.
WORKIN
G DRAFT IN
PROGRESS
Chapter 5
TL/JFF/FN/EIPPCB/LCP_Final Draft June 2016 423
Example plants
For coal additives: Pleasant Prairie power plant (USA).
Reference literature
[ 2, EEB 2012 ]
[New 73 and 74, Eurelectric - VGB 2012]
[New 75, Eurelectric – ECOBA 2012]
[New 76, 77, 78 EEB docs 12/13/14]
5.1.3.4.3.2 Carbon sorbent injection
Description
Mercury absorption by carbon sorbents, such as activated carbon, generally injected in the flue-
gas.
Technical description
This is the most mature mercury-specific control technology, in which mercury is absorbed by
carbon sorbents, with or without chemical treatment. The sorbent injection system can be
enhanced by the addition of a supplementary bag filter. Untreated carbon sorbents may be less
effective for low rank fuels. However, chemically treated sorbents (e.g. with halides such as
chlorine or bromine) can help to convert the more difficult-to-capture mercury contained in such
low rank fuels to a more easily captured form, thereby achieving high mercury reduction across
all coal types.
Sorbent enhancement additives have been also used at some plants to considerably reduce the
rate of sorbent injection and to preserve the quality of its fly ash for reuse. These objectives are
being further enhanced by refining sorbents through milling and changing the sorbent injection
sites. In addition, some applications have found that injecting sorbents on the hot side of air
preheaters can decrease the amount of sorbent needed to achieve the desired levels of mercury
control.
Achieved environmental benefit
Reduction of mercury emissions.
Positive side effect on the removal of SOX and NOX, thereby increasing the cost-
effectiveness of the application.
Increased dust abatement where an ESP or BF is used.
Environmental performance and operational data
Commercial deployments and 50 US Department of Energy (DoE) industry tests of sorbent
injection systems achieved on average 90 % reductions in mercury emissions. These systems are
being used on 25 boilers at 14 US coal-fired plants. The effectiveness of the sorbent injection is
largely affected by the coal type and boiler configuration and by the appropriate and
homogeneous distribution of sorbent material over the duct cross section. A US Environmental
Protection Agency (EPA) analysis of the best performers showed an average mercury emission
reduction of nearly 96 % across all three primary coal ranks i.e. bituminous, sub-bituminous and
lignite.
Mercury removal increases with the amount of sorbent injected into the flue-gases. Among the
plants studied by the US DOE, the average sorbent injection rate was 6.5 vol-%, with rates
ranging from 0.8 vol-% to 17.5 vol-%.
The removal efficiency of the carbon sorbents increases if a bag filter is used instead of an ESP,
due to the longer residence time allowing more contact between the sorbent and the mercury-
laden flue-gas. As a result, only one third of the sorbent is needed to capture the same amount of
mercury compared to an ESP.
WORKIN
G DRAFT IN
PROGRESS

Chapter 5
424 June 2016 TL/JFF/FN/EIPPCB/LCP_Final Draft
However, substantial reductions are not achievable at all plants as:
Sulphur trioxide – which can form under certain operating conditions or from using high-
sulphur bituminous coals – may limit mercury reductions by preventing mercury from binding to carbon sorbents.
Hot-sided electrostatic precipitators can reduce the effectiveness of sorbent injection
systems, because the high operating temperatures reduce the ability of mercury to bind to
sorbents and to be collected in the devices. However, high-temperature mercury sorbents
have now been developed for use in hot-sided ESPs at temperatures up to 430 °C.
Lignite has relatively high levels of elemental mercury, the most difficult form to capture,
e.g. a share of Hg0 to total Hg in flue-gas of 80 % for lignite-firing boilers against a similar
share of 30 % for coal-firing boilers according to a study performed at six power plants in China [ 28, S.Wang et al. 2009 ].
Other strategies, such as blending coals or using other technologies, may be needed to achieve
substantial reductions at some plants with these issues, including those shown below.
Sulphur trioxide
Using an alkali injection system in conjunction with sorbent injection can effectively lessen
the sulphur trioxide interference.
Mercury control vendors are working to develop alternative flue-gas conditioning agents
that could be used instead of sulphur trioxide in the conditioning system to improve the
performance of the electrostatic precipitators without jeopardising mercury reductions using
sorbent injection.
Although selective catalytic reduction NOX abatement systems often improve mercury
capture, in some cases they may lead to sulphur trioxide interference when sulphur in the
coal is converted to sulphur trioxide gas. Newer selective catalytic reduction systems often
have improved catalytic controls that can minimise the conversion of sulphur to sulphur
trioxide gas.
High-sulphur bituminous coal (i.e. with a sulphur content of at least 1.7 % by weight) may
also lead to the formation of sulphur trioxide interference in some cases, although the
number of plants using these high-sulphur coals is likely to decline with increasingly
stringent sulphur controls. However, there are two ways of addressing this problem:
o using alkali-based sorbents to adsorb sulphur trioxide gas before it can interfere with the performance of the sorbent injection system;
o blending the fuel to include some low-sulphur coal.
Hot-side ESP
Using a heat-resistant sorbent. Non-brominated ACI has very little mercury capture above
150 °C. Brominated ACI can provide both stable and high levels of mercury reduction, up
to temperatures of about 290 °C, and heat-resistant sorbents operate up to 430 °C.
Installing a bag filter in addition to the sorbent injection system.
Lignite
Using a higher sorbent injection rate.
Blending with sub-bituminous coal.
Finally, according to a 2009 US EPA study at two plants equipped with a cold-side or hot-side
ESP, with different coal chlorine contents (150 ppm in one case and 1400 ppm in the other
case), with brominated activated carbon injection upstream of these devices, no increase in air
emissions of total and Toxic Equivalent (TEQ) chlorinated and brominated dioxin compounds
were noted when compared to the content without activated carbon injection.
[New 79, US EPA – Atmospheric Environment journal 2009 - Dioxin and furan emissions from
brominated activated carbon injection – Collection of information/US EPA]
WORKIN
G DRAFT IN
PROGRESS
Chapter 5
TL/JFF/FN/EIPPCB/LCP_Final Draft June 2016 425
Cross-media effects
Higher mercury content in the fly ash.
Brominated/chlorinated activated carbon may cause corrosion.
Higher organic matter in the fly ash composition (unburnt carbon in excess of 1–
1.5 percentage points).
Effects on coal combustion residues
Both chemically and non-chemically treated carbon sorbents impact on coal combustion
residues (CCRs), in particular the fly ash and FGD sludge. This results in CCRs with an
increased content of mercury and other co-collected metals (e.g. arsenic and selenium) and the
presence of injected sorbent and other chemical modifiers. Tests undertaken by the US EPA
show that the mercury is strongly retained in the CCRs, and is unlikely to be leached at levels of
environmental concern. In some facilities, arsenic and selenium may be leached at levels of
potential concern, but this can occur both with and without enhanced mercury control
technologies. However, in many cases, the amount of mercury, arsenic and selenium released
from CCRs is estimated to be a small fraction (< 0.1 % – 5 %) of the total content.
Excess bromine that has not reacted with mercury, and which is converted to bromide, can leach
to some degree if stored in wet ponds, depending on the contact time and the amount of water to
which it is exposed. Apart from that, Br will not leach because it is chemically reacted onto the
activated carbon in the gas phase bromination process. There is also limited Br leaching when
the fly ash containing the sorbents is used in concrete.
The carbon in sorbents can render fly ash unusable for some purposes, thus increasing the need
for storage and disposal. Such disposal may not be allowed in some EU countries. However,
advances in sorbent technologies that have reduced sorbent costs at some plants also offer the
potential to preserve the market value of fly ash, and therefore its use as a by-product, e.g. at
least one manufacturer offers a concrete-friendly sorbent to help preserve fly ash sales.
Alternatively, the fly ash could be segregated with a supplementary bag filter or be processed in
an additional treatment facility to extract the mercury-containing carbon fraction. There is a
process available which separates the carbon-rich particles. This fraction, carbon-rich and
containing the mercury, is disposed of as hazardous waste, depending on national legislations.
[New 73, VGB 2012]
When fly ashes are thermally reprocessed, there may be also a need to use an additional
technique to further segregate the mercury-containing carbon fraction prior to the thermal
treatment, in order to avoid the re-release of the captured Hg in the fly ash as elemental mercury
[New 73, VGB 2012].
According to a supplier of brominated ACI (activated carbon injection) systems, the mercury
content of the concrete would be 0.00001 %. However, some discolouration of the concrete can
occur with the use of ACI.
There is an increase in PM loading of < 4 %, due to sorbent injection, and this is even lower
when halideated sorbents are injected. Calculations suggest that the increase in PM2.5 would be
< 0.2 %. When ESPs are used, this increase is offset by the brominated ACI improving the
operation of the ESP, by the sorbent changing the resistivity of the fly ash, resulting in the
change of the electric field of the ESP.
Technical considerations relevant to applicability
Generally applicable for new and existing plants.
Mercury removal is more effective with the use of bag filters. 80–90 % reductions were
achieved with all three main types of coal (bituminous, sub-bituminous and lignite) and on
boiler types that exist at three quarters of US coal-fired plants.
Plain ACI can be used for applications requiring up to 50–60 % mercury removal,
with brominated ACI able to achieve reductions above 90 %.
WORKIN
G DRAFT IN
PROGRESS
Chapter 5
426 June 2016 TL/JFF/FN/EIPPCB/LCP_Final Draft
Economics
In the US DOE R&D programme, the costs of purchasing and installing sorbent injection
systems and monitoring equipment averaged USD 3.6 million, ranging from USD1.2 million to
USD 6.2 million. Where bag filters have also been installed, primarily to assist the sorbent
injection system in Hg reduction, the average cost is USD 16 million, ranging from
USD 12.7 million to USD 24.5 million. The apportioning of these average capital costs is set
out in Table 5.33.
Table 5.33: Example of capital costs for implementing a sorbent injection system for mercury
reduction
Component costs Sorbent injection system
Sorbent injection system +
bag filter to assist in
mercury removal
Number of boilers 14 5
Sorbent injection system USD 2 723 277 USD 1 334 971
Mercury emissions
monitoring system
USD 559 592 USD 119 544
Consulting and engineering USD 381 535 USD 1 444 179
Bag filter USD 19 009 986
TOTAL USD 3 594 023 (1) USD 15 785 997 (
1)
(1) Numbers do not add up to total. The total cost was provided for all of the boilers, but individual cost
category data was only provided for some of them.
Another source from an activated carbon injection systems provider gives fixed cost (2013 price
levels) of USD 0.5–1.5 million per installation.
The average annualised operating costs of sorbent injection systems in the US are USD 640 000
– almost entirely sorbent costs. These costs are now being reduced in some applications by the
use of sorbent enhancement additives.
Eight boilers in the DOE study reported actual or estimated fly ash-related costs at an average
net cost of USD 1.1 million per year.
For those plants that installed a sorbent injection system alone to meet mercury emission
requirements, the cost to purchase, install and operate sorbent injection and monitoring systems
represented an additional cost of USD 0.12 cents per kilowatt hour.
Driving force for implementation
The driver for implementing mercury control techniques is the prospect or existence of
legislation.
Example plant
The US EPA undertook a detailed study of 25 boilers at 14 coal-fired plants in the United States
where sorbents have been commercially applied. Of these, 13 have been identified by the US
authorities – BI England, New Jersey; Brayton Point, Massachusetts; Bridgeport Harbor,
Connecticut; Crawford, Illinois; Fisk, Illinois; Indian River Generating Station, Delaware;
Mercer Generating Station, New Jersey; Presque Isle, Michigan; TS Power Plant, Nevada;
Vermillion Power Station, Illinois; Walter Scott junior Energy Centre, Iowa; Waukegan,
Illinois; Weston, Wisconsin. All met the emissions reductions required by their State, and
averaged 90 % reductions. For example:
A 164 MWe bituminous-fired boiler, built in the 1960s and operating a cold-side
electrostatic precipitator and wet scrubber, exceeded its 90 % reduction requirement,
achieving more than 95 % mercury emission reductions using chemically treated carbon
sorbent.
WORKIN
G DRAFT IN
PROGRESS

Chapter 5
TL/JFF/FN/EIPPCB/LCP_Final Draft June 2016 427
A 400 MWe sub-bituminous-fired boiler, built in the 1960s and operating a cold-side
electrostatic precipitator and a bag filter, achieved a 99 % mercury reduction using
untreated carbon sorbent, exceeding its 90 % reduction regulatory requirement.
A recently constructed 600 MWe sub-bituminous-fired boiler operating a bag filter, dry
scrubber, and selective catalytic reduction system achieved an 85 % mercury emission
reduction using chemically treated carbon sorbent, exceeding its 83 % reduction regulatory
requirement.
Example plants operated in the US in 2013 are given in Table 5.34.
Table 5.34: Example US plants operating brominated activated carbon injection systems
Plant
name
Size,
MWe Fuel NOX SOX Dust Hg
Hg
reduction
rate
Detroit
Edison St.
Clair
169 PRB/low S
bituminous (85/15) LNB none
Cold
ESP
ACI, 48
mg/m3
94 %
GRE
Stanton 10 60 Lignite None SDA BF
ACI, 24
mg/m3
90 %
PPL
Corrette 163 PRB LNB None
Cold
ESP
ACI, 32
mg/m3
90 %
Bicent,
Harden 119 PRB LNB SDA BF
ACI, 16
mg/m3
90 %
Sunflower
Electric,
Holcomb
1
349 PRB LNB SDA BF ACI, 19
mg/m3
93 %
Ameren,
Meramec
2
138 PRB LNB None Cold
ESP
ACI, 53
mg/m3
93 %
Great
river,
Stanton 1
188 PRB None None Cold
ESP
ACI, 27
mg/m3
85 %
NRG,
Limestone
1
890 Lignite and PRB NA WFGD Cold
ESP
ACI, 16
mg/m3
90 %
Progress,
Lee 1 79
EasternLignPRBite
and PRB
bituminous
LNB None Cold
ESP
ACI, 128
mg/m3
85 %
Source: New 80, EEB 2013 Comments
Reference literature
[ 2, EEB 2012 ] [ 38, US-GAO 2009 ]
[New 73, VGB 2012] [New 74, ECOBA2012] [New 80, EEB comments]
5.1.3.4.3.3 Use of halideated additives (e.g. bromide)
Description
Addition of halides to the fuel or into the furnace to oxidise the flue-gas mercury into a soluble
species, thereby enhancing mercury removal in downstream control devices.
Technical description
The bromide can be injected at any of several different points:
to the fuel before it gets into the storage bunker,
to the fuel as it leaves the bunker,
to the partial fuel streams flowing to different coal mills,
WORKIN
G DRAFT IN
PROGRESS
Chapter 5
428 June 2016 TL/JFF/FN/EIPPCB/LCP_Final Draft
to the combustion chamber directly via injection spray nozzles,
to the effluent gas leaving the combustion chamber,
to the boiler gas (if the temperature is high enough i.e. 500 °C, preferably > 800 °C).
The addition rates range from < 40 ppm to 440 ppm Br per tonne of fuel, dry basis, the most
common addition rate being around 50 ppm.
Achieved environmental benefit
Reduced mercury emissions.
Environmental performance and operational data
Mercury oxidation rates of 85 % to > 95 %, reduction rates of 82 % to > 89 %, and emission
levels of < 1µg/Nm3 are reported (VGB 2013).
For units without SCR: higher bromide addition rates are required to achieve the same mercury
oxidation than for units with SCR.
For units without FGD: bromide addition alone does not reduce Hg emissions significantly, but
it improves the effectiveness of ACI for these units. High levels of SO3 in the flue-gas may limit
the efficiency of such a bromide addition/ACI combination and may require an additional SO3
mitigation technology.
It is important to achieve an even distribution of the bromide onto the fuel. Without this, the
performance is less effective.
Cross-media effects
Flue-gas mercury measurements are very difficult to carry out in the presence of bromine in
the flue-gas.
Potential for bromide-induced corrosion in the ductwork, air heater and in FGD systems,
emphasised at higher injection rates. However, the level of Br injected is generally much
lower than the level of Cl contained in the fuel, meaning that equipment corrosion should
not be significantly impacted by the technique. There is still a residual risk in the long term
that needs to be monitored. Experience so far indicates that there is not a clear link between
the use of halideated additives and discernible corrosion problems.
Increase in bromide and mercury in the fly ash and FGD waste water/gypsum. A decrease in
Se in the fly ash is offset by an increase in Se in the FGD liquor. Because of its volatility,
the bromide in the gypsum may be emitted into the air during the heating/calcination of the
gypsum in the processing industry.
Potential for re-emission of mercury from the FGD may compromise the achievement of
mercury emission levels at stack below 1 µg/Nm3
in some cases. In these cases the control of
the FGD redox potential is very important, to prevent the initially adsorbed oxidised
mercury (Hg2+
) being reduced in the FGD into elemental mercury (Hg0
) and re-emitted via
the gas phase through the stack.
Increase level of Br emissions to air (estimation of 300 µg/Nm3 for an injection rate of
50 mg/kg) and to water (estimation of 340 mg/l of [Br-] for an injection rate of 50 mg/kg.
Potential increase of AOX emissions to water.
Technical considerations relevant to applicability
Applicable to coals/lignites with a low chlorine content.
Economics
The following costs correspond to a 600 MWe plant (2013 price levels):
bromide addition: EUR 130 000 (for 25 mg Br per kg fuel);
O&M: EUR 10 000 per year;
annualised installation and license fee costs: EUR 250 000 [(EUR 450 000 installation costs
plus EUR 900 000 license fee) x 0.08 annuity factor].
WORKIN
G DRAFT IN
PROGRESS
Chapter 5
TL/JFF/FN/EIPPCB/LCP_Final Draft June 2016 429
A bromine and bromine derivatives manufacturer in the US provided the following cost data
(2013 price levels) for the different additives available (the exact pricing depends upon the
terms of the contracts, including the volume, contract period, package type, delivery location
etc.):
elemental bromine: mean pricing of USD 4 000/tonne;
calcium bromide 52 % solution: mean pricing of USD 1 600/ tonne;
sodium bromide 44 % solution: mean pricing of USD 1 400/ tonne;
sodium bromide solid: mean pricing of USD 3 000/ tonne.
For plants without SCR (with and without FGD), the use of ACI in conjunction with bromide
addition may be more cost-effective than either ACI or bromide addition alone to achieve the
same level of performance.
Driving force for implementation
No information provided.
Example plants
In the past few years, dozens of US coal-fired units have begun to operate furnace calcium
bromide addition systems to achieve mercury air emissions limits set by local regulations; 50 of
them took part in a survey [ 39, Dombrowski et al. 2012 ].
Reference literature
[ 39, Dombrowski et al. 2012 ] [ 2, EEB 2012 ]
[New 73, Eurelectric - DNVKEMA, 2013]
[New 75, VGB 2012]
[New 74, ecoba2012]
[New 81, New 82, Vosteen Consulting 2013]
5.1.3.4.3.4 Other specific techniques for the prevention and control of gaseous
mercury
Table 5.36 presents other specific techniques to be considered in the determination of BAT for
the prevention and control of mercury emissions from coal- and/or lignite-fired plants, in
addition to the ones describes in Sections 5.1.3.4.3.1 to 5.1.3.4.3.3.
WORKIN
G DRAFT IN
PROGRESS

Chapter 5
430 June 2016 TL/JFF/FN/EIPPCB/LCP_Final Draft
Table 5.35: Other specific techniques to consider for the prevention and control of gaseous mercury emissions
Technique Technical
description
Achieved
environmental
benefits
Environmental
performance and
operational data
Cross-media
effects
Technical considerations
relevant to applicability Economics
Driving force
for
implementatio
n
Example
plants
New plants Existing
plants
Optimisation of
SCR catalysts
for oxidation of
Hg0 to Hg
2+
NA
Increased share of
oxidised Hg in raw
flue-gas and hence
capture in filter
and/or scrubber
R&D on optimised catalysts ongoing
None Generally
applicable
Generally
applicable -co-
benefit already
exists in SCR
upstream of
wet FGD
Could be high if
existing catalysts
have to be
replaced
NA NA
Optimisation of
SCR catalysts to
minimise
oxidation of Hg0
to Hg2+
In combination with
activated carbon
injection
Minimise level of
mercury in waste
water (e.g. in case
of seawater FGD)
while maximising
capture in ESP/BF
Limited experience Mercury transfer to
fly ash
Generally
applicable
Generally
applicable
Could be high if
existing catalysts
have to be
replaced
Limit the
impact on
waste waters
Plant 493
Addition of
activated carbon
in WFGD
NA Reduction of Hg
emissions Limited experience
Reduction in
gypsum quality
(colour, Hg
content)
Generally
applicable Generally
applicable
Addition of
activated carbon
in FGD has low
investment and
operation costs
NA NA
Addition of
organic or
inorganic
sulphides in
FGD
NA Reduction of Hg
emissions
Well known in
waste incineration
Gypsum quality, dissolved organic
carbons (DOC) in
effluent, risk of
foaming resulting
from bacterial
processes
Generally
applicable Generally
applicable Low investment NA NA
Addition of
strong ligands
like bromide in
FGD
NA Reduction of Hg
emissions
Limited to lab-scale
and a few full-scale
tests
More bromide in
waste water than
from coal only
Generally
applicable Generally
applicable NA NA NA
WORKIN
G DRAFT IN
PROGRESS

Chapter 5
TL/JFF/FN/EIPPCB/LCP_Final Draft June 2016 431
Technique Technical
description
Achieved
environmental
benefits
Environmental
performance and
operational data
Cross-media
effects
Technical considerations
relevant to applicability Economics
Driving force
for
implementatio
n
Example
plants
New plants Existing
plants
Precipitate Hg
separately from
other metals in
FGD waste
water
Concentrates Hg to a
low-mass sink and
thus indirectly helps
to keep Hg away
from all other sinks,
such as clean gas,
gypsum, etc.
Makes a small
waste stream
product the main
sink for Hg
Tested at full scale Reduces cross-
media effects NA NA
Only small
amount of waste
to be disposed
of.
Low-Hg main
share of sludge
can be recycled
to the furnace
NA NA
NA = No relevant specific information available
Source: [New 61, LCP BREF 2006] [New 85,Eurelectric draft text 2012] [New 84, DE - Draft VDI 3927-2 2013]
WORKIN
G DRAFT IN
PROGRESS

Chapter 5
432 June 2016 TL/JFF/FN/EIPPCB/LCP_Final Draft
5.1.3.5 Techniques for the prevention and control of SOX, HCl and HF emissions
5.1.3.5.1 General techniques for the prevention and control of SOX, HCl and HF
emissions
Information on general techniques to prevent and control SOX, HCl and HF emissions from
combustion plants is given in Sections 3.2.2.2, 3.2.2.4, and 3.2.2.6.
Table 5.36 gives additional information specific to lignite and/or coal firing. Further details on
related environmental performance and operational data are provided after this table.
WORKIN
G DRAFT IN
PROGRESS
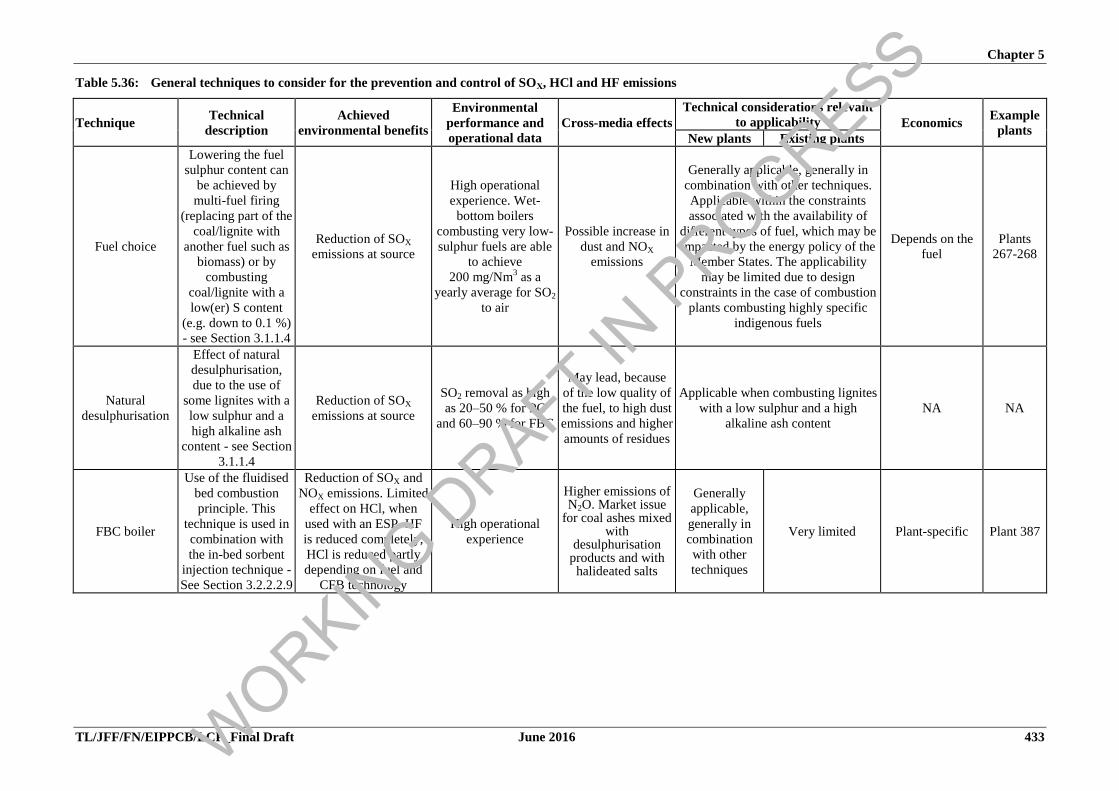
Chapter 5
TL/JFF/FN/EIPPCB/LCP_Final Draft June 2016 433
Table 5.36: General techniques to consider for the prevention and control of SOX, HCl and HF emissions
Technique Technical
description
Achieved
environmental benefits
Environmental
performance and
operational data
Cross-media effects
Technical considerations relevant
to applicability Economics Example
plants New plants Existing plants
Fuel choice
Lowering the fuel
sulphur content can
be achieved by
multi-fuel firing
(replacing part of the
coal/lignite with
another fuel such as
biomass) or by
combusting
coal/lignite with a
low(er) S content
(e.g. down to 0.1 %)
- see Section 3.1.1.4
Reduction of SOX
emissions at source
High operational
experience. Wet-
bottom boilers
combusting very low-
sulphur fuels are able
to achieve
200 mg/Nm3 as a
yearly average for SO2
to air
Possible increase in
dust and NOX
emissions
Generally applicable, generally in
combination with other techniques.
Applicable within the constraints
associated with the availability of
different types of fuel, which may be
impacted by the energy policy of the
Member States. The applicability
may be limited due to design
constraints in the case of combustion
plants combusting highly specific
indigenous fuels
Depends on the
fuel
Plants
267-268
Natural
desulphurisation
Effect of natural
desulphurisation,
due to the use of
some lignites with a
low sulphur and a
high alkaline ash
content - see Section
3.1.1.4
Reduction of SOX
emissions at source
SO2 removal as high
as 20–50 % for PC
and 60–90 % for FBC
May lead, because
of the low quality of
the fuel, to high dust
emissions and higher
amounts of residues
Applicable when combusting lignites
with a low sulphur and a high
alkaline ash content
NA NA
FBC boiler
Use of the fluidised
bed combustion
principle. This
technique is used in
combination with
the in-bed sorbent
injection technique -
See Section 3.2.2.2.9
Reduction of SOX and
NOX emissions. Limited
effect on HCl, when
used with an ESP. HF
is reduced completely,
HCl is reduced partly
depending on fuel and
CFB technology
High operational
experience
Higher emissions of N2O. Market issue
for coal ashes mixed with
desulphurisation products and with
halideated salts
Generally
applicable,
generally in
combination
with other
techniques
Very limited Plant-specific Plant 387
WORKIN
G DRAFT IN
PROGRESS
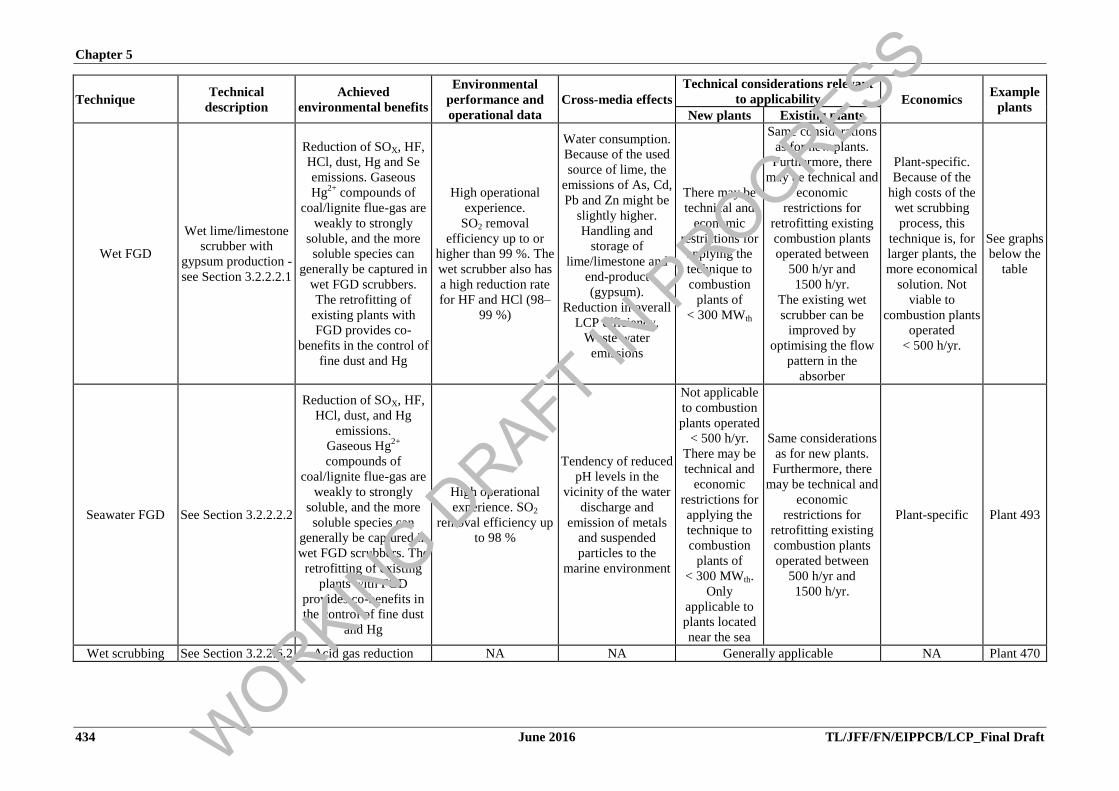
Chapter 5
434 June 2016 TL/JFF/FN/EIPPCB/LCP_Final Draft
Technique Technical
description
Achieved
environmental benefits
Environmental
performance and
operational data
Cross-media effects
Technical considerations relevant
to applicability Economics Example
plants New plants Existing plants
Wet FGD
Wet lime/limestone
scrubber with
gypsum production -
see Section 3.2.2.2.1
Reduction of SOX, HF,
HCl, dust, Hg and Se
emissions. Gaseous
Hg2+
compounds of
coal/lignite flue-gas are
weakly to strongly
soluble, and the more
soluble species can
generally be captured in
wet FGD scrubbers.
The retrofitting of
existing plants with
FGD provides co-
benefits in the control of
fine dust and Hg
High operational
experience.
SO2 removal
efficiency up to or
higher than 99 %. The
wet scrubber also has
a high reduction rate
for HF and HCl (98–
99 %)
Water consumption.
Because of the used
source of lime, the
emissions of As, Cd,
Pb and Zn might be
slightly higher.
Handling and
storage of
lime/limestone and
end-product
(gypsum).
Reduction in overall
LCP efficiency.
Waste water
emissions
There may be
technical and
economic
restrictions for
applying the
technique to
combustion
plants of
< 300 MWth
Same considerations
as for new plants.
Furthermore, there
may be technical and
economic
restrictions for
retrofitting existing
combustion plants
operated between
500 h/yr and
1500 h/yr.
The existing wet
scrubber can be
improved by
optimising the flow
pattern in the
absorber
Plant-specific.
Because of the
high costs of the
wet scrubbing
process, this
technique is, for
larger plants, the
more economical
solution. Not
viable to
combustion plants
operated
< 500 h/yr.
See graphs
below the
table
Seawater FGD See Section 3.2.2.2.2
Reduction of SOX, HF,
HCl, dust, and Hg
emissions.
Gaseous Hg2+
compounds of
coal/lignite flue-gas are
weakly to strongly
soluble, and the more
soluble species can
generally be captured in
wet FGD scrubbers. The
retrofitting of existing
plants with FGD
provides co-benefits in
the control of fine dust
and Hg
High operational
experience. SO2
removal efficiency up
to 98 %
Tendency of reduced
pH levels in the
vicinity of the water
discharge and
emission of metals
and suspended
particles to the
marine environment
Not applicable
to combustion
plants operated
< 500 h/yr.
There may be
technical and
economic
restrictions for
applying the
technique to
combustion
plants of
< 300 MWth.
Only
applicable to
plants located
near the sea
Same considerations
as for new plants.
Furthermore, there
may be technical and
economic
restrictions for
retrofitting existing
combustion plants
operated between
500 h/yr and
1500 h/yr.
Plant-specific Plant 493
Wet scrubbing See Section 3.2.2.6.2 Acid gas reduction NA NA Generally applicable NA Plant 470
WORKIN
G DRAFT IN
PROGRESS

Chapter 5
TL/JFF/FN/EIPPCB/LCP_Final Draft June 2016 435
Technique Technical
description
Achieved
environmental benefits
Environmental
performance and
operational data
Cross-media effects
Technical considerations relevant
to applicability Economics Example
plants New plants Existing plants
Other wet
scrubber types
(Magnesium or
Ammonia or Lye
wet scrubber)
See Sections
3.2.2.2.3, 3.2.2.2.4
and 3.2.2.2.5
Reduction of SOX. The
reduction of other
pollutants depends on
the specific technique
Very limited
Water consumption
+ depends on the
technique
Generally
applicable, but
rarely in new
plants
Depends on the
individual plant Not available NA
Spray dry
scrubber or
absorber (SDA)
See Section 3.2.2.2.6
Reduction of SO2, HF,
HCl, SO3, dust, and Hg
emissions
Gaseous Hg2+
compounds of
coal/lignite flue-gas can
generally also be
captured in spray dry
absorber, in particular in
combination with a BF.
The retrofitting of
existing plants with
FGD provides co-
benefits in the control of
fine dust and Hg
High operational
experience. SO2
removal efficiencies
up to 92 %.
Halide removal
efficiencies > 95 %
Water consumption.
Handling and
storage of lime and
end-product.
Slight reduction in
overall LCP energy
efficiency
Generally
applicable up
to 1250–
1500 MWth in
one absorber
Generally applicable
up to 1250–
1500 MWth in one
absorber
Plant-specific –
indicative costs:
CAPEX EUR
0.028 million/
MW input
excluding civil
works – OPEX
EUR 0.37/ MW
input. No
significant
difference
between new and
retrofitted plants
Plant 443
Sorbent injection
(in-bed, in-furnace
or in-duct dry)
See Sections
3.2.2.2.8, 3.2.2.2.9
and 3.2.2.2.10.
Reduction of SOX, HF,
HCl, dust
High operational
experience. SO2
removal efficiencies
up to 65 % in BFB
boilers, up to 80 % in
duct injection or other
furnace injection
systems and up to 95
% in CFB boilers
Residues that need
to be landfilled if not
utilised in coal
mines.
Higher particulate
matter downstream
of the boiler; in
existing plants, ESPs
may be under
designed to handle
the increased dust
load
Generally
applicable Generally applicable NA
Plants 109
(DSI)
19 - 387
(Boiler
sorbent
injection)
CFB scrubber See Section 3.2.2.2.7
Reduction of SOX and
halide emissions.
Improvement of dust
removal efficiency
SOX removal
efficiency: 90–99 %
Halide reduction
efficiency: > 95 %
By-product
marketability may
be an issue
Generally
applicable Generally applicable NA Plant 189
WORKIN
G DRAFT IN
PROGRESS
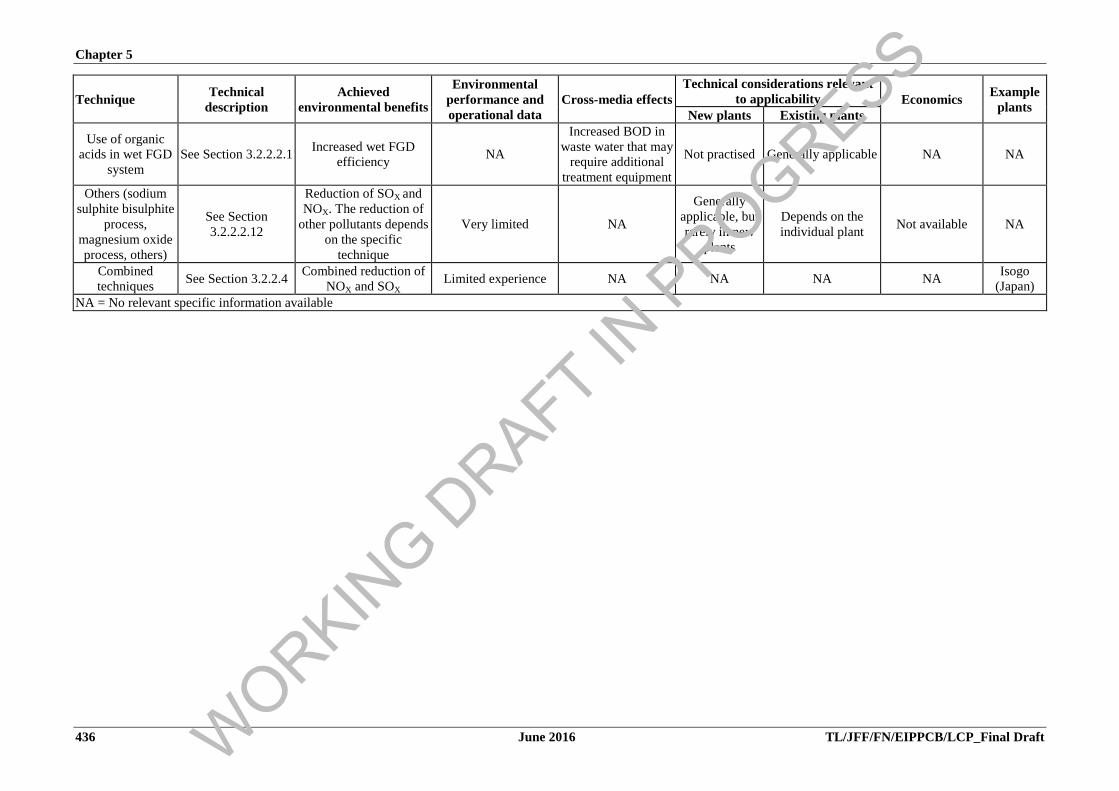
Chapter 5
436 June 2016 TL/JFF/FN/EIPPCB/LCP_Final Draft
Technique Technical
description
Achieved
environmental benefits
Environmental
performance and
operational data
Cross-media effects
Technical considerations relevant
to applicability Economics Example
plants New plants Existing plants
Use of organic
acids in wet FGD
system
See Section 3.2.2.2.1 Increased wet FGD
efficiency NA
Increased BOD in
waste water that may
require additional
treatment equipment
Not practised Generally applicable NA NA
Others (sodium
sulphite bisulphite
process,
magnesium oxide
process, others)
See Section
3.2.2.2.12
Reduction of SOX and
NOX. The reduction of
other pollutants depends
on the specific
technique
Very limited NA
Generally
applicable, but
rarely in new
plants
Depends on the
individual plant Not available NA
Combined
techniques See Section 3.2.2.4
Combined reduction of
NOX and SOX Limited experience NA NA NA NA
Isogo
(Japan)
NA = No relevant specific information available
WORKIN
G DRAFT IN
PROGRESS
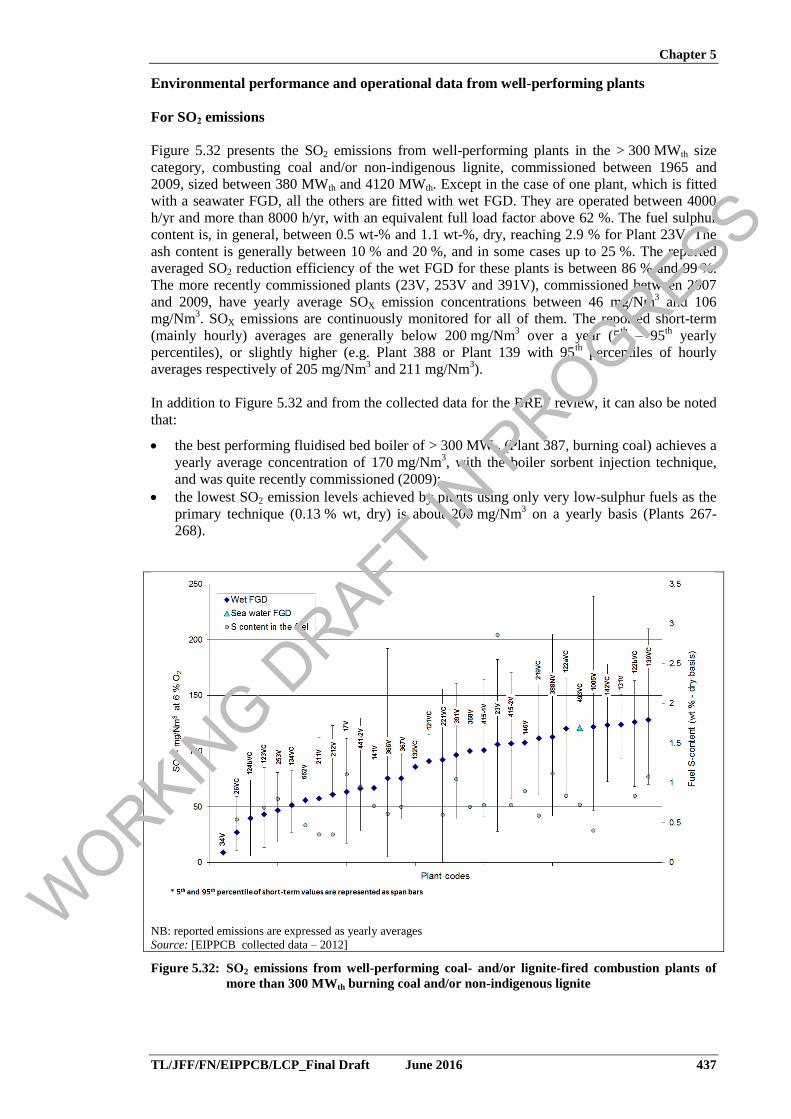
Chapter 5
TL/JFF/FN/EIPPCB/LCP_Final Draft June 2016 437
Environmental performance and operational data from well-performing plants
For SO2 emissions
Figure 5.32 presents the SO2 emissions from well-performing plants in the > 300 MWth size
category, combusting coal and/or non-indigenous lignite, commissioned between 1965 and
2009, sized between 380 MWth and 4120 MWth. Except in the case of one plant, which is fitted
with a seawater FGD, all the others are fitted with wet FGD. They are operated between 4000
h/yr and more than 8000 h/yr, with an equivalent full load factor above 62 %. The fuel sulphur
content is, in general, between 0.5 wt-% and 1.1 wt-%, dry, reaching 2.9 % for Plant 23V. The
ash content is generally between 10 % and 20 %, and in some cases up to 25 %. The reported
averaged SO2 reduction efficiency of the wet FGD for these plants is between 86 % and 99 %.
The more recently commissioned plants (23V, 253V and 391V), commissioned between 2007
and 2009, have yearly average SOX emission concentrations between 46 mg/Nm3 and 106
mg/Nm3. SOX emissions are continuously monitored for all of them. The reported short-term
(mainly hourly) averages are generally below 200 mg/Nm3 over a year (5
th – 95
th yearly
percentiles), or slightly higher (e.g. Plant 388 or Plant 139 with 95th percentiles of hourly
averages respectively of 205 mg/Nm3 and 211 mg/Nm
3).
In addition to Figure 5.32 and from the collected data for the BREF review, it can also be noted
that:
the best performing fluidised bed boiler of > 300 MWth (Plant 387, burning coal) achieves a
yearly average concentration of 170 mg/Nm3, with the boiler sorbent injection technique,
and was quite recently commissioned (2009);
the lowest SO2 emission levels achieved by plants using only very low-sulphur fuels as the
primary technique (0.13 % wt, dry) is about 200 mg/Nm3 on a yearly basis (Plants 267-
268).
NB: reported emissions are expressed as yearly averages
Source: [EIPPCB collected data – 2012]
Figure 5.32: SO2 emissions from well-performing coal- and/or lignite-fired combustion plants of
more than 300 MWth burning coal and/or non-indigenous lignite
WORKIN
G DRAFT IN
PROGRESS
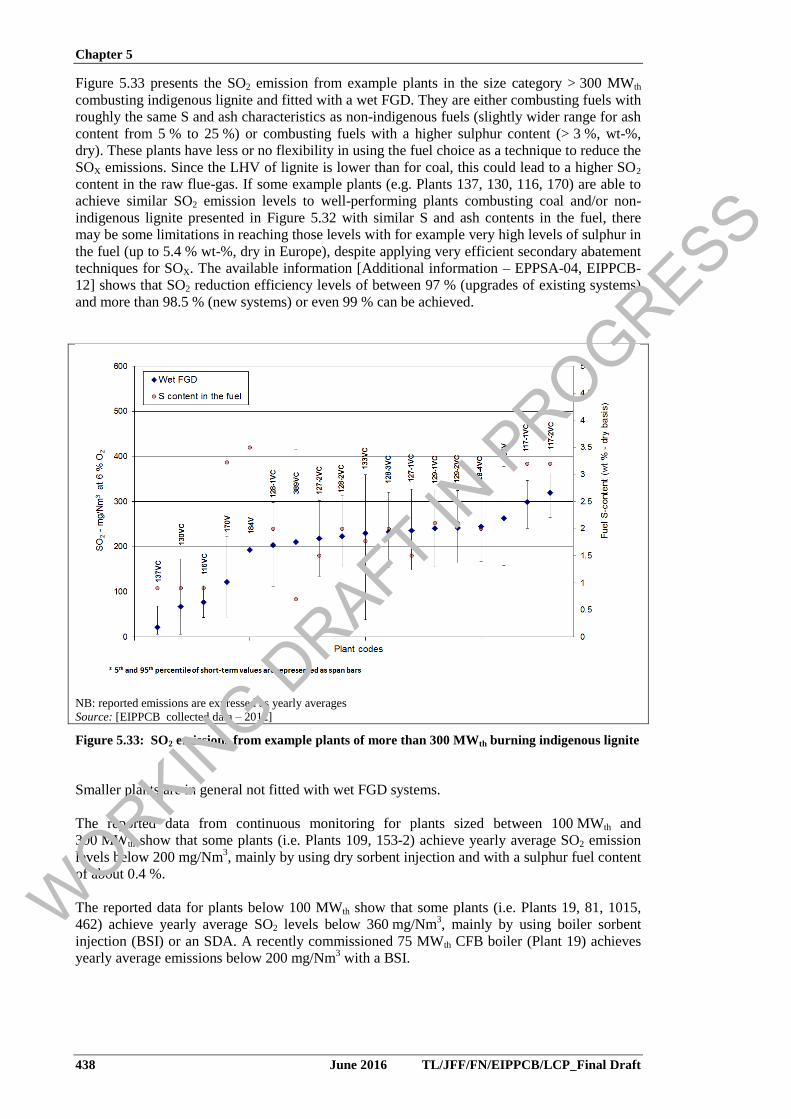
Chapter 5
438 June 2016 TL/JFF/FN/EIPPCB/LCP_Final Draft
Figure 5.33 presents the SO2 emission from example plants in the size category > 300 MWth
combusting indigenous lignite and fitted with a wet FGD. They are either combusting fuels with
roughly the same S and ash characteristics as non-indigenous fuels (slightly wider range for ash
content from 5 % to 25 %) or combusting fuels with a higher sulphur content (> 3 %, wt-%,
dry). These plants have less or no flexibility in using the fuel choice as a technique to reduce the
SOX emissions. Since the LHV of lignite is lower than for coal, this could lead to a higher SO2
content in the raw flue-gas. If some example plants (e.g. Plants 137, 130, 116, 170) are able to
achieve similar SO2 emission levels to well-performing plants combusting coal and/or non-
indigenous lignite presented in Figure 5.32 with similar S and ash contents in the fuel, there
may be some limitations in reaching those levels with for example very high levels of sulphur in
the fuel (up to 5.4 % wt-%, dry in Europe), despite applying very efficient secondary abatement
techniques for SOX. The available information [Additional information – EPPSA-04, EIPPCB-
12] shows that SO2 reduction efficiency levels of between 97 % (upgrades of existing systems)
and more than 98.5 % (new systems) or even 99 % can be achieved.
NB: reported emissions are expressed as yearly averages
Source: [EIPPCB collected data – 2012]
Figure 5.33: SO2 emissions from example plants of more than 300 MWth burning indigenous lignite
Smaller plants are in general not fitted with wet FGD systems.
The reported data from continuous monitoring for plants sized between 100 MWth and
300 MWth show that some plants (i.e. Plants 109, 153-2) achieve yearly average SO2 emission
levels below 200 mg/Nm3, mainly by using dry sorbent injection and with a sulphur fuel content
of about 0.4 %.
The reported data for plants below 100 MWth show that some plants (i.e. Plants 19, 81, 1015,
462) achieve yearly average SO2 levels below 360 mg/Nm3, mainly by using boiler sorbent
injection (BSI) or an SDA. A recently commissioned 75 MWth CFB boiler (Plant 19) achieves
yearly average emissions below 200 mg/Nm3 with a BSI.
WORKIN
G DRAFT IN
PROGRESS

Chapter 5
TL/JFF/FN/EIPPCB/LCP_Final Draft June 2016 439
For HCl and HF emissions
Figure 5.34 and Figure 5.35 show respectively the HCl and HF emissions from well-performing
coal- and/or lignite-fired plants, including CFB boilers, of ≥ 100 MWth. The reported plants are
sized between 145 MWth and 3700 MWth, operated between 2900 h/yr and 8700 h/yr, with an
equivalent full load factor in general above 60 %. These plants were commissioned between
1951 and 2009, and burn coal and/or lignite with Cl and F contents respectively between
0.05 mg/kg and 600 mg/kg, and between 0.01 mg/kg and 400 mg/kg. However, only very few
plants reported data on these fuel characteristics. These pollutants are monitored in different
ways, from periodically, with 1 to 12 measurements per year, to continuously. A quarter of
these plants co-incinerate waste up to 3.3 % (LHV basis).
In addition, example CFB boilers operated by Luminant (Sandow 5) and Dominion energy
(Virginia City Hybrid Center) in the US and fitted with a CFB dry scrubber report HCl
reduction efficiencies of between 95 % and > 99 %, meaning that well-performing CFB or other
types of boiler combusting coal or lignite even with a very high chlorine content
(e.g. > 1000 mg/kg), as may be the case in Europe, can achieve HCl emission levels below
20 mg/Nm3 using this technique for example. Further, HF reduction efficiencies of more than
90 % are also reported.
[EPPSA 01 additional info] [PL additional study]
For plants of ≥ 100 MWth operated less than 1500 h/yr, the levels of HCl and HF emissions may
be higher as they may implement only the low-sulphur fuel technique, possibly in combination
with dry sorbent injection. The achievable levels of emissions in this case correspond thus to the
ones of well-performing plants of < 100 MWth, which use similar techniques.
NB: reported emissions are expressed as yearly averages or averages over the year
Source: [EIPPCB collected data – 2012]
Figure 5.34: HCl emissions from well-performing coal- and/or lignite-fired plants of > 100 MWth
WORKIN
G DRAFT IN
PROGRESS
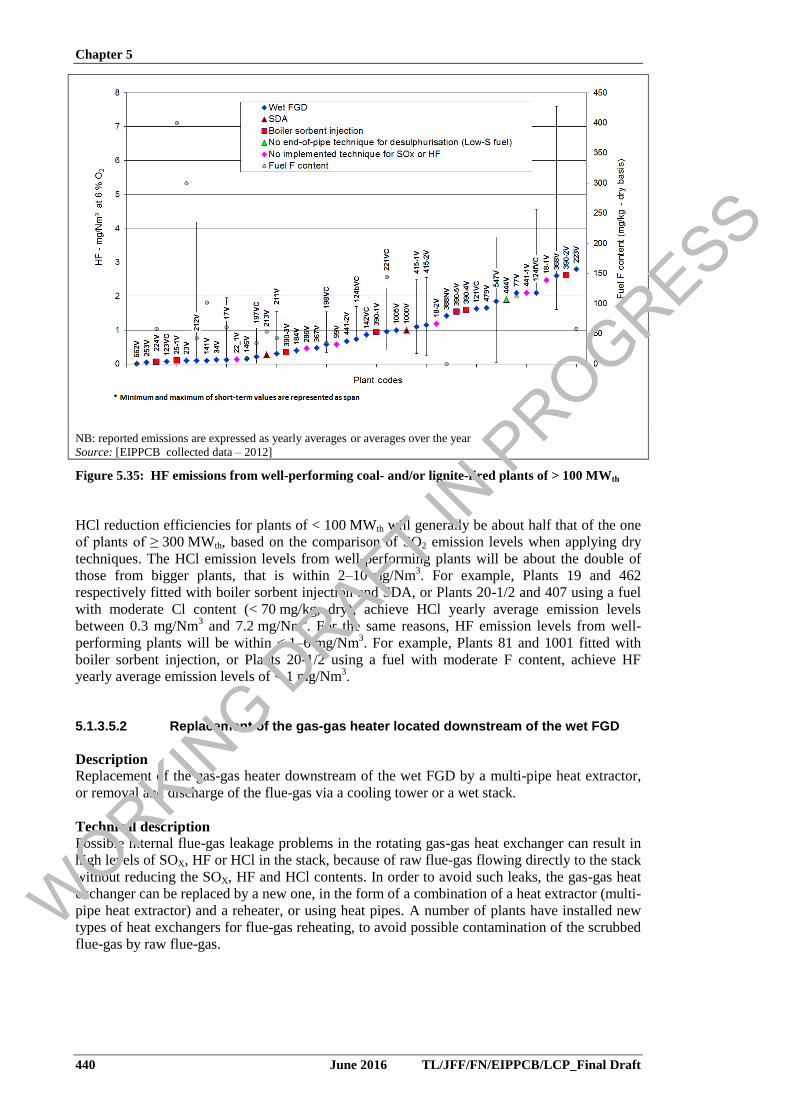
Chapter 5
440 June 2016 TL/JFF/FN/EIPPCB/LCP_Final Draft
NB: reported emissions are expressed as yearly averages or averages over the year
Source: [EIPPCB collected data – 2012]
Figure 5.35: HF emissions from well-performing coal- and/or lignite-fired plants of > 100 MWth
HCl reduction efficiencies for plants of < 100 MWth will generally be about half that of the one
of plants of ≥ 300 MWth, based on the comparison of SO2 emission levels when applying dry
techniques. The HCl emission levels from well-performing plants will be about the double of
those from bigger plants, that is within 2–10 mg/Nm3. For example, Plants 19 and 462
respectively fitted with boiler sorbent injection and SDA, or Plants 20-1/2 and 407 using a fuel
with moderate Cl content (< 70 mg/kg, dry), achieve HCl yearly average emission levels
between 0.3 mg/Nm3 and 7.2 mg/Nm
3. For the same reasons, HF emission levels from well-
performing plants will be within < 1–6 mg/Nm3. For example, Plants 81 and 1001 fitted with
boiler sorbent injection, or Plants 20-1/2 using a fuel with moderate F content, achieve HF
yearly average emission levels of < 1 mg/Nm3.
5.1.3.5.2 Replacement of the gas-gas heater located downstream of the wet FGD
Description
Replacement of the gas-gas heater downstream of the wet FGD by a multi-pipe heat extractor,
or removal and discharge of the flue-gas via a cooling tower or a wet stack.
Technical description
Possible internal flue-gas leakage problems in the rotating gas-gas heat exchanger can result in
high levels of SOX, HF or HCl in the stack, because of raw flue-gas flowing directly to the stack
without reducing the SOX, HF and HCl contents. In order to avoid such leaks, the gas-gas heat
exchanger can be replaced by a new one, in the form of a combination of a heat extractor (multi-
pipe heat extractor) and a reheater, or using heat pipes. A number of plants have installed new
types of heat exchangers for flue-gas reheating, to avoid possible contamination of the scrubbed
flue-gas by raw flue-gas.
WORKIN
G DRAFT IN
PROGRESS
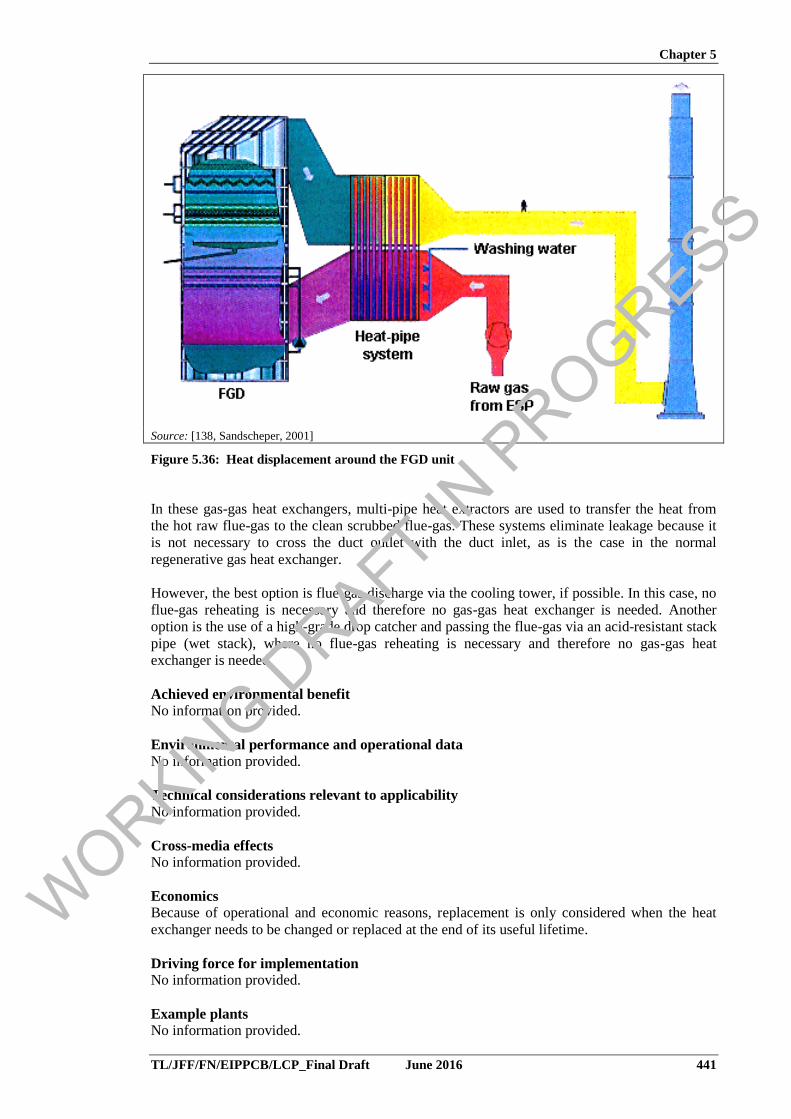
Chapter 5
TL/JFF/FN/EIPPCB/LCP_Final Draft June 2016 441
Source: [138, Sandscheper, 2001]
Figure 5.36: Heat displacement around the FGD unit
In these gas-gas heat exchangers, multi-pipe heat extractors are used to transfer the heat from
the hot raw flue-gas to the clean scrubbed flue-gas. These systems eliminate leakage because it
is not necessary to cross the duct outlet with the duct inlet, as is the case in the normal
regenerative gas heat exchanger.
However, the best option is flue-gas discharge via the cooling tower, if possible. In this case, no
flue-gas reheating is necessary and therefore no gas-gas heat exchanger is needed. Another
option is the use of a high-grade drop catcher and passing the flue-gas via an acid-resistant stack
pipe (wet stack), where no flue-gas reheating is necessary and therefore no gas-gas heat
exchanger is needed.
Achieved environmental benefit
No information provided.
Environmental performance and operational data
No information provided.
Technical considerations relevant to applicability
No information provided.
Cross-media effects
No information provided.
Economics
Because of operational and economic reasons, replacement is only considered when the heat
exchanger needs to be changed or replaced at the end of its useful lifetime.
Driving force for implementation
No information provided.
Example plants
No information provided.
WORKIN
G DRAFT IN
PROGRESS

Chapter 5
442 June 2016 TL/JFF/FN/EIPPCB/LCP_Final Draft
Reference literature
No information provided.
5.1.3.6 Techniques for the prevention and control of NOX, CO and N2O emissions
5.1.3.6.1 General techniques for the prevention and control of NOX, CO and N2O
emissions
Information on general techniques to prevent and control NOX, CO and N2O emissions from
combustion plants is given in Section 3.2.2.3.
Table 5.37 and Table 5.38 give additional information specific to lignite and/or coal firing.
Further details on related environmental performance and operational data are provided after
these tables.
WORKIN
G DRAFT IN
PROGRESS
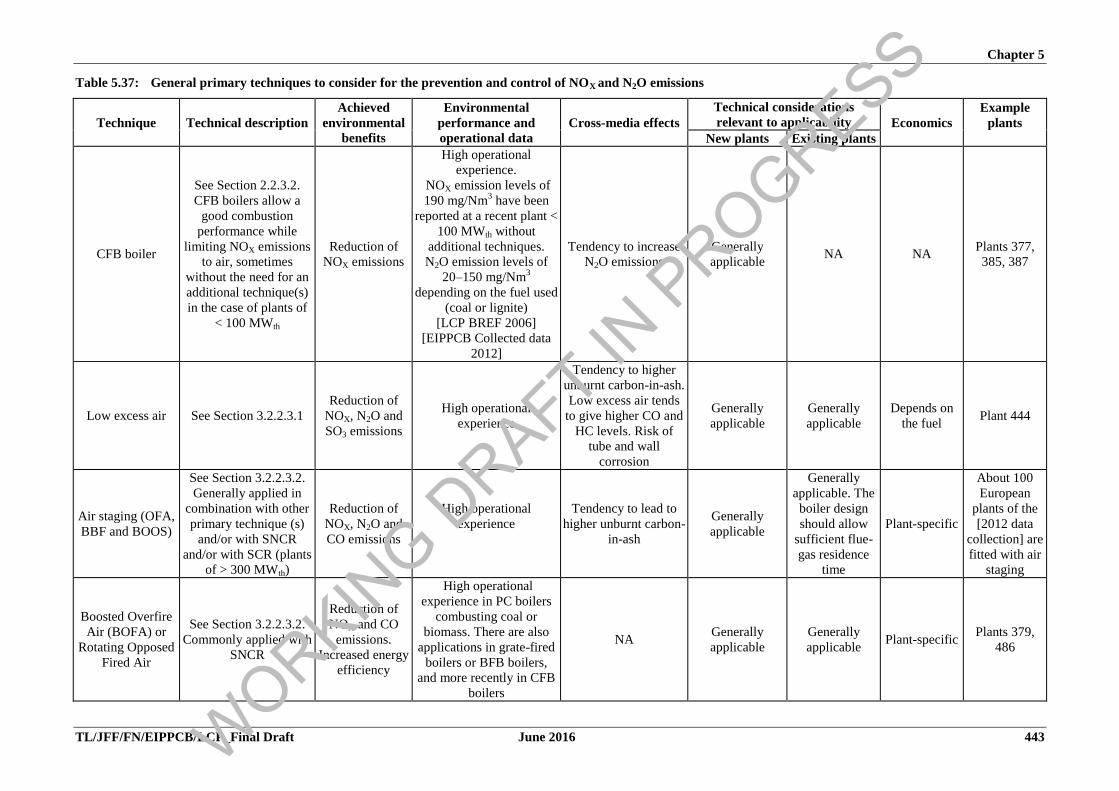
Chapter 5
TL/JFF/FN/EIPPCB/LCP_Final Draft June 2016 443
Table 5.37: General primary techniques to consider for the prevention and control of NOX and N2O emissions
Technique Technical description
Achieved
environmental
benefits
Environmental
performance and
operational data
Cross-media effects
Technical considerations
relevant to applicability Economics
Example
plants
New plants Existing plants
CFB boiler
See Section 2.2.3.2.
CFB boilers allow a
good combustion
performance while
limiting NOX emissions
to air, sometimes
without the need for an
additional technique(s)
in the case of plants of
< 100 MWth
Reduction of
NOX emissions
High operational
experience.
NOX emission levels of
190 mg/Nm3 have been
reported at a recent plant <
100 MWth without
additional techniques.
N2O emission levels of
20–150 mg/Nm3
depending on the fuel used
(coal or lignite)
[LCP BREF 2006]
[EIPPCB Collected data
2012]
Tendency to increase
N2O emissions
Generally
applicable NA NA
Plants 377,
385, 387
Low excess air See Section 3.2.2.3.1
Reduction of
NOX, N2O and
SO3 emissions
High operational
experience
Tendency to higher
unburnt carbon-in-ash.
Low excess air tends
to give higher CO and
HC levels. Risk of
tube and wall
corrosion
Generally
applicable
Generally
applicable
Depends on
the fuel Plant 444
Air staging (OFA,
BBF and BOOS)
See Section 3.2.2.3.2.
Generally applied in
combination with other
primary technique (s)
and/or with SNCR
and/or with SCR (plants
of > 300 MWth)
Reduction of
NOX, N2O and
CO emissions
High operational
experience
Tendency to lead to
higher unburnt carbon-
in-ash
Generally
applicable
Generally
applicable. The
boiler design
should allow
sufficient flue-
gas residence
time
Plant-specific
About 100
European
plants of the
[2012 data
collection] are
fitted with air
staging
Boosted Overfire
Air (BOFA) or
Rotating Opposed
Fired Air
See Section 3.2.2.3.2.
Commonly applied with
SNCR
Reduction of
NOX and CO
emissions.
Increased energy
efficiency
High operational
experience in PC boilers
combusting coal or
biomass. There are also
applications in grate-fired
boilers or BFB boilers,
and more recently in CFB
boilers
NA Generally
applicable
Generally
applicable Plant-specific
Plants 379,
486
WORKIN
G DRAFT IN
PROGRESS

Chapter 5
444 June 2016 TL/JFF/FN/EIPPCB/LCP_Final Draft
Technique Technical description
Achieved
environmental
benefits
Environmental
performance and
operational data
Cross-media effects
Technical considerations
relevant to applicability Economics
Example
plants
New plants Existing plants
Flue-gas
recirculation
(FGR)
See Section 3.2.2.3.3.
Generally applied in
combination with other
primary technique (s)
and/or with SCR (plants
of > 300 MWth)
Reduction of
NOX emissions
High operational
experience
Tendency to lead to
higher unburnt carbon-
in-ash.
Slight decrease in
energy efficiency
Generally
applicable
Generally
applicable Plant-specific
About 25
European
plants of the
[2012 data
collection] are
fitted with
FGR
Low-NOX burners
(LNB) (often
include flue-gas
recirculation and
air staging)
See Section 3.2.2.3.5.
Generally applied in
combination with other
primary technique (s)
and/or with SCR (plants
of > 300 MWth)
Reduction of
NOX emissions
High operational
experience
Tendency to lead to
higher unburnt carbon-
in-ash and to increase
CO generation at low
loads
Generally
applicable
Generally
applicable NA
About 90
European
plants of the
[2012 data
collection] are
fitted with a
LNB
Reburning (Fuel
staging)
See Section 3.2.2.3.6.
Generally applied in
combination with other
primary technique (s)
and/or with SCR (plants
of > 300 MWth)
Reduction of
NOX and CO
emissions
High operational
experience
Tendency to lead to
higher unburnt carbon-
in-ash
Generally
applicable
Applicability
may be limited
by space
restrictions
Plant-specific
More than 25
European
plants of the
[2012 data
collection] are
fitted with fuel
staging
Combustion
optimisation See Section 3.2.2.7.1
Reduction of
NOX, N2O and
CO emissions
High operational
experience.
N2O emission levels of
20–150 mg/Nm3 for CFB
boilers, depending on the
fuel used (hard coal or
lignite) [LCP BREF 2006]
[TWG data collection
2012]
NA Generally
applicable
Generally
applicable NA
Plants 377,
385, 387
Use of catalytic
material such as
MgO or CaO in
the boiler
NA Reduction of
N2O emissions Experimental stage NA
Generally
applicable
Generally
applicable NA NA
Increased flue-gas
temperature NA
Reduction of
N2O emissions Experimental stage NA
Generally
applicable
Generally
applicable NA NA
WORKIN
G DRAFT IN
PROGRESS
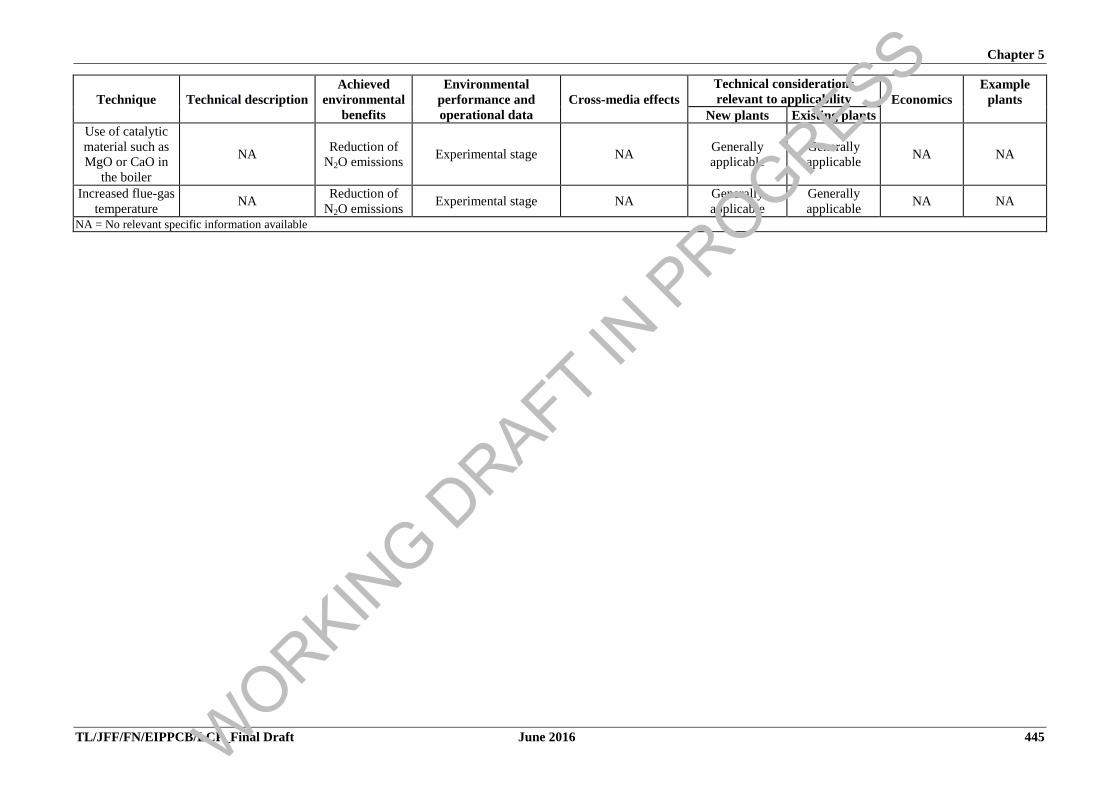
Chapter 5
TL/JFF/FN/EIPPCB/LCP_Final Draft June 2016 445
Technique Technical description
Achieved
environmental
benefits
Environmental
performance and
operational data
Cross-media effects
Technical considerations
relevant to applicability Economics
Example
plants
New plants Existing plants
Use of catalytic
material such as
MgO or CaO in
the boiler
NA Reduction of
N2O emissions Experimental stage NA
Generally
applicable
Generally
applicable NA NA
Increased flue-gas
temperature NA
Reduction of
N2O emissions Experimental stage NA
Generally
applicable
Generally
applicable NA NA
NA = No relevant specific information available
WORKIN
G DRAFT IN
PROGRESS
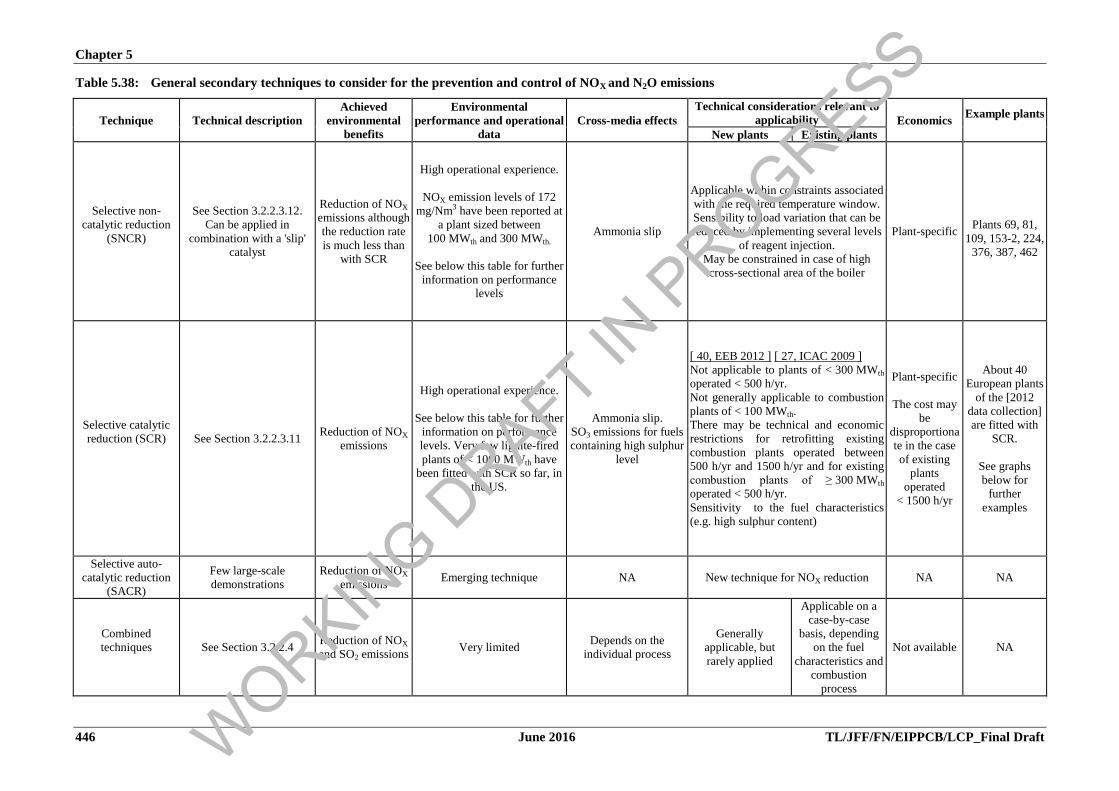
Chapter 5
446 June 2016 TL/JFF/FN/EIPPCB/LCP_Final Draft
Table 5.38: General secondary techniques to consider for the prevention and control of NOX and N2O emissions
Technique Technical description
Achieved
environmental
benefits
Environmental
performance and operational
data
Cross-media effects
Technical considerations relevant to
applicability Economics Example plants
New plants Existing plants
Selective non-
catalytic reduction
(SNCR)
See Section 3.2.2.3.12.
Can be applied in
combination with a 'slip'
catalyst
Reduction of NOX
emissions although
the reduction rate
is much less than
with SCR
High operational experience.
NOX emission levels of 172
mg/Nm3 have been reported at
a plant sized between
100 MWth and 300 MWth.
See below this table for further
information on performance
levels
Ammonia slip
Applicable within constraints associated
with the required temperature window.
Sensibility to load variation that can be
reduced by implementing several levels
of reagent injection.
May be constrained in case of high
cross-sectional area of the boiler
Plant-specific
Plants 69, 81,
109, 153-2, 224,
376, 387, 462
Selective catalytic
reduction (SCR)
See Section 3.2.2.3.11 Reduction of NOX
emissions
High operational experience.
See below this table for further
information on performance
levels. Very few lignite-fired
plants of < 1000 MWth have
been fitted with SCR so far, in
the US.
Ammonia slip.
SO3 emissions for fuels
containing high sulphur
level
[ 40, EEB 2012 ] [ 27, ICAC 2009 ]
Not applicable to plants of < 300 MWth
operated < 500 h/yr.
Not generally applicable to combustion
plants of < 100 MWth.
There may be technical and economic
restrictions for retrofitting existing
combustion plants operated between
500 h/yr and 1500 h/yr and for existing
combustion plants of ≥ 300 MWth
operated < 500 h/yr.
Sensitivity to the fuel characteristics
(e.g. high sulphur content)
Plant-specific
The cost may
be
disproportiona
te in the case
of existing
plants
operated
< 1500 h/yr
About 40
European plants
of the [2012
data collection]
are fitted with
SCR.
See graphs
below for
further
examples
Selective auto-
catalytic reduction
(SACR)
Few large-scale
demonstrations
Reduction of NOX
emissions Emerging technique NA New technique for NOX reduction NA NA
Combined
techniques
See Section 3.2.2.4 Reduction of NOX
and SO2 emissions Very limited
Depends on the
individual process
Generally
applicable, but
rarely applied
Applicable on a
case-by-case
basis, depending
on the fuel
characteristics and
combustion
process
Not available NA
WORKIN
G DRAFT IN
PROGRESS
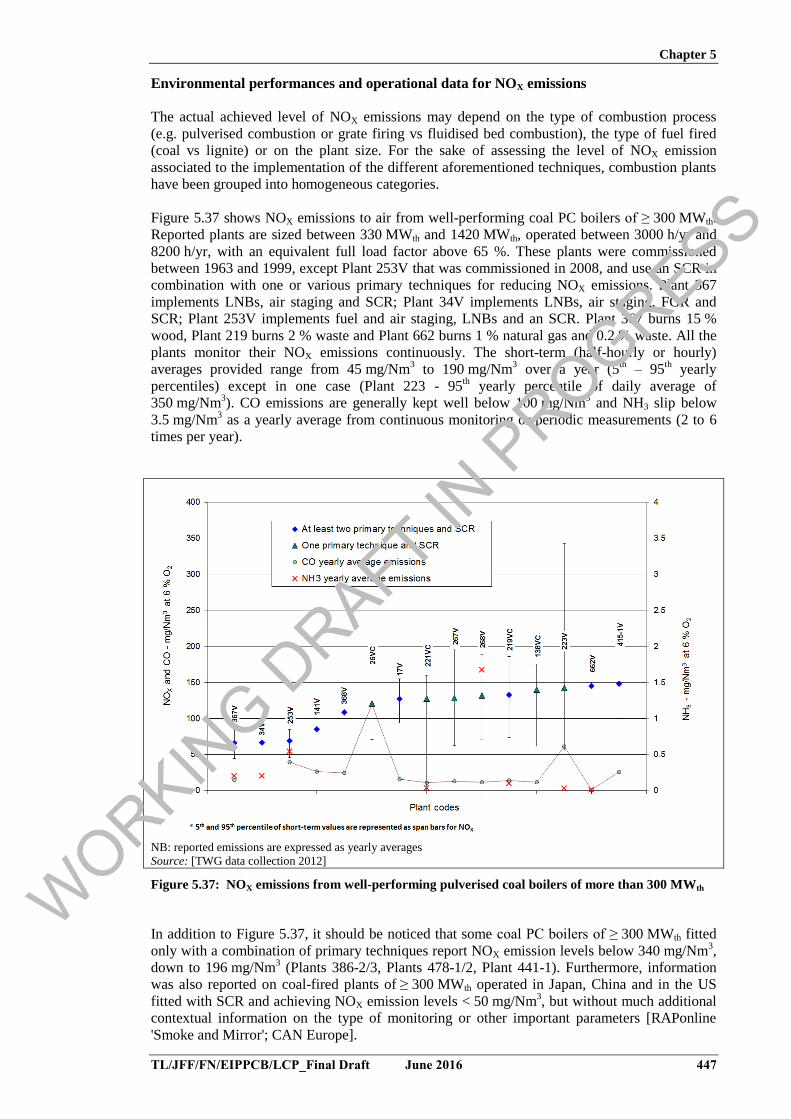
Chapter 5
TL/JFF/FN/EIPPCB/LCP_Final Draft June 2016 447
Environmental performances and operational data for NOX emissions
The actual achieved level of NOX emissions may depend on the type of combustion process
(e.g. pulverised combustion or grate firing vs fluidised bed combustion), the type of fuel fired
(coal vs lignite) or on the plant size. For the sake of assessing the level of NOX emission
associated to the implementation of the different aforementioned techniques, combustion plants
have been grouped into homogeneous categories.
Figure 5.37 shows NOX emissions to air from well-performing coal PC boilers of ≥ 300 MWth.
Reported plants are sized between 330 MWth and 1420 MWth, operated between 3000 h/yr and
8200 h/yr, with an equivalent full load factor above 65 %. These plants were commissioned
between 1963 and 1999, except Plant 253V that was commissioned in 2008, and use an SCR in
combination with one or various primary techniques for reducing NOX emissions. Plant 367
implements LNBs, air staging and SCR; Plant 34V implements LNBs, air staging, FGR and
SCR; Plant 253V implements fuel and air staging, LNBs and an SCR. Plant 367 burns 15 %
wood, Plant 219 burns 2 % waste and Plant 662 burns 1 % natural gas and 0.2 % waste. All the
plants monitor their NOX emissions continuously. The short-term (half-hourly or hourly)
averages provided range from 45 mg/Nm3 to 190 mg/Nm
3 over a year (5
th – 95
th yearly
percentiles) except in one case (Plant 223 - 95th yearly percentile of daily average of
350 mg/Nm3). CO emissions are generally kept well below 100 mg/Nm
3 and NH3 slip below
3.5 mg/Nm3 as a yearly average from continuous monitoring or periodic measurements (2 to 6
times per year).
NB: reported emissions are expressed as yearly averages Source: [TWG data collection 2012]
Figure 5.37: NOX emissions from well-performing pulverised coal boilers of more than 300 MWth
In addition to Figure 5.37, it should be noticed that some coal PC boilers of ≥ 300 MWth fitted
only with a combination of primary techniques report NOX emission levels below 340 mg/Nm3,
down to 196 mg/Nm3 (Plants 386-2/3, Plants 478-1/2, Plant 441-1). Furthermore, information
was also reported on coal-fired plants of ≥ 300 MWth operated in Japan, China and in the US
fitted with SCR and achieving NOX emission levels < 50 mg/Nm3, but without much additional
contextual information on the type of monitoring or other important parameters [RAPonline
'Smoke and Mirror'; CAN Europe].
WORKIN
G DRAFT IN
PROGRESS
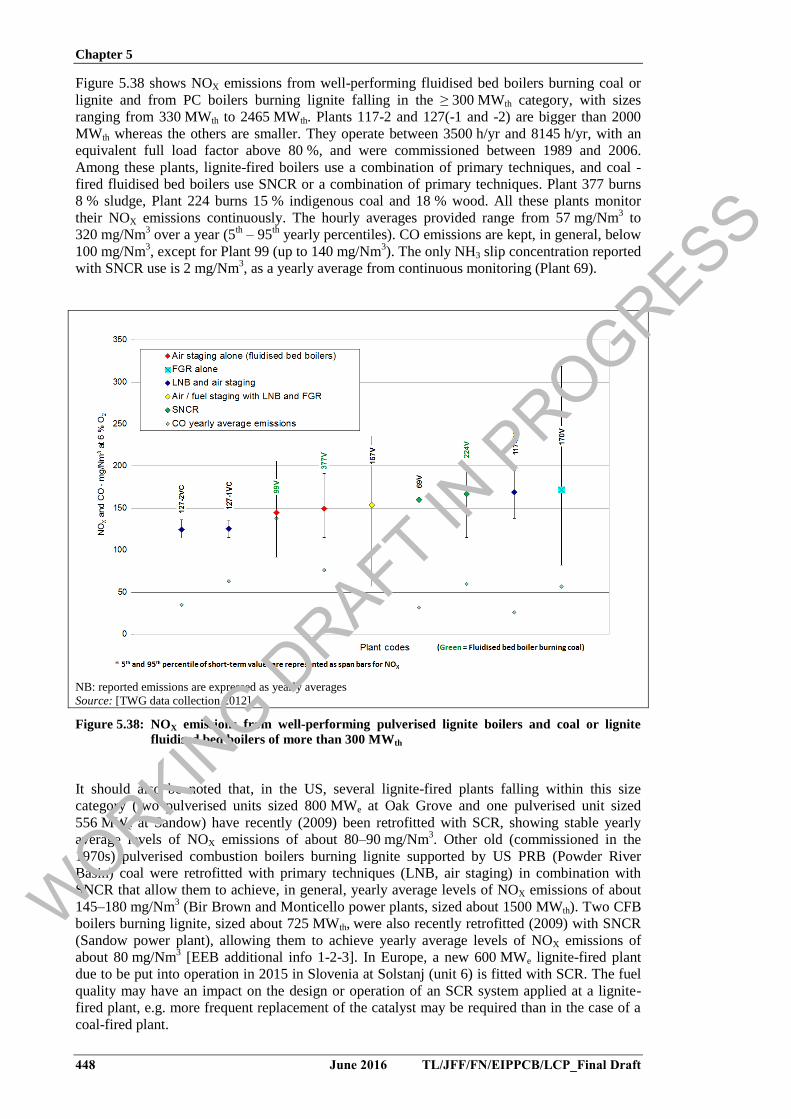
Chapter 5
448 June 2016 TL/JFF/FN/EIPPCB/LCP_Final Draft
Figure 5.38 shows NOX emissions from well-performing fluidised bed boilers burning coal or
lignite and from PC boilers burning lignite falling in the ≥ 300 MWth category, with sizes
ranging from 330 MWth to 2465 MWth. Plants 117-2 and 127(-1 and -2) are bigger than 2000
MWth whereas the others are smaller. They operate between 3500 h/yr and 8145 h/yr, with an
equivalent full load factor above 80 %, and were commissioned between 1989 and 2006.
Among these plants, lignite-fired boilers use a combination of primary techniques, and coal -
fired fluidised bed boilers use SNCR or a combination of primary techniques. Plant 377 burns
8 % sludge, Plant 224 burns 15 % indigenous coal and 18 % wood. All these plants monitor
their NOX emissions continuously. The hourly averages provided range from 57 mg/Nm3 to
320 mg/Nm3 over a year (5
th – 95
th yearly percentiles). CO emissions are kept, in general, below
100 mg/Nm3, except for Plant 99 (up to 140 mg/Nm
3). The only NH3 slip concentration reported
with SNCR use is 2 mg/Nm3, as a yearly average from continuous monitoring (Plant 69).
NB: reported emissions are expressed as yearly averages Source: [TWG data collection 2012]
Figure 5.38: NOX emissions from well-performing pulverised lignite boilers and coal or lignite
fluidised bed boilers of more than 300 MWth
It should also be noted that, in the US, several lignite-fired plants falling within this size
category (two pulverised units sized 800 MWe at Oak Grove and one pulverised unit sized
556 MWe at Sandow) have recently (2009) been retrofitted with SCR, showing stable yearly
average levels of NOX emissions of about 80–90 mg/Nm3. Other old (commissioned in the
1970s) pulverised combustion boilers burning lignite supported by US PRB (Powder River
Basin) coal were retrofitted with primary techniques (LNB, air staging) in combination with
SNCR that allow them to achieve, in general, yearly average levels of NOX emissions of about
145–180 mg/Nm3 (Bir Brown and Monticello power plants, sized about 1500 MWth). Two CFB
boilers burning lignite, sized about 725 MWth, were also recently retrofitted (2009) with SNCR
(Sandow power plant), allowing them to achieve yearly average levels of NOX emissions of
about 80 mg/Nm3 [EEB additional info 1-2-3]. In Europe, a new 600 MWe lignite-fired plant
due to be put into operation in 2015 in Slovenia at Solstanj (unit 6) is fitted with SCR. The fuel
quality may have an impact on the design or operation of an SCR system applied at a lignite-
fired plant, e.g. more frequent replacement of the catalyst may be required than in the case of a
coal-fired plant.
WORKIN
G DRAFT IN
PROGRESS
Chapter 5
TL/JFF/FN/EIPPCB/LCP_Final Draft June 2016 449
Looking at smaller size categories, two example plants (Plant 25-1V – an atmospheric fluidised
bed boiler commissioned in 1996 - and Plant 109V – a grate-fired boiler commissioned in 2004)
sized between 100 MWth and 300 MWth, fitted with primary techniques (air staging and FGR) in
the case of the fluidised bed boiler or with SNCR in the case of the grate-fired boiler, achieve
yearly average NOX emissions between 155 mg/Nm3
and 172 g/Nm3, with CO emissions below
100 mg/Nm3.
Two example plants (Plant 19V – lignite-fired atmospheric fluidised bed boiler, commissioned
in 2010 - and Plant 404V – coal-fired dry-bottom boiler, commissioned in 1995) sized between
50 MWth and 100 MWth, not fitted with any specific technique in the case of the lignite-fired
fluidised bed boiler or fitted with primary techniques (air staging and LNB) in the case of the
coal-fired PC boiler, achieve yearly average NOX emissions between 190 mg/Nm3
and
268 mg/Nm3, with CO emissions below 100 mg/Nm
3. Two other example plants in this size
range, co-firing waste and/or biomass with coal as the main fuel, report yearly average NOX
emissions between 130 mg/Nm3 and 260 mg/Nm
3, with CO emissions between 30 mg/Nm
3 and
130 mg/Nm3 (coal-fired grate-firing and coal-fired atmospheric fluidised bed boiler,
commissioned respectively in 1964 and 1993, fitted respectively with SNCR and a combination
of air staging, flue-gas recirculation and SNCR, operated about 4000 h/yr with an equivalent full
load factor higher than 85 %).
5.1.3.6.2 Thermal input biasing and dynamic classifiers for the prevention and
control of NOX at downshot boilers combusting low volatile coals
Description
Optimisation of the heat distribution in the furnace by controlling the burner firing pattern
together with the use of dynamic classifiers.
Technical description
This technique involves optimising the heat distribution in the furnace by controlling the burner
firing pattern (thermal input biasing). Air is admitted to some out-of-service burners (similar to
overfire air) and the downshot-fired arrangement facilitates the mixing of this air with the
combustion gases to help to achieve carbon burnout.
The technique can be used with reduced air supply to the burners, with emissions achieved
similar to those expected for overfire air, i.e. under 1000 mg/Nm3.
The operation of thermal input biasing is improved by the use of a NOX advisor system. This
system provides operator guidance to achieve the lowest NOX set-up (with starting and stopping
of individual burners), which facilitates optimisation of NOX but can be constrained by fuel type
and drum level issues.
The operation of thermal input biasing (TIB) is improved by the use of dynamic classifiers.
These achieve better control of the Pulverised Fuel (PF) size distribution between burners,
requiring fewer burners in service for a given load under certain fuel conditions.
Achieved environmental benefit
These improvements can give combined benefits of reduced carbon-in-ash losses, lower dust
emissions and reduced NOX emissions.
Environmental performance and operational data
TIB is capable of reducing NOX emissions by around 20 % giving an emission concentration of
under 1200 mg/Nm3 at downshot boilers combusting low volatile (< 10 %) coals.
Emissions of NOX are expected to be further reduced by about 5 % when using dynamic
classifiers compared to TIB only, but with greatly improved carbon burnout and lower dust
emissions.
WORKIN
G DRAFT IN
PROGRESS
Chapter 5
450 June 2016 TL/JFF/FN/EIPPCB/LCP_Final Draft
Technical considerations relevant to applicability
The ability to run dynamic classifiers is compromised by wet, low calorific value fuels that
require the majority of burners to be in service, taking away some ability for thermal input
biasing and thus increasing NOX emissions.
Cross-media effects
Operating issues include increased carbon-in-ash, risk of increased dust emissions, some coal
restriction and the risk of furnace wall tube failures.
Undertaking thermal input biasing too aggressively also brings about safety and integrity
concerns in the boiler, unbalancing the drum level and resulting in localised high component
temperatures potentially leading to operating above safe operating limits.
When using dynamic classifiers together with TIB, there is an increased risk of periods of
increased carbon-in-ash, high dust emissions, or increased slagging in the boiler.
Economics
The costs of TIB were calculated to be: [2012 estimation – 10-year lifetime]
Present value cost, million GBP 8.16
Equivalent annual cost, million
GBP/yr 1.33
Driving force for implementation
No information provided.
Example plants
No information provided.
Reference literature
[UKTWG 19]
WORKIN
G DRAFT IN
PROGRESS

Chapter 5
TL/JFF/FN/EIPPCB/LCP_Final Draft June 2016 451
5.2 Combustion of biomass and peat
5.2.1 Applied processes and techniques
5.2.1.1 Fuel characterisation of biomass and/or peat
Measurements of the fuel characteristics are performed by chemical and mechanical analysis,
either by the plant operator or by the fuel supplier (and supplied to the operator).
In a typical fuel characterisation exercise and quality control procedure, the supplier or the
operator collects representative short-term fuel samples, e.g. daily, in accordance with EN
14778-1:20011 - Sampling of Solid Biomass. Daily fuel samples are analysed for a range of
parameters, including moisture and net calorific value. A monthly (or weekly) composite
sample of biomass is then created using the daily composite samples. The monthly biomass
sample is analysed for further parameters, such as ash, sulphur, nitrogen and carbon content.
The number of measurements reflects the number of days a daily fuel sample is collected when
the plant is operational. The fixed carbon is calculated by subtracting the percentages of
moisture, volatile matter, and ash from a sample mass.
The list of parameters to be determined (with their limit values) is given in the product
declaration of the fuel as part of the contract. For fuel properties, see Section 5.2.2.1.
[ 3, LCP TWG 2012 ]
5.2.1.2 Fuel pretreatment and preparation
The moisture content of some biomass fuels can be high. One way to increase the efficiency of
the plant is fuel drying, which can be done safely in the fuel feeding system to avoid storage of
dried fuel. Steam dryers offer advantages when connected to the steam cycle, particularly in
CHP production, where the drying energy can be fully regenerated to heating. However, despite
the efficiency benefits, regenerative fuel drying systems have seldom proved economically
attractive. Wood chips and bark are often combusted directly without any pre-drying. Special
travel, reciprocating and vibrating grates are used for direct combustion of wood chips. Also,
CFB and BFB boilers use peat and wood directly without any pre-drying.
Dryers using the flue-gas as a source of heat could also be envisaged. However, the possible
generation of organic emissions, such as wax and aromatic compounds, can cause problems, as
wax sticks to the flue-gas channels and creates a potential fire risk in the electrostatic
precipitator, and aromatic compounds can cause odour nuisances for neighbours.
In several cases, presses are used to remove the moisture from bark fuels. However, unless the
press is maintained and operated properly to reduce moisture levels below the level of around
50 %, then the side effects of these pretreatment techniques (high Biochemical Oxygen Demand
(BOD) releases to water, and high energy use and maintenance requirements) may offset the
gains in combustion efficiency that can be expected from the pretreatment.
Belt dryers can also be used for the drying of solid biomass and biofuels. In the belt dryer, warm
air or flue-gas is led through a fuel bed on a moving cloth, on which the fuel dries. Belt drying is
a feasible drying method when suitable flue-gas or suitable energy to produce warm air is
available.
The moisture level of biomass and peat pellets and briquettes is typically < 10–15 %, so further
treatment to reduce the water content is generally not needed.
Straw bales are transported from the storage area by a crane and tier conveyors, and are
shredded, cut or milled before they are fed into the boiler furnace. It is beneficial to keep the
WORKIN
G DRAFT IN
PROGRESS

Chapter 5
452 June 2016 TL/JFF/FN/EIPPCB/LCP_Final Draft
straw on the fields for some time after harvesting, because rainfall decreases the amount of
water-soluble alkalis in the straw ash. These alkalis are detrimental to the combustion conditions
as they lower the ash melting temperature, which then increases the sintering risk of the
fluidised bed and fouls the boiler. The amount of water-soluble alkalis present in the fuel can
substantially affect the corrosion rate of the superheaters. Rain also recycles water-soluble
alkalis back to the soil for the growth of new crops. No other drying of straw besides the natural
drying on the fields is practised.
The use of pelletised biomass is increasing, particularly for use in co-firing and in conversion of
coal plants to biomass. Many different types of biomass can be pelletised including wood,
miscanthus and straw but the greatest usage is likely to be in wood using forestry residues and
thinnings as the main fuel source. The pelleting of biomass uses energy and increases the cost of
the product although this disadvantage is counterbalanced by the ease of transport, handling and
storage, and by the lack of phytosanitary requirements. The moisture content of biomass pellets
is low (around 10 %) since most of the pretreatment occurs during the pelletising process.
[New 86, Eurelectric comments to D1]
Straw used for pulverised fuel boilers is often milled to dust in hammer mills, which have a high
noise level. Attention also has to be paid to noise generation by the subsequent pneumatic
transport to the burner.
5.2.1.3 Combustion technologies specific to biomass and/or peat firing
The use of biomass pellets (primarily from wood) enables both the partial and complete
replacement of coal in a pulverised fuel boiler. This can produce significant reductions in
emissions of NOX, SO2 and CO2.
Many dedicated biomass plants are associated with pulp and paper mills, sawmills, the wood
processing industry or wood pellet producers, providing a significant share of the biomass need
for the internal processes. In other cases, biomass is sourced from local or regional forests, or
agricultural or food manufacturing industries. The co-firing of biomass has been successfully
applied at many FBC combustion plants, where the main fuel is coal, lignite, peat or wood
residue from the pulp and paper industry. Peat is very often used in Finland and Sweden as a
fuel in combination with biomass fuels.
The use of peat may also promote the use of wood. Due to its characteristics, peat is applicable
for co-firing with wood. Technically, it would be more difficult to use only some types of wood
fuel in existing plants because of corrosion and fouling problems. The ability to burn peat also
ensures continuous fuel supply in areas where the availability of wood fuel is insufficient for the
fuel demand.
Combustion technologies used for biomass and/or peat firing include grate firing, fluidised bed
combustion and pulverised fuel firing.
See Section 2.2 for general information on combustion processes and Section 8.1 for
information on multi-fuel firing.
5.2.1.3.1 Grate firing
Grate firing is the oldest firing principle used in boilers. The travelling grate was the most
popular firing system in small boilers until the beginning of the 1980s, when fluidised bed
combustion started to become more popular, largely replacing grate firing. In the 1990s, water-
cooled vibration grates were introduced for mainly straw and wood chip firing, for heat inputs
of 28–150 MW. Today, most new solid-fuel-fired boilers with a fuel input of over 15 MW are
WORKIN
G DRAFT IN
PROGRESS
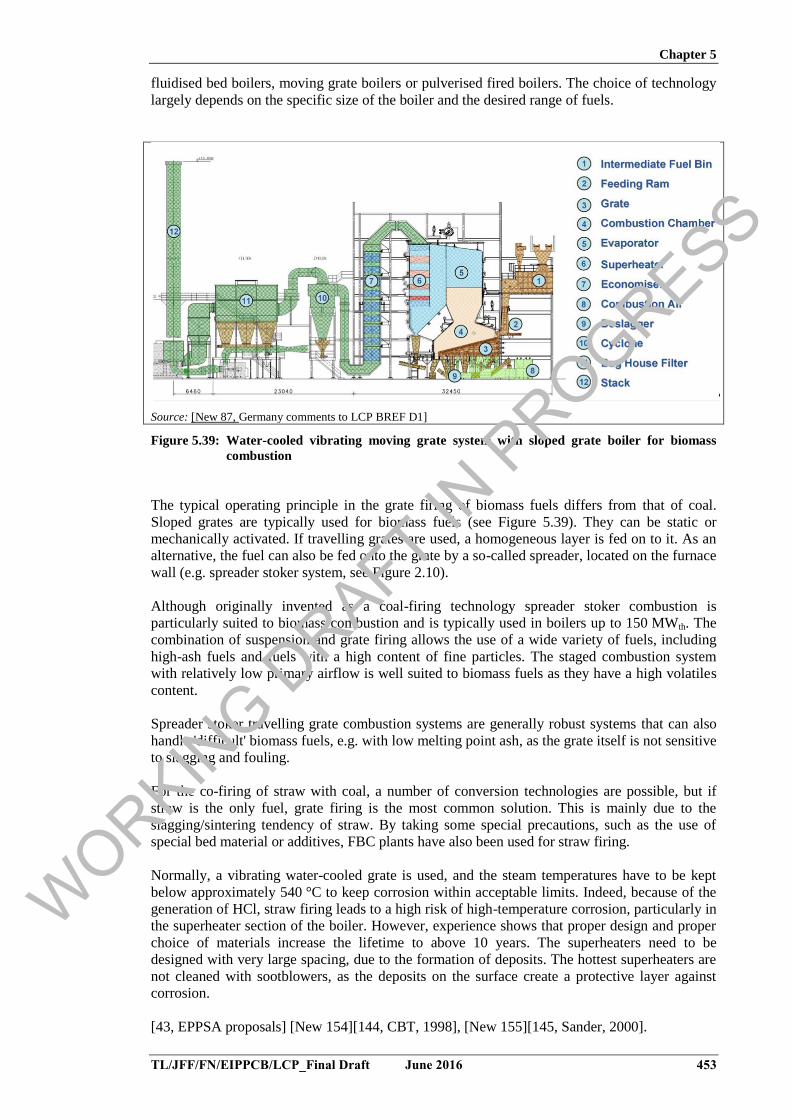
Chapter 5
TL/JFF/FN/EIPPCB/LCP_Final Draft June 2016 453
fluidised bed boilers, moving grate boilers or pulverised fired boilers. The choice of technology
largely depends on the specific size of the boiler and the desired range of fuels.
Source: [New 87, Germany comments to LCP BREF D1]
Figure 5.39: Water-cooled vibrating moving grate system with sloped grate boiler for biomass
combustion
The typical operating principle in the grate firing of biomass fuels differs from that of coal.
Sloped grates are typically used for biomass fuels (see Figure 5.39). They can be static or
mechanically activated. If travelling grates are used, a homogeneous layer is fed on to it. As an
alternative, the fuel can also be fed onto the grate by a so-called spreader, located on the furnace
wall (e.g. spreader stoker system, see Figure 2.10).
Although originally invented as a coal-firing technology spreader stoker combustion is
particularly suited to biomass combustion and is typically used in boilers up to 150 MWth. The
combination of suspension and grate firing allows the use of a wide variety of fuels, including
high-ash fuels and fuels with a high content of fine particles. The staged combustion system
with relatively low primary airflow is well suited to biomass fuels as they have a high volatiles
content.
Spreader stoker travelling grate combustion systems are generally robust systems that can also
handle 'difficult' biomass fuels, e.g. with low melting point ash, as the grate itself is not sensitive
to slagging and fouling.
For the co-firing of straw with coal, a number of conversion technologies are possible, but if
straw is the only fuel, grate firing is the most common solution. This is mainly due to the
slagging/sintering tendency of straw. By taking some special precautions, such as the use of
special bed material or additives, FBC plants have also been used for straw firing.
Normally, a vibrating water-cooled grate is used, and the steam temperatures have to be kept
below approximately 540 °C to keep corrosion within acceptable limits. Indeed, because of the
generation of HCl, straw firing leads to a high risk of high-temperature corrosion, particularly in
the superheater section of the boiler. However, experience shows that proper design and proper
choice of materials increase the lifetime to above 10 years. The superheaters need to be
designed with very large spacing, due to the formation of deposits. The hottest superheaters are
not cleaned with sootblowers, as the deposits on the surface create a protective layer against
corrosion.
[43, EPPSA proposals] [New 154][144, CBT, 1998], [New 155][145, Sander, 2000].
WORKIN
G DRAFT IN
PROGRESS
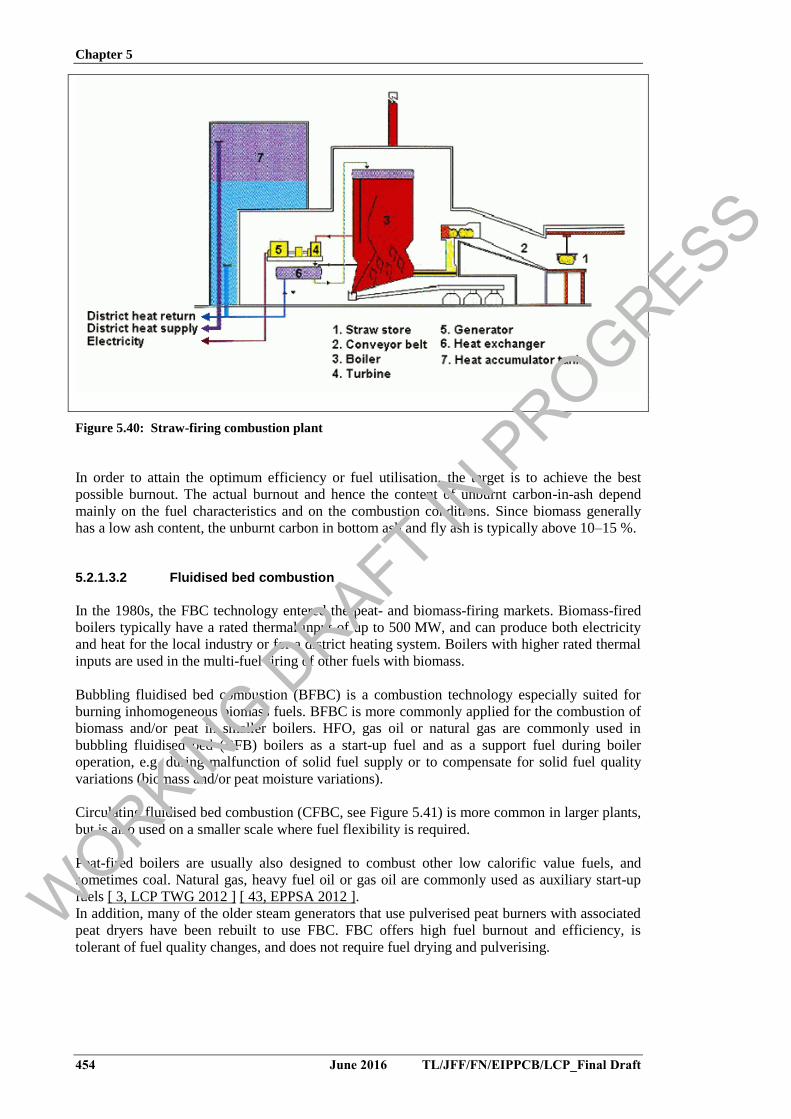
Chapter 5
454 June 2016 TL/JFF/FN/EIPPCB/LCP_Final Draft
Figure 5.40: Straw-firing combustion plant
In order to attain the optimum efficiency or fuel utilisation, the target is to achieve the best
possible burnout. The actual burnout and hence the content of unburnt carbon-in-ash depend
mainly on the fuel characteristics and on the combustion conditions. Since biomass generally
has a low ash content, the unburnt carbon in bottom ash and fly ash is typically above 10–15 %.
5.2.1.3.2 Fluidised bed combustion
In the 1980s, the FBC technology entered the peat- and biomass-firing markets. Biomass-fired
boilers typically have a rated thermal input of up to 500 MW, and can produce both electricity
and heat for the local industry or for a district heating system. Boilers with higher rated thermal
inputs are used in the multi-fuel firing of other fuels with biomass.
Bubbling fluidised bed combustion (BFBC) is a combustion technology especially suited for
burning inhomogeneous biomass fuels. BFBC is more commonly applied for the combustion of
biomass and/or peat in smaller boilers. HFO, gas oil or natural gas are commonly used in
bubbling fluidised bed (BFB) boilers as a start-up fuel and as a support fuel during boiler
operation, e.g. during malfunction of solid fuel supply or to compensate for solid fuel quality
variations (biomass and/or peat moisture variations).
Circulating fluidised bed combustion (CFBC, see Figure 5.41) is more common in larger plants,
but is also used on a smaller scale where fuel flexibility is required.
Peat-fired boilers are usually also designed to combust other low calorific value fuels, and
sometimes coal. Natural gas, heavy fuel oil or gas oil are commonly used as auxiliary start-up
fuels [ 3, LCP TWG 2012 ] [ 43, EPPSA 2012 ].
In addition, many of the older steam generators that use pulverised peat burners with associated
peat dryers have been rebuilt to use FBC. FBC offers high fuel burnout and efficiency, is
tolerant of fuel quality changes, and does not require fuel drying and pulverising.
WORKIN
G DRAFT IN
PROGRESS

Chapter 5
TL/JFF/FN/EIPPCB/LCP_Final Draft June 2016 455
Source: [New 130, 59, Finnish LCP WG, 2000T. Jantti, J. Sarkki, H. Lampenius, The utilization of CFB technology
for large scale biomass-fired power plants, PowerGen Europe, Amsterdam, 2010]
Figure 5.41: Biomass-fired circulating fluidised bed boiler
5.2.1.3.3 Pulverised peat and/or biomass firing
In the late 1970s, pulverised firing, being the standard technology for coal, was the most mature
combustion technology. Consequently, most large peat-fired power plants in the 1970s and in
the first half of the 1980s were based on boilers with pulverised firing. Pulverised firing of
reactive fuels such as peat proved problematic because of difficulties in the drying systems and
in emission control, and because of the need for a support fuel due to the changes in fuel quality
and in emission control.
Starting mainly from the conversion of coal-fired plants to biomass-fired plants, pulverised fuel-
firing systems using pellets with heat inputs up to 800 MW were introduced starting from the
mid-1990s.
Pulverised combustion is also used for wood firing. Plants grinding wood pellets and using
pulverised firing currently have a broad thermal input range (60–800 MWth) [ 3, LCP TWG
2012 ], and large-scale utility boilers firing biomass with a high plant efficiency are feasible.
Compared to fluidised bed combustion, the limiting factors are the lower suspension density and
the slagging effects caused by the higher furnace temperature than in fluidised bed combustion.
[ 3, LCP TWG 2012 ] [ 43, EPPSA 2012 ]
WORKIN
G DRAFT IN
PROGRESS
Chapter 5
456 June 2016 TL/JFF/FN/EIPPCB/LCP_Final Draft
Pulverised biomass firing requires dry fuel and a very small particle size. The cost and energy
consumption of fuel preparation are considerable compared to other biomass-firing techniques.
[New 88, Denmark comments to LCP BREF D1]
In order to convert units to enable dedicated combustion of biomass, it may be necessary to
develop biomass receipt, storage, and handling systems, and facilities to distribute the biomass
to the boilers which need to be specifically designed to ensure that there are no significant
arisings of dust from the process and combustion systems. The fundamental principles of
operation of the plant may remain unchanged through the conversion process but a significant
number of plant components need to be optimised in order to maximise the thermal efficiency
of the plant and minimise emissions. These optimisations include: burner modifications to
ensure that the burners perform in a way that maintains a reliably detectable flame with good
combustion stability; modifications to combustion air systems to reduce the temperature of the
air entering the mills and to reduce the boiler gas exit temperatures; modifications to mills in
order to process the wood pellets to the required particle size to ensure efficient combustion;
modifications to the fuel delivery system to safely transport the wood pellets from storage to the
mills; and modifications to the electrostatic precipitator (ESP) hoppers to improve the handling
of the ash collected from the converted units. [New 86, Eurelectric comments to D1]
5.2.1.4 Technique to increase efficiency
Cogeneration plants are economically feasible at much smaller plant sizes than condensing
power plants (see Section 2.2 for general information on processes for energy generation). They
are also particularly suitable for biomass and/or peat combustion. With a smaller plant, the
biomass and/or peat fuel can be collected over a smaller area, which helps limit the costs and the
environmental impact of fuel transport, usually a major element to consider with plants firing
biomass and/or peat .
Biomass- and/or peat-fired plants are often suitable for combined heat and power applications as
they are generally of a size that can be well matched to local heat demand in industry, district
heating schemes, etc., as opposed to larger utility size plants where the recoverable heat
commonly exceeds local heat demand. Indeed in 2010 about 72 % of the peat used in large
combustion plants in Finland, and 93 % of the biomass, was used in CHP production.
Conversely, in Ireland peat is used only for electricity production.
When biomass is used in existing large-scale pulverised fuel utility boilers, a high plant
efficiency can be achieved. However, the temperature distribution within the boiler changes.
These changes to temperature distributions inside the boiler and modifications to air transport
characteristics may cause minor reductions in the efficiency of a fully converted unit compared
to a coal unit operating at the same load factor. [New 86, Eurelectric comments to D1]
WORKIN
G DRAFT IN
PROGRESS
Chapter 5
TL/JFF/FN/EIPPCB/LCP_Final Draft June 2016 457
5.2.1.5 Control of emissions to air from biomass- and/or peat-fired plants 5.2.1.5.1.1 Control of nitrogen oxides emissions
The low combustion temperatures of grate systems are advantageous for the control of NOX
emissions. Overfire air is commonly used to reduce the generation of NOX emissions. Spreader
stoker firing usually also employs low excess air as a primary NOX reduction measure.
NOX emissions in fluidised bed combustion are usually noticeably lower than in conventional
pulverised fuel combustion. The combustion temperature in FBC is typically low (e.g. when
burning peat), which ensures a low level of thermal NOX formation. Under these conditions,
most of the NOX emissions are caused by fuel-bound nitrogen.
The combustion characteristics of biomass in fully converted boilers are yet to be fully
described. Examples of coal plants converted to biomass (e.g. Plant 14–retrofitted) using SCR
are provided in the LCP TWG 2012 data collection. At low degrees of biomass co-firing
(< 50 % by thermal input), the influence on NOX emissions is low. However, at higher co-firing
degrees (> 50 %) the combustion processes and abatement techniques, and the achievable
emission levels, are significantly influenced by the type and volume of the biomass. When using
existing coal burners and control systems within boilers, the stability of the flame within the
boiler can be changed. This may require modifications to air/fuel distribution and hence to the
NOX reduction capability of the burner. [New 86, Eurelectric comments to D1]
NOX emissions can be reduced by primary techniques (e.g. staged air supply system) and/or use
of SNCR and/or SCR. NOX reduction techniques in biomass combustion may require a
sophisticated secondary air system and a special furnace design enabling two combustion zones.
The NOX formation can be further limited by minimising the excess air ratio and by staging the
combustion air. In modern boilers, secondary air ports are installed in addition to the primary
fluidising air inlets. Some combustion air is injected through these ports, which are located in
the upper part of the furnace. Secondary/tertiary air injected through the upper air ports ensures
a complete burnout. The lower part of the furnace can then be operated with a low air ratio,
which inhibits NOX formation. Additional primary techniques such as the recirculation of the
flue-gases, may also be installed to reduce NOX formation.
The formation of nitrous oxide (N2O) appears to be greater in FBC (especially in circulating
fluidised beds) than in conventional pulverised fuel combustion.
Secondary techniques such as selective catalytic or non-catalytic reduction have been applied to
many biomass- and/or peat-fired boilers, especially new boilers. SNCR has been widely used
and is now a well-established technique for biomass firing. For existing boilers, if SNCR has
not been applied during boiler design, SNCR may be less effective due to the lack of a suitable
temperature window. The process design or the high heat load of an existing boiler can lead to
too short a reaction time because of too high temperature in the upper part of the furnace for
ammonia/urea injection.
SCR was introduced in the mid-1990s; combinations of SNCR and SCR are also applied, e.g.
when the efficiency of SNCR is constrained by a short reaction time in the boiler or load
variations. Small grate boilers can also be fitted with SNCR, or even with low-dust SCR. SCR
requires sufficiently high temperatures to work and to avoid ammonium bisulphate formation.
Low-dust (tail-end) SCR can be installed at flue-gas temperatures of 190 ºC and upwards. High-
dust SCR can operate safely from temperatures of 320 ºC and upwards. The fuel mix palette
used and desired load level of the boiler are the key issues when planning an SCR in an existing
boiler. The main challenges are layout, ductwork, flue-gas draft system and structural changes.
Space availability for the catalyst and layout modification of the flue-gas duct need to be
considered for an SCR retrofit. [New 89, EPPSA comments to D1]
WORKIN
G DRAFT IN
PROGRESS

Chapter 5
458 June 2016 TL/JFF/FN/EIPPCB/LCP_Final Draft
High-dust SCR is applicable for the pulverised combustion of woody biomass, but the use of
high-alkali fuel (e.g. straw) may require low-dust tail-end SCR due to the catalyst poisoning
potential. Once deactivated, the SCR catalysts needs to be regenerated. This can be achieved
(e.g. every second year) by washing the catalyst with water (and/or sulphuric acid), after taking
it out of the system. However, in situ washing with water followed by sulphation (treatment
with SO2 gas) is also possible. [ 43, EPPSA 2012 ]
5.2.1.5.1.2 Control of SOX emissions
At combustion plants using biomass and/or peat, the sulphur content of the fuel is often low or
moderate. Therefore, emissions are frequently so low that often no desulphurisation is applied.
However, with higher sulphur content biomass or peat, post-combustion dry injection processes
are usually applied. The injection of calcium hydroxide or sodium bicarbonate in a dry form
before a bag filter can achieve sufficient SOX emissions reduction. However, sorbent use
increases the amount of ash produced by the combustion plant, and therefore it may also
increase particulate emissions if an ESP rather than a bag filter is used for dust removal. There
is the possibility that the sorbent properties may reduce the electrostatic precipitation efficiency,
causing higher dust emissions, especially when using larger amounts of sorbent to reduce SOX
emissions.
Limestone injection in the furnace of pulverised fuel plants, together with a wet scrubber, can
also be an effective solution in some cases.
Sulphur removal on the grate is not possible because of the minimal contact time between the
SOX and the reactive alkali fed onto the grate. Limestone injection into the furnace is possible,
but is not efficient in grate-firing boilers. In the case of grate-fired boilers, sorbent injection in
the flue-gas duct before a bag filter is therefore the most commonly applied technique. The type
of sorbent depends on the flue-gas temperature. Limestone is used up to 150 ºC, and sodium
bicarbonate is used above this temperature. [New 89, EPPSA comments to D1]
Sulphur emission reduction in pulverised fuel combustion can be achieved by limestone or
dolomite injection in the furnace, but the method is very inefficient and uneconomical. It is even
possible that chlorine corrosion is amplified by these adsorbents.
These measures also remove other harmful emissions, such as HCl and HF.[ 43, EPPSA 2012 ]
Given the relatively low sulphur content of the fuels which are expected to be burnt in a plant
converted from coal, an expected 90 % reduction in sulphur emissions can be expected with the
conversion thereby providing an effective primary measure for the reduction of emissions of
sulphur dioxide. It is also noted that the FGD fitted for the desulphurisation of coal may be
inefficient and ineffective if retained to attempt to further reduce emissions from a unit
converted to biomass. Power plants converted from coal generally have an FGD system but
these have been designed for use with high-sulphur coals and there are concerns that for
engineering reasons it would not be practical or economic to operate a converted unit with an
existing FGD system. This is especially the case where conversion leads to higher back-end
temperatures with implications for the FGD system integrity. [New 86, Eurelectric comments to
D1]
5.2.1.5.1.3 Dust control
When burning biomass (e.g. wood, straw) or peat in grate combustion systems, most of the ash
is left on the grate and collected as bottom ash. Only a small quantity of ash leaves the furnace
as fly ash and is collected in the dust reduction devices. For dust abatement from grate-fired
WORKIN
G DRAFT IN
PROGRESS

Chapter 5
TL/JFF/FN/EIPPCB/LCP_Final Draft June 2016 459
combustion plants, both ESPs and bag filters are currently applied, with the bag filter being the
more common.
In pulverised biomass or peat combustion, the bulk of the ash is carried with the flue-gas out of
the combustion chamber. Only a small quantity is collected as bottom ash.
For large pulverised biomass/peat combustion plants, the ESP is the most commonly used
technique. Bag filters may also be used.
For dust abatement in biomass and/or peat-fired fluidised bed combustion boilers, both ESPs
and bag filters are currently applied, with the bag filter often the preferred technique for plants
using dry sorption techniques and the ESP more often applied in cases where solid fossil fuel
plants were converted to be dedicated biomass plants. The resistivity of the ash of certain fuels
(i.e. straw) may influence the efficiency of the ESP depending on the fuel mix used in the
combustion.
For fluidised bed systems, the fuel is used in a coarsely ground form and for this reason most
ash is extracted as bottom ash. In CFBC, the bed zone is expanded by the higher airflow
velocities, and ash (necessary for this type of combustion) has to be recirculated. Centrifugal
precipitation is an integral component of CFBC to recover coarse ash particles, as shown in
Figure 5.42.
WORKIN
G DRAFT IN
PROGRESS

Chapter 5
460 June 2016 TL/JFF/FN/EIPPCB/LCP_Final Draft
Source:[New 156] [91, Kokk, et al., 2000]
Figure 5.42: Fuel and bed material flow in a biomass-fired CFBC boiler
5.2.1.6 Water and waste water treatment
Pollutant emissions to water are not a major problem for biomass and/or peat combustion plants.
See Section 3.2.4 for general applied techniques in combustion plants for the control of
emissions to water.
5.2.1.7 Handling of combustion residues
A peat-fired power plant produces ash and products from limestone injection. Most of the ash is fly
ash from the flue-gas cleaning system (electrostatic precipitators or bag filters). Some 10–20 % of
the total ash amount is bottom ash at the bottom of the boiler. This may be used as indicated below
or disposed of, depending on the applicable legislation and market conditions.
Peat ash can be used as a raw material, as an additive in the construction and building material
industry or for example as a road construction material. In the stabilisation of mineral aggregates
and in concrete, peat fly ash can be utilised to replace either the finest aggregate material or part of
WORKIN
G DRAFT IN
PROGRESS

Chapter 5
TL/JFF/FN/EIPPCB/LCP_Final Draft June 2016 461
the cement. It may also be used in sewage treatment. The geotechnical properties and mineral
constituents of the ash have to be investigated on a case-by-case basis before commercial use.
Nowadays, peat is seldom fired alone. It is usually fired together with other fuels such as wood,
resulting in most cases in producing mixed ash. The properties of such mixed ash are different from
those of peat ash and, therefore, the utilisation opportunities are slightly different. For instance, the
slightly different composition of the ash resulting from the co-combustion of wood and peat makes
it more difficult to use as a construction material.
In some countries, peat fly ash and some biomass ash or a mixture of both may be used as fertiliser
in forests and on fields. Ash contains some plant nutrients and lime necessary for plants. However,
both environmental and health aspects and regulations have to be taken into account before any
commercial use of biomass and/or peat ash as a fertiliser is allowed.
The fly ash from straw combustion units is usually disposed of, primarily due to its high content
of cadmium. The bottom ash, though, could be applied on fields or used as a road construction
material.
The majority of coal plants converted to biomass generate fly ash and small quantities of bottom
ash which can be used as an additive in the construction and building material industry or may
be disposed of.
5.2.2 Current emission and consumption levels
5.2.2.1 Biomass and peat used in large combustion plants
Different types of biomass and peat are often co-fired in variable proportions in the same
installation, taking into account fuel availability and process needs. Appropriate fuel mixing can
help combustion plants achieve better process and environmental performances. For multi-fuel
firing, see Chapter 8; for the fuel characterisation step, see Section 5.2.1.1 .
Some coal combustion plants from the UK, Belgium, the Netherlands and other countries have
been converted to biomass fuel. [New 86, Eurelectric comments to D1]
Biomass is defined in the IED as products consisting of any vegetable matter from agriculture or
forestry that can be used as a fuel for recovering its energy content, and the following waste:
vegetable residues from agriculture and forestry;
vegetable residues from the food processing industry, if the heat generated is recovered;
fibrous vegetable waste from virgin pulp production and from the production of paper
from pulp, if it is co-incinerated at the place of production and the heat generated is
recovered;
cork waste;
wood waste with the exception of wood waste which may contain halideated organic
compounds or heavy metals as a result of treatment with wood preservatives or coating
and which includes, in particular, such wood waste originating from construction and
demolition waste.
Biomass such as bark, wood chips, sawdust, cardboard, fibreboard or other residues from pulp
mills or sawmills contains high amounts of water. Although the chemical compositions of the
bark and wood of different species are slightly different, and even though the amount of dirt and
soil affects the ash content and composition, biomass derived from forestry and forest industries
has, in broad terms, certain common qualities as a fuel. The sulphur content is low and the ash
content is moderate. The EN ISO 17225 series provide typical values and properties of biomass
fuels. Burnt together with peat, for instance, wood ash can react with sulphur from the peat and
act as a desulphurising agent. Nevertheless, the differences in fuel moisture and consistency are
WORKIN
G DRAFT IN
PROGRESS
Chapter 5
462 June 2016 TL/JFF/FN/EIPPCB/LCP_Final Draft
considerable, and these affect the fuel handling and combustion properties. All these details
need to be taken into account when determining techniques for their storage, transportation,
combustion, and possible flue-gas treatment.
An emerging class of biomass fuel used by pulp and paper mills and in CHP and heating plants
is forestry residues, i.e. small trees, treetops and branches of trees, and sometimes also stumps,
which are collected specifically to be used as fuel in connection with other forestry operations.
Forestry residues are used as chips or hog fuel. Experimentation has also been ongoing for the
last decades into the growing of various short-rotation coppices (e.g. Salix and poplar species)
specifically for fuel, although the economics of these fuels are worsened by the costs of
collection and transport.
Forestry residues, when they are used, are often co-fired with other fuels at existing
installations, particularly at peat or bark residue-fired FBC plants, but plants running mainly or
only on forestry residues are also possible. However, not all forestry biomass is suitable for
burning, even at FBC boilers designed for peat or bark. [TWG data collection 2012]
Straw is a residue from the agricultural production of grain, and indeed most of the annual straw
production is consumed within the agricultural sector. Surplus straw is utilised for energy
production in either small district heat-producing boilers or larger CHP plants of up to 40 MWe.
Straw is converted to power and heat in conventional combustion plants, but many technical
issues have to be considered due to the special characteristics of straw (in particular its high
chlorine content). Other biomass fuels used include olive stones, aspen bark, rubber trees, sugar
cane bagasse, and reed canary grass. All these fuels have a relatively high alkali (Na, K)
content.
Energy generation from peat in the EU is concentrated in six countries: Finland, Ireland,
Sweden, Estonia, Latvia and Lithuania. In these six countries the primary energy use is about
1420 TWh per year, and the mean yearly use of peat energy in the period 2006–2009 was
42 TWh, about 3 % of the total primary energy use. In particular, in both Finland and Ireland
peat is a significant fuel, making up ca. 5–6 % of primary energy consumption. In the EU-27 as
a whole, only is 0.2 % of a primary energy use of ca. 21 000 TWh per year is peat energy.
In Finland, the share of peat energy in district heating is overall 21 %, reaching levels above
30 % in 10 of its provinces. In Estonia and Sweden, this share is 1.2 % and 0.6 % respectively.
[New 90, Background documents Finland D1]
Table 5.39 presents a comparison of biomass and peat with other common fuels.
WORKIN
G DRAFT IN
PROGRESS

Chapter 5
TL/JFF/FN/EIPPCB/LCP_Final Draft June 2016 463
Table 5.39: Comparison of biomass fuels and milled peat with fossil fuels normally used in LCPs
Parameter Unit Steam
coal (1)
Milled
peat Bark Wood (
2) Heavy
fuel oil
Natural
gas
Moisture
%
10 50 55 40 0.5 < 0.1
Ash in dry matter 14 3–6 2–3 0.4 < 0.1 0.0
Volatile matter in dry
fuel 25–35 NA 70–80 80–90 NA NA
Sulphur in dry fuel < 1 0.5 < 0.2 0.05 < 1 0.0
Nitrogen compounds
in dry fuel 1 1.7 0.5 0.5 0.3 0.05
Cl
mg/MJ
fuel LHV
(3)
< 0.1 NA < 0.03 < 0.01 NA NA
As 0.14 0.1 0.01 0.01 0.04 NA
Cd 0.15 0.004 0.015 0.01–1.1 NA NA
Hg 0.003 0.003 0.1 0.001–
0.009 < 0.0001 NA
Ni 0.4 0.3 0.04 0.03 0.9 NA
Pb 0.5 0.3 0.15 0.1–0.7 0.06 NA
Fuel bulk density kg/Nm3 1350 350 350 200 987 NA
Fuel bulk LHV GJ/Nm3 34.3 2.9 2.5 2.1 40 NA
LHV of dry substance MJ/kg
28.7 20 19 19 40.2 48
LHV 25.5 8.4 7.2 10.4 40.1 48
Stoichiometric flue-gas
Nm3/MJ
0.278 0.383 0.435 0.357 0.277 0.297
Stoichiometric dry
flue-gas 0.253 0.281 0.291 0.259 0.246 0.239
Specific CO2 gCO2/kWh 476.1 658.8 NA NA 402.5 172.8
Specific CO2 per LHV
unit gCO2/MJ 90
106–
118 113 100 76 54
Power generated / heat
ratio (LHV) 2.3 2.3–2.7 NA NA 2.3 1.8
Emitted CO2 per
electric kWh g/kWh 207 244 NA NA 175 96
NB:
(1) Polish export coal.
(2) Wood chips.
(3) Order of magnitude figures only.
Source: [New 130] [59, Finnish LCP WG, 2000]
Peat is indigenous in combustion plants. It is a voluminous fuel with a low calorific value like
most of the biomass fuels. Therefore, it can rarely be economically transported over distances of
more than about 100 km. Thus, a number of plants burning peat and/or biomass consist of
small-scale local cogeneration or heat-only plants for small to medium district heating systems.
A great number of those plants in Finland are below 50 MWth. As a result of the cost of
transporting peat to the plants, although peat bogs deep and large enough for economic peat
production exist in all parts of Finland, only a small fraction of them are being exploited. In
energy terms, the largest consumers of peat fuel are the cogeneration and heating plants in the
district heating systems of (mostly inland) cities with populations of 50 000 to 200 000.
Peat is characterised by low ash and sulphur contents, typically around 5 % and 0.20 % (dry)
respectively. Peat has a high volatiles content and is very reactive if its moisture content falls
below 40 % (milled fuel peat). For large-scale use, it is typically used as milled peat, produced
during May to August, dried around 40 % moisture by the sun and wind on the production site,
and subsequently stored next to the production site in large stockpiles, with plastic coverage.
With respect to the high moisture content (around 45–50 wt-% at the time of deliveries) and in
terms of dry substance, peat is more comparable to biomass than to lignite.
Figure 5.43 shows a typical mass flow balance stream from the combustion of peat at a CFB
boiler.
WORKIN
G DRAFT IN
PROGRESS

Chapter 5
464 June 2016 TL/JFF/FN/EIPPCB/LCP_Final Draft
Source: [ New 123, 58, Eurelectric, 2001]
Figure 5.43: Example of the mass flow balance stream of a peat-fired CFBC boiler
5.2.2.2 Energy efficiency of biomass- and peat-fired combustion plants
As mentioned earlier, many biomass- and/or peat-fired power plants are CHP plants. The
cogeneration of electricity and heat enables reaching very high levels of total fuel utilisation,
which may range from 17 % up to 102 % (yearly average on LHV basis – condensing mode). A
typical total fuel utilisation level for cogeneration plants is however difficult to determine on a
general basis. The efficiency is highly site-specific and depends on issues such as the heat load
and changes in the heat load, the price level and the need for electricity in the market, the
applied technology, etc.
The cogeneration of heat and power is usually considered as a technical option whenever
economically feasible, i.e. whenever the local heat demand is high enough to warrant the
construction of the more expensive cogeneration plant instead of the simpler heat- or power-
only plant. Indeed, plants operating for power generation only are also common. The usual
power plant net electrical efficiency range is 11–36 % (yearly average), with the higher end of
the range related to plants for power generation only. With pulverised combustion, electrical
efficiency levels of 38–39 % were achieved in a pulverised peat boiler in Finland.
Biomass- or peat-fired condensing power plants are usually smaller than coal-fired plants, and
the steam pressure and temperature are usually lower than in advanced coal-fired power plants.
The heat rate levels for biomass- and peat-fired FBC power plants are around 3.3–3.6. [TWG
data collection 2012]
Conversion of a coal unit to 100 % biomass firing has a slight impact on the overall thermal
efficiency of the unit. As the biomass used (e.g. pellets) has a lower moisture content compared
to coal, a higher tempering airflow is required at the milling stage, a consequence being that
more combustion air bypasses the air heaters. The result of this is a higher flue-gas exit
temperature and consequently a small reduction in the overall boiler efficiency. However, the
efficiency of a converted unit is closely connected to that of the unit operating with coal. [New
86, Eurelectric comments to D1]
WORKIN
G DRAFT IN
PROGRESS

Chapter 5
TL/JFF/FN/EIPPCB/LCP_Final Draft June 2016 465
5.2.2.3 Emissions to air from biomass- and/or peat-fired combustion plants
The emissions of biomass plants depend mainly on the composition of the fuel, the combustion
process used and the flue-gas treatment. NOX emissions also depend on the combustion
characteristics, and in the cases of higher emissions, the NOX concentrations in the flue-gas can
be reduced with a DeNOX system.
With grate-firing systems for biomass, CO peaks can occur in the vibrating periods of the
vibrating grate. [43, EPPSA proposal]
In Table 5.40, the range of currently observed emission levels for the combustion of biomass
and/or peat is presented. In some cases, the data reported are specific to biomass fuel only and
may not necessarily be representative of both biomass and peat combustion. An indication of
the most common abatement techniques applied in biomass- and/or peat-firing combustion
plants is also given.
WORKIN
G DRAFT IN
PROGRESS

Chapter 5
466 June 2016 TL/JFF/FN/EIPPCB/LCP_Final Draft
Table 5.40: Specific emissions to air from biomass- and/or peat-fired combustion plants
Capacity
(MWth)
Type of
combust
ion
Abatement techniques Emissions to air (mg/Nm3) (1)
SO2 NOX Dust SO2 NOX NH3 Dust CO HF HCl Hg
< 100
GF
DSI/SDA
Air
staging/Fuel
staging/LNB/
Flue-gas
recirculation/
SNCR
ESP alone or
with Flue-gas
condenser/Bag
filter
3–73
220–303
17–22 2–21 24–79 0.23–
0.27 2.2–51
0.0008–
0.0075
FBC
Wet
scrubbing/
DSI/Flue-
gas
condenser/
Boiler
sorbent
injection/W
et FGD
Air
staging/Fuel
staging/LNB/
Flue-gas
recirculation/
SNCR/SCR
ESP alone or
with Flue-gas
condenser/Wet
scrubbing/Wet
FGD/Bag filter
alone or with
Flue-gas
condenser
1–850 70–400 1–15 0.5–42 13–373 0.01–
0.77 0.15–36
0.0006–
0.009
PC Air staging
/LNB ESP 4 194–198 22–27 202–286
100–300
GF
Flue-gas
condenser/
Wet FGD
Air staging
Bag filter with
Flue-gas
condenser and
Wet FGD/ESP
3–376 290–386 1–21 117–251 7–17 0.0003–
0.0011
FBC
Wet
scrubbing/
DSI/Flue-
gas
condenser/
Boiler
sorbent
injection
Air staging
/Fuel
staging/LNB/
Flue-gas
recirculation
SNCR/SCR
1–626 53–400 1–15 1–61 13–928 0.01–
1.3 0.2–15
0.0001–
0.0039
PC
Air
staging/Fuel
staging/
SNCR
ESP 2–3 120–248 3–12 12–515
WORKIN
G DRAFT IN
PROGRESS

Chapter 5
TL/JFF/FN/EIPPCB/LCP_Final Draft June 2016 467
≥ 300
FBC
Flue-gas
condenser/
Boiler
sorbent
injection
Air
staging/LNB/
SNCR
ESP 49–371 174–234 2.6 1–15 4–37 0.5 4–37 0.0029
PC Wet FGD
Air staging
/LNB/ Flue-
gas
recirculation
/SCR
ESP alone or
with Wet FGD 1 42–158 1–5 1–8.5 29–38 0.3 4 0.0003
(1) Data represented are yearly averages of short-term values, without subtraction of uncertainty, dry flue-gas, 6 % reference oxygen.
NB:
GF: Grate firing
FBC: Fluidised bed combustion
PC: Pulverised combustion
DSI: Duct sorbent injection
SDA: Spray dry absorber
Source: [LCP TWG data collection 2012]
WORKIN
G DRAFT IN
PROGRESS
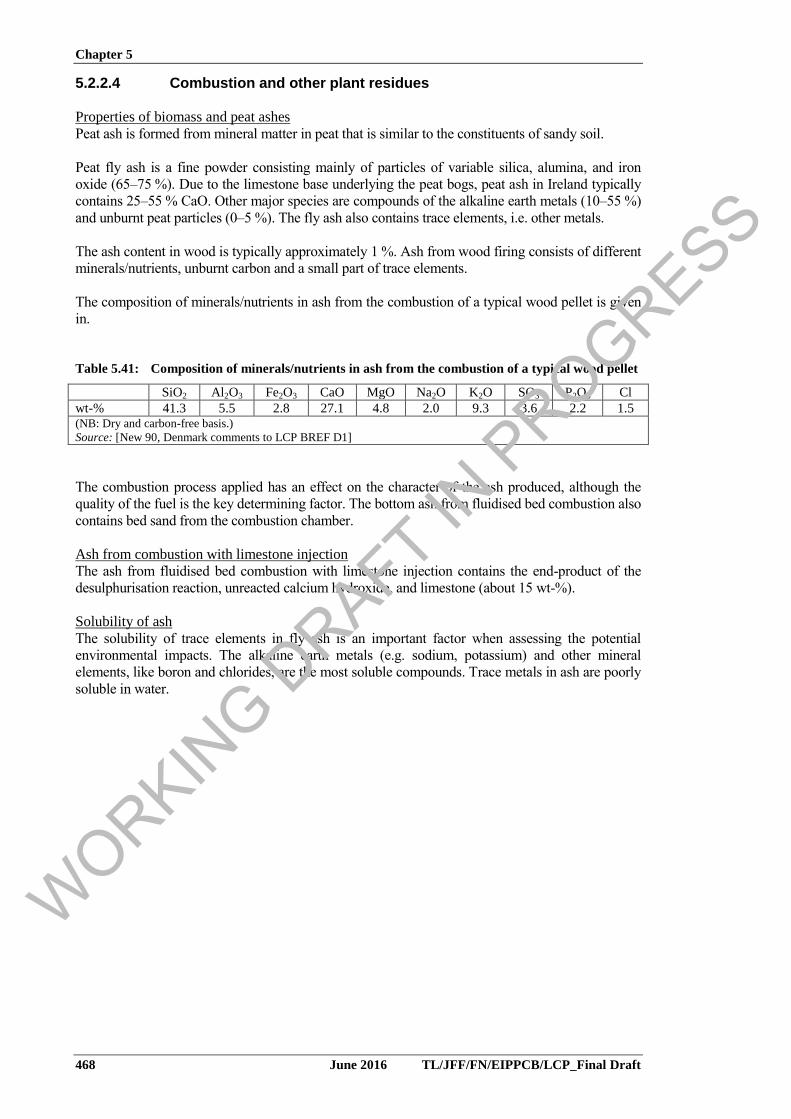
Chapter 5
468 June 2016 TL/JFF/FN/EIPPCB/LCP_Final Draft
5.2.2.4 Combustion and other plant residues
Properties of biomass and peat ashes
Peat ash is formed from mineral matter in peat that is similar to the constituents of sandy soil.
Peat fly ash is a fine powder consisting mainly of particles of variable silica, alumina, and iron
oxide (65–75 %). Due to the limestone base underlying the peat bogs, peat ash in Ireland typically
contains 25–55 % CaO. Other major species are compounds of the alkaline earth metals (10–55 %)
and unburnt peat particles (0–5 %). The fly ash also contains trace elements, i.e. other metals.
The ash content in wood is typically approximately 1 %. Ash from wood firing consists of different
minerals/nutrients, unburnt carbon and a small part of trace elements.
The composition of minerals/nutrients in ash from the combustion of a typical wood pellet is given
in.
Table 5.41: Composition of minerals/nutrients in ash from the combustion of a typical wood pellet
SiO2 Al2O3 Fe2O3 CaO MgO Na2O K2O SO3 P2O5 Cl
wt-% 41.3 5.5 2.8 27.1 4.8 2.0 9.3 3.6 2.2 1.5 (NB: Dry and carbon-free basis.)
Source: [New 90, Denmark comments to LCP BREF D1]
The combustion process applied has an effect on the character of the ash produced, although the
quality of the fuel is the key determining factor. The bottom ash from fluidised bed combustion also
contains bed sand from the combustion chamber.
Ash from combustion with limestone injection
The ash from fluidised bed combustion with limestone injection contains the end-product of the
desulphurisation reaction, unreacted calcium hydroxide, and limestone (about 15 wt-%).
Solubility of ash
The solubility of trace elements in fly ash is an important factor when assessing the potential
environmental impacts. The alkaline earth metals (e.g. sodium, potassium) and other mineral
elements, like boron and chlorides, are the most soluble compounds. Trace metals in ash are poorly
soluble in water.
WORKIN
G DRAFT IN
PROGRESS
Chapter 5
TL/JFF/FN/EIPPCB/LCP_Final Draft June 2016 469
5.2.3 Techniques to consider in the determination of BAT for the combustion of biomass and/or peat
This section describes techniques (or combinations thereof), and associated monitoring,
considered to have the potential for achieving a high level of environmental protection in the
activities within the scope of this document. The techniques described include both the
technology used and the way in which the installations are designed, built, maintained, operated,
and decommissioned.
It covers process-integrated techniques and end-of-pipe techniques. Waste prevention and
management, including waste minimisation and recycling procedures, are also considered.
Furthermore, techniques for reducing the consumption of raw materials, water, and energy are
covered.
Annex III to the Industrial Emissions Directive lists a number of criteria for determining BAT,
and the information within this chapter addresses these considerations. As far as possible, the
standard structure of Table 3.4 is used to outline the information on each technique, to enable a
comparison of techniques and the assessment against the definition of BAT given in the
Industrial Emissions Directive.
This section does not necessarily provide an exhaustive list of techniques that could be applied
in the sector. Other techniques may exist, or may be developed, which could be considered for
the determination of BAT for an individual installation.
In this section, the techniques to be considered have only been fully described when they are
specific to the considered combusted fuel or applied combustion process (combustion of
biomass and peat). Indeed, for most of the techniques, general descriptions are already presented
in Chapter 3. Therefore, in order to avoid repetition, for those general techniques already
described in Chapter 3, only the additional information that is specific to the combustion of
biomass and/or peat is reported here in synthesis tables.
5.2.3.1 Techniques to reduce diffuse/fugitive emissions to air
Information on general techniques to reduce diffuse/fugitive emissions to air is given in Section
2.8. Table 5.42 gives additional information specific to biomass and peat firing, e.g. on
environmental performances and example plants.
WORKIN
G DRAFT IN
PROGRESS

Chapter 5
470 June 2016 TL/JFF/FN/EIPPCB/LCP_Final Draft
Table 5.42: Techniques to reduce diffuse/fugitive emissions to air
Technique Technical description
Achieved
environmental
benefits
Environmental
performance and
operational data
Cross-media effects Technical considerations relevant
to applicability
Example
plants
Unloading, transport and handling of biomass and peat
Enclosed transfers
Closed transfer
systems with bag
filters
Reduction of fugitive
dust emissions
High operational
experience None
Generally applicable
NA
Wind shields Open conveyors with
wind shields
Open conveyor belts can only be
considered for lumpy material (wood
pieces)
Enclosed unloading
Unloading of biomass
and peat in enclosed
buildings equipped
with a bag filter for
dust abatement Generally applicable
Plant 108-1
Cleaning devices Cleaning devices for
conveyor belts NA
Storage of biomass, peat and additives
Enclosed storage
Storage of fine dusty
fuel material in
enclosed areas or silos Reduction of fine
particulates diffuse
emissions High operational
experience None Generally applicable NA
Enclosed storage of
lime/limestone in silos
with dust abatement
Wind shields
Wind shields for open
storage of lumpy
wood, etc.
Reduction of fugitive
dust emissions
NA= No relevant specific information available.
WORKIN
G DRAFT IN
PROGRESS

Chapter 5
TL/JFF/FN/EIPPCB/LCP_Final Draft June 2016 471
5.2.3.2 Techniques to improve the general environmental performance
Information on general techniques to improve the general environmental performance is given
in Section 3.1.1. Table 5.43 gives additional information specific to biomass and peat firing, e.g.
on environmental performances and example plants.
WORKIN
G DRAFT IN
PROGRESS

Chapter 5
472 June 2016 TL/JFF/FN/EIPPCB/LCP_Final Draft
Table 5.43: Techniques to improve the general environmental performance
Technique Technical description Achieved
environmental benefits
Environmental
performance and
operational data
Cross-media effects
Technical considerations relevant
to applicability Example
plants New plants Existing plants
Separate classifying and
storage of biomass fuels
of different sizes and
qualities
Management of co-fired
fuels and arranging for
fuel blends that favour
the limitation of CO and
other pollutants' peaks
Stable combustion
conditions
High operational
experience
NA
Applicable to biomass-fired plants Plant 108-1
Fuel choice
The choice of an
appropriate mixture of
biomasses and peat can
help in controlling the
environmental
performances of the
plant – see also Section
3.1.1.4
Lower emission levels of
SOX, HF, HCl, etc.
Lower specific fuel
consumption
May be constrained by the
availability of different types of fuel
with a better environmental profile
as a whole, which may be impacted
by the energy policy of the Member
States.
For existing combustion plants, the
type of fuel chosen may be limited
by the configuration and the design
of the plant
NA
Fuel specification in
supplier contract
The fuel supplier
adheres to the moisture
(and size) specifications
in the contract
Stable combustion
conditions. Lower NOX
and CO emissions
None
Generally applicable
Advanced control
system See Section 3.2.3.8
Complete combustion,
Low NOX and CO
emissions
Generally
applicable
The applicability
to old
combustion
plants may be
constrained by
the need to
retrofit the
combustion
and/or control
command
system(s)
Plant 42
NB:
NA: No relevant specific information available.
WORKIN
G DRAFT IN
PROGRESS

Chapter 5
TL/JFF/FN/EIPPCB/LCP_Final Draft June 2016 473
5.2.3.3 Techniques to increase energy efficiency
Information on general techniques to increase energy efficiency is given in Section 3.2.3. Table
5.44 gives additional information specific to biomass and peat firing, e.g. on example plants.
Figure 5.44 shows the operating electrical efficiencies and total fuel utilisation of some
European biomass- and/or peat-fired combustion plants, commissioned between 1968 and 2011,
operated between 1700 h/yr and 8700 h/yr, with an equivalent full load factor above 20 %.
Source: [TWG data collection 2012]
Figure 5.44 Operating energy efficiencies of European biomass- and/or peat-fired combustion
plants
The net design total fuel utilisation levels of seven CHP combustion plants were reported by the
[New 66, Task force on energy efficiency – 2014]. Plant 411 reported a value of 73 % and Plant
33 reported a value of 99 %. The net design electrical efficiencies reported by Plant 190 and
Plant 536 are 38 % and 33.7 % respectively.
Compared to bigger plants, which may use a high proportion of peat or wood pellets, smaller
plants (e.g. < 150 MWth) may use a higher share of wet biomass fuels, which is also the case in
newer plants. [New 91, Aalborg Energie Technik, reaction to the BP from DK]
WORKIN
G DRAFT IN
PROGRESS

Chapter 5
474 June 2016 TL/JFF/FN/EIPPCB/LCP_Final Draft
Table 5.44: Techniques to increase energy efficiency
Technique Technical description
Achieved
environmental
benefits
Environmental
performance and
operational data
Cross-media effects
Technical considerations
relevant to applicability Economics Example
plants New Existing
Heat recovery in
CHP plants
Biomass and/or peat are used in
combined heat and power production,
due to the high fuel efficiency
compared to the electrical efficiency
– see Section 3.2.3.2
Increased total fuel
utilisation
High operational
experience
None
Applicable within the constraints
associated with the local power
and heat demand
NA
Plants 539,
660
Change of turbine
blades
Steam turbine blades can be changed
to three-dimensional blades during
regular maintenance intervals – see
Section 3.2.3.13
Increased
efficiency
High operational
experience
The applicability may be
restricted by demand/steam
conditions and/or limited plant
lifetime
NA
Feed-water
preheating using
recovered heat
A regenerative feed-water heating
retrofit is also possible in special
cases – see Section 3.2.3.7
NS Generally
applicable Very limited
Reheat cycle See Section 2.2 There is experience in
plants of ≥ 20 MWe
NA
Generally
applicable Not applicable
Economiser/flue-
gas cooler
This effectively reduces the boiler
(and stack) exit temperature of the
flue-gas, increasing the boiler
efficiency – see also Section 3.2.3.1
NA
Generally
applicable Limited
Heat recovery from
grate cooling
Instead of dumping the heat from the
grate cooling as a loss, it is kept in
the cycle (the grate is part of the
evaporator)
Heat recovery from
fluidised bed
Instead of dumping the heat from the
fluidised bed as a loss, it is kept in
the cycle with a specific heat
exchanger – see also Section 3.2.3.1
Applicable to FBC
Additional
cost for the
heat
exchanger
Flue-gas condenser
Additional heat recovery due to
flue-gas condensation – see also
Section 3.2.3.150
Increased
efficiency / reduced
emissions
High operational
experience
Waste water stream
generated (condenser
blowdown)
Applicable to CHP units provided
there is enough demand for low-
temperature heat
NA Plant 476
Fuel drying
With steam or flue-gas, low value
heat can be recovered from power
processes to increase the fuel energy
(e.g. by recovering the heat from the
flue-gas).
Many alternative technologies are
commercially available. New
technical alternatives are under
Increased
combustion
efficiency,
expansion for
potential biomass
fuels, safer use.
Many benefits are
Steam dryers are most
efficient.
The implementation of
drying systems can save
10 % of fuel
consumption with wet
fuels like peat or wood.
Additional emissions
to water and air:
e.g. bark pressing
may generate high
BOD releases to
water and high
energy use and
maintenance.
Applicable to the combustion of
biomass and/or peat, or to the
combustion of lignite within the
constraints associated with
spontaneous combustion risks
(e.g. the moisture content of peat
is kept above 40 % throughout
the delivery chain).
Additional
cost of dryers
NA
WORKIN
G DRAFT IN
PROGRESS

Chapter 5
TL/JFF/FN/EIPPCB/LCP_Final Draft June 2016 475
Technique Technical description
Achieved
environmental
benefits
Environmental
performance and
operational data
Cross-media effects
Technical considerations
relevant to applicability Economics Example
plants New Existing
development.
With press drying, electricity is used
to reduce the moisture.
See also Section 3.2.3.18
achieved if fuel can
be dried just before
combustion.
Over-drying is avoided;
moisture content of the
raw biomass is reduced
to 40–60 %. Moisture
has a cooling role in the
boiler and affects ESP
efficiency, etc.
Moisture content in
biomass-promoted
biological activity
and may increase the
tendency to self-
ignition
The retrofit of
existing plants
may be
restricted by the
extra calorific
value that can
be obtained
from the drying
operation and
by the limited
retrofit
possibilities
offered by some
boiler designs
or plant
configurations
Biomass
gasification
Gasification constitutes a viable
alternative to normal combustion.
See Chapter 4
Increased plant
efficiency and lower
emission levels.
Gas can be used as a
reburning fuel to
reduce emissions of
NOX
Expected electrical
efficiencies of
51–55 %
NA To date only applied in
demonstration and pilot plants
Expensive in
small scale,
limited
experience
Vaskiluoto
Power
Plant
NB:
NA: No relevant specific information available.Source: [LCP TWG data collection 2012][43,EPPSA proposal]
WORKIN
G DRAFT IN
PROGRESS

Chapter 5
476 June 2016 TL/JFF/FN/EIPPCB/LCP_Final Draft
5.2.3.4 Techniques for the prevention and control of NOX, N2O and CO emissions
Information on general techniques, including information on combustion optimisation, for the
prevention and control of NOX, N2O and CO emissions is given in Section 3.2.2.3. Table 5.45
gives information specific to biomass and/or peat firing, e.g. on environmental performances
and example plants. Further details on related environmental performance and operational data
are provided after the table.
WORKIN
G DRAFT IN
PROGRESS
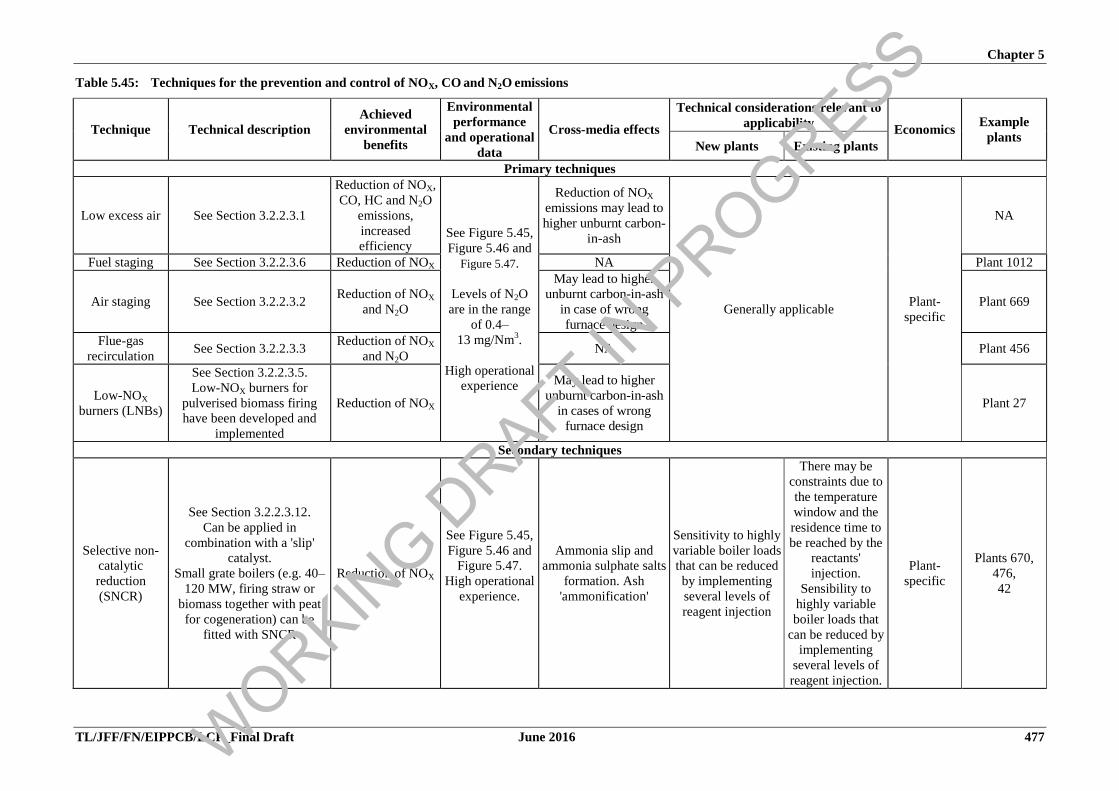
Chapter 5
TL/JFF/FN/EIPPCB/LCP_Final Draft June 2016 477
Table 5.45: Techniques for the prevention and control of NOX, CO and N2O emissions
Technique Technical description
Achieved
environmental
benefits
Environmental
performance
and operational
data
Cross-media effects
Technical considerations relevant to
applicability Economics
Example
plants New plants Existing plants
Primary techniques
Low excess air See Section 3.2.2.3.1
Reduction of NOX,
CO, HC and N2O
emissions,
increased
efficiency See Figure 5.45,
Figure 5.46 and
Figure 5.47.
Levels of N2O
are in the range
of 0.4–
13 mg/Nm3.
High operational
experience
Reduction of NOX
emissions may lead to
higher unburnt carbon-
in-ash
Generally applicable Plant-
specific
NA
Fuel staging See Section 3.2.2.3.6 Reduction of NOX NA Plant 1012
Air staging See Section 3.2.2.3.2 Reduction of NOX
and N2O
May lead to higher
unburnt carbon-in-ash
in case of wrong
furnace design
Plant 669
Flue-gas
recirculation See Section 3.2.2.3.3
Reduction of NOX
and N2O NA Plant 456
Low-NOX
burners (LNBs)
See Section 3.2.2.3.5.
Low-NOX burners for
pulverised biomass firing
have been developed and
implemented
Reduction of NOX
May lead to higher
unburnt carbon-in-ash
in cases of wrong
furnace design
Plant 27
Secondary techniques
Selective non-
catalytic
reduction
(SNCR)
See Section 3.2.2.3.12.
Can be applied in
combination with a 'slip'
catalyst.
Small grate boilers (e.g. 40–
120 MW, firing straw or
biomass together with peat
for cogeneration) can be
fitted with SNCR
Reduction of NOX
See Figure 5.45,
Figure 5.46 and
Figure 5.47.
High operational
experience.
Ammonia slip and
ammonia sulphate salts
formation. Ash
'ammonification'
Sensitivity to highly
variable boiler loads
that can be reduced
by implementing
several levels of
reagent injection
There may be
constraints due to
the temperature
window and the
residence time to
be reached by the
reactants'
injection.
Sensibility to
highly variable
boiler loads that
can be reduced by
implementing
several levels of
reagent injection.
Plant-
specific
Plants 670,
476,
42
WORKIN
G DRAFT IN
PROGRESS

Chapter 5
478 June 2016 TL/JFF/FN/EIPPCB/LCP_Final Draft
Technique Technical description
Achieved
environmental
benefits
Environmental
performance
and operational
data
Cross-media effects
Technical considerations relevant to
applicability Economics
Example
plants New plants Existing plants
Selective
catalytic
reduction (SCR)
See Section 3.2.2.3.11.
Small grate boilers (e.g. 40–
120 MW, firing straw or
biomass together with peat
for cogeneration) can be
fitted with low-dust SCR.
SCR catalyst deactivation
due to poisoning is
manageable.
High-dust SCR may not be
suitable for straw-firing
combustion plants, due to
catalyst deactivation by the
fly ash
Reduction of NOX
See Figure 5.45,
Figure 5.46 and
Figure 5.47.
Catalysts may be
deactivated at low
temperatures due to the
alkali content of the
fuel.
Minor ammonia slip
Generally
applicable
There may be
economic
restrictions for
retrofitting
combustion plants
of < 300 MWth.
Not generally
applicable to
combustion plants
of < 100 MWth
Plant-
specific.
Not viable
for
combustion
plants
operated
< 500 h/yr
Plants 31, 14
NB:
NA: No relevant specific information available.
WORKIN
G DRAFT IN
PROGRESS

Chapter 5
TL/JFF/FN/EIPPCB/LCP_Final Draft June 2016 479
The large majority of well-performing plants shown in Figure 5.45, Figure 5.46, and Figure 5.47
continuously monitor NOX emission concentrations and average short-term values (daily, hourly
or half-hourly basis); some plants monitor periodically. No evidence of correlation between the
plotted emission concentrations and plant age (commissioning years between 1963 and 2011),
load (equivalent full load factor above 38 %) or operating hours (total operating hours per year
ranging between 1700 and 8700) is observed. [ 3, LCP TWG 2012 ]
Figure 5.45 shows NOX, CO and NH3 emissions from well-performing plants of < 100 MWth.
The TWG considered in the Final Meeting that NOX emissions in the case of plants burning
high-alkali fuels may be slightly higher (i.e. up to 250 mg/Nm3).
NB: reported emissions are expressed as yearly averages Source: [TWG data collection 2012]
Figure 5.45: NOX emissions from well-performing biomass- and/or peat-fired plants of < 100 MWth
WORKIN
G DRAFT IN
PROGRESS
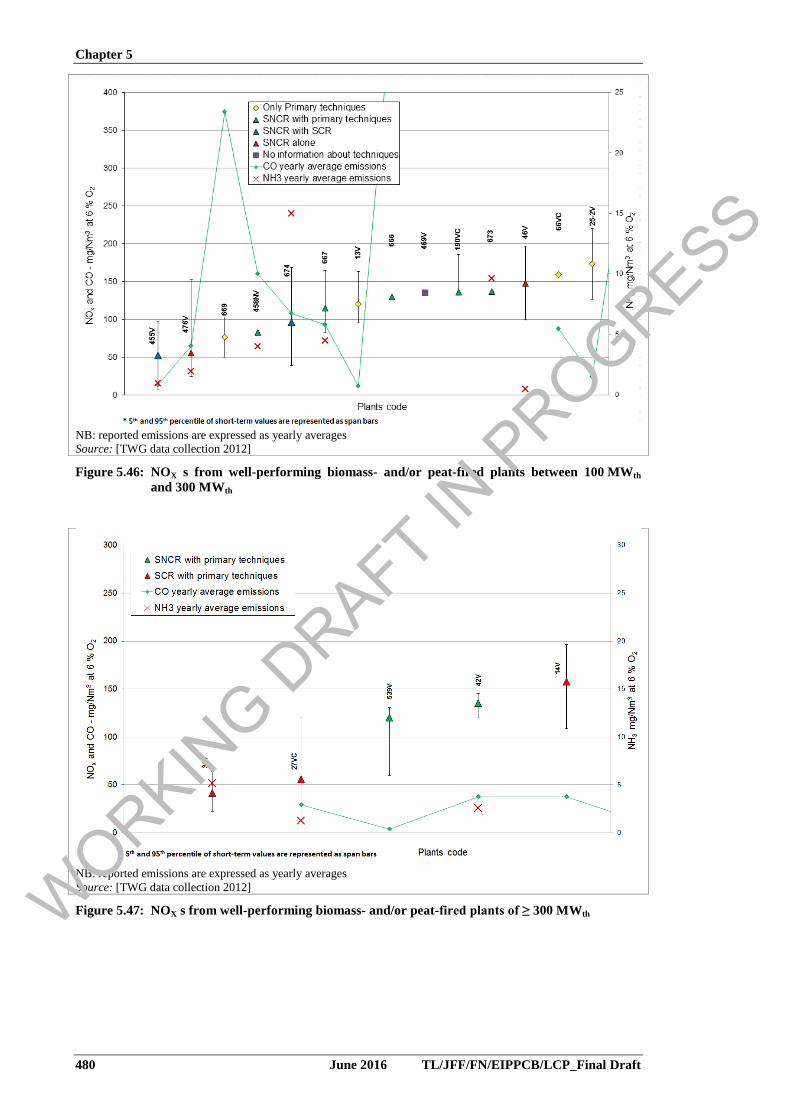
Chapter 5
480 June 2016 TL/JFF/FN/EIPPCB/LCP_Final Draft
NB: reported emissions are expressed as yearly averages Source: [TWG data collection 2012]
Figure 5.46: NOX s from well-performing biomass- and/or peat-fired plants between 100 MWth
and 300 MWth
NB: reported emissions are expressed as yearly averages Source: [TWG data collection 2012]
Figure 5.47: NOX s from well-performing biomass- and/or peat-fired plants of ≥ 300 MWth
WORKIN
G DRAFT IN
PROGRESS

Chapter 5
TL/JFF/FN/EIPPCB/LCP_Final Draft June 2016 481
5.2.3.5 Techniques for the prevention and control of SOX, HCl and HF emissions
Information on general techniques for the prevention and control of SOX, HCl and HF emissions
is given in Section 3.2.2.2. Table 5.46 gives additional information specific to biomass and/or
peat firing, e.g. on environmental performances and example plants. Further details on related
environmental performance and operational data are provided after the table.
WORKIN
G DRAFT IN
PROGRESS

Chapter 5
482 June 2016 TL/JFF/FN/EIPPCB/LCP_Final Draft
Table 5.46: Techniques for the prevention and control of SOX, HCl and HF emissions
Technique
Technical description
Achieved
environmenta
l benefits
Environmental
performance and
operational data
Cross-media
effects
Technical considerations
relevant to applicability Economics
Example
plants
New plants Existing plants
Fuel choice
In the co-combustion of biomass, the
biomass alkali content increases the SOX
capture.
Peat sands keep the boiler clean.
See also Section 3.1.1.4
Reduction of
SOX and HCl
emissions at
source
High operational experience NA
There may be constraints
associated with the availability of
different types of fuel, which may
be impacted by the energy policy
of the Member State
Depends on type of fuel Plant 322
Boiler
sorbent
injection
Furnace injection. The sorbent injected
is usually limestone.
The desulphurisation does not increase
over about 45 % in the BFB boiler,
even with much higher Ca/S ratios. In
CFBC, the highest achievable degree of
desulphurisation is around 80 %, but
that could only be reached with a very
high Ca/S ratio.
See also Sections 2.2 and 3.2.2.2.10
Reduction of
SOX and NOX
emissions
The degree of
desulphurisation in peat-
fired FBC boilers is
significantly lower than in
coal-fired FBC boilers.
According to the
knowledge gained with peat
in FBC boilers, the degree
of desulphurisation in peat
firing with moderate Ca/S
ratios (3–5) for CFBC is
50–70 % and for BFBC is
around 30–40 %.
Emissions of N2O
Significant fouling
was reported in
the BFBC plant.
Generally applicable
EUR 1300–1400/t SO2
removed (SO2 emission:
360 mg/Nm3).
EUR 2100–2700/t SO2
removed (SO2 emission:
200–280 mg/Nm3).
A high Ca/S ratio
implies elevated
limestone feeding rates
and related costs.
Plant 25-2
Spray dry
scrubber or
absorber
(SDA)
See Section 3.2.2.2.6
Reduction of
SOX, HF, HCl,
dust
SO2 removal efficiencies up
to 92 %.
Residues that need
to be landfilled Generally applicable NA
Plant 489-
3
WORKIN
G DRAFT IN
PROGRESS
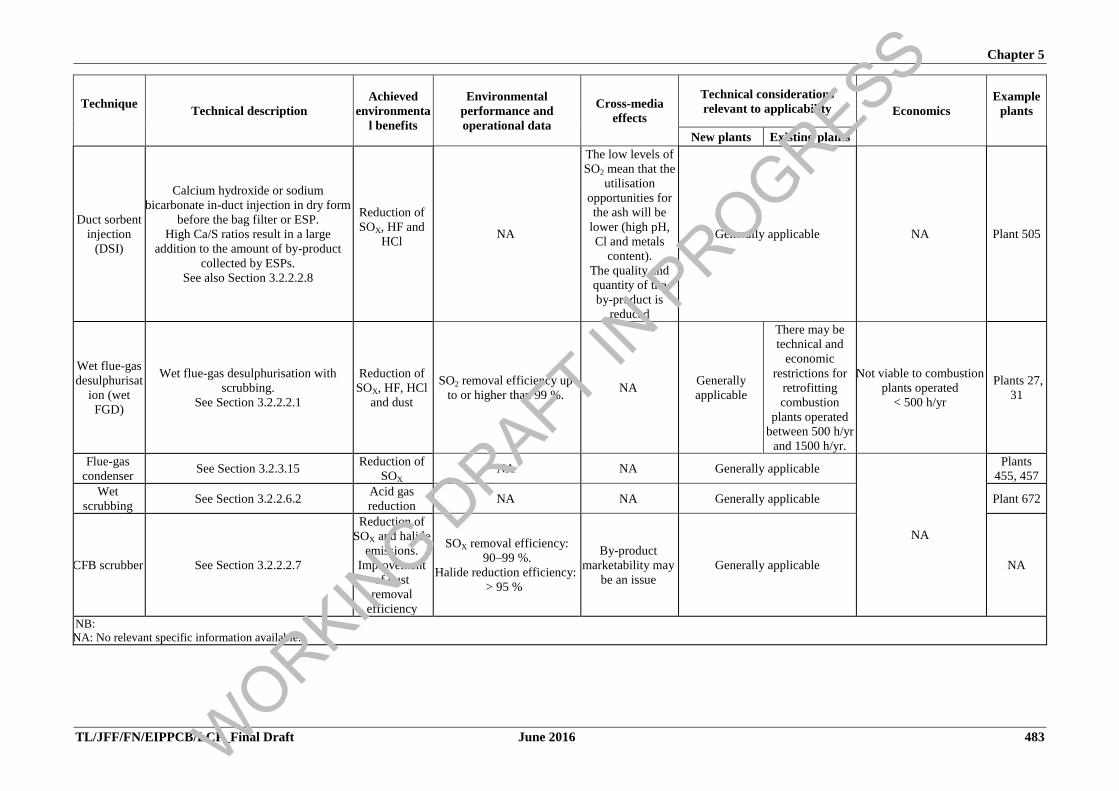
Chapter 5
TL/JFF/FN/EIPPCB/LCP_Final Draft June 2016 483
Technique
Technical description
Achieved
environmenta
l benefits
Environmental
performance and
operational data
Cross-media
effects
Technical considerations
relevant to applicability Economics
Example
plants
New plants Existing plants
Duct sorbent
injection
(DSI)
Calcium hydroxide or sodium
bicarbonate in-duct injection in dry form
before the bag filter or ESP.
High Ca/S ratios result in a large
addition to the amount of by-product
collected by ESPs.
See also Section 3.2.2.2.8
Reduction of
SOX, HF and
HCl
NA
The low levels of
SO2 mean that the
utilisation
opportunities for
the ash will be
lower (high pH,
Cl and metals
content).
The quality and
quantity of the
by-product is
reduced
Generally applicable NA Plant 505
Wet flue-gas
desulphurisat
ion (wet
FGD)
Wet flue-gas desulphurisation with
scrubbing.
See Section 3.2.2.2.1
Reduction of
SOX, HF, HCl
and dust
SO2 removal efficiency up
to or higher than 99 %. NA
Generally
applicable
There may be
technical and
economic
restrictions for
retrofitting
combustion
plants operated
between 500 h/yr
and 1500 h/yr.
Not viable to combustion
plants operated
< 500 h/yr
Plants 27,
31
Flue-gas
condenser See Section 3.2.3.15
Reduction of
SOX NA NA Generally applicable
NA
Plants
455, 457
Wet
scrubbing See Section 3.2.2.6.2
Acid gas
reduction NA NA Generally applicable Plant 672
CFB scrubber See Section 3.2.2.2.7
Reduction of
SOX and halide
emissions.
Improvement
of dust
removal
efficiency
SOX removal efficiency:
90–99 %.
Halide reduction efficiency:
> 95 %
By-product
marketability may
be an issue
Generally applicable NA
NB:
NA: No relevant specific information available.
WORKIN
G DRAFT IN
PROGRESS

Chapter 5
484 June 2016 TL/JFF/FN/EIPPCB/LCP_Final Draft
Several well-performing plants shown in Figure 5.48, Figure 5.49 and Figure 5.50 continuously
monitor SO2 emission concentrations and average short-term values (daily, hourly or
half-hourly basis); some plants monitor these emissions periodically. No evidence of correlation
between the plotted emission concentrations and plant age (commissioning years between 1963
and 2011), load (equivalent full load factor above 38 %) or operating hours per year (total
operating hours ranging between 2800 and 8700) is observed. [ 3, LCP TWG 2012 ] [ 44,
LECOMTE and JANKOV 2012 ]
Dry, semi-dry and wet abatement techniques are applied and available for the three categories of
biomass-firing plants, showing in general lower SOX emissions compared to coal-fired plants.
Considering that wet abatement techniques may be fitted not only for SOX abatement but also
for other pollutants (e.g. HCl) or for other purposes (i.e. flue-gas condenser) and the level of
SOX in the flue-gas may not be very high, the reported SOX emissions are generally low. In
addition to Figure 5.48, Plant 190, reporting yearly average SO2 emissions of 100 mg/Nm3
(short emissions concentration of 215 mg/Nm3), combusts 100 % peat (sulphur content
> 0.1 wt-%), uses the boiler sorbent injection technique, and is considered a representative
example for smaller plants or plants using a higher sulphur content in the fuel. The use of the
duct sorbent injection technique in bigger plants allows achieving emissions below 70 mg/Nm3
(e.g. Plant 46), and, with the use of SDA in plants ≥ 300 MWth, SO2 emissions may be less than
50 mg/Nm3 (e.g. Plant 489-3 is a smaller plant fitted with SDA that reports 50 mg/Nm
3).
NB: reported emissions are expressed as yearly averages Source: [TWG data collection 2012]
Figure 5.48: SO2 emissions from well-performing biomass- and/or peat-fired plants of < 100 MWth
WORKIN
G DRAFT IN
PROGRESS

Chapter 5
TL/JFF/FN/EIPPCB/LCP_Final Draft June 2016 485
NB: reported emissions are expressed as yearly averages Source: [TWG data collection 2012]
Figure 5.49: SO2 emissions from well-performing biomass- and/or peat-fired plants between
≥ 100 MWth and < 300 MWth
NB: reported emissions are expressed as yearly averages Source: [TWG data collection 2012]
Figure 5.50: SO2 emissions from well-performing biomass- and/or peat-fired plants of ≥ 300 MWth
Several plants shown in Figure 5.51 and Figure 5.52 continuously monitor HCl emission
concentrations and average short-term values (hourly, daily or half-hourly basis); some plants
monitor these emissions periodically.
WORKIN
G DRAFT IN
PROGRESS

Chapter 5
486 June 2016 TL/JFF/FN/EIPPCB/LCP_Final Draft
As mentioned before, dry, semi-dry and wet abatement techniques proposed as BAT may be
applied and are available for the three categories of biomass-firing plants. Wet abatement
techniques may be fitted not only for HCl emissions abatement but also for other pollutants (i.e.
SOX) and/or for other purposes (i.e. flue-gas condenser). HCl emissions depend on the Cl
content of the fuel (e.g. Plant 505V, equipped with the duct sorbent injection technique, burns a
Cl content in the biomass close to 0.1 wt-% and reported yearly average HCl emissions of
15 mg/Nm3; and Plant 33, fitted with wet abatement techniques, burns 100 % straw with more
than 0.1 wt-% Cl and reported yearly average HCl emissions below 25 mg/Nm3). Emissions
may depend on the fuel mix but also on other factors (e.g. the use of sulphur-rich compounds to
avoid negative effects due to the alkalinity of certain fuels).
The plants of < 100 MWth represented in Figure 5.51 reported emissions below those reported
by Plant 505V, a 139 MWth plant fitted with duct sorbent injection (i.e. 15 mg/Nm3).
NB: reported emissions are expressed as yearly averages Source: [TWG data collection 2012]
Figure 5.51: HCl emissions from well-performing biomass- and/or peat-fired plants of < 100 MWth
Almost all the plants of ≥ 100 MWth and < 300 MWth burning only woody biomass reported
HCl emissions below 9 mg/Nm3, e.g. Plant 25-2 using boiler sorbent injection. Well-performing
plants are represented in Figure 5.52.
WORKIN
G DRAFT IN
PROGRESS
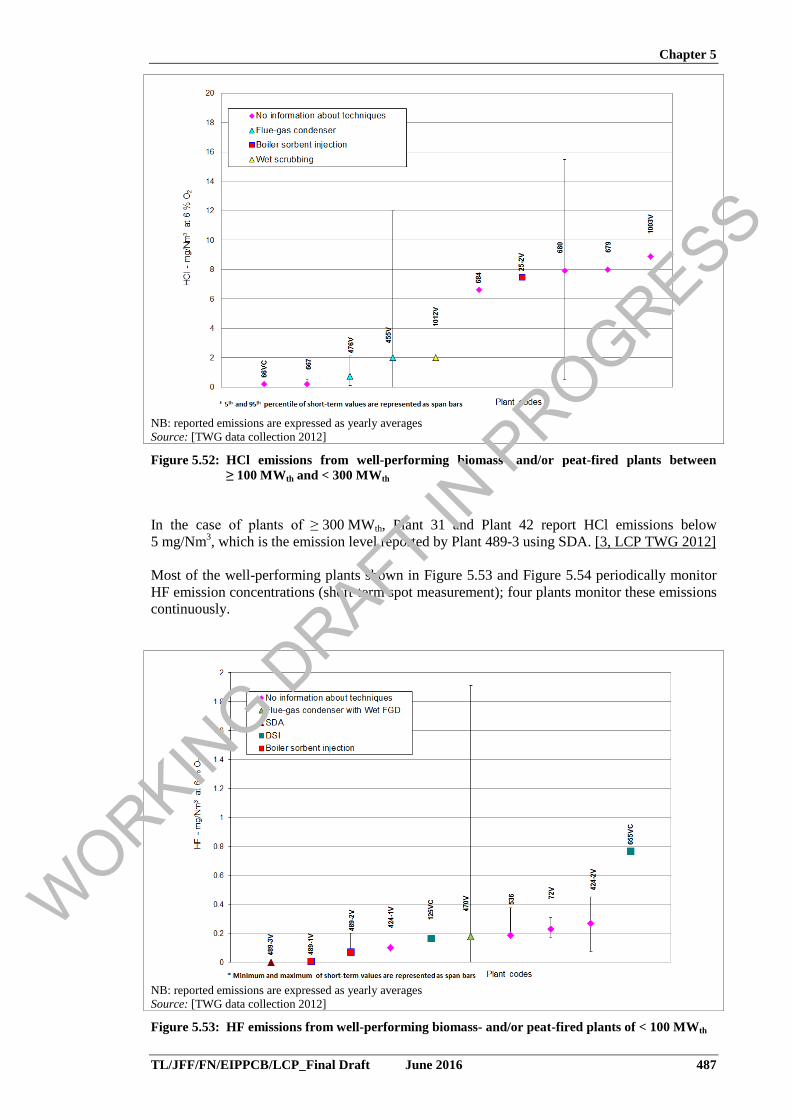
Chapter 5
TL/JFF/FN/EIPPCB/LCP_Final Draft June 2016 487
NB: reported emissions are expressed as yearly averages Source: [TWG data collection 2012]
Figure 5.52: HCl emissions from well-performing biomass- and/or peat-fired plants between
≥ 100 MWth and < 300 MWth
In the case of plants of ≥ 300 MWth, Plant 31 and Plant 42 report HCl emissions below
5 mg/Nm3, which is the emission level reported by Plant 489-3 using SDA. [3, LCP TWG 2012]
Most of the well-performing plants shown in Figure 5.53 and Figure 5.54 periodically monitor
HF emission concentrations (short-term spot measurement); four plants monitor these emissions
continuously.
NB: reported emissions are expressed as yearly averages Source: [TWG data collection 2012]
Figure 5.53: HF emissions from well-performing biomass- and/or peat-fired plants of < 100 MWth
WORKIN
G DRAFT IN
PROGRESS

Chapter 5
488 June 2016 TL/JFF/FN/EIPPCB/LCP_Final Draft
NB: reported emissions are expressed as yearly averages
Source: [TWG data collection 2012]
Figure 5.54: HF emissions from well-performing biomass- and/or peat-fired plants between
≥ 100 MWth and < 300 MWth
In the case of plants of ≥ 300 MWth, Plant 31 and Plant 1004 report HF emissions below
1 mg/Nm3. [TWG data collection 2012]
5.2.3.6 Techniques for the prevention and control of dust and particulate-bound metal emissions
Information on general techniques for the prevention and control of dust and particulate-bound
metals emissions is given in Section 3.2.2.1. Table 5.47 gives additional information specific to
biomass and/or peat firing, e.g. on environmental performances and example plants. Further
details on related environmental performance and operational data are provided after the table.
WORKIN
G DRAFT IN
PROGRESS

Chapter 5
TL/JFF/FN/EIPPCB/LCP_Final Draft June 2016 489
Table 5.47: Techniques for the prevention and control of dust and metal emissions
Technique Technical description Achieved
environmental benefits
Environmental
performance
and operational
data
Cross-media effects
Technical
considerations relevant
to applicability
Economics Example plants
Fuel choice
By switching to a
different fuel or by
modulating the fuel
blend (e.g. fuel with
lower ash content), the
corresponding
emissions are reduced.
See also Section
3.1.1.4
Reduction of
particulate emissions NA NA
Applicable within the
constraints associated
with the availability of
different types of fuel,
which may be impacted
by the energy policy of
the Member State
NA NA
Bag filter See Section 3.2.2.1.2
Reduction of particulate
emissions, including
fine dust (PM2.5 and
PM10) and
particulate-bound heavy
metals High operational
experience
Fire risk. Where the
ash has a high
amount of unburnt
matter, a pre-
collector upstream
of the bag filter may
reduce the risk of
hopper fires and bag
damage
Generally applicable
The investment cost for
a new bag filter is less
than that for an ESP,
but operating costs are
higher
Plants 72, 667
Electrostatic
precipitator (ESP) See Section 3.2.2.1.1
Reduction of particulate
emissions and
particulate-bound heavy
metals
None NA Plants 424-2, 29
Desulphurisation
techniques
See Section 3.2.2.2
These techniques are
mainly used for SOX,
HCl or HF control
SOX and halide
reduction with
additional reduction
effect on dust emissions
NA NA See Table 5.46 NA Plants 672, 31
NB:
NA: No relevant specific information available.
WORKIN
G DRAFT IN
PROGRESS
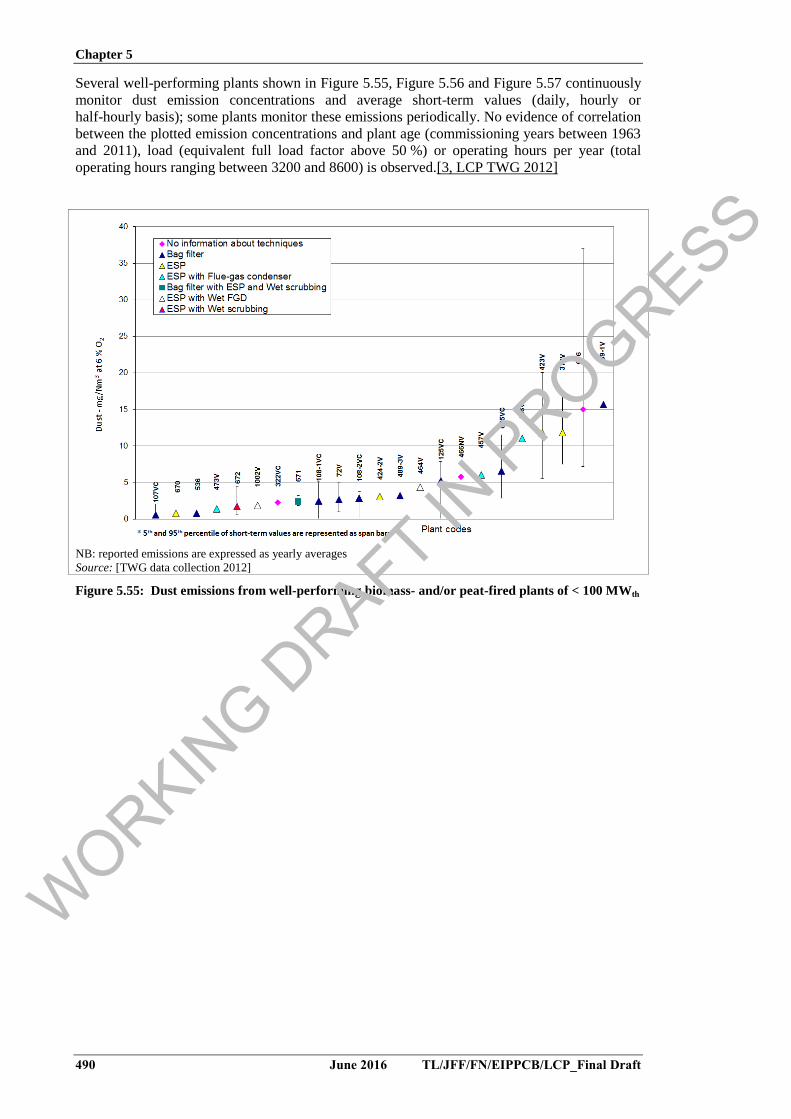
Chapter 5
490 June 2016 TL/JFF/FN/EIPPCB/LCP_Final Draft
Several well-performing plants shown in Figure 5.55, Figure 5.56 and Figure 5.57 continuously
monitor dust emission concentrations and average short-term values (daily, hourly or
half-hourly basis); some plants monitor these emissions periodically. No evidence of correlation
between the plotted emission concentrations and plant age (commissioning years between 1963
and 2011), load (equivalent full load factor above 50 %) or operating hours per year (total
operating hours ranging between 3200 and 8600) is observed.[3, LCP TWG 2012]
NB: reported emissions are expressed as yearly averages Source: [TWG data collection 2012]
Figure 5.55: Dust emissions from well-performing biomass- and/or peat-fired plants of < 100 MWth
WORKIN
G DRAFT IN
PROGRESS

Chapter 5
TL/JFF/FN/EIPPCB/LCP_Final Draft June 2016 491
NB: reported emissions are expressed as yearly averages Source: [TWG data collection 2012]
Figure 5.56: Dust emissions from well-performing biomass- and/or peat-fired plants between
100 MWth and 300 MWth
NB: reported emissions are expressed as yearly averages Source: [TWG data collection 2012]
Figure 5.57: Dust emissions from well-performing biomass- and/or peat-fired plants of ≥ 300 MWth
WORKIN
G DRAFT IN
PROGRESS

Chapter 5
492 June 2016 TL/JFF/FN/EIPPCB/LCP_Final Draft
5.2.3.7 Techniques for the prevention and control of mercury (Hg)
Information on general techniques for the prevention and control of mercury emissions is given
in Section 3.2.2.5. Table 5.48 presents the techniques or combination of techniques commonly
used in combustion plants, and Figure 5.58 gives information specific to biomass and/or peat
firing, e.g. on environmental performances and example plants. Further details on related
environmental performance and operational data are provided after the table.
WORKIN
G DRAFT IN
PROGRESS

Chapter 5
TL/JFF/FN/EIPPCB/LCP_Final Draft June 2016 493
Table 5.48: Techniques for the prevention and control of mercury
Technique Technical
description
Achieved
environmental
benefits
Environmental
performance and
operational data
Cross-media
effects
Technical considerations relevant
to applicability Example plants
Specific techniques to reduce mercury emissions
Activated (halideated)
carbon injection
Activated carbon is
injected upstream of a
bag filter. The
adsorption occurs
both in-duct and on
the filter cake.
See also Section
3.2.2.5 and Section
5.1.3.4.3.2
Reduction of mercury NA NA
Generally applicable Plants 125, 655
Use of halideated
additives in the fuel or
injected in the furnace
See Section 3.2.2.5
and Section
5.1.3.4.3.3
Only applicable in the case of a low
halide content in the fuel NA
Co-benefit from techniques used to reduce emissions of other pollutants
Fuel choice See also Section
3.1.1.4
Reduction of mercury
emissions NA NA
Applicable within the constraints
associated with the availability of
different types of fuel, which may be
impacted by the energy policy of the
Member State
NA
Bag filter
Co-benefit of dust
emissions reduction
by capture of particle-
bound mercury.
See Section 3.2.2.1.2.
The technique is
mainly used for dust
control
See Table 5.47 Plant 66
Electrostatic
precipitator (ESP)
Co-benefit of dust
emissions reduction
by capture of particle-
bound mercury.
See Section 3.2.2.1.1.
The technique is
mainly used for dust
control
See Table 5.47 Plant 455
Dry, semi-dry or wet See Section 3.2.2.5.2. See Table 5.46 Plant 33
WORKIN
G DRAFT IN
PROGRESS

Chapter 5
494 June 2016 TL/JFF/FN/EIPPCB/LCP_Final Draft
FGD system The technique is
mainly used for SOX,
HCl and/or HF
control.
Co-benefit of SOX
emissions reduction
by solubilising and
capturing the oxidised
mercury
NB:
NA: No relevant specific information available.
Source: [LCP TWG data collection 2012] [43, EPPSA proposal]
WORKIN
G DRAFT IN
PROGRESS
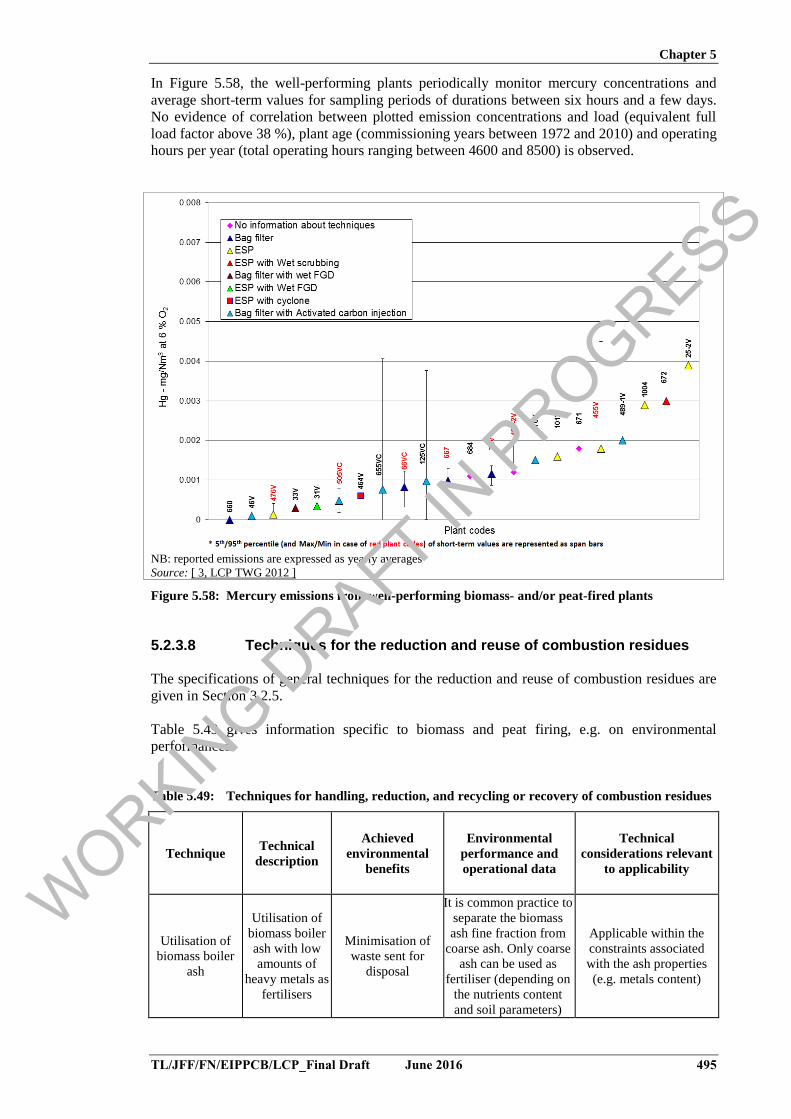
Chapter 5
TL/JFF/FN/EIPPCB/LCP_Final Draft June 2016 495
In Figure 5.58, the well-performing plants periodically monitor mercury concentrations and
average short-term values for sampling periods of durations between six hours and a few days.
No evidence of correlation between plotted emission concentrations and load (equivalent full
load factor above 38 %), plant age (commissioning years between 1972 and 2010) and operating
hours per year (total operating hours ranging between 4600 and 8500) is observed.
NB: reported emissions are expressed as yearly averages Source: [ 3, LCP TWG 2012 ]
Figure 5.58: Mercury emissions from well-performing biomass- and/or peat-fired plants
5.2.3.8 Techniques for the reduction and reuse of combustion residues
The specifications of general techniques for the reduction and reuse of combustion residues are
given in Section 3.2.5.
Table 5.49 gives information specific to biomass and peat firing, e.g. on environmental
performances.
Table 5.49: Techniques for handling, reduction, and recycling or recovery of combustion residues
Technique Technical
description
Achieved
environmental
benefits
Environmental
performance and
operational data
Technical
considerations relevant
to applicability
Utilisation of
biomass boiler
ash
Utilisation of
biomass boiler
ash with low
amounts of
heavy metals as
fertilisers
Minimisation of
waste sent for
disposal
It is common practice to
separate the biomass
ash fine fraction from
coarse ash. Only coarse
ash can be used as
fertiliser (depending on
the nutrients content
and soil parameters)
Applicable within the
constraints associated
with the ash properties
(e.g. metals content)
WORKIN
G DRAFT IN
PROGRESS

WORKIN
G DRAFT IN
PROGRESS

Chapter 6
TL/JFF/FN/EIPPCB/LCP_Final Draft June 2016 497
6 COMBUSTION OF LIQUID FUELS
6.1 Applied processes and techniques
6.1.1 Fuel characterisation
Definitions of the liquid fuels referred to in this chapter are based on the definitions given in
Directive 2012/33/EU of 21 November 2012 amending Council Directive 1999/32/EC.
Therefore, gas oil is used in this document to denote any petroleum-derived liquid fuel falling
within CN code 2710 19 25, 2710 19 29, 2710 19 47, 2710 19 48, 2710 20 17 or 2710 20 19. Or
any petroleum-derived liquid fuel of which less than 65 vol-% (including losses) distils at
250 °C and of which at least 85 vol-% (including losses) distils at 350 °C by the ASTM D86
method.
Heavy fuel oil (HFO) is used to denote any petroleum-derived liquid fuel falling within CN
code 2710 19 51 to 2710 19 68, 2710 20 31, 2710 20 35, 2710 20 39. Or any petroleum-derived
liquid fuel, other than gas oil, which, by reason of its distillation limits, falls within the category
of heavy oils intended for use as fuel and of which less than 65 vol-% (including losses) distils
at 250 °C by the ASTM D86 method. If the distillation cannot be determined by the ASTM D86
method, the petroleum product is likewise categorised as a heavy fuel oil.
Further information about composition and properties of liquid fuels is given in Section 6.2.1.
6.1.2 Pretreatment and preparation of fuels
6.1.2.1 Pretreatment of fuels used in conventional boilers
Petroleum-derived liquid fuels, such as heavy fuel oil and gas oil, used as fuel for large
combustion plants are processed in a refinery so that they comply with national and
international fuel specifications. The different oil qualities used for different types of LCPs are
described in Table 6.1. An important impurity in the combustion of liquid fuels is the amount of
sulphur present in the fuel. Although fuel oil can be processed in the refinery to reduce the
sulphur content, techniques to reduce the sulphur content of oil are not within the scope of this
document and are covered in the BREF for the Refining of Mineral Oil and Gas.
6.1.2.2 Pretreatment of fuels used in diesel engines
In order to ensure correct pumping and operating conditions, diesel engines need a continuous
supply of cleaned and filtered fuel oil at the correct flow and viscosity (for HFO, typically
below 730 cSt at 50 °C). For heavy fuel oil, HFO treatment plants similar to those for gas
turbines (see Section 6.1.3.3) are applied, but with the following differences:
only centrifugal separators are used;
electrical or steam coil-type heaters for heating up the HFO to the appropriate temperature
are used in order to achieve the required injection viscosity, typically 12–20 cSt for a good
atomisation at the nozzle;
in normal cases, de-emulsifier dosing systems for breaking up the oil emulsion are not used,
and neither are additive-dosing systems for raising the melting point of vanadium products.
When operating with gas oil, no preheating or separation of the fuel is usually needed.
WORKIN
G DRAFT IN
PROGRESS

Chapter 6
498 June 2016 TL/JFF/FN/EIPPCB/LCP_Final Draft
6.1.2.3 Pretreatment of fuels for gas turbines
If heavy fuel oil (HFO) is to be used as a fuel in gas turbines, a special treatment procedure is
required. In this case, the fuel treatment plant comprises:
heaters, for heating the untreated HFO (electrical or steam coil type);
de-emulsifier dosing systems, for breaking up the oil emulsion;
separators (centrifugal or electrostatic), for removing the solid impurities in the HFO,
particularly for fuels with a high ash content;
additive-dosing systems, for raising the melting point of the vanadium oxidation products;
and
all the necessary pumps and piping equipment.
Gas oil, when used as a fuel in gas turbines, needs to be treated in order to reduce its sodium,
potassium, and calcium concentrations and to remove solid impurities, which are otherwise
detrimental to the turbine blades. Gas oil is treated at the fuel treatment plant, which comprises
gas oil-cleaning units, either a self-cleaning centrifuge unit or an electrostatic-type unit, and all
the necessary pumps and piping equipment.
6.1.3 Combustion technologies
6.1.3.1 Design of oil-fired boilers
See Section 2.2.2 for a general description of combustion in boilers.
When heavy fuel oil is combusted in boilers, a low viscosity is needed at the burner in order to
ensure correct atomisation of the fuel. To obtain this viscosity, the heavy fuel oil is heated to
around 120–140 ºC. Additives are used to improve the combustion of heavy fuel oil.
Three major technical issues need to be taken into consideration when firing heavy fuel oil:
the need for heated storage, transportation, and additional heating before atomisation, due
to the high viscosity of the HFO;
its tendency to form coke particulates;
the formation of corrosive deposits.
The first two points are due to the high molecular weight and the asphaltene nature of some of
the constituents. The third point stems from the presence of sulphur, nitrogen, vanadium and
other metals in the fuel.
With emulsions, the physical effects of the addition of water lead to better combustion
properties by improving the atomisation. Micro-explosions occur as a result of the formation,
growth and bursting of vapour bubbles within the superheated droplets. As the oil can sustain
very high temperatures during combustion, the water droplets can be superheated. The emulsion
droplets are eventually shattered by the internal formation of water bubbles and their rapid
vaporisation. This process is called secondary atomisation; it increases the evaporation surface
area and the mixing of the burning species in air. The amounts of particulates and smoke formed
are minimised [New 157] [87, Molero de Blas, 1995]. This technique does not provide
additional benefits for modern oil boilers.
Auxiliary steam boilers are generally fuelled with gas oil. Such boilers often operate only a few
hundred hours per year, are usually not equipped with specific abatement techniques and
discharge their flue-gas through the stack of the main unit
Heavy fuel oil and/or gas oil is sometimes used for additional firing in heat recovery boilers or
as a supplementary fuel in natural-gas-fired plants, where it can also be used as back-up fuel.
WORKIN
G DRAFT IN
PROGRESS

Chapter 6
TL/JFF/FN/EIPPCB/LCP_Final Draft June 2016 499
6.1.3.2 Compression ignition (diesel) engines
For information on combustion engine processes, see Section.0
Combustion engines operating with heavy fuel oil and/or gas oil are cost-efficient solutions for
baseload electricity supplies at remote sites like islands. In areas where gas will be available in
the near future, operating on HFO and/or gas oil is also a suitable solution until the plant is
converted to gas operation. After the conversion, HFO can be used as a back-up fuel.
6.1.3.3 Liquid-fuel-fired gas turbines
For general information on gas turbines, see Section 2.3.3.
Two types of liquid-fuel-fired gas turbines are currently used: heavy-duty gas turbines and gas
turbines derived from aeroplane engines, so-called aeroderivative gas turbines.
Gas turbines in general and aeroderivatives in particular usually run on gas oil or on kerosene.
In Europe, there are both large and small gas turbines powered with liquid fuels (not just as the
back-up fuel).
The use of heavy fuel oil and naphtha in gas turbines can be decided only with a plant-specific
assessment. Additionally, for units that accept these fuels, the turbine inlet temperature must be
reduced, which has consequences on the performance. For these reasons, the use of such fuels
for gas turbines is rare.
For recent designs of turbines with high turbine inlet temperatures, the manufacturers’
specifications for fuel supplies are very stringent. They stipulate the physical and chemical
properties needed in order to meet both the equipment demands and the environmental
standards, particularly with regard to metal contaminants (sodium, potassium, lead, vanadium
and calcium), sulphur and ashes.
The cost and availability of gas oil and the stress imposed on gas turbine blades and on the other
parts of the turbine when firing gas oil compared with natural gas, play a significant role when
selecting a combustion process.
6.1.4 Control of emissions to air
When using heavy fuel oil (HFO) and/or gas oil, emissions of SOX and NOX arise respectively
from the sulphur and, besides thermal NOX formation, to a certain extent from the nitrogen
contained in the fuel. Dust originate mainly from the ash content and marginally from heavier
fractions of the fuel [New 158] [146, UFIP, 2001]. The presence of dust can also give rise to
economic costs for the operators, from losses due to unburnt fuel and from deposits in the
combustion hardware, if the equipment is not well maintained.
Particulate emissions from the combustion of HFO may contain two major fractions [New 157]
[87, Molero de Blas, 1995]:
i. material arising from the organic content of the fuel and its incomplete burnout:
unburnt hydrocarbons (smoke),
dust formed via the gas-phase combustion or pyrolysis (soot),
cenospheres produced from cracked fuel or carbon along with ash (coke);
ii. ash from the inorganic and sulphur content of the fuel.
Smoke may arise from unburnt fractions of hydrocarbon fuel exhausted in the form of a fine
spray. Such hydrocarbon fractions are the remainders of reactions frozen by thermal quenching.
WORKIN
G DRAFT IN
PROGRESS
Chapter 6
500 June 2016 TL/JFF/FN/EIPPCB/LCP_Final Draft
Emissions of unburnt hydrocarbons are highest at high equivalence ratios (fuel-rich conditions).
Their main environmental effect is their reactions in the atmosphere with NOX and sunlight to
form photochemical smog.
Soot is formed in gas-phase reactions of vaporised organic matter in a complex process
involving fuel pyrolysis, polymerisation reactions, nucleation, particulate growth, and burnout.
Fuel droplets burning in envelope flames are subjected to very high temperatures, leading to
fuel evaporation and thermal cracking of the large molecular structures, thus resulting in species
with a higher C/H ratio than the fuel source. Soot is most likely to be formed in fuel-rich
conditions, and is normally fully burnt as it mixes with air at a very high temperature in highly
oxidising zones, e.g. as secondary air is injected into the combustion chamber of a gas turbine.
Cenospheres are formed in liquid-phase processes and contain all the non-soot carbon and part
of the ash material. Such particulates are, hollow, porous and nearly spherical, and they range in
size from 1 µm to 100 µm.
Ash fouling and corrosion are major problems when burning heavy fuel oils. Vanadium and
sodium are the most harmful elements, forming vanadium pentoxide (V2O5) and sodium
sulphate (Na2SO4) respectively. Ash deposits jeopardise heat transfer to metallic surfaces and
cause corrosion of the combustion hardware, thus decreasing the equipment lifetime. Values
given in the literature [New 157] [87, Molero de Blas, 1995] show that a mere 0.32 cm thick
deposit can cause a 10 % decrease in turbine power.
Optimal combustion conditions are therefore important for the minimisation of dust and ash
production. Viscous fuel must be preheated before atomising. Additives combine with fuel
constituents and combustion products to form solid, innocuous products that pass harmlessly
through the combustion equipment. Additives could largely reduce the amount of unburnt
carbon to a value as low as 5 wt-% in the collected ashes. A low content of unburnt carbon-in-
ash is desirable as optimum burnout allows an optimum efficiency or fuel utilisation. However,
depending on technical and fuel characteristics, the content of unburnt carbon-in-ash may be
higher when firing HFO. Ashes with a high carbon content are black, while those with a low
carbon content are yellow or grey.
When burning gas oil, the dust mainly consists of soot and hydrocarbons.
At the high temperatures typical of combustion, sulphur combines with carbon, hydrogen and
oxygen to form SO2, SO3, SO, CS, CH, COS, H2S, S and S2. Under such conditions and
sufficient oxygen concentrations, virtually all the sulphur is converted to oxidised forms, with
SO2 as the predominant sulphur compound formed in combustion. Even with a 20 % air
deficiency, 90 % of the sulphur is in the form of SO2 and as little as 0.1 % is as SO3, with SO
accounting for the remainder of the sulphur.
At a lower oxygen concentration (40 % air deficiency), H2S, S2 and HS are also present in
significant proportions, while SO3 is negligible. During combustion, these species are in super-
equilibrium concentrations. As the gases cool, their rates of consumption decrease and
equilibrium may be ‘frozen’ before the products reach room temperature [New 157] [87, Molero
de Blas, 1995].
In oxygen-rich and stoichiometric flames, which are very close to normal operations in boilers,
SO2 and a very small amount of SO3 are present. SO3 has to be as low as possible to minimise
H2SO4 (sulphuric acid) formation, which is responsible for corrosion in the coldest sections of
the boiler.
Cost-effective and technically suitable primary and secondary flue-gas cleaning techniques are
the focus of current product development. The application of primary methods to reduce
emissions to air at source is generally preferable to end-of-pipe abatement, also for cost-
WORKIN
G DRAFT IN
PROGRESS
Chapter 6
TL/JFF/FN/EIPPCB/LCP_Final Draft June 2016 501
effectiveness. Typically, combinations of primary and end-of-pipe techniques are implemented
for the control of the key pollutants.
The emission of sulphur oxides is proportional to the sulphur content of the fuel, unless
secondary abatement techniques are in place. The primary method to reduce SOX emissions is to
use a fuel with a lower sulphur content, whenever commercially available. Switching to low-
sulphur oil can make a significant contribution to reducing SOX emissions. A decrease of 0.5 %
in the oil sulphur content leads to a decrease in the SO2 emission value of about 850–
880 mg/Nm3 at 3 % oxygen in the flue-gas. The sulphur content of gas oil is regulated by
Directive 2012/33/EU amending Directive 1999/32/EC, and since 2008 should be below 0.1 wt-
%. Such a low sulphur content ensures that SO2 emissions from gas-oil-fired boilers, engines
and gas turbines oil are limited. Directive 2012/33/EU also amends the provisions of Directive
1999/32/EC relating to the maximum sulphur content of heavy fuel oil. The Directive states that
heavy fuel oils with a sulphur content exceeding 1 % by mass are not to be used within the EU.
Combustion plants using heavy fuel oil with greater sulphur concentrations are required to limit
their SOX emissions to within the limits set by a permit issued by the competent authority. The
directive also contains provisions for marine fuels, e.g. those limiting the maximum sulphur
content of marine fuels used within the EU Member states' territorial seas, exclusive economic
zones and pollution control zones to 0.5 % as from January 2020.
Multi-fuel firing, i.e. simultaneously burning liquid and gaseous fuels or liquid fuel and
biomass, could also make significant contributions to reducing SO2 emissions. Multi-fuel firing
can take place in the same burner or in different burners located in the same combustion
chamber.
With conventional fuels, the NOX formation rate depends on the gas temperature and on the
amount of nitrogen in the fuel. Both characterise the most important routes for the formation of
NOX. Thermal NOX can be controlled by a reduction of the peak flame temperature (e.g. limited
combustion chamber load).
6.1.4.1 Primary control techniques for emissions to air from boilers
Highly viscous and high-sulphur oils are combusted in boiler-based LCPs. In older oil-fired
boilers, burners with mechanical atomisation were installed. Newer improved burner designs
include steam atomisation, which gives a more efficient combustion of HFO, and results in
lower dust emissions. Dust emission concentrations in the raw flue-gas (before dedusting) lower
than 100 mg/Nm3 may be achieved, depending on the ash content of the HFO. Dust emission
concentrations of 50 mg/Nm3 in the raw flue-gas may be achieved for low-ash HFO (e.g. ash
< 0.02 %, asphaltene < 2 % and Conradson residue carbon content < 8 %), regardless of the
burner type.
[New 93, Eurelectric wish list 2011]
The NOX concentration in the flue-gas of an oil-fired boiler decreases with excess air. The
boiler size and burner and oil atomisation design play an important role in the concentration of
NOX in the flue-gases.
For oil-fired boilers, the usual excess air is in the range of 1.5–2.5 % O2 (in flue-gas). Low
excess air combustion is characterised by 1–1.5 % O2. This technique is rarely used alone, but is
very often used in combination with low-NOX burners (LNBs) or overfire air (OFA).
Flue-gas recirculation is often used in combination with low-NOX burners and/or OFA,
together achieving a 60–75 % NOX reduction efficiency.
Of all the air-staging techniques, the most commonly used in oil-fired boilers are ‘burners out
of service’ (BOOS) and OFA. With modern OFA designs (optimised nozzle design, separated
WORKIN
G DRAFT IN
PROGRESS
Chapter 6
502 June 2016 TL/JFF/FN/EIPPCB/LCP_Final Draft
and swirled or orientable air flux), the NOX reduction can be as high as 60 % in tangential firing
units. The BOOS technique is also used in the retrofit of existing units.
Flue-gas recirculation burners are used in oil-fired boilers matched with various types of
low-NOX burners [New 158] [146, UFIP, 2001], and achieve a NOX emission reduction of
20 %. The key point in designing efficient oil LNBs is to ensure a good oil atomisation coupled
with the burner aerodynamics, so as not to increase the carbon-in-ash level while decreasing
NOX, and while keeping a moderate air excess. Recent LNB designs with a proper oil
atomisation system can reach a 50 % NOX reduction.
In oil-fired boilers, fuel staging [New 158] [146, UFIP, 2001] can be implemented with gas or
oil as the reburning fuel. Gas is more commonly used than oil. Fuel staging is interesting for
new power plants but is less adapted to existing units. Many existing oil-fired boilers were
equipped with gas/oil fuel staging during the 1990s (e.g. units from 35 MWe to 660 MWe are in
service in Italy). These units were all equipped with at least OFA and flue-gas recirculation at
the same time, and some of them with low-NOX burners. The share of the fuel staging is 10–
20 % of the total thermal input. The corresponding NOX reduction efficiency is 50–80 % for oil
staging and 65–80 % for gas staging.
6.1.4.2 Primary control techniques for emissions to air from engines
The main pollutants emitted in the exhaust of a typical diesel engine burning heavy fuel oil
(compression ignition engine) include nitrogen oxides (NOX), dust (PM) and sulphur oxides
(SOX). Thanks to the high combustion temperature, emissions of carbon monoxide and unburnt
hydrocarbons are low.
When combusting heavy fuel oil, the dust mainly consists of the ash and sulphur (resulting in
sulphate) content of the fuel oil and, to a smaller extent, of soot and hydrocarbons With gas oil,
the dust mainly consists of soot and hydrocarbons.
The control of combustion parameters, together with regular maintenance of the combustion
system (checking/replacement of injectors), is a primary technique to control particulate
emissions from large engines. The combustion parameters to be controlled are: fuel atomisation
quality, performance of the equipment dedicated to fuel treatment/warming up, and the air-to-
fuel ratio.
NOX emissions from large liquid-fuel-fired diesel engines have been reduced considerably by
primary techniques resulting from extensive research and development work, whilst maintaining
high engine energy efficiency. Since NOX formation in engines is a function of the flame
temperature and residence time, the focus of these techniques is to reduce the peak temperature
and thus suppress thermal NOX formation in the cylinder. Some primary techniques are:
A baseload engine optimised for low NOX and good fuel consumption is equipped
with: Miller valve timing (early inlet air valve closing, causing the air entering the
cylinder to expand and cool and hence reduce temperature peaks during combustion) to
optimise the NOX-fuel consumption trade-off, a high pressure ratio turbocharger to
maintain the engine output with high Miller timing, a high compression ratio to optimise
the NOX-fuel consumption trade-off, and fuel injection rate shaping.
Fuel injection timing retards.
The addition of water (water injection directly into the combustion space or water-in-fuel
emulsion or humidification of the combustion air).
Exhaust gas recirculation.
Use of a dual fuel engine (in gas mode), which often uses the ‘lean-burn’ technique with
lower NOX.
Higher engine speed. Fuel-efficient, large-bore, low-speed engines tend to have higher
NOX emissions than faster running smaller engines. When the engine speed is lower, NOX
WORKIN
G DRAFT IN
PROGRESS

Chapter 6
TL/JFF/FN/EIPPCB/LCP_Final Draft June 2016 503
concentrations are higher in the combustion chamber because of the longer time available
to form NOX.
6.1.4.3 Primary control techniques for emissions to air from gas turbines
Thermal NOX formation can be restricted by decreasing the combustion temperature. This is
accomplished by the premix burner technique (dry low-NOX or DLN technique), where fuel is
blended with the combustion air in order to avoid excessive peak flame temperatures. This,
however, only operates when the unit is operating at sufficiently high load. A different
combustion method is applied for low-load operation, start-up and shutdown, in order to avoid
flashback.
Applying staged combustion in gas turbines at lower temperatures requires a different gas
turbine design.
Wet abatement emission reduction processes: Steam/water addition is also used to reduce
combustion temperatures and consequently NOX emission levels. Water or steam is injected into
the combustion chambers in order to reduce the combustion temperature, thus avoiding the
formation of thermal NOX. Water is used for injection in gas turbines (GTs) operating in open
cycle, while steam is most often used for GTs operating in combined cycle or in a cogeneration
system. A fuel oil and water emulsion is also an option. Compared to water injection, the use of
a fuel oil and water emulsion reduces water usage by around 25–30 % at the same NOX
reduction rate.
If gas oil is used only as a standby fuel in large-capacity GTs running generally with gas, direct
water injection systems allow the reduction of NOX emissions when running with gas oil. In
fact, DLN for gas oil operation only exist for smaller GTs (< 100 MWth), and may have
operating time limitations (e.g. < 1500 h/yr as constructor´s specification for some models).
[New 92, FREI: Freimark, M., 1990, “NOX Reduction in Large Gas Turbines by Firing an
Oil/Water Emulsion”, VGB Kraftwerkstechnik 70 (1990), Heft 10, S. 742-748.]
6.1.4.4 End-of-pipe techniques to control emissions to air 6.1.4.4.1 Control of dust emissions
Dust emissions can be reduced by applying secondary dedusting devices such as ESPs and bag
filters, as in the case of dust emissions from boilers. Bag filters for dust have already been
installed in recent diesel engines together with the use of sorbent injection for FGD. The sorbent
dilutes the potentially sticky ash/soot that might otherwise cause clogging problems.
In ESPs, dust is generally collected in a dry form, which can then be landfilled in controlled
landfills. However, in combination with SO2 wet scrubbing, the wet ESP technique is applicable
after the FGD for particulate removal. A dry ESP could be used before the wet FGD. [New 93,
Eurelectric wish list 2011].
As the temperature and oxygen content of the flue-gas differ between a diesel engine and a
boiler, the electrical properties of the particulates (e.g. resistivity) differ also, and the
performance of the ESP differs between these two combustion processes.
6.1.4.4.2 Control of SOX emissions
To reduce SOX emissions from liquid-fuel-fired boilers, including especially those burning
HFO, some plants apply wet scrubbers. Wet scrubbing with gypsum as the end-product is the
best performing process for desulphurisation. Nevertheless, due to economic and operational
WORKIN
G DRAFT IN
PROGRESS
Chapter 6
504 June 2016 TL/JFF/FN/EIPPCB/LCP_Final Draft
constraints, it might not be applicable to smaller plants. In smaller plants, flue-gas
desulphurisation may be carried out with lime or limestone dry processes, lime semi-dry
processes, activated carbon processes, or soda and sodium bicarbonate processes.
Dry desulphurisation may be improved by managing an ‘open pass’ on the inside of the boiler,
which increases the contact time at a constant of temperature between sorbent and flue-gases.
The choice between the above processes depends on the required yield of desulphurisation and
on local considerations, i.e. mainly utilisation or landfilling of the desulphurisation by-products
and residues.
A few DeSOX systems were installed over the years in connection with HFO/Orimulsion-fired
diesel engines. Today the majority of these FGD systems are no longer in operation due to a fuel
change to natural gas. Diesel engine flue-gas differs from boiler flue-gas: for instance, it has a
high oxygen content and flow rate, which might have an impact on the reactions in and size of
the DeSOX system. It must also be noted that, due to the high specific flue-gas flow of a diesel
engine (lambda typically about 2.7), the size of the DeSOX system will be relatively big.
Most of the examples of DeSOX systems in diesel power plants so far are wet scrubbers using a
NaOH (about 50 wt-%) water solution as the reagent. The flue-gas is washed with the reagent
water solution and the SO2 is removed. The main components of the system are the reagent
storage tank and transportation system, a scrubber with recirculation pumps, and an oxidation
tank.
In larger diesel power plants, other DeSOX systems (e.g. wet CaCO3 scrubbers, in-duct sorbent
injection before a bag filter) have been used.
6.1.4.4.3 Control of NOX emissions
Secondary techniques for NOX reduction such as SNCR and SCR have been applied to a
number of oil-fired boilers. For existing boilers running with frequent and intense load
variations, SCR and SNCR need to be properly designed and fine-tuned to cope with the
variable conditions.
SNCR can be applied to oil-fired boilers of any size. SNCR techniques include the use of liquid
NH3 solution, gaseous NH3, and urea in solution or solid urea as reduction agents. The reduction
agent is injected into the boiler chamber in areas where the temperature is around 900 °C.
SNCR requires a good knowledge of the temperature distribution in the combustion chamber at
all rates, and a good control of the amount of injected reagent. Control can be achieved by NH3
or NOX monitoring; NOX reduction could reach 60 %, with a NH3 slip lower than 7.5 mg/Nm3.
SCR is a proven technique for liquid-fuel-fired combustion plants.
In Europe, SCR is applied, including to boilers operated for peaking applications, for example
in Austria, Germany, Italy and the Netherlands. Outside Europe it is mostly applied in Japan.
SCR is also applicable for the abatement of NOX emissions from diesel engines. To date, several
hundred engines in power and cogeneration plants in Europe, Asia and the US have been
equipped with SCR. They operate with various grades of liquid fuel, ranging from diesel or fuel
oil to low-grade heavy fuel oil (180 cSt, 5 % S). SCR in the context of an engine operating on
Orimulsion has been tested only in laboratory conditions. An SCR system can be equipped with
an additional oxidation layer for the reduction of CO and NH3, but this is not recommended
when operating with liquid fuels (such as HFO) containing sulphur. An oxidation catalyst
oxidises part of the SO2 to SO3 and consequently additional particulates are formed (sulphate).
Larger diesel engines have low emissions of unburnt carbon. When the NOX reduction rate is up
to 85–90 %, the SCR can be controlled by a simple control system; with higher NOX reduction
rates, complex reagent premixing and injection systems, as well as a more advanced control
WORKIN
G DRAFT IN
PROGRESS

Chapter 6
TL/JFF/FN/EIPPCB/LCP_Final Draft June 2016 505
system, are needed. Diesel engines operated only for a reduced number of hours may undergo
harp load variations. Acording to the electricity demand, these engines may need to be started
up and shut down several times a day. During these periods, the SCR catalyst temperature may
fluctuate outside the necessary effective temperature window.
Some gas turbine combined-cycle plants in Europe, particularly in Austria, France, Germany,
Italy and the Netherlands, have also applied SCR to reduce NOX emissions, including when
running on gas oil. In the US, SCR is commonly used for gas turbines, including those operated
with liquid fuels.
[New 159, 1, Eurelectric draft proposal 2012]
6.1.5 Water consumption and waste water treatment
In boilers, demineralised water is required to compensate for the blowdown water from the
drums, water sampling, water or steam leakage and steam blasting. Condensates from boiler
blowdown can be reprocessed and recycled to the condenser, which spares the corresponding
amount of make-up demineralised water. The quality of the water has to fulfil the requirements
of the boiler manufacturers, which usually requires water treatment. Demineralisation may not
be sufficient to meet these requirements and conditioning, as well as water degassing, may be
needed before injection into the boiler.
For gas turbines and for HRSG systems, demineralised water is required for the following
purposes:
As make-up water for the HRSG, to compensate for the blowdown water from the drums.
Demineralisation is usually sufficient to meet the manufacturers' quality requirements for
this use.
Water injection for NOX abatement (approximately 1 kg water to 1 kg fuel). If steam or
water injection is applied, the water loss has to be compensated for by adding make-up
water.
For washing the gas turbine compressor, demineralised water is normally used. For online
washing, condensate from the water/steam cycle is sometimes used, but more often
demineralised water is supplied to a separate water wash unit. For offline washing, a
detergent is added to the demineralised water to improve the washing effect.
The techniques described for waste water treatment in Chapter 3 are, to a large extent, applied
for the treatment of waste water from liquid-fuel-fired plants.
Operation of the gas turbine and the HRSG (if applied) leads to the following waste water
streams:
Blowdown water from the boiler circulation system to maintain the quality of the boiler
water. The boiler water usually contains additives to protect the boiler from corrosion,
such as ammonia, sodium hydroxide, and/or phosphates. In practice, in most existing
units, this blowdown water is quenched and discharged to sewerage systems or to a water
treatment plant if needed. This blowdown water can also be reconditioned and recycled as
make-up water, since it has better parameters (no O2, little conductivity, no TOC) than
raw water.
Waste water from the gas turbine water washing processes, which can be discharged or
has to be considered chemical waste, depending on the detergents used in the washing
and on the materials for disposal from the compressor.
Water contaminated with oil or oil-containing fluids, which is usually collected and
treated separately in a water treatment plant.
Remaining waste water from the plant, such as scrubbing water, which is treated or
directly discharged to the sewerage system.
WORKIN
G DRAFT IN
PROGRESS

Chapter 6
506 June 2016 TL/JFF/FN/EIPPCB/LCP_Final Draft
An engine-driven power plant usually preserves its water. The cooling circuits contain about
20–30 % of the input fuel energy. The cooling circuit energy must be cooled away, if it cannot
be utilised in another CHP process. This can be achieved through cooling towers using water or
air-cooled radiators. Cooling towers use moderate flows of cooling water and in the case of air-
cooled radiators a very small make-up water flow is need for the engine's internal cooling
circuits. Traditional techniques are used in the treatment of the waste water. A result of the low
water requirement is a small discharge of waste water, and consequently low thermal pollution
of the surrounding watercourses. Another consequence is a low usage of different water
purification chemicals on site and a limited risk, therefore, of chemical spillages.
A single-cycle 130 MWe oil-fired diesel power plant equipped with cooling towers typically
consumes about 220 m3/h of raw water (plant without DeSOX). Air-cooled radiators are very
suitable for engine-driven plants. In the example 130 MWe oil-fired diesel plant, if equipped
with radiators, the make-up water needed (mainly for fuel oil and lube oil separators, make-up
water for the engine cooling circuit, turbo wash water, etc.) would be typically in the order of
5 m3/h or less.
6.1.6 Combustion residues treatment
Ash resulting from fuel oil combustion could have a high carbon content and, in this case, it can
be incinerated. However, good combustion conditions of the liquid fuel, produce ash with a low
carbon content (lower than 20 %), which could be disposed of in controlled landfills.
Final sludges are dewatered, dried, solidified and incinerated, or disposed of by authorised
contractors. Water from sludge dewatering, which is contaminated with oil or fluids containing
oil, is usually collected in a specific system and treated separately. Sludge is also collected from
the treatment of washing effluents from the air preheaters, boilers from the flue-gas side and
from other equipment.
WORKIN
G DRAFT IN
PROGRESS
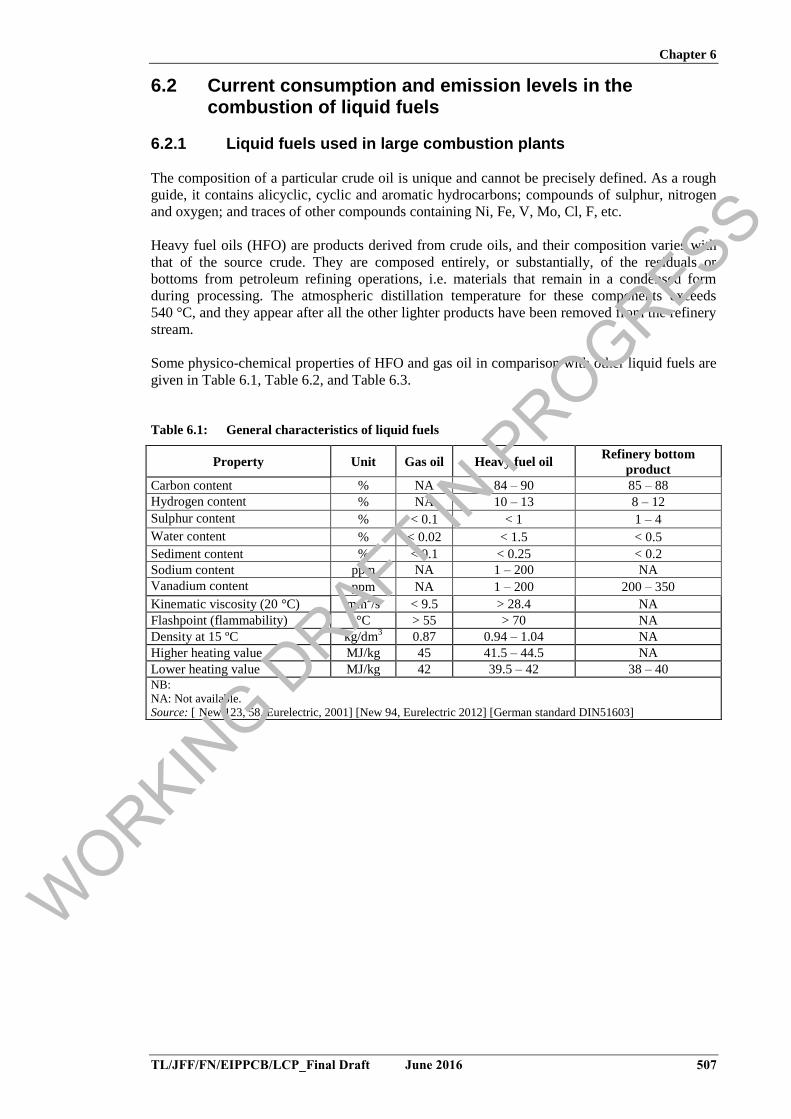
Chapter 6
TL/JFF/FN/EIPPCB/LCP_Final Draft June 2016 507
6.2 Current consumption and emission levels in the combustion of liquid fuels
6.2.1 Liquid fuels used in large combustion plants
The composition of a particular crude oil is unique and cannot be precisely defined. As a rough
guide, it contains alicyclic, cyclic and aromatic hydrocarbons; compounds of sulphur, nitrogen
and oxygen; and traces of other compounds containing Ni, Fe, V, Mo, Cl, F, etc.
Heavy fuel oils (HFO) are products derived from crude oils, and their composition varies with
that of the source crude. They are composed entirely, or substantially, of the residuals or
bottoms from petroleum refining operations, i.e. materials that remain in a condensed form
during processing. The atmospheric distillation temperature for these components exceeds
540 °C, and they appear after all the other lighter products have been removed from the refinery
stream.
Some physico-chemical properties of HFO and gas oil in comparison with other liquid fuels are
given in Table 6.1, Table 6.2, and Table 6.3.
Table 6.1: General characteristics of liquid fuels
Property Unit Gas oil Heavy fuel oil Refinery bottom
product
Carbon content % NA 84 – 90 85 – 88
Hydrogen content % NA 10 – 13 8 – 12
Sulphur content % < 0.1 < 1 1 – 4
Water content % < 0.02 < 1.5 < 0.5
Sediment content % < 0.1 < 0.25 < 0.2
Sodium content ppm NA 1 – 200 NA
Vanadium content ppm NA 1 – 200 200 – 350
Kinematic viscosity (20 °C) mm2/s < 9.5 > 28.4 NA
Flashpoint (flammability) °C > 55 > 70 NA
Density at 15 ºC kg/dm3 0.87 0.94 – 1.04 NA
Higher heating value MJ/kg 45 41.5 – 44.5 NA
Lower heating value MJ/kg 42 39.5 – 42 38 – 40
NB:
NA: Not available.
Source: [ New 123, 58, Eurelectric, 2001] [New 94, Eurelectric 2012] [German standard DIN51603]
WORKIN
G DRAFT IN
PROGRESS
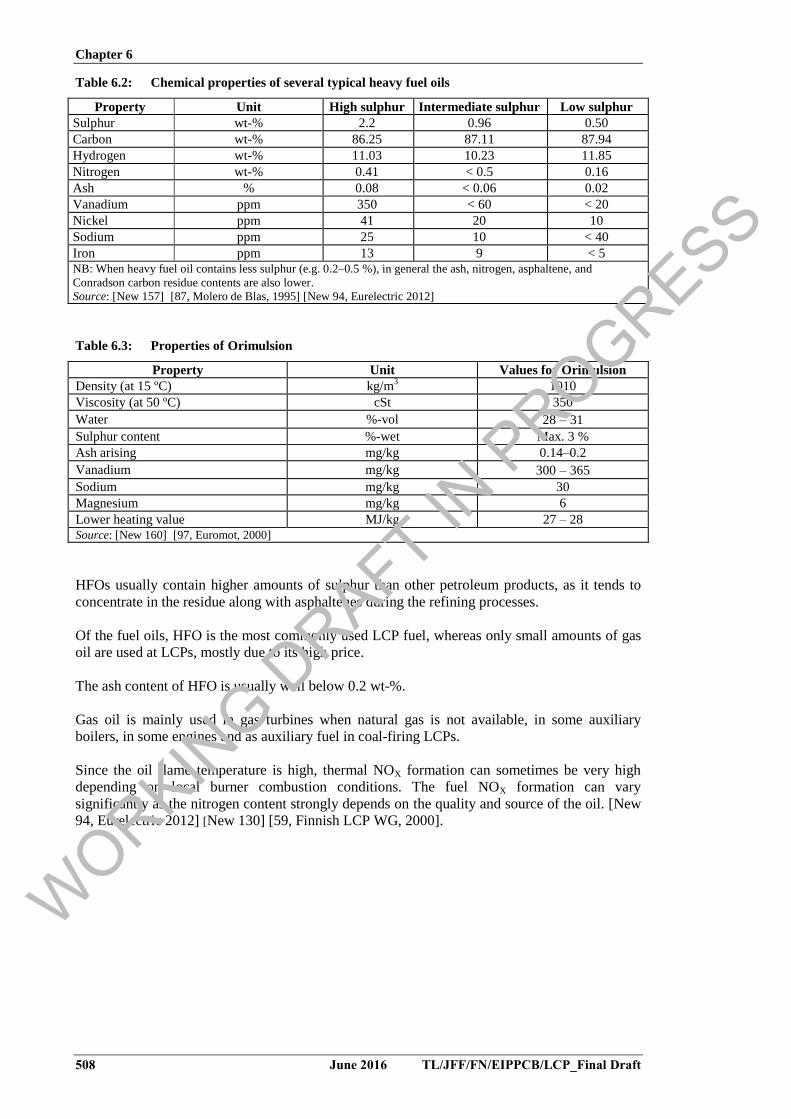
Chapter 6
508 June 2016 TL/JFF/FN/EIPPCB/LCP_Final Draft
Table 6.2: Chemical properties of several typical heavy fuel oils
Property Unit High sulphur Intermediate sulphur Low sulphur
Sulphur wt-% 2.2 0.96 0.50
Carbon wt-% 86.25 87.11 87.94
Hydrogen wt-% 11.03 10.23 11.85
Nitrogen wt-% 0.41 < 0.5 0.16
Ash % 0.08 < 0.06 0.02
Vanadium ppm 350 < 60 < 20
Nickel ppm 41 20 10
Sodium ppm 25 10 < 40
Iron ppm 13 9 < 5
NB: When heavy fuel oil contains less sulphur (e.g. 0.2–0.5 %), in general the ash, nitrogen, asphaltene, and
Conradson carbon residue contents are also lower.
Source: [New 157] [87, Molero de Blas, 1995] [New 94, Eurelectric 2012]
Table 6.3: Properties of Orimulsion
Property Unit Values for Orimulsion
Density (at 15 ºC) kg/m3 1010
Viscosity (at 50 ºC) cSt 350
Water %-vol 28 – 31
Sulphur content %-wet Max. 3 %
Ash arising mg/kg 0.14–0.2
Vanadium mg/kg 300 – 365
Sodium mg/kg 30
Magnesium mg/kg 6
Lower heating value MJ/kg 27 – 28
Source: [New 160] [97, Euromot, 2000]
HFOs usually contain higher amounts of sulphur than other petroleum products, as it tends to
concentrate in the residue along with asphaltenes during the refining processes.
Of the fuel oils, HFO is the most commonly used LCP fuel, whereas only small amounts of gas
oil are used at LCPs, mostly due to its high price.
The ash content of HFO is usually well below 0.2 wt-%.
Gas oil is mainly used in gas turbines when natural gas is not available, in some auxiliary
boilers, in some engines and as auxiliary fuel in coal-firing LCPs.
Since the oil flame temperature is high, thermal NOX formation can sometimes be very high
depending on local burner combustion conditions. The fuel NOX formation can vary
significantly as the nitrogen content strongly depends on the quality and source of the oil. [New
94, Eurelectric 2012] [New 130] [59, Finnish LCP WG, 2000].
WORKIN
G DRAFT IN
PROGRESS

Chapter 6
TL/JFF/FN/EIPPCB/LCP_Final Draft June 2016 509
6.2.2 Efficiency of combustion plants firing HFO and/or gas oil
The design boiler efficiency for a new boiler using liquid fuel is around 95 % (lower heating
value basis). The main losses are from flue-gas waste heat at the stack, unburnt carbon-in-ash,
and radiation losses.
The efficiency of an oil-fired boiler is closely linked to the nature of the fuel and to the ambient
air temperature. However, optimisation of some parameters is possible:
Unburnt carbon-in-ash: Combustion optimisation leads to less unburnt carbon-in-ash. It
should be noted that NOX abatement techniques, with combustion modification, show a
tendency towards increased unburnt carbon.
Air excess: The amount of excess air depends on the boiler type. Typically, 5–8 % excess
air is common for oil-fired boilers. For reasons of combustion quality (i.e. related to CO
and unburnt carbon formation), corrosion and safety, it is often not possible to further
reduce the excess air.
Flue-gas temperature: The temperature of the flue-gas leaving the boiler (depending on
fuel type) is traditionally between 120 °C and 220 °C, to avoid acid corrosion by the
condensation of sulphuric acid. However, some designs incorporate a second stage of air
heaters to lower this temperature below 100 °C, with special claddings on the air heater
and the stack.
Another aspect that influences LCP efficiency is the energy consumption of auxiliary
equipment, which depends on a number of parameters:
Level of pollution control: advanced FGD consumes more energy, and pollution control
generally has a penalty on energy efficiency.
Design of auxiliaries: boiler auxiliaries have to be overdimensioned to withstand all the
variations in parameters in comparison with design values (possible leaks, alternative
fuels, start-up needs, redundant systems, etc.). These technical options lead to non-
optimum auxiliary energy consumption under nominal conditions and design fuel.
Typically, the specific fuel consumption is 0.242 kg/kWhe for HFO-fired boilers and 0.205–
0.225 kg/kWhe for HFO-fired engines.
6.2.3 Emissions to air from liquid-fuel-fired combustion plants
The range of emissions to air from HFO- and gas-oil-fired combustion plants (boilers,
HFO- and/or gas-oil-fired engines and gas-oil-fired gas turbines) are given in Table 6.4.
Reference conditions are dry flue-gas, 3 % oxygen for boilers, 15 % for engines and gas
turbines, and normal operating conditions. Unless stated otherwise, data represented are yearly
averages of short-term values, and averages of samples obtained over one year without
subtraction of uncertainty or long-term estimates. Ammonia emissions are associated with the
use of SCR/SNCR.
WORKIN
G DRAFT IN
PROGRESS

Chapter 6
510 June 2016 TL/JFF/FN/EIPPCB/LCP_Final Draft
Table 6.4: Range of yearly emissions to air from HFO- and/or gas-oil- fired combustion plants
Type of plant
Total rated
thermal input
(MWth)
Abatement techniques Emissions to air (mg/Nm3)
SO2 NOX Dust SO2 NOX NH3 (1) Dust CO TVOC
HFO- and/or gas-
oil-fired boiler
< 100 Fuel choice/
Flue-gas
condenser/
DSI
Fuel choice/
Air staging/
Fuel staging/
LNB
Fuel choice/
Multicyclone/
ESP/
Bag filter
12 – 1676 182 – 576 NA
0.5 – 54 3 – 85 NA
100 – 300 LNB/
Steam addition/
Air staging/
FGR/
SCR
46 – 511 < 3 3 – 52 NA ≥ 300
Fuel choice/
Wet FGD
Fuel choice/
ESP 51 – 750 0.1 – 116
HFO- and/or gas-
oil-fired engine All
Fuel choice/
Low-NOX combustion concept in diesel engines/
SCR/
DSI/
Bag filter
93 – 604 118 – 2442 5–9 5 – 200 44 – 200 5 – 75 (1)
Gas-oil-fired gas
turbine
Fuel choice/
Water or steam addition 1 – 115 102 – 1085 NA 1 – 7 1 – 680 NA
(1) Emissions reported by HFO-fired engines.
NB:
DSI: Duct sorbent injection; Wet FGD: Wet flue-gas desulphurisation; ESP: Electrostatic precipitator; BF: Bag filter; SCR: Selective catalytic reduction of NOX.
NA: Not available.
Source: [ 3, LCP TWG 2012 ]
WORKIN
G DRAFT IN
PROGRESS
Chapter 6
TL/JFF/FN/EIPPCB/LCP_Final Draft June 2016 511
6.3 Techniques to consider in the determination of BAT for the combustion of liquid fuels
This section describes techniques (or combinations thereof), and associated monitoring,
considered to have the potential for achieving a high level of environmental protection in the
activities within the scope of this document. The techniques described include both the
technology used and the way in which the installations are designed, built, maintained, operated,
and decommissioned.
It covers process-integrated techniques and end-of-pipe techniques. Waste prevention and
management, including waste minimisation and recycling procedures, are also considered.
Furthermore, techniques for reducing the consumption of raw materials, water, and energy are
covered.
Annex III to the Industrial Emissions Directive lists a number of criteria for determining BAT,
and the information within this chapter addresses these considerations. As far as possible, the
standard structure of Table 3.4 is used to outline the information on each technique, to enable a
comparison of techniques and the assessment against the definition of BAT given in the
Industrial Emissions Directive.
This section does not necessarily provide an exhaustive list of techniques that could be applied
in the sector. Other techniques may exist, or may be developed, which could be considered for
the determination of BAT for an individual installation.
In this section, the techniques to be considered have only been fully described when they are
specific to the considered combusted fuel or applied combustion process (combustion of liquid
fuels). Indeed, for most of the techniques, general descriptions are already presented in Chapter
3. Therefore, in order to avoid repetition, for those general techniques already described in
Chapter 3, only the additional information that is specific to the combustion of liquid fuels is
reported here in synthesis tables.
6.3.1 Techniques for the prevention of emissions to soil and groundwater
Information on general techniques for the prevention of emissions to soil and groundwater from
the handling and storage of fuels, additives, by-products and wastes is given in Section 3.2,
while Table 6.5 gives additional information on the specific case of liquid fuel combustion, e.g.
on environmental performances and example plants.
WORKIN
G DRAFT IN
PROGRESS

Chapter 6
512 June 2016 TL/JFF/FN/EIPPCB/LCP_Final Draft
Table 6.5: Techniques for the prevention of emissions to soil and groundwater
Technique Technical description
Achieved
environmental
benefits
Environmental
performance and
operational data
Technical considerations
relevant to applicability Economics
New plants Existing
plants
Tanks grouped
inside a retention
basin
The retention basin should be designed to hold
all or part of the volume
Reduced risk of water
and soil
contamination
High operational
experience
Generally applicable
NA
Automatic control
systems
Automatic control systems to prevent overfilling
of storage tanks
Alarms and
procedure settings
Installation of alarms and procedure settings to
detect possible emissions
Double-walled
pipes
Double-walled pipes with control of the spacing
for underground pipes
Regular checks Regular checks of the storage facilities and
piping Generally applicable
Surfaces with
drainage systems
(including oil
traps)
Liquid-tight paving (e.g. concrete) in areas with
drainage systems where operations that could
result in soil contamination are carried out. Oil
traps could be installed. The collected drainage
water needs to be treated to avoid water
contamination by fuel or lubrication oil
Prevention of
groundwater and soil
contamination
Generally
applicable
Limited
applicability Cost of waste water treatment
NB:
NA: No relevant specific information available.
WORKIN
G DRAFT IN
PROGRESS

Chapter 6
TL/JFF/FN/EIPPCB/LCP_Final Draft June 2016 513
6.3.2 Techniques to consider in the determination of BAT for the combustion of HFO and/or gas oil in boilers
6.3.2.1 Techniques to improve the general performance
Information on general techniques to improve the environmental performance of plants is given
in Section 3.1.1, while
Table 6.6 give additional information on the specific case of HFO and/or gas oil combustion in
boilers, e.g. on environmental performances and example plants.
WORKIN
G DRAFT IN
PROGRESS
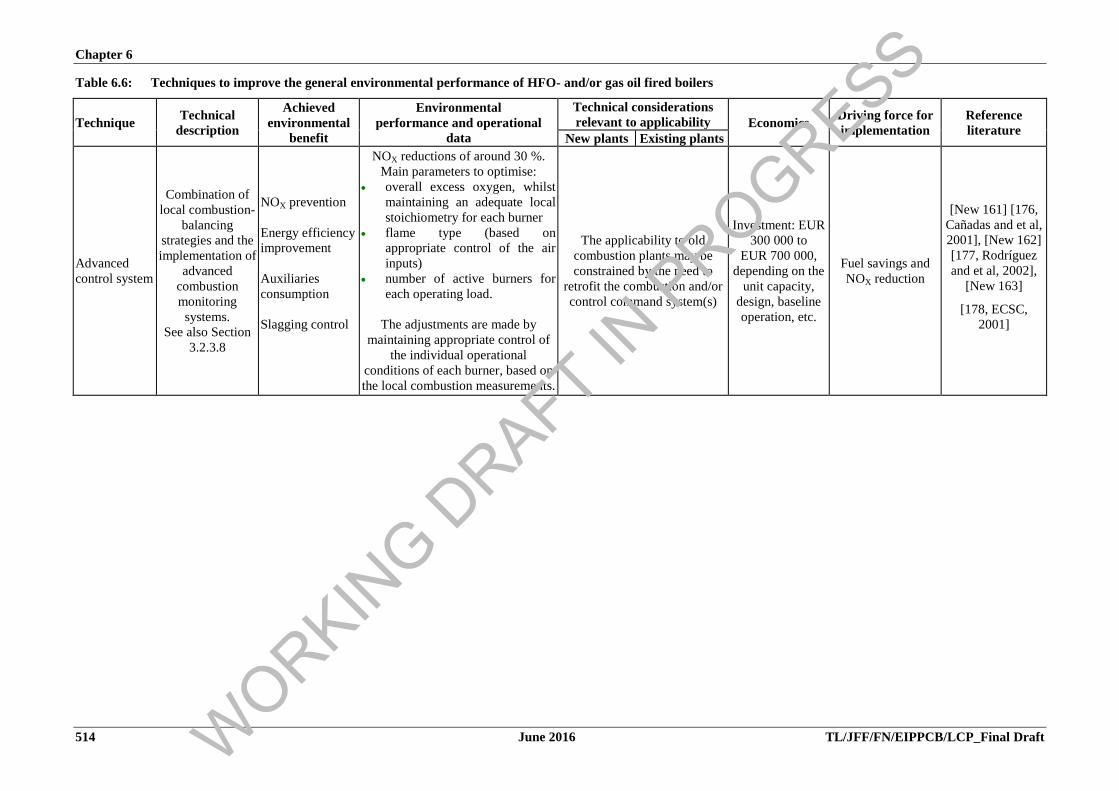
Chapter 6
514 June 2016 TL/JFF/FN/EIPPCB/LCP_Final Draft
Table 6.6: Techniques to improve the general environmental performance of HFO- and/or gas oil fired boilers
Technique Technical
description
Achieved
environmental
benefit
Environmental
performance and operational
data
Technical considerations
relevant to applicability Economics Driving force for
implementation
Reference
literature New plants Existing plants
Advanced
control system
Combination of
local combustion-
balancing
strategies and the
implementation of
advanced
combustion
monitoring
systems.
See also Section
3.2.3.8
NOX prevention
Energy efficiency
improvement
Auxiliaries
consumption
Slagging control
NOX reductions of around 30 %.
Main parameters to optimise:
overall excess oxygen, whilst
maintaining an adequate local
stoichiometry for each burner
flame type (based on
appropriate control of the air
inputs)
number of active burners for
each operating load.
The adjustments are made by
maintaining appropriate control of
the individual operational
conditions of each burner, based on
the local combustion measurements.
The applicability to old
combustion plants may be
constrained by the need to
retrofit the combustion and/or
control command system(s)
Investment: EUR
300 000 to
EUR 700 000,
depending on the
unit capacity,
design, baseline
operation, etc.
Fuel savings and
NOX reduction
[New 161] [176,
Cañadas and et al,
2001], [New 162]
[177, Rodríguez
and et al, 2002],
[New 163]
[178, ECSC,
2001]
WORKIN
G DRAFT IN
PROGRESS

Chapter 6
TL/JFF/FN/EIPPCB/LCP_Final Draft June 2016 515
6.3.2.2 Techniques to increase energy efficiency
Information on general techniques to increase the energy efficiency of combustion plants is
given in Section 3.2.3, while Table 6.7 gives additional information on energy efficiency
specific to the combustion of HFO and/or gas oil in boilers, e.g. on environmental performances
and example plants.
Figure 6.1 shows the operating electrical efficiencies and total fuel utilisation of some European
HFO- and/or gas-oil-fired combustion plants commissioned between 1967 and 2009, operated
between 30 h/yr and 7700 h/yr, and with an equivalent full load factor above 16 %.
Source: [LCP TWG data collection 2012]
Figure 6.1: Operating energy efficiencies of European HFO- and/or gas-oil-fired combustion units
Design net electrical efficiencies were reported by five plants commissioned up to 2010 in the
range of 35.6 – 37.4 %.
[New 66, TWG – Task force on energy efficiency - 2014]
WORKIN
G DRAFT IN
PROGRESS

Chapter 6
516 June 2016 TL/JFF/FN/EIPPCB/LCP_Final Draft
Table 6.7: Techniques to increase the energy efficiency of HFO- and/or gas-oil-fired boilers
Technique Technical
description
Achieved
environmental
benefits
Environmental
performance and operational data
Cross-media
effects
Technical considerations relevant
to applicability Economics
New plants Existing plants
Heat recovery in
CHP plants
See
Section 3.2.3.2
Increased efficiency
High operational experience.
Specific CO2 emission: 370 g/kWh
(produced electricity + recoverable
heat) when operating on HFO at a
total boiler plant efficiency of 80–
96 %
None
Applicable within the constraints
associated with the local power and
heat demand
NA
Change of turbine
blades
Use of advanced
materials to reach
high steam
parameters
Steam turbine blades
can be changed to
three-dimensional
blades during regular
maintenance
intervals.
See Section 3.2.3.13
The use of advanced
materials allows
steam pressures up to
300 bar and steam
temperatures of 560–
570 C.
See Section 3.2.3.5
High operational experience
Practised in new plants
Higher
furnace wall
temperature
may increase
NOX
emissions
Generally applicable to plants where
the combustion energy is transferred
to a steam cycle (e.g. boilers)
Generally
applicable to
plants where the
combustion
energy is
transferred to a
steam cycle (e.g.
boilers). Increased
steam temperature
is limited by the
corrosion
potential of fuel
oil
Not applicable
Supercritical
steam parameters See Section 3.2.3.14 Increased efficiency Practised in new plants None
Generally
applicable to
plants where the
combustion
energy is
transferred to a
steam cycle (e.g.
boilers). Increased
steam temperature
is limited by the
corrosion
potential of fuel
oil
Not applicable
WORKIN
G DRAFT IN
PROGRESS
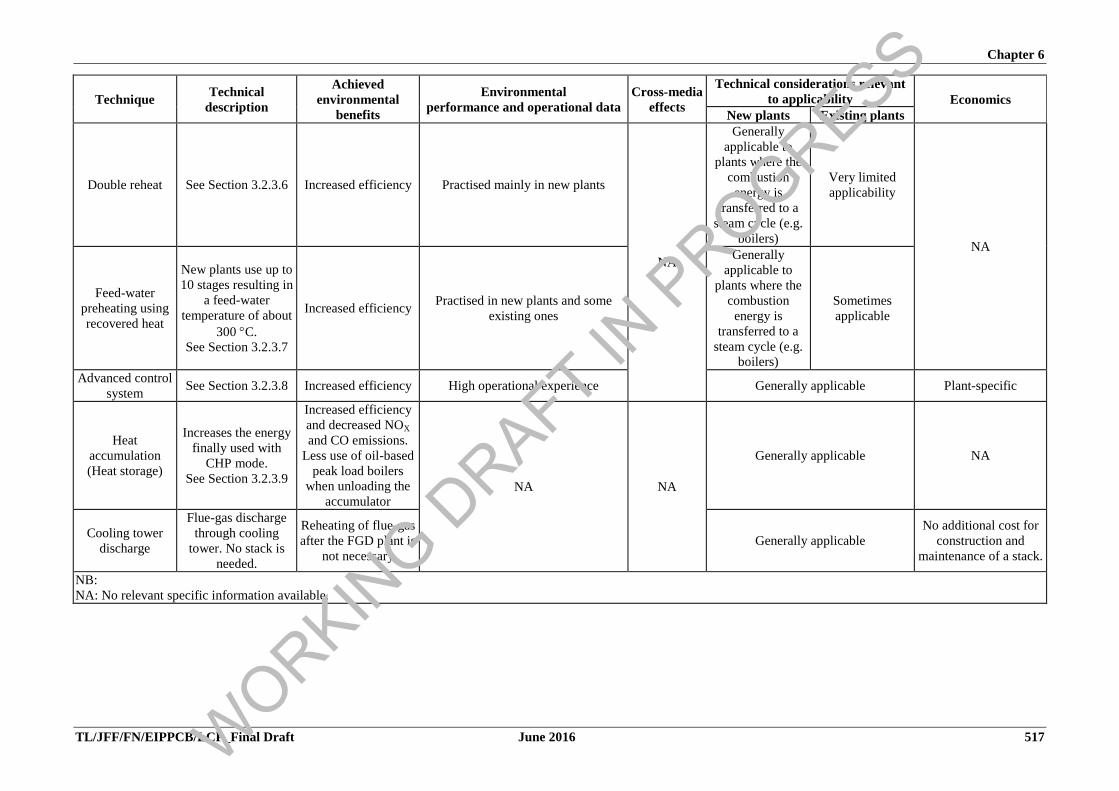
Chapter 6
TL/JFF/FN/EIPPCB/LCP_Final Draft June 2016 517
Technique Technical
description
Achieved
environmental
benefits
Environmental
performance and operational data
Cross-media
effects
Technical considerations relevant
to applicability Economics
New plants Existing plants
Double reheat See Section 3.2.3.6 Increased efficiency Practised mainly in new plants
NA
Generally
applicable to
plants where the
combustion
energy is
transferred to a
steam cycle (e.g.
boilers)
Very limited
applicability
NA
Feed-water
preheating using
recovered heat
New plants use up to
10 stages resulting in
a feed-water
temperature of about
300 C.
See Section 3.2.3.7
Increased efficiency Practised in new plants and some
existing ones
Generally
applicable to
plants where the
combustion
energy is
transferred to a
steam cycle (e.g.
boilers)
Sometimes
applicable
Advanced control
system See Section 3.2.3.8 Increased efficiency High operational experience Generally applicable Plant-specific
Heat
accumulation
(Heat storage)
Increases the energy
finally used with
CHP mode.
See Section 3.2.3.9
Increased efficiency
and decreased NOX
and CO emissions.
Less use of oil-based
peak load boilers
when unloading the
accumulator NA NA
Generally applicable NA
Cooling tower
discharge
Flue-gas discharge
through cooling
tower. No stack is
needed.
Reheating of flue-gas
after the FGD plant is
not necessary
Generally applicable
No additional cost for
construction and
maintenance of a stack.
NB:
NA: No relevant specific information available.
WORKIN
G DRAFT IN
PROGRESS

Chapter 6
518 June 2016 TL/JFF/FN/EIPPCB/LCP_Final Draft
6.3.2.3 Techniques for the prevention and control of NOX and CO
emissions
Information on general techniques for the prevention and control of NOX and CO emissions is
given in Section 3.2.2.3, while Table 6.8 gives additional information on the specific case of
HFO and/or gas oil combustion in boilers, e.g. on environmental performances, economics and
example plants. Further details on related environmental performance and operational data are
provided after the table.
WORKIN
G DRAFT IN
PROGRESS

Chapter 6
TL/JFF/FN/EIPPCB/LCP_Final Draft June 2016 519
Table 6.8: Techniques for the prevention and control of NOX and N2O emissions from HFO- and/or gas-oil-fired boilers
Technique Technical
description
Achieved
environmental
benefits
Environmental
performance and
operational data
Cross-media effects
Technical considerations relevant
to applicability Economics Example
plants New plants Existing plants
Primary techniques
Fuel choice See Section
3.1.1.4 Reduction of NOX NA NA
There may be constraints associated
with the availability of different
types of fuel, which may be
impacted by the energy policy of the
Member State
Depends on
type of fuel Plant 83
Low excess air See Section
3.2.2.3.1
Reduction of NOX
and N2O emissions,
increased efficiency
High operational
experience
Risk of incomplete
combustion. Therefore
emission of other pollutants
may be increased (e.g. CO)
Generally applicable
Plant-specific
NA
Air-staging See Section
3.2.2.3.2
Reduction of NOX
Risk of incomplete
combustion. Therefore
emission of other pollutants
may be increased (e.g. CO)
Plant 498
Flue-gas
recirculation
See Section
3.2.2.3.3
Slight decrease of energy
efficiency Plant 192
Low-NOX
burners (LNBs)
See Section
3.2.2.3.5
Liquids used for firing
may contain nitrogen
compounds, reducing the
LNB benefit as LNBs
have a relatively small
impact on fuel-bound
nitrogen.
High operational
experience
Risk of incomplete
combustion. Therefore
emission of other pollutants
may be increased (e.g. CO)
NA Plant 412-2
Fuel staging See Section
3.2.2.3.6
High operational
experience NA Plant-specific Plant 83
Water/steam
addition See Section 3.2.2.3.10
High operational
experience
Decrease of energy
efficiency. Emission of other
pollutants may be increased
(e.g. CO)
Applicable within the constraints of
water availability NA Plant 468
WORKIN
G DRAFT IN
PROGRESS

Chapter 6
520 June 2016 TL/JFF/FN/EIPPCB/LCP_Final Draft
Technique Technical
description
Achieved
environmental
benefits
Environmental
performance and
operational data
Cross-media effects
Technical considerations relevant
to applicability Economics Example
plants New plants Existing plants
Secondary techniques
Selective non-
catalytic
reduction
(SNCR)
See Section
3.2.2.3.12. Reduction of NOX
NOX reduction rate of
SNCR is less than in the
case of SCR.
High operational
experience
Ammonia slip and ammonia
sulphate salts formation
Slight decrease of energy
efficiency
Not applicable to plants operated
< 500 h/yr.
The applicability may be limited in
the case of combustion plants
operated between 500 h/yr and
1500 h/yr with highly variable boiler
loads
Plant-specific NA
Selective
catalytic
reduction
(SCR)
See Section
3.2.2.3.11
Retrofitted
also in high
dust position
Reduction of NOX
Three layers are usually
sufficient to achieve 90–
92 %NOX reduction.
SCR catalyst
regeneration every five
years.
High operational
experience
Ammonia slip. Slight
decrease of energy efficiency
Not generally applicable to
combustion plants of < 100 MWth.
Not viable for
plants operated
< 500 h/yr
Plants 258, 259
There may be
technical and
economic
restrictions for
retrofitting plants
operated between
500 h/yr and
1500 h/yr.
NB:
NA: No relevant specific information available.
WORKIN
G DRAFT IN
PROGRESS

Chapter 6
TL/JFF/FN/EIPPCB/LCP_Final Draft June 2016 521
Figure 6.2 shows NOX emission concentrations from well-performing plants of < 100 MWth, all
of them using fuel choice as a technique. No evidence of correlation between NOX emissions
concentrations and plant age (commissioning years between 1967 and 2004), load (equivalent
full load factor between 35 % and 80 %), or operating hours per year (total operating hours
ranging between 30 and 1200) is observed for the plotted plants.
NB: reported emissions are expressed as yearly averages Source: [LCP TWG data collection 2012]
Figure 6.2: NOX emissions from well-performing HFO- and/or gas-oil-fired boilers of < 100 MWth
Figure 6.3 shows NOX emission concentrations from well-performing plants of ≥ 100 MWth
(total rated thermal input ranging between 100 MW and 800 MW). They continuously monitor
NOX emission concentrations. No evidence of correlation between the NOX emissions
concentrations and the plant age (commissioning years between 1971 and 2006), load
(equivalent full load factor between 16 % and 76 %), or operating hours per year (total
operating hours ranging between 630 and 5580) is observed for the plotted plants.
Where this information is available, the plants shown in Figure 6.2 maintain the yearly average
CO emissions concentration between 10 mg/Nm3
and 30 mg/Nm3, and the plants shown in
Figure 6.3 maintain the yearly average CO emissions concentration between 10 mg/Nm3 and
20 mg/Nm3. The yearly average NH3 emissions concentrations for the plotted plants are below
3 mg/Nm3.
WORKIN
G DRAFT IN
PROGRESS

Chapter 6
522 June 2016 TL/JFF/FN/EIPPCB/LCP_Final Draft
NB: reported emissions are expressed as yearly averages Source: [LCP TWG data collection 2012]
Figure 6.3: NOX emissions from well-performing HFO- and/or gas-oil-fired boilers of ≥ 100 MWth
6.3.2.4 Techniques for the prevention and control of SOX emissions
Information on general techniques for the prevention and control of SOX emissions is given in
Section 3.2.2.2, while Table 6.9 gives additional information on the techniques specific to the
combustion of HFO and/or gas oil in boilers, e.g. on environmental performances and example
plants. Further details on related environmental performance and operational data are provided
after the table.
WORKIN
G DRAFT IN
PROGRESS
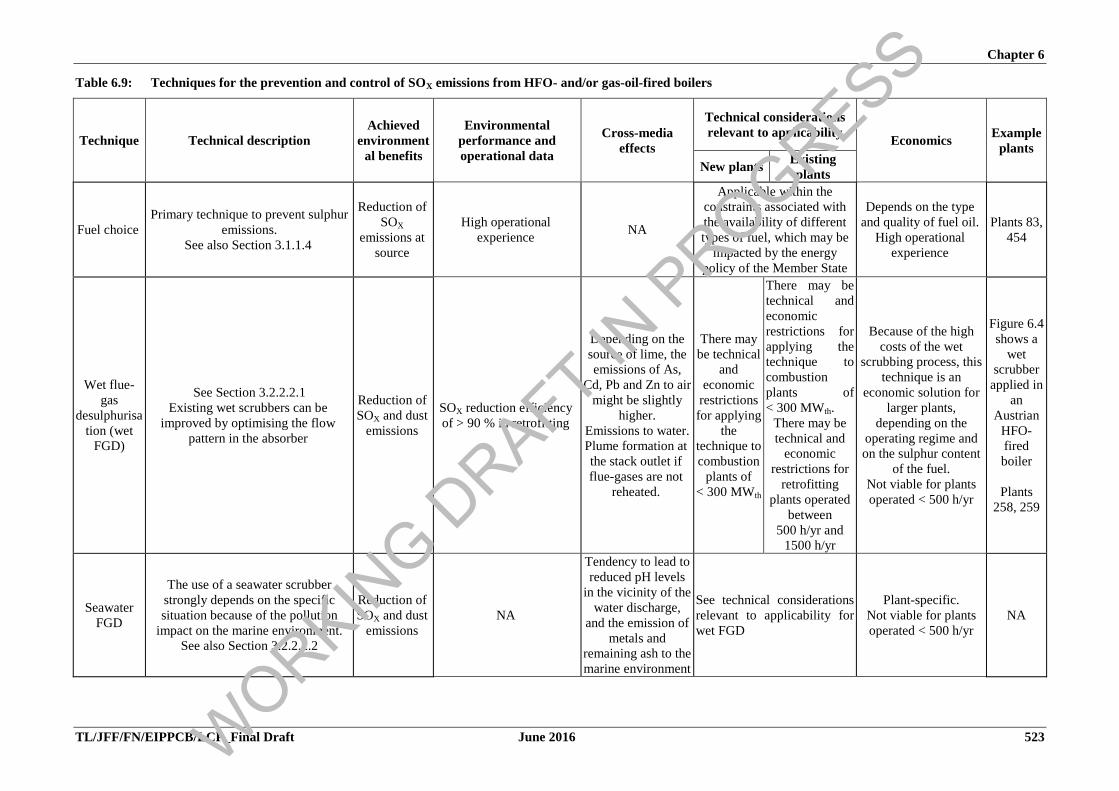
Chapter 6
TL/JFF/FN/EIPPCB/LCP_Final Draft June 2016 523
Table 6.9: Techniques for the prevention and control of SOX emissions from HFO- and/or gas-oil-fired boilers
Technique Technical description
Achieved
environment
al benefits
Environmental
performance and
operational data
Cross-media
effects
Technical considerations
relevant to applicability Economics
Example
plants
New plants Existing
plants
Fuel choice
Primary technique to prevent sulphur
emissions.
See also Section 3.1.1.4
Reduction of
SOX
emissions at
source
High operational
experience NA
Applicable within the
constraints associated with
the availability of different
types of fuel, which may be
impacted by the energy
policy of the Member State
Depends on the type
and quality of fuel oil.
High operational
experience
Plants 83,
454
Wet flue-
gas
desulphurisa
tion (wet
FGD)
See Section 3.2.2.2.1
Existing wet scrubbers can be
improved by optimising the flow
pattern in the absorber
Reduction of
SOX and dust
emissions
SOX reduction efficiency
of > 90 % in retrofitting
Depending on the
source of lime, the
emissions of As,
Cd, Pb and Zn to air
might be slightly
higher.
Emissions to water.
Plume formation at
the stack outlet if
flue-gases are not
reheated.
There may
be technical
and
economic
restrictions
for applying
the
technique to
combustion
plants of
< 300 MWth
There may be
technical and
economic
restrictions for
applying the
technique to
combustion
plants of
< 300 MWth.
There may be
technical and
economic
restrictions for
retrofitting
plants operated
between
500 h/yr and
1500 h/yr
Because of the high
costs of the wet
scrubbing process, this
technique is an
economic solution for
larger plants,
depending on the
operating regime and
on the sulphur content
of the fuel.
Not viable for plants
operated < 500 h/yr
Figure 6.4
shows a
wet
scrubber
applied in
an
Austrian
HFO-
fired
boiler
Plants
258, 259
Seawater
FGD
The use of a seawater scrubber
strongly depends on the specific
situation because of the pollution
impact on the marine environment.
See also Section 3.2.2.2.2
Reduction of
SOX and dust
emissions
NA
Tendency to lead to
reduced pH levels
in the vicinity of the
water discharge,
and the emission of
metals and
remaining ash to the
marine environment
See technical considerations
relevant to applicability for
wet FGD
Plant-specific.
Not viable for plants
operated < 500 h/yr
NA
WORKIN
G DRAFT IN
PROGRESS

Chapter 6
524 June 2016 TL/JFF/FN/EIPPCB/LCP_Final Draft
Technique Technical description
Achieved
environment
al benefits
Environmental
performance and
operational data
Cross-media
effects
Technical considerations
relevant to applicability Economics
Example
plants
New plants Existing
plants
Spray dry
scrubber or
absorber
(SDA)
See Section 3.2.2.2.6
Spray dry scrubbers first produce
dust, and they reduce dust emissions
only in combination with effective
particulate removal systems (BF,
ESP)
Reduction of
SOX emissions
High operational
experience.
Residues that need
to be landfilled Generally applicable Plant-specific NA
Duct sorbent
injection
(DSI)
The injection and dispersion of a dry
powder sorbent in the flue-gas stream.
The sorbent (e.g. sodium bicarbonate,
hydrated lime) reacts with acid gases
(e.g. the gaseous sulphur species,
HCl) to form a solid which is
removed by filtration (bag filter or
electrostatic precipitator)
See also Section 3.2.2.2.8
NA NA
Generally applicable
NA
Plant 70
Flue-gas
condenser See Section 3.2.3.15 Generally applicable Plant 454
NB:
NA: No relevant specific information available.
WORKIN
G DRAFT IN
PROGRESS
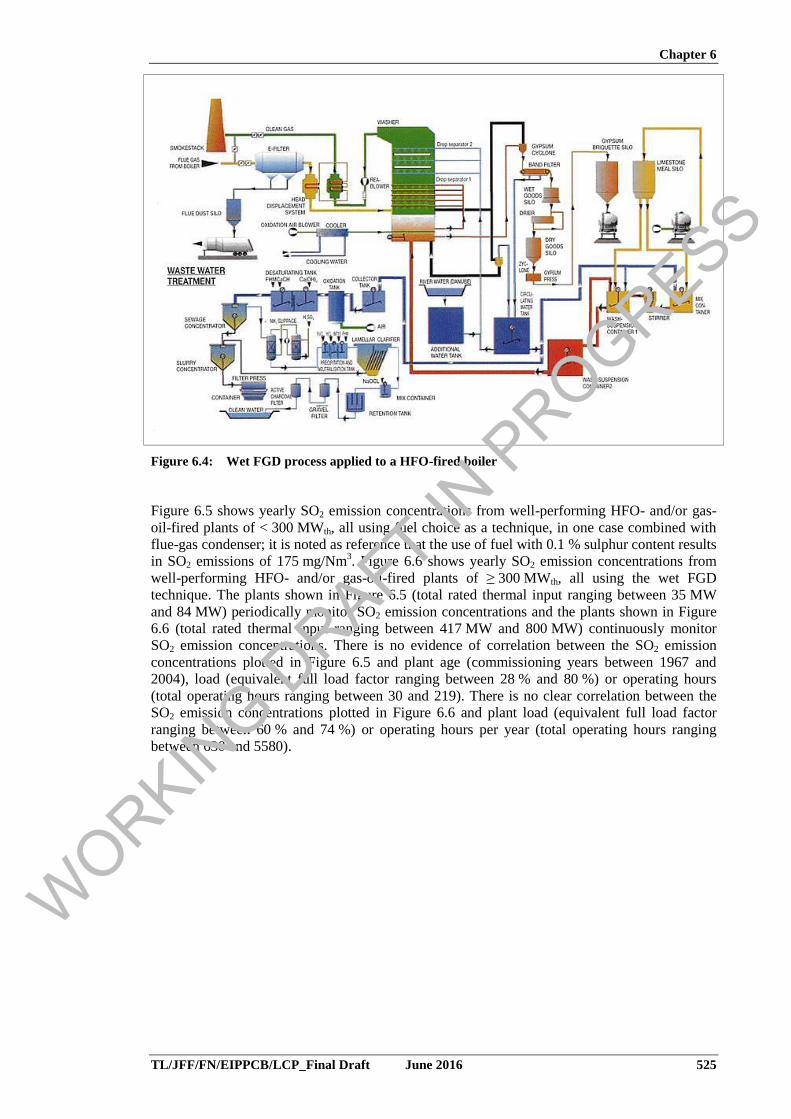
Chapter 6
TL/JFF/FN/EIPPCB/LCP_Final Draft June 2016 525
Figure 6.4: Wet FGD process applied to a HFO-fired boiler
Figure 6.5 shows yearly SO2 emission concentrations from well-performing HFO- and/or gas-
oil-fired plants of < 300 MWth, all using fuel choice as a technique, in one case combined with
flue-gas condenser; it is noted as reference that the use of fuel with 0.1 % sulphur content results
in SO2 emissions of 175 mg/Nm3. Figure 6.6 shows yearly SO2 emission concentrations from
well-performing HFO- and/or gas-oil-fired plants of ≥ 300 MWth, all using the wet FGD
technique. The plants shown in Figure 6.5 (total rated thermal input ranging between 35 MW
and 84 MW) periodically monitor SO2 emission concentrations and the plants shown in Figure
6.6 (total rated thermal input ranging between 417 MW and 800 MW) continuously monitor
SO2 emission concentrations. There is no evidence of correlation between the SO2 emission
concentrations plotted in Figure 6.5 and plant age (commissioning years between 1967 and
2004), load (equivalent full load factor ranging between 28 % and 80 %) or operating hours
(total operating hours ranging between 30 and 219). There is no clear correlation between the
SO2 emission concentrations plotted in Figure 6.6 and plant load (equivalent full load factor
ranging between 60 % and 74 %) or operating hours per year (total operating hours ranging
between 630 and 5580).
WORKIN
G DRAFT IN
PROGRESS
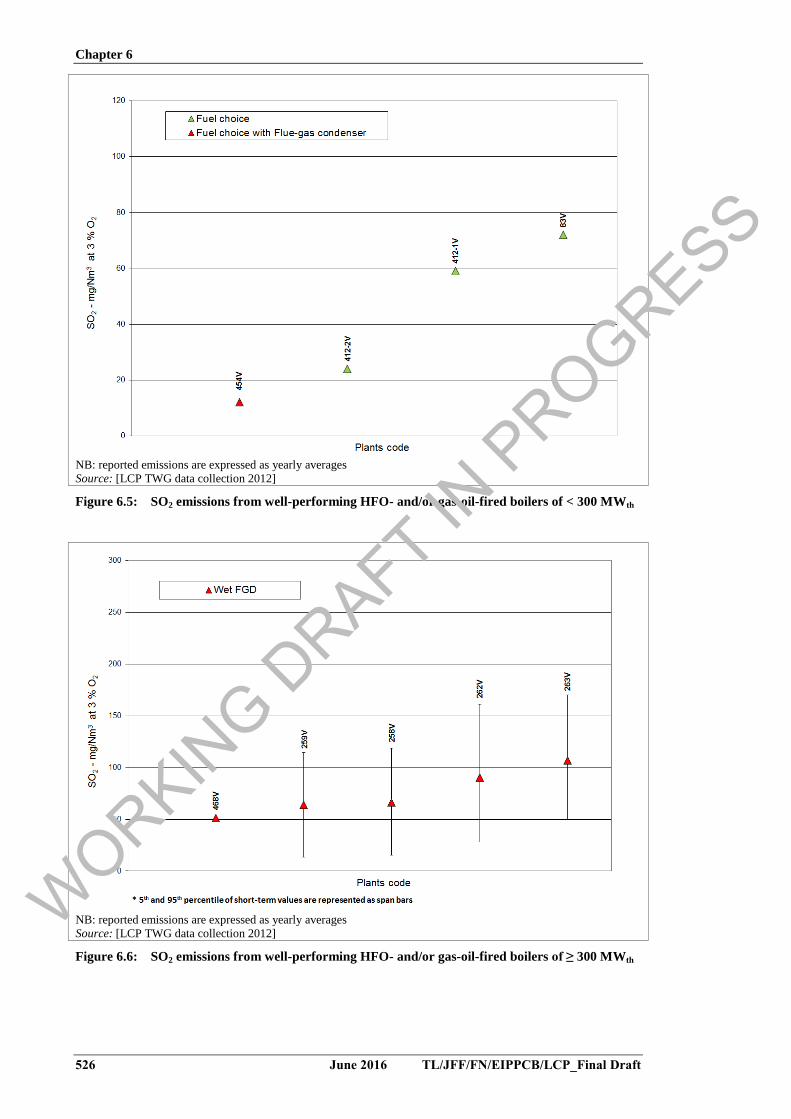
Chapter 6
526 June 2016 TL/JFF/FN/EIPPCB/LCP_Final Draft
NB: reported emissions are expressed as yearly averages Source: [LCP TWG data collection 2012]
Figure 6.5: SO2 emissions from well-performing HFO- and/or gas-oil-fired boilers of < 300 MWth
NB: reported emissions are expressed as yearly averages Source: [LCP TWG data collection 2012]
Figure 6.6: SO2 emissions from well-performing HFO- and/or gas-oil-fired boilers of ≥ 300 MWth
WORKIN
G DRAFT IN
PROGRESS

Chapter 6
TL/JFF/FN/EIPPCB/LCP_Final Draft June 2016 527
6.3.2.5 Techniques for the prevention and control of dust and particulate-bound metals emissions
Information on general techniques for the prevention and control of dust and particulate-bound
metals emissions is given in Section 3.2.2.1. Table 6.10 gives additional information on the
same topic specific to HFO and/or gas oil combustion in boilers, e.g. on environmental
performances and example plants. Further details on related environmental performance and
operational data are provided after the table.
WORKIN
G DRAFT IN
PROGRESS
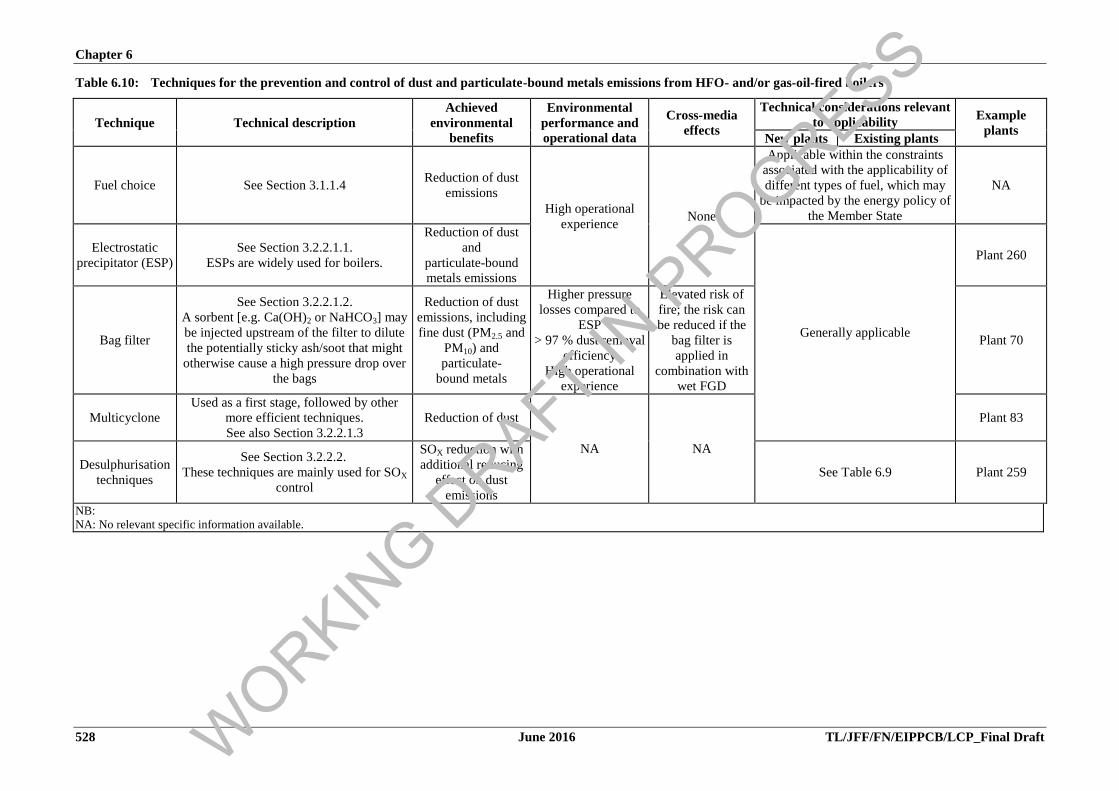
Chapter 6
528 June 2016 TL/JFF/FN/EIPPCB/LCP_Final Draft
Table 6.10: Techniques for the prevention and control of dust and particulate-bound metals emissions from HFO- and/or gas-oil-fired boilers
Technique Technical description
Achieved
environmental
benefits
Environmental
performance and
operational data
Cross-media
effects
Technical considerations relevant
to applicability Example
plants New plants Existing plants
Fuel choice See Section 3.1.1.4 Reduction of dust
emissions
High operational
experience None
Applicable within the constraints
associated with the applicability of
different types of fuel, which may
be impacted by the energy policy of
the Member State
NA
Electrostatic
precipitator (ESP)
See Section 3.2.2.1.1.
ESPs are widely used for boilers.
Reduction of dust
and
particulate-bound
metals emissions
Generally applicable
Plant 260
Bag filter
See Section 3.2.2.1.2.
A sorbent [e.g. Ca(OH)2 or NaHCO3] may
be injected upstream of the filter to dilute
the potentially sticky ash/soot that might
otherwise cause a high pressure drop over
the bags
Reduction of dust
emissions, including
fine dust (PM2.5 and
PM10) and
particulate-
bound metals
Higher pressure
losses compared to
ESP
> 97 % dust removal
efficiency
High operational
experience
Elevated risk of
fire; the risk can
be reduced if the
bag filter is
applied in
combination with
wet FGD
Plant 70
Multicyclone
Used as a first stage, followed by other
more efficient techniques.
See also Section 3.2.2.1.3
Reduction of dust
NA NA
Plant 83
Desulphurisation
techniques
See Section 3.2.2.2.
These techniques are mainly used for SOX
control
SOX reduction with
additional reducing
effect on dust
emissions
See Table 6.9 Plant 259
NB:
NA: No relevant specific information available.
WORKIN
G DRAFT IN
PROGRESS
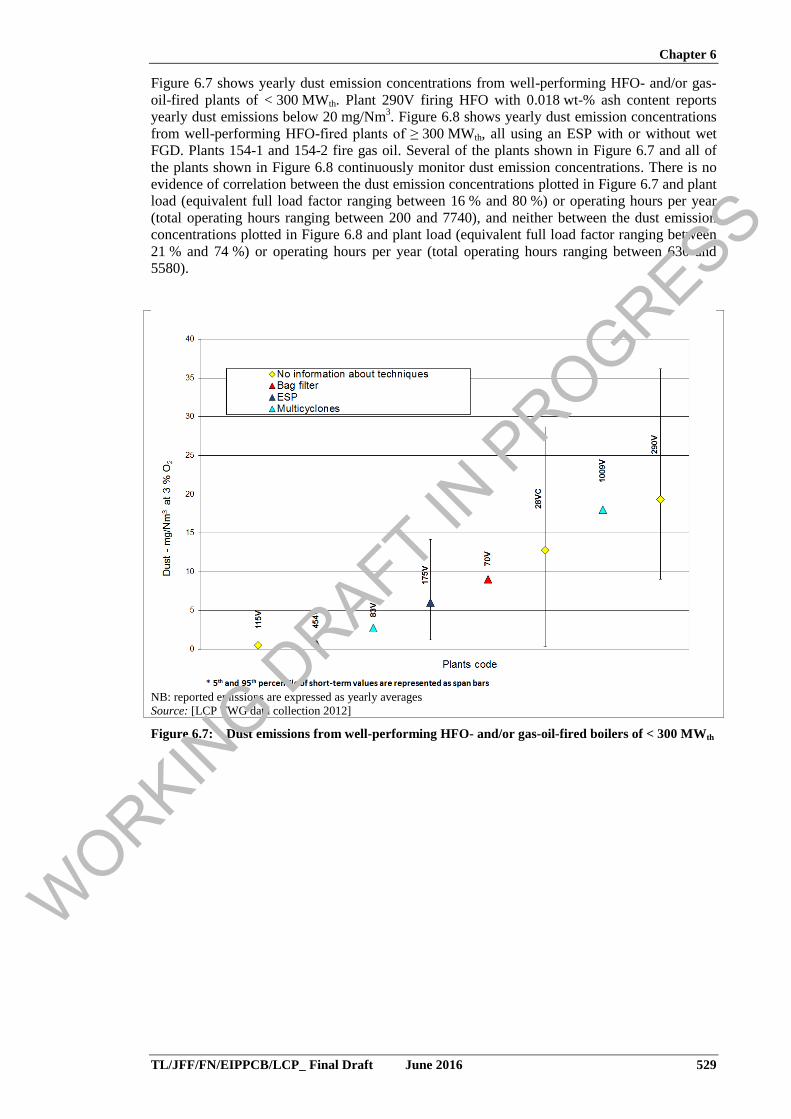
Chapter 6
TL/JFF/FN/EIPPCB/LCP_ Final Draft June 2016 529
Figure 6.7 shows yearly dust emission concentrations from well-performing HFO- and/or gas-
oil-fired plants of < 300 MWth. Plant 290V firing HFO with 0.018 wt-% ash content reports
yearly dust emissions below 20 mg/Nm3. Figure 6.8 shows yearly dust emission concentrations
from well-performing HFO-fired plants of ≥ 300 MWth, all using an ESP with or without wet
FGD. Plants 154-1 and 154-2 fire gas oil. Several of the plants shown in Figure 6.7 and all of
the plants shown in Figure 6.8 continuously monitor dust emission concentrations. There is no
evidence of correlation between the dust emission concentrations plotted in Figure 6.7 and plant
load (equivalent full load factor ranging between 16 % and 80 %) or operating hours per year
(total operating hours ranging between 200 and 7740), and neither between the dust emission
concentrations plotted in Figure 6.8 and plant load (equivalent full load factor ranging between
21 % and 74 %) or operating hours per year (total operating hours ranging between 630 and
5580).
NB: reported emissions are expressed as yearly averages Source: [LCP TWG data collection 2012]
Figure 6.7: Dust emissions from well-performing HFO- and/or gas-oil-fired boilers of < 300 MWth
WORKIN
G DRAFT IN
PROGRESS

Chapter 6
530 June 2016 TL/JFF/FN/EIPPCB/LCP_Final Draft
NB: reported emissions are expressed as yearly averages Source: [LCP TWG data collection 2012]
Figure 6.8: Dust emissions from well-performing HFO- and/or gas-oil-fired boilers of ≥ 300 MWth
6.3.3 Techniques to consider in the determination of BAT for the combustion of HFO and/or gas oil in engines
6.3.3.1 Techniques to increase energy efficiency
Information on general techniques to increase the energy efficiency of combustion plants is
given in Section 3.2.3, while Table 6.11 gives additional information on energy efficiency
specific to the combustion of HFO and/or gas oil in engines, e.g. on environmental
performances and example plants.
Figure 6.9 shows the operating electrical efficiencies and total fuel utilisation of some European
HFO- and/or gas-oil-fired engines, commissioned between 1984 and 2012, operated between
277 h/yr and 8500 h/yr, with an equivalent full load factor between 54 % and 97 %.
WORKIN
G DRAFT IN
PROGRESS
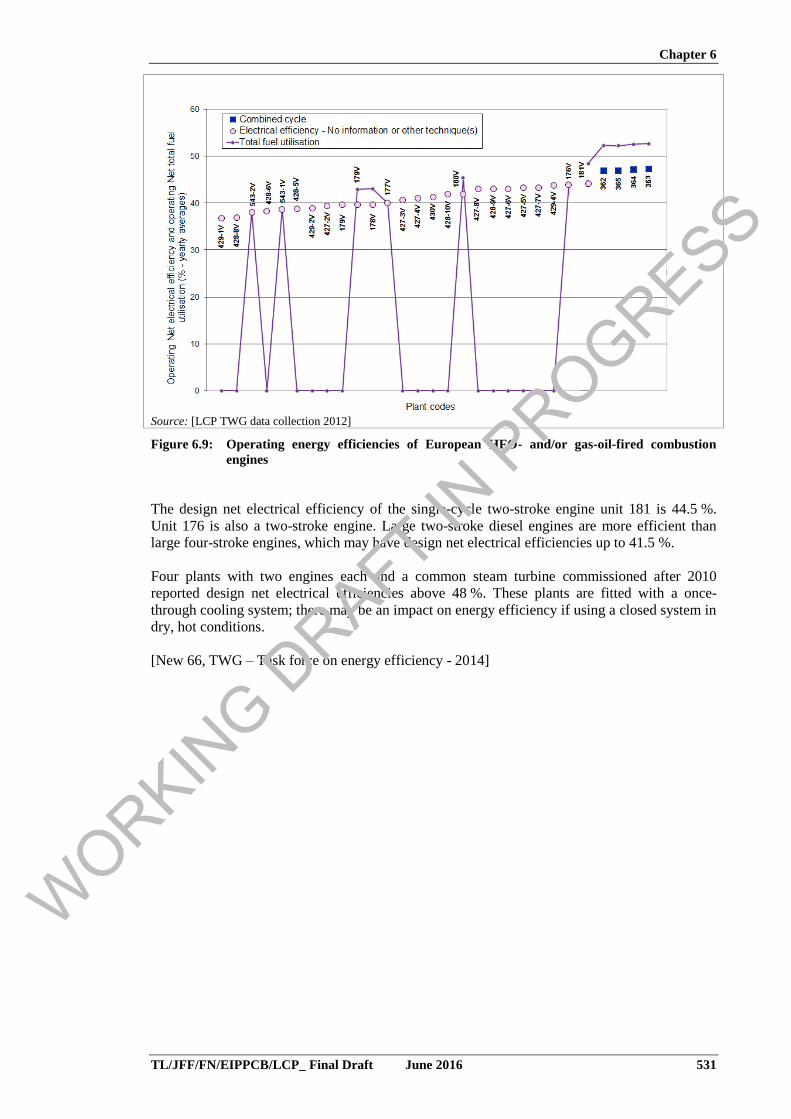
Chapter 6
TL/JFF/FN/EIPPCB/LCP_ Final Draft June 2016 531
Source: [LCP TWG data collection 2012]
Figure 6.9: Operating energy efficiencies of European HFO- and/or gas-oil-fired combustion
engines
The design net electrical efficiency of the single-cycle two-stroke engine unit 181 is 44.5 %.
Unit 176 is also a two-stroke engine. Large two-stroke diesel engines are more efficient than
large four-stroke engines, which may have design net electrical efficiencies up to 41.5 %.
Four plants with two engines each and a common steam turbine commissioned after 2010
reported design net electrical efficiencies above 48 %. These plants are fitted with a once-
through cooling system; there may be an impact on energy efficiency if using a closed system in
dry, hot conditions.
[New 66, TWG – Task force on energy efficiency - 2014]
WORKIN
G DRAFT IN
PROGRESS

Chapter 6
532 June 2016 TL/JFF/FN/EIPPCB/LCP_Final Draft
Table 6.11: Techniques to increase the efficiency of HFO- and/or gas-oil-fired engines
Technique Technical description Achieved environmental
benefits
Environmental
performance and
operational data
Technical considerations relevant to
applicability Example
plants Reference literature
New plants Existing plants
Heat recovery in
CHP plants See Section 3.2.3.2 Increased efficiency
Generally
applicable
Very limited
applicability
[New 136] [88,
Euromot, 2001]
Combined cycle
Following the cleaning
steps, the engine's
exhaust gas, which still
contains a considerable
amount of energy, is
passed through waste
heat recovery boilers.
Part of the energy in
the exhaust gases is
transferred to a steam
cycle.
See also Section
3.2.3.11
Increased efficiency of
engine plants
Additional electricity can be
produced and the net
efficiency of the plant can be
increased up to 48 %
(increasing the electrical
efficiency by more than 5 %)
by decreasing the exhaust gas
temperature to 170 °C when
the plant is operated above
50 % of equivalent full load.
The high efficiency results in
lower fuel consumption per
kWh generated (about 0.19 g
of fuel per kWh).
Generally applicable. In the case of
heat recovery steam generators with
steam turbines the applicability is very
limited for existing plants due to space
restrictions
Plants 362,
363, 364,
365
NA
Change of turbine
blades
Steam turbine blades
can be changed to
three-dimensional
blades during regular
maintenance intervals
Increased efficiency NA
Generally applicable to engines fitted
with HRSG in combined cycle mode,
where the combustion energy is
transferred to a steam cycle.
Applicable where steam turbine blades
are available for the pressure steam of
the turbine NA
Advanced control
system
See also Section
3.2.3.8 Increased efficiency. High operational experience Generally applicable
Heat accumulation
(heat storage) See Section 3.2.3.9 Increased efficiency NA Generally applicable
NB:
NA: No relevant specific information available.
WORKIN
G DRAFT IN
PROGRESS

Chapter 6
TL/JFF/FN/EIPPCB/LCP_ Final Draft June 2016 533
6.3.3.2 Techniques for the prevention and control of NOX and CO
emissions
Information on general techniques for the prevention and control of NOX and CO emissions is
given in Section 3.2.2.3, while Table 6.12 gives additional information on the specific case of
HFO and/or gas oil combustion in engines, e.g. on environmental performances, economics and
example plants. Further details on related environmental performance and operational data are
provided after the table.
WORKIN
G DRAFT IN
PROGRESS

Chapter 6
534 June 2016 TL/JFF/FN/EIPPCB/LCP_Final Draft
Table 6.12: Techniques for the prevention and control of NOX and CO emissions from HFO- and/or gas-oil-fired engines
Technique Technical
description
Achieved
environmental
benefits
Environmental
performance and
operational data
Cross-media effects
Technical considerations
relevant to applicability Economics Example
plants
Reference
literature New plants Existing plants
Exhaust gas
recirculation
See Section
3.2.2.3.3
Reduction of
NOX
NA NA Not applicable to four-stroke
engines Plant-specific NA
NA
Water/steam
addition
See Section 3.2.2.3.10.
This can be done by direct
injection, by means of an
emulsion of fuel and water, or
through a mixture of
combustion air and steam
(humid air)
NOX emissions range:
< 1300 mg/Nm3 to
1600 mg/Nm3
Increased engine fuel
consumption
Applicable within the
constraints of water availability.
The applicability may be limited
in the case of engines where a
retrofit package is not available.
NA
NA
Low-NOX
combustion
concept in
diesel engines
See Section
3.2.2.3.8
Includes the
possibility of
early closing of
the air inlet
valves, which
suppresses the
in-cylinder
temperatures,
thus reducing
NOX formation
By using a low-NOX
combustion concept, the
NOX emissions of
modern engines are up to
40 % lower than that of a
similar engine type from
the beginning of the
1990s whilst maintaining
the same efficiency
Higher pressure
ratios are needed
otherwise the fuel
consumption
increases and the
power output of the
engines might
decrease
Generally applicable Plant 427-
6V
WORKIN
G DRAFT IN
PROGRESS

Chapter 6
TL/JFF/FN/EIPPCB/LCP_Draft June 2016 535
Technique Technical
description
Achieved
environmental
benefits
Environmental
performance and
operational data
Cross-media effects
Technical considerations
relevant to applicability Economics Example
plants
Reference
literature New plants Existing plants
Selective
catalytic
reduction
(SCR)
It can be
retrofitted both in
high- and low-
dust
configurations.
See Section
3.2.2.3.11
Reduction of
NOX
Three layers are
generally sufficient to
achieve 92 % NOX
reduction.
SCR catalyst requires
regeneration every five
years.
A control system may be
needed in order to ensure
correct operation of SCR
Ammonia slip Generally
applicable
There may be
technical and
economic
restrictions for
retrofitting plants
operated between
500 h/yr and
1500 h/yr.
Retrofitting
existing plants
may be
constrained by
the availability of
sufficient space.
See information
on cost for SCR
below this
table.
Not viable for
plants operated
< 500 h/yr
Plants
364, 691
[New 95] [6.1.3-
1]
[New 165] [New
164] [167,
Rigby, et al.,
2001], [New 166]
[181, Ceramics
GmbH, 2002],
[New 136]
NB:
NA: No relevant specific information available.
WORKIN
G DRAFT IN
PROGRESS
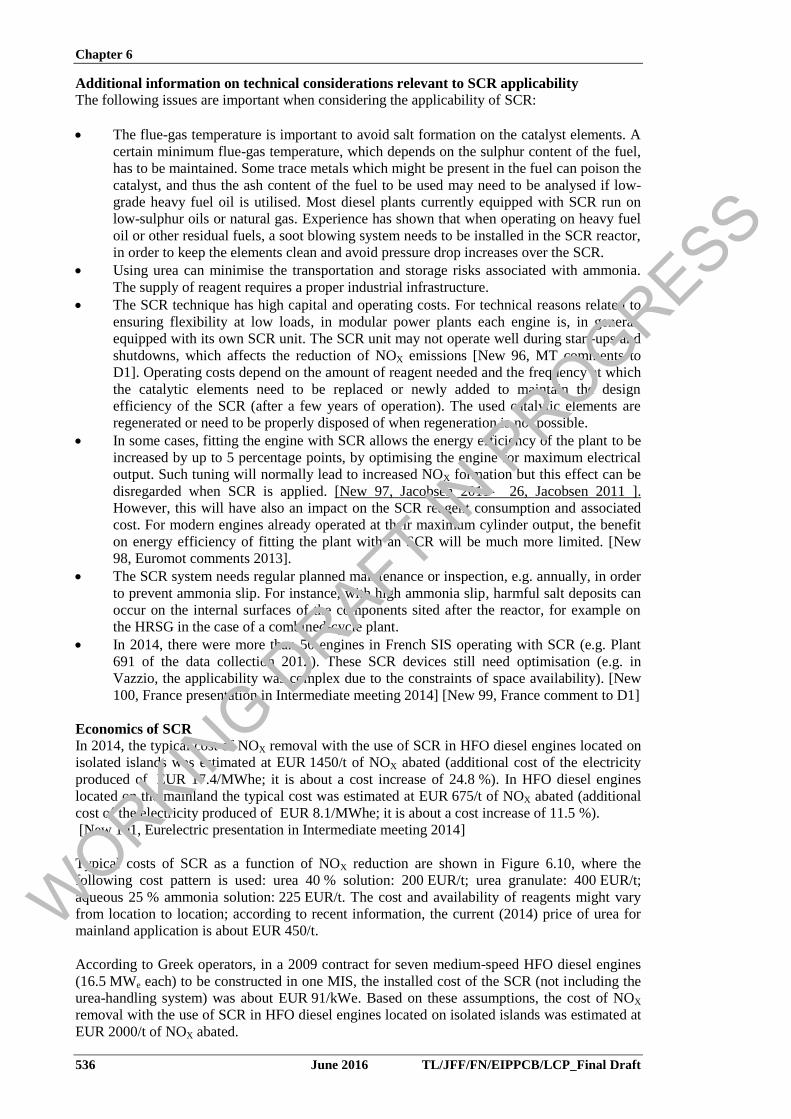
Chapter 6
536 June 2016 TL/JFF/FN/EIPPCB/LCP_Final Draft
Additional information on technical considerations relevant to SCR applicability
The following issues are important when considering the applicability of SCR:
The flue-gas temperature is important to avoid salt formation on the catalyst elements. A
certain minimum flue-gas temperature, which depends on the sulphur content of the fuel,
has to be maintained. Some trace metals which might be present in the fuel can poison the
catalyst, and thus the ash content of the fuel to be used may need to be analysed if low-
grade heavy fuel oil is utilised. Most diesel plants currently equipped with SCR run on
low-sulphur oils or natural gas. Experience has shown that when operating on heavy fuel
oil or other residual fuels, a soot blowing system needs to be installed in the SCR reactor,
in order to keep the elements clean and avoid pressure drop increases over the SCR.
Using urea can minimise the transportation and storage risks associated with ammonia.
The supply of reagent requires a proper industrial infrastructure.
The SCR technique has high capital and operating costs. For technical reasons related to
ensuring flexibility at low loads, in modular power plants each engine is, in general,
equipped with its own SCR unit. The SCR unit may not operate well during start-ups and
shutdowns, which affects the reduction of NOX emissions [New 96, MT comments to
D1]. Operating costs depend on the amount of reagent needed and the frequency at which
the catalytic elements need to be replaced or newly added to maintain the design
efficiency of the SCR (after a few years of operation). The used catalytic elements are
regenerated or need to be properly disposed of when regeneration is not possible.
In some cases, fitting the engine with SCR allows the energy efficiency of the plant to be
increased by up to 5 percentage points, by optimising the engine for maximum electrical
output. Such tuning will normally lead to increased NOX formation but this effect can be
disregarded when SCR is applied. [New 97, Jacobsen 2011- 26, Jacobsen 2011 ].
However, this will have also an impact on the SCR reagent consumption and associated
cost. For modern engines already operated at their maximum cylinder output, the benefit
on energy efficiency of fitting the plant with an SCR will be much more limited. [New
98, Euromot comments 2013].
The SCR system needs regular planned maintenance or inspection, e.g. annually, in order
to prevent ammonia slip. For instance, with high ammonia slip, harmful salt deposits can
occur on the internal surfaces of the components sited after the reactor, for example on
the HRSG in the case of a combined-cycle plant.
In 2014, there were more than 50 engines in French SIS operating with SCR (e.g. Plant
691 of the data collection 2012). These SCR devices still need optimisation (e.g. in
Vazzio, the applicability was complex due to the constraints of space availability). [New
100, France presentation in Intermediate meeting 2014] [New 99, France comment to D1]
Economics of SCR
In 2014, the typical cost of NOX removal with the use of SCR in HFO diesel engines located on
isolated islands was estimated at EUR 1450/t of NOX abated (additional cost of the electricity
produced of EUR 17.4/MWhe; it is about a cost increase of 24.8 %). In HFO diesel engines
located on the mainland the typical cost was estimated at EUR 675/t of NOX abated (additional
cost of the electricity produced of EUR 8.1/MWhe; it is about a cost increase of 11.5 %).
[New 101, Eurelectric presentation in Intermediate meeting 2014]
Typical costs of SCR as a function of NOX reduction are shown in Figure 6.10, where the
following cost pattern is used: urea 40 % solution: 200 EUR/t; urea granulate: 400 EUR/t;
aqueous 25 % ammonia solution: 225 EUR/t. The cost and availability of reagents might vary
from location to location; according to recent information, the current (2014) price of urea for
mainland application is about EUR 450/t.
According to Greek operators, in a 2009 contract for seven medium-speed HFO diesel engines
(16.5 MWe each) to be constructed in one MIS, the installed cost of the SCR (not including the
urea-handling system) was about EUR 91/kWe. Based on these assumptions, the cost of NOX
removal with the use of SCR in HFO diesel engines located on isolated islands was estimated at
EUR 2000/t of NOX abated.
WORKIN
G DRAFT IN
PROGRESS
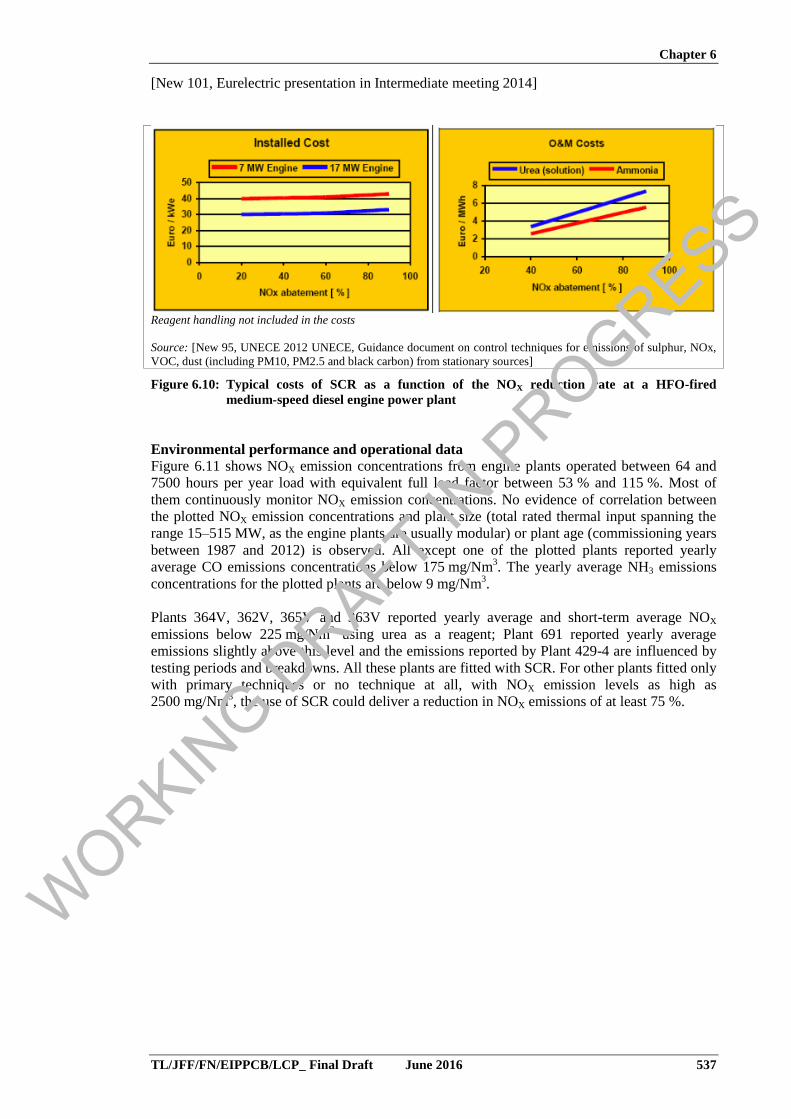
Chapter 6
TL/JFF/FN/EIPPCB/LCP_ Final Draft June 2016 537
[New 101, Eurelectric presentation in Intermediate meeting 2014]
Reagent handling not included in the costs
Source: [New 95, UNECE 2012 UNECE, Guidance document on control techniques for emissions of sulphur, NOx,
VOC, dust (including PM10, PM2.5 and black carbon) from stationary sources]
Figure 6.10: Typical costs of SCR as a function of the NOX reduction rate at a HFO-fired
medium-speed diesel engine power plant
Environmental performance and operational data
Figure 6.11 shows NOX emission concentrations from engine plants operated between 64 and
7500 hours per year load with equivalent full load factor between 53 % and 115 %. Most of
them continuously monitor NOX emission concentrations. No evidence of correlation between
the plotted NOX emission concentrations and plant size (total rated thermal input spanning the
range 15–515 MW, as the engine plants are usually modular) or plant age (commissioning years
between 1987 and 2012) is observed. All except one of the plotted plants reported yearly
average CO emissions concentrations below 175 mg/Nm3. The yearly average NH3 emissions
concentrations for the plotted plants are below 9 mg/Nm3.
Plants 364V, 362V, 365V and 363V reported yearly average and short-term average NOX
emissions below 225 mg/Nm3 using urea as a reagent; Plant 691 reported yearly average
emissions slightly above this level and the emissions reported by Plant 429-4 are influenced by
testing periods and breakdowns. All these plants are fitted with SCR. For other plants fitted only
with primary techniques or no technique at all, with NOX emission levels as high as
2500 mg/Nm3, the use of SCR could deliver a reduction in NOX emissions of at least 75 %.
WORKIN
G DRAFT IN
PROGRESS
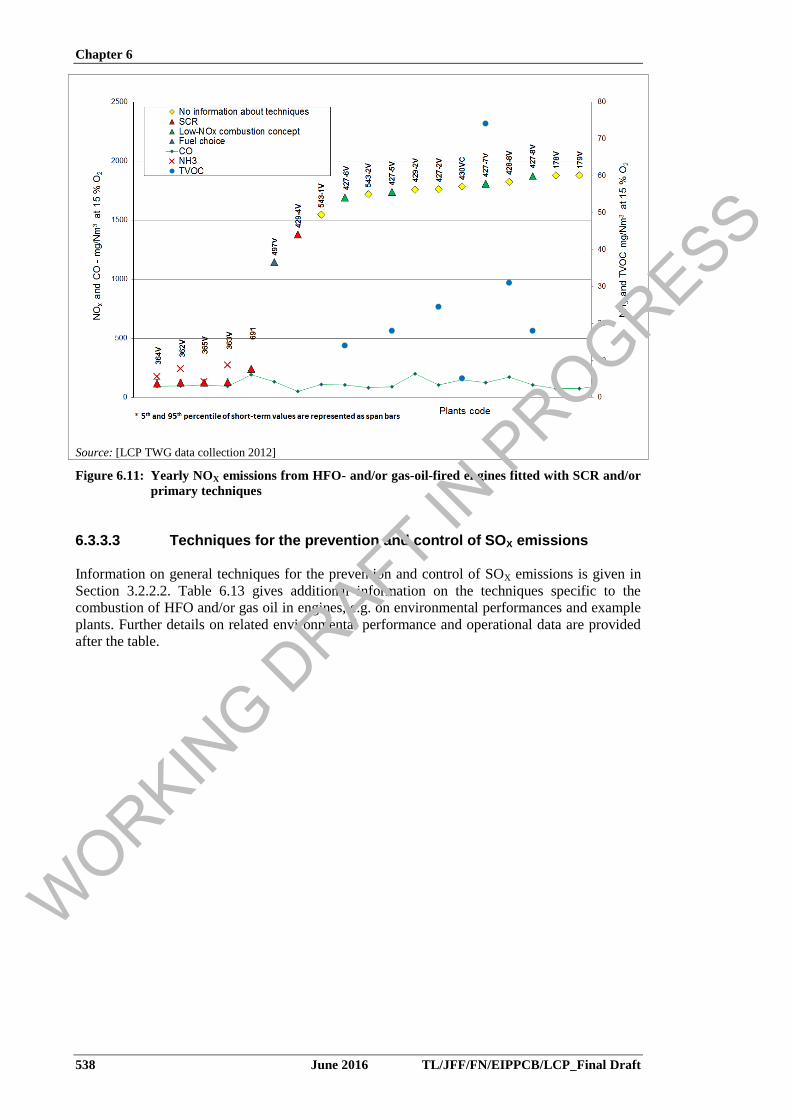
Chapter 6
538 June 2016 TL/JFF/FN/EIPPCB/LCP_Final Draft
Source: [LCP TWG data collection 2012]
Figure 6.11: Yearly NOX emissions from HFO- and/or gas-oil-fired engines fitted with SCR and/or
primary techniques
6.3.3.3 Techniques for the prevention and control of SOX emissions
Information on general techniques for the prevention and control of SOX emissions is given in
Section 3.2.2.2. Table 6.13 gives additional information on the techniques specific to the
combustion of HFO and/or gas oil in engines, e.g. on environmental performances and example
plants. Further details on related environmental performance and operational data are provided
after the table.
WORKIN
G DRAFT IN
PROGRESS
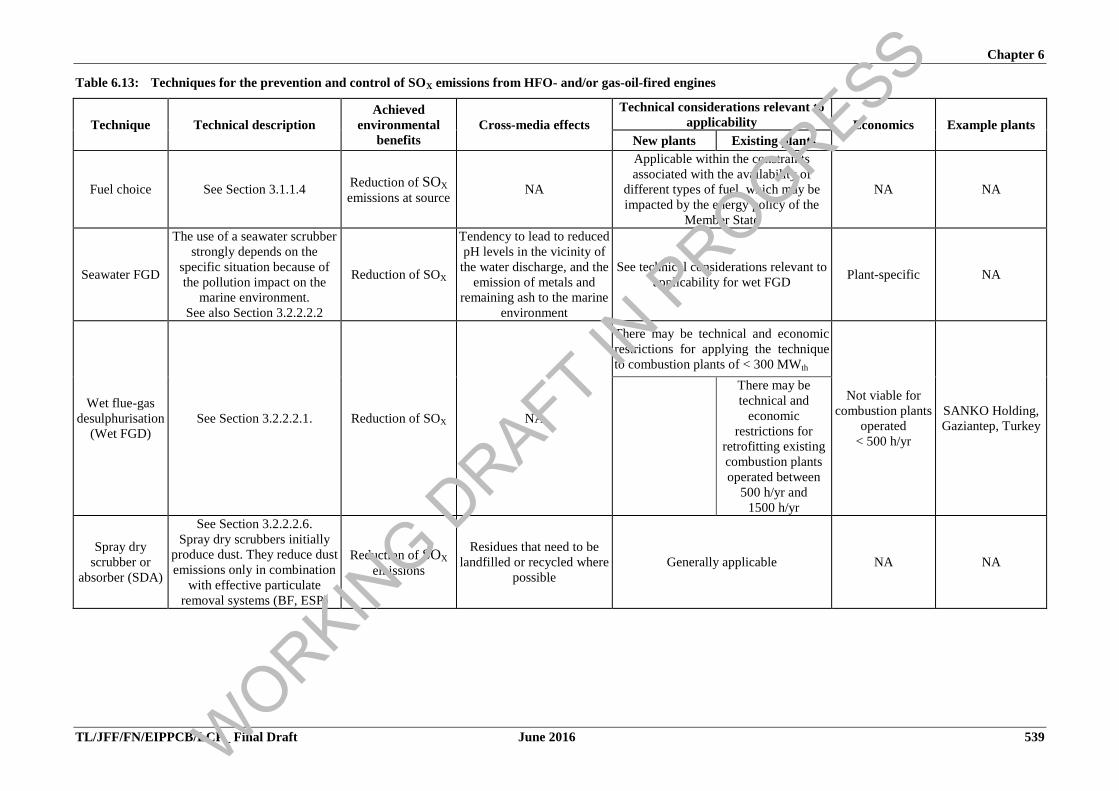
Chapter 6
TL/JFF/FN/EIPPCB/LCP_ Final Draft June 2016 539
Table 6.13: Techniques for the prevention and control of SOX emissions from HFO- and/or gas-oil-fired engines
Technique Technical description
Achieved
environmental
benefits
Cross-media effects
Technical considerations relevant to
applicability Economics Example plants
New plants Existing plants
Fuel choice See Section 3.1.1.4 Reduction of SOX emissions at source
NA
Applicable within the constraints
associated with the availability of
different types of fuel, which may be
impacted by the energy policy of the
Member State
NA NA
Seawater FGD
The use of a seawater scrubber
strongly depends on the
specific situation because of
the pollution impact on the
marine environment.
See also Section 3.2.2.2.2
Reduction of SOX
Tendency to lead to reduced
pH levels in the vicinity of
the water discharge, and the
emission of metals and
remaining ash to the marine
environment
See technical considerations relevant to
applicability for wet FGD Plant-specific NA
Wet flue-gas
desulphurisation
(Wet FGD)
See Section 3.2.2.2.1.
Reduction of SOX NA
There may be technical and economic
restrictions for applying the technique
to combustion plants of < 300 MWth
Not viable for
combustion plants
operated
< 500 h/yr
SANKO Holding,
Gaziantep, Turkey
There may be
technical and
economic
restrictions for
retrofitting existing
combustion plants
operated between
500 h/yr and
1500 h/yr
Spray dry
scrubber or
absorber (SDA)
See Section 3.2.2.2.6.
Spray dry scrubbers initially
produce dust. They reduce dust
emissions only in combination
with effective particulate
removal systems (BF, ESP)
Reduction of SOX
emissions
Residues that need to be
landfilled or recycled where
possible
Generally applicable NA NA
WORKIN
G DRAFT IN
PROGRESS

Chapter 6
540 June 2016 TL/JFF/FN/EIPPCB/LCP_Final Draft
Duct sorbent
injection (DSI)
The injection and dispersion of
a dry powder sorbent in the
flue-gas stream. The sorbent
(e.g. sodium bicarbonate,
hydrated lime) reacts with acid
gases (e.g. the gaseous sulphur
species, HCl) to form a solid
which is removed by filtration
(bag filter or electrostatic
precipitator).
See also Section 3.2.2.2.8
Reduction of SOX
emissions NA
Generally
applicable
There may be
technical restrictions
in the case of
existing combustion
plants
NA Plants 362, 363
NB:
NA: No relevant specific information available.
WORKIN
G DRAFT IN
PROGRESS

Chapter 6
TL/JFF/FN/EIPPCB/LCP_ Final Draft June 2016 541
Figure 6.12 shows SO2 emission concentrations from well-performing engine plants. The engine
plants using DSI shown in Figure 6.12 continuously monitor SOX emission concentrations (SO2
is continuously measured, SO3 is periodically measured, e.g. during calibration, and the SO2 to
SO3 ratio is periodically adjusted). Plant 428-6V was commissioned in 1997 and reported an
equivalent full load factor of 69 % and 5800 operating hours in 2010. It monitors SO2 emissions
continuously. Plant 430 (three engines of 24 MWth each) was commissioned in 2000 and
reported an equivalent full load factor of 74 % and 8700 operating hours in 2010. It monitors
SO2 emissions periodically (four times per year). Plants 362 to 365 were commissioned in 2012
(two engines of 38.5 MWth at each plant) and report similar load and operating hours per year,
93 % and about 6000 hours. For reference, if no secondary abatement technique is applied, a
fuel sulphur content of 0.5 % corresponds to SO2 emissions of 280 mg/Nm3.
NB: reported emissions are expressed as yearly averages Source: [LCP TWG data collection 2012]
Figure 6.12: SO2 emissions from well-performing HFO- and/or gas-oil-fired engines
6.3.3.4 Techniques for the prevention and control of dust and particulate-bound metals emissions
Information on general techniques for the prevention and control of dust and particulate-bound
metals emissions is given in Section 3.2.2.1. Table 6.14 gives additional information on the
same topic specific to HFO and/or gas oil combustion in engines, e.g. on environmental
performances and example plants. Further details on related environmental performance and
operational data are provided after the table.
WORKIN
G DRAFT IN
PROGRESS

Chapter 6
542 June 2016 TL/JFF/FN/EIPPCB/LCP_Final Draft
Table 6.14: Techniques for the prevention and control of dust and particulate-bound metals emissions from HFO- and/or gas-oil-fired engines
Technique Technical
description
Achieved
environmental benefits
Environmental
performance and operational
data
Cross-media
effects
Technical considerations relevant to
applicability Example
plants New plants Existing plants
Fuel choice See Section 3.1.1.4 Reduction of dust
emissions NA None
Applicable within the constraints
associated with the applicability of
different types of fuel, which may be
impacted by the energy policy of the
Member State
NA
Electrostatic
precipitator (ESP)
See Section 3.2.2.1.1
Reduction of dust and
particulate-bound metals
emissions
Very few examples of
applications provided None
Not applicable to combustion plants
operated < 500 h/yr
NA
Bag filter See Section 3.2.2.1.2
Reduction of dust
emissions, particularly
fine dust (PM2.5 and
PM10) and
particulate-bound metals
Higher pressure losses compared
to ESP.
> 97 % dust removal efficiency
obtained by using glass fibre
with a PTFE membrane and
PTFE thread
Elevated risk of
fire; the risk can be
reduced if the bag
filter is applied in
combination with
wet FGD
Plants 362, 363
NB:
NA: No relevant specific information available.
WORKIN
G DRAFT IN
PROGRESS

Chapter 6
TL/JFF/FN/EIPPCB/LCP_Final Draft June 2016 543
Figure 6.13 shows dust emission concentrations from well-performing engine plants operated
between 277 and 8700 hours per year at equivalent full load factor between 58 % and 115 %.
Most of them continuously monitor dust emission concentrations. No evidence of correlation is
observed between the plotted dust emission concentrations and plant size (total rated thermal
input spanning the range 15–515 MW, as engine plants are usually modular) or plant age
(commissioning years between 1992 and 2012). Plants using bag filters to abate dust are also
fitted with DSI to abate SO2 emissions. Plant 543-2 uses 60 % gas oil and 40 % HFO.
NB: reported emissions are expressed as yearly averages Source: [LCP TWG data collection 2012]
Figure 6.13: Dust emissions from well-performing HFO- and/or gas-oil-fired engines
The configuration of abatement techniques of Plants 362, 365, 364 and 365 using bag filters for
dust, DSI for SO2 and SCR for NOX reduction is shown in Figure 6.14.
WORKIN
G DRAFT IN
PROGRESS
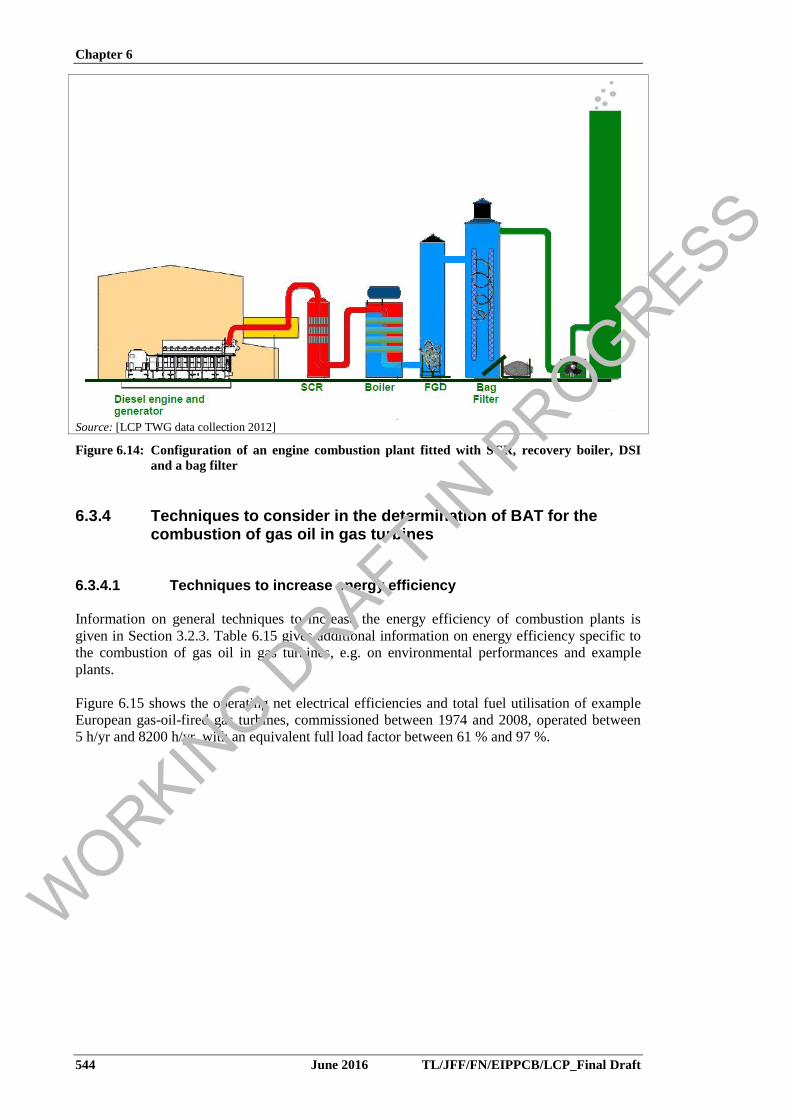
Chapter 6
544 June 2016 TL/JFF/FN/EIPPCB/LCP_Final Draft
Source: [LCP TWG data collection 2012]
Figure 6.14: Configuration of an engine combustion plant fitted with SCR, recovery boiler, DSI
and a bag filter
6.3.4 Techniques to consider in the determination of BAT for the combustion of gas oil in gas turbines
6.3.4.1 Techniques to increase energy efficiency
Information on general techniques to increase the energy efficiency of combustion plants is
given in Section 3.2.3. Table 6.15 gives additional information on energy efficiency specific to
the combustion of gas oil in gas turbines, e.g. on environmental performances and example
plants.
Figure 6.15 shows the operating net electrical efficiencies and total fuel utilisation of example
European gas-oil-fired gas turbines, commissioned between 1974 and 2008, operated between
5 h/yr and 8200 h/yr, with an equivalent full load factor between 61 % and 97 %.
WORKIN
G DRAFT IN
PROGRESS

Chapter 6
TL/JFF/FN/EIPPCB/LCP_Final Draft June 2016 545
Source: [LCP TWG data collection 2012]
Figure 6.15: Operating energy efficiencies of European gas-oil-fired gas turbines
The design net electrical efficiencies reported by three open-cycle gas turbines commissioned
before 2010 are up to 35.7 %. The design value for net electrical efficiency reported by one
combined-cycle gas turbine commissioned before 2010 is 44 %.
[New 66, TWG – Task force on energy efficiency - 2014]
WORKIN
G DRAFT IN
PROGRESS

Chapter 6
546 June 2016 TL/JFF/FN/EIPPCB/LCP_Final Draft
Table 6.15: Techniques to increase the energy efficiency of gas-oil-fired gas turbines
Technique Technical description Achieved environmental
benefits Cross-media effects
Technical considerations relevant to
applicability Example plants
New plants Existing plants
Cogeneration of heat and
power (CHP) See Section 3.2.3.2
Increased energy efficiency
NA Generally applicable Very limited
applicability NA
Advanced control system See Section 3.2.3.8 None Generally applicable
Combined cycle See Section 3.2.3.11 NA
Generally applicable to
new combustion units
operated ≥ 1500 h/yr
Applicable to existing
turbines within the
constraints associated
with the steam cycle
design and the space
availability.
Not applicable to existing
turbines operated
< 1500 h/yr
Plant 446
NB:
NA: No relevant specific information available.
WORKIN
G DRAFT IN
PROGRESS

Chapter 6
TL/JFF/FN/EIPPCB/LCP_Final Draft June 2016 547
6.3.4.2 Techniques for the prevention and control of NOX and CO emissions
Information on general techniques for the prevention and control of NOX and CO emissions is
given in Section 3.2.2.3. Table 6.16 gives additional information on the specific case of gas oil
combustion in gas turbines, e.g. on environmental performances and example plants.
WORKIN
G DRAFT IN
PROGRESS

Chapter 6
548 June 2016 TL/JFF/FN/EIPPCB/LCP_Final Draft
Table 6.16: Techniques for the prevention and control of NOX and CO emissions from gas-oil-fired turbines
Technique Technical description
Achieved
environmental
benefits
Environmental
performance and
operational data
Cross-media
effects
Technical considerations
relevant to applicability Example plants
Reference
literature New plants
Existing
plants
Primary techniques
Water/
steam addition See Section 3.2.2.3.10
Reduction of
NOX
The technique is being
fine-tuned in some plants in
Spain to achieve NOX levels
below 90 mg/Nm3 (data at
15 % O2). Also, dual fuel
GTs are able to meet similar
levels when running on gas
oil
High consumption
of demineralised
water.
Reduction of
electrical
efficiency
Applicable within the
constraints of water
availability Plants 446, 174 NA
Low-NOX
burner (LNB)
in gas oil GT
The fuel is injected through the
fuel lance into the burner flow
field. Directly upstream of the
fuel lance the liquid fuel is
mixed with de-mineralized
water to maintain low
combustion dynamics and
reduce emissions.
Trials in commercial
operation reported NOX
levels below 90 mg/Nm3
(data at 15 % O2)
NA
Only applicable to turbine
models for which low-NOX
burners are available on the
market
Alstom, Berlin–
Mitte
[New 102, ETN
letter]
[Alstom
references]
Secondary techniques
Selective
catalytic
reduction
(SCR)
See Section 3.2.2.3.11.
Some liquid-fuel-fired gas
turbine combined-cycle plants
in Europe, particularly in
Austria, France, Germany, Italy
and the Netherlands, have also
applied SCR to reduce NOX
emissions. As a back-up fuel,
gas oil is used for a limited time
period in dual fuel GTs. In the US, SCR is commonly
used for gas turbines, including those operated with liquid fuels.
Reduction of
NOX NA
Ammonia slip
Slight loss of
energy efficiency
due to pressure
drop
Catalysts may be deactivated
at low temperatures by high
sulphur and ash content,
depending on the fuel oil
quality
Shoreham plant
in New York, 46
MWth). [New
103, permit of
the plant]
[Wärtsilä 04]
[UK TWG 21]
[New 164][167,
Rigby, et al.,
2001]
[New 167] [44,
Austrian
Ministry of
Environment,
2000]
NB:
NA: No relevant specific information available.
WORKIN
G DRAFT IN
PROGRESS
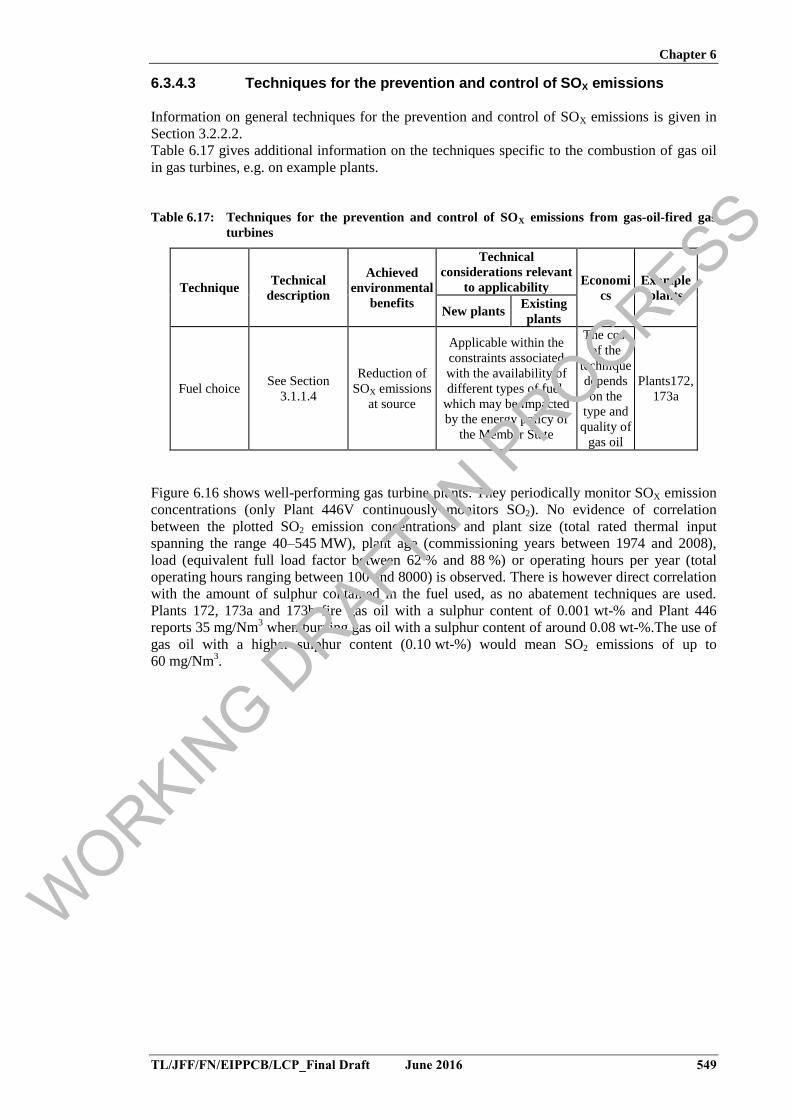
Chapter 6
TL/JFF/FN/EIPPCB/LCP_Final Draft June 2016 549
6.3.4.3 Techniques for the prevention and control of SOX emissions
Information on general techniques for the prevention and control of SOX emissions is given in
Section 3.2.2.2.
Table 6.17 gives additional information on the techniques specific to the combustion of gas oil
in gas turbines, e.g. on example plants.
Table 6.17: Techniques for the prevention and control of SOX emissions from gas-oil-fired gas
turbines
Technique Technical
description
Achieved
environmental
benefits
Technical
considerations relevant
to applicability Economi
cs
Example
plants
New plants Existing
plants
Fuel choice See Section
3.1.1.4
Reduction of
SOX emissions
at source
Applicable within the
constraints associated
with the availability of
different types of fuel,
which may be impacted
by the energy policy of
the Member State
The cost
of the
technique
depends
on the
type and
quality of
gas oil
Plants172,
173a
Figure 6.16 shows well-performing gas turbine plants. They periodically monitor SOX emission
concentrations (only Plant 446V continuously monitors SO2). No evidence of correlation
between the plotted SO2 emission concentrations and plant size (total rated thermal input
spanning the range 40–545 MW), plant age (commissioning years between 1974 and 2008),
load (equivalent full load factor between 62 % and 88 %) or operating hours per year (total
operating hours ranging between 100 and 8000) is observed. There is however direct correlation
with the amount of sulphur contained in the fuel used, as no abatement techniques are used.
Plants 172, 173a and 173b fire gas oil with a sulphur content of 0.001 wt-% and Plant 446
reports 35 mg/Nm3 when burning gas oil with a sulphur content of around 0.08 wt-%.The use of
gas oil with a higher sulphur content (0.10 wt-%) would mean SO2 emissions of up to
60 mg/Nm3.
WORKIN
G DRAFT IN
PROGRESS
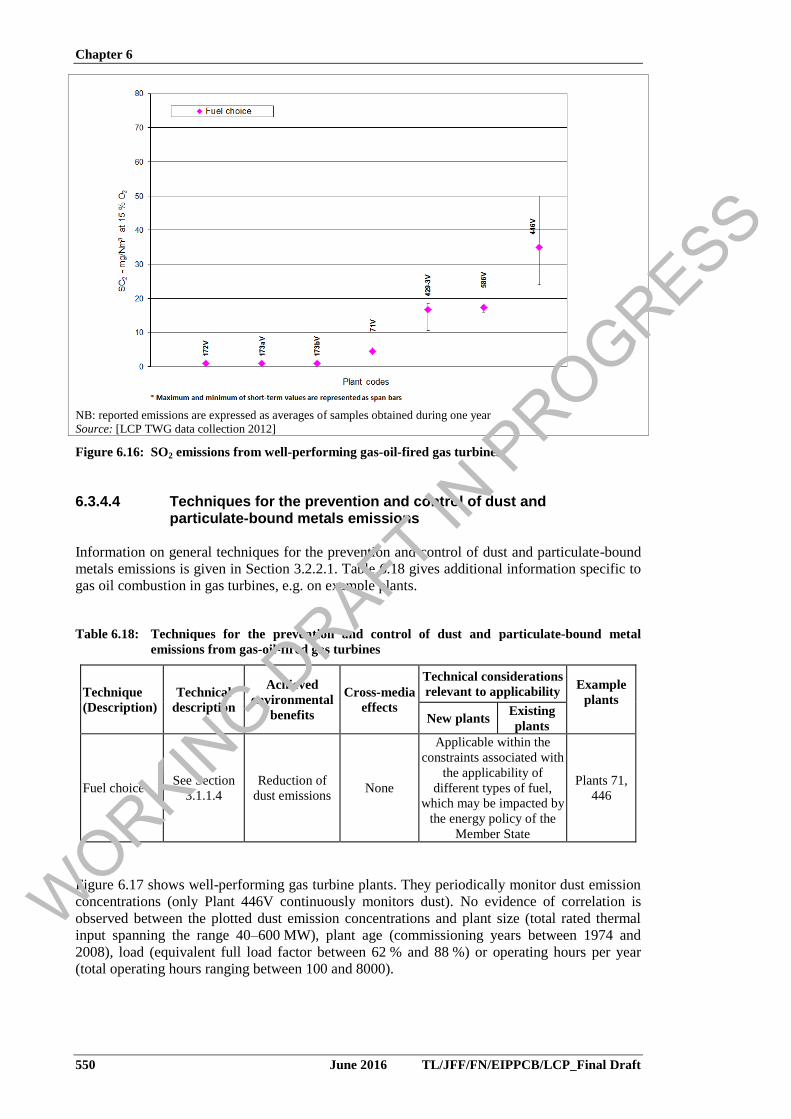
Chapter 6
550 June 2016 TL/JFF/FN/EIPPCB/LCP_Final Draft
NB: reported emissions are expressed as averages of samples obtained during one year Source: [LCP TWG data collection 2012]
Figure 6.16: SO2 emissions from well-performing gas-oil-fired gas turbines
6.3.4.4 Techniques for the prevention and control of dust and particulate-bound metals emissions
Information on general techniques for the prevention and control of dust and particulate-bound
metals emissions is given in Section 3.2.2.1. Table 6.18 gives additional information specific to
gas oil combustion in gas turbines, e.g. on example plants.
Table 6.18: Techniques for the prevention and control of dust and particulate-bound metal
emissions from gas-oil-fired gas turbines
Technique
(Description)
Technical
description
Achieved
environmental
benefits
Cross-media
effects
Technical considerations
relevant to applicability Example
plants
New plants Existing
plants
Fuel choice See Section
3.1.1.4
Reduction of
dust emissions None
Applicable within the
constraints associated with
the applicability of
different types of fuel,
which may be impacted by
the energy policy of the
Member State
Plants 71,
446
Figure 6.17 shows well-performing gas turbine plants. They periodically monitor dust emission
concentrations (only Plant 446V continuously monitors dust). No evidence of correlation is
observed between the plotted dust emission concentrations and plant size (total rated thermal
input spanning the range 40–600 MW), plant age (commissioning years between 1974 and
2008), load (equivalent full load factor between 62 % and 88 %) or operating hours per year
(total operating hours ranging between 100 and 8000).
WORKIN
G DRAFT IN
PROGRESS

Chapter 6
TL/JFF/FN/EIPPCB/LCP_Final Draft June 2016 551
NB: reported emissions are expressed as averages of samples obtained during one year Source: [LCP TWG data collection 2012]
Figure 6.17: Dust emissions from well-performing gas-oil-fired gas turbines
WORKIN
G DRAFT IN
PROGRESS

WORKIN
G DRAFT IN
PROGRESS
Chapter 7
TL/JFF/FN/EIPPCB/LCP_Final Draft June 2016 553
7 COMBUSTION OF GASEOUS FUELS
7.1 Combustion of natural gas
This section first briefly describes the combustion processes applied for natural gas and the
techniques used for preventing and/or reducing consumption for and emissions from such
processes. Then it presents typical consumption and emission levels at natural-gas-fired plants,
before describing in more detail the candidates for best available techniques. Information
applying to several combustion processes and types of fuel combustion can be found in
Chapters 2 and 3. For instance, general information on the unloading, storage and handling of
natural gas can be found in Section 2.8. Information specific to combustion plants burning crude
natural gas on offshore platforms is given in Section 7.4.
7.1.1 Specific applied processes and techniques
This section includes specific features on natural gas combustion. Sections 2.2.2, 2.3.2 and 2.3.3
provide general information on combustion processes firing gaseous fuels, such as gas turbines,
gas engines and gas boilers. Section 3.1 provides information on generally applied techniques in
combustion plants. Section 3.2 describes candidate BAT applying to more than one combustion
process or type of fuel firing.
Gas turbines
See description in Section 2.3.3. In addition to the gas turbines described in that section, this
chapter also addresses dual fuel gas turbines. The requirement to operate in dual fuel mode
further complicates burner design and modification. Where liquid fuels are fired in DLN
machines, the fuel is, in effect, sprayed into the combustor and burns in a diffusion flame. Steam
or water injection is then typically used for NOx abatement. For new modern dual fuel systems,
the performance when firing natural gas is broadly comparable to the performance of a natural-
gas-only system.
Gas-fired boilers
In order to efficiently convert the energy from the steam to electricity, modern gas-fired boilers
use supercritical steam (pressure above 220.6 bar and temperature above 374 °C). Plant
electrical efficiencies of up to 48 % in the condensing mode and fuel utilisation of up to 95 % in
combined heat and power production can be achieved when applying double reheat and an
increase in the supercritical steam parameters to 290 bar and 580 °C in power plants.
Gas-fired boilers are commonly used in process industries and in district heating systems. Most
of them have a thermal input ranging between 50 MW and 300 MW. For combustion plants in
this size range, increasing constraints on SO2 and NOX emissions have represented an incentive
towards greater utilisation of natural gas. Many of these boilers could also be fed with liquid
fuel in emergency situations and are operated in multi-fuel-firing mode. Larger (> 300 MWth)
gas-fired boilers generating only electricity that are also in operation. These gas-fired power
plants are usually operated less than 1500 h/yr and some of them are operated in conjunction
with a gas turbine, where the flue-gas from the gas turbine is used by the steam generator as
combustion air (see also Section 2.4.7 concerning 'combi-plants').
The burners of the boilers are generally arranged over several levels in the walls (front firing or
opposed firing) or are positioned tangentially on several levels in the four corners of the boiler.
They can also be floor-mounted. Firing systems for gas-fired boilers are similar to coal- or oil-
fired boilers.
Gaseous fuels are also used as support or start-up fuel for coal-, lignite-, biomass- and oil-fired
boilers.
WORKIN
G DRAFT IN
PROGRESS
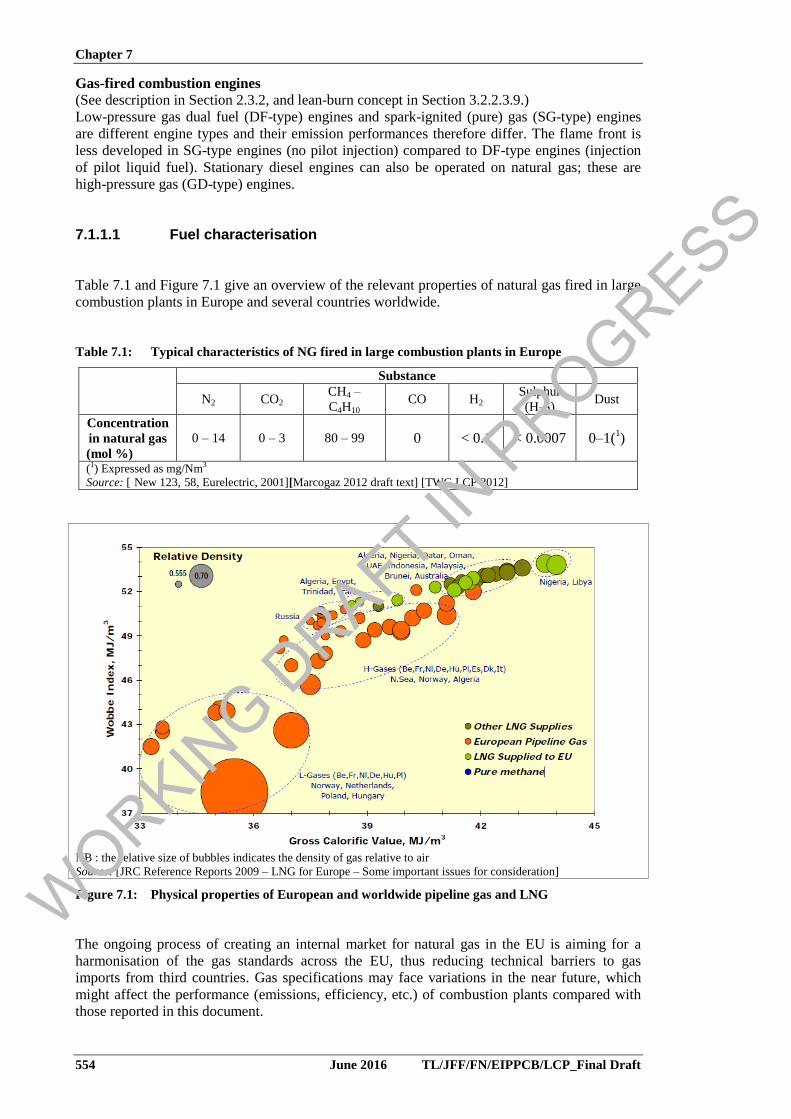
Chapter 7
554 June 2016 TL/JFF/FN/EIPPCB/LCP_Final Draft
Gas-fired combustion engines
(See description in Section 2.3.2, and lean-burn concept in Section 3.2.2.3.9.)
Low-pressure gas dual fuel (DF-type) engines and spark-ignited (pure) gas (SG-type) engines
are different engine types and their emission performances therefore differ. The flame front is
less developed in SG-type engines (no pilot injection) compared to DF-type engines (injection
of pilot liquid fuel). Stationary diesel engines can also be operated on natural gas; these are
high-pressure gas (GD-type) engines.
7.1.1.1 Fuel characterisation
Table 7.1 and Figure 7.1 give an overview of the relevant properties of natural gas fired in large
combustion plants in Europe and several countries worldwide.
Table 7.1: Typical characteristics of NG fired in large combustion plants in Europe
Substance
N2 CO2 CH4 –
C4H10 CO H2
Sulphur
(H2S) Dust
Concentration
in natural gas
(mol %) 0 – 14 0 – 3 80 – 99 0 < 0.1 < 0.0007 0–1(
1)
(1) Expressed as mg/Nm3
Source: [ New 123, 58, Eurelectric, 2001][Marcogaz 2012 draft text] [TWG LCP 2012]
NB : the relative size of bubbles indicates the density of gas relative to air
Source: [JRC Reference Reports 2009 – LNG for Europe – Some important issues for consideration]
Figure 7.1: Physical properties of European and worldwide pipeline gas and LNG
The ongoing process of creating an internal market for natural gas in the EU is aiming for a
harmonisation of the gas standards across the EU, thus reducing technical barriers to gas
imports from third countries. Gas specifications may face variations in the near future, which
might affect the performance (emissions, efficiency, etc.) of combustion plants compared with
those reported in this document.
WORKIN
G DRAFT IN
PROGRESS
Chapter 7
TL/JFF/FN/EIPPCB/LCP_Final Draft June 2016 555
7.1.1.2 Control of emissions to air
Natural gas is a fuel causing mainly NOX and CO emissions, with mostly negligible SOX and
dust emissions. CO2 emissions from natural gas combustion are also inherently substantially
lower than from other fossil fuels.
Dust emissions
Fuel dust contained in natural gas is washed out at the production site, if necessary. Dust or
particulate matter emissions from combustion plants burning natural gas are not an
environmental concern under normal operation and controlled combustion conditions.
SOX emissions
Fuel sulphur in natural gas in the form of H2S is washed out at the production site. Thus, SOX
emissions from combustion plants burning natural gas are not an environmental concern under
normal operation and controlled combustion conditions. However, whilst SO2 emissions are not
environmentally significant, a small portion of the SO2 can oxidise to SO3, a reaction enhanced
where catalyst is present, resulting in fouling and corrosion of downstream surfaces.
7.1.1.2.1 Control of NOX emissions to air from boilers
Boilers and firing systems are, in general, designed for low-NOX firing. Basically, there are
three main ways to reduce thermal NOX emissions:
Application of low-NOX burners. The conditions for low NOX emissions are a low
temperature in the primary combustion zone and a sufficiently long residence time of the
flue-gases in the furnace for a complete burnout. This reduces the flame temperature.
Flue-gas recirculation. It reduces both the flame temperature and the concentration of
oxygen.
Two-stage combustion. This reduces the reaction between oxygen and nitrogen in the air
during the combustion process. Substantially lower NOX emissions can be achieved by
supplying the air at three stages around the individual burner, and supplementing the air
above the individual burners, together with a precise dosing of these air streams.
Additionally, DeNOX end-of-pipe techniques such as SNCR or SCR can also be applied if the
boiler design does not allow primary techniques alone to sufficiently lower NOX emissions, or
when very stringent emission levels have to be met.
7.1.1.2.2 Control of NOX emissions to air from engines
The most important parameter governing the rate of NOX formation in internal combustion
engines is the combustion temperature; the higher the temperature, the higher the NOX content
of the exhaust gases. One method to reduce the combustion temperature is to lower the fuel to
air ratio. The same specific heat quantity released by the combustion of the fuel is then used to
heat up a larger mass of exhaust gases, resulting in a lower maximum combustion temperature.
This primary technique, called lean-burn concept in gas-fired reciprocating engines, is
analogous to dry low-NOX combustors in gas turbines.
The combustion temperature can also be controlled to some extent in gas-fired reciprocating
engines by one or more of the following techniques (many of these are not yet commercially
available, being in the development stage with ongoing laboratory tests; some of the main
difficulties encountered in the development of these techniques are also mentioned):
Delaying combustion by retarding ignition or fuel injection, but with a lower engine
efficiency as a cross-media effect.
WORKIN
G DRAFT IN
PROGRESS
Chapter 7
556 June 2016 TL/JFF/FN/EIPPCB/LCP_Final Draft
Diluting the fuel-air mixture with exhaust gas recirculation (EGR), which replaces some of
the air and contains water vapour that has a relatively high heat capacity and which absorbs
some of the heat of combustion. The use of this technique may however cause clogging
problems.
Introducing liquid water by direct injection. Evaporation of the water cools the fuel-air
mixture.
Reducing the inlet air temperature with a heat exchanger after the turbocharger or via inlet
air humidification.
Modifying the valve timing, compression ratio, turbocharging, and the combustion chamber
configuration, this primarily being an option to increase the efficiency and power output of
the gas engine.
Implementing a process control system.
In some applications (e.g. larger plants in sensitive areas in the US), gas engines have been
equipped with SCR for additional NOX reduction. In the Netherlands, the NOX emission of
hundreds of medium gas engine plants (such as CHP production and CO2 fertilisation in a
greenhouse, with different business models and economic profiles compared to power
generation) of more than 2.5 MWth are abated using SCR.
In the case of SCR, a urea solution is generally the reduction agent of choice for SCR systems
applied to engines. For applications with variable loads, the engine emissions are measured at
different load levels during commissioning. The measured emission values are then entered into
the control system, which ensures that the reduction agent is injected into the exhaust gas stream
in the correct quantities for the varying NOX levels. The catalyst type and the SCR reactor size
are tailored to the pressure drop constraints of each particular application, so that the engine
performance is not affected [New 164][167, Rigby, et al., 2001]. Feedback regulation/control is
often used in combination with SCR for the control of NH3 or urea injection.
Abatement of other pollutants
Lean-burn SG engines and DF engines in the gas mode are often equipped with an oxidation
catalyst, mainly for CO removal. However, in the case of dual fuel engines operated on liquid
fuels, the oxidation catalyst is subject to fouling and may become ineffective for prolonged
operation. The NMVOC emissions from SG engines and DF engines in the gas mode depend on
the natural gas composition. Depending on the legislation in force and the composition of the
natural gas, NMVOC secondary emission reduction techniques might, in some cases, be needed.
Oxidation catalysts for simultaneous CO and NMVOC reduction are applied in these cases. The
oxidation catalyst reduction efficiency for NMVOC is very dependent on the hydrocarbon
composition in the flue-gas, with ethane and propane being especially difficult to remove. The
high-pressure GD-type gas engine has higher NOX emissions than SG/DF-types in gas mode but
low CO and other unburnt gaseous emissions.
7.1.1.2.3 Control of NOX emissions to air from turbines
Three main techniques have been used to prevent or reduce the NOX emissions.
Water or steam injection
For existing installations, water or steam injection has long been the most easily applicable
technique, occasionally in combination with other NOX abatement techniques. Nowadays,
however, the most commonly used solution for new or retrofitted gas turbines combusting
natural gas is to install dry low-NOX burners.
Dry low-NOX burners (DLN)
Dry low-NOX burners are now widely applied for all kinds of gas turbines, including some
offshore gas turbines. A general description of this technique is given in Section 3.2.2.3.7.
WORKIN
G DRAFT IN
PROGRESS
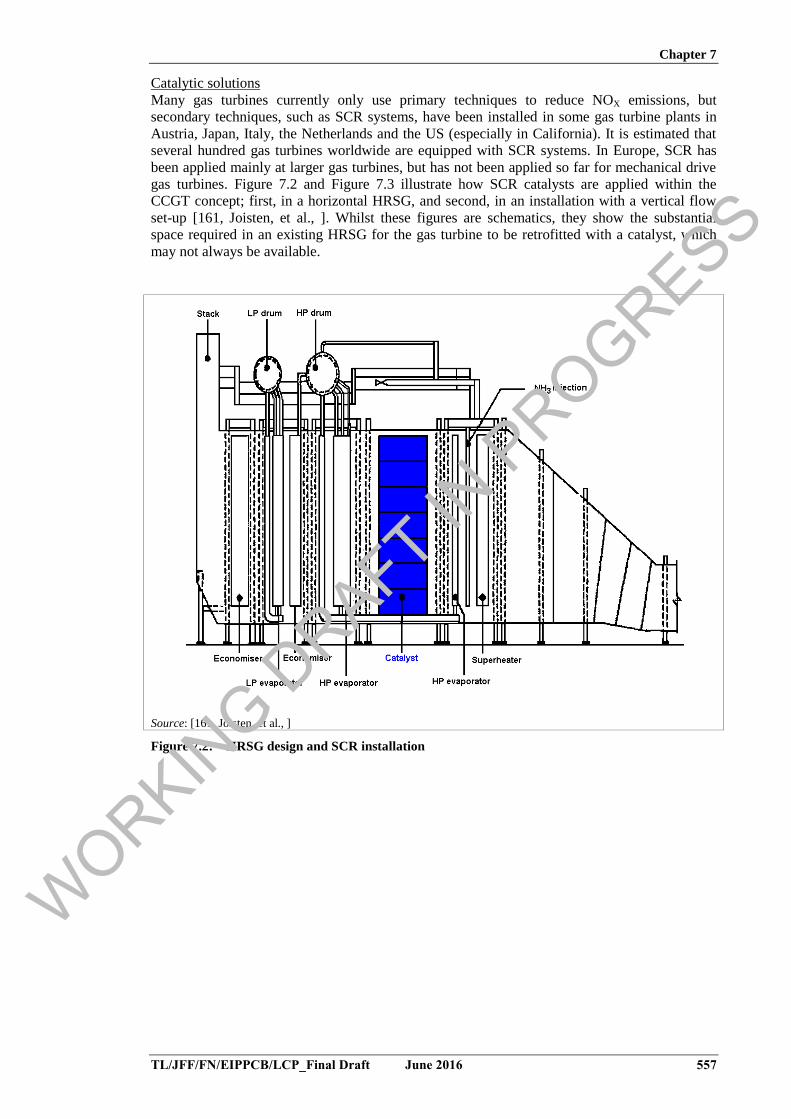
Chapter 7
TL/JFF/FN/EIPPCB/LCP_Final Draft June 2016 557
Catalytic solutions
Many gas turbines currently only use primary techniques to reduce NOX emissions, but
secondary techniques, such as SCR systems, have been installed in some gas turbine plants in
Austria, Japan, Italy, the Netherlands and the US (especially in California). It is estimated that
several hundred gas turbines worldwide are equipped with SCR systems. In Europe, SCR has
been applied mainly at larger gas turbines, but has not been applied so far for mechanical drive
gas turbines. Figure 7.2 and Figure 7.3 illustrate how SCR catalysts are applied within the
CCGT concept; first, in a horizontal HRSG, and second, in an installation with a vertical flow
set-up [161, Joisten, et al., ]. Whilst these figures are schematics, they show the substantial
space required in an existing HRSG for the gas turbine to be retrofitted with a catalyst, which
may not always be available.
Source: [161, Joisten, et al., ]
Figure 7.2: HRSG design and SCR installation
WORKIN
G DRAFT IN
PROGRESS

Chapter 7
558 June 2016 TL/JFF/FN/EIPPCB/LCP_Final Draft
Source: [161, Joisten, et al., ]
Figure 7.3: SCR installation with vertical flow
When even lower NOX emission levels are required in densely populated areas, or when very
strict restrictions on NH3 emissions are applied, a further option is the SCONOX™ technology,
which has been fitted on a few small gas turbines in the US. However, the SCONOX™
technology has not achieved wide deployment, particularly outside North America. The
regeneration cycle required by this technique adds to the cost and complexity, usually making
the simpler DLN set-up preferable.
7.1.1.3 Water and waste water treatment
For the gas turbine and the HRSG, demineralised water is required for the following purposes:
To compensate for the loss of blowdown water from the drums for the HRSG. If steam or
water injection is applied, the water loss also has to be compensated for by make-up
water. The quality has to meet the manufacturer's requirements and water treatment is,
therefore, required. Demineralisation is usually sufficient to meet these requirements.
For washing the gas turbine compressor mainly in the case of power or CHP plants.
Condensate from the water/steam cycle is sometimes used for online washing, but usually
demineralised water is supplied to a separate water wash unit. For offline washing, a
detergent is added to the demineralised water to improve the washing effect.
Waste water from a gas turbine and an HRSG (if applied) includes the following:
WORKIN
G DRAFT IN
PROGRESS

Chapter 7
TL/JFF/FN/EIPPCB/LCP_Final Draft June 2016 559
Blowdown water from the boiler circulation system used to maintain the quality of the
boiler water. To protect the boiler from corrosion, the boiler water usually contains
additives such as ammonia, sodium hydroxide and/or phosphates. In practice, this
blowdown water is quenched and discharged to sewerage systems, or to a water treatment
plant if necessary.
Waste water from the gas turbine water washing process which can be discharged or may
have to be considered a chemical waste, depending on the detergents used for washing
and the compressor materials to be disposed of.
Any water that is contaminated with oil or with fluids containing oil. This is usually
accumulated in a collecting system and discharged separately to a treatment plant.
Remaining waste water from the plant, such as scrubbing water, which is normally
discharged to the on-site treatment plant or to the domestic sewerage system.
Further treatment of waste water from the gas turbine (and/or HRSG if applied) may be
necessary before discharging the waste water.
7.1.2 Current consumption and emission levels
This section reports currently observed emission and consumption levels from natural-gas-fired
plants in Europe or worldwide. Data have been collected at the European level for the year 2010
for the review of this document.
7.1.2.1 Energy efficiency of natural gas combustion plants
Operators and suppliers continuously aim to increase the energy efficiency of combustion
plants, e.g. by optimisation of the process and by new developments in materials and cooling
techniques, which make higher gas turbine inlet temperatures possible. In a combined cycle, the
application of more pressure stages and the increase in allowable steam inlet temperatures
(made possible by the development of high-temperature-resistant materials) also enable an
increase in the efficiency of the steam cycle.
The Grassmann diagram in Figure 7.4 shows the energy flow through a combined-cycle gas
turbine without supplementary firing. The areas shaded grey represent the internal losses of
energy in the gas turbine and in the heat recovery steam generator (HRSG).
Mass stream overview
Source: [50, Korobitsyn, 1998]
Figure 7.4: Grassmann diagram of a gas turbine with HRSG
WORKIN
G DRAFT IN
PROGRESS
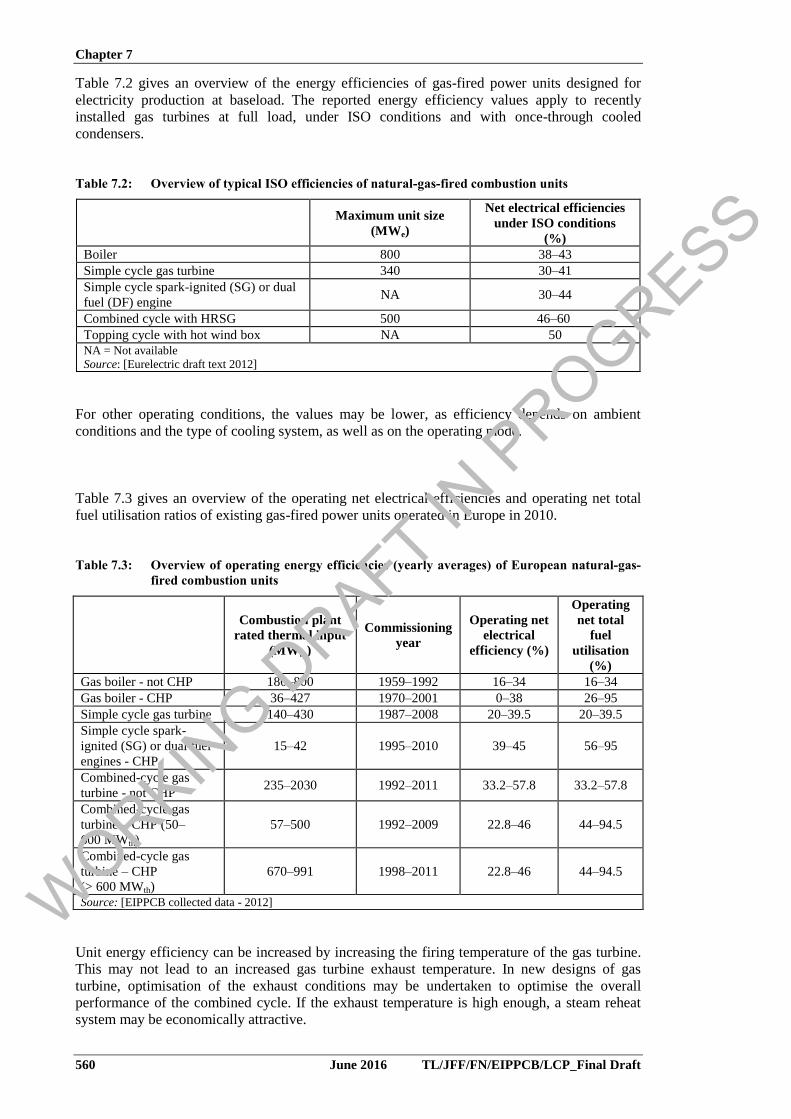
Chapter 7
560 June 2016 TL/JFF/FN/EIPPCB/LCP_Final Draft
Table 7.2 gives an overview of the energy efficiencies of gas-fired power units designed for
electricity production at baseload. The reported energy efficiency values apply to recently
installed gas turbines at full load, under ISO conditions and with once-through cooled
condensers.
Table 7.2: Overview of typical ISO efficiencies of natural-gas-fired combustion units
Maximum unit size
(MWe)
Net electrical efficiencies
under ISO conditions
(%)
Boiler 800 38–43
Simple cycle gas turbine 340 30–41
Simple cycle spark-ignited (SG) or dual
fuel (DF) engine NA 30–44
Combined cycle with HRSG 500 46–60
Topping cycle with hot wind box NA 50
NA = Not available
Source: [Eurelectric draft text 2012]
For other operating conditions, the values may be lower, as efficiency depends on ambient
conditions and the type of cooling system, as well as on the operating mode.
Table 7.3 gives an overview of the operating net electrical efficiencies and operating net total
fuel utilisation ratios of existing gas-fired power units operated in Europe in 2010.
Table 7.3: Overview of operating energy efficiencies (yearly averages) of European natural-gas-
fired combustion units
Combustion plant
rated thermal input
(MWth)
Commissioning
year
Operating net
electrical
efficiency (%)
Operating
net total
fuel
utilisation
(%)
Gas boiler - not CHP 180–800 1959–1992 16–34 16–34
Gas boiler - CHP 36–427 1970–2001 0–38 26–95
Simple cycle gas turbine 140–430 1987–2008 20–39.5 20–39.5
Simple cycle spark-
ignited (SG) or dual fuel
engines - CHP
15–42 1995–2010 39–45 56–95
Combined-cycle gas
turbine - not CHP 235–2030 1992–2011 33.2–57.8 33.2–57.8
Combined-cycle gas
turbine – CHP (50–
600 MWth)
57–500 1992–2009 22.8–46 44–94.5
Combined-cycle gas
turbine – CHP
(> 600 MWth)
670–991 1998–2011 22.8–46 44–94.5
Source: [EIPPCB collected data - 2012]
Unit energy efficiency can be increased by increasing the firing temperature of the gas turbine.
This may not lead to an increased gas turbine exhaust temperature. In new designs of gas
turbine, optimisation of the exhaust conditions may be undertaken to optimise the overall
performance of the combined cycle. If the exhaust temperature is high enough, a steam reheat
system may be economically attractive.
WORKIN
G DRAFT IN
PROGRESS
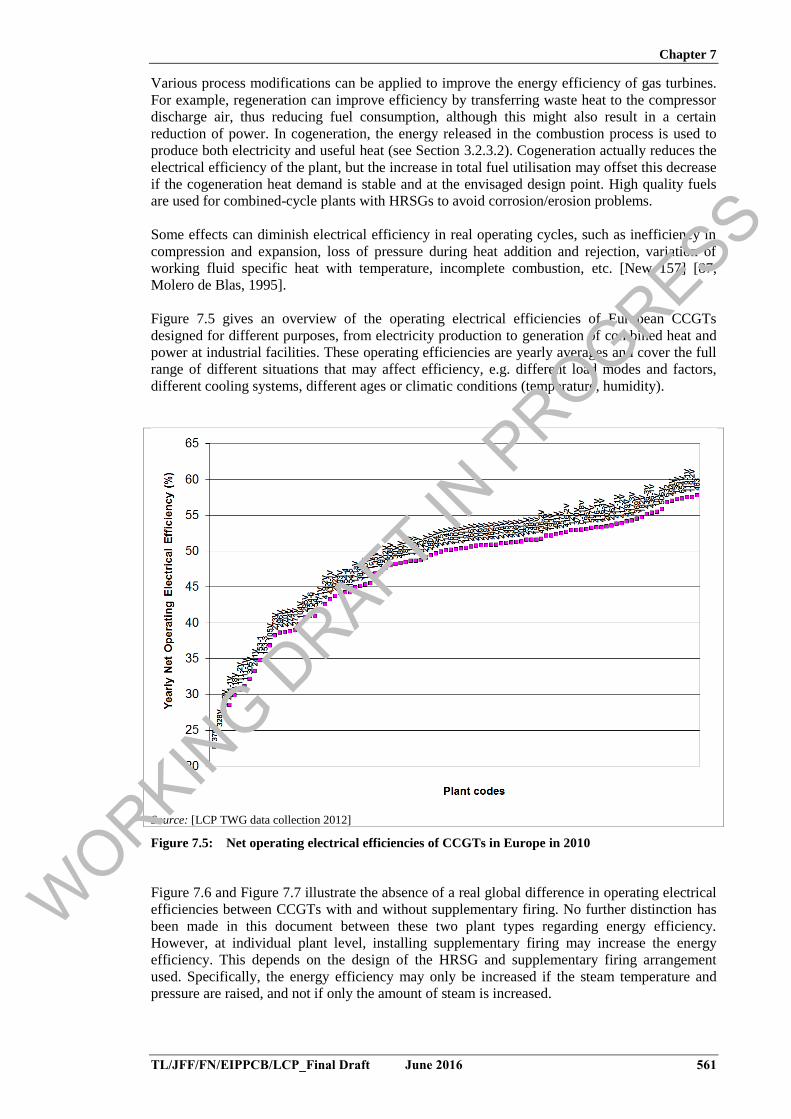
Chapter 7
TL/JFF/FN/EIPPCB/LCP_Final Draft June 2016 561
Various process modifications can be applied to improve the energy efficiency of gas turbines.
For example, regeneration can improve efficiency by transferring waste heat to the compressor
discharge air, thus reducing fuel consumption, although this might also result in a certain
reduction of power. In cogeneration, the energy released in the combustion process is used to
produce both electricity and useful heat (see Section 3.2.3.2). Cogeneration actually reduces the
electrical efficiency of the plant, but the increase in total fuel utilisation may offset this decrease
if the cogeneration heat demand is stable and at the envisaged design point. High quality fuels
are used for combined-cycle plants with HRSGs to avoid corrosion/erosion problems.
Some effects can diminish electrical efficiency in real operating cycles, such as inefficiency in
compression and expansion, loss of pressure during heat addition and rejection, variation of
working fluid specific heat with temperature, incomplete combustion, etc. [New 157] [87,
Molero de Blas, 1995].
Figure 7.5 gives an overview of the operating electrical efficiencies of European CCGTs
designed for different purposes, from electricity production to generation of combined heat and
power at industrial facilities. These operating efficiencies are yearly averages and cover the full
range of different situations that may affect efficiency, e.g. different load modes and factors,
different cooling systems, different ages or climatic conditions (temperature, humidity).
Source: [LCP TWG data collection 2012]
Figure 7.5: Net operating electrical efficiencies of CCGTs in Europe in 2010
Figure 7.6 and Figure 7.7 illustrate the absence of a real global difference in operating electrical
efficiencies between CCGTs with and without supplementary firing. No further distinction has
been made in this document between these two plant types regarding energy efficiency.
However, at individual plant level, installing supplementary firing may increase the energy
efficiency. This depends on the design of the HRSG and supplementary firing arrangement
used. Specifically, the energy efficiency may only be increased if the steam temperature and
pressure are raised, and not if only the amount of steam is increased.
WORKIN
G DRAFT IN
PROGRESS
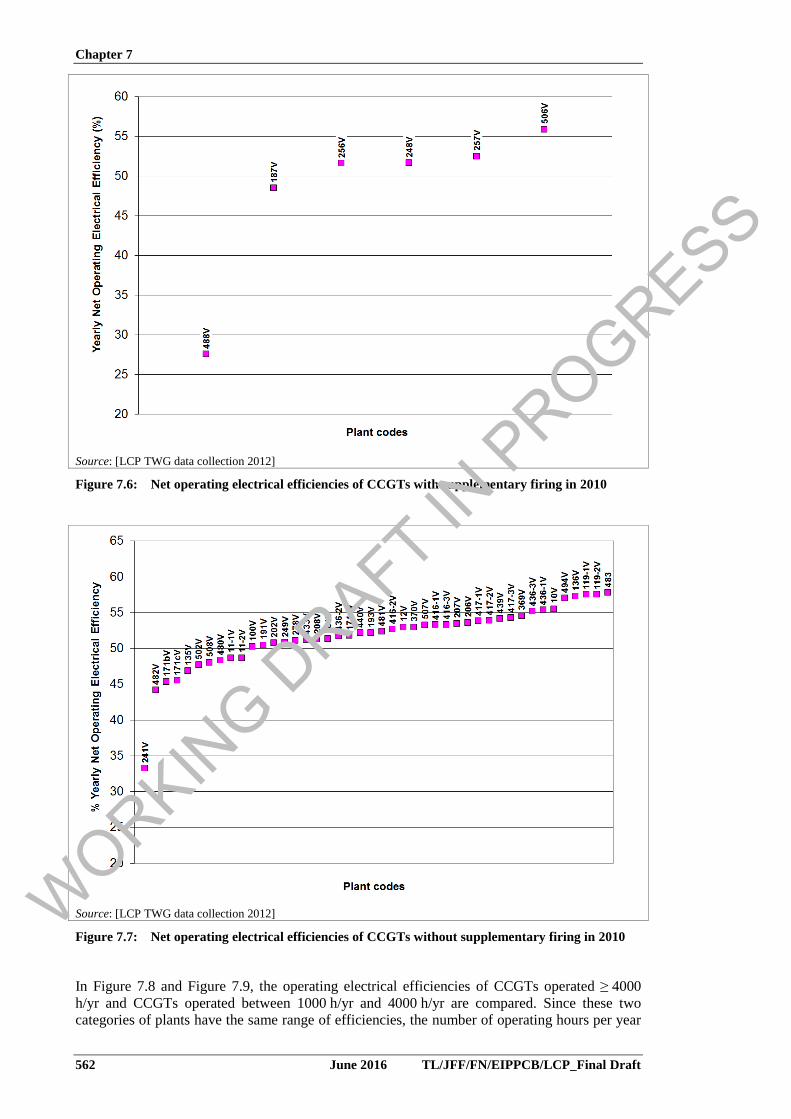
Chapter 7
562 June 2016 TL/JFF/FN/EIPPCB/LCP_Final Draft
Source: [LCP TWG data collection 2012]
Figure 7.6: Net operating electrical efficiencies of CCGTs with supplementary firing in 2010
Source: [LCP TWG data collection 2012]
Figure 7.7: Net operating electrical efficiencies of CCGTs without supplementary firing in 2010
In Figure 7.8 and Figure 7.9, the operating electrical efficiencies of CCGTs operated ≥ 4000
h/yr and CCGTs operated between 1000 h/yr and 4000 h/yr are compared. Since these two
categories of plants have the same range of efficiencies, the number of operating hours per year
WORKIN
G DRAFT IN
PROGRESS
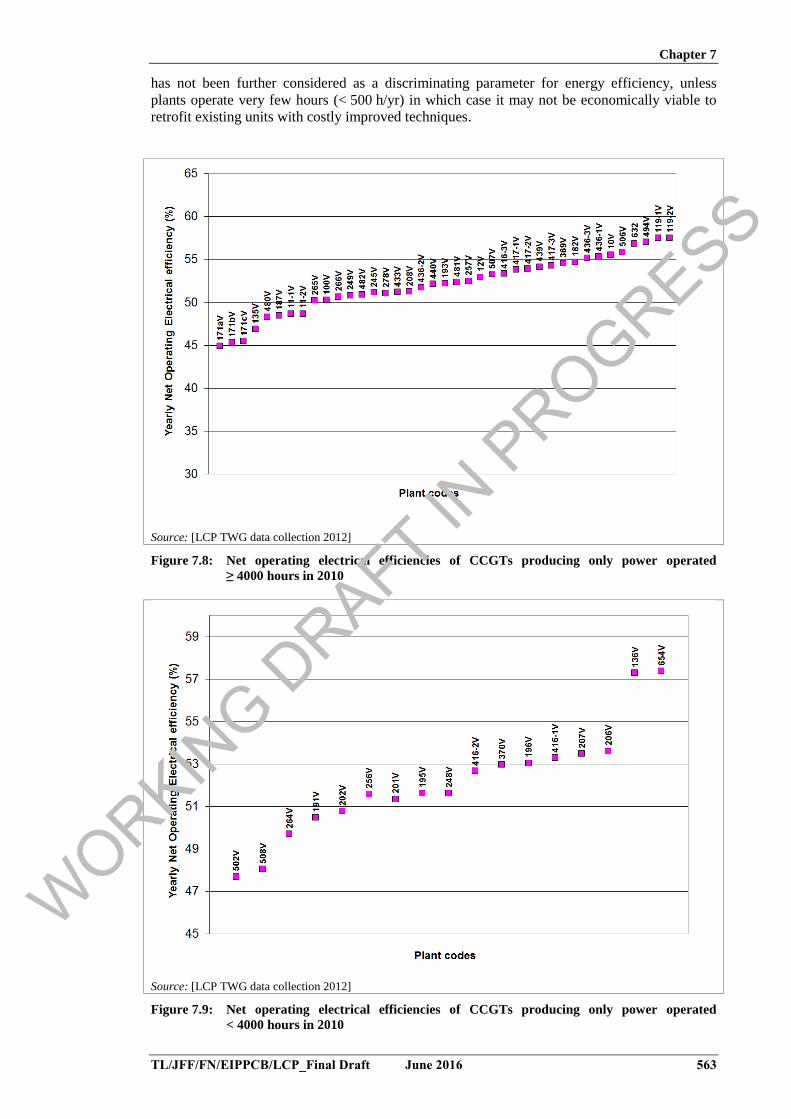
Chapter 7
TL/JFF/FN/EIPPCB/LCP_Final Draft June 2016 563
has not been further considered as a discriminating parameter for energy efficiency, unless
plants operate very few hours (< 500 h/yr) in which case it may not be economically viable to
retrofit existing units with costly improved techniques.
Source: [LCP TWG data collection 2012]
Figure 7.8: Net operating electrical efficiencies of CCGTs producing only power operated
≥ 4000 hours in 2010
Source: [LCP TWG data collection 2012]
Figure 7.9: Net operating electrical efficiencies of CCGTs producing only power operated
< 4000 hours in 2010
WORKIN
G DRAFT IN
PROGRESS
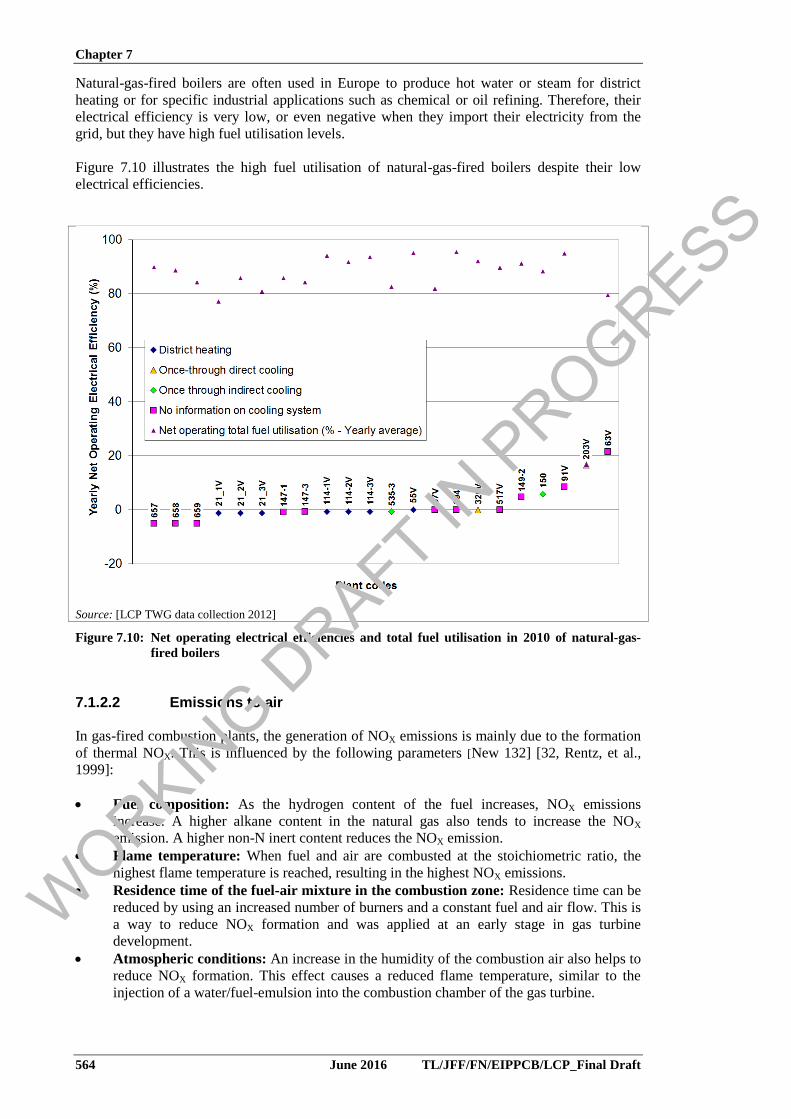
Chapter 7
564 June 2016 TL/JFF/FN/EIPPCB/LCP_Final Draft
Natural-gas-fired boilers are often used in Europe to produce hot water or steam for district
heating or for specific industrial applications such as chemical or oil refining. Therefore, their
electrical efficiency is very low, or even negative when they import their electricity from the
grid, but they have high fuel utilisation levels.
Figure 7.10 illustrates the high fuel utilisation of natural-gas-fired boilers despite their low
electrical efficiencies.
Source: [LCP TWG data collection 2012]
Figure 7.10: Net operating electrical efficiencies and total fuel utilisation in 2010 of natural-gas-
fired boilers
7.1.2.2 Emissions to air
In gas-fired combustion plants, the generation of NOX emissions is mainly due to the formation
of thermal NOX. This is influenced by the following parameters [New 132] [32, Rentz, et al.,
1999]:
Fuel composition: As the hydrogen content of the fuel increases, NOX emissions
increase. A higher alkane content in the natural gas also tends to increase the NOX
emission. A higher non-N inert content reduces the NOX emission.
Flame temperature: When fuel and air are combusted at the stoichiometric ratio, the
highest flame temperature is reached, resulting in the highest NOX emissions.
Residence time of the fuel-air mixture in the combustion zone: Residence time can be
reduced by using an increased number of burners and a constant fuel and air flow. This is
a way to reduce NOX formation and was applied at an early stage in gas turbine
development.
Atmospheric conditions: An increase in the humidity of the combustion air also helps to
reduce NOX formation. This effect causes a reduced flame temperature, similar to the
injection of a water/fuel-emulsion into the combustion chamber of the gas turbine.
WORKIN
G DRAFT IN
PROGRESS

Chapter 7
TL/JFF/FN/EIPPCB/LCP_Final Draft June 2016 565
The variation in load of the combustion plant responding to variations in the energy demand
may influence the level of NOX emissions based on the evolution of the aforementioned
physical parameters. For further details, see Section 3.1.15.
For natural-gas-fired combustion plants, emissions of dust and SO2 are very low: normally well
below 5 mg/Nm3 for dust and well below 10 mg/Nm
3 for SO2 (15 % O2), without applying any
techniques at the plant level. Thus continuous monitoring of SOX and dust is generally not
performed for natural-gas-fired combustion plants.
Gas turbines
Figure 7.11 gives a general overview of NOX emission levels from a data set of European
example plants, regardless of the implemented techniques or the way the plants are operated.
Source: [LCP TWG data collection 2012]
Figure 7.11: NOX emissions from European natural-gas-fired turbines in 2010
NOX emission levels depend on the type of gas turbine and may be affected when trying to
increase energy efficiency, as this leads to higher firing temperatures in the gas turbine. With
increasing temperature, NOX emission levels tend to increase, much faster than the efficiency of
electricity generation. At combustion temperatures beyond 1450 °C, NOX generation increases
exponentially with temperature. The influence of temperature and pressure on NO generation
(the majority compound within emitted NOX) is presented in Figure 7.12. This shows that, for
high combustion temperatures, an increase in the combustion temperature by 50 °C
approximately doubles the NO emissions. Therefore, technical developments to higher
efficiencies may also imply higher NOX emission levels in mg/Nm3.
W
ORKING D
RAFT IN P
ROGRESS
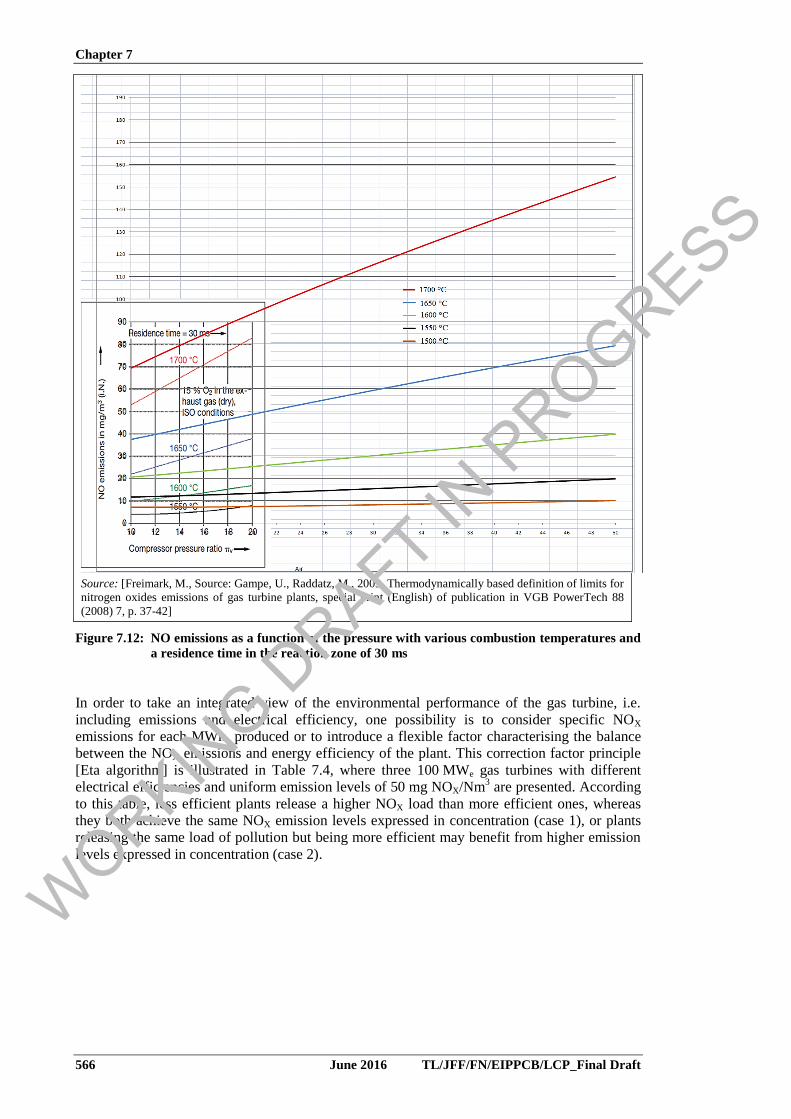
Chapter 7
566 June 2016 TL/JFF/FN/EIPPCB/LCP_Final Draft
Source: [Freimark, M., Source: Gampe, U., Raddatz, M., 2009, Thermodynamically based definition of limits for
nitrogen oxides emissions of gas turbine plants, special print (English) of publication in VGB PowerTech 88
(2008) 7, p. 37-42]
Figure 7.12: NO emissions as a function of the pressure with various combustion temperatures and
a residence time in the reaction zone of 30 ms
In order to take an integrated view of the environmental performance of the gas turbine, i.e.
including emissions and electrical efficiency, one possibility is to consider specific NOX
emissions for each MWhe produced or to introduce a flexible factor characterising the balance
between the NOX emissions and energy efficiency of the plant. This correction factor principle
[Eta algorithm] is illustrated in Table 7.4, where three 100 MWe gas turbines with different
electrical efficiencies and uniform emission levels of 50 mg NOX/Nm3 are presented. According
to this table, less efficient plants release a higher NOX load than more efficient ones, whereas
they both achieve the same NOX emission levels expressed in concentration (case 1), or plants
releasing the same load of pollution but being more efficient may benefit from higher emission
levels expressed in concentration (case 2).
WORKIN
G DRAFT IN
PROGRESS

Chapter 7
TL/JFF/FN/EIPPCB/LCP_Final Draft June 2016 567
Table 7.4: Calculated specific NOX emissions with emission levels of 50 mg/Nm3
Electrical
capacity
(MWe)
Electrical
efficiency
Thermal
capacity
(MWth)
NOX
emission
levels
(mg/Nm3)
case 1
Specific NOX
emissions
(g/MWhe)
case 1
NOX
emission
levels
(mg/Nm3)
case 2
Specific
NOX
emissions
(g/MWhe)
case 2
100 0,35 286 50 433 50 433
100 0,385 260 50 394 55 433
100 0,420 238 50 360 60 433
Source: [M. Freimark – VGB Power Tech, July 2010]
Modern combined-cycle plants with dry low-NOX burners have overcome this 'trade-off'
problem and achieve NOX emission levels of 15–35 mg/Nm3, without using end-of-pipe NOX-
reducing techniques, while still achieving high operating electrical efficiencies (above 55 % on
a yearly average basis). In the case of open-cycle plants, the corresponding electrical efficiency
is about 39 % (e.g. operating net electrical efficiency achieved by Plants 16-1V and 16-2V).
Figure 7.13 provides data on example CCGTs commissioned between 2007 and 2010, operated
between 1600 h/yr and more than 8000 h/yr, with an equivalent full load factor above 74 % and
with operating electrical efficiencies above 55 %. The NOX yearly average (concentration) to
operating electrical efficiency ratio varies from 0.25 to 0.6 mg/Nm3.MWe.
Source: [LCP TWG data collection 2012]
Figure 7.13: Example of CCGTs achieving low NOX emissions and high operating electrical
efficiencies
NOX emissions from older plants can vary between 50 mg/Nm3 and 75 mg/Nm
3, or even higher
(very old gas turbines commissioned before 1990 can reach levels of up to 350 mg/Nm3).
Nowadays, DLN retrofit packages are available on the market, delivering NOX emission levels
below 50 mg/Nm3. However, lower emission levels of NOX may lead to higher CO emissions
for these plants.
WORKIN
G DRAFT IN
PROGRESS

Chapter 7
568 June 2016 TL/JFF/FN/EIPPCB/LCP_Final Draft
Since no major technical problems with waste heat boilers (combined-cycle/cogeneration) have
been observed with gas turbines equipped with SCR technology, SCR can be considered a
proven technique to reduce NOX emissions from gas-fired installations. Disadvantages of SCR
include pressure loss and a resulting loss in efficiency (increase of CO2), as well as possible
emissions of ammonia, and these need to be taken into account in the integrated pollution
prevention approach. According to [New 132] [32, Rentz, et al., 1999], NOX emissions of
20 mg/Nm3 and less are achieved at a site in California using SCR. At that site, NOX emission
values have to be below 20 mg/Nm3 because of ambient air quality problems for most of the
year, including extremely high ozone concentrations or continuous summer smog periods. In
Japan and in Europe, levels of 10–50 mg/Nm3 (15 % O2) for large gas turbines (> 100 MWth)
are commonly achieved with natural gas firing, mainly by using only dry low-NOX systems. In
some cases in Austria, the Netherlands or Italy, SCR has also been implemented, achieving
yearly average NOX concentrations of between 14 mg/Nm3 and 23 mg/Nm
3.
As shown in Figure 7.14 and Figure 7.15, there is no higher NOX emission levels from CCGTs
fitted with supplementary firing at the HRSG level than from those not fitted with it, as also
underlined in the document [UKTWG10]. Therefore, no further distinction is made in this
document between CCGTs with supplementary firing and those without with respect to NOX
emission levels.
Source: [LCP TWG data collection 2012]
Figure 7.14: NOX emissions (yearly averages) from CCGTs fitted with supplementary firing at the
HRSG level
WORKIN
G DRAFT IN
PROGRESS
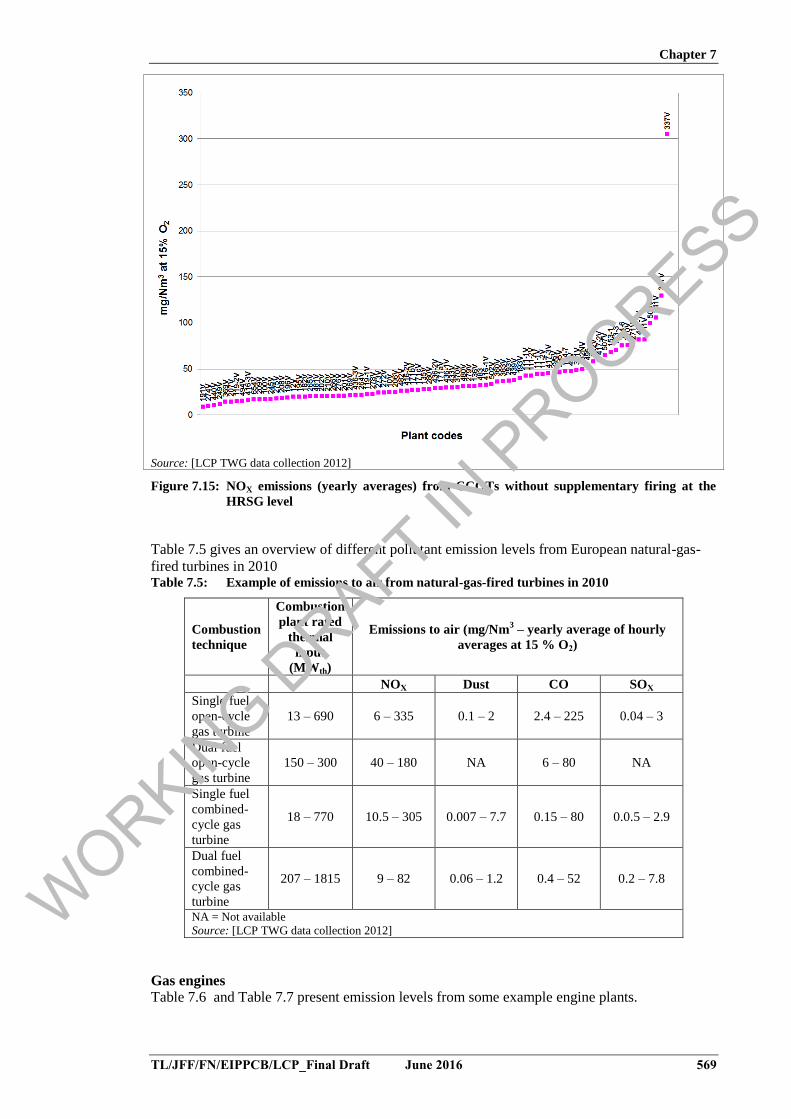
Chapter 7
TL/JFF/FN/EIPPCB/LCP_Final Draft June 2016 569
Source: [LCP TWG data collection 2012]
Figure 7.15: NOX emissions (yearly averages) from CCGTs without supplementary firing at the
HRSG level
Table 7.5 gives an overview of different pollutant emission levels from European natural-gas-
fired turbines in 2010 Table 7.5: Example of emissions to air from natural-gas-fired turbines in 2010
Combustion
technique
Combustion
plant rated
thermal
input
(MWth)
Emissions to air (mg/Nm3 – yearly average of hourly
averages at 15 % O2)
NOX Dust CO SOX Single fuel
open-cycle
gas turbine
13 – 690 6 – 335 0.1 – 2 2.4 – 225 0.04 – 3
Dual fuel
open-cycle
gas turbine 150 – 300 40 – 180 NA 6 – 80 NA
Single fuel
combined-
cycle gas
turbine
18 – 770 10.5 – 305 0.007 – 7.7 0.15 – 80 0.0.5 – 2.9
Dual fuel
combined-
cycle gas
turbine
207 – 1815 9 – 82 0.06 – 1.2 0.4 – 52 0.2 – 7.8
NA = Not available
Source: [LCP TWG data collection 2012]
Gas engines
Table 7.6 and Table 7.7 present emission levels from some example engine plants.
WORKIN
G DRAFT IN
PROGRESS

Chapter 7
570 June 2016 TL/JFF/FN/EIPPCB/LCP_Final Draft
Table 7.6: Examples of NOX emissions for steady-state full engine load (15 % O2)
Installation Fuel used
NOX
(as NO2)(1)
(mg/Nm3)
Average dust
(ISO 9096 or
equivalent
method)
(mg/Nm3)
Remarks
Gas diesel (GD) in
gas mode
Main fuel: natural gas;
pilot fuel: heavy fuel oil
(2.9 wt-% S, 0.05 wt-%
ash, 9 wt-% micro
carbon residue)
1584 – 1612 10–13 120 MWe power
plant in Asia
Spark-ignited gas
engine (SG)
NA 161 – 190 NA 5 MWe plant in
Northern Europe
100 – 280 NA
22 MWth two-stroke
engine used for
mechanical drive in
Europe [Plant 166]
Spark-ignited gas
engine (SG) (low-
NOX tuned)
NA 71 – 83 NA
40 MWe plant in
America. Fuel
consumption about
3 % higher compared
to ‘normal’ rated SG
95 – 190 (2)
Spark plug engine in
lean-burn mode [ 23,
Finland 2012 ]
165 NA
NOX yearly average.
Lean-burn concept.
54 MWth Hungarian
plant
109 NA
Lean-burn concept.
15 MWth Estonian
plant [Plant 40]
150 – 175
Lean-burn concept.
18 MWth Hungarian
plant [Plant 186]
Spark-ignited gas
engine (SG)
5 – 13 SCR
Fresh conditions
27 – 28
NOX yearly average.
Lean-burn concept +
SCR. 30/35 MWth
plant in Italy
Dual fuel engine
- gas mode
- gas oil mode
< 0.05 wt-% S,
< 0.01wt-% ash
147 – 177
1531 – 1751
NA
6–27
5 MWe plant in
Northern Europe
Dual fuel engine in
gas mode 190 – 380 (
2) [ 23, Finland 2012 ]
(1) NOX emission given at 0 ºC, 101.3 kPa, dry gas.
(2) SG engines using primary NOX reduction measures achieve levels of about 190 mg/Nm3 with an optimal heat rate, and
about 100 mg/Nm3 if the SG engine is low NOX tuned at the expense of an increased fuel consumption. DF-type engines
in gas mode using only primary NOX abatement techniques can, with a natural gas quality with a methane number (MN)
higher than 80, be tuned for achieving 190 mg/Nm3. A DF engine in high efficiency tuning (optimum heat rate) achieves
NOX emission levels of about 380 mg/Nm3.
NB:
NA: Not available.
Source: [192, TWG, 2003] [ 23, Finland 2012 ][LCP TWG data collection 2012] [Euromot 2016]
WORKIN
G DRAFT IN
PROGRESS

Chapter 7
TL/JFF/FN/EIPPCB/LCP_Final Draft June 2016 571
Table 7.7: Example emissions of NMVOC, CO and CH4 reported by European natural-gas-fired
engines (15 % O2)
Plant number Emission levels (mg/Nm
3)
CH4 (1) CO NMVOC
40 NA 44 4.4 (4)
166V NA 85–90 NA
186-1V 212 (2) 100 NA
353V (3) 280 37 44
354V (3) 471 39 25
(1) Expressed as C at full load.
(2) Periodic monitoring once a year.
(3) Two-stroke engine type.
(4) This emission level is contested by Euromot based on estimation from an engine supplier.
NA: Not available.
Source: [LCP TWG data collection 2012]
Further information on unburnt carbon emissions is given in Section 7.1.3.2.5.
The efficient combustion of gaseous fuels does not generate particulates. However, local effects
influence the inlet particulate levels and may affect gas turbine operation/emissions [191, GE,
2002].
Gas boilers
Natural-gas-fired boilers are used for different purposes in the power industry, or for providing
heat/steam in dedicated industries, such as the chemical, food and drink, and pulp and paper
industries. The most commonly applied techniques are primary techniques such as air/fuel
staging, flue-gas recirculation, and low-NOX burners, including ultra-low-NOX burners
(ULNBs) (see Section 3.2.2.3). Gas-fired boilers may be quite old but still generally retrofittable
with primary techniques in order to prevent the generation of NOX emissions, or with secondary
techniques such as SNCR or SCR to reduce the NOX generated.
Figure 7.16 gives an overview of NOX emission levels from European natural-gas-fired boilers
for 2010.
Source: [LCP TWG data collection 2012]
Figure 7.16: NOX emissions (yearly averages) from European natural gas boilers in 2010
WORKIN
G DRAFT IN
PROGRESS

Chapter 7
572 June 2016 TL/JFF/FN/EIPPCB/LCP_Final Draft
Table 7.8 gives an overview of different pollutant emission levels from European natural-gas-
fired boilers in 2010.
Table 7.8: Example of emissions to air from natural gas fired-boilers in 2010
Combustion
technique
Combustion
plant rated
thermal
input
(MWth)
Emissions to air (mg/Nm3 – yearly average of hourly
averages at 3 % O2)
NOX Dust CO SO2
Gas-fired
boiler 18 – 800 60 – 215 0.04 – 6.4 0.2 – 375 0.14 – 5.1
Source: [LCP TWG data collection 2012]
7.1.2.3 Emissions to water
The operation of gas-fired plants leads to the following specific waste water:
Scrubbing leakage and rinsing water: scrubbing, leakage and rinsing waters are carried
off to the sewer via an oil separator. The amount is normally about 0.1 m3/h and can be
contaminated with oil. Peaks in the amount of waste waters can occur if the pipelines have
to be flushed. In this case, oil presence is not expected and the contamination consists
mainly of sediment. Gas turbine compressors need to be cleaned periodically with water
and detergent. The frequency of the on/off-line blade washes depends on the type and
technology of the air intake filters and on the environment in which the gas turbine is
operated. If the detergent used is biologically degradable, it is discharged to the surface
water. If heavy metals are present, the water is collected and disposed of off site by an
authorised contractor.
Boiler water blowdown: boiler water that is drained from the boiler for maintenance
purposes is collected and can be treated in a neutralisation basin. After neutralisation, the
water is discharged to the surface water. Boiler water is demineralised water with
supplementary chemicals. The boiler is drained as per the operational requirements of the
plant; this maybe several times a year following maintenance patterns and depends on the
results of water chemistry analysis. It can also depend on the running mode, with plants
operated < 4000 h/yr likely to be drained more often. The salt content in the water/steam
circuit needs to remain within the specifications, to prevent deposits from evaporation and
overheating pipes and to prevent accelerated corrosion. To keep the salt level in the
specified range, boiler water is regularly (if necessary) blown down from the drum to the
cooling water system. Consequently, the blowdown water contains low salt concentrations.
It can also be recycled back to the cooling tower to save make-up water.
Blowdown from demineralisation installation: water treatment plant effluents are
collected and neutralised before discharging to surface water. Some parts of the
demineralisation plant neutralisation waste (e.g. rinse water) can be reused as water feed
to the plant.
If these streams contain pollutants (e.g. metals) they may need further treatment before
discharge.
7.1.2.4 Combustion and other plant residues
The operation of gas-fired plants leads to the following specific combustion and other plant
residues:
WORKIN
G DRAFT IN
PROGRESS
Chapter 7
TL/JFF/FN/EIPPCB/LCP_Final Draft June 2016 573
Solid and liquid residues: Small quantities of solid and liquid residues may be produced
by the operation of gas-fired plants. Most of the residues are the product of subsidiary
activities, such as maintenance and water treatment. The waste substances associated with
these subsidiary activities may include scrap metal, used oil, packaging materials, liquids
used to wash down the compressors/gas turbines, ion exchangers, and activated carbon.
Used oil: Normally, the gas turbine/engine control oil and lubricating oil are changed every
ten years or depending on the analysis results. The quantity of oil involved on each occasion
is about 25 000–40 000 litres per 400 MWe unit in the case of a gas turbine and depends on
specific plant configurations (separate seal and power oil systems, number and type of
bearings, etc.).
Cleaning liquids: The liquids used to wash the compressors and gas turbines are synthetic
detergents dissolved in water. These liquids are used periodically to remove dirt and grease
deposits from the blades; cleaning takes place during shutdown periods. The resulting dirty
liquids are sent to an authorised processor.
Demineralised water chemicals: Demineralised water installations produce waste
chemicals and resins. If an ion exchange installation is used, the chemicals used are
hydrochloric acid (or sulphuric acid) and caustic soda. The salts are normally discharged
into the surface water after neutralisation. The resins are changed once every three to five
years. The amounts of chemicals used and the waste resins depend on the type of
installation, the raw water quality, and the amount of demineralised water produced.
Used catalyst: If the plants apply a CO catalyst and/or SCR system, spent catalysts are
generated every few years in small quantities.
7.1.3 Techniques to consider in the determination of BAT for the combustion of natural gas in boilers / engines / gas turbines
This section describes techniques (or combinations thereof), and associated monitoring,
considered to have the potential for achieving a high level of environmental protection in the
activities within the scope of this document. The techniques described include both the
technology used and the way in which the installations are designed, built, maintained, operated,
and decommissioned.
It covers process-integrated and end-of-pipe techniques. Waste prevention and management,
including waste minimisation and recycling procedures, are also considered. Furthermore,
techniques for reducing the consumption of raw materials, water, and energy are covered.
Annex III to the Industrial Emissions Directive lists a number of criteria for determining BAT,
and the information within this chapter addresses these considerations. As far as possible, the
standard structure of Table 3.4 is used to outline the information on each technique, to enable a
comparison of techniques and the assessment against the definition of BAT given in the
Industrial Emissions Directive.
This section does not necessarily provide an exhaustive list of techniques that could be applied
in the sector. Other techniques may exist, or may be developed, which could be considered for
the determination of BAT for an individual installation.
In this section, the techniques to be considered have only been fully described when they are
specific to the considered combusted fuel or applied combustion process (combustion of natural
gas). Indeed, for most of the techniques, general descriptions are already presented in Chapter 3.
Therefore, in order to avoid repetition, for those general techniques already described in
Chapter 3, only the additional information that is specific to the combustion of iron and steel
process gases is reported here in synthesis tables.
WORKIN
G DRAFT IN
PROGRESS
Chapter 7
574 June 2016 TL/JFF/FN/EIPPCB/LCP_Final Draft
7.1.3.1 Techniques to increase the energy efficiency of natural-gas-fired plants
The energy efficiency is normally highest when the plant is operated at the design parameters.
The energy efficiency usually changes throughout the operational period of the plant and may
be affected by changes, for instance in the load during operation, in fuel quality, etc. The energy
efficiency also depends on the cooling system of the power plant and on the energy
consumption of the flue-gas cleaning system. Applying high-efficiency gas turbine systems can
generate side effects, such as vibration and higher short-term NOX emissions.
7.1.3.1.1 General techniques to increase the energy efficiency of natural-gas-fired
units
Information on general techniques to increase the energy efficiency of combustion units is given
in Section 3.2.3.
Table 7.9 gives additional information specific to natural gas combustion. More information on
cross-media effects, environmental performance and operational data is given after the table.
WORKIN
G DRAFT IN
PROGRESS
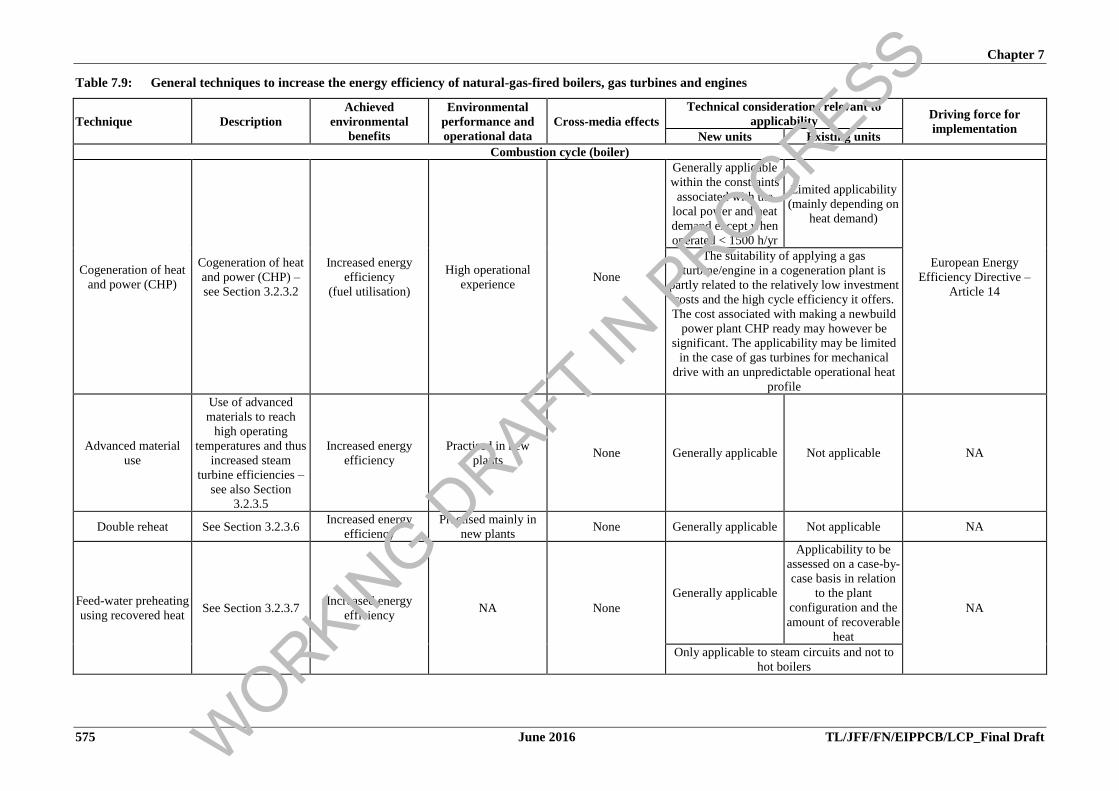
Chapter 7
575 June 2016 TL/JFF/FN/EIPPCB/LCP_Final Draft
Table 7.9: General techniques to increase the energy efficiency of natural-gas-fired boilers, gas turbines and engines
Technique Description
Achieved
environmental
benefits
Environmental
performance and
operational data
Cross-media effects
Technical considerations relevant to
applicability Driving force for
implementation New units Existing units
Combustion cycle (boiler)
Cogeneration of heat
and power (CHP)
Cogeneration of heat
and power (CHP) –
see Section 3.2.3.2
Increased energy
efficiency
(fuel utilisation)
High operational
experience None
Generally applicable
within the constraints
associated with the
local power and heat
demand except when
operated < 1500 h/yr
Limited applicability
(mainly depending on
heat demand)
European Energy
Efficiency Directive –
Article 14
The suitability of applying a gas
turbine/engine in a cogeneration plant is
partly related to the relatively low investment
costs and the high cycle efficiency it offers.
The cost associated with making a newbuild
power plant CHP ready may however be
significant. The applicability may be limited
in the case of gas turbines for mechanical
drive with an unpredictable operational heat
profile
Advanced material
use
Use of advanced
materials to reach
high operating
temperatures and thus
increased steam
turbine efficiencies –
see also Section
3.2.3.5
Increased energy
efficiency
Practised in new
plants None Generally applicable Not applicable NA
Double reheat See Section 3.2.3.6 Increased energy
efficiency
Practised mainly in
new plants None Generally applicable Not applicable NA
Feed-water preheating
using recovered heat See Section 3.2.3.7
Increased energy
efficiency NA None
Generally applicable
Applicability to be
assessed on a case-by-
case basis in relation
to the plant
configuration and the
amount of recoverable
heat
NA
Only applicable to steam circuits and not to
hot boilers
WORKIN
G DRAFT IN
PROGRESS

Chapter 7
576 June 2016 TL/JFF/FN/EIPPCB/LCP_Final Draft
Technique Description
Achieved
environmental
benefits
Environmental
performance and
operational data
Cross-media effects
Technical considerations relevant to
applicability Driving force for
implementation New units Existing units
Advanced control
system
Advanced
computerised control
of combustion
conditions for
emission reduction
and combustion unit
environmental
performance – see
also Section 3.2.3.8
Increased energy
efficiency
High operational
experience None Generally applicable NA
Heat accumulation
(heat storage) in CHP
mode
See Section 3.2.3.9 NA NA NA The applicability may be limited in the case
of low heat load demand NA
Gas turbines
Air preheating
Preheating of
combustion air before
combustion, after
being compressed –
see Section 3.2.3.4
Increased energy
efficiency
High operational
experience
NOX emissions tend
to increase
Generally applicable within the constraints
related to the need to control the NOX
emissions
NA
Advanced control
system
Advanced
computerised control
of the gas turbine and
subsequent recovery
boilers – see Section
3.2.3.8
Increased energy
efficiency
High operational
experience None Generally applicable NA NA
WORKIN
G DRAFT IN
PROGRESS

Chapter 7
577 June 2016 TL/JFF/FN/EIPPCB/LCP_Final Draft
Technique Description
Achieved
environmental
benefits
Environmental
performance and
operational data
Cross-media effects
Technical considerations relevant to
applicability Driving force for
implementation New units Existing units
Advanced material
use
Increase of gas
turbine inlet
temperature and
compressor
pressure is possible
by the use of
advanced gas
turbine materials,
efficient cooling
technologies and
thermal barrier
coatings – see also
Section 3.2.3.5
Increased energy
efficiency NA None Generally applicable Not applicable NA
Gas turbines and engines
Combined cycle See Section 3.2.3.11 Increased energy
efficiency NA NA
Generally applicable
except when operated
< 1500 h/yr
Applicable within the
constraints associated
with the steam cycle
design and the space
availability.
Not applicable to gas
turbines and engines
operated < 1500 h/yr
Not applicable to
mechanical drive gas
turbines operated in
discontinuous mode
with extended load
variations and
frequent start-ups and
shutdowns
NA
Fuel pretreatment
Fuel preheating
Preheating of fuel gas
by recovering the off-
gas energy content –
see also Section
Higher efficiency
NA
NOX emissions tend
to increase
NA NA NA
WORKIN
G DRAFT IN
PROGRESS

Chapter 7
578 June 2016 TL/JFF/FN/EIPPCB/LCP_Final Draft
Technique Description
Achieved
environmental
benefits
Environmental
performance and
operational data
Cross-media effects
Technical considerations relevant to
applicability Driving force for
implementation New units Existing units
3.2.3.18 Generally applicable within the constraints
related to the boiler design and to the need to
control NOX emissions
NA = Not relevant specific information available
WORKIN
G DRAFT IN
PROGRESS
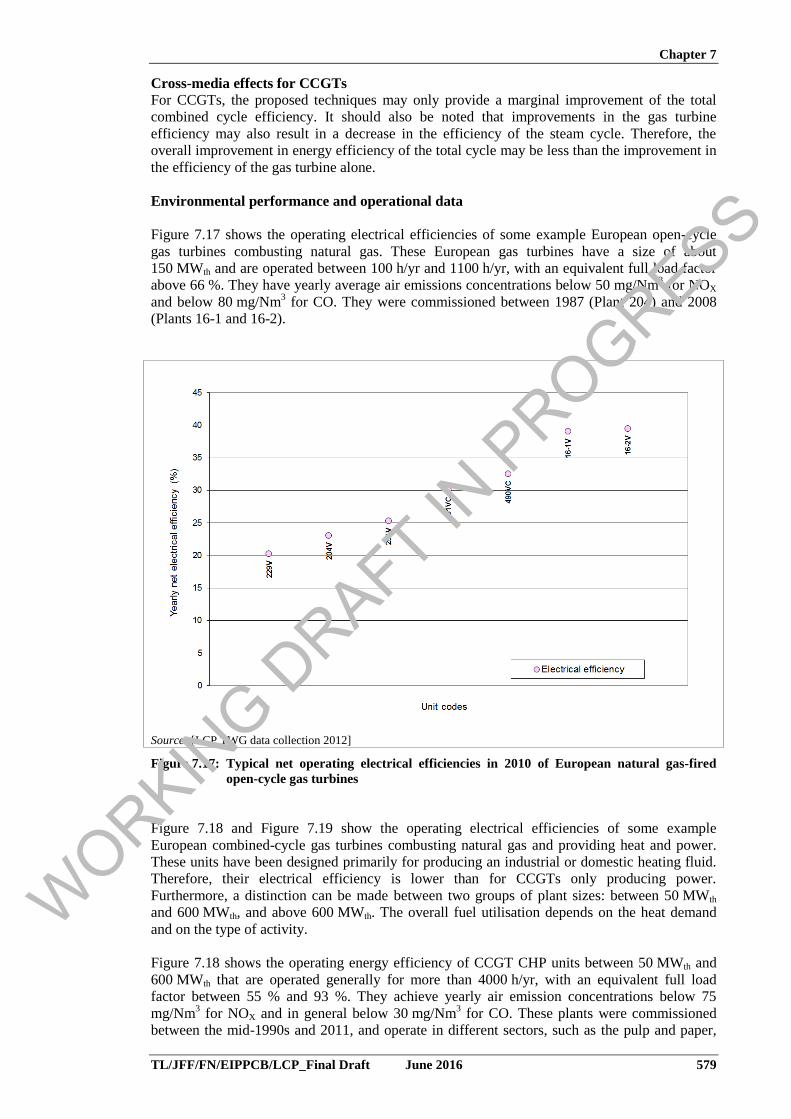
Chapter 7
TL/JFF/FN/EIPPCB/LCP_Final Draft June 2016 579
Cross-media effects for CCGTs
For CCGTs, the proposed techniques may only provide a marginal improvement of the total
combined cycle efficiency. It should also be noted that improvements in the gas turbine
efficiency may also result in a decrease in the efficiency of the steam cycle. Therefore, the
overall improvement in energy efficiency of the total cycle may be less than the improvement in
the efficiency of the gas turbine alone.
Environmental performance and operational data
Figure 7.17 shows the operating electrical efficiencies of some example European open-cycle
gas turbines combusting natural gas. These European gas turbines have a size of about
150 MWth and are operated between 100 h/yr and 1100 h/yr, with an equivalent full load factor
above 66 %. They have yearly average air emissions concentrations below 50 mg/Nm3 for NOX
and below 80 mg/Nm3 for CO. They were commissioned between 1987 (Plant 204) and 2008
(Plants 16-1 and 16-2).
Source: [LCP TWG data collection 2012]
Figure 7.17: Typical net operating electrical efficiencies in 2010 of European natural gas-fired
open-cycle gas turbines
Figure 7.18 and Figure 7.19 show the operating electrical efficiencies of some example
European combined-cycle gas turbines combusting natural gas and providing heat and power.
These units have been designed primarily for producing an industrial or domestic heating fluid.
Therefore, their electrical efficiency is lower than for CCGTs only producing power.
Furthermore, a distinction can be made between two groups of plant sizes: between 50 MWth
and 600 MWth, and above 600 MWth. The overall fuel utilisation depends on the heat demand
and on the type of activity.
Figure 7.18 shows the operating energy efficiency of CCGT CHP units between 50 MWth and
600 MWth that are operated generally for more than 4000 h/yr, with an equivalent full load
factor between 55 % and 93 %. They achieve yearly air emission concentrations below 75
mg/Nm3 for NOX and in general below 30 mg/Nm
3 for CO. These plants were commissioned
between the mid-1990s and 2011, and operate in different sectors, such as the pulp and paper,
WORKIN
G DRAFT IN
PROGRESS

Chapter 7
580 June 2016 TL/JFF/FN/EIPPCB/LCP_Final Draft
food and drink, and chemical industries, or for energy generation for power and district heating.
As the electrical efficiencies of similar plants of a larger size appear to be slightly different, they
are presented separately. Plant 74 has undergone modifications in the gas turbine parts design
(installation of internal brush seals), allowing a thermal energy improvement of 2 percentage
points.
Figure 7.19 shows the operating energy efficiency of CCGT CHP units of more than 600 MWth
that are operated more than 4000 h/yr, with an equivalent full load factor above 70 %, achieving
yearly air emission concentrations in general below 32 mg/Nm3 for NOX and below 5 mg/Nm
3
for CO. These plants were commissioned between 2000 and 2011 and operate as CHP plants in
industrial sectors, such as the chemical industry or for power and district heating. As the
electrical efficiencies of similar plants of a smaller size appear to be slightly different, they are
presented separately.
Source: [LCP TWG data collection 2012]
Figure 7.18: Typical net operating energy efficiencies in 2010 of European natural-gas-fired
combined-cycle gas turbines producing heat and power (plants from 50 MWth to
600 MWth)
WORKIN
G DRAFT IN
PROGRESS
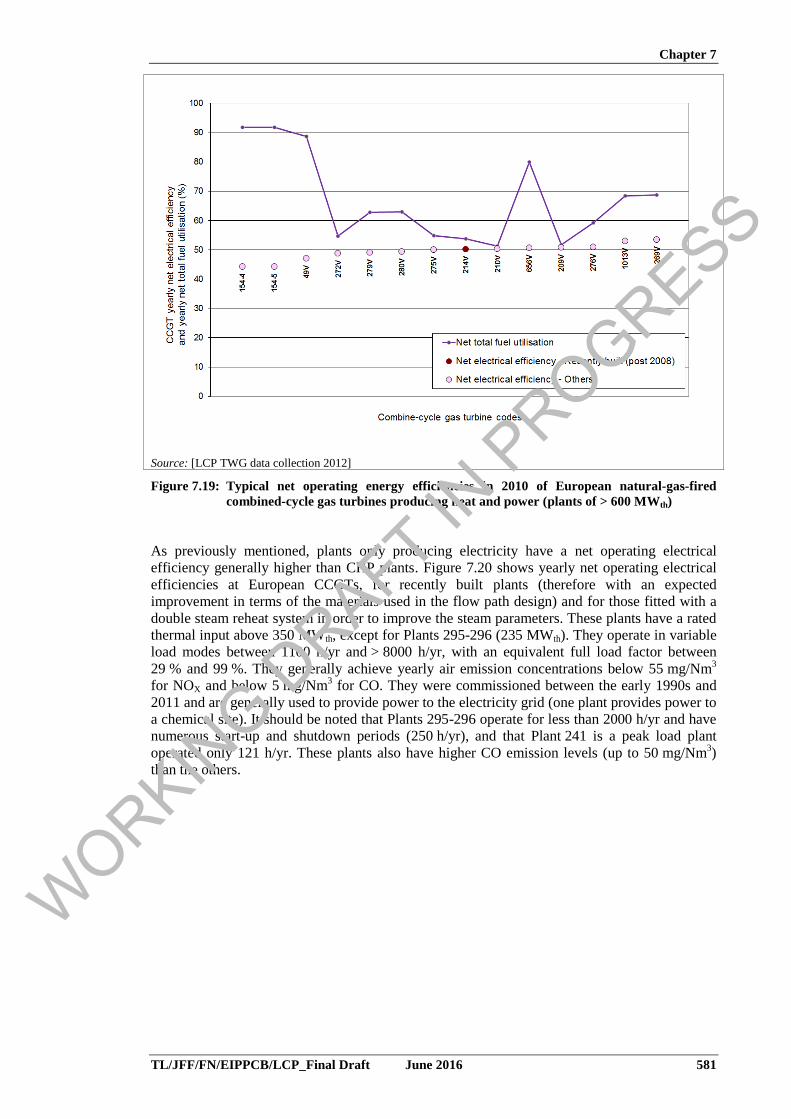
Chapter 7
TL/JFF/FN/EIPPCB/LCP_Final Draft June 2016 581
Source: [LCP TWG data collection 2012]
Figure 7.19: Typical net operating energy efficiencies in 2010 of European natural-gas-fired
combined-cycle gas turbines producing heat and power (plants of > 600 MWth)
As previously mentioned, plants only producing electricity have a net operating electrical
efficiency generally higher than CHP plants. Figure 7.20 shows yearly net operating electrical
efficiencies at European CCGTs, for recently built plants (therefore with an expected
improvement in terms of the materials used in the flow path design) and for those fitted with a
double steam reheat system in order to improve the steam parameters. These plants have a rated
thermal input above 350 MWth, except for Plants 295-296 (235 MWth). They operate in variable
load modes between 1100 h/yr and > 8000 h/yr, with an equivalent full load factor between
29 % and 99 %. They generally achieve yearly air emission concentrations below 55 mg/Nm3
for NOX and below 5 mg/Nm3 for CO. They were commissioned between the early 1990s and
2011 and are generally used to provide power to the electricity grid (one plant provides power to
a chemical site). It should be noted that Plants 295-296 operate for less than 2000 h/yr and have
numerous start-up and shutdown periods (250 h/yr), and that Plant 241 is a peak load plant
operated only 121 h/yr. These plants also have higher CO emission levels (up to 50 mg/Nm3)
than the others.
WORKIN
G DRAFT IN
PROGRESS
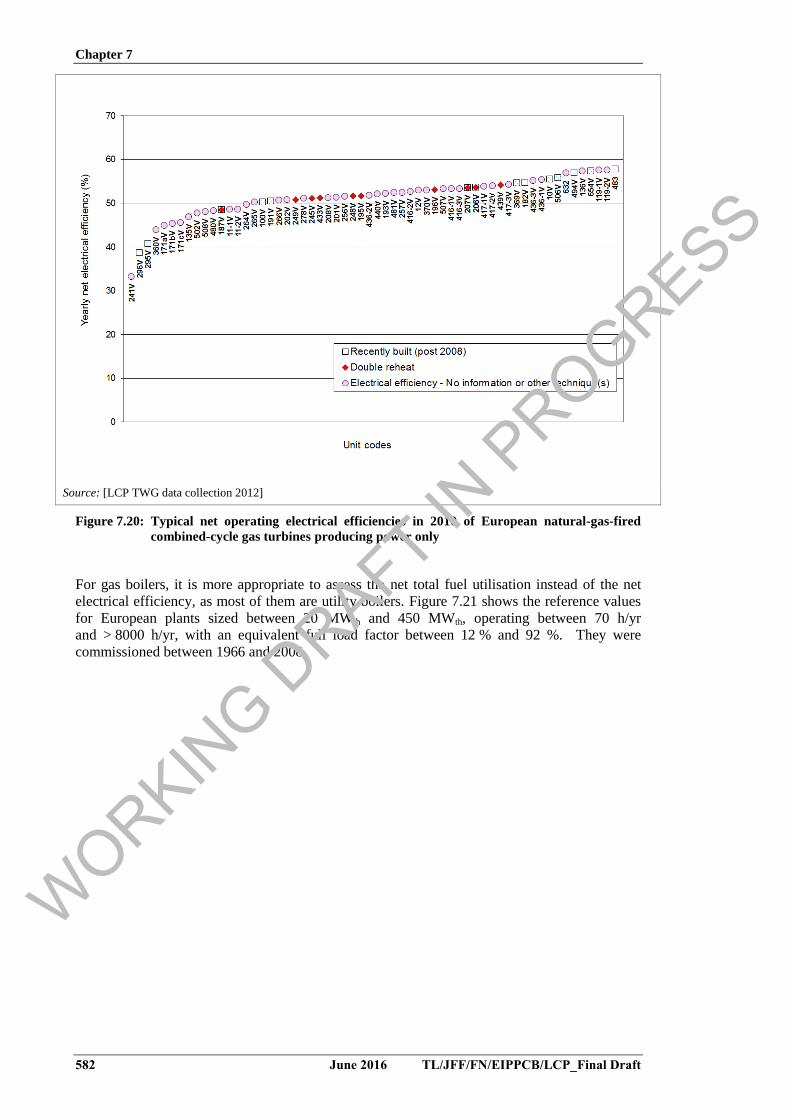
Chapter 7
582 June 2016 TL/JFF/FN/EIPPCB/LCP_Final Draft
Source: [LCP TWG data collection 2012]
Figure 7.20: Typical net operating electrical efficiencies in 2010 of European natural-gas-fired
combined-cycle gas turbines producing power only
For gas boilers, it is more appropriate to assess the net total fuel utilisation instead of the net
electrical efficiency, as most of them are utility boilers. Figure 7.21 shows the reference values
for European plants sized between 20 MWth and 450 MWth, operating between 70 h/yr
and > 8000 h/yr, with an equivalent full load factor between 12 % and 92 %. They were
commissioned between 1966 and 2008.
WORKIN
G DRAFT IN
PROGRESS
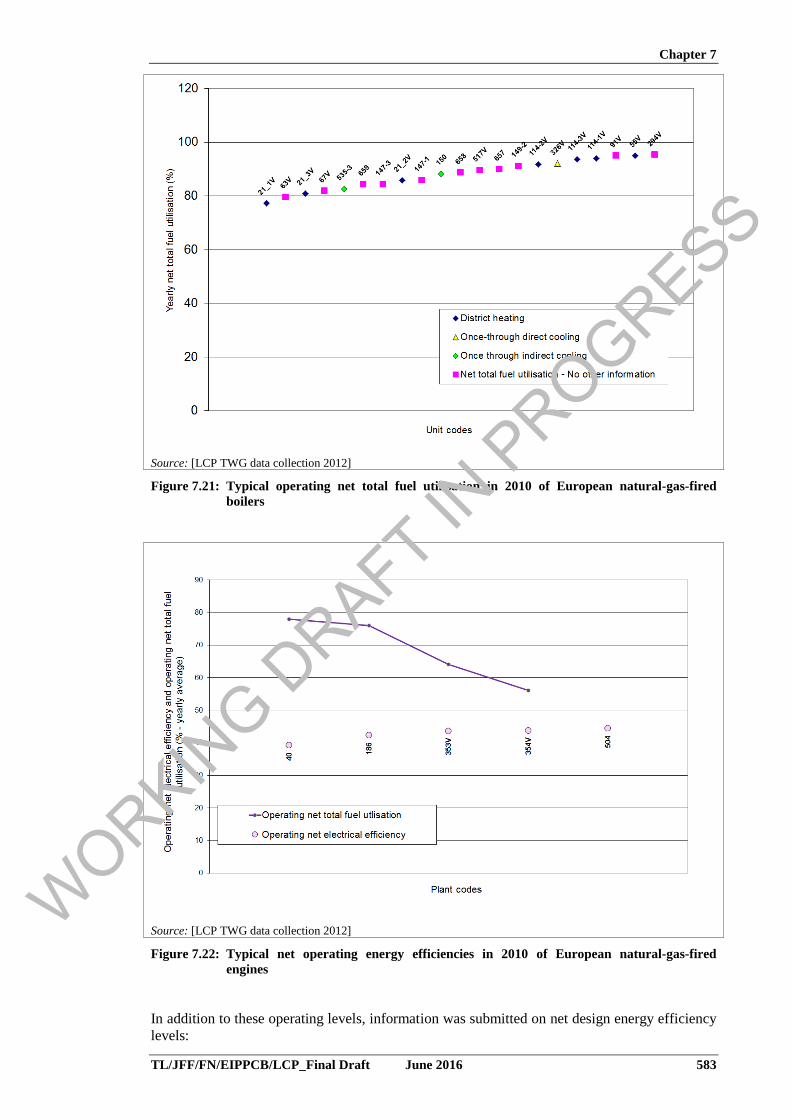
Chapter 7
TL/JFF/FN/EIPPCB/LCP_Final Draft June 2016 583
Source: [LCP TWG data collection 2012]
Figure 7.21: Typical operating net total fuel utilisation in 2010 of European natural-gas-fired
boilers
Source: [LCP TWG data collection 2012]
Figure 7.22: Typical net operating energy efficiencies in 2010 of European natural-gas-fired
engines
In addition to these operating levels, information was submitted on net design energy efficiency
levels:
WORKIN
G DRAFT IN
PROGRESS

Chapter 7
584 June 2016 TL/JFF/FN/EIPPCB/LCP_Final Draft
In the case of mechanical drive uses, net design mechanical efficiencies of between
25 % and 41 % were reported from a set of 19 plants. With the exception of two plants
with efficiency levels of 25 % and 29 %, all the others have efficiency levels above
33.5 %. Example plants commissioned more recently are able to achieve levels higher
than 36.5 % (e.g. Plants 335, 336, 341).
In the case of open-cycle gas turbines, net design electrical efficiencies between 33 %
and 41.5 % were reported by two plants.
In the case of CCGTs producing power only, net design electrical efficiencies between
47 % and 59.7 % were reported from 39 older plants and between 57 % and 60.5 %
from three plants commissioned after 2010.
In the case of CCGT CHP plants, net design total fuel utilisation between 67 % and
89 % were reported from 12 older plants and of 81 % from one plant commissioned
after 2010. It should be noted in this case that:
o operating efficiencies reported in previous figures are sometimes more
comprehensive than this data set;
o in the case of plants more oriented towards electricity production, the same
design net electrical efficiencies are expected as for plants producing electricity
only;
o it may happen that the potential local demand for heat is too low to achieve
high levels of net design total fuel utilisation.
CCGTs sized between 50 MWth and 600 MWth are slightly less efficient than those
larger than 600 MWth.
Four boilers reported a net design total fuel utilisation between 87 % and 95 %.
The engine Plant 186-1 reported a net design total fuel utilisation of 84.5 %
[LCP TWG TFFE 2014]
7.1.3.1.2 Specific techniques to increase the energy efficiency of the fuel supply
and handling activities
7.1.3.1.2.1 Use of expansion turbine
Description
Use of an expansion turbine (turbo expander) to recover energy from the pressurised supplied
fuel.
Technical description
A turbo expander is installed on the natural gas supply line (instead of a classical throttling
valve) to recover power from the expansion of the high pressure natural gas to the supply
pressure of the gas turbine or gas engine plant. The throttling valve is kept as back-up, in case
the turbo expander is not available.
Achieved environmental benefit
Improvement of a plant's overall energy efficiency, by recovery of the energy that would be lost
if a classical throttling valve was used.
Environmental performance and operational data
High operational experience.
The following operational data regarding the turbo expander are reported from a 460 MWth
plant in Belgium:
Nominal gas flow: 86 000 Nm3/h.
Produced power: 2580 kW.
Technical data:
o High-pressure part:
WORKIN
G DRAFT IN
PROGRESS
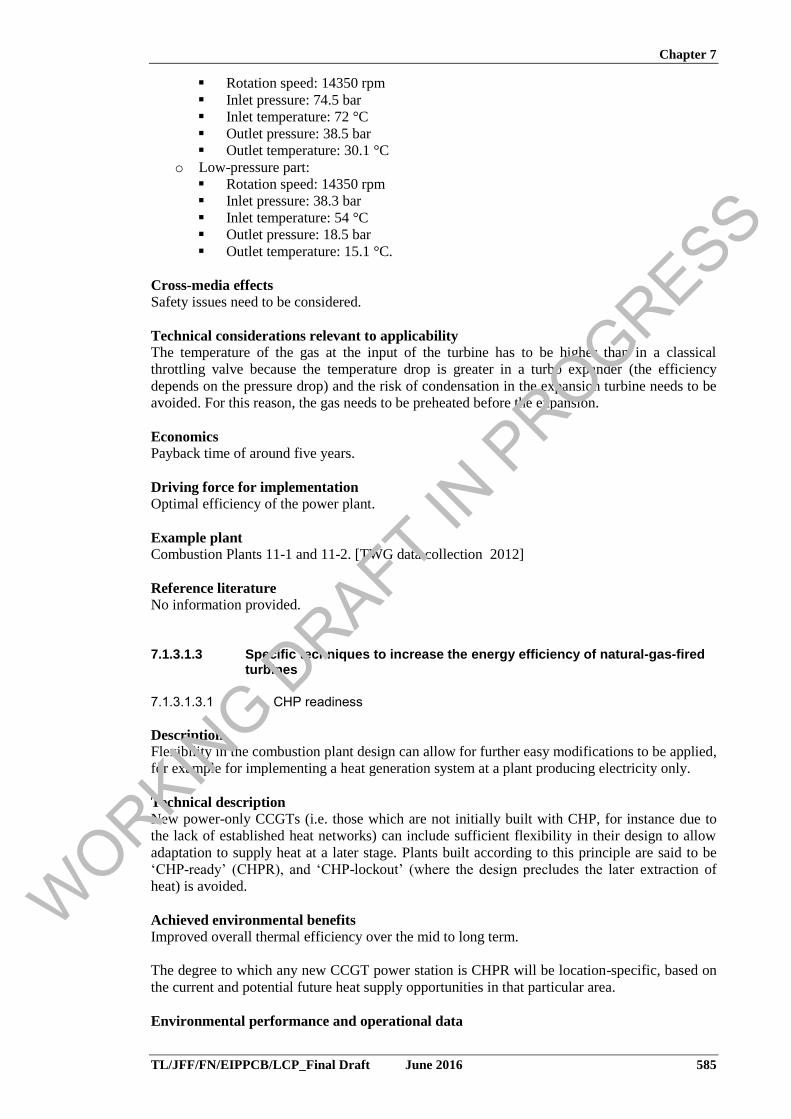
Chapter 7
TL/JFF/FN/EIPPCB/LCP_Final Draft June 2016 585
Rotation speed: 14350 rpm
Inlet pressure: 74.5 bar
Inlet temperature: 72 °C
Outlet pressure: 38.5 bar
Outlet temperature: 30.1 °C
o Low-pressure part:
Rotation speed: 14350 rpm
Inlet pressure: 38.3 bar
Inlet temperature: 54 °C
Outlet pressure: 18.5 bar
Outlet temperature: 15.1 °C.
Cross-media effects
Safety issues need to be considered.
Technical considerations relevant to applicability
The temperature of the gas at the input of the turbine has to be higher than in a classical
throttling valve because the temperature drop is greater in a turbo expander (the efficiency
depends on the pressure drop) and the risk of condensation in the expansion turbine needs to be
avoided. For this reason, the gas needs to be preheated before the expansion.
Economics
Payback time of around five years.
Driving force for implementation
Optimal efficiency of the power plant.
Example plant
Combustion Plants 11-1 and 11-2. [TWG data collection 2012]
Reference literature
No information provided.
7.1.3.1.3 Specific techniques to increase the energy efficiency of natural-gas-fired
turbines
7.1.3.1.3.1 CHP readiness
Description
Flexibility in the combustion plant design can allow for further easy modifications to be applied,
for example for implementing a heat generation system at a plant producing electricity only.
Technical description
New power-only CCGTs (i.e. those which are not initially built with CHP, for instance due to
the lack of established heat networks) can include sufficient flexibility in their design to allow
adaptation to supply heat at a later stage. Plants built according to this principle are said to be
‘CHP-ready’ (CHPR), and ‘CHP-lockout’ (where the design precludes the later extraction of
heat) is avoided.
Achieved environmental benefits
Improved overall thermal efficiency over the mid to long term.
The degree to which any new CCGT power station is CHPR will be location-specific, based on
the current and potential future heat supply opportunities in that particular area.
Environmental performance and operational data
WORKIN
G DRAFT IN
PROGRESS
Chapter 7
586 June 2016 TL/JFF/FN/EIPPCB/LCP_Final Draft
See CHP technique (Section 3.2.3.2).
Cross-media effects
None.
Technical considerations relevant to applicability
Applicable to new CCGTs.
The exact method of steam extraction depends to a large extent on the design of a plant’s steam
turbine(s). In all cases, there are limits to the amount of low-pressure steam which can be
extracted before further modifications are required; for example, re-blading of the low-pressure
section of the steam turbine (ST) may be needed to compensate for lower flows and/or new ST
casings may be needed to allow steam extraction from the turbine itself.
Technical and space requirements have to be assessed, including the following:
The steam extraction points need to be identified and sufficient space provided for access
and for pipe runs. These points do not necessarily have to be fitted with the required
flanges, valves and pipes from the outset, but it must be possible to fit them at a possible
later stage.
The plant systems and control and instrumentation systems should be suitable for later
upgrades, in order to accommodate the extra plant needs associated with heat supply.
The water treatment and the demineralisation plant may need to be increased in size, if
steam is to be piped off site without condensate return.
If the retrofit of a back-pressure turbine is identified as part of the requirements for the heat
supply, then due consideration needs to be given to how this will be integrated electrically
and how the condensate will be returned.
The space needed for a heat exchanger or for an extra water demineralisation stage, if the
steam is to be piped off site without condensate return.
The space needed for back-up boilers to supply heat in the event that the CCGT is off-line.
Also, space may need to be reserved for the later fitting of a back-pressure turbine, if
applicable.
Economics
The efficiency of the CHP scheme should be sufficient to achieve at least a 10 % reduction in
primary energy usage, compared to the separate generation of the heat and power produced to
be considered highly efficient according to Directive 2012/27/EU. For such a comparison, the
primary energy savings (PES) can be calculated according to the following equation provided in
the Energy Efficiency Directive 2012/27/EU:
100
fRe fRe
11
E
CHPE
H
CHPHPES
where:
CHP Hη is the heat efficiency,
CHP Eη is the electrical efficiency, Ref Hη is the reference heat efficiency,
Ref Eη is the reference electrical efficiency.
The cost associated with making a newbuild power plant CHP-ready may be significant. This
would be a function of many factors, including operational expenditure such as fuel costs
associated with suboptimal thermal efficiency prior to connection of the heat load as well as
WORKIN
G DRAFT IN
PROGRESS
Chapter 7
TL/JFF/FN/EIPPCB/LCP_Final Draft June 2016 587
front-end capital costs associated with purchasing bespoke equipment rather than plant
suppliers' more standardised designs. However, any forecast of the potential future heat supply
opportunities has uncertainties and care is needed to avoid over- or under-estimating this
potential. In any case, there remains the risk that this could a) trigger plant inefficiency by
providing a CHP option that the potential future market is unlikely to call on in part or in full,
and b) incur over its life cycle economic losses for no material or environmental gain.
Driving force for implementation
Directive on Energy Efficiency.
Example plants
No information provided.
Reference literature
[ 9, UK-TWG 2012 ]
7.1.3.1.3.2 Flow path optimisation
Description
Aerodynamic optimisation of the entire flow path of the gas turbine system (i.e. between the air
inlet and the exhaust gas outlet).
Technical description
For existing plants, internal brush seals can be installed. These are comprised of a pack of fine
metallic wires held in a frame. They are installed in different parts of the machine to reduce
leakage into the air and hot gas path. A brush seal can easily accommodate a misalignment
normally not tolerated by labyrinth designs.
In the retrofit of Plant 74, the modifications were as follows:
Stage 1 Shrouds (first stage wheel spacer): The original material was changed to improve
material strength and allow a more favourable residence time at the adequate temperature.
The parts design and seals between parts were changed to considerably reduce the leakage
of compressor discharge air into the hot gas path, resulting in an improved gas turbine
performance.
Second and Third Stage Shrouds: New design with honeycomb material. This abradable
coating reduces the clearance between the blades and shrouds. Honeycomb shrouds also
reduce performance degradation, by maintaining tighter clearances throughout the life of the
parts.
Stage 1 Nozzle (moving blades): The major design change incorporated into the improved
cooling, stage 1 nozzle was the addition of a more efficient film-cooling pattern. The seal
design was modified (spline seal and chordal hinge improvements) to decrease the leakage
into the hot gas path.
Stage 2 Nozzle: The new second stage nozzle was coated with an aluminide coating to
provide improved high-temperature oxidation resistance. Other modifications included
changes to the second stage nozzle's internal core plug. Core plug modifications allow more
efficient distribution of the cooling air and reduced nozzle-cooling requirements. Some
brush seals were installed on these parts, thus reducing the leakage.
Stage 2 and 3 Buckets (fixed blades): The blades design incorporated several design
improvements to allow for operation at the higher firing temperature, especially new
material and new cooling holes. There were also some cutter teeth added to the top of the
blades. This allowed cutting of the shrouds' abradable material.
Achieved environmental benefits
Increased thermal efficiency and power output.
WORKIN
G DRAFT IN
PROGRESS
Chapter 7
588 June 2016 TL/JFF/FN/EIPPCB/LCP_Final Draft
Environmental performance and operational data
Implementing internal brush seals can improve the power output by 2.75 percentage points and
the efficiency by 2 percentage points.
Cross-media effects
None.
Technical considerations relevant to applicability
Generally applicable to new and existing plants.
Economics
Low cost when included at the design stage for new plants.
Reported cost for Plant 74: EUR 3.9 million.
Driving force for implementation
No information provided.
Example plants
Combustion Plant 74 (open-cycle gas turbine).
Reference literature
No information provided.
7.1.3.1.3.3 Inlet combustion air cooling
Description
Cooling the gas turbine inlet air can increase the power output and energy efficiency of the gas
turbine by converting it into denser air, giving the gas turbine a higher mass flow rate and
reducing the energy needed for its compression by the compressor.
Technical description
There are two basic systems currently available for inlet cooling: evaporative cooling (the most
cost-effective but limited by the wet-bulb temperature) by evaporating the water contained in
the inlet air, and heat exchange or chilling by heat exchangers in the inlet combustion air duct.
When choosing the cooling system to be implemented, the reduction of cooling air consumption
by the use of efficient cooling technologies, e.g. convection cooling/impingement method, film
cooling, and transpiration cooling, should also be considered.
Figure 7.23 presents the behaviour of a simulated open-cycle gas turbine where implementation
of the two cooling systems is studied. In this graph, is the ambient relative humidity and the
base case represents the gas turbine without any inlet air cooling system. This graph shows that
the chilling method provides a higher thermal efficiency at higher ambient temperatures, and
that the evaporative cooling method provides a higher thermal efficiency when the ambient
intake temperature is lower than 20 °C.
WORKIN
G DRAFT IN
PROGRESS
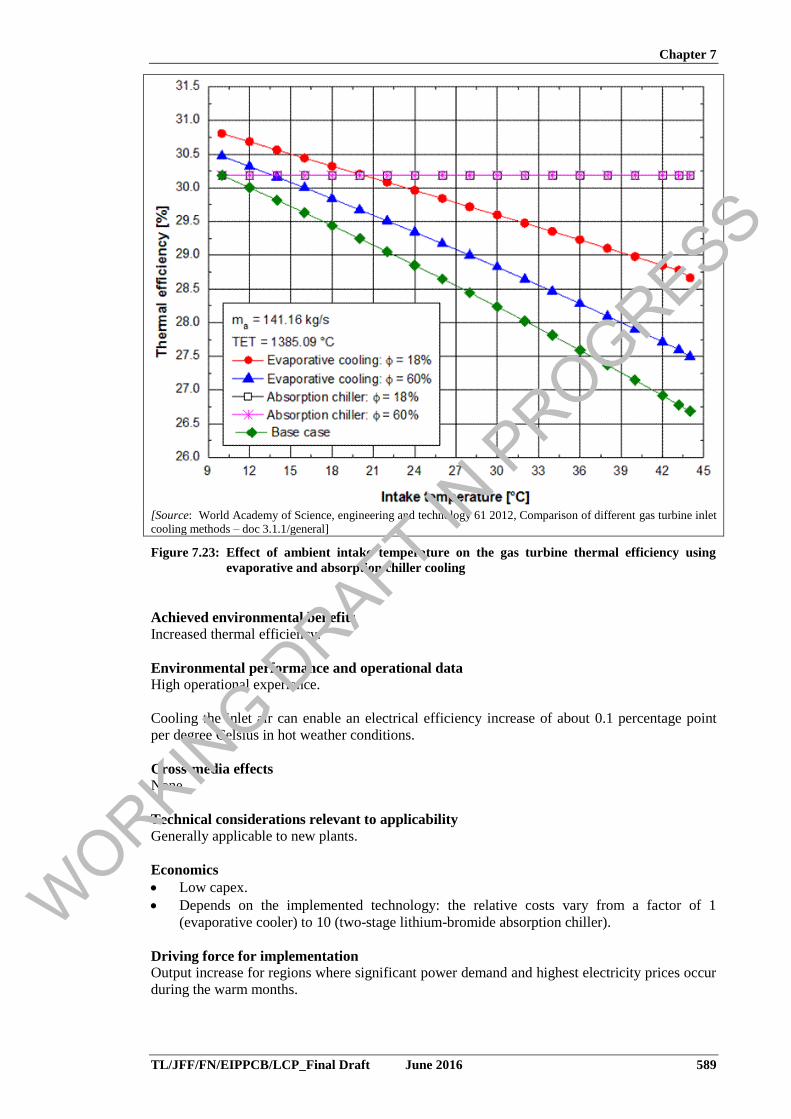
Chapter 7
TL/JFF/FN/EIPPCB/LCP_Final Draft June 2016 589
[Source: World Academy of Science, engineering and technology 61 2012, Comparison of different gas turbine inlet
cooling methods – doc 3.1.1/general]
Figure 7.23: Effect of ambient intake temperature on the gas turbine thermal efficiency using
evaporative and absorption chiller cooling
Achieved environmental benefits
Increased thermal efficiency.
Environmental performance and operational data
High operational experience.
Cooling the inlet air can enable an electrical efficiency increase of about 0.1 percentage point
per degree Celsius in hot weather conditions.
Cross-media effects
None.
Technical considerations relevant to applicability
Generally applicable to new plants.
Economics
Low capex.
Depends on the implemented technology: the relative costs vary from a factor of 1
(evaporative cooler) to 10 (two-stage lithium-bromide absorption chiller).
Driving force for implementation
Output increase for regions where significant power demand and highest electricity prices occur
during the warm months.
WORKIN
G DRAFT IN
PROGRESS
Chapter 7
590 June 2016 TL/JFF/FN/EIPPCB/LCP_Final Draft
Example plant
Combustion Plant 292.
Reference literature
[ 46, dos SANTOS et al. 2012 ] [ 47, Donaldson Company 2005 ]
7.1.3.1.3.4 Recuperative gas turbine cycle
Description
Flue-gas heat recovery in order to preheat the combustion air in simple-cycle gas turbines.
Technical description
The gas turbine cycle efficiency can be improved by modifying the simple cycle to recover heat
from the gas turbine exhaust by the addition of a regenerator (heat exchanger), where the
exhaust flow preheats the compressor discharge air prior to combustion.
There are several possibilities involving heat recirculation for improving the energy efficiency
of gas turbines: location of the heat recuperator between the HP and LP turbines, known as
ARC (alternative recuperation cycle), or on the flue-gas duct, known as CRC (conventional
recuperative gas cycle).
Achieved environmental benefits
Increased thermal efficiency.
Environmental performance and operational data
There is an example of a 4.6 MWth Solar Mercury 50 gas turbine achieving 38.5 % electrical
efficiency. Such units can, in CHP applications, achieve 70 % fuel utilisation without
supplementary firing, and 90 % fuel utilisation with supplementary firing.
Implementation at an old 60 MWth gas turbine in Iran with a low electrical efficiency (26 %)
enabled an electrical efficiency increase of 1.7 percentage points.
Cross-media effects
No information provided.
Technical considerations relevant to applicability
Many of the new efficient gas turbines have a high pressure ratio giving a high compressor
discharge temperature and low gas turbine flue-gas temperature. It is therefore not generally
possible to transfer heat from the exhaust gas to the compressor discharge airflow for modern
gas turbines. This technique applies then to gas turbines with a low to moderate pressure ratio.
Economics
Plant-specific.
Driving force for implementation
No information provided.
Example plants
No information provided.
Reference literature [48, Sayyaadi et al. 2012]
WORKIN
G DRAFT IN
PROGRESS

Chapter 7
TL/JFF/FN/EIPPCB/LCP_Final Draft June 2016 591
7.1.3.2 Techniques for the prevention and control of NOX and CO
emissions 7.1.3.2.1 General techniques for the prevention and control of NOX and CO
emissions from natural-gas-fired boilers
Information on general techniques for the prevention and control of NOX, CO and NH3
emissions is given in Section 3.2. Table 7.10 and Table 7.11 give information specific to
natural-gas-fired boilers, e.g. on environmental performances and example plants.
WORKIN
G DRAFT IN
PROGRESS

Chapter 7
592 June 2016 TL/JFF/FN/EIPPCB/LCP_Final Draft
Table 7.10: General techniques for the prevention and control of NOX and CO emissions from natural-gas-fired boilers
Technique Technical
description
Achieved
environmental
benefits
Environmental
performance and
operational data
Cross-media
effects
Technical considerations relevant to
applicability Example plants
New plants Existing plants
Low excess air
Introducing air into
the combustion
chamber in a
substoichiometric
ratio - see Section
3.2.2.3.1
Reduction of NOX
and increased
efficiency
High operational
experience NA
Generally
applicable
Generally
applicable NA
Reduction of the
combustion air
temperature
See Section
3.2.2.3.4 Reduction of NOX NA
Decreased energy
efficiency
Generally applicable within the
constraints associated with the process
needs
NA
Advanced control
system
This technique is
often used in
combination with
other techniques or
may be used alone
for combustion
plants operated
< 500 h/yr - see
also Section
3.2.3.8
Reduction of NOX High operational
experience None
Generally
applicable
The applicability
to old units may be
constrained by the
need to retrofit the
combustion and/or
control command
system(s)
NA
Flue-gas
recirculation
(FGR)
See Section
3.2.2.3.3 Reduction of NOX
High operational
experience NA
Generally
applicable
Generally
applicable
FGR has been retrofitted in a lot of
different situations. Example plants
commissioned in the 1980s/90s in
different industrial sectors, and even
one plant commissioned in 1959 in the
oil refining sector (Plant 67), report
using FGR (e.g. Plants 67, 325),
including plants operated < 500 h/yr
(e.g. Plant 203)
WORKIN
G DRAFT IN
PROGRESS

Chapter 7
TL/JFF/FN/EIPPCB/LCP_Final Draft June 2016 593
Technique Technical
description
Achieved
environmental
benefits
Environmental
performance and
operational data
Cross-media
effects
Technical considerations relevant to
applicability Example plants
New plants Existing plants
Low-NOX burners
(LNB)
See Section
3.2.2.3.5.
The technique
includes ultra-low-
NOX burners
(ULNBs)
Reduction of NOX High operational
experience NA
Generally
applicable
Applicability may
be limited for some
older plants, in
general
< 50 MWth, where
the flame length of
modern low-NOX
burners is
incompatible with
the boiler design
25 plants out of the 32 gas-fired boilers
that submitted information for the
BREF review report the use of
(U)LNBs. These existing plants belong
to very different industries (oil
refining, chemical industry, district
heating, food and drink, power, pulp
and paper industries). Example
medium plants of down to 15 MWth
were retrofitted with LNBs (e.g. Plant
65 first commissioned in 1974)
Air staging See Section
3.2.2.3.2 Reduction of NOX
High operational
experience NA
Generally
applicable
Applicability may
be limited for very
old, small boilers
(< 50 MWth) due to
lack of height or
limited residence
time for the
complete burnout
Plants 513, 288
Fuel staging See Section
3.2.2.3.5 Reduction of NOX
High operational
experience NA
Generally
applicable
Generally
applicable Plants 215, 657
Steam/water
addition
See Section
3.2.2.3.10 Reduction of NOX NA NA
Generally
applicable
Generally
applicable NA
Selective non-
catalytic reduction
(SNCR)
See Section
3.2.2.3.12.
The combination
with a 'slip' SCR
technique can help
complete the NOX
reduction process
if the residence
time is not long
enough
Reduction of NOX
Example plant
with NOX
reduction between
72 % and 91 %
applying SNCR +
in-duct SCR
Ammonia slip –
safety issue related
to ammonia
storage (e.g. in
residential areas)
Generally
applicable
Generally
applicable
NA
Not applicable to combustion plants
operated < 500 h/yr with highly
variable boiler loads. The applicability
may be limited in the case of
combustion plants operated between
500 h/yr and 1500 h/yr with highly
variable boiler loads
WORKIN
G DRAFT IN
PROGRESS

Chapter 7
594 June 2016 TL/JFF/FN/EIPPCB/LCP_Final Draft
Technique Technical
description
Achieved
environmental
benefits
Environmental
performance and
operational data
Cross-media
effects
Technical considerations relevant to
applicability Example plants
New plants Existing plants
Selective catalytic
reduction (SCR)
See Section
3.2.2.3.11.
This technique can
also be used in a
'reduced' form in
combination with
SNCR, at a global
cost lower than if
using a full SCR
system
Reduction of NOX
High operational
experience.
Example plant
with NOX
reduction between
72 % and 91 %
applying SNCR +
in-duct SCR
Ammonia slip –
safety issue related
to ammonia
storage (e.g. in
residential areas),
CO2 increase,
waste generation
Generally
applicable
There may be
technical and
economic
restrictions to the
retrofitting of
existing plants
operated between
500 h/yr and 1500
h/yr
NA
Not generally economically viable for
plants operated < 500 h/yr.
Not generally applicable to combustion
plants of < 100 MWth
NA = No relevant specific information available
Source: [ 27, ICAC 2009 ]
WORKIN
G DRAFT IN
PROGRESS
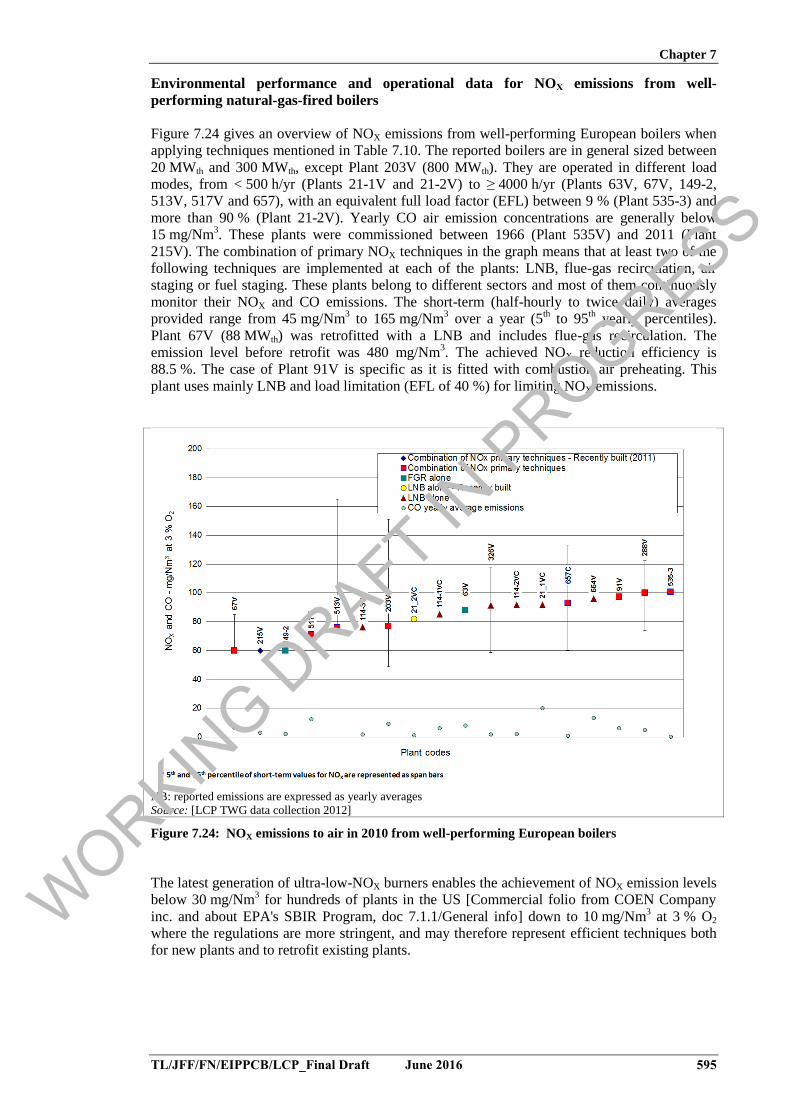
Chapter 7
TL/JFF/FN/EIPPCB/LCP_Final Draft June 2016 595
Environmental performance and operational data for NOX emissions from well-
performing natural-gas-fired boilers
Figure 7.24 gives an overview of NOX emissions from well-performing European boilers when
applying techniques mentioned in Table 7.10. The reported boilers are in general sized between
20 MWth and 300 MWth, except Plant 203V (800 MWth). They are operated in different load
modes, from < 500 h/yr (Plants 21-1V and 21-2V) to ≥ 4000 h/yr (Plants 63V, 67V, 149-2,
513V, 517V and 657), with an equivalent full load factor (EFL) between 9 % (Plant 535-3) and
more than 90 % (Plant 21-2V). Yearly CO air emission concentrations are generally below
15 mg/Nm3. These plants were commissioned between 1966 (Plant 535V) and 2011 (Plant
215V). The combination of primary NOX techniques in the graph means that at least two of the
following techniques are implemented at each of the plants: LNB, flue-gas recirculation, air
staging or fuel staging. These plants belong to different sectors and most of them continuously
monitor their NOX and CO emissions. The short-term (half-hourly to twice daily) averages
provided range from 45 mg/Nm3 to 165 mg/Nm
3 over a year (5
th to 95
th yearly percentiles).
Plant 67V (88 MWth) was retrofitted with a LNB and includes flue-gas recirculation. The
emission level before retrofit was 480 mg/Nm3. The achieved NOX reduction efficiency is
88.5 %. The case of Plant 91V is specific as it is fitted with combustion air preheating. This
plant uses mainly LNB and load limitation (EFL of 40 %) for limiting NOX emissions.
NB: reported emissions are expressed as yearly averages
Source: [LCP TWG data collection 2012]
Figure 7.24: NOX emissions to air in 2010 from well-performing European boilers
The latest generation of ultra-low-NOX burners enables the achievement of NOX emission levels
below 30 mg/Nm3 for hundreds of plants in the US [Commercial folio from COEN Company
inc. and about EPA's SBIR Program, doc 7.1.1/General info] down to 10 mg/Nm3 at 3 % O2
where the regulations are more stringent, and may therefore represent efficient techniques both
for new plants and to retrofit existing plants.
WORKIN
G DRAFT IN
PROGRESS

Chapter 7
596 June 2016 TL/JFF/FN/EIPPCB/LCP_Final Draft
7.1.3.2.2 General techniques for the prevention and control of NOX and CO emissions from natural-gas-fired turbines
Information on general techniques for the prevention and control of NOX, CO and NH3
emissions is given in Section 3.2.2.3. Table 7.11 to Table 7.13 and Figure 7.25 to Figure 7.30
give information specific to natural-gas-fired turbines, e.g. on environmental performances,
economics and example plants.
WORKIN
G DRAFT IN
PROGRESS
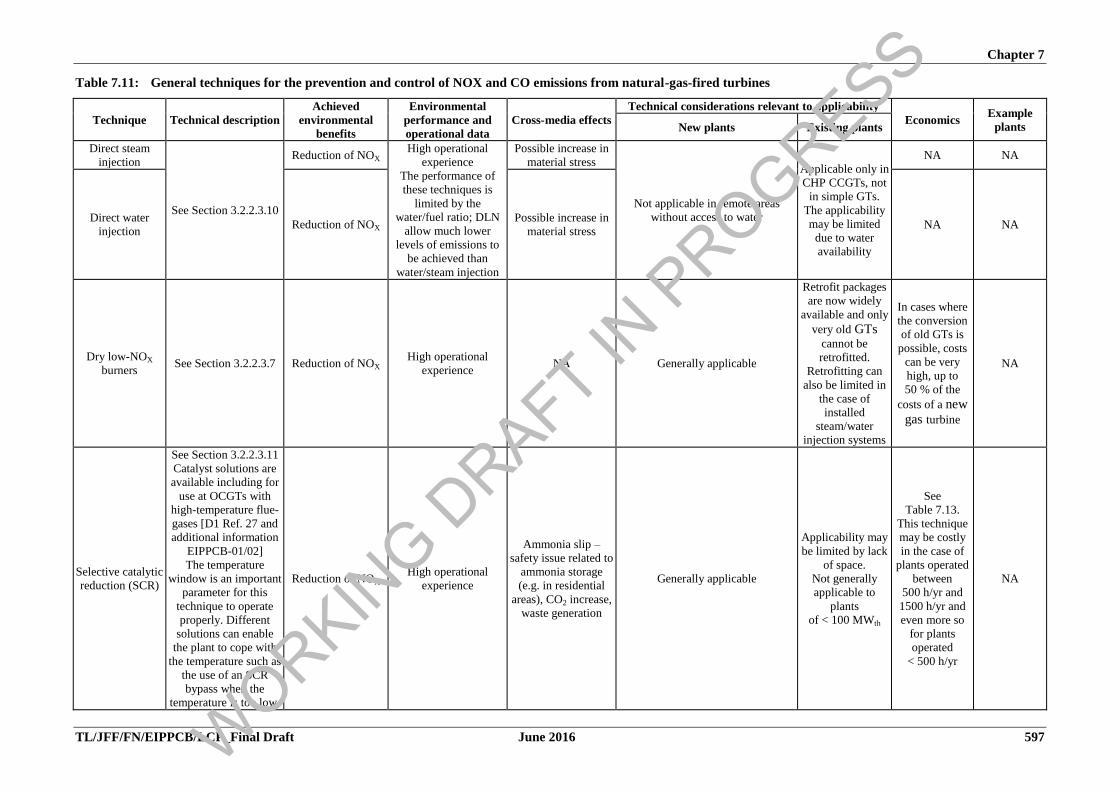
Chapter 7
TL/JFF/FN/EIPPCB/LCP_Final Draft June 2016 597
Table 7.11: General techniques for the prevention and control of NOX and CO emissions from natural-gas-fired turbines
Technique Technical description
Achieved
environmental
benefits
Environmental
performance and
operational data
Cross-media effects
Technical considerations relevant to applicability
Economics Example
plants New plants Existing plants
Direct steam
injection
See Section 3.2.2.3.10
Reduction of NOX High operational
experience
The performance of
these techniques is
limited by the
water/fuel ratio; DLN
allow much lower
levels of emissions to
be achieved than
water/steam injection
Possible increase in
material stress
Not applicable in remote areas
without access to water
Applicable only in
CHP CCGTs, not
in simple GTs.
The applicability
may be limited
due to water
availability
NA NA
Direct water
injection Reduction of NOX
Possible increase in
material stress NA NA
Dry low-NOX
burners See Section 3.2.2.3.7 Reduction of NOX
High operational
experience NA Generally applicable
Retrofit packages
are now widely
available and only
very old GTs
cannot be
retrofitted.
Retrofitting can
also be limited in
the case of
installed
steam/water
injection systems
In cases where
the conversion
of old GTs is
possible, costs
can be very
high, up to
50 % of the
costs of a new
gas turbine
NA
Selective catalytic
reduction (SCR)
See Section 3.2.2.3.11
Catalyst solutions are
available including for
use at OCGTs with
high-temperature flue-
gases [D1 Ref. 27 and
additional information
EIPPCB-01/02]
The temperature
window is an important
parameter for this
technique to operate
properly. Different
solutions can enable
the plant to cope with
the temperature such as
the use of an SCR
bypass when the
temperature is too low,
Reduction of NOX High operational
experience
Ammonia slip –
safety issue related to
ammonia storage
(e.g. in residential
areas), CO2 increase,
waste generation
Generally applicable
Applicability may
be limited by lack
of space.
Not generally
applicable to
plants
of < 100 MWth
See
Table 7.13.
This technique
may be costly
in the case of
plants operated
between
500 h/yr and
1500 h/yr and
even more so
for plants
operated
< 500 h/yr
NA
WORKIN
G DRAFT IN
PROGRESS

Chapter 7
598 June 2016 TL/JFF/FN/EIPPCB/LCP_Final Draft
the proper location of
the SCR system and/or
the use of special
catalysts [see docs Ref
27, additional
information EIPPCB-
01/02/05/08]
Oxidation catalyst See Section 3.2.2.7.2
Reduction
(conversion) of CO
into CO2 and of
unburnt carbon
Limited operational
experience for gas
turbines
SO3 and NO
generation;
CO2 increase;
waste (catalyst)
generation
Generally applicable
Applicability may
be limited by lack
of space, load
requirements and
sulphur content
High capex
Low opex
Plants 162,
164
Cheng steam
injection cycle See Section 3.2.3.3
Simultaneous NOX
reduction and
energy efficiency
increase
NA NA NA NA NA NA
Catalytic
combustion See Section 11.6.1.4
Reduction of NOX.
No ammonia slip
Catalytic combustor
technology was
identified in the 2006
LCP BREF as a very
promising technology
with very low NOX
emissions down to
about 5–6 mg/Nm3.
The technique is so far
only commercially
available for low-
efficiency gas turbines
[EUTurbine comments
to D1]
NA Under development NA
Investment and
maintenance
costs in same
order as for
SCR
[EUTurbine
comments]
NA
Advanced control
system
Automatic regulation
of the main combustion
parameters (air/fuel
ratio at each row of the
burner, air excess, flue-
gas temperature at the
combustion chamber
outlet, etc.) - see also
Section 3.2.3.8
Reduction of NOX
and CO, and energy
efficiency increase
High operational
experience None Generally applicable
The applicability
to old combustion
plants may be
constrained by the
need to retrofit the
combustion and/or
control command
system(s)
NA NA
Combustion
optimisation See Section 3.2.2.7.1
Reduction of NOX
and CO emissions NA NA Generally applicable NA NA
Low-NOX burners
for supplementary
firing
See Section 3.2.2.3.5 Reduction of NOX High operational
experience NA NA NA NA NA
NA = No relevant specific information available
WORKIN
G DRAFT IN
PROGRESS

Chapter 7
TL/JFF/FN/EIPPCB/LCP_Final Draft June 2016 599
Additional information on economics for applying SCR at a gas turbine
Table 7.12: Typical cost components for applying SCR at a gas turbine
Cost Percentage share of
total investment
Installation:
reactor housing
ammonia supply (storage,
vaporisation and injection
systems)
flue-gas ducting
monitoring and control equipment
electro technical installations
insulation, painting, etc.
30 – 40 %
Construction and start-up 20 – 30 %
Planning, licensing, unforeseen 10 %
First catalyst filling 30 %
Table 7.13: Typical cost figures for applying SCR at a gas turbine
Catalyst volume (operation range 300–360 °C) 0.1 m3/MWth
Catalyst price EUR 10 000/m3
Source: [EUTurbines comments to D1 – 2013]
Related operating costs include the costs for ammonia consumption, steam consumption,
electricity consumption, catalyst replacement, maintenance and repair, insurance and taxes, and
possibly personnel, administration and catalyst disposal costs. For an 800 MWth CCGT,
operating costs are about EUR 300 000/yr for 8000 operating hours/yr without including the
cost due to pressure drop. This would result in EUR 0.2 million per 1 mbar over the whole
lifetime, i.e. about EUR 1 million with a typical pressure drop of 5 mbar.
[EUTurbines comments to D1 – 2013]
A UK cost estimate for retrofitting a gas turbine with SCR is presented in Table 7.14. This case
study refers to a 375 MWe plant being retrofitted with SCR in the HRSG or in a tail-end
configuration, operated 6000 h/yr over a 10-year amortisation period [UKTWG10].
WORKIN
G DRAFT IN
PROGRESS
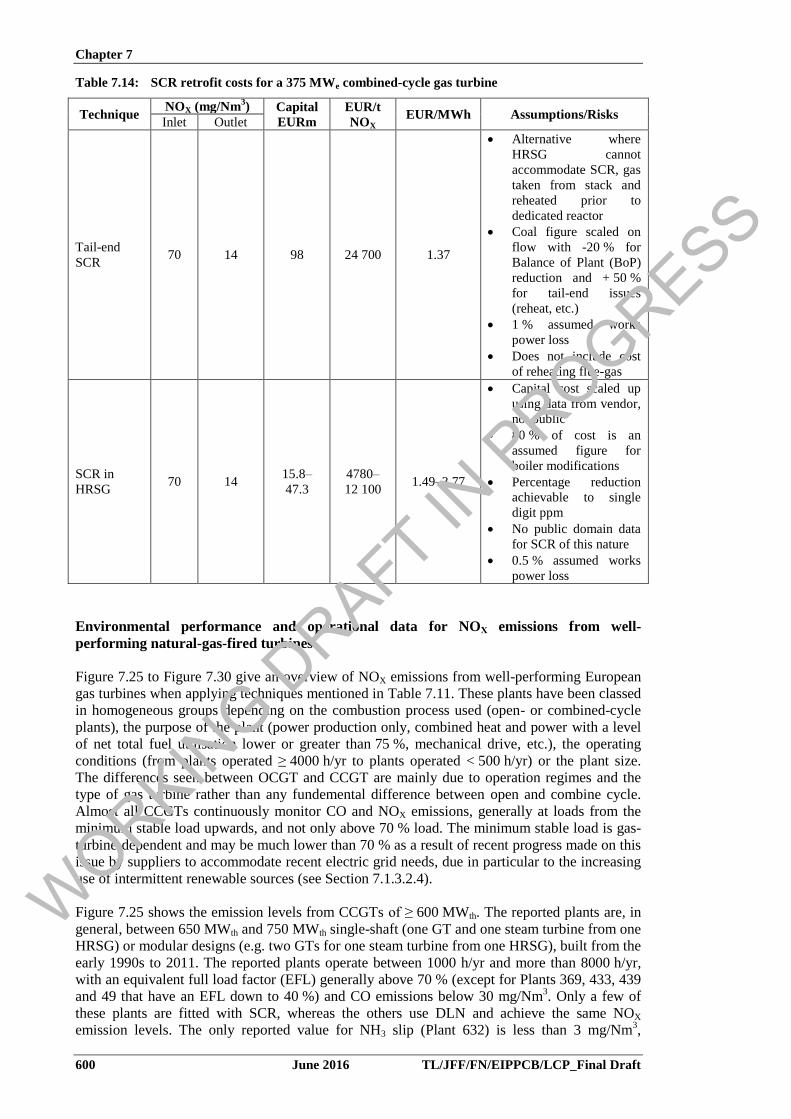
Chapter 7
600 June 2016 TL/JFF/FN/EIPPCB/LCP_Final Draft
Table 7.14: SCR retrofit costs for a 375 MWe combined-cycle gas turbine
Technique NOX (mg/Nm
3) Capital
EURm
EUR/t
NOX EUR/MWh Assumptions/Risks
Inlet Outlet
Tail-end
SCR 70 14 98 24 700 1.37
Alternative where
HRSG cannot
accommodate SCR, gas
taken from stack and
reheated prior to
dedicated reactor
Coal figure scaled on
flow with -20 % for
Balance of Plant (BoP)
reduction and + 50 %
for tail-end issues
(reheat, etc.)
1 % assumed works
power loss
Does not include cost
of reheating flue-gas
SCR in
HRSG 70 14
15.8–
47.3
4780–
12 100 1.49–3.77
Capital cost scaled up
using data from vendor,
not public
80 % of cost is an
assumed figure for
boiler modifications
Percentage reduction
achievable to single
digit ppm
No public domain data
for SCR of this nature
0.5 % assumed works
power loss
Environmental performance and operational data for NOX emissions from well-
performing natural-gas-fired turbines
Figure 7.25 to Figure 7.30 give an overview of NOX emissions from well-performing European
gas turbines when applying techniques mentioned in Table 7.11. These plants have been classed
in homogeneous groups depending on the combustion process used (open- or combined-cycle
plants), the purpose of the plant (power production only, combined heat and power with a level
of net total fuel utilisation lower or greater than 75 %, mechanical drive, etc.), the operating
conditions (from plants operated ≥ 4000 h/yr to plants operated < 500 h/yr) or the plant size.
The differences seen between OCGT and CCGT are mainly due to operation regimes and the
type of gas turbine rather than any fundemental difference between open and combine cycle.
Almost all CCGTs continuously monitor CO and NOX emissions, generally at loads from the
minimum stable load upwards, and not only above 70 % load. The minimum stable load is gas-
turbine-dependent and may be much lower than 70 % as a result of recent progress made on this
issue by suppliers to accommodate recent electric grid needs, due in particular to the increasing
use of intermittent renewable sources (see Section 7.1.3.2.4).
Figure 7.25 shows the emission levels from CCGTs of ≥ 600 MWth. The reported plants are, in
general, between 650 MWth and 750 MWth single-shaft (one GT and one steam turbine from one
HRSG) or modular designs (e.g. two GTs for one steam turbine from one HRSG), built from the
early 1990s to 2011. The reported plants operate between 1000 h/yr and more than 8000 h/yr,
with an equivalent full load factor (EFL) generally above 70 % (except for Plants 369, 433, 439
and 49 that have an EFL down to 40 %) and CO emissions below 30 mg/Nm3. Only a few of
these plants are fitted with SCR, whereas the others use DLN and achieve the same NOX
emission levels. The only reported value for NH3 slip (Plant 632) is less than 3 mg/Nm3,
WORKIN
G DRAFT IN
PROGRESS

Chapter 7
TL/JFF/FN/EIPPCB/LCP_Final Draft June 2016 601
consistent with the performance declared by SCR suppliers. The short-term (from half-hourly to
daily) averages provided range from < 5 mg/Nm3 to about 50 mg/Nm
3, over a year (based on 5
th
to 95th percentiles of short-term averages, with the exception of one 95
th percentile reaching
100 mg/Nm3) when using DLN alone or in combination with SCR.
In the large set of plants that reported information, very few plants of ≥ 600 MWth have a net
total fuel utilisation above 75 %. These plants with a high level of heat supply may have higher
NOX emissions, as shown by the example Plant 49 which achieves a yearly average NOX
emission level of 48 mg/Nm3 whilst having an operating net total fuel utilisation of 88.7 %.
NB: reported emissions are expressed as yearly averages
Source: [LCP TWG data collection 2012]
Figure 7.25: NOX and CO emissions to air in 2010 from well-performing European CCGTs of
≥ 600 MWth
For smaller CCGTs (50–600 MWth), the level of NOX emissions can be different when the
plants are mainly dedicated to the production of heat instead of electricity, as shown below.
Figure 7.26 and Figure 7.27 provide NOX emission levels from well-performing European gas
turbines sized from 90 MWth to about 500 MWth, built from the early 1990s to 2011, and fitted
with DLN, steam/water injection, and/or LNBs for supplementary firing at the HRSG level. The
reported plants operate between 1000 h/yr and more than 8000 h/yr, with an equivalent full load
factor above 45 % and CO emissions in general below 30 mg/Nm3. Two separate graphs are
presented for plants more dedicated to CHP uses (with a net total fuel utilisation above 75 % in
CHP mode) and plants more focused on power generation (with an operating net total fuel
utilisation below 75 %). The NOX emission hourly averages range from 5 mg/Nm3 to
58 mg/Nm3 within a year (5
th to 95
th yearly percentiles) for plants with an operating net total
fuel utilisation below 75 %, and from 12 mg/Nm3 to 100 mg/Nm
3 for plants with an operating
net total fuel utilisation utilisation above this level.
WORKIN
G DRAFT IN
PROGRESS

Chapter 7
602 June 2016 TL/JFF/FN/EIPPCB/LCP_Final Draft
NB: reported emissions are expressed as yearly averages
Source: [LCP TWG data collection 2012]
Figure 7.26: NOX and CO emissions to air in 2010 from well-performing European CCGTs of 50–
600 MWth with a net total fuel utilisation of < 75 %
NB: reported emissions are expressed as yearly averages
Source: [LCP TWG data collection 2012]
Figure 7.27: NOX and CO emissions to air in 2010 from well-performing European CCGTs of 50–
600 MWth with a net total fuel utilisation of ≥ 75 %
WORKIN
G DRAFT IN
PROGRESS
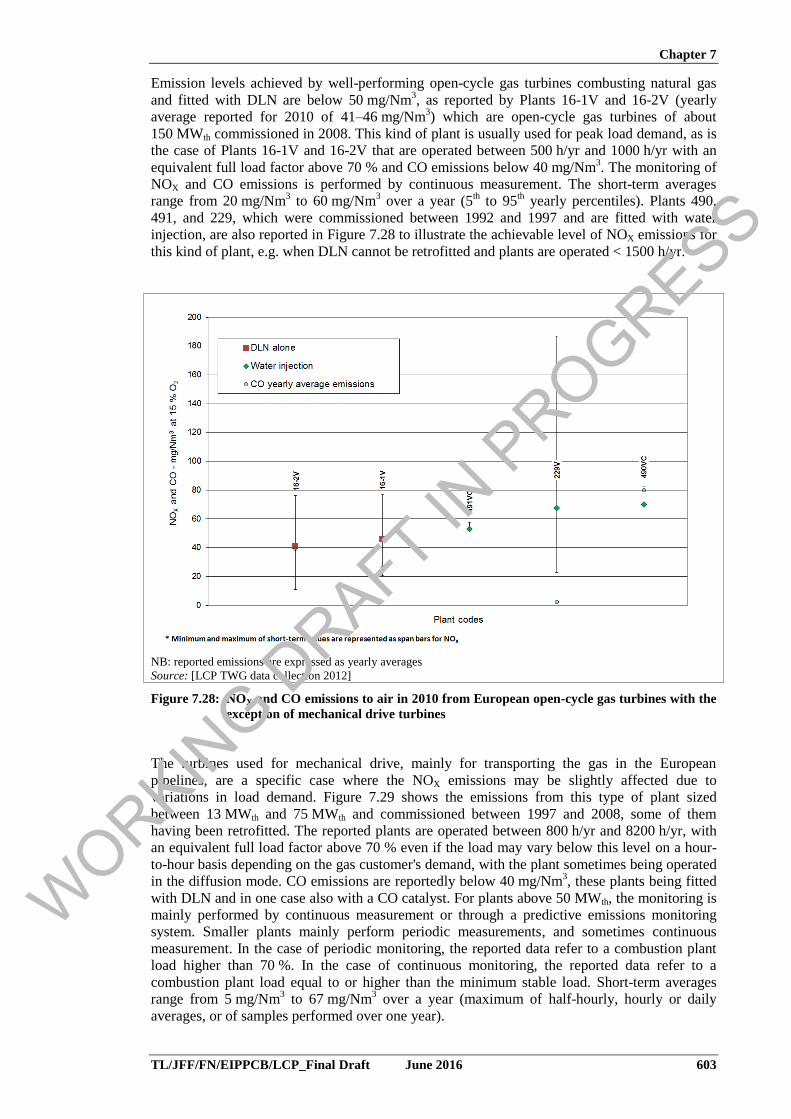
Chapter 7
TL/JFF/FN/EIPPCB/LCP_Final Draft June 2016 603
Emission levels achieved by well-performing open-cycle gas turbines combusting natural gas
and fitted with DLN are below 50 mg/Nm3, as reported by Plants 16-1V and 16-2V (yearly
average reported for 2010 of 41–46 mg/Nm3) which are open-cycle gas turbines of about
150 MWth commissioned in 2008. This kind of plant is usually used for peak load demand, as is
the case of Plants 16-1V and 16-2V that are operated between 500 h/yr and 1000 h/yr with an
equivalent full load factor above 70 % and CO emissions below 40 mg/Nm3. The monitoring of
NOX and CO emissions is performed by continuous measurement. The short-term averages
range from 20 mg/Nm3 to 60 mg/Nm
3 over a year (5
th to 95
th yearly percentiles). Plants 490,
491, and 229, which were commissioned between 1992 and 1997 and are fitted with water
injection, are also reported in Figure 7.28 to illustrate the achievable level of NOX emissions for
this kind of plant, e.g. when DLN cannot be retrofitted and plants are operated < 1500 h/yr.
NB: reported emissions are expressed as yearly averages
Source: [LCP TWG data collection 2012]
Figure 7.28: NOX and CO emissions to air in 2010 from European open-cycle gas turbines with the
exception of mechanical drive turbines
The turbines used for mechanical drive, mainly for transporting the gas in the European
pipelines, are a specific case where the NOX emissions may be slightly affected due to
variations in load demand. Figure 7.29 shows the emissions from this type of plant sized
between 13 MWth and 75 MWth and commissioned between 1997 and 2008, some of them
having been retrofitted. The reported plants are operated between 800 h/yr and 8200 h/yr, with
an equivalent full load factor above 70 % even if the load may vary below this level on a hour-
to-hour basis depending on the gas customer's demand, with the plant sometimes being operated
in the diffusion mode. CO emissions are reportedly below 40 mg/Nm3, these plants being fitted
with DLN and in one case also with a CO catalyst. For plants above 50 MWth, the monitoring is
mainly performed by continuous measurement or through a predictive emissions monitoring
system. Smaller plants mainly perform periodic measurements, and sometimes continuous
measurement. In the case of periodic monitoring, the reported data refer to a combustion plant
load higher than 70 %. In the case of continuous monitoring, the reported data refer to a
combustion plant load equal to or higher than the minimum stable load. Short-term averages
range from 5 mg/Nm3 to 67 mg/Nm
3 over a year (maximum of half-hourly, hourly or daily
averages, or of samples performed over one year).
WORKIN
G DRAFT IN
PROGRESS
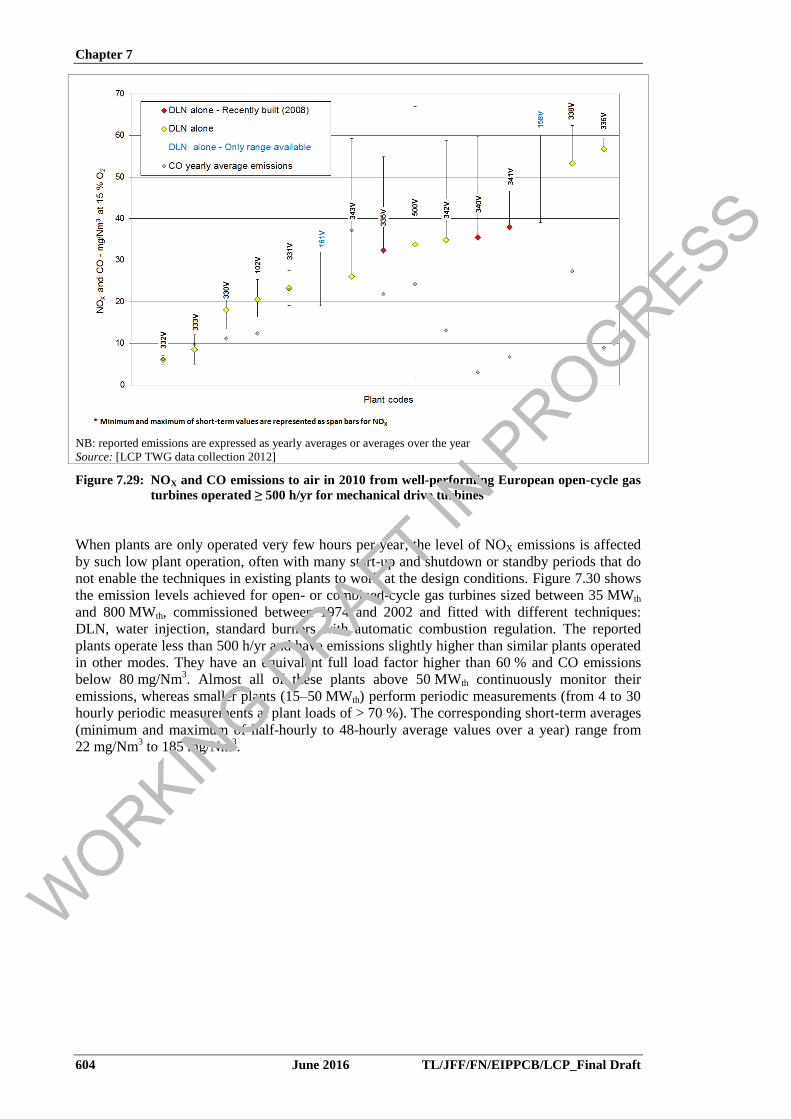
Chapter 7
604 June 2016 TL/JFF/FN/EIPPCB/LCP_Final Draft
NB: reported emissions are expressed as yearly averages or averages over the year
Source: [LCP TWG data collection 2012]
Figure 7.29: NOX and CO emissions to air in 2010 from well-performing European open-cycle gas
turbines operated ≥ 500 h/yr for mechanical drive turbines
When plants are only operated very few hours per year, the level of NOX emissions is affected
by such low plant operation, often with many start-up and shutdown or standby periods that do
not enable the techniques in existing plants to work at the design conditions. Figure 7.30 shows
the emission levels achieved for open- or combined-cycle gas turbines sized between 35 MWth
and 800 MWth, commissioned between 1974 and 2002 and fitted with different techniques:
DLN, water injection, standard burners with automatic combustion regulation. The reported
plants operate less than 500 h/yr and have emissions slightly higher than similar plants operated
in other modes. They have an equivalent full load factor higher than 60 % and CO emissions
below 80 mg/Nm3. Almost all of these plants above 50 MWth continuously monitor their
emissions, whereas smaller plants (15–50 MWth) perform periodic measurements (from 4 to 30
hourly periodic measurements at plant loads of > 70 %). The corresponding short-term averages
(minimum and maximum of half-hourly to 48-hourly average values over a year) range from
22 mg/Nm3 to 185 mg/Nm
3.
WORKIN
G DRAFT IN
PROGRESS

Chapter 7
TL/JFF/FN/EIPPCB/LCP_Final Draft June 2016 605
NB: reported emissions are expressed as yearly averages or averages over the year
Source: [LCP TWG data collection 2012]
Figure 7.30: NOX and CO emissions to air in 2010 from well-performing European gas turbines
operated < 500 h/yr
7.1.3.2.3 Specific techniques for the prevention and control of NOX and CO
emissions from natural-gas-fired turbines – Catalytic pollution control SCONOX
TM system
Description
Use of a single catalyst that operates by simultaneously oxidising CO to CO2, NO to NO2, and
then absorbing NO2 onto its surface through the use of a potassium carbonate absorber coating.
This technique does not require ammonia injection.
Technical description
This technique uses a single catalyst that operates over two cycles: oxidation/absorption and
regeneration. The catalyst works by simultaneously oxidising CO to CO2 and NO to NO2, and
then by absorbing NO2 onto its surface through the use of a potassium carbonate (K2CO3)
absorber coating. The regeneration of the catalyst is accomplished by passing a controlled
mixture of regeneration gases across the surface of the catalyst in the absence of oxygen. The
regeneration gases are steam, hydrogen and carbon dioxide. It uses no ammonia and can operate
effectively at temperatures ranging from 150 °C to 370 °C. The system emits CO2, H2O, N2 and
trace levels of SO2 to the stack. Due to masking and poisoning of the catalyst, it requires annual
catalyst cleaning with deionised water and a K2CO3 solution. The spent cleaning fluids can be
neutralised and disposed of through the sewerage system and are harmless to the water and soil.
An example of a SCONOXTM
system is shown in Figure 7.31.
WORKIN
G DRAFT IN
PROGRESS
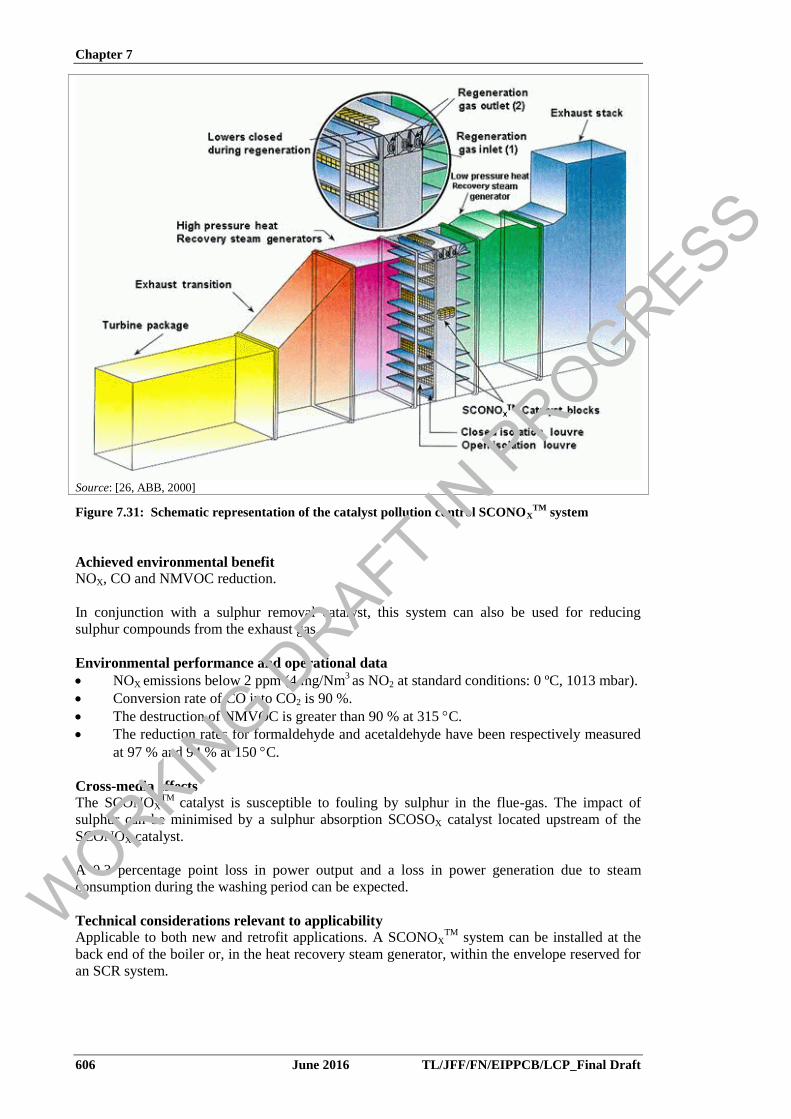
Chapter 7
606 June 2016 TL/JFF/FN/EIPPCB/LCP_Final Draft
Source: [26, ABB, 2000]
Figure 7.31: Schematic representation of the catalyst pollution control SCONOXTM
system
Achieved environmental benefit
NOX, CO and NMVOC reduction.
In conjunction with a sulphur removal catalyst, this system can also be used for reducing
sulphur compounds from the exhaust gas.
Environmental performance and operational data
NOX emissions below 2 ppm (4 mg/Nm3 as NO2 at standard conditions: 0 ºC, 1013 mbar).
Conversion rate of CO into CO2 is 90 %.
The destruction of NMVOC is greater than 90 % at 315 C.
The reduction rates for formaldehyde and acetaldehyde have been respectively measured
at 97 % and 94 % at 150 C.
Cross-media effects
The SCONOXTM
catalyst is susceptible to fouling by sulphur in the flue-gas. The impact of
sulphur can be minimised by a sulphur absorption SCOSOX catalyst located upstream of the
SCONOX catalyst.
A 0.3 percentage point loss in power output and a loss in power generation due to steam
consumption during the washing period can be expected.
Technical considerations relevant to applicability
Applicable to both new and retrofit applications. A SCONOXTM
system can be installed at the
back end of the boiler or, in the heat recovery steam generator, within the envelope reserved for
an SCR system.
WORKIN
G DRAFT IN
PROGRESS

Chapter 7
TL/JFF/FN/EIPPCB/LCP_Final Draft June 2016 607
Economics
The estimated cost figures presented below refer to a typical 400 MWe gas-fired power plant.
They are based on 8000 hours of operation per year and a NOX reduction from 25 ppm to 5 ppm
(50 mg/Nm3
to 10 mg/Nm3 as NO2 at standard conditions: 0 ºC, 1013 mbar), which equals
approximately 666 tonnes annually of NOX removed. Included in the costings are investment
costs, operating and maintenance costs, and indirect annual costs.
Investment costs: EUR 19.2 million
This includes: - plant equipment
- delivery
- fitting
- commissioning/start-up.
This is the total cost from the supplier.
Operating and maintenance costs: EUR 1.6 million per year
This includes: - general maintenance
- steam and natural gas consumption in the regeneration
cycle
- energy cost due to pressure drop across the unit
- average cost per year for catalyst replacement (lifetime
of the catalyst is seven years)
- catalyst disposal/refund.
Additional indirect annual costs to the contractor are not included.
A reduction of NOX from 25 ppm to 2 ppm (50 mg/Nm3
to 4 mg/Nm3
as NO2 at standard
conditions: 0 ºC, 1013 mbar) would increase the investment costs due to the need for an
additional catalyst and would somewhat increase the operating and maintenance costs due to the
increased consumption of natural gas and steam, and due to the increased pressure drop.
Driving force for implementation
Requirements to achieve very low NOX emissions and comply with limitations set on using air
pollution control equipment utilising ammonia, especially for plants situated in densely
populated areas.
Example plants
45 MWe gas turbine at Redding Electric municipal plant (United States).
32 MWe Sunlaw federal cogeneration plant (United States).
5 MWe Wyeth Biopharma plant (United States).
15 MWe University of California, San Diego, cogeneration plant (United States).
Reference literature
[26, ABB, 2000] [49, De Cicco et al. 2004] [ 49, DeCicco et al. 2004 ]
7.1.3.2.4 Prevention and control of NOX and CO emissions from natural-gas-fired
turbines at low load
7.1.3.2.4.1 Low-load operation point (LLOP)
Description
Gas turbine operation at very low load whilst keeping NOX and CO emissions at low levels.
This is enabled by a double combustion stage system that can be decoupled when the power
demand is low, allowing the running of only one row of burners with the associated gas turbine
blading.
WORKIN
G DRAFT IN
PROGRESS
Chapter 7
608 June 2016 TL/JFF/FN/EIPPCB/LCP_Final Draft
Technical description
The electricity market is generally characterised by significant variations in demand during
daytime and night-time. For CCGTs, this results in the need to increase the load during the day
and decrease it during the night, or even shut down the unit. LLOP is useful in both conditions.
If a shutdown is not requested, it allows the unit to operate at a lower load than the conventional
minimum load compatible with the performance of the gas turbine during commercial
operation, also called Minimum Environmental Load (MEL), while keeping pollutant emissions
under control. In case a shutdown is needed only for a few hours, keeping the turbine at LLOP
instead of shutting it down can result in lower emissions from the plant and a lower impact on
the machine lifetime.
LLOP is achieved using a unique configuration of the gas turbine that incorporates a double
combustion stage. A first row of burners is located between the air compressor and the first gas
turbine stage. After the first gas turbine stage, a second row of burners is located, followed by
the remaining part of the gas turbine blading.
In normal operation, both the burner rows are in service and the natural gas is almost evenly
distributed between the two of them. LLOP is achieved by switching off the second burner row
and operating the machine with only the first one. In this condition, the efficiency of the plant is
slightly reduced, but the unit is capable of supporting a very limited load (about 17 % of the
maximum load).
At LLOP, emissions are kept low. Emissions are higher during the transition from MEL to
LLOP, but the time needed for this transition is very short, resulting in a limited amount of total
emissions. In comparison, shutdowns and start-ups are characterised by high emissions for a
longer period of time, which in the case of a short (a few hours) shutdown period usually results
in higher total emissions than by maintaining the plant at LLOP throughout the same period.
At LLOP, the flue-gas temperature is lower than in normal operation, resulting in steam of a
lower temperature being produced. In order to limit thermal stresses on the steam turbine, it is
necessary to gradually control the steam temperature with desuperheaters, during the transition
from MEL to LLOP, and vice versa. Generally the emissions during transition from MEL to
LLOP mode are authorised as transient emissions.
Achieved environmental benefit
Compared to MEL operation, LLOP enables a reduction both in the emission of pollutants and
in natural gas consumption during periods of low or no power demand.
Environmental performance and operational data
If compared to a shutdown and the following start-up cycle, LLOP results in lower emissions of
pollutants if the requested shutdown period is limited to only a few hours.
For example, in the case of the Gissi Plant (Plant 195: Italy, 720 MWth), during shutdown and
the following start-up cycle, NOX and CO emissions can reach, respectively, 215 kg and 55 kg,
whereas during the LLOP mode, NOX and CO emissions reach, respectively, 95 kg and 25 kg.
During the LLOP mode, pollutant concentrations for NOX and CO are below 30 mg/Nm3. For
this example plant, if in 2011 the operator had used the LLOP mode instead of shutdown
followed by a start-up cycle, 990 kg of CO and 3960 kg of NOX emissions would have been
avoided.
In terms of fuel consumption, during shutdown and the following start-up cycle, 45 000 m3 of
natural gas is combusted, whereas 84 000 m3 is combusted during four hours in LLOP mode.
Cross-media effects
Greater consumption of natural gas if compared with start-up/shutdown cycles.
WORKIN
G DRAFT IN
PROGRESS

Chapter 7
TL/JFF/FN/EIPPCB/LCP_Final Draft June 2016 609
Technical considerations relevant to applicability
Application of this technique may be limited by the availability of an appropriate retrofit
package for the installed gas turbine.
Economics
The investment needed to implement LLOP relates to some modifications of the control logic
and the installation of bigger steam desuperheaters in the boiler.
In the example of the Gissi plant, the extra capex to implement LLOP capabilities, while
construction of the plant was already ongoing, was EUR 3.25 million for the unit (720 MWth).
The technique requires negligible additional opex, because no additional components are
installed at the plant. The only difference is the size of components compared with the original
design (e.g. bigger steam desuperheater), but maintenance requirements remain the same.
Driving force for implementation
Emission savings during the periods of low electricity prices.
Lower impact on the lifetime of the machine compared to using shutdown and start-up
cycles, which lead to higher stress on the materials.
Example plant
Plant 195.
7.1.3.2.4.2 Airflow control with improved inlet guided vanes (IGV)
Description
Use of specially designed inlet guided vanes (IGV) located in the air combustion path to better
control the level of oxygen, depending on the load variations of the gas turbine, thus enabling
the same levels of CO and NOX emissions to be maintained at lower loads.
Technical description
The system allows the increase of the airflow control capability, whilst reducing CO and NOX
emissions in a gas turbine load range, which is extended down to 43–45 %. The main
modifications are a new IGV and the first two stages of the compressor vanes and nozzles
profile, as well as a new fast-hydraulic IGV actuator.
In Plant 191, the use of three stages of variable guide vanes on the gas turbine compressor
allows accurate control of the mass flow through the gas turbine, through the entire operational
load range. This allows part-load operation conditions to be optimised, so that a high exhaust
temperature is maintained. This in turn gives excellent part-load thermal efficiency.
Achieved environmental benefits
The technique allows the reduction of the operating gas turbine load down to 43–45 %, thereby
reducing the fuel consumption during off-peak hours, whilst still keeping NOX and CO
emissions under control. The achievable minimum load is constrained by CO formation, which
is influenced by a thorough control of air inflow.
Environmental performance and operational data
Hourly NOX emissions of < 35 mg/Nm3 in the full range of loads, with CO emissions of
< 7 mg/Nm3.
Cross-media effects
None.
Technical considerations relevant to applicability
Applicable to annular combustor-type gas turbines. Air/fuel ratio control is a concern for all gas
turbines ('annular' and 'cannular' combustor types). In annular combustor gas turbines, the
WORKIN
G DRAFT IN
PROGRESS
Chapter 7
610 June 2016 TL/JFF/FN/EIPPCB/LCP_Final Draft
problem can be magnified due to the fact that the fuel rate cannot be controlled separately for
each combustor, whereas cannular GTs allow control of the fuel rate. However, cannular
combustors are more complex.
Economics
Capex for this technique is about EUR 1.5 million for one gas turbine. The payback time can be
short, depending on the frequency and duration of the power market conditions that justify
running the unit at minimum technical load.
Driving force for implementation
Better efficiency and flexibility to react to the fluctuations of the power ancillary services
market.
Example plants
Plants 191, 276 and 278.
7.1.3.2.4.3 Gas turbine inlet excess air management via a bleed valve discharge
Description
The technique used is a DLN utilising excess inlet air management to optimise the flame
temperature control.
Technical description
Inlet excess air management is achieved via a bleed valve discharging, according to the load,
part of the gas turbine compressor air.
Achieved environmental benefits
Significant reduction of CO emissions at low load, whilst maintaining low NOX emissions.
Environmental performance and operational data
For Plant 102 (24 MWth, France), hourly average CO concentrations vary from 1 mg/Nm3 to
195 mg/Nm3 over a year, and the yearly average is 12 mg/Nm
3.
The hourly average for NOX emissions to air varies between 2 mg/Nm3 and 37 mg/Nm
3, with a
yearly average of 28 mg/Nm3.
Cross-media effects
There is no related waste, and a negligible effect on energy efficiency.
Technical considerations relevant to applicability
The technique is not applicable to all DLN-type technologies or gas turbine designs/sizes.
Applicability is higher for smaller gas turbines and lower for aeroderivative gas turbines at
lower loads.
Economics
No information provided.
Driving force
No information provided.
Example plants
Plant 102.
Reference literature
No information provided.
WORKIN
G DRAFT IN
PROGRESS

Chapter 7
TL/JFF/FN/EIPPCB/LCP_Final Draft June 2016 611
7.1.3.2.5 General techniques for the prevention and control of NOX and unburnt
carbon emissions from natural-gas-fired engines
Information on general techniques for the prevention and control of NOX, unburnt carbon and
NH3 emissions is given in Section 3.2.2.3. Table 7.15 gives information specific to natural-gas-
fired engines More detailed information on environmental performance and operational data,
economics, cross-media effects and driving forces is given after the table.
WORKIN
G DRAFT IN
PROGRESS

Chapter 7
612 June 2016 TL/JFF/FN/EIPPCB/LCP_Final Draft
Table 7.15: General techniques for the prevention and control of NOX and unburnt carbon emissions from natural-gas-fired stationary engines
Technique Technical
description
Achieved
environmental
benefits
Environmental
performance and
operational data
Cross-media
effects
Technical considerations
relevant to applicability Economics
Example
plants Reference literature
New plants Existing
plants
Lean-burn
concept
See Section
3.2.2.3.9
Reduction of
NOX NA NA
Generally
applicable Not applicable NA NA NA
Advanced
control system See Section 3.2.3.8
Reduction of
NOX, CO,
NMVOC, CH4
slip
NA NA Generally
applicable
The
applicability to
old combustion
plants may be
constrained by
the need to
retrofit the
combustion
and/or control
command
system(s)
NA NA NA
Selective
catalytic
reduction
(SCR)
See Section
3.2.2.3.11
Reduction of
NOX NA
Ammonia slip –
safety issue
related to
ammonia storage
(e.g. in residential
areas)
Generally
applicable
Applicable
within the
constraints
associated with
space
availability
Plant-
specific –
See example
Table 7.17
This
technique
may be
costly in the
case of plants
operated
between
500 h/yr and
1500 h/yr
and even
more so for
plants
operated
< 500 h/yr
Plants 353,
354
[78, Finkeldei, 2000],
[184, Krishnan, 2002]
WORKIN
G DRAFT IN
PROGRESS

Chapter 7
TL/JFF/FN/EIPPCB/LCP_Final Draft June 2016 613
NA NA NA NA
A plant that operates very few
hours (e.g. less than two hours
per shift) with many start-
ups/shutdowns (e.g. one to
three per day) may face
difficulties to reach the
optimum system efficiency if
the load varies a lot. This
would require a special
catalyst design that may not be
economically viable for plants
operated < 1500 h/yr
NA NA NA
Oxidation
catalyst
See Section
3.2.2.7.2
The oxidation
catalyst reduction
efficiency for
NMVOC is very
dependent on the
hydrocarbon
composition in the
flue-gas, ethane and
propane being
especially difficult
to remove.
Reduction of
NMVOC, and
conversion of
CO into CO2
< 100 mg/Nm3 for
CO emissions
Generally
applicable for
spark-ignited
lean-burn
(SG) and dual
fuel (DF)
engines
Applicable for
spark-ignited
lean-burn (SG)
and dual fuel
(DF) engines
within the
constraints
associated with
space
availability
Plant 186-1
NA = No relevant specific information available
WORKIN
G DRAFT IN
PROGRESS

Chapter 7
614 June 2016 TL/JFF/FN/EIPPCB/LCP_Final Draft
Environmental performance and operational data for NOX and unburnt carbon emissions
from gas-fired engines
Well-performing SG- and DF-type engines achieve yearly NOX emission levels below
100 mg/Nm3. Recent examples, Plants 353V and 354V, commissioned in 2010, operated
between 3500 h/yr and 4000 h/yr, and fitted with the lean-burn concept and SCR, achieve yearly
average NOX emissions of 27–28 mg/Nm3 with maximum hourly averages over the year up to
105–110 mg/Nm3.
Table 7.16 lists the main performance parameters in the case of two other example gas-fired
engine plants fitted with SCR.
Table 7.16: Emission levels of two gas-fired engine power plants equipped with SCR
Plant A Plant B
Location US US
Commissioning year 2002 2001
Plant type Power generation Power generation
Fuel Natural gas Natural gas
Combustion technique 20 gas engines 5 gas engines
Capacity 111 MW 14 MW
Secondary technique SCR
(Reagent: aqueous urea)
SCR
(Reagent: aqueous urea)
NOX without SCR
(mg/Nm3)
159 187
NOX with fresh SCR catalyst *
(mg/Nm3) at 15 vol-% O2
5 – 19 13
NOX reduction rate over SCR 88 – 97 % 93 %
Ammonia slip (NH3)
(mg/Nm3) at 15 vol-% O2
2 – 6 < 2
* This NOX corresponding values are reached under ideal conditions using a new and fresh catalyst and are not
expected to be always achieved throughout the lifetime of the catalyst
Engines operated < 1500 h/yr generally achieve an equivalent level of NOX emissions to
engines operated in other load modes. Should it not be possible to use SCR for plants operated
< 500 h/yr with many start-ups/shutdowns and with a highly variable load, higher emission
levels are expected, as shown by Plant 186-1 which is not fitted with SCR and reports NOX
emission levels of about 175 mg/Nm3 as the maximum of three periodic samples over a year.
The Dutch competent authority performed a study between 2007 (10 engines monitored) and
2009 (30 engines monitored) on small engines (< 5 MWe corresponding to about 11 MWth), and
completed it in 2011 with a further 10 engines. The study reports unburnt hydrocarbon
emissions (average of at least three 30-minute measurements under full load) between
330 mg/Nm3 and 500 mg/Nm
3 expressed as C at MCR (maximum continuous rating) and at
15 % O2. The control of unburnt hydrocarbon emissions may be improved by acting on the main
engine process parameters affecting the in-cylinder conditions relevant for hydrocarbon
emissions which are the air to fuel ratio, the ignition timing and the intake manifold
temperature. Another important parameter determining the unburnt hydrocarbon emission base
level is the size of the combustion chamber crevices.
[NL KEMA 2009 Overview report of follow-up study into methane emissions from gas engines
at continuous full load, updated by NL KEMA 2012 study on hydrocarbon emissions from gas
engine CHP units 2011 measurement program]
WORKIN
G DRAFT IN
PROGRESS
Chapter 7
TL/JFF/FN/EIPPCB/LCP_Final Draft June 2016 615
A study was performed by the Danish competent authority in 2006–2007 in order to get
operational feedback on formaldehyde reduction efficiency by using formaldehyde oxidation
catalysts (five test engines monitored, sized between 2 MWe and 5.1 MWe). Formaldehyde is
formed by partial oxidation of natural gas and is a carcinogen. Reduction efficiencies of about
85 % could be achieved in 10 000 hours of operation, with a decrease of 10 percentage points in
the catalyst reduction efficiency after this period of operation. Formaldehyde emission levels of
between 3.8 mg/Nm3 and 7.5 mg/Nm
3 (15 % O2) could be estimated for operating cycles
between 20 000 hours and 40 000 hours, with a catalyst with one or two layers, depending on
the initial level of emissions at engines with a typical electrical efficiency of about 30 %. The
reduction of unburnt carbon (mainly ethane and propane) after 10 000 hours of operation could
reach 6 % and the reduction of CO emission levels could reach 98 %. The study also concluded
on the possibility to use alternative techniques (Incineration and Recuperative UHC catalysts)
that, despite a higher cost, would also allow the reduction of unburnt carbon at a high rate
(> 98 %).
[DK Study – 2007]
Cross-media effects
Engine optimisation is a compromise between NOX emissions, engine efficiency (fuel
consumption, and thus CO2 emission) and other emissions (such as CO and hydrocarbons
(HC)). A reduction in NOX emissions by primary techniques comes at the expense of increased
CO2 emissions (fuel consumption) as well as unburnt emissions, such as CO and HC, and may
also finally lead to misfiring, which might eventually damage the engine. When SCR is used to
reduce NOX emissions, the air to fuel ratio can be optimised for the best fuel efficiency, and thus
emissions of unburnt substances can also be reduced. Modern gas engines are knock-limited and
therefore the potential for operating engines in a richer fuel mode for improved efficiency (and
higher NOX) and lower CO and HC emissions is limited, as other boundary conditions such as
engine knock must be respected.
As the lean-burn engine operates in a leaner mode at lower NOX levels with higher specific fuel
consumption, the flue-gas temperature gets colder, and as a consequence the useful heat that can
be recovered from the flue-gas (e.g. for steam production in a CHP plant) decreases.
In engines fitted with SCR, urea is mainly used as the reagent, which may result in a certain
amount of ammonia being emitted to the air. The catalyst needs to be changed at certain
intervals in order to maintain the SCR efficiency and the used catalyst is either regenerated or
treated as waste.
[ 23, Finland 2012 ]
Economics
In Europe but in isolated systems, gas engines are usually operated only during part of the year
(i.e. during winter, when there is a need for heating), typically up to 3500–4000 h/yr and/or for
grid stability needs, and also to support the introduction of renewable energy. Customers are
both industry and utilities. In plant applications with varying load conditions, care should be
taken to avoid overheating ('cracking') of the SCR catalysts. In ECCA countries, many gas
engines are also used in CHP plants.
The costs reported in Table 7.17 have been defined for an engine of about 20 MWth or 8.7 MWe
operated for 4000 h/yr. For comparability with other sectors, discounting over 10 years is
considered to calculate annual costs, with an interest rate of 4 % (however, it has to be kept in
mind that although a reciprocating engine in remote areas, e.g. islands, might have a 10-year
payback time, small plants on the mainland are often private, with a much shorter payback
period, i.e. less than 5 years).
Table 7.17 shows the detailed costs of fitting an example engine power plant with SCR.
WORKIN
G DRAFT IN
PROGRESS
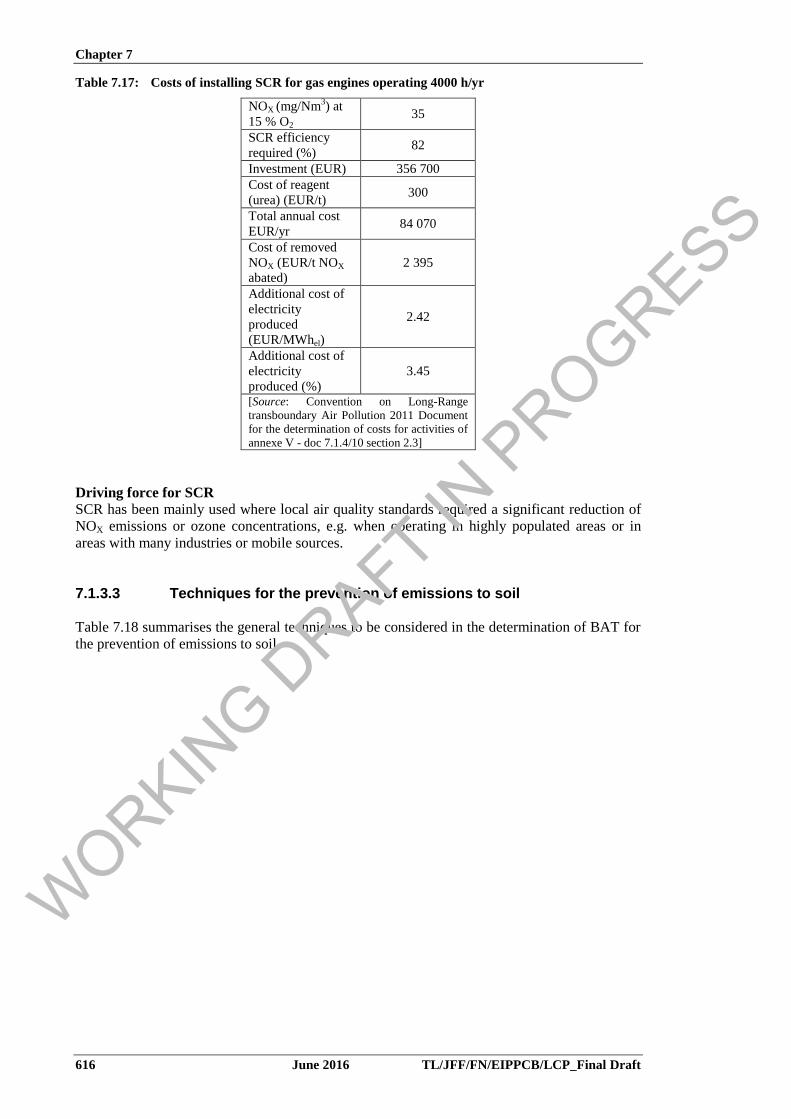
Chapter 7
616 June 2016 TL/JFF/FN/EIPPCB/LCP_Final Draft
Table 7.17: Costs of installing SCR for gas engines operating 4000 h/yr
NOX (mg/Nm3) at
15 % O2 35
SCR efficiency
required (%) 82
Investment (EUR) 356 700
Cost of reagent
(urea) (EUR/t) 300
Total annual cost
EUR/yr 84 070
Cost of removed
NOX (EUR/t NOX
abated)
2 395
Additional cost of
electricity
produced
(EUR/MWhel)
2.42
Additional cost of
electricity
produced (%)
3.45
[Source: Convention on Long-Range
transboundary Air Pollution 2011 Document
for the determination of costs for activities of
annexe V - doc 7.1.4/10 section 2.3]
Driving force for SCR
SCR has been mainly used where local air quality standards required a significant reduction of
NOX emissions or ozone concentrations, e.g. when operating in highly populated areas or in
areas with many industries or mobile sources.
7.1.3.3 Techniques for the prevention of emissions to soil
Table 7.18 summarises the general techniques to be considered in the determination of BAT for
the prevention of emissions to soil.
WORKIN
G DRAFT IN
PROGRESS

Chapter 7
TL/JFF/FN/EIPPCB/LCP_Final Draft June 2016 617
Table 7.18: Techniques for the prevention of emissions to soil
Technique Technical
description
Achieved
environmental
benefits
Cross-
media
effects
Technical considerations
relevant to applicability Economi
cs New plants
Existing
plants
Soil
protection
Install liquid-
tight paving (e.g.
concrete) with
drainage systems
(including oil
separators to
avoid water and
soil
contamination
caused by
lubrication oil)
in areas where
operations that
could result in
soil
contamination
are carried out,
and before
treatment in a
settling pond for
example
Prevention of
soil and
groundwater
contamination
None Generally
applicable
Generally
applicable
High
operation
al
experienc
e. Cost
for waste
water
treatment
WORKIN
G DRAFT IN
PROGRESS
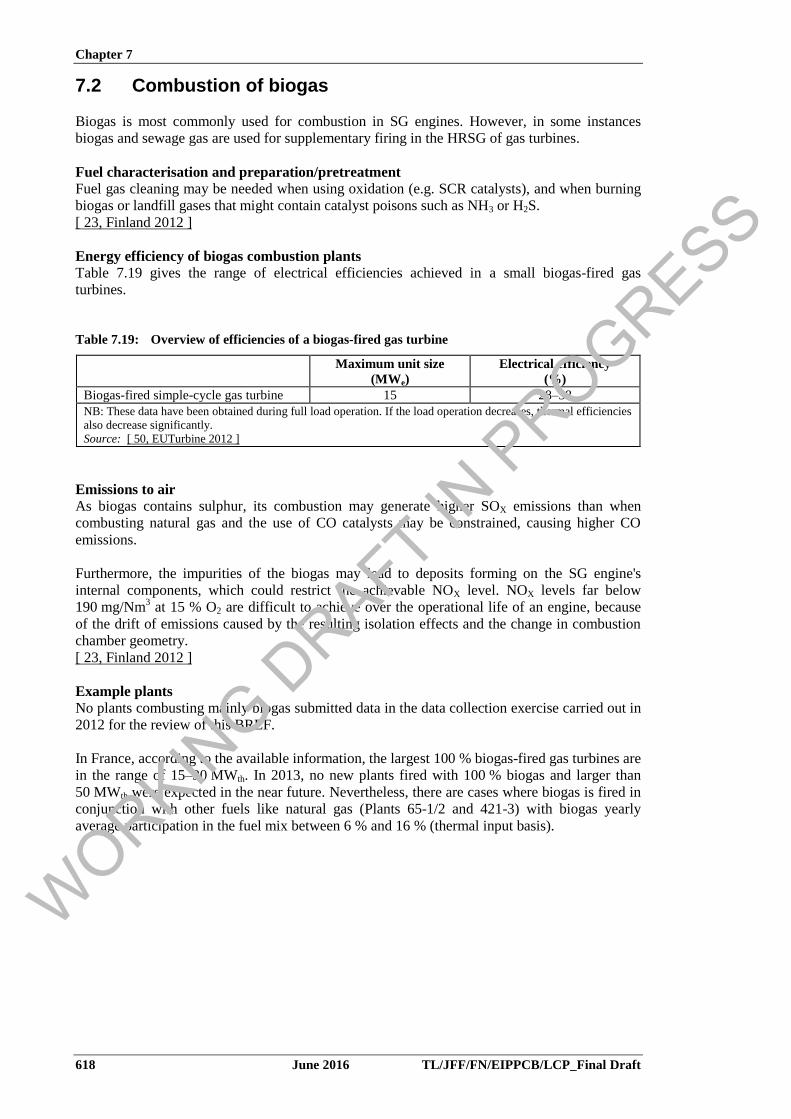
Chapter 7
618 June 2016 TL/JFF/FN/EIPPCB/LCP_Final Draft
7.2 Combustion of biogas
Biogas is most commonly used for combustion in SG engines. However, in some instances
biogas and sewage gas are used for supplementary firing in the HRSG of gas turbines.
Fuel characterisation and preparation/pretreatment
Fuel gas cleaning may be needed when using oxidation (e.g. SCR catalysts), and when burning
biogas or landfill gases that might contain catalyst poisons such as NH3 or H2S.
[ 23, Finland 2012 ]
Energy efficiency of biogas combustion plants
Table 7.19 gives the range of electrical efficiencies achieved in a small biogas-fired gas
turbines.
Table 7.19: Overview of efficiencies of a biogas-fired gas turbine
Maximum unit size
(MWe)
Electrical efficiency
(%)
Biogas-fired simple-cycle gas turbine 15 28–38
NB: These data have been obtained during full load operation. If the load operation decreases, thermal efficiencies
also decrease significantly.
Source: [ 50, EUTurbine 2012 ]
Emissions to air
As biogas contains sulphur, its combustion may generate higher SOX emissions than when
combusting natural gas and the use of CO catalysts may be constrained, causing higher CO
emissions.
Furthermore, the impurities of the biogas may lead to deposits forming on the SG engine's
internal components, which could restrict the achievable NOX level. NOX levels far below
190 mg/Nm3 at 15 % O2 are difficult to achieve over the operational life of an engine, because
of the drift of emissions caused by the resulting isolation effects and the change in combustion
chamber geometry.
[ 23, Finland 2012 ]
Example plants
No plants combusting mainly biogas submitted data in the data collection exercise carried out in
2012 for the review of this BREF.
In France, according to the available information, the largest 100 % biogas-fired gas turbines are
in the range of 15–30 MWth. In 2013, no new plants fired with 100 % biogas and larger than
50 MWth were expected in the near future. Nevertheless, there are cases where biogas is fired in
conjunction with other fuels like natural gas (Plants 65-1/2 and 421-3) with biogas yearly
average participation in the fuel mix between 6 % and 16 % (thermal input basis).
WORKIN
G DRAFT IN
PROGRESS
Chapter 7
TL/JFF/FN/EIPPCB/LCP_Final Draft June 2016 619
7.3 Combustion of process gases from the iron and steel industry
7.3.1 Specific applied processes and techniques
In the European Union, the established route for the primary production of steel is via the blast
furnace (BF) and the basic oxygen furnace (BOF). Iron oxides are reduced in the blast furnace
process utilising the gases carbon monoxide (CO) and, to a lesser extent, hydrogen (H2) derived
from coke and other reductants, such as injected coal, oil, moisture, etc. CO is generated in the
blast furnace by oxidation of the coke by oxygen in the oxygen-enriched blast air. In order to
drive the reduction of the iron oxides at a commercial rate, the gases leaving the blast furnace
must contain some residual reducing gases, CO and H2, together with significant levels of N2
and CO2. The resulting blast furnace gas (BF gas or BFG) will thus have a small heating
potential when fully oxidised. The hot metal produced by the blast furnace contains impurities,
notably carbon, silicon and manganese, which have to be removed. This is achieved by
oxidation in the BOF; the silicon and manganese are removed in the slag, while the carbon is
removed in gaseous form. During the oxidation of the carbon in the iron in the BOF, the off-gas
will contain sufficient quantities of CO to allow it to be used as a fuel (BOF gas). The coke
used in the blast furnace is often produced on site, using recovery coke ovens, in which the
coals are effectively distilled in an oxygen-free environment to produce coke and coke oven gas
(COG). The coke oven gas contains significant amounts of methane and hydrogen so that, once
cleaned, it can be utilised as a high calorific value fuel gas.
Throughout the production route, from raw materials to finished steel, coal is fundamental in
providing the reductant and gaseous energy source for the majority of the processes in an
integrated steelworks. The process gases are produced as a consequence of the operations to
produce metallurgical coke (COG), to produce hot metal (iron) in the blast furnace (BFG), and
to convert this hot metal to steel in the basic oxygen furnace (BOF gas).
The three process gases, coke oven gas (COG), blast furnace gas (BF gas) and basic oxygen
furnace gas (BOF gas), have significantly different compositions and consequently calorific
values. Over the short term (minutes to hours) and over the longer term (weeks to years), the
process gases can vary significantly in volume, availability and composition. The gases are
produced at plants in different locations within a particular steelworks and, consequently, their
distribution to users can be complicated. Within an integrated steelworks, these gases are a
valuable energy source, but the planned or sudden loss of either a process-gas-consuming plant
e.g. a hot mill going down, or a process-gas-producing plant, e.g. the loss of a blast furnace in a
one- or two-furnace plant, has to be managed effectively to minimise flaring. In the steelworks,
boilers and gas turbines are the lowest-priority users, ahead of flaring excess gas, and thus are
the first to suffer depletion of supply when a particular gas is required to satisfy a process
demand elsewhere in the works. Consequently, the boilers and gas turbines are designed, as far
as possible, to be able to respond to these conditions and moderate the impact of these
fluctuations on the rest of the iron- and steelworks and, by minimising the flaring of gases, on
the environment.
The processes used in steel production are significant consumers of energy, so energy use is
strictly managed. This means that the energy flows in an integrated steelworks can be complex,
as illustrated in Figure 7.32. The top priority of energy management in the steelworks is to
optimise overall energy efficiency by maximising the use of process gases within the steelworks
itself. Different processes require gases with different calorific values for acceptable levels of
fuel efficiency, e.g. the higher the required process temperature, the greater the amount of high
calorific gases needed. Process gases are often blended to provide these varying requirements,
and systems to buffer fluctuations in process gas availability in the short term (less than an hour)
are used to regulate the quality and quantity of the fuel gases to some extent. Excess volumes of
process gases are utilised in Combined heat and power plants with the primary purpose of
producing steam for direct or indirect use in the steel industry production processes and with the
WORKIN
G DRAFT IN
PROGRESS
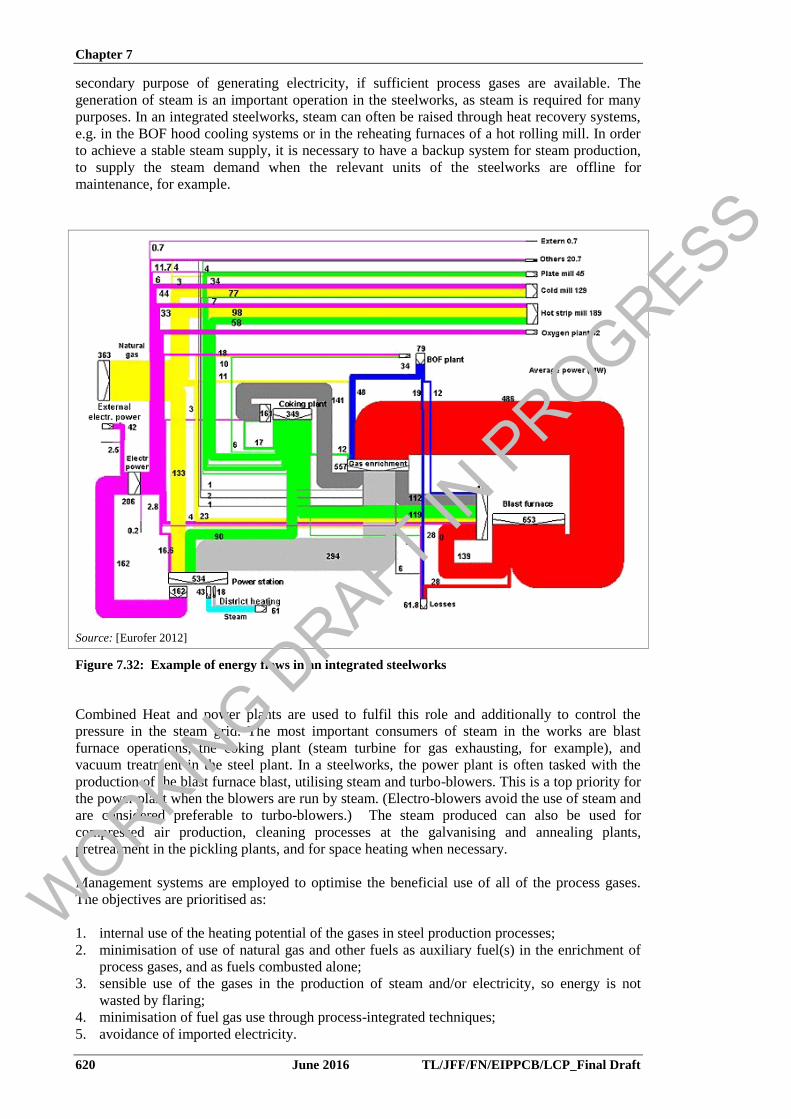
Chapter 7
620 June 2016 TL/JFF/FN/EIPPCB/LCP_Final Draft
secondary purpose of generating electricity, if sufficient process gases are available. The
generation of steam is an important operation in the steelworks, as steam is required for many
purposes. In an integrated steelworks, steam can often be raised through heat recovery systems,
e.g. in the BOF hood cooling systems or in the reheating furnaces of a hot rolling mill. In order
to achieve a stable steam supply, it is necessary to have a backup system for steam production,
to supply the steam demand when the relevant units of the steelworks are offline for
maintenance, for example.
Source: [Eurofer 2012]
Figure 7.32: Example of energy flows in an integrated steelworks
Combined Heat and power plants are used to fulfil this role and additionally to control the
pressure in the steam grid. The most important consumers of steam in the works are blast
furnace operations, the coking plant (steam turbine for gas exhausting, for example), and
vacuum treatment in the steel plant. In a steelworks, the power plant is often tasked with the
production of the blast furnace blast, utilising steam and turbo-blowers. This is a top priority for
the power plant when the blowers are run by steam. (Electro-blowers avoid the use of steam and
are considered preferable to turbo-blowers.) The steam produced can also be used for
compressed air production, cleaning processes at the galvanising and annealing plants,
pretreatment in the pickling plants, and for space heating when necessary.
Management systems are employed to optimise the beneficial use of all of the process gases.
The objectives are prioritised as:
1. internal use of the heating potential of the gases in steel production processes;
2. minimisation of use of natural gas and other fuels as auxiliary fuel(s) in the enrichment of
process gases, and as fuels combusted alone;
3. sensible use of the gases in the production of steam and/or electricity, so energy is not
wasted by flaring;
4. minimisation of fuel gas use through process-integrated techniques;
5. avoidance of imported electricity.
WORKIN
G DRAFT IN
PROGRESS

Chapter 7
TL/JFF/FN/EIPPCB/LCP_Final Draft June 2016 621
The processes employed in the preparation of the iron and steel process gases prior to their use
are described in the IS BREF (2012).
A good plant layout can facilitate the efficient distribution and use of the process gases and
purchased fuels in an integrated steelworks. COG, BF gas and BOF gas constitute the basis of
the energy system in an integrated steelworks. Most of the energy demand is satisfied by these
gases while the remaining demand is balanced with purchased energy, normally electrical
power, together with an auxiliary fuel (that may include natural gas, oil, coal, etc.) depending on
local availability and conditions. These aspects are illustrated in Figure 7.32. The plate mill, for
example, draws much of its energy requirement from the coke oven gas, some from the natural
gas 'make-up' and a small amount of electrical power that may be internally or, at times,
externally generated. Other steelworks lacking access to natural gas may use alternative
auxiliary fuels such as oil and coal.
7.3.1.1 Fuel characterisation and preparation/pretreatment
The three main process gases in the steel industry, COG, BFG and BOF gas, have quite
different characteristics, are produced from different processes, and can be consumed
throughout the works for many purposes, depending on the gas properties and availability in
terms of production and location within a site.
A comparison of the three process gases and an average natural gas is given in Figure 7.33,
where the inert gas portion includes nitrogen and carbon dioxide.
Source: [LCP TWG data collection 2012] [EUROFER 15.04.2013]
Figure 7.33: Comparison of iron and steel process gases and natural gas
Coke oven gas (COG)
Coke oven gas is derived from the dry distillation (coking) of specific types of coal to produce
metallurgical-grade coke, an essential burden component and the major reductant in the blast
furnace for the production of iron. Only certain coals can be converted to coke and several types
may be blended to achieve the desired coke properties. These coke properties are required for
WORKIN
G DRAFT IN
PROGRESS
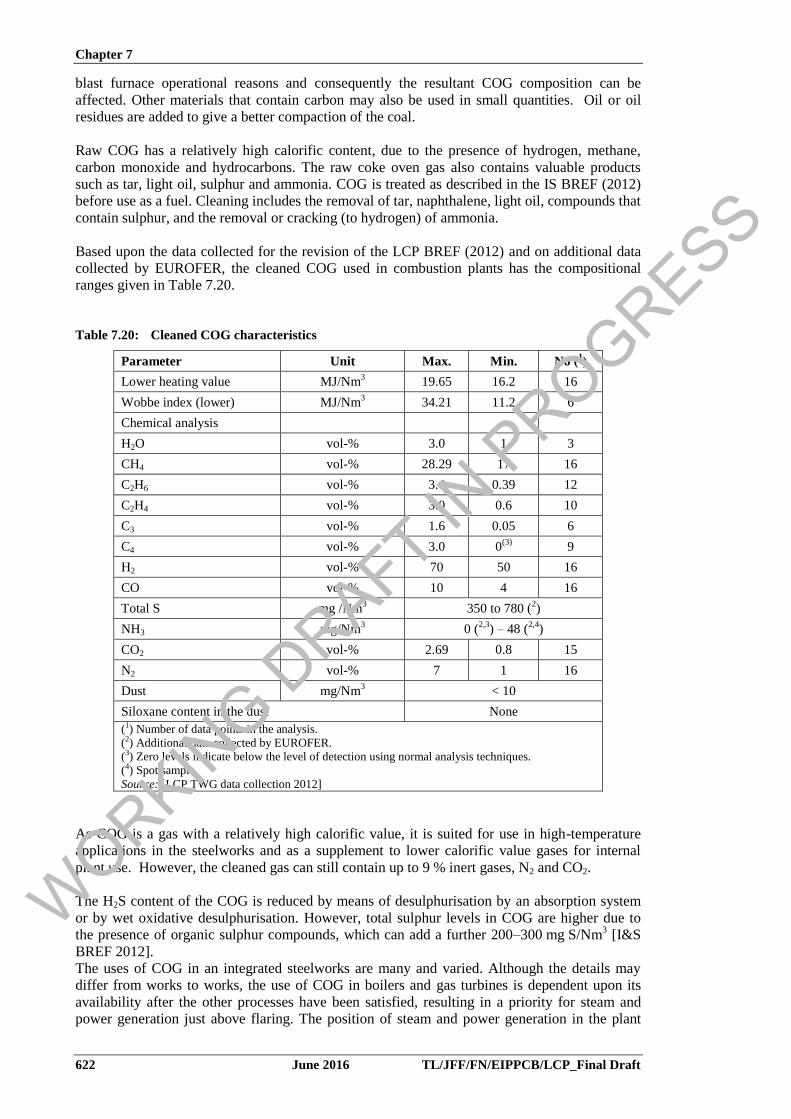
Chapter 7
622 June 2016 TL/JFF/FN/EIPPCB/LCP_Final Draft
blast furnace operational reasons and consequently the resultant COG composition can be
affected. Other materials that contain carbon may also be used in small quantities. Oil or oil
residues are added to give a better compaction of the coal.
Raw COG has a relatively high calorific content, due to the presence of hydrogen, methane,
carbon monoxide and hydrocarbons. The raw coke oven gas also contains valuable products
such as tar, light oil, sulphur and ammonia. COG is treated as described in the IS BREF (2012)
before use as a fuel. Cleaning includes the removal of tar, naphthalene, light oil, compounds that
contain sulphur, and the removal or cracking (to hydrogen) of ammonia.
Based upon the data collected for the revision of the LCP BREF (2012) and on additional data
collected by EUROFER, the cleaned COG used in combustion plants has the compositional
ranges given in Table 7.20.
Table 7.20: Cleaned COG characteristics
Parameter Unit Max. Min. No (1)
Lower heating value MJ/Nm3 19.65 16.2 16
Wobbe index (lower) MJ/Nm3 34.21 11.2 6
Chemical analysis
H2O vol-% 3.0 1 3
CH4 vol-% 28.29 17 16
C2H6 vol-% 3.4 0.39 12
C2H4 vol-% 3.0 0.6 10
C3 vol-% 1.6 0.05 6
C4 vol-% 3.0 0(3)
9
H2 vol-% 70 50 16
CO vol-% 10 4 16
Total S mg /Nm3 350 to 780 (
2)
NH3 mg/Nm3 0 (
2,3) – 48 (
2,4)
CO2 vol-% 2.69 0.8 15
N2 vol-% 7 1 16
Dust mg/Nm3 < 10
Siloxane content in the dust None
(1) Number of data points in the analysis.
(2) Additional data collected by EUROFER.
(3) Zero levels indicate below the level of detection using normal analysis techniques.
(4) Spot sample.
Source: [LCP TWG data collection 2012]
As COG is a gas with a relatively high calorific value, it is suited for use in high-temperature
applications in the steelworks and as a supplement to lower calorific value gases for internal
plant use. However, the cleaned gas can still contain up to 9 % inert gases, N2 and CO2.
The H2S content of the COG is reduced by means of desulphurisation by an absorption system
or by wet oxidative desulphurisation. However, total sulphur levels in COG are higher due to
the presence of organic sulphur compounds, which can add a further 200–300 mg S/Nm3 [I&S
BREF 2012].
The uses of COG in an integrated steelworks are many and varied. Although the details may
differ from works to works, the use of COG in boilers and gas turbines is dependent upon its
availability after the other processes have been satisfied, resulting in a priority for steam and
power generation just above flaring. The position of steam and power generation in the plant
WORKIN
G DRAFT IN
PROGRESS
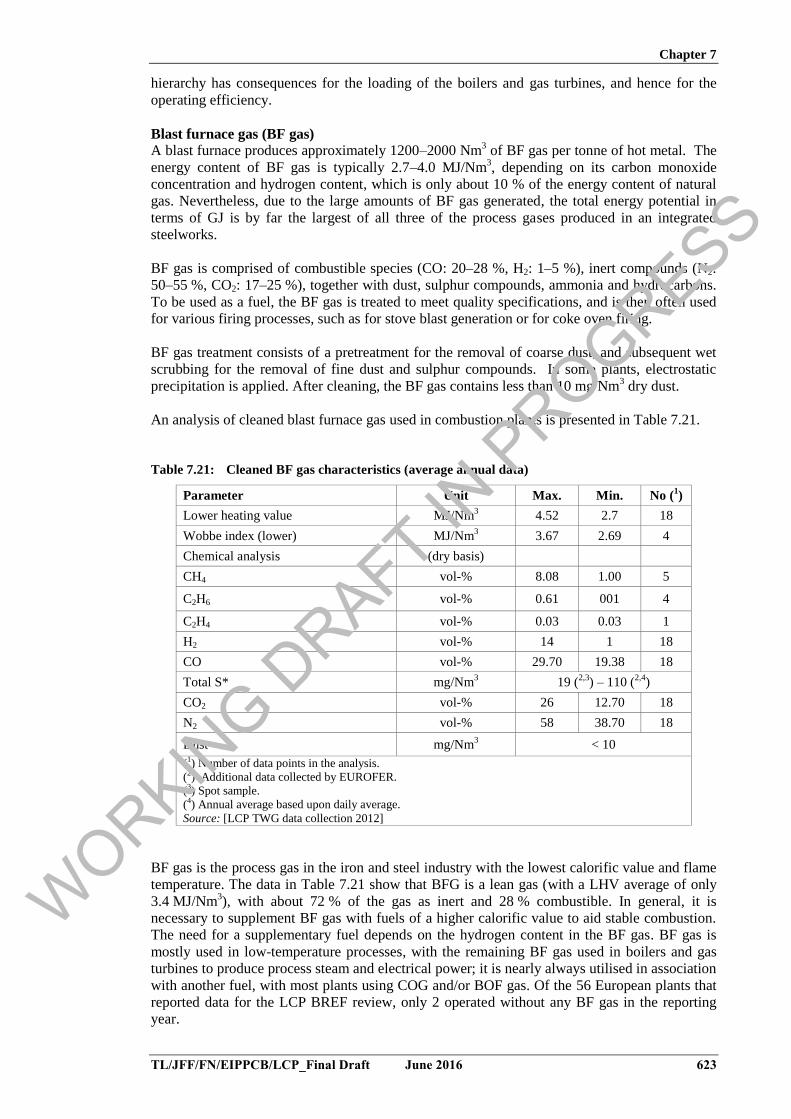
Chapter 7
TL/JFF/FN/EIPPCB/LCP_Final Draft June 2016 623
hierarchy has consequences for the loading of the boilers and gas turbines, and hence for the
operating efficiency.
Blast furnace gas (BF gas)
A blast furnace produces approximately 1200–2000 Nm3 of BF gas per tonne of hot metal. The
energy content of BF gas is typically 2.7–4.0 MJ/Nm3, depending on its carbon monoxide
concentration and hydrogen content, which is only about 10 % of the energy content of natural
gas. Nevertheless, due to the large amounts of BF gas generated, the total energy potential in
terms of GJ is by far the largest of all three of the process gases produced in an integrated
steelworks.
BF gas is comprised of combustible species (CO: 20–28 %, H2: 1–5 %), inert compounds (N2:
50–55 %, CO2: 17–25 %), together with dust, sulphur compounds, ammonia and hydrocarbons.
To be used as a fuel, the BF gas is treated to meet quality specifications, and is then often used
for various firing processes, such as for stove blast generation or for coke oven firing.
BF gas treatment consists of a pretreatment for the removal of coarse dust, and subsequent wet
scrubbing for the removal of fine dust and sulphur compounds. In some plants, electrostatic
precipitation is applied. After cleaning, the BF gas contains less than 10 mg/Nm3 dry dust.
An analysis of cleaned blast furnace gas used in combustion plants is presented in Table 7.21.
Table 7.21: Cleaned BF gas characteristics (average annual data)
Parameter Unit Max. Min. No (1)
Lower heating value MJ/Nm3 4.52 2.7 18
Wobbe index (lower) MJ/Nm3 3.67 2.69 4
Chemical analysis (dry basis)
CH4 vol-% 8.08 1.00 5
C2H6 vol-% 0.61 001 4
C2H4 vol-% 0.03 0.03 1
H2 vol-% 14 1 18
CO vol-% 29.70 19.38 18
Total S* mg/Nm3 19 (
2,3) – 110 (
2,4)
CO2 vol-% 26 12.70 18
N2 vol-% 58 38.70 18
Dust mg/Nm3 < 10
(1) Number of data points in the analysis.
(2) .Additional data collected by EUROFER.
(3) Spot sample.
(4) Annual average based upon daily average.
Source: [LCP TWG data collection 2012]
BF gas is the process gas in the iron and steel industry with the lowest calorific value and flame
temperature. The data in Table 7.21 show that BFG is a lean gas (with a LHV average of only
3.4 MJ/Nm3), with about 72 % of the gas as inert and 28 % combustible. In general, it is
necessary to supplement BF gas with fuels of a higher calorific value to aid stable combustion.
The need for a supplementary fuel depends on the hydrogen content in the BF gas. BF gas is
mostly used in low-temperature processes, with the remaining BF gas used in boilers and gas
turbines to produce process steam and electrical power; it is nearly always utilised in association
with another fuel, with most plants using COG and/or BOF gas. Of the 56 European plants that
reported data for the LCP BREF review, only 2 operated without any BF gas in the reporting
year.
WORKIN
G DRAFT IN
PROGRESS

Chapter 7
624 June 2016 TL/JFF/FN/EIPPCB/LCP_Final Draft
Basic oxygen furnace gas (BOF gas)
The hot metal (iron) produced in the blast furnace is saturated with carbon and contains other
elements such as silicon, manganese, sulphur and phosphorus. The sulphur content in the hot
metal is often removed prior to the BOF process step in a hot metal pretreatment station. In
essence, the undesirable elements are removed in the basic oxygen furnace by oxidation using a
blast of high purity oxygen, the carbon being mostly removed in gaseous form (CO), while the
silicon, manganese and phosphorus are oxidised and are removed as slag. The BOF process is a
batch process and oxygen blowing lasts for about 15 minutes in a total cycle of 30 to 40
minutes, depending on operating conditions. The generation of carbon monoxide is limited to
this blowing period. However, where possible, BOF gas is recovered, cleaned and short-term
buffered for subsequent use as a fuel. In some cases, it is not economically feasible to recover
the BOF gas for use as a fuel elsewhere in the steelworks, and the BOF gas is then combusted in
situ with the generation of steam, hot water or heat.
Recovering the energy potential from the BOF gas involves making efficient use of both the
sensible heat and the chemical energy in the BOF gas. In the past, most of the chemical energy
was dissipated by flaring. BOF gas produced during oxygen blowing leaves the BOF through
the converter mouth and is subsequently caught by the primary exhaust system. This gas has a
temperature of approximately 1200 °C and a flow rate of approximately 50–100 Nm3/t steel.
The gas contains approximately 70–80 % carbon monoxide (CO) when leaving the BOF and has
a heating value of 6–10 MJ/Nm3. Generally, two systems can be used to recover energy from
the converter gas, either partial/full combustion or suppressed combustion.
The cleaning of the recovered BOF gas is achieved by using the following techniques in
combination:
use of a suppressed combustion process;
pre-dedusting to remove coarse dust by means of dry separation techniques (e.g. deflector,
cyclone) or wet separators;
dust abatement by means of:
o dry dedusting (e.g. electrostatic precipitator) for new and existing plants,
o wet dedusting (e.g. wet electrostatic precipitator or scrubber) for existing plants.
The composition of the BOF gas varies with the process used, the recovery method and,
specifically, the oxygen volume. After treatment, the BOF gas available for use in the
combustion plants has the characteristics given in Table 7.22.
Table 7.22: Cleaned BOF gas characteristics (average annual data)
Parameter Unit Max. Min.
Lower heating value MJ/Nm3 8.40 6.34
Wobbe index (lower) MJ/Nm3 8.5 7.98
Chemical analysis
H2 vol-% 4.00 0.47
CO vol-% 69.05 52.52
CO2 vol-% 20.20 15.14
N2 vol-% 26.90 13.92
Dust mg/Nm3 < 10
NB: S compounds in BOF gas are below the level of detection using
normal analysis techniques.
Source: [LCP TWG data collection 2012]
BOF gas is classified as a lean gas in terms of calorific value, with an average LHV of
7.03 MJ/Nm3 and average Wobbe index of 8.40 MJ/Nm
3, but it belongs to the group of rich
WORKIN
G DRAFT IN
PROGRESS
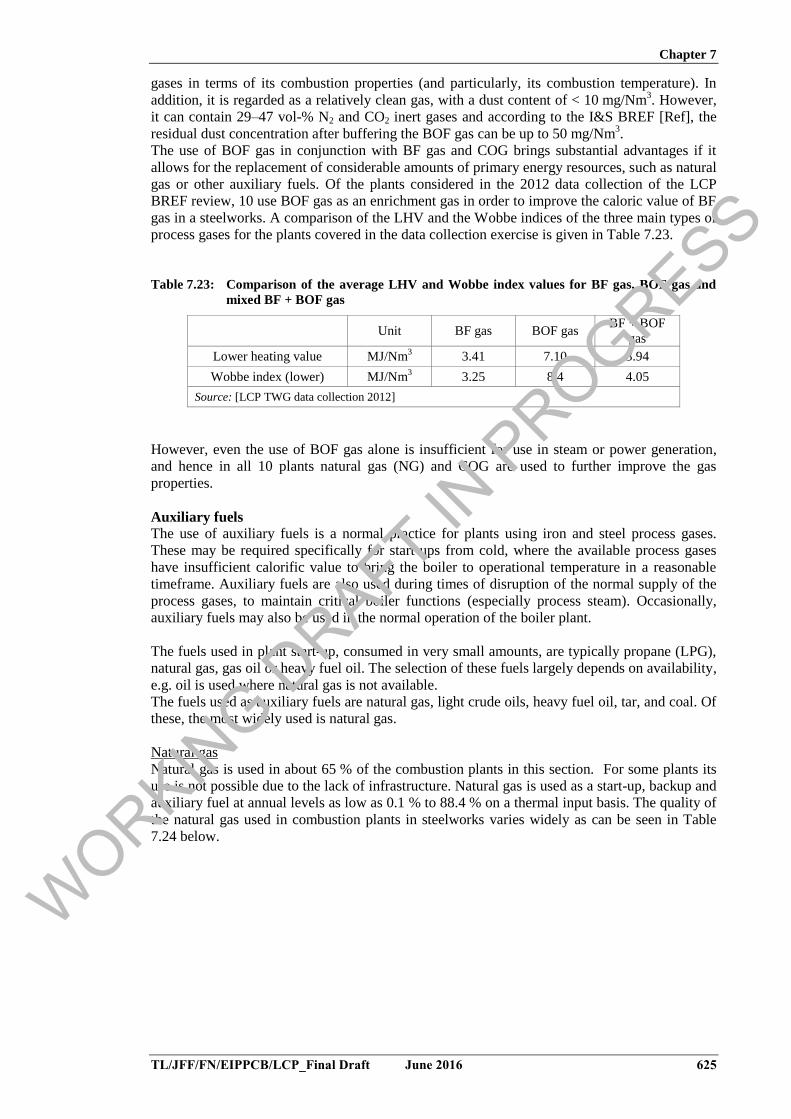
Chapter 7
TL/JFF/FN/EIPPCB/LCP_Final Draft June 2016 625
gases in terms of its combustion properties (and particularly, its combustion temperature). In
addition, it is regarded as a relatively clean gas, with a dust content of < 10 mg/Nm3. However,
it can contain 29–47 vol-% N2 and CO2 inert gases and according to the I&S BREF [Ref], the
residual dust concentration after buffering the BOF gas can be up to 50 mg/Nm3.
The use of BOF gas in conjunction with BF gas and COG brings substantial advantages if it
allows for the replacement of considerable amounts of primary energy resources, such as natural
gas or other auxiliary fuels. Of the plants considered in the 2012 data collection of the LCP
BREF review, 10 use BOF gas as an enrichment gas in order to improve the caloric value of BF
gas in a steelworks. A comparison of the LHV and the Wobbe indices of the three main types of
process gases for the plants covered in the data collection exercise is given in Table 7.23.
Table 7.23: Comparison of the average LHV and Wobbe index values for BF gas, BOF gas and
mixed BF + BOF gas
Unit BF gas BOF gas
BF + BOF
gas
Lower heating value MJ/Nm3 3.41 7.10 3.94
Wobbe index (lower) MJ/Nm3 3.25 8.4 4.05
Source: [LCP TWG data collection 2012]
However, even the use of BOF gas alone is insufficient for use in steam or power generation,
and hence in all 10 plants natural gas (NG) and COG are used to further improve the gas
properties.
Auxiliary fuels
The use of auxiliary fuels is a normal practice for plants using iron and steel process gases.
These may be required specifically for start-ups from cold, where the available process gases
have insufficient calorific value to bring the boiler to operational temperature in a reasonable
timeframe. Auxiliary fuels are also used during times of disruption of the normal supply of the
process gases, to maintain critical boiler functions (especially process steam). Occasionally,
auxiliary fuels may also be used in the normal operation of the boiler plant.
The fuels used in plant start-up, consumed in very small amounts, are typically propane (LPG),
natural gas, gas oil or heavy fuel oil. The selection of these fuels largely depends on availability,
e.g. oil is used where natural gas is not available.
The fuels used as auxiliary fuels are natural gas, light crude oils, heavy fuel oil, tar, and coal. Of
these, the most widely used is natural gas.
Natural gas
Natural gas is used in about 65 % of the combustion plants in this section. For some plants its
use is not possible due to the lack of infrastructure. Natural gas is used as a start-up, backup and
auxiliary fuel at annual levels as low as 0.1 % to 88.4 % on a thermal input basis. The quality of
the natural gas used in combustion plants in steelworks varies widely as can be seen in Table
7.24 below.
WORKIN
G DRAFT IN
PROGRESS

Chapter 7
626 June 2016 TL/JFF/FN/EIPPCB/LCP_Final Draft
Table 7.24: Composition of natural gas used in combustion plants firing iron and steel process
fuels
Parameter Unit Max. Min. No (1)
Lower heating value MJ/Nm3 37.9 31.8 30
Wobbe index (lower) MJ/Nm3 54.5 11.3 20
Chemical analysis
CH4 vol-% 99 80 34
C2H6 vol-% 7.42 0.90 32
C2H4 vol-% 2.20 0.00 2
C3 vol-% 1.90 0.06 31
C4 vol-% 2.34 0.02 26
CO2 vol-% 2.76 0.19 32
N2 vol-% 11.81 0.60 33
(1) Number of data points in the analysis.
Source: [LCP TWG data collection 2012]
Even with relatively high levels of CO2 and N2, the average level of inert gas is low in
comparison with BF gas and BOF gas and is of a similar level as in COG, as illustrated in
Figure 7.33.
Other fuels
Other fuels including gas oil, coal tar and coal are used in very few specific plants, mostly to
maintain the operating temperature or as supplements to the main process gases. Coal is also
used as an additional fuel in one plant considered in this section, at 4.7 % with 95.3 % COG on
a thermal input basis. On the other hand, iron and steel process gases can be used to replace coal
in coal-fired plants, as is the case in several plants in Europe where the coal participation is
between 37 % and 93 % (see Section 5.1 on coal combustion and Chapter 6 on liquid fuel
combustion).
Heavy oil usage varies from 0.4 % to 12.1 %. At the lower end, it is used as a start-up fuel
(0.4–1.2 %) while at the higher end, it is used as a complementary fuel to the process gases
where natural gas is not readily available. Coal tar is used under similar circumstances.
In all cases, the use of these other fuels can have an impact on the emissions from the boilers
and gas turbines.
7.3.1.2 Control of emissions to air from boilers
The role of boilers in an integrated steelworks is to consume the excess process gases and
provide the necessary steam and hot water to all the key processes. Some steelworks may also
generate some electricity to valorise the process gases. As described previously, since the
process fuels (BF gas, COG and BOF gas) are also used in other areas of the integrated works,
most integrated steelworks need to purchase additional fuels (e.g. oil, coal, natural gas). The
demand for these additional fuels can vary over short periods of time, depending on the
operational availability of the consuming plants in the steelworks. Steam and power plants can
utilise both low calorific and high calorific gases and, depending on the energy situation of a
plant, the power plant can be set up to produce electrical power, steam for use in various
situations and/or district heating. A CHP plant can often be used to fulfil the demand for steam
when the dedicated boilers are offline for maintenance, and can additionally be used to control
the pressure in the steam grid.
The overall energy efficiency of an integrated steelworks power plant is generally lower than in
commercial power plants, and the emission levels, e.g. for SOX and dust, are different. The
WORKIN
G DRAFT IN
PROGRESS
Chapter 7
TL/JFF/FN/EIPPCB/LCP_Final Draft June 2016 627
operation of power plants in integrated steelworks that are fired with BF/BOF gas and/or COG
is dependent on the production of the whole integrated iron- and steelworks. When comparing
these with commercial large combustion plants, it is necessary to consider variations in the
amounts and compositions of the fuels, their combustible and inert contents, the timely
availability of these fuels from the iron and steel production processes, and qualitative and
quantitative variability of parameters such as the calorific value.
The main air pollutants emitted by boilers fired with process gases generated by steelworks are
NOX, CO, SOX and dust.
NOX
Because of the comparably low flame temperature when burning BF gas, the formation of
thermal NOX is lower than for other process gases and natural gas. The amount of fuel NOX
generated depends on the nitrogenous compounds. As the amounts of these nitrogenous
compounds, mostly residual ammonia, remaining in COG may be substantial (although data
collected by EUROFER indicates this to be < 50 mg/Nm3 in random sampling), the amount of
fuel NOX generated from this source may also be significant (see Table 2.6 of the IS BREF
(2012)). The formation of thermal NOX resulting from combustion and multi-firing of COG
with natural gas may also be high due to the high combustion temperatures. Most commonly,
primary techniques are applied to reduce the formation of thermal NOX and, under some local
conditions, secondary techniques are applied to reduce emissions of both thermal and fuel NOX.
Carbon monoxide
CO constitutes over 50 % of BOF gas and is also the major combustible component of BF gas,
while in COG it is a minor component. In power plants using these process gases, the objective
is to combust to completion, resulting in low emission levels in the flue-gas. However, boilers
operated in the steelworks are subject to sudden changes of the input fuels, which may
negatively affect the efficient combustion of the gases.
SOX
The principal source of SOX in the emissions of the plants using process gases is derived from
the oxidation of residual sulphur compounds contained in COG and in BFG, mainly in the form
of H2S and organic sulphuric compounds. No further techniques are applied in the plants
combusting mainly these gases.
Reported levels in the data collection show H2S levels in the COG between 15 mg/Nm3 and
300 mg/Nm3 for the year 2010 [LCP TWG 2012]. The total sulphur load in COG is normally in
the range 350 mg/Nm3
to 780 mg/Nm3. In some plants, higher levels of total S have been
reported in the COG [EUROFER - 2013]. The levels for total sulphur in BFG are considerably
lower at 40 mg/Nm3 to 110 mg/Nm
3. [EUROFER - 2013]
Dust
BF gas and BOF gas are dedusted before they are used in boilers, while COG is treated in a by-
product plant, resulting in a reduced dust content compared with the raw gas. Precursors for dust
such as sulphur are also reduced. This results in a comparatively low residual dust content in the
flue-gas after combustion. Thus the control of dust emissions to air when using process gases
from the steel industry is mainly achieved by the removal of particulates before combustion, as
described in the IS BREF (2012).
7.3.1.3 Control of emissions to air from gas turbines
Gas turbines fired with process gases are not commonly used in Europe because of the low
calorific value of the gases, the limited capacity to accept variations of the calorific value of the
gases over time and a poor turndown ratio. Natural gas is the fuel of choice for gas turbines.
WORKIN
G DRAFT IN
PROGRESS
Chapter 7
628 June 2016 TL/JFF/FN/EIPPCB/LCP_Final Draft
In order to improve energy efficiency, the gas turbines are often coupled with a heat recovery
boiler, where process gases can be used to provide the additional heat (see Section 3.2.3.2 of
this document and p. 29–30 of the IS BREF (2012)). Since most integrated steelworks sites have
a surplus of heat, there is little or no internal demand. If there are no private or commercial
consumers available to use the decoupled heat, power plants are operated to combust the surplus
gases to maximise the amount of electrical energy.
Of the eight European gas turbine plants or CCGTs that use I&S process gases and that
submitted data for the LCP BREF review, three of them use exclusively NG in the gas turbine
operation. One stand-alone gas turbine operates on a mixture of 59.4 % NG, 29.1 % BF gas and
11.5 % COG, but can also operate on 100 % NG with steam injection as required. Three CCGTs
operate on a mixture of NG, BF gas, COG and BOF gas, and the supplementary boiler fuels are
NG and BF gas (these plants can also be run on 100 % NG with steam injection). The eighth
plant has a stand-alone gas turbine that operates on a high level of particularly clean BFG
(96.5 % on a thermal input basis). The composition of the BF gas in this case is exceptional, as
the high H2 and CO contents confer a higher LHV of 4.4 MJ/Nm3, compared with an average
value of 3.4 MJ/Nm3. The remaining 3.5 % is made up of 2.2 % BOF gas that has been admixed
to the BF gas and 1.3 % NG.
These plants control their dust and SOX emissions through the same fuel pretreatment
techniques as those used when process gases are combusted in boilers, and control their NOX
emissions by implementing dry low-NOX burners, steam injection when the gas turbine
combusts natural gas, low-NOX burners for the boiler part, or SCR. One gas turbine is also fitted
with fuel preheating. In one operation where the process gases are used in the gas turbine of the
CCGT, the COG is treated to remove traces of oils and tar.
7.3.1.4 Water and waste water treatment
The use of water and the treatment of all waste waters from the cleaning of iron- and steelworks
process gases are fully addressed in the IS BREF (2012).
Many of the boilers utilising the cleaned process gases from the iron and steel industry are
located close to or within the boundaries of the steelworks producing the process gases. In these
situations, the management of water usage and disposal of waste water is normally handled
centrally, with a common system of drainage and discharge to local watercourses for the whole
steelworks. Water flows from LCPs are not significant compared with the total flows at the site
release points, and often are not closely monitored individually. It is therefore not generally
possible to isolate the emissions to water from individual LCPs. Under these circumstances, the
site abstraction, use, and discharge consents are applicable and appropriate monitoring is
applied.
There are some occasions where small amounts of relatively clean water, such as condensate,
blowdown from small boilers or pump effluents do not require any waste water treatment and
can be discharged directly to a watercourse. These discharges are often not subject to regulation
or monitoring. There are some facilities, however, where relatively clean water that is
discharged directly to rivers is monitored for flow, temperature and ammoniacal nitrogen (NH3-
N), and thresholds and limits are applied through a permit system. Other plants discharging
directly to a river have permit conditions relating to volume, temperature, pH, ammoniacal
nitrogen (NH3-N), total suspended solids (TSS), phosphorus and total organic carbon (TOC).
Some coastal water sites are required to carry out spot checks for specific metals contents.
At a few sites, the production of deionised water results in a waste water flow that is dealt with
separately or initially in a waste water treatment plant. This might consist of neutralisation and
sedimentation as treatment techniques, after which the water can be discharged to the
environment. In this situation, separate discharge conditions are applied in relation to flow,
temperature, pH, TSS and adsorbable organic halides (AOX).
WORKIN
G DRAFT IN
PROGRESS

Chapter 7
TL/JFF/FN/EIPPCB/LCP_Final Draft June 2016 629
7.3.2 Current consumption and emission levels
7.3.2.1 Iron and steel process gases used in large combustion plants
In order to better understand the values for plant efficiencies and emissions to air for plants
utilising steelworks process gases, it is essential to appreciate the scale of the use of these gases
in terms of volume as opposed to thermal input alone. In Table 7.25, it can be seen that the
process gases are less effective fuels than natural gas, to the extent that in general terms of
thermal input, 1 volume of natural gas is matched by about 2.6 volumes of COG, 6.5 volumes of
BOF gas and 13.5 volumes of BF gas [LCP TWG data collection 2012]. These factors are
summarised in Table 7.25 below for more than 50 European plants.
Table 7.25: Gas volumes, additional fuel tonnages and thermal inputs per 24 hours for
combustion plants firing iron and steel process gases
Gas/Additional fuel Total amounts Thermal input/24h (MWth)
BF gas 139 763 766 Nm3/24h 136 880
BOF gas 2 379 432 Nm3/24h 5 125
COG 9 492 597 Nm3/24h 45 391
COG + BF gas 3 108 945 Nm3/24h 2 384
BF gas + BOF gas 23 607 329 Nm3/24h 24 464
NG 4 505 974 Nm3/24h 45 983
Light crude 890 t/24h 1 027
HFO 146 t/24h 1 778
Coking tar 39 t/24h 402
Coal 30 t/24h 275
Source: [LCP TWG data collection 2012]
Data in Table 7.25 show the importance of BF gas, both in terms of thermal input and of
volumes used. The volumes of COG that are used are considerably lower, but the higher
calorific value supplements the BF gas, so both gases are often used mixed together in different
proportions, like for example the COG and BF gas mixture shown in Table 7.25. In volume
terms the amount of BOF gas used reflects the peculiarities of the BOF process, cleaning and
storage/buffering of a batch-produced process gas in sufficient beneficial quantities.
The use of tar in 2010 as an auxiliary fuel reflects its availability at the user site, but the practice
has now been discontinued. Commercial auxiliary fuels such as natural gas, coal, gas oil add
further costs to the production of steam and power and are used cautiously by steel producers, to
maintain the outputs and/or for flame stabilisation but generally not to maintain the plant at full
load.
7.3.2.2 Energy efficiency of iron and steel process-gas-fired combustion plants
The energy efficiency of an integrated steelworks combustion plant firing process gases is lower
than the energy efficiency of a commercial power plant. The operation of such plants is
dependent on the production of the whole works and is carried out in such a way so as to avoid
the flaring of these gases which would result in wastage of the energy content and valueless
release of emissions to air. The use of the process gases in steam and power generation
represents a great improvement over flaring in terms of overall efficiency. In existing boilers
and gas turbines, improvements in plant efficiencies in converting the gases to useful steam, hot
WORKIN
G DRAFT IN
PROGRESS
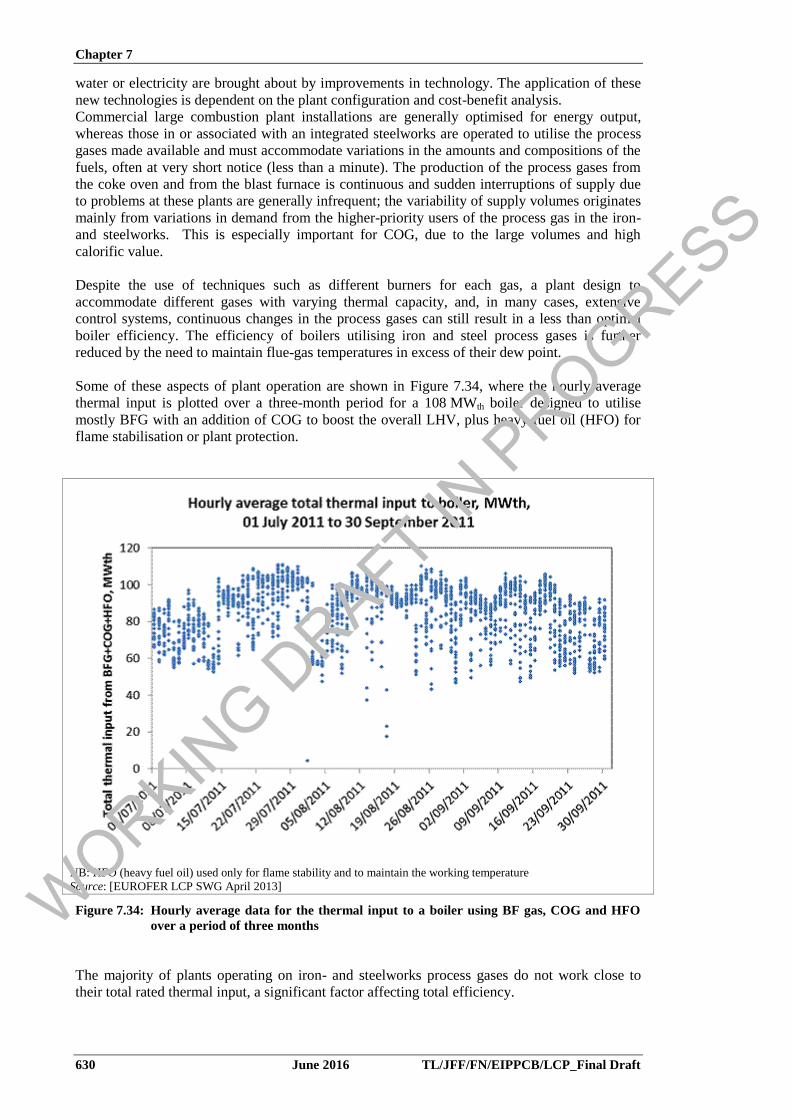
Chapter 7
630 June 2016 TL/JFF/FN/EIPPCB/LCP_Final Draft
water or electricity are brought about by improvements in technology. The application of these
new technologies is dependent on the plant configuration and cost-benefit analysis.
Commercial large combustion plant installations are generally optimised for energy output,
whereas those in or associated with an integrated steelworks are operated to utilise the process
gases made available and must accommodate variations in the amounts and compositions of the
fuels, often at very short notice (less than a minute). The production of the process gases from
the coke oven and from the blast furnace is continuous and sudden interruptions of supply due
to problems at these plants are generally infrequent; the variability of supply volumes originates
mainly from variations in demand from the higher-priority users of the process gas in the iron-
and steelworks. This is especially important for COG, due to the large volumes and high
calorific value.
Despite the use of techniques such as different burners for each gas, a plant design to
accommodate different gases with varying thermal capacity, and, in many cases, extensive
control systems, continuous changes in the process gases can still result in a less than optimal
boiler efficiency. The efficiency of boilers utilising iron and steel process gases is further
reduced by the need to maintain flue-gas temperatures in excess of their dew point.
Some of these aspects of plant operation are shown in Figure 7.34, where the hourly average
thermal input is plotted over a three-month period for a 108 MWth boiler designed to utilise
mostly BFG with an addition of COG to boost the overall LHV, plus heavy fuel oil (HFO) for
flame stabilisation or plant protection.
NB: HFO (heavy fuel oil) used only for flame stability and to maintain the working temperature
Source: [EUROFER LCP SWG April 2013]
Figure 7.34: Hourly average data for the thermal input to a boiler using BF gas, COG and HFO
over a period of three months
The majority of plants operating on iron- and steelworks process gases do not work close to
their total rated thermal input, a significant factor affecting total efficiency.
WORKIN
G DRAFT IN
PROGRESS

Chapter 7
TL/JFF/FN/EIPPCB/LCP_Final Draft June 2016 631
Figure 7.35 shows how the BFG and COG can vary on an hour-by-hour basis within a two-
week period.
Source: [EUROFER LCP SWG April 2013]
Figure 7.35: Hourly average inputs of BF gas and COG to a boiler over a two-week period
Despite the large variations in the availability of the process gases, the overall thermal input to
the boiler (Figure 7.36) is maintained at about 90 MWth when the blast furnace is operating in a
stable manner. For the 43 European plants that submitted data for the LCP BREF review, an
annual estimate of the total thermal input was calculated. This analysis showed that, on average,
the plants have an equivalent full load factor of 73.7 %, with a range between 97.5 % and
46.7 %.
WORKIN
G DRAFT IN
PROGRESS

Chapter 7
632 June 2016 TL/JFF/FN/EIPPCB/LCP_Final Draft
Source: [EUROFER LCP SWG April 2013]
Figure 7.36: Hourly average thermal inputs of BF gas, COG and HFO to a boiler over a two-week
period
Plants with DeNOX systems or other flue-gas treatment systems installed have lower net energy
efficiency because of the energy consumption of these end-of-pipe systems (see Section
2.7.10.1).
The data collected in the data collection exercise [LCP TWG data collection 2012] show that
the average operating net total fuel utilisation is 52.1 %, with a median value of 46.0 %,
between a maximum of 83.6 % and a minimum of 28.0 %. The net operating total fuel
utilisation is strongly dependent on the availability and type of process gases, which depends on
the steelworks operation.
The more limited data for CCGTs indicate that these plants are operated differently from the
boilers. The average operating net total fuel utilisation is 52.6 %, with a median value of
51.5 %, between a maximum of 82.2 % (mostly thermal output) and a minimum of 40.5 % (all
electrical output).
Daily average data for one CCGT illustrates the different approach to operations compared with
boilers. Figure 7.37 shows the daily average total thermal input to a CCGT made up of
contributions from BFG, COG and BOF gas together with NG as an auxiliary fuel. In this case,
the total thermal input from COG and NG is held relatively constant at about 60 % of the total
thermal input, i.e. the NG is increased to compensate for a loss in COG and reduced when COG
availability increases.
WORKIN
G DRAFT IN
PROGRESS
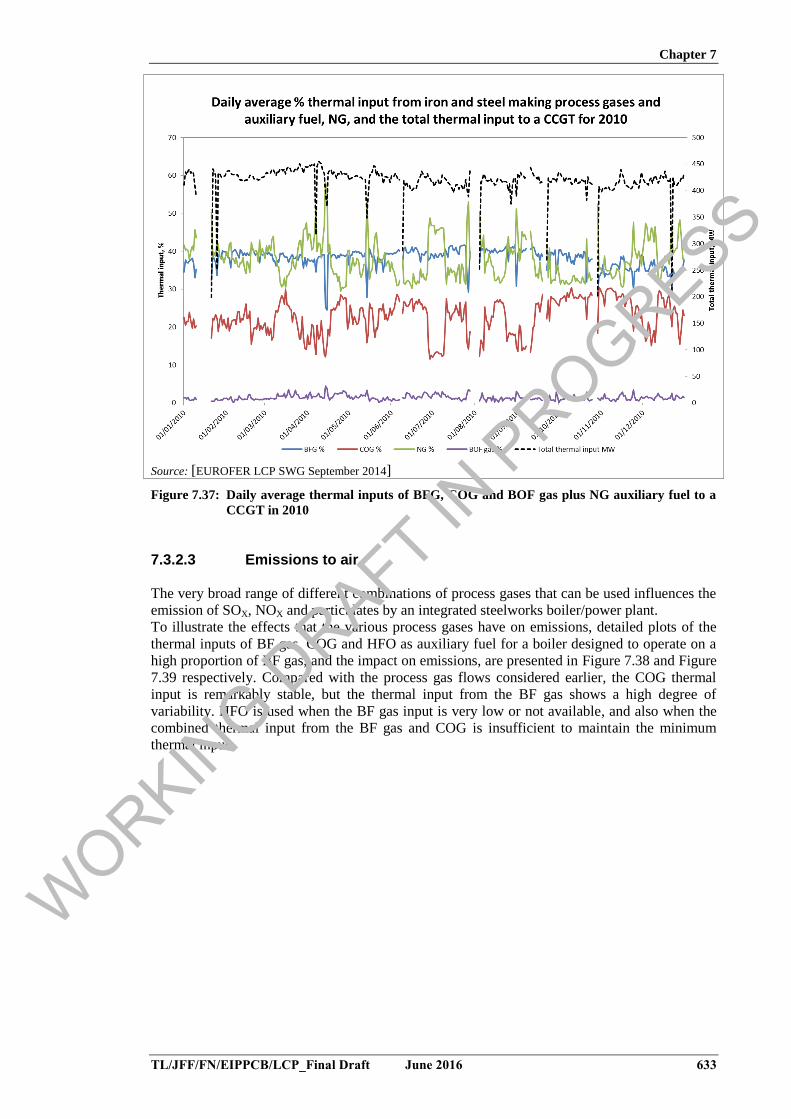
Chapter 7
TL/JFF/FN/EIPPCB/LCP_Final Draft June 2016 633
Source: [EUROFER LCP SWG September 2014]
Figure 7.37: Daily average thermal inputs of BFG, COG and BOF gas plus NG auxiliary fuel to a
CCGT in 2010
7.3.2.3 Emissions to air
The very broad range of different combinations of process gases that can be used influences the
emission of SOX, NOX and particulates by an integrated steelworks boiler/power plant.
To illustrate the effects that the various process gases have on emissions, detailed plots of the
thermal inputs of BF gas, COG and HFO as auxiliary fuel for a boiler designed to operate on a
high proportion of BF gas, and the impact on emissions, are presented in Figure 7.38 and Figure
7.39 respectively. Compared with the process gas flows considered earlier, the COG thermal
input is remarkably stable, but the thermal input from the BF gas shows a high degree of
variability. HFO is used when the BF gas input is very low or not available, and also when the
combined thermal input from the BF gas and COG is insufficient to maintain the minimum
thermal input.
WORKIN
G DRAFT IN
PROGRESS
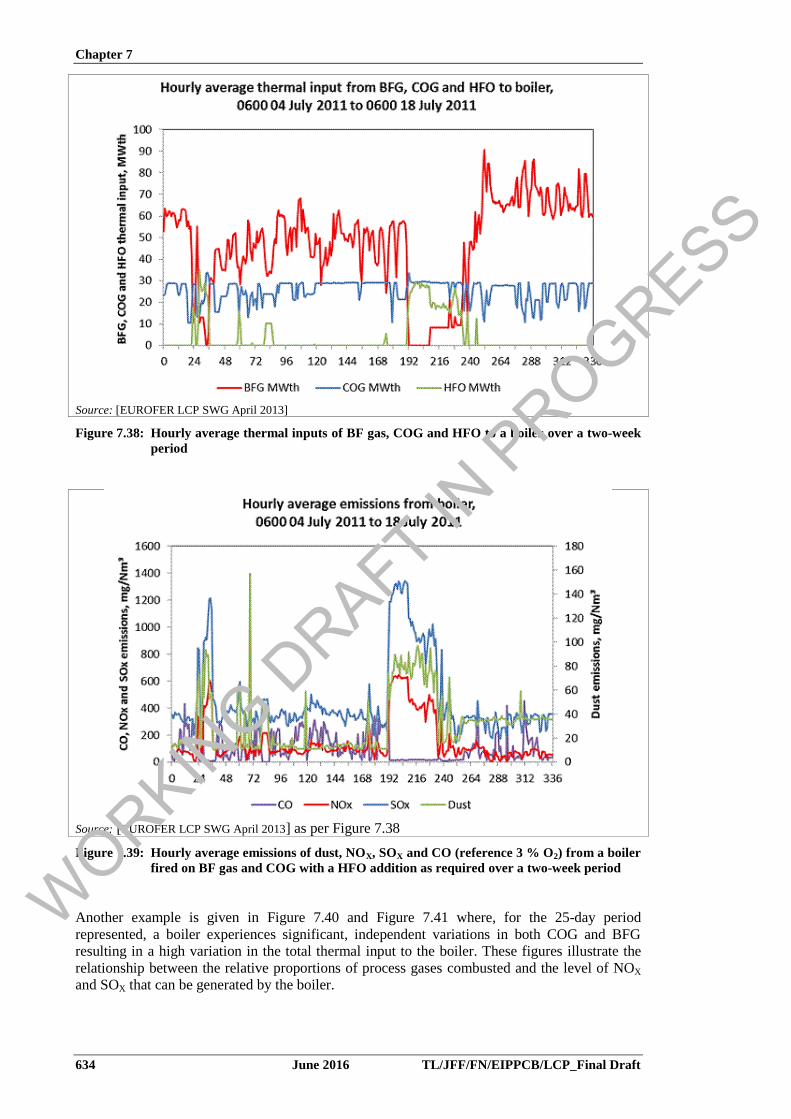
Chapter 7
634 June 2016 TL/JFF/FN/EIPPCB/LCP_Final Draft
Source: [EUROFER LCP SWG April 2013]
Figure 7.38: Hourly average thermal inputs of BF gas, COG and HFO to a boiler over a two-week
period
Source: [EUROFER LCP SWG April 2013] as per Figure 7.38
Figure 7.39: Hourly average emissions of dust, NOX, SOX and CO (reference 3 % O2) from a boiler
fired on BF gas and COG with a HFO addition as required over a two-week period
Another example is given in Figure 7.40 and Figure 7.41 where, for the 25-day period
represented, a boiler experiences significant, independent variations in both COG and BFG
resulting in a high variation in the total thermal input to the boiler. These figures illustrate the
relationship between the relative proportions of process gases combusted and the level of NOX
and SOX that can be generated by the boiler.
WORKIN
G DRAFT IN
PROGRESS
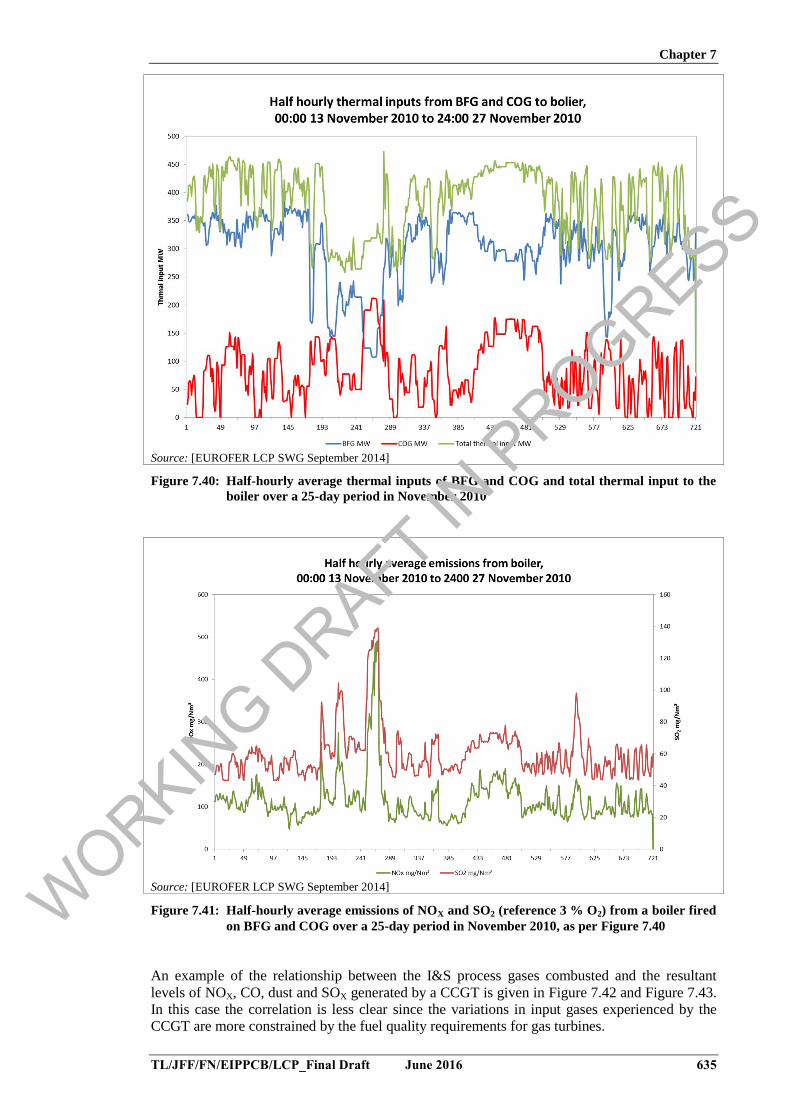
Chapter 7
TL/JFF/FN/EIPPCB/LCP_Final Draft June 2016 635
Source: [EUROFER LCP SWG September 2014]
Figure 7.40: Half-hourly average thermal inputs of BFG and COG and total thermal input to the
boiler over a 25-day period in November 2010
Source: [EUROFER LCP SWG September 2014]
Figure 7.41: Half-hourly average emissions of NOX and SO2 (reference 3 % O2) from a boiler fired
on BFG and COG over a 25-day period in November 2010, as per Figure 7.40
An example of the relationship between the I&S process gases combusted and the resultant
levels of NOX, CO, dust and SOX generated by a CCGT is given in Figure 7.42 and Figure 7.43.
In this case the correlation is less clear since the variations in input gases experienced by the
CCGT are more constrained by the fuel quality requirements for gas turbines.
WORKIN
G DRAFT IN
PROGRESS
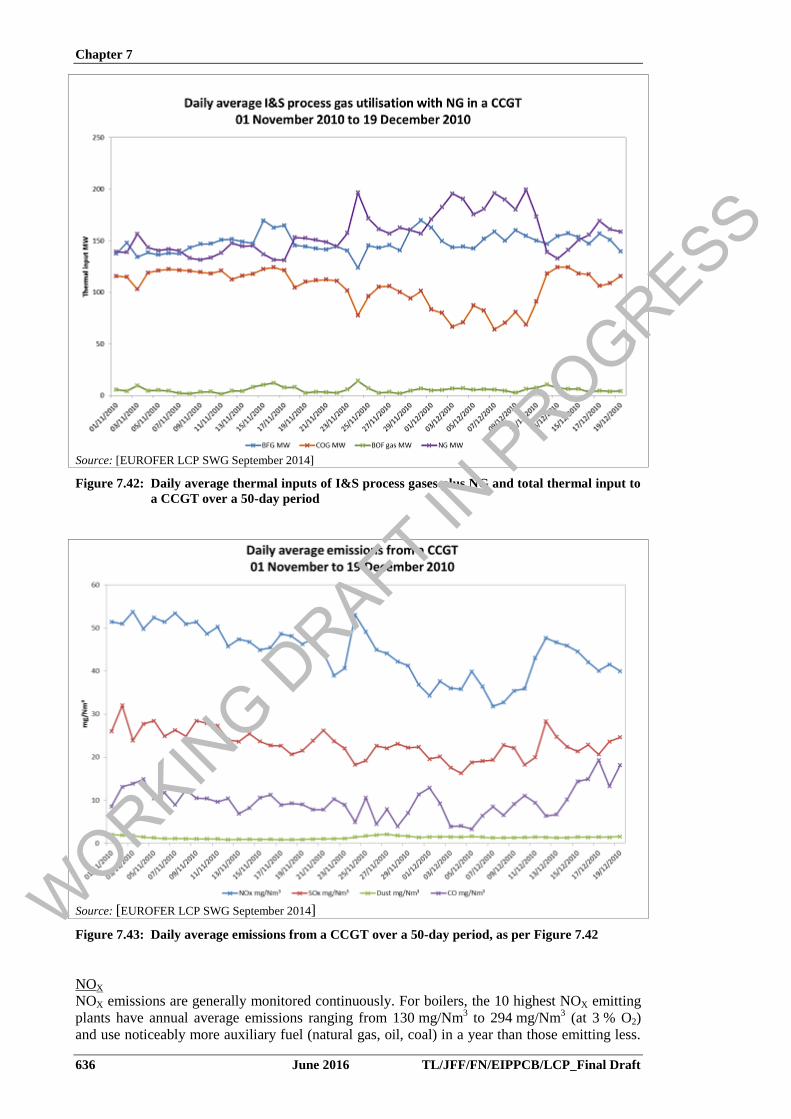
Chapter 7
636 June 2016 TL/JFF/FN/EIPPCB/LCP_Final Draft
Source: [EUROFER LCP SWG September 2014]
Figure 7.42: Daily average thermal inputs of I&S process gases plus NG and total thermal input to
a CCGT over a 50-day period
Source: [EUROFER LCP SWG September 2014]
Figure 7.43: Daily average emissions from a CCGT over a 50-day period, as per Figure 7.42
NOX
NOX emissions are generally monitored continuously. For boilers, the 10 highest NOX emitting
plants have annual average emissions ranging from 130 mg/Nm3 to 294 mg/Nm
3 (at 3 % O2)
and use noticeably more auxiliary fuel (natural gas, oil, coal) in a year than those emitting less.
WORKIN
G DRAFT IN
PROGRESS

Chapter 7
TL/JFF/FN/EIPPCB/LCP_Final Draft June 2016 637
The lowest NOX emitting plants have annual average emissions range from 20 mg/Nm3 to 49
mg/Nm3 (at 3 % O2) and are characterised by high levels of BFG use, averaging 82.7 % BFG on
a thermal input basis. The highest hourly emission is 1174 mg/Nm3 (at 3 % O2).
Plants operated with SCR DeNOX systems have annual average NOX emissions ranging from 30
mg/Nm3 to 84 mg/Nm
3 (at 3 % O2) and a maximum emission level of 566 mg/Nm
3 (at 3 % O2)
on a half-hourly average basis.
The relationship between NOX generation and the relative thermal inputs of combusted BFG
and COG can be seen in an example in Figure 7.44. This figure shows an increase in the NOX
emission when the availability of BFG decreases, which is mirrored by an increased percentage
of COG input. More information about typical NOX emissions from COG combustion without
any primary technique is given in Section 2.2.1.2.1.4 of the Iron and Steel BREF.
WORKIN
G DRAFT IN
PROGRESS
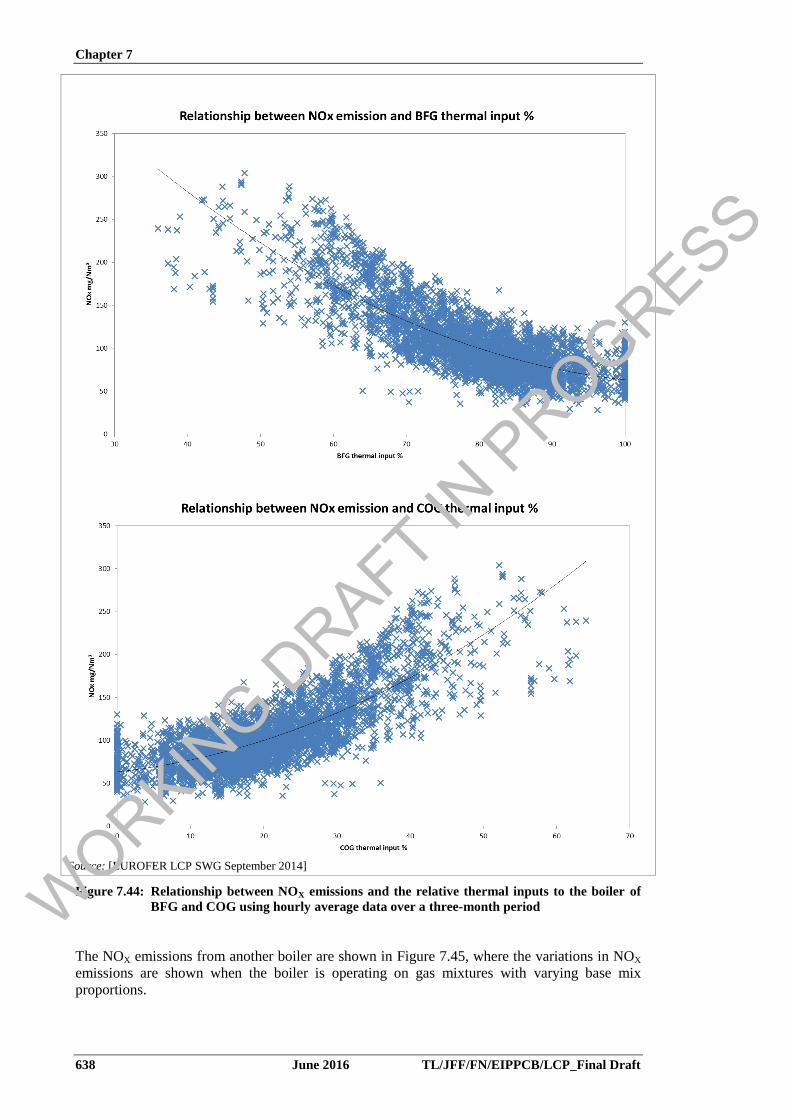
Chapter 7
638 June 2016 TL/JFF/FN/EIPPCB/LCP_Final Draft
Source: [EUROFER LCP SWG September 2014]
Figure 7.44: Relationship between NOX emissions and the relative thermal inputs to the boiler of
BFG and COG using hourly average data over a three-month period
The NOX emissions from another boiler are shown in Figure 7.45, where the variations in NOX
emissions are shown when the boiler is operating on gas mixtures with varying base mix
proportions.
WORKIN
G DRAFT IN
PROGRESS
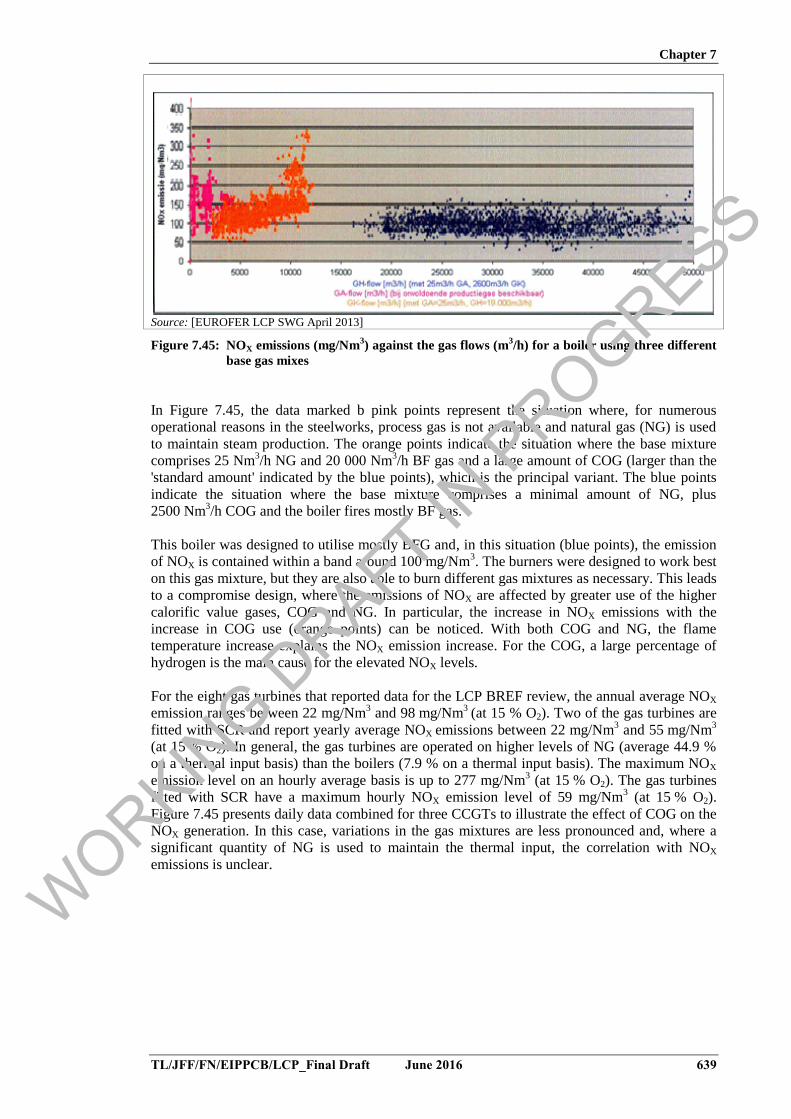
Chapter 7
TL/JFF/FN/EIPPCB/LCP_Final Draft June 2016 639
Source: [EUROFER LCP SWG April 2013]
Figure 7.45: NOX emissions (mg/Nm3) against the gas flows (m
3/h) for a boiler using three different
base gas mixes
In Figure 7.45, the data marked b pink points represent the situation where, for numerous
operational reasons in the steelworks, process gas is not available and natural gas (NG) is used
to maintain steam production. The orange points indicate the situation where the base mixture
comprises 25 Nm3/h NG and 20 000 Nm
3/h BF gas and a large amount of COG (larger than the
'standard amount' indicated by the blue points), which is the principal variant. The blue points
indicate the situation where the base mixture comprises a minimal amount of NG, plus
2500 Nm3/h COG and the boiler fires mostly BF gas.
This boiler was designed to utilise mostly BFG and, in this situation (blue points), the emission
of NOX is contained within a band around 100 mg/Nm3. The burners were designed to work best
on this gas mixture, but they are also able to burn different gas mixtures as necessary. This leads
to a compromise design, where the emissions of NOX are affected by greater use of the higher
calorific value gases, COG and NG. In particular, the increase in NOX emissions with the
increase in COG use (orange points) can be noticed. With both COG and NG, the flame
temperature increase explains the NOX emission increase. For the COG, a large percentage of
hydrogen is the main cause for the elevated NOX levels.
For the eight gas turbines that reported data for the LCP BREF review, the annual average NOX
emission ranges between 22 mg/Nm3 and 98 mg/Nm
3 (at 15 % O2). Two of the gas turbines are
fitted with SCR and report yearly average NOX emissions between 22 mg/Nm3 and 55 mg/Nm
3
(at 15 % O2). In general, the gas turbines are operated on higher levels of NG (average 44.9 %
on a thermal input basis) than the boilers (7.9 % on a thermal input basis). The maximum NOX
emission level on an hourly average basis is up to 277 mg/Nm3 (at 15 % O2). The gas turbines
fitted with SCR have a maximum hourly NOX emission level of 59 mg/Nm3 (at 15 % O2).
Figure 7.45 presents daily data combined for three CCGTs to illustrate the effect of COG on the
NOX generation. In this case, variations in the gas mixtures are less pronounced and, where a
significant quantity of NG is used to maintain the thermal input, the correlation with NOX
emissions is unclear.
WORKIN
G DRAFT IN
PROGRESS
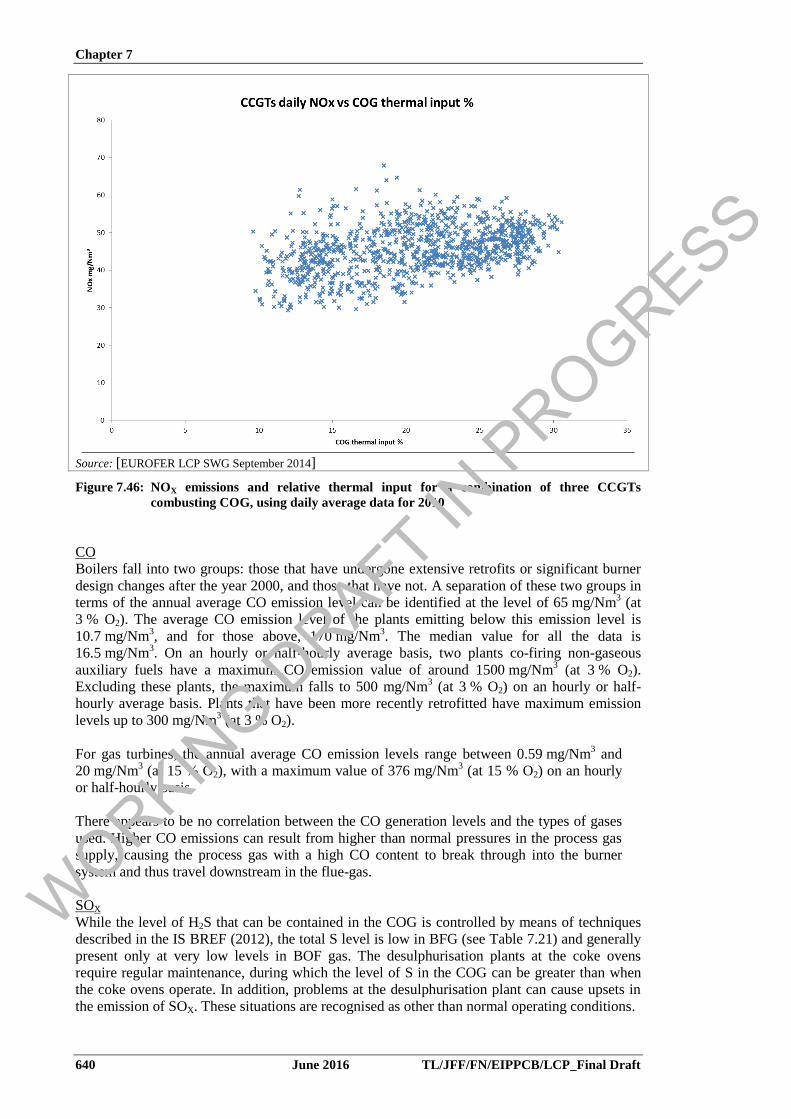
Chapter 7
640 June 2016 TL/JFF/FN/EIPPCB/LCP_Final Draft
Source: [EUROFER LCP SWG September 2014]
Figure 7.46: NOX emissions and relative thermal input for a combination of three CCGTs
combusting COG, using daily average data for 2010
CO
Boilers fall into two groups: those that have undergone extensive retrofits or significant burner
design changes after the year 2000, and those that have not. A separation of these two groups in
terms of the annual average CO emission level can be identified at the level of 65 mg/Nm3 (at
3 % O2). The average CO emission level of the plants emitting below this emission level is
10.7 mg/Nm3, and for those above, 170 mg/Nm
3. The median value for all the data is
16.5 mg/Nm3. On an hourly or half-hourly average basis, two plants co-firing non-gaseous
auxiliary fuels have a maximum CO emission value of around 1500 mg/Nm3 (at 3 % O2).
Excluding these plants, the maximum falls to 500 mg/Nm3 (at 3 % O2) on an hourly or half-
hourly average basis. Plants that have been more recently retrofitted have maximum emission
levels up to 300 mg/Nm3 (at 3 % O2).
For gas turbines, the annual average CO emission levels range between 0.59 mg/Nm3 and
20 mg/Nm3 (at 15 % O2), with a maximum value of 376 mg/Nm
3 (at 15 % O2) on an hourly
or half-hourly basis.
There appears to be no correlation between the CO generation levels and the types of gases
used. Higher CO emissions can result from higher than normal pressures in the process gas
supply, causing the process gas with a high CO content to break through into the burner
system and thus travel downstream in the flue-gas.
SOX
While the level of H2S that can be contained in the COG is controlled by means of techniques
described in the IS BREF (2012), the total S level is low in BFG (see Table 7.21) and generally
present only at very low levels in BOF gas. The desulphurisation plants at the coke ovens
require regular maintenance, during which the level of S in the COG can be greater than when
the coke ovens operate. In addition, problems at the desulphurisation plant can cause upsets in
the emission of SOX. These situations are recognised as other than normal operating conditions.
WORKIN
G DRAFT IN
PROGRESS

Chapter 7
TL/JFF/FN/EIPPCB/LCP_Final Draft June 2016 641
In very general terms, higher emissions of SOX are associated with plants that operate with
auxiliary fuels such as coal, gas oil and/or HFO.
The relationship between SO2 emissions and the relative thermal inputs of combusted BFG and
COG can be seen in an example in Figure 7.47. This figure shows an increase in SO2 emissions
when the availability of BFG decreases, which is mirrored by an increased percentage of the
COG input.
Source: [EUROFER LCP SWG September 2014]
Figure 7.47: Relationship between SO2 emissions and the relative thermal inputs to the boiler of
BFG and COG using hourly average data over a three-month period
WORKIN
G DRAFT IN
PROGRESS
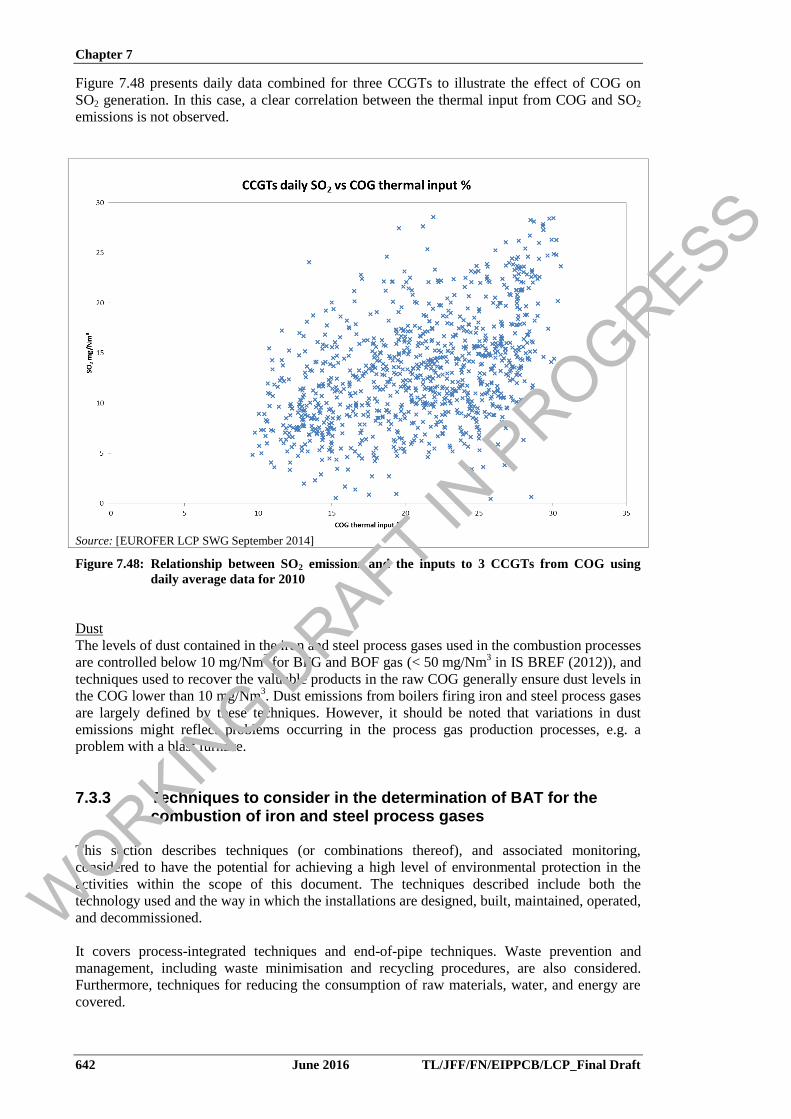
Chapter 7
642 June 2016 TL/JFF/FN/EIPPCB/LCP_Final Draft
Figure 7.48 presents daily data combined for three CCGTs to illustrate the effect of COG on
SO2 generation. In this case, a clear correlation between the thermal input from COG and SO2
emissions is not observed.
Source: [EUROFER LCP SWG September 2014]
Figure 7.48: Relationship between SO2 emissions and the inputs to 3 CCGTs from COG using
daily average data for 2010
Dust
The levels of dust contained in the iron and steel process gases used in the combustion processes
are controlled below 10 mg/Nm3 for BFG and BOF gas (< 50 mg/Nm
3 in IS BREF (2012)), and
techniques used to recover the valuable products in the raw COG generally ensure dust levels in
the COG lower than 10 mg/Nm3. Dust emissions from boilers firing iron and steel process gases
are largely defined by these techniques. However, it should be noted that variations in dust
emissions might reflect problems occurring in the process gas production processes, e.g. a
problem with a blast furnace.
7.3.3 Techniques to consider in the determination of BAT for the combustion of iron and steel process gases
This section describes techniques (or combinations thereof), and associated monitoring,
considered to have the potential for achieving a high level of environmental protection in the
activities within the scope of this document. The techniques described include both the
technology used and the way in which the installations are designed, built, maintained, operated,
and decommissioned.
It covers process-integrated techniques and end-of-pipe techniques. Waste prevention and
management, including waste minimisation and recycling procedures, are also considered.
Furthermore, techniques for reducing the consumption of raw materials, water, and energy are
covered.
WORKIN
G DRAFT IN
PROGRESS
Chapter 7
TL/JFF/FN/EIPPCB/LCP_Final Draft June 2016 643
Annex III to the Industrial Emissions Directive lists a number of criteria for determining BAT,
and the information within this chapter addresses these considerations. As far as possible, the
standard structure of Table 3.4 is used to outline the information on each technique, to enable a
comparison of techniques and the assessment against the definition of BAT given in the
Industrial Emissions Directive.
This section does not necessarily provide an exhaustive list of techniques that could be applied
in the sector. Other techniques may exist, or may be developed, which could be considered for
the determination of BAT for an individual installation.
In this section, the techniques to be considered have only been fully described when they are
specific to the considered combusted fuel or applied combustion process (combustion of iron
and steel process gases). Indeed, for most of the techniques, general descriptions are already
presented in Chapter 3. Therefore, in order to avoid repetition, for those general techniques
already described in Chapter 3, only the additional information that is specific to the combustion
of iron and steel process gases is reported here in synthesis tables.
The energy balance of an integrated iron- and steelworks is complex and this, together with the
uniquely different plant layouts, results in each works having its own systems for optimising
energy usage and hence gas distribution across the consuming plants. The objective is to
maximise the productive use of the I&S process gases, minimise the use of auxiliary fuels, and
optimise the specific energy consumption within the inherent constraints of the system. In order
to achieve this goal, an adequate system is put in place to simultaneously address the technical
possibilities, the economics and organisational issues.
The boilers combusting iron and steel process gases that have been used to illustrate the
performance of techniques to consider in the determination of BAT are sized between 50 MWth
and 1220 MWth and were commissioned mostly between 1953 and 1992, with four more
commissioned between 2002 and 2010. They are operated, generally, between 4500 h/yr and
8760 h/yr (two exceptions are Plant 009 and Plant 630-1 which respectively operated for
1000 hours and 3850 hours in the reference year), with an equivalent full load factor between
42 % and 99 %.
The CCGTs that reported data used to illustrate the performance of techniques to consider in the
determination of BAT are sized between 85 MWth and 440 MWth, and were commissioned
between 1989 and 2001. They are operated, generally, between 6500 h/yr and 8200 h/yr (one
exception is Plant 008 which operated for 1400 hours in the reference year), with an equivalent
full load factor, generally, above 90 % (one exception is Plant 616, with an equivalent full load
factor of 65 %).
7.3.3.1 Techniques to increase energy efficiency 7.3.3.1.1 General techniques to increase energy efficiency
General techniques to be considered in the determination of BAT for increasing the energy
efficiency of natural gas-fired plants or coal-fired plants (Table 7.9, Table 5.27 and Table 5.28)
are also to be considered in the context of combustion plants firing iron and steel process gases.
Further details on the associated environmental performance, operational data, and applicability
or economic constraints are given below.
Environmental performance and operational data
Energy efficiency for plants combusting iron and steel process gases alone or in
combination with other gaseous and/or liquid fuels
WORKIN
G DRAFT IN
PROGRESS
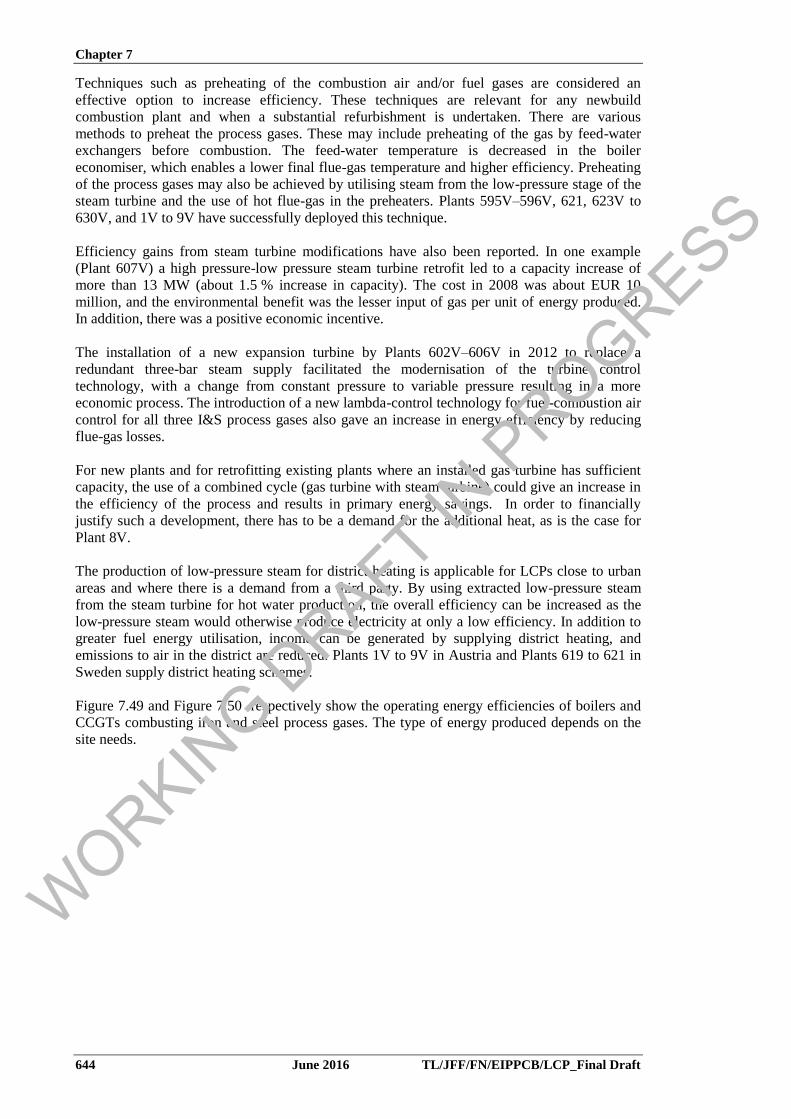
Chapter 7
644 June 2016 TL/JFF/FN/EIPPCB/LCP_Final Draft
Techniques such as preheating of the combustion air and/or fuel gases are considered an
effective option to increase efficiency. These techniques are relevant for any newbuild
combustion plant and when a substantial refurbishment is undertaken. There are various
methods to preheat the process gases. These may include preheating of the gas by feed-water
exchangers before combustion. The feed-water temperature is decreased in the boiler
economiser, which enables a lower final flue-gas temperature and higher efficiency. Preheating
of the process gases may also be achieved by utilising steam from the low-pressure stage of the
steam turbine and the use of hot flue-gas in the preheaters. Plants 595V–596V, 621, 623V to
630V, and 1V to 9V have successfully deployed this technique.
Efficiency gains from steam turbine modifications have also been reported. In one example
(Plant 607V) a high pressure-low pressure steam turbine retrofit led to a capacity increase of
more than 13 MW (about 1.5 % increase in capacity). The cost in 2008 was about EUR 10
million, and the environmental benefit was the lesser input of gas per unit of energy produced.
In addition, there was a positive economic incentive.
The installation of a new expansion turbine by Plants 602V–606V in 2012 to replace a
redundant three-bar steam supply facilitated the modernisation of the turbine control
technology, with a change from constant pressure to variable pressure resulting in a more
economic process. The introduction of a new lambda-control technology for fuel-combustion air
control for all three I&S process gases also gave an increase in energy efficiency by reducing
flue-gas losses.
For new plants and for retrofitting existing plants where an installed gas turbine has sufficient
capacity, the use of a combined cycle (gas turbine with steam turbine) could give an increase in
the efficiency of the process and results in primary energy savings. In order to financially
justify such a development, there has to be a demand for the additional heat, as is the case for
Plant 8V.
The production of low-pressure steam for district heating is applicable for LCPs close to urban
areas and where there is a demand from a third party. By using extracted low-pressure steam
from the steam turbine for hot water production, the overall efficiency can be increased as the
low-pressure steam would otherwise produce electricity at only a low efficiency. In addition to
greater fuel energy utilisation, income can be generated by supplying district heating, and
emissions to air in the district are reduced. Plants 1V to 9V in Austria and Plants 619 to 621 in
Sweden supply district heating schemes.
Figure 7.49 and Figure 7.50 respectively show the operating energy efficiencies of boilers and
CCGTs combusting iron and steel process gases. The type of energy produced depends on the
site needs.
WORKIN
G DRAFT IN
PROGRESS
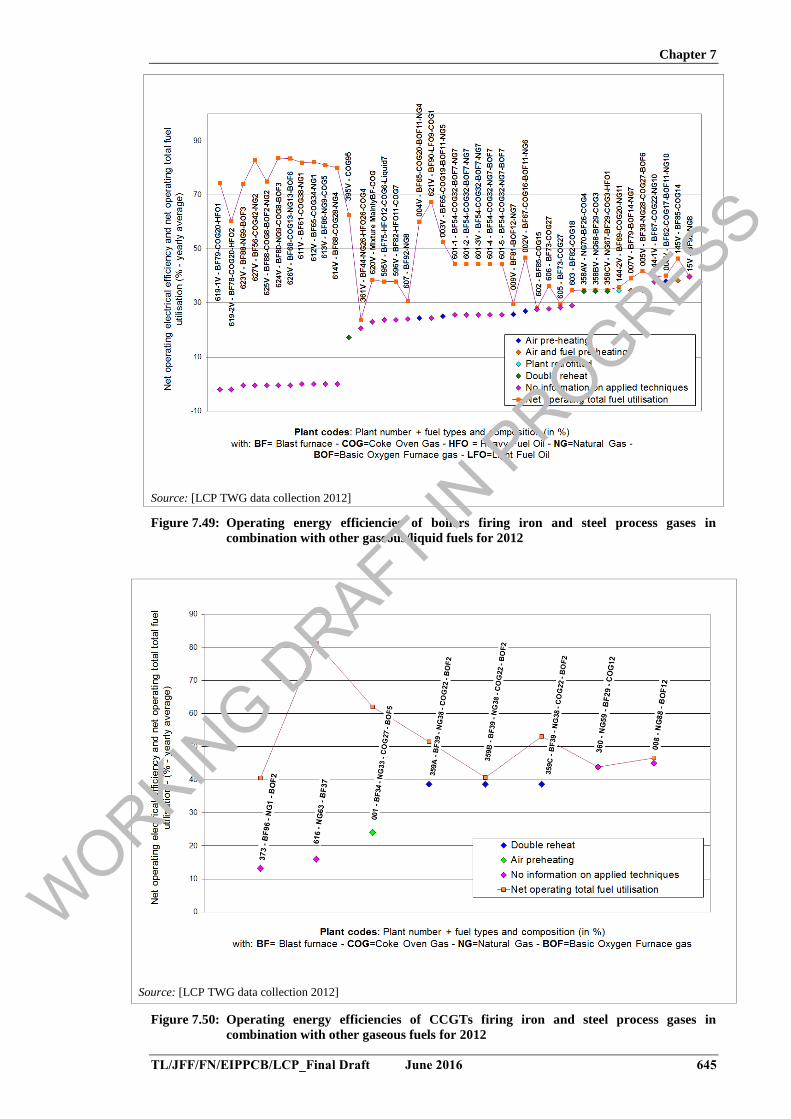
Chapter 7
TL/JFF/FN/EIPPCB/LCP_Final Draft June 2016 645
Source: [LCP TWG data collection 2012]
Figure 7.49: Operating energy efficiencies of boilers firing iron and steel process gases in
combination with other gaseous/liquid fuels for 2012
Source: [LCP TWG data collection 2012]
Figure 7.50: Operating energy efficiencies of CCGTs firing iron and steel process gases in
combination with other gaseous fuels for 2012
WORKIN
G DRAFT IN
PROGRESS
Chapter 7
646 June 2016 TL/JFF/FN/EIPPCB/LCP_Final Draft
In addition to these operating levels, information was submitted on design net electrical
efficiencies with levels between 32.5 % (Unit 361) and 42.5 % (Unit 15).
As for gas turbines firing process gases from the iron and steel industry, only one example of
design net electrical energy efficiency was reported, by Unit 360 with 47 % compared with the
operating yearly value of 43.9 % reported in 2012. Compared with natural gas firing, the design
net electrical energy efficiency is expected to be lower when combusting iron and steel process
gases because of the lower calorific value.
[LCP TWG TFEE 2014]
7.3.3.1.2 Process gas management system
Description Process gas management systems are designed to maximise the productive use of the I&S
process gases. They enable the process gases to be directed to the combustion plants depending
on the process gases availability, as those are distributed in order of priority to the consuming
plants in the steelworks.
Technical description
Combustion plants using I&S process gases are integrated into any system designed to achieve
the most efficient use of these gases across all of the consuming plants of the industrial
installation. To optimise both energy efficiency and environmental emissions, these combustion
plants are included in a process gas management system that considers the whole integrated site,
instead of each process as a stand-alone unit. The most important energy flows and combustion
processes are monitored online. The sophistication of these systems reflects the operational
complexity of the works and incorporates technical, economic and managerial logic within
model-supported systems with extensive levels of IT, integrated with measurement and control
technologies. With a process gas management system, the gases can be used in order of priority
in the iron and steel processes and then in the combustion plants, ensuring flare losses of all
process gases are reduced.
Achieved environmental benefits The more consistently and efficiently the process gases are used in the steelworks applications,
the more regular the flows of gases to the combustion plants are, leading to a more efficient use
of the available gases in the generation of steam and electricity. This is particularly relevant
where there is great variability in the calorific value of the process gases.
An increase in energy efficiency reduces the emission levels for each unit of energy utilised and
can contribute to reducing the use of fossil fuels in the production of steam, heat and electricity.
Environmental performance and operational data
Process gas management systems have operated for many years, often since the commissioning
of the plant. What changes is the complexity of the calculations that can be made and the speed
at which they are made and followed through. This is an area where incremental changes are
implemented, but it is unlikely that the improvements will result in clearly measurable effects
Cross-media effects None.
Technical considerations relevant to applicability
Applicable in integrated iron- and steelworks.
Economics There are continuous cost requirements to maintain, upgrade and refurbish the meters and
hardware associated with the application of these systems. Additionally, costs are associated
with the maintenance and upgrading of the computing hardware and software associated with
WORKIN
G DRAFT IN
PROGRESS

Chapter 7
TL/JFF/FN/EIPPCB/LCP_Final Draft June 2016 647
the operation of the management systems. There are, however, economic advantages to be
gained from the operation of these systems, through lower process energy use and reduced costs
of imported fuels and electricity.
Driving force for implementation:
There are economic and energy efficiency advantages to optimising utilisation of the process
gases across the iron- and steelwork’s network.
Example plants
All integrated iron and steel plants utilise process gas management tools.
Reference literature None provided.
7.3.3.2 Techniques for the prevention and control of NOX and CO
emissions 7.3.3.2.1 General techniques for the prevention and control of NOX and CO
emissions when firing iron and steel process gases
General techniques to be considered in the determination of BAT for preventing and reducing
NOX and CO emissions to air from natural gas-fired plants (Table 7.10 and Table 7.11) are to be
considered in the context of firing iron and steel process gases. Further details on the associated
environmental performance, operational data and applicability or economic constraints are
given below.
Environmental performance and operational data
For NOX and CO emissions from plants combusting iron and steel process gases alone or
in combination with other gaseous and/or liquid fuels
Figure 7.51 and Figure 7.52 respectively show the NOX emissions from well-performing boilers
and CCGTs combusting iron and steel process fuels. The boilers are fitted with a combination of
primary techniques including LNB and/or SCR. The CCGTs are fitted with DLN, steam
injection when using natural gas and/or an SCR. In the case of a high proportion of COG in the
fuel mixture, which could lead to higher NOX levels at the boiler outlet, the application of an
appropriate (combination of) technique(s) (e.g. additional primary technique or SCR) may be
possible.
The corresponding CO emissions are kept under 20 mg/Nm3 in the case of CCGTs, and in
general below 25–50 mg/Nm3, with some plants emitting up to 100 mg/Nm
3 and a few
exceptions up to 225 mg/Nm3, in the case of boilers. No corresponding NH3 emission value has
been reported for the use of SCR.
The incorporation of an SCR system into an existing plant is an extensive process, both
economically and practically, since the boiler into which it will be fitted has to be taken out of
operation for a long period of time. Additionally, where heavy oil is used as an auxiliary fuel,
the catalyst temperature has to be higher, close to 500 °C (normally 300–400 °C), which may be
difficult to achieve for existing boilers.
With the SCR technique, NOX removal can be as high as 80–95 %, but these levels can only be
achieved in new LCPs, where the system has been accommodated from the design stage. When
retrofitting an existing LCP, the unit generally has a lower efficiency, in the range of up to 65–
75 %. Additionally, when considering the effectiveness of the SCR DeNOx system applied to a
boiler using I&S process gases, it has to be realised that the variations in the relative amounts of
the different gases cause significant differences and fluctuations in the amount of thermal NOX
produced. This can result in the suboptimal operation of the system, if ammonia slip is to be
WORKIN
G DRAFT IN
PROGRESS

Chapter 7
648 June 2016 TL/JFF/FN/EIPPCB/LCP_Final Draft
avoided. SCR requires the reactor to be either in constant operation or heated when the plant is
not operational. The heating requires a constant flow of hot air so that the reactor can be started
quickly when needed, but heating is also necessary to protect the catalyst material from water
condensation. Where it is not possible to keep an SCR system operational at all times the cost of
the investment, constant heating, operation and maintenance of the catalytic converter and the
energy consumption for keeping the SCR system reactive may not be justified by the reduction
in NOX.
NB: reported emissions are expressed as yearly averages
Source: [LCP TWG data collection 2012]
Figure 7.51: NOX emissions from well-performing gas boilers combusting iron and steel process
gases
WORKIN
G DRAFT IN
PROGRESS

Chapter 7
TL/JFF/FN/EIPPCB/LCP_Final Draft June 2016 649
NB: reported emissions are expressed as yearly averages
Source: [LCP TWG data collection 2012]
Figure 7.52: NOX emissions from well-performing CCGTs combusting iron and steel process gases
For short-term NOX emissions, the sector is specific as the composition and quantities of
fuels/process gases that are combusted may vary from one day to another and within the same
day from hour to hour and, at times, minute to minute:
Besides the 95th percentile of hourly averages reported in Figure 7.51 for boilers,
additional daily average data were collected by EUROFER in 2014 for another set of
plants, as shown in Figure 7.53.
WORKIN
G DRAFT IN
PROGRESS
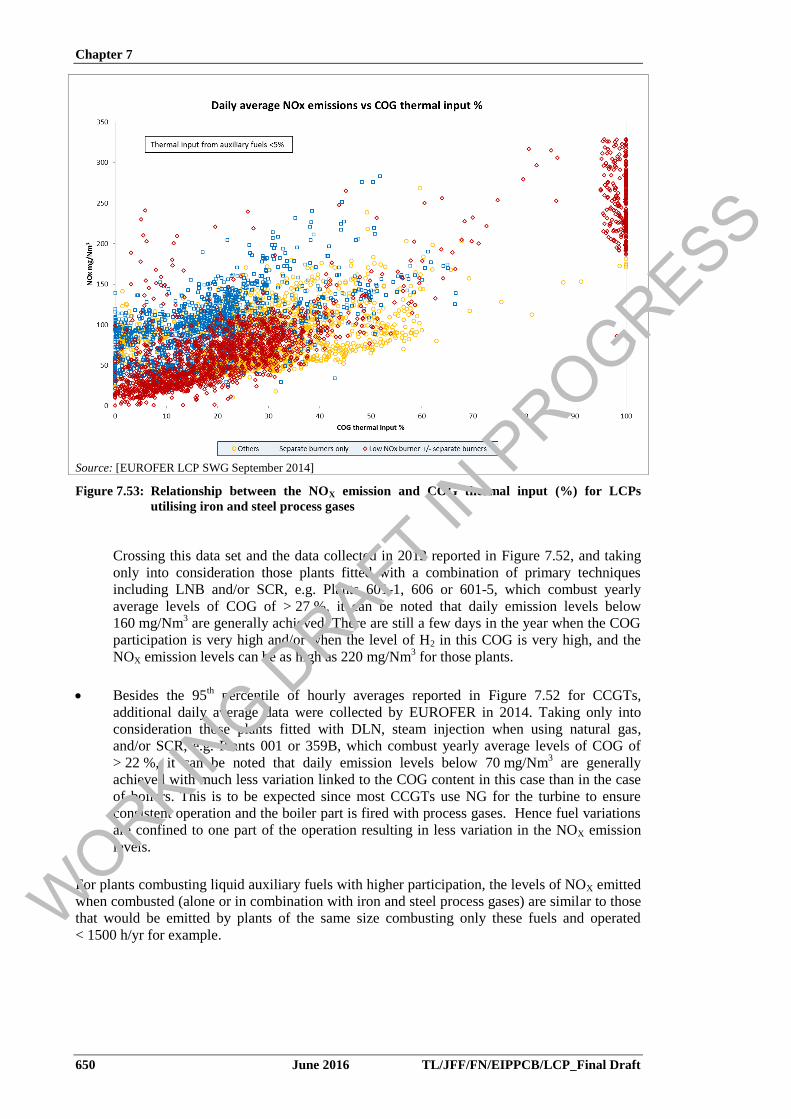
Chapter 7
650 June 2016 TL/JFF/FN/EIPPCB/LCP_Final Draft
Source: [EUROFER LCP SWG September 2014]
Figure 7.53: Relationship between the NOX emission and COG thermal input (%) for LCPs
utilising iron and steel process gases
Crossing this data set and the data collected in 2012 reported in Figure 7.52, and taking
only into consideration those plants fitted with a combination of primary techniques
including LNB and/or SCR, e.g. Plants 601-1, 606 or 601-5, which combust yearly
average levels of COG of > 27 %, it can be noted that daily emission levels below
160 mg/Nm3 are generally achieved. There are still a few days in the year when the COG
participation is very high and/or when the level of H2 in this COG is very high, and the
NOX emission levels can be as high as 220 mg/Nm3 for those plants.
Besides the 95th percentile of hourly averages reported in Figure 7.52 for CCGTs,
additional daily average data were collected by EUROFER in 2014. Taking only into
consideration those plants fitted with DLN, steam injection when using natural gas,
and/or SCR, e.g. Plants 001 or 359B, which combust yearly average levels of COG of
> 22 %, it can be noted that daily emission levels below 70 mg/Nm3 are generally
achieved with much less variation linked to the COG content in this case than in the case
of boilers. This is to be expected since most CCGTs use NG for the turbine to ensure
consistent operation and the boiler part is fired with process gases. Hence fuel variations
are confined to one part of the operation resulting in less variation in the NOX emission
levels.
For plants combusting liquid auxiliary fuels with higher participation, the levels of NOX emitted
when combusted (alone or in combination with iron and steel process gases) are similar to those
that would be emitted by plants of the same size combusting only these fuels and operated
< 1500 h/yr for example. W
ORKING D
RAFT IN P
ROGRESS

Chapter 7
TL/JFF/FN/EIPPCB/LCP_Final Draft June 2016 651
7.3.3.2.2 Specially designed low-NOX burners in multiple rows per type of fuel or including specific features for multi-fuel firing
Description
The use of low-NOX burners adapted to the typical fuels combusted and to the characteristics of
the combustion chamber enables the compromise combination that reduces NOX generation the
most during combustion.
Technical description Each boiler (or gas turbine) utilises different amounts of process gas, so the specially designed
burners are a compromise design based on the most likely average combination of gases. This
results in burner designs that encompass the most recent technology and a design specific to
each boiler in question. At the time of retrofitting, additional techniques may also be introduced
(cost and space permitting), such as flue-gas recirculation.
This technique can be split into individual burners for each process gas or fuel (including high
calorific value fuels) or designed multi-fuel process gas burners. According to the fuel input,
separate lances for COG and NG can be used.
Several different systems are used that can be grouped under the heading of low-NOX burners.
These include:
low-NOX burners for COG;
specialised burners for auxiliary fuels with high calorific values;
individual burners for each process gas;
multi-fuel process-gas burners;
multi-fuel process-gas and auxiliary fuel burners.
Since 2000, multi-fuel low-NOX burners have become available featuring flue-gas recirculation,
air staging and flue-gas recirculation, and air-staged and fuel-staged combined burners.
Achieved environmental benefit
Reduction of NOX emissions. The extent of the reduction depends on the deviation from the
design gas range.
Environmental performance and operational data
In a retrofit of a boiler at TKS Duisburg in 2002, low-NOX burners were installed for the
simultaneous injection of COG and NG through separate lances. Prior to the introduction of
these lances, the range of NOX emissions was 80–180 mg/Nm3, and afterwards, levels below
100 mg/Nm3 could be achieved when operating with the design range of process gases. In 2005,
a further boiler at TKS Duisburg was retrofitted with low-NOX burners, again for COG and NG.
In this case, a reduction from 80–150 mg/Nm3 to < 100 mg/Nm
3 was achieved with the same
proviso. The 100 mg/Nm3 can only be achieved and maintained when the thermal input of COG
(and NG) is held to the burner design specification; higher emissions result in greater levels of
thermal input for the COG.
See also Figure 7.51.
Cross-media effects The emissions of NOX and CO are always related and it may not be technically possible to
simultaneously achieve low NOX and low CO emissions using primary techniques alone.
Technical considerations relevant to applicability Low-NOX burner technology for NG gas is readily available. There has to be sufficient space for
the retrofitting of new low-NOX burners.
WORKIN
G DRAFT IN
PROGRESS
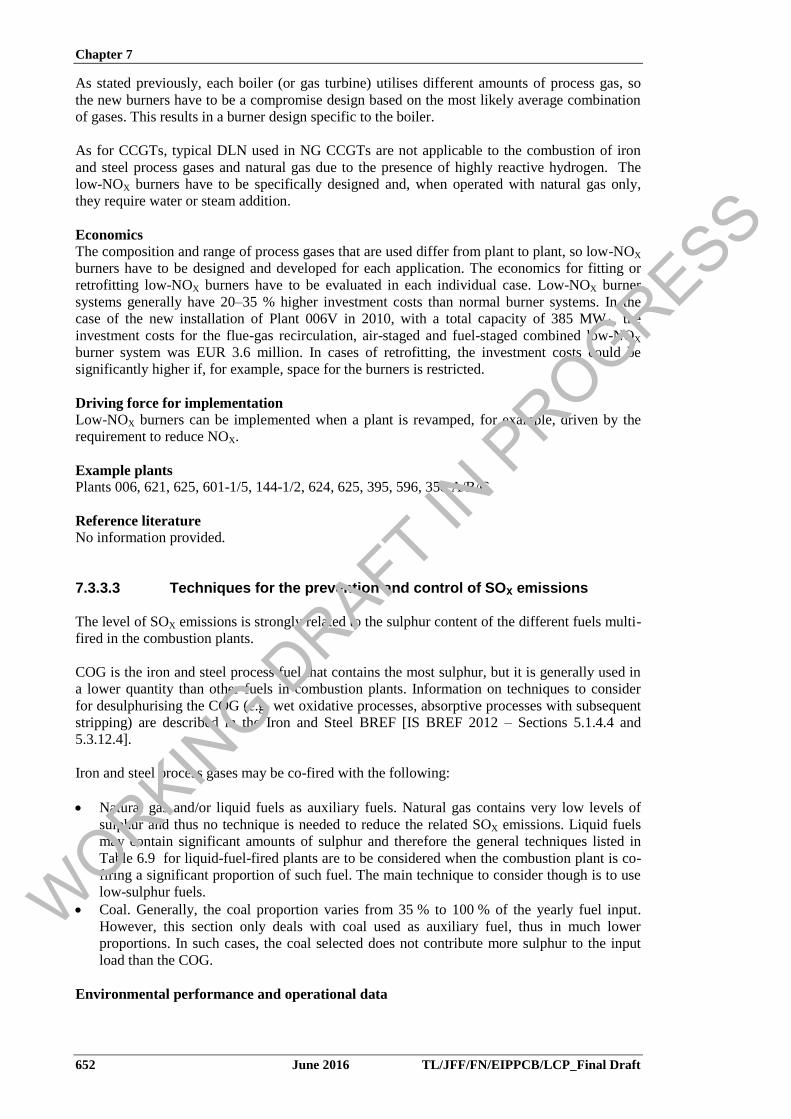
Chapter 7
652 June 2016 TL/JFF/FN/EIPPCB/LCP_Final Draft
As stated previously, each boiler (or gas turbine) utilises different amounts of process gas, so
the new burners have to be a compromise design based on the most likely average combination
of gases. This results in a burner design specific to the boiler.
As for CCGTs, typical DLN used in NG CCGTs are not applicable to the combustion of iron
and steel process gases and natural gas due to the presence of highly reactive hydrogen. The
low-NOX burners have to be specifically designed and, when operated with natural gas only,
they require water or steam addition.
Economics
The composition and range of process gases that are used differ from plant to plant, so low-NOX
burners have to be designed and developed for each application. The economics for fitting or
retrofitting low-NOX burners have to be evaluated in each individual case. Low-NOX burner
systems generally have 20–35 % higher investment costs than normal burner systems. In the
case of the new installation of Plant 006V in 2010, with a total capacity of 385 MWth, the
investment costs for the flue-gas recirculation, air-staged and fuel-staged combined low-NOX
burner system was EUR 3.6 million. In cases of retrofitting, the investment costs could be
significantly higher if, for example, space for the burners is restricted.
Driving force for implementation Low-NOX burners can be implemented when a plant is revamped, for example, driven by the
requirement to reduce NOX.
Example plants Plants 006, 621, 625, 601-1/5, 144-1/2, 624, 625, 395, 596, 358 A/B/C.
Reference literature No information provided.
7.3.3.3 Techniques for the prevention and control of SOX emissions
The level of SOX emissions is strongly related to the sulphur content of the different fuels multi-
fired in the combustion plants.
COG is the iron and steel process fuel that contains the most sulphur, but it is generally used in
a lower quantity than other fuels in combustion plants. Information on techniques to consider
for desulphurising the COG (e.g. wet oxidative processes, absorptive processes with subsequent
stripping) are described in the Iron and Steel BREF [IS BREF 2012 – Sections 5.1.4.4 and
5.3.12.4].
Iron and steel process gases may be co-fired with the following:
Natural gas and/or liquid fuels as auxiliary fuels. Natural gas contains very low levels of
sulphur and thus no technique is needed to reduce the related SOX emissions. Liquid fuels
may contain significant amounts of sulphur and therefore the general techniques listed in
Table 6.9 for liquid-fuel-fired plants are to be considered when the combustion plant is co-
firing a significant proportion of such fuel. The main technique to consider though is to use
low-sulphur fuels.
Coal. Generally, the coal proportion varies from 35 % to 100 % of the yearly fuel input.
However, this section only deals with coal used as auxiliary fuel, thus in much lower
proportions. In such cases, the coal selected does not contribute more sulphur to the input
load than the COG.
Environmental performance and operational data
WORKIN
G DRAFT IN
PROGRESS

Chapter 7
TL/JFF/FN/EIPPCB/LCP_Final Draft June 2016 653
For SOX emissions from multi-fuel-firing combustion plants burning iron and steel process
gases, alone or in combination with other gaseous fuels and/or liquid fuels in boilers, or
with natural gas in CCGTs
Boilers
Figure 7.54 shows the SO2 emissions from well-performing gas-fired boilers combusting iron
and steel process gases, sometimes with liquid fuels and/or natural gas as auxiliary fuels. Both
BFG and BOF gas are generated with low sulphur content and COG is desulphurised as
described in the IS BREF (2012). The limited use of auxiliary fuels enables these plants to
operate without end-of-pipe sulphur abatement techniques. Depending on the available process
gases coming from the iron- and steelworks, these plants combust a majority of BF gas with a
low sulphur content in the fuel diet, or combine desulphurised COG with other fuels, or use
natural gas as auxiliary fuel or liquid fuels with low sulphur contents. Monitoring is generally
carried out by continuous measurement (57 % of the plants), then by periodic measurements
(with between 8 and 52 measurements per year), and in a few cases (16 %) by estimation. Short-
term averages reported are for continuous monitoring, with averaging periods from half-hourly
to 48-hourly. Short-term peak SO2 emissions can arise when the COG desulphurising plant is
undergoing maintenance or when there is a need to use some auxiliary fuel oils at higher rates.
NB: reported emissions are expressed as yearly averages
Source: [LCP TWG data collection 2012]
Figure 7.54: SO2 emissions from well-performing boilers combusting iron and steel process gases
For short-term SOX emissions, the sector is specific as the composition and quantities of
fuels/process gases that are combusted may vary from one day to another and within the same
day from hour to hour and, at times, minute to minute. Besides the 95th percentile of hourly
averages reported in Figure 7.54, additional daily average data were collected by EUROFER in
2014, as shown in Figure 7.55.
WORKIN
G DRAFT IN
PROGRESS

Chapter 7
654 June 2016 TL/JFF/FN/EIPPCB/LCP_Final Draft
Source: [EUROFER LCP SWG September 2014]
Figure 7.55: Relationship between the daily average SO2 emission and COG thermal input (%) for
boilers using iron and steel process gases (thermal input from auxiliary fuels < 5 %)
This graph does not mention the type of technique used to control the SO2 emissions. Crossing
this set of data and the data collected in 2012 reported in Figure 7.54, and taking into
consideration only those plants operating within the environmental performance levels defined
in the IS BREF, e.g. Plants 144-1, 004, 596 or 612, which combust yearly average levels of
COG of > 20 %, it can be noted that daily emission levels below 200 mg/Nm3 are generally
achieved but there are a few days in the year when the COG participation could be very high
and/or when the level of S in this COG may be very high, and when the SO2 emission levels can
be as high as 300 mg/Nm3. The only plant permanently combusting a high share of COG (Plant
395) is fitted with an efficient desulphurisation system to deal with possibly higher SOX levels,
leading to daily SO2 emission levels usually well below 100 mg/Nm3.
CCGTs
Figure 7.56 shows the SO2 emissions from well-performing CCGTs firing iron and steel process
gases in combination with natural gas. COG desulphurisation and high proportions of natural
gas and blast furnace gas are used in the plants reported in this figure. The monitoring is
generally performed by continuous measurement, and short-term reported averaging periods are
from hourly to 48-hourly.
WORKIN
G DRAFT IN
PROGRESS
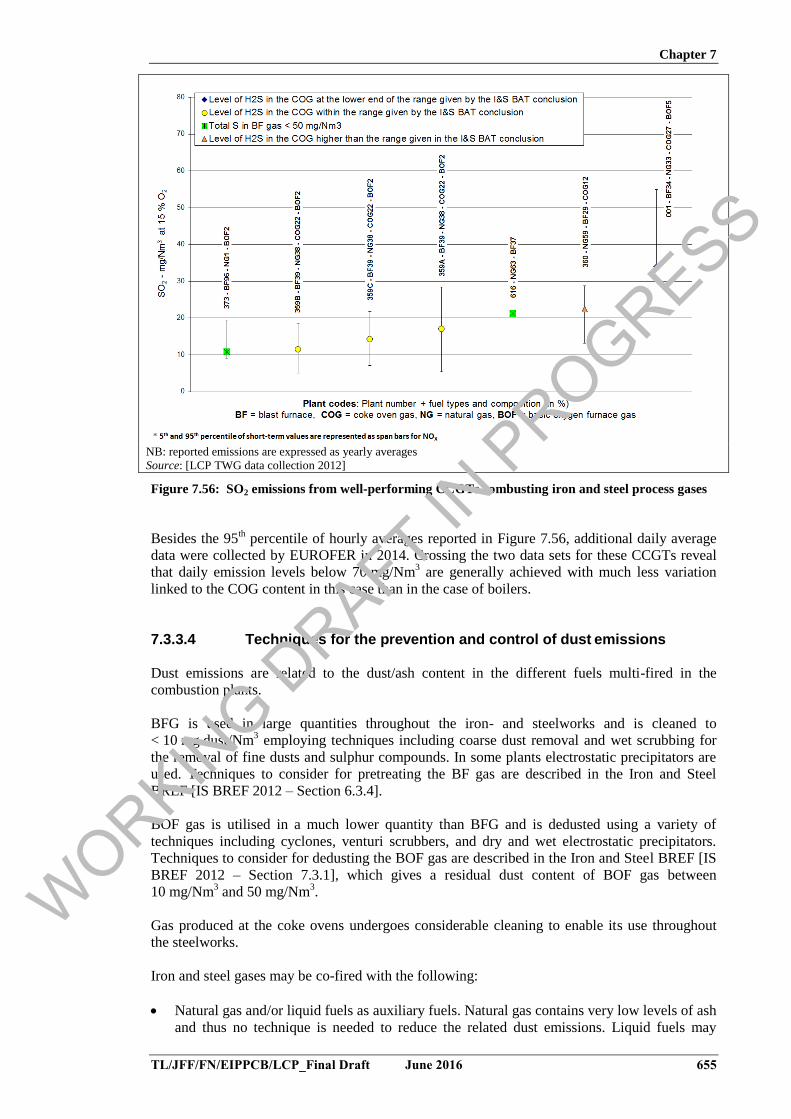
Chapter 7
TL/JFF/FN/EIPPCB/LCP_Final Draft June 2016 655
NB: reported emissions are expressed as yearly averages
Source: [LCP TWG data collection 2012]
Figure 7.56: SO2 emissions from well-performing CCGTs combusting iron and steel process gases
Besides the 95th percentile of hourly averages reported in Figure 7.56, additional daily average
data were collected by EUROFER in 2014. Crossing the two data sets for these CCGTs reveal
that daily emission levels below 70 mg/Nm3 are generally achieved with much less variation
linked to the COG content in this case than in the case of boilers.
7.3.3.4 Techniques for the prevention and control of dust emissions
Dust emissions are related to the dust/ash content in the different fuels multi-fired in the
combustion plants.
BFG is used in large quantities throughout the iron- and steelworks and is cleaned to
< 10 mg dust/Nm3 employing techniques including coarse dust removal and wet scrubbing for
the removal of fine dusts and sulphur compounds. In some plants electrostatic precipitators are
used. Techniques to consider for pretreating the BF gas are described in the Iron and Steel
BREF [IS BREF 2012 – Section 6.3.4].
BOF gas is utilised in a much lower quantity than BFG and is dedusted using a variety of
techniques including cyclones, venturi scrubbers, and dry and wet electrostatic precipitators.
Techniques to consider for dedusting the BOF gas are described in the Iron and Steel BREF [IS
BREF 2012 – Section 7.3.1], which gives a residual dust content of BOF gas between
10 mg/Nm3 and 50 mg/Nm
3.
Gas produced at the coke ovens undergoes considerable cleaning to enable its use throughout
the steelworks.
Iron and steel gases may be co-fired with the following:
Natural gas and/or liquid fuels as auxiliary fuels. Natural gas contains very low levels of ash
and thus no technique is needed to reduce the related dust emissions. Liquid fuels may
WORKIN
G DRAFT IN
PROGRESS
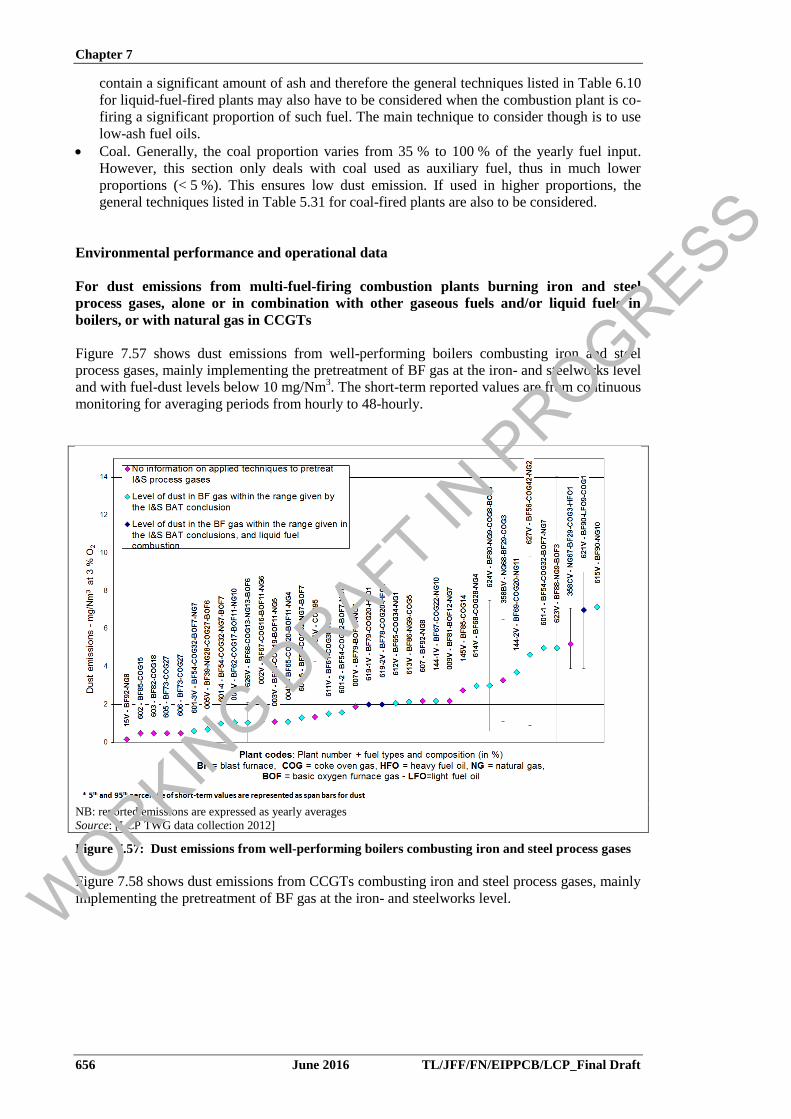
Chapter 7
656 June 2016 TL/JFF/FN/EIPPCB/LCP_Final Draft
contain a significant amount of ash and therefore the general techniques listed in Table 6.10
for liquid-fuel-fired plants may also have to be considered when the combustion plant is co-
firing a significant proportion of such fuel. The main technique to consider though is to use
low-ash fuel oils.
Coal. Generally, the coal proportion varies from 35 % to 100 % of the yearly fuel input.
However, this section only deals with coal used as auxiliary fuel, thus in much lower
proportions (< 5 %). This ensures low dust emission. If used in higher proportions, the
general techniques listed in Table 5.31 for coal-fired plants are also to be considered.
Environmental performance and operational data
For dust emissions from multi-fuel-firing combustion plants burning iron and steel
process gases, alone or in combination with other gaseous fuels and/or liquid fuels in
boilers, or with natural gas in CCGTs
Figure 7.57 shows dust emissions from well-performing boilers combusting iron and steel
process gases, mainly implementing the pretreatment of BF gas at the iron- and steelworks level
and with fuel-dust levels below 10 mg/Nm3. The short-term reported values are from continuous
monitoring for averaging periods from hourly to 48-hourly.
NB: reported emissions are expressed as yearly averages
Source: [LCP TWG data collection 2012]
Figure 7.57: Dust emissions from well-performing boilers combusting iron and steel process gases
Figure 7.58 shows dust emissions from CCGTs combusting iron and steel process gases, mainly
implementing the pretreatment of BF gas at the iron- and steelworks level.
WORKIN
G DRAFT IN
PROGRESS
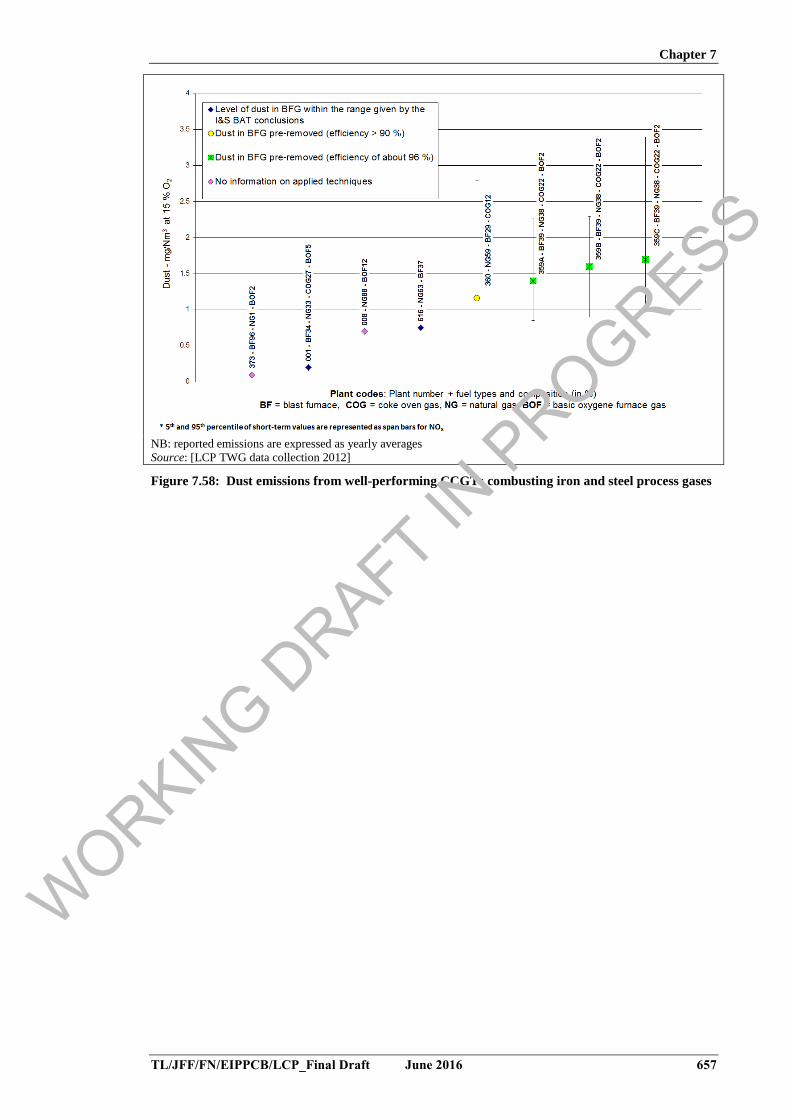
Chapter 7
TL/JFF/FN/EIPPCB/LCP_Final Draft June 2016 657
NB: reported emissions are expressed as yearly averages
Source: [LCP TWG data collection 2012]
Figure 7.58: Dust emissions from well-performing CCGTs combusting iron and steel process gases
WORKIN
G DRAFT IN
PROGRESS
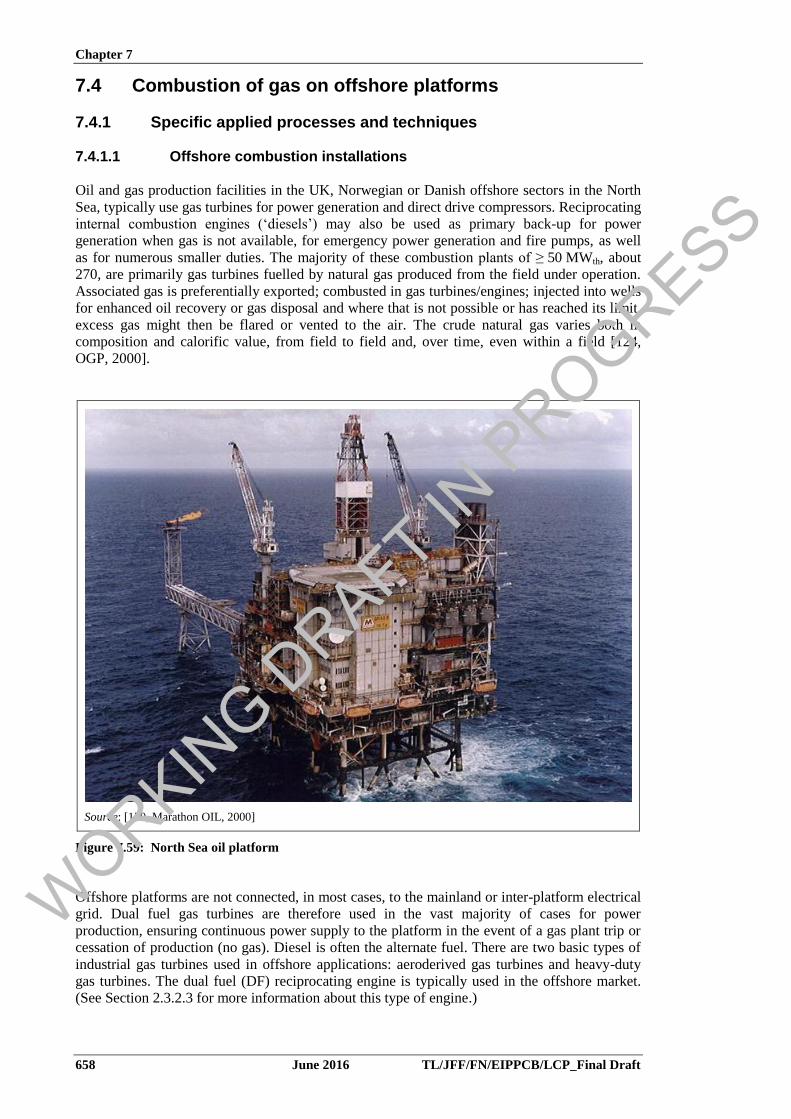
Chapter 7
658 June 2016 TL/JFF/FN/EIPPCB/LCP_Final Draft
7.4 Combustion of gas on offshore platforms
7.4.1 Specific applied processes and techniques
7.4.1.1 Offshore combustion installations
Oil and gas production facilities in the UK, Norwegian or Danish offshore sectors in the North
Sea, typically use gas turbines for power generation and direct drive compressors. Reciprocating
internal combustion engines (‘diesels’) may also be used as primary back-up for power
generation when gas is not available, for emergency power generation and fire pumps, as well
as for numerous smaller duties. The majority of these combustion plants of ≥ 50 MWth, about
270, are primarily gas turbines fuelled by natural gas produced from the field under operation.
Associated gas is preferentially exported; combusted in gas turbines/engines; injected into wells
for enhanced oil recovery or gas disposal and where that is not possible or has reached its limit,
excess gas might then be flared or vented to the air. The crude natural gas varies both in
composition and calorific value, from field to field and, over time, even within a field [124,
OGP, 2000].
Source: [150, Marathon OIL, 2000]
Figure 7.59: North Sea oil platform
Offshore platforms are not connected, in most cases, to the mainland or inter-platform electrical
grid. Dual fuel gas turbines are therefore used in the vast majority of cases for power
production, ensuring continuous power supply to the platform in the event of a gas plant trip or
cessation of production (no gas). Diesel is often the alternate fuel. There are two basic types of
industrial gas turbines used in offshore applications: aeroderived gas turbines and heavy-duty
gas turbines. The dual fuel (DF) reciprocating engine is typically used in the offshore market.
(See Section 2.3.2.3 for more information about this type of engine.)
WORKIN
G DRAFT IN
PROGRESS
Chapter 7
TL/JFF/FN/EIPPCB/LCP_Final Draft June 2016 659
The aeroderivative type of gas turbine is more adaptable to variable loads than the heavy-duty
unit and is, therefore, widely used for gas and oil pumping, as well as for electrical power
generation. The gas turbine may contain more than one concentric shaft, to obtain the optimum
performance from different stages of gas expansion and air compression.
The heavy-duty gas turbines are used mainly for electricity generation. They are often built as a
single-shaft machine, where the compressor, gas turbine and power turbine are all on a single
shaft. On start-up, the complete rotor has to be accelerated to a self-sustaining speed, usually by
a diesel engine or electric motor. When used for power generation, they can maintain good
speed control, even in the event of a loss of electrical load [123, DTI, 2001].
An offshore oil and gas facility, although using some combustion equipment common to
onshore applications, is a more complex and potentially hazardous environment than, say, an
onshore power station, which results in higher costs due to the following reasons:
logistics related to bringing people and equipment to the installation;
limited cabin capacity for additional crew during modification work, which may mean
either a prolonged installation period or the need to rent a flotel (floating hotel);
higher man-hour rates;
hot work in congested process areas is a safety hazard; thus more of the work will have to
be carried complying with strict rules (which add to the cost) or during complete
shutdown (loss of production);
the more extensive and sophisticated fire protection systems often have to be modified
too, in addition to the equipment modifications;
if modifications require additional space, expensive structural work has to be carried out,
if at all possible;
the value of lost or deferred production is often more significant than for a land-based
facility.
In addition, space and weight are at a premium, leading to a much higher equipment density
than is common in onshore applications. In addition, any undue complexity is generally avoided
offshore, because of the weight, space, and operability factors, including safety factors [123,
DTI, 2001]. Therefore, more complex systems, such as combined-cycle plants, are applied only
in a very few cases, as are systems which require significant chemical usage or supporting
equipment offshore, e.g. flue-gas cleaning devices.
WORKIN
G DRAFT IN
PROGRESS
Chapter 7
660 June 2016 TL/JFF/FN/EIPPCB/LCP_Final Draft
7.4.1.2 Control of emissions to air
Consideration of the mechanisms of nitric oxide formation (see also Section 1.3.2.2) shows that
the design of combustion equipment to reduce its formation by the thermal route involves
limiting the overall temperature and residence time, and minimising the formation of hot spots,
by optimising air and fuel mixing.
Improving the thermal efficiency by operating at higher temperatures, however, tends to
increase nitric oxide concentrations, although mass releases may be reduced because of
increased energy efficiency, but this phenomenon is, however, very plant-specific. Normally the
NOX emissions decrease with load due to an decrease in flame temperature. However, for
certain dry low-NOX systems, the emissions of NOX can be higher when operating in part load
mode. It is also worth noting the impact on CO emissions at low loads - they may rise
exponentially in many cases.
Water and steam injections are available for a range of gas turbines. This requires modifying the
fuel jets or installing a separate water injection manifold. Water is injected at a preset ratio with
the fuel. For example, a 50 MWth plant would require about 3 tonnes of water per hour to
achieve a 65 % reduction in NOX emissions. There is a modest increase in power output but a
slight decrease in the turbine efficiency. It is worth noting that the water used for water injection
into turbines for NOX reduction needs to be of a very high quality. All water of this quality
needs to be made from seawater or taken offshore by supply vessels. The energy requirement in
the former would be significant. In the latter case there would be a requirement to supply
throughout the year and this can cause problems during periods of adverse weather. A full-scale
pilot project on water injection was due to start in the spring of 2014 on one of the Norwegian
platforms. The expected environmental performance for NOX emissions was about
< 50 mg/Nm3 when burning gas fuel and < 84 mg/Nm
3 when burning liquid fuel.
Steam injection into the combustion chamber of a gas turbine has the same effect as water
injection in cooling the combustor and reducing the thermal oxides of nitrogen. For a 50 MWth
plant, about 4 tonnes of steam per hour would be required to achieve a 65 % reduction in NOX
emissions. The Cheng steam injection cycle for simultaneously reducing NOX and increasing
efficiency, which can also be applied to all gaseous fuel turbines with conventional combustion
(diffusion flame technology), can be applied to offshore turbines. Conventional steam injection
in gas-fired turbines is described in Section 3.2.2.3.10, where 40 % to 60 % NOX emission
reduction can be achieved with no significant increase in CO emission. However, the Cheng
steam injection cycle provides solutions which make this NOX control technique more qualified
than conventional steam injection. The Cheng system provides unique mixing of gaseous fuel
and steam, so that NOX can be reduced by up to 95 %. Again, the high-quality water required to
produce steam is not usually readily available in an offshore facility [123, DTI, 2001].
More and more turbine manufacturers are developing dry low-NOX emission (DLE) technology,
using gas analyser equipment and software integrated into the fuel and engine management
system, for new turbines and for retrofitting equipment. Because of the special constraints on
offshore platforms (i.e. space, complexity and weight), water and steam injection is not a very
practical solution; dry low-NOX technology is currently applied to about 23 % (i.e. 41 out of
179) of the gas turbines on Norwegian platforms. As reported by [122, Carstensen and
Skorping, 2000], DLE turbines are installed more frequently in mechanical drive applications.
The use of a low-NOX technique needs to be considered in relation to weight, space and
reliability issues as well as the impact of low loading (including the need for spinning reserve).
Post-combustion techniques, such as SCR, have been applied to gas turbines in several
European countries and in parts of Japan and California, in order to meet strict emission
standards for nitrogen oxides. SCR is a chemical reduction of nitrogen oxides by a reducing
agent, usually ammonia gas. Due to the space and weight of such a system and particularly the
health and safety problems encountered during the storage and handling of ammonia, this
WORKIN
G DRAFT IN
PROGRESS
Chapter 7
TL/JFF/FN/EIPPCB/LCP_Final Draft June 2016 661
technique has not been applied and is not considered particularly viable for offshore combustion
plants at present.
There are various techniques for measuring or monitoring emissions from exhaust stacks, of
which the Predictive Emissions Monitoring System (PEMS) and CEMS are for continuous
monitoring and physical periodic sampling used as an alternative. PEMS is widely used in the
US for NOX monitoring. In the US, the operator of a plant can apply to use PEMS instead of
CEMS if the plant can demonstrate that the new PEMS has ‘the same or better precision,
reliability, accessibility and timeliness as that provided by the continuous emission monitoring
systems’. PEMS is implemented as well on European platforms as an alternative to CEMS.
7.4.2 Current consumption and emission levels
7.4.2.1 Non-conventional gaseous fuels combusted
Offshore gas turbines burn crude natural gas supplied directly by the adjacent oilfield. This gas
can have a different composition from that of natural gas normally used for onshore gas
turbines. An example composition of natural gas from an oilfield in the North Sea can be seen in
Table 7.26 but it should be noted that this gas composition may vary significantly across
different facilities and potentially even over the asset's life.
Table 7.26: An example composition of crude natural gas from an oilfield in the North Sea
Component Mol % g/mol
Methane 68.69 46.18
CO2 (1)
14.65 27.01
Ethane 8.18 10.31
Propane 4.45 8.22
n-Butane 1.19 2.9
Nitrogen 0.84 0.98
H2O 0.7 0.52
i-Butane 0.49 1.3
n-Pentane 0.30 0.92
i-Pentane 0.26 0.78
Hexane 0.089 0.32
Heptane 0.06 0.25
Octane 0.033 0.15
H2S 0.007 0.01
Helium 0.0 0.0 (1) The CO2 content of crude natural gas varies quite a bit from field to field, but is
rarely above 10 %.
Source: [78, Finkeldei, 2000]
7.4.2.2 Efficiency of non-conventional gaseous fuels combustion in offshore gas turbines
Open- or simple-cycle configurations are mostly used for offshore facilities, because of space,
weight, and operability reasons. Thermal efficiencies of up to about 41 % can be expected from
the latest new, large gas turbines. However, for existing gas turbines under normal operating
conditions, more typical numbers are 30–35 % thermal efficiency. Higher thermal efficiencies
can lead to high combustion temperatures, which may increase NOX production, thus requiring
sophisticated combustion chamber designs to achieve both high thermal efficiencies and low
emissions [123, DTI, 2001].
WORKIN
G DRAFT IN
PROGRESS
Chapter 7
662 June 2016 TL/JFF/FN/EIPPCB/LCP_Final Draft
The efficiency of the turbines themselves is only one of the factors of the total energy efficiency
of the offshore installation. To make energy production on the platforms more efficient, many
factors need to be taken into account, including:
optimising of the process in order to minimise the energy consumption and the
mechanical requirements;
using variable speed drives for large rotating equipment if loads are variable;
optimising line sizes to reduce pressure drops, using expanders and hydraulic pumps to
utilise pressure drops instead of throttling;
optimising equipment sizing to avoid recycling and part-load operation;
optimising and maintaining inlet and exhaust systems in a way that keeps the pressure
losses as low as practically possible;
utilising the gas turbine exhaust heat for platform heating purposes;
considering the lifetime of field production profiles and hence the energy demand which
may vary significantly over the 20- to 40-year lifetime of a typical field; this has a
significant impact on the loading and machine selection and hence energy efficiency.
7.4.3 Techniques to consider in the determination of BAT
This section describes techniques (or combinations thereof), and associated monitoring,
considered to have the potential for achieving a high level of environmental protection in the
activities within the scope of this document. The techniques described include both the
technology used and the way in which the installations are designed, built, maintained, operated,
and decommissioned.
It covers process-integrated and end-of-pipe techniques. Waste prevention and management,
including waste minimisation and recycling procedures, are also considered. Furthermore,
techniques for reducing the consumption of raw materials, water, and energy are covered.
Annex III to the Industrial Emissions Directive lists a number of criteria for determining BAT,
and the information within this chapter addresses these considerations. As far as possible, the
standard structure of Table 3.4 is used to outline the information on each technique, to enable a
comparison of techniques and the assessment against the definition of BAT given in the
Industrial Emissions Directive.
This section does not necessarily provide an exhaustive list of techniques that could be applied
in the sector. Other techniques may exist, or may be developed, which could be considered for
the determination of BAT for an individual installation.
In this section, the techniques to be considered have only been fully described when they are
specific to the considered combusted fuel or applied combustion process (combustion of fuels
on offshore platforms). Indeed, for most of the techniques, general descriptions are already
presented in Chapter 3. Therefore, in order to avoid repetition, for those general techniques
already described in Chapter 3, only the additional information that is specific to the combustion
of fuels on offshore platforms is reported here in synthesis tables.
7.4.3.1 Techniques to improve the environmental performance of combustion plants used on offshore platforms
To reduce the environmental impact of offshore gas turbines, the following techniques
considered:
for new installations, selecting turbines or engines which can achieve both a high thermal
efficiency and a low emissions spectrum;
WORKIN
G DRAFT IN
PROGRESS

Chapter 7
TL/JFF/FN/EIPPCB/LCP_Final Draft June 2016 663
using dual fuel turbines only where operationally necessary;
minimising the spinning reserve;
providing a fuel gas supply from a point in the topside oil and gas process which offers a
minimum range of fuel gas combustion parameters, e.g. calorific value;
providing a fuel gas supply from a point in the topside oil and gas process which offers
minimum concentrations of sulphurous compounds, to minimise SO2 formation,
appropriately addressing the safety issue that may be linked to the use of ultra-low-
sulphur diesel in Europe due to biofuel (FAME) addition. When using liquid distillate
fuels, preference should be given to low-sulphur types, where the safety and operational
consequences are well understood and manageable;
operating multiple generator or compressor sets at load points which minimise pollution;
optimising the maintenance and refurbishment programmes;
optimising and maintaining inlet and exhaust systems in a way that keeps the pressure
losses as low as possible;
optimising the process in order to minimise the mechanical power requirements and
pollution;
utilising the gas turbine exhaust heat for platform heating purposes where there is a
suitable and consistent heat demand and subject to weight and space constraints.
Modern ‘diesel’ engines are available with high-pressure fuel injection controlled by
electronics. Additionally, optimised combustion chambers have been developed. This
technology can result in increased fuel economy, reduced NOX and other gaseous emissions and
reduced smoke, particularly during acceleration and start-up.
To reduce the environmental impact of offshore engines, the following techniques are
considered:
For new engines, selecting diesels which achieve both high thermal efficiency and a low
emissions spectrum.
Where process gas is used as fuel, providing a supply from a point in the topside process
which will offer minimum emissions of SO2 for example. For liquid distillate fuels,
preference should be given to low-sulphur types, where the safety and operational
consequences are well-understood and manageable.
For larger diesels, considering gas fuelling with a ‘torch oil’ ignition charge.
Optimising injection timing.
Operating multiple generator or compressor sets at load points which minimise pollution.
Optimising maintenance and refurbishment programmes.
7.4.3.2 Techniques to increase energy efficiency
Information on general techniques to increase the energy efficiency of combustion units is given
in Section 3.2.3. Table 7.27 gives additional information specific to combustion for offshore
installations.
WORKIN
G DRAFT IN
PROGRESS
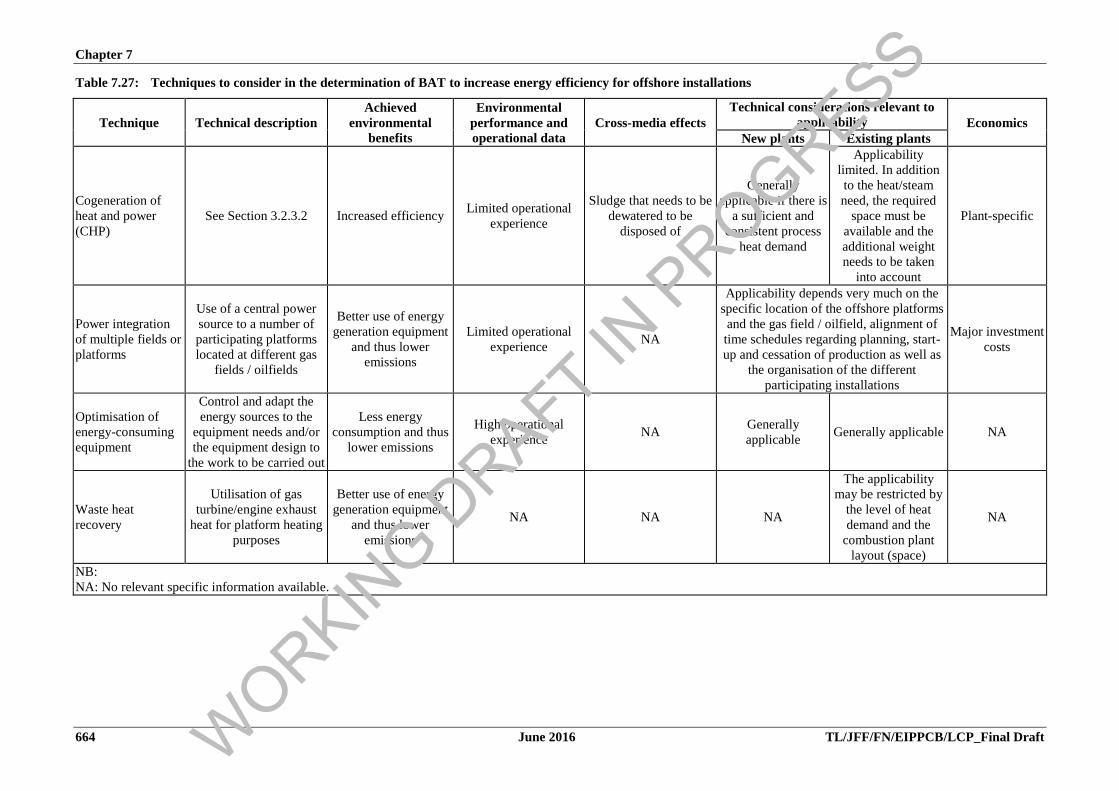
Chapter 7
664 June 2016 TL/JFF/FN/EIPPCB/LCP_Final Draft
Table 7.27: Techniques to consider in the determination of BAT to increase energy efficiency for offshore installations
Technique Technical description
Achieved
environmental
benefits
Environmental
performance and
operational data
Cross-media effects
Technical considerations relevant to
applicability Economics
New plants Existing plants
Cogeneration of
heat and power
(CHP)
See Section 3.2.3.2 Increased efficiency Limited operational
experience
Sludge that needs to be
dewatered to be
disposed of
Generally
applicable if there is
a sufficient and
consistent process
heat demand
Applicability
limited. In addition
to the heat/steam
need, the required
space must be
available and the
additional weight
needs to be taken
into account
Plant-specific
Power integration
of multiple fields or
platforms
Use of a central power
source to a number of
participating platforms
located at different gas
fields / oilfields
Better use of energy
generation equipment
and thus lower
emissions
Limited operational
experience NA
Applicability depends very much on the
specific location of the offshore platforms
and the gas field / oilfield, alignment of
time schedules regarding planning, start-
up and cessation of production as well as
the organisation of the different
participating installations
Major investment
costs
Optimisation of
energy-consuming
equipment
Control and adapt the
energy sources to the
equipment needs and/or
the equipment design to
the work to be carried out
Less energy
consumption and thus
lower emissions
High operational
experience NA
Generally
applicable Generally applicable NA
Waste heat
recovery
Utilisation of gas
turbine/engine exhaust
heat for platform heating
purposes
Better use of energy
generation equipment
and thus lower
emissions
NA NA NA
The applicability
may be restricted by
the level of heat
demand and the
combustion plant
layout (space)
NA
NB:
NA: No relevant specific information available.
WORKIN
G DRAFT IN
PROGRESS

Chapter 7
TL/JFF/FN/EIPPCB/LCP_Final Draft June 2016 665
7.4.3.3 Techniques for the prevention and control of NOX and CO
emissions
Information on general techniques for the prevention and control of NOX, CO and NH3
emissions is given in Section 3.2. Table 7.28 gives information specific to offshore installations.
WORKIN
G DRAFT IN
PROGRESS
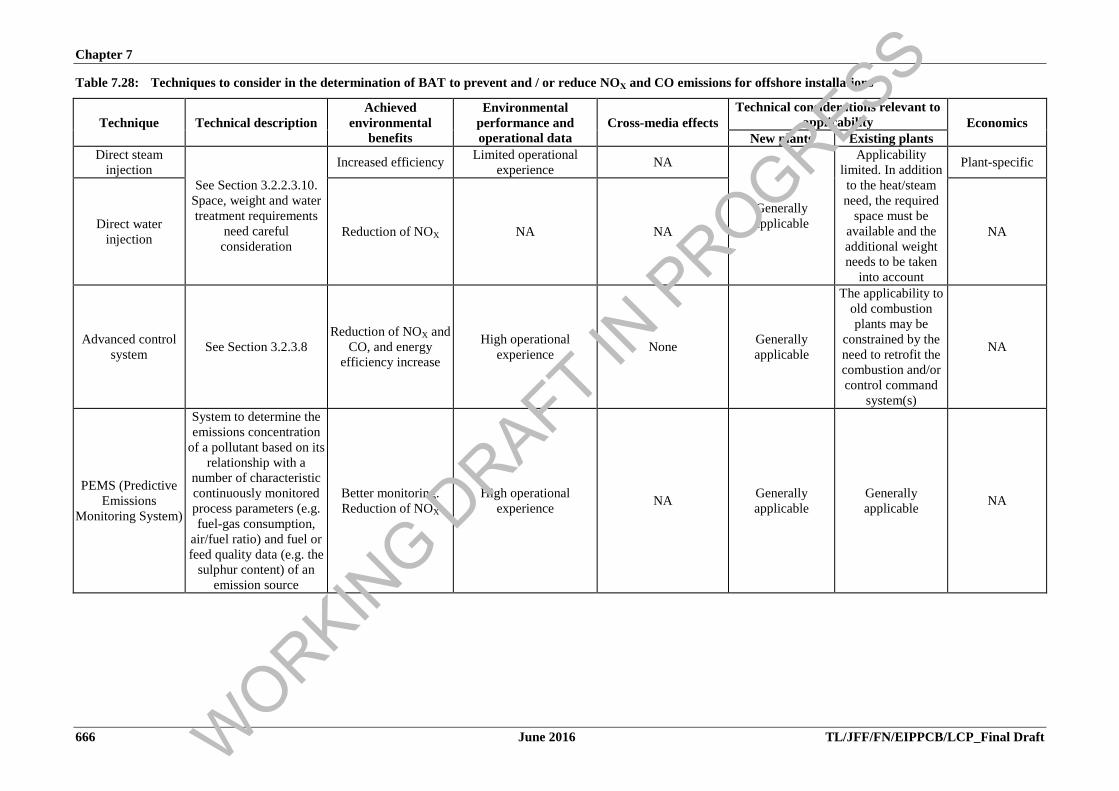
Chapter 7
666 June 2016 TL/JFF/FN/EIPPCB/LCP_Final Draft
Table 7.28: Techniques to consider in the determination of BAT to prevent and / or reduce NOX and CO emissions for offshore installations
Technique Technical description
Achieved
environmental
benefits
Environmental
performance and
operational data
Cross-media effects
Technical considerations relevant to
applicability Economics
New plants Existing plants
Direct steam
injection
See Section 3.2.2.3.10.
Space, weight and water
treatment requirements
need careful
consideration
Increased efficiency Limited operational
experience NA
Generally
applicable
Applicability
limited. In addition
to the heat/steam
need, the required
space must be
available and the
additional weight
needs to be taken
into account
Plant-specific
Direct water
injection Reduction of NOX NA NA NA
Advanced control
system See Section 3.2.3.8
Reduction of NOX and
CO, and energy
efficiency increase
High operational
experience None
Generally
applicable
The applicability to
old combustion
plants may be
constrained by the
need to retrofit the
combustion and/or
control command
system(s)
NA
PEMS (Predictive
Emissions
Monitoring System)
System to determine the
emissions concentration
of a pollutant based on its
relationship with a
number of characteristic
continuously monitored
process parameters (e.g.
fuel-gas consumption,
air/fuel ratio) and fuel or
feed quality data (e.g. the
sulphur content) of an
emission source
Better monitoring.
Reduction of NOX
High operational
experience NA
Generally
applicable
Generally
applicable NA
WORKIN
G DRAFT IN
PROGRESS

Chapter 7
TL/JFF/FN/EIPPCB/LCP_Final Draft June 2016 667
Technique Technical description
Achieved
environmental
benefits
Environmental
performance and
operational data
Cross-media effects
Technical considerations relevant to
applicability Economics
New plants Existing plants
Cheng steam
injection cycle See Section 3.2.3.3
NOX reduction and
efficiency increase NA NA
Generally
applicable
Applicability
limited. In addition
to the heat/steam
need, the required
space must be
available and the
additional weight
needs to be taken
into account
NA
Dry low-NOX
burners (DLN) See Section 3.2.2.3.7 NOX reduction
The DLN technique is
commonly applied to new
gas turbines operated
offshore
Possible reduced
efficiency at part load
Generally
applicable within
the constraints
associated with the
fuel quality
variations
The applicability
may be limited by:
the availability of a
retrofit package (for
low-load operation),
the complexity of
the platform
organisation and
space availability;
and/or constrained
by the fuel quality
variations
NA
Lean-burn concept See Section 3.2.2.3.9 Reduction of NOX High operational
experience
Generally
applicable
Applicable when a
retrofit package is
available
NA
Selective catalytic
reduction (SCR) See Section 3.2.2.3.11 Reduction of NOX Ammonia slip
Not generally
applicable due to
issues related to
health and safety,
continuity of
supply, ammonia
storage, lack of
space, and load
and weight
requirements
Not applicable Plant-specific
WORKIN
G DRAFT IN
PROGRESS
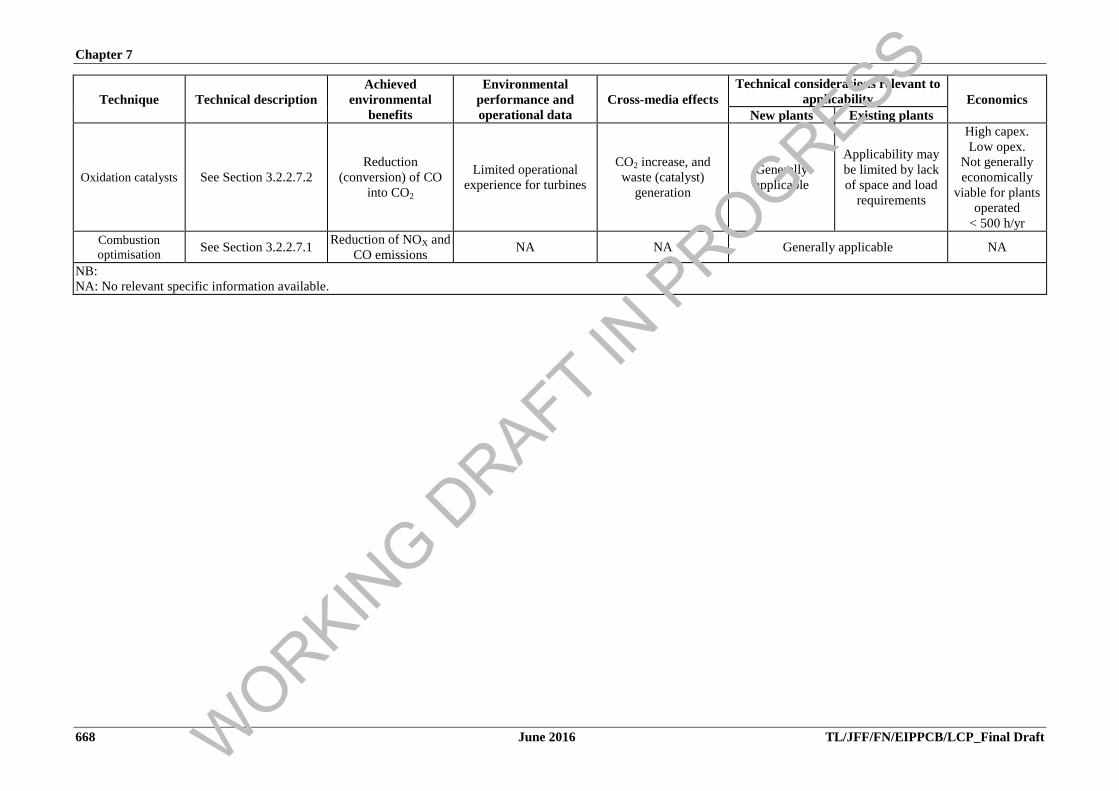
Chapter 7
668 June 2016 TL/JFF/FN/EIPPCB/LCP_Final Draft
Technique Technical description
Achieved
environmental
benefits
Environmental
performance and
operational data
Cross-media effects
Technical considerations relevant to
applicability Economics
New plants Existing plants
Oxidation catalysts See Section 3.2.2.7.2
Reduction
(conversion) of CO
into CO2
Limited operational
experience for turbines
CO2 increase, and
waste (catalyst)
generation
Generally
applicable
Applicability may
be limited by lack
of space and load
requirements
High capex.
Low opex.
Not generally
economically
viable for plants
operated
< 500 h/yr
Combustion
optimisation See Section 3.2.2.7.1
Reduction of NOX and
CO emissions NA NA Generally applicable NA
NB:
NA: No relevant specific information available.
WORKIN
G DRAFT IN
PROGRESS

Chapter 7
TL/JFF/FN/EIPPCB/LCP_Final Draft June 2016 669
Environmental performance and operational data for NOX and CO emissions
Data reported from recently commissioned turbines in Denmark [Additional information – DK-
01/02] on offshore platforms show short-term NOX emission levels of about 15–50 mg/Nm3
when fitted with the DLN technique. Should the DLN technique not be possible to implement
due to poor fuel quality or low-load operation, emissions can be up to 250 mg/Nm3 in the case
of new standard burners and up to 350 mg/Nm3 in the case of existing optimised standard
annular combustion (SAC) burners [DK, NO 2015].
WORKIN
G DRAFT IN
PROGRESS

WORKIN
G DRAFT IN
PROGRESS
Chapter 8
TL/JFF/FN/EIPPCB/LCP_Final Draft June 2016 671
8 MULTI-FUEL COMBUSTION
8.1 Solid multi-fuel combustion
The implementation of multi-fuel firing has significant operational implications. Particularly
when co-milling, biomass fuels must be matched closely with individual plant designs for
optimum performance, and most combustion plants that have experience of commercial multi-
fuel firing have needed to overcome a number of technical issues. Among those, most important
have been the health and safety implications of multi-fuel firing a more reactive fuel that the
plant was not originally designed to handle. Where technical issues lead to limitations on plant
flexibility or availability, multi-fuel firing can also have an adverse impact on the trading of the
electricity or the heat produced by the plant.
The impact that biomass co-firing has on the operation of a coal-fired plant depends on the type
of plant involved, especially the configuration of the milling plant if the biomass is to be co-
milled, the range of coals with which the biomass is to be co-fired, and the characteristics of the
biomass.
[ 1, Eurelectric 2013 ]
8.1.1 Applied processes and techniques used in solid multi-fuel combustion in LCPs
8.1.1.1 Unloading, storage and handling
The processes and techniques used for unloading, storing and handling different solid fuels
combusted in the same combustion plants are the ones used for each individual separate solid
fuel, already described in Section 2.8.
Much of the recent and likely future increase in biomass use will be using pelletised fuels,
mainly wood. The pelletising process reduces the moisture and converts the biomass into a
form which is much easier to transport, store and handle.
Some plants have undergone modifications, which are directly attributable to local conditions
and/or requirements, involving changes to the rail unloading and conveyor system and blending
equipment, principally to minimise dust emissions and to ensure adequate control over the mix
of fuel fired in the boiler.
In the case of multi-fuel firing with petroleum coke (pet coke), coal/pet coke mixes may also be
imported to the plant provided that adequate blend composition tests are carried out at (for
example) a port. Storage of pet coke can be achieved on the normal coal stock either as 100 %
pet coke or as a defined coal/pet coke blend.
8.1.1.2 Fuels characterisation and pretreatment
A basic assessment of any new biomass material proposed for a particular plant is typically
carried out through a combination of standard fuel analysis techniques, single mill testing and
full unit trials.
[ 1, Eurelectric 2013 ]
Biomass and coal have fundamentally different properties as fuels. Biomass contains larger
quantities of alkali and alkaline earth elements (potassium, sodium, calcium, magnesium),
phosphorus and chlorine than coal. As all the constituents of the biomass enter the boiler, several
technical concerns arise. Higher fuel chlorine contents can lead to greater high-temperature
WORKIN
G DRAFT IN
PROGRESS
Chapter 8
672 June 2016 TL/JFF/FN/EIPPCB/LCP_Final Draft
corrosion in boilers. Accelerated fouling and slagging can occur when fuels containing high
levels of potassium are utilised [ 51, Jensen-Holm et al. 2010 ].
The moisture content of biomass and coal may also be different depending on specific fuel
types. Pelletised biomass fuels usually have a moisture content in the order of 10 % by weight,
while some other types of biomass may have much a higher moisture content and may need
additional drying.
8.1.1.3 Techniques to introduce the different fuels into the combustion process
8.1.1.3.1 Mixing with the main fuel
The most common approach to biomass multi-fuel firing that has been adopted at coal-fired
combustion plants is to pulverise the coal and biomass simultaneously in the existing
pulverising mills. This approach has been termed ‘co-milling’, and it allows the simultaneous
size reduction and drying of both the biomass and coal, prior to the two fuels being burnt
together in the furnace. To avoid detrimental effects on mill performance, co-milling may be
limited to < 10 % of the total fuel input.
Where a co-milling approach is adopted, the biomass and coal may be blended before or after
delivery to the combustion plant. The former option is referred to as ‘off-site blending’, and
results in a single fuel stream to the combustion plant, which can be handled in a similar way to
coal. The latter option is referred to as ‘on-site blending’, where two fuels are delivered to the
combustion plant and require separate reception and handling facilities up until the point where
the two fuel streams are blended into one.
[ 1, Eurelectric 2013 ]
Since the particle size distribution is a key figure for correct ignition and combustion one of the
most reliable solutions is to mill separately and mix the fuel just before the burner inlet. This
solution allows optimised pulverisation of both fuels. Pulverised combustion using separate
milling systems is now extensively used for firing a wide range of fuels, from forestry residues
to agricultural residues and energy crops. Fuel is generally pelletised off-site and transported to
the plant by road, ship or rail. At the plant, the pellets are broken up using dedicated hammer
mills or in coal mills which have been re-engineered to accommodate the different grinding
characteristics. Boilers have been shown to operate at a whole range of co-firing levels from low
levels (replacing one mill set) through to a complete conversion where all coal mills and burners
have been replaced or modified.
8.1.1.3.2 Dedicated burners
Biomass – coal firing
'Direct injection' offers an alternative route for supplying co-fired biomass to a coal-fired boiler.
This involves the introduction of the biomass into the boiler as a separate stream, through
dedicated biomass burners. This provides several advantages over co-milling, the most
significant being that the biomass does not affect the flow, milling and classification of the coal,
and that the unit load limitations that can occur when co-milling with low calorific value coals
or biomass are avoided. However, this type of installation is much more capital-intensive than
the limited modifications required for a co-milling approach. Installations for direct injection
schemes have ranged from a simple hopper feeding a pneumatic transport line leading directly
into the furnace to an elaborate chipping/grinding plant feeding separate biomass burners with a
complete burner control system.
The separate handling of biomass also allows co-firing to be carried out in a plant that has strict
limits on the volatile content in the coal. Biofuels typically contain around 80 % volatile matter
WORKIN
G DRAFT IN
PROGRESS
Chapter 8
TL/JFF/FN/EIPPCB/LCP_Final Draft June 2016 673
(on a 'dry-ash-free' basis), whereas coal-fired plants are designed to receive coals with dry-ash-
free volatile contents of less than 45 % for bituminous coals and 10 % for anthracitic coals. This
separate handling also has the advantage that problems that would occur when materials with
bad milling properties are sent through the mill can be effectively bypassed.
[ 1, Eurelectric 2013 ]
8.1.1.4 Solid multi-fuel combustion processes
8.1.1.4.1 Co-firing of biomass and fossil fuels
One of the primary reasons behind the development and introduction of co-firing of biomass,
for instance together with peat or coal, has been the reduction of SO2 and CO2 emissions, as the
replacement of the primary fossil fuel reduces the emission of fossil CO2, whereas the
renewable CO2 originating from the biomass is considered carbon-neutral. Data from the
German Emission Trading Authority show that, in 2010, four lignite and five hard-coal-fired
power plants carried out co-incineration of woody biomass (chips, pellets, etc.) in Germany
using a total of 30 000 tonnes of wood and avoiding around 33 000 tonnes of CO2 compared to
the emissions associated with the use of the main fuel being substituted (the co-firing degree
achieved was 1–12 %).
Due to the lower initial ash melting point for biomass, the furnace exit gas temperature needs to
be reduced. In case of retrofit, the boiler may be down-rated accordingly.
Biomass in general requires a lower primary air temperature for milling and higher air excess
for correct combustion. The result is often, especially in the case of retrofits, that the flue-gas
leaving the boiler cannot be cooled down to the same level as for pure coal combustion, which
may affect the boiler efficiency and requires the checking of any existing filter for temperature
tolerance. These effects can be mitigated for instance by installing a primary air cooler or flue-
gas cooler.
In many cases, the amounts of biomass available at a reasonable cost in any one location are too
small to make a combustion plant based only on biomass economically feasible. The economics
of using these locally available fuels may improve considerably if they can be co-fired with a
commercial fuel at an existing combustion plant. However, there are considerable technical and
environmental restrictions on fuels that can be co-fired. The multi-fuel firing of biomass has
been successfully applied at many Finnish FBC power plants, where the main fuel is peat, coal,
or wood residues from the pulp and paper industry.
Due to its characteristics, peat is suitable for multi-fuel firing with wood, and in existing plants
can help reduce the corrosion and fouling problems that may occur when burning biomass only.
The ability to burn peat also ensures a continuous fuel supply in areas where the availability of
wood fuel is insufficient for the fuel demand.
A different approach has to be taken when the local fuel cannot, for technical reasons, be burnt
together with the main commercial fuel. In this case, a dedicated combustion plant is
constructed for the local fuel with a connection to the larger combustion plant. In Denmark,
several separate combustion units for straw combustion have been constructed with a
connection to coal- or gas-fired large combustion plants.
The fluidised bed combustion (FBC) process provides advantages in terms of ability to burn a
wide variety of different fuels.
Circulating FBC (CFBC) boilers can be designed as multi-fuel boilers, i.e. full capacity can be
reached with coal alone, with combined firing, or with biomass alone. In the multi-fuel firing of
coal and biomass there are separate, independent fuel feeding systems due to the different kinds
WORKIN
G DRAFT IN
PROGRESS

Chapter 8
674 June 2016 TL/JFF/FN/EIPPCB/LCP_Final Draft
of fuel handling. These are also needed to ensure flexible and smooth operation for all possible
fuel combinations.
Source: [103, Kvaerner Pulping Oy, 2001]
Figure 8.1: Industrial CFB boiler with multi-inlet cyclone applied for multi-fuel firing
In the bubbling fluidised bed (BFB) process, the fluidising velocity is reduced and there is no
return of fines by means of a cyclone system. The BFB process is well-suited for burning
inhomogeneous biomass and peat fuels including in multi-fuel firing.
Some technical issues observed in early experiences with the multi-fuel firing of biomass and
other fuels, mainly coal and lignite, are presented below:
1. Up to 20 % wood was co-fired in a power plant in Denmark. This is a front-fired boiler with
natural circulation and a capacity of 125 MWe. Pulverised wood was burnt in two specially
adapted burners. No negative effects were noticed and it was expected that higher co-firing
percentages should be possible. NOX emissions dropped by 35 %. Straw and, to a lesser
extent, wood from energy crops (willow) are the most important biomass fuels in Denmark.
The high potassium chloride content of straw may cause slagging and corrosion problems.
2. Tests were performed with straw in another Danish power plant (150 MWe). Up to 25 % co-
firing was tested in campaigns varying from four weeks to four months. The main
conclusions were as follows:
NOX and SO2 emissions decreased, HCl and dust emissions increased
A small increase in the corrosion rate of the superheater was noticed. The total duration
of the tests was too short to quantify this (it was estimated that there would have been a
50 % increase with a 10 % co-firing proportion).
When more than 10 % straw is co-fired, the alkali content of the fly ash exceeds the limit
for application in cement. For application in concrete the constraints related to alkali
content are less stringent and the straw co-firing degree can be higher than 20 %.
DeNOX catalyst samples exposed to the flue-gas show a quick decrease in activity.
3. Biomass briquettes were co-fired in a lignite-fired power plant in Germany (280 MWe).
There were no problems when firing amounts of up to 10 % by weight.
WORKIN
G DRAFT IN
PROGRESS

Chapter 8
TL/JFF/FN/EIPPCB/LCP_Final Draft June 2016 675
4. Up to 7 % by weight pressed olive stones were co-combusted in a power plant in Greece
consisting of three lignite-fired units with a total installed capacity of 550 MWth for a period
of about six months. Special characteristics of the pressed olive stones compared to the raw
lignite were: much higher calorific value, remarkably lower moisture and ash content, and
higher content of volatile matter. As for ash composition, a much higher concentration of
alkali metal oxides and a lower concentration of silica and alumina compounds resulted in a
lower melting point. The experiments showed no changes in steam operating parameters
(mass flow, temperature and pressure), slagging, and the content of unburnt fuel in the ash.
Due to the significantly lower sulphur content of the pressed olive stones, SO2 emissions
were reduced.
Biomass co-firing in pulverised fuel boilers is economically viable under some countries’
renewable energy regimes and the potential scale has facilitated the development of extensive
supply chains (for both wood and agricultural residues) and the management of the technical
restrictions of fuels that can be used. The co-firing of biomass has been successfully applied at
several pulverised fuel plants (in the UK, the Netherlands, Belgium and Denmark) where the
main fuel was originally coal. The ultimate outcome of co-firing of biomass with coal may be
the complete conversion of a coal boiler to biomass. In this case, in order to handle the different
fuel characteristics of biomass compared to coal (e.g. alkalinity), greater technical adaptations
are needed than in the case of co-firing limited percentages of biomass.
In the UK, plants have been modified to co-fire biomass with throughput capacities of a million
tonnes per year or more. A programme is now in place, following combustion trials, for several
plants to fully convert to biomass with planned throughputs of up to 8 million tonnes of wood
pellets per year.
More information regarding plants converted from coal to biomass is presented in Section 5.2.
There are particular cases where the multi-fuel combustion of coal and certain types of biomass
is closely related to the local availability of specific biomass fuel streams. This is the case, for
instance, of three grate-fired boilers between 116 MWth and 128 MWth commissioned in La
Réunion and Guadeloupe islands between 1992 and 1998 (Plants 684, 686 and 688 in the 2012
data collection). These plants are erected in the vicinity of sugar plants, from which they buy
sugar cane bagasse as fuel and to which they sell steam for industrial use. They combust coal
and bagasse in variable proportions (up to 68 % bagasse in 2012) depending on the availability
of bagasse and on the production needs (electricity needs on the island and heat needs for
industrial uses). Both criteria fluctuate according to the season.
Petroleum coke (pet coke) can also be successfully co-fired with coal at blends of up to 20 % by
thermal input. In the UK, two power plants (2000 MWth and 4000 MWth) have been using pet
coke without appreciable negative impacts since 2004.
8.1.1.5 Control of emissions to air in solid multi-fuel combustion LCPs
Fluidised bed boilers
The low furnace temperatures in the fluidised bed process coupled with staged air feeding result
in NOX emissions typically below 200 mg/Nm3. For further NOX reduction, an ammonia
injection (SNCR) system can be easily installed, which can achieve emission levels down to, or
below, 100 mg/Nm3 (dry, 6 % O2). SOX emissions may be controlled by limestone injection into
the furnace where the conditions for desulphurisation are favourable. The multi-fuel firing of
biofuel with coal will further reduce SOX emissions and limestone consumption. Compared to
coal-only combustion, coal-biomass multi-fuel firing achieves lower primary NOX and SOX
emissions and reduces specific CO2 emissions in proportion to the biomass fuel input.
WORKIN
G DRAFT IN
PROGRESS

Chapter 8
676 June 2016 TL/JFF/FN/EIPPCB/LCP_Final Draft
NB Example plant: 500 MWth, 1.2 % S in coal
Source: [103, Kvaerner Pulping Oy, 2001]
Figure 8.2: The effect of biomass multi-fuel firing on SO2 emissions
Pulverised-fuel boilers
The biomass is mixed with the coal/lignite in the storage area, which may produce fairly high
emissions of dust, or is introduced separately into the combustion chamber.
Typical consequences of multi-fuel firing biomass with coal, in the case of PC boilers
configured as described above, include the following:
NO2 concentrations in the raw flue-gas decrease slightly.
The concentration of dust in the flue-gas after the ESP increases, probably due to the
higher concentration of fine particles; the separation of dust in the FGD ensures low
concentrations in the cleaned flue-gas.
The sulphur contents of biomass fuels are, in general, about ten to a hundred times lower
than in coal, resulting in a reduction of SOX concentrations. HCl emissions may instead
increase in multi-fuel firing due to the high content of chlorine in certain types of
biomass, but they usually remain low if the biomass participation in the fuel mix is
limited. The increased halide levels might, in the long run, also cause corrosion problems
in the FGD system.
The operation of SCR systems is affected by the multi-fuel firing of biomass and coal in boilers
designed for coal. The SCR catalysts are susceptible to poisoning due to condensation of
volatile inorganic species on the catalyst surface. The formation of sulphate- or phosphate-based
deposits on the catalyst surface or the reaction with the catalyst’s active species can significantly
reduce catalyst activity, resulting in a shorter lifetime.
Multi-fuel firing biomass and coal or injecting coal fly ash has been proven to be an effective
measure for limiting the deactivation of the SCR catalyst since the gaseous potassium and
phosphorus species released from the biomass are readily reacted with the coal fly ash, forming
much more stable compounds and larger ash particles, which may require filtering out before
the flue-gas enters the SCR.
Deactivation of high-dust SCR catalyst is one of the critical issues of straw multi-fuel firing.
WORKIN
G DRAFT IN
PROGRESS
Chapter 8
TL/JFF/FN/EIPPCB/LCP_Final Draft June 2016 677
Due to the low combustion temperature, grate firing of biomass may not evaporate alkali metals
and release the salts as aerosols to the same degree as pulverised-fuel or CFB firing, and thus
SCR catalyst deactivation could be a lesser problem with grate firing than with other boiler
types.
Reference literature: [142, Schmidt and Dietl, 1999], [143, Kindler, et al., 2000],
[ 51, Jensen-Holm et al. 2010 ]
8.1.2 Current consumption and emission levels in solid multi-fuel-combustion in LCPs
8.1.2.1 Degree of solid multi-fuel firing in LCPs
Many examples of combustion plants of different types and sizes can be found across the EU,
demonstrating the multi-fuel firing of biomass with coal and lignite to a very broad range of
degrees, even reaching beyond 50 %. The achieved performance and emission levels of these
plants are reported in Section 5.1.3 for plants where the fuel that delivers the majority of thermal
input is coal or lignite, and in Section 5.2.3 when the thermal input delivered by biomass fuel
surpasses the thermal input of the coal or lignite, or when the main fuel is peat.
The following list of example plants provides an overview of the range of plant types and sizes,
and of the multi-fuel firing degrees observed:
Plant 381V is a 180 MWth DBB combusting 5 % woody and herbaceous biomass
together with coal;
Plant 390-6V is a 611 MWth CFB boiler combusting 7 % woody and herbaceous
biomass together with lignite;
Plant 479V is a 1600 MWth CFB boiler combusting 7 % woody biomass together with
coal;
Plant 385V is a 396 MWth CFB boiler combusting 11 % herbaceous biomass together
with coal;
Plant 414VC is a 78 MWth DBB combusting 12 % woody biomass together with lignite;
Plant 693 is a 674 MWth CFB boiler combusting 14 % woody biomass together with
coal;
Plant 367V is a 1384 MWth WBB boiler combusting 15 % woody biomass together with
coal;
Plant 22_1V is a 157 MWth CFB boiler combusting 40 % woody biomass together with
lignite;
Plant 379V is a 186 MWth DBB combusting 43 % woody biomass together with coal;
Plant 688 is a 124 MWth grate-fired boiler combusting 46 % herbaceous biomass
together with coal;
Plant 684 is a 116 MWth grate-fired boiler combusting 64 % sugar cane bagasse
together with 36 % coal;
Plants 489-1V and 489-2V are 92 MWth CFB boilers combusting 94 % woody biomass
and forest residues together with 5 % coal.
8.1.2.2 Effects of solid multi-fuel combustion on plant performance and efficiency
Typical consequences of multi-fuel firing biomass with coal include the temperature of the flue-
gas rising under multi-fuel firing conditions by 5–10 °C and the share of combustible matter,
which is related to the particle size distribution in the ash, nearly doubling. However, the ash
content is a tenth of coal's. Although these effects may lead to a reduction of the boiler
efficiency, studies performed at several combustion plant sites have reported negligible impacts
WORKIN
G DRAFT IN
PROGRESS

Chapter 8
678 June 2016 TL/JFF/FN/EIPPCB/LCP_Final Draft
on the performance of the boiler when co-firing biomass material at up to 5–10 % on a thermal
basis.
Multi-fuel firing petroleum coke requires no adjustments, from a coal-only mode of operation,
in the boiler or in the operational parameters of the plant. However, the increased sulphur
content in pet coke may require either preferential blending with low-sulphur coals or an
increased performance of the associated flue-gas desulphurisation unit. Overall, monitoring data
have shown that the environmental impact of a plant burning a coal-pet coke blend is similar to
that of the same plant burning only coal.
[DEBCO – Demonstration of Large Scale Biomass Co-Firing and Supply Chain Integration,
D7.10 Advanced Biomass Co-Firing Guidebook, 2013]
8.1.2.3 Effects of solid multi-fuel combustion on emissions to air
As mentioned in Section 8.1.1.5, the multi-fuel firing of biomass with coal may be associated,
compared with pure coal firing, with slight reductions in SOX and NOX emissions, and with
increased emissions of HCl. However, by limiting the degree of multi-fuel combustion and/or
using properly implemented techniques, well-performing plants achieve similar emission levels
as comparable plants that do not co-fire biomass.
Figure 5.32 shows SO2 emissions from well-performing coal- and/or lignite-fired combustion
plants of more than 300 MWth. Among the plants shown, Plants 17V, 366V and 367V co-fire
biomass to degrees between 5 % and 30 %. All these plants are fitted with wet FGD and achieve
comparable SO2 emission levels to other similar plants that do not co-fire biomass.
Figure 5.34 shows HCl emissions from well-performing coal- and/or lignite-fired plants of
> 100 MWth. Among the plants shown, Plants 17V, 367V, 390-5V, 390-6V, 224V and 479V co-
fire biomass to degrees between 5 % and 17 %. All these plants are fitted either with wet FGD
or with boiler sorbent injection and achieve comparable HCl emission levels as other similar
plants that do not co-fire biomass.
Figure 5.37 and Figure 5.38 show NOX emissions from well-performing coal and lignite boilers
of more than 300 MWth. Among the plants shown, only two plants (Plant 367V and 224V) co-
fire biomass.
8.1.2.4 Effects of solid multi-fuel combustion on the quality of combustion residues
The quality of residues (fly ash, boiler ash, gypsum sludge) is typically only slightly influenced
in the case of multi-fuel firing. The disposal of these residues together in an opencast mine as
stabilised material is also possible for co-combustion.
The compositions of pulverised fuel ash, furnace bottom ash and gypsum from a unit co-firing
up to 20 % petroleum coke generally remain within the specifications for onward sale.
The quality of residues is affected by the ash content of the co-combusted fuel. The EN
standards on fly ash for concrete cover fly ash with up to 40 % by weight (50 % in the case of
green wood) co-combustion material.
Reference literature: [142, Schmidt and Dietl, 1999], [143, Kindler, et al., 2000].
WORKIN
G DRAFT IN
PROGRESS

Chapter 8
TL/JFF/FN/EIPPCB/LCP_Final Draft June 2016 679
8.1.3 Techniques to consider in the determination of BAT in solid multi-fuel combustion in LCPs
Plants multi-fuel firing coal, lignite, biomass and/or peat apply the techniques that are presented
in Chapter 3 and described as techniques to consider in the determination of BAT for the
combustion of coal and/or lignite in Section 5.1.3 and for the combustion of biomass and/or peat
in Section 5.2.3. The performances of well-performing plants multi-fuel firing solid fuels are
reported in charts and tables in those sections and fall within the ranges observed for well-
performing plants combusting coal and/or lignite and for well-performing plants combusting
biomass and/or peat. No further conclusions are drawn beyond those related to Section 5.1.3 and
to Section 5.2.3.
The techniques referenced above do not necessarily provide an exhaustive list of techniques that
could be applied in the sector. Other techniques may exist, or may be developed, which could be
considered for the determination of BAT for an individual installation.
WORKIN
G DRAFT IN
PROGRESS

Chapter 8
680 June 2016 TL/JFF/FN/EIPPCB/LCP_Final Draft
8.2 Combustion of liquid and gaseous process fuels from the chemical industry
This section covers combustion plants burning liquid and gaseous process fuels from the
chemical industry. While a general description of the combustion of liquid or gaseous fuel in
boilers is given in Chapters 6 and 7, this section also deals with the specific characteristics of
the utility boilers typically in use in the chemical industry.
[ 3, LCP TWG 2012 ]
[ 52, CEFIC 2012 ]
8.2.1 Applied processes and techniques for combustion plants in the chemical industry
The residues of (petro-)chemical processes are used as gaseous and/or liquid fuels (process
fuels) burnt in boilers, often simultaneously, to produce utility steam and/or, in some cases,
electricity as a useful alternative to flaring in the atmosphere or incineration. The residues of
chemical plants have variable compositions and in some cases their composition may not be
known.
The existing large combustion plants located in or near chemical installations and combusting
process fuels have a typical thermal input within the range 100–300 MWth. Steam is produced
by utility boilers operating at variable loads throughout the year to support the production
process in all situations that may occur during the industrial operations. The operational
characteristics of these plants are key for the chemical installation production, as well as for safe
operation.
The design and the operation of combustion plants in the chemical industry may have some
differences from the power generation sector. In addition to the fuel, the main characteristic to
be taken into account is the load mode. Figure 8.3 shows two combustion plants integrated
within a chemical installation.
Source: [ 52, CEFIC 2012 ]
Figure 8.3: Utility boilers in chemical installations
WORKIN
G DRAFT IN
PROGRESS

Chapter 8
TL/JFF/FN/EIPPCB/LCP_Final Draft June 2016 681
8.2.1.1 Operating conditions
Combustion plants in the industry operate at continuous or variable load to support an industrial
process and are designed to supply power and/or steam to the industrial installation during all
situations in which the installation might operate, such as process shutdown, start-up, cleaning
and soot blowing, tests or disturbances. Consequently, the operating load may be different from
the nominal load of the combustion unit.
Boilers in the chemical industry have the following operational specificities, which may affect
the pollutant concentrations in the raw flue-gas:
a. The load is not constant over the whole year and the boiler often operates near the nominal
load only for a short period of time, potentially affecting the pollutant concentration levels
in the raw flue-gas.
b. The boiler may burn different fuels, separately or in multi-fuel combustion mode,
potentially affecting the raw concentration levels.
c. The boiler may burn specific process fuels whose compositions are not constant over the
year and which can consequently influence the raw concentration levels.
Consequently, the difference between yearly average and peak emissions may be larger than for
other boilers combusting fuel with a constant composition and running close to their nominal
load for most of the time.
8.2.1.2 Control of NOX, NH3 and CO
Two important parameters to take into account when evaluating the techniques to reduce NOX
emissions from the boilers burning process fuels in chemical installations are the following:
the hydrogen (H2) content (up to 75 %) in the gaseous fuel, which may favour NOX
formation;
the nitrogen content in the gaseous or liquid fuel (up to 26 %), which has a significant
influence on NOX formation.
As the process fuels' composition depends on the process and as the utility boilers in chemical
installations are very often fuel-flexible, fuel choice and process control are the most commonly
applied techniques to control NOX emissions.
Utility boilers are often not designed as stand-alone combustion units but are built as part of the
chemical installation; therefore, space for the implementation of additional facilities in existing
installations could be restricted.
Other implemented options are SNCR and SCR. In both cases there are logistical requirements
when retrofitting an existing plant, and in the case of SCR considerable space needs to be
available too. Moreover, in the chemical industry, utility boilers may be installed near chemical
units or reactors that in the presence of ammonia could potentially generate explosive
atmospheres and trigger the definition of hazardous zones. Adding the equipment for these
techniques may therefore require special provisions.
8.2.1.3 Control of other pollutants
SOX and dust emissions are usually not major concerns when running the utility boilers in
chemical installations on gaseous process fuels, therefore control techniques have not been
widely applied for pollutants other than NOX. However, when utility boilers run on liquid
process fuels, several pollutants could be generated depending on the fuel composition. In
WORKIN
G DRAFT IN
PROGRESS
Chapter 8
682 June 2016 TL/JFF/FN/EIPPCB/LCP_Final Draft
existing plants there may be not enough space to install flue-gas treatment systems, such us wet
FGD.
The combustion plants referenced in [ 3, LCP TWG 2012 ] have in many cases been built before
the year 1980, with few exceptions such as a few plants built recently in Germany running on
H2-rich gaseous process fuel.
8.2.2 Current emission and consumption levels
8.2.2.1 Consumption of gaseous and liquid process fuels from the chemical industry
Typically, a utility boiler may burn different gaseous and liquid process fuels separately or in
co-firing mode, also with other fuels such as natural gas or heavy fuel oil, which may also be
used as back-up fuels when the process fuels are lacking.
The most important properties of process fuels are as follows:
Variable composition, leading to a broad range of untreated flue-gas concentration levels
(e.g. of NOX) over the year. The NOX concentration in the raw flue-gas may vary at least
within a factor two, sometimes for short periods.
High hydrogen (H2) content in the process fuel, which may significantly increase the
adiabatic flame temperature and therefore may increase NOX concentration levels in the raw
flue-gas. H2 content may vary in the range of up to 75 vol-%. Furthermore, process fuels
from the petrochemical industry may contain other light organic species (e.g. of the ethane
or propane series) that may influence the emissions (raw NOX concentrations when burning
gaseous process fuel may vary within a factor two compared with natural gas).
High nitrogen (N) content in the liquid process fuel, which may significantly increase the
fuel NOX. The N content may reach a value as high as 26 wt-%, depending on the process.
Therefore, the NOX concentration in the raw flue-gas when burning liquid process fuel may
vary within a factor three in comparison with heavy fuel oil, or even more in the case of
process fuels with extremely high N context such as nitrile-rich residues.
Other pollutants in the liquid process fuel (e.g. the sulphur and ash content could be high),
which may generate pollutants in the raw flue-gas (e.g. SOX, dust).
8.2.2.1.1 Energy efficiency
Burning the process fuels from the chemical industry in combustion plants allows for recovery
of the internal energy of these fuels, while avoiding the flaring or incineration of such process
fuels. The operating total fuel utilisation range observed in boilers combusting such process
fuels is 14–92 %, depending on the level of heat recovery; the operating electrical efficiency
range is 10–18 % (yearly average, LHV basis).
[ 3, LCP TWG 2012 ].
These ranges mostly reflect the performances of utility boilers whose main purpose is the
generation of steam and that are operated under variable load conditions. Additionally, the
ranges also include older plants commissioned in the 1960s. In general terms, considering the
combustion characteristics and high calorific values of gaseous and liquid process fuels of the
chemical industry, it can be expected that recent well-performing plants achieve energy
efficiency levels in a similar range to those of plants combusting commercial gaseous and liquid
fuels operated under similar conditions.
WORKIN
G DRAFT IN
PROGRESS

Chapter 8
TL/JFF/FN/EIPPCB/LCP_Final Draft June 2016 683
8.2.2.2 Emissions
Table 8.1 presents the range of emissions to air from process fuel-fired combustion plants linked
with chemical installations. The data represent specific example plants from [ 3, LCP TWG
2012 ]; given the variability of process fuels, these data do not necessarily cover the full
emission ranges observed in existing plants. Due to limitations in the number of monitored
pollutants reported by several of the plants comprised in the ranges shown in Table 8.1, in
certain cases the ranges reported are associated with only a restricted number of plants. This is
the case in particular for emissions of HCl and HF, of metals, and of dioxins and furans. In
general, the available monitoring data for those emissions are within the range of emissions
reported for other types of plants, such as the plants co-incinerating waste described in Chapter
9, which also combust fuels with variable contents of polluting substances. Emissions of
hydrogen chloride and of dioxins and furans are only relevant for the combustion of process
fuels that originate from chlorine-containing streams.
WORKIN
G DRAFT IN
PROGRESS

Chapter 8
684 June 2016 TL/JFF/FN/EIPPCB/LCP_Final Draft
Table 8.1: Ranges of reported emissions to air from boilers firing process fuels from the chemical industry
Rated
thermal
input
Typical
control
techniques
Emissions to air
Dust SOX NOX CO NH3 HF HCl
Total
organic
carbon
Hg
Sb+As+Pb
+Cr+Co
+Cu+Mn
+Ni+V
Cd+Tl Dioxins and
furans
MWth mg/Nm3 ngI–TEQ/Nm
3
85 – 350
LNB/OPT/
SNCR/
SCR < 1 –36 < 1–1400 70–450 0.2–18 0.3–4 0.4 0.1–21 1–13
0.0005–
0.01 0.04–0.2
0.0012–
0.06
NB:
LNB: Low-NOX burners. OPT: Other Primary Techniques to reduce NOX. SCR: Selective catalytic reduction of NOX. SNCR: Selective non-catalytic reduction of NOX.
Data represented are yearly averages of short-term values (dust, SOX, NOX, CO) or averages over one year of short-term sample values (remaining pollutants), without subtraction of uncertainty, and for
dry flue-gas and 3 % reference oxygen level.
Source: [ 52, CEFIC 2012 ]
WORKIN
G DRAFT IN
PROGRESS
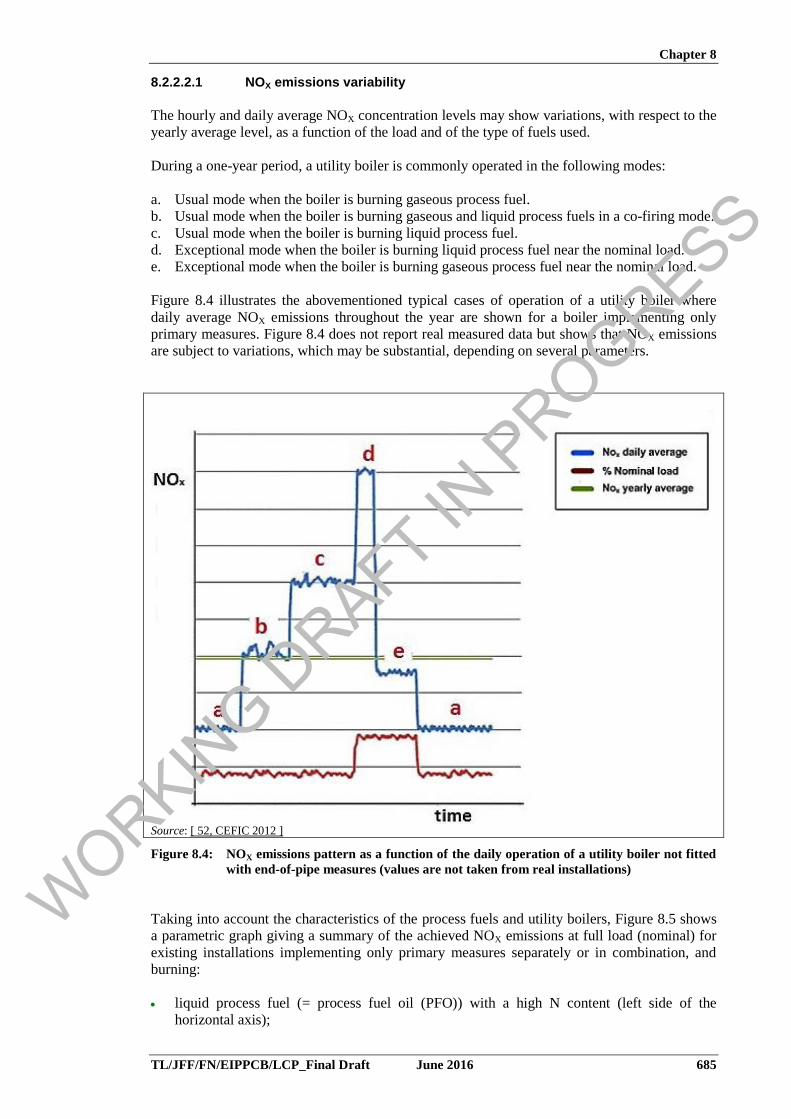
Chapter 8
TL/JFF/FN/EIPPCB/LCP_Final Draft June 2016 685
8.2.2.2.1 NOX emissions variability
The hourly and daily average NOX concentration levels may show variations, with respect to the
yearly average level, as a function of the load and of the type of fuels used.
During a one-year period, a utility boiler is commonly operated in the following modes:
a. Usual mode when the boiler is burning gaseous process fuel.
b. Usual mode when the boiler is burning gaseous and liquid process fuels in a co-firing mode.
c. Usual mode when the boiler is burning liquid process fuel.
d. Exceptional mode when the boiler is burning liquid process fuel near the nominal load.
e. Exceptional mode when the boiler is burning gaseous process fuel near the nominal load.
Figure 8.4 illustrates the abovementioned typical cases of operation of a utility boiler where
daily average NOX emissions throughout the year are shown for a boiler implementing only
primary measures. Figure 8.4 does not report real measured data but shows that NOX emissions
are subject to variations, which may be substantial, depending on several parameters.
Source: [ 52, CEFIC 2012 ]
Figure 8.4: NOX emissions pattern as a function of the daily operation of a utility boiler not fitted
with end-of-pipe measures (values are not taken from real installations)
Taking into account the characteristics of the process fuels and utility boilers, Figure 8.5 shows
a parametric graph giving a summary of the achieved NOX emissions at full load (nominal) for
existing installations implementing only primary measures separately or in combination, and
burning:
liquid process fuel (= process fuel oil (PFO)) with a high N content (left side of the
horizontal axis);
WORKIN
G DRAFT IN
PROGRESS
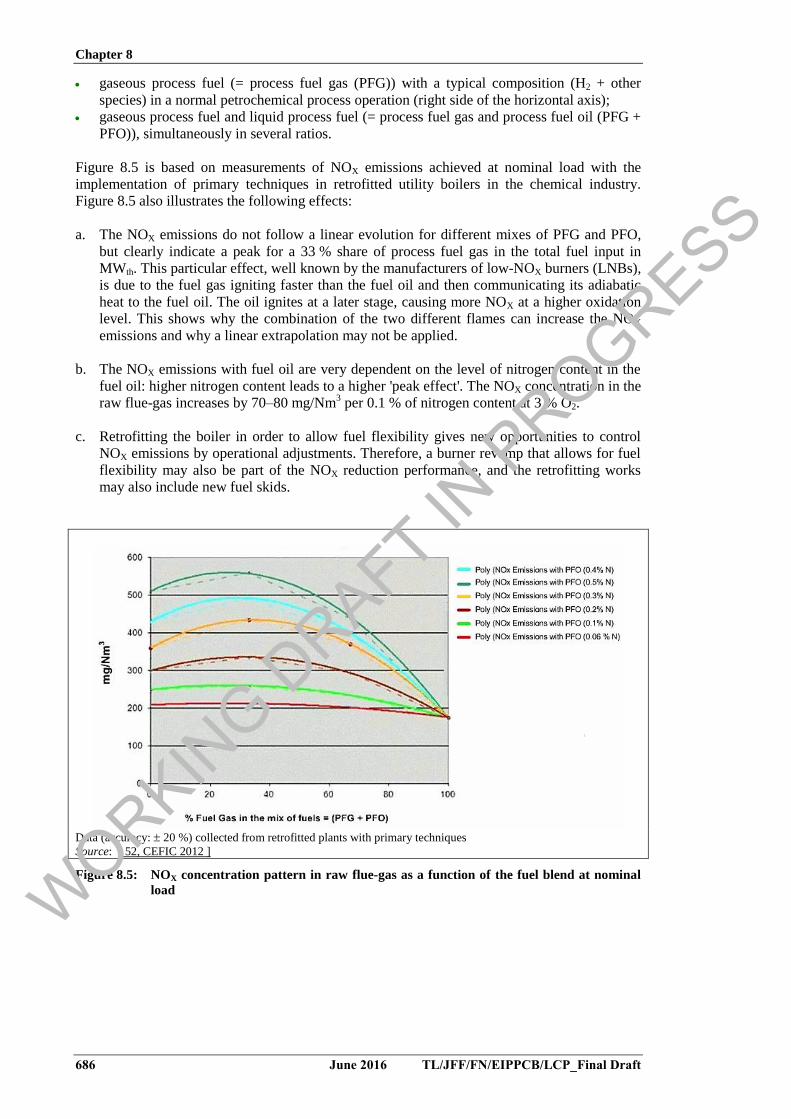
Chapter 8
686 June 2016 TL/JFF/FN/EIPPCB/LCP_Final Draft
gaseous process fuel (= process fuel gas (PFG)) with a typical composition (H2 + other
species) in a normal petrochemical process operation (right side of the horizontal axis);
gaseous process fuel and liquid process fuel (= process fuel gas and process fuel oil (PFG +
PFO)), simultaneously in several ratios.
Figure 8.5 is based on measurements of NOX emissions achieved at nominal load with the
implementation of primary techniques in retrofitted utility boilers in the chemical industry.
Figure 8.5 also illustrates the following effects:
a. The NOX emissions do not follow a linear evolution for different mixes of PFG and PFO,
but clearly indicate a peak for a 33 % share of process fuel gas in the total fuel input in
MWth. This particular effect, well known by the manufacturers of low-NOX burners (LNBs),
is due to the fuel gas igniting faster than the fuel oil and then communicating its adiabatic
heat to the fuel oil. The oil ignites at a later stage, causing more NOX at a higher oxidation
level. This shows why the combination of the two different flames can increase the NOX
emissions and why a linear extrapolation may not be applied.
b. The NOX emissions with fuel oil are very dependent on the level of nitrogen content in the
fuel oil: higher nitrogen content leads to a higher 'peak effect'. The NOX concentration in the
raw flue-gas increases by 70–80 mg/Nm3 per 0.1 % of nitrogen content at 3 % O2.
c. Retrofitting the boiler in order to allow fuel flexibility gives new opportunities to control
NOX emissions by operational adjustments. Therefore, a burner revamp that allows for fuel
flexibility may also be part of the NOX reduction performance, and the retrofitting works
may also include new fuel skids.
Data (accuracy: 20 %) collected from retrofitted plants with primary techniques
Source: [ 52, CEFIC 2012 ]
Figure 8.5: NOX concentration pattern in raw flue-gas as a function of the fuel blend at nominal
load
WORKIN
G DRAFT IN
PROGRESS

Chapter 8
TL/JFF/FN/EIPPCB/LCP_Final Draft June 2016 687
8.2.3 Techniques to consider in the determination of BAT for the combustion of process fuels from the chemical industry
This section describes techniques (or combinations thereof), and associated monitoring,
considered to have the potential for achieving a high level of environmental protection in the
activities within the scope of this document. The techniques described include both the
technology used and the way in which the installations are designed, built, maintained, operated,
and decommissioned.
It covers process-integrated techniques and end-of-pipe techniques. Waste prevention and
management, including waste minimisation and recycling procedures, are also considered.
Furthermore, techniques for reducing the consumption of raw materials, water, and energy are
covered.
Annex III to the Industrial Emissions Directive lists a number of criteria for determining BAT,
and the information within this chapter addresses these considerations. As far as possible, the
standard structure of Table 3.4 is used to outline the information on each technique, to enable a
comparison of techniques and the assessment against the definition of BAT given in the
Industrial Emissions Directive.
This section does not necessarily provide an exhaustive list of techniques that could be applied
in the sector. Other techniques may exist, or may be developed, which could be considered for
the determination of BAT for an individual installation.
In this section, the techniques to be considered have only been fully described when they are
specific to the considered combusted fuel or applied combustion process (combustion of process
fuels from the chemical industry). Indeed, for most of the techniques, general descriptions are
already presented in Chapter 3. Therefore, in order to avoid repetition, for those general
techniques already described in Chapter 3, only the additional information that is specific to the
combustion of process fuels from the chemical industry is reported here in synthesis tables.
8.2.3.1 Techniques for the prevention and control of NOX, CO and NH3 emissions
Information on general techniques, including information on complete combustion, for the
prevention and control of NOX, CO and NH3 emissions are given in Section 3.2.2.3. Table 8.2,
Figure 8.6, Figure 8.7, and Figure 8.8 give information specific to process fuel firing, e.g. on
applicability, environmental performance and example plants. Finally, Figure 8.9 shows the
retrofit of the OFA primary technique in a boiler within a chemical installation.
WORKIN
G DRAFT IN
PROGRESS
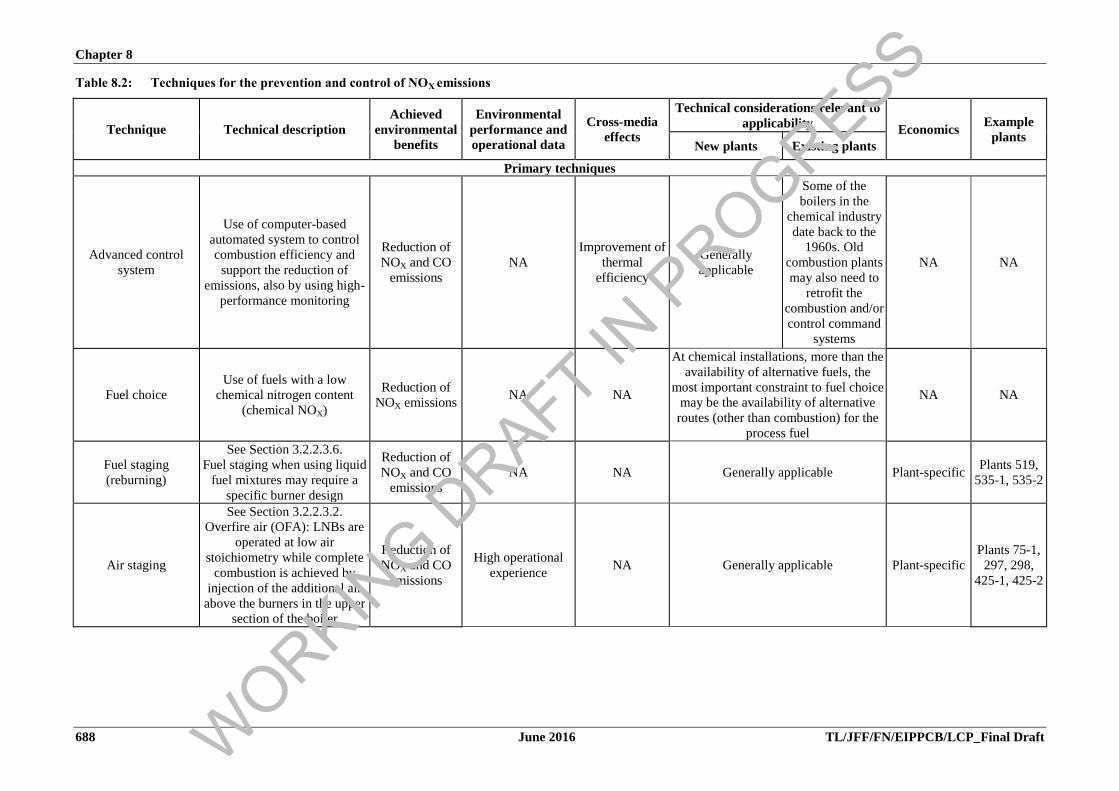
Chapter 8
688 June 2016 TL/JFF/FN/EIPPCB/LCP_Final Draft
Table 8.2: Techniques for the prevention and control of NOX emissions
Technique Technical description
Achieved
environmental
benefits
Environmental
performance and
operational data
Cross-media
effects
Technical considerations relevant to
applicability Economics
Example
plants New plants Existing plants
Primary techniques
Advanced control
system
Use of computer-based
automated system to control
combustion efficiency and
support the reduction of
emissions, also by using high-
performance monitoring
Reduction of
NOX and CO
emissions
NA
Improvement of
thermal
efficiency
Generally
applicable
Some of the
boilers in the
chemical industry
date back to the
1960s. Old
combustion plants
may also need to
retrofit the
combustion and/or
control command
systems
NA NA
Fuel choice
Use of fuels with a low
chemical nitrogen content
(chemical NOX)
Reduction of
NOX emissions NA NA
At chemical installations, more than the
availability of alternative fuels, the
most important constraint to fuel choice
may be the availability of alternative
routes (other than combustion) for the
process fuel
NA NA
Fuel staging
(reburning)
See Section 3.2.2.3.6.
Fuel staging when using liquid
fuel mixtures may require a
specific burner design
Reduction of
NOX and CO
emissions
NA NA Generally applicable Plant-specific Plants 519,
535-1, 535-2
Air staging
See Section 3.2.2.3.2.
Overfire air (OFA): LNBs are
operated at low air
stoichiometry while complete
combustion is achieved by
injection of the additional air
above the burners in the upper
section of the boiler
Reduction of
NOX and CO
emissions
High operational
experience NA Generally applicable Plant-specific
Plants 75-1,
297, 298,
425-1, 425-2
WORKIN
G DRAFT IN
PROGRESS

Chapter 8
TL/JFF/FN/EIPPCB/LCP_Final Draft June 2016 689
Technique Technical description
Achieved
environmental
benefits
Environmental
performance and
operational data
Cross-media
effects
Technical considerations relevant to
applicability Economics
Example
plants New plants Existing plants
Flue-gas recirculation
(FGR)
See Section 3.2.2.3.3.
The adiabatic flame
temperature of the LNB can be
reduced by recirculating a
portion of the flue-gas with the
combustion air in the burner
windbox. This may make FGR
inefficient as a technique for
oil firing. Retrofitting requires
a new burner design
Reduction of
NOX emissions
The technique is
more efficient when
burning fuel gas.
When burning fuel
oil, poor
combustion and
flame instability
may result in
malfunctions and
increases in dust
emissions
Reduced
thermal
efficiency
Generally
applicable
There may be
retrofitting
constraints
associated with
safety of the
chemical
installation
Plant-specific
Plants 154-3,
157-1, 157-
2, 364
Low-NOX burners See Section 3.2.2.3.5 Reduction of
NOX emissions
High operational
experience NA Generally applicable Plant-specific
The majority
of boilers of
the data
collection
Water/steam addition See Section 3.2.2.3.10 Reduction of
NOX emissions NA
Reduced
thermal
efficiency. CO
emissions may
increase
Applicability may be limited by water
availability Plant-specific NA
Secondary techniques
Selective non-catalytic
reduction (SNCR) See Section 3.2.2.3.12 NA
The performance of
the SNCR depends
on the configuration
and geometry of the
multi burner
furnace
Ammonia slip,
possible coating
corrosion
problems on the
boiler water wall
tubes
Generally
applicable
Safety
considerations
raised by the
proximity of other
facilities that
could potentially
generate explosive
atmospheres.
For SCR, also
In an
example, total
capex:
EUR 3.5–4
million.
NOX
reduction:
62 t/yr
Plant 75-2
WORKIN
G DRAFT IN
PROGRESS

Chapter 8
690 June 2016 TL/JFF/FN/EIPPCB/LCP_Final Draft
Technique Technical description
Achieved
environmental
benefits
Environmental
performance and
operational data
Cross-media
effects
Technical considerations relevant to
applicability Economics
Example
plants New plants Existing plants
Selective catalytic
reduction (SCR) See Section 3.2.2.3.11 NA NA
Ammonia slip
(less than with
SNCR)
space availability,
duct size and
configuration to
intervene in the
optimal
temperature
window
NA Plants 61,
62-2
NB:
NA: No relevant specific information available.
WORKIN
G DRAFT IN
PROGRESS
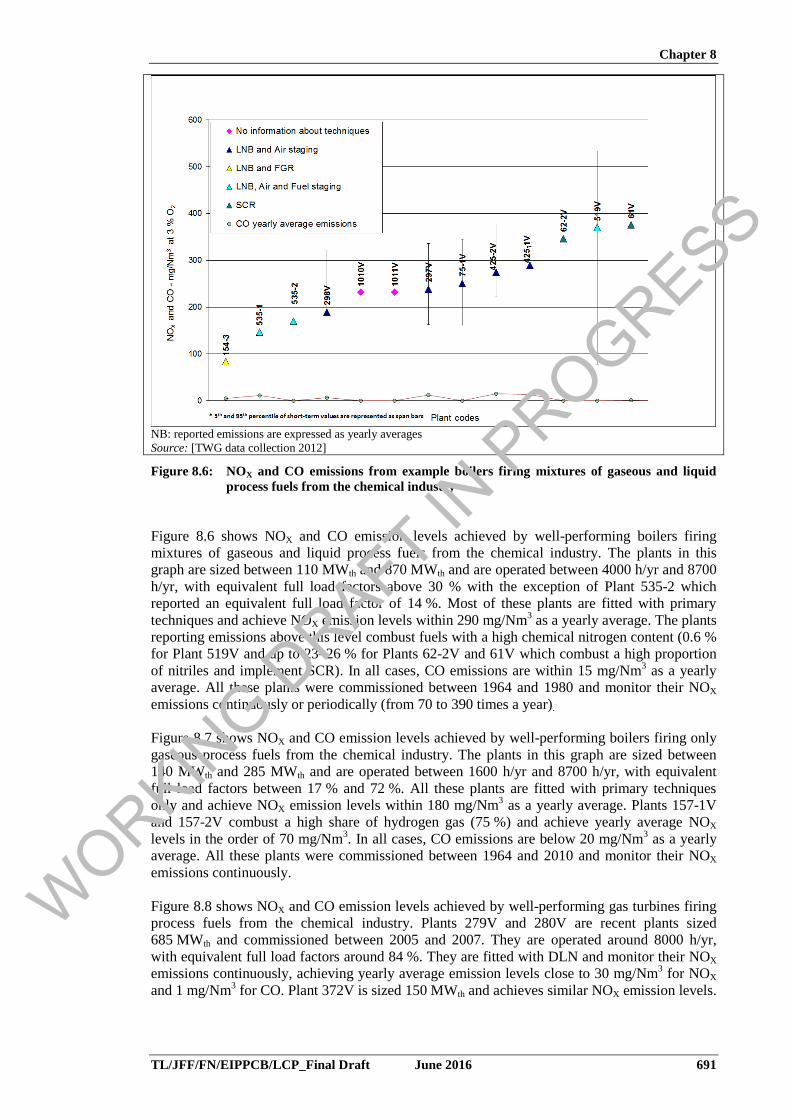
Chapter 8
TL/JFF/FN/EIPPCB/LCP_Final Draft June 2016 691
NB: reported emissions are expressed as yearly averages
Source: [TWG data collection 2012]
Figure 8.6: NOX and CO emissions from example boilers firing mixtures of gaseous and liquid
process fuels from the chemical industry
Figure 8.6 shows NOX and CO emission levels achieved by well-performing boilers firing
mixtures of gaseous and liquid process fuels from the chemical industry. The plants in this
graph are sized between 110 MWth and 870 MWth and are operated between 4000 h/yr and 8700
h/yr, with equivalent full load factors above 30 % with the exception of Plant 535-2 which
reported an equivalent full load factor of 14 %. Most of these plants are fitted with primary
techniques and achieve NOX emission levels within 290 mg/Nm3 as a yearly average. The plants
reporting emissions above this level combust fuels with a high chemical nitrogen content (0.6 %
for Plant 519V and up to 23–26 % for Plants 62-2V and 61V which combust a high proportion
of nitriles and implement SCR). In all cases, CO emissions are within 15 mg/Nm3 as a yearly
average. All these plants were commissioned between 1964 and 1980 and monitor their NOX
emissions continuously or periodically (from 70 to 390 times a year).
Figure 8.7 shows NOX and CO emission levels achieved by well-performing boilers firing only
gaseous process fuels from the chemical industry. The plants in this graph are sized between
140 MWth and 285 MWth and are operated between 1600 h/yr and 8700 h/yr, with equivalent
full load factors between 17 % and 72 %. All these plants are fitted with primary techniques
only and achieve NOX emission levels within 180 mg/Nm3 as a yearly average. Plants 157-1V
and 157-2V combust a high share of hydrogen gas (75 %) and achieve yearly average NOX
levels in the order of 70 mg/Nm3. In all cases, CO emissions are below 20 mg/Nm
3 as a yearly
average. All these plants were commissioned between 1964 and 2010 and monitor their NOX
emissions continuously.
Figure 8.8 shows NOX and CO emission levels achieved by well-performing gas turbines firing
process fuels from the chemical industry. Plants 279V and 280V are recent plants sized
685 MWth and commissioned between 2005 and 2007. They are operated around 8000 h/yr,
with equivalent full load factors around 84 %. They are fitted with DLN and monitor their NOX
emissions continuously, achieving yearly average emission levels close to 30 mg/Nm3 for NOX
and 1 mg/Nm3 for CO. Plant 372V is sized 150 MWth and achieves similar NOX emission levels.
WORKIN
G DRAFT IN
PROGRESS

Chapter 8
692 June 2016 TL/JFF/FN/EIPPCB/LCP_Final Draft
NB: reported emissions are expressed as yearly averages
Source: [TWG data collection 2012]
Figure 8.7: NOX and CO emissions from example boilers firing gaseous process fuels from the
chemical industry
NB: reported emissions are expressed as yearly averages
Source: [TWG data collection 2012]
Figure 8.8: NOX and CO emissions from example gas turbines firing process fuels from the
chemical industry
WORKIN
G DRAFT IN
PROGRESS

Chapter 8
TL/JFF/FN/EIPPCB/LCP_Final Draft June 2016 693
Figure 8.9: Overfire air technique retrofitted in a boiler at a chemical installation
8.2.3.2 Techniques for the prevention and control of other pollutants
Process fuels from the chemical industry can contain dust and sulphur, as well as halides. These
fuels are often burnt with other fuels (e.g. NG, HFO) in combustion plants principally equipped
with primary techniques to reduce the emissions of dust, SOX, HCl and HF; secondary
techniques are more often implemented to reduce the NOX emissions and may be used for dust
and acid gas emissions when the primary techniques are not sufficient. See Figure 8.10 (SOX,
HCl and HF emissions) and Figure 8.11 (dust emissions) for performance levels.
Figure 8.10 shows SO2, HCl and HF emission levels achieved by well-performing plants firing
mixtures of gaseous and liquid process fuels from the chemical industry. The plants in this
graph are sized between 110 MWth and 370 MWth and are operated between 4000 h/yr and 8700
h/yr, with equivalent full load factors between 14 % and 85 %. None of these plants are fitted
with secondary techniques to reduce SOX emissions and generally use fuel choice to achieve
yearly emission levels within 100 mg/Nm3 for SO2. All these plants were commissioned
between 1964 and 1980 and monitor SO2 emissions either continuously or periodically (from 12
to 70 times a year). The few plants reporting HCl or HF emissions monitor them periodically
between three and six times a year.
WORKIN
G DRAFT IN
PROGRESS
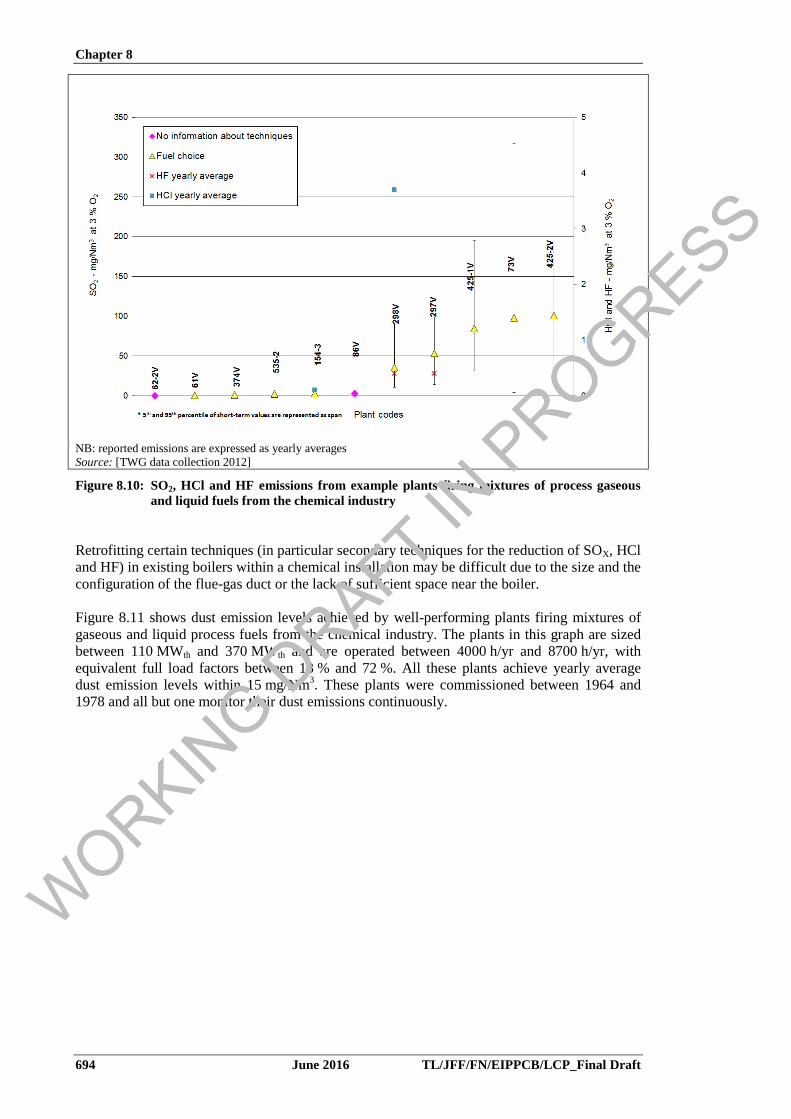
Chapter 8
694 June 2016 TL/JFF/FN/EIPPCB/LCP_Final Draft
NB: reported emissions are expressed as yearly averages
Source: [TWG data collection 2012]
Figure 8.10: SO2, HCl and HF emissions from example plants firing mixtures of process gaseous
and liquid fuels from the chemical industry
Retrofitting certain techniques (in particular secondary techniques for the reduction of SOX, HCl
and HF) in existing boilers within a chemical installation may be difficult due to the size and the
configuration of the flue-gas duct or the lack of sufficient space near the boiler.
Figure 8.11 shows dust emission levels achieved by well-performing plants firing mixtures of
gaseous and liquid process fuels from the chemical industry. The plants in this graph are sized
between 110 MWth and 370 MWth and are operated between 4000 h/yr and 8700 h/yr, with
equivalent full load factors between 13 % and 72 %. All these plants achieve yearly average
dust emission levels within 15 mg/Nm3. These plants were commissioned between 1964 and
1978 and all but one monitor their dust emissions continuously.
WORKIN
G DRAFT IN
PROGRESS
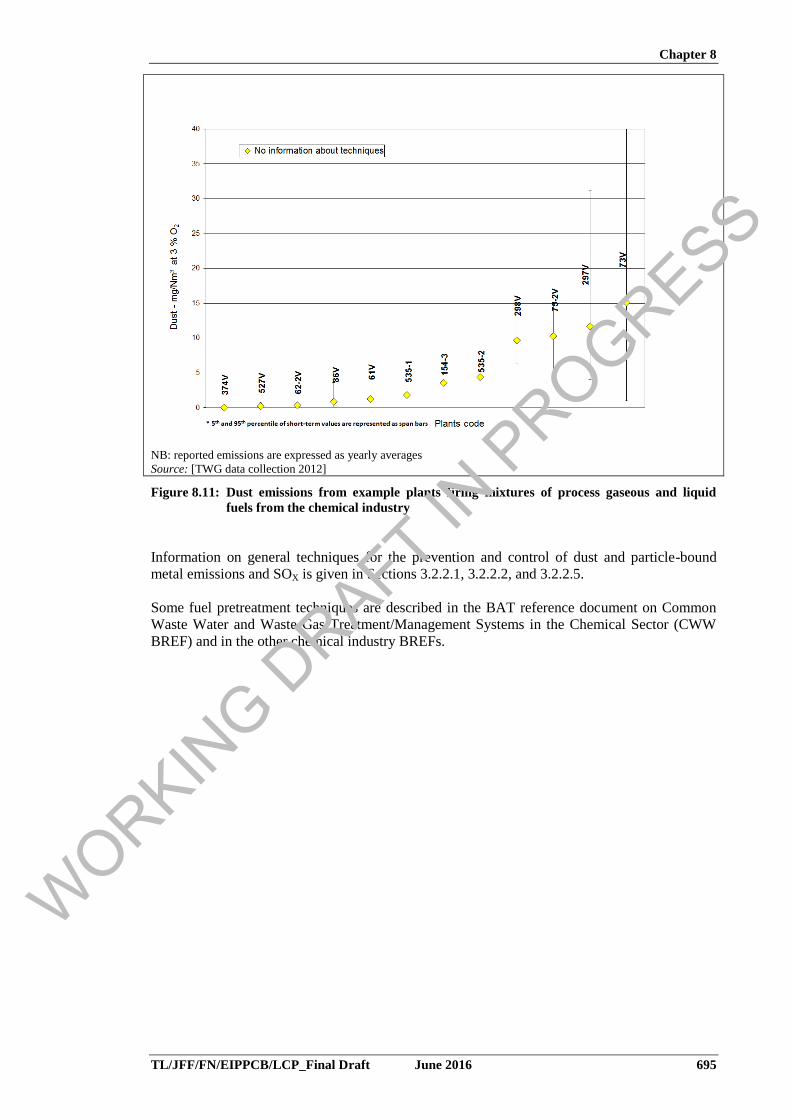
Chapter 8
TL/JFF/FN/EIPPCB/LCP_Final Draft June 2016 695
NB: reported emissions are expressed as yearly averages
Source: [TWG data collection 2012]
Figure 8.11: Dust emissions from example plants firing mixtures of process gaseous and liquid
fuels from the chemical industry
Information on general techniques for the prevention and control of dust and particle-bound
metal emissions and SOX is given in Sections 3.2.2.1, 3.2.2.2, and 3.2.2.5.
Some fuel pretreatment techniques are described in the BAT reference document on Common
Waste Water and Waste Gas Treatment/Management Systems in the Chemical Sector (CWW
BREF) and in the other chemical industry BREFs.
WORKIN
G DRAFT IN
PROGRESS

WORKIN
G DRAFT IN
PROGRESS
Chapter 9
TL/JFF/FN/EIPPCB/LCP_Final Draft June 2016 697
9 WASTE CO-INCINERATION
This chapter mainly focuses on the effects of the co-incineration of waste materials in large
combustion plants (coal-, lignite-, peat-, and wood-fired boilers). Currently, three main factors
are driving waste co-incineration in large combustion plants.
Within the aims of EU-level waste legislation are the reduction of resource use and the
minimisation of the amount of waste disposed of. In this context, legislation in certain
Member States discourages the disposal of waste and biomass waste with high calorific
values (e.g. > 6000 kJ/kg dry substance). Alternative options to treat these waste fractions
include co-incineration as well as incineration and mechanical-biological treatment for
example.
Under the requirements of the Kyoto protocol, greenhouse gas emissions have to be reduced
worldwide. The co-incineration of biomass waste and/or other waste fractions with lower
specific CO2 emissions than the fuel they replace is one option to reduce greenhouse gas
emissions.
Liberalisation of the energy market is intensifying economic pressure on energy producers.
Waste co-incineration can provide additional business opportunities, which may make the
operation of certain large combustion plants more economically attractive.
Waste co-incineration includes materials currently known in literature as waste, solid recovered
fuel (SRF), refuse-derived fuel (RDF) or biomass-waste-derived fuel. Some of these materials
can be classified as hazardous, as they may be contaminated with hazardous substances. The
multi-fuel firing of (non-waste) biomass as defined in the IED is addressed in Section 8.1. Key
issues in waste co-incineration are:
waste quality and characteristics;
boiler design;
waste handling and feeding;
slagging, or bed sintering (fluidised bed boiler);
fouling of heat transfer surfaces;
hot corrosion;
effects on emission levels compared to the emissions that occur when only a conventional
fuel is used;
ash properties, bottom ash removal;
storage of waste; utilisation and/or disposal options for solid waste/residues from co-
combustion.
A wide range of materials can be co-incinerated in LCPs. Annex II (Section 13.2) gives a list of
materials currently co-incinerated in LCPs in the EU.
Within the scope of this chapter, it is assumed that co-incinerated waste is (pre-)accepted and
then pretreated, which typically involves separating the combustible parts from the non-
combustible parts. In order to better understand issues such as the pre-acceptance/acceptance,
incineration or pretreatment of waste, see the waste BREFs, in particular the following:
Waste Treatment (WT): this BREF describes processes and techniques that deal with the
transformation of waste in order for it to be used as a fuel in any combustion process (such
as in large combustion plants, cement works, chemical works, iron/steelworks, etc.). These
pretreatments include sorting, crushing, preparation and so on.
Waste Incineration (WI): this BREF deals with incineration and covers the types of plants
addressed by Chapter IV of the IED or activities listed under point 5.2 of Annex I to the
IED.
WORKIN
G DRAFT IN
PROGRESS
Chapter 9
698 June 2016 TL/JFF/FN/EIPPCB/LCP_Final Draft
9.1 Applied processes and techniques used in the waste co-incineration in LCPs
The use of waste as a fuel in large combustion plants involves the use of certain processes and
techniques. Techniques related to these activities are described in this section. Cross references
are made to other chapters and BREFs where necessary.
9.1.1 Acceptance and pre-acceptance procedures
These procedures are in place to ensure that waste is subjected to appropriate technical appraisal
to ensure its suitability for the proposed use as fuel. Health protection for staff and other persons
possibly in contact with waste has to be considered. Extensive information about these pre-
acceptance and acceptance procedures can be found in the Waste Treatment Industries BREF.
9.1.2 Unloading, storage and handling
The way wastes are unloaded, stored or handled depends on the state of their aggregation and
physical properties.
Gaseous wastes are normally transported to power plants through pipelines and fed directly to
the burners, without storage. The types of techniques used for these materials are no different to
those used for gaseous fuels (see Chapter 7).
Liquid waste can be supplied by ship, train, lorry or pipeline, depending on the availability of
transport systems at the location where the waste is produced. Liquid waste can be stored in
tanks on site or fed directly into the boiler.
The storage and handling of solid waste depends strongly on its physical properties, for
example:
Dried sludge (granulate) can be supplied by ship, train or lorry and is stored in silos or
closed bunkers to avoid fugitive dust emissions. Dried sludge should be combusted
immediately due to its hygroscopic properties.
The formation of methane in sludge silos or bunkers has to be controlled by regular air
exchange. Air containing methane or odorous compounds should be used as combustion air.
During times of boiler stoppage, air exchange and a suitable exhaust gas treatment have to
be guaranteed.
Odorous sludge has to be transported and stored in silos or closed bunkers to prevent odour
emissions.
Wet sludge can be spread over the coal in the coal yard, but the possible generation of odour
emissions and dilution into the waste water treatment system have to be taken into account.
Regarding special provisions for the storage and handling of biomass, reference is made to
Section 2.8.
9.1.3 Characterisation and pretreatment of waste streams
This section describes those processes (e.g. grinding, gasification and pyrolysis) applied to
prepare the waste for combustion as a gaseous, liquid or pulverised solid fuel. This pretreatment
is necessary to assure an adequate burnout in the boiler, due to the short residence time of the
fuel in the furnace. The most direct method of co-incineration is mixing with the main fuel. The
following pretreatment techniques are described below:
milling;
WORKIN
G DRAFT IN
PROGRESS
Chapter 9
TL/JFF/FN/EIPPCB/LCP_Final Draft June 2016 699
drying (see the WT BREF);
pyrolysis (see the WI BREF);
gasification (see Chapter 4 and the WI BREF);
methanisation (see the WT BREF).
It is important to note that some of these pretreatment techniques are already described in the
Waste Treatment and Waste Incineration BREFs. For this reason, no further description is
included in this section.
9.1.3.1 Milling
Milling is used to reduce solid wastes to a size that is suitable to be used in the power plant. For
example, in fluidised bed boilers the particle size is typically no larger than 100 mm, and in
pulverised fuel-fired boilers typically less than 75 m. Information on the type of milling used
with solid fuels is included in Section 5.1.1.2.
9.1.3.2 Drying
Waste that is too wet to be dried in a coal mill needs to be dried elsewhere (pretreated) before it
is mixed with the main fuel. Typical examples of waste that may need to be dried are sewage
sludge and manure (e.g. chicken litter) with moisture contents exceeding 50 %.
The drying of the wet waste can take place at the power station or at the location where the
waste is produced, recovered or collected. This depends greatly on the local infrastructure and
on the kind of waste. Drying of the waste is based on physical and physico-chemical processes
of mass and heat transport, resulting in the evaporation of moisture from the fuel. The heat
required for the evaporation of the moisture can be supplied by convection or conduction. Since
waste drying is not specific to large combustion plants, these processes are not discussed further
in this document. More information can be found in the Waste Treatment BREF.
9.1.3.3 Pyrolysis
Pyrolysis is a thermochemical process in which the waste is converted at a high temperature and
in the absence of oxygen into gaseous, liquid or solid products. Two types of pyrolysis
processes exist:
fast pyrolysis processes, in which the feedstock is rapidly heated to the process
temperature, which were developed for the production of pyrolysis oil or specific
components of this oil;
carbonisation processes, in which the feedstock is heated slowly to the pyrolysis
temperature, resulting in a relatively high solids production.
The solid product of this process (char) contains a high proportion of carbon and can be used as
coal. As the liquid and solid materials produced can be stored before co-combustion, the waste
can be pretreated independently of power plant operation. The gases produced are often used to
supply the heat required for the endothermic conversion process.
Since pyrolysis is not specific to large combustion plants, these processes are not discussed
further in this document. More information can be found in the Waste Incineration BREF.
Pyrolysis is used in co-incineration in a pulverised coal- or lignite-fired power plant when the
coal or lignite cannot be ground in a coal mill to the required dimensions.
WORKIN
G DRAFT IN
PROGRESS
Chapter 9
700 June 2016 TL/JFF/FN/EIPPCB/LCP_Final Draft
9.1.3.4 Gasification
Some wastes contain impurities such as chlorine, alkali, or metals (e.g. aluminium, heavy
metals) in such quantities that they require adequate cleaning before co-incineration in the boiler
takes place. Gasification of these materials may be an attractive option. The gas produced by
gasification can be burnt directly in the LCP or can be cleaned before use in the LCP or gas
turbine. More information can be found in Chapter 4 and in the Waste Incineration BREF.
9.1.3.5 Methanisation
Waste can also be methanised by anaerobic digestion. This technique transforms organic matter
to gas (mainly methane), which can be later used in the LCP. Since waste methanisation is not
specific to LCPs, these processes are not discussed further in this document. More information
can be found in the Waste Treatment BREF.
9.1.4 Techniques to introduce waste into the combustion process
When wastes are co-incinerated in a combustion process, certain procedures need to be applied
to ensure proper combustion. Several techniques can be applied to achieve a proper mixing, for
example wastes can be mixed together with the main fuel during handling and burnt together.
However, other techniques exist where the wastes are introduced into the combustion chamber
through feeding lines other than the main fuel's. The different techniques are described in
Sections 9.1.4.1 to 9.1.4.4.
9.1.4.1 Mixing with the main fuel
The easiest way to introduce waste into the combustion process is by mixing it with the main
fuel and burning it in the combustion chamber or boiler. This may lead to technical and/or
environmental constraints in the combustion plant, related to the milling and drying capacity of
existing solid fuel mills (if the waste is dried and pulverised together with the main fuel) and to
the feeding of the waste.
In a solid-fuel-fired boiler, fuel/waste mixing is possible in the following locations:
on the fuel conveyor belt;
in the fuel bunker;
in the fuel feeder;
at the fuel mill;
on the pulverised fuel lines.
In the first three, the waste is spread over the main solid fuel to achieve an adequate mixing of
the fuel/waste streams. This results in a grinding of the waste together with the main fuel in the
coal mill, as shown in Figure 9.1 for the example of a coal-fired plant. Due to grinding
behaviour constraints, this technique is usually only associated with dried sludge.
WORKIN
G DRAFT IN
PROGRESS
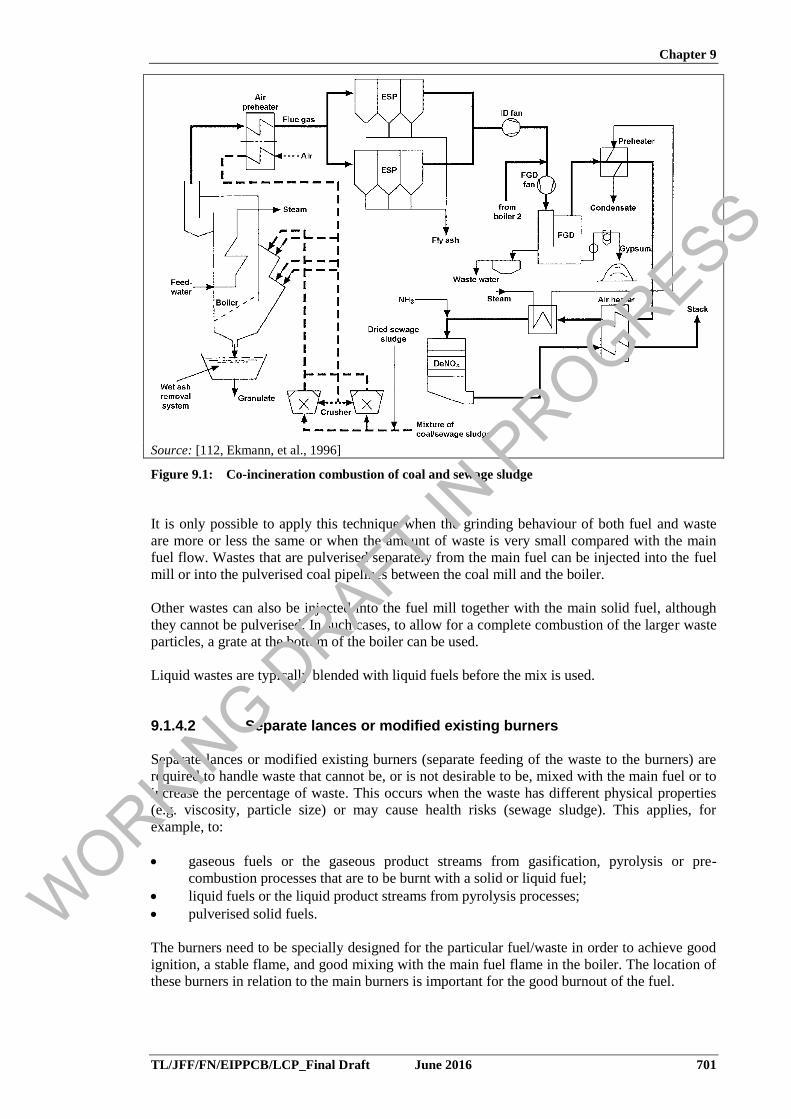
Chapter 9
TL/JFF/FN/EIPPCB/LCP_Final Draft June 2016 701
Source: [112, Ekmann, et al., 1996]
Figure 9.1: Co-incineration combustion of coal and sewage sludge
It is only possible to apply this technique when the grinding behaviour of both fuel and waste
are more or less the same or when the amount of waste is very small compared with the main
fuel flow. Wastes that are pulverised separately from the main fuel can be injected into the fuel
mill or into the pulverised coal pipelines between the coal mill and the boiler.
Other wastes can also be injected into the fuel mill together with the main solid fuel, although
they cannot be pulverised. In such cases, to allow for a complete combustion of the larger waste
particles, a grate at the bottom of the boiler can be used.
Liquid wastes are typically blended with liquid fuels before the mix is used.
9.1.4.2 Separate lances or modified existing burners
Separate lances or modified existing burners (separate feeding of the waste to the burners) are
required to handle waste that cannot be, or is not desirable to be, mixed with the main fuel or to
increase the percentage of waste. This occurs when the waste has different physical properties
(e.g. viscosity, particle size) or may cause health risks (sewage sludge). This applies, for
example, to:
gaseous fuels or the gaseous product streams from gasification, pyrolysis or pre-
combustion processes that are to be burnt with a solid or liquid fuel;
liquid fuels or the liquid product streams from pyrolysis processes;
pulverised solid fuels.
The burners need to be specially designed for the particular fuel/waste in order to achieve good
ignition, a stable flame, and good mixing with the main fuel flame in the boiler. The location of
these burners in relation to the main burners is important for the good burnout of the fuel.
WORKIN
G DRAFT IN
PROGRESS
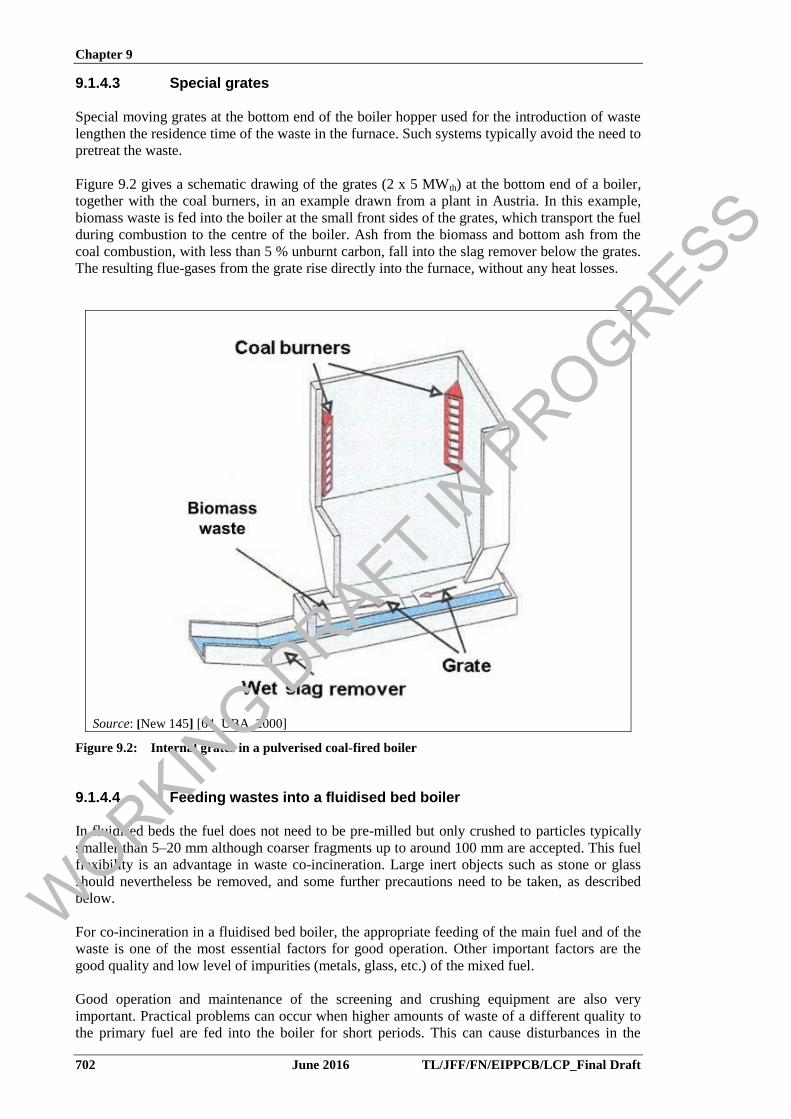
Chapter 9
702 June 2016 TL/JFF/FN/EIPPCB/LCP_Final Draft
9.1.4.3 Special grates
Special moving grates at the bottom end of the boiler hopper used for the introduction of waste
lengthen the residence time of the waste in the furnace. Such systems typically avoid the need to
pretreat the waste.
Figure 9.2 gives a schematic drawing of the grates (2 x 5 MWth) at the bottom end of a boiler,
together with the coal burners, in an example drawn from a plant in Austria. In this example,
biomass waste is fed into the boiler at the small front sides of the grates, which transport the fuel
during combustion to the centre of the boiler. Ash from the biomass and bottom ash from the
coal combustion, with less than 5 % unburnt carbon, fall into the slag remover below the grates.
The resulting flue-gases from the grate rise directly into the furnace, without any heat losses.
Source: [New 145] [64, UBA, 2000]
Figure 9.2: Internal grates in a pulverised coal-fired boiler
9.1.4.4 Feeding wastes into a fluidised bed boiler
In fluidised beds the fuel does not need to be pre-milled but only crushed to particles typically
smaller than 5–20 mm although coarser fragments up to around 100 mm are accepted. This fuel
flexibility is an advantage in waste co-incineration. Large inert objects such as stone or glass
should nevertheless be removed, and some further precautions need to be taken, as described
below.
For co-incineration in a fluidised bed boiler, the appropriate feeding of the main fuel and of the
waste is one of the most essential factors for good operation. Other important factors are the
good quality and low level of impurities (metals, glass, etc.) of the mixed fuel.
Good operation and maintenance of the screening and crushing equipment are also very
important. Practical problems can occur when higher amounts of waste of a different quality to
the primary fuel are fed into the boiler for short periods. This can cause disturbances in the
WORKIN
G DRAFT IN
PROGRESS
Chapter 9
TL/JFF/FN/EIPPCB/LCP_Final Draft June 2016 703
combustion process and also affect the load of the boiler. In fluidised bed combustion, sintering
problems can occur.
In conveyors, some operating problems can occur due, for example, to blockages caused by
long pieces of bark or plastics. These problems can be avoided by proper maintenance of the
crushing system.
Waste should be properly mixed with the main fuel before being fed into the boiler, or there
should be a separate feeding system for the waste so that the feeding can be quickly stopped in
the event of any problems.
9.1.5 Control of emissions to air from waste co-incineration
Flue-gas cleaning processes and techniques applied to the co-incineration of waste do not
necessarily differ from the techniques for cleaning flue-gases from the combustion of solid,
liquid or gaseous fuels as described in Chapters 5 to 7. Depending on the properties of the
waste, in particular the content of metals including for instance mercury, sometimes additional
measures, such as an injection of activated carbon, are applied.
The pollutants SOX, NOX and dust are effectively controlled at power plants that are properly
designed and well operated. A higher input of these pollutants into the firing system can be
balanced (clearly within certain limits) by adaptation of the flue-gas cleaning system and will
normally not lead to higher emissions.
Reduction of HCl and HF emissions is strongly correlated with SOX reduction. The input of
chlorinated compounds is limited by the operator of the power plant also to prevent high-
temperature corrosion.
9.1.6 Water and waste water treatment
Aqueous releases arise from processes such as wet scrubbing, plume conditioning, wet
deslagging, and storage and pretreatment of waste (e.g. drying of sewage sludge).
Neutralisation, settlement and physico-chemical treatments may be necessary to remove any
contaminants from the water streams generated. Water and waste water treatment systems
applied in waste co-incineration do not differ from the techniques for the treatment of water and
waste water from gaseous-, liquid- or solid-fuel-fired LCPs, as described in Sections 3.1.10 and
3.2.4. If necessary, existing waste water treatment systems can be adapted to the removal of
higher loads of pollutants (e.g. Cl, F, Hg).
9.1.7 Handling of combustion residues
The handling of combustion residues applied with waste co-incineration does not differ from
those techniques for handling combustion residues from gaseous-, liquid- or solid-fuel-fired
LCPs, as described in Sections 3.1.11 and 3.2.5. Fly ashes and bottom ashes are generated
during the combustion processes.
While waste incineration plants are typically equipped with complex combinations of flue-gas
cleaning techniques able to deal with broad chemical composition variations in the waste,
certain categories of combustion plants are often not equipped with systems dedicated to the
reduction of metals and mercury in particular (such as one- or two-stage wet scrubbers and
activated carbon systems). Therefore, if no further actions are taken, emissions of these
pollutants to air may increase (depending on the input) as may their concentration in the fly ash,
in the gypsum, or in other solid residues from FGD. If the gypsum is washed, the emissions to
water may also increase.
WORKIN
G DRAFT IN
PROGRESS

Chapter 9
704 June 2016 TL/JFF/FN/EIPPCB/LCP_Final Draft
As the utilisation or disposal of solid residues from combustion is an important economic factor,
operators of power plants carefully control their quality so as not to lose established utilisation
pathways (mostly by limiting the input of waste into the firing system). Important parameters
are the content of alkalis, sulphates, chlorides, silicates, unburnt carbon and metals (depending
on the specific situation). If solid waste from co-incineration has to be landfilled, the
concentration of metals for example and also the leaching behaviour have to be measured.
WORKIN
G DRAFT IN
PROGRESS
Chapter 9
TL/JFF/FN/EIPPCB/LCP_Final Draft June 2016 705
9.2 Current consumption and emission levels in waste co-incineration LCPs
9.2.1 Overview of the waste co-incinerated in LCPs
Waste co-incineration impacts on plant energy efficiency, on emissions to air and water, and
also affects the quality of the combustion residues.
The level of impact is determined by how the properties of the waste differ from those of the
main fuel and by how much, and by the reduction/abatement techniques implemented. The main
physico-chemical properties, which describe the quality of a fuel, are:
calorific value;
ash content;
water content;
volatile matter; and
chemical composition (especially in terms of C, H, O, N, S, Al, K, Na, P, Cl, F, as well as
Hg and other metals).
The main types of waste that are used for co-incineration in LCPs are listed in Annex II (Section
13.2), the most important ones on this list in terms of volume being sewage sludge, paper mill
sludges and residues, waste-derived fuels from the processing of municipal and commercial
waste, animal tissue waste and treated wood waste.
Waste-derived fuels are mainly solid or liquid with a significant amount of ash. For this reason,
co-incineration is more or less limited to the application in solid-fuel-fired boilers. Some of
these materials can be classified as hazardous, as they may be contaminated with hazardous
substances. Table 9.1 to Table 9.3 show examples of waste co-incinerated in coal-fired
combustion plants and of their composition. In this context, reference is also made to Table 5.1
and Table 5.2 presented in Chapter 5 concerning the combustion of coal and lignite.
WORKIN
G DRAFT IN
PROGRESS

Chapter 9
706 June 2016 TL/JFF/FN/EIPPCB/LCP_Final Draft
Table 9.1: Example of coal/lignite and some typical sewage sludge compositions
Parameter Units Range (lignite and coal) Range (sewage sludge;
municipal – industrial)
Water content wt-% 3–60 65–75
Calorific value Hu MJ/kg dry mass 7–38 9–12
Ash content wt-% dry 3–17 40–60
Volatiles wt-% dry 17–60 13–47
Fixed C wt-% dry 19 1
C wt-% dry 60–80 30–50
H wt-% dry 3–9 4–7
N wt-% dry 0.5–2 2–4.7
S wt-% dry 0.5–3 0.5–2
Cl mg/kg dry mass 200–300 500–3000
F mg/kg dry mass 16–20 100–350
As mg/kg dry mass 0.4–18 4–9.2
B mg/kg dry mass No data 30–55
Ba mg/kg dry mass No data 300–500
Be mg/kg dry mass 0.1 0.9–2
Pb mg/kg dry mass 0.4–50 15–412
Cd mg/kg dry mass 0.02–5 0.6–6.5
Co mg/kg dry mass 0.6–21 2–13.4
Cr mg/kg dry mass 1.4–39.1 40–108.6
Cu mg/kg dry mass 1–33 30–456
K mg/kg dry mass No data 1500–2300
Mn mg/kg dry mass 88–160 210–1000
Na mg/kg dry mass No data 1100–4400
Ni mg/kg dry mass 1.6–40.5 30–57
Hg mg/kg dry mass 0.1–0.3 0.2–4.5
Se mg/kg dry mass No data < 5
Sb mg/kg dry mass 1–5 2.4–8.5
Th mg/kg dry mass 0.1–0.3 1.2–2
V mg/kg dry mass 1–105 9–35.4
Sn mg/kg dry mass 4 10–100
Zn mg/kg dry mass 5–60 420–1600
AOX mg/kg dry mass No data 350
Source: [New 145] [64, UBA, 2000], [data collection 2012]
Because of the different origins of secondary wood fuel such as waste wood, demolition wood
(with and without wood preservatives) and pressboard residues, the impurities and
contamination levels may vary widely. Table 9.2 shows the variation in impurities and the
contamination of different waste wood examples, where some of these contain wood treated
with wood preservatives (e.g. demolition wood).
WORKIN
G DRAFT IN
PROGRESS
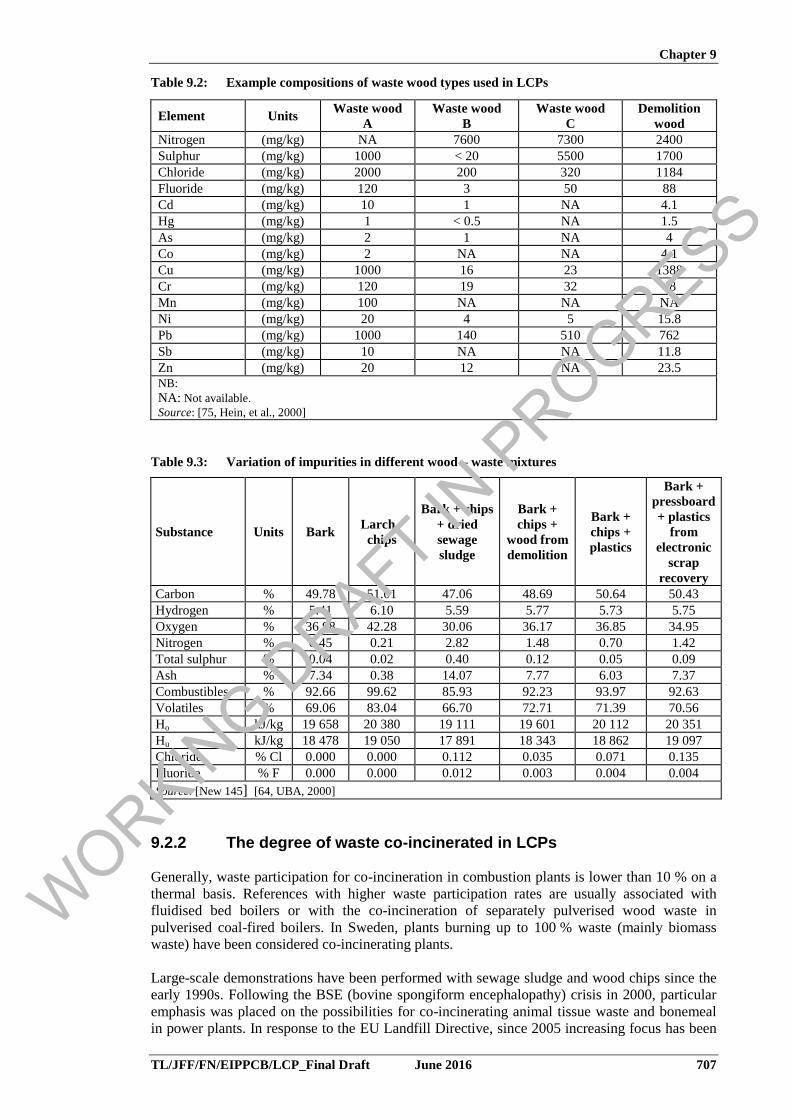
Chapter 9
TL/JFF/FN/EIPPCB/LCP_Final Draft June 2016 707
Table 9.2: Example compositions of waste wood types used in LCPs
Element Units Waste wood
A
Waste wood
B
Waste wood
C
Demolition
wood
Nitrogen (mg/kg) NA 7600 7300 2400
Sulphur (mg/kg) 1000 < 20 5500 1700
Chloride (mg/kg) 2000 200 320 1184
Fluoride (mg/kg) 120 3 50 88
Cd (mg/kg) 10 1 NA 4.1
Hg (mg/kg) 1 < 0.5 NA 1.5
As (mg/kg) 2 1 NA 4
Co (mg/kg) 2 NA NA 4.1
Cu (mg/kg) 1000 16 23 1388
Cr (mg/kg) 120 19 32 48
Mn (mg/kg) 100 NA NA NA
Ni (mg/kg) 20 4 5 15.8
Pb (mg/kg) 1000 140 510 762
Sb (mg/kg) 10 NA NA 11.8
Zn (mg/kg) 20 12 NA 23.5
NB:
NA: Not available.
Source: [75, Hein, et al., 2000]
Table 9.3: Variation of impurities in different wood – waste mixtures
Substance Units Bark Larch -
chips
Bark + chips
+ dried
sewage
sludge
Bark +
chips +
wood from
demolition
Bark +
chips +
plastics
Bark +
pressboard
+ plastics
from
electronic
scrap
recovery
Carbon % 49.78 51.01 47.06 48.69 50.64 50.43
Hydrogen % 5.41 6.10 5.59 5.77 5.73 5.75
Oxygen % 36.98 42.28 30.06 36.17 36.85 34.95
Nitrogen % 0.45 0.21 2.82 1.48 0.70 1.42
Total sulphur % 0.04 0.02 0.40 0.12 0.05 0.09
Ash % 7.34 0.38 14.07 7.77 6.03 7.37
Combustibles % 92.66 99.62 85.93 92.23 93.97 92.63
Volatiles % 69.06 83.04 66.70 72.71 71.39 70.56
Ho kJ/kg 19 658 20 380 19 111 19 601 20 112 20 351
Hu kJ/kg 18 478 19 050 17 891 18 343 18 862 19 097
Chloride % Cl 0.000 0.000 0.112 0.035 0.071 0.135
Fluoride % F 0.000 0.000 0.012 0.003 0.004 0.004
Source: [New 145] [64, UBA, 2000]
9.2.2 The degree of waste co-incinerated in LCPs
Generally, waste participation for co-incineration in combustion plants is lower than 10 % on a
thermal basis. References with higher waste participation rates are usually associated with
fluidised bed boilers or with the co-incineration of separately pulverised wood waste in
pulverised coal-fired boilers. In Sweden, plants burning up to 100 % waste (mainly biomass
waste) have been considered co-incinerating plants.
Large-scale demonstrations have been performed with sewage sludge and wood chips since the
early 1990s. Following the BSE (bovine spongiform encephalopathy) crisis in 2000, particular
emphasis was placed on the possibilities for co-incinerating animal tissue waste and bonemeal
in power plants. In response to the EU Landfill Directive, since 2005 increasing focus has been
WORKIN
G DRAFT IN
PROGRESS

Chapter 9
708 June 2016 TL/JFF/FN/EIPPCB/LCP_Final Draft
placed on the energy recovery of the organic waste fractions of municipal, commercial and
industrial waste flows. Nowadays, co-incineration of sewage sludge, sludges and residues from
the pulp and paper industry, waste-derived fuels, animal tissue waste, and other industrial waste
and process residues is common practice at many coal- and/or lignite-fired large combustion
plants across Europe.
Table 9.4 includes an overview of some power plants where wastes have been co-incinerated.
WORKIN
G DRAFT IN
PROGRESS

Chapter 9
TL/JFF/FN/EIPPCB/LCP_Final Draft June 2016 709
Table 9.4: Experience with waste co-incineration in some LCPs in some EU Member States
Country Main fuel
type
Waste streams co-
incinerated Boiler type
Total rated
thermal input
(MW)
Gross electric
power output
(MW)
Co-firing degree
(thermal) Remarks / handling of waste
Austria Coal Sewage sludge WBB 543 246 0.1 %
France Biomass
Paper sludge and
residues, waste wood,
sewage sludge
CFBC 85 9 Varying Degree of co-incineration over 25 %
France Coal
Meat/bonemeal,
biomass CFBC 81 12 9.3 %
Finland
Peat,
woody
biomass,
(coal) Waste-derived fuel CFBC 206 65 8.4 %
Multi-fuel co-combustion of peat, coal,
biomass and waste
Finland
Peat,
coal,
biomass Waste-derived fuel CFBC 65 NA NA
Germany Lignite Sewage sludge DBB 2 × 2465 2 × 920 1.5 % Mixing with lignite before pulverisation
Germany Coal
Sewage sludge,
meat/bonemeal WBB 2100 838 1.0 %
Mixing of waste with the main fuel before
feeding together
Germany Coal Sewage sludge DBB 1370 550 0.1 %
Germany Lignite
paper sludge, waste-
derived fuel, premixed
waste DBB 2 × 2100 2 × 800 1.9 % / 1.6 % Mixing with lignite before pulverisation
Germany Lignite Waste-derived fuel DBB 4 × 762 2160 2.2–3.5 % Mixing with lignite before pulverisation
Germany Coal
Sewage sludge,
petroleum coke DBB 1870 824 < 5 %
Germany Coal Waste-derived fuel WBB 1528 658 3.9 %
Mixing of waste with the main fuel before
feeding together
Germany Coal
Liquid waste and waste
gases from the chemical
industry WBB 710 247 < 10 %
Integration of chemical production and
steam/power production
Germany Lignite
Sewage sludge,
meat/bonemeal DBB 1524 500 < 2 % Mixing with lignite before pulverisation
Germany Coal Sewage sludge DBB 1125 474 < 5 %
WORKIN
G DRAFT IN
PROGRESS
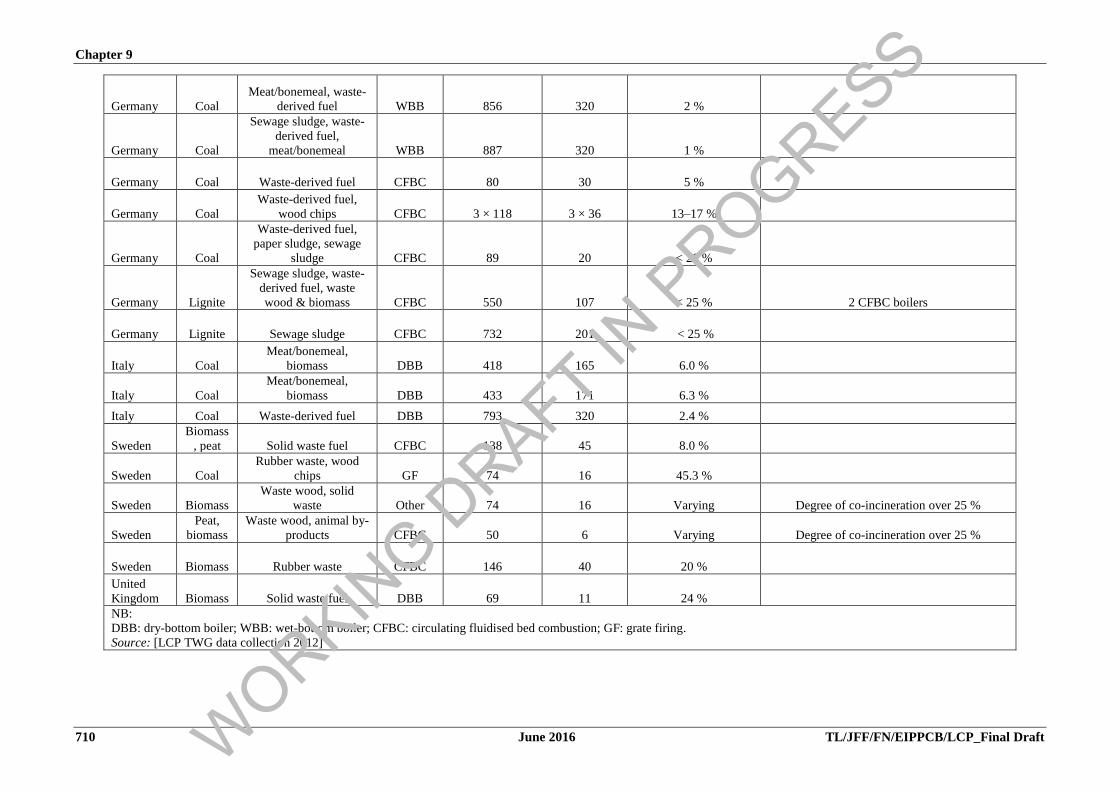
Chapter 9
710 June 2016 TL/JFF/FN/EIPPCB/LCP_Final Draft
Germany Coal
Meat/bonemeal, waste-
derived fuel WBB 856 320 2 %
Germany Coal
Sewage sludge, waste-
derived fuel,
meat/bonemeal WBB 887 320 1 %
Germany Coal Waste-derived fuel CFBC 80 30 5 %
Germany Coal
Waste-derived fuel,
wood chips CFBC 3 × 118 3 × 36 13–17 %
Germany Coal
Waste-derived fuel,
paper sludge, sewage
sludge CFBC 89 20 < 20 %
Germany Lignite
Sewage sludge, waste-
derived fuel, waste
wood & biomass CFBC 550 107 < 25 % 2 CFBC boilers
Germany Lignite Sewage sludge CFBC 732 201 < 25 %
Italy Coal
Meat/bonemeal,
biomass DBB 418 165 6.0 %
Italy Coal
Meat/bonemeal,
biomass DBB 433 171 6.3 %
Italy Coal Waste-derived fuel DBB 793 320 2.4 %
Sweden
Biomass
, peat Solid waste fuel CFBC 138 45 8.0 %
Sweden Coal
Rubber waste, wood
chips GF 74 16 45.3 %
Sweden Biomass
Waste wood, solid
waste Other 74 16 Varying Degree of co-incineration over 25 %
Sweden
Peat,
biomass
Waste wood, animal by-
products CFBC 50 6 Varying Degree of co-incineration over 25 %
Sweden Biomass Rubber waste CFBC 146 40 20 %
United
Kingdom Biomass Solid waste fuel DBB 69 11 24 %
NB:
DBB: dry-bottom boiler; WBB: wet-bottom boiler; CFBC: circulating fluidised bed combustion; GF: grate firing.
Source: [LCP TWG data collection 2012]
WORKIN
G DRAFT IN
PROGRESS

Chapter 9
TL/JFF/FN/EIPPCB/LCP_Final Draft June 2016 711
In Germany, co-incineration of waste has been common practice at many coal- and/or lignite-
fired power plants since the early 1990s. Currently, there are around 40 coal- and/or lignite fired
power plants in the public power sector and the coal and lignite mining sector co-incinerating
waste with a co-firing degree of up to 25 % of the rated thermal input. In 2009, around 2.8
million tonnes of waste were co-incinerated in German power plants including around 1.3
million tonnes of sewage sludge, 0.5 million tonnes of sludges from the pulp and paper industry
and 0.6 million tonnes of waste-derived fuels from the processing of household and commercial
waste as well as 0.4 million tonnes of animal tissue waste, contaminated waste wood and other
industrial waste materials. [BDEW 2013]
Furthermore, many industrial auto-producers in the pulp and paper, wood processing, chemical
and refining industry also co-incinerate industrial waste and residues stemming, among others,
from internal production processes in large combustion plants for electricity, heat and steam
generation.
In 2009, 63 power plants reported co-incineration of waste in the EU Emissions Trading System
(ETS). Of these ETS installations, 54 power plants achieved greenhouse gas emission
reductions through the co-incineration of waste rather than the main fuel. The combined CO2
emission reduction through co-incineration in Germany was calculated by the German Emission
Trading Authority to amount to 1.8 million tonnes of CO2 in 2008 and 2.1 million tonnes in
2009. [Eurelectric – 2013 – Comments to D1].
9.2.3 Effects of waste co-incineration on plant energy efficiency
When a plant is fired with a fuel/waste mix, the conversion efficiencies of the energy inputs of
the individual fuel/waste streams to the energy output have to be considered. This means that, to
characterise the effect of co-incineration on plant energy efficiency, it is necessary to determine
both the conversion efficiency from waste to energy output, and the influence of co-incineration
on the conversion efficiency of the main fuel.
The efficiency of the conversion from waste to energy is influenced by:
the moisture content of the waste;
the waste reactivity;
the grindability of the waste;
the efficiencies of the required pretreatment processes before combustion;
the required house load for handling and pretreatment of the waste;
the calorific value;
the ash content.
Waste co-incineration can influence the conversion of the main fuel to energy output in the
following ways:
excess air may be needed to ensure proper combustion;
the flue-gas temperature and flow in the boiler may change;
there may be increased unburnt carbon in the fly ash;
steam temperatures may change;
the net energy efficiency may be affected by the energy requirement for drying waste on
or off site.
9.2.4 General effects of waste co-incineration in LCPs
The handling, and in particular the combustion, of waste can lead to additional challenges that
may affect the emission levels, the plant´s energy efficiency and availability, and the quantity
WORKIN
G DRAFT IN
PROGRESS

Chapter 9
712 June 2016 TL/JFF/FN/EIPPCB/LCP_Final Draft
and quality of the residues, by-products and waste water. These effects are influenced by the
nature of the waste, in particular with regard to its:
toxicity (also pathogenic germs);
explosion risk (gaseous fuels and dust explosions);
flammability (liquid fuels);
moisture content;
spontaneous heating (biomass);
odour;
fluidity (for sludge and solids);
grindability.
These aspects have to be considered when choosing the waste, to enable proper and safe co-
incineration.
9.2.5 Effect of waste co-incineration on plant performance
Apart from the possible influence of humidity or ash content on plant energy efficiency, co-
incineration may also influence the plant's performance. This may result in a decrease in the
nominal load or the load control speed of the power plant, caused by the capacity constraints of
the components. For example, the capacity of the induced draught flue-gas fans can limit the co-
incineration degree of wet waste. Plant performance (and availability) may also be influenced
by corrosion (due to the sulphur and chlorine contents of the waste), erosion, slagging, or
fouling (due to the alkali content of the ash) of the boiler. Adapting the LCP equipment for the
pretreatment or pre-conversion of the waste, or limiting the degree of co-incineration, helps
prevent a decline in plant performance.
Plant energy efficiency and plant performance can be increasingly influenced the further the
waste deviates from the original design fuel(s) of the boiler. The issues that can be of relevance
when considering such influences include:
the existing design capacity of combustion plant equipment (e.g. due to the requirement
for a higher wet flue-gas flow in the co-incineration of wet waste);
the combustion characteristics of the waste, such as ignition, flame stability, flame
temperature, NOX formation and burnout, which may differ from those of the main fuel;
slagging and fouling, influenced by the chemical composition of the ash (especially
potassium, sodium and sulphur) and the melting trajectory of the ash;
the thermal behaviour of the boiler, especially radiant and convective heat exchange;
corrosion and erosion by salts of boiler parts (caused by sulphur and chlorine compounds
in the waste and the operating conditions in the boiler combustion, e.g. the reducing air);
the quality and behaviour of the by-products and combustion residues;
emissions to air caused by the sulphur, chlorine, heavy metals, organic substances, etc.
contained in the waste;
emissions to water caused by the sulphur, chlorine, heavy metals, organic substances, etc.
contained in the waste;
impacts on the flue-gas cleaning systems due to changes in the composition of the flue-
gas (especially deactivation of the DeNOX catalysts by alkalis, As, P or F; increased fly
ash separation by ESPs; effects on the FGD);
emissions to air and water from waste pretreatment (e.g. drying of sewage sludge).
These impacts can be addressed by limiting the degree of co-incineration to only a small portion
of the main fuel and/or by proper pretreatment of the waste.
WORKIN
G DRAFT IN
PROGRESS
Chapter 9
TL/JFF/FN/EIPPCB/LCP_Final Draft June 2016 713
9.2.6 Effects of waste co-incineration on emissions to air
The chemical composition of the co-incinerated waste is the main factor determining the impact
on emissions to air. Concentrations of certain elements such as mercury can be higher in waste
than in the main fuel, and can thus result in higher concentrations of those elements in the raw
flue-gas. Higher emissions to air of those pollutants may however be avoided by waste selection
and pretreatment measures as well as (additional) primary or secondary air emission control
techniques.
9.2.6.1 Dust
Dust emissions from the stack may change with co-incineration due to the different physical and
chemical composition of the ash, which can affect the ESP performance in particular. Dry solid
waste prone to releasing very fine particles could give rise to fugitive dust emissions, especially
in handling and storage areas.
Dust is present in flue-gas for a number of reasons. Some of it is related to the ash entrained in
the flue-gas by turbulent conditions in the combustion chamber. Light wastes are particularly
prone to this. Similarly, the flue-gas can entrain partially burnt waste.
Compounds and metals, such as cadmium and especially mercury volatilised in the combustion
chamber, can condense into particulate matter when the temperature drops after combustion.
This material can form a submicron fume that can be difficult to remove. Particulates can also
be generated by routine online cleaning, such as during soot blowing.
9.2.6.2 Acid gases
Depending on the type of waste co-incinerated, higher emissions of acid gases may result. These
gases are hydrogen chloride, sulphur dioxide, hydrogen fluoride and nitrogen oxides. The
concentrations of various compounds in the waste determine the levels of the respective acid
gases in the raw flue-gas and thus the abatement techniques to be applied.
9.2.6.3 Carbon oxides
The specific fossil-fuel CO2 emissions of a combustion plant may significantly decrease when
renewable secondary fuels, wastes with a high biogenic content or other wastes with a lower
specific CO2 emission factor than the main fuel are co-incinerated, provided that the overall
plant efficiency is not adversely affected by the co-incineration. In the context of climate change
mitigation policy, this is one of the primary goals, in particular in LCPs subject to the European
Emission Trading scheme, of the widely applied multi-fuel firing of biomass wastes and
secondary fuels with high biogenic contents, as the replacement of the primary fossil fuel
reduces the emission of fossil CO2, whereas the renewable CO2 originating from the biogenic
waste fractions is not accounted for.
Emissions of carbon monoxide may be affected as co-incinerating waste may cause an impact
on certain combustion characteristics (e.g. flame stability). However, the design and operation
measures needed to achieve correct incineration of the waste should prevent carbon monoxide
emissions from rising significantly in co-incineration.
9.2.6.4 Halides
Halide emissions may be higher in the co-incineration of waste with high Cl and/or F contents.
Since chloride and fluoride are not necessarily completely abated by the typical flue-gas
WORKIN
G DRAFT IN
PROGRESS
Chapter 9
714 June 2016 TL/JFF/FN/EIPPCB/LCP_Final Draft
cleaning installations of solid-fuel-fired power plants, the emission of these substances may be
higher than in dedicated waste incinerators if no further action is taken. In the case of fluoride in
particular, emissions tend to be higher when a gas-gas heat exchanger is applied for reheating
the cleaned flue-gases from the FGD.
9.2.6.5 Nitrogen oxides
The waste fuel may have a beneficial or detrimental impact on NOX emissions, depending on
how similar the waste or recovered fuel is to the fuel with which it is co-fired. Highly-volatile
coals may increase the flame temperature, thereby potentially forming more NOX. Waste with a
high percentage of moisture ignites slowly with a low adiabatic flame temperature, thereby
forming less NOX. Installations with NOX abatement techniques have greater flexibility to
accept waste with a higher fuel-nitrogen content.
9.2.6.6 Sulphur oxides
Waste with a much higher sulphur content than the main fuel (coal, lignite, biomass, peat) can
in certain cases cause higher SOX emissions, although the limited co-firing rate and the use of
adequate SOX removal techniques should keep such emission increases to a minimum. In any
case, it is more common for the waste to have a lower sulphur content than the primary fuel,
resulting in lower overall emissions of sulphur compounds.
9.2.6.7 TOC, VOCs and dioxins
Volatile organic compounds (VOCs) in the flue-gas represent unburnt fuel. Co-incineration can
lead to an increase in the emissions of VOCs. However, the emissions of hydrocarbons, VOCs
and PAHs do not change significantly in co-incineration when a good burnout is achieved [
New 123, 58, Eurelectric, 2001].
Dioxins and dioxin-precursor substances can be present in wastes, such as demolition wood and
refuse-derived fuel (RDF), in small quantities and are destroyed in the combustion chamber.
However, they can subsequently reform by the de novo synthesis process, from precursors such
as chlorinated benzenes, PCBs or non-chlorinated precursors, where there is an associated
supply of inorganic chlorine. The mechanism for their reformation is not fully understood, but it
is thought that the presence of copper, soot and fly ash can assist in the process, which occurs
mostly between 200 ºC and 450 ºC. Due to these effects, it has been identified that the co-
incineration of certain types of waste may result in higher dioxin emissions. Dioxin emissions
can be reduced with specific techniques such as activated carbon injection in the flue-gases.
Emissions of dioxins and furans from coal-fired plants are typically low due to their specific
combustion characteristics and the sulphur content of the fuel which impedes the formation of
these compounds. This does not change with co-incineration, even in the case of waste with a
high chlorine content.
9.2.6.8 Metals (Cd+Tl; Hg; Sb+As+Pb+Cr+Co+Cu+Mn+Ni+V)
Metals (e.g. heavy and toxic metals) are already present to a certain extent as natural elements in
fossil fuels. Certain wastes such as sewage sludge and fuel derived from waste or the demolition
of wooden constructions may contain metals, as shown in Table 9.1and Table 9.2, in a higher
quantity than in conventional fuel.
Some metals remain in the furnace bottom ash while others in the flue-gas may condense
downstream from the combustion chamber, where they form particulates. Some highly volatile
WORKIN
G DRAFT IN
PROGRESS
Chapter 9
TL/JFF/FN/EIPPCB/LCP_Final Draft June 2016 715
metal compounds such as cadmium, mercury, thallium and selenium will remain in the vapour
phase or in an ultrafine fume. Regarding waste composition, the Hg concentration is typically
one of the most critical of all elements because of its volatility [ New 123, 58, Eurelectric,
2001]. Due to the general limitations of the waste input (only a few per cent of the total thermal
input of a power plant usually come from co-incinerated waste) and due to comparable
concentrations of Hg in the raw gas of pure coal-fired power plants, the raw gas concentration
of Hg does not increase significantly. However, emitted loads may increase as a result of the
higher flue-gas volumes. For other metals, some emission increases may occur due to possibly
higher concentrations of Pb, Co, Tl, and Se [ New 123, 58, Eurelectric, 2001].
9.2.6.9 Plume
Wastes with a high moisture content, such as poultry litter, are prone to visible plume formation.
There are three generic techniques for conditioning exhaust gases to prevent visible plume
formation from the stack:
exhaust gas reheating;
exhaust gas condensation;
flue-gas temperature control.
Condensation techniques produce large volumes of liquid for disposal, which can be
contaminated by polluting substances and may require neutralisation.
9.2.6.10 Odour
The storage and handling of waste such as odorous sludge can generate odour emissions. Drying
installations in particular need to apply techniques against odour emissions, as described in the
Emissions from Storage BREF. Depending on the waste and on the local situation, storage,
transfer and handling may take place in enclosed areas.
9.2.7 Effects of waste co-incineration on emissions to water
Waste co-incineration can influence emissions to water. However, most sources of waste water,
such as cooling water, condensate or demineralised waste water, are not affected by co-
incineration. The sources of waste water that may be influenced are listed below:
Rinsing waters from waste storage and surface run-off (rainwater).
The common factor in all dewatering (drying) processes is that the separated water
(filtrate or decant water) is polluted to differing extents. This is particularly true when
dewatering at higher temperatures, and may represent an important source of secondary
pollution burden for the water treatment plant.
As described in Chapter 3, flue-gas desulphurisation is the main source of waste water, as
it removes SO2 as well as other pollutants, such as heavy metals, from the flue-gases.
Although the concentration of metals in the effluent of the waste water plant is related to
the influent concentrations, it can be treated to a certain extent by adjusting the type and
amount of chemicals used and should be only slightly affected by co-incineration.
The use of water for dust control of open fuel storage can result in waste water, if this
water is not internally reprocessed, which is normally the case for coal storage. If waste is
not stored or handled properly, rainwater may also become contaminated unnecessarily.
‘Good housekeeping’ will prevent substances being spilled and transferred to drains.
Condensation techniques applied to plume conditioning produce large volumes of liquid
for disposal, which may be contaminated by polluting substances and may require waste
water treatment.
WORKIN
G DRAFT IN
PROGRESS
Chapter 9
716 June 2016 TL/JFF/FN/EIPPCB/LCP_Final Draft
The storage and handling of liquid wastes may involve the risk of dilution into the waste
water treatment system. The use of wet sludge spread over the coal in the coal yard might
also involve dilution into the waste water treatment system.
9.2.8 Effects of waste co-incineration on the quality of combustion residues
A key fundamental of co-incineration is to prevent a decrease in the quality of combustion
residues. This has to be achieved by pretreatment of the waste or by limiting the degree of co-
incineration. The quality of residues has two aspects: technical and environmental quality.
The technical quality is the expression of various parameters, which together determine, to a
large extent, the usability of the residues as a by-product. Apart from the purely physical
properties (e.g. stiffness, porosity, particle size, moisture content), the contents of elements
such as chloride, phosphorus, sulphate and carbon are also important. This applies
especially to ashes in concrete and cement.
The environmental quality of the by-product is related to how substances that are harmful to
human health or the environment can leach from the product in which they are applied to
the environment. Apart from the technical properties, the leaching characteristics determine
whether the by-products can be used for the intended application.
The impact of co-incineration on by-product quality has been extensively investigated and
reported in some countries, such as in the Netherlands. Given the high removal rates of the dust
control techniques prevalent in large combustion plants, more than 99 % of the elements are
found in the ashes. Generally, changes in the composition of the fuel will result in equivalent
changes in the composition of the ashes. Depending on the volatility of the elements,
redistribution may take place, resulting in different concentrations in the fly ash and in the
bottom ash.
Co-incineration causes the ash composition to change correspondingly with the waste
composition. The elemental composition of the by-products can be predicted to the extent that it
is possible to determine the margins of which, when, and in which quantities waste can be co-
incinerated.
Metals, to different degrees, present a risk of leaching into the environment after they have been
exposed to water for a very long time. Leaching characteristics are less important for fly ash
when it is used in immobilised applications in the cement and concrete industry.
Bottom ash, however, applied for example as a layer under a road, can leach some elements in
the long term. A shift in micro-elemental composition and leaching may pose a constraint to the
application of bottom ash from co-incineration.
Gypsum is hardly affected by changing the composition of the fuel. The leaching risk is small,
as the product is applied principally inside buildings, where contact with water does not occur.
Depending on quality requirements, gypsum may be regularly washed before it leaves the
combustion plant.
Filter ashes from pretreatment processes such as gasification are generally more difficult to use
and may have to be sent for disposal. Techniques to immobilise the microelements can open up
possibilities for some uses though.
For an overall evaluation of the environmental impact of metal concentrations, the
immobilisation and stabilisation of metals in the residue should be taken into account, as well as
the calculation of the total content. The extent of immobilisation can be calculated from the
metal concentrations in the eluate.
WORKIN
G DRAFT IN
PROGRESS
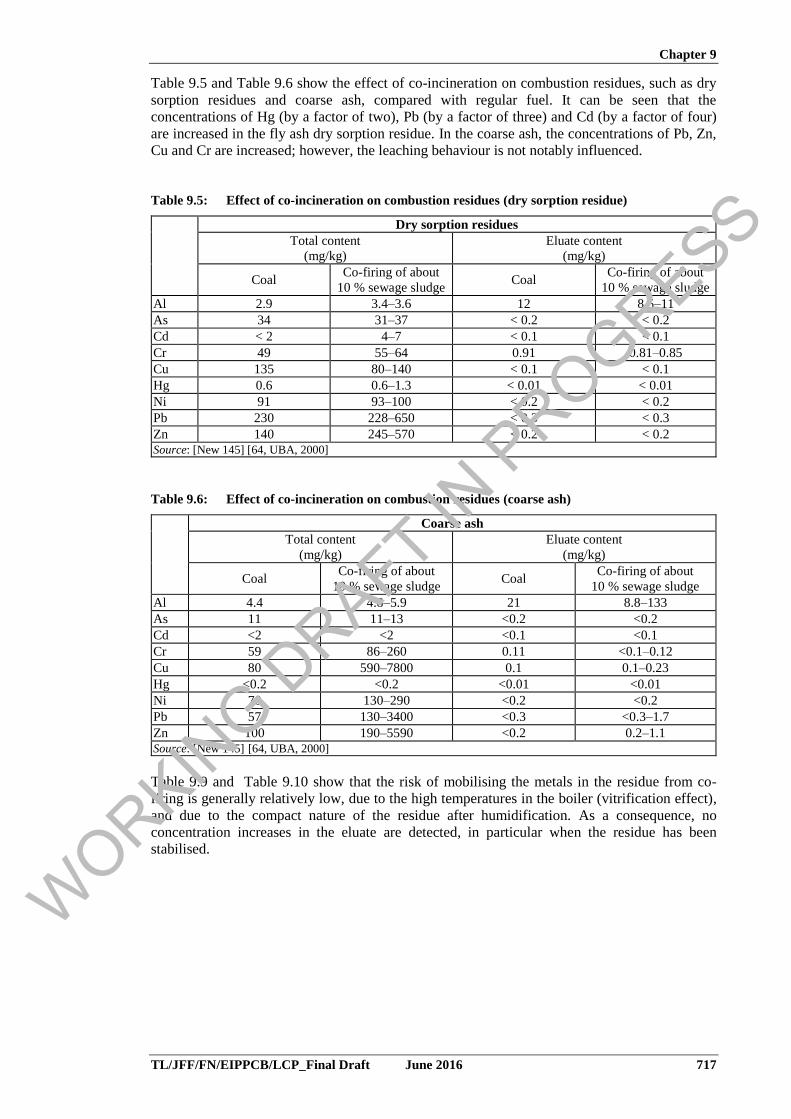
Chapter 9
TL/JFF/FN/EIPPCB/LCP_Final Draft June 2016 717
Table 9.5 and Table 9.6 show the effect of co-incineration on combustion residues, such as dry
sorption residues and coarse ash, compared with regular fuel. It can be seen that the
concentrations of Hg (by a factor of two), Pb (by a factor of three) and Cd (by a factor of four)
are increased in the fly ash dry sorption residue. In the coarse ash, the concentrations of Pb, Zn,
Cu and Cr are increased; however, the leaching behaviour is not notably influenced.
Table 9.5: Effect of co-incineration on combustion residues (dry sorption residue)
Dry sorption residues
Total content
(mg/kg)
Eluate content
(mg/kg)
Coal Co-firing of about
10 % sewage sludge Coal
Co-firing of about
10 % sewage sludge
Al 2.9 3.4–3.6 12 8.5–11
As 34 31–37 < 0.2 < 0.2
Cd < 2 4–7 < 0.1 < 0.1
Cr 49 55–64 0.91 0.81–0.85
Cu 135 80–140 < 0.1 < 0.1
Hg 0.6 0.6–1.3 < 0.01 < 0.01
Ni 91 93–100 < 0.2 < 0.2
Pb 230 228–650 < 0.3 < 0.3
Zn 140 245–570 < 0.2 < 0.2
Source: [New 145] [64, UBA, 2000]
Table 9.6: Effect of co-incineration on combustion residues (coarse ash)
Coarse ash
Total content
(mg/kg)
Eluate content
(mg/kg)
Coal Co-firing of about
10 % sewage sludge Coal
Co-firing of about
10 % sewage sludge
Al 4.4 4.8–5.9 21 8.8–133
As 11 11–13 <0.2 <0.2
Cd <2 <2 <0.1 <0.1
Cr 59 86–260 0.11 <0.1–0.12
Cu 80 590–7800 0.1 0.1–0.23
Hg <0.2 <0.2 <0.01 <0.01
Ni 70 130–290 <0.2 <0.2
Pb 57 130–3400 <0.3 <0.3–1.7
Zn 100 190–5590 <0.2 0.2–1.1
Source: [New 145] [64, UBA, 2000]
Table 9.9 and Table 9.10 show that the risk of mobilising the metals in the residue from co-
firing is generally relatively low, due to the high temperatures in the boiler (vitrification effect),
and due to the compact nature of the residue after humidification. As a consequence, no
concentration increases in the eluate are detected, in particular when the residue has been
stabilised.
WORKIN
G DRAFT IN
PROGRESS
Chapter 9
718 June 2016 TL/JFF/FN/EIPPCB/LCP_Final Draft
9.3 Techniques to consider in the determination of BAT for waste co-incineration
This section describes techniques (or combinations thereof), and associated monitoring,
considered to have the potential for achieving a high level of environmental protection in the
activities within the scope of this document. The techniques described include both the
technology used and the way in which the installations are designed, built, maintained, operated,
and decommissioned.
It covers process-integrated and end-of-pipe techniques. Waste prevention and management,
including waste minimisation and recycling procedures, are also considered.
Annex III to the Industrial Emissions Directive lists a number of criteria for determining BAT,
and the information within this chapter addresses these considerations. As far as possible, the
standard structure of Table 3.4 is used to outline the information on each technique, to enable a
comparison of techniques and the assessment against the definition of BAT given in the
Industrial Emissions Directive.
This section does not necessarily provide an exhaustive list of techniques that could be applied
in the sector. Other techniques may exist, or may be developed, which could be considered for
the determination of BAT for an individual installation.
In this section, the techniques to be considered have only been fully described when they are
specific to the considered combusted fuel or applied combustion process (co-incineration of
waste). Indeed, for most of the techniques, general descriptions are already presented in Chapter
3. Therefore, in order to avoid repetition, for those general techniques already described in
Chapter 3, only the additional information that is specific to the co-incineration of waste is
reported here in synthesis tables.
9.3.1 Techniques for the control of diffuse emissions and odours from the storage and handling of dusty and odorous waste
Table 9.7 summarises the general techniques to be considered in the determination of BAT for
the storage and handling of waste to be co-incinerated.
WORKIN
G DRAFT IN
PROGRESS
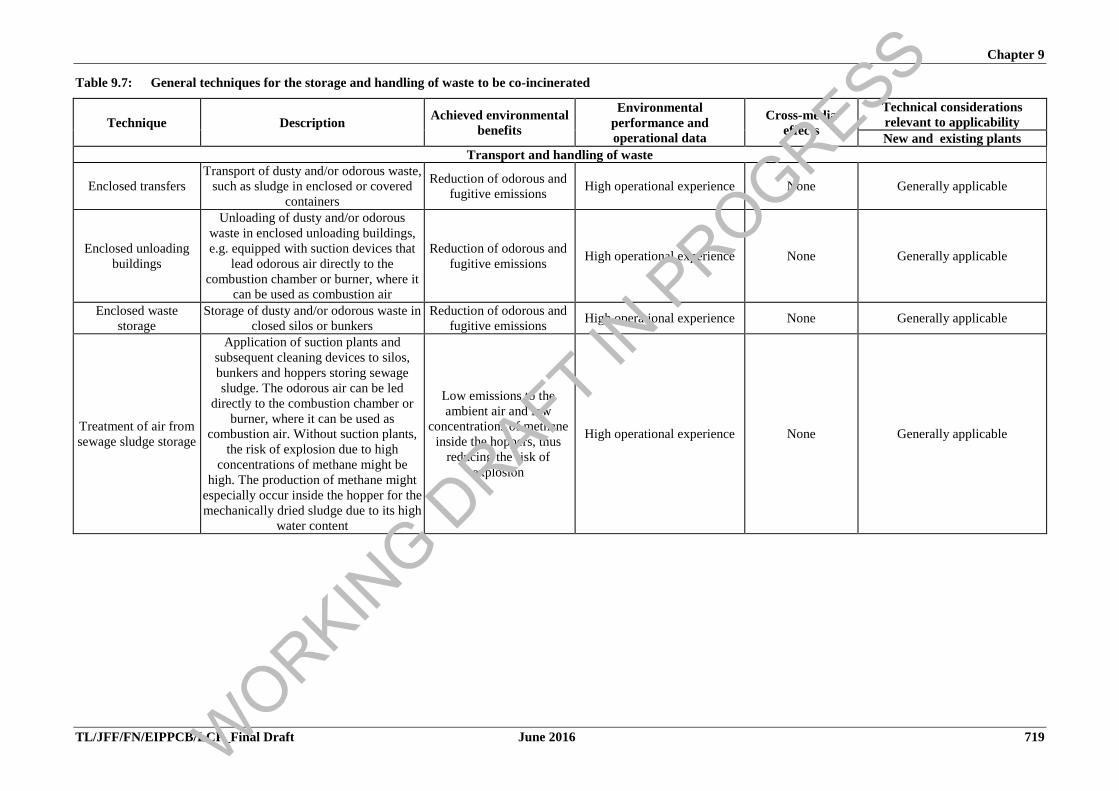
Chapter 9
TL/JFF/FN/EIPPCB/LCP_Final Draft June 2016 719
Table 9.7: General techniques for the storage and handling of waste to be co-incinerated
Technique Description Achieved environmental
benefits
Environmental
performance and
operational data
Cross-media
effects
Technical considerations
relevant to applicability
New and existing plants
Transport and handling of waste
Enclosed transfers
Transport of dusty and/or odorous waste,
such as sludge in enclosed or covered
containers
Reduction of odorous and
fugitive emissions High operational experience None Generally applicable
Enclosed unloading
buildings
Unloading of dusty and/or odorous
waste in enclosed unloading buildings,
e.g. equipped with suction devices that
lead odorous air directly to the
combustion chamber or burner, where it
can be used as combustion air
Reduction of odorous and
fugitive emissions High operational experience None Generally applicable
Enclosed waste
storage
Storage of dusty and/or odorous waste in
closed silos or bunkers
Reduction of odorous and
fugitive emissions High operational experience None Generally applicable
Treatment of air from
sewage sludge storage
Application of suction plants and
subsequent cleaning devices to silos,
bunkers and hoppers storing sewage
sludge. The odorous air can be led
directly to the combustion chamber or
burner, where it can be used as
combustion air. Without suction plants,
the risk of explosion due to high
concentrations of methane might be
high. The production of methane might
especially occur inside the hopper for the
mechanically dried sludge due to its high
water content
Low emissions to the
ambient air and low
concentrations of methane
inside the hoppers, thus
reducing the risk of
explosion
High operational experience None Generally applicable
WORKIN
G DRAFT IN
PROGRESS

Chapter 9
720 June 2016 TL/JFF/FN/EIPPCB/LCP_Final Draft
9.3.2 Techniques for the pretreatment of waste
Table 9.8 summarises the general techniques to be considered in the determination of BAT for
the pretreatment of waste.
Table 9.8: General techniques for the pretreatment of waste to be co-incinerated
Technique Description
Achieved
environmental
benefit
Environmental
performance
and operational
data
Cross-media
effects
Technical
considerations
relevant to
applicability
Driving
force for
implement
ation New
plants
Existing
plants
Drying See WT
BREF
Maintains the
good
performance of
the boiler
High operational
experience
Additional
energy is
needed for
drying.
Although the
high moisture
content of the
waste
negatively
affects the
boiler
performance,
in some cases
the cost and
energy
requirement of
thermal drying
make it more
economical to
fire
mechanically
dried sewage
sludge with a
high water
content
Applicability may be
limited by insufficient
recoverable heat from
the process, by the
required combustion
conditions, or by the
waste moisture
content
Waste with
a high
moisture
content can
be used
once dried
Solar drying
of sewage
sludge
See WT
BREF
Maintains the
good
performance of
the boiler
High operational
experience
Tendency to
generate
odorous
emissions
Applicability may be
limited by space
availability
Reduction
of overall
energy
requirement
of the plant
Pyrolysis
Pretreatment
by pyrolysis
can ensure
an adequate
burnout in
the boiler,
due to the
short
residence
time of the
fuel in the
furnace
The impact of
the waste on
the
performance of
the boiler is
diminished
Limited
operational
experience
Additional
energy is
needed for the
pyrolysis
reactor
Generally
applicable
Applicabil
ity may
depend on
the design
of the
main
boiler
Pyrolysis
can be an
attractive
option for
waste that
cannot be
ground in a
solid fuel
mill to the
required
dimensions
for co-
combustion
in a
pulverised
solid-fuel-
fired
combustion
plant.
A large
variety of
waste can
be used
WORKIN
G DRAFT IN
PROGRESS

Chapter 9
TL/JFF/FN/EIPPCB/LCP_Final Draft June 2016 721
Technique Description
Achieved
environmental
benefit
Environmental
performance
and operational
data
Cross-media
effects
Technical
considerations
relevant to
applicability
Driving
force for
implement
ation New
plants
Existing
plants
Anaerobic
digestion
The waste
needs to be
biodegradabl
e. The
reactor
operates at
low
temperatures
with almost
no corrosion.
See also WT
BREF
Methanisation
of waste has
several
advantages, as
the products are
easily fitted
into the boiler
High operational
experience NA Generally applicable
A large
variety of
waste can
be used.
The
technique is
well suited
for waste
with a high
water
content
Gasification
See Chapter
4.
See also WI
BREF
NA
Limited
operational
experience
NA Generally
applicable
Applicabil
ity may
depend on
the design
of the
main
boiler
Large
quantities of
waste with
high
concentratio
ns of metals
(e.g. Hg)
can be co-
combusted
after
gasification
and
cleaning of
the syngas
NB:
NA: No relevant specific information available.
9.3.3 Techniques to introduce waste into the combustion process
Table 9.9 summarises the general techniques to be considered in the determination of BAT for
the introduction of waste into the combustion process.
WORKIN
G DRAFT IN
PROGRESS

Chapter 9
722 June 2016 TL/JFF/FN/EIPPCB/LCP_Final Draft
Table 9.9: General techniques to introduce waste into the combustion process
Technique Description
Achieved
environmen
tal benefits
Environmental
performance
and
operational
data
Cross-
media
effects
Technical
considerations
relevant to
applicability
Eco
no
mic
s
Example
plants
New
plants
Existing
plants
Mixing with
the main
fuel
A
heterogeneou
s or poorly
mixed fuel
stream or an
uneven
distribution
may
influence the
ignition and
combustion
in the boiler,
and thus has
to be
prevented
Maintains
stable
combustion
conditions
High
operational
experience
None
Mixing is only possible
when the grinding
behaviour of the main
fuel and waste is more
or less the same or
when the amount of
waste is very small
compared to the main
fuel flow
Plant-
specific
Plants 121,
142
Feeding of
main fuel
and waste
together
NA
Good
performance
of the
fluidised bed
boiler
NA None Generally
applicable
Generally
applicable NA NA
NB:
NA: No relevant specific information available.
9.3.4 Techniques for the prevention and control of emissions to air from waste co-incineration in LCPs
Techniques that have been considered in the determination of BAT within the fuel-specific
chapters are to be considered when waste is co-incinerated. However, waste co-incineration can
lead to the following effects:
a change in the flue-gas volume and composition, with consequences for the heat transfer
and flue-gas cleaning systems (e.g. deactivation of the SCR catalyst by As, P, F and alkali
metals), and interference with FGD systems;
good and even combustion conditions have to be enabled (including flame stability, flame
temperature, formation of an oxidative atmosphere at the surfaces of the boiler, and
prevention of the formation of ‘strands’);
emissions to air (especially emissions of Hg, metals, dioxins and furans, HCl, HF, unburnt
carbon, and CO) may be increased.
In addition to the aforementioned techniques, Table 9.10 and Table 9.11 summarise the general
and more specific techniques to consider in the determination of BAT for the prevention and
reduction of emissions to air from waste co-incineration in combustion plants.
More details on environmental performance and operational data related to emissions to air
from European combustion plants co-incinerating waste and applying the techniques listed in
these tables are given after the tables.
WORKIN
G DRAFT IN
PROGRESS

Chapter 9
TL/JFF/FN/EIPPCB/LCP_Final Draft June 2016 723
Table 9.10: General techniques for the prevention and control of emissions to air from waste co-incineration in combustion plants
Technique Description Achieved
environmental benefits
Environmental
performance and
operational data
Technical considerations relevant to
applicability Economics
Dust
ESP See Section 3.2.2.1.1 Reduction of dust and
metals High operational experience Generally applicable Plant-specific
Bag filter See Section 3.2.2.1.2 Reduction of dust and
metals High operational experience Generally applicable Plant-specific
SOX
Wet, semi-dry or dry FGD
techniques See Section 3.2.2.2
Reduction of SOX, HCl,
HF, dust and metals High operational experience
See main fuel-specific chapters for
further details on the applicability of
each technique
Plant-specific
NOX
Combination of primary and/or
secondary techniques See Section 3.2.2.3 Reduction of NOX High operational experience
See main fuel-specific chapters for
further details on the applicability of
each technique
Plant-specific
Metals and others such as VOCs and dioxins
Metal separator in the feeding line See Section 3.2.2.5.5 Reduction of metals in
air, water and residues High operational experience Generally applicable Plant-specific
ESP or bag filter, wet, semi-dry or
dry FGD techniques and, as an
additional option, the injection of
activated carbon and/or halideated
additives
See Section 3.2.2.5
Reduction of SOX, HCl,
HF, dust and metals (in
particular Hg), as well as
VOCs and dioxins
High operational experience
See main fuel-specific chapters for
further details on the applicability of
each technique
Plant-specific
Selective catalytic reduction
(SCR)
SCR usually requires a
bigger, multi-layer catalyst
than for just the DeNOX
function.
See also Section 3.2.2.3.11
Reduction of gaseous
PCDD/F (not
particulate-bound)
NA
See main fuel-specific chapters for
further details on the applicability of
each technique
NA
Wet scrubber
The wet scrubber enables the
quick cooling of the flue-
gases from their combustion
temperature to below 100 °C,
limiting the generation of
dioxins when the flue-gas
cools down.
Reduction of PCDD/F NA
See main fuel-specific chapters for
further details on the applicability of
each technique
NA
WORKIN
G DRAFT IN
PROGRESS

Chapter 9
724 June 2016 TL/JFF/FN/EIPPCB/LCP_Final Draft
See also Section 3.2.2.1.4
NB:
NA: No relevant specific information available.
WORKIN
G DRAFT IN
PROGRESS

Chapter 9
TL/JFF/FN/EIPPCB/LCP_Final Draft June 2016 725
Table 9.11: Specific techniques for the prevention and control of emissions to air from waste co-incineration in combustion plants
Technique Description
Achieved
environmental
benefits
Environmental
performance and
operational data
Cross-media
effects
Technical considerations
relevant to applicability Economics Driving force for
implementation New plants Existing plants
Careful selection of
the waste for co-
incineration
Exact knowledge of waste's
origin, physico-chemical
parameters and hazardous
potential. Wastes are
analysed periodically to
check their quality for co-
incineration. The
comprehensive analysis of
waste on delivery can
include: name and address of
the deliverer, mass, owner
and origin of the waste, water
and ash content, calorific
value, contents of chlorides,
fluorides, sulphur and metals
Better knowledge of
the waste helps to
avoid unexpected
peaks of pollutants
and avoids damaging
the boiler due to
corrosion
High operational
experience None
Generally
applicable
Generally
applicable
Plant-
specific NA
Limitation of the
percentage of waste
that is co-incinerated
NA
Limitation of
additional
environmental
impact
High operational
experience None
Generally
applicable
Generally
applicable
Plant-
specific NA
Gasification See Chapter 4.
See also WI BREF NA
Limited operational
experience NA
Generally
applicable
Applicability
may depend on
the design of the
main boiler
Plant-
specific
Large quantities of
waste with high
metal
concentrations
(including Hg) can
be co-combusted
after gasification
and cleaning of the
gas produced
NB:
NA: No relevant specific information available.
WORKIN
G DRAFT IN
PROGRESS

Chapter 9
726 June 2016 TL/JFF/FN/EIPPCB/LCP_Final Draft
Environmental performance and operational data: emissions to air from combustion
plants applying the general techniques listed in Table 9.10 and Table 9.11
Plants co-incinerating waste are globally divided into two groups, depending on the combustion
fuel of reference:
a. Coal- and/or lignite-fired combustion plants co-incinerating waste
Based on data collected at plant level across the EU for 2010, achieved emission levels for NOX,
SOX, HCl, HF, dust and mercury, as well as energy efficiencies of coal- and/or lignite-fired
plants co-incinerating waste are reported in Section 5.1 together with the emissions of plants
that fire the same main fuels without any co-incineration. In the following paragraphs,
additional contextual information is presented, to highlight the possible influence of waste co-
incineration on the achieved emission levels. As this BREF assesses energy efficiency based on
design values, it is not possible to provide further relevant plant-level analysis to characterise
the influence of waste co-incineration on energy efficiency. Additional graphs are presented for
emissions of metals (Sb+As+Pb+Cr+Co+Cu+Mn+Ni+V, and Cd+Tl), TVOC and PCDD/F
from coal- and/or lignite-fired plants including plants co-incinerating waste.
SO2 emissions
Figure 5.32 shows SO2 emission levels achieved in well-performing plants of more than
300 MWth combusting coal and/or non-indigenous lignite. Of the plants shown in the graph,
Plant 123 and Plant 662 burn 0.1 % and 0.2 % sewage sludge respectively; Plants 211 and 212
burn 2 % animal flour, 2 % residues of vegetable food processing and 2 % sawdust; Plant 146
burns 6 % liquid waste and 2 % solid waste; Plant 219 burns 2 % RDF; Plant 142 burns 4 %
commercial and municipal solid waste. Of the indigenous lignite-fired plants of Figure 5.33,
around half co-incinerate waste to a degree comprised between 2 % and 3 %. All these plants,
like the other plants in the tables, are fitted with wet FGD systems and achieve SO2 emission
levels in the same range.
HCl and HF emissions
Figure 5.34 shows HCl emission levels achieved in well-performing coal- and/or lignite-fired
plants of more than 100 MWth. Table 9.12 summarises the degree of co-incineration in those
plants, and their performance in terms of HCl emissions.
Table 9.12 shows that coal- and/or lignite-fired plants co-incinerating waste achieve annual
average HCl emissions in the same range as plants that do not co-incinerate waste. However,
waste co-incineration may be associated with peaks in the short-term emission levels, shown as
the 'upper range' in the table. Plants 211V and 212V (420–435 MWth), for instance, achieve
yearly average HCl levels below 0.5 mg/Nm3, but with short-term peaks of 94 mg/Nm
3 and
46 mg/Nm3. Both plants are PC boilers firing coal with an average chlorine content of 73 mg/kg
and 6 % waste, averaging between around 1000 mg/kg and 5000 mg/kg of chlorine, which may
explain the occurrence of HCl emission peaks. Plant 17V, the best performing plant reported,
does not co-incinerate waste but burns coal with an average chlorine content of 60 mg/kg with a
small share of biomass with about 950 mg/kg of chlorine.
WORKIN
G DRAFT IN
PROGRESS

Chapter 9
TL/JFF/FN/EIPPCB/LCP_Final Draft June 2016 727
Table 9.12: Co-incineration degree and achieved HCl emissions in well-performing coal- and/or
lignite-fired plants of more than 100 MWth (see Figure 5.34)
Plant
code
Co-
incineration
degree
(by thermal
input)
HCl
yearly
average
(mg/Nm3)
HCl
higher
end of
range1
(mg/Nm3)
Plant
code
Co-
incineration
degree (by
thermal
input)
HCl
yearly
average
(mg/Nm3)
HCl
higher
end of
range1
(mg/Nm3)
17V - 0.12 38.7
77V - 1.20 NA
221VC - 0.23 0.3
441-1V - 1.33 NA
23V - 0.29 NA
367V - 1.35 4.8
212V 6 % 0.30 94.0
117-1VC 3 % 1.35 3.4
415-2V - 0.37 0.7
478-2 - 1.40 2.9
690 - 0.4 NA
25-1V - 1.5 NA
415-1V - 0.42 0.8
390-6V - 1.56 NA
124bV
C - 0.50 0.7
390-1V - 1.60 NA
211V 6 % 0.50 46.0
390-2V - 1.67 NA
141V - 0.50 NA
390-5V - 1.92 NA
101V - 0.52 NA
224V - 1.97 NA
34V - 0.57 NA
662V 0.20 % 2.00 3.0
146V 6 % 0.60 NA
286V - 2.2 NA
213V - 0.7 NA
132VC - 2.17 NA
117-
2VC 3 % 0.70 0.8
390-3V - 2.19 NA
253V - 0.76 1.0
197VC - 2.23 3.6
128-
3VC 2 % 0.80 1.2
478-1 - 2.27 2.3
128-
4VC 2 % 0.80 1.2
442V - 2.52 29.7
123VC 0.10 % 0.85 4.6
479V - 2.88 NA
689 - 0.9 NA
131V - 3.05 7.5
547V - 0.89 1.1
390-4V - 3.10 NA
121VC 1 % 1.00 NA
368V - 3.20 23.0
128-
1VC 3 % 1.00 1.7
198VC - 3.24 4.3
127-
2VC 2 % 1.00 1.7
441-2V - 3.67 NA
128-
2VC 3 % 1.00 1.7
391V - 3.88 NA
127-
1VC 2 % 1.00 1.7
219VC 2 % 4.20 23.8
69V - 1.00 NA
388NV - 4.46 NA
223V - 1.15 NA
18-2V - 4.77 NA
(1) The higher end of the range corresponds to the yearly maximum of hourly averages or maximum of the samples
obtained over the year
Source: [TWG data collection 2012]
Figure 5.35 shows HF emission levels achieved in well-performing coal- and/or lignite-fired
plants of more than 100 MWth. Table 9.17 summarises the degree of co-incineration in those
plants, and their performance in terms of HF emissions. Although the same considerations as for
HCl are in principle valid, in most cases the fluorine content of the waste burnt in the plants
included in the table is not significantly higher than in the main fuel, and the achieved HF
emission levels are similar in plants that do co-incinerate waste and in those that do not.
WORKIN
G DRAFT IN
PROGRESS
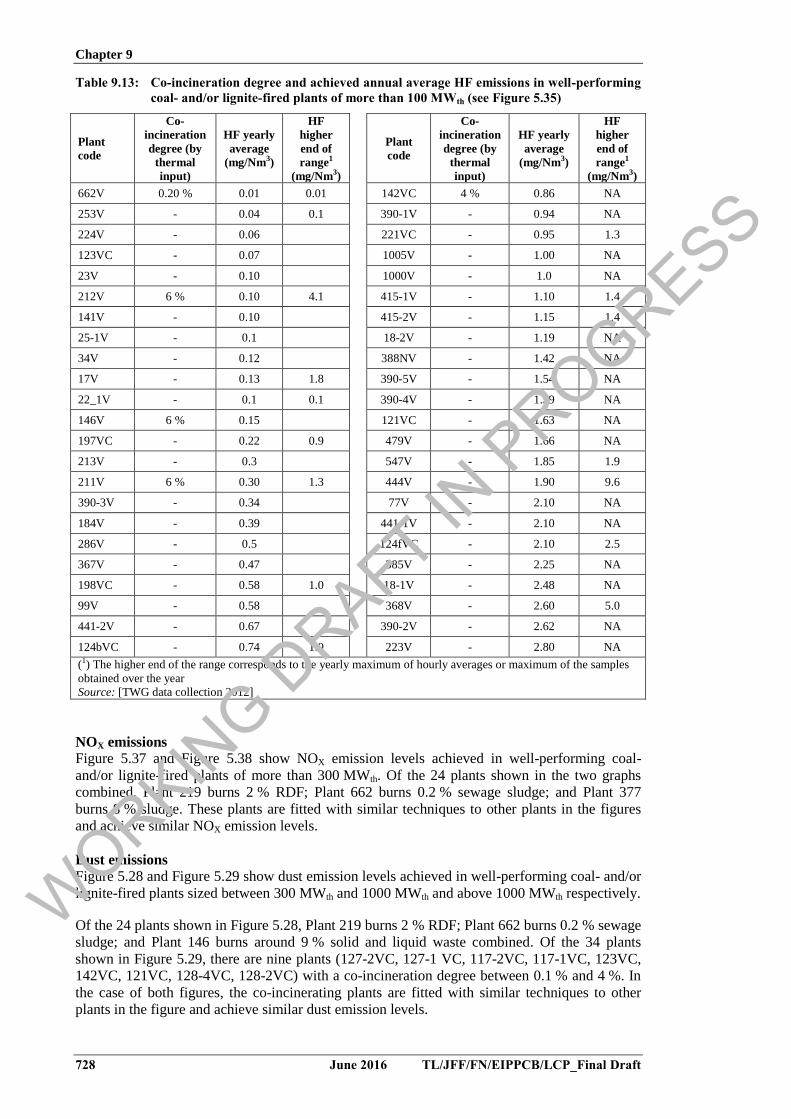
Chapter 9
728 June 2016 TL/JFF/FN/EIPPCB/LCP_Final Draft
Table 9.13: Co-incineration degree and achieved annual average HF emissions in well-performing
coal- and/or lignite-fired plants of more than 100 MWth (see Figure 5.35)
Plant
code
Co-
incineration
degree (by
thermal
input)
HF yearly
average
(mg/Nm3)
HF
higher
end of
range1
(mg/Nm3)
Plant
code
Co-
incineration
degree (by
thermal
input)
HF yearly
average
(mg/Nm3)
HF
higher
end of
range1
(mg/Nm3)
662V 0.20 % 0.01 0.01
142VC 4 % 0.86 NA
253V - 0.04 0.1
390-1V - 0.94 NA
224V - 0.06
221VC - 0.95 1.3
123VC - 0.07
1005V - 1.00 NA
23V - 0.10
1000V - 1.0 NA
212V 6 % 0.10 4.1
415-1V - 1.10 1.4
141V - 0.10
415-2V - 1.15 1.4
25-1V - 0.1
18-2V - 1.19 NA
34V - 0.12
388NV - 1.42 NA
17V - 0.13 1.8
390-5V - 1.54 NA
22_1V - 0.1 0.1
390-4V - 1.59 NA
146V 6 % 0.15
121VC - 1.63 NA
197VC - 0.22 0.9
479V - 1.66 NA
213V - 0.3
547V - 1.85 1.9
211V 6 % 0.30 1.3
444V - 1.90 9.6
390-3V - 0.34
77V - 2.10 NA
184V - 0.39
441-1V - 2.10 NA
286V - 0.5
124fVC - 2.10 2.5
367V - 0.47
385V - 2.25 NA
198VC - 0.58 1.0
18-1V - 2.48 NA
99V - 0.58
368V - 2.60 5.0
441-2V - 0.67
390-2V - 2.62 NA
124bVC - 0.74 1.0
223V - 2.80 NA
(1) The higher end of the range corresponds to the yearly maximum of hourly averages or maximum of the samples
obtained over the year
Source: [TWG data collection 2012]
NOX emissions
Figure 5.37 and Figure 5.38 show NOX emission levels achieved in well-performing coal-
and/or lignite-fired plants of more than 300 MWth. Of the 24 plants shown in the two graphs
combined, Plant 219 burns 2 % RDF; Plant 662 burns 0.2 % sewage sludge; and Plant 377
burns 8 % sludge. These plants are fitted with similar techniques to other plants in the figures
and achieve similar NOX emission levels.
Dust emissions
Figure 5.28 and Figure 5.29 show dust emission levels achieved in well-performing coal- and/or
lignite-fired plants sized between 300 MWth and 1000 MWth and above 1000 MWth respectively.
Of the 24 plants shown in Figure 5.28, Plant 219 burns 2 % RDF; Plant 662 burns 0.2 % sewage
sludge; and Plant 146 burns around 9 % solid and liquid waste combined. Of the 34 plants
shown in Figure 5.29, there are nine plants (127-2VC, 127-1 VC, 117-2VC, 117-1VC, 123VC,
142VC, 121VC, 128-4VC, 128-2VC) with a co-incineration degree between 0.1 % and 4 %. In
the case of both figures, the co-incinerating plants are fitted with similar techniques to other
plants in the figure and achieve similar dust emission levels.
WORKIN
G DRAFT IN
PROGRESS
Chapter 9
TL/JFF/FN/EIPPCB/LCP_Final Draft June 2016 729
Mercury emissions
Figure 5.30 and Figure 5.31 show mercury emission levels achieved in well-performing coal-
and lignite-fired plants respectively.
Of the 52 plants shown in Figure 5.30, there are 12 plants (211V, 156V, 462V, 662V, 81V,
219VC, 212V, 121VC, 142VC, 123VC, 146V, 377V) with a co-incineration degree between
0.1 % and 37 %. None of the plants are fitted with dedicated techniques to remove mercury in
addition to general techniques to remove NOX, SOX, dust and associated pollutants. The
mercury emission levels achieved by the co-incinerating plants are in the same range as those of
other plants, although in the majority of cases the data did not reveal how much of the mercury
input is associated to the coal and to the waste.
Of the 23 plants shown in Figure 5.31, there are six plants (127-2VC, 127-1VC, 128-4VC, 128-
1VC, 128-3VC, 128-2VC) with a waste co-incineration degree between 1.5 % and 3 %. None of
the plants are fitted with dedicated techniques to remove mercury in addition to general
techniques to remove SOX, dust and associated pollutants. Although the mercury emission
levels achieved by the co-incinerating plants are generally on the high side of the range shown
in the figure, the levels reported are in the same range as those of similar plants that do not co-
incinerate waste. This is the case, for instance, for Plants 129-1VC and 129-2VC, which are
technically identical to Plants 128-1VC to 128-4VC (1525 MWth pulverised lignite-fired DBB
fitted with wet FGD and an ESP) but do not co-incinerate waste, and which report the same
mercury emission levels.
Particle-bound metal emissions
Figure 9.3 and Figure 9.4 show metal emission levels achieved in well-performing coal- and/or
lignite-fired combustion plants of > 300 MWth. The reported plants are sized between 380 MWth
and 2500 MWth, operated between 4300 h/yr and 8700 h/yr, with an equivalent full load factor
above 56 %. Two thirds of these plants (15 out of 22 in Figure 9.3 and 11 out of 17 in Figure
9.4) co-incinerate waste with degrees between 0.1 % and 6 % (LHV basis). In particular, Plants
128-1VC to 128-4VC co-incinerate between 2 % and 3 % solid waste with an average metal
content of 1400 mg/kg and achieve average emissions of Sb+As+Pb+Cr+Co+Cu+Mn+Ni+V
below 0.04 mg/Nm3 as an average of samples over the year with low dispersion (below 0.05
mg/Nm3
as a yearly maximum). In other cases, waste co-incineration is shown to be associated
with larger short-term variations, as in Plants 117-1V and 117-2V which co-incinerate 3 %
sewage sludge with an average metal content of 1900 mg/kg. Plants 211V and 212V also co-
incinerate up to 6 % solid waste. All report Cd+Tl emissions below 0.006 mg/Nm3 as an
average of samples over the year and below 0.0075 mg/Nm3 as a maximum.
All these plants were commissioned between 1965 and 2010 and monitor their metal emissions
periodically (from twice a year to nine times a year, except Plant 146V which reported one
measurement only). They have yearly average dust emission levels between 1 mg/Nm3
and
12 mg/Nm3.
Only a few well-performing coal- and/or lignite-fired plants sized below 300 MWth reported a
significant waste co-incineration degree. Among those, the maximum reported Cd+Tl emission
level over the sampling period is around 0.011 mg/Nm3.
WORKIN
G DRAFT IN
PROGRESS

Chapter 9
730 June 2016 TL/JFF/FN/EIPPCB/LCP_Final Draft
NB: reported emissions are expressed as averages over the year
Source: [TWG data collection 2012]
Figure 9.3: Sb+As+Pb+Cr+Co+Cu+Mn+Ni+V emissions from well-performing coal- and/or
lignite-fired plants of more than 300 MWth, including plants co-incinerating waste
WORKIN
G DRAFT IN
PROGRESS

Chapter 9
TL/JFF/FN/EIPPCB/LCP_Final Draft June 2016 731
NB: reported emissions are expressed as averages over the year
Source: [TWG data collection 2012]
Figure 9.4: Cd+Tl emissions from well-performing coal- and lignite-fired plants of more than
300 MWth, including plants co-incinerating waste (averages over the year)
TVOC emissions
Figure 9.5 shows TVOC emission levels achieved in well-performing coal- and/or lignite-fired
combustion plants sized between 74 MWth and 2500 MWth, operated between 4000 h/yr and
8700 h/yr, with an equivalent full load factor above 56 % with the exception of Plant 224V
which reported an equivalent full load factor of 25 %. Half of these plants (16 out of 31) co-
incinerate waste with degrees between 0.1 % and 37 % (LHV basis). All report TVOC
emissions below 5 mg/Nm3 as a yearly average or average of samples over the year. In most
cases, the short-term maxima achieved by these plants are well within 10 mg/Nm3. Plants 17V,
212V and 219VC report maxima above 10 mg/Nm3
and up to 17 mg/Nm3 as a maximum half-
hourly average over the year. Of those, Plants 212V and 219 VC co-incinerate 6 % and 2 %
waste respectively.
All these plants were commissioned between 1964 and 2006 and monitor their TVOC emissions
continuously or periodically (from once a year to nine times a year).
WORKIN
G DRAFT IN
PROGRESS
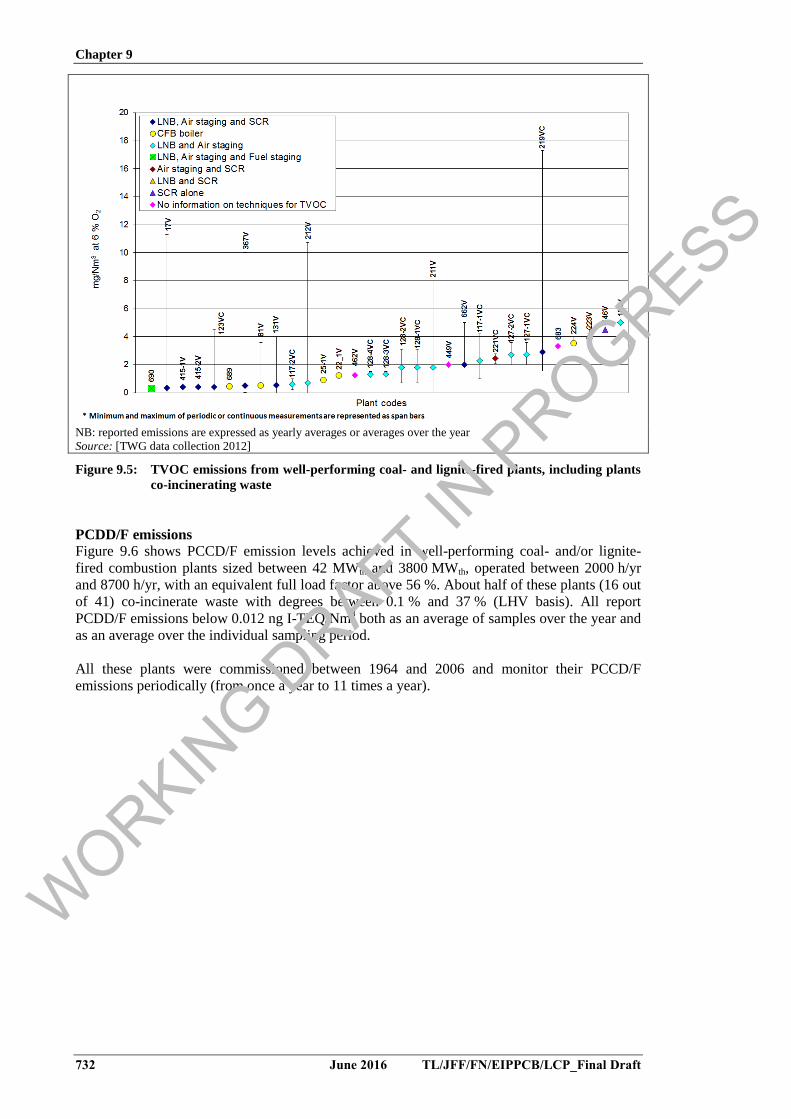
Chapter 9
732 June 2016 TL/JFF/FN/EIPPCB/LCP_Final Draft
NB: reported emissions are expressed as yearly averages or averages over the year
Source: [TWG data collection 2012]
Figure 9.5: TVOC emissions from well-performing coal- and lignite-fired plants, including plants
co-incinerating waste
PCDD/F emissions
Figure 9.6 shows PCCD/F emission levels achieved in well-performing coal- and/or lignite-
fired combustion plants sized between 42 MWth and 3800 MWth, operated between 2000 h/yr
and 8700 h/yr, with an equivalent full load factor above 56 %. About half of these plants (16 out
of 41) co-incinerate waste with degrees between 0.1 % and 37 % (LHV basis). All report
PCDD/F emissions below 0.012 ng I-TEQ/Nm3 both as an average of samples over the year and
as an average over the individual sampling period.
All these plants were commissioned between 1964 and 2006 and monitor their PCCD/F
emissions periodically (from once a year to 11 times a year).
WORKIN
GDRAFT IN
PROGRESS
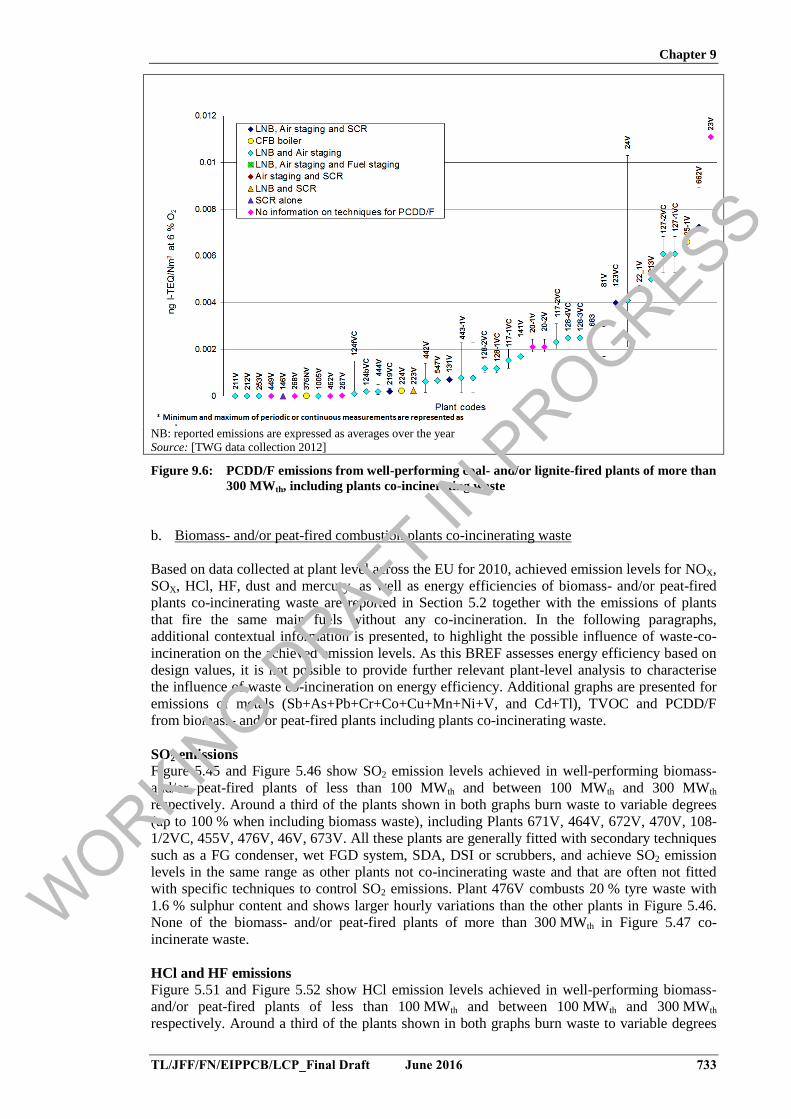
Chapter 9
TL/JFF/FN/EIPPCB/LCP_Final Draft June 2016 733
NB: reported emissions are expressed as averages over the year
Source: [TWG data collection 2012]
Figure 9.6: PCDD/F emissions from well-performing coal- and/or lignite-fired plants of more than
300 MWth, including plants co-incinerating waste
b. Biomass- and/or peat-fired combustion plants co-incinerating waste
Based on data collected at plant level across the EU for 2010, achieved emission levels for NOX,
SOX, HCl, HF, dust and mercury, as well as energy efficiencies of biomass- and/or peat-fired
plants co-incinerating waste are reported in Section 5.2 together with the emissions of plants
that fire the same main fuels without any co-incineration. In the following paragraphs,
additional contextual information is presented, to highlight the possible influence of waste-co-
incineration on the achieved emission levels. As this BREF assesses energy efficiency based on
design values, it is not possible to provide further relevant plant-level analysis to characterise
the influence of waste co-incineration on energy efficiency. Additional graphs are presented for
emissions of metals (Sb+As+Pb+Cr+Co+Cu+Mn+Ni+V, and Cd+Tl), TVOC and PCDD/F
from biomass- and/or peat-fired plants including plants co-incinerating waste.
SO2 emissions
Figure 5.45 and Figure 5.46 show SO2 emission levels achieved in well-performing biomass-
and/or peat-fired plants of less than 100 MWth and between 100 MWth and 300 MWth
respectively. Around a third of the plants shown in both graphs burn waste to variable degrees
(up to 100 % when including biomass waste), including Plants 671V, 464V, 672V, 470V, 108-
1/2VC, 455V, 476V, 46V, 673V. All these plants are generally fitted with secondary techniques
such as a FG condenser, wet FGD system, SDA, DSI or scrubbers, and achieve SO2 emission
levels in the same range as other plants not co-incinerating waste and that are often not fitted
with specific techniques to control SO2 emissions. Plant 476V combusts 20 % tyre waste with
1.6 % sulphur content and shows larger hourly variations than the other plants in Figure 5.46.
None of the biomass- and/or peat-fired plants of more than 300 MWth in Figure 5.47 co-
incinerate waste.
HCl and HF emissions
Figure 5.51 and Figure 5.52 show HCl emission levels achieved in well-performing biomass-
and/or peat-fired plants of less than 100 MWth and between 100 MWth and 300 MWth
respectively. Around a third of the plants shown in both graphs burn waste to variable degrees
WORKIN
GDRAFT IN
PROGRESS

Chapter 9
734 June 2016 TL/JFF/FN/EIPPCB/LCP_Final Draft
(up to 100 % when including biomass waste), including Plants 672V, 470V, 464V, 489-3, 108-
1/2VC, 667V, 476V. Generally, these plants are more often fitted with secondary abatement
techniques targeting HCl than other plants shown in the same graphs, and achieve HCl emission
levels in the same range as other plants that do not co-incinerate waste. None of the biomass-
and/or peat-fired plants of more than 300 MWth of the [TWG data collection 2012] co-incinerate
waste.
Figure 5.53 and Figure 5.54 show HF emission levels achieved in well-performing biomass-
and/or peat-fired plants of less than 100 MWth and between 100 and 300 MWth respectively.
Only a few of the plants shown in both graphs burn waste, including Plants 470V (burning 25 %
solid waste of animal origin) and 46V (burning 8 % SRF). These plants are generally fitted with
secondary abatement techniques and achieve yearly average HF emission levels in the same
range as other plants that do not co-incinerate waste, albeit with relatively high short-term
variations. None of the biomass- and/or peat-fired plants of more than 300 MWth of the [TWG
data collection 2012] co-incinerate waste.
NOX emissions
Figure 5.45 and Figure 5.46 show NOX emission levels achieved in well-performing biomass-
and/or peat-fired plants of less than 100 MWth and between 100 MWth and 300 MWth
respectively. Around a third of the plants shown in both graphs burn waste to variable degrees
(up to 100 % when including biomass waste), including Plants 470, 464V, 672, 671, 655VC,
108-1VC, 455, 476V, 674, 667, 673, 678. The plants in these graphs are mostly fitted with
primary techniques and/or SNCR, and while plants fitted with secondary abatement techniques
mostly achieve lower emission levels than plants fitted with primary techniques only, no clear
correlation can be derived between NOX levels and the degree of waste co-incineration. None of
the biomass- and/or peat-fired plants of more than 300 MWth in Figure 5.47 co-incinerate waste.
Dust emissions
Figure 5.55 and Figure 5.56 show dust emission levels achieved in well-performing biomass-
and/or peat-fired plants of less than 100 MWth and between 100 and 300 MWth respectively.
Around a third of the plants shown in both graphs burn waste to variable degrees (up to 100 %
when including biomass waste), including Plants 672, 671, 108-2VC, 489-3V, 464V, 655VC,
455, 667, 476V, 678, 46V. In the case of both graphs, the co-incinerating plants are fitted with
similar techniques to other plants in the figures and achieve similar dust emission levels. None
of the biomass- and/or peat-fired plants of more than 300 MWth in Figure 5.57 co-incinerate
waste.
Mercury emissions
Figure 5.58 shows mercury emission levels achieved in well-performing biomass- and/or peat-
fired plants. Around half of the 22 plants shown (46V, 476V, 464V, 655VC, 667, 470V, 671,
455V, 672) co-incinerate waste with degrees up to 100 % when including biomass waste. A
third of these plants (46V, 655VC, 470V) are fitted with activated carbon injection together with
a bag filter. Most of these plants monitor their emissions periodically (from once a year to 16
times a year), with three plants monitoring mercury continuously. All achieve mercury emission
levels within 4 µg/Nm3 as an average of samples over the year or a yearly average, and within
5 µg/Nm3 as an average over the sampling period or as a 95
th percentile of short-term averages
in the case of continuous monitoring.
Particle-bound metal emissions
Figure 9.7 and Figure 9.8 show metal emissions levels achieved in well-performing biomass-
and/or peat-fired combustion plants sized between 50 MWth and 365 MWth, operated between
4600 h/yr and 8500 h/yr, with an equivalent full load factor above 44 %. A third of these plants
(Plants 667, 671, 476V, 489-3V, 455V, 72V, 655VC, 470V) co-incinerate waste with degrees
between 2 % and 100 % when including biomass waste.
All these plants report Sb+As+Pb+Cr+Co+Cu+Mn+Ni+V emissions below 0.3 mg/Nm3 and
Cd+Tl emissions below 0.003 mg/Nm3 as an average of samples over the year. Regarding
WORKIN
GDRAFT IN
PROGRESS

Chapter 9
TL/JFF/FN/EIPPCB/LCP_Final Draft June 2016 735
emission variations, some of the plants co-incinerating waste show yearly maxima, either of
Sb+As+Pb+Cr+Co+Cu+Mn+Ni+V or of Cd+Tl, several times higher than their average. This is
the case, for instance, for Plant 455V which co-incinerates 8 % reclaimed wood with a metal
content around 600 mg/kg, and 489-3V which co-incinerates 55 % solid waste.
All these plants monitor their metal emissions periodically (from once a year to 16 times a
year).
NB: reported emissions are expressed as averages over the year
Source: [TWG data collection 2012]
Figure 9.7: Sb+As+Pb+Cr+Co+Cu+Mn+Ni+V emissions from well-performing biomass- and/or
peat-fired plants, including plants co-incinerating waste
WORKIN
GDRAFT IN
PROGRESS
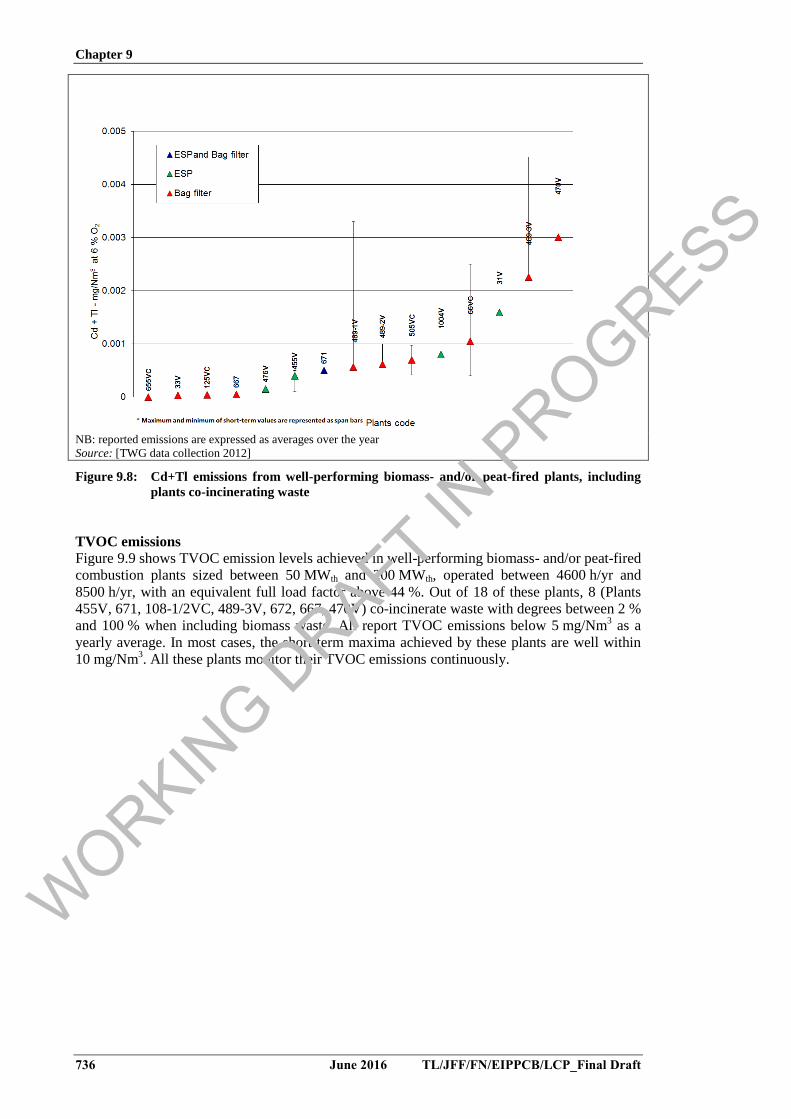
Chapter 9
736 June 2016 TL/JFF/FN/EIPPCB/LCP_Final Draft
NB: reported emissions are expressed as averages over the year
Source: [TWG data collection 2012]
Figure 9.8: Cd+Tl emissions from well-performing biomass- and/or peat-fired plants, including
plants co-incinerating waste
TVOC emissions
Figure 9.9 shows TVOC emission levels achieved in well-performing biomass- and/or peat-fired
combustion plants sized between 50 MWth and 200 MWth, operated between 4600 h/yr and
8500 h/yr, with an equivalent full load factor above 44 %. Out of 18 of these plants, 8 (Plants
455V, 671, 108-1/2VC, 489-3V, 672, 667, 470V) co-incinerate waste with degrees between 2 %
and 100 % when including biomass waste. All report TVOC emissions below 5 mg/Nm3 as a
yearly average. In most cases, the short-term maxima achieved by these plants are well within
10 mg/Nm3. All these plants monitor their TVOC emissions continuously.
WORKIN
GDRAFT IN
PROGRESS
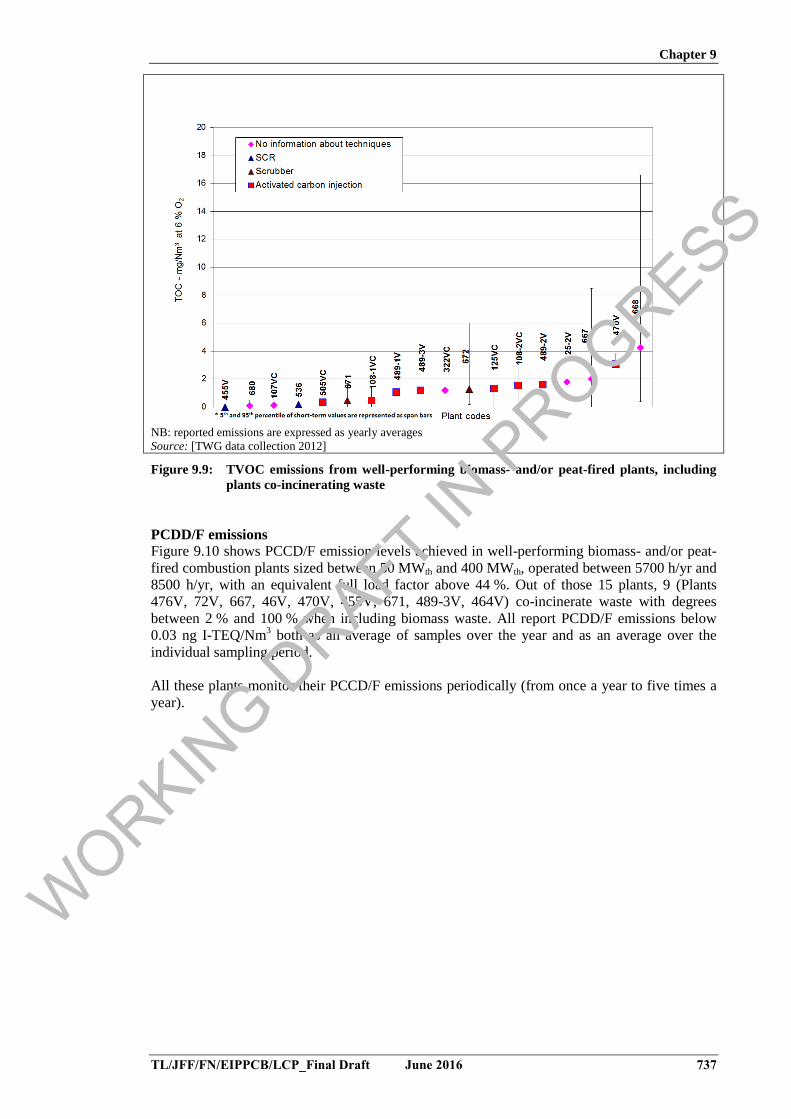
Chapter 9
TL/JFF/FN/EIPPCB/LCP_Final Draft June 2016 737
NB: reported emissions are expressed as yearly averages
Source: [TWG data collection 2012]
Figure 9.9: TVOC emissions from well-performing biomass- and/or peat-fired plants, including
plants co-incinerating waste
PCDD/F emissions
Figure 9.10 shows PCCD/F emission levels achieved in well-performing biomass- and/or peat-
fired combustion plants sized between 50 MWth and 400 MWth, operated between 5700 h/yr and
8500 h/yr, with an equivalent full load factor above 44 %. Out of those 15 plants, 9 (Plants
476V, 72V, 667, 46V, 470V, 455V, 671, 489-3V, 464V) co-incinerate waste with degrees
between 2 % and 100 % when including biomass waste. All report PCDD/F emissions below
0.03 ng I-TEQ/Nm3 both as an average of samples over the year and as an average over the
individual sampling period.
All these plants monitor their PCCD/F emissions periodically (from once a year to five times a
year).
WORKIN
GDRAFT IN
PROGRESS

Chapter 9
738 June 2016 TL/JFF/FN/EIPPCB/LCP_Final Draft
NB: reported emissions are expressed as averages over the year
Source: [TWG data collection 2012]
Figure 9.10: PCDD/F emissions from well-performing biomass- and/or peat-fired plants, including
plants co-incinerating waste
9.3.5 Techniques to reduce the impact of waste co-incineration on the residues generated
Table 9.14 summarises the general techniques to be considered in the determination of BAT for
minimising the impact of waste co-incineration on the residues generated.
Table 9.14: General techniques to reduce the impact of waste co-incineration on the residues
generated
Technique Description
Achieved
environmental
benefits
Environment
al
performance
and
operational
data
Technical considerations
relevant to applicability
New and existing plants
Waste pretreatment Maintain the quality
of gypsum, ashes and
slag at the same level
as that occurring
without waste co-
incineration
Limit the impact
of waste co-
incineration on
possible
valorisation of
residues
High
operational
experience
Generally applicable Limitation of the amount
of waste to be co-
incinerated
Combustion process
adaptation to the co-
incinerated waste
Careful handling and
transport of fly and bottom
ashes
Careful handling and
transport of fly and
bottom ashes
produced by the
process and disposed
of to land on or off
site
Prevention of
spillage, dust
release or the
generation of
odours
High
operational
experience
Generally applicable
WORKIN
GDRAFT IN
PROGRESS

Chapter 10
TL/JFF/FN/EIPPCB/LCP_Final Draft June 2016 739
10 BEST AVAILABLE TECHNIQUES (BAT) CONCLUSIONS
Numbering of BATs and Tables
For reasons of transparency, BATs, tables, and all footnotes included in the tables are
numbered according to the order of the draft document consulted with the Technical
Working Group.
In the final document, where the text indicates that a BAT or table is removed, the
corresponding text will be deleted and the BATs and tables reordered sequentially.
Footnotes will also be reordered.
Scope
These BAT conclusions concern the following activities specified in Annex I to
Directive 2010/75/EU:
1.1: Combustion of fuels in installations with a total rated thermal input of 50 MW
or more, only when this activity takes place in combustion plants with a total rated
thermal input of 50 MW or more.
1.4: Gasification of coal or other fuels in installations with a total rated thermal
input of 20 MW or more, only when this activity is directly associated to a
combustion process.
5.2: Disposal or recovery of waste in waste co-incineration plants for non-
hazardous waste with a capacity exceeding 3 tonnes per hour or for hazardous waste
with a capacity exceeding 10 tonnes per day, only when this activity takes place in
combustion plants covered under 1.1 above.
In particular, these BAT conclusions cover upstream and downstream activities directly
associated to the aforementioned activities including the emission prevention and control
techniques applied.
The fuels considered in these BAT conclusions are any solid, liquid and/or gaseous combustible
material including:
solid fuels (e.g. coal, lignite, peat);
biomass (as defined in Article 3(31) of Directive 2010/75/EU);
liquid fuels (e.g. heavy fuel oil and gas oil);
gaseous fuels (e.g. natural gas, hydrogen-containing gas and syngas);
industry-specific fuels (e.g. by-products from the chemical and iron and steel
industries);
waste except mixed municipal waste as defined in Article 3(39) and except other
waste listed in Article 42(2)(a)(ii) and (iii) of Directive 2010/75/EU.
These BAT conclusions do not address the following:
gasification of fuels, when not directly associated to the combustion of the resulting
syngas;
gasification of fuels and subsequent combustion of syngas when directly associated
to the refining of mineral oil and gas;
the upstream and downstream activities not directly associated to combustion or
gasification activities;
combustion in process furnaces or heaters;
combustion in post-combustion plants;
flaring;
WORKIN
GDRAFT IN
PROGRESS
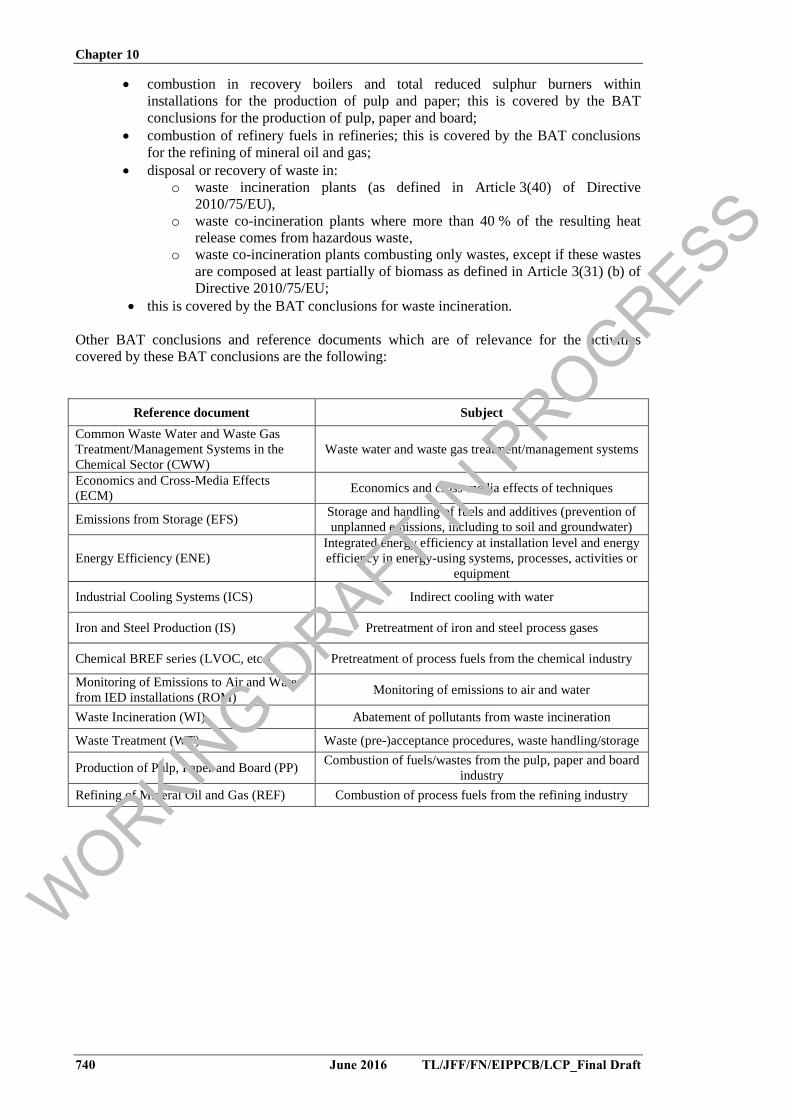
Chapter 10
740 June 2016 TL/JFF/FN/EIPPCB/LCP_Final Draft
combustion in recovery boilers and total reduced sulphur burners within
installations for the production of pulp and paper; this is covered by the BAT
conclusions for the production of pulp, paper and board;
combustion of refinery fuels in refineries; this is covered by the BAT conclusions
for the refining of mineral oil and gas;
disposal or recovery of waste in:
o waste incineration plants (as defined in Article 3(40) of Directive
2010/75/EU),
o waste co-incineration plants where more than 40 % of the resulting heat
release comes from hazardous waste,
o waste co-incineration plants combusting only wastes, except if these wastes
are composed at least partially of biomass as defined in Article 3(31) (b) of
Directive 2010/75/EU;
this is covered by the BAT conclusions for waste incineration.
Other BAT conclusions and reference documents which are of relevance for the activities
covered by these BAT conclusions are the following:
Reference document Subject
Common Waste Water and Waste Gas
Treatment/Management Systems in the
Chemical Sector (CWW)
Waste water and waste gas treatment/management systems
Economics and Cross-Media Effects
(ECM) Economics and cross-media effects of techniques
Emissions from Storage (EFS) Storage and handling of fuels and additives (prevention of
unplanned emissions, including to soil and groundwater)
Energy Efficiency (ENE)
Integrated energy efficiency at installation level and energy
efficiency in energy-using systems, processes, activities or
equipment
Industrial Cooling Systems (ICS) Indirect cooling with water
Iron and Steel Production (IS) Pretreatment of iron and steel process gases
Chemical BREF series (LVOC, etc.) Pretreatment of process fuels from the chemical industry
Monitoring of Emissions to Air and Water
from IED installations (ROM) Monitoring of emissions to air and water
Waste Incineration (WI) Abatement of pollutants from waste incineration
Waste Treatment (WT) Waste (pre-)acceptance procedures, waste handling/storage
Production of Pulp, Paper and Board (PP) Combustion of fuels/wastes from the pulp, paper and board
industry
Refining of Mineral Oil and Gas (REF) Combustion of process fuels from the refining industry
WORKIN
GDRAFT IN
PROGRESS

Chapter 10
TL/JFF/FN/EIPPCB/LCP_Final Draft June 2016 741
Definitions
For the purposes of these BAT conclusions, the following definitions apply:
Term used Definition
General terms
Boiler Any combustion plant with the exception of engines, gas turbines, and process
furnaces or heaters
Combined-cycle gas
turbine (CCGT)
A CCGT is a combustion plant where two thermodynamic cycles are used (i.e.
Brayton and Rankine cycles). In a CCGT, heat from the flue-gas of a gas
turbine (operating according to the Brayton cycle to produce electricity) is
converted to useful energy in a heat recovery steam generator (HRSG), where it
is used to generate steam, which then expands in a steam turbine (operating
according to the Rankine cycle to produce additional electricity).
For the purpose of these BAT conclusions, a CCGT includes configurations
both with and without supplementary firing of the HRSG
Combustion plant
Any technical apparatus in which fuels are oxidised in order to use the heat thus
generated. For the purposes of these BAT conclusions, a combination formed
of:
two or more separate combustion plants where the flue-gases are
discharged through a common stack, or
separate combustion plants which have been granted a permit for the
first time on or after 1 July 1987, or for which the operators have
submitted a complete application for a permit on or after that date,
which are installed in such a way that, taking technical and economic
factors into account, their flue-gases could, in the judgment of the
competent authority, be discharged through a common stack
is considered as a single combustion plant.
For calculating the total rated thermal input of such a combination, the
capacities of all individual combustion plants concerned, which have a rated
thermal input of at least 15 MW, shall be added together
Combustion unit Individual combustion plant
Continuous
measurement
Measurement using an automated measuring system permanently installed on
site
Direct discharge Discharge (to a receiving water body) at the point where the emission leaves
the installation without further downstream treatment
Existing plant A combustion plant which is not a new plant
Existing unit A combustion unit which is not a new unit
Existing flue-gas
desulphurisation
(FGD) system
A flue-gas desulphurisation (FGD) system which is not a new FGD system
Flue-gas
desulphurisation
(FGD) system
System composed of one or a combination of abatement technique(s) whose
purpose is to reduce the level of SOX emitted by a combustion plant
Gas oil
Any petroleum-derived liquid fuel falling within CN code 2710 19 25, 2710 19
29, 2710 19 47, 2710 19 48, 2710 20 17 or 2710 20 19.
Or any petroleum-derived liquid fuel of which less than 65 vol-% (including
losses) distils at 250 °C and of which at least 85 vol-% (including losses) distils
at 350 °C by the ASTM D86 method
Heavy fuel oil (HFO)
Any petroleum-derived liquid fuel falling within CN code 2710 19 51 to 2710
19 68, 2710 20 31, 2710 20 35, 2710 20 39.
Or any petroleum-derived liquid fuel, other than gas oil, which, by reason of its
distillation limits, falls within the category of heavy oils intended for use as fuel
and of which less than 65 vol-% (including losses) distils at 250 °C by the
ASTM D86 method. If the distillation cannot be determined by the ASTM D86
method, the petroleum product is also categorised as a heavy fuel oil
Net electrical
efficiency (combustion
unit and IGCC)
Ratio between the net electrical output (electricity produced on the high-voltage
side of the main transformer minus the imported energy – e.g. for auxiliary
systems' consumption) and the fuel/feedstock energy input (as the
fuel/feedstock lower heating value) at the combustion unit boundary over a
given period of time
WORKIN
GDRAFT IN
PROGRESS
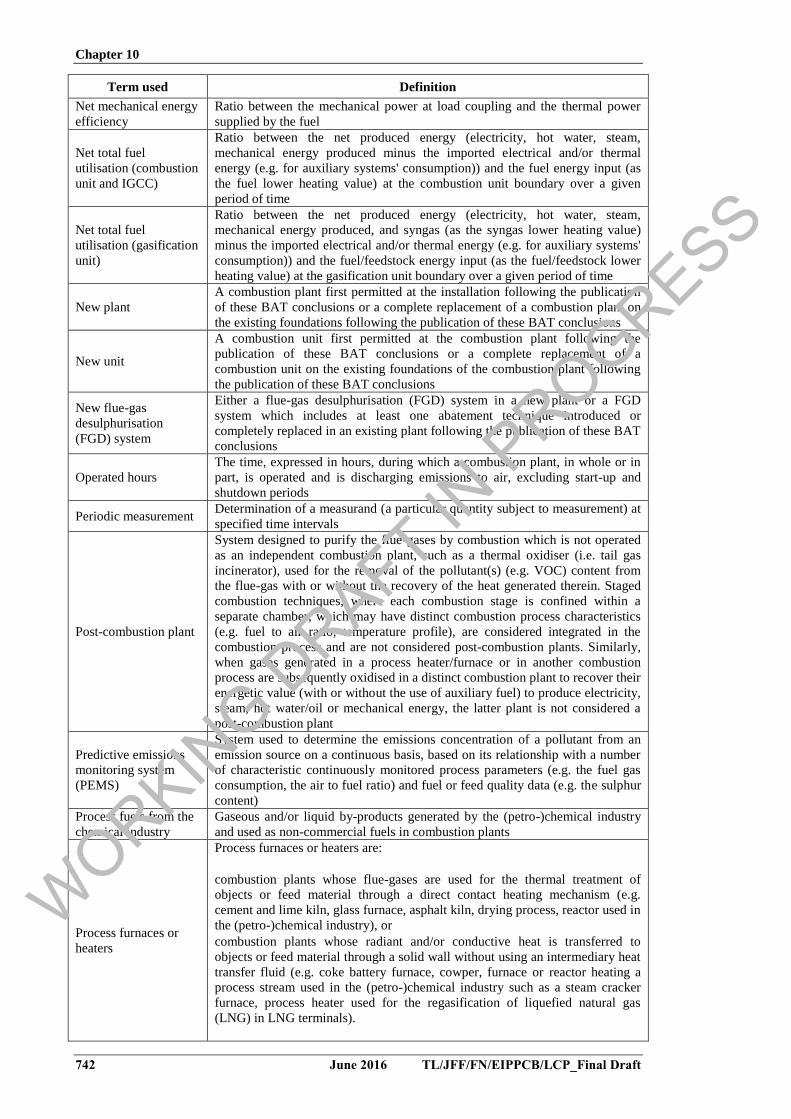
Chapter 10
742 June 2016 TL/JFF/FN/EIPPCB/LCP_Final Draft
Term used Definition
Net mechanical energy
efficiency
Ratio between the mechanical power at load coupling and the thermal power
supplied by the fuel
Net total fuel
utilisation (combustion
unit and IGCC)
Ratio between the net produced energy (electricity, hot water, steam,
mechanical energy produced minus the imported electrical and/or thermal
energy (e.g. for auxiliary systems' consumption)) and the fuel energy input (as
the fuel lower heating value) at the combustion unit boundary over a given
period of time
Net total fuel
utilisation (gasification
unit)
Ratio between the net produced energy (electricity, hot water, steam,
mechanical energy produced, and syngas (as the syngas lower heating value)
minus the imported electrical and/or thermal energy (e.g. for auxiliary systems'
consumption)) and the fuel/feedstock energy input (as the fuel/feedstock lower
heating value) at the gasification unit boundary over a given period of time
New plant
A combustion plant first permitted at the installation following the publication
of these BAT conclusions or a complete replacement of a combustion plant on
the existing foundations following the publication of these BAT conclusions
New unit
A combustion unit first permitted at the combustion plant following the
publication of these BAT conclusions or a complete replacement of a
combustion unit on the existing foundations of the combustion plant following
the publication of these BAT conclusions
New flue-gas
desulphurisation
(FGD) system
Either a flue-gas desulphurisation (FGD) system in a new plant or a FGD
system which includes at least one abatement technique introduced or
completely replaced in an existing plant following the publication of these BAT
conclusions
Operated hours
The time, expressed in hours, during which a combustion plant, in whole or in
part, is operated and is discharging emissions to air, excluding start-up and
shutdown periods
Periodic measurement Determination of a measurand (a particular quantity subject to measurement) at
specified time intervals
Post-combustion plant
System designed to purify the flue-gases by combustion which is not operated
as an independent combustion plant, such as a thermal oxidiser (i.e. tail gas
incinerator), used for the removal of the pollutant(s) (e.g. VOC) content from
the flue-gas with or without the recovery of the heat generated therein. Staged
combustion techniques, where each combustion stage is confined within a
separate chamber, which may have distinct combustion process characteristics
(e.g. fuel to air ratio, temperature profile), are considered integrated in the
combustion process and are not considered post-combustion plants. Similarly,
when gases generated in a process heater/furnace or in another combustion
process are subsequently oxidised in a distinct combustion plant to recover their
energetic value (with or without the use of auxiliary fuel) to produce electricity,
steam, hot water/oil or mechanical energy, the latter plant is not considered a
post-combustion plant
Predictive emissions
monitoring system
(PEMS)
System used to determine the emissions concentration of a pollutant from an
emission source on a continuous basis, based on its relationship with a number
of characteristic continuously monitored process parameters (e.g. the fuel gas
consumption, the air to fuel ratio) and fuel or feed quality data (e.g. the sulphur
content)
Process fuels from the
chemical industry
Gaseous and/or liquid by-products generated by the (petro-)chemical industry
and used as non-commercial fuels in combustion plants
Process furnaces or
heaters
Process furnaces or heaters are:
combustion plants whose flue-gases are used for the thermal treatment of
objects or feed material through a direct contact heating mechanism (e.g.
cement and lime kiln, glass furnace, asphalt kiln, drying process, reactor used in
the (petro-)chemical industry), or
combustion plants whose radiant and/or conductive heat is transferred to
objects or feed material through a solid wall without using an intermediary heat
transfer fluid (e.g. coke battery furnace, cowper, furnace or reactor heating a
process stream used in the (petro-)chemical industry such as a steam cracker
furnace, process heater used for the regasification of liquefied natural gas
(LNG) in LNG terminals).
WORKIN
GDRAFT IN
PROGRESS
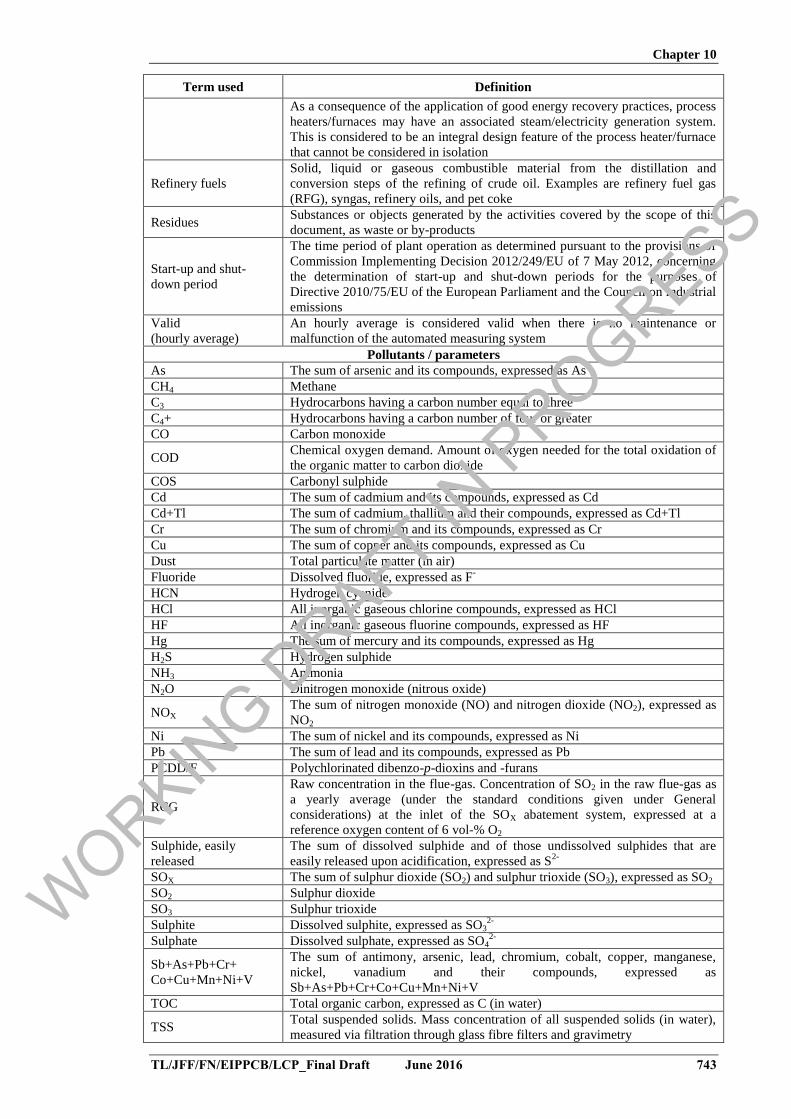
Chapter 10
TL/JFF/FN/EIPPCB/LCP_Final Draft June 2016 743
Term used Definition
As a consequence of the application of good energy recovery practices, process
heaters/furnaces may have an associated steam/electricity generation system.
This is considered to be an integral design feature of the process heater/furnace
that cannot be considered in isolation
Refinery fuels
Solid, liquid or gaseous combustible material from the distillation and
conversion steps of the refining of crude oil. Examples are refinery fuel gas
(RFG), syngas, refinery oils, and pet coke
Residues Substances or objects generated by the activities covered by the scope of this
document, as waste or by-products
Start-up and shut-
down period
The time period of plant operation as determined pursuant to the provisions of
Commission Implementing Decision 2012/249/EU of 7 May 2012, concerning
the determination of start-up and shut-down periods for the purposes of
Directive 2010/75/EU of the European Parliament and the Council on industrial
emissions
Valid
(hourly average)
An hourly average is considered valid when there is no maintenance or
malfunction of the automated measuring system
Pollutants / parameters
As The sum of arsenic and its compounds, expressed as As
CH4 Methane
C3 Hydrocarbons having a carbon number equal to three
C4+ Hydrocarbons having a carbon number of four or greater
CO Carbon monoxide
COD Chemical oxygen demand. Amount of oxygen needed for the total oxidation of
the organic matter to carbon dioxide
COS Carbonyl sulphide
Cd The sum of cadmium and its compounds, expressed as Cd
Cd+Tl The sum of cadmium, thallium and their compounds, expressed as Cd+Tl
Cr The sum of chromium and its compounds, expressed as Cr
Cu The sum of copper and its compounds, expressed as Cu
Dust Total particulate matter (in air)
Fluoride Dissolved fluoride, expressed as F-
HCN Hydrogen cyanide
HCl All inorganic gaseous chlorine compounds, expressed as HCl
HF All inorganic gaseous fluorine compounds, expressed as HF
Hg The sum of mercury and its compounds, expressed as Hg
H2S Hydrogen sulphide
NH3 Ammonia
N2O Dinitrogen monoxide (nitrous oxide)
NOX The sum of nitrogen monoxide (NO) and nitrogen dioxide (NO2), expressed as
NO2
Ni The sum of nickel and its compounds, expressed as Ni
Pb The sum of lead and its compounds, expressed as Pb
PCDD/F Polychlorinated dibenzo-p-dioxins and -furans
RCG
Raw concentration in the flue-gas. Concentration of SO2 in the raw flue-gas as
a yearly average (under the standard conditions given under General
considerations) at the inlet of the SOX abatement system, expressed at a
reference oxygen content of 6 vol-% O2
Sulphide, easily
released
The sum of dissolved sulphide and of those undissolved sulphides that are
easily released upon acidification, expressed as S2-
SOX The sum of sulphur dioxide (SO2) and sulphur trioxide (SO3), expressed as SO2
SO2 Sulphur dioxide
SO3 Sulphur trioxide
Sulphite Dissolved sulphite, expressed as SO32-
Sulphate Dissolved sulphate, expressed as SO42-
Sb+As+Pb+Cr+
Co+Cu+Mn+Ni+V
The sum of antimony, arsenic, lead, chromium, cobalt, copper, manganese,
nickel, vanadium and their compounds, expressed as
Sb+As+Pb+Cr+Co+Cu+Mn+Ni+V
TOC Total organic carbon, expressed as C (in water)
TSS Total suspended solids. Mass concentration of all suspended solids (in water),
measured via filtration through glass fibre filters and gravimetry
WORKIN
GDRAFT IN
PROGRESS

Chapter 10
744 June 2016 TL/JFF/FN/EIPPCB/LCP_Final Draft
Term used Definition
TVOC Total volatile organic carbon, expressed as C (in air)
Zn The sum of zinc and its compounds, expressed as Zn
WORKIN
GDRAFT IN
PROGRESS

Chapter 10
TL/JFF/FN/EIPPCB/LCP_Final Draft June 2016 745
Acronyms
For the purposes of these BAT conclusions, the following acronyms apply:
Acronym Definition
CCGT Combined-cycle gas turbine, with or without supplementary firing
CHP Combined heat and power
COG Coke oven gas
DLN Dry low-NOX burners
DSI Duct sorbent injection
ESP Electrostatic precipitator
FBC Fluidised bed combustion
FGD Flue-gas desulphurisation
HFO Heavy fuel oil
IGCC Integrated gasification combined cycle
LHV Lower heating value
LNB Low-NOX burners
OCGT Open-cycle gas turbine
PC Pulverised combustion
PEMS Predictive emissions monitoring system
SCR Selective catalytic reduction
SDA Spray dry absorber
SNCR Selective non-catalytic reduction
WORKIN
GDRAFT IN
PROGRESS

Chapter 10
746 June 2016 TL/JFF/FN/EIPPCB/LCP_Final Draft
General considerations
Best Available Techniques
The techniques listed and described in these BAT conclusions are neither prescriptive nor
exhaustive. Other techniques may be used that ensure at least an equivalent level of
environmental protection.
Unless otherwise stated, these BAT conclusions are generally applicable.
Emission levels associated with the best available techniques (BAT-AELs)
The BAT-AELs set out in these BAT conclusions may not apply to liquid-fuel-fired and gas-
fired turbines and engines for emergency use operated less than 500 h/yr, when such emergency
use is not compatible with the use of BAT.
BAT-AELs for emissions to air
Emission levels associated with the best available techniques (BAT-AELs) for emissions to air
given in these BAT conclusions refer to concentrations, expressed as mass of emitted substance
per volume of flue-gas under the following standard conditions: dry gas at a temperature of
273.15 K, and a pressure of 101.3 kPa, and expressed in the units mg/Nm3, µg/Nm
3 or ng I-
TEQ/Nm3.
The monitoring associated with the BAT-AELs for emissions to air is given in BAT 3 ter.
Reference conditions for oxygen used to express BAT-AELs in this document are shown in the
table given below.
Activity Reference oxygen level (OR)
Combustion of solid fuels
6 vol-% Combustion of solid fuels in combination
with liquid and/or gaseous fuels
Waste co-incineration
Combustion of liquid and/or gaseous fuels
when not taking place in a gas turbine or
an engine
3 vol-%
Combustion of liquid and/or gaseous fuels
when taking place in a gas turbine or an
engine 15 vol-%
Combustion in IGCC plants
The formula for calculating the emission concentration at the reference oxygen level is:
ER = 21 – OR
21 – OM × EM
where
ER = emission concentration at the reference oxygen level OR;
OR = reference oxygen level in vol-%;
EM = measured emission concentration;
OM = measured oxygen level in vol-%.
For averaging periods, the following definitions apply:
WORKIN
GDRAFT IN
PROGRESS

Chapter 10
TL/JFF/FN/EIPPCB/LCP_Final Draft June 2016 747
Averaging period Definition
Daily average Average over a period of 24 hours of valid hourly averages obtained by
continuous measurements
Yearly average Average over a period of one year of valid hourly averages obtained by
continuous measurements
Average over the sampling
period
Average value of three consecutive measurements of at least 30 minutes
each (1)
Average of samples obtained
during one year
Average of the values obtained during one year of the periodic
measurements taken with the monitoring frequency set for each
parameter (1) For any parameter where, due to sampling or analytical limitations, 30-minute measurement is inappropriate, a
suitable sampling period is employed.
BAT-AELs for emissions to water
Emission levels associated with the best available techniques (BAT-AELs) for emissions to
water given in these BAT conclusions refer to concentrations, expressed as mass of emitted
substance per volume of water, and expressed in µg/l, mg/l, or g/l. The BAT-AELs refer to
24-hour flow-proportional composite samples. Time-proportional composite samples can be
used provided that sufficient flow stability can be demonstrated.
The monitoring associated with BAT-AELs for emissions to water is given in BAT 3 quater.
Energy efficiency levels associated with the best available techniques (BAT-AEELs)
An energy efficiency level associated with the best available techniques (BAT-AEEL) refers to
the ratio between the combustion unit's net energy output(s) and the combustion unit's
fuel/feedstock energy input at actual unit design. The net energy output(s) is determined at the
combustion, gasification, or IGCC unit boundaries, including auxiliary systems (e.g. flue-gas
treatment systems), and for the unit operated at full load.
In the case of combined heat and power (CHP) plants:
the net total fuel utilisation BAT-AEEL refers to the combustion unit operated at full
load and tuned to maximise primarily the heat supply and secondarily the remaining
power that can be generated;
the net electrical efficiency BAT-AEEL refers to the combustion unit generating only
electricity at full load.
BAT-AEELs are expressed as a percentage. The fuel/feedstock energy input is expressed as
lower heating value (LHV).
The monitoring associated with BAT-AEELs is given in BAT 3.
Categorisation of combustion plants/units according to their total rated thermal input
For the purposes of these BAT conclusions, when a range of values for the total rated thermal
input is indicated, this is to be read as 'equal to or greater than the lower end of the range and
lower than the upper end of the range'. For example, the plant category 100–300 MWth is to be
read as: combustion plants with a total rated thermal input equal to or greater than 100 MW and
lower than 300 MW.
When a part of a combustion plant discharging flue-gases through one or more separate ducts
within a common stack is operated less than 1500 h/yr, that part of the plant may be considered
separately for the purpose of these BAT conclusions. For all parts of the plant, the BAT-AELs
apply in relation to the total rated thermal input of the plant. In such cases, the emissions
through each of those ducts are monitored separately.
WORKIN
GDRAFT IN
PROGRESS

Chapter 10
748 June 2016 TL/JFF/FN/EIPPCB/LCP_Final Draft
10.1 General BAT conclusions
The fuel-specific BAT conclusions included in Sections 0 to 10.7 apply in addition to the
general BAT conclusions mentioned in this section.
10.1.1 Environmental management systems
BAT 1. In order to improve the overall environmental performance, BAT is to
implement and adhere to an environmental management system (EMS) that incorporates
all of the following features:
i. commitment of the management, including senior management;
ii. an environmental policy that includes the continuous improvement of the installation by
the management;
iii. planning and establishing the necessary procedures, objectives and targets, in
conjunction with financial planning and investment;
iv. implementation of procedures paying particular attention to:
(a) structure and responsibility
(b) recruitment, training, awareness and competence
(c) communication
(d) employee involvement
(e) documentation
(f) effective process control
(g) planned regular maintenance programmes
(h) emergency preparedness and response
(i) safeguarding compliance with environmental legislation;
v. checking performance and taking corrective action, paying particular attention to:
(a) monitoring and measurement (see also the Reference Report on
Monitoring of Emissions to Air and Water – ROM)
(b) corrective and preventive action
(c) maintenance of records
(d) independent (where practicable) internal and external auditing in order
to determine whether or not the EMS conforms to planned
arrangements and has been properly implemented and maintained;
vi. review of the EMS and its continuing suitability, adequacy and effectiveness by senior
management;
vii. following the development of cleaner technologies;
viii. consideration for the environmental impacts from the eventual decommissioning of the
installation at the stage of designing a new plant, and throughout its operating life
including;
(a) avoiding underground structures
(b) incorporating features that facilitate dismantling
(c) choosing surface finishes that are easily decontaminated
(d) using an equipment configuration that minimises trapped chemicals and
facilitates drainage or cleaning
(e) designing flexible, self-contained equipment that enables phased
closure
(f) using biodegradable and recyclable materials where possible;
ix. application of sectoral benchmarking on a regular basis.
WORKIN
GDRAFT IN
PROGRESS
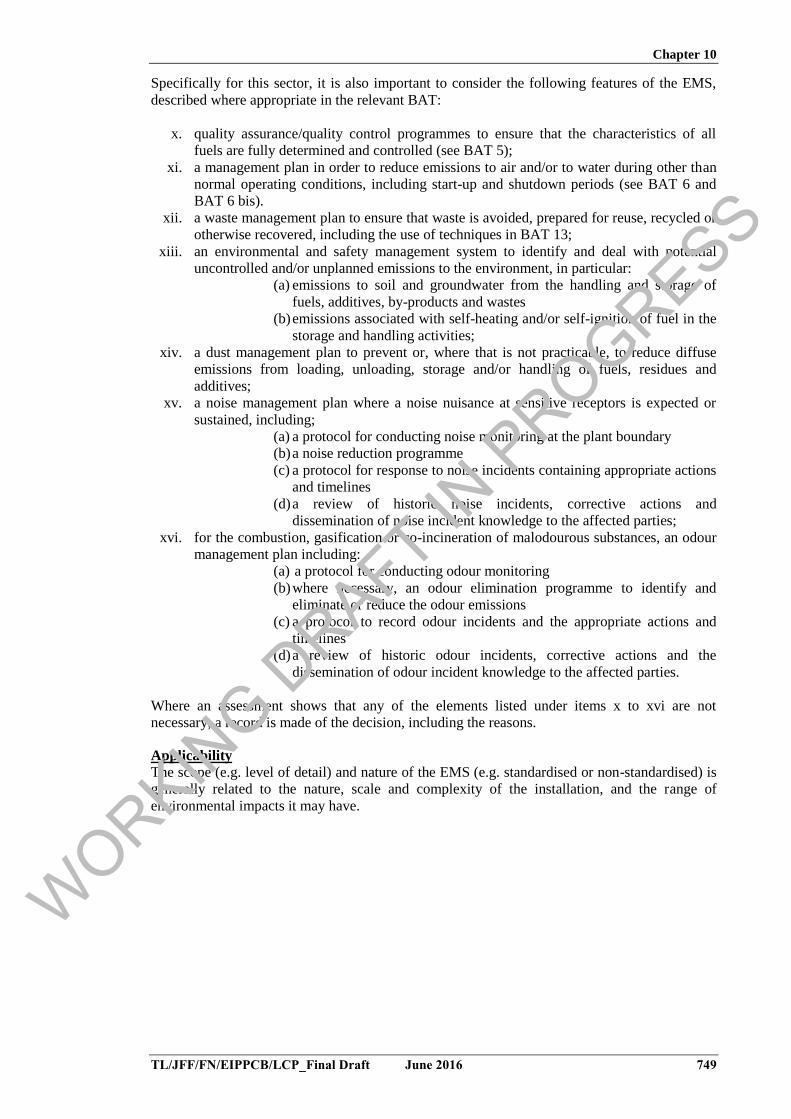
Chapter 10
TL/JFF/FN/EIPPCB/LCP_Final Draft June 2016 749
Specifically for this sector, it is also important to consider the following features of the EMS,
described where appropriate in the relevant BAT:
x. quality assurance/quality control programmes to ensure that the characteristics of all
fuels are fully determined and controlled (see BAT 5);
xi. a management plan in order to reduce emissions to air and/or to water during other than
normal operating conditions, including start-up and shutdown periods (see BAT 6 and
BAT 6 bis).
xii. a waste management plan to ensure that waste is avoided, prepared for reuse, recycled or
otherwise recovered, including the use of techniques in BAT 13;
xiii. an environmental and safety management system to identify and deal with potential
uncontrolled and/or unplanned emissions to the environment, in particular:
(a) emissions to soil and groundwater from the handling and storage of
fuels, additives, by-products and wastes
(b) emissions associated with self-heating and/or self-ignition of fuel in the
storage and handling activities;
xiv. a dust management plan to prevent or, where that is not practicable, to reduce diffuse
emissions from loading, unloading, storage and/or handling of fuels, residues and
additives;
xv. a noise management plan where a noise nuisance at sensitive receptors is expected or
sustained, including;
(a) a protocol for conducting noise monitoring at the plant boundary
(b) a noise reduction programme
(c) a protocol for response to noise incidents containing appropriate actions
and timelines
(d) a review of historic noise incidents, corrective actions and
dissemination of noise incident knowledge to the affected parties;
xvi. for the combustion, gasification or co-incineration of malodourous substances, an odour
management plan including:
(a) a protocol for conducting odour monitoring
(b) where necessary, an odour elimination programme to identify and
eliminate or reduce the odour emissions
(c) a protocol to record odour incidents and the appropriate actions and
timelines
(d) a review of historic odour incidents, corrective actions and the
dissemination of odour incident knowledge to the affected parties.
Where an assessment shows that any of the elements listed under items x to xvi are not
necessary, a record is made of the decision, including the reasons.
Applicability
The scope (e.g. level of detail) and nature of the EMS (e.g. standardised or non-standardised) is
generally related to the nature, scale and complexity of the installation, and the range of
environmental impacts it may have.
WORKIN
GDRAFT IN
PROGRESS

Chapter 10
750 June 2016 TL/JFF/FN/EIPPCB/LCP_Final Draft
10.1.2 Monitoring
BAT 2. Removed
BAT 3. BAT is to determine the net electrical efficiency and/or the net total fuel utilisation
and/or the net mechanical energy efficiency of the gasification, IGCC and/or combustion
units by carrying out a performance test at full load (1), according to EN standards, after
the commissioning of the unit and after each modification that could significantly affect
the net electrical efficiency and/or the net total fuel utilisation and/or the net mechanical
energy efficiency of the unit. If EN standards are not available, BAT is to use ISO,
national or other international standards that ensure the provision of data of an
equivalent scientific quality.
(1) In the case of CHP units, if for technical reasons the performance test cannot be carried out
with the unit operated at full load for the heat supply, the test can be supplemented or
substituted by a calculation using full load parameters.
BAT 3 bis. BAT is to monitor key process parameters relevant for emissions to air and
water including those given below.
Stream Parameter(s) Monitoring
Flue-gas
Flow Periodic or continuous
determination
Oxygen content, temperature, and
pressure Periodic or continuous
measurement Water vapour content (
1)
Waste water from flue-gas
treatment Flow, pH, and temperature Continuous measurement
(1) The continuous measurement of the water vapour content of the flue-gas is not necessary in cases where the
sampled flue-gas is dried before analysis
WORKIN
GDRAFT IN
PROGRESS
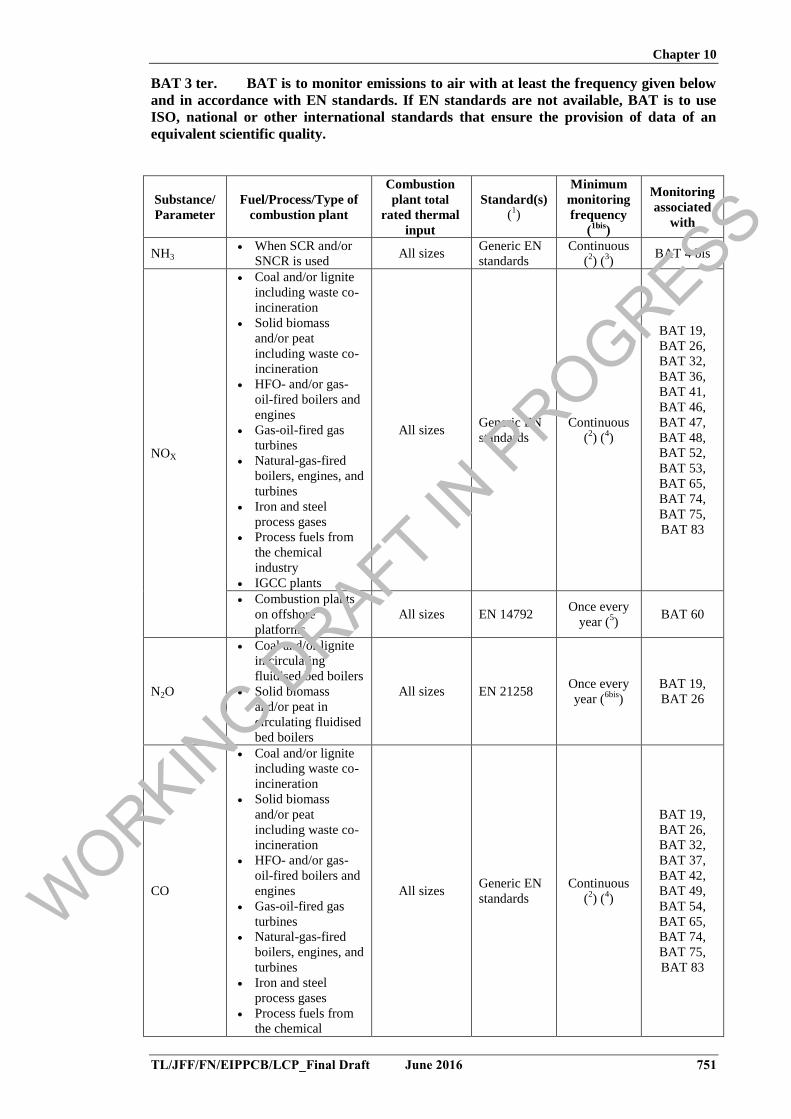
Chapter 10
TL/JFF/FN/EIPPCB/LCP_Final Draft June 2016 751
BAT 3 ter. BAT is to monitor emissions to air with at least the frequency given below
and in accordance with EN standards. If EN standards are not available, BAT is to use
ISO, national or other international standards that ensure the provision of data of an
equivalent scientific quality.
Substance/
Parameter
Fuel/Process/Type of
combustion plant
Combustion
plant total
rated thermal
input
Standard(s) (
1)
Minimum
monitoring
frequency
(1bis
)
Monitoring
associated
with
NH3 When SCR and/or
SNCR is used All sizes
Generic EN
standards
Continuous
(2) (
3)
BAT 4 bis
NOX
Coal and/or lignite
including waste co-
incineration Solid biomass
and/or peat
including waste co-
incineration HFO- and/or gas-
oil-fired boilers and
engines
Gas-oil-fired gas
turbines
Natural-gas-fired
boilers, engines, and
turbines
Iron and steel
process gases
Process fuels from
the chemical
industry
IGCC plants
All sizes Generic EN
standards
Continuous
(2) (
4)
BAT 19,
BAT 26,
BAT 32,
BAT 36,
BAT 41,
BAT 46,
BAT 47,
BAT 48,
BAT 52,
BAT 53,
BAT 65,
BAT 74,
BAT 75,
BAT 83
Combustion plants
on offshore
platforms All sizes EN 14792
Once every
year (5)
BAT 60
N2O
Coal and/or lignite
in circulating
fluidised bed boilers
Solid biomass
and/or peat in
circulating fluidised
bed boilers
All sizes EN 21258 Once every
year (6bis
)
BAT 19,
BAT 26
CO
Coal and/or lignite
including waste co-
incineration
Solid biomass
and/or peat
including waste co-
incineration
HFO- and/or gas-
oil-fired boilers and
engines
Gas-oil-fired gas
turbines
Natural-gas-fired
boilers, engines, and
turbines
Iron and steel
process gases
Process fuels from
the chemical
All sizes Generic EN
standards
Continuous
(2) (
4)
BAT 19,
BAT 26,
BAT 32,
BAT 37,
BAT 42,
BAT 49,
BAT 54,
BAT 65,
BAT 74,
BAT 75,
BAT 83
WORKIN
GDRAFT IN
PROGRESS
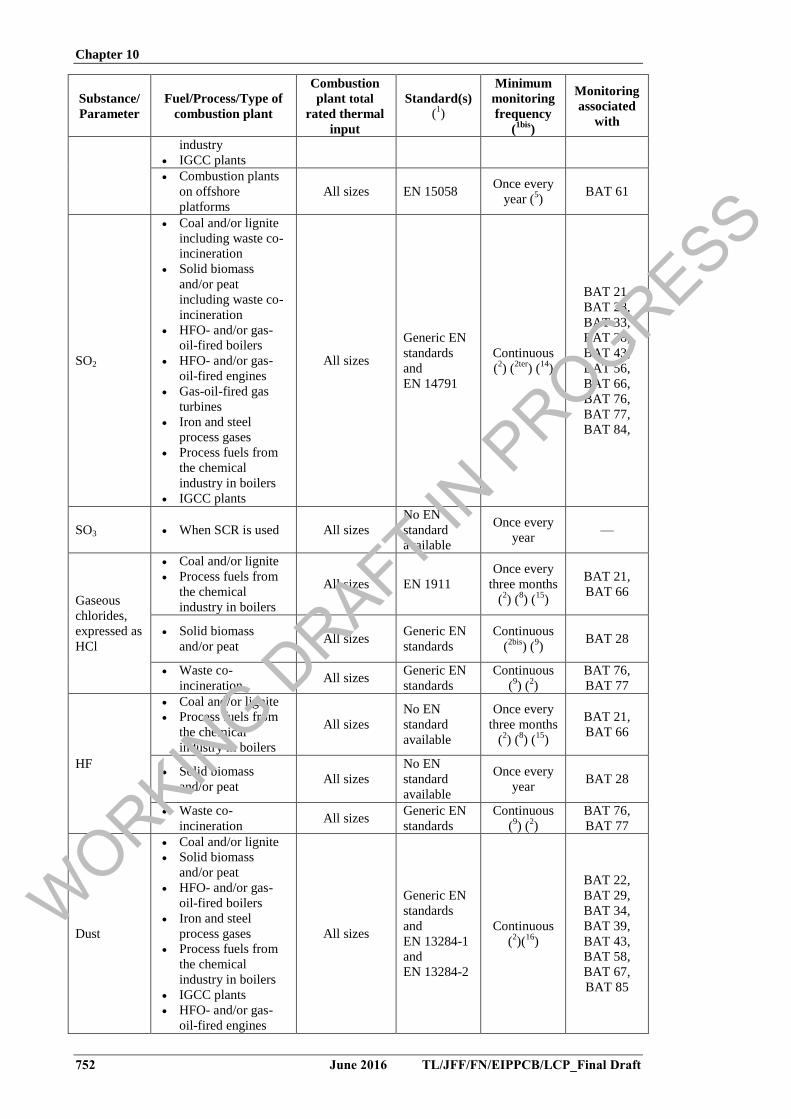
Chapter 10
752 June 2016 TL/JFF/FN/EIPPCB/LCP_Final Draft
Substance/
Parameter
Fuel/Process/Type of
combustion plant
Combustion
plant total
rated thermal
input
Standard(s) (
1)
Minimum
monitoring
frequency
(1bis
)
Monitoring
associated
with
industry
IGCC plants
Combustion plants
on offshore
platforms
All sizes EN 15058 Once every
year (5)
BAT 61
SO2
Coal and/or lignite
including waste co-
incineration
Solid biomass
and/or peat
including waste co-
incineration
HFO- and/or gas-
oil-fired boilers
HFO- and/or gas-
oil-fired engines
Gas-oil-fired gas
turbines
Iron and steel
process gases
Process fuels from
the chemical
industry in boilers
IGCC plants
All sizes
Generic EN
standards
and
EN 14791
Continuous
(2) (
2ter) (
14)
BAT 21,
BAT 28,
BAT 33,
BAT 38,
BAT 43,
BAT 56,
BAT 66,
BAT 76,
BAT 77,
BAT 84,
SO3 When SCR is used All sizes
No EN
standard
available
Once every
year —
Gaseous
chlorides,
expressed as
HCl
Coal and/or lignite
Process fuels from
the chemical
industry in boilers
All sizes EN 1911
Once every
three months
(2) (
8) (
15)
BAT 21,
BAT 66
Solid biomass
and/or peat All sizes
Generic EN
standards
Continuous
(2bis
) (9)
BAT 28
Waste co-
incineration All sizes
Generic EN
standards
Continuous
(9) (
2)
BAT 76,
BAT 77
HF
Coal and/or lignite
Process fuels from
the chemical
industry in boilers
All sizes
No EN
standard
available
Once every
three months
(2) (
8) (
15)
BAT 21,
BAT 66
Solid biomass
and/or peat All sizes
No EN
standard
available
Once every
year BAT 28
Waste co-
incineration All sizes
Generic EN
standards
Continuous
(9) (
2)
BAT 76,
BAT 77
Dust
Coal and/or lignite
Solid biomass
and/or peat
HFO- and/or gas-
oil-fired boilers
Iron and steel
process gases
Process fuels from
the chemical
industry in boilers
IGCC plants
HFO- and/or gas-
oil-fired engines
All sizes
Generic EN
standards
and
EN 13284-1
and
EN 13284-2
Continuous
(2)(
16)
BAT 22,
BAT 29,
BAT 34,
BAT 39,
BAT 43,
BAT 58,
BAT 67,
BAT 85
WORKIN
GDRAFT IN
PROGRESS
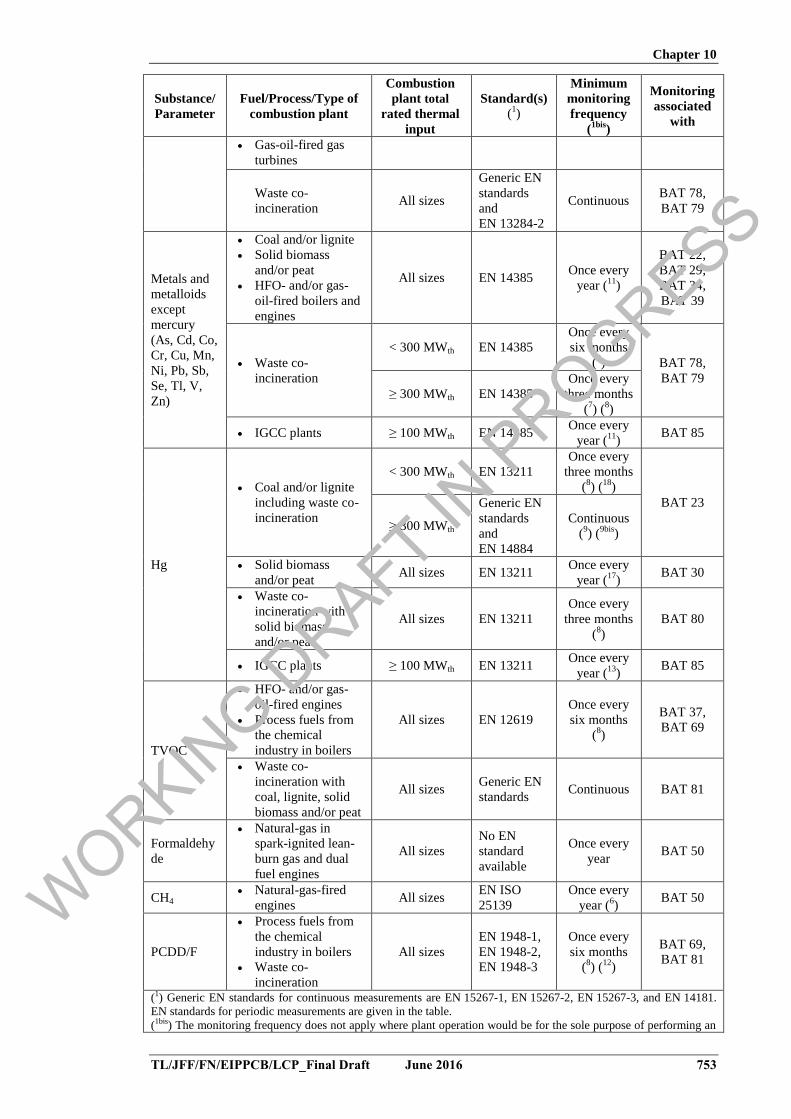
Chapter 10
TL/JFF/FN/EIPPCB/LCP_Final Draft June 2016 753
Substance/
Parameter
Fuel/Process/Type of
combustion plant
Combustion
plant total
rated thermal
input
Standard(s) (
1)
Minimum
monitoring
frequency
(1bis
)
Monitoring
associated
with
Gas-oil-fired gas
turbines
Waste co-
incineration All sizes
Generic EN
standards
and
EN 13284-2
Continuous BAT 78,
BAT 79
Metals and
metalloids
except
mercury
(As, Cd, Co,
Cr, Cu, Mn,
Ni, Pb, Sb,
Se, Tl, V,
Zn)
Coal and/or lignite
Solid biomass
and/or peat
HFO- and/or gas-
oil-fired boilers and
engines
All sizes EN 14385 Once every
year (11
)
BAT 22,
BAT 29,
BAT 34,
BAT 39
Waste co-
incineration
< 300 MWth EN 14385
Once every
six months
(8) BAT 78,
BAT 79
≥ 300 MWth EN 14385
Once every
three months
(7) (
8)
IGCC plants ≥ 100 MWth EN 14385 Once every
year (11
) BAT 85
Hg
Coal and/or lignite
including waste co-
incineration
< 300 MWth EN 13211
Once every
three months
(8) (
18)
BAT 23
≥ 300 MWth
Generic EN
standards
and
EN 14884
Continuous
(9) (
9bis)
Solid biomass
and/or peat All sizes EN 13211
Once every
year (17
) BAT 30
Waste co-
incineration with
solid biomass
and/or peat
All sizes EN 13211
Once every
three months
(8)
BAT 80
IGCC plants ≥ 100 MWth EN 13211 Once every
year (13
) BAT 85
TVOC
HFO- and/or gas-
oil-fired engines
Process fuels from
the chemical
industry in boilers
All sizes EN 12619
Once every
six months
(8)
BAT 37,
BAT 69
Waste co-
incineration with
coal, lignite, solid
biomass and/or peat
All sizes Generic EN
standards Continuous BAT 81
Formaldehy
de
Natural-gas in
spark-ignited lean-
burn gas and dual
fuel engines
All sizes
No EN
standard
available
Once every
year BAT 50
CH4 Natural-gas-fired
engines All sizes
EN ISO
25139
Once every
year (6)
BAT 50
PCDD/F
Process fuels from
the chemical
industry in boilers
Waste co-
incineration
All sizes
EN 1948-1,
EN 1948-2,
EN 1948-3
Once every
six months
(8) (
12)
BAT 69,
BAT 81
(1) Generic EN standards for continuous measurements are EN 15267-1, EN 15267-2, EN 15267-3, and EN 14181.
EN standards for periodic measurements are given in the table.
(1bis) The monitoring frequency does not apply where plant operation would be for the sole purpose of performing an
WORKIN
GDRAFT IN
PROGRESS

Chapter 10
754 June 2016 TL/JFF/FN/EIPPCB/LCP_Final Draft
Substance/
Parameter
Fuel/Process/Type of
combustion plant
Combustion
plant total
rated thermal
input
Standard(s) (
1)
Minimum
monitoring
frequency
(1bis
)
Monitoring
associated
with
emission measurement.
(2) In the case of plants with a rated thermal input of < 100 MW operated < 1500 h/yr, the minimum monitoring
frequency may be at least once every six months. For gas turbines, periodic monitoring is carried out with a
combustion plant load of > 70 %. For co-incineration of waste with coal, lignite, solid biomass and/or peat, the
monitoring frequency needs to also take into account Part 6 of Annex VI to the IED.
(2bis) In the case of plants with a rated thermal input of < 100 MW operated < 500 h/yr, the minimum monitoring
frequency may be at least once every year. In the case of plants with a rated thermal input of < 100 MW operated
between 500 h/yr and 1500 h/yr, the monitoring frequency may be reduced to at least once every six months.
(2ter) As an alternative to the continuous measurement in the case of plants combusting oil with a known sulphur
content and where there is no flue-gas desulphurisation system, periodic measurements at least once every three
months and/or other procedures ensuring the provision of data of an equivalent scientific quality may be used to
determine the SO2 emissions.
(3) In the case of use of SCR, the minimum monitoring frequency may be at least once every year, if the emission
levels are proven to be sufficiently stable.
(4) In the case of natural-gas-fired turbines with a rated thermal input of < 100 MW operated < 1500 h/yr, or in the
case of existing OCGTs, PEMS may be used instead.
(5) PEMS may be used instead.
(6) Measurements are carried out with the plant operated at loads of > 70 %.
(6bis) Two sets of measurements are carried out, one with the plant operated at loads of > 70 % and the other one at
loads of < 70 %.
(7) In the case of plants operated < 1500 h/yr, the minimum monitoring frequency may be at least once every six
months.
(8) If the emission levels are proven to be sufficiently stable, periodic measurements may be carried out each time that
a change of the fuel and/or waste characteristics may have an impact on the emissions, but in any case at least once
every year. For co-incineration of waste with coal, lignite, solid biomass and/or peat, the monitoring frequency needs
to also take into account Part 6 of Annex VI to the IED.
(9) If the emission levels are proven to be sufficiently stable, periodic measurements may be carried out each time that
a change of the fuel and/or waste characteristics may have an impact on the emissions, but in any case at least once
every six months.
(9bis) Continuous sampling combined with frequent analysis of time-integrated samples, e.g. by a standardised sorbent
trap monitoring method, may be used as an alternative to continuous measurements.
(11) The list of pollutants monitored and the monitoring frequency may be adjusted after an initial characterisation of
the fuel (see BAT 5) based on an assessment of the relevance of pollutant releases (e.g. concentration in fuel, flue-gas
treatment employed) in the emissions to air, but in any case at least each time that a change of the fuel characteristics
may have an impact on the emissions.
(12) In the case of process fuels from the chemical industry, monitoring is only applicable when the fuels contain
chlorinated substances.
(13) The minimum monitoring frequency does not apply in the case of plants operated < 1500 h/yr.
(14) In the case of process fuels from the chemical industry, the monitoring frequency may be adjusted for plants of
< 100 MWth after an initial characterisation of the fuel (see BAT 5) based on an assessment of the relevance of
pollutant releases (e.g. concentration in fuel, flue-gas treatment employed) in the emissions to air, but in any case at
least each time that a change of the fuel characteristics may have an impact on the emissions.
(15) In the case of process fuels from the chemical industry, the monitoring frequency may be adjusted after an initial
characterisation of the fuel (see BAT 5) based on an assessment of the relevance of pollutant releases (e.g.
concentration in fuel, flue-gas treatment employed) in the emissions to air, but in any case at least each time that a
change of the fuel characteristics may have an impact on the emissions.
(16) In the case of plants combusting iron and steel process gases, the minimum monitoring frequency may be at least
once every six months if the emission levels are proven to be sufficiently stable.
(17) If the emission levels are proven to be sufficiently stable due to the low mercury content in the fuel, periodic
measurements may be carried out only each time that a change of the fuel characteristics may have an impact on the
emissions.
(18) In the case of plants operated < 1500 h/yr, the minimum monitoring frequency may be at least once every year.
WORKIN
GDRAFT IN
PROGRESS
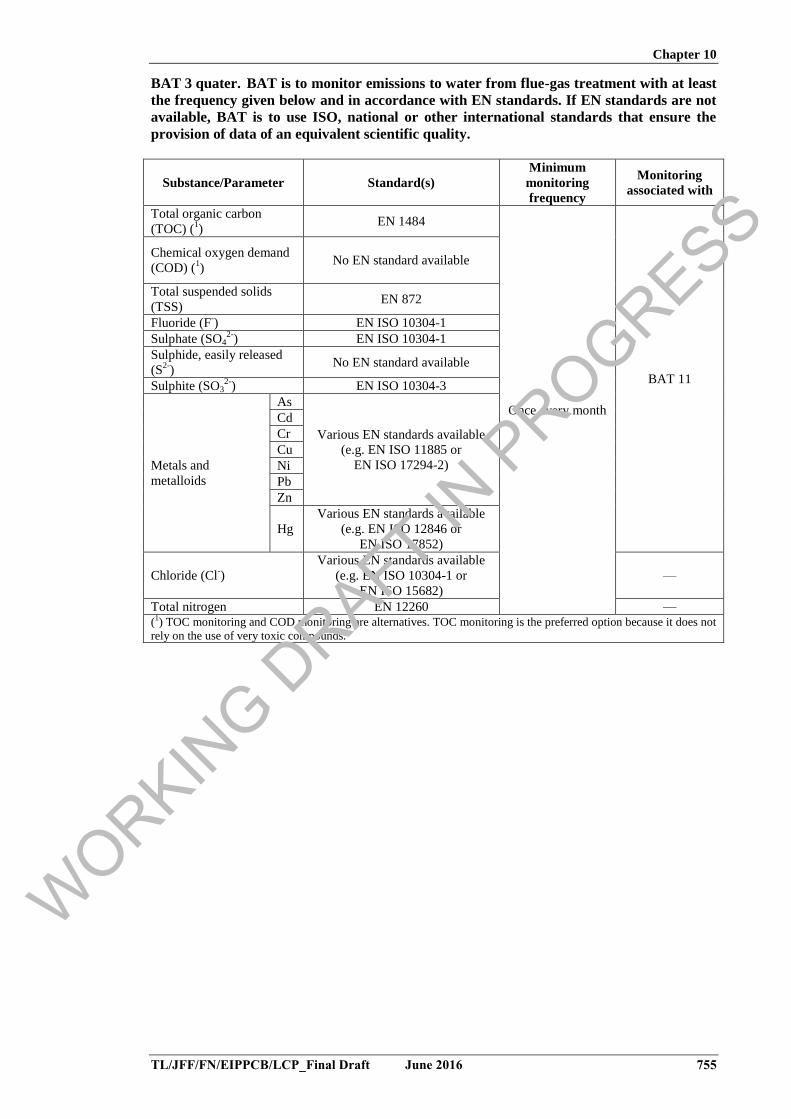
Chapter 10
TL/JFF/FN/EIPPCB/LCP_Final Draft June 2016 755
BAT 3 quater. BAT is to monitor emissions to water from flue-gas treatment with at least
the frequency given below and in accordance with EN standards. If EN standards are not
available, BAT is to use ISO, national or other international standards that ensure the
provision of data of an equivalent scientific quality.
Substance/Parameter Standard(s)
Minimum
monitoring
frequency
Monitoring
associated with
Total organic carbon
(TOC) (1)
EN 1484
Once every month
BAT 11
Chemical oxygen demand
(COD) (1)
No EN standard available
Total suspended solids
(TSS) EN 872
Fluoride (F-) EN ISO 10304-1
Sulphate (SO42-
) EN ISO 10304-1
Sulphide, easily released
(S2-
) No EN standard available
Sulphite (SO32-
) EN ISO 10304-3
Metals and
metalloids
As
Various EN standards available
(e.g. EN ISO 11885 or
EN ISO 17294-2)
Cd
Cr
Cu
Ni
Pb
Zn
Hg
Various EN standards available
(e.g. EN ISO 12846 or
EN ISO 17852)
Chloride (Cl-)
Various EN standards available
(e.g. EN ISO 10304-1 or
EN ISO 15682)
—
Total nitrogen EN 12260 — (1) TOC monitoring and COD monitoring are alternatives. TOC monitoring is the preferred option because it does not
rely on the use of very toxic compounds.
WORKIN
GDRAFT IN
PROGRESS
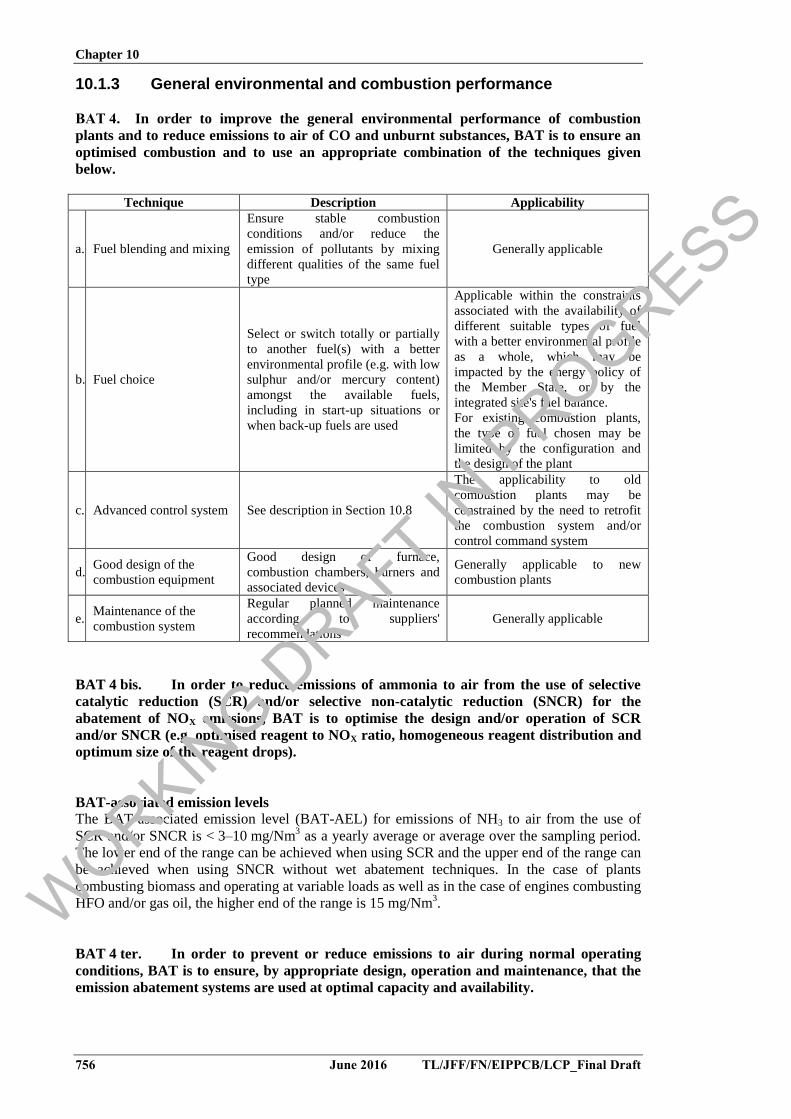
Chapter 10
756 June 2016 TL/JFF/FN/EIPPCB/LCP_Final Draft
10.1.3 General environmental and combustion performance
BAT 4. In order to improve the general environmental performance of combustion
plants and to reduce emissions to air of CO and unburnt substances, BAT is to ensure an
optimised combustion and to use an appropriate combination of the techniques given
below.
Technique Description Applicability
a. Fuel blending and mixing
Ensure stable combustion
conditions and/or reduce the
emission of pollutants by mixing
different qualities of the same fuel
type
Generally applicable
b. Fuel choice
Select or switch totally or partially
to another fuel(s) with a better
environmental profile (e.g. with low
sulphur and/or mercury content)
amongst the available fuels,
including in start-up situations or
when back-up fuels are used
Applicable within the constraints
associated with the availability of
different suitable types of fuel
with a better environmental profile
as a whole, which may be
impacted by the energy policy of
the Member State, or by the
integrated site's fuel balance.
For existing combustion plants,
the type of fuel chosen may be
limited by the configuration and
the design of the plant
c. Advanced control system See description in Section 10.8
The applicability to old
combustion plants may be
constrained by the need to retrofit
the combustion system and/or
control command system
d. Good design of the
combustion equipment
Good design of furnace,
combustion chambers, burners and
associated devices
Generally applicable to new
combustion plants
e. Maintenance of the
combustion system
Regular planned maintenance
according to suppliers'
recommendations
Generally applicable
BAT 4 bis. In order to reduce emissions of ammonia to air from the use of selective
catalytic reduction (SCR) and/or selective non-catalytic reduction (SNCR) for the
abatement of NOX emissions, BAT is to optimise the design and/or operation of SCR
and/or SNCR (e.g. optimised reagent to NOX ratio, homogeneous reagent distribution and
optimum size of the reagent drops).
BAT-associated emission levels
The BAT-associated emission level (BAT-AEL) for emissions of NH3 to air from the use of
SCR and/or SNCR is < 3–10 mg/Nm3 as a yearly average or average over the sampling period.
The lower end of the range can be achieved when using SCR and the upper end of the range can
be achieved when using SNCR without wet abatement techniques. In the case of plants
combusting biomass and operating at variable loads as well as in the case of engines combusting
HFO and/or gas oil, the higher end of the range is 15 mg/Nm3.
BAT 4 ter. In order to prevent or reduce emissions to air during normal operating
conditions, BAT is to ensure, by appropriate design, operation and maintenance, that the
emission abatement systems are used at optimal capacity and availability.
WORKIN
GDRAFT IN
PROGRESS
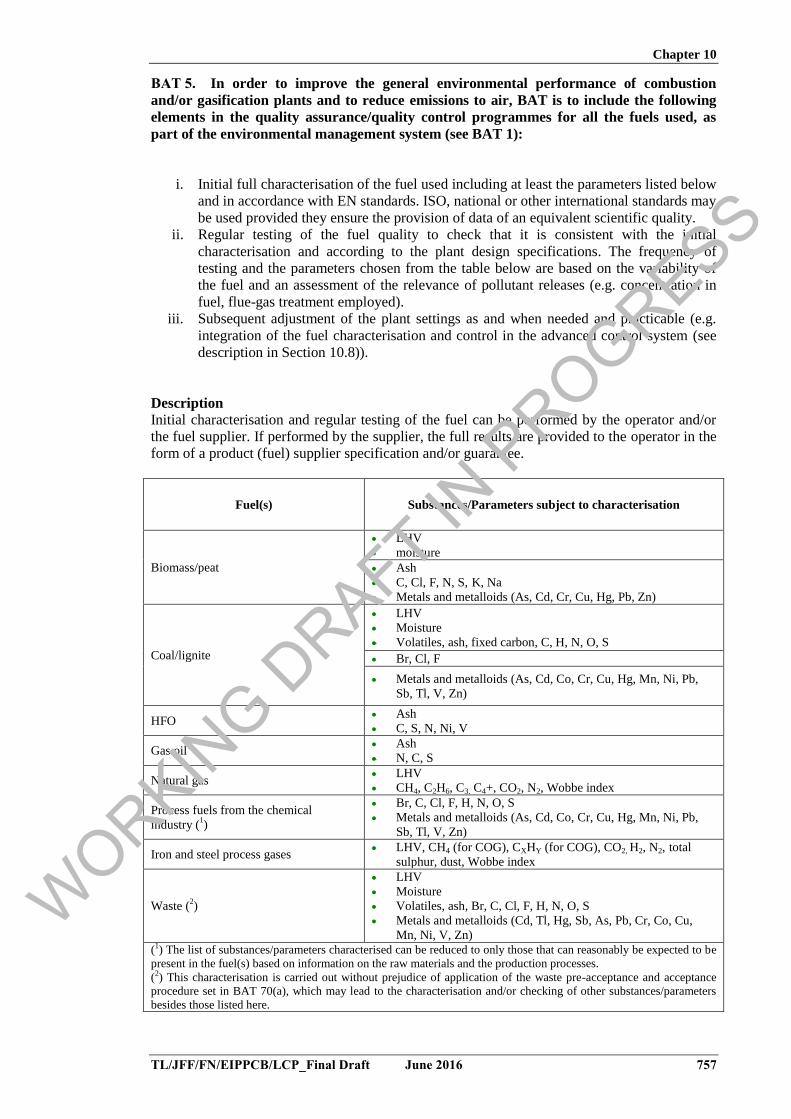
Chapter 10
TL/JFF/FN/EIPPCB/LCP_Final Draft June 2016 757
BAT 5. In order to improve the general environmental performance of combustion
and/or gasification plants and to reduce emissions to air, BAT is to include the following
elements in the quality assurance/quality control programmes for all the fuels used, as
part of the environmental management system (see BAT 1):
i. Initial full characterisation of the fuel used including at least the parameters listed below
and in accordance with EN standards. ISO, national or other international standards may
be used provided they ensure the provision of data of an equivalent scientific quality.
ii. Regular testing of the fuel quality to check that it is consistent with the initial
characterisation and according to the plant design specifications. The frequency of
testing and the parameters chosen from the table below are based on the variability of
the fuel and an assessment of the relevance of pollutant releases (e.g. concentration in
fuel, flue-gas treatment employed).
iii. Subsequent adjustment of the plant settings as and when needed and practicable (e.g.
integration of the fuel characterisation and control in the advanced control system (see
description in Section 10.8)).
Description
Initial characterisation and regular testing of the fuel can be performed by the operator and/or
the fuel supplier. If performed by the supplier, the full results are provided to the operator in the
form of a product (fuel) supplier specification and/or guarantee.
Fuel(s) Substances/Parameters subject to characterisation
Biomass/peat
LHV
moisture
Ash
C, Cl, F, N, S, K, Na
Metals and metalloids (As, Cd, Cr, Cu, Hg, Pb, Zn)
Coal/lignite
LHV
Moisture
Volatiles, ash, fixed carbon, C, H, N, O, S
Br, Cl, F
Metals and metalloids (As, Cd, Co, Cr, Cu, Hg, Mn, Ni, Pb,
Sb, Tl, V, Zn)
HFO Ash
C, S, N, Ni, V
Gas oil Ash
N, C, S
Natural gas LHV
CH4, C2H6, C3, C4+, CO2, N2, Wobbe index
Process fuels from the chemical
industry (1)
Br, C, Cl, F, H, N, O, S
Metals and metalloids (As, Cd, Co, Cr, Cu, Hg, Mn, Ni, Pb,
Sb, Tl, V, Zn)
Iron and steel process gases LHV, CH4 (for COG), CXHY (for COG), CO2, H2, N2, total
sulphur, dust, Wobbe index
Waste (2)
LHV
Moisture
Volatiles, ash, Br, C, Cl, F, H, N, O, S
Metals and metalloids (Cd, Tl, Hg, Sb, As, Pb, Cr, Co, Cu,
Mn, Ni, V, Zn)
(1) The list of substances/parameters characterised can be reduced to only those that can reasonably be expected to be
present in the fuel(s) based on information on the raw materials and the production processes.
(2) This characterisation is carried out without prejudice of application of the waste pre-acceptance and acceptance
procedure set in BAT 70(a), which may lead to the characterisation and/or checking of other substances/parameters
besides those listed here.
WORKIN
GDRAFT IN
PROGRESS
Chapter 10
758 June 2016 TL/JFF/FN/EIPPCB/LCP_Final Draft
BAT 6. In order to reduce emissions to air and/or to water during other than normal
operating conditions (OTNOC), BAT is to set up and implement a management plan as
part of the environmental management system (see BAT 1), commensurate with the
relevance of potential pollutant releases, that includes the following elements:
appropriate design of the systems considered relevant in causing OTNOC that may have
an impact on emissions to air, water and/or soil (e.g. low-load design concepts for
reducing the minimum start-up and shutdown loads for stable generation in gas
turbines);
set-up and implementation of a specific preventive maintenance plan for these relevant
systems;
review and recording of emissions caused by OTNOC and associated circumstances and
implementation of corrective actions if necessary;
periodic assessment of the overall emissions during OTNOC (e.g. frequency of events,
duration, emissions quantification/estimation) and implementation of corrective actions
if necessary.
BAT 6 bis. BAT is to appropriately monitor emissions to air and/or to water during
OTNOC.
Description
The monitoring can be carried out by direct measurement of emissions or by monitoring of
surrogate parameters if this proves to be of equal or better scientific quality than the direct
measurement of emissions. Emissions during start-up and shutdown (SU/SD) may be assessed
based on a detailed emission measurement carried out for a typical SU/SD procedure at least
once every year, and using the results of this measurement to estimate the emissions for each
and every SU/SD throughout the year.
WORKIN
GDRAFT IN
PROGRESS
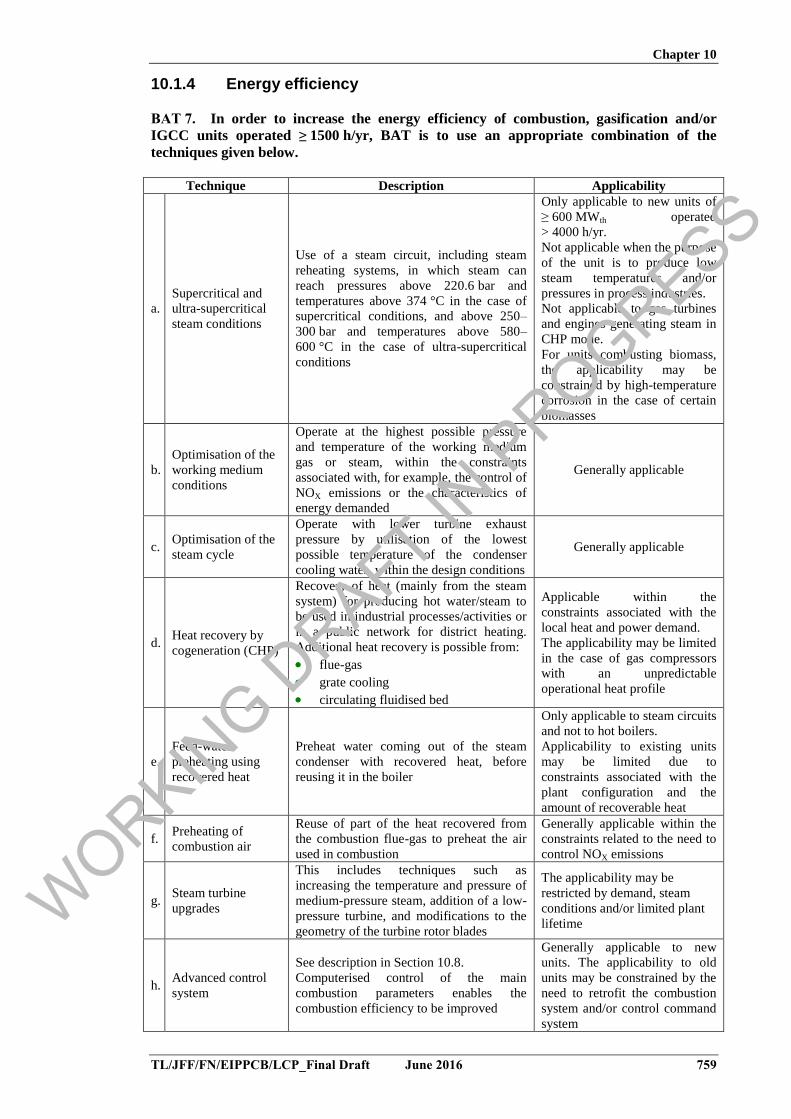
Chapter 10
TL/JFF/FN/EIPPCB/LCP_Final Draft June 2016 759
10.1.4 Energy efficiency
BAT 7. In order to increase the energy efficiency of combustion, gasification and/or
IGCC units operated ≥ 1500 h/yr, BAT is to use an appropriate combination of the
techniques given below.
Technique Description Applicability
a.
Supercritical and
ultra-supercritical
steam conditions
Use of a steam circuit, including steam
reheating systems, in which steam can
reach pressures above 220.6 bar and
temperatures above 374 °C in the case of
supercritical conditions, and above 250–
300 bar and temperatures above 580–
600 °C in the case of ultra-supercritical
conditions
Only applicable to new units of
≥ 600 MWth operated
> 4000 h/yr.
Not applicable when the purpose
of the unit is to produce low
steam temperatures and/or
pressures in process industries.
Not applicable to gas turbines
and engines generating steam in
CHP mode.
For units combusting biomass,
the applicability may be
constrained by high-temperature
corrosion in the case of certain
biomasses
b.
Optimisation of the
working medium
conditions
Operate at the highest possible pressure
and temperature of the working medium
gas or steam, within the constraints
associated with, for example, the control of
NOX emissions or the characteristics of
energy demanded
Generally applicable
c. Optimisation of the
steam cycle
Operate with lower turbine exhaust
pressure by utilisation of the lowest
possible temperature of the condenser
cooling water, within the design conditions
Generally applicable
d. Heat recovery by
cogeneration (CHP)
Recovery of heat (mainly from the steam
system) for producing hot water/steam to
be used in industrial processes/activities or
in a public network for district heating.
Additional heat recovery is possible from:
flue-gas
grate cooling
circulating fluidised bed
Applicable within the
constraints associated with the
local heat and power demand.
The applicability may be limited
in the case of gas compressors
with an unpredictable
operational heat profile
e.
Feed-water
preheating using
recovered heat
Preheat water coming out of the steam
condenser with recovered heat, before
reusing it in the boiler
Only applicable to steam circuits
and not to hot boilers.
Applicability to existing units
may be limited due to
constraints associated with the
plant configuration and the
amount of recoverable heat
f. Preheating of
combustion air
Reuse of part of the heat recovered from
the combustion flue-gas to preheat the air
used in combustion
Generally applicable within the
constraints related to the need to
control NOX emissions
g. Steam turbine
upgrades
This includes techniques such as
increasing the temperature and pressure of
medium-pressure steam, addition of a low-
pressure turbine, and modifications to the
geometry of the turbine rotor blades
The applicability may be
restricted by demand, steam
conditions and/or limited plant
lifetime
h. Advanced control
system
See description in Section 10.8.
Computerised control of the main
combustion parameters enables the
combustion efficiency to be improved
Generally applicable to new
units. The applicability to old
units may be constrained by the
need to retrofit the combustion
system and/or control command
system
WORKIN
GDRAFT IN
PROGRESS
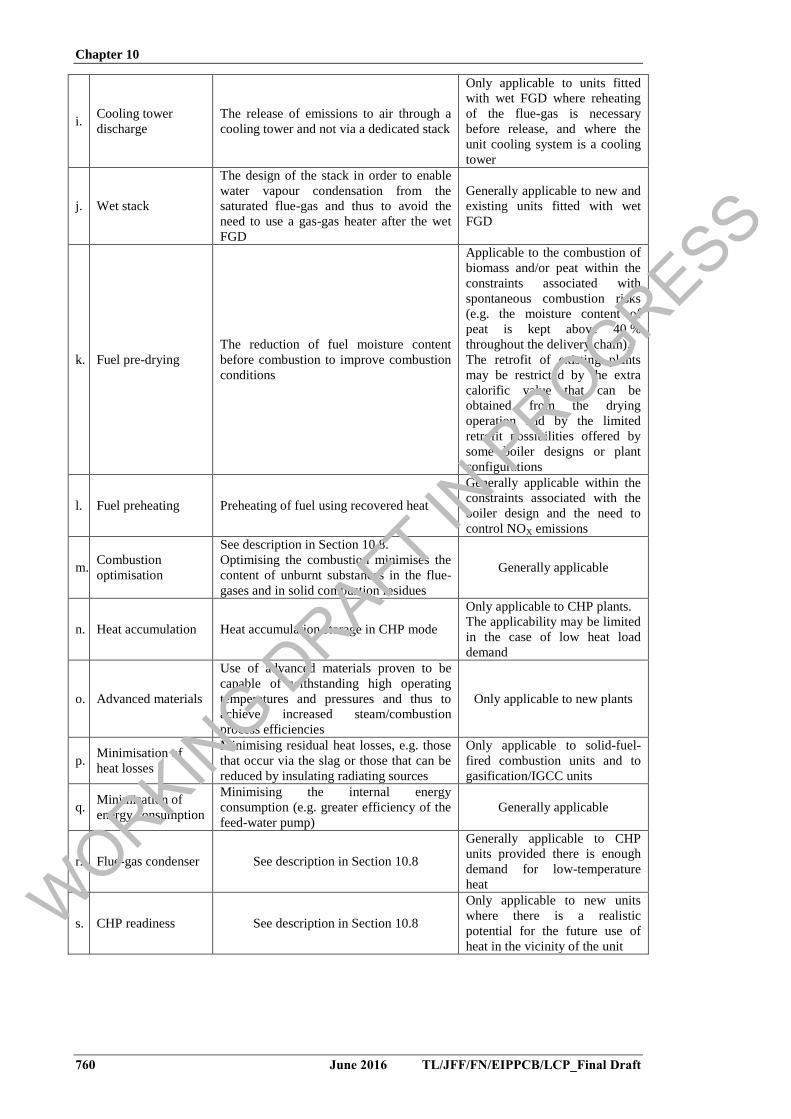
Chapter 10
760 June 2016 TL/JFF/FN/EIPPCB/LCP_Final Draft
i. Cooling tower
discharge
The release of emissions to air through a
cooling tower and not via a dedicated stack
Only applicable to units fitted
with wet FGD where reheating
of the flue-gas is necessary
before release, and where the
unit cooling system is a cooling
tower
j. Wet stack
The design of the stack in order to enable
water vapour condensation from the
saturated flue-gas and thus to avoid the
need to use a gas-gas heater after the wet
FGD
Generally applicable to new and
existing units fitted with wet
FGD
k. Fuel pre-drying
The reduction of fuel moisture content
before combustion to improve combustion
conditions
Applicable to the combustion of
biomass and/or peat within the
constraints associated with
spontaneous combustion risks
(e.g. the moisture content of
peat is kept above 40 %
throughout the delivery chain).
The retrofit of existing plants
may be restricted by the extra
calorific value that can be
obtained from the drying
operation and by the limited
retrofit possibilities offered by
some boiler designs or plant
configurations
l. Fuel preheating Preheating of fuel using recovered heat
Generally applicable within the
constraints associated with the
boiler design and the need to
control NOX emissions
m. Combustion
optimisation
See description in Section 10.8.
Optimising the combustion minimises the
content of unburnt substances in the flue-
gases and in solid combustion residues
Generally applicable
n. Heat accumulation Heat accumulation storage in CHP mode
Only applicable to CHP plants.
The applicability may be limited
in the case of low heat load
demand
o. Advanced materials
Use of advanced materials proven to be
capable of withstanding high operating
temperatures and pressures and thus to
achieve increased steam/combustion
process efficiencies
Only applicable to new plants
p. Minimisation of
heat losses
Minimising residual heat losses, e.g. those
that occur via the slag or those that can be
reduced by insulating radiating sources
Only applicable to solid-fuel-
fired combustion units and to
gasification/IGCC units
q. Minimisation of
energy consumption
Minimising the internal energy
consumption (e.g. greater efficiency of the
feed-water pump)
Generally applicable
r. Flue-gas condenser See description in Section 10.8
Generally applicable to CHP
units provided there is enough
demand for low-temperature
heat
s. CHP readiness See description in Section 10.8
Only applicable to new units
where there is a realistic
potential for the future use of
heat in the vicinity of the unit
WORKIN
GDRAFT IN
PROGRESS

Chapter 10
TL/JFF/FN/EIPPCB/LCP_Final Draft June 2016 761
10.1.5 Removed
BAT 8. Removed
BAT 9. Removed
10.1.6 Water usage and emissions to water
BAT 10. In order to reduce water usage and the volume of contaminated waste water
discharged, BAT is to use one or both of the techniques given below.
Technique Description Applicability
a. Water recycling
Residual aqueous streams, including run-
off water, from the plant are reused for
other purposes. The degree of recycling is
limited by the quality requirements of the
recipient water stream and the water
balance of the plant
Not applicable to waste water
from cooling systems when water
treatment chemicals and/or high
concentrations of salts from
seawater are present
b. Dry bottom ash
handling
Dry, hot bottom ash falls from the furnace
onto a mechanical conveyor system and is
cooled down by air or water in a closed
cycle. No water is used in direct contact
with the ash for cooling or transportation
Only applicable to plants
combusting solid fuels.
There may be technical
restrictions that prevent
retrofitting to existing
combustion plants
BAT 10 bis. In order to prevent the contamination of uncontaminated waste water and
to reduce emissions to water, BAT is to segregate waste water streams and to treat them
separately, depending on the pollutant content.
Description Waste water streams that are typically segregated and treated include surface run-off water,
cooling water, and waste water from flue-gas treatment.
Applicability
The applicability may be restricted in the case of existing plants due to the configuration of the
drainage systems.
WORKIN
GDRAFT IN
PROGRESS

Chapter 10
762 June 2016 TL/JFF/FN/EIPPCB/LCP_Final Draft
BAT 11. In order to reduce emissions to water from flue-gas treatment, BAT is to use an
appropriate combination of the techniques given below, and to use secondary techniques
as close as possible to the source in order to avoid dilution.
Technique Typical pollutants
prevented/abated Applicability
Primary techniques
a.
Optimised combustion (see
BAT 4) and flue-gas
treatment systems (e.g.
SCR/SNCR, see BAT 4 bis)
Organic compounds,
ammonia (NH3) Generally applicable
Secondary techniques (1)
b. Adsorption on activated
carbon
Organic compounds,
mercury (Hg) Generally applicable
c. Aerobic biological treatment
Biodegradable organic
compounds,
ammonium (NH4+)
Generally applicable for the treatment of
organic compounds. Aerobic biological
treatment of ammonium (NH4+) may not
be applicable in the case of high chloride
concentrations (i.e. around 10 g/l)
d. Anoxic/anaerobic biological
treatment
Mercury (Hg), nitrate
(NO3-), nitrite (NO2
-)
Generally applicable
e. Coagulation and flocculation Suspended solids Generally applicable
f. Crystallisation
Metals and metalloids,
sulphate (SO42-
),
fluoride (F-)
Generally applicable
g. Filtration (e.g. sand filtration,
microfiltration, ultrafiltration)
Suspended solids,
metals Generally applicable
h. Flotation Suspended solids, free
oil Generally applicable
i. Ion exchange Metals Generally applicable
j. Neutralisation Acids, alkalis Generally applicable
k. Oxidation Sulphide (S
2-), sulphite
(SO32-
) Generally applicable
l. Precipitation
Metals and metalloids,
sulphate (SO42-
),
fluoride (F-)
Generally applicable
m. Sedimentation Suspended solids Generally applicable
n. Stripping Ammonia (NH3) Generally applicable (1) The descriptions of the techniques are given in Section 10.8.6.
The BAT-AELs refer to direct discharges to a receiving water body at the point where the
emission leaves the installation.
WORKIN
GDRAFT IN
PROGRESS

Chapter 10
TL/JFF/FN/EIPPCB/LCP_Final Draft June 2016 763
Table 10.1: BAT-AELs for direct discharges to a receiving water body from flue-gas treatment
Substance/Parameter BAT-AELs
Daily average
Total organic carbon (TOC) 20–50 mg/l (1) (
4) (
5)
Chemical oxygen demand (COD) 60–150 mg/l (1) (
4) (
5)
Total suspended solids (TSS) 10–30 mg/l
Fluoride (F-) 10–25 mg/l (
5)
Sulphate (SO42-
) 1.3–2.0 g/l (2) (
3) (
5) (
6)
Sulphide (S2-
), easily released 0.1–0.2 mg/l (5)
Sulphite (SO32-
) 1–20 mg/l (5)
Metals and metalloids
As 10–50 µg/l
Cd 2–5 µg/l
Cr 10–50 µg/l
Cu 10–50 µg/l
Hg 0.2–3 µg/l
Ni 10–50 µg/l
Pb 10–20 µg/l
Zn 50–200 µg/l (1) Either the BAT-AEL for TOC or the BAT-AEL for COD applies. TOC is the preferred option because its
monitoring does not rely on the use of very toxic compounds.
(2) The BAT-AEL only applies to combustion plants using calcium compounds in flue-gas treatment.
(3) The upper end of the range may not apply in the case of highly saline waste water (e.g. chloride
concentrations ≥ 5 g/l) due to the increased solubility of calcium sulphate.
(4) These BAT-AELs apply after subtraction of the intake load.
(5) These BAT-AELs only apply to waste water from the use of wet FGD.
(6) This BAT-AEL does not apply to discharges to the sea or brackish water bodies.
WORKIN
GDRAFT IN
PROGRESS
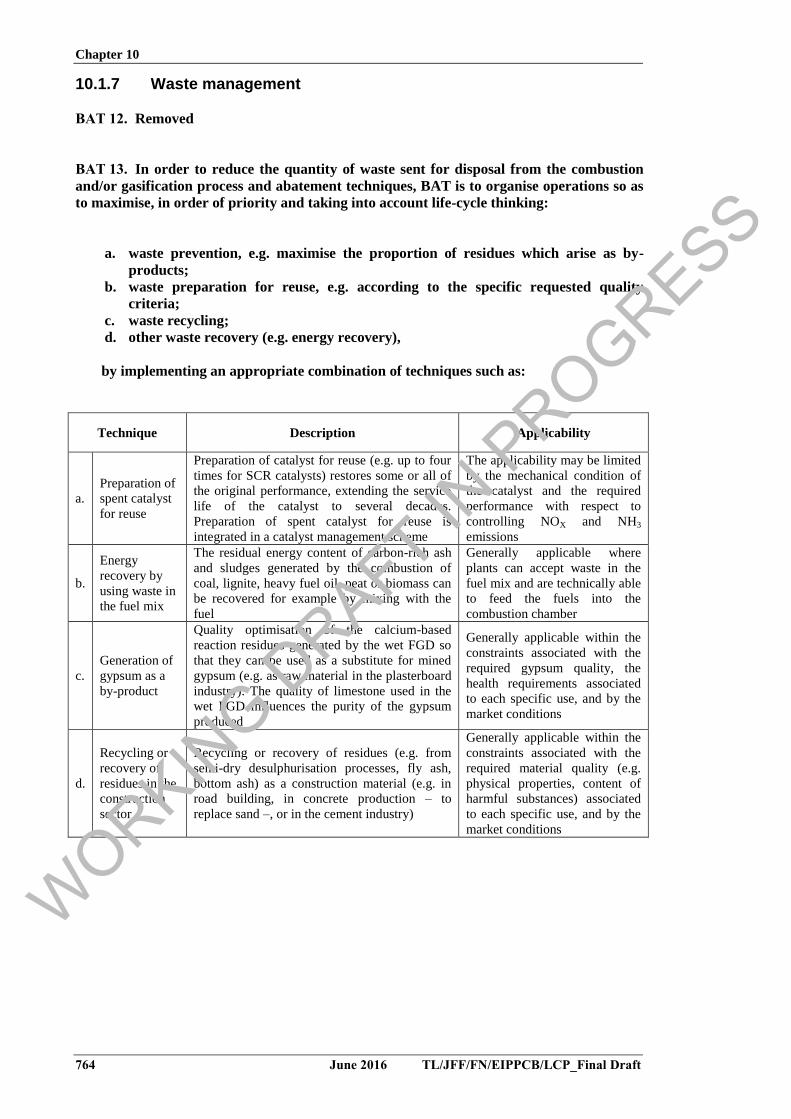
Chapter 10
764 June 2016 TL/JFF/FN/EIPPCB/LCP_Final Draft
10.1.7 Waste management
BAT 12. Removed
BAT 13. In order to reduce the quantity of waste sent for disposal from the combustion
and/or gasification process and abatement techniques, BAT is to organise operations so as
to maximise, in order of priority and taking into account life-cycle thinking:
a. waste prevention, e.g. maximise the proportion of residues which arise as by-
products;
b. waste preparation for reuse, e.g. according to the specific requested quality
criteria;
c. waste recycling;
d. other waste recovery (e.g. energy recovery),
by implementing an appropriate combination of techniques such as:
Technique Description Applicability
a.
Preparation of
spent catalyst
for reuse
Preparation of catalyst for reuse (e.g. up to four
times for SCR catalysts) restores some or all of
the original performance, extending the service
life of the catalyst to several decades.
Preparation of spent catalyst for reuse is
integrated in a catalyst management scheme
The applicability may be limited
by the mechanical condition of
the catalyst and the required
performance with respect to
controlling NOX and NH3
emissions
b.
Energy
recovery by
using waste in
the fuel mix
The residual energy content of carbon-rich ash
and sludges generated by the combustion of
coal, lignite, heavy fuel oil, peat or biomass can
be recovered for example by mixing with the
fuel
Generally applicable where
plants can accept waste in the
fuel mix and are technically able
to feed the fuels into the
combustion chamber
c.
Generation of
gypsum as a
by-product
Quality optimisation of the calcium-based
reaction residues generated by the wet FGD so
that they can be used as a substitute for mined
gypsum (e.g. as raw material in the plasterboard
industry). The quality of limestone used in the
wet FGD influences the purity of the gypsum
produced
Generally applicable within the
constraints associated with the
required gypsum quality, the
health requirements associated
to each specific use, and by the
market conditions
d.
Recycling or
recovery of
residues in the
construction
sector
Recycling or recovery of residues (e.g. from
semi-dry desulphurisation processes, fly ash,
bottom ash) as a construction material (e.g. in
road building, in concrete production – to
replace sand –, or in the cement industry)
Generally applicable within the
constraints associated with the
required material quality (e.g.
physical properties, content of
harmful substances) associated
to each specific use, and by the
market conditions
WORKIN
GDRAFT IN
PROGRESS

Chapter 10
TL/JFF/FN/EIPPCB/LCP_Final Draft June 2016 765
10.1.8 Noise emissions
BAT 14. In order to reduce noise emissions, BAT is to use one or a combination of the
techniques given below.
Technique Description Applicability
a.
Appropriate location of
equipment and
buildings
Noise levels can be reduced by
increasing the distance between the
emitter and the receiver and by using
buildings as noise screens
Generally applicable to new plants.
In the case of existing plants, the
relocation of equipment and
production units may be restricted
by lack of space or by excessive
costs
b. Operational measures
These include:
improved inspection and
maintenance of equipment
closing of doors and windows
of enclosed areas, if possible
equipment operated by
experienced staff
avoidance of noisy activities at
night, if possible
provisions for noise control
during maintenance activities
Generally applicable
c. Low-noise equipment This potentially includes
compressors, pumps and disks
Generally applicable when the
equipment is new or replaced
d. Noise abatement
Noise propagation can be reduced
by inserting obstacles between the
emitter and the receiver.
Appropriate obstacles include
protection walls, embankments and
buildings
Generally applicable to new plants.
In the case of existing plants, the
insertion of obstacles may be
restricted by lack of space
e. Noise-control
equipment
This includes:
i. noise-reducers
ii. vibration or acoustic
insulation, or vibration isolation
iii. enclosure of noisy
equipment
iv. soundproofing of buildings
The applicability may be restricted
by lack of space
10.1.9 Removed
BAT 15. Removed 10.1.10 Removed
BAT 16. Removed
WORKIN
GDRAFT IN
PROGRESS
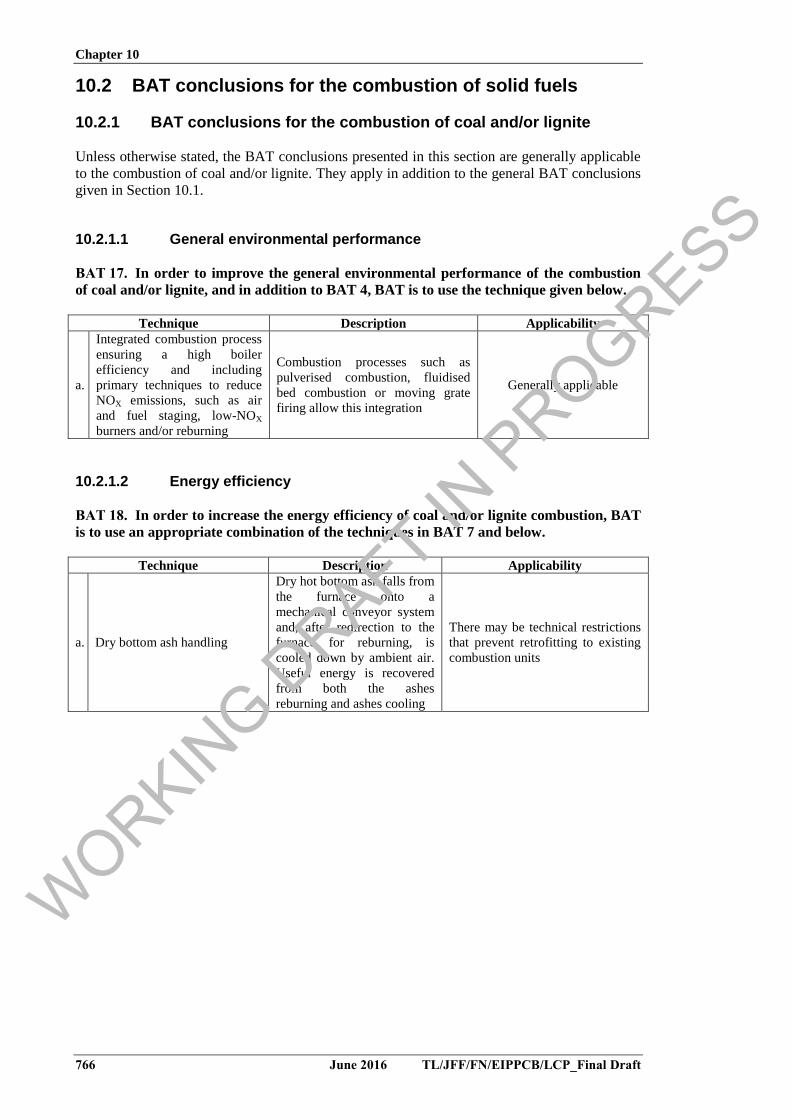
Chapter 10
766 June 2016 TL/JFF/FN/EIPPCB/LCP_Final Draft
10.2 BAT conclusions for the combustion of solid fuels
10.2.1 BAT conclusions for the combustion of coal and/or lignite
Unless otherwise stated, the BAT conclusions presented in this section are generally applicable
to the combustion of coal and/or lignite. They apply in addition to the general BAT conclusions
given in Section 10.1.
10.2.1.1 General environmental performance
BAT 17. In order to improve the general environmental performance of the combustion
of coal and/or lignite, and in addition to BAT 4, BAT is to use the technique given below.
Technique Description Applicability
a.
Integrated combustion process
ensuring a high boiler
efficiency and including
primary techniques to reduce
NOX emissions, such as air
and fuel staging, low-NOX
burners and/or reburning
Combustion processes such as
pulverised combustion, fluidised
bed combustion or moving grate
firing allow this integration
Generally applicable
10.2.1.2 Energy efficiency
BAT 18. In order to increase the energy efficiency of coal and/or lignite combustion, BAT
is to use an appropriate combination of the techniques in BAT 7 and below.
Technique Description Applicability
a. Dry bottom ash handling
Dry hot bottom ash falls from
the furnace onto a
mechanical conveyor system
and, after redirection to the
furnace for reburning, is
cooled down by ambient air.
Useful energy is recovered
from both the ashes
reburning and ashes cooling
There may be technical restrictions
that prevent retrofitting to existing
combustion units
WORKIN
GDRAFT IN
PROGRESS

Chapter 10
TL/JFF/FN/EIPPCB/LCP_Final Draft June 2016 767
Table 10.2: BAT-associated energy efficiency levels (BAT-AEELs) for coal and/or lignite
combustion
Type of combustion unit
BAT-AEELs (7) (
12)
Net electrical efficiency (%) (1)
Net total fuel utilisation
(%) (1) (
6) (
13)
New unit (2) (4) Existing unit (2) (3) New or existing unit
Coal-fired, ≥ 1000 MWth 45–46 33.5–44 75–97
Lignite-fired,
≥ 1000 MWth 42–44 (
5) 33.5–42.5 75–97
Coal-fired, < 1000 MWth 36.5–41.5 (10
) 32.5–41.5 75–97
Lignite-fired,
< 1000 MWth 36.5–40 (
11) 31.5–39.5 75–97
(1) Within the given BAT-AEEL ranges, the achieved energy efficiency can be negatively affected (up to four
percentage points) by the type of cooling system used or the geographical location of the unit.
(2) The lower ends of the BAT-AEEL ranges are achieved in the case of unfavourable climatic conditions, low-grade
lignite-fired units, and/or old units (first commissioned before 1985).
(3) The achievable improvement of thermal efficiency depends on the specific unit, but an increase of more than three
percentage points is seen as associated with the use of BAT for existing units, depending on the original design of the
unit and on the retrofits already performed.
(4) The higher end of the BAT-AEEL range can be achieved with high steam parameters (pressure, temperature).
(5) In the case of units burning lignite with a lower heating value below 6 MJ/kg, the lower end of the BAT-AEEL
range is 41.5 %.
(6) These levels may not be achievable in case the potential heat demand is too low.
(7) These BAT-AEELs do not apply in the case of units operated < 1500 h/yr.
(10) The higher end of the BAT-AEEL range may be up to 46 % in the case of units of ≥ 600 MWth using supercritical
or ultra-supercritical steam conditions.
(11) The higher end of the BAT-AEEL range may be up to 44 % in the case of units of ≥ 600 MWth using supercritical
or ultra-supercritical steam conditions.
(12) In the case of CHP units, only one of the two BAT-AEELs 'Net electrical efficiency' or 'Net total fuel utilisation'
applies, depending on the CHP unit design (i.e. either more oriented towards electricity generation or towards heat
generation).
(13) These BAT-AEELs do not apply to plants generating only electricity.
WORKIN
GDRAFT IN
PROGRESS

Chapter 10
768 June 2016 TL/JFF/FN/EIPPCB/LCP_Final Draft
10.2.1.3 NOX, N2O and CO emissions to air
BAT 19. In order to prevent and/or reduce NOX emissions to air while limiting CO and
N2O emissions to air from the combustion of coal and/or lignite, BAT is to use one or a
combination of the techniques given below.
Technique Description Applicability
a. Combustion optimisation
See description in Section 10.8.
Generally used in combination
with other techniques
Generally applicable
b.
Combination of other
primary techniques for NOX
reduction (e.g. air staging,
fuel staging, flue-gas
recirculation, LNB)
See description in Section 10.8
for each single technique.
The choice and performance of
(an) appropriate (combination of)
primary techniques may be
influenced by the boiler design
Generally applicable
c. Selective non-catalytic
reduction (SNCR)
See description in Section 10.8.
Can be applied with 'slip' SCR
The applicability may be limited
in the case of boilers with a high
cross-sectional area preventing
homogeneous mixing of NH3
and NOX.
The applicability may be limited
in the case of combustion plants
operated < 1500 h/yr with highly
variable boiler loads
d. Selective catalytic reduction
(SCR) See description in Section 10.8.
Not applicable to combustion
plants of < 300 MWth operated
< 500 h/yr.
Not generally applicable to
combustion plants of
< 100 MWth.
There may be technical and
economic restrictions for
retrofitting existing combustion
plants operated between
500 h/yr and 1500 h/yr and for
existing combustion plants of
≥ 300 MWth operated < 500 h/yr
e. Combined techniques for
NOX and SOX reduction See description in Section 10.8.
Applicable on a case-by-case
basis, depending on the fuel
characteristics and combustion
process
WORKIN
GDRAFT IN
PROGRESS

Chapter 10
TL/JFF/FN/EIPPCB/LCP_Final Draft June 2016 769
Table 10.3: BAT-associated emission levels (BAT-AELs) for NOX emissions to air from the
combustion of coal and/or lignite
Combustion plant
total rated thermal
input
(MWth)
BAT-AELs (mg/Nm3)
Yearly average Daily average or average over the
sampling period
New plant Existing plant (4) New plant Existing plant (
7) (
11)
< 100 100–150 100–270 155–200 165–330
100–300 50–100 100–180 80–130 155–210
≥ 300, FBC boiler
combusting coal and/or
lignite and lignite-fired
PC boiler
50–85 < 85–150 (8)(
9) 80–125 140–165 (
10)
≥ 300, coal-fired PC
boiler 65–85 65–150 80–125 < 85–165 (
6)
(4) These BAT-AELs do not apply to plants operated < 1500 h/yr.
(6) In the case of plants put into operation no later than 7 January 2014, the higher end of the range is 200 mg/Nm3 for
plants operated ≥ 1500 h/yr, and 220 mg/Nm3 for plants operated < 1500 h/yr.
(7) In the case of plants put into operation no later than 1 July 1987, which are operated < 1500 h/yr and for which
SCR and/or SNCR is not applicable, the higher end of the range is 340 mg/Nm3.
(8) The lower end of the range is considered achievable when using SCR.
(9) The higher end of the range is 175 mg/Nm3 for FBC boilers put into operation no later than 7 January 2014 and for
lignite-fired PC boilers.
(10) The higher end of the range is 220 mg/Nm3 for FBC boilers put into operation no later than 7 January 2014 and
for lignite-fired PC boilers.
(11) These levels are indicative for plants operated < 500 h/yr.
As an indication, the yearly average CO emission levels for existing combustion plants operated
≥ 1500 h/yr or for new combustion plants will generally be as follows:
Combustion plant total rated thermal input (MWth) CO indicative emission
level (mg/Nm3)
< 300 < 30–140
≥ 300, FBC boiler combusting coal and/or lignite and lignite-fired PC boiler < 30–100 (1)
≥ 300, coal-fired PC boiler < 5–100 (1)
(1) The higher end of the range may be up to 140 mg/Nm3 in the case of limitations due to boiler design, and/or in the
case of fluidised bed boilers not fitted with secondary abatement techniques for NOX emissions reduction.
BAT 20. Removed
Table 10.4: Removed
WORKIN
GDRAFT IN
PROGRESS
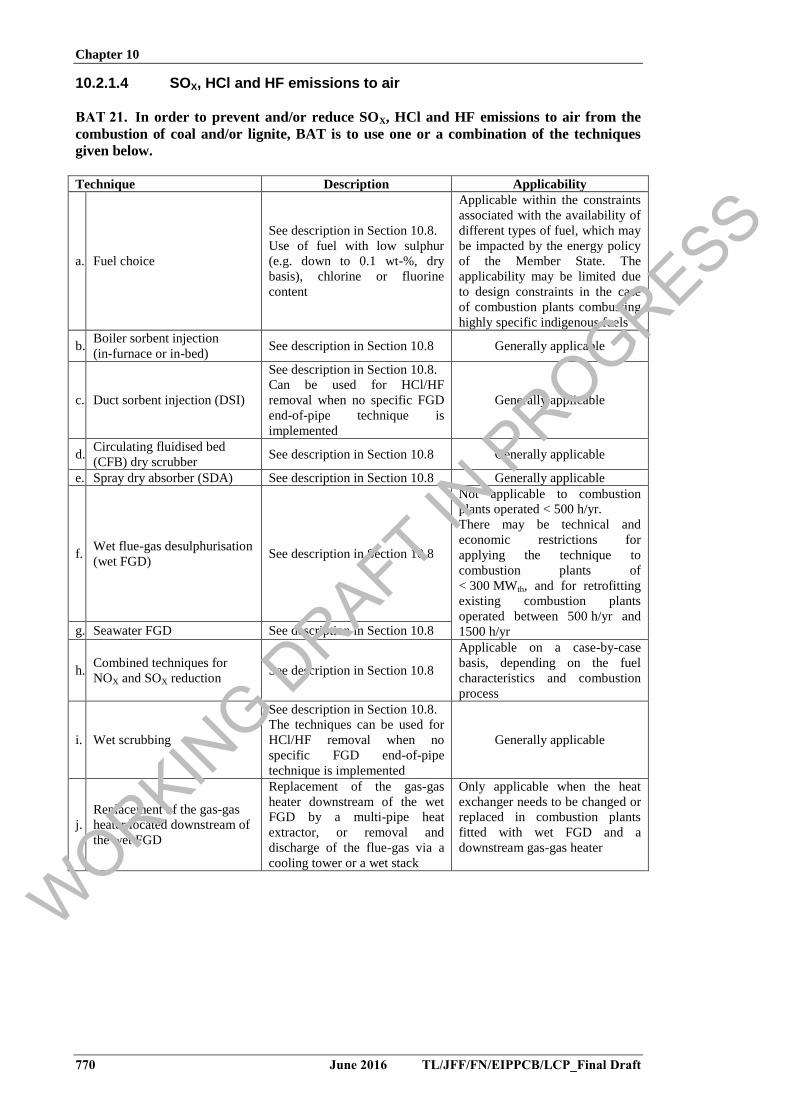
Chapter 10
770 June 2016 TL/JFF/FN/EIPPCB/LCP_Final Draft
10.2.1.4 SOX, HCl and HF emissions to air
BAT 21. In order to prevent and/or reduce SOX, HCl and HF emissions to air from the
combustion of coal and/or lignite, BAT is to use one or a combination of the techniques
given below.
Technique Description Applicability
a. Fuel choice
See description in Section 10.8.
Use of fuel with low sulphur
(e.g. down to 0.1 wt-%, dry
basis), chlorine or fluorine
content
Applicable within the constraints
associated with the availability of
different types of fuel, which may
be impacted by the energy policy
of the Member State. The
applicability may be limited due
to design constraints in the case
of combustion plants combusting
highly specific indigenous fuels
b. Boiler sorbent injection
(in-furnace or in-bed) See description in Section 10.8 Generally applicable
c. Duct sorbent injection (DSI)
See description in Section 10.8.
Can be used for HCl/HF
removal when no specific FGD
end-of-pipe technique is
implemented
Generally applicable
d. Circulating fluidised bed
(CFB) dry scrubber See description in Section 10.8 Generally applicable
e. Spray dry absorber (SDA) See description in Section 10.8 Generally applicable
f. Wet flue-gas desulphurisation
(wet FGD) See description in Section 10.8
Not applicable to combustion
plants operated < 500 h/yr.
There may be technical and
economic restrictions for
applying the technique to
combustion plants of
< 300 MWth, and for retrofitting
existing combustion plants
operated between 500 h/yr and
1500 h/yr g. Seawater FGD See description in Section 10.8
h. Combined techniques for
NOX and SOX reduction See description in Section 10.8
Applicable on a case-by-case
basis, depending on the fuel
characteristics and combustion
process
i. Wet scrubbing
See description in Section 10.8.
The techniques can be used for
HCl/HF removal when no
specific FGD end-of-pipe
technique is implemented
Generally applicable
j.
Replacement of the gas-gas
heater located downstream of
the wet FGD
Replacement of the gas-gas
heater downstream of the wet
FGD by a multi-pipe heat
extractor, or removal and
discharge of the flue-gas via a
cooling tower or a wet stack
Only applicable when the heat
exchanger needs to be changed or
replaced in combustion plants
fitted with wet FGD and a
downstream gas-gas heater
WORKIN
GDRAFT IN
PROGRESS

Chapter 10
TL/JFF/FN/EIPPCB/LCP_Final Draft June 2016 771
Table 10.5: BAT-associated emission levels (BAT-AELs) for SO2 emissions to air from the
combustion of coal and/or lignite
Combustion plant
total rated thermal
input
(MWth)
BAT-AELs (mg/Nm3)
Yearly average Daily
average
Daily average or
average over the
sampling period
New plant Existing plant (3) New plant Existing plant (
7)
< 100 150–200 150–360 170–220 170–400
100–300 80–150 95–200 135–200 135–220 (5)
≥ 300, PC boiler 10–75 10–130 (6) 25–110 25–165 (
4)
≥ 300, Fluidised bed
boiler (1)
20–75 20–180 25–110 50–220
(1) For circulating fluidised bed boilers, the lower end of the range can be achieved by using high-efficiency wet
FGD. The higher end of the range can be achieved by using boiler in-bed sorbent injection.
(3) These BAT-AELs do not apply to plants operated < 1500 h/yr.
(4) The higher end of the BAT-AEL range is 220 mg/Nm3 in the case of plants put into operation no later than
7 January 2014 and operated < 1500 h/yr. For other existing plants put into operation no later than 7 January 2014, the
higher end of the BAT-AEL range is 205 mg/Nm3.
(5) In the case of plants put into operation no later than 7 January 2014, the upper end of the BAT-AEL range
is 250 mg/Nm3.
(6) The lower end of the range can be achieved when using low-sulphur fuel in combination with a wet abatement
system.
(7) These levels are indicative for plants operated < 500 h/yr.
For a combustion plant with a total rated thermal input of more than 300 MW, which is
specifically designed to fire indigenous lignite fuels and which can demonstrate that it
cannot achieve the BAT-AELs mentioned in
Table 10.5 for techno-economic reasons, the daily average BAT-AELs set out in Table
10.5 do not apply, and the upper end of the yearly average BAT-AEL range is as
follows:
(i) for a new FGD system: RCG x 0.01 with a maximum of 200 mg/Nm3;
(ii) for an existing FGD system: RCG x 0.03 with a maximum of 320 mg/Nm3;
in which RCG represents the concentration of SO2 in the raw flue-gas as a yearly
average (under the standard conditions given under General considerations) at the inlet
of the SOX abatement system, expressed at a reference oxygen content of 6 vol-% O2.
(iii) If boiler sorbent injection is applied as part of the FGD system, the RCG may be
adjusted by taking into account the SO2 reduction efficiency of this technique (ηBSI), as
follows: RCG (adjusted) = RCG (measured) / (1-ηBSI).
WORKIN
GDRAFT IN
PROGRESS
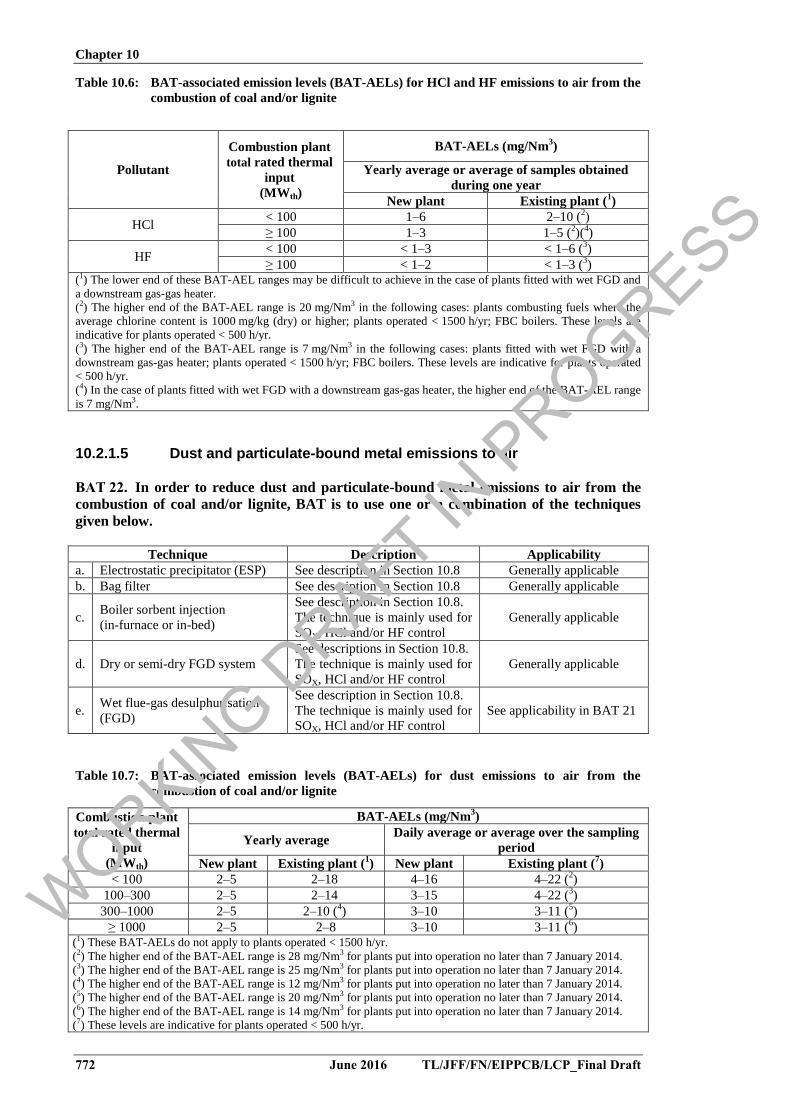
Chapter 10
772 June 2016 TL/JFF/FN/EIPPCB/LCP_Final Draft
Table 10.6: BAT-associated emission levels (BAT-AELs) for HCl and HF emissions to air from the
combustion of coal and/or lignite
Pollutant
Combustion plant
total rated thermal
input
(MWth)
BAT-AELs (mg/Nm3)
Yearly average or average of samples obtained
during one year
New plant Existing plant (1)
HCl < 100 1–6 2–10 (
2)
≥ 100 1–3 1–5 (2)(
4)
HF < 100 < 1–3 < 1–6 (
3)
≥ 100 < 1–2 < 1–3 (3)
(1) The lower end of these BAT-AEL ranges may be difficult to achieve in the case of plants fitted with wet FGD and
a downstream gas-gas heater.
(2) The higher end of the BAT-AEL range is 20 mg/Nm3 in the following cases: plants combusting fuels where the
average chlorine content is 1000 mg/kg (dry) or higher; plants operated < 1500 h/yr; FBC boilers. These levels are
indicative for plants operated < 500 h/yr.
(3) The higher end of the BAT-AEL range is 7 mg/Nm3 in the following cases: plants fitted with wet FGD with a
downstream gas-gas heater; plants operated < 1500 h/yr; FBC boilers. These levels are indicative for plants operated
< 500 h/yr.
(4) In the case of plants fitted with wet FGD with a downstream gas-gas heater, the higher end of the BAT-AEL range
is 7 mg/Nm3.
10.2.1.5 Dust and particulate-bound metal emissions to air
BAT 22. In order to reduce dust and particulate-bound metal emissions to air from the
combustion of coal and/or lignite, BAT is to use one or a combination of the techniques
given below.
Technique Description Applicability
a. Electrostatic precipitator (ESP) See description in Section 10.8 Generally applicable
b. Bag filter See description in Section 10.8 Generally applicable
c. Boiler sorbent injection
(in-furnace or in-bed)
See description in Section 10.8.
The technique is mainly used for
SOX, HCl and/or HF control
Generally applicable
d. Dry or semi-dry FGD system
See descriptions in Section 10.8.
The technique is mainly used for
SOX, HCl and/or HF control
Generally applicable
e. Wet flue-gas desulphurisation
(FGD)
See description in Section 10.8.
The technique is mainly used for
SOX, HCl and/or HF control
See applicability in BAT 21
Table 10.7: BAT-associated emission levels (BAT-AELs) for dust emissions to air from the
combustion of coal and/or lignite
Combustion plant
total rated thermal
input
(MWth)
BAT-AELs (mg/Nm3)
Yearly average Daily average or average over the sampling
period
New plant Existing plant (1) New plant Existing plant (
7)
< 100 2–5 2–18 4–16 4–22 (2)
100–300 2–5 2–14 3–15 4–22 (3)
300–1000 2–5 2–10 (4) 3–10 3–11 (
5)
≥ 1000 2–5 2–8 3–10 3–11 (6)
(1) These BAT-AELs do not apply to plants operated < 1500 h/yr.
(2) The higher end of the BAT-AEL range is 28 mg/Nm3 for plants put into operation no later than 7 January 2014.
(3) The higher end of the BAT-AEL range is 25 mg/Nm3 for plants put into operation no later than 7 January 2014.
(4) The higher end of the BAT-AEL range is 12 mg/Nm3 for plants put into operation no later than 7 January 2014.
(5) The higher end of the BAT-AEL range is 20 mg/Nm3 for plants put into operation no later than 7 January 2014.
(6) The higher end of the BAT-AEL range is 14 mg/Nm3 for plants put into operation no later than 7 January 2014.
(7) These levels are indicative for plants operated < 500 h/yr.
WORKIN
GDRAFT IN
PROGRESS
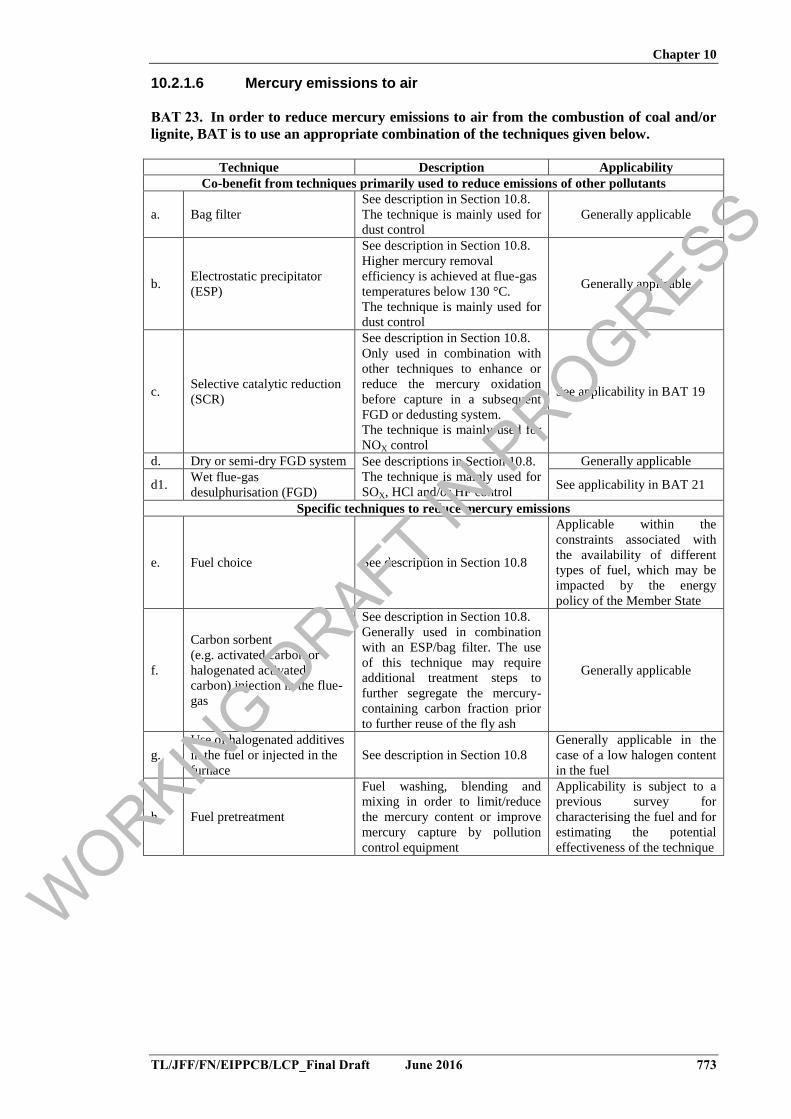
Chapter 10
TL/JFF/FN/EIPPCB/LCP_Final Draft June 2016 773
10.2.1.6 Mercury emissions to air
BAT 23. In order to reduce mercury emissions to air from the combustion of coal and/or
lignite, BAT is to use an appropriate combination of the techniques given below.
Technique Description Applicability
Co-benefit from techniques primarily used to reduce emissions of other pollutants
a. Bag filter
See description in Section 10.8.
The technique is mainly used for
dust control
Generally applicable
b. Electrostatic precipitator
(ESP)
See description in Section 10.8.
Higher mercury removal
efficiency is achieved at flue-gas
temperatures below 130 °C.
The technique is mainly used for
dust control
Generally applicable
c. Selective catalytic reduction
(SCR)
See description in Section 10.8.
Only used in combination with
other techniques to enhance or
reduce the mercury oxidation
before capture in a subsequent
FGD or dedusting system.
The technique is mainly used for
NOX control
See applicability in BAT 19
d. Dry or semi-dry FGD system See descriptions in Section 10.8.
The technique is mainly used for
SOX, HCl and/or HF control
Generally applicable
d1. Wet flue-gas
desulphurisation (FGD) See applicability in BAT 21
Specific techniques to reduce mercury emissions
e. Fuel choice See description in Section 10.8
Applicable within the
constraints associated with
the availability of different
types of fuel, which may be
impacted by the energy
policy of the Member State
f.
Carbon sorbent
(e.g. activated carbon or
halogenated activated
carbon) injection in the flue-
gas
See description in Section 10.8.
Generally used in combination
with an ESP/bag filter. The use
of this technique may require
additional treatment steps to
further segregate the mercury-
containing carbon fraction prior
to further reuse of the fly ash
Generally applicable
g.
Use of halogenated additives
in the fuel or injected in the
furnace
See description in Section 10.8
Generally applicable in the
case of a low halogen content
in the fuel
h. Fuel pretreatment
Fuel washing, blending and
mixing in order to limit/reduce
the mercury content or improve
mercury capture by pollution
control equipment
Applicability is subject to a
previous survey for
characterising the fuel and for
estimating the potential
effectiveness of the technique
WORKIN
GDRAFT IN
PROGRESS
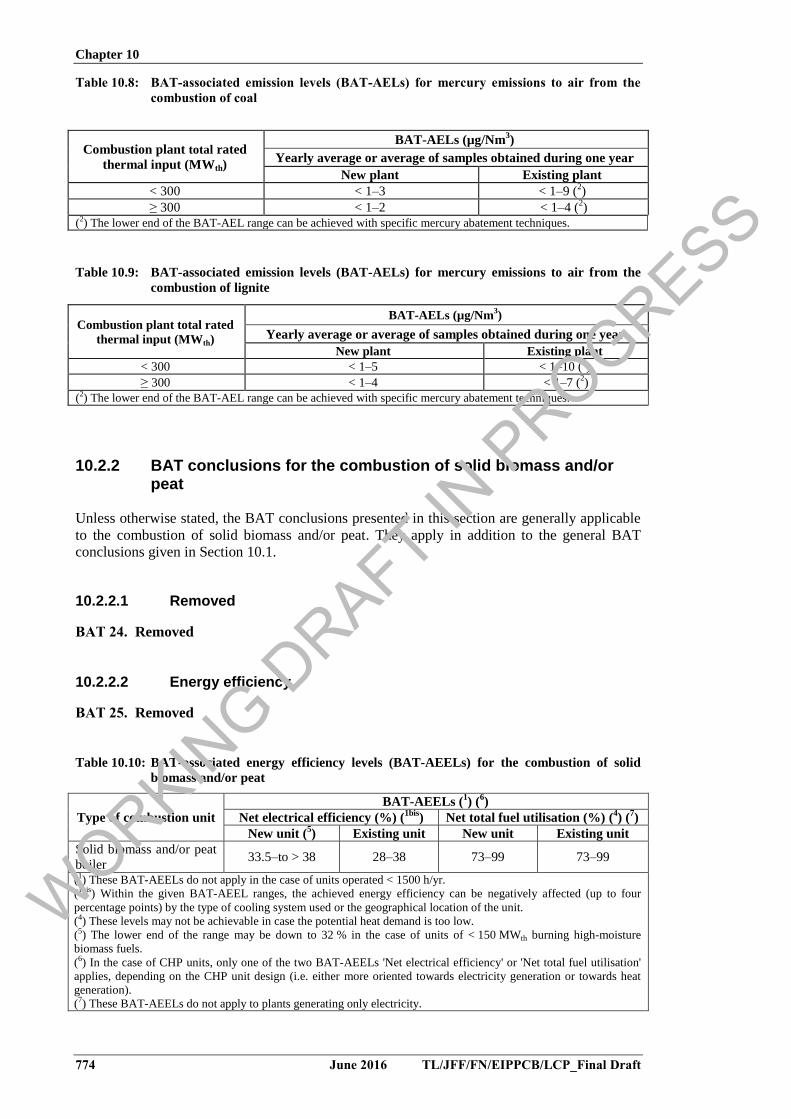
Chapter 10
774 June 2016 TL/JFF/FN/EIPPCB/LCP_Final Draft
Table 10.8: BAT-associated emission levels (BAT-AELs) for mercury emissions to air from the
combustion of coal
Combustion plant total rated
thermal input (MWth)
BAT-AELs (µg/Nm3)
Yearly average or average of samples obtained during one year
New plant Existing plant
< 300 < 1–3 < 1–9 (2)
≥ 300 < 1–2 < 1–4 (2)
(2) The lower end of the BAT-AEL range can be achieved with specific mercury abatement techniques.
Table 10.9: BAT-associated emission levels (BAT-AELs) for mercury emissions to air from the
combustion of lignite
Combustion plant total rated
thermal input (MWth)
BAT-AELs (µg/Nm3)
Yearly average or average of samples obtained during one year
New plant Existing plant
< 300 < 1–5 < 1–10 (2)
≥ 300 < 1–4 < 1–7 (2)
(2) The lower end of the BAT-AEL range can be achieved with specific mercury abatement techniques.
10.2.2 BAT conclusions for the combustion of solid biomass and/or peat
Unless otherwise stated, the BAT conclusions presented in this section are generally applicable
to the combustion of solid biomass and/or peat. They apply in addition to the general BAT
conclusions given in Section 10.1.
10.2.2.1 Removed
BAT 24. Removed
10.2.2.2 Energy efficiency
BAT 25. Removed
Table 10.10: BAT-associated energy efficiency levels (BAT-AEELs) for the combustion of solid
biomass and/or peat
Type of combustion unit
BAT-AEELs (1) (
6)
Net electrical efficiency (%) (1bis
) Net total fuel utilisation (%) (4) (
7)
New unit (5) Existing unit New unit Existing unit
Solid biomass and/or peat
boiler 33.5–to > 38 28–38 73–99 73–99
(1) These BAT-AEELs do not apply in the case of units operated < 1500 h/yr.
(1bis) Within the given BAT-AEEL ranges, the achieved energy efficiency can be negatively affected (up to four
percentage points) by the type of cooling system used or the geographical location of the unit.
(4) These levels may not be achievable in case the potential heat demand is too low.
(5) The lower end of the range may be down to 32 % in the case of units of < 150 MWth burning high-moisture
biomass fuels.
(6) In the case of CHP units, only one of the two BAT-AEELs 'Net electrical efficiency' or 'Net total fuel utilisation'
applies, depending on the CHP unit design (i.e. either more oriented towards electricity generation or towards heat
generation).
(7) These BAT-AEELs do not apply to plants generating only electricity.
WORKIN
GDRAFT IN
PROGRESS
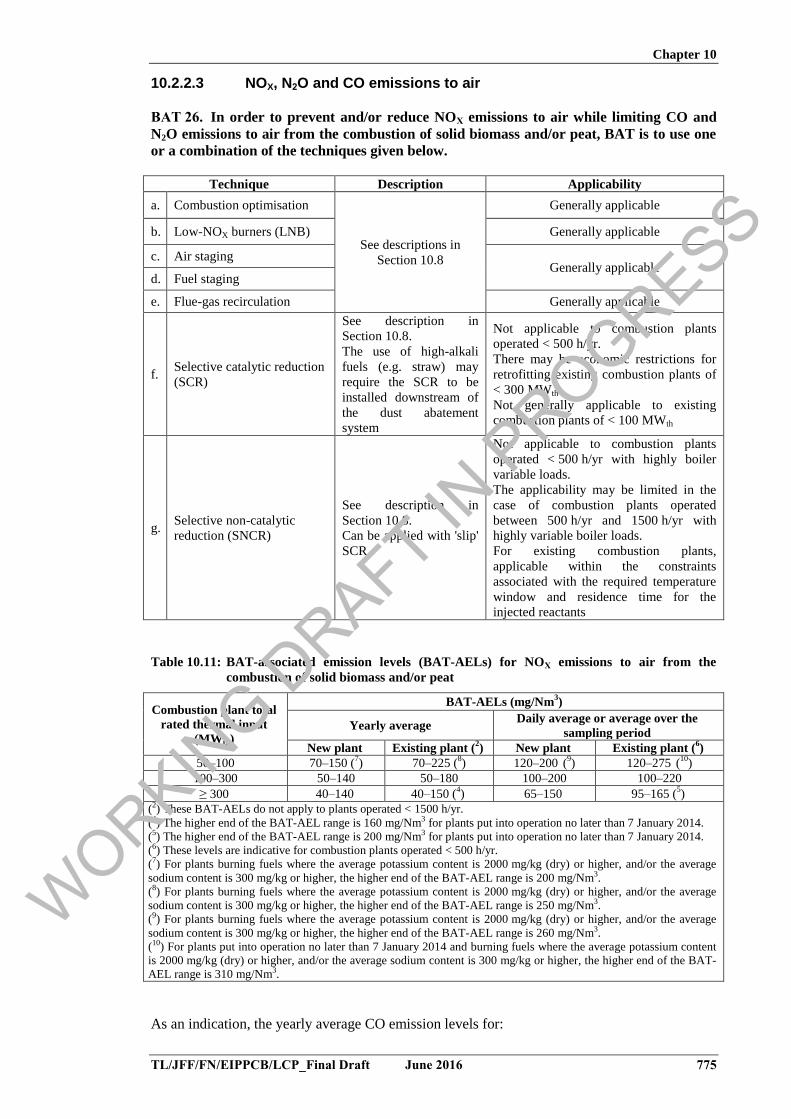
Chapter 10
TL/JFF/FN/EIPPCB/LCP_Final Draft June 2016 775
10.2.2.3 NOX, N2O and CO emissions to air
BAT 26. In order to prevent and/or reduce NOX emissions to air while limiting CO and
N2O emissions to air from the combustion of solid biomass and/or peat, BAT is to use one
or a combination of the techniques given below.
Technique Description Applicability
a. Combustion optimisation
See descriptions in
Section 10.8
Generally applicable
b. Low-NOX burners (LNB) Generally applicable
c. Air staging Generally applicable
d. Fuel staging
e. Flue-gas recirculation Generally applicable
f.Selective catalytic reduction
(SCR)
See description in
Section 10.8.
The use of high-alkali
fuels (e.g. straw) may
require the SCR to be
installed downstream of
the dust abatement
system
Not applicable to combustion plants
operated < 500 h/yr.
There may be economic restrictions for
retrofitting existing combustion plants of
< 300 MWth.
Not generally applicable to existing
combustion plants of < 100 MWth
g.Selective non-catalytic
reduction (SNCR)
See description in
Section 10.8.
Can be applied with 'slip'
SCR
Not applicable to combustion plants
operated < 500 h/yr with highly boiler
variable loads.
The applicability may be limited in the
case of combustion plants operated
between 500 h/yr and 1500 h/yr with
highly variable boiler loads.
For existing combustion plants,
applicable within the constraints
associated with the required temperature
window and residence time for the
injected reactants
Table 10.11: BAT-associated emission levels (BAT-AELs) for NOX emissions to air from the
combustion of solid biomass and/or peat
Combustion plant total
rated thermal input
(MWth)
BAT-AELs (mg/Nm3)
Yearly average Daily average or average over the
sampling period
New plant Existing plant (2) New plant Existing plant (
6)
50–100 70–150 (7) 70–225 (
8) 120–200 (9
) 120–275 (10)
100–300 50–140 50–180 100–200 100–220
≥ 300 40–140 40–150 (4) 65–150 95–165 (
5)
(2) These BAT-AELs do not apply to plants operated < 1500 h/yr.
(4) The higher end of the BAT-AEL range is 160 mg/Nm3 for plants put into operation no later than 7 January 2014.
(5) The higher end of the BAT-AEL range is 200 mg/Nm3 for plants put into operation no later than 7 January 2014.
(6) These levels are indicative for combustion plants operated < 500 h/yr.
(7) For plants burning fuels where the average potassium content is 2000 mg/kg (dry) or higher, and/or the average
sodium content is 300 mg/kg or higher, the higher end of the BAT-AEL range is 200 mg/Nm3.
(8) For plants burning fuels where the average potassium content is 2000 mg/kg (dry) or higher, and/or the average
sodium content is 300 mg/kg or higher, the higher end of the BAT-AEL range is 250 mg/Nm3.
(9) For plants burning fuels where the average potassium content is 2000 mg/kg (dry) or higher, and/or the average
sodium content is 300 mg/kg or higher, the higher end of the BAT-AEL range is 260 mg/Nm3.
(10) For plants put into operation no later than 7 January 2014 and burning fuels where the average potassium content
is 2000 mg/kg (dry) or higher, and/or the average sodium content is 300 mg/kg or higher, the higher end of the BAT-
AEL range is 310 mg/Nm3.
As an indication, the yearly average CO emission levels for:
WORKIN
GDRAFT IN
PROGRESS

Chapter 10
776 June 2016 TL/JFF/FN/EIPPCB/LCP_Final Draft
existing combustion plants of 50–100 MWth operated ≥ 500 h/yr, or new combustion
plants of 50–100 MWth, will generally be < 30–250 mg/Nm3;
existing combustion plants of 100–300 MWth operated ≥ 1500 h/yr, or new combustion
plants of 100–300 MWth, will generally be < 30–160 mg/Nm3;
existing combustion plants of ≥ 300 MWth operated ≥ 1500 h/yr, or new combustion
plants of ≥ 300 MWth, will generally be < 30–80 mg/Nm3.
BAT 27. Removed
10.2.2.4 SOX, HCl and HF emissions to air
BAT 28. In order to prevent and/or reduce SOX, HCl and HF emissions to air from the
combustion of solid biomass and/or peat, BAT is to use one or a combination of the
techniques given below.
Technique Description Applicability
a. Fuel choice See description in Section 10.8
Applicable within the constraints
associated with the availability of
different types of fuel, which may be
impacted by the energy policy of the
Member State
b. Flue-gas condenser
See descriptions in Section 10.8
Generally applicable
c.
Wet flue-gas
desulphurisation
(wet FGD)
Not applicable to combustion plants
operated < 500 h/yr.
There may be technical and economic
restrictions for retrofitting existing
combustion plants operated between
500 h/yr and 1500 h/yr
d.
Boiler sorbent
injection
(in-furnace or in-bed)
Generally applicable
e. Duct sorbent
injection (DSI) See description in Section 10.8 Generally applicable
f. Spray dry absorber
(SDA) See description in Section 10.8 Generally applicable
g. Wet scrubbing See description in Section 10.8 Generally applicable
h.
Circulating fluidised
bed (CFB)
dry scrubber
See description in Section 10.8 Generally applicable
WORKIN
GDRAFT IN
PROGRESS
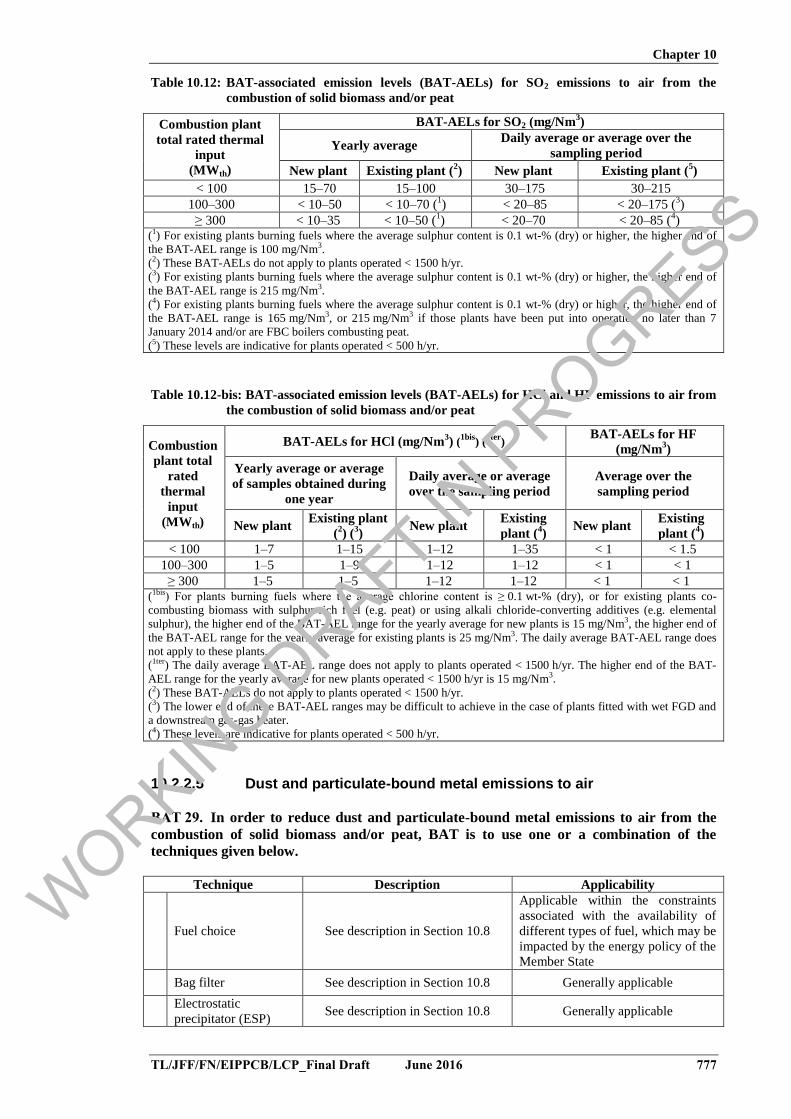
Chapter 10
TL/JFF/FN/EIPPCB/LCP_Final Draft June 2016 777
Table 10.12: BAT-associated emission levels (BAT-AELs) for SO2 emissions to air from the
combustion of solid biomass and/or peat
Combustion plant
total rated thermal
input
(MWth)
BAT-AELs for SO2 (mg/Nm3)
Yearly average Daily average or average over the
sampling period
New plant Existing plant (2) New plant Existing plant (
5)
< 100 15–70 15–100 30–175 30–215
100–300 < 10–50 < 10–70 (1) < 20–85 < 20–175 (
3)
≥ 300 < 10–35 < 10–50 (1) < 20–70 < 20–85 (
4)
(1) For existing plants burning fuels where the average sulphur content is 0.1 wt-% (dry) or higher, the higher end of
the BAT-AEL range is 100 mg/Nm3.
(2) These BAT-AELs do not apply to plants operated < 1500 h/yr.
(3) For existing plants burning fuels where the average sulphur content is 0.1 wt-% (dry) or higher, the higher end of
the BAT-AEL range is 215 mg/Nm3.
(4) For existing plants burning fuels where the average sulphur content is 0.1 wt-% (dry) or higher, the higher end of
the BAT-AEL range is 165 mg/Nm3, or 215 mg/Nm3 if those plants have been put into operation no later than 7
January 2014 and/or are FBC boilers combusting peat.
(5) These levels are indicative for plants operated < 500 h/yr.
Table 10.12-bis: BAT-associated emission levels (BAT-AELs) for HCl and HF emissions to air from
the combustion of solid biomass and/or peat
Combustion
plant total
rated
thermal
input
(MWth)
BAT-AELs for HCl (mg/Nm3) (
1bis) (
1ter)
BAT-AELs for HF
(mg/Nm3)
Yearly average or average
of samples obtained during
one year
Daily average or average
over the sampling period
Average over the
sampling period
New plant Existing plant
(2) (
3)
New plant Existing
plant (4)
New plant Existing
plant (4)
< 100 1–7 1–15 1–12 1–35 < 1 < 1.5
100–300 1–5 1–9 1–12 1–12 < 1 < 1
≥ 300 1–5 1–5 1–12 1–12 < 1 < 1 (1bis) For plants burning fuels where the average chlorine content is ≥ 0.1 wt-% (dry), or for existing plants co-
combusting biomass with sulphur-rich fuel (e.g. peat) or using alkali chloride-converting additives (e.g. elemental
sulphur), the higher end of the BAT-AEL range for the yearly average for new plants is 15 mg/Nm3, the higher end of
the BAT-AEL range for the yearly average for existing plants is 25 mg/Nm3. The daily average BAT-AEL range does
not apply to these plants.
(1ter) The daily average BAT-AEL range does not apply to plants operated < 1500 h/yr. The higher end of the BAT-
AEL range for the yearly average for new plants operated < 1500 h/yr is 15 mg/Nm3.
(2) These BAT-AELs do not apply to plants operated < 1500 h/yr.
(3) The lower end of these BAT-AEL ranges may be difficult to achieve in the case of plants fitted with wet FGD and
a downstream gas-gas heater.
(4) These levels are indicative for plants operated < 500 h/yr.
10.2.2.5 Dust and particulate-bound metal emissions to air
BAT 29. In order to reduce dust and particulate-bound metal emissions to air from the
combustion of solid biomass and/or peat, BAT is to use one or a combination of the
techniques given below.
Technique Description Applicability
Fuel choice See description in Section 10.8
Applicable within the constraints
associated with the availability of
different types of fuel, which may be
impacted by the energy policy of the
Member State
Bag filter See description in Section 10.8 Generally applicable
Electrostatic
precipitator (ESP) See description in Section 10.8 Generally applicable
WORKIN
GDRAFT IN
PROGRESS
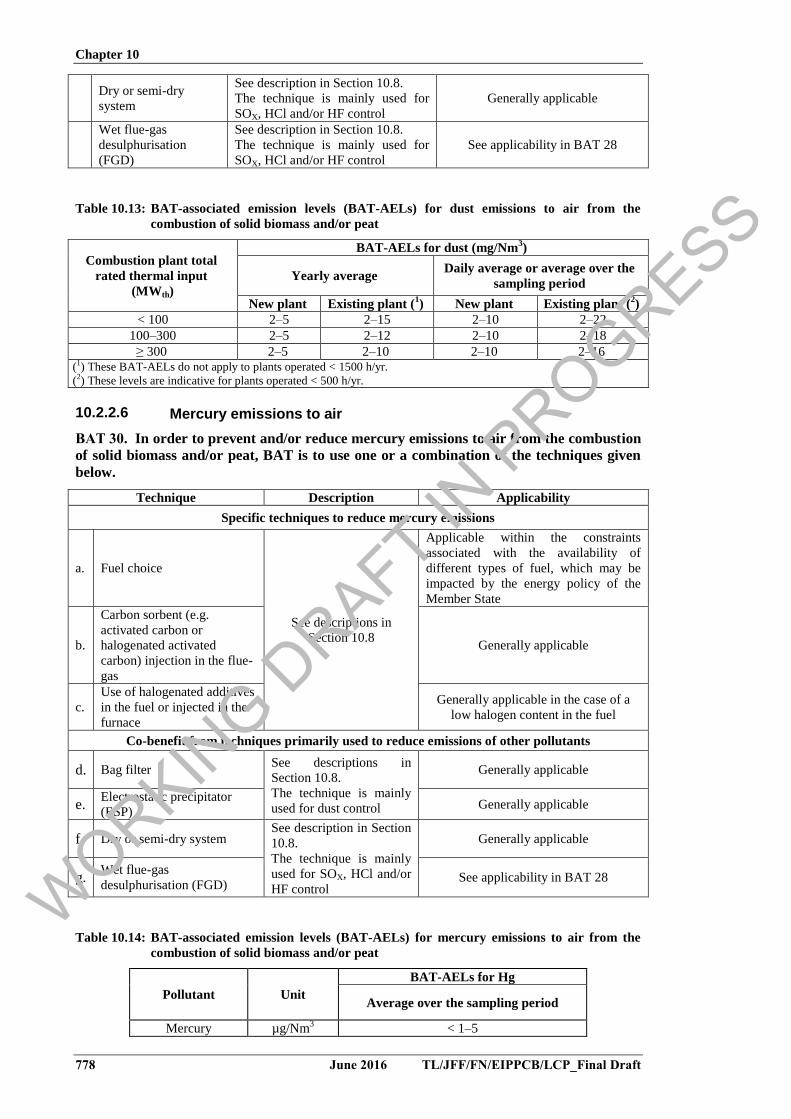
Chapter 10
778 June 2016 TL/JFF/FN/EIPPCB/LCP_Final Draft
Dry or semi-dry
system
See description in Section 10.8.
The technique is mainly used for
SOX, HCl and/or HF control
Generally applicable
Wet flue-gas
desulphurisation
(FGD)
See description in Section 10.8.
The technique is mainly used for
SOX, HCl and/or HF control
See applicability in BAT 28
Table 10.13: BAT-associated emission levels (BAT-AELs) for dust emissions to air from the
combustion of solid biomass and/or peat
Combustion plant total
rated thermal input
(MWth)
BAT-AELs for dust (mg/Nm3)
Yearly average Daily average or average over the
sampling period
New plant Existing plant (1) New plant Existing plant (
2)
< 100 2–5 2–15 2–10 2–22
100–300 2–5 2–12 2–10 2–18
≥ 300 2–5 2–10 2–10 2–16 (1) These BAT-AELs do not apply to plants operated < 1500 h/yr.
(2) These levels are indicative for plants operated < 500 h/yr.
10.2.2.6 Mercury emissions to air
BAT 30. In order to prevent and/or reduce mercury emissions to air from the combustion
of solid biomass and/or peat, BAT is to use one or a combination of the techniques given
below.
Technique Description Applicability
Specific techniques to reduce mercury emissions
a. Fuel choice
See descriptions in
Section 10.8
Applicable within the constraints
associated with the availability of
different types of fuel, which may be
impacted by the energy policy of the
Member State
b.
Carbon sorbent (e.g.
activated carbon or
halogenated activated
carbon) injection in the flue-
gas
Generally applicable
c. Use of halogenated additives
in the fuel or injected in the
furnace
Generally applicable in the case of a
low halogen content in the fuel
Co-benefit from techniques primarily used to reduce emissions of other pollutants
d. Bag filter See descriptions in
Section 10.8.
The technique is mainly
used for dust control
Generally applicable
e. Electrostatic precipitator
(ESP) Generally applicable
f. Dry or semi-dry system See description in Section
10.8.
The technique is mainly
used for SOX, HCl and/or
HF control
Generally applicable
g. Wet flue-gas
desulphurisation (FGD) See applicability in BAT 28
Table 10.14: BAT-associated emission levels (BAT-AELs) for mercury emissions to air from the
combustion of solid biomass and/or peat
Pollutant Unit
BAT-AELs for Hg
Average over the sampling period
Mercury µg/Nm3 < 1–5
WORKIN
G DRAFT IN
PROGRESS
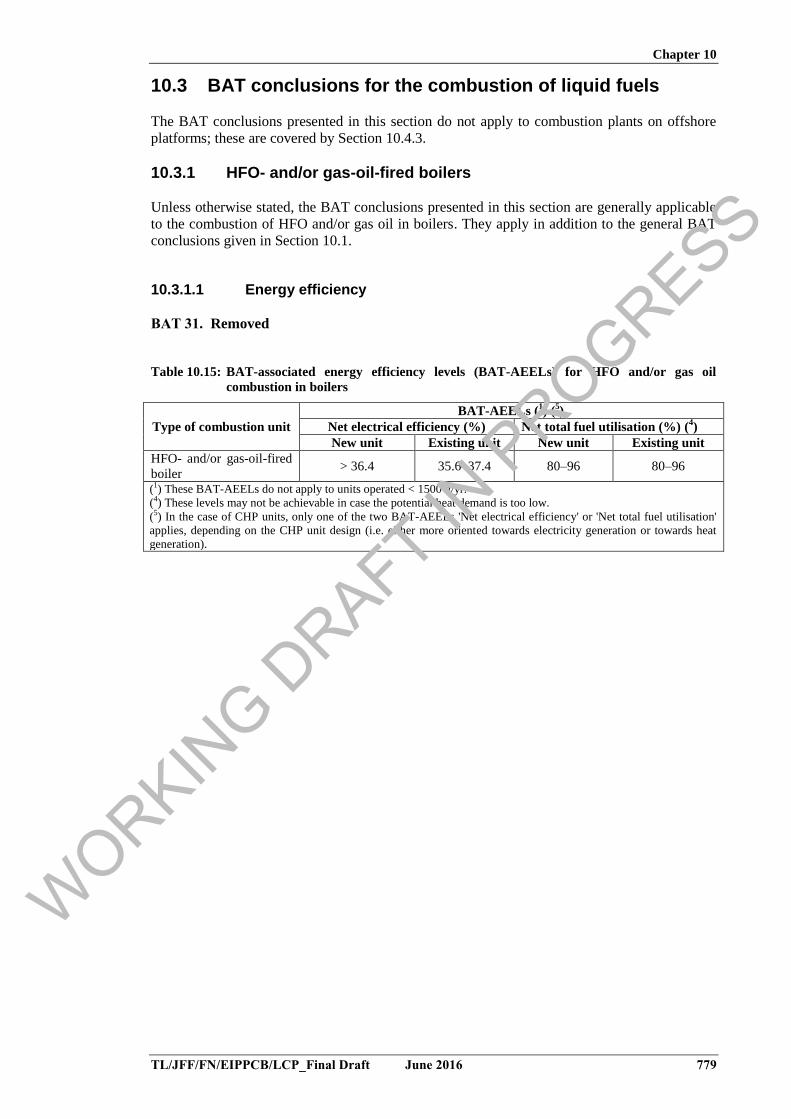
Chapter 10
TL/JFF/FN/EIPPCB/LCP_Final Draft June 2016 779
10.3 BAT conclusions for the combustion of liquid fuels
The BAT conclusions presented in this section do not apply to combustion plants on offshore
platforms; these are covered by Section 10.4.3.
10.3.1 HFO- and/or gas-oil-fired boilers
Unless otherwise stated, the BAT conclusions presented in this section are generally applicable
to the combustion of HFO and/or gas oil in boilers. They apply in addition to the general BAT
conclusions given in Section 10.1.
10.3.1.1 Energy efficiency
BAT 31. Removed
Table 10.15: BAT-associated energy efficiency levels (BAT-AEELs) for HFO and/or gas oil
combustion in boilers
Type of combustion unit
BAT-AEELs (1) (
5)
Net electrical efficiency (%) Net total fuel utilisation (%) (4)
New unit Existing unit New unit Existing unit
HFO- and/or gas-oil-fired
boiler > 36.4 35.6–37.4 80–96 80–96
(1) These BAT-AEELs do not apply to units operated < 1500 h/yr.
(4) These levels may not be achievable in case the potential heat demand is too low.
(5) In the case of CHP units, only one of the two BAT-AEELs 'Net electrical efficiency' or 'Net total fuel utilisation'
applies, depending on the CHP unit design (i.e. either more oriented towards electricity generation or towards heat
generation).
WORKIN
GDRAFT IN
PROGRESS

Chapter 10
780 June 2016 TL/JFF/FN/EIPPCB/LCP_Final Draft
10.3.1.2 NOX and CO emissions to air
BAT 32. In order to prevent and/or reduce NOX emissions to air while limiting CO
emissions to air from the combustion of HFO and/or gas oil in boilers, BAT is to use one or
a combination of the techniques given below.
Technique Description Applicability
a. Fuel choice See description in Section 10.8
Applicable within the constraints
associated with the availability of
different types of fuel, which may
be impacted by the energy policy
of the Member State
b. Water/steam addition See description in Section 10.8 Applicable within the constraints
of water availability
c. Air staging See description in Section 10.8 Generally applicable
d. Fuel staging See description in Section 10.8 Generally applicable
e. Flue-gas recirculation See description in Section 10.8 Generally applicable
f. Low-NOX burners (LNB) See description in Section 10.8 Generally applicable
g. Advanced control system See description in Section 10.8
Generally applicable to new
combustion plants. The
applicability to old combustion
plants may be constrained by the
need to retrofit the combustion
system and/or control command
system
h. Selective catalytic
reduction (SCR) See description in Section 10.8
Not applicable to combustion
plants operated < 500 h/yr.
There may be technical and
economic restrictions for
retrofitting existing combustion
plants operated between 500 h/yr
and 1500 h/yr.
Not generally applicable to
combustion plants of < 100 MWth
i. Selective non-catalytic
reduction (SNCR) See description in Section 10.8
Not applicable to combustion
plants operated < 500 h/yr with
highly variable boiler loads.
The applicability may be limited in
the case of combustion plants
operated between 500 h/yr and
1500 h/yr with highly variable
boiler loads
WORKIN
G DRAFT IN
PROGRESS
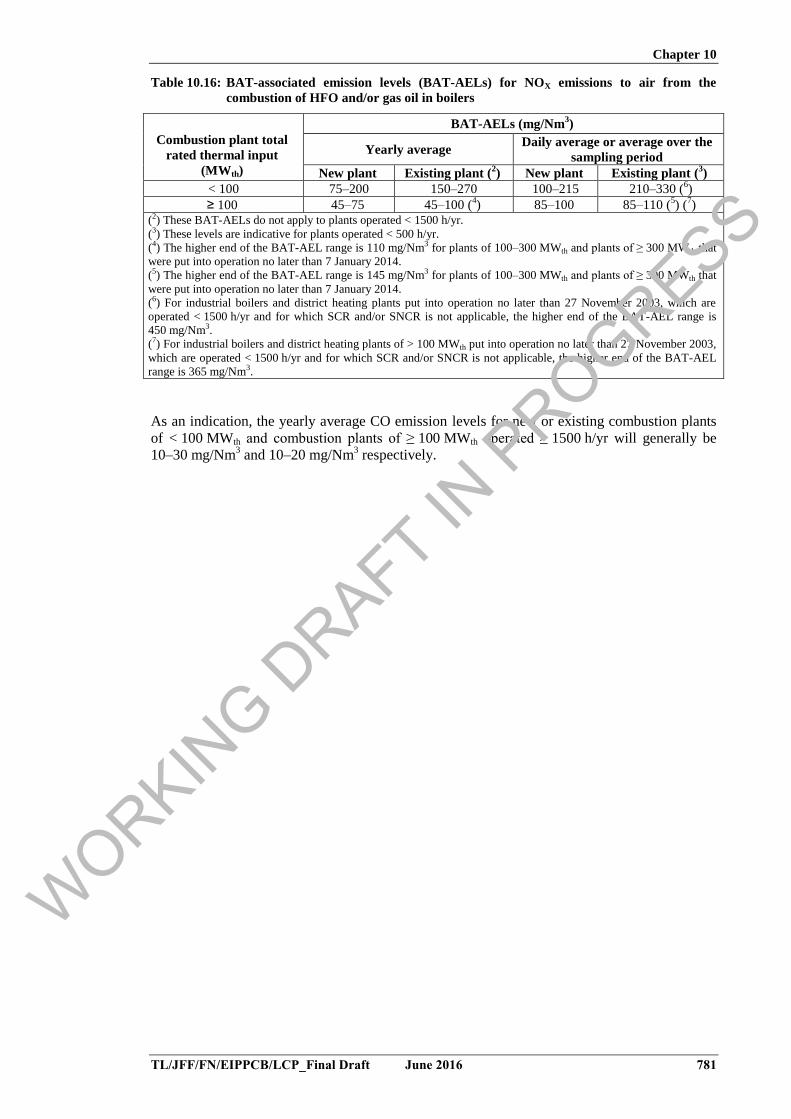
Chapter 10
TL/JFF/FN/EIPPCB/LCP_Final Draft June 2016 781
Table 10.16: BAT-associated emission levels (BAT-AELs) for NOX emissions to air from the
combustion of HFO and/or gas oil in boilers
Combustion plant total
rated thermal input
(MWth)
BAT-AELs (mg/Nm3)
Yearly average Daily average or average over the
sampling period
New plant Existing plant (2) New plant Existing plant (
3)
< 100 75–200 150–270 100–215 210–330 (6)
≥ 100 45–75 45–100 (4) 85–100 85–110 (
5) (
7)
(2) These BAT-AELs do not apply to plants operated < 1500 h/yr.
(3) These levels are indicative for plants operated < 500 h/yr.
(4) The higher end of the BAT-AEL range is 110 mg/Nm3 for plants of 100–300 MWth and plants of ≥ 300 MWth that
were put into operation no later than 7 January 2014.
(5) The higher end of the BAT-AEL range is 145 mg/Nm3 for plants of 100–300 MWth and plants of ≥ 300 MWth that
were put into operation no later than 7 January 2014.
(6) For industrial boilers and district heating plants put into operation no later than 27 November 2003, which are
operated < 1500 h/yr and for which SCR and/or SNCR is not applicable, the higher end of the BAT-AEL range is
450 mg/Nm3.
(7) For industrial boilers and district heating plants of > 100 MWth put into operation no later than 27 November 2003,
which are operated < 1500 h/yr and for which SCR and/or SNCR is not applicable, the higher end of the BAT-AEL
range is 365 mg/Nm3.
As an indication, the yearly average CO emission levels for new or existing combustion plants
of < 100 MWth and combustion plants of ≥ 100 MWth operated ≥ 1500 h/yr will generally be
10–30 mg/Nm3 and 10–20 mg/Nm
3 respectively.
WORKIN
G DRAFT IN
PROGRESS

Chapter 10
782 June 2016 TL/JFF/FN/EIPPCB/LCP_Final Draft
10.3.1.3 SOX, HCl and HF emissions to air
BAT 33. In order to prevent and/or reduce SOX, HCl and HF emissions to air from the
combustion of HFO and/or gas oil in boilers, BAT is to use one or a combination of the
techniques given below.
Technique Description Applicability
a. Fuel choice See description in Section 10.8
Applicable within the constraints
associated with the availability of
different types of fuel, which may
be impacted by the energy policy
of the Member State
b. Flue-gas condenser See description in Section 10.8 Generally applicable
c.
Wet flue-gas
desulphurisation
(wet FGD)
See description in Section 10.8
There may be technical and
economic restrictions for applying
the technique to combustion
plants of < 300 MWth. Not applicable to combustion
plants operated < 500 h/yr.
There may be technical and
economic restrictions for
retrofitting existing combustion plants operated between 500 h/yr
and 1500 h/yr
d. Duct sorbent injection
(DSI) See description in Section 10.8 Generally applicable
e. Spray dry absorber
(SDA) See description in Section 10.8 Generally applicable
f. Seawater FGD See description in Section 10.8
There may be technical and
economic restrictions for applying
the technique to combustion
plants of < 300 MWth. Not applicable to combustion
plants operated < 500 h/yr.
There may be technical and
economic restrictions for
retrofitting existing combustion plants operated between 500 h/yr
and 1500 h/yr
Table 10.17: BAT-associated emission levels (BAT-AELs) for SO2 emissions to air from the
combustion of HFO and/or gas oil in boilers
Combustion plant
total rated thermal
input
(MWth)
BAT-AELs for SO2 (mg/Nm3)
Yearly average Daily average or average over the
sampling period
New plant Existing plant (3) New plant Existing plant (
5)
< 300 50–175 50–175 150–200 150–200 (6)
≥ 300 35–50 50–110 50–120 150–165 (4) (
7)
(3) These BAT-AELs do not apply to plants operated < 1500 h/yr.
(4) The higher end of the BAT-AEL range is 175 mg/Nm3 for plants put into operation no later than 7 January 2014.
(5) These levels are indicative for plants operated < 500 h/yr.
(6) For industrial boilers and district heating plants put into operation no later than 27 November 2003 and operated
< 1500 h/yr, the higher end of the BAT-AEL range is 400 mg/Nm3.
(7) For industrial boilers and district heating plants put into operation no later than 27 November 2003, which are
operated < 1500 h/yr and for which wet FGD is not applicable, the higher end of the BAT-AEL range is 200 mg/Nm3.
WORKIN
GDRAFT IN
PROGRESS
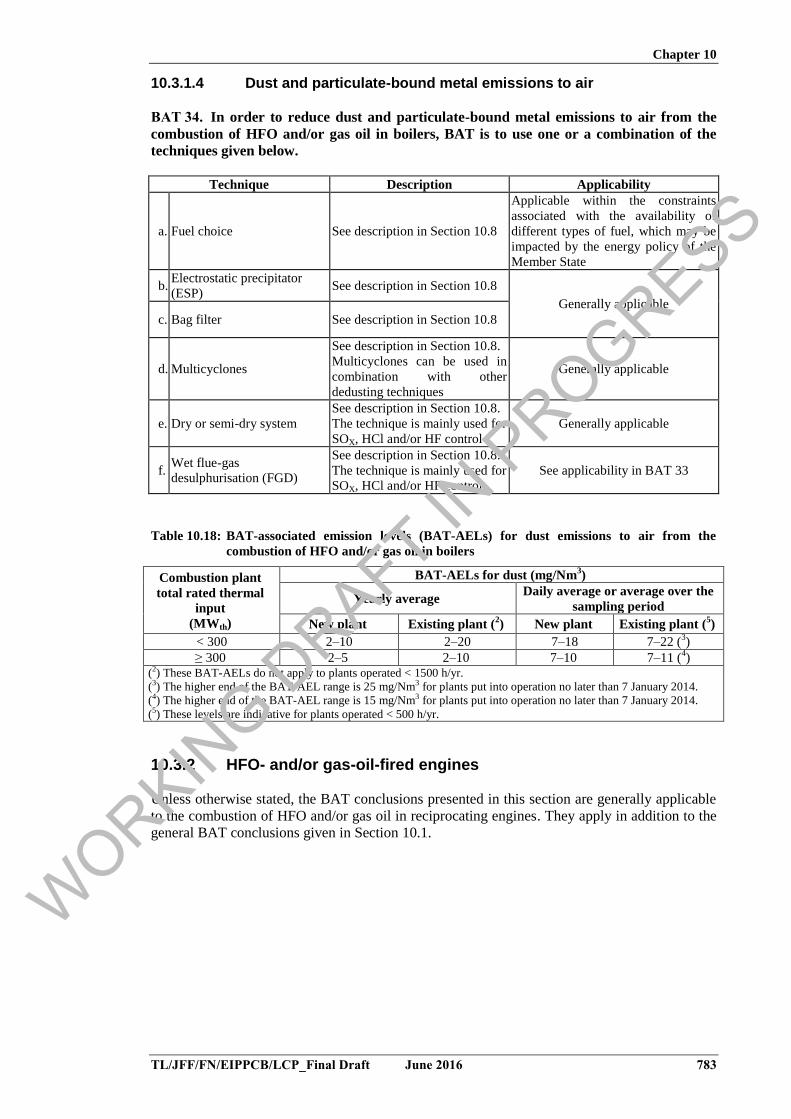
Chapter 10
TL/JFF/FN/EIPPCB/LCP_Final Draft June 2016 783
10.3.1.4 Dust and particulate-bound metal emissions to air
BAT 34. In order to reduce dust and particulate-bound metal emissions to air from the
combustion of HFO and/or gas oil in boilers, BAT is to use one or a combination of the
techniques given below.
Technique Description Applicability
a. Fuel choice See description in Section 10.8
Applicable within the constraints
associated with the availability of
different types of fuel, which may be
impacted by the energy policy of the
Member State
b. Electrostatic precipitator
(ESP) See description in Section 10.8
Generally applicable
c. Bag filter See description in Section 10.8
d. Multicyclones
See description in Section 10.8.
Multicyclones can be used in
combination with other
dedusting techniques
Generally applicable
e. Dry or semi-dry system
See description in Section 10.8.
The technique is mainly used for
SOX, HCl and/or HF control
Generally applicable
f. Wet flue-gas
desulphurisation (FGD)
See description in Section 10.8.
The technique is mainly used for
SOX, HCl and/or HF control
See applicability in BAT 33
Table 10.18: BAT-associated emission levels (BAT-AELs) for dust emissions to air from the
combustion of HFO and/or gas oil in boilers
Combustion plant
total rated thermal
input
(MWth)
BAT-AELs for dust (mg/Nm3)
Yearly average Daily average or average over the
sampling period
New plant Existing plant (2) New plant Existing plant (
5)
< 300 2–10 2–20 7–18 7–22 (3)
≥ 300 2–5 2–10 7–10 7–11 (4)
(2) These BAT-AELs do not apply to plants operated < 1500 h/yr.
(3) The higher end of the BAT-AEL range is 25 mg/Nm3 for plants put into operation no later than 7 January 2014.
(4) The higher end of the BAT-AEL range is 15 mg/Nm3 for plants put into operation no later than 7 January 2014.
(5) These levels are indicative for plants operated < 500 h/yr.
10.3.2 HFO- and/or gas-oil-fired engines
Unless otherwise stated, the BAT conclusions presented in this section are generally applicable
to the combustion of HFO and/or gas oil in reciprocating engines. They apply in addition to the
general BAT conclusions given in Section 10.1.
WORKIN
G DRAFT IN
PROGRESS
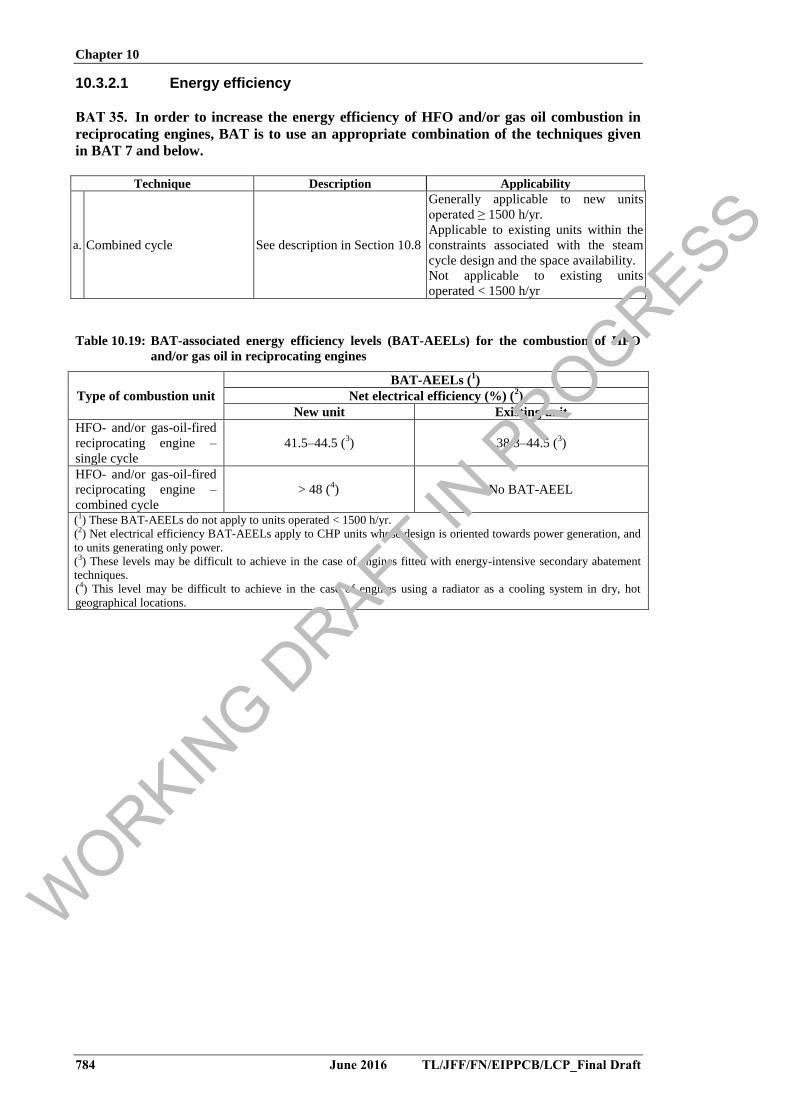
Chapter 10
784 June 2016 TL/JFF/FN/EIPPCB/LCP_Final Draft
10.3.2.1 Energy efficiency
BAT 35. In order to increase the energy efficiency of HFO and/or gas oil combustion in
reciprocating engines, BAT is to use an appropriate combination of the techniques given
in BAT 7 and below.
Technique Description Applicability
a. Combined cycle See description in Section 10.8
Generally applicable to new units
operated ≥ 1500 h/yr.
Applicable to existing units within the
constraints associated with the steam
cycle design and the space availability.
Not applicable to existing units
operated < 1500 h/yr
Table 10.19: BAT-associated energy efficiency levels (BAT-AEELs) for the combustion of HFO
and/or gas oil in reciprocating engines
Type of combustion unit
BAT-AEELs (1)
Net electrical efficiency (%) (2)
New unit Existing unit
HFO- and/or gas-oil-fired
reciprocating engine –
single cycle
41.5–44.5 (3) 38.3–44.5 (
3)
HFO- and/or gas-oil-fired
reciprocating engine –
combined cycle
> 48 (4) No BAT-AEEL
(1) These BAT-AEELs do not apply to units operated < 1500 h/yr.
(2) Net electrical efficiency BAT-AEELs apply to CHP units whose design is oriented towards power generation, and
to units generating only power.
(3) These levels may be difficult to achieve in the case of engines fitted with energy-intensive secondary abatement
techniques.
(4) This level may be difficult to achieve in the case of engines using a radiator as a cooling system in dry, hot
geographical locations.
WORKIN
GDRAFT IN
PROGRESS
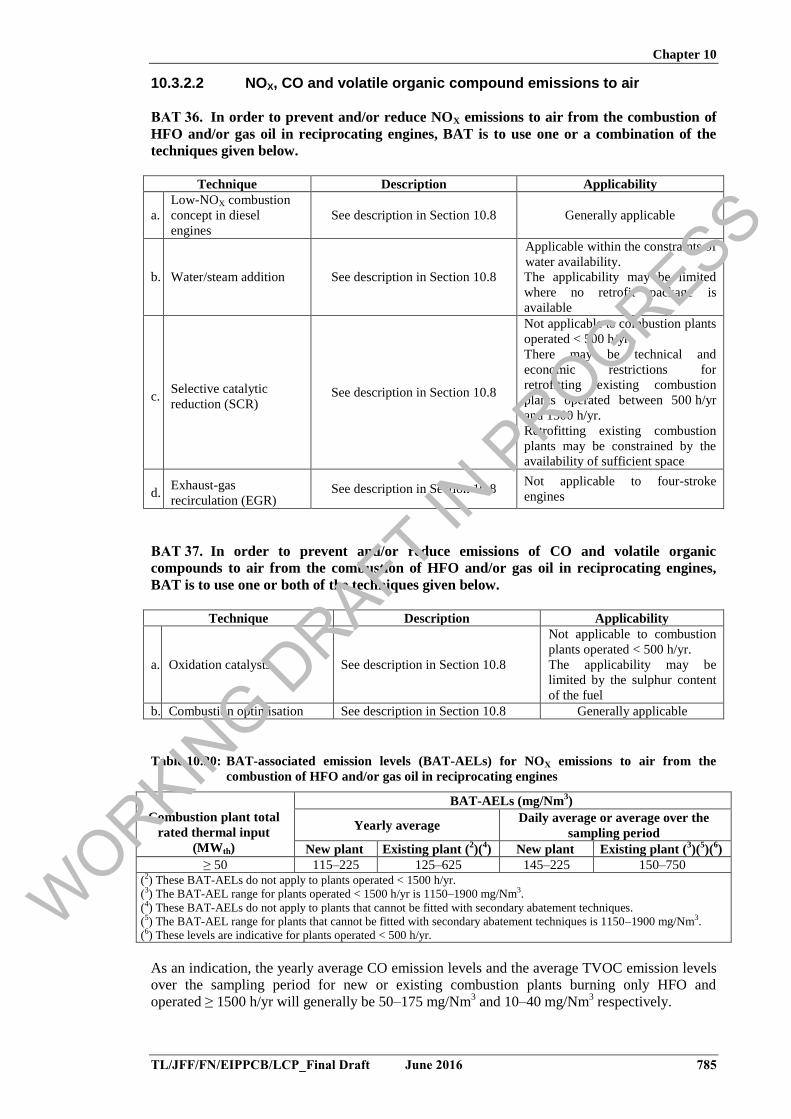
Chapter 10
TL/JFF/FN/EIPPCB/LCP_Final Draft June 2016 785
10.3.2.2 NOX, CO and volatile organic compound emissions to air
BAT 36. In order to prevent and/or reduce NOX emissions to air from the combustion of
HFO and/or gas oil in reciprocating engines, BAT is to use one or a combination of the
techniques given below.
Technique Description Applicability
a. Low-NOX combustion
concept in diesel
engines
See description in Section 10.8 Generally applicable
b. Water/steam addition See description in Section 10.8
Applicable within the constraints of
water availability.
The applicability may be limited
where no retrofit package is
available
c. Selective catalytic
reduction (SCR) See description in Section 10.8
Not applicable to combustion plants
operated < 500 h/yr.
There may be technical and
economic restrictions for
retrofitting existing combustion
plants operated between 500 h/yr
and 1500 h/yr.
Retrofitting existing combustion
plants may be constrained by the
availability of sufficient space
d. Exhaust-gas
recirculation (EGR) See description in Section 10.8
Not applicable to four-stroke
engines
BAT 37. In order to prevent and/or reduce emissions of CO and volatile organic
compounds to air from the combustion of HFO and/or gas oil in reciprocating engines,
BAT is to use one or both of the techniques given below.
Technique Description Applicability
a. Oxidation catalysts See description in Section 10.8
Not applicable to combustion
plants operated < 500 h/yr.
The applicability may be
limited by the sulphur content
of the fuel
b. Combustion optimisation See description in Section 10.8 Generally applicable
Table 10.20: BAT-associated emission levels (BAT-AELs) for NOX emissions to air from the
combustion of HFO and/or gas oil in reciprocating engines
Combustion plant total
rated thermal input
(MWth)
BAT-AELs (mg/Nm3)
Yearly average Daily average or average over the
sampling period
New plant Existing plant (2)(
4) New plant Existing plant (
3)(
5)(
6)
≥ 50 115–225 125–625 145–225 150–750 (2) These BAT-AELs do not apply to plants operated < 1500 h/yr.
(3) The BAT-AEL range for plants operated < 1500 h/yr is 1150–1900 mg/Nm3.
(4) These BAT-AELs do not apply to plants that cannot be fitted with secondary abatement techniques.
(5) The BAT-AEL range for plants that cannot be fitted with secondary abatement techniques is 1150–1900 mg/Nm3.
(6) These levels are indicative for plants operated < 500 h/yr.
As an indication, the yearly average CO emission levels and the average TVOC emission levels
over the sampling period for new or existing combustion plants burning only HFO and
operated ≥ 1500 h/yr will generally be 50–175 mg/Nm3 and 10–40 mg/Nm
3 respectively.
WORKIN
GDRAFT IN
PROGRESS
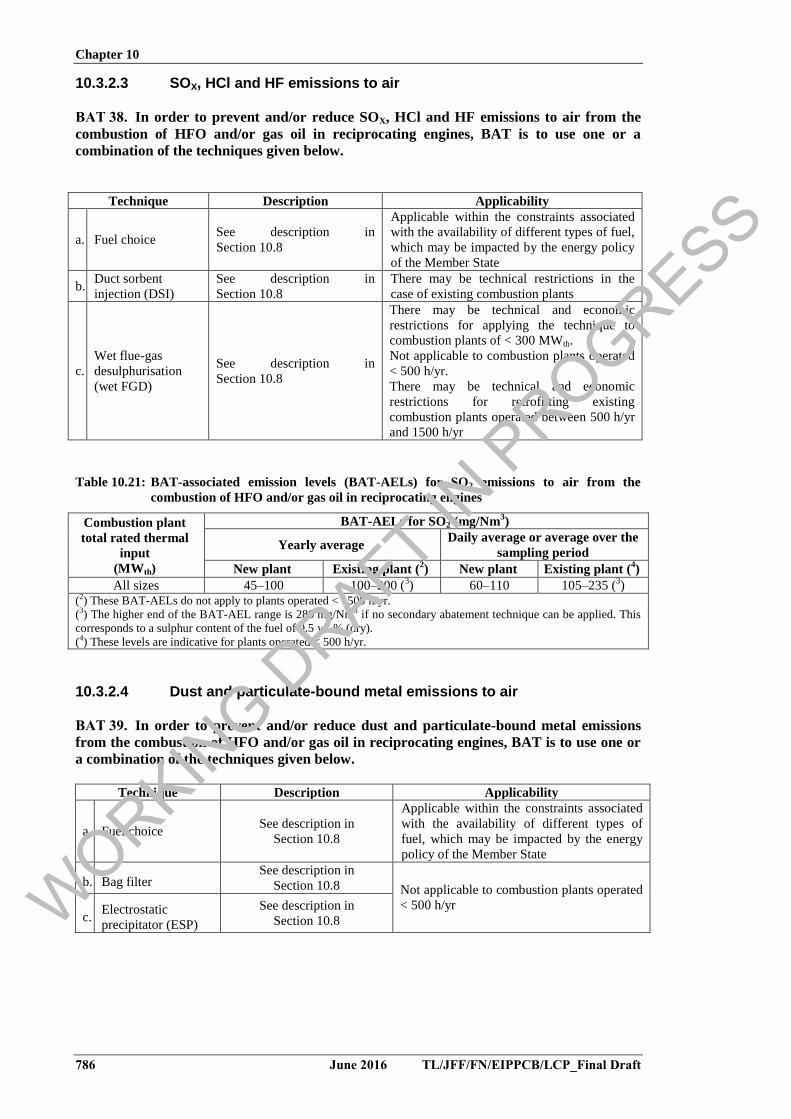
Chapter 10
786 June 2016 TL/JFF/FN/EIPPCB/LCP_Final Draft
10.3.2.3 SOX, HCl and HF emissions to air
BAT 38. In order to prevent and/or reduce SOX, HCl and HF emissions to air from the
combustion of HFO and/or gas oil in reciprocating engines, BAT is to use one or a
combination of the techniques given below.
Technique Description Applicability
a. Fuel choice See description in
Section 10.8
Applicable within the constraints associated
with the availability of different types of fuel,
which may be impacted by the energy policy
of the Member State
b. Duct sorbent
injection (DSI)
See description in
Section 10.8 There may be technical restrictions in the
case of existing combustion plants
c. Wet flue-gas
desulphurisation
(wet FGD)
See description in
Section 10.8
There may be technical and economic
restrictions for applying the technique to
combustion plants of < 300 MWth.
Not applicable to combustion plants operated
< 500 h/yr.
There may be technical and economic
restrictions for retrofitting existing
combustion plants operated between 500 h/yr
and 1500 h/yr
Table 10.21: BAT-associated emission levels (BAT-AELs) for SO2 emissions to air from the
combustion of HFO and/or gas oil in reciprocating engines
Combustion plant
total rated thermal
input
(MWth)
BAT-AELs for SO2 (mg/Nm3)
Yearly average Daily average or average over the
sampling period
New plant Existing plant (2) New plant Existing plant (
4)
All sizes 45–100 100–200 (3) 60–110 105–235 (
3)
(2) These BAT-AELs do not apply to plants operated < 1500 h/yr.
(3) The higher end of the BAT-AEL range is 280 mg/Nm3 if no secondary abatement technique can be applied. This
corresponds to a sulphur content of the fuel of 0.5 wt-% (dry).
(4) These levels are indicative for plants operated < 500 h/yr.
10.3.2.4 Dust and particulate-bound metal emissions to air
BAT 39. In order to prevent and/or reduce dust and particulate-bound metal emissions
from the combustion of HFO and/or gas oil in reciprocating engines, BAT is to use one or
a combination of the techniques given below.
Technique Description Applicability
a. Fuel choice See description in
Section 10.8
Applicable within the constraints associated
with the availability of different types of
fuel, which may be impacted by the energy
policy of the Member State
b. Bag filter See description in
Section 10.8 Not applicable to combustion plants operated
< 500 h/yr c. Electrostatic
precipitator (ESP)
See description in
Section 10.8 WORKIN
G DRAFT IN
PROGRESS
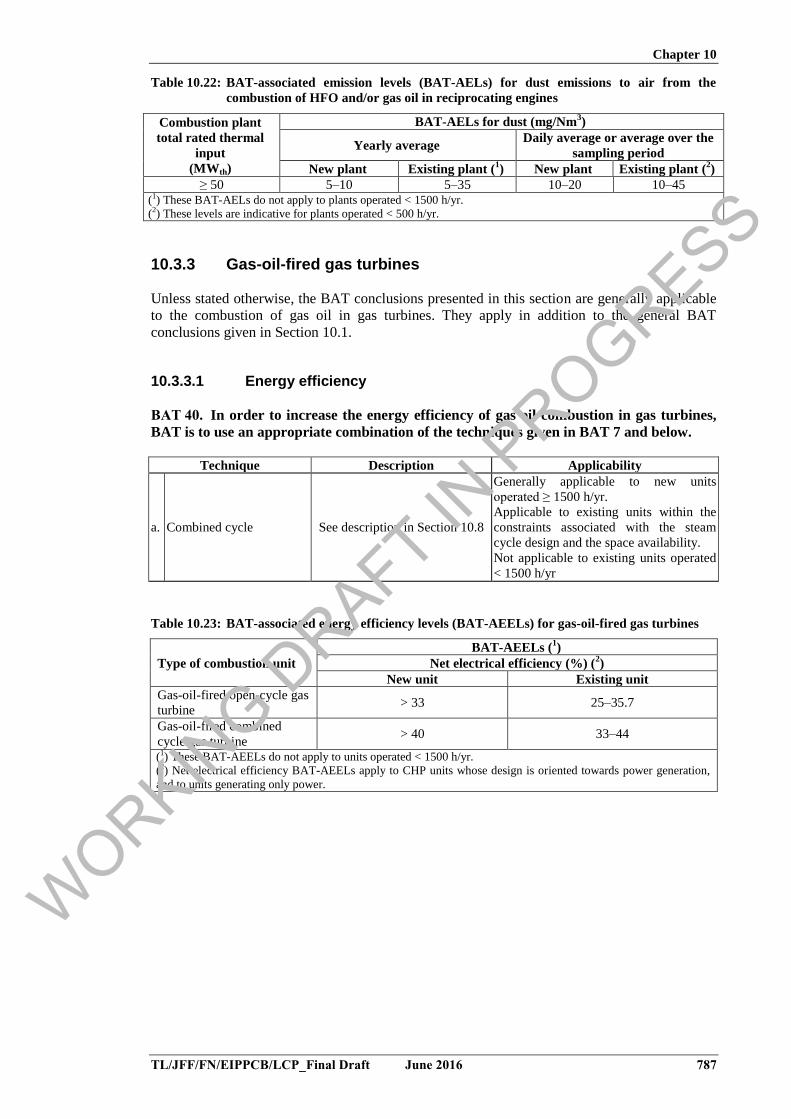
Chapter 10
TL/JFF/FN/EIPPCB/LCP_Final Draft June 2016 787
Table 10.22: BAT-associated emission levels (BAT-AELs) for dust emissions to air from the
combustion of HFO and/or gas oil in reciprocating engines
Combustion plant
total rated thermal
input
(MWth)
BAT-AELs for dust (mg/Nm3)
Yearly average Daily average or average over the
sampling period
New plant Existing plant (1) New plant Existing plant (
2)
≥ 50 5–10 5–35 10–20 10–45 (1) These BAT-AELs do not apply to plants operated < 1500 h/yr.
(2) These levels are indicative for plants operated < 500 h/yr.
10.3.3 Gas-oil-fired gas turbines
Unless stated otherwise, the BAT conclusions presented in this section are generally applicable
to the combustion of gas oil in gas turbines. They apply in addition to the general BAT
conclusions given in Section 10.1.
10.3.3.1 Energy efficiency
BAT 40. In order to increase the energy efficiency of gas oil combustion in gas turbines,
BAT is to use an appropriate combination of the techniques given in BAT 7 and below.
Technique Description Applicability
a. Combined cycle See description in Section 10.8
Generally applicable to new units
operated ≥ 1500 h/yr.
Applicable to existing units within the
constraints associated with the steam
cycle design and the space availability.
Not applicable to existing units operated
< 1500 h/yr
Table 10.23: BAT-associated energy efficiency levels (BAT-AEELs) for gas-oil-fired gas turbines
Type of combustion unit
BAT-AEELs (1)
Net electrical efficiency (%) (2)
New unit Existing unit
Gas-oil-fired open-cycle gas
turbine > 33 25–35.7
Gas-oil-fired combined
cycle gas turbine > 40 33–44
(1) These BAT-AEELs do not apply to units operated < 1500 h/yr.
(2) Net electrical efficiency BAT-AEELs apply to CHP units whose design is oriented towards power generation,
and to units generating only power.
WORKIN
GDRAFT IN
PROGRESS
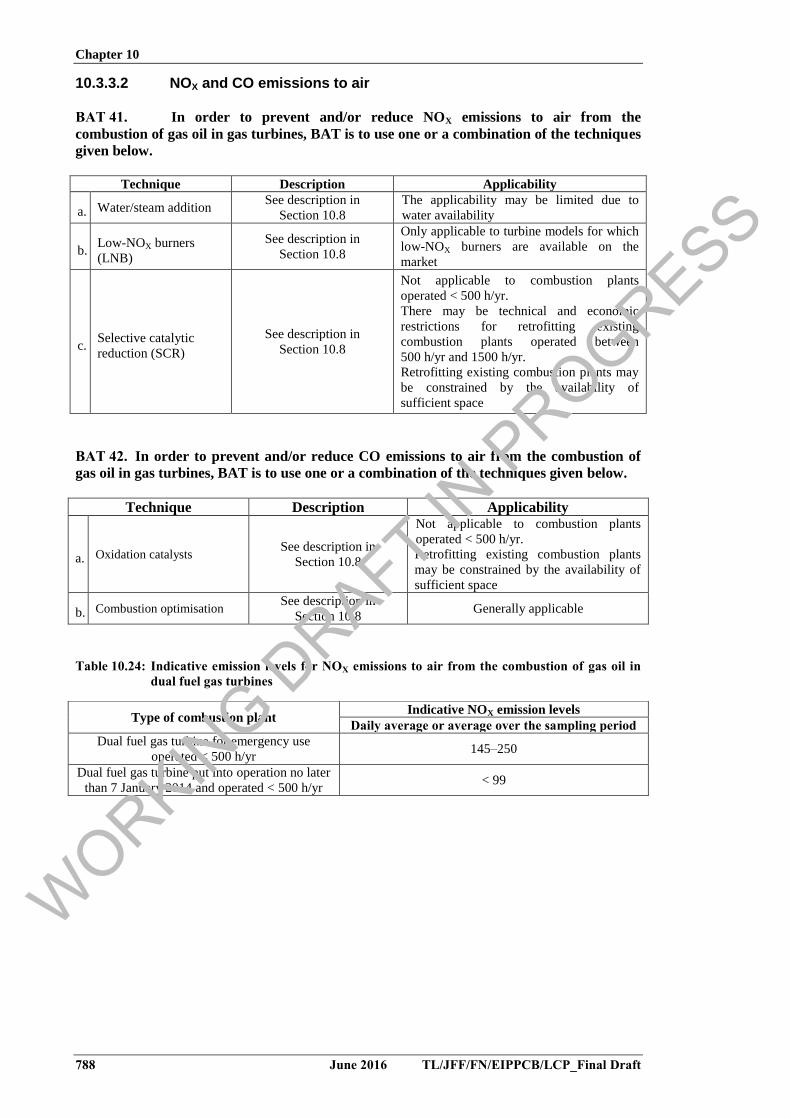
Chapter 10
788 June 2016 TL/JFF/FN/EIPPCB/LCP_Final Draft
10.3.3.2 NOX and CO emissions to air
BAT 41. In order to prevent and/or reduce NOX emissions to air from the
combustion of gas oil in gas turbines, BAT is to use one or a combination of the techniques
given below.
Technique Description Applicability
a. Water/steam addition See description in
Section 10.8 The applicability may be limited due to
water availability
b. Low-NOX burners
(LNB)
See description in
Section 10.8
Only applicable to turbine models for which
low-NOX burners are available on the
market
c. Selective catalytic
reduction (SCR)
See description in
Section 10.8
Not applicable to combustion plants
operated < 500 h/yr.
There may be technical and economic
restrictions for retrofitting existing
combustion plants operated between
500 h/yr and 1500 h/yr.
Retrofitting existing combustion plants may
be constrained by the availability of
sufficient space
BAT 42. In order to prevent and/or reduce CO emissions to air from the combustion of
gas oil in gas turbines, BAT is to use one or a combination of the techniques given below.
Technique Description Applicability
a. Oxidation catalysts See description in
Section 10.8
Not applicable to combustion plants
operated < 500 h/yr.
Retrofitting existing combustion plants
may be constrained by the availability of
sufficient space
b. Combustion optimisation See description in
Section 10.8 Generally applicable
Table 10.24: Indicative emission levels for NOX emissions to air from the combustion of gas oil in
dual fuel gas turbines
Type of combustion plant Indicative NOX emission levels
Daily average or average over the sampling period
Dual fuel gas turbine for emergency use
operated < 500 h/yr 145–250
Dual fuel gas turbine put into operation no later
than 7 January 2014 and operated < 500 h/yr < 99
WORKIN
G DRAFT IN
PROGRESS

Chapter 10
TL/JFF/FN/EIPPCB/LCP_Final Draft June 2016 789
10.3.3.3 SOX and dust emissions to air
BAT 43. In order to prevent and/or reduce SOX and dust emissions to air from the
combustion of gas oil in gas turbines, BAT is to use the technique given below.
Technique Description Applicability
a. Fuel choice See description in
Section 10.8
Applicable within the constraints associated with the
availability of different types of fuel, which may be
impacted by the energy policy of the Member State
Table 10.25: BAT-associated emission levels for SO2 and dust emissions to air from the combustion
of gas oil in gas turbines, including dual fuel gas turbines
Combustion
plant total rated
thermal input
(MWth)
BAT-AELs (mg/Nm3)
SO2 Dust
New plant or existing plant New plant or existing plant
Yearly
average (2)
Daily average or
average over the
sampling period (3)
Yearly average
(2)
Daily average or
average over the
sampling period (3)
≥ 50 35–60 50–66 2–5 2–10 (2) These BAT-AELs do not apply to plants operated < 1500 h/yr.
(3) These levels are indicative for plants operated < 500 h/yr.
WORKIN
G DRAFT IN
PROGRESS

Chapter 10
790 June 2016 TL/JFF/FN/EIPPCB/LCP_Final Draft
10.4 BAT conclusions for the combustion of gaseous fuels
10.4.1 BAT conclusions for the combustion of natural gas
Unless otherwise stated, the BAT conclusions presented in this section are generally applicable
to the combustion of natural gas. They apply in addition to the general BAT conclusions given
in Section 10.1. They do not apply to combustion plants on offshore platforms; these are
covered by Section 10.4.3.
10.4.1.1 Energy efficiency
BAT 44. In order to increase the energy efficiency of natural gas combustion, BAT is to
use one or an appropriate combination of the techniques in BAT 7 and below.
Technique Description Applicability
a.Combined cycle See description in Section 10.8
Generally applicable to new
gas turbines and engines
except when operated
< 1500 h/yr.
Applicable to existing gas
turbines and engines within
the constraints associated
with the steam cycle design
and the space availability.
Not applicable to existing
gas turbines and engines
operated < 1500 h/yr.
Not applicable to
mechanical drive gas
turbines operated in
discontinuous mode with
extended load variations and
frequent start-ups and
shutdowns.
Not applicable to boilers
BAT 45. Removed
WORKIN
G DRAFT IN
PROGRESS
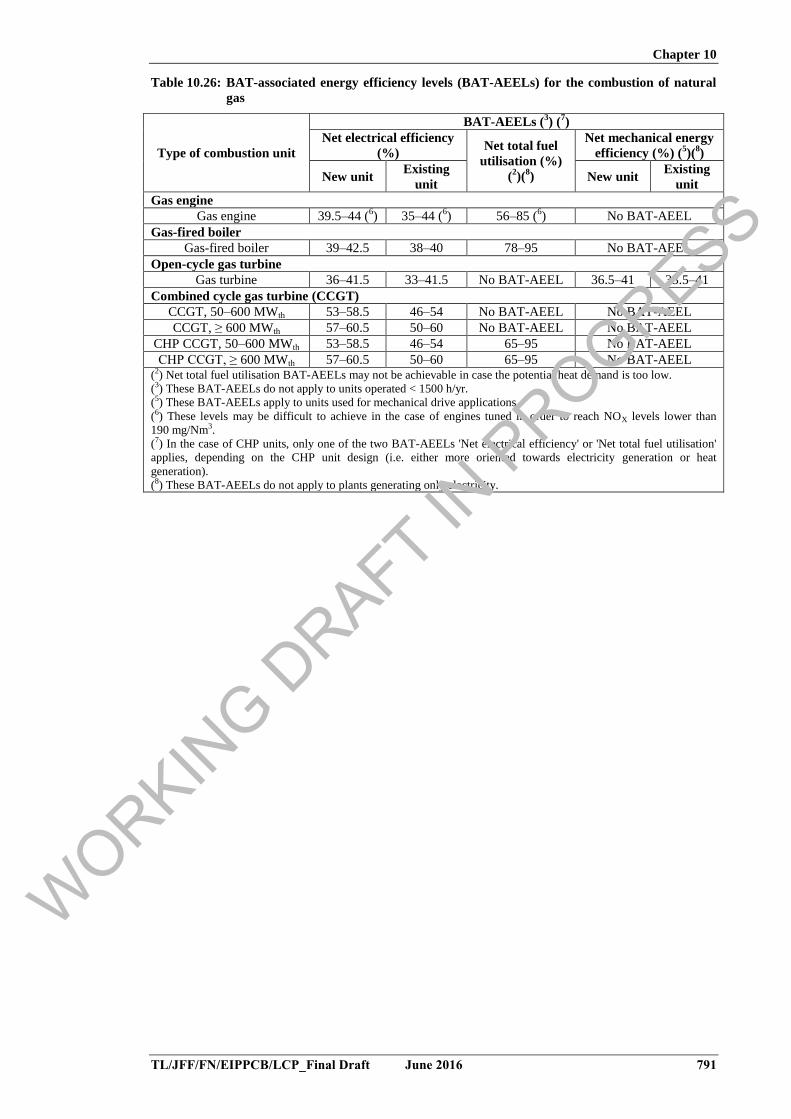
Chapter 10
TL/JFF/FN/EIPPCB/LCP_Final Draft June 2016 791
Table 10.26: BAT-associated energy efficiency levels (BAT-AEELs) for the combustion of natural
gas
Type of combustion unit
BAT-AEELs (3) (
7)
Net electrical efficiency
(%) Net total fuel
utilisation (%)
(2)(
8)
Net mechanical energy
efficiency (%) (5)(
8)
New unit Existing
unit New unit
Existing
unit
Gas engine
Gas engine 39.5–44 (6) 35–44 (
6) 56–85 (
6) No BAT-AEEL
Gas-fired boiler
Gas-fired boiler 39–42.5 38–40 78–95 No BAT-AEEL
Open-cycle gas turbine
Gas turbine 36–41.5 33–41.5 No BAT-AEEL 36.5–41 33.5–41
Combined cycle gas turbine (CCGT)
CCGT, 50–600 MWth 53–58.5 46–54 No BAT-AEEL No BAT-AEEL
CCGT, ≥ 600 MWth 57–60.5 50–60 No BAT-AEEL No BAT-AEEL
CHP CCGT, 50–600 MWth 53–58.5 46–54 65–95 No BAT-AEEL
CHP CCGT, ≥ 600 MWth 57–60.5 50–60 65–95 No BAT-AEEL (2) Net total fuel utilisation BAT-AEELs may not be achievable in case the potential heat demand is too low.
(3) These BAT-AEELs do not apply to units operated < 1500 h/yr.
(5) These BAT-AEELs apply to units used for mechanical drive applications.
(6) These levels may be difficult to achieve in the case of engines tuned in order to reach NOX levels lower than
190 mg/Nm3.
(7) In the case of CHP units, only one of the two BAT-AEELs 'Net electrical efficiency' or 'Net total fuel utilisation'
applies, depending on the CHP unit design (i.e. either more oriented towards electricity generation or heat
generation).
(8) These BAT-AEELs do not apply to plants generating only electricity.
WORKIN
G DRAFT IN
PROGRESS
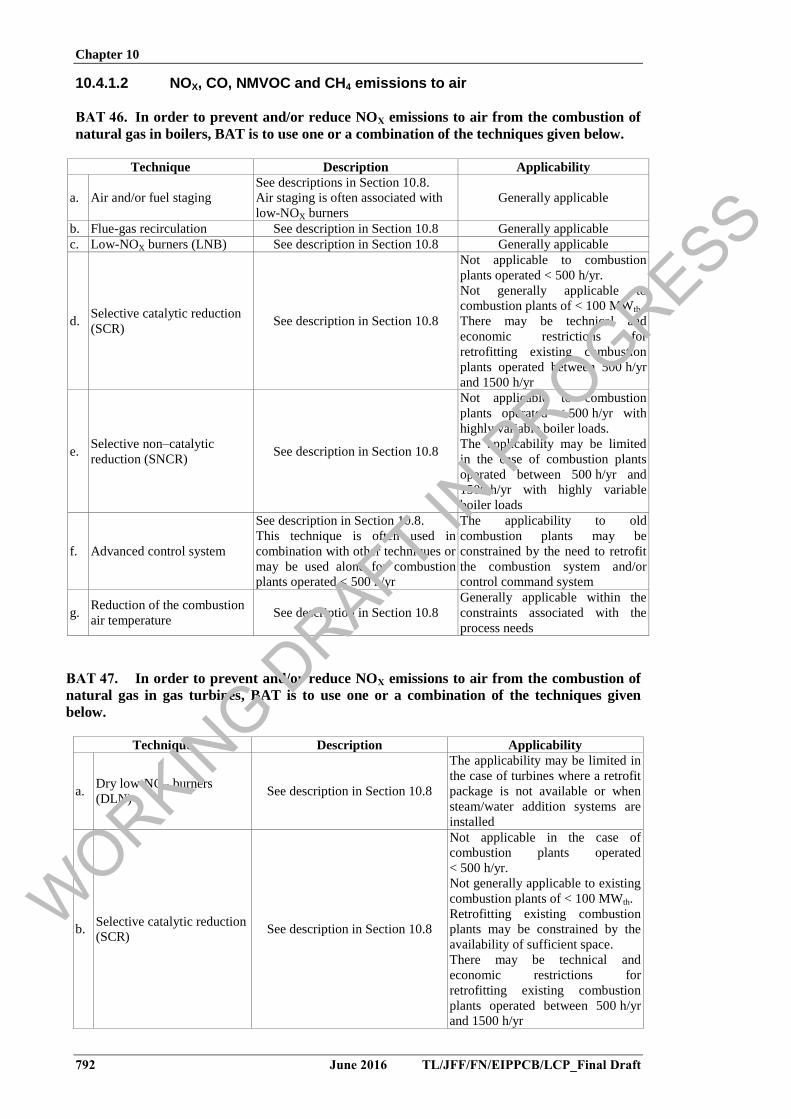
Chapter 10
792 June 2016 TL/JFF/FN/EIPPCB/LCP_Final Draft
10.4.1.2 NOX, CO, NMVOC and CH4 emissions to air
BAT 46. In order to prevent and/or reduce NOX emissions to air from the combustion of
natural gas in boilers, BAT is to use one or a combination of the techniques given below.
Technique Description Applicability
a. Air and/or fuel staging
See descriptions in Section 10.8.
Air staging is often associated with
low-NOX burners
Generally applicable
b. Flue-gas recirculation See description in Section 10.8 Generally applicable
c. Low-NOX burners (LNB) See description in Section 10.8 Generally applicable
d. Selective catalytic reduction
(SCR) See description in Section 10.8
Not applicable to combustion
plants operated < 500 h/yr.
Not generally applicable to
combustion plants of < 100 MWth.
There may be technical and
economic restrictions for
retrofitting existing combustion
plants operated between 500 h/yr
and 1500 h/yr
e. Selective non–catalytic
reduction (SNCR) See description in Section 10.8
Not applicable to combustion
plants operated < 500 h/yr with
highly variable boiler loads.
The applicability may be limited
in the case of combustion plants
operated between 500 h/yr and
1500 h/yr with highly variable
boiler loads
f. Advanced control system
See description in Section 10.8.
This technique is often used in
combination with other techniques or
may be used alone for combustion
plants operated < 500 h/yr
The applicability to old
combustion plants may be
constrained by the need to retrofit
the combustion system and/or
control command system
g. Reduction of the combustion
air temperature See description in Section 10.8
Generally applicable within the
constraints associated with the
process needs
BAT 47. In order to prevent and/or reduce NOX emissions to air from the combustion of
natural gas in gas turbines, BAT is to use one or a combination of the techniques given
below.
Technique Description Applicability
a. Dry low-NOX burners
(DLN) See description in Section 10.8
The applicability may be limited in
the case of turbines where a retrofit
package is not available or when
steam/water addition systems are
installed
b. Selective catalytic reduction
(SCR) See description in Section 10.8
Not applicable in the case of
combustion plants operated
< 500 h/yr.
Not generally applicable to existing
combustion plants of < 100 MWth.
Retrofitting existing combustion
plants may be constrained by the
availability of sufficient space.
There may be technical and
economic restrictions for
retrofitting existing combustion
plants operated between 500 h/yr
and 1500 h/yr
WORKIN
G DRAFT IN
PROGRESS

Chapter 10
TL/JFF/FN/EIPPCB/LCP_Final Draft June 2016 793
c. Water/steam addition See description in Section 10.8 The applicability may be limited
due to water availability
d. Advanced control system
See description in Section 10.8.
This technique is often used in
combination with other techniques
or may be used alone for
combustion plants operated
< 500 h/yr
The applicability to old combustion
plants may be constrained by the
need to retrofit the combustion
system and/or control command
system
e. Low-load design concept
Adaptation of the process control
and related equipment to maintain
good combustion efficiency when
the demand in energy varies, e.g.
by improving the inlet airflow
control capability or by splitting the
combustion process into decoupled
combustion stages
The applicability may be limited by
the gas turbine design
f. Low-NOX burners (LNB) See description in Section 10.8
Generally applicable to
supplementary firing for heat
recovery steam generators
(HRSGs) in the case of combined-
cycle gas turbine (CCGT)
combustion plants
BAT 48. In order to prevent and/or reduce NOX emissions to air from the combustion of
natural gas in engines, BAT is to use one or a combination of the techniques given below.
Technique Description Applicability
a. Lean-burn concept
See description in Section 10.8.
Generally used in combination with
SCR
Only applicable to new gas-fired
engines
b. Advanced lean-burn concept See description in Section 10.8 Only applicable to new spark plug
or other ignited engines
c. Selective catalytic reduction
(SCR) See description in Section 10.8
Retrofitting existing combustion
plants may be constrained by the
availability of sufficient space.
Not applicable to combustion
plants operated < 500 h/yr.
There may be technical and
economic restrictions for
retrofitting existing combustion
plants operated between 500 h/yr
and 1500 h/yr
d. Advanced control system
See description in Section 10.8.
This technique is often used in
combination with other techniques
or may be used alone for
combustion plants operated
< 500 h/yr
The applicability to old
combustion plants may be
constrained by the need to retrofit
the combustion system and/or
control command system
BAT 49. In order to prevent and/or reduce CO emissions to air from the combustion of
natural gas, BAT is to use one or both of the techniques given below.
Technique Description
a. Combustion optimisation See description in Section 10.8
b. Oxidation catalysts See description in Section 10.8
WORKIN
G DRAFT IN
PROGRESS
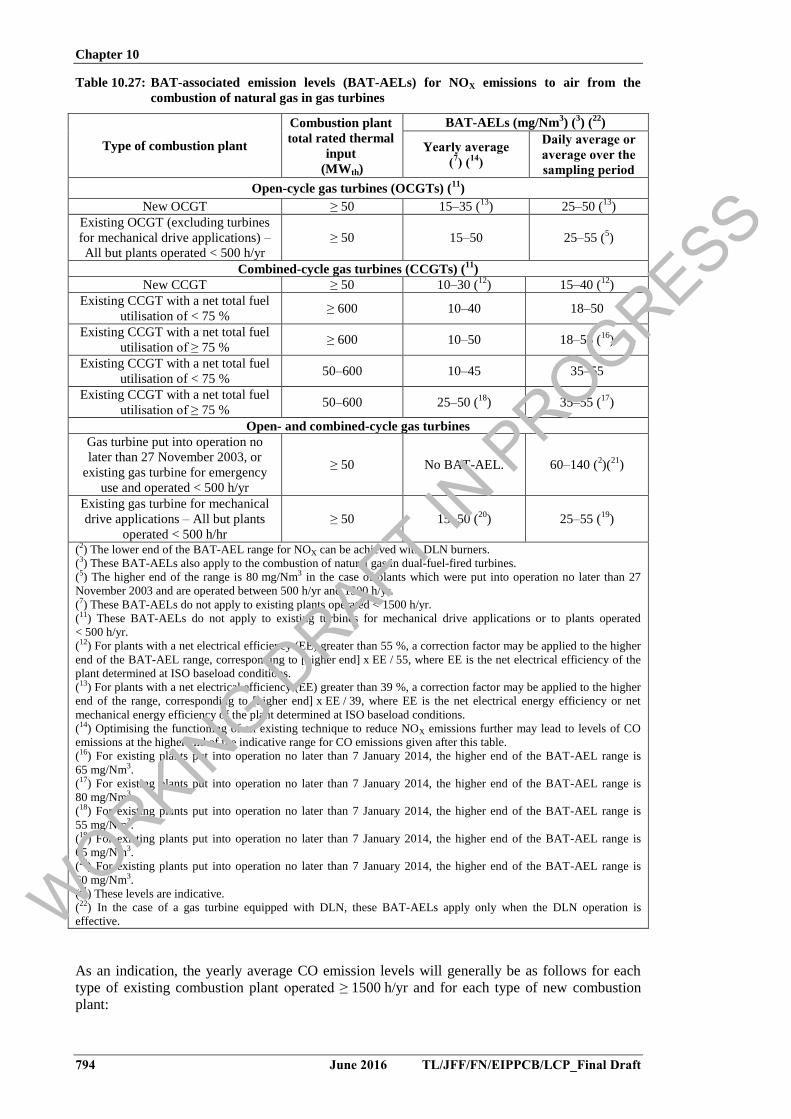
Chapter 10
794 June 2016 TL/JFF/FN/EIPPCB/LCP_Final Draft
Table 10.27: BAT-associated emission levels (BAT-AELs) for NOX emissions to air from the
combustion of natural gas in gas turbines
Type of combustion plant
Combustion plant
total rated thermal
input
(MWth)
BAT-AELs (mg/Nm3) (
3) (
22)
Yearly average
(7) (
14)
Daily average or
average over the
sampling period
Open-cycle gas turbines (OCGTs) (11
)
New OCGT ≥ 50 15–35 (13
) 25–50 (13
)
Existing OCGT (excluding turbines
for mechanical drive applications) –
All but plants operated < 500 h/yr
≥ 50 15–50 25–55 (5)
Combined-cycle gas turbines (CCGTs) (11
)
New CCGT ≥ 50 10–30 (12
) 15–40 (12
)
Existing CCGT with a net total fuel
utilisation of < 75 % ≥ 600 10–40 18–50
Existing CCGT with a net total fuel
utilisation of ≥ 75 % ≥ 600 10–50 18–55 (
16)
Existing CCGT with a net total fuel
utilisation of < 75 % 50–600 10–45 35–55
Existing CCGT with a net total fuel
utilisation of ≥ 75 % 50–600 25–50 (
18) 35–55 (
17)
Open- and combined-cycle gas turbines
Gas turbine put into operation no
later than 27 November 2003, or
existing gas turbine for emergency
use and operated < 500 h/yr
≥ 50 No BAT-AEL. 60–140 (2)(
21)
Existing gas turbine for mechanical
drive applications – All but plants
operated < 500 h/hr
≥ 50 15–50 (20
) 25–55 (19
)
(2) The lower end of the BAT-AEL range for NOX can be achieved with DLN burners.
(3) These BAT-AELs also apply to the combustion of natural gas in dual-fuel-fired turbines.
(5) The higher end of the range is 80 mg/Nm3 in the case of plants which were put into operation no later than 27
November 2003 and are operated between 500 h/yr and 1500 h/yr.
(7) These BAT-AELs do not apply to existing plants operated < 1500 h/yr.
(11) These BAT-AELs do not apply to existing turbines for mechanical drive applications or to plants operated
< 500 h/yr.
(12) For plants with a net electrical efficiency (EE) greater than 55 %, a correction factor may be applied to the higher
end of the BAT-AEL range, corresponding to [higher end] x EE / 55, where EE is the net electrical efficiency of the
plant determined at ISO baseload conditions.
(13) For plants with a net electrical efficiency (EE) greater than 39 %, a correction factor may be applied to the higher
end of the range, corresponding to [higher end] x EE / 39, where EE is the net electrical energy efficiency or net
mechanical energy efficiency of the plant determined at ISO baseload conditions.
(14) Optimising the functioning of an existing technique to reduce NOX emissions further may lead to levels of CO
emissions at the higher end of the indicative range for CO emissions given after this table.
(16) For existing plants put into operation no later than 7 January 2014, the higher end of the BAT-AEL range is
65 mg/Nm3.
(17) For existing plants put into operation no later than 7 January 2014, the higher end of the BAT-AEL range is
80 mg/Nm3.
(18) For existing plants put into operation no later than 7 January 2014, the higher end of the BAT-AEL range is
55 mg/Nm3.
(19) For existing plants put into operation no later than 7 January 2014, the higher end of the BAT-AEL range is
65 mg/Nm3.
(20) For existing plants put into operation no later than 7 January 2014, the higher end of the BAT-AEL range is
60 mg/Nm3.
(21) These levels are indicative.
(22) In the case of a gas turbine equipped with DLN, these BAT-AELs apply only when the DLN operation is
effective.
As an indication, the yearly average CO emission levels will generally be as follows for each
type of existing combustion plant operated ≥ 1500 h/yr and for each type of new combustion
plant:
WORKIN
G DRAFT IN
PROGRESS

Chapter 10
TL/JFF/FN/EIPPCB/LCP_Final Draft June 2016 795
New OCGT of ≥ 50 MWth: < 5–40 mg/Nm3. For plants with a net electrical efficiency
(EE) greater than 39 %, a correction factor may be applied to the higher end of this
range, corresponding to [higher end] x EE / 39, where EE is the net electrical energy
efficiency or net mechanical energy efficiency of the plant determined at ISO baseload
conditions.
Existing OCGT of ≥ 50 MWth and operated ≥ 500 h/yr (excluding turbines for
mechanical drive applications): < 5–40 mg/Nm3. The higher end of this range will
generally be 80 mg/Nm3 in the case of existing plants that cannot be fitted with dry
techniques for NOX reduction, or 50 mg/Nm3 for plants that operate at low load.
New CCGT of ≥ 50 MWth: < 5–30 mg/Nm3. For plants with a net electrical efficiency
(EE) greater than 55 %, a correction factor may be applied to the higher end of the
range, corresponding to [higher end] x EE / 55, where EE is the net electrical energy
efficiency of the plant determined at ISO baseload conditions.
Existing CCGT of ≥ 50 MWth: < 5–30 mg/Nm3. The higher end of this range will
generally be 50 mg/Nm3 for plants that operate at low load.
Existing gas turbines of ≥ 50 MWth for mechanical drive applications operated
≥ 500 h/yr: < 5–40 mg/Nm3. The higher end of the range will generally be 50 mg/Nm
3
when plants operate at low load.
In the case of a gas turbine equipped with DLN burners, these indicative levels correspond to
when the DLN operation is effective.
Table 10.28: BAT-associated emission levels (BAT-AELs) for NOX emissions to air from the
combustion of natural gas in boilers and engines
Type of combustion plant
BAT-AELs (mg/Nm3)
Yearly average (4)
Daily average or average
over the sampling period
New plant Existing plant New
plant Existing plant
Boiler 10–60 50–100 (3) 30–85 85–110 (
5)
Engine (1) 20–75 20–100 (
3) 55–85 55–110 (
2)(
5)
(1) These BAT-AELs only apply to spark-ignited and dual-fuel engines. They do not apply to gas-diesel engines.
(2) In the case of engines for emergency use operated < 500 h/yr that could not apply the lean-burn concept or use
SCR, the higher end of the indicative range is 175 mg/Nm3.
(3) These BAT-AELs do not apply to plants operated < 1500 h/yr.
(4) Optimising the functioning of an existing technique to reduce NOX emissions further may lead to levels of CO
emissions at the higher end of the indicative range for CO emissions given after this table.
(5) These levels are indicative for plants operated < 500 h/yr.
As an indication, the yearly average CO emission levels for new boilers will generally be < 5–
15 mg/Nm3 and for existing boilers operated ≥ 1500 h/yr they will generally be < 5–40 mg/Nm
3.
The yearly average CO levels for existing engines operated ≥ 1500 h/yr and for new engines
will generally be 30–100 mg/Nm3.
BAT 50. In order to reduce non-methane volatile organic compounds (NMVOC) and
methane (CH4) emissions to air from the combustion of natural gas in spark-ignited lean-
burn gas engines, BAT is to ensure an optimised combustion and/or to apply oxidation
catalysts.
Description
Oxidation catalysts are not effective at reducing saturated hydrocarbons containing less than
four carbon atoms.
WORKIN
G DRAFT IN
PROGRESS
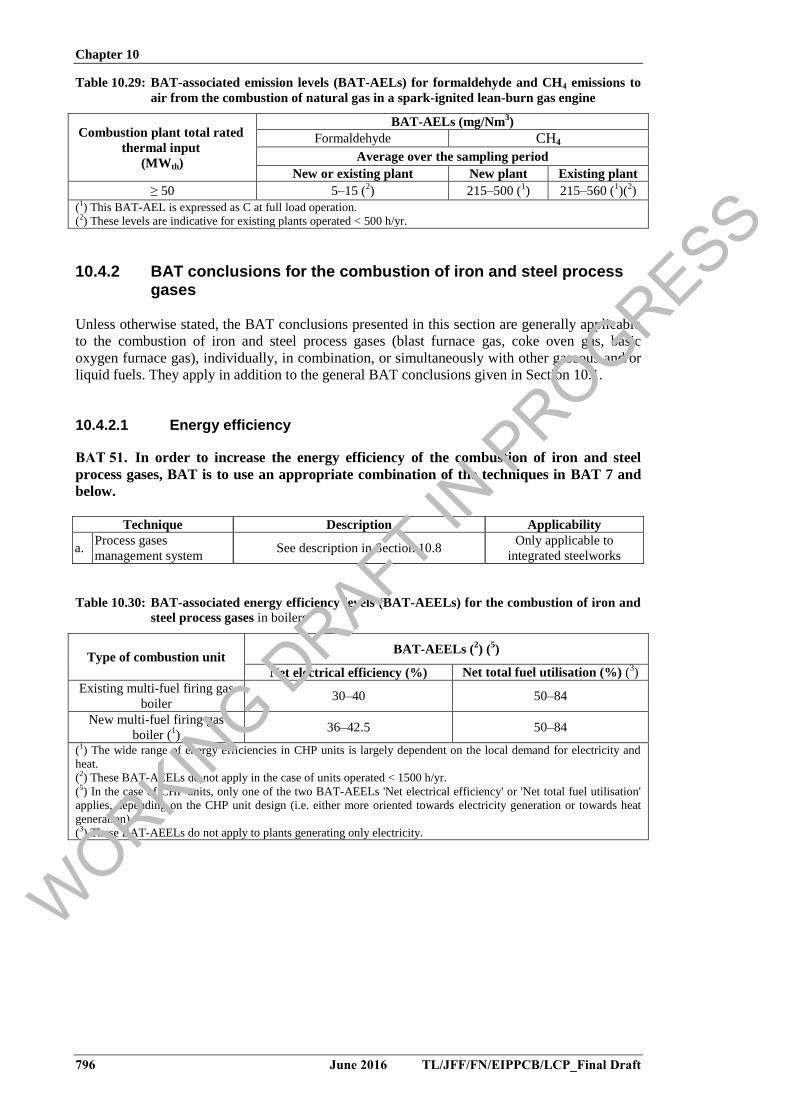
Chapter 10
796 June 2016 TL/JFF/FN/EIPPCB/LCP_Final Draft
Table 10.29: BAT-associated emission levels (BAT-AELs) for formaldehyde and CH4 emissions to
air from the combustion of natural gas in a spark-ignited lean-burn gas engine
Combustion plant total rated
thermal input
(MWth)
BAT-AELs (mg/Nm3)
Formaldehyde CH4
Average over the sampling period
New or existing plant New plant Existing plant
≥ 50 5–15 (2) 215–500 (
1) 215–560 (
1)(
2)
(1) This BAT-AEL is expressed as C at full load operation.
(2) These levels are indicative for existing plants operated < 500 h/yr.
10.4.2 BAT conclusions for the combustion of iron and steel process gases
Unless otherwise stated, the BAT conclusions presented in this section are generally applicable
to the combustion of iron and steel process gases (blast furnace gas, coke oven gas, basic
oxygen furnace gas), individually, in combination, or simultaneously with other gaseous and/or
liquid fuels. They apply in addition to the general BAT conclusions given in Section 10.1.
10.4.2.1 Energy efficiency
BAT 51. In order to increase the energy efficiency of the combustion of iron and steel
process gases, BAT is to use an appropriate combination of the techniques in BAT 7 and
below.
Technique Description Applicability
a. Process gases
management system See description in Section 10.8
Only applicable to
integrated steelworks
Table 10.30: BAT-associated energy efficiency levels (BAT-AEELs) for the combustion of iron and
steel process gases in boilers
Type of combustion unit BAT-AEELs (
2) (
5)
Net electrical efficiency (%) Net total fuel utilisation (%) (3)
Existing multi-fuel firing gas
boiler 30–40 50–84
New multi-fuel firing gas
boiler (1)
36–42.5 50–84
(1) The wide range of energy efficiencies in CHP units is largely dependent on the local demand for electricity and
heat.
(2) These BAT-AEELs do not apply in the case of units operated < 1500 h/yr.
(5) In the case of CHP units, only one of the two BAT-AEELs 'Net electrical efficiency' or 'Net total fuel utilisation'
applies, depending on the CHP unit design (i.e. either more oriented towards electricity generation or towards heat
generation).
(3) These BAT-AEELs do not apply to plants generating only electricity.
WORKIN
G DRAFT IN
PROGRESS
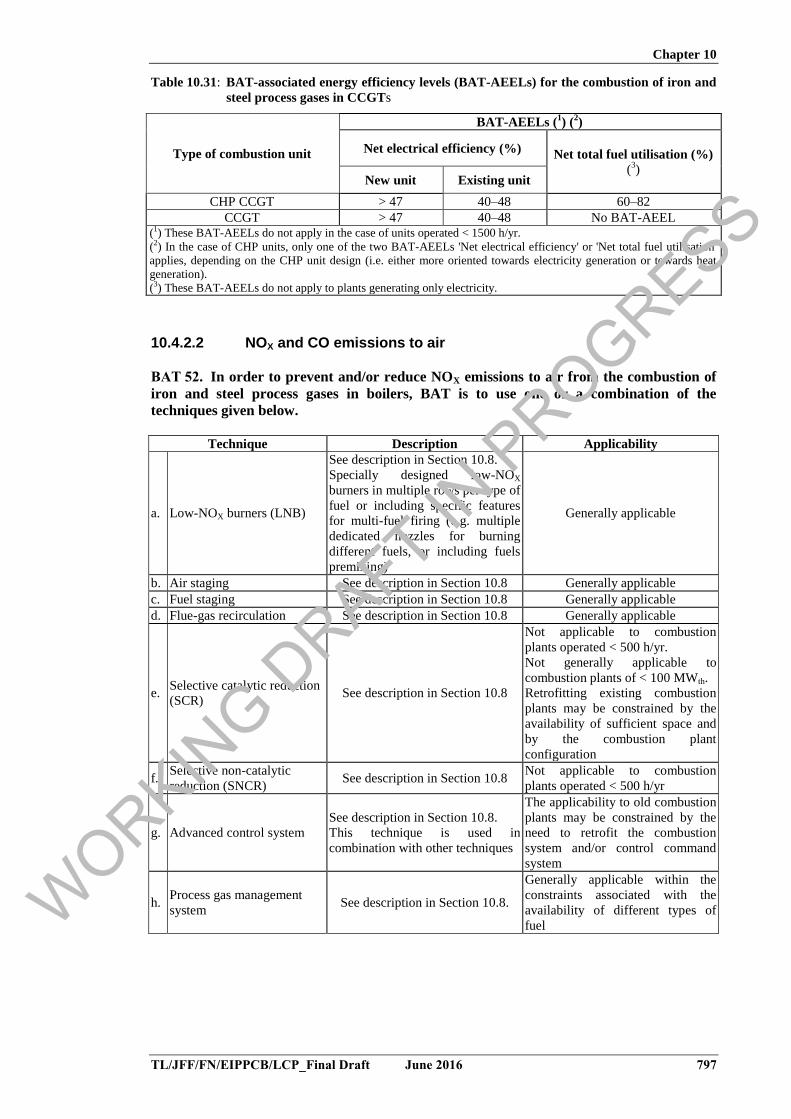
Chapter 10
TL/JFF/FN/EIPPCB/LCP_Final Draft June 2016 797
Table 10.31: BAT-associated energy efficiency levels (BAT-AEELs) for the combustion of iron and
steel process gases in CCGTs
Type of combustion unit
BAT-AEELs (1) (
2)
Net electrical efficiency (%) Net total fuel utilisation (%)
(3)
New unit Existing unit
CHP CCGT > 47 40–48 60–82 CCGT > 47 40–48 No BAT-AEEL
(1) These BAT-AEELs do not apply in the case of units operated < 1500 h/yr.
(2) In the case of CHP units, only one of the two BAT-AEELs 'Net electrical efficiency' or 'Net total fuel utilisation'
applies, depending on the CHP unit design (i.e. either more oriented towards electricity generation or towards heat
generation).
(3) These BAT-AEELs do not apply to plants generating only electricity.
10.4.2.2 NOX and CO emissions to air
BAT 52. In order to prevent and/or reduce NOX emissions to air from the combustion of
iron and steel process gases in boilers, BAT is to use one or a combination of the
techniques given below.
Technique Description Applicability
a. Low-NOX burners (LNB)
See description in Section 10.8.
Specially designed low-NOX
burners in multiple rows per type of
fuel or including specific features
for multi-fuel firing (e.g. multiple
dedicated nozzles for burning
different fuels, or including fuels
premixing)
Generally applicable
b. Air staging See description in Section 10.8 Generally applicable
c. Fuel staging See description in Section 10.8 Generally applicable
d. Flue-gas recirculation See description in Section 10.8 Generally applicable
e. Selective catalytic reduction
(SCR) See description in Section 10.8
Not applicable to combustion
plants operated < 500 h/yr.
Not generally applicable to
combustion plants of < 100 MWth.
Retrofitting existing combustion
plants may be constrained by the
availability of sufficient space and
by the combustion plant
configuration
f. Selective non-catalytic
reduction (SNCR) See description in Section 10.8
Not applicable to combustion
plants operated < 500 h/yr
g. Advanced control system
See description in Section 10.8.
This technique is used in
combination with other techniques
The applicability to old combustion
plants may be constrained by the
need to retrofit the combustion
system and/or control command
system
h. Process gas management
system See description in Section 10.8.
Generally applicable within the
constraints associated with the
availability of different types of
fuel WORKIN
G DRAFT IN
PROGRESS
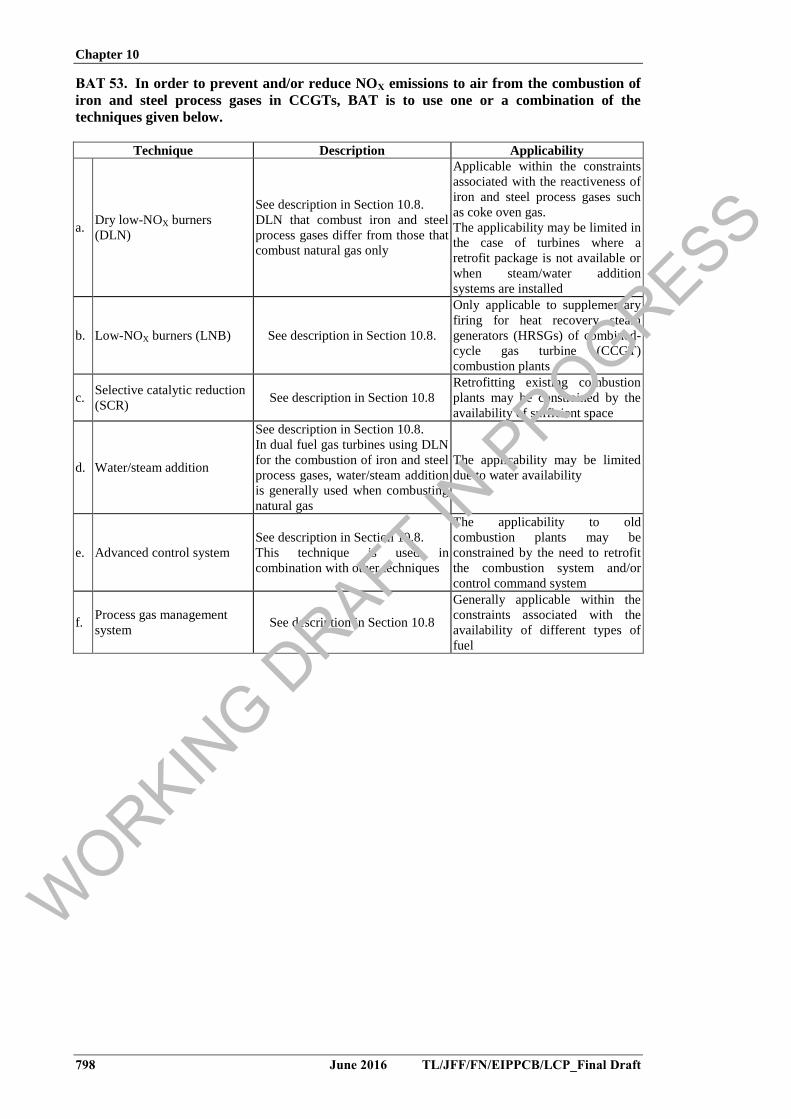
Chapter 10
798 June 2016 TL/JFF/FN/EIPPCB/LCP_Final Draft
BAT 53. In order to prevent and/or reduce NOX emissions to air from the combustion of
iron and steel process gases in CCGTs, BAT is to use one or a combination of the
techniques given below.
Technique Description Applicability
a. Dry low-NOX burners
(DLN)
See description in Section 10.8.
DLN that combust iron and steel
process gases differ from those that
combust natural gas only
Applicable within the constraints
associated with the reactiveness of
iron and steel process gases such
as coke oven gas.
The applicability may be limited in
the case of turbines where a
retrofit package is not available or
when steam/water addition
systems are installed
b. Low-NOX burners (LNB) See description in Section 10.8.
Only applicable to supplementary
firing for heat recovery steam
generators (HRSGs) of combined-
cycle gas turbine (CCGT)
combustion plants
c. Selective catalytic reduction
(SCR) See description in Section 10.8
Retrofitting existing combustion
plants may be constrained by the
availability of sufficient space
d. Water/steam addition
See description in Section 10.8.
In dual fuel gas turbines using DLN
for the combustion of iron and steel
process gases, water/steam addition
is generally used when combusting
natural gas
The applicability may be limited
due to water availability
e. Advanced control system
See description in Section 10.8.
This technique is used in
combination with other techniques
The applicability to old
combustion plants may be
constrained by the need to retrofit
the combustion system and/or
control command system
f. Process gas management
system See description in Section 10.8
Generally applicable within the
constraints associated with the
availability of different types of
fuel
WORKIN
G DRAFT IN
PROGRESS
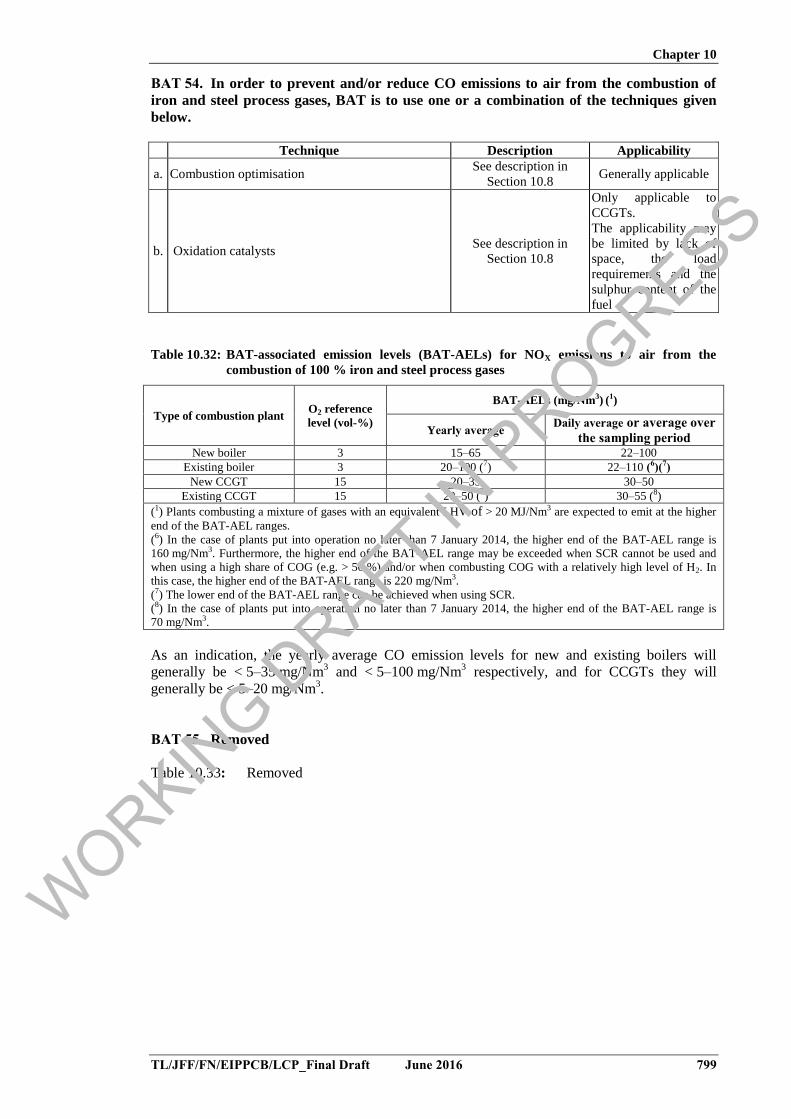
Chapter 10
TL/JFF/FN/EIPPCB/LCP_Final Draft June 2016 799
BAT 54. In order to prevent and/or reduce CO emissions to air from the combustion of
iron and steel process gases, BAT is to use one or a combination of the techniques given
below.
Technique Description Applicability
a. Combustion optimisation See description in
Section 10.8 Generally applicable
b. Oxidation catalysts See description in
Section 10.8
Only applicable to
CCGTs.
The applicability may
be limited by lack of
space, the load
requirements and the
sulphur content of the
fuel
Table 10.32: BAT-associated emission levels (BAT-AELs) for NOX emissions to air from the
combustion of 100 % iron and steel process gases
Type of combustion plant O2 reference
level (vol-%)
BAT-AELs (mg/Nm3) (1)
Yearly average Daily average or average over
the sampling period
New boiler 3 15–65 22–100
Existing boiler 3 20–100 (7) 22–110 (6)(7)
New CCGT 15 20–35 30–50
Existing CCGT 15 20–50 (7) 30–55 (8)
(1) Plants combusting a mixture of gases with an equivalent LHV of > 20 MJ/Nm3 are expected to emit at the higher
end of the BAT-AEL ranges.
(6) In the case of plants put into operation no later than 7 January 2014, the higher end of the BAT-AEL range is
160 mg/Nm3. Furthermore, the higher end of the BAT-AEL range may be exceeded when SCR cannot be used and
when using a high share of COG (e.g. > 50 %) and/or when combusting COG with a relatively high level of H2. In
this case, the higher end of the BAT-AEL range is 220 mg/Nm3.
(7) The lower end of the BAT-AEL range can be achieved when using SCR.
(8) In the case of plants put into operation no later than 7 January 2014, the higher end of the BAT-AEL range is
70 mg/Nm3.
As an indication, the yearly average CO emission levels for new and existing boilers will
generally be < 5–35 mg/Nm3 and < 5–100 mg/Nm
3 respectively, and for CCGTs they will
generally be < 5–20 mg/Nm3.
BAT 55. Removed
Table 10.33: Removed
WORKIN
G DRAFT IN
PROGRESS

Chapter 10
800 June 2016 TL/JFF/FN/EIPPCB/LCP_Final Draft
10.4.2.3 SOX emissions to air
BAT 56. In order to prevent and/or reduce SOX emissions to air from the combustion of
iron and steel process gases, BAT is to use a combination of the techniques given below.
Technique Description Applicability
a. Coke oven gas pretreatment at
the iron- and steel-works
Use of one of the following techniques:
desulphurisation by absorption systems;
wet oxidative desulphurisation
Only applicable
to coke oven gas
combustion
plants
b. Process gas management system
and auxiliary fuel choice
See description in Section 10.8.
Use, as much as the iron- and steel-works
allow it, of:
a majority of blast furnace gas with a
low sulphur content in the fuel diet;
a combination of fuels with a low
averaged sulphur content, e.g.
individual process fuels with a very low
S content such as:
o Blast furnace gas with a sulphur
content < 10 mg/Nm3;
o coke oven gas with a sulphur
content < 300 mg/Nm3;
and auxiliary fuels such as:
o natural gas;
o liquid fuels with a sulphur content
of ≤ 0.4 % (in boilers).
Use of a limited amount of fuels with a
higher sulphur content
Generally
applicable within
the constraints
associated with
the availability of
different types of
fuel
Table 10.34: BAT-associated emission levels (BAT-AELs) for SO2 emissions to air from the
combustion of 100 % iron and steel process gases
Type of combustion plant O2 reference
level (%)
BAT-AELs for SO2 (mg/Nm3)
Yearly average Daily average or average
over the sampling period
New or existing boiler 3 25–150 50–200 (2)
New or existing CCGT 15 10–45 20–70
(2) The higher end of the BAT-AEL range may be exceeded when using a high share of COG (e.g. > 50 %). In this
case, the higher end of the BAT-AEL range is 300 mg/Nm3.
BAT 57. Removed
Table 10.35: Removed
10.4.2.4 Dust emissions to air
BAT 58. In order to reduce dust emissions to air from the combustion of iron and steel
process gases, BAT is to use one or a combination of the techniques given below.
Technique Description Applicability
a. Fuel choice/management
Use of a combination of
process gases and
auxiliary fuels with a low
averaged dust or ash
content
Generally applicable within the
constraints associated with the
availability of different types of
fuel
b. Blast furnace gas pretreatment at
the iron- and steel-works
Use of one or a
combination of dry
Only applicable if blast furnace
gas is combusted
WORKIN
G DRAFT IN
PROGRESS
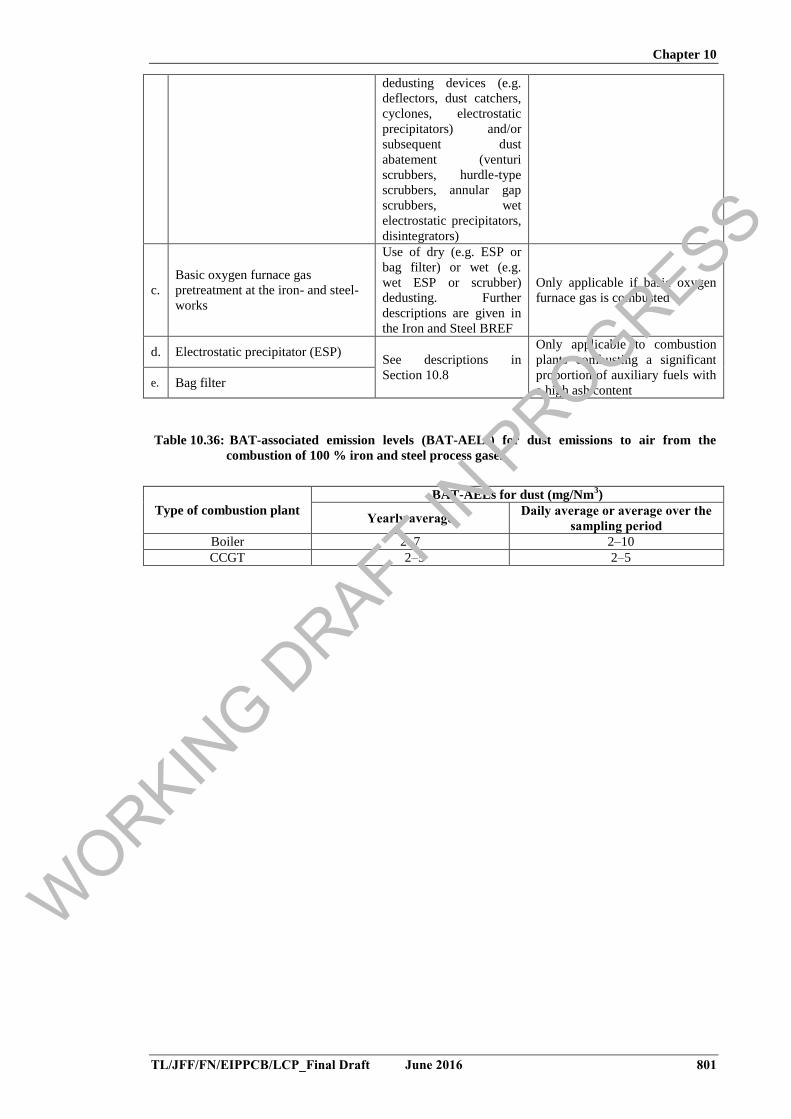
Chapter 10
TL/JFF/FN/EIPPCB/LCP_Final Draft June 2016 801
dedusting devices (e.g.
deflectors, dust catchers,
cyclones, electrostatic
precipitators) and/or
subsequent dust
abatement (venturi
scrubbers, hurdle-type
scrubbers, annular gap
scrubbers, wet
electrostatic precipitators,
disintegrators)
c.
Basic oxygen furnace gas
pretreatment at the iron- and steel-
works
Use of dry (e.g. ESP or
bag filter) or wet (e.g.
wet ESP or scrubber)
dedusting. Further
descriptions are given in
the Iron and Steel BREF
Only applicable if basic oxygen
furnace gas is combusted
d. Electrostatic precipitator (ESP) See descriptions in
Section 10.8
Only applicable to combustion
plants combusting a significant
proportion of auxiliary fuels with
a high ash content e. Bag filter
Table 10.36: BAT-associated emission levels (BAT-AELs) for dust emissions to air from the
combustion of 100 % iron and steel process gases
Type of combustion plant
BAT-AELs for dust (mg/Nm3)
Yearly average Daily average or average over the
sampling period
Boiler 2–7 2–10
CCGT 2–5 2–5
WORKIN
G DRAFT IN
PROGRESS

Chapter 10
802 June 2016 TL/JFF/FN/EIPPCB/LCP_Final Draft
10.4.3 BAT conclusions for the combustion of gaseous and/or liquid fuels on offshore platforms
Unless otherwise stated, the BAT conclusions presented in this section are generally applicable
to the combustion of gaseous and/or liquid fuels on offshore platforms. They apply in addition
to the general BAT conclusions given in Section 10.1.
BAT 59. In order to improve the general environmental performance of the combustion
of gaseous and/or liquid fuels on offshore platforms, BAT is to use one or a combination of
the techniques given below.
Techniques Description Applicability
a. Minimise the 'spinning
reserve'
When running with spinning
reserve for operational reliability
reasons, the number of additional
turbines is minimised, except in
exceptional circumstances
Generally applicable
b. Fuel choice
Provide a fuel gas supply from a
point in the topside oil and gas
process which offers a minimum
range of fuel gas combustion
parameters, e.g. calorific value, and
minimum concentrations of
sulphurous compounds to minimise
SO2 formation. For liquid distillate
fuels, preference is given to low-
sulphur fuels
Generally applicable
c. Load control
Operate multiple generator or
compressor sets at load points
which minimise pollution
Generally applicable
d. Control pressure losses
Optimise and maintain inlet and
exhaust systems in a way that keeps
the pressure losses as low as
possible
Generally applicable
e. Process optimisation
Optimise the process in order to
minimise the mechanical power
requirements
Generally applicable
f. Heat recovery
Utilisation of gas turbine/engine
exhaust heat for platform heating
purposes
Generally applicable to new
combustion plants.
In existing combustion
plants, the applicability may
be restricted by the level of
heat demand and the
combustion plant layout
(space)
g. Injection timing Optimise injection timing in
engines Generally applicable
h. Power integration of multiple
gas fields / oilfields
Use of a central power source to
supply a number of participating
platforms located at different gas
fields / oilfields
The applicability may be
limited depending on the
location of the different gas
fields / oilfields and on the
organisation of the different
participating platforms,
including alignment of time
schedules regarding
planning, start-up and
cessation of production
WORKIN
G DRAFT IN
PROGRESS
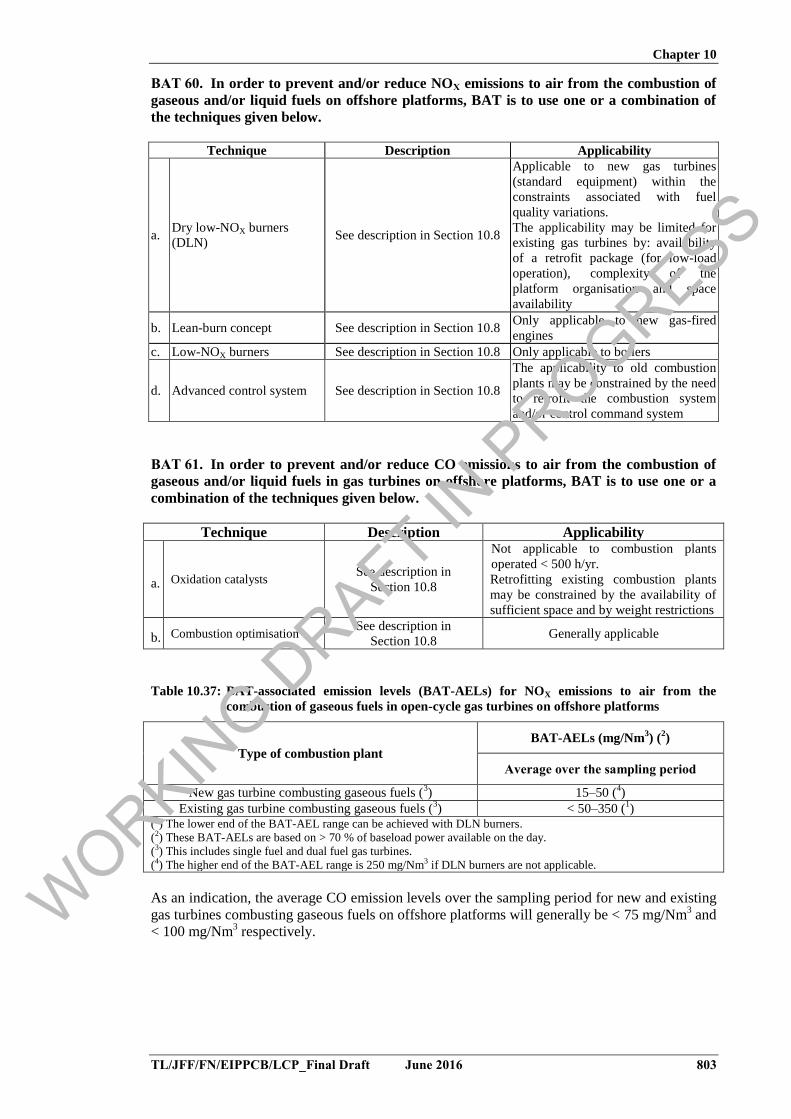
Chapter 10
TL/JFF/FN/EIPPCB/LCP_Final Draft June 2016 803
BAT 60. In order to prevent and/or reduce NOX emissions to air from the combustion of
gaseous and/or liquid fuels on offshore platforms, BAT is to use one or a combination of
the techniques given below.
Technique Description Applicability
a. Dry low-NOX burners
(DLN) See description in Section 10.8
Applicable to new gas turbines
(standard equipment) within the
constraints associated with fuel
quality variations.
The applicability may be limited for
existing gas turbines by: availability
of a retrofit package (for low-load
operation), complexity of the
platform organisation and space
availability
b. Lean-burn concept See description in Section 10.8 Only applicable to new gas-fired
engines
c. Low-NOX burners See description in Section 10.8 Only applicable to boilers
d. Advanced control system See description in Section 10.8
The applicability to old combustion
plants may be constrained by the need
to retrofit the combustion system
and/or control command system
BAT 61. In order to prevent and/or reduce CO emissions to air from the combustion of
gaseous and/or liquid fuels in gas turbines on offshore platforms, BAT is to use one or a
combination of the techniques given below.
Technique Description Applicability
a. Oxidation catalysts See description in
Section 10.8
Not applicable to combustion plants
operated < 500 h/yr.
Retrofitting existing combustion plants
may be constrained by the availability of
sufficient space and by weight restrictions
b. Combustion optimisation See description in
Section 10.8 Generally applicable
Table 10.37: BAT-associated emission levels (BAT-AELs) for NOX emissions to air from the
combustion of gaseous fuels in open-cycle gas turbines on offshore platforms
Type of combustion plant
BAT-AELs (mg/Nm3) (
2)
Average over the sampling period
New gas turbine combusting gaseous fuels (3) 15–50 (
4)
Existing gas turbine combusting gaseous fuels (3) < 50–350 (
1)
(1) The lower end of the BAT-AEL range can be achieved with DLN burners.
(2) These BAT-AELs are based on > 70 % of baseload power available on the day.
(3) This includes single fuel and dual fuel gas turbines.
(4) The higher end of the BAT-AEL range is 250 mg/Nm3 if DLN burners are not applicable.
As an indication, the average CO emission levels over the sampling period for new and existing
gas turbines combusting gaseous fuels on offshore platforms will generally be < 75 mg/Nm3 and
< 100 mg/Nm3 respectively.
WORKIN
G DRAFT IN
PROGRESS
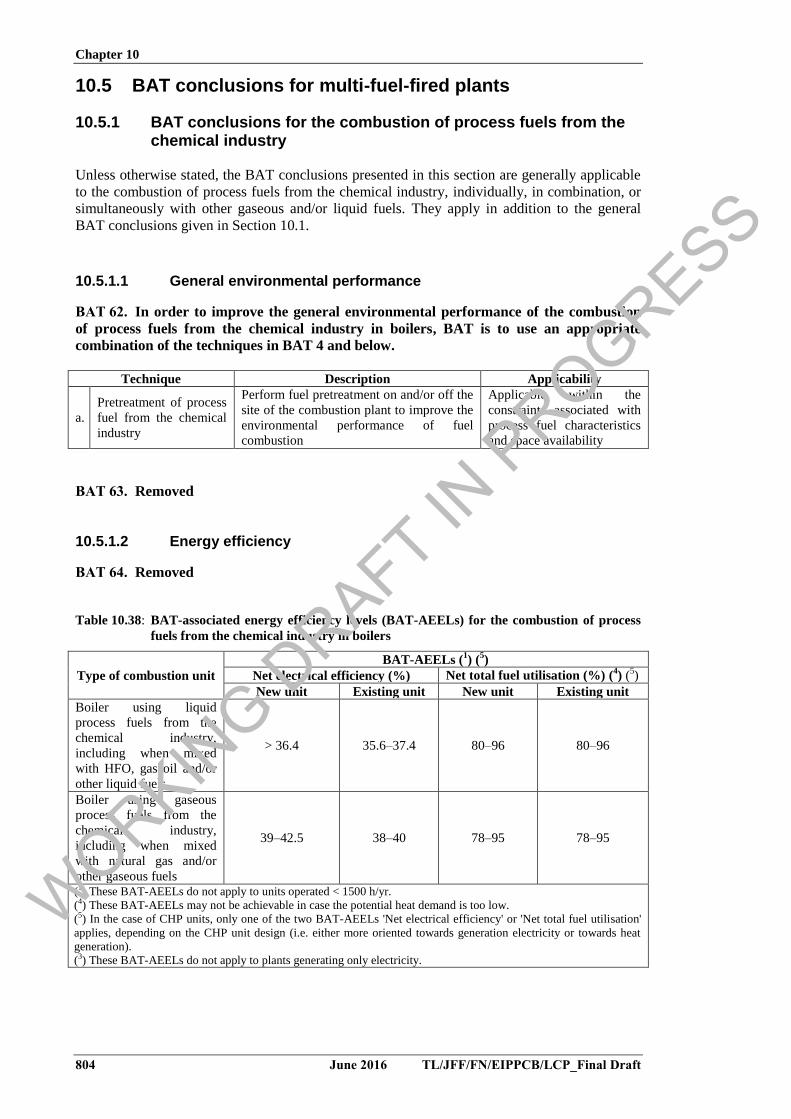
Chapter 10
804 June 2016 TL/JFF/FN/EIPPCB/LCP_Final Draft
10.5 BAT conclusions for multi-fuel-fired plants
10.5.1 BAT conclusions for the combustion of process fuels from the chemical industry
Unless otherwise stated, the BAT conclusions presented in this section are generally applicable
to the combustion of process fuels from the chemical industry, individually, in combination, or
simultaneously with other gaseous and/or liquid fuels. They apply in addition to the general
BAT conclusions given in Section 10.1.
10.5.1.1 General environmental performance
BAT 62. In order to improve the general environmental performance of the combustion
of process fuels from the chemical industry in boilers, BAT is to use an appropriate
combination of the techniques in BAT 4 and below.
Technique Description Applicability
a.
Pretreatment of process
fuel from the chemical
industry
Perform fuel pretreatment on and/or off the
site of the combustion plant to improve the
environmental performance of fuel
combustion
Applicable within the
constraints associated with
process fuel characteristics
and space availability
BAT 63. Removed
10.5.1.2 Energy efficiency
BAT 64. Removed
Table 10.38: BAT-associated energy efficiency levels (BAT-AEELs) for the combustion of process
fuels from the chemical industry in boilers
Type of combustion unit
BAT-AEELs (1) (
5)
Net electrical efficiency (%) Net total fuel utilisation (%) (4) (
5)
New unit Existing unit New unit Existing unit
Boiler using liquid
process fuels from the
chemical industry,
including when mixed
with HFO, gas oil and/or
other liquid fuels
> 36.4 35.6–37.4 80–96 80–96
Boiler using gaseous
process fuels from the
chemical industry,
including when mixed
with natural gas and/or
other gaseous fuels
39–42.5 38–40 78–95 78–95
(1) These BAT-AEELs do not apply to units operated < 1500 h/yr.
(4) These BAT-AEELs may not be achievable in case the potential heat demand is too low.
(5) In the case of CHP units, only one of the two BAT-AEELs 'Net electrical efficiency' or 'Net total fuel utilisation'
applies, depending on the CHP unit design (i.e. either more oriented towards generation electricity or towards heat
generation).
(3) These BAT-AEELs do not apply to plants generating only electricity.
WORKIN
G DRAFT IN
PROGRESS

Chapter 10
TL/JFF/FN/EIPPCB/LCP_Final Draft June 2016 805
10.5.1.3 NOX and CO emissions to air
BAT 65. In order to prevent and/or reduce NOX emissions to air while limiting CO
emissions to air from the combustion of process fuels from the chemical industry, BAT is
to use one or a combination of the techniques given below.
Technique Description Applicability
a. Low-NOX burners (LNB) See description in
Section 10.8 Generally applicable
b. Air staging See description in
Section 10.8 Generally applicable
c. Fuel staging
See description in
Section 10.8.
Applying fuel staging when
using liquid fuel mixtures
may require a specific burner
design
Generally applicable
d. Flue-gas recirculation See description in
Section 10.8
Generally applicable to new combustion
plants.
Applicable to existing combustion
plants within the constraints associated
with chemical installation safety
e. Selective non-catalytic
reduction (SNCR)
See description in
Section 10.8
Generally applicable to new combustion
plants.
Applicable to existing combustion
plants within the constraints associated
with chemical installation safety.
Not applicable to combustion plants
operated < 500 h/yr.
The applicability may be limited in the
case of combustion plants operated
between 500 h/yr and 1500 h/yr with
frequent fuel changes and frequent load
variations
f. Selective catalytic
reduction (SCR)
See description in
Section 10.8
Generally applicable to new combustion
plants.
Applicable to existing combustion
plants within the constraints associated
with duct configuration, space
availability and chemical installation
safety.
Not applicable to combustion plants
operated < 500 h/yr.
There may be technical and economic
restrictions for retrofitting existing
combustion plants operated between
500 h/yr and 1500 h/yr.
Not generally applicable to combustion
plants of < 100 MWth
g. Fuel choice See description in
Section 10.8
Applicable within the constraints
associated with the availability of
different types of fuel and/or an
alternative use of the process fuel
h. Water/steam addition See description in
Section 10.8
The applicability may be limited due to
water availability
i. Advanced control system See description in
Section 10.8
The applicability to old combustion
plants may be constrained by the need
to retrofit the combustion system and/or
control command system
WORKIN
GDRAFT IN
PROGRESS
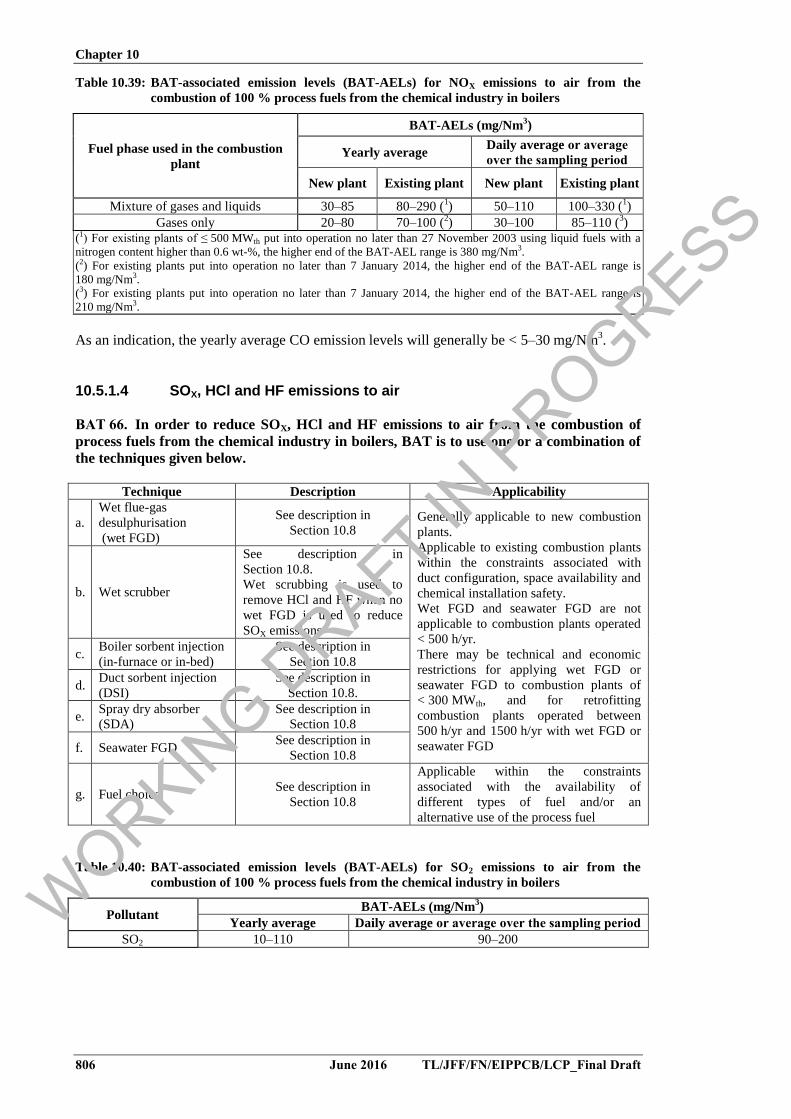
Chapter 10
806 June 2016 TL/JFF/FN/EIPPCB/LCP_Final Draft
Table 10.39: BAT-associated emission levels (BAT-AELs) for NOX emissions to air from the
combustion of 100 % process fuels from the chemical industry in boilers
Fuel phase used in the combustion
plant
BAT-AELs (mg/Nm3)
Yearly average Daily average or average
over the sampling period
New plant Existing plant New plant Existing plant
Mixture of gases and liquids 30–85 80–290 (1) 50–110 100–330 (
1)
Gases only 20–80 70–100 (2) 30–100 85–110 (
3)
(1) For existing plants of ≤ 500 MWth put into operation no later than 27 November 2003 using liquid fuels with a
nitrogen content higher than 0.6 wt-%, the higher end of the BAT-AEL range is 380 mg/Nm3.
(2) For existing plants put into operation no later than 7 January 2014, the higher end of the BAT-AEL range is
180 mg/Nm3.
(3) For existing plants put into operation no later than 7 January 2014, the higher end of the BAT-AEL range is
210 mg/Nm3.
As an indication, the yearly average CO emission levels will generally be < 5–30 mg/Nm3.
10.5.1.4 SOX, HCl and HF emissions to air
BAT 66. In order to reduce SOX, HCl and HF emissions to air from the combustion of
process fuels from the chemical industry in boilers, BAT is to use one or a combination of
the techniques given below.
Technique Description Applicability
a. Wet flue-gas
desulphurisation
(wet FGD)
See description in
Section 10.8 Generally applicable to new combustion
plants.
Applicable to existing combustion plants
within the constraints associated with
duct configuration, space availability and
chemical installation safety.
Wet FGD and seawater FGD are not
applicable to combustion plants operated
< 500 h/yr.
There may be technical and economic
restrictions for applying wet FGD or
seawater FGD to combustion plants of
< 300 MWth, and for retrofitting
combustion plants operated between
500 h/yr and 1500 h/yr with wet FGD or
seawater FGD
b. Wet scrubber
See description in
Section 10.8.
Wet scrubbing is used to
remove HCl and HF when no
wet FGD is used to reduce
SOX emissions
c. Boiler sorbent injection
(in-furnace or in-bed)
See description in
Section 10.8
d. Duct sorbent injection
(DSI)
See description in
Section 10.8.
e. Spray dry absorber
(SDA)
See description in
Section 10.8
f. Seawater FGD See description in
Section 10.8
g. Fuel choice See description in
Section 10.8
Applicable within the constraints
associated with the availability of
different types of fuel and/or an
alternative use of the process fuel
Table 10.40: BAT-associated emission levels (BAT-AELs) for SO2 emissions to air from the
combustion of 100 % process fuels from the chemical industry in boilers
Pollutant BAT-AELs (mg/Nm
3)
Yearly average Daily average or average over the sampling period
SO2 10–110 90–200 W
ORKING D
RAFT IN P
ROGRESS
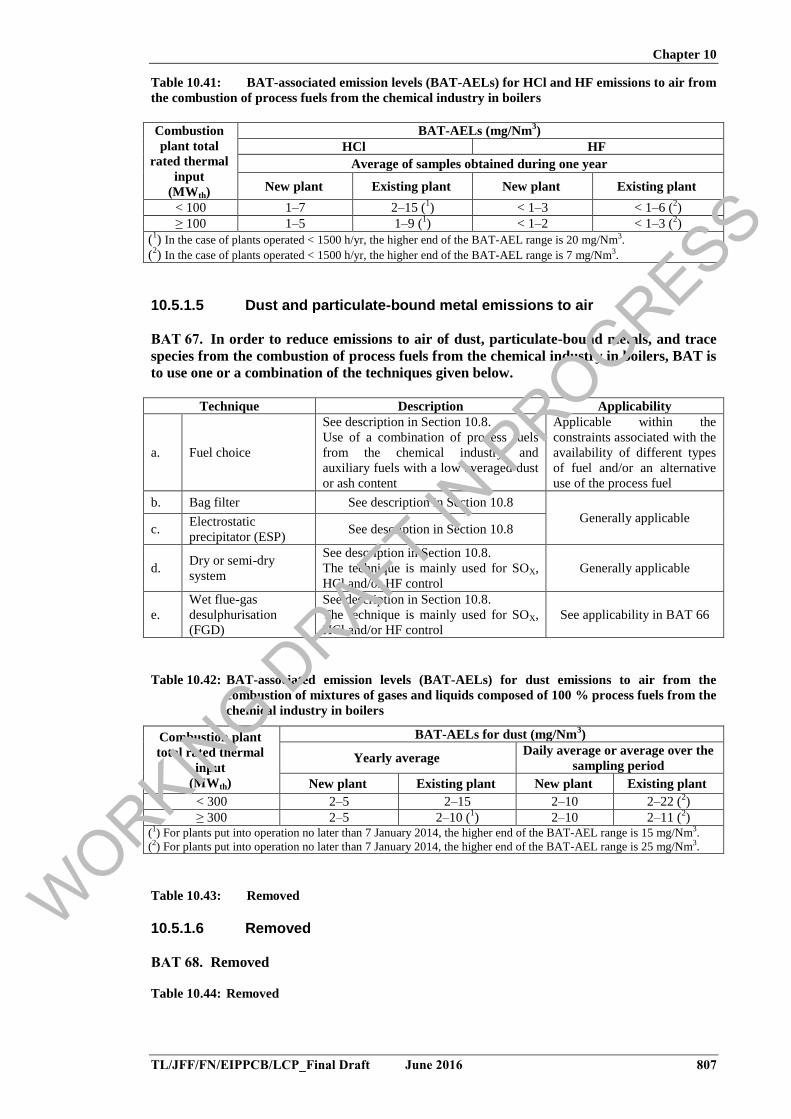
Chapter 10
TL/JFF/FN/EIPPCB/LCP_Final Draft June 2016 807
Table 10.41: BAT-associated emission levels (BAT-AELs) for HCl and HF emissions to air from
the combustion of process fuels from the chemical industry in boilers
Combustion
plant total
rated thermal
input
(MWth)
BAT-AELs (mg/Nm3)
HCl HF
Average of samples obtained during one year
New plant Existing plant New plant Existing plant
< 100 1–7 2–15 (1) < 1–3 < 1–6 (
2)
≥ 100 1–5 1–9 (1) < 1–2 < 1–3 (
2)
(1) In the case of plants operated < 1500 h/yr, the higher end of the BAT-AEL range is 20 mg/Nm3.
(2) In the case of plants operated < 1500 h/yr, the higher end of the BAT-AEL range is 7 mg/Nm3.
10.5.1.5 Dust and particulate-bound metal emissions to air
BAT 67. In order to reduce emissions to air of dust, particulate-bound metals, and trace
species from the combustion of process fuels from the chemical industry in boilers, BAT is
to use one or a combination of the techniques given below.
Technique Description Applicability
a. Fuel choice
See description in Section 10.8.
Use of a combination of process fuels
from the chemical industry and
auxiliary fuels with a low averaged dust
or ash content
Applicable within the
constraints associated with the
availability of different types
of fuel and/or an alternative
use of the process fuel
b. Bag filter See description in Section 10.8
Generally applicable c. Electrostatic
precipitator (ESP) See description in Section 10.8
d. Dry or semi-dry
system
See description in Section 10.8.
The technique is mainly used for SOX,
HCl and/or HF control
Generally applicable
e. Wet flue-gas
desulphurisation
(FGD)
See description in Section 10.8.
The technique is mainly used for SOX,
HCl and/or HF control
See applicability in BAT 66
Table 10.42: BAT-associated emission levels (BAT-AELs) for dust emissions to air from the
combustion of mixtures of gases and liquids composed of 100 % process fuels from the
chemical industry in boilers
Combustion plant
total rated thermal
input
(MWth)
BAT-AELs for dust (mg/Nm3)
Yearly average Daily average or average over the
sampling period
New plant Existing plant New plant Existing plant
< 300 2–5 2–15 2–10 2–22 (2)
≥ 300 2–5 2–10 (1) 2–10 2–11 (
2)
(1) For plants put into operation no later than 7 January 2014, the higher end of the BAT-AEL range is 15 mg/Nm3.
(2) For plants put into operation no later than 7 January 2014, the higher end of the BAT-AEL range is 25 mg/Nm3.
Table 10.43: Removed
10.5.1.6 Removed
BAT 68. Removed
Table 10.44: Removed
WORKIN
G DRAFT IN
PROGRESS
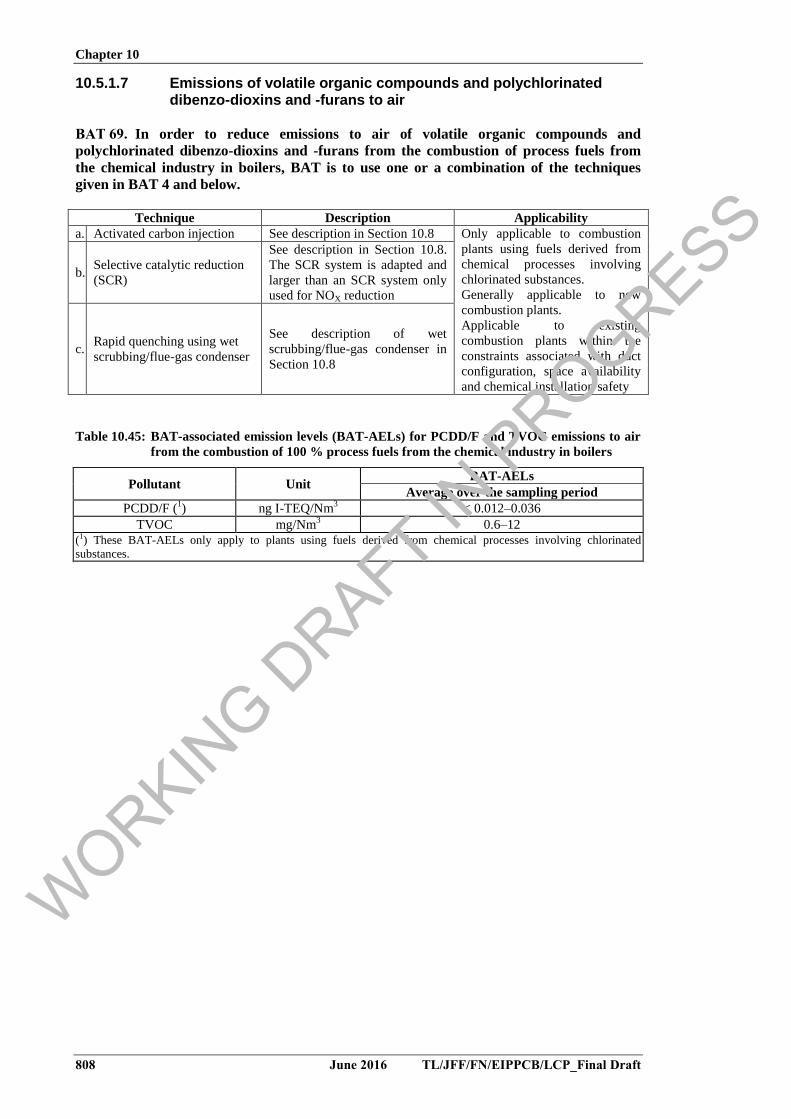
Chapter 10
808 June 2016 TL/JFF/FN/EIPPCB/LCP_Final Draft
10.5.1.7 Emissions of volatile organic compounds and polychlorinated dibenzo-dioxins and -furans to air
BAT 69. In order to reduce emissions to air of volatile organic compounds and
polychlorinated dibenzo-dioxins and -furans from the combustion of process fuels from
the chemical industry in boilers, BAT is to use one or a combination of the techniques
given in BAT 4 and below.
Technique Description Applicability
a. Activated carbon injection See description in Section 10.8 Only applicable to combustion
plants using fuels derived from
chemical processes involving
chlorinated substances.
Generally applicable to new
combustion plants.
Applicable to existing
combustion plants within the
constraints associated with duct
configuration, space availability
and chemical installation safety
b. Selective catalytic reduction
(SCR)
See description in Section 10.8.
The SCR system is adapted and
larger than an SCR system only
used for NOX reduction
c. Rapid quenching using wet
scrubbing/flue-gas condenser
See description of wet
scrubbing/flue-gas condenser in
Section 10.8
Table 10.45: BAT-associated emission levels (BAT-AELs) for PCDD/F and TVOC emissions to air
from the combustion of 100 % process fuels from the chemical industry in boilers
Pollutant Unit BAT-AELs
Average over the sampling period
PCDD/F (1) ng I-TEQ/Nm
3 < 0.012–0.036
TVOC mg/Nm3 0.6–12
(1) These BAT-AELs only apply to plants using fuels derived from chemical processes involving chlorinated
substances.
WORKIN
G DRAFT IN
PROGRESS
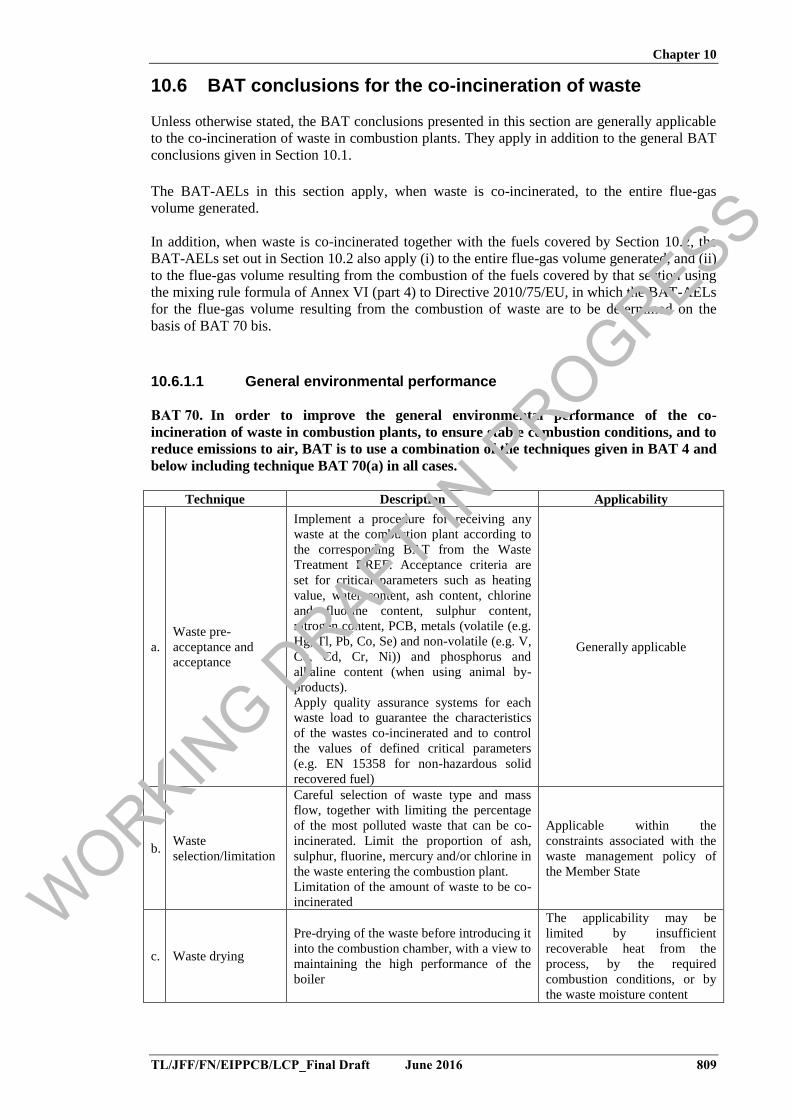
Chapter 10
TL/JFF/FN/EIPPCB/LCP_Final Draft June 2016 809
10.6 BAT conclusions for the co-incineration of waste
Unless otherwise stated, the BAT conclusions presented in this section are generally applicable
to the co-incineration of waste in combustion plants. They apply in addition to the general BAT
conclusions given in Section 10.1.
The BAT-AELs in this section apply, when waste is co-incinerated, to the entire flue-gas
volume generated.
In addition, when waste is co-incinerated together with the fuels covered by Section 10.2, the
BAT-AELs set out in Section 10.2 also apply (i) to the entire flue-gas volume generated, and (ii)
to the flue-gas volume resulting from the combustion of the fuels covered by that section using
the mixing rule formula of Annex VI (part 4) to Directive 2010/75/EU, in which the BAT-AELs
for the flue-gas volume resulting from the combustion of waste are to be determined on the
basis of BAT 70 bis.
10.6.1.1 General environmental performance
BAT 70. In order to improve the general environmental performance of the co-
incineration of waste in combustion plants, to ensure stable combustion conditions, and to
reduce emissions to air, BAT is to use a combination of the techniques given in BAT 4 and
below including technique BAT 70(a) in all cases.
Technique Description Applicability
a. Waste pre-
acceptance and
acceptance
Implement a procedure for receiving any
waste at the combustion plant according to
the corresponding BAT from the Waste
Treatment BREF. Acceptance criteria are
set for critical parameters such as heating
value, water content, ash content, chlorine
and fluorine content, sulphur content,
nitrogen content, PCB, metals (volatile (e.g.
Hg, Tl, Pb, Co, Se) and non-volatile (e.g. V,
Cu, Cd, Cr, Ni)) and phosphorus and
alkaline content (when using animal by-
products).
Apply quality assurance systems for each
waste load to guarantee the characteristics
of the wastes co-incinerated and to control
the values of defined critical parameters
(e.g. EN 15358 for non-hazardous solid
recovered fuel)
Generally applicable
b. Waste
selection/limitation
Careful selection of waste type and mass
flow, together with limiting the percentage
of the most polluted waste that can be co-
incinerated. Limit the proportion of ash,
sulphur, fluorine, mercury and/or chlorine in
the waste entering the combustion plant.
Limitation of the amount of waste to be co-
incinerated
Applicable within the
constraints associated with the
waste management policy of
the Member State
c. Waste drying
Pre-drying of the waste before introducing it
into the combustion chamber, with a view to
maintaining the high performance of the
boiler
The applicability may be
limited by insufficient
recoverable heat from the
process, by the required
combustion conditions, or by
the waste moisture content
WORKIN
G DRAFT IN
PROGRESS
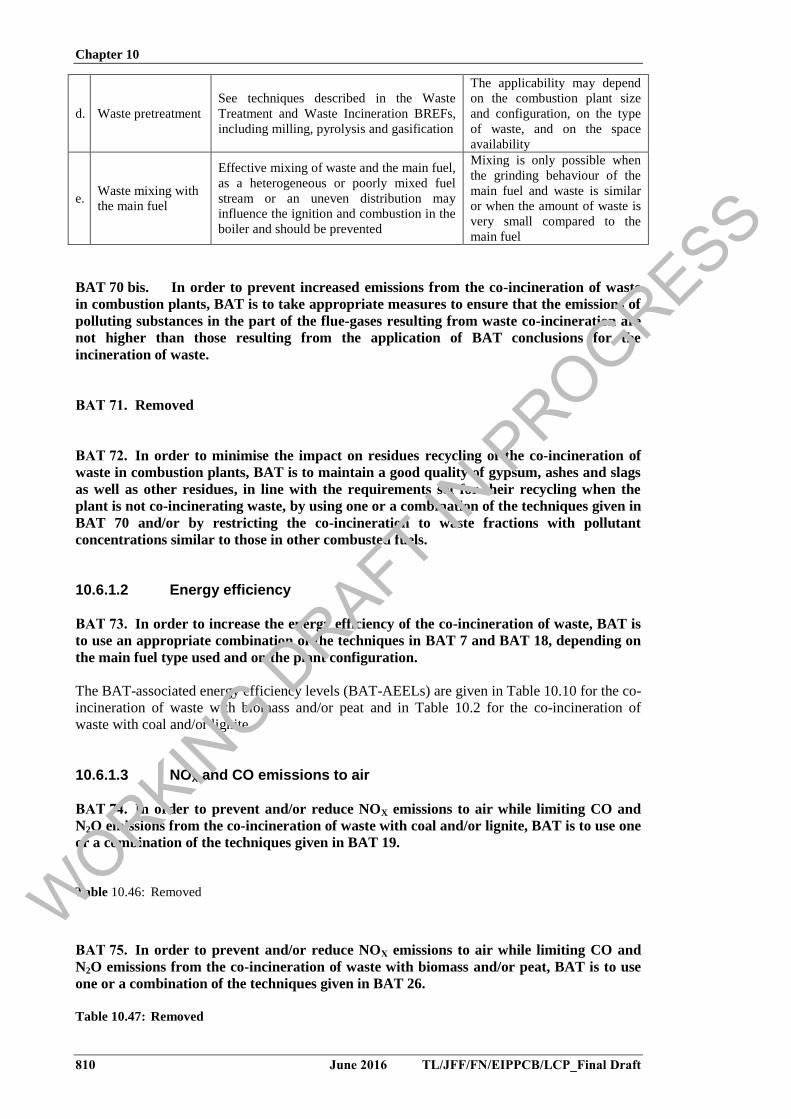
Chapter 10
810 June 2016 TL/JFF/FN/EIPPCB/LCP_Final Draft
d. Waste pretreatment
See techniques described in the Waste
Treatment and Waste Incineration BREFs,
including milling, pyrolysis and gasification
The applicability may depend
on the combustion plant size
and configuration, on the type
of waste, and on the space
availability
e. Waste mixing with
the main fuel
Effective mixing of waste and the main fuel,
as a heterogeneous or poorly mixed fuel
stream or an uneven distribution may
influence the ignition and combustion in the
boiler and should be prevented
Mixing is only possible when
the grinding behaviour of the
main fuel and waste is similar
or when the amount of waste is
very small compared to the
main fuel
BAT 70 bis. In order to prevent increased emissions from the co-incineration of waste
in combustion plants, BAT is to take appropriate measures to ensure that the emissions of
polluting substances in the part of the flue-gases resulting from waste co-incineration are
not higher than those resulting from the application of BAT conclusions for the
incineration of waste.
BAT 71. Removed
BAT 72. In order to minimise the impact on residues recycling of the co-incineration of
waste in combustion plants, BAT is to maintain a good quality of gypsum, ashes and slags
as well as other residues, in line with the requirements set for their recycling when the
plant is not co-incinerating waste, by using one or a combination of the techniques given in
BAT 70 and/or by restricting the co-incineration to waste fractions with pollutant
concentrations similar to those in other combusted fuels.
10.6.1.2 Energy efficiency
BAT 73. In order to increase the energy efficiency of the co-incineration of waste, BAT is
to use an appropriate combination of the techniques in BAT 7 and BAT 18, depending on
the main fuel type used and on the plant configuration.
The BAT-associated energy efficiency levels (BAT-AEELs) are given in Table 10.10 for the co-
incineration of waste with biomass and/or peat and in Table 10.2 for the co-incineration of
waste with coal and/or lignite.
10.6.1.3 NOX and CO emissions to air
BAT 74. In order to prevent and/or reduce NOX emissions to air while limiting CO and
N2O emissions from the co-incineration of waste with coal and/or lignite, BAT is to use one
or a combination of the techniques given in BAT 19.
Table 10.46: Removed
BAT 75. In order to prevent and/or reduce NOX emissions to air while limiting CO and
N2O emissions from the co-incineration of waste with biomass and/or peat, BAT is to use
one or a combination of the techniques given in BAT 26.
Table 10.47: Removed
WORKIN
G DRAFT IN
PROGRESS
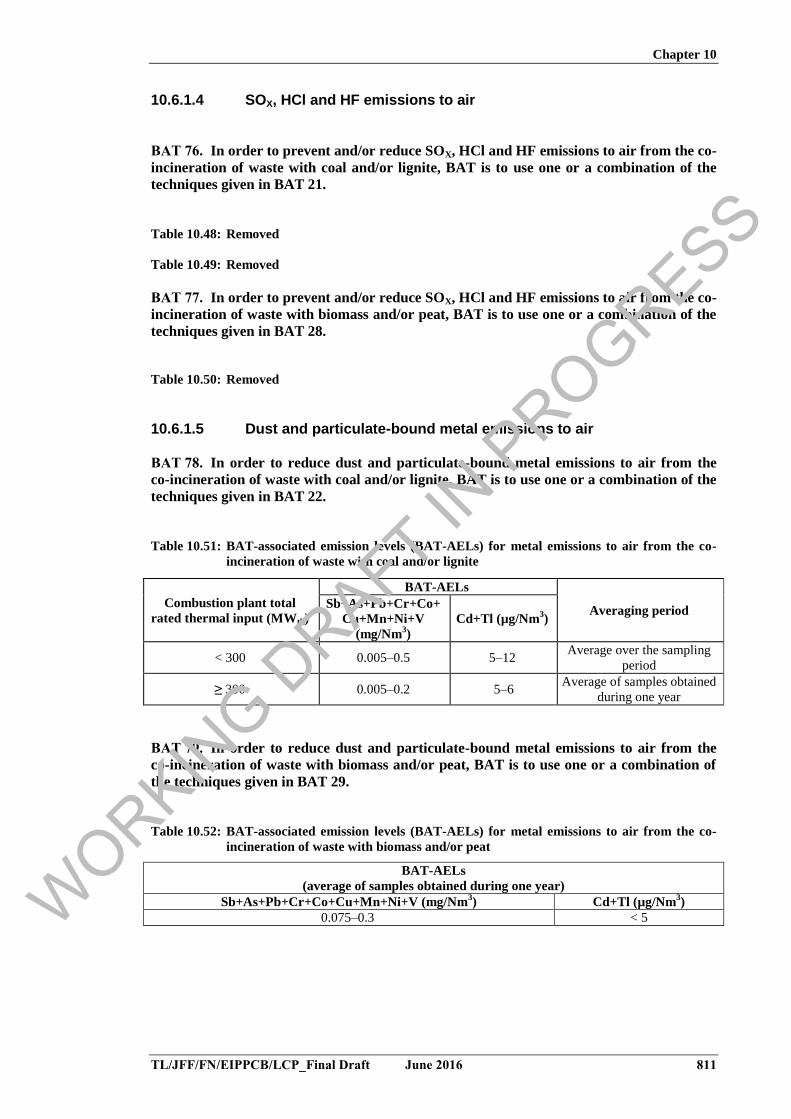
Chapter 10
TL/JFF/FN/EIPPCB/LCP_Final Draft June 2016 811
10.6.1.4 SOX, HCl and HF emissions to air
BAT 76. In order to prevent and/or reduce SOX, HCl and HF emissions to air from the co-
incineration of waste with coal and/or lignite, BAT is to use one or a combination of the
techniques given in BAT 21.
Table 10.48: Removed
Table 10.49: Removed
BAT 77. In order to prevent and/or reduce SOX, HCl and HF emissions to air from the co-
incineration of waste with biomass and/or peat, BAT is to use one or a combination of the
techniques given in BAT 28.
Table 10.50: Removed
10.6.1.5 Dust and particulate-bound metal emissions to air
BAT 78. In order to reduce dust and particulate-bound metal emissions to air from the
co-incineration of waste with coal and/or lignite, BAT is to use one or a combination of the
techniques given in BAT 22.
Table 10.51: BAT-associated emission levels (BAT-AELs) for metal emissions to air from the co-
incineration of waste with coal and/or lignite
Combustion plant total
rated thermal input (MWth)
BAT-AELs
Averaging period Sb+As+Pb+Cr+Co+
Cu+Mn+Ni+V
(mg/Nm3)
Cd+Tl (µg/Nm3)
< 300 0.005–0.5 5–12 Average over the sampling
period
≥ 300 0.005–0.2 5–6 Average of samples obtained
during one year
BAT 79. In order to reduce dust and particulate-bound metal emissions to air from the
co-incineration of waste with biomass and/or peat, BAT is to use one or a combination of
the techniques given in BAT 29.
Table 10.52: BAT-associated emission levels (BAT-AELs) for metal emissions to air from the co-
incineration of waste with biomass and/or peat
BAT-AELs
(average of samples obtained during one year)
Sb+As+Pb+Cr+Co+Cu+Mn+Ni+V (mg/Nm3) Cd+Tl (µg/Nm
3)
0.075–0.3 < 5 WORKIN
G DRAFT IN
PROGRESS

Chapter 10
812 June 2016 TL/JFF/FN/EIPPCB/LCP_Final Draft
10.6.1.6 Mercury emissions to air
BAT 80. In order to reduce mercury emissions to air from the co-incineration of waste
with biomass, peat, coal and/or lignite, BAT is to use one or a combination of the
techniques given in BAT 23 and BAT 30.
Table 10.53: Removed
10.6.1.7 Emissions of volatile organic compounds and polychlorinated dibenzo-dioxins and -furans to air
BAT 81. In order to reduce emissions of volatile organic compounds and polychlorinated
dibenzo-dioxins and -furans to air from the co-incineration of waste with biomass, peat,
coal and/or lignite, BAT is to use a combination of the techniques given in BAT 4, BAT 29
and below.
Technique Description Applicability
a. Activated carbon
injection
This process is based on the adsorption
of pollutant molecules by the activated
carbon
Generally applicable
b. Selective catalytic
reduction (SCR)
See description in Section 10.8. The
SCR system is adapted and larger than
an SCR system only used for NOX
reduction
See applicability restrictions
in BAT 19 and in BAT 26
c.
Rapid quenching using
wet scrubbing/flue-gas
condenser
See description of wet scrubbing/flue-
gas condenser in Section 10.8 Generally applicable
Table 10.54: BAT-associated emission levels (BAT-AELs) for PCDD/F and TVOC emissions to air
from the co-incineration of waste with biomass, peat, coal and/or lignite
Type of combustion plant
BAT-AELs
PCDD/F (ng I-TEQ/Nm3) TVOC (mg/Nm
3)
Average over the sampling period Yearly average Daily average
Biomass-, peat-, coal- and/or
lignite-fired combustion plant < 0.01–0.03 < 0.1–5 0.5–10
WORKIN
G DRAFT IN
PROGRESS
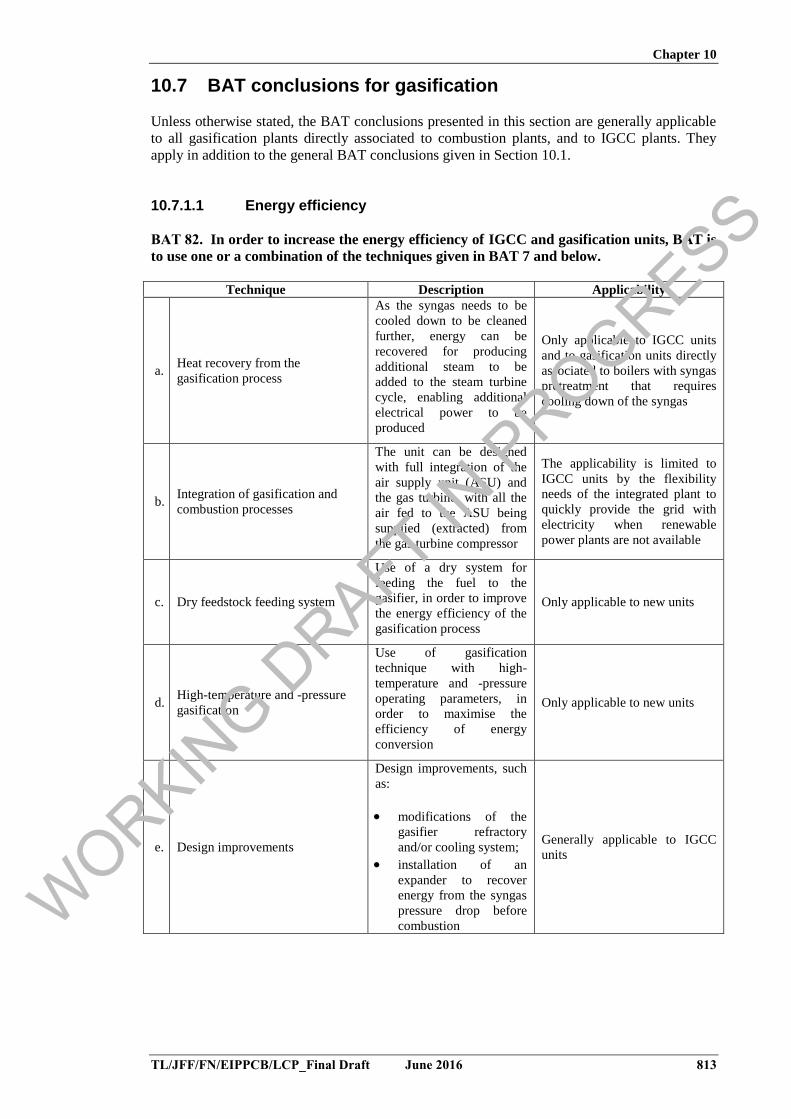
Chapter 10
TL/JFF/FN/EIPPCB/LCP_Final Draft June 2016 813
10.7 BAT conclusions for gasification
Unless otherwise stated, the BAT conclusions presented in this section are generally applicable
to all gasification plants directly associated to combustion plants, and to IGCC plants. They
apply in addition to the general BAT conclusions given in Section 10.1.
10.7.1.1 Energy efficiency
BAT 82. In order to increase the energy efficiency of IGCC and gasification units, BAT is
to use one or a combination of the techniques given in BAT 7 and below.
Technique Description Applicability
a. Heat recovery from the
gasification process
As the syngas needs to be
cooled down to be cleaned
further, energy can be
recovered for producing
additional steam to be
added to the steam turbine
cycle, enabling additional
electrical power to be
produced
Only applicable to IGCC units
and to gasification units directly
associated to boilers with syngas
pretreatment that requires
cooling down of the syngas
b. Integration of gasification and
combustion processes
The unit can be designed
with full integration of the
air supply unit (ASU) and
the gas turbine, with all the
air fed to the ASU being
supplied (extracted) from
the gas turbine compressor
The applicability is limited to
IGCC units by the flexibility
needs of the integrated plant to
quickly provide the grid with
electricity when renewable
power plants are not available
c. Dry feedstock feeding system
Use of a dry system for
feeding the fuel to the
gasifier, in order to improve
the energy efficiency of the
gasification process
Only applicable to new units
d. High-temperature and -pressure
gasification
Use of gasification
technique with high-
temperature and -pressure
operating parameters, in
order to maximise the
efficiency of energy
conversion
Only applicable to new units
e. Design improvements
Design improvements, such
as:
modifications of the
gasifier refractory
and/or cooling system;
installation of an
expander to recover
energy from the syngas
pressure drop before
combustion
Generally applicable to IGCC
units
WORKIN
G DRAFT IN
PROGRESS

Chapter 10
814 June 2016 TL/JFF/FN/EIPPCB/LCP_Final Draft
Table 10.55: BAT-associated energy efficiency levels (BAT-AEELs) for gasification and IGCC
units
Type of combustion unit
configuration
BAT-AEELs
Net electrical efficiency (%) of
an IGCC unit Net total fuel utilisation (%) of a
new or existing gasification unit New unit Existing unit
Gasification unit directly
associated to a boiler without
prior syngas treatment
No BAT-AEEL > 98
Gasification unit directly
associated to a boiler with
prior syngas treatment
No BAT-AEEL > 91
IGCC unit No BAT-AEEL 34–46 > 91
10.7.1.2 NOX and CO emissions to air
BAT 83. In order to prevent and/or reduce NOX emissions to air while limiting CO
emissions to air from IGCC plants, BAT is to use one or a combination of the techniques
given below.
Technique Description Applicability
a. Dry low-NOX burners
(DLN)
See description in
Section 10.8
Only applicable to the gas turbine part of
the IGCC plant.
Generally applicable to new IGCC plants.
Applicable on a case-by-case basis for
existing IGCC plants, depending on the
availability of a retrofit package. Not
applicable for syngas with a hydrogen
content of > 15 %
b. Syngas dilution with
waste nitrogen from the
air supply unit (ASU)
The ASU separates the
oxygen from the nitrogen
in the air, in order to
supply high-quality
oxygen to the gasifier.
The waste nitrogen from
the ASU is reused to
reduce the combustion
temperature in the gas
turbine, by being
premixed with the syngas
before combustion
Only applicable when an ASU is used for
the gasification process
c. Water/steam addition
See description in
Section 10.8. Some
intermediate-pressure
steam from the steam
turbine is reused for this
purpose
Only applicable to the gas turbine part of
the IGCC plant.
The applicability may be limited due to
water availability
d. Selective catalytic
reduction (SCR)
See description in
Section 10.8
Not applicable to IGCC plants operated
< 500 h/yr.
Retrofitting existing IGCC plants may be
constrained by the availability of sufficient
space.
There may be technical and economic
restrictions for retrofitting existing IGCC
plants operated between 500 h/yr and
1500 h/yr
e. Combustion optimisation See description in
Section 10.8 Generally applicable
WORKIN
G DRAFT IN
PROGRESS
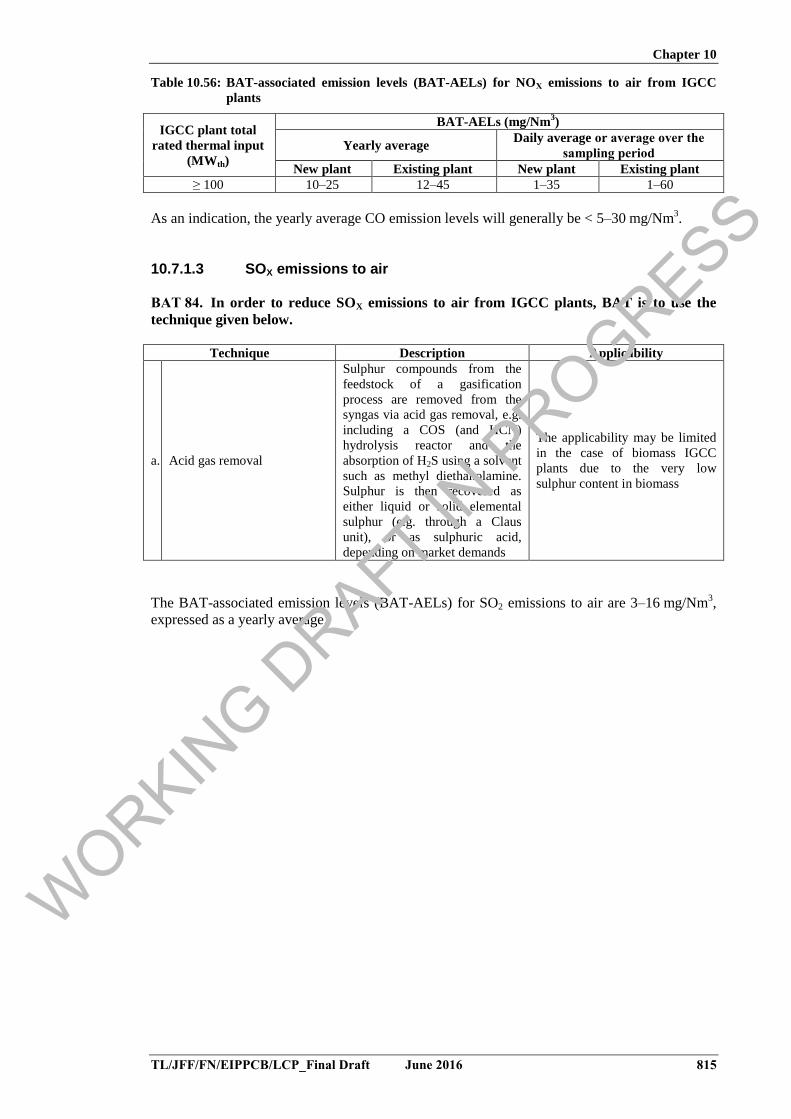
Chapter 10
TL/JFF/FN/EIPPCB/LCP_Final Draft June 2016 815
Table 10.56: BAT-associated emission levels (BAT-AELs) for NOX emissions to air from IGCC
plants
IGCC plant total
rated thermal input
(MWth)
BAT-AELs (mg/Nm3)
Yearly average Daily average or average over the
sampling period
New plant Existing plant New plant Existing plant
≥ 100 10–25 12–45 1–35 1–60
As an indication, the yearly average CO emission levels will generally be < 5–30 mg/Nm3.
10.7.1.3 SOX emissions to air
BAT 84. In order to reduce SOX emissions to air from IGCC plants, BAT is to use the
technique given below.
Technique Description Applicability
a. Acid gas removal
Sulphur compounds from the
feedstock of a gasification
process are removed from the
syngas via acid gas removal, e.g.
including a COS (and HCN)
hydrolysis reactor and the
absorption of H2S using a solvent
such as methyl diethanolamine.
Sulphur is then recovered as
either liquid or solid elemental
sulphur (e.g. through a Claus
unit), or as sulphuric acid,
depending on market demands
The applicability may be limited
in the case of biomass IGCC
plants due to the very low
sulphur content in biomass
The BAT-associated emission levels (BAT-AELs) for SO2 emissions to air are 3–16 mg/Nm3,
expressed as a yearly average.
WORKIN
G DRAFT IN
PROGRESS

Chapter 10
816 June 2016 TL/JFF/FN/EIPPCB/LCP_Final Draft
10.7.1.4 Dust, particulate-bound metal, ammonia and halogen emissions to air
BAT 85. In order to prevent or reduce dust, particulate-bound metal, ammonia and
halogen emissions to air from IGCC plants, BAT is to use one or a combination of the
techniques given below.
Technique Description Applicability
a. Syngas filtration
Dedusting using fly ash cyclones,
bag filters, ESPs and/or candle
filters to remove fly ash and
unconverted carbon. Bag filters and
ESPs are used in the case of syngas
temperatures up to 400 °C
Generally applicable
b.
Syngas tars and ashes
recirculation to the
gasifier
Tars and ashes with a high carbon
content generated in the raw syngas
are separated in cyclones and
recirculated to the gasifier, in the
case of a low syngas temperature at
the gasifier outlet (< 1100 °C)
Generally applicable
c. Syngas washing
Syngas passes through a water
scrubber, downstream of other
dedusting technique(s), where
chlorides, ammonia, particles and
halides are separated
Generally applicable
Table 10.57: BAT-associated emission levels (BAT-AELs) for dust and particulate-bound metal
emissions to air from IGCC plants
IGCC plant total rated
thermal input
(MWth)
BAT-AELs
Sb+As+Pb+Cr+Co+C
u+Mn+Ni+V
(mg/Nm3)
(Average over the
sampling period)
Hg (µg/Nm3)
(Average over the
sampling period)
Dust (mg/Nm3)
(yearly average)
≥ 100 < 0.025 < 1 < 2.5
WORKIN
G DRAFT IN
PROGRESS

Chapter 10
TL/JFF/FN/EIPPCB/LCP_Final Draft June 2016 817
10.8 Description of techniques
10.8.1 General techniques
Technique Description
Fuel choice
The use of fuel with a low content of potential pollution-generating
compounds (e.g. low sulphur, ash, nitrogen, mercury, fluorine or
chlorine content)
Advanced control system
The use of a computer-based automatic system to control the
combustion efficiency and support the prevention and/or reduction of
emissions. This also includes the use of high-performance monitoring
Combustion optimisation
Measures taken to maximise the efficiency of energy conversion, e.g. in
the furnace/boiler, while minimising emissions (in particular of CO).
This is achieved by a combination of techniques including good design
of the combustion equipment, optimisation of the temperature (e.g.
efficient mixing of the fuel and combustion air) and residence time in
the combustion zone, and/or use of an advanced control system
10.8.2 Techniques to increase energy efficiency
Technique Description
Ultra-supercritical steam
parameters
The use of a steam circuit, including reheat systems, in which steam
can reach pressures above 250–300 bar and temperatures above 580–
600 °C
Supercritical steam parameters
The use of a steam circuit, including steam reheating systems, in
which steam can reach pressures above 220.6 bar and temperatures of
> 540°C
CHP readiness
The measures taken to allow the later export of a useful quantity of
heat to an off-site heat load in a way that will achieve at least a 10 %
reduction in primary energy usage compared to the separate
generation of the heat and power produced. This includes identifying
and retaining access to specific points in the steam system from which
steam can be extracted, as well as making sufficient space available to
allow the later fitting of items such as pipework, heat exchangers,
extra water demineralisation capacity, standby boiler plant and back-
pressure turbines. Balance of Plant (BoP) systems and
control/instrumentation systems are suitable for upgrade. Later
connection of back-pressure turbine(s) is also possible
Advanced control system See Section 10.8.1
Wet stack
The design of the stack in order to enable water vapour condensation
from the saturated flue-gas and thus to avoid using a flue-gas reheater
after the wet FGD
Flue-gas condenser
A heat exchanger where water is preheated by the flue-gas before it is
heated in the steam condenser. The vapour content in the flue-gas thus
condenses as it is cooled by the heating water. The flue-gas condenser
is used both to increase the energy efficiency of the combustion unit
and to remove dust and SOX from the flue-gas
Combined cycle
Combination of two or more thermodynamic cycles, e.g. a Brayton
cycle (gas turbine/combustion engine) with a Rankine cycle (steam
turbine/boiler), to convert heat loss from the flue-gas of the first cycle
to useful energy by subsequent cycle(s)
Process gases management
system
A system that enables the iron and steel process gases that can be used
as fuels (e.g. blast furnace, coke oven, basic oxygen furnace gases) to
be directed to the combustion plants, depending on the availability of
these fuels and on the type of combustion plants in an integrated
steelworks
Combustion optimisation See Section 10.8.1
WORKIN
GDRAFT IN
PROGRESS
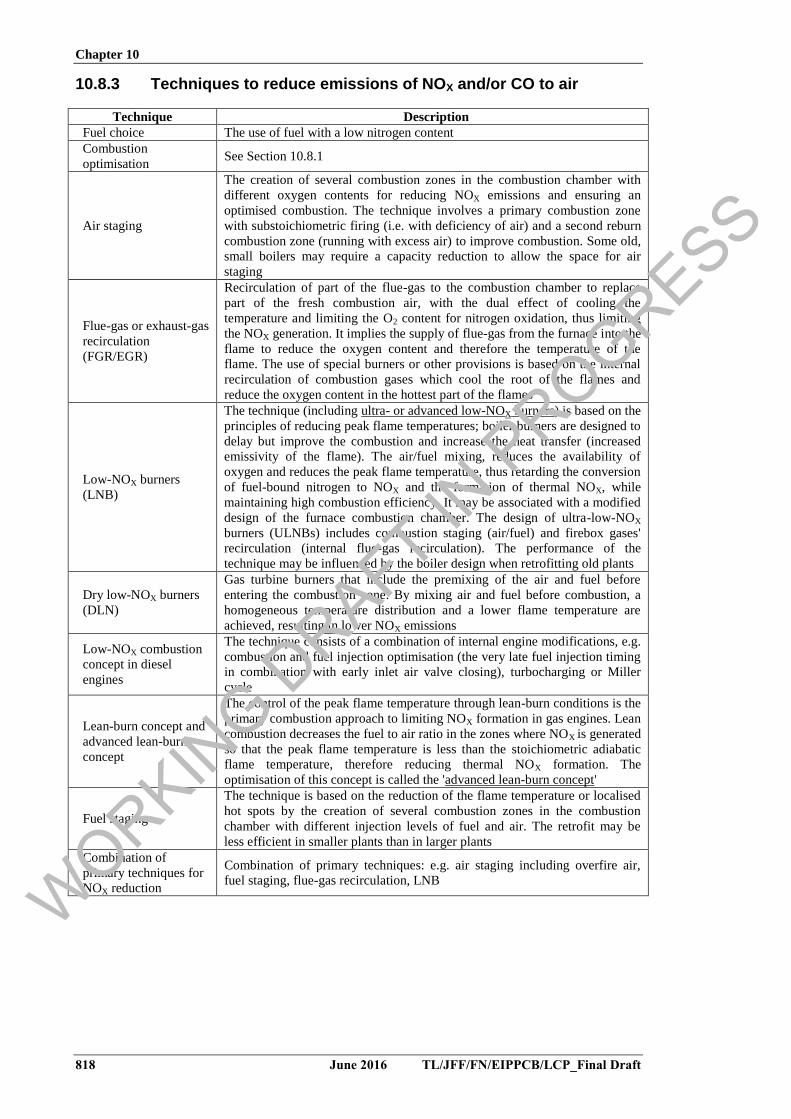
Chapter 10
818 June 2016 TL/JFF/FN/EIPPCB/LCP_Final Draft
10.8.3 Techniques to reduce emissions of NOX and/or CO to air
Technique Description
Fuel choice The use of fuel with a low nitrogen content
Combustion
optimisation See Section 10.8.1
Air staging
The creation of several combustion zones in the combustion chamber with
different oxygen contents for reducing NOX emissions and ensuring an
optimised combustion. The technique involves a primary combustion zone
with substoichiometric firing (i.e. with deficiency of air) and a second reburn
combustion zone (running with excess air) to improve combustion. Some old,
small boilers may require a capacity reduction to allow the space for air
staging
Flue-gas or exhaust-gas
recirculation
(FGR/EGR)
Recirculation of part of the flue-gas to the combustion chamber to replace
part of the fresh combustion air, with the dual effect of cooling the
temperature and limiting the O2 content for nitrogen oxidation, thus limiting
the NOX generation. It implies the supply of flue-gas from the furnace into the
flame to reduce the oxygen content and therefore the temperature of the
flame. The use of special burners or other provisions is based on the internal
recirculation of combustion gases which cool the root of the flames and
reduce the oxygen content in the hottest part of the flames
Low-NOX burners
(LNB)
The technique (including ultra- or advanced low-NOX burners) is based on the
principles of reducing peak flame temperatures; boiler burners are designed to
delay but improve the combustion and increase the heat transfer (increased
emissivity of the flame). The air/fuel mixing, reduces the availability of
oxygen and reduces the peak flame temperature, thus retarding the conversion
of fuel-bound nitrogen to NOX and the formation of thermal NOX, while
maintaining high combustion efficiency. It may be associated with a modified
design of the furnace combustion chamber. The design of ultra-low-NOX
burners (ULNBs) includes combustion staging (air/fuel) and firebox gases'
recirculation (internal flue-gas recirculation). The performance of the
technique may be influenced by the boiler design when retrofitting old plants
Dry low-NOX burners
(DLN)
Gas turbine burners that include the premixing of the air and fuel before
entering the combustion zone. By mixing air and fuel before combustion, a
homogeneous temperature distribution and a lower flame temperature are
achieved, resulting in lower NOX emissions
Low-NOX combustion
concept in diesel
engines
The technique consists of a combination of internal engine modifications, e.g.
combustion and fuel injection optimisation (the very late fuel injection timing
in combination with early inlet air valve closing), turbocharging or Miller
cycle
Lean-burn concept and
advanced lean-burn
concept
The control of the peak flame temperature through lean-burn conditions is the
primary combustion approach to limiting NOX formation in gas engines. Lean
combustion decreases the fuel to air ratio in the zones where NOX is generated
so that the peak flame temperature is less than the stoichiometric adiabatic
flame temperature, therefore reducing thermal NOX formation. The
optimisation of this concept is called the 'advanced lean-burn concept'
Fuel staging
The technique is based on the reduction of the flame temperature or localised
hot spots by the creation of several combustion zones in the combustion
chamber with different injection levels of fuel and air. The retrofit may be
less efficient in smaller plants than in larger plants
Combination of
primary techniques for
NOX reduction
Combination of primary techniques: e.g. air staging including overfire air,
fuel staging, flue-gas recirculation, LNB
WORKIN
G DRAFT IN
PROGRESS

Chapter 10
TL/JFF/FN/EIPPCB/LCP_Final Draft June 2016 819
Selective catalytic
reduction (SCR)
Selective reduction of nitrogen oxides with ammonia or urea in the presence
of a catalyst. The technique is based on the reduction of NOX to nitrogen in a
catalytic bed by reaction with ammonia (in general aqueous solution) at an
optimum operating temperature of around 300–450 °C. Several layers of
catalyst may be applied. A higher NOX reduction is achieved with the use of
several layers of catalyst. The technique design can be modular, special
catalyst can be used and/or preheating can be used to cope with low loads or
with a wide flue-gas temperature window. 'In-duct' or 'slip' SCR is a
technique that combines SNCR with downstream SCR which reduces
ammonia slip from the SNCR unit
Selective non-catalytic
reduction (SNCR)
Selective reduction of nitrogen oxides with ammonia or urea without a
catalyst. The technique is based on the reduction of NOX to nitrogen by
reaction with ammonia or urea at a high temperature. The operating
temperature window is maintained between 800 °C and 1000 °C for optimal
reaction
Water/steam addition
Water or steam is used as a diluent for reducing the combustion temperature
in gas turbines, engines or boilers and the thermal NOX formation. It is either
premixed with the fuel prior to its combustion (fuel emulsion, humidification
or saturation) or directly injected in the combustion chamber (water/steam
injection)
Low excess air
The technique is mainly based on the following features:
minimisation of air leakages into the furnace
careful control of air used for combustion
modified design of the furnace combustion chamber
Combined techniques
for NOX and SOX
reduction
The use of complex and integrated abatement techniques for combined
reduction of NOX, SOX and, often, other pollutants from the flue-gas, e.g.
activated carbon and DeSONOX processes. They can be applied either alone
or in combination with other primary techniques in coal-fired PC boilers
Advanced control
system See Section 10.8.2
Oxidation catalysts
The use of catalysts (that usually contain precious metals such as palladium or
platinum) to oxidise carbon monoxide and unburnt hydrocarbons with oxygen
to form CO2 and water vapour
Reduction of the
combustion air
temperature
The use of combustion air at ambient temperature. The combustion air is not
preheated in a regenerative air preheater
WORKIN
G DRAFT IN
PROGRESS
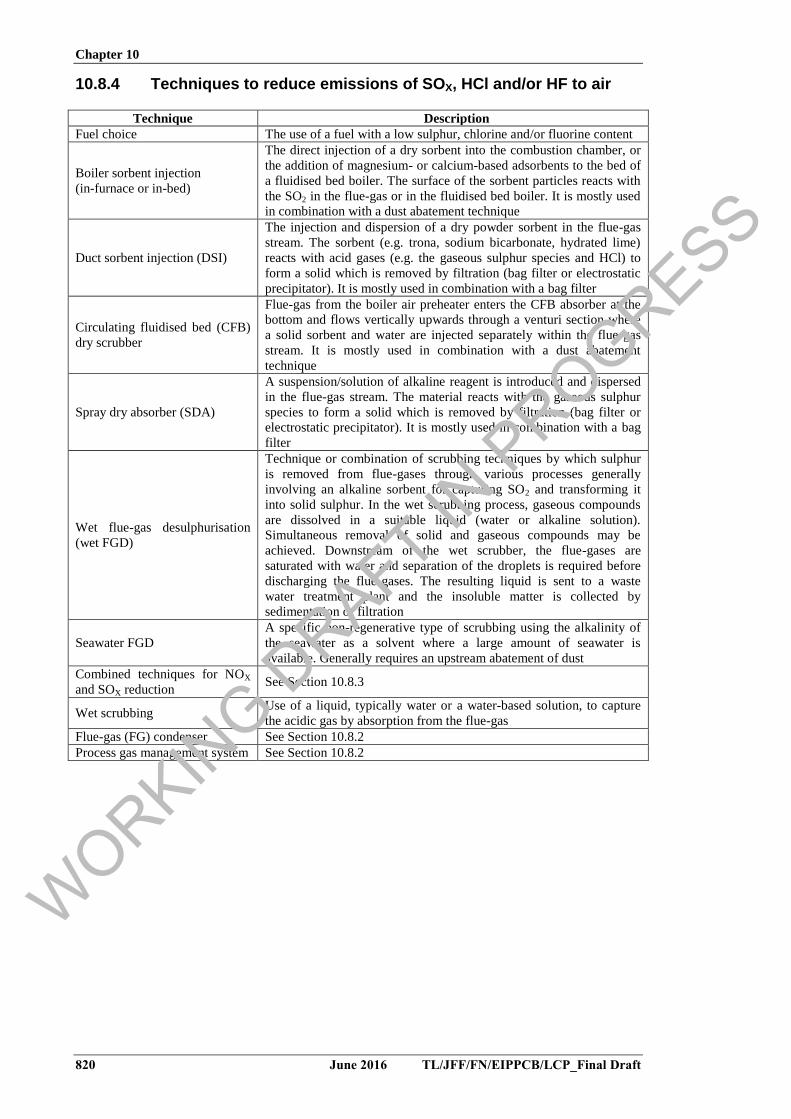
Chapter 10
820 June 2016 TL/JFF/FN/EIPPCB/LCP_Final Draft
10.8.4 Techniques to reduce emissions of SOX, HCl and/or HF to air
Technique Description
Fuel choice The use of a fuel with a low sulphur, chlorine and/or fluorine content
Boiler sorbent injection
(in-furnace or in-bed)
The direct injection of a dry sorbent into the combustion chamber, or
the addition of magnesium- or calcium-based adsorbents to the bed of
a fluidised bed boiler. The surface of the sorbent particles reacts with
the SO2 in the flue-gas or in the fluidised bed boiler. It is mostly used
in combination with a dust abatement technique
Duct sorbent injection (DSI)
The injection and dispersion of a dry powder sorbent in the flue-gas
stream. The sorbent (e.g. trona, sodium bicarbonate, hydrated lime)
reacts with acid gases (e.g. the gaseous sulphur species and HCl) to
form a solid which is removed by filtration (bag filter or electrostatic
precipitator). It is mostly used in combination with a bag filter
Circulating fluidised bed (CFB)
dry scrubber
Flue-gas from the boiler air preheater enters the CFB absorber at the
bottom and flows vertically upwards through a venturi section where
a solid sorbent and water are injected separately within the flue-gas
stream. It is mostly used in combination with a dust abatement
technique
Spray dry absorber (SDA)
A suspension/solution of alkaline reagent is introduced and dispersed
in the flue-gas stream. The material reacts with the gaseous sulphur
species to form a solid which is removed by filtration (bag filter or
electrostatic precipitator). It is mostly used in combination with a bag
filter
Wet flue-gas desulphurisation
(wet FGD)
Technique or combination of scrubbing techniques by which sulphur
is removed from flue-gases through various processes generally
involving an alkaline sorbent for capturing SO2 and transforming it
into solid sulphur. In the wet scrubbing process, gaseous compounds
are dissolved in a suitable liquid (water or alkaline solution).
Simultaneous removal of solid and gaseous compounds may be
achieved. Downstream of the wet scrubber, the flue-gases are
saturated with water and separation of the droplets is required before
discharging the flue-gases. The resulting liquid is sent to a waste
water treatment plant and the insoluble matter is collected by
sedimentation or filtration
Seawater FGD
A specific non-regenerative type of scrubbing using the alkalinity of
the seawater as a solvent where a large amount of seawater is
available. Generally requires an upstream abatement of dust
Combined techniques for NOX
and SOX reduction See Section 10.8.3
Wet scrubbing Use of a liquid, typically water or a water-based solution, to capture
the acidic gas by absorption from the flue-gas
Flue-gas (FG) condenser See Section 10.8.2
Process gas management system See Section 10.8.2
WORKIN
G DRAFT IN
PROGRESS
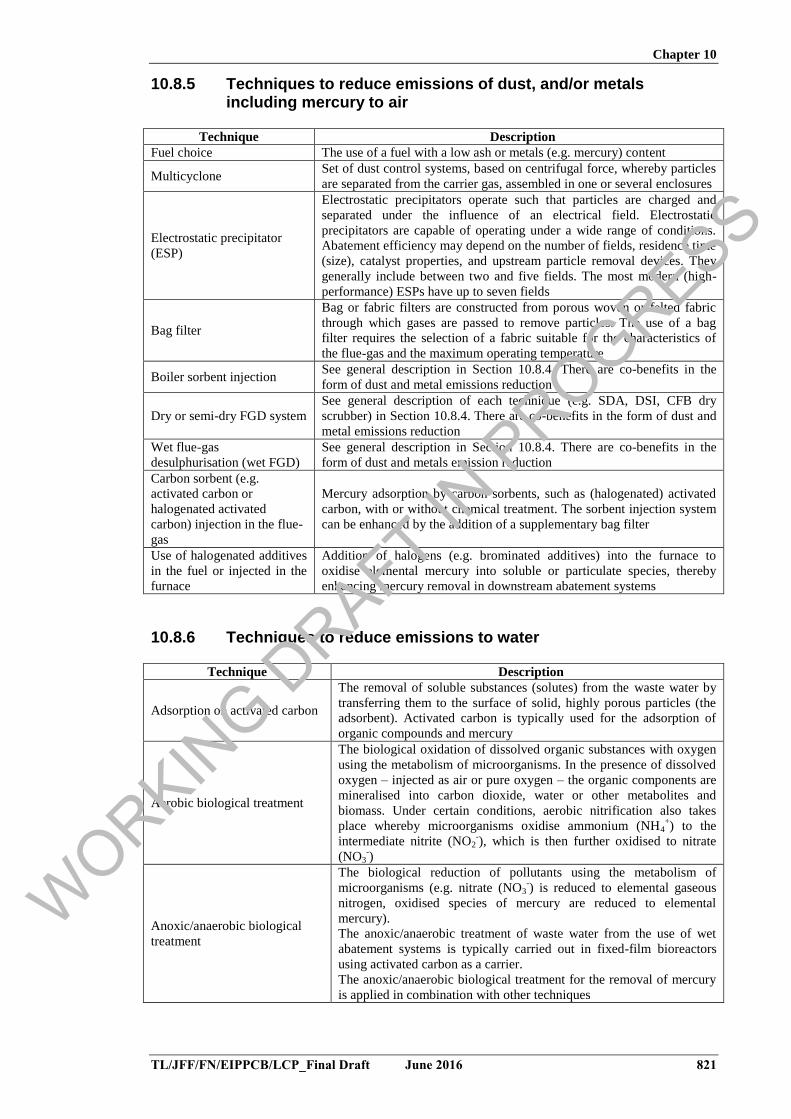
Chapter 10
TL/JFF/FN/EIPPCB/LCP_Final Draft June 2016 821
10.8.5 Techniques to reduce emissions of dust, and/or metals including mercury to air
Technique Description
Fuel choice The use of a fuel with a low ash or metals (e.g. mercury) content
Multicyclone Set of dust control systems, based on centrifugal force, whereby particles
are separated from the carrier gas, assembled in one or several enclosures
Electrostatic precipitator
(ESP)
Electrostatic precipitators operate such that particles are charged and
separated under the influence of an electrical field. Electrostatic
precipitators are capable of operating under a wide range of conditions.
Abatement efficiency may depend on the number of fields, residence time
(size), catalyst properties, and upstream particle removal devices. They
generally include between two and five fields. The most modern (high-
performance) ESPs have up to seven fields
Bag filter
Bag or fabric filters are constructed from porous woven or felted fabric
through which gases are passed to remove particles. The use of a bag
filter requires the selection of a fabric suitable for the characteristics of
the flue-gas and the maximum operating temperature
Boiler sorbent injection See general description in Section 10.8.4. There are co-benefits in the
form of dust and metal emissions reduction
Dry or semi-dry FGD system
See general description of each technique (e.g. SDA, DSI, CFB dry
scrubber) in Section 10.8.4. There are co-benefits in the form of dust and
metal emissions reduction
Wet flue-gas
desulphurisation (wet FGD)
See general description in Section 10.8.4. There are co-benefits in the
form of dust and metals emission reduction
Carbon sorbent (e.g.
activated carbon or
halogenated activated
carbon) injection in the flue-
gas
Mercury adsorption by carbon sorbents, such as (halogenated) activated
carbon, with or without chemical treatment. The sorbent injection system
can be enhanced by the addition of a supplementary bag filter
Use of halogenated additives
in the fuel or injected in the
furnace
Addition of halogens (e.g. brominated additives) into the furnace to
oxidise elemental mercury into soluble or particulate species, thereby
enhancing mercury removal in downstream abatement systems
10.8.6 Techniques to reduce emissions to water
Technique Description
Adsorption on activated carbon
The removal of soluble substances (solutes) from the waste water by
transferring them to the surface of solid, highly porous particles (the
adsorbent). Activated carbon is typically used for the adsorption of
organic compounds and mercury
Aerobic biological treatment
The biological oxidation of dissolved organic substances with oxygen
using the metabolism of microorganisms. In the presence of dissolved
oxygen – injected as air or pure oxygen – the organic components are
mineralised into carbon dioxide, water or other metabolites and
biomass. Under certain conditions, aerobic nitrification also takes
place whereby microorganisms oxidise ammonium (NH4+) to the
intermediate nitrite (NO2-), which is then further oxidised to nitrate
(NO3-)
Anoxic/anaerobic biological
treatment
The biological reduction of pollutants using the metabolism of
microorganisms (e.g. nitrate (NO3-) is reduced to elemental gaseous
nitrogen, oxidised species of mercury are reduced to elemental
mercury).
The anoxic/anaerobic treatment of waste water from the use of wet
abatement systems is typically carried out in fixed-film bioreactors
using activated carbon as a carrier.
The anoxic/anaerobic biological treatment for the removal of mercury
is applied in combination with other techniques
WORKIN
GDRAFT IN
PROGRESS

Chapter 10
822 June 2016 TL/JFF/FN/EIPPCB/LCP_Final Draft
Coagulation and flocculation
Coagulation and flocculation are used to separate suspended solids
from waste water and are often carried out in successive steps.
Coagulation is carried out by adding coagulants with charges opposite
to those of the suspended solids. Flocculation is carried out by adding
polymers, so that collisions of microfloc particles cause them to bond
thereby producing larger flocs
Crystallisation
The removal of ionic pollutants from waste water by crystallising them
on a seed material such as sand or minerals, in a fluidised bed process.
Some combustion plants use crystallisation after evaporation (see BAT
10)
Filtration
The separation of solids from waste water by passing it through a
porous medium. It includes different types of techniques, e.g. sand
filtration, microfiltration and ultrafiltration
Flotation
The separation of solid or liquid particles from waste water by
attaching them to fine gas bubbles, usually air. The buoyant particles
accumulate at the water surface and are collected with skimmers
Ion exchange
The removal of ionic pollutants from waste water and their
replacement by more acceptable ions by transferring them to an ion
exchange resin. The pollutants are temporarily retained and afterwards
released into a regeneration or backwashing liquid
Neutralisation
The adjustment of the pH of the waste water to the neutral pH level
(approximately 7) by adding chemicals. Sodium hydroxide (NaOH) or
calcium hydroxide (Ca(OH)2) is generally used to increase the pH
whereas sulphuric acid (H2SO4), hydrochloric acid (HCl) or carbon
dioxide (CO2) is used to decrease the pH. The precipitation of some
substances may occur during neutralisation
Oil-water separation
The removal of free oil from waste water by mechanical treatment
using devices such as the American Petroleum Institute separator, a
corrugated plate interceptor, or a parallel plate interceptor. Oil-water
separation is normally followed by flotation, supported by
coagulation/flocculation. In some cases, emulsion breaking may be
needed prior to oil-water separation
Oxidation
The conversion of pollutants by chemical oxidising agents to similar
compounds that are less hazardous and/or easier to abate. In the case
of waste water from the use of wet abatement systems, air may be used
to oxidise sulphite (SO32-
) to sulphate (SO42-
)
Precipitation
The conversion of dissolved pollutants into insoluble compounds by
adding chemical precipitants. The solid precipitates formed are
subsequently separated by sedimentation, flotation or filtration. If
necessary, this may be followed by microfiltration or ultrafiltration.
Typical chemicals used for metal precipitation are lime, dolomite,
sodium hydroxide, sodium carbonate, sodium sulphide and
organosulphides. Calcium salts (other than lime) are used to
precipitate sulphate or fluoride
Sedimentation The separation of suspended solids by gravitational settling
Stripping
The removal of volatile pollutants (e.g. ammonia) from waste water by
contact with a high flow of a gas current in order to transfer them to
the gas phase. The pollutants are removed from the stripping gas in a
downstream treatment and may potentially be reused
WORKIN
G DRAFT IN
PROGRESS

Chapter 11
TL/JFF/FN/EIPPCB/LCP_Final Draft June 2016 823
11 EMERGING TECHNIQUES
11.1 Common processes and techniques for energy generation
11.1.1 High-temperature and -pressure super critical coal plant Efficiencies of > 50 % can be achieved with steam conditions of 320–330 bar, 630–650 ºC live
steam and 650–680 ºC reheat steam. The European research project Advanced (700 °C) PF
Power Plant, with steam conditions of 350/700/720 (bar pressure, ºC live and reheat steam), has
efficiencies in the range of 52–55 %.
The availability of these plants depends on provision, at a financially acceptable level, of the
specific alloys required for the construction materials of a boiler that can operate under these
high temperatures and pressures. [UK wish list 4.1.6]
WORKIN
G DRAFT IN
PROGRESS

Chapter 11
824 June 2016 TL/JFF/FN/EIPPCB/LCP_Final Draft
11.2 Common technical combustion processes
11.2.1 Techniques to reduce sulphur oxide emissions
11.2.1.1 Bubbling technology
End-of-pipe desulphurisation (wet FGD) systems using bubbling technology (or a combination
of bubbling and spray technologies) instead of circulation pumps have been developed by
several companies including Alstom, Chiyoda, AE&E and others.
Reported benefits associated with the suppression of recycle pumps, spray nozzles, headers,
separate oxidation tanks and thickeners are: compact design while achieving high
desulphurisation rates; low capital cost; and reduced power consumption.
These systems are currently implemented in some oil-fired and coal-fired plants
[ 37, EGTEI 2012 ]
11.2.2 Combined techniques to reduce sulphur oxide and nitrogen oxide emissions
11.2.2.1 Emerging gas/solid catalytic processes
Some processes which are currently being developed are the ‘Parsons Flue-gas Clean-up’
process and the ‘Lurgi CFB’ process. These processes have only been installed on a pilot plant
scale and are therefore not presented in this chapter.
11.2.2.2 Alkali injection
This process uses the direct injection of one or more dry sorbents such as sodium bicarbonate
into the flue-gas stream. Tests have demonstrated the capability of alkali injection into the
furnace, duct or spray dry scrubber, for combined SO2 and NOX reduction as well as for the
removal of other acid gases (e.g. HCl). The mechanism by which this occurs is not completely
understood, but these processes can reduce NOX significantly. Up to 90 % NOX reduction has
been achieved, depending on factors such as the ratio of SO2 to NOX in the flue-gas, the reaction
temperature, the granulometry of the sorbent, and the residence time. In addition to the
uncertainty regarding the NOX reduction performance, a problem of alkali injection is that the
higher NO2 concentrations can give a brown-orange colouration to the flue-gas. As this process
is still at the demonstration stage, no information on the general performance can be given.
11.2.2.3 Wet scrubber with additives to achieve NOX removal
These processes are generally based on existing wet scrubbing techniques for the removal of
SO2 (limestone or lime slurries), with additives used to achieve NOX removal. Additives such as
Fe(II), EDTA and yellow phosphorus have been shown to achieve variable NOX removal
efficiencies at the laboratory or pilot plant scale. On a commercial scale, about 10 wet,
combined SO2 and NOX removal plants have been operated, with unit capacities of 10 000–
200 000 m3/h. These processes use ClO2 or O3 as an oxidising agent, which is added to the gas,
before it is subjected to sodium wet scrubbing to remove 30–80 % of the NOX and more than
90 % of the SO2. In addition, more than 95 % of the mercury is removed by sodium scrubbing
using NaClO as the additive. These processes are not suitable to treat large volumes of gas
because of the high cost of the oxidising agent and of the problems of disposing of waste water
containing nitrite and nitrate. Due to the lack of information as to whether this process is
actually applied to a large combustion plant, no information on the general performance can be
given.
WORKIN
G DRAFT IN
PROGRESS
Chapter 11
TL/JFF/FN/EIPPCB/LCP_Final Draft June 2016 825
11.2.3 Techniques to reduce metal emissions
11.2.3.1 Membrane filtration to reduce metals in scrubber waste water
Description
Treatment of waste water from wet scrubbers (furnace flue-gas condensate) with silicon carbide
(SiC) ceramic membranes. The technique described is based on the example supplied by
LiqTech.
[DK comments to D1]
Technical description
Membrane filtration with silicon carbide ceramic membranes is an inside-out pressure-driven
separation process. The ceramic membranes are operated in the so-called cross-flow mode.
Cross-flow filtration is a filtration method in which the feed flow is tangential to the surface of
the membrane in order to sweep rejected particles and solutes away. The feed fluid is separated
into two product streams, the permeate, which is depleted of the rejected particles, and the
retentate (or concentrate), which is enriched in those particles. The ceramic membranes are
cleaned using back flush, back pulse and cleaning in place (CIP) and/or chemically enhanced
backwash (CEB).
Achieved environmental benefit
The operating cost and environmental impact can be significantly reduced when reusing the
treated scrubber water in a closed loop, i.e. the polluted liquid is passed through SiC membranes
followed by reverse osmosis membranes. When reusing the treated water, an estimated 80 %
reduction in clean water usage can be achieved; waste water discharge and chemical sludge
handling, and their associated costs, could also be reduced by 90 %.
Environmental performance and operational data
Results from a power plant in Denmark for the removal of heavy metals in the scrubber waste
water stream using SiC membranes are given in the table below.
WORKIN
G DRAFT IN
PROGRESS

Chapter 11
826 June 2016 TL/JFF/FN/EIPPCB/LCP_Final Draft
Table 11.1: Removal of heavy metals and other pollutants from scrubber waste water
Feed Permeate Reduction
Conductivity 118 mS/m 36.5 mS/m 69 %
Arsenic 0.0003 ppm 0.0002 ppm 33 %
Barium 0.033 ppm 0.0097 ppm 71 %
Lead 0.004 ppm 0.0001 ppm 97.5 %
Cadmium* 0,0038 ppm 0,00005 ppm 99 %
Mercury 0,0007 ppm < 0,00005 ppm 93 %
Nickel 0,0042 ppm 0,0006 ppm 86 %
Chromium 0.0033 ppm 0.001 ppm 70 %
Copper 0.0026 ppm 0.002 ppm 23 %
Manganese 0.103 ppm 0.031 ppm 70 %
Selenium 0.0014 ppm 0.0003 ppm 79 %
Chloride 85 ppm 16 ppm 81 %
Sulphate 210 ppm 43 ppm 80 %
Nitrate 20 ppm 12 ppm 40 %
Sodium 54.7 ppm 18 ppm 67 %
Calcium 42.2 ppm 8.89 ppm 79 %
TOC 0.5 ppm 0.2 ppm 60 %
Cross-media effects
None.
Technical considerations relevant to applicability
The SiC membrane filtration technology can generally be used in waste water streams that
require the removal of suspended metals. SiC membranes can handle extreme environments due
to their high thermal and chemical resistance.
Economics
Example data for a 25 m3/h SiC membrane-based ultrafiltration plant are presented in the
following table.
Table 11.2: Economic parameters for an example SiC membrane ultrafiltration plant
Capacity 25 m3/h
Flux per m2 350–400 LMH
Numbers of SiC membrane elements 10 pcs
Total plant investment costs - Capex EUR 300 000–400 000
Total running costs – Opex per year EUR 50 000
Typical water savings (80 %) 20 m3/h per hour multiplied by local water
price
Typical discharge savings (90 %) – Estimated
discharge fee of EUR 3 per m3
EUR 3 per m3/h = 22.5 m
3h*24*365*EUR 3 =
EUR 591 300
Payback time < 1 year
Source: [DK comments to D1]
Driving force for implementation
Higher discharge fees for waste water containing heavy metals.
Reduction of water consumption and reuse of water.
Replacement of a number of technologies with one filtration step.
Compliance with new waste water discharge quality standards.
Example plants
Power plant, Randers, Denmark (Industrial Scale Pilot experiment 2012).
WORKIN
GDRAFT IN
PROGRESS

Chapter 11
TL/JFF/FN/EIPPCB/LCP_Final Draft June 2016 827
Power plant, Germany (Industrial Scale Pilot experiment 2013) and ongoing project for full
scale system to be commissioned in 2014.
Power plant, Germany (Industrial Scale Pilot experiment 2013+2014).
11.2.4 CO2 capture processes
To reduce the emissions of CO2 beyond the levels that can be achieved by maximising the
thermal efficiency of processes and techniques generating energy, CO2 emissions from fossil-
fuel-fired combustion plants can be captured and then transported and stored underground.
The additional carbon capture plant requires additional energy consumption, e.g. for the heating
needed for CO2 desorption. CO2 capture processes therefore lead to an efficiency loss estimated
at 8–12 percentage points for existing coal-fired power plants. Due to the efficiency drop
associated with CO2 capture, increasing the efficiency of fossil-fuel-fired power plants is the
first step. In parallel, improvement of the energy efficiency of CO2 capture processes and
optimisation of the steam cycle for the heat demands of CO2 capture are priorities. [54, UK-
TWG 2012]
The development of CO2 capture technologies is being pursued by global power plant suppliers
in collaboration with utility companies, academia and governments, particularly in Europe,
North America and Australia. Several solutions are currently being developed. They are usually
classified into post-combustion, oxy-fuel and pre-combustion capture processes:
[EPPSA – doc. 9.2.10/7]
Post-combustion processes consist of extracting the CO2 that is diluted in the
combustion flue-gas. Post-combustion is the most advanced technology today. The
solvents for CO2 post-combustion capture can be physical, chemical, or intermediate.
Chemical solvents, such as amines, are most likely to be used. Other post-combustion
capture solutions are absorption (new solvents, chilled ammonia), adsorption, anti-
sublimation, and membranes.
Oxy-combustion processes consist of burning a fuel in oxygen. The gases produced by
the oxy-combustion process are mainly water and CO2, from which CO2 can easily be
removed at the end of the process.
Pre-combustion processes involve conversion (gasification or partial oxidation) of fuel
into a synthesis gas (carbon monoxide and hydrogen) which is then reacted with steam
in a shift reactor to convert CO into CO2 or another organic substance. The process
produces highly concentrated CO2 that is readily removable by physical absorbents. H2
can then be burnt in a gas turbine. For the moment, none of the existing coal-fired IGCC
plants includes shift conversion with CO2 capture.
The required CO2 purity level determines the choice of pollutant abatement techniques. The
level and nature of impurities in the CO2 stream can affect some CO2 capture processes that are
sensitive to pollutants, and can also be important for CO2 transport and storage. For example,
NO2 and SO2 from flue-gas react with amines (post-combustion capture) to form stable, non-
regenerable salts and so cause a loss of some amines. With amines, the SO2 specification is
usually set as < 40 mg/Nm3 and the NO2 specification as < 50 mg/Nm
3 (based on a daily
average, standard conditions and an O2 level of 6 %. Depending on the chemical solvent used,
specifications may be different). Limits for SOX can be achieved by some FGD technologies.
Experience shows that limestone gypsum FGD plants can be designed to reduce SO2 emissions
down to 10 mg/Nm3 with an increase in capital costs of about 7 % and a 27 % increase in
operating costs. Limits for NOX are technically achievable by the use of low-NOX burners and
SCR.
Other types of CCS technology are available but are not yet mature enough for application in
large combustion plants.
WORKIN
G DRAFT IN
PROGRESS
Chapter 11
828 June 2016 TL/JFF/FN/EIPPCB/LCP_Final Draft
CO2 capture and storage in power plants is now being demonstrated in a few small-scale pilot
plants. The first large-scale demonstration plant has been in operation since October 2014 at
Unit 3 (a 160 MW coal-fired plant) at the Boundary Dam Power Station at Esteven,
Saskatchewan, Canada. With a total plant cost of around CAD 1.5 billion, first financial
analyses estimate that the achieved CCS costs are still substantially higher than the 2020
objective of below EUR 25/tonne of CO2 avoided.
There is no consensus on which option (post-, pre- or oxy-combustion) will be the least costly in
the future; each has pros and cons and the costs appear to be comparable. The efficiency
penalties of CO2 capture will become lower for future power plants.
Carbon capture options being considered for coal include pre-combustion coal gasification, oxy-
fuel combustion, and post-combustion. A number of post-combustion scrubbing methods are
being trialled. [ 36, EGTEI 2012 ] [ 37, EGTEI 2012 ]
Cross-media effects
Where additional SO2 abatement is required to achieve the necessary purity of the CO2 gas
stream, this will offset the higher SO2 emissions resulting from the relatively high efficiency
penalty of carbon capture. However, NOX and dust emissions may be expected to increase by an
amount proportional to the fuel penalty for CCS operation. Direct NH3 emissions can also
increase due to degradation of the amines used in post-combustion capture technologies.
[EEA Technical report 14/2011: Air pollution impacts from carbon capture and storage (CCS)]
11.2.4.1 Post-combustion CO2 capture processes [EPPSA – doc 9.2.10 / 7]
11.2.4.1.1 Amine Process
In the Amine Process for carbon dioxide capture from power plant-generated flue-gas, the flue-
gas is treated with aqueous amine solution, which reacts with CO2. Raising the temperature
reverses the reaction and CO2 is released. The solution is recycled for reuse. Several pilot plants
fitted with the Amine Process have been in operation in recent years. While the following
process description assumes application to a coal-fired utility boiler, the Amine Process can be
modified, as required, for post-combustion CO2 removal from many different utility and
industrial combustion processes.
A generic schematic of the Amine Process is shown in Figure 11.1.
WORKIN
G DRAFT IN
PROGRESS

Chapter 11
TL/JFF/FN/EIPPCB/LCP_Final Draft June 2016 829
Figure 11.1: Amine Process using UCARSOLTM
FGC 3000 (Alstom and Dow Chemical)
The Amine Process is based on the chemistry of the amine-CO2-H2O system and the ability of
the amine solution to absorb CO2 at low temperatures and to release the CO2 at moderately
elevated temperatures. CO2 and water produce carbonic acid to react with amine solution in the
absorption column, forming chemical compounds (carbamate or bicarbonate) and resulting in
the removal of CO2 from the gaseous stream. In the example process shown in Figure 11.1, CO2
is absorbed in an amine solution at a temperature around 50 °C (120 °F) and at atmospheric
pressure. The primary absorption reaction is described in ionic form as follows:
2R-NH2 + CO2(g) -> R-NH3+ + R-NH-COO- (1)
R-NH2 represents the amine used for the process.
The typical target CO2 removal efficiency is 90 % though efficiencies of up to 99 % could be
achieved in well-designed absorbers.
Figure 11.2 shows a simplified flow diagram of a power plant with post-combustion CO2
capture.
WORKIN
G DRAFT IN
PROGRESS

Chapter 11
830 June 2016 TL/JFF/FN/EIPPCB/LCP_Final Draft
Figure 11.2: Simplified flow diagram of a power plant with post-combustion CO2 capture
Flue-gas from the boiler is picked up downstream of any installed Air Quality Control System
(AQCS) equipment. Concentrations of NO2 (nitrogen oxide), SO2, SO3 (sulphur oxides), HCl,
(hydrochloric acid), mercury and particulate matter (PM) need to be kept relatively low to
prevent co-absorption and amine solution degradation. SOX concentrations should ideally be
kept below 20 ppmv. NO2, the portion of NOX that will react with the amine solution, should be
kept below 10 ppmv. Also, the temperature of the flue-gas entering the CO2 absorber should be
below 50 °C (120 °F). Additional AQCS equipment may need to be installed to meet these
requirements.
Booster fans overcome the pressure drop associated with the plant vessels and ductwork. Flue-
gas is carried to the CO2 absorption system for treatment and then to the stack for release into
the atmosphere. Monitoring equipment (CO2 analyser) measures the CO2 contained in the flue-
gas entering the CO2 absorption system as well as the CO2 level leaving the absorption system.
This information determines the absorber efficiency.
The flue-gas leaving the top of the absorber, containing mainly nitrogen, oxygen, water and a
low concentration of CO2, is exhausted to the existing outlet duct. It does not require any reheat
under normal conditions.
The CO2-rich solution exiting the CO2 absorber contains 3–10 mol % CO2 in solution. The
stream of the rich amine solution from the CO2 absorber is heated in the rich/lean heat
exchangers and sent to the regenerator via one or more feed points. In some processes, half of
the feed goes through one exchanger and is sent to the middle of the regenerator.
Regeneration reverses the absorption reactions with the application of heat. The regenerator
column contains mass transfer devices (trays or random packing). There, the rich solution flows
down the column counter-current to the steam produced by the boiling part of the lean solution
exiting the bottom of the regenerator column.
The flow of the lean solution is entirely or partly sent to the regenerator reboiler, where part of
the solution (mainly water) is vaporised while providing the energy to remove CO2 (heat of
desorption) from the solution. This steam promotes the dilution necessary for stripping the CO2
from the rich solution. The remainder of the lean solution that is not vaporised enters the sump
of the regenerator column, where it is pumped back to the top of the CO2 absorber through the
rich/lean heat exchangers and the lean solution cooler. The hot lean solution is cooled in the
WORKIN
G DRAFT IN
PROGRESS
Chapter 11
TL/JFF/FN/EIPPCB/LCP_Final Draft June 2016 831
cross exchangers, and the heat recovered warms the rich solution coming from the CO2
absorber. The CO2-loaded steam leaves the top of the regeneration columns after having gone
through a high-efficiency mist eliminator to minimise water and amine carry-over.
The CO2 compression system may involve the use of integrally geared centrifugal compressors
with multiple compression stages. The compressors are equipped with intercoolers and after-
coolers, where the CO2 is cooled using condensate from the steam/water cycle as the cooling
medium. A CO2 drying unit is provided to remove moisture from the CO2 product. Standard
drying technologies such as tri-ethylene glycol (TEG) or Molecular Sieve Adsorbers (MSA) are
utilised.
Filtration of the amine solution is necessary to reduce the amount of foaming in the absorber
column and to keep the amine solution's CO2 absorption potential at its optimum. The insoluble
contaminants can usually be removed by mechanical filtration. Soluble contaminants that are
surface-active can be removed to a certain extent by activated carbon filtration. Before entering
the CO2 absorber, a slipstream of 10 % – depending upon the dust load – of the lean solution
flows through mechanical cartridge filters and possibly also through an activated carbon filter to
reduce impurities in the amine solution. They remove solids from the solvent and carbon fines,
which may escape from the carbon bed.
Amine is used in an aqueous solution to selectively capture CO2 from the flue-gas (gas mixture
of N2, CO2, O2 and other trace gases) by chemical absorption in a gas-liquid contact tower
(absorber) at relatively low temperatures and CO2-loaded amine is stripped (chemical
desorption) at a relatively higher temperature to separate the CO2 and to regenerate the amine
solution for reuse. In the process, due to the cyclic exposure of the amine to variable process
conditions, mainly the temperature, O2 and traces of strong acid gases, a small fraction of the
amine will undergo irreversible chemical change. In the continuous liquid closed-loop process,
these trace compounds will accumulate. The purpose of the reclaimer is to separate the active
portion of the amine solution from the inactive stable organic salts by-products.
In Norway, the post-combustion amine absorption process has been demonstrated to be able to
cope with large and rapid variations in the load of the combustion plant and with start-
up/shutdown conditions.
Example pilot plants
South Charleston site, West Virginia (USA). Pilot plant sized for approximately 5 tonnes of CO2
per day from a side stream from a coal-fired industrial boiler.
C2A2, Le Havre (France). Pilot plant sized for approximately 25 tonnes of CO2 per day
captured from a flue-gas slipstream of 6.5 tonnes per hour from a 600 MWe coal-fired boiler.
The test carbon capture programme was in operation between July 2013 and March 2014.
Maasvlakte (MPP 3) pilot plant Electrabel, E.ON – Hitachi Power Europe (The Netherlands).
~1.1 Mt CO2 per year foreseen to be captured for a total of 5 Mt of CO2 over the demonstration
phase of the project at a 1100 MWe coal-fired plant (250 MWe equivalent for the carbon capture
plant).
11.2.4.1.2 Chilled Ammonia Process
The flue-gas leaving the WFGD system is cooled and sent to the CO2 absorber, where the CO2
in the flue-gas reacts with ammonium carbonate to form ammonium bicarbonate (ABC). The
flue-gas stream, with most of the CO2 removed, returns to the existing stack for discharge, and
the bleed stream is sent to the plant waste water treatment system for processing. The rich
ammonium bicarbonate (ABC) solution is sent to a regenerator column under pressure. Heat is
added in the regenerator to separate the CO2 and return the ammonium carbonate (AC) solution
to the CO2 absorber for re-use. The CO2 stream is scrubbed to remove excess ammonia, then
compressed and transported to the storage system.
WORKIN
G DRAFT IN
PROGRESS

Chapter 11
832 June 2016 TL/JFF/FN/EIPPCB/LCP_Final Draft
In the Chilled Ammonia Process (CAP), CO2 is absorbed in an ammoniated solution at
temperatures lower than the flue-gas desulphurisation system exit temperature. Therefore,
cooling of the flue-gas is a necessary step within the process, resulting in condensation of
moisture from the flue-gas. Gaseous ammonia (NH3) is released from the ammoniated solution
during absorption of CO2. To minimise gaseous NH3 emissions, CO2 absorption is carried out at
lower flue-gas temperatures. Generally, a lower absorption temperature results in lower
ammonia emissions from the CAP absorber and higher power consumption for the cooling
process equipment. Aqueous ammonium carbonate ((NH4)2CO3) is formed at a temperature that
optimises the cooling energy demand, carbon dioxide removal efficiency, and ammonia vapour
in the flue-gas. A regeneration vessel produces the gaseous CO2 product stream by reversing the
absorption reactions with the application of heat. The CO2 product stream leaves the CAP
regenerator vessel at a higher pressure than in other CO2 processes. This results in fewer stages
of downstream CO2 compression equipment. The ammonia and water reaction products are
stripped and condensed from the resulting gas stream for use as reagent and flue-gas wash
solvent respectively. A detailed flow diagram of the process is shown in Figure 11.3.
Figure 11.3: Chilled Ammonia Process flow diagram
Part of the flue-gas from the outlet of the upstream wet flue-gas desulphurisation (WFGD) is
directed to the Chilled Ammonia Process for treatment. The flue-gas stream contains between
10 % and 13 % CO2 depending on the power output and operation of the plant. The flue-gas
operating temperature is approximately 52–57 °C (125–135 °F) and is saturated with moisture.
Also present are residual contaminants such as SO2, SO3, HCl, and particulate matter (PM).
The flue-gas conditioning system consists of two packed-bed sections, Direct Contact Cooler 1
(DCC1) and Direct Contact Cooler 2 (DCC2), and a circulation loop through an evaporative
cooling tower (see Figure 11.3).
The flue-gas is cooled in DCC1 for condensation and removal of moisture. The solution's pH in
the DCC1/DCC2 loop is controlled to facilitate high SO2 capture efficiency in DCC1 and high
NH3 capture efficiency in DCC2.
WORKIN
G DRAFT IN
PROGRESS
Chapter 11
TL/JFF/FN/EIPPCB/LCP_Final Draft June 2016 833
The use of the incoming SO2 and acid gases is effective in the removal of ammonia as 1 mole of
SO2 introduced to DCC2 reacts with 2 moles of NH3 exiting the water wash to produce
ammonium sulphate product.
Depending on the absorber operating temperature and the ammonia concentration in the ionic
solution, the treated flue-gas leaving the absorber system contains varying amounts of gaseous
ammonia. This ammonia in the flue-gas must be captured and returned to the process in order to
minimise ammonia losses from the system, control emissions of ammonia to the environment
and maintain stable operating conditions. The water wash NH3 column is designed to absorb the
majority of the incoming ammonia for return to the process.
Rich ammoniated solution is pumped from the absorber to the regenerator through a series of
heat exchangers in order to recover heat from the lean ammoniated stream, which is leaving the
regenerator bottom. In the regenerator column, as heat is applied, CO2 evolves from the rich
solution. The composition of the vapour stream leaving the regenerator is a function of
temperature, pressure, and the relative concentrations of CO2, ammonia, and water in the
solution.
At moderately elevated temperatures, the vapour pressure of CO2 in the ammoniated solution
increases rapidly while the vapour pressure of the ammonia and water remain relatively low. As
a result, the CO2 is emitted from the regenerator at high pressure, which is a significant feature
of the technology. The higher CO2 product stream pressure significantly reduces the
downstream CO2 compressor power and size. In addition, the CO2 from the regenerator contains
very low concentrations of ammonia (< 50 ppm) and water vapour (< 0.3 mol %), resulting in
low overall heat consumption. The CO2 product stream can be easily washed and cooled to
produce an extremely pure CO2 gas stream.
An ammonia recovery stripper is included to strip ammonia from ammoniated water. A design
based on low-pressure ammonia stripping has been recommended based on experience gained in
pilot plants.
See the relevant part of Section 11.2.4.1.1 for a description of the CO2 compression system.
Example pilot plants
We Energies Pleasant Prairie power plant P4, Wisconsin (USA). The unit, sized to around
15 000 tonnes of CO2 per year, commenced operations in June 2008.
E.ON Karlshamn Field Validation Unit (Sweden). The pilot unit, designed to capture 15 000
tonnes of CO2 per year at full capacity, was commissioned in 2009 and operated for
approximately 2000 hours, achieving a 90 % capture rate.
AEP Mountaineer Product Validation Facility, West Virginia (USA). 30 MW slipstream from
the 1 300 MW plant, equivalent to 0.1 Mt/yr of CO2. Between October 2009 and December
2010, 21 000 tonnes CO2 were captured at a > 90 % capture rate and 15 000 tonnes stored.
Process availability reached almost 100 % for both capture and storage.
11.2.4.1.3 Biocatalysis techniques to remove CO2 from flue-gases
A recent development in the field of carbon capture techniques is the use of enzymes to remove
CO2 from the flue-gases. An example is the proprietary system developed by Akermin, Inc.,
which incorporates carbonic anhydrase as a biocatalyst to accelerate CO2 separation by
promoting the hydration of CO2 to bicarbonate at a rate substantially higher than amines. In this
system, the problem of low enzyme stability under high pH, temperature and shear forces has
been addressed by embedding the enzyme in a thin polymer film in the immediate vicinity of
the gas-liquid interface.
Reported benefits of this technique include: low investment costs due to elimination of auxiliary
components (e.g. polishing scrubber, direct contact cooler, wash columns, solvent reclaimers);
WORKIN
G DRAFT IN
PROGRESS
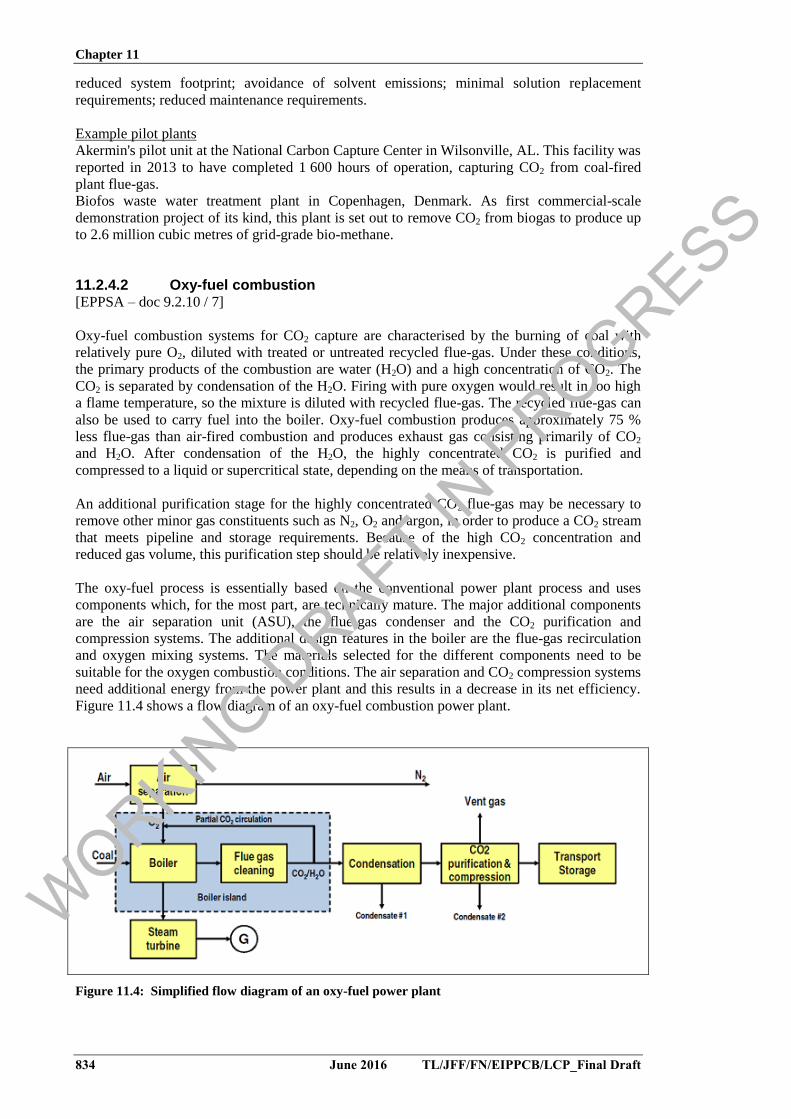
Chapter 11
834 June 2016 TL/JFF/FN/EIPPCB/LCP_Final Draft
reduced system footprint; avoidance of solvent emissions; minimal solution replacement
requirements; reduced maintenance requirements.
Example pilot plants
Akermin's pilot unit at the National Carbon Capture Center in Wilsonville, AL. This facility was
reported in 2013 to have completed 1 600 hours of operation, capturing CO2 from coal-fired
plant flue-gas.
Biofos waste water treatment plant in Copenhagen, Denmark. As first commercial-scale
demonstration project of its kind, this plant is set out to remove CO2 from biogas to produce up
to 2.6 million cubic metres of grid-grade bio-methane.
11.2.4.2 Oxy-fuel combustion [EPPSA – doc 9.2.10 / 7]
Oxy-fuel combustion systems for CO2 capture are characterised by the burning of coal with
relatively pure O2, diluted with treated or untreated recycled flue-gas. Under these conditions,
the primary products of the combustion are water (H2O) and a high concentration of CO2. The
CO2 is separated by condensation of the H2O. Firing with pure oxygen would result in too high
a flame temperature, so the mixture is diluted with recycled flue-gas. The recycled flue-gas can
also be used to carry fuel into the boiler. Oxy-fuel combustion produces approximately 75 %
less flue-gas than air-fired combustion and produces exhaust gas consisting primarily of CO2
and H2O. After condensation of the H2O, the highly concentrated CO2 is purified and
compressed to a liquid or supercritical state, depending on the means of transportation.
An additional purification stage for the highly concentrated CO2 flue-gas may be necessary to
remove other minor gas constituents such as N2, O2 and argon, in order to produce a CO2 stream
that meets pipeline and storage requirements. Because of the high CO2 concentration and
reduced gas volume, this purification step should be relatively inexpensive.
The oxy-fuel process is essentially based on the conventional power plant process and uses
components which, for the most part, are technically mature. The major additional components
are the air separation unit (ASU), the flue-gas condenser and the CO2 purification and
compression systems. The additional design features in the boiler are the flue-gas recirculation
and oxygen mixing systems. The materials selected for the different components need to be
suitable for the oxygen combustion conditions. The air separation and CO2 compression systems
need additional energy from the power plant and this results in a decrease in its net efficiency.
Figure 11.4 shows a flow diagram of an oxy-fuel combustion power plant.
Figure 11.4: Simplified flow diagram of an oxy-fuel power plant
WORKIN
G DRAFT IN
PROGRESS
Chapter 11
TL/JFF/FN/EIPPCB/LCP_Final Draft June 2016 835
The effects of combustion in O2/CO2 atmospheres on the boiler design depend on the selected
oxygen concentration in the oxidant: if the O2 content is about 23–28 % in mass, the air-blown
boiler design can be adopted essentially as it is, while, if the O2 content is higher, the furnace
may be smaller.
In an oxy-fuel combustion process, almost all of the N2 is removed from the air, there resulting
in a stream that is approximately 95–97.5 % O2. Due to the N2 removal from the air, oxy-fuel
combustion produces approximately 75 % less combustion product volume than air-fired
combustion. The lower gas volume also allows for flue-gas contaminants (SOX, NOX, mercury,
particulates) to be more easily removed and at a lower cost. Because N2 is removed from the air,
NOX production from the boiler is greatly reduced as well.
A first-generation oxy-fuel combustion technology configuration uses a cryogenic process for
O2 separation, atmospheric combustion for fuel conversion, conventional pollution control
methods (SOX, NOX, mercury, particulates), and mechanical compression for CO2
pressurisation. The first-generation configuration can be used for retrofitting existing power
plants without major modification but requires considerable extra space to accommodate the
additional components.
In an advanced second-generation oxy-fuel combustion configuration, cryogenic air separation
may be replaced by other technologies, e.g. the chemical looping process, in which oxygen is
transferred from the air to the fuel through an oxygen carrier. However, such technologies are in
early development stages and will not be applicable to new plants before 2020 and perhaps not
to the existing fleet. Second-generation oxy-fuel combustion will probably operate with higher
concentrations of oxygen, thus increasing the challenges but also increasing overall plant
efficiency and decreasing boiler size.
The Air Quality Control Systems (AQCS) required for the oxy-combustion process are not
different from the systems used for conventional steam power plants, i.e. dust removal system,
DeNOX system, if required by the plant operation (operation in dual mode or partial load in air),
and DeSOX system. The dust removal system could be either an ESP or a baghouse system and
both dry and wet systems could be considered for the DeSOX. The flue-gas condenser (FGC) is
positioned after the AQCS to remove water vapour and produce a CO2-rich stream, which meets
the requirements of the gas processing unit. This equipment is more specific to the oxy-
combustion chain and often not present in a conventional power plant.
In the condenser, the flue-gas is cooled by cooling water, either directly or indirectly. The
condensed water is collected at the bottom of the FGC for further treatment. Some of the
condensate is used for the quenching process and is pumped to the top of the condenser where it
is distributed to the flue-gas. The condensation is followed by absorption of traces of acid gases
not captured in the preceding DeSOX unit. A sodium hydroxide solution may be added to the
quench water to neutralise the captured acids.
Example pilot plants
Windsor boiler simulation facility, Connecticut (USA). 15 MWth oxy-fuel pulverised coal
boiler.
Schwarze Pumpe (Germany). 30 MWth oxy-fuel pulverised coal boiler.
Lacq (France). 30 MWth gas fired boiler.
CIUDEN (Spain). 30 MWth oxy-CFB coal-fired boiler.
Basis for calculation of emissions from an oxy-fuel power plant
If CO2 is removed from the flue-gas stream the overall volume of the flue-gas released to the
atmosphere is reduced; however, metrics for emissions still link limit values for classic
pollutants (notably NOX, SOX, CO and particulates) to flue-gas volumes (mg/Nm3) in Europe
and therefore need to be reconsidered. The expression of the emission levels based on the
volumetric unit of flue-gas can conveniently be applied to normal combustion processes in air
firing. When the fuels are burnt with air, the exact composition of the air is known, containing
WORKIN
G DRAFT IN
PROGRESS
Chapter 11
836 June 2016 TL/JFF/FN/EIPPCB/LCP_Final Draft
mainly O2 (20.95 vol-%) and N2 (78.09 vol-%). Due to the high concentration of nitrogen in the
air, flue-gas CO2 concentrations are typically 3–15 vol-% (dry basis) depending on the fuel and
the combustion technology.
When the combustion is carried out without air, the nitrogen from air does not dilute the
emission concentrations in the flue-gases. This means that emission concentrations from the
boiler are typically much higher in oxygen firing than in air firing. However, the oxy-fuel flue-
gases from the boiler are released directly to the atmosphere only if some occasional, short-
term, interruption of the CPU (compression and purification unit) or CO2 transportation line
prevents the reception of CO2 and it does not make sense to shut down the ASU and switch the
boiler to air combustion. In case of a longer interruption of the CCS system, either both the
boiler and the ASU will be shut down or, if the boiler is designed to be capable of operating
with air combustion as well, it can continue producing power.
In normal CCS operation, all the flue-gas from the oxy-combustion process are led to the CPU
and no emissions to air from the boiler itself are anticipated. Instead, inert (non-condensable)
gases in the CO2 stream to the CPU are separated and vented during the CO2 purification and
compression. However, the mass flow rates of emission compounds (SOX, NOX, CO, etc.) to the
atmosphere from the carbon capture unit are much lower than in air firing.
Given the above, the emission levels based on the concentrations and volumetric units are not
applicable to the CCS processes. The CCS processes may produce high concentrations of
emission compounds with small gas flow rates to be released into the atmosphere.
CCS processes can produce small amounts of vent gases (despite the capture technology), which
may have high concentrations of emissions exceeding the current concentration-based limits.
However, the emissions are significantly lower than those produced by air-fired boilers (e.g. if
compared on an annual basis). Therefore, emission levels in CCS applications could
conveniently be expressed on an energy basis, e.g. as milligrams per megajoule (mg/MJ) or
milligrams per megawatt hour (mg/MWh).
WORKIN
G DRAFT IN
PROGRESS
Chapter 11
TL/JFF/FN/EIPPCB/LCP_Final Draft June 2016 837
11.2.4.3 Carbon Capture Readiness
Although carbon capture readiness is not an emerging technique per se, it is linked to the
emerging CCS techniques.
Following the provisions laid down in Directive 2009/31/EC (CCS Directive), Article 36 of the
IED establishes the carbon capture readiness legal requirement for all plants of > 300MWe that
meet the necessary conditions in terms of: availability of suitable storage sites; technical and
economic feasibility of transport facilities; and technical and economic feasibility of retrofitting
for CO2 capture.
A carbon capture ready (CCR) plant is a plant which can include CO2 capture when the
necessary regulatory or economic drivers are in place. The aim of building plants that are
capture ready is to reduce the risk of stranded assets and ‘carbon lock-in’. Developers of CCR
plants should take responsibility for ensuring that all known factors in their control that would
prevent installation and operation of CO2 capture have been identified and eliminated.
In the UK formal criteria have been laid down, requiring that all new power stations of
> 300 MWe should only be consented to if they can be considered CCR. [54, UK-TWG 2012].
The CCR requirements proposed in 2009 by the UK Department of Energy and Climate Change
include demonstration:
that sufficient space is available on or near the site to accommodate carbon capture
equipment in the future;
that retrofitting the chosen carbon capture technology is technically feasible;
of the likelihood that linking to a full CCS chain including retrofitting of capture
equipment will be economically feasible within the power station's lifetime.
If granted consent, operators of the power station will subsequently be required to:
ensure that control over the space required for the installation of the carbon capture
equipment is retained;
periodically report as to whether it remains technically feasible to retrofit the power station
until the plant moves to retrofit CCS, as CCS technology evolves and modifications may
be introduced to the plant configuration.
11.2.4.3.1 Plant space and access requirements
Space would need to be provided for the CO2 capture equipment (scrubbers, CO2 compressors,
oxygen production plant, etc.) and additional infrastructure including cooling water and
electrical systems, safety barrier zones, pipework and tie-ins to existing equipment. Further
space may be needed during construction, for storage of equipment and materials and for access
to the existing plant.
Retrofitting CO2 capture would reduce the net power output: if the net power output from the
site had to be maintained, space would also have to be provided for construction of an additional
power generation plant.
11.2.4.3.2 Power plant CCR pre-investments
Further pre-investments can be made to reduce the cost and downtime for the retrofit of CO2
capture. Some potential CCR pre-investments apply to all technologies, including oversizing
pipe-racks and making provision for expansion of the plant control system and on-site electrical
distribution. These pre-investments could be relatively attractive, as they are generally low-cost
but could result in significant reductions in the costs and downtime for the retrofit. Other
potential pre-investments apply to specific capture technologies, as outlined below.
WORKIN
GDRAFT IN
PROGRESS

Chapter 11
838 June 2016 TL/JFF/FN/EIPPCB/LCP_Final Draft
Pulverised coal plants with post-combustion capture
The main areas of the plant which will be affected by the retrofitting of CO2 capture are the
flue-gas treatment unit and the steam turbine and its ancillaries. The feed gas to post-
combustion CO2 scrubbers needs to have low SOX and NO2 concentrations to minimise
degradation of current (and probably future) solvents. If the power plant is to be built without
FGD, provision should be made to add a suitable FGD system when CO2 capture is retrofitted.
If the plant is to be built with FGD, either the FGD system should be designed to meet the flue-
gas purity requirements of CO2 capture or provision should be made to upgrade the FGD
performance in future.
Using current post-combustion amine scrubbing technology, about 40–50 % of the low-pressure
steam has to be extracted from the steam turbine, for use in the amine regenerator reboiler.
There are various ways in which the steam turbine could be designed to minimise the penalties
associated with retrofitting this steam extraction and to allow for future changes in extraction
levels. After capture retrofit, more low-grade heat would be available for boiler feed-water
preheating. This has some impacts on the steam turbine and condensate preheating equipment,
which should be taken into account in a CCR design.
Pre-investment in a high-efficiency ultra-supercritical steam cycle would minimise the quantity
of CO2 that would have to be to be captured, transported and stored per kWh of electricity. This
investment would have the added benefit of reducing CO2 emissions even before the CCR
retrofit.
Pulverised coal oxy-combustion plants
Leakage of air into the boiler and its ancillaries should be minimised, to avoid contamination of
the CO2 product. Air ducts and fans should be designed to enable them to be reused for flue-gas
recycling after the plant has been converted to oxy-combustion. FGD may or may not be needed
after conversion to oxy-combustion, depending on the plant design and the sulphur content of
the fuel. If it is intended to use FGD after conversion to oxy-combustion, the FGD plant should
be designed so that it could be adapted to the different gas flows and compositions.
Modification of the steam cycle to utilise additional low-grade heat and pre-investment in an
ultra-supercritical steam cycle, as mentioned above for post-combustion capture, also apply to
oxy-combustion.
Integrated gasification combined-cycle plants with pre-combustion capture
Retrofit of CO2 capture to an IGCC plant would involve the addition of shift converters,
modification of the acid gas removal plant to enable it to also separate CO2, conversion of the
gas turbines to hydrogen combustion and some changes to the steam system. The shift
conversion reaction is exothermic, which reduces the overall heat of combustion of the fuel gas.
To avoid having to operate the gas turbine at a reduced load after the capture retrofit, which
would be an efficiency and cost penalty, provision could be made for increasing the capacity of
the gasification plant, oxygen production plant and other ancillary plants. The intention to
retrofit CO2 capture could also have implications for the choice of gasifier and gas turbine.
Natural gas combined-cycle plants
Natural gas combined-cycle plants could be retrofitted with pre- or post-combustion capture.
For post-combustion capture, steam would need to be extracted from the steam turbine, as
described above for a coal-fired plant. For pre-combustion capture, natural gas partial oxidation,
shift conversion and CO2 separation plants would need to be retrofitted, the gas turbine would
have to be converted to hydrogen combustion and the HRSG and steam turbine would have to
cope with the resulting changes in flue-gas flow rate, composition and temperature. All of these
issues should be taken into account in a capture ready plant design.
WORKIN
G DRAFT IN
PROGRESS

Chapter 11
TL/JFF/FN/EIPPCB/LCP_Final Draft June 2016 839
11.3 Gasification / Liquefaction / Pyrolysis of fuels
Table 11.3 summarises the gasification technologies which have been or are being developed by
various organisations in several countries.
Table 11.3: Gasification technologies
Technology
name Gasifier type
Owner and
location
Current status and
size Notes
British Gas/Lurgi
(BGL)
Moving-bed
slagging
Envirotherm
(Germany),
Allied
Technologies
(US)
12 ft diameter unit
with
coal and wastes (now
shut down)
Offered
commercially for
~1 000 t/day
Econo Power
International
Corporation
(EPIC)
Two-stage fixed-
bed – air-blown,
atmospheric
pressure
EPIC (US)
Widely used in China.
Typical size 3.6m
diameter,
250 MMBtu/h of fuel
gas
Two gasifiers
ordered for
Homeland, IA
EAGLE Dry feed two-
stage entrained JPower (Japan)
Test programme on
150 t/day pilot
170 MW IGCC
planned for 2016
Aerojet
Rocketdyne
Dry feed single
stage
downflow
entrained
Aerojet
Rocketdyne (US)
Conceptual. Pilot
gasifier at GTI
2009
Larger units
planned in China,
US and Colombia
HT Winkler Circulating
fluidised bed Uhde (Germany)
25 bar 150 mtpd pilot
operated in 1990s.
10 bar 800 t/day unit
ran 1985-1994
Future
development
uncertain
KRW Bubbling
fluidised bed KBR (US)
800 t/day unit for
100 MW IGCC. Did
not run successfully
Future
development
unlikely
SES (GTI U Gas) Fluidised bed
GTI
Exclusive license
to SES (2006)
4x100 t/day gasifiers
at 4 bar in Shanghai.
25 bar PDU at GTI
Additional
gasifiers to be
supplied to China
HRL IDGCC
(Integrated
Drying
Gasification
Combined Cycle)
Circulating
fluidised bed
Research Labs
(HRL)
(Australia)
Test programme on
10 MW unit (1997-8)
400 MW IDGCC
planned in Latrobe
Valley
BHEL Fluidised bed BHEL (India) 30 t/day pilot plant
130 MW IGCC
planned in South
India
GreatPoint
Energy -
bluegas™
Catalytic
fluidised bed
GreatPoint
Energy (US)
Pilot tests at GTI.
Funding obtained for
larger unit
Several projects
planned in China
and US
Hydromax Molten metal
(iron and tin)
Alchemix
(Arizona, US)
0.3 m batch unit at
CSIRO, Australia
Cyclic process.
Licensed to
Diversified
Energy, AZ
Pyroneer Low-temperature
CFB gasification
DONG Energy
Power
(Denmark)
6 MW fuel-flexible
gasification plant at
Asnæs Power Station
in Kalundborg
suitable for
gasification of straw,
manure fibre, energy
crops, etc.
The gas is very
clean, due to the
low gasification
temperature and
can be fed directly
to the coal boiler
WORKIN
G DRAFT IN
PROGRESS
Chapter 11
840 June 2016 TL/JFF/FN/EIPPCB/LCP_Final Draft
Coal- and multi-fuel-based IGCC
TPRI (Thermal Power Research Institute) has developed a dry coal-fed two-stage entrained
gasifier that is to be used in the GreenGen IGCC project in China. A successful
demonstration of their gasification technologies at a commercial size is needed before they
can really be considered as offering IGCC plants with the necessary guarantees.
Siemens' 500 MWth gasifiers have a coal capacity of about 1800 tonnes per day. In 2009,
Siemens proposed a larger 1200 MWth gasifier. Both gasification and power block islands
can be offered.
KBR/Southern Company has formed an alliance based on the KBR Transport gasification
technology. Henceforth this will be referred to as the TRIGTM
technology. A successful
demonstration of their gasification technologies at a commercial size is needed before they
can really be considered as offering IGCC plants with the necessary guarantees.
ECUST (the East China University of Science & Technology) has developed its own
version of a slurry-fed downflow entrained gasifier; 13 commercial projects have been
initiated in China and it is now offered internationally.
BHEL (India) Fluidised Bed
The BHEL gasifier is air-blown and gasification tests on the 30 mtpd pilot plant with Singareni
coal (40 % ash) showed a carbon conversion of 88–89 % and a cold gas efficiency of 68.8 %
with a syngas LHV of 1050 kcal/Nm3. BHEL plans a 125 MW fluidised bed IGCC project with
Andra Pradesh Genco at Vijaywada in South India. A similar project with NTPC at Auraiya in
North India was also discussed, but NTPC and BHEL could not agree on terms and NTPC is
now planning to proceed on its own with an IGCC project and will appoint a consultant to
prepare a design specification.
GreatPoint Energy
GreatPoint Energy (GPE) is a start-up company based in Massachusetts that plans on
commercialising a proprietary catalytic gasification process, bluegas™, for converting coal and
petroleum coke to SNG without the use of oxygen. It appears to be largely derived from the
Exxon Catalytic Gasification process piloted briefly in the 1980s. A small unit has been tested at
the GTI flexible test facility in Des Plaines, IL for ~1200 hours. A 1–3 stpd pilot plant is
planned to be built at Dominion’s Brayton Point power station in Massachusetts. There are also
plans for a later scale-up to 40–50 stpd.
The Exxon Catalytic process was tested in a Process Development Unit of 1 mtpd size. The
process adds 10–15 % potassium carbonate to the coal in a bubbling fluidised bed gasifier,
which allows the gasification, water gas shift and methanation reactions to proceed in a single
vessel at the same temperature. Some of the issues to be addressed in further development of the
Exxon technology are:
high usage of potassium carbonate;
reliable and inexpensive catalyst recovery;
gasifier scale-up;
avoidance of agglomeration in the gasifier;
high syngas recycle rate;
economic heat recovery for the recycled syngas.
Hydromax molten metal gasification
Hydromax is a cyclic process using gasification in a molten metal (an alloy of iron and tin) bath.
The process envisages the use of two or more molten metal bath smelters operated in a cyclical
way. The coal mineral matter forms a slag layer in the bath that must be periodically removed.
The two parts of the cyclic process are the reaction of steam and oxygen with iron to produce
hydrogen and iron oxide and the reduction of the iron oxide back to elemental iron, with the
production of syngas.
WORKIN
G DRAFT IN
PROGRESS
Chapter 11
TL/JFF/FN/EIPPCB/LCP_Final Draft June 2016 841
Entrained-flow gasifier improvements The main improvements to entrained-flow gasifiers are summarised in this section.
Slurry-fed gasifiers (GE/Texaco, E Gas, ECUST) have the advantage of being able to pump the
feed at high pressures. The energy used for pumping is lower than the energy used to compress
the conveying gas. Some schemes have been suggested to use slurry pumping to attain high
pressures and with additional flash drying to give a dry coal feed with the flashed steam readded
to the syngas downstream of the gasifier to provide the syngas moisture for the shift reaction.
Another alternative is to feed the coal as a coal in liquid CO2 slurry either with or without a
flash drying step. Such improvements could be particularly advantageous for the abundant, and
low-cost, low rank coals such as Powder River Basin (PRB) sub-bituminous coals.
Pratt & Whitney Rocketdyne (PWR), with financial and technical assistance from ExxonMobil
and DOE, are also developing their own version of a solids feed pump for high-pressure
entrained gasifiers.
For the GE/Texaco process, the most important developments are to improve the carbon
conversion per pass (possibly in conjunction with a new improved feed system, and/or larger
volume gasifiers to allow more residence time) and a continuous slag let-down system to
eliminate the lock hoppers. The replacement of the carbon scrubber by a warm or hot gas filter
could markedly reduce the O&M costs associated with the black and grey water circuits around
the scrubber and would improve plant availability. Use of a cooled screen instead of a refractory
lining for the gasifier could also reduce forced outages and improve availability.
The development of the ECUST technology in China, with its four horizontally opposed
injectors in a downflow configuration represents a potential improvement on the single
downflow injector technology of GE and Siemens. It should improve carbon conversion by
avoiding the direct feed trajectory into the gasifier outlet.
A higher pressure E Gas gasifier with tall cylindrical design, the ESTR (entrained slagging
transport) has been proposed. However, more recently it was suggested that the current inverted
T (sometimes called the iron cross) design can, after all, be adapted to larger sizes and
somewhat higher pressures. This will improve the performance for low rank coals and could
enable lower cost CO2 capture through use of a physical absorption system such as Selexol.
Although methane is produced from the second stage feed, the two-stage gasifiers could be run
with only a minor amount of coal slurry fed to the second stage and with additional water as the
quench water to achieve the lower outlet temperature and to produce a syngas of a low methane
and high moisture content consistent with the needs for hydrogen, high CO2 capture and for
synthesis applications. Operating in this manner could also eliminate the need for a syngas
cooler. It may be noted that E-Gas already incorporates a continuous slag removal process and a
hot gas filter into their process.
The IEA GHG R&D sponsored study with Foster Wheeler Italiana showed that dry coal-fed
entrained gasifiers such as those of Shell and Siemens become more expensive and less efficient
at high pressures if the lock hopper pneumatic conveying feed systems is used. Higher pressures
require more conveying nitrogen per unit of coal fed. A truly continuous high-pressure coal
feeder, preferably on as-received coal or minimally dried coal, would be a marked
improvement. However, a conveying gas would still be required to move the pressurised coal
into the gasifier injectors. In CO2 capture and synthesis applications, the syngas is shifted and
some of the CO2 is removed. This captured CO2 can then also be used as the conveying gas for
the feed coal, reducing the inert gas in the downstream clean-up and synthesis, and perhaps
improving the economics. These organisations could also potentially use their dry coal feed
expertise to adopt something like a pumped slurry flash system as feed at high pressure. Shell
currently uses an expensive syngas cooler in their solid fuel gasification process; however, for
CO2 capture, hydrogen production and synthesis, in 2007 they offered a lower cost partial
quench system. The Shell process already incorporates a cooling screen (water wall) and a hot
gas filter but would benefit from a continuous slag removal system.
WORKIN
GDRAFT IN
PROGRESS
Chapter 11
842 June 2016 TL/JFF/FN/EIPPCB/LCP_Final Draft
The EAGLE gasifier is an oxygen-blown, dry coal-fed, two-stage upflow entrained-flow reactor
with a membrane wall. A 150 mt/day pilot plant gasifier was built at the Wakamatsu Research
Facility of JPower (formerly the Electric Power Development Corporation (EPDC)) in Japan. A
typical gas composition has been reported as ~55 % CO, ~24 % hydrogen and ~18 % nitrogen
(the high nitrogen content is to be expected because of the relatively small size and the use of
nitrogen in instrument purges etc.). An update from JPower and Chugoku announced the
formation of a joint venture for their IGCC project at Chugoku’s Osaki station in Hiroshima and
an increase from the original 150 MW to 170 MW. This project is to include CCS. Initial
operations are targeted for late 2016. Testing of shift catalysts and physical solvents for CO2
capture are continuing at the EAGLE pilot gasifier.
Economy of scale
Larger gasifiers would result in significant economic improvements in most marketplace
applications. Furthermore, future trends in the marketplace, as listed below, all point to the need
for larger gasifiers to match the fuel requirements of the downstream equipment in a rational
multi-train manner:
The more efficient gas turbines from various suppliers, with higher pressure ratios and
firing temperatures, will have higher fuel requirements when adapted to IGCC;
the 50 Hz IGCC market requires gasifiers sized to meet the fuel needs of gas turbines which
are ~1.4 times those needed for the equivalent 60 Hz turbines;
economy of scale is very important for all applications including the Coal-to-Liquids
technology using Fischer Tropsch, methanol or EMRE MTG synthesis.
Advanced concept power blocks
Some advanced concepts could potentially capture CO2 from the power block exhaust flue-gas.
For such concepts there would be no limit on the acceptable fuel components (e.g. methane) in
the syngas.
The oxygen-fired rocket engine proposed by Clean Energy Systems could be fired with clean
syngas of any composition and, after condensing the moisture, would result in a concentrated
CO2 exhaust stream that could be dried and compressed for transportation and sequestration. A
5 MW demonstration unit has been tested near Bakersfield, California with support from the US
DOE and Siemens. A larger unit of ~50 MW may be used in Phase 3 of the WESTCARB
sequestration partnership to provide CO2 for a substantial sequestration injection project in the
San Joaquin Basin.
Siemens has been developing a Solid Oxide Fuel Cell (SOFC) that incorporates an oxidising
function (similar to the Oxygen Transfer Membranes (OTM) being developed by Air Products
and Praxair under the DOE programme) for completing the combustion of the anode gas to CO2
and moisture. The SOFC could potentially be supplied with clean syngas of any composition
(providing it was clean enough) and the resultant exhaust stream could be dried and compressed
for transportation and sequestration. A 250 kW SOFC with this OTM feature has been supplied
by Siemens to Shell Hydrogen at a Norwegian location. However, there has been little recent
news about this test unit.
Biomass gasification
Low-temperature CFB gasification: Pyroneer
DONG Energy has recently developed and commissioned a 6 MW fuel-flexible gasification
plant at Asnæs Power Station in Kalundborg suitable for gasification of straw, manure fibre,
energy crops, etc. The Pyroneer gasification technology has been developed with the purpose of
being able to co-fire large amounts of high-alkaline biomass fractions in coal-fired boilers.
Biomass fractions, such as straw, willow and miscanthus, contain large amounts of alkaline
which tends to corrode the current high-efficiency supercritical boiler technologies and
deactivate the catalytic DeNOX cleaning systems. Furthermore, the direct co-firing technology
tends to ‘destroy’ the alkaline and nutrients in the biomass, and hence these useful species
WORKIN
G DRAFT IN
PROGRESS

Chapter 11
TL/JFF/FN/EIPPCB/LCP_Final Draft June 2016 843
cannot easily be reused as a fertiliser as they are mixed with the coal fly ash. If biomass is
gasified at a suitably low temperature, the troublesome alkaline species can be maintained in a
solid state. It can then be separated from the created gas by a cyclone, and instead of causing
corrosion in the boiler, it can be reused as a fertiliser product.
The latest version of this technology can split biomass and waste fractions into a clean,
combustible gas and a useful fertiliser product. It is expected that it will be possible to remove
around 90 % of the alkaline present in the biomass, and hence it will be possible to obtain
relatively high biomass to coal ratios in the boiler without operating at a reduced steam
temperature and reduced efficiency. The technology allows 1 GJ of biomass to replace 0.95 GJ
of coal. The intention is to further upscale the technology to 50–150 MW. DONG Energy was
expected to commission a 50 MW gasifier in 2015.
Furthermore, the technology has the potential to be equipped with a hot gas filter, and thus the
produced gas could be used in gas-fired applications. The gasifier can also be pressurised and
used in various configurations that could deliver synthesis gas for further processing in gas
turbines or in the production of liquid fuels and chemicals.
The gas is very clean, due to the low gasification temperature, and can be fed directly to the
coal boiler. Maximum operating temperatures are 700–750 °C. A drawback of the low-
temperature CFB process is that it produces gas with a high tar content.
'Güssing' technology (Vienna University of Technology) This technology involves a fluidised bed and steam for gasification (fast internal circulating
fluidised bed).
The Güssing plant (Austria) is a commercial operation producing electricity and district heating
for the surrounding area, but the plant is also the core of an energy research centre focusing on
gasification techniques with an array of related pilot projects, for example SNG and methanol
production, FT processing, and the use of solid oxide fuel cells (SOFC). [Brandin et al., 2011]
The plant uses steam gasification and is indirectly heated by hot bed material from an external
riser. The gasifier can be described as being of BFB design with an internally circulating bed.
Part of the main BFB, containing unconverted char, is moved over to the raiser where it meets
air as the raiser medium. The char is combusted during transportation to the top of the raiser,
heating the entrained bed material in the process. At the top of the raiser, the hot solid bed
material is separated in a cyclone and returned to the BFB, while the flue-gas goes to the stack.
The plant uses wood chips as biofuel.
The plant has a total thermal input of 8 MWth, and produces 2 MWe of electric power and
4.5 MWth of district heating. The biomass-to-electricity efficiency is 25 % and the overall
efficiency is 81 %.
GoBiGas project (Sweden) This project for 20 MW SNG production is at the commissioning stage. The GoBiGas plant is
projected as a 100 MWSNG twin-bed FICFB (Fast Internally Circulating Fluidised Bed) with
cogeneration of biofuels and district heating – and includes the possibility to lead some of the
gas to a gas engine or gas turbine for production of electricity and heat.
MELINA and OLGA (ECN, the Netherlands) Similar to the Güssing process, this has been especially developed for SNG production. OLGA
is a tar removal technology. A conversion efficiency of 70 % for biomass to SNG has been
proposed.
WORKIN
G DRAFT IN
PROGRESS
Chapter 11
844 June 2016 TL/JFF/FN/EIPPCB/LCP_Final Draft
Updraught gasification This is carried out in the Harboøre updraught gasifier with a gas engine. Tar from the gas is
collected and used in a boiler. The process uses Babcock & Wilcox Vølund technology, and
exports to Italy and Japan. The technology is at the commercial stage but plant sizes are small.
Staged gasification Viking and WEISS Hadsund use a two-stage downdraught gasifier. Drying and pyrolysis of the
biomass fuel, gasification of the char, and cracking of the tar result in a very clean gas that can
be used in gas engines. The technology is at the commercial stage but only in small plants of
< 1 MWe.
11.3.1 IGCC (Integrated gasification combined cycle) See general description in Chapter 4.
IGCC plants present a significant advantage for CO2 scrubbing compared to other thermal
electricity-generating processes thanks to low actual volume flows due to lower mole flows and
higher pressure levels. In combination with moderately high CO2 levels, this leads to small
column sizes and high partial CO2 pressure.
Several companies and institutions carry out research under US DOE programmes for an
optimised low-NOX combined-cycle combustion without secondary NOX abatement (namely
SCR), by controlling the CO shift reaction. By controlling this reaction, gas quality can be
normalised and gas diluted for flame temperature control, and desired levels of energy density
targeted – the main determinants for NOX formation in downstream combustion. The catalyst
bed is fed with a fuel-rich fuel/gas mixture and cooled indirectly by the remaining combustion
air, which mixes further downstream for turbine combustion.
It is thought that IGCC could in future reach 50 % efficiency (LHV basis).
[ 36, EGTEI 2012 ] [ 37, EGTEI 2012 ]
11.3.2 Underground coal gasification Underground coal gasification (and power generation) underwent tests and trials in the former
USSR, China, Europe and the USA before the year 2000. More recently, pilot-scale tests were
carried out in Australia, Canada, China and South Africa and have been proposed in additional
countries including the UK, Poland, Ukraine, China, Russia and the USA.
Underground coal gasification (UCG) involves reacting (burning) coal in situ/in seam, using a
mixture of air/oxygen, possibly with some steam, to produce a syngas. The steam may come
from water which leaks into the underground cavity, from water already in the coal seam or
from steam deliberately injected. Some coal combustion generates enough heat to support the
process reactions. Gasification at elevated temperatures with a stoichiometric shortage of
oxygen principally produces the gases hydrogen and carbon monoxide, combined with many
other products including carbon dioxide, hydrocarbons such as methane, tars, and compounds
such as hydrogen sulphide and carbonyl sulphide (COS) arising from impurities in the coal.
The syngas produced is cleaned and can be used in a combustion plant or as a chemicals/liquid
fuels feedstock. UCG offers the potential for using the energy stored in coal in an economic and
environmentally sensitive way, particularly from deposits which are unmineable by
conventional methods. If UCG were to be successfully developed and widely deployed, then the
world’s coal reserves might be revised upwards by a substantial amount. Site selection of the
places where UCG could be carried out is critical to any development as the geology must be
appropriate.
WORKIN
G DRAFT IN
PROGRESS

Chapter 11
TL/JFF/FN/EIPPCB/LCP_Final Draft June 2016 845
Several technologies have been trialled at different scales up to the industrial scale. While
certain principles, methodologies and monitoring techniques have been established, the results
have not yet been such as to allow considering UCG a commercially proven technique.
Early in 2009, the UK Coal Authority awarded the first licence in the UK to win coal by using
UCG. In the licence granted, the initial target horizons are unworked coal seams from 500 m to
3500 m deep.
[IEA Clean Coal Center Report CCC/151: Underground coal gasification 2009]
WORKIN
G DRAFT IN
PROGRESS
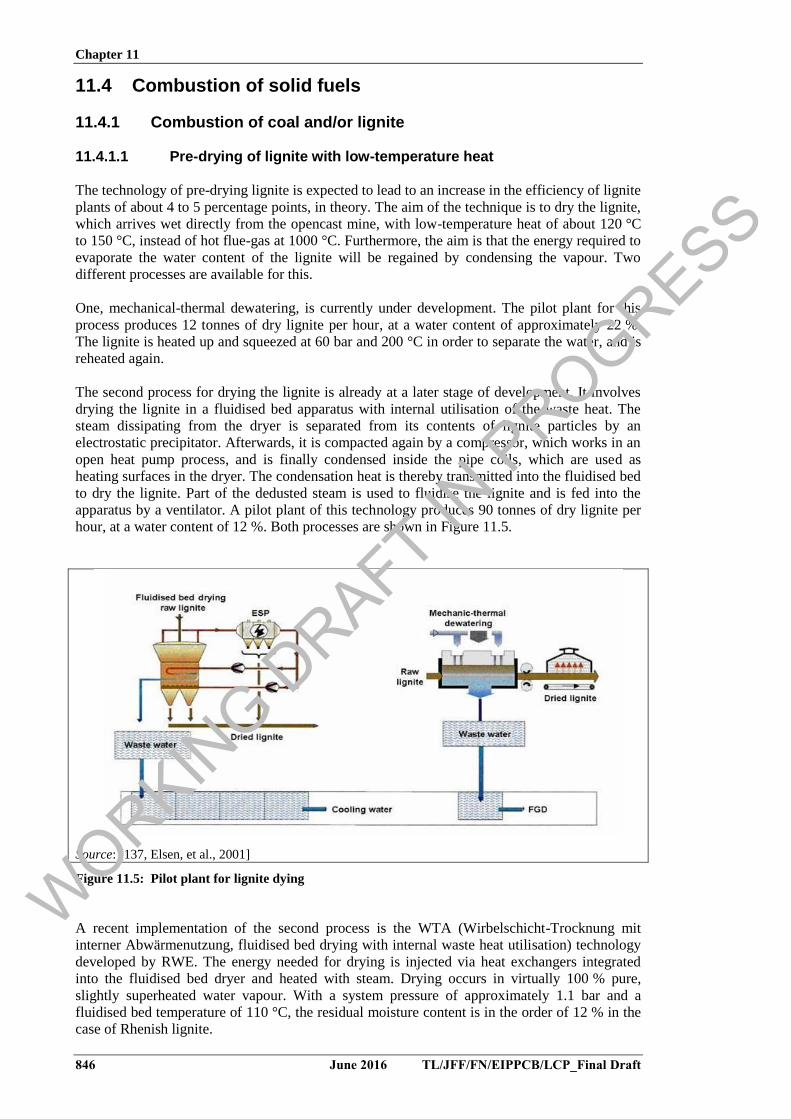
Chapter 11
846 June 2016 TL/JFF/FN/EIPPCB/LCP_Final Draft
11.4 Combustion of solid fuels
11.4.1 Combustion of coal and/or lignite
11.4.1.1 Pre-drying of lignite with low-temperature heat
The technology of pre-drying lignite is expected to lead to an increase in the efficiency of lignite
plants of about 4 to 5 percentage points, in theory. The aim of the technique is to dry the lignite,
which arrives wet directly from the opencast mine, with low-temperature heat of about 120 °C
to 150 °C, instead of hot flue-gas at 1000 °C. Furthermore, the aim is that the energy required to
evaporate the water content of the lignite will be regained by condensing the vapour. Two
different processes are available for this.
One, mechanical-thermal dewatering, is currently under development. The pilot plant for this
process produces 12 tonnes of dry lignite per hour, at a water content of approximately 22 %.
The lignite is heated up and squeezed at 60 bar and 200 °C in order to separate the water, and is
reheated again.
The second process for drying the lignite is already at a later stage of development. It involves
drying the lignite in a fluidised bed apparatus with internal utilisation of the waste heat. The
steam dissipating from the dryer is separated from its contents of lignite particles by an
electrostatic precipitator. Afterwards, it is compacted again by a compressor, which works in an
open heat pump process, and is finally condensed inside the pipe coils, which are used as
heating surfaces in the dryer. The condensation heat is thereby transmitted into the fluidised bed
to dry the lignite. Part of the dedusted steam is used to fluidise the lignite and is fed into the
apparatus by a ventilator. A pilot plant of this technology produces 90 tonnes of dry lignite per
hour, at a water content of 12 %. Both processes are shown in Figure 11.5.
Source: [137, Elsen, et al., 2001]
Figure 11.5: Pilot plant for lignite dying
A recent implementation of the second process is the WTA (Wirbelschicht-Trocknung mit
interner Abwärmenutzung, fluidised bed drying with internal waste heat utilisation) technology
developed by RWE. The energy needed for drying is injected via heat exchangers integrated
into the fluidised bed dryer and heated with steam. Drying occurs in virtually 100 % pure,
slightly superheated water vapour. With a system pressure of approximately 1.1 bar and a
fluidised bed temperature of 110 °C, the residual moisture content is in the order of 12 % in the
case of Rhenish lignite.
WORKIN
G DRAFT IN
PROGRESS
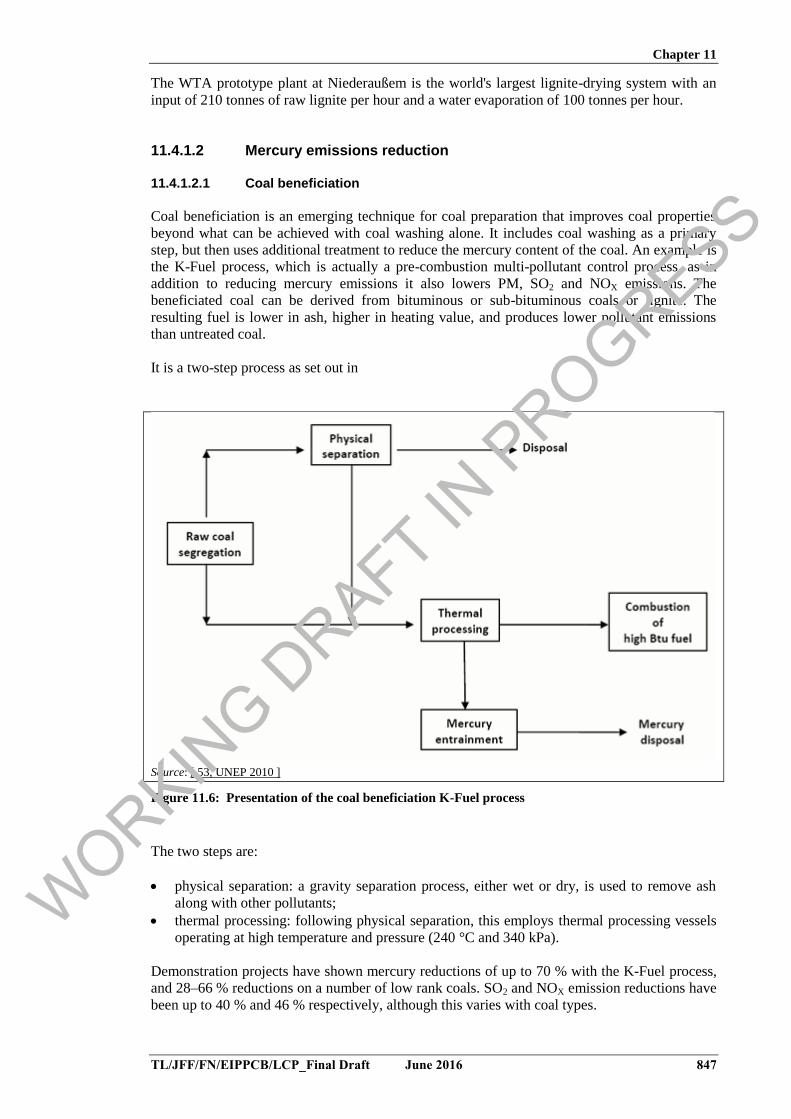
Chapter 11
TL/JFF/FN/EIPPCB/LCP_Final Draft June 2016 847
The WTA prototype plant at Niederaußem is the world's largest lignite-drying system with an
input of 210 tonnes of raw lignite per hour and a water evaporation of 100 tonnes per hour.
11.4.1.2 Mercury emissions reduction 11.4.1.2.1 Coal beneficiation
Coal beneficiation is an emerging technique for coal preparation that improves coal properties
beyond what can be achieved with coal washing alone. It includes coal washing as a primary
step, but then uses additional treatment to reduce the mercury content of the coal. An example is
the K-Fuel process, which is actually a pre-combustion multi-pollutant control process, as in
addition to reducing mercury emissions it also lowers PM, SO2 and NOX emissions. The
beneficiated coal can be derived from bituminous or sub-bituminous coals or lignite. The
resulting fuel is lower in ash, higher in heating value, and produces lower pollutant emissions
than untreated coal.
It is a two-step process as set out in
Source: [ 53, UNEP 2010 ]
Figure 11.6: Presentation of the coal beneficiation K-Fuel process
The two steps are:
physical separation: a gravity separation process, either wet or dry, is used to remove ash
along with other pollutants;
thermal processing: following physical separation, this employs thermal processing vessels
operating at high temperature and pressure (240 °C and 340 kPa).
Demonstration projects have shown mercury reductions of up to 70 % with the K-Fuel process,
and 28–66 % reductions on a number of low rank coals. SO2 and NOX emission reductions have
been up to 40 % and 46 % respectively, although this varies with coal types.
WORKIN
G DRAFT IN
PROGRESS
Chapter 11
848 June 2016 TL/JFF/FN/EIPPCB/LCP_Final Draft
Because of the limited operational experience, there is currently no adequate information to
estimate the price of the processed coal. In the future, the price for K-Fuel may be based on the
price of a competing coal on a heating value basis plus credits for environmental benefits (SO2,
NOX and mercury emissions reduction).
11.4.1.2.2 Oxidation catalysts
Oxidation catalysts can be in the form of powdered chemicals injected into either the boiler or
the boiler’s exhaust gas, to help change elemental mercury into oxidised mercury, which is
easier to capture. The oxidation of elemental mercury, which is then collected by particulate
control devices or absorbed across a wet scrubber system, has the potential to be a reliable and
cost-effective mercury control strategy for some coal-fired power plants.
The US DOE cites examples of oxidation catalysts tested at operating power plants, including
the following:
URS Corporation tested oxidation catalysts at a plant that fires a blend of Texas lignite and
sub-bituminous coals. Tests completed in April 2005 showed that oxidation catalysts
enabled the wet scrubber to achieve mercury emissions reduction ranging from 76 % to
87 %, compared with only a 36 % reduction under baseline conditions. URS also tested oxidation catalysts at a boiler firing low-sulphur eastern bituminous coal
equipped with a cold-side ESP.
This seven-year programme tested gold- and platinum-based oxidation catalysts and was
completed by the end of 2010, and evidenced several experimental limitations.
Parameters under scrutiny were the following: amount of catalyst required to achieve high
mercury oxidation percentages, catalyst life, and efficiency of mercury capture.
There are also oxidation catalysts with fixed, active layers on a metal or ceramic supporting
structure. Tests are being done with an additional Hg catalyst layer in DeNOX catalysts.
[ 2, EEB 2012 ] [ 38, US-GAO 2009 ]
11.4.1.2.3 Other novel control technologies
The 'Thief Process' was patented by the NETL of the US DOE and licensed to Nalco Mobotec.
It may be a cost-effective alternative to sorbent injection. Some preliminary cost assessments
made by the NETL and published in 2006 indicate levelised cost savings that would be
approximately 50 % of the levelised cost of a conventional activated carbon injection system.
No commercial-stage applications of the technique have been identified.
On the basis of this 'Thief Process', the NETL recently (2012) patented a 'Thief carbon catalyst'
for the oxidation of mercury in power plant effluent streams generated from industrial sources
including coal-fired power plants. The active component of the catalyst is the partially
combusted coal, termed 'Thief' carbon, which can be pretreated with a halide or left untreated in
the presence of an effluent gas entrained with a halide. It is stated that this catalyst has the dual
advantages of high mercury oxidation levels and high adsorption levels for halides or halide-
containing compounds. This technology would have the advantages of a longer catalyst life and
concurrent lower long-term costs.
[ 2, EEB 2012 ] [ 38, US-GAO 2009 ]]
WORKIN
G DRAFT IN
PROGRESS
Chapter 11
TL/JFF/FN/EIPPCB/LCP_Final Draft June 2016 849
11.4.1.2.4 Photochemical oxidation process
Photochemical oxidation is a patented process that introduces an ultraviolet light into the
exhaust gas to help convert mercury to an oxidised form for collection in other pollution control
devices.
[ 2, EEB 2012 ] [ 38, US-GAO 2009 ]
11.4.1.3 Multi-pollutant control technologies
The following are currently emerging multi-pollutant control technologies:
The Regenerative Activated Coke Technology (ReACT™) system developed, tested and
commercialised by Hamon Research-Cottrel (HRC) consists of activated coke in a moving
bed with regeneration of the coke before return to the adsorber with sulphuric acid as a by-
product. Removal efficiencies of > 90 % for SO2 and mercury and > 20 % for NOX are
claimed; the particulate matter concentration would be also reduced by 50 %.
In August 2013, HRC announced it had received full notice to proceed with the engineering,
procurement and installation of a ReACT™ system at a 320 MWe unit in a Wisconsin
power plant burning PRB coal. The estimated cost of this project was USD 250 million.
The US company Eco Power Solutions developed, tested and commercialised a system
using an ozone injection process for NOX conversion. A fogging spray is mixed with a
hydrogen peroxide solution for SOX conversion that is condensed concurrently with other
pollutants over coils to remove all combustion emissions from the exhaust gas stream. This
process converts NOX and SOX to nitric and sulphuric acid in the waste water stream
collected at the bottom of the unit. Simultaneously unburnt hydrocarbons and particulate
matter are removed during the condensation phase along with carbonic acid resulting from
dissolved CO2. This waste water can then be treated and recycled.
Removal efficiencies of > 99 % and > 98 % are claimed for SOX and NOX respectively as
well as high removal efficiencies for mercury, arsenic, nickel and particulate matter
(> 95 %). HCl would also be removed with a high efficiency and CO2 would be also partly
captured (30–50 %).This system’s capital costs are claimed to be 25 % lower than the
alternatives' and the cost per tonne of emissions reduction would be 20–40 % lower than
traditional technologies'. Another advantage is that this technology could be installed and
running in 30 months.
The Israel-based company Lextran developed and commercialised a process in which
absorption is realised by reacting SO2 and NOX with a proprietary catalyst in a wet scrubber
environment process, replacing the lime emulsion. The catalyst is an organic substance in an
emulsion form which contains an active sulphur-oxygen functional group, with catalytic
properties which enhance the oxidation reactions of SOX and NOX into SO4 and NO3 anions.
After facilitating the initial oxidation, the catalyst is released and recycled back into the
process, leaving the pollutants in a chemical form suitable to become commercially
beneficial by-products (fertilisers) with further neutralisation by ammonia, KOH or other
basic reagents to control the type of by-product. The possible by-products are therefore
mainly ammonium nitrate, ammonium sulphate, potassium sulphate, potassium nitrate and
others.
Tests have shown that this technology would be capable of removing up to 99 % of SOX
and up to 90 % of NOX. A study conducted by the Electric Power Research Institute
suggests that a 500 MW boiler using this technology could save an estimated 40 % in
combined capital and operating costs over 10 years compared to baseline pollution control
methods.
WORKIN
G DRAFT IN
PROGRESS
Chapter 11
850 June 2016 TL/JFF/FN/EIPPCB/LCP_Final Draft
11.5 Combustion of liquid fuels
11.5.1 Combustion of liquid petroleum commercial fuels in boilers / engines / turbines
11.5.1.1 Two-stage turbocharging for large internal combustion engines
A combination of the Miller cycle (early inlet valve closure timings before bottom dead centre
(BDC)) and high-pressure turbocharging is used to reduce emissions of NOX and, at the same
time, lower fuel consumption and CO2 emissions while achieving higher power density
(increased unit output). In recent years, two-stage turbocharging has found its first applications
in the field of automotive and high-speed engines. For large stationary engines, this concept is
currently at the demonstration stage due to the increased complexity.
The Miller concept has been introduced in steps in large medium-speed engines to overcome the
trade-off between thermal NOX formation and fuel consumption. In the bigger engines, for a
possible future extreme Miller concept, a single stage turbocharger is not enough and two-stage
turbocharging will be needed.
Prototype testing under lab conditions have shown the potential to reduce NOX by 60 % while
simultaneously reducing fuel consumption by up to 3 %. However, there remain numerous
technical difficulties to be overcome before large two-stage turbocharged medium-speed diesel
engines are broadly in use.
In particular, where the combination with SCR would be needed to further reduce NOX
emissions, in the case of sulphur-containing fuels the exhaust temperature after the turbine of
the second turbocharger would be too low to avoid condensation of ammonium bisulphate, so
the SCR equipment would need to be inserted between the turbines of the first and the second
turbochargers, which affects the transient behaviour of the engine.
As a consequence, further R&D work and extensive testing are needed before the concept with
the combined SCR and Miller two-stage turbocharging can be commercially released.
[EUROMOT submission on 2-stage turbo-charging_Final 2012-04-27_2.pdf]
11.5.2 Fuel cell applications
Fuel cell applications are expected to be a future energy technique for clean liquid fuels. They
may offer improvements in environmental protection and are expected to lead to higher energy
efficiencies (possibly by up to 70 %). Proof of the stability of operation for a qualified lifetime
is required before they can be broadly applied. At the moment, the size of the pilot plants is
small compared to LCPs.
WORKIN
G DRAFT IN
PROGRESS

Chapter 11
TL/JFF/FN/EIPPCB/LCP_Final Draft June 2016 851
11.6 Combustion of gaseous fuels
11.6.1 Combustion of natural gas in boilers / engines / turbines
11.6.1.1 Miller cycle and two-stage turbocharging in lean-burn gas engines
For a general description of the combination of the Miller cycle and two-stage turbocharging,
see Section 6.1.4.2 under combustion of liquid fuels.
The lean-burn-type gas engines' Otto cycle results in substantially reduced NOX production;
nevertheless, the maximum cycle temperature is a limiting factor for the mean effective pressure
and efficiency due to the knock effect. The Miller cycle allows a considerably reduced
combustion temperature and consequently enables higher compression ratios, higher firing
pressures and higher mean effective pressures.
Laboratory tests have shown similar efficiency increases as in diesel engine tests. However, the
tests have shown an increased methane slip due to the higher cylinder pressure. As a
consequence, primary techniques in use today to reduce total hydrocarbon emissions in gas
engines will have to be further developed to maintain the methane slip levels achieved by gas
engines currently on the market. In order to further reduce methane slips with the two-stage
turbocharger concept, the development of viable suitable secondary abatement methods may be
needed (see Section 11.6.1.2).
[EUROMOT submission on 2-stage turbo-charging_Final 2012-04-27_2.pdf]
11.6.1.2 Contol of methane slip from gas-fired lean-burn engines
Since the beginning of the 1990s primary in-engine measures have been used to reduce
hydrocarbon emissions while maintaining low NOX levels. Tests have shown that there is
further hydrocarbon reduction potential in primary measures, but there are limiting factors that
do not allow for the total avoidance of unburnt fuel.
Around the middle of the 1990s the development of secondary methane abatement techniques
started. This on-going work has resulted in the development of several concepts but also
evidenced a number of technical problems that are yet to be solved. Different secondary
abatement options have been explored, including the use of an oxidation catalyst, the plasma
process, afterburners and recuperative thermal oxidisers. While the plasma process and
afterburner are not further described due to the high energy penalty, the other two processes are
outlined below.
[EUROMOT submission on Methane Slip_Final 2012-04-27_2.pdf]
11.6.1.2.1 Oxidation catalyst
Tests with oxidation catalysts in the context of lean-burn engines have shown that, due to
methane's higher ignition temperature compared with CO or other hydrocarbons, the exhaust
temperature in the order of 400–450 ºC is too low for effective CH4 abatement and should be
raised by at least about 200 ºC.
In order to reach the required temperature level, the oxidation catalyst could be placed in the
flue-gas stream before the turbocharger or by use of regenerative heat exchangers behind the
turbocharger. While the latter option affects the dynamics and performance of the engine
substantially, the former does not but does represent increased engineering challenges.
An additional challenge evidenced by the tests has been the fast degradation of catalyst activity,
requiring the development of a regeneration scheme. The high costs of noble-metal-based
WORKIN
G DRAFT IN
PROGRESS
Chapter 11
852 June 2016 TL/JFF/FN/EIPPCB/LCP_Final Draft
oxidation catalysts also contribute to the remaining challenges to the commercial viability of the
product.
11.6.1.2.2 Recuperative oxidiser
The functional principle of recuperative oxidisers is based on an internal bed (typically sand or
ceramic material) that is heated up to 800 ºC, allowing the ignition of CH4. The internal bed
stores heat the heat released by the destruction of CH4 and sometimes is also heated by an extra
heat source. The exhaust flow direction in/out of the reactor is switched at intervals to keep as
much heat as possible in the bed. The heat of the bed is continuously transported towards the
outlet of the bed by the exhaust gas. The flue-gas entering the inlet of the reactor is heated by
the bed and the hydrocarbon content is ignited in the middle of the bed. In order to compensate
for the high pressure drop caused by the internal bed, an extra flue-gas fan might be needed.
Recuperative reactors offer high THC and CH4 reductions, but are large in size and capital-
intensive. They also require constant operation and thus are not suitable for interrupted
operation mode applications such as peak load plants.
11.6.1.3 Oxy-combustion
Oxy-combustion enables the capture of CO2 by direct compression of the flue-gas without
further chemical capture or separation. Optimisation of the competitiveness of the oxy-
combustion process for power generation requires several developments:
adaptation of cryogenic air separation units for more energy-efficient utilisation and
operability for use in large oxy-fuel burners;
power plants or development of new oxy-combustion technologies, such as chemical
looping combustion;
adaptation of combustion technologies to oxygen firing;
safe operation under enhanced oxygen firing and carbon dioxide-related safety issues;
optimisation of heat transfer in the boiler;
optimisation of the steam cycle in order to compensate efficiency loss due to CCS;
optimisation of flue-gas recirculation.
Several 10–50 MWth demonstration plants were planned worldwide up to 2010, with 100–
500 MWth demonstration units possible by around 2015. Oxy-combustion technologies could be
commercially available around 2020.
The reduction of NOX emissions (on a mass emissions basis) in oxy-combustion processes is
mainly due to the very low concentration of N2 from air in the combustor. The decrease in NOX
formation is then the result of the recirculation of flue-gas (and due to interactions between the
recycled NOX, fuel-nitrogen and hydrocarbons released from the fuel).
[ 36, EGTEI 2012 ]
11.6.1.4 Catalytic combustion
Catalytic combustion is a technology that combusts fuel flamelessly. This process releases the
same amount of energy as flame-based combustion systems but at a lower peak temperature.
Importantly, this lower temperature is below the threshold at which NOX is formed. This is
achieved by combustion on a palladium-based catalytic surface. As the temperature range in
which the catalyst is active is limited, both at the low end (not enough activity) and at the high
end (degradation), the combustion process consists of three stages:
WORKIN
G DRAFT IN
PROGRESS
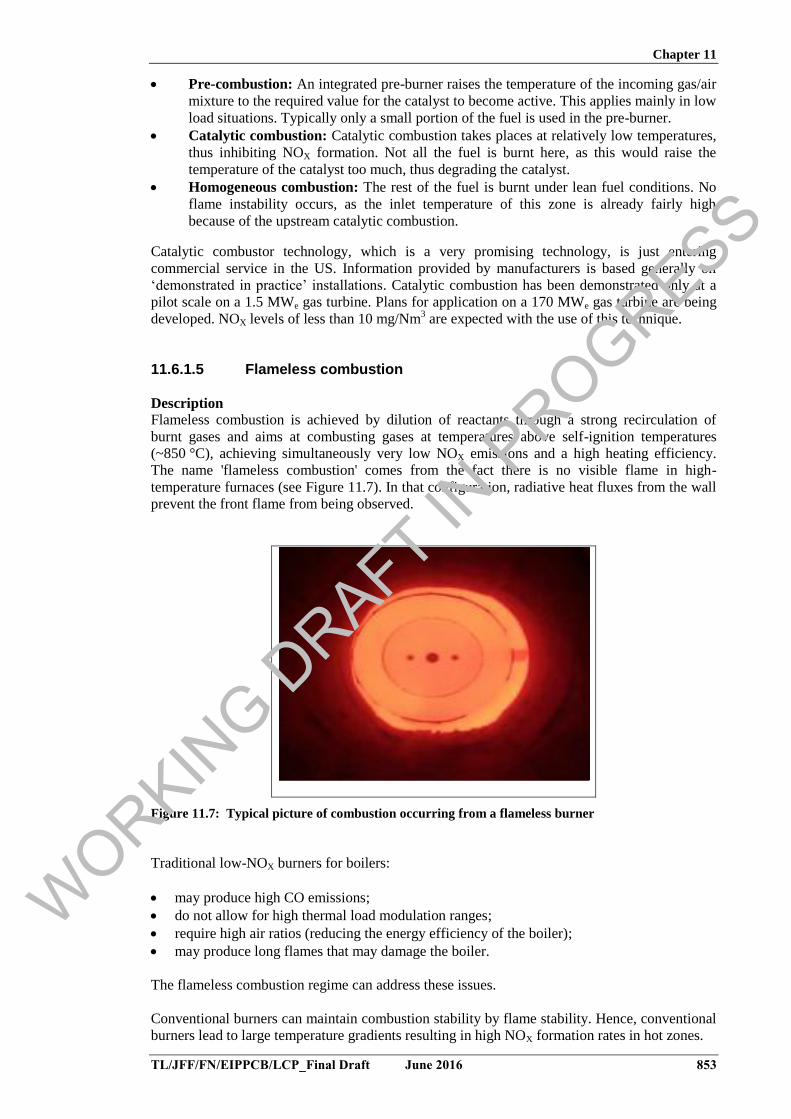
Chapter 11
TL/JFF/FN/EIPPCB/LCP_Final Draft June 2016 853
Pre-combustion: An integrated pre-burner raises the temperature of the incoming gas/air
mixture to the required value for the catalyst to become active. This applies mainly in low
load situations. Typically only a small portion of the fuel is used in the pre-burner.
Catalytic combustion: Catalytic combustion takes places at relatively low temperatures,
thus inhibiting NOX formation. Not all the fuel is burnt here, as this would raise the
temperature of the catalyst too much, thus degrading the catalyst.
Homogeneous combustion: The rest of the fuel is burnt under lean fuel conditions. No
flame instability occurs, as the inlet temperature of this zone is already fairly high
because of the upstream catalytic combustion.
Catalytic combustor technology, which is a very promising technology, is just entering
commercial service in the US. Information provided by manufacturers is based generally on
‘demonstrated in practice’ installations. Catalytic combustion has been demonstrated only at a
pilot scale on a 1.5 MWe gas turbine. Plans for application on a 170 MWe gas turbine are being
developed. NOX levels of less than 10 mg/Nm3 are expected with the use of this technique.
11.6.1.5 Flameless combustion
Description
Flameless combustion is achieved by dilution of reactants through a strong recirculation of
burnt gases and aims at combusting gases at temperatures above self-ignition temperatures
(~850 °C), achieving simultaneously very low NOX emissions and a high heating efficiency.
The name 'flameless combustion' comes from the fact there is no visible flame in high-
temperature furnaces (see Figure 11.7). In that configuration, radiative heat fluxes from the wall
prevent the front flame from being observed.
Figure 11.7: Typical picture of combustion occurring from a flameless burner
Traditional low-NOX burners for boilers:
may produce high CO emissions;
do not allow for high thermal load modulation ranges;
require high air ratios (reducing the energy efficiency of the boiler);
may produce long flames that may damage the boiler.
The flameless combustion regime can address these issues.
Conventional burners can maintain combustion stability by flame stability. Hence, conventional
burners lead to large temperature gradients resulting in high NOX formation rates in hot zones.
WORKIN
G DRAFT IN
PROGRESS
Chapter 11
854 June 2016 TL/JFF/FN/EIPPCB/LCP_Final Draft
The state of flameless combustion can be obtained by different means. One route, already
commercialised for high air inlet temperatures (industrial furnaces), is based on an increase in
recirculation rates to high recirculation ratios in order to maintain stable combustion. Indeed, for
recirculation rates above a certain ratio (Kv > 3 (Milani and Wünning, 2001)), the high injection
momentum of the fuel-air mixture keeps the combustion stable provided that auto-ignition is
secured at the reactant mix point. Simultaneously, high levels of dilution induced by high
recirculation rates minimise the temperature gradient as well as fluctuations in the combustion
chamber.
Achieved environmental benefits
Reduction of NOX emissions.
Environmental performance and operational data
NOX concentrations lower than 50 mg/Nm3 (at 3 % O2), without any external FGR or secondary
NOX abatement techniques.
Status of implementation
The concept of flameless combustion was introduced in the 1980s and the 1990s for industrial
furnace applications (e.g. glass furnaces) where temperatures are significantly higher
(> 1 000 °C) than the ones found in combustion plants.
Research activities (CANOE project) have been carried out since 2010 by CRIGEN (ENGIE,
formerly GDF Suez) in association with CORIA (Université de Rouen / INSA Rouen) and
Ecole Centrale de Paris, in order to transfer the concept to boilers. These activities have been
based on computer simulations, lab-scale and semi-industrial-scale pilot tests (including flame
stability, modelling tools development, 'flame' detection for safety issues, cost estimations, etc.)
with a focus on gas-fired boilers (fire tubes and water tubes) where temperatures are lower than
1 000 °C.
As of 2015, a design has been validated on a 1 MWth fire tube boiler. Results have shown that
NOX emissions lower than 50 mg/Nm3 (at 3 % O2) can be obtained over the whole thermal load
range.
Additional tests at a full demonstration scale (5 MWth) are expected in 2016 and commercial
burners within the 10–500 MWth range are expected by 2018.
Economics and applicability
Retrofits are the main target for industrial natural-gas-fired boilers (simple burner change and
minimal boiler modifications), although new plants can also benefit from this technology. The
economic impact of flameless combustion is based on a high heating efficiency, a long boiler
lifetime and low operational costs.
Driving force for implementation
Achievement of low NOX concentrations without secondary NOX abatement techniques.
High modulation range.
Short flame.
Reference literature
Ourliac, M. et al.: “Projet CANOE – Clean flameless combustion boiler”, Rapport final,
Convention ADEME / GDF SUEZ / CORIA / Ecole Centrale Paris #0974C0047, May 2015.
Ourliac, M. et al.: “MILD combustion for industrial boilers”, 10th European Conference on
Industrial Furnaces and Boilers conference (INFUB) – Porto (Portugal), April 2015.
Stierlin, P. and Villermaux C.: “Combustion plants, natural gas and NOX emissions: What is at
stake in flameless combustion for NOX Reduction”, EFE Seminar on IED directive and its
industrial impacts, Paris, November 2011.
WORKIN
G DRAFT IN
PROGRESS
Chapter 11
TL/JFF/FN/EIPPCB/LCP_Final Draft June 2016 855
Stierlin P.: “Flameless combustion in industrial boilers”, presented at: 19th EGTEI Meeting,
Rome, 2011.
Villermaux, C. et al.: “GDF SUEZ activities on flameless combustion: from physical
phenomena analysis to industrial-scale applications”, International Gas Research Union
Conference, Paris, 2008.
Levy, Y., Sherbaum, V. and Arfi, P.: “Basic thermodynamics of FLOXCOM, the low-NOX gas
turbines adiabatic combustor”, in: Applied Thermal Engineering, 24(2004), pp. 1593-1605.
Milani, A. And Wünning, J.: “Flameless Oxidation Technology”, in: Proceedings of the 25th
Event of the Italian Section of the Combustion Institute, Rome, 2002, pp. I.17-I.21
Milani, A. et al., “What is Flameless Combustion?”, 2002, available at IFRF Online
Combustion Handbook.
11.6.1.6 Closed-loop steam cooling
Another advanced gas turbine development is the use of steam cooling instead of air cooling in
combined-cycle gas turbines (CCGTs). Usually, extracted air from the gas turbine compressor is
used for the cooling of the turbine shaft and blading. The amount of cooling air is up to 20–
25 % of the compressor airflow. The extracted air is not available for the combustion process
and loses pressure when flowing through the narrow channels in the turbine blades, which
causes efficiency losses in the gas turbine process. By using steam instead of compressed air,
these disadvantages are eliminated. Steam cooling is more efficient than air cooling.
In the turbines mentioned above, a closed-loop steam cooling system is applied. Steam cools the
hot components, such as turbine blades, vanes, or transition pieces. The used steam is not mixed
with the main gas flow through the gas turbine (as in an open system), but is routed back to the
steam system, where it can be expanded as reheat steam through the steam turbine. The steam
for the cooling is extracted from the exhaust section of the high-pressure steam turbine. The
steam is reheated to the reheat temperature and then mixed with the reheated steam from the
heat recovery steam generator (HRSG), and led to the intermediate-pressure section of the steam
turbine for further expansion. The cooling steam does not affect the main flow through the gas
turbine and, in principle, there should be no consumption of water. Closed-loop steam cooling
has some disadvantages in CCGTs operating in flexible mode.
By applying steam cooling, the turbine inlet temperature is increased without any relevant
increase in combustion temperature. As a result, a higher efficiency is obtained without an
increase in NOX emissions. Cooling by steam instead of air strongly reduces the air bled from
the compressor, the compressed air, and thus the power consumption of the compressor. This
also results in higher gas turbine efficiency and in a specific emissions reduction.
With this new cooling technology, a combined-cycle efficiency improvement of one or two
percentage points can be achieved and an efficiency of 60 % can be expected. Several system
manufacturers have developed CCGT technology exceeding 58 % efficiency in commercial
operation, but none of them reached 60 %. Efficiency is expected to rise in the coming years up
to 62 %.
Example plants
Although the concept is still undergoing further development, the closed-loop cooling system is
already applied in commercial systems such as GE's 'H' series of CCGTs. Example plants are:
the Baglan Bay CCGT in the UK;
TEPCO's Futtsu 4 1 520 MWe site in Japan;
the Inland Empire CCGT site in Southern California.
WORKIN
G DRAFT IN
PROGRESS
Chapter 11
856 June 2016 TL/JFF/FN/EIPPCB/LCP_Final Draft
[ 55, EEB 2012 ]
11.6.1.7 Further development potential
Some further important potential improvements include:
improving the materials and cooling to enable turbine inlet temperatures of 1500 °C for
frame-type gas turbines and 1700 °C for aeroderivative gas turbines to be achieved;
reducing the amount of compressed air used for the cooling medium;
cooling the blades with external cooling flow (water or steam);
in the future, generally using single crystal blades;
improving the temperature profile at the turbine inlet; without hot spots, the general
temperature can be set just below the temperature limit given by the material [ New 123,
58, Eurelectric, 2001].
11.6.1.8 Recuperative options
There are several options to recover the exhaust gas heat into the gas turbine process. This
section describes some of these features.
11.6.1.8.1 Intercooled recuperated gas turbine
A large part of the power that is generated by the turbine is required to drive the compressor. A
way to improve the gas turbine efficiency is to reduce the compressor work by cooling the
airflow through the compressor. The compressor power is proportional to the volume flow.
Theoretically, cooling after each compressor stage will give the largest reduction of compressor
work, however in practice only a restrictive number of cooling stages is feasible.
If the temperature of the gas turbine exhaust gas is higher than the outlet air temperature of the
compressor, it is possible to transfer some of the heat from the exhaust gas to the compressor
outlet air. This improves the gas turbine efficiency because less fuel is required to heat the gas
to the desired turbine inlet temperature. This kind of recuperation can mainly be used for gas
turbines with a moderate compression ratio or for gas turbines with intercooled compressors.
Designs incorporating the application of both compressor intercooling and recuperation as
described can reach an efficiency of 54 %, calculated at a turbine inlet temperature of 1200 °C [
New 123, 58, Eurelectric, 2001].
11.6.1.8.2 HAT cycle
In the humidified air turbine (HAT) cycle, humidification of the compressed air after the air
compressor allows the compressed air temperature to be decreased. In the HAT cycle, all the air
is saturated with water vapour utilising waste heat from compressor intercoolers and from the
gas turbine exhaust. With this cycle, a higher possible amount of regenerated heat from the
exhaust gases can be used than with an intercooled and recuperation process. The difficulty with
this cycle is that standard gas turbines cannot be used for the process, as the mass flow through
the turbine is increased too much through the saturation of all the compressor air with water.
The high content of water vapour in the combustion air might also create problems for the
burners, although with this process a lower compressor ratio results in a higher efficiency. An
efficiency of about 53 % is feasible for a turbine inlet temperature of 1200 °C [ New 123, 58,
Eurelectric, 2001].
WORKIN
G DRAFT IN
PROGRESS

Chapter 11
TL/JFF/FN/EIPPCB/LCP_Final Draft June 2016 857
11.6.1.8.3 TOPHAT process
In this process, the air is humidified at the compressor inlet by the injection of water.
Theoretically, an injection is also possible after each stage of the compressor. This improves the
gas turbine efficiency by up to 55 %, calculated for an inlet turbine temperature of 1200 °C,
which is the highest value for the efficiency of the cycles described before. A further
improvement of the TOPHAT cycle is possible by injecting water between the different
compressor stages. Therefore, the water needs to be heated and pressurised. For the heating of
the injection water, heat from the exhaust gases is used [ New 123, 58, Eurelectric, 2001].
11.6.1.8.4 CHAT cycle
The Cascade Humidified Advanced Turbine (CHAT) cycle makes use of a low-pressure and a
high-pressure gas turbine on separate shafts and composed from existing compressors and
turbines to allow for the increased mass flow through the turbines due to saturation with water.
The cycle includes intercooling between the separate compressors, as well as reheating of the
flue-gas between the separate turbines [ New 123, 58, Eurelectric, 2001].
11.6.1.9 Advanced lean-burn approach for gas engines
The incorporation of water injection and other techniques to lean-burn gas engines is the focus
of ongoing R&D efforts with several engine manufacturers and is being pursued as part of the
US Department of Energy’s Advanced Reciprocating Engine Systems (ARES) programme. One
of the goals of the programme is to develop a 45 % efficiency (HHV) medium-sized natural gas
engine operating with NOx emissions at a level of 15 mg/Nm3. The engine unit sizes
participating in the ARES programme are in the range 1-2 MW shaft.
[ 22, US-EPA 2008 ]
11.6.2 Fuel cell applications
Hydrogen fuel cells for small- to medium-scale electricity production and peak capacity
could be considered as alternatives to OCGTs and reciprocating engines. Hydrogen
production from renewable or from off-peak surplus power and storage could also be
considered. [ 54, UK-TWG 2012 ]
WORKIN
G DRAFT IN
PROGRESS

WORKIN
G DRAFT IN
PROGRESS

Chapter 12
TL/JFF/FN/EIPPCB/LCP_Final Draft June 2016 859
12 CONCLUDING REMARKS AND RECOMMENDATIONS FOR FUTURE WORK
Timing of the review process
The key milestones of the review process for the BREF for Large Combustion Plants are
summarised in Table 12.1.
Table 12.1: Key milestones in the review of the BREF for Large Combustion Plants
Key milestone Date
Reactivation of the TWG January 2011
Call for wishes (about 2400 wishes were submitted
by the TWG for the review) March - May 2011
Kick-off TWG meeting October 2011
Workshop for finalising the plant-specific
questionnaire template December 2011
Collection of information November 2011 - September 2012
First draft of the revised LCP BREF June 2013
End of commenting period on the first draft (8510
comments received) September 2013
Informal intermediate TWG meeting June 2014
Final TWG meeting June 2015
Webinar and written consultation on remaining
issues after the final TWG meeting July - September 2015
During the review process, a total of 24 sites were visited by the EIPPCB in six Member States
(Spain, the Netherlands, Germany, Poland, Estonia and Finland).
Sources of information and information gaps
During the review process, several hundred documents were shared by the TWG via the
Commission’s BAT information system (BATIS). These included approximately:
425 reports and case studies;
583 plant-specific questionnaires covering a total of:
o 112 coal combustion plants, including 11 waste co-incineration plants,
o 36 lignite combustion plants, including 9 waste co-incineration plants,
o 65 biomass and/or peat combustion plants, including 15 waste co-incineration plants,
o 190 natural gas combustion plants (37 boilers, 7 gas engines and 146 gas turbines),
o 73 liquid fuel combustion plants (29 boilers, 32 engines and 12 gas turbines),
o 62 combustion plants firing iron and steel process gases,
o 31 combustion plants firing liquid and/or gaseous process fuels from the (petro-)
chemical industry,
o 9 combustion plants firing other fuels and/or wastes,
o 5 gasification plants, 3 of which are not covered by the LCP BREF scope.
The plant-specific questionnaires were submitted from most of the EU countries by the
individual operators, with the help of industry federations, and were checked by Member State
Competent Authorities.
Contributions in the form of draft text for the BREF were provided by EPPSA,
EURELECTRIC, EUTurbines, Marcogaz, EUROFER and CEFIC.
All these documents were assessed by the EIPPCB and taken into consideration for drawing up
this document. Only very few of them could not be shared via BATIS due for example to
copyright restrictions or confidentiality issues.
Further to the documents submission, specific tasks were carried out by the TWG:
WORKIN
G DRAFT IN
PROGRESS

Chapter 12
860 June 2016 TL/JFF/FN/EIPPCB/LCP_Final Draft
A subgroup was set up to make drafting proposals for the text on the gasification chapter
and to design the related plant-specific questionnaire template.
An additional plant-level data collection was carried out between June 2014 and September
2014 in order to complement the data available to assess the possible relationship between
short-term and long-term emissions.
A task force was set up to collect additional design energy efficiency data at plant level
between June 2014 and September 2014.
As a result, around (xx – To be updated once the references are really inserted in the text)
references are included in the LCP BREF (see the References section).
Degree of consensus reached during the information exchange
A total of 85 BAT conclusions have been set for the sector. These BAT conclusions include:
257 BAT-AEL ranges plus 74 alternative levels expressed in footnotes to BAT-AEL tables,
74 BAT-AEEL ranges plus 5 alternative levels expressed in footnotes to BAT-AEL tables,
19 indicative emission level ranges plus 7 alternative emission levels.
At the final TWG meeting in June 2015, a high degree of consensus was reached on most of
these BAT conclusions. However, 89 dissenting views were expressed by different members of
the TWG.
The number of dissenting views is explained by the high number of BAT conclusions, BAT-
AELs and BAT-AEELs in this document, as well as by the high number of TWG members
actively involved in the BREF review process and, in particular, in the final TWG meeting (140
participants).
It should be noted that, for the majority of BAT conclusions on which dissenting views were
expressed, those views included TWG members calling for a higher level of environmental
protection as well as TWG members expressing the view that the agreed conclusions would be
too strict.
A detailed overview of the dissenting views expressed is provided in Table 12.2.
WORKIN
G DRAFT IN
PROGRESS

Chapter 12
TL/JFF/FN/EIPPCB/LCP_Final Draft June 2016 861
Table 12.2: Dissenting views expressed
N° BAT
conclusion Dissenting view Expressed by
Alternative
proposed level (if
any)
1 Scope Exclude from the scope of the LCP BREF Activity 5.2 of the Annex I to the IED, except for the combustion of
wastes that are biomass as defined in IED Article 3(31) RO, UK NA
2 Scope Exclude all co-incineration of hazardous waste from the LCP BREF scope SE, CAN
Europe, EEB NA
3
Definition of
combustion
plant
Change the definition of combustion plants as follows:
'… For the purposes of these BAT conclusions, a combination formed of:
…
separate combustion plants which are installed in such a way that, taking technical and economic factors
into account, their flue-gases could, in the judgment of the competent authority, be discharged through a
common stack.
is considered as a single combustion plant.
[…] For the purpose of these BAT conclusions an installation on the same site which has a technical connection
and which could have an effect on emissions and pollution (e.g. abatement techniques implemented at the
combustion plant) is considered as integral part of the combustion plant.'
EEB NA
4
Definition of
combustion
plant
Change the definition of combustion plant to:
'Any technical apparatus in which fuels are oxidised in order to use the heat thus generated.
For the scope of these BAT conclusions, a combination formed by separate combustion units whose flue-
gases are or could be discharged through a common stack shall be considered as a single combustion plant.
For calculating the total rated thermal input of such a combination, the capacities of all combustion units
concerned, which have a rated thermal input of at least 15 MW, shall be added'.
Remove the word 'total' from the first column of all the BAT-AEL tables
FI NA
5 BAT 3.ter
Reword footnote (3): In the case of SCR or SNCR combined with wet abatement techniques (e.g. wet/semi-wet
FGD or flue-gas condenser), the monitoring frequency of NH3 emissions may be at least once every year, if the
emissions are proven to be sufficiently stable
CZ NA
6 BAT 4.bis Remove the statement that sets the higher end of the NH3 BAT-AEL range at 15 mg/Nm
3 in the case of
combustion plants firing biomass and operating at variable loads and in the case of engines firing HFO/gas oil
NL, CAN
Europe, EEB NA
7 BAT 11 Decrease the upper end of the BAT-AEL ranges for emissions to water for a number of parameters
TOC CAN Europe,
EEB 20 mg/l
COD CAN Europe,
EEB 60 mg/l
Fluoride EEB 12 mg/l
Sulphite CAN Europe,
EEB 5 mg/l
WORKIN
G DRAFT IN
PROGRESS
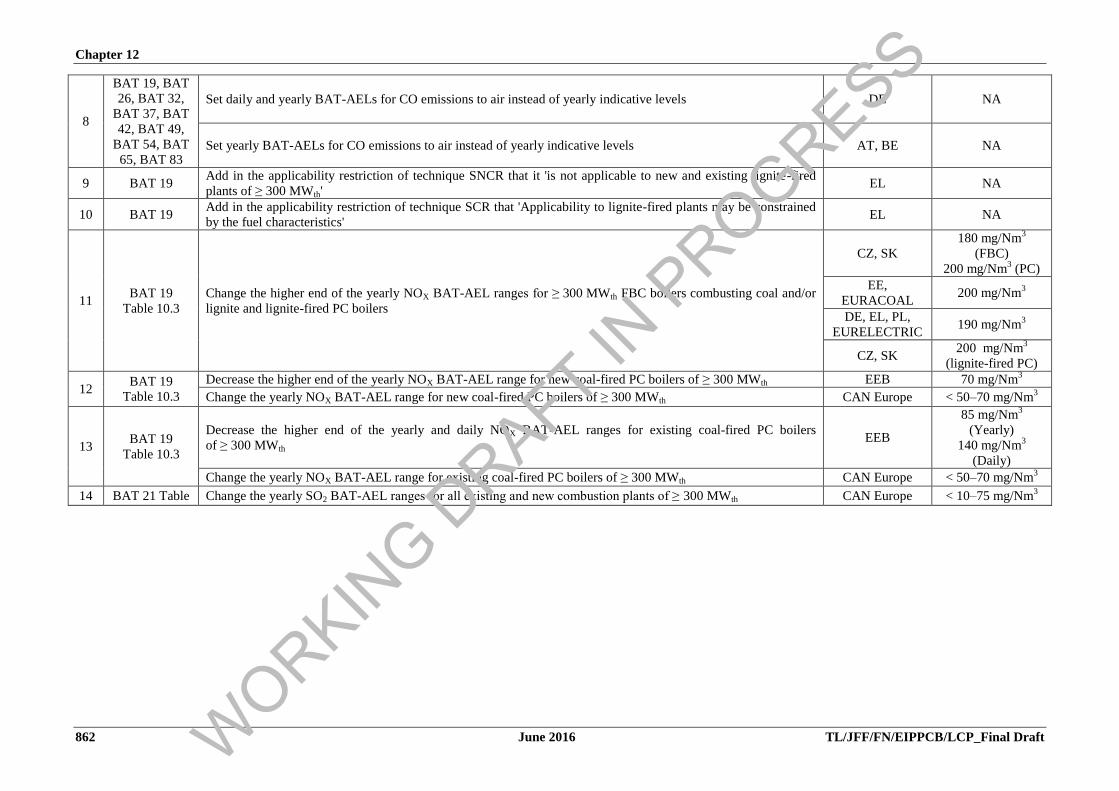
Chapter 12
862 June 2016 TL/JFF/FN/EIPPCB/LCP_Final Draft
8
BAT 19, BAT
26, BAT 32,
BAT 37, BAT
42, BAT 49,
BAT 54, BAT
65, BAT 83
Set daily and yearly BAT-AELs for CO emissions to air instead of yearly indicative levels DE NA
Set yearly BAT-AELs for CO emissions to air instead of yearly indicative levels AT, BE NA
9 BAT 19 Add in the applicability restriction of technique SNCR that it 'is not applicable to new and existing lignite-fired
plants of ≥ 300 MWth' EL NA
10 BAT 19 Add in the applicability restriction of technique SCR that 'Applicability to lignite-fired plants may be constrained
by the fuel characteristics' EL NA
11 BAT 19
Table 10.3
Change the higher end of the yearly NOX BAT-AEL ranges for ≥ 300 MWth FBC boilers combusting coal and/or
lignite and lignite-fired PC boilers
CZ, SK
180 mg/Nm3
(FBC)
200 mg/Nm3 (PC)
EE,
EURACOAL 200 mg/Nm
3
DE, EL, PL,
EURELECTRIC 190 mg/Nm
3
CZ, SK 200 mg/Nm
3
(lignite-fired PC)
12 BAT 19
Table 10.3
Decrease the higher end of the yearly NOX BAT-AEL range for new coal-fired PC boilers of ≥ 300 MWth EEB 70 mg/Nm3
Change the yearly NOX BAT-AEL range for new coal-fired PC boilers of ≥ 300 MWth CAN Europe < 50–70 mg/Nm3
13 BAT 19
Table 10.3
Decrease the higher end of the yearly and daily NOX BAT-AEL ranges for existing coal-fired PC boilers
of ≥ 300 MWth EEB
85 mg/Nm3
(Yearly)
140 mg/Nm3
(Daily)
Change the yearly NOX BAT-AEL range for existing coal-fired PC boilers of ≥ 300 MWth CAN Europe < 50–70 mg/Nm3
14 BAT 21 Table Change the yearly SO2 BAT-AEL ranges for all existing and new combustion plants of ≥ 300 MWth CAN Europe < 10–75 mg/Nm3
WORKIN
G DRAFT IN
PROGRESS

Chapter 12
TL/JFF/FN/EIPPCB/LCP_Final Draft June 2016 863
10.5
Change the yearly and daily SO2 BAT-AEL ranges for existing and new combustion plants of ≥ 300 MWth EEB
A) Coal:
Existing:
< 40 mg/Nm3
(Yearly)
< 75 mg/Nm3
(Daily)
B) Lignite (1–
3.25 % S, dry):
Existing:
< 130 mg/Nm3
(Yearly)
< 205 mg/Nm3
(Daily)
New:
< 75 mg/Nm3
(Yearly)
< 110 mg/Nm3
(Daily)
C) Lignite (< 1 %
S, dry):
Existing:
< 40 mg/Nm3
(Yearly)
< 75 mg/Nm3
(Daily)
New:
< 20 mg/Nm3
(Yearly)
< 60 mg/Nm3
(Daily)
15 BAT 21
Table 10.5 Increase the higher end of the yearly SO2 BAT-AEL range for existing coal- and lignite-fired PC boilers EL 170 mg/Nm
3
16
BAT 21
(Plants of
≥ 300 MWth
burning
indigenous
Change in formula (i) the multiplier factor for new FGD systems
CZ, EL, SK,
Euroheat &
Power
RCG x 0.02, with a
maximum of
200 mg/Nm3
WORKIN
G DRAFT IN
PROGRESS

Chapter 12
864 June 2016 TL/JFF/FN/EIPPCB/LCP_Final Draft
lignite that
cannot achieve
the BAT-
AELs set in
Table 10.5)
Change in formula (ii) the multiplier factor and the higher end of the range for existing FGD systems EURACOAL
RCG x 0.04, with a
maximum of
400 mg/Nm3
17 BAT 21
Table 10.6
Add the following footnote to all HCl BAT-AEL ranges of Table 10.6: 'In the case of FBC boilers applying the
dry sorption technique for SO2 reduction, the higher end of the range is 60 mg/Nm³ for plants using lignite and for
plants using coal with a chlorine content of 500 mg/kg or less (dry matter).'
PL,
EURACOAL,
EURELECTRIC
NA
18 BAT 22
Table 10.7
Change the higher end of the yearly dust BAT-AEL range for existing lignite-fired plants of ≥ 1000 MWth put into
operation no later than 7 January 2014
CZ, EL, SK,
EURACOAL.
Euroheat &
Power
10 mg/Nm3
19 BAT 22
Table 10.7
Decrease the higher end of the yearly dust BAT-AEL ranges for new and existing plants of 300–1000 MWth EEB
3.5 mg/Nm3 (New)
6 mg/Nm3
(Existing)
Decrease the higher end of the yearly dust BAT-AEL ranges for new and existing plants of ≥ 1000 MWth
EEB 3.5 mg/Nm
3
(Existing)
CAN Europe,
EEB < 2 mg/Nm
3 (New)
20 BAT 23. f Change the applicability restriction of the technique 'Carbon sorbent injection…' to 'Applicable within the
constraints given by the by-product quality requirements for recovery'
CZ, EE, EL,
EURACOAL,
EURELECTRIC
NA
21 BAT 23.g
Change the applicability restriction of the technique 'Use of halideated additives…' to 'Applicable within the
constraints given by the by-product quality requirements for recovery, the control of halide emissions to the
environment, and the long term corrosion potential'
CZ, EL,
EURACOAL,
EURELECTRIC
NA
22 BAT 23
Table 10.8 Set a common mercury BAT-AEL for all new and existing coal- and lignite-fired plants CAN Europe < 1 μg/Nm
3
23
BAT 23
Table 10.8 and
Table 10.9
Add a footnote mentioning that the mercury BAT-AELs do not apply to plants of > 300 MWth operated
< 1500 h/yr
CZ,
EURACOAL NA
24 BAT 23
Table 10.8 Decrease the higher end of the mercury BAT-AEL range for new and existing coal-fired plants of < 300 MWth EEB
0.6 µg/Nm3 (New)
3.5 µg/Nm3
(Existing)
25 BAT 23
Table 10.8 Decrease the higher end of the mercury BAT-AEL range for new and existing coal-fired plants of ≥ 300 MWth EEB
0.5 µg/Nm3(New)
1.5 µg/Nm3
(Existing)
26 BAT 23
Table 10.8 Remove footnote (
2)
EURACOAL,
EURELECTRIC NA
WORKIN
G DRAFT IN
PROGRESS

Chapter 12
TL/JFF/FN/EIPPCB/LCP_Final Draft June 2016 865
27 BAT 23
Table 10.9 Increase the higher end of the mercury BAT-AEL range for existing lignite-fired plants of < 300 MWth
CZ, EL, PL,
EURACOAL,
EURELECTRIC,
Euroheat &
Power
20 µg/Nm3
28 BAT 23
Table 10.9 Decrease the higher end of the mercury BAT-AEL range for new and existing lignite-fired plants of < 300 MWth EEB
1 µg/Nm3 (New)
3.5 µg/Nm3
(Existing)
29 BAT 23
Table 10.9 Increase the higher end of the mercury BAT-AEL range for existing lignite-fired plants of ≥ 300 MWth
CZ 18 µg/Nm3
EL, PL,
EURACOAL,
EURELECTRIC,
Euroheat &
Power
20 µg/Nm3
30 BAT 23
Table 10.9 Decrease the higher end of the mercury BAT-AEL range for new and existing lignite-fired plants of ≥ 300 MWth EEB
1 µg/Nm3(New)
3 µg/Nm3(Existing)
31 BAT 23
Table 10.9 Remove footnote (
2)
EL,
EURACOAL,
EURELECTRIC
NA
32 BAT 26
Table 10.11
Increase the higher end of the yearly and daily NOX BAT-AEL ranges for existing plants of < 100 MWth.
Add a footnote indicating that for plants put into operation no later than 7 January 2014 the upper end of the daily
NOX BAT-AEL range for existing plants of < 100 MWth is 310 mg/Nm3
FI, CEPI,
EURELECTRIC,
Euroheat &
Power
250 mg/Nm3
(Yearly)
275 mg/Nm3
(Daily)
33 BAT 26
Table 10.11 Decrease the higher end of the daily NOX BAT-AEL range for new plants of < 100 MWth BE 180 mg/Nm
3
34 BAT 26
Table 10.11
Increase the higher end of the yearly and daily NOX BAT-AEL ranges for existing BFB boilers of 100–300 MWth
put into operation no later than 7 January 2014
CEPI, Euroheat
& Power
240 mg/Nm3
(Yearly)
IE
250 mg/Nm3
(Yearly)
250 mg/Nm3
(Daily)
Increase the higher ends of the yearly and daily NOX BAT-AEL ranges for BFB boilers of 100–300 MWth put into
operation no later than 7 January 2014, in case of limitations of SNCR applicability
FI
250 mg/Nm3
(Yearly)
275 mg/Nm3
(Daily)
EURELECTRIC
220 mg/Nm3
(Yearly)
240 mg/Nm3
(Daily)
WORKIN
G DRAFT IN
PROGRESS
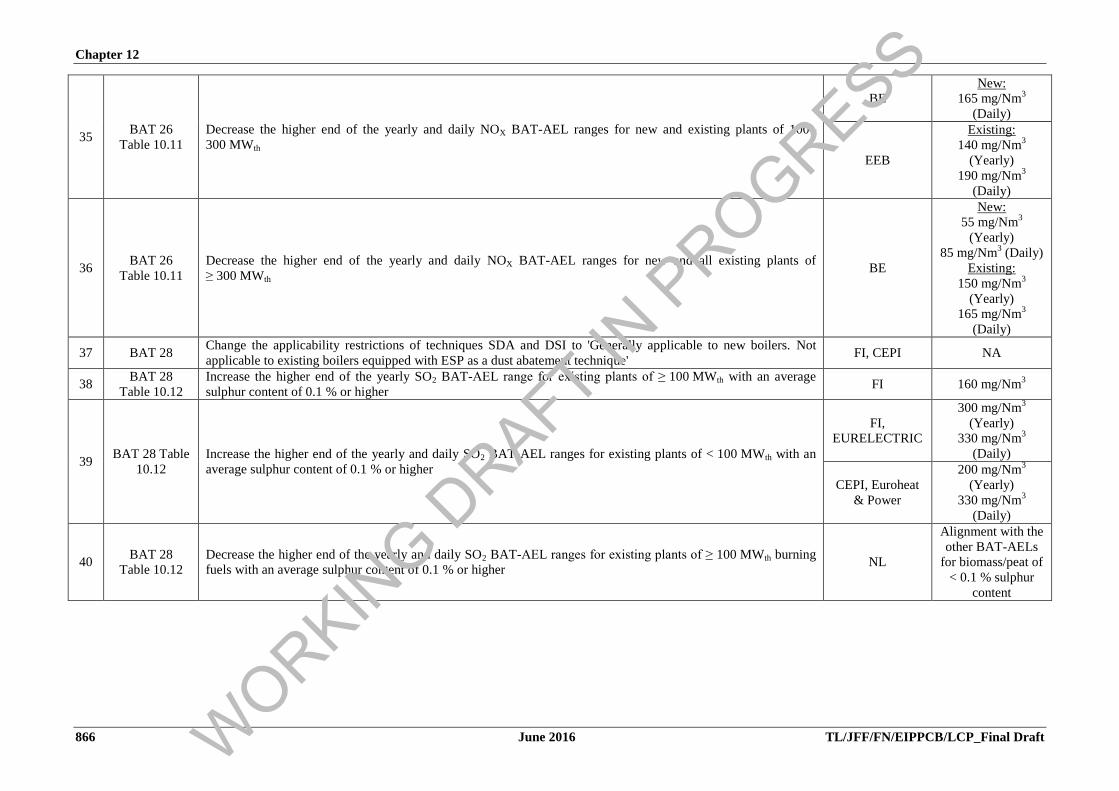
Chapter 12
866 June 2016 TL/JFF/FN/EIPPCB/LCP_Final Draft
35 BAT 26
Table 10.11
Decrease the higher end of the yearly and daily NOX BAT-AEL ranges for new and existing plants of 100–
300 MWth
BE
New:
165 mg/Nm3
(Daily)
EEB
Existing:
140 mg/Nm3
(Yearly)
190 mg/Nm3
(Daily)
36 BAT 26
Table 10.11
Decrease the higher end of the yearly and daily NOX BAT-AEL ranges for new and all existing plants of
≥ 300 MWth BE
New:
55 mg/Nm3
(Yearly)
85 mg/Nm3 (Daily)
Existing:
150 mg/Nm3
(Yearly)
165 mg/Nm3
(Daily)
37 BAT 28 Change the applicability restrictions of techniques SDA and DSI to 'Generally applicable to new boilers. Not
applicable to existing boilers equipped with ESP as a dust abatement technique' FI, CEPI NA
38 BAT 28
Table 10.12
Increase the higher end of the yearly SO2 BAT-AEL range for existing plants of ≥ 100 MWth with an average
sulphur content of 0.1 % or higher FI 160 mg/Nm
3
39 BAT 28 Table
10.12
Increase the higher end of the yearly and daily SO2 BAT-AEL ranges for existing plants of < 100 MWth with an
average sulphur content of 0.1 % or higher
FI,
EURELECTRIC
300 mg/Nm3
(Yearly)
330 mg/Nm3
(Daily)
CEPI, Euroheat
& Power
200 mg/Nm3
(Yearly)
330 mg/Nm3
(Daily)
40 BAT 28
Table 10.12
Decrease the higher end of the yearly and daily SO2 BAT-AEL ranges for existing plants of ≥ 100 MWth burning
fuels with an average sulphur content of 0.1 % or higher NL
Alignment with the
other BAT-AELs
for biomass/peat of
< 0.1 % sulphur
content
WORKIN
G DRAFT IN
PROGRESS

Chapter 12
TL/JFF/FN/EIPPCB/LCP_Final Draft June 2016 867
41 BAT 28
Table 10.12 Decrease the higher end of the yearly and daily SO2 BAT-AEL ranges for new and existing plants of < 100 MWth EEB
New:
50 mg/Nm3
(Yearly)
85 mg/Nm3 (Daily)
Existing:
65 mg/Nm3
(Yearly)
180 mg/Nm3
(Daily)
42
BAT 28
Table 10.12
bis
Add to footnote (1.bis
) that the higher end of the yearly HCl BAT-AEL range for existing plants is 50 mg/Nm3 in
the case of existing plants operated with an ESP
FI, CEPI,
EURELECTRIC,
Euroheat &
Power
NA
43 BAT 29
Table 10.13
Increase the higher ends of the yearly and daily dust BAT-AEL ranges for plants of < 100 MWth put into operation
no later than 7 January 2014
DK 25 mg/Nm3 (Daily)
FI, SE 24 mg/Nm3 (Daily)
CEPI 22 mg/Nm
3
(Yearly)
44 BAT 29
Table 10.13 Decrease the higher end of the yearly and daily dust BAT-AEL ranges for new and existing plants of < 100 MWth EEB
New:
3.5 mg/Nm3
(Yearly)
6 mg/Nm3 (Daily)
Existing:
6 mg/Nm3 (Yearly)
12 mg/Nm3 (Daily)
45 BAT 29
Table 10.13 Increase the higher end of the yearly dust BAT-AEL range for existing plants of 100–300 MWth CEPI 18 mg/Nm
3
46 BAT 29
Table 10.13
Decrease the higher end of the yearly and daily dust BAT-AEL ranges for new and existing plants of 100–
300 MWth EEB
New:
3.5 mg/Nm3
(Yearly)
12 mg/Nm3 (Daily)
Existing:
5 mg/Nm3 (Yearly)
16 mg/Nm3 (Daily)
47 BAT 29
Table 10.13
Increase the higher end of the daily dust BAT-AEL range in the case of existing plants put into operation no later
than 7 January 2014 and using only an ESP FI 18 mg/Nm
3
48 BAT 29
Table 10.13 Decrease the higher end of the yearly and daily dust BAT-AEL ranges for new and existing plants of ≥ 300 MWth EEB
New:
3 mg/Nm3 (Yearly)
8 mg/Nm3 (Daily)
Existing:
5 mg/Nm3 (Yearly)
10 mg/Nm3 (Daily)
WORKIN
G DRAFT IN
PROGRESS
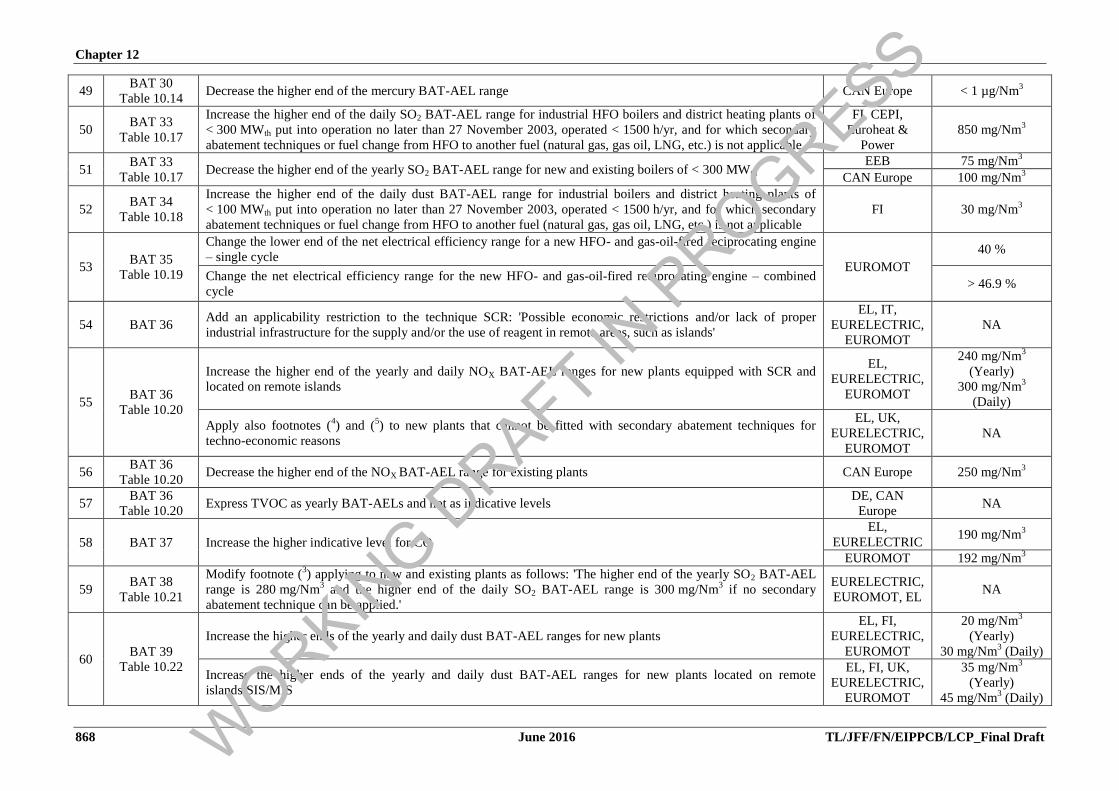
Chapter 12
868 June 2016 TL/JFF/FN/EIPPCB/LCP_Final Draft
49 BAT 30
Table 10.14 Decrease the higher end of the mercury BAT-AEL range CAN Europe < 1 µg/Nm
3
50 BAT 33
Table 10.17
Increase the higher end of the daily SO2 BAT-AEL range for industrial HFO boilers and district heating plants of
< 300 MWth put into operation no later than 27 November 2003, operated < 1500 h/yr, and for which secondary
abatement techniques or fuel change from HFO to another fuel (natural gas, gas oil, LNG, etc.) is not applicable
FI, CEPI,
Euroheat &
Power
850 mg/Nm3
51 BAT 33
Table 10.17 Decrease the higher end of the yearly SO2 BAT-AEL range for new and existing boilers of < 300 MWth
EEB 75 mg/Nm3
CAN Europe 100 mg/Nm3
52 BAT 34
Table 10.18
Increase the higher end of the daily dust BAT-AEL range for industrial boilers and district heating plants of
< 100 MWth put into operation no later than 27 November 2003, operated < 1500 h/yr, and for which secondary
abatement techniques or fuel change from HFO to another fuel (natural gas, gas oil, LNG, etc.) is not applicable
FI 30 mg/Nm3
53 BAT 35
Table 10.19
Change the lower end of the net electrical efficiency range for a new HFO- and gas-oil-fired reciprocating engine
– single cycle EUROMOT
40 %
Change the net electrical efficiency range for the new HFO- and gas-oil-fired reciprocating engine – combined
cycle > 46.9 %
54 BAT 36 Add an applicability restriction to the technique SCR: 'Possible economic restrictions and/or lack of proper
industrial infrastructure for the supply and/or the use of reagent in remote areas, such as islands'
EL, IT,
EURELECTRIC,
EUROMOT
NA
55 BAT 36
Table 10.20
Increase the higher end of the yearly and daily NOX BAT-AEL ranges for new plants equipped with SCR and
located on remote islands
EL,
EURELECTRIC,
EUROMOT
240 mg/Nm3
(Yearly)
300 mg/Nm3
(Daily)
Apply also footnotes (4) and (
5) to new plants that cannot be fitted with secondary abatement techniques for
techno-economic reasons
EL, UK,
EURELECTRIC,
EUROMOT
NA
56 BAT 36
Table 10.20 Decrease the higher end of the NOX BAT-AEL range for existing plants CAN Europe 250 mg/Nm
3
57 BAT 36
Table 10.20 Express TVOC as yearly BAT-AELs and not as indicative levels
DE, CAN
Europe NA
58 BAT 37 Increase the higher indicative level for CO
EL,
EURELECTRIC 190 mg/Nm
3
EUROMOT 192 mg/Nm3
59 BAT 38
Table 10.21
Modify footnote (3) applying to new and existing plants as follows: 'The higher end of the yearly SO2 BAT-AEL
range is 280 mg/Nm3 and the higher end of the daily SO2 BAT-AEL range is 300 mg/Nm
3 if no secondary
abatement technique can be applied.'
EURELECTRIC,
EUROMOT, EL NA
60 BAT 39
Table 10.22
Increase the higher ends of the yearly and daily dust BAT-AEL ranges for new plants
EL, FI,
EURELECTRIC,
EUROMOT
20 mg/Nm3
(Yearly)
30 mg/Nm3 (Daily)
Increase the higher ends of the yearly and daily dust BAT-AEL ranges for new plants located on remote
islands/SIS/MIS
EL, FI, UK,
EURELECTRIC,
EUROMOT
35 mg/Nm3
(Yearly)
45 mg/Nm3 (Daily)
WORKIN
G DRAFT IN
PROGRESS
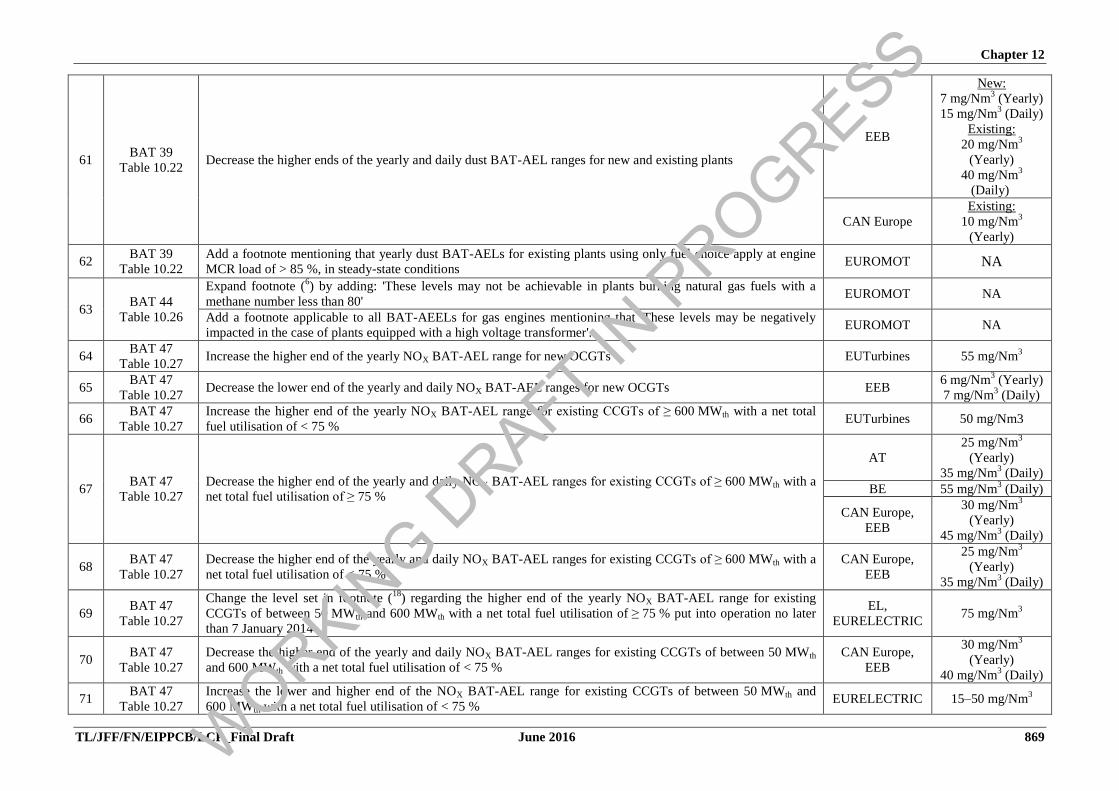
Chapter 12
TL/JFF/FN/EIPPCB/LCP_Final Draft June 2016 869
61 BAT 39
Table 10.22 Decrease the higher ends of the yearly and daily dust BAT-AEL ranges for new and existing plants
EEB
New:
7 mg/Nm3 (Yearly)
15 mg/Nm3 (Daily)
Existing:
20 mg/Nm3
(Yearly)
40 mg/Nm3
(Daily)
CAN Europe
Existing:
10 mg/Nm3
(Yearly)
62 BAT 39
Table 10.22
Add a footnote mentioning that yearly dust BAT-AELs for existing plants using only fuel choice apply at engine
MCR load of > 85 %, in steady-state conditions EUROMOT NA
63 BAT 44
Table 10.26
Expand footnote (6) by adding: 'These levels may not be achievable in plants burning natural gas fuels with a
methane number less than 80' EUROMOT NA
Add a footnote applicable to all BAT-AEELs for gas engines mentioning that 'These levels may be negatively
impacted in the case of plants equipped with a high voltage transformer'. EUROMOT NA
64 BAT 47
Table 10.27 Increase the higher end of the yearly NOX BAT-AEL range for new OCGTs EUTurbines 55 mg/Nm
3
65 BAT 47
Table 10.27 Decrease the lower end of the yearly and daily NOX BAT-AEL ranges for new OCGTs EEB
6 mg/Nm3 (Yearly)
7 mg/Nm3 (Daily)
66 BAT 47
Table 10.27
Increase the higher end of the yearly NOX BAT-AEL range for existing CCGTs of ≥ 600 MWth with a net total
fuel utilisation of < 75 % EUTurbines 50 mg/Nm3
67 BAT 47
Table 10.27
Decrease the higher end of the yearly and daily NOX BAT-AEL ranges for existing CCGTs of ≥ 600 MWth with a
net total fuel utilisation of ≥ 75 %
AT
25 mg/Nm3
(Yearly)
35 mg/Nm3 (Daily)
BE 55 mg/Nm3 (Daily)
CAN Europe,
EEB
30 mg/Nm3
(Yearly)
45 mg/Nm3 (Daily)
68 BAT 47
Table 10.27
Decrease the higher end of the yearly and daily NOX BAT-AEL ranges for existing CCGTs of ≥ 600 MWth with a
net total fuel utilisation of < 75 %
CAN Europe,
EEB
25 mg/Nm3
(Yearly)
35 mg/Nm3 (Daily)
69 BAT 47
Table 10.27
Change the level set in footnote (18
) regarding the higher end of the yearly NOX BAT-AEL range for existing
CCGTs of between 50 MWth and 600 MWth with a net total fuel utilisation of ≥ 75 % put into operation no later
than 7 January 2014
EL,
EURELECTRIC 75 mg/Nm
3
70 BAT 47
Table 10.27
Decrease the higher end of the yearly and daily NOX BAT-AEL ranges for existing CCGTs of between 50 MWth
and 600 MWth with a net total fuel utilisation of < 75 %
CAN Europe,
EEB
30 mg/Nm3
(Yearly)
40 mg/Nm3 (Daily)
71 BAT 47
Table 10.27
Increase the lower and higher end of the NOX BAT-AEL range for existing CCGTs of between 50 MWth and
600 MWth with a net total fuel utilisation of < 75 % EURELECTRIC 15–50 mg/Nm
3
WORKIN
G DRAFT IN
PROGRESS
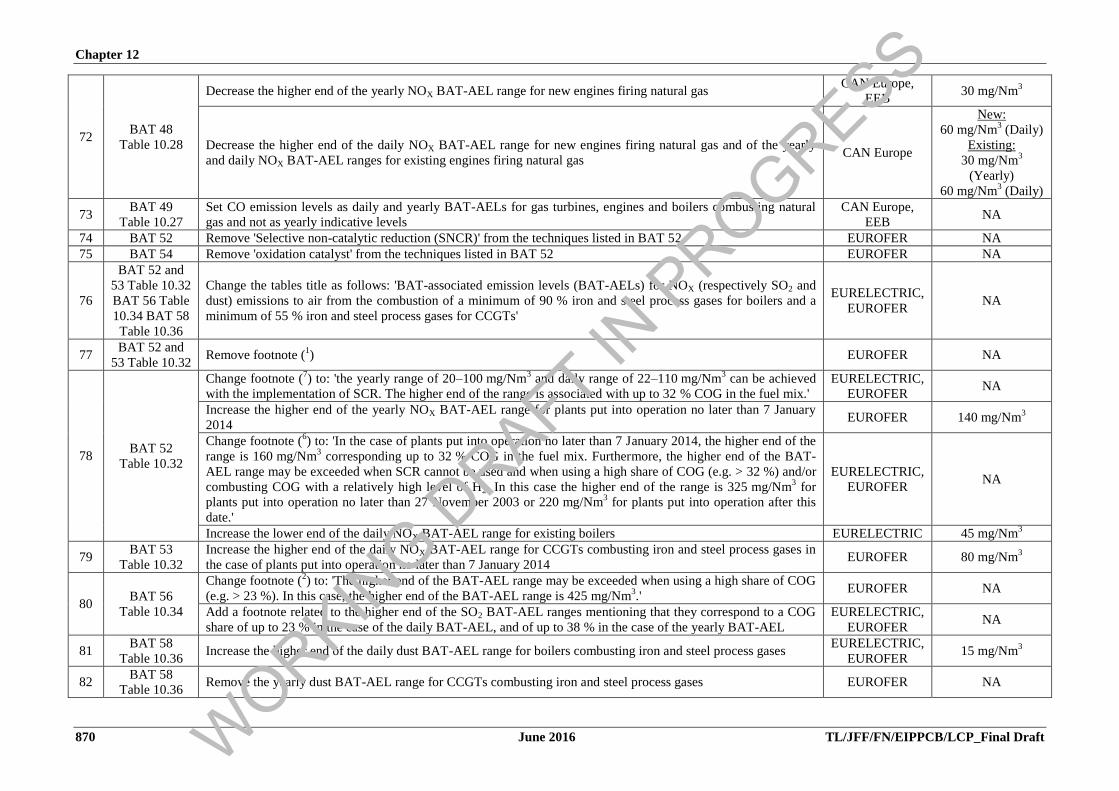
Chapter 12
870 June 2016 TL/JFF/FN/EIPPCB/LCP_Final Draft
72 BAT 48
Table 10.28
Decrease the higher end of the yearly NOX BAT-AEL range for new engines firing natural gas CAN Europe,
EEB 30 mg/Nm
3
Decrease the higher end of the daily NOX BAT-AEL range for new engines firing natural gas and of the yearly
and daily NOX BAT-AEL ranges for existing engines firing natural gas CAN Europe
New:
60 mg/Nm3 (Daily)
Existing:
30 mg/Nm3
(Yearly)
60 mg/Nm3 (Daily)
73 BAT 49
Table 10.27
Set CO emission levels as daily and yearly BAT-AELs for gas turbines, engines and boilers combusting natural
gas and not as yearly indicative levels
CAN Europe,
EEB NA
74 BAT 52 Remove 'Selective non-catalytic reduction (SNCR)' from the techniques listed in BAT 52 EUROFER NA
75 BAT 54 Remove 'oxidation catalyst' from the techniques listed in BAT 52 EUROFER NA
76
BAT 52 and
53 Table 10.32
BAT 56 Table
10.34 BAT 58
Table 10.36
Change the tables title as follows: 'BAT-associated emission levels (BAT-AELs) for NOX (respectively SO2 and
dust) emissions to air from the combustion of a minimum of 90 % iron and steel process gases for boilers and a
minimum of 55 % iron and steel process gases for CCGTs'
EURELECTRIC,
EUROFER NA
77 BAT 52 and
53 Table 10.32 Remove footnote (
1) EUROFER NA
78 BAT 52
Table 10.32
Change footnote (7) to: 'the yearly range of 20–100 mg/Nm
3 and daily range of 22–110 mg/Nm
3 can be achieved
with the implementation of SCR. The higher end of the range is associated with up to 32 % COG in the fuel mix.'
EURELECTRIC,
EUROFER NA
Increase the higher end of the yearly NOX BAT-AEL range for plants put into operation no later than 7 January
2014 EUROFER 140 mg/Nm
3
Change footnote (6) to: 'In the case of plants put into operation no later than 7 January 2014, the higher end of the
range is 160 mg/Nm3 corresponding up to 32 % COG in the fuel mix. Furthermore, the higher end of the BAT-
AEL range may be exceeded when SCR cannot be used and when using a high share of COG (e.g. > 32 %) and/or
combusting COG with a relatively high level of H2. In this case the higher end of the range is 325 mg/Nm3 for
plants put into operation no later than 27 November 2003 or 220 mg/Nm3 for plants put into operation after this
date.'
EURELECTRIC,
EUROFER NA
Increase the lower end of the daily NOX BAT-AEL range for existing boilers EURELECTRIC 45 mg/Nm3
79 BAT 53
Table 10.32
Increase the higher end of the daily NOX BAT-AEL range for CCGTs combusting iron and steel process gases in
the case of plants put into operation no later than 7 January 2014 EUROFER 80 mg/Nm
3
80 BAT 56
Table 10.34
Change footnote (2) to: 'The higher end of the BAT-AEL range may be exceeded when using a high share of COG
(e.g. > 23 %). In this case, the higher end of the BAT-AEL range is 425 mg/Nm3.'
EUROFER NA
Add a footnote related to the higher end of the SO2 BAT-AEL ranges mentioning that they correspond to a COG
share of up to 23 % in the case of the daily BAT-AEL, and of up to 38 % in the case of the yearly BAT-AEL
EURELECTRIC,
EUROFER NA
81 BAT 58
Table 10.36 Increase the higher end of the daily dust BAT-AEL range for boilers combusting iron and steel process gases
EURELECTRIC,
EUROFER 15 mg/Nm
3
82 BAT 58
Table 10.36 Remove the yearly dust BAT-AEL range for CCGTs combusting iron and steel process gases EUROFER NA
WORKIN
G DRAFT IN
PROGRESS

Chapter 12
TL/JFF/FN/EIPPCB/LCP_Final Draft June 2016 871
83 BAT 66
Table 10.40
Change the title of Table 10.40 as follows: 'BAT-associated emission levels (BAT-AELs) for SO2 emissions to air
from the combustion of process fuels from the chemical industry in boilers', and include a footnote associated with
the 'daily average or average over the sampling period' stating that 'the higher end of the BAT-AEL range may be
different on days when auxiliary liquid fuels are used. In this case, the higher end of the BAT-AEL range may
correspond to the higher end of the BAT-AEL range applicable to the corresponding auxiliary fuel for the case of
plants operated <1500 h/yr.'
CEFIC NA
84 BAT 67
Table 10.42 Decrease the higher end of the yearly dust BAT-AEL range for existing plants EEB 10 mg/Nm
3
85 BAT 61 Table
10.37 Remove footnote (
2)
CAN Europe,
EEB NA
86 BAT 78
Table 10.51 Decrease the higher ends of the BAT-AELs ranges for plants of > 300 MWth
Cd-Tl
EEB
3 µg/Nm3
87 Sb+As+Pb+Cr+Co+Cu+
Mn+Ni+V 0.4 mg/Nm
3
88 BAT 79 Table
10.52 Decrease the higher end of the Cd-Tl BAT-AEL range
CAN Europe,
EEB < 2 µg/Nm
3
89 BAT 81 Table
10.54
Separate TVOC and PCDD/F BAT-AELs should be established for combustion plants firing coal and/or lignite as
well as biomass and/or peat EEB NA
NB:
NA: No alternative proposed level
WORKIN
G DRAFT IN
PROGRESS

Chapter 12
872 June 2016 TL/JFF/FN/EIPPCB/LCP_Final Draft
Consultation of the Forum and subsequent formal adoption procedure of the BAT
Conclusions
At a later stage, the opinion of the Forum and any other information concerning the formal
adoption of the BAT conclusions will be added here.
Recommendations for future work
The information exchange revealed a number of issues that should be addressed during the next
review of the LCP BREF. This includes the following recommendations:
To collect more information on start-up, shutdown and OTNOC emissions.
To collect more information on the operation of engines and turbines for emergency use,
and on the number of hours they are operated.
Related to emissions to water, to collect:
o information on techniques to reduce chloride emissions to water from flue-gas
treatment;
o information on techniques to reduce total nitrogen emissions to water from flue-gas
treatment;
o more information on biological treatment techniques.
Related to emissions to air, to collect:
o Ammonia emissions data from the use of selective catalytic reduction (SCR) and/or
selective non-catalytic reduction (SNCR) for the abatement of NOX emissions, in
particular for engines.
o More information on the use of SCR when combusting natural gas in boilers.
o More information on the use of SCR when combusting natural gas in turbines.
o More information on the applicability of oxidation catalysts when combusting natural
gas.
o More information on the applicability of PEMS to other sectors besides OCGTs.
Follow the ongoing development of an EN standard related to PEMS.
o More information on CCGT plants with steam/water injection being converted to
OCGTs, and especially in relation to the availability of a source of water of a suitable
quality.
o More information on offshore platforms, in particular on the use of dual fuel gas
turbines combusting liquid fuels.
o Further information on the applicability of the SCR technique to prevent and/or reduce
NOX emissions to air while limiting CO and N2O emissions to air from the combustion
of coal and/or lignite, in particular with respect to the combustion of indigenous fuels.
o More data on N2O emissions from coal- and/or lignite-fired CFB boilers.
o More information in order to assess if there is a need to differentiate between coal and
lignite concerning SO2 emission levels.
o Information on the combustion of biomass with a high alkaline content.
o More information on the performance and efficiency of boiler sorbent injection for
BFB boilers to prevent and/or reduce SOX, HCl and HF emissions to air from the
combustion of solid biomass and/or peat.
o More information on the combustion of straw and peat.
o More information on the combustion of straw concerning HF emissions.
o Short-term data on HCl emissions, and information on the relationship between the use
of S-rich fuels or elemental S (extended to other additives) and the HCl/HF emission
levels.
o More information, in the context of waste co-incineration, on Mn emissions
originating from biomass and/or peat.
o More information, in the context of waste co-incineration, on PCDD/F emissions in
order to review if there is a need to differentiate between biomass/peat and coal/lignite
combustion.
o More information on the use of the SCR technique to prevent and/or reduce NOX
emissions to air from the combustion of HFO and/or gas oil in reciprocating engines in
small isolated systems.
WORKIN
G DRAFT IN
PROGRESS

Chapter 12
TL/JFF/FN/EIPPCB/LCP_Final Draft June 2016 873
o Further information on the impact of high nitrogen and hydrogen contents on NOX
emissions from the combustion plants using process fuels from the chemical industry.
Suggested topics for future R&D work
The Commission is launching and supporting, through its Research and Technological
Development programmes, a series of projects dealing with clean technologies, emerging
effluent treatment and recycling technologies and management strategies. Potentially, these
projects could provide a useful contribution to future BREF reviews. Readers are therefore
invited to inform the European IPPC Bureau of any research results which are relevant to the
scope of this document (see also the fifth section of the Preface of this document).
WORKIN
G DRAFT IN
PROGRESS

WORKIN
G DRAFT IN
PROGRESS

Chapter 13
TL/JFF/FN/EIPPCB/LCP_Final Draft June 2016 875
13 ANNEXES
13.1 Annex I - List of European plants that took part in the data collection exercise in 2012
Note to table 13.1
List of acronyms used for combustion processes:
BFB: Bubbling fluidised bed; CCGT: Combined-cycle gas turbine; CFB: Circulating fluidised bed; DBB:
Dry-bottom boiler; DF Engine: Dual fuel engine; GB: Grate-fired boiler; GasB: Gas-fired boiler; HRSG:
Heat recovery steam generator; LiquidB: Liquid-fuel-fired boiler; OCGT: Open-cycle gas turbine; SG
Engine: Spark-ignited gas engine; WBB: Wet-bottom boiler.
List of acronyms used for techniques:
AS: Air staging; BF: Bag filter; CHP: Combined heat & power; DLN: Dry low-NOX burners; DSI: Duct
sorbent injection; ESP: Electrostatic precipitator; FG condenser: Flue-gas condenser; FGR: Flue-gas
recirculation; LNB: Low-NOX burner; PM: Primary measures; SCR: Selective catalytic reduction; SNCR:
Selective non-catalytic reduction; WESP: Wet ESP; WFGD: Wet flue-gas desulphurisation.
List of acronyms used for fuels:
BF: Blast furnace gas; BOF: Basic oxygen furnace gas; Ch: Chemical; COG: Coke oven gas; DFO:
Distillate fuel oil; FB: Fruit biomass (stones/shells/kernels); Forest R: Forest residues; HFO: Heavy fuel
oil; NG: Natural gas; WB: Woody biomass; WBB: Woody biomass woodchip; WWTP: Waste water
treatment plant.
NA: information not available
WORKIN
G DRAFT IN
PROGRESS

Chapter 13
876 June 2016 TL/JFF/FN/EIPPCB/LCP_Final Draft
Table 13.1: List of European plants that took part in the data collection exercise in 2012
Plant
code
Co
un
try
Plant name
Co
mb
ust
ion
pro
cess
Techniques
(Air emissions and/or
Energy efficiency)
Industrial
sector
To
tal
ra
ted
ther
ma
l in
pu
t
(MW
)
Type of fuel (%)
Total
operating
time
under
NOC
(hours) Eq
uiv
ale
nt
full
loa
d o
per
ati
ng
fact
or
(%)
Yea
r o
f
the
firs
t
com
mis
sio
nin
g
001V AT Voestalpine Stahl GmbH -
Block 01 - Linz CCGT DLN - SCR + Air preheating Iron & Steel 165
BF 34 - NG 33 -
COG 27 - BOF 5 8072 65 1996
002V AT Voestalpine Stahl GmbH -
Block 03 - Linz GasB LNB - SCR - Air preheating Iron & Steel 109
BF 67 - COG 16 -
BOF 11 - NG 6 7817 84 2002
003V AT Voestalpine Stahl GmbH -
Block 04 - Linz GasB LNB - SCR - Air preheating Iron & Steel 90
BF 65 - COG 19 -
BOF 11 - NG 5 7132 80 1985
004V AT Voestalpine Stahl GmbH -
Block 05 - Linz GasB LNB - SCR - Air preheating Iron & Steel 90
BF 65 - COG 20 -
BOF 11 -NG 4 8221 79 1985
005V AT Voestalpine Stahl GmbH -
Block 06 - Linz GasB FGR - SCR - Air preheating Iron & Steel 223
BF 39 - NG 28 -
COG 27 - BOF 6 5561 71 1973
006V AT Voestalpine Stahl GmbH -
Block 07 - Linz GasB
FGR - Fuel staging - LNB -
SCR - Air preheating Iron & Steel 385
BF 62 - COG 17 -
BOF 11 - NG 10 7162 87 2010
007V AT
Voestalpine Stahl Donawitz
GmbH & Co KG - Block 01
- Donawitz
GasB SCR - Air and Fuel
preheating Iron & Steel 180 BF 79 - BOF 14 - NG 7 8500 80 2008
008V AT
Voestalpine Stahl Donawitz
GmbH & Co KG - Block 02
- Donawitz
CCGT DLN - SCR Iron & Steel 85 NG 88 - BOF 12 1417 81 2001
009V AT
Voestalpine Stahl Donawitz
GmbH & Co KG - Block 03
- Donawitz
GasB Air preheating Iron & Steel 80 BF 81 - BOF 12 - NG 7 994 84 1986
10V BE Electrabel GDF Suez -
Amercoeur 1 - Roux CCGT DLN Power 749 NG 100 6188 87 2009
11-1V BE
Electrabel GDF Suez -
Herdersbrug GT11 -
Brugge
CCGT DLN Power 460 NG 100 6808 83 1998
11-2V BE
Electrabel GDF Suez -
Herdersbrug GT12 -
Brugge
CCGT DLN Power 460 NG 100 7637 83 1998
WORKIN
G DRAFT IN
PROGRESS
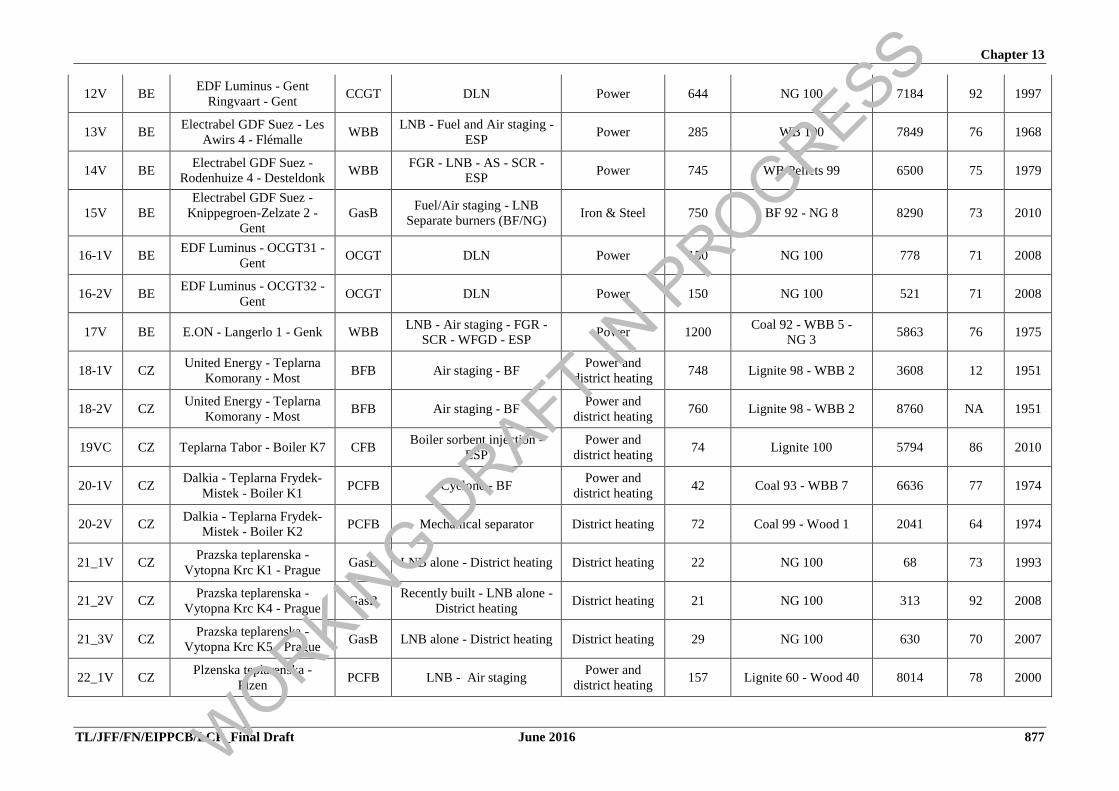
Chapter 13
TL/JFF/FN/EIPPCB/LCP_Final Draft June 2016 877
12V BE EDF Luminus - Gent
Ringvaart - Gent CCGT DLN Power 644 NG 100 7184 92 1997
13V BE Electrabel GDF Suez - Les
Awirs 4 - Flémalle WBB
LNB - Fuel and Air staging -
ESP Power 285 WB 100 7849 76 1968
14V BE Electrabel GDF Suez -
Rodenhuize 4 - Desteldonk WBB
FGR - LNB - AS - SCR -
ESP Power 745 WB Pellets 99 6500 75 1979
15V BE
Electrabel GDF Suez -
Knippegroen-Zelzate 2 -
Gent
GasB Fuel/Air staging - LNB
Separate burners (BF/NG) Iron & Steel 750 BF 92 - NG 8 8290 73 2010
16-1V BE EDF Luminus - OCGT31 -
Gent OCGT DLN Power 150 NG 100 778 71 2008
16-2V BE EDF Luminus - OCGT32 -
Gent OCGT DLN Power 150 NG 100 521 71 2008
17V BE E.ON - Langerlo 1 - Genk WBB LNB - Air staging - FGR -
SCR - WFGD - ESP Power 1200
Coal 92 - WBB 5 -
NG 3 5863 76 1975
18-1V CZ United Energy - Teplarna
Komorany - Most BFB Air staging - BF
Power and
district heating 748 Lignite 98 - WBB 2 3608 12 1951
18-2V CZ United Energy - Teplarna
Komorany - Most BFB Air staging - BF
Power and
district heating 760 Lignite 98 - WBB 2 8760 NA 1951
19VC CZ Teplarna Tabor - Boiler K7 CFB Boiler sorbent injection -
ESP
Power and
district heating 74 Lignite 100 5794 86 2010
20-1V CZ Dalkia - Teplarna Frydek-
Mistek - Boiler K1 PCFB Cyclone - BF
Power and
district heating 42 Coal 93 - WBB 7 6636 77 1974
20-2V CZ Dalkia - Teplarna Frydek-
Mistek - Boiler K2 PCFB Mechanical separator District heating 72 Coal 99 - Wood 1 2041 64 1974
21_1V CZ Prazska teplarenska -
Vytopna Krc K1 - Prague GasB LNB alone - District heating District heating 22 NG 100 68 73 1993
21_2V CZ Prazska teplarenska -
Vytopna Krc K4 - Prague GasB
Recently built - LNB alone -
District heating District heating 21 NG 100 313 92 2008
21_3V CZ Prazska teplarenska -
Vytopna Krc K5 - Prague GasB LNB alone - District heating District heating 29 NG 100 630 70 2007
22_1V CZ Plzenska teplarenska -
Plzen PCFB LNB - Air staging
Power and
district heating 157 Lignite 60 - Wood 40 8014 78 2000
WORKIN
G DRAFT IN
PROGRESS
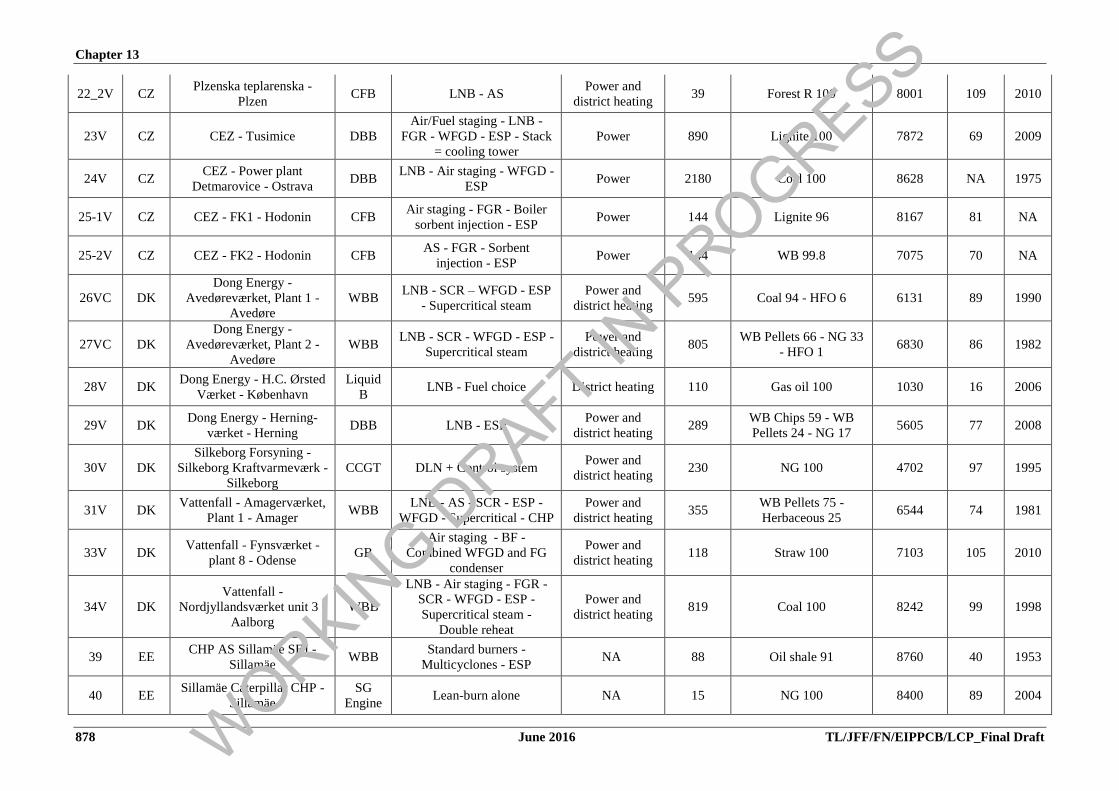
Chapter 13
878 June 2016 TL/JFF/FN/EIPPCB/LCP_Final Draft
22_2V CZ Plzenska teplarenska -
Plzen CFB LNB - AS
Power and
district heating 39 Forest R 100 8001 109 2010
23V CZ CEZ - Tusimice DBB
Air/Fuel staging - LNB -
FGR - WFGD - ESP - Stack
= cooling tower
Power 890 Lignite 100 7872 69 2009
24V CZ CEZ - Power plant
Detmarovice - Ostrava DBB
LNB - Air staging - WFGD -
ESP Power 2180 Coal 100 8628 NA 1975
25-1V CZ CEZ - FK1 - Hodonin CFB Air staging - FGR - Boiler
sorbent injection - ESP Power 144 Lignite 96 8167 81 NA
25-2V CZ CEZ - FK2 - Hodonin CFB AS - FGR - Sorbent
injection - ESP Power 144 WB 99.8 7075 70 NA
26VC DK
Dong Energy -
Avedøreværket, Plant 1 -
Avedøre
WBB LNB - SCR – WFGD - ESP
- Supercritical steam
Power and
district heating 595 Coal 94 - HFO 6 6131 89 1990
27VC DK
Dong Energy -
Avedøreværket, Plant 2 -
Avedøre
WBB LNB - SCR - WFGD - ESP -
Supercritical steam
Power and
district heating 805
WB Pellets 66 - NG 33
- HFO 1 6830 86 1982
28V DK Dong Energy - H.C. Ørsted
Værket - København
Liquid
B LNB - Fuel choice District heating 110 Gas oil 100 1030 16 2006
29V DK Dong Energy - Herning-
værket - Herning DBB LNB - ESP
Power and
district heating 289
WB Chips 59 - WB
Pellets 24 - NG 17 5605 77 2008
30V DK
Silkeborg Forsyning -
Silkeborg Kraftvarmeværk -
Silkeborg
CCGT DLN + Control system Power and
district heating 230 NG 100 4702 97 1995
31V DK Vattenfall - Amagerværket,
Plant 1 - Amager WBB
LNB - AS - SCR - ESP -
WFGD - Supercritical - CHP
Power and
district heating 355
WB Pellets 75 -
Herbaceous 25 6544 74 1981
33V DK Vattenfall - Fynsværket -
plant 8 - Odense GB
Air staging - BF -
Combined WFGD and FG
condenser
Power and
district heating 118 Straw 100 7103 105 2010
34V DK
Vattenfall -
Nordjyllandsværket unit 3 -
Aalborg
WBB
LNB - Air staging - FGR -
SCR - WFGD - ESP -
Supercritical steam -
Double reheat
Power and
district heating 819 Coal 100 8242 99 1998
39 EE CHP AS Sillamäe SEJ -
Sillamäe WBB
Standard burners -
Multicyclones - ESP NA 88 Oil shale 91 8760 40 1953
40 EE Sillamäe Caterpillar CHP -
Sillamäe
SG
Engine Lean-burn alone NA 15 NG 100 8400 89 2004
WORKIN
G DRAFT IN
PROGRESS

Chapter 13
TL/JFF/FN/EIPPCB/LCP_Final Draft June 2016 879
42V FI
Kaukaan Voima Oy -
Kaukaa power plant -
Lappeenranta
CFB LNB - AS - FGR - SNCR -
Sorbent injection - ESP Pulp and paper 410
Bark 60 - Peat 20 -
Forest R 20 7186 59 2009
46V FI Porin Prosessivoima - Pori CFB SNCR - DSI - BF - ACI Chemical
industry 206
Peat 47 - WB - 25
Forest R 16 -
Solid waste 8 - Coal 3
8261 86 1999
49V FI Helsingin Energia -
Vuosaari B - Helsinki CCGT
DLN alone - GT blades
modification
Power and
district heating 991 NG 100 8371 40 1998
54V FI
Helsingin Energia - Lassila
district heating plant, unit 1
- Helsinki
Liquid
B CHP District heating 132 HFO 95 - Gas oil 5 83 78 1977
55V FI
Helsingin Energia - Lassila
district heating plant, unit 4
- Helsinki
GasB HFO/gas oil mixing -
District heating District heating 50
NG 96 - HFO 3 -
Gas oil 1 1163 79 1995
56V FI
Helsingin Energia -
Munkkisaari district heating
plant, unit 1 - Helsinki
Liquid
B
Multicyclones - Air staging -
LNB District heating 50 HFO 100 266 71 2005
61V FR Rhodia - unit 4 - Chalampé Liquid
B SCR - Fuel choice
Chemical
industry 110 Liquid process fuel 100 8171 52 1966
62-1V FR Rhodia - unit 5 - Chalampé Boiler SCR Chemical
industry 180 NG 43 8168 43 1972
62-2V FR Rhodia - unit 5 - Chalampé Boiler SCR NA 180 Liquid process fuel 57 8168 43 1972
63V FR Rhodia - unit 6 - Chalampé GasB FGR alone Chemical
industry 185 NG 100 7813 50 2001
65-1V FR Kronenbourg - K2 -
Obernai GasB Multi-fuel LNB Food & Drink 15
NG 67 - Biogas 16 -
HFO 17 3136 44 1974
65-2V FR Kronenbourg - K2 -
Obernai GasB Multi-fuel LNB Food & Drink 15
NG 66.4 - HFO 17.2 -
Biogas 16.4 3136 44 1974
66V FR Smurfit/Kappa/Dalkia -
Facture BFB
Air staging - FGR - BF -
Double reheat - CHP Pulp and paper 124
WB 10 - Bark 40 -
WB 50 8337.25 109 2010
67V FR Sobeji/Total - Lacq GasB LNB (FGR) - FGR Oil refining 88 NG 100 8000 70 1959
68V FR Cofely - Stains Liquid
B LNB - Multicyclones District heating 65 HFO 100 1800 15 1975
WORKIN
G DRAFT IN
PROGRESS
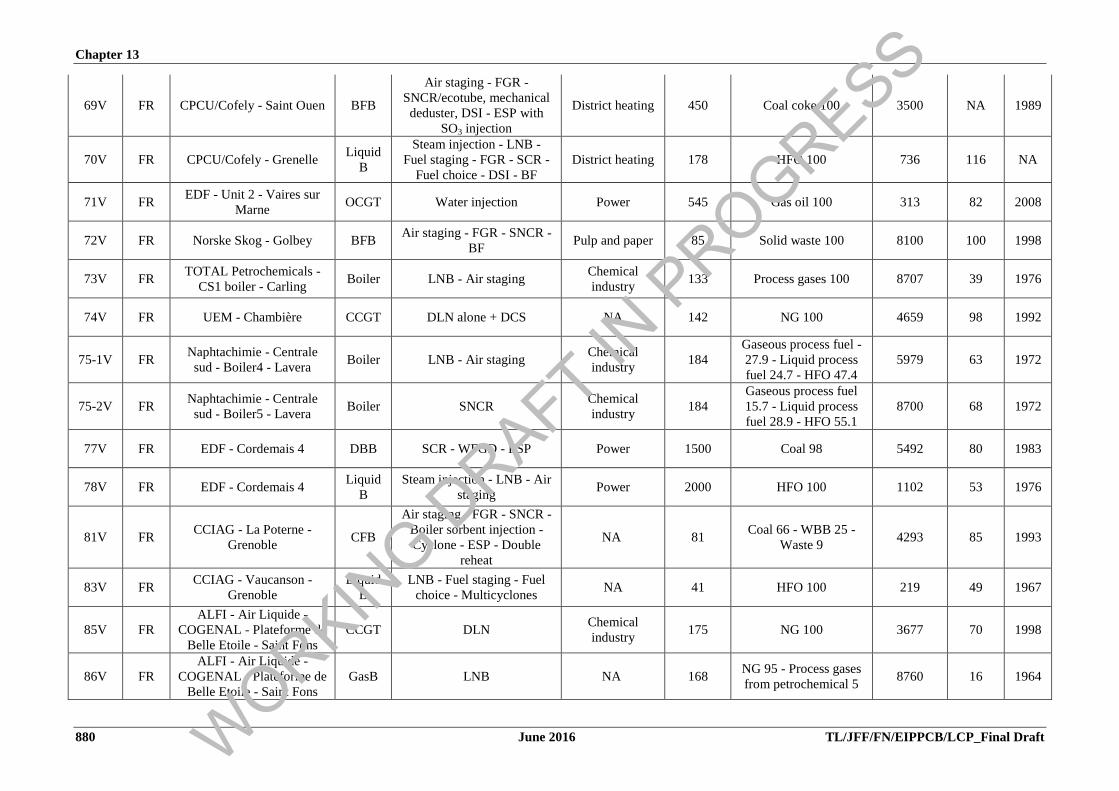
Chapter 13
880 June 2016 TL/JFF/FN/EIPPCB/LCP_Final Draft
69V FR CPCU/Cofely - Saint Ouen BFB
Air staging - FGR -
SNCR/ecotube, mechanical
deduster, DSI - ESP with
SO3 injection
District heating 450 Coal coke 100 3500 NA 1989
70V FR CPCU/Cofely - Grenelle Liquid
B
Steam injection - LNB -
Fuel staging - FGR - SCR -
Fuel choice - DSI - BF
District heating 178 HFO 100 736 116 NA
71V FR EDF - Unit 2 - Vaires sur
Marne OCGT Water injection Power 545 Gas oil 100 313 82 2008
72V FR Norske Skog - Golbey BFB Air staging - FGR - SNCR -
BF Pulp and paper 85 Solid waste 100 8100 100 1998
73V FR TOTAL Petrochemicals -
CS1 boiler - Carling Boiler LNB - Air staging
Chemical
industry 133 Process gases 100 8707 39 1976
74V FR UEM - Chambière CCGT DLN alone + DCS NA 142 NG 100 4659 98 1992
75-1V FR Naphtachimie - Centrale
sud - Boiler4 - Lavera Boiler LNB - Air staging
Chemical
industry 184
Gaseous process fuel -
27.9 - Liquid process
fuel 24.7 - HFO 47.4
5979 63 1972
75-2V FR Naphtachimie - Centrale
sud - Boiler5 - Lavera Boiler SNCR
Chemical
industry 184
Gaseous process fuel
15.7 - Liquid process
fuel 28.9 - HFO 55.1
8700 68 1972
77V FR EDF - Cordemais 4 DBB SCR - WFGD - ESP Power 1500 Coal 98 5492 80 1983
78V FR EDF - Cordemais 4 Liquid
B
Steam injection - LNB - Air
staging Power 2000 HFO 100 1102 53 1976
81V FR CCIAG - La Poterne -
Grenoble CFB
Air staging - FGR - SNCR -
Boiler sorbent injection -
Cyclone - ESP - Double
reheat
NA 81 Coal 66 - WBB 25 -
Waste 9 4293 85 1993
83V FR CCIAG - Vaucanson -
Grenoble
Liquid
B
LNB - Fuel staging - Fuel
choice - Multicyclones NA 41 HFO 100 219 49 1967
85V FR
ALFI - Air Liquide -
COGENAL - Plateforme de
Belle Etoile - Saint Fons
CCGT DLN Chemical
industry 175 NG 100 3677 70 1998
86V FR
ALFI - Air Liquide -
COGENAL - Plateforme de
Belle Etoile - Saint Fons
GasB LNB NA 168 NG 95 - Process gases
from petrochemical 5 8760 16 1964
WORKIN
G DRAFT IN
PROGRESS
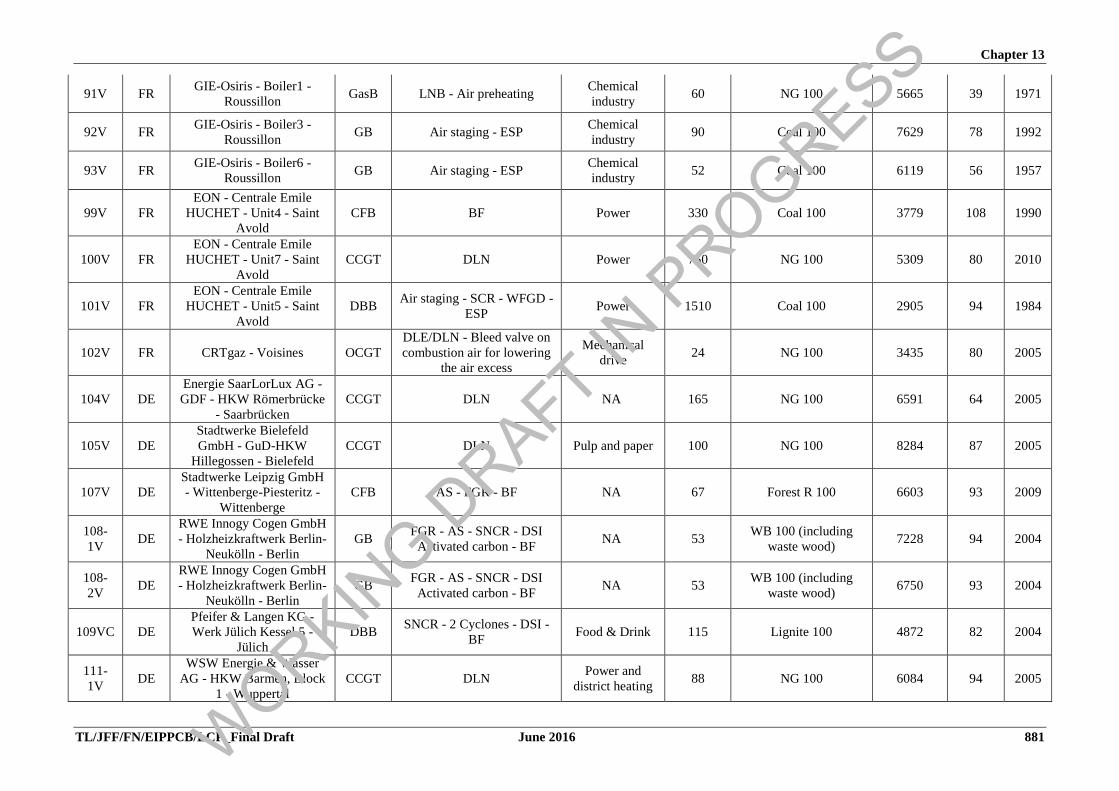
Chapter 13
TL/JFF/FN/EIPPCB/LCP_Final Draft June 2016 881
91V FR GIE-Osiris - Boiler1 -
Roussillon GasB LNB - Air preheating
Chemical
industry 60 NG 100 5665 39 1971
92V FR GIE-Osiris - Boiler3 -
Roussillon GB Air staging - ESP
Chemical
industry 90 Coal 100 7629 78 1992
93V FR GIE-Osiris - Boiler6 -
Roussillon GB Air staging - ESP
Chemical
industry 52 Coal 100 6119 56 1957
99V FR
EON - Centrale Emile
HUCHET - Unit4 - Saint
Avold
CFB BF Power 330 Coal 100 3779 108 1990
100V FR
EON - Centrale Emile
HUCHET - Unit7 - Saint
Avold
CCGT DLN Power 750 NG 100 5309 80 2010
101V FR
EON - Centrale Emile
HUCHET - Unit5 - Saint
Avold
DBB Air staging - SCR - WFGD -
ESP Power 1510 Coal 100 2905 94 1984
102V FR CRTgaz - Voisines OCGT
DLE/DLN - Bleed valve on
combustion air for lowering
the air excess
Mechanical
drive 24 NG 100 3435 80 2005
104V DE
Energie SaarLorLux AG -
GDF - HKW Römerbrücke
- Saarbrücken
CCGT DLN NA 165 NG 100 6591 64 2005
105V DE
Stadtwerke Bielefeld
GmbH - GuD-HKW
Hillegossen - Bielefeld
CCGT DLN Pulp and paper 100 NG 100 8284 87 2005
107V DE
Stadtwerke Leipzig GmbH
- Wittenberge-Piesteritz -
Wittenberge
CFB AS - FGR - BF NA 67 Forest R 100 6603 93 2009
108-
1V DE
RWE Innogy Cogen GmbH
- Holzheizkraftwerk Berlin-
Neukölln - Berlin
GB FGR - AS - SNCR - DSI
Activated carbon - BF NA 53
WB 100 (including
waste wood) 7228 94 2004
108-
2V DE
RWE Innogy Cogen GmbH
- Holzheizkraftwerk Berlin-
Neukölln - Berlin
GB FGR - AS - SNCR - DSI
Activated carbon - BF NA 53
WB 100 (including
waste wood) 6750 93 2004
109VC DE
Pfeifer & Langen KG -
Werk Jülich Kessel 5 -
Jülich
DBB SNCR - 2 Cyclones - DSI -
BF Food & Drink 115 Lignite 100 4872 82 2004
111-
1V DE
WSW Energie & Wasser
AG - HKW Barmen, Block
1 - Wuppertal
CCGT DLN Power and
district heating 88 NG 100 6084 94 2005
WORKIN
G DRAFT IN
PROGRESS
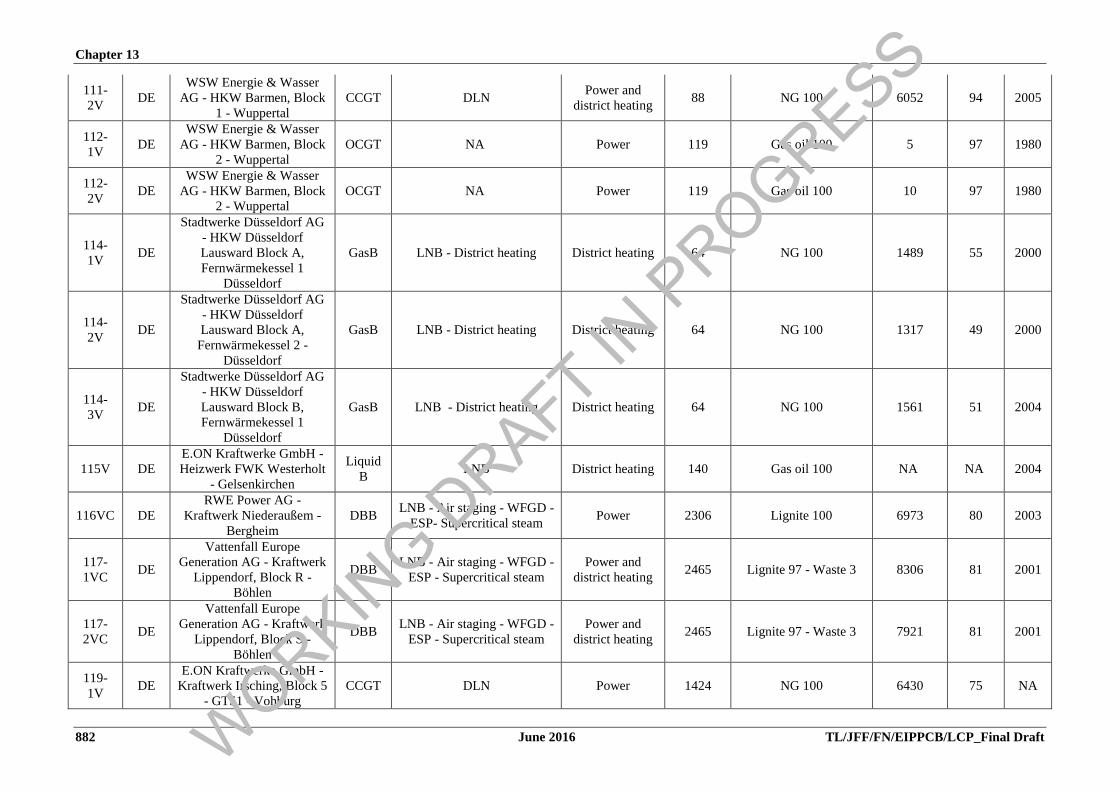
Chapter 13
882 June 2016 TL/JFF/FN/EIPPCB/LCP_Final Draft
111-
2V DE
WSW Energie & Wasser
AG - HKW Barmen, Block
1 - Wuppertal
CCGT DLN Power and
district heating 88 NG 100 6052 94 2005
112-
1V DE
WSW Energie & Wasser
AG - HKW Barmen, Block
2 - Wuppertal
OCGT NA Power 119 Gas oil 100 5 97 1980
112-
2V DE
WSW Energie & Wasser
AG - HKW Barmen, Block
2 - Wuppertal
OCGT NA Power 119 Gas oil 100 10 97 1980
114-
1V DE
Stadtwerke Düsseldorf AG
- HKW Düsseldorf
Lausward Block A,
Fernwärmekessel 1
Düsseldorf
GasB LNB - District heating District heating 64 NG 100 1489 55 2000
114-
2V DE
Stadtwerke Düsseldorf AG
- HKW Düsseldorf
Lausward Block A,
Fernwärmekessel 2 -
Düsseldorf
GasB LNB - District heating District heating 64 NG 100 1317 49 2000
114-
3V DE
Stadtwerke Düsseldorf AG
- HKW Düsseldorf
Lausward Block B,
Fernwärmekessel 1
Düsseldorf
GasB LNB - District heating District heating 64 NG 100 1561 51 2004
115V DE
E.ON Kraftwerke GmbH -
Heizwerk FWK Westerholt
- Gelsenkirchen
Liquid
B LNB District heating 140 Gas oil 100 NA NA 2004
116VC DE
RWE Power AG -
Kraftwerk Niederaußem -
Bergheim
DBB LNB - Air staging - WFGD -
ESP- Supercritical steam Power 2306 Lignite 100 6973 80 2003
117-
1VC DE
Vattenfall Europe
Generation AG - Kraftwerk
Lippendorf, Block R -
Böhlen
DBB LNB - Air staging - WFGD -
ESP - Supercritical steam
Power and
district heating 2465 Lignite 97 - Waste 3 8306 81 2001
117-
2VC DE
Vattenfall Europe
Generation AG - Kraftwerk
Lippendorf, Block S -
Böhlen
DBB LNB - Air staging - WFGD -
ESP - Supercritical steam
Power and
district heating 2465 Lignite 97 - Waste 3 7921 81 2001
119-
1V DE
E.ON Kraftwerke GmbH -
Kraftwerk Irsching, Block 5
- GT51 - Vohburg
CCGT DLN Power 1424 NG 100 6430 75 NA
WORKIN
G DRAFT IN
PROGRESS

Chapter 13
TL/JFF/FN/EIPPCB/LCP_Final Draft June 2016 883
119-
2V DE
E.ON Kraftwerke GmbH -
Kraftwerk Irsching, Block 5
- GT52 - Vohburg
CCGT DLN Power 1424 NG 100 6430 75 NA
121V DE
RWE Power AG -
Kraftwerk Ibbenbüren,
Block B - Ibbenbüren
WBB LNB - Air staging - SCR -
WFGD - ESP Power 2100 Coal 96 - Waste 1 7958 84 1985
122aV
C DE
Steag GmbH - Kraftwerk
Voerde, Block A - Voerde DBB LNB - SCR - WFGD - ESP Power 1870 Coal 100 6342 78 1982
122bV
C DE
Steag GmbH - Kraftwerk
Voerde, Block B - Voerde DBB LNB - SCR - WFGD - ESP Power 1870 Coal 100 6395 78 1985
123V DE
E.ON Kraftwerke GmbH -
Kraftwerk Staudinger Block
5 - Großkrotzenburg
DBB LNB - Air staging - SCR -
WFGD - ESP
Power and
district heating 1370 Coal 99.9 - Waste 0.1 7034 73 1992
124bV
C DE
E.ON Kraftwerke GmbH -
Kraftwerk Scholven, Block
B - Gelsenkirchen
DBB LNB - Air staging - SCR -
WFGD - ESP
Power and
district heating 990 Coal 99 6463 80 1968
124fV
C DE
E.ON Kraftwerke GmbH -
Kraftwerk Scholven, Block
F - Gelsenkirchen
DBB LNB - Air staging - SCR -
WFGD - ESP Power 1860 Coal 99 4346 78 1985
125V DE
N.prior Energy GmbH - PN
Biomasseheizkraftwerk
Papenburg GmbH & Co.
KG - Papenburg
CFB
LNB - AS - FGR - DSI
Activated carbon - cyclones
- BF
Power 65 WB 99.8 7857 99 2003
127-
1VC DE
Vattenfall Europe
Generation AG - Kraftwerk
Schwarze Pumpe Block A -
Spremberg
DBB LNB - Air staging - WFGD -
ESP - Supercritical steam
Power and
district heating 2100 Lignite 98 - Waste 2 8145 91 1998
127-
2VC DE
Vattenfall Europe
Generation AG - Kraftwerk
Schwarze Pumpe Block B -
Spremberg
DBB LNB - Air staging - WFGD -
ESP - Supercritical steam
Power and
district heating 2100
Lignite 98.5 -
Waste 1.5 6312 91 1998
128-
1VC DE
Vattenfall Europe
Generation AG - Kraftwerk
Jänschwalde A - Peitz
DBB LNB - Air staging - WFGD -
ESP
Power and
district heating 1524 Lignite 97 - Waste 3 6561 83 1981
128-
2VC DE
Vattenfall Europe
Generation AG - Kraftwerk
Jänschwalde B - Peitz
DBB LNB - Air staging - WFGD -
ESP
Power and
district heating 1524 Lignite 97 - Waste 3 7736 83 1982
128-
3VC DE
Vattenfall Europe
Generation AG - Kraftwerk
Jänschwalde C - Peitz
DBB LNB - Air staging - WFGD -
ESP
Power and
district heating 1524 Lignite 98 - Waste 2 8587 84 1983
WORKIN
G DRAFT IN
PROGRESS

Chapter 13
884 June 2016 TL/JFF/FN/EIPPCB/LCP_Final Draft
128-
4VC DE
Vattenfall Europe
Generation AG - Kraftwerk
Jänschwalde D - Peitz
DBB LNB - Air staging - WFGD -
ESP
Power and
district heating 1524 Lignite 98 - Waste 2 8404 85 1985
129-
1VC DE
Vattenfall Europe
Generation AG - Kraftwerk
Jänschwalde E - Peitz
DBB LNB - Air staging - WFGD -
ESP
Power and
district heating 1524 Lignite 100 7700 85 1987
129-
2VC DE
Vattenfall Europe
Generation AG - Kraftwerk
Jänschwalde F - Peitz
DBB LNB - Air staging - WFGD -
ESP
Power and
district heating 1524 Lignite 100 7346 85 1988
130VC DE
RWE Power AG -
Kraftwerk Neurath, Block E
- Grevenbroich
DBB LNB - Air staging - WFGD -
ESP Power 1702 Lignite 100 7345 84 1975
131V DE E.ON Kraftwerke GmbH -
Kraftwerk Wilhelmshaven DBB
LNB - Air staging - SCR -
WFGD - ESP Power 1870
Coal 98.8 - Gas oil 1 -
Coke 0.2 5721 83 1976
132VC DE
E.ON Kraftwerke GmbH -
Kraftwerk Heyden -
Petershagen
DBB LNB - Air staging - SCR -
Fuel staging - WFGD - ESP Power 2150 Coal 100 6836 78 1987
133VC DE
E.ON Kraftwerke GmbH -
Kraftwerk Schkopau -
Korbetha
DBB
LNB - Air/Fuel staging -
WFGD - ESP - Supercritical
steam
Power and
Chemical
industry
1256 Lignite 100 6634 NA NA
134VC DE E.ON Kraftwerke GmbH -
FWK Buer - Gelsenkirchen DBB
LNB - Air staging - SCR -
WFGD - ESP - Supercritical
steam
Power and
district heating 383 Coal 99.5 - HFO 0.5 6909 91 1985
135V DE
E.ON Kraftwerke GmbH -
Kraftwerk Kirchmöser -
Brandenburg
CCGT DLN Power 360 NG 100 4081 95 1994
136V DE
E.ON Kraftwerke GmbH -
Kraftwerk Irsching, Block 4
- Vohburg an der Donau
CCGT Retrofit from GT to CCGT -
DLN Power 900 NG 100 3914 86 2007
137VC DE
RWE Power AG -
Kraftwerk Neurath, Block
A - Grevenbroich
DBB Air staging - LNB - FGR -
WFGD - ESP Power 855 Lignite 100 6720 77 1972
138V DE
Steag GmbH -
Heizkraftwerk Herne,
Block 3 - Herne
WBB
LNB - Air staging - SCR -
WFGD - ESP with SO3
injection
Iron & Steel 805 Coal 91 - COG 9 5225 65 1963
139V DE
Steag GmbH -
Heizkraftwerk Herne,
Block 4 - Herne
DBB
LNB - Air staging - SCR -
WFGD - ESP with SO3
injection - Supercritical
steam
Iron & Steel 1278 Coal 93 - COG 7 6189 62 1989
WORKIN
G DRAFT IN
PROGRESS
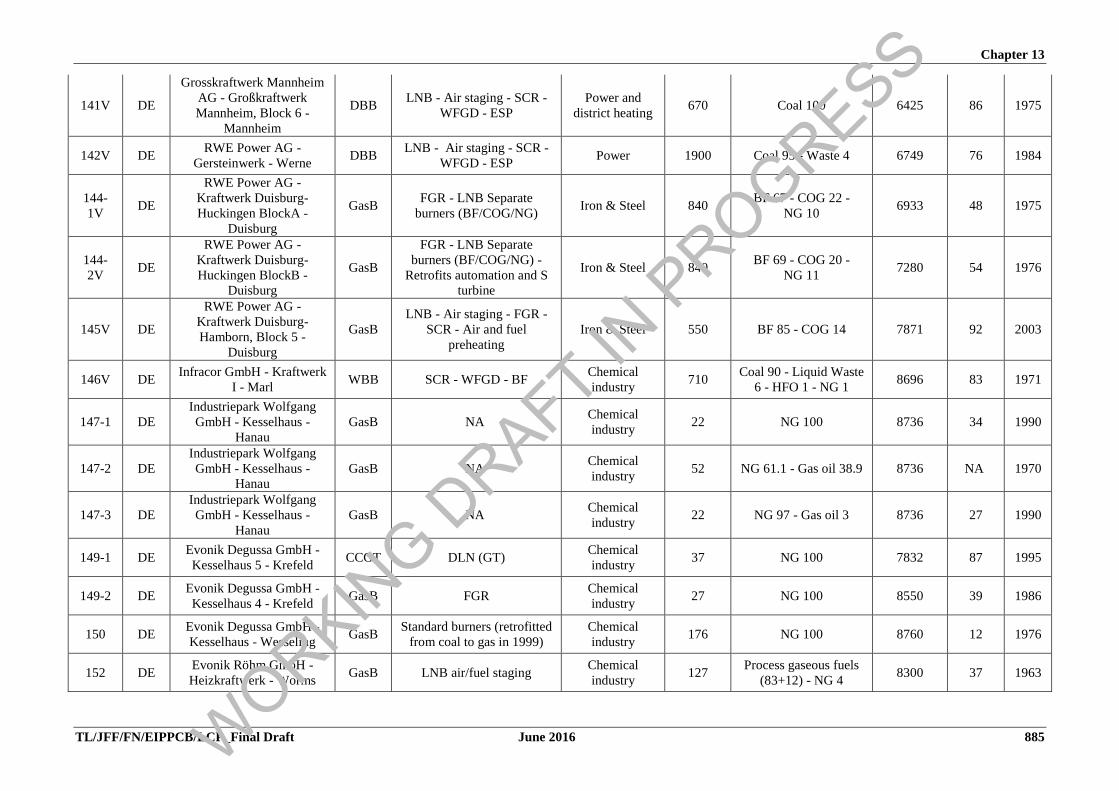
Chapter 13
TL/JFF/FN/EIPPCB/LCP_Final Draft June 2016 885
141V DE
Grosskraftwerk Mannheim
AG - Großkraftwerk
Mannheim, Block 6 -
Mannheim
DBB LNB - Air staging - SCR -
WFGD - ESP
Power and
district heating 670 Coal 100 6425 86 1975
142V DE RWE Power AG -
Gersteinwerk - Werne DBB
LNB - Air staging - SCR -
WFGD - ESP Power 1900 Coal 95 - Waste 4 6749 76 1984
144-
1V DE
RWE Power AG -
Kraftwerk Duisburg-
Huckingen BlockA -
Duisburg
GasB FGR - LNB Separate
burners (BF/COG/NG) Iron & Steel 840
BF 67 - COG 22 -
NG 10 6933 48 1975
144-
2V DE
RWE Power AG -
Kraftwerk Duisburg-
Huckingen BlockB -
Duisburg
GasB
FGR - LNB Separate
burners (BF/COG/NG) -
Retrofits automation and S
turbine
Iron & Steel 840 BF 69 - COG 20 -
NG 11 7280 54 1976
145V DE
RWE Power AG -
Kraftwerk Duisburg-
Hamborn, Block 5 -
Duisburg
GasB
LNB - Air staging - FGR -
SCR - Air and fuel
preheating
Iron & Steel 550 BF 85 - COG 14 7871 92 2003
146V DE Infracor GmbH - Kraftwerk
I - Marl WBB SCR - WFGD - BF
Chemical
industry 710
Coal 90 - Liquid Waste
6 - HFO 1 - NG 1 8696 83 1971
147-1 DE
Industriepark Wolfgang
GmbH - Kesselhaus -
Hanau
GasB NA Chemical
industry 22 NG 100 8736 34 1990
147-2 DE
Industriepark Wolfgang
GmbH - Kesselhaus -
Hanau
GasB NA Chemical
industry 52 NG 61.1 - Gas oil 38.9 8736 NA 1970
147-3 DE
Industriepark Wolfgang
GmbH - Kesselhaus -
Hanau
GasB NA Chemical
industry 22 NG 97 - Gas oil 3 8736 27 1990
149-1 DE Evonik Degussa GmbH -
Kesselhaus 5 - Krefeld CCGT DLN (GT)
Chemical
industry 37 NG 100 7832 87 1995
149-2 DE Evonik Degussa GmbH -
Kesselhaus 4 - Krefeld GasB FGR
Chemical
industry 27 NG 100 8550 39 1986
150 DE Evonik Degussa GmbH -
Kesselhaus - Wesseling GasB
Standard burners (retrofitted
from coal to gas in 1999)
Chemical
industry 176 NG 100 8760 12 1976
152 DE Evonik Röhm GmbH -
Heizkraftwerk - Worms GasB LNB air/fuel staging
Chemical
industry 127
Process gaseous fuels
(83+12) - NG 4 8300 37 1963
WORKIN
G DRAFT IN
PROGRESS

Chapter 13
886 June 2016 TL/JFF/FN/EIPPCB/LCP_Final Draft
153-1 DE
Solvay Chemicals GmbH -
Cogeneration plant TG 1 -
Rheinberg
CCGT Water injection Chemical
industry 74 NG 100 7030 89 1996
153-2C DE
Solvay Chemicals GmbH -
Coal Boiler GN 6 -
Rheinberg
WBB LNB - Air staging - SNCR -
DSI
Chemical
industry 192 Coal 100 8415 81 1983
153-3 DE
Solvay Chemicals GmbH -
Cogeneration plant TG 2 -
Rheinberg
CCGT Water injection Chemical
industry 74 NG 100 6478 96 1996
154-1 DE
BASF AG - Ludwigshafen-
Mitte -
Schnellstartreservekessel 10
- Ludwigshafen
Liquid
B No abatement techniques
Chemical
industry 327 Gas oil 100 1015 21 1970
154-2 DE
BASF AG - Ludwigshafen-
Mitte -
Schnellstartreservekessel 11
- Ludwigshafen
Liquid
B No abatement techniques
Chemical
industry 327 Gas oil 100 1015 21 1970
154-3 DE
BASF AG - Ludwigshafen-
Mitte - Kraftwerk Nord
Kessel 301 + Kessel 302 -
Ludwigshafen
Boiler LNB - FGR Chemical
industry 368
Process gas fuel 43 -
NG 30 - Liquid process
fuel 27
7716 63 1964
154-4 DE
BASF AG - Ludwigshafen-
Mitte - GuD A800 Block 11
- Ludwigshafen
CCGT DLN Chemical
industry 715 NG 100 8334 72 2005
154-5 DE
BASF AG - Ludwigshafen-
Mitte - GuD A800 Block 12
- Ludwigshafen
CCGT DLN Chemical
industry 715 NG 100 8334 72 2005
154-6 DE
BASF AG - Ludwigshafen-
Mitte - GuD C211 Block 1 -
Ludwigshafen
CCGT DLN - Planned burner
retrofit in 2012
Chemical
industry 500 NG 100 6940 84 1997
154-7 DE
BASF AG - Ludwigshafen-
Mitte - GuD C211 Block 2 -
Ludwigshafen
CCGT DLN Chemical
industry 500 NG 100 6940 84 1997
156V DE CURRENTA GmbH&CO
OHG - WSK L57 - Krefeld CFB
Fuel staging - Air staging -
FGR - Boiler sorbent
injection - Cyclone - BF
Chemical
industry 207
Coal 61 - NG 25 -
Gaseous fuel 11 -
Liquid waste 2
7884 73 1992
157-
1V DE
Dow Deutschland Anlagen
GmbH - Steam boiler 15HA
- Stade
GasB LNB - FGR Chemical
industry 165 NG 25 - H2 75 7452 36 2010
WORKIN
G DRAFT IN
PROGRESS
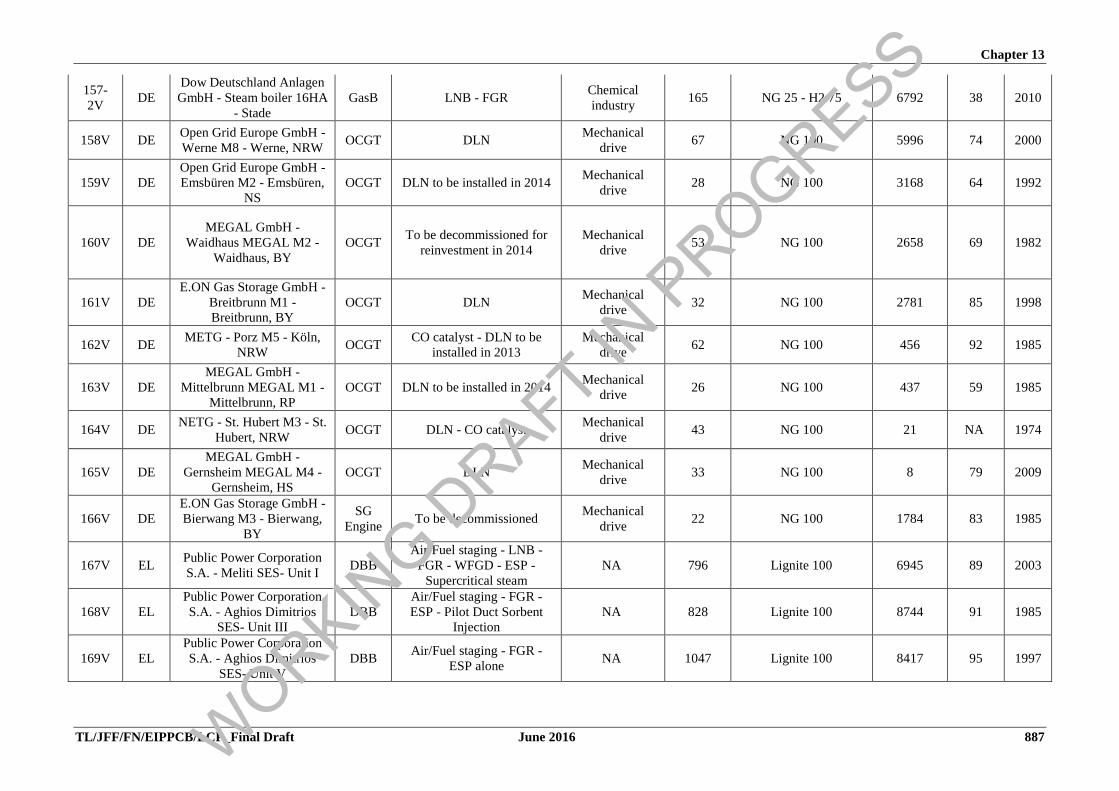
Chapter 13
TL/JFF/FN/EIPPCB/LCP_Final Draft June 2016 887
157-
2V DE
Dow Deutschland Anlagen
GmbH - Steam boiler 16HA
- Stade
GasB LNB - FGR Chemical
industry 165 NG 25 - H2 75 6792 38 2010
158V DE Open Grid Europe GmbH -
Werne M8 - Werne, NRW OCGT DLN
Mechanical
drive 67 NG 100 5996 74 2000
159V DE
Open Grid Europe GmbH -
Emsbüren M2 - Emsbüren,
NS
OCGT DLN to be installed in 2014 Mechanical
drive 28 NG 100 3168 64 1992
160V DE
MEGAL GmbH -
Waidhaus MEGAL M2 -
Waidhaus, BY
OCGT To be decommissioned for
reinvestment in 2014
Mechanical
drive 53 NG 100 2658 69 1982
161V DE
E.ON Gas Storage GmbH -
Breitbrunn M1 -
Breitbrunn, BY
OCGT DLN Mechanical
drive 32 NG 100 2781 85 1998
162V DE METG - Porz M5 - Köln,
NRW OCGT
CO catalyst - DLN to be
installed in 2013
Mechanical
drive 62 NG 100 456 92 1985
163V DE
MEGAL GmbH -
Mittelbrunn MEGAL M1 -
Mittelbrunn, RP
OCGT DLN to be installed in 2014 Mechanical
drive 26 NG 100 437 59 1985
164V DE NETG - St. Hubert M3 - St.
Hubert, NRW OCGT DLN - CO catalyst
Mechanical
drive 43 NG 100 21 NA 1974
165V DE
MEGAL GmbH -
Gernsheim MEGAL M4 -
Gernsheim, HS
OCGT DLN Mechanical
drive 33 NG 100 8 79 2009
166V DE
E.ON Gas Storage GmbH -
Bierwang M3 - Bierwang,
BY
SG
Engine To be decommissioned
Mechanical
drive 22 NG 100 1784 83 1985
167V EL Public Power Corporation
S.A. - Meliti SES- Unit I DBB
Air/Fuel staging - LNB -
FGR - WFGD - ESP -
Supercritical steam
NA 796 Lignite 100 6945 89 2003
168V EL
Public Power Corporation
S.A. - Aghios Dimitrios
SES- Unit III
DBB
Air/Fuel staging - FGR -
ESP - Pilot Duct Sorbent
Injection
NA 828 Lignite 100 8744 91 1985
169V EL
Public Power Corporation
S.A. - Aghios Dimitrios
SES- Unit V
DBB Air/Fuel staging - FGR -
ESP alone NA 1047 Lignite 100 8417 95 1997
WORKIN
G DRAFT IN
PROGRESS
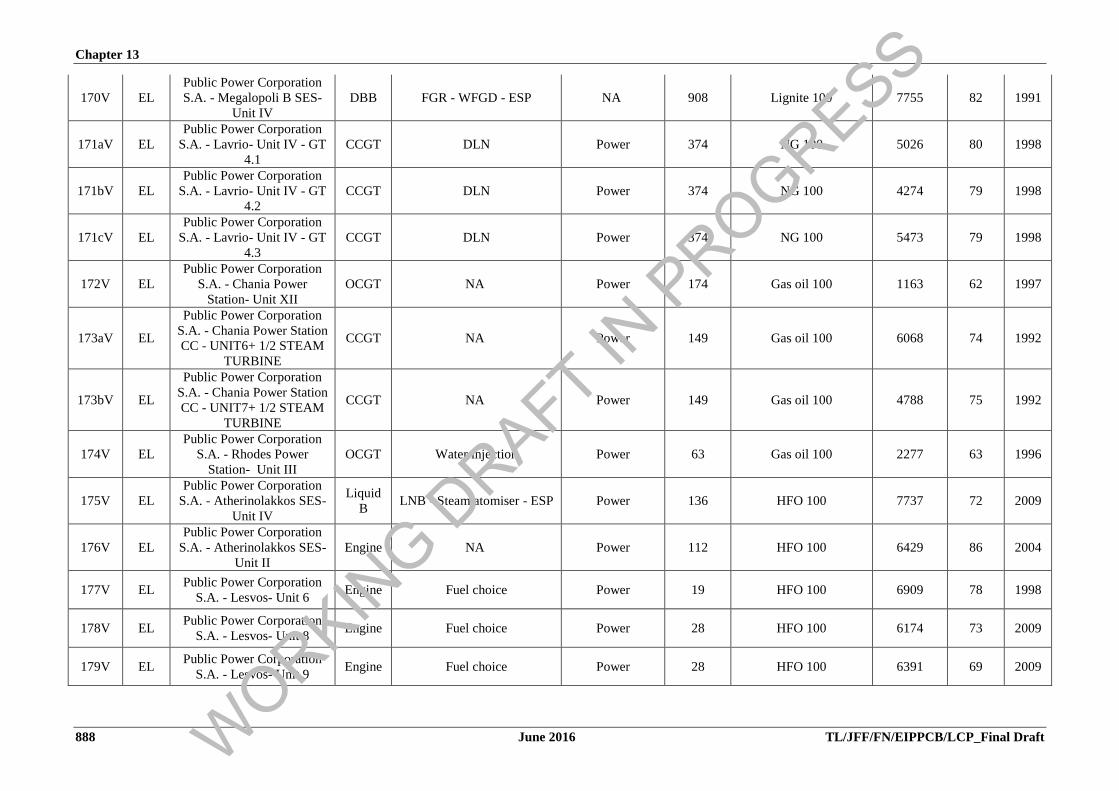
Chapter 13
888 June 2016 TL/JFF/FN/EIPPCB/LCP_Final Draft
170V EL
Public Power Corporation
S.A. - Megalopoli B SES-
Unit IV
DBB FGR - WFGD - ESP NA 908 Lignite 100 7755 82 1991
171aV EL
Public Power Corporation
S.A. - Lavrio- Unit IV - GT
4.1
CCGT DLN Power 374 NG 100 5026 80 1998
171bV EL
Public Power Corporation
S.A. - Lavrio- Unit IV - GT
4.2
CCGT DLN Power 374 NG 100 4274 79 1998
171cV EL
Public Power Corporation
S.A. - Lavrio- Unit IV - GT
4.3
CCGT DLN Power 374 NG 100 5473 79 1998
172V EL
Public Power Corporation
S.A. - Chania Power
Station- Unit XII
OCGT NA Power 174 Gas oil 100 1163 62 1997
173aV EL
Public Power Corporation
S.A. - Chania Power Station
CC - UNIT6+ 1/2 STEAM
TURBINE
CCGT NA Power 149 Gas oil 100 6068 74 1992
173bV EL
Public Power Corporation
S.A. - Chania Power Station
CC - UNIT7+ 1/2 STEAM
TURBINE
CCGT NA Power 149 Gas oil 100 4788 75 1992
174V EL
Public Power Corporation
S.A. - Rhodes Power
Station- Unit III
OCGT Water injection Power 63 Gas oil 100 2277 63 1996
175V EL
Public Power Corporation
S.A. - Atherinolakkos SES-
Unit IV
Liquid
B LNB - Steam atomiser - ESP Power 136 HFO 100 7737 72 2009
176V EL
Public Power Corporation
S.A. - Atherinolakkos SES-
Unit II
Engine NA Power 112 HFO 100 6429 86 2004
177V EL Public Power Corporation
S.A. - Lesvos- Unit 6 Engine Fuel choice Power 19 HFO 100 6909 78 1998
178V EL Public Power Corporation
S.A. - Lesvos- Unit 8 Engine Fuel choice Power 28 HFO 100 6174 73 2009
179V EL Public Power Corporation
S.A. - Lesvos- Unit 9 Engine Fuel choice Power 28 HFO 100 6391 69 2009
WORKIN
G DRAFT IN
PROGRESS

Chapter 13
TL/JFF/FN/EIPPCB/LCP_Final Draft June 2016 889
180V EL Public Power Corporation
S.A. - Lesvos- Unit 10 Engine Fuel choice Power 26 HFO 100 6323 74 2000
181V EL Public Power Corporation
S.A. - Lesvos- Unit 11 Engine Fuel choice Power 25 HFO 100 6940 65 1988
182V EL Heron II - Thiva CCGT DLN Power 754 NG 100 8091 76 2010
183 HU
MVM Vertes Power Plant
Ltd. - Vertesi Eromu -
Oroszlany
WBB NA Power and
district heating 165
Lignite 64 - Wood 30 -
Straw 5 -
Petrochemical residues
1
NA NA 1963
184V HU
Matrai Eromu ZRt. -
Hungary Visonta, Eromu u
11.
WBB LNB - Air staging - WFGD -
ESP NA 2396 Lignite 84 8700 87 1969
185 HU
Sinergy Kft. - Furedi utca
Gas Engine CHP -
Budapest
SG
Engine NA
Power and
district heating 42 NG 100 NA NA 2005
186-1 HU
CHP-Erőmű Kft. -
Ujpalotai Gas Engine
Power Plant - Budapest
SG
Engine NA
Power and
district heating 54 NG 100 5968 98 2005
187V IE
Bord Gais Eireann -
Whitegate Power Station -
Whitegate, Cork
CCGT DLN - Double reheat Power 754 NG 100 6941 90 2010
188V IE
Bord na Móna - Edenderry
Power - Edenderry, Co
Offaly
BFB LNB - Air/Fuel staging -
Sorbent injection - ESP NA 293 Peat 89 - WB 11 7660 87 2000
189V IE
ESB Energy International -
ESB Moneypoint Unit 1 -
Co Clare, Ireland
WBB LNB - SCR - FGD CFB dry
scrubber Power 970 Coal 98 - HFO 2 6690 56 1986
190V IE
ESB Energy International -
ESB Lough Ree - Co
Longford, Ireland
CFB AS - SNCR - Sorbent
injection - BF Power 263 Peat 100 8178 89 2004
191V IE
ESB Energy International -
ESB Aghada CCGT - Co
Cork, Ireland
CCGT
DLN - Emulsified fuel when
running only on gas oil -
Fuel preheating at 150 °C
Power 743 NG 100 3732 85 2010
192V IE
Endesa Ireland Ltd. -
Tarbert Unit 3 - Tarbert,
County Kerry
Liquid
B NA Power 641 HFO 100 2275 34 1976
WORKIN
G DRAFT IN
PROGRESS
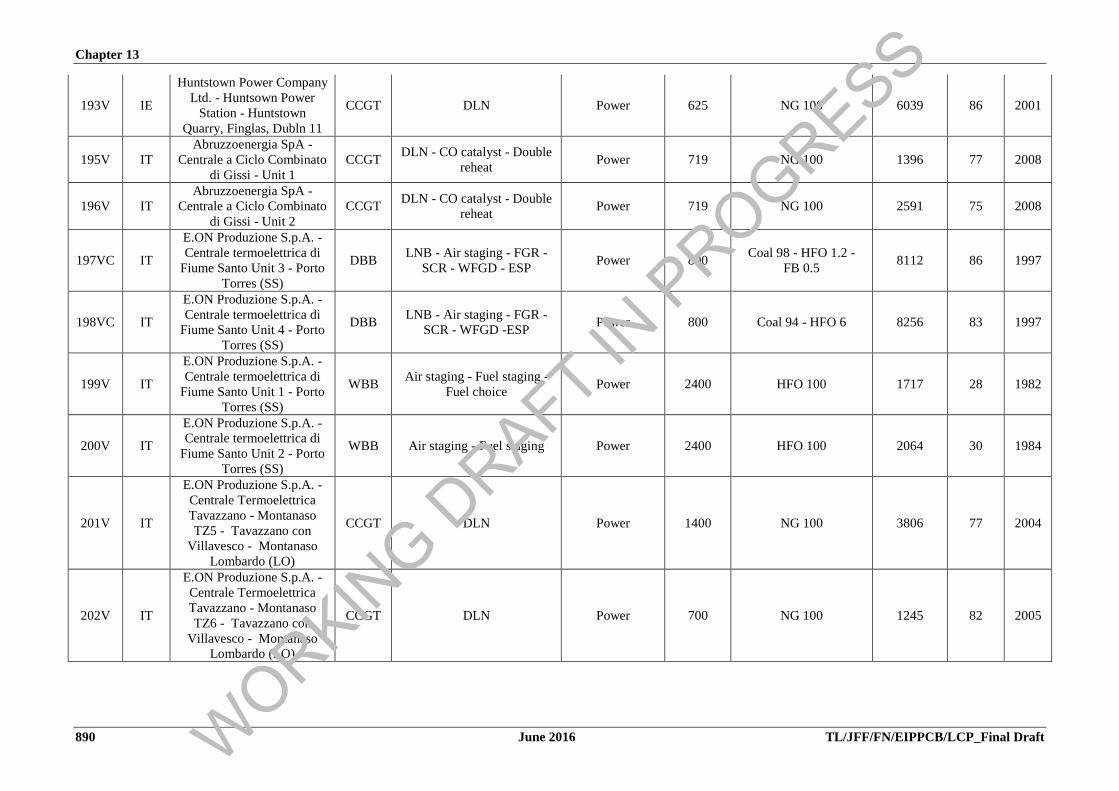
Chapter 13
890 June 2016 TL/JFF/FN/EIPPCB/LCP_Final Draft
193V IE
Huntstown Power Company
Ltd. - Huntsown Power
Station - Huntstown
Quarry, Finglas, Dubln 11
CCGT DLN Power 625 NG 100 6039 86 2001
195V IT
Abruzzoenergia SpA -
Centrale a Ciclo Combinato
di Gissi - Unit 1
CCGT DLN - CO catalyst - Double
reheat Power 719 NG 100 1396 77 2008
196V IT
Abruzzoenergia SpA -
Centrale a Ciclo Combinato
di Gissi - Unit 2
CCGT DLN - CO catalyst - Double
reheat Power 719 NG 100 2591 75 2008
197VC IT
E.ON Produzione S.p.A. -
Centrale termoelettrica di
Fiume Santo Unit 3 - Porto
Torres (SS)
DBB LNB - Air staging - FGR -
SCR - WFGD - ESP Power 800
Coal 98 - HFO 1.2 -
FB 0.5 8112 86 1997
198VC IT
E.ON Produzione S.p.A. -
Centrale termoelettrica di
Fiume Santo Unit 4 - Porto
Torres (SS)
DBB LNB - Air staging - FGR -
SCR - WFGD -ESP Power 800 Coal 94 - HFO 6 8256 83 1997
199V IT
E.ON Produzione S.p.A. -
Centrale termoelettrica di
Fiume Santo Unit 1 - Porto
Torres (SS)
WBB Air staging - Fuel staging -
Fuel choice Power 2400 HFO 100 1717 28 1982
200V IT
E.ON Produzione S.p.A. -
Centrale termoelettrica di
Fiume Santo Unit 2 - Porto
Torres (SS)
WBB Air staging - Fuel staging Power 2400 HFO 100 2064 30 1984
201V IT
E.ON Produzione S.p.A. -
Centrale Termoelettrica
Tavazzano - Montanaso
TZ5 - Tavazzano con
Villavesco - Montanaso
Lombardo (LO)
CCGT DLN Power 1400 NG 100 3806 77 2004
202V IT
E.ON Produzione S.p.A. -
Centrale Termoelettrica
Tavazzano - Montanaso
TZ6 - Tavazzano con
Villavesco - Montanaso
Lombardo (LO)
CCGT DLN Power 700 NG 100 1245 82 2005
WORKIN
G DRAFT IN
PROGRESS
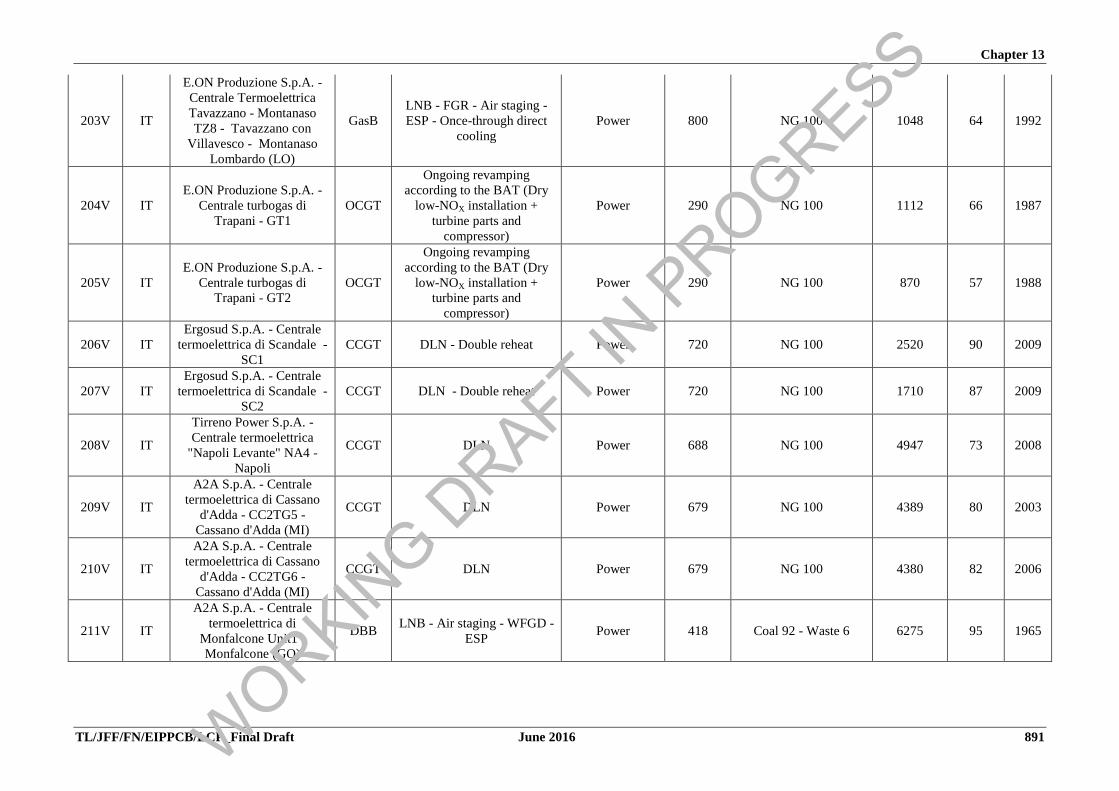
Chapter 13
TL/JFF/FN/EIPPCB/LCP_Final Draft June 2016 891
203V IT
E.ON Produzione S.p.A. -
Centrale Termoelettrica
Tavazzano - Montanaso
TZ8 - Tavazzano con
Villavesco - Montanaso
Lombardo (LO)
GasB
LNB - FGR - Air staging -
ESP - Once-through direct
cooling
Power 800 NG 100 1048 64 1992
204V IT
E.ON Produzione S.p.A. -
Centrale turbogas di
Trapani - GT1
OCGT
Ongoing revamping
according to the BAT (Dry
low-NOX installation +
turbine parts and
compressor)
Power 290 NG 100 1112 66 1987
205V IT
E.ON Produzione S.p.A. -
Centrale turbogas di
Trapani - GT2
OCGT
Ongoing revamping
according to the BAT (Dry
low-NOX installation +
turbine parts and
compressor)
Power 290 NG 100 870 57 1988
206V IT
Ergosud S.p.A. - Centrale
termoelettrica di Scandale -
SC1
CCGT DLN - Double reheat Power 720 NG 100 2520 90 2009
207V IT
Ergosud S.p.A. - Centrale
termoelettrica di Scandale -
SC2
CCGT DLN - Double reheat Power 720 NG 100 1710 87 2009
208V IT
Tirreno Power S.p.A. -
Centrale termoelettrica
"Napoli Levante" NA4 -
Napoli
CCGT DLN Power 688 NG 100 4947 73 2008
209V IT
A2A S.p.A. - Centrale
termoelettrica di Cassano
d'Adda - CC2TG5 -
Cassano d'Adda (MI)
CCGT DLN Power 679 NG 100 4389 80 2003
210V IT
A2A S.p.A. - Centrale
termoelettrica di Cassano
d'Adda - CC2TG6 -
Cassano d'Adda (MI)
CCGT DLN Power 679 NG 100 4380 82 2006
211V IT
A2A S.p.A. - Centrale
termoelettrica di
Monfalcone Unit1 -
Monfalcone (GO)
DBB LNB - Air staging - WFGD -
ESP Power 418 Coal 92 - Waste 6 6275 95 1965
WORKIN
G DRAFT IN
PROGRESS
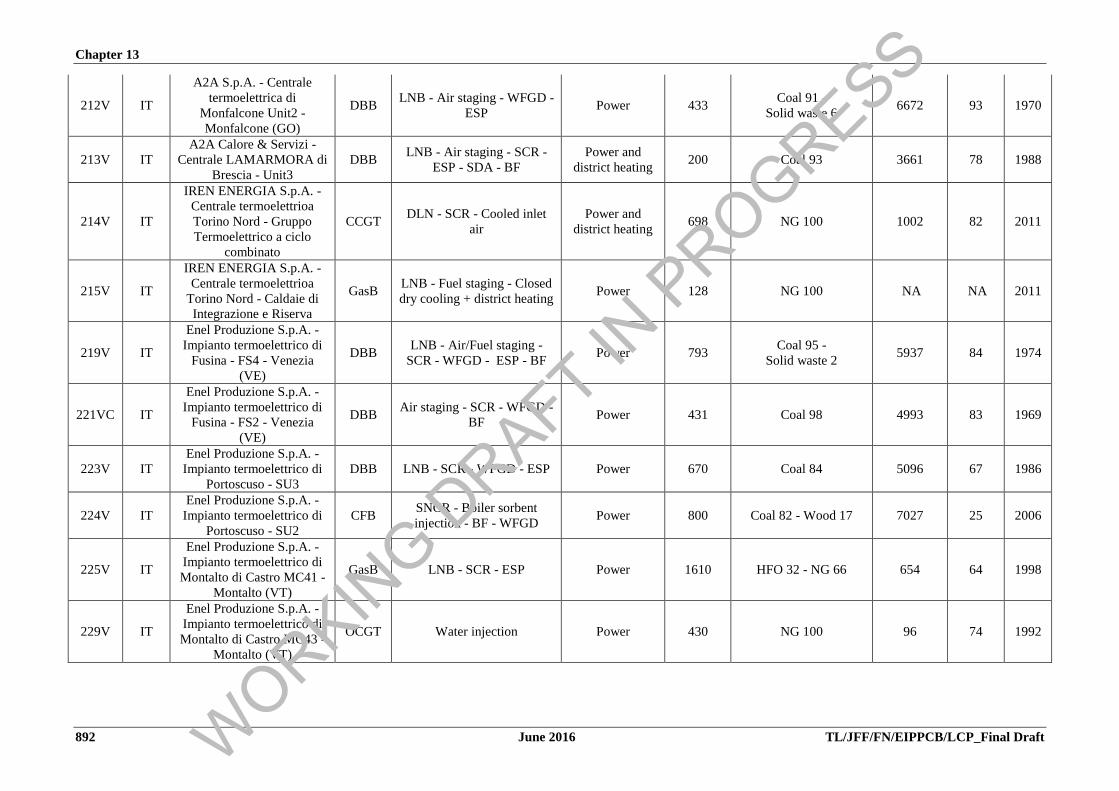
Chapter 13
892 June 2016 TL/JFF/FN/EIPPCB/LCP_Final Draft
212V IT
A2A S.p.A. - Centrale
termoelettrica di
Monfalcone Unit2 -
Monfalcone (GO)
DBB LNB - Air staging - WFGD -
ESP Power 433
Coal 91 -
Solid waste 6 6672 93 1970
213V IT
A2A Calore & Servizi -
Centrale LAMARMORA di
Brescia - Unit3
DBB LNB - Air staging - SCR -
ESP - SDA - BF
Power and
district heating 200 Coal 93 3661 78 1988
214V IT
IREN ENERGIA S.p.A. -
Centrale termoelettrioa
Torino Nord - Gruppo
Termoelettrico a ciclo
combinato
CCGT DLN - SCR - Cooled inlet
air
Power and
district heating 698 NG 100 1002 82 2011
215V IT
IREN ENERGIA S.p.A. -
Centrale termoelettrioa
Torino Nord - Caldaie di
Integrazione e Riserva
GasB LNB - Fuel staging - Closed
dry cooling + district heating Power 128 NG 100 NA NA 2011
219V IT
Enel Produzione S.p.A. -
Impianto termoelettrico di
Fusina - FS4 - Venezia
(VE)
DBB LNB - Air/Fuel staging -
SCR - WFGD - ESP - BF Power 793
Coal 95 -
Solid waste 2 5937 84 1974
221VC IT
Enel Produzione S.p.A. -
Impianto termoelettrico di
Fusina - FS2 - Venezia
(VE)
DBB Air staging - SCR - WFGD -
BF Power 431 Coal 98 4993 83 1969
223V IT
Enel Produzione S.p.A. -
Impianto termoelettrico di
Portoscuso - SU3
DBB LNB - SCR - WFGD - ESP Power 670 Coal 84 5096 67 1986
224V IT
Enel Produzione S.p.A. -
Impianto termoelettrico di
Portoscuso - SU2
CFB SNCR - Boiler sorbent
injection - BF - WFGD Power 800 Coal 82 - Wood 17 7027 25 2006
225V IT
Enel Produzione S.p.A. -
Impianto termoelettrico di
Montalto di Castro MC41 -
Montalto (VT)
GasB LNB - SCR - ESP Power 1610 HFO 32 - NG 66 654 64 1998
229V IT
Enel Produzione S.p.A. -
Impianto termoelettrico di
Montalto di Castro MC43 -
Montalto (VT)
OCGT Water injection Power 430 NG 100 96 74 1992
WORKIN
G DRAFT IN
PROGRESS
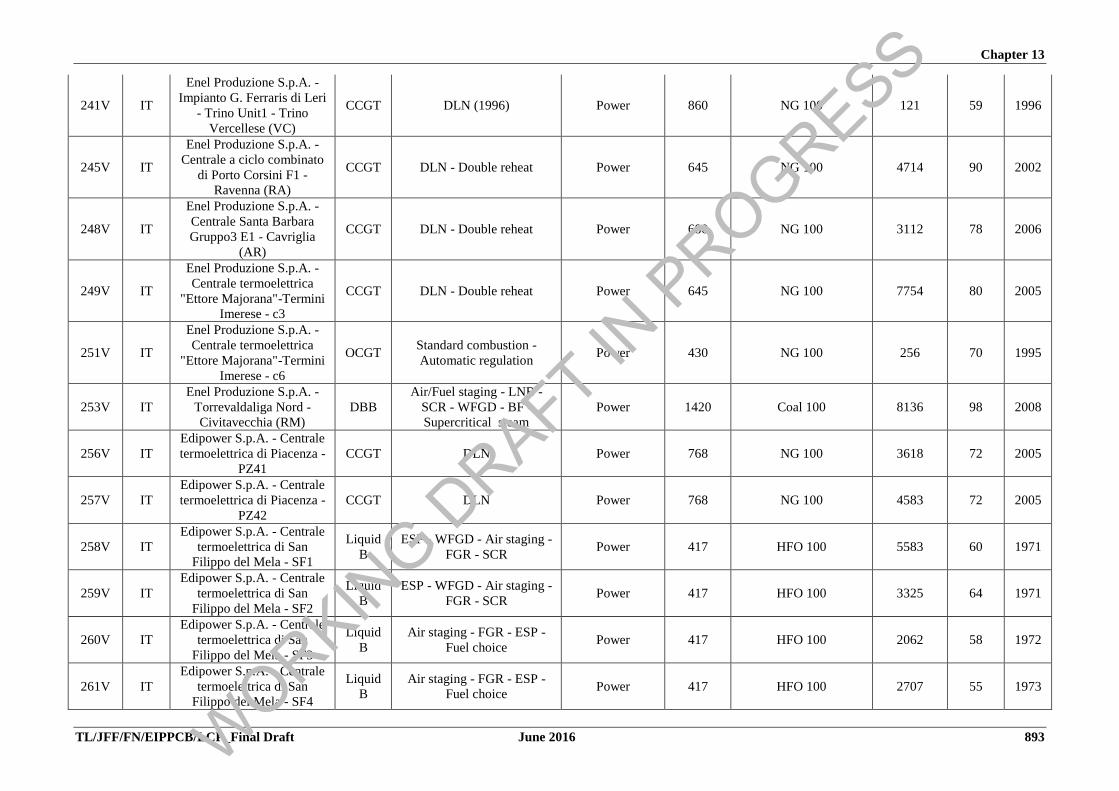
Chapter 13
TL/JFF/FN/EIPPCB/LCP_Final Draft June 2016 893
241V IT
Enel Produzione S.p.A. -
Impianto G. Ferraris di Leri
- Trino Unit1 - Trino
Vercellese (VC)
CCGT DLN (1996) Power 860 NG 100 121 59 1996
245V IT
Enel Produzione S.p.A. -
Centrale a ciclo combinato
di Porto Corsini F1 -
Ravenna (RA)
CCGT DLN - Double reheat Power 645 NG 100 4714 90 2002
248V IT
Enel Produzione S.p.A. -
Centrale Santa Barbara
Gruppo3 E1 - Cavriglia
(AR)
CCGT DLN - Double reheat Power 680 NG 100 3112 78 2006
249V IT
Enel Produzione S.p.A. -
Centrale termoelettrica
"Ettore Majorana"-Termini
Imerese - c3
CCGT DLN - Double reheat Power 645 NG 100 7754 80 2005
251V IT
Enel Produzione S.p.A. -
Centrale termoelettrica
"Ettore Majorana"-Termini
Imerese - c6
OCGT Standard combustion -
Automatic regulation Power 430 NG 100 256 70 1995
253V IT
Enel Produzione S.p.A. -
Torrevaldaliga Nord -
Civitavecchia (RM)
DBB
Air/Fuel staging - LNB -
SCR - WFGD - BF -
Supercritical steam
Power 1420 Coal 100 8136 98 2008
256V IT
Edipower S.p.A. - Centrale
termoelettrica di Piacenza -
PZ41
CCGT DLN Power 768 NG 100 3618 72 2005
257V IT
Edipower S.p.A. - Centrale
termoelettrica di Piacenza -
PZ42
CCGT DLN Power 768 NG 100 4583 72 2005
258V IT
Edipower S.p.A. - Centrale
termoelettrica di San
Filippo del Mela - SF1
Liquid
B
ESP - WFGD - Air staging -
FGR - SCR Power 417 HFO 100 5583 60 1971
259V IT
Edipower S.p.A. - Centrale
termoelettrica di San
Filippo del Mela - SF2
Liquid
B
ESP - WFGD - Air staging -
FGR - SCR Power 417 HFO 100 3325 64 1971
260V IT
Edipower S.p.A. - Centrale
termoelettrica di San
Filippo del Mela - SF3
Liquid
B
Air staging - FGR - ESP -
Fuel choice Power 417 HFO 100 2062 58 1972
261V IT
Edipower S.p.A. - Centrale
termoelettrica di San
Filippo del Mela - SF4
Liquid
B
Air staging - FGR - ESP -
Fuel choice Power 417 HFO 100 2707 55 1973
WORKIN
G DRAFT IN
PROGRESS

Chapter 13
894 June 2016 TL/JFF/FN/EIPPCB/LCP_Final Draft
262V IT
Edipower S.p.A. - Centrale
termoelettrica di San
Filippo del Mela - SF5
Liquid
B
ESP - WFGD - Steam
injection - Air staging - FGR
- SCR
Power 798 HFO 100 2397 67 1975
263V IT
Edipower S.p.A. - Centrale
termoelettrica di San
Filippo del Mela - SF6
Liquid
B
ESP - WFGD - Steam
injection - Air staging - FGR
- SCR
Power 798 HFO 100 1560 69 1975
264V IT
Edipower S.p.A. - Centrale
termoelettrica di Sermide -
3E
CCGT DLN Power 684 NG 100 1156 80 2003
265V IT
Edipower S.p.A. - Centrale
termoelettrica di Sermide -
4G
CCGT DLN Power 684 NG 100 5201 76 2004
266V IT
Edipower S.p.A. - Centrale
termoelettrica di Sermide -
4H
CCGT DLN Power 684 NG 100 4794 77 2004
267V IT Edipower S.p.A. - Brindisi -
BR3 WBB
FGR - SCR - Balanced air
flow - Low-S coal - ESP Power 857 Coal 96 - HFO 4 3421 69 74
268V IT Edipower S.p.A. - Brindisi -
BR4 WBB
FGR - SCR - Balanced air
flow - Low-S coal - ESP Power 857 Coal 97 - HFO 3 2992 68 1977
269V IT Edison S.p.A - Centrale
termoelettrica di Candela CCGT DLN
Power and
district heating 670 NG 100 7079 90 2005
270V IT
Edison S.p.A - Marghera
Levante - Marghera (VE) -
TG3
CCGT Steam injection Chemical
industry 393 NG 100 1731 79 1992
271V IT
Edison S.p.A - Marghera
Levante - Marghera (VE) -
TG4
CCGT Steam injection Chemical
industry 393 NG 100 1037 82 1992
272V IT
Edison S.p.A - Marghera
Levante - Marghera (VE) -
TG5
CCGT DLN Chemical
industry 669 NG 100 7957 75 2001
273V IT
ROSEN Rosignano Energia
S.p.A. - Centrale di
Rosignano TG1 -
Rosignano Marittimo (LI)
CCGT DLN Chemical
industry 449 NG 100 8314 93 1997
274V IT
ROSEN Rosignano Energia
S.p.A. - Centrale di
Rosignano TG2 -
Rosignano Marittimo (LI)
CCGT DLN Chemical
industry 449 NG 100 7322 94 1997
WORKIN
G DRAFT IN
PROGRESS
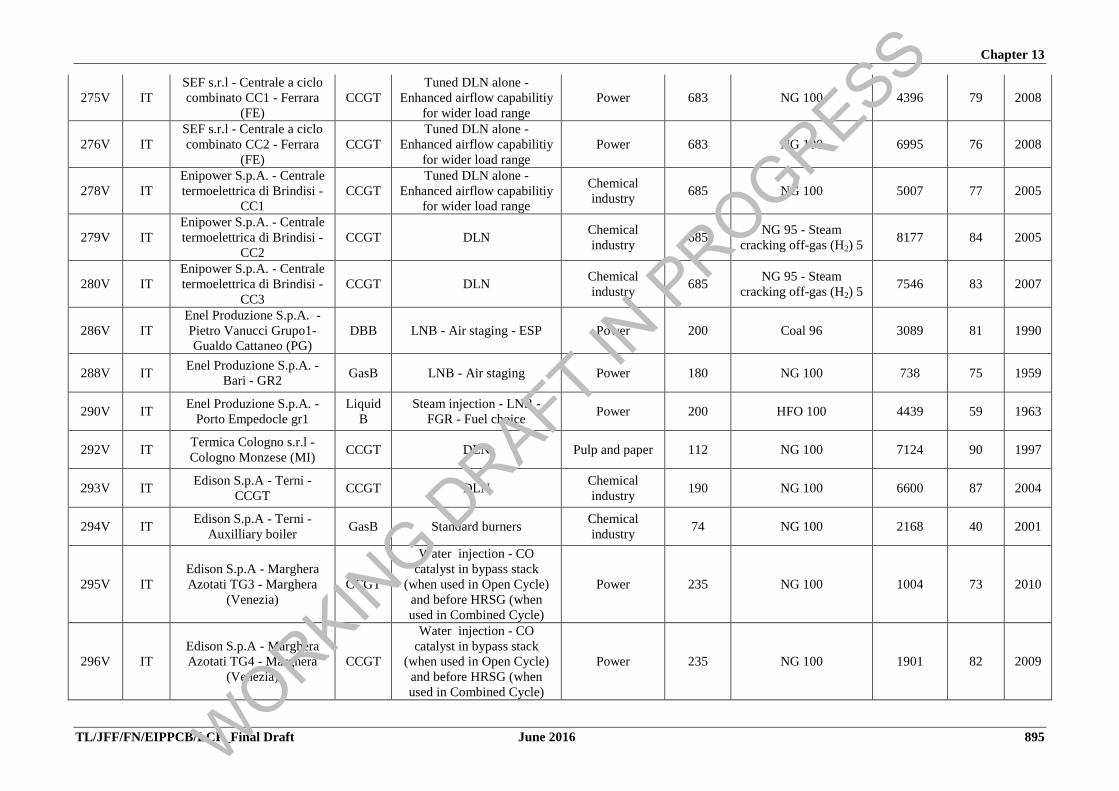
Chapter 13
TL/JFF/FN/EIPPCB/LCP_Final Draft June 2016 895
275V IT
SEF s.r.l - Centrale a ciclo
combinato CC1 - Ferrara
(FE)
CCGT
Tuned DLN alone -
Enhanced airflow capabilitiy
for wider load range
Power 683 NG 100 4396 79 2008
276V IT
SEF s.r.l - Centrale a ciclo
combinato CC2 - Ferrara
(FE)
CCGT
Tuned DLN alone -
Enhanced airflow capabilitiy
for wider load range
Power 683 NG 100 6995 76 2008
278V IT
Enipower S.p.A. - Centrale
termoelettrica di Brindisi -
CC1
CCGT
Tuned DLN alone -
Enhanced airflow capabilitiy
for wider load range
Chemical
industry 685 NG 100 5007 77 2005
279V IT
Enipower S.p.A. - Centrale
termoelettrica di Brindisi -
CC2
CCGT DLN Chemical
industry 685
NG 95 - Steam
cracking off-gas (H2) 5 8177 84 2005
280V IT
Enipower S.p.A. - Centrale
termoelettrica di Brindisi -
CC3
CCGT DLN Chemical
industry 685
NG 95 - Steam
cracking off-gas (H2) 5 7546 83 2007
286V IT
Enel Produzione S.p.A. -
Pietro Vanucci Grupo1-
Gualdo Cattaneo (PG)
DBB LNB - Air staging - ESP Power 200 Coal 96 3089 81 1990
288V IT Enel Produzione S.p.A. -
Bari - GR2 GasB LNB - Air staging Power 180 NG 100 738 75 1959
290V IT Enel Produzione S.p.A. -
Porto Empedocle gr1
Liquid
B
Steam injection - LNB -
FGR - Fuel choice Power 200 HFO 100 4439 59 1963
292V IT Termica Cologno s.r.l -
Cologno Monzese (MI) CCGT DLN Pulp and paper 112 NG 100 7124 90 1997
293V IT Edison S.p.A - Terni -
CCGT CCGT DLN
Chemical
industry 190 NG 100 6600 87 2004
294V IT Edison S.p.A - Terni -
Auxilliary boiler GasB Standard burners
Chemical
industry 74 NG 100 2168 40 2001
295V IT
Edison S.p.A - Marghera
Azotati TG3 - Marghera
(Venezia)
CCGT
Water injection - CO
catalyst in bypass stack
(when used in Open Cycle)
and before HRSG (when
used in Combined Cycle)
Power 235 NG 100 1004 73 2010
296V IT
Edison S.p.A - Marghera
Azotati TG4 - Marghera
(Venezia)
CCGT
Water injection - CO
catalyst in bypass stack
(when used in Open Cycle)
and before HRSG (when
used in Combined Cycle)
Power 235 NG 100 1901 82 2009
WORKIN
G DRAFT IN
PROGRESS

Chapter 13
896 June 2016 TL/JFF/FN/EIPPCB/LCP_Final Draft
297V IT
Polimeri Europa S.p.A. -
SA1-B4 - Porto Marghera
(VE)
Boiler Fuel choice - LNB - Air
staging - Double reheat
Chemical
industry 278
Liquid process fuel
66.6 - NG 21.2 -
Gaseous process fuel
17
4066 28 1966
298V IT Polimeri Europa S.p.A. -
Porto Marghera (VE) DBB
Fuel choice – Low-ash fuel -
LNB - Air staging - Double
reheat
Chemical
industry 139
Liquid process fuel 64
- NG 19 - Gaseous
process fuel 17
7158 72 1966
305V IT FENICE S.p.A -
Pedrignano (PR) CCGT DLN CHP 91 NG 100 NA NA 2008
307V IT
Società ionica gas S.p.A. -
360-KA-503 - Crotone
(KR)
CCGT DLN Mechanical
drive 18 NG 100 8400 84 2004
311V IT
Società ionica gas S.p.A. -
3601-KA-001 - Crotone
(KR)
CCGT DLN Mechanical
drive 21 NG 100 8400 67 2010
313V IT
Eni e&p - Distretto
Meridionale Centro Olio
Val D'agri Gas Turbine
V470-MT-001A & HRSG
V620-VC-001A - Viggiano
(PZ)
CCGT DLN GOSP (Gas oil
separation plant) 43
NG 75 - Off-gas oil
storage to HRSG 25 6739 89 2001
314V IT
Eni e&p - Distretto
Meridionale Centro Olio
Val D'agri Gas Turbine
V470-MT-001B & HRSG
V620-VC-001B - Viggiano
(PZ)
CCGT DLN GOSP (Gas oil
separation plant) 43
NG 75 - Off-gas oil
storage to HRSG 25 5557 88 2001
315V IT
Eni e&p - Distretto
Meridionale Centro Olio
Val D'agri Gas Turbine
V470-MT-001C & HRSG
V620-VC-001C - Viggiano
(PZ)
CCGT DLN GOSP (Gas oil
separation plant) 43
NG 75 - Off-gas oil
storage to HRSG 25 5492 88 2001
317V IT
Eni e&p - Distretto
Meridionale Centro Olio
Val D'agri V620-FG.001 B
- Viggiano (PZ)
GasB LNB GOSP (Gas oil
separation plant) 66 Gaseous process fuel 8559 36 2004
318V IT
Eni e&p - Distretto
Meridionale Centro Olio
Val D'agri V620-FG.001 C
- Viggiano (PZ)
GasB LNB GOSP (Gas oil
separation plant) 66 Gaseous process fuel 8471 36 2004
WORKIN
G DRAFT IN
PROGRESS
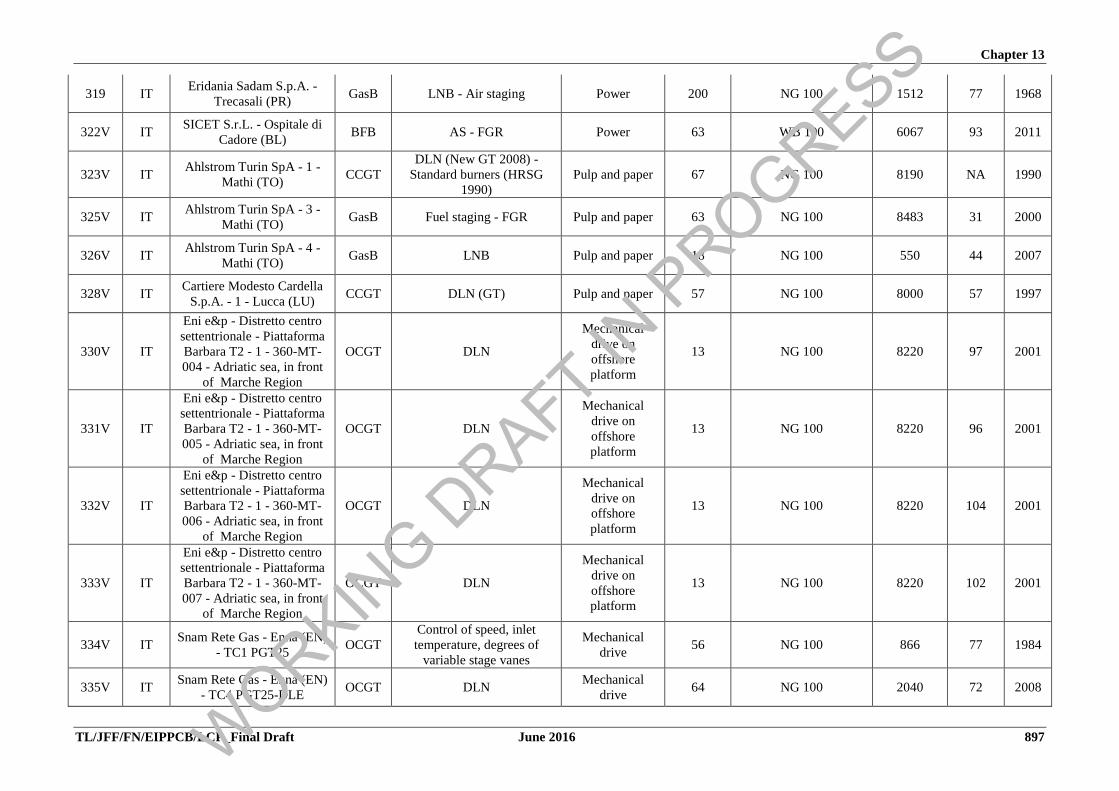
Chapter 13
TL/JFF/FN/EIPPCB/LCP_Final Draft June 2016 897
319 IT Eridania Sadam S.p.A. -
Trecasali (PR) GasB LNB - Air staging Power 200 NG 100 1512 77 1968
322V IT SICET S.r.L. - Ospitale di
Cadore (BL) BFB AS - FGR Power 63 WB 100 6067 93 2011
323V IT Ahlstrom Turin SpA - 1 -
Mathi (TO) CCGT
DLN (New GT 2008) -
Standard burners (HRSG
1990)
Pulp and paper 67 NG 100 8190 NA 1990
325V IT Ahlstrom Turin SpA - 3 -
Mathi (TO) GasB Fuel staging - FGR Pulp and paper 63 NG 100 8483 31 2000
326V IT Ahlstrom Turin SpA - 4 -
Mathi (TO) GasB LNB Pulp and paper 18 NG 100 550 44 2007
328V IT Cartiere Modesto Cardella
S.p.A. - 1 - Lucca (LU) CCGT DLN (GT) Pulp and paper 57 NG 100 8000 57 1997
330V IT
Eni e&p - Distretto centro
settentrionale - Piattaforma
Barbara T2 - 1 - 360-MT-
004 - Adriatic sea, in front
of Marche Region
OCGT DLN
Mechanical
drive on
offshore
platform
13 NG 100 8220 97 2001
331V IT
Eni e&p - Distretto centro
settentrionale - Piattaforma
Barbara T2 - 1 - 360-MT-
005 - Adriatic sea, in front
of Marche Region
OCGT DLN
Mechanical
drive on
offshore
platform
13 NG 100 8220 96 2001
332V IT
Eni e&p - Distretto centro
settentrionale - Piattaforma
Barbara T2 - 1 - 360-MT-
006 - Adriatic sea, in front
of Marche Region
OCGT DLN
Mechanical
drive on
offshore
platform
13 NG 100 8220 104 2001
333V IT
Eni e&p - Distretto centro
settentrionale - Piattaforma
Barbara T2 - 1 - 360-MT-
007 - Adriatic sea, in front
of Marche Region
OCGT DLN
Mechanical
drive on
offshore
platform
13 NG 100 8220 102 2001
334V IT Snam Rete Gas - Enna (EN)
- TC1 PGT25 OCGT
Control of speed, inlet
temperature, degrees of
variable stage vanes
Mechanical
drive 56 NG 100 866 77 1984
335V IT Snam Rete Gas - Enna (EN)
- TC4 PGT25-DLE OCGT DLN
Mechanical
drive 64 NG 100 2040 72 2008
WORKIN
G DRAFT IN
PROGRESS
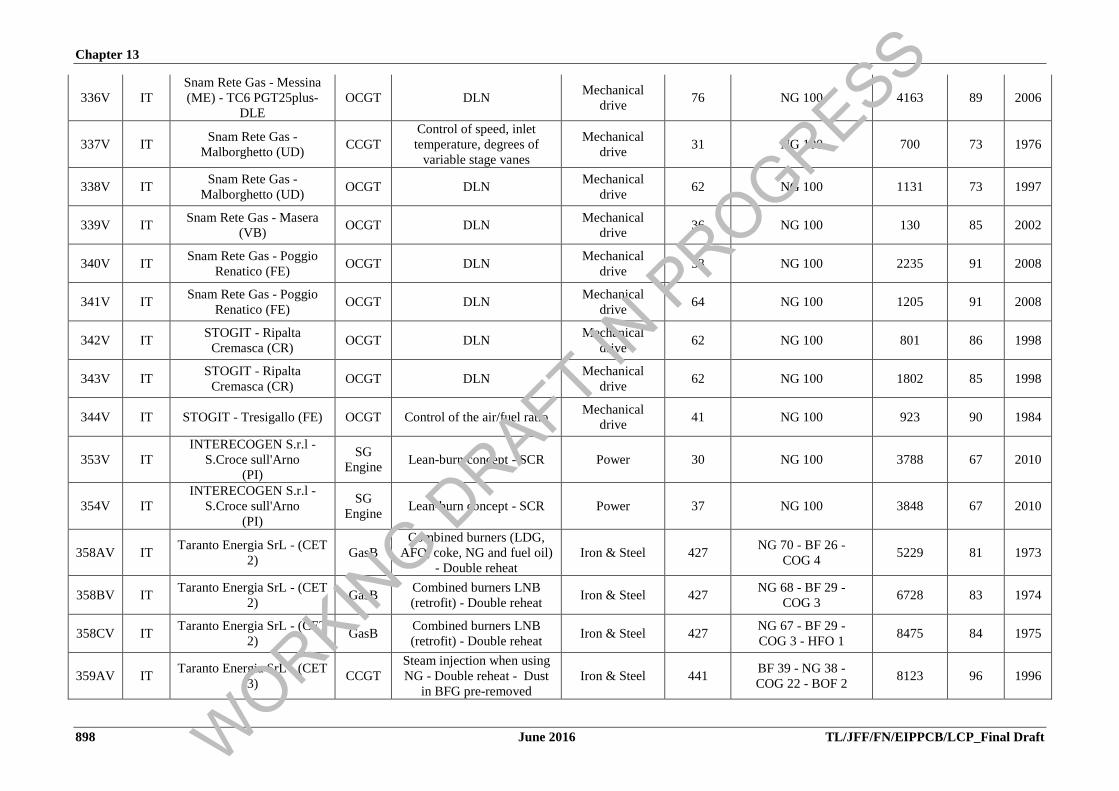
Chapter 13
898 June 2016 TL/JFF/FN/EIPPCB/LCP_Final Draft
336V IT
Snam Rete Gas - Messina
(ME) - TC6 PGT25plus-
DLE
OCGT DLN Mechanical
drive 76 NG 100 4163 89 2006
337V IT Snam Rete Gas -
Malborghetto (UD) CCGT
Control of speed, inlet
temperature, degrees of
variable stage vanes
Mechanical
drive 31 NG 100 700 73 1976
338V IT Snam Rete Gas -
Malborghetto (UD) OCGT DLN
Mechanical
drive 62 NG 100 1131 73 1997
339V IT Snam Rete Gas - Masera
(VB) OCGT DLN
Mechanical
drive 36 NG 100 130 85 2002
340V IT Snam Rete Gas - Poggio
Renatico (FE) OCGT DLN
Mechanical
drive 33 NG 100 2235 91 2008
341V IT Snam Rete Gas - Poggio
Renatico (FE) OCGT DLN
Mechanical
drive 64 NG 100 1205 91 2008
342V IT STOGIT - Ripalta
Cremasca (CR) OCGT DLN
Mechanical
drive 62 NG 100 801 86 1998
343V IT STOGIT - Ripalta
Cremasca (CR) OCGT DLN
Mechanical
drive 62 NG 100 1802 85 1998
344V IT STOGIT - Tresigallo (FE) OCGT Control of the air/fuel ratio Mechanical
drive 41 NG 100 923 90 1984
353V IT
INTERECOGEN S.r.l -
S.Croce sull'Arno
(PI)
SG
Engine Lean-burn concept - SCR Power 30 NG 100 3788 67 2010
354V IT
INTERECOGEN S.r.l -
S.Croce sull'Arno
(PI)
SG
Engine Lean-burn concept - SCR Power 37 NG 100 3848 67 2010
358AV IT Taranto Energia SrL - (CET
2) GasB
Combined burners (LDG,
AFO, coke, NG and fuel oil)
- Double reheat
Iron & Steel 427 NG 70 - BF 26 -
COG 4 5229 81 1973
358BV IT Taranto Energia SrL - (CET
2) GasB
Combined burners LNB
(retrofit) - Double reheat Iron & Steel 427
NG 68 - BF 29 -
COG 3 6728 83 1974
358CV IT Taranto Energia SrL - (CET
2) GasB
Combined burners LNB
(retrofit) - Double reheat Iron & Steel 427
NG 67 - BF 29 -
COG 3 - HFO 1 8475 84 1975
359AV IT Taranto Energia SrL - (CET
3) CCGT
Steam injection when using
NG - Double reheat - Dust
in BFG pre-removed
Iron & Steel 441 BF 39 - NG 38 -
COG 22 - BOF 2 8123 96 1996
WORKIN
G DRAFT IN
PROGRESS
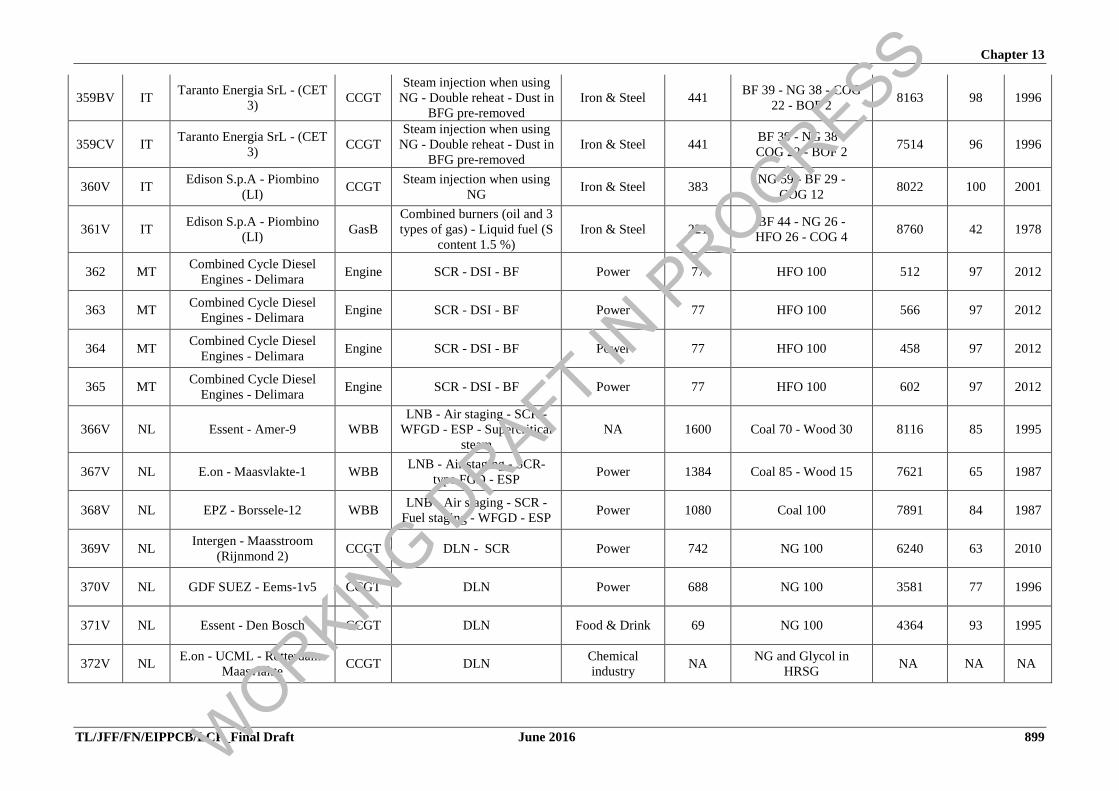
Chapter 13
TL/JFF/FN/EIPPCB/LCP_Final Draft June 2016 899
359BV IT Taranto Energia SrL - (CET
3) CCGT
Steam injection when using
NG - Double reheat - Dust in
BFG pre-removed
Iron & Steel 441 BF 39 - NG 38 - COG
22 - BOF 2 8163 98 1996
359CV IT Taranto Energia SrL - (CET
3) CCGT
Steam injection when using
NG - Double reheat - Dust in
BFG pre-removed
Iron & Steel 441 BF 39 - NG 38 -
COG 22 - BOF 2 7514 96 1996
360V IT Edison S.p.A - Piombino
(LI) CCGT
Steam injection when using
NG Iron & Steel 383
NG 59 - BF 29 -
COG 12 8022 100 2001
361V IT Edison S.p.A - Piombino
(LI) GasB
Combined burners (oil and 3
types of gas) - Liquid fuel (S
content 1.5 %)
Iron & Steel 221 BF 44 - NG 26 -
HFO 26 - COG 4 8760 42 1978
362 MT Combined Cycle Diesel
Engines - Delimara Engine SCR - DSI - BF Power 77 HFO 100 512 97 2012
363 MT Combined Cycle Diesel
Engines - Delimara Engine SCR - DSI - BF Power 77 HFO 100 566 97 2012
364 MT Combined Cycle Diesel
Engines - Delimara Engine SCR - DSI - BF Power 77 HFO 100 458 97 2012
365 MT Combined Cycle Diesel
Engines - Delimara Engine SCR - DSI - BF Power 77 HFO 100 602 97 2012
366V NL Essent - Amer-9 WBB
LNB - Air staging - SCR -
WFGD - ESP - Supercritical
steam
NA 1600 Coal 70 - Wood 30 8116 85 1995
367V NL E.on - Maasvlakte-1 WBB LNB - Air staging - SCR-
type FGD - ESP Power 1384 Coal 85 - Wood 15 7621 65 1987
368V NL EPZ - Borssele-12 WBB LNB - Air staging - SCR -
Fuel staging - WFGD - ESP Power 1080 Coal 100 7891 84 1987
369V NL Intergen - Maasstroom
(Rijnmond 2) CCGT DLN - SCR Power 742 NG 100 6240 63 2010
370V NL GDF SUEZ - Eems-1v5 CCGT DLN Power 688 NG 100 3581 77 1996
371V NL Essent - Den Bosch CCGT DLN Food & Drink 69 NG 100 4364 93 1995
372V NL E.on - UCML - Rotterdam-
Maasvlakte CCGT DLN
Chemical
industry NA
NG and Glycol in
HRSG NA NA NA
WORKIN
G DRAFT IN
PROGRESS

Chapter 13
900 June 2016 TL/JFF/FN/EIPPCB/LCP_Final Draft
373V NL Nuon - IJmond-1 - Ijmuiden CCGT DLN Iron & Steel 347 BF 96 - NG 1 - BOF 2 6445 92 1997
374V NL EDEA - F-3501 - Sittard-
Geleen GasB LNB - FGR - Fuel choice
Chemical
industry 140 Process gases 100 8100 72 1978
375V NL Nuon - WKC2 Emmtec -
Emmen CCGT Steam injection NA 141 NG 100 7625 28 2003
376NV PL Dalkia Poznań SA - EC II
Karolin DBB
Reported air emissions data
for one boiler of the four:
ESP - SDA - BF
Power and
district heating 920
Coal 96 - WBB 1.4 -
Herbaceous 1.1 8760 NA NA
377V PL TAURON Wytwarzanie SA
- EC Katowice PCFB
Air staging - Boiler sorbent
injection - ESP
Power and
district heating 378 Coal 92 - Sludge 8 7807 80 1999
378V PL EC Białystok SA -
Białystok BFB
Air/Fuel staging - FGR -
ESP
Power and
district heating 87 WB 100 7874 107 1978
379V PL KOGENERACJA SA - EC
Wrocław WBB
LNB - Air staging - Fuel
staging - Planned additional
DeNOX improvements and
Desulphurisation in 2015
Power and
district heating 186 Coal 57 - Wood 43 6571 89 1972
380V PL EC Kraków SA WBB LNB - Air staging - Double
reheat
Power and
district heating 331 Coal 89 - HB 12 6113 92 1978
381V PL Dalkia Łódź SA DBB LNB - Air/Fuel staging Power and
district heating 360
Coal 95 - Wood 2 -
Herbaceous 3 4118 45 1977
382V PL EC Zielona Góra SA CCGT DLN Power and
district heating 383 NG 100 7417 89 2004
383V PL
PGE Górnictwo i
Energetyka
Konwencjonalna SA - EC
Lublin Wrotków
CCGT DLN Power and
district heating 488 NG 100 5845 87 2002
384-
1V PL
Tauron Wytwarzanie SA -
Jaworzno III DBB
LNB - Air staging - Double
reheat Power 3360 Coal 99 5927 90 1976
384-
2V PL
Tauron Wytwarzanie SA -
Jaworzno III, Elektrownia
III
DBB LNB - Air staging Power 3360 Coal 99 5927 90 1976
384-
3V PL
Tauron Wytwarzanie SA -
Jaworzno III, Elektrownia
III
DBB LNB - Air staging Power 3360 Coal 99 5927 90 1976
WORKIN
G DRAFT IN
PROGRESS
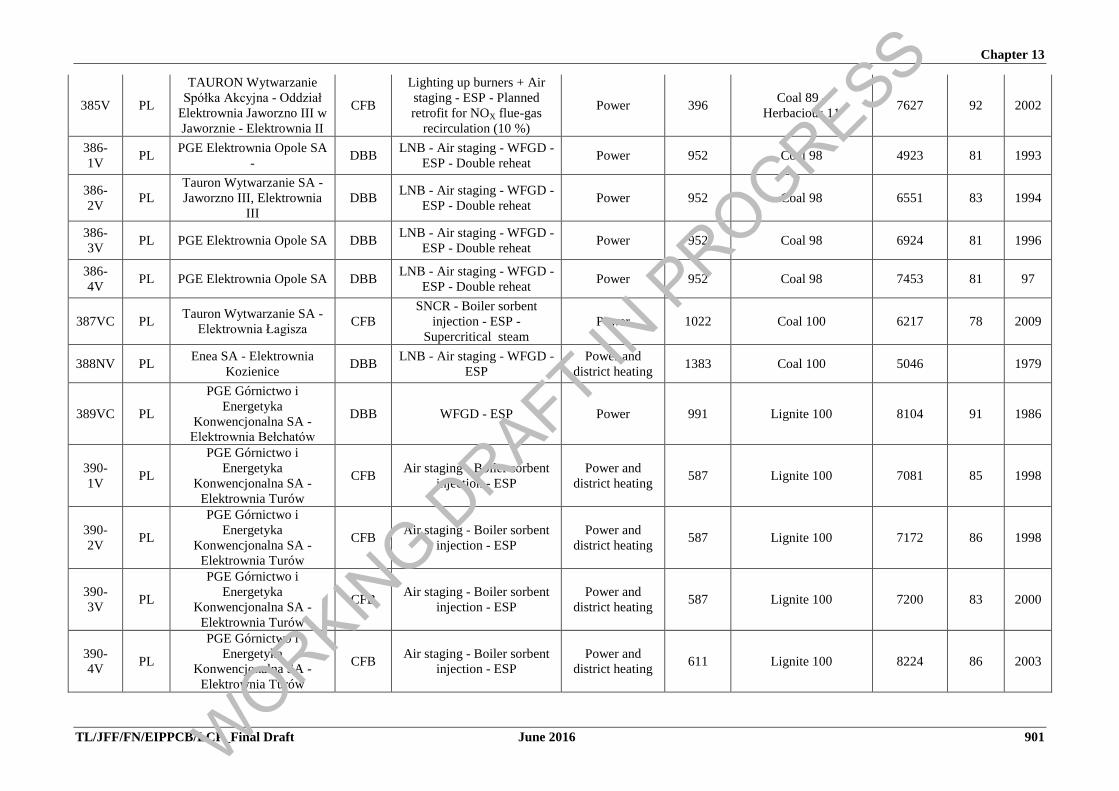
Chapter 13
TL/JFF/FN/EIPPCB/LCP_Final Draft June 2016 901
385V PL
TAURON Wytwarzanie
Spółka Akcyjna - Oddział
Elektrownia Jaworzno III w
Jaworznie - Elektrownia II
CFB
Lighting up burners + Air
staging - ESP - Planned
retrofit for NOX flue-gas
recirculation (10 %)
Power 396 Coal 89 -
Herbacious 11 7627 92 2002
386-
1V PL
PGE Elektrownia Opole SA
- DBB
LNB - Air staging - WFGD -
ESP - Double reheat Power 952 Coal 98 4923 81 1993
386-
2V PL
Tauron Wytwarzanie SA -
Jaworzno III, Elektrownia
III
DBB LNB - Air staging - WFGD -
ESP - Double reheat Power 952 Coal 98 6551 83 1994
386-
3V PL PGE Elektrownia Opole SA DBB
LNB - Air staging - WFGD -
ESP - Double reheat Power 952 Coal 98 6924 81 1996
386-
4V PL PGE Elektrownia Opole SA DBB
LNB - Air staging - WFGD -
ESP - Double reheat Power 952 Coal 98 7453 81 97
387VC PL Tauron Wytwarzanie SA -
Elektrownia Łagisza CFB
SNCR - Boiler sorbent
injection - ESP -
Supercritical steam
Power 1022 Coal 100 6217 78 2009
388NV PL Enea SA - Elektrownia
Kozienice DBB
LNB - Air staging - WFGD -
ESP
Power and
district heating 1383 Coal 100 5046 1979
389VC PL
PGE Górnictwo i
Energetyka
Konwencjonalna SA -
Elektrownia Bełchatów
DBB WFGD - ESP Power 991 Lignite 100 8104 91 1986
390-
1V PL
PGE Górnictwo i
Energetyka
Konwencjonalna SA -
Elektrownia Turów
CFB Air staging - Boiler sorbent
injection - ESP
Power and
district heating 587 Lignite 100 7081 85 1998
390-
2V PL
PGE Górnictwo i
Energetyka
Konwencjonalna SA -
Elektrownia Turów
CFB Air staging - Boiler sorbent
injection - ESP
Power and
district heating 587 Lignite 100 7172 86 1998
390-
3V PL
PGE Górnictwo i
Energetyka
Konwencjonalna SA -
Elektrownia Turów
CFB Air staging - Boiler sorbent
injection - ESP
Power and
district heating 587 Lignite 100 7200 83 2000
390-
4V PL
PGE Górnictwo i
Energetyka
Konwencjonalna SA -
Elektrownia Turów
CFB Air staging - Boiler sorbent
injection - ESP
Power and
district heating 611 Lignite 100 8224 86 2003
WORKIN
G DRAFT IN
PROGRESS
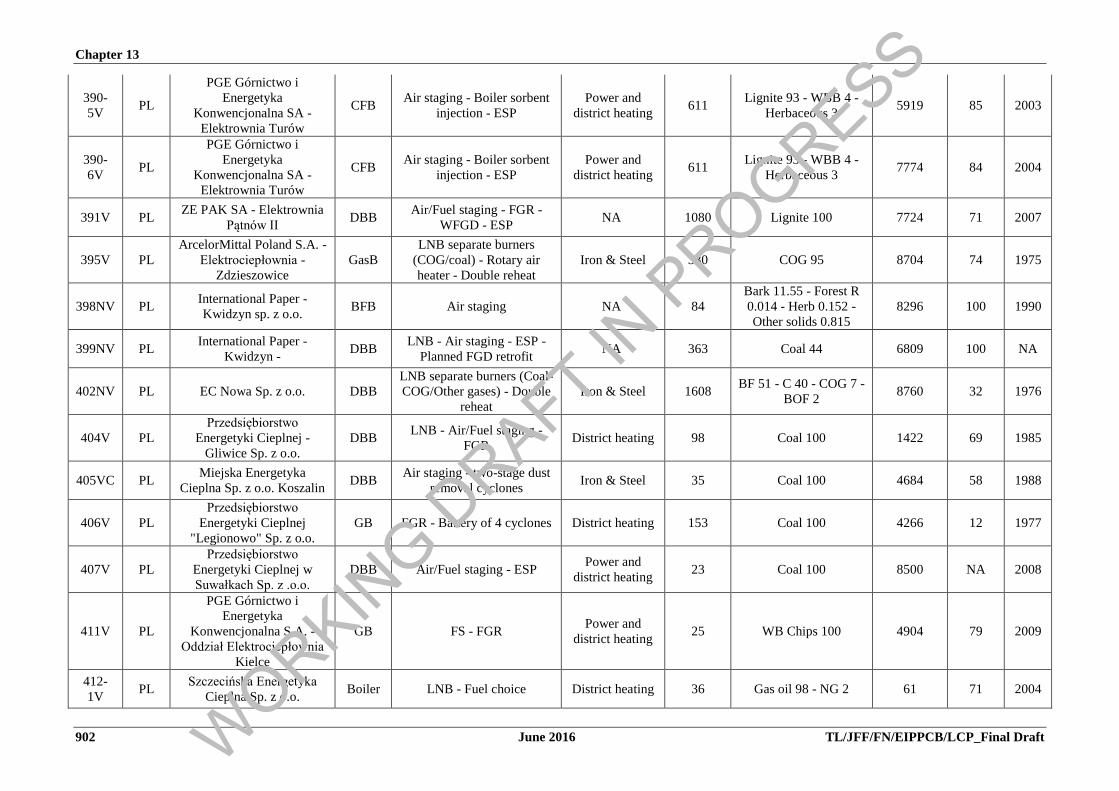
Chapter 13
902 June 2016 TL/JFF/FN/EIPPCB/LCP_Final Draft
390-
5V PL
PGE Górnictwo i
Energetyka
Konwencjonalna SA -
Elektrownia Turów
CFB Air staging - Boiler sorbent
injection - ESP
Power and
district heating 611
Lignite 93 - WBB 4 -
Herbaceous 3 5919 85 2003
390-
6V PL
PGE Górnictwo i
Energetyka
Konwencjonalna SA -
Elektrownia Turów
CFB Air staging - Boiler sorbent
injection - ESP
Power and
district heating 611
Lignite 93 - WBB 4 -
Herbaceous 3 7774 84 2004
391V PL ZE PAK SA - Elektrownia
Pątnów II DBB
Air/Fuel staging - FGR -
WFGD - ESP NA 1080 Lignite 100 7724 71 2007
395V PL
ArcelorMittal Poland S.A. -
Elektrociepłownia -
Zdzieszowice
GasB
LNB separate burners
(COG/coal) - Rotary air
heater - Double reheat
Iron & Steel 330 COG 95 8704 74 1975
398NV PL International Paper -
Kwidzyn sp. z o.o. BFB Air staging NA 84
Bark 11.55 - Forest R
0.014 - Herb 0.152 -
Other solids 0.815
8296 100 1990
399NV PL International Paper -
Kwidzyn - DBB
LNB - Air staging - ESP -
Planned FGD retrofit NA 363 Coal 44 6809 100 NA
402NV PL EC Nowa Sp. z o.o. DBB
LNB separate burners (Coal-
COG/Other gases) - Double
reheat
Iron & Steel 1608 BF 51 - C 40 - COG 7 -
BOF 2 8760 32 1976
404V PL
Przedsiębiorstwo
Energetyki Cieplnej -
Gliwice Sp. z o.o.
DBB LNB - Air/Fuel staging -
FGR District heating 98 Coal 100 1422 69 1985
405VC PL Miejska Energetyka
Cieplna Sp. z o.o. Koszalin DBB
Air staging - two-stage dust
removal cyclones Iron & Steel 35 Coal 100 4684 58 1988
406V PL
Przedsiębiorstwo
Energetyki Cieplnej
"Legionowo" Sp. z o.o.
GB FGR - Battery of 4 cyclones District heating 153 Coal 100 4266 12 1977
407V PL
Przedsiębiorstwo
Energetyki Cieplnej w
Suwałkach Sp. z .o.o.
DBB Air/Fuel staging - ESP Power and
district heating 23 Coal 100 8500 NA 2008
411V PL
PGE Górnictwo i
Energetyka
Konwencjonalna S.A. -
Oddział Elektrociepłownia
Kielce
GB FS - FGR Power and
district heating 25 WB Chips 100 4904 79 2009
412-
1V PL
Szczecińska Energetyka
Cieplna Sp. z o.o. Boiler LNB - Fuel choice District heating 36 Gas oil 98 - NG 2 61 71 2004
WORKIN
G DRAFT IN
PROGRESS

Chapter 13
TL/JFF/FN/EIPPCB/LCP_Final Draft June 2016 903
412-
2V PL
Szczecińska Energetyka
Cieplna Sp. z o.o. Boiler LNB - Fuel choice NA 36 Gas oil 95 - NG 5 30 80 2004
414VC PL
PGE Górnictwo i
Energetyka
Konwencjonalna S.A. -
Oddział Elektrociepłownia
Zgierz
BFB
LNB - Air/Fuel staging -
FGR - Low S content
(0.6 %) - ESP alone
NA 78 Lignite 88 - Wood 12 4618 54 1987
415-
1V PT
Central Termoeléctrica do
Pego, Abrantes WBB
LNB - Air staging - SCR -
WFGD - ESP Power 816 Coal 100 5534 73 1992
415-
2V PT
Central Termoeléctrica do
Pego, Abrantes WBB
LNB - Air staging - SCR -
WFGD - ESP Power 816 Coal 100 5131 72 1995
416-
1V PT
Central Termoeléctrica do
Ribatejo, Carregado CCGT DLN Power 682 NG 100 3163 81 2003
416-
2V PT
Central Termoeléctrica do
Ribatejo, Carregado CCGT DLN Power 682 NG 100 2953 82 2004
416-
3V PT
Central Termoeléctrica do
Ribatejo, Carregado CCGT DLN Power 682 NG 100 4316 82 2005
417-
1V PT
Central de Ciclo
Combinado da Tapada do
Outeiro, Medas, Gondomar
CCGT DLN Power 605 NG 100 4943 82 1999
417-
2V PT
Central de Ciclo
Combinado da Tapada do
Outeiro, Medas, Gondomar
CCGT DLN Power 605 NG 100 6286 86 1999
417-
3V PT
Central de Ciclo
Combinado da Tapada do
Outeiro, Medas, Gondomar
CCGT DLN Power 605 NG 100 6941 85 1999
418V PT
Central de Cogeração da
Energin, Póvoa de Sta. Iria,
Vila Franca de Xira
CCGT DLN (GT) + LNB (SF) Chemical
industry 153 NG 100 7626 84 2002
419-
1V PT
Central de Cogeração da
SPCG, Sado, Setúbal CCGT DLN (GT) + LNB (SF) Pulp and paper 106 NG 100 6571 93 2009
419-
2V PT
Central de Cogeração da
SPCG, Sado, Setúbal CCGT DLN (GT) + LNB (SF) Pulp and paper 106 NG 100 7871 83 2009
WORKIN
G DRAFT IN
PROGRESS
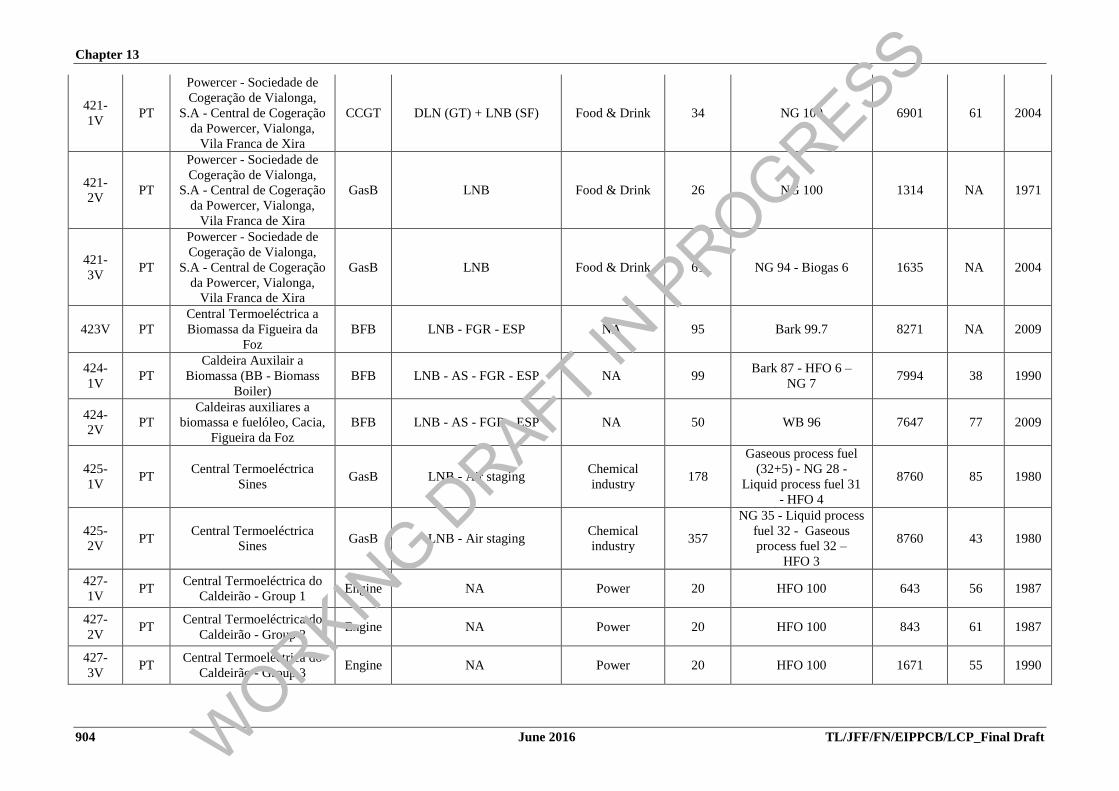
Chapter 13
904 June 2016 TL/JFF/FN/EIPPCB/LCP_Final Draft
421-
1V PT
Powercer - Sociedade de
Cogeração de Vialonga,
S.A - Central de Cogeração
da Powercer, Vialonga,
Vila Franca de Xira
CCGT DLN (GT) + LNB (SF) Food & Drink 34 NG 100 6901 61 2004
421-
2V PT
Powercer - Sociedade de
Cogeração de Vialonga,
S.A - Central de Cogeração
da Powercer, Vialonga,
Vila Franca de Xira
GasB LNB Food & Drink 26 NG 100 1314 NA 1971
421-
3V PT
Powercer - Sociedade de
Cogeração de Vialonga,
S.A - Central de Cogeração
da Powercer, Vialonga,
Vila Franca de Xira
GasB LNB Food & Drink 61 NG 94 - Biogas 6 1635 NA 2004
423V PT
Central Termoeléctrica a
Biomassa da Figueira da
Foz
BFB LNB - FGR - ESP NA 95 Bark 99.7 8271 NA 2009
424-
1V PT
Caldeira Auxilair a
Biomassa (BB - Biomass
Boiler)
BFB LNB - AS - FGR - ESP NA 99 Bark 87 - HFO 6 –
NG 7 7994 38 1990
424-
2V PT
Caldeiras auxiliares a
biomassa e fuelóleo, Cacia,
Figueira da Foz
BFB LNB - AS - FGR - ESP NA 50 WB 96 7647 77 2009
425-
1V PT
Central Termoeléctrica
Sines GasB LNB - Air staging
Chemical
industry 178
Gaseous process fuel
(32+5) - NG 28 -
Liquid process fuel 31
- HFO 4
8760 85 1980
425-
2V PT
Central Termoeléctrica
Sines GasB LNB - Air staging
Chemical
industry 357
NG 35 - Liquid process
fuel 32 - Gaseous
process fuel 32 –
HFO 3
8760 43 1980
427-
1V PT
Central Termoeléctrica do
Caldeirão - Group 1 Engine NA Power 20 HFO 100 643 56 1987
427-
2V PT
Central Termoeléctrica do
Caldeirão - Group 2 Engine NA Power 20 HFO 100 843 61 1987
427-
3V PT
Central Termoeléctrica do
Caldeirão - Group 3 Engine NA Power 20 HFO 100 1671 55 1990
WORKIN
G DRAFT IN
PROGRESS
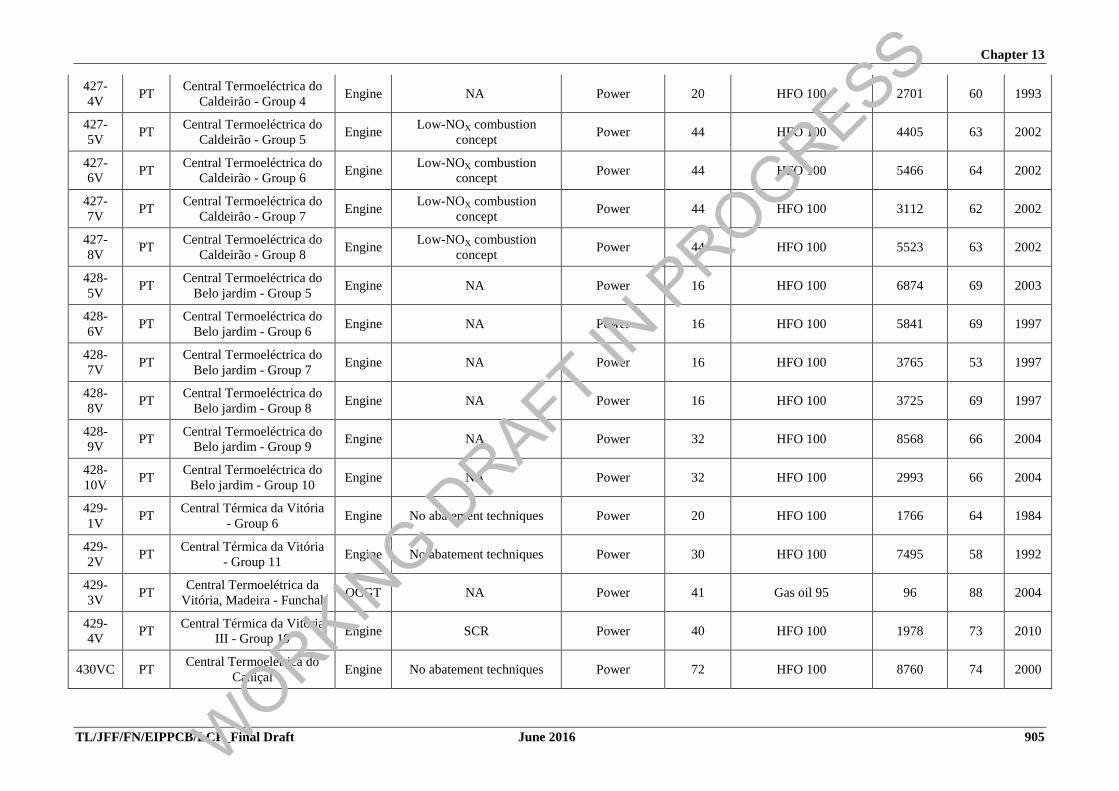
Chapter 13
TL/JFF/FN/EIPPCB/LCP_Final Draft June 2016 905
427-
4V PT
Central Termoeléctrica do
Caldeirão - Group 4 Engine NA Power 20 HFO 100 2701 60 1993
427-
5V PT
Central Termoeléctrica do
Caldeirão - Group 5 Engine
Low-NOX combustion
concept Power 44 HFO 100 4405 63 2002
427-
6V PT
Central Termoeléctrica do
Caldeirão - Group 6 Engine
Low-NOX combustion
concept Power 44 HFO 100 5466 64 2002
427-
7V PT
Central Termoeléctrica do
Caldeirão - Group 7 Engine
Low-NOX combustion
concept Power 44 HFO 100 3112 62 2002
427-
8V PT
Central Termoeléctrica do
Caldeirão - Group 8 Engine
Low-NOX combustion
concept Power 44 HFO 100 5523 63 2002
428-
5V PT
Central Termoeléctrica do
Belo jardim - Group 5 Engine NA Power 16 HFO 100 6874 69 2003
428-
6V PT
Central Termoeléctrica do
Belo jardim - Group 6 Engine NA Power 16 HFO 100 5841 69 1997
428-
7V PT
Central Termoeléctrica do
Belo jardim - Group 7 Engine NA Power 16 HFO 100 3765 53 1997
428-
8V PT
Central Termoeléctrica do
Belo jardim - Group 8 Engine NA Power 16 HFO 100 3725 69 1997
428-
9V PT
Central Termoeléctrica do
Belo jardim - Group 9 Engine NA Power 32 HFO 100 8568 66 2004
428-
10V PT
Central Termoeléctrica do
Belo jardim - Group 10 Engine NA Power 32 HFO 100 2993 66 2004
429-
1V PT
Central Térmica da Vitória
- Group 6 Engine No abatement techniques Power 20 HFO 100 1766 64 1984
429-
2V PT
Central Térmica da Vitória
- Group 11 Engine No abatement techniques Power 30 HFO 100 7495 58 1992
429-
3V PT
Central Termoelétrica da
Vitória, Madeira - Funchal OCGT NA Power 41 Gas oil 95 96 88 2004
429-
4V PT
Central Térmica da Vitória
III - Group 19 Engine SCR Power 40 HFO 100 1978 73 2010
430VC PT Central Termoelétrica do
Caniçal Engine No abatement techniques Power 72 HFO 100 8760 74 2000
WORKIN
G DRAFT IN
PROGRESS

Chapter 13
906 June 2016 TL/JFF/FN/EIPPCB/LCP_Final Draft
431V ES Central GICC, Puertollano
(Ciudad Real) CCGT
IGCC - Water injection and
lean-burn mode Power 726 Coke 75 - Coal 25 5325 85 1998
432NV ES GDF SUEZ - Castelnou
Energía CCGT Emulsified fuel Power
NG 100 3332 NA 2006
433V ES Castellon 4, Castellón CCGT DLN alone - Double reheat Power 1501 NG 100 6600 50 2008
434V ES Velilla 2, Velilla del Río
Carrión (Palencia) WBB
LNB - Air staging - WFGD -
ESP Power 1016 Coal 99.7 - Coke 0.3 6110 86 1984
435-
1V ES
CT La Robla, La Robla
(León) WBB ESP Power 822 Coal 100 695 85 1971
435-
2V ES
CT La Robla, La Robla
(León) WBB
LNB - Air staging - WFGD -
ESP Power 1024 Coal 100 2771 81 1984
436-
1V ES
CTCC Sagunto Polígono
Industrial del Puerto
(Polígono Químico)
(Valencia)
CCGT DLN Power 732 NG 100 6503 79 2007
436-
2V ES
CTCC Sagunto Polígono
Industrial del Puerto
(Polígono Químico)
(Valencia)
CCGT DLN Power 736 NG 100 6817 79 2007
436-
3V ES
CTCC Sagunto Polígono
Industrial del Puerto
(Polígono Químico)
(Valencia)
CCGT DLN Power 734 NG 100 6404 80 2007
437V ES CT PUENTE NUEVO,
ESPIEL (CÓRDOBA) WBB
LNB - Air/Fuel staging -
FGR-type FGD - ESP Power 872 Coal 100 4597 84 1981
438V ES CT LOS BARRIOS
(CÁDIZ) DBB
Air /Fuel staging - Flexicom
system (fuel distribution) -
FGD - ESP
Power 1645 Coal 100 6218 61 1985
439V ES CCGT ESCATRÓN
(ZARAGOZA) CCGT DLN - Double reheat Power 1384 NG 100 6453 68 2008
440V ES Soto 4, Rivera de Arriba CCGT DLN - Emulsified fuel (in
case of dual fuel) Power 747 NG 100 6111 58 2008
441-
1V ES CT Aboño, Gijón WBB
LNB Separate burners - ESP
alone - DCS Iron & Steel 1094
Coal 75 - BF 20 –
COG 5 4832 61 NA
WORKIN
G DRAFT IN
PROGRESS
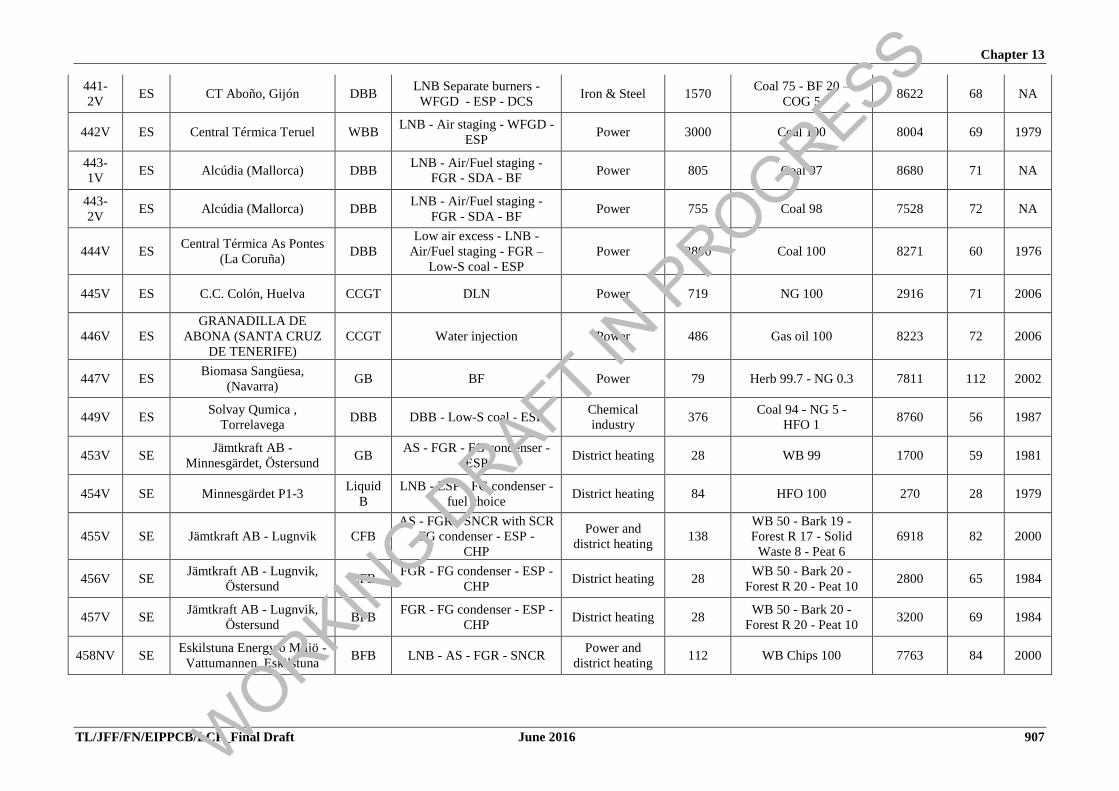
Chapter 13
TL/JFF/FN/EIPPCB/LCP_Final Draft June 2016 907
441-
2V ES CT Aboño, Gijón DBB
LNB Separate burners -
WFGD - ESP - DCS Iron & Steel 1570
Coal 75 - BF 20 –
COG 5 8622 68 NA
442V ES Central Térmica Teruel WBB LNB - Air staging - WFGD -
ESP Power 3000 Coal 100 8004 69 1979
443-
1V ES Alcúdia (Mallorca) DBB
LNB - Air/Fuel staging -
FGR - SDA - BF Power 805 Coal 97 8680 71 NA
443-
2V ES Alcúdia (Mallorca) DBB
LNB - Air/Fuel staging -
FGR - SDA - BF Power 755 Coal 98 7528 72 NA
444V ES Central Térmica As Pontes
(La Coruña) DBB
Low air excess - LNB -
Air/Fuel staging - FGR –
Low-S coal - ESP
Power 3800 Coal 100 8271 60 1976
445V ES C.C. Colón, Huelva CCGT DLN Power 719 NG 100 2916 71 2006
446V ES
GRANADILLA DE
ABONA (SANTA CRUZ
DE TENERIFE)
CCGT Water injection Power 486 Gas oil 100 8223 72 2006
447V ES Biomasa Sangüesa,
(Navarra) GB BF Power 79 Herb 99.7 - NG 0.3 7811 112 2002
449V ES Solvay Qumica ,
Torrelavega DBB DBB - Low-S coal - ESP
Chemical
industry 376
Coal 94 - NG 5 -
HFO 1 8760 56 1987
453V SE Jämtkraft AB -
Minnesgärdet, Östersund GB
AS - FGR - FG condenser -
ESP District heating 28 WB 99 1700 59 1981
454V SE Minnesgärdet P1-3 Liquid
B
LNB - ESP - FG condenser -
fuel choice District heating 84 HFO 100 270 28 1979
455V SE Jämtkraft AB - Lugnvik CFB
AS - FGR - SNCR with SCR
FG condenser - ESP -
CHP
Power and
district heating 138
WB 50 - Bark 19 -
Forest R 17 - Solid
Waste 8 - Peat 6
6918 82 2000
456V SE Jämtkraft AB - Lugnvik,
Östersund CFB
FGR - FG condenser - ESP -
CHP District heating 28
WB 50 - Bark 20 -
Forest R 20 - Peat 10 2800 65 1984
457V SE Jämtkraft AB - Lugnvik,
Östersund BFB
FGR - FG condenser - ESP -
CHP District heating 28
WB 50 - Bark 20 -
Forest R 20 - Peat 10 3200 69 1984
458NV SE Eskilstuna Energy o Miljö -
Vattumannen, Eskilstuna BFB LNB - AS - FGR - SNCR
Power and
district heating 112 WB Chips 100 7763 84 2000
WORKIN
G DRAFT IN
PROGRESS
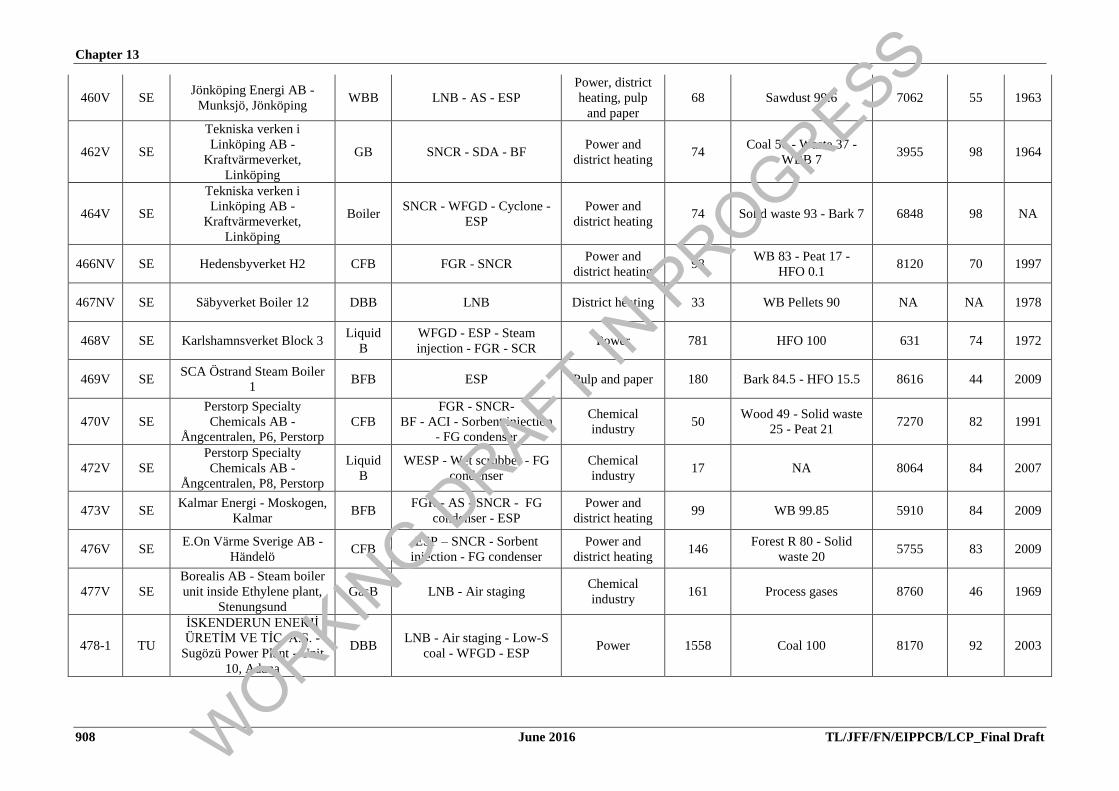
Chapter 13
908 June 2016 TL/JFF/FN/EIPPCB/LCP_Final Draft
460V SE Jönköping Energi AB -
Munksjö, Jönköping WBB LNB - AS - ESP
Power, district
heating, pulp
and paper
68 Sawdust 99.6 7062 55 1963
462V SE
Tekniska verken i
Linköping AB -
Kraftvärmeverket,
Linköping
GB SNCR - SDA - BF Power and
district heating 74
Coal 56 - Waste 37 -
WBB 7 3955 98 1964
464V SE
Tekniska verken i
Linköping AB -
Kraftvärmeverket,
Linköping
Boiler SNCR - WFGD - Cyclone -
ESP
Power and
district heating 74 Solid waste 93 - Bark 7 6848 98 NA
466NV SE Hedensbyverket H2 CFB FGR - SNCR Power and
district heating 98
WB 83 - Peat 17 -
HFO 0.1 8120 70 1997
467NV SE Säbyverket Boiler 12 DBB LNB District heating 33 WB Pellets 90 NA NA 1978
468V SE Karlshamnsverket Block 3 Liquid
B
WFGD - ESP - Steam
injection - FGR - SCR Power 781 HFO 100 631 74 1972
469V SE SCA Östrand Steam Boiler
1 BFB ESP Pulp and paper 180 Bark 84.5 - HFO 15.5 8616 44 2009
470V SE
Perstorp Specialty
Chemicals AB -
Ångcentralen, P6, Perstorp
CFB
FGR - SNCR-
BF - ACI - Sorbent injection
- FG condenser
Chemical
industry 50
Wood 49 - Solid waste
25 - Peat 21 7270 82 1991
472V SE
Perstorp Specialty
Chemicals AB -
Ångcentralen, P8, Perstorp
Liquid
B
WESP - Wet scrubber - FG
condenser
Chemical
industry 17 NA 8064 84 2007
473V SE Kalmar Energi - Moskogen,
Kalmar BFB
FGR - AS - SNCR - FG
condenser - ESP
Power and
district heating 99 WB 99.85 5910 84 2009
476V SE E.On Värme Sverige AB -
Händelö CFB
ESP – SNCR - Sorbent
injection - FG condenser
Power and
district heating 146
Forest R 80 - Solid
waste 20 5755 83 2009
477V SE
Borealis AB - Steam boiler
unit inside Ethylene plant,
Stenungsund
GasB LNB - Air staging Chemical
industry 161 Process gases 8760 46 1969
478-1 TU
İSKENDERUN ENERJİ
ÜRETİM VE TİC. A.Ş. -
Sugözü Power Plant - Unit
10, Adana
DBB LNB - Air staging - Low-S
coal - WFGD - ESP Power 1558 Coal 100 8170 92 2003
WORKIN
G DRAFT IN
PROGRESS
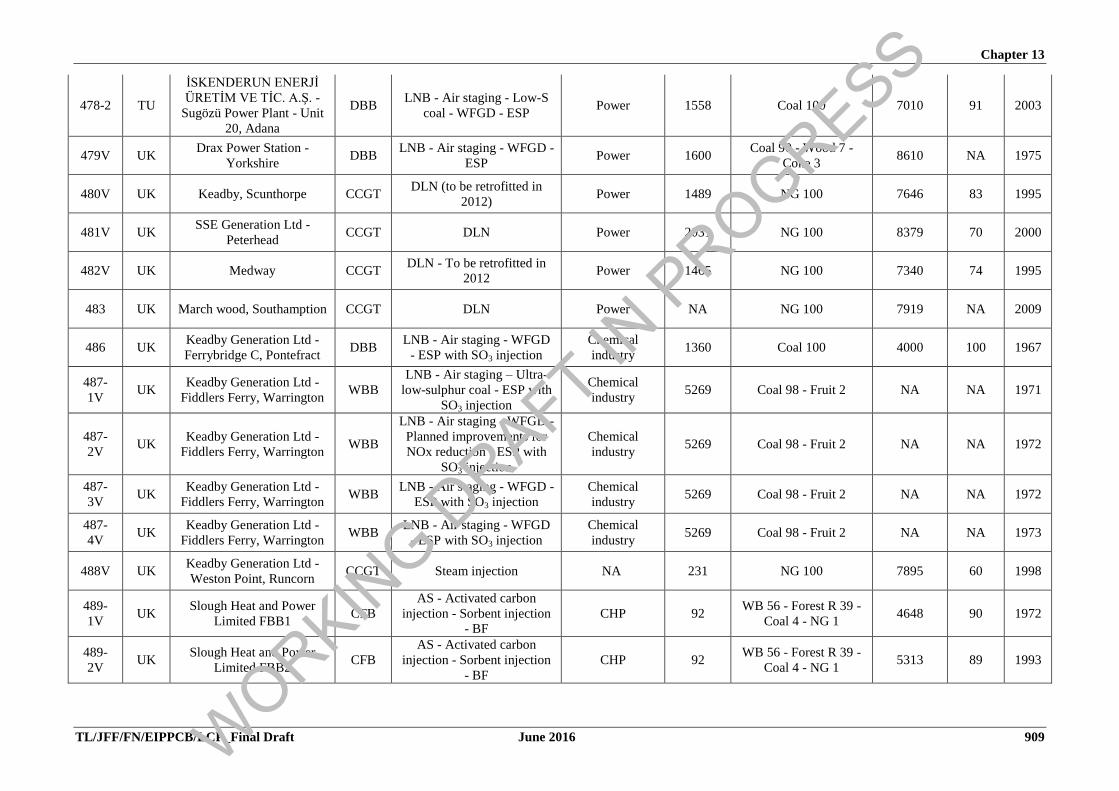
Chapter 13
TL/JFF/FN/EIPPCB/LCP_Final Draft June 2016 909
478-2 TU
İSKENDERUN ENERJİ
ÜRETİM VE TİC. A.Ş. -
Sugözü Power Plant - Unit
20, Adana
DBB LNB - Air staging - Low-S
coal - WFGD - ESP Power 1558 Coal 100 7010 91 2003
479V UK Drax Power Station -
Yorkshire DBB
LNB - Air staging - WFGD -
ESP Power 1600
Coal 90 - Wood 7 -
Coke 3 8610 NA 1975
480V UK Keadby, Scunthorpe CCGT DLN (to be retrofitted in
2012) Power 1489 NG 100 7646 83 1995
481V UK SSE Generation Ltd -
Peterhead CCGT DLN Power 2031 NG 100 8379 70 2000
482V UK Medway CCGT DLN - To be retrofitted in
2012 Power 1465 NG 100 7340 74 1995
483 UK March wood, Southamption CCGT DLN Power NA NG 100 7919 NA 2009
486 UK Keadby Generation Ltd -
Ferrybridge C, Pontefract DBB
LNB - Air staging - WFGD
- ESP with SO3 injection
Chemical
industry 1360 Coal 100 4000 100 1967
487-
1V UK
Keadby Generation Ltd -
Fiddlers Ferry, Warrington WBB
LNB - Air staging – Ultra-
low-sulphur coal - ESP with
SO3 injection
Chemical
industry 5269 Coal 98 - Fruit 2 NA NA 1971
487-
2V UK
Keadby Generation Ltd -
Fiddlers Ferry, Warrington WBB
LNB - Air staging - WFGD -
Planned improvements for
NOx reduction - ESP with
SO3 injection
Chemical
industry 5269 Coal 98 - Fruit 2 NA NA 1972
487-
3V UK
Keadby Generation Ltd -
Fiddlers Ferry, Warrington WBB
LNB - Air staging - WFGD -
ESP with SO3 injection
Chemical
industry 5269 Coal 98 - Fruit 2 NA NA 1972
487-
4V UK
Keadby Generation Ltd -
Fiddlers Ferry, Warrington WBB
LNB - Air staging - WFGD
- ESP with SO3 injection
Chemical
industry 5269 Coal 98 - Fruit 2 NA NA 1973
488V UK Keadby Generation Ltd -
Weston Point, Runcorn CCGT Steam injection NA 231 NG 100 7895 60 1998
489-
1V UK
Slough Heat and Power
Limited FBB1 CFB
AS - Activated carbon
injection - Sorbent injection
- BF
CHP 92 WB 56 - Forest R 39 -
Coal 4 - NG 1 4648 90 1972
489-
2V UK
Slough Heat and Power
Limited FBB2 CFB
AS - Activated carbon
injection - Sorbent injection
- BF
CHP 92 WB 56 - Forest R 39 -
Coal 4 - NG 1 5313 89 1993
WORKIN
G DRAFT IN
PROGRESS
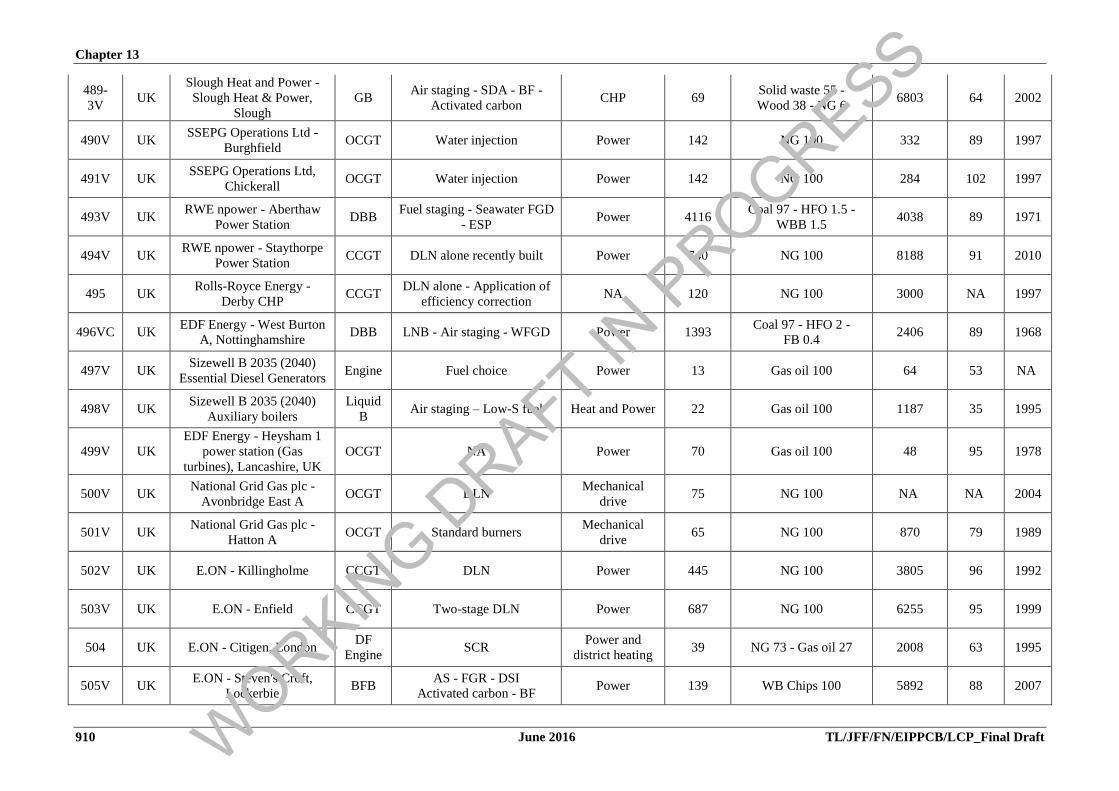
Chapter 13
910 June 2016 TL/JFF/FN/EIPPCB/LCP_Final Draft
489-
3V UK
Slough Heat and Power -
Slough Heat & Power,
Slough
GB Air staging - SDA - BF -
Activated carbon CHP 69
Solid waste 55 -
Wood 38 - NG 6 6803 64 2002
490V UK SSEPG Operations Ltd -
Burghfield OCGT Water injection Power 142 NG 100 332 89 1997
491V UK SSEPG Operations Ltd,
Chickerall OCGT Water injection Power 142 NG 100 284 102 1997
493V UK RWE npower - Aberthaw
Power Station DBB
Fuel staging - Seawater FGD
- ESP Power 4116
Coal 97 - HFO 1.5 -
WBB 1.5 4038 89 1971
494V UK RWE npower - Staythorpe
Power Station CCGT DLN alone recently built Power 740 NG 100 8188 91 2010
495 UK Rolls-Royce Energy -
Derby CHP CCGT
DLN alone - Application of
efficiency correction NA 120 NG 100 3000 NA 1997
496VC UK EDF Energy - West Burton
A, Nottinghamshire DBB LNB - Air staging - WFGD Power 1393
Coal 97 - HFO 2 -
FB 0.4 2406 89 1968
497V UK Sizewell B 2035 (2040)
Essential Diesel Generators Engine Fuel choice Power 13 Gas oil 100 64 53 NA
498V UK Sizewell B 2035 (2040)
Auxiliary boilers
Liquid
B Air staging – Low-S fuel Heat and Power 22 Gas oil 100 1187 35 1995
499V UK
EDF Energy - Heysham 1
power station (Gas
turbines), Lancashire, UK
OCGT NA Power 70 Gas oil 100 48 95 1978
500V UK National Grid Gas plc -
Avonbridge East A OCGT DLN
Mechanical
drive 75 NG 100 NA NA 2004
501V UK National Grid Gas plc -
Hatton A OCGT Standard burners
Mechanical
drive 65 NG 100 870 79 1989
502V UK E.ON - Killingholme CCGT DLN Power 445 NG 100 3805 96 1992
503V UK E.ON - Enfield CCGT Two-stage DLN Power 687 NG 100 6255 95 1999
504 UK E.ON - Citigen, London DF
Engine SCR
Power and
district heating 39 NG 73 - Gas oil 27 2008 63 1995
505V UK E.ON - Steven's Croft,
Lockerbie BFB
AS - FGR - DSI
Activated carbon - BF Power 139 WB Chips 100 5892 88 2007
WORKIN
G DRAFT IN
PROGRESS

Chapter 13
TL/JFF/FN/EIPPCB/LCP_Final Draft June 2016 911
506V UK Centrica - Langage Energy
Centre, Plymouth CCGT DLN Power 750 NG 100 5125 98 2009
507V UK
Centrica - South Humber
Bank power station,
Stallingborough
CCGT DLN Power 458 NG 100 7358 100 2001
508V UK Centrica - Killingholme
Power Station CCGT DLN Power 448 NG 100 1642 94 1993
509 UK
BASF Performance
Products plc - On site
Boilerhouse, Paisley
GasB LNB - Plant to be derated
under 50 MWth
Chemical
industry 76 NG 100 NA NA NA
513V UK Polimerieuropa -
Grangemouth GasB
LNB - Air staging - Switch
from HFO to gas oil as
secondary fuel
Chemical
industry 53 NG 100 8256 31 1996
517V UK Dalkia Plc - Alderley Park
Energy Centre, Cheshire GasB LNB - FGR NA 74 NG 100 8760 14 2004
518V UK British Sugar - Wissington
Sugar Factory, Norfolk CCGT DLN (GT) + LNB (SF) Food & Drink 207 NG 82 - DFO 18 8423 81 1998
519V FR TOTAL - Boiler 202 -
Gonfreville l'Orcher Boiler LNB - Air&fuel staging
Chemical
industry 135
Gaseous process fuel
48.3 - Liquid process
fuel 6.8 - HFO 44.3
8574 58 1972
520V FR SOLVAY - GNF - Tavaux WBB LNB - Air staging - ESP
with SO3 injection
Chemical
industry 134 Coal 100 8088 80 1984
521V FR SOLVAY - GNB - Tavaux GasB Air staging - FGR - LNB Chemical
industry 84 NG 64 - H2 36 5586 54 1978
527V NL DOW - K5 - Dow
Terneuzen Boiler LNB - Air staging
Chemical
industry 285 Process gases 100 1622 NA 1976
529 BE Borealis Polymers NV -
PPUT - Beringen GasB LNB - Air staging - FGR
Chemical
industry 108
Process gases 66 -
NG 33 6006 13 1977
535-1 BE BASF-Antwerpen - Utility
plant GasB LNB - Air&fuel staging
Chemical
industry 165
Liquid process fuel
(30.3+3.6+0.5) -
Gaseous fuel 6.6 -
NG 59
7678 44 1966
535-2 BE BASF-Antwerpen - Utility
plant GasB
LNB - Air and fuel staging -
Fuel choice
Chemical
industry 208
Liquid process fuel 42
- NG 58 5655 14 1966
535-3 BE BASF-Antwerpen - Utility
plant GasB
Each fuel has its own burner
- LNB - Air and fuel staging
Chemical
industry 161 NG 100 2910 9 1966
WORKIN
G DRAFT IN
PROGRESS
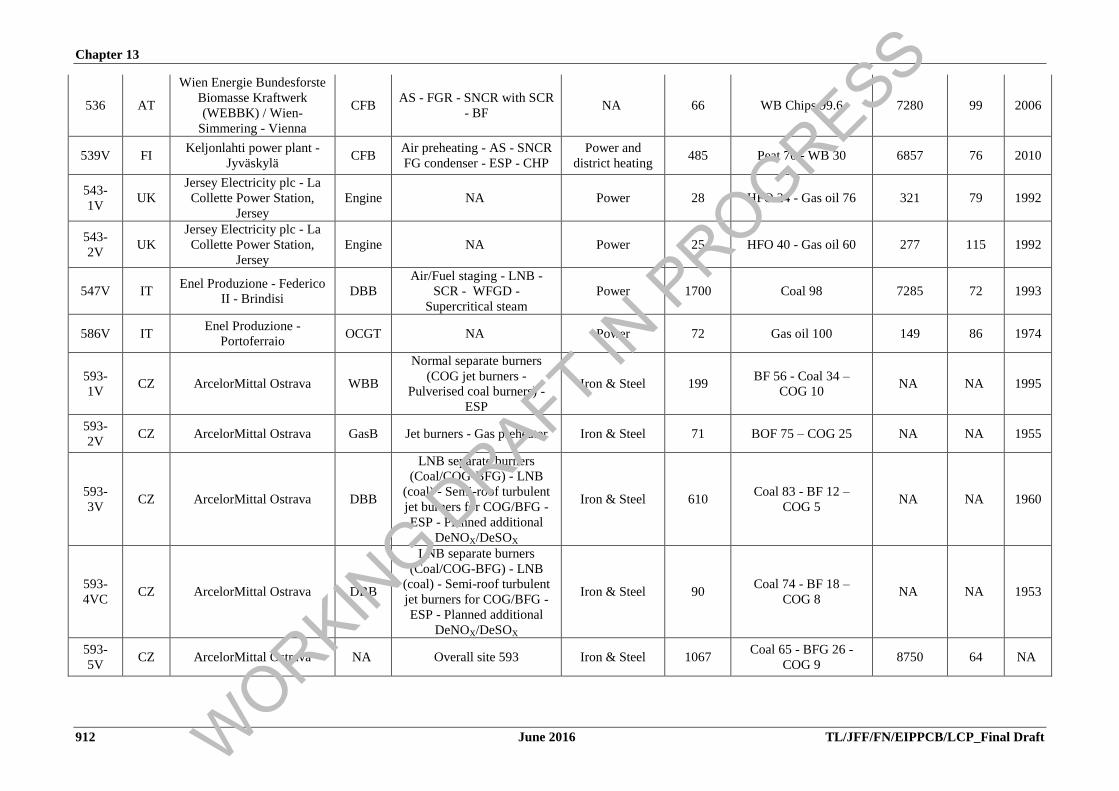
Chapter 13
912 June 2016 TL/JFF/FN/EIPPCB/LCP_Final Draft
536 AT
Wien Energie Bundesforste
Biomasse Kraftwerk
(WEBBK) / Wien-
Simmering - Vienna
CFB AS - FGR - SNCR with SCR
- BF NA 66 WB Chips 99.6 7280 99 2006
539V FI Keljonlahti power plant -
Jyväskylä CFB
Air preheating - AS - SNCR
FG condenser - ESP - CHP
Power and
district heating 485 Peat 70 - WB 30 6857 76 2010
543-
1V UK
Jersey Electricity plc - La
Collette Power Station,
Jersey
Engine NA Power 28 HFO 24 - Gas oil 76 321 79 1992
543-
2V UK
Jersey Electricity plc - La
Collette Power Station,
Jersey
Engine NA Power 25 HFO 40 - Gas oil 60 277 115 1992
547V IT Enel Produzione - Federico
II - Brindisi DBB
Air/Fuel staging - LNB -
SCR - WFGD -
Supercritical steam
Power 1700 Coal 98 7285 72 1993
586V IT Enel Produzione -
Portoferraio OCGT NA Power 72 Gas oil 100 149 86 1974
593-
1V CZ ArcelorMittal Ostrava WBB
Normal separate burners
(COG jet burners -
Pulverised coal burners) -
ESP
Iron & Steel 199 BF 56 - Coal 34 –
COG 10 NA NA 1995
593-
2V CZ ArcelorMittal Ostrava GasB Jet burners - Gas preheater Iron & Steel 71 BOF 75 – COG 25 NA NA 1955
593-
3V CZ ArcelorMittal Ostrava DBB
LNB separate burners
(Coal/COG-BFG) - LNB
(coal) - Semi-roof turbulent
jet burners for COG/BFG -
ESP - Planned additional
DeNOX/DeSOX
Iron & Steel 610 Coal 83 - BF 12 –
COG 5 NA NA 1960
593-
4VC CZ ArcelorMittal Ostrava DBB
LNB separate burners
(Coal/COG-BFG) - LNB
(coal) - Semi-roof turbulent
jet burners for COG/BFG -
ESP - Planned additional
DeNOX/DeSOX
Iron & Steel 90 Coal 74 - BF 18 –
COG 8 NA NA 1953
593-
5V CZ ArcelorMittal Ostrava NA Overall site 593 Iron & Steel 1067
Coal 65 - BFG 26 -
COG 9 8750 64 NA
WORKIN
G DRAFT IN
PROGRESS
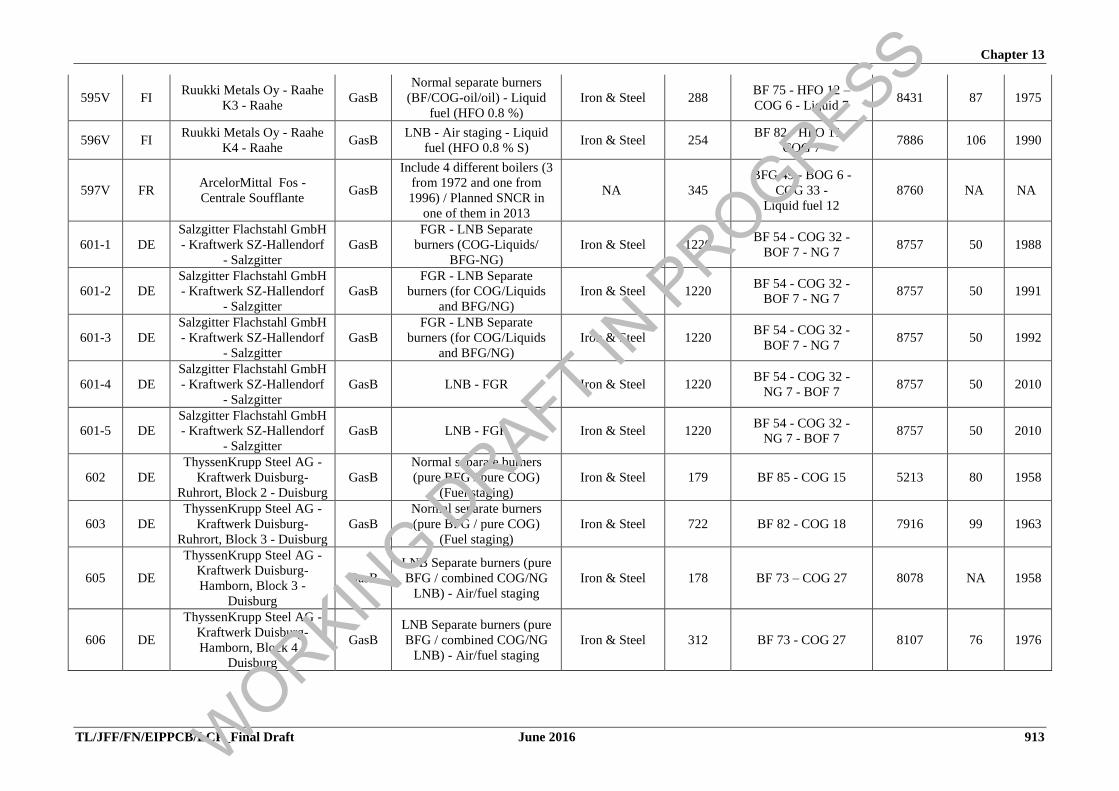
Chapter 13
TL/JFF/FN/EIPPCB/LCP_Final Draft June 2016 913
595V FI Ruukki Metals Oy - Raahe
K3 - Raahe GasB
Normal separate burners
(BF/COG-oil/oil) - Liquid
fuel (HFO 0.8 %)
Iron & Steel 288 BF 75 - HFO 12 –
COG 6 - Liquid 7 8431 87 1975
596V FI Ruukki Metals Oy - Raahe
K4 - Raahe GasB
LNB - Air staging - Liquid
fuel (HFO 0.8 % S) Iron & Steel 254
BF 82 - HFO 11 -
COG 7 7886 106 1990
597V FR ArcelorMittal Fos -
Centrale Soufflante GasB
Include 4 different boilers (3
from 1972 and one from
1996) / Planned SNCR in
one of them in 2013
NA 345
BFG 49 - BOG 6 -
COG 33 -
Liquid fuel 12
8760 NA NA
601-1 DE
Salzgitter Flachstahl GmbH
- Kraftwerk SZ-Hallendorf
- Salzgitter
GasB
FGR - LNB Separate
burners (COG-Liquids/
BFG-NG)
Iron & Steel 1220 BF 54 - COG 32 -
BOF 7 - NG 7 8757 50 1988
601-2 DE
Salzgitter Flachstahl GmbH
- Kraftwerk SZ-Hallendorf
- Salzgitter
GasB
FGR - LNB Separate
burners (for COG/Liquids
and BFG/NG)
Iron & Steel 1220 BF 54 - COG 32 -
BOF 7 - NG 7 8757 50 1991
601-3 DE
Salzgitter Flachstahl GmbH
- Kraftwerk SZ-Hallendorf
- Salzgitter
GasB
FGR - LNB Separate
burners (for COG/Liquids
and BFG/NG)
Iron & Steel 1220 BF 54 - COG 32 -
BOF 7 - NG 7 8757 50 1992
601-4 DE
Salzgitter Flachstahl GmbH
- Kraftwerk SZ-Hallendorf
- Salzgitter
GasB LNB - FGR Iron & Steel 1220 BF 54 - COG 32 -
NG 7 - BOF 7 8757 50 2010
601-5 DE
Salzgitter Flachstahl GmbH
- Kraftwerk SZ-Hallendorf
- Salzgitter
GasB LNB - FGR Iron & Steel 1220 BF 54 - COG 32 -
NG 7 - BOF 7 8757 50 2010
602 DE
ThyssenKrupp Steel AG -
Kraftwerk Duisburg-
Ruhrort, Block 2 - Duisburg
GasB
Normal separate burners
(pure BFG / pure COG)
(Fuel staging)
Iron & Steel 179 BF 85 - COG 15 5213 80 1958
603 DE
ThyssenKrupp Steel AG -
Kraftwerk Duisburg-
Ruhrort, Block 3 - Duisburg
GasB
Normal separate burners
(pure BFG / pure COG)
(Fuel staging)
Iron & Steel 722 BF 82 - COG 18 7916 99 1963
605 DE
ThyssenKrupp Steel AG -
Kraftwerk Duisburg-
Hamborn, Block 3 -
Duisburg
GasB
LNB Separate burners (pure
BFG / combined COG/NG
LNB) - Air/fuel staging
Iron & Steel 178 BF 73 – COG 27 8078 NA 1958
606 DE
ThyssenKrupp Steel AG -
Kraftwerk Duisburg-
Hamborn, Block 4 -
Duisburg
GasB
LNB Separate burners (pure
BFG / combined COG/NG
LNB) - Air/fuel staging
Iron & Steel 312 BF 73 - COG 27 8107 76 1976
WORKIN
G DRAFT IN
PROGRESS
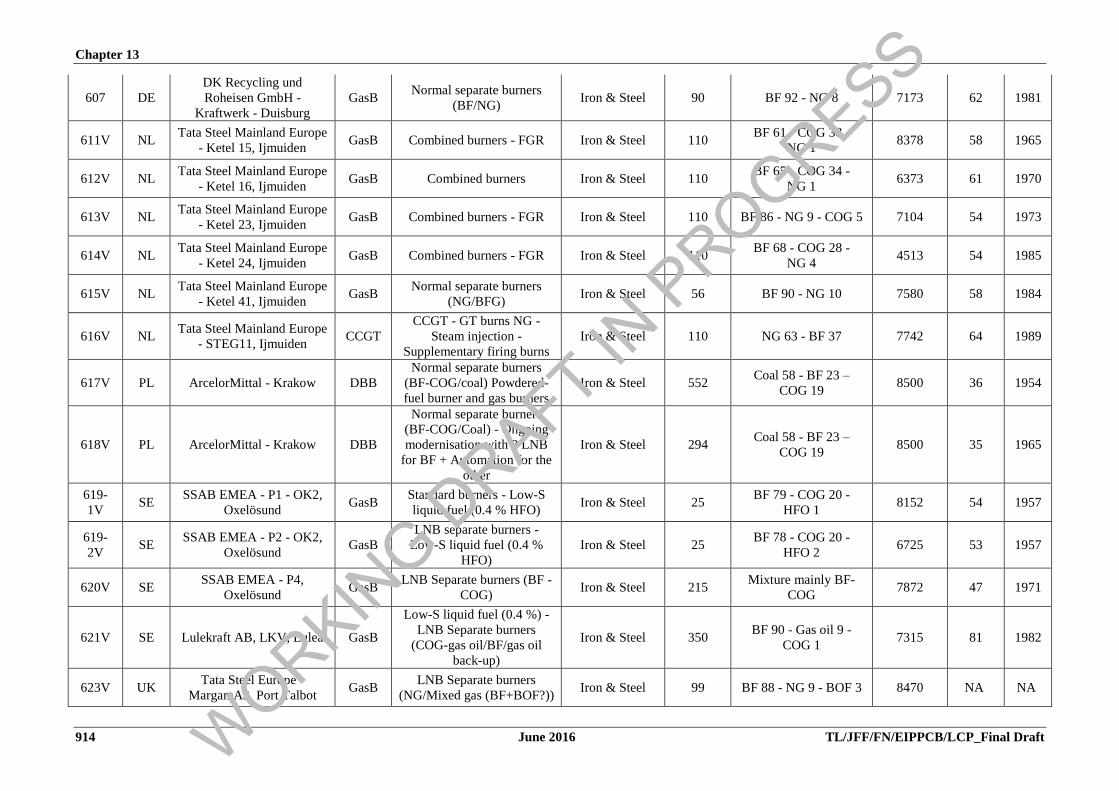
Chapter 13
914 June 2016 TL/JFF/FN/EIPPCB/LCP_Final Draft
607 DE
DK Recycling und
Roheisen GmbH -
Kraftwerk - Duisburg
GasB Normal separate burners
(BF/NG) Iron & Steel 90 BF 92 - NG 8 7173 62 1981
611V NL Tata Steel Mainland Europe
- Ketel 15, Ijmuiden GasB Combined burners - FGR Iron & Steel 110
BF 61 - COG 38 -
NG 1 8378 58 1965
612V NL Tata Steel Mainland Europe
- Ketel 16, Ijmuiden GasB Combined burners Iron & Steel 110
BF 65 - COG 34 -
NG 1 6373 61 1970
613V NL Tata Steel Mainland Europe
- Ketel 23, Ijmuiden GasB Combined burners - FGR Iron & Steel 110 BF 86 - NG 9 - COG 5 7104 54 1973
614V NL Tata Steel Mainland Europe
- Ketel 24, Ijmuiden GasB Combined burners - FGR Iron & Steel 110
BF 68 - COG 28 -
NG 4 4513 54 1985
615V NL Tata Steel Mainland Europe
- Ketel 41, Ijmuiden GasB
Normal separate burners
(NG/BFG) Iron & Steel 56 BF 90 - NG 10 7580 58 1984
616V NL Tata Steel Mainland Europe
- STEG11, Ijmuiden CCGT
CCGT - GT burns NG -
Steam injection -
Supplementary firing burns
Iron & Steel 110 NG 63 - BF 37 7742 64 1989
617V PL ArcelorMittal - Krakow DBB
Normal separate burners
(BF-COG/coal) Powdered-
fuel burner and gas burners
Iron & Steel 552 Coal 58 - BF 23 –
COG 19 8500 36 1954
618V PL ArcelorMittal - Krakow DBB
Normal separate burners
(BF-COG/Coal) - Ongoing
modernisation with 8 LNB
for BF + Automation for the
other
Iron & Steel 294 Coal 58 - BF 23 –
COG 19 8500 35 1965
619-
1V SE
SSAB EMEA - P1 - OK2,
Oxelösund GasB
Standard burners - Low-S
liquid fuel (0.4 % HFO) Iron & Steel 25
BF 79 - COG 20 -
HFO 1 8152 54 1957
619-
2V SE
SSAB EMEA - P2 - OK2,
Oxelösund GasB
LNB separate burners -
Low-S liquid fuel (0.4 %
HFO)
Iron & Steel 25 BF 78 - COG 20 -
HFO 2 6725 53 1957
620V SE SSAB EMEA - P4,
Oxelösund GasB
LNB Separate burners (BF -
COG) Iron & Steel 215
Mixture mainly BF-
COG 7872 47 1971
621V SE Lulekraft AB, LKV, Luleå GasB
Low-S liquid fuel (0.4 %) -
LNB Separate burners
(COG-gas oil/BF/gas oil
back-up)
Iron & Steel 350 BF 90 - Gas oil 9 -
COG 1 7315 81 1982
623V UK Tata Steel Europe -
MargamA3, Port Talbot GasB
LNB Separate burners
(NG/Mixed gas (BF+BOF?)) Iron & Steel 99 BF 88 - NG 9 - BOF 3 8470 NA NA
WORKIN
G DRAFT IN
PROGRESS

Chapter 13
TL/JFF/FN/EIPPCB/LCP_Final Draft June 2016 915
624V UK Tata Steel Europe -
MargamA5, Port Talbot GasB
FGR - LNB separate burners
(NG/COG/Mixed gas?) Iron & Steel 50
BF 80 - NG 9 - COG 8
- BOF 3 8668 NA NA
625V UK Tata Steel Europe -
MargamB, Port Talbot GasB
FGR - LNB separate burners
(NG/COG/Mixed gas?) Iron & Steel 80
BF 88 - COG 8 -
BOF 2 - NG 2 8620 NA NA
626V UK Tata Steel Europe -
MargamC, Port Talbot GasB
FGR - LNB Separate
burners (NG/COG/Mixed
gas?)
Iron & Steel 268 BF 68 - COG 13 -
NG 13 - BOF 6 8760 NA NA
627V UK Tata Steel Europe - Service
boilers, Port Talbot GasB
LNB separate burners
(NG/BF/COG) Iron & Steel 114
BF 56 - COG 42 -
NG 2 8760 NA NA
628-
1V UK
Tata Steel Europe - Central
Power Station, Scunthorpe GasB
NEI combined burners
BFG/COG Iron & Steel 108
BF 60 - COG 37 –
HFO 3 7769 83 1976
628-
2V UK
Tata Steel Europe - Central
Power Station, Scunthorpe GasB
NEI combined burners
BFG/COG burners - Low-S
liquid fuel (0.17 %)
Iron & Steel 108 BF 63 - COG 34 –
HFO 3 8022 83 1976
628-
3V UK
Tata Steel Europe - Central
Power Station, Scunthorpe GasB Peabody-type M22 burners Iron & Steel 49 BF 88 - COG 12 4974 64 1960
629-
1V UK
Tata Steel Europe - Turbo
Blower House A,
Scunthorpe
GasB Typhoon-type BFG burner -
Low-S liquid fuel (0.17 %) Iron & Steel 39
BF 96 - COG 3 -
HFO 1 8124 70 1953
629-
2V UK
Tata Steel Europe - Turbo
Blower House A,
Scunthorpe
GasB Typhoon-type BFG burner -
Low-S liquid fuel (0.17 %) Iron & Steel 39
BF 96 - COG 3 -
Gas oil 1 7619 72 1953
629-
3V UK
Tata Steel Europe - Turbo
Blower House A,
Scunthorpe
GasB Typhoon-type BFG burner -
Low-S liquid fuel (0.17 %) Iron & Steel 39
BF 96 - COG 2 -
HFO 2 6870 77 1953
629-
4V UK
Tata Steel Europe - Turbo
Blower House A,
Scunthorpe
GasB Typhoon-type BFG burner -
Low-S liquid fuel (0.17 %) Iron & Steel 39
BF 96 - COG 2 -
HFO 2 7039 73 1953
630-
1V UK
Tata Steel Europe - Turbo
Blower House B,
Scunthorpe
GasB Typhoon-type BFG burner -
Low-S liquid fuel (0.17 %) Iron & Steel 54
BF 94 - COG 3 -
Gas oil 3 3851 81 1953
630-
2V UK
Tata Steel Europe - Turbo
Blower House B,
Scunthorpe
GasB Typhoon-type BFG burner -
Low-S liquid fuel (0.17 %) Iron & Steel 54
BF 97 - COG 2 -
HFO 1 7337 87 1961
632 AT GuD Kraftwerk Timelkam CCGT
DLN - SCR - Only range
available - Air mass flow
reduction for low loads
Power 705 NG 100 4600 90 2008
WORKIN
G DRAFT IN
PROGRESS

Chapter 13
916 June 2016 TL/JFF/FN/EIPPCB/LCP_Final Draft
654V BE T-Power n.v. - Tessenderlo CCGT DLN Power 750 NG 100 1680 100 2011
655V DE
Mark-E Aktiengesellschaft
-
Biomasseverstromungsanla
ge Hagen-Kabel - Hagen
GB LNB - AS - FGR - SNCR -
DSI activated carbon - BF Power 86
WB 99.2 (including
waste wood) 8433 74 2004
656V AT WIEN Energie GmbH -
Donaustadt 3 - Vienna CCGT DLN - SCR
Power and
district heating 686 NG 100 5831 90 2001
657 EE Tallina Kute - Kadaka BH -
Tallinn GasB
LNB - Air/Fuel staging -
FGR District heating 316 NG 100 8150 14 1997
658 EE Tallina Kute -Mustamae
BH - Tallinn GasB
Combination NOX PM
(Air/Fuel staging and 16
LNB in 1/4 boilers)
District heating 446 NG 100 NA NA NA
659 EE Tallina Kute - Ulemiste BH
- Tallinn GasB Standard burners District heating 255 NG 100 2112 10 1999
660 EE Fortum Eesti AS - Parnu
Niidu CHP - Parnu BFB
LNB - FGR - SNCR - DSI -
BF NA 81
WB Chips 83 - Peat 16
- NG 1 7920 97 NA
661 EE
Fortum Eesti AS - Parnu
Suur Joe boilerhouse -
Parnu
NA NA NA 70 Peat 10 - NG 50 -
HFO 1 6768 19 NA
662V AT FHKW Mellach WBB Air/Fuel staging - LNB -
SCR - WFGD - BF
Power and
district heating 543
Coal 98.8 - NG 1 -
Waste 0.2 6427 95 1986
664V FR Cristal Union - Boiler
FML13 - Erstein GasB NA NA 51 NG 100 3216 74 NA
665 DE GKW Smurfit Kappa
Zülpich Papier NA Water injection Pulp and paper 38 NG 19 8426 61 1996
666 SE ÅC2 Obbola DBB -
other SNCR - Air staging - ESP Pulp and paper 110 Bark 95 7987 43 1975
667 SE Smurfit Kappa Kraftliner
Piteå BFB
SNCR - Air staging - Flue-
gas recirculation - BF Pulp and paper 165
Bark 67 - Wood chips
31 - Solid waste 2 8500 44 2007
668 SE Södra Cell Mönsterås BFB SNCR - Air staging - Flue-
gas recirculation - ESP Pulp and paper 96 Bark 95.5 8066 75 1979
669 SE Södra Cell Mörrum BFB Air staging - Flue-gas
recirculation - ESP Pulp and paper 111 Bark 95 6400 57 2002
WORKIN
G DRAFT IN
PROGRESS

Chapter 13
TL/JFF/FN/EIPPCB/LCP_Final Draft June 2016 917
670 SE Stora Enso Fors CFB SNCR - Air staging - Flue-
gas recirculation - ESP Pulp and paper 61
Forest R 89 - Bark 8 -
Pellets 3 8101 96 1985
671 SE Stora Enso Hylte AB - 2 BFB
SNCR - Air staging - Flue-
gas recirculation - ESP - BF
- Scrubber
Pulp and paper 80 Solid waste 100 7626 64 1972
672 SE Stora Enso Hylte AB -4 CFB
SNCR - Air staging - Flue-
gas recirculation - ESP -
Scrubber
Pulp and paper 65 SW 15 - Solid waste 65
- Bark 20 7627 65 1973
673 SE Nymölla Mill BFB
SNCR - Air staging - Flue-
gas recirculation - ESP -
scrubber
Pulp and paper 115
Bark 58 - HFO 17 -
Petroleum gas 8 - Solid
fuel (sludge) 17
8699 49 NA
674 SE Stora Enso Skoghall AB
Boiler 11 BFB
SNCR with SCR - Air
staging - Flue-gas
recirculation - ESP
Pulp and paper 179
Forest R 66 - Bark 18 -
Sawdust 9 - Other
(sludge) 3.5 - Other
(fibre from WWTP)
3.5
7847 54 1977
675 ES Zicuñaga Gas
turbine DLN - Water injection Pulp and paper NA NG NA NA 2008
676 ES Ence Navia BFB NA Pulp and paper 75 Bark NA NA NA
677 FI Metsä Group Simpele BFB Air staging - Flue-gas
recirculation - ESP Pulp and paper 127 WB 62 - Peat 38 8395 51 1976
678 FI Äänevoima Oy BFB Air staging - Flue-gas
recirculation Pulp and paper 173
Peat 14 - WB 82.5 -
Solid Waste 3.5 8313 58 2002
679 FI Stora Enso Imatra BFB Air staging - Flue-gas
recirculation Pulp and paper 267 Bark 100 NA NA 1992
680 FI UPM Jämsänkoski Boiler Air staging - Flue-gas
recirculation Pulp and paper 205
WB 14.1 - Forest R
60.4 - Peat 19.1 -
WB 6.3 - HFO 0.1
8453 52 2002
681 FI Äänevoima Oy oil Boiler Air staging - LNB -
multicyclone Pulp and paper 93 HFO 584 23 1996
682 PT Setubal BFB Air staging - Flue-gas
recirculation - ESP Pulp and paper 134 Bark 98.5 6932 52 1978
683 FR CTBR Tranche 1 - Saint
André - La Réunion GB Air staging alone - ESP NA 101 Coal 100 7270 110 1992
WORKIN
G DRAFT IN
PROGRESS

Chapter 13
918 June 2016 TL/JFF/FN/EIPPCB/LCP_Final Draft
684 FR CTBR Tranche 1 - Saint
André - La Réunion GB Air staging - ESP NA 116 Herb 64 - Coal 36 8712 101 1992
685 FR CTG A Tranche 1 - St
Louis - La Réunion GB Air staging alone - ESP NA 103 Coal 100 7563 107 1995
686 FR CTG A Tranche 1 - St
Louis - La Réunion GB Air staging - ESP NA 128 Herb 68 - Coal 32 8569 91 1995
687 FR CTM Tranche 1 - Le Moule
- Guadeloupe GB Air staging alone - ESP NA 91 Coal 100 7548 104 1998
688 FR CTM Tranche 1 - Le Moule
- Guadeloupe GB Air staging alone - ESP NA 124 Coal 53.5 - Herb 46.5 8047 93 1998
689 FR CTBR 2 - Cambuston - La
Réunion Boiler Air/fuel staging - ESP Power 144 Coal 100 7705 108 2004
690 FR CTG B St Louis - La
Réunion Boiler
LNB - Air/fuel staging -
SNCR - ESP NA 163 Coal 100 7950 97 2006
691 FR PEI-Port-Est La Réunion Engine SCR Power 516 HFO 99.9 5500 70 2012
692 FR EDF SEI Lucciana Gas
turbine Water injection NA 140
Liquid fuel - Gas
oil/light fuel oil -
Diesel
2159 14 2008
693 PL Siersza Power Plant CFB CFB - ESP NA 674 Coal 86 - Wood 14 7800 89 2001
1000V
Anon
ymou
s
Anonymous DBB LNB - Air staging - SDA -
ESP
Power and
district heating 265 Coal 97 3283 99 1977
1001V
Anon
ymou
s
Anonymous CFB Boiler sorbent injection -
ESP District heating 80 Coal 100 1960 75 1986
1002V
Anon
ymou
s
Anonymous BFB Air staging - FGR - ESP -
WFGD + FG condenser
Power and
district heating 58 Wood 78 - Peat 22 7430 80 2009
1003V
Anon
ymou
s
Anonymous BFB Air staging - FGR - ESP -
CHP Pulp and paper 295
Bark 53 - Peat 16 -
Forest R 24 - Wood
chips 6
7106 50 2002
1004V
Anon
ymou
s
Anonymous CFB Air staging - ESP Power and
district heating 325
Peat 86 - Forest R 10 -
Wood 3 - Seeds 1 7564 97 1990
WORKIN
G DRAFT IN
PROGRESS
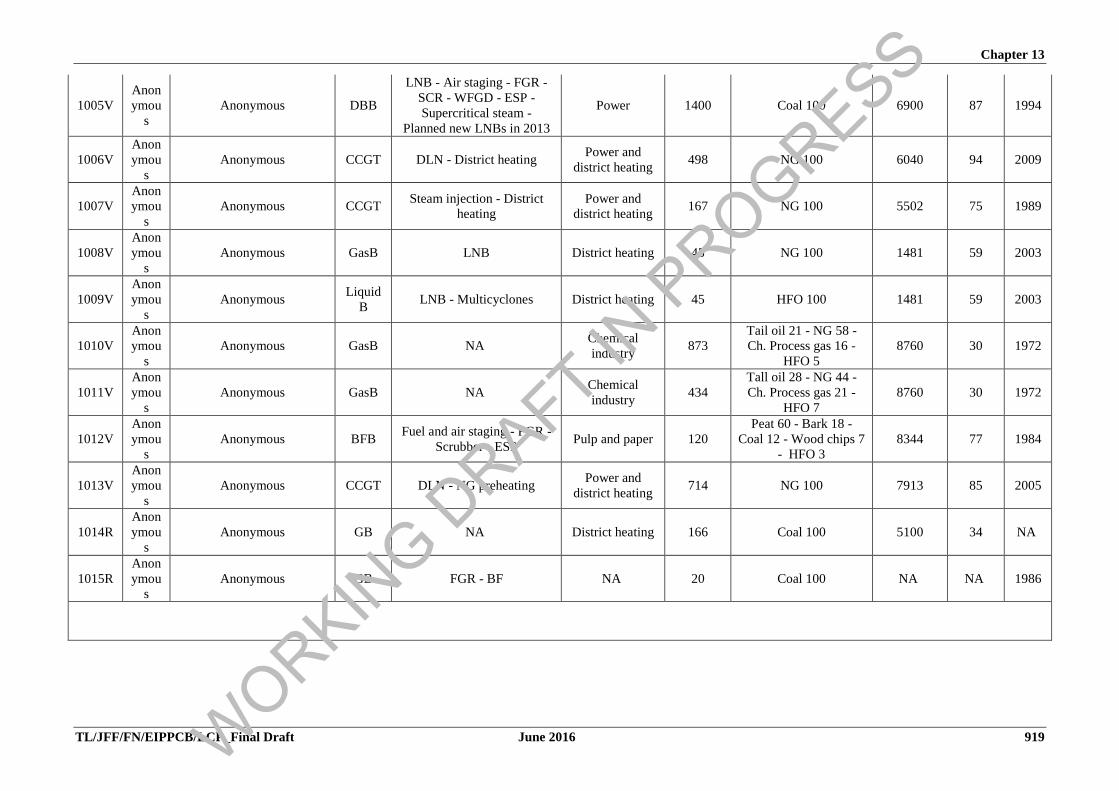
Chapter 13
TL/JFF/FN/EIPPCB/LCP_Final Draft June 2016 919
1005V
Anon
ymou
s
Anonymous DBB
LNB - Air staging - FGR -
SCR - WFGD - ESP -
Supercritical steam -
Planned new LNBs in 2013
Power 1400 Coal 100 6900 87 1994
1006V
Anon
ymou
s
Anonymous CCGT DLN - District heating Power and
district heating 498 NG 100 6040 94 2009
1007V
Anon
ymou
s
Anonymous CCGT Steam injection - District
heating
Power and
district heating 167 NG 100 5502 75 1989
1008V
Anon
ymou
s
Anonymous GasB LNB District heating 45 NG 100 1481 59 2003
1009V
Anon
ymou
s
Anonymous Liquid
B LNB - Multicyclones District heating 45 HFO 100 1481 59 2003
1010V
Anon
ymou
s
Anonymous GasB NA Chemical
industry 873
Tail oil 21 - NG 58 -
Ch. Process gas 16 -
HFO 5
8760 30 1972
1011V
Anon
ymou
s
Anonymous GasB NA Chemical
industry 434
Tall oil 28 - NG 44 -
Ch. Process gas 21 -
HFO 7
8760 30 1972
1012V
Anon
ymou
s
Anonymous BFB Fuel and air staging - FGR -
Scrubber - ESP Pulp and paper 120
Peat 60 - Bark 18 -
Coal 12 - Wood chips 7
- HFO 3
8344 77 1984
1013V
Anon
ymou
s
Anonymous CCGT DLN - NG preheating Power and
district heating 714 NG 100 7913 85 2005
1014R
Anon
ymou
s
Anonymous GB NA District heating 166 Coal 100 5100 34 NA
1015R
Anon
ymou
s
Anonymous GB FGR - BF NA 20 Coal 100 NA NA 1986
WORKIN
G DRAFT IN
PROGRESS
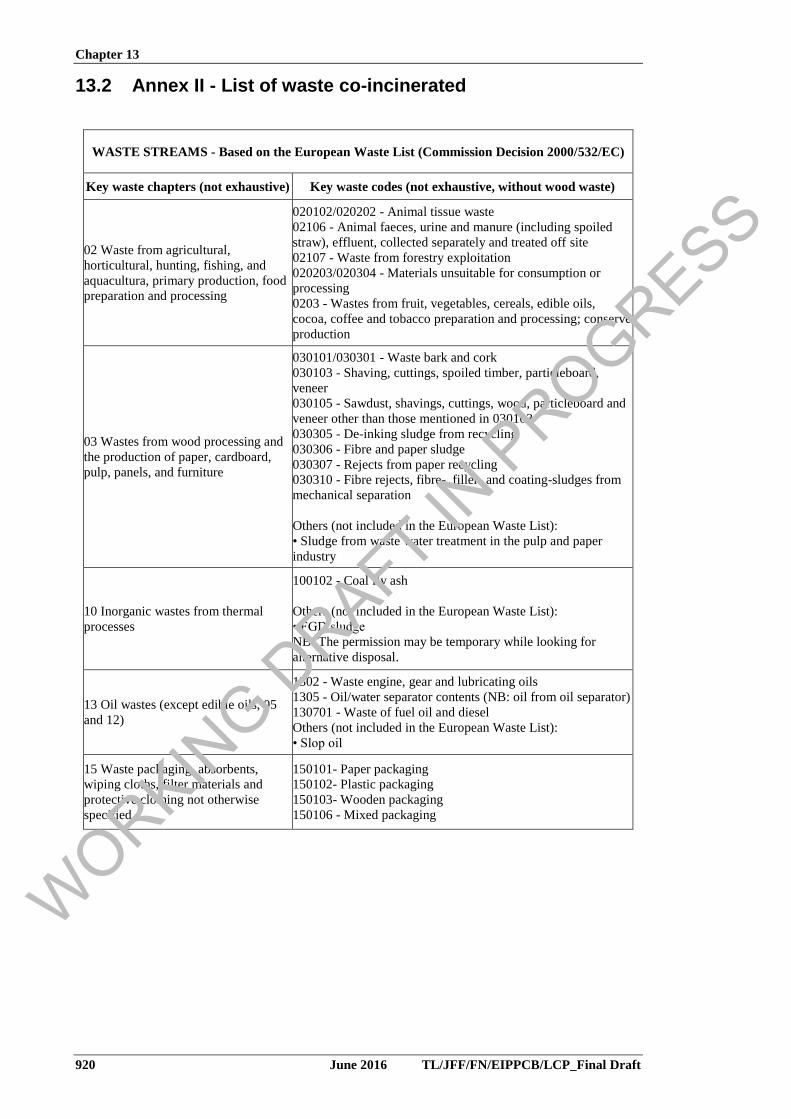
Chapter 13
920 June 2016 TL/JFF/FN/EIPPCB/LCP_Final Draft
13.2 Annex II - List of waste co-incinerated
WASTE STREAMS - Based on the European Waste List (Commission Decision 2000/532/EC)
Key waste chapters (not exhaustive) Key waste codes (not exhaustive, without wood waste)
02 Waste from agricultural,
horticultural, hunting, fishing, and
aquacultura, primary production, food
preparation and processing
020102/020202 - Animal tissue waste
02106 - Animal faeces, urine and manure (including spoiled
straw), effluent, collected separately and treated off site
02107 - Waste from forestry exploitation
020203/020304 - Materials unsuitable for consumption or
processing
0203 - Wastes from fruit, vegetables, cereals, edible oils,
cocoa, coffee and tobacco preparation and processing; conserve
production
03 Wastes from wood processing and
the production of paper, cardboard,
pulp, panels, and furniture
030101/030301 - Waste bark and cork
030103 - Shaving, cuttings, spoiled timber, particleboard,
veneer
030105 - Sawdust, shavings, cuttings, wood, particleboard and
veneer other than those mentioned in 030103
030305 - De-inking sludge from recycling
030306 - Fibre and paper sludge
030307 - Rejects from paper recycling
030310 - Fibre rejects, fibre-, filler- and coating-sludges from
mechanical separation
Others (not included in the European Waste List):
• Sludge from waste water treatment in the pulp and paper
industry
10 Inorganic wastes from thermal
processes
100102 - Coal fly ash
Others (not included in the European Waste List):
• FGD sludge
NB: The permission may be temporary while looking for
alternative disposal.
13 Oil wastes (except edible oils, 05
and 12)
1302 - Waste engine, gear and lubricating oils
1305 - Oil/water separator contents (NB: oil from oil separator)
130701 - Waste of fuel oil and diesel
Others (not included in the European Waste List):
• Slop oil
15 Waste packaging, absorbents,
wiping cloths, filter materials and
protective clothing not otherwise
specified
150101- Paper packaging
150102- Plastic packaging
150103- Wooden packaging
150106 - Mixed packaging
WORKIN
G DRAFT IN
PROGRESS

Chapter 13
TL/JFF/FN/EIPPCB/LCP_Final Draft June 2016 921
17 Construction and demolition wastes
170201 - Wood
170203 - Plastic
170303* - Tar and tar products
170904 - Other mixed construction and demolition wastes
Others (not included in the European Waste List):
• Mixed glass, plastic, wood
19 Wastes from waste treatment
facilities, off-site waste water treatment
plants and the water industry
190204* - Premixed wastes
190207 - Oil and concentrate from separation
190210 - Other combustible waste
190501 - Non-composted fraction
190503 - Off-specification compost; Sludge from the treatment of
industrial waste water; Urban waste water sludge
1909 - Wastes from the preparation of drinking water or water for
industrial use
191210 - Combustible waste (refuse-derived fuel)
191211* - Other wastes (including mixtures of materials) from
mechanical treatment of waste containing dangerous substances
191212 - Other wastes (including mixtures of materials) from
mechanical treatment of wastes other than those mentioned in
191211*
Others (not included in the European Waste List):
• Plastic and rubber
• Waste-derived fuels
• Other (mixed) waste from mechanical treatment of waste
WASTE THAT CEASES TO BE WASTE (examples based on national practices)
Please note that these materials are not considered waste but fuel (see Article 6 'end-of-waste' of Directive
98/2008/EC on waste)
Situations vary across the EU and the different streams can be either in compliance with the definition of
biomass for LCP, waste streams or end-of-waste/waste that ceases to be waste.
Process fuel oil from waste lubricating oil
Natural non-hazardous agricultural or forestry material used for the production of energy but which has not
been excluded from (Article 2 of) the revised Waste Framework Directive but which has subsequently
passed the end-of-waste test. This potentially includes biomass residues from the olive, sunflower, grape,
peanut and palm production industries.
Meat and bone (animal tissue)
Source: [Eurelectric 2012][SE comments to D1, 2013][CEPI comments to D1, 2013]
NB: For hazardous waste:
Waste and residues from industrial process are occasionally co-incinerated in public power and heat plants
(e.g.: waste from the textile industry [0402]; waste from phosphor production [0609]; waste from the
chemical industry). Such industry-specific wastes (especially from waste Chapters 4 to 7) are comparable to
certain production residues used within those industries.
Quantities vary but, in certain cases, permits can include restrictions to the amount used related to the
combustion fuel (e.g. coal) in weight.
W
ORKING D
RAFT IN P
ROGRESS

Chapter 13
922 June 2016 TL/JFF/FN/EIPPCB/LCP_Final Draft
13.3 Annex III - Example tool for converting emission levels to different averaging periods
In December 2014, the Netherlands, with the support of Eurelectric, provided in a memo a
statistical tool based on Student's T distribution for deriving daily and monthly averages for
emissions to air, from the 95th percentile of the hourly averages and the yearly averages, based
on plant-specific data collected in 2011–2012 and 2014. The statistical tool was further
developed by the Netherlands in August 2015.
This tool was not used by the TWG for the LCP BREF review. It is presented here as an
example tool for converting different types of averaging periods corresponding to emissions to
air from LCPs.
Using 95th
percentile of hourly and yearly average levels to derive a monthly average level
The tool provides formulas for estimating the maximum of the daily averages (MaxDA-St) and
the maximum of the monthly averages (MaxMA-St) over the year, using as input data: 1) the
reported 95th percentile of hourly averages (95 %HA) and yearly averages (YA), and 2)
parameters reflecting a typical number of independent hourly averages per day (Nivd), a number
of acceptable daily average exceedances in five years (i.e. one exceedance) and a number of
minimum valid daily averages per month (i.e. five).
For each plant/pollutant, the memo reports the calculated statistical 95th
percentile of the daily
averages. By minimising the sum of squares of the difference between the observed and
statistically calculated 95th percentiles of the daily averages, an optimal Nivd for the selected
plants/pollutants has been determined. An overall Nivd of 2.5 seems to be the best fit for NOX,
SO2 and dust. A Nivd value of 2.5 corresponds to periods with elevated emissions covering
40 % of the operation time in a day.
Using a Nivd of 2.5, the statistical equations for the calculation of the MaxDA-st and MaxMA-
St averages for NOX, SO2 and dust are:
MaxDA-St=YA+1.98*(95%HA-YA)/sqrt(Nivd)= YA+1.25*(95%HA-YA)
MaxMA-St=YA+0.89*(95%HA-YA)/sqrt(Nivd)= YA+0.56*(95%HA-YA)
For CO, the optimal Nivd of 2.5 shows a poor fit, probably due to the daily and monthly
averages of the CO emissions not following the Gaussian distribution. Although this would
suggest using a different statistical approach, a Nivd of 1 provides an acceptable fit between the
measured and statistical averages. Therefore for CO it is proposed to us a Nivd of 1, which
results in the following equations:
MaxDA-St = YA+1.98*(95%HA-YA)/sqrt(Nivd) = YA+1.98*(95%HA-YA)
MaxMA-St = YA+0.89*(95%HA-YA)/sqrt(Nivd) = YA+0.89*(95%HA-YA)
Using daily and yearly average levels to derive a monthly average level
Independently of the chosen Nivd, a simplification of the system of equations can be solved as
follows to derive a maximum monthly average level interpolated based on the maximum daily
average level and on the yearly average:
MaxMA-St = 0.45 * MaxDA-St + 0.55 * YA
Table 13 shows maximum monthly average emission levels that, based on the previous formula,
would correspond to the yearly average and maximum daily average levels in some example
cases.
WORKIN
G DRAFT IN
PROGRESS

Chapter 13
TL/JFF/FN/EIPPCB/LCP_Final Draft June 2016 923
Table 13.2: Example of monthly average levels calculated using the NL/Eurelectric tool
NOX emission levels corresponding
to theoretical cases
Maximum daily
level, mg/Nm3
Interpolated
maximum monthly
level, mg/Nm3
Yearly level,
mg/Nm3
New > 300 MWth coal-fired PC boiler 100 83.5 70
Existing > 300 MWth coal-fired PC
boiler 125 116.75 110
New gas-fired OCGT 35 29.5 25
Existing gas-fired OCGT 40 34.5 30
Source: Example calculations based on [NL-Eurelectric 2015]
WORKIN
G DRAFT IN
PROGRESS

Chapter 13
924 June 2016 TL/JFF/FN/EIPPCB/LCP_Final Draft
13.4 Annex IV - Measurement uncertainties reported by the plants that participated in the 2012 data collection
In the 2012 data collection (see Section 1.3.9), plant operators were asked to provide
information on the 'uncertainty of a single measurement for the 95 % confidence interval' for
each of the reported pollutants.
This annex gives the uncertainties reported for measurements of NOX, SOX and dust, expressed
as a percentage of the measured value. When plants reported the uncertainty as an absolute
value, the percentage was calculated based on the yearly average emissions.
As for NOX measurement uncertainty, 191 plants reported uncertainties of 20 % or below, while
101 additional plants reported that the uncertainty was within 20 % without specifying a precise
value. Figure 13.1 shows the distribution of NOX measurement uncertainties, taking into
consideration only the plants that reported a specific uncertainty value within 20 %.
To illustrate the correlation between percentage uncertainty and emission level, the left-hand
side of the figure plots the percentage measurement uncertainty versus the yearly average NOX
emission concentration of the same plant. While most observations are located in the lower left
triangle of the quadrant, the correlation between the uncertainty and the emission level is too
weak to be expressed in a statistically significant mathematical form. The right-hand side of the
same figure plots, in increasing order, the percentage uncertainty (solid dots) and the absolute
uncertainty (open dots, in log scale) reported by the plants of the sample. Where a plant reported
the measurement uncertainty as a percentage but not as a concentration, the absolute uncertainty
was approximated by multiplying the percentage uncertainty by the average yearly emission
level. Note that the dots (percentage and absolute uncertainty) associated with the same
horizontal point do not necessarily correspond to the same plant. The figure shows that around
40 % of these plants reported uncertainties within 5 %, around 75 % of the plants reported
uncertainties within 10 %, and more than 90 % reported uncertainties below 15 %. In terms of
absolute uncertainties, around 25 % of these plants report uncertainties within 3 mg/Nm3, 50 %
of the plants report uncertainties within 6 mg/Nm3, and 75 % of the plants report uncertainties
within 12 mg/Nm3.
Figure 13.1: Measurement uncertainties reported for NOX emissions
As for SO2 measurement uncertainty, 110 plants reported uncertainties of 20 % or below, while
78 additional plants reported that the uncertainty was within 20 % without specifying a precise
value. Figure 13.2 shows the distribution of SO2 measurement uncertainties, taking into
consideration only the plants that reported a specific uncertainty value within 20 %.
WORKIN
G DRAFT IN
PROGRESS
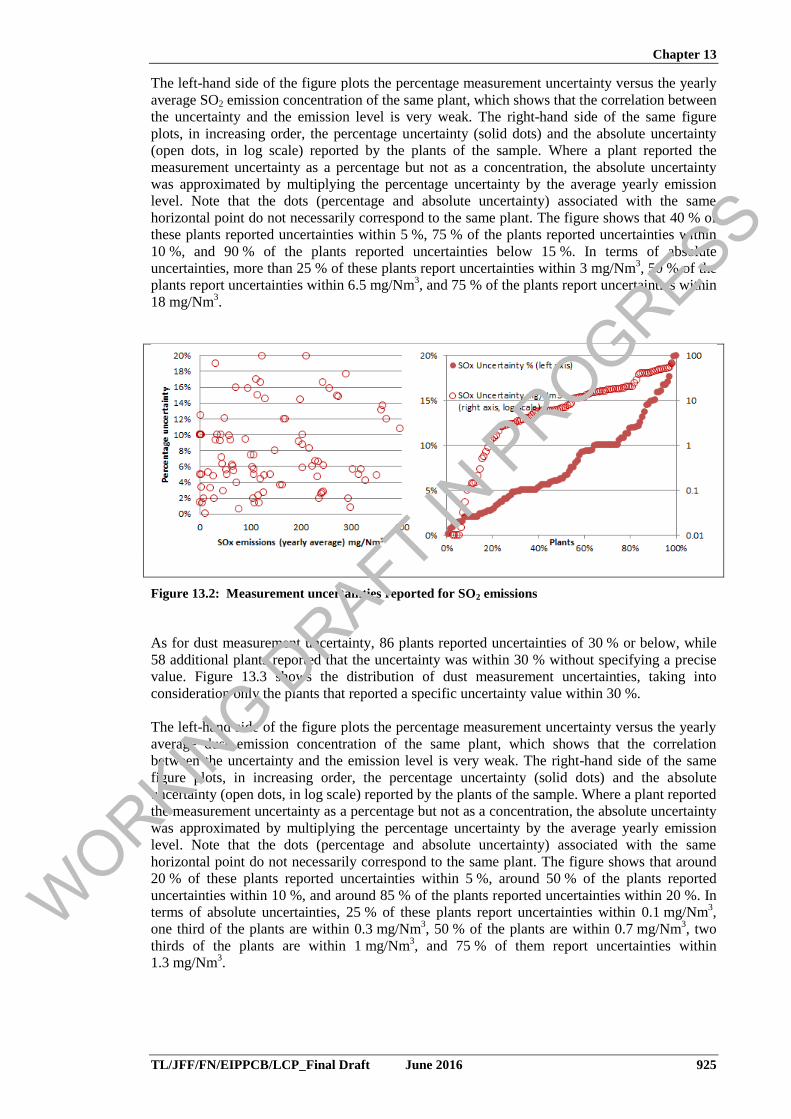
Chapter 13
TL/JFF/FN/EIPPCB/LCP_Final Draft June 2016 925
The left-hand side of the figure plots the percentage measurement uncertainty versus the yearly
average SO2 emission concentration of the same plant, which shows that the correlation between
the uncertainty and the emission level is very weak. The right-hand side of the same figure
plots, in increasing order, the percentage uncertainty (solid dots) and the absolute uncertainty
(open dots, in log scale) reported by the plants of the sample. Where a plant reported the
measurement uncertainty as a percentage but not as a concentration, the absolute uncertainty
was approximated by multiplying the percentage uncertainty by the average yearly emission
level. Note that the dots (percentage and absolute uncertainty) associated with the same
horizontal point do not necessarily correspond to the same plant. The figure shows that 40 % of
these plants reported uncertainties within 5 %, 75 % of the plants reported uncertainties within
10 %, and 90 % of the plants reported uncertainties below 15 %. In terms of absolute
uncertainties, more than 25 % of these plants report uncertainties within 3 mg/Nm3, 50 % of the
plants report uncertainties within 6.5 mg/Nm3, and 75 % of the plants report uncertainties within
18 mg/Nm3.
Figure 13.2: Measurement uncertainties reported for SO2 emissions
As for dust measurement uncertainty, 86 plants reported uncertainties of 30 % or below, while
58 additional plants reported that the uncertainty was within 30 % without specifying a precise
value. Figure 13.3 shows the distribution of dust measurement uncertainties, taking into
consideration only the plants that reported a specific uncertainty value within 30 %.
The left-hand side of the figure plots the percentage measurement uncertainty versus the yearly
average dust emission concentration of the same plant, which shows that the correlation
between the uncertainty and the emission level is very weak. The right-hand side of the same
figure plots, in increasing order, the percentage uncertainty (solid dots) and the absolute
uncertainty (open dots, in log scale) reported by the plants of the sample. Where a plant reported
the measurement uncertainty as a percentage but not as a concentration, the absolute uncertainty
was approximated by multiplying the percentage uncertainty by the average yearly emission
level. Note that the dots (percentage and absolute uncertainty) associated with the same
horizontal point do not necessarily correspond to the same plant. The figure shows that around
20 % of these plants reported uncertainties within 5 %, around 50 % of the plants reported
uncertainties within 10 %, and around 85 % of the plants reported uncertainties within 20 %. In
terms of absolute uncertainties, 25 % of these plants report uncertainties within 0.1 mg/Nm3,
one third of the plants are within 0.3 mg/Nm3, 50 % of the plants are within 0.7 mg/Nm
3, two
thirds of the plants are within 1 mg/Nm3, and 75 % of them report uncertainties within
1.3 mg/Nm3.
WORKIN
G DRAFT IN
PROGRESS

Chapter 13
926 June 2016 TL/JFF/FN/EIPPCB/LCP_Final Draft
Figure 13.3: Measurement uncertainties reported for dust emissions
WORKIN
G DRAFT IN
PROGRESS

Glossary
TL/JFF/FN/EIPPCB/LCP_Final Draft June 2016 927
GLOSSARY
This glossary is meant to facilitate the understanding of the information contained in this
document. The definitions of terms in this glossary are not legal definitions (even if some of
them may coincide with definitions given in European legislation), they are meant to help the
reader understand some key terms in the context of their use in the specific sector covered by
this document.
This glossary is divided into the following sections:
I. ISO country codes
II. Monetary units
III. Unit prefixes, number separators and notations
IV. Units and measures
V. Chemical elements
VI. Acronyms and definitions
WORKIN
G DRAFT IN
PROGRESS

Glossary
928 June 2016 TL/JFF/FN/EIPPCB/LCP_Final Draft
I. ISO country codes
ISO code Country
Member States (*)
AT Austria
BE Belgium
BG Bulgaria
CZ Czech Republic
CY Cyprus
DE Germany
DK Denmark
EE Estonia
EL Greece
ES Spain
FI Finland
FR France
HU Hungary
IE Ireland
IT Italy
LT Lithuania
LU Luxembourg
LV Latvia
MT Malta
NL Netherlands
PL Poland
PT Portugal
RO Romania
SE Sweden
SI Slovenia
SK Slovakia
UK United Kingdom
Non-member countries
CN China
JP Japan
NO Norway
US United States
(*) The protocol order of the Member States is based on
the alphabetical order of their geographical names in the
original language(s).
II. Monetary units
Code(1) Country/territory Currency
Member State currencies
EUR Euro area (2) euro (pl. euros)
DKK Denmark Danish krone (pl. kroner)
GBP United Kingdom pound sterling (inv.)
SEK Sweden krona (pl. kronor)
Other currencies
NOK Norway Norwegian krone
USD United States US dollar
(1) ISO 4217 codes.
(2) Includes Austria, Belgium, Cyprus, Estonia, Finland, France, Germany, Greece, Ireland,
Italy, Luxembourg, Malta, the Netherlands, Portugal, Slovakia, Slovenia and Spain.
WORKIN
G DRAFT IN
PROGRESS

Glossary
TL/JFF/FN/EIPPCB/LCP_Final Draft June 2016 929
III. Unit prefixes, number separators and notations
Numbers in this document are written using the '.' character as the decimal separator and the
space as the separator for thousands.
The symbol ~ (around; more or less) is the notation used to indicate approximation.
The symbol Δ (delta) is the notation used to indicate a difference.
The following table contains the frequently used prefixes:
Symbol Prefix 10
n Word Decimal Number
Y yotta 1024
Septillion 1 000 000 000 000 000 000 000 000
Z zetta 1021
Sextillion 1 000 000 000 000 000 000 000
E exa 1018
Quintillion 1 000 000 000 000 000 000
P peta 1015
Quadrillion 1 000 000 000 000 000
T tera 1012
Trillion 1 000 000 000 000
G giga 109 Billion 1 000 000 000
M mega 106 Million 1 000 000
k kilo 103 Thousand 1000
h hecto 102 Hundred 100
da deca 101 Ten 10
------- ------- 1 One 1
d deci 10−1
Tenth 0.1
c centi 10−2
Hundredth 0.01
m milli 10−3
Thousandth 0.001
µ micro 10−6
Millionth 0.000 001
n nano 10−9
Billionth 0.000 000 001
p pico 10−12
Trillionth 0.000 000 000 001
f femto 10−15
Quadrillionth 0.000 000 000 000 001
a atto 10−18
Quintillionth 0.000 000 000 000 000 001
z zepto 10−21
Sextillionth 0.000 000 000 000 000 000 001
y yocto 10−24
Septillionth 0.000 000 000 000 000 000 000 001
WORKIN
G DRAFT IN
PROGRESS
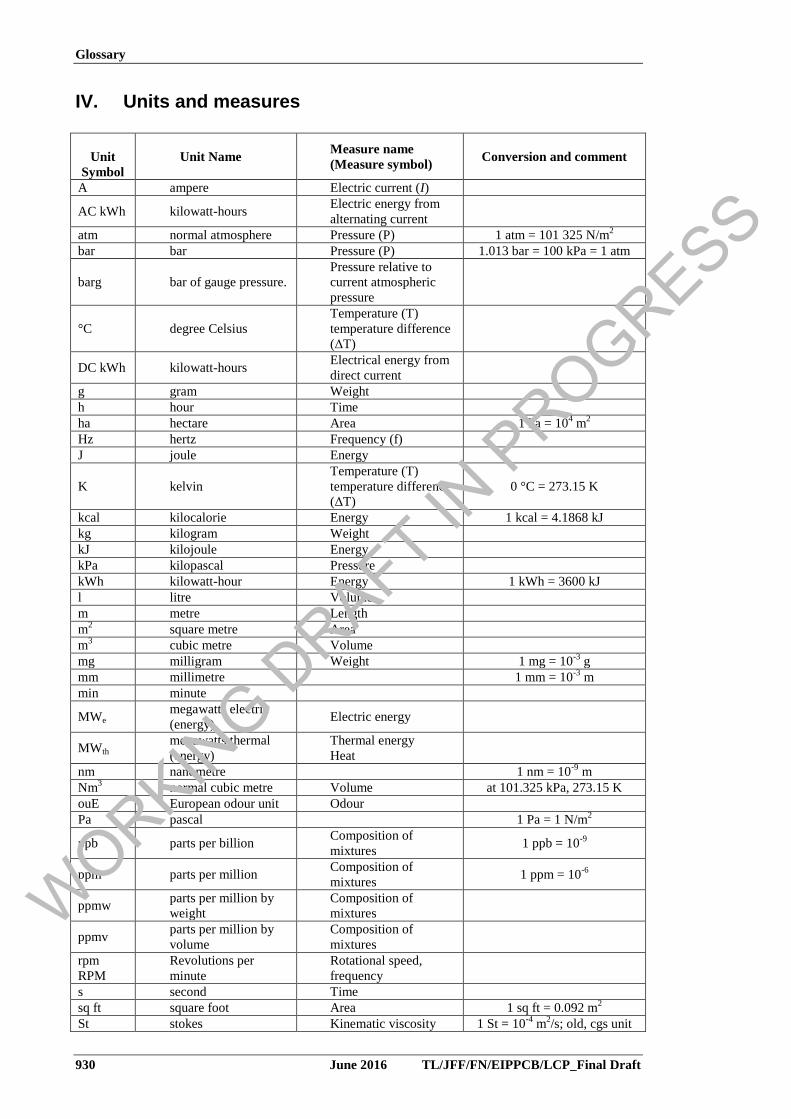
Glossary
930 June 2016 TL/JFF/FN/EIPPCB/LCP_Final Draft
IV. Units and measures
Unit
Symbol
Unit Name Measure name
(Measure symbol) Conversion and comment
A ampere Electric current (I)
AC kWh kilowatt-hours Electric energy from
alternating current
atm normal atmosphere Pressure (P) 1 atm = 101 325 N/m2
bar bar Pressure (P) 1.013 bar = 100 kPa = 1 atm
barg bar of gauge pressure.
Pressure relative to
current atmospheric
pressure
°C degree Celsius
Temperature (T)
temperature difference
(ΔT)
DC kWh kilowatt-hours Electrical energy from
direct current
g gram Weight
h hour Time
ha hectare Area 1 ha = 104 m
2
Hz hertz Frequency (f)
J joule Energy
K kelvin
Temperature (T)
temperature difference
(ΔT)
0 °C = 273.15 K
kcal kilocalorie Energy 1 kcal = 4.1868 kJ
kg kilogram Weight
kJ kilojoule Energy
kPa kilopascal Pressure
kWh kilowatt-hour Energy 1 kWh = 3600 kJ
l litre Volume
m metre Length
m2 square metre Area
m3 cubic metre Volume
mg milligram Weight 1 mg = 10-3
g
mm millimetre 1 mm = 10-3
m
min minute
MWe megawatts electric
(energy) Electric energy
MWth megawatts thermal
(energy)
Thermal energy
Heat
nm nanometre 1 nm = 10-9
m
Nm3 normal cubic metre Volume at 101.325 kPa, 273.15 K
ouE European odour unit Odour
Pa pascal 1 Pa = 1 N/m2
ppb parts per billion Composition of
mixtures 1 ppb = 10
-9
ppm parts per million Composition of
mixtures 1 ppm = 10
-6
ppmw parts per million by
weight
Composition of
mixtures
ppmv parts per million by
volume
Composition of
mixtures
rpm
RPM
Revolutions per
minute
Rotational speed,
frequency
s second Time
sq ft square foot Area 1 sq ft = 0.092 m2
St stokes Kinematic viscosity 1 St = 10-4
m2/s; old, cgs unit
WORKIN
G DRAFT IN
PROGRESS

Glossary
TL/JFF/FN/EIPPCB/LCP_Final Draft June 2016 931
t metric tonne Weight 1 t = 1000 kg or 106 g
t/d tonnes per day Mass flow
Materials consumption
t/yr tonnes per year Mass flow
Materials consumption
V volt Voltage (V)
Electric potential
vol-%
% v/v percentage by volume
Composition of
mixtures
wt-%
% w/w percentage by weight
Composition of
mixtures
W watt Power 1 W = 1 J/s
yr year Time
μm micrometre Length 1 μm = 10-6
m
WORKIN
G DRAFT IN
PROGRESS

Glossary
932 June 2016 TL/JFF/FN/EIPPCB/LCP_Final Draft
V. Chemical elements
Symbol Name Symbol Name
Ac Actinium Mn Manganese
Ag Silver Mo Molybdenum
Al Aluminium N Nitrogen
Am Americium Na Sodium
Ar Argon Nb Niobium
As Arsenic Nd Neodymium
At Astatine Ne Neon
Au Gold Ni Nickel
B Boron No Nobelium
Ba Barium Np Neptunium
Be Beryllium O Oxygen
Bi Bismuth Os Osmium
Bk Berkelium P Phosphorus
Br Bromine Pa Protactinium
C Carbon Pb Lead
Ca Calcium Pd Palladium
Cd Cadmium Pm Promethium
Ce Cerium Po Polonium
Cf Californium Pr Praseodymium
Cl Chlorine Pt Platinum
Cm Curium Pu Plutonium
Co Cobalt Ra Radium
Cr Chromium Rb Rubidium
Cs Caesium Re Rhenium
Cu Copper Rf Rutherfordium
Dy Dysprosium Rh Rhodium
Er Erbium Rn Radon
Es Einsteinium Ru Ruthenium
Eu Europium S Sulphur
F Fluorine Sb Antimony
Fe Iron Sc Scandium
Fm Fermium Se Selenium
Fr Francium Si Silicon
Ga Gallium Sm Samarium
Gd Gadolinium Sn Tin
Ge Germanium Sr Strontium
H Hydrogen Ta Tantalum
He Helium Tb Terbium
Hf Hafnium Tc Technetium
Hg Mercury Te Tellurium
Ho Holmium Th Thorium
I Iodine Ti Titanium
In Indium Tl Thallium
Ir Iridium Tm Thulium
K Potassium U Uranium
Kr Krypton V Vanadium
La Lanthanum W Tungsten
Li Lithium Xe Xenon
Lr Lawrencium Y Yttrium
Lu Lutetium Yb Ytterbium
Md Mendelevium Zn Zinc
Mg Magnesium Zr Zirconium
WORKIN
G DRAFT IN
PROGRESS

Glossary
TL/JFF/FN/EIPPCB/LCP_Final Draft June 2016 933
VI. Acronyms and definitions
Term used Definition
General terms
Boiler Any combustion plant with the exception of engines and gas turbines, process
furnaces or heaters
Combined-cycle gas
turbine (CCGT)
A CCGT is a combustion plant where two thermodynamic cycles are used (i.e.
Brayton and Rankine cycles). In a CCGT, heat from the flue-gas of a gas
turbine (operating according to the Brayton cycle to produce electricity) is
converted to useful energy in a heat recovery steam generator (HRSG), where it
is used to generate steam, which then expands in a steam turbine (operating
according to the Rankine cycle to produce additional electricity).
For the purpose of these BAT conclusions, a CCGT includes configurations
both with and without supplementary firing of the HRSG.
Combustion plant
Any technical apparatus in which fuels are oxidised in order to use the heat thus
generated. For the purposes of these BAT conclusions, a combination formed
of:
two or more separate combustion plants where the flue-gases are
discharged through a common stack, or
separate combustion plants which have been granted a permit for the
first time on or after 1 July 1987, or for which the operators have
submitted a complete application for a permit on or after that date,
which are installed in such a way that, taking technical and economic
factors into account, their flue-gases could, in the judgment of the
competent authority, be discharged through a common stack
is considered as a single combustion plant.
For calculating the total rated thermal input of such a combination, the
capacities of all individual combustion plants concerned, which have a rated
thermal input of at least 15 MW, shall be added together.
Combustion unit Individual combustion plant
Continuous
measurement
Measurement using an automated measuring system permanently installed on
site
Direct discharge Discharge (to a receiving water body) at the point where the emission leaves
the installation without further downstream treatment
Existing plant A combustion plant which is not a new plant
Existing unit A combustion unit which is not a new unit
Existing flue-gas
desulphurisation
(FGD) system
A flue-gas desulphurisation (FGD) system which is not a new FGD system
Flue-gas
desulphurisation
(FGD) system
System composed of one or a combination of abatement technique(s) whose
purpose is to reduce the level of SOX emitted by a combustion plant
Gas oil
Any petroleum-derived liquid fuel falling within CN code 2710 19 25, 2710 19
29, 2710 19 47, 2710 19 48, 2710 20 17 or 2710 20 19.
Or any petroleum-derived liquid fuel of which less than 65 vol-% (including
losses) distils at 250 °C and of which at least 85 vol-% (including losses) distils
at 350 °C by the ASTM D86 method.
Heat to power ratio Ratio of generated heat over electrical power in a cogeneration system.
Heavy fuel oil (HFO)
Any petroleum-derived liquid fuel falling within CN code 2710 19 51 to 2710
19 68, 2710 20 31, 2710 20 35, 2710 20 39.
Or any petroleum-derived liquid fuel, other than gas oil, which, by reason of its
distillation limits, falls within the category of heavy oils intended for use as fuel
and of which less than 65 vol-% (including losses) distils at 250 °C by the
ASTM D86 method. If the distillation cannot be determined by the ASTM D86
method, the petroleum product is also categorised as a heavy fuel oil.
Net electrical
efficiency (combustion
unit and IGCC)
Ratio between the net electrical output (electricity produced on the high-voltage
side of the main transformer minus the imported energy – e.g. for auxiliary
systems' consumption) and the fuel/feedstock energy input (as the
WORKIN
G DRAFT IN
PROGRESS
Glossary
934 June 2016 TL/JFF/FN/EIPPCB/LCP_Final Draft
fuel/feedstock lower heating value) at the combustion unit boundary over a
given period of time
Net mechanical energy
efficiency
Ratio between the mechanical power at load coupling and the thermal power
supplied by the fuel
Net total fuel
utilisation (combustion
unit and IGCC)
Ratio between the net produced energy (electricity, hot water, steam,
mechanical energy produced minus the imported electrical and/or thermal
energy (e.g. for auxiliary systems' consumption)) and the fuel energy input (as
the fuel lower heating value) at the combustion unit boundary over a given
period of time
Net total fuel
utilisation (gasification
unit)
Ratio between the net produced energy (electricity, hot water, steam,
mechanical energy produced, and syngas (as the syngas lower heating value)
minus the imported electrical and/or thermal energy (e.g. for auxiliary systems'
consumption)) and the fuel/feedstock energy input (as the fuel/feedstock lower
heating value) at the gasification unit boundary over a given period of time
New plant
A combustion plant first permitted at the installation following the publication
of these BAT conclusions or a complete replacement of a combustion plant on
the existing foundations following the publication of these BAT conclusions
New unit
A combustion unit first permitted at the combustion plant following the
publication of these BAT conclusions or a complete replacement of a
combustion unit on the existing foundations of the combustion plant following
the publication of these BAT conclusions
New flue-gas
desulphurisation
(FGD) system
Either a flue-gas desulphurisation (FGD) system in a new plant or a FGD
system which includes at least one abatement technique introduced or
completely replaced in an existing plant following the publication of these BAT
conclusions
Operated hours
The time, expressed in hours, during which a combustion plant, in whole or in
part, is operated and is discharging emissions to air, excluding start-up and
shutdown periods
Periodic measurement Determination of a measurand (a particular quantity subject to measurement) at
specified time intervals using manual or automated methods
Post-combustion plant
System designed to purify the flue-gases by combustion which is not operated
as an independent combustion plant, such as a thermal oxidiser equipment (i.e.
tail gas incinerator), used for the removal of the pollutant(s) (e.g. VOC) content
from the flue-gas with or without the recovery of the heat generated therein.
Staged combustion techniques, where each combustion stage is confined within
a separate chamber, which may have distinct combustion process characteristics
(e.g. fuel to air ratio, temperature profile), are considered integrated in the
combustion process and are not considered post-combustion plants. Similarly,
when gases generated in a process heater/furnace or in another combustion
process are subsequently oxidised in a distinct combustion plant to recover their
energetic value (with or without the use of auxiliary fuel) to produce electricity,
steam, hot water/oil or mechanical energy, the latter plant is not considered a
post-combustion plant
Predictive emissions
monitoring system
(PEMS)
System used to determine the emissions concentration of a pollutant from an
emission source on a continuous basis, based on its relationship with a number
of characteristic continuously monitored process parameters (e.g. the fuel gas
consumption, the air to fuel ratio) and fuel or feed quality data (e.g. the sulphur
content)
Process fuels from the
chemical industry
Gaseous and/or liquid by-products generated by the (petro-)chemical industry
and used as non-commercial fuels in combustion plants
Process furnaces or
heaters
Process furnaces or heaters are:
combustion plants whose flue-gases are used for the thermal treatment of
objects or feed material through a direct contact heating mechanism (e.g.
cement and lime kiln, glass furnace, asphalt kiln, drying process, reactor
used in the (petro-)chemical industry), or
combustion plants whose radiant and/or conductive heat is transferred to
objects or feed material through a solid wall without using an intermediary
heat transfer fluid (e.g. coke battery furnace, cowper, furnace or reactor
heating a process stream used in the (petro-)chemical industry such as a
steam cracker furnace, process heater used for the regasification of
liquefied natural gas (LNG) in LNG terminals).
As a consequence of the application of good energy recovery practices, process
WORKIN
G DRAFT IN
PROGRESS
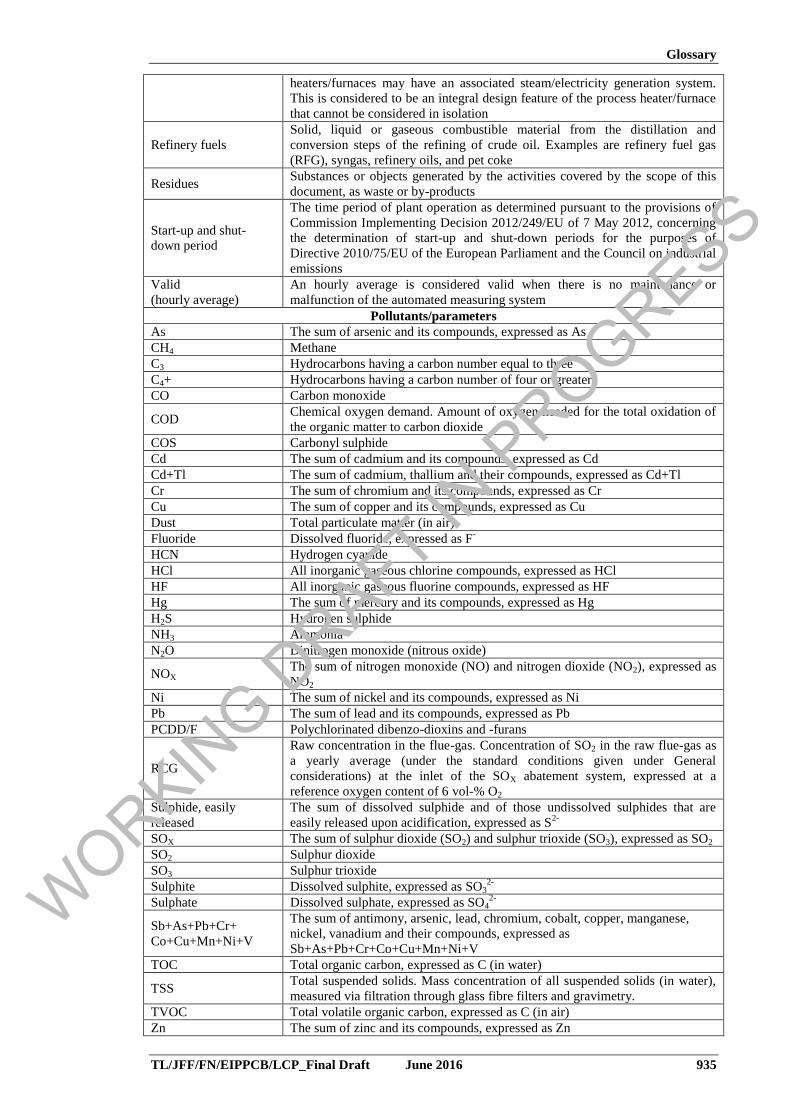
Glossary
TL/JFF/FN/EIPPCB/LCP_Final Draft June 2016 935
heaters/furnaces may have an associated steam/electricity generation system.
This is considered to be an integral design feature of the process heater/furnace
that cannot be considered in isolation
Refinery fuels
Solid, liquid or gaseous combustible material from the distillation and
conversion steps of the refining of crude oil. Examples are refinery fuel gas
(RFG), syngas, refinery oils, and pet coke
Residues Substances or objects generated by the activities covered by the scope of this
document, as waste or by-products
Start-up and shut-
down period
The time period of plant operation as determined pursuant to the provisions of
Commission Implementing Decision 2012/249/EU of 7 May 2012, concerning
the determination of start-up and shut-down periods for the purposes of
Directive 2010/75/EU of the European Parliament and the Council on industrial
emissions
Valid
(hourly average)
An hourly average is considered valid when there is no maintenance or
malfunction of the automated measuring system
Pollutants/parameters
As The sum of arsenic and its compounds, expressed as As
CH4 Methane
C3 Hydrocarbons having a carbon number equal to three
C4+ Hydrocarbons having a carbon number of four or greater
CO Carbon monoxide
COD Chemical oxygen demand. Amount of oxygen needed for the total oxidation of
the organic matter to carbon dioxide
COS Carbonyl sulphide
Cd The sum of cadmium and its compounds, expressed as Cd
Cd+Tl The sum of cadmium, thallium and their compounds, expressed as Cd+Tl
Cr The sum of chromium and its compounds, expressed as Cr
Cu The sum of copper and its compounds, expressed as Cu
Dust Total particulate matter (in air)
Fluoride Dissolved fluoride, expressed as F-
HCN Hydrogen cyanide
HCl All inorganic gaseous chlorine compounds, expressed as HCl
HF All inorganic gaseous fluorine compounds, expressed as HF
Hg The sum of mercury and its compounds, expressed as Hg
H2S Hydrogen sulphide
NH3 Ammonia
N2O Dinitrogen monoxide (nitrous oxide)
NOX The sum of nitrogen monoxide (NO) and nitrogen dioxide (NO2), expressed as
NO2
Ni The sum of nickel and its compounds, expressed as Ni
Pb The sum of lead and its compounds, expressed as Pb
PCDD/F Polychlorinated dibenzo-dioxins and -furans
RCG
Raw concentration in the flue-gas. Concentration of SO2 in the raw flue-gas as
a yearly average (under the standard conditions given under General
considerations) at the inlet of the SOX abatement system, expressed at a
reference oxygen content of 6 vol-% O2
Sulphide, easily
released
The sum of dissolved sulphide and of those undissolved sulphides that are
easily released upon acidification, expressed as S2-
SOX The sum of sulphur dioxide (SO2) and sulphur trioxide (SO3), expressed as SO2
SO2 Sulphur dioxide
SO3 Sulphur trioxide
Sulphite Dissolved sulphite, expressed as SO32-
Sulphate Dissolved sulphate, expressed as SO42-
Sb+As+Pb+Cr+
Co+Cu+Mn+Ni+V
The sum of antimony, arsenic, lead, chromium, cobalt, copper, manganese,
nickel, vanadium and their compounds, expressed as
Sb+As+Pb+Cr+Co+Cu+Mn+Ni+V
TOC Total organic carbon, expressed as C (in water)
TSS Total suspended solids. Mass concentration of all suspended solids (in water),
measured via filtration through glass fibre filters and gravimetry.
TVOC Total volatile organic carbon, expressed as C (in air)
Zn The sum of zinc and its compounds, expressed as Zn
WORKIN
G DRAFT IN
PROGRESS

Glossary
936 June 2016 TL/JFF/FN/EIPPCB/LCP_Final Draft
ACRONYMS
ACI: Activated carbon injection AGR: Acid gas removal ASU: Air separation unit
BAT-AEL: Emission level associated with the Best Available Techniques, as defined in the IED
BBS: Biased burner firing
BF: Bag filter
BFB: Bubbling fluidised bed
BF(G): Blast furnace (gas)
BFBC: Bubbling FBC
BOF(G): Basic oxygen furnace (gas)
BOOS: Burner out of service
CCGT: Combined-cycle gas turbine
CCRs: Coal combustion residues
CCPs: Coal combustion products
CCS: Carbon capture and storage
CHP: Combined heat and power
COD: Chemical oxygen demand
COG: Coke oven gas
CFB: Circulating fluidised bed
CFBC: Circulating FBC
DBB: Dry-bottom boiler
DENOX: process/technique for reducing nitrogen oxides from flue-gases
DESOX: process/technique for reducing sulphur oxides from flue-gases
DF: Dual fuel (engine type)
DLE: Dry low-NOX emissions
DLN: Dry low-NOX burners
DOE: see US DOE
DSI: Duct sorbent injection
EOR: Enhanced oil recovery (techniques for increasing the amount of crude oil that can be
extracted from an oil field)
ESP: Electrostatic precipitator
ETS: (European) Emissions Trading System
FBC: Fluidised bed combustion
FGD: Flue-gas desulphurisation
FGR: Flue-gas recirculation
GD: Gas diesel (engine type)
GF: Grate firing
GT: Gas turbine
HHV: Higher heating value
HFO: Heavy fuel oil
HP: High pressure (steam)
HRSG: Heat recovery steam generator
IED: Industrial Emissions Directive (2010/75/EU)
IGCC: Integrated gasification combined cycle
IP: Intermediate pressure (steam)
IPPC: Integrated Pollution Prevention and Control
I&S: Iron and Steel
ISO: International Organisation for Standardisation
I-TEQ: International Toxicity Equivalence (used for PCDD/F)
LCP: Large combustion plant
LHV: Lower heating value
LNB: Low-NOX burners
LNG: Liquefied natural gas
LP: Low pressure (steam)
MS: (European) Member State
WORKIN
G DRAFT IN
PROGRESS

Glossary
TL/JFF/FN/EIPPCB/LCP_Final Draft June 2016 937
MSW: Municipal solid waste
MDEA: Methyl diethanolamine
ND: Not determined
NG: Natural gas
NMVOC: Non-methane volatile organic compounds
NOC: Normal operating conditions
NOX: Nitrogen oxides (NO + NO2, normally expressed as NO2)
OFA: Overfire air
OCGT: Open-cycle gas turbine
OTNOC: Other than normal operating conditions
PAH: Polycyclic aromatic hydrocarbon
PC: Pulverised combustion
PCDD/F: Polychlorinated dibenzodioxins/furans
PEMS: Predictive emissions monitoring system
PFBC: Pressurised FBC
PM: Particulate matter
PM10: Particulate matter of less than 10 μm
PM2.5: Particulate matter of less than 2.5 μm
PRB: Powder River Basin (US coal)
QA/QC: Quality Assurance/Quality Control
RDF: Refuse-derived fuel
SACR: Selective autocatalytic NOX reduction
SC: Supercritical (steam)
SCR: Selective catalytic reduction
SDA: Spray dry absorber
SG: Spark-ignited (engine type)
SNCR: Selective non-catalytic reduction
SNG: Synthetic natural gas
SOX: Sulphur oxides (SO2 and SO3)
SRF: Solid refuse-derived fuel
ST: Steam turbine
TOC: Total organic carbon
TSS: Total suspended solids (water)
TWG: Technical Working Group
UHC: Unburnt hydrocarbons
USC: Ultra-supercritical (steam)
US DOE: United States Department of Energy
US EPA: United States Environmental Protection Agency
VOC: Volatile organic compound
WBB: Wet-bottom boiler
WFGD: Wet FGD
WWT(P): Waste water treatment (plant)
WORKIN
G DRAFT IN
PROGRESS

WORKIN
G DRAFT IN
PROGRESS

References
TL/JFF/FN/EIPPCB/LCP_Final Draft June 2016 939
REFERENCES
Other references besides those below are mentioned directly in the text. They will be added to
the following list once the cross references are created in BATIS with the corresponding
information
[1] Eurelectric, Draft text proposal, Eurelectric, 2013.
[2] EEB, Mercury emissions from coal-fired combustion plants, 2012.
[3] LCP TWG, Data collection , 2012.
[4] deBiasi, 'Combined cycle heat rates at simple cycle $/kW plant costs', , Vol. March -
April 2013, 2013.
[5] Eurelectric, Draft text proposal & study 'Reference Power Plant North-Rhine-Westfalia
VGB PowerTech 2004', 2012.
[6] Marcogaz, Draft text proposal , 2012.
[7] NOVOX - Finland, CHP and district heating networks in cold climate, 2012.
[8] NOVOX - Finland, Industrial CHP production, 2012.
[9] UK-TWG, CHP-Ready and BAT for UK CCGT power stations, 2012.
[10] METSO, DNA LCP Emission Monitoring, 2012.
[11] Airikka et al., 'Optimized combustion through collaboration of boiler and automation
supplier', , 2010, Amsterdam, The Netherlands.
[12] UK-TWG, Mid merit operation for existing plants, 2012.
[13] METSO, Start-up analysis, 2012.
[14] MOBLEY et al., 'Organic acids can enhance wet limestone flue-gas scrubbing', , Vol.
May 1986, 1986, pp. 32 - 35.
[15] WANG and BURBANK, Adipic Acid enhanced lime and limestone testing at the EPA
alkali scrubbing test facility, 1982.
[16] GEA Niro, Draft text proposal , 2012.
[17] GEA Niro, General questionnaire about spray dry absorber performance, 2012.
[18] CaO Hellas - GREECE, Greenlime injection method for mitigation of sulfur compounds
at power plants using lignite or other solid fossil fuels, 2011.
[19] EEB, NOx reduction in small or reduced load plants: Mobotec's NOx/SO2 reduction
technology, 2012.
[20] COOMBS et al., 'SCR levels of NOx Reduction with ROFA and Rotamix (SNCR) at
Dynegy's Vermilion Power Station', , 2004, Clearwater Beach, FL, USA.
[21] Poland, ROFA (R) Combustion system, 2012.
[22] US-EPA, Technology characterization: reciprocating engines, 2008.
[23] Finland, UNECE Gothenburg Protocol: Draft Guidance document on control techniques
for emissions from stationary sources , 2012.
[24] Evonik and Southern Company, SCR Catalyst regeneration - 10 years of R&D and
commercial application, 2008.
[25] Haldor Topsoe, Description of SCR DENOX process, 2012.
[26] Jacobsen, 'NOx reduction system for diesel engines today & tomorrow', Worldwide
Independent Power, Vol. May 2011, 2011, pp. 19 - 24.
[27] ICAC, White Paper - SCR control of NOx emissions from fossil-fuel-fired electric power
plants, 2009.
[28] S.Wang et al., 'Mercury emissions and speciation of coal-fired power plants in China', ,
Vol. 9, 2009, pp. 24051 - 24083.
[29] Cormetech Inc. and Mitsubishi Heavy Insductries, 'Advanced SCR catalysts tune
oxydized mercury removal', Power, Vol. August 2010, 2010.
[30] Germany, Draft VDI 3927-1 - Waste gas cleaning, 2013.
WORKIN
G DRAFT IN
PROGRESS
References
940 June 2016 TL/JFF/FN/EIPPCB/LCP_Final Draft
[31] CHIRONNA, 'Wet scrubbing of acidic gases', , Vol. June 2011, 2011.
[32] Airikka, Combustion Optimizer (Case Billerud AB Karlsborg Sweden), 2012.
[36] EGTEI, Emerging techniques and technologies for large combustion plants up to 500
MWth capacity, 2012.
[37] EGTEI, Fact sheets on emerging techniques for plants > 500 MWth, 2012.
[38] US-GAO, Mercury Control Technologies at Coal-Fired Power Plants Have Achieved
Substantial Emissions Reductions, 2009.
[39] Dombrowski et al., 'Balance of Plant Effects of Bromide Addition for Mercury Control', ,
2012, Baltimore, USA.
[40] EEB, A comparison between Texas and EU Lignite, 2012.
[41] BWE a/s, Description of vibrating grate, 2012.
[42] BWE, Description of pulverised fuel firing of biomass, 2012.
[43] EPPSA, 'Draft text proposal', Personal Communication, 2012.
[44] LECOMTE and JANKOV, Site visits in Finland, 2012.
[46] dos SANTOS et al., 'Comparison of Different Gas Turbine Inlet
Air Cooling Methods', , Vol. 61, 2012, pp. 40 - 45.
[47] Donaldson Company, Cooling inlet air improves turbine output, 2005.
[48] Sayyaadi et al., 'Efficiency enhancement of a gas turbine cycle using an optimized tubular
recuperative heat exchanger', , Vol. 38, 2012, pp. 362 - 375.
[49] DeCicco et al., 'Multi-Pollutant Emission Reduction Technology
For Stationary Gas Turbines and IC Engines', Personal Communication, 2004.
[50] EUTurbine, Draft text proposal , 2012.
[51] Jensen-Holm et al., 'SCR DeNOx catalyst considerations
when using biomass in power generation', Personal Communication, 2010.
[52] CEFIC, Study about NOx reduction in large combustion plants in petrochemical plants,
2012.
[53] UNEP, Process Optimization Guidance for Reducing Mercury Emissions from Coal
Combustion in Power Plants , 2010.
[54] UK-TWG, UK Wish list , 2012.
[55] EEB, Efficiency levels currently being achieved by new CCGTs, 2012.
WORKIN
G DRAFT IN
PROGRESS