landslide definition by an integrated monitoring system
TRANSCRIPT

Fifth International Conference on Construction in the 21st Century (CITC-V) “Collaboration and Integration in Engineering, Management and Technology” May 20-22, 2009, Istanbul, Turkey
Landslide Definition by an Integrated Monitoring System
Konstantinos Lakakis (Assistant Professor, Aristotle Univerciy of Thessaloniki, Thessaloniki, Greece)
Manolis Charalampakis
(Civil Engineer, Egnatia Odos A.E., Thessaloniki, Greece)
Paraskevas Savvaidis (Professor, Aristotle Univerciy of Thessaloniki, Thessaloniki, Greece)
Abstract Landslides are one of the major types of natural hazards being responsible for great infrastructure damage world-wide, endangering thousands of people every year. In this paper, the case study of a big embankment of Egnatia Odos Highway in Northern Greece, founded on a landslide area, is examined by the means of an Integrated Monitoring System. The major goal is to define the exact area of the landslide, describe the characteristics of the movement (displacement/deformation) and determine the environmental causes that contribute to the phenomenon. The system consists of a combination of geotechnical instruments and a geodetic high precision monitoring system. The geotechnical instruments consist of deep inclinometers, piezometers and tilitmeters, which provide data of the sub-surface displacements and surface tilt deformations along with piezometric data. The high precision geodetic monitoring system, based on GPS and high precision motorized TPS measurements, provides surface displacements, which combined with the inclinometer data, makes it possible to determine the geometry and kinematics of the unstable area. The deformation history results are examined in combination with geological and environmental data provided by piezometers, standpipes and rain-gauges to assess the stability condition and design the most adequate compensation measures. Keywords Monitoring, landslides, GPS, motorized TPS, Inclinometer 1. Introduction Landslide is a wide term for earth condition that implies sliding movement. The landslides as they have been classified by Cruden and Varnes (1996) can be defined by their basic movement mechanism as Falls, Topples, Slides, Spreads and Flows. There is also a wide terminology of landslide characteristics that describe the type of the earth material, the activity state, the magnitude, the distribution and the velocity of movement. In infrastructure works, measurements are applied to diminish any geotechnical hazard as much as possible. A case where a fast slide occurs is considered as a construction failure and needs rehabilitation.

Monitoring mission in infrastructure is to investigate very slow deformations and evaluate the risk to a hazardous development or even a failure of the structure, before the signs of the displacements become obvious. 2. Site The case study is an embankment of 25 m height and 150 m long. Approximately 50m of it is constructed with reinforced soil on one side (figure1.)
Figure 1. Asomata case study. The morphology of the area alters from hilly at the west side of the embankment to flat. The main geological formations that are encountered, as they have been established by the borehole investigations, are Holocene sedimentary deposits, travertine, Pleistocene clays, the ophiolite bedrock and a thick layer of weathered ophiolite material that cavers the bedrock. All the layers have very low permeability. 3. Instrumentation The monitoring system consists of 15 inclinometers, 4 piezometers, 3 survey monuments placed in the landslide area, 18 targets placed on the shoulder, 3 fixed survey monuments and 12 tiltplates placed on the reinforced soil. The place of the instruments is shown on figure 1. 3.1 GPS investigation methodology The survey is designed to achieve displacement measurements of high accuracy. The methodology is based on a repeatedly observed local geodetic control network with the use of the Global Positioning System (GPS). A geodetic control network is established consisting of three reference stations (T1, T2, T3), which define a stable reference frame and three monitoring stations (M6, M7, M8) located in the landslide area. One of the survey monuments (M6) is used as the base for the motorized TPS which is used for surveying a series of targets on the shoulder of the embankment. The survey is taken place short after the GPS measurements and the target positions are calculated relative to the basic monument’s results. The reference stations and the monuments along with the geotechnical instrument positions are shown in figure 2.
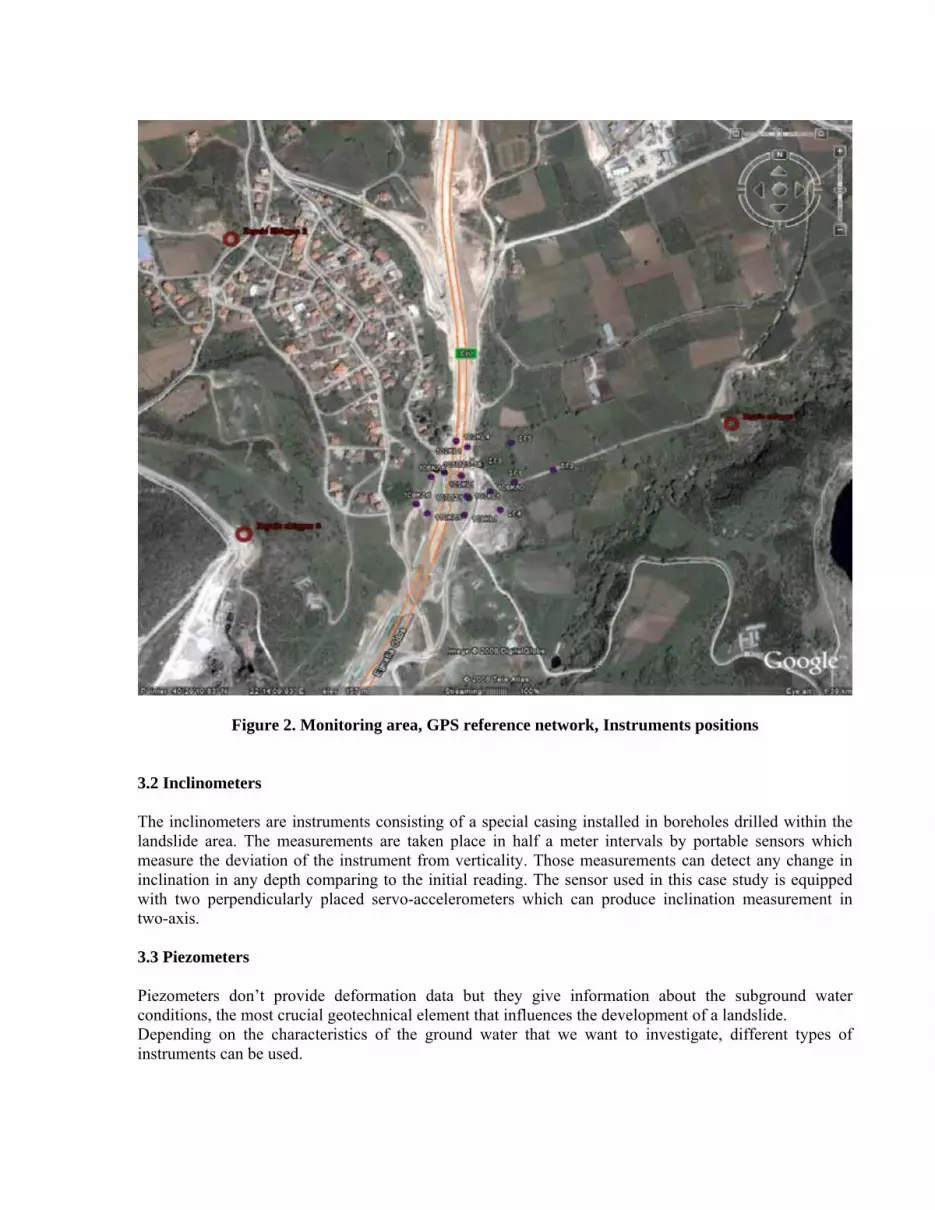
Figure 2. Monitoring area, GPS reference network, Instruments positions 3.2 Inclinometers The inclinometers are instruments consisting of a special casing installed in boreholes drilled within the landslide area. The measurements are taken place in half a meter intervals by portable sensors which measure the deviation of the instrument from verticality. Those measurements can detect any change in inclination in any depth comparing to the initial reading. The sensor used in this case study is equipped with two perpendicularly placed servo-accelerometers which can produce inclination measurement in two-axis. 3.3 Piezometers Piezometers don’t provide deformation data but they give information about the subground water conditions, the most crucial geotechnical element that influences the development of a landslide. Depending on the characteristics of the ground water that we want to investigate, different types of instruments can be used.

3.4 Tiltmeters In order to complete the structures behavior, a set of tiltplates has been installed on the reinforced soil area. This section of the embankment is constructed by three walls of precast concrete panels supported by steel strips inside the embankment body. The tiltplates offer a stable, not misshaping area which can be measured with a portable tiltmeter. These measurements provide the inclination of the corresponding section of the wall and, compared to the initial measurement, they give information on the way the wall is deformed. The plates that are installed on the vertical walls can only give one-axis deformation (figure 3, A1 to A3), while the horizontal placed A4 tiltplate can provide inclination measurements in two axis.
A4
A3Reinforced soil
A2
A1
Piles
Figure 3. Tiltplates installation in reinforced soil.
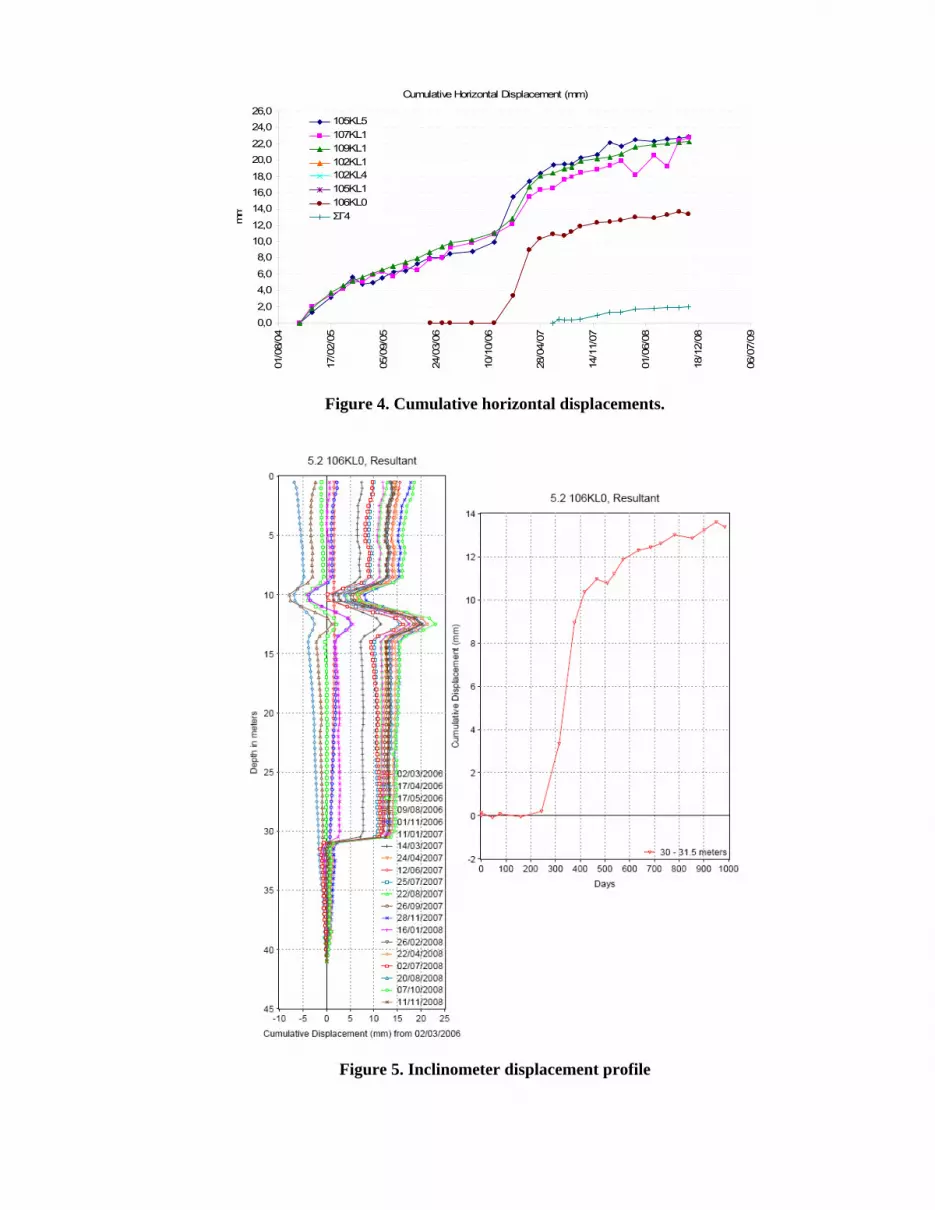
4. Results and discussion The instruments have been installed in different time periods. The first inclinometers were installed in 2004. The observations carried out with those instruments indicated a sliding area, so another set of instruments were installed in June of 2007 in order to establish the proportions and the characteristics of it. The measurements revealed a shear displacement at maximum depth of 34 meters below the ground. The head of the slip face appears to be close to the west slope of the embankment while the other end seems to extend about 200 m East. The slide development is very slow, roughly 5 mm/year average. The rate of displacement does not have a characteristic seasonable variation; instead it appears to be around an average of 0.5mm per month (October 2004-November 2006). At the end of the 2007 winter season (February-March of 2007), the displacement rate reached a peak of 2.5 mm/month and then it stabilized to a very small rate (figure 4). Figure 5 shows an inclinometer displacement profile transformed at the main deformation direction. The graph shows the shear deformation at 31 m depth. Deformation of the casing that is not indicating ground movements, like the ones from 9 to 14 m depth, are not taken into account.
Cumulative Horizontal Displacement (mm)
0,02,0
4,06,0
8,010,012,0
14,016,018,0
20,022,0
24,026,0
01/0
8/04
17/0
2/05
05/0
9/05
24/0
3/06
10/1
0/06
28/0
4/07
14/1
1/07
01/0
6/08
18/1
2/08
06/0
7/09
mm
105KL5107KL1109KL1102KL1102KL4105KL1106KL0ΣΓ4
Figure 4. Cumulative horizontal displacements.
Figure 5. Inclinometer displacement profile

The GPS survey investigation started in August 2008 and another period of measurements took place in February 2009. The GPS analysis evaluated the accuracy of the adjustment (error ellipsoid) of about 2 mm. The adjusted vectors are displayed in figure 6. The horizontal displacements that have been observed are very small and they don’t exceed the limits of the estimated error. This finding is in agreement with the inclinometer measurements, which indicate deformation of less than a 0.5 mm, for the corresponding time period. Nevertheless, the vertical displacements are more significant and show 16 mm for monument M6 and -13 mm on M7. The uplift of M6 confirms the position of the monument on the upper area of the slide, while the observed heave on M7 indicates that the monument is located at the toe area of the landslide circle. This observation is very significant because the closest inclinometer (SG2) did not indicate any horizontal deformation.
Figure 6. GPS vector processing The observations of the survey targets on the embankment shoulder and tiltmeter measurements (which were installed on August of 2008), were inside the accuracy limits. The geodetic deformation results in meters are displayed in table 1. The piezometer observations show a high water level (4 m depth) at the west area of the embankment (piezometer PZ105), while downhill the embankment the water level is lower (about 14 m deep). The observations show very small seasonal deviation and did not correspond to the heavy rainfall seasons as recorded by the closest rain gauge (figure 7). That observation could be a result of the local water management infrastructure and the low capability of the specific type of instrument (standpipes) to record pressure variations in low permeability material.
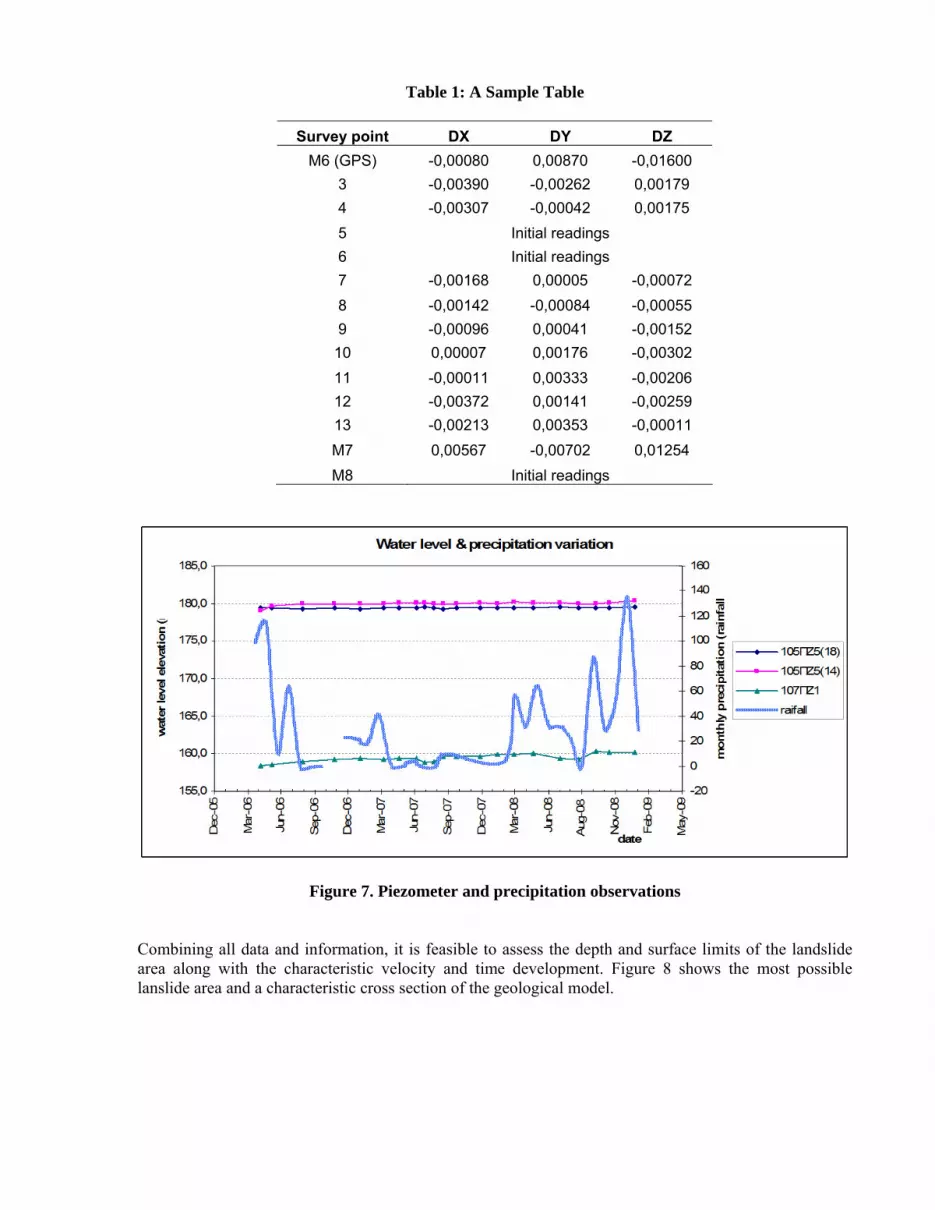
Table 1: A Sample Table
Survey point DX DY DZ M6 (GPS) -0,00080 0,00870 -0,01600
3 -0,00390 -0,00262 0,00179 4 -0,00307 -0,00042 0,00175 5 Initial readings 6 Initial readings 7 -0,00168 0,00005 -0,00072 8 -0,00142 -0,00084 -0,00055 9 -0,00096 0,00041 -0,00152 10 0,00007 0,00176 -0,00302 11 -0,00011 0,00333 -0,00206 12 -0,00372 0,00141 -0,00259 13 -0,00213 0,00353 -0,00011 M7 0,00567 -0,00702 0,01254 M8 Initial readings
Figure 7. Piezometer and precipitation observations
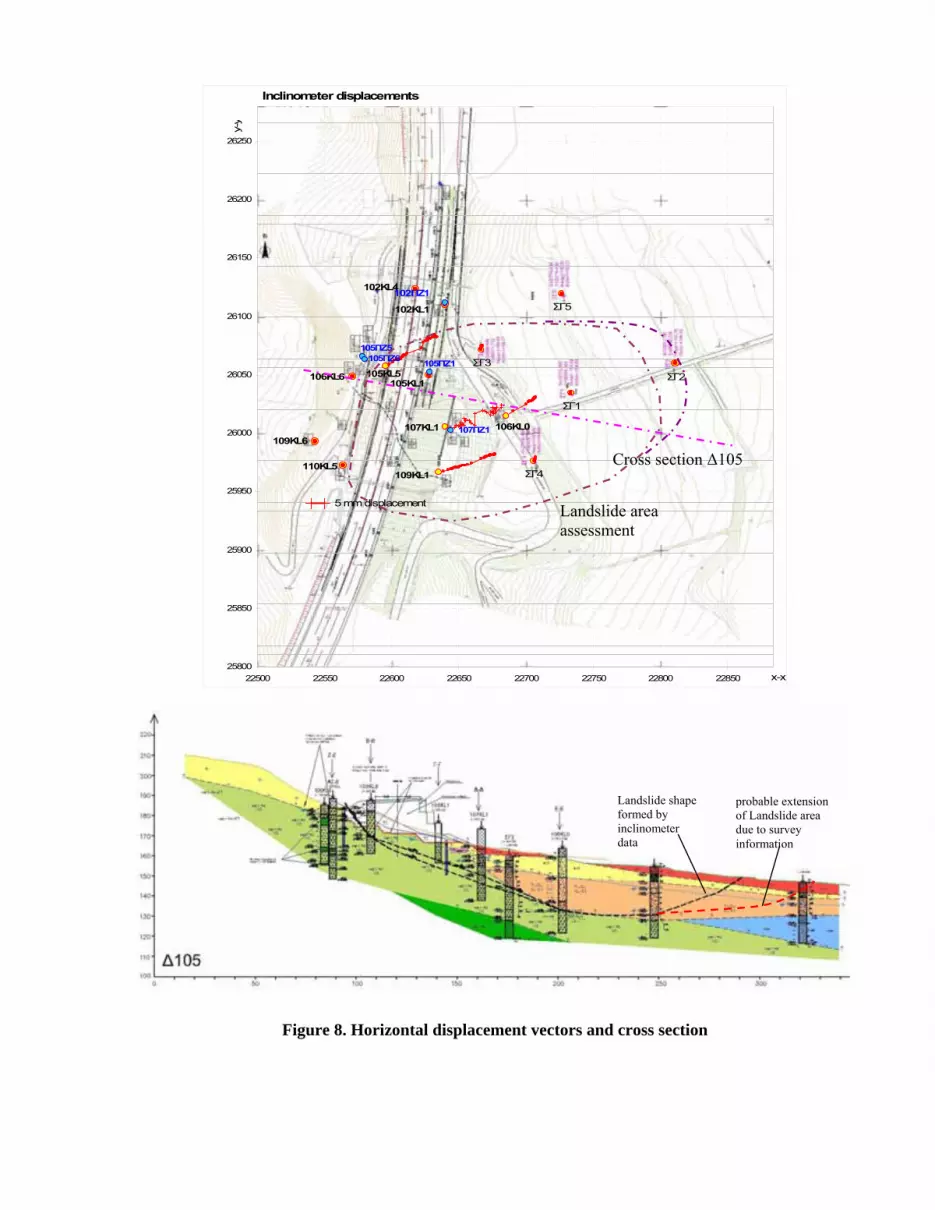
Combining all data and information, it is feasible to assess the depth and surface limits of the landslide area along with the characteristic velocity and time development. Figure 8 shows the most possible lanslide area and a characteristic cross section of the geological model.
107ΠΖ1
105KL5
107KL1
109KL1
105KL1106KL6
106KL0L6
110KL5
105ΠΖ5105ΠΖ6 105ΠΖ1
5 mm displacement
ΣΓ1
ΣΓ2ΣΓ3
ΣΓ4
Landslide shape formed by inclinometer data
probable extension of Landslide area due to survey information
Inclinometer displacements
102KL1
102KL4
109K
102ΠΖ1ΣΓ5
25800
25850
25900
25950
26000
26050
26100
26150
26200
26250
22500 22550 22600 22650 22700 22750 22800 22850 x-x
y-y
Cross section ∆105
Landslide area assessment
Figure 8. Horizontal displacement vectors and cross section

5. Conclusions Based in the study contex of this particular case we can product some specific and general conclusions and of we can make some proposals for future work.
• A first conclusion is that the integration of the different monitoring systems and instruments is a necessity if we want the most reliable data for decision making.
• In this particular case the integration and also the amount of the observations (measurements) is limited. So we can make partial analytical process but, until now, only hermeneutic integrated analysis.
• It has been founded from the above analysis that all kind of instruments and measurements guide us to the same kind of geological phenomenon. We talk about a westward, slow and deep landslide which mapped horizontally in figure 8.
6. References ASTM D4622-86, “Standard test method for rock monitoring using inclinometers”. Cruden, D., et al. (1996), “Landslides. Investigation and Mitigation”. Transportation Research Board,
National Research Council. Dunnicliff, J. (1993), “Geotechnical instrumentation for monitoring field performance”, A Wiley, N.Y.
ISRM (1981), “Suggested methods for monitoring rock movements using inclinometers and tiltmeters”.
Lakakis, K., Zeimpekis A. and Savvaidis, P. (2001), Monitoring Ground Displacements at a National Highway Project: The Case of "Egnatia Odos" in Greece, Proceedings of IAG Workshop "Monitoring of Constructions and Local Geodynamic Process", Wuhan University, China, 2001.
Lakakis, K., Chalimourdas, S., and Savvaidis, P. (2007), Geodetic Monitoring of Constructions, Journal of Surveying Engineers of Northern Greece, vol. 9, pp. 34-37.
Mikkelsen P.E. (2003), “Advances in inclinometer data analysis”, FMGM 2003, Oslo, Norway. Papatolios, K.T, Lakakis, K. and Haralabakis, M. (2004), “Integrated assessment of the stability of natural
flysch slopes along Egnatia Highway, Northern Greece”. Proceedings of the 5th International Symposium on Eastern Mediterranean Geology, pp. 1012-1015.