land use change, urban agglomeration, and urban sprawl
TRANSCRIPT

land
Article
Land Use Change, Urban Agglomeration,and Urban Sprawl: A Sustainable Development Perspectiveof Makassar City, Indonesia
Batara Surya 1,* , Agus Salim 2, Hernita Hernita 3, Seri Suriani 4, Firman Menne 5 and Emil Salim Rasyidi 1
�����������������
Citation: Surya, B.; Salim, A.;
Hernita, H.; Suriani, S.; Menne, F.;
Rasyidi, E.S. Land Use Change,
Urban Agglomeration, and Urban
Sprawl: A Sustainable Development
Perspective of Makassar City,
Indonesia. Land 2021, 10, 556.
https://doi.org/10.3390/land10060556
Academic Editors:
Ileana Pătru-Stupariu and
Christine Fürst
Received: 22 April 2021
Accepted: 24 May 2021
Published: 25 May 2021
Publisher’s Note: MDPI stays neutral
with regard to jurisdictional claims in
published maps and institutional affil-
iations.
Copyright: © 2021 by the authors.
Licensee MDPI, Basel, Switzerland.
This article is an open access article
distributed under the terms and
conditions of the Creative Commons
Attribution (CC BY) license (https://
creativecommons.org/licenses/by/
4.0/).
1 Department of Urban and Regional Planning, Faculty of Engineering,University Bosowa, Makassar City 90231, Indonesia; [email protected]
2 Department of Regional Planning, Faculty of Engineering,University Bosowa, Makassar City 90231, Indonesia; [email protected]
3 Department of Economic, STIM Lasharan Jaya, Makassar City 90231, Indonesia;[email protected]
4 Department of Financial Management, Faculty of Economic and Business,University Bosowa, Makassar City 90231, Indonesia; [email protected]
5 Department of Accounting, Faculty of Economic and Business,University Bosowa, Makassar City 90231, Indonesia; [email protected]
* Correspondence: [email protected]
Abstract: Urbanization towards the expansion of the city area causes urban sprawl and changes inspace use. Furthermore, urban agglomeration towards urban spatial integration causes a decreasein environmental quality. This study aims to analyze (1) land-use change and urban sprawl workas determinants of environmental quality degradation in suburban areas. (2) The effect of urbansprawl, urban agglomeration, land-use change, urban activity systems, and transportation systems onenvironmental quality degradation in suburban areas. A combination of quantitative and qualitativeapproaches is used sequentially in this study. Data obtained through observation, surveys, anddocumentation. The results showed that the expansion of the Makassar City area to the suburbs hadan impact on spatial dynamics, spatial segregation, and environmental degradation. Furthermore,urban sprawl, land-use change, urban agglomeration, activity systems, and transportation systemshave a positive correlation to environmental quality degradation with a determination coefficientof 85.9%. This study recommends the handling of urban sprawl, land-use change, and urbanagglomeration to be considered in the formulation of development policies towards the sustainabilityof natural resources and the environment of Makassar City, Indonesia.
Keywords: land-use change; urban sprawl; urban agglomeration; sustainable development
1. Introduction
Urban expansion due to urbanization contributes to urban growth, changes in spatialstructure, and spatial patterns in suburban areas in the case of large and metropolitan cities.Urbanization in the dynamics of metropolitan cities has led to changes in traditional ruralcharacteristics towards urban characteristics [1]. That is, urbanization does not only affectthe characteristics of society, economy, and culture but also ecological and environmentalaspects [2]. Thus, urbanization is closely related to an increase in population, changes inland-use, and urban spatial patterns towards a decrease in environmental quality [3,4].Furthermore, urban urbanization towards urban expansion is marked by the developmentof large-scale settlements, industry, centers of economic activity, and connectivity of thetransportation network system [5]. Increased socio-economic activities in the suburbshave an impact on traffic congestion, pollution, urban sprawl, conversion of productiveagricultural land, socio-economic problems, and a decrease in the environmental quality
Land 2021, 10, 556. https://doi.org/10.3390/land10060556 https://www.mdpi.com/journal/land
Land 2021, 10, 556 2 of 31
of suburban areas [6]. Thus, urbanization and suburbanization in suburban areas causechanges in spatial characteristics from previously monocentric to polycentric [7–9].
The World Bank states that urbanization in Indonesia has reached 55% [10]. Thisfigure, when compared to several developing countries, is classified as lagging behind whencompared to Brazil which has reached a rate of 86.3%. In the 2017 period, around 144 millionIndonesians lived in cities out of a total population of 264 million people [11]. Furthermore,the urban category in Southeast Asia in relation to population distribution places urbanareas in Indonesia in the second-highest position, or 54.7%. Malaysia ranks first with 75.4%.Thailand occupies the third position with an urban population distribution of 49.2%. ThePhilippines and Vietnam are respectively in fourth and fifth positions with 46.7% and35.2% [12]. Thus, the number of urban residents coupled with the expansion of the city tothe suburbs has an impact on the burden of infrastructure financing, increasing demandfor housing facilities, changes in land-use, and a decrease in environmental quality [13,14].
The urban population in Indonesia which increases every year has an impact onincreasing the financing of urban infrastructure and meeting the needs for residentialfacilities. This condition is marked by the existence of new areas which are predominantlydeveloped in the suburban areas. Furthermore, the land area for each person living in bigand metropolitan cities in Indonesia occupies an average of 40 meters. This figure is thesmallest size of all countries in the East and Southeast Asia region [13]. Thus, urbanizationin the case of urban areas in Indonesia has an impact on increasing urban activity, urbansprawl, and its effect on decreasing the quality of the suburban environment. Urban sprawlis a complex phenomenon that requires treatment and study of the factors that cause thiscondition to occur [15]. Thus, an effective strategy is needed to control urban growth,developing spatial patterns, and driving forces for urban expansion [16]. Furthermore,urban sprawl is the effect of the expansion of the big city area and the urban process thatappears is the polarizing effect of the socio-economic activities of the city center moving tothe suburban area [17,18].
Urbanization has an important impact on the environment, changes in land-use inten-sity, spatial structure, and urban spatial patterns [19,20]. The urban sprawl that developsin suburban areas occurs due to several factors, namely (i) relatively low land prices, and(ii) low population density. These two factors cause the urban spatial distribution to beefficient and effective in relation to space utilization and its effect on environmental qualitydegradation [21,22]. Furthermore, housing and settlement development activities andincreased transportation infrastructure development have an impact on the complexity ofspace utilization [23] This condition is characterized by environmental imbalance, morphol-ogy, and loss of urban natural vegetation [24,25]. Thus, the construction of new settlementsin suburban areas and their impact on the environment are very important in the processof urban growth [26].
City expansion due to excessive urbanization is a phenomenon that is quite prominentin the case of big and metropolitan cities in Indonesia. That is, urbanization has animpact on environmental imbalance, congestion, pollution, and urban sprawl [27]. Theexpansion of urban areas has significantly altered the characteristics of the suburban areaand decreased environmental quality [28]. The expansion of urban areas coupled withincreased urban activity, and the construction of new settlements in suburban areas havean impact on the conversion of productive agricultural land, transportation movementsystems, and a decrease in environmental quality [29]. Furthermore, it is very importantto plan well the provision of various urban infrastructure and services including theurban transport system [26]. Thus, comprehensive, and integrated handling towards thesustainability of the urban system is needed [30].
An urban agglomeration is the unification of areas into one physical, economic, social,and cultural entity. Urban agglomeration (UA) is a specialized geospatial organizationof a series of cities formed when the city crosses a highly developed stage [31]. Anurban agglomeration consists of large urban groups in the sense of the developmentcenter zone of a city that is connected to the surrounding cities which also develop. That

Land 2021, 10, 556 3 of 31
is, the spatial structure of urban agglomeration not only reflects the interactions andrelationships between cities but also shows the stages of urban development [32,33]. Thus,urban agglomeration is basically aimed at integrating urban resources, adjusting industrialstructures, narrowing the gap between urban and rural areas, improving urban functions,strengthening urban competitiveness, and promoting sustainable regional developmentstrategies [34]. The urban agglomeration policy is formulated as a response to variousgrowth poles according to the developing industrial agglomeration stages [35]. That is,urban resilience has become a requirement for the sustainable development of moderncities and urban agglomerations [36]. Furthermore, the spatial dynamics and the tendencyof urban agglomerations that develop in suburban areas towards the integration of urbansystems have an impact on land-use changes, movement of the transportation system, anda decrease in environmental quality [37,38].
Urban sprawl in the suburbs of Makassar City in relation to population mobility illus-trates that support for the availability of transportation facilities in terms of transportationservices is identified as inadequate in terms of safety, comfort, and timeliness of getting tothe destination. Furthermore, the choice of people living in the suburban area based on theorigin and destination of the movement is more dominant using private transportation.This condition has an impact on increasing traffic volume and congestion on the main roadcorridor leading to the city. Thus, urban transportation policies are more dominant in thedirection of increasing the capacity of road bodies and the construction of ring roads toreduce traffic congestion, but they are less effective in solving long-term transportationproblems [39]. Another factor that also contributes to the urban sprawl in the suburbs ofMakassar City is the weak control over space utilization due to the ineffective implementa-tion of urban spatial planning. Thus, high population growth, urban sprawl, and controlof space utilization in suburban areas are challenges that require solutions to address theintegration of urban systems, effective use of space, and sustainable development [40,41].
The acceleration and expansion of Makassar City to the suburbs due to urbanizationhave an impact on changes in land-use typology of suburban areas, spatial structure, andspatial patterns. The expansion of urban areas to suburban areas causes changes in spatialuse and increases in socio-economic activities towards urban spatial integration. [42,43].Furthermore, the division of Makassar City into suburban areas is marked by an increase inurban activities, including (1) housing and settlements covering an area of 1889.74 hectare;(2) trade and services covering an area of 25.67 hectare; (3) industry covering an area of401.9 hectare, and (4) education and health facilities covering an area of 24.36 hectare.Weak control over spatial use and mismatch between the stipulated spatial plans and thenumber of permits issued by the government for housing and settlement developmenthave resulted in the conversion of productive agricultural land, land reclamation, andenvironmental degradation. In addition, urban activities that tend to increase and thetendency of the community to use vacant land for housing needs as well as the constructionof new settlements carried out by developers, are factors that trigger urban sprawl. Spatialintegration coupled with urban agglomeration towards industrialization has an impact onthe complexity of spatial use in suburban areas. Industrial agglomeration is an economicphenomenon and has a significant effect on land-use efficiency [44]. Furthermore, urbansprawl and urban agglomeration in the suburbs of Makassar City contribute to environ-mental degradation, spatial segregation, and differentiation of community activities. Thus,the expansion of the urban area towards the suburban area causes building density, unevenpopulation distribution, and a decrease in environmental quality [45,46].
Research results that support this study include research conducted by Morollón andYserte [47], this study found that urban sprawl has an impact on environmental damage,unsustainable mobility, regional fiscal solvency, quality of life, and the health of the urbanpopulation. In a study conducted by Al Jarah et al. [48], the results of this study foundthat rapid urbanization has an impact on decreasing environmental quality, urban spatialpatterns, and ineffective implementation of urban development due to space allocationthat is not in accordance with the predetermined master plan. In research conducted

Land 2021, 10, 556 4 of 31
by Feng et al. [49], it was found that urban sprawl and industrial agglomeration havean impact on environmental quality degradation, changes in industrial structure, andtechnological innovation. The three results of these studies are at a meeting point byemphasizing that the urban sprawl contributes to the decline in environmental quality,regional fiscal solvency, quality of life, population health, and urban spatial dynamics.Thus, urban spawl and urban agglomeration coupled with changes in land-use and anincrease in the transportation movement system in the suburbs of Makassar City are veryimportant and strategic matters to be resolved immediately through development policiesfrom the government towards the integration of the urban system. Thus, the focus of thisstudy is aimed at answering research questions, namely: (1) How do land-use changes andurban sprawl work as determinants of environmental quality degradation in suburbanareas? (2) How do urban sprawl, urban agglomeration, land-use change, urban activitysystem, and transportation system affect the degradation of environmental quality insuburban areas?
2. Conceptual Framework
The increase in development activities in the suburban area is indicated by the con-version of productive agricultural land to residential development and socio-economicactivities. Knox et al. [50] formulates urbanization as a process of spatial and economicchange caused by human factors and their impact on natural resources which results ineconomic, social, and physical conditions as well as problems that must be faced in theformulation of urban development policies. The faster the rate of economic growth, thefaster the trend of population urbanization and its impact on the prevalence of poverty andurban inequality [51]. Thus, urbanization as a process of forming cities and communitieswill have an impact on inequality and socio-economic disparities. Increased urban activ-ity and transportation have a direct impact on ecosystem conditions [52]. Urban spatialdynamics contribute directly to changes in land-use patterns, urban ecology, morphology,and the sustainability of urban diversity [53].
2.1. Urban Sprawl and Urban Agglomeration
The expansion of the area due to urbanization has an impact on the conversion of land-use functions and the suburbanization of the suburban areas in relation to the developmentof new areas for various urban activities. Furthermore, land-use conversion cannot beseparated from the city development policy set by the government due to the demands ofdevelopment needs. Furthermore, urban expansion towards suburban areas contributesto economic growth, and population growth as well as the impact on environmentalquality degradation [54]. That is, urban expansion is closely related to the preparation ofdevelopment zones and new economic activities in suburban areas [55,56].
That is, the characteristics of land-use change due to urban spatial expansion are verydifferent for each urban area and are highly dependent on spatial physical conditionsand land availability [57]. These eight factors lead to changes in spatial structure andspatial patterns in the direction of changes in population mobility and spatial use in thesuburban areas which are not assessed on the basis, of agricultural land productivity butare assessed based on the function of developing space [58]. Thus, spatial expansiontowards suburban areas contributes to changes in spatial structure, spatial patterns, andurban agglomeration [29]. The distribution flow of goods and services, labor migration,and increased economic productivity cause social mobility vertically and horizontally [59].
2.2. Transportation System Connectivity
The connectivity of the core city transportation system to the hinterland area is atriggering factor for urban sprawl and urban agglomeration. Urban sprawl has a signifi-cantly negative impact on environmental efficiency, but with the continual improvement ofindustrial agglomeration, the negative effects of urban sprawl will be partially offset [60].The increase in traffic volume on the main city roads has an impact on congestion and the

Land 2021, 10, 556 5 of 31
traveling time to the destination area becomes inefficient and travel costs become quitehigh [61]. The economic cost and environmental impact of traffic jams in large metropolitanareas are enormous [62]. Transportation system connectivity due to spatial expansion isclosely related to urban sprawl and urban agglomeration that develops in suburban areas.Over-agglomeration in a region, mainly triggered by poor planning and mismanagementof resource allocation, may also become a barrier for sustainable development [63].
2.3. Sustainable Development of the Suburbs
The expansion of the core city area to the suburbs has an impact on the integrationof the urban system and its effects on the socio-economic conditions of the community.As a result, the people who originally occupied the land often lose their land as the mainsource of livelihood for the community [64]. In developing countries, in particular, citieshave experienced rapid growth in transport-related challenges, including pollution, con-gestion, accidents, public transport decline, environmental degradation, climate change,energy depletion, visual intrusion, and lack of accessibility for the urban poor [65]. Urbansustainability has become a significant challenge globally due to rapidly growing urban-ization and industrialization [66]. Sustainability is often conceived of as an attempt tobalance competing economic, environmental, and social priorities [67]. Furthermore, byintegrating functions, various ecological and socio-economic services can be provided si-multaneously and synergies can be developed that enable greater overall performance andmore sustainable development [68]. The conceptual framework of this study is presentedin Figure 1 below.
Land 2021, 10, x FOR PEER REVIEW 5 of 33
2.2. Transportation System Connectivity The connectivity of the core city transportation system to the hinterland area is a trig-
gering factor for urban sprawl and urban agglomeration. Urban sprawl has a significantly negative impact on environmental efficiency, but with the continual improvement of indus-trial agglomeration, the negative effects of urban sprawl will be partially offset [60]. The increase in traffic volume on the main city roads has an impact on congestion and the trav-eling time to the destination area becomes inefficient and travel costs become quite high [61]. The economic cost and environmental impact of traffic jams in large metropolitan areas are enormous [62]. Transportation system connectivity due to spatial expansion is closely re-lated to urban sprawl and urban agglomeration that develops in suburban areas. Over-ag-glomeration in a region, mainly triggered by poor planning and mismanagement of re-source allocation, may also become a barrier for sustainable development [63].
2.3. Sustainable Development of the Suburbs The expansion of the core city area to the suburbs has an impact on the integration of
the urban system and its effects on the socio-economic conditions of the community. As a result, the people who originally occupied the land often lose their land as the main source of livelihood for the community [64]. In developing countries, in particular, cities have experienced rapid growth in transport-related challenges, including pollution, conges-tion, accidents, public transport decline, environmental degradation, climate change, en-ergy depletion, visual intrusion, and lack of accessibility for the urban poor [65]. Urban sustainability has become a significant challenge globally due to rapidly growing urbani-zation and industrialization [66]. Sustainability is often conceived of as an attempt to bal-ance competing economic, environmental, and social priorities [67]. Furthermore, by inte-grating functions, various ecological and socio-economic services can be provided simulta-neously and synergies can be developed that enable greater overall performance and more sustainable development [68]. The conceptual framework of this study is presented in Fig-ure 1 below.
Figure 1. Conceptual framework of urban spawl and land-use change in Makassar City. Source: Author elaborator.
Figure 1. Conceptual framework of urban spawl and land-use change in Makassar City. Source: Author elaborator.
3. Material and Method3.1. Research Design
This study is directed at understanding that urban sprawl, land-use change, andurban agglomeration and their impact on environmental quality degradation in suburbanareas. This study uses a combination of quantitative-qualitative approaches sequentially.The case studies were selected in this study with the following considerations: First, thecomplexity of spatial use and environmental degradation are quite prominent problemsin the dynamics of suburban development. Second, the urban sprawl case has an impact
Land 2021, 10, 556 6 of 31
on the sustainability of the urban system of Makassar City. Third, the context of the caseof land-use change on the outskirts of Makassar City is quite complex. These three thingsare very strategic problems in the growth and development of big and metropolitan cities.This means that the spatial expansion of primary cities in the metropolitan urban systemcontributes to changes in land-use, urban sprawl, and urban agglomeration towards urbanspatial integration and affects the sustainability of the city. In accordance with the chosenapproach, namely case studies, this type of research is a combination of quantitative-qualitative approaches [69].
3.2. Study Area
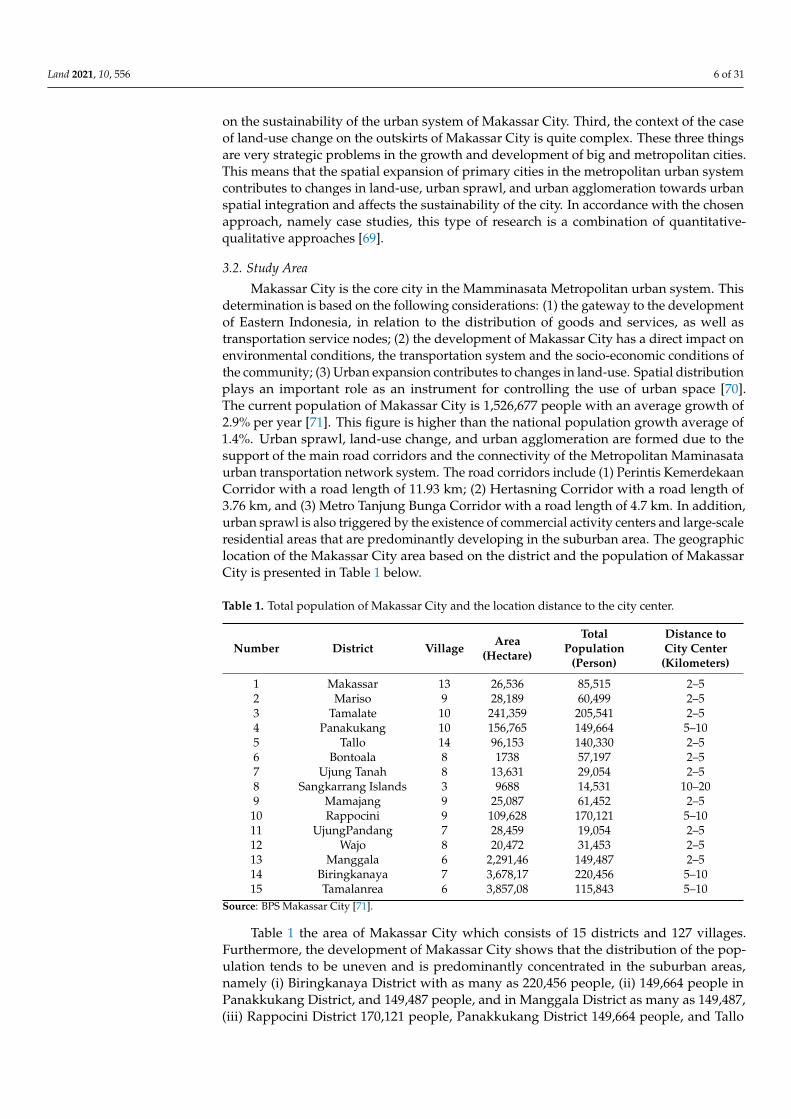
Makassar City is the core city in the Mamminasata Metropolitan urban system. Thisdetermination is based on the following considerations: (1) the gateway to the developmentof Eastern Indonesia, in relation to the distribution of goods and services, as well astransportation service nodes; (2) the development of Makassar City has a direct impact onenvironmental conditions, the transportation system and the socio-economic conditions ofthe community; (3) Urban expansion contributes to changes in land-use. Spatial distributionplays an important role as an instrument for controlling the use of urban space [70].The current population of Makassar City is 1,526,677 people with an average growth of2.9% per year [71]. This figure is higher than the national population growth average of1.4%. Urban sprawl, land-use change, and urban agglomeration are formed due to thesupport of the main road corridors and the connectivity of the Metropolitan Maminasataurban transportation network system. The road corridors include (1) Perintis KemerdekaanCorridor with a road length of 11.93 km; (2) Hertasning Corridor with a road length of3.76 km, and (3) Metro Tanjung Bunga Corridor with a road length of 4.7 km. In addition,urban sprawl is also triggered by the existence of commercial activity centers and large-scaleresidential areas that are predominantly developing in the suburban area. The geographiclocation of the Makassar City area based on the district and the population of MakassarCity is presented in Table 1 below.
Table 1. Total population of Makassar City and the location distance to the city center.
Number District Village Area(Hectare)
TotalPopulation
(Person)
Distance toCity Center
(Kilometers)
1 Makassar 13 26,536 85,515 2–52 Mariso 9 28,189 60,499 2–53 Tamalate 10 241,359 205,541 2–54 Panakukang 10 156,765 149,664 5–105 Tallo 14 96,153 140,330 2–56 Bontoala 8 1738 57,197 2–57 Ujung Tanah 8 13,631 29,054 2–58 Sangkarrang Islands 3 9688 14,531 10–209 Mamajang 9 25,087 61,452 2–5
10 Rappocini 9 109,628 170,121 5–1011 UjungPandang 7 28,459 19,054 2–512 Wajo 8 20,472 31,453 2–513 Manggala 6 2,291,46 149,487 2–514 Biringkanaya 7 3,678,17 220,456 5–1015 Tamalanrea 6 3,857,08 115,843 5–10
Source: BPS Makassar City [71].
Table 1 the area of Makassar City which consists of 15 districts and 127 villages.Furthermore, the development of Makassar City shows that the distribution of the pop-ulation tends to be uneven and is predominantly concentrated in the suburban areas,namely (i) Biringkanaya District with as many as 220,456 people, (ii) 149,664 people inPanakkukang District, and 149,487 people, and in Manggala District as many as 149,487,(iii) Rappocini District 170,121 people, Panakkukang District 149,664 people, and Tallo
Land 2021, 10, 556 7 of 31
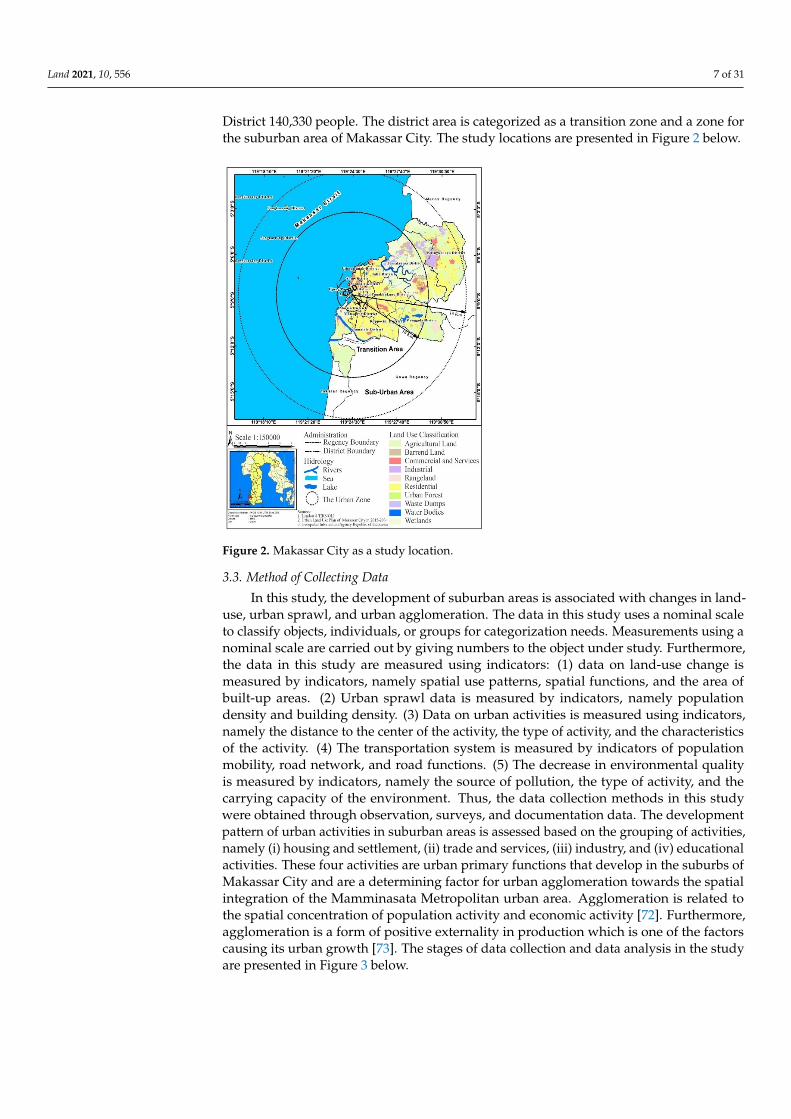
District 140,330 people. The district area is categorized as a transition zone and a zone forthe suburban area of Makassar City. The study locations are presented in Figure 2 below.
Land 2021, 10, x FOR PEER REVIEW 7 of 33
13 Manggala 6 2,291,46 149,487 2–5 14 Biringkanaya 7 3,678,17 220,456 5–10 15 Tamalanrea 6 3,857,08 115,843 5–10
Source: BPS Makassar City [71].
Table 1 the area of Makassar City which consists of 15 districts and 127 villages. Fur-thermore, the development of Makassar City shows that the distribution of the population tends to be uneven and is predominantly concentrated in the suburban areas, namely (i) Biringkanaya District with as many as 220,456 people, (ii) 149,664 people in Panakkukang District, and 149,487 people, and in Manggala District as many as 149,487, (iii) Rappocini District 170,121 people, Panakkukang District 149,664 people, and Tallo District 140,330 people. The district area is categorized as a transition zone and a zone for the suburban area of Makassar City. The study locations are presented in Figure 2 below.
Figure 2. Makassar City as a study location.
3.3. Method of Collecting Data
In this study, the development of suburban areas is associated with changes in land-use, urban sprawl, and urban agglomeration. The data in this study uses a nominal scale to classify objects, individuals, or groups for categorization needs. Measurements using a nominal scale are carried out by giving numbers to the object under study. Furthermore, the data in this study are measured using indicators: (1) data on land-use change is meas-ured by indicators, namely spatial use patterns, spatial functions, and the area of built-up areas. (2) Urban sprawl data is measured by indicators, namely population density and building density. (3) Data on urban activities is measured using indicators, namely the distance to the center of the activity, the type of activity, and the characteristics of the activity. (4) The transportation system is measured by indicators of population mobility, road network, and road functions. (5) The decrease in environmental quality is measured by indicators, namely the source of pollution, the type of activity, and the carrying capac-ity of the environment. Thus, the data collection methods in this study were obtained through observation, surveys, and documentation data. The development pattern of ur-ban activities in suburban areas is assessed based on the grouping of activities, namely (i)
Figure 2. Makassar City as a study location.
3.3. Method of Collecting Data
In this study, the development of suburban areas is associated with changes in land-use, urban sprawl, and urban agglomeration. The data in this study uses a nominal scaleto classify objects, individuals, or groups for categorization needs. Measurements using anominal scale are carried out by giving numbers to the object under study. Furthermore,the data in this study are measured using indicators: (1) data on land-use change ismeasured by indicators, namely spatial use patterns, spatial functions, and the area ofbuilt-up areas. (2) Urban sprawl data is measured by indicators, namely populationdensity and building density. (3) Data on urban activities is measured using indicators,namely the distance to the center of the activity, the type of activity, and the characteristicsof the activity. (4) The transportation system is measured by indicators of populationmobility, road network, and road functions. (5) The decrease in environmental qualityis measured by indicators, namely the source of pollution, the type of activity, and thecarrying capacity of the environment. Thus, the data collection methods in this studywere obtained through observation, surveys, and documentation data. The developmentpattern of urban activities in suburban areas is assessed based on the grouping of activities,namely (i) housing and settlement, (ii) trade and services, (iii) industry, and (iv) educationalactivities. These four activities are urban primary functions that develop in the suburbs ofMakassar City and are a determining factor for urban agglomeration towards the spatialintegration of the Mamminasata Metropolitan urban area. Agglomeration is related tothe spatial concentration of population activity and economic activity [72]. Furthermore,agglomeration is a form of positive externality in production which is one of the factorscausing its urban growth [73]. The stages of data collection and data analysis in the studyare presented in Figure 3 below.

Land 2021, 10, 556 8 of 31
Land 2021, 10, x FOR PEER REVIEW 8 of 33
housing and settlement, (ii) trade and services, (iii) industry, and (iv) educational activi-ties. These four activities are urban primary functions that develop in the suburbs of Ma-kassar City and are a determining factor for urban agglomeration towards the spatial in-tegration of the Mamminasata Metropolitan urban area. Agglomeration is related to the spatial concentration of population activity and economic activity [72]. Furthermore, ag-glomeration is a form of positive externality in production which is one of the factors causing its urban growth [73]. The stages of data collection and data analysis in the study are presented in Figure 3 below.
Figure 3. Flowchart of the methodology. Source: Author elaborator.
Data grouping in this study was carried out by comparing the results of field obser-vations, surveys, documentation, and mapping results from satellite imagery maps. Thus, the data in this study were divided into two main categories, namely primary and sec-ondary data. Land-use change data is reviewed based on the dynamics of the develop-ment of Makassar City for the period 2006–2020 which is adjusted to the results of obser-vations made in the field. Land use data is then carried out by overlapping maps and processed through a geographic information system (GIS). Furthermore, the urban sprawl in this study was assessed based on indicators of population density, building density, accessibility, road network, distance to the city center, and mixed land-use, namely hous-ing, workplaces, and socio-economic facilities [74,75]. Each studied variable is then as-signed its average value and standard deviation to determine the size of the sprawl and its impact. The measurement of urban agglomeration in this study is grouped into three
Figure 3. Flowchart of the methodology. Source: Author elaborator.
Data grouping in this study was carried out by comparing the results of field observa-tions, surveys, documentation, and mapping results from satellite imagery maps. Thus, thedata in this study were divided into two main categories, namely primary and secondarydata. Land-use change data is reviewed based on the dynamics of the development ofMakassar City for the period 2006–2020 which is adjusted to the results of observationsmade in the field. Land use data is then carried out by overlapping maps and processedthrough a geographic information system (GIS). Furthermore, the urban sprawl in thisstudy was assessed based on indicators of population density, building density, acces-sibility, road network, distance to the city center, and mixed land-use, namely housing,workplaces, and socio-economic facilities [74,75]. Each studied variable is then assigned itsaverage value and standard deviation to determine the size of the sprawl and its impact.The measurement of urban agglomeration in this study is grouped into three categories,namely (i) agglomeration in the city center, (ii) agglomeration in the transition zone, and(iii) agglomeration in the suburban zone. Urban agglomeration has an impact on increasingthe movement of rural populations towards urban areas [76,77].
Data collection in this study was carried out through observation, surveys, anddocumentation. Researchers play a role as the main instrument in collecting data orinformation through observation and documentation [78,79]. Furthermore, the main surveyinstrument is a questionnaire obtained from respondents. Thus, the two instruments inthis study are triangulating. This means that the data in this study were obtained throughobservation, questionnaires, and documentation. Data collection methods and data sourcesin this study are presented in Table 2 below.
Land 2021, 10, 556 9 of 31
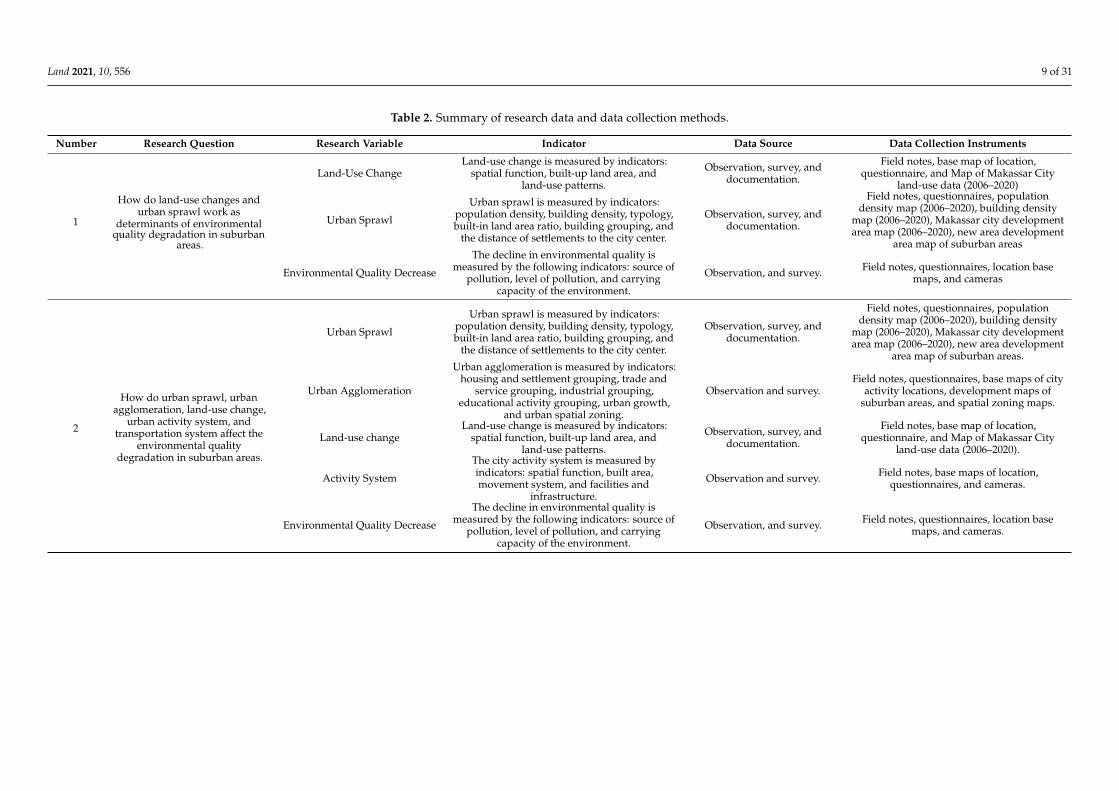
Table 2. Summary of research data and data collection methods.
Number Research Question Research Variable Indicator Data Source Data Collection Instruments
1
How do land-use changes andurban sprawl work as
determinants of environmentalquality degradation in suburban
areas.
Land-Use ChangeLand-use change is measured by indicators:
spatial function, built-up land area, andland-use patterns.
Observation, survey, anddocumentation.
Field notes, base map of location,questionnaire, and Map of Makassar City
land-use data (2006–2020)
Urban Sprawl
Urban sprawl is measured by indicators:population density, building density, typology,built-in land area ratio, building grouping, and
the distance of settlements to the city center.
Observation, survey, anddocumentation.
Field notes, questionnaires, populationdensity map (2006–2020), building density
map (2006–2020), Makassar city developmentarea map (2006–2020), new area development
area map of suburban areas
Environmental Quality Decrease
The decline in environmental quality ismeasured by the following indicators: source of
pollution, level of pollution, and carryingcapacity of the environment.
Observation, and survey. Field notes, questionnaires, location basemaps, and cameras
2
How do urban sprawl, urbanagglomeration, land-use change,
urban activity system, andtransportation system affect the
environmental qualitydegradation in suburban areas.
Urban Sprawl
Urban sprawl is measured by indicators:population density, building density, typology,built-in land area ratio, building grouping, and
the distance of settlements to the city center.
Observation, survey, anddocumentation.
Field notes, questionnaires, populationdensity map (2006–2020), building density
map (2006–2020), Makassar city developmentarea map (2006–2020), new area development
area map of suburban areas.
Urban Agglomeration
Urban agglomeration is measured by indicators:housing and settlement grouping, trade and
service grouping, industrial grouping,educational activity grouping, urban growth,
and urban spatial zoning.
Observation and survey.Field notes, questionnaires, base maps of city
activity locations, development maps ofsuburban areas, and spatial zoning maps.
Land-use changeLand-use change is measured by indicators:
spatial function, built-up land area, andland-use patterns.
Observation, survey, anddocumentation.
Field notes, base map of location,questionnaire, and Map of Makassar City
land-use data (2006–2020).
Activity System
The city activity system is measured byindicators: spatial function, built area,movement system, and facilities and
infrastructure.
Observation and survey. Field notes, base maps of location,questionnaires, and cameras.
Environmental Quality Decrease
The decline in environmental quality ismeasured by the following indicators: source of
pollution, level of pollution, and carryingcapacity of the environment.
Observation, and survey. Field notes, questionnaires, location basemaps, and cameras.

Land 2021, 10, 556 10 of 31
3.3.1. Observation
The observations in this study were used to observe the characteristics of the urbansprawl, changes in land-use, urban agglomeration, and mobility of the population in thesuburbs of Makassar City. The instruments used in the observation were base maps andfield notes. Observations were used to trace the data: (1) urban sprawl that developed inthe suburban area; (2) changes in land-use based on development activities carried outby the community and developers during a certain period of time; (3) the grouping ofurban activities, namely housing and settlements, trade and services, industry, offices,and education, (4) the system of socio-economic activities that develop in the suburbanareas; (5) mobility of the population from the suburban area to the center, and (6) urbanactivities that develop and their impact on the decline in the quality of suburban areas.Furthermore, observations in this study are also used in data retrieval, including (a) thepattern of housing development activities carried out by the community and developers;(b) transportation facilities used by the community in mobility, and (c) new developmentareas developed by the government. The data obtained through observation is used byresearchers to describe changes in land-use and developing urban agglomerations. The aimis to describe the urban sprawl and land-use changes that are developing on the outskirtsof Makassar City.
3.3.2. Questionnaire
The use of questionnaires in this study is used for two functions: (1) description,which describes the socio-economic characteristics of communities located in rural areas;and (2) measurement, namely the assignment of values to each variable and indicator used.The questionnaire in this study used a structured and unstructured list of questions thathad been prepared previously. Furthermore, the questionnaire was used in tracing the data:(1) development patterns carried out by the community and developers; (2) changes inland-use in suburban areas; (4) urban activity grouping; (4) the system of urban activitiesin relation to the socio-economic activities of the community; (4) the transportation system(origin and destination patterns) based on population mobility, distance to the city center,and the means of transportation used, and (5) decreasing environmental quality basedon developments carried out by the community and developers. The results of datacollection through questionnaires are then measured using interval and ratio scales. Thequestionnaire was distributed to districts that are included in the category of suburbs inMakassar City. The reason the researchers determined the location was to compare sprawl,land-use change, urban agglomeration, transportation system, population mobility, andurban activities that affect environmental degradation.
Data collection through questionnaires was carried out from August to October 2020.Furthermore, structured interviews using a questionnaire conducted by researchers werecarried out by asking questions to respondents based on predetermined questions. Fillingin the questionnaire was not submitted to the respondent but was guided by researchersand enumerators. The enumerators were chosen based on considerations, namely, thosewho can collect data, are close to and understand the socio-cultural conditions of therespondents. Before carrying out their duties in the field, the enumerators were giveninstructions and exercises in filling out the questionnaire as well as techniques for con-ducting interviews with respondents. The criteria for actors who fill out the questionnaire(respondents) are (i) local residents located in suburban areas, and immigrants who builda shelter in suburban areas, (ii) people who have socio-economic activities in suburbanareas, (iii) developers who carry out housing development activities in suburban areas,and (iv) local government. Furthermore, the respondents in this study were determinedusing a purposive sampling technique which the researcher determined based on certaincharacteristics. Withdrawal of samples refers to Isaac and Michael [80]. Furthermore, theformulations used in determining the sample are as follows.

Land 2021, 10, 556 11 of 31
s = λ2NPQ/d2 (N − 1) + λ2 PQ (1)
where s is the number of samples, N is the number, of population λ2 is Chi-Square, theerror rate is 1%, 5%, and 10% d = 0.05 P = Q = 0.5. The number of samples in this studywas set at 400 samples. The number of samples (respondents) in this study is presented inTable 3 below.
Table 3. Number of respondents in this study.
Number District Total Population(Person)
Number ofRespondents
1 Makassar 85,515 102 Mariso 60,499 63 Tamalate 205,541 604 Panakukang 149,664 455 Tallo 140,330 466 Bontoala 57,197 67 Ujung Tanah 29,054 48 Sangkarrang Islands 14,531 29 Mamajang 61,452 610 Rappocini 170,121 6011 UjungPandang 19,054 312 Wajo 31,453 413 Manggala 149,487 4514 Biringkanaya 220,456 7315 Tamalanrea 115,843 30
Source: Author’s elaboration.
3.3.3. Documentation
This study uses various documents relating to the situation and conditions of thesuburbs of Makassar City. The documents referred to include (1) Makassar City Spatial Planobtained through the Makassar City Spatial Planning Service; (2) Population data obtainedfrom the Makassar City Statistics Office; (3) the socio-economic profile of the communityis obtained from the District Office, and (4) Plans for development and development ofthe outskirts of Makassar City are obtained through the Regional Development PlanningAgency and developers who are carrying out development. The four documents are usedby researchers to support the data from observations and questionnaires.
3.4. Data Analysis Method
Qualitative data analysis was carried out during data collection and after completingdata collection. The analysis is carried out interactively and continues to completion.Thus, qualitative data analysis in this study is divided into three categories, namely datareduction, data display, and conclusion. Data reduction is carried out with the followingconsiderations: (1) the data obtained in the field is quite a lot, complex and complicated, sothat data reduction and data grouping must be done immediately for interpretation needs;(2) selecting and summarizing the main things, focusing on the important things, themesand patterns, then formulating the conclusions; (3) reduced data are used to provide a clearpicture according to the focus of the study; (4) data reduction is done by providing codeson certain aspects according to the objectives to be achieved in this study.
The quantitative analysis in this study is used to answer research questions, howare the effects of urban sprawl, land-use change, urban agglomeration, urban activitysystems, and the transportation system on environmental degradation in the suburbanarea. Multiple regression analysis in this study is used to determine how much influencethe independent variable has on the dependent variable and to predict the value of thedependent variable when all the independent variables have known values. The urbansprawl analysis considers the ratio of households in one village to total households to one
Land 2021, 10, 556 12 of 31
sub-district area (A), the ratio of the built-up area of the district to the total built-up area(B). Furthermore, the relationship between the two ratios in the sense that, if (A) is reduced(B) results in a value of 0 then it is categorized in normal conditions, if the result is positive,it indicates compact, and if the value is negative, it indicates a sprawl [81].
Sprawl measurement for each district in Makassar City uses several analytical ap-proaches, including (1) population density analysis; (2) building density analysis; (3) theanalysis of the distance to the city center uses a network analysis approach, the indicatorsbeing assessed are the road network and the distribution of buildings; (4) developmentanalysis, in relation to road network coverage and distribution of new buildings in the2020 period, using a buffering approach with a distance of 100m, as the basis for assessingthe highway strip index; (5) analysis of the construction of irregular activity patterns, usinga distance approach of the location of new housing buildings that are fragmented and lo-cated outside the center of the old residential building to the center of activity. The distancecalculation uses the road network analysis approach and the results obtained are describedusing the development index approach without a pattern; (6) sprawl characteristics areclassified into three levels and using scoring analysis. The results were then mappedfor each category, namely high, medium, and low; (7) urban sprawl level analysis usesscoring analysis, namely (i) score 1 shows the influence of the variable on the sprawlinglevel with the low category, (ii) score 2 shows the variable on the sprawling level withthe medium category, and (iii) score 3 shows the effect of the variable on the sprawl inthe high category. The results of the assessment through scoring are then followed up forsprawl classification. The aim is to define three typology categories based on the classrange results. The formulations used in determining the urban sprawl typology categoryare as follows:
KP = ∑ P/LT KB =∑ UB
LTIHS = ∑ JBUBJJ/ ∑ JBU (2)
IHS = TBU/ ∑ JBU RK = NT − NTR/ ∑ K (3)
Explanations related to the formula used include (1) Population Density (KP) iscalculated based on the ratio of the total population (people) to the area of districts anddistricts (hectares); (2) building density (KB) is calculated based on the ratio of the numberof buildings (units) to the area of built land (hectares); (3) the highway lane index (IHS)is calculated based on the ratio of the number of new buildings in road network support(units) to the number of new buildings (units) for the period 2006, 2010, 2015 and 2020; (4)the highway lane index (IHS) is calculated based on the ratio of the total building distance(meters) to the number of new buildings (units) for the period 2006, 2010, 2015 and 2020,and (5) class distance (RK) is calculated based on the highest score minus the lowest scorefor the number of classes (3). The results of the analysis are then explained descriptivelyqualitatively and quantitatively. To test the effect of urban sprawl (X1), land-use change(X2), urban agglomeration (X3), urban activity system (X4), transportation system (X5),environmental quality degradation (Y), based on questionnaire data obtained in the field.The data is then analyzed using multiple regression methods. The analytical formulationsused are as follows.
Y = b0 + bX1 + bX2 + bX3 + bnxn + ε (4)
rxy =n ∑ Xiyi − ∑ Xi ∑ yi√
n ∑ X2i −(
∑ X2i
)2 √n ∑ y2
i − (∑ yi)2
(5)
y.12 =√
R2y.12 (6)
R2y.12 = 1 – JKG/(n − 1) s2y (7)
where Y is the dependent variable, b0 is the regression constant, b1, b2 the regressioncoefficient/influence X1, X2, X3 are the independent variables, ε = 0. The correlation

Land 2021, 10, 556 13 of 31
coefficient (r) is a measure of the linear relationship of the X and Y variables. The r-valueranges from (+1) to (−1). The value of r that is (+) is indicated by the value of b that is(+), and the value of r that is (−) is indicated by the value of b that is (−). If the value of rapproaches +1 or r approaches −1, then X and Y have a high linear correlation. If r = +1 orr = −1, then X and Y have a perfect linear correlation. If r = 0, then X and Y do not have alinear relationship. R2y.12 is the coefficient of determination for multiple linear regression,JKG is the sum of squares of errors, and s2y is the sum of squares of y (corrected).
4. Result4.1. Determinant of Urban Sprawl and Land Use Change
The expansion of the Makassar City area to the suburbs has an impact on changingthe characteristics of transportation towards increasing population mobility. The changein transportation characteristics is due to the increasing need for transportation servicesfor the community in relation to the existence of developing centers of socio-economicactivities. Furthermore, the economic activity pattern of urban center residents and sub-urban residents together form a travel profile that is influenced by external and internalfactors. External factors relate to the movement of transportation from the city center andthe movement of transportation to the urban area of the Mamminasata Metropolitan Area.Meanwhile, internal factors are influenced by the existence of new housing complexesand the mobility of the population towards the center of socio-economic activities and themovement towards the city center. The transportation system and population mobilityin suburban areas are closely related to the dynamics of the development of MakassarCity. The spatial development of Makassar City is linear and concentric is presented inFigure 4 below.
Figure 4 shows a linear and concentric spatial development pattern in the suburbsof Makassar City. This condition specifically occurs in the center of the suburbs as aresult, of the accumulation of socio-economic activities, and the center point is markedby the existence of a shopping center, followed by the development of various othersocio-economic activities, and supported by the existence of new settlements that arecohesive. Field facts found to illustrate that efforts to control the spatial physical formof Makassar City in the transition zone and the suburban zone are much easier, with theconsideration that outside the built-up area it is still empty land, so that regulations thatlead to the acceleration of the city’s spatial physical development can be implemented withminimal resistance. Field findings show that new development areas in Makassar Cityhave the potential to experience floods, land erosion in river basins, and coastal abrasion.The triggering factors are land reclamation, land-use for river use areas, and damage tomangrove forest habitat. Land use planning is an action to eliminate disaster risk andimprove environmental quality for the better [82]. The change in spatial use of MakassarCity is presented in Table 4 below.
Table 4. Space utilization of Makassar City for the period 2006–2020.
Number Type of ActivitySpace Utilization (Hectares)
Year 2006–2010 Percentage (%) Year 2015–2020 Percentage (%)
1 Commercial 7.34 0.04 266,143 15.142 Education 27.73 0.16 182,895 1.043 Settlement 786,181 44.73 10,589.31 37.974 Health 5.21 0.03 112,149 0.645 Offices 5.77 0.03 139,155 0.796 Sports facilities 53.39 0.30 621,697 3.547 Social facilities 18.77 0.11 4,349,693 24.758 Rice fields and mixed gardens 640,963 36.47 528,945 3.01
Source: Author elaborator, map(c) 2019 Google.

Land 2021, 10, 556 14 of 31Land 2021, 10, x FOR PEER REVIEW 14 of 33
Figure 4. The development of Makassar City is linear and concentric.
Figure 4 shows a linear and concentric spatial development pattern in the suburbs of Makassar City. This condition specifically occurs in the center of the suburbs as a result, of the accumulation of socio-economic activities, and the center point is marked by the existence of a shopping center, followed by the development of various other socio-eco-nomic activities, and supported by the existence of new settlements that are cohesive. Field facts found to illustrate that efforts to control the spatial physical form of Makassar City in the transition zone and the suburban zone are much easier, with the consideration that outside the built-up area it is still empty land, so that regulations that lead to the acceleration of the city's spatial physical development can be implemented with minimal resistance. Field findings show that new development areas in Makassar City have the potential to experience floods, land erosion in river basins, and coastal abrasion. The trig-gering factors are land reclamation, land-use for river use areas, and damage to mangrove forest habitat. Land use planning is an action to eliminate disaster risk and improve envi-ronmental quality for the better [82]. The change in spatial use of Makassar City is pre-sented in Table 4 below.
Figure 4. The development of Makassar City is linear and concentric.
Table 4 shows the change in the use of space in Makassar City towards urban differen-tiation due to the increasing scale of the modern industrial society and the developmentof new growth poles. Three things that underlie this process occur, among others: (1) thedistribution of the range and intensity of the relationship between activities towards thechanging character of modern society; (2) differentiation of spatial functions and commu-nity activity patterns, and (3) the more complex spatial organization. Field facts foundshow that spatial physical changes in Makassar City have a positive contribution to socio-economic changes at the micro-level of society. Furthermore, if it is based on the process offorming spatial and social diversity in relation to the developing socio-economic character-istics, three symptoms are found, namely: (1) changes in the intensity of economic activitytowards the creation of a new economic order, which requires certain types of expertiseand skills to access work of a formal nature. This condition illustrates that educationalbackground as an index of social differentiation is an important factor; (2) differentiation ofnew functions which tends to continue due to increased reach and services and their impacton social and economic choices for the community. This condition allows for a number, ofalternative activity patterns for the community; (3) social order moves towards changesin population mobility and population composition towards societal differentiation. Thedifferences and assimilation of the community, both migrants and indigenous people, aremoving towards social and cultural transformation as one social group [83].
Land 2021, 10, 556 15 of 31
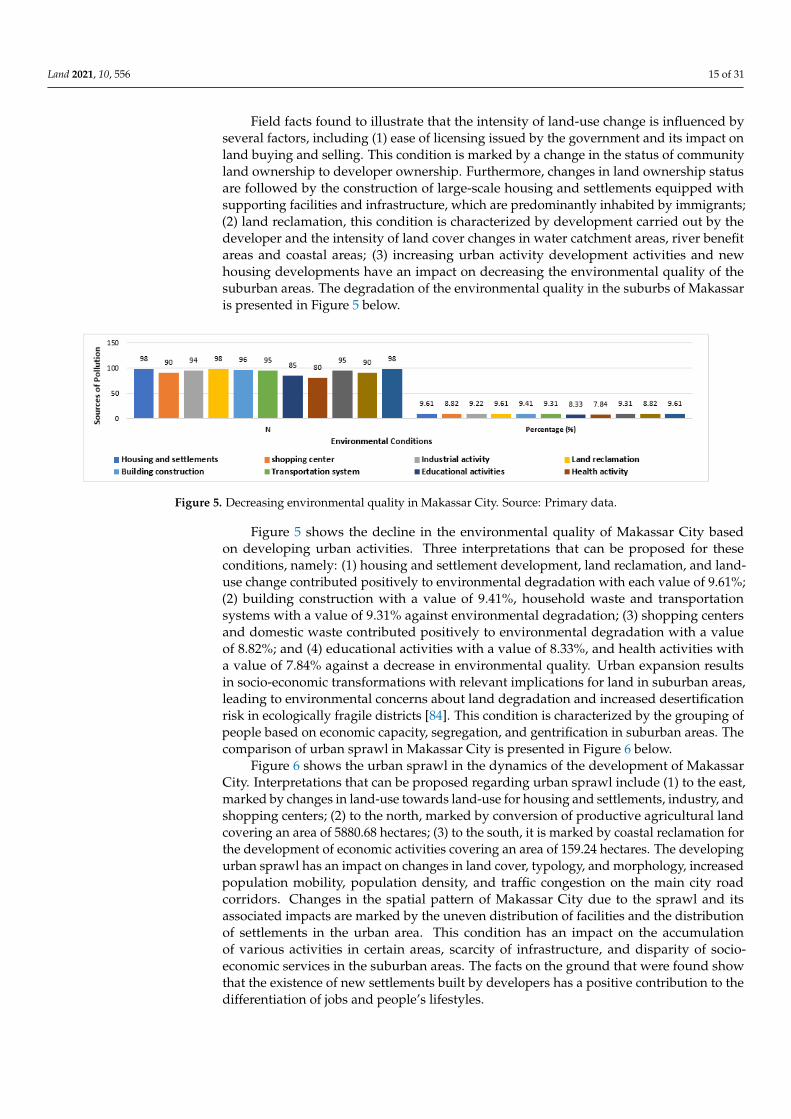
Field facts found to illustrate that the intensity of land-use change is influenced byseveral factors, including (1) ease of licensing issued by the government and its impact onland buying and selling. This condition is marked by a change in the status of communityland ownership to developer ownership. Furthermore, changes in land ownership statusare followed by the construction of large-scale housing and settlements equipped withsupporting facilities and infrastructure, which are predominantly inhabited by immigrants;(2) land reclamation, this condition is characterized by development carried out by thedeveloper and the intensity of land cover changes in water catchment areas, river benefitareas and coastal areas; (3) increasing urban activity development activities and newhousing developments have an impact on decreasing the environmental quality of thesuburban areas. The degradation of the environmental quality in the suburbs of Makassaris presented in Figure 5 below.
Land 2021, 10, x FOR PEER REVIEW 16 of 33
Figure 5. Decreasing environmental quality in Makassar City. Source: Primary data.
Figure 5 shows the decline in the environmental quality of Makassar City based on developing urban activities. Three interpretations that can be proposed for these condi-tions, namely: (1) housing and settlement development, land reclamation, and land-use change contributed positively to environmental degradation with each value of 9.61%; (2) building construction with a value of 9.41%, household waste and transportation systems with a value of 9.31% against environmental degradation; (3) shopping centers and do-mestic waste contributed positively to environmental degradation with a value of 8.82%; and (4) educational activities with a value of 8.33%, and health activities with a value of 7.84% against a decrease in environmental quality. Urban expansion results in socio-eco-nomic transformations with relevant implications for land in suburban areas, leading to environmental concerns about land degradation and increased desertification risk in eco-logically fragile districts [84]. This condition is characterized by the grouping of people based on economic capacity, segregation, and gentrification in suburban areas. The com-parison of urban sprawl in Makassar City is presented in Figure 6 below.
Figure 6. Comparison of the urban sprawl of Makassar City: (A) 2006, (B) 2009, (C) 2016, and (D) 2020.
Figure 5. Decreasing environmental quality in Makassar City. Source: Primary data.
Figure 5 shows the decline in the environmental quality of Makassar City basedon developing urban activities. Three interpretations that can be proposed for theseconditions, namely: (1) housing and settlement development, land reclamation, and land-use change contributed positively to environmental degradation with each value of 9.61%;(2) building construction with a value of 9.41%, household waste and transportationsystems with a value of 9.31% against environmental degradation; (3) shopping centersand domestic waste contributed positively to environmental degradation with a valueof 8.82%; and (4) educational activities with a value of 8.33%, and health activities witha value of 7.84% against a decrease in environmental quality. Urban expansion resultsin socio-economic transformations with relevant implications for land in suburban areas,leading to environmental concerns about land degradation and increased desertificationrisk in ecologically fragile districts [84]. This condition is characterized by the grouping ofpeople based on economic capacity, segregation, and gentrification in suburban areas. Thecomparison of urban sprawl in Makassar City is presented in Figure 6 below.
Figure 6 shows the urban sprawl in the dynamics of the development of MakassarCity. Interpretations that can be proposed regarding urban sprawl include (1) to the east,marked by changes in land-use towards land-use for housing and settlements, industry, andshopping centers; (2) to the north, marked by conversion of productive agricultural landcovering an area of 5880.68 hectares; (3) to the south, it is marked by coastal reclamation forthe development of economic activities covering an area of 159.24 hectares. The developingurban sprawl has an impact on changes in land cover, typology, and morphology, increasedpopulation mobility, population density, and traffic congestion on the main city roadcorridors. Changes in the spatial pattern of Makassar City due to the sprawl and itsassociated impacts are marked by the uneven distribution of facilities and the distributionof settlements in the urban area. This condition has an impact on the accumulationof various activities in certain areas, scarcity of infrastructure, and disparity of socio-economic services in the suburban areas. The facts on the ground that were found showthat the existence of new settlements built by developers has a positive contribution to thedifferentiation of jobs and people’s lifestyles.

Land 2021, 10, 556 16 of 31
Land 2021, 10, x FOR PEER REVIEW 16 of 33
Figure 5. Decreasing environmental quality in Makassar City. Source: Primary data.
Figure 5 shows the decline in the environmental quality of Makassar City based on developing urban activities. Three interpretations that can be proposed for these condi-tions, namely: (1) housing and settlement development, land reclamation, and land-use change contributed positively to environmental degradation with each value of 9.61%; (2) building construction with a value of 9.41%, household waste and transportation systems with a value of 9.31% against environmental degradation; (3) shopping centers and do-mestic waste contributed positively to environmental degradation with a value of 8.82%; and (4) educational activities with a value of 8.33%, and health activities with a value of 7.84% against a decrease in environmental quality. Urban expansion results in socio-eco-nomic transformations with relevant implications for land in suburban areas, leading to environmental concerns about land degradation and increased desertification risk in eco-logically fragile districts [84]. This condition is characterized by the grouping of people based on economic capacity, segregation, and gentrification in suburban areas. The com-parison of urban sprawl in Makassar City is presented in Figure 6 below.
Figure 6. Comparison of the urban sprawl of Makassar City: (A) 2006, (B) 2009, (C) 2016, and (D) 2020.
Figure 6. Comparison of the urban sprawl of Makassar City: (A) 2006, (B) 2009, (C) 2016,and (D) 2020.
The factors that trigger sprawl in the suburbs of Makassar City includes (1) lower landprices and high land purchase transactions, which developers use to build large-scale settle-ments and commercial areas; (2) Support for infrastructure development developed by thegovernment, namely road infrastructure, airports and other infrastructure; (3) increasingcommunity income, marked by the ability of the community to pay land tax and mobil-ity for work, business, and social activities; (4) consistency in the implementation of theMakassar City planning plan, in relation to controlling spatial use; (5) the tax rate is quitelow when compared to the tax rate at the city center; (6) high population growth due to ur-banization and migration; (7) residential options for high-income groups to build a shelterin suburban areas. These seven factors make a positive contribution to the suburbanizationof the suburban areas towards increasing population density. Increased industrial activityin line with housing development not only has an impact on increasing population butalso contributes to the deterioration of the environmental quality of suburban areas [14].
The ever-increasing population in the suburban area is positively associated with areduction in agricultural land and an increase in building density. This condition illustratesthat the expansion of the spatial layout of Makassar City to the outskirts of the city has animpact on changing the livelihoods of local communities from being agrarian to industrialcities. Furthermore, the orientation of local community activities is dominant due tochanges in environmental conditions, namely laborers, masons, and construction workers,including urban informal activities (mobile traders and food stalls) and a small proportionof them still work in agricultural activities but are not dominant. Metropolization is thecause of the economic transformation, spatial use, and social culture of society [85].
The population density of Makassar City (see Figure A1 in Appendix A). The re-sults of the population density analysis show that: (1) The high-density category islocated in the Tallo District, Bontoala District, Makassar District, Mariso, and Mama-

Land 2021, 10, 556 17 of 31
jang District with population density figures of 24,070–33,935 people/hectare; (2) Thecategory of medium density is located in Wajo District and Rappocini District witha number of 15,806–18,431 people/hectare; (3) The low-density category is located inthe Ujung Pandang District, Tamalate District, Panakkukang District, Tamalanrea Dis-trict, Manggala District, Biringkanaya District, and Sangkarrang Islands with a figure of3638–11,047 people/hectare. Interpretations that can be proposed are related to the pop-ulation density of Makassar City, namely: (a) district areas with high-density categoriesshow a fairly, low urban sprawl; (b) districts with a low population density category showa high level of urban sprawl. These results confirm that urban sprawl tends to developin districts with low density in relation to the available land area. Thus, land area andlow land value are factors that trigger the community and developers for new housingfacilities and develop towards large-scale settlements in the suburban areas. The role ofgovernment is very important to maintain environmental balance and ensure the rights offuture generations to the natural environment [86].
The results of the field confirmation show that the role of the government also con-tributes to the sprawl in the suburban areas. This condition is marked by the numberof building permits issued and location permits granted to developers. Thus, the urbansprawl trend in the suburbs of Makassar City is influenced by three main factors, namely(i) the use of vacant land for the construction of housing facilities by the community, (ii) theconstruction of new housing by developers, and (iii) government policies in grantinglocation permits. and building permits. Field facts found indicate that the developmentmechanisms and procedures in the suburbs of Makassar City have not yet referred to thepredetermined spatial plan. The development of large-scale settlements affects the typologyand morphology of the suburban area towards the formation of the built environment [87].
The density of buildings in Makassar City (see Figure A2). Interpretations that canbe proposed for these results: (1) in 2005 the building density level was 30.47%, then in2019, the building density was 60.24%. This figure shows that for 15 years the buildingdensity in Makassar City has increased by 29.77%. (2) Building density is differentiatedbased on four main classifications, namely (i) building density at the city center of 91.22%,(ii) the eastern area of Makassar City covering five sub-districts with a building density of63%, (iii) the area the North covers four districts with a building density of 76.91%, (iv) theSouth includes three districts with a building density of 80.3%. In addition, the relativelylow building density indicates irregular development. Field facts that have been foundillustrate that the massive increase in building density is located, in the East and Southregions. Furthermore, the districts detected with a fairly, low level of building density arelocated, in the Tamalanrea District, Tamalate District, Manggala District, and BiringkanayaDistrict. The four districts are categorized as experiencing irregular developments in thedynamics of the development of Makassar City for the period 2006–2020. The spatialexpansion of Makassar City to the suburbs area has a positive correlation with changesin the lives of local communities. This condition is marked, social relations betweencommunities are starting to decline and only take place in small groups. Field facts thatwere found indicate the existence of local community settlements that tend to be clustered incertain locations and come into, contact with new housing locations inhabited by migrantresidents. Thus, urban sprawl has a positive contribution to changes in typology andmorphology of the suburban area [88].
Furthermore, based on the factor of consideration, the distance to the Central BusinessDistrict (CBD) location is determined based on the accumulation of spatial functions bothin the old city area and on new developments in Makassar City. These CBDs include(i) CBD of the old city, (ii) CBD of Panakkukang Mas, (iii) CBD Daya, and (iv) CBD of theMetro Tanjung Bunga area. Indications for district areas that experience sprawl throughbuffering are set with a radius of reach as far as 5–10 km. Field facts that are found illustrate:(1) 83.20% of the sub-districts in Makassar City are within a radius of five kilometers and(2) 16.80% of the areas are in a radius of ten kilometers. Thus, the farther a district is to theCBD location, the higher the sprawl rate and the closer the district is to the CBD location, the
Land 2021, 10, 556 18 of 31
relatively low urban sprawl rate and highly dependent on developing residential clusters.The level of income of the community influences the decision to choose the location ofresidence and the shape of the city is closely related to the population distribution [89].
The typology and comparison of the distance between the districts to the CBD location(see Figure A3). Three things can be explained in relation to this, among others: (1) 25.42%of districts which are five kilometers from the old city center; (2) 39.89% of districts thathave a distance, of five kilometers to the CBD location of Panakkukang Mas; (3) 37.09%of district areas that have a distance, of five kilometers to CBD Daya, and (iv) 18.58% ofdistricts that have a distance of five kilometers to the CBD of the Metro Tanjung Bungaarea. In the context of urban sprawl in Makassar City, slum settlements are found adjacentto the CBD location. The location of these slum settlements is marked by the existenceof the urban poor, characterized by spatial segregation and a decline in environmentalquality. Slum settlements that develop are closely related to poor health conditions, sourcesof pollution, sources of disease spread, and deviant behavior that affect people’s lives [90].
The expansion of the Makassar City area shows that 29.77% of the district experiencesurban sprawl with typological diversity. Typology of urban sprawl is divided into threemain categories, namely: (1) Typology 1 covers eight sub-districts or 15.32% of the totalarea of Makassar City; (2) Typology 2 covers two district areas or 13.01% of the total areaof Makassar City, and (3) Typology 3 covers four districts or 71.65% of the total area ofMakassar City. These results confirm that during the period of 15 years urban sprawlincreased significantly and this increase occurred between the period 2010–2020. The fieldfacts found show that urban sprawl is categorized as high in relation to several things,namely (i) the acceleration of development in Makassar City towards suburban areasare followed by development policies that provide easy licensing for developers to buildnew housing, (ii) conversion of productive agricultural land due to weak control overspatial use, (iii) massive land-use conversion in the suburban area, and (iv) land valuewhich is quite low and the productivity of agricultural land tends to decline, causing highland transactions between local people and housing developers. Government policiesrelated to land-use will require ecological and environmental conservation actions towardssustainable economic and social development [91]. Furthermore, the process of expandingthe urban area towards the outskirts of Makassar City is divided into three categories,namely: (1) The concentric distribution is characterized by equal distribution of activitythroughout the existing urban areas and this type is categorized as the slow spread. (2) Thelongitudinal spread is characterized by the urban stretch that develops along the existingroad network. This means that the transportation network plays an important role in theprocess. (3) The spread of hopping is characterized by a separate building pattern from themain city and CBD.
Two categories of urban sprawl that have developed in the suburbs of Makassar Cityare: (1) in 2006 the trend of urban sprawl was still limited to the border area between thecore zone and the transition zone; (2) In 2010–2020, the spatial expansion of Makassar Citytends to expand towards the Mamminasata Metropolitan urban area which is developingrapidly both linearly following the main road corridors and developing concentrically(p-value 0.01 and z-zero 2.44). This condition develops apart from the result of a fairly, lowland value, another supporting factor is the integration of the Mamminasa Metropolitanurban system. Furthermore, different conditions in the period 2006–2010 tended to developconcentrically with a p-value of 0.01 and a z-zero of 2.51. This condition is influenced by thepreference for living in the suburbs. A summary of the urban sprawl typology of MakassarCity is in Table 5 below.

Land 2021, 10, 556 19 of 31
Table 5. Comparison of urban sprawl typology in Makassar City in 2006, 2010, and 2020.
Parameter Quantification Typology
Population Density Year 2006 Year 2010 Year 2020
High 24.000–34.000 1 1 1, 2Moderate 13.000–24.000 1, 2 1, 2 2
Low 0–13.000 1, 2, 3 1, 2, 3 1, 2, 3
Building Density
High 79–100 1 1 1
Moderate 59–79 - 2 2Low 0–59 1, 2, 3 2, 3 3
Distance to City Center (CBD)
Far 7001–12.000 2, 3 3 3Moderate 3.000–7.000 1, 2 1, 2, 3 1, 2, 3
Near 0–3.000 1 1 1
Development within Road Network Coverage
Affordable 0.9–1.00 1, 2 1, 2 1
Quite Affordable 0.8–0.9 1, 2, 3 1, 2, 3 1, 2
Unreachable 0.7–0.8 3 3 3
The Pattern of Development Is Irregular
High 1.200–1.900 - 3 3Moderate 600–1.200 3 1, 3 1, 2
Low 200–600 1, 2 1, 2 1Source: Analysis results.
Table 5 shows the differences in the urban sprawl typology of Makassar City. Inter-pretations that can be submitted regarding these results, namely: (1) in 2006 the sprawltendency of Makassar City was dominant in developing transitional areas and new de-velopment areas, namely in Tamalanrea and Manggala Districts; (2) the 2010 period thetendency of sprawl to show dominantly towards the transition area and sub-urban Makas-sar City; and (3) In 2020 the dominant urban sprawl moved to the suburbs, namely in theareas of Panakkukang Districts, Biringkanaya Districts, and Tamalate Districts.
4.2. Urban Agglomeration and Transportation Systems
The position of Makassar City as a core city in the Mamminatasa Metropolitan urbansystem. Three factors determine urban unification, among others: (1) ease of productionprocesses and trade flows that cause a built-in system environment; (2) Makassar Cityprovides various socio-economic facilities as well as a variety of goods and services sothat it becomes an attractive factor for the mobility of the surrounding urban population,and (3) the availability of public facilities in Makassar City, which is more dominantwhen compared to the surrounding cities, causes the demand for goods and services inits territorial areas to be quite high. Furthermore, the relationship between populationdensity distribution and public service facilities has a direct relationship with the layoutof public facilities [92]. Agglomeration in the development dynamics of Makassar City ischaracterized by the grouping of several dominant socio-economic activities that developin the suburbs which are located directly adjacent to the Mamminasata Metropolitan urbanarea.
Field facts found show that along the developing road corridors are marked by thepresence of shopping centers, service services, offices, industry, health facilities, and newsettlements developed by the developer. The existence of the Makassar City road corri-dor has an impact on urban agglomeration towards the unification of the MamminasataMetropolitan urban area. Thus, during the 2006–2020 period, the acceleration of devel-
Land 2021, 10, 556 20 of 31
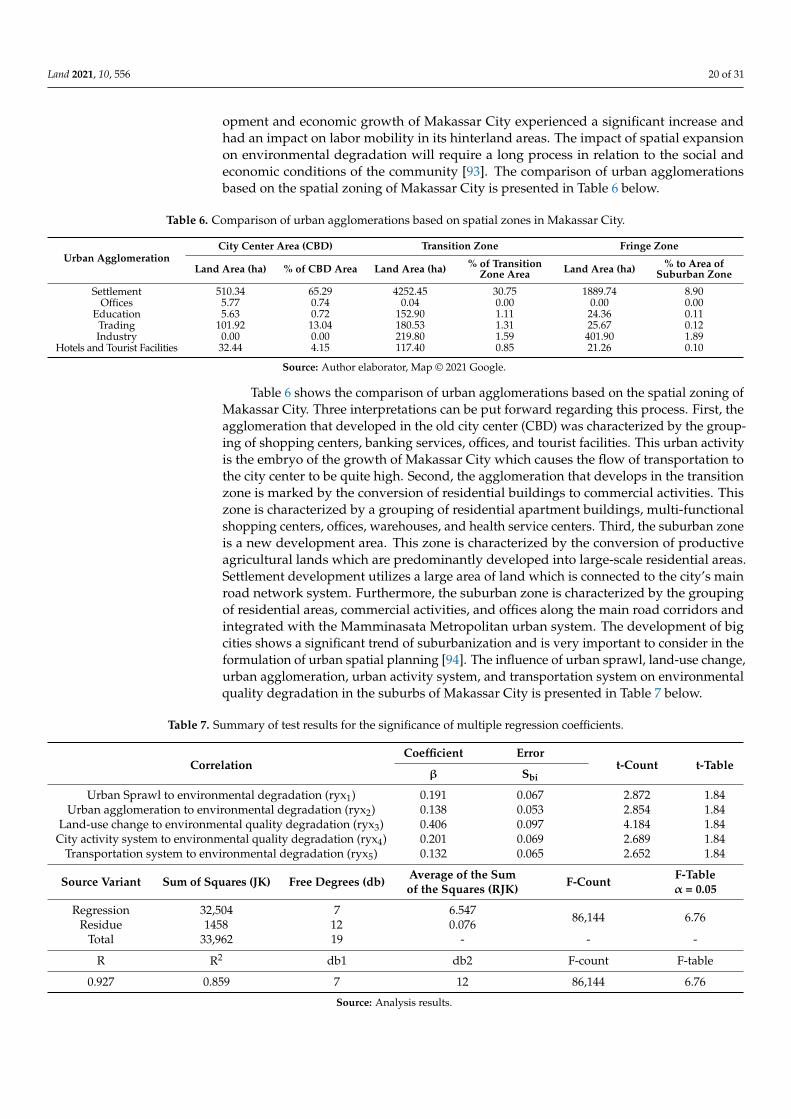
opment and economic growth of Makassar City experienced a significant increase andhad an impact on labor mobility in its hinterland areas. The impact of spatial expansionon environmental degradation will require a long process in relation to the social andeconomic conditions of the community [93]. The comparison of urban agglomerationsbased on the spatial zoning of Makassar City is presented in Table 6 below.
Table 6. Comparison of urban agglomerations based on spatial zones in Makassar City.
Urban AgglomerationCity Center Area (CBD) Transition Zone Fringe Zone
Land Area (ha) % of CBD Area Land Area (ha) % of TransitionZone Area Land Area (ha) % to Area of
Suburban Zone
Settlement 510.34 65.29 4252.45 30.75 1889.74 8.90Offices 5.77 0.74 0.04 0.00 0.00 0.00
Education 5.63 0.72 152.90 1.11 24.36 0.11Trading 101.92 13.04 180.53 1.31 25.67 0.12Industry 0.00 0.00 219.80 1.59 401.90 1.89
Hotels and Tourist Facilities 32.44 4.15 117.40 0.85 21.26 0.10
Source: Author elaborator, Map © 2021 Google.
Table 6 shows the comparison of urban agglomerations based on the spatial zoning ofMakassar City. Three interpretations can be put forward regarding this process. First, theagglomeration that developed in the old city center (CBD) was characterized by the group-ing of shopping centers, banking services, offices, and tourist facilities. This urban activityis the embryo of the growth of Makassar City which causes the flow of transportation tothe city center to be quite high. Second, the agglomeration that develops in the transitionzone is marked by the conversion of residential buildings to commercial activities. Thiszone is characterized by a grouping of residential apartment buildings, multi-functionalshopping centers, offices, warehouses, and health service centers. Third, the suburban zoneis a new development area. This zone is characterized by the conversion of productiveagricultural lands which are predominantly developed into large-scale residential areas.Settlement development utilizes a large area of land which is connected to the city’s mainroad network system. Furthermore, the suburban zone is characterized by the groupingof residential areas, commercial activities, and offices along the main road corridors andintegrated with the Mamminasata Metropolitan urban system. The development of bigcities shows a significant trend of suburbanization and is very important to consider in theformulation of urban spatial planning [94]. The influence of urban sprawl, land-use change,urban agglomeration, urban activity system, and transportation system on environmentalquality degradation in the suburbs of Makassar City is presented in Table 7 below.
Table 7. Summary of test results for the significance of multiple regression coefficients.
CorrelationCoefficient Error
t-Count t-Tableβ Sbi
Urban Sprawl to environmental degradation (ryx1) 0.191 0.067 2.872 1.84Urban agglomeration to environmental degradation (ryx2) 0.138 0.053 2.854 1.84
Land-use change to environmental quality degradation (ryx3) 0.406 0.097 4.184 1.84City activity system to environmental quality degradation (ryx4) 0.201 0.069 2.689 1.84
Transportation system to environmental degradation (ryx5) 0.132 0.065 2.652 1.84
Source Variant Sum of Squares (JK) Free Degrees (db) Average of the Sumof the Squares (RJK) F-Count F-Table
α = 0.05
RegressionResidue
32,5041458
712
6.5470.076 86,144 6.76
Total 33,962 19 - - -
R R2 db1 db2 F-count F-table
0.927 0.859 7 12 86,144 6.76
Source: Analysis results.

Land 2021, 10, 556 21 of 31
The results of Table 7 that can be explained include (1) urban sprawl has a positivecorrelation with environmental degradation; (2) urban agglomeration has a positive corre-lation with environmental degradation; (3) land-use change has a positive correlation toenvironmental quality degradation; (4) the system of activities has a positive correlation toenvironmental quality degradation, and (5) the transportation system has a positive corre-lation to environmental quality degradation. Thus, it can be concluded that urban sprawl,urban agglomeration, changes in land-use, urban activity systems, and transportationsystems have a significant effect on environmental quality degradation with a coefficientof determination of the effect of 85.9%. Thus, it is necessary to evaluate environmentalconditions by taking, into account the socio-economic conditions of the community insuburban areas [95].
5. Discussion5.1. Urban Sprawl and Urban Agglomeration Handling Solutions
Urban sprawl, changes in land-use, and urban agglomeration in the suburbs of Makas-sar City have contributed positively to environmental degradation. Furthermore, theconversion of land-use functions and the conversion of productive agricultural lands dueto industrial development, housing, trade, services, and education. Furthermore, theexpansion of Makassar City towards the outskirts has an impact on increasing populationmobility, traffic volume, and spatial segregation. Thus, the solutions needed to handle ur-ban sprawl include (1) consistency in spatial planning implementation through tighteningthe granting of location permits and distribution patterns of urban activities; (2) applicationof incentives and disincentives followed by law enforcement against violations of spatialplanning; (3) arrangement of peripheral areas through population density distribution,intensification of economic and social activities, towards sustainable development of subur-ban areas. The sustainability of the handling is aimed at creating a livable urban future [96].The implementation of development policies and development of suburban areas is carriedout consistently through the following efforts: (1) realizing social justice for all groups ofsociety, especially low-income people; (2) conserving land-use through efforts to tightenpermits for spatial use to support the sustainability of ecosystem functions; (3) synergizingpopulation density towards meeting the needs of socio-economic activities, intensifyingpublic transportation, and increasing community welfare towards sustainable develop-ment of suburban areas by involving the role of community participation. Sustainabledevelopment and urban development strategies can be achieved through the cooperationof all stakeholders [97].
The successful handling of urban sprawl and urban agglomeration in the suburbsof Makassar City will require various actions, including: (1) developing a public trans-portation system that is accessible, comfortable, safe, and economical; (2) developing newsettlement nodes by applying a mixed land-use pattern that is integrated with the urbanactivity system; (3) integrating zoning for spatial use which is oriented towards environ-mental sustainability, and (4) distribution of urban activities to reduce service disparitiesand anticipation of gentrification and segregation of suburban areas. In order, to supportthe effectiveness and efficiency of spatial use in suburban areas, the compact city conceptas part of the spatial plan for Makassar City is very important to implement to anticipateland-use changes that are aligned with the application of incentives and disincentives. Theapplication of this policy is carried out by simulating appropriate programs to minimizethe negative impacts caused. The role of strategic planning is very important as part ofurban governance which requires the involvement of the community and the private sectortowards sustainable development [98].
5.2. Sustainability of the Suburbs of Makassar City
The sustainability of the urban system of Makassar City in relation to the handling ofurban sprawl, land-use change, and future urban agglomeration, is oriented towards fivebasic principles, namely environmental, economic, social, and strengthening government

Land 2021, 10, 556 22 of 31
capacity in decision making. Several things need to be considered in the formulation ofdevelopment policies for the suburbs of Makassar City, among others: (1) building publicawareness of efforts to save the environment; (2) building equality in accessing urbanspatial functions based on economic justice principles to reduce disparities in servicesbetween urban areas; (3) ecological sustainability is oriented to the arrangement of thesuburban areas based on natural disaster mitigation which is synchronized with globalclimate change.
Sustainable development in the context of the suburban area is oriented towards fourmain things as part of efforts to control spatial use, among others: (1) equitable distributionand social justice, in this case reducing inequality in excessive use of natural resourcesthrough efforts to equalize land distribution and fulfillment. urban service standards;(2) Respect for diversity, in this case in addition to preserving biodiversity, it is alsonecessary to anticipate the emergence of discrimination against urban space access towardscommunal harmony and cultural diversity to prevent segregation in the socio-economicdynamics of society; (3) integrative, in this case, the implementation of the developmentof the suburban areas guided by the reciprocal relationship between humans and theenvironment; and (4) long-term perspective, in this case, spatial planning which is orientedtowards optimizing the management and utilization of natural resources that can be used inthe long term and able to accommodate the interests of the general public. Spatial planningobjectives become the basis for decision-making related to government, private sector, andactions community taken [99]. Spatial planning using a cross-sectoral approach aims tobalance spatial aspects and land requirements towards environmental, social, and economicsustainability [100]. The results of the analysis that have been carried out illustrate thatthe development orientation of the suburbs of Makassar City in relation to urban sprawland urban agglomeration will require development policy support from the governmentwhich is oriented towards three main pillars in the sustainability of urban development,namely environmental, economic, and social as part of the direction of development to beachieved, namely equitable development and improvement of community welfare whilemaintaining the balance of the urban environment. The sustainability of Makassar Citydevelopment is presented in Figure 7 below.
6. Conclusions
The expansion of the Makassar City area to the suburbs has an impact on land-use changes and the characteristics of the transportation system due to increased socio-economic activities. Urban sprawl in the spatial dynamics of suburban areas has differentcharacteristics and is highly dependent on population density, building density, space ca-pacity, and environmental carrying capacity. The intensity of land-use change in suburbanareas is influenced by several factors, namely ease of licensing, changes in land ownershipstatus, and suburbanization. The impact of land-use change contributes to the land-use ofwater catchment areas, river use areas, and coastal benefit areas due to land reclamationfor housing and settlement development needs as well as urban infrastructure. Increaseddevelopment activities in suburban areas have a positive contribution to river water qualitypollution, air pollution, and damage to natural vegetation towards environmental degrada-tion. Development activities that continue to increase, both carried out by the communityand developers, are accompanied by the construction of a road network system, in additionto encouraging increased population mobility and increased socio-economic activitiestowards the integration of the urban system, which is positively associated with urbansprawl in suburban areas. Factors that trigger sprawl in suburban areas, namely low landprices, infrastructure development developed by the government, increased communityincome, inconsistencies in the implementation of spatial plans, low tax rates, populationgrowth, and preference for community settlements. Urban sprawl tends to develop indistrict areas with low density in relation to the available land area. Thus, the expansion ofurban areas to suburban areas is positively associated with socioeconomic disparities andslum settlements towards spatial segregation and a decrease in environmental quality.

Land 2021, 10, 556 23 of 31Land 2021, 10, x FOR PEER REVIEW 24 of 33
Figure 7. Sustainable development of the suburbs of Makassar City. Source: Author’s elaboration.
6. Conclusions The expansion of the Makassar City area to the suburbs has an impact on land-use
changes and the characteristics of the transportation system due to increased socio-eco-nomic activities. Urban sprawl in the spatial dynamics of suburban areas has different characteristics and is highly dependent on population density, building density, space ca-pacity, and environmental carrying capacity. The intensity of land-use change in subur-ban areas is influenced by several factors, namely ease of licensing, changes in land own-ership status, and suburbanization. The impact of land-use change contributes to the land-use of water catchment areas, river use areas, and coastal benefit areas due to land recla-mation for housing and settlement development needs as well as urban infrastructure. Increased development activities in suburban areas have a positive contribution to river water quality pollution, air pollution, and damage to natural vegetation towards environ-mental degradation. Development activities that continue to increase, both carried out by the community and developers, are accompanied by the construction of a road network system, in addition to encouraging increased population mobility and increased socio-economic activities towards the integration of the urban system, which is positively asso-ciated with urban sprawl in suburban areas. Factors that trigger sprawl in suburban areas, namely low land prices, infrastructure development developed by the government, in-creased community income, inconsistencies in the implementation of spatial plans, low tax rates, population growth, and preference for community settlements. Urban sprawl tends to develop in district areas with low density in relation to the available land area.
Figure 7. Sustainable development of the suburbs of Makassar City. Source: Author’s elaboration.
Urban agglomeration in the dynamics of development of Makassar City has an impacton economic growth and is positively associated with changes in land-use, spatial struc-ture, spatial patterns, typology, and morphology of suburban areas towards environmentaldegradation. Urban agglomeration coupled with urban spatial integration has an impacton agricultural land conversion, changes in people’s lifestyles, urbanization, migration,suburbanization, and socio-economic disparities towards industrialization of suburbanareas. The acceleration of the development of Makassar City has an impact on energymobility and the flow of transportation to the city center is quite high. Urban agglomerationbased on growing spatial zoning has an impact on the grouping of housing and settlements,commercial activities, industry, educational facilities, and offices that dominate the areaon the main city road corridors towards the integration of the urban system. Thus, urbansprawl, urban agglomeration, changes in land-use, urban activity systems, and transporta-tion systems have a significant effect on the deterioration of the environmental qualityof suburban areas. To deal with urban sprawl and urban agglomeration that develops insuburban areas, it will require the support of development policies from the governmentwhich is implemented consistently through the following efforts: (1) realizing social justicefor all levels of society, (2) conservation of land and watershed resources through effortsto tighten space utilization permits to support the preservation of ecosystem functions;(3) synergizing population density and building density supported by the fulfillment ofsocio-economic activities; (4) preparation of adequate public transportation facilities, and(5) increasing the welfare of the community towards sustainable development based oncommunity participation.

Land 2021, 10, 556 24 of 31
The sustainability of the urban system of Makassar City as a solution to dealingwith urban sprawl, land-use change, and urban agglomeration in the future, is orientedto several basic principles, namely environmental, economic, social, and strengtheninggovernment capacity in decision making. Several things that need to be considered inthe formulation of development policies for the suburbs of Makassar City, among others:(1) building public awareness of efforts to save the environment; (2) building equality inaccessing urban spatial functions based on the principles of economic justice and reducingdisparities in services between urban areas; (3) ecological sustainability is oriented tothe arrangement of the suburban areas based on natural disaster mitigation which issynchronized with global climate change. Furthermore, the actions needed in developingsuburban areas towards sustainable urban development include (a) land stewardshipwhich emphasizes the importance of building ecological ethics to manage and preserveecosystems; (b) determining the threshold for spatial use based on the management of thebuilt environment and anticipating environmental quality degradation through monitoringand management of waste, air pollution, and depletion of resources in a sustainable manner;(c) interdependence includes not only ecological relationships between species and naturebut also economic and cultural relationships at the local and regional levels; (d) economicrestructuring by means of expanding employment opportunities for the community insynergy with efforts to preserve the environment; (e) social justice in meeting people’sneeds for decent work, education and health services; (f) intergenerational needs thatemphasize the need for the long term to improve people’s welfare.
Sustainable development in the suburbs of Makassar City in the future is orientedtowards four main things as part of efforts to control spatial use, including: (1) equitablesocial and economic facilities based on social justice to reduce inequality in excessive useof natural resources and equitable land distribution followed by fulfillment urban servicestandards; (2) respect for diversity, in this case in addition to preserving biodiversity,it is also necessary to anticipate the emergence of discrimination against urban spaceaccess towards community harmony and cultural diversity to prevent segregation in thesocio-economic dynamics of society; (3) integrative, in this case the implementation of thedevelopment of the suburban areas guided by the reciprocal relationship between humansand the environment, and (4) long-term perspective, in this case is to implement spatialplanning that is oriented towards optimizing the management and utilization of naturalresources effectively and efficiently for the long term and able to accommodate the interestsof the general public.
Author Contributions: B.S., conceptualization; B.S., H.H., and A.S., compiling the research; S.S.,F.M., and E.S.R., establishing the study; B.S., H.H.; S.S., and F.M., processing data; A.S., F.M., andE.S.R., contributing to materials/methods/analysis tools; B.S., S.S., and H.H., analyzing data; F.M.and E.S.R., contributing to data checking; B.S., H.H., S.S.; S.S., F.M., and E.S.R., writing and revisingconcepts. All authors have read and agreed to the published version of the manuscript.
Funding: This research is funded by the Government through the Ministry of Education and Cultureof the Republic of Indonesia in the form of research and development grant assistance for universities.
Institutional Review Board Statement: This research was conducted with the approval of theInstitute for Research and Community Service (LPPM Bosowa Makassar University) with ContractNumber 12/LPPM/VIII/2020 dated 12 August 2020. Furthermore, funding for this research isfunded through the Bosowa Makassar University Institute through research and development andhas been approved by the Chairperson of the Bosowa University LPPM.
Informed Consent Statement: The results of this study have received approval from the Institutefor Research and Community Service at Bosowa University Makassar as outlined in the approval ofthe Chairperson of LPPM Number 72 / LPPM / IX / 2020.
Data Availability Statement: We fully support open scientific exchange through MDPI in sharingand archiving research data from this study. We fully comply with the provisions that have been setby referring to the established journal guidelines.

Land 2021, 10, 556 25 of 31
Acknowledgments: We are grateful for the participation of stakeholders in contributing ideas andideas to the implementation of this study. Thank you to the Ministry of Education and Culture of theRepublic of Indonesia for their support and grant aid for applied research grants in supporting theresearch of this study.
Conflicts of Interest: The authors declare no conflict of interest.
Appendix A
Land 2021, 10, x FOR PEER REVIEW 27 of 33
Appendix A
Figure A1. Population density of Makassar City by district: (A) in 2006, (B) in 2010, (C) in 2015, and (D) in 2020.
Figure A1. Population density of Makassar City by district: (A) in 2006, (B) in 2010, (C) in 2015, and (D) in 2020.

Land 2021, 10, 556 26 of 31Land 2021, 10, x FOR PEER REVIEW 28 of 33
Figure A2. Comparison of building density in Makassar City: (A) 2006, (B) 2009, (C) 2016, and (D) 2020. Figure A2. Comparison of building density in Makassar City: (A) 2006, (B) 2009, (C) 2016, and (D) 2020.
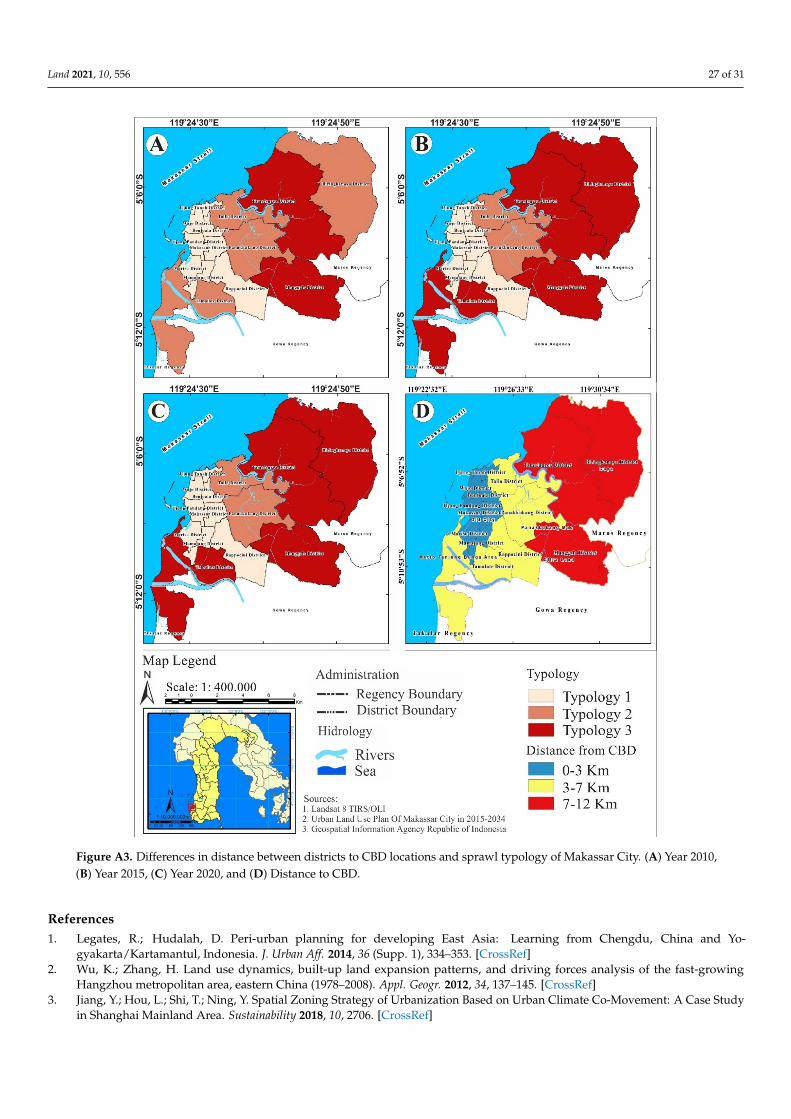
Land 2021, 10, 556 27 of 31Land 2021, 10, x FOR PEER REVIEW 29 of 33
Figure A3. Differences in distance between districts to CBD locations and sprawl typology of Makassar City. (A) Year 2010, (B) Year 2015, (C) Year 2020, and (D) Distance to CBD.
Figure A3. Differences in distance between districts to CBD locations and sprawl typology of Makassar City. (A) Year 2010,(B) Year 2015, (C) Year 2020, and (D) Distance to CBD.
References1. Legates, R.; Hudalah, D. Peri-urban planning for developing East Asia: Learning from Chengdu, China and Yo-
gyakarta/Kartamantul, Indonesia. J. Urban Aff. 2014, 36 (Supp. 1), 334–353. [CrossRef]2. Wu, K.; Zhang, H. Land use dynamics, built-up land expansion patterns, and driving forces analysis of the fast-growing
Hangzhou metropolitan area, eastern China (1978–2008). Appl. Geogr. 2012, 34, 137–145. [CrossRef]3. Jiang, Y.; Hou, L.; Shi, T.; Ning, Y. Spatial Zoning Strategy of Urbanization Based on Urban Climate Co-Movement: A Case Study
in Shanghai Mainland Area. Sustainability 2018, 10, 2706. [CrossRef]

Land 2021, 10, 556 28 of 31
4. Surya, B.; Ahmad, D.N.A.; Sakti, H.H.; Sahban, H. Land Use Change, Spatial Interaction, and Sustainable Development in theMetropolitan Urban Areas, South Sulawesi Province, Indonesia. Land 2020, 9, 95. [CrossRef]
5. Surya, B.; Ahmad, D.N.A.; Bahrun, R.S.; Saleh, H. Urban farming as a slum settlement solution (study on slum settlements inTanjung Merdeka Village, Makassar City). IOP Conf. Ser. Earth Environ. Sci. 2020, 562, 012006. [CrossRef]
6. Švajlenka, J.; Kozlovská, M. Houses Based on Wood as an Ecological and Sustainable Housing Alternative-Case Study. Sustain-ability 2018, 10, 1502. [CrossRef]
7. Zhang, Y.; Song, R.; van Nes, R.; He, S.; Yin, W. Identifying Urban Structure Based on Transit-Oriented Development. Sustainability2019, 11, 7241. [CrossRef]
8. Anas, A.; Arnott, R.J.; Small, K.A. Urban spatial structure. J. Econ. Lit. 1998, 36, 1426–1464.9. Garcia-López, M.À.; Muñiz, I. Urban spatial structure, agglomeration economies, and economic growth in Barcelona: An
intra-metropolitan perspective. Pap. Reg. Sci. 2013, 92, 515–534. [CrossRef]10. Kloosterman, R.C.; Musterd, S. The polycentric Urban region: Towards a research Agenda. Urban Stud. 2001, 38, 623–633.
[CrossRef]11. Work Bank. Laju Urbanisasi di Indonesia. 2019. Available online: https://www.google.com/search?q=Urbanisasi+di+Indonesia+
(Work+Bank%2C+2019)&oq=Urbanisasi+di+Indonesia+(Work+Bank%2C+2019)&aqs=chrome..69i57.18168j0j8&sourceid=chrome&ie=UTF-8 (accessed on 3 March 2020).
12. Asian Development Bank. Annual Report. 2019. Available online: https://www.adb.org/sites/default/files/institutional-document/650011/adb-annual-report-2019.pdf (accessed on 3 December 2020).
13. Word Bank. Kajian Kebijakan Pembangunan 2014. Indonesia: Menghindari Perangkap. Available online: http://documents.worldbank.org/curated/en/132131468051887925/pdf/889290REVISED00y0review020140bahasa.pdf (accessed on 3 March 2020).
14. Handayani, W.; Chigbu, U.E.; Rudiarto, I.; Putri, I.H.S. Urbanization and Increasing Flood Risk in the Northern Coast of CentralJava—Indonesia: An Assessment towards Better Land Use Policy and Flood Management. Land 2020, 9, 343. [CrossRef]
15. Egidi, G.; Cividino, S.; Vinci, S.; Sateriano, A.; Salvia, R. Towards Local Forms of Sprawl: A Brief Reflection on MediterraneanUrbanization. Sustainability 2020, 12, 582. [CrossRef]
16. Huang, D.; Tan, X.; Liu, T.; Chu, E.; Kong, F. Effects of Hierarchical City Centers on the Intensity and Direction of Urban LandExpansion: A Case Study of Beijing. Land 2020, 9, 312. [CrossRef]
17. KungLai, S. Effects of land use plans on urban development: A property rights approach. J. Urban Manag. 2020, 9, 1–5. [CrossRef]18. Kurda, K.P.; Vavrouchová, H. Land Cover Change and Landscape Transformations (2000–2018) in the Rural Municipalities of the
Upper Silesia-Zagłebie Metropolis. Sustainability 2020, 12, 9911. [CrossRef]19. Surya, B.; Menne, F.; Sabhan, H.; Suriani, S.; Abubakar, H.; Idris, M. Economic Growth, Increasing Productivity of SMEs, and
Open Innovation. J. Open Innov. Technol. Mark. Complex 2021, 7, 20. [CrossRef]20. Ashik, F.R.; Mim, S.A.; Neema, M.N. Towards vertical spatial equity of urban facilities: An integration of spatial and aspatial
accessibility. J. Urban Manag. 2020, 9, 77–92. [CrossRef]21. Assaf, C.; Adams, C.; Ferreira, F.F.; França, H. Land use and cover modeling as a tool for analyzing nature conservation policies –
A case study of Juréia-Itatins. Land Use Policy 2020, 100, 104895. [CrossRef]22. Carruthers, J.I.; Ulfarrson, G.F. Urban Sprawl and the Cost of Public Services. Environ. Plan. B Urban Anal. City Sci. 2003, 30,
503–522. [CrossRef]23. Zerhouny, M.; Fadil, A.; Hakdaoui, M. Underground Space Utilization in the Urban Land-Use Planning of Casablanca (Morocco).
Land 2018, 7, 143. [CrossRef]24. Wojewodzic, T.; Janus, J.; Dacko, M.; Pijanowski, J.; Taszakowski, J. Measuring the effectiveness of land consolidation: An
economic approach based on selected case studies from Poland. Land Use Policy 2021, 100, 104888. [CrossRef]25. Cheng, J. Analysis of commercial land leasing of the district governments of Beijing in China. Land Use Policy 2021, 100, 104881.
[CrossRef]26. Hlaváˇcek, P.; Kopáˇcek, M.; Horáˇcková, L. Impact of Suburbanisation on Sustainable Development of Settlements in Suburban
Spaces: Smart and New Solutions. Sustainability 2019, 11, 7182. [CrossRef]27. Surya, B.; Hadijah, H.; Suriani, S.; Baharuddin, B.; Fitriyah, A.T.; Menne, F.; Rasyidi, E.S. Spatial Transformation of a New City in
2006–2020: Perspectives on the Spatial Dynamics, Environmental Quality Degradation, and Socio—Economic Sustainability ofLocal Communities in Makassar City, Indonesia. Land 2020, 9, 324. [CrossRef]
28. Zhang, Q.; Zhang, H.; Zhao, D.; Cheng, B.; Yu, C.; Yang, Y. Does Urban Sprawl Inhibit Urban Eco-Efficiency? Empirical Studies ofSuper-Efficiency and Threshold Regression Models. Sustainability 2019, 11, 5598. [CrossRef]
29. Alipbeki, O.; Alipbekova, C.; Sterenharz, A.; Toleubekova, Z.; Makenova, S.; Aliyev, M.; Mineyev, N. Analysis of Land-UseChange in Shortandy District in Terms of Sustainable Development. Land 2020, 9, 147. [CrossRef]
30. Vaidyanathan, V.; King, R.A.; de Jong, M. Understanding urban transportation in India as polycentric system. Policy Soc. 2013, 32,175–185. [CrossRef]
31. Surya, B.; Hamsina, H.; Ridwan, R.; Baharuddin, B.; Menne, F.; Fitriyah, A.T.; Rasyidi, E.S. The Complexity of Space Utilizationand Environmental Pollution Control in the Main Corridor of Makassar City, South Sulawesi, Indonesia. Sustainability 2020, 12,9244. [CrossRef]
32. Surya, B. The Dynamics of Spatial Structure and Spatial Pattern Changes at the Fringe Area of Makassar City. Indones. J. Geogr.2015, 47, 11–19. [CrossRef]

Land 2021, 10, 556 29 of 31
33. Tian, Y. Mutualistic Pattern of Intra-Urban Agglomeration, and Impact Analysis: A Case Study of 11 Urban Agglomerations ofMainland China. ISPRS Int. J. Geo-Inf. 2020, 9, 565. [CrossRef]
34. Surya, B. Change Phenomena of Spatial Physical in the Dynamics of Development in Urban Fringe Area. Indones. J. Geogr. 2016,48, 118–134. [CrossRef]
35. Zhao, Y.; Zhang, G.; Zhao, H. Spatial Network Structures of Urban Agglomeration Based on the Improved Gravity Model: ACase Study in China’s Two Urban Agglomerations. Complexity 2021, 6651444. [CrossRef]
36. Han, H.; Li, H. Coupling Coordination Evaluation between Population and Land Urbanization in Ha-Chang Urban Agglomera-tion. Sustainability 2020, 12, 357. [CrossRef]
37. Shen, N.; Zhao, Y.; Wang, Q. Diversified Agglomeration, Specialized Agglomeration, and Emission Reduction Effect—A NonlinearTest Based on Chinese City Data. Sustainability 2018, 10, 2002. [CrossRef]
38. Ma, F.; Wang, Z.; Sun, Q.; Yuen, K.F.; Zhang, Y.; Xue, H.; Zhao, S. Spatial–Temporal Evolution of Urban Resilience and ItsInfluencing Factors: Evidence from the Guanzhong Plain Urban Agglomeration. Sustainability 2020, 12, 2593. [CrossRef]
39. Surya, B.; Saleh, H.; Suriani, S.; Sakti, H.H.; Hadijah, H.; Idris, M. Environmental Pollution Control and Sustainability Managementof Slum Settlements in Makassar City, South Sulawesi, Indonesia. Land 2020, 9, 279. [CrossRef]
40. Yao, Z.; Ye, K.; Xiao, L.; Wang, X. Radiation Effect of Urban Agglomeration’s Transportation Network: Evidence from Chengdu–Chongqing Urban Agglomeration, China. Land 2021, 10, 520. [CrossRef]
41. Nugmanova, A.; Arndt, W.H.; Hossain, M.A.; Kim, J.R. Effectiveness of Ring Roads in Reducing Traffic Congestion in Cities forLong Run: Big Almaty Ring Road Case Study. Sustainability 2019, 11, 4973. [CrossRef]
42. Surya, B.; Syafri, S.; Sahban, H.; Sakti, H.H. Natural Resource Conservation Based on Community Economic Empowerment:Perspectives on Watershed Management and Slum Settlements in Makassar City, South Sulawesi, Indonesia. Land 2020, 9, 104.[CrossRef]
43. Forsyth, A.; Peiser, R. Lessons from planned resettlement and new town experiences for avoiding climate sprawl. Landsc. UrbanPlan. 2021, 205, 103957. [CrossRef]
44. Han, W.; Zhang, Y.; Cai, J.; Ma, E. Does Urban Industrial Agglomeration Lead to the Improvement of Land Use Efficiency inChina? An Empirical Study from a Spatial Perspective. Sustainability 2019, 11, 986. [CrossRef]
45. Ahrens, A.; Lyons, S. Changes in Land Cover and Urban Sprawl in Ireland From a Comparative Perspective Over 1990–2012.Land 2019, 8, 16. [CrossRef]
46. Guyot, M.; Araldi, A.; Fusco, G.; Thomas, I. The urban form of Brussels from the street perspective: The role of vegetation in thedefinition of the urban fabric. Landsc. Urban Plan. 2021, 205, 103947. [CrossRef]
47. Morollón, F.R.; Yserte, R.G. Recent Literature about Urban Sprawl: A Renewed Relevance of the Phenomenon from the Perspectiveof Environmental Sustainability. Sustainability 2020, 12, 6551. [CrossRef]
48. Al Jarah, S.H.; Zhou, B.; Abdullah, R.J.; Lu, Y.; Yu, W. Urbanization and Urban Sprawl Issues in City Structure: A Case of theSulaymaniah Iraqi Kurdistan Region. Sustainability 2019, 11, 485. [CrossRef]
49. Feng, D.; Li, J.; Li, X.; Zhang, Z. The Effects of Urban Sprawl and Industrial Agglomeration on Environmental Efficiency: Evidencefrom the Beijing–Tianjin–Hebei Urban Agglomeration. Sustainability 2019, 11, 3042. [CrossRef]
50. Knox, P.; McCarthy, L.M. Urbanization: An Introduction to Urban Geography, 3rd ed.; Pearson Educ. Ltd.: Harlow, UK, 2014;pp. 1–142. Available online: https://files.pearsoned.de/inf/ext/9781292047935 (accessed on 23 November 2020).
51. The ASEAN Secretariat. Asean Sustainable Urbanisation Strategy. Association of Southeast Asian Nations (ASEAN) 2018. Avail-able online: https://asean.org/storage/2018/11/ASEAN-Sustainable-Urbanisation-Strategy-ASUS.pdf (accessed on 5 May 2020).
52. Izakoviˇcová, Z.; Mederly, P.; Petroviˇc, F. Long-Term Land Use Changes Driven by Urbanisation and Their Environmental Effects(Example of Trnava City, Slovakia). Sustainability 2017, 9, 1553. [CrossRef]
53. Rousta, I.; Sarif, M.O.; Gupta, R.D.; Olafsson, H.; Ranagalage, M.; Murayama, Y.; Zhang, H.; Mushore, T.D. SpatiotemporalAnalysis of Land Use/Land Cover and Its Effects on Surface Urban Heat Island Using Landsat Data: A Case Study of MetropolitanCity Tehran (1988–2018). Sustainability 2018, 10, 4433. [CrossRef]
54. Zhang, Y.; Xie, H. Interactive Relationship among Urban Expansion, Economic Development, and Population Growth since theReform and Opening up in China: An Analysis Based on a Vector Error Correction Model. Land 2019, 8, 153. [CrossRef]
55. Surya, B. Spatial Articulation, and Coexistence of Mode of Production in the Dynamics of Development at The Urban Fringe ofMakassar City. J. Eng. Appl. Sci. 2015, 10, 214–222. [CrossRef]
56. Barton, J.R.; Ramírez, M.I. The Role of Planning Policies in Promoting Urban Sprawl in Intermediate Cities: Evidence from Chile.Sustainability 2019, 11, 7165. [CrossRef]
57. Gao, J.; Wei, Y.D.; Chen, W.; Yenneti, K. Urban Land Expansion and Structural Change in the Yangtze River Delta, China.Sustainability 2015, 7, 10281–10307. [CrossRef]
58. Surya, B. Inequility of Space Reproduction Control and Urban Slum Area Management Sustainability (Case Study: Slum Area ofBuloa Urban Village in Makassar City). J. Eng. Appl. Sci. 2018, 13, 6033–6042. [CrossRef]
59. Surya, B.; Saleh, H.; Remmang, H. Economic Gentrification and Socio-Cultural Transformation Metropolitan Suburban ofMamminasata. J. Eng. Appl. Sci. 2018, 13, 6072–6084. [CrossRef]
60. Jiang, S.; Ferreira, J.; Gonzalez, M.C. Discovering urban spatial-temporal structure from human activity patterns. In Proceedingsof the ACM SIGKDD International Workshop on Urban Computing, Beijing, China, 12 August 2012; pp. 95–102. [CrossRef]

Land 2021, 10, 556 30 of 31
61. Hernita, H.; Surya, B.; Perwira, I.; Abubakar, H.; Idris, M. Economic Business Sustainability and Strengthening Human ResourceCapacity Based on Increasing the Productivity of Small and Medium Enterprises (SMEs) in Makassar City, Indonesia. Sustainability2021, 13, 3177. [CrossRef]
62. Surya, B. Optimization of Function and Role of Traditional Markets in Urban Development System of Ketapang City (a casestudy: Range Sentap Market, Delta Pawan Subdistrict, Ketapang city). World Appl. Sci. J. 2015, 33, 1457–1471. [CrossRef]
63. Surya, B.; Saleh, H. Transformation of metropolitan suburban area (a study on new town development in Moncongloe-PattalassangMetropolitan Maminasata). IOP Conf. Ser. Earth Environ. Sci. 2018, 202, 012027. [CrossRef]
64. Pratomo, R.A.; Samsura, D.A.A.; van der Krabben, E. Transformation of Local People’s Property Rights Induced by New TownDevelopment (Case Studies in Peri-Urban Areas in Indonesia). Land 2020, 9, 236. [CrossRef]
65. Wang, Z.; Zhao, J.; Lin, S.; Liu, Y. Identification of Industrial Land Parcels, and Its Implications for Environmental RiskManagement in the Beijing–Tianjin–Hebei Urban Agglomeration. Sustainability 2020, 12, 174. [CrossRef]
66. Surya, B. Social Change, Spatial Articulation in the Dynamics of Boomtown Construction and Development (Case Satudy ofMetro Tanjung Bunga Boomtown, Makassar). Mod. Appl. Sci. 2014, 8, 238–245. [CrossRef]
67. Mangi, M.Y.; Yue, Z.; Kalwar, S.; Lashari, Z.A. Comparative Analysis of Urban Development Trends of Beijing and KarachiMetropolitan Areas. Sustainability 2020, 12, 451. [CrossRef]
68. Boyer, R.H.W.; Peterson, N.D.; Arora, P.; Caldwell, K. Five Approaches to Social Sustainability and an Integrated Way Forward.Sustainability 2016, 8, 878. [CrossRef]
69. Denzin, N.K.; dan Lincoln, Y.S. (Eds.) Handbook of Qualitative Research; Terjemahan Dariyatno dkk; Pustaka Pelajar: Jogjakarta,Indonesia, 2009; ISBN 978-602-84. Available online: https://openlibrary.telkomuniversity.ac.id/pustaka/9769/handbook-of-qualitative-research.html (accessed on 20 April 2020).
70. Huang, D.; Liu, Z.; Zhao, X. Monocentric or Polycentric? The Urban Spatial Structure of Employment in Beijing. Sustainability2015, 7, 11632–11656. [CrossRef]
71. BPS Makassar City. Kota Makassar Dalam Angka. 2019. Available online: https://makassarkota.bps.go.id/publication/2019/08/16/4ca03301b8e2b8414e33f6a3/kota-makassar-dalam-angka-2019.html (accessed on 13 February 2020).
72. Malmberg, A.; Maskell, P. Towards and Explanation of Industry Agglomeration and Regional Spezialitation. Eur. Plan. Stud.1997, 5, 25–41. [CrossRef]
73. Bhatta, B.; Saraswati, S.; Bandyopadhyay, D. Urban Sprawl Measurement From Remote Sensing Data. Appl. Geogr. 2010, 30,731–740. [CrossRef]
74. Viljoen, C.; Lowies, B.; Lushington, K.; McGreal, S. Female perspectives on housing quality and household characteristics,perceptions and challenges: Evidence from Australia. Habitat Int. 2020, 105, 102276. [CrossRef]
75. Schneider, C.; Achilles, B.; Merbitz, H. Urbanity and Urbanization: An Interdisciplinary Review Combining Cultural and PhysicalApproaches. Land 2014, 3, 105–130. [CrossRef]
76. Monteiro, F.F.; Gonçalves, W.A.; Andrade, L.M.B.; Villavicencio, L.M.M.; Silva, C.M.S. Assessment of Urban Heat Islands in Brazilbased on MODIS remote sensing data. Urban Clim. 2021, 35, 100726. [CrossRef]
77. Surya, B.; Saleh, H.; Hamsina, H.; Idris, M.; Ahmad, D.N.A. Rural Agribusiness-based Agropolitan Area Development andEnvironmental Management Sustainability: Regional Economic Growth Perspectives. Int. J. Energy Econ. Policy 2021, 1, 142–157.[CrossRef]
78. Creswell, J.W. Research Design Pendekatan Metode Kualitatif, Kuantitatif, dan Campuran; Pustaka Pelajar: Jakarta, Indonesia, 2016;ISBN 9786022295846.
79. Sugiyono. Metode Penelitian Kuantitatif, Kualitatif dan R&D. Bandung: PT Alfabet. 2016. Available online: http://cvalfabeta.com/product/metode-penelitian-kuantitatif-kualitatif-dan-rd-mpkk/ (accessed on 5 May 2020).
80. Isaac, S.; Michael, W.B. Handbook in Research and Evaluation; EDITS Publishers: San Diego, CA, USA, 1981; Volume 234. [CrossRef]81. Zandi, R.; Zanganeh, M.; Akbari, E. Zoning and spatial analysis of poverty in urban areas (Case Study: Sabzevar City-Iran). J.
Urban Manag. 2019, 8, 342–354. [CrossRef]82. Das, M.; Das, A. Dynamics of Urbanization and its impact on Urban Ecosystem Services (UESs): A study of a medium size town
of West Bengal, Eastern India. J. Urban Manag. 2019, 8, 420–434. [CrossRef]83. Surya, B.; Muhibuddin, A.; Suriani, S.; Rasyidi, E.S.; Baharuddin, B.; Fitriyah, A.T.; Abubakar, H. Economic Evaluation, Use of
Renewable Energy, and Sustainable Urban Development Mamminasata Metropolitan, Indonesia. Sustainability 2021, 13, 1165.[CrossRef]
84. Syafri, S.; Surya, B.; Ridwan, R.; Bahri, S.; Rasyidi, E.S.; Sudarman, S. Water Quality Pollution Control and Watershed ManagementBased on Community Participation in Maros City, South Sulawesi, Indonesia. Sustainability 2020, 12, 10260. [CrossRef]
85. Brueckner, J.K.; Thisse, J.F.; Zenou, Y. Why is central Paris rich and downtown Detroit poor? Eur. Econ. Rev. 1999, 43, 91–107.[CrossRef]
86. Hwang, U.; Woo, M. Analysis of Inter-Relationships between Urban Decline and Urban Sprawl in City-Regions of South Korea.Sustainability 2020, 12, 1656. [CrossRef]
87. Surya, B.; Syafri, S.; Hadijah, H.; Baharuddin, B.; Fitriyah, A.T.; Sakti, H.H. Management of Slum-Based Urban Farming andEconomic Empowerment of the Community of Makassar City, South Sulawesi, Indonesia. Sustainability 2020, 12, 7324. [CrossRef]

Land 2021, 10, 556 31 of 31
88. Surya, B.; Suriani, S.; Menne, F.; Abubakar, H.; Idris, M.; Rasyidi, E.S.; Remmang, H. Community Empowerment and Utilizationof Renewable Energy: Entrepreneurial Perspective for Community Resilience Based on Sustainable Management of SlumSettlements in Makassar City, Indonesia. Sustainability 2021, 13, 3178. [CrossRef]
89. Yuan, F.; Wei, Y.D.; Wu, J.W. Amenity effects of urban facilities on housing prices in China: Accessibility, scarcity, and urbanspaces. Cities 2020, 96, 102433. [CrossRef]
90. Wang, Y.; Liu, K. Evolution of Urban Socio-Spatial Structure in Modern Times in Xi’an, China. Sustainability 2017, 9, 1935.[CrossRef]
91. Krier, R. Urband Space; John Wiley & Sons: Hoboken, NJ, USA, 1979.92. Saleh, H.; Surya, B.; Hamsina, H. Implementation of Sustainable Development Goals to Makassar Zero Waste and Energy Source.
Int. J. Energy Econ. Policy 2020, 10, 530–538. [CrossRef]93. Baker, S. Sustainable Development; Routledge: London, UK, 2006; p. 245.94. Bounoua, L.; Fathi, N.; El Berkaoui, M.; El Ghazouani, L.; Messouli, M. Assessment of Sustainability Development in Urban
Areas of Morocco. Urban Sci. 2020, 4, 18. [CrossRef]95. Dushkova, D.; Haase, D. Not Simply Green: Nature-Based Solutions as a Concept and Practical Approach for Sustainability
Studies and Planning Agendas in Cities. Land 2020, 9, 19. [CrossRef]96. Surya, B. Spatial Interaction Pattern and the Process of City Activity Formation System (Case study, Ternate City, Tidore
Archipelago City and Sofifi City of North Maluku, Indonesia). Res. J. Appl. Sci. 2015, 10, 880–892. [CrossRef]97. Teferi, Z.A.; Newman, P. Slum Regeneration and Sustainability: Applying the Extended Metabolism Model and the SDGs.
Sustainability 2017, 9, 2273. [CrossRef]98. Ageev, I.A.; Ageeva, V.V. Urban lifestyle as an element of consumption ideal and economic wellbeing: Meaning-changing
transformation from Soviet period to modernity. Procedia Soc. Behav. Sci. 2015, 166, 24–29. [CrossRef]99. Saleh, H.; Surya, B.; Ahmad, D.N.A.; Manda, D. The Role of Natural and Human Resources on Economic Growth and Regional
Development: With Discussion of Open Innovation Dynamics. J. Open Innov. Technol. Mark. Complex. 2020, 6, 103. [CrossRef]100. Lankao, P.R.; Gnatz, D.M.; Wilhelmi, O.; Hayden, M. Urban Sustainability and Resilience: From Theory to Practice. Sustainability
2016, 8, 1224. [CrossRef]