urban sprawl and its impacts on land use change in central ethiopia
TRANSCRIPT

U
DTa
b
c
d
e
f
g
a
ARRAA
KEILSU
1
m2fiItato
ateplc
T
h1
Urban Forestry & Urban Greening 16 (2016) 132–141
Contents lists available at ScienceDirect
Urban Forestry & Urban Greening
j ourna l h om epage: www.elsev ier .com/ locate /u fug
rban sprawl and its impacts on land use change in Central Ethiopia
iriba Dadia, Hossein Azadib,c,d,∗, Feyera Senbetae, Ketema Abebea, Fatemeh Taheri f,ill Stellmacherg
Ethiopian Institute of Architecture, Building Construction and City Development (EiABC), Addis Ababa University, EthiopiaCentre for Environmental Sciences, Hasselt University, BelgiumEconomics and Rural Development, University of Liège, BelgiumDepartment of Geography, Ghent University, BelgiumCenter for Environment and Development, Addis Ababa University, EthiopiaKhuzestan Ramin Agricultural and Natural Resources University, IranCenter for Development Research (ZEF), University of Bonn, Germany
r t i c l e i n f o
rticle history:eceived 13 April 2015eceived in revised form 10 February 2016ccepted 10 February 2016vailable online 15 February 2016
a b s t r a c t
This study aimed to understand the major drivers of urban sprawl and its impacts on land use conversionin the peri-urban kebeles of the Dukem town, Central Ethiopia. GIS software was used to create status andlocation maps of industries out of the GPS data. The results from qualitative data obtained from interviewsand focus group discussions showed that more land was used beyond the total size of land allocatedinitially planned for. Furthermore, urban sprawl has also caused an extensive agricultural land conversion
eywords:nvironmental planningndustrializationand use managementustainable land userbanization
(ALC) that has seriously affected agricultural production. Industrialization, residential expansion andinfrastructure development were identified as the leading drivers of ALC that negatively affects the sizeof cultivated land and food crop production in the hinterlands. In contrast with government policies andcommunity expectations, most converted lands had a very low development status and some of themwere underdeveloped and demonstrated leapfrog sprawling.
© 2016 Elsevier GmbH. All rights reserved.
. Introduction
Land is one of the main production inputs, which is a vital ele-ent in the socioeconomic development of all nations (Aribigbola,
008; RDPS, 2003). Yet, this valuable and scarce resource is inxed supply (Azadi et al., 2012), requiring sustainable utilization.
n developing countries, most people rely on agricultural produc-ions, making land an important asset (Tuyen, 2013). Therefore,ny change to the agricultural land use in these countries requireshoughtful planning to both conserve the land and reduce the risksf undermining the livelihoods of the people.
Existing literature shows and documents that economic growthnd persistent urbanization is an unavoidable global phenomenonhat initiates urban encroachment into agricultural lands (Azadit al., 2011a; Paul and McKenzie, 2013). While some studies state
ositive outcomes from agricultural land conversions (ALCs) inocal communities, others argue against them and report negativeonsequences (Chen et al., 2009; Nguyen et al., 2011; Nguyen and
∗ Corresponding author at: Department of Geography, Ghent University, Belgium.el.: +32 (0)9 264 46 95; fax: +32 (0)9 264 49 85.
E-mail address: [email protected] (H. Azadi).
ttp://dx.doi.org/10.1016/j.ufug.2016.02.005618-8667/© 2016 Elsevier GmbH. All rights reserved.
Ho, 2013). Therefore, identifying the major drivers of land conver-sion (LC) and planning to reduce their impacts on the livelihoodsof local peoples and their environment are advantageous. Thispaper focuses on identifying those major ALC drivers and under-standing their impacts on the subsistence of local farmers acrossthe peri-urban Dukem town. Besides that, it considers alternativessuggested for appropriate management plans and implementationtools in order to address these drivers.
Industrialization has often been nicknamed as “an engine of eco-nomic growth” for nations and usually is an essential and desirableprocess that accelerates economic growth and reduces long-runpoverty (Azadi et al., 2011a; Tariq, 2006). Despite serving as “anengine of economic growth”, rapid economic growth and a persistentincrease in urban population, trigger encroachments and urbansprawling (Cardenas, 1996; Jiang et al., 2012) that undermineagricultural lands and agricultural activities. Numerous studiesworldwide have shown industrialization and urbanization as themajor drivers of ALCs and have thoroughly documented how itaffects the livelihood of local farmers in China, Vietnam, Malaysia,
Philippines, India and Spain (Azadi et al., 2011b; Paul and McKenzie,2013). Liu et al. (2009)’s study based on the analysis of land covermaps during 1990–2006 found that most arable lands were lostto urban and rural settlement developments in China’s Southern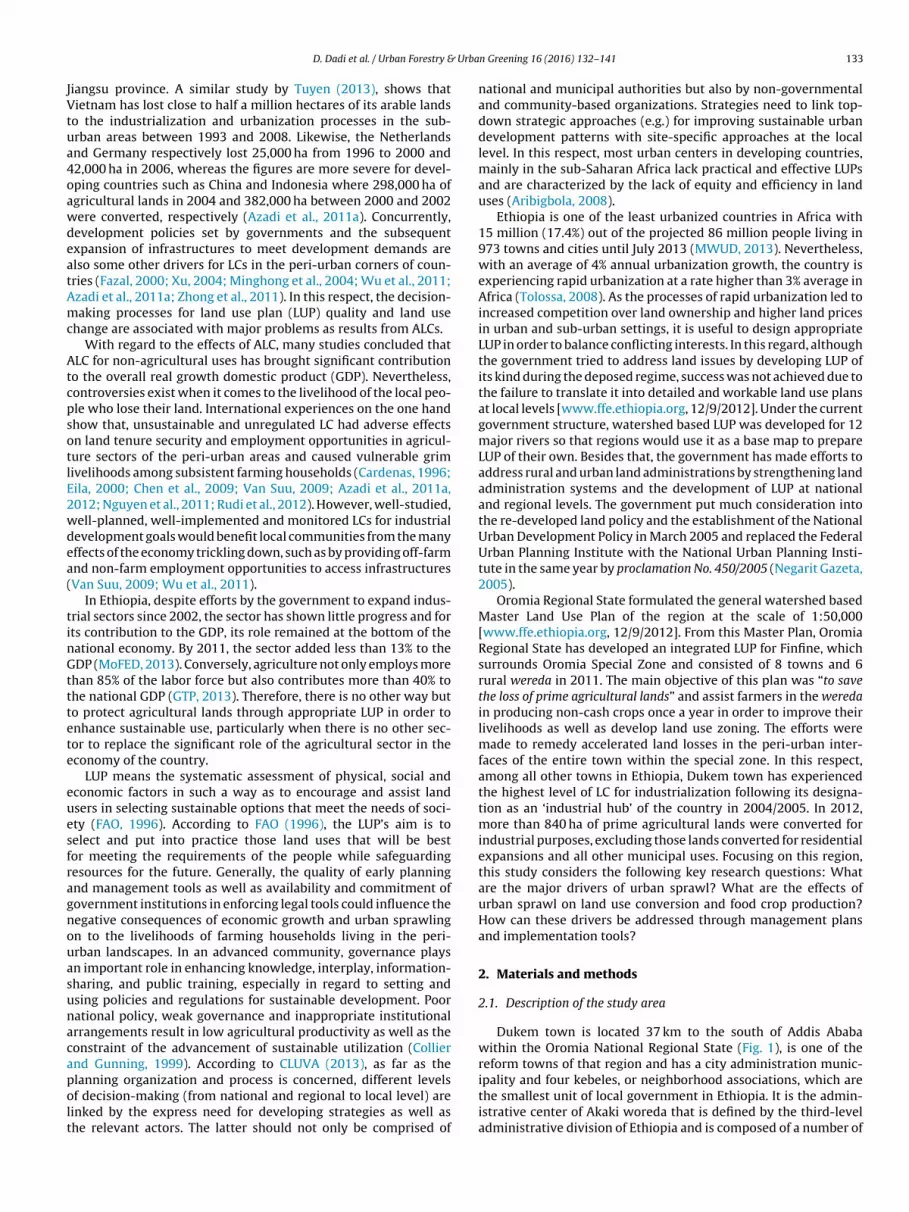
Urba
JVtua4oawdeatAmc
AtcpsotlE2wdea(
tinGtttete
euesfragnouasunacapolt
D. Dadi et al. / Urban Forestry &
iangsu province. A similar study by Tuyen (2013), shows thatietnam has lost close to half a million hectares of its arable lands
o the industrialization and urbanization processes in the sub-rban areas between 1993 and 2008. Likewise, the Netherlandsnd Germany respectively lost 25,000 ha from 1996 to 2000 and2,000 ha in 2006, whereas the figures are more severe for devel-ping countries such as China and Indonesia where 298,000 ha ofgricultural lands in 2004 and 382,000 ha between 2000 and 2002ere converted, respectively (Azadi et al., 2011a). Concurrently,evelopment policies set by governments and the subsequentxpansion of infrastructures to meet development demands arelso some other drivers for LCs in the peri-urban corners of coun-ries (Fazal, 2000; Xu, 2004; Minghong et al., 2004; Wu et al., 2011;zadi et al., 2011a; Zhong et al., 2011). In this respect, the decision-aking processes for land use plan (LUP) quality and land use
hange are associated with major problems as results from ALCs.With regard to the effects of ALC, many studies concluded that
LC for non-agricultural uses has brought significant contributiono the overall real growth domestic product (GDP). Nevertheless,ontroversies exist when it comes to the livelihood of the local peo-le who lose their land. International experiences on the one handhow that, unsustainable and unregulated LC had adverse effectsn land tenure security and employment opportunities in agricul-ure sectors of the peri-urban areas and caused vulnerable grimivelihoods among subsistent farming households (Cardenas, 1996;ila, 2000; Chen et al., 2009; Van Suu, 2009; Azadi et al., 2011a,012; Nguyen et al., 2011; Rudi et al., 2012). However, well-studied,ell-planned, well-implemented and monitored LCs for industrialevelopment goals would benefit local communities from the manyffects of the economy trickling down, such as by providing off-farmnd non-farm employment opportunities to access infrastructuresVan Suu, 2009; Wu et al., 2011).
In Ethiopia, despite efforts by the government to expand indus-rial sectors since 2002, the sector has shown little progress and forts contribution to the GDP, its role remained at the bottom of theational economy. By 2011, the sector added less than 13% to theDP (MoFED, 2013). Conversely, agriculture not only employs more
han 85% of the labor force but also contributes more than 40% tohe national GDP (GTP, 2013). Therefore, there is no other way buto protect agricultural lands through appropriate LUP in order tonhance sustainable use, particularly when there is no other sec-or to replace the significant role of the agricultural sector in theconomy of the country.
LUP means the systematic assessment of physical, social andconomic factors in such a way as to encourage and assist landsers in selecting sustainable options that meet the needs of soci-ty (FAO, 1996). According to FAO (1996), the LUP’s aim is toelect and put into practice those land uses that will be bestor meeting the requirements of the people while safeguardingesources for the future. Generally, the quality of early planningnd management tools as well as availability and commitment ofovernment institutions in enforcing legal tools could influence theegative consequences of economic growth and urban sprawlingn to the livelihoods of farming households living in the peri-rban landscapes. In an advanced community, governance playsn important role in enhancing knowledge, interplay, information-haring, and public training, especially in regard to setting andsing policies and regulations for sustainable development. Poorational policy, weak governance and inappropriate institutionalrrangements result in low agricultural productivity as well as theonstraint of the advancement of sustainable utilization (Colliernd Gunning, 1999). According to CLUVA (2013), as far as the
lanning organization and process is concerned, different levelsf decision-making (from national and regional to local level) areinked by the express need for developing strategies as well ashe relevant actors. The latter should not only be comprised ofn Greening 16 (2016) 132–141 133
national and municipal authorities but also by non-governmentaland community-based organizations. Strategies need to link top-down strategic approaches (e.g.) for improving sustainable urbandevelopment patterns with site-specific approaches at the locallevel. In this respect, most urban centers in developing countries,mainly in the sub-Saharan Africa lack practical and effective LUPsand are characterized by the lack of equity and efficiency in landuses (Aribigbola, 2008).
Ethiopia is one of the least urbanized countries in Africa with15 million (17.4%) out of the projected 86 million people living in973 towns and cities until July 2013 (MWUD, 2013). Nevertheless,with an average of 4% annual urbanization growth, the country isexperiencing rapid urbanization at a rate higher than 3% average inAfrica (Tolossa, 2008). As the processes of rapid urbanization led toincreased competition over land ownership and higher land pricesin urban and sub-urban settings, it is useful to design appropriateLUP in order to balance conflicting interests. In this regard, althoughthe government tried to address land issues by developing LUP ofits kind during the deposed regime, success was not achieved due tothe failure to translate it into detailed and workable land use plansat local levels [www.ffe.ethiopia.org, 12/9/2012]. Under the currentgovernment structure, watershed based LUP was developed for 12major rivers so that regions would use it as a base map to prepareLUP of their own. Besides that, the government has made efforts toaddress rural and urban land administrations by strengthening landadministration systems and the development of LUP at nationaland regional levels. The government put much consideration intothe re-developed land policy and the establishment of the NationalUrban Development Policy in March 2005 and replaced the FederalUrban Planning Institute with the National Urban Planning Insti-tute in the same year by proclamation No. 450/2005 (Negarit Gazeta,2005).
Oromia Regional State formulated the general watershed basedMaster Land Use Plan of the region at the scale of 1:50,000[www.ffe.ethiopia.org, 12/9/2012]. From this Master Plan, OromiaRegional State has developed an integrated LUP for Finfine, whichsurrounds Oromia Special Zone and consisted of 8 towns and 6rural wereda in 2011. The main objective of this plan was “to savethe loss of prime agricultural lands” and assist farmers in the weredain producing non-cash crops once a year in order to improve theirlivelihoods as well as develop land use zoning. The efforts weremade to remedy accelerated land losses in the peri-urban inter-faces of the entire town within the special zone. In this respect,among all other towns in Ethiopia, Dukem town has experiencedthe highest level of LC for industrialization following its designa-tion as an ‘industrial hub’ of the country in 2004/2005. In 2012,more than 840 ha of prime agricultural lands were converted forindustrial purposes, excluding those lands converted for residentialexpansions and all other municipal uses. Focusing on this region,this study considers the following key research questions: Whatare the major drivers of urban sprawl? What are the effects ofurban sprawl on land use conversion and food crop production?How can these drivers be addressed through management plansand implementation tools?
2. Materials and methods
2.1. Description of the study area
Dukem town is located 37 km to the south of Addis Ababawithin the Oromia National Regional State (Fig. 1), is one of thereform towns of that region and has a city administration munic-
ipality and four kebeles, or neighborhood associations, which arethe smallest unit of local government in Ethiopia. It is the admin-istrative center of Akaki woreda that is defined by the third-leveladministrative division of Ethiopia and is composed of a number of
134 D. Dadi et al. / Urban Forestry & Urban Greening 16 (2016) 132–141
of Duk
kiiAtb9tw
apafstfwcs
2
lwpsspteasidtt
Fig. 1. Location
ebeles. It is understood that formulating good land governances the main challenge for the urban development, pressure thats shared between the federal, regional and district governments.ccording to Proclamation No. 65/2003 article 6 (1), all cities in
he Oromia National Regional State are grouped into four levelsased on the total size of the inhabitants (ranging from more than0,000 to 2000) (Megeleta Oromia, 2003). The total population ofhe Dukem town was around 24,000 by the end of 2011, which fallsithin the third level.
Based on the data obtained from National Meteorological Sati-tion, the study area has an average annual temperature andrecipitation of 19.5 ◦C and 861 mm, respectively (NMS, 2013). Therea experiences uni-modal rainfall over a three-month periodrom mid-June to mid-September. Agriculture is the principalource of employment and household income for the majority ofhe people living in the study area. Subsistence and small scalearming of annual crops is the dominant land-use type togetherith rearing livestock. Wheat and teff are the dominant annual
rops grown and are the preferred food crops for household con-umption in the study area (Mengistae, 1991).
.2. Data collection and analysis
The study employed both qualitative and quantitative data col-ected from primary and secondary resources. Qualitative data
ere generated through focus group discussions (FGD) (i.e., com-osed of seven household heads: (five male and two female))elected purposively from the rural kebele in October 2013. Theelections were made based on the households’ age (i.e., elderlyreferred) and the number of years they lived in the area (i.e.,hose who lived many years in the area). These data were gath-red with the assistance of development agents (DAs) and kebeledministration officials. The discussions covered specific topicsuch as the comparison between the farmlands’ size and the
ncome obtained from farming before and after the industrialevelopments; whether residents were consulted prior to LC andheir role in the valuation process of the land and other proper-ies; as well as employment opportunities. Additionally, individualem town, 2013.
farmland owners were also identified in the study area with thehelp of DAs and six informants; two from the three kebele werepurposively selected for an interview due to the opportunitiesand challenges that resulted from the industrial and residentialexpansion across their localities. Further, DAs were also sourcesof qualitative information in order to complement informationobtained from farmers.
Quantitative data on the number and type of licensed indus-trial investments were collected from secondary sources compiledby investment and land administration offices in the Dukem town.Data on the total lands cultivated and major food crops harvestedover five years were also obtained from the agriculture depart-ment. In order to supply the quantitative and qualitative datagathered, the Global Positioning System (GPS) was used to col-lect the coordinates of the spatial location of individual industries,while a digital camera was utilized to take still pictures of industrialand residential expansions over the converted lands. Field verifi-cations for the status of the converted lands and the patterns ofresidential expansions were applied between February and March2013.
Three focal people from the Department of Investment, Landand Environment Protection Unit – the office responsible for theLUP implementation, investment land identification, preparationand status monitoring – were also selected for the interview. Thedata used in the analysis of the total annual cultivated lands andtotal production for major crops over the five consecutive yearswere also acquired from the department of Agriculture’s annualreports. Most of the quantitative data used in this study were ana-lyzed using MS-Excel to draw bar graphs and line charts in orderto understand the trends of the size of cultivated lands in hectareand the total size of food crops including wheat and teff harvestedbetween 2005 and 2010. The ArcGIS tool was also utilized for gener-ating a location map of the study area through drawing the spatialdistribution of industries resulted from the GPS coordinates col-
lected in the field. Several other maps were also built using ArcGISto indicate different layouts of the LUP and to enhance the anal-ysis of land uses in relation to the local environment such as thehydrology and topography of the area.
Urban Greening 16 (2016) 132–141 135
3
3
sdstPotwd
t1aru(eaidmftlioohcwpaloatu
leTmt
TL
S
D. Dadi et al. / Urban Forestry &
. Results and discussion
.1. Urban land use
Owing to the rapid industrialization and urbanization processince 2004, Dukem town has experienced dynamic economic andemographic changes. This dynamism caused urban land expan-ion that led to the conversion of considerable size of the ALs inhe urban fringe. The town did not have LUP until Oromia Urbanlanning Institute prepared the first LUP for the town in 2008. Databtained from the Dukem town Land and Environmental Protec-ion office in 2011 shows that the total urbanized area of the townas 648.7 ha in 2008. The entire urbanized area was classified intoifferent land use types as depicted in Table 1.
Table 1 presents the land size allocated for each land use type inhe LUP developed in 2008. The largest segment of the land (nearly/3rd of the total land) was devoted to housing while industriesnd storage uses accounted for 148.8 ha (22.8%) and 86.2 ha (13.3%),espectively. This gives an insight into the leading category of landse from which demands for land originates. A study by Willis et al.2001) shows that early lack of knowledge about the size of thexisting urban lands and the quality of urban growth projection is
major challenge that urban centers in developing countries facen order to ensure sustainable and healthy urban growth. Likewise,espite the Oromia Urban Planning Institute’s efforts, the imple-entation of LUP was met with setbacks. However, it was too late
or the bureau to get full control over the complex land informa-ion. Secondly, an investor is given a full mandate to propose theocation and the size of the plot of land he/she intends to investn by a directive No. 128/2011. The role of the investment officef the town is only limited to ensure that the area is not occupiedr granted to another project. Thirdly, the investment commissionas been welcoming applicants for investment to the town if he/sheomes with a project design that shows the type of the project asell as the proposed capital and employment opportunities theirroject would create. Equally, although article 10 of the contractgreement obliged investors to start developing 25% of the grantedand within six months, they have this right to transfer the land usewnership to a third party by article 9 (2) of the same contractgreement. Therefore, speculative land dealers and rent seekersook the advantage of article 9 (2) to grab the land, but may benable or not interested any more to develop the land.
Furthermore, the decision on the size and location of investmentand could come either from the regional or federal government,specially when the land application comes from foreign investors.
hus, lack of uniformity, broken or delayed information and com-unication between line offices has created an information gaphat was ultimately reflected by the dwindling of urban lands seven
able 1and use types of the Dukem town on the LUP prepared in 2008.
Land use category Share
Total area (ha) Urbanized area (%)
Housing 148.8 22.8Commerce 30.3 4.67Administration 3.6 0.55Services 21.7 3.34Recreation 3.7 0.57Transport & road network 53.9 8.3Industry and storage 86.2 13.3Open area 40.1 6.18Water body 0.98 0.15Vacant 260.5 40.16
Total 648.7 100
ource: OWWDSE (2011).
Fig. 2. Major land use types in the LUP and implementation history.
years ahead of the proposed life span of LUP. Excessive demandfor the land has also initiated the sprawling of investments andsettlements on the outskirts into agricultural lands. For instance,the number of individual industries grew from less than 50 beforethe designation of the Dukem town as Industry Zone in 2005, toover 642 units in 2011. Considering the worsening land situationin the region, OLEPB prepared a working guideline and standard in2011. To date, a complete understanding of the existing situationand projecting future trends related to the industrial flow and highin-migration has never been reported.
As depicted in Fig. 2, three years after the approval of the LUP in2011, the total plots of land granted for industrial and storage uti-lizations were expanded to twice the total size of land allocated forboth housing and industry and storage. In other words, the total sizeof land used for industrial expansion was exceeded by about five-fold (498%) between 2008 and 2011 compared to the 86 ha (100%)initially allocated by the LUP in 2008. Likewise, despite 148 ha ofland devoted to urban housing on the LUP, 372 ha of urban landsdeveloped for housing in less than three years show a substantialincrease by around two folds (224 ha ∼ 151%) from the primary landsize of 148 ha (100%).
Table 2 shows a comparison of plot sizes approved for someinvestment projects before and after the guidelines that assisteddecision making on the plot sizes to be granted to an applicantaccording to the predefined criteria, such as investment type andthe size of investment capitals formulated in November 2011. Inthis respect, the process of granting plot size suffers from a lack ofuniformity even for similar investment projects before November2011 (Table 2). There were cases in which an applicant with asmall investment capital was granted a larger plot size comparedto other projects with a bigger investment capital. For instance,an applicant with an investment capital of USD 494,000 was given0.18 ha to establish edible oil factory while 0.2 ha was approvedfor similar projects with a small proposed capital (i.e., USD 64,000)(Table 2). Concomitantly, in spite of the huge investment capitalproposed for developing a textile factory (i.e., Table 2, 5a and b, ofUSD 1,389,000), only 0.1 ha was approved whereas a similar projectwith much less investment capital was granted 0.3 ha (i.e., 5b, USD167,000). Table 2 also presents the maximum land size requiredfor developments based on the size of proposed investment capi-tal as well as the type (characteristics) of investments. As a result,housing, industrial sprawling and ongoing encroachment into agri-cultural lands have caused urban lands inappropriately utilized inthree rural kebeles in the peri-urban Dukem, which eventually ledto their re-integration into the municipal administration. The aim
of the guideline was to ensure uniformity while addressing con-siderable demands for urban lands, which lead to the sprawling of
136 D. Dadi et al. / Urban Forestry & Urban Greening 16 (2016) 132–141
Table 2Comparison of plots sizes approved before and after setting standard for plot sizes required for projects in 2012.
No Approved areas before a standard was formulated (Nov 2011) Required area after standard was formulated (2012)
Project type Area (ha) Capital (inthousands USD)
Price (USD/m2) Capital required (inthousands USD)
Area required (ha)
I. Agro-processing1 Coffee processing 1.5 50 20.9 2193 0.242 Honey processing 0.3 167 18.05 90 0.93II. Manufacturing industry1a Electric cable 4.0 33,333 74.05 518 4.51b Electric cable 0.5 89 74.05 518 0.122a Edible oil factory 0.18 494 1215 118 0.742b Edible oil factory 0.2 64 67.5 135 0.953 Leather garment 2.53 1222 67.5 1877 1.654a Soap factory 3.0 128 101.78 3053 0.134b Soap factory 0.3 167 101.78 305 0.1645a Textile factory 0.1 1389 101.67 102 1.375b Textile factory 0.2 167 101.67 203 0.164
1943.95 9112 10.96
S
rl
ag2taaataan
tal
Table 3The proportion of the land allocated for each land use type in the re-developed LUP,2011.
Land use category Proposed land use
Total area (ha) Urbanized area (%)
Residence 1308 36.5Commerce 215 6.0Services 63 1.75Administration 11 0.3Industry and storage 658 18.34Recreation 100 2.78Reserved 201 5.6Forest & buffer 428 12.0Urban agriculture 60 1.7Transport & road network 542 15.1
S
Total 12.51 37,270
ource: Compiled from data, 2012.
esidential areas and investments into the peri-urban agriculturalands due to uncontrolled and unsustainable land uses.
In addition to the guidelines, the Oromia Water Works Designnd Supervision Enterprise (OWWDSE) redeveloped the new inte-rated LUP by revising the old LUP of the town in November011. The purpose of the redeveloped LUP was to handle sus-ained demands of investment lands, housing expansion, regulatedgricultural land losses and to remedy land shortages for currentnd future uses. The redevelopment plan of LUP also aimed toddress the probability of the rapid industrialization and urbaniza-ion spillovers on local biophysical resources as well as establishnd strengthen socioeconomic linkages between urban and ruralreas. Fig. 3 presents the redeveloped LUP while its detailed expla-ation is presented in Table 3.
Similar to the old LUP, more urban lands were earmarked forhe expansion of housing, manufacturing industries and storagesnd the provision of infrastructures compared to the amount ofands allocated to other land use types in the redeveloped LUP
Fig. 3. The redeveloped Lource: Oromia Water Works Design and Supervision Enterprise, 2013.
Total 3586 100
Source: Generated from OWWDSE documents (2011).
UP of Dukem, 2008.

D. Dadi et al. / Urban Forestry & Urban Greening 16 (2016) 132–141 137
F ential(
(ottsrti
3
ipsDiluA
3o
paApiebp(
“wctt
Ddhpa
declining trends of the total crops harvested over the six successiveharvesting seasons considered in this study area.
In line with the total size of the cultivated lands, the aggregateyield harvested from these lands had shown a successive reduction
ig. 4. Residential and industrial sprawling into agricultural land, Dukem: (A) residPhotography by the first author, 2013).
Table 3). These three land use types together sum up 2508 ha (70%)f the total 3586 ha (100%) of urban boundaries in the new LUPhat became the leading drivers of ALC in the three rural kebeles ofhe Dukem town. Therefore, as shown in Tables 1 and 2, the totalize of the urbanized area increased from 648 ha to 3586 ha in theedeveloped LUP. Also, in both the developed and redeveloped LUP,he largest segment of the urban land was devoted to the housing,ndustries and storage and the provision of infrastructures.
.2. Management and monitoring of urban land use
As indicated in the preceding section, the OLEPB was establishedn 2009 with the duties and responsibilities of land administration,reparation and implementing LUPs at the town and city levels. Inpite of these efforts, document reviews and discussions with theukem town investment office and land administration officials
ndicated that there is hardly any kind of comprehensive and regu-ar management or monitoring practices carried out so far. Hence,p to date data and precise information on the size of convertedLs and the level of such conversions are missing.
.2.1. The effects of rapid industrialization and urban sprawlingn agricultural lands and food crop cultivation
Urban LUP preparations based on the scientific principles oflanning requires an understanding of complex processes and thective involvement of multi-level stakeholders (Azadi et al., 2011c).ccording to Samat (2006), three phases are considered crucialrior to any planning in the LUP preparation. These include estimat-
ng the urban population growth rates, current and future potentialmployment opportunities, in-migration and determining urbanoundaries. Furthermore, an appropriate implementation of thelan is indispensable to ensure effective and optimal land useWillis et al., 2001).
In this regard, the industrial zone within the Dukem town calledEastern Industrial Zone”, which belongs to Chinese owners, andas granted more than 230 ha of the land used to cultivate food
rops in the Xadacha kebele. The size of the land granted solely forhis industrial zone is about 260% times larger than the total size ofhe 86 ha land allocated on the LUP for this town.
Furthermore, data obtained from the investment office of theukem town shows that more than 515 ha of AL were already
istributed for all other investment uses until 2011. On the otherand, the Eastern Industrial Zone and all the other industrial zonesroposed creating employment opportunities for up to 46,000nd 15,000 labor forces, respectively. This signifies a prospectsprawling into agricultural land and (B) industrial sprawling into agricultural land
of continuous pressure on the existing urban lands in the townas incoming people would also demand more housing, alongwith the expansion of infrastructures in the near or far future(Fig. 4A and B).
As argued in many studies (Cardenas, 1996; Eila, 2000; Chenet al., 2009; Van Suu, 2009; Azadi et al., 2011a, 2012; Nguyen et al.,2011; Rudi et al., 2012), unsustainable ALC in the urban fringes hasbeen posing negative implications by reducing farmlands and cropyields which threaten the livelihood of local people.
Fig. 5 shows the size and trends of the total cultivated land togrow stable food crops over the six successive harvesting seasonsin all the kebeles surrounding the Dukem town. Accordingly, thetotal size of the cultivated land for wheat and teff growth showsthose trends declining. The figure prior to the emerging of indus-trialization was 365.59 km2 in 2005 while the size dropped sharplyto 218.60 km2 six years later in 2011 with a total reduction of147 km2 (40%) from the initial size. More specifically, the total cul-tivated land to grow wheat declined from 230.82 km2 in 2005 to104.82 km2 (55%) in 2011, whereas the figure for teff shrunk from134.77 km2 to 93.67 km2 (30.4%) over the same period. This clearlyshows the swift decline of croplands over time and the growing vul-nerability of the rural households for whom agriculture remainedthe only source of the household livelihood income. Fig. 6 shows the
Fig. 5. Size of the total cultivated land to grow cereals in Akaki district, 2005–2011.
138 D. Dadi et al. / Urban Forestry & Urba
ade1v2tttipjtrch
fptpt
Fig. 6. Total food crops harvested over five harvesting seasons, 2005–2011.
s well. The overall yield harvested for both crop types decreasedrastically between the 2005 and 2011 harvesting seasons. Forxample, the cumulative yield (teff and wheat) was reduced from280.3 tons in 2005 to 867.7 tons in 2011. Within the selected har-esting years, the total yield of wheat dropped from 877.12 tons in005 to 394.3 tons in 2011. Although the figure for teff shows fluc-uation from one harvesting season to the next (Fig. 6), the overallrend shows a slight increase. An assessment was also made forhe price of teff and wheat in the study area that showed a sharpncrease in the price of both teff and wheat crops. Interestingly, therice of one 100 kg of teff raised from nearly USD 21.6 in 2005 to
ust over USD 92 in 2012 while wheat showed a price hike to morehan 54 USD in 2012 compared to the price in 2005. In this respect,eduction in the size of household farm size and crop productionsombined with the global food price trends have been challengingousehold food security.
The development practitioners in the study area justify thatarmers were in the regular orientation and equipped with land
lowing tools and yield enhancing inputs. Apparently, this points tohe options of fostering land productivity in order to secure surplusroduction from the remaining land (Tuyen, 2013). Nevertheless,he main problem for the local people as reflected in the FGD, isFig. 7. Patterns of industrial sprawling in the r
n Greening 16 (2016) 132–141
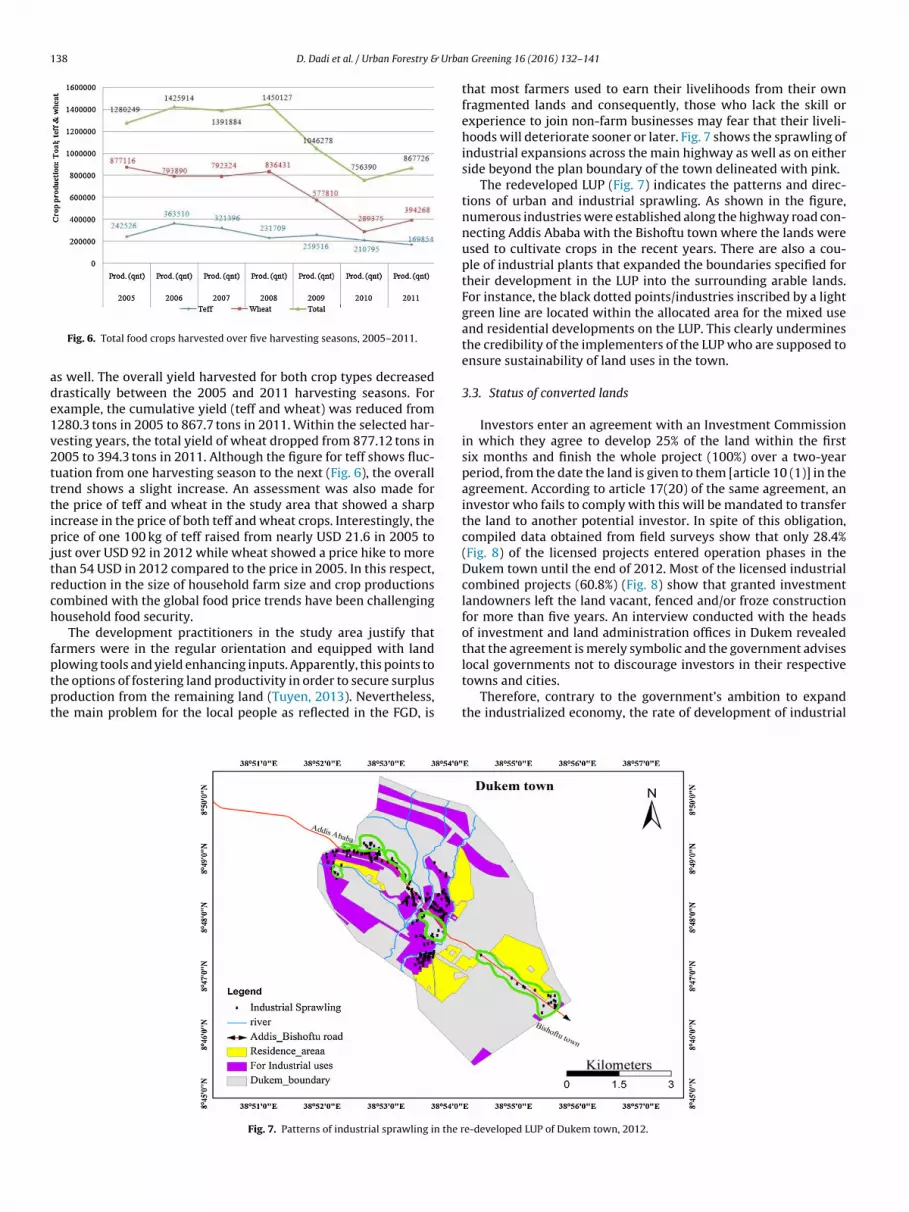
that most farmers used to earn their livelihoods from their ownfragmented lands and consequently, those who lack the skill orexperience to join non-farm businesses may fear that their liveli-hoods will deteriorate sooner or later. Fig. 7 shows the sprawling ofindustrial expansions across the main highway as well as on eitherside beyond the plan boundary of the town delineated with pink.
The redeveloped LUP (Fig. 7) indicates the patterns and direc-tions of urban and industrial sprawling. As shown in the figure,numerous industries were established along the highway road con-necting Addis Ababa with the Bishoftu town where the lands wereused to cultivate crops in the recent years. There are also a cou-ple of industrial plants that expanded the boundaries specified fortheir development in the LUP into the surrounding arable lands.For instance, the black dotted points/industries inscribed by a lightgreen line are located within the allocated area for the mixed useand residential developments on the LUP. This clearly underminesthe credibility of the implementers of the LUP who are supposed toensure sustainability of land uses in the town.
3.3. Status of converted lands
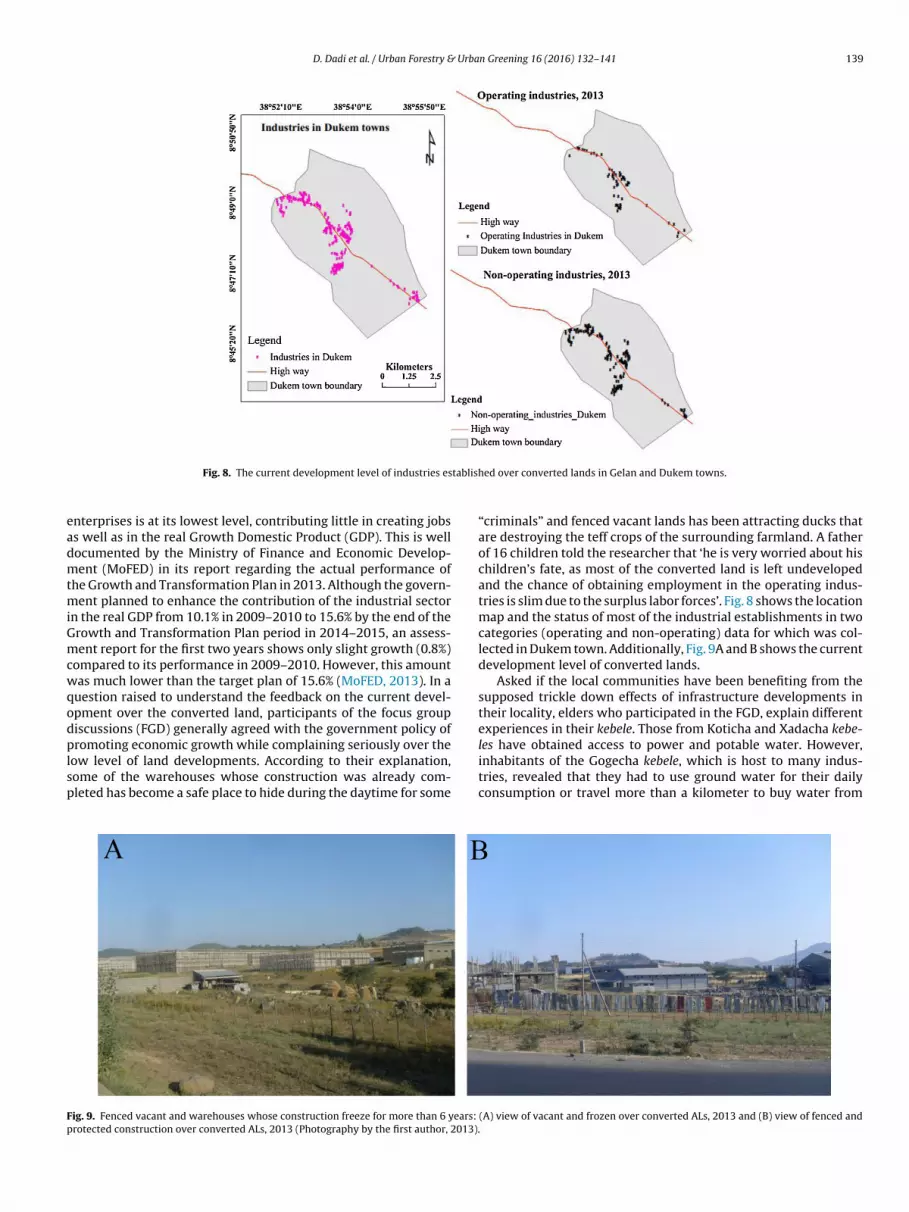
Investors enter an agreement with an Investment Commissionin which they agree to develop 25% of the land within the firstsix months and finish the whole project (100%) over a two-yearperiod, from the date the land is given to them [article 10 (1)] in theagreement. According to article 17(20) of the same agreement, aninvestor who fails to comply with this will be mandated to transferthe land to another potential investor. In spite of this obligation,compiled data obtained from field surveys show that only 28.4%(Fig. 8) of the licensed projects entered operation phases in theDukem town until the end of 2012. Most of the licensed industrialcombined projects (60.8%) (Fig. 8) show that granted investmentlandowners left the land vacant, fenced and/or froze constructionfor more than five years. An interview conducted with the headsof investment and land administration offices in Dukem revealedthat the agreement is merely symbolic and the government advises
local governments not to discourage investors in their respectivetowns and cities.Therefore, contrary to the government’s ambition to expandthe industrialized economy, the rate of development of industrial
e-developed LUP of Dukem town, 2012.
D. Dadi et al. / Urban Forestry & Urban Greening 16 (2016) 132–141 139
tablish
eadmtmiGmcwqodplsp
Fp
Fig. 8. The current development level of industries es
nterprises is at its lowest level, contributing little in creating jobss well as in the real Growth Domestic Product (GDP). This is wellocumented by the Ministry of Finance and Economic Develop-ent (MoFED) in its report regarding the actual performance of
he Growth and Transformation Plan in 2013. Although the govern-ent planned to enhance the contribution of the industrial sector
n the real GDP from 10.1% in 2009–2010 to 15.6% by the end of therowth and Transformation Plan period in 2014–2015, an assess-ent report for the first two years shows only slight growth (0.8%)
ompared to its performance in 2009–2010. However, this amountas much lower than the target plan of 15.6% (MoFED, 2013). In a
uestion raised to understand the feedback on the current devel-pment over the converted land, participants of the focus groupiscussions (FGD) generally agreed with the government policy ofromoting economic growth while complaining seriously over the
ow level of land developments. According to their explanation,ome of the warehouses whose construction was already com-leted has become a safe place to hide during the daytime for some
ig. 9. Fenced vacant and warehouses whose construction freeze for more than 6 years:
rotected construction over converted ALs, 2013 (Photography by the first author, 2013).
ed over converted lands in Gelan and Dukem towns.
“criminals” and fenced vacant lands has been attracting ducks thatare destroying the teff crops of the surrounding farmland. A fatherof 16 children told the researcher that ‘he is very worried about hischildren’s fate, as most of the converted land is left undevelopedand the chance of obtaining employment in the operating indus-tries is slim due to the surplus labor forces’. Fig. 8 shows the locationmap and the status of most of the industrial establishments in twocategories (operating and non-operating) data for which was col-lected in Dukem town. Additionally, Fig. 9A and B shows the currentdevelopment level of converted lands.
Asked if the local communities have been benefiting from thesupposed trickle down effects of infrastructure developments intheir locality, elders who participated in the FGD, explain differentexperiences in their kebele. Those from Koticha and Xadacha kebe-les have obtained access to power and potable water. However,
inhabitants of the Gogecha kebele, which is host to many indus-tries, revealed that they had to use ground water for their dailyconsumption or travel more than a kilometer to buy water from(A) view of vacant and frozen over converted ALs, 2013 and (B) view of fenced and

1 Urba
Dw
4
ttplmdtstAstOeasmlptMtbtriSamuamiathafoa
A
Dh
R
A
A
A
A
40 D. Dadi et al. / Urban Forestry &
ukem town or elsewhere obtaining a twenty litter jerry can ofater every two/three days from the nearby industries.
. Conclusion
The existing LUP of the Dukem town was intended to ensurehe sustainable and efficient utilization of existing lands withinhe urbanized boundary of the town. It was also intended to be alausible measure for curbing the swift conversion of agricultural
ands in urban fringes. The study revealed that significant invest-ents for the industrial and residential expansions remained major
rivers of ALCs based on the overall hectares of lands allocated forhe LUPs and the size of the lands actually distributed. Similarly,tudies in European cities such as Munich or Manchester showedhat residential areas are concentrated on the largest proportion ofLCs (Pauleit and Duhme, 2000; Gill et al., 2007, 2008). Also, thetudy by CLUVA (2013) in Africa shows that the largest propor-ionate share of ALCs was found in residential and industrial areas.ther similar studies by Liu et al. (2009), Tuyen (2013) and Azadit al. (2011a) in China, Vietnam, Netherlands and Germany havelso documented industrialization as the major drivers of ALCs. Thetudy showed a delay in the preparation of the binding LUP imple-entation tools such as guidelines on plot size allocation led to a
ack of uniformity in most decisions made on plot size grants forrojects. Because of such delays, many hectares of land were dis-ributed much beyond what was allocated on the LUP ahead of time.
oreover, as discussed by CLUVA (2013), this study also concludedhat land management and monitoring tools were not only found toe inefficient, but also were not fully implemented. Simultaneously,he rapid industrialization of the town has been accompanied withapid urban population growth and urban sprawling, leading to thencorporation of the three kebeles in the peri-urban of the town.uch issues significantly affect the size of the total cultivated landnd food crop production. Surprisingly, the study revealed thatost of the converted lands for industrial establishments were
nderdeveloped or were not even developed at all. In order toddress the major problems resulting from urban sprawling andanage the subsequent ALCs in the peri-urban Dukem, the follow-
ng comments could be helpful. The government officials at regionalnd local levels responsible for granting urban lands should sticko the standards formulated by BLEPO. It can also be suggested thatigher-level government officials should develop clear and attain-ble LUP implementation regulations, rules and legal enforcementsor the failed or faulty implementations. Furthermore, it is also rec-mmended to develop efficient and workable land managementnd monitoring systems.
cknowledgement
The authors wish to thank Ms. Bethany Gardner from theepartment of Linguistics, the State University of New York at Bing-amton, for her kind help in improving the English of this text.
eferences
ribigbola, A., 2008. Improving Urban Land Use Planning and Management inNigeria: The Case of Akure. Theoretical and Empirical Researches in UrbanManagement, Year 3, No. 9.
zadi, H., Ho, P., Hasfiati, L., 2011a. Agricultural land conversion drivers: acomparison between less developed, developing and developed countries.Land Degrad. Dev. 22, 596–604.
zadi, H., Talsma, N., Ho, P., Zarafshani, K., 2011b. GM crops in Ethiopia: a realistic
way to increase agricultural performance. Trends Biotechnol. 29 (1),6–8.zadi, H., Ho, P., Hafni, E., Zarafshani, K., Witlox, F.F., 2011c. Multi-stakeholderinvolvement and urban green space performance. J. Environ. Plan. Manage. 54(6), 785–811.
n Greening 16 (2016) 132–141
Azadi, H., Veronique, V., Acker, V., Zarafshani, K., Witlox, F., 2012. Food systems:new-ruralism versus new-urbanism. J. Sci. Food Agric. 92, 2224–2226.
Cardenas, D., 1996. Effects of Land-Use Conversion on Local Agriculture: The Caseof Cavite, Philippines. Socioeconomic Research Division, PCARRD, Los Banos,Philippines.
Chen, Y., Li, X., Tian, Y., Tan, M., 2009. Structural change of agricultural land useintensity and its regional disparity in China. J. Geogr. Sci. 19, 545–556.
CLUVA (CLimate change and Urban Vulnerability in Africa), 2013. Assessingvulnerability of urban systems, populations and goods in relation to naturaland man-made disasters in Africa. http://www.cluva.eu/deliverables/CLUVAD2.9.pdf.
Collier, P., Gunning, J.W., 1999. Explaining African economy performance. J. Econ.Lit. 37, 64–111.
Eila, M.S., 2000. Socioeconomic impacts of land use conversion: a case study ofRaic-Pavia, Iloilo Province, the Philippines. UP School of Urban and RegionalPlanning http://surp.ph/pages/theses-and-dissertations/.
FAO, 1996. Management and Conservation Service under the Guidance of theInterdepartmental Working Group on Land Use Planning, Guidelines forLand-Use Planning: FAO Development Series 1. Food and AgricultureOrganization of the United Nations Prepared by the Soil Resources, ISSN1020-0819.
Fazal, S., 2000. Urban expansion and loss of agricultural land – a GIS based study ofSaharanpur City. Environ. Urban. 12 (2).
Gill, S., Handley, J., Ennos, R., Pauleit, S., 2007. Adapting cities for climate change:the role of the green infrastructure. J. Built Environ. 33 (1), s115–s133.
Gill, S., Handley, J., Pauleit, S., Ennos, R., Theuray, N., Lindley, S., 2008.Characterising the urban environment of UK cities and towns: a template forlandscape planning in a changing climate. Landsc. Urban Plan. 87, 210–222.
GTP (Growth and Transformation Plan), 2013. Annual Progress Report forF.Y. 2011/12. Ministry of Finance & Economic Development, Ethiopiahttp://www.undp.org/content/dam/ethiopia/docs/GTP%20APR%202004%20English%20Version Sept%207.pdf.
Jiang, L., Deng, X., Seto, K., 2012. Multilevel modeling of urban expansion andcultivated land conversion for urban hotspot counties in China. Landsc. UrbanPlan. 108, 131–139.
Liu, Y.S., Wang, J., Long, H., 2009. Analysis of arable land loss and its impact on ruralsustainability in Southern Jiangsu Province of China. J. Environ. Manage. 91 (3),646–653.
Megeleta Oromia, 2003. The Oromia Regional State: The Urban Local GovernmentProclamation. Proclamation No. 65/2003. Finfine, Ethiopia.
Mengistae, T., 1991. Social accounts of three Ethiopian villages: a study ofinstitutions and policy. In: Doss, C., Olson, C. (Eds.), Issues in African RuralDevelopment. African Rural Social Science Research Network. WinrockInternational Institute for Agricultural Development, Arlington, USA, pp.1–21.
Minghong, T., Xiubin, L., Hui, X., Changhe, L., 2004. Urban land expansion andarable land loss in China: a case study in Tianjin-Hebel region. Land Use Policy22, 187–196.
MoFED, 2013. Annual Progress Report for F.Y. 2011/12 Growth and TransformationPlan, Addis Ababa, Ethiopia. Ministry of Finance and Economic Development,Federal Democratic Republic of Ethiopia.
MWUD, Ethiopian Ministry of Works and Urban Development, 2013. http://participedia.net/en/organizations/ethiopian-ministry-works-and-urban-development-mwud.
Negarit Gazeta, 2005. The Establishment of the Federal Urban Planning Institute,Proclamation. Proclamation No, 456/2005, Addis Ababa, Ethiopia.
Nguyen, V., Ho, T., 2013. Effects of recovery of agricultural land to life, the jobs offarmers in Van Lam District, Hung Yen Province. J. Sci. Dev. 11, 59–67.
Nguyen, V., Vu, D., Philippe, L., 2011. Peasant response to agricultural landconversion and mechanisms of social differentiation in Hung Yen province,Northern Vietnam. In: Paper Presented at the 7th Asia InternationalConference, Hanoi, Vietnam, http://orbi.ulg.ac.be/handle/2268/100469(15.11.13).
NMS, 2013. National Meteorological Station Report, Addis Ababa, Ethiopia. FederalDemocratic Republic of Ethiopia.
OWWDSE, 2011. Finfine Surrounding Special Zone of Oromia, Integrated Land UsePlanning Study Project; final report (Unpublished document). Finfine (AddisAbaba), Ethiopia.
Paul, V., McKenzie, F.H., 2013. Peri-urban farmland conservation and developmentof alternative food networks: insights from a case-study area in metropolitanBarcelona (Catalonia, Spain). Land Use Policy 30, 94–105.
Pauleit, S., Duhme, F., 2000. Assessing the environmental performance of landcover types for urban planning. J. Landsc. Urban Plan. 52 (1), 1–20.
RDPS, 2003. Rural Development Policy and Strategy. Federal Democratic Republicof Ethiopia, Addis Ababa, Ethiopia.
Rudi, L.M., Azadi, H., Witlox, F., 2012. Reconcilability of socioeconomicdevelopment, enhancement and environmental improvement in the context ofSub-Saharan Africa. Glob. Planet. Change 86–87, 1–10.
Samat, N., 2006. Application of geographic information system in urban land use inMalaysia. In: Proceedings of the 4th Taipei International Conference on DigitalEarth, 25–26 May 2006, University Sains Malaysia, Taiwan, Malaysia.
Tariq, 2006. Characteristics of Industrial Effluents and Their Possible Impacts onthe Quality of Underground Water. Department of Soil & EnvironmentalSciences, NWFP Agricultural University, Peshawar, Pakistan.
Tolossa, D., 2008. Understanding the Realities of Urban Poor and Their FoodSecurity Situations: A Case Study at Berta Gibi and Gemechu Safar in Addis

Urba
T
V
D. Dadi et al. / Urban Forestry &
Ababa City, Ethiopia. Institute of Developing Economies, External TradeOrganization: V.R.F. Series, Japan.
uyen, T.Q., 2013. Livelihood strategies for coping with land loss amonghouseholds in Vietnam’s sub-urban area. Can. Center Sci. Educ. 9 (15),
33–46.an Suu, N., 2009. Industrialization and urbanization in Vietnam: howappropriation of agricultural land use rights transformed farmers: livelihoodsin a peri-urban Hanoi village? Eadn Working Paper No. 38. Vietnam NationalUniversity, Hanoi, Vietnam.
n Greening 16 (2016) 132–141 141
Willis, K.G., Turner, R.K., Bateman, I.J., 2001. Urban Planning and Management.Edward Elgar, Cheltenham, UK and Northampton, MA.
Wu, Fisher, M., Pascual, U., 2011. Urbanization and the viability of local agriculturaleconomies. Land Econ. 87, 109–125.
Xu, W., 2004. The changing dynamic of land-use change in rural China: a casestudy of Yuhang, Zhejiang Province. Environ. Plan. A 36, 1595–1615.
Zhong, T., Huang, X., Zhang, X., Wang, K., 2011. Temporal and spatial variability ofagricultural land loss in relation to policy and accessibility in a low hilly regionof Southeast China. Land Use Policy 28, 762–769.