urban sprawl and housing bubble (1997-2007) in valència (spain) according to corine and siose data
TRANSCRIPT
SPRAWL URBANO E BOLLA IMMOBILIARE (1997-2007) IN VALÈNCIA (SPAGNA) SECONDO CORINE E SIOSE
URBAN SPRAWL AND HOUSING BUBBLE (1997-2007) IN
VALÈNCIA (SPAIN) ACCORDING TO CORINE AND SIOSE DATA
Joan Carles Membrado1
Riassunto Durante la bolla immobiliare spagnola (1997-2007) le superfici artificiali nella costiera València furono cresciute come mai prima, a causa del boom edilizio. Secondo CORINE 2006, queste superfici raggiunsero il 4,8% del territorio di València (erano il 2,6% nel 1990), e quasi il 7% secondo SIOSE 2005 (un GIS molto accurato e preciso sulle coperture del suolo, solo per la Spagna). Il modello di crescita più sviluppato in questo periodo è stato lo sprawl urbano, che era stato quasi sconosciuto a València prima del 1990. Parole chiave: bolla immobiliare spagnola, sprawl urbano, València, CORINE, SIOSE
Abstract During the Spanish housing bubble (1997-2007) artificial surfaces grew in coastal València as never before, due to the construction boom. According to CORINE 2006 they reached 4.8% of the whole Valencian territory (they represented 2.6% in 1990), and almost 7% according to SIOSE 2005 (an accurate and precise Spanish GIS on land cover and use). The most developed growth pattern in that period was urban sprawl, which had been almost totally absent in València before 1990. Key words: Spanish housing bubble, urban sprawl, València, CORINE, SIOSE
1. Introduction In this paper, whose information is referred to the eastern Spanish region of
València, I intend to (i) present the most remarkable CORINE and SIOSE data
about the evolution and distribution of its artificial surfaces, which knew a strong
rise –particularly as regards the urban sprawl– during the Spanish housing
bubble (1997-2007) and (ii) compare the differences between CORINE and
SIOSE technical features and nomenclature, which results in some remarkable
differences between both. I have personal experience of working with both land
use and cover GIS’s, as I was the person in charge of photo interpretation and
cartographic generalization for the CORINE (2000 and 2006) and SIOSE (2005)
projects in València, being then a member of the Institut Cartogràfic Valencià.
CORINE Land Cover allows us to observe that artificial surfaces almost
double between 1990 and 2006 in València, thanks to the phenomenon known
as the Spanish housing bubble (1997-2007). In 2008, the collapse of this
1 Departament de Geografia, Universitat de València (Spain)
housing bubble put a severe end to this huge growth of artificial surfaces. As for
SIOSE, this is another GIS on land cover which allows us to study the land use
distribution in Spain. It is not as useful a tool as CORINE to observe the
evolution of the housing bubble in València, since it was started in 2005.
Nevertheless, due to its higher level of accuracy, SIOSE is able to offer far more
information than CORINE.
In this paper we will analyze the evolution of land uses in València by
comparing CORINE 1990 (i.e., before the construction boom) and CORINE
2006 (which was carried out at the peak of the housing bubble) –we will see
that the main feature in this diachronic analysis is the remarkable growth of
urban sprawl. Furthermore, we will also carry out a synchronic analysis of
differences regarding the artificial surface results in València between SIOSE
2005 and CORINE 2006.
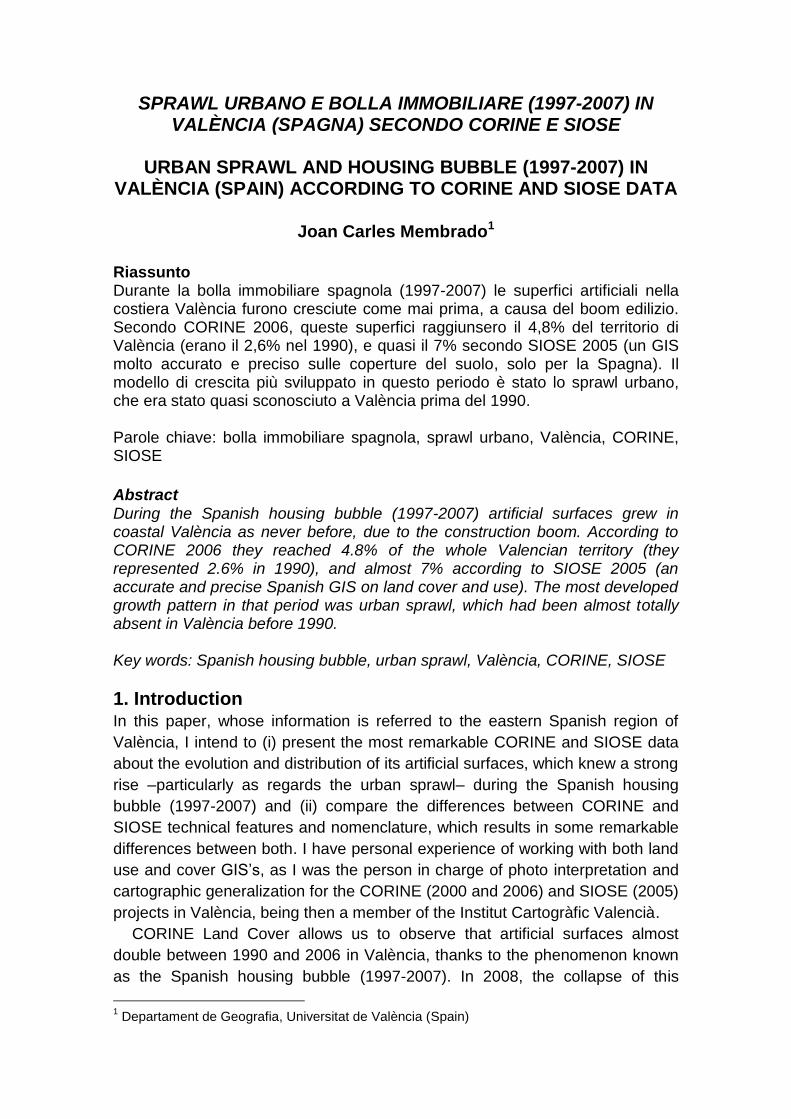
2. The facts 2.1 About València València, officially called Comunitat Valenciana, is a 23.000 km2 territory in
eastern Spain inhabited by more than five million people. València (historically
known in Italy as Valenza) is one of the seventeen comunidades autónomas
(‘autonomous communities’) which make up Spain. Its main cities are: its
capital, València City,2 with an urban agglomeration reaching more than 1.7
million (pop. 2012), the urban area of Alacant (Alicante) and Elx (Elche), which
jointly comprise more than 750,000, and the urban area of Castelló, with slightly
more than 375,000 inhabitants (figure 1). The next two most populated areas
are located in touristic Costa Blanca: la Marina (Dénia-Calp-Benidorm), with
more than 350.000 inhabitants (figures 1 and 8), and Torrevieja, with more than
230.000 (figures 1 and 9). These last two areas are characterized by urban
sprawl, by the presence of a noteworthy northern European permanent
population and by high growth rates during the Spanish housing bubble period.
València has been traditionally known abroad because of the oranges it
produces and exports, albeit nowadays this fruit generates little or no revenue
for the farmers. After 1960, València developed a well-diversified industry as
well, which is now declining: València’s ceramic tile industry, for instance, was
in the 1990’s second only to that of Sassuolo (Emilia-Romagna) worldwide,
whereas both have recently been surpassed by the ceramic tile production of
China and of Brazil. In the last fifteen years, València has been known too
because of the housing bubble it experienced, which suddenly collapsed in
2008 –a fact which in this territory considerably aggravated the consequences
of the last global economic crisis. Since the 1960’s València, and particularly
2 València is the name both of the region and of its capital city. In this paper we will call it
València City when referring to the capital city.
Costa Blanca, has been a remarkable tourist destination as well, and tourism is
the only economic sector which is not declining there in our time.
Figure 1. Location of València and its main cities
Source: compiled by the author using data from Institut Cartogràfic Valencià
2.2 The 1997-2007 Spanish housing bubble
Between 1997 and 2007, economic growth in Spain was based in the
development of the construction sector, which was particularly remarkable all
along the Mediterranean coast (including València), in Madrid and in the
Balearic and Canary islands. This Spanish housing boom reached its peak in
2006, when, according to the European Mortgage Federation, 760,168 houses
were started in Spain, more than the sum of those started in Italy (261,455) and
in the United Kingdom (230,330) plus those completed in Germany (249,436)3,
in spite of the fact that these three countries are not only far more populated
than Spain, but they also enjoy a bigger per capita income.
This huge urban development can be explained by two main factors. First of
all, Spain, as a member of the Euro zone from its creation in 1999, enjoyed the
benefits of being part of a currency regarded as strong and safe: it was thus
easy for Spanish banks and companies to get credit from abroad –until the
3 There are no data about housing starts in Germany, and that is why we use the house
completed data for Germany (Hypostat 2009: a review of Europe’s mortgage and housing markets, 75-76). In 2006 almost 18 houses per 1000 inhabitants were started in Spain, whereas in Italy they were 4.5 and in the UK 3,8. The same year only 3 houses per 1000 inhabitants were completed in Germany (Hypostat 2006: a review of Europe’s mortgage and housing markets, p. 9).
global financial crisis started in 2007. Secondly, the 1998 Spanish building code
made it easier to build (any non-protected piece of land could now be built on)
(Rullan, 1999), and town councils began to facilitate and promote urban
expansion so as to use it as a source of revenue (via taxes). The conjunction of
both factors led to the considerable investment of private capital (both Spanish
and foreign) in the housing sector, which offered quick, substantial returns.
Thus, an insufficient regulatory framework allowed a bigger intervention than
before of private initiatives in the construction sector, but these initiatives
eventually proved unable to control the spontaneous growth process of the
sector and to attenuate its impact on environmental sustainability (Artigues and
Rullan, 2007; Burriel, 2008).
Meanwhile, this growth process reinforced itself: the easy credit led to the low
interest rates that banks charged on loans to buy a house, which in turn led to
people noting the advantages of buying a house as opposed to renting it, which
led to more people wanting to buy a house; the construction fever produced a
considerable and prolonged rise of employment in Spain (the unemployed went
from 21% of the Spanish active population in 1997 to only 8% in 2006, whereas
in 2012, after more than four years of crisis, they represent 25%), which
increased many families’ disposable income and attracted many immigrants (we
must take into account that in 1995 only 1% of the inhabitants of València were
immigrants from out of Spain, whereas in 2004 non-Spanish immigrants
represented more than 10% of the total Valencian population, and in 2011,
more than 17%), which in turn also led to more people wanting to buy a
house… Eventually, when credit lines were cut in the midst of the 2007 global
financial crisis, the housing bubble burst and the whole castle in the air of the
construction-centered economy collapsed.
The huge investment of money and energy in the housing sector in those
years was made –in Spain and, particularly, in the Valencian case– at the
expense of the industry, and the price for this was industrial decline. In 2008 the
industrial sector had shrank to just 14% of the Valencian GDP, when 12 years
before it had represented 28%. The evolution of the Valencian economy from
the mid-1990’s has been unbalanced: the huge investment in housing and
construction, where quick, easy profits could be made, forgetting R&D or the
development of other sectors more sustainable in the long term, has resulted in
a steep fall of employment in València, steeper even than the Spanish average
(Boira, 2012, p. 116).
3. Comparison between CORINE and SIOSE and their results for València 3.1 The CORINE and SIOSE GIS’s: their technical differences
The CORINE Land Cover project was started in 1985 by an initiative of the
European Commission, with the aim of gathering environmental information
about the European Union. CORINE (Coordination of Information on the
Environment) has been integrated since 1994 in the European Environment
Agency (EEA), which is the institution responsible for providing information on
Europe's environmental and territorial policies –to this aim it uses CORINE data.
Its first version dates from 1990, and then it was updated in 2000 and 2006.
In 2005 the Spanish Instituto Geográfico Nacional promoted another GIS
project on land use, in this case only for the Spanish territory, that intended to
be much more accurate than CORINE. This project was called by its Spanish
acronym SIOSE, standing for ‘Sistema de Información de Ocupación del Suelo
en España’ (Spain’s Land Cover Information System). SIOSE is the GIS with
the highest level of territorial disaggregation and homogenization ever created
so far in Spain on land cover and land use. Thanks to this huge level of detail,
SIOSE is an optimal tool for developing regional planning strategies, for the
planning and management of environmental resources, for dynamic studies on
land cover, for environmental impact assessment and for sustainable
development promotion, among other applications (IGN, 2006, Membrado,
2011a; p. 6-7). After the first SIOSE version from 2005, it was updated in 2009.
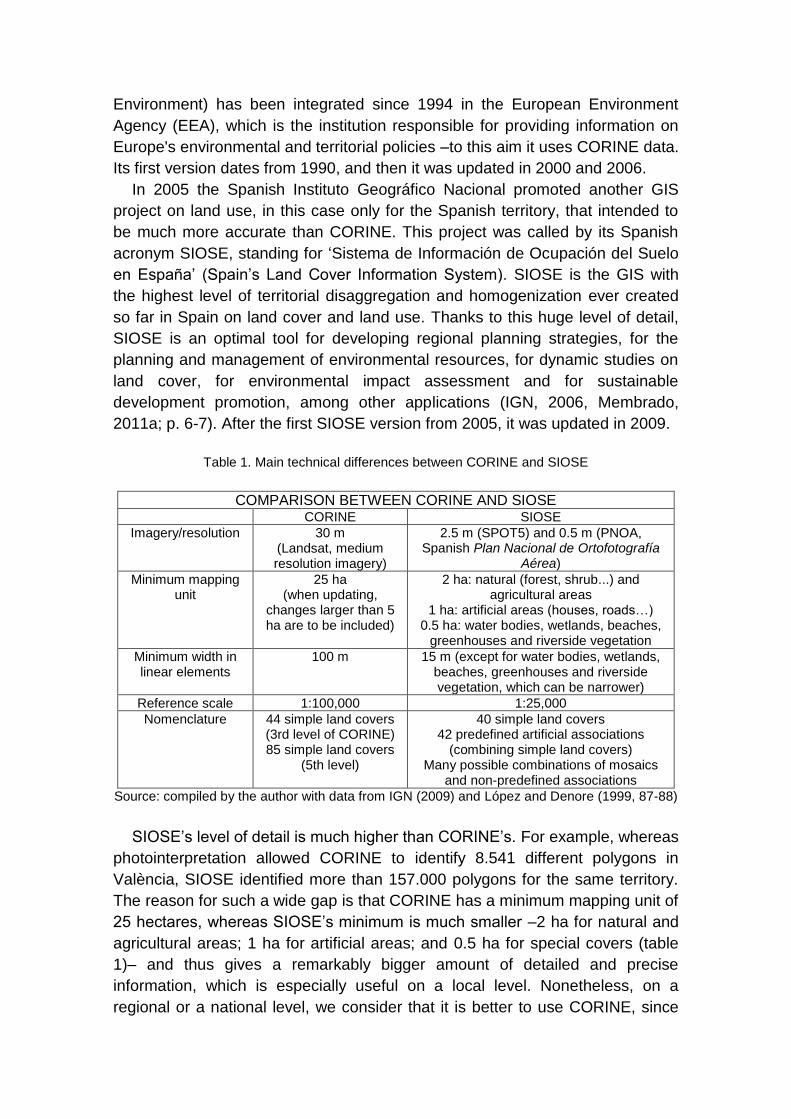
Table 1. Main technical differences between CORINE and SIOSE
COMPARISON BETWEEN CORINE AND SIOSE
CORINE SIOSE
Imagery/resolution 30 m (Landsat, medium resolution imagery)
2.5 m (SPOT5) and 0.5 m (PNOA, Spanish Plan Nacional de Ortofotografía
Aérea)
Minimum mapping unit
25 ha (when updating,
changes larger than 5 ha are to be included)
2 ha: natural (forest, shrub...) and agricultural areas
1 ha: artificial areas (houses, roads…) 0.5 ha: water bodies, wetlands, beaches,
greenhouses and riverside vegetation
Minimum width in linear elements
100 m 15 m (except for water bodies, wetlands, beaches, greenhouses and riverside vegetation, which can be narrower)
Reference scale 1:100,000 1:25,000
Nomenclature 44 simple land covers (3rd level of CORINE) 85 simple land covers
(5th level)
40 simple land covers 42 predefined artificial associations
(combining simple land covers) Many possible combinations of mosaics
and non-predefined associations
Source: compiled by the author with data from IGN (2009) and López and Denore (1999, 87-88)
SIOSE’s level of detail is much higher than CORINE’s. For example, whereas
photointerpretation allowed CORINE to identify 8.541 different polygons in
València, SIOSE identified more than 157.000 polygons for the same territory.
The reason for such a wide gap is that CORINE has a minimum mapping unit of
25 hectares, whereas SIOSE’s minimum is much smaller –2 ha for natural and
agricultural areas; 1 ha for artificial areas; and 0.5 ha for special covers (table
1)– and thus gives a remarkably bigger amount of detailed and precise
information, which is especially useful on a local level. Nonetheless, on a
regional or a national level, we consider that it is better to use CORINE, since
SIOSE’s level of detail would be excessive in this case, as it would make it
difficult to compare the differences and coincidences between European
regions or between European countries.
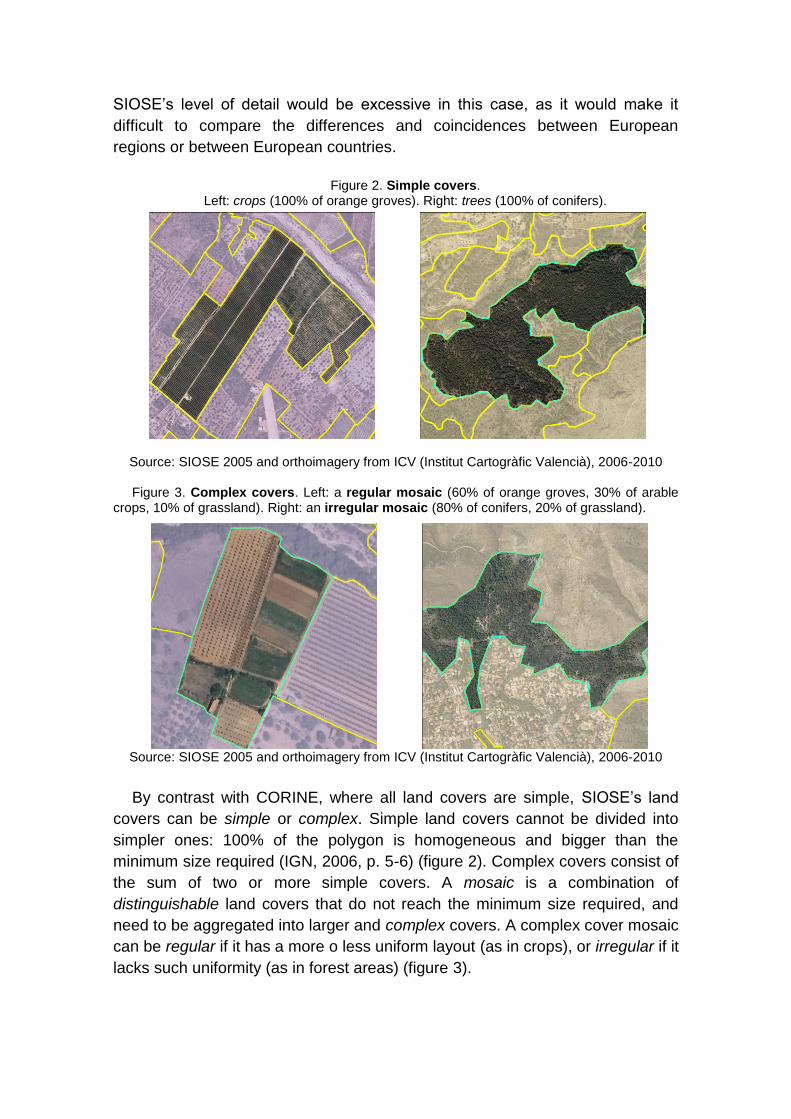
Figure 2. Simple covers.
Left: crops (100% of orange groves). Right: trees (100% of conifers).
Source: SIOSE 2005 and orthoimagery from ICV (Institut Cartogràfic Valencià), 2006-2010
Figure 3. Complex covers. Left: a regular mosaic (60% of orange groves, 30% of arable crops, 10% of grassland). Right: an irregular mosaic (80% of conifers, 20% of grassland).
Source: SIOSE 2005 and orthoimagery from ICV (Institut Cartogràfic Valencià), 2006-2010
By contrast with CORINE, where all land covers are simple, SIOSE’s land
covers can be simple or complex. Simple land covers cannot be divided into
simpler ones: 100% of the polygon is homogeneous and bigger than the
minimum size required (IGN, 2006, p. 5-6) (figure 2). Complex covers consist of
the sum of two or more simple covers. A mosaic is a combination of
distinguishable land covers that do not reach the minimum size required, and
need to be aggregated into larger and complex covers. A complex cover mosaic
can be regular if it has a more o less uniform layout (as in crops), or irregular if it
lacks such uniformity (as in forest areas) (figure 3).
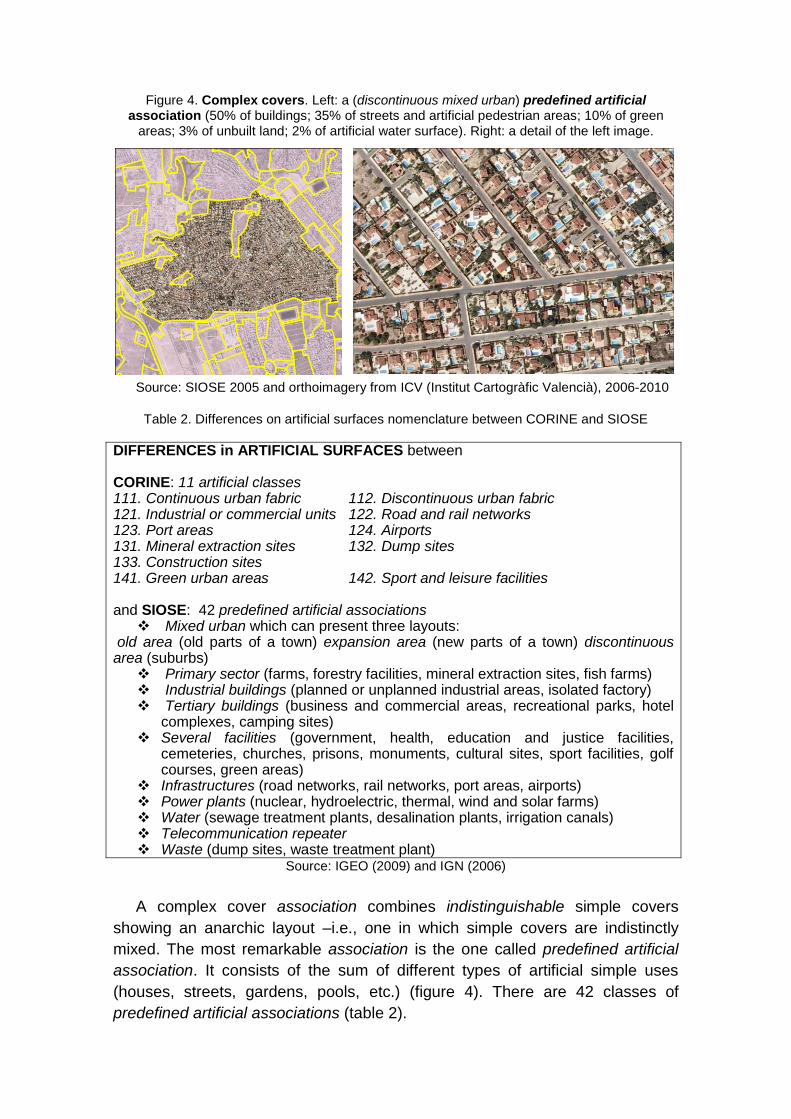
Figure 4. Complex covers. Left: a (discontinuous mixed urban) predefined artificial association (50% of buildings; 35% of streets and artificial pedestrian areas; 10% of green
areas; 3% of unbuilt land; 2% of artificial water surface). Right: a detail of the left image.
Source: SIOSE 2005 and orthoimagery from ICV (Institut Cartogràfic Valencià), 2006-2010
Table 2. Differences on artificial surfaces nomenclature between CORINE and SIOSE
DIFFERENCES in ARTIFICIAL SURFACES between CORINE: 11 artificial classes 111. Continuous urban fabric 112. Discontinuous urban fabric 121. Industrial or commercial units 122. Road and rail networks 123. Port areas 124. Airports 131. Mineral extraction sites 132. Dump sites 133. Construction sites 141. Green urban areas 142. Sport and leisure facilities and SIOSE: 42 predefined artificial associations
Mixed urban which can present three layouts: old area (old parts of a town) expansion area (new parts of a town) discontinuous area (suburbs)
Primary sector (farms, forestry facilities, mineral extraction sites, fish farms) Industrial buildings (planned or unplanned industrial areas, isolated factory) Tertiary buildings (business and commercial areas, recreational parks, hotel
complexes, camping sites) Several facilities (government, health, education and justice facilities,
cemeteries, churches, prisons, monuments, cultural sites, sport facilities, golf courses, green areas)
Infrastructures (road networks, rail networks, port areas, airports) Power plants (nuclear, hydroelectric, thermal, wind and solar farms) Water (sewage treatment plants, desalination plants, irrigation canals) Telecommunication repeater Waste (dump sites, waste treatment plant)
Source: IGEO (2009) and IGN (2006)
A complex cover association combines indistinguishable simple covers
showing an anarchic layout –i.e., one in which simple covers are indistinctly
mixed. The most remarkable association is the one called predefined artificial
association. It consists of the sum of different types of artificial simple uses
(houses, streets, gardens, pools, etc.) (figure 4). There are 42 classes of
predefined artificial associations (table 2).
3.2. Differences between CORINE and SIOSE results as regards València
3.2.1. València as a paradigm of the Spanish housing bubble and urban sprawl:
the evolution of land use in the Valencian territory as reflected in CORINE
SIOSE data refer only to the years 2005 and 2009 –therefore they do not allow
us to observe the evolution of land use in the period of the Spanish housing
bubble (1997-2007), whereas CORINE is an excellent tool to make a diachronic
study of land use evolution, since it was mapped for the first time in 1990 (i.e.,
before the great boom of the Spanish construction sector), and then updated in
2000 and 2006 (now CORINE is being updated again with 2012 imagery).
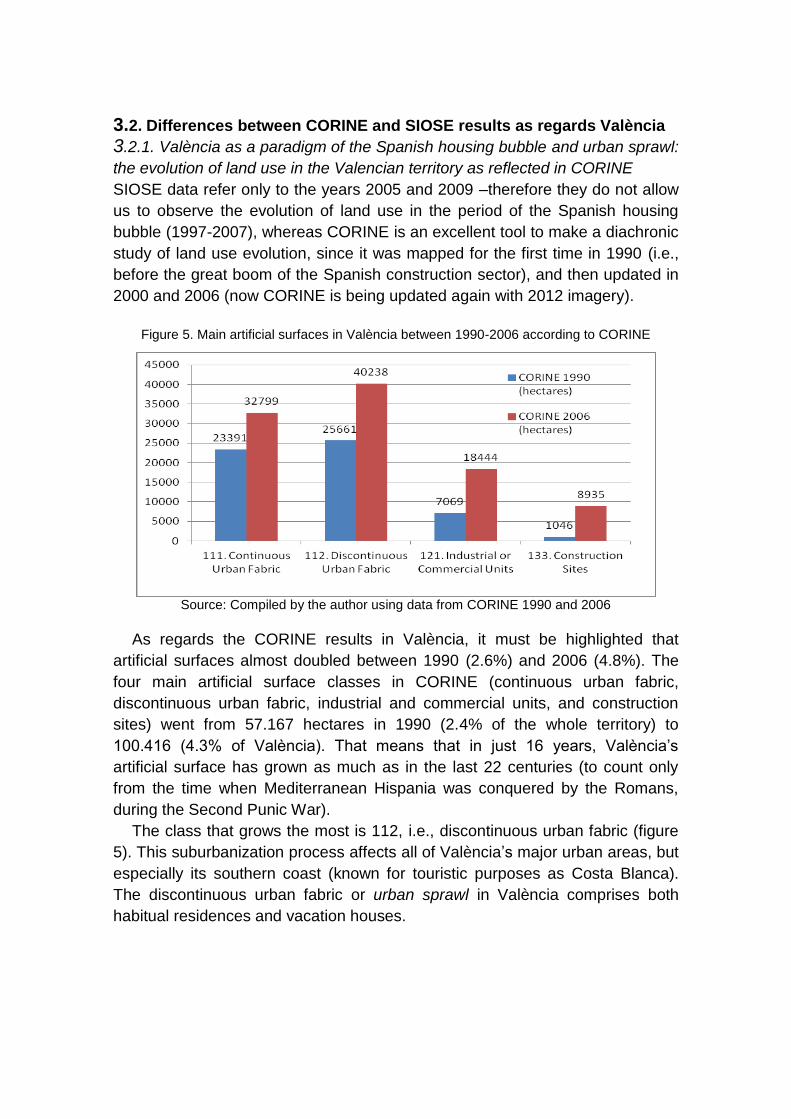
Figure 5. Main artificial surfaces in València between 1990-2006 according to CORINE
Source: Compiled by the author using data from CORINE 1990 and 2006
As regards the CORINE results in València, it must be highlighted that
artificial surfaces almost doubled between 1990 (2.6%) and 2006 (4.8%). The
four main artificial surface classes in CORINE (continuous urban fabric,
discontinuous urban fabric, industrial and commercial units, and construction
sites) went from 57.167 hectares in 1990 (2.4% of the whole territory) to
100.416 (4.3% of València). That means that in just 16 years, València’s
artificial surface has grown as much as in the last 22 centuries (to count only
from the time when Mediterranean Hispania was conquered by the Romans,
during the Second Punic War).
The class that grows the most is 112, i.e., discontinuous urban fabric (figure
5). This suburbanization process affects all of València’s major urban areas, but
especially its southern coast (known for touristic purposes as Costa Blanca).
The discontinuous urban fabric or urban sprawl in València comprises both
habitual residences and vacation houses.
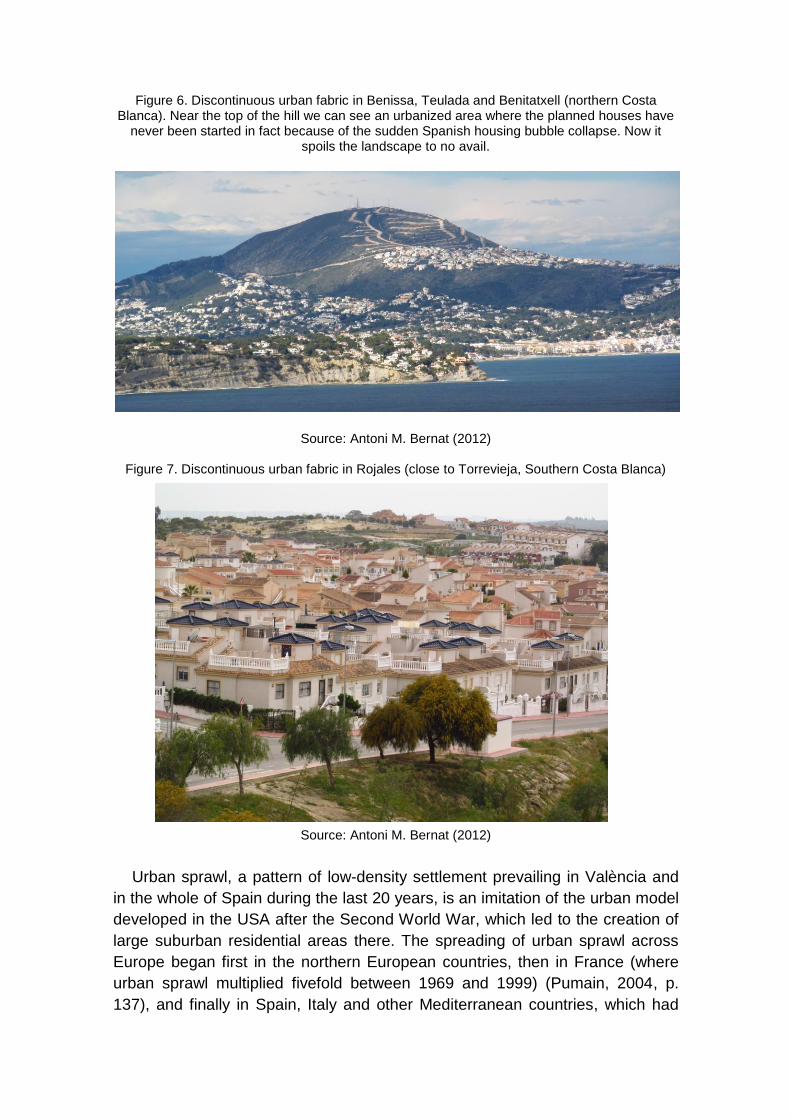
Figure 6. Discontinuous urban fabric in Benissa, Teulada and Benitatxell (northern Costa Blanca). Near the top of the hill we can see an urbanized area where the planned houses have
never been started in fact because of the sudden Spanish housing bubble collapse. Now it spoils the landscape to no avail.
Source: Antoni M. Bernat (2012)
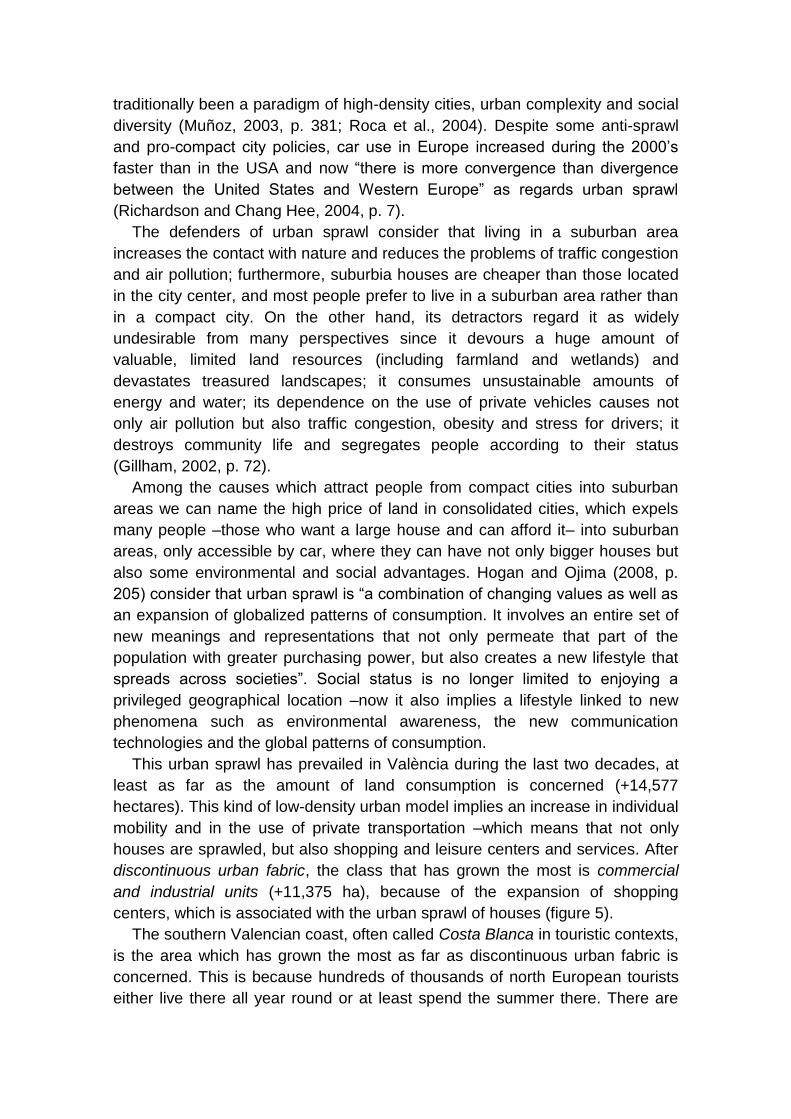
Figure 7. Discontinuous urban fabric in Rojales (close to Torrevieja, Southern Costa Blanca)
Source: Antoni M. Bernat (2012)
Urban sprawl, a pattern of low-density settlement prevailing in València and
in the whole of Spain during the last 20 years, is an imitation of the urban model
developed in the USA after the Second World War, which led to the creation of
large suburban residential areas there. The spreading of urban sprawl across
Europe began first in the northern European countries, then in France (where
urban sprawl multiplied fivefold between 1969 and 1999) (Pumain, 2004, p.
137), and finally in Spain, Italy and other Mediterranean countries, which had
traditionally been a paradigm of high-density cities, urban complexity and social
diversity (Muñoz, 2003, p. 381; Roca et al., 2004). Despite some anti-sprawl
and pro-compact city policies, car use in Europe increased during the 2000’s
faster than in the USA and now “there is more convergence than divergence
between the United States and Western Europe” as regards urban sprawl
(Richardson and Chang Hee, 2004, p. 7).
The defenders of urban sprawl consider that living in a suburban area
increases the contact with nature and reduces the problems of traffic congestion
and air pollution; furthermore, suburbia houses are cheaper than those located
in the city center, and most people prefer to live in a suburban area rather than
in a compact city. On the other hand, its detractors regard it as widely
undesirable from many perspectives since it devours a huge amount of
valuable, limited land resources (including farmland and wetlands) and
devastates treasured landscapes; it consumes unsustainable amounts of
energy and water; its dependence on the use of private vehicles causes not
only air pollution but also traffic congestion, obesity and stress for drivers; it
destroys community life and segregates people according to their status
(Gillham, 2002, p. 72).
Among the causes which attract people from compact cities into suburban
areas we can name the high price of land in consolidated cities, which expels
many people –those who want a large house and can afford it– into suburban
areas, only accessible by car, where they can have not only bigger houses but
also some environmental and social advantages. Hogan and Ojima (2008, p.
205) consider that urban sprawl is “a combination of changing values as well as
an expansion of globalized patterns of consumption. It involves an entire set of
new meanings and representations that not only permeate that part of the
population with greater purchasing power, but also creates a new lifestyle that
spreads across societies”. Social status is no longer limited to enjoying a
privileged geographical location –now it also implies a lifestyle linked to new
phenomena such as environmental awareness, the new communication
technologies and the global patterns of consumption.
This urban sprawl has prevailed in València during the last two decades, at
least as far as the amount of land consumption is concerned (+14,577
hectares). This kind of low-density urban model implies an increase in individual
mobility and in the use of private transportation –which means that not only
houses are sprawled, but also shopping and leisure centers and services. After
discontinuous urban fabric, the class that has grown the most is commercial
and industrial units (+11,375 ha), because of the expansion of shopping
centers, which is associated with the urban sprawl of houses (figure 5).
The southern Valencian coast, often called Costa Blanca in touristic contexts,
is the area which has grown the most as far as discontinuous urban fabric is
concerned. This is because hundreds of thousands of north European tourists
either live there all year round or at least spend the summer there. There are
almost 300.000 citizens from western European countries (richer than Spain)
living in València (pop. 2011). Half of them are British, 50.000 from Germany
(and other German speaking countries), 31.000 from the Benelux, almost
25.000 from Italy, 22.000 from Scandinavia, and 21.000 from France. 83% of
them all live in a small area restricted to Costa Blanca and its surroundings, in
the province of Alacant/Alicante, which is the one with the highest rate of
foreigners in all of Spain: almost one in four people living in this province have a
nationality different from the Spanish one.4
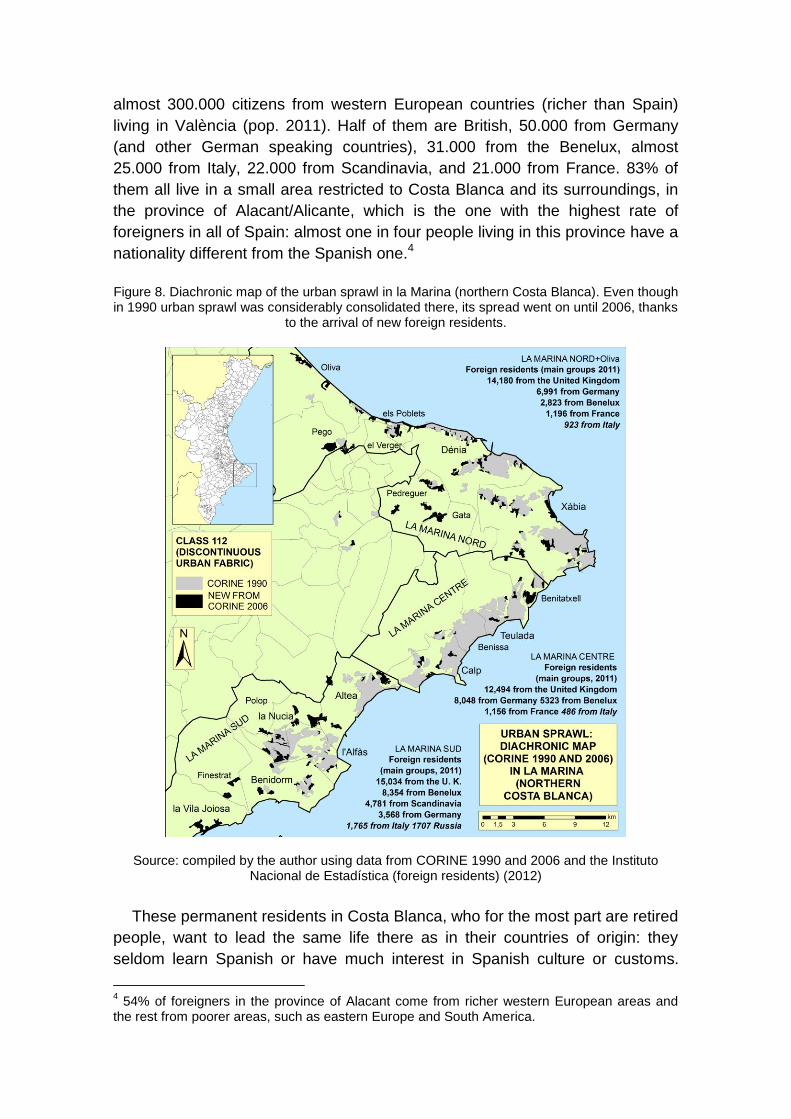
Figure 8. Diachronic map of the urban sprawl in la Marina (northern Costa Blanca). Even though in 1990 urban sprawl was considerably consolidated there, its spread went on until 2006, thanks
to the arrival of new foreign residents.
Source: compiled by the author using data from CORINE 1990 and 2006 and the Instituto
Nacional de Estadística (foreign residents) (2012)
These permanent residents in Costa Blanca, who for the most part are retired
people, want to lead the same life there as in their countries of origin: they
seldom learn Spanish or have much interest in Spanish culture or customs.
4 54% of foreigners in the province of Alacant come from richer western European areas and
the rest from poorer areas, such as eastern Europe and South America.
What lures them to the Spanish coast is the sun, the proximity of the sea and
the relaxed atmosphere of the Mediterranean, a paradise for the retired where
they can begin a new life.
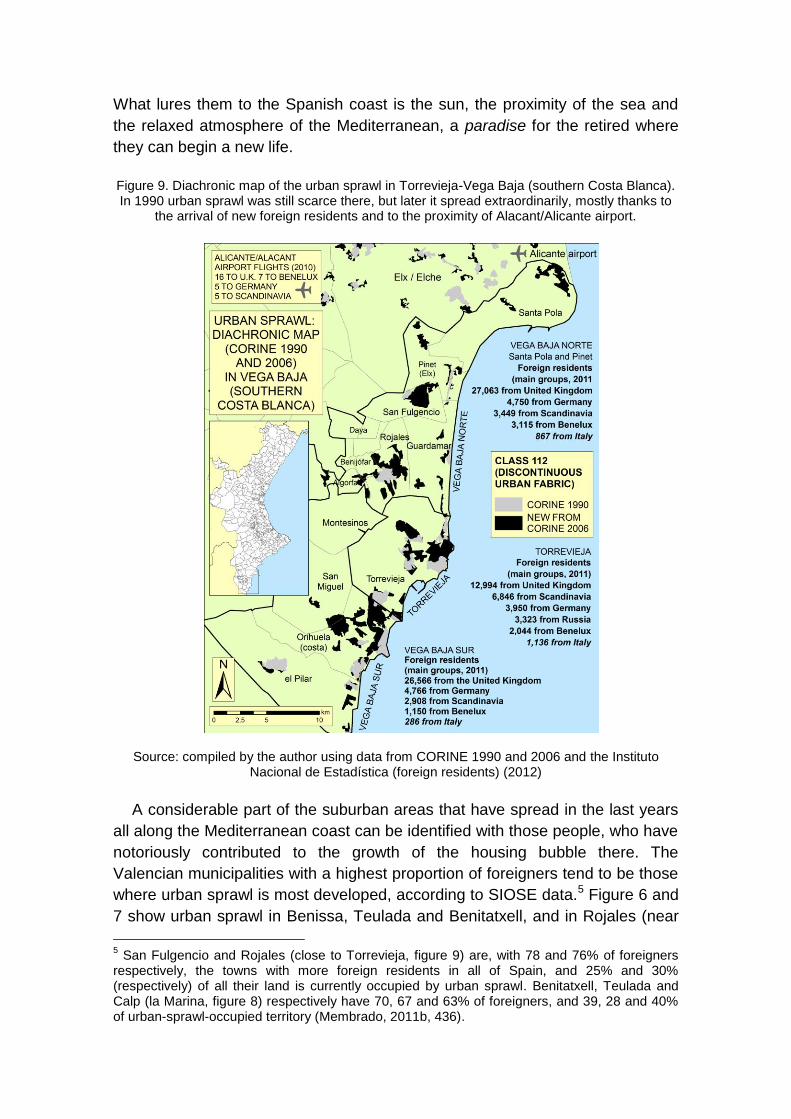
Figure 9. Diachronic map of the urban sprawl in Torrevieja-Vega Baja (southern Costa Blanca). In 1990 urban sprawl was still scarce there, but later it spread extraordinarily, mostly thanks to
the arrival of new foreign residents and to the proximity of Alacant/Alicante airport.
Source: compiled by the author using data from CORINE 1990 and 2006 and the Instituto
Nacional de Estadística (foreign residents) (2012)
A considerable part of the suburban areas that have spread in the last years
all along the Mediterranean coast can be identified with those people, who have
notoriously contributed to the growth of the housing bubble there. The
Valencian municipalities with a highest proportion of foreigners tend to be those
where urban sprawl is most developed, according to SIOSE data.5 Figure 6 and
7 show urban sprawl in Benissa, Teulada and Benitatxell, and in Rojales (near
5 San Fulgencio and Rojales (close to Torrevieja, figure 9) are, with 78 and 76% of foreigners
respectively, the towns with more foreign residents in all of Spain, and 25% and 30% (respectively) of all their land is currently occupied by urban sprawl. Benitatxell, Teulada and Calp (la Marina, figure 8) respectively have 70, 67 and 63% of foreigners, and 39, 28 and 40% of urban-sprawl-occupied territory (Membrado, 2011b, 436).
Torrevieja), both of them mostly housing retired English people. Figures 8 and 9
show the figures of foreign residents (only the main groups) coming from richer
countries than Spain in northern and southern Costa Blanca, respectively.
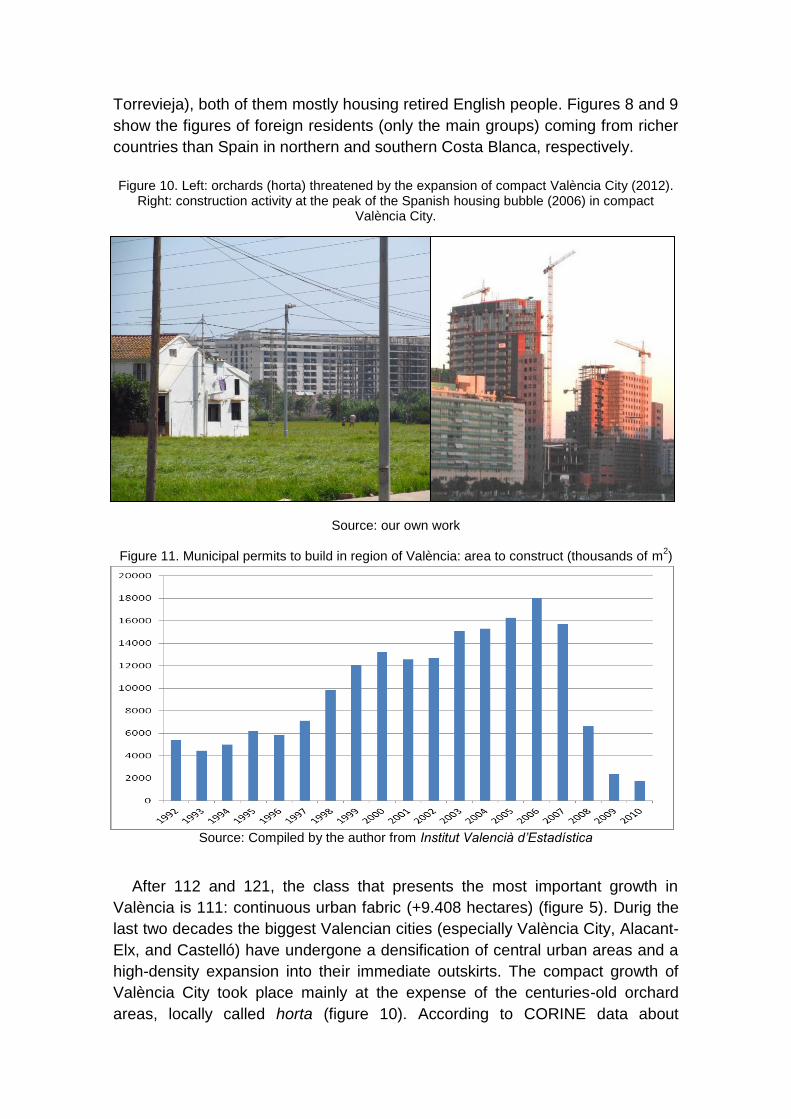
Figure 10. Left: orchards (horta) threatened by the expansion of compact València City (2012).
Right: construction activity at the peak of the Spanish housing bubble (2006) in compact València City.
Source: our own work
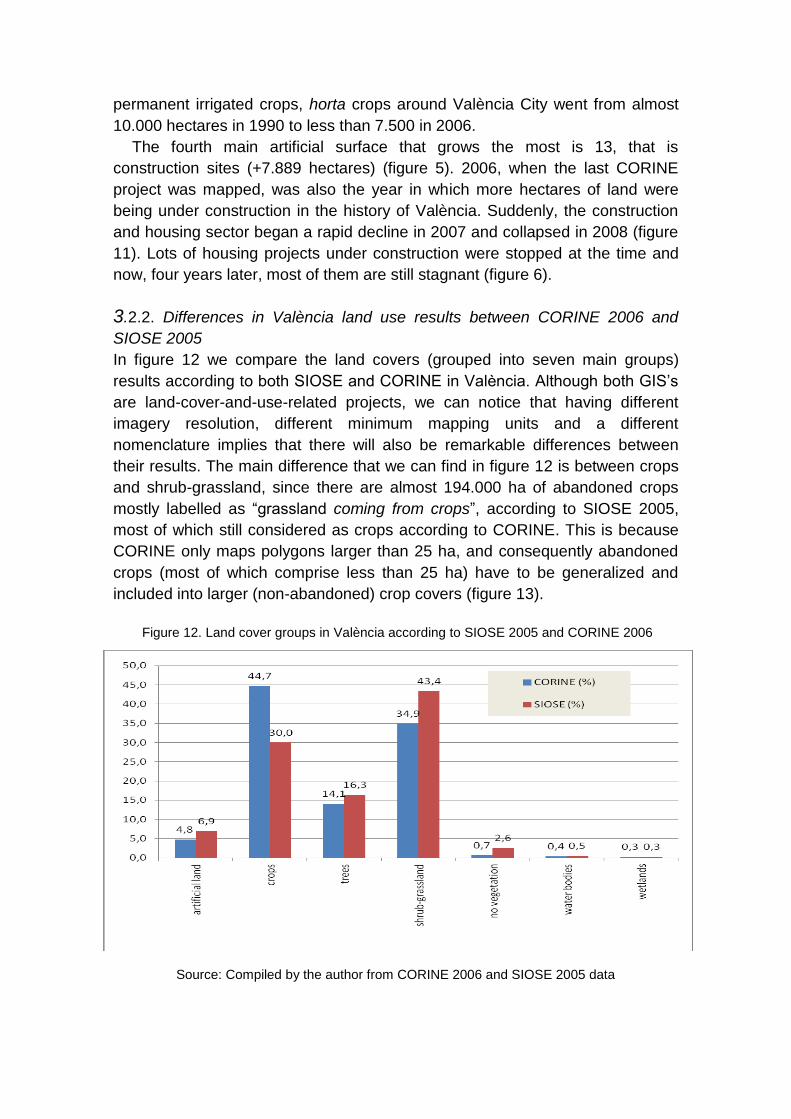
Figure 11. Municipal permits to build in region of València: area to construct (thousands of m
2)
Source: Compiled by the author from Institut Valencià d’Estadística
After 112 and 121, the class that presents the most important growth in
València is 111: continuous urban fabric (+9.408 hectares) (figure 5). Durig the
last two decades the biggest Valencian cities (especially València City, Alacant-
Elx, and Castelló) have undergone a densification of central urban areas and a
high-density expansion into their immediate outskirts. The compact growth of
València City took place mainly at the expense of the centuries-old orchard
areas, locally called horta (figure 10). According to CORINE data about
permanent irrigated crops, horta crops around València City went from almost
10.000 hectares in 1990 to less than 7.500 in 2006.
The fourth main artificial surface that grows the most is 13, that is
construction sites (+7.889 hectares) (figure 5). 2006, when the last CORINE
project was mapped, was also the year in which more hectares of land were
being under construction in the history of València. Suddenly, the construction
and housing sector began a rapid decline in 2007 and collapsed in 2008 (figure
11). Lots of housing projects under construction were stopped at the time and
now, four years later, most of them are still stagnant (figure 6).
3.2.2. Differences in València land use results between CORINE 2006 and
SIOSE 2005
In figure 12 we compare the land covers (grouped into seven main groups)
results according to both SIOSE and CORINE in València. Although both GIS’s
are land-cover-and-use-related projects, we can notice that having different
imagery resolution, different minimum mapping units and a different
nomenclature implies that there will also be remarkable differences between
their results. The main difference that we can find in figure 12 is between crops
and shrub-grassland, since there are almost 194.000 ha of abandoned crops
mostly labelled as “grassland coming from crops”, according to SIOSE 2005,
most of which still considered as crops according to CORINE. This is because
CORINE only maps polygons larger than 25 ha, and consequently abandoned
crops (most of which comprise less than 25 ha) have to be generalized and
included into larger (non-abandoned) crop covers (figure 13).
Figure 12. Land cover groups in València according to SIOSE 2005 and CORINE 2006
Source: Compiled by the author from CORINE 2006 and SIOSE 2005 data
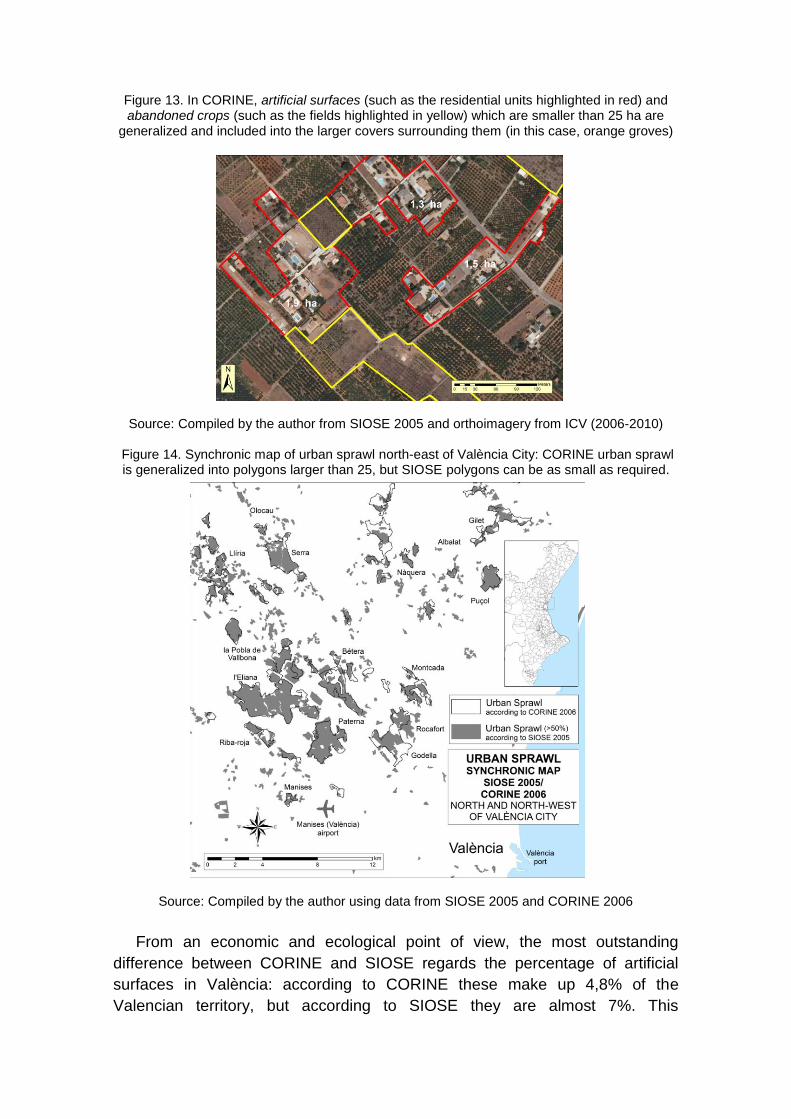
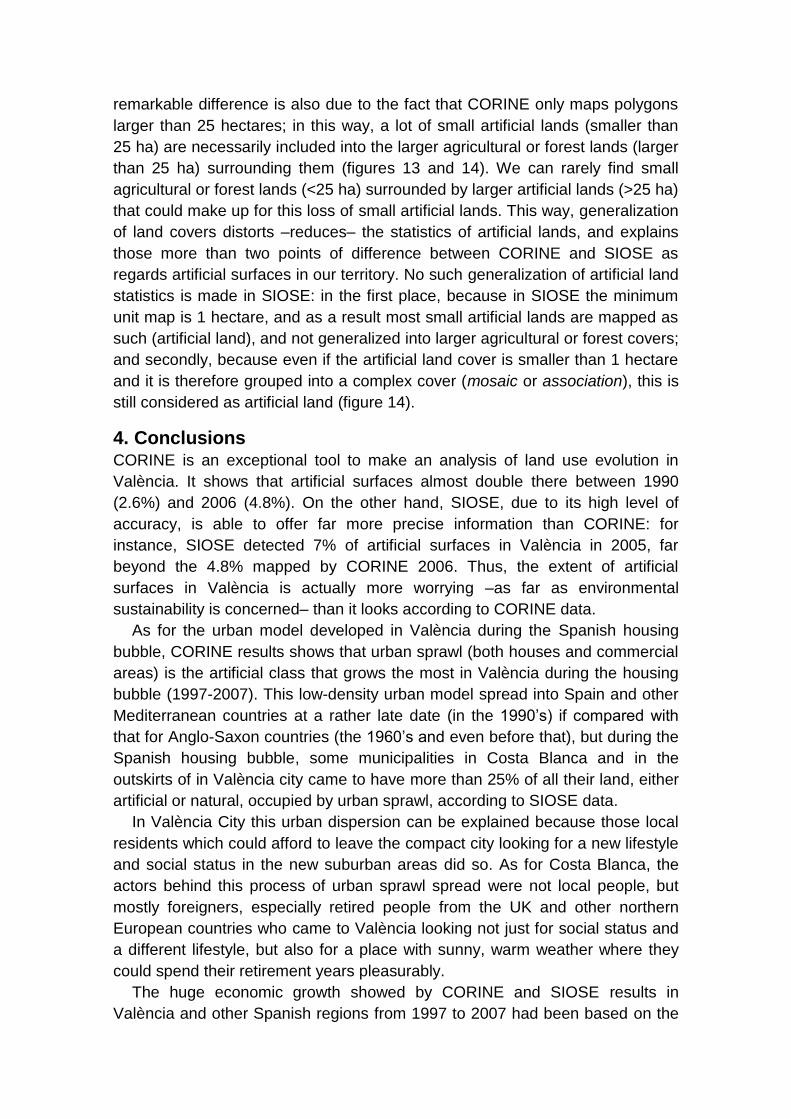
Figure 13. In CORINE, artificial surfaces (such as the residential units highlighted in red) and abandoned crops (such as the fields highlighted in yellow) which are smaller than 25 ha are
generalized and included into the larger covers surrounding them (in this case, orange groves)
Source: Compiled by the author from SIOSE 2005 and orthoimagery from ICV (2006-2010)
Figure 14. Synchronic map of urban sprawl north-east of València City: CORINE urban sprawl is generalized into polygons larger than 25, but SIOSE polygons can be as small as required.
Source: Compiled by the author using data from SIOSE 2005 and CORINE 2006
From an economic and ecological point of view, the most outstanding
difference between CORINE and SIOSE regards the percentage of artificial
surfaces in València: according to CORINE these make up 4,8% of the
Valencian territory, but according to SIOSE they are almost 7%. This
remarkable difference is also due to the fact that CORINE only maps polygons
larger than 25 hectares; in this way, a lot of small artificial lands (smaller than
25 ha) are necessarily included into the larger agricultural or forest lands (larger
than 25 ha) surrounding them (figures 13 and 14). We can rarely find small
agricultural or forest lands (<25 ha) surrounded by larger artificial lands (>25 ha)
that could make up for this loss of small artificial lands. This way, generalization
of land covers distorts –reduces– the statistics of artificial lands, and explains
those more than two points of difference between CORINE and SIOSE as
regards artificial surfaces in our territory. No such generalization of artificial land
statistics is made in SIOSE: in the first place, because in SIOSE the minimum
unit map is 1 hectare, and as a result most small artificial lands are mapped as
such (artificial land), and not generalized into larger agricultural or forest covers;
and secondly, because even if the artificial land cover is smaller than 1 hectare
and it is therefore grouped into a complex cover (mosaic or association), this is
still considered as artificial land (figure 14).
4. Conclusions
CORINE is an exceptional tool to make an analysis of land use evolution in
València. It shows that artificial surfaces almost double there between 1990
(2.6%) and 2006 (4.8%). On the other hand, SIOSE, due to its high level of
accuracy, is able to offer far more precise information than CORINE: for
instance, SIOSE detected 7% of artificial surfaces in València in 2005, far
beyond the 4.8% mapped by CORINE 2006. Thus, the extent of artificial
surfaces in València is actually more worrying –as far as environmental
sustainability is concerned– than it looks according to CORINE data.
As for the urban model developed in València during the Spanish housing
bubble, CORINE results shows that urban sprawl (both houses and commercial
areas) is the artificial class that grows the most in València during the housing
bubble (1997-2007). This low-density urban model spread into Spain and other
Mediterranean countries at a rather late date (in the 1990’s) if compared with
that for Anglo-Saxon countries (the 1960’s and even before that), but during the
Spanish housing bubble, some municipalities in Costa Blanca and in the
outskirts of in València city came to have more than 25% of all their land, either
artificial or natural, occupied by urban sprawl, according to SIOSE data.
In València City this urban dispersion can be explained because those local
residents which could afford to leave the compact city looking for a new lifestyle
and social status in the new suburban areas did so. As for Costa Blanca, the
actors behind this process of urban sprawl spread were not local people, but
mostly foreigners, especially retired people from the UK and other northern
European countries who came to València looking not just for social status and
a different lifestyle, but also for a place with sunny, warm weather where they
could spend their retirement years pleasurably.
The huge economic growth showed by CORINE and SIOSE results in
València and other Spanish regions from 1997 to 2007 had been based on the
rise of the construction sector, a phenomenon linked to urban sprawl –
especially in coastal Mediterranean areas. Thus employment in Spain grew and
absorbed both Spanish and migrant labor, even though no less than 5 million
foreign migrants arrived in Spain between 1997 and 2008. In 2006 the number
of houses started in Spain reached more than the sum of those started in Italy,
the United Kingdom and Germany in that year. Suddenly, when the international
financial crisis erupted in 2007, the Spanish bubble collapsed. Three years
later, the level of construction in Spain was the lowest since 1963 and the
unemployment went from 8%, at the beginning of 2007, to 25% at the end of
2012. The decline of the construction sector that started in 2008 and led to the
current economic crisis can, on the other hand, be regarded as an opportunity
to rethink València’s urban model –as urban sprawl is widely considered as
undesirable for many reasons– and make it more environmentally sustainable,
after several decades of land misuse.
5. References
ARTIGUES, A. and O. RULLAN (2007), Nuevo modelo de producción residencial y territorio urbano disperso (Mallorca, 1998-2006), “Scripta Nova”, XI, 245 (10), Universitat de Barcelona: http://www.ub.es/geocrit/sn/sn-24510.htm <retrieved Nov. 2012>
BOIRA, J. V. (2012), Valencia, la tormenta perfecta, RBA, Barcelona, p. 220. BURRIEL, E. L. (2008), La década prodigiosa del urbanismo español (1997-2006),
“Scripta Nova”, XII, 270 (64), Universitat de Barcelona: http://www.ub.es/geocrit/sn/sn-270/sn-270-64.htm <retrieved Nov. 2012>
EMF (EUROPEAN MORTGAGE FEDERATION) (2007 and 2010), Hypostat 2006 and Hypostat 2009: a review of Europe’s mortgage and housing markets, EMF: http://www.hypo.org/Objects/6/Files/Hypostat%202008%20-%20light%20version.pdf <retrieved Nov. 2012>
GILLHAM, O. (2002), The Limitless City: a Primer on the Urban Sprawl Debate, Island Press, Washington DC, p. 309.
HOGAN, D.J. and R. OJIMA (2008), Urban sprawl: A challenge for sustainability, in G. MARTINE, G. MCGRANAHAN, M. MONTGOMERY and R. FERNÁNDEZ-CASTILLA (EDS.): “The new global frontier. Urbanization, poverty and environment in the 21th century”, Earthscan ed., London, pp. 203-216.
ICV (INSTITUT CARTOGRÀFIC VALENCIÀ) (2006-2010), PNOA (Plan Nacional de Ortofotografía Aérea) orthoimagery, València: http://terrasit.gva.es/val/ <retrieved Nov. 2012>
IGEO (INSTITUTO GEOGRÁFICO PORTUGUÊS) (2009), CORINE Land Cover 2006
for Continental Portugal, Lisbon: http://www.igeo.pt/gdr/pdf/CLC2006_nomenclature_en.pdf <retrieved Nov. 2012>
IGN (2006), SIOSE. Manual de fotointerpretación, Madrid, Ministerio de Fomento:http://www.ign.es/siose/Documentacion/Guia_Tecnica_SIOSE/070322_Manual_Fotointerpretacion_SIOSE_v1_2.pdf <retrieved Nov. 2012>
IGN, (2009), Plan Nacional de Ortofotografía Aérea, Madrid, Ministerio de Fomento http://www.ign.es/ign/layoutIn/actividadesFotoTelePNOA.do <retrieved Nov. 2012>
INE (INSTITUTO NACIONAL DE ESTADÍSTICA) (2012), Explotación Estadística del Padrón (Población por sexo, municipios y nacionalidad), Madrid: http://www.ine.es/jaxi/menu.do?type=pcaxis&path=%2Ft20%2Fe245&file=inebase&L=0 <retrieved Nov. 2012>
IVE (INSTITUT VALENCIÀ D’ESTADÍSTICA) (2012), Banco de Datos Territorial. Estadística de construcción de edificios. Licencias municipales de obra: superficie a construir de nueva planta, València: http://www.ive.es/portal/page/portal/IVE_PEGV/CONTENTS/temas/Cas/aecv00185.html<retrieved Nov. 2012>
LÓPEZ, M. J. and B. J. DENORE (1999), Los satélites de observación de la tierra en el 2000, “Cuadernos de Geografía”, 65-66, Universitat de València, pp. 81-102.
MEMBRADO, J. C. (2005), Grandi trasformazioni urbane nelle città valenzane (1991-2004). Studio secondo i dati del Corine Land Cover, “Giornate Programma Centurio UE”, Reggio Calabria.
MEMBRADO, J. C. (2011a), SIOSE Valencia 2005: resultados, aplicaciones y comparación con CORINE, “Cuadernos de Geografía”, 89, Universitat de València, pp. 1-22.
MEMBRADO, J. C. (2011b), Cartografía del urbanismo expansivo valenciano según SIOSE, proceedings of “XXII Congreso de la Asociación de Geógrafos Españoles”, Asociación de Geógrafos Españoles, Alacant/Alicante, pp. 427-438.
MEMBRADO, J. C. (2012), Results and Comparison between CORINE and SIOSE in the Land of València (Spain) (session about Land Use and Land Cover Change - Global Change), “32nd International Geographical Congress”, Cologne.
MUÑOZ, F. (2003), Lock Living: Urban Sprawl in Mediterranean Cities, “Cities, International Journal of Urban Policy and Planning”, issue 6, vol. 20, Elsevier Science, Oxford, pp. 381-385.
PUMAIN, D. (2004), Urban Sprawl: Is there a French case?, “Urban Sprawl in Western Europe and the United States”, Ashgate, Aldershot (England), pp. 137-157.
RICHARDSON, H. W. AND C. B. CHANG-HEE (EDS.) (2004), Urban Sprawl in Western Europe and the United States, Ashgate, Bodmin, UK.
ROCA, J., M. C. BURNS, AND J. M. CARRERAS (2004), Monitoring Urban Sprawl around Barcelona’s Metropolitan Area with the Aid of Satellite Imagery, “20th ISPRS Congress”, Istanbul.
RULLÁN, O. (1999), La nueva Ley del Suelo de 1998 en el contexto del neo-liberalismo postmoderno, “Investigaciones Geográficas”, 22, Alacant, pp. 5-21.