kuscer cer trans 24092012
TRANSCRIPT
PIEZOELECTRIC THICK-FILM STRUCTURES FOR HIGH-
FREQUENCY APPLICATIONS PREPARED BY
ELECTROPHORETIC DEPOSITION
Journal: MS&T 2012 Ceramic Transactions
Manuscript ID: Draft
Symposium: Solution-Based Processing for Ceramic Materials
Date Submitted by the Author: n/a
Complete List of Authors: Kuscer, Danjela; Jozef Stefan Institute, CO NAMASTE,
1
PIEZOELECTRIC THICK-FILM STRUCTURES FOR HIGH-FREQUENCY APPLICATIONS
PREPARED BY ELECTROPHORETIC DEPOSITION
Danjela Kuscer1,2
, Andre-Pierre Abelard1,3
, Marija Kosec1,2
, Franck Levassort3
1Jožef Stefan Institute, Ljubljana, Slovenia
2Centre of Excellence NAMASTE, Ljubljana, Slovenia
3 Université François Rabelais, GREMAN CNRS 7347, Tours, France
ABSTRACT
We have studied the processing of thick films based on lead-zirconuim-titanate (PZT) by
electrophoretic deposition (EPD) for high-frequency ultrasound transducer applications. The
PZT powder prepared by a conventional solid-state synthesis was dispersed in ethanol using a
polyacrylic acid. The negatively charged PZT particles were deposited on a Au/Al2O3 substrate
at a constant current density of 1.56 mA/cm2. To prevent any crack formation in the PZT layer
during the drying, some polyvinyl butyral (PVB) was added to the suspension. The PVB did not
significantly influence zeta-potential of the particles and the conductivity of the suspension, but
it decreased the mobility of the particles by increasing the viscosity of the suspension. The PZT
thick films were sintered at 950oC for 2 h in the presence of a PbO-rich liquid phase. After the
sintering the thick films were homogeneous, without any cracks, and had a density of between 80
and 85 % of the theoretical value. The thickensses of the sintered PZT thick films varied from 15
to 38 µm and depended on the deposition conditions,i.e., on the deposition time and on the
properties of the suspension, namely the viscosity, the conductivity of the suspension and the
zeta-potential of the particles. The PZT thick films were then electromechanically characterised.
The resonant frequencies of the transducer, which are defined by the thicknesses of the
piezoelectric layers, were 75 MHz and 36 MHz for PZT layers with thickensses of 15 and 38 µm,
respectively. All the sintered PZT thick films had a high coupling factor of around 50 %. The
results indicate that piezoelectric PZT thick films with a tailored thickness and density can be
prepared using theelectrophoretic deposition process and that these PZT thick films can be used
for the fabrication of transducers operating at high-frequencies.
INTRODUCTION
Ultrasonic systems are frequently used in medicine for imaging and therapy because of
their relatively low costs and the non-ionizing character of the ultrasound. A system operating at
high frequency enables non-destructive investigations of the skin, the eyes and blood vessels, as
well as the imaging of small animals1. The performance of the system is determined by the
characteristics of the transducer, i.e., the electrical input impedance, the electroacoustic response
and the radiation pattern2. A single-element transducer consists of a piezoelectric element
positioned between two electrodes. The thickness of the piezoelectric layer defines the resonant
frequency of the transducer because the thickness represents half the wavelength of the
ultrasound wave. In addition to the piezoelectric layer, the backing, matching layer and lenses
are needed to dampen the resonance, improve the sensitivity and the axial resolution of the
transducer and to focus the acoustic beam, respectively1,2
.
For piezoelectric transducer applications the most frequently used piezoelectric material
is based on lead-zirconium titanate, a solid solution of PbZrO3 and PbTiO3. The piezoelectric and
ferroelectric properties of the solid solution are tailored by varying the Zr/Ti ratio in the
Pb(Zr,Ti)O3 perovskite structure. The composition at the morphotropic phase boundary
Pb(Zr0.53Ti0.47)O3, which is denoted PZT, is characterized by a high dielectric constant at room
temperature, i.e.,1500, and a high coupling factor of around 50 %. The values of the dielectric
Page 1 of 11
2
constant and the coupling factors are required to be high for a piezoelectric transducer. In
addition, the piezoelectric material should have a low acoustical impedance. For dense PZT it is
around 30 MRa; however, it is significantly lowered when the material consists a certain amount
of pores3.
PZT is processed by solid-state synthesis from its constituent oxides. In the first step TiO2
and PbO form PbTiO3 at 500 °C. Than, upon heating the ZrO2 and PbO2 react with the PbTiO3,
forming thermodynamically favourable Zr-rich solid solutions4,5
. In the final step these solid
solutions react with PbTiO3 and form the Pb(Zr,Ti)O3 solid solution. Fine-grained powders, high
processing temperatures and long sintering times are used to avoid the presence of any
intermediate products in the final PZT. However, the high processing temperature causes PbO-
losses and consequently a change in the PZT's stoichiometry 6.
For high-frequency ultrasound transducer applications bulk PZT ceramic are not
frequently used, because the ceramic must be cut and polished to specified dimensions. The final
step is the assembling of a layer of ceramic, a few tens of micrometres thick, with the other
components. This imposes limits on the minimum dimensions of the manufactured parts and it
constrains the geometry of the parts to simple shapes, like discs, plates, rings, cylinders, etc. A
more frequently used approach is thick-film technology, where a layer is built on the substrate.
This technology enables the direct integration of layers onto the substrates and therefore
eliminates the difficulties associated with handling thin, bulk ceramics 7.
In order of geometrically focus of the ultrasound wave, the thick-film piezoelectric layer
must be patterned on a non-flat substrate. Electrophoretic deposition (EPD) is a method that
enables the deposition of charged particles in a conductive, complex-shaped substrate when
applying a DC electric field8 . The method makes possible the control of the thickness and
morphology of the as-deposited layer by varying the deposition conditions, such as the
deposition time and the electrical field. For this reason we found the method to be attractive for
processing ultrasound transducers9.
In order to be able to process the thick films by EPD a stable suspension with well
dispersed, charged particles is required. The anionic polyelectrolyte polyacrylic acid (PAA)
dissociated in ethanol in the presence of the organic base n-butlyamine is used for charging
Al2O3 10
as well as the PZT particles 9
in ethanol. The challenge is in the drying and sintering of
the as-deposited layer, since the layer may crack spontaneously during the drying after a critical
thickness 11
. During the sintering the as-deposited layer is in constrained conditions12
. It shrinks
due to the driving force for sintering, but it is clamped on the rigid substrate and as a
consequence the stresses are created in the layer . The stresses are relaxed via the formation of
cracks that are highly undesirable in piezoelectric thick films.
The aim of this study was to process a piezoelectric PZT thick film on a flat electroded
alumina substrate using EPD. The layers with a targeted thickness of around 30 µm and a density
of around 80 % of the theoretical value were characterized and assesses for high-frequency-
transducer applications.
EXPERIMENTAL
The Pb(Zr0.53Ti0.47)O3 (denoted PZT) powder was synthesized from PbO (99.9 %,
Aldrich, Germany), ZrO2 (99 %, Tosoh, Japan) and TiO2 (99.8 %, Alfa Aesar, Germany) by
solid state synthesis. The oxides were mixed in a molar ratio corresponding to a stoichiometry of
PbZr0.53Ti0.47O3.They were homogenized in a planetary mill for 2 hours. After drying, the
mixture was calcined at 950 °C for 2 hours, re-milled and re-calcined at 1100oC for 1 h. After a
second calcination the powder was milled for 8 hours in an attritor mill and dried.
Page 2 of 11
3
The electrophoretic deposition experiments were performed using ethanol-based
suspensions containing 1 vol. % of PZT powder that were prepared as follows. Polyacrylic acid
(PAA) from Alfa Aesar (50 wt. % of PAA in water, molar mass 2000) was mixed with n-
butylamine (BA) from Alfa Aesar. The amount of PAA is given as a mol of PAA per mass of
PZT powder, i.e., µmol/g. The PAA/BA molar ratio was 1/2.5. Into the PAA and BA mixture we
added ethanol (Carlo Erba) and PZT powder. The suspension was homogenised in a ZrO2
planetary mill at 150 rpm for 1 h. An identical procedure was used for processing the PbO
suspension. The PZT and PbO suspensions were mixed in a stoichiometry corresponding to 98
mol. % of PZT and 2 mol. % of PbO. The suspension is denoted as PZT PbO.
In some cases polyvinyl butyral (PVB, Aldrich, molar mass 50 000-80 000) was added to
the suspension. A total of 3 wt. % of PVB was added to the PZT PbO ethanol-based suspension
and mixed with a magnetic stirrer for 8 hours. The suspension is denoted as PZT PbO PVB.
A standard electrophoretic deposition setup was employed. The vertically aligned
electrodes were separated by a distance of 17 mm. Two identical Al2O3 square-plates (Kyocera,
99.9 %) with a thickness of 0.5 mm and a length of 12.5 mm, covered on one side by gold
electrodes (ESL 8884-G), were used as the working and counter electrodes. The area of the
electrode was 0.64 cm2. The deposition process was performed at a constant current density of
1.56 mA/cm2, provided by a Keithley 2400 source meter. The experiments were conducted at
ambient temperature and without any mechanical stirring. The deposition times were 60, 80 and
90 seconds. After the deposition the samples were placed in an ethanol-rich atmosphere and
dried at ambient temperature.
The particle size and the particle-size distribution were determined using a static light-
scattering particle-size analyser (Microtrac S3500, USA). The zeta-potential of the particles was
measured in diluted ethanol dispersions using a zeta-potential analyser ZetaPALS (Brookhaven
Instruments Corporation, USA). The viscosity of the suspensions was determined at 25°C for
shear rates between 10 and 100 s-1
after an equilibration period of 30 s with a CC 27 cylindrical
system using a Physica MCR 301 rheometer (Anton Parr, Austria). The conductivity of the
suspensions was measured using an InoLab Cond 730 (WTW, Germany).The sintered thick films
were investigated with a scanning electron microscope (JEOL 5800, Tokyo, Japan). The density
of the sintered thick film was obtained by a quantitative characterization of the ceramic
microstructure. This characterization was obtained from SEM images turned into a binary image
computerized in image-analysis software (ImageTools 3.0, University of Texas Health Science
Center, San Antonio, USA) to determine the quantity of pores13.
The dielectric, mechanical and piezoelectric parameters were deduced by measuring the
complex electrical impedance around the fundamental thickness mode of the resonance. The
experimental set-up was composed of an HP 4395 vector analyser and its impedance test kit. To
simulate the theoretical behaviour of the electrical impedance of the samples as a function of
frequency for the thickness mode, an equivalent electrical circuit model was used. The KLM
scheme was retained14
. From the complex electrical impedance and the fitting process, the
thickness-mode parameters of the EPD piezoelectric thick films were deduced. The structure of
the samples is composed of three inert layers (two golds electrodes and an alumina substrate) and
one piezoelectric layer (PZT thick film)15
. The parameters of those layers are fed into the KLM
model and considered to be constant. The parameters values of the inert layers16,17
are given in
Table I.
Page 3 of 11
4
Table I: Material properties of the inert layers of the thick-film structure
Layer Material thickness (µm) vL(m/s) ρ (kg/m3) Z (MRa)
Front electrode Gold 0.2 3240 19700 63.8
Bottom electrode Gold 10 3240 19700 63.8
Substrate Alumina 640 3900 10500 41 VL: longitudinal wave velocity; ρ: density; Z: acoustic impedance
With the KLM model, five parameters were deduced (i.e., the effective thickness-mode
coupling factor kt, the longitudinal wave velocity vL, the dielectric constant at constant strain
ε33S, and the loss factor (mechanical δm and dielectric δe). On this basis and from additional
measurements of the density and the thickness of the piezoelectric thick film, the acoustical
impedance (Z) and the resonant frequency of the thick film (f0) in free mechanical resonance
conditions were deduced. The accuracy of this characterization method for a multilayer structure
was discussed in earlier work18,19
.
RESULTS AND DISCUSSION
Properties of PZT PbO and PZT PbO PVB suspensions
The PZT and PbO ethanol-based suspensions were stable and no sedimentation of the
particles was observed after two hours. The zeta-potential of the PZT particles in the ethanol was
50 ± 5 mV. The conductivity of the PZT suspension was 24 µS/cm at 25°C. The zeta-potential of
the PbO particles in the ethanol was 40 ± 5 mV and the conductivity of the suspension was 12
µS/cm at 25°C. The PZT PbO suspension exhibited well-dispersed particles, and also in this case
we did not observe any sedimentation after two hours. The zeta-potential of the particles was -50
± 7 mV. The conductivity of the PZT-PbO suspension was 20 µS/cm at 25°C. After the addition
of 3 wt. % of PVB to the PZT PbO suspension the zeta- potential of the particles did not change
significantly; it was -47 ± 7 mV. The conductivity of the PZT-PbO-PVB suspension was 22
µS/cm at 25°C.
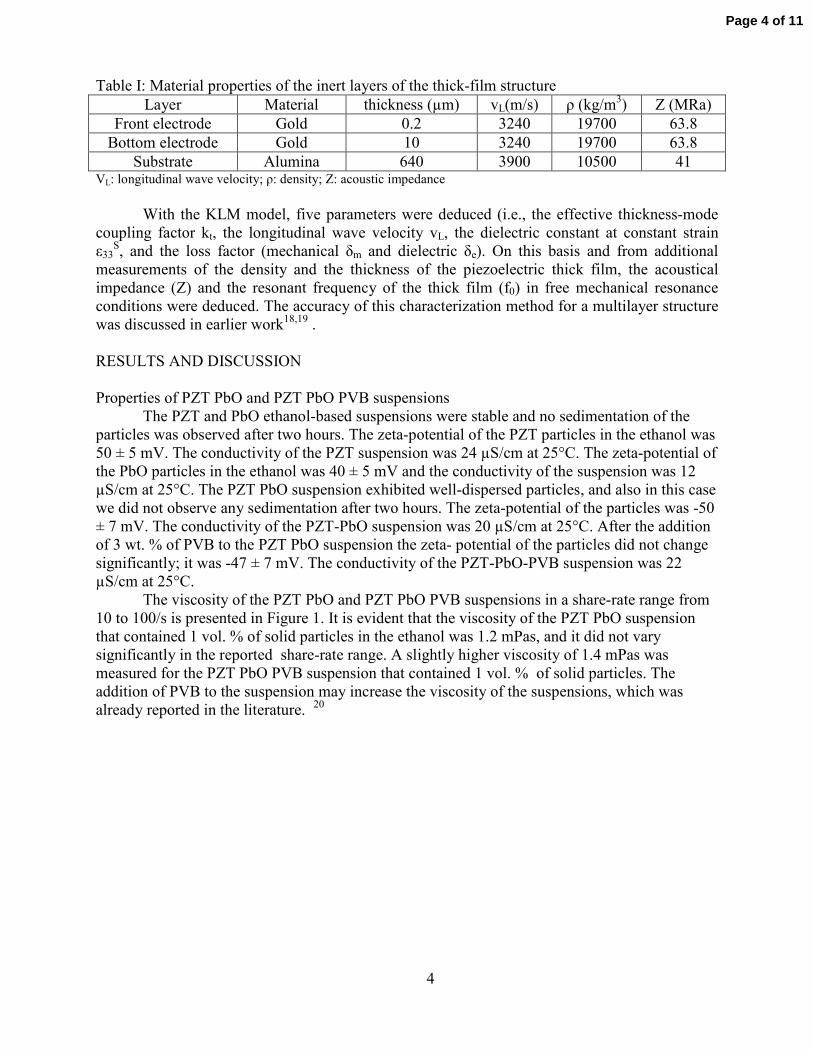
The viscosity of the PZT PbO and PZT PbO PVB suspensions in a share-rate range from
10 to 100/s is presented in Figure 1. It is evident that the viscosity of the PZT PbO suspension
that contained 1 vol. % of solid particles in the ethanol was 1.2 mPas, and it did not vary
significantly in the reported share-rate range. A slightly higher viscosity of 1.4 mPas was
measured for the PZT PbO PVB suspension that contained 1 vol. % of solid particles. The
addition of PVB to the suspension may increase the viscosity of the suspensions, which was
already reported in the literature. 20
Page 4 of 11
5
0 20 40 60 80 1000.0
0.5
1.0
1.5
2.0
2.5
3.0
PZT PbO PVB
Vis
cosity [m
Pa·s
]
Shear Rate [1/s]
PZT PbO
Figure 1: The viscosity of the PZT PbO and PZT PbO PVB suspensions, both containing 1 vol %
of solid particles, as a function of the share rate in the share-rate range 10 to 100/s.
We have measured the mass of the deposit obtained from the PZT PbO and PZT PbO
PVB suspensions for different deposition times. Masses of 9 mg, 12.1 mg and 14.4 mg were
obtained from the PZT PbO suspension after 60, 80 and 90 seconds. Masses of 7.5 mg, 11.2 mg
and 12.2 mg were obtained from the PZT PbO PVB suspension after 60, 80 and 90 seconds. The
mass of the deposit increased with the increasing deposition time. It is evident that the mass
obtained from the PZT PbO suspension was slightly higher than the one obtained from the PZT
PbO PVB suspension. This phenomenon may originate from the mobility of the particles. The
mobility of the particles during the electrophoretic deposition process depends on many
parameters, including the viscosity of the suspension8. A higher viscosity of the suspension
results in a lower mobility of the particles. In the PZT PbO and PZT PbO PVB suspensions the
zeta-potential of the particles and the conductivity of the suspensions were similar, and therefore
we consider that the lower deposition mass in the case of the PZT PbO PVB suspension was the
result of the higher viscosity of this suspension.
The layers deposited for 60, 80 and 90 seconds were crack-free after drying. However,
when a longer deposition time was used some cracks appeared. This was particularly evident in
the deposits from the PZT PbO suspension. The addition of the PVB significantly reduced the
formation of cracks in the as-deposited and dried layers.
PZT thick films on flat alumina substrates
The dried deposits obtained from the PZT PbO and PZT PbO PVB suspensions after the
depositions for 60, 80 and 90 seconds were sintered at 950°C for 2 hours in a PbO-rich
atmosphere. The samples deposited from the PZT PbO suspensions for 60, 80 and 90 seconds are
denoted PZT PbO_60, PZT_80 and PZT PbO_90, respectively. The samples deposited from the
PZT PbO PVB suspensions for 60, 80 and 90 seconds are denoted, respectively, PZT PbO
PVB_60, PZT PbO PVB_80 and PZT PbO PVB_90. The microstructures of the samples from
the PZT PbO and PZT PbO PVB suspensions are shown in Figure 2 and Figure 3, respectively.
Page 5 of 11
6
a) b)
c)
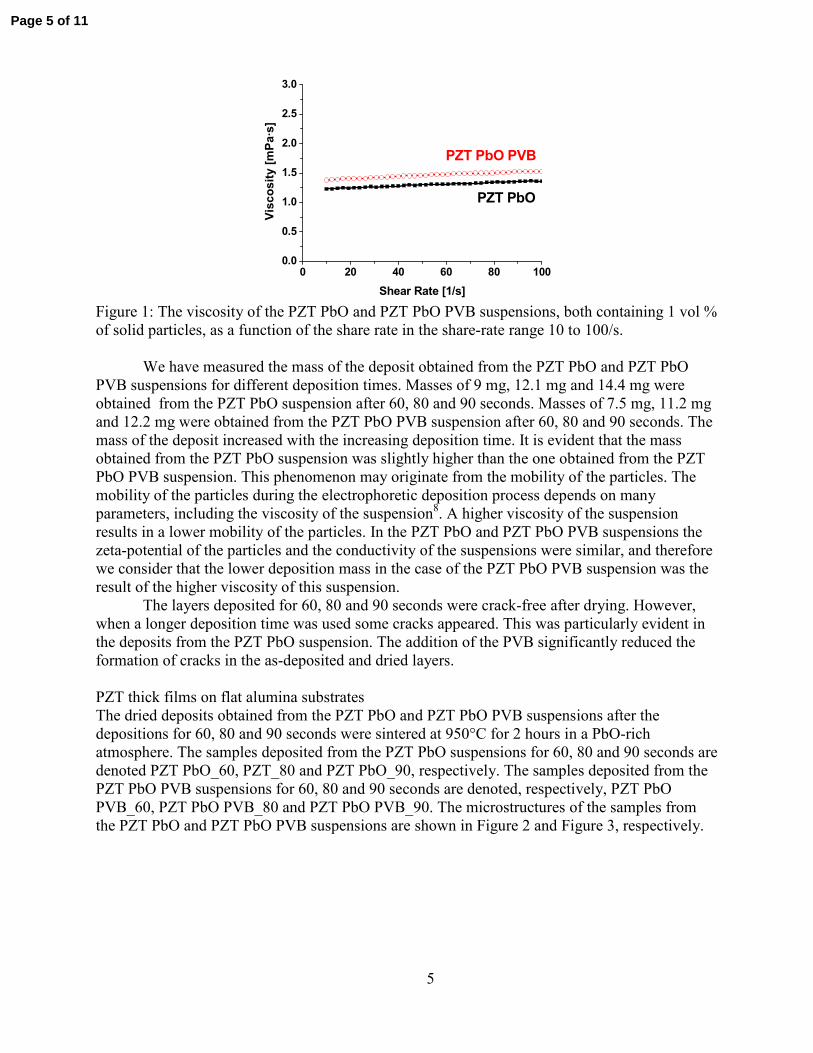
Figure 2: Cross-section SEM image of the deposits obtained from the PZT PbO suspension
sintered at 950oC for 2 hours. The samples were deposited at various deposition times. a) PZT
PbO_60; b) PZT PbO_80; c) PZT PbO_90.
a) b)
Page 6 of 11
7
c)
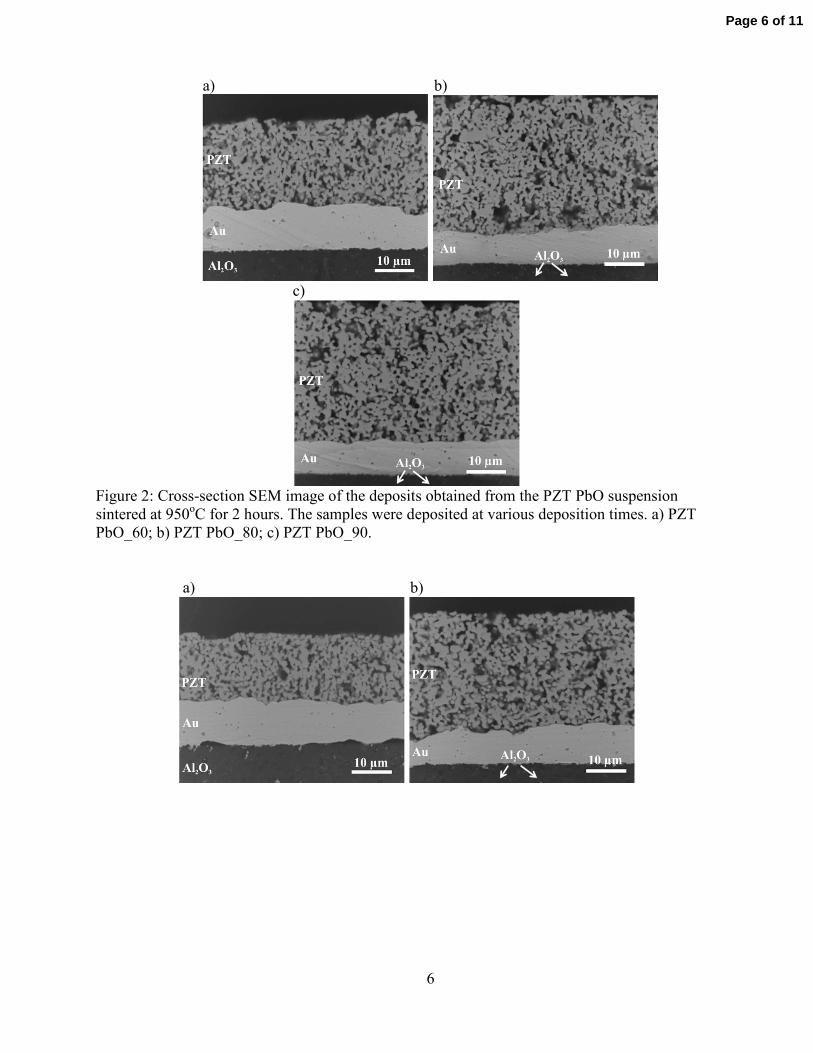
Figure 3: Cross-section SEM image of the deposits obtained from the PZT PbO PVB suspension
sintered at 950oC for 2 hours. The samples were deposited at various deposition times. a) PZT
PbO PVB_60; b) PZT PbO PVB_80; c) PZT PbO PVB_90
From the images it is evident that the PZT thick films are relatively homogeneous and
consist of one- to two- micrometer-sized PZT grains. The PZT layer is well adhered to the
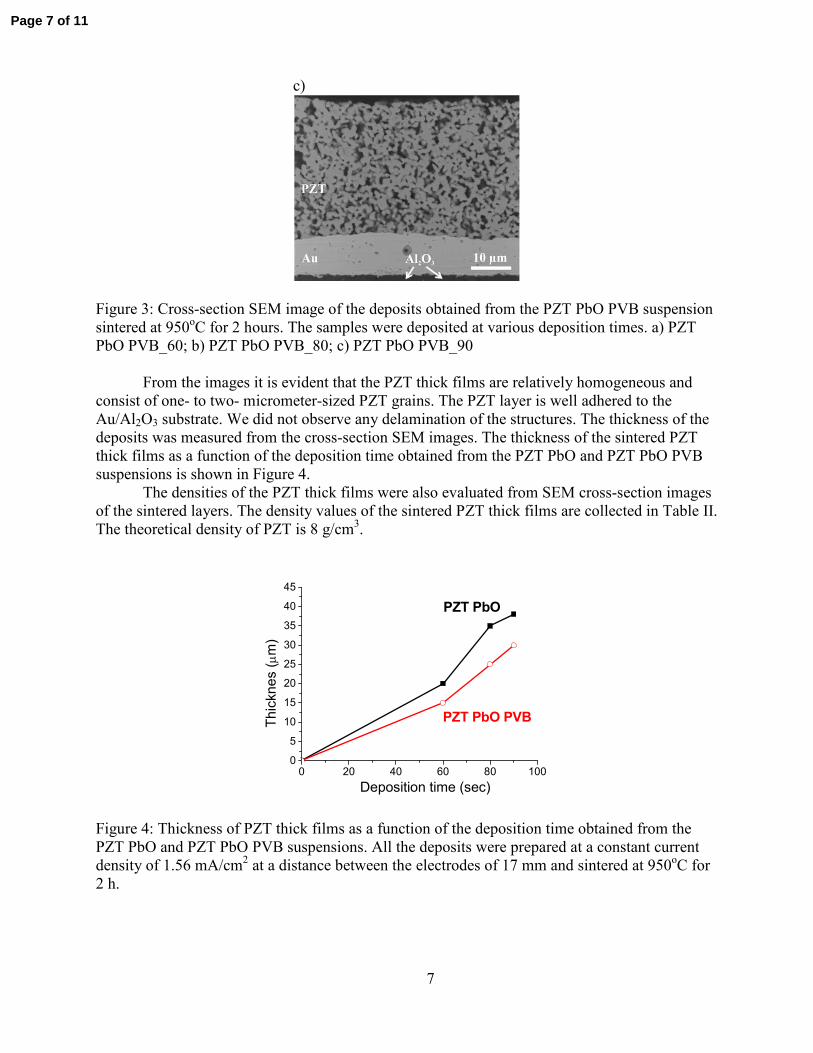
Au/Al2O3 substrate. We did not observe any delamination of the structures. The thickness of the
deposits was measured from the cross-section SEM images. The thickness of the sintered PZT
thick films as a function of the deposition time obtained from the PZT PbO and PZT PbO PVB
suspensions is shown in Figure 4.
The densities of the PZT thick films were also evaluated from SEM cross-section images
of the sintered layers. The density values of the sintered PZT thick films are collected in Table II.
The theoretical density of PZT is 8 g/cm3.
0 20 40 60 80 1000
5
10
15
20
25
30
35
40
45
PZT PbO PVBThicknes (µm)
Deposition time (sec)
PZT PbO
Figure 4: Thickness of PZT thick films as a function of the deposition time obtained from the
PZT PbO and PZT PbO PVB suspensions. All the deposits were prepared at a constant current
density of 1.56 mA/cm2 at a distance between the electrodes of 17 mm and sintered at 950
oC for
2 h.
Page 7 of 11
8
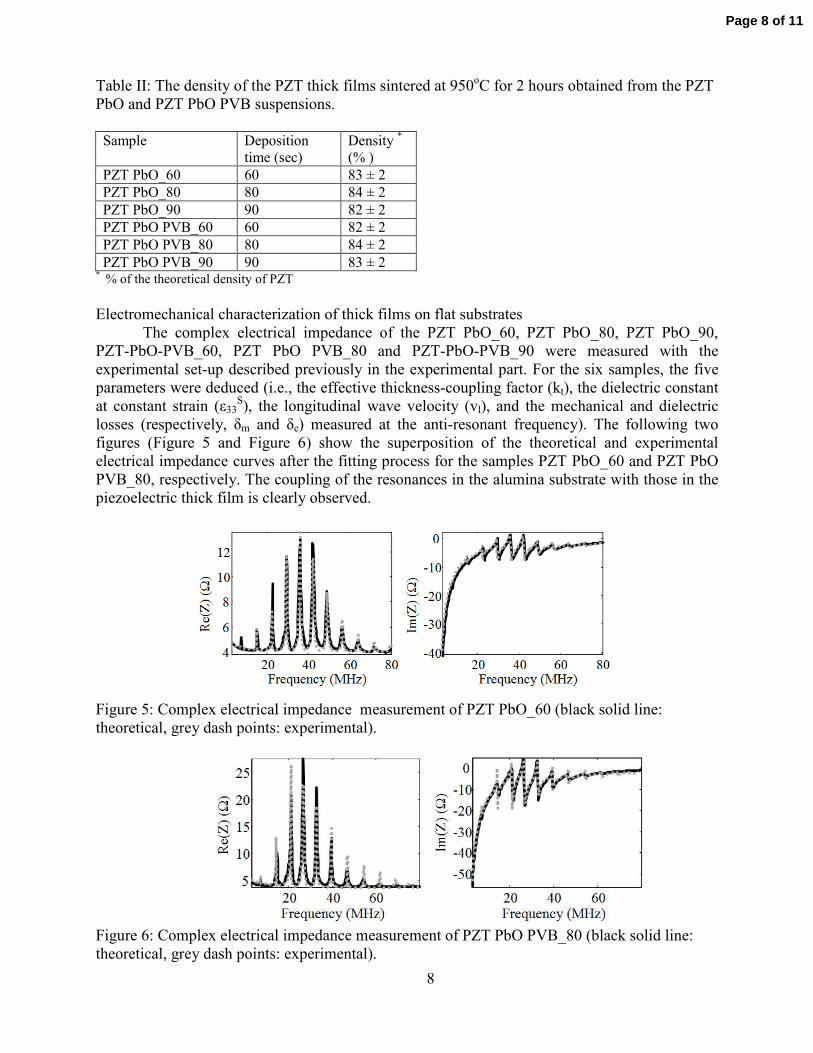
Table II: The density of the PZT thick films sintered at 950oC for 2 hours obtained from the PZT
PbO and PZT PbO PVB suspensions.
Sample Deposition
time (sec)
Density *
(% )
PZT PbO_60 60 83 ± 2
PZT PbO_80 80 84 ± 2
PZT PbO_90 90 82 ± 2
PZT PbO PVB_60 60 82 ± 2
PZT PbO PVB_80 80 84 ± 2
PZT PbO PVB_90 90 83 ± 2 * % of the theoretical density of PZT
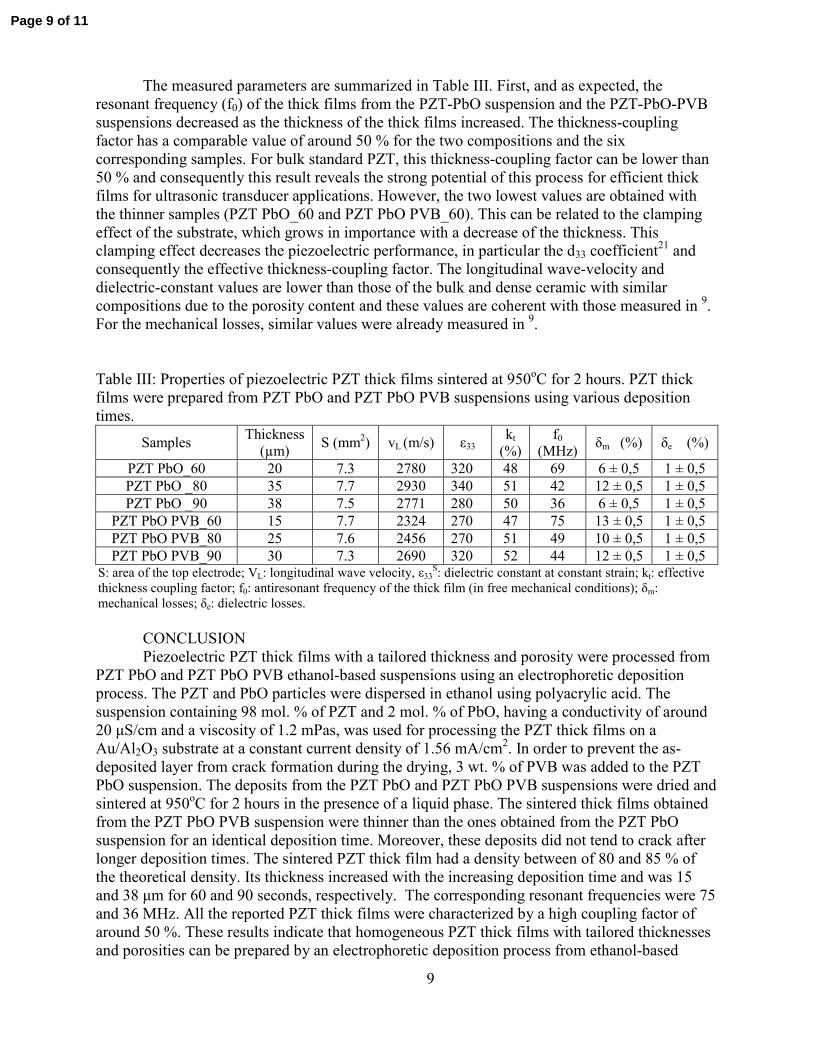
Electromechanical characterization of thick films on flat substrates
The complex electrical impedance of the PZT PbO_60, PZT PbO_80, PZT PbO_90,
PZT-PbO-PVB_60, PZT PbO PVB_80 and PZT-PbO-PVB_90 were measured with the
experimental set-up described previously in the experimental part. For the six samples, the five
parameters were deduced (i.e., the effective thickness-coupling factor (kt), the dielectric constant
at constant strain (ε33S), the longitudinal wave velocity (vl), and the mechanical and dielectric
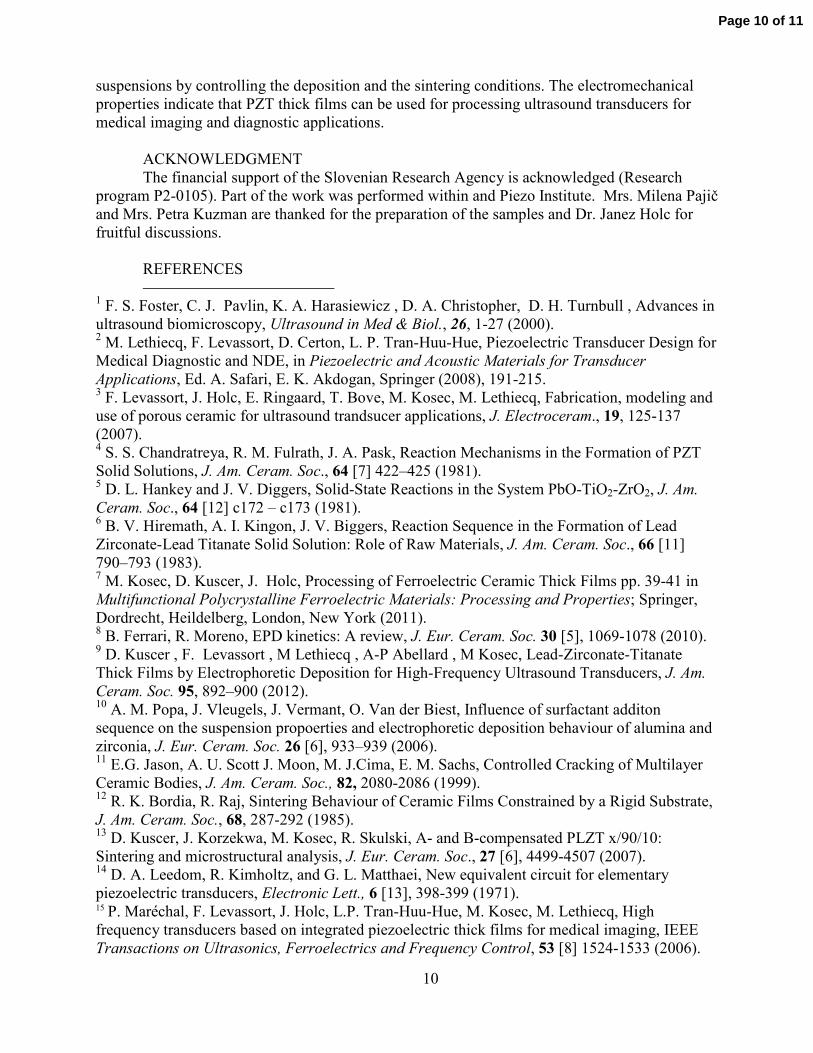
losses (respectively, δm and δe) measured at the anti-resonant frequency). The following two
figures (Figure 5 and Figure 6) show the superposition of the theoretical and experimental
electrical impedance curves after the fitting process for the samples PZT PbO_60 and PZT PbO
PVB_80, respectively. The coupling of the resonances in the alumina substrate with those in the
piezoelectric thick film is clearly observed.
Figure 5: Complex electrical impedance measurement of PZT PbO_60 (black solid line:
theoretical, grey dash points: experimental).
Figure 6: Complex electrical impedance measurement of PZT PbO PVB_80 (black solid line:
theoretical, grey dash points: experimental).
Page 8 of 11
9
The measured parameters are summarized in Table III. First, and as expected, the
resonant frequency (f0) of the thick films from the PZT-PbO suspension and the PZT-PbO-PVB
suspensions decreased as the thickness of the thick films increased. The thickness-coupling
factor has a comparable value of around 50 % for the two compositions and the six
corresponding samples. For bulk standard PZT, this thickness-coupling factor can be lower than
50 % and consequently this result reveals the strong potential of this process for efficient thick
films for ultrasonic transducer applications. However, the two lowest values are obtained with
the thinner samples (PZT PbO_60 and PZT PbO PVB_60). This can be related to the clamping
effect of the substrate, which grows in importance with a decrease of the thickness. This
clamping effect decreases the piezoelectric performance, in particular the d33 coefficient21
and
consequently the effective thickness-coupling factor. The longitudinal wave-velocity and
dielectric-constant values are lower than those of the bulk and dense ceramic with similar
compositions due to the porosity content and these values are coherent with those measured in 9.
For the mechanical losses, similar values were already measured in 9.
Table III: Properties of piezoelectric PZT thick films sintered at 950oC for 2 hours. PZT thick
films were prepared from PZT PbO and PZT PbO PVB suspensions using various deposition
times.
Samples Thickness
(µm) S (mm
2) vL (m/s) ε33
kt
(%)
f0
(MHz) δm (%) δe (%)
PZT PbO_60 20 7.3 2780 320 48 69 6 ± 0,5 1 ± 0,5
PZT PbO _80 35 7.7 2930 340 51 42 12 ± 0,5 1 ± 0,5
PZT PbO _90 38 7.5 2771 280 50 36 6 ± 0,5 1 ± 0,5
PZT PbO PVB_60 15 7.7 2324 270 47 75 13 ± 0,5 1 ± 0,5
PZT PbO PVB_80 25 7.6 2456 270 51 49 10 ± 0,5 1 ± 0,5
PZT PbO PVB_90 30 7.3 2690 320 52 44 12 ± 0,5 1 ± 0,5 S: area of the top electrode; VL: longitudinal wave velocity, ε33
S: dielectric constant at constant strain; kt: effective
thickness coupling factor; f0: antiresonant frequency of the thick film (in free mechanical conditions); δm:
mechanical losses; δe: dielectric losses.
CONCLUSION
Piezoelectric PZT thick films with a tailored thickness and porosity were processed from
PZT PbO and PZT PbO PVB ethanol-based suspensions using an electrophoretic deposition
process. The PZT and PbO particles were dispersed in ethanol using polyacrylic acid. The
suspension containing 98 mol. % of PZT and 2 mol. % of PbO, having a conductivity of around
20 µS/cm and a viscosity of 1.2 mPas, was used for processing the PZT thick films on a
Au/Al2O3 substrate at a constant current density of 1.56 mA/cm2. In order to prevent the as-
deposited layer from crack formation during the drying, 3 wt. % of PVB was added to the PZT
PbO suspension. The deposits from the PZT PbO and PZT PbO PVB suspensions were dried and
sintered at 950oC for 2 hours in the presence of a liquid phase. The sintered thick films obtained
from the PZT PbO PVB suspension were thinner than the ones obtained from the PZT PbO
suspension for an identical deposition time. Moreover, these deposits did not tend to crack after
longer deposition times. The sintered PZT thick film had a density between of 80 and 85 % of
the theoretical density. Its thickness increased with the increasing deposition time and was 15
and 38 µm for 60 and 90 seconds, respectively. The corresponding resonant frequencies were 75
and 36 MHz. All the reported PZT thick films were characterized by a high coupling factor of
around 50 %. These results indicate that homogeneous PZT thick films with tailored thicknesses
and porosities can be prepared by an electrophoretic deposition process from ethanol-based
Page 9 of 11
10
suspensions by controlling the deposition and the sintering conditions. The electromechanical
properties indicate that PZT thick films can be used for processing ultrasound transducers for
medical imaging and diagnostic applications.
ACKNOWLEDGMENT
The financial support of the Slovenian Research Agency is acknowledged (Research
program P2-0105). Part of the work was performed within and Piezo Institute. Mrs. Milena Pajič
and Mrs. Petra Kuzman are thanked for the preparation of the samples and Dr. Janez Holc for
fruitful discussions.
REFERENCES
1 F. S. Foster, C. J. Pavlin, K. A. Harasiewicz , D. A. Christopher, D. H. Turnbull , Advances in
ultrasound biomicroscopy, Ultrasound in Med & Biol., 26, 1-27 (2000). 2 M. Lethiecq, F. Levassort, D. Certon, L. P. Tran-Huu-Hue, Piezoelectric Transducer Design for
Medical Diagnostic and NDE, in Piezoelectric and Acoustic Materials for Transducer
Applications, Ed. A. Safari, E. K. Akdogan, Springer (2008), 191-215. 3 F. Levassort, J. Holc, E. Ringaard, T. Bove, M. Kosec, M. Lethiecq, Fabrication, modeling and
use of porous ceramic for ultrasound trandsucer applications, J. Electroceram., 19, 125-137
(2007). 4 S. S. Chandratreya, R. M. Fulrath, J. A. Pask, Reaction Mechanisms in the Formation of PZT
Solid Solutions, J. Am. Ceram. Soc., 64 [7] 422–425 (1981). 5 D. L. Hankey and J. V. Diggers, Solid-State Reactions in the System PbO-TiO2-ZrO2, J. Am.
Ceram. Soc., 64 [12] c172 – c173 (1981). 6 B. V. Hiremath, A. I. Kingon, J. V. Biggers, Reaction Sequence in the Formation of Lead
Zirconate-Lead Titanate Solid Solution: Role of Raw Materials, J. Am. Ceram. Soc., 66 [11]
790–793 (1983). 7 M. Kosec, D. Kuscer, J. Holc, Processing of Ferroelectric Ceramic Thick Films pp. 39-41 in
Multifunctional Polycrystalline Ferroelectric Materials: Processing and Properties; Springer,
Dordrecht, Heildelberg, London, New York (2011). 8 B. Ferrari, R. Moreno, EPD kinetics: A review, J. Eur. Ceram. Soc. 30 [5], 1069-1078 (2010).
9 D. Kuscer , F. Levassort , M Lethiecq , A-P Abellard , M Kosec, Lead-Zirconate-Titanate
Thick Films by Electrophoretic Deposition for High-Frequency Ultrasound Transducers, J. Am.
Ceram. Soc. 95, 892–900 (2012). 10
A. M. Popa, J. Vleugels, J. Vermant, O. Van der Biest, Influence of surfactant additon
sequence on the suspension propoerties and electrophoretic deposition behaviour of alumina and
zirconia, J. Eur. Ceram. Soc. 26 [6], 933–939 (2006). 11
E.G. Jason, A. U. Scott J. Moon, M. J.Cima, E. M. Sachs, Controlled Cracking of Multilayer
Ceramic Bodies, J. Am. Ceram. Soc., 82, 2080-2086 (1999). 12
R. K. Bordia, R. Raj, Sintering Behaviour of Ceramic Films Constrained by a Rigid Substrate,
J. Am. Ceram. Soc., 68, 287-292 (1985). 13
D. Kuscer, J. Korzekwa, M. Kosec, R. Skulski, A- and B-compensated PLZT x/90/10:
Sintering and microstructural analysis, J. Eur. Ceram. Soc., 27 [6], 4499-4507 (2007). 14
D. A. Leedom, R. Kimholtz, and G. L. Matthaei, New equivalent circuit for elementary
piezoelectric transducers, Electronic Lett., 6 [13], 398-399 (1971). 15
P. Maréchal, F. Levassort, J. Holc, L.P. Tran-Huu-Hue, M. Kosec, M. Lethiecq, High
frequency transducers based on integrated piezoelectric thick films for medical imaging, IEEE
Transactions on Ultrasonics, Ferroelectrics and Frequency Control, 53 [8] 1524-1533 (2006).
Page 10 of 11

11
16
A.R. Selfridge, Approximate material properties in isotropic materials, IEEE Trans. Sonics
Ultrason., 32 [3] 381-394 (1985). 17
http://www.ondacorp.com/tecref_acoustictable.shtml (Last viewed 23th of May 2010) 18
M. Lukacs, T. Olding, M. Sayer, R. Tasker, S. Sherrit, Thickness mode material constants of
a supported piezoelectric film, J. Appl. Phys., 85 [5] 2835-2843 (1999). 19
A. Bardaine, P. Boy, P. Belleville, O. Acher, F. Levassort, Improvement of composite sol-
gel process for manufacturing 40 µm piezoelectric thick films, J. Eur. Ceram. Soc., 28 [8]
1649-1655 (2008). 20
W. J. Tseng, C-L. Lin, Effect of polyvinyl butyral on the rheologycal properties of BaTiO3
powder in ethanol-isopropanol mixtures, Mat. Lett., 57, 223-228 (2002). 21
A. Barzegar, D. Damjanovic, N. Setter, The effect of boundary conditions and sample aspect
ratio on apparent d33 piezoelectric coefficient determined by direct quasistatic method , IEEE
Trans. Ultrason. Ferroelectr. Freq. Control, 51 [3] 262–270 (2004).
Page 11 of 11