kinetics of leaf extension in maize: parameterization for two tropically adapted cultivars planted...
TRANSCRIPT

A
(bactplee©
K
1
eaiacaeapveoto
1d
Europ. J. Agronomy 27 (2007) 215–224
Kinetics of leaf extension in maize: Parameterization for twotropically adapted cultivars planted on two dates at Gatton
C.J. Birch a,∗, B. Andrieu b, C. Fournier b, C. Kroesen a
a The University of Queensland, Gatton Campus, Gatton, Queensland, Australiab Institut National de la Recherche Agronomique, Centre de Versailles-Grignon,
Unite Environment et Grandes Cultures, 78850 Thiverval-Grignon, France
Received 28 August 2006; received in revised form 27 March 2007; accepted 12 April 2007
bstract
The kinetics of extension of individual leaves and component laminae and sheaths in maize were studied in two field experiments at GattonAustralia) using two cultivars, Pioneer 3527 and Pioneer C87, in one experiment and Pioneer C87 only in the second. Destructive samplingased on non-destructive observations to ensure accurate representation of the population was used to establish timing of leaf initiation, leaf tipppearance, ligule being able to be discerned and full extension of organs. The appearance and extension of leaves were related to thermal time,alculated from temperature measured in the region of cell division and extension. Extension of leaves and sheaths was analysed using the firsthree phases of a four phase framework consisting of two exponential phases, rapid (linear) extension and transition to final organ length. The last
hase was not examined as there were insufficient data. Final organ length was related to leaf position, and linear extension rates of leaves andaminae were linearly related to final organ length, with differing equations for upper and lower leaves. The study has proposed extensions to anxisting analytical approach, and argues that regular patterns of extension of leaves and sheaths can be explained in relation to the position of thear using a physiological approach.2007 Published by Elsevier B.V.
ion; L
wr1nt(ca
iqom
eywords: Maize; Zea mays; Leaf extension; Lamina extension; Sheath extens
. Introduction
A key process in the development of crop canopies is thextension of leaves, which along with extension of internodesnd thus the stem provides the vertical distribution of leaf arean the canopy. Phyllochron describes the time interval betweenppearance of successive leaves and is a useful basis of quantifi-ation of production of plant organs (Robertson, 1994; Birch etl., 1998b). Earlier, Hesketh et al. (1988) have related leaf areaxpansion, sheath and internode extension to V-stage scales,developmental index based on the number of liguled leaves
resent (a comprehensive recent description of V-stages is pro-ided by Darby and Lauer, 2004). Also, Reid et al. (1990)xamined the dynamics of maize canopy developed, focusing
n phytomer ontogeny. These earlier studies provide a concep-ual basis for more detailed studies of both leaf extension andrgan development.∗ Corresponding author. Tel.: +61 7 5460 1302; fax: +61 7 5460 1112.E-mail address: [email protected] (C.J. Birch).
ptl((te
161-0301/$ – see front matter © 2007 Published by Elsevier B.V.oi:10.1016/j.eja.2007.04.003
eaf kinetics; Plant architecture modelling
Leaf expansion results from longitudinal extension and leafidth acquisition, which generally respond differently to envi-
onmental factors (Fournier and Andrieu, 1999; Tardieu et al.,999; Fournier, 2000; Ljutovac, 2002). Most crop models doot consider extension of individual leaves nor do they considerhe dynamics of vertical extension of plants, though Robertson1994) reported that the vertical distribution of leaf area in a cropanopy can be modeled relatively easily from parameters suchs leaf appearance, final leaf number, leaf sizes and leaf angles.
Plant architectural models can predict spatial distributionn both the vertical and horizontal domains, and thus improveuantification of resource distribution, such as light through-ut the canopy (Hanan, 1997; Chelle and Andrieu, 1999) andorphological and architectural traits that contribute to crop
roductivity (Guo et al., 2006). Such models can be appliedo simulate intercrops (where a short stature crop relies onight remaining after interception by a taller companion crop)
Adiku et al., 1998) or pastures containing two or more speciesMahalatti, 1998) and more generally address temporal and spa-ial aspects of heterogeneous canopies (Birch et al., 2003; Guot al., 2006).
2 . Agro
uafsdcctt
oeWaedaamaTaibPeeTftdiso
istttcd(taPt
2
lemss
hdcooeeg
oiis(pl(qNn7apatl
IaoSdts
2
gepooarbe
eafer
16 C.J. Birch et al. / Europ. J
In order to describe in detail the exchanges between individ-al plants and their environment, such as resource acquisition,rchitectural models require detailed quantification of organormation and expansion. Such processes are only partly under-tood, and generic parameterizations are required in order toevelop architectural models of a range of species. Identifi-ation of architectural patterns and plasticity is also likely toontribute to the understanding of underlying mechanisms andheir response to environmental variables and genotype charac-eristics.
Three zones of cells exist in growing cereal leaves or intern-des: a meristematic zone of cell division and limited cellxtension, a zone of cell extension, and a zone of mature cells.
hen organs develop, the three regions are created sequentiallynd thus successive phases in the dynamics of extension can bexpected. Four phases in the extension of maize internodes wereescribed by Fournier and Andrieu (2000a,b), confirmed ondditional cultivars by Birch et al. (2002) and used by Hillier etl. (2005) in estimating parameters of organ growth for kineticsodels. A four phase frame was also shown to be appropri-
te for describing lamina extension in wheat (Ljutovac, 2002).hese are: Phase I, during which organ growth is meristematicnd extension is exponential; Phase II, during which extensions exponential, but with a higher relative extension rate, proba-ly corresponding to the development of a cell extension zone;hase III, during which the mature zone is being produced andxtension rate is essentially constant; and Phase IV, during whichxtension rate decreases rapidly as final length is approached.his approach may be preferred to the use of logistic or growth
unctions for which there is no specific biological justificationhough they have inherent flexibility (Hillier et al., 2005). Theuration of Phase I depends on species, being a major phasen wheat (Malvoisin, 1984; Ljutovac, 2002), whereas it is veryhort and can be difficult to distinguish from Phase II in somether species such as sorghum or maize (Hillier et al., 2005).
This work extends to leaves earlier research on extension ofnternodes of tropically adapted cultivars on maize and assessesimilarities and differences in patterns and rates of processes inropical and a temperate cultivar. For this, the paper examineshe applicability and quantification of Phases I, II and III ofhe four phases analysis to (i) the extension to leaves, and theironstituent laminae and sheaths, (ii) the parameter values thatescribe leaf (lamina plus sheath), lamina and sheath extensionfor example, length of mature organs, extension rates duringhe different phases), and (iii) correlation between parametersnd leaf position and possible relationships among parameters.hase IV was not included as there were insufficient data during
his short phase to quantify it.
. Materials and methods
Two field experiments were conducted at Gatton, Queens-and, Australia (latitude 27◦33′S, longitude 152◦20′E). The first
xperiment was described in Birch et al. (2002). Two cultivars ofaize of differing comparative relative maturity, CRM (a mea-ure of time from emergence to grain moisture content beinguitable for harvest (Lauer, 1998; Yang et al., 2005)), both F1
tbd(
nomy 27 (2007) 215–224
ybrids (Pioneer 3527, CRM 106 d, and Pioneer C87, CRM 130, referred to as P3527 and C87) were grown under non-limitingonditions of nutrient and water supply, and pests were rigor-usly controlled chemically or mechanically (weeds). An areaf 32 m × 24 m of each cultivar was planted, of which 4 m atach end and two outside rows were guard areas. The secondxperiment was designed in the same way but only C87 wasrown.
The crops were planted at a seed population of 140 000 ha−1
n 4 October 1999 (experiment 1) and 17 January 2000 (exper-ment 2), and thinned to 70 000 ha−1 (19 cm between plantsn 0.75 m rows) once established (three visible leaves). Theoil at the experimental site was a moderately fertile vertosolLawes series) (Schafer et al., 1986). It had non-limiting sup-lies of nutrients other than N and Zn when assessed usingocal standards and holds 195 mm plant available water to 1.8 mDalgleish and Foale, 1998). Water stress was prevented by fre-uent trickle irrigation (lines in each row beside the plants).utrients applied were: nitrogen at 100 kg N/ha as ammoniumitrate before planting and incorporated by irrigation, and at5 kg N/ha 3 and 6 weeks after emergence. Zinc was applied asfoliar spray at 1 kg ZnSO4·7H2O plus 1 kg urea in 100 L waterer hectare 2 weeks after emergence, and again 4 and 6 weeksfter emergence. Other nutrients were adequately supplied byhe soil when assessed against standards used for maize in thisocation.
For comparison, data for a temperate cultivar Dea grown atNRA campus of Thiverval-Grignon, France (48◦51′N, 1◦58′E)t 9.5 plants m−2 planted on 15 May 2000 are included. Detailsf cultural practices are provided in Andrieu et al. (2006).ampling and data collection procedures were similar to thoseescribed in detail below for the present experiments, excepthat greater detail of leaf extension when primordia were veryhort was collected.
.1. Plant sampling and data collection
Plants were sampled from each cultivar regularly from emer-ence (leaf 1 of 50% of the sown seed population havingmerged) to the end of the expansion of the canopy. Whenlants had five visible leaves (three fully expanded), the lengthsf leaf 3 and the visible length of leaf 4 were determinedn 32 plants, and 10 reference plants with length of leaves 3nd 4 close to the median value were tagged to be used aseference of crop development in future samplings. Adequateorders around tagged plants were retained to mitigate edgeffects.
Samplings were carried out at 07:30 h on 1, 2 or, over week-nds, 3 day intervals. At each sampling, the number of visiblend fully expanded leaves and the lengths of the most recentlyully expanded leaf and the visible length (from the point ofmergence from the whorl to tip) of the first leaf above it oneference plants were measured. The median length of these
wo leaves was determined and three plants with compara-le leaf number and lengths were harvested for dissection andetailed measurement of visible and total lamina and sheathwhere present) lengths of all leaves that were initiated. A stere-
. Agro
oltft
iTpoal
2
pBotiaacTttgs
2
etTe
awotIaiiiB
p(Fc
bsl
2
wFdlvlmde
euooa
L
wPwolasoR
lmur
2
otltmatsosecv
C.J. Birch et al. / Europ. J
microscope was used to measure the length of very smalleaves. Apex height was also determined during plant dissec-ion in order to assess the position of the growth zone of leavesor placement of thermocouples for field measurement of itsemperature.
The basal end of expanding leaves was examined microscop-cally to detect the time at which the ligule became discernible.his is slightly later than the occurrence of cellular changes thatroduce the ligule, but once evident as a lighter coloured bandf cells, the presence of the ligule and sheath was recorded,nd subsequently data was recorded on both lamina and sheathength.
.2. Temperature measurements
Detailed information on the protocol and results of tem-erature measurements in the first experiment was given inirch et al. (2002), and were similar in experiment 2, thusnly a brief account is given here. Maximum and minimumemperatures were recorded at the nearby Lawes Meteorolog-cal Station, in a standard Stevenson screen. Soil temperaturet 5 cm, apex temperature (once the apex was above ground),nd air temperature at 20 cm above ground were recorded usingopper constantan thermocouples connected to a data logger.he temperatures used in thermal time calculations were soil
emperature, while the apex was below the ground surface,hen apex temperature until the apex was 20 cm above theround, and subsequently temperatures taken in the Stevensoncreen.
.3. Analysis of leaf extension
Analyses of lamina, sheath and leaf (lamina plus sheath)xtension were based on a thermal time scale, using a baseemperature of 9.8 ◦C (Durand et al., 1982; Ben Haj Salah andardieu, 1996) as in Fournier and Andrieu (2000a,b) and Bircht al. (2002).
In this paper, we describe the extension of leaves, laminaend sheaths of individual maize leaves during Phases I–III. Dataere insufficiently detailed to examine the extension of eachrgan just after their initiation or from the end of linear extensiono final organ length and no further mention is made of PhaseV. Phase I could only be examined in sheaths, at a few positionslong the shoot. Phase I for laminae, though, has been detectedn another study with maize (cultivar Dea) grown in France, andn that study was complete when leaves are around 0.5 cm longn leaves 4–9 and around 2.0 cm in higher leaves (Andrieu andirch, 2000, unpublished data).
Analyses of subsequent phases of extension followed therocedures in Fournier and Andrieu (2000a) and Birch et al.2002). Lamina extension was analysed for Phases II and III.or sheaths, Phase II and at some positions Phases I and IIIould be characterized.
In this analysis, LN denotes leaf position (numbered from theottom to top of the plant, with 1 being the first true leaf). Forome items, normalised position (NP), the ratio of LN to totaleaf number (TL) was used.
2
l
nomy 27 (2007) 215–224 217
.4. Exponential extension of leaves
The natural logarithms of lamina, sheath and leaf lengthere plotted against thermal time (TT, ◦Cd) since emergence.rom these plots, extension of leaves, laminae and sheathsuring Phase II was examined by regression of the naturalogarithm of lengths of individual leaves and laminae (pro-ided they were ≥0.5 cm for leaves 4–10 and ≥2.5 cm foreaves higher on the stem) to the length at the commence-
ent of effective linear extension (Phase III), determined asescribed in Fournier and Andrieu (2000a) on thermal time sincemergence.
Organ lengths at the estimated commencement of linearxtension were usually close to 12% of final organ length. Thepper limits were chosen from graphical analyses of length ofrgans plotted against thermal time from emergence, to ensurergans were extending exponentially, as described in Fourniernd Andrieu (2000a) and Birch et al. (2002). The regressions:
oge (organ length) = a + RER × TT (1)
ere used to calculate the relative rate of extension (RER) duringhase II and for sheaths, Phase I when possible. In this study,e found that length at the end of Phase I of sheaths was 1.5%f final leaf length (LL), and for leaves, Phase II ended whenength was 12% of LL. These limits were used in subsequentnalyses. When considering both sheath and leaf data, cubicmooth splines (Bartels et al., 1987) calculated at the pointsf measurement fitting using median organ length was applied,ER being the first derivatives of cubic smooth splines.
Thermal duration of exponential extension of leaves andaminae during Phase II was calculated assuming Phase II com-
enced when leaf length was 0.8 cm and 2.8 cm for lower andpper leaves, respectively and was complete when organ lengtheached 12% of final length.
.5. Linear phase of extension
Provided there were sufficient data in the linear phase, the ratef extension (cm (◦Cd)−1) was calculated at each position alonghe shoot for sheaths, laminae and leaves, by regressing organength on thermal time. The commencement and completion ofhe linear phase of extension was identified graphically in the
anner described in Fournier and Andrieu (2000a) and Birch etl. (2002). The regression equation was then used to determinehe intercept (TT1) for each organ on the thermal time axis byetting organ length = 0. Similarly, thermal time at completionf extension (TT2) for each organ was determined as the inter-ection of the fitted linear regression and final organ length. Thequivalent linear duration of extension for each organ was cal-ulated as the difference between the appropriate TT2 and TT1alues.
.6. Duration of extension
The thermal durations of extension from primordium ofeaf being detected (length not exceeding 0.5 cm) to com-

218 C.J. Birch et al. / Europ. J. Agronomy 27 (2007) 215–224
Table 1The coefficients LLo, LNo, a and b in the modified bell curve describing final length of leaves and laminae (Eq. (2)) in Pioneer 3527 and Pioneer C87 (experiments1 and 2)
Organ LLo(cm) LNo a b r2 (adj)
P3527Laminae 100a 12a −0.01437 ± 0.00042 0.00046 ± 0.00004 0.99Leaves 121.6 ± 1.47 11.8 ± 0.10 −0.01337 ± 0.00049 0.00046 ± 0.00004 0.99
C87 (experiment 1)Laminae 93a 13a −0.01066 ± 0.00031 0.00037 ± 0.00002 0.99Leaves 116.1 ± 1.29 12.6 ± 0.10 −0.01012 ± 0.00031 0.00041 ± 0.00016 0.99
C87 (experiment 2)a a −0
−0
pllta
2n
atm
L
wltioae
2
M(aa1
3
3
2
3
l
tddtto
aTN
alina for leaf 6. This was followed by a curvilinear pattern for theremainder of the leaves. The relationship for C87—experiment1 was described by two quadratic equations:
Laminae 91 13Leaves 109.6 ± 1.3 13.1 ± 0.09
a Values supplied in optimization.
letion of lamina extension and from the formation of theigule to completion of extension of the sheath were calcu-ated for LN 8–18 (laminae) and 11–20 (sheaths), that arehe positions for which sufficiently detailed data were avail-ble.
.7. Relating final leaf, lamina and sheath length to leafumber
To examine the relationships between lengths of mature organnd LN, the final length of leaves and laminae were relatedo length and position of the longest leaf or lamina using the
odified bell curve:
L = LLo × exp (a(LN − LNo)2 + b(LN − LNo)3), (2)
here LL is the length (cm) of the organ, LLo the length (cm) ofongest organ, LN the leaf position, numbered from the bottom tohe top, and LNo is the position of longest lamina. This procedures similar to that used for relating leaf area to the area and positionf the largest leaf in maize (Dwyer and Stewart, 1986; Keatingnd Wafula, 1992; Birch et al., 1998a) and sorghum (Carberryt al., 1993).
.7.1. Statistical analysesStatistical analyses were carried out using SYSTAT,
icrosoft EXCEL, SIGMAPLOT, and the software package ‘R’R, http://www.r-project.org), and are reported at P ≤ 0.05. Inll analyses and assessments, the top two leaves were excludeds these have different characteristics of extension (Robertson,994), confirmed in analyses in the present study.
. Results
.1. Number and length of mature organs
P3527 produced an average of 20 leaves and C87 and 22 and4 leaves in experiments 1 and 2, respectively.
.1.1. Final length of leaves, laminae and sheathsMedian final length of leaves and laminae as a function of
eaf number (numbered from the bottom to the top) increased
Fiaa
.01240 ± 0.00029 0.00046 ± 0.00019 0.99
.01111 ± 0.00036 0.00027 ± 0.00001 0.99
o leaf number 11–14, depending on final leaf number (Fig. 1,ata for C87 experiment 1). For leaves above this level, lengthecreased approximately linearly with position, except for theop one or two leaves that were shorter. Sheath lengths increasedo leaf 8–10, and above this level most were slightly shorter, butf similar length.
Leaf and lamina length could be related to maximum lengthnd position of the longest leaf using Eq. (2) (Table 1).he position of the longest leaf was found approximately atP 0.6.When the percentage of leaf present as lamina was plotted
gainst LN (Fig. 2) there was an initial rapid increase to 75%amina at around leaf 4 followed by a small decline to 70% lam-
ig. 1. Final leaf (�), lamina (�) and sheath (�) length in Pioneer C87 (exper-ment 1) at Gatton, Australia. The arrow shows the position of the principal ear,nd xo the position of the largest leaf providing the best fit of Eq. (1) for laminaend leaves.

C.J. Birch et al. / Europ. J. Agronomy 27 (2007) 215–224 219
FCl
(
L
3
3
irao
3
3s
r
Fev
Table 2Means and ranges of relative extension rate during Phase II of leaves for Pioneer3527 (LN 8–18) and PioneereC87 (LN 11–20 and LN 9–18 in experiments 1and 2)
Organ LeavesP3527 0.038 (0.020–0.040)CC
wodadwwplo
e1FTcDR
3
9fcam6
3
ig. 2. Percentage of final leaf length present as lamina in Pioneer 3527 (�),87 (experiment 1) (�), C87 (experiment 2) (©) and Dea (�) plotted against
eaf position.
(i) For LN ≤ 6:
%lamina = 47.2 + 12.0LN − 1.33LN2, r2 = 0.91 (3)
ii) For 7 ≤ LN < TL-2:
%lamina = 49.1 + 4.61LN − 0.15LN2, r2 = 0.81 (4)
The maxima of these relationships were 74% and 84.5% nearN = 4.5 and 15.
.2. Analysis of kinetics of extension
.2.1. Temporal leaf, lamina and sheath extensionThe length of leaves and laminae followed a similar pattern
n all leaves with a slow initial phase followed by an increasingate of extension, an effectively linear phase, and finally slowings final organ length was approached (Fig. 3, data for laminaef C87, experiment 1).
.3. Analysis of kinetics of individual organs
.3.1. Relative rate of extension of leaves, laminae andheaths during Phases I and II
Phase II of extension of a leaf was complete when the leafeached 12% of its final length. Phase II of extension of a sheath
ig. 3. Median length (cm) of laminae plotted against thermal time (◦Cd) aftermergence for Pioneer C87 (experiment 1). The differing symbols are for indi-idual leaves, from leaf 4 to leaf 21.
d0tDeft
TC(lC
Oabcr
87 (experiment 1) 0.031 (0.025–0.037)87 (experiment 2) 0.032 (0.015–0.038)
as complete when the sheath reached the same size, that is 12%f final leaf length (examples in Fig. 4a). Fig. 4b shows RERuring Phase II for the whole leaves (left) and the sheaths (right),s a function of LN. Means of and ranges in RER of leavesuring Phase II are shown in Table 2. RER for leaves and sheathsere similar during Phase II. The pattern of RER of Phase IIas similar between genotypes, decreasing approximately toosition TL/2, then is stable and decreasing for last one or twoeaves. No obvious correlation with final length of the organ wasbserved.
For sheaths, Phase I was detected as a period of exponentialxtension with low RER (shown clearly in Fig. 4a for LN 13 and7). RER for Phase I of sheaths of upper leaves are shown inig. 4b, and were around 0.018 ◦Cd−1, lower than for Phase II.here were few differences among individual leaves or betweenultivars and planting times in the Gatton experiments. Data forea in France show similar patterns in relation to LN, thoughER values tend to be higher.
.3.2. Duration of Phase II of leaf extensionDurations could only be calculated for LN above 8 (P3527),
(C87, experiment 1) and 11 (C87, experiment 2) and onlyor those positions where significant RER values could be cal-ulated. Duration of Phase II were mostly between 32 ◦Cdnd 42 ◦Cd within or between cultivars, except for the upper-ost two or three leaves, which had longer durations (up to
0 ◦Cd).
.3.3. Rate of linear extensionThere was considerable variation in rate of extension of leaves
uring Phase III. Linear extension rates (LER) increased from.35 cm ◦Cd−1 to around 0.55 cm ◦Cd−1 for leaves 8–18 andhen declining to values around 0.25 cm ◦Cd−1 (Fig. 5). Data for
ea shows similar trends though the rates of extension were gen-rally lower, and the maximum rate of 0.42 cm ◦Cd−1 occurredor leaves 8–10, above which there was a relatively rapid declineo 0.32 cm ◦Cd−1 for leaf 15.
able 3onstants, coefficients, coefficients of determination for regression
y = a + bLN + cLN2) of linear extension rates (LER, ◦Cd leaf−1) (y) ofeaves on leaf position (LN) for combined data for Pioneer 3527 and Pioneer87 (experiments 1 and 2)
rgan Leaves0.060.079−0.0031
2 0.74

220 C.J. Birch et al. / Europ. J. Agronomy 27 (2007) 215–224
Fig. 4. (a) Thermal time courses of leaf (black) and sheath (open) length for leaves 5, 9, 13 and 17 of cultivar P3527. Upper panels are log-scaled. Time origin iswhen organ length (leaf or sheath) equals 0.12 × mature leaf length (∼expected length of the growing zone), which is a good approximation of the end of Phase II. (b)R 87 (exF tivesb s.
t(r
F(a
elative elongation rate (RER) as a function of leaf position (LN) for P3527, Crance. Left figure is for RER of Phase II, and is the median of the first derivaoth sheath and leaf data. Right: RER during Phase I for sheaths of upper leave
When LER was regressed on LN for P3527 and C87, the rela-ionships were described by curvilinear (quadratic) equationsTable 3, combined data only), and had maximum extensionates near LN = 13.
ig. 5. Extension rates during linear phase (Phase III) of leaves of Pioneer 3527�), C87 (experiment 1) (�), C87 (experiment 2) (©) and Dea (�) plottedgainst leaf position (LN). Vertical error bars represent ± S.E.
3l
1tDttE(a
3e
TCLlC
O
LL
periments 1 and 2) and Dea, a temperate cultivar grown at Thiverval-Grignon,of cubic smooth splines, calculated at the points of measurement, considering
.3.4. Effective linear duration of extension of laminae andeaves
Effective linear duration (ELD, ◦Cd) of leaves increased from20 ◦Cd for leaf 4 to around 180–210 ◦Cd for leaves midway uphe stem and then declined for higher leaves (Fig. 6). Data forea follow a similar pattern but duration is longer to leaf 13 and
hen declines rapidly. A similar pattern was present for laminaehough ELD was 20–30 ◦Cd shorter. The relationships betweenLD and LN were also described by curvilinear equations
Table 4). Maximum ELD were estimated to be near 180 ◦Cd
nd 205 ◦Cd near LN = 13 or 14 for both laminae and leaves..3.4.1. Thermal duration between ontogenetic events in leafxtension. The duration of the interval between one ontoge-
able 4onstants, coefficients, coefficients of determination for regression (y = a + bN + c LN2) of effective linear duration (ELD, ◦Cd leaf−1) (y) of laminae and
eaves on leaf position (LN) for combined data for Pioneer 3527 and Pioneer87 (experiments 1 and 2)
rgan a b c r2
aminae 32.8 20.7 −0.74 0.75eaves 63.6 19.9 −0.71 0.68
C.J. Birch et al. / Europ. J. Agronomy 27 (2007) 215–224 221
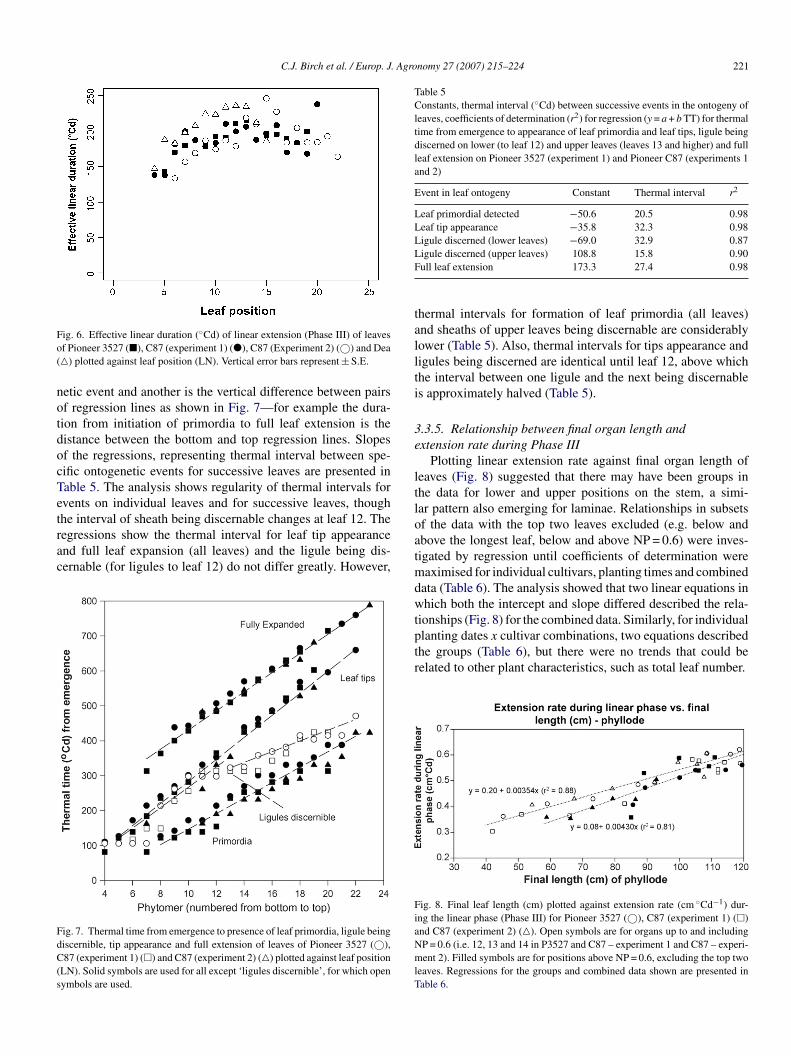
Fo(
notdocTetrac
FdC(s
Table 5Constants, thermal interval (◦Cd) between successive events in the ontogeny ofleaves, coefficients of determination (r2) for regression (y = a + b TT) for thermaltime from emergence to appearance of leaf primordia and leaf tips, ligule beingdiscerned on lower (to leaf 12) and upper leaves (leaves 13 and higher) and fullleaf extension on Pioneer 3527 (experiment 1) and Pioneer C87 (experiments 1and 2)
Event in leaf ontogeny Constant Thermal interval r2
Leaf primordial detected −50.6 20.5 0.98Leaf tip appearance −35.8 32.3 0.98Ligule discerned (lower leaves) −69.0 32.9 0.87LF
tallti
3e
ltl
ig. 6. Effective linear duration (◦Cd) of linear extension (Phase III) of leavesf Pioneer 3527 (�), C87 (experiment 1) (�), C87 (Experiment 2) (©) and Dea�) plotted against leaf position (LN). Vertical error bars represent ± S.E.
etic event and another is the vertical difference between pairsf regression lines as shown in Fig. 7—for example the dura-ion from initiation of primordia to full leaf extension is theistance between the bottom and top regression lines. Slopesf the regressions, representing thermal interval between spe-ific ontogenetic events for successive leaves are presented inable 5. The analysis shows regularity of thermal intervals forvents on individual leaves and for successive leaves, though
he interval of sheath being discernable changes at leaf 12. Theegressions show the thermal interval for leaf tip appearancend full leaf expansion (all leaves) and the ligule being dis-ernable (for ligules to leaf 12) do not differ greatly. However,ig. 7. Thermal time from emergence to presence of leaf primordia, ligule beingiscernible, tip appearance and full extension of leaves of Pioneer 3527 (©),87 (experiment 1) (�) and C87 (experiment 2) (�) plotted against leaf position
LN). Solid symbols are used for all except ‘ligules discernible’, for which openymbols are used.
oatmdwtptr
FiaNmlT
igule discerned (upper leaves) 108.8 15.8 0.90ull leaf extension 173.3 27.4 0.98
hermal intervals for formation of leaf primordia (all leaves)nd sheaths of upper leaves being discernable are considerablyower (Table 5). Also, thermal intervals for tips appearance andigules being discerned are identical until leaf 12, above whichhe interval between one ligule and the next being discernables approximately halved (Table 5).
.3.5. Relationship between final organ length andxtension rate during Phase III
Plotting linear extension rate against final organ length ofeaves (Fig. 8) suggested that there may have been groups inhe data for lower and upper positions on the stem, a simi-ar pattern also emerging for laminae. Relationships in subsetsf the data with the top two leaves excluded (e.g. below andbove the longest leaf, below and above NP = 0.6) were inves-igated by regression until coefficients of determination were
aximised for individual cultivars, planting times and combinedata (Table 6). The analysis showed that two linear equations inhich both the intercept and slope differed described the rela-
ionships (Fig. 8) for the combined data. Similarly, for individual
lanting dates x cultivar combinations, two equations describedhe groups (Table 6), but there were no trends that could beelated to other plant characteristics, such as total leaf number.ig. 8. Final leaf length (cm) plotted against extension rate (cm ◦Cd−1) dur-ng the linear phase (Phase III) for Pioneer 3527 (©), C87 (experiment 1) (�)nd C87 (experiment 2) (�). Open symbols are for organs up to and includingP = 0.6 (i.e. 12, 13 and 14 in P3527 and C87 – experiment 1 and C87 – experi-ent 2). Filled symbols are for positions above NP = 0.6, excluding the top two
eaves. Regressions for the groups and combined data shown are presented inable 6.

222 C.J. Birch et al. / Europ. J. Agro
Table 6Coefficients a and b in the linear regression y = a + bx, where y = extension rateduring the linear phase of extension and x = final organ length, for leaves ofmaize cultivars Pioneer 3527 (experiment 1) and Pioneer C87 (experiments 1and 2) at Gatton, Australia
Cultivar Planting date Phytomerposition
a b r2
P3527 4 October 1999 1–12 0.24 0.00347 0.9013–18 0.10 0.00394 0.85All (1–18) 0.20 0.00327 0.82
C87 4 October 1999 1–13 0.14 0.00378 0.9114–20 No regressionAll (1–20) 0.13 0.00393 0.81
17 January 2000 1–14 0.22 0.00317 0.8315–22 0.16 0.00413 0.88All (1–22) 0.16 0.00365 0.72
Both cv 17 January 2000 NP ≤ 0.6 0.21 0.00354 0.88NP > 0.6 0.08 0.00430 0.78
All data 0.16 0.00367 0.81
Lma
4
lnapnr1cspe
aaappHrl
A
cea
aa
eL
bmnsipoempatsinshtDl
4
4
abtttpwdt
llbeopsdelc
udoP1t
eaf positions, numbered from bottom to top, are for below and above nor-alised position (NP) = 0.6, or for all positions. The flag leaf and one below it
re excluded from the regressions.
. Discussion
This study was undertaken under water and nutrient non-imiting conditions. Leaf size and rate of leaf production doot decline until nitrogen supply is severely limiting (Vos etl., 2005), so the results here should be able to be applied tolants suffering mild to moderate nitrogen stress. They shouldot be applied to water stressed situations, as leaf extensionate and final length are reduced by water stress (Robertson,994; Tardieu et al., 2000). Also, though the analysis is relativelyomplex, it attempts to address biological processes, whereas aimpler approach involving a lesser number of parameters mayrovide more accurate estimates, but be less informative (Hilliert al., 2005).
Leaf and lamina length could be related to maximum lengthnd position of the longest leaf; Eq. (1) establishes that a similarpproach to predicting leaf and lamina length as used for leafrea (Dwyer and Stewart, 1986; Birch et al., 1998a) may beossible. It was not possible to relate coefficients in Table 1 tolant parameters such as TL, as the range in TL was too narrow.owever, the coefficients a, b and Ao in an analogous equation
elating individual leaf area (A) to area of the largest leaf (Ao),eaf position (LN):
= Ao exp (a(LN − LNo)2 + b(LN − LNo)3) (5)
ould be related to TL (Birch et al., 1998a), so it would bexpected that with a wider range in TL, relationships between, b and LNo and TL would be found.
This study has extended the applicability of the four phasenalysis of organ extension from internodes of maize (Fournier
nd Andrieu, 2000a,b; Birch et al., 2002) to laminae and sheaths.The analysis found that there were differences in some param-ters according to leaf position. When expressed as a function ofN, the proportion of leaves present as laminae was described
ucct
nomy 27 (2007) 215–224
y two curvilinear equations, and these could provide a usefuleans of apportioning leaf length into its component lami-
ae and sheaths. The initial rapid increase is associated withome of the leaves present in the embryo which have very shortnternodes. The subsequent small decline in percentage of leavesresent as lamina ends with the onset of stem extension, intern-de 6 or 7 being the first to elongate in these experiments (Bircht al., 2002). Also, leaves 7 and above are initiated after ger-ination and are autotrophic, whereas lower leaves depending
artly or wholly on carbohydrate reserves in the seed (Padilland Otegui, 2005; Karim et al., 2000). The near linear increaseo 85% of the leaves present as laminae up to leaf 13 or 14 corre-ponds closely to the range in which final internode lengths alsoncrease (Birch et al., 2002). Over this range, sheath length didot differ greatly, while lamina and total leaf length increasedubstantially. The decline in proportion of leaf present as laminaigher on the stem arises from the greater proportionate reduc-ion in lamina than sheath length (Fig. 1), a trend also found inea and Nobilis grown in France (Andrieu et al., 2006), with
esser numbers of leaves (15) than here (20–24).
.1. Kinetics of individual organs
.1.1. Relative extension ratePhase II of exponential extension could be detected in sheaths
nd leaves for all leaves, and Phase I could be detected in sheaths,ut only for the upper leaves. As discussed by Hillier et al. (2005)he ability to distinguish or not exponential phases depends onhe duration of each phase and on the contrast in RER betweenhe two phases. In lower leaves, Phase I of sheath extensionrobably occurred earlier and may have been quite short. Thoughe had not enough measurements to precisely quantify the RERuring Phase II of sheath, data shown in Fig. 4a strongly suggesthat it is equal to the RER of during Phase II for laminae.
It is interesting to note that a ratio of 12% between currentength and final leaf length was a good criterion for estimating theength of an organ at the end of Phase II. Similarly, a ratio of 1.5%etween current length and final leaf length (approximately thexpected length of the multiplication zone) was a good estimatorf the end of Phase I for upper sheaths. This, together with therevious observation, that Phase II is similar between leaves andheaths suggests that the length of the elongation zone and theistribution of RER within the zone are conservative during leafxtension. The existence of a longer Phase I for sheaths of uppereaves may, however, indicate that RER within the division zonehanged over time.
There were no significant differences among the varietiessed here in RER during Phase II of laminae and though fewerata were available, sheaths; a finding similar to that for intern-des (Birch et al., 2002). The tendency to lower RER values forhase II higher on the stem, and particularly for the uppermost–2 leaves is consistent with findings of Andrieu et al. (2006),hough their data is for combined Phases I and II and RER val-
es were higher. The higher values in Andrieu et al. (2006) areonsistent with higher values for Phase II for internodes of theultivar Dea than in P3527 and C87 (Birch et al., 2002). Fur-her, the data in the present study shows similar trends to that for
. Agro
Pitdfitroa
4e(dsalwasSeso2
pSiaishcdpifiw
wgpsoiasotfHnats
ottt–tofm
4e
pinIsufiieiirl
5
altam(aaoltetpsbdc
A
Q
C.J. Birch et al. / Europ. J
hase II of internodes in Birch et al. (2002). The values for lam-nae and leaves though were higher than for internodes, whereashose for sheaths were similar, especially above LN 11. As weo not have data for leaves below position 8 or detailed dataor organs when they were very short, future research shouldnclude intensive sampling to allow comparison of trends withhose for Dea in Andrieu et al. (2006). The similarity of trendsevealed in the data that is available suggests that other aspectsf extension of leaves not studied in detail here will be similar,lbeit the absolute values of parameters may differ.
.1.1.1. Thermal interval between ontogenetic events in leafxtension. The regularity in patterns of thermal intervalsFigs. 5 and 6) can be explained by the differing rates and thermalurations of extension of organs (Fig. 4a and b), which compen-ate for the differing lengths of leaves and component laminaend sheaths on the stem (Fig. 1). We have few data for the first feweaves, most of which were in any case present in the embryo, andhich only undergo extension after germination. Lower leaves
ppear to consistently have different extension characteristicso differing thermal durations between events seems consistent.imilarly, the uppermost 1 or 2 leaves generally have differingxtension characteristics (Robertson, 1994; Andrieu et al., 2006)upporting findings in the present study. The upper few intern-des also differ in extensions rates from lower ones (Birch et al.,002), so the pattern appears consistent across organs.
Our data illustrates clear coordination of events within thelant, a general feature in grasses (Rickman and Klepper, 1995;kinner and Nelson, 1995; Fournier et al., 2005). Regularities
n thermal intervals for formation of leaf primordia, leaf tipppearance and full expansion of leaves have been investigatedn maize (Padilla and Otegui, 2005; Soler et al., 2005). In thistudy the position of the ear, at LN position 12 or 13 seems toave an important influence, with rates of most extension pro-esses changing at (e.g. linear extension rate, sheath becomingiscernable) or just below (e.g. RER of leaves and sheaths) thisosition. Also, consistent with these changes, final leaf lengthncreases to this position and decreases on higher leaves. Thisnding is similar to that for internodes (Birch et al., 2002), inhich the position of the ear was important.While the growth of the ear was not studied in the present
ork, expansion of the upper leaves, extension of the stem androwth of the ear proceed simultaneously. Consequently, sup-ly of assimilate and growth substances must be shared amongeveral actively growing sinks, with competition among themccurring. By contrast, during earlier growth, the canopy isncreasing in size, thus the availability of assimilate increases,nd prior to the onset of stem (internode) extension, the onlyinks are expanding leaves and roots. Hence, increases in ratesf extension of leaves and final leaf size may be explained inerms of assimilate supply. Later in plant growth, competitionor assimilate may reduce rates of leaf extension and thus size.owever, the reduction in interval between one ligule and the
ext being discernable in the vicinity of leaf 12 is interesting,nd implies that developmental changes associated with the ini-iation of the reproductive organs impact on leaf growth, andpecifically, the duration of extension of laminae. This confirmsAlac
nomy 27 (2007) 215–224 223
bservations reported in Dea (Andrieu et al., 2006) and supporthe idea that reproductive development may regulate leaf sizehrough a change in the regulation of developmental timing ofhe phases of leaf extension rather than – or in combination withcompetition for assimilates. It would be interesting to examine
his concept with maize plants with a greater or lesser numberf leaves—specifically, whether the change in thermal intervalsrom one ligule being discernable to the next changes in the sameanner as position of the ear does.
.1.2. Relationship between final organ length and linearxtension rate
Fournier and Andrieu (2000a,b) identified two subsets ofositions along the shoot differing by the relationship betweennternode extension rate and final length. In this study, exami-ation of the relationship between extension rate during PhaseII and final organ length (Fig. 8, Table 6) also revealed twoubsets of laminae and leaves. These corresponded to lower andpper leaves, within which rates of extension were related tonal length of organs, a behaviour similar to that for internodes
n Dea, P3527 and C87 (Fournier and Andrieu, 2000a,b; Bircht al., 2002). The explanation may be similar to that proposedn Birch et al. (2002) for internodes that extend simultaneouslyn that plant resources are preferentially allocated to stem andeproductive structures that grow simultaneously with uppereaves.
. Conclusions
This study has confirmed and extended the analyticalpproach of Fournier and Andrieu (2000a) for internodes toeaves (laminae plus sheaths) and sheaths. It complementshe previously reported application (Birch et al., 2002) of thepproach for analysis of internode extension of maize in auch warmer environment than used by Fournier and Andrieu
2000a,b). Thus, a single approach to the analysis of extension ofll organs on maize appears applicable. It would be useful to beble to describe the pattern of organ extension by using only oner a few easily measurable plant parameter, as the total number ofeaves depends on genotype and environmental conditions prioro tassel initiation and largely determines the schedule of organxtension. The regular patterns presented in this work, indicatehat total number of leaves and position of the ear may be usefularameters on which to base description and modelling of exten-ion of vegetative organs of the maize plant. The concept shoulde tested on a wider range of genotypes and environmental con-itions. Relationships between parameters and environmentalonditions, specifically temperature should be explored further.
cknowledgements
The financial support of the senior author by University ofueensland, Australia and Institut National de la Recherche
gronomique (INRA), France from which a post-doctoral fel-owship was received is gratefully acknowledged. The authorslso wish to thank Mr. A.J. Foster and Mr. R.J. Bell, Techni-al Officers, The University of Queensland, for assistance with

2 . Agro
dr
R
A
A
B
B
B
B
B
B
C
C
D
D
D
D
F
F
F
F
F
G
H
H
H
K
K
L
L
M
M
P
R
R
R
S
S
S
T
T
V
24 C.J. Birch et al. / Europ. J
ata collection. We also acknowledge the helpful comments ofeviewers of this paper.
eferences
diku, S.G.K., Rose, C.W., Gabric, A., Braddock, R.D., Carberry, P.S., McCown, R.L., 1998. An evaluation of the performance of maize and cowpeasole and intercropping systems at two savanna zones of Ghana: a simulationstudy. In: Tijskens, L.M.M., Hertog, M.L.A.T.M. (Eds.), Proceedings of theSymposium on Applications of Modelling as an Innovative Technology inthe Agri-Food Chain—Model-IT. ACTA Horticulturae 476. InternationalSociety of Horticultural Science, pp. 251–262.
ndrieu, B., Hillier, J., Birch, C., 2006. Onset of sheath extension and durationof lamina extension are major determinants of the response of maize laminalength to plant density. Ann. Bot. 98, 1005–1016.
artels, R.H., Beatty, J.C., Barsky, B.A., 1987. An Introduction to Splines forUse in Computer Graphics and Geometric Modeling. Morgan Kaufmann,Los Altos, CA.
en Haj Salah, H., Tardieu, F., 1996. Quantitative analysis of the combinedeffects of evaporative demand and light on leaf extension rate in well wateredfield and laboratory grown plants. J. Exp. Bot. 47, 1698–1989.
irch, C.J., Andrieu, B., Fournier, C., 2002. Dynamics of internode and stemextension in three cultivars of maize. Agronomie 22, 511–524.
irch, C.J., Hammer, G.L., Rickert, K.G., 1998a. Improved methods for pre-dicting individual leaf area and leaf senescence in maize (Zea mays). Aust.J. Agric. Res. 49, 249–262.
irch, C.J., Vos, J., Kiniry, J.R., Bos, H.B., Elings, A., 1998b. Phyllochronresponds to acclimation to temperature and irradiance in maize. Field CropRes. 59, 187–200.
irch, C.J., Vos, J., van der Putten, P.E.L., 2003. Crop development and canopyproduction in contrasting cultivars of maize grown in a cool temperate envi-ronment. Eur. J. Agron. 19, 173–188.
arberry, P.S., Muchow, R.C., Hammer, G.L., 1993. Modelling the genotypicand environmental control of leaf area dynamics in grain sorghum. II. Indi-vidual leaf level. Field Crop Res. 33, 311–328.
helle, M., Andrieu, B., 1999. Radiative models for architectural modelling.Agronomie 19, 225–240.
algleish, N., Foale, M., 1998. Soil Matters—Monitoring Soil Water and Nutri-ents in Raingrown Farming. Agricultural Production Systems Research Unit,Toowoomba, Australia.
arby, H., Lauer, J., 2004. Plant physiology—critical stages in the life of acorn plant, pp 17–24, Field Corn. (online) http://www.mn.nrcs.usda.gov/technical/ecs/pest/planningaids (accessed January 5, 2007).
urand, R., Bonhomme, R., Derieux, M., 1982. Seuil optimal des sommesde temperatures, application au mais (Zea mays L.). Agronomie 2, 587–589.
wyer, L.M., Stewart, D.W., 1986. Leaf area development in field grown maize.Agron. J. 78, 334–343.
ournier, C., Andrieu, B., 1999. ADEL–maize: an L-system based model forthe integration of growth processes from the organ to the canopy. Appli-cation to regulation of morphogenesis by light availability. Agronomie 19,313–327.
ournier, C., 2000. Modelisation des interactions entre plantes au sein des peu-plements. Application a la simulation des regulations de la morphogeneseaerienne du maıs (Zea mays L.) par la competition pour la lumiere. Thesede doctorat. Institut National Agronomique Paris-Grignon, Paris.
ournier, C., Andrieu, B., 2000a. Dynamics of the extension of internodes in
maize (Zea mays L.): analysis of phases of extension and their relationshipsto leaf development. Ann. Bot. 86, 551–563.ournier, C., Andrieu, B., 2000b. Dynamics of the extension of internodes inmaize (Zea mays L.). Effects of shade treatment on extension patterns. Ann.Bot. 86, 1127–1134.
Y
nomy 27 (2007) 215–224
ournier, C., Durand, J.L., Ljutovac, S., Schaufele, R., Gastal, F., Andrieu, B.,2005. A functional–structural model of elongation of the grass leaf and itsrelationships with the phyllochron. New Phytol. 166, 881–894.
uo, Y., Ma, Y., Zhan, A., Li, B., Dingkuhn, M., Luquet, D., de Reffye, P., 2006.Parameter optimization and field validation of the functional–structuralmodel GREENLAB for maize. Ann. Bot. 97, 217–230.
anan, J.S., 1997. Virtual plants—integrating architectural and physiologicalplant models. Environ. Model. Softw. 12, 35–42.
esketh, J.D., Warrington, I.J., Reid, J.F., 1988. The dynamics of corn canopydevelopment: phytomer ontogeny. Biotronics 17, 69–77.
illier, J., Makowski, D., Andrieu, B., 2005. Maximum likelihood inference andbootstrap methods for plant organ growth via multi-phase kinetic models andtheir application to maize. Ann. Bot. 96, 137–148.
arim, M.A., Fracheboud, Y., Stamp, P., 2000. Effect of high temperature onseedling growth and photosynthesis of tropical maize genotypes. J. Agron.Crop Sci. 184, 217–223.
eating, B.A., Wafula, B.M., 1992. Modelling the fully expanded area of maizeleaves. Field Crop Res. 29, 163–176.
auer, J.G., 1998. The Wisconsin comparative relative maturity system (CRM)for corn, Field Crops 28.31-21 (online) http://corn.agronomy.wisconsin.edu(accessed March 10, 2006).
jutovac, S., 2002. Coordination dans l’extension des organes aeriens etconsequence pour les relations entre les dimensions finales des organes chezle ble. These de doctorat. Institut National Agronomique Paris-Grignon,Paris, France.
ahalatti, M.N., 1998. Modelling interactions in grass—clover mixtures. Ph.D.Thesis. Wageningen Argicultural University, The Netherlands.
alvoisin, P., 1984. Organogenese et croissance du maıtre-brin du ble ten-dre (Triticum aestivum) du semis a la floraison. II. Controle des relationsentre la croissance et la vascularisation de la tige et des feuilles. Essai demodelisation. Agronomie 4, 587–596.
adilla, J.M., Otegui, M.E., 2005. Co-ordination between leaf initiation andleaf appearance in field-grown maize (Zea mays): genotypic differences inresponse of rates to temperature. Ann. Bot. 96, 997–1007.
eid, J.F., Zur, B., Hesketh, J.D., 1990. The dynamics of a maize canopy devel-opment. 2. Leaf area expansion. Biotronics 19, 99–107.
ickman, R.W., Klepper, B.L., 1995. The phyllochron: where do we go in thefuture? Crop Sci., 44–49.
obertson, M.J., 1994. Relationships between internode extension, plant heightand leaf appearance in maize. Field Crop Res. 38, 135–145.
chafer, B.M., Ritchie, A.M., Strachan, D.B., 1986. Soils of the QueenslandAgricultural College farm, Darbalara. Queensland Agricultural College,Technical Paper No. 7.
kinner, R.H., Nelson, C.J., 1995. Elongation of the grass leaf and its relationshipwith the phyllochron. Crop Sci. 35, 4–10.
oler, C.M.T., Sentelhas, P.C., Hoogenboom, G., 2005. Thermal time for pheno-logical development of four maize hybrids grown off-season in a subtropicalenvironment. J. Agric. Sci. 143, 169–182.
ardieu, F., Granier, C., Muller, B., 1999. Modelling leaf expansion in a fluctuat-ing environment: are changes in specific leaf area a consequence of changesin expansion rate? New Phytol. 143, 33–43.
ardieu, F., Reymond, M., Hamard, P., Granier, C., Muller, B., 2000. Spatialdistributions of expansion rate, cell division rate and cell size in maizeleaves: a synthesis of the effects of soil water status, evaporative demandand temperature. J. Exp. Bot. 51, 1505–1514.
os, J., van der Putten, P.E.L., Birch, C.J., 2005. Effect of nitrogen supply on leafappearance, leaf growth, leaf nitrogen economy and photosynthetic capacityin maize. Field Crop Res. 39, 64–73.
ang, H.S., Dobermann, A., Cassman, K.G., Walters, D.T., 2000. Hybrid-Maize(2005). A Simulation Model for Corn Growth and Yield. Nebraska Coop-erative Extension CD 9, Version 2005. University of Nebraska-Lincoln,Lincoln, NE (online) http://www.hybridmaize.unl.edu/Assets/UserMAnual(accessed March 3, 2006).