kinetics of contractile activation in voltage clamped frog skeletal muscle fibers
TRANSCRIPT

Biophysical Journal Volume 73 October 1997 1999-2011
Kinetics of Contractile Activation in Voltage Clamped Frog SkeletalMuscle Fibers
Peter Szentesi, Zoltan Papp, Geza Szucs, Ldsz1o Kovacs, and Laszlo CsernochDepartment of Physiology, University Medical School Debrecen, Debrecen, Hungary H-4012
ABSTRACT Excitation-contraction coupling events leading to the onset of contraction were studied in single skeletal frogmuscle fibers. This entailed the simultaneous measurement of the changes in intracellular calcium concentration usingantipyrylazo Ill and fura-2, isometric force, and clamp voltage in a modified single vaseline gap chamber for the first time. Thecalcium transients were incorporated into an analysis of calcium binding to regulatory sites of troponin C (TnC) that permittedboth a linear and a cooperative interaction. The analysis assumed that the onset of mechanical activation corresponds witha particular TnC saturation with calcium setting constraints for the calcium binding parameters of the regulatory sites. Usinga simple model that successfully reproduced both the time course and the relative amplitudes of the measured isometric forcetransients over a wide membrane potential range, koff of TnC was calculated to be 78 s- 1 for the cooperative model at 1 00C.Together with the above constraints this gave a dissociation constant of 8.8 2.5 ,uM and a relative TnC saturation at thethreshold (Sth) that would cause just detectable movement of 0.17 ± 0.03 (n = 13; mean ± SE). The predictions were foundto be independent of the history of calcium binding to the regulatory sites. The observed delay between reaching Sth and theonset of fiber movement (8.7 ± 1.0 ms; mean ± SE, n = 37; from seven fibers) was independent of the membrane potentialgiving an upper estimate for the delay in myofilament activation. We thus emerge with quantitative values for the calciumbinding to the regulatory sites on TnC under maintained structural conditions close to those in vivo.
INTRODUCTION
Excitation-contraction coupling in skeletal muscle, initiatedby the application of a depolarizing step, can culminate inthe appearance of a just-detectable muscle contraction. Therequired size of such depolarization depends on pulse du-ration. Adrian et al. (1969) explained such a strength-dura-tion relationship in terms of the buildup of a hypotheticalactivator to a critical level for each such pulse. Horowiczand Schneider (1981) subsequently associated thresholdcontraction with a fixed transfer of intramembrane chargeindependent of the size and duration of the clamp pulse, andthus equated the proposed activator with the intramembranecharge movement. Melzer et al. (1986b), on the other hand,equated a critical amount of charge to the just-detectablerelease of calcium from the sarcoplasmic reticulum (SR).Intramembrane charge being the proposed activator wasquestioned by Miledi and co-workers (1983) who suggestedthe equality of the intracellular calcium concentration([Ca]2+]) at the just-detectable contraction.
However, Kovalcs et al. (1987) demonstrated that thecalcium transients associated with the onset of just-detect-able movement depended on the size and duration of thedepolarizing pulse. They proposed instead that differentpoints on the strength-duration curve for the contractionthreshold corresponded to equal occupancies of the regula-tory sites of troponin C (TnC) by calcium.
Receivedfor publication 21 October 1996 and in final form 18 June 1997.Address reprint requests to Laszl6 Csemoch, Department of Physiology,University Medical School Debrecen, Debrecen, P.O. Box 22, HungaryH-4012. Tel.: (36)-52-416-634; Fax: (36)-52-432-289; E-mail:[email protected] 1997 by the Biophysical Society0006-3495/97/10/1999/13 $2.00
The present work goes on to analyze the experimentalstrength-duration curve within the framework of a hypoth-esis that the onset of contraction depends upon a criticaloccupancy of the regulatory sites on TnC. The analysisexamined whether this hypothesis would lead to an inter-nally consistent description of the calcium binding to TnC.It also tested whether this simple assumption would allowthe determination of the parameters of calcium binding tothis regulatory protein. Although the presence of a thresholdsaturation, as will be shown, did set constraints for theseparameters, their exact value could not be determined basedsolely on this assumption. An independent estimation had,therefore, to be introduced for one of the parameters bymeasuring and then fitting the force transients using asimple model of actomyosin interaction.The analysis emerged with values for the calcium binding
properties, and with a fixed value of the threshold occu-pancy of the regulatory sites on TnC in conditions close toin vivo and maintained filament structure. These valuesagree with earlier biochemical data and the independentanalysis of Kovacs et al. (1987). The measurements alsorevealed an -9 ms difference between the calcium bindingto TnC and the actual shortening, giving an upper estimatefor the time necessary for the conformational changes andinteractions within the contractile filaments.
Preliminary accounts on parts of this work have previouslybeen published (Csernoch et al., 1994; Kovacs et al., 1995).
METHODS
Preparation and solutionsThe frogs (Rana esculenta) were killed by rapid decapitation, followed bypithing. The dissection of single skeletal muscle fibers from the semiten-
1 999

Volume 73 October 1997
dinosus muscles and the mounting of single fibers in a single vaseline-gapvoltage clamp were done as described earlier in detail (Kovacs et al., 1987).Briefly, the mechanical separation of fibers was carried out in Ringer'ssolution (in mM, 115 NaCl, 2.5 KCI, 1.8 CaCl2, and 1 Tris sodiummaleate) and the fiber was then transferred to the recording chamber. Aftercompleting the vaseline isolation the fiber segment in the open-end poolwas permeabilized by applying a solution containing 0.01% saponin for30 s. This solution was then exchanged to an internal solution containing,in mM, 102.5 Cs-glutamate, 5.5 MgCl2, 5 Na2ATP, 6 glucose, 5 creatinephosphate, 17.7 Tris maleate, 0.0082 CaCl2, and 0.1 EGTA. The solutionin the closed-end pool was exchanged to an external solution (in mM) 125TEA-CH3SO3 (tetraethylammonium methanesulfonate), 5 Cs-HEPES, 2CaCl2, and 10-7 g/l TTX. All solutions were pH = 7.00 + 0.05. The dyesantipyrylazo III (APIH) and fura-2 were applied in the internal solution in1 mM and 50 ,uM concentration, respectively. Fura-2 was purchased fromMolecular Probes, Inc. (Eugene, OR), and APIII from ICN Biochemicals,Inc. (Cleveland, OH); all other reagents were of analytical grade.
Fibers were connected to the force transducer with metal clips attachedto the tendon. The sarcomere length was 2.0 - 2.4 ,um as measured byocular micrometer at 600x magnification. Although the contractions stud-ied in this paper can be regarded as close to isometric, strong depolarizationdid cause the fibers to shorten by stretching the tendon (fibers seemed to beheld fast at the cut end so contraction did not pull fiber portions out of thevaseline seal). Optical detection of tendon displacement (see below) re-vealed that these changes in fiber length were <5%. The measurementswere carried out at low (8-11°C) temperatures to reproduce the experi-mental conditions in earlier studies (Adrian et al., 1969) and to enable thecharacterization of rapid events.
Experimental set-up
Fibers were voltage clamped as described earlier (Kovacs et al., 1987) andthe holding potential was set to -100 mV in all cases. The optical set-upwas essentially the same as described in detail elsewhere (Klein et al.,1988; Sarkozi et al., 1996). In brief, the experimental chamber was placedon the optical bench of an upright microscope and transilluminated usinga tungsten halogen light source. The fiber was also epi-illuminated at 380or 358 nm using a 75 W xenon arch lamp (Oriel 60000; Stratford, CT). Thetransmitted light intensities were measured at 720 and 850 nm usinginterference filters (Omega Opticals, U.S.A.) with 20 nm bandwidth whilethe fluorescence of fura-2 was detected at 510 nm using an interferencefilter (Omega Opticals, U.S.A.) with a bandwidth of 40 nm. Force devel-opment was measured using an AE801 force transducer (SensoNor,Horten, Norway) coated with silicon rubber to ensure electric isolation.
Data were acquired simultaneously on six channels (current, voltage,light intensities at 510, 720, and 850 nm, and force) using an online-connected computer. The analog to digital conversion was done on 12 bitsat every 250,us. Four consecutive points were averaged to yield thecorresponding data point for every ms.
Calculation of the APIII calcium transients andthe saturation of fura-2
Changes in intracellular free calcium concentration below the contractionthreshold were calculated from the APIII and intrinsic fiber absorbancemeasured at 720 and 850 nm, respectively, as described earlier (Melzer etal., 1986a) using the kinetic correction (Csernoch et al., 1991). For su-prathreshold depolarizations (see Results) composite calcium transients,calculated from APIII absorbance and fura-2 fluorescence, were used(Sark6zi et al., 1996).
To calculate the relative saturation of fura-2 with calcium (Sf = [Ca-fura-2]/[fura-2]T, where [Ca-fura-2] denotes the calcium bound to fura-2while [fura-2]T the total fura-2 present) we followed the method describedby Klein et al. (1988) and Csernoch et al. (1993). The fluorescenceintensity was measured at 380 nm (F380) during the pulse while thefluorescence intensity using 358 nm (F358) as the incident light was linearly
extrapolated from measurements done between pulses. The Sf was thencalculated from
Sf = (R-Rmin)/(Rmax -Rmin) (1)where R denotes F380/F358, while Rmax and Rmin are the maximal andminimal values of R. To determine the rate constants (ko,,nf and k.ff,f) of thecalcium fura-2 reaction the
dR/dt = k..,f [Ca2]i* (Rmax- Rmin) -koff,f (R - Rmin)(2)
differential equation was fitted using the calcium transient measured withAPHI (Klein et al., 1988). This method gave a direct, and internallyconsistent, calibration of the fura-2 signal inside the muscle fiber. Rear-ranging Eq. 2 and solving for [Ca2+]i allowed us to calculate the calciumconcentration changes in contracting fibers using the parameters deter-mined from subthreshold pulses.
It should be noted that both dyes have been reported to bind tomyoplasmic constituents (Baylor et al., 1986; Konishi et al., 1988). Thismight change their calcium binding properties, rendering the magnitude ofthe calculated [Ca2+]i inadequate. Although this influences the obtainedkon of TnC the other parameters are not affected (see Discussion).
Optical detection of fiber contractionThe contraction threshold was determined visually at 400X magnificationas described by Kovacs et al. (1987). The optical signal accompanyingfiber shortening was dissected from the absorbance change measured at850 nm where APIII has no absorbance.
The displacement of the tendon was measured according to Kovacs etal. (1987). In brief, a small alufoil was attached to the tendon and the slitwas positioned so that upon contraction the alufoil covers greater andgreater areas of the slit. The resulting decrease in light intensity was takenas the representation of tendon displacement. The alufoil was long enoughto allow the placing of the slit far to the side of the fiber so fiber portionsnever interfered with the measurements. Measuring the total light intensityusing slits of different length enabled us to convert the optical data intoactual displacement. It should be noted that the illumination of the slit wasfound to be homogenous; therefore, the changes in light intensity were
linearly related to displacement (i.e., when AI/I was -0.01 the alufoilmoved by 1% of the length of the slit).
Statistical analysis and curve fittingAll averages are expressed as mean ± standard error of the mean (SE).Statistical significance was calculated using Student's t-test. To assess the[Ca2+]i dependence of peak force the Hill equation was used:
FmaxF= n-Papao
(3)
where Fmax is the maximal force that the fiber can develop, pCa50 is thenegative logarithm of calcium concentration at which half maximal force ismeasured, and n is the index of cooperativity. The voltage (Vr) dependenceof peak force (F) was fitted with the following equation:
F = 1+&FmaVI + e-(V.-V')/N (4)
where Fmn, has the same meaning as above, V' is the voltage where halfmaximal force is achieved, and k is the slope factor. Curves were fittedusing the least-squares algorithm of Nelder and Mead (Johnson and Faunt,1992). Latencies were calculated by fitting straight lines to the data pointsbefore the change in the trace and examining the variance of the deter-mined slope as described earlier (Close, 1981).
2000 Biophysical Journal

Kinetics of Contractile Activation
TheoryCalculation of thin filament activation
The calculation of the binding of calcium to different intra-cellular binding sites followed the method of Csernoch et al.(1993) assuming the main buffers to be parvalbumin andtroponin C. Both proteins were assumed to have two high-affinity calcium-magnesium sites, with TnC also havingtwo low-affinity, calcium-specific sites, the binding towhich initiates contraction.The calcium binding to the regulatory sites of TnC was
assumed to follow a simple four state scheme (S1) whereT(0, 0) and T(1, 1) denotes the sites when both are free or
occupied by calcium, while T(1, 0) and T(0, 1) stand for site1 or site 2 alone having calcium bound, respectively. Thebinding of the first calcium was assumed to increase theaffinity for the second by a factor of 10 (cooperative bind-ing). For comparison calculations were done with the same
affinity for both sites (independent binding) as well. Therelative saturation (St = [Ca-Tn]/[Tn]T, where [Ca-Tn] de-notes the concentration of calcium bound to both regulatorysites and [Tn]T the concentration of these sites) was thencalculated by numerically integrating the differential equa-tions resulting from SI.
T(0, 1)
T(0, 0) T(1, 1) (S1)
T(1, 0)
When calcium was bound to the regulatory sites on a TnCmolecule (calcium bound inhibited state) the adjacent tro-pomyosin was assumed to change its conformation to en-
able the actin and myosin interaction (calcium bound dis-inhibited state). These two states were assumed to be ininstantaneous equilibrium. In the model this was manifestedas an increase of the association rate of actin and myosin inthe actomyosin model used (see below). Since neighboringtropomyosins were reported to interact (Wegner, 1979;Geeves and Lehrer, 1994) the probability that the activationof one will activate the next, even though its troponin C was
free of Ca2 , was also included.
To account for the activation by calcium the attachmentrate of myosin to actin (k+2) was increased 20X if the actinfilament moved from the "calcium bound inhibited" to the"calcium bound disinhibited" state. To calculate the gener-ated force first the differential equations resulting from S2
dXl/dt =-k+l X1 + k-I * X2 + k+-4 * X4, (5a)
dX2/dt=k+jXI -(k-l+k+2)-X2 +k2-X3,
dX3/dt = k+2-X2 - (k-2+ k+3) *X3 + k_3 * X4,
XI + X2 + X3 + X4 = 1,
(5b)
(5c)
(5d)
where Xi are the relative occupancies in S2, k+j and k-i arethe forward and backward rate constants, were solved. Theforce at time t (F(t)) was assumed to be proportional to theincrease in attached states (AAS), that is,
F(t)= N'AAS, (6)
where N is the proportionality coefficient (depends on thenumber of cross-bridges and on the force generated by a
single cross-bridge) and AAS = {X3(t) + X4(t)} -
{X3(t = 0) + X4(t = 0)}. To account for the increasedaffinity of calcium binding to TnC with attached cross-
bridges (Guth and Potter, 1987) koff was also varied pro-portionally with the attached states
koff(t) = koff(O)/{1 + [(M - 1) * AAS/AASmax]}, (7)
where k0ffO) is the rate at rest (t = 0), M is the relativechange in affinity, and AASm,, is the maximal change in
attached states.
Implementation of the model
A computer program written in PASCAL (Borland Pascal7.0) implemented the model. This first analyzed the eventsat the contraction threshold and set the constrains for thebinding properties of TnC, between kon and k0ff as well as
between Kd and the threshold saturation, Sh, (see Results).Using a set of starting values (for calcium binding to TnCand those in Table 1) the program then determined the
The actomyosin interaction
A simple four state model (Scheme 2) was used to fit themeasured force transients. Actomyosin was assumed to beeither in the detached (1 and 2) or attached (3 and 4) state.
k+3X4 (AM) - X3 (AM-ADP)
k-3
k+4
(S2)
k_2 k+2
k-
XI (M-ATP) -k+ ' X2 (M-ADP- Pi)
TABLE 1 Parameters of the acto-myosin interaction used inthe model calculations
Description Value
Transition from XI to X2 (k+1) 130 s-' (1)Transition from X2 to XI (k-,) 12 s-' (1)Association constant of M to A 104 M- l (2)Transition from X3 to X2 (k-2)Transition from X3 to X4 (k+3) 8.3 s-' (3)Transition from X4 to X3 (k3) *Detachment rate of M from A (k+4) *
M, myosin; A, actin. Abbreviations used in the text are given in parenthe-ses.*Parameters varied in fits.(1) Goldman, 1987; (2) Tregear and Marston, 1979; (3) Dantzig et al.,1992.
Szentesi et al. 2001

Volume 73 October 1997
calcium binding to the regulatory sites on TnC. The calcu-lation proceeded to determine the appearance of calciumbound disinhibited states using the relative calcium occu-pancy of TnC and Sth. This change induced the transition ofthe actin-myosin system from detached to attached states.At rest (before stimulation) 96% of actin and myosin werein the detached form, calculated as the steady-state solutionwith the parameters given in Table 1.The calculated force transient (F(t)) was then compared
to the measured. Using the method of Nelder and Mead(Johnson and Faunt, 1992) the parameters (k0ff, M, k-2, k-3,and k+4) were adjusted to obtain a least-squares fit. Thefitting procedure usually included 3-5 calcium and forcetransients and 200-300 points from each trace. It gavechi-squared (x2) values in the range of 0.001-0.005 if x2was normalized to the number of points and to the maximalattained force.
A
A [Ca2+]J
C
Sf
RESULTS
i 2
B
PM
D- 1.0
- 0
The Results are organized into three sections. The firstsection examines the events at different points of thestrength-duration curve for just-detectable contraction. Itconcludes showing that, although a clear relationship can beestablished between the different parameters of calciumbinding to TnC, they cannot be determined without addi-tional information. The second describes the simultaneousmeasurement of events in excitation-contraction coupling,changes in [Ca21]J and force, in a single vaseline gapsystem under voltage clamp control. The third sectionbrings together the results from the previous two using asimple model to fit the force transients on the basis of themeasured [Ca2+]i to emerge with values for the calciumbinding properties of TnC.
Analysis of threshold events
Calcium binding properties of troponin C
When a skeletal muscle fiber is depolarized the increase in[Ca2+]i has to exceed certain levels before contraction willoccur. Depending on the length and amplitude of the depo-larizing pulse this attained [Ca2+]i might vary. To accountfor this observation we assumed, following the line ofreasoning by Kovacs et al. (1987), that the saturation of TnChas reached a certain critical level (threshold saturation, Sfh)before just-detectable contraction occurred. In the followingwe first test whether this assumption would lead to a singleset of parameters describing the calcium binding to TnC.
In the experiment presented in Fig. 1, calcium transientswere recorded at two points of the strength-duration curvefor just-detectable contraction, namely at pulse durations of10 and 100 ms, respectively. Fig. 1, A and B show thecorresponding APIII calcium transients while C and Dpresent the saturation of fura-2 calculated from the mea-sured fluorescence. In accordance with the findings of Ko-vacs et al. (1987), the shorter pulse brought about the
E F
St
- 0.2
-0
i/ f 10 ms
FIGURE 1 Changes in the intracellular free [Ca21] (A and B) and in therelative saturation of fura-2 (C and D) and of troponin C (E and F) at twodifferent pulses of the strength-duration curve for just-detectable move-ment. The pulses were a 10 ms depolarization to -28 mV and a 100 msdepolarization to -43 mV for the left and right columns, respectively. Thechange in membrane potential is shown as the lowermost traces. The rateconstants for the calcium binding to TnC were selected so that the maximalsaturation would reach 0.2. The values were ko,, = 0.84 X 10⁷ M- I s'-l andk0ff = 85.9 s-' for the binding of the first calcium in the cooperativemodel, solid traces, and ko, = 1.18 x 10⁷ M-' s-' and koff = 76.2 s-' forthe independent binding model, dotted traces. Fiber 75, [APIII] = 628 and641 ,AM, [fura-2] = 21.5 and 22.1 AM for the left and right columns,respectively; pl = 105 ,um, d = 104 ,um, sl = 2.0 ,um, T = 9.1°C.
greater increase in [Ca2+]i, 2.9 and 1.8 ,uM for the 10 and100 ms pulse, respectively, in spite of the fact that they bothresulted in the same mechanical activation. In the 13 fibersincluded in this study these values were 2.40 ± 0.24 and1.53 ± 0.18 ,uM, respectively, the former being higher ineach and every experiment.As an example, Fig. 1, E and F show that the rate con-
stants of calcium binding to TnC can be selected so that thecalcium bound to TnC will reach the same critical level (0.2in this example) for both the 10 (Fig. 1 E) and 100 ms (Fig.1 F) pulse. The attained maximum of saturation, 0.2, cor-
2002 Biophysical Journal
mv-1 00 M\
Kinetics of Contractile Activation
responds to Sth since the increase in [Ca2+]i resulted in ajust-detectable movement. It is also demonstrated that thisselection can be made using either the cooperative (solidtraces) or the independent (dotted traces) binding model forthe calcium-TnC reaction. The rate constants used in thecalculations were kln = 1.18 x 10⁷ and 0.84 X 10⁷ M-1s 1, whereas koff = 76.2 and 85.9 s-1 for the independentand cooperative models, respectively. It should be notedthat this selection of the rate constants was unique for theparticular Sth. Suitable k00-koff pairs, however, as will beshown in Fig. 2 A and B, were to be found not only for Sth =0.2, but for any depicted saturation as well.As shown in the figure (Fig. 1, E and F) the kinetics of
the calcium bound to TnC, especially the rising phases,were almost completely independent of the model chosen.The only difference seen was a shift in the declining phaseof the transients calculated with the cooperative model. Ithas to be noted that this similarity in time courses of thecalculated calcium binding changed very little with chang-ing the desired final saturation (data not shown). Neverthe-less, increasing the maximal saturation did result in anincrease of the rate of rise during and in a slowing down ofthe decay after the depolarizing pulse. As an indication ofthe similar time courses during the rising phase, the time-to-peak of calcium bound to TnC varied little with themodel used, being 58 and 28 ms with the cooperative, while51 and 24 ms with the independent model for the 100 and 10ms pulses, respectively. Furthermore, changing the maximalsaturation from 0.1 to 0.9, the time-to-peak shifted by only2 ms, that is, from 58 to 56 ms for the 100 ms pulse and
90
50
10
50 100 0 30
kon [106 M 1s 1J k [106 M- s-1110 C
tn 5_
O - I0 5 10 15
KD LpM]
10 D
cn
5_
0 6 12 18
KD [PM]
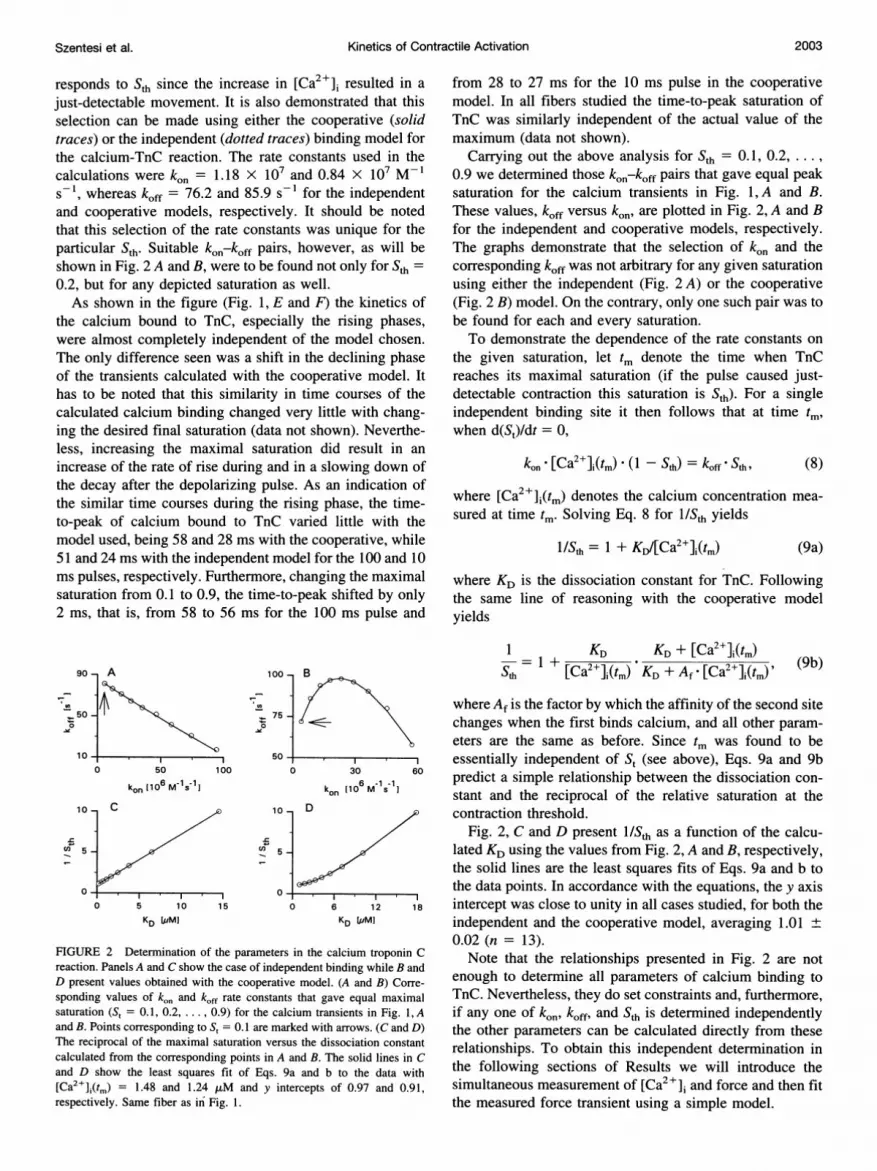
FIGURE 2 Determination of the parameters in the calcium troponin Creaction. Panels A and C show the case of independent binding while B andD present values obtained with the cooperative model. (A and B) Corre-sponding values of k0n and koff rate constants that gave equal maximalsaturation (St = 0.1, 0.2, ..., 0.9) for the calcium transients in Fig. 1, Aand B. Points corresponding to St = 0.1 are marked with arrows. (C and D)The reciprocal of the maximal saturation versus the dissociation constant
calculated from the corresponding points in A and B. The solid lines in Cand D show the least squares fit of Eqs. 9a and b to the data with[Ca21]#(tm) = 1.48 and 1.24 ,uM and y intercepts of 0.97 and 0.91,respectively. Same fiber as in Fig. 1.
from 28 to 27 ms for the 10 ms pulse in the cooperativemodel. In all fibers studied the time-to-peak saturation ofTnC was similarly independent of the actual value of themaximum (data not shown).
Carrying out the above analysis for Sth = 0.1, 0.2,.0.9 we determined those k00-koff pairs that gave equal peaksaturation for the calcium transients in Fig. 1,A and B.These values, koff versus kI., are plotted in Fig. 2, A and Bfor the independent and cooperative models, respectively.The graphs demonstrate that the selection of kIc0 and thecorresponding koff was not arbitrary for any given saturationusing either the independent (Fig. 2 A) or the cooperative(Fig. 2 B) model. On the contrary, only one such pair was tobe found for each and every saturation.To demonstrate the dependence of the rate constants on
the given saturation, let tm denote the time when TnCreaches its maximal saturation (if the pulse caused just-detectable contraction this saturation is Sth). For a singleindependent binding site it then follows that at time ti,mwhen d(St)/dt = 0,
kon - [Ca ]I(tm) . (1 - Sth) = koff* Sth, (8)
where [Ca2+]I(t,) denotes the calcium concentration mea-sured at time t,. Solving Eq. 8 for I/Sth yields
l/Sth = 1 + KD/[Ca2+]i(tm) (9a)
where KD is the dissociation constant for TnC. Followingthe same line of reasoning with the cooperative modelyields
= 1 +KD KD + [Ca2]i(tm)
-= + [Ca 2+]i(tm) KD+ Af[ 2+]i(t)' (9b)
where Af is the factor by which the affinity of the second sitechanges when the first binds calcium, and all other param-eters are the same as before. Since tm was found to beessentially independent of St (see above), Eqs. 9a and 9bpredict a simple relationship between the dissociation con-stant and the reciprocal of the relative saturation at thecontraction threshold.
Fig. 2, C and D present l/Sth as a function of the calcu-lated KD using the values from Fig. 2, A and B, respectively,the solid lines are the least squares fits of Eqs. 9a and b tothe data points. In accordance with the equations, the y axisintercept was close to unity in all cases studied, for both theindependent and the cooperative model, averaging 1.01 +0.02 (n = 13).
Note that the relationships presented in Fig. 2 are notenough to determine all parameters of calcium binding toTnC. Nevertheless, they do set constraints and, furthermore,if any one of kIn, k0ff, and Sth is determined independentlythe other parameters can be calculated directly from theserelationships. To obtain this independent determination inthe following sections of Results we will introduce thesimultaneous measurement of [Ca2+]i and force and then fitthe measured force transient using a simple model.
2003Szentesi et al.

Volume 73 October 1997
This fit enabled us to determine the dissociation rate ofcalcium from TnC yielding an average k0ff of 78 s- 1 for thecooperative, and 56 s- 1 for the independent models, respec-tively (see Table 2 and related text). Using the cooperativemodel and this fitted value for k0ff the corresponding klnwas 0.69 X 10⁷ M-1 s for the fiber presented in Figs. 1and 2. This resulted in a KD = 11.3 ,uM and a thresholdsaturation of 0.19. On average for the 13 fibers studiedkon = 0.89 ± 0.25 X 10⁷ M-1 s-', KD= 8.8 ± 2.5 ,uM andthe threshold saturation was 0.168 ± 0.031 with the coop-erative model using koff obtained from the fitting of forcetransients.
A B
[Ca2+]i 1 pjM
D ES St0. 1 -
-N
-47.1 mV
_o7L1Oo-36.9
J L1-80.
C
F
473 -57.2
_1
The threshold saturation of TnC is independent of changesin the resting [Ca2+]J,An increase in the resting calcium concentration wouldresult in a corresponding increase in the resting saturation ofthe regulatory sites on TnC. If a threshold saturation doesexist, such an increased resting saturation should decreasethe amplitude of the calcium transients required to evoke ajust-detectable contraction. Fig. 3 demonstrates that this isindeed what was observed. Resting [Ca2+]i was thereforevaried and the calcium transients corresponding to points onthe strength-duration curve were analyzed to provide anindependent test of the presence of a threshold saturation.The fiber was held at a holding potential of -100 mV and
the analysis presented in connection with Figs. 1 and 2 wascarried out. The trace in Fig. 3 A shows the APIII calciumtransient corresponding to the 100 ms pulse of the strength-duration curve while the trace in D demonstrates the calcu-lated calcium binding to TnC. The rate constants used in thecalculation were k0. = 0.47 X 10⁷ M-1 s-1 and k0ff = 78s- 1. Two interventions were then used to change the resting[Ca2+]i, namely, a subthreshold prepulse from the -100mV holding potential to -57.2 mV (Fig. 3 C) that resultedin a 327 nM increase in [Ca2+]i and the lowering of theholding potential to -80 mV (Fig. 3 B), resulting in a 84nM increase in the resting [Ca2+]i.The upper row in Fig. 3 shows the APIII calcium tran-
sients for the 100 ms pulses of the strength-duration curvecorresponding to the above interventions. The figure dem-onstrates that the higher the resting [Ca2+] and the conse-quent increase in the saturation of TnC before the pulse
TABLE 2 Parameters of the acto-myosin interaction andcalcium binding to TnC determined from the fits of compositecalcium transients to the measured force
k0ff Mean+ k-2 k3 k+4(s- l) SE (s- l) (s- 1) (s- 1)
77.9 14.8* 3.6 0.8* 19.1 ± 2.9 10.6 3.0 24.6 3.156.3 + 11.2* 5.6 ± 1.0* 18.4 ± 2.7 15.4 ± 3.3 21.7 ± 3.6
Calcium binding to the regulatory sites of TnC used the cooperative modelfor the first, and independent binding for the second row. Values aremean ± SE from six fibers.*Significantly (p < 0.04) different for the two binding models of TnC.
FIGURE 3 The effect of resting [Ca21]i on the calcium transients mea-sured at the contraction threshold (A, B, C) and on the calculated calciumbinding to TnC (D, E, F). In order to change the resting [Ca21] comparedto control (A and D) the fiber was either depolarized to -57.2 mV(threshold of just-detectable calcium release) for 100 ms (C and F) or itsholding potential was decreased to -80 mV (B and E). The changes inmembrane potential are given below the records. The rate constants of thecalcium TnC reaction were then determined for the transient in A (koI =0.47 X 10⁷ M- s -1 and 78 s'-; for details see text) and used for all tracesin the figure. The resting [Ca21]i were 128, 212, and 455 nM, as deter-mined from the fura-2 saturations before the pulse, for the traces in A, Band C, respectively. Fiber 97, [APIII] = 410-667 AM, [fura-2] = 41.3-42.6 ,uM, pl = 140 ,um, d = 78 ,um, sl = 2.0 ,um, T = 8.5-9.7°C.
were, the smaller the amplitude of the calcium transientsbecame. This decrease was likely due to the change inresting [Ca2+]i rather than to changes in fiber status, sincethe sequence of obtaining the records was A, C, and finally B.
Using the rate constants from A, the saturation of TnCwas calculated for the records with different resting [Ca2+]i.Taking the resting occupancy into account the maximalsaturations reached for these pulses were almost identical,being 0.209, 0.204, and 0.199 for D, E, and F, respectively,showing that the selection of rate constants was close toindependent of the resting calcium. There was a smalldecrease in maximal saturation with increasing resting[Ca2+]i not only in this fiber but in all five fibers studied ofthe order of 1.1 ± 0.3% for a 200 nM increase in resting[Ca2+]1.
This observation shows that the calculated threshold sat-uration of TnC was close to independent of the restingsaturation of TnC before the test pulse. It also establishesthe fact that the parameters of calcium binding to TnC donot depend on previous history. It renders the possibilitythat diffusional delays would explain the inequality of thecalcium transients corresponding to different points on thestrength-duration curve for just-detectable contractionunlikely.
Simultaneous measurement of calciumconcentration and force
The following section introduces how force and [Ca2+]i canbe measured in a single vaseline gap system. It demonstratesthat the overall parameters, voltage- and [Ca2+]i-depen-
2004 Biophysical Journal

Kinetics of Contractile Activation
dence of force were not far from those in intact and skinnedfibers, rendering the measured force transients suitable forthe determination of the calcium binding properties of TnC.It also shows that, close to the threshold, force and opticalsignals have a similar time course.
Optically detected fiber displacement reflects the timecourse of measured force
When absorbance measurements are carried out on contract-ing fibers, a late component of light intensity change can bedetected which has been associated with fiber displacementand termed movement artifact (e.g., Melzer et al., 1986a).Although this movement artifact was present at all wave-lengths, the correction of the 720 nm signal with the 850 nmsignal did not fully eliminate it. Fig. 4 A shows such acalcium transient, calculated from the signals obtained at720 and 850 nm, superimposed on the measured force. Theearly increase in [Ca21]i that preceded the development of
A t C
.'
nInB
" B
I I.~~~~~~I
S'SI
I~~~~~~~~~~I.
D
-jm
FIGURE 4 Comparison of the kinetics of the optical signals and theforce transient. (A) Superimposed records of a calcium transient, calculatedsolely from the absorbance records, and changes in force (all force tran-sients are dotted in the figure). Note that the early rise in [Ca21]J wasfollowed by a secondary broad peak, the kinetics of which resembled thetime course of the force transient. (B) Same as in A except the APIIIcalcium transient from A was replaced by the composite record. Thehorizontal tick marks the point from which [Ca21]i was calculated from thefura-2 signal. (C) Superimposed traces of force and the displacement of thetendon. Note that light intensity decrease is shown as upward deflection toease the comparison. (D) Light intensity changes measured at 850 nm onthe alufoil attached to the tendon (trace a) and on the fiber (trace b). Thesignal from the fiber showed two components from which the secondstarted at the same time and had the same kinetics as the signal representingthe displacement of the tendon. Fiber 214, the depolarizing pulse was to 0mV for 20 ms (A and C) and to -20 mV for 80 ms (B and D). APIIIconcentration ([APIII]) = 387 for panel C and 432 ,uM for panel D; pathlength (pl) = 85 ,um, horizontal diameter (d) = 80 ,um, sarcomere length(sl) = 2.5 Am, temperature (T) = 10.7°C. Vertical calibration correspondsto 1 or 2,uM, 6 ,uN, and - l0-3 (= 0.2 p.m) for [Ca21]i (A or B), force andAl/I, respectively.
force can be regarded as good estimate of the actual timecourse of calcium concentration change, whereas the broadpeak present after the pulse was most likely a movementartifact. For pulses that caused slightly suprathreshold con-tractions the time course of movement artifact and measuredforce agreed remarkably well (Fig. 4 A).To calculate the time course of [Ca2+]i devoid of move-
ment artifacts composite calcium transients were con-structed following the method of Sarkozi et al. (1996). Thecomposite calcium transient (Fig. 4 B) contained the APIIIcalcium signal at early times and the change in [Ca2+]icalculated from the fura-2 fluorescence at later parts of therecord. The transition in Fig. 4 B is marked by a horizontalline positioned on the composite calcium transient. It cor-responded in time to the point where the APIII and fura-2calcium transients started to deviate from each other, 9 msafter the termination of the pulse for the record in Fig. 4 B.As demonstrated in Fig. 4, and also in Figs. 5 and 8, suchcomposite calcium transients were readily calculated fromthe absorbance and fluorescence records and provided a fairestimate of [Ca21]i in contracting fibers. The resulting timecourse of [Ca2+]j and its relative position to the forcetransient resembled that measured on intact fibers withaction potential stimulation (e.g. Claflin et al., 1994).The simultaneous detection of fiber absorbance and force
enabled us to correlate the components of light intensitychange and fiber contraction. Fig. 4 C demonstrates that thedisplacement of the tendon, measured optically as the dis-
A[ca2+],
J N
B CSf
Vm(,[mV]
-16 -
-35 -
-44 -
-53 -
Force
100 ms
FIGURE 5 Voltage dependence of [Ca2+]i and force increase. (A) Com-posite calcium transients calculated from the absorbance and fluorescencesignals. (B) The relative saturation of fura-2, the horizontal ticks beloweach trace represent 0% saturation. (C) Simultaneously measured force.Note that there was a definite increase in [Ca2+]i at the smallest depolar-ization without any sizable change in force. The time courses of membranepotential change are given below the records, the actual values during thetest pulses are shown next to the traces in each row. Fiber 266, [APIII] =780-828 ,uM, fura-2 concentration ([fura-2]) = 18.1-18.4 ,uM, pl = 105,um, d = 78 ,um, sl = 2.2 ,um, T = 10.7°C. Vertical calibration corre-sponds to 2 ,uM, 0.3 and 75 ,uN for [Ca2+]i,.Sf and force, respectively.
2005Szentesi et al.

Volume 73 October 1997
placement of an alufoil attached to it, and the measuredforce were almost identical in time course. This is expectedif the elasticity of the connection between the force trans-ducer and the actually contracting element is linear. If thesame pulse was repeated with the slit of illumination posi-tioned first on the alufoil (trace a in Fig. 4 B) and then on thefiber (trace b) the components of fiber absorbance could beclearly dissected. To exclude any interference from APIII,absorbance changes were measured at 850 nm. The earlyincrease (downward deflection) in light intensity on trace breflects the intrinsic absorbance change of the fiber (seeMelzer et al., 1986a) and was always present even below thecontraction threshold if calcium was released from the SR.Note that a longer pulse, at smaller depolarization, was usedin this case where the intrinsic absorbance change of thefiber could be distinguished more readily. The intrinsicsignal was interrupted by a decrease in light intensity, thetime course of which followed closely the displacement ofthe tendon. Note how well the latencies of trace a and of thesecond component of trace b match. The calculated averagedifference for the latencies was <1 Ims, the former beinglonger, for the 13 fibers with appropriate pulses. This lattercomponent can, therefore, be taken as the optical represen-tation of the time course of contraction in measurementswhere the slit was positioned on the fiber.
Pulses presented in Fig. 4 were only slightly suprathresh-old, maximal force being 30 ,zN (<5% of maximal force;compare also to Figs. 5, 6, and 8), to demonstrate thatoptical signals were very sensitive to movement. Althoughthe time course of the movement artifact cannot completelyreplace the actual force transient, the latency of the opticalrecords is probably a better measure for the latency ofcontraction for small force increases due to the smallernoise on the optical signals.
Comparison of calcium and force transients
To compare [Ca2+]i and force over a wide voltage rangeand, therefore, over a wide range of mechanical activation,composite records of calcium transients were calculatedfrom the APIII absorbance and fura-2 fluorescence. Fig. 5presents the composite calcium transients (Fig. 5 A), thecalculated saturation of fura-2 (Fig. 5 B), and the measuredforce (Fig. 5 C). The depolarizations only went as far as-15.9 mV (lasting 60 ms), this does not represent fullactivation: larger contractions often damaged the vaselineseal. The composite calcium transients as well as the satu-ration of fura-2 in these contracting fibers showed all thefeatures presented previously on non-contracting (stretched)fibers in a wide voltage range. During the course of all theexperiments, the resting [Ca2+]i remained almost constant,as could be assessed from the similar fura-2 saturationsbefore each pulse.
With increasing depolarization, the maximal force notonly became greater but also its rate of rise increased, andthe latency of the transients decreased from 52 ms at -53.3mV to 15 ms at -15.9 mV, in accordance with earlier
voltage clamp measurements (Gomolla et al., 1983). Fig. 6shows the voltage dependence of the maximal force (Fig.6 A) for another fiber where several long, 80 or 100 ms,pulses were repeated to assess the voltage dependence morereliably. Fitting Eq. 4 to the data points (presented as a solidline in Fig. 6 A) revealed a steep voltage dependence: theslope factor was found to be 5.4 mV with V' = -43.3 mVand Fmna = 930 ,uN.
A1.0
zEax 0.500LL
0.0-65
B1.0
zEG) 0.5
oU-
0.0
C
U
0U-
1.0
0.5
0.0
-45 Vm [mV] -25
7 6 5 4pCa
0 4 [Ca8+i[pM18
FIGURE 6 Voltage and [Ca2]i dependence of the parameters of theforce transients. (A) Voltage dependence of peak force. Values taken frommeasurements where the duration of the test pulse was 80 or 100 ms. Thesolid line shows the least squares fit of Eq. 4 to the data points with Fm.= 930 ,AN, V' = -43.3 mV, and k = 5.4 mV. (B) Calcium concentrationdependence of peak force. The graph shows data from pulses with shorterdurations (filled circles) as well. Least squares fit of Eq. 3 to the opensymbols is superimposed as a solid line. The parameters of the fit were
Fmax =933 ,uN, pCa50 = 5.34, n = 1.73. (C) Phase plots of four forcetransients. Superimposed is the fit from part B. Note that the scale of theabscissa is linear. Fiber 275, sl = 2.4 ,um, T = 10°C.
2006 Biophysical Journal
Kinetics of Contractile Activation
To enable a comparison with skinned preparations Fig.6 B presents the [Ca2+]i dependence of the peak force. Note,however, that this comparison should be regarded as ap-proximate since tetanic force could not be determined. Val-ues from pulses of shorter duration, 20 to 60 ms, were alsoincluded into this graph (filled symbols). Data points repre-senting the long pulses (open symbols) were fitted with theHill equation, Eq. 3, resulting in Fmax of 933 ,uN, pCa5O of5.3, and the index of cooperativity of 1.73. In six fiberswhere sufficient numbers of long pulses were applied, Fmaxwas 660 ± 94 ,uN (mean ± SE), pCa50 was 5.43 ± 0.09,and the index of cooperativity was 1.79 ± 0.11. Thesevalues represent a calcium dependence that was shifted tohigher [Ca2+]i and was less steep as compared to skinnedfibers (e.g., Stienen et al., 1995). The difference might arisefrom the fact that the points, peak force versus peak [Ca2+]i,do not represent a steady state.
This possibility was tested by plotting the force-[Ca2 ]Jrelationship during four typical transients on the phaseplane. As shown previously for cardiac cells (Dobrunz et al.,1995), the force versus [Ca2+]i relationship was indepen-dent of the level of previous activation during relaxation. Incardiac cells, the calcium dependence of tetanic force fol-lowed the same curve as the relaxation process, while that ofpeak twitch force was shifted to higher [Ca2+]j. To demon-strate that this was the case for skeletal muscle fibers aswell, the calcium dependence of peak force from Fig. 6 Bwas replotted in Fig. 6 C as a continuous curve. The positionof the calculated calcium dependence of peak force relativeto the phase plots in our measurements argues in favor ofthe hypothesis that part of the lower cooperativity and thehigher pCa50 might arise from the non steady-state condi-tions during an 80-100 ms pulse.
These data suggest that the parameters of contractileactivation in the single vaseline gap are not far from thoseof intact and skinned fibers; therefore, the cut fiber prepa-ration should provide a convenient system for studying thekinetic relationship between [Ca2+]i and force.
Kinetic analysis of force transients
Having established the measurement of force the followingsection aims at the determination of a depicted parameter,k.ff, of calcium binding to TnC to complete the analysis ofthe calcium binding of this regulatory protein. We firstdemonstrate that, in line with expectations, there is a lagbetween calcium binding and force production, presumablydue to the conformational changes taking place in the thinand thick filaments. This is followed by the fitting of theforce transients with a simple model of actomyosin interac-tion to give k0ff as one of the fitted parameters.
Comparison of calcium binding to TnC with optical signalsabove the contraction threshold
The composite calcium transients were used to calculate thecalcium binding to TnC when the absorbance records were
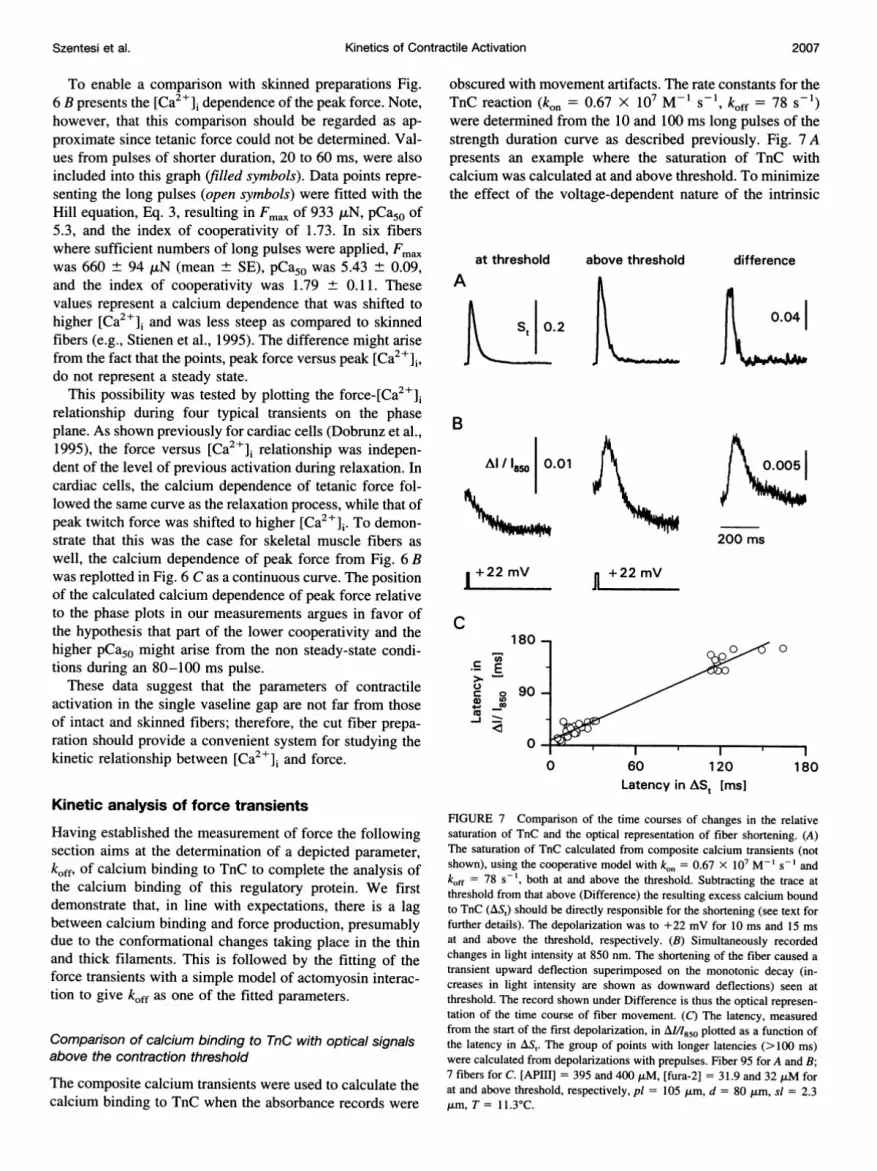
obscured with movement artifacts. The rate constants for theTnC reaction (kol = 0.67 X 10⁷ M-ls-1 , koff = 78 s-1)were determined from the 10 and 100 ms long pulses of thestrength duration curve as described previously. Fig. 7 Apresents an example where the saturation of TnC withcalcium was calculated at and above threshold. To minimizethe effect of the voltage-dependent nature of the intrinsic
at threshold above threshold
A
St 0.2
difference
0.04
B
Al /l 0.01
"- n --
200 ms
1 +22 mV
C
c
C.)
a)4)-J
180 -
E
0 90 -
La
0
n +22 mV
0 00
l-t0 60 120
Latency in ASt [ms]180
FIGURE 7 Comparison of the time courses of changes in the relativesaturation of TnC and the optical representation of fiber shortening. (A)The saturation of TnC calculated from composite calcium transients (notshown), using the cooperative model with kon = 0.67 X 10⁷ M-1 s-' andkoff = 78 s-1, both at and above the threshold. Subtracting the trace atthreshold from that above (Difference) the resulting excess calcium boundto TnC (AS,) should be directly responsible for the shortening (see text forfurther details). The depolarization was to +22 mV for 10 ms and 15 msat and above the threshold, respectively. (B) Simultaneously recordedchanges in light intensity at 850 nm. The shortening of the fiber caused atransient upward deflection superimposed on the monotonic decay (in-creases in light intensity are shown as downward deflections) seen atthreshold. The record shown under Difference is thus the optical represen-tation of the time course of fiber movement. (C) The latency, measuredfrom the start of the first depolarization, in A/I/850 plotted as a function ofthe latency in AS,. The group of points with longer latencies (>100 ms)were calculated from depolarizations with prepulses. Fiber 95 for A and B;7 fibers for C. [APIII] = 395 and 400 ,uM, [fura-2] = 31.9 and 32 ,AM forat and above threshold, respectively, pl = 105 ,um, d = 80 ,um, sl = 2.3,um, T = 11.3C.
Szentesi et al. 2007

Volume 73 October 1997
fiber absorbance change, the suprathreshold pulse wasevoked by increasing the duration of the threshold pulse,from 10 to 15 ms, while keeping its amplitude constant.Since the calcium bound to TnC at the contraction thresholdrepresents the maximal saturation that will not result in fibershortening, the difference between the saturation abovethreshold and at threshold (excess bound calcium; Fig. 7 A,Difference) should be regarded as the representation of thecalcium that was directly involved in initiating the shortening.
Fig. 7 also presents the simultaneously recorded AM/I850transients both at and above the threshold (Fig. 7 B). Thetrace at the threshold showed a monotonic decline (increasein light intensity), the intrinsic absorbance change of thefiber (Melzer et al., 1986a). Above threshold the movementartifact was superimposed on the monotonic decline ofintrinsic fiber absorbance resulting in biphasic transient.The difference of the two records (above threshold-atthreshold; Fig. 7 B, Difference) is the optical representationof the time course of fiber shortening. It should thereforecorrelate with the calculated excess bound calcium.
It is expected from the voltage-dependent nature of cal-cium mobilization from the SR that the latencies of both theexcess bound calcium and the optically detected movementshould show a clear voltage dependence. Furthermore, thedifference between the rise in [Ca2+]i and the onset ofexcess bound calcium and/or the contraction should de-crease with increasing depolarization due to the faster rateof rise of the calcium transient. On the other hand, the timerequired for the conformational changes of the contractileproteins and cross-bridge cycling should be independent ofthe membrane potential. These processes occur after thecalcium has bound to TnC and before the fiber actuallybegins to shorten, thus the difference in the latencies ofAl/I850 and of the excess bound calcium should be indepen-dent of membrane voltage and reflect the time necessary forthe activation of thin and thick filaments. It should be notedthat the compliant structures within muscle fiber influencethe observed delay in shortening; therefore, the value givenbelow is an overestimate of the actual time necessary for theconformational changes to take place (see Discussion).
Fig. 7 C presents the latencies calculated from the absor-bance records as the function of the latencies of the excessbound calcium. In the measurements using prepulses, thelatencies were calculated from the beginning of the firstdepolarization and not from the beginning of the test pulse.A straight line was fitted through the points using theleast-squares method yielding a slope of 1.11 and a y-intercept of 8.8 ms. This shows that the two sets of datawere closely correlated (the slope was almost unity) andsuggests that there was a measurable lag between the cal-cium binding to TnC and the actual initiation of contraction.Calculating the paired differences of the latencies gave8.7 ± 0.9 ms (n = 37), a value significantly (p < 0.01)greater than zero. In accordance with the above and takingthe compliant structures into account (see Discussion), thislag represents an upper estimate of the time necessary for
the conformational change of the subunits of troponin, oftropomyosin, and the actomyosin interaction.
Using an actomyosin model to reproduce the time courseof isometric force
To extend the analyses presented in the previous sectionsthe measured force was reconstructed on the basis of thecalcium transient. Using a least-squares algorithm to mini-mize the difference between the calculated and measuredforce transients, the parameters of the steps involved, cal-cium binding to TnC and the actin-myosin interaction, werealso determined.
Fig. 8 demonstrates that the model was capable of pre-dicting the generated force for different calcium concentra-tions and different levels of mechanical activation by simul-taneously fitting five composite calcium transients (Fig.8 A). The depolarizations covered a wide voltage, from-48.6 to -15.9 mV, and [Ca2+]i range, from 1.6 to 7.1,uM. Fig. 8 B presents the measured and fitted force tran-sients superimposed. The obtained value of koff was 70.7s-' with a corresponding threshold saturation of 0.18. Thesmallest depolarization was just above threshold, St(max) =0.19, while the largest calcium transient brought TnC closeto full, St(max) = 0.73, saturation. The parameters obtainedfrom the fit were k-2= 30.4 s-1, k3 = 13.1 s-, k+4 =18.1 s- 1, andM = 3.17. The calculated transients describedthe latencies and the rising phases of almost all transientsremarkably well. The falling phases were, however, lessaccurately predicted as expected from the work of Stein etal. (1988).
Table 2 summarizes the results from the fits carried outon six fibers. The fits were done as described in connectionwith Fig. 8 allowing the five parameters (see above) to befitted. To test if the independent model for the calcium
A2ca2 +]
B Force
100PNI
n-48.6 -r43.9 n-34.6 g-25.3 -15.9
FIGURE 8 Reconstruction of force in a wide voltage range. (A) Com-posite calcium transients evoked by 20-ms-long depolarizing pulses withvarious amplitudes. The actual time course of membrane potential changeis given together with its value during the test depolarization as thelowermost trace in each column. (B) The calculated force, dotted traces,superimposed on the measured transients. The least squares fit included allrecords shown. The parameters of the model that gave the best fit were
k0ff = 91.4s-5, k-2 = 1.78 s-', kg = 56.8 s-', k+4= 3.53 s-', M = 4.4.Fiber 274, [APIII] = 401-506 ,uM, [fura-2] = 20.8-22.7 ,uM, pl = 90 ,um,d = 120 ,um, sl = 2.3 ,um, T = I1.5°C.
2008 Biophysical Journal
Kinetics of Contractile Activation
binding to TnC was capable of describing the measuredforce transients the fits were repeated assuming no interac-tion between the calcium-specific sites on troponin C. Thesecond row in Table 2 presents the averaged results fromthese fits. There was no significant change in any of thefitted parameters for the actomyosin interaction; however,both k0ff and M changed significantly (p < 0.04). Thisdecrease was expected, since by losing cooperativity, themodel can only compensate for the decrease in calciumbinding if the affinity of the sites is increased.Due to the compliant connections and the relatively low
time resolution, these measurements cannot distinguish be-tween different models of the actomyosin interaction. Fur-thermore, the calculated parameters of the actin and myosininteraction are less meaningful in this oversimplified model.However, the calculated value of k0ff could be used todetermine the other parameters of calcium binding to TnCas it was done in the first section of Results. It should benoted that k0ff was found rather independent of the actomy-osin model used (data not shown, see Discussion) indicatingthat its value depended more on the measured kinetics of theforce transients than on the model chosen.
DISCUSSION
This paper reports calcium and force transients over a widemembrane potential range in voltage clamped amphibianskeletal muscle fibers in a vaseline gap measured simulta-neously for the first time. The early events in excitation-contraction coupling were studied and the strength-durationcurve analyzed in terms of a hypothesis that a just-detect-able contraction corresponds to a constant critical calciumsaturation of TnC. We emerged with a quantitative descrip-tion of the events beginning with an increase in [Ca2+]i andending with the generation of force. Our analysis success-fully reproduced the time course of force transients andgave estimates for the in vivo calcium binding properties ofTnC that agreed with earlier biochemical measurements.The experiments also indicated a voltage-independent delayof 9 ms as an upper limit for the conformational changes inthe contractile filaments.
Calcium transients at the contraction threshold
Voltage clamped skeletal muscle fibers need a critical de-polarization from the holding potential that depends on theselected pulse duration to produce a just-detectable contrac-tion. This strength-duration relationship was explained interms of the buildup of a hypothetical activator to a criticallevel (Adrian et al., 1969). Different groups equated thisactivator with different physical events in excitation-con-traction coupling. Horowicz and Schneider (1981) proposedfixed transfer of intramembrane charge, while Miledi et al.(1983) suggested that a critical level of [Ca2+]2 wouldcorrespond to all points on the strength-duration curve. Incontrast, when drugs that alter SR calcium release, as caf-
feine or perchlorate, were used the charge movement andthe calcium transient measured at small depolarizations(100 ms pulse duration) of the strength-duration curve wereconsiderably altered, whereas those at large depolarizationsand short pulse durations were hardly changed (Csernoch etal., 1987; Gonzailez and Rios, 1993). Furthermore, calciumtransients were different if measured at different points ofthe strength-duration curve for just-detectable contraction.The maximal [Ca2+]i increase was smaller for a 100 msthan for a 10 ms long pulse (Kovacs et al., 1987 and Fig. 1in this paper). These observations led us to propose that therate constants of the calcium binding to TnC are such thatthe calcium saturation of TnC would be the same in spite ofthe different calcium transients.An alternative possibility explaining the difference in the
acquired size of the calcium transients corresponding todifferent points of the strength-duration curve might arisefrom diffusional delays. In this framework shorter pulseswould need to induce larger calcium transients in order toachieve equal critical [Ca2+], at the same calcium-specificsites on TnC. However, the application of a previous anal-ysis of calcium diffusion along the sarcomere (Pizarro et al.,1991) makes such a possibility unlikely unless the TnCbinding sites reside in their own, partially isolated, diffu-sional compartment. We included experiments that makecalcium fluxes through such a compartment unlikely. ThusFig. 3 shows that the predicted values of critical TnCcalcium binding were not influenced by conditioning volt-age steps that induced a presaturation of the calcium bindingsites.
The rate constants of thecalcium-troponin C reaction
To determine the calcium binding properties of TnC weassumed, as suggested by Kovacs et al. (1987), that itsrelative saturation reaches a critical level when just-detect-able contraction is attained. As demonstrated in Fig. 2 thisresulted in two functions relating the three independentparameters, k.., koff, and Sth, of calcium binding to TnC. Tocalculate the actual values of these binding constants one ofthe above three parameters had to be determined indepen-dently. This was done by including k0ff as one of the fittedparameters in the analysis of force transients (Table 2).From the two rate constants the off-rate was selected
since its values in the literature seem to be less variable (see,e.g., Robertson et al., 1981 for list), even including cardiacisoforms, than values for ko, The value, 78 s-1, obtainedfor koff from fits to the force transients (Table 2) is in closeagreement with those published in the literature (Robertsonet al., 1981; Johnson et al., 1981; Rosenfeld et al., 1985). Itshould be noted that even the value obtained with theindependent binding model, 56 s-1 (Table 2), is within thelimits published earlier.
According to Eq. 8 kon always appears as a multiplicandof the measured [Ca2+]j. Any uncertainty in the detection of
2009Szentesi et al.
Volume 73 October 1997
[Ca2+]i would cause inverse changes in the calculated as-sociation rate. That is, if the measured calcium concentra-tion is underestimated, due to possible binding of the dyesto intracellular constituents (Baylor et al., 1986 and Konishiet al., 1988 for APIII and fura-2, respectively), the calcu-lated association rate and, consequently, the associationconstant would be overestimated. On the other hand, anyuncertainties in [Ca2+]i are compensated for with changesin kon. This also establishes the fact that the obtained valuesof koff and Sth are independent of the scaling of [Ca2+]i.The question, however, is whether the selection of the
actomyosin model influenced the calculated value of k0ff. Inour earlier calculations (e.g., Kovacs et al., 1995) a moreelaborate model of Dantzig et al. (1992) was used thatincluded, among others, the binding of substrates and adistortion-dependent transition. In this paper we adopted amuch simpler model. Nevertheless, the obtained koff wasessentially independent of the model used, 78 s-1 in thesecalculations and 85 s-1 in Kovacs et al. (1995) using theabove mentioned model, showing that it most likely repre-sents the true value of koff.
Validity of the models used to calculate thecalcium activation of the thin filament
To calculate the calcium binding to TnC a cooperativebinding reaction scheme was used (S1) since several papershave been published on thin filament cooperativity (e.g.,Rosenfeld et al., 1985) even showing that binding of cal-cium to one of the calcium specific sites can not triggercontraction alone (Sheng et al., 1990). Stein et al. (1988)even argued that cooperative interaction gave better fits tothe force transient in frogs than did the non-cooperative.Nevertheless, as shown in Fig. 1, the independent bindingmodel gave a similar time course if the threshold saturationof TnC was assumed to be the same.
Earlier reports on calcium regulation of skeletal muscleactivation (Hill, 1983) assumed a change in the affinity ofTnC for calcium upon the association of actin with myosin.This was incorporated into the model by changing k0ffproportionally with the association of actin to myosin. Al-though the obtained change in affinity 3.6 and 5.6 (param-eter M in Table 2) was smaller than that used by Hill (1983)it was significantly greater than 1, suggesting that suchchange is present under in vivo conditions.
Neighboring tropomyosin molecules were also assumedto interact and this interaction was proposed to account for,or part of, the cooperativity seen with myosin subfrag-ment-1 and regulated actin (Wegner, 1979; Hill, 1983).Following the line of reasoning given by Hill (1983) theinteraction of neighboring tropomyosins would result in ahigher interaction free energy (a greater negative value) ifthe two molecules were in the same state. Assuming onlytwo states, one that allows and one that blocks the actomy-osin interaction, the ratio of the molecules in the two states
calculations e-2 was used throughout (using an integer as
the power greatly reduced the calculation time).
The time required for the activation of thecontractile filaments
The present theory of the regulation of skeletal musclecontraction, the inhibition of actomyosin interaction viatroponin and tropomyosin, predicts that after the binding ofcalcium to the regulatory domain of troponin (subunit C),several conformational changes must take place before ac-
tual shortening can begin.Diffraction studies have revealed that certain reflections
that are associated with the thin filaments occur in fibersstretched beyond filament overlap (Kress et al., 1986) dem-onstrating that structural changes take place within the thinfilaments without any interaction between actin and myosin.In the report of Kress et al. (1986), where the time resolu-tion is the best, the difference between the change in dif-fraction and the onset of contraction is -5 ms (value readfrom Fig. 3 of that paper) which is in good agreement withour estimation of 9 ms. The reason for the slightly highervalue obtained in this study might reflect that our valueincludes the conformational change of TnC as well, whilethose from diffraction studies probably report the time afterthe movement of tropomyosin.
Compliant structures and connections might interferewith the estimation of delays in force development and rise.As an example, the compliant nature of the thin filamentmight account for some, or much, of the delays observed inx-ray diffraction (Huxley et al., 1994). A series of experi-ments were, therefore, preformed to estimate the compli-ance of our system (we are not aware of any previousestimates of the compliance of the single vaseline gap
system). Under essentially the same conditions the tendonhad a compliance of 1.5 X 10⁻² m/N, the fiber and thetendon together 3.4 X 10⁻² m/N, and the full system 6.1 X10⁻² m/N. As expected, these values are higher than thecorresponding data published for skinned fibers attached tosteel hooks (e.g., Higuchi et al., 1995). To minimize theerror resulting from the compliance of the connection we
used the optical signal on the fiber as an indicator ofmovement. Although its time course was too complex tosimply equate with that of force the onset was reliablydetected. This method, although eliminating problems aris-ing from compliant connections, could not reduce any delayoriginating from the compliant filaments rendering the ob-tained value, 8.7 ms, an upper estimate for the time of theinteractions in the contractile filaments.
It should be noted, however, that although the latency ofcontraction was always longer than the latency of reachingthreshold saturation of TnC, the obtained differences variedbetween 2 and 15 ms (see Fig. 7 C). This renders thecalculated average value of the difference less meaningful,despite the small (1 ms) standard error of the mean. The
calculates to -0.18. This corresponds to e-1 7, during the
2010 Biophysical Journal
scatter was, at least in part, due to the imperfect estimation

Szentesi et al. Kinetics of Contractile Activation 2011
of the threshold saturation, e.g., if the threshold saturationwas underestimated in a given fiber the difference in laten-cies was overestimated.
The authors are indebted to Dr. C. L.-H. Huang for carefully reading anddiscussing the manuscript, to Dr. G. J. M. Stienen for helpful comments,and to R. Ori for skilled technical assistance.
This work was sponsored by Hungarian OTKA Grants T016957 andF5467, and the Muscular Dystrophy Association.
REFERENCES
Adrian, R. H., W. K. Chandler, and A. L. Hodgkin. 1969. The kinetics ofmechanical activation in frog muscle. J. Physiol. 204:207-230.
Baylor, S. M., S. Hollingworth, C. S. Hui, and M. E. Quinta-Ferreira. 1986.Properties of the metallochromic dyes arsenazo III, antipyrylazo III andazo 1 in frog skeletal muscle fibers at rest. J. Physiol. 377:89-141.
Claflin, D. R., D. L. Morgan, D. G. Stephenson, and F. J. Julian. 1994. Theintracellular Ca21 transients and tension in frog skeletal muscle fibersmeasured with high temporal resolution. J. Physiol. 475:319-325.
Close, R. I. 1981. Activation delays in frog twitch muscle fibers. J. Physiol.313:81-100.
Csernoch, L., V. Jacquemond, and M. F. Schneider. 1993. Microinjectionof strong calcium buffers suppresses the peak of calcium release in frogskeletal muscle fibers. J. Gen. Physiol. 101:297-333.
Csemoch, L., L. Kovacs, and G. Szuics. 1987. Perchlorate and the relation-ship between charge movement and contractile activation in frog skeletalmuscle fibers. J. Physiol. 390:213-227.
Csemoch, L., G. Pizarro, I. Uribe, M. Rodriguez, and E. Rios. 1991.Interfering with calcium release suppresses Jy, the "hump" componentof intramembranous charge movement in skeletal muscle. J. Gen.Physiol. 97:845-884.
Csemoch, L., P. Szentesi, G. Sziucs, and L. Kovacs. 1994. Time course offiber shortening and its temporal correlation to calcium binding totroponin C in skeletal muscle. J. Muscle Res. Cell Motil. 15:174a.(Abstr.).
Dantzig, J. A., Y. E. Goldman, N. C. Millar, J. Lacktis, and E. Homsher.1992. Reversal of the cross-bridge force-generating transition by pho-togeneration of phosphate in rabbit psoas muscle fibers. J. Physiol.451:247-278.
Dobrunz, L. E., P. H. Backx, and D. T. Yue. 1995. Steady-state [Ca21]i-force relationship in intact twitching cardiac muscle: direct evidence formodulation by isoproterenol and EMD 53998. Biophys. J. 69:189-201.
Geeves, M. A., and S. S. Lehrer. 1994. Dynamics of the muscle thinfilament regulatory switch: the size of the cooperative unit. Biophys. J.67:273-282.
Goldman, Y. E. 1987. Kinetics of the actomyosin ATPase in muscle fibers.Annu. Rev. Physiol. 49:637-654.
Gomolla, M., G. Gottschalk, and H. C. Luttgau. 1983. Perchlorate-inducedalteration in electrical and mechanical parameters of frog skeletal musclefibers. J. Physiol. 343:197-214.
Gonzalez, A., and E. Rfos. 1993. Perchlorate enhances transmission inskeletal muscle excitation-contraction coupling. J. Gen. Physiol. 102:373-421.
Guth, K., and J. D. Potter. 1987. Effect of rigor and cycling cross-bridgeson the structure of troponin C and Ca2' affinity of the Ca2'-specificregulatory sites in skinned rabbit psoas fibers. J. Bio. Chem. 262:13627-13635.
Higuchi, H., T. Yanagida, and Y. E. Goldman. 1995. Compliance of thinfilaments in skinned fibers of rabbit skeletal muscle. Biophys. J. 69:1000-1010.
Hill, T. L. 1983. Two elementary models for the regulation of skeletalmuscle contraction by calcium. Biophys. J. 44:383-396.
Horowicz, P., and M. F. Schneider. 1981. Membrane charge moved atcontraction thresholds in skeletal muscle fibers. J. Physiol. 277:483-506.
Huxley, H. E., A. Stewart, H. Sosa, and T. Irving. 1994. X-ray diffractionmeasurements of the extensibility of actin and myosin filaments incontracting muscle. Biophys. J. 67:2411-2421.
Johnson, M. L., and L. M. Faunt. 1992. Parameter estimation by least-squares methods. In Numerical Computer Methods. L. Brand and M. L.Johnson, editors. Academic Press, San Diego. 1-37.
Johnson, J. D., D. E. Robinson, S. P. Robertson, A. Schwartz, and J. D.Potter. 1981. Ca2' exchange with troponin and the regulation of musclecontraction. In Regulation of Muscle Contraction: Excitation-Contraction Coupling. A. D. Grinnell and M. A. B. Brazier, editors.Academic Press, New York. 241-257.
Klein, M. G., B. J. Simon, G. Sziucs, and M. F. Schneider. 1988. Simul-taneous recording of calcium transients in skeletal muscle using high andlow affinity calcium indicators. Biophys. J. 55:971-988.
Konishi, M., A. Olson, S. Hollingworth, and S. M. Baylor. 1988. Myo-plasmic binding of Fura-2 investigated by steady-state fluorescence andabsorbance measurements. Biophys. J. 54:1089-1104.
Kovdcs, L., P. Szentesi, and L. Csernoch. 1995. Kinetic comparison ofisometric tension and intracellular calcium concentration changes in frogskeletal muscle fibers. J. Physiol. 487:159.
Kovacs, L., G. Szu1cs, and L. Csemoch. 1987. Calcium transients andcalcium binding to troponin at the contraction threshold in skeletalmuscle. Biophys. J. 51:521-526.
Kress, M., H. E. Huxley, A. R. Faruqi, and J. Hendrix. 1986. Structuralchanges during activation of frog muscle studied by time-resolved X-raydiffraction. J. Mol. Biol. 188:325-342.
Melzer, W., E. Rfos, and M. F. Schneider. 1986a. The removal of myo-plasmic free calcium following calcium release in frog skeletal muscle.J. Physiol. 372:261-292.
Melzer, W., M. F. Schneider, B. J. Simon, and G. Szucs. 1986b. Intramem-brane charge movement and calcium release in frog skeletal muscle.J. Physiol. 373:481-511.
Miledi, R., I. Parker, and P. H. Zhu. 1983. Calcium transients studied undervoltage-clamp control in frog twitch muscle fibers. J. Physio. 340:649-680.
Pizarro, G., L. Csernoch, I. Uribe, M. Rodriguez, and E. Rios. 1991. Therelationship between Qy and Ca release from the sarcoplasmic reticulumin skeletal muscle. J. Gen. Physiol. 97:913-947.
Robertson, S. P., J. D. Johnson, and J. D. Potter. 1981. The time-course ofCa2' exchange with calmodulin, troponin, parvalbumin, and myosin inresponse to transient increases in Ca2+. Biophys. J. 34:559-569.
Rosenfeld, S. S., and E. W. Taylor. 1985. Kinetic studies of calciumbinding to regulatory complexes from skeletal muscle. J. Biol. Chem.260:252-261.
Sarkozi, S., P. Szentesi, I. Jona, and L. Csemoch. 1996. Effects of cardiacglycosides on excitation-contraction coupling in frog skeletal musclefibers. J. Physiol. 495:611-626.
Sheng, Z., W. L. Strauss, J.-M. Francois, and J. D. Potter. 1990. Evidencethat both Ca21 specific sites of skeletal muscle TnC are required for fullactivity. J. Biol. Chem. 265:21554-21560.
Stein, R. B., J. Bobet, M. N. Oguztoreli, and M. Fryer. 1988. The kineticsrelating calcium and force in skeletal muscle. Biophys. J. 54:705-717.
Stienen, G. J. M., R. Zaremba, and G. Elzinga. 1995. ATP utilization forcalcium uptake and force production in skinned muscle fibers of Xeno-pus laevis. J. Physiol. 482:109-122.
Tregear, R. T., and S. B. Marston. 1979. The crossbridge theory. Annu.Rev. Physiol. 41:723-736.
Wegner, A. 1979. Equilibrium of the actin-tropomyosin interaction. J. Mol.Biol. 131:839-853.