kinetic spectrophotometric method for the determination of ramipril in pharmaceutical formulations
TRANSCRIPT
J. Serb. Chem. Soc. 71 (10) 1107–1120 (2006) UDC 633.88+543.62:615.9
JSCS–3505 Original scientific paper
A kinetic spectrophotometric method for the determination of
lansoprazole in pharmaceutical formulations
NAFISUR RAHMAN*, ZEHRA BANO, SYED NAJMUL HEJAZ AZMI andMOHAMMAD KASHIF
Department of Chemistry, Aligarh Muslim University, Aligarh 202002, Uttar Pradesh, India
(e-mail: [email protected])
(Received 5 October, revised 27 December 2005)
Abstract: A simple kinetic spectrophotometric method has been developed for the deter-mination of lansoprazole in pharmaceutical formulations. The method is based on the oxi-dation of the drug with alkaline potassium permanganate at room temperature. The reac-tion was followed spectrophotometrically by measuring the increase in the absorbanceowing to the formation of MnO 4
2- at 610 nm (Method A) and the decrease in theabsorbance at 530 nm due to the disapperance of MnO4
- (Method B). Calibration proce-dures were adopted for the assay of the drug. The calibration curves were linear over the
concentration ranges of 5 – 150 and 5 – 70 �g ml-1, with the corresponding calibration
Equations: rate = –3.915 � 10-6 + 5.271 � 10-5c and �A = 1.04 � 10-3 + 1.78 � 10-3
c formethods A, and B, respectively. A statistical comparison of the results of the proposedprocedures with those of the reference spectrophotometric method show excellent agree-ment and indicated no significant difference between the compared methods in terms ofaccuracy and precision. Interval hypothesis tests were also performed, which indicatedthat the true bias of all samples was less than ± 2 %.
Keywords: lansoprazole, potassium permanganate, kinetic determination, spectro-photometry, pharmaceutical formulations.
INTRODUCTION
Lansoprazole is an important proton pump inhibitor that suppresses gastric acid se-
cretion by specific inhibition of the gastric H+, K+ ATPase enzyme system at the secre-
tory surface of the gastric parietal cells.1 As defined in Martindale, The Extra Pharmaco-
peia,2 it is chemically 2-[[[3-methyl-4-(2,2,2-trifluoroethoxy)-2-pyridinyl]methyl]sul-
finyl]-1-H-benzimidazole [103577-45-3; M. W. 369.36]. The drug is effectively useful
in the treatment of duodenal ulcer, gastric ulcer, reflux oesophagitis and helicobactor
pylori infection. In addition to its efficacy in healing or maintenance treatment, it may
provide a more effective system relief than other comparative agents. Owing to the vital
importance of the drug, the development of a sensitive, simple and fast method for its de-
termination is of urgent need.
1107
doi: 10.2298/JSC0610107R
* Corresponding author.
The assay of drug is only listed in the monograph of The United States Pharmaco-
poeia, which describes a high performance liquid chromatographic method.3 Lanso-
prazole has been determined in pharmaceutical preparations using high performance
liquid chromatography,4–6 high performance thin layer chromatography,7,8 capillary
electrophoresis,9 flow injection analysis10 and electroanalytical methods.11,12 The
spectrophotometric methods are the instrumental method of choice and have practical
and significant advantages over other methods. In the literature, few spectrophotomet-
ric methods have been reported13,14 for the quantification of the cited drug. Moustafa
reported15 three spectrophotometric methods. The first two methods are based on the
charge transfer complexation reaction of the drug with 2,3-dichloro-5,6-dicy-
ano-1,4-benzoquinone and iodine. The third method involves the formation of a ter-
nary complex of the drug with eosin and Cu(II), which absorbs maximally at 549 nm.
Lansoprazole forms an ion-pair complex with bromocresol green16 which was ex-
tracted into an orgnic solvent for quantitative determination at 420 nm. Spectrophoto-
metric procedures for its determination in commercial dosage forms have also been
discussed. They are based on the reaction of the drug with p-dimethylaminobenzalde-
hyde,17 folin-ciocaltaeu's phenol reagent,18 and vanilin.19
The literature is still lacking a kinetic spectrophotometric method for the de-
termination of the cited drug. Furthermore, some specific advantages in the appli-
cation of a kinetic method are to be expected, such as selectivty due to the measure-
ment of the evolution of the absorbance with the reaction time.
In this paper, a kinetically based spectrophotometric method is proposed for
the determination of lansoprazole in bulk and capsules by measuring the change in
the absorbance at 610 nm and 530 nm, whereby the oxidation of the drug with alka-
line KMnO4 at 25 ± 1 °C is followed.
EXPERIMENTAL
Apparatus
A Shimadzu UV-visible spectrophotometer (Model No. 1601, Kyoto, Tokyo, Japan) withmatched quartz cells was used to measure the absorption spectra and a Spectronic 20 D+ (MiltonRoy Company, USA) for recording the absorbance of the solution.
Reagents
All employed reagents were of analytical or pharmaceutical grade. The potassium permanga-
nate (GR Grade, Merck Limited, Mumbai, India) solution, (6.0 � 10-3M) should be freshly preparedand its apparent purity was assayed titrimetrically (Vogel 2002). Sodium hydroxide (E. Merck, In-dia) solution (1.0 M) was prepared in distilled water.
Test solution
The lansoprazole (Cipla, India, Ltd.) solution (0.1% w/v) was prepared by dissolving 100 mgof the reagent in 0.5 ml of 0.10 M NaOH and then diluting to 100 ml with distilled water. Thelansoprazole solution was freshly prepared and used within 5 hours.
Marketed products
The commercial pharmaceutical preparations of lansoprazole, i.e., Lanzol (Cipla Ltd., Mum-
bai, India), Lansofast (Cadila Healthcare Ltd., Ahemdabad, India), Propilan (Glenmark Pharma-
1108 RAHMAN et al.
ceuticals Ltd., Mumbai, India) and Lancid (Brown and Burk Pharmaceuticals Ltd., Bangalore, In-
dia) were purchased from a local pharmacist.
Recommended procedure
Method A. Aliquots of 0.1 % lansoprazole solution to obtain find concentrations in the range
5–150 �g ml-1 were pipetted into a series of 10 ml volumetric flaks. Subsequently, 1.5 ml of 1 M
NaOH was added followed by 2.0 ml of 6.0 � 10-3 M potassium permanganate solution and then di-
luted to volume with distilled water. The contents of the flask were mixed well and immediately
transferred to the spectrophotometric cell. The absorance at 610 nm was recorded at 25 ± 1 °C as a
function of time against prepared reagent blank. The initial rate of formation of MnO42- at the differ-
ent concentrations of lansoprazole was evaluated from the slope of the tangent to the absor-
bance–time curve. The calibration curve was constructed by plotting initial rate of reaction against
the final concentration of lansoprazole in �g ml-1. The amount of lansoprazole in unknown samples
was calculated either from the calibration curve of the corresponding regression equation.
Method B. Aliquots of 0.1 % lansoprazole solution, corresponding to 50–700 �g, were trans-
ferred into a series of 10 mL volumetric flasks. Then 1 ml of 1 M NaOH was added, followed by 0.8
ml of 6.0 x 10⁻³ M potassium permanganate solution and the solution was made up to the mark with
distilled water. The decrease in the absorbance of the solution was measured at 530 nm as a function
of time. The initial rate of disappearance of MnO4– was determined from the slope of the tangent to
the absorbance–time curve. The calibration curve was constructed by plotting �A vs. lansoprazole
concentration. The amount of lansoprazole in unknown samples was calculated either from the cali-
bration graph of the corresponding regression equation.
Procedure for the determination of lansoprazole in capsules
The content of the capsules (enteric coated granules) was accurately weighed and finely pow-
dered. An amount of the powder equivalent to 200 mg of lansoprazole was dissolved in 50 ml of
methanol and allowed to stand for a few minutes before being filtered through Whatmann No. 42 fil-
ter paper. The filtrate was evaporated to dryness and the residue was dissolved in 0.5 ml of 0.1 M
NaOH and diluted to25 ml with distilled water. The recovery of lansoprazole was calculated from
the corresponding linear regression equations or calibration graphs.
RESULTS AND DISCUSSION
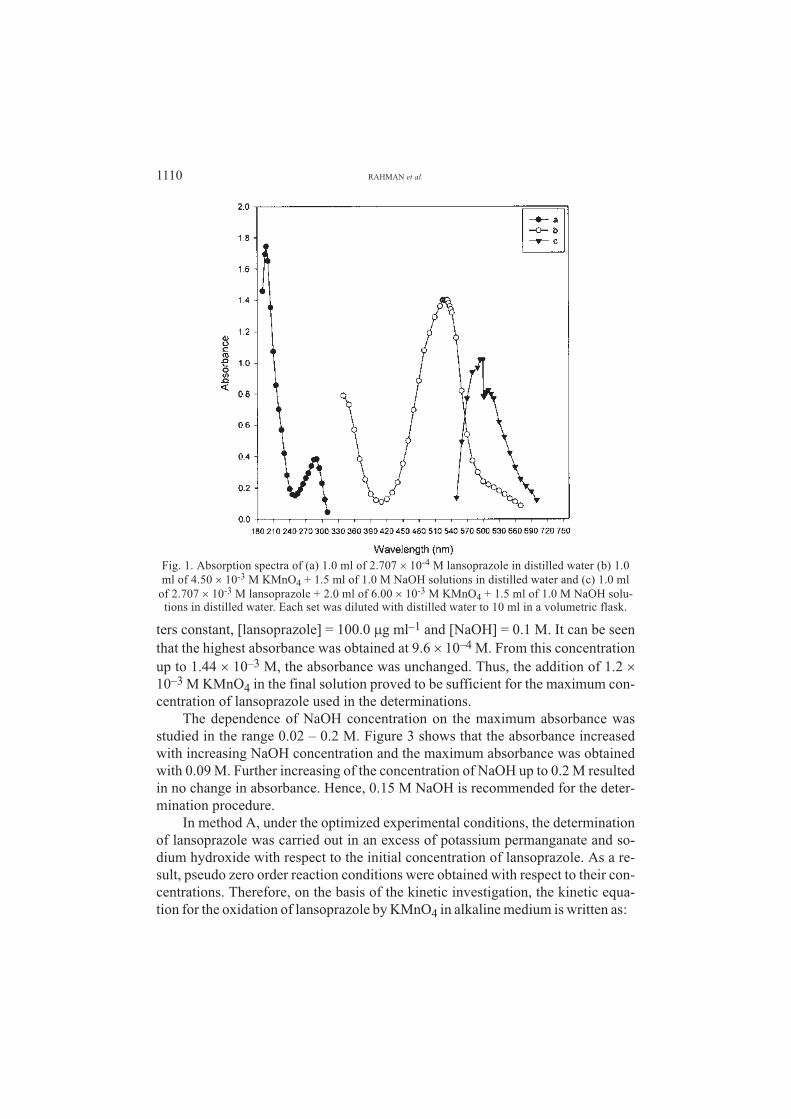
The absorption spectrum of lansoprazole solution in distilled water shows two ab-
sorption bands, peaking at 197 and 287.5 nm (Fig. 1 curve a) while that of potassium
permanganate solution in alkaline medium exhibits and absorption band peaking at
530 nm (Fig. 1curve b). The course of the reaction commences on addition of aqueous
alkaline potasium permanganate to the lansoprazole solution resulting in the formation
of a new band peaking at 610 nm (Fig. 1 curve c). This band is attributed to the forma-
tion of manganate ions in the presence of the drug. Thus, the intensity of the green col-
oured solution increased with time owing to the formation of MnO42–, whereas the
absorbance of the solution at 530 nm decreased as the reaction proceded due to the dis-
appearance of MnO4–. These facts were used to develop a kinetically based spectro-
photometric method for the determination of lansoprazole.
The optimum conditions affecting the formation of manganate ions were stud-
ied and maintained throughout the experiments.
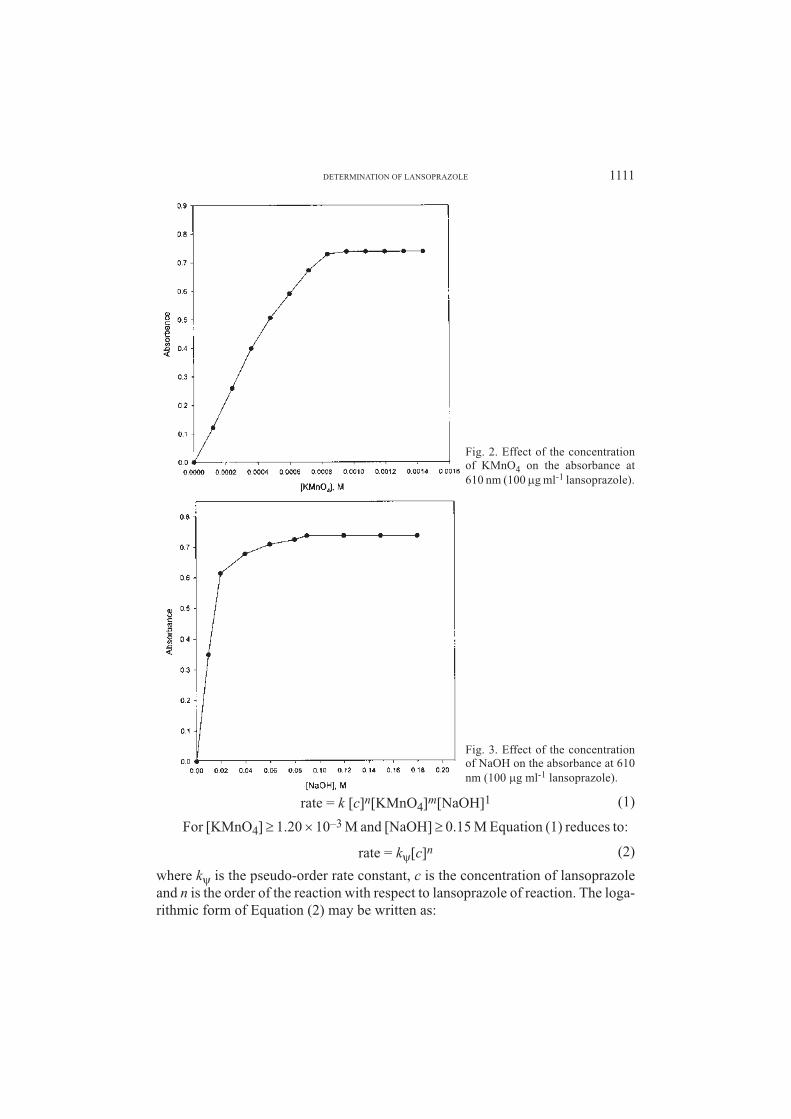
The effect of KMnO4 concentration on the absorbance was studied in the
range 1.2 � 10–4 – 1.44 � 10–3 M (Fig. 2), keeping all other experimental parame-
DETERMINATION OF LANSOPRAZOLE 1109
ters constant, �lansoprazole� = 100.0 �g ml–1 and �NaOH� = 0.1 M. It can be seen
that the highest absorbance was obtained at 9.6 � 10–4 M. From this concentration
up to 1.44 � 10–3 M, the absorbance was unchanged. Thus, the addition of 1.2 �
10–3 M KMnO4 in the final solution proved to be sufficient for the maximum con-
centration of lansoprazole used in the determinations.
The dependence of NaOH concentration on the maximum absorbance was
studied in the range 0.02 – 0.2 M. Figure 3 shows that the absorbance increased
with increasing NaOH concentration and the maximum absorbance was obtained
with 0.09 M. Further increasing of the concentration of NaOH up to 0.2 M resulted
in no change in absorbance. Hence, 0.15 M NaOH is recommended for the deter-
mination procedure.
In method A, under the optimized experimental conditions, the determination
of lansoprazole was carried out in an excess of potassium permanganate and so-
dium hydroxide with respect to the initial concentration of lansoprazole. As a re-
sult, pseudo zero order reaction conditions were obtained with respect to their con-
centrations. Therefore, on the basis of the kinetic investigation, the kinetic equa-
tion for the oxidation of lansoprazole by KMnO4 in alkaline medium is written as:
1110 RAHMAN et al.
Fig. 1. Absorption spectra of (a) 1.0 ml of 2.707 � 10-4 M lansoprazole in distilled water (b) 1.0
ml of 4.50 � 10-3 M KMnO4 + 1.5 ml of 1.0 M NaOH solutions in distilled water and (c) 1.0 ml
of 2.707 � 10-3 M lansoprazole + 2.0 ml of 6.00 � 10-3 M KMnO4 + 1.5 ml of 1.0 M NaOH solu-tions in distilled water. Each set was diluted with distilled water to 10 ml in a volumetric flask.
rate = k �c�n�KMnO4�m�NaOH�1 (1)
For �KMnO4� � 1.20 � 10–3 M and �NaOH� � 0.15 M Equation (1) reduces to:
rate = k��c�n (2)
where k� is the pseudo-order rate constant, c is the concentration of lansoprazole
and n is the order of the reaction with respect to lansoprazole of reaction. The loga-
rithmic form of Equation (2) may be written as:
DETERMINATION OF LANSOPRAZOLE 1111
Fig. 2. Effect of the concentrationof KMnO4 on the absorbance at
610 nm (100 �g ml-1 lansoprazole).
Fig. 3. Effect of the concentrationof NaOH on the absorbance at 610
nm (100 �g ml-1 lansoprazole).
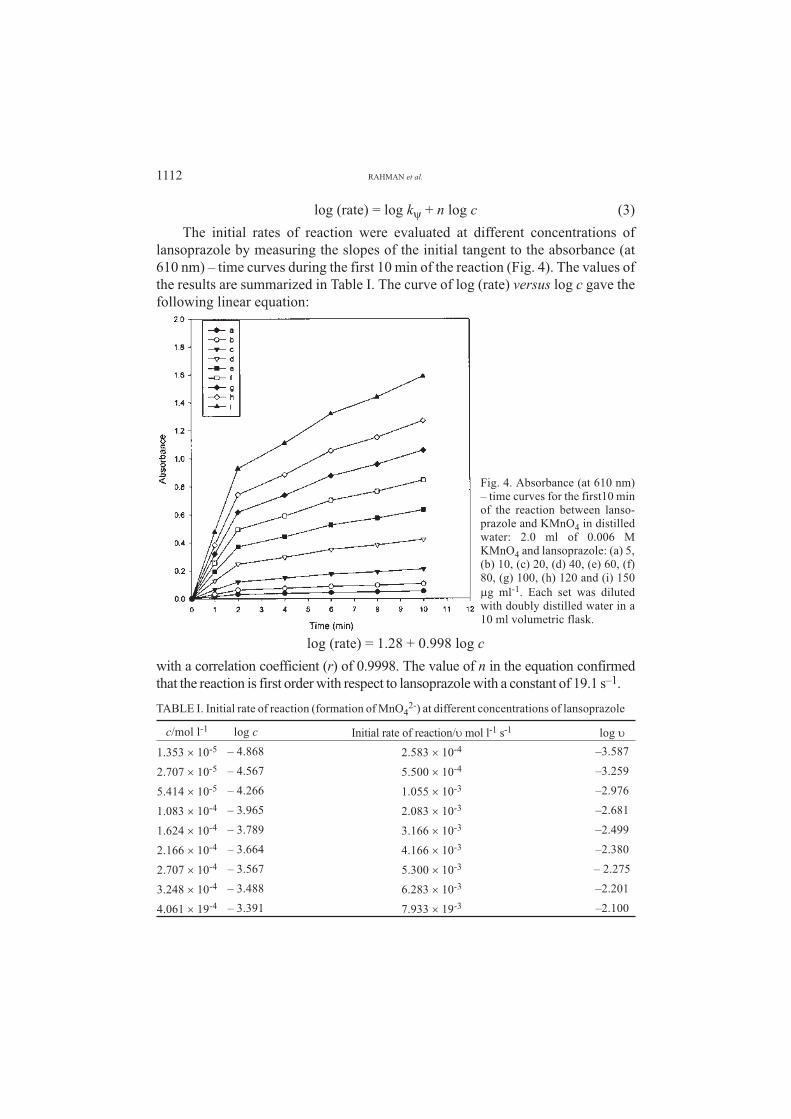
log (rate) = log k� + n log c (3)
The initial rates of reaction were evaluated at different concentrations of
lansoprazole by measuring the slopes of the initial tangent to the absorbance (at
610 nm) – time curves during the first 10 min of the reaction (Fig. 4). The values of
the results are summarized in Table I. The curve of log (rate) versus log c gave the
following linear equation:
log (rate) = 1.28 + 0.998 log c
with a correlation coefficient (r) of 0.9998. The value of n in the equation confirmed
that the reaction is first order with respect to lansoprazole with a constant of 19.1 s–1.
TABLE I. Initial rate of reaction (formation of MnO42-) at different concentrations of lansoprazole
c/mol l-1 log c Initial rate of reaction/� mol l-1 s-1 log �
1.353 � 10-5 – 4.868 2.583 � 10-4 –3.587
2.707 � 10-5 – 4.567 5.500 � 10-4 –3.259
5.414 � 10-5 – 4.266 1.055 � 10-3 –2.976
1.083 � 10-4 – 3.965 2.083 � 10-3 –2.681
1.624 � 10-4 – 3.789 3.166 � 10-3 –2.499
2.166 � 10-4 – 3.664 4.166 � 10-3 –2.380
2.707 � 10-4 – 3.567 5.300 � 10-3 – 2.275
3.248 � 10-4 – 3.488 6.283 � 10-3 –2.201
4.061 � 19-4 – 3.391 7.933 � 19-3 –2.100
1112 RAHMAN et al.
Fig. 4. Absorbance (at 610 nm)– time curves for the first10 minof the reaction between lanso-prazole and KMnO4 in distilledwater: 2.0 ml of 0.006 MKMnO4 and lansoprazole: (a) 5,(b) 10, (c) 20, (d) 40, (e) 60, (f)80, (g) 100, (h) 120 and (i) 150
�g ml-1. Each set was dilutedwith doubly distilled water in a10 ml volumetric flask.
The calibration curve was prepared by plotting the initial rate versus the con-
centration of lansoprazole and was found to be linear over the concentration range
of 5–10 �g ml–1 The regression analysis of the calibration data yelded the follow-
ing regression Equation:
rate = –3.915 � 10–6 + 5.271 � 10–5 c
(N = 9, ± tSa = 4.279 � 10–5 , ± tSb = 5.285 � 10–4 at the 95 % confindence level)
with a coefficient of correlation, r = 0.9999. The variance was calculated21 by sta-
tistical treatment of the calibration data at nine concentration levels and found to be
9.796 � 10–10 �g ml–1. The low value of variance speaks for the negligible scatter-
ing of the experimental data points around the regression line.
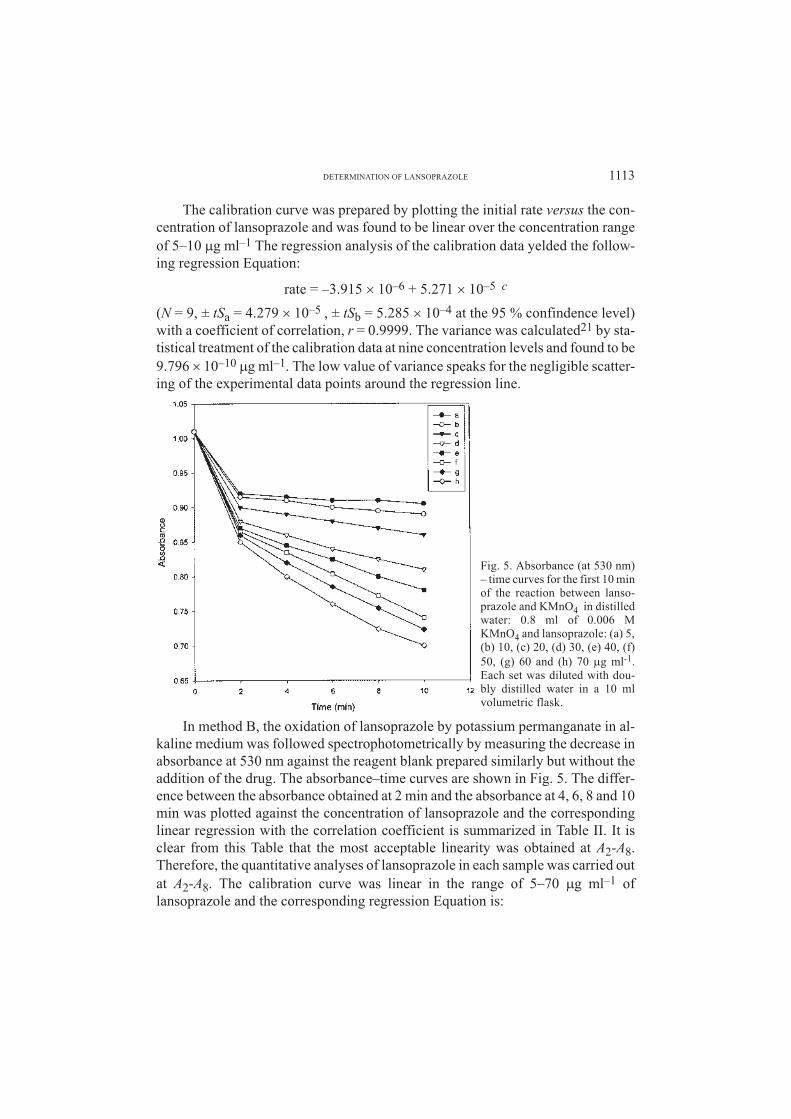
In method B, the oxidation of lansoprazole by potassium permanganate in al-
kaline medium was followed spectrophotometrically by measuring the decrease in
absorbance at 530 nm against the reagent blank prepared similarly but without the
addition of the drug. The absorbance–time curves are shown in Fig. 5. The differ-
ence between the absorbance obtained at 2 min and the absorbance at 4, 6, 8 and 10
min was plotted against the concentration of lansoprazole and the corresponding
linear regression with the correlation coefficient is summarized in Table II. It is
clear from this Table that the most acceptable linearity was obtained at A2-A8.
Therefore, the quantitative analyses of lansoprazole in each sample was carried out
at A2-A8. The calibration curve was linear in the range of 5–70 �g ml–1 of
lansoprazole and the corresponding regression Equation is:
DETERMINATION OF LANSOPRAZOLE 1113
Fig. 5. Absorbance (at 530 nm)– time curves for the first 10 minof the reaction between lanso-prazole and KMnO4 in distilledwater: 0.8 ml of 0.006 MKMnO4 and lansoprazole: (a) 5,(b) 10, (c) 20, (d) 30, (e) 40, (f)
50, (g) 60 and (h) 70 �g ml-1.Each set was diluted with dou-bly distilled water in a 10 mlvolumetric flask.
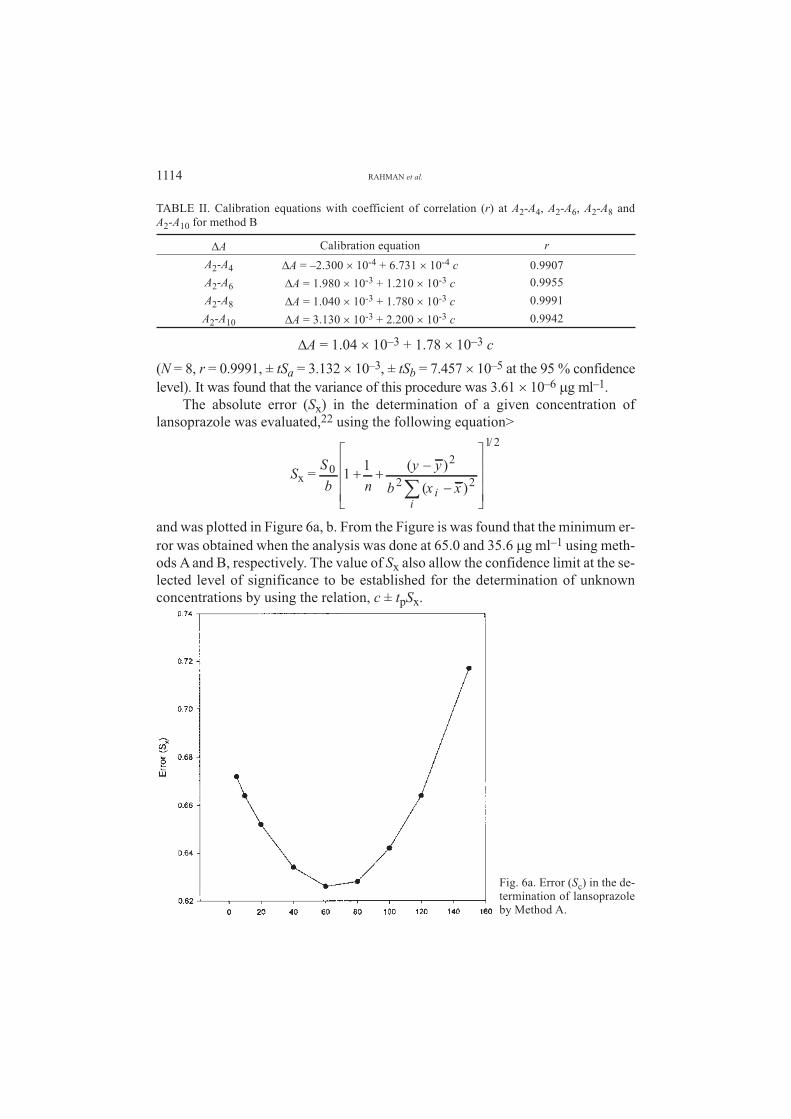
TABLE II. Calibration equations with coefficient of correlation (r) at A2-A4, A2-A6, A2-A8 and
A2-A10 for method B
�A Calibration equation r
A2-A4 �A = –2.300 � 10-4 + 6.731 � 10-4 c 0.9907
A2-A6 �A = 1.980 � 10-3 + 1.210 � 10-3 c 0.9955
A2-A8 �A = 1.040 � 10-3 + 1.780 � 10-3 c 0.9991
A2-A10 �A = 3.130 � 10-3 + 2.200 � 10-3 c 0.9942
�A = 1.04 � 10–3 + 1.78 � 10–3 c
(N = 8, r = 0.9991, ± tSa = 3.132 � 10–3, ± tSb = 7.457 � 10–5 at the 95 % confidence
level). It was found that the variance of this procedure was 3.61 � 10–6 �g ml–1.
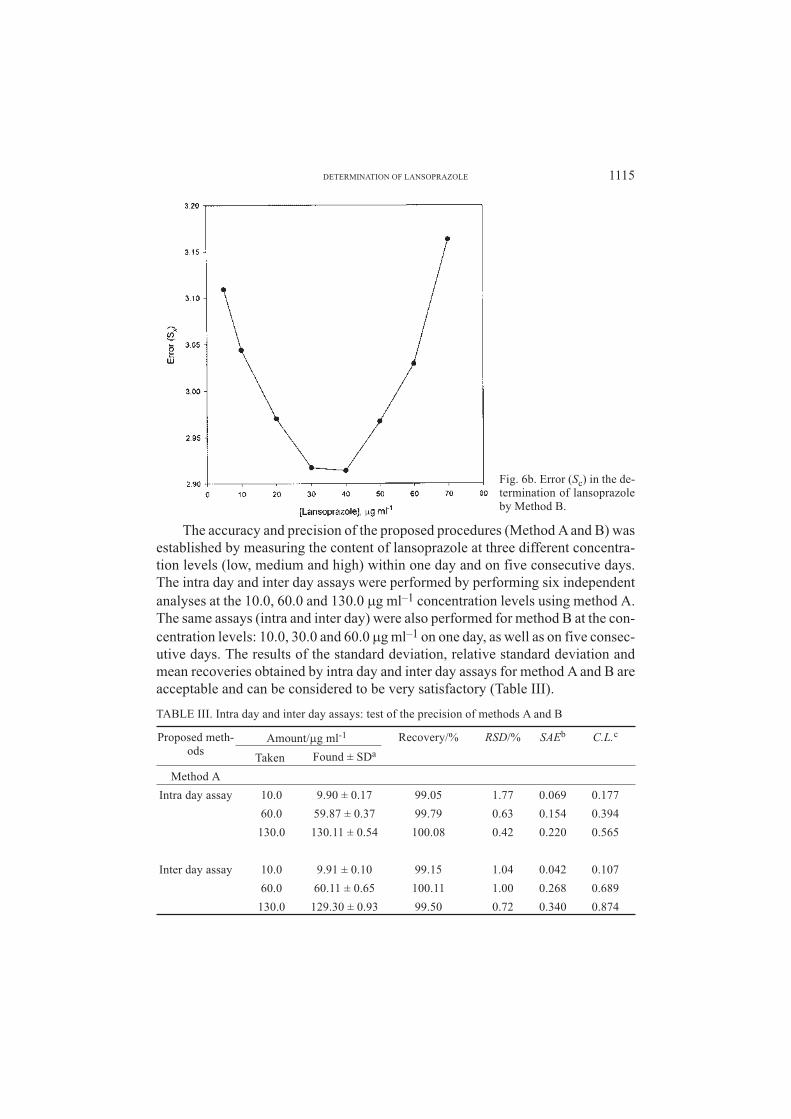
The absolute error (Sx) in the determination of a given concentration of
lansoprazole was evaluated,22 using the following equation>
Sx =S
b n
y y
b x xi
i
02
2 2
1 2
11
�
�
�
�
�
�
��
( )
( )
/
and was plotted in Figure 6a, b. From the Figure is was found that the minimum er-
ror was obtained when the analysis was done at 65.0 and 35.6 �g ml–1 using meth-
ods A and B, respectively. The value of Sx also allow the confidence limit at the se-
lected level of significance to be established for the determination of unknown
concentrations by using the relation, c ± tpSx.
1114 RAHMAN et al.
Fig. 6a. Error (Sc) in the de-termination of lansoprazoleby Method A.
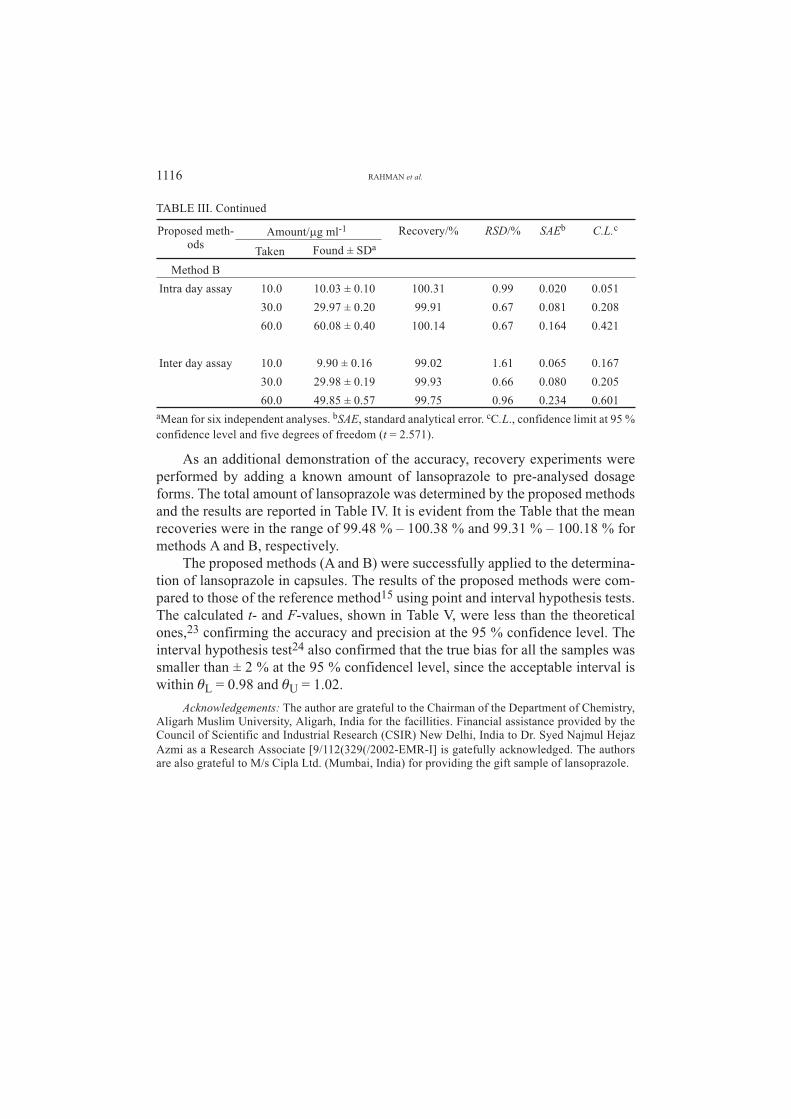
The accuracy and precision of the proposed procedures (Method A and B) was
established by measuring the content of lansoprazole at three different concentra-
tion levels (low, medium and high) within one day and on five consecutive days.
The intra day and inter day assays were performed by performing six independent
analyses at the 10.0, 60.0 and 130.0 �g ml–1 concentration levels using method A.
The same assays (intra and inter day) were also performed for method B at the con-
centration levels: 10.0, 30.0 and 60.0 �g ml–1 on one day, as well as on five consec-
utive days. The results of the standard deviation, relative standard deviation and
mean recoveries obtained by intra day and inter day assays for method A and B are
acceptable and can be considered to be very satisfactory (Table III).
TABLE III. Intra day and inter day assays: test of the precision of methods A and B
Proposed meth-ods
Amount/�g ml-1 Recovery/% RSD/% SAEb C.L.c
Taken Found ± SDa
Method A
Intra day assay 10.0 9.90 ± 0.17 99.05 1.77 0.069 0.177
60.0 59.87 ± 0.37 99.79 0.63 0.154 0.394
130.0 130.11 ± 0.54 100.08 0.42 0.220 0.565
Inter day assay 10.0 9.91 ± 0.10 99.15 1.04 0.042 0.107
60.0 60.11 ± 0.65 100.11 1.00 0.268 0.689
130.0 129.30 ± 0.93 99.50 0.72 0.340 0.874
DETERMINATION OF LANSOPRAZOLE 1115
Fig. 6b. Error (Sc) in the de-termination of lansoprazoleby Method B.
Proposed meth-ods
Amount/�g ml-1 Recovery/% RSD/% SAEb C.L.c
Taken Found ± SDa
Method B
Intra day assay 10.0 10.03 ± 0.10 100.31 0.99 0.020 0.051
30.0 29.97 ± 0.20 99.91 0.67 0.081 0.208
60.0 60.08 ± 0.40 100.14 0.67 0.164 0.421
Inter day assay 10.0 9.90 ± 0.16 99.02 1.61 0.065 0.167
30.0 29.98 ± 0.19 99.93 0.66 0.080 0.205
60.0 49.85 ± 0.57 99.75 0.96 0.234 0.601
aMean for six independent analyses. bSAE, standard analytical error. cC.L., confidence limit at 95 %
confidence level and five degrees of freedom (t = 2.571).
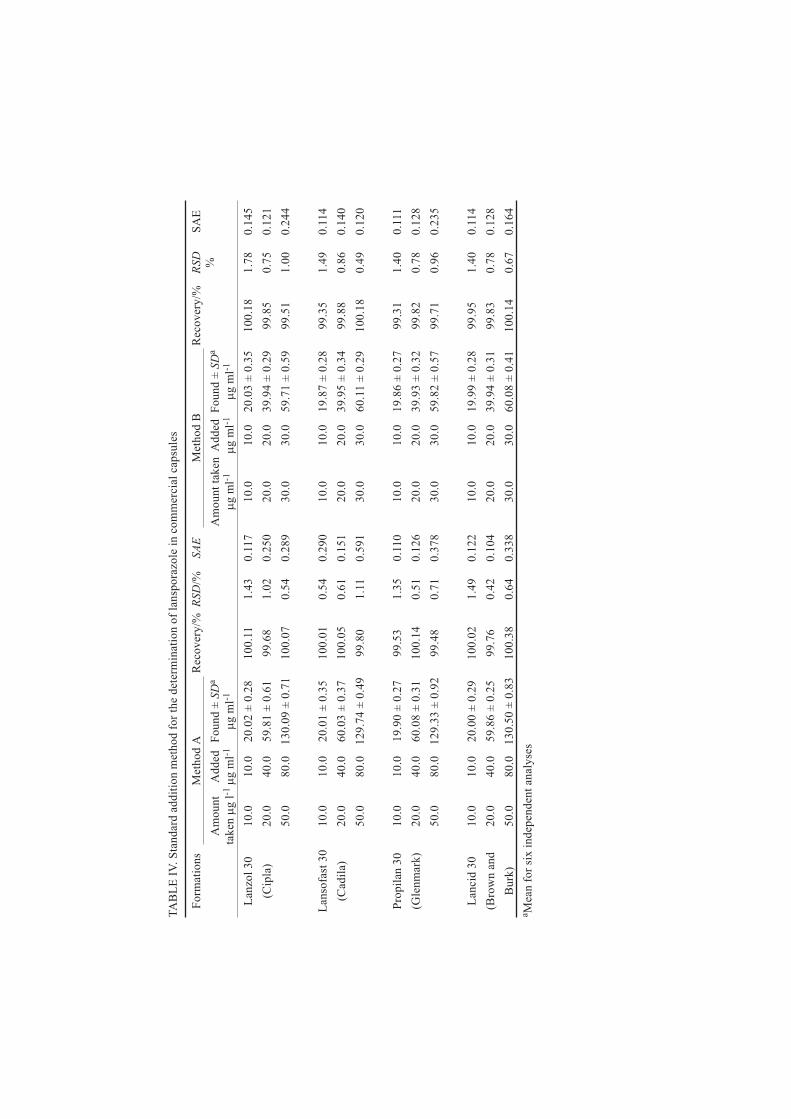
As an additional demonstration of the accuracy, recovery experiments were
performed by adding a known amount of lansoprazole to pre-analysed dosage
forms. The total amount of lansoprazole was determined by the proposed methods
and the results are reported in Table IV. It is evident from the Table that the mean
recoveries were in the range of 99.48 % – 100.38 % and 99.31 % – 100.18 % for
methods A and B, respectively.
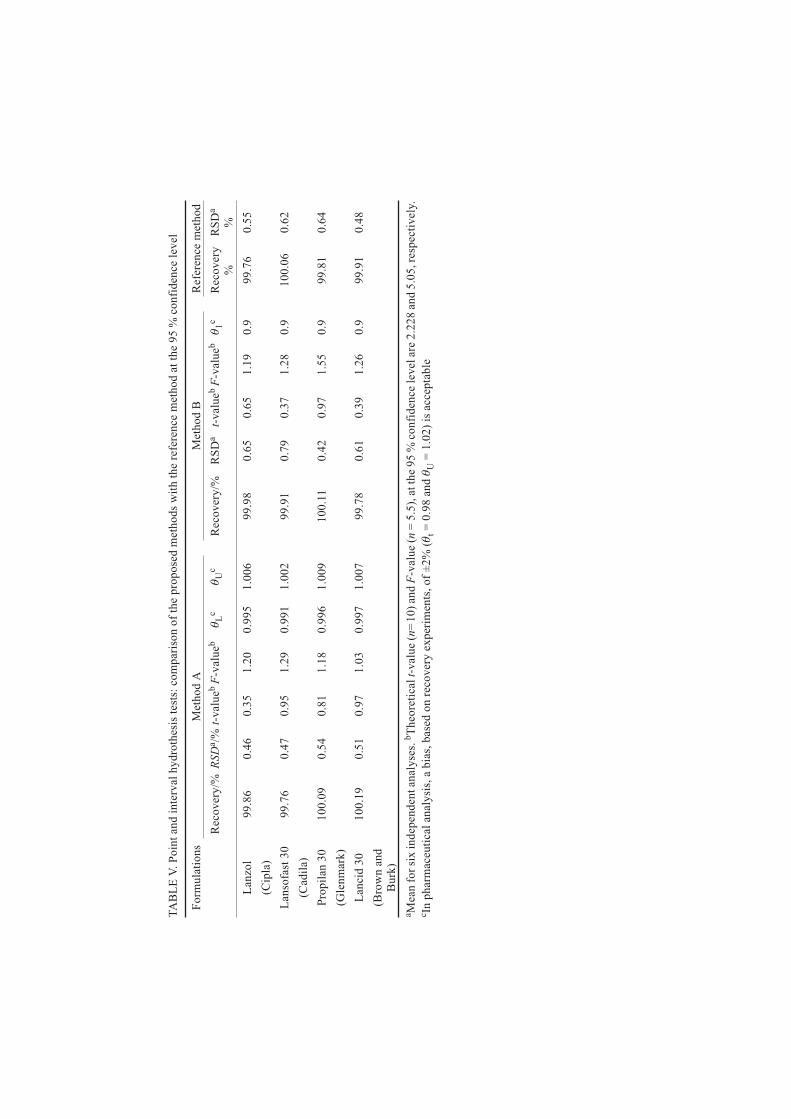
The proposed methods (A and B) were successfully applied to the determina-
tion of lansoprazole in capsules. The results of the proposed methods were com-
pared to those of the reference method15 using point and interval hypothesis tests.
The calculated t- and F-values, shown in Table V, were less than the theoretical
ones,23 confirming the accuracy and precision at the 95 % confidence level. The
interval hypothesis test24 also confirmed that the true bias for all the samples was
smaller than ± 2 % at the 95 % confidencel level, since the acceptable interval is
within �L = 0.98 and �U = 1.02.
Acknowledgements: The author are grateful to the Chairman of the Department of Chemistry,Aligarh Muslim University, Aligarh, India for the facillities. Financial assistance provided by theCouncil of Scientific and Industrial Research (CSIR) New Delhi, India to Dr. Syed Najmul Hejaz
Azmi as a Research Associate �9/112(329(/2002-EMR-I� is gatefully acknowledged. The authors
are also grateful to M/s Cipla Ltd. (Mumbai, India) for providing the gift sample of lansoprazole.
1116 RAHMAN et al.
TABLE III. Continued
TA
BL
EIV
.S
tan
dar
dad
dit
ion
met
ho
dfo
rth
ed
eter
min
atio
no
fla
nsp
ora
zole
inco
mm
erci
alca
psu
les
Fo
rmat
ion
sM
eth
od
AR
eco
ver
y/%
RS
D/%
SA
EM
eth
od
BR
eco
ver
y/%
RS
D
%S
AE
Am
ou
nt
tak
en�
gl-1
Ad
ded
�g
ml-1
Fo
un
d±
SD
a
�g
ml-1
Am
ou
nt
tak
en
�g
ml-1
Ad
ded
�g
ml-1
Fo
un
d±
SD
a
�g
ml-1
Lan
zol
30
10
.01
0.0
20
.02
±0
.28
10
0.1
11
.43
0.1
17
10
.01
0.0
20
.03
±0
.35
10
0.1
81
.78
0.1
45
(Cip
la)
20
.04
0.0
59
.81
±0
.61
99
.68
1.0
20
.25
02
0.0
20
.03
9.9
4±
0.2
99
9.8
50
.75
0.1
21
50
.08
0.0
13
0.0
9±
0.7
11
00
.07
0.5
40
.28
93
0.0
30
.05
9.7
1±
0.5
99
9.5
11
.00
0.2
44
Lan
sofa
st3
01
0.0
10
.02
0.0
1±
0.3
51
00
.01
0.5
40
.29
01
0.0
10
.01
9.8
7±
0.2
89
9.3
51
.49
0.1
14
(Cad
ila)
20
.04
0.0
60
.03
±0
.37
10
0.0
50
.61
0.1
51
20
.02
0.0
39
.95
±0
.34
99
.88
0.8
60
.14
0
50
.08
0.0
12
9.7
4±
0.4
99
9.8
01
.11
0.5
91
30
.03
0.0
60
.11
±0
.29
10
0.1
80
.49
0.1
20
Pro
pil
an3
01
0.0
10
.01
9.9
0±
0.2
79
9.5
31
.35
0.1
10
10
.01
0.0
19
.86
±0
.27
99
.31
1.4
00
.111
(Gle
nm
ark
)2
0.0
40
.06
0.0
8±
0.3
11
00
.14
0.5
10
.12
62
0.0
20
.03
9.9
3±
0.3
29
9.8
20
.78
0.1
28
50
.08
0.0
12
9.3
3±
0.9
29
9.4
80
.71
0.3
78
30
.03
0.0
59
.82
±0
.57
99
.71
0.9
60
.23
5
Lan
cid
30
10
.01
0.0
20
.00
±0
.29
10
0.0
21
.49
0.1
22
10
.01
0.0
19
.99
±0
.28
99
.95
1.4
00
.11
4
(Bro
wn
and
20
.04
0.0
59
.86
±0
.25
99
.76
0.4
20
.10
42
0.0
20
.03
9.9
4±
0.3
19
9.8
30
.78
0.1
28
Bu
rk)
50
.08
0.0
13
0.5
0±
0.8
31
00
.38
0.6
40
.33
83
0.0
30
.06
0.0
8±
0.4
11
00
.14
0.6
70
.16
4
aM
ean
for
six
ind
epen
den
tan
aly
ses
TA
BL
EV
.P
oin
tan
din
terv
alh
yd
roth
esis
test
s:co
mp
aris
on
of
the
pro
po
sed
met
ho
ds
wit
hth
ere
fere
nce
met
ho
dat
the
95
%co
nfi
den
cele
vel
Fo
rmu
lati
on
sM
eth
od
AM
eth
od
BR
efer
ence
met
ho
d
Rec
ov
ery
/%R
SD
a/%
t-v
alu
eb
F-v
alu
eb
�L
c�
Uc
Rec
ov
ery
/%R
SD
at-
val
ue
bF
-val
ue
b�
1c
Rec
ov
ery
%R
SD
a
%
Lan
zol
99
.86
0.4
60
.35
1.2
00
.99
51
.00
69
9.9
80
.65
0.6
51
.19
0.9
99
.76
0.5
5
(Cip
la)
Lan
sofa
st3
09
9.7
60
.47
0.9
51
.29
0.9
91
1.0
02
99
.91
0.7
90
.37
1.2
80
.91
00
.06
0.6
2
(Cad
ila)
Pro
pil
an3
01
00
.09
0.5
40
.81
1.1
80
.99
61
.00
91
00
.11
0.4
20
.97
1.5
50
.99
9.8
10
.64
(Gle
nm
ark
)
Lan
cid
30
10
0.1
90
.51
0.9
71
.03
0.9
97
1.0
07
99
.78
0.6
10
.39
1.2
60
.99
9.9
10
.48
(Bro
wn
and
Bu
rk)
aM
ean
for
six
ind
epen
den
tan
aly
ses.
bT
heo
reti
calt-
val
ue
(n=
10
)an
dF
-val
ue
(n=
5.5
),atth
e9
5%
co
nfi
den
ce
lev
elare
2.2
28
an
d5
.05
,re
specti
vely
.cIn
ph
arm
aceu
tica
lan
aly
sis,
ab
ias,
bas
edo
nre
cov
ery
exp
erim
ents
,o
f±
2%
(�t=
0.9
8an
d�
U=
1.0
2)
isac
cep
tab
le
I Z V O D
KINETI^KI SPEKTROFOTOMETRIJSKI METOD ZA ODRE\IVAWE
LANSOPRAZOLA U FARMACEUTSKIM FORMULACIJAMA
NAFISUR RAHMAN, ZEHRA BANO, SYED NAJMUL HEJAZ AZMI i MOHAMMAD KASHIF
Department of Chemistry, Aligarh Muslim University, Aligarh202002, Uttar Pradesh, India
Razijen je jednostavan kineti~ki spektrofotometrijski metod za odre|ivawe
lansoprazola u farmaceutskim formulacijama. Metod se zasniva na oksidaciji leka
alkalnim kalijum-permanganatom na sobnoj temperaturi. Reakcija je pra}ena spek-
trofotometrijski merewem porasta apsorpcije usled stvarawa MnO42- na 610 nm
(metod A) i smawewem absorpcije na 530 nm usled nestajawa MnO4- (metod B). Za
odre|ivawe leka primewen je kalibracioni postupak. Kalibraciona linija je line-
rna u rasponu koncentracija od 5–150 i 5–70 �g ml-1, a odgovaraju}e jedna~ine su brzina
= –3.915 � 10-6 + 5,271 � 10-5c i �A = –1.04 � 10-3 + 1,78 � 10-5 c za metode A i B.
Statisti~ko pore}ewe rezultata predlo`enih postupaka sa referentnim spektrofo-
tometrijskim metodama pokazalo je izvanredno slagawe i ukazalo da ne postoji zna~aj-
na razlika izme|u upore|enih metoda u pogledu ta~nosti i preciznosti. Interval te-
sta hipoteze je tako|e odre|en i odstupawe svih uzoraka je mawe od ± 2 %.
(Primqeno 5. oktobra, revidirano 27. decembra 2005)
REFERENCES
1. C. M. Spencer, D. Faulds, Drug 48 (1994) 404
2. Martindale, The Extra Pharmacopoeia, 33rd, Ed. Royal Pharmaceutical Society, London, 2002,
p. 1230
3. The United States Pharmacopoeia, 27. Edn., National Formulary 22, Asian Edition, Rockville,
MD, USA, 2004, p. 1068
4. A. Avgerinos, T. Karidas, C. Potsides, A. Axarlis, Eur. J. Drug. Met. Pharmacokin 23 (1998) 329
5. M. F. Zaater, N. Najib, E. Ghanem, Saudi Pharm. J. 7 (1999) 123
6. K. Borner, E. Borner, H. Lode, Chromatographia 45 (1997) 450
7. A. P. Argenkar, S. S. Kunjir, J. Planar Chromatogr. – Mod. TLC: 9 (1996) 296
8. K. K. andya, V. D. Modi, M. C. Satiya, I. A. Modi, B. K. Chakravarth, T. P. Gandhi, J.
Chromatogr., B: Biomed. Sci. Appl. 693 (1997) 199
9. D. Dogrukol-Ak, M. Tuncel, H. Y. Aboul-Enien, Chromatographia: 54 (2001) 527
10. D. Yeniceli, D. Dogrukol-Ak, M. Tuncel, J. Pharm. Biomed. Anal. 36 (2004) 145
11. C. Yardimci, N. Ozaltin, Analyst. 126 (2001) 361
12. A. Radi, J. Pharm. Biomed. Anal. 31 (2003) 1007
13. M. Wahbi, O. Abdel-Razak, A. A. Gazy, H. Mahgoub, M. S. Moneeb, J. Pharm. Biomed. Anal.
30 (2002) 1133
14. N. Ozaltin, J. Pharm. Biomed. Anal. 20 (1999) 599
15. A. A. M. Moustafa, J. Pharm., Biomed. Anal. 22 (2000) 45
16. R. J. Sadana, G. P. Kalpana, East Pharm. 43 (2000) 101
17. M. Rajshree, S. Krutika, S. K. Banerjee, Indian J. Pharm. Sci. 59 (1997) 203
18. Puratchikodi, G. Krishnamoorthy, B. Jaykar, R. Valaramathy, East. Pharm. 42 (1999) 127
19. R. Mashru, S. K. Banerjee, East. Pharm. 42 (1999) 125
20. "Vogel's Textbook of Quantitative Chemical Analysis", 6th Edn., Pearson Education, Singapore,
2002, p. 420
21. V. V. Nillimov, The Application of Mathematical Statistics of Chemical Analysis Pergamon
Press, Oxford,1963, 189
22. B. Morelli, Anal. Lett 20 (1987) 141
DETERMINATION OF LANSOPRAZOLE 1119

23. G. D. Christan, Data Handling, 6th Edn. Analytical Chemistry, J. Wiley, Singapore, 2004, p. 90
25. C. Hartmann, J. S. Verbeke, W. Verbeke, W. Pennickx, Y. V.Neyden, P. Vankeerbergeh, D. L.
Massart, Anal. Chem. 67 (1995) 4491.
1120 RAHMAN et al.

DETERMINATION OF LANSOPRAZOLE 1117

1118 RAHMAN et al.