kinetic model of sucrose accumulation in maturing sugarcane culm tissue
TRANSCRIPT
www.elsevier.com/locate/phytochem
Phytochemistry 68 (2007) 2375–2392
PHYTOCHEMISTRY
Kinetic model of sucrose accumulation in maturingsugarcane culm tissue
Lafras Uys a, Frederik C. Botha b,c, Jan-Hendrik S. Hofmeyr a, Johann M. Rohwer a,*
a Triple-J Group for Molecular Cell Physiology, Department of Biochemistry, Stellenbosch University, Private Bag X1, 7602 Matieland, South Africab South African Sugarcane Research Institute, Private Bag X02, 4300 Mount Edgecombe, South Africa
c Institute for Plant Biotechnology, Stellenbosch University, Private Bag X1, 7602 Matieland, South Africa
Received 5 February 2007; received in revised form 11 April 2007Available online 6 June 2007
Abstract
Biochemically, it is not completely understood why or how commercial varieties of sugarcane (Saccharum officinarum) are able toaccumulate sucrose in high concentrations. Such concentrations are obtained despite the presence of sucrose synthesis/breakdown cycles(futile cycling) in the culm of the storage parenchyma. Given the complexity of the process, kinetic modelling may help to elucidate thefactors governing sucrose accumulation or direct the design of experimental optimisation strategies.
This paper describes the extension of an existing model of sucrose accumulation (Rohwer, J.M., Botha, F.C., 2001. Analysis ofsucrose accumulation in the sugar cane culm on the basis of in vitro kinetic data. Biochem. J. 358, 437–445) to account for isoformsof sucrose synthase and fructokinase, carbon partitioning towards fibre formation, and the glycolytic enzymes phosphofructokinase(PFK), pyrophosphate-dependent PFK and aldolase. Moreover, by including data on the maximal activity of the enzymes as measuredin different internodes, a growth model was constructed that describes the metabolic behaviour as sugarcane parenchymal tissue maturesfrom internodes 3–10.
While there was some discrepancy between modelled and experimentally determined steady-state sucrose concentrations in the cyto-plasm, steady-state fluxes showed a better fit. The model supports a hypothesis of vacuolar sucrose accumulation against a concentrationgradient. A detailed metabolic control analysis of sucrose synthase showed that each isoform has a unique control profile. Fructoseuptake by the cell and sucrose uptake by the vacuole had a negative control on the futile cycling of sucrose and a positive control onsucrose accumulation, while the control profile for neutral invertase was reversed. When the activities of these three enzymes were chan-ged from their reference values, the effects on futile cycling and sucrose accumulation were amplified.
The model can be run online at the JWS Online database (http://jjj.biochem.sun.ac.za/database/uys).� 2007 Elsevier Ltd. All rights reserved.
Keywords: Sugarcane; Kinetic modelling; Metabolic control analysis; Plant metabolism; Sucrose accumulation
1. Introduction
Commercial varieties of sugarcane (Saccharum officina-rum) preferentially store sucrose in high concentrations,as opposed to starch. Dry matter accumulation and sucrosecontent increase sharply within the top internodes (Moore,1995; Moore and Maretzki, 1996; Whittaker and Botha,
0031-9422/$ - see front matter � 2007 Elsevier Ltd. All rights reserved.
doi:10.1016/j.phytochem.2007.04.023
* Corresponding author. Tel.: +27 21 808 5843; fax: +27 21 808 5863.E-mail address: [email protected] (J.M. Rohwer).
1997). The increase in sucrose content during internodematuration coincides with a repartitioning of carbontowards sucrose storage rather than insoluble matter andrespiration (Whittaker and Botha, 1997). Moreover, insome varieties sucrose does not accumulate linearly withtime, since the rate of accumulation increases significantlywith internode maturity (Whittaker and Botha, 1997;Botha and Black, 2000). Although it is well known that sig-nificant differences in sucrose content are evident between,for example, ancestral and commercial sugarcane varieties,the biochemical basis for this is still poorly understood. If

Fig. 1. Reaction scheme of the extended sucrose accumulation model.Metabolites are shaded in light grey and enclosed in rectangular boxes(variables) or circles (external fixed metabolites). Enzymes are enclosed inrectangular boxes without shading. A number 2 next to a line indicates astoichiometric coefficient. Abbreviations for enzymes and transport steps:
HK, Hexokinase; FRK, Fructokinase; UDPGDH, UDP-Glucose dehy-drogenase; PFK, Phosphofructokinase; PFP, Pyrophosphate-dependentPFK; NI, Neutral invertase; SuSy, Sucrose synthase; ALD, Aldolase; SPS,Sucrose phosphate synthetase; SPase, Sucrose phosphatase; VAC, vacu-olar sucrose import. Metabolites: Glc, Glucose; Fru, Fructose; Suc,Sucrose; S6P, Sucrose-6-phosphate; HexP, Hexose phosphate; FbP,Fructose-1,6-bisphosphate; UDPGA, UDP-Glucuronic acid; TrP, triosephosphate.
2376 L. Uys et al. / Phytochemistry 68 (2007) 2375–2392
control points for this process could be identified, thiswould suggest rational experimental intervention strategiesfor maximising sucrose yield.
An important feature of the sucrose accumulation path-way in sugarcane culm is the pronounced futile cycling ofsucrose. This is in part due to three known invertase iso-forms that are present in storage parenchyma (Boschet al., 2004; Hatch and Glasziou, 1963; Ma et al., 2000;Prado et al., 1980; Rose and Botha, 2000; Vattuoneet al., 1981; Venkataramana et al., 1991; Vorster andBotha, 1998, 1999; Zhu et al., 1997), as well as the presenceof enzymes such as sucrose synthase, which are readilyreversible (Schafer et al., 2004b). In an initial attempt toquantify the regulatory characteristics of this process andto identify control points, our group created a kineticmodel of sucrose accumulation in the sugarcane culm(Rohwer and Botha, 2001). In line with experimental data,this model succinctly captured the futile cycling propertyand predicted approximately 22% of synthesised sucroseto be broken down again via this cycle. The model assumedthat increased flux of sucrose into the vacuole should befollowed by increased sucrose accumulation—to achievethis, a decrease in futile cycling was needed. The study con-cluded that increased specific activities of cytoplasmic glu-cose and fructose uptake, as well as of vacuolar sucroseuptake, should increase sucrose accumulation. Conversely,a decrease in neutral invertase activity should have thesame effect.
Although our initial model (Rohwer and Botha, 2001)provided useful results, its construction was based on anumber of simplifying—and potentially limiting—assump-tions, including the following:
� the vacuole was not modelled as an explicit storagecompartment,� the levels of metabolic cofactors were clamped at exper-
imentally determined concentrations,� the model was restricted to internode 5 (numbered from
the top of the plant) as representative of medium-mature(and thus developing) tissue,� carbon partitioning towards fibre formation was not
included,� different enzyme isoforms were not considered explicitly,
and catalysis was modelled as the implicit average ofsuch isoforms when present and� maximal activities of some enzymes were estimated due
to lack of experimental data.
It is clear from the above that considerable scope existsfor refinement and expansion of the model, and in thispaper we present a more detailed and extended analysis.Based on our original model (Rohwer and Botha, 2001),maximal activities for the enzymes experimentally mea-sured in tissues of varying stages of maturity (internodes3–10) allowed us to build internode specific models andthus create a growth profile of metabolism around sucroseaccumulation. A carbon utilisation branch towards fibre
formation was also added. We subsequently used kineticmodelling to identify those reactions in the cytoplasm ofthe storage parenchyma that have the largest influence onsugarcane sucrose yield.
2. Building the kinetic model
This section describes in detail how the sucrose accumu-lation model was extended. For a general introduction tothe methods used (steady-state kinetic modelling and con-trol analysis), the reader is referred to Appendix A.
2.1. Stoichiometry
The model is described in terms of the mass transferbetween metabolite pools (the stoichiometry), the rates ofconversion from one metabolite to another (the rate equa-tions and ODEs) and the ‘‘fixed’’ terms in the rate equa-tions (the input parameters). The reaction schemesummarising the stoichiometry is shown in Fig. 1. The fol-lowing are the most important extensions of the originalmodel Rohwer and Botha, 2001:

L. Uys et al. / Phytochemistry 68 (2007) 2375–2392 2377
� Sucrose synthase (SuSy) and fructokinase (FRK) aremodelled in terms of their respective isozymes asopposed to single reactions with averaged kineticparameters.� Rather than modelling a single glycolytic reaction from
fructose-6-phosphate (F6P), partitioning to glycolysisnow includes the phosphofructokinase (PFK)-pyro-phosphate-dependent PFK (PFP) split and the aldolase(ALD)-catalysed draining reaction.� UDP-glucose dehydrogenase (UDPGDH) drains hexose
phosphates into UDP-glucuronic acid (UDPGA), theprecursor for cell wall biosynthesis.
Neither the apoplast nor the vacuole is explicitlyincluded in the model. This means that transport stepsacross these boundaries act as source and sink reactionsfor the system, and the corresponding source and sinkmetabolite concentrations are clamped in the model.
In keeping with the approach followed by Rohwer andBotha (2001), the interconversion of UDP-glucose(UDPGlc), F6P, glucose-6-phosphate (G6P) and glucose-1-phosphate (G1P) are modelled as a single equilibriumblock, and values for these metabolite concentrations arecalculated as fractions of the total hexose phosphate poolby using the equilibrium constants for the reactions.
2.2. Parameters
Model parameters can be divided into kinetic con-stants for the enzymes (e.g. Michaelis, inhibition or equi-librium constants), maximal activities of the various stepsand the concentrations of external species. The latter,sometimes also referred to as ‘‘clamped’’ species, are typ-ically the source and sink metabolites, which are assumedto be buffered by the system and are therefore fixed inthe model to allow a steady-state to be calculated. Math-ematically, they are boundary conditions for the systemof ODEs.
Reported enzyme maximal activities show large varia-tions. Ideally, all activities should be measured under iden-tical circumstances and preferably in the same sourcetissue. Therefore, we aimed for as consistent a data set aspossible by restricting ourselves to values reported fromone laboratory. The enzyme maximal activities for the dif-ferent internodes are listed in Table 3 and the conversion toa common unit is described in Appendix B.1. Consistencyof the data is also further discussed in Section 3.5.
Kinetic constants were collected from a number of dif-ferent literature sources and are listed in Table 4 anddescribed in Appendix B.2. The clamped concentrationsof all cofactors and external source metabolites are givenin Table 5. Cofactors in the model (e.g. ATP and PPi)are clamped and their regeneration is not modelled explic-itly because of insufficient kinetic data for all the steps con-tributing to their regeneration. This is consistent with theapproach followed in the original model and further detailis available in Rohwer and Botha (2001).
2.3. Availability
The model can be interrogated live on the JWS Onlinewebsite (http://jjj.biochem.sun.ac.za/database/uys), requir-ing only a web browser. In addition, model definition filesin PySCeS and SBML formats are available for downloadfrom the same URL.
3. Model analysis and discussion
This section deals first with a comparison of the statevariables as predicted by the model to independent experi-mental literature data. Next, the metabolic changes associ-ated with internode maturation are explored, and weinvestigate in detail the control exercised by the SuSy iso-zymes over the reactions and metabolite concentrations.Finally, parameter scans are performed for maximal activ-ities of enzymes that have the greatest effect on futilecycling of sucrose to establish the effect on sucrose accumu-lation rate. A general discussion places our results in thecontext of existing knowledge.
3.1. Comparison to experimental data
Comparisons of the model-predicted steady-state fluxand concentration values to experimental data are givenin Figs. 2 and 3. Measurements of carbon partitioning insugarcane storage tissue (Bindon and Botha, 2002) wereused for the comparison with simulated flux values. Theseexperiments analysed steady-state labelling in tissue discs,where steady-state conditions may thus be assumed tohold. Furthermore maximal activity data was obtainedfrom in vitro assays of sugarcane tissue of a particularinternode (i.e. maturity). Since the time-scale of growth ismuch slower than that covered by the metabolic model,the steady-state comparison is again valid (see also Appen-dix A.2). Experimental flux values were only reported forinternodes 3, 5 and 9; values for internodes 4, 6, 7 and 8were obtained from a spline interpolation, which was usedas a first approximation for the missing data. An artificialdata point (0.1· the predictor for internode 9) was intro-duced for a fictitious internode 20 to anchor the spline.All predictor data were present in the spline values correctto an accuracy of approximately 1% or better.
Data are presented as a ratio between glycolytic, storageor fibre fluxes and flux of glucose uptake. The version ofthe model used to validate the fluxes had the maximalactivity of fructose uptake set to 10�6 mM min�1 (effec-tively zero) to mimic the experimental protocol, in whichonly radiolabelled glucose was fed to tissue disks. A valueof 10�6 mM min�1 was used, rather than absolute zero, toensure the numerical stability of the solver algorithms. Thegood correlation between experimental and modelled fluxvalues for UDPGDH is due to the fact that the experimen-tal data were used to estimate a Vmax value for UDPGDH(see also Appendix B.1). Flux ratios for JVAC
J Glcup
did not

a
b
c
Fig. 3. Comparison of model-predicted flux ratios (solid line) withexperimental data (+). (a)–(c) Various flux ratios, experimental data fromBindon and Botha (2002).
a
b
Fig. 2. Test set of experimentally determined sucrose concentrations andcomparison of model-predicted sucrose concentrations with experimentaldata. (a) Boxplot of sucrose levels in the culm tissue of various internodes.Data were collected from Bindon and Botha (2002), Bosch (2005), Boschet al. (2004), Botha and Black (2000), Botha et al. (1996), Glasziou (1960),Komor (1994), Rae et al. (2005), Rose and Botha (2000), Walsh et al.(2005), Whittaker and Botha (1997) and Zhu et al. (1997), representingdifferent varieties, seasonal and environmental conditions. The data wereconverted to a common unit and pooled (Uys, 2006). The centre lineindicates the median value, the box the first and third quartile, and thewhiskers extend to the most extreme values in the range 1.5· the range ofthe box. Outliers are indicated by +. (b) Comparison of model outputs(solid line) with experimental data (+).
2378 L. Uys et al. / Phytochemistry 68 (2007) 2375–2392
correlate well with experimental data. The reason for this isnot immediately clear; however, it is possible that the modelunderestimates sucrose flux into the vacuole and overesti-mates flux into glycolysis. The model-predicted flux valuesalways add up to 100%, because these three reactions arethe only sink reactions present in the model and thereforerepresent the total flux out of the system. An unaccountedfor sink reaction or non-steady-state conditions in theexperimental set-up could also contribute to the disparity.Importantly, models that do not exactly predict experimen-tal fluxes and concentrations may still be useful. For exam-ple, the overall dynamic behaviour of a model can still becaptured and its control properties can be calculated.
The comparison of experimental and simulated sucroseconcentrations is shown in Fig. 2. If one assumes that the
measurement of sucrose concentrations in each sugarcaneinternode is a snapshot of a prevailing quasi-steady-state,then a comparison of model-predicted steady-state valuesusing maximal activities measured in that internode shouldbe justified. Nevertheless, the comparison is slightly mis-leading, because
� the model only predicts sucrose concentrations in the
cytoplasm, whereas� the experimentally determined sucrose concentrations
account for sucrose in the entire internodal volume, i.e.sucrose in the cytoplasm, apoplast, vacuole, phloemand other compartments.

L. Uys et al. / Phytochemistry 68 (2007) 2375–2392 2379
We make the comparison to point out that if the modelis correct then sucrose should not accumulate in the cyto-plasm because the expected sucrose concentrations aremuch higher than those predicted by the model. This pointis discussed extensively in Section 3.6.
Fig. 4. Steady-state properties of the model for internodes 3–10. Fluxes arebackground. The figure follows the same layout as the reaction scheme in Fig
3.2. Modelling sugarcane growth
In order to investigate metabolic changes that occur dur-ing the maturation process of sugarcane culm tissue, weprepared a set of eight models, representative of internodes
shown with a blue background, steady-state concentrations with a green. 1.
2380 L. Uys et al. / Phytochemistry 68 (2007) 2375–2392
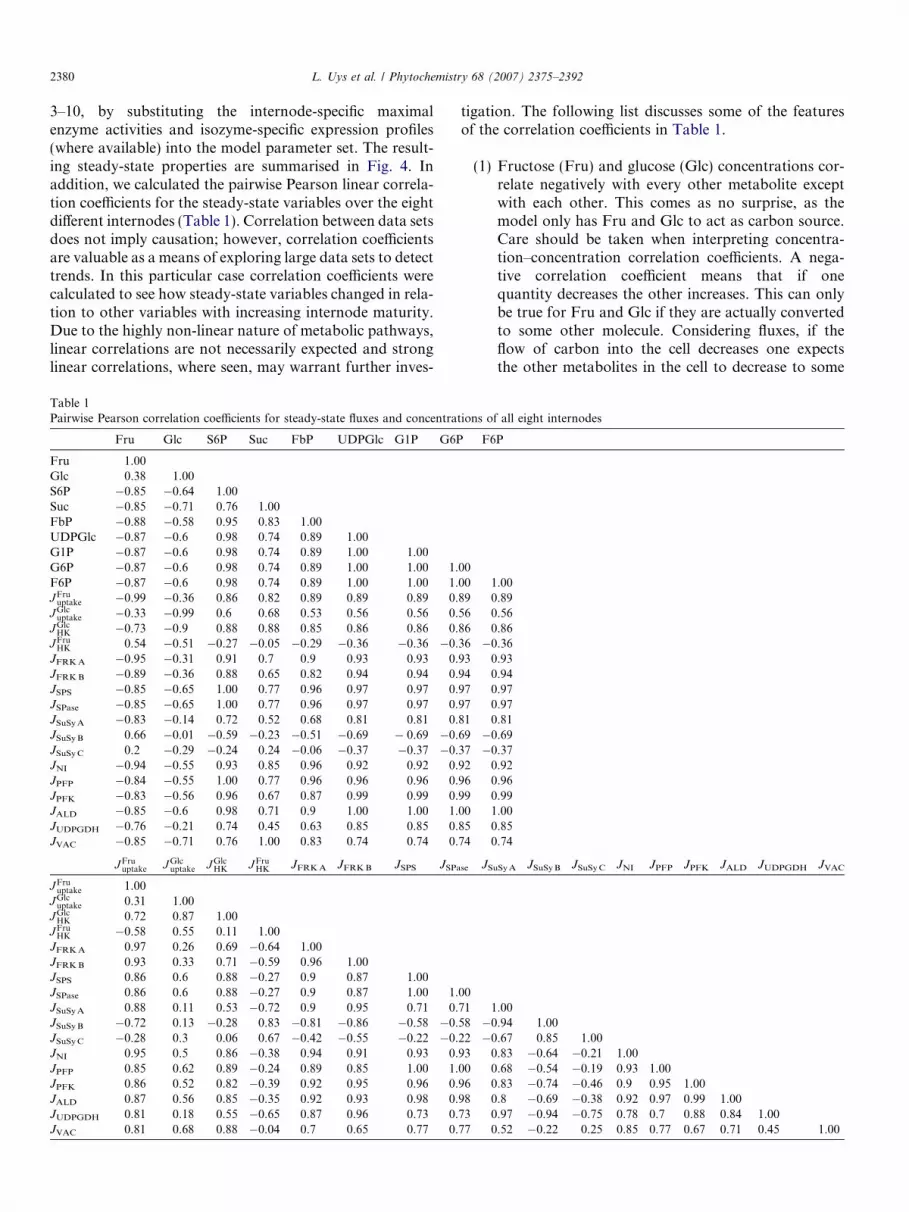
3–10, by substituting the internode-specific maximalenzyme activities and isozyme-specific expression profiles(where available) into the model parameter set. The result-ing steady-state properties are summarised in Fig. 4. Inaddition, we calculated the pairwise Pearson linear correla-tion coefficients for the steady-state variables over the eightdifferent internodes (Table 1). Correlation between data setsdoes not imply causation; however, correlation coefficientsare valuable as a means of exploring large data sets to detecttrends. In this particular case correlation coefficients werecalculated to see how steady-state variables changed in rela-tion to other variables with increasing internode maturity.Due to the highly non-linear nature of metabolic pathways,linear correlations are not necessarily expected and stronglinear correlations, where seen, may warrant further inves-
Table 1Pairwise Pearson correlation coefficients for steady-state fluxes and concentra
Fru Glc S6P Suc FbP UDPGlc G1P G6P
Fru 1.00Glc 0.38 1.00S6P �0.85 �0.64 1.00Suc �0.85 �0.71 0.76 1.00FbP �0.88 �0.58 0.95 0.83 1.00UDPGlc �0.87 �0.6 0.98 0.74 0.89 1.00G1P �0.87 �0.6 0.98 0.74 0.89 1.00 1.00G6P �0.87 �0.6 0.98 0.74 0.89 1.00 1.00 1.F6P �0.87 �0.6 0.98 0.74 0.89 1.00 1.00 1.JFru
uptake �0.99 �0.36 0.86 0.82 0.89 0.89 0.89 0.JGlc
uptake �0.33 �0.99 0.6 0.68 0.53 0.56 0.56 0.JGlc
HK �0.73 �0.9 0.88 0.88 0.85 0.86 0.86 0.JFru
HK 0.54 �0.51 �0.27 �0.05 �0.29 �0.36 �0.36 �0.JFRK A �0.95 �0.31 0.91 0.7 0.9 0.93 0.93 0.JFRK B �0.89 �0.36 0.88 0.65 0.82 0.94 0.94 0.JSPS �0.85 �0.65 1.00 0.77 0.96 0.97 0.97 0.JSPase �0.85 �0.65 1.00 0.77 0.96 0.97 0.97 0.JSuSy A �0.83 �0.14 0.72 0.52 0.68 0.81 0.81 0.JSuSy B 0.66 �0.01 �0.59 �0.23 �0.51 �0.69 � 0.69 �0.JSuSy C 0.2 �0.29 �0.24 0.24 �0.06 �0.37 �0.37 �0.JNI �0.94 �0.55 0.93 0.85 0.96 0.92 0.92 0.JPFP �0.84 �0.55 1.00 0.77 0.96 0.96 0.96 0.JPFK �0.83 �0.56 0.96 0.67 0.87 0.99 0.99 0.JALD �0.85 �0.6 0.98 0.71 0.9 1.00 1.00 1.JUDPGDH �0.76 �0.21 0.74 0.45 0.63 0.85 0.85 0.JVAC �0.85 �0.71 0.76 1.00 0.83 0.74 0.74 0.
JFruuptake J Glc
uptake J GlcHK JFru
HK JFRK A JFRK B JSPS JSPa
JFruuptake 1.00
JGlcuptake 0.31 1.00
JGlcHK 0.72 0.87 1.00
JFruHK �0.58 0.55 0.11 1.00
JFRK A 0.97 0.26 0.69 �0.64 1.00JFRK B 0.93 0.33 0.71 �0.59 0.96 1.00JSPS 0.86 0.6 0.88 �0.27 0.9 0.87 1.00JSPase 0.86 0.6 0.88 �0.27 0.9 0.87 1.00 1.JSuSy A 0.88 0.11 0.53 �0.72 0.9 0.95 0.71 0.JSuSy B �0.72 0.13 �0.28 0.83 �0.81 �0.86 �0.58 �0.JSuSy C �0.28 0.3 0.06 0.67 �0.42 �0.55 �0.22 �0.JNI 0.95 0.5 0.86 �0.38 0.94 0.91 0.93 0.JPFP 0.85 0.62 0.89 �0.24 0.89 0.85 1.00 1.JPFK 0.86 0.52 0.82 �0.39 0.92 0.95 0.96 0.JALD 0.87 0.56 0.85 �0.35 0.92 0.93 0.98 0.JUDPGDH 0.81 0.18 0.55 �0.65 0.87 0.96 0.73 0.JVAC 0.81 0.68 0.88 �0.04 0.7 0.65 0.77 0.
tigation. The following list discusses some of the featuresof the correlation coefficients in Table 1.
(1) Fructose (Fru) and glucose (Glc) concentrations cor-relate negatively with every other metabolite exceptwith each other. This comes as no surprise, as themodel only has Fru and Glc to act as carbon source.Care should be taken when interpreting concentra-tion–concentration correlation coefficients. A nega-tive correlation coefficient means that if onequantity decreases the other increases. This can onlybe true for Fru and Glc if they are actually convertedto some other molecule. Considering fluxes, if theflow of carbon into the cell decreases one expectsthe other metabolites in the cell to decrease to some
tions of all eight internodes
F6P
0000 1.0089 0.8956 0.5686 0.8636 �0.3693 0.9394 0.9497 0.9797 0.9781 0.8169 �0.6937 �0.3792 0.9296 0.9699 0.9900 1.0085 0.8574 0.74
se JSuSy A JSuSy B JSuSy C JNI JPFP JPFK JALD JUDPGDH JVAC
0071 1.0058 �0.94 1.0022 �0.67 0.85 1.0093 0.83 �0.64 �0.21 1.0000 0.68 �0.54 �0.19 0.93 1.0096 0.83 �0.74 �0.46 0.9 0.95 1.0098 0.8 �0.69 �0.38 0.92 0.97 0.99 1.0073 0.97 �0.94 �0.75 0.78 0.7 0.88 0.84 1.0077 0.52 �0.22 0.25 0.85 0.77 0.67 0.71 0.45 1.00

L. Uys et al. / Phytochemistry 68 (2007) 2375–2392 2381
extent, which would require the coefficient to be posi-tive. This is supported by the positive correlationcoefficients between J Fru
uptake and J Glcuptake and all the
metabolites except Fru and Glc. The negative correla-tions between J Fru
uptake and J Glcuptake on the one hand and
Fru and Glc on the other can be explained by thefeedback inhibition of the intracellular sugars ontheir respective uptake steps.
(2) Metabolites of the hexose phosphate pool, excludingfructose-1,6-bisphosphate (FbP), all have identicalcorrelation profiles since the model assumes thatthese species are in equilibrium. Sucrose-6-phosphate(S6P) is almost completely linearly correlated to thehexose phosphate pool for two reasons: first, S6P isonly synthesised from hexose phosphates, and sec-ond, the sucrose phosphate synthase (SPS) reactionmakes only the one product (S6P), which in turn isthe sole substrate for sucrose phosphatase (SPase)and no other reactions (Fig. 4). Thus, if the hexosephosphate concentration increases then the SPS flux
Fig. 5. Flux- and concentration-control coefficients of SuSy A, B & C as calccoefficients are shown by a series of eight bar graphs representing internodes
will increase and more S6P will be formed. S6P is neg-atively correlated to sucrose (Suc), since dephospho-rylation of S6P yields Suc.
(3) JVAC is completely positively correlated to Suc. Thisis expected, since the vacuolar sucrose uptake rateequation is a function of Suc only. The strongest cor-relation of Suc, after JVAC, is to JSuSy A and JSuSy C.The correlation with JSuSy C is as expected, since ofthe sucrose synthesising enzymes, JSuSy C carries byfar the largest steady-state flux. From this it can beinferred that the synthesis and storage of sucrose ismostly dependent on SuSy C.
3.3. Control by SuSy isozymes
One of the main extensions of the current model com-pared to the original version in Rohwer and Botha (2001)is the explicit modelling of the isozymes of SuSy andFRK (see Section 2.1). Hence, we calculated the controlcoefficient of each of the three SuSy isozymes on all the
ulated by the model. For each model variable on the X-axis, the control3–10.

2382 L. Uys et al. / Phytochemistry 68 (2007) 2375–2392
model variables (Fig. 5). The three isozymes had the mostcontrol over themselves and negative control over eachother. This is not really surprising since they all competefor the same substrate. It would also explain why all threeenzymes had negative control over flux through fructose-phosphorylating hexokinase. In all cases the relationship
CJxSuSy A : CJx
SuSy B : CJxSuSy C ¼ J SuSy A : J SuSy B : J SuSy C ð1Þ
held true, where Jx is any steady-state flux other thanthrough the SuSy isozymes. Thus, the amount of controlby an enzyme over the fluxes and concentrations in a sys-tem is shared by the isoforms of that enzyme, and more-over, the size of the fraction of that control residing in anisoform is proportional to the flux carried by that isoform.
3.4. Control analysis of sucrose accumulation
Metabolic control analysis (MCA) allows us to identifythose reactions with the greatest control on the flux ofsucrose accumulation into the vacuole. With a kineticmodel, the effect of changing the levels of these enzymescan be investigated. In Rohwer and Botha (2001) weargued that futile cycling of sucrose is an energeticallyexpensive process that decreases the amount of sucroseavailable for partitioning into storage. The control of thisprocess was investigated by defining a futile cycling controlcoefficient (FCCC) as CJNI=JVAC
i (Rohwer and Botha, 2001),which quantifies the extent to which a reaction can increaseor decrease the flux ratio of vacuolar sucrose accumulationto breakdown by neutral invertase. The smaller JNI/JVAC
is, the more sucrose is being stored as opposed to beingbroken down. It would therefore be valuable to knowwhich enzymes have the largest effect on this value, as theywould constitute good candidates for biotechnologicalmanipulation to increase sucrose yield. FCCCs of all theenzymes were calculated for all eight internodes (Table
Table 2Futile cycling control coefficients, defined as CJNI=J VAC
i (see text), for all eight i
Perturbation Internode (i)
3 4 5 6 7
V Glcup �0.802 �0.748 �0.904 �0.905 �0.976
V Fruup �0.768 �0.69 �0.622 �0.582 �0.692
VVAC �0.341 �0.328 �0.535 �0.494 �0.611VSPS �0.069 �0.036 �0.01 �0.012 �0.017VSuSy A �0.013 �0.009 0.004 0.003 0.004VSPase �0.002 0 0 0 0VALD 0 0.001 0 0 0V Fru
HK 0 0 0.001 0 0.001VFRK B 0.01 0.004 0.001 0.001 0.001VUDPGDH 0.025 0.015 0.002 0.004 �0.002VPFP 0.02 0.017 0.001 0.003 �0.001VSuSy B �0.003 �0.006 0.006 0.007 0.015VSuSy C �0.007 �0.011 0.008 0.01 0.019VPFK 0.041 0.023 0 0.001 0VFRKA 0.24 0.149 0.172 0.138 0.24VNI 0.692 0.658 0.796 0.806 0.868V Glc
HK 0.976 0.962 1.08 1.021 1.152
The slope is the first derivative of a linear regression line and gives an indicat
2). The results obtained for each internode do not differsignificantly from the original model of Rohwer and Botha(2001). Glcup, Fruup and VAC retained the largest negativeimpact on futile cycling, while HKGlc and NI were still themain contributors to futile cycling. The analysis of FCCCsalso shows that the control over futile cycling does notshift drastically with internode maturity, and we concludethat the same enzymes are responsible for futile cyclingregardless of physiological changes due to internodal tissuematuration.
vGlcHK and vNI had the largest positive control over JNI/
JVAC, whereas vGlcuptake, vFru
uptake and vVAC had the largest neg-ative control (Table 2). These two groups of antagonisticenzymes were chosen for in silico manipulation of theirlevels. Increasing concentrations of enzymes with largenegative control over futile cycling should lead to adecrease in futile cycling, while the converse is true forenzymes with large positive control. Hence, the givenmaximal activity of NI was decreased and those of Fruup
and VAC were increased in the model. Steady-state solu-tions were calculated as these enzymes were incrementedfive-fold from their initial reference values (Fig. 6). Simi-lar to Rohwer and Botha (2001), futile cycling was foundto decrease and the conversion ratio of hexoses to sucroseremained virtually constant over all the manipulations.The flux of sucrose into the vacuole increased with allthe changes made. It is expected that all species concen-trations should respond to such an alteration in the max-imal activity of an enzyme, including, for example,cofactor concentrations. The fact that cofactors areclamped at constant concentrations in our model is thusa simplifying, albeit necessary, assumption, since to ourknowledge these analyses have not yet been performedin vivo. The fact that none of the manipulated enzymeshas any direct cofactor dependence may mitigate thissimplification.
nternodes in order of increasing magnitude of the mean
Mean s.d. Slope
8 9 10
�0.927 �0.971 �0.917 �0.894 0.079 �0.024�0.58 �0.537 �0.548 �0.627 0.081 0.028�0.504 �0.487 �0.489 �0.474 0.095 �0.022�0.016 �0.021 �0.036 �0.027 0.02 0.003
0.002 0.001 0 �0.001 0.006 0.0020 0 0 0 0.001 00 0 0 0 0 00 0.001 0.001 0 0 00.001 0 0 0.002 0.003 �0.0010.002 0.001 0.001 0.006 0.009 �0.0030.004 0.005 0.011 0.007 0.008 �0.0010.011 0.017 0.017 0.008 0.009 0.0030.015 0.022 0.022 0.01 0.013 0.0050.001 0.003 0.01 0.01 0.015 �0.0040.141 0.101 0.134 0.164 0.051 �0.0120.814 0.811 0.782 0.778 0.069 0.0181.037 1.055 1.011 1.037 0.061 0.008
ion by how much a coefficient changes with internode maturity.
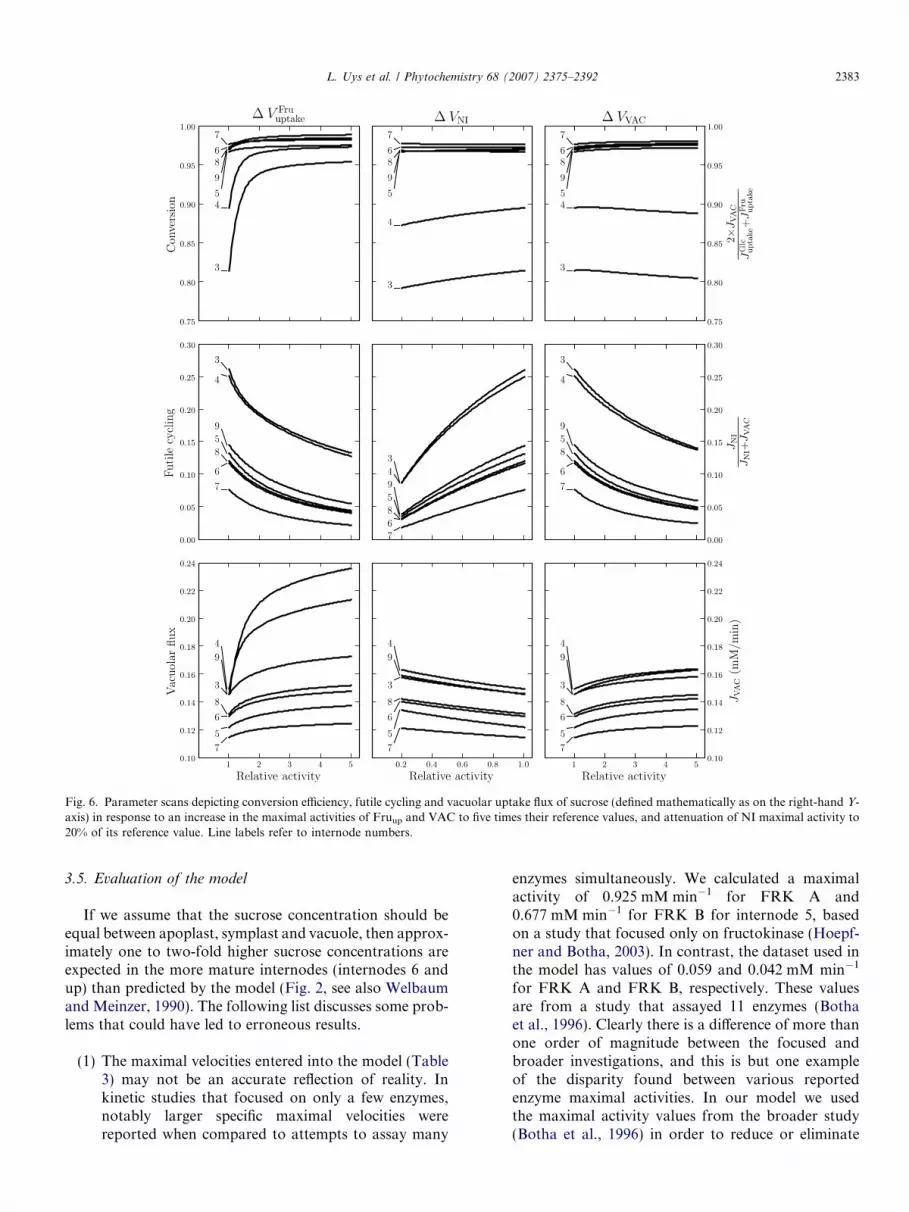
Fig. 6. Parameter scans depicting conversion efficiency, futile cycling and vacuolar uptake flux of sucrose (defined mathematically as on the right-hand Y-axis) in response to an increase in the maximal activities of Fruup and VAC to five times their reference values, and attenuation of NI maximal activity to20% of its reference value. Line labels refer to internode numbers.
L. Uys et al. / Phytochemistry 68 (2007) 2375–2392 2383
3.5. Evaluation of the model
If we assume that the sucrose concentration should beequal between apoplast, symplast and vacuole, then approx-imately one to two-fold higher sucrose concentrations areexpected in the more mature internodes (internodes 6 andup) than predicted by the model (Fig. 2, see also Welbaumand Meinzer, 1990). The following list discusses some prob-lems that could have led to erroneous results.
(1) The maximal velocities entered into the model (Table3) may not be an accurate reflection of reality. Inkinetic studies that focused on only a few enzymes,notably larger specific maximal velocities werereported when compared to attempts to assay many
enzymes simultaneously. We calculated a maximalactivity of 0.925 mM min�1 for FRK A and0.677 mM min�1 for FRK B for internode 5, basedon a study that focused only on fructokinase (Hoepf-ner and Botha, 2003). In contrast, the dataset used inthe model has values of 0.059 and 0.042 mM min�1
for FRK A and FRK B, respectively. These valuesare from a study that assayed 11 enzymes (Bothaet al., 1996). Clearly there is a difference of more thanone order of magnitude between the focused andbroader investigations, and this is but one exampleof the disparity found between various reportedenzyme maximal activities. In our model we usedthe maximal activity values from the broader study(Botha et al., 1996) in order to reduce or eliminate

Table 3Maximal activities in mM min�1 for all enzymes and transport steps in the model for each internode
Enzyme Internode (i) References
3 4 5 6 7 8 9 10
V Fruuptake 0.286 0.286 0.286 0.286 0.286 0.286 0.286 0.286 Rohwer and Botha (2001)
V Glcuptake 0.286 0.286 0.286 0.286 0.286 0.286 0.286 0.286
VVAC 1.000 1.000 1.000 1.000 1.000 1.000 1.000 1.000VSPase 0.500 0.500 0.500 0.500 0.500 0.500 0.500 0.500
Vf SPS 0.205 0.252 0.263 0.269 0.317 0.253 0.266 0.325 Botha (p.c.)Vr SPS 0.108 0.133 0.139 0.142 0.167 0.134 0.140 0.171
V GlcHK 0.204 0.173 0.125 0.115 0.106 0.128 0.178 0.166
V FruHK 0.204 0.173 0.125 0.115 0.106 0.128 0.178 0.166
VNI 0.320 0.399 0.238 0.213 0.147 0.197 0.174 0.235 Botha et al. (1996)VPFP 0.375 0.410 0.322 0.316 0.277 0.355 0.363 0.499VPFK 0.189 0.272 0.132 0.143 0.168 0.265 0.278 0.365VALD 0.862 0.442 0.379 0.310 0.288 0.357 0.366 0.498
VFRK A 0.155 0.137 0.059 0.078 0.055 0.072 0.055 0.080 Botha et al. (1996), allocation to isoforms discussed in textVFRK B 0.171 0.118 0.042 0.048 0.030 0.035 0.024 0.032VSuSy A 0.163 0.156 0.077 0.047 0.028 0.016 0.007 0.000VSuSy B 0.109 0.184 0.145 0.137 0.130 0.130 0.130 0.095Vf SuSy C 0.109 0.184 0.145 0.137 0.130 0.130 0.130 0.095Vr SuSy C 0.256 0.431 0.340 0.323 0.305 0.306 0.306 0.224
VUDPGDH 0.022 0.011 0.007 0.004 0.004 0.003 0.001 0.001 Estimate
The origin of this data is discussed in the text.p.c. – private communication.
2384 L. Uys et al. / Phytochemistry 68 (2007) 2375–2392
many of the possible causes that give rise to varia-tions in enzyme assays. Specifically, this study useddata
� for plant samples from the same sugarcane varietyand possibly even from the same plant,� where assay conditions were kept relatively similar
for all the enzyme assays and,� where assays were performed in the same labora-
tory by one group of investigators.
Fig. 7. Response coefficients (RJ PFKF6P0:5
) of the half saturation constant forPFK with respect to F6P (F6P0.5) on the flux through PFK (JPFK) plottedagainst internode number.
Furthermore, the values reported in Botha et al. (1996)included maximal activities for almost all immature tomature internodes. These considerations outweighed thechoice to select values from more focused studies. Whilefocused studies may individually perhaps be more accurate,their assay conditions are in most cases incompatible withassay conditions for other enzymes.
(2) Inhibition of PFK by ATP and PFP by inorganicphosphate may play a role in the degree to which car-bon is partitioned to glycolysis. Both ATP and inor-ganic phosphate concentrations were clamped in themodel resulting in static inhibitory effects on theseenzymes, and control of fluxes and concentrationsby these enzymes. These metabolites were kept con-stant because no acceptable kinetic data were foundfor the regeneration of ATP and inorganic phos-phate. The reactions could therefore not be modelled,and it was assumed that the model was not limited bythe regeneration of either of these species. If, forexample, the inorganic phosphate concentration hadbeen free to vary, then the flux to glycolysis wouldhave run dry, because it would have been used upas a substrate if not replenished.
(3) Some kinetic parameters were estimated from mea-surements of related enzymes in other plant species.Steady-state solutions are sometimes sensitive tosmall changes in parameters. Future refinements ofthe model could be able to correct this by includingparameter values measured in sugarcane. As anexample, we calculated the response coefficient (see
L. Uys et al. / Phytochemistry 68 (2007) 2375–2392 2385
Appendix A.3) of the flux through PFK (JPFK) withrespect to a change in the half-saturation constantof PFK for F6P (F6P0.5). Fig. 7 shows how RJPFK
F6P0:5
changes with internode number. For example, ininternode 5, RJPFK
F6P0:5¼ �2:24. This means that a 10%
change in the value of F6P0.5 should lead to an almost22% decrease in JPFK. This sort of amplification of asmall change in a parameter into a larger change in asteady-state variable means that care must be takenwith the selection of parameter values.
(4) In our model, sugar uptake is restricted to fructoseand glucose, though it has been shown that sugarcanetissue disks are able to take up sucrose (Komor,2000a,b; Komor et al., 1981; Titus, 2005). The mech-anism by which this occurs is not yet clear. Weattempted to include this data into the sucrose accu-mulation model, but were unable to obtain biologi-cally feasible steady-state solutions (data notshown). Introducing an extra source of sucrose inthe model could possibly change the cytoplasmicsucrose profile of the maturing internodes.
(5) There are possibly three isoforms of hexokinase(Hoepfner and Botha, 2004). It is conceivable thatkinetic parameters would differ depending onwhether fructose or glucose is phosphorylated. Otherenzymes may also well be present in different iso-forms. Explicitly modelling SuSy and FRK isozymeshas shown that this can affect steady-state modelsolutions—the control profile of the SuSy isozymesis given as an example (Fig. 5). Most importantly,the control of an enzyme is not equally distributedbetween isoforms, and the control distribution mayshift with physiological conditions. It is expected thatif hexokinase, or any other enzyme for that matter, ismodelled in terms of its isoforms, a metabolic controlanalysis would pinpoint which isozymes have signifi-cant effects on sucrose accumulation.
3.6. The case for vacuolar sucrose uptake
The experimental sucrose concentrations in Fig. 2 showa linear increase of the mean sucrose concentration asinternodes mature. From internodes 3–10, this gradient isabout 39 mM internode�1. In other words, the totalsucrose concentration increases by about 34% per inter-node as culm tissue matures. In contrast, the model showedvirtually constant sucrose concentrations across all theinternodes. A comparable percentage increase in simulatedsucrose concentrations was therefore not observed. So thequestion is, where is the sucrose? If the majority of thesucrose is not in the cytoplasm, it has to be either in thevacuole or the apoplast. The pairwise Pearson correlationcoefficient of Suc with JVAC is 1.0 (Table 1). From this itcan be inferred that any increase in Suc will lead to anincrease in the rate at which Suc is accumulating in the vac-uole. An increase in JVAC with Suc is not surprising, as vac-uolar sucrose uptake is modelled with irreversible
Michaelis–Menten kinetics (see Appendix C for discussionon this choice of rate equation), making the flux directlydependent on Suc. This may well be a simplification, anda clearer conception is needed of what exactly the mecha-nism is of sucrose uptake across the tonoplast.
The modelling results show that Glc and Fru concentra-tions remain higher than those of sucrose (Fig. 4). Sincethere is net synthesis of sucrose, removal from the cytoplas-mic compartment has to exist, otherwise higher cytoplas-mic Suc concentrations should be seen. High precursorand low product concentrations would favour sucrose syn-thesis, so higher Glc and Fru concentrations can beexpected to support net sucrose synthesis. It has beenshown that vacuoles can accumulate sugars other thatsucrose (Preisser and Komor, 1991); however, our modeldoes not specifically account for this. The only way thatcarbohydrates can be mobilised from the vacuole is bybreakdown of vacuolar sucrose into glucose and fructose.It is unlikely that a large concentration gradient wouldexist between vacuolar and cytoplasmic glucose and fruc-tose. It can be hypothesised that this state of affairs sustainsthe cytoplasmic synthesis of sucrose and immediate accu-mulation thereof in the vacuole.
Sucrose can enter an internode in one of three ways:from leaves attached to a node, or via vascular tissue fromthe less mature internodes above, or more mature inter-nodes below. The sucrose from internodes below can beassumed to contribute to total internodal sucrose accumu-lation if sucrose unloading further down the plant is satu-rated. Incident radiation from sunlight decreases withcanopy depth and increases with leaf size. The rate ofsucrose unloading by the leaves per internode might thusbe assumed to remain relatively constant. An internodedoes not retain all the sucrose that passes by in the phloem;it follows that the amount of sucrose available for uptakeincreases with internode maturity. This increased supplyof sucrose is not reflected in our model, as it should leadto an increased supply of apoplastic glucose and fructosethrough the action of acid wall invertase for the moremature internodes; however, for lack of more specific data,apoplastic glucose and fructose are clamped at 5 mM forall internodes. The cytoplasmic sucrose concentration doesnot increase significantly, leaving only the vacuole and theapoplastic space to store sucrose (Welbaum and Meinzer,1990). Only the former has the available space to accumu-late large amounts of sucrose. A more detailed model ofsucrose accumulation would be able to address this.
It has been proposed that phloem transport occursmostly because of an osmotic pressure gradient alongphloem tubes. This phenomenon is called the ‘‘OsmoticallyGenerated Pessure Flow’’ (OGPF) model and was firstdescribed by Munch (1926, 1927, 1930). The pressure gra-dient results from solutes being loaded into the phloem atthe source tissue and removed at the sink tissues. Thehydrostatic pressure drives solutes from source to sink.Thompson and Holbrook (2003a) have published a theo-retical model of this phenomenon and also provide a more

2386 L. Uys et al. / Phytochemistry 68 (2007) 2375–2392
in-depth discussion of the OGPF model. The Thompsonand Holbrook model has subsequently been analysed andcompared to known data on phloem transport in a numberof plant species (Thompson and Holbrook, 2003b, 2004;Thompson, 2005). If this proves to be correct and it isassumed that phloem unloading in sugarcane is primarilysymplastic, then no significant sucrose concentrationswould be expected in the parenchymal cytoplasm, becausehigh cytoplasmic sucrose concentrations would destroy anyosmotic pressure differences between sink and source tis-sue. Accumulation in the vacuole, or possibly even theapoplast, would be an absolute necessity if a constant flowof photosynthate and signalling molecules is to beachieved. It could be argued that solute concentrations inthe cytoplasm should not increase. This would allow themaintenance, or possibly regulation of an osmotic pressuredifference, in which case the model-predicted concentra-tions would be consistent with physiological concentra-tions. Unfortunately, no reliable data on solutecompartmentation exists in parenchymal tissue.
4. Conclusion
The results presented here suggest that sucrose is notaccumulated in the cytoplasm of the sugarcane storageparenchyma, but is rather transported into another com-partment. The control of the flux split between sucroseaccumulation and sucrose breakdown also does not shiftdrastically with the maturation of internodes; in fact, themajority of control resided in the same set of enzymes(i.e. Glcup, Fruup, VAC, HKGlc and NI) in all eight inter-nodes investigated. Finally, the futile cycling of sucroseseems to decrease as sugarcane internodes mature.
Acknowledgements
This work was funded by the National BioinformaticsNetwork (South Africa). We thank Brett Olivier for helpwith preparing model description files in SBML format.
Appendix A. Methods of analysis
A.1. Kinetic modelling of metabolism
One of the central aims of computational systems biol-ogy is to describe mathematically the dynamic behaviourof living organisms. The advantages of this approach aremany; amongst others, it allows a formal, rigorousapproach to be applied to biology. For example, withinsuch a formalism, metabolism can be described as a highlyparameterised system of enzyme catalysed reactions and, asa first approximation, such a system may be characterisedby a set of ordinary differential equations (ODEs), termeda kinetic model of the system. Computational systems biol-
ogy proceeds from the premise that by studying propertiesof the model we indirectly study the properties of the met-abolic pathway concerned.
To briefly illustrate this approach, consider the follow-ing reaction scheme:
where X1 and X4 are external metabolites (source andsink), the concentrations of which are treated as constant.S2 and S3 are variable metabolites and E1–E4 are enzymescatalysing a particular step. The rate at which an enzymecatalyses a reaction can be described by an appropriate rateequation that, in this case, is a function of metabolite con-centrations (substrates, products or effectors) and a set ofparameters (e.g. Michaelis constants).
The topology of the above reaction scheme can be cap-tured in matrix form,
ðA:1Þ
where the elements of N are stoichiometric coefficients.Changes in metabolite concentrations are then given by,
dS
dt¼ Nv ðA:2Þ
where S and v are vectors of metabolites and rate equa-tions, respectively. Eq. (A.2) effectively defines our systemof ODEs, i.e. the kinetic model.
A.2. Steady-state solutions of a model
Frequently, biochemical pathways operate under condi-tions where the concentrations of the variable species andthe fluxes through the reactions do not change significantlywith time. Such a state is termed a (quasi-)steady-state.Kinetic models of pathways are very useful for steady-stateanalysis, since the solution to the system,
Nv ¼ 0 ðA:3Þ
describes the steady-state concentrations and fluxes. Impor-tantly, assuming a steady-state solution implies that thephysiological interpretation of such a solution actuallyholds true, i.e. that rates and concentrations in a cell arein fact time-invariant. This assumption is certainly validfor small time scales, where drastic changes in state vari-ables are unlikely to occur. Moreover, any particular
L. Uys et al. / Phytochemistry 68 (2007) 2375–2392 2387
steady-state is only valid for a specific set of conditions.Cells are subjected to ever changing environments and ifenvironmental conditions change, the conditions insidethe cell change. This environmental change can be reflectedin a change in the parameters that govern the kinetic model,which in turn will lead to a different steady-state solution.The concept of a quasi-steady-state deals with this issue:on small time scales fluxes and concentrations in a cell arein steady-state, but this steady-state itself changes over lar-ger time scales. Steady-state solutions to a model thus pro-vide a snapshot of conditions in a cell. The limitations of asteady-state as predicted by a model with static parametersshould always be kept in mind, particularly its restriction toa single set of environmental conditions. In the current pa-per we deal with this issue by modelling every internode as aseparate (quasi-)steady-state with unique parameters (Sec-tion 3.2). This assumption is reasonable considering that:
� Most validation data are in fact from steady-state exper-iments. For example, the experimental data used in thecomparison in Fig. 3 are from flux measurements madein steady-state labelled sugarcane tissue discs.� The temporal resolution for fluxes is in the order of min-
utes (model units are mM min�1). It is expected thatquasi-steady-state conditions should prevail under suchshort timescales, since growth rates are typically mea-sured over months in sugarcane. Of course, on thelonger time scale growth rates would not be expectedto exhibit steady-state behaviour (e.g., sucrose accumu-lation is not a steady-state phenomenon). It is for thisreason that we used kinetic parameter substitution tomodel growth.
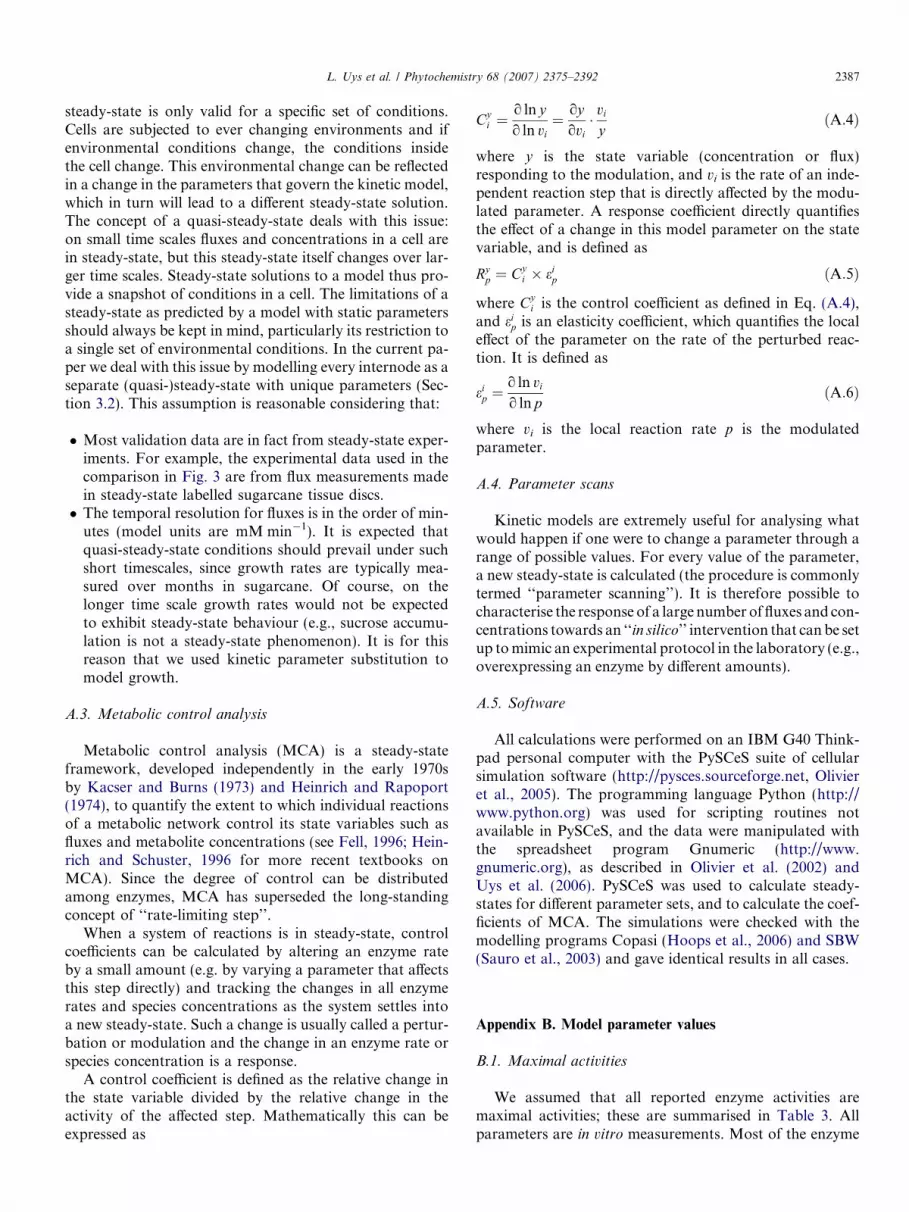
A.3. Metabolic control analysis
Metabolic control analysis (MCA) is a steady-stateframework, developed independently in the early 1970sby Kacser and Burns (1973) and Heinrich and Rapoport(1974), to quantify the extent to which individual reactionsof a metabolic network control its state variables such asfluxes and metabolite concentrations (see Fell, 1996; Hein-rich and Schuster, 1996 for more recent textbooks onMCA). Since the degree of control can be distributedamong enzymes, MCA has superseded the long-standingconcept of ‘‘rate-limiting step’’.
When a system of reactions is in steady-state, controlcoefficients can be calculated by altering an enzyme rateby a small amount (e.g. by varying a parameter that affectsthis step directly) and tracking the changes in all enzymerates and species concentrations as the system settles intoa new steady-state. Such a change is usually called a pertur-bation or modulation and the change in an enzyme rate orspecies concentration is a response.
A control coefficient is defined as the relative change inthe state variable divided by the relative change in theactivity of the affected step. Mathematically this can beexpressed as
Cyi ¼
o ln yo ln vi
¼ oyovi� vi
yðA:4Þ
where y is the state variable (concentration or flux)responding to the modulation, and vi is the rate of an inde-pendent reaction step that is directly affected by the modu-lated parameter. A response coefficient directly quantifiesthe effect of a change in this model parameter on the statevariable, and is defined as
Ryp ¼ Cy
i � eip ðA:5Þ
where Cyi is the control coefficient as defined in Eq. (A.4),
and eip is an elasticity coefficient, which quantifies the local
effect of the parameter on the rate of the perturbed reac-tion. It is defined as
eip ¼
o ln vi
o ln pðA:6Þ
where vi is the local reaction rate p is the modulatedparameter.
A.4. Parameter scans
Kinetic models are extremely useful for analysing whatwould happen if one were to change a parameter through arange of possible values. For every value of the parameter,a new steady-state is calculated (the procedure is commonlytermed ‘‘parameter scanning’’). It is therefore possible tocharacterise the response of a large number of fluxes and con-centrations towards an ‘‘in silico’’ intervention that can be setup to mimic an experimental protocol in the laboratory (e.g.,overexpressing an enzyme by different amounts).
A.5. Software
All calculations were performed on an IBM G40 Think-pad personal computer with the PySCeS suite of cellularsimulation software (http://pysces.sourceforge.net, Olivieret al., 2005). The programming language Python (http://www.python.org) was used for scripting routines notavailable in PySCeS, and the data were manipulated withthe spreadsheet program Gnumeric (http://www.gnumeric.org), as described in Olivier et al. (2002) andUys et al. (2006). PySCeS was used to calculate steady-states for different parameter sets, and to calculate the coef-ficients of MCA. The simulations were checked with themodelling programs Copasi (Hoops et al., 2006) and SBW(Sauro et al., 2003) and gave identical results in all cases.
Appendix B. Model parameter values
B.1. Maximal activities
We assumed that all reported enzyme activities aremaximal activities; these are summarised in Table 3. Allparameters are in vitro measurements. Most of the enzyme

Table 4Michaelis (m), half-saturation (0.5), inhibition (i) and equilibrium (eq)constants used in the model
Parameter Value Reference
Fru & Glc uptake
KFrum KGlc
m 0.2 Rohwer and Botha(2001)
KFrui KGlc
i 1
Hexokinase
KGlcm 0.07 Rohwer and Botha
(2001)KATP
m 0.25KFru
m 10KG6P
i 0.1KF6P
i 10
SPS
Keq 10KS6P
i 0.07 Rohwer and Botha(2001)
KPii 3
KUDPGlci 1.4
KF6Pi 0.4
KUDPGlcm 1.8
KUDPm 0.3
KS6Pm 0.1
KF6Pm 0.6
FRKFRK AKFru
m 0.028 Hoepfner and Botha(2004)
FRK BKFrum 0.074
FRK AKATPm 0.14
FRK BKATPm 0.18
FRK BKFrui 0.016
Vacuolar Suc uptake
KSucm 100 Rohwer and Botha
(2001)NI
KGlci 15 Rohwer and Botha
(2001)KFru
i 15KSuc
m 10
UDPGDH
KUDPGlcm 0.0187 Turner and Botha (2002)
KNADþm 0.0722
SuSyKeq 0.5 Values for SuSy A & B
were modified fromSchafer et al. (2005) to fitthe Haldane relationshipParameters for SuSy Cwere obtained fromSchafer et al. (2004a)
SuSy AKSucm 22.51
SuSy AKUDPm 0.58
SuSy AKUDPGlcm 6.67
SuSy AKFrum 12.29
SuSy BKSucm 70.55
SuSy BKUDPm 0.14
SuSy BKUDPGlcm 0.82
SuSy BKFrum 18.08
SuSy CKUDPi 0.0871
SuSy CKSuci 1390
SuSy CKFrui 3.1
SuSy CKSucm 35.9
2388 L. Uys et al. / Phytochemistry 68 (2007) 2375–2392
activities change with internode maturity, but a subset wasassumed to stay constant over all the internodes considered.
B.1.1. Activities that change with internode maturity
These activities restrict the model to the chosen inter-nodes, i.e. 3–10, since enzymes from these are assayed mostfrequently. The experimental values used were usuallyreported as moles substrate converted per mass of totalprotein. A change in this quantity reflects a change inenzyme number. Changes in internode volume (S. Bosch,unpublished data) are accounted for in the conversion toour unit of choice, mM min�1. This allows the extensionof the model to various internodes since the specific activ-ities reported in the literature are transformed into a profileof catalytic activity changes during internode maturation.
SuSy and FRK: The forward maximal velocities reportedin Botha et al. (1996) measure the total activity of a specificreaction. As such, when isozymes are present, these valuescan be considered the weighted average value for the differ-ent isozymes. Therefore, we divided the overall value forFRK between FRK A and FRK B using the forwardmaximal velocity ratios in Hoepfner and Botha (2003),and the overall value for SuSy between SuSy A, B & Cusing the Vf/Vr ratios reported in Schafer et al. (2004b).
UDPGDH: VUDPGDH was estimated so that the steady-state flux to fibre as a fraction of glucose uptake matchedin vitro flux measurements of Bindon and Botha (2002).Although a specific activity has been reported forUDPGDH in Turner and Botha (2002), measurementswere only performed on immature tissue and a maximalactivity profile could not be obtained.
B.1.2. Activities that stay constant with internode maturity
Vacuolar sucrose uptake: The vacuolar uptake step actsas a sink, hence it is irreversible. This is not implausible,since uptake can occur against a concentration gradient.No indication of saturation at physiological concentrationsseems to exist (Preisser and Komor, 1991). Keeping thesame maximal uptake rate of 1 mM min�1 as in the originalmodel (Rohwer and Botha, 2001) ensured that the enzymewill not saturate and steady-state flux through the trans-porter could vary through a large range.
SPS and SPase: No internode-specific maximal activityvalues for SPase could be found. In this case the originalvalue used by Rohwer and Botha (2001) for SPase wasassumed to remain constant with internode maturity. SPSand SPase occur on the same branch, hence the steady-stateflux through both enzymes will always be the same. SPaseactivity is higher than that of SPS for every internode,therefore steady-state flux through the branch can neverbe higher than the maximal activity of SPS. The controlprofile for both enzymes is also expected to be similar.Slight changes in the maximal activity of SPase thereforehave virtually no effect on the model output. Together withSPase’s irreversible rate equation, the assumption of amaximal velocity that does not change with internodematurity is thus warranted.
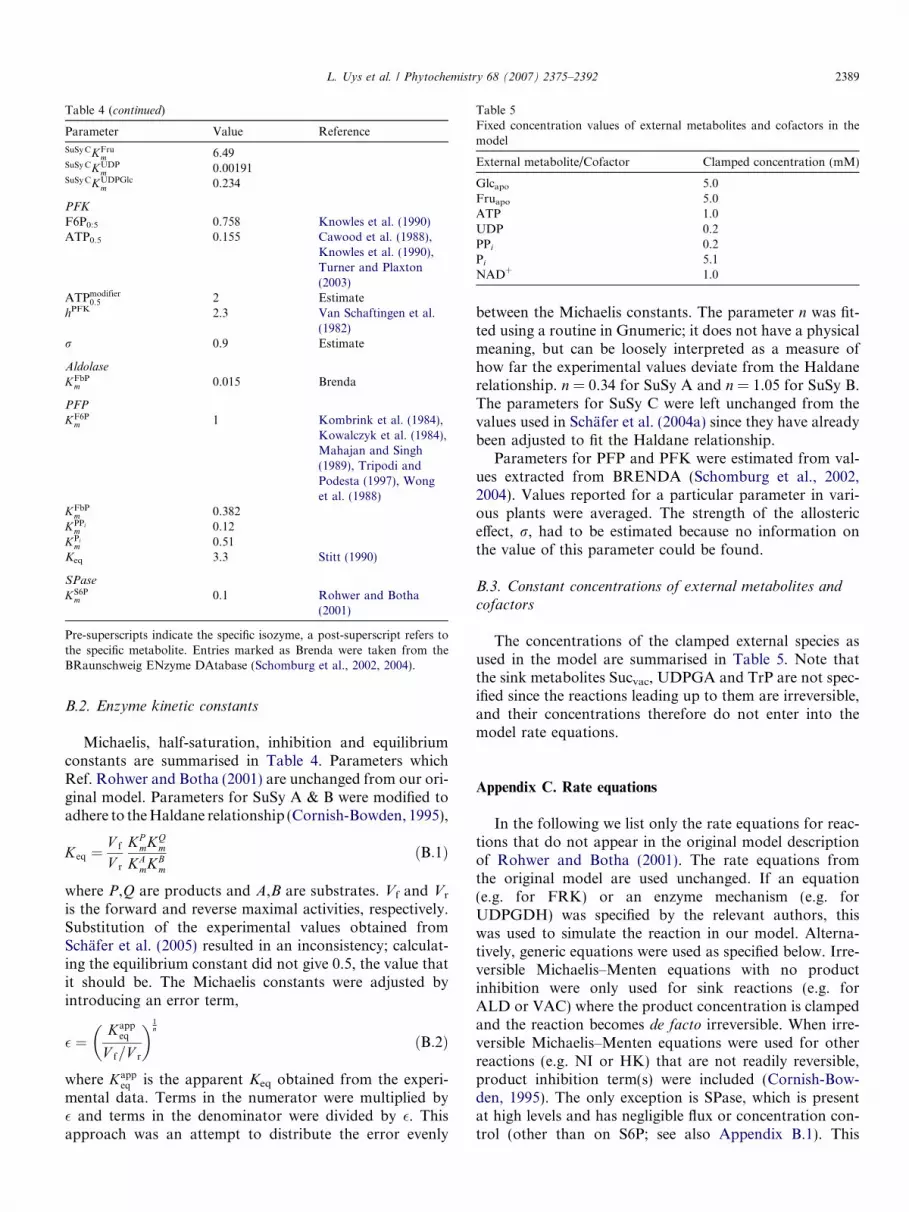
Table 4 (continued)
Parameter Value Reference
SuSy CKFrum 6.49
SuSy CKUDPm 0.00191
SuSy CKUDPGlcm 0.234
PFK
F6P0:5 0.758 Knowles et al. (1990)ATP0.5 0.155 Cawood et al. (1988),
Knowles et al. (1990),Turner and Plaxton(2003)
ATPmodifier0:5 2 Estimate
hPFK 2.3 Van Schaftingen et al.(1982)
r 0.9 Estimate
Aldolase
KFbPm 0.015 Brenda
PFP
KF6Pm 1 Kombrink et al. (1984),
Kowalczyk et al. (1984),Mahajan and Singh(1989), Tripodi andPodesta (1997), Wonget al. (1988)
KFbPm 0.382
KPPim 0.12
KPim 0.51
Keq 3.3 Stitt (1990)
SPase
KS6Pm 0.1 Rohwer and Botha
(2001)
Pre-superscripts indicate the specific isozyme, a post-superscript refers tothe specific metabolite. Entries marked as Brenda were taken from theBRaunschweig ENzyme DAtabase (Schomburg et al., 2002, 2004).
Table 5Fixed concentration values of external metabolites and cofactors in themodel
External metabolite/Cofactor Clamped concentration (mM)
Glcapo 5.0Fruapo 5.0ATP 1.0UDP 0.2PPi 0.2Pi 5.1NAD+ 1.0
L. Uys et al. / Phytochemistry 68 (2007) 2375–2392 2389
B.2. Enzyme kinetic constants
Michaelis, half-saturation, inhibition and equilibriumconstants are summarised in Table 4. Parameters whichRef. Rohwer and Botha (2001) are unchanged from our ori-ginal model. Parameters for SuSy A & B were modified toadhere to the Haldane relationship (Cornish-Bowden, 1995),
Keq ¼V f
V r
KPmKQ
m
KAmKB
m
ðB:1Þ
where P,Q are products and A,B are substrates. Vf and Vr
is the forward and reverse maximal activities, respectively.Substitution of the experimental values obtained fromSchafer et al. (2005) resulted in an inconsistency; calculat-ing the equilibrium constant did not give 0.5, the value thatit should be. The Michaelis constants were adjusted byintroducing an error term,
� ¼Kapp
eq
V f=V r
� �1n
ðB:2Þ
where Kappeq is the apparent Keq obtained from the experi-
mental data. Terms in the numerator were multiplied by� and terms in the denominator were divided by �. Thisapproach was an attempt to distribute the error evenly
between the Michaelis constants. The parameter n was fit-ted using a routine in Gnumeric; it does not have a physicalmeaning, but can be loosely interpreted as a measure ofhow far the experimental values deviate from the Haldanerelationship. n = 0.34 for SuSy A and n = 1.05 for SuSy B.The parameters for SuSy C were left unchanged from thevalues used in Schafer et al. (2004a) since they have alreadybeen adjusted to fit the Haldane relationship.
Parameters for PFP and PFK were estimated from val-ues extracted from BRENDA (Schomburg et al., 2002,2004). Values reported for a particular parameter in vari-ous plants were averaged. The strength of the allostericeffect, r, had to be estimated because no information onthe value of this parameter could be found.
B.3. Constant concentrations of external metabolites and
cofactors
The concentrations of the clamped external species asused in the model are summarised in Table 5. Note thatthe sink metabolites Sucvac, UDPGA and TrP are not spec-ified since the reactions leading up to them are irreversible,and their concentrations therefore do not enter into themodel rate equations.
Appendix C. Rate equations
In the following we list only the rate equations for reac-tions that do not appear in the original model descriptionof Rohwer and Botha (2001). The rate equations fromthe original model are used unchanged. If an equation(e.g. for FRK) or an enzyme mechanism (e.g. forUDPGDH) was specified by the relevant authors, thiswas used to simulate the reaction in our model. Alterna-tively, generic equations were used as specified below. Irre-versible Michaelis–Menten equations with no productinhibition were only used for sink reactions (e.g. forALD or VAC) where the product concentration is clampedand the reaction becomes de facto irreversible. When irre-versible Michaelis–Menten equations were used for otherreactions (e.g. NI or HK) that are not readily reversible,product inhibition term(s) were included (Cornish-Bow-den, 1995). The only exception is SPase, which is presentat high levels and has negligible flux or concentration con-trol (other than on S6P; see also Appendix B.1). This

2390 L. Uys et al. / Phytochemistry 68 (2007) 2375–2392
approach is in agreement with our previous model (Roh-wer and Botha, 2001).
C.1. PFP
PFP catalyses the pyrophosphate-dependent phosphory-lation of F6P to FbP
F6Pþ PPi�FbPþ Pi
and was modelled as a reversible two substrate two productMichaelis–Menten type rate equation assuming equilib-rium binding of substrates and products.
vPFP ¼V PFP
PFPKF6Pm �PFP K
PPim½F6P�½PPi� � ½FbP�½Pi �
PFPKeq
� �1þ ½F6P�
PFPKF6Pmþ ½FbP�
PFPKFbPm
� �1þ ½PPi �
PFPKPPimþ ½Pi�
PFPKPim
� � ðC:1Þ
C.2. PFK
Phosphofructokinase was modelled as a two-substrateHill-type equation (Hanekom, 2006; Hanekom et al., 2006)
F6PþATP! FbPþADP
vPFK ¼V PFKab
1þl1þr4hlþ
aþbð Þ 1þr2hlð Þ1þr4hl þ ab
where a ¼ ½F6P�F6P0:5
� �h
b ¼ ½ATP�ATP0:5
� �h
l ¼ ½ATP�ATPmodifier
0:5
!h
r ¼ coefficient of allosteric modification
C.3. ALD
The aldolase reaction was described by an irreversibleMichaelis–Menten mechanism.
FbP! 2TrP
vALD ¼V ALD½FbP�
ALDKFbPm þ ½FbP�
ðC:2Þ
C.4. SuSy
SuSy was modelled with a reversible bi-substrateMichaelis–Menten equation,
UDPGlcþ Fru� SucþUDP
vSuSy A;B ¼�V SuSy A;B
SuSy A;BKSucm �SuSy A;BKUDP
m½UDP�½Suc� � ½Fru�½UDPGlc�
SuSyKeq
� �1þ ½UDPGlc�
SuSy A;BKUDPGlcm
þ ½UDP�SuSy A;BKUDP
m
� �1þ ½Fru�
SuSy A;BKFrumþ ½Suc�
SuSy A;BKSucm
� �ðC:3Þ
where VSuSy A,B are the maximal velocities of SuSy A & B,KS
m are Michaelis constants with respect to metabolite S,and SuSyKeq is the equilibrium constant for the reaction.VSuSy A,B and SuSyKeq are defined in terms of the sucrose
breakdown reaction (the enzyme is most commonly assayedin this direction). However, the model reaction is defined inthe direction of sucrose synthesis. In keeping with the ap-proach of Rohwer and Botha (2001), the negative signwas prepended to cast the model in terms of positive stea-dy-state fluxes.
C.5. FRK
Fructokinase only phosphorylates fructose as opposedto hexokinase, which takes both Glc and Fru as sub-strates.
FruþATP! F6PþADP
This enzyme occurs as two known isozymes, labeled FRKA & B. The rate equations from the original enzyme char-acterisation (Hoepfner and Botha, 2003, 2004) were used tomodel the respective catalytic steps
vFRK A ¼V FRK A½Fru�½ATP�
FRK AKATPm ½Fru�þFRK AKFru
m ½ATP� þ ½Fru�½ATP�ðC:4Þ
vFRK B ¼V FRK B½Fru�½ATP�
FRK BKATPm ½Fru� � 1þ ½Fru�
FRK BKFrui
� �þFRK BKFru
m ½ATP� þ ½Fru�½ATP�
ðC:5Þ
C.6. UDPGDH
The inclusion of UDPGDH in the model introduces athird possible route that carbohydrates can follow in thesugarcane culm. This is a four-electron transfer reactionwith the following net stoichiometry:
UDPGlcþ 2NADþ ! UDPGAþ 2NADH
UDPGA is the precursor to pectin and hemicellulose,which in turn are the building blocks of extracellular ma-trix polysaccharides (Turner and Botha, 2002). Storageand respiration are already accounted for in the modeland this reaction ensures that the hexose phosphate poolcan be used for fibre formation. UDPGDH was modelledas an irreversible bi-uni-uni-bi reaction (Turner and Botha,2002), using a three substrate Michaelis–Menten equation(Cornish-Bowden, 1995)
vUDPGDH ¼V UDPGDH½UDPGlc�½NADþ�2
UDPGDHKUDPGlcm �UDPGDHKNADþ
m ½NADþ�
þ 2 UDPGDHKNADþ
m ½UDPGlc�½NADþ�� �
þ UDPGDHKUDPGlcm ½NADþ�2 þ ½UDPGlc�
� ½NADþ�2: ðC:6Þ

L. Uys et al. / Phytochemistry 68 (2007) 2375–2392 2391
References
Bindon, K., Botha, F., 2002. Carbon allocation to the insoluble fraction,respiration and triose-phosphate cycling in the sugarcane culm.Physiol. Plantarum 116, 12–19.
Bosch, S., 2005. Trehalose and carbon partitioning in sugarcane. Ph.D.thesis, University of Stellenbosch.
Bosch, S., Grof, C., Botha, F., 2004. Expression of neutral invertase insugarcane. Plant Sci. 166, 1125–1133.
Botha, F.C., Black, K.G., 2000. Sucrose phosphate synthase and sucrosesynthase activity during maturation of internodal tissue in sugarcane.Aust. J. Plant Physiol. 27, 81–85.
Botha, F.C., Whittaker, A., Vorster, D.J., Black, K.G., 1996. Sucroseaccumulation rate, carbon partitioning and expression of key enzymeactivities in sugarcane stem tissue. In: Wilson, J.R., Hogarth, D.M.,Campbell, J.A., Garside, A.L. (Eds.), Sugarcane: Research TowardsEfficient and Sustainable Production. CSIRO division of TropicalCrops and Pastures, Brisbane, pp. 98–101.
Cawood, M., Botha, F., Small, J., 1988. Properties of the phosphofruc-tokinase isoenzymes from germinating cucumber seeds. J. PlantPhysiol. 132, 204–209.
Cornish-Bowden, A., 1995. Fundamentals of Enzyme Kinetics. PortlandPress, London.
Fell, D.A., 1996. Understanding the Control of Metabolism. PortlandPress, London.
Glasziou, K., 1960. Accumulation and transformation of sugars in sugarcane stalks. Plant Physiol., 895–901.
Hanekom, A.J., 2006. Generic kinetic equations for modelling multisub-strate reactions in computational systems biology. Master’s thesis,Stellenbosch University.
Hanekom, A.J., Hofmeyr, J.-H.S., Snoep, J.L., Rohwer, J.M., 2006.Experimental evidence for allosteric modifier saturation as predictedby the bi-substrate hill equation. IEE Proc.-Syst. Biol. 153 (5), 342–345.
Hatch, M.D., Glasziou, K.T., 1963. Sugar accumulation cycle in sugarcane II: relationship of invertase activity to sugar content and growthrate storage tissue of plants grown in controlled environments. PlantPhysiol. 38, 344–348.
Heinrich, R., Rapoport, T.A., 1974. A linear steady-state treatment ofenzymatic chains. General properties, control and effector strength.Eur. J. Biochem. 42, 89–95.
Heinrich, R., Schuster, S., 1996. The Regulation of Cellular Systems.Chapman & Hall, New York.
Hoepfner, S.W., Botha, F.C., 2003. Expression of fructokinase isoforms inthe sugarcane culm. Plant Physiol. Biochem. 41, 741–747.
Hoepfner, S.W., Botha, F.C., 2004. Purification and characterisation offructokinase from the culm of sugarcane. Plant Sci. 167, 645–654.
Hoops, S., Sahle, S., Gauges, R., Lee, C., Pahle, J., Simus, N., Singhal,M., Xu, L., Mendes, P., Kummer, U., 2006. COPASI – a COmplexPAthway SImulator. Bioinformatics 22 (24), 3067–3074.
Kacser, H., Burns, J.A., 1973. The control of flux. Symp. Soc. Exp. Biol.27, 65–104.
Knowles, V., Greyson, M., Dennis, D., 1990. Characterization of ATP-dependent fructose 6-phosphate 1-phosphotransferase isozymes fromleaf and endosperm tissues of Ricinus communis. Plant Physiol. 92,155–159.
Kombrink, E., Kruger, N., Beevers, H., 1984. Kinetic properties ofpyrophosphate:D-fructose-6-phosphate phosphotransferase from ger-minating castor bean endosperm. Plant Physiol. 74, 395–401.
Komor, E., 1994. Regulation by futile cycles: the transport of carbon andnitrogen in plants. In: Schulze, E.D. (Ed.), Flux Control in BiologicalSystems. Academic Press, San Diego, pp. 153–201.
Komor, E., 2000a. The physiology of sucrose storage in sugarcane. In:Gupta, A.K., Kaur, N. (Eds.), Carbohydrate Reserves in Plants –Synthesis and Regulation. Elsevier Science, Amsterdam, pp. 35–54.
Komor, E., 2000b. Source physiology and assimilate transport: theinteraction of sucrose metabolism, starch storage and phloem export in
source leaves and the effect on sugar status in phloem. Aust. J. PlantPhysiol. 27, 497–505.
Komor, E., Thom, M., Maretzki, A., 1981. The mechanism of sugaruptake by sugarcane suspension cells. Planta 153, 181–192.
Kowalczyk, S., Januszewska, B., Cymerska, E., Maslowski, P., 1984. Theoccurence of inorganic pyrophosphate:D-fructose-6-phosphate 1-phos-photransferase in higher plants I: Initial characterization of partiallypurified enzyme from Sanseviera trifasciata leaves. Physiol. Plantarum60, 31–37.
Ma, H., Albert, H., Paull, R., Moore, P., 2000. Metabolic engineeringof invertase activities in different subcellular compartments affectssucrose accumulation in sugarcane cells. Aust. J. Plant Physiol. 27,1021–1030.
Mahajan, R., Singh, R., 1989. Properties of pyrophosphate:D-fructose-6-phosphate phosphotransferase from endosperm of developing wheat(Triticum aestivum L.) grains. Plant Physiol. 91, 421–426.
Moore, P.H., 1995. Temporal and spatial regulation of sucrose accumu-lation in the sugarcane. Aust. J. Plant Physiol. 22, 661–679.
Moore, P.H., Maretzki, A., 1996. Sugarcane. In: Zamski, E., Schaffer,A.A. (Eds.), Photoassimilate Distribution in Plants and Crops: Source-Sink Relationships. Marcel Dekker Inc., New York, pp. 643–669.
Munch, E., 1926. Uber Dynamik der Saftstromungen. Ber. Deut. Bot.Ges. 44, 68–71.
Munch, E., 1927. Versuche uber den Saftkreislauf. Ber. Deut. Bot. Ges.45, 340–356.
Munch, E., 1930. Die Stoffbewegungen in der Pflanze, vol. 45, Jena:Gustav Fischer.
Olivier, B.G., Rohwer, J.M., Hofmeyr, J.-H.S., 2002. Modelling cellularprocesses with Python and SciPy. Mol. Biol. Rep. 29, 249–254.
Olivier, B.G., Rohwer, J.M., Hofmeyr, J.-H.S., 2005. Modelling cellularsystems with PySCeS. Bioinformatics 21 (4), 560–561.
Prado, F.E., Fleischmacher, O.L., Vattuone, M.A., Sampietro, A.R.,1980. Cell wall invertases of sugar cane. Phytochemistry 21 (12), 2825–2828.
Preisser, J., Komor, E., 1991. Sucrose uptake into vacuoles of sugarcanesuspension cells. Planta (Historical Archive) 186 (1), 109–114.
Rae, A.L., Perroux, J.M., Grof, C.P.L., 2005. Sucrose partitioningbetween vascular bundles and storage parenchyma in the sugarcanestem: a potential role for the ShSUT1 sucrose transporter. Planta 220(6), 817–825.
Rohwer, J.M., Botha, F.C., 2001. Analysis of sucrose accumulation in thesugar cane culm on the basis of in vitro kinetic data. Biochem. J. 358,437–445.
Rose, S., Botha, F., 2000. Distribution patterns of neutral invertase andsugar content in sugarcane internodal tissues. Plant Physiol. Biochem.38, 819–824.
Sauro, H.M., Hucka, M., Finney, A., Wellock, C., Bolouri, H., Doyle, J.,Kitano, H., 2003. Next generation simulation tools: the SystemsBiology Workbench and BioSPICE integration. OMICS 7 (4), 355–372.
Schafer, W.E., Rohwer, J.M., Botha, F.C., 2004a. A kinetic study ofsugarcane sucrose synthase. Eur. J. Biochem. 271, 3971–3977.
Schafer, W.E., Rohwer, J.M., Botha, F.C., 2004b. Protein-level expressionand localization of sucrose synthase in the sugarcane culm. Physiol.Plantarum 121, 187–195.
Schafer, W.E., Rohwer, J.M., Botha, F.C., 2005. Partial purification andcharacterisation of sucrose synthase in sugarcane. J. Plant Physiol.162, 11–20.
Schomburg, I., Chang, A., Ebeling, C., Gremse, M., Heldt, C., Huhn, G.,Schomburg, D., 2004. BRENDA, the enzyme database: updates andmajor new developments. Nucleic Acids Res. 32 (Database issue),D431–D433.
Schomburg, I., Chang, A., Hofmann, O., Ebeling, C., Ehrentreich, F.,Schomburg, D., 2002. BRENDA: a resource for enzyme data andmetabolic information. Trends Biochem. Sci. 27 (1), 54–56.
Stitt, M., 1990. Fructose-2,6-bisphosphate as a regulatory molecule inplants. Annu. Rev. Plant Physiol. Plant. Mol. Biol. 41, 153–185.

2392 L. Uys et al. / Phytochemistry 68 (2007) 2375–2392
Thompson, M., 2005. Scaling phloem transport: elasticity and pressure-concentration waves. J. Theor. Biol. 236, 229–241.
Thompson, M., Holbrook, N., 2003a. Application of a single-solute non-steady-state phloem model to the study of long distance assimilatetransport. J. Theor. Biol. 220, 419–455.
Thompson, M., Holbrook, N., 2003b. Scaling phloem transport: waterpotential equilibrium and osmoregulatory flow. Plant Cell Environ. 26,1561–1577.
Thompson, M., Holbrook, N., 2004. Scaling phloem transport: informa-tion transmission. Plant Cell Environ. 27, 509–519.
Titus, C., 2005. Sucrose transporters and sucrose uptake mechanisms insugarcane. Master’s thesis, University of Stellenbosch.
Tripodi, K., Podesta, F., 1997. Purification and structural and kineticcharacterization of the pyrophosphate:fructose-6-phosphate 1-phos-photransferase from the crassulacean acid metabolism plant, pineap-ple. Plant Physiol. 113, 779–786.
Turner, W., Botha, F.C., 2002. Purification and kinetic properties ofUDP-glucose dehydrogenase from sugarcane. Arch. Biochem. Bio-phys. 407 (2), 209–216.
Turner, W., Plaxton, W., 2003. Purification and characterization ofpyrophosphate- and ATP-dependent phosphofructokinases frombanana fruit. Planta 217, 113–121.
Uys, L., 2006. Computational systems biology of sucrose accumulation insugarcane. Master’s thesis, University of Stellenbosch.
Uys, L., Hofmeyr, J.-H., Snoep, J., Rohwer, J., 2006. Software tools thatfacilitate kinetic modelling with large data sets: an example usinggrowth modelling in sugarcane. IEE Proc.-Syst. Biol. 153 (5), 385–389.
Van Schaftingen, E., Lederer, B., Bartrons, R., Hers, H.-G., 1982. Akinetic study of pyrophosphate: fructose-6-phosphate phosphotrans-ferase from potato tubers. Eur. J. Biochem. 129, 191–195.
Vattuone, M.A., Prado, F.E., Sampietro, A.R., 1981. Cell wall invertasesfrom sugar cane. Phytochemistry 20 (2), 189–191.
Venkataramana, S., Naidu, K.M., Singh, S., 1991. Invertases and growthfactors dependent sucrose accumulation in sugarcane. Plant Sci. 74 (1),65–72.
Vorster, D.J., Botha, F.C., 1998. Partial purification and characterisationof sugarcane neutral invertase. Phytochemistry 49, 651–655.
Vorster, D.J., Botha, F.C., 1999. Sugarcane internodal invertases andtissue maturity. J. Plant Physiol. 155, 470–476.
Walsh, K., Sky, R., Brown, S., 2005. The anatomy of the pathway ofsucrose unloading within the sugarcane stalk. Funct. Plant Biol. 32,367–374.
Welbaum, G., Meinzer, F., 1990. Compartmentation of solutes and waterin developing sugarcane stalk in tissue. Plant Physiol. 93, 1147–1153.
Whittaker, A., Botha, F.C., 1997. Carbon partitioning during sucroseaccumulation in sugarcane internodal tissue. Plant Physiol. 115, 1651–1659.
Wong, J., Kang, T., Buchanan, B., 1988. A novel pyrophosphate D-fructose-6-phosphate 1-phosphotransferase from carrot roots: relationto PFK from the same source. FEBS Lett. 238, 405–410.
Zhu, Y.J., Komor, E., Moore, P.H., 1997. Sucrose accumulation in thesugarcane stem is regulated by the difference between the activities ofsoluble acid invertase and sucrose phosphate synthase. Plant Physiol.115, 609–616.