absorption and translocation of glyphosate and sucrose in glyphosate-resistant cotton
TRANSCRIPT

ABSTRACT THOMAS, WALTER EDWARD. Physiological evaluations of translocation of glyphosate in glyphosate resistant crops including interaction with cotton growth regulators. (Under the direction of Dr. John W. Wilcut.)
Field studies were conducted in 2004 to evaluate corn tolerance, weed control, grain
yield, and net returns in transgenic and non-transgenic corn with various herbicide
systems. No significant differences between hybrid systems were observed for weed
control. Grain yield was variable between hybrids and locations due to environmental
differences. Consequently, net returns for each hybrid system within a location were also
variable.
Studies were conducted at three locations in North Carolina in 2004 to evaluate
density-dependent effects of glyphosate-resistant (GR) corn on GR cotton growth and lint
yield. The examined GR corn densities had a significant effect on cotton yield, but not as
significant as many other problematic grass and broadleaf weeds.
Two studies were conducted to investigate the influence of corn growth stage on the
absorption and translocation of glyphosate in glyphosate-resistant (GR) corn. Regardless
of corn growth stage, the leaves above the treated leaf and roots were the greatest sinks for
14C-glyphosate. These data suggest that reproductive tissues such as the tassel and ear
shoots can accumulate 14C-glyphosate at higher concentrations that other tissues, especially
when the herbicide treatment is applied postemergence after the V6 stage.
Studies were conduc ted to evaluate absorption and translocation of 14C-glyphosate in
both commercial glyphosate-resistant (GR) cotton events [GR event 1, released 1997
(GRE1) and GR event 2, released 2006 (GRE2)] were evaluated at the 4- leaf (L) and 8-L
growth stages. Glyphosate absorption, as a percentage of applied, increased over time. In

8-L cotton, glyphosate absorption was not different between events. Glyphosate
translocation patterns were not different between events or harvest timings and exhibited a
source-sink relationship. Based on the percentage of 14C exported out of the treated leaf,
glyphosate and sucrose translocation patterns were similar, indicating that glyphosate may
be used as a photoassimilate model in GRE2 cotton.
Studies examined various morphological characteristics and 14C-glyphosate
translocation in cotton as influenced by 14C-treatment timing and mepiquat chloride (MC).
No significant differences in plant height, leaf area, and specific leaf weight were observed
for any treatment. Dry weight of first position fruits on nodes 1, 2, and 3 of MC treated
plants accumulated greater biomass compared to fruits on non-treated plants. No
significant observations were found for 14C-glyphosate translocation. These data support
previous research that showed increased fruit weight and provides insight into the potential
for MC treatment to alter source to sink relationship in cotton.
Studies examined various morphological characteristics and 14C-glyphosate
translocation in cotton as influenced by cotton plant growth regulator regimes and source
leaf. MC and MP reduced cotton height and the number of nodes per plant. Total fruit
retention and first position fruit retention were not influenced by any treatment. Based on
these data, MC and MP do not influence 14C-glyphosate translocation.
Greenhouse studies were conducted to evaluate the rain-free requirement for mepiquat
chloride and mepiquat chloride plus cyclanilide with and without surfactant and to evaluate
absorption and translocation of cyclanilide. Based on these data, a rain-free period of 8
hours is needed to maximize efficacy, regardless of plant growth regulator or the use of
surfactant. Absorption of cyclanilide ranged from 11 to 15% at 3 and 48 HAT,

respectively. Averaged over harvest intervals, 18% of the applied cyclanilide remained in
the treated leaf while 1.7 and 6.5% of the applied cyclanilide was found in the above and
below treated leaf tissue, respectively.

PHYSIOLOGICAL EVALUATIONS OF TRANSLOCATION OF GLYPHOSATE IN GLYPHOSATE RESISTANT CROPS INCLUDING INTERACTION WITH
COTTON GROWTH REGULATORS
By
WALTER EDWARD THOMAS
A dissertation submitted to the Graduate Faculty of North Carolina State University
in partial fulfillment of the requirements for the Degree of
Doctor of Philosophy
Crop Science
Raleigh
2006
APPROVED BY: _____________________________ _____________________________ Dr. Candace H. Haigler Dr. Alan C. York _____________________________ _____________________________ Dr. David W. Monks Dr. John W. Wilcut Chair of Advisory Committee

ii
BIOGRAPHY
Walter E. Thomas was born in Sanford, North Carolina on June 12, 1979 to Neill B.
Thomas, Jr. and Frances G. Thomas. He was raised in Lillington, North Carolina, a small
rural town. He graduated in 1997 from Western Harnett High School as a North Carolina
Scholar and Honor Student. Following graduation, he enrolled at North Carolina State
University where he earned a bachelor of science degree in Agronomy with a
concentration in Turfgrass Management. In October 2000, he earned the American FFA
degree, the highest degree bestowed upon FFA members. He graduated sum cum laude, a
College of Agriculture and Life Sciences Honor Student, and a University Scholar. Walter
earned a Master of Science in Crop Science and a minor in Entomology from North
Carolina State University in December of 2003. Following graduation, he pursued a
doctor of philosophy in Crop Science at North Carolina State University.
While pursuing his degrees, Walter has won awards in the graduate student poster
contests at the Southern Weed Science Society and Weed Science Society of North
Carolina and graduate student oral presentation contests at the Beltwide Cotton
Conference. He was also awarded the Deere & Co. Graduate Fellowship from the
American Society of Agronomy. He was a participant and award winner in weed contests
conducted by the Northeastern and Southern Weed Science Societies. In 2005, he was a
member of the first place team at the Northeastern Weed Science Society Weed Contest in
Lancaster, PA.

iii
ACKNOWLEDGEMENTS
I would like to sincerely thank Dr. John Wilcut, my major advisor, for his guidance,
patience, and friendship. I also extend appreciation to my committee members, Drs.
Candace Haigler, Clifford Koger, David Monks, Dale Shaner, and Alan York. I would
also like to thank Shawn Askew, Whitnee Barker, Ian Burke, Scott Clewis, Wesley
Everman, Wendy Pline, Bridget Robinson, and Shawn Troxler for their friendship, advice,
and encouragement. I greatly appreciate the many hours of laboratory and greenhouse
assistance provided by Carianne Grubb, Joey Hope, Abigail Mayhew, Cassandra Mayhew,
Diana Thomas, Jared Wilcut, and Caitlyn Wilcut. I would also like to thank Dr. Fred
Corbin for his advice and wonderful life stories and Bonnie Sheldon for her friendship and
willingness to help with any task.
I am greatful for the unending support, encouragement, and love provided by wife,
Tracy. I sincerely appreciate the encouragement from my parents, Baxley and Frances,
siblings, Neill and Diana, and many other family members who have supported me along
this journey.

iv
TABLE OF CONTENTS
LIST OF TABLES.................................................................................................................... vi LIST OF FIGURES .................................................................................................................. ix INTRODUCTION AND LITERATURE REVIEW .................................................................1
INTRODUCTION...........................................................................................................1 LITERATURE CITED .................................................................................................11
GLYPHOSATE-RESISTANT CORN INTERFERENCE IN GLYPHOSATE-RESISTANT COTTON...........................................................................................................17
ABSTRACT..................................................................................................................17 INTRODUCTION.........................................................................................................18 MATERIALS AND METHODS ..................................................................................19 RESULTS AND DISCUSSION ...................................................................................22 LITERATURE CITED .................................................................................................27
INFLUENCE OF CORN GROWTH STAGE ON ABSORPTION AND TRANSLOCATION OF GLYPHOSATE IN GLYPHOSATE-RESISTANT CORN ...........40
ABSTRACT..................................................................................................................41 INTRODUCTION.........................................................................................................42 MATERIALS AND METHODS ..................................................................................43 RESULTS AND DISCUSSION ...................................................................................45 LITERATURE CITED .................................................................................................52
ABSORPTION AND TRANSLOCATION OF GLYPHOSATE AND SUCROSE IN GLYPHOSATE-RESISTANT COTTON ...............................................................................63
ABSTRACT..................................................................................................................63 INTRODUCTION.........................................................................................................64 MATERIALS AND METHODS ..................................................................................67 RESULTS AND DISCUSSION ...................................................................................69 LITERATURE CITED .................................................................................................76
TRANSLOCATION OF SPOT APPLICATIONS OF GLYPHOSATE AS INFLUENCED BY MEPIQUAT CHLORIDE APPLICATIONS IN COTTON.............................................86
ABSTRACT..................................................................................................................87 INTRODUCTION.........................................................................................................88 MATERIALS AND METHODS ..................................................................................91 RESULTS AND DISCUSSION ...................................................................................93 LITERATURE CITED ...............................................................................................102

v
TRANSLOCATION OF 14C-GLYPHOSATE AS INFLUENCED BY VARIOUS PLANT GROWTH REGULATORS IN COTTON............................................................................119
ABSTRACT................................................................................................................120 INTRODUCTION.......................................................................................................121 MATERIALS AND METHODS ................................................................................123 RESULTS AND DISCUSSION .................................................................................125 LITERATURE CITED ...............................................................................................133
RAIN-FREE REQUIREMENT AND PHYSIOLOGICAL PROPERTIES OF COTTON PLANT GROWTH REGULATORS ....................................................................................144
ABSTRACT................................................................................................................145 INTRODUCTION.......................................................................................................145 MATERIALS AND METHODS ................................................................................147 RESULTS AND DISCUSSION .................................................................................149 CONCLUSIONS.........................................................................................................152 REFERENCES............................................................................................................154

vi
LIST OF TABLES
GLYPHOSATE-RESISTANT CORN INTERFERENCE IN GLYPHOSATE-
RESISTANT COTTON
Table 1. Regression parameters (H = a e-be-Kt) describing the relationship between cotton height and time in days after crop planting at various densities of corn interference where H, a, e, and t are based on the plant height in cm, the upper asymptote for late-season plant height, the base of natural logarithm, and the time in days after planting, respectively, while b and k are constants. Values in parenthesis are standard errors. ...............................31 Table 2. Economic thresholds for glyphosate-resistant corn in glyphosate-resistant cotton. ......................................................................................................................................33
INFLUENCE OF CORN GROWTH STAGE ON ABSORPTION AND
TRANSLOCATION OF GLYPHOSATE IN GLYPHOSATE-RESISTANT CORN
Table 1. Distribution of 14C-glyphosate in glyphosate-resistant corn, averaged over trials, treatment timings (V4, V6, and V8), and harvests timings (3 and 7 d after treatment). .........57 Table 2. Concentration of 14C-glyphosate in glyphosate-resistant corn treated at V4, V6, or V8, averaged over trials and harvests (3 and 7 d after treatment). ......................................58 Table 3. Distribution of foliar-applied 14C-glyphosate in glyphosate-resistant corn treated at V4, V6, or V8 and harvested at various vegetative and reproductive growth stages, averaged over trials ..................................................................................................................59 Table 4. Distribution of foliar-applied 14C-glyphosate in glyphosate-resistant corn treated at V4, V6, or V8 and harvested at various vegetative and reproductive growth stages, averaged over trials ..................................................................................................................61
ABSORPTION AND TRANSLOCATION OF GLYPHOSATE AND SUCROSE IN
GLYPHOSATE-RESISTANT COTTON Table 1. Translocation of 14C-glyphosate in cotton. Translocation values are a percentage of absorbed 14C-glyphosate, averaged over glyphosate-resistant event and harvest timing .......................................................................................................................................81 Table 2. Translocation of glyphosate and sucrose in 5- and 10- leaf cotton as a percentage of absorbed 14C, averaged over runs and harvest timings .......................................................82

vii
Table 3. Translocation of 14C compounds (glyphosate and sucrose) in 5- and 10-leaf cotton as a percentage of exported 14C from the treated leaf, averaged over runs and harvest timings .....................................................................................................................................84
TRANSLOCATION OF SPOT APPLICATIONS OF GLYPHOSATE AS INFLUENCED
BY MEPIQUAT CHLORIDE APPLICATIONS IN COTTON Table 1. Interaction of 14C-glyphosate timing and mepiquat chloride on the total plant height at harvest, treated leaf node, and absorption of 14C-glyphosate, averaged over trials. ..............................................................................................................................106 Table 2. 14C-glyphosate timing main effect on total fruit retention and first position fruit retention, averaged over trials and mepiquat chloride regime...............................................107 Table 3. Interaction of nodal position and leaf position within sympodia on leaf area, averaged over trials, 14C-glyphosate timing, and mepiquat chloride.....................................108 Table 4. Interaction of mepiquat chloride and sympodial position for fresh weight of the various cotton parts within each position on nodes A, C and D, averaged over trials and 14C-glyphosate timing. For nodes B and E, fresh weight is presented by the various cotton parts within sympodial position, averaged over trials, 14C-glyphosate timing, and mepiquat chloride. .................................................................................................................................109 Table 5. Interaction of mepiquat chloride and sympodial position for dry weight of the various cotton parts within each position on nodes A, B, C, and D, averaged over trials and 14C-glyphosate timing. For node E, dry weight is presented by the various cotton parts within sympodial position, averaged over trials, 14C-glyphosate timing, and mepiquat chloride ..................................................................................................................................111 Table 6. The levels of significant difference for the main effects and their interactions on 14C-glyphosate concentration in cotton for each node...........................................................113 Table 7. Interaction of parts within each position and sympodial position for 14C-glyphosate concentration, averaged over trials, 14C-glyphosate timing, and mepiquat chloride ..................................................................................................................................114 Table 8. Interaction of mepiquat chloride and sympodial position for 14C-glyphosate concentration in the various cotton parts within each position for node A, averaged over trials .......................................................................................................................................115 Table 9. Interaction of 14C-glyphosate timing, mepiquat chloride, and sympodial position for 14C-glyphosate concentration in the various cotton parts within each position, averaged over trials ...............................................................................................................................116

viii
TRANSLOCATION OF 14C-GLYPHOSATE AS INFLUENCED BY VARIOUS PLANT GROWTH REGULATORS IN COTTON
Table 1. Cotton height as influenced by cotton plant growth regulator regimes, averaged over trials and 14C-glyphosate placement. .............................................................................137 Table 2. Leaf area as influenced by plant position and cotton plant growth regulator regimes, averaged over trials and 14C-glyphosate placement ................................................138 Table 3. Dry weight of plant parts as influenced by plant position and cotton plant growth regulator regimes, averaged over trials and 14C-glyphosate placement ................................139 Table 4. Translocation of 14C-glyphosate as influenced by plant position, averaged over trials, 14C-glyphosate placement, and cotton plant growth regulator regimes. Data are from the node containing the treated leaf.......................................................................................142 Table 5. Translocation of 14C-glyphosate as influenced by plant position, averaged over trials, 14C-glyphosate placement, and cotton plant growth regulator regimes. Data are from one node above the treated leaf node.....................................................................................143
RAIN-FREE REQUIREMENT AND PHYSIOLOGICAL PROPERTIES OF COTTON
PLANT GROWTH REGULATORS
Table 1. Parameters (standard error) for regression analysis [y = -a ln(time) + b] on the change in cotton height in response to various simulated rainfall timings. . ........................157 Table 2. F-values and probabilities of the main effects and interactions evaluated for translocation data ...................................................................................................................159
Table 3. Translocation of 14C-cyclanilide to various plant parts, averaged over trials, and harvest intervals .....................................................................................................................160

ix
LIST OF FIGURES
GLYPHOSATE-RESISTANT CORN INTERFERENCE IN GLYPHOSATE-RESISTANT COTTON
Figure 1. Glyphosate-resistant corn height, glyphosate-resistant cotton height with no weed interference, and glyphosate-resistant cotton height with 5.25 corn plant per m of cotton row are shown. Bars represent standard error of the mean. Regression parameters and corresponding R2 values are shown in Table 1. ................................................................34 Figure 2. Effect of glyphosate-resistant corn density at the last measuring timing at each location (104, 95, and 101 d after planting at Clayton, Lewiston-Woodville, and Rocky Mount, respectively). Bars represent standard error of the mean...........................................35 Figure 3. Effect of glyphosate-resistant corn density on late-season glyphosate-resistant corn biomass per plant shown by location. Bars represent standard error of the mean. A linear response was not observed at Lewiston-Woodville and Rocky Mount .........................36 Figure 4. Effect of glyphosate-resistant corn density on late-season glyphosate-resistant corn seed weight per plant shown by location. Bars represent standard error of the mean. A linear response was not observed at Lewiston-Woodville and Rocky Mount.....................37 Figure 5. Effect of glyphosate-resistant corn biomass per m crop row on cotton lint yield shown by location. Bars represent standard error of the mean...............................................38 Figure 6. Cotton lint yield loss associated with season- long glyphosate-resistant corn interference. Bars represent standard error of the mean.........................................................39
ABSORPTION AND TRANSLOCATION OF GLYPHOSATE AND SUCROSE IN
GLYPHOSATE-RESISTANT COTTON
Figure 1. Absorption of glyphosate in 4-lf and 8- lf cotton is shown as a percentage of applied, averaged trials. In 8- lf cotton, absorption is also averaged over trials and glyphosate resistance events ....................................................................................................85
RAIN-FREE REQUIREMENT AND PHYSIOLOGICAL PROPERTIES OF COTTON PLANT GROWTH REGULATORS
Figure 1. The change in total plant height from 0 to 7 and 7 to 14 d after treatment for no surfactant and surfactant studies, averaged over runs and cotton plant growth regulators. Data modeled using y = -a ln(time) + b. Parameters for equations are shown in table 1. ....161 Figure 2. Absorption of 14C-cyclanilide as a percentage of applied, averaged over trials ..162

1
INTRODUCTION
Objective 1. Herbicide-resistant (HR) crops are becoming increasingly prevalent in the
southeastern United States. Herbicide-resistant corn hectarage has steadily increased from
7% in 2000 to 26% in 2005 (USDA-NASS 2000, 2005). The use of HR cotton has been
more widespread with 46 and 61% planted in 2000 and 2005, respectively (USDA-NASS
2000, 2005). In North Carolina, 78% of the planted cotton in 2005 contained a herbicide-
resistant trait (USDA-NASS 2005). In addition to the wide-spread use of glyphosate-
resistant (GR) corn and cotton, many of the weed management systems within each
cropping system utilize only glyphosate. Additional herbicidal options like metolachlor
and pendimethalin included in some cotton weed management systems are also registered
in corn and are unlikely to control volunteer corn. The combination of continuous use of
GR cropping systems with the inclusion of only glyphosate allows for growth and
subsequent competition of GR volunteers (York et al. 2004, 2005).
Since the registration of GR cotton, less than 50% of the NC hectarage receives any
residual preemergence treatment (A. C. York, personal communication). A vast majority
of this hectarage is only treated with glyphosate or glyphosate plus S-metolachlor for the
first 4 to 5 wks after crop emergence. In addition, weather conditions like hurricanes
commonly destroy corn. Therefore, GR corn volunteers are often left uncontrolled. Since
interference between GR corn and GR cotton has not been investigated, studies were
conducted to determine effects of a range of GR corn densities on GR cotton growth and
yield and to evaluate growth of GR corn as affected by plant density (Chapter 1, pp. 17 -
39).
2
GR corn was taller than GR cotton as early as 25 d after planting, depending on
location. A GR corn density of 5.25 plant/m of crop row reduced late-season cotton height
by 49, 24, and 28% at Clayton, Lewiston-Woodville, and Rocky Mount, respectively,
compared to weed-free cotton height. Using the rectangular hyperbola model with the
asymptote (a) constrained to 100% maximum yield loss, the estimated coefficient i (yield
loss per unit density as density approaches zero) was 9, 5, and 5 at Clayton, Lewiston-
Woodville, and Rocky Mount, respectively. The examined GR corn densities had a
significant effect on cotton yield, but not as significant as many other problematic grass
and broadleaf weeds.
Objective 2. Glyphosate has been shown to negatively influence various reproductive
characteristics in GR corn and cotton (Pline et al. 2002a; Thomas et al. 2004).
Investigations concluded that yield reductions in GR cotton were due to lower CP4-5-
enolpyruvylshikimate-3-phosphate synthase (EPSPS) expression in male reproductive
portions of flowers compared to vegetative tissues (Pline et al. 2002a). In addition to
lower EPSPS levels, pollen viability was reduced and stigma length was increased
following glyphosate treatments (Pline et al. 2002a, 2002b, 2002c; Yasour et al. 2000). In
GR corn, pollen viability reductions were evident with glyphosate treatments after the V6
stage, however, no yield reductions were observed with any glyphosate treatment
combination (Thomas et al. 2004). The combination of tassel initiation [as early as two
wks after corn emergence (Kiesselbach 1992)] and the source-to-sink translocation of
glyphosate (Gougler and Geiger 1981; Hetherington et al. 1999; McAllister and Haderlie
1985; Pline et al. 2001; Sandberg et al. 1980; Wyrill and Burnside 1976; Viator et al. 2003)
may partially explain the observed pollen viability reductions (Thomas et al. 2004). Based

3
on this hypothesis, our objectives were to evaluate absorption and translocation of
glyphosate applied at the V4, V6, or V8 stage using various harvest timings. The first
study evaluated the immediate effects (3 and 7 DAT) on absorption and translocation of
glyphosate. A second study evaluated the distribution of foliar-applied glyphosate (V4,
V6, and V8) by harvesting at four vegetative and reproductive stages (V8, V12, V16, and
R1) (Chapter 2, pp. 40 - 62).
In the second study, 42 to 60% of the applied 14C-glyphosate remained in the corn
tissues at anthesis. The leaves above the treated leaf and roots accumulated the greatest
amounts of 14C-glyphosate, regardless of corn growth stages. When plants were treated at
V4, V6, and V8 stages, the concentration of 14C-glyphosate in the tassel at the V12 harvest
timing was 184, 431, and 921 Bq g-1 dry tissue, respectively. Likewise, increasing levels
of 14C-glyphosate concentrations between corn growth stages were also observed in ear
shoots. These data suggest that reproductive tissues such as the tassel and ear shoots can
accumulate 14C-glyphosate at higher concentrations than other tissues, especially when the
herbicide is applied POST after the V6 stage.
Objective 3. In addition to laboratory analyses of CP4-EPSPS expression levels (Pline et
al. 2002a), determination of shikimic acid levels (which accumulates following inhibition
of EPSPS) (Pline et al. 2002b; Viator et al. 2003), and floral morphology assessments
(Pline et al. 2002b), several researchers have reported abscission of first position bolls
(Jones and Snipes 1999; Viator et al. 2003, 2004), which in some years resulted in delayed
maturity. Depending on year, Viator et al. (2004) reported an 8% yield reduction
following applications of glyphosate POST at 0.84 kg ae/ha followed by glyphosate
postemergence-directed at 0.84 kg/ha compared to treatments that did not include

4
glyphosate. The lack of glyphosate tolerance in reproductive tissues of glyphosate-
resistant event 1 (GRE1) lead to the development of a new generation of GR cotton.
The new generation, glyphosate-resistant event 2 (GRE2) cotton, uses an identical
resistance gene but different promoters as compared to the original resistance technology
(Anonymous 2005). The use of alternate promoters has increased the tolerance in
reproductive portions of the plant while maintaining tolerance levels in vegetative parts
(Anonymous 2005). Consequently, glyphosate can be applied POST up to 7 days before
harvest. Multiple researchers have investigated the physiological behavior of 14C-
glyphosate in GRE1 cotton (Pline et al. 2001, 2002a; Viator et al. 2003), however limited
research investigating similar responses to glyphosate in GRE2 cotton has been reported.
Thus, our objective was to evaluate absorption and translocation of glyphosate in these two
events at different cotton growth stages (Chapter 3, pp. 63 - 85).
Glyphosate absorption, as a percentage of applied, increased over time with 29 and
36% absorption at 7 DAT in GRE1 and GRE2 cotton at the 4- lf growth stage, respectively.
In 8- lf cotton, glyphosate absorption (33% at 7 DAT) was not different between events.
Glyphosate translocation patterns were not different between events or harvest timings and
exhibited a source-to-sink relationship. Observed translocation differences between cotton
growth stages were probably due to reduced glyphosate export from the treated leaf of 8-lf
cotton.
Objective 4. Previous photoassimilate movement research in cotton used radiolabeled
substrates including CO2 and sucrose (Ashley 1972; Benedict and Kohel 1975; Benedict et
al. 1973; Horrocks et al. 1978). However, these substrates are metabolized into multiple
plant products, which may complicate analysis and data interpretation. Glyphosate, which

5
is not readily metabolized in plants (Duke 1988; Sandberg et al. 1980) and shares similar
translocation patterns to sucrose (Dewey and Appleby 1983; Tardif and Leroux 1993), may
offer an additional tool in photoassimilate research. Glyphosate-resistant event 2 cotton in
combination with glyphosate may provide tools to study photoassimilate translocation in
cotton in the absence of glyphosate toxicity (Feng and Chiu 2005). Even though several
researchers observed similar glyphosate and sucrose translocation patterns in a number of
weed species (Dewey and Appleby 1983; Shieh et al. 1993; Tardif and Leroux 1993), a
comparison of glyphosate and sucrose translocation in GR cotton or other GR crops has
not been conducted. Thus, our objective was to compare glyphosate and sucrose
translocation patterns in GRE2 cotton as influenced by cotton growth stage (Chapter 3, pp.
63 - 85).
Averaged over trials, 14C compounds, and growth stages, cotton absorbed 28% of the
applied dose at 14 d after treatment. Based on the percentage of 14C exported out of the
treated leaf, glyphosate and sucrose translocation patterns were similar, indicating that
glyphosate may be used as a photoassimilate model in GRE2 cotton.
Objectives 5 and 6. Development and retention of cotton fruits are influenced by supply
and demand of plant photoassimilates. The complex balance of these source-to-sink
relationships varies by plant position and age (Ashley 1972; Benedict and Kohel 1975) as
well as environmental conditions (Guinn 1982). Multiple researchers have investigated
photoassimilate patterns in cotton with 14CO2 (Ashley1972; Benedict and Kohel 1975;
Horrocks et al. 1978) and 14C-glyphosate (Feng and Chiu 2005). Ashley (1972) and
Horrocks et al. (1978) showed that the subtending leaf of a fruit was the primary
photoassimilate source.

6
Glyphosate, a commonly used systemic herbicide, is symplastic in nature and is
translocated in the phloem following a source-to-sink relationship (Dewey and Appleby
1983; Sandberg et al. 1980; Tardif and Leroux 1993). Due to these properties, similar
patterns of glyphosate and sucrose translocation have been reported in Canada thistle
[Cirsium arvense (L.) Scop.], cotton, quackgrass [Elyrigia repens (L.) Nevski], and tall
morningglory [Ipomoea purpurea (L.) Roth.] (Dewey and Appleby 1983; Harker and
Dekker 1988; Klevorn and Wyse 1984; McAllister and Haderlie 1985; Shieh et al. 1993;
Tardif and Leroux 1993; Thomas et al. 2006).
Many cotton production systems include the use of plant growth regulators (PGRs) to
manage vegetative cotton growth. Mepiquat chloride and mepiquat pentaborate, two
onium-type growth regulators commonly used in these systems, inhibit gibberillic acid
synthesis by stopping the conversion of geranylgeranyl diphosphate to ent-kaurene,
consequently reducing cell enlargement and the rate of cell division (Rademacher 2000;
Srivastava 1993). The visual effects of these PGRs include reduced stem and leaf
expansion and cotton reaching maturity earlier than cotton not treated with PGRs (Reddy
et al. 1990, 1996; York 1983a, 1983b). However, cotton yield responses were variable
(Kerby 1985). Since PGRs have been shown to alter cotton canopy architecture and fruit
maturity, photoassimilate translocation patterns are presumably altered by these
applications. Even though research has not confirmed differences in photoassimilate
translocation in response to MC treatment using 14CO2 technology (Zhao and Oosterhuis
2000), glyphosate and glyphosate-resistant technology offer new tools for investigating
photoassimilate translocation patterns in cotton (Feng and Chiu 2005).

7
Since glyphosate movement has been correlated with sucrose movement in cotton
(Thomas et al. 2006) and multiple weed species (Dewey and Appleby 1983; Harker and
Dekker 1988; Klevorn and Wyse 1984; McAllister and Haderlie 1985; Shieh et al. 1993;
Tardif and Leroux 1993), our objectives were to evaluate translocation of 14C-glyphosate at
different timings relative to a single MC treatment (Chapter 4, pp. 86 - 118) and to
evaluate translocation of 14C-glyphosate from various source leaves as influenced by
multiple cotton PGR regimes (Chapter 5, pp. 119 - 143).
Due to the large number of plant parts, data for a five-node section of each plant was
recorded for each parameter (the mainstem leaf on node B received the 14C-glyphosate
treatment). No significant differences in plant height, leaf area, and specific leaf weight
were observed for any 14C-glyphosate timing or MC combination. At the time of MC
treatment and 21 DMC, total fruit retention was 85 and 70%, respectively. Even though all
plants retained at least 86% of all first position fruits, a significant decline was observed
from the day of MC treatment to 21 DMC (92 and 86%, respectively). Fresh and dry
weight data showed similar responses with multiple first position fruits of MC-treated
plants accumulating more biomass compared to first position fruits of non-treated plants.
For dry weight of plants parts, first position fruits on nodes A, B, and C of MC-treated
plants accumulated 30, 35, and 45% greater biomass, respectively, compared to first
position fruits of non-treated plants. Absorption of 14C-glyphosate was not influenced by
either 14C-glyphosate timing or MC treatment. Even though no significant observations
were found on node A, several numerical observations offer support for reduced leaf
expansion and increased biomass accumulation in response to MC treatment. In node A,
second position fruits on MC-treated plants contained 68% more 14C-glyphosate g-1 of dry

8
tissue than second position fruits of non-treated plants. In addition, numerical increases in
14C-glyphosate concentration in the leaf and stem of the second position of node A in MC-
treated plants were observed compared to the same parts of non-treated plants. On node D,
first position fruits of MC-treated plant contained nearly 6 and 7 times the 14C-glyphosate
concentration at 0 and 21 DMC treatment compared to the respective timing for non-
treated plants. In addition, all other comparisons with first position fruit were numerically
greater with MC treatment. These data support previous research that showed increased
fruit weight and provides insight into the potential for MC treatment to alter the source-to-
sink relationship in reproductive cotton.
Studies examined various morphological characteristics and 14C-glyphosate
translocation in cotton as influenced by cotton plant growth regulator regimes [none,
mepiquat chloride (MC), mepiquat pentaborate (MP)] and source leaf (14C-glyphosate was
applied to mainstem and sympodial leaves). Mepiquat chloride and MP reduced cotton
height by 13 and 20%, respectively, compared to non-treated plants. Mepiquat chloride
and MP reduced the number of mainstem nodes by 1.4 and 1.9 nodes plant-1, respectively,
compared to non-treated plants. Total fruit retention, first position fruit retention, low
sympodial fruit retention (nodes 6-10), high sympodial fruit retention (nodes 11-15), and
the location of the first sympodial branch were not influenced by either 14C-glyphosate
treatment or cotton PGR regime. On node 19, MC and MP reduced the leaf area of the
mainstem leaf by 59 and 73%, compared to the mainstem leaf of non-treated plants. This
observed reduction may be partially influenced by the reduction in cotton height and the
number of nodes. Leaf area at other positions was only influenced by node and position
within nodes. Absorption of 14C-glyphosate was not influenced by either 14C-glyphosate

9
placement or cotton PGR regime. Based on these data, MC and MP do not influence 14C-
glyphosate translocation, which presumably indicates no direct influence on
photoassimilate translocation.
Objective 7. In 2006, a prepackaged mixture of mepiquat chloride and cyclanilide, which
inhibits gibberellic acid synthesis and auxin transport, respectively, was registered for use
in cotton. Compared to known polar auxin transport inhibitors (1-N-naphthylphthalamic
acid and 2, 3, 4-triiodobenzoic acid) [12], Pederson [13] reported similar levels of
inhibition of auxin transport with 10 µm of cyclanilide in etiolated coleoptiles of corn (Zea
mays). Due to limited basipetal transport of auxin in cyclanilide treated plants, apical
dominance is not maintained, allowing for increased lateral shoot growth [13-17].
Since the prepackaged mixture of mepiquat chloride plus cyclanilide has recently been
registered, limited data are available with regard to rain-free requirements and distribution
within cotton. Therefore, our objectives were (1) to determine the rain-free interval for
mepiquat chloride and mepiquat chloride plus cyclanilide alone or in combination with a
non- ionic surfactant and (2) to evaluate absorption and translocation of cyclanilide in
cotton (Chapter 6, pp. 144 - 162).
No significant differences in the number of nodes, leaf area, and plant part fresh and
dry weight were observed with any PGR treatment and rainfall simulation combination.
Both plant growth regulators responded similarly to rainfall interval. As rain-free period
increased, cotton height was reduced. Based on these data, a rain-free period of 8 hours is
needed to maximize efficacy, regardless of the use of surfactant. Absorption of cyclanilide
ranged from 11 to 15% at 3 and 48 HAT, respectively. Averaged over harvest intervals,

10
18% of the applied cyclanilide remained in the treated leaf while 1.7 and 6.5% of the
applied cyclanilide was found in the above and below treated leaf tissue, respectively.
11
Literature Cited
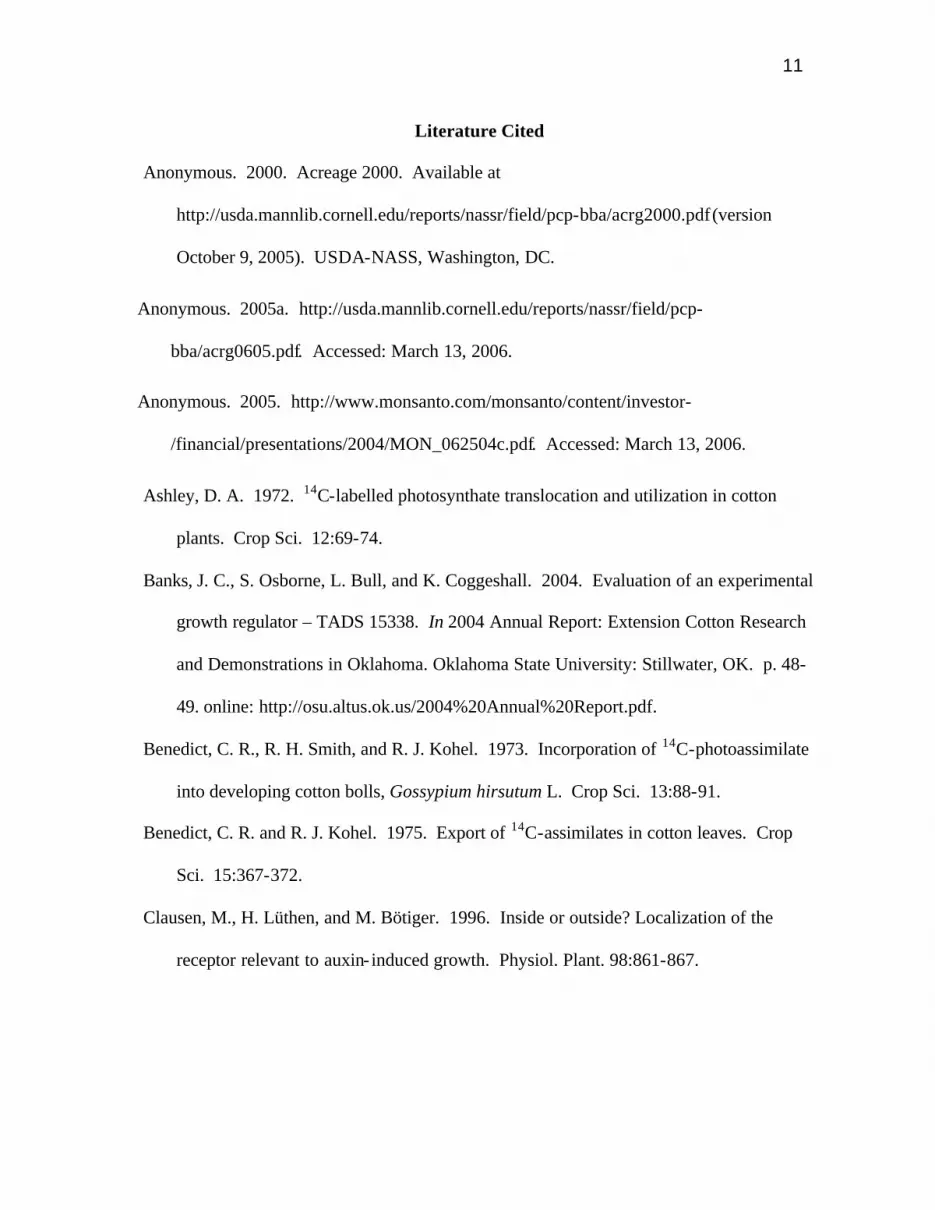
Anonymous. 2000. Acreage 2000. Available at
http://usda.mannlib.cornell.edu/reports/nassr/field/pcp-bba/acrg2000.pdf (version
October 9, 2005). USDA-NASS, Washington, DC.
Anonymous. 2005a. http://usda.mannlib.cornell.edu/reports/nassr/field/pcp-
bba/acrg0605.pdf. Accessed: March 13, 2006.
Anonymous. 2005. http://www.monsanto.com/monsanto/content/investor-
/financial/presentations/2004/MON_062504c.pdf. Accessed: March 13, 2006.
Ashley, D. A. 1972. 14C-labelled photosynthate translocation and utilization in cotton
plants. Crop Sci. 12:69-74.
Banks, J. C., S. Osborne, L. Bull, and K. Coggeshall. 2004. Evaluation of an experimental
growth regulator – TADS 15338. In 2004 Annual Report: Extension Cotton Research
and Demonstrations in Oklahoma. Oklahoma State University: Stillwater, OK. p. 48-
49. online: http://osu.altus.ok.us/2004%20Annual%20Report.pdf.
Benedict, C. R., R. H. Smith, and R. J. Kohel. 1973. Incorporation of 14C-photoassimilate
into developing cotton bolls, Gossypium hirsutum L. Crop Sci. 13:88-91.
Benedict, C. R. and R. J. Kohel. 1975. Export of 14C-assimilates in cotton leaves. Crop
Sci. 15:367-372.
Clausen, M., H. Lüthen, and M. Bötiger. 1996. Inside or outside? Localization of the
receptor relevant to auxin- induced growth. Physiol. Plant. 98:861-867.

12
Dewey, S. A. and A. P. Appleby. 1983. A comparison between glyphosate and assimilate
translocation patterns in tall morningglory (Ipomoea purpurea). Weed Sci. 31:308-
314.
Duke, S. O. 1988. Glyphosate. In P. C. Kearney, D. D. Kaufman eds., Herbicides:
Chemistry, Degradation and Mode of Action. Marcel Dekker, New York, pp. 1-70.
Elfving, D. C. and D.B. Visser. 2005. Cyclanilide induces lateral branching in apple trees.
HortSci. 40:119-122.
Faircloth, J. C., D. N. Horton, G. U. White, N. O’Berry, and M. Weeks. 2005. TADS
15338/PGR effects. In 2005 Peanut and Cotton Research Evaluations in Plant Growth
Regulators, Weed Science, Varieties, and Defoliants # 424-202. Virginia Polytechnic
Institute and State University: Blacksburg, VA. online:
http://www.ext.vt.edu/pubs/cotton/424-202-05/424-202-05.html.
Feng, P.C.C. and T. Chiu. 2005. Distribution of [14C]glyphosate in mature glyphosate-
resistant cotton from application to a single leaf or over-the-top spray. Pest. Biochem.
Physiol. 82:36-45.
Gougler, J. A. and D. R. Geiger. 1981. Uptake and distribution of N-
phosphonomethylglycine in sugarbeet plants. Plant Physiol. 68:668-672.
Guinn, G. 1982. Causes of square and boll shedding in cotton. USDA Tech. Bull. 1672.
U.S. Government Printing Office, Washington, D.C. pp. 1-22.
Harker, K. N. and J. Dekker. 1988. Effects of phenology on translocation patterns of
several herbicides in quackgrass, Agropyron repens. Weed Sci. 36:463-472.
13
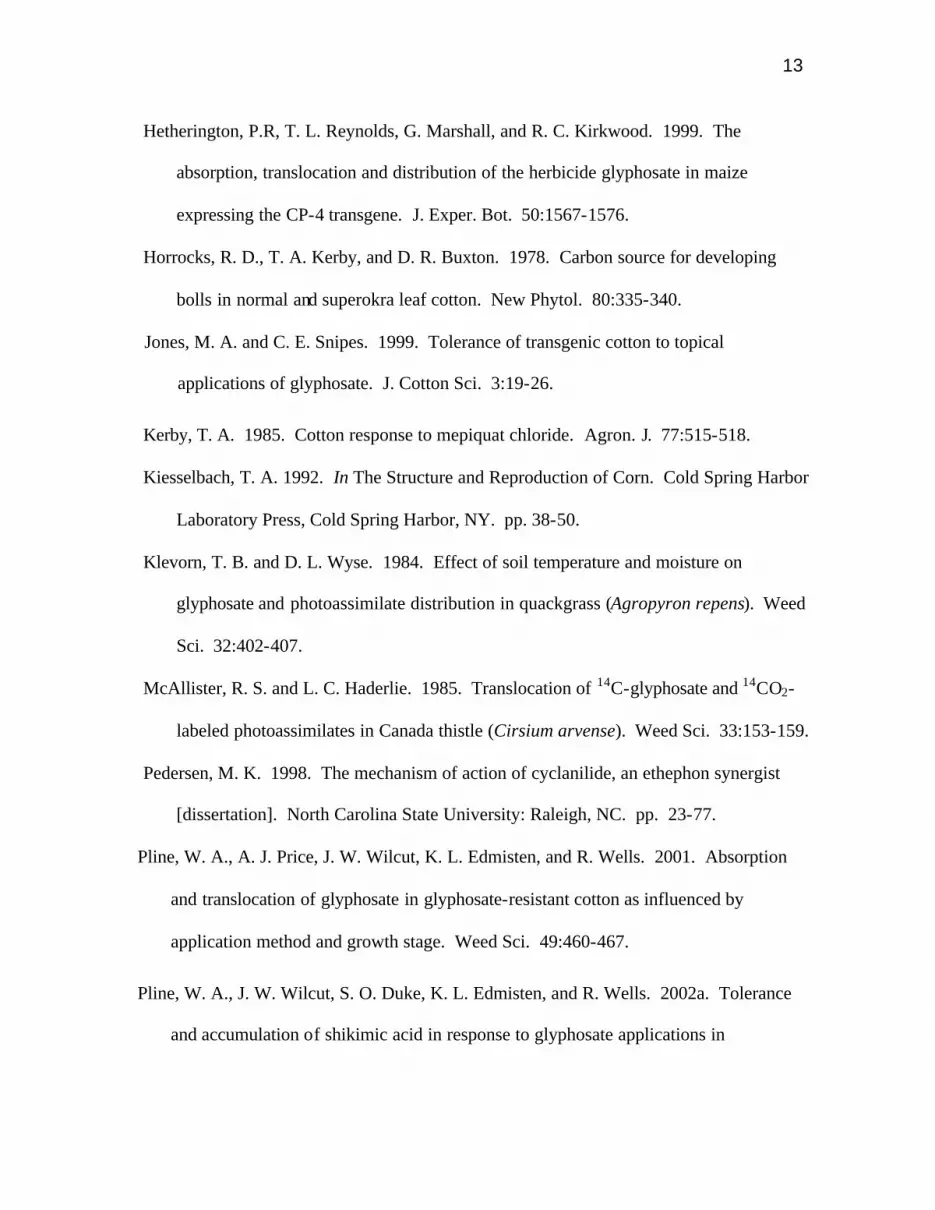
Hetherington, P.R, T. L. Reynolds, G. Marshall, and R. C. Kirkwood. 1999. The
absorption, translocation and distribution of the herbicide glyphosate in maize
expressing the CP-4 transgene. J. Exper. Bot. 50:1567-1576.
Horrocks, R. D., T. A. Kerby, and D. R. Buxton. 1978. Carbon source for developing
bolls in normal and superokra leaf cotton. New Phytol. 80:335-340.
Jones, M. A. and C. E. Snipes. 1999. Tolerance of transgenic cotton to topical
applications of glyphosate. J. Cotton Sci. 3:19-26.
Kerby, T. A. 1985. Cotton response to mepiquat chloride. Agron. J. 77:515-518.
Kiesselbach, T. A. 1992. In The Structure and Reproduction of Corn. Cold Spring Harbor
Laboratory Press, Cold Spring Harbor, NY. pp. 38-50.
Klevorn, T. B. and D. L. Wyse. 1984. Effect of soil temperature and moisture on
glyphosate and photoassimilate distribution in quackgrass (Agropyron repens). Weed
Sci. 32:402-407.
McAllister, R. S. and L. C. Haderlie. 1985. Translocation of 14C-glyphosate and 14CO2-
labeled photoassimilates in Canada thistle (Cirsium arvense). Weed Sci. 33:153-159.
Pedersen, M. K. 1998. The mechanism of action of cyclanilide, an ethephon synergist
[dissertation]. North Carolina State University: Raleigh, NC. pp. 23-77.
Pline, W. A., A. J. Price, J. W. Wilcut, K. L. Edmisten, and R. Wells. 2001. Absorption
and translocation of glyphosate in glyphosate-resistant cotton as influenced by
application method and growth stage. Weed Sci. 49:460-467.
Pline, W. A., J. W. Wilcut, S. O. Duke, K. L. Edmisten, and R. Wells. 2002a. Tolerance
and accumulation of shikimic acid in response to glyphosate applications in

14
glyphosate-resistant and nonglyphosate-resistant cotton (Gossypium hirsutum L.). J.
Agric. Food Chem. 50:506-512.
Pline, W. A., R. Viator, J. W. Wilcut, K. L. Edmisten, J. Thomas, and R. Wells. 2002b.
Reproductive abnormalities in glyphosate-resistant cotton caused by lower CP4-EPSPS
levels in the male reproductive tissue. Weed Sci. 50:438-447.
Rademacher, W. 2000. Growth retardants: effects on gibberellin biosynthesis and other
metabolic pathways. Ann. Rev. Plant Physiol. Mole. Biol. 51:501-531.
Reddy, V. R, D. N. Baker, and H. F. Hodges. 1990. Temperature and mepiquat chloride
effects on cotton canopy architecture. Agron. J. 82:190-195.
Reddy, A. R., K. R. Reddy, and H. F. Hodges. 1996. Mepiquat chloride (PIX)- induced
changes in photosynthesis and growth of cotton. Plant Growth Regul. 20:179-183.
Sandberg, C. L., W. F. Meggitt, and D. Penner. 1980. Absorption, translocation, and
metabolism of 14C-glyphosate in several weed species. Weed Res. 20:195-200.
Shieh, W., D. R. Geiger, and S. R. Buczynski. 1993. Distribution of imported glyphosate
in quackgrass (Elytrigia repens) rhizomes in relation to assimilate accumulation.
Weed Sci. 41:7-11.
Srivastava, L. M. 2002a. Gibberellins. In Plant Growth and Development. Academic
Press: New York. pp. 172-181.
Srivastava, L. M. 2002b. Auxins. In: Plant Growth and Development. Academic Press:
New York. pp. 155-156.
Srivastava, L. M. 2002c. Uptake and transport of hormones. In: Plant Growth and
Development. Academic Press: New York. pp. 296-299.

15
Tamas, I. A. 1995. Hormonal regulation of apical dominance. In: P. J. Davies ed., Plant
Hormones: Physiology, Biochemistry, and Molecular Biology, 2nd edition. Kluwer
Academic Publishers: Norwell, MA. pp. 572-597.
Tardif, F. J. and G. D. Leroux. 1993. Translocation of glyphosate, quizalofol, and sucrose
in quackgrass (Elytrigia repens) biotypes. 41:341-346
Thomas, W. E., W. A. Pline, J. F. Thomas, K. L. Edmisten, R. Wells, and J. W. Wilcut.
2004. Glyphosate negatively affects pollen viability but not pollination and seed set in
glyphosate-resistant corn. Weed Sci. 52:725-734.
Viator, R. P., S. A. Senseman, and J. T. Cothren. 2003. Boll abscission responses of
glyphosate-resistant cotton (Gossypium hirsutum) to glyphosate. Weed Technol.
17:571-575.
Viator, R. P., P. H. Jost, S. A. Senseman, and J. T. Cothren. 2004. Effect of glyphosate
application timings and methods on glyphosate-resistant cotton. Weed Sci. 52:147-
151.
Wyrill, J. B. and O. C. Burnside. 1976. Absorption, translocation, and metabolism of 2,4-
D and glyphosate in common milkweed and hemp dogbane. Weed Sci. 24:557-566.
Yasuor, H., M., Sibony, B. Rubin, I. Flash, and E. Gat. 2000. Influence of glyphosate
(Roundup Ultra) rate and time of application on weed control and performance of DP
5415RR cotton in Israel: Field and laboratory experiments. Proc. Beltwide Cotton
Conf. pp. 1480-1483.
York, A. C. 1983a. Cotton cultivar response to mepiqua t chloride. Agron. J. 75: 663-
667.

16
York, A. C. 1983b. Response of cotton to mepiquat chloride with varying levels N rates
and plant populations. Agron. J. 75:667-672.
York, A. C., A. M. Stewart, P. R. Vidrine, and A. S. Culpepper. 2004. Control of
volunteer glyphosate-resistant cotton in glyphosate-resistant soybean. Weed Technol.
18:532-539.
York, A. C., J. B. Beam, and A. S. Culpepper. 2005. Control of volunteer glyphosate-
resistant soybean in cotton. J. Cotton Sci. 9:102-109.
Zhao D. and D. M. Oosterhuis. 2000. Pix Plus and mepiquat chloride effects on
physiology, growth, and yield of field-grown cotton. J. Plant Growth Regul. 19:415-
422.

17
Glyphosate-Resistant Corn Interference in Glyphosate-Resistant Cotton1
WALTER E. THOMAS, WESLEY J. EVERMAN, SCOTT B. CLEWIS, and JOHN W.
WILCUT2
Abstract: Studies were conducted at three locations in North Carolina in 2004 to evaluate
density-dependent effects of glyphosate-resistant (GR) corn on GR cotton growth and lint
yield. GR corn was taller than GR cotton as early as 25 d after planting, depending on
location. A GR corn density of 5.25 plant/m of crop row reduced late-season cotton height
by 49, 24, and 28% at Clayton, Lewiston-Woodville, and Rocky Mount, respectively,
compared to weed-free cotton height. At Clayton, GR corn dry biomass per m crop row
and GR corn seed biomass per m of crop row decreased linearly. The relationship between
GR corn and GR cotton yield loss was described by the rectangular hyperbola model with
the asymptote (a) constrained to 100% maximum yield loss. The estimated coefficient i
(yield loss per unit density as density approaches zero) was 9, 5, and 5 at Clayton,
Lewiston-Woodville, and Rocky Mount, respectively. The examined GR corn densities
had a significant effect on cotton yield, but not as significant as many other problematic
grass and broadleaf weeds.
1 Received for publication and in revised form.
2 Graduate Research Assistant, Graduate Research Assistant, Agricultural Research
Technician, and Professor, North Carolina State University, Box 7620 Raleigh, NC
27695-7620, [email protected].

18
Nomenclature: Glyphosate, corn, Zea mays L., ZEAMX, ‘DKC 69-71RR; cotton,
Gossypium hirsutum L., ‘FM 989RR’, ST 4892RR’.
Keywords: Competition, economic threshold, models, weed biomass, weed density, plant
height.
INTRODUCTION
Herbicide-resistant crops are becoming increasingly prevalent in the southeastern
United States. Herbicide-resistant corn hectarage has steadily increased from 7% in 2000
to 26% in 2005 (USDA-NASS 2000, 2005). The use of herbicide-resistant cotton has been
more widespread with 46 and 61% planted in 2000 and 2005, respectively (USDA-NASS
2000, 2005). In North Carolina, 78% of the planted cotton in 2005 contained a herbicide-
resistant trait (USDA-NASS 2005). In addition to the wide-spread use of glyphosate-
resistant (GR) corn and cotton, many of the weed management systems within each
cropping system utilize only glyphosate. Additional herbicidal options like metolachlor
and pendimethalin included in some cotton weed management systems are also registered
in corn and are unlikely to control volunteer corn. Many graminicides are registered for
use in cotton to control annual and perennial grasses and may be needed to control
volunteer GR corn. The combination of continuous use of GR cropping systems with the
inclusion of only glyphosate allows for growth and subsequent competition of GR
volunteers (York et al. 2004, 2005).
Since the registration of GR cotton, less than 50% of the North Carolina hectarage
receives any residual preemergence treatment (A. C. York, personal communication). A
19
vast majority of this hectarage is only treated with glyphosate or glyphosate plus S-
metolachlor for the first 4 to 5 wks after crop emergence. In addition, weather conditions
like hurricanes commonly destroy corn. Therefore, GR corn volunteers are often left
uncontrolled. If an economic threshold is to be realized, data on weed interference must be
collected for yield- loss prediction models (Coble and Byrd 1992). Since interference
between GR corn and GR cotton has not been investigated, studies were conducted to
determine effects of a range of GR corn densities on GR cotton growth and yield and to
evaluate growth of GR corn as affected by plant density.
MATERIALS AND METHODS
Field experiments were conducted at the Central Crops Research Station near Clayton,
NC, the Upper Coastal Plain Research Station near Rocky Mount, NC, and the Peanut Belt
Research Station near Lewiston-Woodville, NC in 2004. Soil at these locations was a
Norfolk loamy sand (fine- loamy, siliceous, thermic Typic Paleudults) having 0.9 to 1.1%
organic matter and pH 5.8 to 6.0. All sites were disked and smoothed with a field
cultivator, and pendimethalin at 0.84 kg ai/ha was applied preemergence (PRE). Cotton
cultivars were ‘FM 989RR’ at Clayton and Lewiston-Woodville and ‘ST 4892RR’ at
Rocky Mount. Seed were planted on conventional seedbeds at 15 seeds per m of cotton
row on May 6, May 13, and May 11 at Clayton, Lewiston-Woodville, and Rocky Mount,
respectively. Plots were 6 m long and four 91-cm rows at Lewiston-Woodville and Rocky
Mount with four 97-cm rows at Clayton. Fertilization and pest management practices were
standard for cotton production in North Carolina. Glyphosate at 0.84 kg ae/ha was applied
as recommended by the registration (Anonymous 2005) up to eight- leaf cotton to control
20
emerged weeds. After the four- leaf stage, glyphosate was applied postemergence-directed
to limit contact with cotton foliage. After the eight- leaf stage, weeds were removed by
hand. The experimental design was a randomized complete block with treatments
replicated three times.
On the day of cotton planting at each location, GR corn ‘DKC 69-71RR’ was planted
at desired densities 15 cm from the crop row and evenly spaced along crop rows. Corn
densities were 0, 1, 2, 4, 8, 16, and 32 plants per 6.1 m of row in the center two rows of
each plot, which is equivalent to 0, 0.16, 0.33, 0.65, 1.31, 2.62, and 5.25 plants per m of
row. The outer two rows of each plot were left as weed-free borders.
Corn and cotton heights were measured at 11, 20, 34, 49, 66, 81, and 104 d after
planting (DAP) at Clayton, 20, 24, 31, 37, 46, 58, 72, and 95 DAP at Lewiston-Woodville,
and 23, 36, 44, 52, 63, 79, and 101 DAP at Rocky Mount. Up to four randomly selected
GR corn plants from each plot were measured from soil surface to top of the plant. Four
randomly selected cotton plants from the center two rows of each plot were measured for
height from the soil surface to the apical meristem. At the end of the growing season, up
to four GR corn plants were randomly selected from each plot to measure above-ground
dry biomass and kernel set. The remaining GR corn plants were cut at ground level and
removed from plots to facilitate cotton harvest. The center two rows of each plot were
harvested once with a spindle picker modified for small-plot research.
Statistical Analyses. Data were tested for homogeneity of variance prior to statistical
analysis by plotting residuals. Analysis of variance (ANOVA) was performed on GR corn
dry biomass, kernel set, and cotton yield loss as a percentage of weed-free yield. Linear,

21
quadratic, and higher-order polynomial effects of GR corn density were tested by
partitioning sums of squares (Draper and Smith 1981). Weed density main effects were
tested by error associated with appropriate location by weed density interactions (McIntosh
1983). If significant GR corn density effects were observed, regression analysis was
performed. Nonlinear models were used if ANOVA indicated higher-order polynomial
effects of GR corn density were more significant than linear effects. Iterations were
performed to determine parameter estimates with least sums of squares for all nonlinear
models using the Gauss-Newton method via PROC NLIN in SAS (SAS 1998).
The Gompertz equation was fit to plant heights of each species in each plot (Askew
and Wilcut 2001; Draper and Smith 1981; Rawlings et al. 1998). Variables in the
Gompertz equation are H, a, e, and T, which are based on plant height in cm, the upper
asymptote for late-season plant height, the base of natural logarithm, and the time in days
after planting, respectively, while b and k are constants. Multivariate analysis of variance
(PROC MANOVA; SAS 1998) was conducted on the three estimated parameters for each
fitted curve to test for location, weed density, and location by weed density effects.
The rectangular hyperbola (Askew and Wilcut 2001; Cousens 1988) was used to
describe density-dependent effects of GR corn on cotton yield loss. Variables in the
rectangular hyperbola are Y, a, D, and i, which are based on a percent reduction of weed-
free yield, the asymptote for percentage yield loss, the weed density per m crop row, and
the yield loss per weed as weed density approaches zero, respectively. Coefficients of
determination (R2) were calculated for nonlinear regressions as in other studies (Askew
and Wilcut 2001; Jasieniuk et al. 1999). The approximated R2 and residual mean squares
were used to determine goodness of fit to nonlinear models.

22
RESULTS AND DISCUSSION
GR Corn and Cotton Height. GR corn and GR cotton heights were significantly
different at each location, thus data are presented by location. Heights of GR corn and GR
cotton plotted against time fit the Gompertz growth model well (Figure 1). Average late-
season height of GR corn was 248, 231, and 234 cm at Clayton, Lewiston-Woodville, and
Rocky Mount, respectively. GR corn began to grow taller than GR cotton as early as 25
DAP, depending on location. In addition, cotton height decreased with increasing GR
corn density (Figure 2). When grown in competition with 5.25 GR corn plants per m of
row, cotton height was reduced by 49, 24, and 28% at Clayton, Lewiston-Woodville, and
Rocky Mount, respectively, compared to weed-free cotton (Figure 1). Weeds that grow
above crop canopies often intercept light and are more competitive. In addition to direct
influences on competition, tall weeds that canopy over cotton may interfere with
agrichemical deposition onto cotton foliage. Consequently, yield reduction could be
magnified due to indirect influences of weeds that grow taller than cotton like GR corn.
GR Corn Above-Ground Dry Biomass and Seed Production. The effect of GR corn
density on GR corn dry biomass was significantly affected by location. Thus data are
shown by locations (Figure 3). Glyphosate-resistant corn above-ground dry biomass
decreased linearly with increasing weed density at Clayton. At Clayton, GR corn dry
biomass decreased from 515 g per plant at 0.16 plants/m of row to 379 g per plant at 5.5
plants/m of row. Buffalobur (Solanum rostratum Dunal.) (Rushing et al. 1985a), tropic
croton (Croton glandulosus var. septentrionalis Muell.-Arg.) (Askew and Wilcut 2001),
23
tumble pigweed (Amaranthus albus L.) (Rushing et al. 1985b), and velvetleaf (Abutilon
theophrasti Medicus) (Bailey et al. 2003) produced 325, 154, 268, and 177 g dry biomass
per plant, respectively at 0.2 plants/m density. Density-dependent decline in weed dry
biomass per plant is indicative of intraspecific competition (Bridges and Chandler 1987;
Rushing et al. 1985a, 1985b; Snipes et al. 1982). However, at Lewiston-Woodville and
Rocky Mount, GR corn above-ground biomass was not linearly influenced. The use of
hybrid corn may have contributed to the lack of response of corn dry biomass to planting
density. Planting densities for corn production generally range from 4.9 to 6.9 plants per
m of corn row in North Carolina, depending on row spacing and water holding capacity
(Heiniger et al. 2005).
The effect of GR corn density on GR corn kernel production was affected by location,
thus data were shown by locations (Figure 4). There was an inverse relationship between
GR corn kernel biomass and weed density at Clayton. At Clayton, GR corn kernel
biomass decreased from 324 g per plant at 0.16 plants/m of row to 145 g per plant at 5.5
plants/m of row. Similarly to GR corn above-ground dry biomass, the lack of response for
seed production at Lewiston-Woodville and Rocky Mount may be explained by the use of
hybrid corn and its corresponding recommended planting density.
Cotton Yield Loss. As GR corn dry biomass/m of crop row increased, cotton lint yield
decreased (Figure 5). The relationship of dry biomass and lint yield varied between
locations. Cotton lint yield decreased 57, 54, and 145 kg/ha at Clayton, Lewiston-
Woodville, and Rocky Mount, respectively, with each 500 g increase in weed biomass/m
of crop row (Figure 4). At Rocky Mount, GR corn dry biomass remained relatively
constant (Figure 3), which may explain the greater reduction in yield with limited increases

24
in biomass production. Jimsonweed (Datura stramonium L.) (Scott et al. 2000),
ladysthumb (Polygonum persicaria var. persicaria L.) (Askew and Wilcut 2002a), Palmer
amaranth (Amaranthus palmeri L.) (Rowland et al. 1999), Pennsylvania smartweed
(Polygonum pensylvanicum var. laevigatum Fern.) (Askew and Wilcut 2002b), tropic
croton (Askew and Wilcut 2001), unicorn-plant [Proboscidea louisianica (Mill.) Thellung]
(Riffle et al. 1989), and velvetleaf (Smith et al. 1990) also exhibited an inverse relationship
of plant biomass to cotton lint yield.
Although i values varied from 5 to 9 among locations (Figure 6), concomitant changes
in a values were such that predicted lint yield losses at GR corn densities below two plants
per m of row were relatively stable. For example, one GR corn plant/m of crop row
decreased lint yield 8, 5, and 5% in Clayton, Lewiston-Woodville, and Rocky Mount,
respectively. Prediction accuracy at the lower end of weed density ranges is more
important than at higher weed densities since economic thresholds often occur at weed
densities below one weed/m of crop row (White and Coble 1997). Lee et al. (2005)
evaluated GR soybean as a weed in GR cotton with i values ranging from 1.7 to 2.8,
depending on location. Byrd and Coble (1991) reported between 1 and 6% lint yield loss,
depending upon year, with 0.33 large crabgrass plants per m of crop row. One
johnsongrass [Sorghum halepense (L.) Pers.] plant per m of cotton row reduced lint yield
by 56 and 86% in 1996 and 1997, respectively, when harvested with a spindle picker
(Wood et al. 2002). Bridges and Chandler (1987) reported yield losses of 14 and 40% with
johnsongrass densities of 0.4 and 0.8 plant per m, respectively. Brown et al. (1985)
investigated the influence of bermudagrass [Cynodon dactylon (L.) Pers.] interference
during an initial establishment season and a subsequent season. Yield losses were only

25
observed in the initial season with moisture stress during the cotton fruiting period (Brown
et al. 1985). However, in subsequent years, yield was negatively affected. For example,
one plant per 7.5 m of cotton row reduced yield at least 25% at all locations (Brown et al.
1985). Even though limited data are available for annual grass weed interference,
interference of numerous broadleaf weeds in cotton has been investigated. Cotton lint
yield losses ranged from 22 to 69% from a weed density of 1 plant/m of row for ivyleaf
morningglory, jimsonweed, ladysthumb, pale smartweed, Palmer amaranth, Pennsylvania
smartweed, tropic croton, and velvetleaf (Askew and Wilcut 2002a, 2002b, 2002c; Bailey
et al. 2003; Morgan et al. 2001; Rogers et al. 1996; Rowland et al. 1999; Scott et al. 2000;
Wood et al. 1999). Yield losses associated with GR corn were less than with many grass
and broadleaf weeds common in cotton but still significant due to value of the cotton crop.
Furthermore, these yield loss estimates may be overestimated due to the use of hybrid
corn. Jugenheimer (1976) discussed several characteristics of hybrid vigor. When hybrids
are open pollinated, hybrid vigor is reduced (Jugenheimer 1976). In normal field situations
with volunteer GR corn, these volunteers would display reduced vigor compared to
commercial hybrids.
Numerous graminicides, including clethodim, fluazifop, quizalofop, and sethoxydim,
are registered for POST treatment of GR corn control in GR cotton (York and Culpeper
2005). Herbicide costs as listed in HADSS3 plus a $10/ha application fee are shown
(Table 2). Economic threshold was based on a support price of $1.32/kg for cotton lint
3 HADSS, Herbicide Application Decision Support System-North Carolina version,
AgRenaissance Software LLC, PO Box 91235, Raleigh, NC 27675.

26
(Askew and Wilcut 2001) and weed-free yield potential of 1,704, 1,668, and 1,577 kg/ha at
Clayton, Lewiston-Woodville, and Rocky Mount, respectively. The economic threshold
for the various graminicides ranged from 2 to 8 GR corn plant per 100 m of crop row
(Table 2), depending on herbicide selection and weed-free yield potential. However, these
calculations assume that other cotton cultivars will respond similarly to GR corn
interference, that graminicides are equally efficacious, that similar weed-free yields are
attainable, and a selling price of $1.32/kg for cotton lint.
GR corn is less competitive than many grass and broadleaf weeds of cotton. In
addition to direct yield losses, GR corn may limit light interception, interfere with
agrichemical applications, and reduce harvest efficiency. Due to known differences
in hybrid vigor between commercial hybrids and open-pollinated hybrids
(Jugenheimer 1976), these data may overestimate the potential for corn to cause
yield losses due to the use of hybrid corn in this study.
ACKNOWLEDGEMENTS
The authors thank the excellent staff of the Central Crops Research, Peanut Belt
Research, and Upper Coastal Plain Research Stations for assistance and the North Carolina
Cotton Quality Improvement Committee and Cotton Incorporated for partial funding of
this research. We also thank Dr. Cavell Brownie for her review of statistical analyses.
Appreciation is also extended to Ian Burke, Jared Wilcut, and Caitlyn Wilcut for technical
assistance.

27
LITERATURE CITED
Anonymous. 2005. Roundup WeatherMAX label. Monsanto Co., St. Louis. MO.
Askew, S. D. and J. W. Wilcut. 2001. Tropic croton interference in cotton. Weed Sci.
49:184-189.
Askew, S. D. and J. W. Wilcut. 2002a. Ladysthumb interference and seed production in
cotton. Weed Sci. 50:326-332.
Askew, S. D. and J. W. Wilcut. 2002b. Pennsylvania smartweed interference and achene
production in cotton. Weed Sci. 50:350-356.
Askew, S. D. and J. W. Wilcut. 2002c. Pale smartweed interference and achene
production in cotton. Weed Sci. 50:357-363.
Bailey, W. A., S. D. Askew, S. Dorai-Raj, and J. W. Wilcut. 2003. Velvetleaf (Abutilon
theophrasti) interference and seed production dynamics in cotton. Weed Sci. 51:94-
101.
Bridges, D. C. and J. M. Chandler. 1987. Influence of johnsongrass (Sorghum halepense)
density and period of competition on cotton yield. Weed Sci. 35:63-67.
Brown, S. M., T. Whitwell, and J. E. Street. 1985. Common bermudagrass (Cynodon
dactylon) competition in cotton (Gossypium hirsutum). Weed Sci. 33:503-506.
Byrd, J. D., Jr. and H. D. Coble. 1991. Interference of selected weeds in cotton
(Gossypium hirsutum). Weed Technol. 5:263-269.
Coble, H. D. and J. D. Byrd, Jr. 1992. Interference of weeds with cotton. In Weeds of
Cotton: Characteristics and Control. The Cotton Foundation, Memphis, TN. pp. 73-
85.

28
Cousens, R. 1988. Misinterpretations of results in weed research through inappropriate
use of statistics. Weed Res. 28:281-289.
Draper, N. R. and H. Smith. 1981. Applied Regression Analysis. J. Wiley, New York,
NY. pp. 33-42 and 511.
Heiniger, R. W., J. F. Spears, D. T. Bowman, and E. J. Dunphy. 2005. Crop management.
In North Carolina Corn Production Guide. North Carolina Cooperative Extension
Service, Raleigh, NC. online: http://www.ces.ncsu.edu/plymouth/cropsci/cornguide/.
Jasieniuk, M., B. D. Maxwell, R. L. Anderson, J. O. Evans, D. J. Lyon, S. D. Miller, D. W.
Morishita, A. G. Ogg, Jr., S. Seefeldt, P. W. Stahlman, F. E. Northam, P. Westra, Z.
Kebede, and G. A. Wicks. 1999. Site-to-site and year-to-year variation in Triticum
aestivum-Aegilops cylindrica interference relationships. Weed Sci. 47:529-537.
Jugenheimer, R. W. 1976. Heterosis. In Corn: Improvement, Seed Production, and Uses.
John Wiley & Sons: New York. pp. 55-60.
Lee, D. R., D. K. Miller, M. Matthews, J. W. Wilcut, I. C. Burke, and C. M. Wilcut. 2005.
When crops become weeds: effects of full season interference from Roundup Ready
cotton or soybean. Proc. Beltwide Cotton Conf. p. 2948.
McIntosh, M. S. 1983. Analysis of combined experiments. Agron. J. 75:153-155.
Morgan, G. D., P. A. Bauman, and J. M. Chandler. 2001. Competitive impact of Palmer
amaranth (Amaranthus palmeri) on cotton (Gossypium hirsutum) development and
yield. Weed Technol. 15:408-412.
Rawlings, J. O., S. G. Pantula, and D. A. Dickey. 1998. Applied regression analysis – A
Research Tool. 2nd ed. New York: Springer. pp. 486-489.

29
Riffle, M. S., D. S. Murray, L. M. Verhalen, and D. L. Weeks. 1989. Duration and
intensity of unicorn-plant (Proboscidea louisianica) interference with cotton
(Gossypium hirsutum). Weed Technol. 3:313-316.
Rogers, J. B., D. S. Murray, L. M. Verhalen, and P. L. Claypool. 1996. Ivyleaf
morningglory (Ipomoea hederacea) interference with cotton (Gossypium hirsutum).
Weed Technol. 10:107-114.
Rowland, M. W., D. S. Murray, and L. M. Verhalen. 1999. Full-season Palmer amaranth
(Amaranthus palmeri) interference with cotton (Gossypium hirsutum). Weed Sci.
47:305-309.
Rushing, D. W., D. S. Murray, and L. M. Verhalen. 1985a. Weed interference with cotton
(Gossypium hirsutum). I. buffalobur (Solanum rostratum). Weed Sci. 33:810-814.
Rushing, D. W., D. S. Murray, and L. M. Verhalen. 1985b. Weed interference with cotton
(Gossypium hirsutum). II. tumble pigweed (Amaranthus albus). Weed Sci. 33:815-
818.
[SAS] Statistical Analysis Systems. 1998. SAS/STAT® User's Guide. Release 7.00.
Cary, NC: Statistical Analysis Systems Institute. 1028 p.
Scott, G. H., S. D. Askew, J. W. Wilcut, and C. Brownie. 2000. Datura stramonium
interference and seed rain in Gossypium hirsutum. Weed Sci. 48:613-617.
Smith, B. S., D. S. Murray, and D. L. Weeks. 1990. Velvetleaf (Abutilon theophrasti)
interference with cotton (Gossypium hirsutum). Weed Technol. 4:799-803.
Snipes, C. E., G. A. Buchanan, J. E. Street, and J. A. McGuire. 1982. Competition of
common cocklebur (Xanthium pensylvanicum) with cotton (Gossypium hirsutum).
Weed Sci. 30:553-556.

30
USDA-NASS. 2000. Acreage 2000. Available at
http://usda.mannlib.cornell.edu/reports/nassr/field/pcp-bba/acrg2000.pdf (version
October 9, 2005). USDA-NASS, Washington, DC.
USDA-NASS. 2005. Acreage 2005. Available at
http://usda.mannlib.cornell.edu/reports/nassr/field/pcp-bba/acrg0605.pdf (version
October 9, 2005). USDA-NASS, Washington, DC.
White, A. D. and H. D. Coble. 1997. Validation of HERB for use in peanut (Arachis
hypogaea). Weed Technol. 11:573-579.
Wood, M. L., D. S. Murray, R. B. Westerman, L. M. Verhalen, and P. L. Claypool. 1999.
Full-season interference of Ipomoea hederacea with Gossypium hirsutum. Weed Sci.
47:693-696.
Wood, M. L., D. S. Murray, J. C. Banks, L. M. Verhalen, R. B. Westerman, and K. B.
Anderson. 2002. Johnsongrass (Sorghum halepense) density effects on cotton
(Gossypium hirsutum) harvest and economic value. Weed Technol. 16:495-501.
York, A. C., A. M. Stewart, P. R. Vidrine, and A. S. Culpepper. 2004. Control of
volunteer glyphosate-resistant cotton in glyphosate-resistant soybean. Weed Technol.
18:532-539.
York, A. C., J. B. Beam, and A. S. Culpepper. 2005. Control of volunteer glyphosate-
resistant soybean in cotton. J. Cotton Sci. 9:102-109.
York, A. C. and A. S.Culpepper. 2005. Weed management in Cotton. In Cotton
Information AG 417. North Carolina Cooperative Extension Service, Raleigh, NC.
pp. 75-114.

31
Table 1. Regression parameters (H = a e-be-Kt) describing the relationship between cotton
height and time in days after crop planting at various densities of corn interference where
H, a, e, and t are based on the plant height in cm, the upper asymptote for late-season plant
height, the base of natural logarithm, and the time in days after planting, respectively,
while b and k are constants. Values in parenthesis are standard errors.
Location Interference
level
a b K
R2
Cotton height (cm)
Lewiston- 0 93.9 (2.14) 8.55 0.067 0.99
Woodville 0.16 95.1 (3.67) 8.75 0.067 0.96
0.33 94.3 (1.95) 7.25 0.060 0.99
0.66 88.9 (3.42) 7.67 0.063 0.96
1.31 83.4 (3.92) 7.68 0.065 0.94
2.62 72.1 (2.98) 7.33 0.069 0.94
5.25 71.4 (2.81) 6.43 0.064 0.95
Rocky Mount 0 99.9 (4.02) 9.84 0.064 0.95
0.16 103.4 (3.45) 9.21 0.060 0.97
0.33 99.4 (3.39) 9.32 0.062 0.97
0.66 97.7 (3.19) 8.94 0.062 0.97
1.31 93.4 (4.06) 9.11 0.063 0.94
2.62 73.2 (4.86) 8.55 0.068 0.91
5.25 71.7 (4.86) 8.07 0.066 0.82
Clayton 0 115.4 (5.79) 8.30 0.062 0.95
0.16 118.7 (5.76) 9.58 0.064 0.95
0.33 115.7 (7.39) 6.32 0.053 0.93
0.66 113.1 (5.58) 5.42 0.050 0.96
1.31 98.0 (4.69) 5.86 0.056 0.95

32
Table 1 (continued)
2.62 91.3 (7.13) 4.18 0.048 0.89
5.25 58.6 (5.12) 4.81 0.073 0.71
Corn height (cm)
Lewiston-Woodville 249.2 (4.53) 12.26 0.066 0.96
Rocky Mount 249.5 (5.36) 20.6 0.070 0.93
Clayton 254.9 (3.46) 15.6 0.075 0.97

33
Table 2. Economic thresholds for glyphosate-resistant corn in glyphosate-resistant cotton.
Herbicidea Cost Clayton
Lewiston-
Woodville
Rocky
Mount Clayton
Lewiston-
Woodville
Rocky
Mount
$/ha _ corn plants/100 m of row _ ______ plants/ha ______
Clethodim 35.37 5.05 5.26 2.92 523 546 318
Fluazifop 28.49 4.05 4.22 2.34 419 438 256
Quizalofop 50.04 7.19 7.52 4.15 745 777 453
Sethoxydim 28.15 4.00 4.18 2.31 415 433 253
a Herbicide costs included the herbicide (HADSS price) and application costs ($10/ha).

34
Figure 1. Glyphosate-resistant corn height, glyphosate-resistant cotton height with no
weed interference, and glyphosate-resistant cotton height with 5.25 corn plant per m of
cotton row are shown. Bars represent standard error of the mean. Regression parameters
and corresponding R2 values are shown in Table 1.
0
50
100
150
200
250
300CornCotton - Weed FreeCotton - 5.25 GR corn plant/m row
Hei
gh
t (c
m)
0
50
100
150
200
250
CornCotton - Weed FreeCotton - 5.25 GR corn plants/m row
Days after planting (d)
0 20 40 60 80 100 120
0
50
100
150
200
250
CornCotton - Weed FreeCotton - 5.25 GR corn plants mrow
Lewiston
Rocky Mount
Clayton

35
Figure 2. Effect of glyphosate-resistant corn density at the last measuring timing at each
location (104, 95, and 101 d after planting at Clayton, Lewiston-Woodville, and Rocky
Mount, respectively). Bars represent standard error of the mean.
Glyphosate-resistant corn density (plants/m of cotton row)
0 1 2 3 4 5
Co
tto
n h
eig
ht
(cm
)
40
60
80
100
120
140
Lewiston y = -3.991x + 91.2, R2 = 0.82Rocky Mount y = -7.16x + 95.5, R2 = 0.90Clayton y = -10.72x + 109.5, R2 = 095

36
Figure 3. Effect of glyphosate-resistant corn density on late-season glyphosate-resistant
corn biomass per plant shown by location. Bars represent standard error of the mean. A
linear response was not observed at Lewiston-Woodville and Rocky Mount.
Glyphosate-resistant corn density (plants/m of cotton row)
0 1 2 3 4 5
Pla
nt d
ry w
eig
ht (
g)
0
100
200
300
400
500
600
700LewistonRocky MountClayton y = -39.4x + 580.8; R2 = 0.80

37
Figure 4. Effect of glyphosate-resistant corn density on late-season glyphosate-resistant
corn seed weight per plant shown by location. Bars represent standard error of the mean.
A linear response was not observed at Lewiston-Woodville and Rocky Mount.
Glyphosate-resistant corn density (plants/m of cotton row)
0 1 2 3 4 5
See
d W
eig
ht (
g)
100
150
200
250
300
350
400LewistonRocky MountClayton y = -35.9x + 314.6, R2 = 0.87

38
Figure 5. Effect of glyphosate-resistant corn biomass per m crop row on cotton lint yield
shown by location. Bars represent standard error of the mean.
Glyphosate-resistant corn dry biomass (g/m of cotton row)
0 2000 4000 6000 8000 10000 12000 14000
Lin
t Y
ield
(kg
/ha)
0
200
400
600
800
1000
1200
1400
1600
1800
2000
Lewiston y = -0.107x + 1434; R2 = 0.65Rocky Mount y = -0.290x + 1568; R2 = 0.94Clayton y = -0.114x + 1611; R2 = 0.96

39
Figure 6. Cotton lint yield loss associated with season-long glyphosate-resistant corn
interference. Bars represent standard error of the mean.
Glyphosate-resistant corn density (plants/m of cotton row)
0 5 10 15 20 25 30 35
Per
cen
t yi
eld
loss
0
20
40
60
80
100
Lewiston y = 5.29x / (1 + (5.29x)/100); R2 = 0.98Rocky Mount y = 5.37x / (1 + (5.37x)/100); R2 = 0.96Clayton y = 8.98x / (1 + (8.98x)/100); R2 = 0.97

40
Thomas et al.: 14C-glyphosate in glyphosate-resistant corn
Influence of corn growth stage on absorption and translocation of glyphosate in
glyphosate-resistant corn
Walter E. Thomas
Crop Science Department, North Carolina State University, Raleigh, NC 27695-7620
Ian C. Burke
Southern Weed Science Research Unit, USDA-ARS, Stoneville, MS 38776
Yvonna S. Sheldon
Crop Science Department, North Carolina State University, Raleigh, NC 27695-7620
John W. Wilcut
Corresponding author: Crop Science Department, North Carolina State University,
Raleigh, NC 27695-7620; [email protected]

41
Abstract: Two studies were conducted to investigate the influence of corn growth stage
on absorption and translocation of glyphosate in glyphosate-resistant (GR) corn. In the
first study, GR corn was treated with 14C-glyphosate at three growth stages and harvested
at 3 and 7 d after treatment (DAT). Averaged over trials, growth stages, and harvest
timings, 42% of the applied 14C-glyphosate was absorbed. Regardless of corn growth
stage, the leaves above the treated leaf were the greatest sinks for 14C-glyphosate,
accumulating 8% of the applied 14C-glyphosate. Root tissue also accumulated significant
levels of glyphosate (5%) compared to other potential sites of glyphosate translocation. A
second study was conducted to determine the distribution of 14C-glyphosate at V4, V6, and
V8 growth stages when harvested at V8, V12, V16, and R1 stages. Forty-four to 60% of
the applied 14C-glyphosate remained in the corn tissues at anthesis. The leaves above the
treated leaf and roots accumulated the greatest amounts of 14C-glyphosate, regardless of
corn growth stages. When plants were treated at V4, V6, and V8 stages, the concentration
of 14C-glyphosate in the tassel at the V12 harvest timing was 184, 431, and 921 Bq g-1 dry
tissue, respectively. Likewise, increasing levels of 14C-glyphosate concentrations between
corn growth stages were also observed in ear shoots. These data suggest that reproductive
tissues such as the tassel and ear shoots can accumulate 14C-glyphosate at higher
concentrations than other tissues, especially when the herbicide is applied POST after the
V6 stage.
Nomenclature: Glyphosate; corn ‘DK 687 RR’.
Keywords: Glyphosate distribution, herbicide-resistant crops, transgenic crops.

42
Introduction
Since their commercial release in the mid 1990s, GR crops have become extremely
popular among growers due to reduced potential for environmental impact (Sprankle et al.
1975; Wauchope et al. 2002), broad-spectrum weed control (Corbett et al. 2004; Culpepper
and York 1998; Culpepper et al. 2000; Johnson et al. 2000; Payne and Oliver 2000; Scott
et al. 2002), and postemergence (POST) application flexibility (Hart and Wax 1999;
Johnson 2000). These benefits are also apparent in GR corn, where glyphosate can be
applied POST up to the V8 stage or 76 cm in height (Anonymous 2003), but adoption of
GR corn has been slower when compared to GR cotton (Gossypium hirsutum L.) and
soybean [Glycine max (L.) Merr.] (Anonymous 2005).
Glyphosate has reportedly caused yield reduction in GR cotton (Jones and Snipes
1999; Viator et al. 2004). Further investigations concluded that yield reductions were due
to lower CP4-5-enolpyruvylshikimate-3-phosphate synthase (EPSPS) expression in male
reproductive portions of cotton flowers compared to vegetative tissues (Pline et al. 2002a).
In addition to lower EPSPS levels, pollen viability was reduced and stigma length was
increased following glyphosate treatments (Pline et al. 2002a, 2002b, 2002c; Yasour et al.
2000). Even though no yield reductions have been reported in GR corn (Ferrell and Witt
2002; Johnson et al. 2000; Nolte and Young 2002) and soybean (Elmore et al. 2001a,
2001b) in response to glyphosate treatments, research was conducted to eva luate
reproductive responses in GR corn, including pollen viability and yield potential (Thomas
et al. 2004). Pollen viability reductions were evident with glyphosate treatments after the
V6 stage, however, no yield reductions were observed with any glyphosate treatment
combination (Thomas et al. 2004). Since tassel initiation can begin as early as 2 wks after

43
emergence (Kiesselbach 1992), it is possible that any glyphosate treatment to GR corn
after tassel initiation may negatively affect pollen viability, and anther and pollen
production. Studies have shown that glyphosate translocation is similar to photoassimilate
translocation (Gougler and Geiger 1981; McAllister and Haderlie 1985), which follows a
source to sink relationship (Sandberg et al. 1980; Wyrill and Burnside 1976). More recent
research demonstrated glyphosate accumulation in sinks, including meristematic and
reproductive regions (Feng et al. 2003; Hetherington et al. 1999; Pline et al. 2001; Viator
et al. 2003). Therefore, it is probable that glyphosate may accumulate in reproductive
sinks like the ear and tassel. If accumulation does occur, then this accumulation may
explain the resulting pollen damage and reduction in pollen and anther production
(Thomas et al. 2004).
Our objectives were to evaluate absorption and translocation of glyphosate applied at
the V4, V6, or V8 stage using various harvest timings. The first study evaluated the
immediate effects (3 and 7 DAT) on absorption and translocation of glyphosate. A second
study evalua ted the distribution of foliar-applied glyphosate by harvesting at four
vegetative and reproductive stages.
Materials and Methods
Plant material. For each study, Dekalb ‘687 RR’ GR corn was planted in 30-cm diameter
pots containing a commercial potting mixture1 and grown in a polyethylene covered
greenhouse maintained at 25 ± 2 C constant temperature where natural sunlight was
supplemented 4 h daily with mercury halide lights, providing a 16-h day length. Studies
were conducted from August 2002 to April 2003.

44
14C-Glyphosate Treatments and Sampling. Glyphosate at 0.84 kg ae ha-1 was applied
POST at V4, V6, and V8 corn growth stages. Before each glyphosate POST application, a
20-cm2 area of the newest completely expanded leaf was covered with aluminum fo il to
prevent spray contact with the leaf surface. Ten 1-? l droplets of 14C-glyphosate2
containing 5 kBq plus 0.25% (v/v) non- ionic surfactant3 were manually applied with a
microsyringe to the area of each covered leaf portion in the 14C-glyphosate timing study
(Pline et al. 2001). In the 14C-glyphosate-corn growth stage study, 16.7 kBq of 14C-
glyphosate plus 0.25% (v/v) non-ionic surfactant were applied as previously described.
For the timing study, plants were harvested at 3 and 7 d after treatment (DAT). Plants
in the glyphosate-corn growth stage study were harvested at V8, V12, V16, and R1.
Absorption was determined by rinsing the treated leaf portion with 10 ml of a
methanol:water (1:1, v/v) plus 0.25% (v/v) non- ionic surfactant to remove non-absorbed
glyphosate (Askew and Wilcut 2002; Pline et al. 2001). A 1.0-ml aliquot was taken from
the leaf rinsate, diluted in 15 ml scintillation fluid4 and radioactivity was quantified with
liquid scintillation spectrometry (LSS)5. All plants were then divided into four regions: 1)
treated leaf, 2) above treated leaf, 3) below treated leaf, and 4) roots. The treated leaf was
removed at the point of attachment to the stem, which determined the division for above
and below the treated leaf sections. The treated leaf was divided into treated portion, tip,
base, and sheath. The above-treated and below-treated leaf tissues were each divided into
leaves and stem. If present, the developing brace roots, tassel, and ear shoots were
removed and placed in separate bags. Plant parts were dried for 48 h at 70 C, weighed,
homogenized, and combusted with a biological sample oxidizer6. Radioactivity in the
oxidized samples was quantified by LSS.

45
Experimental Design and Data Analysis. The glyphosate timing study was arranged as
factorial with glyphosate application timing and harvest interval factors in a completely
randomized design with four replications. The glyphosate-corn growth stage study was
also arranged as a factorial with glyphosate application timing and harvest interval factors
in a completely randomized design with four replications. Both studies were repeated once
in time. Prior to analysis, data were tested for homogeneity of variance by plotting
residuals. Log transformation of 14C-glyphosate concent ration (Bq g-1 dry tissue)
improved homogeneity of variance based on visual inspection of plotted residuals;
therefore, data were transformed. Analysis of variance conducted using a mixed model in
SAS8 revealed no run by treatment interaction, thus data were averaged over runs. Data
were analyzed for main effects and interactions. Mean separations were performed on data
using Fisher’s Protected LSD at P=0.05. When interactions were significant, LSD tests
were performed separately across the levels of a given factor within the levels of the other
factor.
Results and Discussion
14C-Glyphosate Timing Study. The objective of this study was to measure the amount of
14C-glyphosate, applied POST at V4, V6, and V8 corn growth stages, remaining in the
plant tissues at 3 and 7 DAT. Absorption of glyphosate was not influenced by trial, corn
growth stage, or harvest timing, thus data were averaged over trial, growth stage, and
harvest timing. Forty-two percent of the applied 14C-glyphosate was collected in the leaf
wash (Table 1). Therefore, these data suggest that absorption of 14C-glyphosate had
reached a plateau at 3 DAT. Previous research has indicated that glyphosate absorption is
46
biphasic, with an initial rapid rate of glyphosate absorption in the first 24 h followed by a
longer phase of slow uptake (Burton and Balke 1988; Feng et al. 2003; Gaskin and
Holloway 1992; Hetherington et al. 1999; Masiunas and Weller 1988). When glyphosate
was applied in fine, medium, and coarse droplet sizes, Feng et al. (2003) reported that 30,
35, and 49% of the applied 14C-glyphosate was absorbed at 3 DAT, respectively.
Similarly, Hetherington et al. (1999) reported between 45 to 65% absorption of the applied
14C-glyphosate in corn, depending on glyphosate concentration.
Translocation of 14C-glyphosate as a percentage of applied was not influenced by trial,
treatment timing, or harvest timing, thus data were averaged over trial, treatment timing,
and harvest timing (Table 1). Regardless of corn growth stage, the leaves above the treated
leaf were the greatest sinks for 14C-glyphosate, accumulating 8% of the applied 14C-
glyphosate. Root tissue also accumulated significant levels of glyphosate (5%) compared
to other potential sites of glyphosate translocation. All other plant parts accumulated 1.4%
or less of applied 14C-glyphosate. Feng et al. (2003) observed 9 to 16% and 12 to 23% of
the recovered 14C-glyphosate in roots and leaves 6 to 8 of GR corn, respectively,
depending on the droplet size. Hetherington et al. (1999) reported that the shoot and root
fractions accumulated 25 to 40% of the applied 14C-glyphosate. Previous research in GR
cotton (Pline et al. 2001; Viator et al. 2003) and weed species (Kirkwood et al. 2000;
Sandberg et al. 1980; Satchivi et al. 2000) have shown similar source to sink translocation
patterns with glyphosate.
The concentration of 14C-glyphosate as activity per unit of dry matter (Bq g-1 dry
tissue) was not influenced by trial or harvest timing, thus data were averaged over trial and
harvest timing (Table 2). The concentration of translocated 14C-glyphosate was not

47
significantly different at either harvest timing. However, significant levels of
accumulation were observed for several plant parts compared across corn growth stages.
Concentration of 14C-glyphosate in the leaves above and below the treated leaf and the
sheath and tip of the treated leaf declined with increasing growth stage (Table 2). The
decline in concentration in the leaves may be an indication of a shift in sink strength.
Kiesselbach (1992) has indicated that tassel and ear formation can begin as early as the V6
stage. Even though tassels were not found at the V6 stage, tassels at the V8 stage
contained numerically 3 and 6 times greater concentration of 14C-glyphosate than leaves
above the treated leaf and roots, respectively. These levels of glyphosate accumulation in
the tassel may explain reduced pollen viability due to glyphosate application after the V6
stage (Thomas et al. 2004).
14C-Glyphosate-Corn Growth Stage Study. The objective of this study was to measure
the amount of 14C-glyphosate, applied POST at V4, V6, and V8 growth stages, remaining
in the plant tissues at various growth stages up to anthesis. The level of 14C-glyphosate
recovery was variable and never exceeded 74% of the applied (Table 3). In a similar
evaluation of 14C-glyphosate fate in GR cotton, Pline et al. (2001) reported recovery levels
ranging from 36 to 99% of the applied, depending on the application and harvest timings.
McAllister and Haderlie (1985) reported recovery averaging 42% of the applied 14C-
glyphosate in an outdoor study in which the 14C-glyphosate label was left on treated
Canada thistle [Cirsium arvense (L.) Scop.] plants for 8 d. 14C-glyphosate degradation
either by the plant or by leaf surface microbes with a subsequent loss of 14CO2 may explain
low 14C recovery (McAllister and Haderlie 1985; Pline et al. 2001). Additionally,
translocation of 14C-glyphosate beyond the region in which roots were collected due to

48
harvest inefficiency or exudation may also be potential sources of losses (McAllister and
Haderlie 1985; Pline et al. 2001; Rodrigues et al. 1982).
At all corn growth stages, accumulation based on the percentage of applied 14C-
glyphosate was greatest in the leaves above the treated leaf and roots (Table 3), regardless
of growth stage or harvest timing. After accounting for significant differences in biomass
of the various plant parts (Table 4), the concentration of 14C-glyphosate accumulated (Bq
g-1 dry tissue) in these leaves is similar to other vegetative tissues. However, roots and
reproductive tissue show numerically higher concentrations of 14C-glyphosate compared to
the leaves above the treated leaf at V8, V12, and V16 harvest timings, regardless of growth
stage (Table 4). Furthermore, the concentration of 14C-glyphosate in the roots of plants
treated at V4 declined from 444 to 168 Bq g-1 with harvests at V8 and R1, respectively.
When 14C-glyphosate was applied at V6 and V8 stages, similar numerical reductions of
14C-glyphosate concentrations were observed in roots. The decline in translocation to
vegetative sinks may indicate a shift toward reproductive development. Pline et al. (2001)
observed a similar alteration in translocation pattern comparing vegetative and
reproductive stages of cotton. Following cessation of fruiting in cotton, resources (14C)
were reallocated to roots, which may be influenced by the perennial habitat of cotton (Pline
et al. 2001). Since corn is annual, a similar reallocation of 14C to the roots was not
observed.
As accumulation in vegetative tissues began to decline through successive harvests, a
corresponding increase in accumulation of 14C-glyphosate was observed in tassels and ear
shoots (Table 3 and 4). The observed glyphosate translocation patterns resemble normal
translocation patterns of plants shifting from vegetative to reproductive stages of growth.

49
In plants treated at the V4 stage, the percentage of applied 14C-glyphosate in reproductive
tissues (sum of percentages for tassel and ear shoots) was 0.01, 0.37, 1.06, and 0.87% at
V8, V12, V16, and R1 harvest timings, respectively. When glyphosate was applied POST
to corn at the V8 stage, accumulation in reproductive tissues was 0.03, 1.59, 4.88, and
2.06% at V8, V12, V16, and R1 harvest timings, respectively. At the time of the R1
harvest, significant amounts of pollen had been shed, which may be responsible for the
observed decline in 14C-glyphosate accumulation.
The concentration of 14C-glyphosate (Bq g-1 dry tissue) also increased in reproductive
tissues. Numerical increases of 14C-glyphosate concentrations in the tassel and ear shoots
compared to above ground vegetative tissues were apparent, regardless of growth stage.
When plants were treated at V4, V6, and V8 stages, the concentration of 14C-glyphosate in
the tassel at the V12 harvest timing was 184, 431, and 921 Bq g-1 dry tissue, respectively.
Similarly, the concentration of 14C-glyphosate in ear shoots was the greatest at the V12
harvest timing with 253, 464, and 1,166 Bq g-1 dry tissue in plants treated at the V4, V6,
and V8 stages, respectively. Even though these are numerical differences, the stage-
dependent differences in 14C-glyphosate concentration in the tassel may explain the
observed reductions in corn pollen viability in response to glyphosate POST treatments
after the V6 stage (Thomas et al. 2004). Based on these data, glyphosate POST treatments
made later in the corn growing season result in greater glyphosate accumulation in
reproductive tissues.
Forty-four to 60% of the applied 14C-glyphosate remained in the corn tissues at
anthesis. In addition to glyphosate remaining in the plant tissue through anthesis,
glyphosate was transported to meristematic regions including apical leaves and stems,

50
roots, and reproductive tissues. However, the level of glyphosate translocation to
reproductive tissues was dependent on the corn growth stage at the time of glyphosate
treatment with the greatest accumulation in plants treated at the V8 stage. In general, these
data offer some explanation into the observed growth stage dependent reproductive
response - specifically pollen viability to glyphosate POST treatments in GR corn (Thomas
et al. 2004).
Sources of Materials
1 MetroMix 200, Sun Gro Horticulture, 15831 N.E. 8th Street, Suite 100, Bellevue, WA
98008.
2 Roundup UltraMax, Monsanto Co., 800 N. Lindbergh Blvd., St. Louis, MO 63167.
3 14C-glyphosate G-8392, Sigma Chemical Co., P. O. Box 14508, St. Louis, MO
63178.
4 Induce (mixture of alkyl polyoxylkane ether, free fatty acids, and isopropanol), Helena
Chemical Co., 5100 Popular Avenue, Memphis, TN 38137.
5 Scintiverse® SX18-4 Universal Liquid Scintillation Cocktail, Fisher Scientific, 1
Regeant Road, Fair Lawn, NJ 07410.
6 Packard Tri-Carb 2100TR Liquid Scintillation Spectrometer, Packard Instrument Co.,
220 Warrenville Rd., Downers Grove, IL 60515.
7 Model OX500 Biological Material Oxidizer, R. J. Harvey Instrument Corp., 123
Patterson St., Hillsdale, NJ 07642.
8 [SAS] Statistical Analysis Systems software, Ver. 8., SAS Institute, Inc., Box 8000,
SAS Circle, Cary, NC 27513.

51
Acknowledgements
The authors thank Wesley Everman, Shaun Casteel, and Jared Wilcut for greenhouse
and laboratory assistance. Appreciation is also extended to Cavell Brownie, professor of
statistics, for review of statistical procedures.

52
Literature Cited
Anonymous. 2003. Roundup WeatherMAX supplemental label 63003B1-24. Monsanto
Co., St. Louis, MO.
Anonymous. 2005. Acreage data [online]. Available at http://
usda.mannlib.cornell.edu/reports/nassr/field/pcp-bba/acrg0605.pdf (version March 10,
2006).
Askew, S. D. and J. W. Wilcut. 2002. Absorption, translocation, and metabolism of
foliar-applied CGA 362622 in cotton, peanut, and selected weeds. Weed Sci. 50:293-
298.
Burton, J. D. and N. E. Balke. 1988. Glyphosate uptake by suspension-cultured potato
(Solanum tuberosum and S. brevidens) cells. Weed Sci. 36:146-153.
Corbett, J. L., S. A. Askew, W. E. Thomas, and J. W. Wilcut. 2004. Weed efficacy
evaluations for bromoxynil, glufosinate, glyphosate, pyrithiobac, and sulfosate. Weed
Technol. 18:443-453.
Culpepper, A. S. and A. C. York. 1998. Weed management in glyphosate-tolerant cotton.
J. Cotton Sci. 2:174-185.
Culpepper, A. S., A. C. York, R. B. Batts, and K. M. Jennings. 2000. Weed management
in glufosinate- and glyphosate-resistant soybean (Glycine max). Weed Technol.
14:77-88.
Elmore, R. W., F. W. Roeth, R. N. Klein, S. Z. Knezevic, A. Martin, L. A. Nelson, and C.
A. Shapiro. 2001a. Glyphosate-resistant soybean cultivar response to glyphosate.
Agron. J. 93:404-407.

53
Elmore, R. W., F. W. Roeth, L. A. Nelson, C. A. Shapiro, R. N. Klein, S. Z. Knezevic, and
A. Martin. 2001b. Glyphosate-resistant soybean cultivar yields compared with sister
lines. Agron. J. 93:408-412.
Feng, P.C.C., T. Chiu, R. D. Sammons, and J. S. Ryerse. 2003. Droplet size affects
glyphosate retention, absorption, and translocation in corn. Weed Sci. 51:443-448.
Ferrell, J. A and W. W. Witt. 2002. Comparison of glyphosate with other herbicides for
weed control in corn (Zea mays): Efficacy and economics. Weed Technol. 16:701-
706.
Gaskin, R. E. and P. J. Holloway. 1992. Some physiochemical factors influencing foliar
uptake enhancement of glyphosate-mon(isopropylammonium) by polyoxyethylene
surfactants. Pestic. Sci. 34:195-206.
Gougler, J. A. and D. R. Geiger. 1981. Uptake and distribution of N-
phosphonomethylglycine in sugarbeet plants. Plant Physiol. 68:668-672.
Hart, S. E. and L. M. Wax. 1999. Review and future prospectus on the impacts of
herbicide resistant maize on weed management. Maydica 44:25-36.
Hetherington, P.R, T. L. Reynolds, G. Marshall, and R. C. Kirkwood. 1999. The
absorption, translocation and distribution of the herbicide glyphosate in maize
expressing the CP-4 transgene. J. Exper. Bot. 50:1567-1576.
Johnson, W. G., P. R. Bradley, S. E. Hart, M. L. Buesinger, and R. E. Massey. 2000.
Efficacy and economics of weed management in glyphosate-resistant corn (Zea mays).
Weed Technol. 14:57-65.
Jones, M. A. and C. E. Snipes. 1999. Tolerance of transgenic cotton to topical application
of glyphosate. J. Cotton Sci. 3:19-26.

54
Kiesselbach, T. A. 1992. In The Structure and Reproduction of Corn. Cold Spring Harbor
Laboratory Press, Cold Spring Harbor, NY. pp. 38-50.
Kirkwood, R. C., R. Hetherington, T. L. Reynolds, and G. Marshall. 2000. Absorption,
localization, translocation and activity of glyphosate in barnyardgrass (Echinochloa
crus-galli (L.) Beauv.): influence of herbicide and surfactant concentration. Pest
Manag. Sci. 56:359-367.
Masiunas, J. B. and S. C. Weller. 1988. Glyphosate activity in potato (Solanum
tuberosum) under different temperature regimes and light levels. Weed Sci. 36:137-
140.
McAllister, R. S. and L. C. Haderlie. 1985. Translocation of 14C-glyphosate and 14CO2-
labeled photoassimilates in Canada thistle (Cirsium arvense). Weed Sci. 33:153-159.
Nolte, S. A. and B. G. Young. 2002. Efficacy and economic return on investment fo r
conventional and herbicide-resistant corn (Zea mays). Weed Technol. 16:371-378.
Payne, S. A. and L. R. Oliver. 2000. Weed control programs in drilled glyphosate-resistant
soybean. Weed Technol. 14:413-422.
Pline, W. A., A. J. Price, J. W. Wilcut, K. L. Edmisten, and R. Wells. 2001. Absorption
and translocation of glyphosate in glyphosate-resistant cotton as influenced by
application method and growth stage . Weed Sci. 49:460-467.
Pline, W. A., R. Viator, J. W. Wilcut, K. L. Edmisten, J. F. Thomas, and R. Wells. 2002a.
Reproductive abnormalities in glyphosate-resistant cotton caused by lower CP4-
EPSPS levels in the male reproductive tissue. Weed Sci. 50:438-447.

55
Pline, W.A, K. L. Edmisten, T. Oliver, J. W. Wilcut, R. Wells, and N. S. Allen. 2002b.
Use of digital image analysis, viability stains, and germination assays to estimate
conventional and glyphosate-resistant cotton pollen viability. Crop Sci. 42:2193-
2200.
Pline, W. A., K. L. Edmisten, J. W. Wilcut, R. Wells, and J. Thomas. 2003a. Glyphosate-
induced reductions in pollen viability and seed set in glyphosate-resistant cotton and
attempted remediation by gibberellic acid (GA(3)). Weed Sci. 15:19-27.
Rodrigues J.J.V., A. D. Worsham, and F. T. Corbin. 1982. Exudation of glyphosate from
wheat (Triticum aestivum) plants and its effects on interplanted corn (Zea mays) and
soybeans (Glycine max). Weed Sci. 30:316–320.
Sandberg, C. L., W. F. Meggitt, and D. Penner. 1980. Absorption, translocation, and
metabolism of 14C-glyphosate in several weed species. Weed Res. 20:195-200.
Satchivi, N. M., L. M. Wax, E. W. Stoller, and D. P. Briskin. 2000. Absorption and
translocation of glyphosate isopropylamine and trimethylsulfonium salts in Abutilon
theophrasti and Setaria faberi. Weed Sci. 48:675-679.
Scott, G. H., S. D. Askew, and J. W. Wilcut. 2002. Glyphosate systems for weed control
in glyphosate-tolerant cotton. Weed Technol. 16:191-198.
Sprankle, P., W. F. Meggitt, and D. Penner. 1975. Absorption, mobility, and microbial
degradation of glyphosate in soil. Weed Sci. 23:229-234.
Thomas, W. E., W. A. Pline, J. F. Thomas, K. L. Edmisten, R. Wells, and J. W. Wilcut.
2004. Glyphosate negatively affects pollen viability but not pollination and seed set in
glyphosate-resistant corn. Weed Sci. 52:725-734.
56
Viator, R. P, S. A. Senseman, and J. T. Cothren. 2003. Boll abscission responses of
glyphosate-resistant cotton (Gossypium hirsutum L.) to glyphosate. Weed Tech.
17:571-575.
Viator, R. P., P. H. Jost, S. A. Senseman, and J. T. Cothren. 2004. Effect of glyphosate
application timings and methods on glyphosate-resistant cotton. Weed Sci. 52:147-
151.
Wauchope, R. D., T. L. Estesm, R. Allen, J. L. Baker, A. G. Hornsby, R. L. Jones, R. P.
Richards, and D. I. Gustafson. 2002. Predicted impact of transgenic, herbicide-
tolerant corn on drinking water quality in vulnerable watersheds of the mid-western
USA. Pest Manag. Sci. 58:146-160.
Wyrill, J. B. and O. C. Burnside. 1976. Absorption, translocation, and metabolism of 2,4-
D and glyphosate in common milkweed and hemp dogbane. Weed Sci. 24:557-566.
Yasuor, H., M., Sibony, B. Rubin, I. Flash, and E. Gat. 2000. Influence of glyphosate
(Roundup Ultra) rate and time of application on weed control and performance of DP
5415RR cotton in Israel: Field and laboratory experiments. Proc. Beltwide Cotton
Conf. pp. 1480-1483.

57
Table 1. Distribution of 14C-glyphosate in glyphosate-resistant corn, averaged over trials,
treatment timings (V4, V6, and V8), and harvests timings (3 and 7 d after treatment).a
Plant Part Meanbc SEM
___ % of 14C glyphosate applied ___
ATL-leaves 7.8 0.4
BTL-leaves 1.4 0.1 BTL-stems 1.3 0.4 Roots 4.8 0.3 Tasseld 0.1 0.0 TL 5.3 0.5 TL-base 1.2 0.2 TL-sheath 0.9 0.1 TL-tip 0.9 0.2 Leaf wash 41.5 1.5 LSDb 1.72 a Abbreviations: ATL, above treated leaf; BTL, below treated leaf; SEM, standard error
of the mean; TL, treated leaf.
b Least significant difference at P=0.05 of translocation data.
c Total recovery of 14C-glyphosate was 65.2%, averaged over trials, treatment timings,
and harvest timings.
d Tassels were only harvested with V8 treatments and harvest timings.
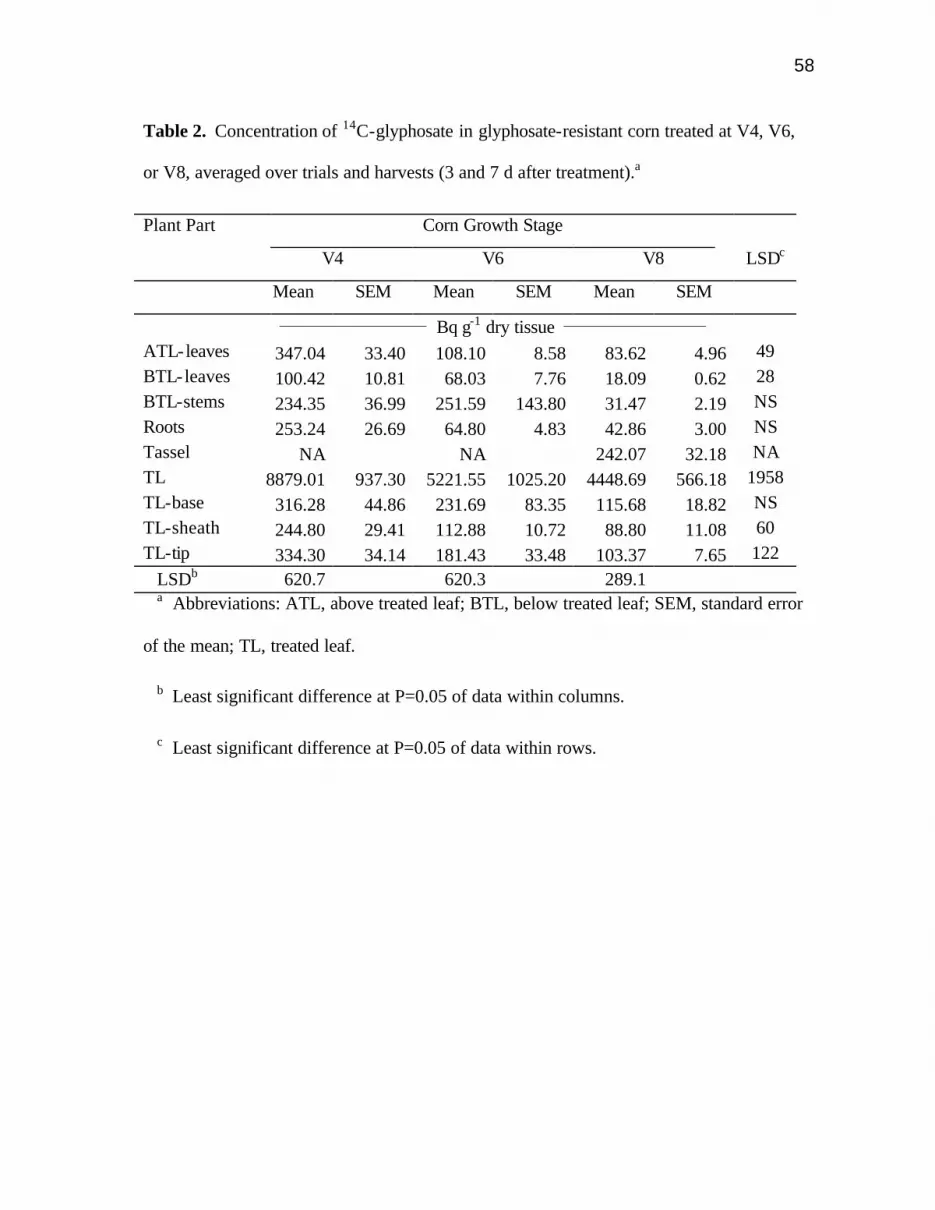
58
Table 2. Concentration of 14C-glyphosate in glyphosate-resistant corn treated at V4, V6,
or V8, averaged over trials and harvests (3 and 7 d after treatment).a
Plant Part Corn Growth Stage
V4 V6 V8 LSDc
Mean SEM Mean SEM Mean SEM
________________________ Bq g-1 dry tissue _______________________ ATL-leaves 347.04 33.40 108.10 8.58 83.62 4.96 49 BTL-leaves 100.42 10.81 68.03 7.76 18.09 0.62 28 BTL-stems 234.35 36.99 251.59 143.80 31.47 2.19 NS Roots 253.24 26.69 64.80 4.83 42.86 3.00 NS Tassel NA NA 242.07 32.18 NA TL 8879.01 937.30 5221.55 1025.20 4448.69 566.18 1958 TL-base 316.28 44.86 231.69 83.35 115.68 18.82 NS TL-sheath 244.80 29.41 112.88 10.72 88.80 11.08 60 TL-tip 334.30 34.14 181.43 33.48 103.37 7.65 122 LSDb 620.7 620.3 289.1 a Abbreviations: ATL, above treated leaf; BTL, below treated leaf; SEM, standard error
of the mean; TL, treated leaf.
b Least significant difference at P=0.05 of data within columns.
c Least significant difference at P=0.05 of data within rows.

59
Table 3. Distribution of foliar-applied 14C-glyphosate in glyphosate-resistant corn treated at V4, V6, or V8 and harvested at
various vegetative and reproductive growth stages, averaged over trials.
Stag Plant part Harvest timing V8 V12 V16 R1
Mean SEM Mean SEM Mean SEM Mean SEM LSDa __________________________________ % of 14C glyphosate applied __________________________________ 4 ATL-leaves 4.67 1.88 9.22 2.59 8.84 2.46 6.90 1.58 NS 4 ATL - stems 0.46 0.23 1.86 0.46 3.65 1.16 2.67 0.57 NS 4 Brace roots 0.14 0.06 2.89 1.39 2.54 0.78 1.77 0.30 NS 4 BTL - leaves 0.06 0.02 0.12 0.05 0.16 0.06 0.04 0.01 NS 4 BTL - stems 0.07 0.04 . . 0.03 0.00 0.11 0.11 NS 4 Roots 8.49 1.71 11.88 1.32 10.71 1.32 9.07 2.58 NS 4 Ear shoots . . 0.05 0.01 0.27 0.03 0.52 0.12 0.16 4 Tassel 0.01 0.00 0.32 0.12 0.79 0.13 0.35 0.07 0.45 4 TL 3.40 1.56 9.98 1.72 12.60 1.11 11.74 3.41 NS 4 TL - base 0.12 0.06 0.13 0.02 0.21 0.04 0.65 0.23 0.20 4 TL - sheath 0.08 0.03 0.37 0.05 0.37 0.06 0.86 0.42 NS 4 TL - tip 0.49 0.26 0.78 0.19 0.58 0.07 0.54 0.13 NS 4 Leaf wash 23.81 5.45 22.09 5.42 26.60 1.81 8.12 2.36 NS Recovery 41.80 59.70 67.33 43.67 6 ATL-leaves 2.61 1.09 16.18 4.44 11.11 4.45 12.63 3.42 NS 6 ATL - stems 0.59 0.22 9.68 6.93 3.76 0.88 7.30 3.96 NS 6 Brace roots 1.12 0.62 3.24 0.19 4.82 1.23 2.42 0.85 2.33 6 BTL - leaves 0.10 0.04 0.21 0.04 0.39 0.09 0.43 0.20 NS 6 BTL - stems 0.39 0.30 1.65 0.23 1.63 0.42 1.30 0.30 NS 6 Roots 8.61 1.84 11.52 1.99 13.09 1.04 10.23 2.39 NS 6 Ear shoots . . 0.14 0.04 0.71 0.13 1.52 0.45 NS 6 Tassel 0.01 0.01 0.81 0.13 1.79 0.25 0.33 0.13 0.44

60
Table 3 (continued) 6 TL 3.81 2.30 15.90 1.01 13.80 1.15 14.77 2.88 5.7 6 TL - base 0.57 0.36 0.77 0.15 1.32 0.49 1.41 0.38 NS 6 TL - sheath 1.89 1.69 1.39 0.34 0.88 0.15 1.95 0.74 NS 6 TL - tip 0.34 0.13 2.19 0.35 2.14 0.61 2.53 0.48 NS 6 Leaf wash 11.92 4.58 3.40 0.75 1.98 0.50 1.67 0.38 NS Recovery 31.94 67.08 57.42 58.50 8 ATL-leaves 17.42 6.17 22.49 6.46 14.51 5.00 11.58 3.04 NS 8 ATL - stems 0.57 0.37 3.81 1.41 5.53 1.41 3.72 0.98 NS 8 Brace roots 2.09 1.18 5.17 1.38 7.71 1.61 6.05 2.03 8.23 8 BTL - leaves 0.37 0.02 1.01 0.26 1.46 0.28 0.92 0.24 NS 8 BTL - stems 0.87 0.54 6.83 0.90 6.56 0.54 3.75 0.87 3.54 8 Roots 7.78 1.57 11.61 2.24 11.72 1.59 10.00 2.96 NS 8 Ear shoots . . 0.18 0.03 1.07 0.14 1.67 0.32 0.63 8 Tassel 0.03 0.02 1.41 0.32 3.81 0.47 0.39 0.16 1.76 8 TL 8.46 2.47 9.38 1.39 11.49 0.86 9.21 1.95 NS 8 TL - base 0.90 0.25 1.07 0.12 1.41 0.22 3.64 1.12 NS 8 TL - sheath 1.21 0.46 3.39 2.02 3.08 1.84 1.69 0.42 NS 8 TL - tip 1.64 0.58 2.98 0.49 2.77 0.28 6.06 1.77 NS 8 Leaf wash 2.97 0.76 2.01 0.42 2.24 0.27 1.04 0.40 NS Recovery 44.32 71.35 73.37 59.72
b 5.15 8.06 3.72 4.67
a Least significant difference at P=0.05 of translocation data within columns.
b Least significant difference at P=0.05 of translocation data within rows.

61
Table 4. Distribution of foliar-applied 14C-glyphosate in glyphosate-resistant corn treated at V4, V6, or V8 and harvested at
various vegetative and reproductive growth stages, averaged over trials.
Stage Plant part Harvest timing V8 V12 V16 R1 Mean SEM Mean SEM Mean SEM Mean SEM LSDa _________________________________________ Bq g-1 dry tissue _________________________________________ 4 ATL-leaves 61.36 24.89 66.25 17.82 55.07 15.68 41.01 11.83 NS 4 ATL - stems 21.82 8.75 30.70 8.70 28.79 8.27 14.64 2.41 NS 4 Brace roots 136.07 31.69 169.40 74.88 95.69 21.14 51.39 8.26 NS 4 BTL - leaves 18.90 8.68 71.18 28.69 121.28 57.56 29.12 3.46 NS 4 BTL - stems 25.50 6.10 . . . . 45.05 . . 4 Roots 444.34 84.52 443.88 54.12 249.04 29.67 167.85 40.07 187 4 Ear shoots . . 253.40 52.00 79.39 13.17 20.38 4.83 NS 4 Tassel 371.88 140.49 183.52 38.06 117.62 20.69 42.31 8.45 NS 4 TL 11332.65 4846.67 29233.99 5152.85 39951.42 4328.45 37265.64 13462.13 NS 4 TL - base 158.05 81.59 198.21 23.95 283.06 44.33 534.29 164.51 NS 4 TL - sheath 75.13 34.61 321.09 29.37 317.44 41.69 821.47 473.40 NS 4 TL - tip 537.14 160.28 1239.19 148.05 1240.76 140.27 988.46 217.49 NS 6 ATL-leaves 25.95 9.69 115.80 33.02 65.56 26.40 78.33 23.49 NS 6 ATL - stems 27.68 12.06 157.63 111.29 38.78 8.97 36.66 18.75 NS 6 Brace roots 160.81 42.39 196.53 22.45 172.81 21.66 73.42 26.02 NS 6 BTL - leaves 20.90 4.28 27.60 6.18 34.23 4.66 45.83 21.76 NS 6 BTL - stems 36.99 25.42 164.95 20.95 119.63 15.65 53.64 9.98 NS 6 Roots 417.89 89.10 405.56 62.06 274.48 28.60 188.27 35.34 NS 6 Ear shoots . . 464.11 47.46 243.19 37.31 30.07 5.83 92.1 6 Tassel 160.33 36.03 430.76 68.42 240.24 19.48 44.80 18.43 137 6 TL 6881.78 3862.99 24362.96 1674.84 29586.34 2260.07 22986.46 5082.29 7245 6 TL - base 276.00 141.03 285.27 60.60 491.56 169.80 504.71 143.45 NS 6 TL - sheath 1733.03 1626.23 416.04 96.41 292.06 48.48 595.73 248.83 NS

62
Table 4 (continued) 6 TL - tip 778.19 485.23 1253.20 134.93 1375.61 329.74 1775.92 399.00 NS 8 ATL-leaves 318.01 127.56 202.14 57.09 88.70 30.86 78.41 27.23 NS 8 ATL - stems 178.99 112.21 124.79 46.68 73.64 19.65 28.87 6.43 NS 8 Brace roots 360.75 157.04 272.83 65.58 373.49 54.71 152.07 46.30 NS 8 BTL - leaves 16.93 3.06 37.18 9.61 47.43 9.46 31.67 9.19 NS 8 BTL - stems 43.77 26.29 222.27 19.74 151.57 10.40 53.29 11.93 85.9 8 Roots 344.66 53.61 436.67 66.23 291.08 44.14 152.00 33.95 NS 8 Ear shoots . . 1166.40 221.97 301.72 39.48 45.98 6.72 212.3 8 Tassel 1047.09 625.06 921.09 131.67 447.00 54.71 45.74 17.94 NS 8 TL 9358.86 2770.10 11930.08 1780.90 20438.68 2953.29 10402.89 2438.42 NS 8 TL - base 174.79 53.58 186.79 14.93 246.05 41.68 585.81 138.09 NS 8 TL - sheath 333.41 140.09 300.80 38.01 714.01 458.72 435.61 103.90 NS 8 TL - tip 632.23 267.60 1065.47 179.23 859.43 155.12 3689.21 1723.66 1486 LSDb 2580 2345 5583 8428 a Least significant difference at P=0.05 of data within columns.
b Least significant difference at P=0.05 of data within rows.

63
Absorption and Translocation of Glyphosate and Sucrose in Glyphosate-Resistant
Cotton4
WALTER E. THOMAS, WESLEY J. EVERMAN, IAN C. BURKE, CLIFFORD H.
KOGER, and JOHN W. WILCUT5
Abstract: Studies were conducted to evaluate absorption and translocation of 14C-
glyphosate in glyphosate-resistant (GR) cotton. Both commercial GR cotton events
[glyphosate-resistant event 1, marketed as Roundup Ready®– released 1997 (GRE1) and
glyphosate-resistant event 2, marketed as Roundup Ready Flex® – released 2006 (GRE2)]
were evaluated at the 4-leaf (lf) and 8- lf growth stages. Plants were harvested at 1, 3, 5,
and 7 d after treatment (DAT). Glyphosate absorption, as a percentage of applied,
increased over time with 29 and 36% absorption at 7 DAT in 4- lf GRE1 and GRE2 cotton,
respectively. In 8-lf cotton, glyphosate absorption (33% at 7 DAT) was not different
between events. Glyphosate translocation patterns were not different between events or
harvest timings and exhibited a source-sink relationship. Observed translocation
differences between cotton growth stages were probably due to reduced glyphosate export
4 Received for publication and in revised form.
5 First, second, and fifth author; Graduate Research Assistant, Graduate Research
Assistant, and Professor, North Carolina State University, Box 7620 Raleigh, NC 27695-
7620, [email protected]; third, Postdoctoral Research Associate, Southern Weed
Science Research Unit, USDA-ARS, Stoneville, MS 38776 and fourth, Scientist, Crop
Genetics and Production Research, USDA-ARS, Stoneville, MS 38776.

64
from the treated leaf of 8-lf cotton. An additional study compared absorption and
translocation of 14C-glyphosate and 14C-sucrose in 5- and 10- lf GRE2 cotton. Averaged
over trials, 14C compounds, and growth stages, cotton absorbed 28% of the applied dose at
14 d after treatment. Based on the percentage of 14C exported out of the treated leaf,
glyphosate and sucrose translocation patterns were similar, indicating that glyphosate may
be used as a photoassimilate model in GRE2 cotton.
Nomenclature: Glyphosate; cotton, Gossypium hirsutum L.
Keywords: Herbicide-resistant crops, transgenic crops.
INTRODUCTION
Glyphosate-resistant (GR) cotton is widely used throughout the United States. Cotton
cultivars containing a herbicide resistance gene accounted for 78 and 61% of all cotton
planted in North Carolina and the United States, respectively, in 2005 (Anonymous
2005a). Glyphosate-resistant systems have become extremely popular with cotton
producers for several reasons. Glyphosate provides broad-spectrum weed control with
limited environmental impact. Glyphosate-resistant cotton systems allow for reductions in
the use of soil-applied residual herbicides, which consequently reduces the potential for
these herbicides to leach into groundwater (Blanchard and Donald 1997; Buhler et al.
1993; Pantone et al. 1992; Wilcut et al. 1995). Glyphosate is degraded by soil microbes
and tightly adsorbed to soil colloids, which accounts for its lack of soil activity (Duke
1988; Sprankle et al. 1975a, 1975b). In addition, many GR cotton cultivars also contain

65
transgenic Bacillus thuringiensis insect technology, thus enhancing the utility of GR
technology.
In addition to the positive environmental aspects of glyphosate, grower acceptance is
due to the low cost and the simplicity of the GR systems (Shaner 2000). Since glyphosate
is a broad-spectrum herbicide and has flexibility of application timing in glyphosate-
resistant event 11 (GRE1) cotton [postemergence over the top (POST) up to 4- lf and
postemergence-directed from 4- lf through LAYBY], the use of GR cotton increases the
flexibility of POST cotton weed management decisions (Anonymous 2005b). However,
several researchers have reported abscission of first position bolls (Jones and Snipes 1999;
Viator et al. 2003, 2004), which in some years resulted in delayed maturity. Depending on
year, Viator et al. (2004) reported an 8% yield reduction following applications of
glyphosate POST at 0.84 kg ae/ha followed by glyphosate postemergence-directed at 0.84
kg/ha compared to treatments that did not include glyphosate. Using 14C-glyphosate,
enzyme-linked immunosorbent assays, and measurement of shikimic acid accumulation
(which accumulates following inhibition of 5-enolpyruvylshikimate-3-phosphate synthase
(EPSPS) [EC 2.5.1.19]), researchers have found increased glyphosate sensitivity in male
reproductive tissues (Pline et al. 2002a, 2002b; Viator et al. 2003). Further research
indicated that pollen viability as well as increased stigma length reduced pollination and
consequently reduced seed cotton yields (Pline et al. 2002b). The lack of glyphosate
tolerance in reproductive tissues of GRE1 lead to the development of a new generation of
GR cotton.
The new generation, glyphosate-resistant event 22 (GRE2) cotton, uses an identical
resistance gene but different promoters as compared to the original resistance technology

66
(Anonymous 2005c). The use of alternate promoters has increased the tolerance in
reproductive portions of the plant while maintaining tolerance levels in vegetative parts
(Anonymous 2005c). Consequently, glyphosate can be applied POST up to the 14- lf
growth stage. Multiple researchers have investigated the physiological behavior of 14C-
glyphosate in GRE1 cotton (Pline et al. 2001, 2002a; Viator et al. 2003), however limited
research investigating similar responses to glyphosate in GRE2 cotton has been reported.
Previous photoassimilate movement research in cotton used radiolabeled substrates
including CO2 and sucrose (Ashley 1972; Benedict and Kohel 1975; Benedict et al. 1973;
Horrocks et al. 1978). However, these substrates are metabolized into multiple plant
products, which may complicate analysis and data interpretation. Glyphosate, which is not
readily metabolized in plants (Duke 1988; Sandberg et al. 1980) and shares similar
translocation patterns to sucrose (Dewey and Appleby 1983; Tardif and Leroux 1993), may
offer an additional tool in photoassimilate research. Glyphosate-resistant event 2 cotton in
combination with glyphosate may provide tools to study photoassimilate translocation in
cotton in the absence of glyphosate toxicity (Feng and Chiu 2005). Even though several
researchers observed similar glyphosate and sucrose translocation patterns in a number of
weed species (Dewey and Appleby 1983; Shieh et al. 1993; Tardif and Leroux 1993), a
comparison of glyphosate and sucrose translocation in GR cotton or other GR crops has
not been conducted.
Due to the commercial availability of two GR events in cotton and properties of
glyphosate translocation, our objectives were (1) to evaluate absorption and translocation
of glyphosate in these two events at different cotton growth stages and (2) to compare

67
glyphosate and sucrose translocation patterns in GRE2 cotton as influenced by cotton
growth stage.
MATERIALS AND METHODS
Plant Material. Deltapine ‘5415 RR’ (GRE1) and an experimental GRE22 variety of
cotton were planted in 12-cm pots containing a commercial potting medium3 and grown in
a polyethylene covered greenhouse maintained at 28 + 2 C constant temperature where
natural sunlight was supplemented 4-h daily with mercury halide lights, providing a 16-h
day length. For the comparison of glyphosate and sucrose, a GRE2 cotton variety was
planted in 30-cm pots and grown at similar environmental conditions described for the
previous experiment. Studies for GR event and glyphosate/sucrose comparisons were
conducted from August 2003 to February 2004 and from August 2005 to December 2005,
respectively.
14C-Glyphosate Treatments and Sampling for Glyphosate-Resistant Event
Comparison. Both cotton events were broadcast-treated at the 4- lf and 8- lf growth stage
with glyphosate4 POST at 0.84 kg/ha. Before each POST glyphosate treatment, a 20-cm2
area of the fourth and eighth true leaf was covered with aluminum foil to protect spray
from coming in contact with the leaf surface. Immediately after broadcast application of
glyphosate, aluminum foil was removed and 10 1- ? l droplets of 14C-glyphosate5
containing 4.2 kBq plus 0.25% non- ionic surfactant6 were manually applied with a
microsyringe to each previously protected leaf portion (Pline et al. 2001).
Plants were harvested at 1, 3, 5, and 7 d after treatment (DAT). Absorption was
determined by rinsing the 20-cm2 treated portion of the leaf with 10 ml of a

68
methanol:water (1:1, v/v) mixture plus 0.25% non- ionic surfactant6 (Askew and Wilcut
2002). A 1.0-ml aliquot was taken from the leaf rinsate, diluted in 15 ml scintillation fluid7
and radioactivity was quantified with liquid scintillation spectrometry (LSS)8. All plants
were then divided into 1) treated leaf, 2) leaves above treated leaf, 3) leaves below treated
leaf, 4) stems below treated leaf, and 5) roots. The treated leaf was removed at the point of
attachment to the stem, which also determined the division for above and below treated-
leaf sections. If present, the developing sympodia were removed and placed in separate
bags. Plant parts were dried for 48 h at 50 C for 2 d, weighed, homogenized, and
combusted with a biological sample oxidizer9. Radioactivity in the oxidized samples was
quantified by LSS.
14C-Glyphosate Treatments and Sampling for Glyphosate/Sucrose Comparison.
Ten1-? l droplets of either 14C-glyphosate5 or 14C-sucrose10 containing 5 kBq plus non-
ionic surfactant5 at 0.25% (v/v) were added to each plant (Pline et al. 2001; Tardif and
Leroux 1993). Radiolabel compounds were applied to the upper most fully expanded leaf
(fourth mainstem leaf from the apex) of cotton plants at the 5- and 10- lf growth stages.
Plants were harvested at 7 and 14 DAT. Plants treated at the 5- lf growth stage were
divided into: 1) treated leaf, 2) leaves above treated leaf, 3) stems above treated leaf, 4)
sympodial tissue (leaves, stems, and fruits) above treated leaf, 5) leaves below treated leaf,
6) stems below treated leaf, 7) sympodial tissue (leaves, stems, and fruits) below treated
leaf, and 8) roots. Plants treated at the 10- lf growth stage were divided into: 1) treated
leaf, 2) leaves above treated leaf, 3) stems above treated leaf, 4) leaves below treated leaf,
5) stems below treated leaf, 6) sympodial leaves above treated leaf, 7) sympodial stems
above treated leaf, 8) sympodia l fruits above treated leaf, 9) sympodial leaves below

69
treated leaf, 10) sympodial stems below treated leaf, 11) sympodial fruits below treated
leaf, and 12) roots. Radioactivity quantification for absorption and translocation was
conducted as previously described.
Experimental Design and Data Analysis. Studies were arranged in split blocks with
randomization within blocks. The blocks in GR events studies were composed of the two
varieties with the four harvest timings randomized within varieties while blocks in
glyphosate/sucrose comparison were composed of the two cotton growth stages with the
four harvest timings randomized within 14C compound. Glyphosate-resistant event and
glyphosate/sucrose studies contained four and three replications of treatments,
respectively. All experiments were repeated in time. All data were subjected to ANOVA
using general linear and mixed models in SAS11 for glyphosate resistance event and
glyphosate/sucrose comparisons, respectively. Results were averaged over trials due to a
lack of significant trial main effect. Data were analyzed for main effects and interactions.
Mean separations were performed on data using Fisher’s Protected LSD at P=0.05. When
interactions were significant, LSD (0.05) tests were performed separately across the levels
of a given factor within the levels of the other factor.
RESULTS AND DISCUSSION
14C-Glyphosate Absorption for Glyphosate-Resistant Event Comparison. Absorption
increased from 18% of applied 14C-glyphosate at 1 DAT to 36% at 7 DAT in GRE2 cotton
(Figure 1). Absorption increased at similar rates in GRE1 cotton at the 4- lf growth stage (9
and 29% at 1 and 7 DAT, respectively). Even though differences in absorption were

70
observed between GR events at the 4- lf growth stage, the overall response was similar,
indicating that the biological significance of these differences is probably minimal. In 8-lf
cotton, absorption was not different between GR events. Absorption increased from 14%
at 1 DAT to 33% at 7 DAT. Pline et al. (2001) reported 19, 29, 45, and 41% absorption of
applied 14C-glyphosate at 4-lf, 8- lf, 12- lf, and midbloom stages of GRE1, respectively,
averaged over application method (mature leaf and stem) and harvest timing (3 and 7
DAT). At 100% relative humidity, non-transgenic cotton grown at 22 and 32 C absorbed
36 and 43% of the applied 14C-glyphosate, respectively, with the inclusion of a surfactant
(Wills 1978). Differences in amounts of absorbed 14C-glyphosate may reflect differences
in environmental conditions such as relative humidity and temperature (Masiunas and
Weller 1988; Reddy 2000; Wills 1978).
14C-Glyphosate Translocation for Glyphosate-Resistant Event Comparison.
Translocation of 14C-glyphosate in cotton was not influenced by trials, events, or harvest
timings, thus data were averaged over trials, events, and harvest timings (Table 1). The
greatest amount of radioactivity remained in the treated leaf, regardless of cotton growth
stage. Since 14C-glyphosate generally follows a source-to-sink translocation pattern
(Dewey and Appleby 1983; Sandberg et al. 1980, Tardif and Leroux 1993), the leaf that
received the radiolabel was still expanding, potentially reducing further export into other
active metabolic sinks. In addition, limited glyphosate export has been reported due to
surfactant damage from manual droplet applications of glyphosate in velvetleaf (Abutilon
theophrasti Medikus) (Feng et al. 1998, Ryerse et al. 2004). When glyphosate was applied
to young leaves near the apex of non-transgenic cotton, Wills (1978) also showed limited
translocation from these expanding leaves.

71
Even though the greatest amount of absorbed 14C remained in the treated leaf,
significant levels of translocation were observed at both cotton growth stages (Table 1). In
4-lf cotton, the tissue below the treated leaf accumulated similar amounts of 14C-
glyphosate, ranging from 10 to 15%. Leaves above the treated leaf were also significant
sinks for 14C-glyphosate, equivalent to stems below the treated leaf and roots. Glyphosate
translocation in 8- lf cotton also followed a source-to sink relationship. However, the
leaves below the treated leaf accumulated 7.2% of the absorbed glyphosate, the greatest
level of accumulation compared to other plant parts. The leaves above the treated leaf and
roots were active sinks, but accumulated less 14C-glyphosate than the tissues below the
treated leaf.
Comparing 4- and 8- lf cotton, more 14C-glyphosate was retained in the treated leaf of
8-lf cotton, which consequently limited translocation to other plant parts. GRE1 cotton
treated with glyphosate POST at 4- and 8-lf stages retained 10 and 27% of the applied 14C
(Pline et al. 2001). The differences in 14C-glyphosate retention in the treated leaf may
explain the observed differences in glyphosate accumulation in plant parts between the two
cotton growth stages.
Absorption for Glyphosate/Sucrose Comparison. Absorption of 14C compounds
(glyphosate and sucrose) by GRE2 cotton was not influenced by trial, 14C compound, or
growth stage (data not shown). Thus data were averaged over trials, 14C compounds, and
growth stages. Cotton absorbed 36 and 28% of the applied dose of 14C compounds at 7
and 14 d after treatment, regardless of growth stage and 14C compound (data not shown).
Translocation for glyphosate/sucrose comparison. Translocation of 14C-compounds in
GRE2 cotton was not influenced by trials or harvest timings, thus data were averaged over

72
trials and harvest timings (Table 2). The greatest amount of 14C remained in the treated
leaf, regardless of growth stage or compound. However, more 14C-sucrose was
translocated from the treated leaf compared to 14C-glyphosate at both cotton growth stages
(Table 2). McAllister and Haderlie (1985) also reported high retention (> 70% of
absorbed) of 14CO2 and 14C-glyphosate in Canada thistle [Cirsium arvense (L.) Scop.].
Due to these differences in 14C export from the treated leaf (Table 2), the quantities of
14C in all tissues except the treated leaf were summed and a percentage of exported 14C was
calculated for each plant part. After accounting for differences in 14C export, no
translocation differences between glyphosate and sucrose were observed, regardless of
growth stage. Thus, data were shown averaged over 14C compounds (Table 3).
In five- leaf cotton, 35 and 11% of the translocated 14C were exported out of the treated
leaf to apical leaves and roots, respectively (Table 3). These observed translocation
patterns were similar to previous research using either 14C-glyphosate or 14C-sucrose
(Dewey and Appleby 1983; Sandberg et al. 1980; Shieh et al. 1993; Tardif and Leroux
1993). The leaves and stems below the treated leaf accumulated 19 and 18%, respectively,
of the translocated radioactivity (Table 3). Even though tissues below the treated leaf were
not meristematic regions at this phenological stage, the accumulation may have been due to
continued tissue expansion in both leaves and stems. The levels of radioactivity in stems
below the treated leaf may also be explained by the transport mechanisms contained in the
stems. Similarly when glyphosate was applied POST to 4-lf cotton, Pline et al. (2001)
reported a glyphosate concentration of 256, 127, 57, and 53 Bq/g dry tissue in immature
leaves and buds, stems, mature leaves, and roots, respectively. Since roots are a major sink
for glyphosate and sucrose (Dewey and Appleby 1983; McAllister and Haderlie 1985;

73
Sandberg et al. 1980; Shieh et al. 1993; Tardif and Leroux 1993), the stems between the
source and sink were more likely to contain larger amounts of radioactivity due to the
transport mechanisms in the stem.
Even though translocation patterns were different between cotton growth stages, the
distribution continued to follow a source-to-sink relationship. Previous research has also
shown that 14C-glyphosate translocation patterns were influenced by cotton growth stage
(Pline et al. 2001). Cotton at the 10- leaf growth stage usually contains multiple metabolic
sinks, including shoot and root apical meristems as well as the expanding tissue of multiple
fruiting branches, which include leaves, stems, and fruits (Mauney 1986). The mainstem
leaves and stems below the treated leaf contained 24 and 23% of the translocated
radioactivity, respectively (Table 3). In 10-leaf cotton, the expanding sympodial tissues
below the source leaf contained 22% of the translocated activity. The majority of the
activity in sympodial tissue below the source leaf was contained in the leaves probably due
to the chronology of tissue development, where the leaf, stem, and fruit expand in
successive order within each position of the sympodia (Mauney 1986). The expanding
leaves above the source leaf and roots continued to be metabolic sinks, receiving 11 and
9% of the translocated activity, respectively (Table 3). The sympodial tissues above the
source leaf also received some activity (6% of translocated), however, these sinks may not
be as great compared to more developed sympodial tissue below the source leaf (Mauney
1986). Based on a compilation of research data on carbohydrate distribution in bolls,
Schubert et al. (1986) concluded that boll size and age where significant factors in
photoassimilate accumulation. In our study, the most mature sympodial tissues were
below the treated leaf, which may explain the greater partitioning into this region.

74
Since cotton is a perennial crop grown as an annual, the number and strength of sink
tissue varies by developmental stage of growth. In vegetative stages, the shoot and root
apical meristems are the primary sink tissues, which is evidenced by the level of 14C
translocated to these tissues (35 and 11% of the translocated 14C, respectively). When
cotton begins reproductive growth, multiple sink tissues arise including sympodial
branches (leaves, stems, and fruits) on numerous nodes. Due to the increase in sink
number, translocation patterns are altered. For examples, translocation of 14C-compounds
increased by 5 and 11 percentage points in stems and sympodial leaves below the treated
leaf, respectively, comparing 5- and 10- lf cotton. In addition, the expanding leaves above
the treated leaf received numerically less radioactivity, potentially indicating a reduction in
sink strength.
Tardif and Leroux (1993) showed that translocation of glyphosate and sucrose were
similar in 3 of 5 evaluated quackgrass [Elytrigia repens ((L.) Beauv.] biotypes.
Correlations for 14C- glyphosate and 3H-sucrose localization in tips, buds, and rhizome
segments of quackgrass were 0.89, 0.93, and 0.98, respectively (Shieh et al. 1993). In a
field experiment, McAllister and Haderlie (1985) showed similar translocation patterns
between metabolized 14CO2 and 14C-glyphosate in Canada thistle, depending on
experimental environment. Additional data indicated differences in shoot/root partitioning
of glyphosate and sucrose where glyphosate preferentially accumulated in roots and shoots
of Canada thistle and tall morningglory [Ipomoea purpurea (L.) Roth.], respectively
(McAllister and Haderlie 1985; Dewey and Appleby 1983). Comparing 14C-sucrose and
14C-glyphosate, our data did not exhibit different translocation patterns to specific tissues,
75
possibly due to the greater number of sinks in reproductive cotton compared to Canada
thistle and tall morningglory.
These data show that glyphosate is translocated to metabolically active tissues like
shoot and root apical meristems, regardless of GR cotton event. The evaluation of
physiological behavior of glyphosate and sucrose showed equivalent absorption, regardless
of cotton growth stage. However, transport of glyphosate from the treated leaf was less
than sucrose at both growth stages. Due to these differences in transport from the treated
leaves, an evaluation of translocated 14C from the treated leaf showed no differences
between glyphosate and sucrose. Translocation patterns varied with cotton growth stages
probably due to the increase in potential metabolic sinks as cotton matures (Mauney 1986).
Based on these data and previous research (McAllister and Haderlie 1985; Shieh et al.
1985; Tardif and Leroux 1993), glyphosate may have potential for use as a model system
to study photoassimilate movement in GR cotton.
ACKNOWLEDGEMENTS
The authors thank Whitnee Askew, Scott Clewis, Wesley Everman, Sara Hans,
Abigail Mayhew, Caitlyn Wilcut, and Jared Wilcut for greenhouse and laboratory
assistance. Appreciation is also extended to Cavell Brownie, professor of statistics, for
review of statistical procedures and to Cotton Incorporated for partial funding of this
research.

76
LITERATURE CITED
Anonymous. 2005a. Acreage. http://usda.mannlib.cornell.edu/reports/nassr-/field/pcp-
bba/acrg0605.pdf. Accessed: March 13, 2006.
Anonymous. 2005b. Roundup WeatherMax label. Monsanto Co., St. Louis, MO.
Anonymous. 2005c. Roundup Ready Flex Cotton Update.
http://www.monsanto.com/monsanto/content/investor-
/financial/presentations/2004/MON_062504c.pdf. Accessed: March 13, 2006.
Ashley, D. A. 1972. 14C-labelled photosynthate translocation and utilization in cotton
plants. Crop Sci. 12:69-74.
Askew, S. D. and J. W. Wilcut. 2002. Absorption, translocation, and metabolism of
foliar-applied CGA 362622 in cotton, peanut, and selected weeds. Weed Sci. 50:293-
298.
Benedict, C. R. and R. J. Kohel. 1975. Export of 14C-assimilates in cotton leaves. Crop
Sci. 15:367-372.
Benedict, C. R., R. H. Smith, and R. J. Kohel. 1973. Incorporation of 14C-photoassimilate
into developing cotton bolls, Gossypium hirsutum L. Crop Sci. 13:88-91.
Blanchard, P. E. and W. W. Donald. 1997. Herbicide contamination of groundwater
beneath claypan soils in north-central Missouri. J. Environ. Qual. 26:1612-1621.
Buhler, D. D., G. W. Randall, W. C. Koskinen, and D. L. Wyse. 1993. Atrazine and
alachlor losses from subsurface tile drainage of clay loam soil. J. Environ. Qual.
22:583-588.

77
Dewey, S. A. and A. P. Appleby. 1983. A comparison between glyphosate and assimilate
translocation patterns in tall morningglory (Ipomoea purpurea). Weed Sci. 31:308-
314.
Duke, S. O. 1988. Glyphosate. In P. C. Kearney, D. D. Kaufman eds., Herbicides:
Chemistry, Degradation and Mode of Action. Marcel Dekker, New York, pp. 1-70.
Feng, P.C.C. and T. Chiu. 2005. Distribution of [14C]glyphosate in mature glyphosate-
resistant cotton from application to a single leaf or over-the-top spray. Pest. Biochem.
Physiol. 82:36-45.
Feng, P.C.C., J. S. Ryerse, and R. D. Sammons. 1998. Correlation of leaf damage with
uptake and translocation of glyphosate in velvetleaf (Abutilon theophrasti). Weed
Technol. 12:300-307.
Horrocks, R. D., T. A. Kerby, and D. R. Buxton. 1978. Carbon source for developing
bolls in normal and superokra leaf cotton. New Phytol. 80:335-340.
Jones, M. A. and C. E. Snipes. 1999. Tolerance of transgenic cotton to topical
applications of glyphosate. J. Cotton Sci. 3:19-26.
Mauney, J. R. 1986. Vegetative growth and development of fruiting sites. In J. R.
Mauney and J. McD. Stewart, eds. Cotton Physiology Number One The Cotton
Foundation Reference Book Series. Memphis, TN: The Cotton Foundation. pp. 11-
28.
McAllister, R. S. and L. C. Haderlie. 1985. Translocation of 14C-glyphosate and 14CO2 –
labeled photoassimilates in Canada thistle (Cirsium arvense). Weed Sci. 33:153-159.

78
Pantone, D. J., R. A. Young, D. D. Buhler, C. V. Eberlein, W. C. Koskinen, and F.
Forcella. 1992. Water quality impacts associated with pre- and postemerge
applications of atrazine in maize. J. Environ. Qual. 21:567-573.
Pline, W. A., J. W. Wilcut, S. O. Duke, K. L. Edmisten, and R. Wells. 2002a. Tolerance
and accumulation of shikimic acid in response to glyphosate applications in
glyphosate-resistant and nonglyphosate-resistant cotton (Gossypium hirsutum L.). J.
Agric. Food Chem. 50:506-512.
Pline, W. A., R. Viator, J. W. Wilcut, K. L. Edmisten, J. Thomas, and R. Wells. 2002b.
Reproductive abnormalities in glyphosate-resistant cotton caused by lower C4-EPSPS
levels in the male reproductive tissue. Weed Sci. 50:438-447.
Pline, W. A., A. J. Price, J. W. Wilcut, K. L. Edmisten, and R. Wells. 2001. Absorption
and translocation of glyphosate in glyphosate-resistant cotton as influenced by
application method and growth stage. Weed Sci. 49:460-467.
Reddy, K. N. 2000. Factors affecting toxicity, absorption, and translocation of glyphosate
in redvine (Brunnichia ovata). Weed Technol. 14:457-462.
Ryerse, J. S., R. A. Downer, R. D. Sammons, and P.C.C. Feng. 2004. Effect of
glyphosate spray droplets on leaf cytology in velvetleaf (Abutilon theophrasti). Weed
Sci. 52:302-309.
Sandberg, C. L., W. F. Meggitt, and D. Penner. 1980. Absorption, translocation, and
metabolism of 14C-glyphosate in several weed species. Weed Res. 20:195-200.
Schubert, A. M., C. R. Benedict, and R. J. Kohel. 1986. Carbohydrate distribution in
bolls. In J. R. Mauney and J. McD. Stewart, eds. Cotton Physiology Number One
79
The Cotton Foundation Reference Book Series. Memphis, TN: The Cotton
Foundation. pp. 311-324.
Shaner, D. L. 2000. The impact of glyphosate-tolerant crops on the use of other herbicides
and on resistance management. Pest Manag. Sci. 56:320-326.
Shieh, W., D. R. Geiger, and S. R. Buczynski. 1993. Distribution of imported glyphosate
in quackgrass (Elytrigia repens) rhizomes in relation to assimilate accumulation.
Weed Sci. 41:7-11.
Sprankle, P., W. F. Meggitt, D. Penner. 1975a. Rapid inactivation of glyphosate in the
soil. Weed Sci. 23:224-228.
Sprankle, P., W. F. Meggitt, and D. Penner. 1975b. Absorption, mobility, and microbial
degradation of glyphosate in the soil. Weed Sci. 23:229-234.
Tardif, F. J. and G. D. Leroux. 1993. Translocation of glyphosate, quizalofol, and sucrose
in quackgrass (Elytrigia repens) biotypes. Weed Sci. 41:341-346.
Viator, R. P., P. H. Jost, S. A. Senseman, and J. T. Cothren. 2004. Effect of glyphosate
application timings and methods on glyphosate-resistant cotton. Weed Sci. 52:147-
151.
Viator, R. P., S. A. Senseman, and J. T. Cothren. 2003. Boll abscission responses of
glyphosate-resistant cotton (Gossypium hirsutum) to glyphosate. Weed Technol.
17:571-575.
Wilcut, J. W., H. D. Coble, A. C. York, and D. W. Monks. 1995. The niche for herbicide-
resistant crops in U. S. agriculture. In S. O. Duke, ed. Herbicide-Resistant Crops:

80
Agricultural, Environmental, Economic, Regulatory, and Technical Aspects. Boca
Raton: CRC and Lewis Publishers. pp. 213-230.
Wills, G. D. 1978. Factors affecting toxicity and translocation of glyphosate in cotton
(Gossypium hirsutum). Weed Sci. 26:509-513.

81
Table 1. Translocation of 14C-glyphosate in cotton. Translocation values are a percentage
of absorbed 14C-glyphosate, averaged over glyphosate-resistant event and harvest timing.
a Fisher’s Protected LSD test at P=0.05 calculated for values within columns.
b Fisher’s Protected LSD test at P=0.05 calculated for values within rows.
Plant part Four- leaf
stage Eight-leaf
stage
Translocation
______________ % of absorbed 14C ____________ LSD (0.05)b
Leaves above treated leaf 6.2 2.7 NS
Treated leaf 57.3 82.3 24.0
Leaves below treated leaf 15.4 7.2 7.3
Stems below treated leaf 11.7 5.1 NS
Roots 9.5 2.1 NS
Reproductive shoots NA 0.6 NA
LSD (0.05)a 7.4 1.4

82
Table 2. Translocation of glyphosate and sucrose in 5- and 10- leaf cotton as a percentage
of absorbed 14C, averaged over runs and harvest timings.
Compound Plant parta Cotton growth stageb
Five- leaf 10-leaf LSDc
____ % ____ ___ % ___
Glyphosate ATL – leaves 4.79 de 2.83 e NS
Glyphosate ATL – stems 0.81 ef 0.95 e NS
Glyphosate ATL – sympodial leavesd 0.82 ef 0.73 e NS
Glyphosate ATL – sympodial stems NA 0.31 e NA
Glyphosate ATL – sympodial fruits NA 0.50 e NA
Glyphosate Treated leaf 86.13 a 70.40 a NS
Glyphosate BTL – leaves 3.39 def 12.87 cd NS
Glyphosate BTL – stems 2.10 ef 5.31 de 2.9
Glyphosate BTL – sympodial leavesd 0.47 f 2.67 e 1.2
Glyphosate BTL – sympodial stems NA 1.27 e NA
Glyphosate BTL – sympodial fruits NA 0.41 e NA
Glyphosate Roots 1.49 ef 1.76 e NS
Sucrose ATL – leaves 10.33 c 9.04 de NS
Sucrose ATL – stems 1.96 ef 5.14 de NS
Sucrose ATL – sympodial leavesd 1.58 ef 1.60 e NS
Sucrose ATL – sympodial stems NA 0.71 e NA
Sucrose ATL – sympodial fruits NA 1.03 e NA
Sucrose Treated leaf 70.41 b 23.76 b 15.1
Sucrose BTL – leaves 4.82 de 12.51 cd 3.7
Sucrose BTL – stems 6.66 cd 18.64 bc NS
Sucrose BTL – sympodial stems d 0.97 ef 12.34 cd NS
Sucrose BTL – sympodial fruits NA 6.66 de NA
Sucrose BTL – sympodial leaves NA 1.18 e NA

83
Table 2 (continued)
Sucrose Roots 3.01 def 7.40 de NS a Abbreviations: ATL, above treated leaf; BTL, below treated leaf.
b Means within a column followed by the same letter are not different according to Fisher’s
Protected LSD test at P=0.05.
c Fisher’s Protected LSD test at P=0.05 for data within columns.
d Percent of radioactivity in the part labeled sympodial leaves includes all sympodial tissues
including leaves, stems, and fruits in 5-lf cotton.

84
Table 3. Translocation of 14C compounds (glyphosate and sucrose) in 5- and 10-leaf
cotton as a percentage of exported 14C from the treated leaf, averaged over runs and harvest
timings.a
Plant partb Cotton growth stagec
Five- leaf 10-leaf LSDd
_______ % _________ ________ % _______
ATL – leaves 35.20 a 11.33 bc NS
ATL – stems 6.41 d 5.17 de NS
ATL – sympodial leavese 6.12 d 2.65 e NS
ATL – sympodial stems NA 1.07 e NA
ATL – sympodial fruits NA 1.78 e NA
BTL – leaves 19.46 b 23.85 a NS
BTL – stems 18.11 b 23.37 a 1.9
BTL – sympodial leavese 3.23 d 13.69 b 2.0
BTL – sympodial stems NA 6.81 cde NA
BTL – sympodial fruits NA 1.55 e NA
Roots 10.90 c 8.74 bcd NS
a Translocation is calculated based on the amounts of radioactivity transported out of the treated
leaf.
b Abbreviations: ATL, above treated leaf; BTL, below treated leaf.
c Means within a column followed by the same letter are not different according to Fisher’s
Protected LSD test at P=0.05.
d Fisher’s Protected LSD test at P=0.05 for data within columns.
e Percent of radioactivity in the part labeled sympodial leaves includes all sympodial tissues
including leaves, stems, and fruits in 5-lf cotton.

85
Figure 1. Absorption of glyphosate in 4-lf and 8- lf cotton is shown as a percentage of applied, averaged trials. In 8- lf cotton,
absorption is also averaged over trials and glyphosate resistance events.
0 2 4 60
10
20
30
40
50
GRE 1 y = 3.04x + 11.05 R2 = 0.71GRE 2 y = 2.99x + 13.88 R2 = 0.96
0 2 4 6
y = 3.02x + 12.47 R2 = 0.95
4 leaf cotton 8 leaf cotton
Abs
orpt
ion
(% o
f app
lied)

86
Thomas et al: Glyphosate translocation as influenced by mepiquat chloride.
Translocation of spot-applied glyphosate as influenced by mepiquat chloride in
cotton.
Walter E. Thomas
Yvonna S. Sheldon
Crop Science Department, Box 7620, North Carolina State University, Raleigh, NC 27695-
7620
Clifford H. Koger
Crop Genetics and Production Research, USDA-ARS, Stoneville, MS 38776
John W. Wilcut
Corresponding author. Crop Science Department, Box 7620, North Carolina State
University, Raleigh, NC 27695-7620; [email protected]
Received and approved.

87
Abstract: Studies examined various morphological characteristics and 14C-glyphosate
translocation in cotton as influenced by 14C-treatment timing [0, 7, 14, and 21 d after
mepiquat chloride (MC) treatment (DMC)] and cotton plant growth regulator regime (none
and MC at 49 g ai ha-1). Due to the large number of plant parts, data for a five-node
section of each plant was recorded for each parameter (the mainstem leaf on node B
received the 14C-glyphosate treatment). No significant differences in plant height, leaf
area, and specific leaf weight were observed for any 14C-glyphosate timing or MC
combination. At the time of MC treatment and 21 DMC, total fruit retention was 85 and
70%, respectively. Even though all plants retained at least 86% of all first position fruits, a
significant decline was observed from the day of MC treatment to 21 DMC (92 and 86%,
respectively). Fresh and dry weight data showed similar responses with multiple first
position fruits of MC-treated plants accumulating more biomass compared to first position
fruits of non-treated plants. For dry weight of plants parts, first position fruits on nodes A,
B, and C of MC-treated plants accumulated 30, 35, and 45% greater biomass, respectively,
compared to first position fruits of non-treated plants. Absorption of 14C-glyphosate was
not influenced by either 14C-glyphosate timing or MC treatment. Even though no
significant observations were found on node A, several numerical observations offer
support for reduced leaf expansion and increased biomass accumulation in response to MC
treatment. In node A, second position fruits on MC-treated plants contained 68% more
14C-glyphosate g-1 of dry tissue than second position fruits of non-treated plants. In
addition, numerical increases in 14C-glyphosate concentration in the leaf and stem of the
second position of node A in MC-treated plants were observed compared to the same parts
of non-treated plants. On node D, first position fruits of MC-treated plant contained nearly

88
6 and 7 times the 14C-glyphosate concentration at 0 and 21 DMC treatment compared to
the respective timing for non-treated plants. In addition, all other comparisons with first
position fruit were numerically greater with MC treatment. These data support previous
research that showed increased fruit weight and provides insight into the potential for MC
treatment to alter the source-to-sink relationship in reproductive cotton.
Nomenclature: Glyphosate, mepiquat chloride, cotton, Gossypium hirsutum L.
Key words: Photoassimilates, plant growth regulators.
Introduction
Development and retention of cotton fruits are influenced by supply and demand of
plant photoassimilates. The complex balance of these source-to-sink relationships varies
by plant position and age (Ashley 1972; Benedict and Kohel 1975) as well as
environmental conditions (Guinn 1982). Multiple researchers have investigated
photoassimilate patterns in cotton with 14CO2 (Ashley1972; Benedict and Kohel 1975;
Horrocks et al. 1978) and 14C-glyphosate (Feng and Chiu 2005). Ashley (1972) and
Horrocks et al. (1978) showed that the subtending leaf of a fruit was the primary
photoassimilate source. Furthermore, Ashley (1972) showed that at least 88% of the 14C-
photoassimilate remained in the treated sympodial branch. With different leaf morphology
of normal and superokra leaf cotton, Horrocks et al. (1978) revealed that the smaller
superokra leaves supplied 88% of the photoassimilate to the subtending fruits compared to
normal leaves, indicating that photoassimilate translocation patterns were similar
regardless of leaf morphological differences.

89
Glyphosate, a commonly used systemic herbicide, is symplastic in nature and is
translocated in the phloem following a source-to-sink relationship (Dewey and Appleby
1983; Sandberg et al. 1980; Tardif and Leroux 1993). Due to these properties, similar
patterns of glyphosate and sucrose translocation have been reported in Canada thistle
[Cirsium arvense (L.) Scop.], cotton, quackgrass [Elytrigia repens (L.) Nevski], and tall
morningglory [Ipomoea purpurea (L.) Roth.] (Dewey and Appleby 1983; Harker and
Dekker 1988; Klevorn and Wyse 1984; McAllister and Haderlie 1985; Shieh et al. 1993;
Tardif and Leroux 1993; Thomas et al. 2006). After accounting for differences in export
between glyphosate and sucrose, Thomas et al. (2006) showed that glyphosate and sucrose
were distributed equally, regardless of cotton growth stage (5- and 10- leaf). Furthermore,
Tadrif and Leroux (1993) found that glyphosate and sucrose translocation was not
significantly different in three biotypes of quackgrass. Correlations for 14C- glyphosate
and 3H-sucrose localization in tips, buds, and rhizome segments of quackgrass were 0.89,
0.93, and 0.98, respectively (Shieh et al. 1993). However, Harker and Dekker (1988) have
shown that glyphosate translocation is less than sucrose translocation, but follows a similar
translocation pattern. Other research has found similar translocation relationships between
photoassimilates and glyphosate, depending on plant species, phenological stage, and
environmental stress levels (Dewey and Appleby 1983; Klevorn and Wyse 1984;
McAllister and Haderlie 1985). However, glyphosate treatment in susceptible species may
limit its own translocation (Geiger and Bestman 1990; Hetherington et al. 1999). In order
to utilize glyphosate as a photoassimilate model, genetically engineered glyphosate-
resistant plants may be used to reduce limitation of glyphosate translocation such as in
glyphosate-susceptible cotton (Feng and Chiu 2005; Hetherington et al. 1999). A new
90
generation of glyphosate-resistant cotton (GR2) allowed glyphosate application up to
seven days before harvest, due to reported increased reproductive tolerance. By combining
the herbicidal characteristics of glyphosate and glyphosate-resistant technology in cotton,
Feng and Chiu (2005) examined glyphosate translocation as influenced by plant position to
show similar patterns of translocation from sympodial leaves to adjacent fruits.
Many cotton production systems include the use of plant growth regulators (PGRs) to
manage vegetative cotton growth. Mepiquat chloride and mepiquat pentaborate, two
onium-type growth regulators commonly used in these systems, inhibit gibberillic acid
synthesis by stopping the conversion of geranylgeranyl diphosphate to ent-kaurene,
consequently reducing cell enlargement and the rate of cell division (Rademacher 2000;
Srivastava 1993). The visual effects of these PGRs include reduced stem and leaf
expansion and cotton reaching matur ity earlier than cotton not treated with PGRs (Reddy
et al. 1990, 1996; York 1983a, 1983b). However, cotton yield responses were variable
(Kerby 1985). Since PGRs have been shown to alter cotton canopy architecture and fruit
maturity, photoassimilate translocation patterns are presumably altered by these
applications. Based on increased dry matter partitioning into fruits, Zhao and Oosterhuis
(2000) postulated that these observed differences may be due to altered photoassimilate
translocation. However, Zhao and Oosterhuis (2000) did not observe any translocation
differences of metabolized 14CO2 from the leaf into the adjacent fruit. Even though
research has not confirmed differences in photoassimilate translocation in response to MC
treatment using 14CO2 and 14C-sucrose technology, glyphosate and glyphosate-resistant
technology offer new tools for investigating photoassimilate translocation patterns in
cotton (Feng and Chiu 2005).

91
Since glyphosate movement has been correlated with sucrose movement in cotton
(Thomas et al. 2006) and multiple weed species (Dewey and Appleby 1983; Harker and
Dekker 1988; Klevorn and Wyse 1984; McAllister and Haderlie 1985; Shieh et al. 1993;
Tardif and Leroux 1993), our objectives were to evaluate translocation of glyphosate at
different timings relative to a single MC treatment.
Materials and Methods
Plant material. An experimental GR2 cotton variety was planted in 30-cm pots (9 liter
volume) containing a commercial potting medium1 and grown in a polyethylene covered
greenhouse maintained at 28 + 2 C constant temperature where natural sunlight was
supplemented 4 h daily with mercury halide lights, providing a 16-h day length. After the
8-lf stage, all plants received 300 mL of fertilizer solution2 (1.3 cm2/L) weekly.
14C-Glyphosate Treatments and Sampling. A two-factor factorial arrangement of
treatments experiment was conducted with the first factor consisting of PGR regimes of no
PGR or MC2 at 49 g ai ha-1 applied at first bloom (plants with 14 nodes). Time of 14C-
glyphosate4 spot application on 0, 7, 14, and 21 DMC application was the second factor.
14C-glyphosate at 8,333 Bq plus non- ionic surfactant5 at 0.25% (v/v) per plant was
manually applied in 10 1-uL droplets on the upper most fully expanded leaf of each plant
(Pline et al. 2001).
Prior to destructive harvests, total plant height was measured and fruit retention was
mapped for each plant. All plants were harvested at 14 d after each 14C-glyphosate timing
and were partitioned into nodes, positions within each sympodial branch, and parts within
each position. Each mainstem nodal section contained a leaf and stem section while each

92
sympodial position contained a leaf, stem, and fruit (square/boll). Fresh weight, dry
weight, and leaf area (where applicable) were recorded for each part. Absorption was
determined by rinsing the treated portion of the leaf with 10 ml of a methanol:water (1:1
v/v) plus a non-ionic surfactant5 (0.25% v/v). A 1.0-ml aliquot was taken from the leaf
rinsate, diluted in 15 ml scintillation fluid6 and radioactivity was quantified with liquid
scintillation spectrometry (LSS)7. Divided plant parts were dried for 48 h at 70 C,
weighed, and combusted with a biological sample oxidizer8. Radioactivity in the oxidized
samples was quantified by LSS. Due to the large number of samples, only a five-node
section of each plant was processed for 14C quantification. The selected regions included
the treated leaf node (node B), one node below the treated leaf (node A), and three
consecutive nodes above the treated leaf (nodes C, D, and E). 14C-glyphosate was applied
to the mainstem leaf on nodes 11 to 14, depending on 14C-application timing (Table 1).
All plant parts for the first replication were oxidized to estimate the total recovery. Based
on this estimation, at least 80% of the absorbed 14C-glyphosate was found in this five-node
section.
Experimental Design and Data Analysis. Studies were arranged in randomized complete
blocks with four replications. Studies were repeated once in time. Data were tested for
homogeneity of variance by plotting residuals. 14C-glyphosate concentration (Bq g-1 dry
tissue) was log transformed to improve homogeneity of variance. Homogeneity of other
parameters was not improved with transformations. Analysis of variance conducted using
a mixed model in SAS9 revealed no trial by treatment interaction, thus data were averaged
over trials. Data were analyzed for main effects and interactions. Mean separations were
performed on data using LS means at P=0.05.

93
Results and Discussion
Cotton morphology. No significant differences in plant height were observed for any
14C-glyphosate timing or PGR combination (Table 1). Previous research has shown height
reduction with MC under variable environmental conditions (Pettigrew and Johnson 2005;
Nichols et al. 2003; Reddy et al. 1996; Zhao and Oosterhuis 2000). The lack of cotton
height reductions in this experiment may be due to the MC application timing and
environmental conditions. Mepiquat chloride was applied at 49 g ha-1 at first bloom,
which may not provide adequate growth regulation in optimum greenhouse conditions.
Previous research has shown that multiple applications are needed in some environmental
situations to adequately limit vegetative growth (Edmisten 1994, 2004; Hake et al. 1991;
Watkins et al. 1998). Since our objective of this study was to evaluate 14C-glyphosate
translocation patterns at various time intervals following MC treatment, multiple MC
treatments were not possible.
Total fruit retention and first position fruit retention were not influenced by trial or
MC treatment, thus data were averaged over trials and MC treatment (Table 2). Total fruit
retention and first position fruit retention declined as cotton matured. On the d of MC
treatment and 21 DMC, total fruit retention was 85 and 70%, respectively. Even though all
plants retained at least 86% of all first position fruits, a significant decline was observed
from the day of MC treatment to 21 DMC treatment (92 and 86%, respectively). Fruit
abortion is commonly observed near the end of the fruiting cycle (Guinn 1982). Fruit
abortion is a normal biological response to a number of interrelated factors, including light,
temperature, water stress, insects, disease, and available nutrients (Guinn 1982).

94
Furthermore, the level of retention is based on the balance between the number of
developing fruits and leaf area of healthy leaves (Hake et al. 1991).
Even though our data did not show significant differences in fruit retention or
placement on the plant, previous research has reported greater retention on more basal
fruiting branches and lower retention on more apical fruiting branches following MC
treatment (Hake et al. 1991; Kerby et al. 1986). The ability of MC to alter fruiting patterns
is stage dependent (A.C. York, personal communication). Furthermore, Kerby et al.
(1986) reported more harvestable fruits on the first, second, and monopodial positions on
nodes 8 to 12 of MC-treated plants. With the use of MC at 49 g ha-1, York (1983a)
reported greater fruit production (fruit m-2) at 3 of 6 locations. At population of 235,000
cotton plants ha-1, York (1983b) reported a 14% increase in fruit production with the use of
MC at 49 g ha-1. In addition, Cook and Kennedy (2000) reported that MC treatment can
increase fruit retention on the second position of lower sympodial branches in response to
varying levels of fruit loss. Based on the increased fruit retention in lower portions of the
plant, Cook and Kennedy (2000) postulated that this higher retention would maintain sink
strength in the lower portion of the plant canopy, which may consequently limit further
fruit develop on higher nodes (Kerby et al. 1986).
Leaf area was not influenced by trial, 14C-glyphosate timing, or MC treatment, thus
data were averaged over trial, 14C-glyphosate timing, and MC treatment (Table 3). Leaf
area decreased with increasing nodal position. The treated leaf [the mainstem leaf
subtending nodes 11 to 14, depending on 14C-glyphosate timing (Table 1)] was 177 cm2.
Mainstem leaf area for nodes C, D, and E was 13, 28, and 45% less, respectively,
compared to the mainstem leaf subtending node B. Comparing the leaf subtending the first

95
position of each node, a similar decline in leaf size for fruiting positions was observed. In
addition to a smaller leaf size for more vertical nodal positions, leaf size on sympodial
branches was also smaller with increasing distance from the mainstem, regardless of node.
On node B, the leaf subtending the first and second position was 74 and 22 cm2,
respectively. Sadras (1995) has discussed the implications for reduced leaf area with
increasing vertical and horizontal position within the plant canopy on fruit distribution.
Mepiquat chloride treatments have been reported to reduce leaf area (Reddy et al. 1990,
1996; Zhao and Oosterhuis 2000). Total leaf area of MC-treated plants was reduced by
16% compared to non-treated plants (Reddy et al. 1996). In different temperature regimes,
Reddy et al. (1990) observed that leaf area was reduced the least in the lowest and highest
temperature regimes. However, specific leaf weight responses were variable (Reddy et al.
1990; Zhao and Oosterhuis 2000). Our data did not show any difference in specific leaf
weight or leaf area in response to MC treatment (data not shown). The timing of MC
treatment and environmental conditions may have allowed maximum leaf expansion on the
examined nodes before MC treatment.
Fresh weight was not influenced by trial or 14C-glyphosate timing, thus data were
averaged over trial and 14C-glyphosate timing (Table 4). Significant interactions between
MC treatment and plant parts were observed for node A, C, and D. All other nodes
exhibited only a plant part main effect. Fresh weight of first position fruit on MC-treated
plants was 25 and 48% greater on nodes A and C, respectively, compared to first position
fruits on non-treated plants. On node D, similar numerical differences were observed.
Even though leaf area differences were not significant for MC treatment, the mainstem leaf
of MC-treated plants weighed 17% less than the mainstem leaf of non-treated plants,

96
which may be indicative of a reduction in leaf area or a change in carbon allocation
patterns.
Dry weight was not influenced by trial or 14C-glyphosate timing, thus data were
averaged over trial and 14C-glyphosate timing (Table 5). Significant interactions between
MC treatment and plant parts were observed for nodes A, B, C, and D. Similar to fresh
weights of plants parts, first position fruits on nodes A, B, and C of MC-treated plants
accumulated 30, 35, and 45% greater biomass, respectively, compared to first position
fruits of non-treated plants. Conversely, the mainstem leaf of nodes B, C, and D of MC-
treated plant accumulated 16, 13, and 16% less biomass, respectively, compared to the
corresponding mainstem leaves of non-treated plants. Research has shown significant
increases in reproductive biomass production in response to MC treatments (Hake et al.
1991; Kerby et al. 1986; Pettigrew and Johnson 2005; Sawan and Sakr 1990; York 1983,
1983b; Zhao and Oosterhuis 2000). At 5 of 8 locations and averaged over 14 varieties,
York (1983a) reported significant fruit weight (g fruit-1) increases ranging from 3 to 10%
in response to MC treatment. York (1983b) reported similar increases (3 to 6%) in fruit
weight (g fruit-1) at 4 of 5 locations, averaged over nitrogen rates and plant population. A
more detailed analysis of fruit composition revealed an increase in seed weight with MC
treatments, which accounted for 75% of the increase in fruit weight (York 1983a). Zhao
and Oosterhuis (2000) reported similar increases in fruit weight and reduced lint fraction
for various MC formulations, depending on year and location. For vegetative parts, Zhao
and Oosterhuis showed no differences for dry weight of leaves and petioles (% of total dry
weight) between MC formulations and non-treated plants at Carbondale, AR in 1997.

97
14C-Glyphosate Translocation. Absorption of 14C-glyphosate was not influenced by
either 14C-glyphosate timing or MC treatment (Table 1). Absorption of 14C-glyphosate
ranged from 89 to 95% of the applied. Pline et al. (2001) showed that 10 to 44% of the
applied 14C-glyphosate remained in the leaf wash, depending on the treatment timing and
harvest interval. Due to the treatment placement (fourth most apical mainstem leaf), all
leaves were near the same phenological stage of development, which limited the variability
of 14C-glyphosate absorption associated with difference in leaf age (Feng and Chui 2005).
14C-glyphosate translocation from the source leaf varied by node, position within
sympodia, and plant parts within each position (Table 6). For 14C-glyphosate
concentration, the plant parts within positions were highly (>0.01) significant at all
evaluated nodes. Except for the treated leaf node (node B), the mainstem plant parts
generally contained less 14C-glyphosate compared to plant parts on the sympodial branch
(Table 7). On nodes C and D, all second position parts contained greater 14C-glyphosate
concentrations than any other plant tissue within each node. As shown by previous work
(Pline et al. 2001; Sandberg et al. 1980; Viator et al. 2003), 14C-glyphosate is transported
to actively growing tissue like the expanding leaf, stem, and fruit of the second position.
When 14C-glyphosate was applied to mainstem leaf subtending node 9, 22 and 9% of the
applied 14C-glyphosate was exported to the plant and sympodial branch, respectively (Feng
and Chiu 2005). However, when glyphosate was applied to the leaf subtending the first
position on node 9, similar 14C-glyphosate distribution to the plant and sympodial branch
was observed (Feng and Chiu 2005).
A 14C-glyphosate timing by position and plant part interaction was shown for node A
(p=0.1) and C (p=0.05) while a MC treatment by position and plant part interaction was

98
observed for node A (p=0.1) (Table 6). Several observations offer support for reduced leaf
expansion (Reddy et al. 1990, 1996; Zhao and Oosterhuis 2000) and increased biomass
accumulation (Hake et al. 1991; Kerby et al. 1986; Pettigrew and Johnson 2005; Sawan
and Sakr 1990; York 1983, 1983b; Zhao and Oosterhuis 2000) in response to MC
treatment (Table 8). Numerically, the mainstem leaf of non-treated and MC-treated plants
accumulated 136 and 38 Bq g-1 dry tissue, respectively. In non-treated plants, leaf
expansion may have been occurring, which required more photoassimilate compared to
non-expanding leaf tissue of MC-treated plants. Second position fruits on MC-treated
plants contained 68% more 14C-glyphosate g-1 of dry tissue than second position fruits of
non-treated plants. In addition, numerical increases in 14C-glyphosate concentration in the
leaf and stem of the second position of MC-treated plants were observed compared to the
same parts of non-treated plants. Even though the weight of plant parts was not different
on the second position, these data indicate that these parts in MC-treated plants were
stronger sinks compared to non-treated plants. Futhermore, the larger fruit weight on the
first position fruit may have maintained the sink strength in the lower portion of the plant
canopy (Cook and Kennedy 2000), allowing for greater 14C-glyphosate translocation into
the expanding tissues of the second position of MC-treated plants. Investigations with
flurprimidol, another gibberillic acid synthesis inhibitor, on 8-wk old Canada thistle
revealed greater translocation of 14C-sucrose (75% of applied) following flurprimidol at
0.54 kg ai ha-1 followed by glyphosate at 2.24 kg ai ha-1 (7 wk after the flurprimidol
treatment) compared to plants receiving only glyphosate (58%) (Tworkoski et al. 1992).
Based on these data (Tworkoski 1992), flurprimidol significantly altered the translocation
of photoassimilates compared to non-treated plants.

99
A 14C-glyphosate timing by MC treatment by position and plant part interaction was
observed for node C (p=0.05) and D (p=0.01). MC-treated plants had greater 14C-
glyphosate concentration in first position fruits at 0 and 7 DMC on node C and D,
respectively, compared to non-treated plants (Table 9). On node D, first position fruits of
MC-treated plants contained nearly 6 and 7 times the 14C-glyphosate concentration at 0 and
21 DMC treatment compared to the respective timing for non-treated plants. In addition,
all other comparisons with first position fruit were numerically greater with MC treatment.
Even though few observations were significant, several trends were apparent. Comparing
the stems on the first position of node C, stem of MC-treated plants contained numerically
greater 14C-glyphosate concentrations, regardless of 14C-glyphosate timing. This greater
concentration of 14C-glyphosate may be indicative of greater translocation to either the
adjacent fruit and more distal plant parts, which were active sinks (Table 7).
Even though plant height, leaf area, or specific leaf weights were not significantly
influenced by MC treatment, fresh and dry weight of plant parts and 14C-glyphosate
translocation were influenced by MC treatment. Plants treated with MC caused increased
biomass accumulation in the first position fruits on nodes A, B, and C compared to fruits
on non-treated plants. Similar numerical increases were observed for fruit dry weight on
node D. Since leaf age was similar among 14C-glyphosate treatments, absorption was not
influenced by treatment timing. 14C-glyphosate concentration was influenced by MC
treatment (node A) and MC treatment by 14C-glyphosate timing (nodes C and D).
Increased 14C-glyphosate concentrations were observed in response to MC treatment in
these nodes. These data support previous research that showed increased fruit weight and
provides insight into the potential for MC treatment to alter the source-to-sink relationship

100
in reproductive cotton and utility of using glyphosate to study photoassimilate
translocation patterns in GR2 cotton.
Sources of Materials 1 MetroMix 200, Sun Gro Horticulture, 15831 N.E. 8th Street, Suite 100, Bellevue, WA
98008.
2 Peters Professional 20-20-20 General Purpose, The Scotts Company, 14111 Scottslawn
Road, Marysville, OH 43041.
3 Mepichlor, Micro Flo Company, P. O. Box 772099, Memphis, TN 38117.
4 14C-glyphosate G-8392, Sigma Chemical Co., P. O. Box 14508, St. Louis, MO
63178.
5 Induce (mixture of alkyl polyoxylkane ether, free fatty acids, and isopropanol), Helena
Chemical Co., 5100 Popular Avenue, Memphis, TN 38137.
6 Scintiverse® SX18-4 Universal Liquid Scintillation Cocktail, Fisher Scientific, 1
Regeant Road, Fair Lawn, NJ 07410.
7 Packard Tri-Carb 2100TR Liquid Scintillation Spectrometer, Packard Instrument Co.,
220 Warrenville Rd., Downers Grove, IL 60515.
8 Model OX500 Biological Material Oxidizer, R. J. Harvey Instrument Corp., 123
Patterson St., Hillsdale, NJ 07642.
9 [SAS] Statistical Analysis Systems software, Ver. 8., SAS Institute, Inc., Box 8000,
SAS Circle, Cary, NC 27513.

101
Acknowledgements
The authors thank Ian Burke, Wesley Everman, Abigail Mayhew, Cassandra Mayhew,
Diana Thomas, Caitlyn Wilcut, and Jared Wilcut for greenhouse and laboratory assistance.
Appreciation is also extended to Cavell Brownie, professor of statistics, for review of
statistical procedures and to Cotton Incorporated and the North Carolina Cotton Growers
Association for partial funding of this research.
102
Literature Cited
Ashley, D. A. 1972. 14C-labelled photosynthate translocation and utilization in cotton
plants. Crop Sci. 12:69-74.
Benedict, C. R. and R. J. Kohel. 1975. Export of 14C-assimilates in cotton leaves. Crop
Sci. 15:367-372.
Cook, D. R. and C. W. Kennedy. 2000. Early flower bud loss and mepiquat chloride
effects on cotton yield distribution. Crop Sci. 40:1678-1684.
Dewey, S. A. and A. P. Appleby. 1983. A comparison between glyphosate and assimilate
translocation patterns in tall morningglory (Ipomoea purpurea). Weed Sci. 31:308-
314.
Edmisten, K. L. 1994. The use of plant monitoring techniques as an aid in determining
mepiquat chloride rates in rain fed cotton. In G. A. Constable and N. W. Forrester
eds. Proceedings of the World Cotton Research Conference. pp. 25-28.
Edmisten, K. L. 2004. Suggestions for growth regulator use. In 2004 Cotton Information
AG-417. NC Cooperative Extension Service, Raleigh, NC. pp. 56-62.
Feng, P.C.C. and T. Chiu. 2005. Distribution of [14C]glyphosate in mature glyphosate-
resistant cotton from application to a single leaf or over-the-top spray. Pest. Biochem.
Physiol. 82:36-45.
Geiger, D. R. and H. D. Bestman. 1990. Self- limitation of herbicide mobility by
phytotoxic action. Weed Sci. 38:324-329.
Guinn, G. 1982. Causes of square and boll shedding in cotton. USDA Tech. Bull. 1672.
U.S. Government Printing Office, Washington, D.C. pp. 1-22.

103
Hake, K., T. Kerby, W. McCarty, D. O’Neal, and J. Supak. 1991. Physiology of PIX. In
Physiology Today – Newsletter of the Cotton Physiology Education Program Vol.2
(6). National Cotton Council: Memphis, TN.
Harker, K. N. and J. Dekker. 1988. Effects of phenology on translocation patterns of
several herbic ides in quackgrass, Agropyron repens. Weed Sci. 36:463-472.
Hetherington, P. R., T. L. Reynolds, G. Marshall, and R. C. Kirkwood. 1999. The
absorption, translocation and distribution of the herbicide glyphosate in maize
expressing the CP-4 transgene. J. Exper. Bot. 50:1567-1576.
Horrocks, R. D., T. A. Kerby, and D. R. Buxton. 1978. Carbon source for developing
bolls in normal and superokra leaf cotton. New Phytol. 80:335-340.
Jenkins, J. N., J. C. McCarty, Jr., and W. L. Parrott. 1990. Effectiveness of fruiting sites
in cotton: yield. Crop Sci. 30:365-369.
Kerby, T. A. 1985. Cotton response to mepiquat chloride. Agron. J. 77:515-518.
Kerby, T. A., K. Hake, and M. Keeley. 1986. Cotton fruiting modification with mepiquat
chloride. Agron. J. 78:907-912.
Klevorn, T. B. and D. L. Wyse. 1984. Effect of soil temperature and moisture on
glyphosate and photoassimilate distribution in quackgrass (Agropyron repens). Weed
Sci. 32:402-407.
McAllister, R. S. and L. C. Haderlie. 1985. Translocation of 14C-glyphosate and 14CO2 –
labeled photoassimilates in Canada thistle (Cirsium arvense). Weed Sci. 33:153-159.
Nichols, S. P., C. E. Snipes, and M. A. Jones. 2003. Evaluation of row spacing and
mepiquat chloride in cotton. J. Cotton Sci. 7:148-155 [online]. Available at
http://www.cotton.org/journal/. Accessed April 11, 2006.

104
Pettigrew, W. T. and J. T. Johnson. 2005. Effects of different seeding rates and plant
growth regulators on early-planted cotton. J. Cotton Sci. 9:189-198 [online].
Available at http://www.cotton.org/journal/. Accessed April 11, 2006.
Pline, W. A., A. J. Price, J. W. Wilcut, K. L. Edmisten, and R. Wells. 2001. Absorption
and translocation of glyphosate in glyphosate-resistant cotton as influenced by
application method and growth stage . Weed Sci. 49:460-467.
Rademacher, W. 2000. Growth retardants: effects on gibberellin biosynthesis and other
metabolic pathways. Ann. Rev. Plant Physiol. Mole. Biol. 51:501-531.
Reddy, V. R, D. N. Baker, and H. F. Hodges. 1990. Temperature and mepiquat chloride
effects on cotton canopy architecture. Agron. J. 82:190-195.
Reddy, A. R., K. R. Reddy, and H. F. Hodges. 1996. Mepiquat chloride (PIX)- induced
changes in photosynthesis and growth of cotton. Plant Growth Regul. 20:179-183.
Sadras, V. O. 1995. Compensatory growth in cotton after loss of reproductive organs.
Field Crop Res. 40:1-18.
Sandberg, C. L., W. F. Meggitt, and D. Penner. 1980. Absorption, translocation, and
metabolism of 14C-glyphosate in several weed species. Weed Res. 20:195-200.
Sawan, Z. M. and R. A. Sakr. 1990. Response of Egyptian cotton (Gossypium
barbadense) yield to 1, 1-dimethyl piperidinium chloride (PIX). J. Agric. Sci.
114:335-338.
Shieh, W., D. R. Geiger, and S. R. Buczynski. 1993. Distribution of imported glyphosate
in quackgrass (Elytrigia repens) rhizomes in relation to assimilate accumulation.
Weed Sci. 41:7-11.

105
Srivastava, L. M. 1993. Gibberellins. In Plant Growth and Development. Academic
Press: New York. 2002. pp. 172-181.
Tardif, F. J. and G. D. Leroux. 1993. Translocation of glyphosate, quizalofol, and sucrose
in quackgrass (Elytrigia repens) biotypes. Weed Sci. 41:341-346
Thomas, W. E., I. C. Burke, C. H. Koger, and J. W. Wilcut. 2006. Absorption and
translocation of glyphosate and sucrose in glyphosate-resistant cotton. Weed Technol.
Submitted.
Tworkoski, T. J. and J. P. Sterrett. 1992. Phytotoxic effects, regrowth, and 14C-sucrose
translocation in Canada thistle with mefluidide, flurprimidol, and systemic herbicides.
J. Plant Growth Regul. 11:105-111.
Viator, R. P., S. A. Senseman, and J. T. Cothren. 2003. Boll abscission responses of
glyphosate-resistant cotton (Gossypium hirsutum) to glyphosate. Weed Technol.
17:571-575.
Watkins, K. B., Y. C. Lu, and V. R. Reddy. 1998. An economic evaluation of alternative
pix application strategies for cotton production using GOSSYM/COMAX. Comp.
Electron. Agric. 20:251-262.
York, A. C. 1983a. Cotton cultivar response to mepiquat chloride. Agron. J. 75: 663-
667.
York, A. C. 1983b. Response of cotton to mepiquat chloride with varying levels N
rates and plant populations. Agron. J. 75:667-672.
Zhao D. and D. M. Oosterhuis. 2000. Pix Plus and mepiquat chloride effects on
physiology, growth, and yield of field-grown cotton. J. Plant Growth Regul. 19:415-
422.

106
Table 1. Interaction of 14C-glyphosate timing and mepiquat chloride on the total plant height at harvest, treated leaf node, and
absorption of 14C-glyphosate, averaged over trials.
Timinga PGRb Plant height Treated leaf node Absorption DMC Mean SEMc Mean SEM Mean SEM ____________ cm
____________ _____ Nodal number _____ ______ % of applied
______
0 None 125.4 4.77 11.1 0.23 89.3 2.77 0 MC 130.3 6.48 12.5 0.5 94.1 1.29 7 None 125.1 4.02 12.6 0.42 93.3 1.21 7 MC 130.6 3.14 12.1 0.23 94.0 0.82 14 None 124.3 1.87 11.6 0.37 92.3 1.45 14 MC 126.6 5.00 12.9 0.4 94.6 0.80 21 None 126.8 4.35 12.9 0.55 93.6 0.73 21 MC 129.2 5.69 13.6 0.32 93.7 1.73 LSD (0.05) NS 0.48 NS a 14C-glyphosate at 8,333 Bq plus non- ionic surfactant at 0.25% (v/v) per plant was manually applied in ten 1-uL droplets on
the upper most fully expanded leaf of each plant. Applications were made at 0 [day of mepiquat chloride (MC) applications], 7,
14, and 21 d after MC treatment (DMC).
b PGR regimes were no PGR (none) or MC at 49 g ai ha-1 applied at first bloom (MC).
c Standard error of the mean.

107
Table 2. 14C-glyphosate timing main effect on total fruit retention and first position fruit
retention, averaged over trials and mepiquat chloride regime.
Timinga Total fruit retention 1st position fruit retention DMC Mean SEMc Mean SEM _________________________________ % _________________________________ 0 84.8 4.9 92.1 3.0 7 86.7 4.4 92.8 3.6 14 88.0 3.6 98.7 0.9 21 70.1 5.7 85.9 3.9 LSD (0.05) 13.9 9.5 a 14C-glyphosate at 8,333 Bq plus non- ionic surfactant at 0.25% (v/v) per plant was
manually applied in ten 1-uL droplets on the upper most fully expanded leaf of each plant.
Applications were made at 0 [day of mepiquat chloride (MC) applications], 7, 14, and 21 d
after MC treatment (DMC).
b Standard error of the mean.

108
Table 3. Interaction of nodal position and leaf position within sympodia on leaf area, averaged over trials, 14C-glyphosate
timing, and mepiquat chloride.
Position Leaf area
Node Aa Node Bb Node C Node D Node E _____________________________________________________ cm2 _____________________________________________________
Mainstem 197 a 177 a 155 a 127 a 97 a
First 84 b 74 b 57 b 34 b 13 b
Second 35 c 22 c 4 c 2 c .
a Means within a column followed by the same letter are not different according to LSD test at P=0.05.
b All node letters have been arbitrarily defined. Node A is one node below the treated leaf while nodes C, D, and E are one,
two, and three nodes above the treated leaf, respectively. Node B is the site of 14C-glyphosate application, with actual nodal
values shown in Table 1.

109
Table 4. Interaction of mepiquat chloride and sympodial position for fresh weight of the various cotton parts within each
position on nodes A, C and D, averaged over trials and 14C-glyphosate timing. For nodes B and E, fresh weight is presented by
the various cotton parts within sympodial position, averaged over trials, 14C-glyphosate timing, and mepiquat chloride.a
PGRb Position Part Fresh weight regime Node Acd Node B Node C Node D Node E _______________________________________________________ g _______________________________________________________ None Mainstem Leaf 5.46 c 4.68 a 3.85 a None Mainstem Stem 2.34 d 1.26 cde 0.85 cd None First Leaf 1.92 def 1.54 cd 0.76 cd None First Stem 0.97 efg 0.65 efg 0.44 ef None First Fruit 7.80 b 1.72 c 0.88 cd None Second Leaf 0.76 efg 0.15 g 0.06 gh None Second Stem 0.33 g 0.12 g 0.04 gh None Second Fruit 0.72 efg 0.28 g 0.08 gh MC Mainstem Leaf 5.03 c 4.10 a 3.18 b MC Mainstem Stem 2.03 de 0.97 def 0.59 def MC First Leaf 1.96 de 1.24 cde 0.66 cde MC First Stem 1.03 defg 0.57 fg 0.34 fg MC First Fruit 10.43 a 3.31 b 0.95 c MC Second Leaf 0.64 fg 0.17 g 0.04 h MC Second Stem 0.24 g 0.08 g 0.03 h MC Second Fruit 0.87 efg 0.18 g 0.08 gh Mainstem Leaf 4.88 b 2.52 a Mainstem Stem 1.68 c 0.38 b First Leaf 1.78 c 0.25 bc First Stem 0.84 d 0.20 c First Fruit 5.71 a 0.40 b Second Leaf 0.42 d 0.01 d Second Stem 0.19 d 0.01 d Second Fruit 0.56 d 0.02 d a Abbreviation: MC, mepiquat chloride; PGR, plant growth regulator.
b PGR regimes were no PGR (none) or MC at 49 g ai ha-1 applied at first bloom (MC).
110
Table 4 (continued)
c All node letters have been arbitrarily defined. Node A is one node below the treated leaf while nodes C, D, and E are one,
two, and three nodes above the treated leaf, respectively. Node B is the site of 14C-glyphosate application, with actual nodal
values shown in Table 1.
d Means within a column followed by the same letter are not different according to LSD test at P=0.05.

111
Table 5. Interaction of mepiquat chloride and sympodial position for dry weight of the various cotton parts within each position
on nodes A, B, C, and D, averaged over trials and 14C-glyphosate timing. For node E, dry weight is presented by the various
cotton parts within sympodial position, averaged over trials, 14C-glyphosate timing, and mepiquat chloride.a
PGRb Position Part Dry weight regime Node Acd Node B Node C Node D Node E _______________________________________________________ g _______________________________________________________ None Mainstem Leaf 1.18 b 1.21 a 1.04 a 0.82 a None Mainstem Stem 0.67 c 0.50 d 0.32 d 0.16 c None First Leaf 0.43 cde 0.41 de 0.30 d 0.16 c None First Stem 0.30 def 0.27 efg 0.17 ef 0.09 d None First Fruit 1.31 b 0.69 c 0.29 d 0.16 c None Second Leaf 0.16 ef 0.09 hi 0.04 h 0.01 ef None Second Stem 0.07 f 0.04 I 0.02 h 0.01 f None Second Fruit 0.13 f 0.10 ghi 0.05 gh 0.02 ef MC Mainstem Leaf 1.15 b 1.02 b 0.90 b 0.69 b MC Mainstem Stem 0.62 c 0.44 de 0.26 def MC First Leaf 0.44 cd 0.37 def 0.26 de 0.13 cd MC First Stem 0.32 def 0.23 fgh 0.15 fg 0.08 de MC First Fruit 1.87 a 1.06 ab 0.53 c 0.16 c MC Second Leaf 0.14 f 0.09 hi 0.03 h 0.01 f MC Second Stem 0.06 f 0.04 i 0.01 h 0.00 f MC Second Fruit 0.13 f 0.10 ghi 0.04 h 0.02 f Mainstem Leaf 0.49 a Mainstem Stem 0.06 bc First Leaf 0.06 bc First Stem 0.03 cd First Fruit 0.08 b Second Leaf Second Stem Second Fruit a Abbreviation: MC, mepiquat chloride; PGR, plant growth regulator.
b PGR regimes were no PGR (none) or MC at 49 g ai ha-1 applied at first bloom (MC).

112
Table 5 (continued)
c All node letters have been arbitrarily defined. Node A is one node below the treated leaf while nodes C, D, and E are one,
two, and three nodes above the treated leaf, respectively. Node B is the site of 14C-glyphosate application, with actual nodal
values shown in Table 1.
d Means within a column followed by the same letter are not different according to LSD test at P=0.05.

113
Table 6. The levels of significant difference for the main effects and their interactions on
14C-glyphosate concentration in cotton for each node.
Nodea
A B C D E
14C- timing NS NS NS NS NS
PGR regime NS NS NS NS NS
14C- timing * PGR regime NS NS NS NS NS
position_partb *** *** *** *** ***
14C- timing *position_part * NS ** NS NS
PGR regime *position_part * NS NS NS NS
14C- timing * PGR regime *position_part NS NS ** *** NS
a *, **, ***, Significantly different at the 0.1, 0.05, and 0.01 probability level,
respectively, using a mixed model in SAS.
b Prior to analysis, the data representation for each position and parts within each
position were merged to simplify data analysis.
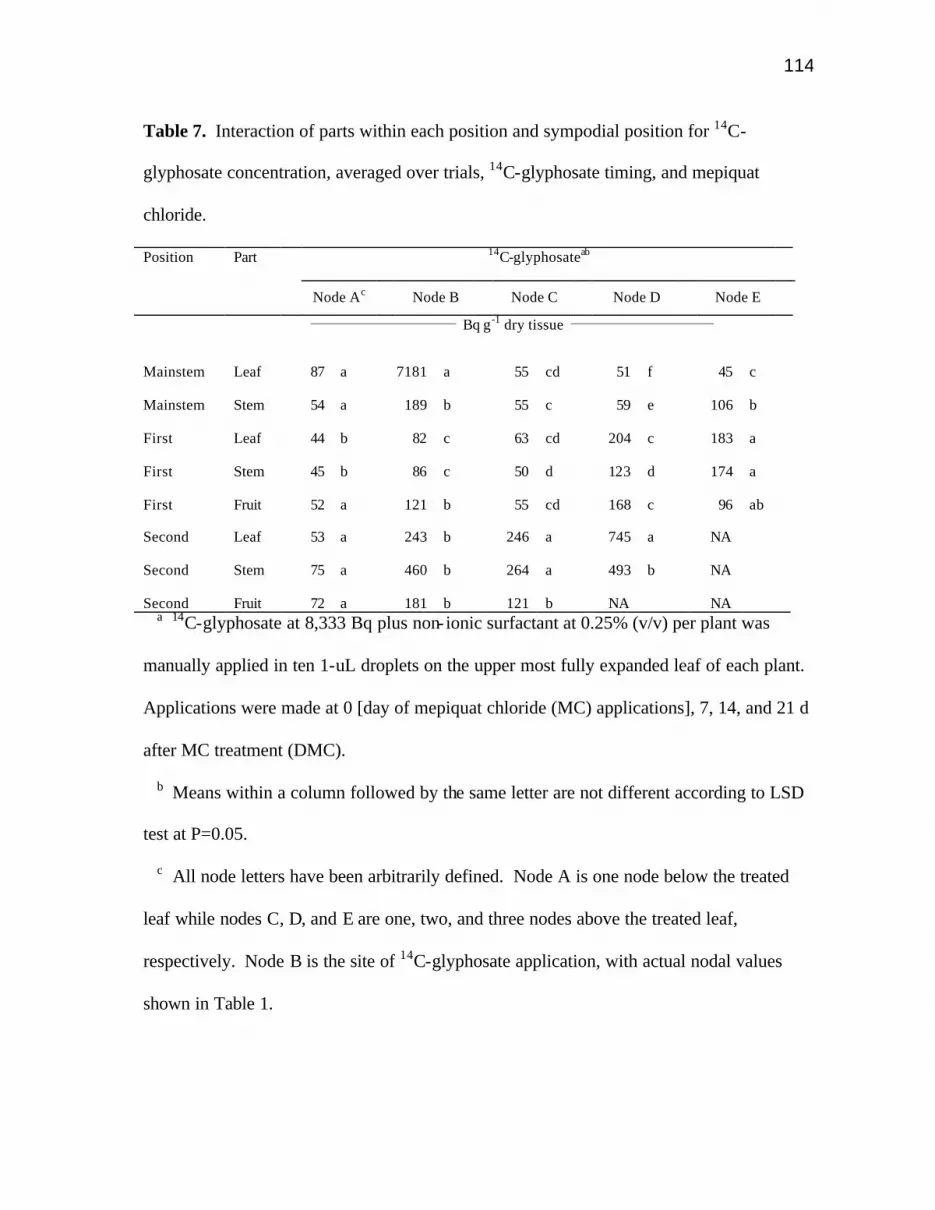
114
Table 7. Interaction of parts within each position and sympodial position for 14C-
glyphosate concentration, averaged over trials, 14C-glyphosate timing, and mepiquat
chloride.
Position Part 14C-glyphosateab
Node Ac Node B Node C Node D Node E
_____________________________ Bq g-1 dry tissue _____________________________
Mainstem Leaf 87 a 7181 a 55 cd 51 f 45 c
Mainstem Stem 54 a 189 b 55 c 59 e 106 b
First Leaf 44 b 82 c 63 cd 204 c 183 a
First Stem 45 b 86 c 50 d 123 d 174 a
First Fruit 52 a 121 b 55 cd 168 c 96 ab
Second Leaf 53 a 243 b 246 a 745 a NA
Second Stem 75 a 460 b 264 a 493 b NA
Second Fruit 72 a 181 b 121 b NA NA a 14C-glyphosate at 8,333 Bq plus non- ionic surfactant at 0.25% (v/v) per plant was
manually applied in ten 1-uL droplets on the upper most fully expanded leaf of each plant.
Applications were made at 0 [day of mepiquat chloride (MC) applications], 7, 14, and 21 d
after MC treatment (DMC).
b Means within a column followed by the same letter are not different according to LSD
test at P=0.05.
c All node letters have been arbitrarily defined. Node A is one node below the treated
leaf while nodes C, D, and E are one, two, and three nodes above the treated leaf,
respectively. Node B is the site of 14C-glyphosate application, with actual nodal values
shown in Table 1.

115
Table 8. Interaction of mepiquat chloride and sympodial position for 14C-glyphosate
concentration in the various cotton parts within each position for node A, averaged over
trials.a
PGRab Position Part 14C-glyphosate regime Node Ac Bq g-1 dry tissue None Mainstem Leaf 136 f None Mainstem Stem 51 bcd None First Leaf 41 f None First Stem 47 f None First Fruit 49 b-e None Second Leaf 50 b-e None Second Stem 60 b-e None Second Fruit 35 c-f MC Mainstem Leaf 38 ef MC Mainstem Stem 57 bc MC First Leaf 47 def MC First Stem 42 ef MC First Fruit 56 bc MC Second Leaf 56 bc MC Second Stem 89 b MC Second Fruit 109 a a Abbreviation: MC, mepiquat chloride; PGR, plant growth regulator.
b PGR regimes were no PGR (none) or MC at 49 g ai ha-1 applied at first bloom (MC).
c Means within a column followed by the same letter are not different according to LSD
test at P=0.10.

116
Table 9. Interaction of 14C-glyphosate timing, mepiquat chloride, and sympodial position
for 14C-glyphosate concentration in the various cotton parts within each position, averaged
over trials.a
Timinga PGRbc Position Part 14C-glyphosate DMC regime Node Cde Node D ________________ Bq g-1 dry tissue ______________ 0 None Mainstem Leaf 71 ef 113 e 7 None Mainstem Leaf 38 ef 96 e 14 None Mainstem Leaf 61 ef 121 e 21 None Mainstem Leaf 74 ef 344 bcde 0 MC Mainstem Leaf 42 ef 258 bcde 7 MC Mainstem Leaf 64 ef 117 e 14 MC Mainstem Leaf 54 ef 128 de 21 MC Mainstem Leaf 38 ef 166 bcde 0 None Mainstem Stem 58 ef 73 e 7 None Mainstem Stem 51 ef 100 e 14 None Mainstem Stem 42 ef 89 e 21 None Mainstem Stem 50 ef 137 de 0 MC Mainstem Stem 56 ef 729 b 7 MC Mainstem Stem 58 ef 85 e 14 MC Mainstem Stem 54 ef 143 de 21 MC Mainstem Stem 131 ef 273 bcde 0 None First Leaf 42 ef 68 e 7 None First Leaf 59 ef 92 e 14 None First Leaf 41 ef 78 e 21 None First Leaf 44 ef 85 e 0 MC First Leaf 80 ef 225 de 7 MC First Leaf 59 ef 86 e 14 MC First Leaf 28 f 105 e 21 MC First Leaf 43 ef 245 bcde 0 None First Stem 68 ef 210 de 7 None First Stem 55 ef 159 de 14 None First Stem 62 ef 173 de 21 None First Stem 81 ef 196 bcde 0 MC First Stem 213 cdef 181 bcde 7 MC First Stem 114 ef 153 de 14 MC First Stem 282 bcde 243 bcde 21 MC First Stem 92 cdef 1784 a 0 None First Fruit 146 cdef 278 bcde 7 None First Fruit 218 cdef 384 bcde 14 None First Fruit 206 cdef 643 bcd 21 None First Fruit 341 bcd 273 bcde

117
Table 9 (continued) 0 MC First Fruit 81 ef 1603 a 7 MC First Fruit 350 bc 222 cde 14 MC First Fruit 470 ab 773 bc 21 MC First Fruit 162 cdef 1796 a 0 None Second Leaf 203 cdef 185 de 7 None Second Leaf 348 abcd 466 bcde 14 None Second Leaf 164 cdef 423 bcde 21 None Second Leaf 220 cdef 210 bcde 0 MC Second Leaf 108 def 259 bcde 7 MC Second Leaf 364 abc 253 bcde 14 MC Second Leaf 567 a 356 bcde 21 MC Second Leaf 138 cdef 0 None Second Stem 21 f 44 e 7 None Second Stem 50 ef 47 e 14 None Second Stem 52 ef 41 e 21 None Second Stem 47 ef 56 e 0 MC Second Stem 73 ef 47 e 7 MC Second Stem 71 ef 52 e 14 MC Second Stem 56 ef 61 e 21 MC Second Stem 72 ef 63 e 0 None Second Fruit 43 ef 55 e 7 None Second Fruit 48 ef 48 e 14 None Second Fruit 52 ef 46 e 21 None Second Fruit 58 ef 70 e 0 MC Second Fruit 56 ef 43 e 7 MC Second Fruit 66 ef 71 e 14 MC Second Fruit 45 ef 67 e 21 MC Second Fruit 70 ef 70 e a 14C-glyphosate at 8,333 Bq plus non- ionic surfactant at 0.25% (v/v) per plant was
manually applied in ten 1-uL droplets on the upper most fully expanded leaf of each plant.
Applications were made at 0 [day of mepiquat chloride (MC) applications], 7, 14, and 21 d
after MC treatment (DMC).
b Abbreviation: MC, mepiquat chloride; PGR, plant growth regulator.
c PGR regimes were no PGR (none) or MC at 49 g ai ha-1 applied at first bloom (MC).
d All node letters have been arbitrarily defined. Node A is one node below the treated
leaf while nodes C, D, and E are one, two, and three nodes above the treated leaf,
118
Table 9 (continued)
respectively. Node B is the site of 14C-glyphosate application, with actual nodal values
shown in Table 1.
e Means within a column followed by the same letter are not different according to LSD
test at P=0.05.

119
Thomas et al: Glyphosate translocation as influenced by cotton growth regulators.
Translocation of 14C-glyphosate as influenced by various plant growth regulators in
cotton.
Walter E. Thomas
Yvonna S. Sheldon
Whitnee B. Askew
Crop Science Department, Box 7620, North Carolina State University, Raleigh, NC 27695-
7620
Clifford H. Koger
Crop Genetics and Production Research, USDA-ARS, Stoneville, MS 38776
John W. Wilcut
Corresponding author. Crop Science Department, Box 7620, North Carolina State
University, Raleigh, NC 27695-7620; [email protected]
Received and approved.

120
Abstract: Studies examined various morphological characteristics and 14C-glyphosate
translocation in cotton as influenced by cotton plant growth regulator regimes [none,
mepiquat chloride (MC), mepiquat pentaborate (MP)] and source leaf (14C-glyphosate was
applied to mainstem and sympodial leaves). Mepiquat chloride and MP reduced cotton
height by 13 and 20%, respectively, compared to non-treated plants. Mepiquat chloride
and MP reduced the number of mainstem nodes by 1.4 and 1.9 nodes plant-1, respectively,
compared to non-treated plants. Total fruit retention, first position fruit retention, low
sympodial fruit retention (nodes 6-10), high sympodial fruit retention (nodes 11-15), and
the location of the first sympodial branch were not influenced by either 14C-glyphosate
treatment or cotton PGR regime. On node 19, MC and MP reduced the leaf area of the
mainstem leaf by 59 and 73%, compared to the mainstem leaf of non-treated plants. This
observed reduction may be partially influenced by the reduction in cotton height and the
number of nodes. Leaf area at other positions was only influenced by node and position
within nodes. Absorption of 14C-glyphosate was not influenced by either 14C-glyphosate
placement or cotton PGR regime. Based on these data, MC and MP do not influence 14C-
glyphosate translocation, which presumably indicates no direct influence on
photoassimilate translocation.
Nomenclature: Glyphosate, mepiqua t chloride, mepiquat pentaborate, cotton, Gossypium
hirsutum L.
Key words: Translocation, photoassimilates.

121
Introduction
Development and retention of cotton fruits are influenced by supply and demand of
photoassimilates. The complex balance of these source-to-sink relationships varies by
plant position and age (Ashley 1972; Benedict and Kohel 1975) as well as environmental
conditions (Guinn 1982). Multiple researchers have investigated photoassimilate patterns
in cotton with 14CO2 (Ashley 1972; Benedict and Kohel 1975; Horrocks et al. 1978) and
14C-glyphosate (Feng and Chiu 2005). Ashley (1972) and Horrocks et al. (1978) showed
that the subtending leaf of a fruit was its primary photoassimilate source. Furthermore,
Ashley (1972) showed that at least 88% of the 14C-photoassimilate remained in the treated
sympodial branch. With different leaf morphology of normal and superokra leaf cotton,
Horrocks et al. (1978) found that the smaller superokra leaves supplied 88% of the
photoassimilate to the subtending fruits compared to normal leaves, indicating that
photoassimilate translocation patterns are similar regardless of leaf morphological
differences.
Glyphosate, a commonly used systemic herbicide, is translocated in the phloem
following a source-to-sink relationship (Dewey and Appleby 1983; Sandberg et al. 1980;
Tardif and Leroux 1993). Due to these properties, similar patterns of glyphosate and
sucrose translocation have been reported in Canada thistle [Cirsium arvense (L.) Scop.],
cotton, quackgrass [Elytrigia repens (L.) Nevski], and tall morningglory [Ipomoea
purpurea (L.) Roth.] (Dewey and Appleby 1983; Harker and Dekker 1988; Klevorn and
Wyse 1984; McAllister and Haderlie 1985; Shieh et al. 1993; Tardif and Leroux 1993;
Thomas et al. 2006). After accounting for differences in export between glyphosate and
sucrose, Thomas et al. (2006) showed that glyphosate and sucrose were distributed equally,
122
regardless of cotton growth stage (5- and 10- leaf). Furthermore, Tadrif and Leroux (1993)
found that glyphosate and sucrose translocation was not significantly different in three
biotypes of quackgrass. Correlations for 14C- glyphosate and 3H-sucrose localization in
tips, buds, and rhizome segments of quackgrass were 0.89, 0.93, and 0.98, respectively
(Shieh et al. 1993). However, Harker and Dekker (1988) have shown that glyphosate
translocation is less than sucrose translocation in quackgrass, but follows a similar
translocation pattern. Other research has found similar translocation relationships between
photoassimilates and glyphosate, depending on plant species, phenological stage, and
environmental stress levels (Dewey and Appleby 1983; Klevorn and Wyse 1984;
McAllister and Haderlie 1985). However, glyphosate treatment in susceptible species may
limit its own translocation (Geiger and Bestman 1990; Hetherington et al. 1999). In order
to utilize glyphosate as a photoassimilate model, genetically engineered glyphosate-
resistant plants may be used to limit this phenomenon (Feng and Chiu 2005; Hetherington
et al. 1999). A new generation of glyphosate-resistant cotton (GR2) allowed glyphosate
application up 7 day before harvest due to reported increased reproductive tolerance. By
combining the herbicidal characteristics of glyphosate and glyphosate-resistant technology
in cotton, Feng and Chiu (2005) examined glyphosate translocation as influenced by plant
position to show similar patterns of translocation from sympodia leaves to adjacent fruits.
Many cotton production systems include the use of plant growth regulators (PGRs) to
manage vegetative cotton growth. Mepiquat chloride (MC) and mepiquat pentaborate
(MP), two onium-type growth regulators commonly used in these systems, inhibit
gibberillic acid synthesis by stopping the conversion of geranylgeranyl diphosphate to ent-
kaurene, consequently reducing cell enlargement and the rate of cell division (Rademacher

123
2000; Srivastava 1993). The visual effects of these PGRs included reduced stem and leaf
expansion and generally enhanced earliness of cotton (Reddy et al. 1990, 1996; York
1983a, 1983b). However, cotton yield responses were variable (Kerby 1985). Since PGR
applications have been shown to alter cotton canopy architecture and fruit maturity,
photoassimilate translocation patterns are presumably altered by these applications. Based
on increased dry matter partitioning into fruits, Zhao and Oosterhuis (2000) postulated that
these observed differences may be due to altered photoassimilate translocation. However,
Zhao and Oosterhuis (2000) did not observe any translocation differences of 14CO2 from
the leaf into the adjacent fruit. Even though research has not confirmed differences in
photoassimilate translocation in response to cotton PGR regimes using 14CO2 and 14C-
sucrose technology, glyphosate and glyphosate-resistant technology offer new tools for
investigating photoassimilate translocation patterns in cotton (Feng and Chiu 2005).
Since glyphosate movement has been correlated with sucrose movement in cotton
(Thomas et al. 2006) and multiple weed species (Dewey and Appleby 1983; Harker and
Dekker 1988; Klevorn and Wyse 1984; McAllister and Haderlie 1985; Shieh et al. 1993;
Tardif and Leroux 1993), our objectives were to evaluate translocation of 14C-glyphosate
from various source leaves as influenced by multiple cotton PGR regimes.
Materials and Methods
Plant material. An experimental GR2 cotton variety was planted in 30-cm pots (9 liter
volume) containing a commercial potting medium1 and grown in a plastic greenhouse
maintained at 28 + 2 C constant temperature where natural sunlight were supplemented 4 h

124
daily with mercury halide lights, providing a 16-h day length. After the 8-lf stage, all
plants received 300 mL of fertilizer solution2 (1.3 cm2/L) weekly.
14C-Glyphosate Treatments and Sampling. A two-factor factorial treatment
arrangement was used. Cotton PGR regimes were either (1) nothing, (2) MC3 at 12 g ai ha-
1 at match head square followed by (fb) MC at 37 g ha-1 at first bloom, or (3) MP4 at 29 g
ai ha-1 at match head square fb MP at 86 g ha-1 at first bloom. The second factor,
placement of 14C-glyphosate5, was applied to either (1) the mainstem leaf on the first
reproductive branch, (2) the leaf subtending the first fruit on the first reproductive branch,
(3) the leaf subtend ing the second fruit on the first reproductive branch, (4) the mainstem
leaf on the fifth reproductive branch, (5) the leaf subtending the first fruit on the fifth
reproductive branch, and (6) the leaf subtending the second fruit on the fifth reproductive
branch. 14C-glyphosate at 8,333 Bq plus non-ionic surfactant6 at 0.25% (v/v) per plant was
manually applied in 10 –1-uL droplets on the selected leaf of each plant (Pline et al. 2001).
All applications were made 21 days after the first bloom on the most mature reproductive
branch.
Prior to destructive harvests, all plants were mapped for fruit retention (Jenkins et al.
1990). Total plant height was also recorded. All plants were harvested at 14 d after each
14C-glyphosate treatment and were partitioned into nodes, positions within each sympodial
branch, and parts within each position. Each mainstem nodal section contained a leaf and
stem section while each reproductive position contained a leaf, stem, and fruit
(square/boll). Mature fruits were divided into peduncles/bracts, lint, locules, and seed.
Fresh weight, dry weight, and leaf area (where applicable) were recorded for each part.
Absorption was determined by rinsing the treated portion of the leaf with 10 ml of a

125
methanol:water (1:1 v/v) plus a non- ionic surfactant6 (0.25% v/v) (Askew and Wilcut
2001; Pline et al. 2001). The leaf rinsate was diluted in 10 ml scintillation fluid7 and
radioactivity was quantified with liquid scintillation spectrometry (LSS)8. Divided plant
parts were dried for 48 h at 70 C, weighed, and combusted with a biological sample
oxidizer9. Radioactivity in the oxidized samples was quantified by LSS. Due to the large
number of samples, only two nodes of each plant were processed for 14C quantification.
The selected regions included the treated leaf node and one node above the treated leaf.
Experimental Design and Data Analysis. Studies were arranged in complete randomized
blocks with four replications. Studies were repeated in time. Analysis of variance
conducted using a mixed model in SAS10 revealed no trial by treatment interaction, thus
data were averaged over trials. Data were analyzed for main effects and interactions.
Mean separations were performed on data using LS means at P=0.05.
Results and Discussion
Cotton morphology. Cotton height was not influenced by trial or 14C-glyphosate
placement, thus data were averaged over trial and 14C-glyphosate placement. Mepiquat
chloride and MP reduced cotton height by 13 and 20%, respectively, compared to non-
treated plants (Table 1). Previous research has shown height reduction with MC in
variable environmental conditions (Pettigrew and Johnson 2005; Nichols et al. 2003;
Reddy et al. 1996; Zhao and Oosterhuis 2000). Averaged over multiple tests conducted
between 1979 and 1983, Kerby (1985) reported a 17% reduction in height with 49 g ha-1 of
MC. In Arkansas, height reduction ranged from 15 to 28% with multiple treatments of
MC, depending on year and location (Zhao and Oosterhuis 2000). Sequential treatments of

126
MC at 24 g ha-1 reduced cotton by 26% at 5 wks after pinhead square, compared to non-
treated plants (Nichols et al. 2003).
The number of mainstem nodes was not influenced by trial or 14C-glyphosate
placement, thus data were averaged over trial and 14C-glyphosate placement. Mepiquat
chloride and MP reduced the number of mainstem nodes by 1.4 and 1.9 nodes plant-1,
respectively, compared to non-treated plants (Table 1). When MC was applied
sequentially at 24 g ha-1, the number of mainstem nodes was reduced by 1.5 nodes plant-1
(Nichols et al. 2003). Additional reductions in the number of nodes were observed with
four treatments of MC at 37 g ha-1 (Nichols et al. 2003). However, Zhao and Oosterhuis
(2000) did not observe a significant reduction in the number of nodes in response to MC
treatments.
Total fruit retention, first position fruit retention, low sympodial fruit retention (nodes
6 to 10), high sympodial fruit retention (nodes 11 to 15), and the location of the first
sympodial branch were not influenced by either 14C-glyphosate treatment or cotton PGR
regime (data not shown). Even though our data did not show significant differences in
fruit retention or placement on the plant, previous research has reported greater retention
on more basal fruiting branches and lower retention on more apical fruiting branches
following MC treatment (Hake et al. 1991; Kerby et al. 1986). Furthermore, Kerby et al.
(1986) reported more harvestable fruits on the first, second, and monopodial positions on
nodes 8 to 12 of MC treated plants. With the use of MC at 49 g ha-1, York (1983a)
reported greater fruit production (fruit m-2) at 3 of 6 locations. At population of 235,000
plant ha-1, York (1983b) reported a 14% increase in fruit production with the use of MC at
49 g ha-1. In addition, Cook and Kennedy (2000) showed that MC treatment could also

127
increase fruit retention on the second position of lower sympodial branches in response to
varying levels of fruit loss. Based on the increased fruit retention in lower portions of the
plant, Cook and Kennedy (2000) postulated that this higher retention would maintain sink
strength in the lower portion of the plant canopy, which may consequently limit further
fruit develop on higher nodes (Kerby et al. 1986).
Leaf area was not influenced by trial or 14C-glyphosate placement, thus data were
averaged over trial and 14C-glyphosate placement (Table 2). On node 19, MC and MP
reduced the leaf area of the mainstem leaf by 59 and 73%, compared to the mainstem leaf
of non-treated plants. This observed reduction may be partially influenced by the
reduction in cotton height and the number of nodes (Table 1). Mepiquat pentaborate
treatment also reduced the mainstem leaf area on node 11 compared to non-treated plants.
Mepiquat chloride treatments have been reported to reduce leaf area (Reddy et al. 1990,
1996; Zhao and Oosterhuis 2000). Total leaf area of MC treated plants was reduced by
16% compared to non-treated plants (Reddy et al. 1996). In different temperature regimes,
Reddy et al. (1990) observed that leaf area was reduced the least in the lowest and highest
temperature regimes. In our data, leaf area on all other nodes was not influenced by MC or
MP treatment (data not shown). Generally, leaf area decreased with increasing nodal
position. Comparing the leaf subtending the first position of each node, a similar decline
in leaf size for fruiting positions was observed. In addition to a smaller leaf size for more
vertical nodal positions, leaf size on sympodial branches was also smaller with increasing
distance from the mainstem, regardless of node. Sadras (1995) has discussed the
implications for reduced leaf area with increasing vertical and horizontal position within
the plant canopy on fruit distribution. These data did not show any difference in specific

128
leaf weight in response to cotton PGR regime (data not shown). Other research has shown
variable responses of specific leaf weight to MC treatments (Reddy et al. 1990; Zhao and
Oosterhuis 2000).
Dry weight of plant parts for each position was not influenced by trial or 14C-
glyphosate placement, thus data were averaged over trial and 14C-glyphosate placement for
nodes 6, 7, 8, 9, 11, 13, and 14 (Table 2). All other nodes were only influenced by plant
position (data not shown). Even though significant differences in leaf area were observed,
no differences in leaf dry weight were observed, regardless of node or position. Numerical
reductions in mainstem stem dry weight were observed for nodes 6, 7, 8, 9, 11, 13, and 14
of MC and MP treated plants, which is supported by the reductions in cotton height with
these cotton PGRs. Mepiquat chloride treated plants produced 39, 31 and 30 % less lint on
first position fruits on nodes 6, 7, and 8, respectively. Mepiquat pentaborate treated plants
produced 29, 32 and 31 % less lint on first position fruits on nodes 6, 7, and 8,
respectively. Similar numerical dry weight reductions in the lint fraction from second
position fruits on nodes 6, 7, and 8 were observed. However, significant dry weight
increases in the lint fraction were observed on first position fruit on node 11 of MP treated
plants and on second position fruit on node 9 of MC treated plants. Numerical increases in
seed dry weight were observed on first position fruit on nodes 7, 8, and 9 and second
position fruit on node 7 of MC and MP treated plants. York (1983 a, b) showed increases
in fruit weight (g fruit-1) ranging from 3 to 10% in response to MC treatment. A more
detailed analysis of fruit composition revealed an increase in seed weight with MC
treatments, which accounted for 75% of the increase in fruit weight (York 1983a). Zhao
and Oosterhuis (2000) reported similar increases in fruit weight and reduced lint fraction

129
for various MC formulations, depending on year and location. For vegetative parts, Zhao
and Oosterhuis showed no differences for dry weight of leaves and petioles (% of total dry
weight) between MC formulations and non-treated plants at Carbondale, AR in 1997.
14C-Glyphosate Translocation. Absorption of 14C-glyphosate was not influenced by
either 14C-glyphosate placement or cotton PGR regime (data not shown). However, when
more mature leaves were treated with 14C-glyphosate, absorption was numerically lower.
Feng and Chiu (2005) showed that glyphosate absorption was lower with increasing leaf
age. Absorption of 14C-glyphosate was greater than 94% of the applied. After evaluating
the 14C-glyphosate content in the treated leaf, all leaves contained at least 65% of the
applied, which may be indicative of 14C-glyphosate remaining on the leaf surface due to an
inefficient wash technique or fixation in the cuticle. Pline et al. (2001) showed that 10 to
44% of the applied 14C-glyphosate remained in the leaf wash, depending on the treatment
timing and harvest interval.
Translocation of 14C-glypohsate was not influenced by trial or cotton PGR regime,
thus data were averaged over trials and cotton PGR regime (Tables 4 and 5). Based on
these data, MC and MP do not influence 14C-glyphosate translocation, which presumably
indicates no direct influence on photoassimilate translocation. Even though no significant
differences were observed, numerical differences were observed that parallel previous
research (Ashley 1972; Benedict et al 1975; Benedict and Kohel 1975; Feng and Chiu
2005; Horrocks et al. 1978). When 14C-glyphosate was applied to the mainstem leaf and
leaf subtending the first position on the most mature reproductive node, six and four
percent of the applied 14C-glyphosate was translocated to the first position fruit. The lint
fraction of these fruits contained 40 and 30% of the 14C-glyphosate found in the fruit.

130
When 14CO2 was applied to a subtending leaf at various times after anthesis, translocation
of assimilates was maximized at 13, 25, and 25 d after anthesis for the boll wall, ovule, and
lint, respectively (Benedict and Kohel 1975). In addition, the ovule contained the greatest
activity at all harvest timings (7, 13,19, 25, 31, and 37 d after anthesis) (Benedict and
Kohel 1975). Based on the age of the first position fruit on the mature sympodial branch
(35 d after anthesis at harvest), lower accumulation was observed compared to fruits on a
more immature node. When 14C-glyphosate was applied to younger mainstem and first
position leaves, the first position fruit accumulated 11 and 9% of the applied 14C-
glyphosate. Since these fruits were younger (approximately 23 d after anthesis), a greater
accumulation was observed in lint and seed fractions. In addition, Benedict et al. (1973)
reported a maximum 14C-photosynthate incorporation rate into lint near 30 d after anthesis.
Other researchers have described similar photoassimilate demands based on fruit age
(Schubert et al. 1986).
Using a similar 14C-glyphosate placement regime, Feng and Chui (2005) have
proposed a directional model for photoassimilate movement where glyphosate is
translocated to more distal sympodial parts. Feng and Chui (2005) showed that subtending
leaf on the first position primarily supplies assimilates to the fruit subtending the second
position. Excess glyphosate was exported from the sympodial branch into the downward
stream. Furthermore, distinct differences in translocation comparing the mature and
immature branches were observed (Feng and Chiu 2005). Based on numerical differences,
our data also support the conclusion that more immature sympodial branches export
greater amounts of assimilate to plant tissue, due to the low sink strength of these
immature tissues. Generally, subtending leaves to fruits are the primary source of

131
photoassimilates (Ashley 1972; Benedict et al 1975; Benedict and Kohel 1975; Horrocks et
al. 1978), but accumulation rates vary by sympodial age, position of the source leaf, and
position and sink strength of the fruit (Feng and Chiu 2005).
These data have shown that MC and MP reduce cotton height, the number of
mainstem nodes, and leaf expansion, which all consequently increase the compactness of
the cotton canopy. These canopy characteristics facilitate insect management and decrease
boll rot (Schott and Walter 1991; Edmisten 2004). Even though MC and MP altered
canopy architecture, no 14C-glyphosate translocation differences were observed in response
to these cotton PGRs. Therefore, MC and MP treatment may be influencing other
morphological and physiological properties of cotton plants (Schott and Walter 1991)
without directly altering photoassimilate movement.
Sources of Materials
1 MetroMix 200, Sun Gro Horticulture, 15831 N.E. 8th Street, Suite 100, Bellevue, WA
98008.
2 Peters Professional 20-20-20 General Purpose, The Scotts Company, 14111 Scottslawn
Road, Marysville, OH 43041.
3 Mepichlor, Micro Flo Company, P. O. Box 772099, Memphis, TN 38117.
4 Pentia, BASF Corporation, 26 Davis Drive, Research Triangle Park, NC 27709.
5 14C-glyphosate G-8392, Sigma Chemical Co., P. O. Box 14508, St. Louis, MO
63178.
6 Induce (mixture of alkyl polyoxylkane ether, free fatty acids, and isopropanol), Helena
Chemical Co., 5100 Popular Avenue, Memphis, TN 38137.

132
7 Scintiverse® SX18-4 Universal Liquid Scintillation Cocktail, Fisher Scientific, 1
Regeant Road, Fair Lawn, NJ 07410.
8 Packard Tri-Carb 2100TR Liquid Scintillation Spectrometer, Packard Instrument Co.,
220 Warrenville Rd., Downers Grove, IL 60515.
9 Model OX500 Biological Material Oxidizer, R. J. Harvey Instrument Corp., 123
Patterson St., Hillsdale, NJ 07642.
10 [SAS] Statistical Analysis Systems software, Ver. 8., SAS Institute, Inc., Box 8000,
SAS Circle, Cary, NC 27513.
Acknowledgements
The authors thank Ian Burke, Scott Clewis, Wesley Everman, Abigail Mayhew,
Cassandra Mayhew, Diana Thomas, Caitlyn Wilcut, and Jared Wilcut for greenhouse and
laboratory assistance. Appreciation is also extended to Cavell Brownie, professor of
statistics, for review of statistical procedures and to Cotton Incorporated and the North
Carolina Cotton Growers Association for partial funding of this research.

133
Literature Cited
Ashley, D. A. 1972. 14C-labelled photosynthate translocation and utilization in cotton
plants. Crop Sci. 12:69-74.
Askew, S. D. and J. W. Wilcut. 2002. Absorption, translocation, and metabolism of
foliar-applied CGA 362622 in cotton, peanut, and selected weeds. Weed Sci. 50:293-
298.
Benedict, C. R. R. J. Kohel. 1973. Incorporation of 14C-photosynthate into developing
cotton bolls, Gossypium hirsutum L. Crop Sci. 13:88-91.
Benedict, C. R. and R. J. Kohel. 1975. Export of 14C-assimilates in cotton leaves. Crop
Sci. 15:367-372.
Cook, D. R. and C. W. Kennedy. 2000. Early flower bud loss and mepiquat chloride
effects on cotton yield distribution. Crop Sci. 40:1678-1684.
Dewey, S. A. and A. P. Appleby. 1983. A comparison between glyphosate and assimilate
translocation patterns in tall morningglory (Ipomoea purpurea). Weed Sci. 31:308-
314.
Edmisten, K. L. 2004. Suggestions for growth regulator use. In 2004 Cotton Information
AG-417. NC Cooperative Extension Service, Raleigh, NC. pp. 56-62.
Feng, P.C.C. and T. Chiu. 2005. Distribution of [14C]glyphosate in mature glyphosate-
resistant cotton from application to a single leaf or over-the-top spray. Pest. Biochem.
Physiol. 82:36-45.
Geiger, D. R. and H. D. Bestman. 1990. Self- limitation of herbicide mobility by
phytotoxic action. Weed Sci. 38:324-329.
134
Guinn, G. 1982. Causes of square and boll shedding in cotton. USDA Tech. Bull. 1672.
U.S. Government Printing Office, Washington, D.C. pp. 1-22.
Hake, K., T. Kerby, W. McCarty, D. O’Neal, and J. Supak. 1991. Physiology of PIX. In
Physiology Today – Newsletter of the Cotton Physiology Education Program Vol.2
(6). National Cotton Council: Memphis, TN.
Harker, K. N. and J. Dekker. 1988. Effects of phenology on translocation patterns of
several herbicides in quackgrass, Agropyron repens. Weed Sci. 36:463-472.
Hetherington, P. R., T. L. Reynolds, G. Marshall, and R. C. Kirkwood. 1999. The
absorption, translocation and distribution of the herbicide glyphosate in maize
expressing the CP-4 transgene. J. Exper. Bot. 50:1567-1576.
Horrocks, R. D., T. A. Kerby, and D. R. Buxton. 1978. Carbon source for developing
bolls in normal and superokra leaf cotton. New Phytol. 80:335-340.
Jenkins, J. N., J. C. McCarty, Jr., and W. L. Parrott. 1990. Effectiveness of fruiting sites
in cotton: yield. Crop Sci. 30:365-369.
Kerby, T. A. 1985. Cotton response to mepiquat chloride. Agron. J. 77:515-518.
Kerby, T. A., K. Hake, and M. Keeley. 1986. Cotton fruiting modification with mepiquat
chloride. Agron. J. 78:907-912.
Klevorn, T. B. and D. L. Wyse. 1984. Effect of soil temperature and moisture on
glyphosate and photoassimilate distribution in quackgrass (Agropyron repens). Weed
Sci. 32:402-407.
McAllister, R. S. and L. C. Haderlie. 1985. Translocation of 14C-glyphosate and 14CO2 –
labeled photoassimilates in Canada thistle (Cirsium arvense). Weed Sci. 33:153-159.
135
Nichols, S. P., C. E. Snipes, and M. A. Jones. 2003. Evaluation of row spacing and
mepiquat chloride in cotton. J. Cotton Sci. 7:148-155 [online]. Available at
http://www.cotton.org/journal/. Accessed April 11, 2006.
Pettigrew, W. T. and J. T. Johnson. 2005. Effects of different seeding rates and plant
growth regulators on early-planted cotton. J. Cotton Sci. 9:189-198 [online].
Available at http://www.cotton.org/journal/. Accessed April 11, 2006.
Pline, W. A., A. J. Price, J. W. Wilcut, K. L. Edmisten, and R. Wells. 2001. Absorption
and translocation of glyphosate in glyphosate-resistant cotton as influenced by
application method and growth stage . Weed Sci. 49:460-467.
Rademacher, W. 2000. Growth retardants: effects on gibberellin biosynthesis and other
metabolic pathways. Ann. Rev. Plant Physiol. Mole. Biol. 51:501-531.
Reddy, V. R, D. N. Baker, and H. F. Hodges. 1990. Temperature and mepiquat chloride
effects on cotton canopy architecture. Agron. J. 82:190-195.
Reddy, A. R., K. R. Reddy, and H. F. Hodges. 1996. Mepiquat chloride (PIX)- induced
changes in photosynthesis and growth of cotton. Plant Growth Regul. 20:179-183.
Sadras, V. O. 1995. Compensatory growth in cotton after loss of reproductive organs.
Field Crop Res. 40:1-18.
Sandberg, C. L., W. F. Meggitt, and D. Penner. 1980. Absorption, translocation, and
metabolism of 14C-glyphosate in several weed species. Weed Res. 20:195-200.
Schott, P. E. and H. Walter. 1991. Bioregulators: present and future fields of
application. In: H W. Gausman ed., Plant Biochemical Regulators. Marcel Dekker:
New York. pp. 263-268.

136
Schubert, A. M., C. R. Benedict, and R. J. Kohel. 1986. Carbohydrate distribution in
bolls. In J. R. Mauney and J. McD. Stewart, eds. Cotton Physiology Number One
The Cotton Foundation Reference Book Series. Memphis, TN: The Cotton
Foundation. pp. 311-324.
Shieh, W., D. R. Geiger, and S. R. Buczynski. 1993. Distribution of imported glyphosate
in quackgrass (Elytrigia repens) rhizomes in relation to assimilate accumulation.
Weed Sci. 41:7-11.
Srivastava, L. M. 1993. Gibberellins. In Plant Growth and Development. Academic
Press: New York. 2002. pp. 172-181.
Tardif, F. J. and G. D. Leroux. 1993. Translocation of glyphosate, quizalofol, and sucrose
in quackgrass (Elytrigia repens) biotypes. 41:341-346
Thomas, W. E., I. C. Burke, C. H. Koger, and J. W. Wilcut. 2006. Absorption and
translocation of glyphosate and sucrose in glyphosate-resistant cotton. Weed Sci.
Submitted.
York, A. C. 1983a. Cotton cultivar response to mepiquat chloride. Agron. J. 75: 663-
667.
York, A. C. 1983b. Response of cotton to mepiquat chloride with varying levels N
rates and plant populations. Agron. J. 75:667-672.
Zhao D. and D. M. Oosterhuis. 2000. Pix Plus and mepiquat chloride effects on
physiology, growth, and yield of field-grown cotton. J. Plant Growth Regul. 19:415-
422.

137
Table 1. Cotton height as influenced by cotton plant growth regulator regimes, averaged
over trials and 14C-glyphosate placement.
PGR regimea Height Nodes
cm #
None 115 a 19.4 a
Mepiquat chloride 100 ab 18.0 b
Mepiquat pentaborate 92 b 17.5 b
a Cotton plant growth regulator regimes were: (1) none, (2) mepiquat chloride (MC) at
12 g ai ha-1 at match head square followed by (fb) MC at 37 g ha-1 at first bloom, or (3)
mepiquat pentaborate (MP) at 29 g ai ha-1 at match head square fb MP at 86 g ha-1 at first
bloom.

138
Table 2. Leaf area as influenced by plant position and cotton plant growth regulator
regimes, averaged over trials and 14C-glyphosate placement.
Plant position PGR Leaf areab
regimea Nodec
11 13 19
____________________________ cm2 ____________________________
Mainstem None 158 a 142 a 41 a
1st position None 78 c 57 b 2 c
2nd position None 39 d 24 cd 4 bc
Mainstem MP 138 b 133 a 11 bc
1st position MP 74 c 42 bc 4 bc
2nd position MP 35 de 8 de .
Mainstem MC 166 a 151 a 17 d
1st position MC 86 c 51 bc 5 bc
2nd position MC 34 de 8 de . a Cotton plant growth regulator regimes were: (1) none, (2) mepiquat chloride (MC) at
12 g ai ha-1 at match head square followed by (fb) MC at 37 g ha-1 at first bloom, or (3)
mepiquat pentaborate (MP) at 29 g ai ha-1 at match head square fb MP at 86 g ha-1 at first
bloom.
b Means within a column followed by the same letter are not different according to LSD
test at P=0.05.
c All other nodes containing sympodial branches (>6) were only significant for plant
position effects.

139
Table 3. Dry weight of plant parts as influenced by plant position and cotton plant growth regulator regimes, averaged over
trials and 14C-glyphosate placement.
PGR Plant Plant Dry weight
regimea position part Nodebcd
6 7 8 9 11 13 14
__________________________________________________________________ g __________________________________________________________________
None Mainstem Leaf 0.82 i 0.86 g 0.92 hij 0.97 kl 1.09 efg 1.02 bcd 0.93 ab
MP Mainstem Leaf 0.87 ij 0.87 g 0.97 ghi 0.87 klm 1.06 efg 1.04 abc 0.88 b
MC Mainstem Leaf 0.87 i 0.90 g 1.03 fgh 1.06 jk 1.17 d-g 1.15 ab 0.99 ab
None Mainstem Stem 1.22 efg 1.05 fg 1.08 fgh 0.91 kl 0.65 fgh 0.44 f 0.31 f
MP Mainstem Stem 1.02 ghi 0.88 g 0.85 h-k 0.70 k-o 0.45 h-m 0.19 k-o 0.12 h-l
MC Mainstem Stem 1.08 f-j 0.96 g 1.01 fgh 0.85 klm 0.50 hij 0.26 h-l 0.16 g-i
None First Leaf 0.14 l-o 0.34 h-m 0.39 k-n 0.47 m-q 0.49 h-l 0.39 f-i 0.28 f
MP First Leaf 0.28 klm 0.30 i-m 0.42 j-n 0.44 m-s 0.53 hik 0.27 g-k 0.17 g-j
MC First Leaf 0.09 m-p 0.33 h-m 0.47 i-n 0.65 l-p 0.56 hik 0.36 f-j 0.24 fgh
None First Stem 0.20 lmn 0.31 i-m 0.27 mn 0.34 o-r 0.29 j-s 0.21 j-m 0.14 h-k
MP First Stem 0.09 l-p 0.36 h-l 0.24 lmn 0.27 p-r 0.26 j-r 0.10 m-r 0.06 klm
MC First Stem 0.01 m-p 0.21 j-m 0.30 lmn 0.37 n-r 0.26 l-s 0.17 k-r 0.07 j-m
None First Lint 3.40 a 3.88 a 3.49 a 3.12 a 1.73 b 0.75 e 0.56 e
MP First Lint 2.40 b 2.64 b 2.40 b 2.80 abc 2.37 a 0.77 de 0.30 fgh

140
Table 3 (continued)
MC First Lint 2.09 b 2.69 b 2.46 b 2.60 bcd 1.46 bc 0.81 e 0.68 de
None First Seed 2.12 bc 1.39 c-g 2.23 bcd 2.20 cde 1.26 cde 0.97 a-e NE
MP First Seed 2.12 b 2.18 bc 2.32 bc 1.98 d-g 1.18 b-f NE NE
MC First Seed 1.89 bcd 1.59 c-f 2.38 bc 2.23 cde 1.18 c-g 1.35 ab NE
None First Bracts 0.12 l-o 0.37 h-l 0.31 lmn 0.34 o-r 0.26 j-s 0.42 fgh 0.24 fgh
MP First Bracts NEd 0.19 j-m 1.21 fgh 0.27 pqr 0.34 i-o 0.23 f-q 0.21 f-k
MC First Bracts 0.07 m-p 0.24 j-m 0.28 lmn 0.38 n-r 0.27 k-s 0.18 k-r 0.24 fgh
None First Locules 1.40 de 1.86 cd 1.78 cde 1.68 e-h 1.40 cd 1.19 a 0.82 bcd
MP First Locules 1.21 e-h 1.48 de 1.49 def 1.43 f-j 1.51 bc 0.83 cde 0.90 abc
MC First Locules 1.09 e-i 1.34 ef 1.40 efg 1.56 f-i 1.20 de 1.15 ab 0.73 cde
None Second Leaf NE 0.30 i-m 0.29 lmn 0.33 o-r 0.23 m-q 0.15 k-r 0.08 i-m
MP Second Leaf NE 0.12 klm 0.26 lmn 0.29 o-r 0.21 n-q 0.04 p-s 0.02 i-m
MC Second Leaf NE 0.26 j-m 0.38 k-n 0.40 n-r 0.20 m-q 0.05 n-s 0.00 lm
None Second Stem NE 0.16 klm 0.11 n 0.14 r 0.09 o-t 0.04 o-s 0.02 m
MP Second Stem NE NE 0.07 n 0.07 uv 0.04 q-t 0.01 rs 0.00 klm
MC Second Stem NE 0.09 klm 0.09 n 0.15 qr 0.05 p-t 0.01 qrs NE
None Second Lint 1.49 c-f 1.41 d-g 1.44 d-h 1.01 i-l 0.58 f-q 0.22 f-r 0.05 f-m
MP Second Lint 1.06 e-i 1.22 efg 1.27 e-h 1.29 f-l NE NE NE
MC Second Lint 0.96 e-i 0.93 e-j 0.89 f-m 3.14 abc 0.58 d-q NE NE

141
Table 3 (continued)
None Second Seed 1.17 d-i 0.55 e-m 1.24 c-m 1.25 e-q NE NE NE
MP Second Seed 0.80 g-k 1.13 efg 1.01 e-m 0.62 h-r NE NE NE
MC Second Seed 0.72 g-l 1.30 c-k 0.95 e-n 1.21 e-r NE NE NE
None Second Bracts NE 0.14 j-m 0.07 mn 0.15 o-r 0.24 h-q 0.10 l-r 0.02 g-m
MP Second Bracts NE 0.05 lm 0.08 mn 0.19 n-t NE NE NE
MC Second Bracts NE 0.11 h-m 0.09 lmn 0.72 j-r 0.07 h-q 0.04 f-r 0.01 f-m
None Second Locules 0.90 ghi 0.97 e-h 1.07 f-j 0.91 j-n 1.09 c-f 0.20 f-r 0.01 f-m
MP Second Locules 0.82 hi 1.02 fg 1.05 f-k 1.11 g-m NE NE NE
MC Second Locules 0.99 e-i 1.05 e-i 0.96 f-l 2.19 c-f 0.69 c-q 0.23 f-r 0.02 f-m
a Cotton plant growth regulator regimes were: (1) none, (2) mepiquat chloride (MC) at 12 g ai ha-1 at match head square
followed by (fb) MC at 37 g ha-1 at first bloom, or (3) mepiquat pentaborate (MP) at 29 g ai ha-1 at match head square fb90 MP
at 86 g ha-1 at first bloom.
b Means within a column followed by the same letter are not different according to LSD test at P=0.05.
c All other nodes containing sympodial branches (>6) were only significant for plant position effects.
d The estimate for plant parts was not calculable using a mixed model.

142
Table 4. Translocation of 14C-glyphosate as influenced by plant position, averaged over trials, 14C-glyphosate placement, and
cotton plant growth regulator regimes. Data are from the node containing the treated leaf.
Position Plant 14C-glyphosate treatment locationa
part Mature sympodial branch Immature sympodial branch
Treated leaf
Mainstem 1st position 2nd position Mainstem 1st position 2nd position
__________________________________________________ % of applied __________________________________________________
Mainstem Leaf 78.22 a 0.23 b 0.32 b 65.46 a 2.94 b 5.15 b Mainstem Stem 1.44 b 0.47 b 0.32 b 0.28 b 0.21 b 0.25 b First Bract 0.60 b 0.59 b 0.21 b 0.40 b 0.73 b 0.09 b First Leaf NEb 70.47 a 0.17 b 3.85 b 71.78 a 0.25 b First Locules 1.28 b 1.57 b 0.59 b 1.18 b 2.18 b 0.99 b First Lint 2.36 b 1.33 b 0.58 b 2.42 b 2.58 b 0.59 b First Stem 0.20 b 0.62 b 0.13 b NE 0.52 b NE First Seed 1.67 b 1.54 b 0.50 b 2.42 b 2.83 b 0.94 b Second Bract NE 0.35 b 1.40 b NE NE NE Second Leaf 0.63 b 0.29 b 71.47 a 1.11 b 8.10 b 76.29 a Second Locules NE 1.02 b 1.45 b NE NE NE Second Lint 0.19 b 1.02 b 1.70 b NE NE NE Second Stem 0.04 b 0.05 b 0.79 b NE b 0.12 b 0.55 b Second Seed 0.65 b 1.24 b 1.89 b NE . NE NE
a Means within a column followed by the same letter are not different according to LSD test at P=0.05.
b The estimate for plant parts was not calculable using a mixed model.
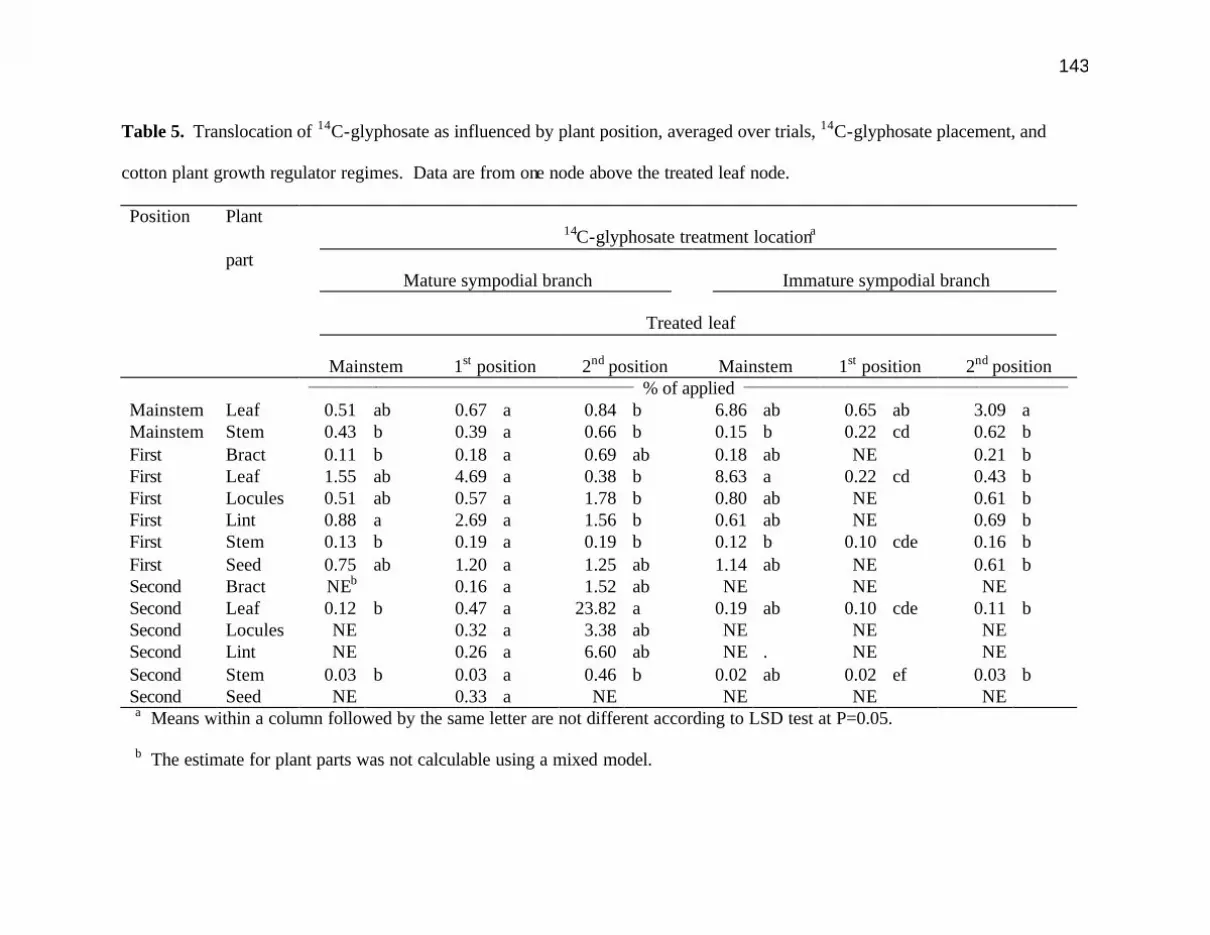
143
Table 5. Translocation of 14C-glyphosate as influenced by plant position, averaged over trials, 14C-glyphosate placement, and
cotton plant growth regulator regimes. Data are from one node above the treated leaf node.
Position Plant 14C-glyphosate treatment locationa
part Mature sympodial branch Immature sympodial branch
Treated leaf
Mainstem 1st position 2nd position Mainstem 1st position 2nd position
_____________________________________________________ % of applied _____________________________________________________
Mainstem Leaf 0.51 ab 0.67 a 0.84 b 6.86 ab 0.65 ab 3.09 a Mainstem Stem 0.43 b 0.39 a 0.66 b 0.15 b 0.22 cd 0.62 b First Bract 0.11 b 0.18 a 0.69 ab 0.18 ab NE 0.21 b First Leaf 1.55 ab 4.69 a 0.38 b 8.63 a 0.22 cd 0.43 b First Locules 0.51 ab 0.57 a 1.78 b 0.80 ab NE 0.61 b First Lint 0.88 a 2.69 a 1.56 b 0.61 ab NE 0.69 b First Stem 0.13 b 0.19 a 0.19 b 0.12 b 0.10 cde 0.16 b First Seed 0.75 ab 1.20 a 1.25 ab 1.14 ab NE 0.61 b Second Bract NEb 0.16 a 1.52 ab NE NE NE Second Leaf 0.12 b 0.47 a 23.82 a 0.19 ab 0.10 cde 0.11 b Second Locules NE 0.32 a 3.38 ab NE NE NE Second Lint NE 0.26 a 6.60 ab NE . NE NE Second Stem 0.03 b 0.03 a 0.46 b 0.02 ab 0.02 ef 0.03 b Second Seed NE 0.33 a NE NE NE NE
a Means within a column followed by the same letter are not different according to LSD test at P=0.05.
b The estimate for plant parts was not calculable using a mixed model.

144
Rain-Free Requirement and Physiological Properties of Cotton Plant Growth
Regulators
Walter E. Thomas
Wesley J. Everman
Crop Science Department, North Carolina State University, Raleigh, NC 27695-7620
James R. Collins
Bayer CropScience, 2 T. W. Alexander Dr., Research Triangle Park, NC 27709
John W. Wilcut
Corresponding author. Crop Science Department, North Carolina State University,
Raleigh, NC 27695-7620; [email protected], phone: 919.515.5647, fax:
919.515.5315
145
Abstract
Greenhouse studies were conducted to (1) evaluate the rain-free requirement for mepiquat
chloride and mepiquat chloride plus cyclanilide with and without surfactant and to (2)
evaluate absorption and translocation of cyclanilide, a component of a new cotton plant
growth regulator. No significant differences in the number of nodes, leaf area, and plant
part fresh and dry weight were observed with any PGR treatment and rainfall simulation
combination. Both plant growth regulators responded similarly to rainfall interval. As
rain-free period increased, cotton height was reduced. Based on these data, a rain-free
period of 8 hours is needed to maximize efficacy, regardless of the use of surfactant.
Absorption of cyclanilide ranged from 11 to 15% at 3 and 48 HAT, respectively.
Averaged over harvest intervals, 18% of the applied cyclanilide remained in the treated
leaf while 1.7 and 6.5% of the applied cyclanilide was found in the above and below
treated leaf tissue, respectively.
Keywords: plant height, absorption, translocation, rain-free period, leaf area.
1. Introduction
Many cotton (Gossypium hirsutum) production systems include the use of plant
growth regulators6 to manage vegetative growth. Mepiquat chloride, an onium-type
growth regulator commonly used in cotton, inhibits gibberillic acid synthesis by stopping
the conversion of geranlgeranyl diphosphate to ent-kaurene, consequently reducing cell
enlargement and the rate of cell division [1, 2]. The visual effects of these PGRs include
reduced stem and leaf expansion and generally enhanced earliness of cotton [3-6].
6 PGRs, plant growth regulators.

146
Mepiquat chloride treatment can also facilitate insect management and decrease boll rot [4,
7]. However, yield responses to mepiquat chloride are often variable [8].
Multiple mepiquat chloride treatments at various application rates are commonly used
to manage cotton growth [4, 7]. Due to the interactions of environmental conditions with
mepiquat chloride treatments [7], recommendations for treatment to cotton vary widely by
geographic region. A new prepackaged mixture of mepiquat chloride and cyclanilide has
been reported to limit the variability in application rate while maintaining plant growth
regulation [9, 10]. Cyclanilide is amalonanilate with a cyclopropane ring similar to 1-
aminocyclopropane-1-carboxylic acid [11]. Compared to known polar auxin transport
inhibitors (1-N-naphthylphthalamic acid7 and 2, 3, 4-triiodobenzoic acid 8) [12], Pederson
[13] reported similar levels of inhibition of auxin transport with 10 ? m of cyclanilide in
etiolated coleoptiles of corn (Zea mays). Due to limited basipetal transport of auxin in
cyclanilide treated plants, apical dominance is not maintained, allowing for increased
lateral shoot growth [13-17]. Thus the mixture of mepiquat chloride and cyclanilide
inhibits gibberillic acid synthesis and auxin transport, respectively. Due to the dual modes
of action, this prepackaged mixture has been shown to regulate cotton growth with limited
variability in application rate compared to mepiquat chloride alone treatments [9, 10].
Since the prepackaged mixture of mepiquat chloride plus cyclanilide has recently been
registered, limited data are available with regard to rain-free requirements and fate within
cotton. Therefore, our objectives were (1) to determine the rain-free interval for mepiquat
7 NPA, 1-N-naphthylphthalamic acid.
8 TIBA, 2, 3, 4-triiodobenzoic acid.

147
chloride and mepiquat chloride plus cyclanilide alone or in combination with a non-ionic
surfactant and (2) to evaluate absorption and translocation of cyclanilide in cotton.
2. Materials and Methods
2.1 Plant material
Stoneville ‘4892 RR/BG’ cotton was planted in 30-cm pots containing a commercial
potting medium (Metro Mix 200, Sun Gro Horticulture) and grown in a plastic greenhouse
maintained at 28 + 2 C constant temperature where natural sunlight was supplemented 4 h
daily with mercury halide lights, providing a 16-h day length. Studies were conducted
from July to November 2005.
2.2 Determination of rain-free requirement
A factorial treatment arrangement of cotton PGRs (2 levels) and simulated rainfall
timings (8) was used. Cotton was treated at matchhead square, which corresponded with
10- to 11-leaf growth stage, with a prepackaged mixture of mepiquat chloride at 16.1 g ai
ha-1 plus cyclanilide at 3.9 g ai ha-1 postemergence over the top (Stance, Bayer
CropScience) or mepiquat chloride at 24.5 g ai ha-1 postemergence over the top
(MepiChlor, MicroFlo). In a second study, non- ionic surfactant (Induce, Helena Chemical
Co.) at 0.25% (v/v) was added to both PGR treatments. An apparatus was designed using
HH-SS50WSQ nozzles to deliver a simulated rainfall at 7.6 cm hr-1 at 207 kPa. Simulated
rainfall was applied for 10 min at 0.25, 0.5, 1, 2, 4, 8, and 24 h after PGR treatment. PGR-
treated plants with no rainfall and no PGR-treated plants were included for comparison.
On the day of PGR treatment, all plants were marked at the third and fifth nodes from
the apex. Plant height was recorded at 0, 7, and 14 d after PGR treatment from the soil to

148
the plant apex and from the marked nodal positions to the apex. At 14 d after PGR
treatment, all plants were destructively harvested by node and parts within nodes. Within
each node, parts included mainstem leaf, mainstem stem, reproductive/vegetative leaves,
reproductive/vegetative stems, and reproductive/vegetative fruits. Fresh and dry weights
were recorded for all parts while mainstem nodal length and leaf area were recorded where
applicable.
2.3 Absorption and translocation of cyclanilide
Cotton was treated at matchhead square, which corresponded with 10- to 11-leaf
growth stage with a prepackaged mixture of mepiquat chloride at 16.1 g ai ha-1 plus
cyclanilide at 3.9 g ai ha-1 postemergence over the top. Prior to PGR treatment, a 20 cm3
area of the newest completely expanded leaf was covered with aluminum foil to prevent
spray contact with the leaf surface. The covered area of each plant was treated with 10-one
? l droplets containing 8.3 kBq of 14C-cyclanilide (cyclanilide, specific activity 7.5 ? ? q
mg-1, Bayer CropScience).
Plants were harvested at 3, 8, 24, 48, 72, 168, 336, and 504 h after treatment.
Absorption was determined by rinsing the treated portion of the leaf with 10 ml of a
methanol:water (1:1, v/v) plus 0.25% non- ionic surfactant (Induce, Helena Chemical Co.)
[17] and diluted in 15 ml scintillation fluid (Ultima Gold, PerkinElmer) and radioactivity
was quantified with liquid scintillation spectrometry (Tri-Carb 2100TR, Packard
Instruments). All plants were then divided into four regions: 1) treated leaf, 2) above
treated leaf, 3) below treated leaf, and 4) roots. The treated leaf was removed at the point
of attachment to the stem, which determined the division for above and below the treated
leaf sections. The mainstem tissue above and below the treated leaf were each divided into
149
leaves and stems. The reproductive branches above and below the treated leaf were each
divided into leaves, stems, and fruits. Plant parts were dried for 48 h at 70 C for 2 d,
weighed, homogenized, and combusted with a biological sample oxidizer (OX-500, R. J.
Harvey Instrument Co.). Radioactivity in the oxidized samples was quantified by liquid
scintillation spectrometry.
2.4 Experimental design and data analysis
Studies were arranged in randomized complete blocks. Rain-free requirement and
14C-cyclanilide studies contained four and three replications of treatments, respectively,
and were repeated in time. All data were subjected to analysis of variance. Trials were
averaged due to insignificant trial interactions. Significant simulated rainfall and
absorption effects were observed, thus regression analysis was performed. Nonlinear
models were used if ANOVA indicated higher-order polynomial effects were more
significant than linear effects. Iterations were performed to determine parameter estimates
with least sums of squares for all nonlinear models using the Gauss-Newton method via
PROC NLIN in SAS [18].
3. Results and Discussion
3.1 Determination of rain-free interval
Since no differences were observed between trials, all data were averaged over trials.
No significant differences in the number of nodes, leaf area, and plant part fresh and dry
weight were observed with any PGR treatment and rainfall simulation combination (data
not shown). Regardless of the use of surfactant, no significant differences in plant height

150
were observed with mepiquat chloride alone or in combination with cyclanilide, indicating
that these two commercial products have similar rain-free requirements (data not shown).
However, significant reductions in plant height, which are a primary indicator of plant
growth regulator efficacy in cotton, were observed for the simulated rainfall effect in no
surfactant and surfactant studies (Table 1 and Figure 1). The change in total plant height,
measured as the difference in growth between 0 to 7 d and 7 to 14 d after application,
showed a significant response to rainfall interval, regardless of the inclusion of surfactant.
As the rain-free period increased, plant height was reduced. Averaged over PGR
treatments without surfactant, the change in total plant height at 0 to 7 d was reduced by 5
and 19% with simulated rainfall at 4 and 8 h after treatment, respectively, compared to no
PGR-treated plants. Similarly when surfactant was added, the change in total plant height
at 0 to 7 d after treatment was reduced by 1 and 19% with a simulated rainfall at 4 and 8 h
after treatment, respectively, compared to no PGR-treated plants.
Since the apical regions of cotton contain the majority of expanding leaf and stem
tissue, the growth rates of the 5 and 3 node apical regions were similar to the total growth
rate as evidenced by regression parameters (Table 1). Plants treated with either PGR did
not have continued growth reduction, which is evidenced by the variability in growth rates
at 7 to 14 d after treatment. These data support previous research documenting the need
for multiple applications of PGRs to adequately manage vegetative growth of cotton in
optimum environmental conditions [4, 7]. Based on these data, a rain-free period of 8 h is
required for both PGRs evaluated, regardless of the inclusion of a surfactant.
3.2 14C-Cyclanilide Absorption and Translocation
151
Absorption of 14C-cyclanilide by cotton was not influenced by trial, thus data were
averaged over trials (Figure 1). Absorption, as a percentage of the applied 14C-cyclanilide,
increased over time and ranged from 11 to 15% at 3 and 48 HAT, respectively.
Absorption after 48 h was variable (53 to 67%). Other research has shown less than 7%
absorption of cyclanilide in cotton [20]. The observed increase in absorption of cyclanilide
after 48 HAT may be due to cuticlar binding. Previous research with cyclanilide included
a 3 min chloroform wash [20], which probably removed most of the cuticle and potentially
the bound cyclanilide. In addition, Collins [20] did not evaluate the long term
physiological behavior of cyclanilide.
Translocation of 14C-cyclanilide was not significantly different between trials, thus
data were averaged over trials. Even though harvest timings main effects and the harvest
timing by plant part interaction were significant, only the plant part factor will be discussed
due to the large F value compared to the other parameters (Table 2). Translocation of 14C-
cyclanilide is shown as a percentage of the applied radioactivity (Table 3). The treated leaf
contained the greatest amounts of cyclanilide (18%). Mainstem leaves below the treated
leaf contained more cyclanilide than mainstem stems and reproductive leaves, stems, and
fruit above the treated leaf. Numerically, 1.7 and 6.5% of the applied cyclanilide was
found above and below the treated leaf, respectively. The observed translocation patterns
of cyclanilide are similar to basipetal translocation of auxin [15]. Even though levels of
cyclanilide were significantly different based on the applied dose, no differences in
cyclanilide translocation out of the treated leaf were observed when the accumulation was
based on the level of activity per unit of dry matter (Table 3). With the two data
presentations, the low translocation of cyclanilide may be of limited biological

152
significance. Since cyclanilide inhibits auxin transport and hormones are biologically
active at extremely low concentrations, only relatively small quantities of cyclanilide may
be needed to provide this inhibitory role. For example, Pederson [12] showed that
cyclanilide at 10 ? m could effectively inhibit auxin transport in etiolated coleoptiles of
corn. These small quantities may be below the level of detection limits with the radiolabel
techniques used. In previous research, no translocation of cyclanilide in 5- leaf cotton was
reported [20].
4. Conclusions
Auxin has been implicated in a number of plant processes, including induction of cell
division, stem elongation, and apical dominance [15]. One major role of gibberillic acid is
promotion of cell elongation [2]. Inhibiting cell elongation through alterations of the
physiological properties of multiple plant hormones may provide more consistent plant
height reductions compared to inhibiting only gibberellic acid synthesis. In addition,
cyclanilide may increase the number of lateral fruiting branches as reported in apples [14].
Field data comparing these two PGRs support these observations [9, 10].
Based on plant height data, the primary indicator of PGR efficacy in cotton, an 8-h
rain-free period is required for optimum performance of mepiquat chloride and mepiquat
chloride plus cyclanilide, regardless of the inclusion of surfactant. Comparing these two
commercial products, no significant differences were noted with regard to cotton height
reductions. Therefore, mepiquat chloride and mepiquat chloride plus cyclanilide provide
equivalent cotton height reductions with similar rain-free period requirements. However,

153
additional research is needed to evaluate the efficacy of mepiquat chloride and mepiquat
chloride plus cyclanilide in optimum and sub-optimum environmental conditions.
In the 14C-cyclanilide studies, at least 15% of the applied cyclanilide was absorbed at
48 h after treatment. However, limited translocation (< 3% of applied dose) to individual
plant parts was observed with the greatest amount being transported to mainstem leaves
below the treated leaf (2%). The basipetal direction and low levels of translocation of
cyclanilide may partially explain the need for multiple applications of PGRs to adequately
limit vegetative growth of cotton in optimum environmental conditions. Additional
physiological studies should be conducted to investigate the basis for synergism of
mepiquat chloride and cyclanilide in cotton.
Acknowledgements
The authors thank Whitnee Askew, Ian Burke, Scott Clewis, Abigail Mayhew, Bonnie
Sheldon, Caitlyn Wilcut, and Jared Wilcut for greenhouse and laboratory assistance.
Appreciation is also extended to Dr. Cavell Brownie, professor of Statistics, for statistical
analysis review and to Bayer CropScience for partial funding of this research.

154
References
[1] W. Rademacher, Growth retardants: effects on gibberellin biosynthesis and other
metabolic pathways, Ann. Rev. Plant Physiol. Mol. Biol. 51 (2000) 501-531.
[2] L.M Srivastava, Gibberellins, in: Plant Growth and Development, Academic Press, New
York, 2002, pp. 172-181.
[3] V.R Reddy, D.N. Baker, H.F. Hodges, Temperature and mepiquat chloride effects on
cotton canopy architecture, Agron. J. 82 (1990) 190-195.
[4] P.E. Schott, H. Walter, Bioregulators: present and future fields of application, in: H W.
Gausman (ed.), Plant Biochemical Regulators, Marcel Dekker, New York, 1991, pp.
263-268.
[5] A.C. York, Cotton cultivar response to mepiquat chloride, Agron. J. 75 (1983) 663-667.
[6] A.C. York, Response of cotton to mepiquat chloride with varying levels N rates and
plant populations, Agron. J. 75 (1983) 667-672.
[7] K.L. Edmisten, Suggestions for growth regulator use. In: 2006 Cotton Information.
North Carolina Cooperative Extension Service, Raleigh, NC, 2006, pp. 55-61.
[8] T.A. Kerby, Cotton response to mepiquat chloride, Agron. J. 77 (1985) 515-518.
[9] J.C. Faircloth, D.N. Horton, G.U. White, N. O’Berry, M. Weeks, TADS 15338/PGR
effects, In 2005 Peanut and Cotton Research Evaluations in Plant Growth Regulators,
Weed Science, Varieties, and Defoliants # 424-202, Virginia Polytechnic Institute and
State University, Blacksburg, VA, 2006, online:
http://www.ext.vt.edu/pubs/cotton/424-202-05/424-202-05.html.

155
[10] J.C. Banks, S. Osborne, L. Bull, K. Coggeshall, Evaluation of an experimental growth
regulator – TADS 15338, In 2004 Annual Report: Extension Cotton Research and
Demonstrations in Oklahoma, Oklahoma State University, Stillwater, OK, 2004, p.
48-49, online: http://osu.altus.ok.us/2004%20Annual%20Report.pdf.
[11] M.K. Pederson, J.D. Burton, H.D. Coble, Effect of cyclanilide, ethephon, auxin
transport inhibitors, and temperature on whole plant defoliation, Crop Sci. 45 (2006)
In press.
[12] M. Clausen, H. Lüthen, M. Bötiger, Inside or outside? Localization of the receptor
relevant to auxin- induced growth, Physiol. Plant 98 (1996) 861-867.
[13] M.K. Pedersen, The mechanism of action of cyclanilide, an ethephon synergist
[dissertation], North Carolina State University, Raleigh, NC, 1998, pp. 23-77.
[14] D.C. Elfving, D.B. Visser, Cyclanilide induces lateral branching in apple trees,
HortSci. 40 (2005) 119-122.
[15] L.M. Srivastava, Auxins. In: Plant Growth and Development, Academic Press, New
York, 2002, pp. 155-156.
[16] L.M. Srivastava, Uptake and transport of hormones, In: Plant Growth and
Development, Academic Press, New York, 2002, pp. 296-299.
[17] I.A. Tamas, Hormonal regulation of apical dominance, In: P. J. Davies (ed.), Plant
Hormones: Physiology, Biochemistry, and Molecular Biology, 2nd edition, Kluwer
Academic Publishers, Norwell, MA, 1995, pp. 572-597.
[18] S.D. Askew, J. W. Wilcut, Absorption, translocation, and metabolism of foliar-applied
CGA 362622 in cotton, peanut, and selected weeds, Weed Sci. 50 (2002) 293-298.
156
[19] [SAS] Statistical Analysis Systems, SAS/STAT® User's Guide, Release 7.00, Cary,
NC, Statistical Ana lysis Systems Institute, 1998, p. 1028.
[20] J.R. Collins, Impact of cyclanilide synergist on ethephon performance in cotton
(Gossypium hirsutum L.) [dissertation]. North Carolina State University, Raleigh,
NC, 1999, pp. 44-56.

157
Table 1
Parameters (standard error) for regression analysis [y = -a ln(time) + b] on the change in cotton height in response to various
simulated rainfall timings.
Surfactantab Timec Measurement a SEd b SE R2e
None 0 to 7 d1 Totalf 0.892 0.139 14.29 0.229 0.89
None 0 to 7 d2 5 apical nodes 0.875 0.138 14.69 0.229 0.89
None 0 to 7 d3 3 apical nodes 0.633 0.118 12.56 0.195 0.85
NIS 0 to 7 d4 Totalf 0.736 0.263 17.11 0.435 0.61
NIS 0 to 7 d5 5 apical nodes 0.602 0.250 16.54 0.414 0.56
NIS 0 to 7 d6 3 apical nodes 0.589 0.285 14.58 0.471 0.46
None 7 to 14 d7 Totalf 0.267 0.145 11.31 0.240 0.41
None 7 to 14 d8 5 apical nodes 0.301 0.156 12.02 0.259 0.43
None 7 to 14 d9 3 apical nodes 0.289 0.177 12.05 0.292 0.35
NIS 7 to 14 d10 Totalf 0.142 0.725 13.79 1.20 0.01
NIS 7 to 14 d11 5 apical nodes 0.164 0.711 13.69 1.18 0.02
NIS 7 to 14 d12 3 apical nodes 0.179 0.697 13.44 1.16 0.02
a Abbreviation: NIS, non- ionic surfactant.
b A non- ionic surfactant at 0.25% (v/v) was included.

158
Table 1 (continued)
c Means (cm) for non-treated and no-rain controls were: 114.8, 12.0; 215.7, 12.7; 313.5, 9.7; 417.5, 14.1; 517.3, 14.1; 614.8,
11.7; 713.5, 9.3; 813.2, 9.1; 913.2, 9.8; 1016.2, 12.3; 1116.2, 12.3; and 1216.1, 12.1, respectively.
d Standard error of the estimated parameter.
e Using treatment means, R2 is a percent of the sum of squares for rainfall intervals.
f Regression lines for total plant height are shown in Figure 1.

159
Table 2
F-values and probabilities of the main effects and interactions evaluated for translocation
data.
Translocation
% of applied Bq g-1 dry tissue
F Value Pr > F F Value Pr > F
Time 1.23 0.3950 9.51 0.0041
Plant part 616.5 <0.0001 112.5 <0.0001
Time*Plant part 15.16 <0.0001 3.60 <0.0001

160
Table 3
Translocation of 14C-cyclanilide to various plant parts, averaged over trials, and harvest
intervals.
a Fisher’s Protected LSD test at P=0.05.
b Abbreviations: SEM, standard error of the mean.
c Percent translocation to various plant parts as a percentage of the applied 14C-
cyclanilide.
Plant part Translocationa Mean SEMb Mean SEMb ______ % of appliedc _____ ___ Bq g-1 dry tissue __ Treated leaf 17.53 2.00 666.54 64.05 ATL – mainstem leaves 0.76 0.12 11.83 0.84 ATL – mainstem stems 0.25 0.04 11.86 0.80 ATL – reproductive leaves 0.36 0.07 16.30 1.70 ATL – reproductive stems 0.09 0.02 15.77 1.34 ATL – reproductive fruit 0.19 0.04 13.67 1.09 BTL – mainstem leaves 2.16 0.24 15.02 1.47 BTL – mainstem stems 1.75 0.24 15.87 2.55 BTL – reproductive leaves 1.16 0.16 13.34 1.50 BTL – reproductive stems 0.43 0.07 14.81 3.01 BTL – reproductive fruit 0.14 0.03 12.97 1.53 Roots 0.82 0.16 14.92 2.89 Leaf wash 58.03 3.83 LSD 1.82 49.7 Recovery 83.7

161
Figure 1. The change in total plant height from 0 to 7 and 7 to 14 d after treatment for no surfactant and surfactant studies,
averaged over runs and cotton plant growth regulators. Data modeled using y = -a ln(time) + b. Parameters for equations are
shown in table 1.
No Surfactant
Time of Rainfall Simulation
0 5 10 15 20 25
Cha
nge
in h
eigh
t (cm
)
10
12
14
16
18
20
Growth (0 to 7 d after treatment)Growth (7 to 14 d after treatment)
Surfactant (0.25% v/v NIS)
0 5 10 15 20 25 30

162
Figure 2. Absorption of 14C-cyclanilide as a percentage of applied, averaged over trials.
Time (h)
0 200 400 600
Abs
orpt
ion
(% o
f app
lied)
0
10
20
30
40
50
60
70
80
Y = 55.25
1 + e
X – 47.9820.85 ( )-