journal of pharmaceutical and biomedical analysis xxx (2014) xxx–xxx high performance liquid...
TRANSCRIPT
Our reference: PBA 9683 P-authorquery-v9
AUTHOR QUERY FORM
Journal: PBA Please e-mail or fax your responses and any corrections to:
E-mail: [email protected]
Article Number: 9683 Fax: +353 6170 9272
Dear Author,
Please check your proof carefully and mark all corrections at the appropriate place in the proof (e.g., by using on-screenannotation in the PDF file) or compile them in a separate list. Note: if you opt to annotate the file with software other thanAdobe Reader then please also highlight the appropriate place in the PDF file. To ensure fast publication of your paper pleasereturn your corrections within 48 hours.
For correction or revision of any artwork, please consult http://www.elsevier.com/artworkinstructions.
Any queries or remarks that have arisen during the processing of your manuscript are listed below and highlighted by flags inthe proof. Click on the ‘Q’ link to go to the location in the proof.
Location in Query / Remark: click on the Q link to goarticle Please insert your reply or correction at the corresponding line in the proof
Q1 Please confirm that given names and surnames have been identified correctly.Q2 One or more sponsor names and the sponsor country identifier may have been edited to a standard format
that enables better searching and identification of your article. Please check and correct if necessary.Q3 Fig. 5 will appear in black and white in print and in color on the web. Based on this, the respective
figure captions have been updated. Please check, and correct if necessary.Q4 Please provide the definition for the significance of ‘*’ in Table 2.
Please check this box or indicate your approval ifyou have no corrections to make to the PDF file
Thank you for your assistance.
PBA 9683 1
ARTICLE IN PRESSG Model
Journal of Pharmaceutical and Biomedical Analysis xxx (2014) xxx–xxx
Contents lists available at ScienceDirect
Journal of Pharmaceutical and Biomedical Analysis
jo ur nal homepage: www.elsev ier .com/ locate / jpba
Graphical Abstract
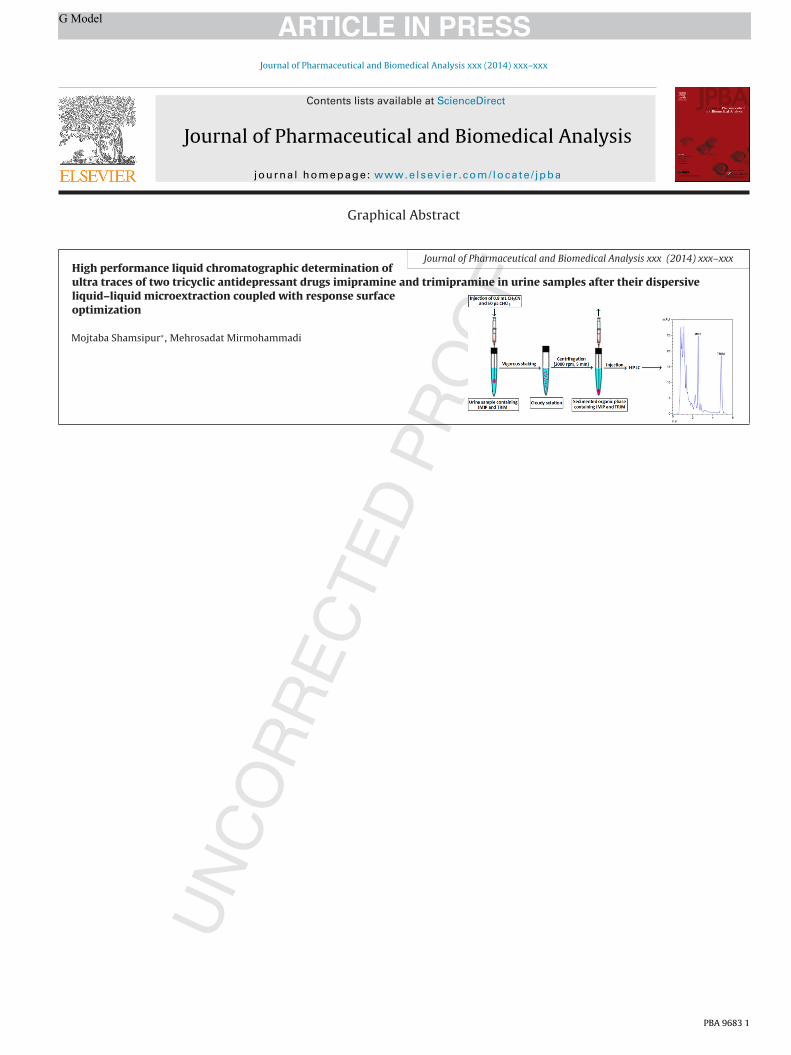
Journal of Pharmaceutical and Biomedical Analysis xxx (2014) xxx–xxxHigh performance liquid chromatographic determination ofultra traces of two tricyclic antidepressant drugs imipramine and trimipramine in urine samples after their dispersiveliquid–liquid microextraction coupled with response surfaceoptimization
Mojtaba Shamsipur∗, Mehrosadat Mirmohammadi
PBA 9683 1
ARTICLE IN PRESSG Model
Journal of Pharmaceutical and Biomedical Analysis xxx (2014) xxx–xxx
Contents lists available at ScienceDirect
Journal of Pharmaceutical and Biomedical Analysis
jo ur nal homepage: www.elsev ier .com/ locate / jpba
Highlights
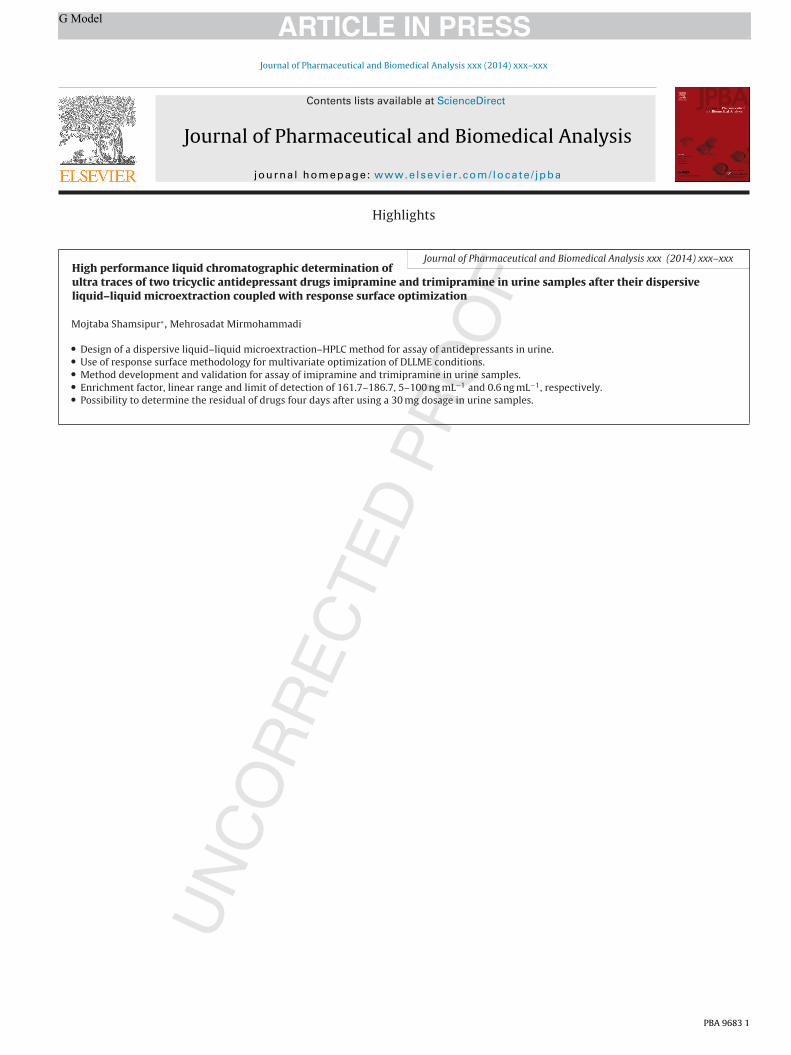
Journal of Pharmaceutical and Biomedical Analysis xxx (2014) xxx–xxxHigh performance liquid chromatographic determination ofultra traces of two tricyclic antidepressant drugs imipramine and trimipramine in urine samples after their dispersiveliquid–liquid microextraction coupled with response surface optimization
Mojtaba Shamsipur∗, Mehrosadat Mirmohammadi
• Design of a dispersive liquid–liquid microextraction–HPLC method for assay of antidepressants in urine.• Use of response surface methodology for multivariate optimization of DLLME conditions.• Method development and validation for assay of imipramine and trimipramine in urine samples.• Enrichment factor, linear range and limit of detection of 161.7–186.7, 5–100 ng mL−1 and 0.6 ng mL−1, respectively.• Possibility to determine the residual of drugs four days after using a 30 mg dosage in urine samples.
Please cite this article in press as: M. Shamsipur, M. Mirmohammadi, High performance liquid chromatographic determination of ultratraces of two tricyclic antidepressant drugs imipramine and trimipramine in urine samples after their dispersive liquid–liquid microex-traction coupled with response surface optimization, J. Pharm. Biomed. Anal. (2014), http://dx.doi.org/10.1016/j.jpba.2014.08.008
ARTICLE IN PRESSG ModelPBA 9683 1–8
Journal of Pharmaceutical and Biomedical Analysis xxx (2014) xxx–xxx
Contents lists available at ScienceDirect
Journal of Pharmaceutical and Biomedical Analysis
journa l homepage: www.e lsev ier .com/ locate / jpba
High performance liquid chromatographic determination of ultratraces of two tricyclic antidepressant drugs imipramine andtrimipramine in urine samples after their dispersive liquid–liquidmicroextraction coupled with response surface optimization
1
2
3
4
Mojtaba Shamsipur ∗, Mehrosadat MirmohammadiQ15
Department of Chemistry, Razi University, Kermanshah, Iran6
7
a r t i c l e i n f o8
9
Article history:10
Received 22 March 201411
Received in revised form 3 August 201412
Accepted 5 August 201413
Available online xxx14
15
Keywords:16
Dispersive liquid–liquid microextraction17
High-performance liquidchromatography–ultraviolet detection
18
19
Response surface methodology20
Tricyclic antidepressants21
Urine analysis22
a b s t r a c t
Dispersive liquid–liquid microextraction (DLLME) coupled with high performance liquid chromatog-raphy by ultraviolet detection (HPLC–UV) as a fast and inexpensive technique was applied to thedetermination of imipramine and trimipramine in urine samples. Response surface methodology (RSM)was used for multivariate optimization of the effects of seven different parameters influencing the extrac-tion efficiency of the proposed method. Under optimized experimental conditions, the enrichment factorsand extraction recoveries were between 161.7–186.7 and 97–112%, respectively. The linear range andlimit of detection for both analytes found to be 5–100 ng mL−1 and 0.6 ng mL−1, respectively. The relativestandard deviations for 5 ng mL−1 of the drugs in urine samples were in the range of 5.1–6.1 (n = 5). Thedeveloped method was successfully applied to real urine sample analyses.
© 2014 Published by Elsevier B.V.
23
1. Introduction24
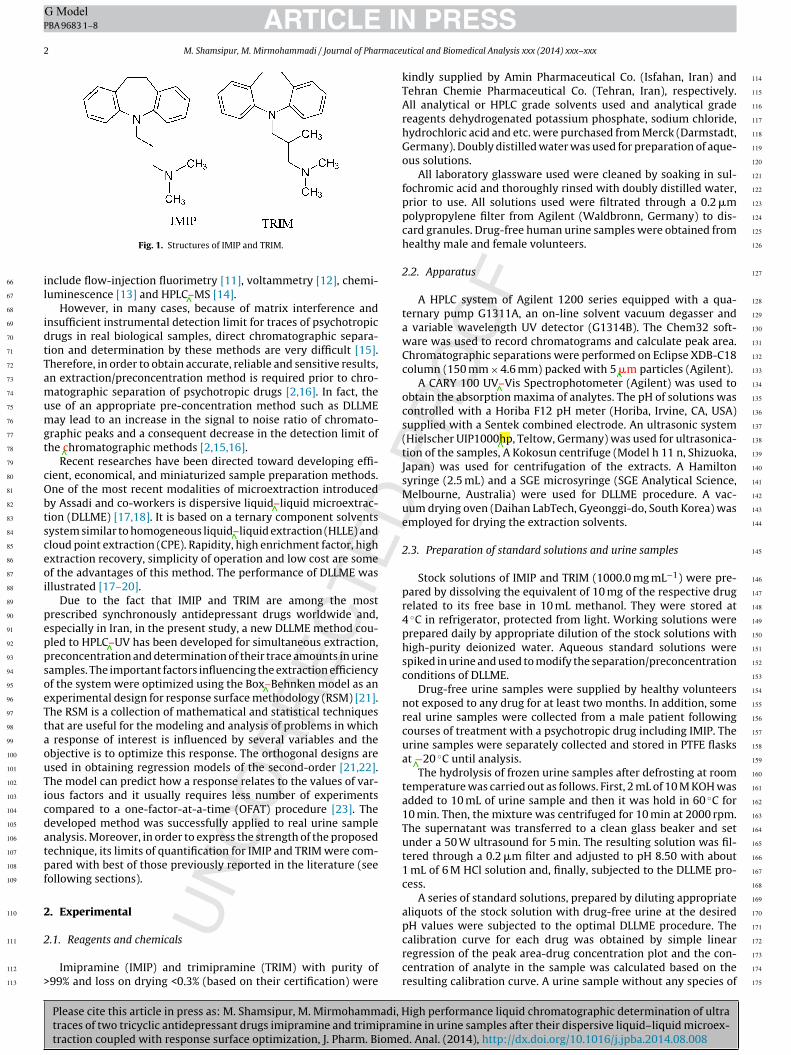
Imipramine (IMIP) and trimipramine (TRIM), with the chemical25
structures shown in Fig. 1, are among widely used tricyclic antide-26
pressants (TCAs) throughout the world. Imipramine is mainly used27
in the treatment of major depression and enuresis (inability to28
control urination). It has also been evaluated for use in panic dis-29
order [1]. Trimipramine is chemically similar to other tricyclic30
antidepressants such as imipramine as well as the antipsychotic31
levomepromazine (Nozinan). Trimipramine mechanism of action32
differs from other TCAs. It is only a moderate reuptake inhibitor33
of norepinephrine, and a weak reuptake inhibitor of serotonin and34
dopamine. Its main effects are due to considerable receptor antago-35
nism [2]. However, these drugs possess some side effects and could36
cause toxic accidents to human. It has been reported that even37
selective serotonin reuptake inhibiter (SSRI) with fewer side effects38
could cause toxic accidents, resulted in arousing aggressive charac-39
ter in the patients [3]. The published literature in this respect clearly40
demonstrated that the poisoning trouble could happen by taking41
∗ Corresponding author. Tel.: +98 21 66908032; fax: +98 21 66908030.E-mail address: [email protected] (M. Shamsipur).
large amounts of antidepressant drugs, many of such incidents 42
being related to suicides [4]. Antidepressants also have a higher 43
risk of serious cardiovascular side effects [5]. Thus, fast screening 44
test of these drugs in biological fluids is of critical importance. 45
Currently, there are a number of commercially available kits, 46
such as Triage® immunoassay test kit, in the market for the detec- 47
tion of many, but not all, tricyclic antidepressants. Although the 48
tricyclic antidepressants can be well detected by this kit, their 49
detection limits, which are in the range of 1000–4000 nM, are not 50
sufficient for many clinical purposes [4]. Thus, the development of 51
new or improved assay methods for trace levels of antidepressant 52
drugs in biological samples is of increasing interest. The general 53
methods for analyzing psychotropic drugs in different biological 54
samples are based on combining an efficient separation technique 55
with a sensitive detection method. At present, a number of separa- 56
tion/determination techniques, including high-performance liquid 57
chromatography (HPLC) [6,7], capillary electrophoresis (CE) [8] and 58
gas chromatography (GC) [9,10] have been used for the analy- 59
sis of psychotropic drugs. Among those methods, HPLC has been 60
considered as the most efficient and robust specific technique 61
due to some advantages including convenience, simple operation, 62
strong separation ability and wide sample application. Some other 63
detection techniques have also been used to accurately determine 64
the concentration of psychotropic drugs in various samples; these 65
http://dx.doi.org/10.1016/j.jpba.2014.08.0080731-7085/© 2014 Published by Elsevier B.V.
Please cite this article in press as: M. Shamsipur, M. Mirmohammadi, High performance liquid chromatographic determination of ultratraces of two tricyclic antidepressant drugs imipramine and trimipramine in urine samples after their dispersive liquid–liquid microex-traction coupled with response surface optimization, J. Pharm. Biomed. Anal. (2014), http://dx.doi.org/10.1016/j.jpba.2014.08.008
ARTICLE IN PRESSG ModelPBA 9683 1–8
2 M. Shamsipur, M. Mirmohammadi / Journal of Pharmaceutical and Biomedical Analysis xxx (2014) xxx–xxx
Fig. 1. Structures of IMIP and TRIM.
include flow-injection fluorimetry [11], voltammetry [12], chemi-66
luminescence [13] and HPLC–MS [14].67
However, in many cases, because of matrix interference and68
insufficient instrumental detection limit for traces of psychotropic69
drugs in real biological samples, direct chromatographic separa-70
tion and determination by these methods are very difficult [15].71
Therefore, in order to obtain accurate, reliable and sensitive results,72
an extraction/preconcentration method is required prior to chro-73
matographic separation of psychotropic drugs [2,16]. In fact, the74
use of an appropriate pre-concentration method such as DLLME75
may lead to an increase in the signal to noise ratio of chromato-76
graphic peaks and a consequent decrease in the detection limit of77
the chromatographic methods [2,15,16].78
Recent researches have been directed toward developing effi-79
cient, economical, and miniaturized sample preparation methods.80
One of the most recent modalities of microextraction introduced81
by Assadi and co-workers is dispersive liquid–liquid microextrac-82
tion (DLLME) [17,18]. It is based on a ternary component solvents83
system similar to homogeneous liquid–liquid extraction (HLLE) and84
cloud point extraction (CPE). Rapidity, high enrichment factor, high85
extraction recovery, simplicity of operation and low cost are some86
of the advantages of this method. The performance of DLLME was87
illustrated [17–20].88
Due to the fact that IMIP and TRIM are among the most89
prescribed synchronously antidepressant drugs worldwide and,90
especially in Iran, in the present study, a new DLLME method cou-91
pled to HPLC–UV has been developed for simultaneous extraction,92
preconcentration and determination of their trace amounts in urine93
samples. The important factors influencing the extraction efficiency94
of the system were optimized using the Box–Behnken model as an95
experimental design for response surface methodology (RSM) [21].96
The RSM is a collection of mathematical and statistical techniques97
that are useful for the modeling and analysis of problems in which98
a response of interest is influenced by several variables and the99
objective is to optimize this response. The orthogonal designs are100
used in obtaining regression models of the second-order [21,22].101
The model can predict how a response relates to the values of var-102
ious factors and it usually requires less number of experiments103
compared to a one-factor-at-a-time (OFAT) procedure [23]. The104
developed method was successfully applied to real urine sample105
analysis. Moreover, in order to express the strength of the proposed106
technique, its limits of quantification for IMIP and TRIM were com-107
pared with best of those previously reported in the literature (see108
following sections).109
2. Experimental110
2.1. Reagents and chemicals111
Imipramine (IMIP) and trimipramine (TRIM) with purity of112
>99% and loss on drying <0.3% (based on their certification) were113
kindly supplied by Amin Pharmaceutical Co. (Isfahan, Iran) and 114
Tehran Chemie Pharmaceutical Co. (Tehran, Iran), respectively. 115
All analytical or HPLC grade solvents used and analytical grade 116
reagents dehydrogenated potassium phosphate, sodium chloride, 117
hydrochloric acid and etc. were purchased from Merck (Darmstadt, 118
Germany). Doubly distilled water was used for preparation of aque- 119
ous solutions. 120
All laboratory glassware used were cleaned by soaking in sul- 121
fochromic acid and thoroughly rinsed with doubly distilled water, 122
prior to use. All solutions used were filtrated through a 0.2 �m 123
polypropylene filter from Agilent (Waldbronn, Germany) to dis- 124
card granules. Drug-free human urine samples were obtained from 125
healthy male and female volunteers. 126
2.2. Apparatus 127
A HPLC system of Agilent 1200 series equipped with a qua- 128
ternary pump G1311A, an on-line solvent vacuum degasser and 129
a variable wavelength UV detector (G1314B). The Chem32 soft- 130
ware was used to record chromatograms and calculate peak area. 131
Chromatographic separations were performed on Eclipse XDB-C18 132
column (150 mm × 4.6 mm) packed with 5 �m particles (Agilent). 133
A CARY 100 UV–Vis Spectrophotometer (Agilent) was used to 134
obtain the absorption maxima of analytes. The pH of solutions was 135
controlled with a Horiba F12 pH meter (Horiba, Irvine, CA, USA) 136
supplied with a Sentek combined electrode. An ultrasonic system 137
(Hielscher UIP1000hp, Teltow, Germany) was used for ultrasonica- 138
tion of the samples, A Kokosun centrifuge (Model h 11 n, Shizuoka, 139
Japan) was used for centrifugation of the extracts. A Hamilton 140
syringe (2.5 mL) and a SGE microsyringe (SGE Analytical Science, 141
Melbourne, Australia) were used for DLLME procedure. A vac- 142
uum drying oven (Daihan LabTech, Gyeonggi-do, South Korea) was 143
employed for drying the extraction solvents. 144
2.3. Preparation of standard solutions and urine samples 145
Stock solutions of IMIP and TRIM (1000.0 mg mL−1) were pre- 146
pared by dissolving the equivalent of 10 mg of the respective drug 147
related to its free base in 10 mL methanol. They were stored at 148
4 ◦C in refrigerator, protected from light. Working solutions were 149
prepared daily by appropriate dilution of the stock solutions with 150
high-purity deionized water. Aqueous standard solutions were 151
spiked in urine and used to modify the separation/preconcentration 152
conditions of DLLME. 153
Drug-free urine samples were supplied by healthy volunteers 154
not exposed to any drug for at least two months. In addition, some 155
real urine samples were collected from a male patient following 156
courses of treatment with a psychotropic drug including IMIP. The 157
urine samples were separately collected and stored in PTFE flasks 158
at −20 ◦C until analysis. 159
The hydrolysis of frozen urine samples after defrosting at room 160
temperature was carried out as follows. First, 2 mL of 10 M KOH was 161
added to 10 mL of urine sample and then it was hold in 60 ◦C for 162
10 min. Then, the mixture was centrifuged for 10 min at 2000 rpm. 163
The supernatant was transferred to a clean glass beaker and set 164
under a 50 W ultrasound for 5 min. The resulting solution was fil- 165
tered through a 0.2 �m filter and adjusted to pH 8.50 with about 166
1 mL of 6 M HCl solution and, finally, subjected to the DLLME pro- 167
cess. 168
A series of standard solutions, prepared by diluting appropriate 169
aliquots of the stock solution with drug-free urine at the desired 170
pH values were subjected to the optimal DLLME procedure. The 171
calibration curve for each drug was obtained by simple linear 172
regression of the peak area-drug concentration plot and the con- 173
centration of analyte in the sample was calculated based on the 174
resulting calibration curve. A urine sample without any species of 175
Please cite this article in press as: M. Shamsipur, M. Mirmohammadi, High performance liquid chromatographic determination of ultratraces of two tricyclic antidepressant drugs imipramine and trimipramine in urine samples after their dispersive liquid–liquid microex-traction coupled with response surface optimization, J. Pharm. Biomed. Anal. (2014), http://dx.doi.org/10.1016/j.jpba.2014.08.008
ARTICLE IN PRESSG ModelPBA 9683 1–8
M. Shamsipur, M. Mirmohammadi / Journal of Pharmaceutical and Biomedical Analysis xxx (2014) xxx–xxx 3
Table 1The factors included in the response surface design and the corresponding levels.
Factor Abbreviation Level
Low High
Volume of extraction solvent (�L) VE 10 60Volume of dispersion solvent (mL) VD 0.1 1.5Salt percent %S 0 10Sample pH pH 3 11Centrifuge time (min) tC 1 15Reaction time (s) tR 0 6Centrifuge revolution per minute (rpm) w 1000 3000
interest was used as the blank solution. The amounts of IMIP and176
TRIM were determined after the blank solution was subjected to177
the procedure described for sample. The actual concentrations of178
the analytes were obtained after blank subtraction.179
2.4. Procedures180
To a calibrated 10 mL screw cap glass test tube was added181
1.00 mL of hydrolyzed urine at pH 8.5, 1.00 mL of aqueous sample182
solution of analytes at a concentration level of 5 �g mL−1 and 0.2 mL183
of 25 wt% of NaCl and diluted to 5.00 mL with doubly distilled water.184
After rapidly and vigorously injecting of 0.8 mL of acetonitrile (as185
disperser solvent) containing 50 �L of chloroform (as extraction186
solvent) into sample solution by a syringe, a cloudy solution was187
formed in the test tube (the cloudy state was stable for at least188
2 h) and then the mixture was gently shaken. The separation of189
the phases was achieved by centrifugation at 2000 rpm for 5 min.190
In the case of aqueous samples, a small droplet of chloroform was191
sedimented in the bottom of the conical test tube. While in the192
case of urine samples, a white lipidic compound was sedimented193
in the bottom of the conical test tube, most probably due to the co-194
sedimentation of the matrices (such as carbamide and uric acid)195
in urine at high pH values [15]. However, by ultrasonic irradiation196
of the urine samples before DLLME procedure, these lipid materi-197
als were shattered and the sediment solvent was separated easily198
in the bottom of the conical tube after centrifuging process. The199
volume of sediment phase was determined using a 50 �L microsy-200
ring and found to be 45.7 ± 0.2 �L. Then, 40.0 �L of the sedimented201
phase was removed with a microsyring and placed in a 5 mL screw202
cap glass test tube and dried in a vacuum drying oven at a temper-203
ature of 25 ◦C and pressure of −0.08 MPa. Finally, the object was204
dissolved in 30 �L acetonitrile and injected into the 20 �L injection205
loop of HPLC for ensuing analysis.206
Optimization of different parameters affecting the extraction by207
the DLLME method was performed by a full Box–Behnken design208
[21] using the Minitab® 16.2 statistical software [23]. This response209
surface design was employed with seven plan factors at two levels210
in three blocks. These factors include volume of extraction solvent211
(VE), volume of dispersion solvent (VD), salt percentage (%S), sample212
pH, centrifuge revolutions per minute (w), time of reaction (tR) and213
time of centrifugation (tC). Table 1 depicts the abbreviation and214
levels of each factor employed in the design.215
In order to examine the enrichment factor of each analyte, three216
replicate extractions were performed at optimal conditions from217
urine solutions consisting 5 ng mL−1 IMIP and TRIM. The enrich-218
ment factor (EF) was calculated as the ratio of final concentration219
of analytes in sediment phase (CSed) and its concentration in the220
original solution (C0). In this case, Csed was calculated from the221
calibration curve and C0 was 5 ng mL−1, as:222
EF = Csed
C0223
Percent recovery (%R) was also evaluated from the enrichment 224
factors obtained, as: 225
%R =(
V sed
Vaq
)× EF × 100 226
where Vsed and Vaq are the volumes of sediment phase and aqueous 227
sample, respectively. 228
3. Results and discussion 229
Because urine is a biological fluid and its complex matrix would 230
cause a negative effect on the recovery of analytes under ordinary 231
conditions, the hydrolysis of urine into an appropriate form for 232
DLLME method is a critical requirement [15]. Therefore, each urine 233
sample was basified using 2 M of KOH so that, after hydrolysis, most 234
of interfering compounds such as carbamide, uric acid, calcium salt 235
and some rarely present protein, glucose, calcium phosphate and 236
so on was precipitated out. As mentioned in Section 2.4, by ultra- 237
sonic irradiation of the urine samples before DLLME procedure, it 238
was possible to break down the structure of such lipid materials 239
remaining, which interfere in removal of sediment part. 240
In the design of a DLLME method combined with HPLC–UV for 241
the pre-concentration and determination of TCAs in biological flu- 242
ids, there are several factors that affect the extraction process; these 243
include the nature and volume of extraction and disperser solvents, 244
pH of solution, salt effect and reaction and centrifugation times. In 245
the present study, the selection of best extraction and dispersion 246
solvents was achieved by one-factor-at-a-time (OFAT) experiments 247
and the other parameters were optimized by the response sur- 248
face methodology to reduce the interaction between the effective 249
factors [24,25]. 250
3.1. Selection of extraction solvent 251
Choosing the most suitable extraction solvent is of primary 252
importance for achieving good extractability and selectivity of the 253
target analytes in DLLME. In this context, some factors should be 254
considered: the extraction solvent must be immiscible with water, 255
the solubility of analytes should be higher in the organic phase than 256
the donor phase to promote the extraction of the analytes and the 257
density of the organic solvent must be higher than water and it 258
should be non-volatile in the course of extraction [17]. Therefore, 259
several organic solvents as carbon disulfide (CS2), dichloromethane 260
(CH2Cl2), chlorobenzene (C6H5Cl), carbon tetrachloride (CCl4) and 261
chloroform (CHCl3), which have the above mentioned characteris- 262
tics, were studied. Thus, to a series of 5.0 mL of 100 ng mL−1 of the 263
two drug sample solutions was added 1.00 mL of acetonitrile, as dis- 264
perser solvent, containing 50.0 �L of different extraction solvents, 265
and the recommended procedure was followed. 266
The results revealed that, in the cases of CS2 and CH2Cl2, no 267
cloudy state was observed and also no sediment droplet of extract 268
was formed in the bottom of the tube after centrifugation. This is 269
most possibly due to higher water solubility of these solvents than 270
the other tested solvents [9]. While, in the cases of use of C6H5Cl, 271
CCl4 and CHCl3 as extraction solvents, the cloudy state was occurred 272
and a sediment droplet of extract was formed in the bottom of test 273
tube. However, after HPLC–UV analysis of the resulting extracts, it 274
was found that C6H5Cl has a strong peak at 2.035 min which was 275
partially overlapped with the peak of IMIP at 2.479 min, but not 276
with that of TRIM, observed at 4.754 min, so that the simultaneous 277
detection of the two drugs cannot be performed accurately in this 278
solvent. On the other hand, there was no overlapping problem in the 279
resulting chromatograms in the cases of CCl4 and CHCl3 as extrac- 280
tion solvent and the extraction efficiency of both solvents for IMIP 281
and TRIM was more or less the same. However, the interference of 282
Please cite this article in press as: M. Shamsipur, M. Mirmohammadi, High performance liquid chromatographic determination of ultratraces of two tricyclic antidepressant drugs imipramine and trimipramine in urine samples after their dispersive liquid–liquid microex-traction coupled with response surface optimization, J. Pharm. Biomed. Anal. (2014), http://dx.doi.org/10.1016/j.jpba.2014.08.008
ARTICLE IN PRESSG ModelPBA 9683 1–8
4 M. Shamsipur, M. Mirmohammadi / Journal of Pharmaceutical and Biomedical Analysis xxx (2014) xxx–xxx
Table 2Response surface design experiments and the responses for IMIP and TRIM.Q4
No. Parameter EFIMIP EFTRIM %RIMIP %RTRIM
pH %S VD VE tR tC w
1 3 5 0.1 30 6 8 2000 35.565 36.472 21.339 21.8832 7 5 0.8 50 6 15 2000 195.916 233.819 117.550 140.2923 7 10 1.5 30 3 15 2000 8.308 4.939 4.985 2.9634 11 5 1.5 30 6 8 2000 * * * *5 7 5 0.8 30 3 8 2000 110.707 127.131 66.424 76.2796 7 10 0.8 30 6 8 3000 5.607 * 3.364 *7 7 5 0.1 50 3 8 1000 85.169 79.831 51.101 47.8998 7 0 1.5 30 3 1 2000 15.184 7.567 9.110 4.5409 11 5 0.8 30 3 1 1000 83.204 72.736 49.923 43.642
10 7 0 0.1 30 3 15 2000 19.113 13.348 11.468 8.00911 3 0 0.8 50 3 8 2000 218.017 242.228 130.810 145.33712 3 5 0.8 30 3 15 1000 78.539 78.254 47.123 46.95313 7 5 0.8 10 6 1 2000 14.202 11.508 8.521 6.90514 7 5 0.1 10 3 8 3000 6.098 7.041 3.659 4.22515 7 5 0.8 50 0 1 2000 233.242 247.747 139.945 148.64816 7 5 1.5 10 3 8 1000 * * * *17 7 5 1.5 50 3 8 3000 * * * *18 11 5 0.8 30 3 15 3000 152.698 143.686 91.619 86.21219 3 5 1.5 30 0 8 2000 4.625 * 2.775 *20 3 5 0.8 30 3 1 3000 75.346 84.298 45.208 50.57921 7 5 0.8 10 0 15 2000 * * * *22 7 10 0.1 30 3 1 2000 67.243 69.057 40.346 41.43423 7 0 0.8 30 0 8 3000 51.036 89.291 30.621 53.57524 11 5 0.1 30 0 8 2000 90.080 79.568 54.048 47.74125 3 10 0.8 10 3 8 2000 3.152 * 1.891 *26 7 0 0.8 30 6 8 1000 102.849 108.211 61.709 64.92727 7 5 0.8 30 3 8 2000 57.911 62.488 34.747 37.49328 7 5 0.8 30 3 8 2000 60.858 64.853 36.515 38.91229 7 10 0.8 30 0 8 1000 39.740 261.674 23.844 157.00430 11 0 0.8 10 3 8 2000 * * * *31 11 10 0.8 50 3 8 2000 109.479 77.466 65.688 46.480
white lipoids sediment in DLLME of urine samples was higher in283
CCl4 than that in CHCl3; therefore, chloroform was selected as the284
most suitable extraction solvent for subsequent experiments.285
3.2. Selection of disperser solvent286
The disperser solvent must be miscible in both the extraction287
solvent (organic phase) and the sample solution (aqueous phase).288
Therefore, the ability of acetone, methanol, ethanol, isopropanol289
and acetonitrile as disperser solvent was tested, by extracting a290
series of 5.0 mL of 100 ng mL−1 of the two drug sample solutions291
after addition of 1.00 mL of each candidate disperser solvent con-292
taining 50.0 �L of chloroform, as extraction solvent. In the case of293
methanol, a cloudy state was observed but no sediment droplet294
of extract was found in the bottom of the extraction tube after295
centrifugation. It is apparently because of higher solubility of chlo-296
roform in methanol than the other tried disperser solvents.297
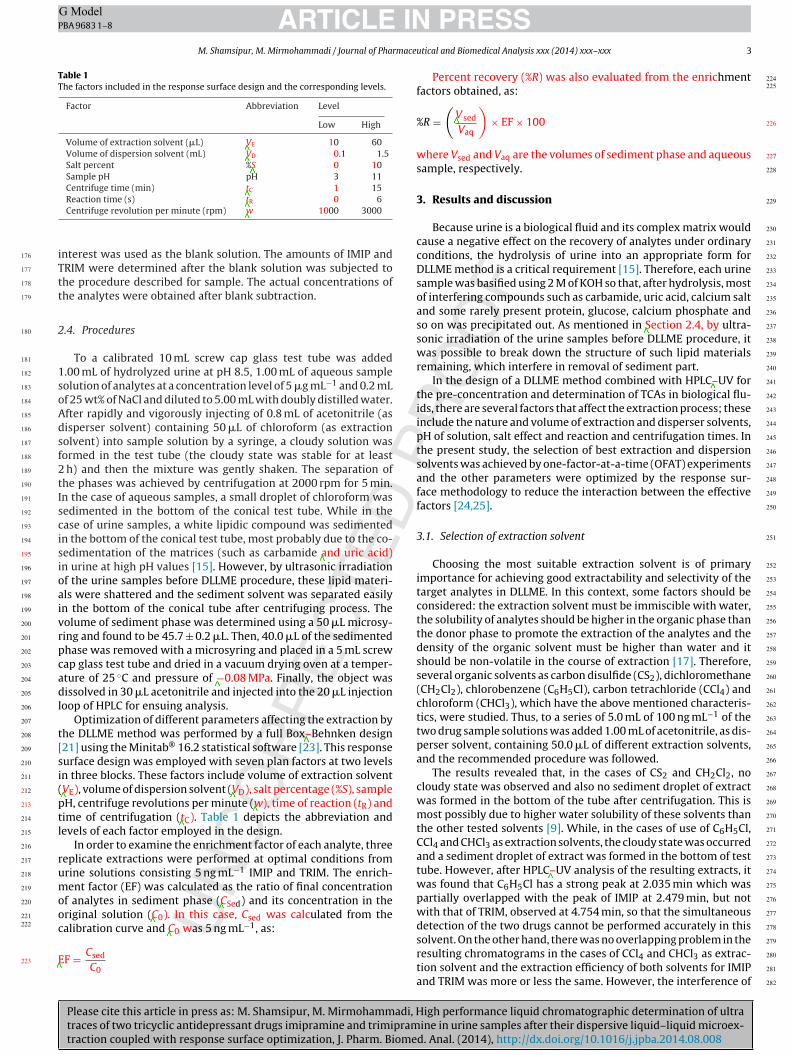
While, the use of ethanol, acetone and acetonitrile as disperser298
solvent not only possessed a good cloudy state but also revealed299
an acceptable sediment phase and proper HPLC results. However,300
a maximum peak area was obtained by using acetonitrile as a dis-301
perser solvent (Fig. 2). This is most likely due to the synergistic302
effect of good compatibility of acetonitrile with aqueous solution303
and low distribution ratio of analyte drugs in the binary mixed304
solution of water and acetonitrile [15]. Therefore, acetonitrile was305
selected as a disperser solvent for further experiments.306
3.3. Optimization of extraction parameters by the response307
surface design308
After performing some preliminary experiments, optimization309
of the extraction conditions for DLLME method was conducted310
using a response surface design of Box–Behnken [21], with seven311
factors as illustrated in Table 2. Two dependent variables of312
extraction recovery (%R) and enrichment factor (EF) were opti- 313
mized with the model. 314
In each experiment, a suitable amount of extraction solvent (VE) 315
was injected into the urine sample containing a given percent of 316
salt (%S) at an adjusted pH. After elapse of a given reaction time 317
(tR) between the extraction and dispersion processes, an intended 318
volume of dispersion solvent (VD) was injected vigorously. Then the 319
cloudy solution was centrifuged in a suitable centrifuge revolution 320
per minute (w, rpm) and given period of time (tC), the sediment 321
phase formed in the bottom of the extraction tube was taken by 322
a microsyring and placed in a clean tube and dried in a vacuum 323
oven. Finally, the sediment was dissolved in 30 �L of acetonitrile 324
and injected into the HPLC column for following analysis. The data 325
Fig. 2. Selection of disperser solvent.
Please cite this article in press as: M. Shamsipur, M. Mirmohammadi, High performance liquid chromatographic determination of ultratraces of two tricyclic antidepressant drugs imipramine and trimipramine in urine samples after their dispersive liquid–liquid microex-traction coupled with response surface optimization, J. Pharm. Biomed. Anal. (2014), http://dx.doi.org/10.1016/j.jpba.2014.08.008
ARTICLE IN PRESSG ModelPBA 9683 1–8
M. Shamsipur, M. Mirmohammadi / Journal of Pharmaceutical and Biomedical Analysis xxx (2014) xxx–xxx 5
Table 3Estimated regression coefficients and analysis of variance (ANOVA) of the predicted model for R% and EF.
Term IMIP TRIM
Coeff. for EF Coeff. for %R Regression and ANOVA factors for EF and %R Coeff. for EF Coeff. for %R Regression and ANOVA factors for EF and %R
P F P F
pH 1.5223 0.9134 0.861 0.76 −8.039 −4.8234 0.395 0.76%S 10.5889 6.3533 0.189 3.02 14.5334 8.72 0.099 3.02VD 12.4556 −7.4733 0.321 0.85 12.1425 −7.2855 0.369 0.85VE 75.0813 45.0488 0 62.07 79.1801 47.508 0.000 62.07tR 33.0446 19.8268 0.002 22.43 47.5954 28.5572 0.000 22.43tC 9.6723 5.8034 0.26 1.75 11.8699 7.1219 0.202 1.75w 13.4703 8.0822 0.133 1.31 10.546 6.3276 0.268 1.31pH × pH −7.1219 −4.2731 0.516 7.83 18.0455 10.8273 0.137 7.83%S × %S 17.1532 10.2919 0.125 2.42 12.2507 −7.3504 0.301 2.42VD × VD 65.9702 39.5821 0 1.14 78.9741 47.3845 0.000 1.14VE × VE 5.7506 3.4504 0.609 28.7 5.7172 3.4303 0.637 28.7tR × tR 23.6893 14.2136 0.046 0.23 37.5014 22.5008 0.006 0.23tC × tC 22.5954 13.5573 0.05 9.9 18.595 11.157 0.127 9.9w × w 16.5478 −9.9287 0.141 2.57 13.0187 −7.8112 0.277 2.57pH × %S 12.8356 7.7014 0.322 1.26 8.3925 5.0355 0.545 1.26pH × VD 11.3179 −6.7907 0.547 1.38 18.7739 11.2644 0.358 1.38pH × VE −4.9675 −2.9805 0.698 0.38 12.9035 −7.7421 0.356 0.38pH × tR −5.5143 −3.3086 0.751 0.89 −8.3261 −4.9957 0.657 0.89pH × tC 0.0921 0.0553 0.994 0.9 −0.761 −0.4566 0.956 0.9pH × w −5.8423 −3.5054 0.649 0.2 10.2101 −6.126 0.463 0.2%S × VD −7.2263 −4.3358 0.633 0 −6.4155 −3.8493 0.695 0%S × VE 10.1856 6.1114 0.43 0.56 8.2721 4.9632 0.551 0.56%S × tR 21.6451 12.9871 0.103 0.16 31.4732 18.8839 0.033 0.16%S × tC 3.2305 1.9383 0.831 0.37 1.4679 0.8807 0.928 0.37%S × w 7.1059 4.2635 0.58 5.34 −2.9398 −1.7639 0.831 5.34VD × VE 44.0224 26.4134 0.03 0.01 48.5733 29.144 0.027 0.01VD × tR 25.1566 15.0939 0.196 0.05 37.7802 22.6681 0.078 0.05VD × tC −5.8089 −3.4853 0.701 5.78 −4.2708 −2.5625 0.794 5.78VD × w 18.1928 10.9157 0.337 3.5 16.0136 9.6082 0.431 3.5VE × tR 18.4404 11.0643 0.229 0.07 15.9107 −9.5464 0.332 0.07VE × tC −4.0386 −2.4231 0.788 0.65 10.3891 −6.2335 0.524 0.65VE × w 9.8793 5.9276 0.571 0.99 13.3072 7.9843 0.480 0.99tR × tC 27.8784 −16.727 0.076 0.42 31.8713 19.1228 0.061 0.42tR × w 32.0712 19.2427 0.02 0.52 −25.068 15.0408 0.082 0.52tC × w −3.9187 −2.3512 0.76 3.98 −6.772 −4.0632 0.625 3.98
summarized in Table 2 show the %R and EF responses obtained for326
31 experiments designed by using the MINITAB software.327
Table 3 contains the estimated regression coefficients and the328
analysis of variance (ANOVA) of the effects for each term in the329
model. This table summarizes the linear terms, the squared terms,330
and the interactions. A P-value less than 0.05 in this table indi-331
cates the statistical significance of an effect at 95% confidence level.332
Small P-value of VE and tR, for EFIMIP, %RIMIP, %RTRIM and EFTRIM indi-333
cate that volume of extracting solvent (VE) and time of reaction334
(tR) effects are statistically significant. V2D and t2
R show significant335
effects on EFIMIP, %RIMIP, EFTRIM and %RTRIM while t2C influences only336
%RIMIP and %RTRIM. Effects of VD × VE on EFIMIP, %RIMIP, EFTRIM and337
%RTRIM, tR × w on EFIMIP and %RIMIP and %S × tR on EFTRIM, %RTRIM are338
statistically significant because of their small P-values.339
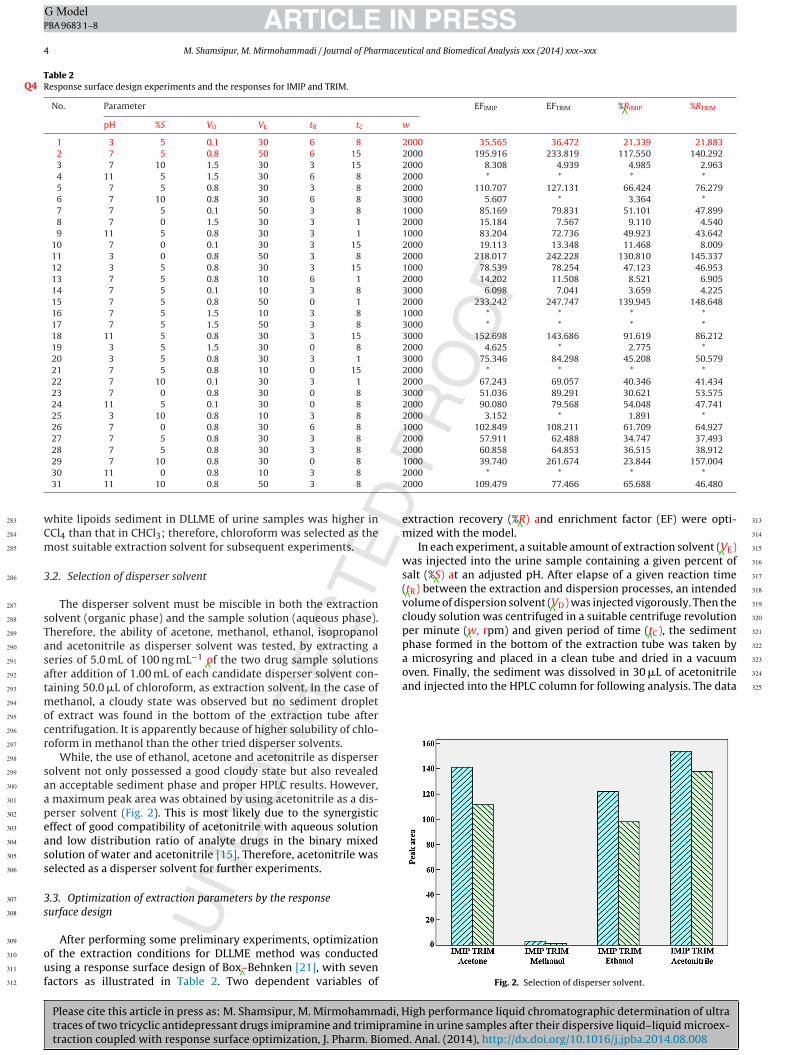
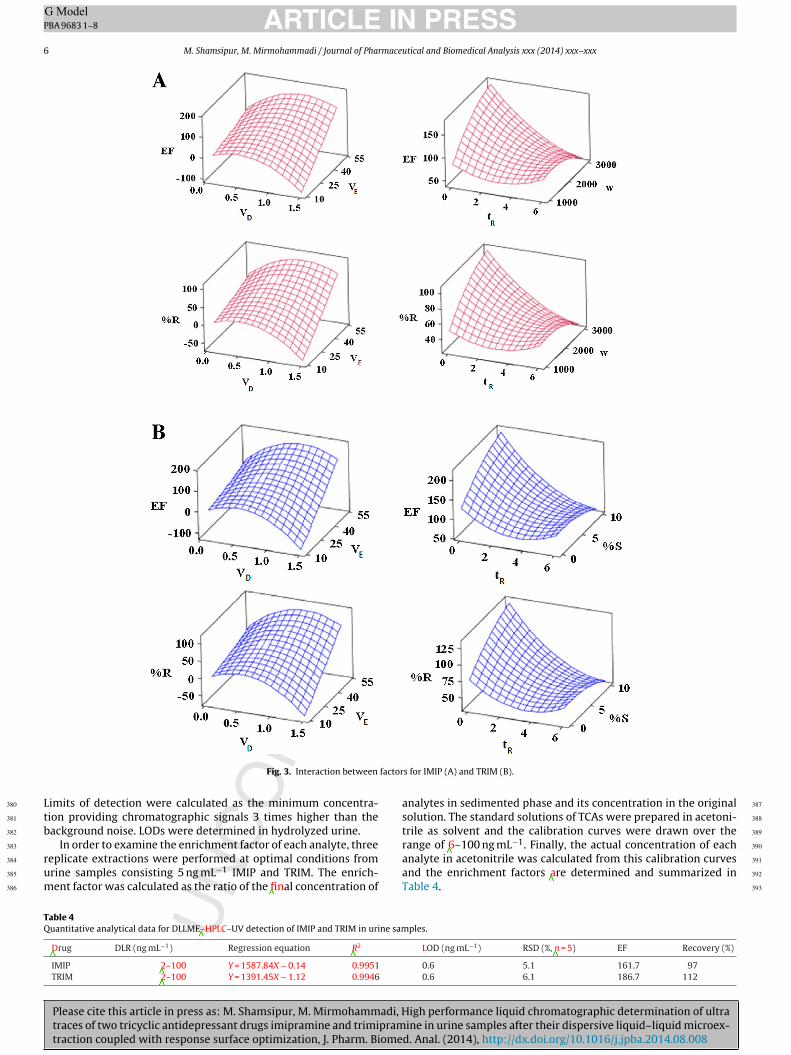
As it is seen from Fig. 3, the curvatures of the resulting plots340
of EF and %R values against VD and VE and tR and w, for both IMIP341
and TRIM cases, indicate the existence of interaction between the342
factors affecting the DLLME process.343
3.4. Optimization by the response surface design344
To assess whether the residuals are normally distributed,345
goodness-of-fit test (Anderson–Darling) statistics [23,25] was346
applied. The results showed the large P-values.347
For both EFIMIP and %RIMIP (P = 0.849) and EFTRIM and %RTRIM348
(P = 0.543), which exhibited that the residuals followed a normal349
distribution.350
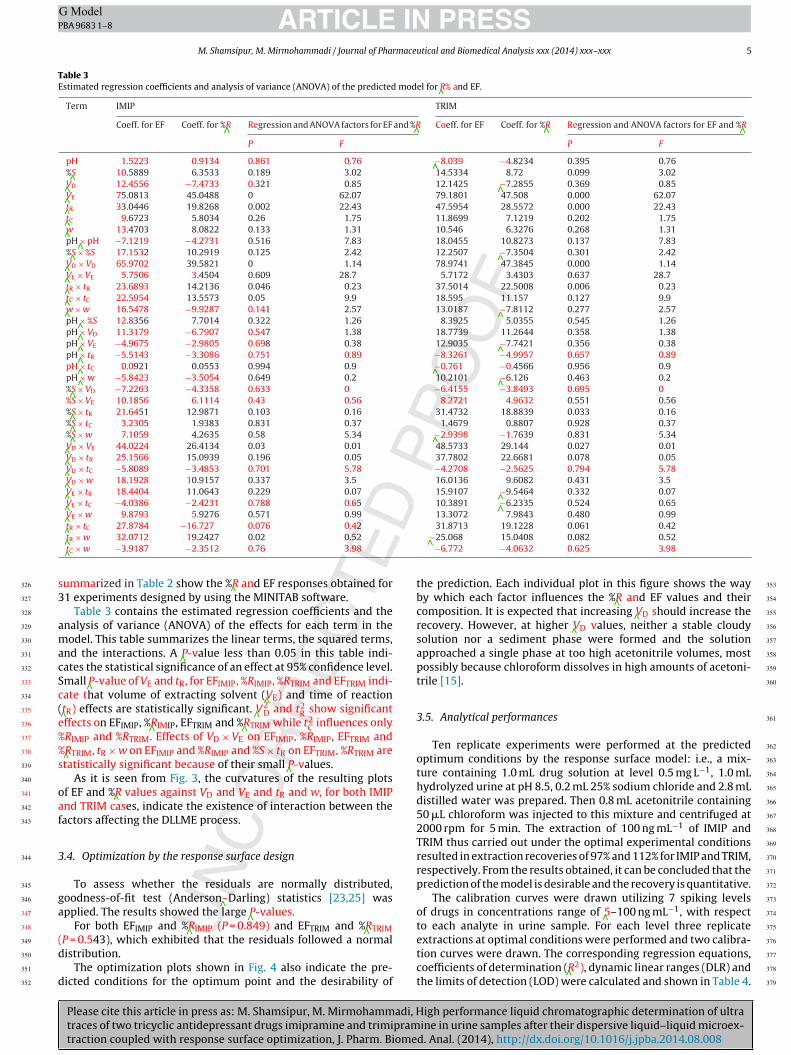
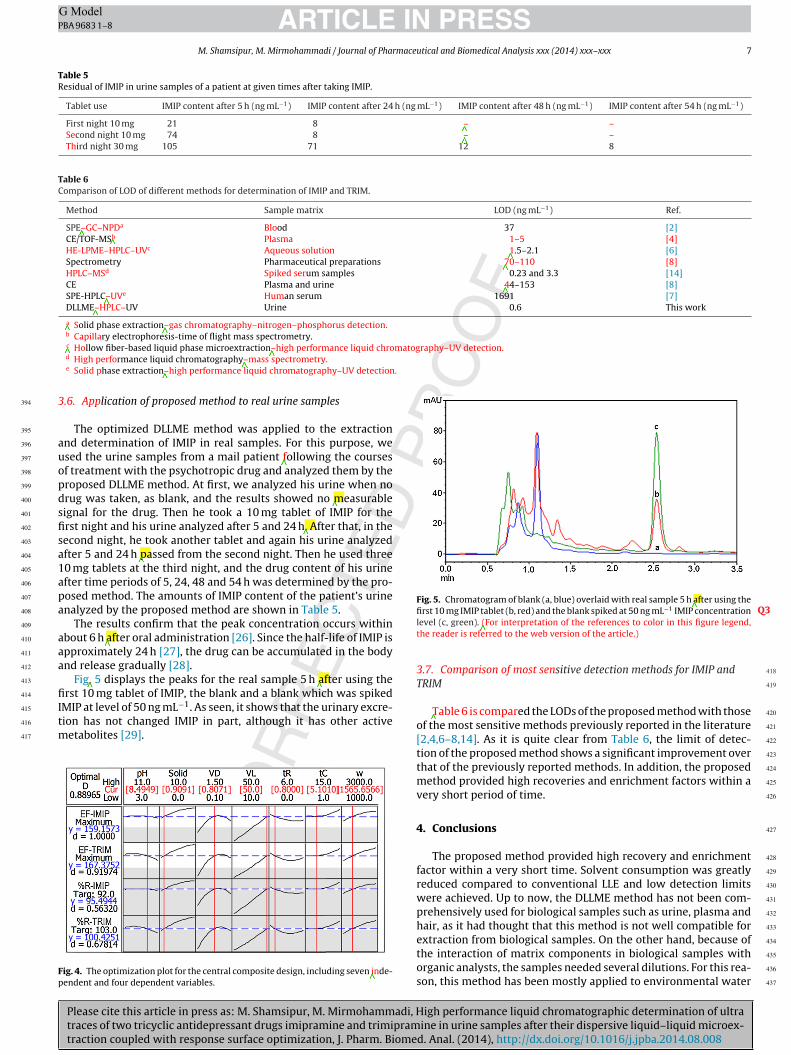
The optimization plots shown in Fig. 4 also indicate the pre-351
dicted conditions for the optimum point and the desirability of352
the prediction. Each individual plot in this figure shows the way 353
by which each factor influences the %R and EF values and their 354
composition. It is expected that increasing VD should increase the 355
recovery. However, at higher VD values, neither a stable cloudy 356
solution nor a sediment phase were formed and the solution 357
approached a single phase at too high acetonitrile volumes, most 358
possibly because chloroform dissolves in high amounts of acetoni- 359
trile [15]. 360
3.5. Analytical performances 361
Ten replicate experiments were performed at the predicted 362
optimum conditions by the response surface model: i.e., a mix- 363
ture containing 1.0 mL drug solution at level 0.5 mg L−1, 1.0 mL 364
hydrolyzed urine at pH 8.5, 0.2 mL 25% sodium chloride and 2.8 mL 365
distilled water was prepared. Then 0.8 mL acetonitrile containing 366
50 �L chloroform was injected to this mixture and centrifuged at 367
2000 rpm for 5 min. The extraction of 100 ng mL−1 of IMIP and 368
TRIM thus carried out under the optimal experimental conditions 369
resulted in extraction recoveries of 97% and 112% for IMIP and TRIM, 370
respectively. From the results obtained, it can be concluded that the 371
prediction of the model is desirable and the recovery is quantitative. 372
The calibration curves were drawn utilizing 7 spiking levels 373
of drugs in concentrations range of 5–100 ng mL−1, with respect 374
to each analyte in urine sample. For each level three replicate 375
extractions at optimal conditions were performed and two calibra- 376
tion curves were drawn. The corresponding regression equations, 377
coefficients of determination (R2), dynamic linear ranges (DLR) and 378
the limits of detection (LOD) were calculated and shown in Table 4. 379
Please cite this article in press as: M. Shamsipur, M. Mirmohammadi, High performance liquid chromatographic determination of ultratraces of two tricyclic antidepressant drugs imipramine and trimipramine in urine samples after their dispersive liquid–liquid microex-traction coupled with response surface optimization, J. Pharm. Biomed. Anal. (2014), http://dx.doi.org/10.1016/j.jpba.2014.08.008
ARTICLE IN PRESSG ModelPBA 9683 1–8
6 M. Shamsipur, M. Mirmohammadi / Journal of Pharmaceutical and Biomedical Analysis xxx (2014) xxx–xxx
Fig. 3. Interaction between factors for IMIP (A) and TRIM (B).
Limits of detection were calculated as the minimum concentra-380
tion providing chromatographic signals 3 times higher than the381
background noise. LODs were determined in hydrolyzed urine.382
In order to examine the enrichment factor of each analyte, three383
replicate extractions were performed at optimal conditions from384
urine samples consisting 5 ng mL−1 IMIP and TRIM. The enrich-385
ment factor was calculated as the ratio of the final concentration of386
analytes in sedimented phase and its concentration in the original 387
solution. The standard solutions of TCAs were prepared in acetoni- 388
trile as solvent and the calibration curves were drawn over the 389
range of 6–100 ng mL−1. Finally, the actual concentration of each 390
analyte in acetonitrile was calculated from this calibration curves 391
and the enrichment factors are determined and summarized in 392
Table 4. 393
Table 4Quantitative analytical data for DLLME–HPLC–UV detection of IMIP and TRIM in urine samples.
Drug DLR (ng mL−1) Regression equation R2 LOD (ng mL−1) RSD (%, n = 5) EF Recovery (%)
IMIP 2–100 Y = 1587.84X − 0.14 0.9951 0.6 5.1 161.7 97TRIM 2–100 Y = 1391.45X − 1.12 0.9946 0.6 6.1 186.7 112
Please cite this article in press as: M. Shamsipur, M. Mirmohammadi, High performance liquid chromatographic determination of ultratraces of two tricyclic antidepressant drugs imipramine and trimipramine in urine samples after their dispersive liquid–liquid microex-traction coupled with response surface optimization, J. Pharm. Biomed. Anal. (2014), http://dx.doi.org/10.1016/j.jpba.2014.08.008
ARTICLE IN PRESSG ModelPBA 9683 1–8
M. Shamsipur, M. Mirmohammadi / Journal of Pharmaceutical and Biomedical Analysis xxx (2014) xxx–xxx 7
Table 5Residual of IMIP in urine samples of a patient at given times after taking IMIP.
Tablet use IMIP content after 5 h (ng mL−1) IMIP content after 24 h (ng mL−1) IMIP content after 48 h (ng mL−1) IMIP content after 54 h (ng mL−1)
First night 10 mg 21 8 – –Second night 10 mg 74 8 – –Third night 30 mg 105 71 12 8
Table 6Comparison of LOD of different methods for determination of IMIP and TRIM.
Method Sample matrix LOD (ng mL−1) Ref.
SPE–GC–NPDa Blood 37 [2]CE/TOF-MSb Plasma 1–5 [4]HE-LPME–HPLC–UVc Aqueous solution 1.5–2.1 [6]Spectrometry Pharmaceutical preparations 70–110 [8]HPLC–MSd Spiked serum samples 0.23 and 3.3 [14]CE Plasma and urine 44–153 [8]SPE-HPLC–UVe Human serum 1691 [7]DLLME–HPLC–UV Urine 0.6 This work
a Solid phase extraction–gas chromatography–nitrogen–phosphorus detection.b Capillary electrophoresis-time of flight mass spectrometry.c Hollow fiber-based liquid phase microextraction–high performance liquid chromatography–UV detection.d High performance liquid chromatography–mass spectrometry.e Solid phase extraction–high performance liquid chromatography–UV detection.
3.6. Application of proposed method to real urine samples394
The optimized DLLME method was applied to the extraction395
and determination of IMIP in real samples. For this purpose, we396
used the urine samples from a mail patient following the courses397
of treatment with the psychotropic drug and analyzed them by the398
proposed DLLME method. At first, we analyzed his urine when no399
drug was taken, as blank, and the results showed no measurable400
signal for the drug. Then he took a 10 mg tablet of IMIP for the401
first night and his urine analyzed after 5 and 24 h. After that, in the402
second night, he took another tablet and again his urine analyzed403
after 5 and 24 h passed from the second night. Then he used three404
10 mg tablets at the third night, and the drug content of his urine405
after time periods of 5, 24, 48 and 54 h was determined by the pro-406
posed method. The amounts of IMIP content of the patient’s urine407
analyzed by the proposed method are shown in Table 5.408
The results confirm that the peak concentration occurs within409
about 6 h after oral administration [26]. Since the half-life of IMIP is410
approximately 24 h [27], the drug can be accumulated in the body411
and release gradually [28].412
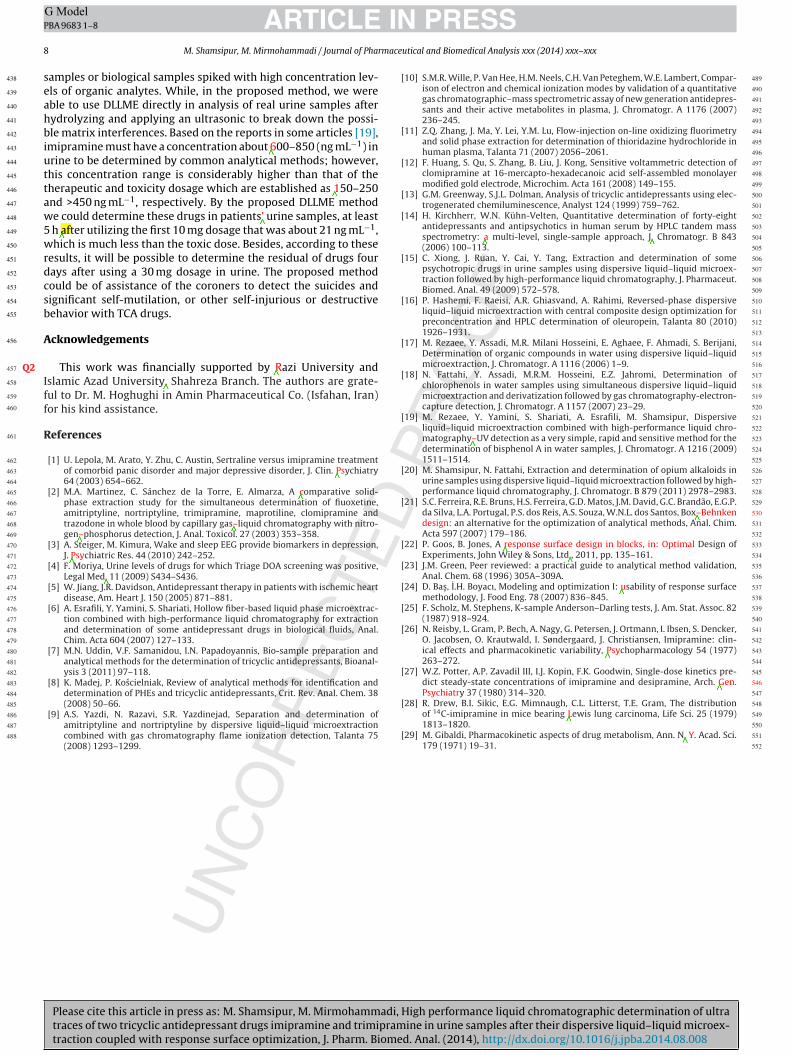
Fig. 5 displays the peaks for the real sample 5 h after using the413
first 10 mg tablet of IMIP, the blank and a blank which was spiked414
IMIP at level of 50 ng mL−1. As seen, it shows that the urinary excre-415
tion has not changed IMIP in part, although it has other active416
metabolites [29].417
Fig. 4. The optimization plot for the central composite design, including seven inde-pendent and four dependent variables.
Fig. 5. Chromatogram of blank (a, blue) overlaid with real sample 5 h after using thefirst 10 mg IMIP tablet (b, red) and the blank spiked at 50 ng mL−1 IMIP concentration Q3level (c, green). (For interpretation of the references to color in this figure legend,the reader is referred to the web version of the article.)
3.7. Comparison of most sensitive detection methods for IMIP and 418
TRIM 419
Table 6 is compared the LODs of the proposed method with those 420
of the most sensitive methods previously reported in the literature 421
[2,4,6–8,14]. As it is quite clear from Table 6, the limit of detec- 422
tion of the proposed method shows a significant improvement over 423
that of the previously reported methods. In addition, the proposed 424
method provided high recoveries and enrichment factors within a 425
very short period of time. 426
4. Conclusions 427
The proposed method provided high recovery and enrichment 428
factor within a very short time. Solvent consumption was greatly 429
reduced compared to conventional LLE and low detection limits 430
were achieved. Up to now, the DLLME method has not been com- 431
prehensively used for biological samples such as urine, plasma and 432
hair, as it had thought that this method is not well compatible for 433
extraction from biological samples. On the other hand, because of 434
the interaction of matrix components in biological samples with 435
organic analysts, the samples needed several dilutions. For this rea- 436
son, this method has been mostly applied to environmental water 437
Please cite this article in press as: M. Shamsipur, M. Mirmohammadi, High performance liquid chromatographic determination of ultratraces of two tricyclic antidepressant drugs imipramine and trimipramine in urine samples after their dispersive liquid–liquid microex-traction coupled with response surface optimization, J. Pharm. Biomed. Anal. (2014), http://dx.doi.org/10.1016/j.jpba.2014.08.008
ARTICLE IN PRESSG ModelPBA 9683 1–8
8 M. Shamsipur, M. Mirmohammadi / Journal of Pharmaceutical and Biomedical Analysis xxx (2014) xxx–xxx
samples or biological samples spiked with high concentration lev-438
els of organic analytes. While, in the proposed method, we were439
able to use DLLME directly in analysis of real urine samples after440
hydrolyzing and applying an ultrasonic to break down the possi-441
ble matrix interferences. Based on the reports in some articles [19],442
imipramine must have a concentration about 600–850 (ng mL−1) in443
urine to be determined by common analytical methods; however,444
this concentration range is considerably higher than that of the445
therapeutic and toxicity dosage which are established as 150–250446
and >450 ng mL−1, respectively. By the proposed DLLME method447
we could determine these drugs in patients’ urine samples, at least448
5 h after utilizing the first 10 mg dosage that was about 21 ng mL−1,449
which is much less than the toxic dose. Besides, according to these450
results, it will be possible to determine the residual of drugs four451
days after using a 30 mg dosage in urine. The proposed method452
could be of assistance of the coroners to detect the suicides and453
significant self-mutilation, or other self-injurious or destructive454
behavior with TCA drugs.455
Acknowledgements456
This work was financially supported by Razi University andQ2457
Islamic Azad University, Shahreza Branch. The authors are grate-458
ful to Dr. M. Hoghughi in Amin Pharmaceutical Co. (Isfahan, Iran)459
for his kind assistance.460
References461
[1] U. Lepola, M. Arato, Y. Zhu, C. Austin, Sertraline versus imipramine treatment462
of comorbid panic disorder and major depressive disorder, J. Clin. Psychiatry463
64 (2003) 654–662.464
[2] M.A. Martinez, C. Sánchez de la Torre, E. Almarza, A comparative solid-465
phase extraction study for the simultaneous determination of fiuoxetine,466
amitriptyline, nortriptyline, trimipramine, maprotiline, clomipramine and467
trazodone in whole blood by capillary gas–liquid chromatography with nitro-468
gen–phosphorus detection, J. Anal. Toxicol. 27 (2003) 353–358.469
[3] A. Steiger, M. Kimura, Wake and sleep EEG provide biomarkers in depression,470
J. Psychiatric Res. 44 (2010) 242–252.471
[4] F. Moriya, Urine levels of drugs for which Triage DOA screening was positive,472
Legal Med. 11 (2009) S434–S436.473
[5] W. Jiang, J.R. Davidson, Antidepressant therapy in patients with ischemic heart474
disease, Am. Heart J. 150 (2005) 871–881.475
[6] A. Esrafili, Y. Yamini, S. Shariati, Hollow fiber-based liquid phase microextrac-476
tion combined with high-performance liquid chromatography for extraction477
and determination of some antidepressant drugs in biological fluids, Anal.478
Chim. Acta 604 (2007) 127–133.479
[7] M.N. Uddin, V.F. Samanidou, I.N. Papadoyannis, Bio-sample preparation and480
analytical methods for the determination of tricyclic antidepressants, Bioanal-481
ysis 3 (2011) 97–118.482
[8] K. Madej, P. Koscielniak, Review of analytical methods for identification and483
determination of PHEs and tricyclic antidepressants, Crit. Rev. Anal. Chem. 38484
(2008) 50–66.485
[9] A.S. Yazdi, N. Razavi, S.R. Yazdinejad, Separation and determination of486
amitriptyline and nortriptyline by dispersive liquid–liquid microextraction487
combined with gas chromatography flame ionization detection, Talanta 75488
(2008) 1293–1299.
[10] S.M.R. Wille, P. Van Hee, H.M. Neels, C.H. Van Peteghem, W.E. Lambert, Compar- 489
ison of electron and chemical ionization modes by validation of a quantitative 490
gas chromatographic–mass spectrometric assay of new generation antidepres- 491
sants and their active metabolites in plasma, J. Chromatogr. A 1176 (2007) 492
236–245. 493
[11] Z.Q. Zhang, J. Ma, Y. Lei, Y.M. Lu, Flow-injection on-line oxidizing fluorimetry 494
and solid phase extraction for determination of thioridazine hydrochloride in 495
human plasma, Talanta 71 (2007) 2056–2061. 496
[12] F. Huang, S. Qu, S. Zhang, B. Liu, J. Kong, Sensitive voltammetric detection of 497
clomipramine at 16-mercapto-hexadecanoic acid self-assembled monolayer 498
modified gold electrode, Microchim. Acta 161 (2008) 149–155. 499
[13] G.M. Greenway, S.J.L. Dolman, Analysis of tricyclic antidepressants using elec- 500
trogenerated chemiluminescence, Analyst 124 (1999) 759–762. 501
[14] H. Kirchherr, W.N. Kühn-Velten, Quantitative determination of forty-eight 502
antidepressants and antipsychotics in human serum by HPLC tandem mass 503
spectrometry: a multi-level, single-sample approach, J. Chromatogr. B 843 504
(2006) 100–113. 505
[15] C. Xiong, J. Ruan, Y. Cai, Y. Tang, Extraction and determination of some 506
psychotropic drugs in urine samples using dispersive liquid–liquid microex- 507
traction followed by high-performance liquid chromatography, J. Pharmaceut. 508
Biomed. Anal. 49 (2009) 572–578. 509
[16] P. Hashemi, F. Raeisi, A.R. Ghiasvand, A. Rahimi, Reversed-phase dispersive 510
liquid–liquid microextraction with central composite design optimization for 511
preconcentration and HPLC determination of oleuropein, Talanta 80 (2010) 512
1926–1931. 513
[17] M. Rezaee, Y. Assadi, M.R. Milani Hosseini, E. Aghaee, F. Ahmadi, S. Berijani, 514
Determination of organic compounds in water using dispersive liquid–liquid 515
microextraction, J. Chromatogr. A 1116 (2006) 1–9. 516
[18] N. Fattahi, Y. Assadi, M.R.M. Hosseini, E.Z. Jahromi, Determination of 517
chlorophenols in water samples using simultaneous dispersive liquid–liquid 518
microextraction and derivatization followed by gas chromatography-electron- 519
capture detection, J. Chromatogr. A 1157 (2007) 23–29. 520
[19] M. Rezaee, Y. Yamini, S. Shariati, A. Esrafili, M. Shamsipur, Dispersive 521
liquid–liquid microextraction combined with high-performance liquid chro- 522
matography–UV detection as a very simple, rapid and sensitive method for the 523
determination of bisphenol A in water samples, J. Chromatogr. A 1216 (2009) 524
1511–1514. 525
[20] M. Shamsipur, N. Fattahi, Extraction and determination of opium alkaloids in 526
urine samples using dispersive liquid–liquid microextraction followed by high- 527
performance liquid chromatography, J. Chromatogr. B 879 (2011) 2978–2983. 528
[21] S.C. Ferreira, R.E. Bruns, H.S. Ferreira, G.D. Matos, J.M. David, G.C. Brandão, E.G.P. 529
da Silva, L.A. Portugal, P.S. dos Reis, A.S. Souza, W.N.L. dos Santos, Box–Behnken 530
design: an alternative for the optimization of analytical methods, Anal. Chim. 531
Acta 597 (2007) 179–186. 532
[22] P. Goos, B. Jones, A response surface design in blocks, in: Optimal Design of 533
Experiments, John Wiley & Sons, Ltd., 2011, pp. 135–161. 534
[23] J.M. Green, Peer reviewed: a practical guide to analytical method validation, 535
Anal. Chem. 68 (1996) 305A–309A. 536
[24] D. Bas, I.H. Boyacı, Modeling and optimization I: usability of response surface 537
methodology, J. Food Eng. 78 (2007) 836–845. 538
[25] F. Scholz, M. Stephens, K-sample Anderson–Darling tests, J. Am. Stat. Assoc. 82 539
(1987) 918–924. 540
[26] N. Reisby, L. Gram, P. Bech, A. Nagy, G. Petersen, J. Ortmann, I. Ibsen, S. Dencker, 541
O. Jacobsen, O. Krautwald, I. Søndergaard, J. Christiansen, Imipramine: clin- 542
ical effects and pharmacokinetic variability, Psychopharmacology 54 (1977) 543
263–272. 544
[27] W.Z. Potter, A.P. Zavadil III, I.J. Kopin, F.K. Goodwin, Single-dose kinetics pre- 545
dict steady-state concentrations of imipramine and desipramine, Arch. Gen. 546
Psychiatry 37 (1980) 314–320. 547
[28] R. Drew, B.I. Sikic, E.G. Mimnaugh, C.L. Litterst, T.E. Gram, The distribution 548
of 14C-imipramine in mice bearing Lewis lung carcinoma, Life Sci. 25 (1979) 549
1813–1820. 550
[29] M. Gibaldi, Pharmacokinetic aspects of drug metabolism, Ann. N. Y. Acad. Sci. 551
179 (1971) 19–31. 552