isbn xxx-xxx-xxxxx-x-x 1 an alternative method in evaluation approach of airport pavement...
TRANSCRIPT
Proceeding of Malaysian Universities Transportation Research Forum and Conferences 2010 (MUTRF C2010), 21 December 2010, Universiti Tenaga Nasional. ISBN XXX-XXX-XXXXX-X-X
1
AN ALTERNATIVE METHOD IN EVALUATION APPROACH OF
AIRPORT PAVEMENT PERFORMANCE
Ervina Ahyudanari1*, Nasir Shafiq2, Ibrahim Kamaruddin 3
ABSTRACT:
Airport pavement needs to be maintained regularly in order to guarantee the safety in airport operation. The time schedule for airport pavement maintenance is based on analysis of data monitoring of airport pavement condition. The monitoring system is usually conducted on daily or in certain frequent basis. For busy airport, pavement inspection during daytime is difficult to be implemented. This paper proposes an alternative method in predicting the pavement condition based on recorded data of traffic and pavement maintenance history. The method starts with comparison of airport pavement strength and all aircraft types operated; continues with checking adequate design of pavement structure. The pavements that meet these two preliminary evaluations, i.e. pavement strength and structure, are unlikely to have structural defect and are considered to have surface defects. The second comparison is between the operational characteristics and type of pavement functional distress type. The agreement of the second comparison will be considered as the preliminary judgment of the existing pavement performance.
Keywords: Airport Pavement, Operational Characteristics, Pavement Performance
INTRODUCTION
The cost of pavement maintenance may be reduced if the right maintenance timing can be captured based on periodic pavement evaluation. The periodic pavement evaluation requires good management in time and adequate experienced staff. Time management become crucial in busy airport since there is difficulty in conducting pavement evaluation.
Pavement evaluation consists of two types; those are evaluation on functional of pavement and evaluation on structural condition of pavements (Ullidtz, 1987). The functional condition of pavement relates to comfort (Woods, 2008), safety (FAA, 1997) and user cost. The structural condition of pavements could be evaluated through laboratory methods, in situ methods and falling weight deflectometer (Gopalakrishnan & Thompson, 2007). The structural condition also may be approached by 1 PhD Student, Universiti Teknologi PETRONAS, Tronoh 31750, Perak Darul Ridzuan, MALAYSIA 2 Associate Proffesor, Universiti Teknologi PETRONAS, Tronoh 31750, Perak Darul Ridzuan. MALAYSIA 3 Associate Proffesor, Universiti Teknologi PETRONAS, Tronoh 31750, Perak Darul Ridzuan. MALAYSIA *Correspondence Author: Ervina Ahyudanari, Universiti Teknologi Petronas, Malaysia. E-mail: [email protected]
Proceeding of Malaysian Universities Transportation Research Forum and Conferences 2010 (MUTRF C2010), 21 December 2010, Universiti Tenaga Nasional. ISBN XXX-XXX-XXXXX-X-X
2
deriving elastic parameters (Wardle & Rodway, 1998), residual life (Garg, Guo, & McQueen, 2004) and overlay design, also use of ACN/PCN method (FAA, 2006) and (Loizos & Charonitis, 2004).
Both pavement evaluation types require field inspections that necessitate daylight schedule in conjunction with skilled and experienced staff as field inspector and data interpreter. Usually, airport management will hire consultant to conduct the field inspection and data analysis of pavement performance.
This paper attempts to present an alternative approach in conducting pavement evaluation that may be used as an alternative if the field activity is not viable. The alternative approach presented here is in conceptual format based on historical data of traffic and pavement maintenance available. The objective of this alternative pavement evaluation is to provide a conceptual method to evaluate pavement condition for airports which have limited experienced staffs.
This paper caters the proposed method in the following sequence. The objective and the reason behind the proposed method is presented in Introduction Section. The next section is Literature Review that covers the previous works related to the topic in this paper. The step by step method in developing the proposed method is briefly described in Methodology Section. Results and Analysis Section presents the result of data analysis and additional analysis to support the concept of the proposed method. The last section is Conclusion and Further Works as the closure of this paper.
LITERATURE REVIEW
Airport Pavement Strength
Airport pavement strength is denoted as Pavement Classification Number (PCN) that indicates the load carrying capacity of a pavement without specifying any particular airplane or providing information of pavement structure (FAA, 2006). PCN is the reference number to manage operational characteristics of particular aircraft on particular airport. To express the effect of an individual airplane on different pavements structure, International Civil Aviation Organization (ICAO) adopted Aircraft Classification Number (ACN) that was introduced in 1978 (ICAO, 2004). The value of ACN should be less or equal to PCN value to operate without any restriction. The airport operator uses ACN-PCN method to evaluate the acceptable operation of an aircraft. This ACN-PCN is the only structural classification procedure for airport pavement that internationally adopted (Loizos & Charonitis, 2004).
The value of ACN is determined at a frequency of 10,000 coverages. This means that the particular aircraft with ACN value greater than PCN value is possible to operate in the corresponding pavement as long as the coverage frequency is less than 10,000 (FAA, 2006). The frequency of aircraft coverage is not the same as the frequency of aircraft movement. To have the coverage value of an aircraft, there is a need to have mathematical derivation based on pass to coverage ratio of each aircraft (FAA, 2006).
Airport Pavement Design
Airport pavement design in Indonesia follows the design guidelines published by Federal Aviation Administration (FAA). Most of the first establishment of airports pavements in Indonesia is around some decades ago and some rehabilitation of pavements, such as overlay, has been conducted in order to guarantee the safety of airport operational. Therefore, airport operator needs to evaluate the adequacy of pavement structure. FAA’s Advisory Circular related to airport pavement design (FAA, 2006b) also provides back calculation process to check the adequate existing structure in carrying the existing traffic.
Proceeding of Malaysian Universities Transportation Research Forum and Conferences 2010 (MUTRF C2010), 21 December 2010, Universiti Tenaga Nasional. ISBN XXX-XXX-XXXXX-X-X
3
Aircraft Take Off/Landing Process
Almost all aircrafts operated in hub airport will land and take off in the same day, only in base airport that aircrafts land and take off in the following day. In the take off phase, aircraft moves from stationary state, ground maneuver; roll up then into airborne state. Similarly, in landing phase, the aircraft from airborne state maneuver to ground borne state. Both aircraft maneuvers impose certain load on different area on pavement.
The area imposed by the load from aircraft movements depends on the aircraft weight, wheel track, frequency of movements, take off and landing direction. Take off and landing direction depends on prevailing wind when aircraft does ground maneuver or approach the runway. Technology of jet engines and wings of each aircraft influence take off and landing distance required in a particular airport.
According to Horenjeff (Horonjeff, McKelvey, Sproule, & Young, 2010), the range of runway required for each aircraft varies from 340m (DA-42, Twin Star) to 3000m (A-380). Additionally, aircraft is not always landing in the same lateral path. The variation forms normal distribution as discovered by HoSang (HoSang, 1975).
METHODOLOGY
Data Collection
The alternative in monitoring method on airport pavement performance that is proposed in this paper uses data from Juanda International Airport, Surabaya, Indonesia. This airport is operated under PT Angkasa Pura 1. The Juanda Airport is denoted as SUB following International Air Transport Association (IATA) code with 3000m in runway length and has runway direction 10/28. The runway direction represents runway designation of magnetic azimuth, which is measured clockwise from the magnetic declination. Pavement strength (PCN) for SUB is 83/F/D/X/T. This means that the load carrying capacity of the pavement is 83, F is flexible pavement, D shows the strength of subgrade based on CBR value that is less than 4; X illustrates that the allowable tire pressure for the particular pavement is limited to 218 psi (1.5 MPa); and T indicates that the pavement strength value (PCN) is evaluated by technical method.
Data related to traffic, such as aircraft movements as well as type of aircraft also utilized from
operational characteristics of SUB. Data traffic used is data from year 2007. Other data related to pavement structure and pavement maintenance history also available from the particular airport.
Assumptions SUB is selected as the location of the study and is assumed that there is no significant change in the environmental condition. Therefore, the environmental factors will not be considered. The aircraft type information available in data of traffic is only indicates the series type of particular aircraft. In aircraft manual provided by aircraft manufacturer, each series has variation on take off weight, tire pressure, type of jet engine and dimension of wheels configuration. Since there is no detail information related to variation mentioned, the aircraft selected is assumed to be have the same characteristics. For example, B737 (http://www.boeing.com) has variation on weight and engine types since weight and jet engine types in aircraft industry is customized depends on the function of the aircraft to the airline (passenger or cargo). Therefore, in analysis only one type of weight and engine that will be considered.
Proceeding of Malaysian Universities Transportation Research Forum and Conferences 2010 (MUTRF C2010), 21 December 2010, Universiti Tenaga Nasional. ISBN XXX-XXX-XXXXX-X-X
4
Methodology
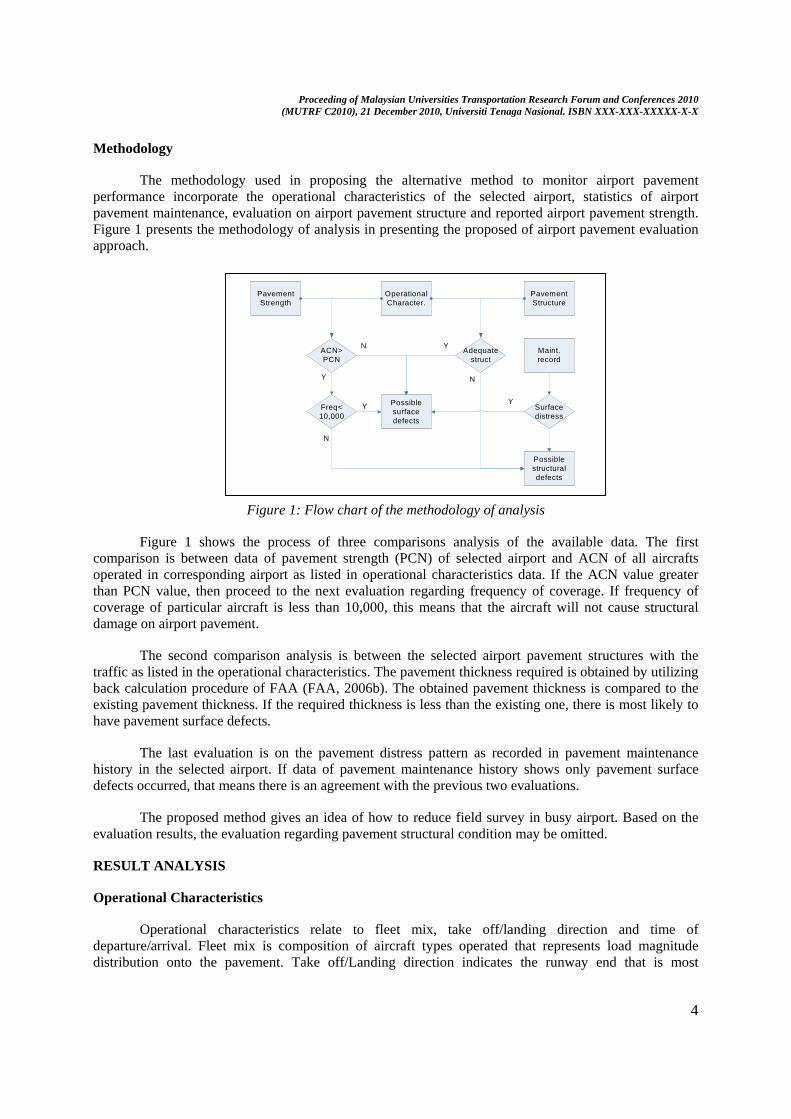
The methodology used in proposing the alternative method to monitor airport pavement performance incorporate the operational characteristics of the selected airport, statistics of airport pavement maintenance, evaluation on airport pavement structure and reported airport pavement strength. Figure 1 presents the methodology of analysis in presenting the proposed of airport pavement evaluation approach.
Figure 1: Flow chart of the methodology of analysis
Figure 1 shows the process of three comparisons analysis of the available data. The first comparison is between data of pavement strength (PCN) of selected airport and ACN of all aircrafts operated in corresponding airport as listed in operational characteristics data. If the ACN value greater than PCN value, then proceed to the next evaluation regarding frequency of coverage. If frequency of coverage of particular aircraft is less than 10,000, this means that the aircraft will not cause structural damage on airport pavement.
The second comparison analysis is between the selected airport pavement structures with the traffic as listed in the operational characteristics. The pavement thickness required is obtained by utilizing back calculation procedure of FAA (FAA, 2006b). The obtained pavement thickness is compared to the existing pavement thickness. If the required thickness is less than the existing one, there is most likely to have pavement surface defects.
The last evaluation is on the pavement distress pattern as recorded in pavement maintenance history in the selected airport. If data of pavement maintenance history shows only pavement surface defects occurred, that means there is an agreement with the previous two evaluations.
The proposed method gives an idea of how to reduce field survey in busy airport. Based on the evaluation results, the evaluation regarding pavement structural condition may be omitted.
RESULT ANALYSIS
Operational Characteristics
Operational characteristics relate to fleet mix, take off/landing direction and time of departure/arrival. Fleet mix is composition of aircraft types operated that represents load magnitude distribution onto the pavement. Take off/Landing direction indicates the runway end that is most
Pavement Strength
Operational Character.
Pavement Structure
ACN>PCN
Freq<10,000
Adequate struct
Possible surface defects
Maint. record
Surface distress
Possible structural defects
N
Y
Y
N
Y
N
Y
Proceeding of Malaysian Universities Transportation Research Forum and Conferences 2010 (MUTRF C2010), 21 December 2010, Universiti Tenaga Nasional. ISBN XXX-XXX-XXXXX-X-X
5
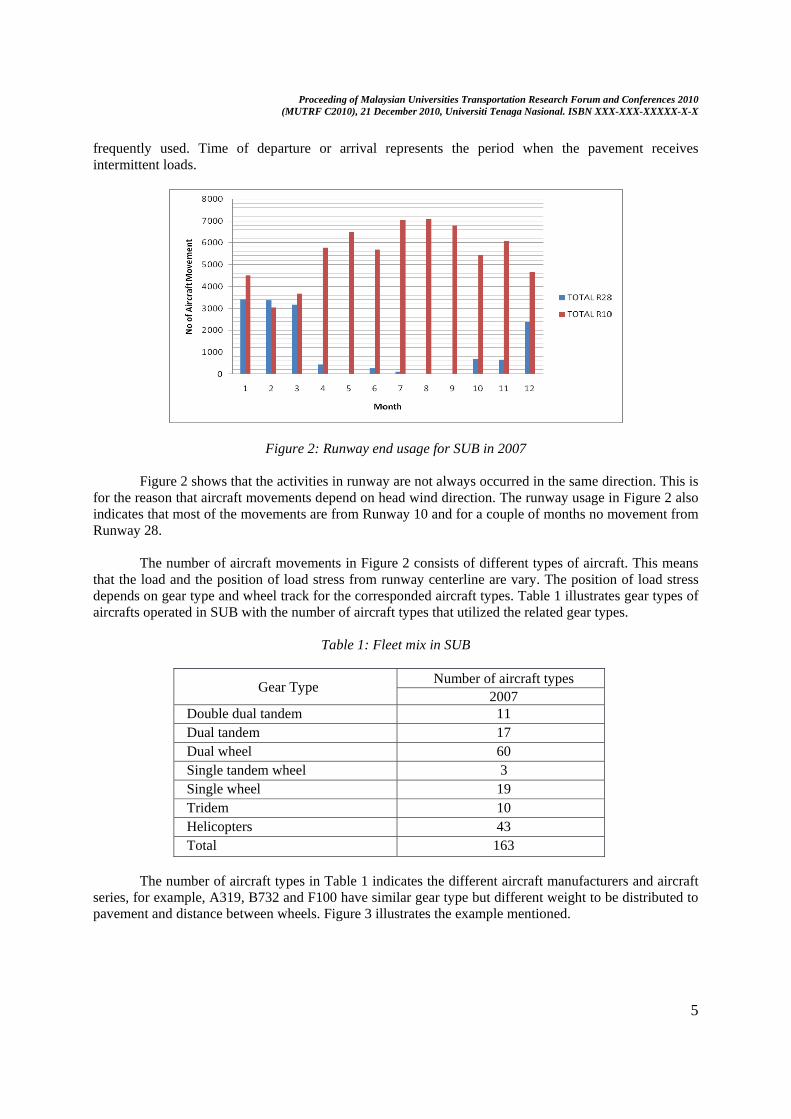
frequently used. Time of departure or arrival represents the period when the pavement receives intermittent loads.
Figure 2: Runway end usage for SUB in 2007
Figure 2 shows that the activities in runway are not always occurred in the same direction. This is for the reason that aircraft movements depend on head wind direction. The runway usage in Figure 2 also indicates that most of the movements are from Runway 10 and for a couple of months no movement from Runway 28. The number of aircraft movements in Figure 2 consists of different types of aircraft. This means that the load and the position of load stress from runway centerline are vary. The position of load stress depends on gear type and wheel track for the corresponded aircraft types. Table 1 illustrates gear types of aircrafts operated in SUB with the number of aircraft types that utilized the related gear types.
Table 1: Fleet mix in SUB
Gear Type Number of aircraft types 2007
Double dual tandem 11 Dual tandem 17 Dual wheel 60 Single tandem wheel 3 Single wheel 19 Tridem 10 Helicopters 43 Total 163
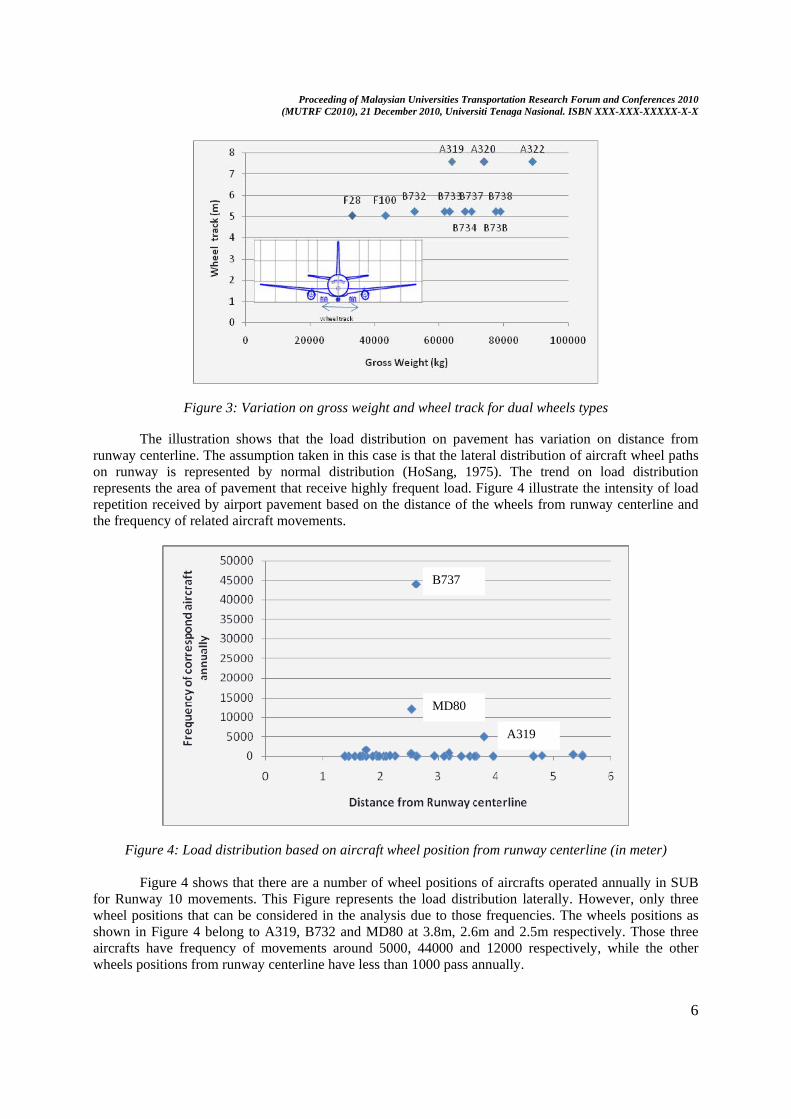
The number of aircraft types in Table 1 indicates the different aircraft manufacturers and aircraft series, for example, A319, B732 and F100 have similar gear type but different weight to be distributed to pavement and distance between wheels. Figure 3 illustrates the example mentioned.
Proceeding of Malaysian Universities Transportation Research Forum and Conferences 2010 (MUTRF C2010), 21 December 2010, Universiti Tenaga Nasional. ISBN XXX-XXX-XXXXX-X-X
6
Figure 3: Variation on gross weight and wheel track for dual wheels types
The illustration shows that the load distribution on pavement has variation on distance from runway centerline. The assumption taken in this case is that the lateral distribution of aircraft wheel paths on runway is represented by normal distribution (HoSang, 1975). The trend on load distribution represents the area of pavement that receive highly frequent load. Figure 4 illustrate the intensity of load repetition received by airport pavement based on the distance of the wheels from runway centerline and the frequency of related aircraft movements.
Figure 4: Load distribution based on aircraft wheel position from runway centerline (in meter)
Figure 4 shows that there are a number of wheel positions of aircrafts operated annually in SUB for Runway 10 movements. This Figure represents the load distribution laterally. However, only three wheel positions that can be considered in the analysis due to those frequencies. The wheels positions as shown in Figure 4 belong to A319, B732 and MD80 at 3.8m, 2.6m and 2.5m respectively. Those three aircrafts have frequency of movements around 5000, 44000 and 12000 respectively, while the other wheels positions from runway centerline have less than 1000 pass annually.
A319
MD80
B737
Proceeding of Malaysian Universities Transportation Research Forum and Conferences 2010 (MUTRF C2010), 21 December 2010, Universiti Tenaga Nasional. ISBN XXX-XXX-XXXXX-X-X
7
The next analysis is the length of take off distance to see the load distribution longitudinally from each runway end. The analysis of load distribution longitudinally only consider A319, B732 and MD80 which have take off distance 1750m, 1830m and 2052m respectively.
From both lateral and longitudinal load distribution, the wheel paths of B732 and MD80 can be
combined. This come to the result that at 2.55m from runway centerline, the pavement surface received high intensity load for approximately 56000 pass for 2000m long instead of 3000m (the length of runway). This means that at this area, pavement has high severity compare to other area.
Airport Pavement Strength
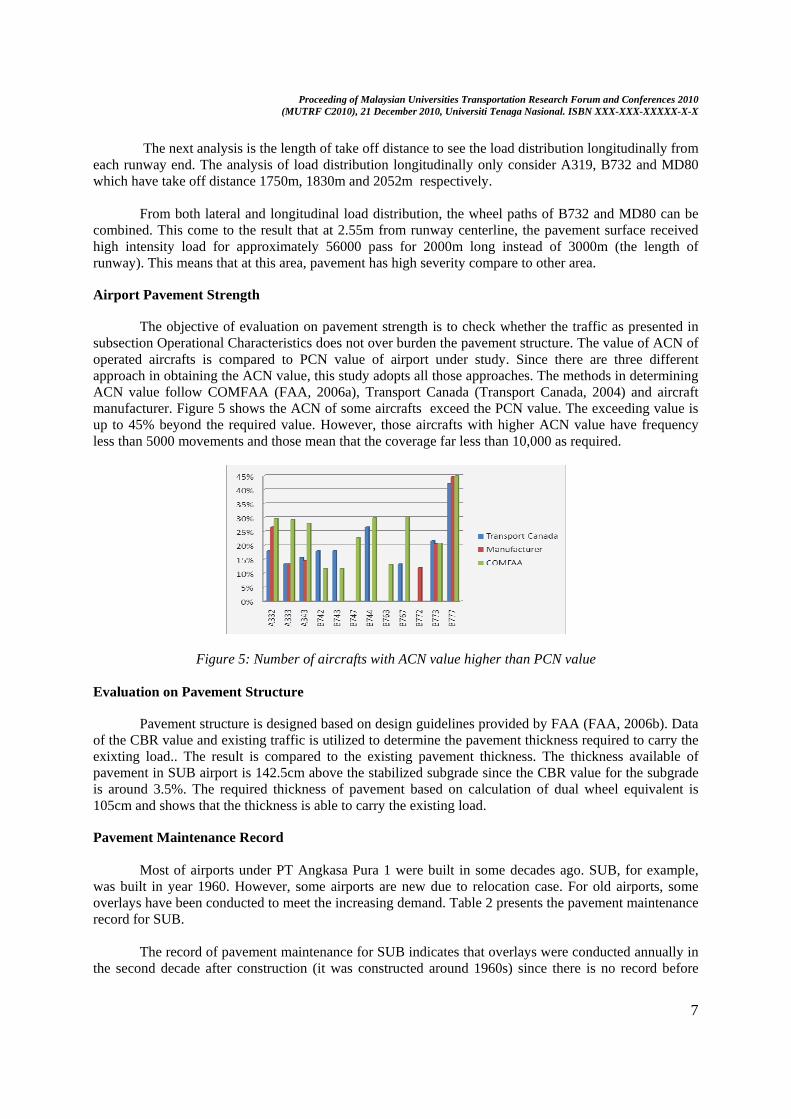
The objective of evaluation on pavement strength is to check whether the traffic as presented in subsection Operational Characteristics does not over burden the pavement structure. The value of ACN of operated aircrafts is compared to PCN value of airport under study. Since there are three different approach in obtaining the ACN value, this study adopts all those approaches. The methods in determining ACN value follow COMFAA (FAA, 2006a), Transport Canada (Transport Canada, 2004) and aircraft manufacturer. Figure 5 shows the ACN of some aircrafts exceed the PCN value. The exceeding value is up to 45% beyond the required value. However, those aircrafts with higher ACN value have frequency less than 5000 movements and those mean that the coverage far less than 10,000 as required.
Figure 5: Number of aircrafts with ACN value higher than PCN value Evaluation on Pavement Structure
Pavement structure is designed based on design guidelines provided by FAA (FAA, 2006b). Data of the CBR value and existing traffic is utilized to determine the pavement thickness required to carry the exixting load.. The result is compared to the existing pavement thickness. The thickness available of pavement in SUB airport is 142.5cm above the stabilized subgrade since the CBR value for the subgrade is around 3.5%. The required thickness of pavement based on calculation of dual wheel equivalent is 105cm and shows that the thickness is able to carry the existing load.
Pavement Maintenance Record
Most of airports under PT Angkasa Pura 1 were built in some decades ago. SUB, for example, was built in year 1960. However, some airports are new due to relocation case. For old airports, some overlays have been conducted to meet the increasing demand. Table 2 presents the pavement maintenance record for SUB.
The record of pavement maintenance for SUB indicates that overlays were conducted annually in
the second decade after construction (it was constructed around 1960s) since there is no record before
Proceeding of Malaysian Universities Transportation Research Forum and Conferences 2010 (MUTRF C2010), 21 December 2010, Universiti Tenaga Nasional. ISBN XXX-XXX-XXXXX-X-X
8
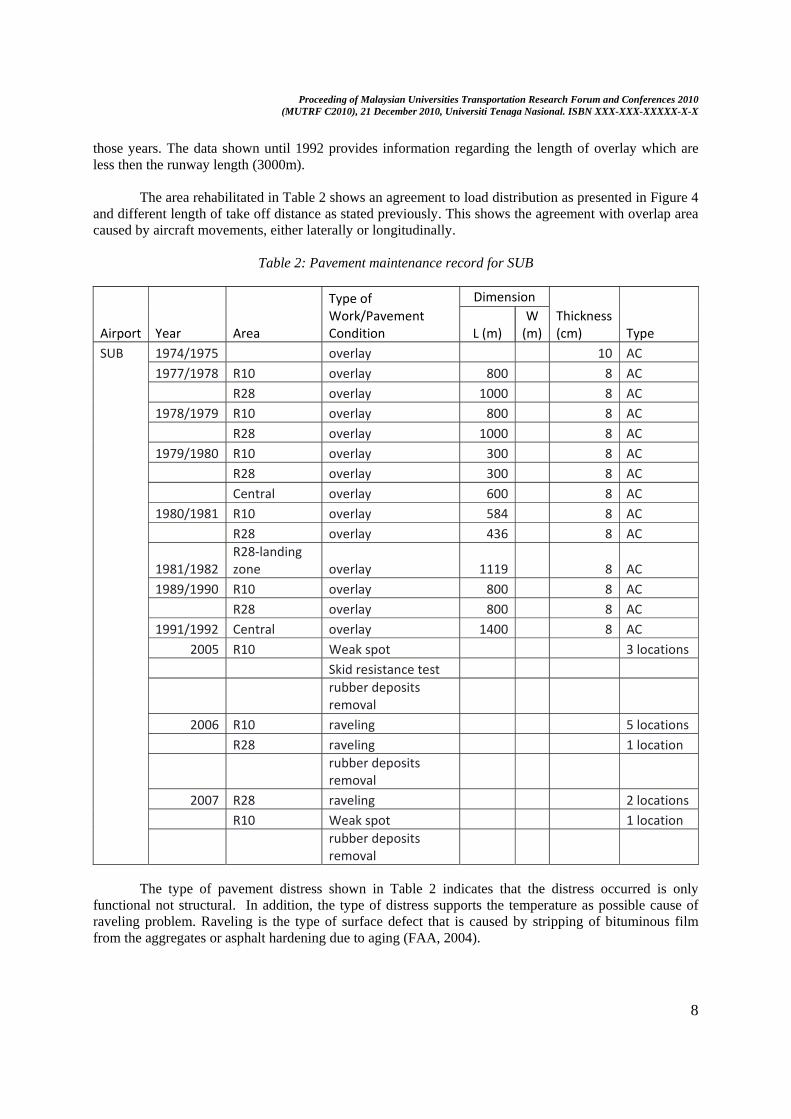
those years. The data shown until 1992 provides information regarding the length of overlay which are less then the runway length (3000m).
The area rehabilitated in Table 2 shows an agreement to load distribution as presented in Figure 4
and different length of take off distance as stated previously. This shows the agreement with overlap area caused by aircraft movements, either laterally or longitudinally.
Table 2: Pavement maintenance record for SUB
Airport Year Area
Type of Work/Pavement Condition
Dimension Thickness (cm) Type L (m)
W (m)
SUB 1974/1975 overlay 10 AC 1977/1978 R10 overlay 800 8 AC
R28 overlay 1000 8 AC 1978/1979 R10 overlay 800 8 AC
R28 overlay 1000 8 AC 1979/1980 R10 overlay 300 8 AC
R28 overlay 300 8 AC Central overlay 600 8 AC
1980/1981 R10 overlay 584 8 AC R28 overlay 436 8 AC
1981/1982 R28‐landing zone overlay 1119 8 AC
1989/1990 R10 overlay 800 8 AC R28 overlay 800 8 AC
1991/1992 Central overlay 1400 8 AC 2005 R10 Weak spot 3 locations
Skid resistance test rubber deposits removal
2006 R10 raveling 5 locations R28 raveling 1 location
rubber deposits removal
2007 R28 raveling 2 locations R10 Weak spot 1 location
rubber deposits removal
The type of pavement distress shown in Table 2 indicates that the distress occurred is only functional not structural. In addition, the type of distress supports the temperature as possible cause of raveling problem. Raveling is the type of surface defect that is caused by stripping of bituminous film from the aggregates or asphalt hardening due to aging (FAA, 2004).
Proceeding of Malaysian Universities Transportation Research Forum and Conferences 2010 (MUTRF C2010), 21 December 2010, Universiti Tenaga Nasional. ISBN XXX-XXX-XXXXX-X-X
9
CONCLUSIONS AND FURTHER WORKS
Conclusions
This paper presents the alternative in evaluation approach of airport pavement performance. The methodology to conduct the alternative approach has been presented and covers three-comparison analysis. Those comparison analyses require data related to airport pavement strength, operational characteristics, airport pavement structure and airport pavement maintenance record.
The comparison analysis conducted shows that the load pattern as represented by ACN value and load distribution on pavement, both laterally and longitudinally, has an agreement to the pavement distress occurred as recorded in pavement maintenance history. The analysis results indicate that the airport pavement under study needs maintenance for surface condition and not structural.
The proposed method may use as an alternative in monitoring airport pavement performance for busy airport. Therefore, the safety operational can be guaranteed. However, some justifications are required to determine the degree of the pavement surface defects predicted.
Further Works
As stated previously that the concept of this method needs further analysis. The analysis that would support the concept relates to determination of loading area, and relationship between the frequency of aircraft movements and rate of pavement aging. Determination of loading area requires further analysis of wheel configuration and dimension, frequency of movements, and aircraft speed. To be able to analyze the rate of pavement aging, there is a need to incorporate the bituminous behavior in receiving the repetition load at certain temperature due to solar radiation.
ACKNOWLEDGEMENT
This research is sponsored by University Teknologi Petronas, Malaysia with support data from PT Angkasa Pura 1 Indonesia. Appreciation is also addressed to Assoc.Prof. Dr.Madzlan Napiah and Dr.Syed Baharom for the feedback to improve this paper.
REFERENCES
FAA. (1997). Measurement, construction, and maintenance of skid-resistant airport pavement surfaces. Advisory Circular 150/5320-1 (pp. 1-45). Washington D.C.: Federal Aviation Administration. Retrieved from www.faa.gov.
FAA. (2004). Airfield pavement surface evaluation and rating manual. In L. Entine (Ed.), Advisory Circular 150/5320-17 (p. 57). Federal Aviation Administration.
FAA. (2006a). Standardize Method of Reporting Airport Pavement Strength - PCN. In D. L. Bennett (Ed.), Advisory Circular 150/5335-5A (p. 63). Wahington, D.C.: U.S. Department of Transportation Federal Aviation Administration. Retrieved from www.faa.gov.
FAA. (2006b). Airport Pavement Design and Evaluation. Advisory Circular 150/5320-6D. Federal Aviation Administration.
Proceeding of Malaysian Universities Transportation Research Forum and Conferences 2010 (MUTRF C2010), 21 December 2010, Universiti Tenaga Nasional. ISBN XXX-XXX-XXXXX-X-X
10
Garg, N., Guo, E., & McQueen, R. (2004). Operational Life of Airport Pavements. Security (DOT/FAA/AR., pp. 1-117). Washington, D.C.: FAA, US Department of Transportation.
Gopalakrishnan, K., & Thompson, M. R. (2007). Use of nondestructive test deflection data for predicting airport pavement performance. Journal of Transportation Engineering, 133(6), 389. doi: 10.1061/(ASCE)0733-947X(2007)133:6(389).
Horonjeff, R., McKelvey, F. X., Sproule, W. J., & Young, S. B. (2010). Planning and Design of Airports. (L. S. Hager, Ed.) (Fifth Edit., pp. 51-55). McGraw-Hill.
HoSang, V. A. (1975). Field Survey and Analysis of Aircraft Distribution on Airport Pavements (p. 286). Washington D.C. Retrieved from www.airporttech.tc.faa.gov.
ICAO. (2004). Aerodromes. Annex 14. International Civil Aviation Organization.
Loizos, A., & Charonitis, G. (2004). Bearing Capacity and Structural Classification of Flexible Airport Pavements. Journal of Transportation Engineering, 130(I), 34-42. doi: 10.1061/(ASCE)0733-947X(2004)130:1(34).
Transport Canada. (2004). Aircraft Classification Numbers ( ACN ’ s ). Transport Canada Technical Program (pp. 0-18). Ottawa, Ontario: Transport Canada. Retrieved from http://www.tc.gc.ca/CivilAviation/International/Technical/menu.htm.
Ullidtz, P. (1987). Pavement Analysis (pp. 228-284). Lyngby, Denmark: Elsevier Science Publisher B.V.
Wardle, L. J., & Rodway, B. (1998). Layered Elastic Pavement Design- Recent Developments. Transport 98, 19th ARRB Conference (pp. 7-11). Sydney. Retrieved from mincad.com.au/…/Arrb98Paper.htm.
Woods, J. E. (2008). A study of airport pavement-aircraft interaction using wavelet analysis. gradworks.umi.com. THE UNIVERSITY OF TEXAS AT SAN ANTONIO. Retrieved from http://gradworks.umi.com/14/50/1450630.html.