joint defra/ea flood and coastal erosion risk management
TRANSCRIPT
Joint Defra/EA Flood and Coastal Erosion Risk Management R&D Programme
Annex A:
Preliminary guidance on the use of benefits transfer for riverine recreation and angling and coastal recreation
R&D Project Record FD2013/PR2
Produced: November 2004

ii
Statement of use This report provides guidance on the use of MCA and ASTs to assist in the appraisal of flood and coastal erosion risk management projects, strategies and policies. It should be noted that it does not constitute official government policy or guidance, which is unlikely to be available until work to develop the methodology and identify appropriate sources of data has been undertaken through pilot studies.
This report may be downloaded from the Defra/EA R&D Programme website (http://www.defra.gov.uk/environ.fcd/research), use the search tool located on the project information and publications page. Copies are held by all EA Regional Information Centres, contact The Environment Agency’s National Customer Contact Centre by emailing [email protected] or by telephoning 08708506506.
Dissemination Status Internal: Released internally External: Released to public domain
Keywords: Multi criteria analysis, MCA, appraisal summary table, AST, decision rule
Research contractor contact details: Lead contractor: Risk & Policy Analysts Ltd (RPA), Farthing Green House, 1 Beccles Road, Loddon, Norfolk, NR14 6LT (Tel: 01508 528465; Fax: 01508 520758; www.rpaltd.co.uk). The project director was Meg Postle, the project manager for RPA was John Ash with research support from Susana Dias and other members of RPA staff.
The research team also included: Colin Green (Flood Hazard Research Centre, Middlesex University); Alan Pearman (University of Leeds); Ron Janssen (The Institute of Environmental Studies, Free University, Amsterdam), Terry Oakes and Hugh Payne (Independent Consultants)
Acknowledgements The assistance of those providing information for the case studies is gratefully acknowledged.
Defra project manager: Matt Crossman, Defra, 3D Ergon House, Horseferry Rd, London, SW1P 2AL. Email: [email protected]
Publishing organisation DefraFlood Management Division Ergon House Horseferry Road London SW1P 2AL Tel: 020 7238 3000 Fax: 020 7238 6187 www.defra.gov.uk/environ/fcd
â Crown copyright (Defra); 2005
Copyright in the typographical arrangement and design rests with the Crown. This publication (excluding the logo) may be reproduced free of charge in any format or medium provided that it is reproduced accurately and not used in a misleading context. The material must be acknowledged as Crown copyright with the title and source of the publication specified. The views expressed in this document are not necessarily those of Defra or the Environment Agency. Its officers, servants or agents accept no liability whatsoever for any loss or damage arising from the interpretation or use of the information, or reliance on views contained herein.
Published by the Department for Environment, Food and Rural Affairs. Printed in the UK, March 2005 on recycled material containing 80% post-consumer waste and 20% totally chlorine free virgin pulp.
PB No. 10734/PR2 ISBN 0-85521-146-6
A1: Introduction 1
Statement of use This report provides guidance on the use of MCA and ASTs to assist in the appraisal of flood and coastal erosion risk management projects, strategies and policies. It should be noted that it does not constitute official government policy or guidance, which is unlikely to be available until work to develop the methodology and identify appropriate sources of data has been undertaken through pilot studies. In the interim it expected that ASTs will be incorporated in the Project Appraisal Report template and it is suggested that any MCA application involving weighting and scoring or application of the extended decision rule should only be undertaken following consultation with Defra’s Flood Management Division.
This report may be downloaded from the Defra/EA R&D Programme website (http://www.defra.gov.uk/environ.fcd/research), use the search tool located on the project information and publications page. Copies are held by all EA Regional Information Centres, contact The Environment Agency’s National Customer Contact Centre by emailing [email protected] or by telephoning 08708506506.
Dissemination Status Internal: Released internally External: Released to public domain
Keywords: Multi criteria analysis, MCA, appraisal summary table, AST, decision rule
Research contractor contact details: Lead contractor: Risk & Policy Analysts Ltd (RPA), Farthing Green House, 1 Beccles Road, Loddon, Norfolk, NR14 6LT (Tel: 01508 528465; Fax: 01508 520758; www.rpaltd.co.uk). The project director was Meg Postle, the project manager for RPA was John Ash with research support from Susana Dias and other members of RPA staff.
The research team also included: Colin Green (Flood Hazard Research Centre, Middlesex University); Alan Pearman (University of Leeds); Ron Janssen (The Institute of Environmental Studies, Free University, Amsterdam), Terry Oakes and Hugh Payne (Independent Consultants)
Acknowledgements The assistance of those proving information for the case studies is gratefully acknowledged.
Defra project manager: Matt Crossman, Defra, 3D Ergon House, Horseferry Rd, London, SW1P 2AL. Email: [email protected]
Publishing organisation DefraFlood Management Division Ergon House

A1: Introduction 2
Horseferry Road London SW1P 2AL Tel: 020 7238 3000 Fax: 020 7238 6187 www.defra.gov.uk/environ/fcd
A1: Introduction 1
A1. Introduction In this Annex we provide an example of preliminary guidance on the use of benefits transfer (BT) for the following impact categories:
• rivers:- informal recreation - angling
• coastal:- recreation.
The above impacts categories have been selected on the basis of the transferability of the studies to the flood management and coastal defence context. Overall, recreation benefits (both formal and informal), depending on the nature of the problems and the options chosen to address them, will have the following components (based on Penning-Rowsell et al., 2003):
1. The prevention of further deterioration: losses associated with the ‘do-nothing’ option when compared to the existing scenario. Almost all coastal protection projects and some riverine and coastal flood defence ones will have this component. Options that only prevent further deterioration and simply reinstate the site to its current condition will involve this component. Note, however, that benefits can also arise under the ‘do-nothing’ option if, by walking away for instance, the river is restored to a more natural state and, as a result, attracts more visitors.
2. The improvement of the condition of the site from the current state to a better one: gains. For example, the replacement of hard river flood defence structures reaching the end of their life with more soft engineered defences may enhance the recreational value of a river site. Beach nourishment for coastal protection purposes may result in a ‘better’ beach in recreational terms. In coastal defence and river management schemes, for example off-shore reefs, new sea walls with promenades or river flood banks or retention lakes, may also change sites in ways that may provide new recreational opportunities and thus may enhance the recreational potential of the sites.
The BT approaches for river and coastal sites are described in turn. The AMP4 Guidance (RPA, 2003) distinguishes between recreational users for river and coastal sites. For fluvial flood defence, studies from the AMP4 Guidance have been deemed applicable.
Angling is considered separately, because of the special nature of this type of users. For coastal sites the applicability of most existing valuations is much more limited. The most relevant are the values from the Multi-Coloured Manual (Penning-Rowsell, et al 2003), although coastal recreation for the more specialised user has also been looked at.

A1: Introduction 2
Other impacts categories are being further investigated (we are currently reviewing the scope for BT for valuation of landscape impacts and in-stream recreation for rivers. We also expect to include a section on the valuation of stress related effects in the future).
A2: Rivers 3
A2. Rivers A2.1 Informal recreation
Overview
The term informal recreation covers a wide range of different activities, such as:
• walking and hiking; • picnicking; • dog-walking; and • nature appreciation related activities such as birdwatching and
photography.
Flood management and coastal defence schemes could potentially impact upon informal recreational users. For example, the construction of a concrete floodwall could lead to the loss of footpaths whereas soft engineering defences or a carefully designed hard defence could enhance the recreational value of a site. Options that provide habitat creation in addition to flood defence (such as managed set back or washlands) can also provide additional recreation benefits for users such as birdwatchers.
Qualitative description of impacts
Identifying the impacts on recreation from flood management and coastal defence options involves identifying the impacts of changes to the physical environment under the ‘do-nothing’ and the ‘do-something’ options. The qualitative description of impacts should be recorded in the AST, with this including the following aspects:
• is there access to the river? Is this good, moderate or poor? (identify possible access sites, car parks, footpaths, etc.)?
• does informal recreation take place along the river or within the wetland area now (look at provision of facilities, aesthetic quality of the site, etc)?
• would the option result in significant changes, e.g. visual intrusion, loss of footpaths, new walks, etc. such that they would be perceived by informal recreation users?
The decision to proceed with the monetary valuation of informal recreation related impacts should thus include consideration of the degree to which users would perceive the impacts arising from the different options to be important. If impacts are not likely to be perceived as important by users, then they should be considered negligible. If the opposite happens, i.e. impacts are expected to be important, the number of users needs to be estimated. The approach set out below is based on the AMP4 methodology for calculating participation rates, and has been adjusted for the flood management and coastal defence context.
4 A2: Rivers
Calculating the population affected
In preparing the monetary valuation, it is important to estimate the number of users likely to be affected by the options. Sources of information on participation rates include:• Site visits or visitor surveys: counts of visitors along the affected stretch
or at a given site at different times during the day and year to give the basis for an estimate of annual number of visits;
• Consultation-based estimates: number of trips to the affected site per year or as a point estimate based on consultation with recreation officers, District Council car park officers, tourist offices and ramblers club, etc; and
• Default data: reliance on standard formulae of estimates.
The most robust approach is to collect site-specific data based on visitor counts. The least robust approach to developing estimates of likely visitor numbers is the use of default values as site specific factors are less likely to be taken into account. Note that this assessment is based on estimating current levels of use.Reliable methods do not exist for predicting changes in informal recreation visitor numbers.
Site visits or visitor surveys
The results of counts carried out during site visits or as part of visitor surveys can be used directly to calculate annual visitor rates to informal recreation sites. The approach to take will depend upon the format that the site count is in. If the site count is given as a spot count, or number of visitors per day, the steps below should be followed in order to derive an estimate of the annual number of visitors. If the count is of weekly visitors, then this should be multiplied by four, to estimate monthly trips and then Steps 2 and 3 should be followed. Where the site count gives monthly visitors, Step 3 will have to be followed. If the count is of car park numbers, this will need to be converted into number of visitors by multiplying by 2.3 (as 2.3 is the number of adults per household, from National Statistics); if the site count gives annual number of visits, there is no need to make any adjustments.
Visitors (from car park numbers) = number of cars parked x 2.3
Where several different counts have been undertaken both the mean and median values can be taken. If these are similar, estimates are likely to be fairly robust. If these two values differ significantly, then both values should be carried forward as a lower and upper bound, as they will provide a range and an indication of the uncertainty surrounding the visitor rates estimates.
Step 1: Converting a daily count into weekly visit numbers
The most appropriate adjustment factors are given in Table A2.1.
A2: Rivers 5
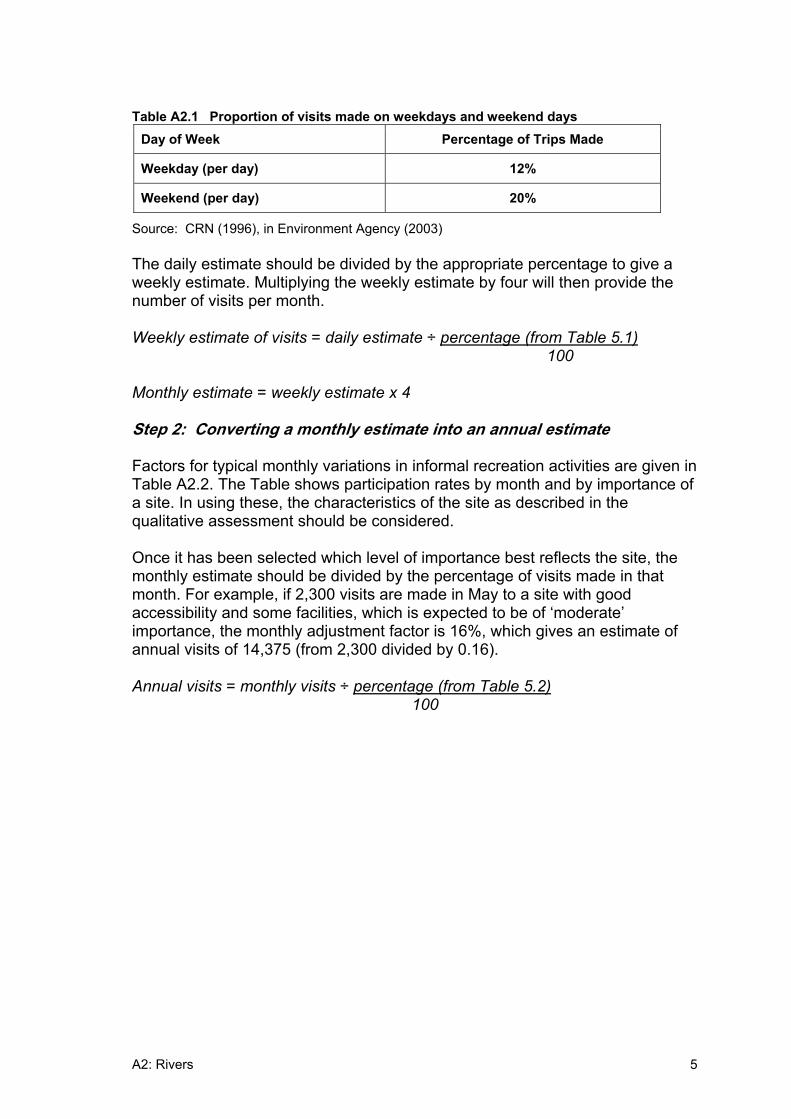
Table A2.1 Proportion of visits made on weekdays and weekend days Day of Week Percentage of Trips Made
Weekday (per day) 12%
Weekend (per day) 20%
Source: CRN (1996), in Environment Agency (2003)
The daily estimate should be divided by the appropriate percentage to give a weekly estimate. Multiplying the weekly estimate by four will then provide the number of visits per month.
Weekly estimate of visits = daily estimate ÷ percentage (from Table 5.1)100
Monthly estimate = weekly estimate x 4
Step 2: Converting a monthly estimate into an annual estimate
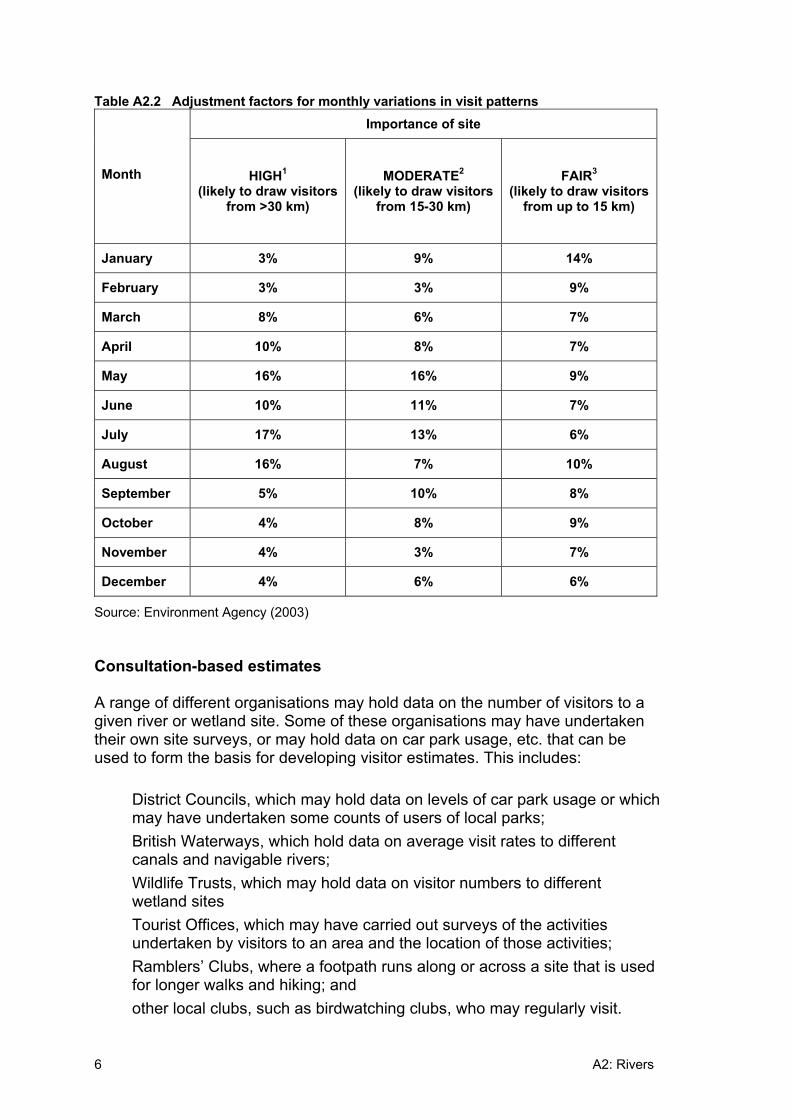
Factors for typical monthly variations in informal recreation activities are given in Table A2.2. The Table shows participation rates by month and by importance of a site. In using these, the characteristics of the site as described in the qualitative assessment should be considered.
Once it has been selected which level of importance best reflects the site, the monthly estimate should be divided by the percentage of visits made in that month. For example, if 2,300 visits are made in May to a site with good accessibility and some facilities, which is expected to be of ‘moderate’ importance, the monthly adjustment factor is 16%, which gives an estimate of annual visits of 14,375 (from 2,300 divided by 0.16).
Annual visits = monthly visits ÷ percentage (from Table 5.2) 100
6 A2: Rivers
Table A2.2 Adjustment factors for monthly variations in visit patterns Importance of site
Month HIGH1
(likely to draw visitors from >30 km)
MODERATE2
(likely to draw visitors from 15-30 km)
FAIR3
(likely to draw visitors from up to 15 km)
January 3% 9% 14%
February 3% 3% 9%
March 8% 6% 7%
April 10% 8% 7%
May 16% 16% 9%
June 10% 11% 7%
July 17% 13% 6%
August 16% 7% 10%
September 5% 10% 8%
October 4% 8% 9%
November 4% 3% 7%
December 4% 6% 6%
Source: Environment Agency (2003)
Consultation-based estimates
A range of different organisations may hold data on the number of visitors to a given river or wetland site. Some of these organisations may have undertaken their own site surveys, or may hold data on car park usage, etc. that can be used to form the basis for developing visitor estimates. This includes:
• District Councils, which may hold data on levels of car park usage or which may have undertaken some counts of users of local parks;
• British Waterways, which hold data on average visit rates to different canals and navigable rivers;
• Wildlife Trusts, which may hold data on visitor numbers to different wetland sites
• Tourist Offices, which may have carried out surveys of the activities undertaken by visitors to an area and the location of those activities;
• Ramblers’ Clubs, where a footpath runs along or across a site that is used for longer walks and hiking; and
• other local clubs, such as birdwatching clubs, who may regularly visit.
A2: Rivers 7
Club secretaries may only be able to give an indication of the number of visits likely to be made by their members, or may be able to provide guesstimates of visit rates more generally.
The format in which the data is provided will determine the steps to derive an annual estimate of number of visits. This may involve following the appropriate step(s) above.
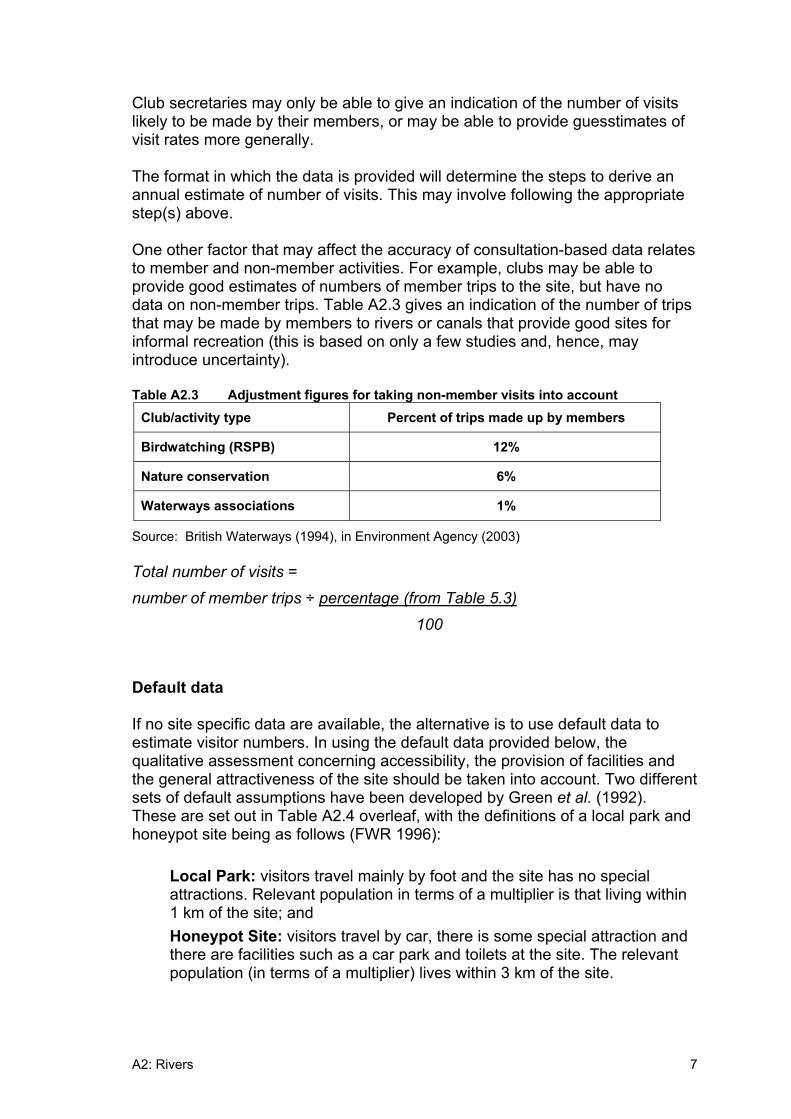
One other factor that may affect the accuracy of consultation-based data relates to member and non-member activities. For example, clubs may be able to provide good estimates of numbers of member trips to the site, but have no data on non-member trips. Table A2.3 gives an indication of the number of trips that may be made by members to rivers or canals that provide good sites for informal recreation (this is based on only a few studies and, hence, may introduce uncertainty).
Table A2.3 Adjustment figures for taking non-member visits into account Club/activity type Percent of trips made up by members
Birdwatching (RSPB) 12%
Nature conservation 6%
Waterways associations 1%
Source: British Waterways (1994), in Environment Agency (2003)
Total number of visits = number of member trips ÷ percentage (from Table 5.3)
100
Default data
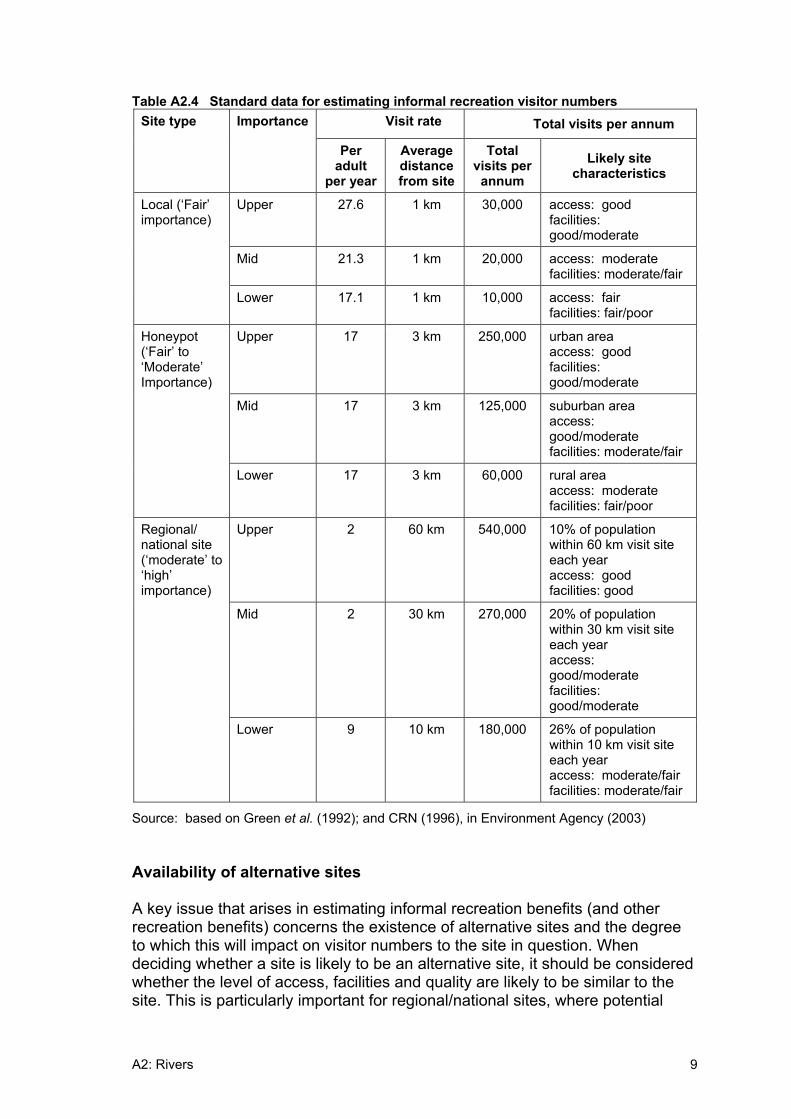
If no site specific data are available, the alternative is to use default data to estimate visitor numbers. In using the default data provided below, the qualitative assessment concerning accessibility, the provision of facilities and the general attractiveness of the site should be taken into account. Two different sets of default assumptions have been developed by Green et al. (1992).These are set out in Table A2.4 overleaf, with the definitions of a local park and honeypot site being as follows (FWR 1996):
• Local Park: visitors travel mainly by foot and the site has no special attractions. Relevant population in terms of a multiplier is that living within 1 km of the site; and
• Honeypot Site: visitors travel by car, there is some special attraction and there are facilities such as a car park and toilets at the site. The relevant population (in terms of a multiplier) lives within 3 km of the site.
8 A2: Rivers
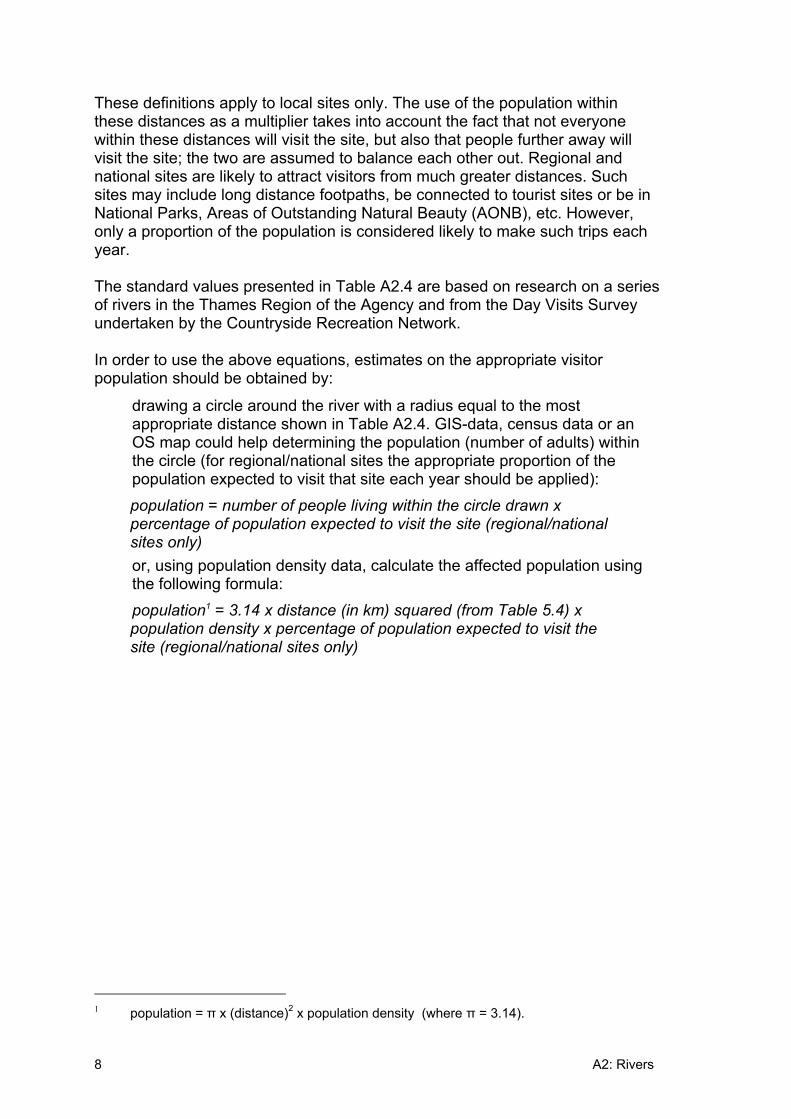
These definitions apply to local sites only. The use of the population within these distances as a multiplier takes into account the fact that not everyone within these distances will visit the site, but also that people further away will visit the site; the two are assumed to balance each other out. Regional and national sites are likely to attract visitors from much greater distances. Such sites may include long distance footpaths, be connected to tourist sites or be in National Parks, Areas of Outstanding Natural Beauty (AONB), etc. However, only a proportion of the population is considered likely to make such trips each year.
The standard values presented in Table A2.4 are based on research on a series of rivers in the Thames Region of the Agency and from the Day Visits Survey undertaken by the Countryside Recreation Network.
In order to use the above equations, estimates on the appropriate visitor population should be obtained by:
• drawing a circle around the river with a radius equal to the most appropriate distance shown in Table A2.4. GIS-data, census data or an OS map could help determining the population (number of adults) within the circle (for regional/national sites the appropriate proportion of the population expected to visit that site each year should be applied):
population = number of people living within the circle drawn x percentage of population expected to visit the site (regional/national sites only)
• or, using population density data, calculate the affected population using the following formula: population1 = 3.14 x distance (in km) squared (from Table 5.4) x population density x percentage of population expected to visit the site (regional/national sites only)
1 population = x (distance)2 x population density (where = 3.14).
A2: Rivers 9
Table A2.4 Standard data for estimating informal recreation visitor numbers Visit rate Total visits per annum Site type Importance
Peradult
per year
Average distance from site
Totalvisits per
annumLikely site
characteristics
Upper 27.6 1 km 30,000 access: good facilities:good/moderate
Mid 21.3 1 km 20,000 access: moderate facilities: moderate/fair
Local (‘Fair’ importance)
Lower 17.1 1 km 10,000 access: fair facilities: fair/poor
Upper 17 3 km 250,000 urban area access: good facilities:good/moderate
Mid 17 3 km 125,000 suburban area access: good/moderate facilities: moderate/fair
Honeypot (‘Fair’ to ‘Moderate’Importance)
Lower 17 3 km 60,000 rural area access: moderate facilities: fair/poor
Upper 2 60 km 540,000 10% of population within 60 km visit site each year access: good facilities: good
Mid 2 30 km 270,000 20% of population within 30 km visit site each year access: good/moderate facilities:good/moderate
Regional/ national site (‘moderate’ to ‘high’importance)
Lower 9 10 km 180,000 26% of population within 10 km visit site each year access: moderate/fair facilities: moderate/fair
Source: based on Green et al. (1992); and CRN (1996), in Environment Agency (2003)
Availability of alternative sites
A key issue that arises in estimating informal recreation benefits (and other recreation benefits) concerns the existence of alternative sites and the degree to which this will impact on visitor numbers to the site in question. When deciding whether a site is likely to be an alternative site, it should be considered whether the level of access, facilities and quality are likely to be similar to the site. This is particularly important for regional/national sites, where potential
10 A2: Rivers
alternatives must also be of regional/national importance to be considered appropriate alternatives.
If there are alternative sites within the same distance as considered above, the total number of adult visits per annum should be divided by the number of alternative sites plus one (to account for the site in question). Number of visits to site in question = total number of visits (estimated above)
number of alternative sites plus one
Reality checks
The estimation of participation rates is normally associated with a high degree of uncertainty. The following checks are suggested to examine whether the calculated figures are of the right order of magnitude (especially when using default data).
The first check is to divide the estimate of annual visits by 365 to calculate the implied number of visitors per day to see whether this figure seems right in the context of the site, access to it and its characteristics. The default data in particular may lead to overestimates in rural areas or for poor quality sites.
Reality check 1: daily number of visits = number of visits to your site365
Table A2.5 provides an indication of the number of visits made to different rivers, with details given on the type of river, level of access, facilities and importance provided. These can then be compared with the descriptions given in Table 6.4 and the site to determine whether the estimates are likely to be realistic.
A2: Rivers 11
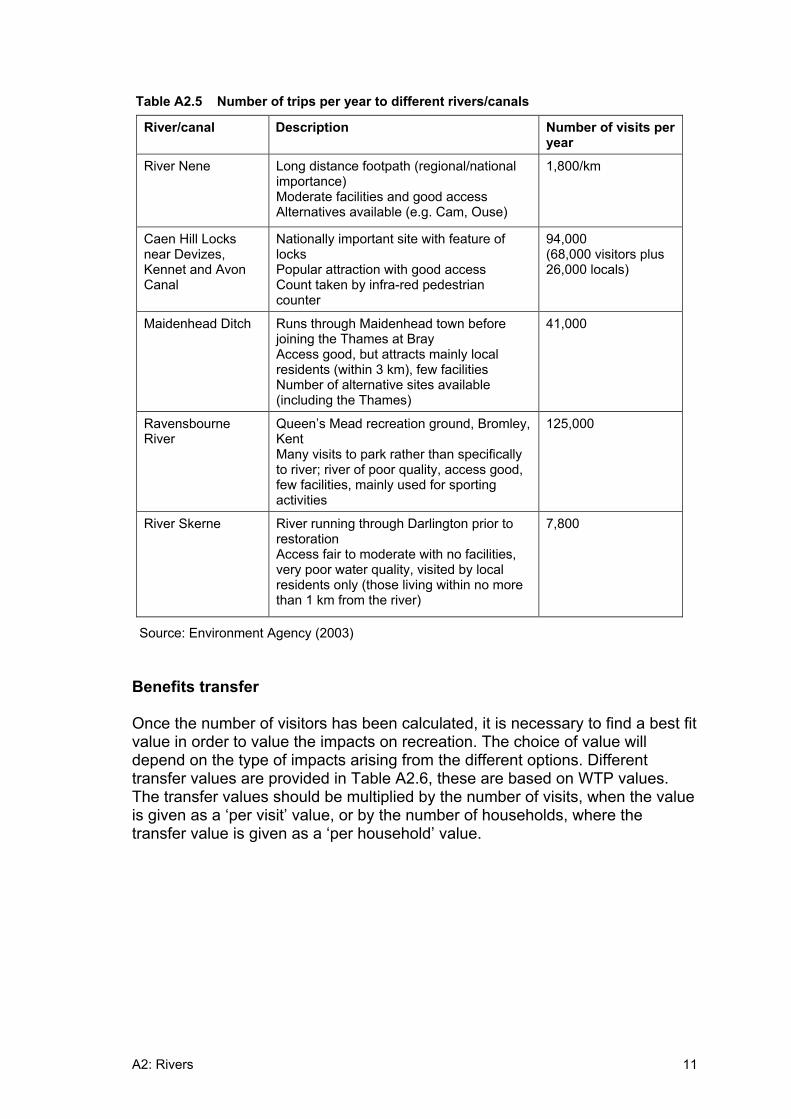
Table A2.5 Number of trips per year to different rivers/canals
Source: Environment Agency (2003)
Benefits transfer
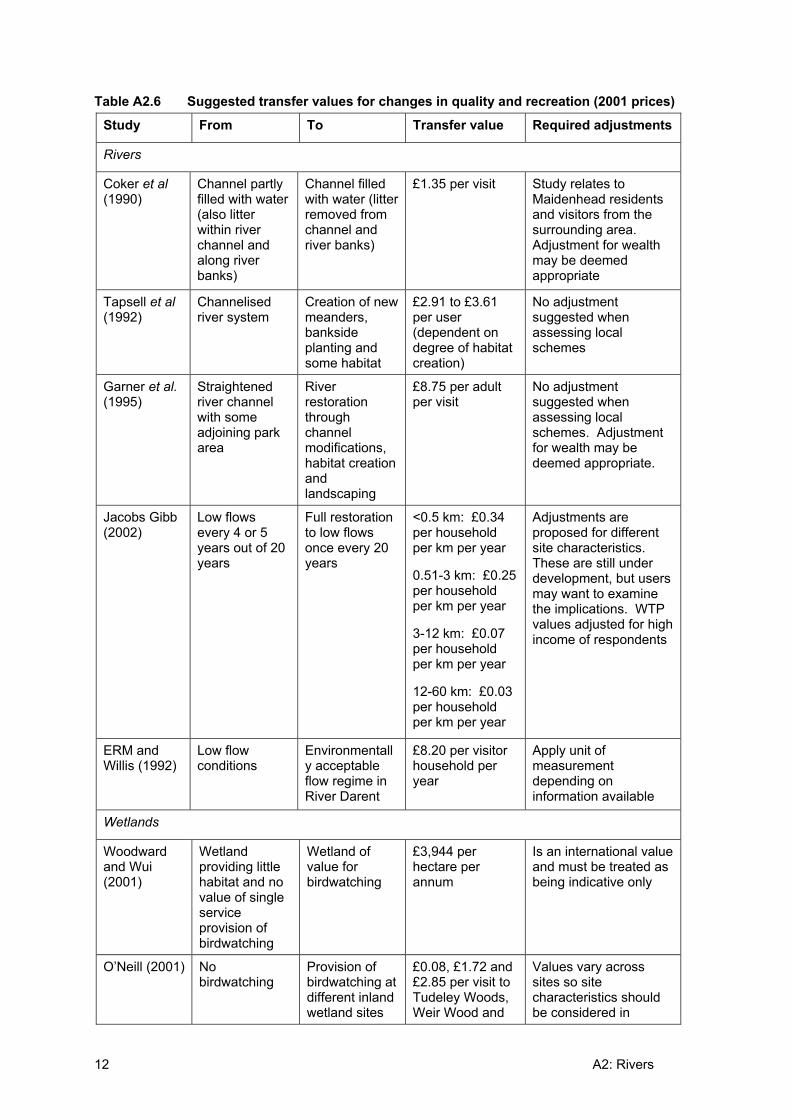
Once the number of visitors has been calculated, it is necessary to find a best fit value in order to value the impacts on recreation. The choice of value will depend on the type of impacts arising from the different options. Different transfer values are provided in Table A2.6, these are based on WTP values. The transfer values should be multiplied by the number of visits, when the value is given as a ‘per visit’ value, or by the number of households, where the transfer value is given as a ‘per household’ value.
River/canal Description Number of visits per year
River Nene Long distance footpath (regional/national importance) Moderate facilities and good access Alternatives available (e.g. Cam, Ouse)
1,800/km
Caen Hill Locks near Devizes, Kennet and Avon Canal
Nationally important site with feature of locks Popular attraction with good access Count taken by infra-red pedestrian counter
94,000(68,000 visitors plus 26,000 locals)
Maidenhead Ditch Runs through Maidenhead town before joining the Thames at Bray Access good, but attracts mainly local residents (within 3 km), few facilities Number of alternative sites available (including the Thames)
41,000
Ravensbourne River
Queen’s Mead recreation ground, Bromley, KentMany visits to park rather than specifically to river; river of poor quality, access good, few facilities, mainly used for sporting activities
125,000
River Skerne River running through Darlington prior to restoration Access fair to moderate with no facilities, very poor water quality, visited by local residents only (those living within no more than 1 km from the river)
7,800
12 A2: Rivers
Table A2.6 Suggested transfer values for changes in quality and recreation (2001 prices)
Study From To Transfer value Required adjustments
Rivers
Coker et al (1990)
Channel partly filled with water (also litter within river channel and along river banks)
Channel filled with water (litter removed from channel and river banks)
£1.35 per visit Study relates to Maidenhead residents and visitors from the surrounding area. Adjustment for wealth may be deemed appropriate
Tapsell et al (1992)
Channelised river system
Creation of new meanders, bankside planting and some habitat
£2.91 to £3.61 per user (dependent on degree of habitat creation)
No adjustment suggested when assessing local schemes
Garner et al.(1995)
Straightened river channel with some adjoining park area
River restoration through channel modifications, habitat creation andlandscaping
£8.75 per adult per visit
No adjustment suggested when assessing local schemes. Adjustment for wealth may be deemed appropriate.
Jacobs Gibb (2002)
Low flows every 4 or 5 years out of 20 years
Full restoration to low flows once every 20 years
<0.5 km: £0.34 per household per km per year
0.51-3 km: £0.25 per household per km per year
3-12 km: £0.07 per household per km per year
12-60 km: £0.03 per household per km per year
Adjustments are proposed for different site characteristics. These are still under development, but users may want to examine the implications. WTP values adjusted for high income of respondents
ERM and Willis (1992)
Low flow conditions
Environmentally acceptable flow regime in River Darent
£8.20 per visitor household per year
Apply unit of measurement depending on information available
Wetlands
Woodward and Wui (2001)
Wetland providing little habitat and no value of single service provision of birdwatching
Wetland of value for birdwatching
£3,944 per hectare per annum
Is an international value and must be treated as being indicative only
O’Neill (2001) No birdwatching
Provision of birdwatching at different inland wetland sites
£0.08, £1.72 and £2.85 per visit to Tudeley Woods, Weir Wood and
Values vary across sites so site characteristics should be considered in

A2: Rivers 13
Study From To Transfer value Required adjustments
PulboroughBrooks
choosing a value
Klein and Bateman(2001)
Current site quality and characteristics
Protection against future damage to the site and loss of birdwatching and habitat
£1.69 per visit or £51.42 per household per annum (assumes 13 visits per adult/annum and 2.3adult/household)
Apply unit of measurement depending on information available. Adjustment for resident household visitors may be needed
Source: Environment Agency (2003)
A3: Angling 14
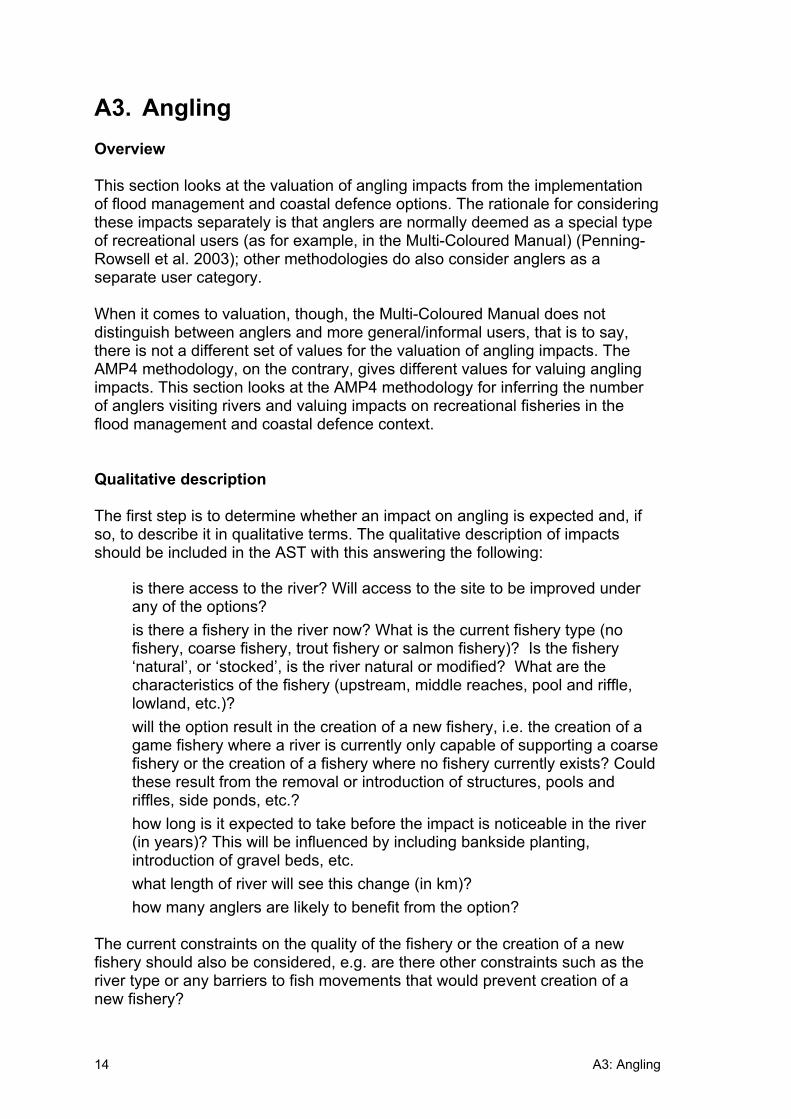
A3. Angling Overview
This section looks at the valuation of angling impacts from the implementation of flood management and coastal defence options. The rationale for considering these impacts separately is that anglers are normally deemed as a special type of recreational users (as for example, in the Multi-Coloured Manual) (Penning-Rowsell et al. 2003); other methodologies do also consider anglers as a separate user category.
When it comes to valuation, though, the Multi-Coloured Manual does not distinguish between anglers and more general/informal users, that is to say, there is not a different set of values for the valuation of angling impacts. The AMP4 methodology, on the contrary, gives different values for valuing angling impacts. This section looks at the AMP4 methodology for inferring the number of anglers visiting rivers and valuing impacts on recreational fisheries in the flood management and coastal defence context.
Qualitative description
The first step is to determine whether an impact on angling is expected and, if so, to describe it in qualitative terms. The qualitative description of impacts should be included in the AST with this answering the following:
• is there access to the river? Will access to the site to be improved under any of the options?
• is there a fishery in the river now? What is the current fishery type (no fishery, coarse fishery, trout fishery or salmon fishery)? Is the fishery ‘natural’, or ‘stocked’, is the river natural or modified? What are the characteristics of the fishery (upstream, middle reaches, pool and riffle, lowland, etc.)?
• will the option result in the creation of a new fishery, i.e. the creation of a game fishery where a river is currently only capable of supporting a coarse fishery or the creation of a fishery where no fishery currently exists? Could these result from the removal or introduction of structures, pools and riffles, side ponds, etc.?
• how long is it expected to take before the impact is noticeable in the river (in years)? This will be influenced by including bankside planting, introduction of gravel beds, etc.
• what length of river will see this change (in km)? • how many anglers are likely to benefit from the option?
The current constraints on the quality of the fishery or the creation of a new fishery should also be considered, e.g. are there other constraints such as the river type or any barriers to fish movements that would prevent creation of a new fishery?
A3: Angling 15
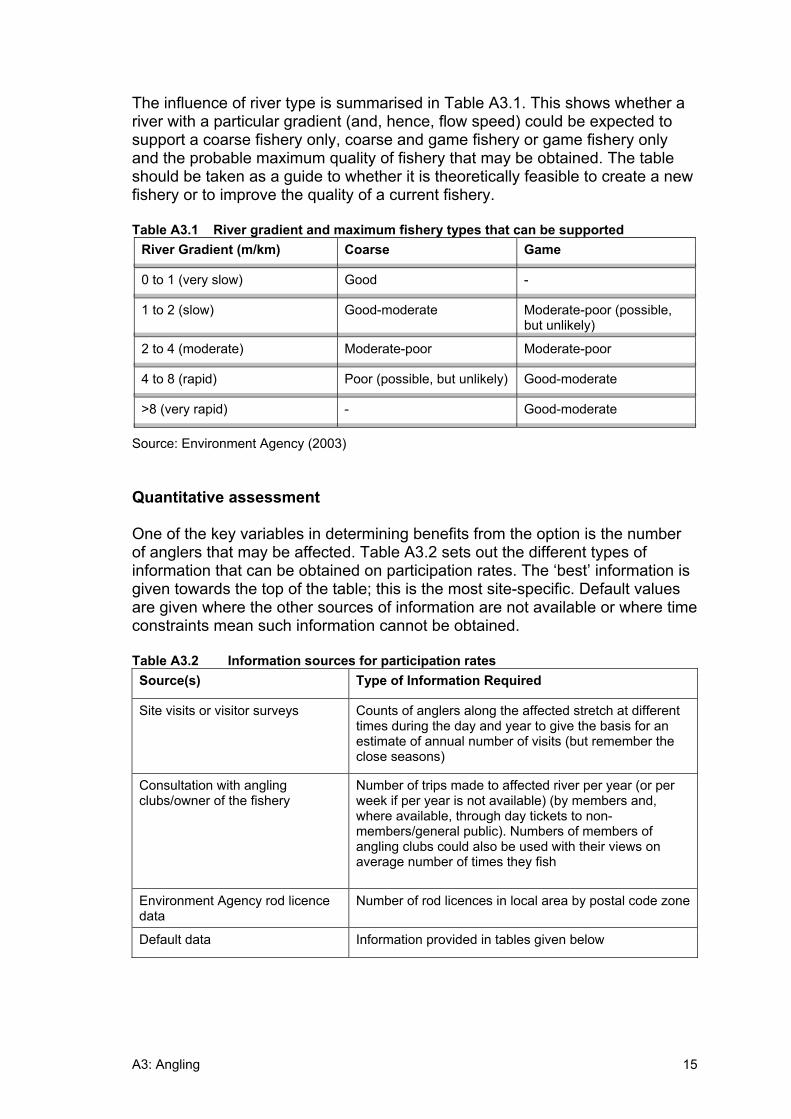
The influence of river type is summarised in Table A3.1. This shows whether a river with a particular gradient (and, hence, flow speed) could be expected to support a coarse fishery only, coarse and game fishery or game fishery only and the probable maximum quality of fishery that may be obtained. The table should be taken as a guide to whether it is theoretically feasible to create a new fishery or to improve the quality of a current fishery.
Table A3.1 River gradient and maximum fishery types that can be supported River Gradient (m/km) Coarse Game
0 to 1 (very slow) Good -
1 to 2 (slow) Good-moderate Moderate-poor (possible, but unlikely)
2 to 4 (moderate) Moderate-poor Moderate-poor
4 to 8 (rapid) Poor (possible, but unlikely) Good-moderate
>8 (very rapid) - Good-moderate
Source: Environment Agency (2003)
Quantitative assessment
One of the key variables in determining benefits from the option is the number of anglers that may be affected. Table A3.2 sets out the different types of information that can be obtained on participation rates. The ‘best’ information is given towards the top of the table; this is the most site-specific. Default values are given where the other sources of information are not available or where time constraints mean such information cannot be obtained.
Table A3.2 Information sources for participation rates Source(s) Type of Information Required
Site visits or visitor surveys Counts of anglers along the affected stretch at different times during the day and year to give the basis for an estimate of annual number of visits (but remember the close seasons)
Consultation with angling clubs/owner of the fishery
Number of trips made to affected river per year (or per week if per year is not available) (by members and, where available, through day tickets to non-members/general public). Numbers of members of angling clubs could also be used with their views on average number of times they fish
Environment Agency rod licence data
Number of rod licences in local area by postal code zone
Default data Information provided in tables given below
A3: Angling 16
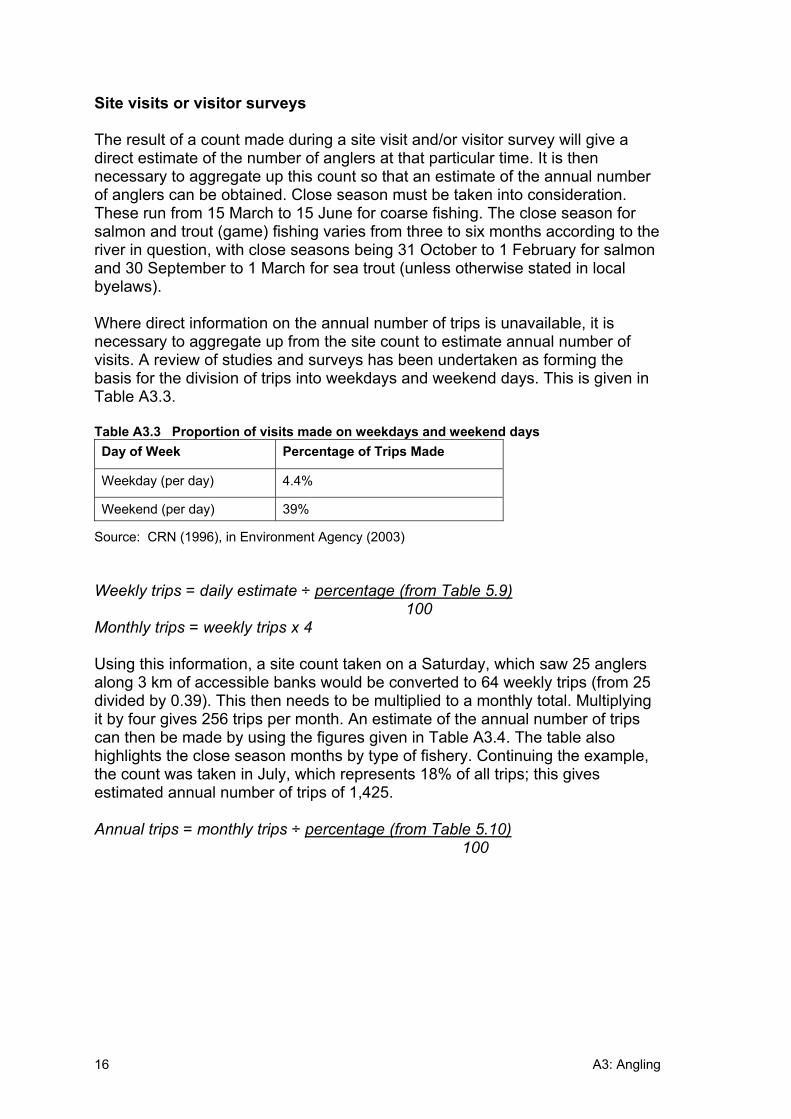
Site visits or visitor surveys
The result of a count made during a site visit and/or visitor survey will give a direct estimate of the number of anglers at that particular time. It is then necessary to aggregate up this count so that an estimate of the annual number of anglers can be obtained. Close season must be taken into consideration.These run from 15 March to 15 June for coarse fishing. The close season for salmon and trout (game) fishing varies from three to six months according to the river in question, with close seasons being 31 October to 1 February for salmon and 30 September to 1 March for sea trout (unless otherwise stated in local byelaws).
Where direct information on the annual number of trips is unavailable, it is necessary to aggregate up from the site count to estimate annual number of visits. A review of studies and surveys has been undertaken as forming the basis for the division of trips into weekdays and weekend days. This is given in Table A3.3.
Table A3.3 Proportion of visits made on weekdays and weekend days Day of Week Percentage of Trips Made
Weekday (per day) 4.4%
Weekend (per day) 39%
Source: CRN (1996), in Environment Agency (2003)
Weekly trips = daily estimate ÷ percentage (from Table 5.9) 100 Monthly trips = weekly trips x 4
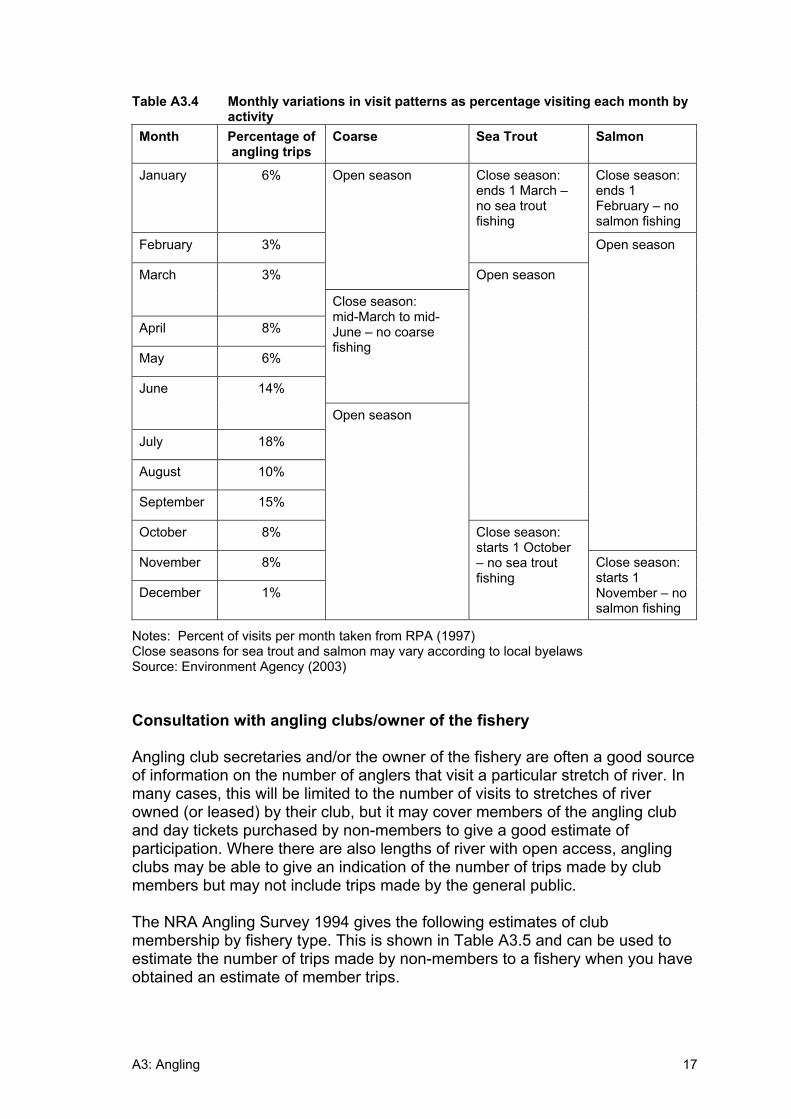
Using this information, a site count taken on a Saturday, which saw 25 anglers along 3 km of accessible banks would be converted to 64 weekly trips (from 25 divided by 0.39). This then needs to be multiplied to a monthly total. Multiplying it by four gives 256 trips per month. An estimate of the annual number of trips can then be made by using the figures given in Table A3.4. The table also highlights the close season months by type of fishery. Continuing the example, the count was taken in July, which represents 18% of all trips; this gives estimated annual number of trips of 1,425.
Annual trips = monthly trips ÷ percentage (from Table 5.10) 100
A3: Angling 17
Table A3.4 Monthly variations in visit patterns as percentage visiting each month by activity
Month Percentage of angling trips
Coarse Sea Trout Salmon
January 6% Close season: ends 1 February – no salmon fishing
February 3%
Close season: ends 1 March – no sea trout fishing
Open season
March 3%
April 8%
May 6%
Close season: mid-March to mid-June – no coarse fishing
June 14%
July 18%
August 10%
September 15%
Open season
October 8%
Open season
November 8%
December 1%
Open season
Close season: starts 1 October – no sea trout fishing
Close season: starts 1 November – no salmon fishing
Notes: Percent of visits per month taken from RPA (1997) Close seasons for sea trout and salmon may vary according to local byelaws Source: Environment Agency (2003)
Consultation with angling clubs/owner of the fishery
Angling club secretaries and/or the owner of the fishery are often a good source of information on the number of anglers that visit a particular stretch of river. In many cases, this will be limited to the number of visits to stretches of river owned (or leased) by their club, but it may cover members of the angling club and day tickets purchased by non-members to give a good estimate of participation. Where there are also lengths of river with open access, angling clubs may be able to give an indication of the number of trips made by club members but may not include trips made by the general public.
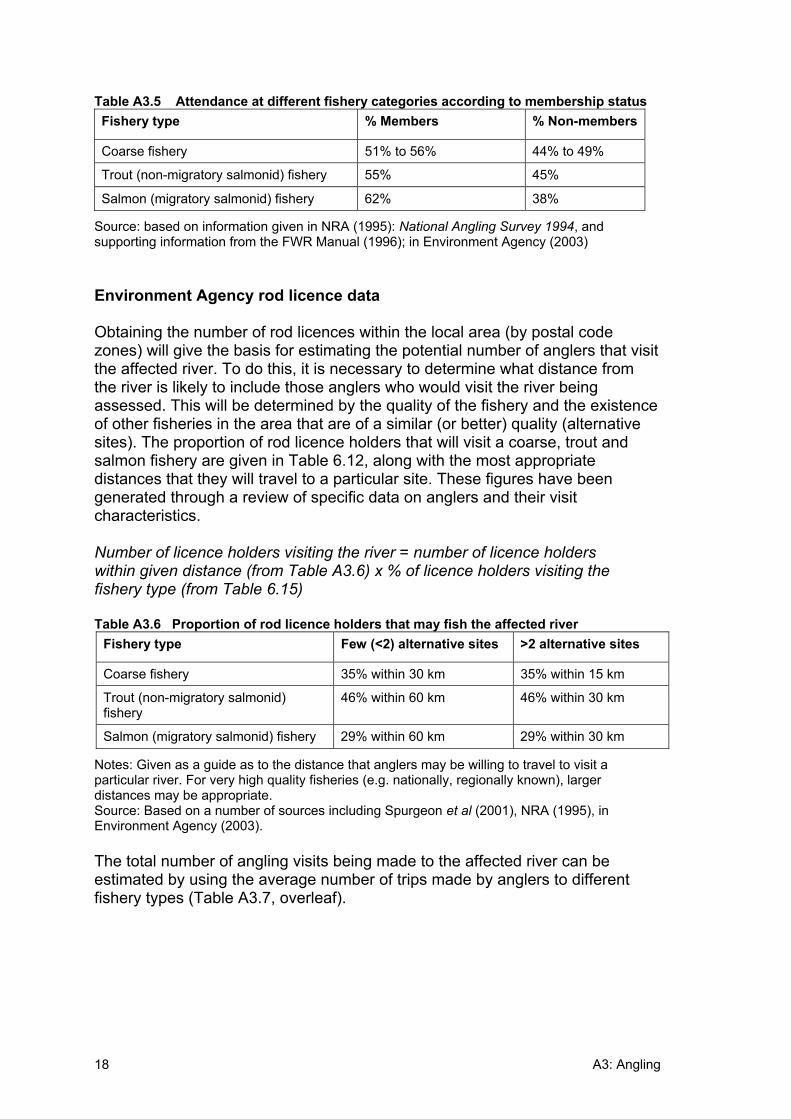
The NRA Angling Survey 1994 gives the following estimates of club membership by fishery type. This is shown in Table A3.5 and can be used to estimate the number of trips made by non-members to a fishery when you have obtained an estimate of member trips.
A3: Angling 18
Table A3.5 Attendance at different fishery categories according to membership status Fishery type % Members % Non-members
Coarse fishery 51% to 56% 44% to 49%
Trout (non-migratory salmonid) fishery 55% 45%
Salmon (migratory salmonid) fishery 62% 38%
Source: based on information given in NRA (1995): National Angling Survey 1994, and supporting information from the FWR Manual (1996); in Environment Agency (2003)
Environment Agency rod licence data
Obtaining the number of rod licences within the local area (by postal code zones) will give the basis for estimating the potential number of anglers that visit the affected river. To do this, it is necessary to determine what distance from the river is likely to include those anglers who would visit the river being assessed. This will be determined by the quality of the fishery and the existence of other fisheries in the area that are of a similar (or better) quality (alternative sites). The proportion of rod licence holders that will visit a coarse, trout and salmon fishery are given in Table 6.12, along with the most appropriate distances that they will travel to a particular site. These figures have been generated through a review of specific data on anglers and their visit characteristics.
Number of licence holders visiting the river = number of licence holders within given distance (from Table A3.6) x % of licence holders visiting the fishery type (from Table 6.15)
Table A3.6 Proportion of rod licence holders that may fish the affected river Fishery type Few (<2) alternative sites >2 alternative sites
Coarse fishery 35% within 30 km 35% within 15 km
Trout (non-migratory salmonid) fishery
46% within 60 km 46% within 30 km
Salmon (migratory salmonid) fishery 29% within 60 km 29% within 30 km
Notes: Given as a guide as to the distance that anglers may be willing to travel to visit a particular river. For very high quality fisheries (e.g. nationally, regionally known), larger distances may be appropriate. Source: Based on a number of sources including Spurgeon et al (2001), NRA (1995), in Environment Agency (2003).
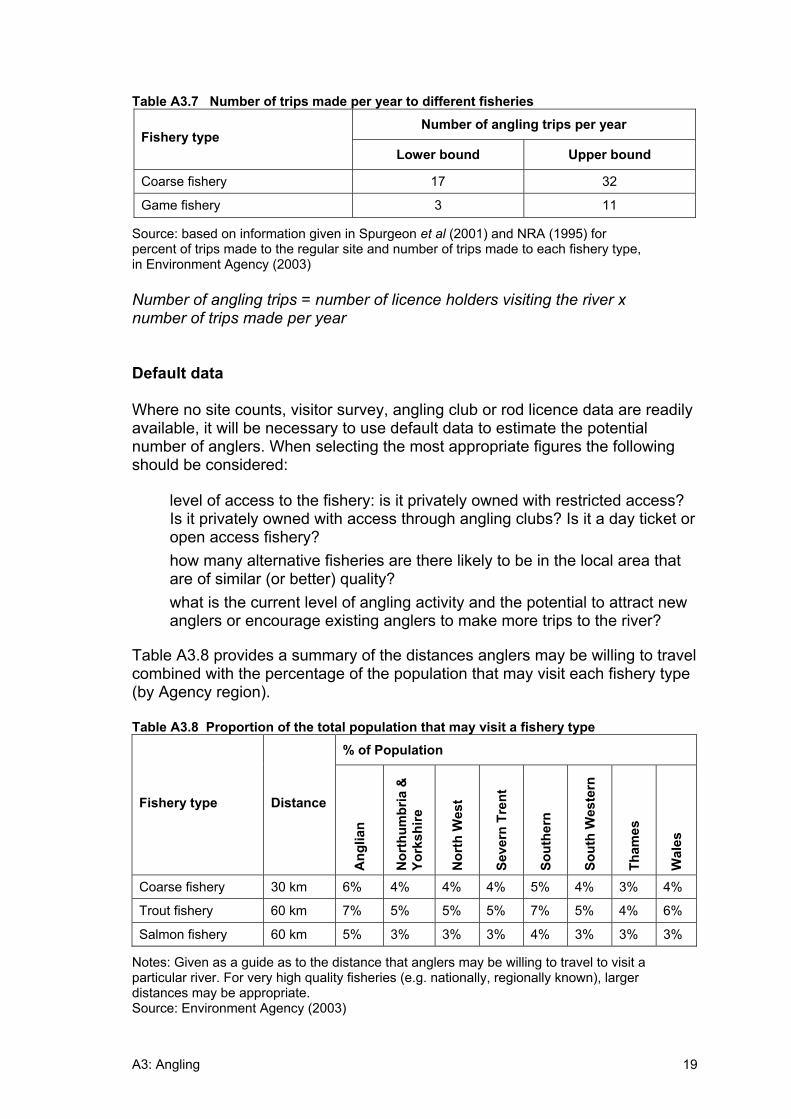
The total number of angling visits being made to the affected river can be estimated by using the average number of trips made by anglers to different fishery types (Table A3.7, overleaf).
A3: Angling 19
Table A3.7 Number of trips made per year to different fisheries Number of angling trips per year
Fishery type Lower bound Upper bound
Coarse fishery 17 32
Game fishery 3 11
Source: based on information given in Spurgeon et al (2001) and NRA (1995) for percent of trips made to the regular site and number of trips made to each fishery type, in Environment Agency (2003)
Number of angling trips = number of licence holders visiting the river x number of trips made per year
Default data
Where no site counts, visitor survey, angling club or rod licence data are readily available, it will be necessary to use default data to estimate the potential number of anglers. When selecting the most appropriate figures the following should be considered:
• level of access to the fishery: is it privately owned with restricted access?Is it privately owned with access through angling clubs? Is it a day ticket or open access fishery?
• how many alternative fisheries are there likely to be in the local area that are of similar (or better) quality?
• what is the current level of angling activity and the potential to attract new anglers or encourage existing anglers to make more trips to the river?
Table A3.8 provides a summary of the distances anglers may be willing to travel combined with the percentage of the population that may visit each fishery type (by Agency region).
Table A3.8 Proportion of the total population that may visit a fishery type % of Population
Fishery type Distance
Ang
lian
Nor
thum
bria
&
York
shire
Nor
th W
est
Seve
rn T
rent
Sout
hern
Sout
h W
este
rn
Tham
es
Wal
es
Coarse fishery 30 km 6% 4% 4% 4% 5% 4% 3% 4%
Trout fishery 60 km 7% 5% 5% 5% 7% 5% 4% 6%
Salmon fishery 60 km 5% 3% 3% 3% 4% 3% 3% 3%
Notes: Given as a guide as to the distance that anglers may be willing to travel to visit a particular river. For very high quality fisheries (e.g. nationally, regionally known), larger distances may be appropriate. Source: Environment Agency (2003)
A3: Angling 20
There are two methods to infer the number of population affected:
• drawing a circle around the river with a radius equal to the most appropriate distance shown in Table 5.14 and either using GIS-data, census data or an OS map determine the population (number of adults) within the circle: population = number of people living within the circle drawn x percentage of population expected to visit the fishery type
• or, using the population density data, to calculate the affected population by using the following formula: population = 3.14 x distance (in km) squared x population density
Table A3.7 shows the average number of trips made to fisheries of different type and quality. Two values are given (an upper and lower bound) to highlight uncertainty within the estimates.
Number of angling trips = population x average number of trips (Table A3.7)
Alternative sites
The estimated number of angling trips made to each fishery type each year is calculated by multiplying the appropriate population by the number of trips made to each fishery type. However, this needs to be corrected for the number of alternative sites that may be available. The adjustment is made by estimating the number of alternative sites of better or similar angling opportunities and dividing the total number of angling trips made each year by the number of alternative sites plus one (to account for the site in question).
Number of angling trips total number of angling trips (from above)to site in question = number of alternative sites plus one Reality checks
The estimation of participation rates can often be associated with a high degree of uncertainty. The following checks are designed to give an indication of whether the obtained participation rate estimates are likely to be appropriate for the affected length of river in question. There are two approaches given here:
• comparison with maximum angler densities; and • comparison with expected number of visitors to different types and
qualities of fishery.
These comparisons are not designed to estimate participation rates, but rather to provide an indication of the expected number of visitors.
A3: Angling 21
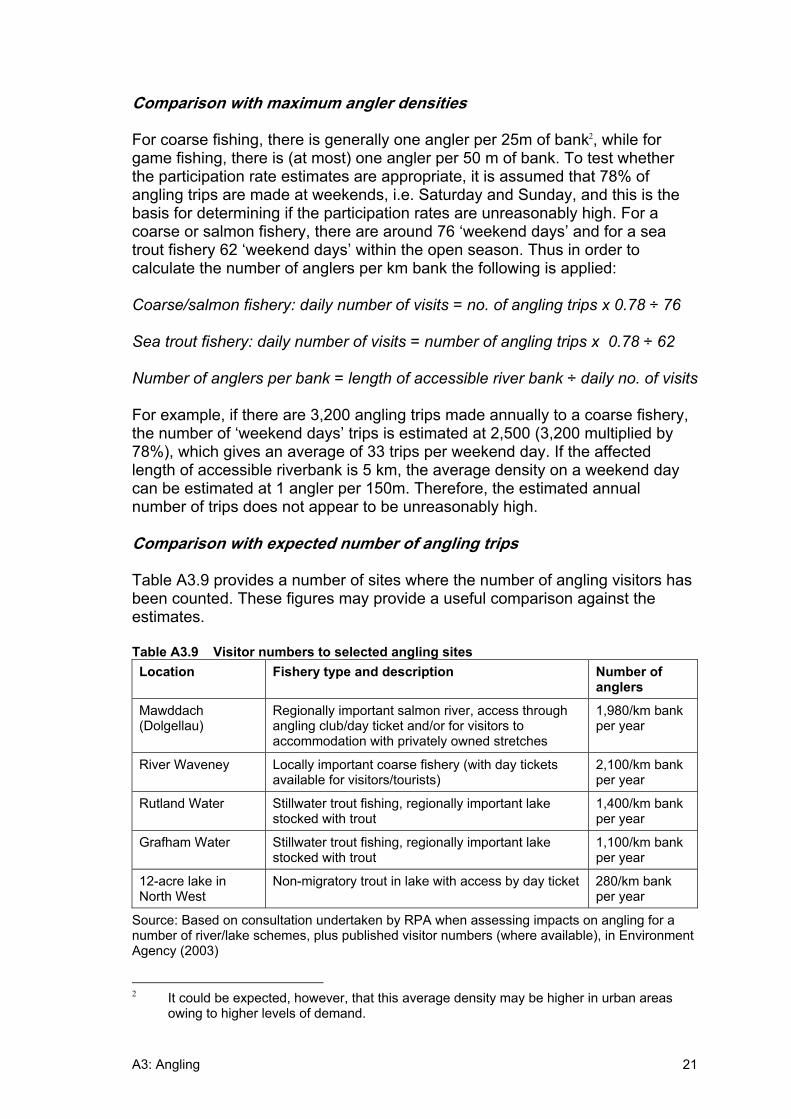
Comparison with maximum angler densities
For coarse fishing, there is generally one angler per 25m of bank2, while for game fishing, there is (at most) one angler per 50 m of bank. To test whether the participation rate estimates are appropriate, it is assumed that 78% of angling trips are made at weekends, i.e. Saturday and Sunday, and this is the basis for determining if the participation rates are unreasonably high. For a coarse or salmon fishery, there are around 76 ‘weekend days’ and for a sea trout fishery 62 ‘weekend days’ within the open season. Thus in order to calculate the number of anglers per km bank the following is applied:
Coarse/salmon fishery: daily number of visits = no. of angling trips x 0.78 ÷ 76
Sea trout fishery: daily number of visits = number of angling trips x 0.78 ÷ 62
Number of anglers per bank = length of accessible river bank ÷ daily no. of visits
For example, if there are 3,200 angling trips made annually to a coarse fishery, the number of ‘weekend days’ trips is estimated at 2,500 (3,200 multiplied by 78%), which gives an average of 33 trips per weekend day. If the affected length of accessible riverbank is 5 km, the average density on a weekend day can be estimated at 1 angler per 150m. Therefore, the estimated annual number of trips does not appear to be unreasonably high.
Comparison with expected number of angling trips
Table A3.9 provides a number of sites where the number of angling visitors has been counted. These figures may provide a useful comparison against the estimates.
Table A3.9 Visitor numbers to selected angling sites Location Fishery type and description Number of
anglers
Mawddach(Dolgellau)
Regionally important salmon river, access through angling club/day ticket and/or for visitors to accommodation with privately owned stretches
1,980/km bank per year
River Waveney Locally important coarse fishery (with day tickets available for visitors/tourists)
2,100/km bank per year
Rutland Water Stillwater trout fishing, regionally important lake stocked with trout
1,400/km bank per year
Grafham Water Stillwater trout fishing, regionally important lake stocked with trout
1,100/km bank per year
12-acre lake in North West
Non-migratory trout in lake with access by day ticket 280/km bank per year
Source: Based on consultation undertaken by RPA when assessing impacts on angling for a number of river/lake schemes, plus published visitor numbers (where available), in Environment Agency (2003)
2 It could be expected, however, that this average density may be higher in urban areas
owing to higher levels of demand.
A3: Angling 22
Benefits transfer
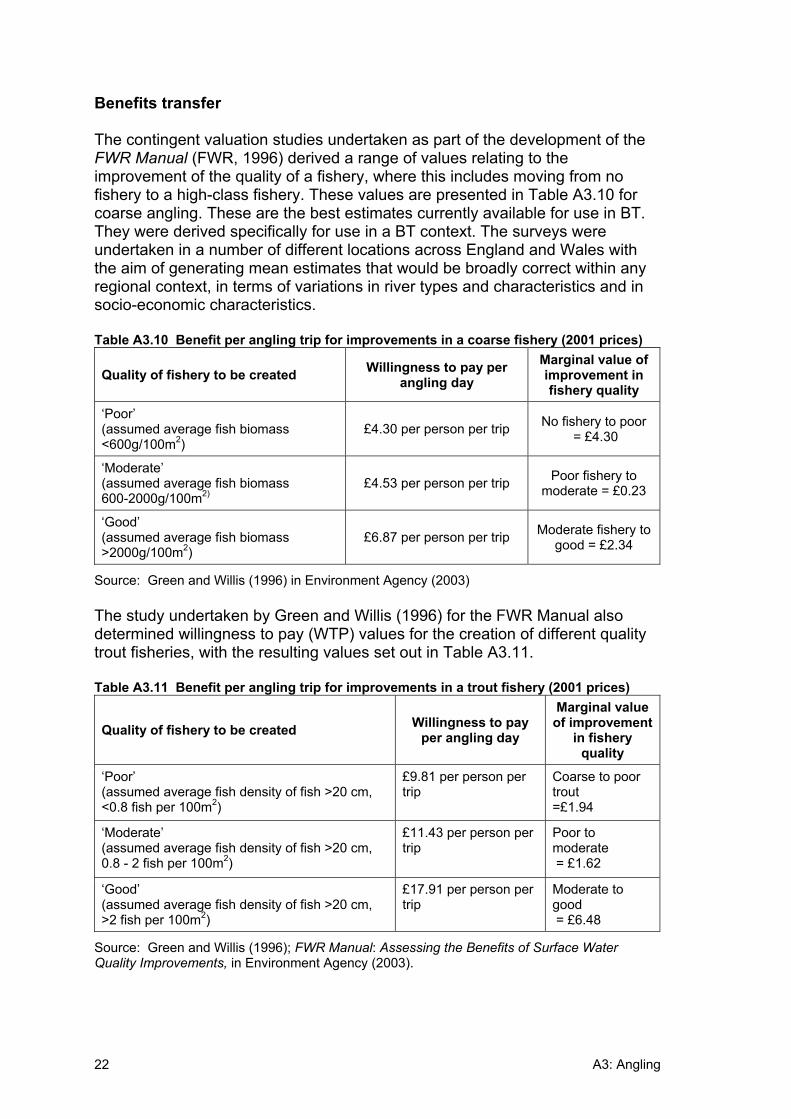
The contingent valuation studies undertaken as part of the development of the FWR Manual (FWR, 1996) derived a range of values relating to the improvement of the quality of a fishery, where this includes moving from no fishery to a high-class fishery. These values are presented in Table A3.10 for coarse angling. These are the best estimates currently available for use in BT. They were derived specifically for use in a BT context. The surveys were undertaken in a number of different locations across England and Wales with the aim of generating mean estimates that would be broadly correct within any regional context, in terms of variations in river types and characteristics and in socio-economic characteristics.
Table A3.10 Benefit per angling trip for improvements in a coarse fishery (2001 prices)
Quality of fishery to be created Willingness to pay per angling day
Marginal value of improvement in fishery quality
‘Poor’(assumed average fish biomass <600g/100m2)
£4.30 per person per trip No fishery to poor = £4.30
‘Moderate’(assumed average fish biomass 600-2000g/100m2)
£4.53 per person per trip Poor fishery to moderate = £0.23
‘Good’(assumed average fish biomass >2000g/100m2)
£6.87 per person per trip Moderate fishery to good = £2.34
Source: Green and Willis (1996) in Environment Agency (2003)
The study undertaken by Green and Willis (1996) for the FWR Manual also determined willingness to pay (WTP) values for the creation of different quality trout fisheries, with the resulting values set out in Table A3.11.
Table A3.11 Benefit per angling trip for improvements in a trout fishery (2001 prices)
Quality of fishery to be created Willingness to pay per angling day
Marginal value of improvement
in fishery quality
‘Poor’(assumed average fish density of fish >20 cm, <0.8 fish per 100m2)
£9.81 per person per trip
Coarse to poor trout=£1.94
‘Moderate’(assumed average fish density of fish >20 cm, 0.8 - 2 fish per 100m2)
£11.43 per person per trip
Poor to moderate = £1.62
‘Good’(assumed average fish density of fish >20 cm, >2 fish per 100m2)
£17.91 per person per trip
Moderate to good = £6.48
Source: Green and Willis (1996); FWR Manual: Assessing the Benefits of Surface Water Quality Improvements, in Environment Agency (2003).
A3: Angling 23
Only two surveys have been identified which have derived estimates of the value of a salmon angling day. The first was undertaken by Radford (1984) and found a value of roughly £17.30 per angler per day. The second study is that undertaken for the FWR Manual. A value of £28.20 per person per trip was found for the creation of a new, good quality site, where an average angler had a 1 in 10 chance of catching a salmon each day3. Both values could be carried forward as a lower and upper bound, as they will provide a range and an indication of the uncertainty surrounding the estimates.
3 The figure of £28.20 is supported by research undertaken on salmon fisheries in Northern
Ireland (Davis and O’Neill 1992). This study found WTP values of between £20 and £28.50 (depending on experience) for maintaining access to angling licences and permits in Northern Ireland
A4: Coastal Sites 24
A4. Coastal sites A4.1 Recreation
Overview
This section discusses the valuation of recreational benefits from coastal protection and draws on the multi-coloured manual with regard to transfer values. This is because the values used in other methodologies are of more limited transferability, being linked with water quality changes. There is another advantage from using the values provided in the multi-coloured manual, this being that they include more specialist users. For aggregation, the methodology proposed in the AMP4 methodology has been adjusted in order to integrate informal and more specialist recreational users.
Qualitative description of impacts
The first step in the assessment is to determine whether recreation activities take place along the beaches/shoreline that will be affected by the scheme. To do this, the following questions are to be considered:
• how long is the relevant shoreline that will be affected and what is the extent of the access to the shoreline? Are there car parks, promenades, footpaths, etc. providing access?
• does recreation take place along the shoreline now? Are there any data on visitor numbers to the shoreline area? To what extent is the shoreline likely to be used for recreation purposes throughout the year?
• would it be likely to develop new recreational opportunities or change existing recreational activities in the future if the option is implemented (e.g. increasing the length of the promenade)? In answering this the decision maker should think about whether there is a nearby population centre and whether there are already nicer areas nearby that draw more local residents.
The answers to the above questions should be summarised and incorporated into the AST. If benefits to recreational users are expected to arise, then the next step is to move on to the quantitative assessment.
Quantitative assessment for recreation
There are a number of different methods available for estimating the number of people that may visit a particular beach for recreation purposes. The ‘best’ method will depend upon (i) the amount of information that is readily available and (ii) the amount of time you have to obtain and/or calculate potential participation rates.
Table A4.1 sets out two different approaches for estimating the number of beach users. The first relates to actual counts that have been made on the
A4: Coastal sites 25
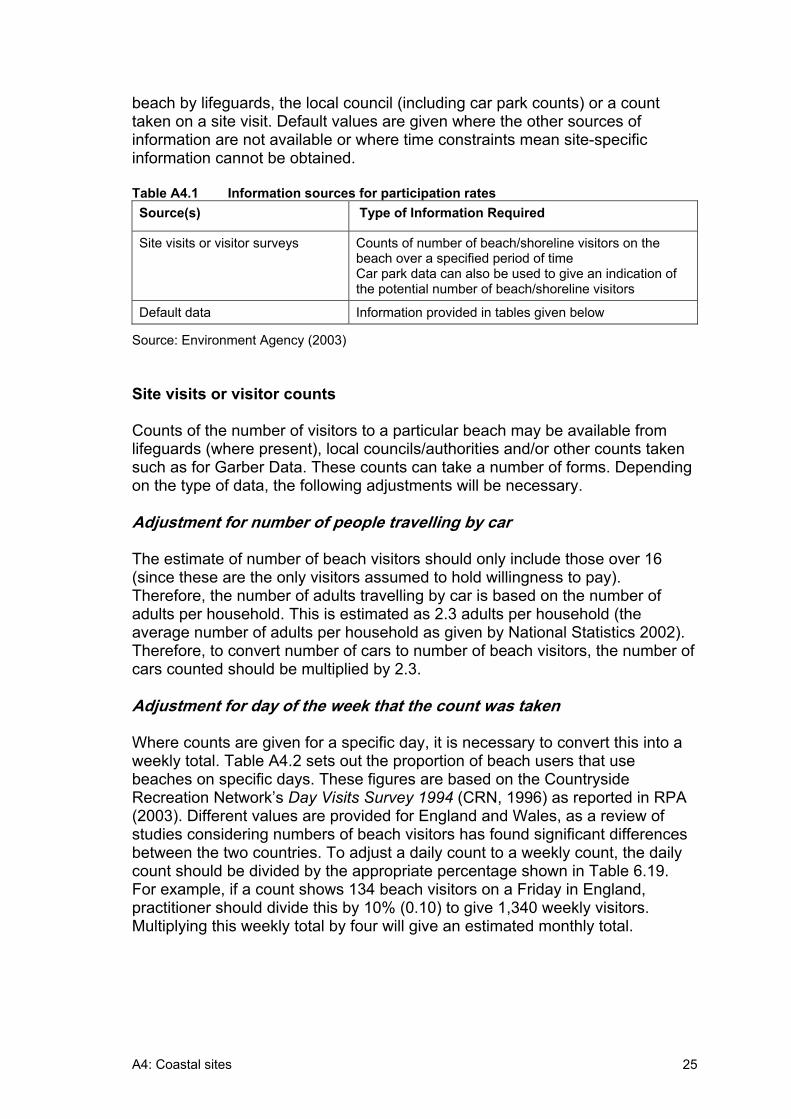
beach by lifeguards, the local council (including car park counts) or a count taken on a site visit. Default values are given where the other sources of information are not available or where time constraints mean site-specific information cannot be obtained.
Table A4.1 Information sources for participation rates Source(s) Type of Information Required
Site visits or visitor surveys Counts of number of beach/shoreline visitors on the beach over a specified period of time Car park data can also be used to give an indication of the potential number of beach/shoreline visitors
Default data Information provided in tables given below
Source: Environment Agency (2003)
Site visits or visitor counts
Counts of the number of visitors to a particular beach may be available from lifeguards (where present), local councils/authorities and/or other counts taken such as for Garber Data. These counts can take a number of forms. Depending on the type of data, the following adjustments will be necessary.
Adjustment for number of people travelling by car
The estimate of number of beach visitors should only include those over 16 (since these are the only visitors assumed to hold willingness to pay).Therefore, the number of adults travelling by car is based on the number of adults per household. This is estimated as 2.3 adults per household (the average number of adults per household as given by National Statistics 2002). Therefore, to convert number of cars to number of beach visitors, the number of cars counted should be multiplied by 2.3.
Adjustment for day of the week that the count was taken
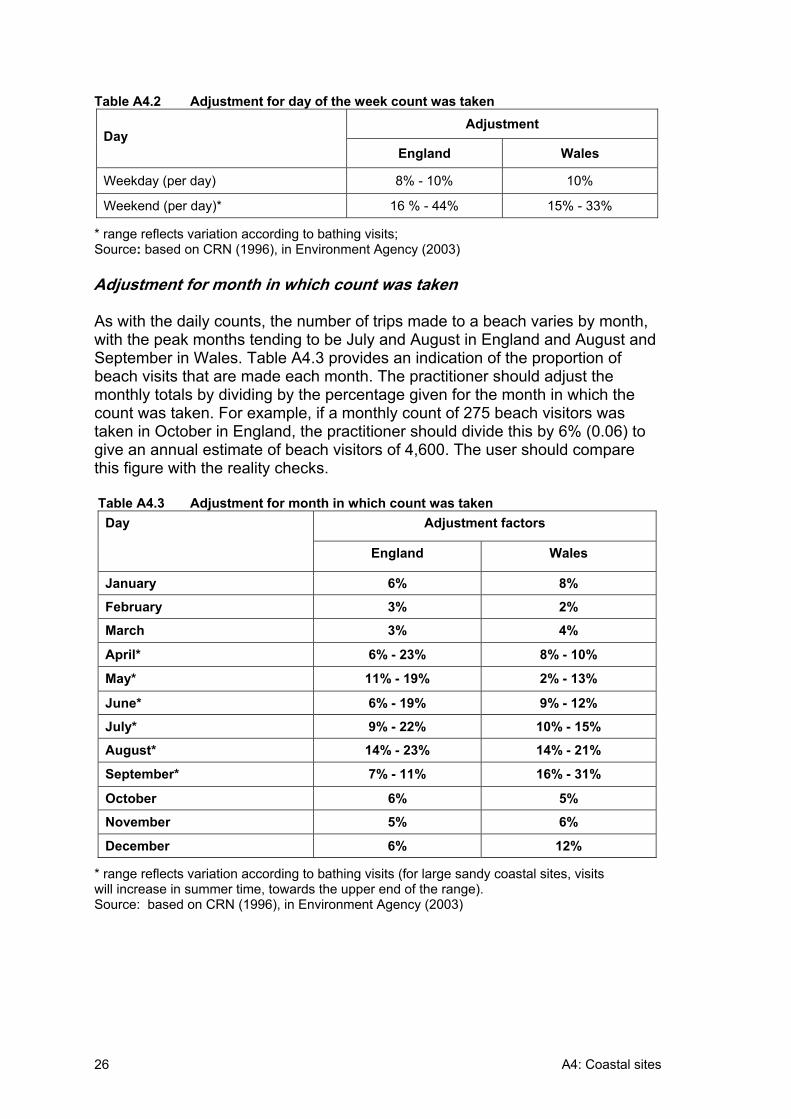
Where counts are given for a specific day, it is necessary to convert this into a weekly total. Table A4.2 sets out the proportion of beach users that use beaches on specific days. These figures are based on the Countryside Recreation Network’s Day Visits Survey 1994 (CRN, 1996) as reported in RPA (2003). Different values are provided for England and Wales, as a review of studies considering numbers of beach visitors has found significant differences between the two countries. To adjust a daily count to a weekly count, the daily count should be divided by the appropriate percentage shown in Table 6.19. For example, if a count shows 134 beach visitors on a Friday in England, practitioner should divide this by 10% (0.10) to give 1,340 weekly visitors.Multiplying this weekly total by four will give an estimated monthly total.
A4: Coastal sites 26
Table A4.2 Adjustment for day of the week count was taken Adjustment
Day England Wales
Weekday (per day) 8% - 10% 10%
Weekend (per day)* 16 % - 44% 15% - 33%
* range reflects variation according to bathing visits; Source: based on CRN (1996), in Environment Agency (2003)
Adjustment for month in which count was taken
As with the daily counts, the number of trips made to a beach varies by month, with the peak months tending to be July and August in England and August and September in Wales. Table A4.3 provides an indication of the proportion of beach visits that are made each month. The practitioner should adjust the monthly totals by dividing by the percentage given for the month in which the count was taken. For example, if a monthly count of 275 beach visitors was taken in October in England, the practitioner should divide this by 6% (0.06) to give an annual estimate of beach visitors of 4,600. The user should compare this figure with the reality checks.
Table A4.3 Adjustment for month in which count was taken Adjustment factors Day
England Wales
January 6% 8%
February 3% 2%
March 3% 4%
April* 6% - 23% 8% - 10%
May* 11% - 19% 2% - 13%
June* 6% - 19% 9% - 12%
July* 9% - 22% 10% - 15%
August* 14% - 23% 14% - 21%
September* 7% - 11% 16% - 31%
October 6% 5%
November 5% 6%
December 6% 12%
* range reflects variation according to bathing visits (for large sandy coastal sites, visits will increase in summer time, towards the upper end of the range). Source: based on CRN (1996), in Environment Agency (2003)
A4: Coastal sites 27
Default data
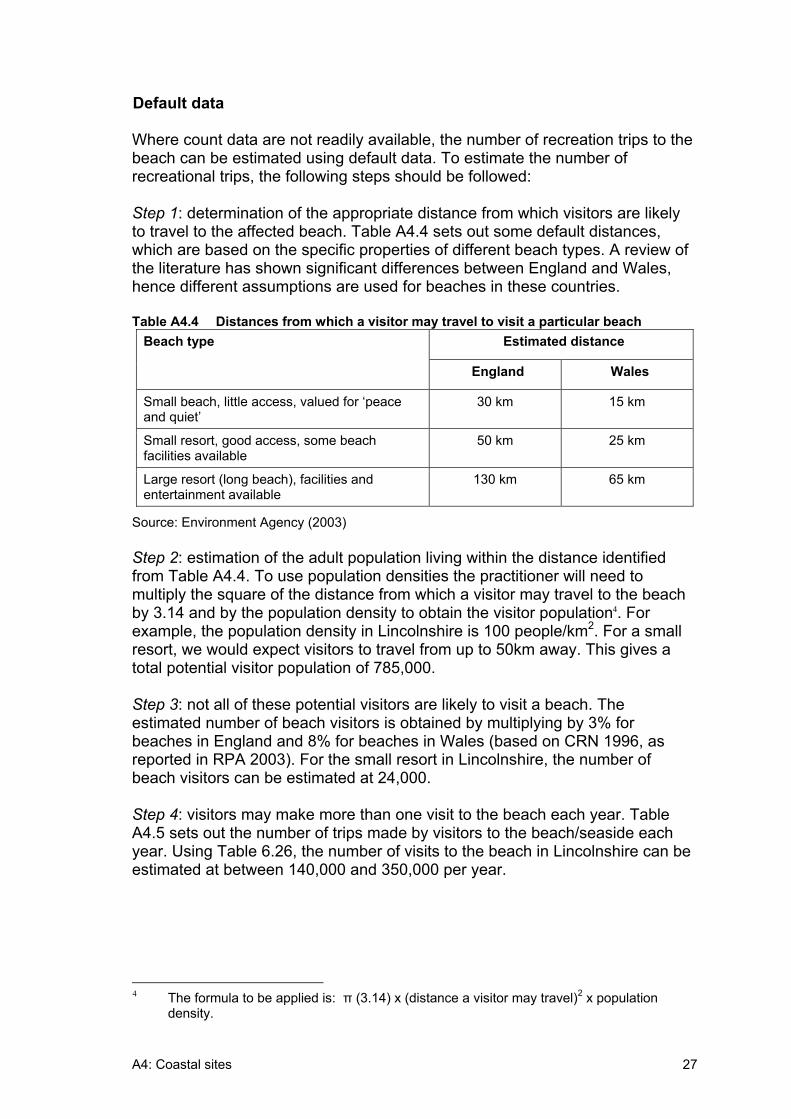
Where count data are not readily available, the number of recreation trips to the beach can be estimated using default data. To estimate the number of recreational trips, the following steps should be followed:
Step 1: determination of the appropriate distance from which visitors are likely to travel to the affected beach. Table A4.4 sets out some default distances, which are based on the specific properties of different beach types. A review of the literature has shown significant differences between England and Wales, hence different assumptions are used for beaches in these countries.
Table A4.4 Distances from which a visitor may travel to visit a particular beach Estimated distance Beach type
England Wales
Small beach, little access, valued for ‘peace and quiet’
30 km 15 km
Small resort, good access, some beach facilities available
50 km 25 km
Large resort (long beach), facilities and entertainment available
130 km 65 km
Source: Environment Agency (2003)
Step 2: estimation of the adult population living within the distance identified from Table A4.4. To use population densities the practitioner will need to multiply the square of the distance from which a visitor may travel to the beach by 3.14 and by the population density to obtain the visitor population4. For example, the population density in Lincolnshire is 100 people/km2. For a small resort, we would expect visitors to travel from up to 50km away. This gives a total potential visitor population of 785,000.
Step 3: not all of these potential visitors are likely to visit a beach. The estimated number of beach visitors is obtained by multiplying by 3% for beaches in England and 8% for beaches in Wales (based on CRN 1996, as reported in RPA 2003). For the small resort in Lincolnshire, the number of beach visitors can be estimated at 24,000.
Step 4: visitors may make more than one visit to the beach each year. Table A4.5 sets out the number of trips made by visitors to the beach/seaside each year. Using Table 6.26, the number of visits to the beach in Lincolnshire can be estimated at between 140,000 and 350,000 per year.
4 The formula to be applied is: (3.14) x (distance a visitor may travel)2 x population
density.
A4: Coastal sites 28
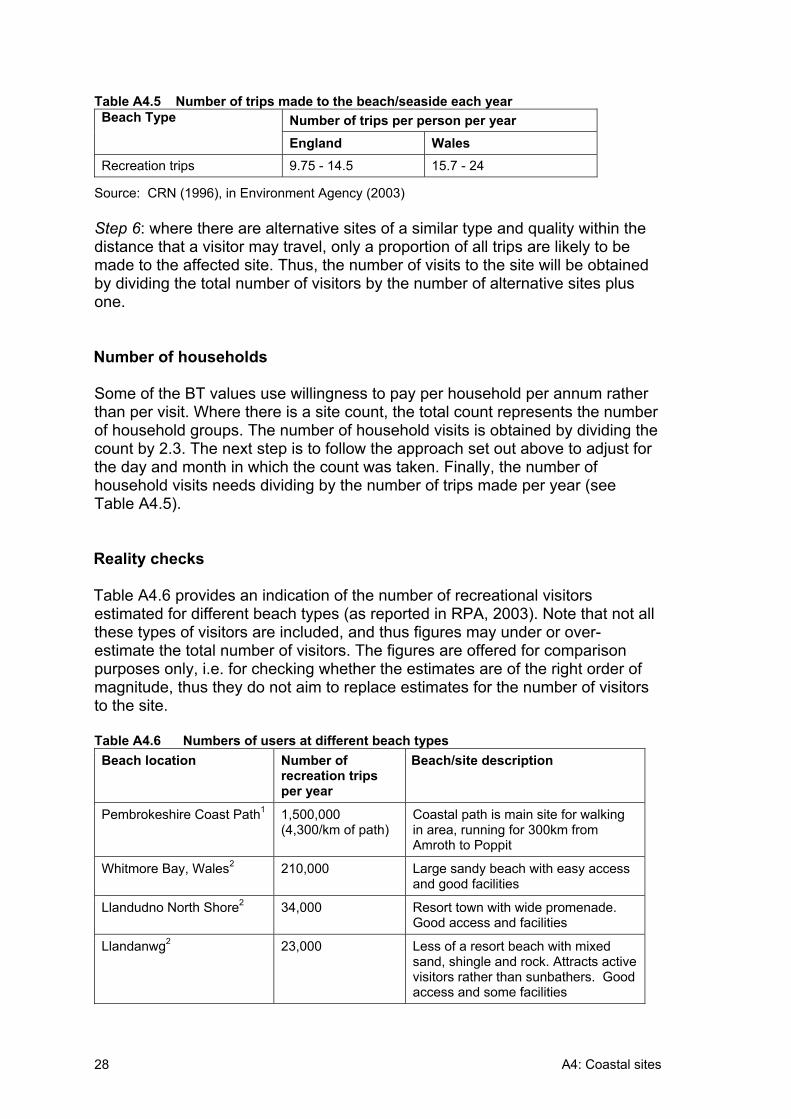
Table A4.5 Number of trips made to the beach/seaside each year Number of trips per person per year Beach Type
England Wales Recreation trips 9.75 - 14.5 15.7 - 24
Source: CRN (1996), in Environment Agency (2003)
Step 6: where there are alternative sites of a similar type and quality within the distance that a visitor may travel, only a proportion of all trips are likely to be made to the affected site. Thus, the number of visits to the site will be obtained by dividing the total number of visitors by the number of alternative sites plus one.
Number of households
Some of the BT values use willingness to pay per household per annum rather than per visit. Where there is a site count, the total count represents the number of household groups. The number of household visits is obtained by dividing the count by 2.3. The next step is to follow the approach set out above to adjust for the day and month in which the count was taken. Finally, the number of household visits needs dividing by the number of trips made per year (see Table A4.5).
Reality checks
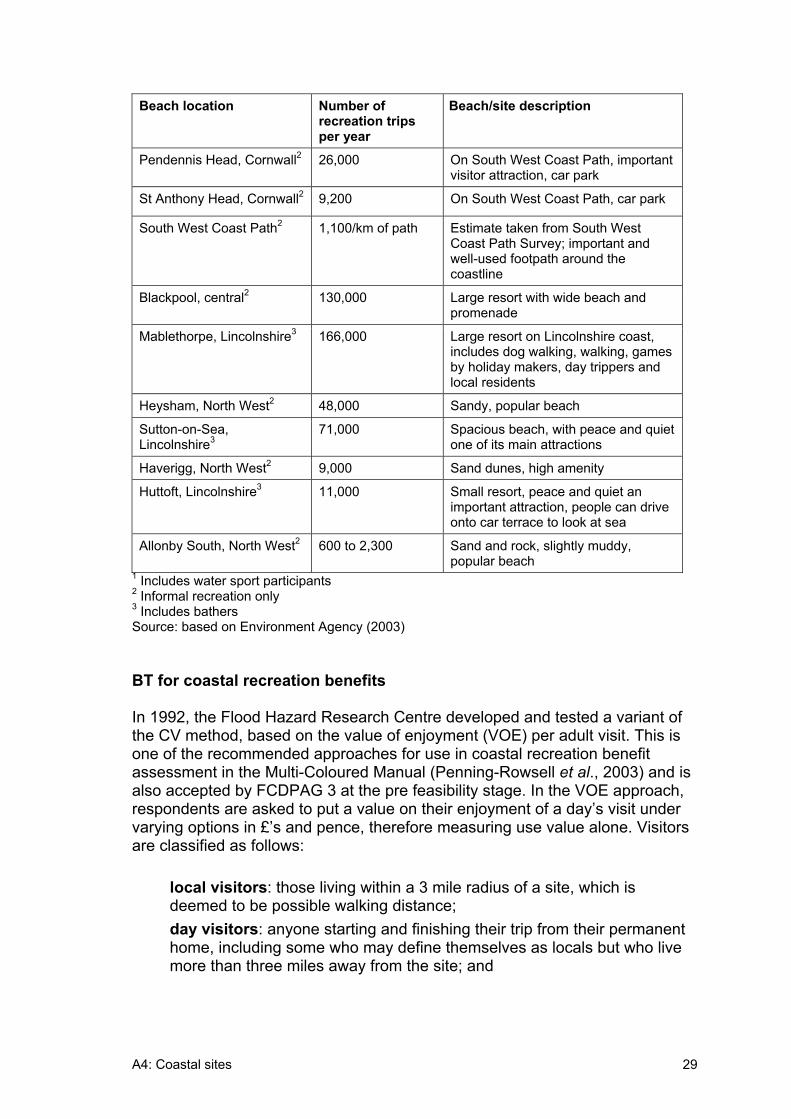
Table A4.6 provides an indication of the number of recreational visitors estimated for different beach types (as reported in RPA, 2003). Note that not all these types of visitors are included, and thus figures may under or over-estimate the total number of visitors. The figures are offered for comparison purposes only, i.e. for checking whether the estimates are of the right order of magnitude, thus they do not aim to replace estimates for the number of visitors to the site.
Table A4.6 Numbers of users at different beach types Beach location Number of
recreation trips per year
Beach/site description
Pembrokeshire Coast Path1 1,500,000 (4,300/km of path)
Coastal path is main site for walking in area, running for 300km from Amroth to Poppit
Whitmore Bay, Wales2 210,000 Large sandy beach with easy access and good facilities
Llandudno North Shore2 34,000 Resort town with wide promenade. Good access and facilities
Llandanwg2 23,000 Less of a resort beach with mixed sand, shingle and rock. Attracts active visitors rather than sunbathers. Good access and some facilities
A4: Coastal sites 29
Beach location Number of recreation trips per year
Beach/site description
Pendennis Head, Cornwall2 26,000 On South West Coast Path, important visitor attraction, car park
St Anthony Head, Cornwall2 9,200 On South West Coast Path, car park
South West Coast Path2 1,100/km of path Estimate taken from South West Coast Path Survey; important and well-used footpath around the coastline
Blackpool, central2 130,000 Large resort with wide beach and promenade
Mablethorpe, Lincolnshire3 166,000 Large resort on Lincolnshire coast, includes dog walking, walking, games by holiday makers, day trippers and local residents
Heysham, North West2 48,000 Sandy, popular beach
Sutton-on-Sea, Lincolnshire3
71,000 Spacious beach, with peace and quiet one of its main attractions
Haverigg, North West2 9,000 Sand dunes, high amenity
Huttoft, Lincolnshire3 11,000 Small resort, peace and quiet an important attraction, people can drive onto car terrace to look at sea
Allonby South, North West2 600 to 2,300 Sand and rock, slightly muddy, popular beach
1 Includes water sport participants 2 Informal recreation only 3 Includes bathers Source: based on Environment Agency (2003)
BT for coastal recreation benefits
In 1992, the Flood Hazard Research Centre developed and tested a variant of the CV method, based on the value of enjoyment (VOE) per adult visit. This is one of the recommended approaches for use in coastal recreation benefit assessment in the Multi-Coloured Manual (Penning-Rowsell et al., 2003) and is also accepted by FCDPAG 3 at the pre feasibility stage. In the VOE approach, respondents are asked to put a value on their enjoyment of a day’s visit under varying options in £’s and pence, therefore measuring use value alone. Visitors are classified as follows:
• local visitors: those living within a 3 mile radius of a site, which is deemed to be possible walking distance;
• day visitors: anyone starting and finishing their trip from their permanent home, including some who may define themselves as locals but who live more than three miles away from the site; and
A4: Coastal sites 30
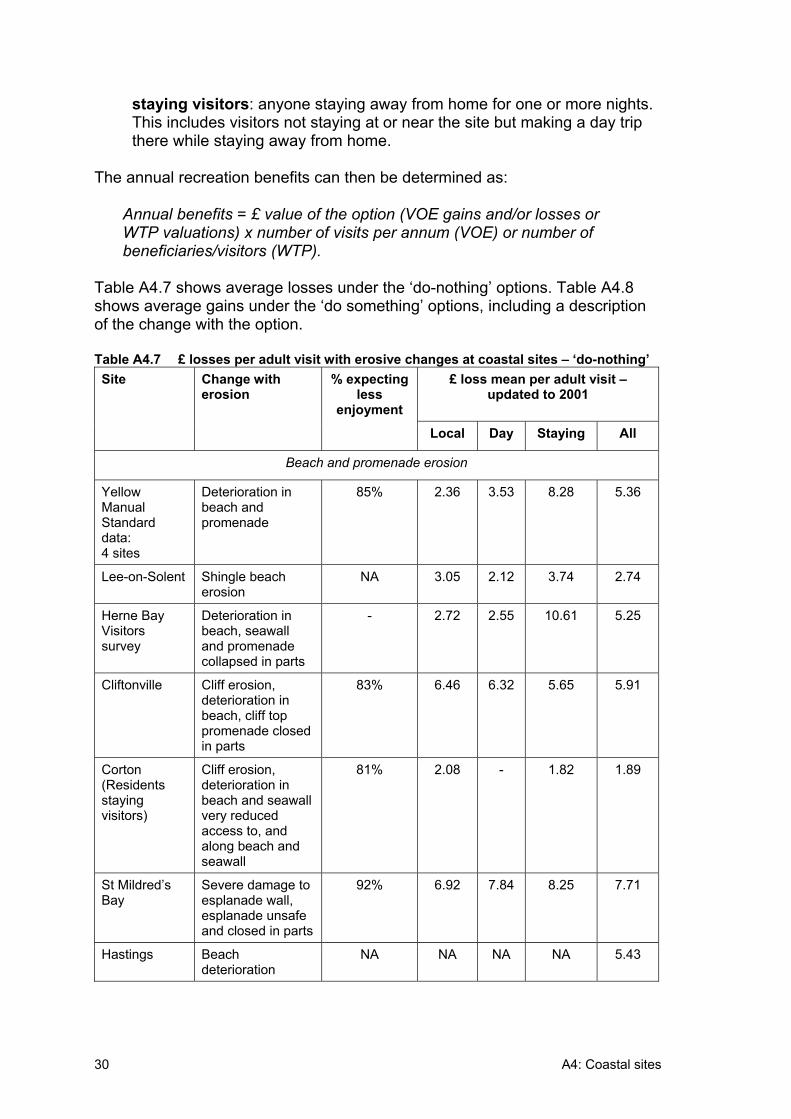
• staying visitors: anyone staying away from home for one or more nights.This includes visitors not staying at or near the site but making a day trip there while staying away from home.
The annual recreation benefits can then be determined as:
Annual benefits = £ value of the option (VOE gains and/or losses or WTP valuations) x number of visits per annum (VOE) or number of beneficiaries/visitors (WTP).
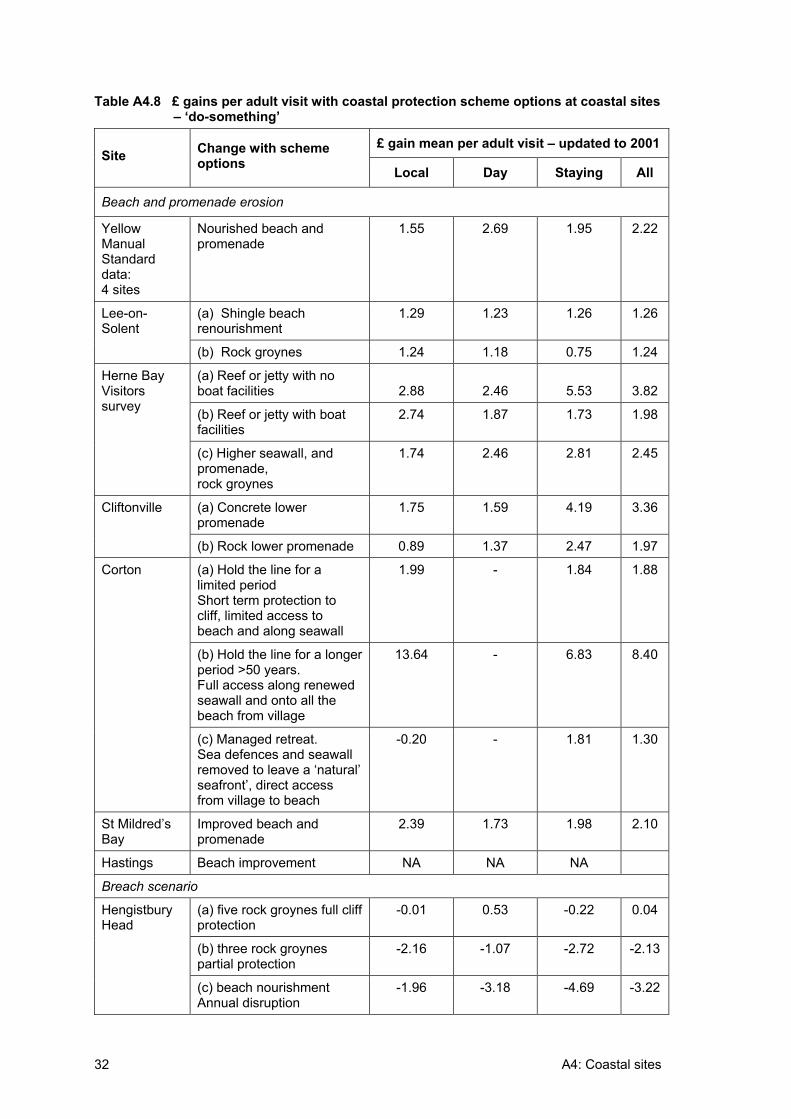
Table A4.7 shows average losses under the ‘do-nothing’ options. Table A4.8 shows average gains under the ‘do something’ options, including a description of the change with the option.
Table A4.7 £ losses per adult visit with erosive changes at coastal sites – ‘do-nothing’ £ loss mean per adult visit –
updated to 2001 Site Change with
erosion% expecting
lessenjoyment
Local Day Staying All
Beach and promenade erosion
YellowManualStandarddata:4 sites
Deterioration in beach and promenade
85% 2.36 3.53 8.28 5.36
Lee-on-Solent Shingle beach erosion
NA 3.05 2.12 3.74 2.74
Herne Bay Visitors survey
Deterioration in beach, seawall and promenade collapsed in parts
- 2.72 2.55 10.61 5.25
Cliftonville Cliff erosion, deterioration in beach, cliff top promenade closed in parts
83% 6.46 6.32 5.65 5.91
Corton (Residents stayingvisitors)
Cliff erosion, deterioration in beach and seawall very reduced access to, and along beach and seawall
81% 2.08 - 1.82 1.89
St Mildred’s Bay
Severe damage to esplanade wall, esplanade unsafe and closed in parts
92% 6.92 7.84 8.25 7.71
Hastings Beach deterioration
NA NA NA NA 5.43
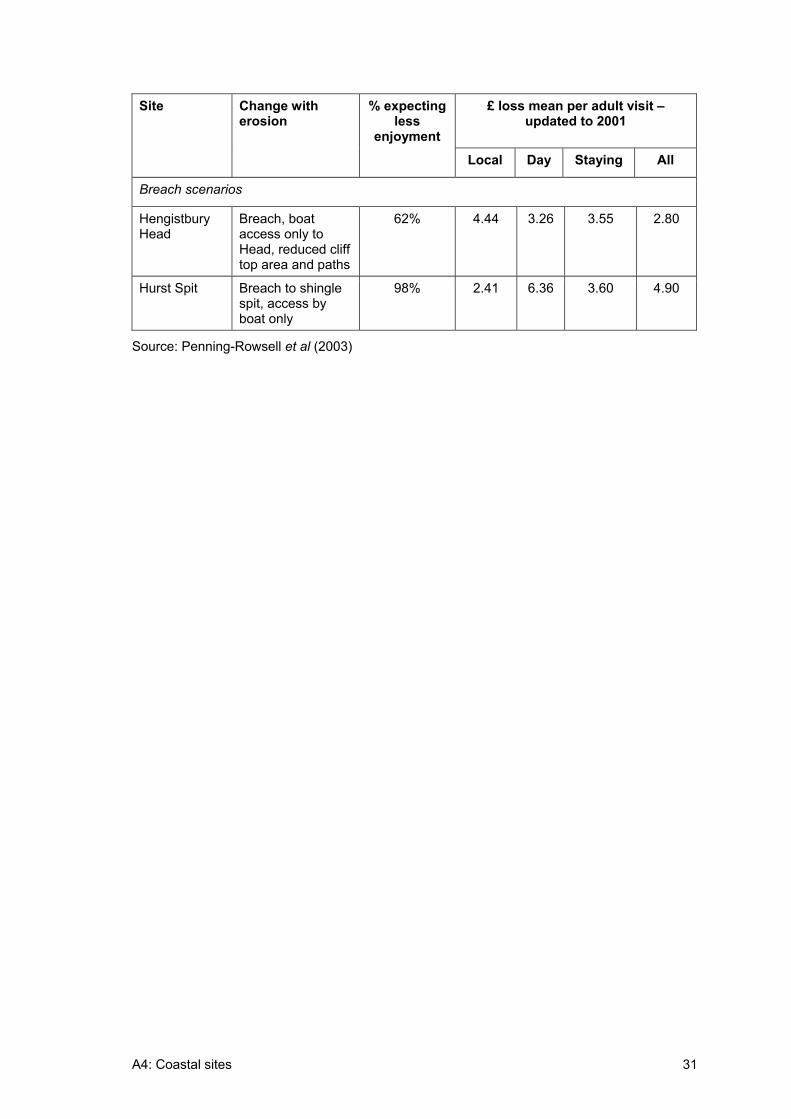
A4: Coastal sites 31
£ loss mean per adult visit – updated to 2001
Site Change with erosion
% expecting less
enjoyment
Local Day Staying All
Breach scenarios
Hengistbury Head
Breach, boat access only to Head, reduced cliff top area and paths
62% 4.44 3.26 3.55 2.80
Hurst Spit Breach to shingle spit, access by boat only
98% 2.41 6.36 3.60 4.90
Source: Penning-Rowsell et al (2003)
A4: Coastal sites 32
Table A4.8 £ gains per adult visit with coastal protection scheme options at coastal sites – ‘do-something’
£ gain mean per adult visit – updated to 2001 Site Change with scheme
options Local Day Staying All
Beach and promenade erosion
YellowManualStandarddata:4 sites
Nourished beach and promenade
1.55 2.69 1.95 2.22
(a) Shingle beach renourishment
1.29 1.23 1.26 1.26 Lee-on-Solent
(b) Rock groynes 1.24 1.18 0.75 1.24
(a) Reef or jetty with no boat facilities 2.88 2.46 5.53 3.82
(b) Reef or jetty with boat facilities
2.74 1.87 1.73 1.98
Herne Bay Visitors survey
(c) Higher seawall, and promenade, rock groynes
1.74 2.46 2.81 2.45
(a) Concrete lower promenade
1.75 1.59 4.19 3.36 Cliftonville
(b) Rock lower promenade 0.89 1.37 2.47 1.97
(a) Hold the line for a limited period Short term protection to cliff, limited access to beach and along seawall
1.99 - 1.84 1.88
(b) Hold the line for a longer period >50 years. Full access along renewed seawall and onto all the beach from village
13.64 - 6.83 8.40
Corton
(c) Managed retreat. Sea defences and seawall removed to leave a ‘natural’ seafront’, direct access from village to beach
-0.20 - 1.81 1.30
St Mildred’s Bay
Improved beach and promenade
2.39 1.73 1.98 2.10
Hastings Beach improvement NA NA NA
Breach scenario
(a) five rock groynes full cliff protection
-0.01 0.53 -0.22 0.04
(b) three rock groynes partial protection
-2.16 -1.07 -2.72 -2.13
Hengistbury Head
(c) beach nourishment Annual disruption
-1.96 -3.18 -4.69 -3.22
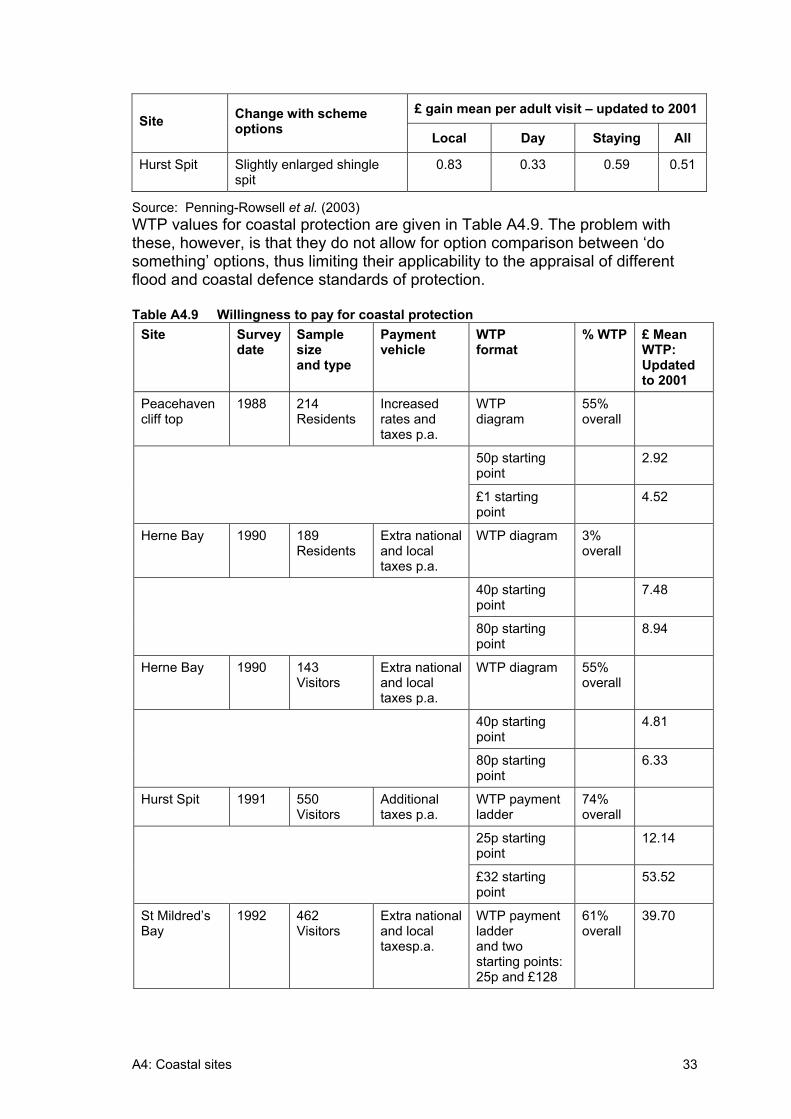
A4: Coastal sites 33
£ gain mean per adult visit – updated to 2001 Site Change with scheme
optionsLocal Day Staying All
Hurst Spit Slightly enlarged shingle spit
0.83 0.33 0.59 0.51
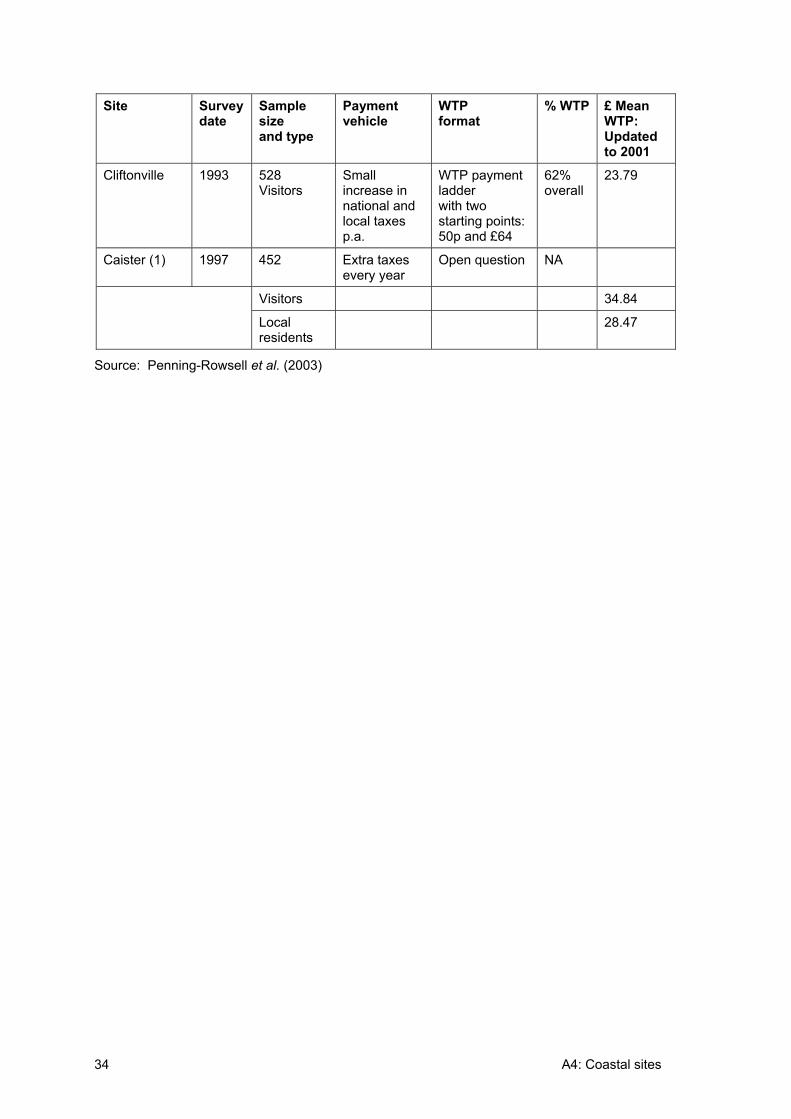
Source: Penning-Rowsell et al. (2003) WTP values for coastal protection are given in Table A4.9. The problem with these, however, is that they do not allow for option comparison between ‘do something’ options, thus limiting their applicability to the appraisal of different flood and coastal defence standards of protection.
Table A4.9 Willingness to pay for coastal protection Site Survey
dateSamplesizeand type
Payment vehicle
WTPformat
% WTP £ Mean WTP:Updated to 2001
Peacehaven cliff top
1988 214 Residents
Increased rates and taxes p.a.
WTPdiagram
55%overall
50p starting point
2.92
£1 starting point
4.52
Herne Bay 1990 189 Residents
Extra national and local taxes p.a.
WTP diagram 3% overall
40p starting point
7.48
80p starting point
8.94
Herne Bay 1990 143 Visitors
Extra national and local taxes p.a.
WTP diagram 55% overall
40p starting point
4.81
80p starting point
6.33
Hurst Spit 1991 550 Visitors
Additionaltaxes p.a.
WTP payment ladder
74%overall
25p starting point
12.14
£32 starting point
53.52
St Mildred’s Bay
1992 462 Visitors
Extra national and local taxesp.a.
WTP payment ladder and two starting points: 25p and £128
61%overall
39.70
A4: Coastal sites 34
Site Survey date
Samplesizeand type
Payment vehicle
WTPformat
% WTP £ Mean WTP:Updated to 2001
Cliftonville 1993 528 Visitors
Smallincrease in national and local taxes p.a.
WTP payment ladder with two starting points: 50p and £64
62%overall
23.79
Caister (1) 1997 452 Extra taxes every year
Open question NA
Visitors 34.84
Localresidents
28.47
Source: Penning-Rowsell et al. (2003)
A5: Sensitivity analysis 35
A5. Sensitivity analysis Sensitivity analysis is an important part of the economic appraisal of impacts as a means of checking the robustness of the valuation of impacts. It is recognised as a paramount step in the different appraisal methodologies, including flood management and coastal defence appraisals, but also more general government guidance. The Green Book (HM Treasury 2003), for instance, notes that where there is significant uncertainty about values assigned to outputs and outcomes, or to their probabilities, sensitivity analysis can establish how vulnerable the conclusions of the appraisal are to alternative plausible assumptions (HM Treasury 2003).
Within the flood management and coastal defence context, FCDPAG 3 notes that, for major projects, it is particularly important to identify ‘switching points’ where a change in the assumptions would change the option choice (MAFF 1999).
The purpose of the sensitivity analysis should thus be to assess the impact that changing the values of parameters would have on the benefits of the option, that is, the impacts of changing assumptions on calculating the number of users affected, when applicable, and/or benefits transfer values. FCDPAG 3 also lists other possibilities for inclusion within the sensitivity analysis, and those more applicable to benefits transfer are:
• timing of benefits/dis-benefits, that is, when impacts are expected to arise and cease; and
• threshold of flooding (for instance, sensitiveness about the level and frequency of flooding affecting recreation and angling under different management options).
It is important, however, to undertake a sensitivity analysis in a reasonable manner. The Green Book stresses that although sensitivity analysis can be carried out on all parameters associated with uncertainty, it is essential that this is undertaken for those factors that have the most significant impacts on the NPV. Thus, we a recommend sensitivity analysis only when there is a high degree of uncertainty to the benefits and any changes in parameters could prove important to the end-results.
A6: References 36
A6. References FWR (1996) Assessing the Benefits of Surface Water Quality Improvements – Manual, Foundation for Water Research, Marlow.
Penning-Rowsell E, Johnson C, Tunstall S, Tapsell S, Morris J, Chatterton J, Coker A and Green C (2003): The Benefits of Flood and Coastal Defence: techniques and data for 2003 (Multi-Coloured Manual), Middlesex University, Enfield.
RPA (2003) Assessment of Benefits for Water Quality and Water Resourced Schemes in the PRO4 Environment Programme – Guidance, Report prepared for the Environment Agency.
RPA (2003) Evaluating a Multi-Criteria Analysis (MCA) Methodology for Application to Flood Management and Coastal Defence Appraisals – Issues Report, Report prepared for the Environment Agency.
Also refer to the Case study report.
Joint Defra/EA Flood and Coastal Erosion Risk Management R&D Programme
Annex B.1:
Case study no.1:
Assessment of the Kelling Hard to Lowestoft Ness shoreline management plan
R&D Project Record FD2013/PR2
Produced: November 2004

ii
Statement of use This report provides guidance on the use of MCA and ASTs to assist in the appraisal of flood and coastal erosion risk management projects, strategies and policies. It should be noted that it does not constitute official government policy or guidance, which is unlikely to be available until work to develop the methodology and identify appropriate sources of data has been undertaken through pilot studies.
This report may be downloaded from the Defra/EA R&D Programme website (http://www.defra.gov.uk/environ.fcd/research), use the search tool located on the project information and publications page. Copies are held by all EA Regional Information Centres, contact The Environment Agency’s National Customer Contact Centre by emailing [email protected] or by telephoning 08708506506.
Dissemination Status Internal: Released internally External: Released to public domain
Keywords: Multi criteria analysis, MCA, appraisal summary table, AST, decision rule
Research contractor contact details: Lead contractor: Risk & Policy Analysts Ltd (RPA), Farthing Green House, 1 Beccles Road, Loddon, Norfolk, NR14 6LT (Tel: 01508 528465; Fax: 01508 520758; www.rpaltd.co.uk). The project director was Meg Postle, the project manager for RPA was John Ash with research support from Susana Dias and other members of RPA staff.
The research team also included: Colin Green (Flood Hazard Research Centre, Middlesex University); Alan Pearman (University of Leeds); Ron Janssen (The Institute of Environmental Studies, Free University, Amsterdam), Terry Oakes and Hugh Payne (Independent Consultants)
Acknowledgements The assistance of those providing information for the case studies is gratefully acknowledged.
Defra project manager: Matt Crossman, Defra, 3D Ergon House, Horseferry Rd, London, SW1P 2AL. Email: [email protected]
Publishing organisation DefraFlood Management Division Ergon House Horseferry Road London SW1P 2AL Tel: 020 7238 3000 Fax: 020 7238 6187 www.defra.gov.uk/environ/fcd
â Crown copyright (Defra); 2005
Copyright in the typographical arrangement and design rests with the Crown. This publication (excluding the logo) may be reproduced free of charge in any format or medium provided that it is reproduced accurately and not used in a misleading context. The material must be acknowledged as Crown copyright with the title and source of the publication specified. The views expressed in this document are not necessarily those of Defra or the Environment Agency. Its officers, servants or agents accept no liability whatsoever for any loss or damage arising from the interpretation or use of the information, or reliance on views contained herein.
Published by the Department for Environment, Food and Rural Affairs. Printed in the UK, March 2005 on recycled material containing 80% post-consumer waste and 20% totally chlorine free virgin pulp.
PB No. 10734/PR2 ISBN 0-85521-146-6
Section 1: Introduction 1
1. Introduction The Shoreline Management Plan (SMP) for Kelling Hard to Lowestoft Ness is being revised and updated by Halcrow Group Limited. The case study draws on information from the revision as well as the original SMP produced in 1996, but the assessment described here has been developed through the application of the Multi-Criteria Analysis (MCA) approach.
Key data sources for the case study include:
• William Halcrow & Partners (1995): Sheringham to Lowestoft Shoreline Management Plan Sediment Sub-Cell 3B, Phase 1, May 1995 (including maps); and
• William Halcrow & Partners (1996): Sheringham to Lowestoft Shoreline Management Plan Sediment Sub-Cell 3B, Phase 2, May 1996.
1.1 Summary of the project area
The project area for the whole SMP runs along the North Norfolk coast from Kelling Hard to Lowestoft Ness. This has been sub-divided into 32 assessment units. Due to time and information constraints, three assessment units are considered in this case study. They have been selected to cover as wide a range of issues as possible. The three assessment units are:
• Cromer (urban frontage); • Winterton (rural frontage with important environmental assets); and • Trimingham to Mundesley1 (mixed urban/rural frontage with cliffs designate
as SSSI).
The assessment unit for Cromer runs from Bernard Road to Cromer Coastguard Lookout. The town of Cromer has a population of 7,000 and is predominantly residential, although the town is heavily reliant on income from tourism. There are important recreational facilities including a pier, golf course, holiday amenities and the promenade. The beach is an important attraction for visitors. Cromer Sea Front County Wildlife Site (CWS) covers an area between West Runton Cliffs SSSI and Overstrand Cliffs SSSI.
Within the assessment unit for Winterton, which runs from Winterton Beach Road to Long Beach Estate, Hemsby, there are areas of SPA, SSSI, NNR and CWS. The unit is covered by the Winterton to Horsey component of the Great Yarmouth North Denes SPA, which supports a breeding population of Little Tern and Ringed Plover. Landward of the SPA is the Winterton to Horsey SSSI, which is important for rare species present in the dune and scrub. The unit falls
1 The names of the assessment units may differ slightly from those given in Halcrow Group
Limited reports for the updating of the SMP. This is because maps of the scale required were only available for the 1996 SMP.
Section 1: Introduction 2
within the Norfolk Coast AONB. The main settlement within the unit is Winterton-on-Sea, a predominantly residential area with some holiday accommodation, public amenity buildings and open land. There is also good beach access and the unit attracts recreational walkers and birdwatchers.Much of the land backing the conservation and recreational areas is agricultural.
For Trimingham, the assessment unit runs from Beacon Hill to Seaview Road, Mundesley. The unit is characterised by cliffs that diminish in height towards Mundesley. A narrow sandy beach fronts the cliffs, widening slightly towards Mundesley. The unit has two large cliff top chalet/caravan parks, with residential properties behind and between the parks. All of the cliff top properties are at risk of erosion. Vale Road provides the only access to the beach for 6km south of Overstrand. Sidestrand and Trimingham Cliffs SSSI runs through the whole of the assessment unit, and require ongoing erosion to maintain the environmental interests. The whole stretch of coastline lies within the Area of Outstanding Natural Beauty (AONB).
1.2 Existing defences
The defences at Cromer include a Victorian promenade above a groyned beach. The beach also forms an important part of the defences. The condition of the defences is generally good.
There are no built defences at Winterton. The sand dunes provide natural defences and, while they are established and relatively stable, they are still mobile. The area is also generally accreting.
Timber defences above a concrete apron coupled with a timber groyne field form the defences from Trimingham to Mundesley. Much of the timber revetment is in a very poor condition.
1.3 Policy framework
The original SMP was produced in 1996 for the coastline between Sheringham and Lowestoft Ness. The framework developed within the SMP sets out a protocol for a sustainable approach to shoreline management on a wide area scale. The original SMP is currently being updated to take into account the revision to procedural guidelines for undertaking an SMP.
The preferred options within the original SMP for each of the case study assessment units were:
• Cromer (Berneard Road to Cromer Coastguard Lookout): hold the existing line;
• Winterton (Winterton Beach Road to Hemsby, Long Beach Estate): ‘do-nothing’; and
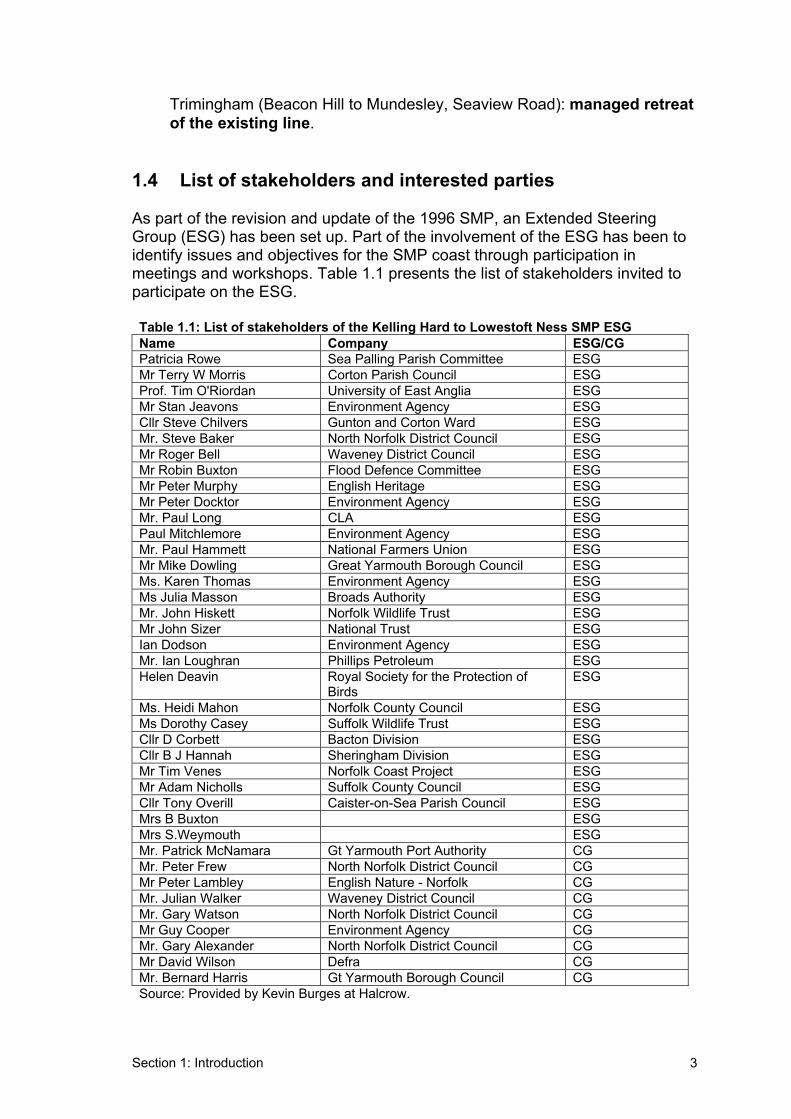
Section 1: Introduction 3
• Trimingham (Beacon Hill to Mundesley, Seaview Road): managed retreat of the existing line.
1.4 List of stakeholders and interested parties
As part of the revision and update of the 1996 SMP, an Extended Steering Group (ESG) has been set up. Part of the involvement of the ESG has been to identify issues and objectives for the SMP coast through participation in meetings and workshops. Table 1.1 presents the list of stakeholders invited to participate on the ESG.
Table 1.1: List of stakeholders of the Kelling Hard to Lowestoft Ness SMP ESG Name Company ESG/CG Patricia Rowe Sea Palling Parish Committee ESG Mr Terry W Morris Corton Parish Council ESG Prof. Tim O'Riordan University of East Anglia ESG Mr Stan Jeavons Environment Agency ESG Cllr Steve Chilvers Gunton and Corton Ward ESG Mr. Steve Baker North Norfolk District Council ESG Mr Roger Bell Waveney District Council ESG Mr Robin Buxton Flood Defence Committee ESG Mr Peter Murphy English Heritage ESG Mr Peter Docktor Environment Agency ESG Mr. Paul Long CLA ESG Paul Mitchlemore Environment Agency ESG Mr. Paul Hammett National Farmers Union ESG Mr Mike Dowling Great Yarmouth Borough Council ESG Ms. Karen Thomas Environment Agency ESG Ms Julia Masson Broads Authority ESG Mr. John Hiskett Norfolk Wildlife Trust ESG Mr John Sizer National Trust ESG Ian Dodson Environment Agency ESG Mr. Ian Loughran Phillips Petroleum ESG Helen Deavin Royal Society for the Protection of
BirdsESG
Ms. Heidi Mahon Norfolk County Council ESG Ms Dorothy Casey Suffolk Wildlife Trust ESG Cllr D Corbett Bacton Division ESG Cllr B J Hannah Sheringham Division ESG Mr Tim Venes Norfolk Coast Project ESG Mr Adam Nicholls Suffolk County Council ESG Cllr Tony Overill Caister-on-Sea Parish Council ESG Mrs B Buxton ESG Mrs S.Weymouth ESG Mr. Patrick McNamara Gt Yarmouth Port Authority CG Mr. Peter Frew North Norfolk District Council CG Mr Peter Lambley English Nature - Norfolk CG Mr. Julian Walker Waveney District Council CG Mr. Gary Watson North Norfolk District Council CG Mr Guy Cooper Environment Agency CG Mr. Gary Alexander North Norfolk District Council CG Mr David Wilson Defra CG Mr. Bernard Harris Gt Yarmouth Borough Council CG Source: Provided by Kevin Burges at Halcrow.
Section 2: Definition of objectives and management options 4
2. Definition of objectives and management options
The aim of the SMP is ‘to promote sustainable management policies, for a coastline for the 22nd century, which achieve objectives without committing to unsustainable defences’. Further issues and objectives have been defined by the ESG. Four overarching objectives have also been developed to ensure that the policy along the coast will be set within existing legislation and other constraints in addition to those identified during consultation. These objectives are:
• Framework objective: shoreline management policies should comply with the current flood and coastal defence management framework where public funding would be required for their implementation;
• Technical objective: shoreline management policies should seek to have no adverse effect on any physical processes that benefits rely upon;
• Environmental objective: shoreline management policies should take due consideration of biodiversity and seek to achieve Biodiversity Action Plan targets; and
• Socio-economic objective: shoreline management policies should consider current regional development agency objectives and statutory planning policies.
The assessment of options for the case study against these objectives is based upon the usual options appraised in an SMP. These options are:
• ‘do-nothing’;• managed realignment; • hold the line; and • advance the line.
For the three assessment units appraised in the case study, the advance the line option was not considered as it was either not technically feasible or would be prohibitively expensive.
Section 3: Structuring the problem 5
3. Structuring the problem This section intends to break down the problem into its component parts, identifying the set of impacts and associated criteria that will be used to make a decision. In other words carries out a screening exercise for the Cromer, Winterton and Trimingham assessment units of the Kelling Hard to Lowestoft Ness SMP.
3.1 Summary of the screening exercise
This screening exercise is used to determine (i) which categories are relevant and (ii) which categories will be appraised by assigning a monetary value to impacts and which will be appraised by assigning a score to the impacts.Relevant categories are those where there is a difference in the impacts of the three options being appraised (‘do-nothing’, managed realignment and hold the line).
The screening exercise for the SMP case study was based on the following sources of information:
• William Halcrow & Partners (1995): Sheringham to Lowestoft Shoreline Management Plan Sediment Sub-Cell 3B, Phase 1, May 1995 (including maps);
• William Halcrow & Partners (1996): Sheringham to Lowestoft Shoreline Management Plan Sediment Sub-Cell 3B, Phase 2, May 1996; and
• Halcrow Group Limited (2003): Kelling Hard to Lowestoft Ness Shoreline Management Plan – Extended Steering Group Policy Development Workshop, November 2003.
The high level screening exercise highlighted the fact that the majority of the more significant impacts of the options for the SMP are related to economic assets such as housing and commercial premises; agricultural land; and to recreation and tourism activities in the area, such as the beach and the landscape in general. Environmental issues are also important, particularly for Winterton and Trimingham.
It also becomes clear that the majority of impact categories will be assessed through scoring. Assets, historical environment and recreation, however, will be assigned monetary values for Cromer; assets and recreation will be valued in monetary terms for Trimingham; and no categories will be valued for Winterton. The number of categories considered as part of the appraisal for Winterton is reduced considerably by screening, since only impacts on assets, physical habitats and policy integration are relevant and/or significantly different between the options.
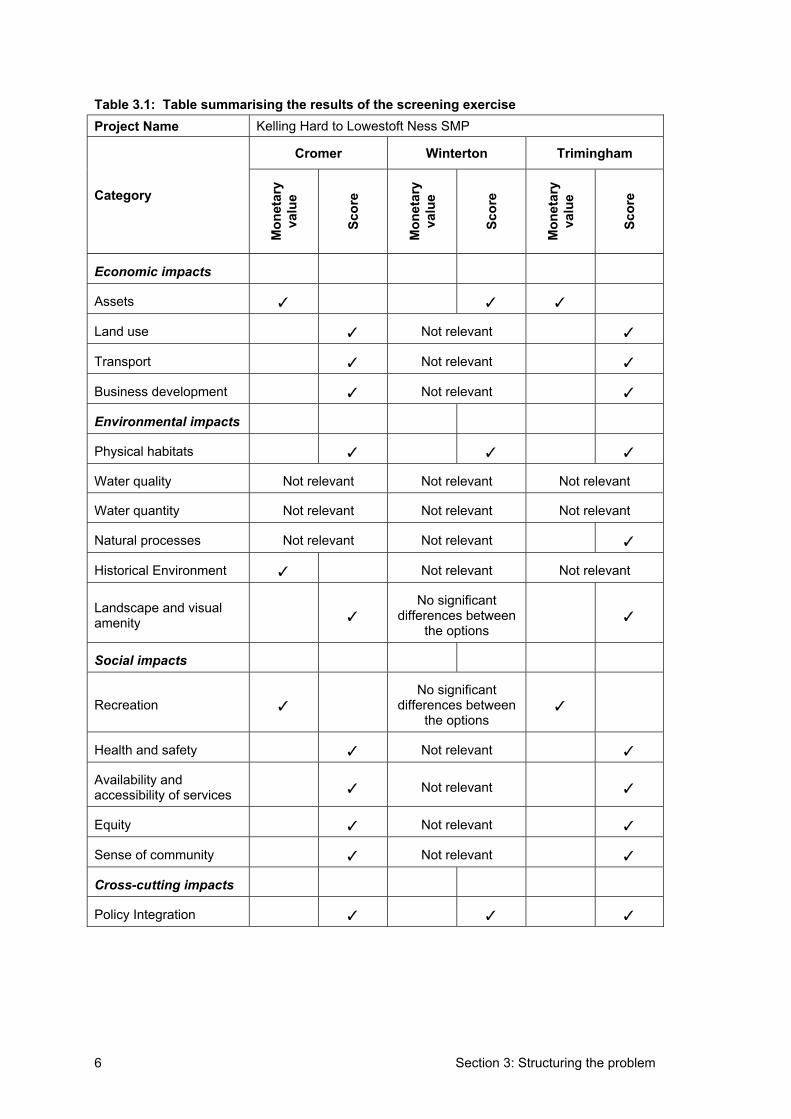
Section 3: Structuring the problem 6
Table 3.1: Table summarising the results of the screening exerciseProject Name Kelling Hard to Lowestoft Ness SMP
Cromer Winterton Trimingham
Category
Mon
etar
yva
lue
Scor
e
Mon
etar
yva
lue
Scor
e
Mon
etar
yva
lue
Scor
e
Economic impacts
Assets ✓ ✓ ✓
Land use ✓ Not relevant ✓
Transport ✓ Not relevant ✓
Business development ✓ Not relevant ✓
Environmental impacts
Physical habitats ✓ ✓ ✓
Water quality Not relevant Not relevant Not relevant
Water quantity Not relevant Not relevant Not relevant
Natural processes Not relevant Not relevant ✓
Historical Environment ✓ Not relevant Not relevant
Landscape and visual amenity ✓
No significant differences between
the options ✓
Social impacts
Recreation ✓
No significant differences between
the options ✓
Health and safety ✓ Not relevant ✓
Availability and accessibility of services ✓ Not relevant ✓
Equity ✓ Not relevant ✓
Sense of community ✓ Not relevant ✓
Cross-cutting impacts
Policy Integration ✓ ✓ ✓
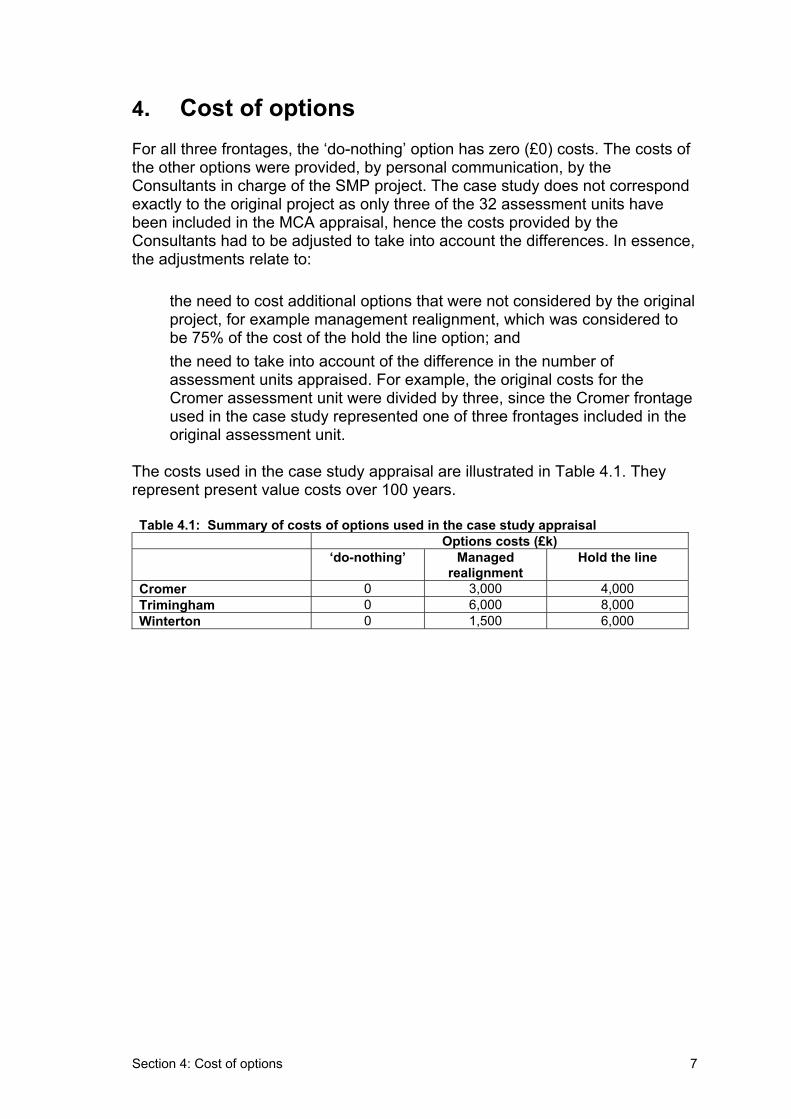
Section 4: Cost of options 7
4. Cost of options For all three frontages, the ‘do-nothing’ option has zero (£0) costs. The costs of the other options were provided, by personal communication, by the Consultants in charge of the SMP project. The case study does not correspond exactly to the original project as only three of the 32 assessment units have been included in the MCA appraisal, hence the costs provided by the Consultants had to be adjusted to take into account the differences. In essence, the adjustments relate to:
• the need to cost additional options that were not considered by the original project, for example management realignment, which was considered to be 75% of the cost of the hold the line option; and
• the need to take into account of the difference in the number of assessment units appraised. For example, the original costs for the Cromer assessment unit were divided by three, since the Cromer frontage used in the case study represented one of three frontages included in the original assessment unit.
The costs used in the case study appraisal are illustrated in Table 4.1. They represent present value costs over 100 years.
Table 4.1: Summary of costs of options used in the case study appraisal Options costs (£k)
‘do-nothing’ Managed realignment
Hold the line
Cromer 0 3,000 4,000 Trimingham 0 6,000 8,000 Winterton 0 1,500 6,000
Section 5: Assessment of impacts 8
5. Assessment of impacts 5.1. Qualitative and quantitative assessment
The qualitative and quantitative assessment of the different options for each of the management units was carried out using the Appraisal Summary Table for the Main Assessment (MA-AST) and it is presented in Appendices B1.2 to B1.4 to this Annex.
The assessment followed a stepped approach, starting with the qualitative assessment of all impact categories and moving to the quantitative assessment whenever information was available.
5.2 Monetary valuation of impacts
5.2.1 Assets
Damages to assets (primarily residential and non-residential properties) under the ‘do-nothing’ option have been estimated for Cromer and Trimingham (note, these damages are often assumed to be the same for the managed realignment option). No assets were directly affected by erosion for Winterton.
Cromer
All damages to assets will occur because of erosion. Over the 100-year time horizon a total of 40 residential properties, 30 commercial/tourist properties, 1km of promenade, 1 lifeboat station, and one pier will be lost as a result of erosion. Only damages due to loss of residential properties, commercial/tourist properties and the lifeboat station are considered under the category of assets.
The total value of the residential properties is estimated using information on the average house price in ‘NR27 9’ from the Land Registry Internet site, of £128,000 (October-December 2003). The total value of properties affected by erosion is £5.1 million (£128 000 x 40).
The total value of commercial/tourist properties is estimated using data from the Valuation Agency Office Internet Site. This provides information on the rateable value of commercial premises in the ‘NR27 9’ postcode sector. The average rateable value is £20,000 per year. This allows an estimate of property value of £200,000 to be made (from 10x the rateable value). Thus, the total value of commercial/tourist properties affected by erosion is £6.0 million (£200,000 x 30).
The value of the lifeboat station is taken as £200,000 as no information on the rateable value or property value was available.
The timing of losses differs according to the location of the property. It is assumed that erosion of properties (both residential and commercial/tourist)
Section 5: Assessment of impacts 9
begins in year 20 and continues to year 99. For the purposes of the economic appraisal, it has been assumed that 1/80th of the total value of the assets is lost each year. This means that the damages incurred each year (before discounting) are the same. Thus, in year 99, all properties affected by erosion in the 100-year time horizon will have been lost.
Trimingham
Damages to assets for Trimingham are also caused by erosion. Over the 100- year time horizon, seven residential properties, two caravans, 7ha of agricultural land and one agricultural reservoir would be lost.
The average price of detached properties in the ‘NR11 8’ postcode sector is given as £220,000 on the Land Registry Internet site (for October-December 2003). Each of the seven properties is located at a different distance from the coast such that the time when each property will be eroded is not the same.The year when a property would be lost has been calculated as the time taken for erosion to reach the boundary of the property (measured from the maps given in William Halcrow & Partners, 1995). The properties are assumed to be lost in:
• one property eroded in year 36; • one property eroded in year 42; • one property eroded in year 48; • one property eroded in year 71; • one property eroded in year 83; and • two properties eroded in year 89.
The value of the caravan parks is based on the rateable value multiplied by 10. The average rateable value is taken as £60,000 per year (from information on the Valuation Agency Office Internet site), giving a total value of £600,000 per caravan park. The timing when each park would be lost is taken as the time when half of the site would be lost. This occurs in year 30 for the caravan park near Vale Road and year 60 for the caravan park near the SSSI.
Agricultural land is assumed to be lost when more than half of the land is eroded. The value of the agricultural land is assumed to be Grade 3 and is taken as £7,203 per ha (from Nix, 2002). This is multiplied by 0.45 to remove the effect of subsidies, to give £3,241 per ha. The time when the individual fields would be considered ‘lost’ varies from year 48 to year 77, with the majority of land lost in year 65 (0.6 ha lost in year 48, 5.7ha lost in year 65 and 0.7ha lost in year 77).
5.2.2 Historical environment
Impacts on the historical environment have only been assigned a monetary value for Cromer. There are no known significant impacts on the historical environment for Trimingham and Winterton.
Section 5: Assessment of impacts 10
The area of Cromer that would be eroded under the ‘do-nothing’ option contains five Grade II listed buildings that would be eroded. It is also assumed that they would be eroded under managed realignment. No monetary values are available on the heritage aspect of these buildings, hence, it is assumed that their value is twice that of the commercial property value, i.e. £400,000. The time at which each Grade II listed building would be lost varies throughout the 100-year time horizon and one building is assumed to be lost every 20 years (i.e. years 20, 40, 60, 80 and 99).
5.2.3 Recreation
Monetary values have been placed on impacts on recreation for both Cromer and Trimingham. No significant difference between the options is expected for Winterton.
Cromer
Erosion of the promenade would result in the loss of access to the beach from the town. The loss of visitor attractions, such as the pier and commercial/tourist properties in the town itself would also result in a loss of tourists. It is estimated that 100,000 visits per year are made to Cromer beach/promenade each year and that these would be lost over time as erosion of the promenade and other attractions occurs. The average value of a trip to Cromer is estimated at £3.59 (from a value given in the Multi-Coloured Manual for the deterioration in the beach and promenade (Middlesex University Flood Hazard Research Centre (MUFHRC), 2003). The maximum losses in any one, year can therefore be estimated at £359,000.
Erosion of the promenade is expected to begin in year 20 and the total length of the promenade, access to the beach and other tourist facilities (including the pier) will be lost by year 49. Between year 20 and 48, the proportion of visits to Cromer affected increases by 3% per year (or 3,000 visits per year) from 3% (or 3,000) in year 20 to 97% (or 97,000) in year 48. From year 49 onwards, 100,000 visits are lost every year.
Trimingham
Access to the beach via Vale Road is the only access point for 6km south of Overstrand. Loss of access would, therefore, result in a significant decrease in the number of beach visits, as there are no alternative access points for a considerable distance. It is estimated that 30,000 visits per year are made to the beach at Trimingham (based on beach visitor data given in Environment Agency, 2003). These trips would be lost once access to the beach is lost. This is expected to occur in year 20, after which time no further recreation could occur along the beach. The value per trip is taken as £1.89 (from a value given in the Multi-Coloured Manual (MUFHRC, 2003) for cliff erosion, deterioration in beach and seawall, much reduced access to and along the beach and seawall). The maximum (undiscounted) loss that would occur in any one year can therefore be estimated at £56,700 per year.
Section 5: Assessment of impacts 11
5.3 Scoring of impacts
The approach to assigning scores to the categories varied according to the assessment unit being appraised and the type of (quantitative) information that was available upon which to base the scores. Furthermore, the SMP case study was used to test four different scoring systems. This case study report provides the scores that were assigned when a relative scoring system across the units was used. More information on the other scoring systems that were trialled, with their relative advantages and disadvantages can be found in the main report (Section 6). A summary of the scores assigned and the justification behind them for all three assessment units is provided in Table 5.1.
Table 5.1: Table summarising scores and monetary estimates
Project Name Kelling Hard to Lowestoft Ness SMP: CROMER, WINTERTON and TRIMINGHAM assessment units
Cromer Winterton Trimingham
Category
‘do-
noth
ing’
Man
aged
real
ignm
ent
Hol
d th
e lin
e
‘do-
noth
ing’
Man
aged
real
ignm
ent
Hol
d th
e lin
e
‘do-
noth
ing’
Man
aged
real
ignm
ent
Hol
d th
e lin
e
Justification for scores
Economic impacts
Assets
£2.0
m
£2.0
m
£0.0
7m
Neg
.
Neg
.
Neg
.
£0.5
m
£0.2
m
£0.0
2m See Section 4.1.1
Land use 0 0 100 - - - 0 33 100
Reflects the degree of land use change that would occur, where there would be a total land use changes under ‘do-nothing’ and managed realignment and no change in land use under hold the line for Cromer. Hold the line for Trimingham would also result in no change in land use, hence, both hold the line options are assigned a score of 100. Both ‘do-nothing’ options would result in a total change of land use and are scored 0. Managed realignment for Trimingham would result in a change in 2 (out of 3) land use types, hence, a score of 33 is assigned (to reflect the two-thirds of land uses that would change).
Transport 0 0 100 - - - 40 40 100
Cromer would result in the maximum length of roads lost (0.75km) under ‘do-nothing’ and managed realignment. Under hold the line, no roads would be lost. For Trimingham, 0.3km of road would be lost, such that ‘do-nothing’ and management realignment are assigned a score of 40 (from 0.3 ÷ 0.75). Hold the line would protect all roads for both units, hence, is
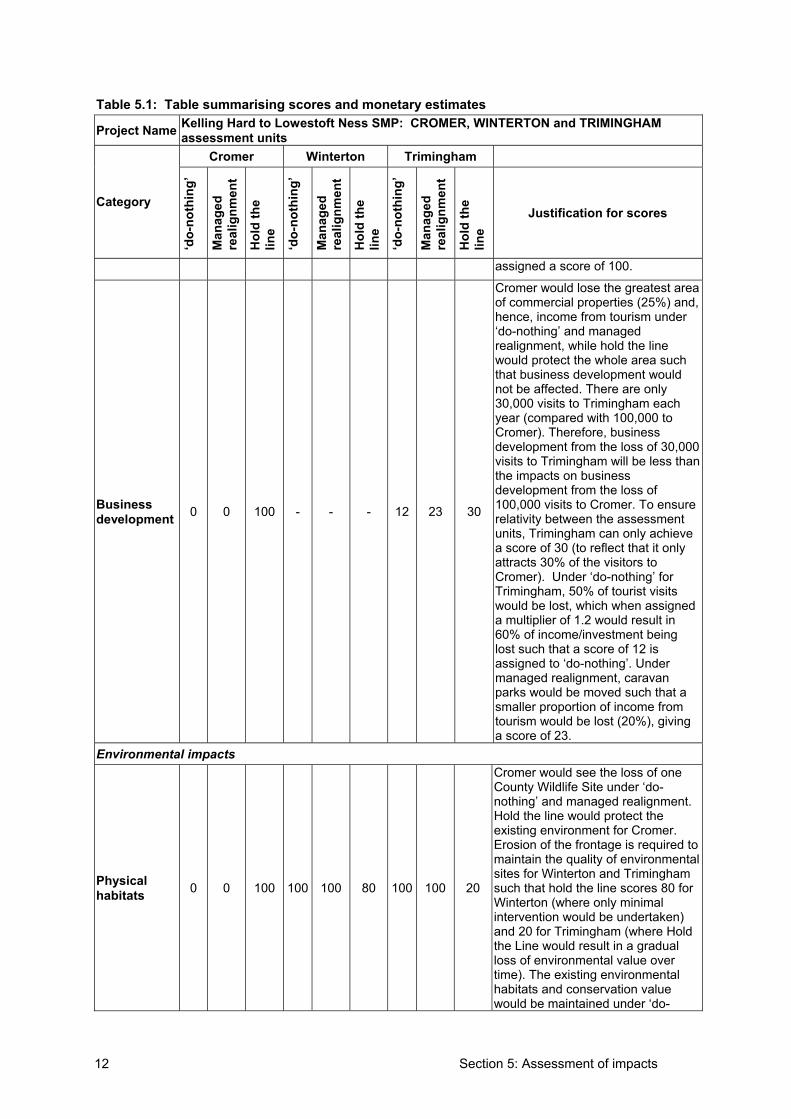
Section 5: Assessment of impacts 12
Table 5.1: Table summarising scores and monetary estimates
Project Name Kelling Hard to Lowestoft Ness SMP: CROMER, WINTERTON and TRIMINGHAM assessment units
Cromer Winterton Trimingham
Category ‘d
o-no
thin
g’
Man
aged
real
ignm
ent
Hol
d th
e lin
e
‘do-
noth
ing’
Man
aged
real
ignm
ent
Hol
d th
e lin
e
‘do-
noth
ing’
Man
aged
real
ignm
ent
Hol
d th
e lin
e
Justification for scores
assigned a score of 100.
Businessdevelopment 0 0 100 - - - 12 23 30
Cromer would lose the greatest area of commercial properties (25%) and, hence, income from tourism under ‘do-nothing’ and managed realignment, while hold the line would protect the whole area such that business development would not be affected. There are only 30,000 visits to Trimingham each year (compared with 100,000 to Cromer). Therefore, business development from the loss of 30,000 visits to Trimingham will be less than the impacts on business development from the loss of 100,000 visits to Cromer. To ensure relativity between the assessment units, Trimingham can only achieve a score of 30 (to reflect that it only attracts 30% of the visitors to Cromer). Under ‘do-nothing’ for Trimingham, 50% of tourist visits would be lost, which when assigned a multiplier of 1.2 would result in 60% of income/investment being lost such that a score of 12 is assigned to ‘do-nothing’. Under managed realignment, caravan parks would be moved such that a smaller proportion of income from tourism would be lost (20%), giving a score of 23.
Environmental impacts
Physical habitats 0 0 100 100 100 80 100 100 20
Cromer would see the loss of one County Wildlife Site under ‘do-nothing’ and managed realignment.Hold the line would protect the existing environment for Cromer. Erosion of the frontage is required to maintain the quality of environmental sites for Winterton and Trimingham such that hold the line scores 80 for Winterton (where only minimal intervention would be undertaken) and 20 for Trimingham (where Hold the Line would result in a gradual loss of environmental value over time). The existing environmental habitats and conservation value would be maintained under ‘do-
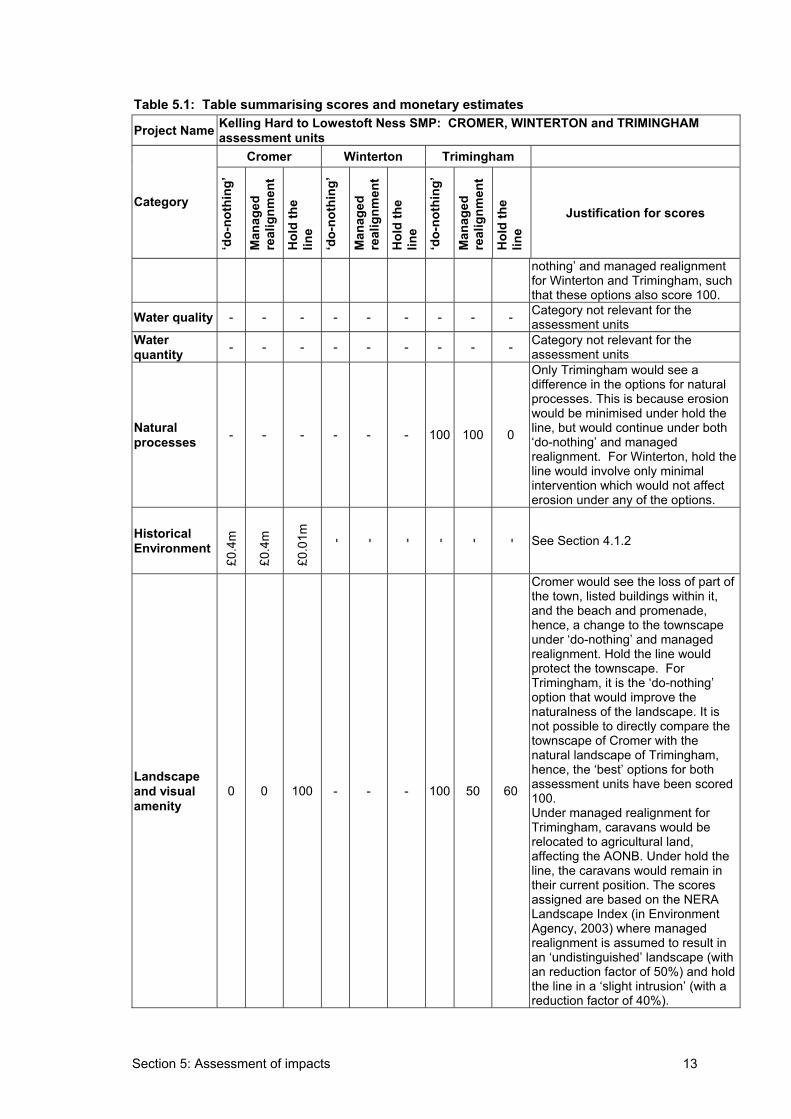
Section 5: Assessment of impacts 13
Table 5.1: Table summarising scores and monetary estimates
Project Name Kelling Hard to Lowestoft Ness SMP: CROMER, WINTERTON and TRIMINGHAM assessment units
Cromer Winterton Trimingham
Category
‘do-
noth
ing’
Man
aged
real
ignm
ent
Hol
d th
e lin
e
‘do-
noth
ing’
Man
aged
real
ignm
ent
Hol
d th
e lin
e
‘do-
noth
ing’
Man
aged
real
ignm
ent
Hol
d th
e lin
e
Justification for scores
nothing’ and managed realignment for Winterton and Trimingham, such that these options also score 100.
Water quality - - - - - - - - - Category not relevant for the assessment units
Waterquantity - - - - - - - - - Category not relevant for the
assessment units
Naturalprocesses - - - - - - 100 100 0
Only Trimingham would see a difference in the options for natural processes. This is because erosion would be minimised under hold the line, but would continue under both ‘do-nothing’ and managed realignment. For Winterton, hold the line would involve only minimal intervention which would not affect erosion under any of the options.
HistoricalEnvironment
£0.4
m
£0.4
m
£0.0
1m - - - - - - See Section 4.1.2
Landscapeand visual amenity
0 0 100 - - - 100 50 60
Cromer would see the loss of part of the town, listed buildings within it, and the beach and promenade, hence, a change to the townscape under ‘do-nothing’ and managed realignment. Hold the line would protect the townscape. For Trimingham, it is the ‘do-nothing’ option that would improve the naturalness of the landscape. It is not possible to directly compare the townscape of Cromer with the natural landscape of Trimingham, hence, the ‘best’ options for both assessment units have been scored 100.Under managed realignment for Trimingham, caravans would be relocated to agricultural land, affecting the AONB. Under hold the line, the caravans would remain in their current position. The scores assigned are based on the NERA Landscape Index (in Environment Agency, 2003) where managed realignment is assumed to result in an ‘undistinguished’ landscape (with an reduction factor of 50%) and hold the line in a ‘slight intrusion’ (with a reduction factor of 40%).
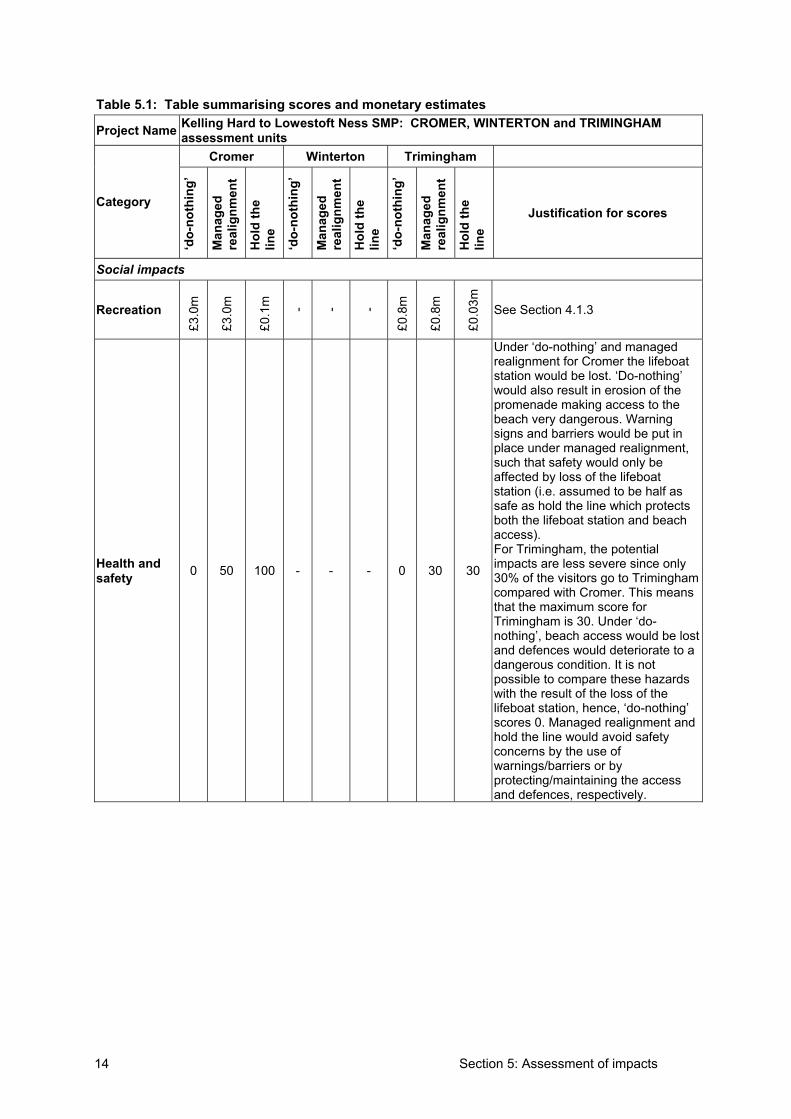
Section 5: Assessment of impacts 14
Table 5.1: Table summarising scores and monetary estimates
Project Name Kelling Hard to Lowestoft Ness SMP: CROMER, WINTERTON and TRIMINGHAM assessment units
Cromer Winterton Trimingham
Category ‘d
o-no
thin
g’
Man
aged
real
ignm
ent
Hol
d th
e lin
e
‘do-
noth
ing’
Man
aged
real
ignm
ent
Hol
d th
e lin
e
‘do-
noth
ing’
Man
aged
real
ignm
ent
Hol
d th
e lin
e
Justification for scores
Social impacts
Recreation
£3.0
m
£3.0
m
£0.1
m - - -
£0.8
m
£0.8
m
£0.0
3m See Section 4.1.3
Health and safety 0 50 100 - - - 0 30 30
Under ‘do-nothing’ and managed realignment for Cromer the lifeboat station would be lost. ‘Do-nothing’ would also result in erosion of the promenade making access to the beach very dangerous. Warning signs and barriers would be put in place under managed realignment, such that safety would only be affected by loss of the lifeboat station (i.e. assumed to be half as safe as hold the line which protects both the lifeboat station and beach access).For Trimingham, the potential impacts are less severe since only 30% of the visitors go to Trimingham compared with Cromer. This means that the maximum score for Trimingham is 30. Under ‘do-nothing’, beach access would be lost and defences would deteriorate to a dangerous condition. It is not possible to compare these hazards with the result of the loss of the lifeboat station, hence, ‘do-nothing’ scores 0. Managed realignment and hold the line would avoid safety concerns by the use of warnings/barriers or by protecting/maintaining the access and defences, respectively.
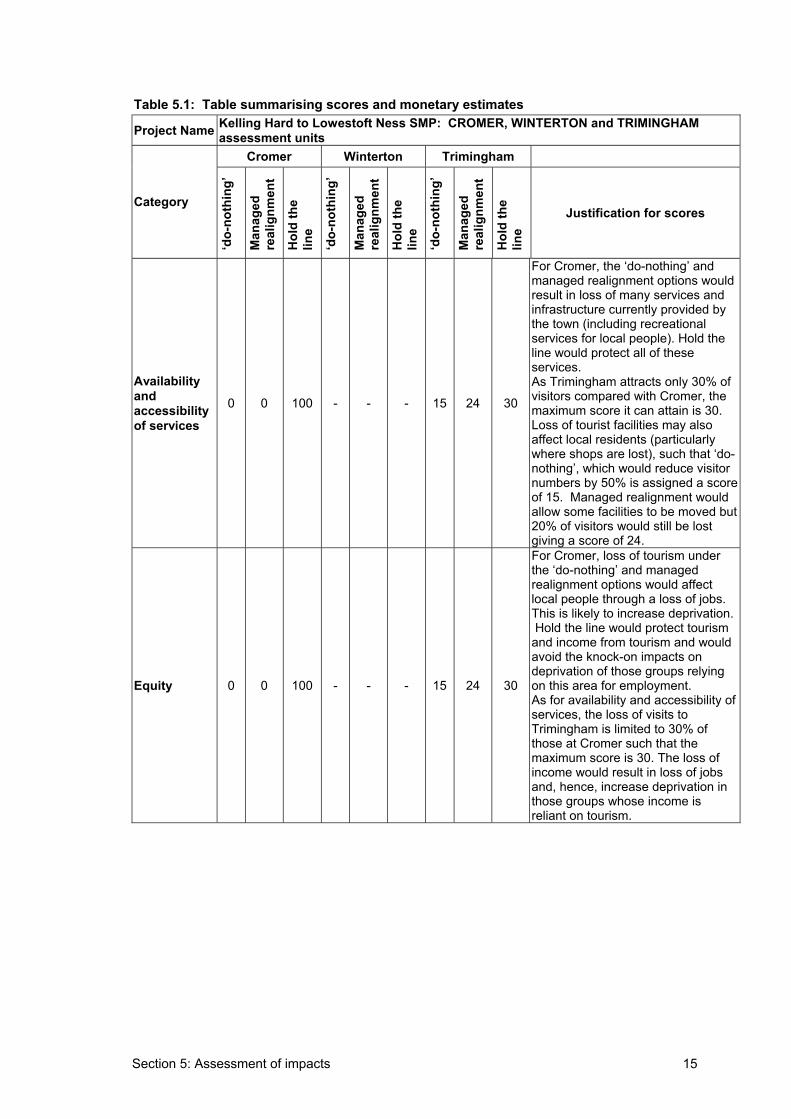
Section 5: Assessment of impacts 15
Table 5.1: Table summarising scores and monetary estimates
Project Name Kelling Hard to Lowestoft Ness SMP: CROMER, WINTERTON and TRIMINGHAM assessment units
Cromer Winterton Trimingham
Category
‘do-
noth
ing’
Man
aged
real
ignm
ent
Hol
d th
e lin
e
‘do-
noth
ing’
Man
aged
real
ignm
ent
Hol
d th
e lin
e
‘do-
noth
ing’
Man
aged
real
ignm
ent
Hol
d th
e lin
e
Justification for scores
Availability andaccessibility of services
0 0 100 - - - 15 24 30
For Cromer, the ‘do-nothing’ and managed realignment options would result in loss of many services and infrastructure currently provided by the town (including recreational services for local people). Hold the line would protect all of these services.As Trimingham attracts only 30% of visitors compared with Cromer, the maximum score it can attain is 30. Loss of tourist facilities may also affect local residents (particularly where shops are lost), such that ‘do-nothing’, which would reduce visitor numbers by 50% is assigned a score of 15. Managed realignment would allow some facilities to be moved but 20% of visitors would still be lost giving a score of 24.
Equity 0 0 100 - - - 15 24 30
For Cromer, loss of tourism under the ‘do-nothing’ and managed realignment options would affect local people through a loss of jobs. This is likely to increase deprivation. Hold the line would protect tourism and income from tourism and would avoid the knock-on impacts on deprivation of those groups relying on this area for employment. As for availability and accessibility of services, the loss of visits to Trimingham is limited to 30% of those at Cromer such that the maximum score is 30. The loss of income would result in loss of jobs and, hence, increase deprivation in those groups whose income is reliant on tourism.
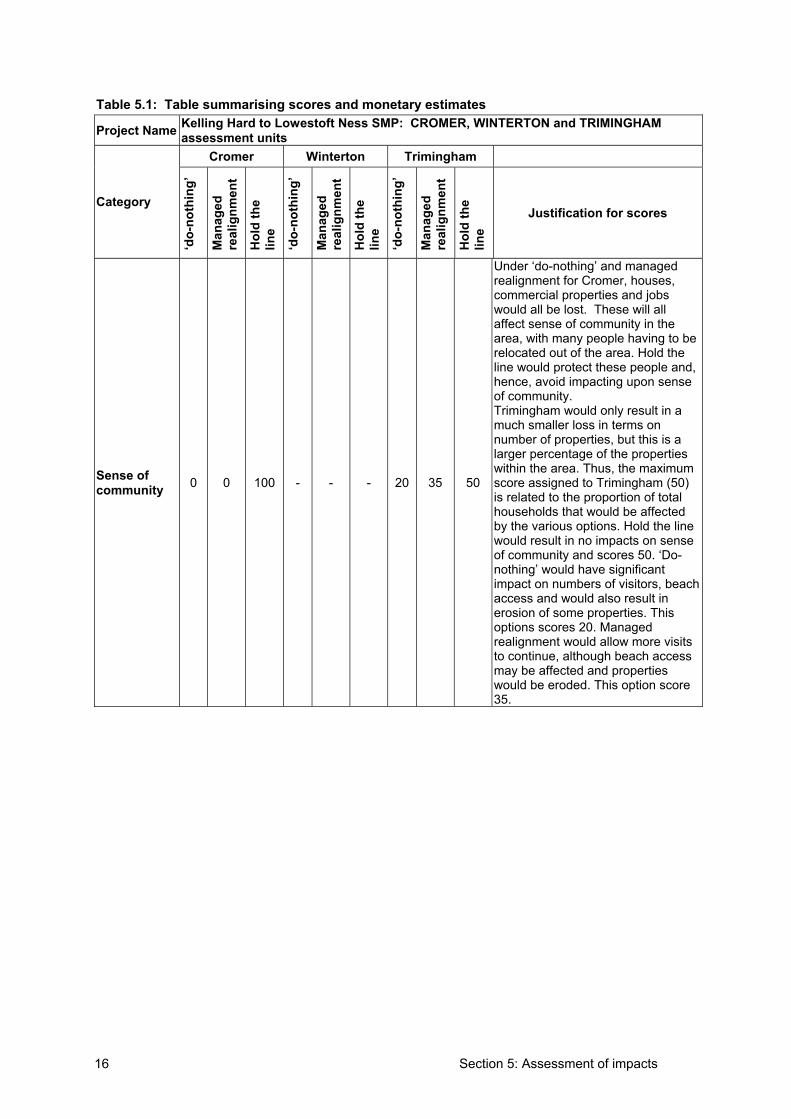
Section 5: Assessment of impacts 16
Table 5.1: Table summarising scores and monetary estimates
Project Name Kelling Hard to Lowestoft Ness SMP: CROMER, WINTERTON and TRIMINGHAM assessment units
Cromer Winterton Trimingham
Category ‘d
o-no
thin
g’
Man
aged
real
ignm
ent
Hol
d th
e lin
e
‘do-
noth
ing’
Man
aged
real
ignm
ent
Hol
d th
e lin
e
‘do-
noth
ing’
Man
aged
real
ignm
ent
Hol
d th
e lin
e
Justification for scores
Sense of community 0 0 100 - - - 20 35 50
Under ‘do-nothing’ and managed realignment for Cromer, houses, commercial properties and jobs would all be lost. These will all affect sense of community in the area, with many people having to be relocated out of the area. Hold the line would protect these people and, hence, avoid impacting upon sense of community. Trimingham would only result in a much smaller loss in terms on number of properties, but this is a larger percentage of the properties within the area. Thus, the maximum score assigned to Trimingham (50) is related to the proportion of total households that would be affected by the various options. Hold the line would result in no impacts on sense of community and scores 50. ‘Do-nothing’ would have significant impact on numbers of visitors, beach access and would also result in erosion of some properties. This options scores 20. Managed realignment would allow more visits to continue, although beach access may be affected and properties would be eroded. This option score 35.
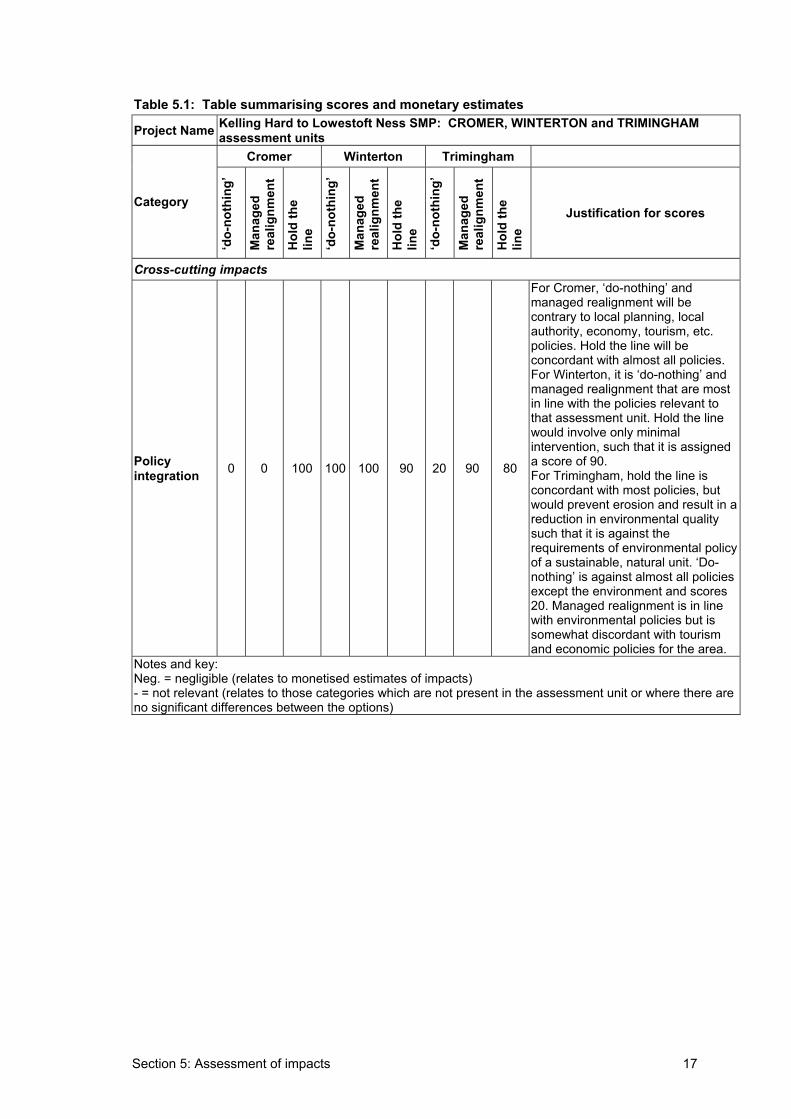
Section 5: Assessment of impacts 17
Table 5.1: Table summarising scores and monetary estimates
Project Name Kelling Hard to Lowestoft Ness SMP: CROMER, WINTERTON and TRIMINGHAM assessment units
Cromer Winterton Trimingham
Category
‘do-
noth
ing’
Man
aged
real
ignm
ent
Hol
d th
e lin
e
‘do-
noth
ing’
Man
aged
real
ignm
ent
Hol
d th
e lin
e
‘do-
noth
ing’
Man
aged
real
ignm
ent
Hol
d th
e lin
e
Justification for scores
Cross-cutting impacts
Policy integration 0 0 100 100 100 90 20 90 80
For Cromer, ‘do-nothing’ and managed realignment will be contrary to local planning, local authority, economy, tourism, etc. policies. Hold the line will be concordant with almost all policies. For Winterton, it is ‘do-nothing’ and managed realignment that are most in line with the policies relevant to that assessment unit. Hold the line would involve only minimal intervention, such that it is assigned a score of 90. For Trimingham, hold the line is concordant with most policies, but would prevent erosion and result in a reduction in environmental quality such that it is against the requirements of environmental policy of a sustainable, natural unit. ‘Do-nothing’ is against almost all policies except the environment and scores 20. Managed realignment is in line with environmental policies but is somewhat discordant with tourism and economic policies for the area.
Notes and key:Neg. = negligible (relates to monetised estimates of impacts) - = not relevant (relates to those categories which are not present in the assessment unit or where there are no significant differences between the options)
Section 6: Weighting and comparison of options 18
6. Weighting and comparison of options 6.1 Source of weights
In all cases, the Constrained Random Weight Generator (CRWG) was used to calculate minimum, maximum and average total weighted scores and total weighted incremental scores for the options under consideration. These, along with interpretation, are provided in the summary tables for each management unit.
6.2 Comparison of options
6.2.1 Cromer
Table 7.1 provides a summary table of monetary costs and benefits and scores for the Cromer Management Unit.
As can be seen from the table, ‘Hold the Line’ is the option with the highest benefit-cost ratio with a benefit-cost ratio of 1.28. The option also has an incremental benefit-cost ratio of 5.12, which far exceeds the necessary criterion of robustly greater than 1 (i.e. 1.5). As such, no additional benefit is required to meet the incremental benefit-cost criterion of 1.5.
In terms of intangible benefits, ‘Hold the Line’ scores 100 for all criteria and thus will score 100 regardless of the weights. The CRWG was used to calculate intangible benefits incremental to the Managed re-alignment option. These are all positive (ranging between 86.5 and 99.3). It can be concluded, therefore, that as there are no intangible incremental dis-benefits that could act to reduce the incremental monetary benefit-cost ratio of 5.12, ‘hold the line’ is the preferred option.
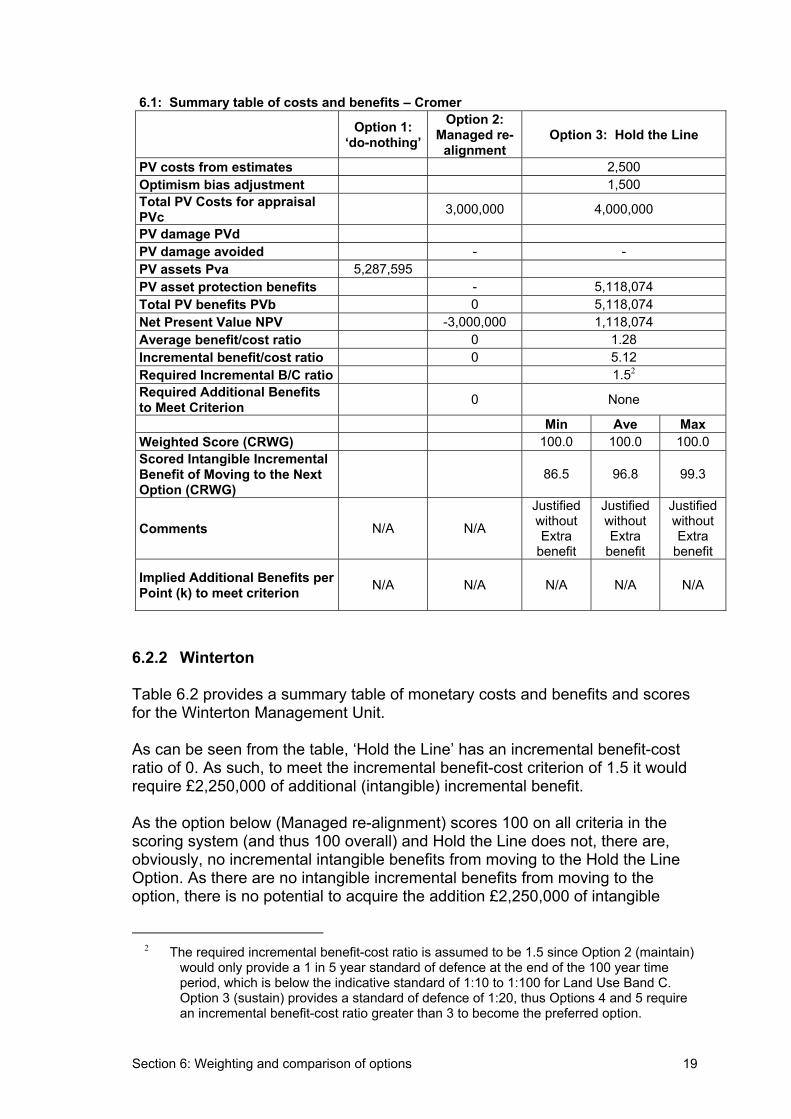
Section 6: Weighting and comparison of options 19
6.1: Summary table of costs and benefits – Cromer
Option 1:‘do-nothing’
Option 2:Managed re-
alignmentOption 3: Hold the Line
PV costs from estimates 2,500 Optimism bias adjustment 1,500 Total PV Costs for appraisal PVc 3,000,000 4,000,000
PV damage PVd PV damage avoided - - PV assets Pva 5,287,595 PV asset protection benefits - 5,118,074 Total PV benefits PVb 0 5,118,074 Net Present Value NPV -3,000,000 1,118,074 Average benefit/cost ratio 0 1.28 Incremental benefit/cost ratio 0 5.12 Required Incremental B/C ratio 1.52
Required Additional Benefits to Meet Criterion 0 None
Min Ave Max Weighted Score (CRWG) 100.0 100.0 100.0 Scored Intangible Incremental Benefit of Moving to the Next Option (CRWG)
86.5 96.8 99.3
Comments N/A N/A
JustifiedwithoutExtra
benefit
JustifiedwithoutExtra
benefit
JustifiedwithoutExtra
benefit
Implied Additional Benefits per Point (k) to meet criterion N/A N/A N/A N/A N/A
6.2.2 Winterton
Table 6.2 provides a summary table of monetary costs and benefits and scores for the Winterton Management Unit.
As can be seen from the table, ‘Hold the Line’ has an incremental benefit-cost ratio of 0. As such, to meet the incremental benefit-cost criterion of 1.5 it would require £2,250,000 of additional (intangible) incremental benefit.
As the option below (Managed re-alignment) scores 100 on all criteria in the scoring system (and thus 100 overall) and Hold the Line does not, there are, obviously, no incremental intangible benefits from moving to the Hold the Line Option. As there are no intangible incremental benefits from moving to the option, there is no potential to acquire the addition £2,250,000 of intangible
2 The required incremental benefit-cost ratio is assumed to be 1.5 since Option 2 (maintain)
would only provide a 1 in 5 year standard of defence at the end of the 100 year time period, which is below the indicative standard of 1:10 to 1:100 for Land Use Band C.Option 3 (sustain) provides a standard of defence of 1:20, thus Options 4 and 5 require an incremental benefit-cost ratio greater than 3 to become the preferred option.
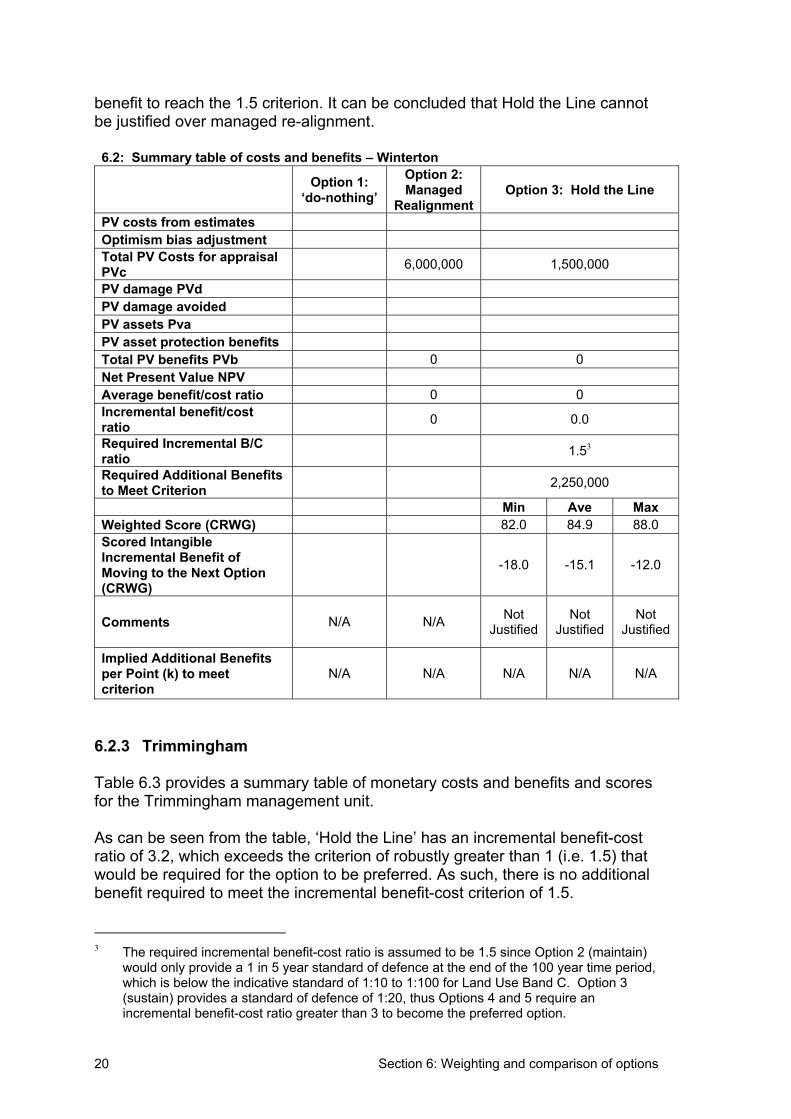
Section 6: Weighting and comparison of options 20
benefit to reach the 1.5 criterion. It can be concluded that Hold the Line cannot be justified over managed re-alignment.
6.2: Summary table of costs and benefits – Winterton
Option 1:‘do-nothing’
Option 2:Managed
RealignmentOption 3: Hold the Line
PV costs from estimates Optimism bias adjustment Total PV Costs for appraisal PVc 6,000,000 1,500,000
PV damage PVd PV damage avoided PV assets Pva PV asset protection benefits Total PV benefits PVb 0 0 Net Present Value NPV Average benefit/cost ratio 0 0 Incremental benefit/cost ratio 0 0.0
Required Incremental B/C ratio 1.53
Required Additional Benefits to Meet Criterion 2,250,000
Min Ave Max Weighted Score (CRWG) 82.0 84.9 88.0 Scored Intangible Incremental Benefit of Moving to the Next Option (CRWG)
-18.0 -15.1 -12.0
Comments N/A N/A NotJustified
NotJustified
NotJustified
Implied Additional Benefits per Point (k) to meet criterion
N/A N/A N/A N/A N/A
6.2.3 Trimmingham
Table 6.3 provides a summary table of monetary costs and benefits and scores for the Trimmingham management unit.
As can be seen from the table, ‘Hold the Line’ has an incremental benefit-cost ratio of 3.2, which exceeds the criterion of robustly greater than 1 (i.e. 1.5) that would be required for the option to be preferred. As such, there is no additional benefit required to meet the incremental benefit-cost criterion of 1.5.
3 The required incremental benefit-cost ratio is assumed to be 1.5 since Option 2 (maintain)
would only provide a 1 in 5 year standard of defence at the end of the 100 year time period, which is below the indicative standard of 1:10 to 1:100 for Land Use Band C. Option 3 (sustain) provides a standard of defence of 1:20, thus Options 4 and 5 require an incremental benefit-cost ratio greater than 3 to become the preferred option.
Section 6: Weighting and comparison of options 21
However, analysis with the CRWG suggests that, depending on the weights used, resulting total weighted scores indicate that there may be intangible dis-benefits from the ‘Hold the Line’ option.
In such circumstances the decision rules dictate that one should examine the margin between the monetary benefit-cost ratio and the criterion to make sure that the magnitude of intangible incremental dis-benefit is not large enough to reduce the overall benefits side of the equation to one that is below the criterion.
In this case, from the table it can be seen that an intangible dis-benefit with a value greater than around £512,000 would reduce the incremental-benefit cost ratio from 3.2 to one that is below the 1.5 criterion. The next question to consider is whether or not this is likely.
This, in turn, requires consideration of the actual likely magnitude of the incremental dis-benefit, and what this would imply the value of a point on the index (k) would have to be to change the conclusion from one of ‘justified’ to one of ‘not justified’ (and therein the total value of the assets being considered in the scoring index as a whole).
In this case, using a worst-case scenario of the lower bound estimate (-19.8), this would imply that the value of a point on the index (k in pounds) would have to be around £26,000 (-512,000/-19.8) to make a difference to the outcome of the decision. This would imply that the total value of the intangible assets being considered in the 100 point scoring system as whole would have to total around £2,600,000 to change the decision even if the lowest possible estimate were used. As this is equivalent to more than twice the asset protection benefits of £1,251,898 that have been valued in monetary terms, it could be concluded that this is an unreasonably high estimate of the value of intangible assets, and thus, even using a worst case estimate of intangible incremental dis-benefit, the ‘Hold the Line’ option is still likely to be justified.
The analysis could probably stop here with the conclusion that the ‘Hold the Line’ option is justified. However, if greater certainty were required, the analysis could continue by examining what the magnitude of incremental intangible benefits/dis-benefits is more likely to be (as opposed to the worst case scenario).
As noted previously, the upper bound estimate of intangible incremental benefits is 24.0, and here no additional benefit would be required for the option to be justified. The mid bound value from the CRWG lies around -3.3 and the lower bound estimate that has already been considered lies at around -19.8.Thus, the actual level of incremental intangible benefits lies somewhere between -19.8 and 24.0.
Examination of trends and relationships in the weights responsible for the lower range estimate reveals that these are the result of environmental impacts being weighted much more highly than economic impacts (and, on average the
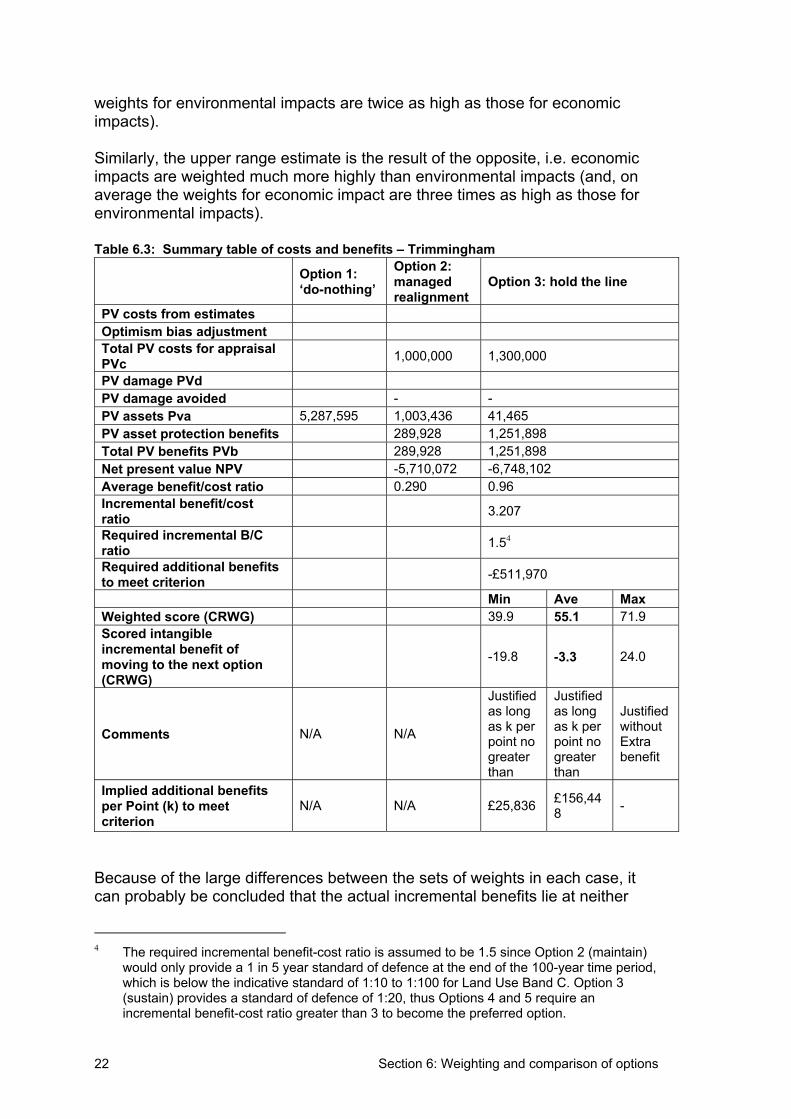
Section 6: Weighting and comparison of options 22
weights for environmental impacts are twice as high as those for economic impacts).
Similarly, the upper range estimate is the result of the opposite, i.e. economic impacts are weighted much more highly than environmental impacts (and, on average the weights for economic impact are three times as high as those for environmental impacts).
Table 6.3: Summary table of costs and benefits – Trimmingham
Option 1: ‘do-nothing’
Option 2:managedrealignment
Option 3: hold the line
PV costs from estimates Optimism bias adjustment Total PV costs for appraisal PVc 1,000,000 1,300,000
PV damage PVd PV damage avoided - - PV assets Pva 5,287,595 1,003,436 41,465 PV asset protection benefits 289,928 1,251,898 Total PV benefits PVb 289,928 1,251,898 Net present value NPV -5,710,072 -6,748,102 Average benefit/cost ratio 0.290 0.96 Incremental benefit/cost ratio 3.207
Required incremental B/C ratio 1.54
Required additional benefits to meet criterion -£511,970
Min Ave Max Weighted score (CRWG) 39.9 55.1 71.9Scored intangible incremental benefit of moving to the next option (CRWG)
-19.8 -3.3 24.0
Comments N/A N/A
Justifiedas long as k per point no greaterthan
Justifiedas long as k per point no greaterthan
JustifiedwithoutExtrabenefit
Implied additional benefits per Point (k) to meet criterion
N/A N/A £25,836 £156,448 -
Because of the large differences between the sets of weights in each case, it can probably be concluded that the actual incremental benefits lie at neither
4 The required incremental benefit-cost ratio is assumed to be 1.5 since Option 2 (maintain)
would only provide a 1 in 5 year standard of defence at the end of the 100-year time period, which is below the indicative standard of 1:10 to 1:100 for Land Use Band C. Option 3 (sustain) provides a standard of defence of 1:20, thus Options 4 and 5 require an incremental benefit-cost ratio greater than 3 to become the preferred option.
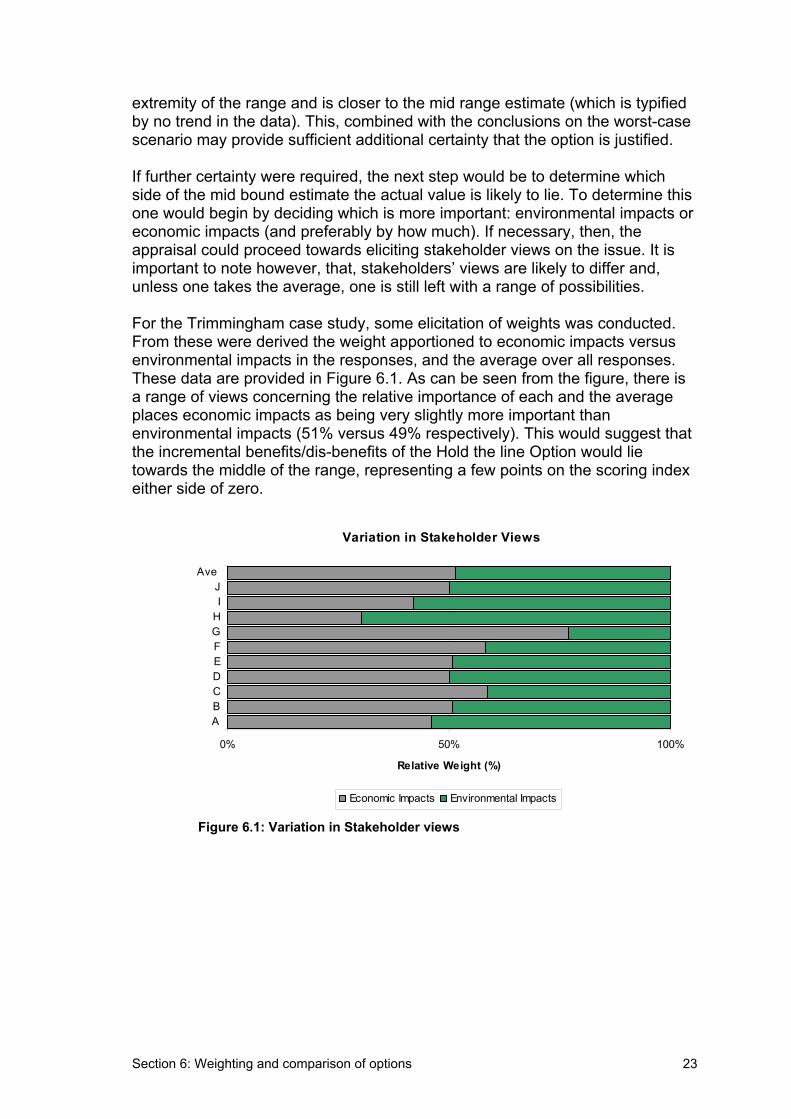
Section 6: Weighting and comparison of options 23
extremity of the range and is closer to the mid range estimate (which is typified by no trend in the data). This, combined with the conclusions on the worst-case scenario may provide sufficient additional certainty that the option is justified.
If further certainty were required, the next step would be to determine which side of the mid bound estimate the actual value is likely to lie. To determine this one would begin by deciding which is more important: environmental impacts or economic impacts (and preferably by how much). If necessary, then, the appraisal could proceed towards eliciting stakeholder views on the issue. It is important to note however, that, stakeholders’ views are likely to differ and, unless one takes the average, one is still left with a range of possibilities.
For the Trimmingham case study, some elicitation of weights was conducted.From these were derived the weight apportioned to economic impacts versus environmental impacts in the responses, and the average over all responses.These data are provided in Figure 6.1. As can be seen from the figure, there is a range of views concerning the relative importance of each and the average places economic impacts as being very slightly more important than environmental impacts (51% versus 49% respectively). This would suggest that the incremental benefits/dis-benefits of the Hold the line Option would lie towards the middle of the range, representing a few points on the scoring index either side of zero.
Variation in Stakeholder Views
0% 50% 100%
ABCDEFGHIJ
Ave
Relative Weight (%)
Economic Impacts Environmental Impacts
Figure 6.1: Variation in Stakeholder views
Section 6: Weighting and comparison of options 24
7. References Environment Agency (2003): Assessment of Benefits for Water Quality and Water Resources Schemes in the PR04 Environment Programme, Guidance prepared by RPA, February 2003.
Halcrow Group Limited (2003): Kelling Hard to Lowestoft Ness Shoreline Management Plan – Extended Steering Group Policy Development Workshop, November 2003.
Land Registry Internet Site:http://www.landreg.gov.uk/ppr/interactive/ppr_ualbs.asp.
Middlesex University Flood Hazard Research Centre (MUFHRC) (2003): The Benefits of Flood and Coastal Defence: Techniques and Data for 2003 (Multi-Coloured Manual), draft.
Nix J (2003): Farm Management Pocketbook, 34th Edition (2004), Imperial College at Wye, September 2003.
Valuation Agency Office Internet Site:http://open.voa.gov.uk/rating/irlw_2000.list.
William Halcrow & Partners (1995): Sheringham to Lowestoft Shoreline Management Plan Sediment Sub-Cell 3B, Phase 1, May 1995 (including maps).
William Halcrow & Partners (1996): Sheringham to Lowestoft Shoreline Management Plan Sediment Sub-Cell 3B, Phase 2, May 1996.
Appendix B1.1 25
Appendix B1.1
Appraisal summary table for high level screening – S-AST for the Kelling Hard to Lowestoft SMP –Cromer, Trimingham and Winterton Frontages
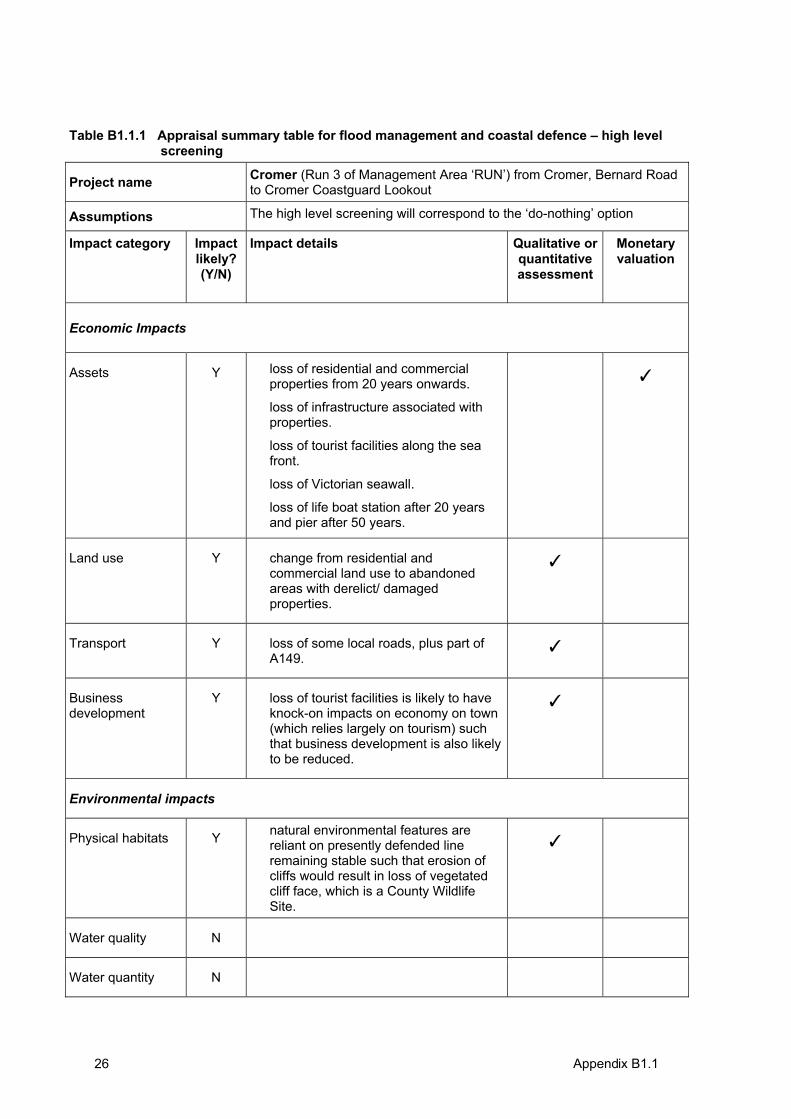
Appendix B1.1 26
Table B1.1.1 Appraisal summary table for flood management and coastal defence – high level screening
Project name Cromer (Run 3 of Management Area ‘RUN’) from Cromer, Bernard Road to Cromer Coastguard Lookout
Assumptions The high level screening will correspond to the ‘do-nothing’ option
Impact category Impact likely? (Y/N)
Impact details Qualitative or quantitative assessment
Monetary valuation
Economic Impacts
Assets Y • loss of residential and commercial properties from 20 years onwards.
• loss of infrastructure associated with properties.
• loss of tourist facilities along the sea front.
• loss of Victorian seawall.
• loss of life boat station after 20 years and pier after 50 years.
Land use Y • change from residential and commercial land use to abandoned areas with derelict/ damaged properties.
Transport Y • loss of some local roads, plus part of A149.
Businessdevelopment
Y • loss of tourist facilities is likely to have knock-on impacts on economy on town (which relies largely on tourism) such that business development is also likely to be reduced.
Environmental impacts
Physical habitats Y • natural environmental features are reliant on presently defended line remaining stable such that erosion of cliffs would result in loss of vegetated cliff face, which is a County Wildlife Site.
Water quality N
Water quantity N
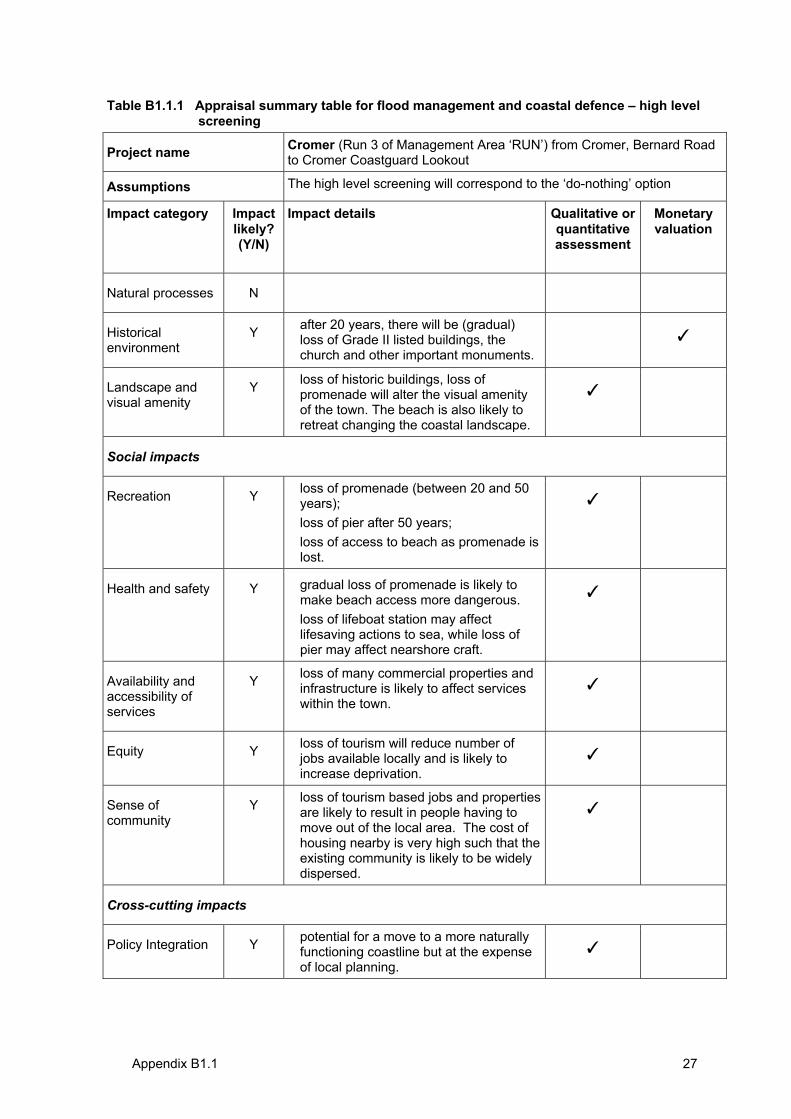
Appendix B1.1 27
Table B1.1.1 Appraisal summary table for flood management and coastal defence – high level screening
Project name Cromer (Run 3 of Management Area ‘RUN’) from Cromer, Bernard Road to Cromer Coastguard Lookout
Assumptions The high level screening will correspond to the ‘do-nothing’ option
Impact category Impact likely? (Y/N)
Impact details Qualitative or quantitative assessment
Monetary valuation
Natural processes N
Historicalenvironment
Y • after 20 years, there will be (gradual) loss of Grade II listed buildings, the church and other important monuments.
Landscape and visual amenity
Y • loss of historic buildings, loss of promenade will alter the visual amenity of the town. The beach is also likely to retreat changing the coastal landscape.
Social impacts
Recreation Y • loss of promenade (between 20 and 50 years);
• loss of pier after 50 years; • loss of access to beach as promenade is
lost.
Health and safety Y • gradual loss of promenade is likely to make beach access more dangerous.
• loss of lifeboat station may affect lifesaving actions to sea, while loss of pier may affect nearshore craft.
Availability and accessibility of services
Y • loss of many commercial properties and infrastructure is likely to affect services within the town.
Equity Y • loss of tourism will reduce number of jobs available locally and is likely to increase deprivation.
Sense of community
Y • loss of tourism based jobs and properties are likely to result in people having to move out of the local area. The cost of housing nearby is very high such that the existing community is likely to be widely dispersed.
Cross-cutting impacts
Policy Integration Y • potential for a move to a more naturally functioning coastline but at the expense of local planning.
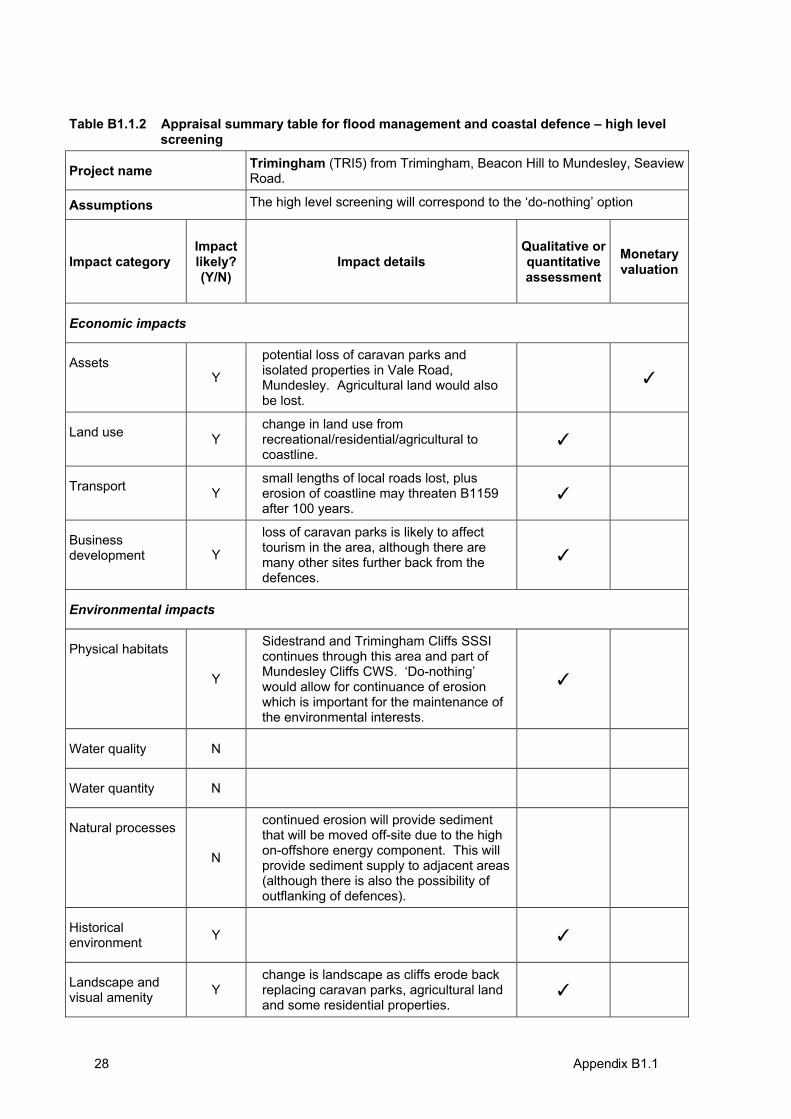
Appendix B1.1 28
Table B1.1.2 Appraisal summary table for flood management and coastal defence – high level screening
Project name Trimingham (TRI5) from Trimingham, Beacon Hill to Mundesley, Seaview Road.
Assumptions The high level screening will correspond to the ‘do-nothing’ option
Impact category Impactlikely? (Y/N)
Impact details Qualitative or quantitative assessment
Monetary valuation
Economic impacts
AssetsY
• potential loss of caravan parks and isolated properties in Vale Road, Mundesley. Agricultural land would also be lost.
Land use Y• change in land use from
recreational/residential/agricultural to coastline.
Transport Y• small lengths of local roads lost, plus
erosion of coastline may threaten B1159 after 100 years.
Businessdevelopment Y
• loss of caravan parks is likely to affect tourism in the area, although there are many other sites further back from the defences.
Environmental impacts
Physical habitats
Y
• Sidestrand and Trimingham Cliffs SSSI continues through this area and part of Mundesley Cliffs CWS. ‘Do-nothing’ would allow for continuance of erosion which is important for the maintenance of the environmental interests.
Water quality N
Water quantity N
Natural processes
N
• continued erosion will provide sediment that will be moved off-site due to the high on-offshore energy component. This will provide sediment supply to adjacent areas (although there is also the possibility of outflanking of defences).
Historicalenvironment Y
Landscape and visual amenity Y
• change is landscape as cliffs erode back replacing caravan parks, agricultural land and some residential properties.
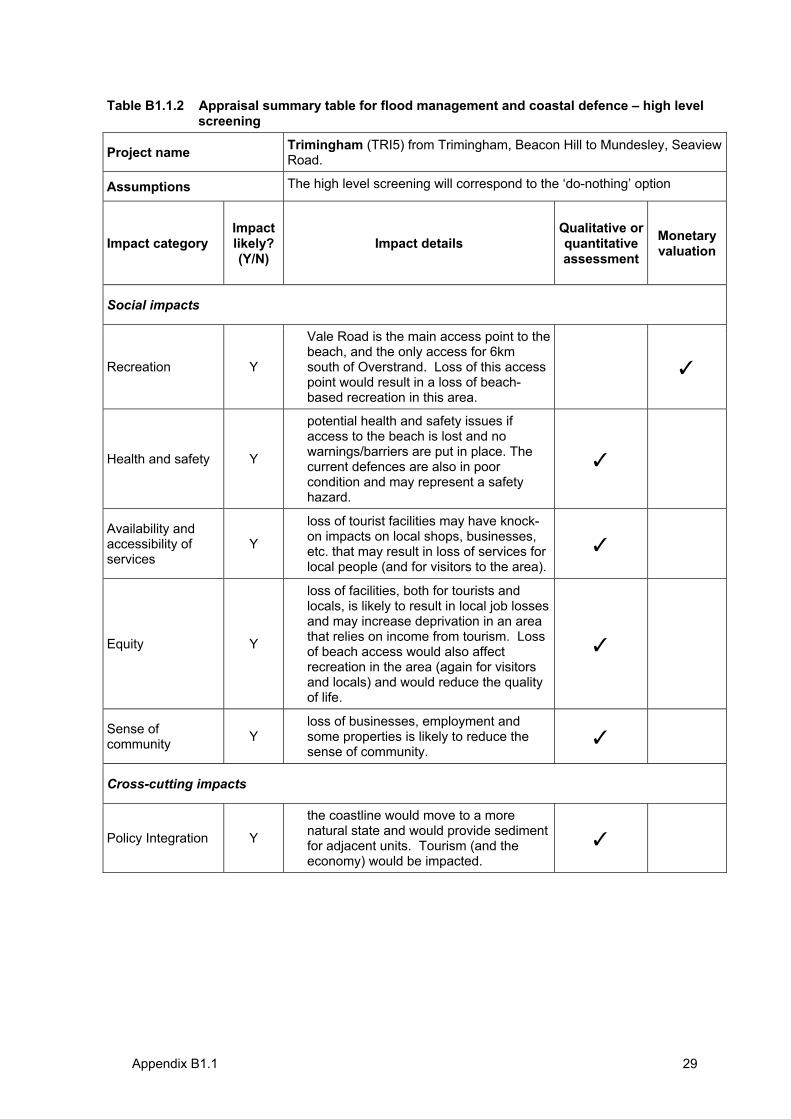
Appendix B1.1 29
Table B1.1.2 Appraisal summary table for flood management and coastal defence – high level screening
Project name Trimingham (TRI5) from Trimingham, Beacon Hill to Mundesley, Seaview Road.
Assumptions The high level screening will correspond to the ‘do-nothing’ option
Impact category Impactlikely? (Y/N)
Impact details Qualitative or quantitative assessment
Monetary valuation
Social impacts
Recreation Y
• Vale Road is the main access point to the beach, and the only access for 6km south of Overstrand. Loss of this access point would result in a loss of beach-based recreation in this area.
✓
Health and safety Y
• potential health and safety issues if access to the beach is lost and no warnings/barriers are put in place. The current defences are also in poor condition and may represent a safety hazard.
✓
Availability and accessibility of services
Y
• loss of tourist facilities may have knock-on impacts on local shops, businesses, etc. that may result in loss of services for local people (and for visitors to the area).
✓
Equity Y
• loss of facilities, both for tourists and locals, is likely to result in local job losses and may increase deprivation in an area that relies on income from tourism. Loss of beach access would also affect recreation in the area (again for visitors and locals) and would reduce the quality of life.
✓
Sense of community Y
• loss of businesses, employment and some properties is likely to reduce the sense of community.
✓
Cross-cutting impacts
Policy Integration Y
• the coastline would move to a more natural state and would provide sediment for adjacent units. Tourism (and the economy) would be impacted.
✓
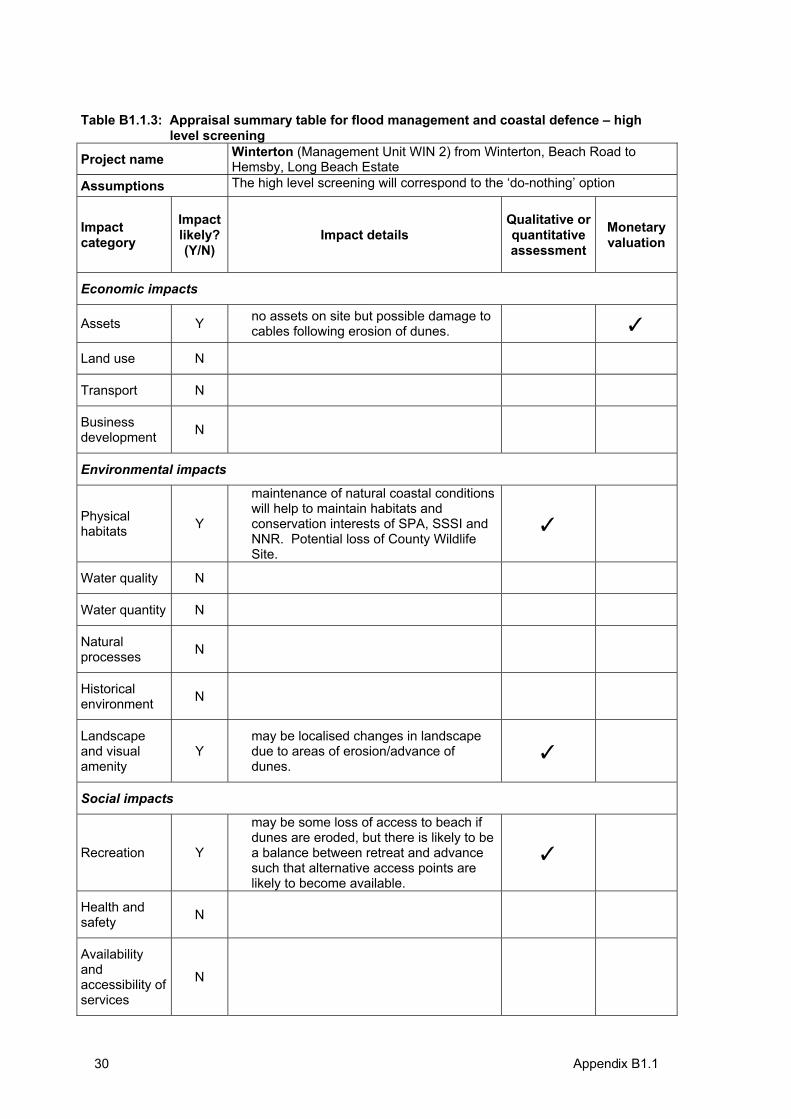
Appendix B1.1 30
Table B1.1.3: Appraisal summary table for flood management and coastal defence – high level screening
Project name Winterton (Management Unit WIN 2) from Winterton, Beach Road to Hemsby, Long Beach Estate
Assumptions The high level screening will correspond to the ‘do-nothing’ option
Impactcategory
Impactlikely? (Y/N)
Impact details Qualitative or quantitative assessment
Monetary valuation
Economic impacts
Assets Y • no assets on site but possible damage to cables following erosion of dunes. ✓
Land use N
Transport N
Businessdevelopment N
Environmental impacts
Physical habitats Y
• maintenance of natural coastal conditions will help to maintain habitats and conservation interests of SPA, SSSI and NNR. Potential loss of County Wildlife Site.
✓
Water quality N
Water quantity N
Naturalprocesses N
Historicalenvironment N
Landscapeand visual amenity
Y• may be localised changes in landscape
due to areas of erosion/advance of dunes.
✓
Social impacts
Recreation Y
• may be some loss of access to beach if dunes are eroded, but there is likely to be a balance between retreat and advance such that alternative access points are likely to become available.
✓
Health and safety N
Availability andaccessibility of services
N
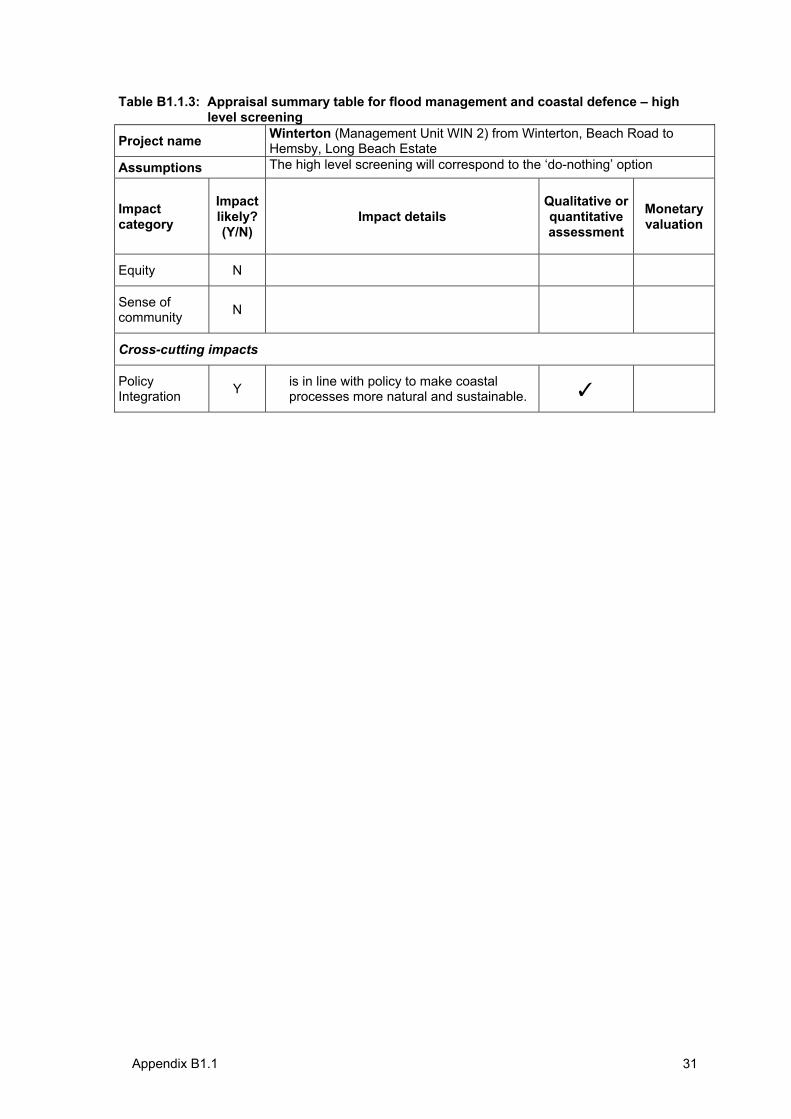
Appendix B1.1 31
Table B1.1.3: Appraisal summary table for flood management and coastal defence – high level screening
Project name Winterton (Management Unit WIN 2) from Winterton, Beach Road to Hemsby, Long Beach Estate
Assumptions The high level screening will correspond to the ‘do-nothing’ option
Impactcategory
Impactlikely? (Y/N)
Impact details Qualitative or quantitative assessment
Monetary valuation
Equity N
Sense of community N
Cross-cutting impacts
Policy Integration Y • is in line with policy to make coastal
processes more natural and sustainable. ✓

Appendix B1.2 33
Appendix B1.2:
Appraisal summary table for main assessment – MA-AST for Kelling Hard to Lowestoft Ness SMP – Cromer Frontage
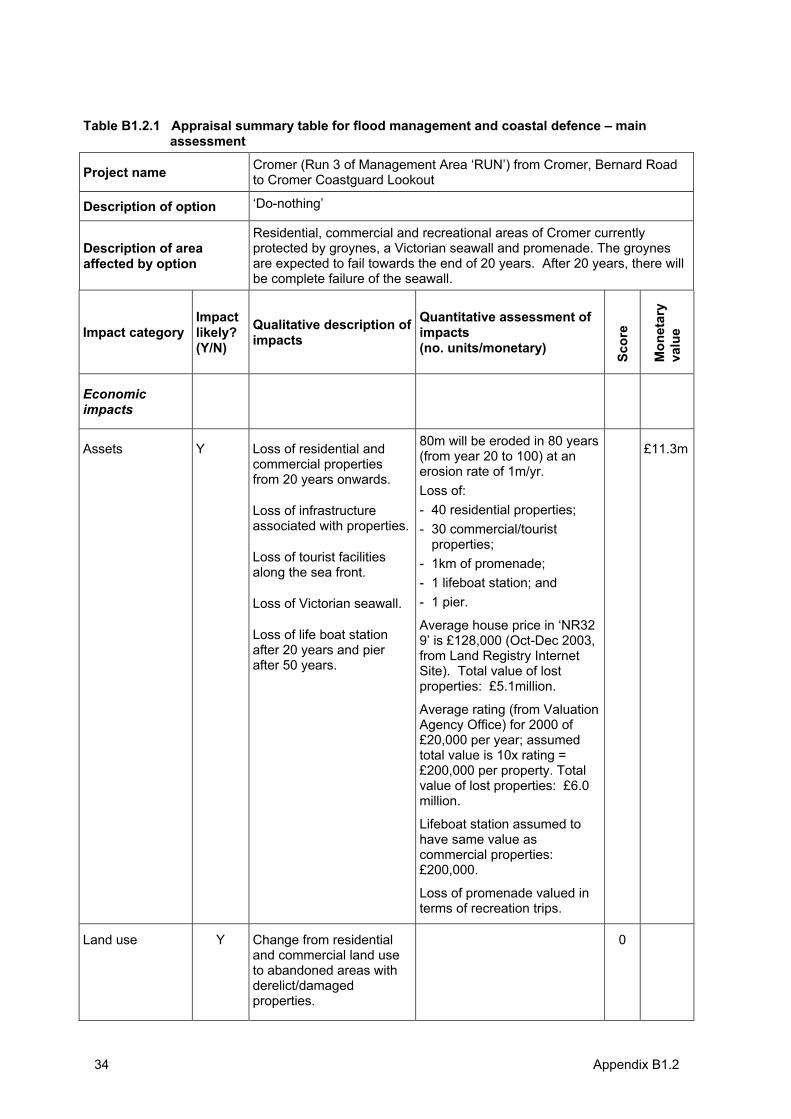
Appendix B1.2 34
Table B1.2.1 Appraisal summary table for flood management and coastal defence – main assessment
Project name Cromer (Run 3 of Management Area ‘RUN’) from Cromer, Bernard Road to Cromer Coastguard Lookout
Description of option ‘Do-nothing’
Description of area affected by option
Residential, commercial and recreational areas of Cromer currently protected by groynes, a Victorian seawall and promenade. The groynes are expected to fail towards the end of 20 years. After 20 years, there will be complete failure of the seawall.
Impact category Impactlikely? (Y/N)
Qualitative description of impacts
Quantitative assessment of impacts(no. units/monetary)
Scor
e
Mon
etar
yva
lue
Economicimpacts
Assets Y Loss of residential and commercial properties from 20 years onwards.
Loss of infrastructure associated with properties.
Loss of tourist facilities along the sea front.
Loss of Victorian seawall.
Loss of life boat station after 20 years and pier after 50 years.
80m will be eroded in 80 years (from year 20 to 100) at an erosion rate of 1m/yr. Loss of: - 40 residential properties; - 30 commercial/tourist
properties;- 1km of promenade; - 1 lifeboat station; and - 1 pier.
Average house price in ‘NR32 9’ is £128,000 (Oct-Dec 2003, from Land Registry Internet Site). Total value of lost properties: £5.1million.
Average rating (from Valuation Agency Office) for 2000 of £20,000 per year; assumed total value is 10x rating = £200,000 per property. Total value of lost properties: £6.0 million.
Lifeboat station assumed to have same value as commercial properties: £200,000.
Loss of promenade valued in terms of recreation trips.
£11.3m
Land use Y Change from residential and commercial land use to abandoned areas with derelict/damagedproperties.
0
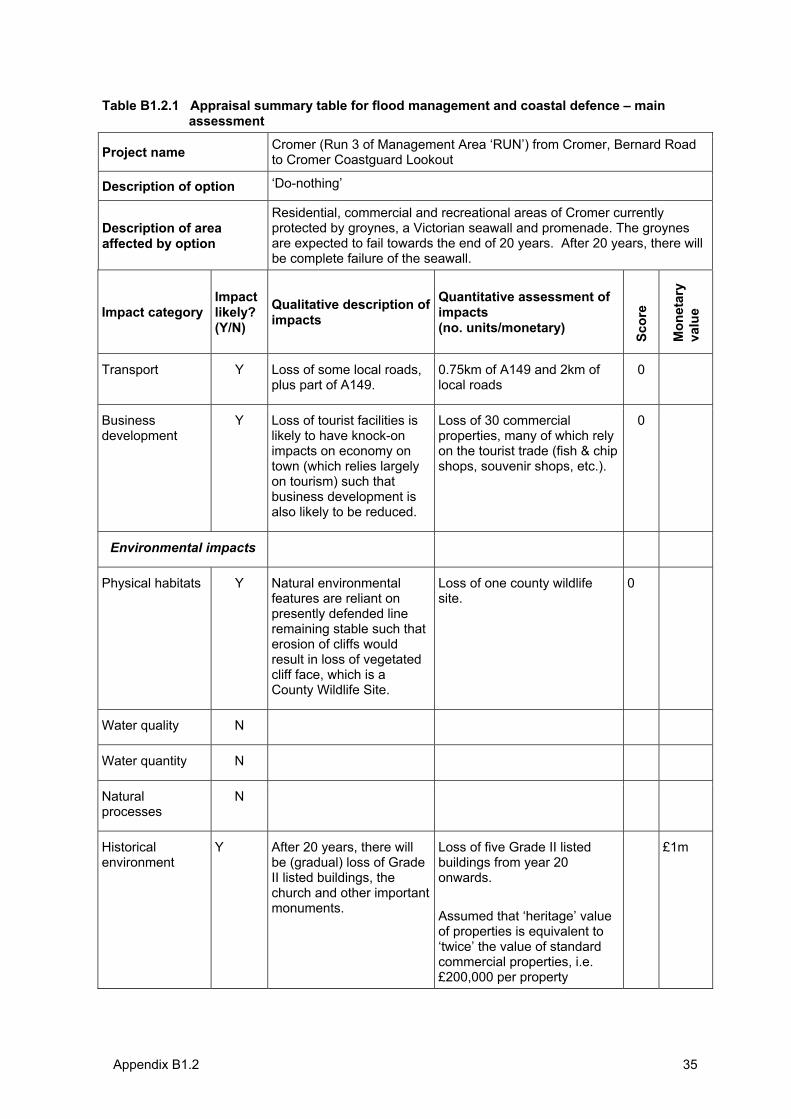
Appendix B1.2 35
Table B1.2.1 Appraisal summary table for flood management and coastal defence – main assessment
Project name Cromer (Run 3 of Management Area ‘RUN’) from Cromer, Bernard Road to Cromer Coastguard Lookout
Description of option ‘Do-nothing’
Description of area affected by option
Residential, commercial and recreational areas of Cromer currently protected by groynes, a Victorian seawall and promenade. The groynes are expected to fail towards the end of 20 years. After 20 years, there will be complete failure of the seawall.
Impact category Impactlikely? (Y/N)
Qualitative description of impacts
Quantitative assessment of impacts(no. units/monetary)
Scor
e
Mon
etar
yva
lue
Transport Y Loss of some local roads, plus part of A149.
0.75km of A149 and 2km of local roads
0
Businessdevelopment
Y Loss of tourist facilities is likely to have knock-on impacts on economy on town (which relies largely on tourism) such that business development is also likely to be reduced.
Loss of 30 commercial properties, many of which rely on the tourist trade (fish & chip shops, souvenir shops, etc.).
0
Environmental impacts
Physical habitats Y Natural environmental features are reliant on presently defended line remaining stable such that erosion of cliffs would result in loss of vegetated cliff face, which is a County Wildlife Site.
Loss of one county wildlife site.
0
Water quality N
Water quantity N
Naturalprocesses
N
Historicalenvironment
Y After 20 years, there will be (gradual) loss of Grade II listed buildings, the church and other important monuments.
Loss of five Grade II listed buildings from year 20 onwards.
Assumed that ‘heritage’ value of properties is equivalent to ‘twice’ the value of standard commercial properties, i.e. £200,000 per property
£1m
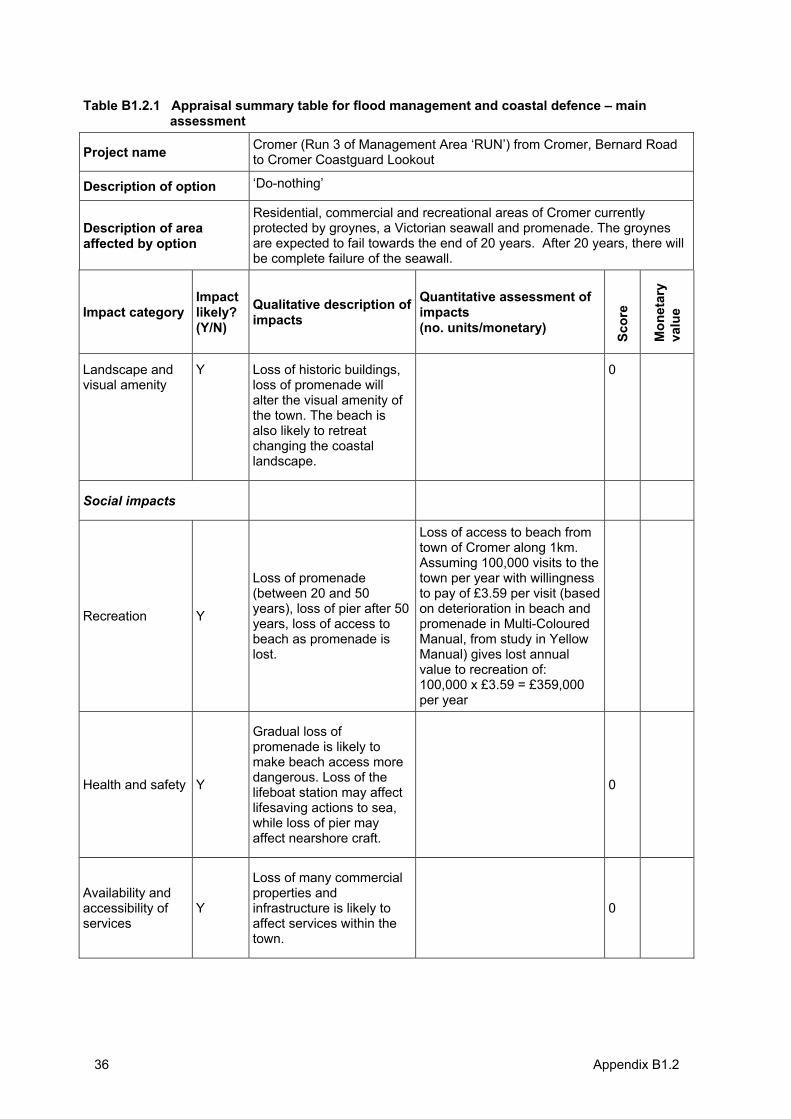
Appendix B1.2 36
Table B1.2.1 Appraisal summary table for flood management and coastal defence – main assessment
Project name Cromer (Run 3 of Management Area ‘RUN’) from Cromer, Bernard Road to Cromer Coastguard Lookout
Description of option ‘Do-nothing’
Description of area affected by option
Residential, commercial and recreational areas of Cromer currently protected by groynes, a Victorian seawall and promenade. The groynes are expected to fail towards the end of 20 years. After 20 years, there will be complete failure of the seawall.
Impact category Impactlikely? (Y/N)
Qualitative description of impacts
Quantitative assessment of impacts(no. units/monetary)
Scor
e
Mon
etar
yva
lue
Landscape and visual amenity
Y Loss of historic buildings, loss of promenade will alter the visual amenity of the town. The beach is also likely to retreat changing the coastal landscape.
0
Social impacts
Recreation Y
Loss of promenade (between 20 and 50 years), loss of pier after 50 years, loss of access to beach as promenade is lost.
Loss of access to beach from town of Cromer along 1km. Assuming 100,000 visits to the town per year with willingness to pay of £3.59 per visit (based on deterioration in beach and promenade in Multi-Coloured Manual, from study in Yellow Manual) gives lost annual value to recreation of: 100,000 x £3.59 = £359,000 per year
Health and safety Y
Gradual loss of promenade is likely to make beach access more dangerous. Loss of the lifeboat station may affect lifesaving actions to sea, while loss of pier may affect nearshore craft.
0
Availability and accessibility of services
Y
Loss of many commercial properties and infrastructure is likely to affect services within the town.
0
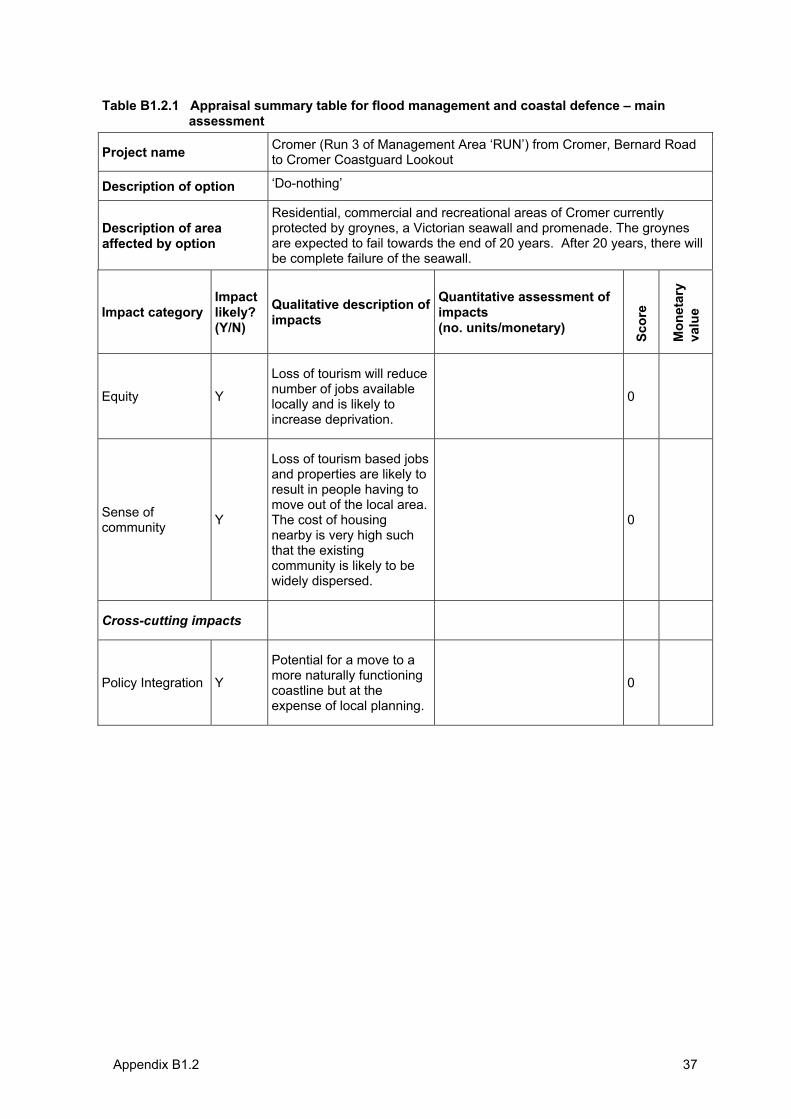
Appendix B1.2 37
Table B1.2.1 Appraisal summary table for flood management and coastal defence – main assessment
Project name Cromer (Run 3 of Management Area ‘RUN’) from Cromer, Bernard Road to Cromer Coastguard Lookout
Description of option ‘Do-nothing’
Description of area affected by option
Residential, commercial and recreational areas of Cromer currently protected by groynes, a Victorian seawall and promenade. The groynes are expected to fail towards the end of 20 years. After 20 years, there will be complete failure of the seawall.
Impact category Impactlikely? (Y/N)
Qualitative description of impacts
Quantitative assessment of impacts(no. units/monetary)
Scor
e
Mon
etar
yva
lue
Equity Y
Loss of tourism will reduce number of jobs available locally and is likely to increase deprivation.
0
Sense of community Y
Loss of tourism based jobs and properties are likely to result in people having to move out of the local area. The cost of housing nearby is very high such that the existing community is likely to be widely dispersed.
0
Cross-cutting impacts
Policy Integration Y
Potential for a move to a more naturally functioning coastline but at the expense of local planning.
0
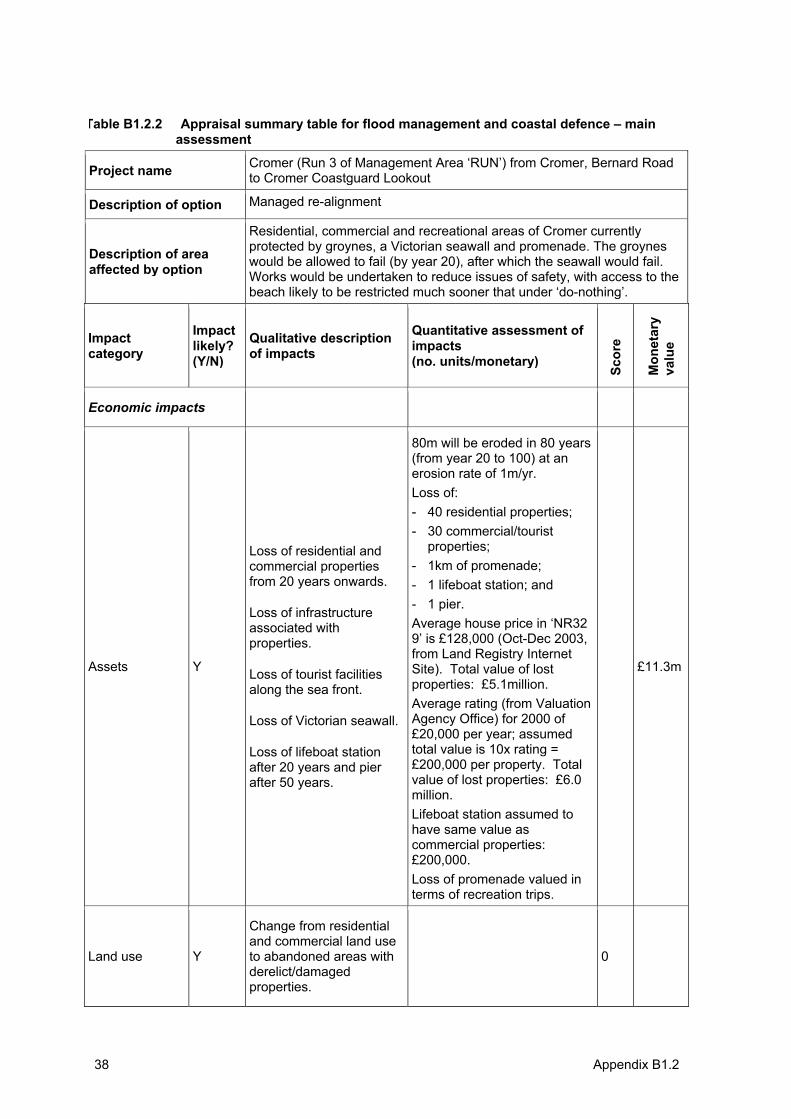
Appendix B1.2 38
Table B1.2.2 Appraisal summary table for flood management and coastal defence – main assessment
Project name Cromer (Run 3 of Management Area ‘RUN’) from Cromer, Bernard Road to Cromer Coastguard Lookout
Description of option Managed re-alignment
Description of area affected by option
Residential, commercial and recreational areas of Cromer currently protected by groynes, a Victorian seawall and promenade. The groynes would be allowed to fail (by year 20), after which the seawall would fail. Works would be undertaken to reduce issues of safety, with access to the beach likely to be restricted much sooner that under ‘do-nothing’.
Impactcategory
Impactlikely? (Y/N)
Qualitative description of impacts
Quantitative assessment of impacts(no. units/monetary)
Scor
e
Mon
etar
yva
lue
Economic impacts
Assets Y
Loss of residential and commercial properties from 20 years onwards.
Loss of infrastructure associated with properties.
Loss of tourist facilities along the sea front.
Loss of Victorian seawall.
Loss of lifeboat station after 20 years and pier after 50 years.
80m will be eroded in 80 years (from year 20 to 100) at an erosion rate of 1m/yr. Loss of: - 40 residential properties; - 30 commercial/tourist
properties;- 1km of promenade; - 1 lifeboat station; and - 1 pier. Average house price in ‘NR32 9’ is £128,000 (Oct-Dec 2003, from Land Registry Internet Site). Total value of lost properties: £5.1million. Average rating (from Valuation Agency Office) for 2000 of £20,000 per year; assumed total value is 10x rating = £200,000 per property. Total value of lost properties: £6.0 million.Lifeboat station assumed to have same value as commercial properties: £200,000.Loss of promenade valued in terms of recreation trips.
£11.3m
Land use Y
Change from residential and commercial land use to abandoned areas with derelict/damagedproperties.
0
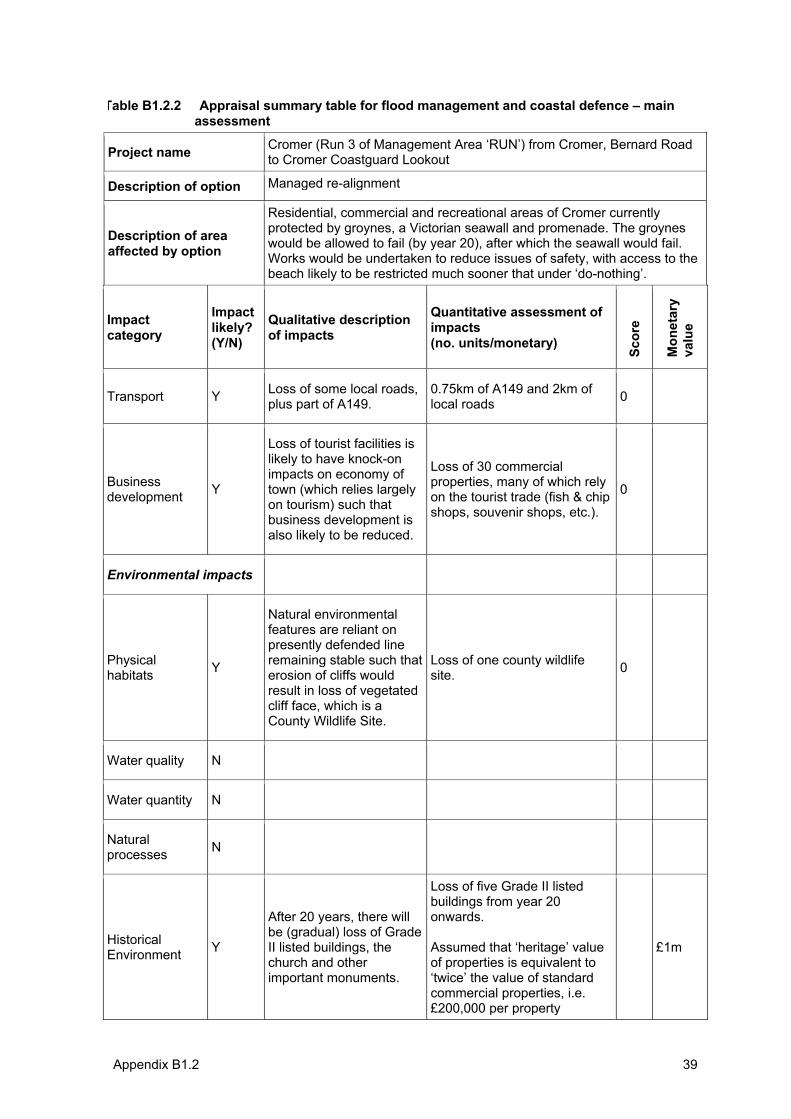
Appendix B1.2 39
Table B1.2.2 Appraisal summary table for flood management and coastal defence – main assessment
Project name Cromer (Run 3 of Management Area ‘RUN’) from Cromer, Bernard Road to Cromer Coastguard Lookout
Description of option Managed re-alignment
Description of area affected by option
Residential, commercial and recreational areas of Cromer currently protected by groynes, a Victorian seawall and promenade. The groynes would be allowed to fail (by year 20), after which the seawall would fail. Works would be undertaken to reduce issues of safety, with access to the beach likely to be restricted much sooner that under ‘do-nothing’.
Impactcategory
Impactlikely? (Y/N)
Qualitative description of impacts
Quantitative assessment of impacts(no. units/monetary)
Scor
e
Mon
etar
yva
lue
Transport Y Loss of some local roads, plus part of A149.
0.75km of A149 and 2km of local roads 0
Businessdevelopment Y
Loss of tourist facilities is likely to have knock-on impacts on economy of town (which relies largely on tourism) such that business development is also likely to be reduced.
Loss of 30 commercial properties, many of which rely on the tourist trade (fish & chip shops, souvenir shops, etc.).
0
Environmental impacts
Physical habitats Y
Natural environmental features are reliant on presently defended line remaining stable such that erosion of cliffs would result in loss of vegetated cliff face, which is a County Wildlife Site.
Loss of one county wildlife site. 0
Water quality N
Water quantity N
Naturalprocesses N
HistoricalEnvironment Y
After 20 years, there will be (gradual) loss of Grade II listed buildings, the church and other important monuments.
Loss of five Grade II listed buildings from year 20 onwards.
Assumed that ‘heritage’ value of properties is equivalent to ‘twice’ the value of standard commercial properties, i.e. £200,000 per property
£1m
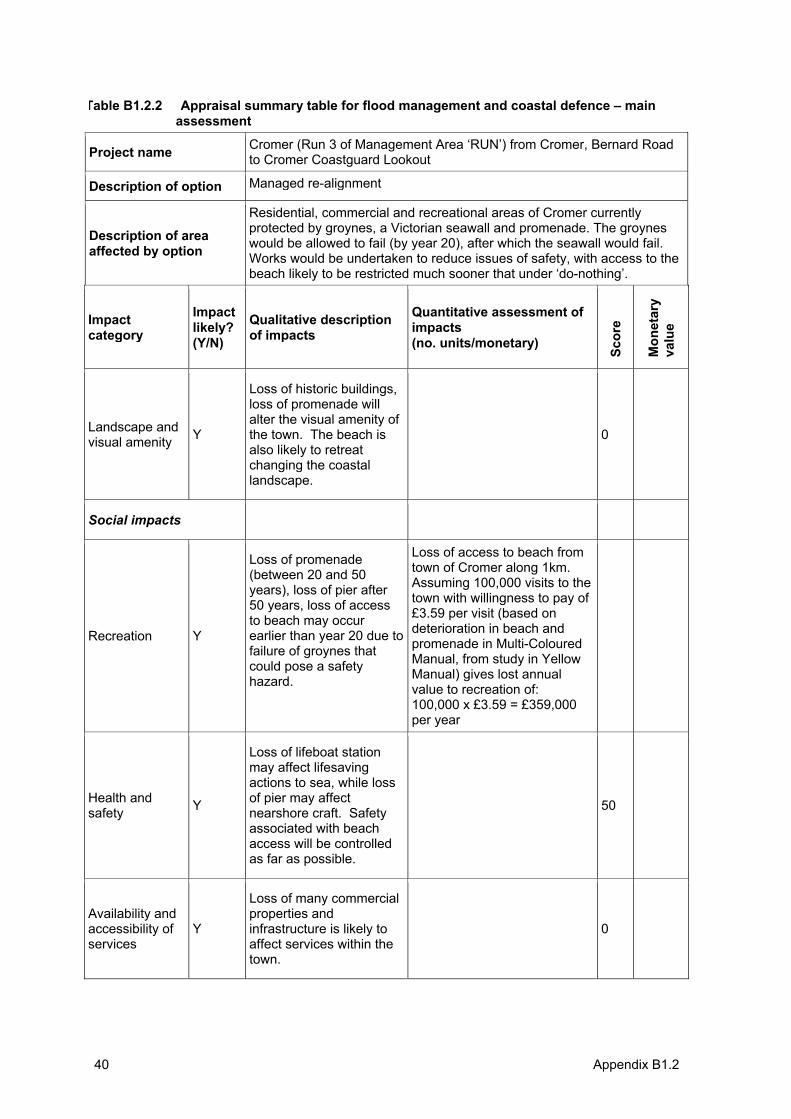
Appendix B1.2 40
Table B1.2.2 Appraisal summary table for flood management and coastal defence – main assessment
Project name Cromer (Run 3 of Management Area ‘RUN’) from Cromer, Bernard Road to Cromer Coastguard Lookout
Description of option Managed re-alignment
Description of area affected by option
Residential, commercial and recreational areas of Cromer currently protected by groynes, a Victorian seawall and promenade. The groynes would be allowed to fail (by year 20), after which the seawall would fail. Works would be undertaken to reduce issues of safety, with access to the beach likely to be restricted much sooner that under ‘do-nothing’.
Impactcategory
Impactlikely? (Y/N)
Qualitative description of impacts
Quantitative assessment of impacts(no. units/monetary)
Scor
e
Mon
etar
yva
lue
Landscape and visual amenity Y
Loss of historic buildings, loss of promenade will alter the visual amenity of the town. The beach is also likely to retreat changing the coastal landscape.
0
Social impacts
Recreation Y
Loss of promenade (between 20 and 50 years), loss of pier after 50 years, loss of access to beach may occur earlier than year 20 due to failure of groynes that could pose a safety hazard.
Loss of access to beach from town of Cromer along 1km.Assuming 100,000 visits to the town with willingness to pay of £3.59 per visit (based on deterioration in beach and promenade in Multi-Coloured Manual, from study in Yellow Manual) gives lost annual value to recreation of: 100,000 x £3.59 = £359,000 per year
Health and safety Y
Loss of lifeboat station may affect lifesaving actions to sea, while loss of pier may affect nearshore craft. Safety associated with beach access will be controlled as far as possible.
50
Availability and accessibility of services
Y
Loss of many commercial properties and infrastructure is likely to affect services within the town.
0
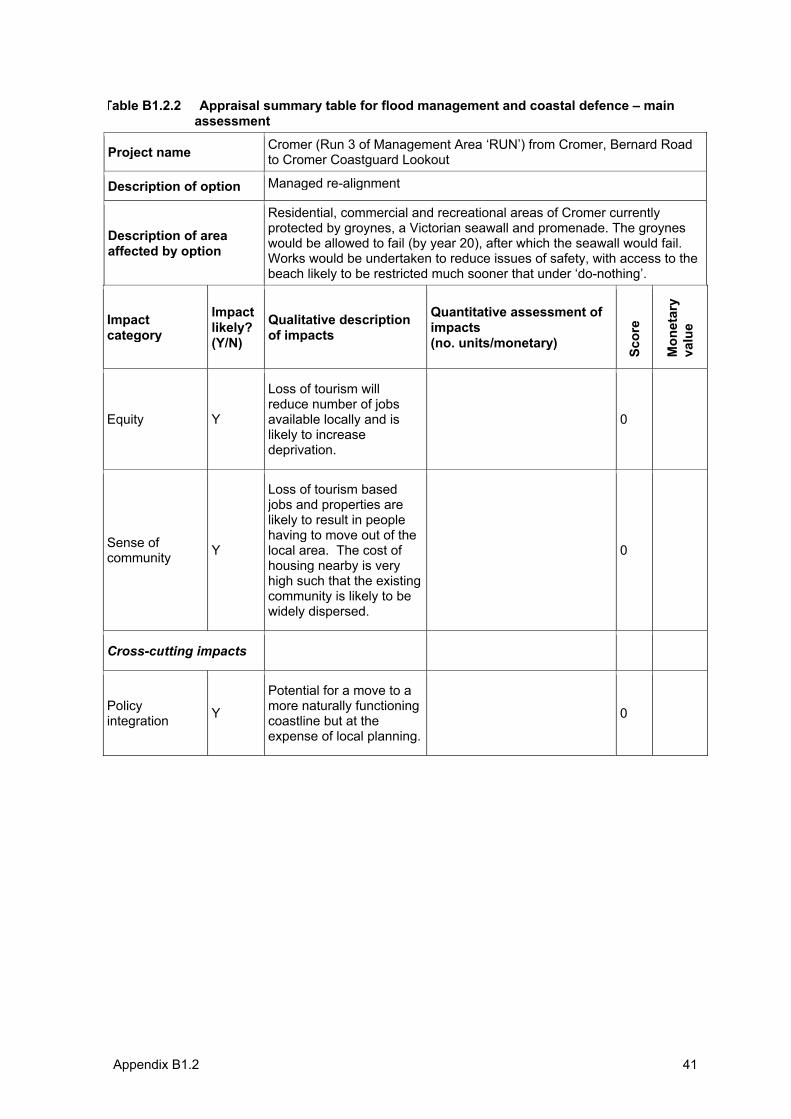
Appendix B1.2 41
Table B1.2.2 Appraisal summary table for flood management and coastal defence – main assessment
Project name Cromer (Run 3 of Management Area ‘RUN’) from Cromer, Bernard Road to Cromer Coastguard Lookout
Description of option Managed re-alignment
Description of area affected by option
Residential, commercial and recreational areas of Cromer currently protected by groynes, a Victorian seawall and promenade. The groynes would be allowed to fail (by year 20), after which the seawall would fail. Works would be undertaken to reduce issues of safety, with access to the beach likely to be restricted much sooner that under ‘do-nothing’.
Impactcategory
Impactlikely? (Y/N)
Qualitative description of impacts
Quantitative assessment of impacts(no. units/monetary)
Scor
e
Mon
etar
yva
lue
Equity Y
Loss of tourism will reduce number of jobs available locally and is likely to increase deprivation.
0
Sense of community Y
Loss of tourism based jobs and properties are likely to result in people having to move out of the local area. The cost of housing nearby is very high such that the existing community is likely to be widely dispersed.
0
Cross-cutting impacts
Policy integration Y
Potential for a move to a more naturally functioning coastline but at the expense of local planning.
0
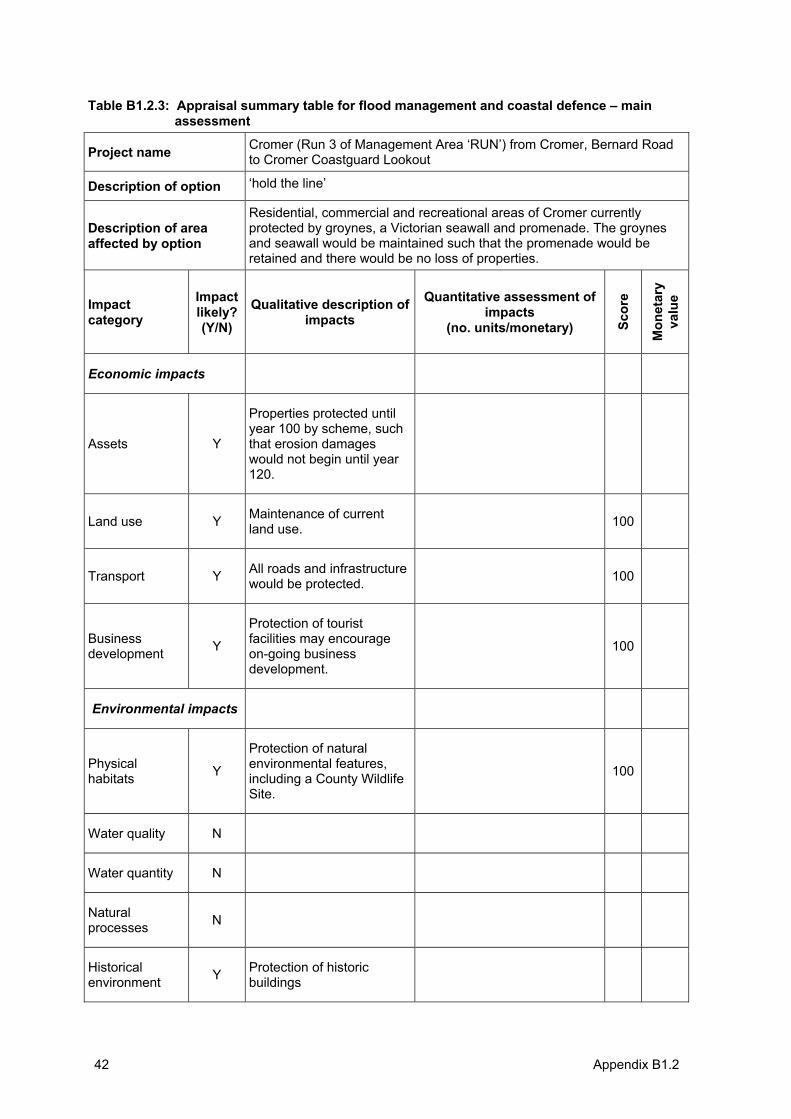
Appendix B1.2 42
Table B1.2.3: Appraisal summary table for flood management and coastal defence – main assessment
Project name Cromer (Run 3 of Management Area ‘RUN’) from Cromer, Bernard Road to Cromer Coastguard Lookout
Description of option ‘hold the line’
Description of area affected by option
Residential, commercial and recreational areas of Cromer currently protected by groynes, a Victorian seawall and promenade. The groynes and seawall would be maintained such that the promenade would be retained and there would be no loss of properties.
Impactcategory
Impactlikely? (Y/N)
Qualitative description of impacts
Quantitative assessment of impacts
(no. units/monetary) Scor
e
Mon
etar
yva
lue
Economic impacts
Assets Y
Properties protected until year 100 by scheme, such that erosion damages would not begin until year 120.
Land use Y Maintenance of current land use. 100
Transport Y All roads and infrastructure would be protected. 100
Businessdevelopment Y
Protection of tourist facilities may encourage on-going business development.
100
Environmental impacts
Physical habitats Y
Protection of natural environmental features, including a County Wildlife Site.
100
Water quality N
Water quantity N
Naturalprocesses N
Historicalenvironment Y Protection of historic
buildings
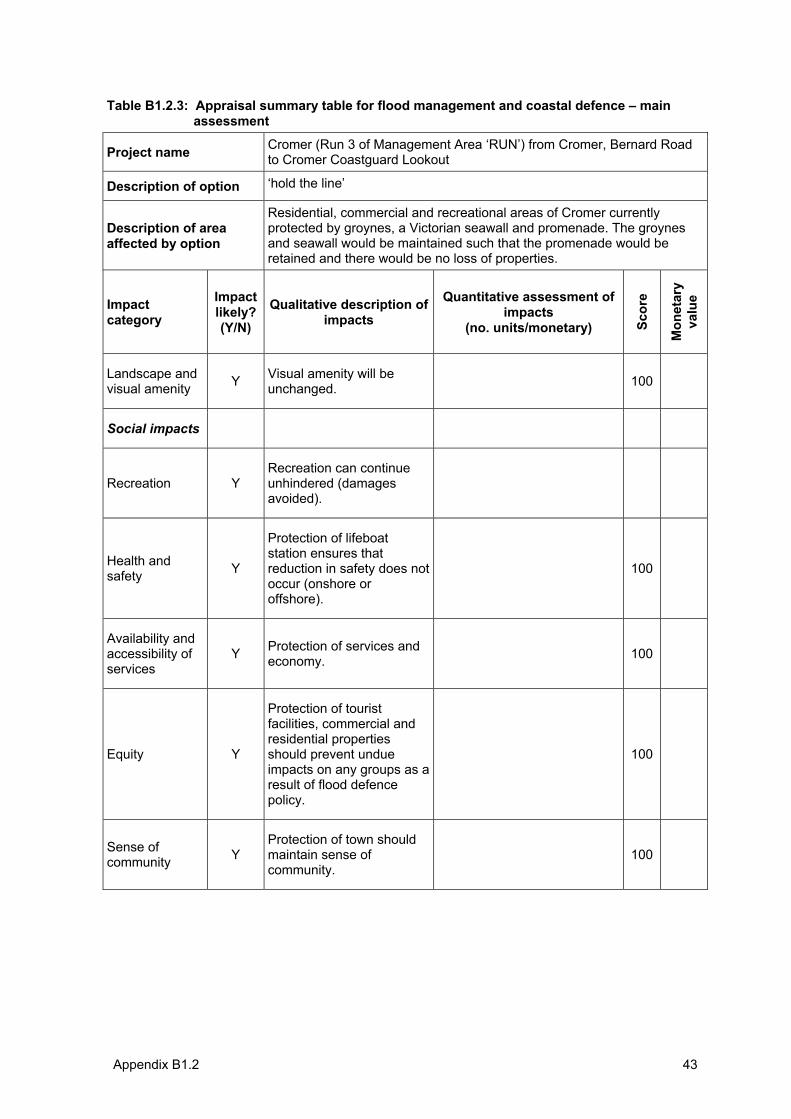
Appendix B1.2 43
Table B1.2.3: Appraisal summary table for flood management and coastal defence – main assessment
Project name Cromer (Run 3 of Management Area ‘RUN’) from Cromer, Bernard Road to Cromer Coastguard Lookout
Description of option ‘hold the line’
Description of area affected by option
Residential, commercial and recreational areas of Cromer currently protected by groynes, a Victorian seawall and promenade. The groynes and seawall would be maintained such that the promenade would be retained and there would be no loss of properties.
Impactcategory
Impactlikely? (Y/N)
Qualitative description of impacts
Quantitative assessment of impacts
(no. units/monetary) Scor
e
Mon
etar
yva
lue
Landscape and visual amenity Y Visual amenity will be
unchanged. 100
Social impacts
Recreation Y Recreation can continue unhindered (damages avoided).
Health and safety Y
Protection of lifeboat station ensures that reduction in safety does not occur (onshore or offshore).
100
Availability and accessibility of services
Y Protection of services and economy. 100
Equity Y
Protection of tourist facilities, commercial and residential properties should prevent undue impacts on any groups as a result of flood defence policy.
100
Sense of community Y
Protection of town should maintain sense of community.
100
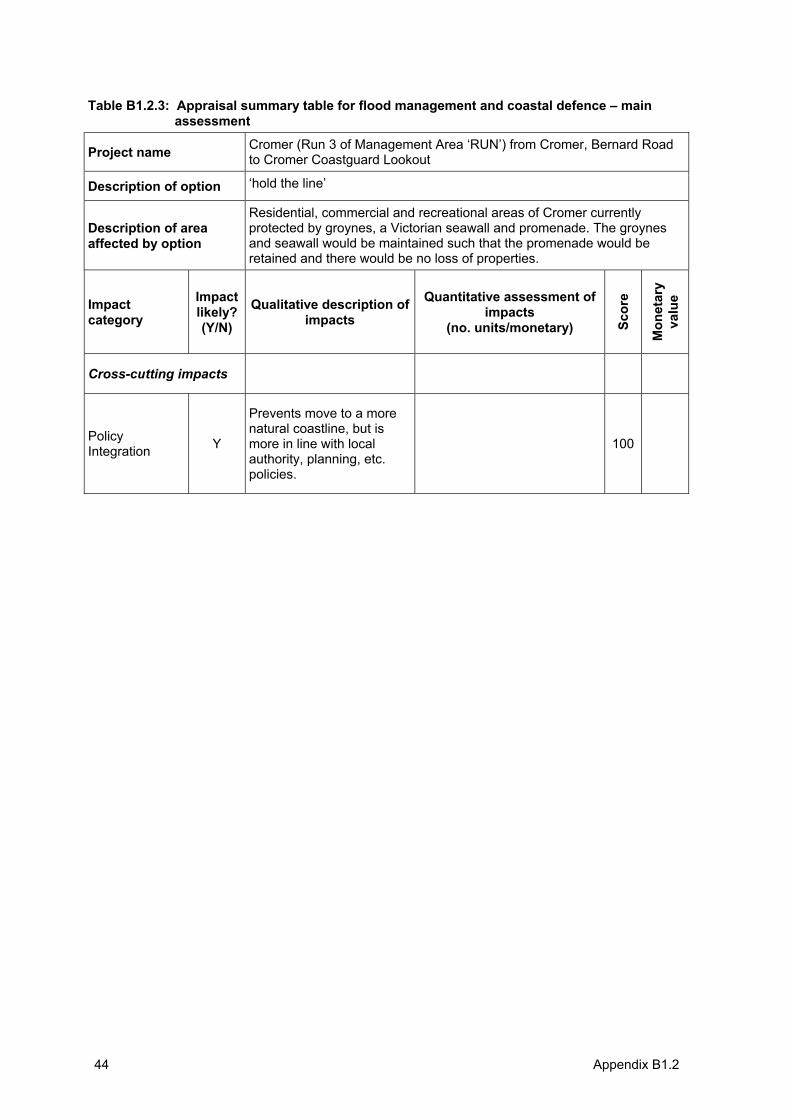
Appendix B1.2 44
Table B1.2.3: Appraisal summary table for flood management and coastal defence – main assessment
Project name Cromer (Run 3 of Management Area ‘RUN’) from Cromer, Bernard Road to Cromer Coastguard Lookout
Description of option ‘hold the line’
Description of area affected by option
Residential, commercial and recreational areas of Cromer currently protected by groynes, a Victorian seawall and promenade. The groynes and seawall would be maintained such that the promenade would be retained and there would be no loss of properties.
Impactcategory
Impactlikely? (Y/N)
Qualitative description of impacts
Quantitative assessment of impacts
(no. units/monetary) Scor
e
Mon
etar
yva
lue
Cross-cutting impacts
Policy Integration Y
Prevents move to a more natural coastline, but is more in line with local authority, planning, etc. policies.
100
Appendix B1.3 45
Appendix B1.3:
Appraisal summary table for main assessment – MA-AST for Kelling Hard to Lowestoft Ness SMP –Trimingham Frontage
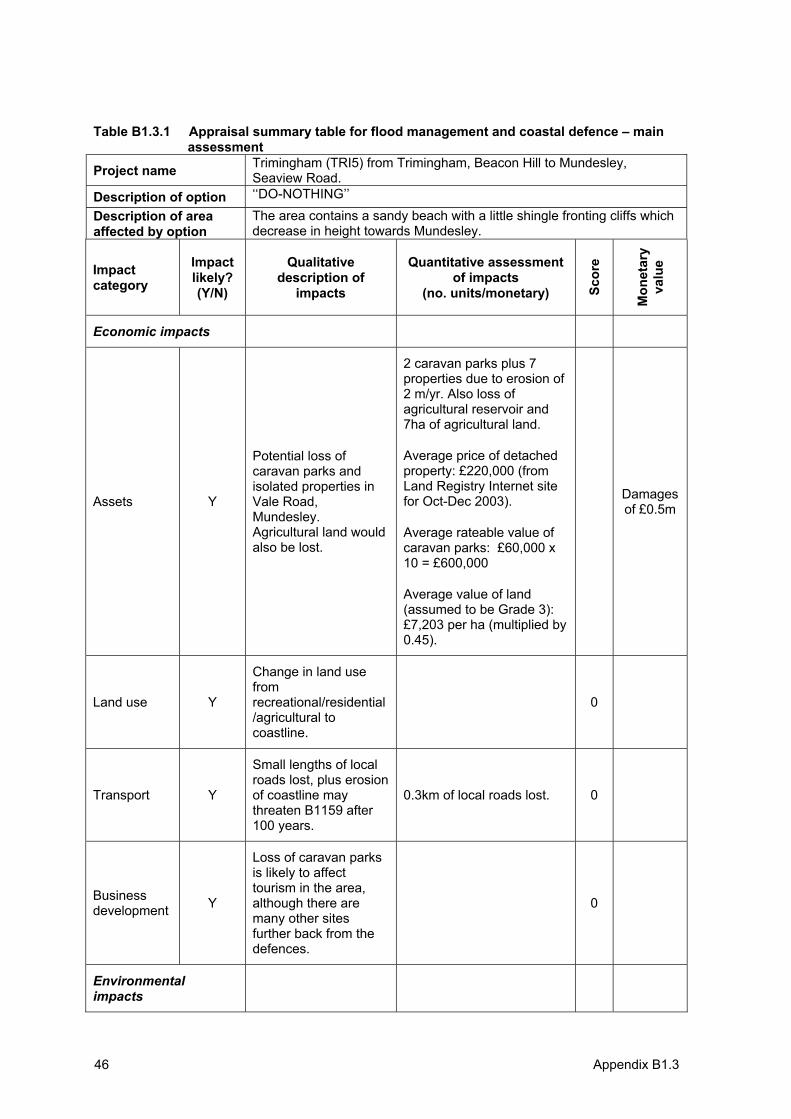
Appendix B1.3 46
Table B1.3.1 Appraisal summary table for flood management and coastal defence – main assessment
Project name Trimingham (TRI5) from Trimingham, Beacon Hill to Mundesley, Seaview Road.
Description of option ‘‘DO-NOTHING’’
Description of area affected by option
The area contains a sandy beach with a little shingle fronting cliffs which decrease in height towards Mundesley.
Impactcategory
Impactlikely? (Y/N)
Qualitative description of
impacts
Quantitative assessment of impacts
(no. units/monetary) Scor
e
Mon
etar
yva
lue
Economic impacts
Assets Y
Potential loss of caravan parks and isolated properties in Vale Road, Mundesley.Agricultural land would also be lost.
2 caravan parks plus 7 properties due to erosion of 2 m/yr. Also loss of agricultural reservoir and 7ha of agricultural land.
Average price of detached property: £220,000 (from Land Registry Internet site for Oct-Dec 2003).
Average rateable value of caravan parks: £60,000 x 10 = £600,000
Average value of land (assumed to be Grade 3):£7,203 per ha (multiplied by 0.45).
Damagesof £0.5m
Land use Y
Change in land use fromrecreational/residential/agricultural to coastline.
0
Transport Y
Small lengths of local roads lost, plus erosion of coastline may threaten B1159 after 100 years.
0.3km of local roads lost. 0
Businessdevelopment Y
Loss of caravan parks is likely to affect tourism in the area, although there are many other sites further back from the defences.
0
Environmentalimpacts
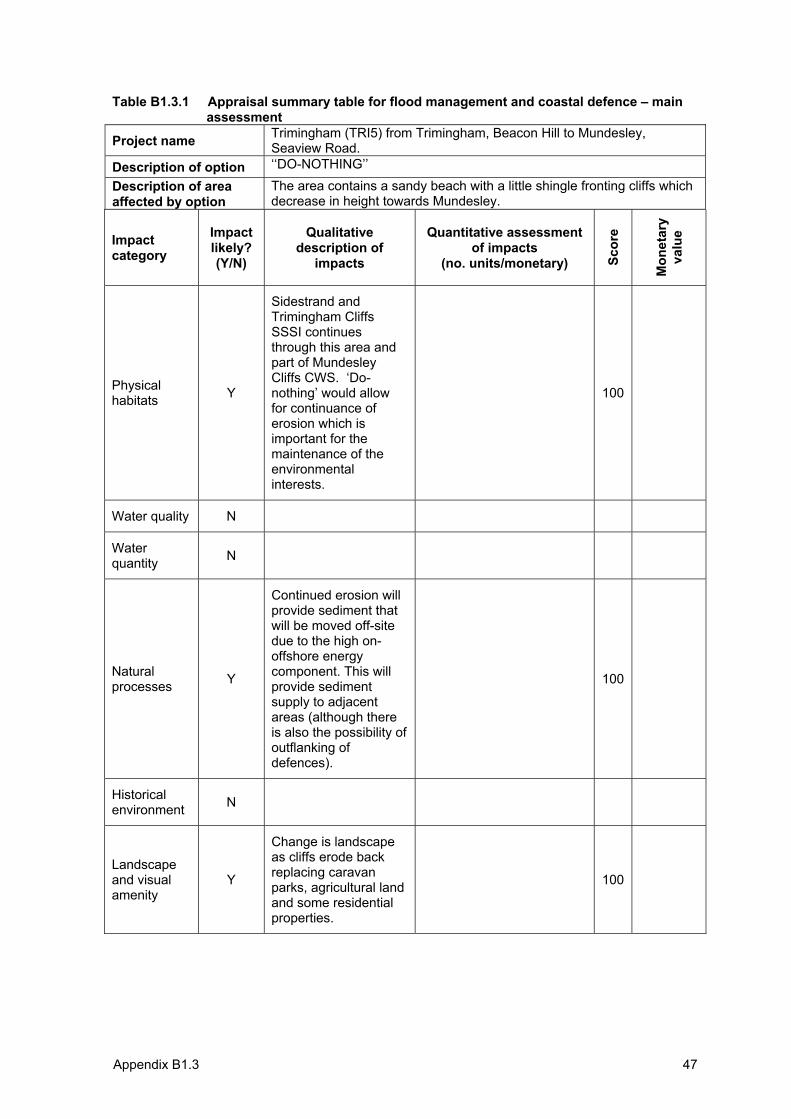
Appendix B1.3 47
Table B1.3.1 Appraisal summary table for flood management and coastal defence – main assessment
Project name Trimingham (TRI5) from Trimingham, Beacon Hill to Mundesley, Seaview Road.
Description of option ‘‘DO-NOTHING’’
Description of area affected by option
The area contains a sandy beach with a little shingle fronting cliffs which decrease in height towards Mundesley.
Impactcategory
Impactlikely? (Y/N)
Qualitative description of
impacts
Quantitative assessment of impacts
(no. units/monetary) Scor
e
Mon
etar
yva
lue
Physical habitats Y
Sidestrand and Trimingham Cliffs SSSI continues through this area and part of Mundesley Cliffs CWS. ‘Do-nothing’ would allow for continuance of erosion which is important for the maintenance of the environmentalinterests.
100
Water quality N
Waterquantity N
Naturalprocesses Y
Continued erosion will provide sediment that will be moved off-site due to the high on-offshore energy component. This will provide sediment supply to adjacent areas (although there is also the possibility of outflanking of defences).
100
Historicalenvironment N
Landscapeand visual amenity
Y
Change is landscape as cliffs erode back replacing caravan parks, agricultural land and some residential properties.
100
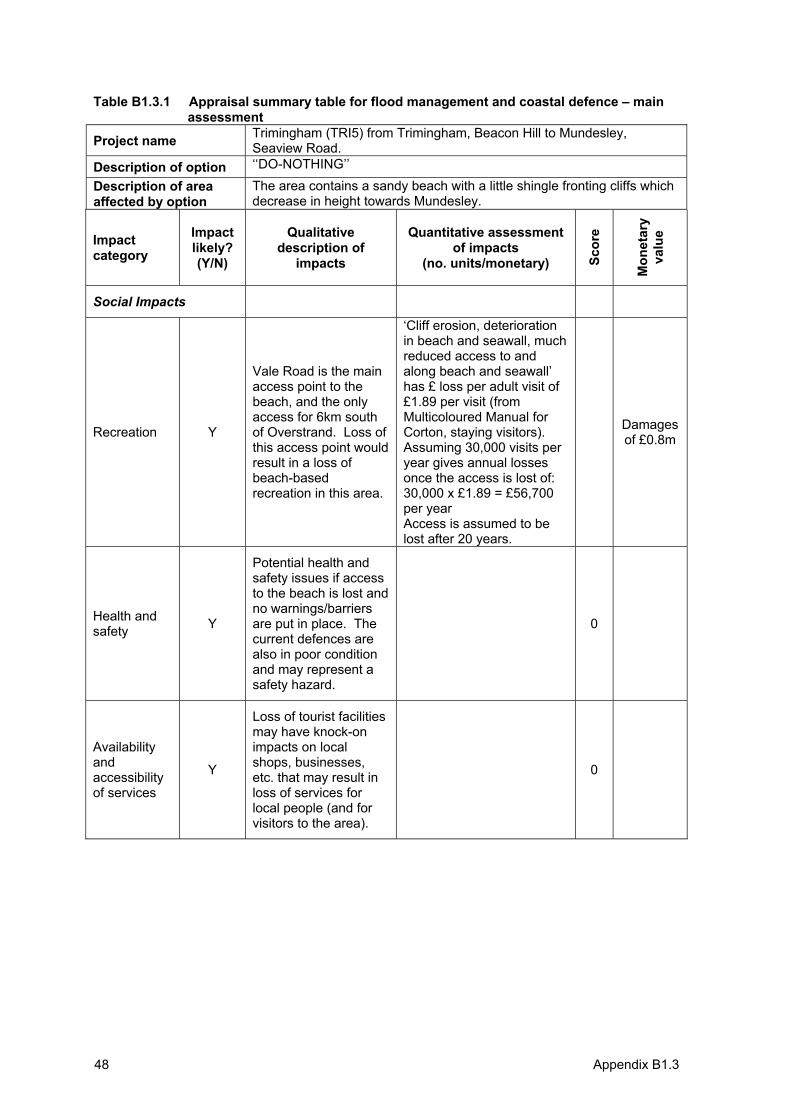
Appendix B1.3 48
Table B1.3.1 Appraisal summary table for flood management and coastal defence – main assessment
Project name Trimingham (TRI5) from Trimingham, Beacon Hill to Mundesley, Seaview Road.
Description of option ‘‘DO-NOTHING’’
Description of area affected by option
The area contains a sandy beach with a little shingle fronting cliffs which decrease in height towards Mundesley.
Impactcategory
Impactlikely? (Y/N)
Qualitative description of
impacts
Quantitative assessment of impacts
(no. units/monetary) Scor
e
Mon
etar
yva
lue
Social Impacts
Recreation Y
Vale Road is the main access point to the beach, and the only access for 6km south of Overstrand. Loss of this access point would result in a loss of beach-basedrecreation in this area.
‘Cliff erosion, deterioration in beach and seawall, much reduced access to and along beach and seawall’ has £ loss per adult visit of £1.89 per visit (from Multicoloured Manual for Corton, staying visitors). Assuming 30,000 visits per year gives annual losses once the access is lost of:30,000 x £1.89 = £56,700 per year Access is assumed to be lost after 20 years.
Damagesof £0.8m
Health and safety Y
Potential health and safety issues if access to the beach is lost and no warnings/barriers are put in place. The current defences are also in poor condition and may represent a safety hazard.
0
Availability andaccessibility of services
Y
Loss of tourist facilities may have knock-on impacts on local shops, businesses, etc. that may result in loss of services for local people (and for visitors to the area).
0
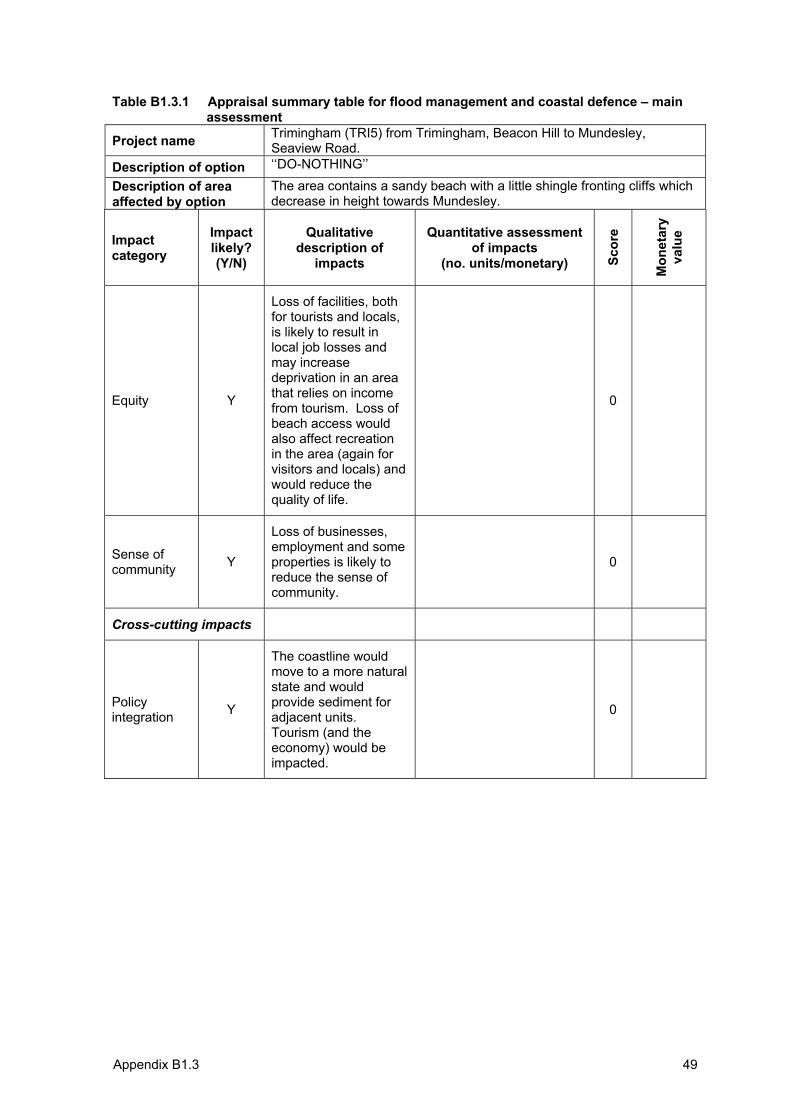
Appendix B1.3 49
Table B1.3.1 Appraisal summary table for flood management and coastal defence – main assessment
Project name Trimingham (TRI5) from Trimingham, Beacon Hill to Mundesley, Seaview Road.
Description of option ‘‘DO-NOTHING’’
Description of area affected by option
The area contains a sandy beach with a little shingle fronting cliffs which decrease in height towards Mundesley.
Impactcategory
Impactlikely? (Y/N)
Qualitative description of
impacts
Quantitative assessment of impacts
(no. units/monetary) Scor
e
Mon
etar
yva
lue
Equity Y
Loss of facilities, both for tourists and locals, is likely to result in local job losses and may increase deprivation in an area that relies on income from tourism. Loss of beach access would also affect recreation in the area (again for visitors and locals) and would reduce the quality of life.
0
Sense of community Y
Loss of businesses, employment and some properties is likely to reduce the sense of community.
0
Cross-cutting impacts
Policy integration Y
The coastline would move to a more natural state and would provide sediment for adjacent units.Tourism (and the economy) would be impacted.
0
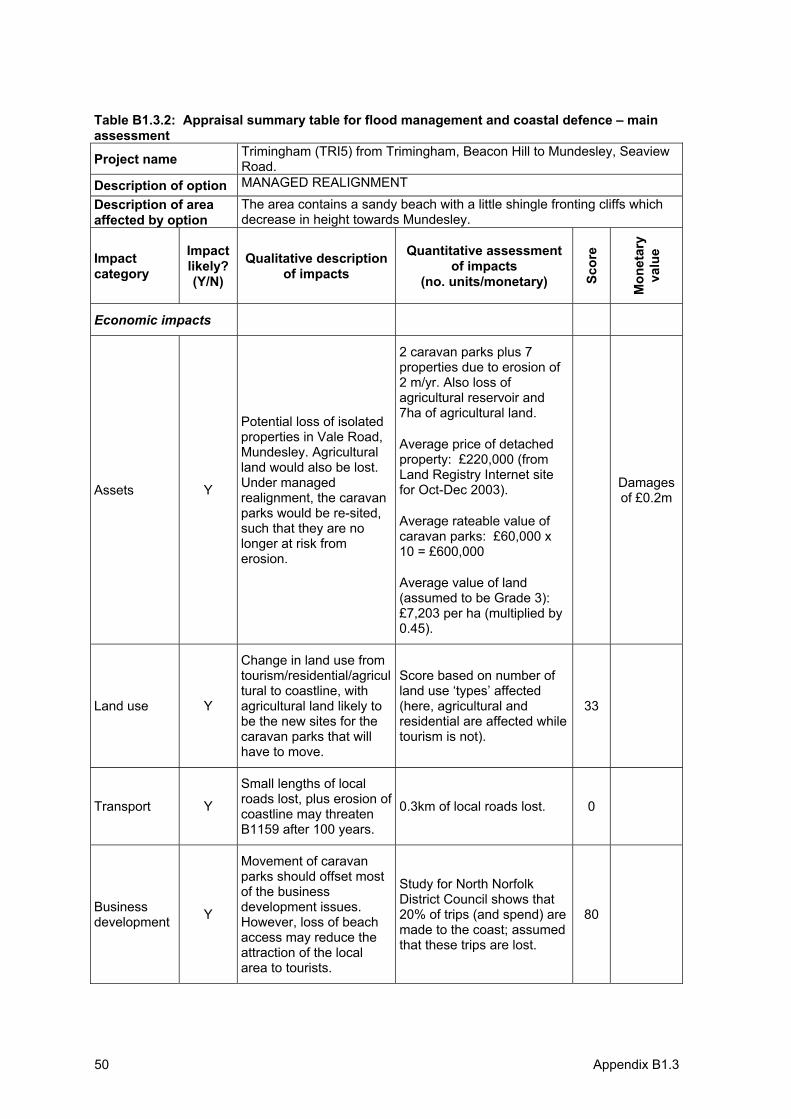
Appendix B1.3 50
Table B1.3.2: Appraisal summary table for flood management and coastal defence – main assessment
Project name Trimingham (TRI5) from Trimingham, Beacon Hill to Mundesley, Seaview Road.
Description of option MANAGED REALIGNMENT
Description of area affected by option
The area contains a sandy beach with a little shingle fronting cliffs which decrease in height towards Mundesley.
Impactcategory
Impactlikely? (Y/N)
Qualitative description of impacts
Quantitative assessment of impacts
(no. units/monetary) Scor
e
Mon
etar
yva
lue
Economic impacts
Assets Y
Potential loss of isolated properties in Vale Road, Mundesley. Agricultural land would also be lost.Under managed realignment, the caravan parks would be re-sited, such that they are no longer at risk from erosion.
2 caravan parks plus 7 properties due to erosion of 2 m/yr. Also loss of agricultural reservoir and 7ha of agricultural land.
Average price of detached property: £220,000 (from Land Registry Internet site for Oct-Dec 2003).
Average rateable value of caravan parks: £60,000 x 10 = £600,000
Average value of land (assumed to be Grade 3):£7,203 per ha (multiplied by 0.45).
Damagesof £0.2m
Land use Y
Change in land use from tourism/residential/agricultural to coastline, with agricultural land likely to be the new sites for the caravan parks that will have to move.
Score based on number of land use ‘types’ affected (here, agricultural and residential are affected while tourism is not).
33
Transport Y
Small lengths of local roads lost, plus erosion of coastline may threaten B1159 after 100 years.
0.3km of local roads lost. 0
Businessdevelopment Y
Movement of caravan parks should offset most of the business development issues.However, loss of beach access may reduce the attraction of the local area to tourists.
Study for North Norfolk District Council shows that 20% of trips (and spend) are made to the coast; assumed that these trips are lost.
80
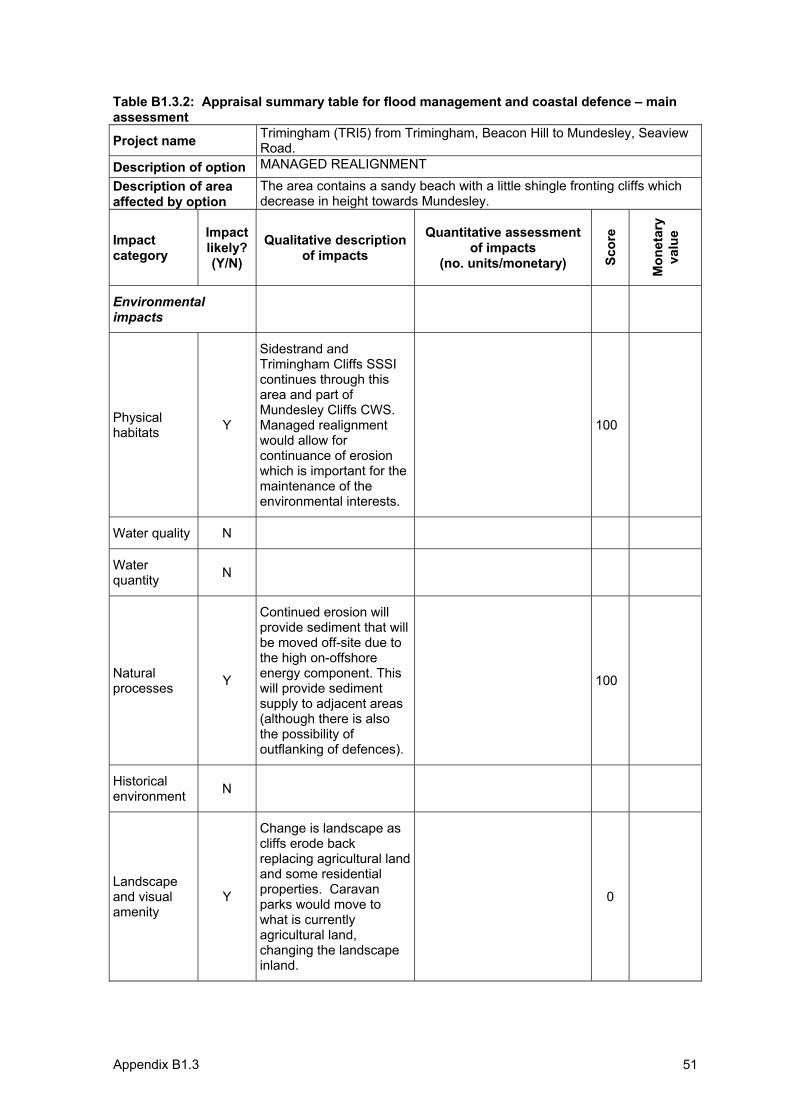
Appendix B1.3 51
Table B1.3.2: Appraisal summary table for flood management and coastal defence – main assessment
Project name Trimingham (TRI5) from Trimingham, Beacon Hill to Mundesley, Seaview Road.
Description of option MANAGED REALIGNMENT
Description of area affected by option
The area contains a sandy beach with a little shingle fronting cliffs which decrease in height towards Mundesley.
Impactcategory
Impactlikely? (Y/N)
Qualitative description of impacts
Quantitative assessment of impacts
(no. units/monetary) Scor
e
Mon
etar
yva
lue
Environmentalimpacts
Physical habitats Y
Sidestrand and Trimingham Cliffs SSSI continues through this area and part of Mundesley Cliffs CWS. Managed realignment would allow for continuance of erosion which is important for the maintenance of the environmental interests.
100
Water quality N
Waterquantity N
Naturalprocesses Y
Continued erosion will provide sediment that will be moved off-site due to the high on-offshore energy component. This will provide sediment supply to adjacent areas (although there is also the possibility of outflanking of defences).
100
Historicalenvironment N
Landscapeand visual amenity
Y
Change is landscape as cliffs erode back replacing agricultural land and some residential properties. Caravan parks would move to what is currently agricultural land, changing the landscape inland.
0
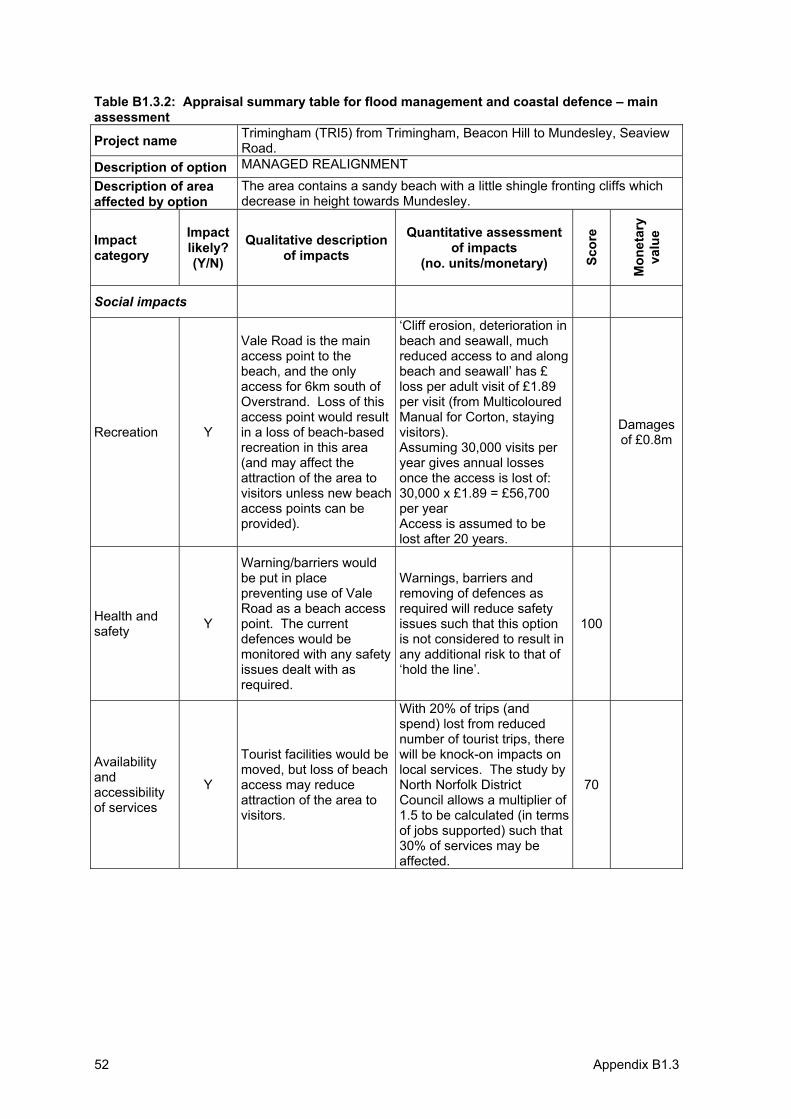
Appendix B1.3 52
Table B1.3.2: Appraisal summary table for flood management and coastal defence – main assessment
Project name Trimingham (TRI5) from Trimingham, Beacon Hill to Mundesley, Seaview Road.
Description of option MANAGED REALIGNMENT
Description of area affected by option
The area contains a sandy beach with a little shingle fronting cliffs which decrease in height towards Mundesley.
Impactcategory
Impactlikely? (Y/N)
Qualitative description of impacts
Quantitative assessment of impacts
(no. units/monetary) Scor
e
Mon
etar
yva
lue
Social impacts
Recreation Y
Vale Road is the main access point to the beach, and the only access for 6km south of Overstrand. Loss of this access point would result in a loss of beach-based recreation in this area (and may affect the attraction of the area to visitors unless new beach access points can be provided).
‘Cliff erosion, deterioration in beach and seawall, much reduced access to and along beach and seawall’ has £ loss per adult visit of £1.89 per visit (from Multicoloured Manual for Corton, staying visitors).Assuming 30,000 visits per year gives annual losses once the access is lost of:30,000 x £1.89 = £56,700 per year Access is assumed to be lost after 20 years.
Damagesof £0.8m
Health and safety Y
Warning/barriers would be put in place preventing use of Vale Road as a beach access point. The current defences would be monitored with any safety issues dealt with as required.
Warnings, barriers and removing of defences as required will reduce safety issues such that this option is not considered to result in any additional risk to that of ‘hold the line’.
100
Availability andaccessibility of services
Y
Tourist facilities would be moved, but loss of beach access may reduce attraction of the area to visitors.
With 20% of trips (and spend) lost from reduced number of tourist trips, there will be knock-on impacts on local services. The study by North Norfolk District Council allows a multiplier of 1.5 to be calculated (in terms of jobs supported) such that 30% of services may be affected.
70
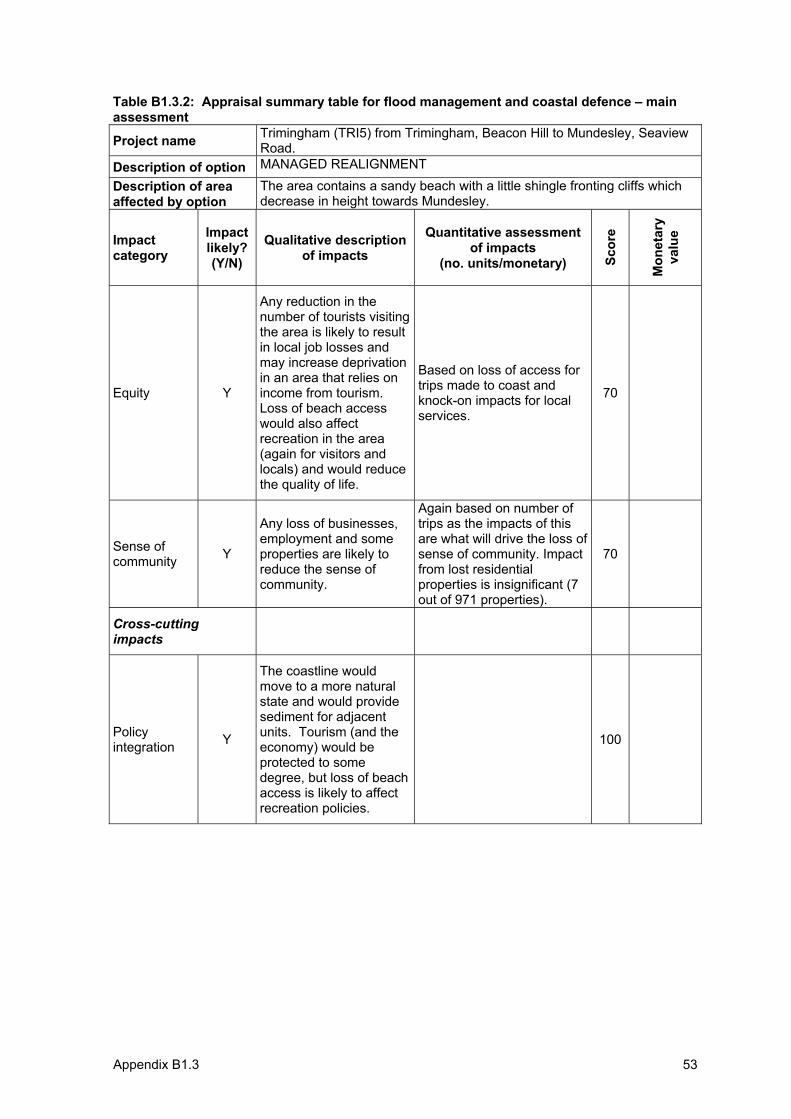
Appendix B1.3 53
Table B1.3.2: Appraisal summary table for flood management and coastal defence – main assessment
Project name Trimingham (TRI5) from Trimingham, Beacon Hill to Mundesley, Seaview Road.
Description of option MANAGED REALIGNMENT
Description of area affected by option
The area contains a sandy beach with a little shingle fronting cliffs which decrease in height towards Mundesley.
Impactcategory
Impactlikely? (Y/N)
Qualitative description of impacts
Quantitative assessment of impacts
(no. units/monetary) Scor
e
Mon
etar
yva
lue
Equity Y
Any reduction in the number of tourists visiting the area is likely to result in local job losses and may increase deprivation in an area that relies on income from tourism. Loss of beach access would also affect recreation in the area (again for visitors and locals) and would reduce the quality of life.
Based on loss of access for trips made to coast and knock-on impacts for local services.
70
Sense of community Y
Any loss of businesses, employment and some properties are likely to reduce the sense of community.
Again based on number of trips as the impacts of this are what will drive the loss of sense of community. Impact from lost residential properties is insignificant (7 out of 971 properties).
70
Cross-cuttingimpacts
Policy integration Y
The coastline would move to a more natural state and would provide sediment for adjacent units. Tourism (and the economy) would be protected to some degree, but loss of beach access is likely to affect recreation policies.
100
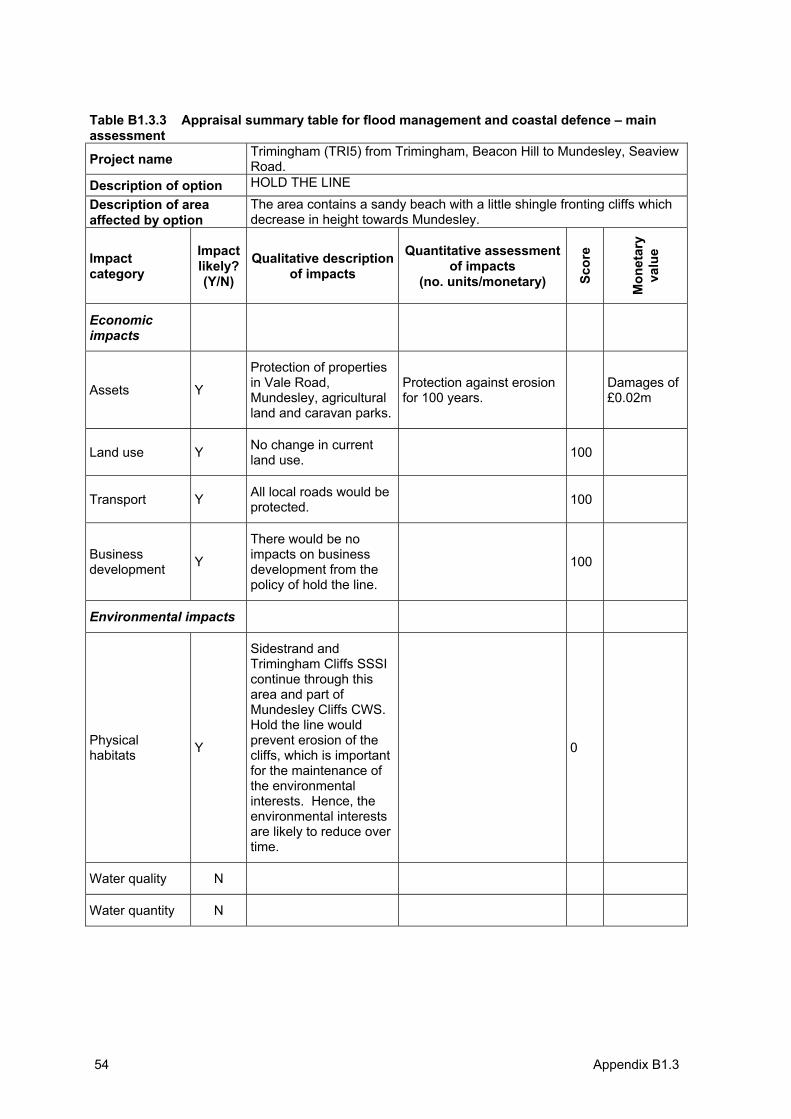
Appendix B1.3 54
Table B1.3.3 Appraisal summary table for flood management and coastal defence – main assessment
Project name Trimingham (TRI5) from Trimingham, Beacon Hill to Mundesley, Seaview Road.
Description of option HOLD THE LINE
Description of area affected by option
The area contains a sandy beach with a little shingle fronting cliffs which decrease in height towards Mundesley.
Impactcategory
Impactlikely? (Y/N)
Qualitative description of impacts
Quantitative assessment of impacts
(no. units/monetary) Scor
e
Mon
etar
yva
lue
Economicimpacts
Assets Y
Protection of properties in Vale Road, Mundesley, agricultural land and caravan parks.
Protection against erosion for 100 years.
Damages of £0.02m
Land use Y No change in current land use. 100
Transport Y All local roads would be protected. 100
Businessdevelopment Y
There would be no impacts on business development from the policy of hold the line.
100
Environmental impacts
Physical habitats Y
Sidestrand and Trimingham Cliffs SSSI continue through this area and part of Mundesley Cliffs CWS. Hold the line would prevent erosion of the cliffs, which is important for the maintenance of the environmental interests. Hence, the environmental interests are likely to reduce over time.
0
Water quality N
Water quantity N
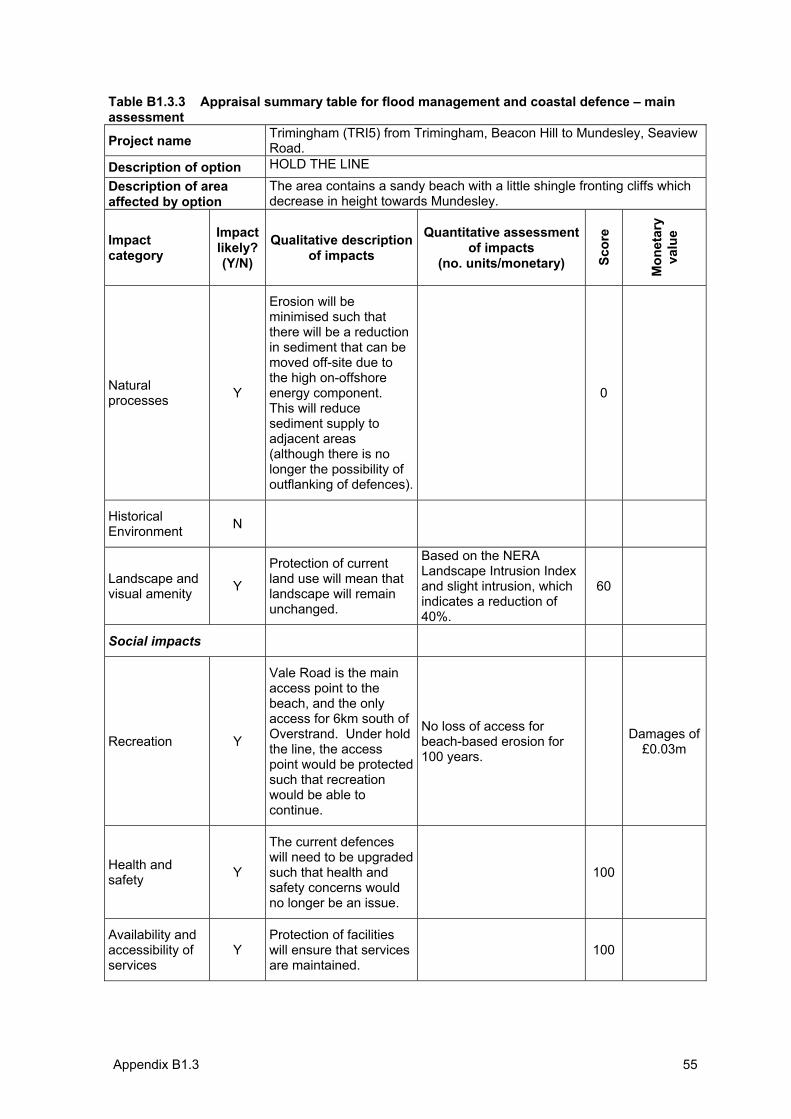
Appendix B1.3 55
Table B1.3.3 Appraisal summary table for flood management and coastal defence – main assessment
Project name Trimingham (TRI5) from Trimingham, Beacon Hill to Mundesley, Seaview Road.
Description of option HOLD THE LINE
Description of area affected by option
The area contains a sandy beach with a little shingle fronting cliffs which decrease in height towards Mundesley.
Impactcategory
Impactlikely? (Y/N)
Qualitative description of impacts
Quantitative assessment of impacts
(no. units/monetary) Scor
e
Mon
etar
yva
lue
Naturalprocesses Y
Erosion will be minimised such that there will be a reduction in sediment that can be moved off-site due to the high on-offshore energy component.This will reduce sediment supply to adjacent areas (although there is no longer the possibility of outflanking of defences).
0
HistoricalEnvironment N
Landscape and visual amenity Y
Protection of current land use will mean that landscape will remain unchanged.
Based on the NERA Landscape Intrusion Index and slight intrusion, which indicates a reduction of 40%.
60
Social impacts
Recreation Y
Vale Road is the main access point to the beach, and the only access for 6km south of Overstrand. Under hold the line, the access point would be protected such that recreation would be able to continue.
No loss of access for beach-based erosion for 100 years.
Damages of £0.03m
Health and safety Y
The current defences will need to be upgraded such that health and safety concerns would no longer be an issue.
100
Availability and accessibility of services
YProtection of facilities will ensure that services are maintained.
100
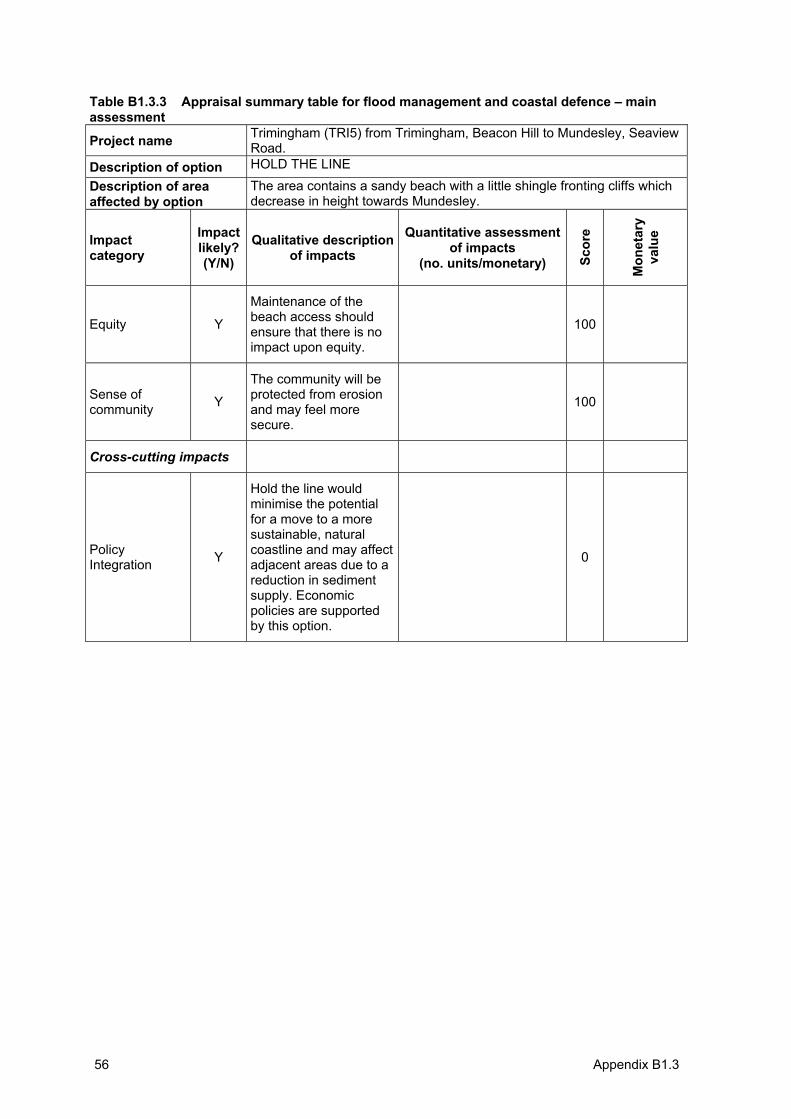
Appendix B1.3 56
Table B1.3.3 Appraisal summary table for flood management and coastal defence – main assessment
Project name Trimingham (TRI5) from Trimingham, Beacon Hill to Mundesley, Seaview Road.
Description of option HOLD THE LINE
Description of area affected by option
The area contains a sandy beach with a little shingle fronting cliffs which decrease in height towards Mundesley.
Impactcategory
Impactlikely? (Y/N)
Qualitative description of impacts
Quantitative assessment of impacts
(no. units/monetary) Scor
e
Mon
etar
yva
lue
Equity Y
Maintenance of the beach access should ensure that there is no impact upon equity.
100
Sense of community Y
The community will be protected from erosion and may feel more secure.
100
Cross-cutting impacts
Policy Integration Y
Hold the line would minimise the potential for a move to a more sustainable, natural coastline and may affect adjacent areas due to a reduction in sediment supply. Economic policies are supported by this option.
0
Appendix B1.4 57
Appendix B1.4:
Appraisal summary table for main assessment – MA-AST for Kelling Hard to Lowestoft Ness SMP –Winterton Frontage
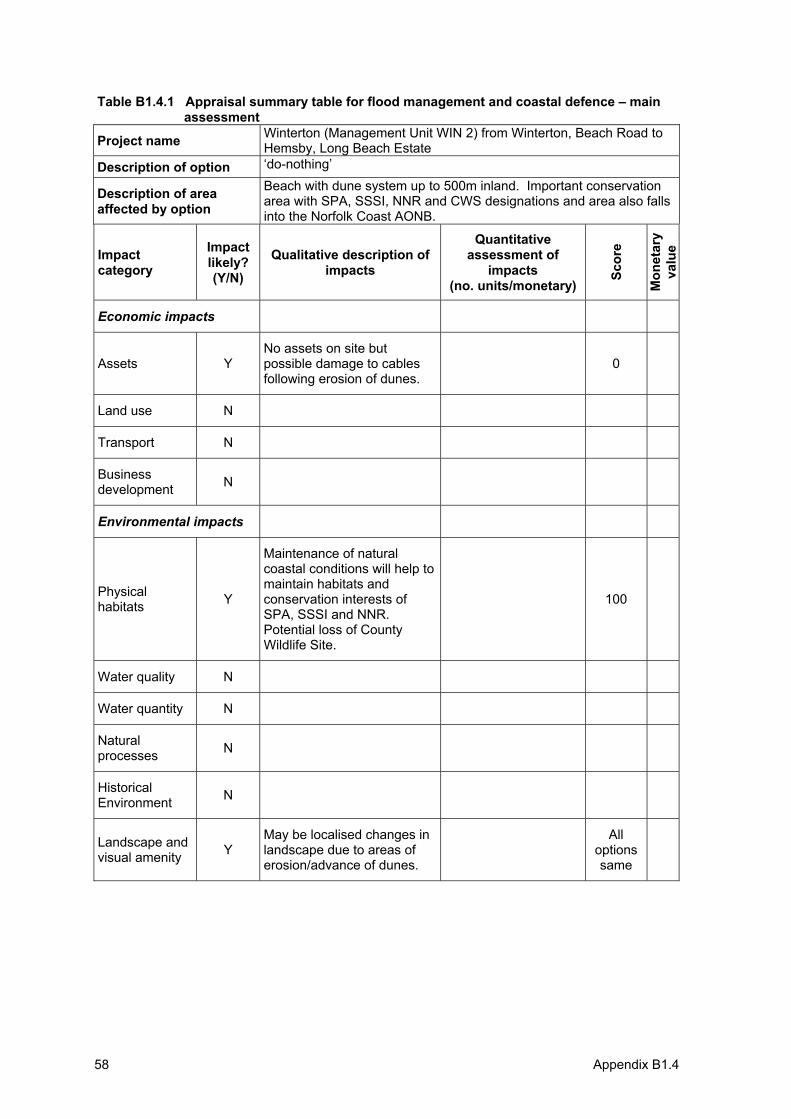
Appendix B1.4 58
Table B1.4.1 Appraisal summary table for flood management and coastal defence – main assessment
Project name Winterton (Management Unit WIN 2) from Winterton, Beach Road to Hemsby, Long Beach Estate
Description of option ‘do-nothing’
Description of area affected by option
Beach with dune system up to 500m inland. Important conservation area with SPA, SSSI, NNR and CWS designations and area also falls into the Norfolk Coast AONB.
Impactcategory
Impactlikely? (Y/N)
Qualitative description of impacts
Quantitative assessment of
impacts(no. units/monetary)
Scor
e
Mon
etar
yva
lue
Economic impacts
Assets YNo assets on site but possible damage to cables following erosion of dunes.
0
Land use N
Transport N
Businessdevelopment N
Environmental impacts
Physical habitats Y
Maintenance of natural coastal conditions will help to maintain habitats and conservation interests of SPA, SSSI and NNR. Potential loss of County Wildlife Site.
100
Water quality N
Water quantity N
Naturalprocesses N
HistoricalEnvironment N
Landscape and visual amenity Y
May be localised changes in landscape due to areas of erosion/advance of dunes.
Alloptionssame
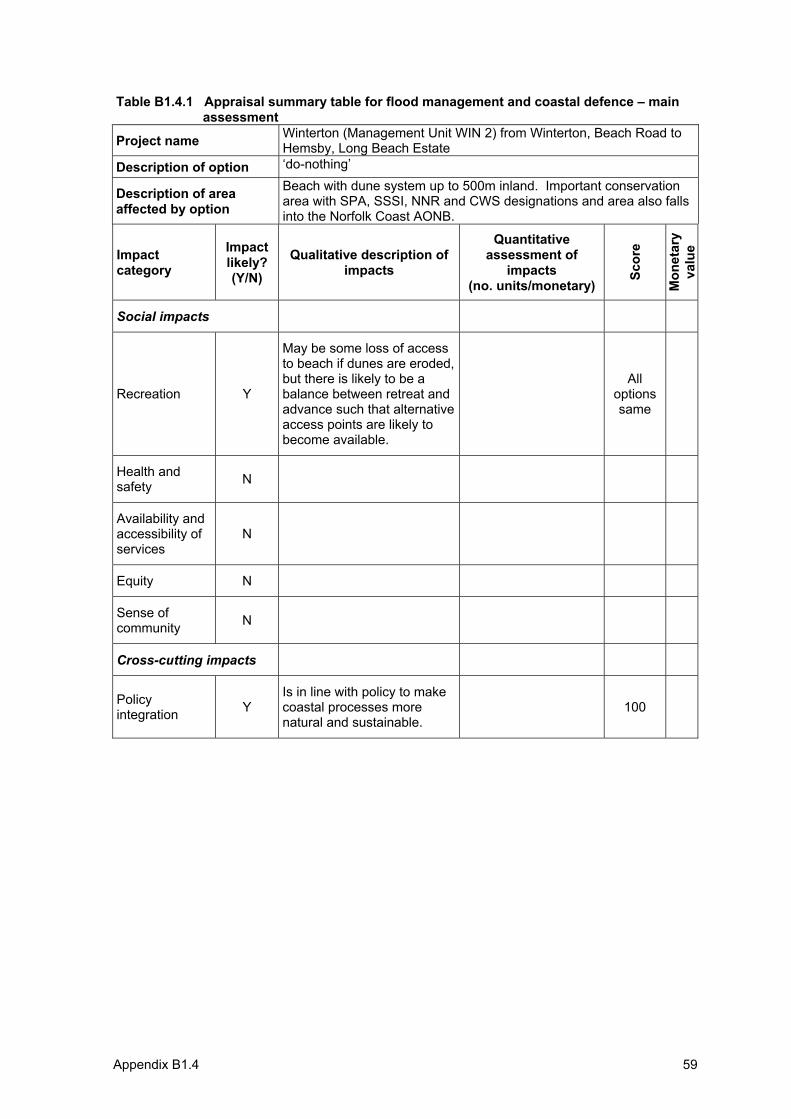
Appendix B1.4 59
Table B1.4.1 Appraisal summary table for flood management and coastal defence – main assessment
Project name Winterton (Management Unit WIN 2) from Winterton, Beach Road to Hemsby, Long Beach Estate
Description of option ‘do-nothing’
Description of area affected by option
Beach with dune system up to 500m inland. Important conservation area with SPA, SSSI, NNR and CWS designations and area also falls into the Norfolk Coast AONB.
Impactcategory
Impactlikely? (Y/N)
Qualitative description of impacts
Quantitative assessment of
impacts(no. units/monetary)
Scor
e
Mon
etar
yva
lue
Social impacts
Recreation Y
May be some loss of access to beach if dunes are eroded, but there is likely to be a balance between retreat and advance such that alternative access points are likely to become available.
Alloptionssame
Health and safety N
Availability and accessibility of services
N
Equity N
Sense of community N
Cross-cutting impacts
Policy integration Y
Is in line with policy to make coastal processes more natural and sustainable.
100
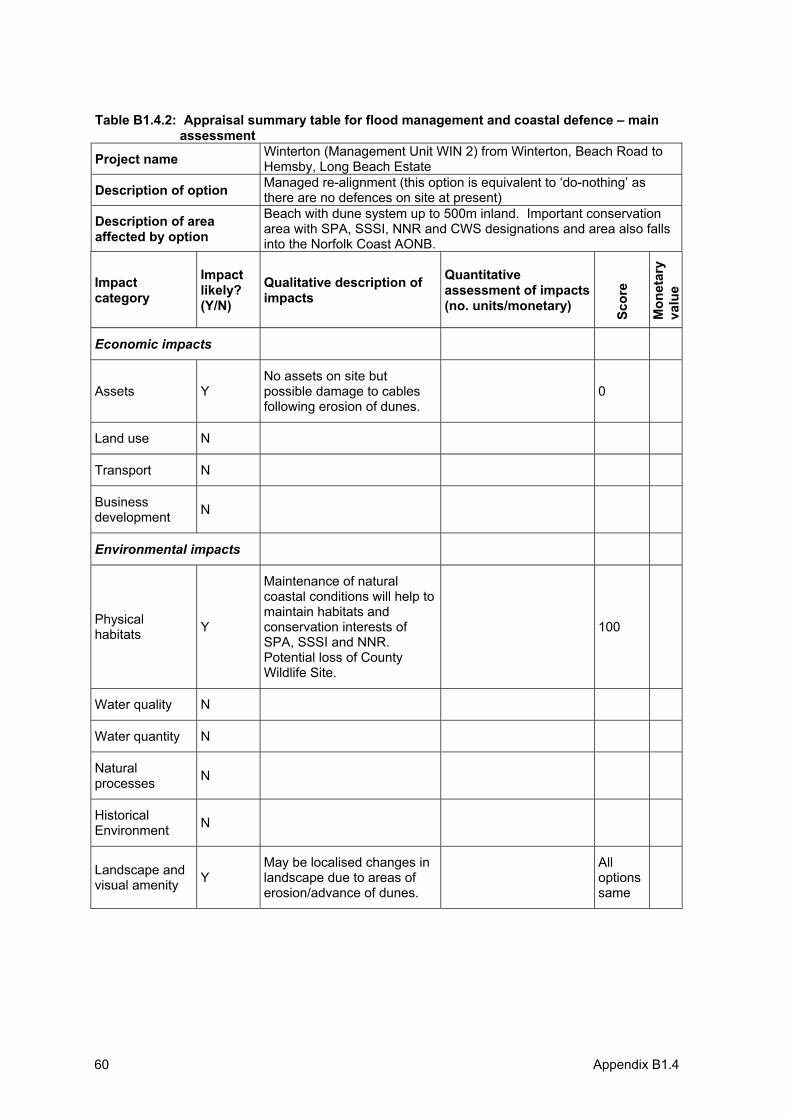
Appendix B1.4 60
Table B1.4.2: Appraisal summary table for flood management and coastal defence – main assessment
Project name Winterton (Management Unit WIN 2) from Winterton, Beach Road to Hemsby, Long Beach Estate
Description of option Managed re-alignment (this option is equivalent to ‘do-nothing’ as there are no defences on site at present)
Description of area affected by option
Beach with dune system up to 500m inland. Important conservation area with SPA, SSSI, NNR and CWS designations and area also falls into the Norfolk Coast AONB.
Impactcategory
Impactlikely? (Y/N)
Qualitative description of impacts
Quantitative assessment of impacts (no. units/monetary)
Scor
e
Mon
etar
yva
lue
Economic impacts
Assets YNo assets on site but possible damage to cables following erosion of dunes.
0
Land use N
Transport N
Businessdevelopment N
Environmental impacts
Physical habitats Y
Maintenance of natural coastal conditions will help to maintain habitats and conservation interests of SPA, SSSI and NNR. Potential loss of County Wildlife Site.
100
Water quality N
Water quantity N
Naturalprocesses N
HistoricalEnvironment N
Landscape and visual amenity Y
May be localised changes in landscape due to areas of erosion/advance of dunes.
Alloptionssame
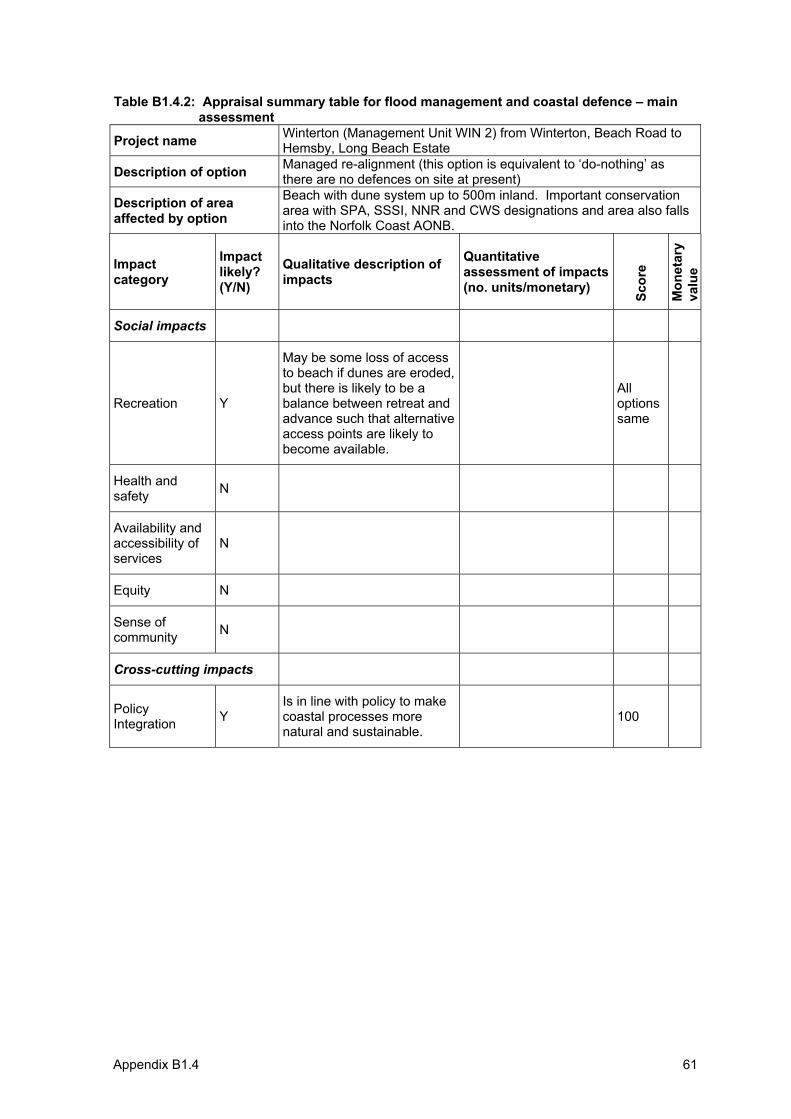
Appendix B1.4 61
Table B1.4.2: Appraisal summary table for flood management and coastal defence – main assessment
Project name Winterton (Management Unit WIN 2) from Winterton, Beach Road to Hemsby, Long Beach Estate
Description of option Managed re-alignment (this option is equivalent to ‘do-nothing’ as there are no defences on site at present)
Description of area affected by option
Beach with dune system up to 500m inland. Important conservation area with SPA, SSSI, NNR and CWS designations and area also falls into the Norfolk Coast AONB.
Impactcategory
Impactlikely? (Y/N)
Qualitative description of impacts
Quantitative assessment of impacts (no. units/monetary)
Scor
e
Mon
etar
yva
lue
Social impacts
Recreation Y
May be some loss of access to beach if dunes are eroded, but there is likely to be a balance between retreat and advance such that alternative access points are likely to become available.
Alloptionssame
Health and safety N
Availability and accessibility of services
N
Equity N
Sense of community N
Cross-cutting impacts
Policy Integration Y
Is in line with policy to make coastal processes more natural and sustainable.
100
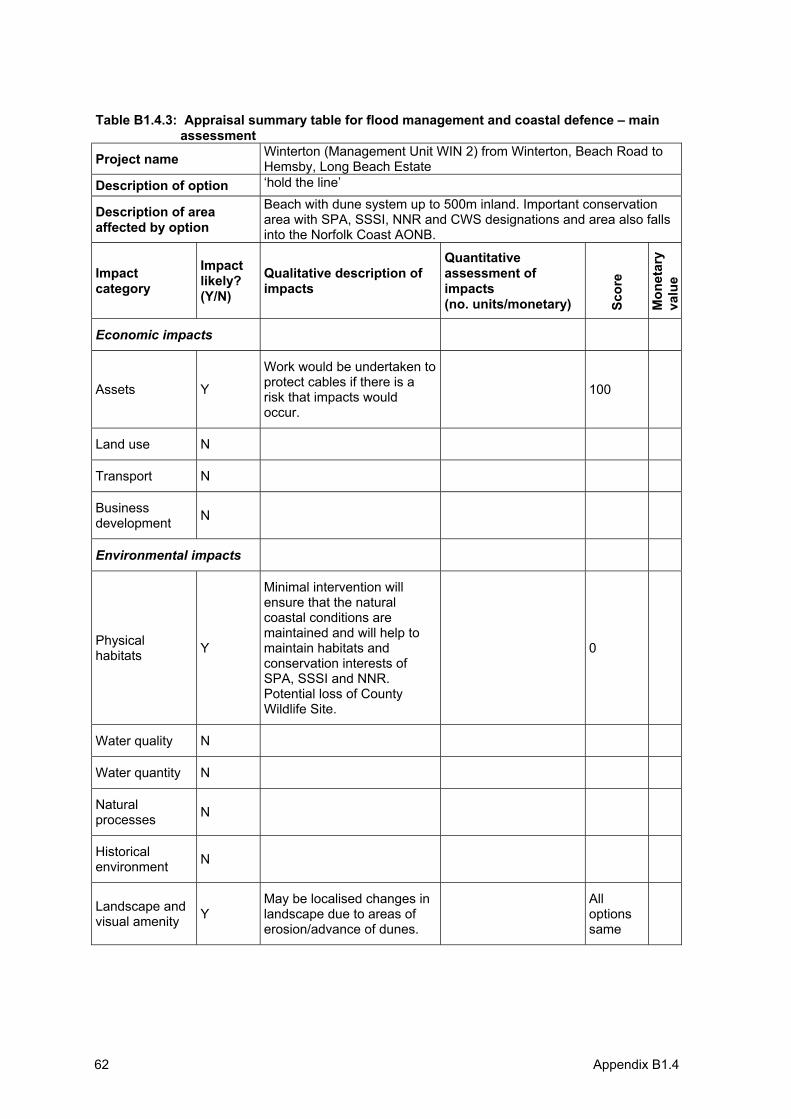
Appendix B1.4 62
Table B1.4.3: Appraisal summary table for flood management and coastal defence – main assessment
Project name Winterton (Management Unit WIN 2) from Winterton, Beach Road to Hemsby, Long Beach Estate
Description of option ‘hold the line’
Description of area affected by option
Beach with dune system up to 500m inland. Important conservation area with SPA, SSSI, NNR and CWS designations and area also falls into the Norfolk Coast AONB.
Impactcategory
Impactlikely? (Y/N)
Qualitative description of impacts
Quantitative assessment of impacts(no. units/monetary) Sc
ore
Mon
etar
yva
lue
Economic impacts
Assets Y
Work would be undertaken to protect cables if there is a risk that impacts would occur.
100
Land use N
Transport N
Businessdevelopment N
Environmental impacts
Physical habitats Y
Minimal intervention will ensure that the natural coastal conditions are maintained and will help to maintain habitats and conservation interests of SPA, SSSI and NNR. Potential loss of County Wildlife Site.
0
Water quality N
Water quantity N
Naturalprocesses N
Historicalenvironment N
Landscape and visual amenity Y
May be localised changes in landscape due to areas of erosion/advance of dunes.
Alloptionssame
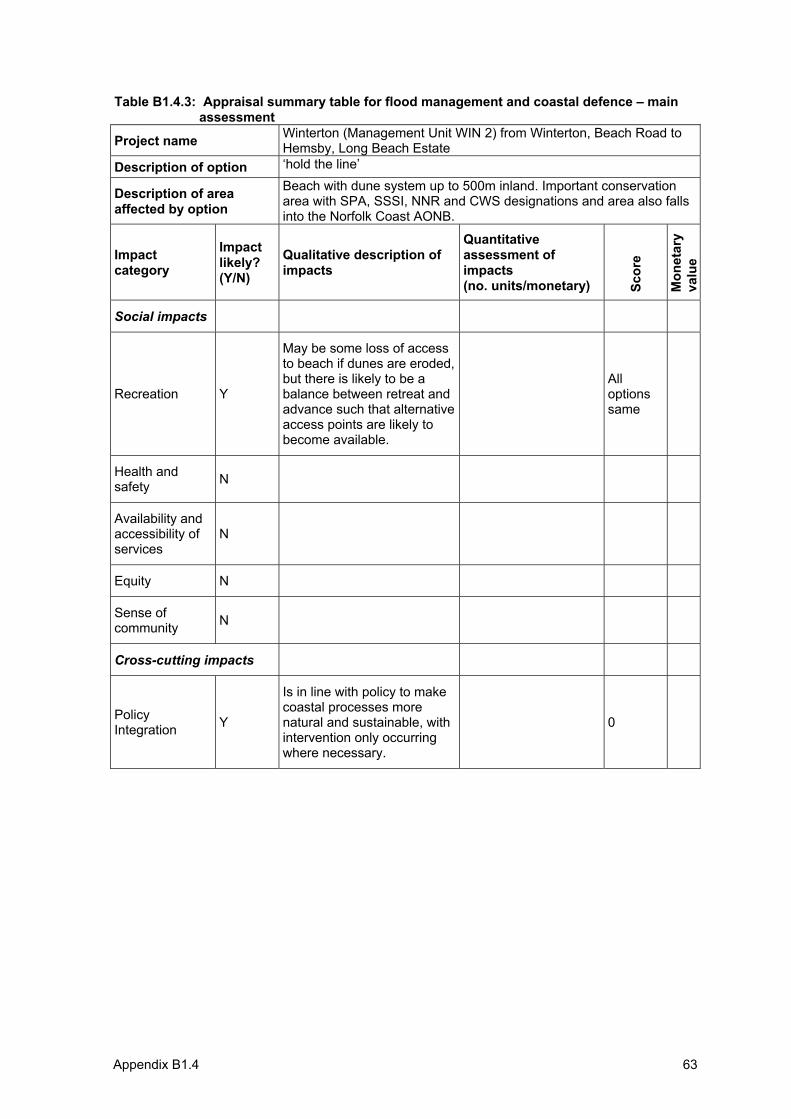
Appendix B1.4 63
Table B1.4.3: Appraisal summary table for flood management and coastal defence – main assessment
Project name Winterton (Management Unit WIN 2) from Winterton, Beach Road to Hemsby, Long Beach Estate
Description of option ‘hold the line’
Description of area affected by option
Beach with dune system up to 500m inland. Important conservation area with SPA, SSSI, NNR and CWS designations and area also falls into the Norfolk Coast AONB.
Impactcategory
Impactlikely? (Y/N)
Qualitative description of impacts
Quantitative assessment of impacts(no. units/monetary) Sc
ore
Mon
etar
yva
lue
Social impacts
Recreation Y
May be some loss of access to beach if dunes are eroded, but there is likely to be a balance between retreat and advance such that alternative access points are likely to become available.
Alloptionssame
Health and safety N
Availability and accessibility of services
N
Equity N
Sense of community N
Cross-cutting impacts
Policy Integration Y
Is in line with policy to make coastal processes more natural and sustainable, with intervention only occurring where necessary.
0
Joint Defra/EA Flood and Coastal Erosion Risk Management R&D Programme
Annex B.2:
Case study no.2:
Assessment of the Pagham to East Head coastal defence strategy
R&D Project Record FD2013/PR2
Produced: November 2004

ii
Statement of use This report provides guidance on the use of MCA and ASTs to assist in the appraisal of flood and coastal erosion risk management projects, strategies and policies. It should be noted that it does not constitute official government policy or guidance, which is unlikely to be available until work to develop the methodology and identify appropriate sources of data has been undertaken through pilot studies.
This report may be downloaded from the Defra/EA R&D Programme website (http://www.defra.gov.uk/environ.fcd/research), use the search tool located on the project information and publications page. Copies are held by all EA Regional Information Centres, contact The Environment Agency’s National Customer Contact Centre by emailing [email protected] or by telephoning 08708506506.
Dissemination Status Internal: Released internally External: Released to public domain
Keywords: Multi criteria analysis, MCA, appraisal summary table, AST, decision rule
Research contractor contact details: Lead contractor: Risk & Policy Analysts Ltd (RPA), Farthing Green House, 1 Beccles Road, Loddon, Norfolk, NR14 6LT (Tel: 01508 528465; Fax: 01508 520758; www.rpaltd.co.uk). The project director was Meg Postle, the project manager for RPA was John Ash with research support from Susana Dias and other members of RPA staff.
The research team also included: Colin Green (Flood Hazard Research Centre, Middlesex University); Alan Pearman (University of Leeds); Ron Janssen (The Institute of Environmental Studies, Free University, Amsterdam), Terry Oakes and Hugh Payne (Independent Consultants)
Acknowledgements The assistance of those providing information for the case studies is gratefully acknowledged.
Defra project manager: Matt Crossman, Defra, 3D Ergon House, Horseferry Rd, London, SW1P 2AL. Email: [email protected]
Publishing organisation DefraFlood Management Division Ergon House Horseferry Road London SW1P 2AL Tel: 020 7238 3000 Fax: 020 7238 6187 www.defra.gov.uk/environ/fcd
â Crown copyright (Defra); 2005
Copyright in the typographical arrangement and design rests with the Crown. This publication (excluding the logo) may be reproduced free of charge in any format or medium provided that it is reproduced accurately and not used in a misleading context. The material must be acknowledged as Crown copyright with the title and source of the publication specified. The views expressed in this document are not necessarily those of Defra or the Environment Agency. Its officers, servants or agents accept no liability whatsoever for any loss or damage arising from the interpretation or use of the information, or reliance on views contained herein.
Published by the Department for Environment, Food and Rural Affairs. Printed in the UK, March 2005 on recycled material containing 80% post-consumer waste and 20% totally chlorine free virgin pulp.
PB No. 10734/PR2 ISBN 0-85521-146-6
Section 1: Introduction 1
1. Introduction
1.1 Overview
This report presents the MCA-based project appraisal process for part of the Pagham to East Head Coastal Defence Strategy. This strategy assessment was based on the original appraisal process - The Pagham to East Head Coastal Defence Strategy - carried out by the Environment Agency (EA), Chichester District Council and Arun District Council in 2001. The Pagham to East Head Coastal Defence Strategy has been revised since then.
The information reported here is based on the following documents:
• Pagham to East Head Coastal Defence Strategy - main document; and • Pagham to East Head Coastal Defence Strategy - annexes
A significant amount of information was provided for this case study, including the several amended versions of the strategy appraisal.
The coastal defence strategy area extends from Pagham Beach in the east to East Head in the west, covering a distance of approximately 21km of open coastline. It also includes Pagham Harbour, which contains approximately 7.5km of enclosed shoreline.
The study frontage can be broadly described, from east to west, by the following coastal features:
• extensive shingle beaches, banks and spits at the mouth of Pagham Harbour;
• extensive areas of mudflats and saltmarsh surrounded by brackish marsh and pasture in Pagham Harbour;
• shingle beaches with coastal defences fronting extensive residential development at Selsey;
• shingle beaches and banks fronting an extensive area of low lying land used for agricultural and recreational purposes at Medmerry;
• extensive shingle beaches fronting East Wittering; • extensive shingle beach with high quality and high value residential
development along the Cakeham Frontage; and • dynamic dune/shingle system with coastal flora and fauna at East Head.
For the original appraisal process, the coastal strip was divided into seven management units (MU - discrete lengths of coastline that possess similar characteristics in terms of natural coastal processes and land use) that in turn were subdivided into operational units (OU). A summary of the management units and operational units is given in Table 1.1.
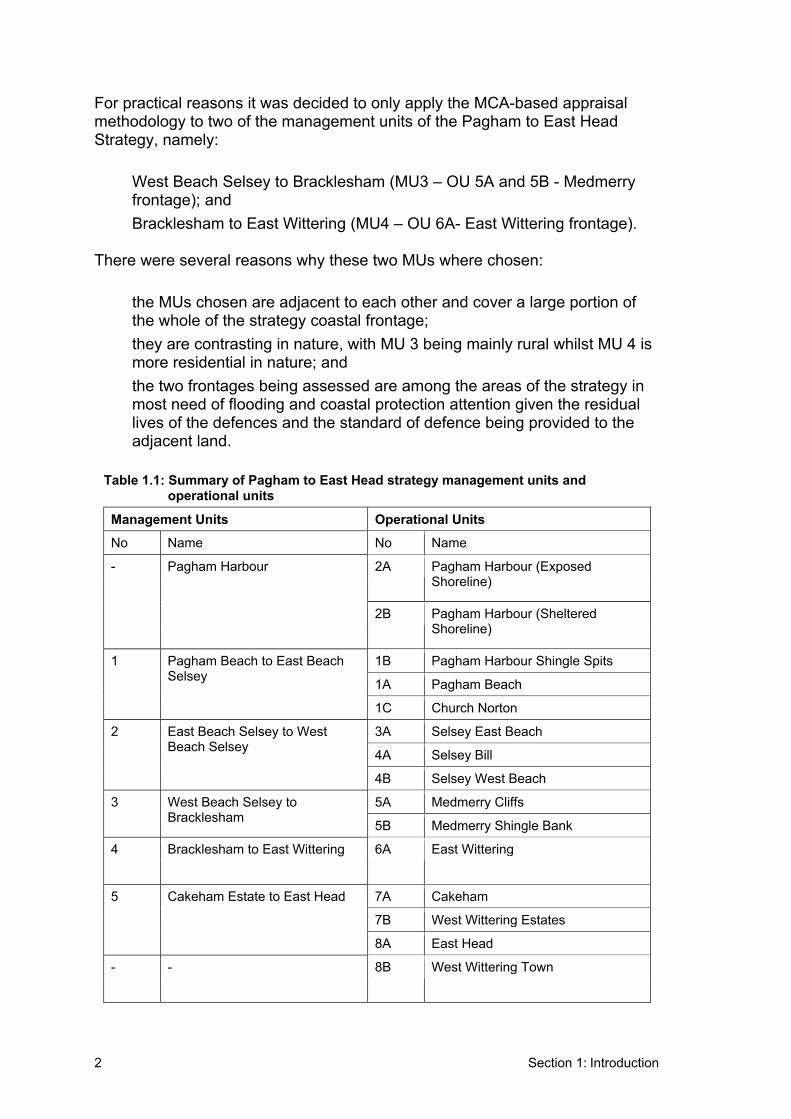
2 Section 1: Introduction
For practical reasons it was decided to only apply the MCA-based appraisal methodology to two of the management units of the Pagham to East Head Strategy, namely:
• West Beach Selsey to Bracklesham (MU3 – OU 5A and 5B - Medmerry frontage); and
• Bracklesham to East Wittering (MU4 – OU 6A- East Wittering frontage).
There were several reasons why these two MUs where chosen:
• the MUs chosen are adjacent to each other and cover a large portion of the whole of the strategy coastal frontage;
• they are contrasting in nature, with MU 3 being mainly rural whilst MU 4 is more residential in nature; and
• the two frontages being assessed are among the areas of the strategy in most need of flooding and coastal protection attention given the residual lives of the defences and the standard of defence being provided to the adjacent land.
Table 1.1: Summary of Pagham to East Head strategy management units and operational units
Management Units Operational Units
No Name No Name
2A Pagham Harbour (Exposed Shoreline)
- Pagham Harbour
2B Pagham Harbour (Sheltered Shoreline)
1B Pagham Harbour Shingle Spits
1A Pagham Beach
1 Pagham Beach to East Beach Selsey
1C Church Norton
3A Selsey East Beach
4A Selsey Bill
2 East Beach Selsey to West Beach Selsey
4B Selsey West Beach
5A Medmerry Cliffs 3 West Beach Selsey to Bracklesham 5B Medmerry Shingle Bank
4 Bracklesham to East Wittering 6A East Wittering
7A Cakeham
7B West Wittering Estates
5 Cakeham Estate to East Head
8A East Head
- - 8B West Wittering Town
Section 1: Introduction 3
1.2 Summary of the project area
From East Head to Selsey Bill Peninsula the coastline is dominated by the broad sweep of Bracklesham Bay. The predominantly flint gravel beach that runs along the entire frontage is punctuated by the built up frontage of East Wittering, where the extensive sea walls and defences protect the town from erosion. The shingle ridge running from East Wittering to West Selsey provides expansive views across low-lying grade 3 agricultural land (Medmerry frontage), in its majority arable or improved grassland, although an area of semi-improved grassland lies adjacent to the coastline. Former marsh and intertidal land, this largely treeless area is now crossed by a network of drainage ditches feeding into Broad Rife, the main dyke that eventually flows into Pagham Harbour.Based on the Environment Agency classification systems, the stretch of the Broad Rife between the Selsey Sewage Treatment Works and Northcommon Farm has a “poor” chemical quality and a biological class of B (good).
At both its eastern and western edges this agricultural landscape is interrupted by tourism development. Holiday sites and caravans lie behind the sea defences along the western extent of the Medmerry frontage, and at the eastern end of East Wittering (at the eastern end of Medmerry frontage).
It is in this setting that the two management units being appraised in this case study are situated, Medmerry and East Wittering Frontage.
1.2.1 Medmerry Frontage
Operational Units 5A and 5B (MU 3) cover the stretch of coastline between Selsey and East Wittering, known as Medmerry. This frontage is part of Bracklesham Bay and is an area of natural cliffs and shingle banks.
The land use around the frontage is predominantly agricultural (arable and pasture) with one of the main commercial features of the study area being a specialist lettuce growing farm and salad-packing plant, which occupies land across the Selsey Peninsula to Medmerry.
There are residential properties along the east of the frontage. Also, there are also small industrial and retail units located in this frontage, as well as a sewage treatment work plant. The only road link to Selsey also crosses the floodplain in the Medmerry frontage.
A number of caravan sites, with fixed and touring pitches, and other holiday accommodation are located in the area. The two larger resorts are the West Sands/White Horse/Greenlawns complex that accommodates more than 2000 caravans and the Selsey Country Club, which has around 300 chalets. Both resorts provide amenities such as swimming pools, clubhouses, sports facilities and a golf club.
4 Section 1: Introduction
Tourism and recreation play a significant role in the local economy of the area, as indicated by the large caravan parks and holiday villages. The beach itself is a popular tourist attraction and site for recreation activities.
Land based recreational activities along the coast are generally informal but considered important within the region. Cycling constitutes a method of local transportation as well as recreational activity undertaken by local residents and holiday makers alike, with a route along the coast from Selsey to Bracklesham. A cycle hire shop is located at East Wittering.
Shoreline angling takes place along the coast at Bracklesham, both at club and individual level. Also, there is one access point for beach launched sailing boats at Bracklesham.
The environmental importance of the study frontage is reflected in the wide range and number of designated sites of nature conservation interest.
The inter-tidal area from West Wittering to West Street, Selsey, and an area of low-lying pasture at Broad Rife is designated as the Bracklesham Bay Site of Special Scientific Interest (SSSI). This SSSI consists of unimproved grazing pasture, which is important for the bird populations they support (including breeding redshank, ringed plover, snipe, lapwing, wintering ruff, golden plover and Brent geese amongst others), saltmarsh, shingle bank, rifes and associated reed beds, and geological exposures. The loop in Broad Rife, at Medmerry, is probably the most important site in West Sussex for over-wintering short-eared owls.
The backshore is designated for its wet grassland habitat and includes a backshore Site of Nature Conservation Importance (SNCI) - Crablands Farm Meadow. Also, located just offshore, there is a marine SNCI - Bracklesham Balls.
Much of the coastline is also of importance for its geological and geomorphological interests. Both Medmerry and East Wittering frontages are classified as Geological Conservation Review Sites (GCRs). The foreshore along the wide sweep of Bracklesham Bay provides exposures through marine clays and sands of Tertiary age that yield a diverse fossil flora and fauna, including many species of fossil fish. Quaternary deposits yielding information on past environmental conditions and flora and fauna occur in this area. Due to the frequency of geological exposures of Tertiary and Quaternary age, the use of this resource both recreationally and educationally is considered of regional and national importance. Students from primary school age up to graduates use the area for fossil collecting and scientific research.
In addition, there have been a large number of occasional archaeological findings that provide evidence of early human activity along Selsey and Bracklesham coastline. These include Palaeolithic flint tools, Bronze Age and Iron Age artefacts and a Saxon settlement.
Section 1: Introduction 5
1.2.2 East Wittering Frontage
Operational Unit 6A (East Wittering frontage) makes up the fourth management unit and extends from the edge of Medmerry, to the east end of the Strand in Cakeham. The coastline is dominated by cliff and beach features, and the existing defences include timber groynes and a reinforced concrete seawall and apron.
The East Wittering frontage includes the urban areas of Bracklesham and East Wittering. Situated at the eastern end of the frontage are the Bracklesham Caravan and Boat Club with fixed caravans and chalets. The reminder of the frontage comprises a residential housing area. There is also arable and pasture farmland located inland.
The frontage provides a popular beach for informal recreational use, including traditional beach activities, dog walking and windsurfing. Also, sub-aqua activity is undertaken from East Wittering both at club and individual levels. Under water visibility is often excellent and the rich wildlife and cultural heritage (wricks and geological features) form a significant component of the diving experience. In addition, shoreline angling also takes place along the coast East Wittering, both at club and individual level.
Like the Medmerry frontage, this area of coastline is part of the Bracklesham Bay SSSI and GCRs and Bracklesham Ball mSNCI. In addition, there are several sites of historical interest along the shoreline and in the nearshore zone. The foreshore comprises fossiliferous marine clays and sands of Tertiary age that yield a significant flora and fish fauna.
As mentioned above, today land use along the study coastline is characterised by contrasts between the urban areas such as East Wittering and adjoining agricultural land, in Medmerry. The coastal strip being assessed has been naturally retreating. The proliferation of coastal defences along the frontage, has also resulted in a reduction of a natural supply of beach-building material. During the past 20 years, beach nourishment has become common practice in attempting to maintain a balanced sediment budget along much of the frontage, in particular Medmerry.
If the existing defences were to fail the majority of the frontage would be subject to flooding and erosion and subsequently to the loss of high value assets.
1.3 Existing defences
The whole area is managed in some way at present. Existing defences along the study coastline consist mainly of shingle beaches and groynes.
Historically, the low-lying land between Medmerry and Bracklesham has been protected by a shingle bank. This bank has retreated landward and become narrower due to progressive overtopping. Defence management has been
6 Section 1: Introduction
necessary to maintain the defences. In addition, the low-lying areas are drained by a number of rifes, with either pumped or gravity outfalls.
The existing defences for the Medmerry include timber groynes in fair to poor condition and in places a sheet piled sea wall also in fair to poor condition. The frontage is characterised by a cliffed backshore approximately 3m high (5m OD), a steep (approximately 1:8) flint shingle upper foreshore and a relatively gently sloping lower foreshore comprising medium to coarse sand.
Between May 1976 and February 1980, the Environment Agency implemented a major sea defence scheme along the Medmerry frontage, which included the placement of 230,000m3 of imported shingle recharge material and the construction of false heads to all 52 groynes (Environment Agency, 1998b).After completion, the shingle banks were reported to be 30m wide in most places. Beach recycling was carried out between February 1980 and December 1989, to maintain the desired beach profiles.
However, the shingle bank was breached in three places during the storms of December 1989, and approximately 70% of the original recharge material was lost to sea and never recovered. The recharge scheme had lasted effectively for only six years, and the shingle bank width had reduced to a maximum of 25m and a minimum of 10m. This reserve was depleted further during the storms of April 1994, when the shingle bank width was reduced from 20 to 3m over a 500m length at the Broad Rife outfall and from 7 to 1m adjacent to the windmill. However, most of the shingle was recovered.
Medmerry is among the areas of the whole strategy frontage most liable to flooding and overtopping.
Along the East Wittering frontage shingle beaches are backed by hard defences in the form of concrete sea walls and timber groynes.
In the south of the frontage a sea wall is fronted by a healthy beach. However, there is evidence of abrasion and undermining of parts of the sea wall. In this part of the shoreline there are also timber groynes with low residual life due to sever abrasion and/or lowering clay levels that have reduced the level of penetration of the piles.
The north part of the frontage is protected by timber groynes, with low residual life, and timber breastworks in parts. The latter are in manageable conditions but potentially threatened if beach levels fall significantly.
The residual life of defences in both MUs is very small, with the Medmerry frontage having less than 1-year residual life and East Wittering approximately 5 years. (Posford Duvivier, 2001). The degree of protection afforded by the defences, falls below that normally considered to be appropriate for the type of land use located behind the defended frontage. In consideration of the residual life of the defences and the standard of protection currently provided, the frontage most in need of attention is the Medmerry coastline, between Selsey and East Wittering.
Section 1: Introduction 7
1.4 Policy framework
The East Solent and South Downs Shoreline Management Plans (SMP) form the policy basis for the Pagham to East Head Coastal Strategy. The first Management Unit (MU) of the East Solent SMP overlaps with the last MU of the South Downs SMP. The preferred generic policy options identified in each SMP for this overlap are compatible.
The Pagham to East Head Coastal Defence Strategy is designed to provide a strategic framework of preferred policies for the coastal defence of the study area over the next 50 years, up to the year 2050. It will be reviewed and updated on a five-yearly basis.
The Environment Agency (EA) has permissive powers for the construction of sea defences along the coast for the 3.8km Medmerry stretch of coastline.Chichester District Council is the Coast Protection Authority for the majority of the remaining study coastline. The District Council’s Executive Board administers the construction and maintenance of coastal defence work.
Each of the three Operating Authorities responsible for the frontage carries out running maintenance of their structures. The EA also undertakes regular beach recharge and recycling. From time to time, major constructions works are undertaken to refurbish or upgrade the defences.
The EA has a Local Sussex Flood Defence Committee, which comprises representatives from local authorities and appointments made by MAFF. The principal role of the Committee is to review the work activities carried out by the Environment Agency and approve the allocation of flood defence funds.
1.5 List of stakeholders and interested parties
The Pagham to East Head Coastal Defence Strategy consultation was undertaken in two stages:
• initial consultation: general consultation including an explanation of the study and the consultation process and a specialist consultation during the Strategic Environmental Assessment (SEA) and the economic appraisal (finished in 1999);
• full consultation: the consultation draft report was made available for public inspection in local council offices, libraries, etc, as well as three questionnaire exhibitions were undertaken. In addition, local meetings were held with smaller, specific groups of interested parties and organisations.
General consultation has been undertaken with groups that have an interest in the long-term defence of the Selsey Peninsula. Groups contacted are listed in Table 1.2.
8 Section 1: Introduction
As part of the public consultation process the Environment Agency, Chichester District Council and Arun District Council sought the opinions of members of the public through the completion of questionnaires distributed at three public exhibitions. Its purpose was twofold:
• to learn more about those who have an active interest in the coastline; and• to seek their views on the type of coastal defences they would like to see
in place.
Continuing from the initial consultation stages by letter and public displays a series of meetings were arranged with local interest groups. The meetings were held by request, following completion of the general questionnaire proforma, to gain a more detailed understanding of the issues relating to the individual frontages. The bodies that requested meetings ranged from commercial organisations, residents associations and concerned individuals.The meetings were attended by Posford Duvivier with other representatives from the Client Group sometimes present. The Local Interest Groups involved with meetings are listed in Table 1.2.
Table 1.2: Groups and individuals consulted on the Pagham to East Head Costal Defence Strategy
Consultationstage
Groups consulted
GeneralConsultation
Local Authorities; Environment Agency; County Councils; Navigational Interests; Statutory Consultees (e.g. Crown Estate, MAFF, DETR); Parish Councils
Residents Associations; Commercial Interests;Major Land Owners; Conservation Groups; Recreation Bodies; Local Residents
LocalConsultation
National Farmers Union; Pagham Residents Association;Mr Hume Wallace; Environment Agency (Mr P Pett);West Wittering Residents Association;Medmerry Owners; National Trust/English Nature; West Selsey Caravan Association;Natures Way (David Landmead);Sussex Beach Holiday Village
Selsey Bill Residents Association; Mr A Shaw; Earnley Parish Council; Mr M Heaton & Mr J Heinjie; Mr D Bunn, Mr J Bunn & Mr O James; Friends of the Earth; Mr D Bone; Chichester District Council Planners; Havant Borough Council; West Sussex County Council
Section 2: Definition of objectives and management options 9
2. Definition of objectives and management options
Posfords Duvivier (2001a) defined three different groups/levels of objectives for the Pagham to East Head Strategy:
• strategic objectives which are common to all coastal defence strategies; • study coastline objectives which are relevant only to the frontage being
assessed; and • operational unit (OU) objectives which reflect the key interests within each
OU.
The Pagham to East Head Strategy defines sustainable development as its main strategic objective. A coastal defence generic strategy is sustainable if it is:
• compatible with processes at work; • compatible with adjacent preferred options; • environmentally acceptable; • technically realistic; and • economically viable.
Table 2.1 illustrates the study coastline objectives defined by the Environment Agency for the Pagham to East Head frontage.
The appraisal of strategic options has to take into account the policy options selected by the Shoreline Management Plans. In general terms, the SMPs recommended that the preferred generic option would be to hold the line in the short term and consider managed retreat between Pagham Harbour and East Beach, and to hold line between East Beach and East Head. Table 2.2 presents the recommended policy option for the two frontages being assessed in this report.
The Pagham to East Head Coastal Defence Strategy considered a long list of options for all management units and each option was assessed in terms of the strategic, study coastline and operational objectives listed above.
The ‘do-nothing’ option was also assessed against the different objectives set out earlier. The Pagham to East Head Strategy considered that the ‘do-nothing’ option did not satisfy the strategic objectives. According to the Strategy, a do-nothing policy would result in almost immediate widespread erosion, and flooding damages along the majority of the study frontage. For these reasons the ‘do-nothing’ option was not carried forward in the appraisal process.
It should be noted that the MCA-based appraisal methodology will use the ‘do-nothing’ option as a baseline for the appraisal.
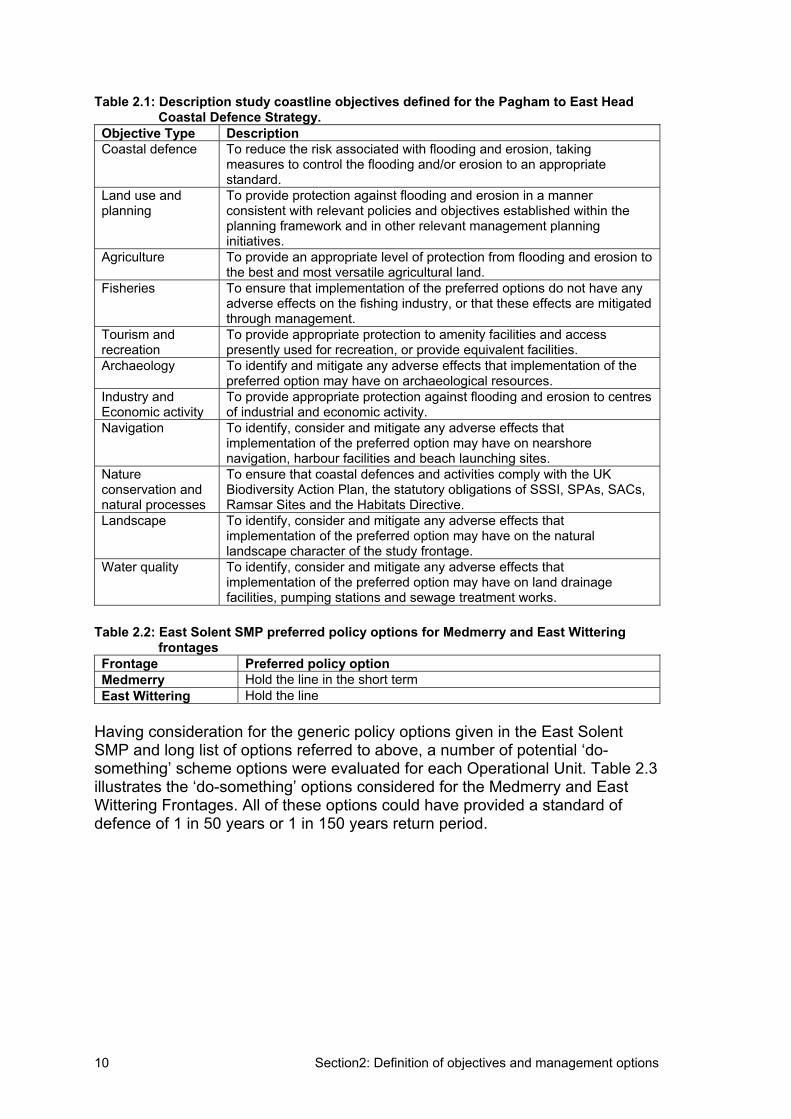
10 Section2: Definition of objectives and management options
Table 2.1: Description study coastline objectives defined for the Pagham to East Head Coastal Defence Strategy.
Objective Type Description Coastal defence To reduce the risk associated with flooding and erosion, taking
measures to control the flooding and/or erosion to an appropriate standard.
Land use and planning
To provide protection against flooding and erosion in a manner consistent with relevant policies and objectives established within the planning framework and in other relevant management planning initiatives.
Agriculture To provide an appropriate level of protection from flooding and erosion to the best and most versatile agricultural land.
Fisheries To ensure that implementation of the preferred options do not have any adverse effects on the fishing industry, or that these effects are mitigated through management.
Tourism and recreation
To provide appropriate protection to amenity facilities and access presently used for recreation, or provide equivalent facilities.
Archaeology To identify and mitigate any adverse effects that implementation of the preferred option may have on archaeological resources.
Industry and Economic activity
To provide appropriate protection against flooding and erosion to centres of industrial and economic activity.
Navigation To identify, consider and mitigate any adverse effects that implementation of the preferred option may have on nearshore navigation, harbour facilities and beach launching sites.
Natureconservation and natural processes
To ensure that coastal defences and activities comply with the UK Biodiversity Action Plan, the statutory obligations of SSSI, SPAs, SACs, Ramsar Sites and the Habitats Directive.
Landscape To identify, consider and mitigate any adverse effects that implementation of the preferred option may have on the natural landscape character of the study frontage.
Water quality To identify, consider and mitigate any adverse effects that implementation of the preferred option may have on land drainage facilities, pumping stations and sewage treatment works.
Table 2.2: East Solent SMP preferred policy options for Medmerry and East Wittering frontages
Frontage Preferred policy option Medmerry Hold the line in the short term East Wittering Hold the line
Having consideration for the generic policy options given in the East Solent SMP and long list of options referred to above, a number of potential ‘do-something’ scheme options were evaluated for each Operational Unit. Table 2.3 illustrates the ‘do-something’ options considered for the Medmerry and East Wittering Frontages. All of these options could have provided a standard of defence of 1 in 50 years or 1 in 150 years return period.
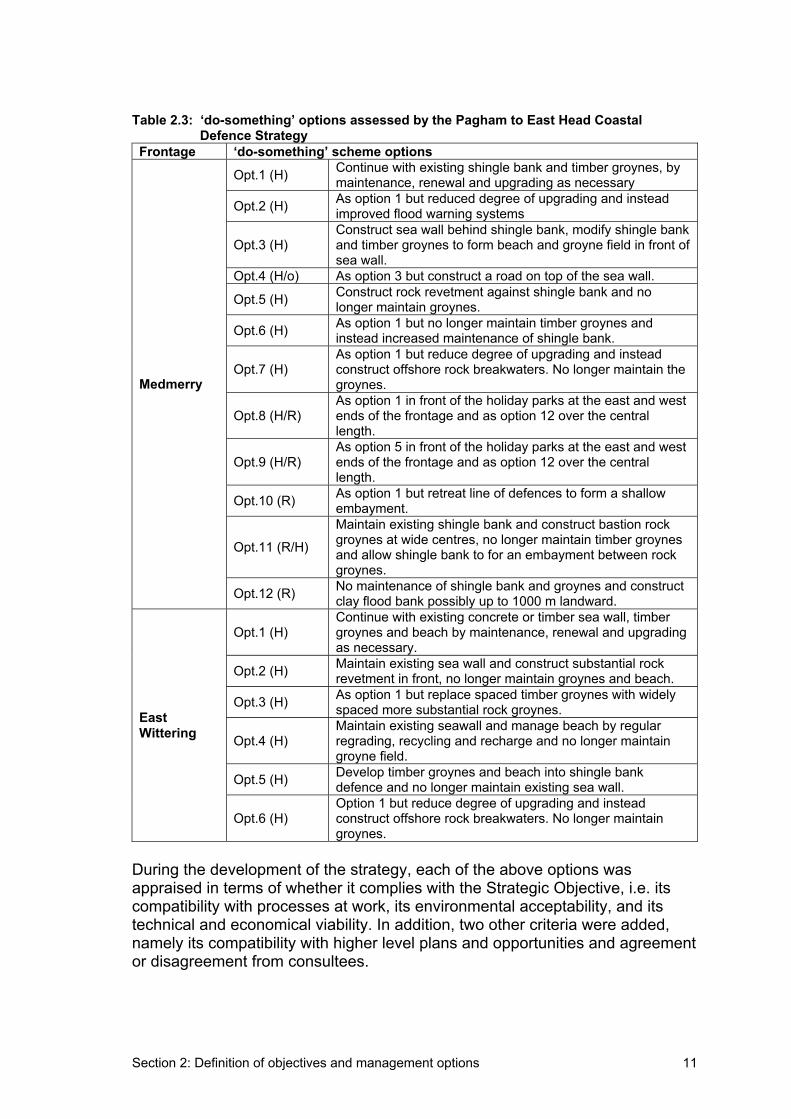
Section 2: Definition of objectives and management options 11
Table 2.3: ‘do-something’ options assessed by the Pagham to East Head Coastal Defence Strategy
Frontage ‘do-something’ scheme options
Opt.1 (H) Continue with existing shingle bank and timber groynes, by maintenance, renewal and upgrading as necessary
Opt.2 (H) As option 1 but reduced degree of upgrading and instead improved flood warning systems
Opt.3 (H) Construct sea wall behind shingle bank, modify shingle bank and timber groynes to form beach and groyne field in front of sea wall.
Opt.4 (H/o) As option 3 but construct a road on top of the sea wall.
Opt.5 (H) Construct rock revetment against shingle bank and no longer maintain groynes.
Opt.6 (H) As option 1 but no longer maintain timber groynes and instead increased maintenance of shingle bank.
Opt.7 (H) As option 1 but reduce degree of upgrading and instead construct offshore rock breakwaters. No longer maintain the groynes.
Opt.8 (H/R) As option 1 in front of the holiday parks at the east and west ends of the frontage and as option 12 over the central length.
Opt.9 (H/R) As option 5 in front of the holiday parks at the east and west ends of the frontage and as option 12 over the central length.
Opt.10 (R) As option 1 but retreat line of defences to form a shallow embayment.
Opt.11 (R/H)
Maintain existing shingle bank and construct bastion rock groynes at wide centres, no longer maintain timber groynes and allow shingle bank to for an embayment between rock groynes.
Medmerry
Opt.12 (R) No maintenance of shingle bank and groynes and construct clay flood bank possibly up to 1000 m landward.
Opt.1 (H) Continue with existing concrete or timber sea wall, timber groynes and beach by maintenance, renewal and upgrading as necessary.
Opt.2 (H) Maintain existing sea wall and construct substantial rock revetment in front, no longer maintain groynes and beach.
Opt.3 (H) As option 1 but replace spaced timber groynes with widely spaced more substantial rock groynes.
Opt.4 (H) Maintain existing seawall and manage beach by regular regrading, recycling and recharge and no longer maintain groyne field.
Opt.5 (H) Develop timber groynes and beach into shingle bank defence and no longer maintain existing sea wall.
EastWittering
Opt.6 (H) Option 1 but reduce degree of upgrading and instead construct offshore rock breakwaters. No longer maintain groynes.
During the development of the strategy, each of the above options was appraised in terms of whether it complies with the Strategic Objective, i.e. its compatibility with processes at work, its environmental acceptability, and its technical and economical viability. In addition, two other criteria were added, namely its compatibility with higher level plans and opportunities and agreement or disagreement from consultees.
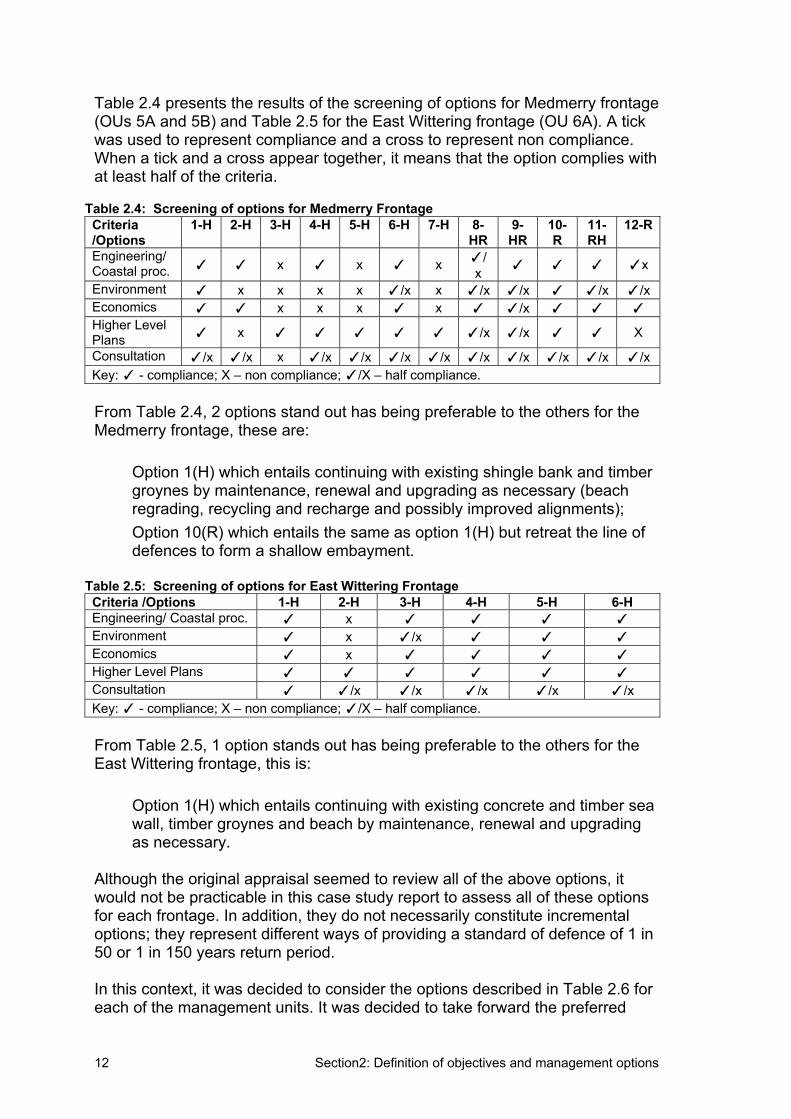
12 Section2: Definition of objectives and management options
Table 2.4 presents the results of the screening of options for Medmerry frontage (OUs 5A and 5B) and Table 2.5 for the East Wittering frontage (OU 6A). A tick was used to represent compliance and a cross to represent non compliance. When a tick and a cross appear together, it means that the option complies with at least half of the criteria.
Table 2.4: Screening of options for Medmerry Frontage Criteria/Options
1-H 2-H 3-H 4-H 5-H 6-H 7-H 8-HR
9-HR
10-R
11-RH
12-R
Engineering/Coastal proc. x x x /
x x
Environment x x x x /x x /x /x /x /xEconomics x x x x /xHigher Level Plans x /x /x X
Consultation /x /x x /x /x /x /x /x /x /x /x /xKey: - compliance; X – non compliance; /X – half compliance.
From Table 2.4, 2 options stand out has being preferable to the others for the Medmerry frontage, these are:
• Option 1(H) which entails continuing with existing shingle bank and timber groynes by maintenance, renewal and upgrading as necessary (beach regrading, recycling and recharge and possibly improved alignments);
• Option 10(R) which entails the same as option 1(H) but retreat the line of defences to form a shallow embayment.
Table 2.5: Screening of options for East Wittering Frontage Criteria /Options 1-H 2-H 3-H 4-H 5-H 6-H Engineering/ Coastal proc. xEnvironment x /xEconomics xHigher Level Plans Consultation /x /x /x /x /xKey: - compliance; X – non compliance; /X – half compliance.
From Table 2.5, 1 option stands out has being preferable to the others for the East Wittering frontage, this is:
• Option 1(H) which entails continuing with existing concrete and timber sea wall, timber groynes and beach by maintenance, renewal and upgrading as necessary.
Although the original appraisal seemed to review all of the above options, it would not be practicable in this case study report to assess all of these options for each frontage. In addition, they do not necessarily constitute incremental options; they represent different ways of providing a standard of defence of 1 in 50 or 1 in 150 years return period.
In this context, it was decided to consider the options described in Table 2.6 for each of the management units. It was decided to take forward the preferred
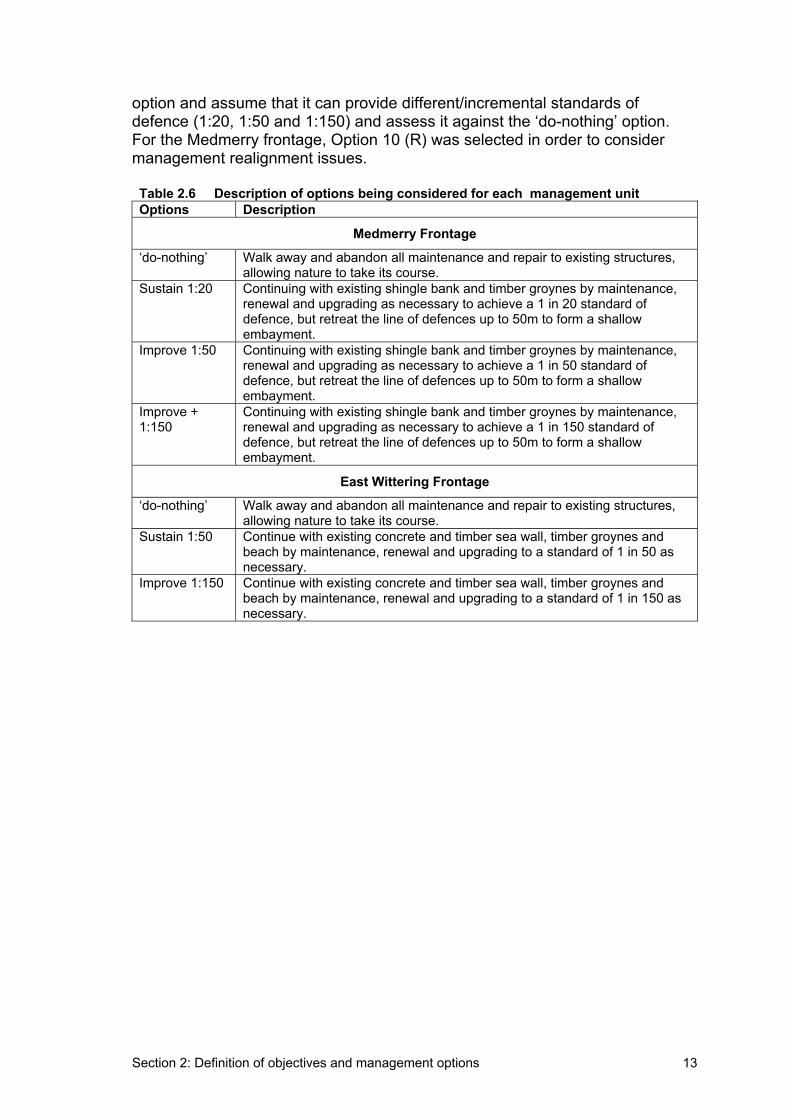
Section 2: Definition of objectives and management options 13
option and assume that it can provide different/incremental standards of defence (1:20, 1:50 and 1:150) and assess it against the ‘do-nothing’ option. For the Medmerry frontage, Option 10 (R) was selected in order to consider management realignment issues.
Table 2.6 Description of options being considered for each management unit Options Description
Medmerry Frontage
‘do-nothing’ Walk away and abandon all maintenance and repair to existing structures, allowing nature to take its course.
Sustain 1:20 Continuing with existing shingle bank and timber groynes by maintenance, renewal and upgrading as necessary to achieve a 1 in 20 standard of defence, but retreat the line of defences up to 50m to form a shallow embayment.
Improve 1:50 Continuing with existing shingle bank and timber groynes by maintenance, renewal and upgrading as necessary to achieve a 1 in 50 standard of defence, but retreat the line of defences up to 50m to form a shallow embayment.
Improve + 1:150
Continuing with existing shingle bank and timber groynes by maintenance, renewal and upgrading as necessary to achieve a 1 in 150 standard of defence, but retreat the line of defences up to 50m to form a shallow embayment.
East Wittering Frontage
‘do-nothing’ Walk away and abandon all maintenance and repair to existing structures, allowing nature to take its course.
Sustain 1:50 Continue with existing concrete and timber sea wall, timber groynes and beach by maintenance, renewal and upgrading to a standard of 1 in 50 as necessary.
Improve 1:150 Continue with existing concrete and timber sea wall, timber groynes and beach by maintenance, renewal and upgrading to a standard of 1 in 150 as necessary.
14 Section3: Structuring the problem
3. Structuring the problem This section aims to break down the problem into its component parts, identifying the set of impacts and associated criteria that will be used to make the decision. In other words a screening exercise is carried out for the Pagham to East Head Coastal Protection Strategy.
3.1 Summary of the screening exercise
This screening exercise is used to determine (i) which categories are relevant and (ii) which categories will be appraised by assigning monetary value to impacts and which will be appraised by assigning a score to the impacts.Relevant categories are those where there is a difference in the impacts of the 4 options being appraised (do-nothing, sustain, improve and improve plus).
The screening exercise for the strategy was based on the following sources of information:
• Pagham to East Head Coastal Defence Strategy - main document; and • Pagham to East Head Coastal Defence Strategy - annexes
The detailed high level screening for both Medmerry and East Wittering Frontages is presented in Appendices B2.1 to this report - Appraisal Summary Table for Flood Management and Coastal Defence for High Level Screening (AST-FMDC-S) – Table 3.1 summarises the results of the screening exercise for both frontages.
The high level screening exercise highlighted the fact that the majority of the most significant impacts of the options for the strategy are related to economic assets, such as agricultural land for Medmerry and housing and commercial properties for East Wittering, and recreation and tourism activities in both frontages. Environmental issues are also important, in particular in what relates to physical habitats and natural processes.
The number of impact categories being assessed through monetary valuation is smaller than the number of impact categories being assessed through scoring.This is particularly the case for the East Wittering Frontage.
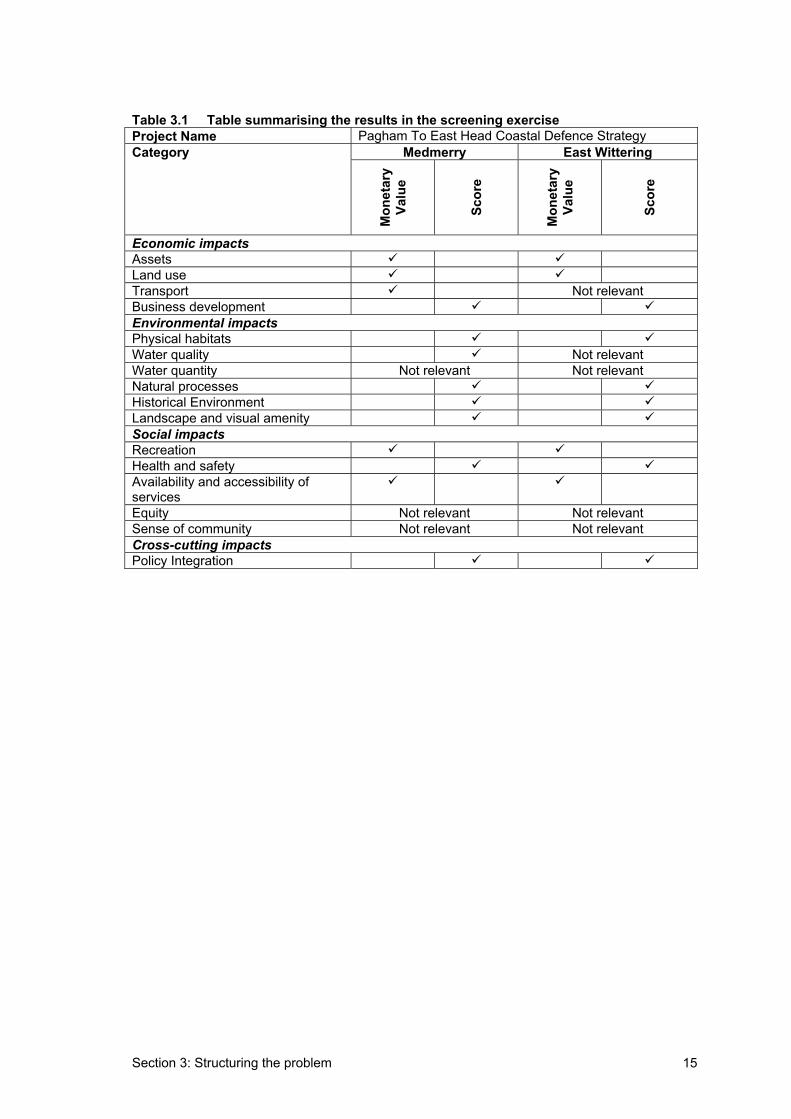
Section 3: Structuring the problem 15
Table 3.1 Table summarising the results in the screening exercise Project Name Pagham To East Head Coastal Defence Strategy
Medmerry East Wittering Category
Mon
etar
yVa
lue
Scor
e
Mon
etar
yVa
lue
Scor
e
Economic impactsAssetsLand useTransport Not relevant Business development Environmental impactsPhysical habitats Water quality Not relevant Water quantity Not relevant Not relevant Natural processes Historical EnvironmentLandscape and visual amenity Social impactsRecreationHealth and safety Availability and accessibility of servicesEquity Not relevant Not relevant Sense of community Not relevant Not relevant Cross-cutting impactsPolicy Integration
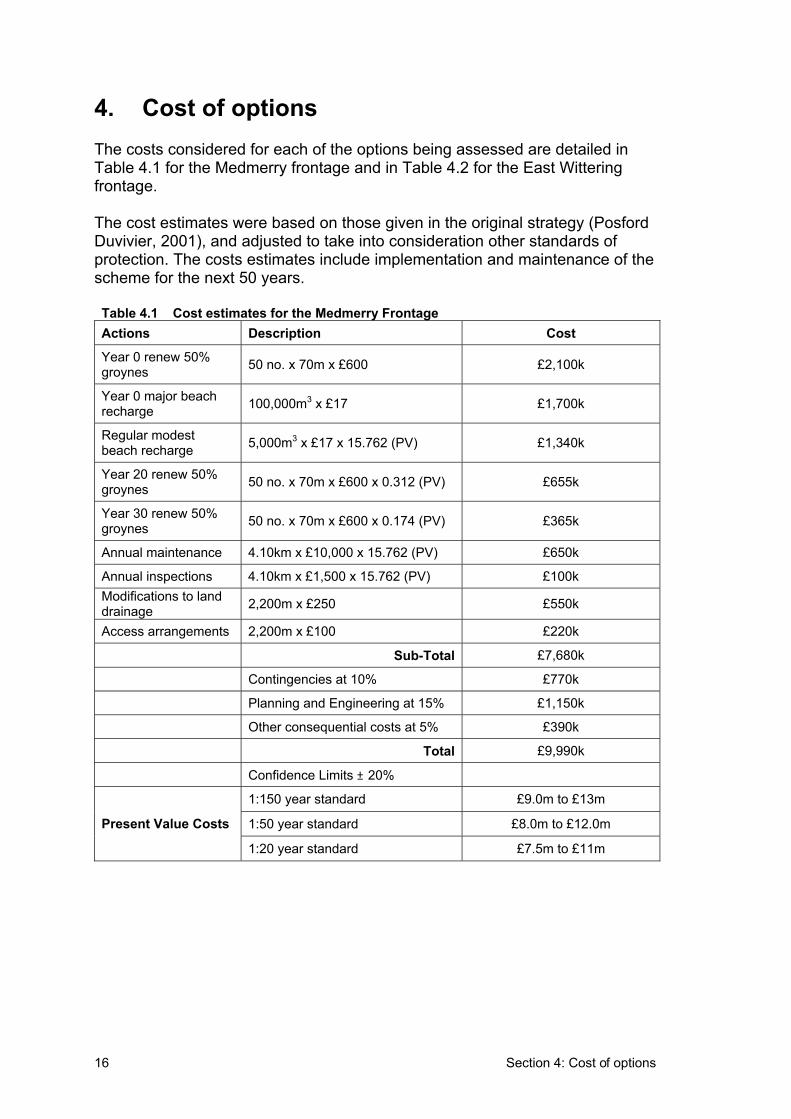
16 Section 4: Cost of options
4. Cost of options The costs considered for each of the options being assessed are detailed in Table 4.1 for the Medmerry frontage and in Table 4.2 for the East Wittering frontage.
The cost estimates were based on those given in the original strategy (Posford Duvivier, 2001), and adjusted to take into consideration other standards of protection. The costs estimates include implementation and maintenance of the scheme for the next 50 years.
Table 4.1 Cost estimates for the Medmerry Frontage Actions Description Cost
Year 0 renew 50% groynes 50 no. x 70m x £600 £2,100k
Year 0 major beach recharge 100,000m3 x £17 £1,700k
Regular modest beach recharge 5,000m3 x £17 x 15.762 (PV) £1,340k
Year 20 renew 50% groynes 50 no. x 70m x £600 x 0.312 (PV) £655k
Year 30 renew 50% groynes 50 no. x 70m x £600 x 0.174 (PV) £365k
Annual maintenance 4.10km x £10,000 x 15.762 (PV) £650k
Annual inspections 4.10km x £1,500 x 15.762 (PV) £100k Modifications to land drainage 2,200m x £250 £550k
Access arrangements 2,200m x £100 £220k
Sub-Total £7,680k
Contingencies at 10% £770k
Planning and Engineering at 15% £1,150k
Other consequential costs at 5% £390k
Total £9,990k
Confidence Limits ± 20%
1:150 year standard £9.0m to £13m
1:50 year standard £8.0m to £12.0m Present Value Costs
1:20 year standard £7.5m to £11m
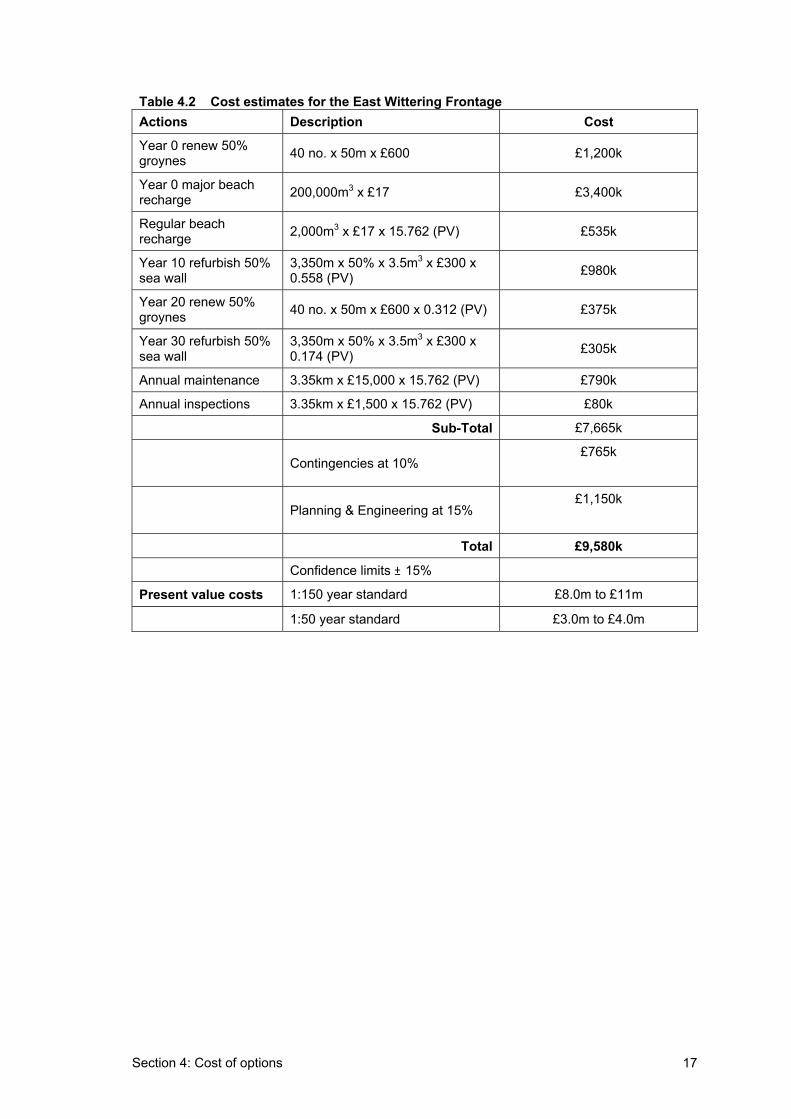
Section 4: Cost of options 17
Table 4.2 Cost estimates for the East Wittering Frontage Actions Description Cost
Year 0 renew 50% groynes 40 no. x 50m x £600 £1,200k
Year 0 major beach recharge 200,000m3 x £17 £3,400k
Regular beach recharge 2,000m3 x £17 x 15.762 (PV) £535k
Year 10 refurbish 50% sea wall
3,350m x 50% x 3.5m3 x £300 x 0.558 (PV) £980k
Year 20 renew 50% groynes 40 no. x 50m x £600 x 0.312 (PV) £375k
Year 30 refurbish 50% sea wall
3,350m x 50% x 3.5m3 x £300 x 0.174 (PV) £305k
Annual maintenance 3.35km x £15,000 x 15.762 (PV) £790k
Annual inspections 3.35km x £1,500 x 15.762 (PV) £80k
Sub-Total £7,665k
Contingencies at 10% £765k
Planning & Engineering at 15% £1,150k
Total £9,580k
Confidence limits ± 15%
Present value costs 1:150 year standard £8.0m to £11m
1:50 year standard £3.0m to £4.0m
18 Section 5: Assessment of impacts
5. Assessment of impacts 5.1 Qualitative and quantitative assessment
The qualitative and quantitative assessment of the different options for each of the management units was carried out using the Appraisal Summary Table for the Main Assessment (MA-AST) and it is presented in Appendix B2.2 to this Annex.
The assessment followed a stepped approach, starting with the qualitative assessment of all impact categories and moving to the quantitative assessment whenever information was available.
5.2 Monetary valuation of impacts
All of the following information was obtained from the Pagham to East Head Coastal Defence Strategy – Appendix G Economic Appraisal (Posford Duvivier, 2001). We were provided with different revised versions of the economic assessment for the Pagham to East Head Coastal Defence Strategy. It was decided to use the original version of the assessment, because the information on it was more complete. Nonetheless, some assumptions have been made and these are noted in the text.
Benefits accruing from provision of defences (i.e. damages avoided) were subdivided into 4 categories:
• write-off benefits; • intermittent flooding after breach benefits; • overtopping benefits; and • erosion benefits.
5.2.1 Write-off benefits
Assets
The write-off flooding (inundation from the sea) protection benefits are the damages to the assets that would be written-off by being flooded under the 1:1 year event, following failure of defences.
For residential properties, those houses located in land that is below the 1:1 year return period water levels are considered to be flooded every year and therefore would no longer have any market value, i.e. are written-off. For the economic appraisal, the write-off value assigned to each property was based on the 1991 ‘middle value’ Council Tax band, supplied by the Arun District Council. In order to actualise these values, they were increased by 10% which, according to the Council of Mortgage Lenders, corresponds to the average increase in property prices from 1991 to 1997 in the whole of the UK.
Section 5: Assessment of impacts 19
For commercial properties, as for residential properties, those premises located within the 1:1 year return period flood are written-off. The written-off cost of a commercial property corresponds to one half of the replacement value in £/m2,taken from Spon’s Architects’ and Builder’s Price Book (Spon & Spon, 1997).The reduction in replacement value is to cover depreciation since construction.
For significantly valued, isolated commercial property such as wastewater treatment works, the write-off benefit is capped at the cost of constructing a flood defence embankment around the asset.
For caravan parks, it was considered that caravans situated on land lying below 1:1 year flood contour can be relocated to another site and are therefore not written-off under the ‘do-nothing’ scenario. Instead a nominal sum of £2,000 has been assigned to each caravan to cover relocation expenses, as indicated as an appropriate upper limit by MAFF. Because, during consultation, the value of £2,000 was questioned by stakeholders, the value attributed to caravan relocation was used as a sensitivity testing parameter.
Land Use
Farmland flooded by salt water on annual basis would be unfit to support either grazing or arable crops. Such land is likely to become saltmarsh and therefore should be written-off as agricultural land. The write-off value assigned corresponds to the market value of the land (Nix (1998) average value), factored by 0.41.
In the assessment the value of benefits from land use are included under the asset category.
5.2.2 Intermittent flooding after breach
Assets
The intermittent flooding (inundation by the sea) protection benefits accruing from carrying coast protection works are derived from an assessment of the damages to the assets that would flood intermittently under the 1:1, 1:5, 1:20, 1:50 and 1:200 year events. These damages are related to the depth of flooding to each individual asset.
Using visual assessments of doorstep thresholds and figures extracted from Penning-Rowsell (1992 - Yellow Manual), updated to 1998 prices using the Retail Price Index, residential depth-related damages were calculated. There are also indirect costs of post-flooding costs in houses to be accounted for.Costs of heating were valued at £124 per household (Red Manual values
1 0.4 was the value referenced in the Pagham to East Head Coastal Defence Strategy.
Although it is realised that this value should be 0.45, no changes were made to the end result. It was not thought relevant for the purpose of this report to make any modifications to the values given by Posford Duvivier (2001)
20 Section 5: Assessment of impacts
updated to 1998 prices). Dehumidifier costs were valued at £610 per property suffering from over 30cm of flooding.
For commercial properties, depth-damage data was extracted from a variety of sources including Parker et al. (1997 – Red Manual) and N’Jai et al. (1990 – FLAIR).
For caravans, a doorstep threshold flood depth for static caravans was assessed at 0.5m, and depth-damage data for prefabricated buildings from Penning-Rowsell (1992 - Yellow Manual) were used (in the absence of data for caravans) with the extraction of the irrelevant components.
Land use
The calculation of damages to agricultural land from intermittent flooding follow the procedure described in scenario III of PAG. An average value of £360/ha was calculated based on distribution of 70% arable land and 30% grazing land. Adjusted net margins were calculated from Nix (1998) values. As a result of crop rotation, a whole range of crops were assessed, which may not be representative of what is grown in the region at present.
Transport
Generally, local roads within the area will be flooded when the houses are flooded, hence traffic disruptions is likely to be small.
A section of the B2145 passes through low lying land which would be flooded in a 1:1 year event if defences of OU 5A/5B are allow to fail. If the road was regularly impassable by flooding it is likely that the road would be raised.Therefore, the benefits arising from its protection correspond to the cost of raising the low-lying section of the road.
Business development
According to Posford Duvivier (2001), the Red Manual notes that flooding of retail, distribution, office and leisure services is unlikely to generate significant indirect loss to the nation. Therefore this has not been assessed in monetary terms. They will, however, be considered in qualitative terms.
Accessibility and availability of services
As well as repair and cleaning costs to facilities/utilities, there are indirect costs if facilities are disrupted to consumers that have not been flooded. Consultation is on going regrading areas that are affected.
The value of emergency services was estimated to be £179 per property, according to figures in the Red Manual updated to 1998 prices.
Section 5: Assessment of impacts 21
5.2.3 Erosion protection benefits
The erosion protection benefits accruing from carrying out coast protection works are derived from an assessment of the economic value of extension to the life of, or delay in, loss of the erosion-prone properties for a period of time equal to the life of the works (Penning-Rowsell et al., 1992).
For residential properties, the value assigned to each property was based on the 1991 ‘middle value’ council tax band, supplied by the Arun District Council. In order to actualise these values, they were increased by 10%, which, according to the Council of Mortgage Lenders, corresponds to the average increase in property prices from 1991 to 1997 in the whole of the UK. A distance of 5m was adopted as a minimum acceptable safety margin between the top edge of the eroded bank, cliff or slope face following defence failure, and the building in question. The property is written-off should this safety margin be reduced by further erosion. In case of soft defences, the safety margin has been assessed from the landward edge of the active beach.
For commercial properties, the value assigned corresponds to one half of the replacement value in £/m2, taken from Spon’s Architects’ and Builder’s Price Book (Spon & Spon, 1997). The same safety margin as for residential properties is used.
5.2.4 Overtopping damages
Overtopping damages have been calculated using water volumes derived from modelling, and route from topographic data. The intermittent overtopping flooding zone is defined as the area which would flood in a storm with severity 1:200 years or less, without breaching of defences. For certain OU with soft defences overtopping damages have not been considered, because if significant overtopping was to occur then a breach would also occur.
For residential properties lying within the overtopping flooding zone, figures from Penning-Rowsell et al.(1992) were used in the calculation of the damages. For commercial properties, depth-related data was extracted from Parker et al. (1997 – Red Manual) and N’Jai et al. (1990 – FLAIR).
5.2.5 Monetary valuation of intangible benefits
For the valuation of intangible benefits Posford Duvivier (2001), grouped Operational Units together, depending of the environmental resources present in the units. For the OUs being assessed in this case study, OU 5B has been assessed separately, whilst OUs 5A and 6A have been grouped together with OUs 4B and 7A. For the purpose of this economic appraisal the benefits were divided between the four OUs, have as base the % of coastline they occupy.So for example, OU 5A occupies 6 % of the coastline whilst OU 6A occupies 56%, which means that OU 5A will accrue 6% of the intangible benefits whilst OU 6A will accrue 56%.
22 Section 5: Assessment of impacts
Recreation
Operational units 5A and 6A
Deterioration of beach, groynes and seawall will occur over the next 5 years.By year 10 the defence would have collapsed and progressive erosion would have taken place.
The deterioration of the beach will affect visitor enjoyment. The loss of enjoyment is calculated using the Hastings case study from Penning-Rowsell et al. (1992 – Yellow Manual). This value is separated in different values for different levels of beach, seawall and groyne deterioration. The total (central case) benefit from enjoyment from the beach is £7,584,250 (i.e. £455,055 for OU 5A and £4,247,180 for OU 6A).
In addition, it is estimated that the public slipway will deteriorate at year 5, to the extent that the structure will be deemed unsafe. The recreational value of the slipway is calculated as the cost of replacing the slipway. It is estimated that the cost of replacing the slipway is £100,000 (Posford Duvivier Environment, 1999), and thereafter it will require reconstruction every 10 years at £35,000. The total (central case) cost is £104,750.
Operational Unit 5B
The shingle bank will breach within one year, and regular flooding of the land behind will occur. Groynes will also deteriorate over the next 5 years. The shingle bank will cease to be an effective defence after 5 years. After 10 years the shingle bank will not exist and saltmarsh and mudflats will become established.
The deterioration of the beach will affect visitor enjoyment. The loss of enjoyment is calculated using the Hastings case study from Penning-Rowsell et al. (1992 – Yellow Manual). This value is separated in different values for different levels of beach, seawall and groyne deterioration. However, no value for loss of enjoyment is used after year 10 because of the significant changes in habitat and the lack of data to account for this.
The annual payments for creation of saltmarsh in the Habitat Scheme in Essex (Mouchel, 1997) are used as the proxy value for creation of habitat. The values are:
• £525/ha for creation of saltmarsh on land currently in arable production; • £448/ha for creation of saltmarsh on land which is currently set-aside; and • £195/ha for land currently in permanent grass.
It is estimated that in the breach scenario, a total of 408ha will flood annually, and an additional 274ha will flood intermittently. Calculations were made of the area of grassland and arable land from which saltmarsh (and mudflat) will be created. The total (central case) recreational benefits are £103,000.
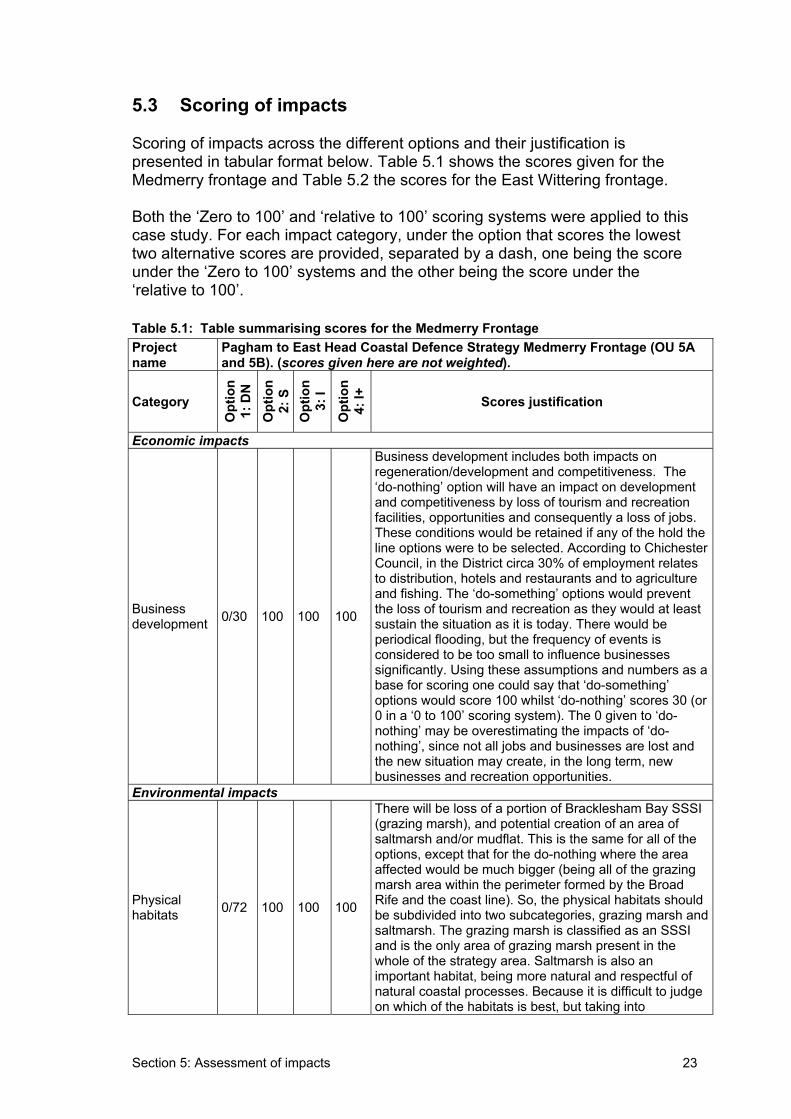
Section 5: Assessment of impacts 23
5.3 Scoring of impacts
Scoring of impacts across the different options and their justification is presented in tabular format below. Table 5.1 shows the scores given for the Medmerry frontage and Table 5.2 the scores for the East Wittering frontage.
Both the ‘Zero to 100’ and ‘relative to 100’ scoring systems were applied to this case study. For each impact category, under the option that scores the lowest two alternative scores are provided, separated by a dash, one being the score under the ‘Zero to 100’ systems and the other being the score under the ‘relative to 100’.
Table 5.1: Table summarising scores for the Medmerry Frontage Projectname
Pagham to East Head Coastal Defence Strategy Medmerry Frontage (OU 5A and 5B). (scores given here are not weighted).
Category
Opt
ion
1: D
N
Opt
ion
2: S
O
ptio
n3:
I
Opt
ion
4: I+
Scores justification
Economic impacts
Businessdevelopment 0/30 100 100 100
Business development includes both impacts on regeneration/development and competitiveness. The ‘do-nothing’ option will have an impact on development and competitiveness by loss of tourism and recreation facilities, opportunities and consequently a loss of jobs. These conditions would be retained if any of the hold the line options were to be selected. According to Chichester Council, in the District circa 30% of employment relates to distribution, hotels and restaurants and to agriculture and fishing. The ‘do-something’ options would prevent the loss of tourism and recreation as they would at least sustain the situation as it is today. There would be periodical flooding, but the frequency of events is considered to be too small to influence businesses significantly. Using these assumptions and numbers as a base for scoring one could say that ‘do-something’ options would score 100 whilst ‘do-nothing’ scores 30 (or 0 in a ‘0 to 100’ scoring system). The 0 given to ‘do-nothing’ may be overestimating the impacts of ‘do-nothing’, since not all jobs and businesses are lost and the new situation may create, in the long term, new businesses and recreation opportunities.
Environmental impacts
Physical habitats 0/72 100 100 100
There will be loss of a portion of Bracklesham Bay SSSI (grazing marsh), and potential creation of an area of saltmarsh and/or mudflat. This is the same for all of the options, except that for the do-nothing where the area affected would be much bigger (being all of the grazing marsh area within the perimeter formed by the Broad Rife and the coast line). So, the physical habitats should be subdivided into two subcategories, grazing marsh and saltmarsh. The grazing marsh is classified as an SSSI and is the only area of grazing marsh present in the whole of the strategy area. Saltmarsh is also an important habitat, being more natural and respectful of natural coastal processes. Because it is difficult to judge on which of the habitats is best, but taking into
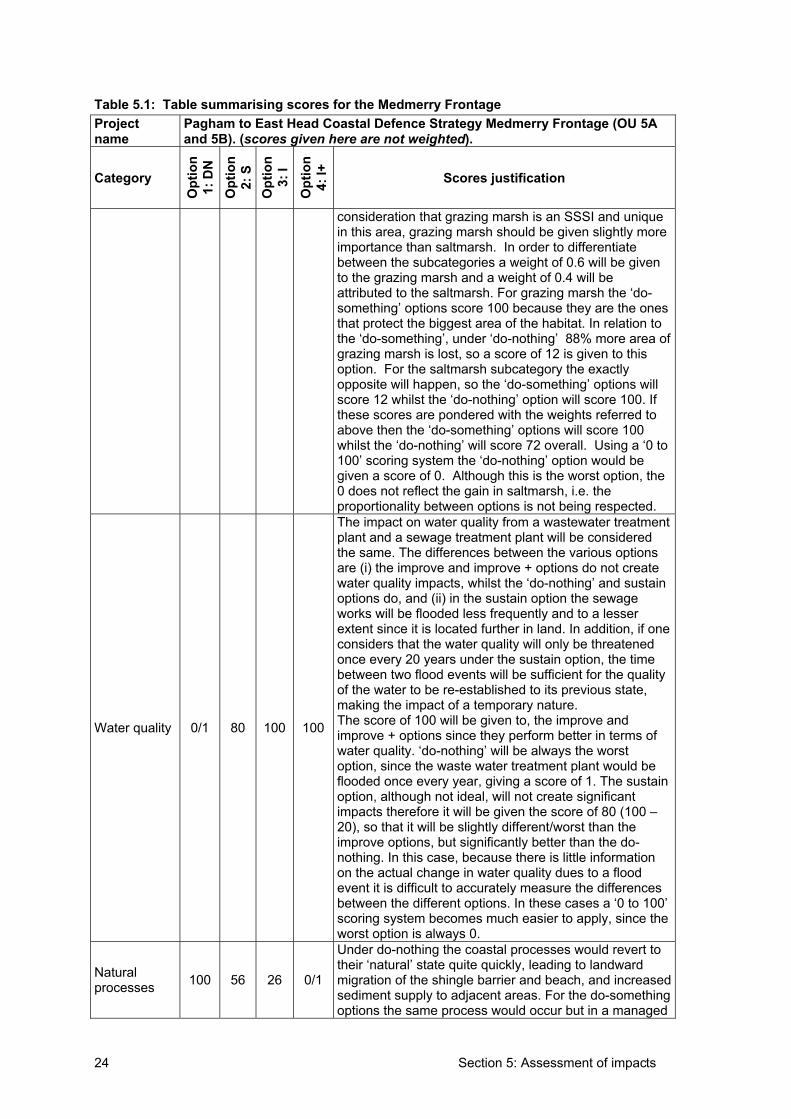
24 Section 5: Assessment of impacts
Table 5.1: Table summarising scores for the Medmerry Frontage Projectname
Pagham to East Head Coastal Defence Strategy Medmerry Frontage (OU 5A and 5B). (scores given here are not weighted).
Category O
ptio
n1:
DN
O
ptio
n2:
S
Opt
ion
3: I
Opt
ion
4: I+
Scores justification
consideration that grazing marsh is an SSSI and unique in this area, grazing marsh should be given slightly more importance than saltmarsh. In order to differentiate between the subcategories a weight of 0.6 will be given to the grazing marsh and a weight of 0.4 will be attributed to the saltmarsh. For grazing marsh the ‘do-something’ options score 100 because they are the ones that protect the biggest area of the habitat. In relation to the ‘do-something’, under ‘do-nothing’ 88% more area of grazing marsh is lost, so a score of 12 is given to this option. For the saltmarsh subcategory the exactly opposite will happen, so the ‘do-something’ options will score 12 whilst the ‘do-nothing’ option will score 100. If these scores are pondered with the weights referred to above then the ‘do-something’ options will score 100 whilst the ‘do-nothing’ will score 72 overall. Using a ‘0 to 100’ scoring system the ‘do-nothing’ option would be given a score of 0. Although this is the worst option, the 0 does not reflect the gain in saltmarsh, i.e. the proportionality between options is not being respected.
Water quality 0/1 80 100 100
The impact on water quality from a wastewater treatment plant and a sewage treatment plant will be considered the same. The differences between the various options are (i) the improve and improve + options do not create water quality impacts, whilst the ‘do-nothing’ and sustain options do, and (ii) in the sustain option the sewage works will be flooded less frequently and to a lesser extent since it is located further in land. In addition, if one considers that the water quality will only be threatened once every 20 years under the sustain option, the time between two flood events will be sufficient for the quality of the water to be re-established to its previous state, making the impact of a temporary nature. The score of 100 will be given to, the improve and improve + options since they perform better in terms of water quality. ‘do-nothing’ will be always the worst option, since the waste water treatment plant would be flooded once every year, giving a score of 1. The sustain option, although not ideal, will not create significant impacts therefore it will be given the score of 80 (100 – 20), so that it will be slightly different/worst than the improve options, but significantly better than the do-nothing. In this case, because there is little information on the actual change in water quality dues to a flood event it is difficult to accurately measure the differences between the different options. In these cases a ‘0 to 100’ scoring system becomes much easier to apply, since the worst option is always 0.
Naturalprocesses 100 56 26 0/1
Under do-nothing the coastal processes would revert to their ‘natural’ state quite quickly, leading to landward migration of the shingle barrier and beach, and increased sediment supply to adjacent areas. For the do-something options the same process would occur but in a managed
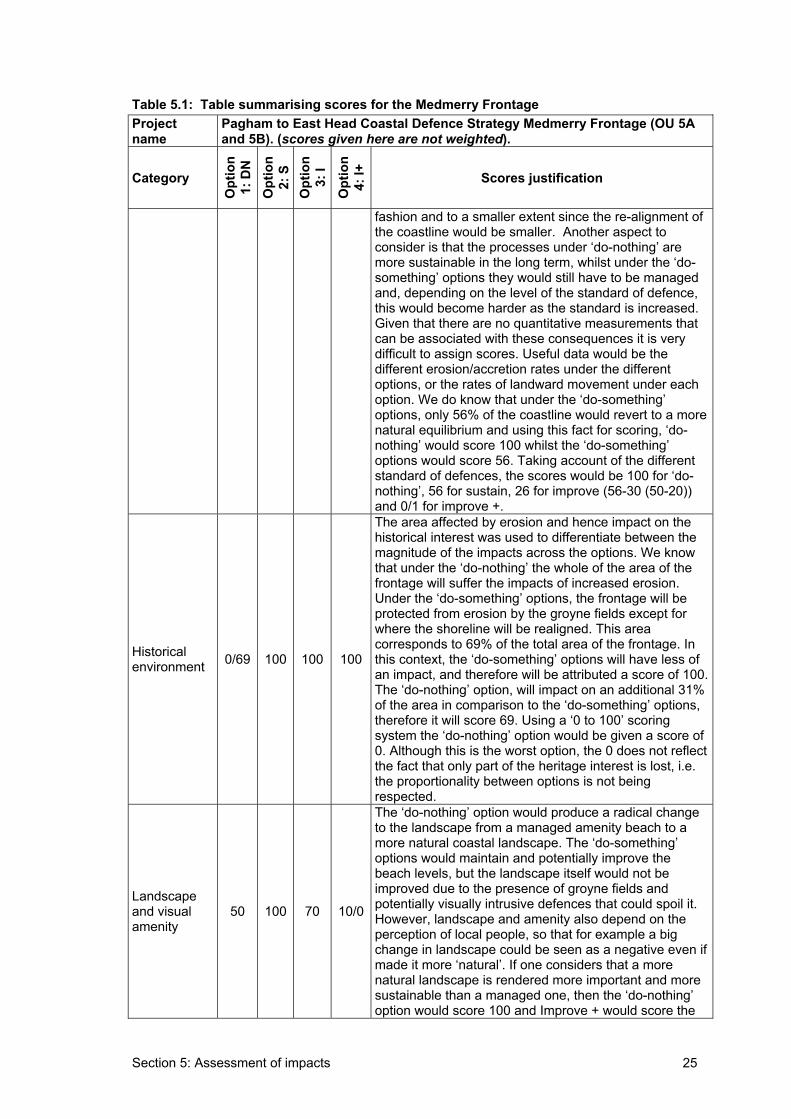
Section 5: Assessment of impacts 25
Table 5.1: Table summarising scores for the Medmerry Frontage Projectname
Pagham to East Head Coastal Defence Strategy Medmerry Frontage (OU 5A and 5B). (scores given here are not weighted).
Category
Opt
ion
1: D
N
Opt
ion
2: S
O
ptio
n3:
I
Opt
ion
4: I+
Scores justification
fashion and to a smaller extent since the re-alignment of the coastline would be smaller. Another aspect to consider is that the processes under ‘do-nothing’ are more sustainable in the long term, whilst under the ‘do-something’ options they would still have to be managed and, depending on the level of the standard of defence, this would become harder as the standard is increased.Given that there are no quantitative measurements that can be associated with these consequences it is very difficult to assign scores. Useful data would be the different erosion/accretion rates under the different options, or the rates of landward movement under each option. We do know that under the ‘do-something’ options, only 56% of the coastline would revert to a more natural equilibrium and using this fact for scoring, ‘do-nothing’ would score 100 whilst the ‘do-something’ options would score 56. Taking account of the different standard of defences, the scores would be 100 for ‘do-nothing’, 56 for sustain, 26 for improve (56-30 (50-20)) and 0/1 for improve +.
Historicalenvironment 0/69 100 100 100
The area affected by erosion and hence impact on the historical interest was used to differentiate between the magnitude of the impacts across the options. We know that under the ‘do-nothing’ the whole of the area of the frontage will suffer the impacts of increased erosion.Under the ‘do-something’ options, the frontage will be protected from erosion by the groyne fields except for where the shoreline will be realigned. This area corresponds to 69% of the total area of the frontage. In this context, the ‘do-something’ options will have less of an impact, and therefore will be attributed a score of 100. The ‘do-nothing’ option, will impact on an additional 31% of the area in comparison to the ‘do-something’ options, therefore it will score 69. Using a ‘0 to 100’ scoring system the ‘do-nothing’ option would be given a score of 0. Although this is the worst option, the 0 does not reflect the fact that only part of the heritage interest is lost, i.e. the proportionality between options is not being respected.
Landscapeand visual amenity
50 100 70 10/0
The ‘do-nothing’ option would produce a radical change to the landscape from a managed amenity beach to a more natural coastal landscape. The ‘do-something’ options would maintain and potentially improve the beach levels, but the landscape itself would not be improved due to the presence of groyne fields and potentially visually intrusive defences that could spoil it.However, landscape and amenity also depend on the perception of local people, so that for example a big change in landscape could be seen as a negative even if made it more ‘natural’. If one considers that a more natural landscape is rendered more important and more sustainable than a managed one, then the ‘do-nothing’ option would score 100 and Improve + would score the
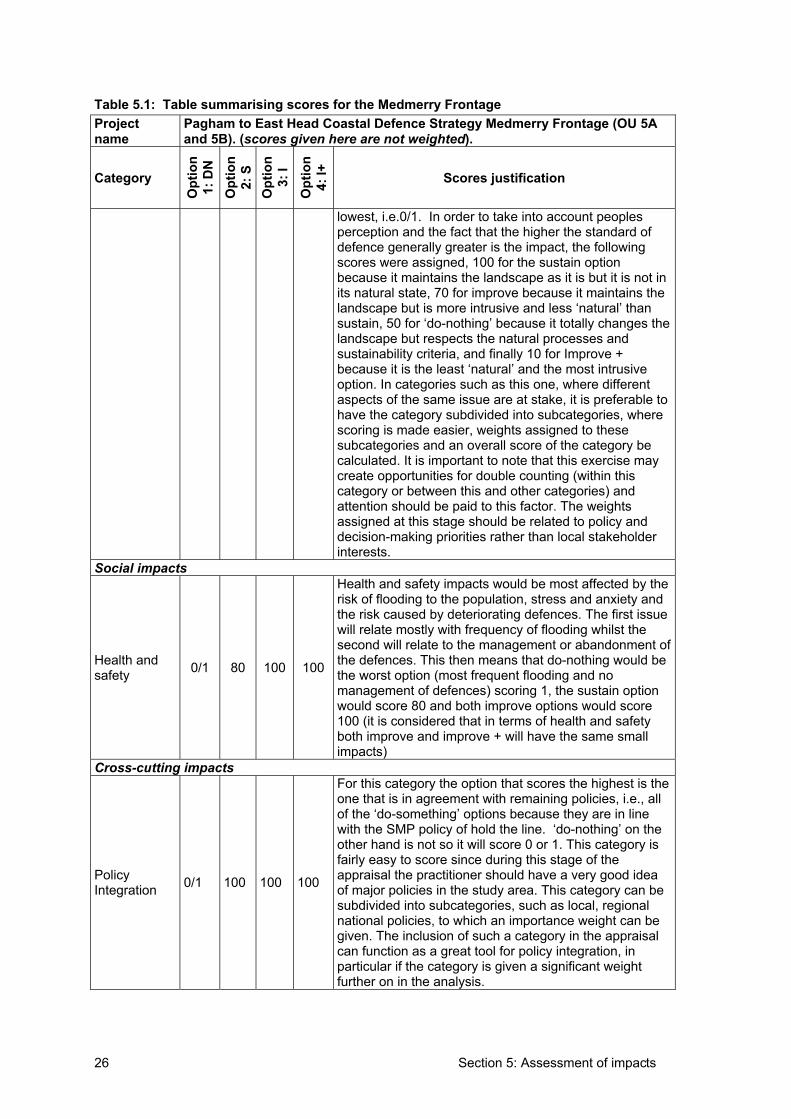
26 Section 5: Assessment of impacts
Table 5.1: Table summarising scores for the Medmerry Frontage Projectname
Pagham to East Head Coastal Defence Strategy Medmerry Frontage (OU 5A and 5B). (scores given here are not weighted).
Category O
ptio
n1:
DN
O
ptio
n2:
S
Opt
ion
3: I
Opt
ion
4: I+
Scores justification
lowest, i.e.0/1. In order to take into account peoples perception and the fact that the higher the standard of defence generally greater is the impact, the following scores were assigned, 100 for the sustain option because it maintains the landscape as it is but it is not in its natural state, 70 for improve because it maintains the landscape but is more intrusive and less ‘natural’ than sustain, 50 for ‘do-nothing’ because it totally changes the landscape but respects the natural processes and sustainability criteria, and finally 10 for Improve + because it is the least ‘natural’ and the most intrusive option. In categories such as this one, where different aspects of the same issue are at stake, it is preferable to have the category subdivided into subcategories, where scoring is made easier, weights assigned to these subcategories and an overall score of the category be calculated. It is important to note that this exercise may create opportunities for double counting (within this category or between this and other categories) and attention should be paid to this factor. The weights assigned at this stage should be related to policy and decision-making priorities rather than local stakeholder interests.
Social impacts
Health and safety 0/1 80 100 100
Health and safety impacts would be most affected by the risk of flooding to the population, stress and anxiety and the risk caused by deteriorating defences. The first issue will relate mostly with frequency of flooding whilst the second will relate to the management or abandonment of the defences. This then means that do-nothing would be the worst option (most frequent flooding and no management of defences) scoring 1, the sustain option would score 80 and both improve options would score 100 (it is considered that in terms of health and safety both improve and improve + will have the same small impacts)
Cross-cutting impacts
Policy Integration 0/1 100 100 100
For this category the option that scores the highest is the one that is in agreement with remaining policies, i.e., all of the ‘do-something’ options because they are in line with the SMP policy of hold the line. ‘do-nothing’ on the other hand is not so it will score 0 or 1. This category is fairly easy to score since during this stage of the appraisal the practitioner should have a very good idea of major policies in the study area. This category can be subdivided into subcategories, such as local, regional national policies, to which an importance weight can be given. The inclusion of such a category in the appraisal can function as a great tool for policy integration, in particular if the category is given a significant weight further on in the analysis.
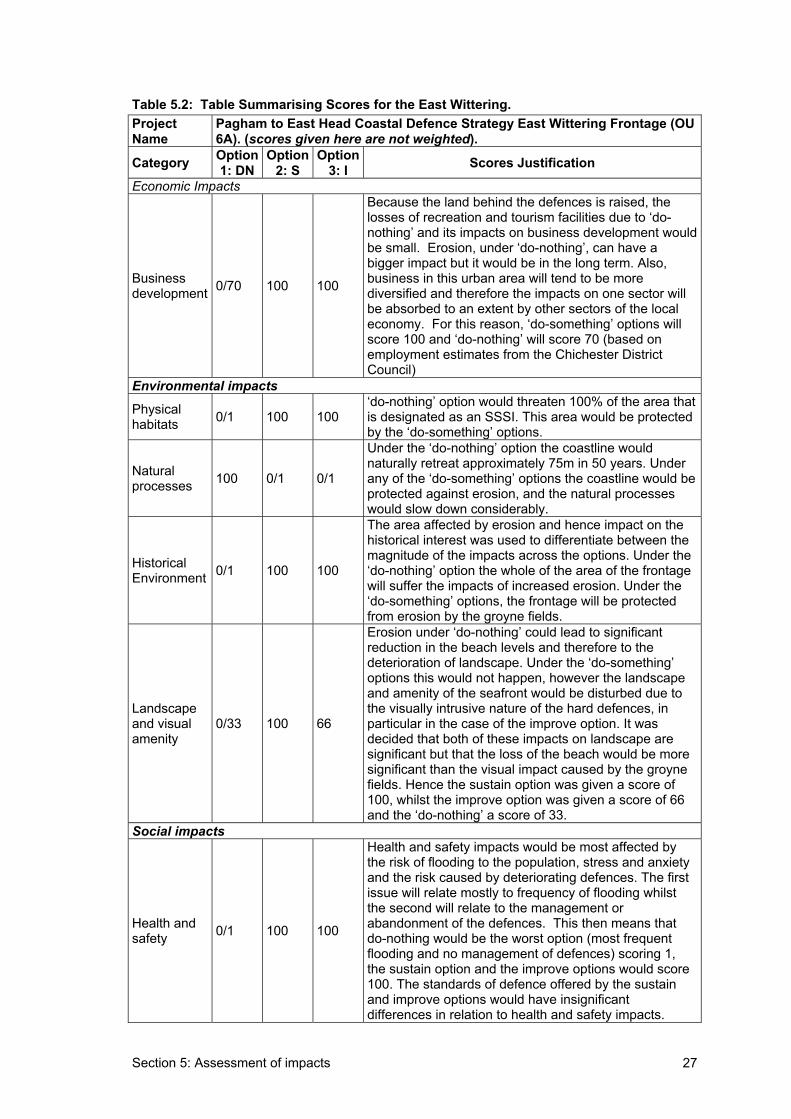
Section 5: Assessment of impacts 27
Table 5.2: Table Summarising Scores for the East Wittering. ProjectName
Pagham to East Head Coastal Defence Strategy East Wittering Frontage (OU 6A). (scores given here are not weighted).
Category Option1: DN
Option2: S
Option3: I Scores Justification
Economic Impacts
Businessdevelopment 0/70 100 100
Because the land behind the defences is raised, the losses of recreation and tourism facilities due to ‘do-nothing’ and its impacts on business development would be small. Erosion, under ‘do-nothing’, can have a bigger impact but it would be in the long term. Also, business in this urban area will tend to be more diversified and therefore the impacts on one sector will be absorbed to an extent by other sectors of the local economy. For this reason, ‘do-something’ options will score 100 and ‘do-nothing’ will score 70 (based on employment estimates from the Chichester District Council)
Environmental impacts
Physical habitats 0/1 100 100
‘do-nothing’ option would threaten 100% of the area that is designated as an SSSI. This area would be protected by the ‘do-something’ options.
Naturalprocesses 100 0/1 0/1
Under the ‘do-nothing’ option the coastline would naturally retreat approximately 75m in 50 years. Under any of the ‘do-something’ options the coastline would be protected against erosion, and the natural processes would slow down considerably.
HistoricalEnvironment 0/1 100 100
The area affected by erosion and hence impact on the historical interest was used to differentiate between the magnitude of the impacts across the options. Under the ‘do-nothing’ option the whole of the area of the frontage will suffer the impacts of increased erosion. Under the ‘do-something’ options, the frontage will be protected from erosion by the groyne fields.
Landscapeand visual amenity
0/33 100 66
Erosion under ‘do-nothing’ could lead to significant reduction in the beach levels and therefore to the deterioration of landscape. Under the ‘do-something’ options this would not happen, however the landscape and amenity of the seafront would be disturbed due to the visually intrusive nature of the hard defences, in particular in the case of the improve option. It was decided that both of these impacts on landscape are significant but that the loss of the beach would be more significant than the visual impact caused by the groyne fields. Hence the sustain option was given a score of 100, whilst the improve option was given a score of 66 and the ‘do-nothing’ a score of 33.
Social impacts
Health and safety 0/1 100 100
Health and safety impacts would be most affected by the risk of flooding to the population, stress and anxiety and the risk caused by deteriorating defences. The first issue will relate mostly to frequency of flooding whilst the second will relate to the management or abandonment of the defences. This then means that do-nothing would be the worst option (most frequent flooding and no management of defences) scoring 1, the sustain option and the improve options would score 100. The standards of defence offered by the sustain and improve options would have insignificant differences in relation to health and safety impacts.
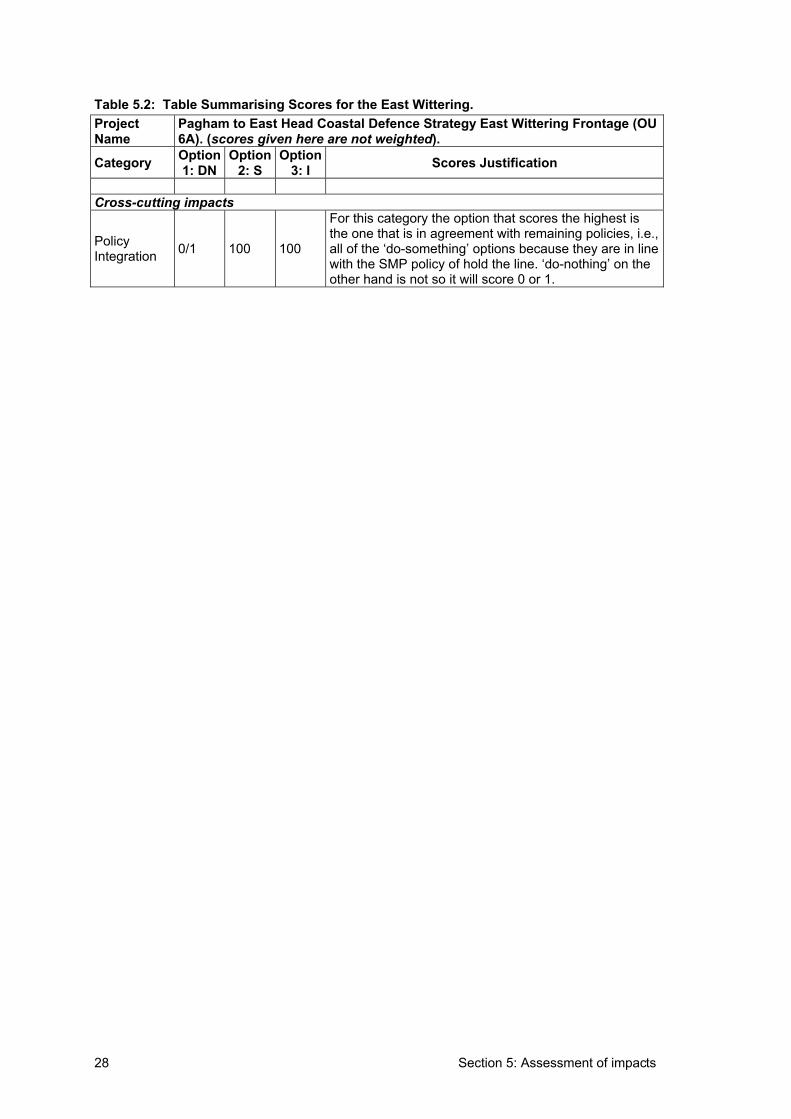
28 Section 5: Assessment of impacts
Table 5.2: Table Summarising Scores for the East Wittering. ProjectName
Pagham to East Head Coastal Defence Strategy East Wittering Frontage (OU 6A). (scores given here are not weighted).
Category Option1: DN
Option2: S
Option3: I Scores Justification
Cross-cutting impacts
Policy Integration 0/1 100 100
For this category the option that scores the highest is the one that is in agreement with remaining policies, i.e., all of the ‘do-something’ options because they are in line with the SMP policy of hold the line. ‘do-nothing’ on the other hand is not so it will score 0 or 1.
Section 6: Weighting and comparison of options 29
6. Weighting and comparison of options 6.1 Source of weights
In all cases, the Constrained Random Weight Generator (CRWG) was used to calculate minimum, maximum and average total weighted scores and total weighted incremental scores for the options under consideration. These, along with interpretation, are provided in the summary tables for each management unit.
6.2 Comparison of options
6.2.1 Medmerry
Table 6.1 provides a summary table of monetary costs and benefits and scores for the Medmerry Management Unit.
Analysis of the preferred option starts with the option with the highest benefit-cost ratio, which, in this case is Option 4: Improve +. The Benefit-Cost Ratio is (robustly) above 1. Option 4 also represents a move above the indicative standard and, as there are no ‘next’ options, according to FCDPAG3, this is the preferred option on the basis of monetary costs and benefits. The CRWG has been applied to detect the level of potential intangible benefit from the option to ensure primarily that there are not large intangible dis-benefits that could potentially offset the monetary benefits and change the decision. The calculations from the CRWG suggest that the intangible benefits incremental to the ‘do-nothing’ option are all positive and of the order of between 31 to 87.4. As such, there are no intangible dis-benefits that could change the decision context. Option 4: Improve + is the preferred option.
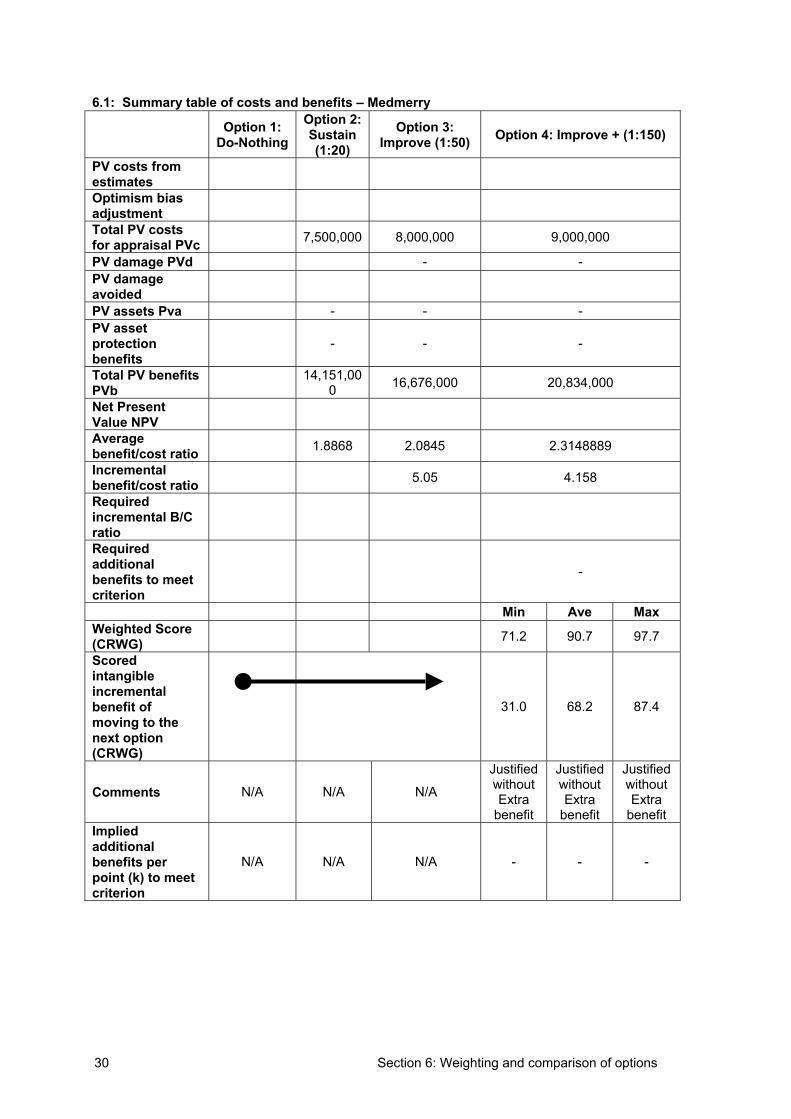
30 Section 6: Weighting and comparison of options
6.1: Summary table of costs and benefits – Medmerry
Option 1:Do-Nothing
Option 2: Sustain(1:20)
Option 3: Improve (1:50) Option 4: Improve + (1:150)
PV costs from estimates
Optimism bias adjustment
Total PV costs for appraisal PVc 7,500,000 8,000,000 9,000,000
PV damage PVd - - PV damage avoided
PV assets Pva - - - PV asset protectionbenefits
- - -
Total PV benefits PVb
14,151,000 16,676,000 20,834,000
Net Present Value NPV
Average benefit/cost ratio 1.8868 2.0845 2.3148889
Incrementalbenefit/cost ratio 5.05 4.158
Requiredincremental B/C ratio
Requiredadditionalbenefits to meet criterion
-
Min Ave Max Weighted Score (CRWG) 71.2 90.7 97.7
Scoredintangibleincrementalbenefit of moving to the next option (CRWG)
31.0 68.2 87.4
Comments N/A N/A N/A
JustifiedwithoutExtra
benefit
JustifiedwithoutExtra
benefit
JustifiedwithoutExtra
benefitImpliedadditionalbenefits per point (k) to meet criterion
N/A N/A N/A - - -
Section 6: Weighting and comparison of options 31
6.2.2 East Wittering
Table 6.2 provides a summary table of monetary costs and benefits and scores for the East Wittering Management Unit.
Analysis of the preferred option starts with the option with the highest benefit-cost ratio, which, in this case is Option 2: Sustain.
The next highest option is Option 3: Improve which must attain an incremental benefit cost ratio of 3 to be the preferred option. On the basis of monetary costs and benefits, the option only achieves an incremental benefit-cost ratio of 0.03 and therefore would require some £14,870,000 of intangible benefit to achieve the criterion. However, calculations with the CRWG generator reveal that the Improve Option cannot achieve an incremental intangible benefit with any set of weights. Thus, it can be concluded that, as there are no intangible benefits and the option does not attain a high enough incremental benefit-cost ratio on the basis of monetary costs and benefits, Option 3: Improve is not justified.
The preferred option is Option 2: Sustain.
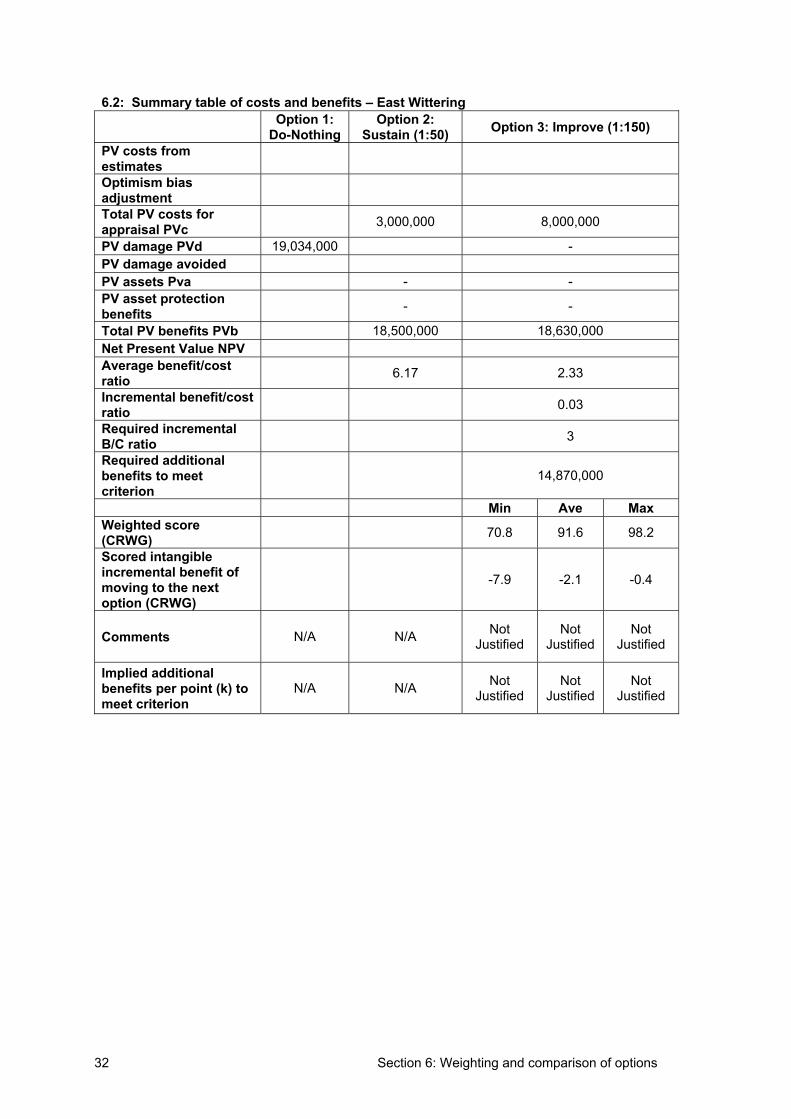
32 Section 6: Weighting and comparison of options
6.2: Summary table of costs and benefits – East Wittering Option 1:
Do-NothingOption 2:
Sustain (1:50) Option 3: Improve (1:150)
PV costs from estimates
Optimism bias adjustment
Total PV costs for appraisal PVc 3,000,000 8,000,000
PV damage PVd 19,034,000 - PV damage avoided PV assets Pva - - PV asset protection benefits - -
Total PV benefits PVb 18,500,000 18,630,000 Net Present Value NPV Average benefit/cost ratio 6.17 2.33
Incremental benefit/cost ratio 0.03
Required incremental B/C ratio 3
Required additional benefits to meet criterion
14,870,000
Min Ave Max Weighted score (CRWG) 70.8 91.6 98.2
Scored intangible incremental benefit of moving to the next option (CRWG)
-7.9 -2.1 -0.4
Comments N/A N/A NotJustified
NotJustified
NotJustified
Implied additional benefits per point (k) to meet criterion
N/A N/A NotJustified
NotJustified
NotJustified
Section 7: References 33
7. References Posford Duvivier (1999): Pagham to East Head Coastal Defence Strategy – Main Report, report produced for the Environment Agency, Chichester District Council and Arum District Council, September 1999.
Posford Duvivier (1999): Pagham to East Head Coastal Defence Strategy – Supporting Document, report produced for the Environment Agency, Chichester District Council and Arum District Council, September 1999.
Posford Duvivier (2001): Pagham to East Head Coastal Defence Strategy – Main Report, report produced for the Environment Agency, Chichester District Council and Arum District Council, January 2001.
Posford Duvivier (2001): Pagham to East Head Coastal Defence Strategy – Supporting Document, report produced for the Environment Agency, Chichester District Council and Arum District Council, January 2001.
Royal Haskoning (2001): Pagham to East Head Coastal Defence Strategy –Economic Update, report produced for the Environment Agency, May 2003.
34 Appendix B2.1
Appendix B2.1:
Appraisal summary table for high level screening for Pagham to East Head coastal defence strategy – Medmerry and East Wittering Frontages
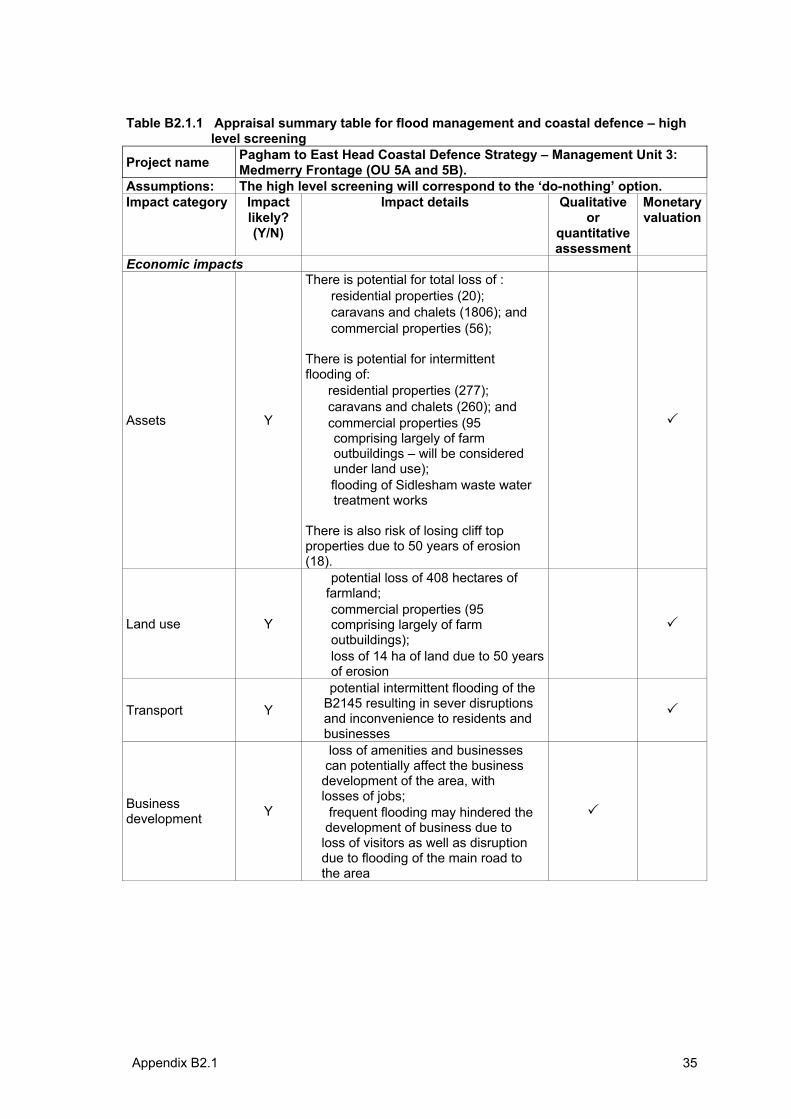
Appendix B2.1 35
Table B2.1.1 Appraisal summary table for flood management and coastal defence – high level screening
Project name Pagham to East Head Coastal Defence Strategy – Management Unit 3: Medmerry Frontage (OU 5A and 5B).
Assumptions: The high level screening will correspond to the ‘do-nothing’ option. Impact category Impact
likely? (Y/N)
Impact details Qualitative or
quantitative assessment
Monetary valuation
Economic impacts
Assets Y
There is potential for total loss of : • residential properties (20); • caravans and chalets (1806); and • commercial properties (56);
There is potential for intermittent flooding of: • residential properties (277); • caravans and chalets (260); and • commercial properties (95
comprising largely of farm outbuildings – will be considered under land use);
• flooding of Sidlesham waste water treatment works
There is also risk of losing cliff top properties due to 50 years of erosion (18).
Land use Y
• potential loss of 408 hectares offarmland;
• commercial properties (95 comprising largely of farm outbuildings);
• loss of 14 ha of land due to 50 years of erosion
Transport Y
• potential intermittent flooding of theB2145 resulting in sever disruptionsand inconvenience to residents andbusinesses
Businessdevelopment Y
• loss of amenities and businesses can potentially affect the businessdevelopment of the area, withlosses of jobs;
• frequent flooding may hindered the development of business due toloss of visitors as well as disruptiondue to flooding of the main road tothe area
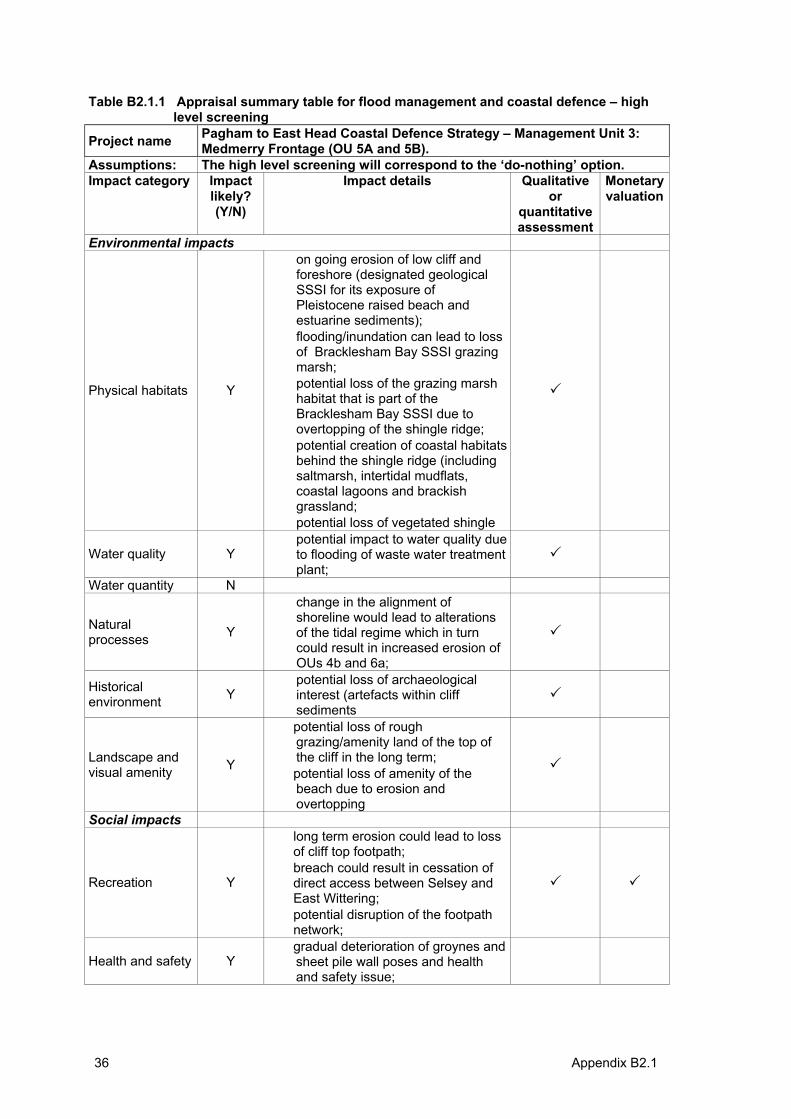
36 Appendix B2.1
Table B2.1.1 Appraisal summary table for flood management and coastal defence – high level screening
Project name Pagham to East Head Coastal Defence Strategy – Management Unit 3: Medmerry Frontage (OU 5A and 5B).
Assumptions: The high level screening will correspond to the ‘do-nothing’ option. Impact category Impact
likely? (Y/N)
Impact details Qualitative or
quantitative assessment
Monetary valuation
Environmental impacts
Physical habitats Y
• on going erosion of low cliff and foreshore (designated geological SSSI for its exposure of Pleistocene raised beach and estuarine sediments);
• flooding/inundation can lead to loss of Bracklesham Bay SSSI grazing marsh;
• potential loss of the grazing marsh habitat that is part of the Bracklesham Bay SSSI due to overtopping of the shingle ridge;
• potential creation of coastal habitats behind the shingle ridge (including saltmarsh, intertidal mudflats, coastal lagoons and brackish grassland;
• potential loss of vegetated shingle
Water quality Y • potential impact to water quality due
to flooding of waste water treatment plant;
Water quantity N
Naturalprocesses Y
• change in the alignment of shoreline would lead to alterations of the tidal regime which in turn could result in increased erosion of OUs 4b and 6a;
Historicalenvironment Y
• potential loss of archaeologicalinterest (artefacts within cliff sediments
Landscape and visual amenity Y
• potential loss of rough grazing/amenity land of the top of the cliff in the long term;
• potential loss of amenity of the beach due to erosion and overtopping
Social impacts
Recreation Y
• long term erosion could lead to loss of cliff top footpath;
• breach could result in cessation of direct access between Selsey and East Wittering;
• potential disruption of the footpath network;
Health and safety Y • gradual deterioration of groynes and
sheet pile wall poses and health and safety issue;
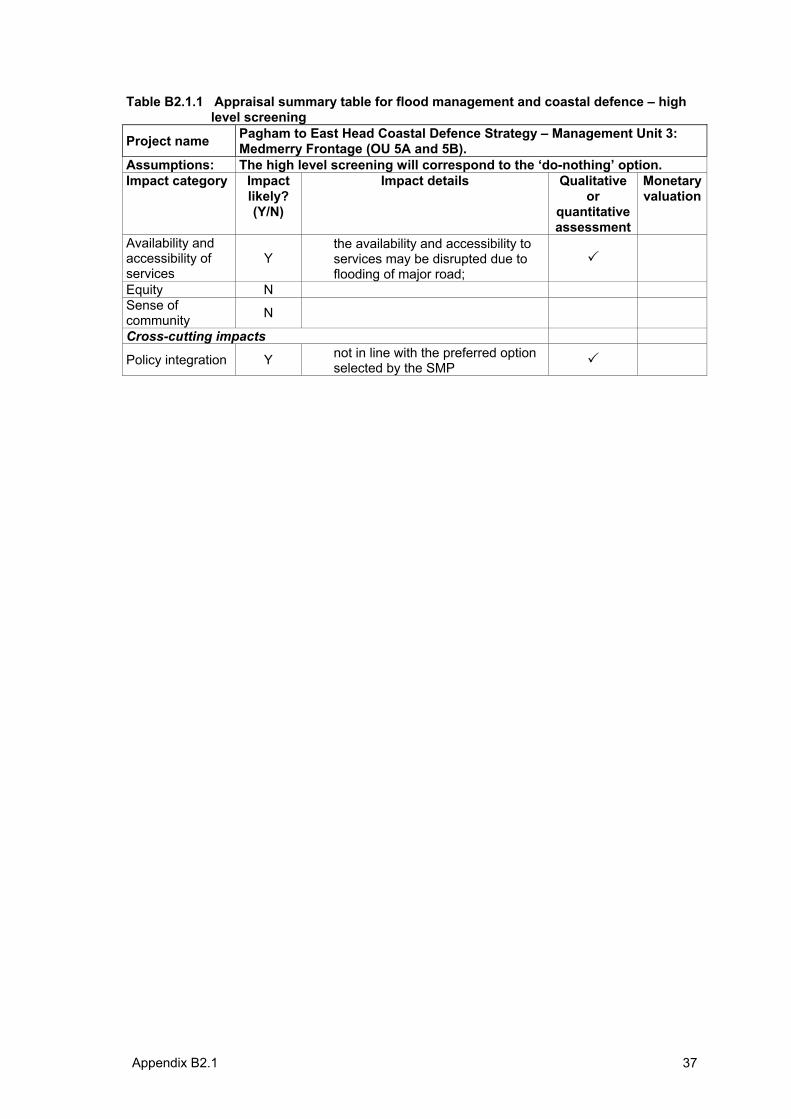
Appendix B2.1 37
Table B2.1.1 Appraisal summary table for flood management and coastal defence – high level screening
Project name Pagham to East Head Coastal Defence Strategy – Management Unit 3: Medmerry Frontage (OU 5A and 5B).
Assumptions: The high level screening will correspond to the ‘do-nothing’ option. Impact category Impact
likely? (Y/N)
Impact details Qualitative or
quantitative assessment
Monetary valuation
Availability and accessibility of services
Y• the availability and accessibility to
services may be disrupted due to flooding of major road;
Equity N Sense of community N
Cross-cutting impacts
Policy integration Y • not in line with the preferred option selected by the SMP
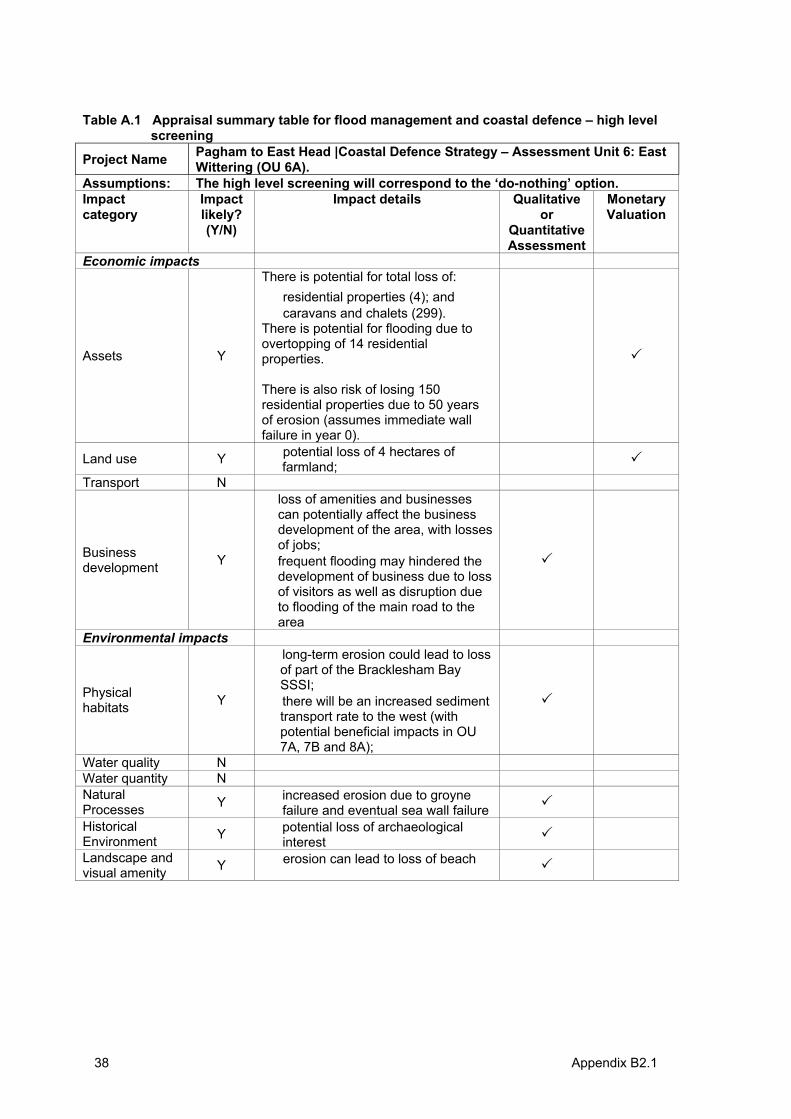
38 Appendix B2.1
Table A.1 Appraisal summary table for flood management and coastal defence – high level screening
Project Name Pagham to East Head |Coastal Defence Strategy – Assessment Unit 6: East Wittering (OU 6A).
Assumptions: The high level screening will correspond to the ‘do-nothing’ option. Impactcategory
Impactlikely? (Y/N)
Impact details Qualitative or
Quantitative Assessment
Monetary Valuation
Economic impacts
Assets Y
There is potential for total loss of: • residential properties (4); and • caravans and chalets (299). There is potential for flooding due to overtopping of 14 residential properties.
There is also risk of losing 150 residential properties due to 50 years of erosion (assumes immediate wall failure in year 0).
Land use Y • potential loss of 4 hectares of farmland;
Transport N
Businessdevelopment Y
• loss of amenities and businesses can potentially affect the business development of the area, with losses of jobs;
• frequent flooding may hindered the development of business due to loss of visitors as well as disruption due to flooding of the main road to the area
Environmental impacts
Physical habitats Y
• long-term erosion could lead to loss of part of the Bracklesham Bay SSSI;
• there will be an increased sediment transport rate to the west (with potential beneficial impacts in OU 7A, 7B and 8A);
Water quality N Water quantity N NaturalProcesses Y • increased erosion due to groyne
failure and eventual sea wall failure HistoricalEnvironment Y • potential loss of archaeological
interestLandscape and visual amenity Y • erosion can lead to loss of beach
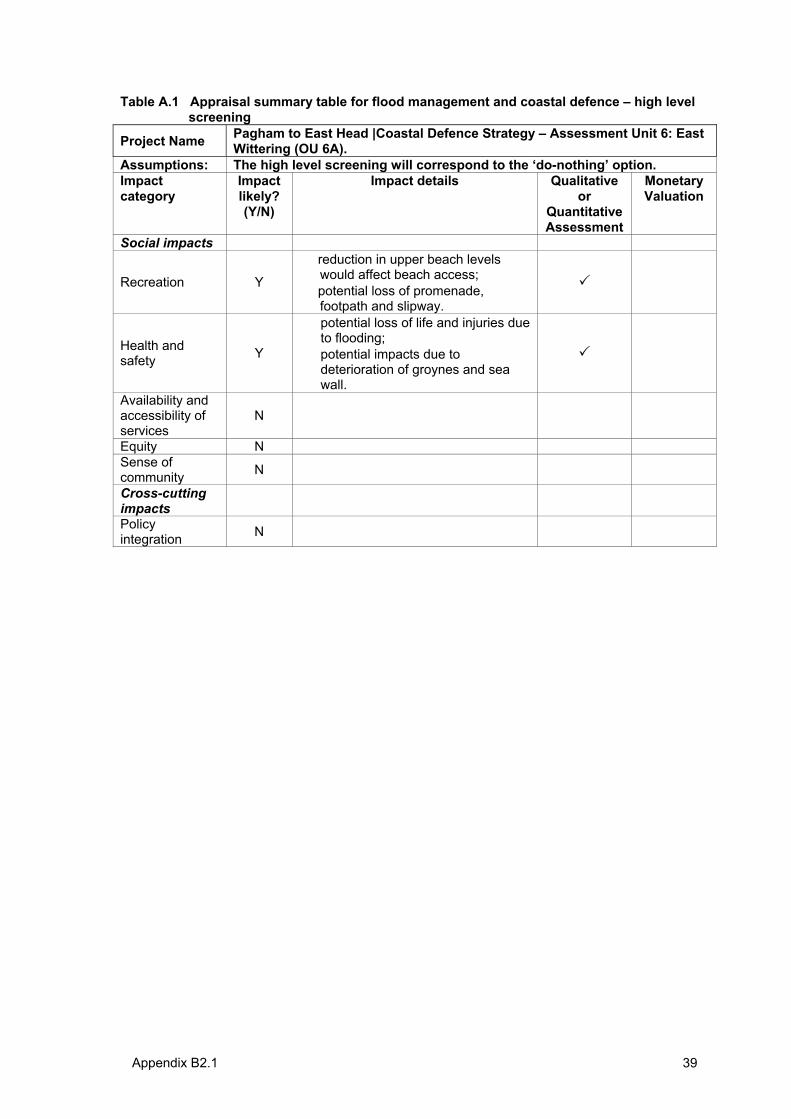
Appendix B2.1 39
Table A.1 Appraisal summary table for flood management and coastal defence – high level screening
Project Name Pagham to East Head |Coastal Defence Strategy – Assessment Unit 6: East Wittering (OU 6A).
Assumptions: The high level screening will correspond to the ‘do-nothing’ option. Impactcategory
Impactlikely? (Y/N)
Impact details Qualitative or
Quantitative Assessment
Monetary Valuation
Social impacts
Recreation Y
• reduction in upper beach levels would affect beach access;
• potential loss of promenade, footpath and slipway.
Health and safety Y
• potential loss of life and injuries due to flooding;
• potential impacts due to deterioration of groynes and sea wall.
Availability and accessibility of services
N
Equity N Sense of community N
Cross-cuttingimpactsPolicy integration N
40 Appendix B2.2
Appendix B2.2:
Appraisal summary table for mainassessment – MA-AST for Pagham toEast Head coastal defence strategy –Medmerry Frontage
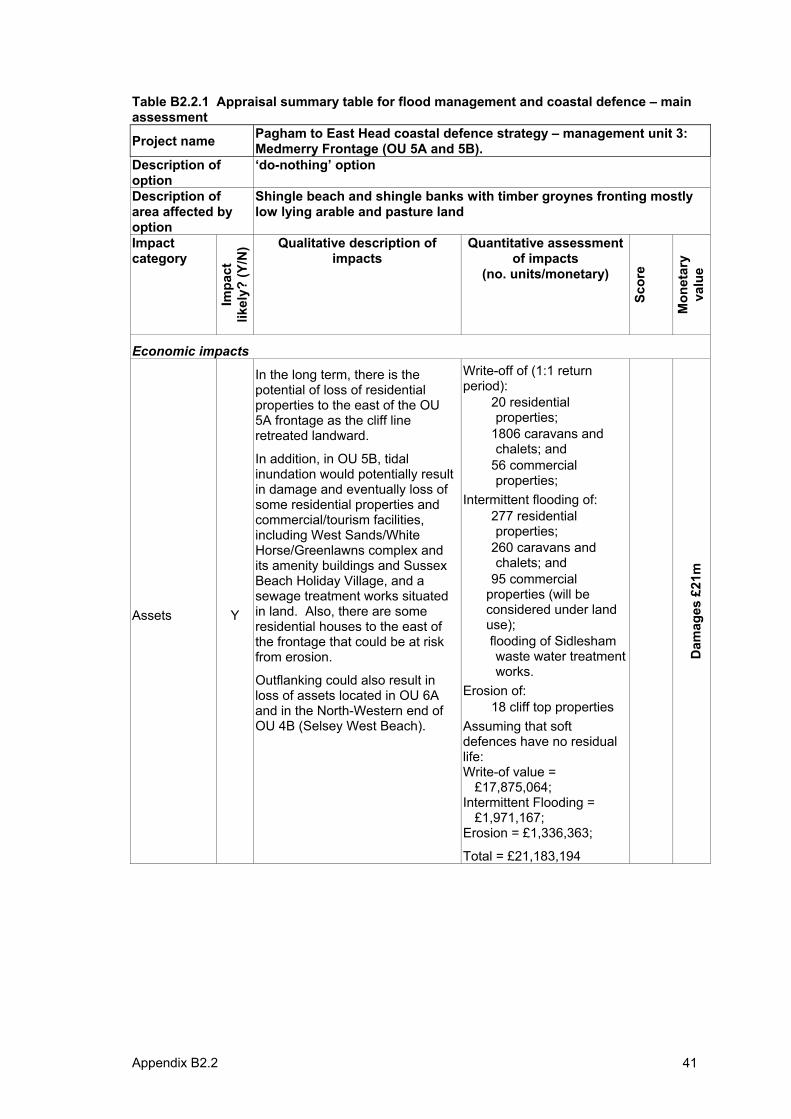
Appendix B2.2 41
Table B2.2.1 Appraisal summary table for flood management and coastal defence – main assessment
Project name Pagham to East Head coastal defence strategy – management unit 3: Medmerry Frontage (OU 5A and 5B).
Description of option
‘do-nothing’ option
Description of area affected by option
Shingle beach and shingle banks with timber groynes fronting mostly low lying arable and pasture land
Impactcategory
Impa
ctlik
ely?
(Y/N
) Qualitative description of impacts
Quantitative assessment of impacts
(no. units/monetary)
Scor
e
Mon
etar
yva
lue
Economic impacts
Assets Y
In the long term, there is the potential of loss of residential properties to the east of the OU 5A frontage as the cliff line retreated landward.
In addition, in OU 5B, tidal inundation would potentially result in damage and eventually loss of some residential properties and commercial/tourism facilities, including West Sands/White Horse/Greenlawns complex and its amenity buildings and Sussex Beach Holiday Village, and a sewage treatment works situated in land. Also, there are some residential houses to the east of the frontage that could be at risk from erosion.
Outflanking could also result in loss of assets located in OU 6A and in the North-Western end of OU 4B (Selsey West Beach).
Write-off of (1:1 return period):• 20 residential
properties;• 1806 caravans and
chalets; and • 56 commercial
properties;Intermittent flooding of: • 277 residential
properties;• 260 caravans and
chalets; and • 95 commercial
properties (will beconsidered under land use);
• flooding of Sidlesham waste water treatment works.
Erosion of: • 18 cliff top properties Assuming that soft defences have no residual life:Write-of value =
£17,875,064;Intermittent Flooding =
£1,971,167;Erosion = £1,336,363;
Total = £21,183,194
Dam
ages
£21
m
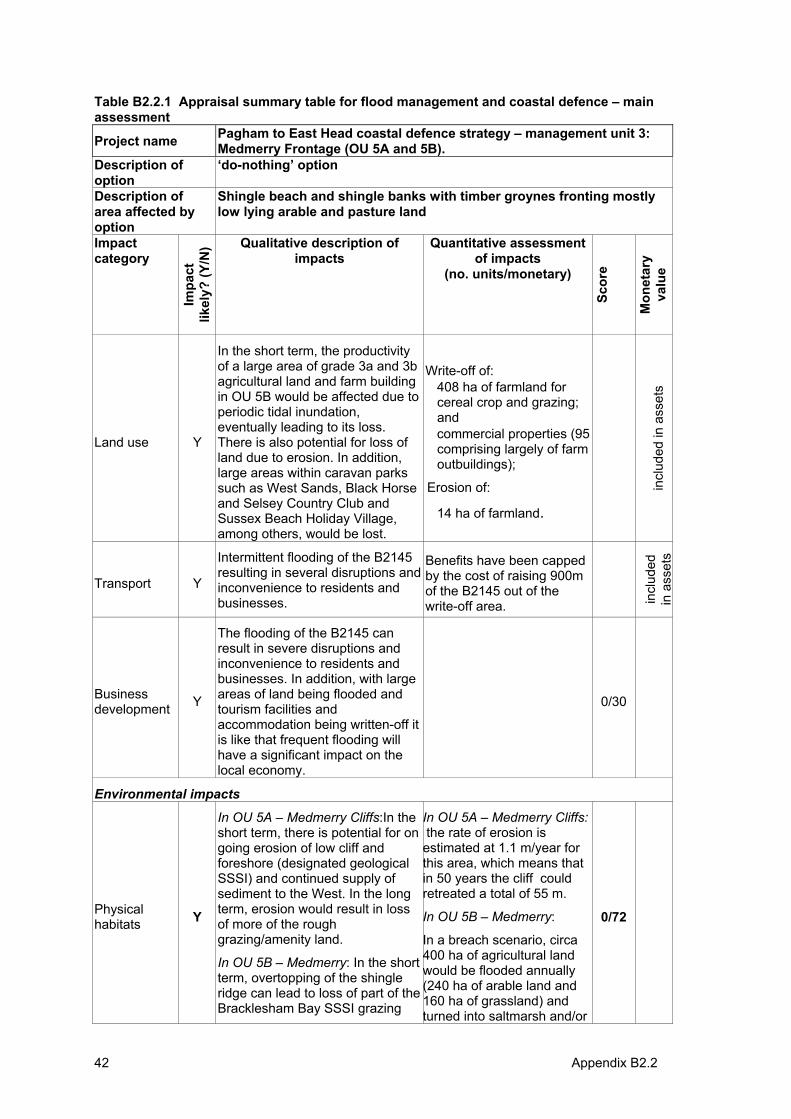
42 Appendix B2.2
Table B2.2.1 Appraisal summary table for flood management and coastal defence – main assessment
Project name Pagham to East Head coastal defence strategy – management unit 3: Medmerry Frontage (OU 5A and 5B).
Description of option
‘do-nothing’ option
Description of area affected by option
Shingle beach and shingle banks with timber groynes fronting mostly low lying arable and pasture land
Impactcategory
Impa
ctlik
ely?
(Y/N
) Qualitative description of impacts
Quantitative assessment of impacts
(no. units/monetary)
Scor
e
Mon
etar
yva
lue
Land use Y
In the short term, the productivity of a large area of grade 3a and 3b agricultural land and farm building in OU 5B would be affected due to periodic tidal inundation, eventually leading to its loss. There is also potential for loss of land due to erosion. In addition, large areas within caravan parks such as West Sands, Black Horse and Selsey Country Club and Sussex Beach Holiday Village, among others, would be lost.
Write-off of: • 408 ha of farmland for
cereal crop and grazing; and
• commercial properties (95 comprising largely of farm outbuildings);
Erosion of:
• 14 ha of farmland.
incl
uded
in a
sset
s
Transport Y
Intermittent flooding of the B2145 resulting in several disruptions and inconvenience to residents and businesses.
Benefits have been capped by the cost of raising 900m of the B2145 out of the write-off area. in
clud
edin
ass
ets
Businessdevelopment Y
The flooding of the B2145 can result in severe disruptions and inconvenience to residents and businesses. In addition, with large areas of land being flooded and tourism facilities and accommodation being written-off it is like that frequent flooding will have a significant impact on the local economy.
0/30
Environmental impacts
Physical habitats Y
In OU 5A – Medmerry Cliffs:In the short term, there is potential for on going erosion of low cliff and foreshore (designated geological SSSI) and continued supply of sediment to the West. In the long term, erosion would result in loss of more of the rough grazing/amenity land.
In OU 5B – Medmerry: In the short term, overtopping of the shingle ridge can lead to loss of part of the Bracklesham Bay SSSI grazing
In OU 5A – Medmerry Cliffs: the rate of erosion is estimated at 1.1 m/year for this area, which means that in 50 years the cliff could retreated a total of 55 m.
In OU 5B – Medmerry:
In a breach scenario, circa 400 ha of agricultural land would be flooded annually (240 ha of arable land and 160 ha of grassland) and turned into saltmarsh and/or
0/72
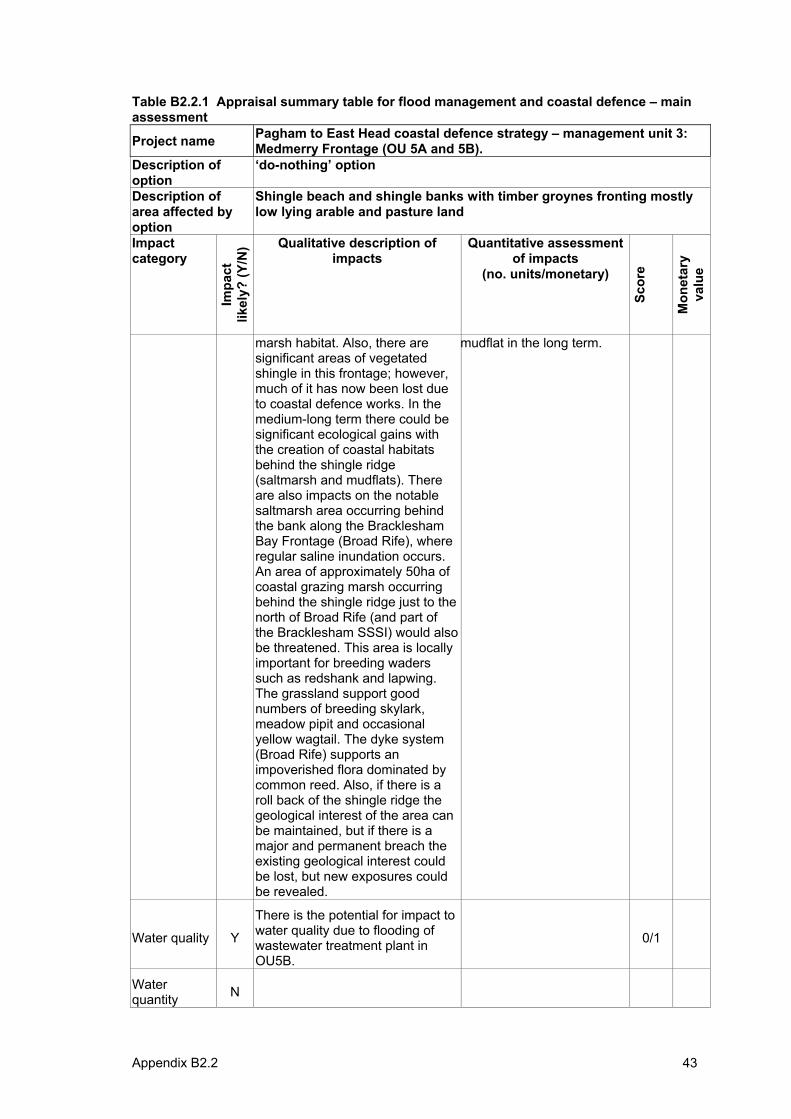
Appendix B2.2 43
Table B2.2.1 Appraisal summary table for flood management and coastal defence – main assessment
Project name Pagham to East Head coastal defence strategy – management unit 3: Medmerry Frontage (OU 5A and 5B).
Description of option
‘do-nothing’ option
Description of area affected by option
Shingle beach and shingle banks with timber groynes fronting mostly low lying arable and pasture land
Impactcategory
Impa
ctlik
ely?
(Y/N
) Qualitative description of impacts
Quantitative assessment of impacts
(no. units/monetary)
Scor
e
Mon
etar
yva
lue
marsh habitat. Also, there are significant areas of vegetated shingle in this frontage; however, much of it has now been lost due to coastal defence works. In the medium-long term there could be significant ecological gains with the creation of coastal habitats behind the shingle ridge (saltmarsh and mudflats). There are also impacts on the notable saltmarsh area occurring behind the bank along the Bracklesham Bay Frontage (Broad Rife), where regular saline inundation occurs. An area of approximately 50ha of coastal grazing marsh occurring behind the shingle ridge just to the north of Broad Rife (and part of the Bracklesham SSSI) would also be threatened. This area is locally important for breeding waders such as redshank and lapwing. The grassland support good numbers of breeding skylark, meadow pipit and occasional yellow wagtail. The dyke system (Broad Rife) supports an impoverished flora dominated by common reed. Also, if there is a roll back of the shingle ridge the geological interest of the area can be maintained, but if there is a major and permanent breach the existing geological interest could be lost, but new exposures could be revealed.
mudflat in the long term.
Water quality Y
There is the potential for impact to water quality due to flooding of wastewater treatment plant in OU5B.
0/1
Waterquantity N
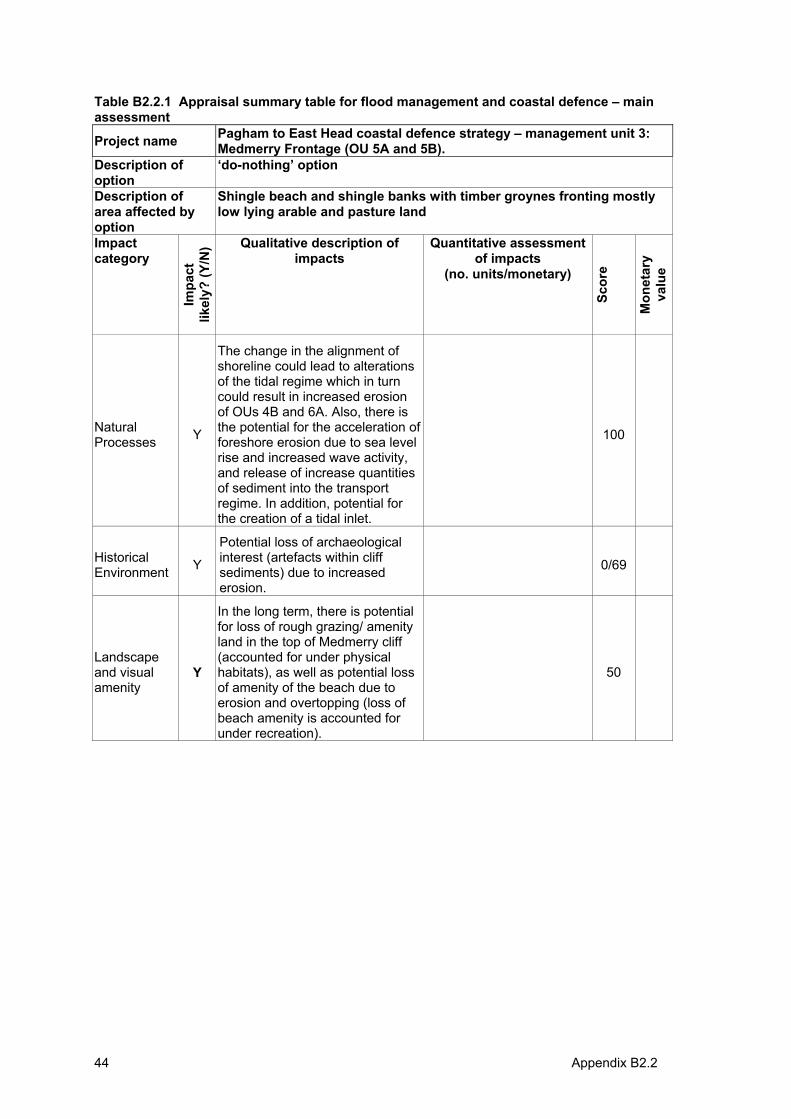
44 Appendix B2.2
Table B2.2.1 Appraisal summary table for flood management and coastal defence – main assessment
Project name Pagham to East Head coastal defence strategy – management unit 3: Medmerry Frontage (OU 5A and 5B).
Description of option
‘do-nothing’ option
Description of area affected by option
Shingle beach and shingle banks with timber groynes fronting mostly low lying arable and pasture land
Impactcategory
Impa
ctlik
ely?
(Y/N
) Qualitative description of impacts
Quantitative assessment of impacts
(no. units/monetary)
Scor
e
Mon
etar
yva
lue
NaturalProcesses Y
The change in the alignment of shoreline could lead to alterations of the tidal regime which in turn could result in increased erosion of OUs 4B and 6A. Also, there is the potential for the acceleration of foreshore erosion due to sea level rise and increased wave activity, and release of increase quantities of sediment into the transport regime. In addition, potential for the creation of a tidal inlet.
100
HistoricalEnvironment Y
Potential loss of archaeological interest (artefacts within cliff sediments) due to increased erosion.
0/69
Landscapeand visual amenity
Y
In the long term, there is potential for loss of rough grazing/ amenity land in the top of Medmerry cliff (accounted for under physical habitats), as well as potential loss of amenity of the beach due to erosion and overtopping (loss of beach amenity is accounted for under recreation).
50
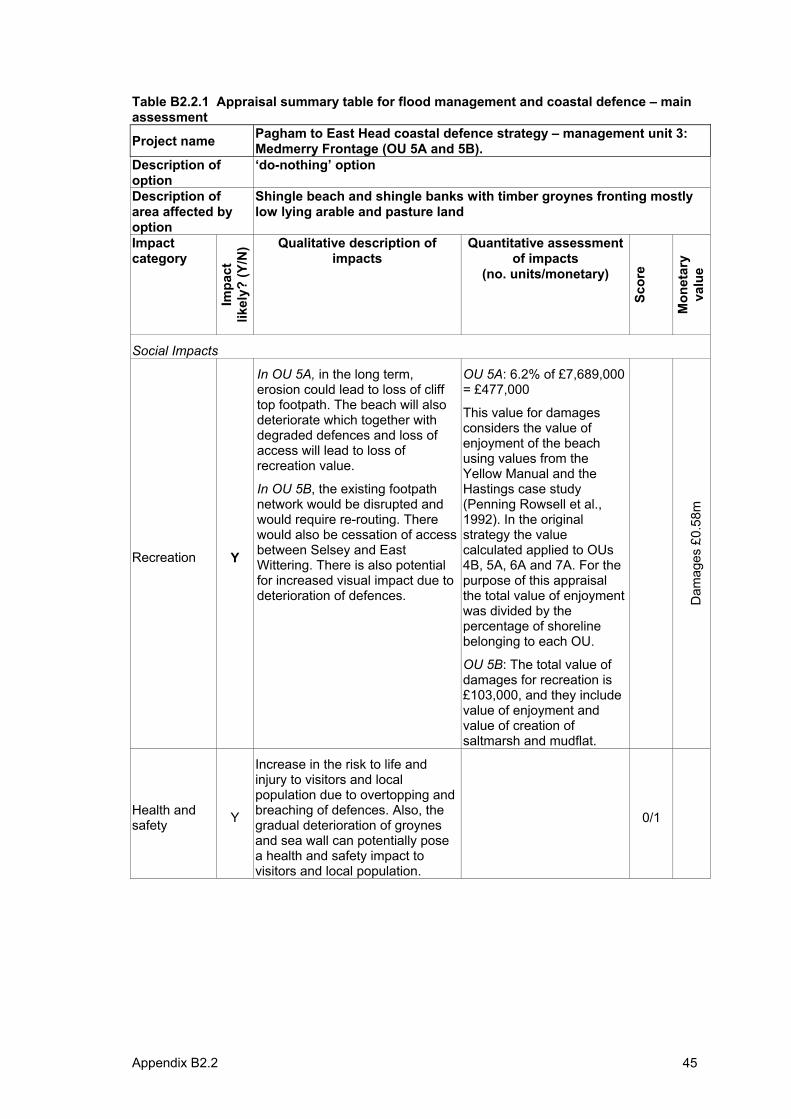
Appendix B2.2 45
Table B2.2.1 Appraisal summary table for flood management and coastal defence – main assessment
Project name Pagham to East Head coastal defence strategy – management unit 3: Medmerry Frontage (OU 5A and 5B).
Description of option
‘do-nothing’ option
Description of area affected by option
Shingle beach and shingle banks with timber groynes fronting mostly low lying arable and pasture land
Impactcategory
Impa
ctlik
ely?
(Y/N
) Qualitative description of impacts
Quantitative assessment of impacts
(no. units/monetary)
Scor
e
Mon
etar
yva
lue
Social Impacts
Recreation Y
In OU 5A, in the long term, erosion could lead to loss of cliff top footpath. The beach will also deteriorate which together with degraded defences and loss of access will lead to loss of recreation value.
In OU 5B, the existing footpath network would be disrupted and would require re-routing. There would also be cessation of access between Selsey and East Wittering. There is also potential for increased visual impact due to deterioration of defences.
OU 5A: 6.2% of £7,689,000 = £477,000
This value for damages considers the value of enjoyment of the beach using values from the Yellow Manual and the Hastings case study (Penning Rowsell et al., 1992). In the original strategy the value calculated applied to OUs 4B, 5A, 6A and 7A. For the purpose of this appraisal the total value of enjoyment was divided by the percentage of shoreline belonging to each OU.
OU 5B: The total value of damages for recreation is £103,000, and they include value of enjoyment and value of creation of saltmarsh and mudflat.
Dam
ages
£0.
58m
Health and safety Y
Increase in the risk to life and injury to visitors and local population due to overtopping and breaching of defences. Also, the gradual deterioration of groynes and sea wall can potentially pose a health and safety impact to visitors and local population.
0/1
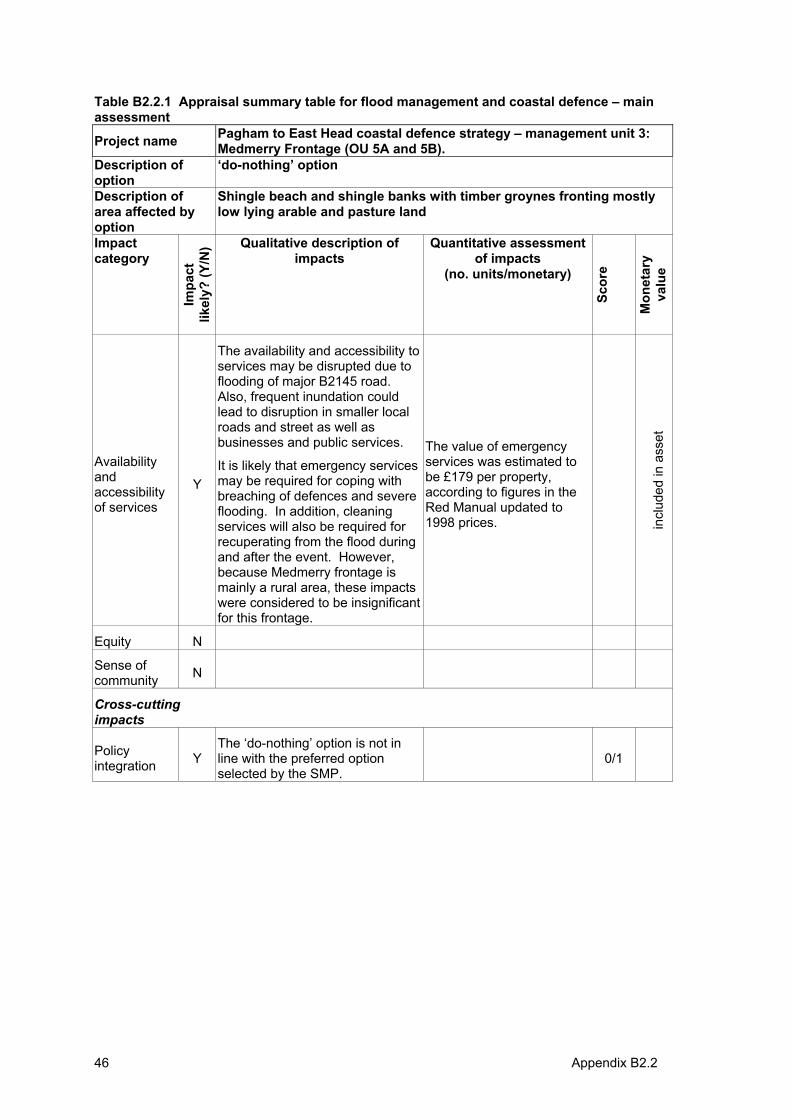
46 Appendix B2.2
Table B2.2.1 Appraisal summary table for flood management and coastal defence – main assessment
Project name Pagham to East Head coastal defence strategy – management unit 3: Medmerry Frontage (OU 5A and 5B).
Description of option
‘do-nothing’ option
Description of area affected by option
Shingle beach and shingle banks with timber groynes fronting mostly low lying arable and pasture land
Impactcategory
Impa
ctlik
ely?
(Y/N
) Qualitative description of impacts
Quantitative assessment of impacts
(no. units/monetary)
Scor
e
Mon
etar
yva
lue
Availability andaccessibility of services
Y
The availability and accessibility to services may be disrupted due to flooding of major B2145 road. Also, frequent inundation could lead to disruption in smaller local roads and street as well as businesses and public services.
It is likely that emergency services may be required for coping with breaching of defences and severe flooding. In addition, cleaning services will also be required for recuperating from the flood during and after the event. However, because Medmerry frontage is mainly a rural area, these impacts were considered to be insignificant for this frontage.
The value of emergency services was estimated to be £179 per property, according to figures in the Red Manual updated to 1998 prices. in
clud
ed in
ass
et
Equity N
Sense of community N
Cross-cuttingimpacts
Policy integration Y
The ‘do-nothing’ option is not in line with the preferred option selected by the SMP.
0/1
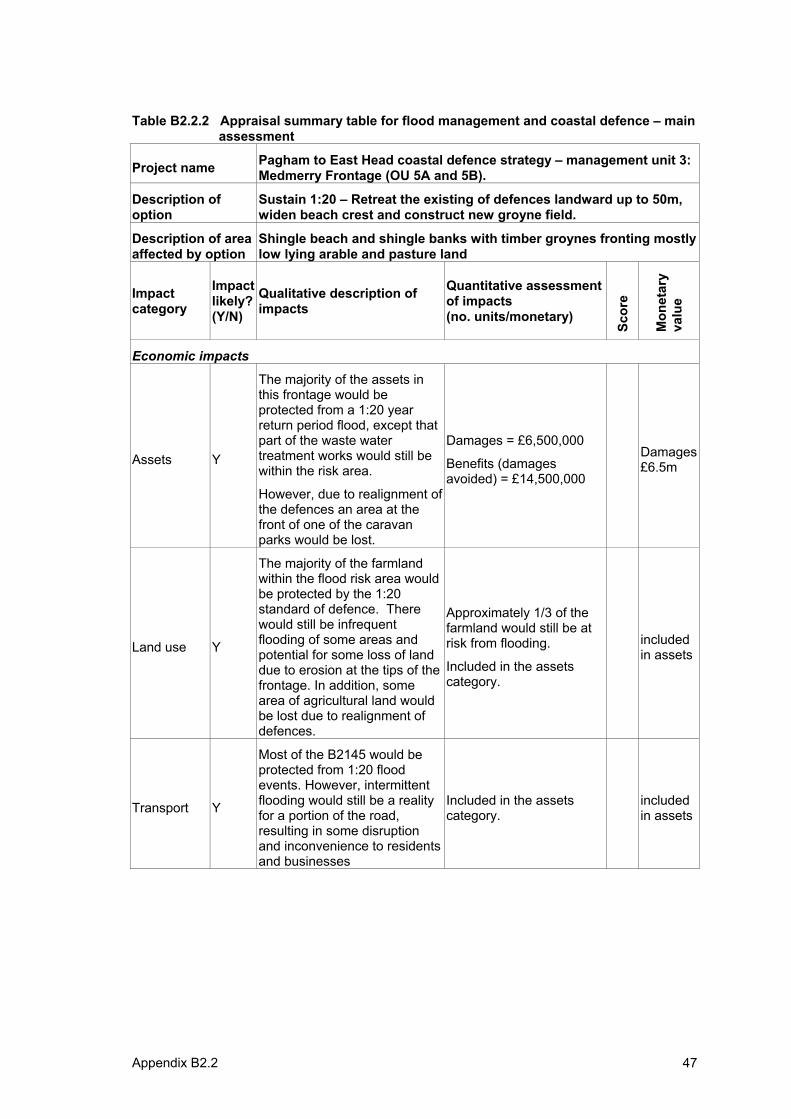
Appendix B2.2 47
Table B2.2.2 Appraisal summary table for flood management and coastal defence – main assessment
Project name Pagham to East Head coastal defence strategy – management unit 3: Medmerry Frontage (OU 5A and 5B).
Description of option
Sustain 1:20 – Retreat the existing of defences landward up to 50m, widen beach crest and construct new groyne field.
Description of area affected by option
Shingle beach and shingle banks with timber groynes fronting mostly low lying arable and pasture land
Impactcategory
Impactlikely? (Y/N)
Qualitative description of impacts
Quantitative assessment of impacts(no. units/monetary)
Scor
e
Mon
etar
yva
lue
Economic impacts
Assets Y
The majority of the assets in this frontage would be protected from a 1:20 year return period flood, except that part of the waste water treatment works would still be within the risk area.
However, due to realignment of the defences an area at the front of one of the caravan parks would be lost.
Damages = £6,500,000
Benefits (damages avoided) = £14,500,000
Damages£6.5m
Land use Y
The majority of the farmland within the flood risk area would be protected by the 1:20 standard of defence. There would still be infrequent flooding of some areas and potential for some loss of land due to erosion at the tips of the frontage. In addition, some area of agricultural land would be lost due to realignment of defences.
Approximately 1/3 of the farmland would still be at risk from flooding.
Included in the assets category.
includedin assets
Transport Y
Most of the B2145 would be protected from 1:20 flood events. However, intermittent flooding would still be a reality for a portion of the road, resulting in some disruption and inconvenience to residents and businesses
Included in the assets category.
includedin assets
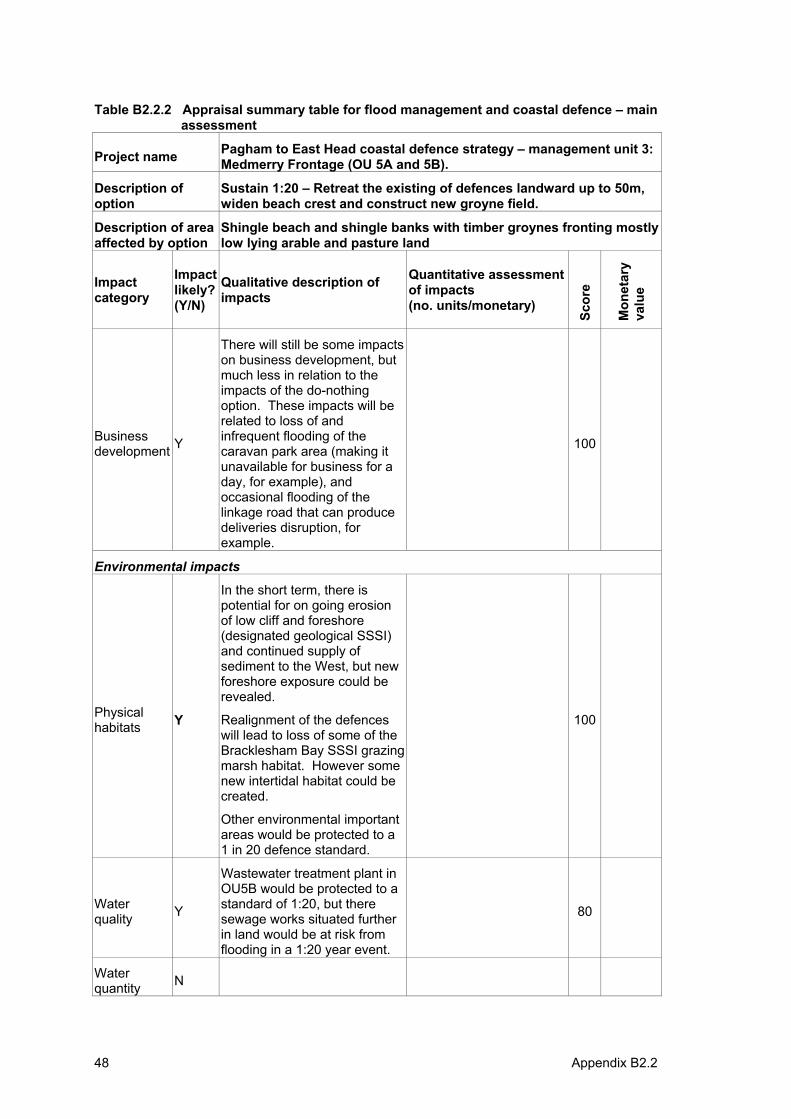
48 Appendix B2.2
Table B2.2.2 Appraisal summary table for flood management and coastal defence – main assessment
Project name Pagham to East Head coastal defence strategy – management unit 3: Medmerry Frontage (OU 5A and 5B).
Description of option
Sustain 1:20 – Retreat the existing of defences landward up to 50m, widen beach crest and construct new groyne field.
Description of area affected by option
Shingle beach and shingle banks with timber groynes fronting mostly low lying arable and pasture land
Impactcategory
Impactlikely? (Y/N)
Qualitative description of impacts
Quantitative assessment of impacts(no. units/monetary)
Scor
e
Mon
etar
yva
lue
Businessdevelopment Y
There will still be some impacts on business development, but much less in relation to the impacts of the do-nothing option. These impacts will be related to loss of and infrequent flooding of the caravan park area (making it unavailable for business for a day, for example), and occasional flooding of the linkage road that can produce deliveries disruption, for example.
100
Environmental impacts
Physical habitats Y
In the short term, there is potential for on going erosion of low cliff and foreshore (designated geological SSSI) and continued supply of sediment to the West, but new foreshore exposure could be revealed.
Realignment of the defences will lead to loss of some of the Bracklesham Bay SSSI grazing marsh habitat. However some new intertidal habitat could be created.
Other environmental important areas would be protected to a 1 in 20 defence standard.
100
Waterquality Y
Wastewater treatment plant in OU5B would be protected to a standard of 1:20, but there sewage works situated further in land would be at risk from flooding in a 1:20 year event.
80
Waterquantity N
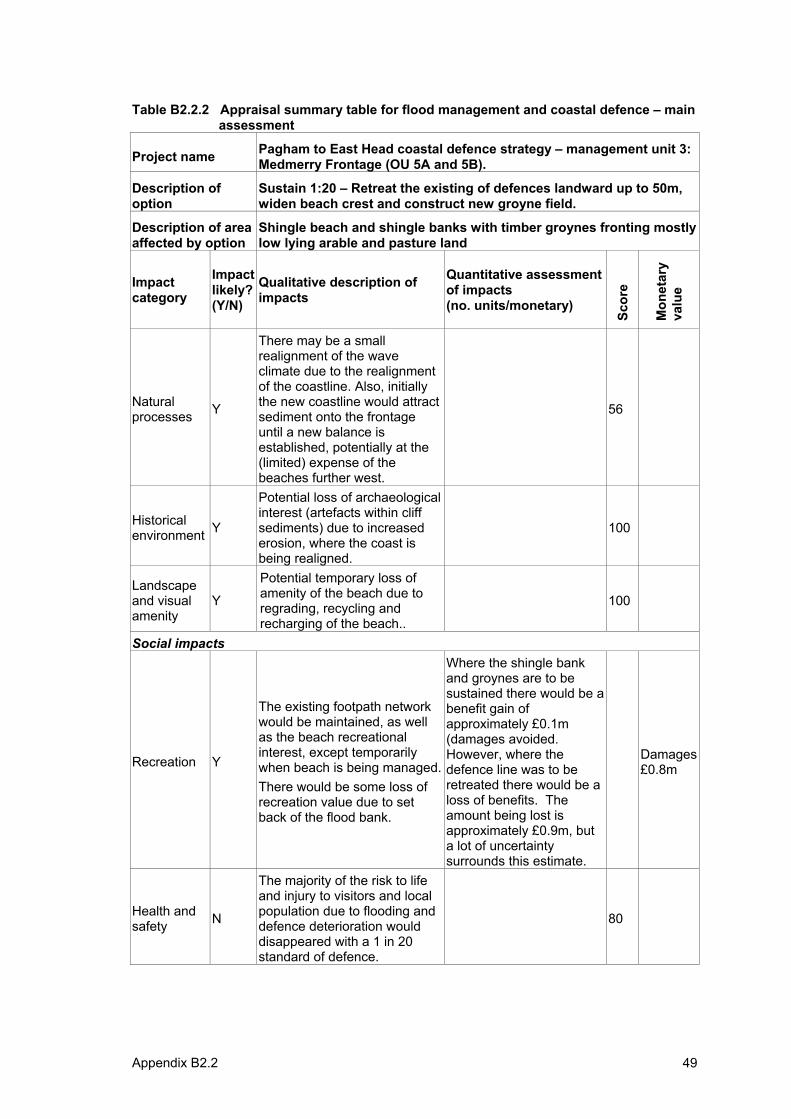
Appendix B2.2 49
Table B2.2.2 Appraisal summary table for flood management and coastal defence – main assessment
Project name Pagham to East Head coastal defence strategy – management unit 3: Medmerry Frontage (OU 5A and 5B).
Description of option
Sustain 1:20 – Retreat the existing of defences landward up to 50m, widen beach crest and construct new groyne field.
Description of area affected by option
Shingle beach and shingle banks with timber groynes fronting mostly low lying arable and pasture land
Impactcategory
Impactlikely? (Y/N)
Qualitative description of impacts
Quantitative assessment of impacts(no. units/monetary)
Scor
e
Mon
etar
yva
lue
Naturalprocesses Y
There may be a small realignment of the wave climate due to the realignment of the coastline. Also, initially the new coastline would attract sediment onto the frontage until a new balance is established, potentially at the (limited) expense of the beaches further west.
56
Historicalenvironment Y
Potential loss of archaeological interest (artefacts within cliff sediments) due to increased erosion, where the coast is being realigned.
100
Landscapeand visual amenity
Y
Potential temporary loss of amenity of the beach due to regrading, recycling and recharging of the beach..
100
Social impacts
Recreation Y
The existing footpath network would be maintained, as well as the beach recreational interest, except temporarily when beach is being managed.There would be some loss of recreation value due to set back of the flood bank.
Where the shingle bank and groynes are to be sustained there would be a benefit gain of approximately £0.1m (damages avoided. However, where the defence line was to be retreated there would be a loss of benefits. The amount being lost is approximately £0.9m, but a lot of uncertainty surrounds this estimate.
Damages£0.8m
Health and safety N
The majority of the risk to life and injury to visitors and local population due to flooding and defence deterioration would disappeared with a 1 in 20 standard of defence.
80
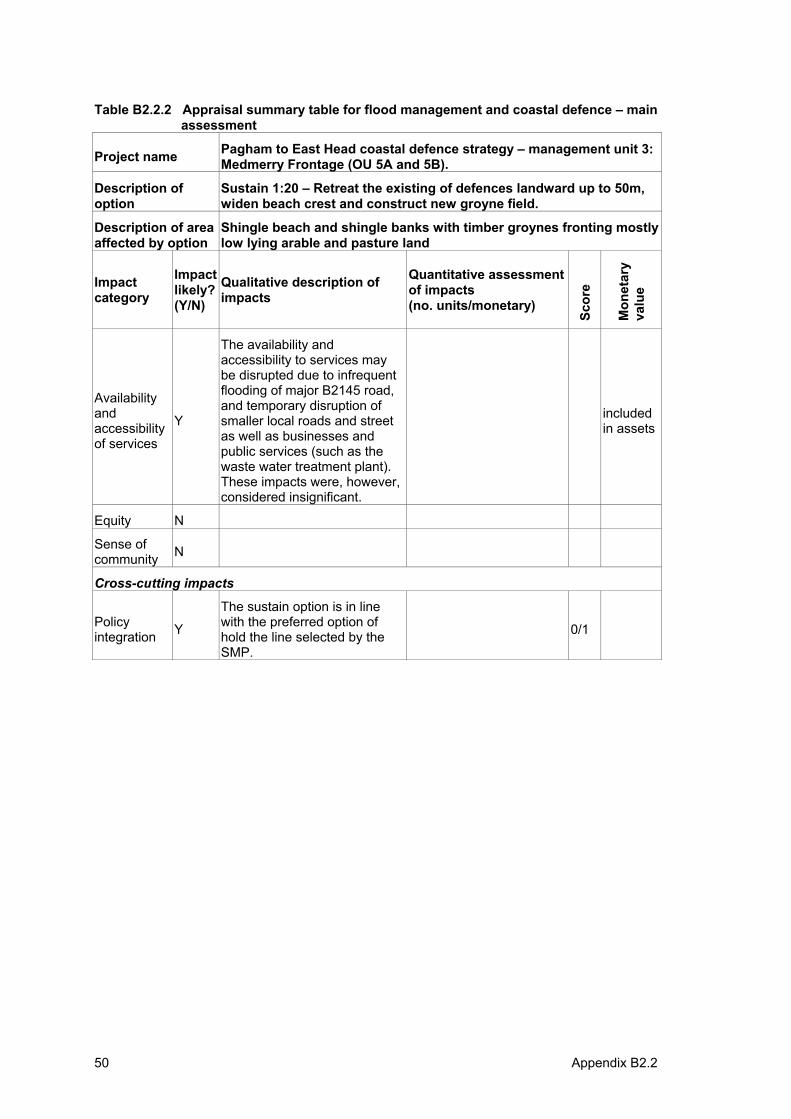
50 Appendix B2.2
Table B2.2.2 Appraisal summary table for flood management and coastal defence – main assessment
Project name Pagham to East Head coastal defence strategy – management unit 3: Medmerry Frontage (OU 5A and 5B).
Description of option
Sustain 1:20 – Retreat the existing of defences landward up to 50m, widen beach crest and construct new groyne field.
Description of area affected by option
Shingle beach and shingle banks with timber groynes fronting mostly low lying arable and pasture land
Impactcategory
Impactlikely? (Y/N)
Qualitative description of impacts
Quantitative assessment of impacts(no. units/monetary)
Scor
e
Mon
etar
yva
lue
Availability andaccessibility of services
Y
The availability and accessibility to services may be disrupted due to infrequent flooding of major B2145 road, and temporary disruption of smaller local roads and street as well as businesses and public services (such as the waste water treatment plant). These impacts were, however, considered insignificant.
includedin assets
Equity N
Sense of community N
Cross-cutting impacts
Policy integration Y
The sustain option is in line with the preferred option of hold the line selected by the SMP.
0/1
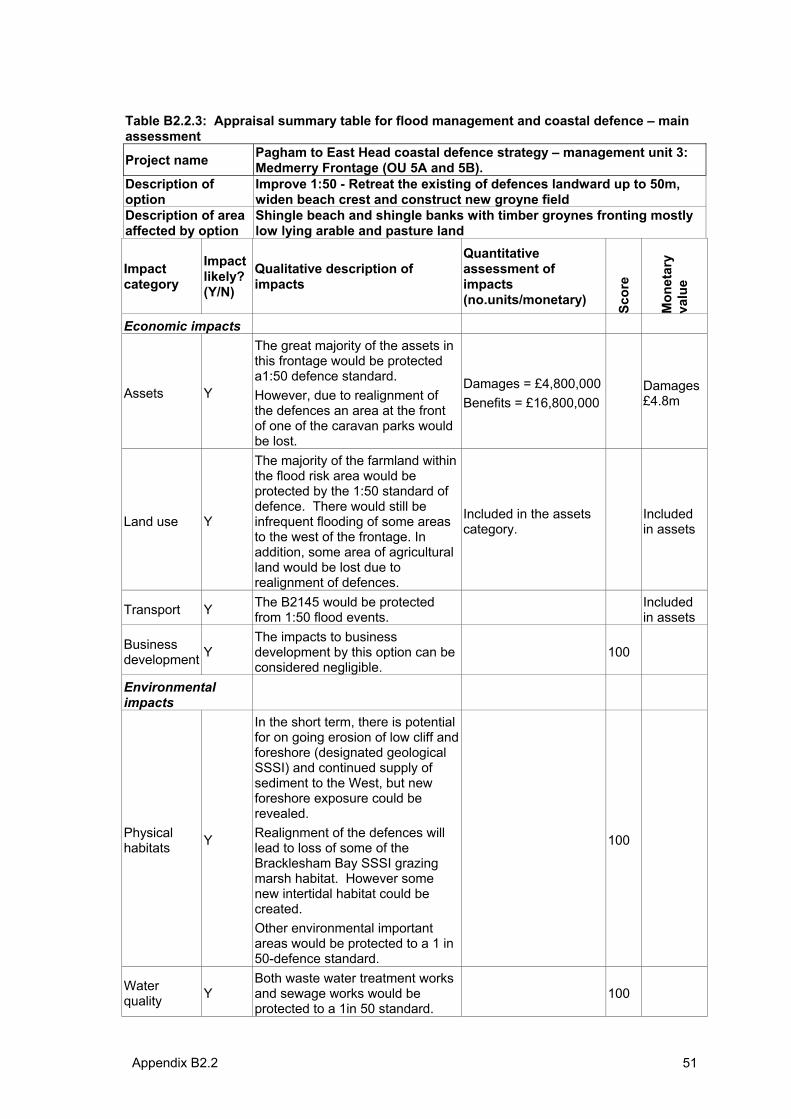
Appendix B2.2 51
Table B2.2.3: Appraisal summary table for flood management and coastal defence – main assessment
Project name Pagham to East Head coastal defence strategy – management unit 3: Medmerry Frontage (OU 5A and 5B).
Description of option
Improve 1:50 - Retreat the existing of defences landward up to 50m, widen beach crest and construct new groyne field
Description of area affected by option
Shingle beach and shingle banks with timber groynes fronting mostly low lying arable and pasture land
Impactcategory
Impactlikely? (Y/N)
Qualitative description of impacts
Quantitative assessment of impacts(no.units/monetary)
Scor
e
Mon
etar
yva
lue
Economic impacts
Assets Y
The great majority of the assets in this frontage would be protected a1:50 defence standard. However, due to realignment of the defences an area at the front of one of the caravan parks would be lost.
Damages = £4,800,000 Benefits = £16,800,000
Damages£4.8m
Land use Y
The majority of the farmland within the flood risk area would be protected by the 1:50 standard of defence. There would still be infrequent flooding of some areas to the west of the frontage. In addition, some area of agricultural land would be lost due to realignment of defences.
Included in the assets category.
Includedin assets
Transport Y The B2145 would be protected from 1:50 flood events.
Includedin assets
Businessdevelopment Y
The impacts to business development by this option can be considered negligible.
100
Environmentalimpacts
Physical habitats Y
In the short term, there is potential for on going erosion of low cliff and foreshore (designated geological SSSI) and continued supply of sediment to the West, but new foreshore exposure could be revealed.Realignment of the defences will lead to loss of some of the Bracklesham Bay SSSI grazing marsh habitat. However some new intertidal habitat could be created.Other environmental important areas would be protected to a 1 in 50-defence standard.
100
Waterquality Y
Both waste water treatment works and sewage works would be protected to a 1in 50 standard.
100
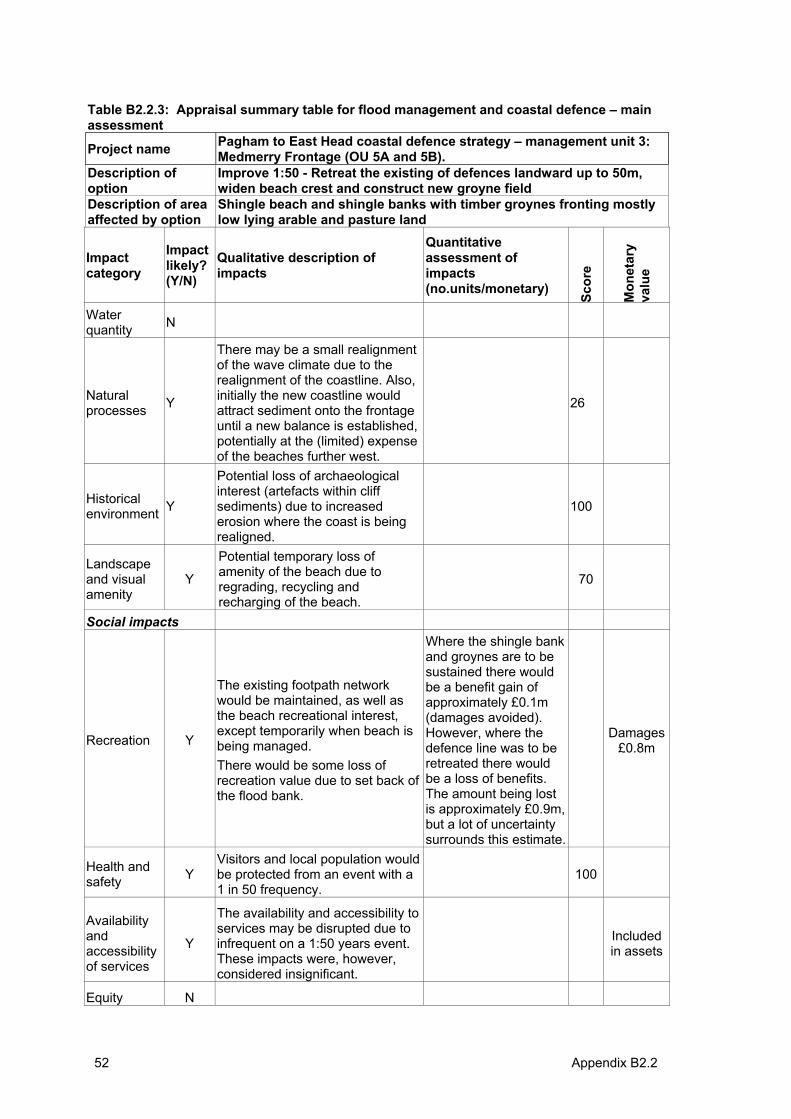
52 Appendix B2.2
Table B2.2.3: Appraisal summary table for flood management and coastal defence – main assessment
Project name Pagham to East Head coastal defence strategy – management unit 3: Medmerry Frontage (OU 5A and 5B).
Description of option
Improve 1:50 - Retreat the existing of defences landward up to 50m, widen beach crest and construct new groyne field
Description of area affected by option
Shingle beach and shingle banks with timber groynes fronting mostly low lying arable and pasture land
Impactcategory
Impactlikely? (Y/N)
Qualitative description of impacts
Quantitative assessment of impacts(no.units/monetary)
Scor
e
Mon
etar
yva
lue
Waterquantity N
Naturalprocesses Y
There may be a small realignment of the wave climate due to the realignment of the coastline. Also, initially the new coastline would attract sediment onto the frontage until a new balance is established, potentially at the (limited) expense of the beaches further west.
26
Historicalenvironment Y
Potential loss of archaeological interest (artefacts within cliff sediments) due to increased erosion where the coast is being realigned.
100
Landscapeand visual amenity
Y
Potential temporary loss of amenity of the beach due to regrading, recycling and recharging of the beach.
70
Social impacts
Recreation Y
The existing footpath network would be maintained, as well as the beach recreational interest, except temporarily when beach is being managed. There would be some loss of recreation value due to set back of the flood bank.
Where the shingle bank and groynes are to be sustained there would be a benefit gain of approximately £0.1m (damages avoided).However, where the defence line was to be retreated there would be a loss of benefits.The amount being lost is approximately £0.9m, but a lot of uncertainty surrounds this estimate.
Damages£0.8m
Health and safety Y
Visitors and local population would be protected from an event with a 1 in 50 frequency.
100
Availability andaccessibility of services
Y
The availability and accessibility to services may be disrupted due to infrequent on a 1:50 years event.These impacts were, however, considered insignificant.
Includedin assets
Equity N
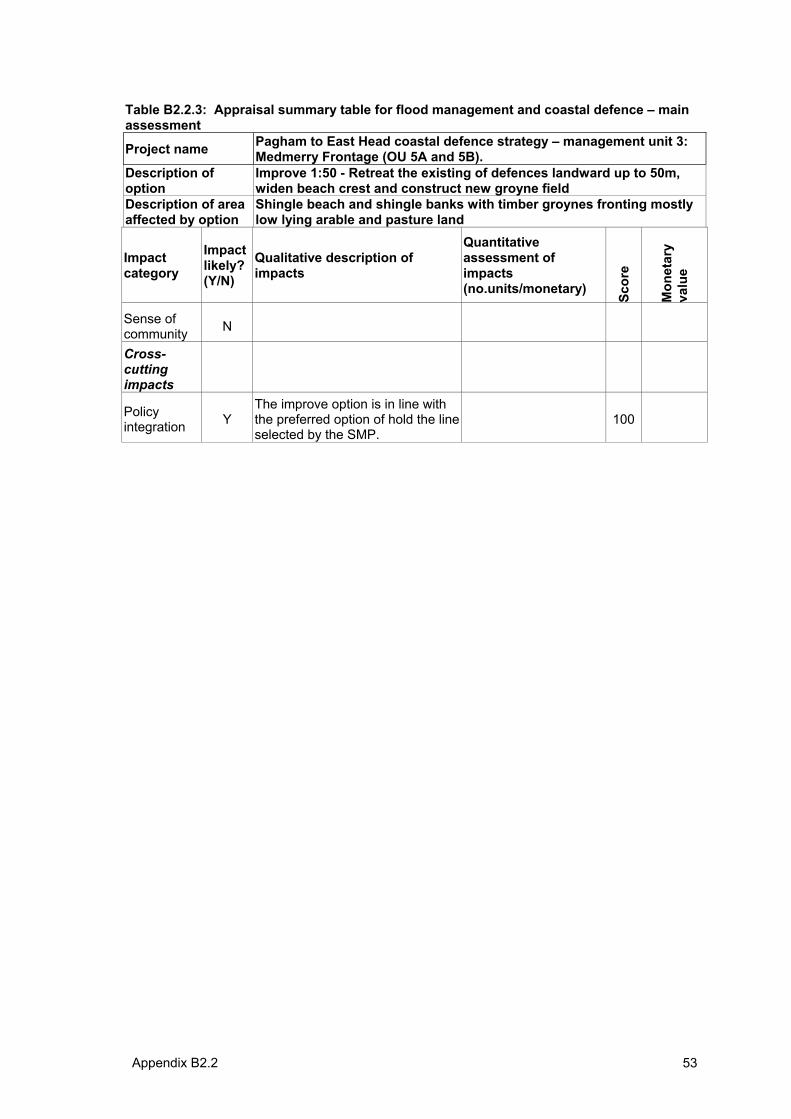
Appendix B2.2 53
Table B2.2.3: Appraisal summary table for flood management and coastal defence – main assessment
Project name Pagham to East Head coastal defence strategy – management unit 3: Medmerry Frontage (OU 5A and 5B).
Description of option
Improve 1:50 - Retreat the existing of defences landward up to 50m, widen beach crest and construct new groyne field
Description of area affected by option
Shingle beach and shingle banks with timber groynes fronting mostly low lying arable and pasture land
Impactcategory
Impactlikely? (Y/N)
Qualitative description of impacts
Quantitative assessment of impacts(no.units/monetary)
Scor
e
Mon
etar
yva
lue
Sense of community N
Cross-cuttingimpacts
Policy integration Y
The improve option is in line with the preferred option of hold the line selected by the SMP.
100
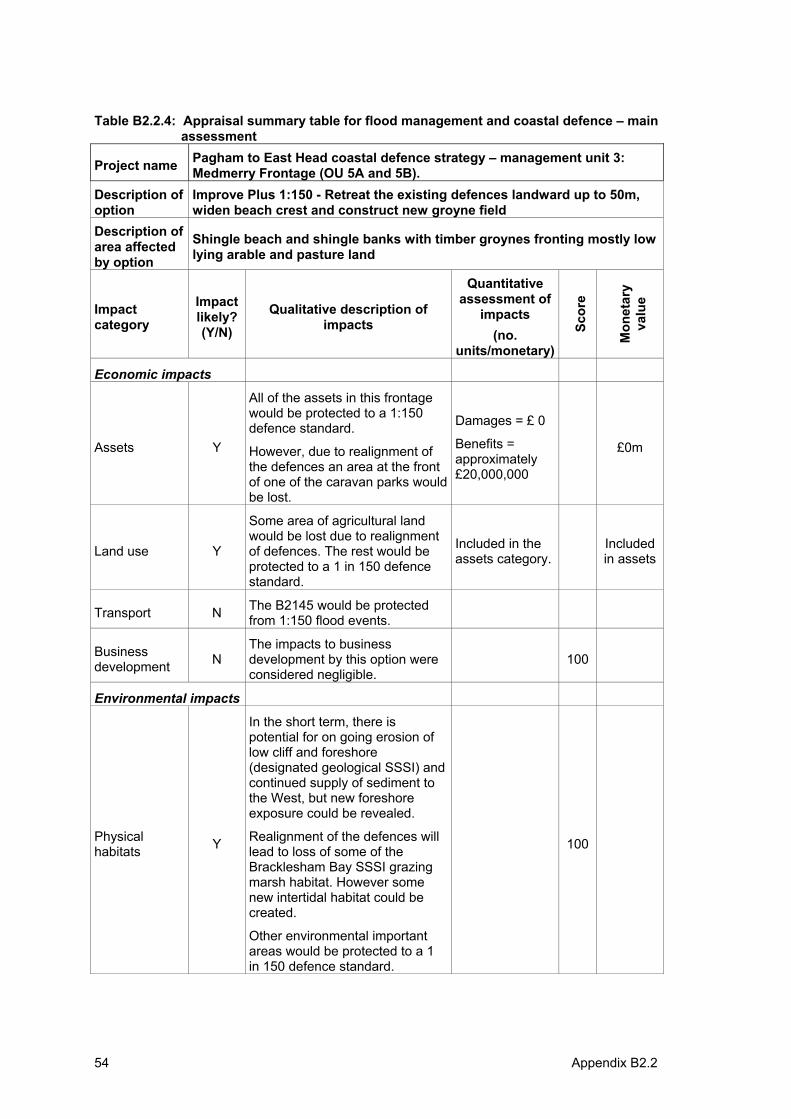
54 Appendix B2.2
Table B2.2.4: Appraisal summary table for flood management and coastal defence – main assessment
Project name Pagham to East Head coastal defence strategy – management unit 3: Medmerry Frontage (OU 5A and 5B).
Description of option
Improve Plus 1:150 - Retreat the existing defences landward up to 50m, widen beach crest and construct new groyne field
Description of area affected by option
Shingle beach and shingle banks with timber groynes fronting mostly low lying arable and pasture land
Impactcategory
Impactlikely? (Y/N)
Qualitative description of impacts
Quantitative assessment of
impacts(no.
units/monetary)
Scor
e
Mon
etar
yva
lue
Economic impacts
Assets Y
All of the assets in this frontage would be protected to a 1:150 defence standard.
However, due to realignment of the defences an area at the front of one of the caravan parks would be lost.
Damages = £ 0
Benefits = approximately£20,000,000
£0m
Land use Y
Some area of agricultural land would be lost due to realignment of defences. The rest would be protected to a 1 in 150 defence standard.
Included in the assets category.
Includedin assets
Transport N The B2145 would be protected from 1:150 flood events.
Businessdevelopment N
The impacts to business development by this option were considered negligible.
100
Environmental impacts
Physical habitats Y
In the short term, there is potential for on going erosion of low cliff and foreshore (designated geological SSSI) and continued supply of sediment to the West, but new foreshore exposure could be revealed.
Realignment of the defences will lead to loss of some of the Bracklesham Bay SSSI grazing marsh habitat. However some new intertidal habitat could be created.
Other environmental important areas would be protected to a 1 in 150 defence standard.
100
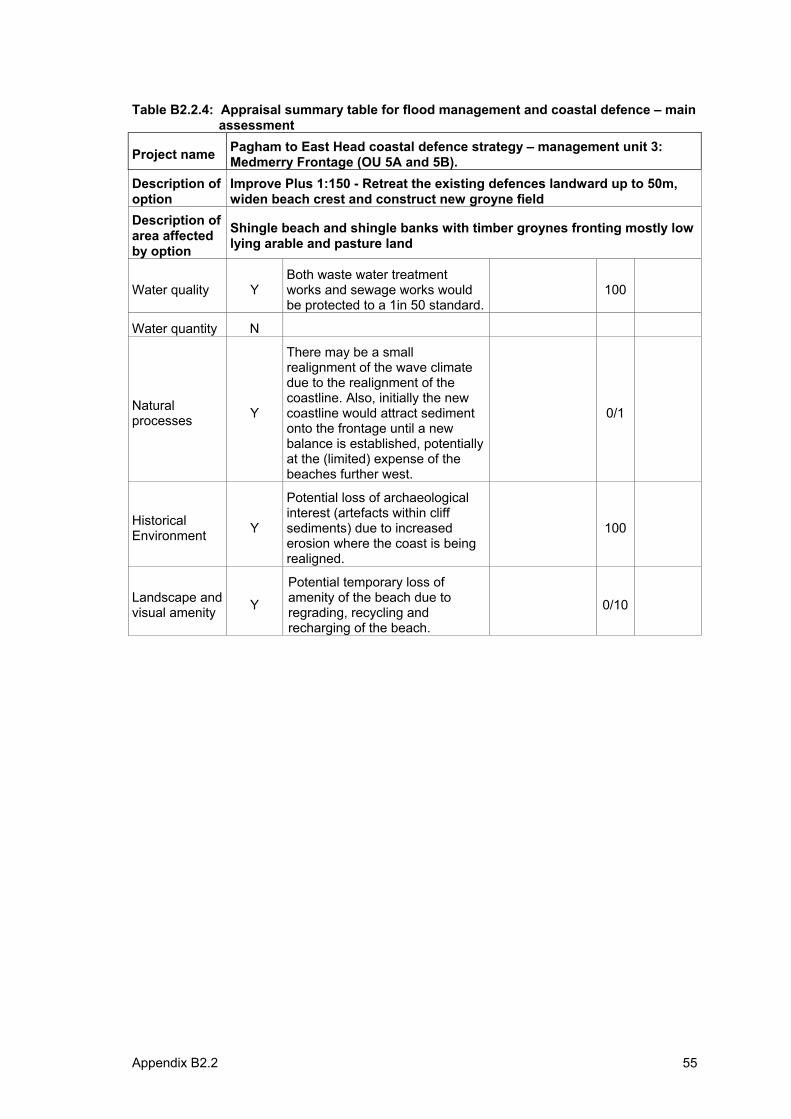
Appendix B2.2 55
Table B2.2.4: Appraisal summary table for flood management and coastal defence – main assessment
Project name Pagham to East Head coastal defence strategy – management unit 3: Medmerry Frontage (OU 5A and 5B).
Description of option
Improve Plus 1:150 - Retreat the existing defences landward up to 50m, widen beach crest and construct new groyne field
Description of area affected by option
Shingle beach and shingle banks with timber groynes fronting mostly low lying arable and pasture land
Water quality Y Both waste water treatment works and sewage works would be protected to a 1in 50 standard.
100
Water quantity N
Naturalprocesses Y
There may be a small realignment of the wave climate due to the realignment of the coastline. Also, initially the new coastline would attract sediment onto the frontage until a new balance is established, potentially at the (limited) expense of the beaches further west.
0/1
HistoricalEnvironment Y
Potential loss of archaeological interest (artefacts within cliff sediments) due to increased erosion where the coast is being realigned.
100
Landscape and visual amenity Y
Potential temporary loss of amenity of the beach due to regrading, recycling and recharging of the beach.
0/10
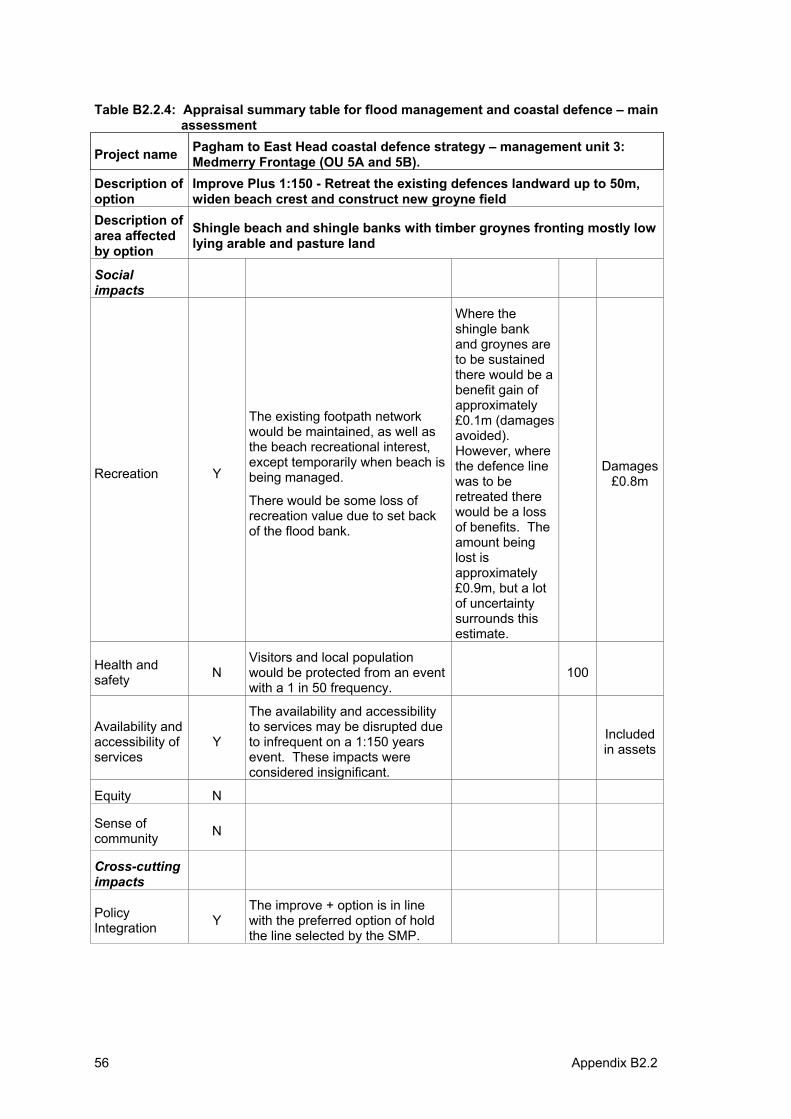
56 Appendix B2.2
Table B2.2.4: Appraisal summary table for flood management and coastal defence – main assessment
Project name Pagham to East Head coastal defence strategy – management unit 3: Medmerry Frontage (OU 5A and 5B).
Description of option
Improve Plus 1:150 - Retreat the existing defences landward up to 50m, widen beach crest and construct new groyne field
Description of area affected by option
Shingle beach and shingle banks with timber groynes fronting mostly low lying arable and pasture land
Socialimpacts
Recreation Y
The existing footpath network would be maintained, as well as the beach recreational interest, except temporarily when beach is being managed.
There would be some loss of recreation value due to set back of the flood bank.
Where the shingle bank and groynes are to be sustained there would be a benefit gain of approximately£0.1m (damages avoided).However, where the defence line was to be retreated there would be a loss of benefits. The amount being lost is approximately£0.9m, but a lot of uncertainty surrounds this estimate.
Damages£0.8m
Health and safety N
Visitors and local population would be protected from an event with a 1 in 50 frequency.
100
Availability and accessibility of services
Y
The availability and accessibility to services may be disrupted due to infrequent on a 1:150 years event. These impacts were considered insignificant.
Includedin assets
Equity N
Sense of community N
Cross-cuttingimpacts
Policy Integration Y
The improve + option is in line with the preferred option of hold the line selected by the SMP.
Appendix B2.3 57
Appendix B2.3:
Appraisal summary table for main assessment – MA-ASTfor Pagham to East Head coastal defence strategy – East Wittering Frontage
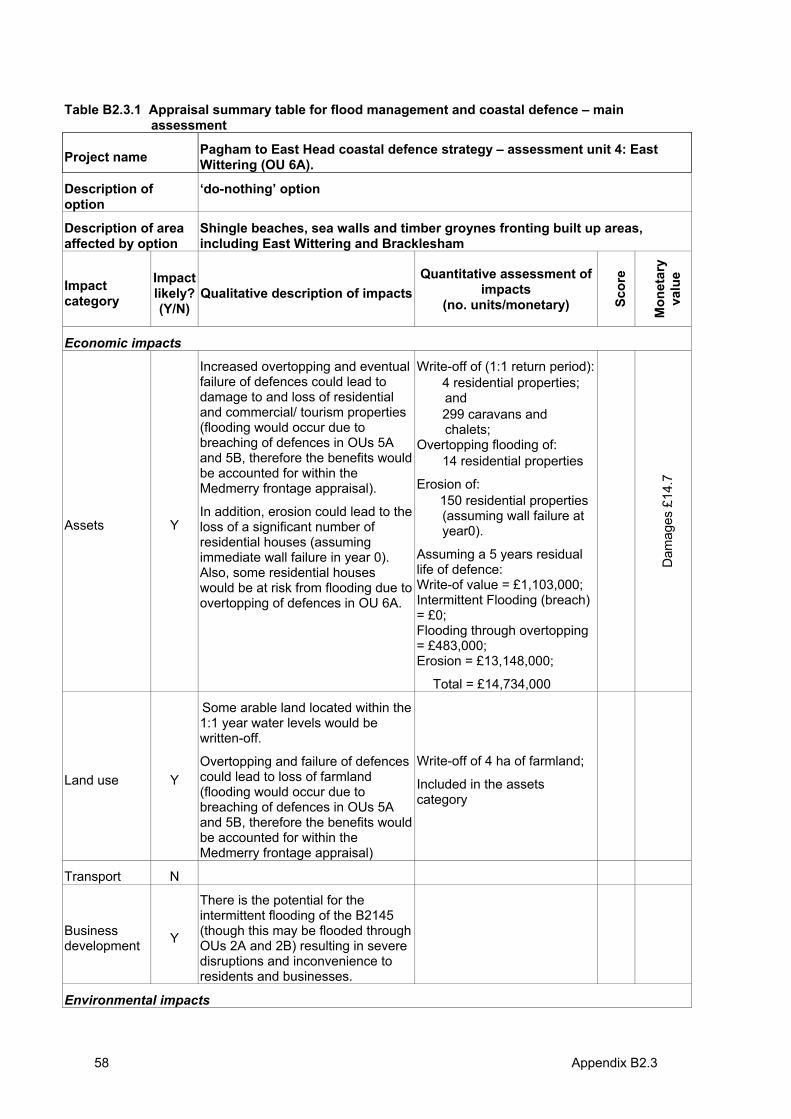
58 Appendix B2.3
Table B2.3.1 Appraisal summary table for flood management and coastal defence – main assessment
Project name Pagham to East Head coastal defence strategy – assessment unit 4: East Wittering (OU 6A).
Description of option
‘do-nothing’ option
Description of area affected by option
Shingle beaches, sea walls and timber groynes fronting built up areas, including East Wittering and Bracklesham
Impactcategory
Impactlikely? (Y/N)
Qualitative description of impacts Quantitative assessment of
impacts(no. units/monetary) Sc
ore
Mon
etar
yva
lue
Economic impacts
Assets Y
Increased overtopping and eventual failure of defences could lead to damage to and loss of residential and commercial/ tourism properties (flooding would occur due to breaching of defences in OUs 5A and 5B, therefore the benefits would be accounted for within the Medmerry frontage appraisal).
In addition, erosion could lead to the loss of a significant number of residential houses (assuming immediate wall failure in year 0). Also, some residential houses would be at risk from flooding due to overtopping of defences in OU 6A.
Write-off of (1:1 return period): • 4 residential properties;
and• 299 caravans and
chalets;Overtopping flooding of: • 14 residential properties
Erosion of: • 150 residential properties
(assuming wall failure at year0).
Assuming a 5 years residual life of defence: Write-of value = £1,103,000; Intermittent Flooding (breach) = £0; Flooding through overtopping = £483,000; Erosion = £13,148,000;
Total = £14,734,000 D
amag
es £
14.7
Land use Y
Some arable land located within the 1:1 year water levels would be written-off.
Overtopping and failure of defences could lead to loss of farmland (flooding would occur due to breaching of defences in OUs 5A and 5B, therefore the benefits would be accounted for within the Medmerry frontage appraisal)
Write-off of 4 ha of farmland;
Included in the assets category
Transport N
Businessdevelopment Y
There is the potential for the intermittent flooding of the B2145 (though this may be flooded through OUs 2A and 2B) resulting in severe disruptions and inconvenience to residents and businesses.
Environmental impacts
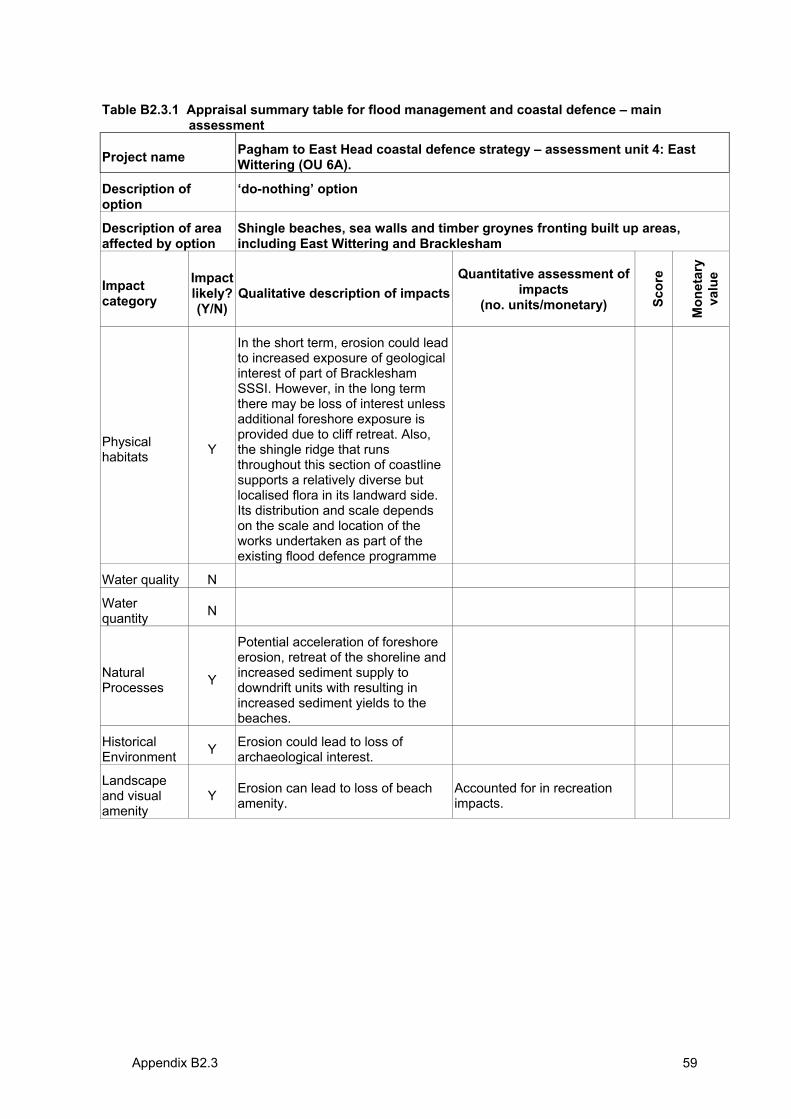
Appendix B2.3 59
Table B2.3.1 Appraisal summary table for flood management and coastal defence – main assessment
Project name Pagham to East Head coastal defence strategy – assessment unit 4: East Wittering (OU 6A).
Description of option
‘do-nothing’ option
Description of area affected by option
Shingle beaches, sea walls and timber groynes fronting built up areas, including East Wittering and Bracklesham
Impactcategory
Impactlikely? (Y/N)
Qualitative description of impacts Quantitative assessment of
impacts(no. units/monetary) Sc
ore
Mon
etar
yva
lue
Physical habitats Y
In the short term, erosion could lead to increased exposure of geological interest of part of Bracklesham SSSI. However, in the long term there may be loss of interest unless additional foreshore exposure is provided due to cliff retreat. Also, the shingle ridge that runs throughout this section of coastline supports a relatively diverse but localised flora in its landward side. Its distribution and scale depends on the scale and location of the works undertaken as part of the existing flood defence programme
Water quality N
Waterquantity N
NaturalProcesses Y
Potential acceleration of foreshore erosion, retreat of the shoreline and increased sediment supply to downdrift units with resulting in increased sediment yields to the beaches.
HistoricalEnvironment Y Erosion could lead to loss of
archaeological interest.
Landscapeand visual amenity
Y Erosion can lead to loss of beach amenity.
Accounted for in recreation impacts.
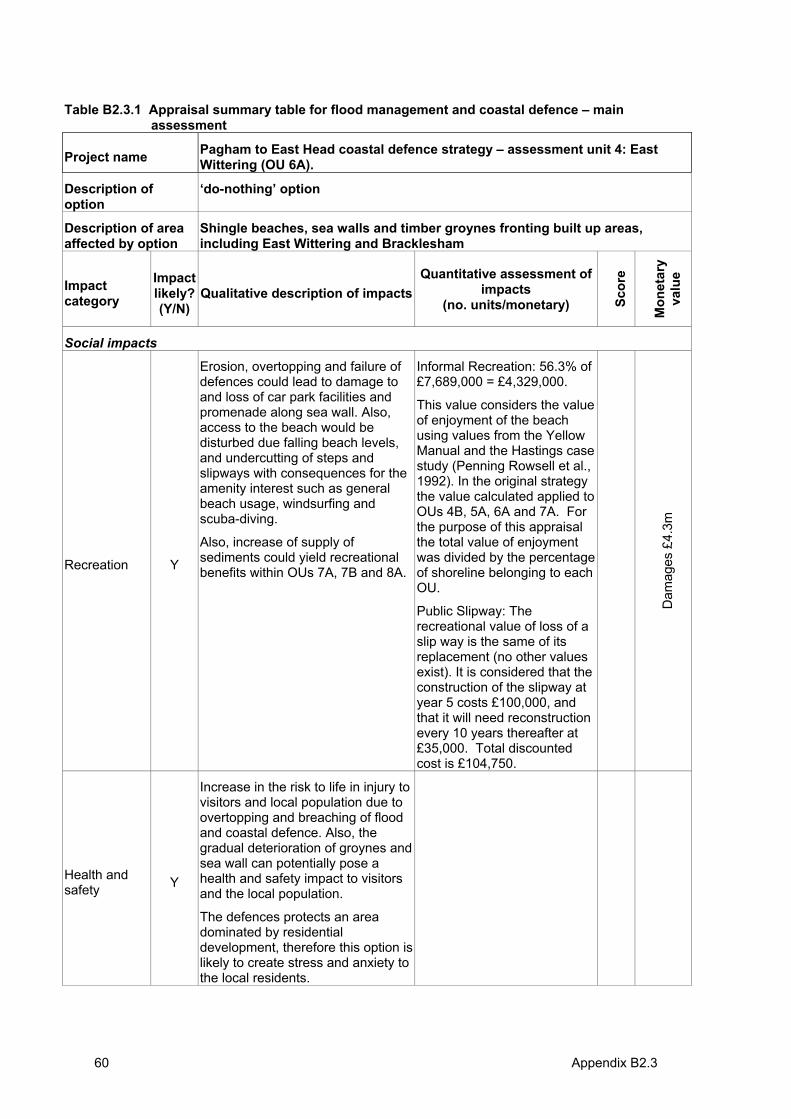
60 Appendix B2.3
Table B2.3.1 Appraisal summary table for flood management and coastal defence – main assessment
Project name Pagham to East Head coastal defence strategy – assessment unit 4: East Wittering (OU 6A).
Description of option
‘do-nothing’ option
Description of area affected by option
Shingle beaches, sea walls and timber groynes fronting built up areas, including East Wittering and Bracklesham
Impactcategory
Impactlikely? (Y/N)
Qualitative description of impacts Quantitative assessment of
impacts(no. units/monetary) Sc
ore
Mon
etar
yva
lue
Social impacts
Recreation Y
Erosion, overtopping and failure of defences could lead to damage to and loss of car park facilities and promenade along sea wall. Also, access to the beach would be disturbed due falling beach levels, and undercutting of steps and slipways with consequences for the amenity interest such as general beach usage, windsurfing and scuba-diving.
Also, increase of supply of sediments could yield recreational benefits within OUs 7A, 7B and 8A.
Informal Recreation: 56.3% of £7,689,000 = £4,329,000.
This value considers the value of enjoyment of the beach using values from the Yellow Manual and the Hastings case study (Penning Rowsell et al., 1992). In the original strategy the value calculated applied to OUs 4B, 5A, 6A and 7A. For the purpose of this appraisal the total value of enjoyment was divided by the percentage of shoreline belonging to each OU.
Public Slipway: The recreational value of loss of a slip way is the same of its replacement (no other values exist). It is considered that the construction of the slipway at year 5 costs £100,000, and that it will need reconstruction every 10 years thereafter at £35,000. Total discounted cost is £104,750.
Dam
ages
£4.
3m
Health and safety Y
Increase in the risk to life in injury to visitors and local population due to overtopping and breaching of flood and coastal defence. Also, the gradual deterioration of groynes and sea wall can potentially pose a health and safety impact to visitors and the local population.
The defences protects an area dominated by residential development, therefore this option is likely to create stress and anxiety to the local residents.
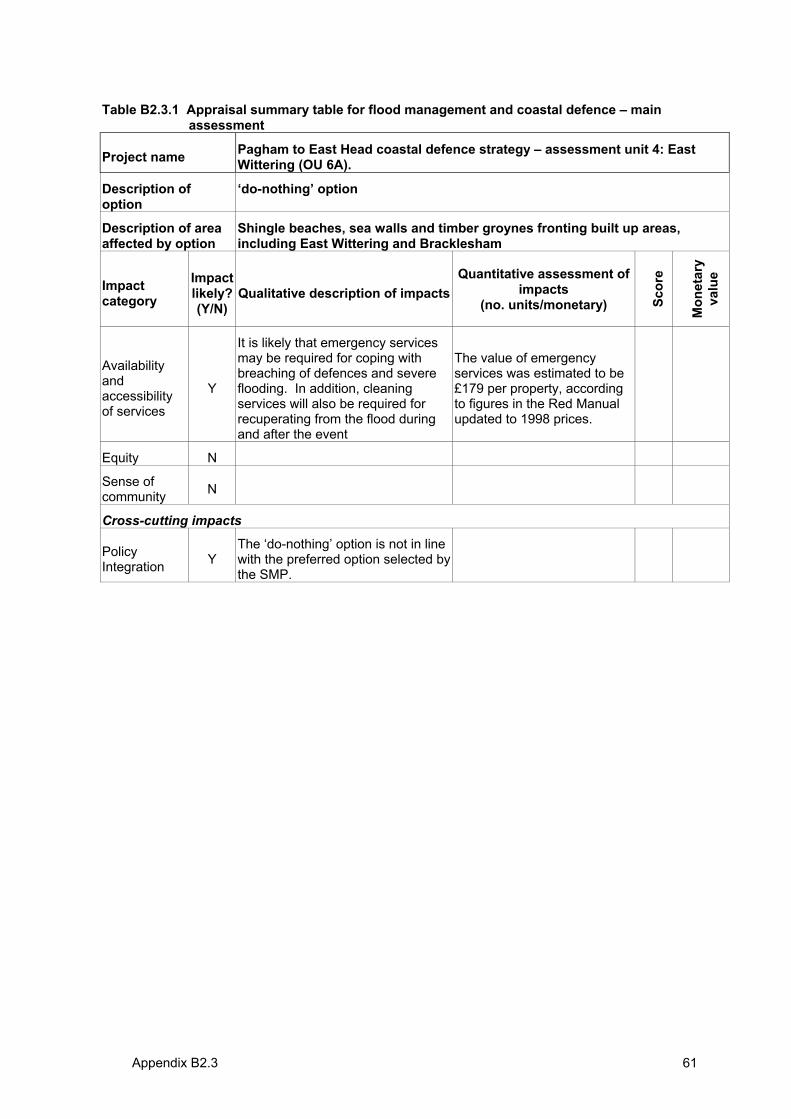
Appendix B2.3 61
Table B2.3.1 Appraisal summary table for flood management and coastal defence – main assessment
Project name Pagham to East Head coastal defence strategy – assessment unit 4: East Wittering (OU 6A).
Description of option
‘do-nothing’ option
Description of area affected by option
Shingle beaches, sea walls and timber groynes fronting built up areas, including East Wittering and Bracklesham
Impactcategory
Impactlikely? (Y/N)
Qualitative description of impacts Quantitative assessment of
impacts(no. units/monetary) Sc
ore
Mon
etar
yva
lue
Availability andaccessibility of services
Y
It is likely that emergency services may be required for coping with breaching of defences and severe flooding. In addition, cleaning services will also be required for recuperating from the flood during and after the event
The value of emergency services was estimated to be £179 per property, according to figures in the Red Manual updated to 1998 prices.
Equity N
Sense of community N
Cross-cutting impacts
Policy Integration Y
The ‘do-nothing’ option is not in line with the preferred option selected by the SMP.
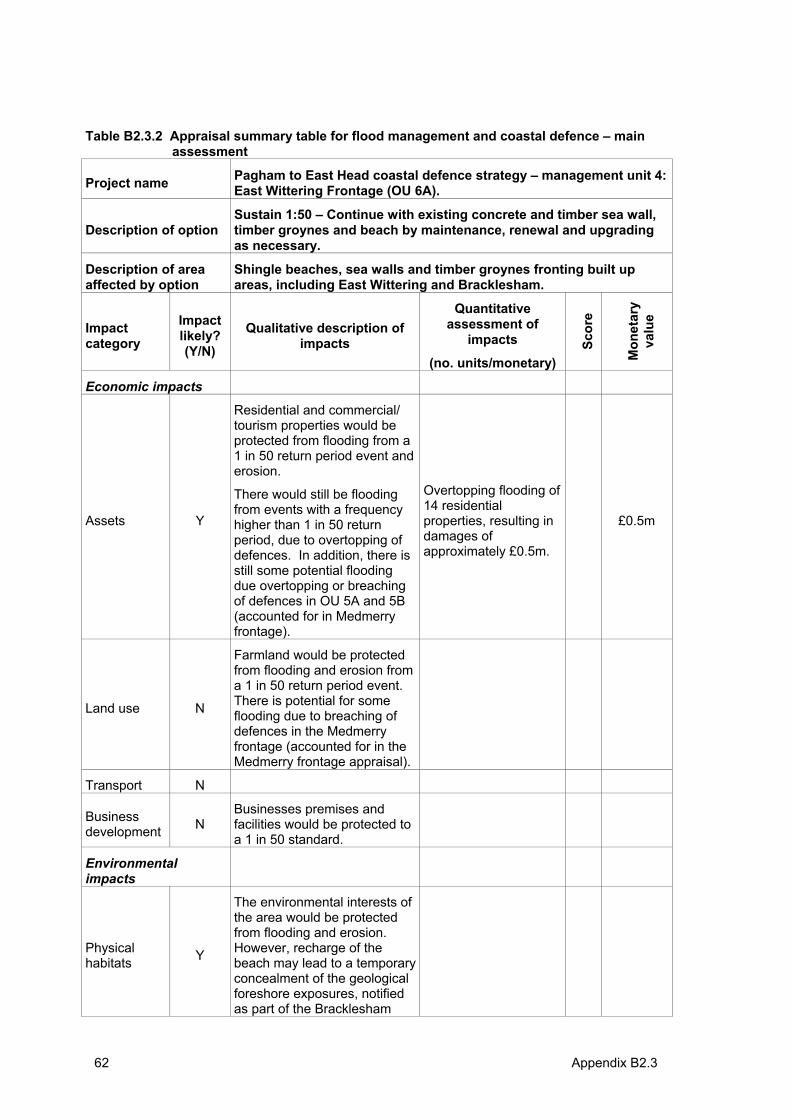
62 Appendix B2.3
Table B2.3.2 Appraisal summary table for flood management and coastal defence – main assessment
Project name Pagham to East Head coastal defence strategy – management unit 4: East Wittering Frontage (OU 6A).
Description of option Sustain 1:50 – Continue with existing concrete and timber sea wall, timber groynes and beach by maintenance, renewal and upgrading as necessary.
Description of area affected by option
Shingle beaches, sea walls and timber groynes fronting built up areas, including East Wittering and Bracklesham.
Impactcategory
Impactlikely? (Y/N)
Qualitative description of impacts
Quantitative assessment of
impacts
(no. units/monetary)
Scor
e
Mon
etar
yva
lue
Economic impacts
Assets Y
Residential and commercial/ tourism properties would be protected from flooding from a 1 in 50 return period event and erosion.
There would still be flooding from events with a frequency higher than 1 in 50 return period, due to overtopping of defences. In addition, there is still some potential flooding due overtopping or breaching of defences in OU 5A and 5B (accounted for in Medmerry frontage).
Overtopping flooding of 14 residential properties, resulting in damages of approximately £0.5m.
£0.5m
Land use N
Farmland would be protected from flooding and erosion from a 1 in 50 return period event.There is potential for some flooding due to breaching of defences in the Medmerry frontage (accounted for in the Medmerry frontage appraisal).
Transport N
Businessdevelopment N
Businesses premises and facilities would be protected to a 1 in 50 standard.
Environmentalimpacts
Physical habitats Y
The environmental interests of the area would be protected from flooding and erosion. However, recharge of the beach may lead to a temporary concealment of the geological foreshore exposures, notified as part of the Bracklesham
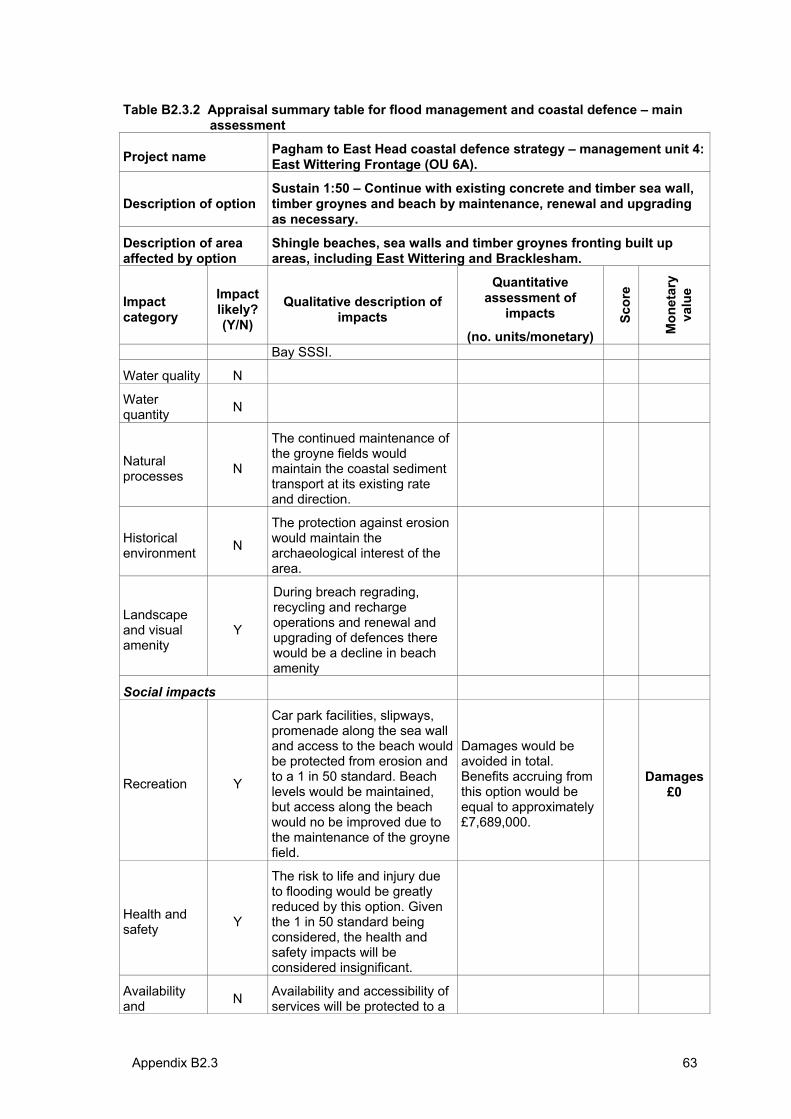
Appendix B2.3 63
Table B2.3.2 Appraisal summary table for flood management and coastal defence – main assessment
Project name Pagham to East Head coastal defence strategy – management unit 4: East Wittering Frontage (OU 6A).
Description of option Sustain 1:50 – Continue with existing concrete and timber sea wall, timber groynes and beach by maintenance, renewal and upgrading as necessary.
Description of area affected by option
Shingle beaches, sea walls and timber groynes fronting built up areas, including East Wittering and Bracklesham.
Impactcategory
Impactlikely? (Y/N)
Qualitative description of impacts
Quantitative assessment of
impacts
(no. units/monetary)
Scor
e
Mon
etar
yva
lue
Bay SSSI.
Water quality N
Waterquantity N
Naturalprocesses N
The continued maintenance of the groyne fields would maintain the coastal sediment transport at its existing rate and direction.
Historicalenvironment N
The protection against erosion would maintain the archaeological interest of the area.
Landscapeand visual amenity
Y
During breach regrading, recycling and recharge operations and renewal and upgrading of defences there would be a decline in beach amenity
Social impacts
Recreation Y
Car park facilities, slipways, promenade along the sea wall and access to the beach would be protected from erosion and to a 1 in 50 standard. Beach levels would be maintained, but access along the beach would no be improved due to the maintenance of the groyne field.
Damages would be avoided in total.Benefits accruing from this option would be equal to approximately £7,689,000.
Damages£0
Health and safety Y
The risk to life and injury due to flooding would be greatly reduced by this option. Given the 1 in 50 standard being considered, the health and safety impacts will be considered insignificant.
Availability and N Availability and accessibility of
services will be protected to a
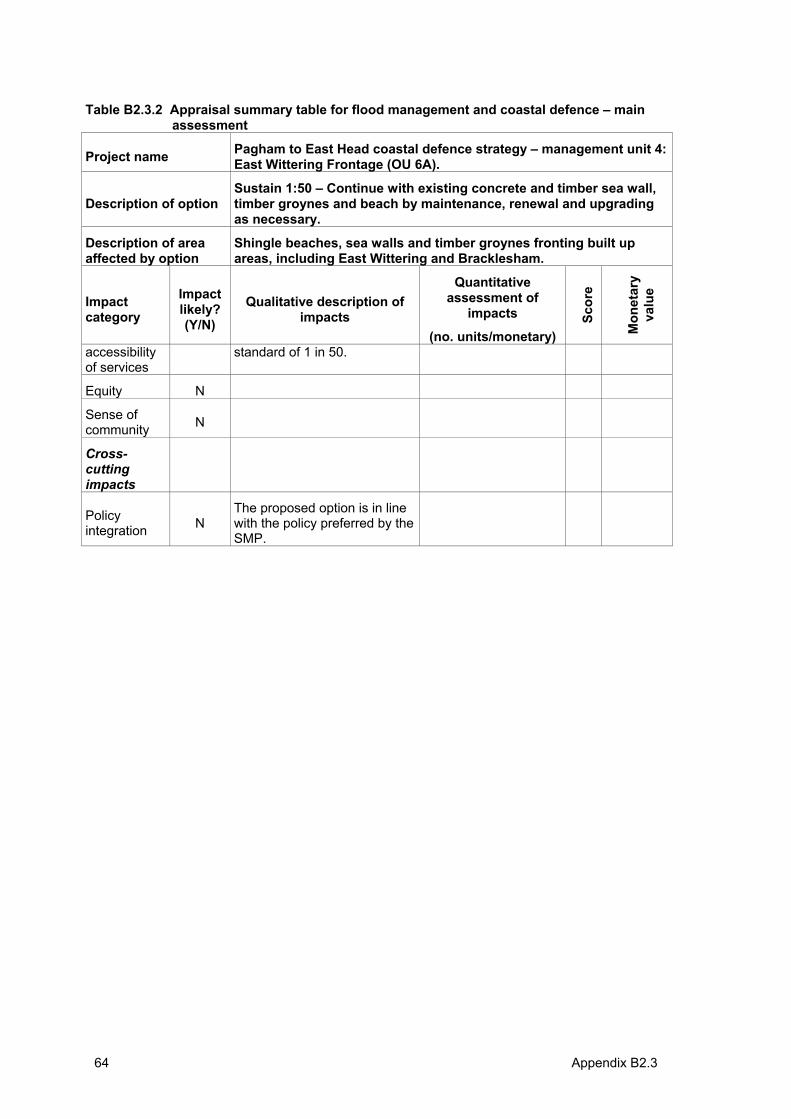
64 Appendix B2.3
Table B2.3.2 Appraisal summary table for flood management and coastal defence – main assessment
Project name Pagham to East Head coastal defence strategy – management unit 4: East Wittering Frontage (OU 6A).
Description of option Sustain 1:50 – Continue with existing concrete and timber sea wall, timber groynes and beach by maintenance, renewal and upgrading as necessary.
Description of area affected by option
Shingle beaches, sea walls and timber groynes fronting built up areas, including East Wittering and Bracklesham.
Impactcategory
Impactlikely? (Y/N)
Qualitative description of impacts
Quantitative assessment of
impacts
(no. units/monetary)
Scor
e
Mon
etar
yva
lue
accessibility of services
standard of 1 in 50.
Equity N
Sense of community N
Cross-cuttingimpacts
Policy integration N
The proposed option is in line with the policy preferred by the SMP.
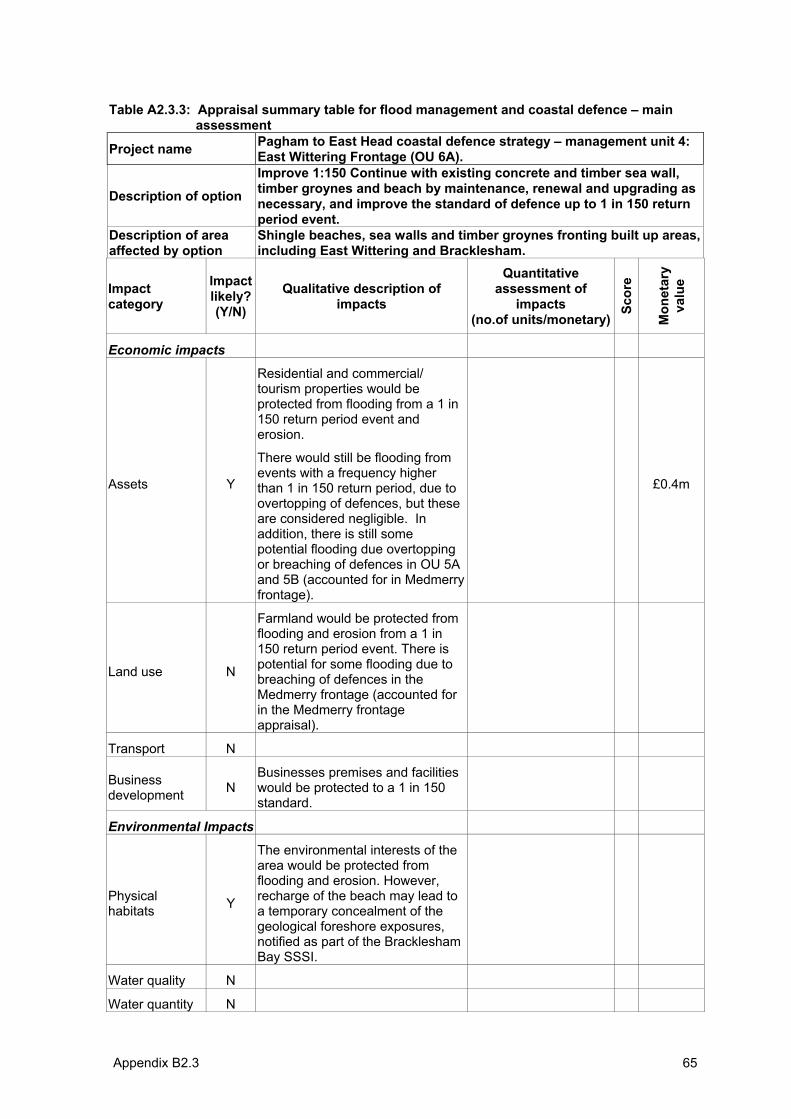
Appendix B2.3 65
Table A2.3.3: Appraisal summary table for flood management and coastal defence – main assessment
Project name Pagham to East Head coastal defence strategy – management unit 4: East Wittering Frontage (OU 6A).
Description of option
Improve 1:150 Continue with existing concrete and timber sea wall, timber groynes and beach by maintenance, renewal and upgrading as necessary, and improve the standard of defence up to 1 in 150 return period event.
Description of area affected by option
Shingle beaches, sea walls and timber groynes fronting built up areas, including East Wittering and Bracklesham.
Impactcategory
Impactlikely? (Y/N)
Qualitative description of impacts
Quantitative assessment of
impacts(no.of units/monetary)
Scor
e
Mon
etar
yva
lue
Economic impacts
Assets Y
Residential and commercial/ tourism properties would be protected from flooding from a 1 in 150 return period event and erosion.
There would still be flooding from events with a frequency higher than 1 in 150 return period, due to overtopping of defences, but these are considered negligible. In addition, there is still some potential flooding due overtopping or breaching of defences in OU 5A and 5B (accounted for in Medmerry frontage).
£0.4m
Land use N
Farmland would be protected from flooding and erosion from a 1 in 150 return period event. There is potential for some flooding due to breaching of defences in the Medmerry frontage (accounted for in the Medmerry frontage appraisal).
Transport N
Businessdevelopment N
Businesses premises and facilities would be protected to a 1 in 150 standard.
Environmental Impacts
Physical habitats Y
The environmental interests of the area would be protected from flooding and erosion. However, recharge of the beach may lead to a temporary concealment of the geological foreshore exposures, notified as part of the Bracklesham Bay SSSI.
Water quality N
Water quantity N
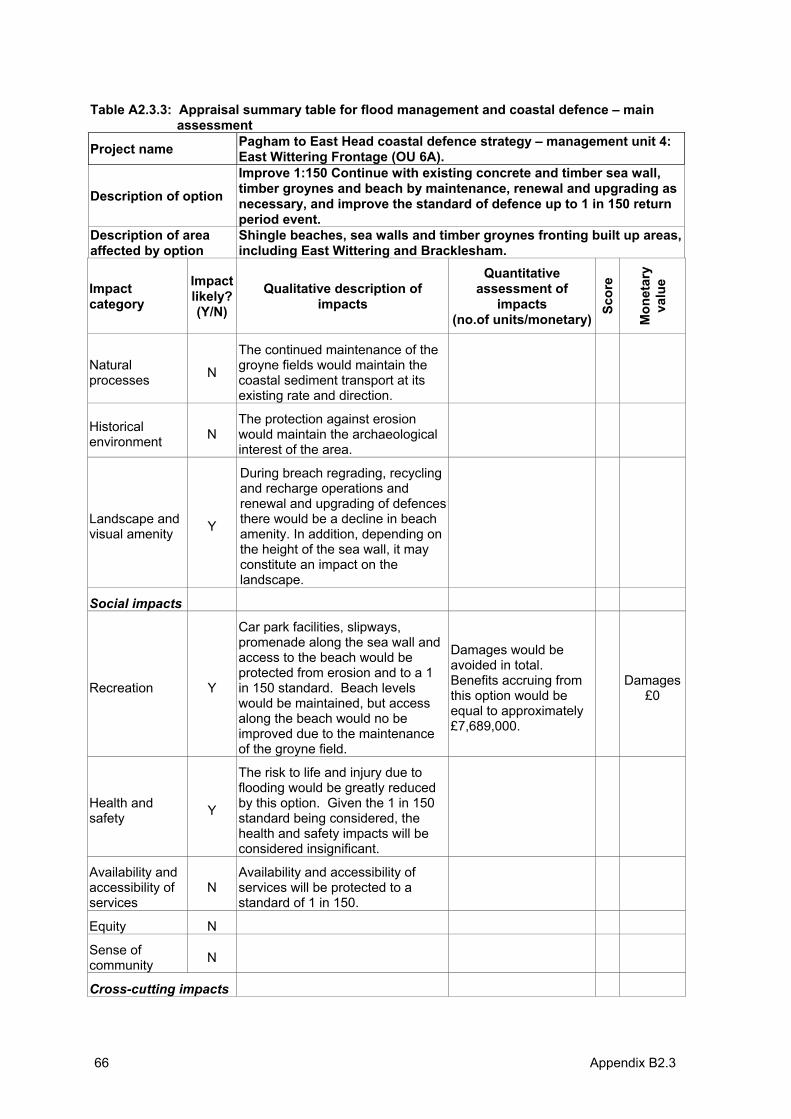
66 Appendix B2.3
Table A2.3.3: Appraisal summary table for flood management and coastal defence – main assessment
Project name Pagham to East Head coastal defence strategy – management unit 4: East Wittering Frontage (OU 6A).
Description of option
Improve 1:150 Continue with existing concrete and timber sea wall, timber groynes and beach by maintenance, renewal and upgrading as necessary, and improve the standard of defence up to 1 in 150 return period event.
Description of area affected by option
Shingle beaches, sea walls and timber groynes fronting built up areas, including East Wittering and Bracklesham.
Impactcategory
Impactlikely? (Y/N)
Qualitative description of impacts
Quantitative assessment of
impacts(no.of units/monetary)
Scor
e
Mon
etar
yva
lue
Naturalprocesses N
The continued maintenance of the groyne fields would maintain the coastal sediment transport at its existing rate and direction.
Historicalenvironment N
The protection against erosion would maintain the archaeological interest of the area.
Landscape and visual amenity Y
During breach regrading, recycling and recharge operations and renewal and upgrading of defences there would be a decline in beach amenity. In addition, depending on the height of the sea wall, it may constitute an impact on the landscape.
Social impacts
Recreation Y
Car park facilities, slipways, promenade along the sea wall and access to the beach would be protected from erosion and to a 1 in 150 standard. Beach levels would be maintained, but access along the beach would no be improved due to the maintenance of the groyne field.
Damages would be avoided in total.Benefits accruing from this option would be equal to approximately £7,689,000.
Damages£0
Health and safety Y
The risk to life and injury due to flooding would be greatly reduced by this option. Given the 1 in 150 standard being considered, the health and safety impacts will be considered insignificant.
Availability and accessibility of services
NAvailability and accessibility of services will be protected to a standard of 1 in 150.
Equity N
Sense of community N
Cross-cutting impacts
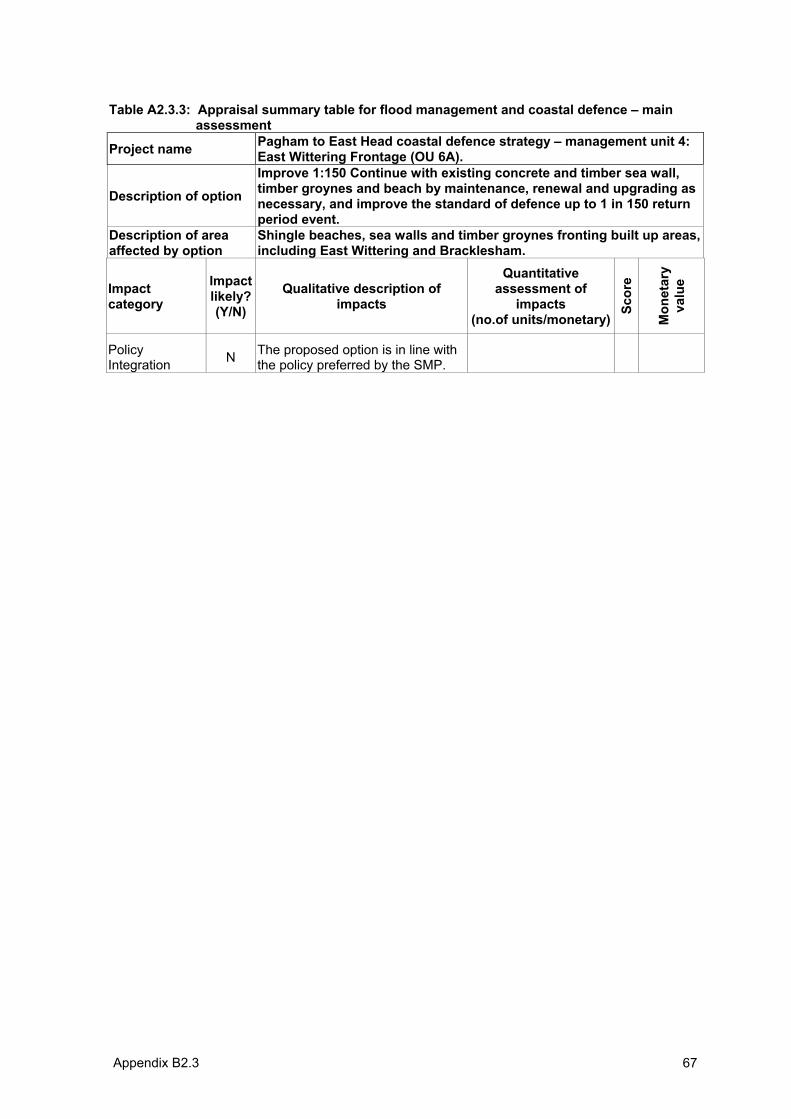
Appendix B2.3 67
Table A2.3.3: Appraisal summary table for flood management and coastal defence – main assessment
Project name Pagham to East Head coastal defence strategy – management unit 4: East Wittering Frontage (OU 6A).
Description of option
Improve 1:150 Continue with existing concrete and timber sea wall, timber groynes and beach by maintenance, renewal and upgrading as necessary, and improve the standard of defence up to 1 in 150 return period event.
Description of area affected by option
Shingle beaches, sea walls and timber groynes fronting built up areas, including East Wittering and Bracklesham.
Impactcategory
Impactlikely? (Y/N)
Qualitative description of impacts
Quantitative assessment of
impacts(no.of units/monetary)
Scor
e
Mon
etar
yva
lue
Policy Integration N The proposed option is in line with
the policy preferred by the SMP.
Joint Defra/EA Flood and Coastal Erosion Risk Management R&D Programme
Annex B.3:
Case study no.3:
Assessment of the Dymchurch sea defence scheme
R&D Project Record FD2013/PR2
Produced: November 2004
ii
Statement of use This report provides guidance on the use of MCA and ASTs to assist in the appraisal of flood and coastal erosion risk management projects, strategies and policies. It should be noted that it does not constitute official government policy or guidance, which is unlikely to be available until work to develop the methodology and identify appropriate sources of data has been undertaken through pilot studies.
This report may be downloaded from the Defra/EA R&D Programme website (http://www.defra.gov.uk/environ.fcd/research), use the search tool located on the project information and publications page. Copies are held by all EA Regional Information Centres, contact The Environment Agency’s National Customer Contact Centre by emailing [email protected] or by telephoning 08708506506.
Dissemination Status Internal: Released internally External: Released to public domain
Keywords: Multi criteria analysis, MCA, appraisal summary table, AST, decision rule
Research contractor contact details: Lead contractor: Risk & Policy Analysts Ltd (RPA), Farthing Green House, 1 Beccles Road, Loddon, Norfolk, NR14 6LT (Tel: 01508 528465; Fax: 01508 520758; www.rpaltd.co.uk). The project director was Meg Postle, the project manager for RPA was John Ash with research support from Susana Dias and other members of RPA staff.
The research team also included: Colin Green (Flood Hazard Research Centre, Middlesex University); Alan Pearman (University of Leeds); Ron Janssen (The Institute of Environmental Studies, Free University, Amsterdam), Terry Oakes and Hugh Payne (Independent Consultants)
Acknowledgements The assistance of those providing information for the case studies is gratefully acknowledged.
Defra project manager: Matt Crossman, Defra, 3D Ergon House, Horseferry Rd, London, SW1P 2AL. Email: [email protected]
Publishing organisation DefraFlood Management Division Ergon House Horseferry Road London SW1P 2AL Tel: 020 7238 3000 Fax: 020 7238 6187 www.defra.gov.uk/environ/fcd
â Crown copyright (Defra); 2005
Copyright in the typographical arrangement and design rests with the Crown. This publication (excluding the logo) may be reproduced free of charge in any format or medium provided that it is reproduced accurately and not used in a misleading context. The material must be acknowledged as Crown copyright with the title and source of the publication specified. The views expressed in this document are not necessarily those of Defra or the Environment Agency. Its officers, servants or agents accept no liability whatsoever for any loss or damage arising from the interpretation or use of the information, or reliance on views contained herein.
Published by the Department for Environment, Food and Rural Affairs. Printed in the UK, March 2005 on recycled material containing 80% post-consumer waste and 20% totally chlorine free virgin pulp.
PB No. 10734/PR2 ISBN 0-85521-146-6
Section 1: Introduction 1
1. Introduction This report presents the MCA-based project appraisal process for the Dymchurch Sea Defence Scheme. This scheme appraisal follows as much as possible the original appraisal process carried out by the Environment Agency (EA).
The base information reported here is based on the following:
• visit to Dymchurch Sea Defence Scheme, followed by meeting with Steve Thompsett (EA Project Manager), Chris Powel and Ray Traynor (BBR) and Anita Ferguson (EA Kent Area Improvements Engineer);
• High Knocke to Dymchurch Sea Defence Scheme Environmental Scoping Study (BBR, 2003);
• Project Appraisal Report (PAR) for the High Knocke to Dymchurch Redoubt Sea Defences (Environment Agency, 2004);
• Folkestone to Rye Coastal Defence Strategy Main Report (HR Wallingford, 2001); and
• Folkestone to Rye Coastal Defence Strategy Executive Summary (HR Wallingford, 2001).
1.1 Summary of the project area
The stretch of coast between High Knocke and Dymchurch Redoubt lies within Shepway District in Kent, between St Mary’s Bay and Hythe. The area covers management units (MU) 18/7 to 18/13 as identified in the Beachy Head to South Foreland Shoreline Management Plan (SMP) and in the Folkestone to Rye Coastal Defence Strategy.
Dymchurch town centre, with shops, businesses and housing, extending along the A259, relies on existing seawalls for protection against inundation. Land levels are generally between 2 and 3 metres above mean sea level, i.e. up to 2 metres below the high water mark of spring tides and as much as 3 metres below predicted 50-year water levels.
The housing and nature of buildings in Dymchurch and St Mary’s Bay have a variety of origins. These include remains of a 12th Century Parish Church and the old village of Dymchurch dating back to the 14th Century (including an inn), through to the 20th Century bungalows that form the majority of the housing (many of which are let as holiday homes). The main shopping area is close to the sea front and includes the amusement arcade and several shops associated with the touristy character of the town. The New Beach Holiday Centre is a dominant feature on the A259 at the northern end of Dymchurch and there are a number of other caravan sites (with a combined total of 630 caravans).
In terms of landscape, the massive Dymchurch wall and the three Martello Towers dominate the coastal landscape of Dymchurch town and St Mary’s Bay.
Section 1: Introduction 2
The sandy beaches between Dymchurch Redoubt and St Mary's Bay are the main reason for the development of a tourist resort along this coastline. The imposing bulk of the Dymchurch Wall separates the beach from the low-lying land on which Dymchurch and St Mary's Bay are built. The beaches have a gentle slope giving a large expanse of firm sand for the traditional seaside pursuits at low tide as well as providing safe bathing. At each high tide the beaches are completely covered.
There is an amusement arcade and fun fair close to the beach. The car parks at High Knocke and St Mary's Bay also provide a focus for holidaymakers and day-trippers using the beaches. There are also public slipways at Dymchurch and High Knocke. Access to the beach can be gained by steps over the seawall at many other points. These are used by people walking to the beach from the hotels, campsites, caravan sites and rented accommodation along the coast. Thus the whole length of the beach is used for recreation with clusters of people around the main centres and car parks.
Tourism facilities in the area include the New Beach Holiday Centre with 20 chalets at Dymchurch and 5 caravan parks in the St Mary’s Bay and Dymchurch area that hold around 630 caravans.
1.2 Existing defences
The sea defences from High Knocke to Dymchurch Redoubt consist of original clay embankments which have been progressively dressed on their seaward face, protected on the crest and have had rear upstand walls added at various dates. The seawalls throughout the Dymchurch frontage have been affected by falling beach levels over many years and now, in areas, require urgent attention. Shingle occurs only sporadically as a narrow fillet at the toe of the walls, and the low sand foreshore allows larger waves to reach the seawall (BBR, 2003). The defences are generally much older than other sections of Management Unit 18 and need frequent maintenance and major upgrading, in response to wave induced damage, deterioration due to old age and the effects of long term foreshore lowering (BBR, 2003).
From High Knocke to Chapel Road the beach levels are relatively stable but the width of the foreshore between high and low water of medium tides reduces from 350m at the southern end to 250m at the northern end of the frontage. The situation is further exacerbated by the inability of the present system of long and short timber groynes along this frontage to arrest the littoral currents in this area.
Under the current maintenance policy, present standard of defence is less than 1 in 10 years and a breach (probably within 5 years) of defences could lead to flooding of the urban settlements and of Romney Marsh (BBR, 2003).
According to the Folkestone to Rye Coastal Defence Strategy (HR Wallingford, 2001) the primary agent of coastal change in this area is wave action at the
Section 1: Introduction 3
shoreline. The study area is exposed to the prevailing south-westerly winds giving rise to severe storm attack at the coast.
Severe flood damage occurs when extreme wave and water levels conditions combine. However this is rare as the correlation between extreme water level and wave height is relatively low (on average once every 200 years for a storm event) (HR Wallingford, 2001).
In what relates to beach behaviour, the Folkestone to Rye Coastal Strategy estimates that the net sand drift in from south west to north east at an average rate of 100,000 m3/a in the Dymchurch frontage, increasing from 80,000 m3/aon the west to 100,000 m3/a on the east.
1.3 Policy framework
In 1996 a Shoreline Management Plan (SMP) was produced for the stretch of coastline between Beachy Head, in East Sussex and South Foreland, in Kent. The framework developed within the SMP sets out a protocol for a sustainable approach to shoreline management on a wide area scale.
The preferred policy option identified in the SMP for the area is to hold the line, by continuing maintenance of the walls to maintain the defence to the backshore area. The SMP also noted that this area provides an opportunity for realignment, which would require secondary defence lines, remodelling of drainage outfalls and consideration of the presently important coastal road (HR Wallingford, 2001).
In 1998 the Environment Agency and the Shepway District Council jointly commissioned HR Wallingford to undertake the development of the Strategy Plan for the area extending from Folkestone to Rye, following the policy framework set out in the SMP. This strategy was agreed in 20011.
The Folkestone to Rye Coastal Defence Strategy identifies broad-brush opportunities and constrains for coastal management over the next fifty years as well as a more detailed Coastal Defence Implementation Plan for the net five years based on need.
The Folkestone to Rye Coastal Defence Strategy (HR Wallingford, 2001) admits that in the medium to long term (< 50 years) the Hold the Line policy identified in the SMP is appropriate. It adds, however, that future planning actions should recognise that continued protection is not sustainable in the very long term (> 50 years) and retreat may ultimately need to be considered.
1 According to Steve Thompsett (Environment Agency Project Manager), the approval of the
FRCDS is pending on approval of two or more schemes included in it, such as Dymchurch Coastal Defence Scheme.
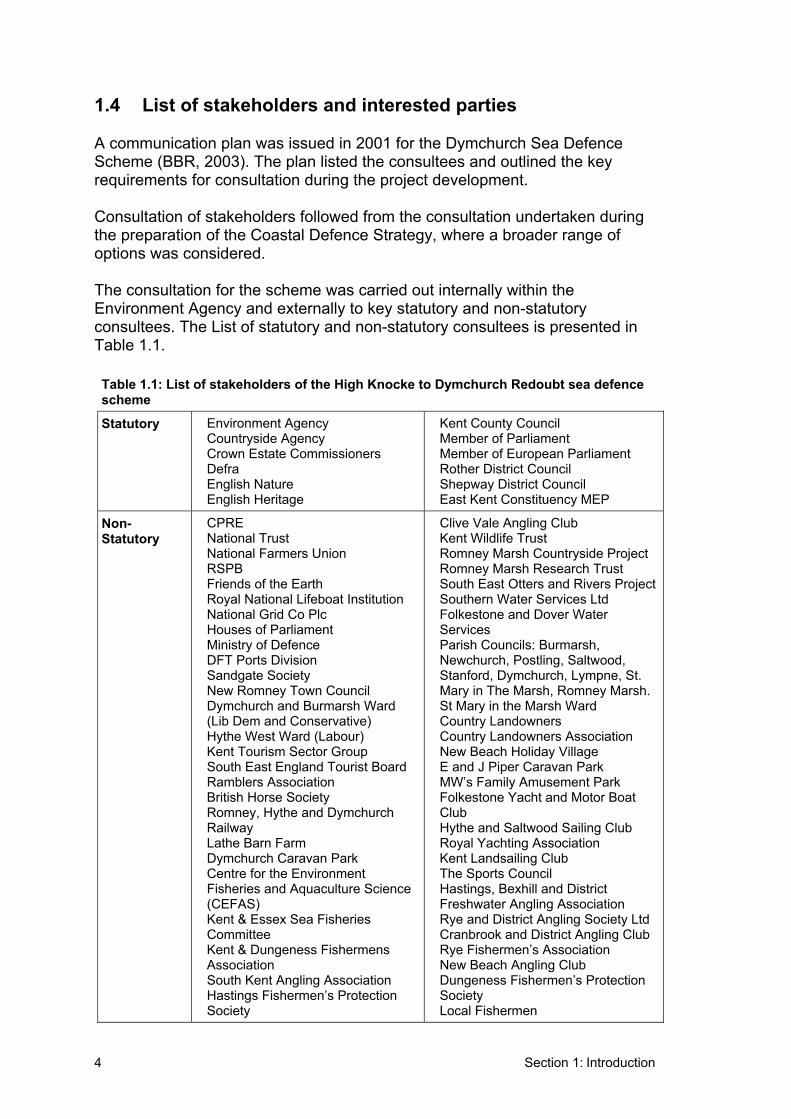
Section 1: Introduction 4
1.4 List of stakeholders and interested parties
A communication plan was issued in 2001 for the Dymchurch Sea Defence Scheme (BBR, 2003). The plan listed the consultees and outlined the key requirements for consultation during the project development.
Consultation of stakeholders followed from the consultation undertaken during the preparation of the Coastal Defence Strategy, where a broader range of options was considered.
The consultation for the scheme was carried out internally within the Environment Agency and externally to key statutory and non-statutory consultees. The List of statutory and non-statutory consultees is presented in Table 1.1.
Table 1.1: List of stakeholders of the High Knocke to Dymchurch Redoubt sea defence scheme
Statutory • Environment Agency• Countryside Agency • Crown Estate Commissioners• Defra• English Nature • English Heritage
• Kent County Council • Member of Parliament • Member of European Parliament • Rother District Council• Shepway District Council • East Kent Constituency MEP
Non-Statutory
• CPRE• National Trust • National Farmers Union • RSPB• Friends of the Earth • Royal National Lifeboat Institution• National Grid Co Plc• Houses of Parliament • Ministry of Defence • DFT Ports Division • Sandgate Society • New Romney Town Council• Dymchurch and Burmarsh Ward
(Lib Dem and Conservative) • Hythe West Ward (Labour) • Kent Tourism Sector Group • South East England Tourist Board • Ramblers Association• British Horse Society • Romney, Hythe and Dymchurch
Railway • Lathe Barn Farm • Dymchurch Caravan Park • Centre for the Environment
Fisheries and Aquaculture Science (CEFAS)
• Kent & Essex Sea Fisheries Committee
• Kent & Dungeness Fishermens Association
• South Kent Angling Association • Hastings Fishermen’s Protection
Society
• Clive Vale Angling Club• Kent Wildlife Trust • Romney Marsh Countryside Project • Romney Marsh Research Trust • South East Otters and Rivers Project • Southern Water Services Ltd • Folkestone and Dover Water
Services• Parish Councils: Burmarsh,
Newchurch, Postling, Saltwood, Stanford, Dymchurch, Lympne, St. Mary in The Marsh, Romney Marsh.
• St Mary in the Marsh Ward • Country Landowners • Country Landowners Association • New Beach Holiday Village • E and J Piper Caravan Park • MW’s Family Amusement Park • Folkestone Yacht and Motor Boat
Club• Hythe and Saltwood Sailing Club • Royal Yachting Association • Kent Landsailing Club • The Sports Council • Hastings, Bexhill and District
Freshwater Angling Association • Rye and District Angling Society Ltd • Cranbrook and District Angling Club • Rye Fishermen’s Association • New Beach Angling Club • Dungeness Fishermen’s Protection
Society • Local Fishermen
Section 1: Introduction 5
Source: BBR (2003): High Knock to Dymchurch Redoubt Sea Defence Scheme – Environmental Scoping Study, Internal Working Paper, Revision II, October 2003. Notes: Individual landowners in the seafront region of this study area have also been contacted separately and consultation packs will also be made available to Dymchurch shop owners through Mr Woolls at the Amusement Park (Babtie Group, 2003).
Consultation was undertaken during the following stages of the development of the project:
• screening and option identification; • scoping exercise; • draft environmental report or environmental statement; and • environmental action plan.
In addition, a beach users survey and a Contingent Valuation Method (CVM) survey were also undertaken at Dymchurch to assess the value of the sandy beach to the local community and visitors.
Section 2: Definition of objectives and management options 6
2. Definition of objectives and management options
According to Babtie Group (2004) the works will be developed to meet the Environment Agency’s operational aim of reducing “the risk of flooding from rivers and the sea to people, property and the natural environment by providing effective defences and awareness”.
In order to meet the broader aims of the Environment Agency, including sustainable defence, the following objectives have been developed (Environment Agency, 2004):
• to maintain protection against overtopping of defences by storms with a minimum return period of 1 in 100 years for a period of 100 years;
• to reduce the risk of breach of defences; • to provide minimum adverse effects on the coastal zone in construction,
operation and decommissioning; • to include suitable measures to mitigate against identified environmental
impacts; and • to maintain the recreational amenity value of the frontage.
The Shoreline Management Plan and the Folkestone to Rye Coastal Defence Strategy have confirmed a long-term policy of hold the line. The Folkestone to Rye Coastal Defence Strategy (FRCDS) identified the High Knocke to Grand Redoubt frontage (Dymchurch) as Priority Action No.3. The existing standard of defence at Dymchurch was identified as 1:10 years and a standard of 1:100 years was recommended.
The options for the Dymchurch area considered during the development of the scheme are presented in Table 2.1.
The Folkestone to Rye Coastal Defence Strategy did not seem to fully resolve the preferred option for Dymchurch. The preferred options (regional and local) focussed on a major beach management solution using either a sand or shingle beach, with control structures and minor works to the seawall. Consultation on the strategy had identified that the sand option was preferable on amenity grounds as the reputation of Dymchurch, as a coastal resort, is built upon its sandy beaches.
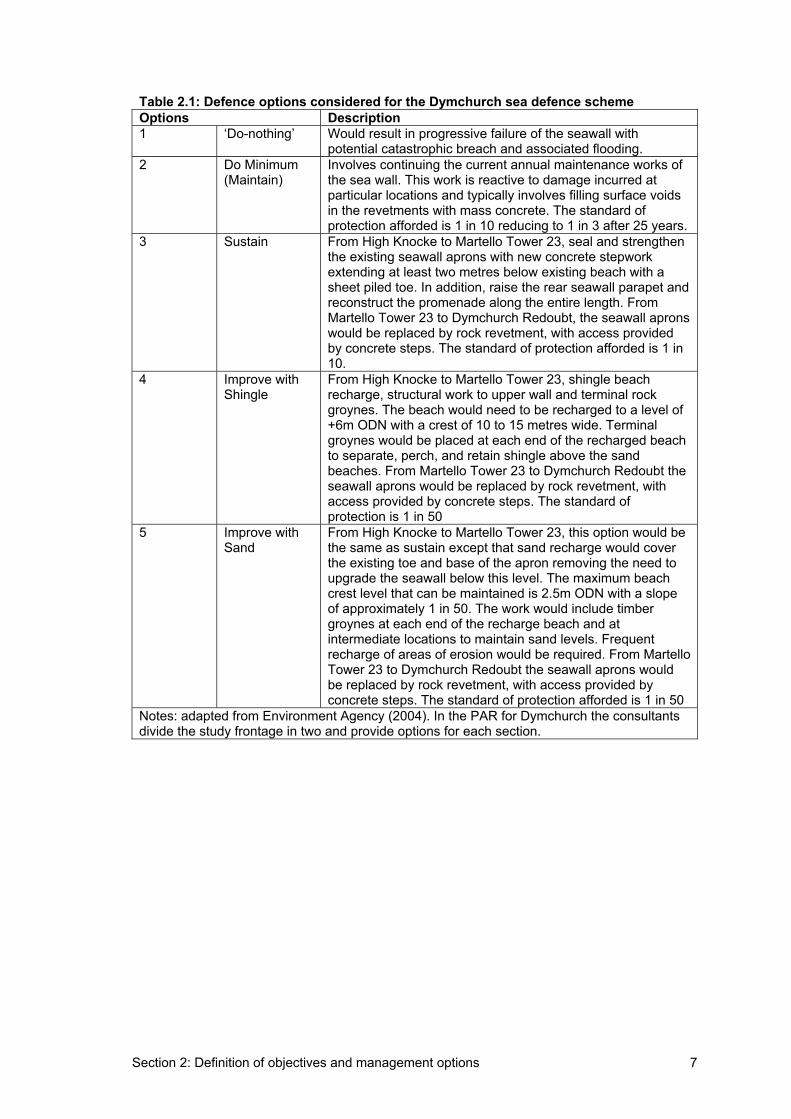
Section 2: Definition of objectives and management options 7
Table 2.1: Defence options considered for the Dymchurch sea defence scheme Options Description 1 ‘Do-nothing’ Would result in progressive failure of the seawall with
potential catastrophic breach and associated flooding. 2 Do Minimum
(Maintain)Involves continuing the current annual maintenance works of the sea wall. This work is reactive to damage incurred at particular locations and typically involves filling surface voids in the revetments with mass concrete. The standard of protection afforded is 1 in 10 reducing to 1 in 3 after 25 years.
3 Sustain From High Knocke to Martello Tower 23, seal and strengthen the existing seawall aprons with new concrete stepwork extending at least two metres below existing beach with a sheet piled toe. In addition, raise the rear seawall parapet and reconstruct the promenade along the entire length. From Martello Tower 23 to Dymchurch Redoubt, the seawall aprons would be replaced by rock revetment, with access provided by concrete steps. The standard of protection afforded is 1 in 10.
4 Improve with Shingle
From High Knocke to Martello Tower 23, shingle beach recharge, structural work to upper wall and terminal rock groynes. The beach would need to be recharged to a level of +6m ODN with a crest of 10 to 15 metres wide. Terminal groynes would be placed at each end of the recharged beach to separate, perch, and retain shingle above the sand beaches. From Martello Tower 23 to Dymchurch Redoubt the seawall aprons would be replaced by rock revetment, with access provided by concrete steps. The standard of protection is 1 in 50
5 Improve with Sand
From High Knocke to Martello Tower 23, this option would be the same as sustain except that sand recharge would cover the existing toe and base of the apron removing the need to upgrade the seawall below this level. The maximum beach crest level that can be maintained is 2.5m ODN with a slope of approximately 1 in 50. The work would include timber groynes at each end of the recharge beach and at intermediate locations to maintain sand levels. Frequent recharge of areas of erosion would be required. From Martello Tower 23 to Dymchurch Redoubt the seawall aprons would be replaced by rock revetment, with access provided by concrete steps. The standard of protection afforded is 1 in 50
Notes: adapted from Environment Agency (2004). In the PAR for Dymchurch the consultants divide the study frontage in two and provide options for each section.
Section 3: Structuring the problem8
3. Structuring the problem This section aims to break down the problem into its component parts, identifying the set of impacts and associated criteria that will be used to make the decision. In other words it carries out a screening exercise for the Dymchurch coastal defence scheme.
3.1 Summary of the screening exercise
This screening exercise is used to determine (i) which categories are relevant and (ii) which categories will be appraised by assigning monetary value to impacts and which will be appraised by assigning a score to the impacts. Relevant categories are those where there is a difference in the impacts of the 4 options being appraised (‘do-nothing’, sustain, improve and improve plus).
The detailed high level screening for both Dymchurch is presented in Appendices A3.1 to this report - Appraisal Summary Table for Flood Management and Coastal Defence for High Level Screening (AST-FMDC-S) – Table 3.1 summarises the results of the screening exercise.
The screening exercise highlighted the fact that the majority of the more significant impacts of the Dymchurch Sea Defence Scheme (DSDS) are related to economic assets such as housing and commercial premises as well as agricultural land, and to recreation and tourism activities in the area, such as the beach and the landscape in general. There are some environmental impacts, but these are not so significant given that the area does not encompass great conservation interests.
It also becomes clear that cost benefit analysis (CBA) will be the main valuation tool, since the more significant impact categories can be valued using this technique. Multi-criteria analysis (MCA) will be particularly important when assessing the historical environment impacts category, which plays a very important role in this frontage, and some of the recreational sub-categories, also very significant. Table 3.1 indicates which categories of impacts will be valued using CBA and which categories will be assessed using MCA.
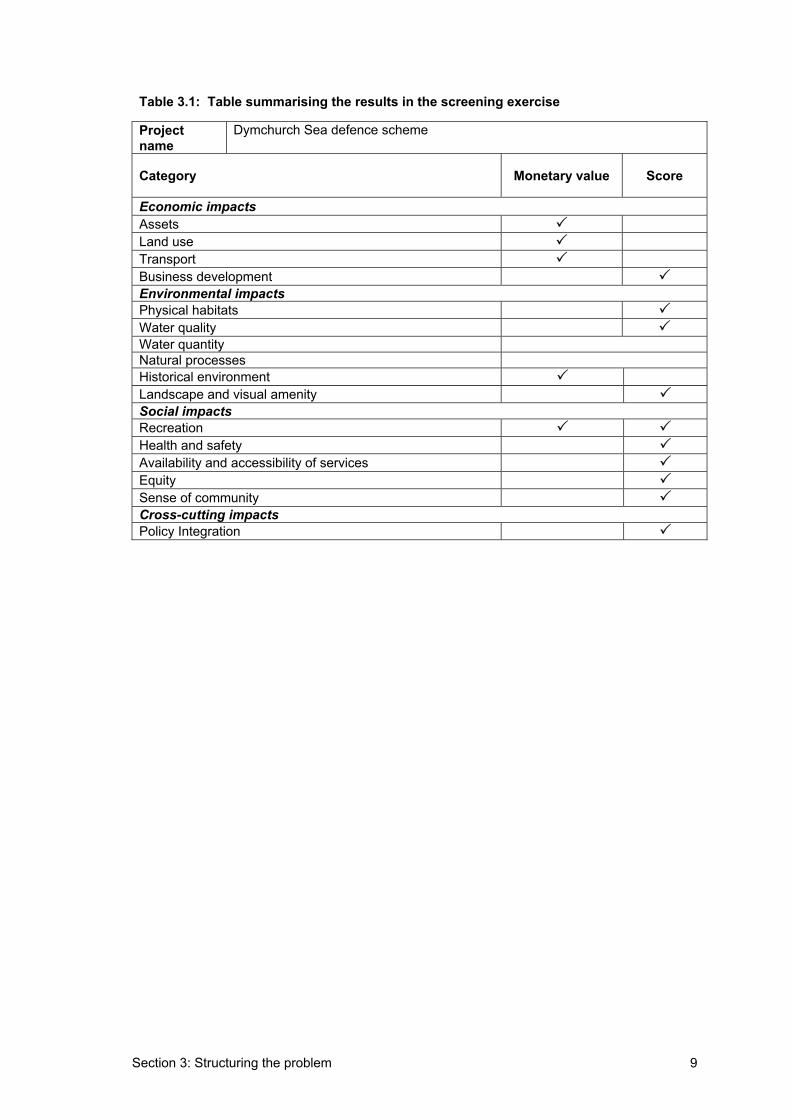
Section 3: Structuring the problem 9
Table 3.1: Table summarising the results in the screening exercise
Projectname
Dymchurch Sea defence scheme
Category Monetary value Score
Economic impactsAssetsLand useTransportBusiness development Environmental impactsPhysical habitats Water quality Water quantity Natural processes Historical environmentLandscape and visual amenity Social impactsRecreationHealth and safety Availability and accessibility of services EquitySense of community Cross-cutting impactsPolicy Integration
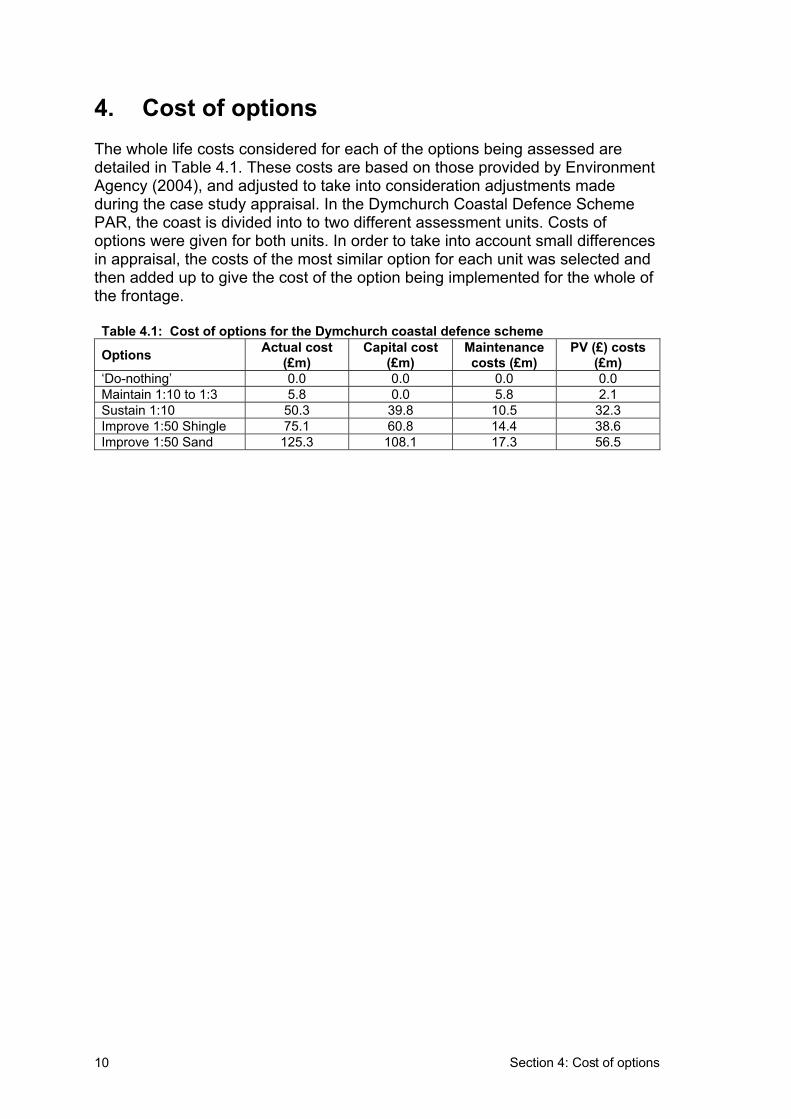
Section 4: Cost of options 10
4. Cost of options The whole life costs considered for each of the options being assessed are detailed in Table 4.1. These costs are based on those provided by Environment Agency (2004), and adjusted to take into consideration adjustments made during the case study appraisal. In the Dymchurch Coastal Defence Scheme PAR, the coast is divided into to two different assessment units. Costs of options were given for both units. In order to take into account small differences in appraisal, the costs of the most similar option for each unit was selected and then added up to give the cost of the option being implemented for the whole of the frontage.
Table 4.1: Cost of options for the Dymchurch coastal defence scheme
Options Actual cost (£m)
Capital cost (£m)
Maintenancecosts (£m)
PV (£) costs (£m)
‘Do-nothing’ 0.0 0.0 0.0 0.0 Maintain 1:10 to 1:3 5.8 0.0 5.8 2.1 Sustain 1:10 50.3 39.8 10.5 32.3 Improve 1:50 Shingle 75.1 60.8 14.4 38.6 Improve 1:50 Sand 125.3 108.1 17.3 56.5
Section 5: Assessment of impacts 11
5. Assessment of impacts 5.1 Qualitative and quantitative assessment
The qualitative and quantitative assessment of the different options for each of the management units was carried out using the Appraisal Summary Table for the Main Assessment (MA-AST) and it is presented in Appendix B3.2 to this Annex.
The assessment followed a stepped approach, starting with the qualitative assessment of all impact categories and moving to the quantitative assessment whenever information was available.
5.2 Monetary valuation of impacts
All of the following information was obtained from the Folkestone to Rye Coastal Defence Strategy (FRDC) Study (HR Wallingford, 2001) and High Knocke to Dymchurch Redoubt Sea Defences Project Appraisal Report (Environment Agency, 2004). The damage assessment in the PAR was developed from the damage assessment produced for the FRCDS. The appraisal period was extended to 100 years, the discount rates were changed to 3.5% and substituting the FLAIR Flood damages by the ones in the Multicoloured Manual (MCM).
Benefits accruing from provision of defences (i.e. damages avoided) can be subdivided into 4 categories:
• write-off benefits; • intermittent flooding after breach benefits; • overtopping benefits; and • erosion benefits.
5.2.1 Write-off benefits
Assets
Where flood damage is suffered so frequently that the present value of the flood damage during the life of the scheme exceeds the value of the property, the property is written off and the losses are capped at the write-off value of the property.
Residential property value prices have been obtained from a combination of data including that from Office of the Deputy Prime Minister, the Halifax and HM Land Registry.
Section 5: Assessment of impacts12
A method based on the house equivalent method was used to calculate the value of commercial properties. In addition, a category of ‘Special Parks’ is used to value assets such as holiday camps and amusement parks. For write-off value, 1 Special Park is equivalent to 10.1 household equivalents, i.e. £808,000.
For Caravans that would be written-off it is considered that they could be relocated. Instead a nominal sum of £2,000 has been assigned to each caravan to cover relocation expenses, as indicated as an appropriate upper limit by MAFF.
Land use
Farmland flooded by salt water once every 10 years or lost through erosion is considered to be unfit for agriculture. In this situation the value of the loss is assumed to be the risk-free market value of the land multiplied by a factor of 0.45 to reflect the inflated price of agricultural land resulting from Government subsidy.
The survey of land values for the southeast region was used to calculate the risk-market value of agricultural land.
Historical environment
For many of the Schedule Ancient Monuments (SAM) and archaeological features of the area there is a statutory duty to protect them from damage. Therefore, the assessment of their value in national economic terms would be unnecessary. A nominal value of £2,000,000 has been assigned to each.
5.2.2 Intermittent flooding after breach
Assets
The value of recurrent flood damage to properties has been calculated using standard references (FLAIR and Yellow Manual, updated to the Multicolour Manual). It was considered that all properties flooded are inundated by salt water for a period of less than 12 hours. This is a reasonable assumption since the majority of properties are at risk from salt water flooding and the multitude of drainage pathways across the Marsh act to remove the worst of any flood waters.
For caravans, a threshold level is assumed to be 500mm above the surrounding ground level.
Section 5: Assessment of impacts 13
Land use
For the occasional losses of agricultural output as a result of flooding, i.e. losses of crop or land unfit for production for one year, a distinction as been made between arable and pastureland. According to the June 1997 Agricultural and Horticultural Census, the approximate ration between pasture and arable land use is 1 to 2.4 for the Kent Region.
For pastureland it has been assumed that livestock can be moved to a safer area, and the only cost is the loss of land use against which a rent is required. This constitutes a transfer payment and therefore cannot be considered. If, however, the land is damaged and the livestock cannot return for a long period of time, the write-off value of the land is used.
For arable land, a gross margin as been assumed to reflect the national loss.This approach was coupled with a local farmers survey regarding details of crops and produce prices.
Transport
The damages incurred by transport infrastructures under the ‘do-nothing’ option were calculated using the methodology recommended by the Yellow Manual, i.e. consideration of the likely diversion that would be required and any increase in cost associated with using such diversion.
For the A259, two different diversions were considered, and the cost of disruption is defined by the difference in the cost of travelling either diversion 1 or 2 compared with travelling the normal route.
5.2.3 Erosion protection benefits
Assets
In what regards outfalls and pumping stations, in the event of continued erosion they could be lost. The nominal replacement cost (£200,000) of these structures is used.
Historical environment
For many of the Schedule Ancient Monuments (SAM) and archaeological features of the area there is a statutory duty to protect from damage. Therefore it was decided that assessment of their value in national economic terms would be unnecessary. A nominal value of £2,000,000 has been assigned to each.
Section 5: Assessment of impacts14
5.2.4 Monetary valuation of intangible benefits
Recreation
Dymchurch is known for its sandy beach, which is popular both with local residents and visitors. However, due to the age of the defences protecting Dymchurch there is a risk that the beach will be lost.
In order to identify the importance of the beach to amenity and recreation, a Continent Valuation Assessment was commissioned (HR Wallingford, 2003).
The recreation losses will be calculated using information supplied in this study. It is known that there are approximately 160,000 visitors to the beach each year and that each of them is willing to pay £3.59 per visit.
5.3 Scoring of impacts
Scoring of impacts across the different options and their justification is presented in tabular format below. Table 5.1, overleaf, shows the scores for the Dymchurch.
Both the ‘Zero to 100’ and ‘relative to 100’ scoring systems were applied to this case study. The exercise demonstrates that the robustness of the scores is intrinsically related with the quality and quantity of information available. It also shows that when the base information for the scores is sparse, it is easier to use a ‘0 to 100’ score system simply because in this case two of the options are fixed and the remaining options have to assessed in relation to these two. However, this situation may not reflect accurately the reality, in particular in what concerns proportionality between the options.
Section 5: Assessment of impacts 15
Table 5.1: Table summarising scores and monetary estimates
Project name Dymchurch (scores given here are not weighted; monetary values are in PV terms over 100 years at 3,5% (reducing)).
Category O
ptio
n 1:
Opt
ion
2:
Opt
ion
3:
Opt
ion
4:
Opt
ion
5:
Scores justification
Economic impacts
0 70 70 81 100
Both the Strategy and the Scheme appraisal identify tourism as a major contributor to the local economy. It is estimated that between 7% and 14% of all employment in Shepway District, is provided by tourism (HR Wallingford, 2001). Considering that the quality status of the coast, in particular the beach, will significantly influence tourism, it is assumed that any change (positive or negative) to the coast will have a significant impact on business development. In this context, the option that will score the highest (100) is the one that will have the most positive influence (option 5). Option 4 will have a less positive effect. According to the Beach Users Survey (HR Wallingford, 2002), if the beach were to be built up with shingle instead of sand there would be a loss of 19% in visitor numbers. The same study indicates that 30% of visitors would not visit another beach in the area if the beach amenity were lost. For this reason, a score of 70 was given to option 2 and 3.
Businessdevelopment
55 85 85 86 100
Both the Strategy and the Scheme appraisal identify tourism as a major contributor to the local economy. It is estimated that between 7% and 14% of all employment in Shepway District, is provided by tourism (HR Wallingford, 2001). Considering that the quality status of the coast, in particular the beach, will significantly influence tourism, it is assumed that any change (positive or negative) to the coast will have a significant impact on business development. If we assume that the situation as it is today has no impact on business development, i.e. option 2 and 3 (maintain and sustain will be assumed to have approximately the same impact) then, options 4 and 5 will have a benefit in relation to the situation today and ‘do-nothing’ will have an impact. According to the Beach Users Survey (HR Wallingford, 2002), if the improve with shingle and improve with sand option were to go ahead, 1% and 15% of visitors respectively will visit the beach more often, and hence create more business. In this context, option 5 would score the highest (100), options 2 and 3 would score 15 points below option 5 (i.e. 85) and option 4 would score 1 point more than existing situation (i.e. 86) As for the ‘do-nothing’ option, the same study indicates that 30% of visitors would not visit another beach in the area if the beach amenity was lost, hence its scores 55, or 30 points below the current situation.
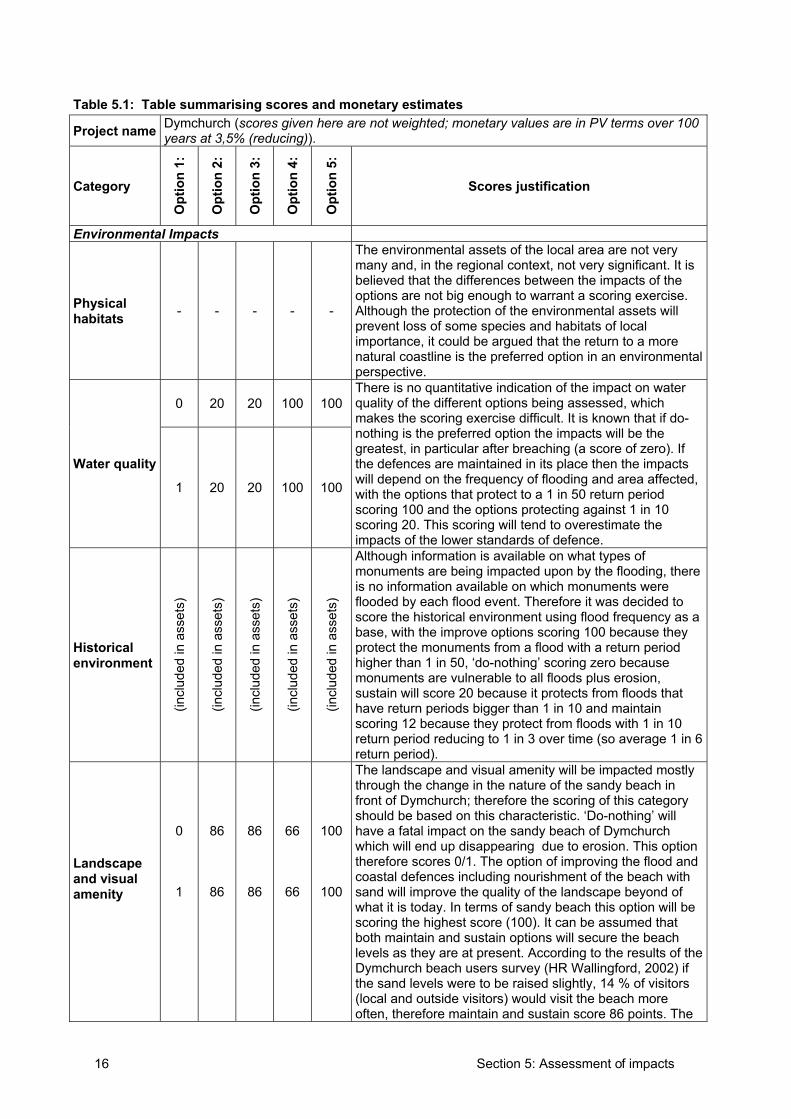
Section 5: Assessment of impacts 16
Table 5.1: Table summarising scores and monetary estimates
Project name Dymchurch (scores given here are not weighted; monetary values are in PV terms over 100 years at 3,5% (reducing)).
Category O
ptio
n 1:
Opt
ion
2:
Opt
ion
3:
Opt
ion
4:
Opt
ion
5:
Scores justification
Environmental Impacts
Physical habitats - - - - -
The environmental assets of the local area are not very many and, in the regional context, not very significant. It is believed that the differences between the impacts of the options are not big enough to warrant a scoring exercise. Although the protection of the environmental assets will prevent loss of some species and habitats of local importance, it could be argued that the return to a more natural coastline is the preferred option in an environmental perspective.
0 20 20 100 100
Water quality
1 20 20 100 100
There is no quantitative indication of the impact on water quality of the different options being assessed, which makes the scoring exercise difficult. It is known that if do-nothing is the preferred option the impacts will be the greatest, in particular after breaching (a score of zero). If the defences are maintained in its place then the impacts will depend on the frequency of flooding and area affected, with the options that protect to a 1 in 50 return period scoring 100 and the options protecting against 1 in 10 scoring 20. This scoring will tend to overestimate the impacts of the lower standards of defence.
Historicalenvironment
(incl
uded
in a
sset
s)
(incl
uded
in a
sset
s)
(incl
uded
in a
sset
s)
(incl
uded
in a
sset
s)
(incl
uded
in a
sset
s)
Although information is available on what types of monuments are being impacted upon by the flooding, there is no information available on which monuments were flooded by each flood event. Therefore it was decided to score the historical environment using flood frequency as a base, with the improve options scoring 100 because they protect the monuments from a flood with a return period higher than 1 in 50, ‘do-nothing’ scoring zero because monuments are vulnerable to all floods plus erosion, sustain will score 20 because it protects from floods that have return periods bigger than 1 in 10 and maintain scoring 12 because they protect from floods with 1 in 10 return period reducing to 1 in 3 over time (so average 1 in 6 return period).
Landscapeand visual amenity
0
1
86
86
86
86
66
66
100
100
The landscape and visual amenity will be impacted mostly through the change in the nature of the sandy beach in front of Dymchurch; therefore the scoring of this category should be based on this characteristic. ‘Do-nothing’ will have a fatal impact on the sandy beach of Dymchurch which will end up disappearing due to erosion. This option therefore scores 0/1. The option of improving the flood and coastal defences including nourishment of the beach with sand will improve the quality of the landscape beyond of what it is today. In terms of sandy beach this option will be scoring the highest score (100). It can be assumed that both maintain and sustain options will secure the beach levels as they are at present. According to the results of the Dymchurch beach users survey (HR Wallingford, 2002) if the sand levels were to be raised slightly, 14 % of visitors (local and outside visitors) would visit the beach more often, therefore maintain and sustain score 86 points. The
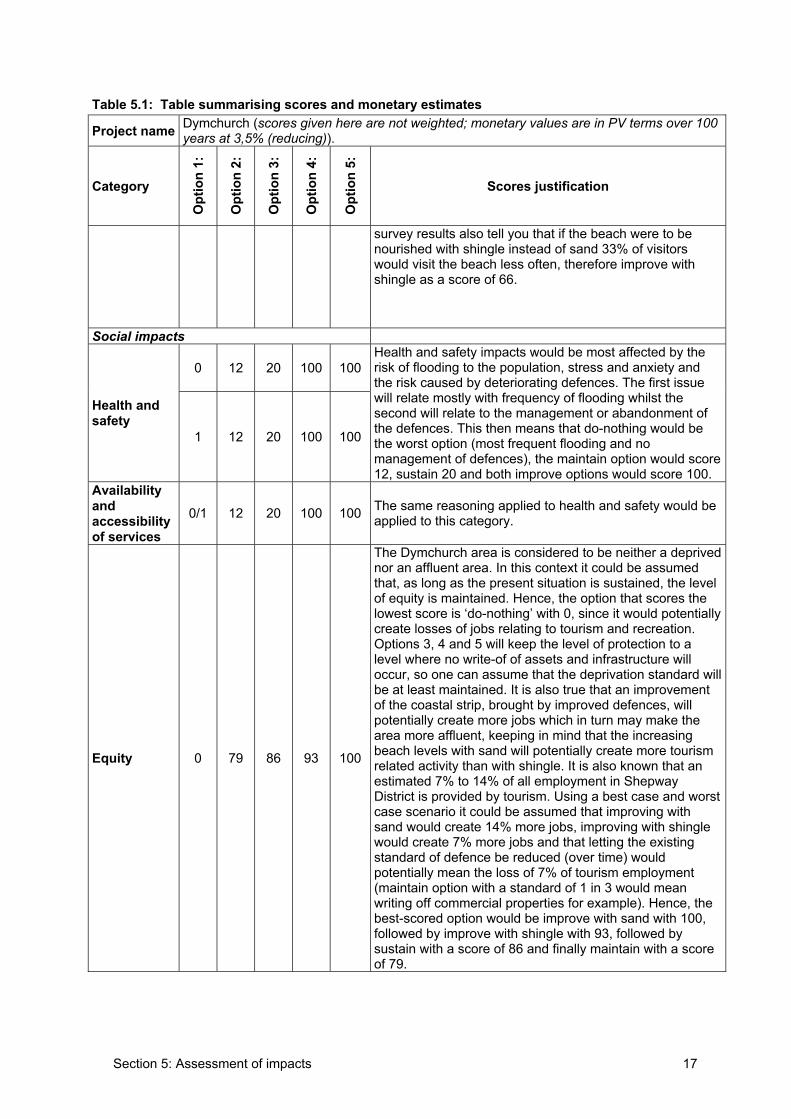
Section 5: Assessment of impacts 17
Table 5.1: Table summarising scores and monetary estimates
Project name Dymchurch (scores given here are not weighted; monetary values are in PV terms over 100 years at 3,5% (reducing)).
Category O
ptio
n 1:
Opt
ion
2:
Opt
ion
3:
Opt
ion
4:
Opt
ion
5:
Scores justification
survey results also tell you that if the beach were to be nourished with shingle instead of sand 33% of visitors would visit the beach less often, therefore improve with shingle as a score of 66.
Social impacts
0 12 20 100 100
Health and safety
1 12 20 100 100
Health and safety impacts would be most affected by the risk of flooding to the population, stress and anxiety and the risk caused by deteriorating defences. The first issue will relate mostly with frequency of flooding whilst the second will relate to the management or abandonment of the defences. This then means that do-nothing would be the worst option (most frequent flooding and no management of defences), the maintain option would score 12, sustain 20 and both improve options would score 100.
Availability andaccessibility of services
0/1 12 20 100 100 The same reasoning applied to health and safety would be applied to this category.
Equity 0 79 86 93 100
The Dymchurch area is considered to be neither a deprived nor an affluent area. In this context it could be assumed that, as long as the present situation is sustained, the level of equity is maintained. Hence, the option that scores the lowest score is ‘do-nothing’ with 0, since it would potentially create losses of jobs relating to tourism and recreation. Options 3, 4 and 5 will keep the level of protection to a level where no write-of of assets and infrastructure will occur, so one can assume that the deprivation standard will be at least maintained. It is also true that an improvement of the coastal strip, brought by improved defences, will potentially create more jobs which in turn may make the area more affluent, keeping in mind that the increasing beach levels with sand will potentially create more tourism related activity than with shingle. It is also known that an estimated 7% to 14% of all employment in Shepway District is provided by tourism. Using a best case and worst case scenario it could be assumed that improving with sand would create 14% more jobs, improving with shingle would create 7% more jobs and that letting the existing standard of defence be reduced (over time) would potentially mean the loss of 7% of tourism employment (maintain option with a standard of 1 in 3 would mean writing off commercial properties for example). Hence, the best-scored option would be improve with sand with 100, followed by improve with shingle with 93, followed by sustain with a score of 86 and finally maintain with a score of 79.
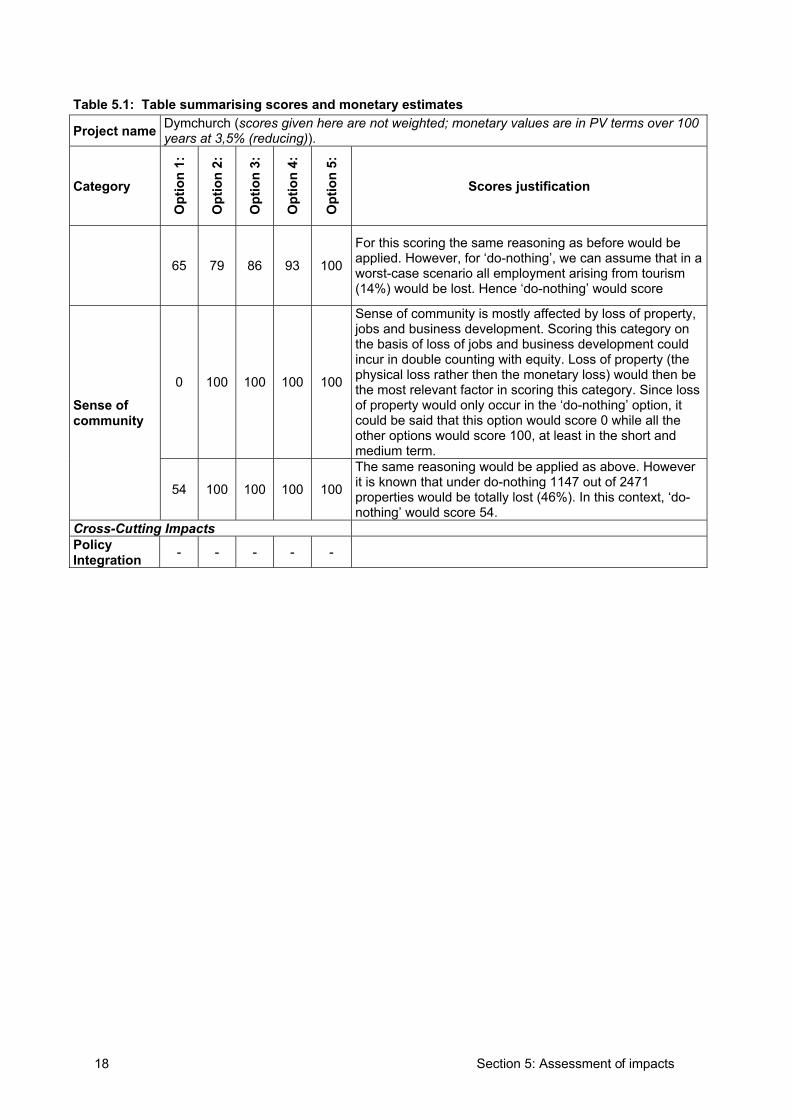
Section 5: Assessment of impacts 18
Table 5.1: Table summarising scores and monetary estimates
Project name Dymchurch (scores given here are not weighted; monetary values are in PV terms over 100 years at 3,5% (reducing)).
Category O
ptio
n 1:
Opt
ion
2:
Opt
ion
3:
Opt
ion
4:
Opt
ion
5:
Scores justification
65 79 86 93 100
For this scoring the same reasoning as before would be applied. However, for ‘do-nothing’, we can assume that in a worst-case scenario all employment arising from tourism (14%) would be lost. Hence ‘do-nothing’ would score
0 100 100 100 100
Sense of community is mostly affected by loss of property, jobs and business development. Scoring this category on the basis of loss of jobs and business development could incur in double counting with equity. Loss of property (the physical loss rather then the monetary loss) would then be the most relevant factor in scoring this category. Since loss of property would only occur in the ‘do-nothing’ option, it could be said that this option would score 0 while all the other options would score 100, at least in the short and medium term.
Sense of community
54 100 100 100 100
The same reasoning would be applied as above. However it is known that under do-nothing 1147 out of 2471 properties would be totally lost (46%). In this context, ‘do-nothing’ would score 54.
Cross-Cutting Impacts Policy Integration - - - - -
Section 6: Weighting 19
6. Weighting 6.1 Weighting methods and analysis used
It was not possible to directly or indirectly elicit weights for the Dymchurch case study. For this reason, analysis of scores combined with monetary costs and benefits was by means of the Constrained Random Weight Generator (CRWG). A CRWG analysis considers options sequentially starting from the ‘do-nothing’ option as per the traditional benefit-cost and incremental benefit-cost ratio analyses. The same rules and guidance are used as the traditional flood defence appraisals. Details of the principles and mechanism behind the CRWG are provided in Section 7 of the main report.
As described elsewhere, for a given comparison, the CRWG is programmed to identify more than 1,000 sets of weights where the total weighted intangible score (I) combined with k is sufficiently large to bring the overall benefit cost ratio and/or incremental benefit cost ratio within the bounds of the decision rules. The larger the I-score, the smaller (and, depending on context, the more reasonable) the value of k has to be.
The analysis was used to identify:
• whether it is mathematically possible for one option be preferred over others;
• if it is mathematically possible for one option to be preferred over another, whether this occurs within reasonable limits of the value of k (where this can either be unreasonably high); and
• if it is at least possible that it could be preferred within a reasonable value of k, whether the conditions for this in terms of the relative weights between categories of impact are reasonable.
6.1.2 Application of CRWG analysis to Dymchurch
For Dymchurch there are five options including the ‘do-nothing’ option. The results of the appraisal of monetary costs and benefits for the different options are presented in Table 6.1.
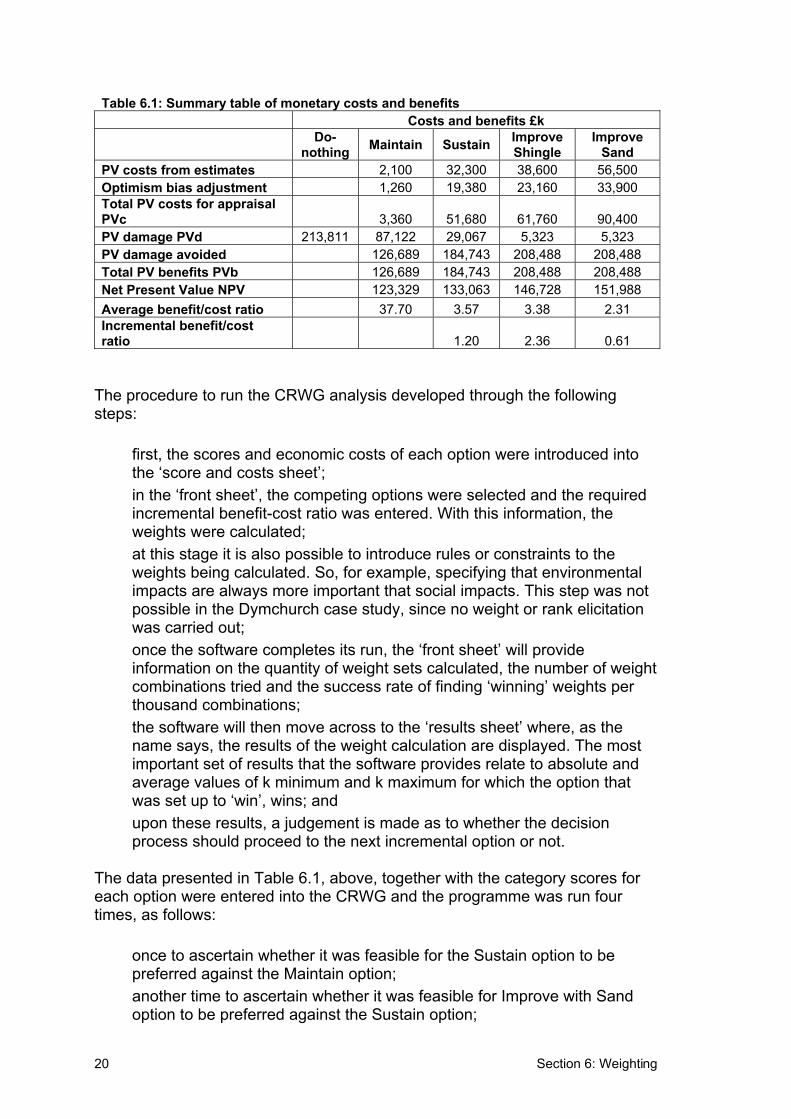
Section 6: Weighting20
Table 6.1: Summary table of monetary costs and benefits Costs and benefits £k
Do-nothing Maintain Sustain Improve
ShingleImprove
SandPV costs from estimates 2,100 32,300 38,600 56,500 Optimism bias adjustment 1,260 19,380 23,160 33,900 Total PV costs for appraisal PVc 3,360 51,680 61,760 90,400 PV damage PVd 213,811 87,122 29,067 5,323 5,323 PV damage avoided 126,689 184,743 208,488 208,488 Total PV benefits PVb 126,689 184,743 208,488 208,488 Net Present Value NPV 123,329 133,063 146,728 151,988 Average benefit/cost ratio 37.70 3.57 3.38 2.31 Incremental benefit/cost ratio 1.20 2.36 0.61
The procedure to run the CRWG analysis developed through the following steps:
• first, the scores and economic costs of each option were introduced into the ‘score and costs sheet’;
• in the ‘front sheet’, the competing options were selected and the required incremental benefit-cost ratio was entered. With this information, the weights were calculated;
• at this stage it is also possible to introduce rules or constraints to the weights being calculated. So, for example, specifying that environmental impacts are always more important that social impacts. This step was not possible in the Dymchurch case study, since no weight or rank elicitation was carried out;
• once the software completes its run, the ‘front sheet’ will provide information on the quantity of weight sets calculated, the number of weight combinations tried and the success rate of finding ‘winning’ weights per thousand combinations;
• the software will then move across to the ‘results sheet’ where, as the name says, the results of the weight calculation are displayed. The most important set of results that the software provides relate to absolute and average values of k minimum and k maximum for which the option that was set up to ‘win’, wins; and
• upon these results, a judgement is made as to whether the decision process should proceed to the next incremental option or not.
The data presented in Table 6.1, above, together with the category scores for each option were entered into the CRWG and the programme was run four times, as follows:
• once to ascertain whether it was feasible for the Sustain option to be preferred against the Maintain option;
• another time to ascertain whether it was feasible for Improve with Sand option to be preferred against the Sustain option;
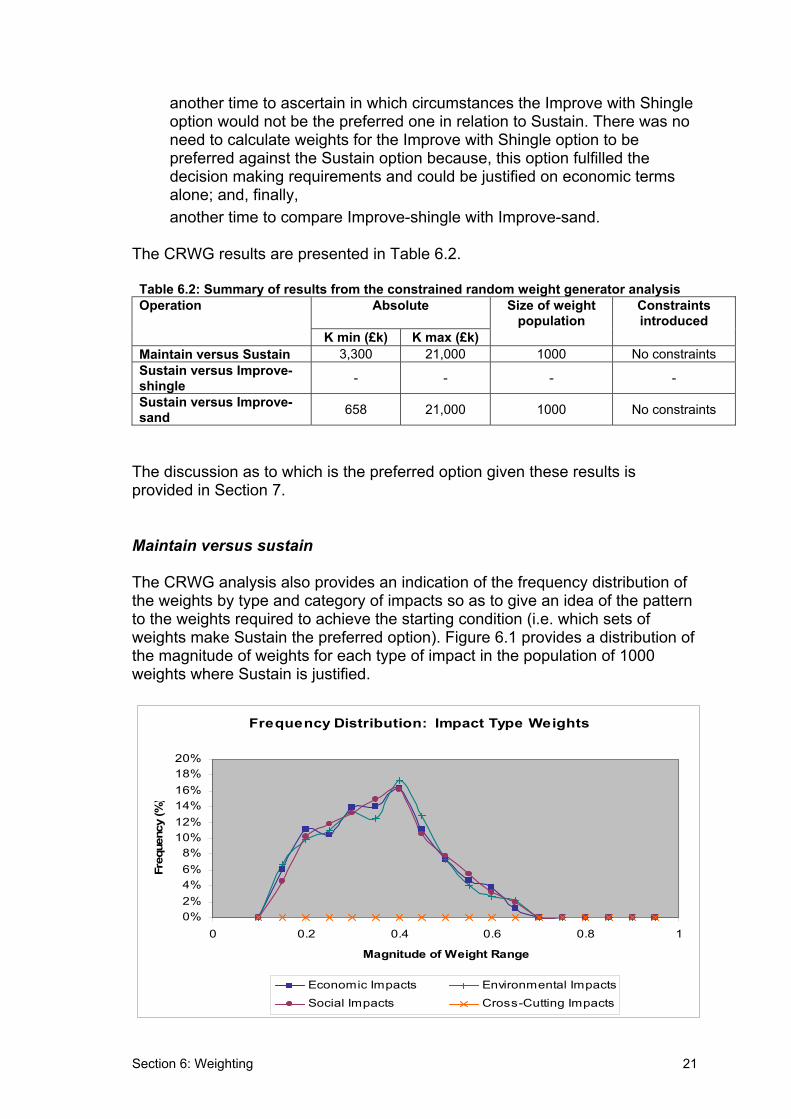
Section 6: Weighting 21
• another time to ascertain in which circumstances the Improve with Shingle option would not be the preferred one in relation to Sustain. There was no need to calculate weights for the Improve with Shingle option to be preferred against the Sustain option because, this option fulfilled the decision making requirements and could be justified on economic terms alone; and, finally,
• another time to compare Improve-shingle with Improve-sand.
The CRWG results are presented in Table 6.2.
Table 6.2: Summary of results from the constrained random weight generator analysis AbsoluteOperation
K min (£k) K max (£k)
Size of weight population
Constraintsintroduced
Maintain versus Sustain 3,300 21,000 1000 No constraints Sustain versus Improve-shingle - - - -
Sustain versus Improve-sand 658 21,000 1000 No constraints
The discussion as to which is the preferred option given these results is provided in Section 7.
Maintain versus sustain
The CRWG analysis also provides an indication of the frequency distribution of the weights by type and category of impacts so as to give an idea of the pattern to the weights required to achieve the starting condition (i.e. which sets of weights make Sustain the preferred option). Figure 6.1 provides a distribution of the magnitude of weights for each type of impact in the population of 1000 weights where Sustain is justified.
Frequency Distribution: Impact Type Weights
0%2%4%6%8%
10%12%14%16%18%20%
0 0.2 0.4 0.6 0.8 1
Magnitude of Weight Range
Freq
uenc
y (%
)
Economic Impacts Environmental Impacts
Social Impacts Cross-Cutting Impacts
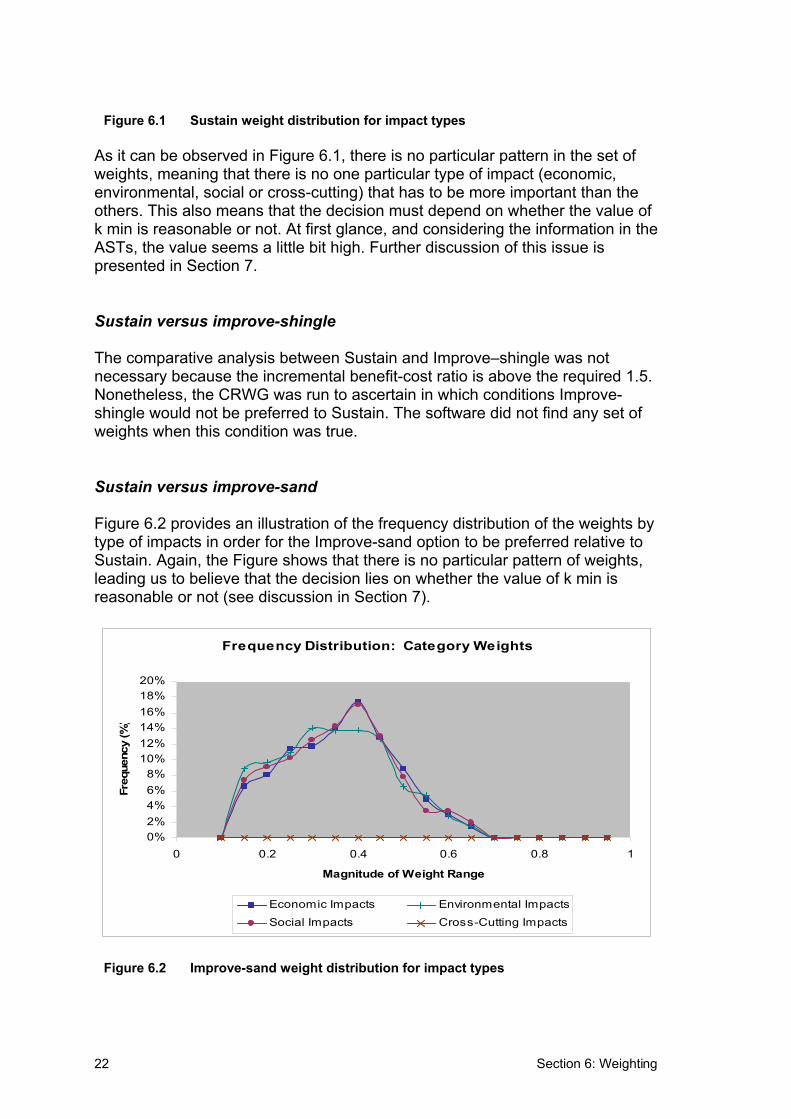
Section 6: Weighting22
Figure 6.1 Sustain weight distribution for impact types
As it can be observed in Figure 6.1, there is no particular pattern in the set of weights, meaning that there is no one particular type of impact (economic, environmental, social or cross-cutting) that has to be more important than the others. This also means that the decision must depend on whether the value of k min is reasonable or not. At first glance, and considering the information in the ASTs, the value seems a little bit high. Further discussion of this issue is presented in Section 7.
Sustain versus improve-shingle
The comparative analysis between Sustain and Improve–shingle was not necessary because the incremental benefit-cost ratio is above the required 1.5. Nonetheless, the CRWG was run to ascertain in which conditions Improve-shingle would not be preferred to Sustain. The software did not find any set of weights when this condition was true.
Sustain versus improve-sand
Figure 6.2 provides an illustration of the frequency distribution of the weights by type of impacts in order for the Improve-sand option to be preferred relative to Sustain. Again, the Figure shows that there is no particular pattern of weights, leading us to believe that the decision lies on whether the value of k min is reasonable or not (see discussion in Section 7).
Frequency Distribution: Category Weights
0%2%4%6%8%
10%12%14%16%18%20%
0 0.2 0.4 0.6 0.8 1
Magnitude of Weight Range
Freq
uenc
y (%
)
Economic Impacts Environmental Impacts
Social Impacts Cross-Cutting Impacts
Figure 6.2 Improve-sand weight distribution for impact types
Section 6: Weighting 23
Improve-shingle versus improve-sand
Finally, a comparison between the two improve options was carried out. Both options provide a standard of defence from 1 in 50 return year event; therefore they are not incremental against each other. Nonetheless, in the eventuality of both options being preferred against Sustain, it will be necessary to decide which of them is preferred in relation to the other.
The CRWG was run for these two options, and it became clear after some time that the software could not find a set of weights where Improve-sand would be preferred against Improve-shingle. This result is potentially related to the fact that there is not many differences between the scores of these two options, both of them scoring significantly highly, but the Improve-sand option is significantly more costly than Improve-shingle. In other words it is difficult to justify the increase in costs on the basis of small differences in benefits.
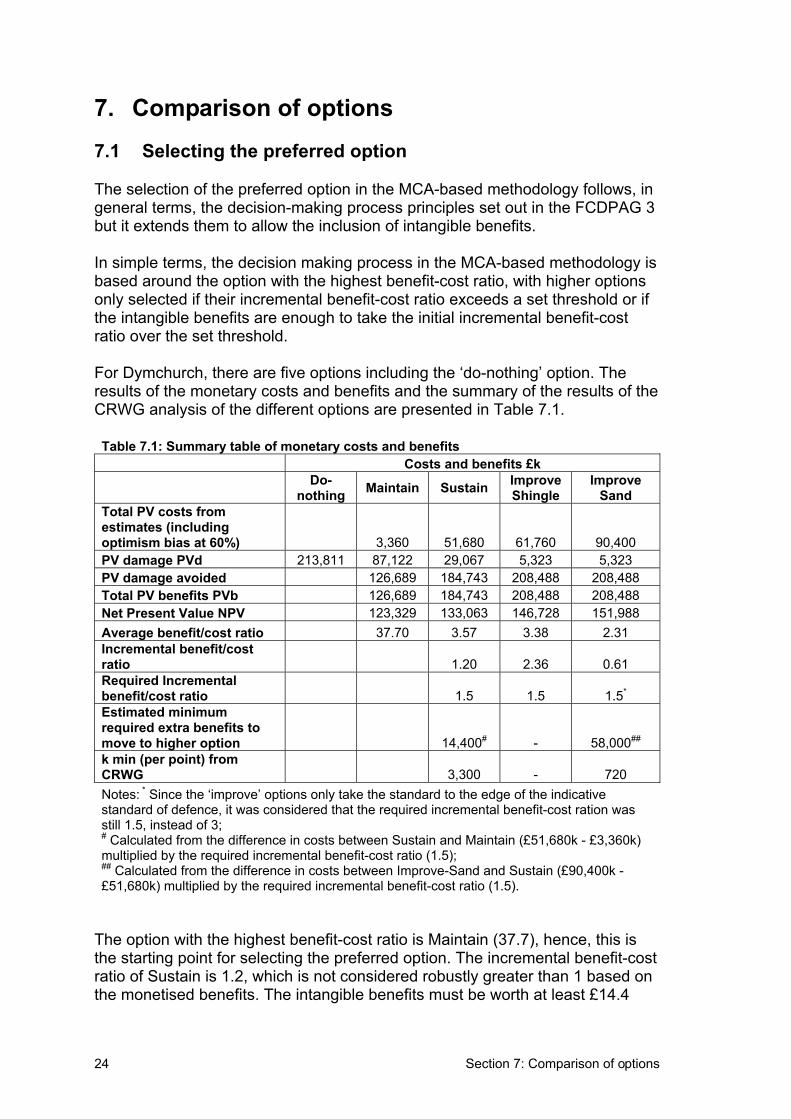
Section 7: Comparison of options24
7. Comparison of options 7.1 Selecting the preferred option
The selection of the preferred option in the MCA-based methodology follows, in general terms, the decision-making process principles set out in the FCDPAG 3 but it extends them to allow the inclusion of intangible benefits.
In simple terms, the decision making process in the MCA-based methodology is based around the option with the highest benefit-cost ratio, with higher options only selected if their incremental benefit-cost ratio exceeds a set threshold or if the intangible benefits are enough to take the initial incremental benefit-cost ratio over the set threshold.
For Dymchurch, there are five options including the ‘do-nothing’ option. The results of the monetary costs and benefits and the summary of the results of the CRWG analysis of the different options are presented in Table 7.1.
Table 7.1: Summary table of monetary costs and benefits Costs and benefits £k
Do-nothing Maintain Sustain Improve
ShingleImprove
SandTotal PV costs from estimates (including optimism bias at 60%) 3,360 51,680 61,760 90,400 PV damage PVd 213,811 87,122 29,067 5,323 5,323 PV damage avoided 126,689 184,743 208,488 208,488 Total PV benefits PVb 126,689 184,743 208,488 208,488 Net Present Value NPV 123,329 133,063 146,728 151,988 Average benefit/cost ratio 37.70 3.57 3.38 2.31 Incremental benefit/cost ratio 1.20 2.36 0.61 Required Incremental benefit/cost ratio 1.5 1.5 1.5*
Estimated minimum required extra benefits to move to higher option 14,400# - 58,000##
k min (per point) from CRWG 3,300 - 720 Notes: * Since the ‘improve’ options only take the standard to the edge of the indicative standard of defence, it was considered that the required incremental benefit-cost ration was still 1.5, instead of 3; # Calculated from the difference in costs between Sustain and Maintain (£51,680k - £3,360k) multiplied by the required incremental benefit-cost ratio (1.5); ## Calculated from the difference in costs between Improve-Sand and Sustain (£90,400k - £51,680k) multiplied by the required incremental benefit-cost ratio (1.5).
The option with the highest benefit-cost ratio is Maintain (37.7), hence, this is the starting point for selecting the preferred option. The incremental benefit-cost ratio of Sustain is 1.2, which is not considered robustly greater than 1 based on the monetised benefits. The intangible benefits must be worth at least £14.4
Section 7: Comparison of options 25
million, to increase the incremental benefit-cost ratio of Sustain over Maintain to 1.5 (see Table 7.1).
The CRWG results show that the Sustain option achieves an overall incremental benefit cost ratio of greater than 1.5 when k min is £3.3 million. This is quite a high value and needs to be considered in the context of the difference in points between the weighted scores of the competing options.
The use of the CRWG means that the weighted scores for the options are not available. However, consideration of the AST shows that the only differences between the Maintain and Sustain options relate to the social impacts categories, in particular the ‘health and safety’ and ‘availability and accessibility of services’ categories. This information in addition to examples of the economic values associated with similar impacts or activities can assist in determining whether the required k per point value appears reasonable.
The comparator table (Table 6.1 in the FD2013/PR) sets out some examples of the financial or economic value associated with different impacts or activities.These are given here to aid thinking processes. The values can be compared against the impact category scores (and other information recorded in the AST) to provide a context for deciding whether or not an implied k value of protecting a habitat, for example, would appear reasonable.
The estimates relating to health and safety in the comparator table suggest that expenditure per household per year on law and security is £1,160 and on health is £3,600 per household per year. Hence, a figure of £4,760 per household per year is used to indicate the value of health and safety to local residents. For the health and safety impacts to be worth at least £3,300,000 (k min calculated by the CRWG), a total of 693 properties must be flooded over the 100-year time horizon.
Maintain offers a standard of defence of 1 in 10 reducing to 1 in 3 over time and Sustain offers a standard of defence of 1 in 10 throughout the 100-year time horizon. Therefore, the difference between the Maintain and Sustain options occurs for flood events greater than 1 in 3 but less than 1 in 10. A 1 in 9 year flood would be expected to occur, on average, 11 times over a 100-year time horizon. It is known (from the AST) that on each event, 2,471 residential properties would be affected by the flood. If the health and safety value is £4,760 per property and 11 floods occur over the 100-year time horizon, the indicative total damages can be estimated at almost £130 million. This suggests that it is not unreasonable to assume that the Sustain option is justified.
Nonetheless, it may also be appropriate to obtain weights from local stakeholders to confirm the importance of the social impacts. This would allow weighted scores to be calculated and a more precise indication to be estimated of the level of intangible benefits required to make Sustain the preferred option.
Section 7: Comparison of options26
Option 4 – Improve with shingle (1 in 50)
If the Sustain option is justified, the analysis proceeds to consideration of the incremental benefits of moving to Option 4, improve with shingle. Because Option 4 represents an increase to the minimum indicative standard for the area (but not above), it requires an incremental benefit-cost ratio of greater than 1.5 to be justified.
As it can be seen in Table 7.1, incremental benefit-cost ratio is 2.36, therefore this option is justified on economic arguments alone and no additional intangible benefits are required.
Option 5 – Improve with sand (1:50)
Having identified that Option 4 was likely to be justified, the next consideration was whether Option 5, improve with sand could be justified. Option 5 offers a standard of defence of 1 in 50 for the area, i.e. the same as Option 4. Hence, Improve with Sand is only incremental over Sustain and, therefore, to be justified it must also achieve an overall incremental benefit-cost ratio of greater than 1.5.
As it can be seen in Table 7.1, the incremental benefit-cost ratio for this option is 0.61. In order to raise this to 1.5, the minimum value of the intangible benefits required is £58 million.
With no constraints operating on the relative magnitude of weights, the CRWG analysis identified that Option 5 can only be justified when k is greater than an absolute minimum of £720,000. Here k relates to a per point difference in the weighted scores of the two options, rather than a total value as previously given.
The Improve with Sand option is scored as the best option for all categories (i.e. has an unweighted score of 100). Therefore, there are considerable differences in intangible benefits between Option 5 and Sustain for all impact categories with the exception of the ‘sense of community’ where both options score the same. Given the quantity of differences between the two options, it is considered that a weight elicitation exercise is required to assess the relative importance of the categories. This will allow the weighted scores to be calculated and the value of the indicative benefits required to allow Option 5 (improve-sand) to be preferred over Sustain.
The information gathered from the weight elicitation exercise will also be important when considering the relative benefits of Option 4 (improve-shingle) against Option 5 (improve-sand), as differences between these two options are only reflected in the intangible scores. For the weight elicitation exercise to be valuable in identifying the differences between Options 4 and 5 it would also need to focus on the relative importance of ‘landscape and visual amenity’, ‘equity’ and ‘business development’.
Section 8: References 27
8. References Babtie Group (2003): High Knock to Dymchurch Redoubt Sea Defence Scheme – Environmental Scoping Study, Internal Working Paper, Revision II, October 2003.
Babtie Brown & Root (2003): High Knock to Dymchurch Redoubt Communication Plan – Draft R02.
Environment Agency (2004): Project Appraisal Report for the High Knocke to Dymchurch Redoubt Sea Defences, Environment Agency Southern Region, April 2004.
HR Wallingford (2001): Folkestone to Rye Coastal Defence Strategy Study – Main Report, report downloaded from Folkestone to Rye Coastal Defence Strategy Internet site (http://www.folkestone-rye.net).
HR Wallingford (2001): Folkestone to Rye Coastal Defence Strategy Study – Executive Summary, report downloaded from Folkestone to Rye Coastal Defence Strategy Internet site (http://www.folkestone-rye.net).
HR Wallingford (2003): Contingent Valuation Method Survey – Dymchurch (Draft), Report EX 4670, February 2003.
Roncarati Research Group (2002): Dymchurch Beach Users Survey, report prepared for HR Wallingford Ltd, September/October 2002.

Section 8: References28
Appendix B3.1
Appraisal summary table for high levelScreening – S-AST for Dymchurch sea defence scheme
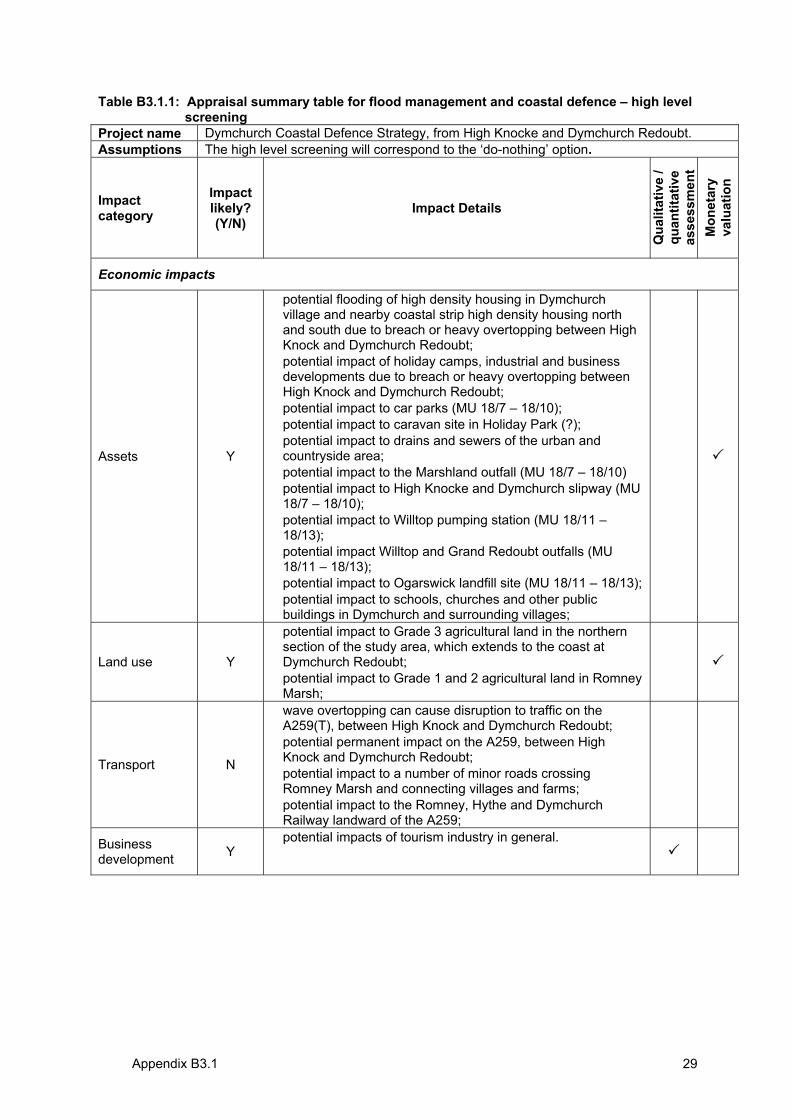
Appendix B3.1 29
Table B3.1.1: Appraisal summary table for flood management and coastal defence – high level screening
Project name Dymchurch Coastal Defence Strategy, from High Knocke and Dymchurch Redoubt.Assumptions The high level screening will correspond to the ‘do-nothing’ option.
Impactcategory
Impactlikely? (Y/N)
Impact Details
Qua
litat
ive
/ qu
antit
ativ
eas
sess
men
tM
onet
ary
valu
atio
n
Economic impacts
Assets Y
• potential flooding of high density housing in Dymchurch village and nearby coastal strip high density housing north and south due to breach or heavy overtopping between High Knock and Dymchurch Redoubt;
• potential impact of holiday camps, industrial and business developments due to breach or heavy overtopping between High Knock and Dymchurch Redoubt;
• potential impact to car parks (MU 18/7 – 18/10); • potential impact to caravan site in Holiday Park (?); • potential impact to drains and sewers of the urban and
countryside area; • potential impact to the Marshland outfall (MU 18/7 – 18/10) • potential impact to High Knocke and Dymchurch slipway (MU
18/7 – 18/10); • potential impact to Willtop pumping station (MU 18/11 –
18/13);• potential impact Willtop and Grand Redoubt outfalls (MU
18/11 – 18/13); • potential impact to Ogarswick landfill site (MU 18/11 – 18/13); • potential impact to schools, churches and other public
buildings in Dymchurch and surrounding villages;
Land use Y
• potential impact to Grade 3 agricultural land in the northern section of the study area, which extends to the coast at Dymchurch Redoubt;
• potential impact to Grade 1 and 2 agricultural land in Romney Marsh;
Transport N
• wave overtopping can cause disruption to traffic on the A259(T), between High Knock and Dymchurch Redoubt;
• potential permanent impact on the A259, between High Knock and Dymchurch Redoubt;
• potential impact to a number of minor roads crossing Romney Marsh and connecting villages and farms;
• potential impact to the Romney, Hythe and Dymchurch Railway landward of the A259;
Businessdevelopment Y
• potential impacts of tourism industry in general.

Appendix B3.1 30
Table B3.1.1: Appraisal summary table for flood management and coastal defence – high level screening
Project name Dymchurch Coastal Defence Strategy, from High Knocke and Dymchurch Redoubt.Assumptions The high level screening will correspond to the ‘do-nothing’ option.
Impactcategory
Impactlikely? (Y/N)
Impact Details
Qua
litat
ive
/ qu
antit
ativ
eas
sess
men
tM
onet
ary
valu
atio
n
Environmental impacts
Physical habitats Y
• potential impact to SNCI located at Dymchurch, consisting of a small area of relic grazing marsh and provides one of the only areas which as not been converted to arable and hosts several rare and scarce species of flora and fauna;
• potential impact to freshwater dykes that run through the marshy grassland, exhibiting fresh water flora, water voles, yellowhammer and sedge wabler;
• potential impact to the Site of Nature Conservation Interest (SNCI) at Hythe Ranges (outside the study area but adjoins the northern boundary). The site comprises of shingle backed by grassland and scrub (used by MOD) and hosts several rare and scarce species of flora and fauna (vegetated shingle is a BAP priority habitat);
• potential impact to vegetated shingle that constitutes a priority habitat under the Biodiversity Action Plan;
• potential impact to the sandy shores of Dymchurch which are used by shorebirds for roosting sites;
• potential impact to Romney Warren SSSI and pLNR; • potential impact on natural spawning and nursery grounds
for many species of fish (for example lemon sole, sole, sprat and mackerel);
Water quality Y
• potential impact to coastal waters quality during construction;
• potential impact to coastal waters quality during flooding due to increased flushing of agricultural land;
Water quantity N
Naturalprocesses N
Historicalenvironment Y
• potential impact to Martello Tower and Dymchurch Redoubt both Schedule Ancient Monuments;
• potential impact to 9 monuments listed on the Sites and Monuments Register;
• potential damage to two Conservation Areas within Dymchurch;
• potential impact to 22 listed buildings within the Civil Parish of Dymchurch;
• potential impact to 13th Century sea wall; • potential impact to Fort Lodge, World War II underground
operational post and Saxon site; • potential site of high archaeological potential located near
Dymchurch can be damaged under do-nothing; • potential impact to ancient churches in Romney Marsh; • potential impact to potential evidence for Roman
settlements in Romney Marsh;
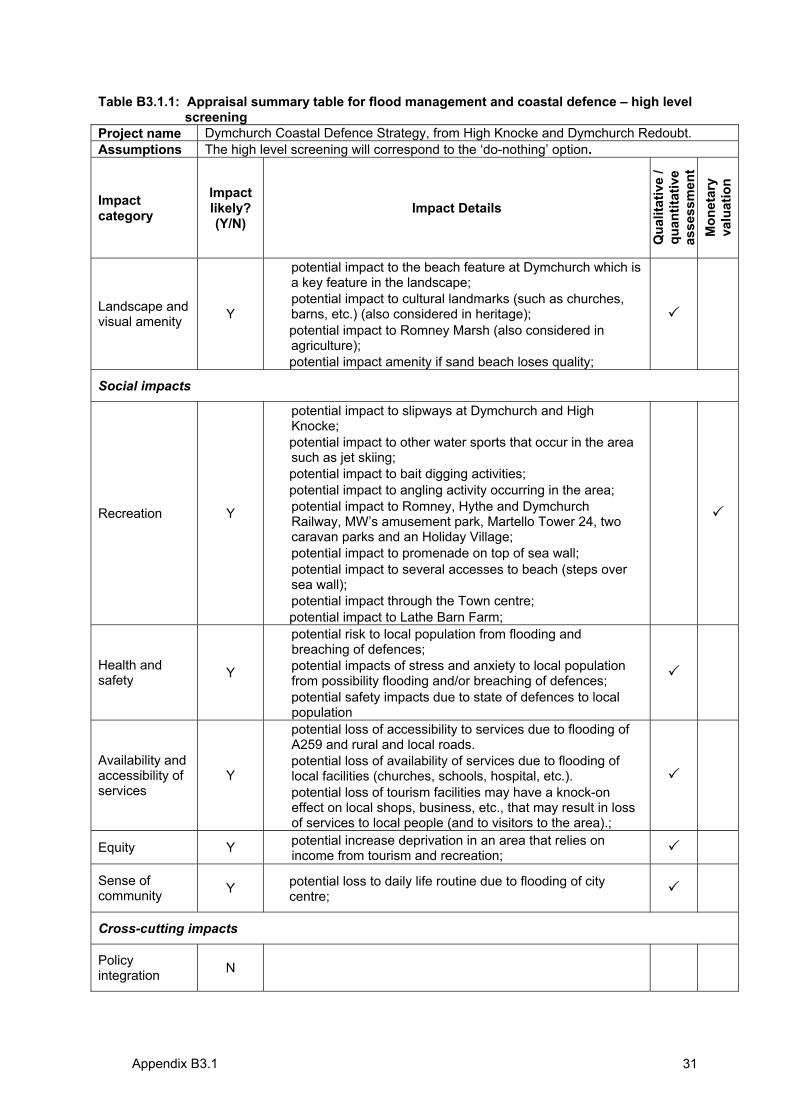
Appendix B3.1 31
Table B3.1.1: Appraisal summary table for flood management and coastal defence – high level screening
Project name Dymchurch Coastal Defence Strategy, from High Knocke and Dymchurch Redoubt.Assumptions The high level screening will correspond to the ‘do-nothing’ option.
Impactcategory
Impactlikely? (Y/N)
Impact Details
Qua
litat
ive
/ qu
antit
ativ
eas
sess
men
tM
onet
ary
valu
atio
n
Landscape and visual amenity Y
• potential impact to the beach feature at Dymchurch which is a key feature in the landscape;
• potential impact to cultural landmarks (such as churches, barns, etc.) (also considered in heritage);
• potential impact to Romney Marsh (also considered in agriculture);
• potential impact amenity if sand beach loses quality;
Social impacts
Recreation Y
• potential impact to slipways at Dymchurch and High Knocke;
• potential impact to other water sports that occur in the area such as jet skiing;
• potential impact to bait digging activities; • potential impact to angling activity occurring in the area; • potential impact to Romney, Hythe and Dymchurch
Railway, MW’s amusement park, Martello Tower 24, two caravan parks and an Holiday Village;
• potential impact to promenade on top of sea wall; • potential impact to several accesses to beach (steps over
sea wall); • potential impact through the Town centre; • potential impact to Lathe Barn Farm;
Health and safety Y
• potential risk to local population from flooding and breaching of defences;
• potential impacts of stress and anxiety to local population from possibility flooding and/or breaching of defences;
• potential safety impacts due to state of defences to local population
Availability and accessibility of services
Y
• potential loss of accessibility to services due to flooding of A259 and rural and local roads.
• potential loss of availability of services due to flooding of local facilities (churches, schools, hospital, etc.).
• potential loss of tourism facilities may have a knock-on effect on local shops, business, etc., that may result in loss of services to local people (and to visitors to the area).;
Equity Y • potential increase deprivation in an area that relies on income from tourism and recreation;
Sense of community Y • potential loss to daily life routine due to flooding of city
centre;
Cross-cutting impacts
Policy integration N
Appendix B3.2 32
Appendix B3.2:
Appraisal summary table for main assessment – MA-AST for the Dymchurch sea defence scheme
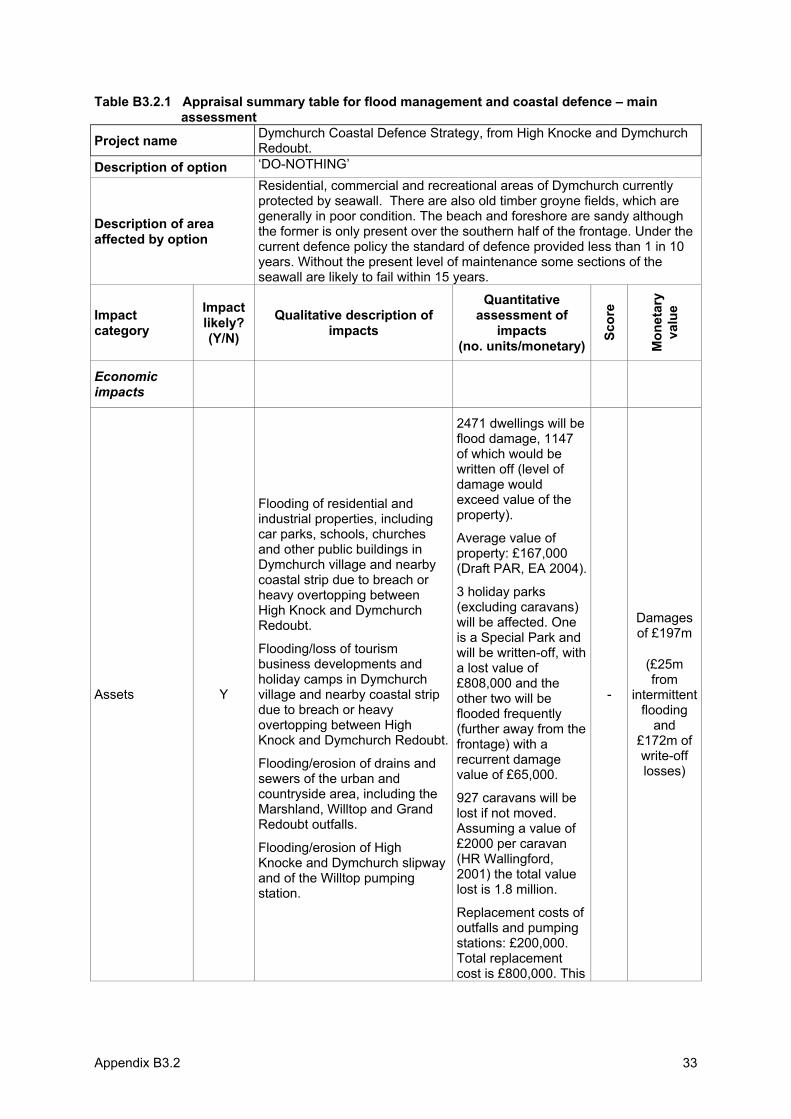
Appendix B3.2 33
Table B3.2.1 Appraisal summary table for flood management and coastal defence – main assessment
Project name Dymchurch Coastal Defence Strategy, from High Knocke and Dymchurch Redoubt.
Description of option ‘DO-NOTHING’
Description of area affected by option
Residential, commercial and recreational areas of Dymchurch currently protected by seawall. There are also old timber groyne fields, which are generally in poor condition. The beach and foreshore are sandy although the former is only present over the southern half of the frontage. Under the current defence policy the standard of defence provided less than 1 in 10 years. Without the present level of maintenance some sections of the seawall are likely to fail within 15 years.
Impactcategory
Impactlikely? (Y/N)
Qualitative description of impacts
Quantitative assessment of
impacts(no. units/monetary)
Scor
e
Mon
etar
yva
lue
Economicimpacts
Assets Y
Flooding of residential and industrial properties, including car parks, schools, churches and other public buildings in Dymchurch village and nearby coastal strip due to breach or heavy overtopping between High Knock and Dymchurch Redoubt.
Flooding/loss of tourism business developments and holiday camps in Dymchurch village and nearby coastal strip due to breach or heavy overtopping between High Knock and Dymchurch Redoubt.
Flooding/erosion of drains and sewers of the urban and countryside area, including the Marshland, Willtop and Grand Redoubt outfalls.
Flooding/erosion of High Knocke and Dymchurch slipway and of the Willtop pumping station.
2471 dwellings will be flood damage, 1147 of which would be written off (level of damage would exceed value of the property).
Average value of property: £167,000 (Draft PAR, EA 2004).
3 holiday parks (excluding caravans) will be affected. One is a Special Park and will be written-off, with a lost value of £808,000 and the other two will be flooded frequently (further away from the frontage) with a recurrent damage value of £65,000.
927 caravans will be lost if not moved.Assuming a value of £2000 per caravan (HR Wallingford, 2001) the total value lost is 1.8 million.
Replacement costs of outfalls and pumping stations: £200,000. Total replacement cost is £800,000. This
-
Damagesof £197m
(£25mfrom
intermittentflooding
and£172m of write-offlosses)
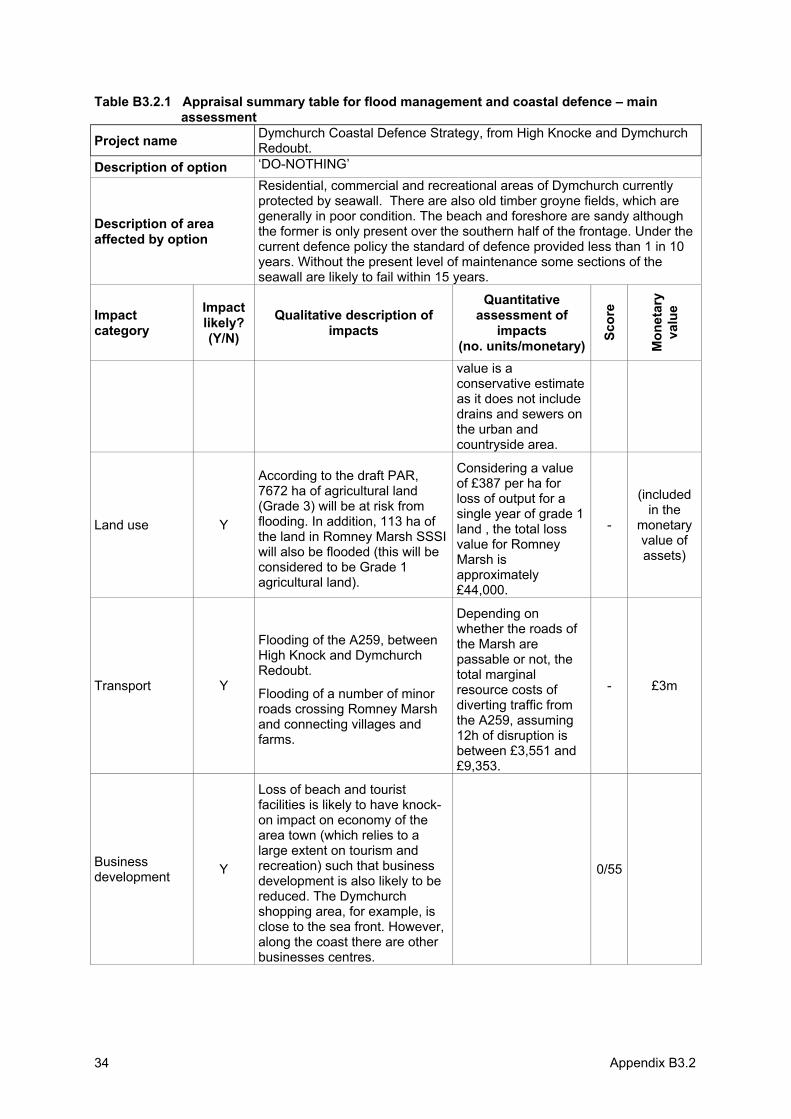
Appendix B3.234
Table B3.2.1 Appraisal summary table for flood management and coastal defence – main assessment
Project name Dymchurch Coastal Defence Strategy, from High Knocke and Dymchurch Redoubt.
Description of option ‘DO-NOTHING’
Description of area affected by option
Residential, commercial and recreational areas of Dymchurch currently protected by seawall. There are also old timber groyne fields, which are generally in poor condition. The beach and foreshore are sandy although the former is only present over the southern half of the frontage. Under the current defence policy the standard of defence provided less than 1 in 10 years. Without the present level of maintenance some sections of the seawall are likely to fail within 15 years.
Impactcategory
Impactlikely? (Y/N)
Qualitative description of impacts
Quantitative assessment of
impacts(no. units/monetary)
Scor
e
Mon
etar
yva
lue
value is a conservative estimate as it does not include drains and sewers on the urban and countryside area.
Land use Y
According to the draft PAR, 7672 ha of agricultural land (Grade 3) will be at risk from flooding. In addition, 113 ha of the land in Romney Marsh SSSI will also be flooded (this will be considered to be Grade 1 agricultural land).
Considering a value of £387 per ha for loss of output for a single year of grade 1 land , the total loss value for Romney Marsh is approximately£44,000.
-
(includedin the
monetaryvalue of assets)
Transport Y
Flooding of the A259, between High Knock and Dymchurch Redoubt.
Flooding of a number of minor roads crossing Romney Marsh and connecting villages and farms.
Depending on whether the roads of the Marsh are passable or not, the total marginal resource costs of diverting traffic from the A259, assuming 12h of disruption is between £3,551 and £9,353.
- £3m
Businessdevelopment Y
Loss of beach and tourist facilities is likely to have knock-on impact on economy of the area town (which relies to a large extent on tourism and recreation) such that business development is also likely to be reduced. The Dymchurch shopping area, for example, is close to the sea front. However, along the coast there are other businesses centres.
0/55
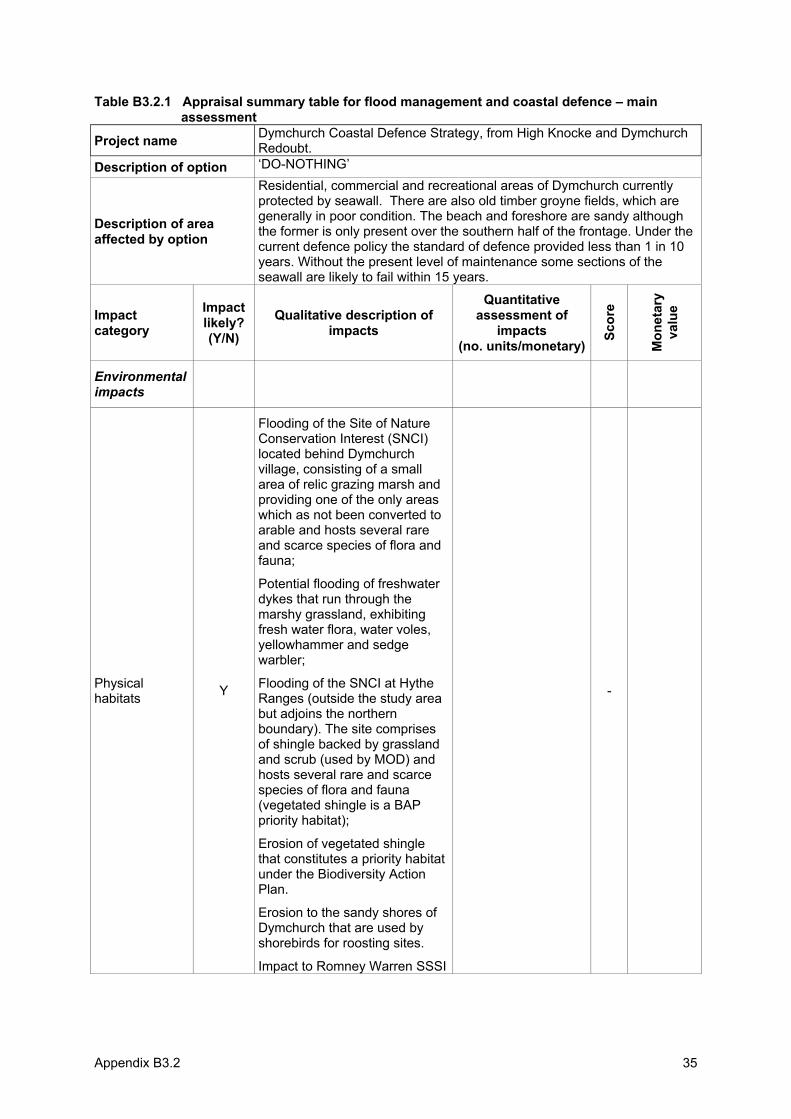
Appendix B3.2 35
Table B3.2.1 Appraisal summary table for flood management and coastal defence – main assessment
Project name Dymchurch Coastal Defence Strategy, from High Knocke and Dymchurch Redoubt.
Description of option ‘DO-NOTHING’
Description of area affected by option
Residential, commercial and recreational areas of Dymchurch currently protected by seawall. There are also old timber groyne fields, which are generally in poor condition. The beach and foreshore are sandy although the former is only present over the southern half of the frontage. Under the current defence policy the standard of defence provided less than 1 in 10 years. Without the present level of maintenance some sections of the seawall are likely to fail within 15 years.
Impactcategory
Impactlikely? (Y/N)
Qualitative description of impacts
Quantitative assessment of
impacts(no. units/monetary)
Scor
e
Mon
etar
yva
lue
Environmentalimpacts
Physical habitats Y
Flooding of the Site of Nature Conservation Interest (SNCI) located behind Dymchurch village, consisting of a small area of relic grazing marsh and providing one of the only areas which as not been converted to arable and hosts several rare and scarce species of flora and fauna;
Potential flooding of freshwater dykes that run through the marshy grassland, exhibiting fresh water flora, water voles, yellowhammer and sedge warbler;
Flooding of the SNCI at Hythe Ranges (outside the study area but adjoins the northern boundary). The site comprises of shingle backed by grassland and scrub (used by MOD) and hosts several rare and scarce species of flora and fauna (vegetated shingle is a BAP priority habitat);
Erosion of vegetated shingle that constitutes a priority habitat under the Biodiversity Action Plan.
Erosion to the sandy shores of Dymchurch that are used by shorebirds for roosting sites.
Impact to Romney Warren SSSI
-
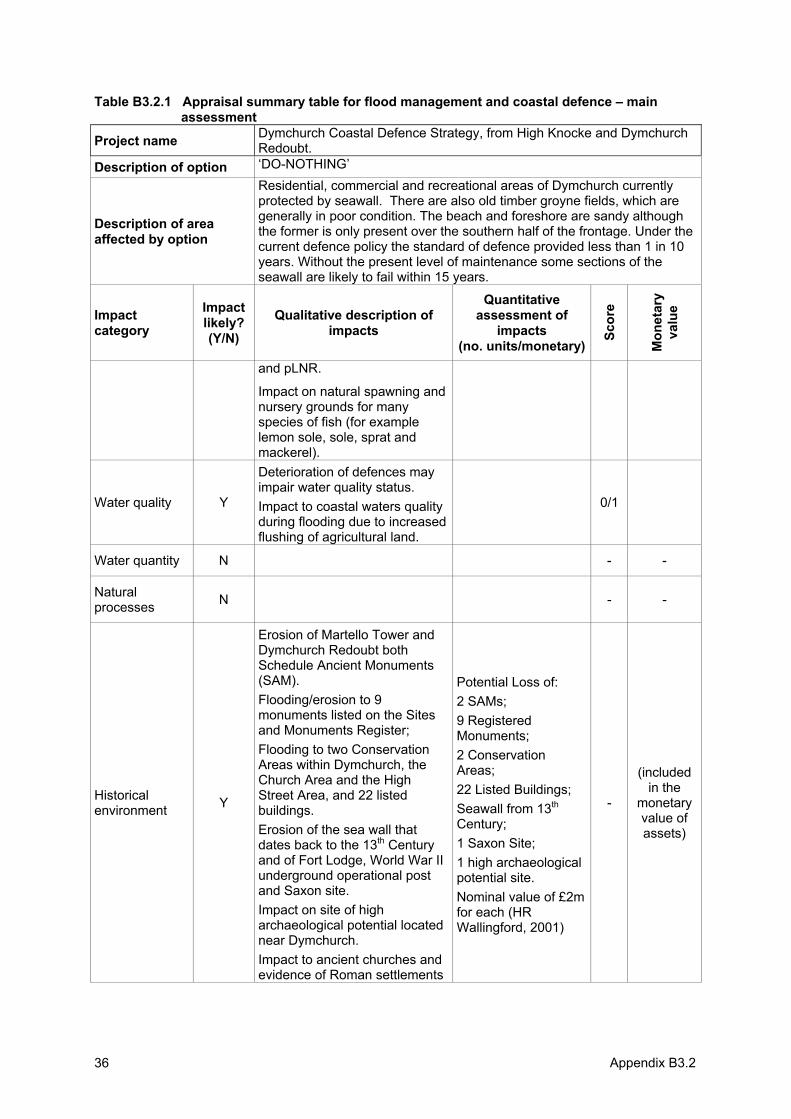
Appendix B3.236
Table B3.2.1 Appraisal summary table for flood management and coastal defence – main assessment
Project name Dymchurch Coastal Defence Strategy, from High Knocke and Dymchurch Redoubt.
Description of option ‘DO-NOTHING’
Description of area affected by option
Residential, commercial and recreational areas of Dymchurch currently protected by seawall. There are also old timber groyne fields, which are generally in poor condition. The beach and foreshore are sandy although the former is only present over the southern half of the frontage. Under the current defence policy the standard of defence provided less than 1 in 10 years. Without the present level of maintenance some sections of the seawall are likely to fail within 15 years.
Impactcategory
Impactlikely? (Y/N)
Qualitative description of impacts
Quantitative assessment of
impacts(no. units/monetary)
Scor
e
Mon
etar
yva
lue
and pLNR.
Impact on natural spawning and nursery grounds for many species of fish (for example lemon sole, sole, sprat and mackerel).
Water quality Y
Deterioration of defences may impair water quality status. Impact to coastal waters quality during flooding due to increased flushing of agricultural land.
0/1
Water quantity N - -
Naturalprocesses N - -
Historicalenvironment Y
Erosion of Martello Tower and Dymchurch Redoubt both Schedule Ancient Monuments (SAM).Flooding/erosion to 9 monuments listed on the Sites and Monuments Register; Flooding to two Conservation Areas within Dymchurch, the Church Area and the High Street Area, and 22 listed buildings.Erosion of the sea wall that dates back to the 13th Century and of Fort Lodge, World War II underground operational post and Saxon site.Impact on site of high archaeological potential located near Dymchurch. Impact to ancient churches and evidence of Roman settlements
Potential Loss of: 2 SAMs; 9 Registered Monuments;2 Conservation Areas;22 Listed Buildings; Seawall from 13th
Century;1 Saxon Site; 1 high archaeological potential site. Nominal value of £2m for each (HR Wallingford, 2001)
-
(includedin the
monetaryvalue of assets)
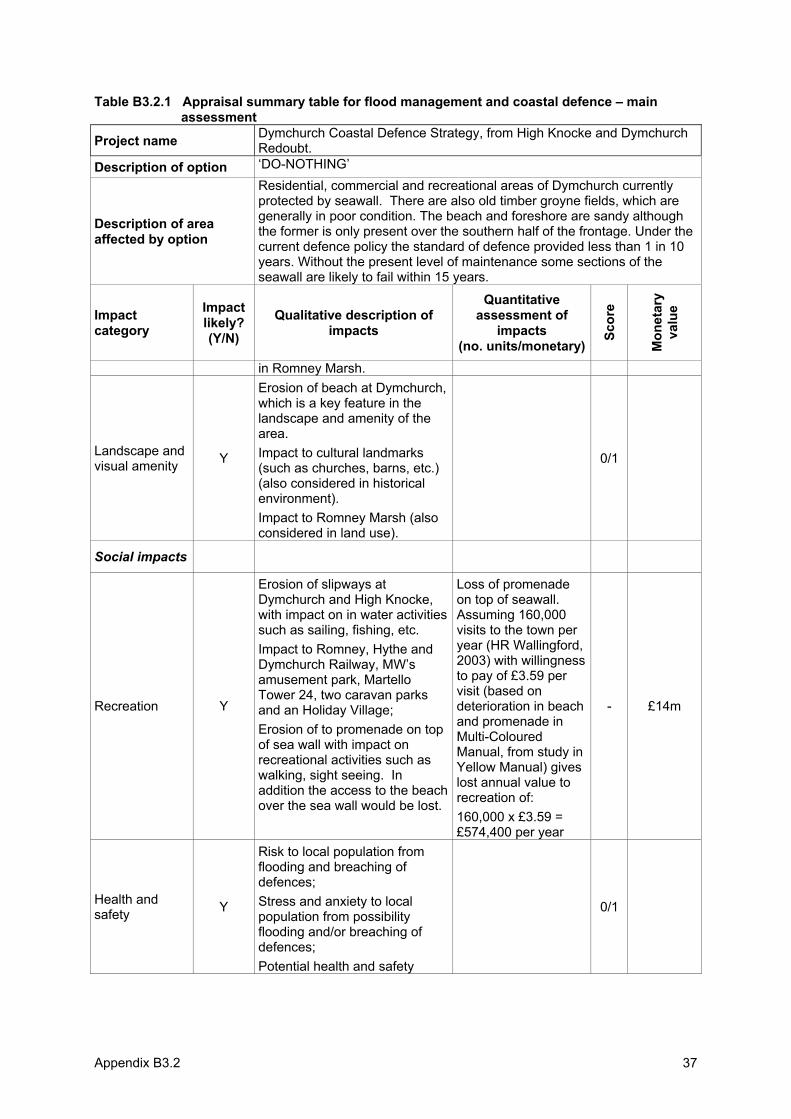
Appendix B3.2 37
Table B3.2.1 Appraisal summary table for flood management and coastal defence – main assessment
Project name Dymchurch Coastal Defence Strategy, from High Knocke and Dymchurch Redoubt.
Description of option ‘DO-NOTHING’
Description of area affected by option
Residential, commercial and recreational areas of Dymchurch currently protected by seawall. There are also old timber groyne fields, which are generally in poor condition. The beach and foreshore are sandy although the former is only present over the southern half of the frontage. Under the current defence policy the standard of defence provided less than 1 in 10 years. Without the present level of maintenance some sections of the seawall are likely to fail within 15 years.
Impactcategory
Impactlikely? (Y/N)
Qualitative description of impacts
Quantitative assessment of
impacts(no. units/monetary)
Scor
e
Mon
etar
yva
lue
in Romney Marsh.
Landscape and visual amenity Y
Erosion of beach at Dymchurch, which is a key feature in the landscape and amenity of the area.Impact to cultural landmarks (such as churches, barns, etc.) (also considered in historical environment).Impact to Romney Marsh (also considered in land use).
0/1
Social impacts
Recreation Y
Erosion of slipways at Dymchurch and High Knocke, with impact on in water activities such as sailing, fishing, etc. Impact to Romney, Hythe and Dymchurch Railway, MW’s amusement park, Martello Tower 24, two caravan parks and an Holiday Village; Erosion of to promenade on top of sea wall with impact on recreational activities such as walking, sight seeing. In addition the access to the beach over the sea wall would be lost.
Loss of promenade on top of seawall.Assuming 160,000 visits to the town per year (HR Wallingford, 2003) with willingness to pay of £3.59 per visit (based on deterioration in beach and promenade in Multi-ColouredManual, from study in Yellow Manual) gives lost annual value to recreation of: 160,000 x £3.59 = £574,400 per year
- £14m
Health and safety Y
Risk to local population from flooding and breaching of defences;Stress and anxiety to local population from possibility flooding and/or breaching of defences;Potential health and safety
0/1
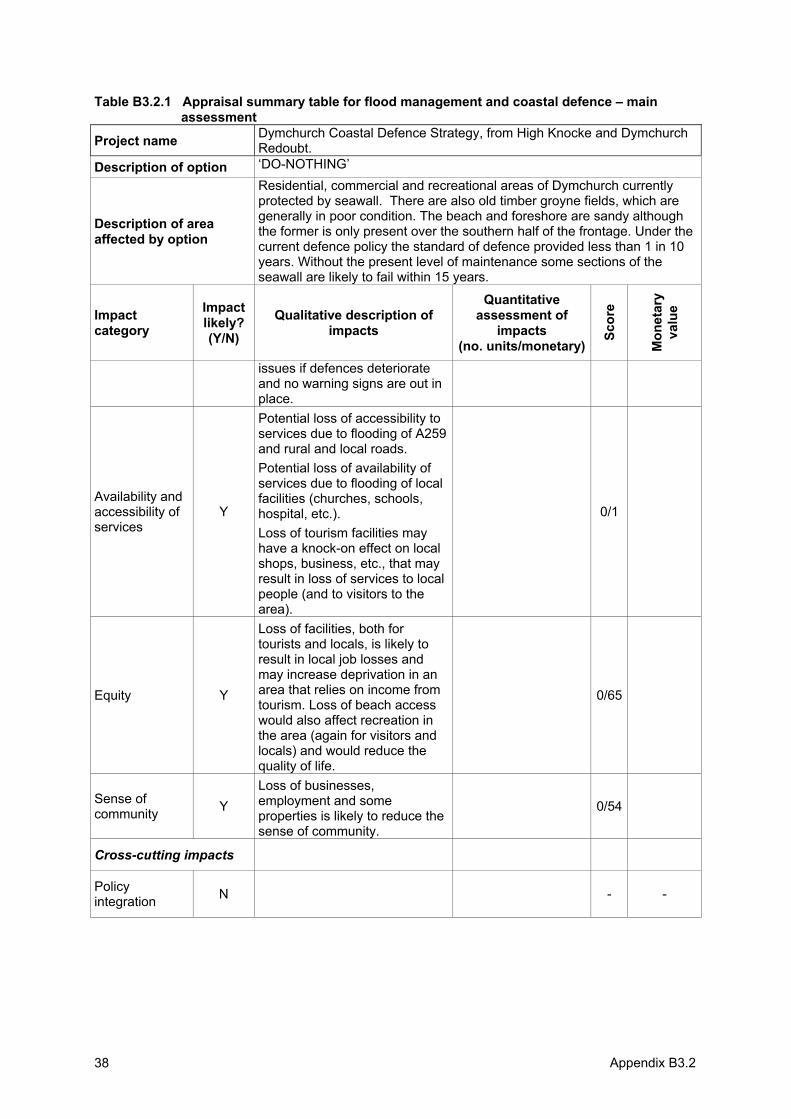
Appendix B3.238
Table B3.2.1 Appraisal summary table for flood management and coastal defence – main assessment
Project name Dymchurch Coastal Defence Strategy, from High Knocke and Dymchurch Redoubt.
Description of option ‘DO-NOTHING’
Description of area affected by option
Residential, commercial and recreational areas of Dymchurch currently protected by seawall. There are also old timber groyne fields, which are generally in poor condition. The beach and foreshore are sandy although the former is only present over the southern half of the frontage. Under the current defence policy the standard of defence provided less than 1 in 10 years. Without the present level of maintenance some sections of the seawall are likely to fail within 15 years.
Impactcategory
Impactlikely? (Y/N)
Qualitative description of impacts
Quantitative assessment of
impacts(no. units/monetary)
Scor
e
Mon
etar
yva
lue
issues if defences deteriorate and no warning signs are out in place.
Availability and accessibility of services
Y
Potential loss of accessibility to services due to flooding of A259 and rural and local roads. Potential loss of availability of services due to flooding of local facilities (churches, schools, hospital, etc.). Loss of tourism facilities may have a knock-on effect on local shops, business, etc., that may result in loss of services to local people (and to visitors to the area).
0/1
Equity Y
Loss of facilities, both for tourists and locals, is likely to result in local job losses and may increase deprivation in an area that relies on income from tourism. Loss of beach access would also affect recreation in the area (again for visitors and locals) and would reduce the quality of life.
0/65
Sense of community Y
Loss of businesses, employment and some properties is likely to reduce the sense of community.
0/54
Cross-cutting impacts
Policy integration N - -
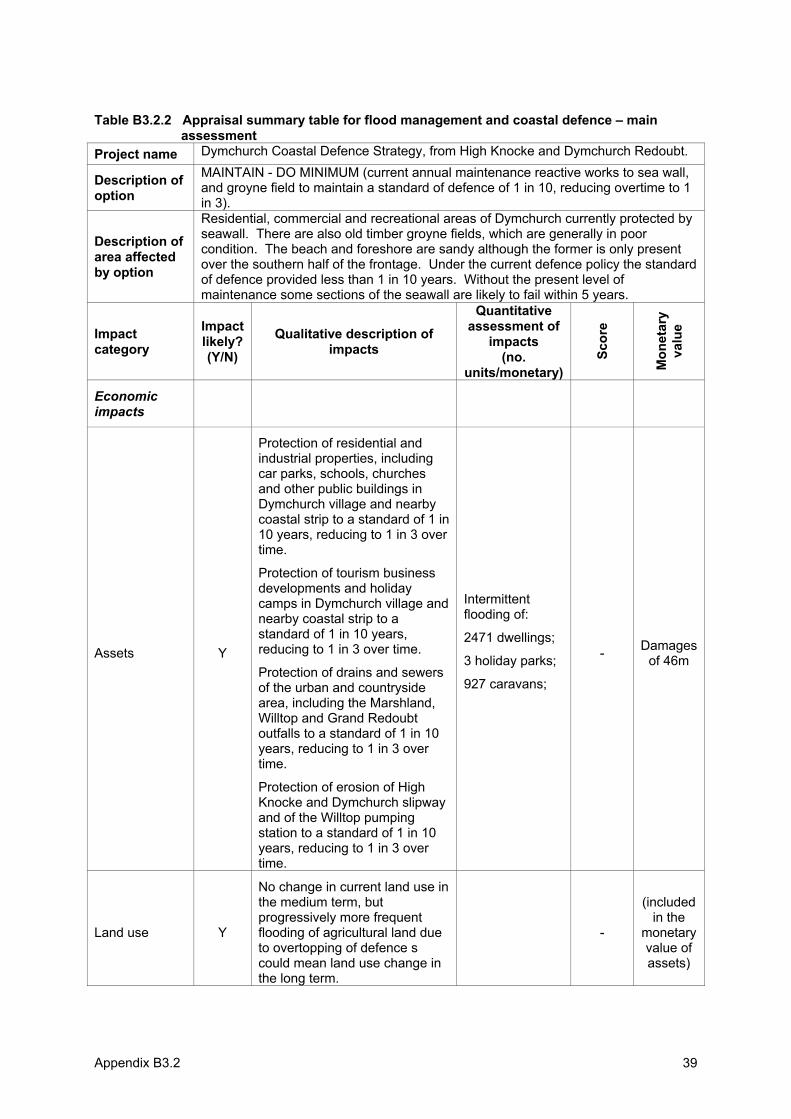
Appendix B3.2 39
Table B3.2.2 Appraisal summary table for flood management and coastal defence – main assessment
Project name Dymchurch Coastal Defence Strategy, from High Knocke and Dymchurch Redoubt.
Description of option
MAINTAIN - DO MINIMUM (current annual maintenance reactive works to sea wall, and groyne field to maintain a standard of defence of 1 in 10, reducing overtime to 1 in 3).
Description of area affected by option
Residential, commercial and recreational areas of Dymchurch currently protected by seawall. There are also old timber groyne fields, which are generally in poor condition. The beach and foreshore are sandy although the former is only present over the southern half of the frontage. Under the current defence policy the standard of defence provided less than 1 in 10 years. Without the present level of maintenance some sections of the seawall are likely to fail within 5 years.
Impactcategory
Impactlikely? (Y/N)
Qualitative description of impacts
Quantitative assessment of
impacts(no.
units/monetary)
Scor
e
Mon
etar
yva
lue
Economicimpacts
Assets Y
Protection of residential and industrial properties, including car parks, schools, churches and other public buildings in Dymchurch village and nearby coastal strip to a standard of 1 in 10 years, reducing to 1 in 3 over time.
Protection of tourism business developments and holiday camps in Dymchurch village and nearby coastal strip to a standard of 1 in 10 years, reducing to 1 in 3 over time.
Protection of drains and sewers of the urban and countryside area, including the Marshland, Willtop and Grand Redoubt outfalls to a standard of 1 in 10 years, reducing to 1 in 3 over time.
Protection of erosion of High Knocke and Dymchurch slipway and of the Willtop pumping station to a standard of 1 in 10 years, reducing to 1 in 3 over time.
Intermittentflooding of:
2471 dwellings;
3 holiday parks;
927 caravans;
- Damagesof 46m
Land use Y
No change in current land use in the medium term, but progressively more frequent flooding of agricultural land due to overtopping of defence s could mean land use change in the long term.
-
(includedin the
monetaryvalue of assets)
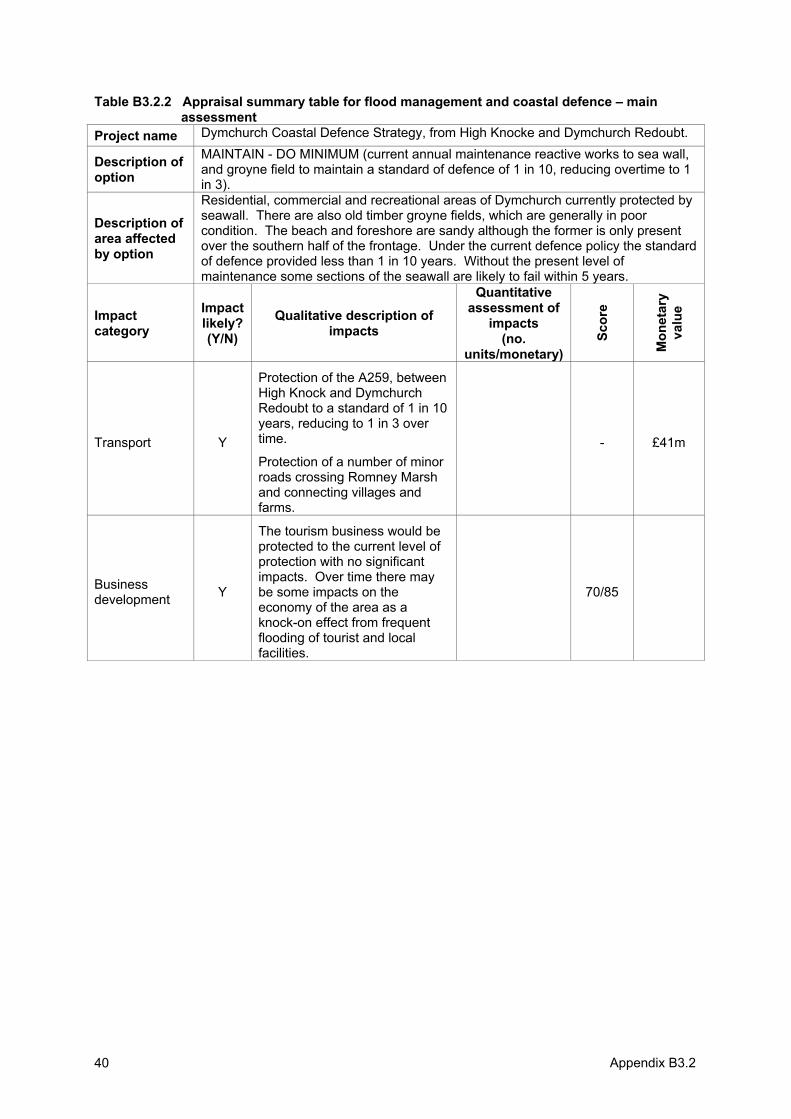
Appendix B3.240
Table B3.2.2 Appraisal summary table for flood management and coastal defence – main assessment
Project name Dymchurch Coastal Defence Strategy, from High Knocke and Dymchurch Redoubt.
Description of option
MAINTAIN - DO MINIMUM (current annual maintenance reactive works to sea wall, and groyne field to maintain a standard of defence of 1 in 10, reducing overtime to 1 in 3).
Description of area affected by option
Residential, commercial and recreational areas of Dymchurch currently protected by seawall. There are also old timber groyne fields, which are generally in poor condition. The beach and foreshore are sandy although the former is only present over the southern half of the frontage. Under the current defence policy the standard of defence provided less than 1 in 10 years. Without the present level of maintenance some sections of the seawall are likely to fail within 5 years.
Impactcategory
Impactlikely? (Y/N)
Qualitative description of impacts
Quantitative assessment of
impacts(no.
units/monetary)
Scor
e
Mon
etar
yva
lue
Transport Y
Protection of the A259, between High Knock and Dymchurch Redoubt to a standard of 1 in 10 years, reducing to 1 in 3 over time.
Protection of a number of minor roads crossing Romney Marsh and connecting villages and farms.
- £41m
Businessdevelopment Y
The tourism business would be protected to the current level of protection with no significant impacts. Over time there may be some impacts on the economy of the area as a knock-on effect from frequent flooding of tourist and local facilities.
70/85
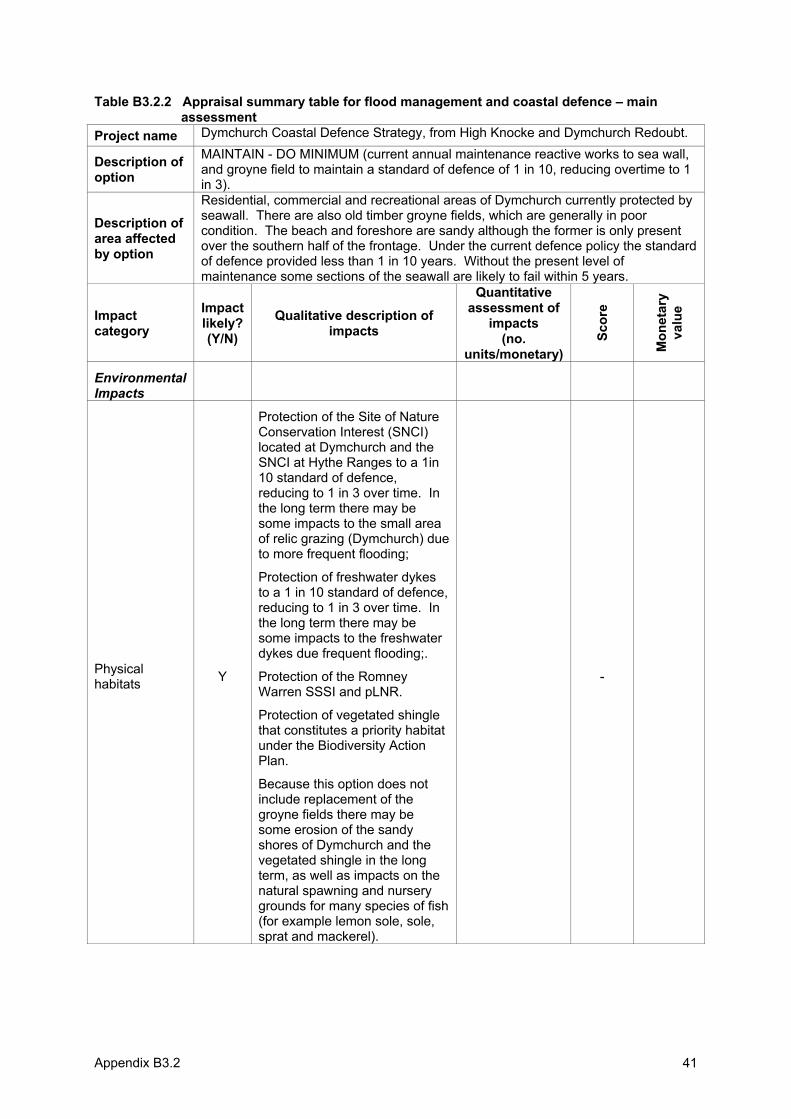
Appendix B3.2 41
Table B3.2.2 Appraisal summary table for flood management and coastal defence – main assessment
Project name Dymchurch Coastal Defence Strategy, from High Knocke and Dymchurch Redoubt.
Description of option
MAINTAIN - DO MINIMUM (current annual maintenance reactive works to sea wall, and groyne field to maintain a standard of defence of 1 in 10, reducing overtime to 1 in 3).
Description of area affected by option
Residential, commercial and recreational areas of Dymchurch currently protected by seawall. There are also old timber groyne fields, which are generally in poor condition. The beach and foreshore are sandy although the former is only present over the southern half of the frontage. Under the current defence policy the standard of defence provided less than 1 in 10 years. Without the present level of maintenance some sections of the seawall are likely to fail within 5 years.
Impactcategory
Impactlikely? (Y/N)
Qualitative description of impacts
Quantitative assessment of
impacts(no.
units/monetary)
Scor
e
Mon
etar
yva
lue
EnvironmentalImpacts
Physical habitats Y
Protection of the Site of Nature Conservation Interest (SNCI) located at Dymchurch and the SNCI at Hythe Ranges to a 1in 10 standard of defence, reducing to 1 in 3 over time. In the long term there may be some impacts to the small area of relic grazing (Dymchurch) due to more frequent flooding;
Protection of freshwater dykes to a 1 in 10 standard of defence, reducing to 1 in 3 over time. In the long term there may be some impacts to the freshwater dykes due frequent flooding;.
Protection of the Romney Warren SSSI and pLNR.
Protection of vegetated shingle that constitutes a priority habitat under the Biodiversity Action Plan.
Because this option does not include replacement of the groyne fields there may be some erosion of the sandy shores of Dymchurch and the vegetated shingle in the long term, as well as impacts on the natural spawning and nursery grounds for many species of fish (for example lemon sole, sole, sprat and mackerel).
-
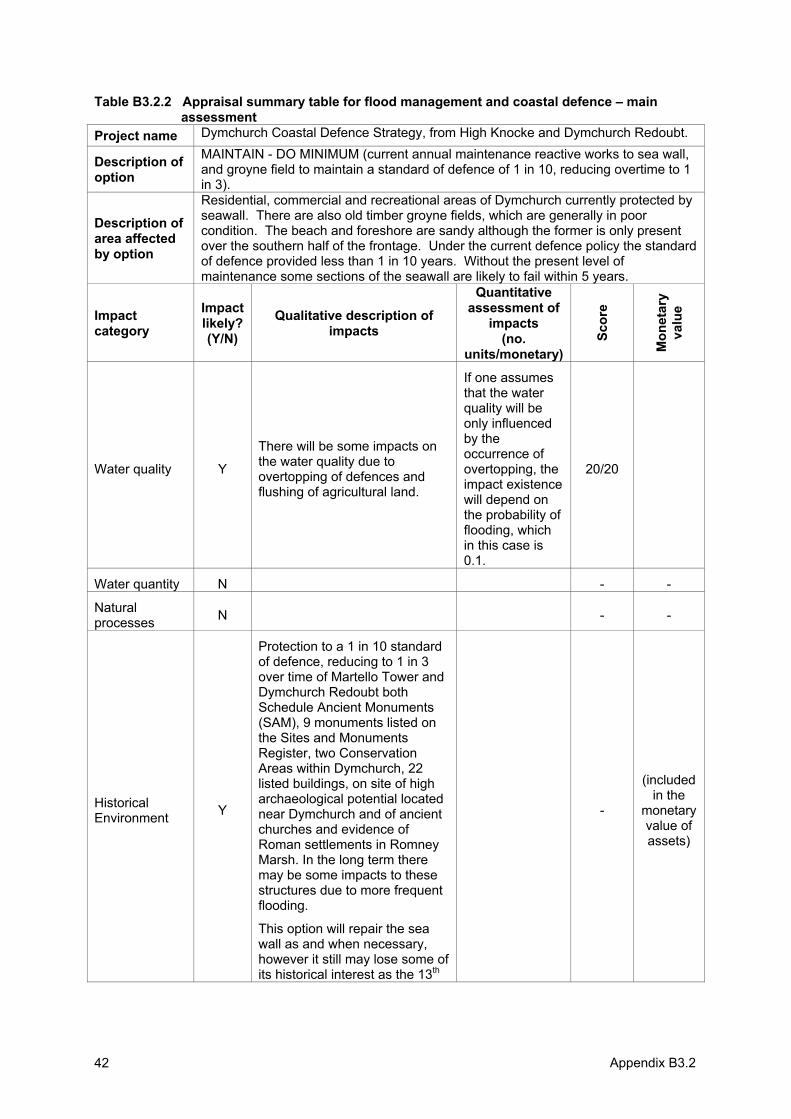
Appendix B3.242
Table B3.2.2 Appraisal summary table for flood management and coastal defence – main assessment
Project name Dymchurch Coastal Defence Strategy, from High Knocke and Dymchurch Redoubt.
Description of option
MAINTAIN - DO MINIMUM (current annual maintenance reactive works to sea wall, and groyne field to maintain a standard of defence of 1 in 10, reducing overtime to 1 in 3).
Description of area affected by option
Residential, commercial and recreational areas of Dymchurch currently protected by seawall. There are also old timber groyne fields, which are generally in poor condition. The beach and foreshore are sandy although the former is only present over the southern half of the frontage. Under the current defence policy the standard of defence provided less than 1 in 10 years. Without the present level of maintenance some sections of the seawall are likely to fail within 5 years.
Impactcategory
Impactlikely? (Y/N)
Qualitative description of impacts
Quantitative assessment of
impacts(no.
units/monetary)
Scor
e
Mon
etar
yva
lue
Water quality Y
There will be some impacts on the water quality due to overtopping of defences and flushing of agricultural land.
If one assumes that the water quality will be only influenced by the occurrence of overtopping, the impact existence will depend on the probability of flooding, which in this case is 0.1.
20/20
Water quantity N - -
Naturalprocesses N - -
HistoricalEnvironment Y
Protection to a 1 in 10 standard of defence, reducing to 1 in 3 over time of Martello Tower and Dymchurch Redoubt both Schedule Ancient Monuments (SAM), 9 monuments listed on the Sites and Monuments Register, two Conservation Areas within Dymchurch, 22 listed buildings, on site of high archaeological potential located near Dymchurch and of ancient churches and evidence of Roman settlements in Romney Marsh. In the long term there may be some impacts to these structures due to more frequent flooding.
This option will repair the sea wall as and when necessary, however it still may lose some of its historical interest as the 13th
-
(includedin the
monetaryvalue of assets)
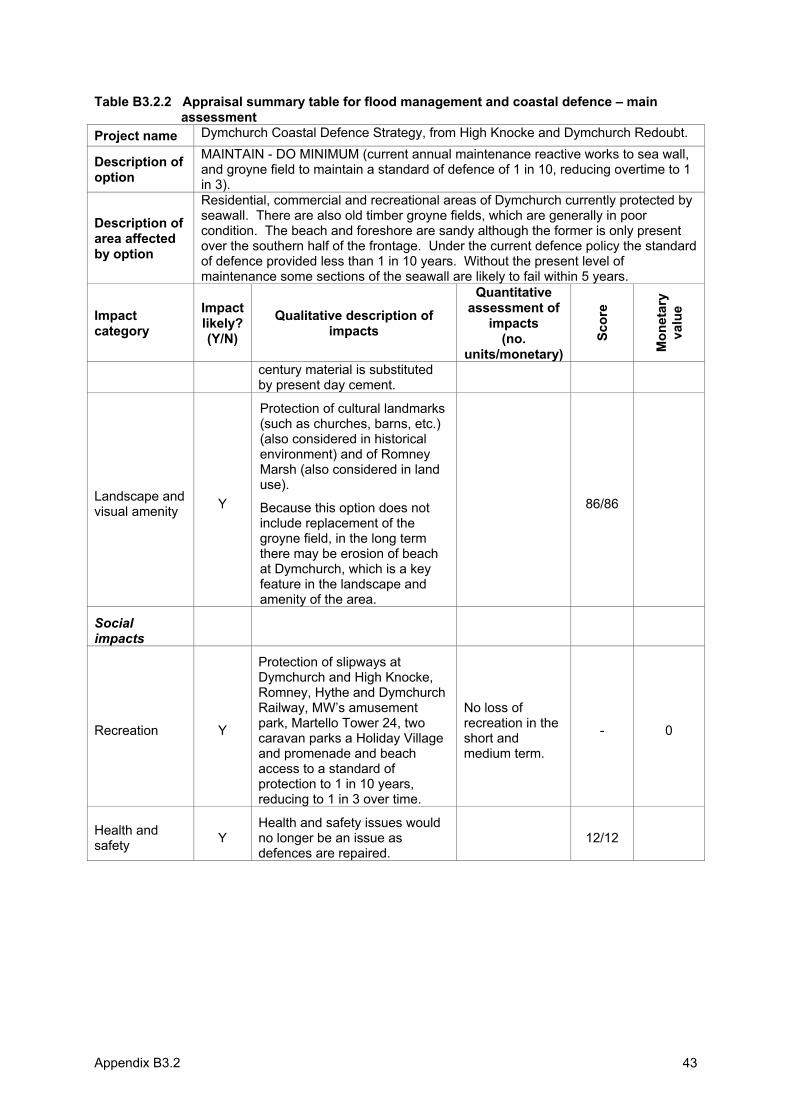
Appendix B3.2 43
Table B3.2.2 Appraisal summary table for flood management and coastal defence – main assessment
Project name Dymchurch Coastal Defence Strategy, from High Knocke and Dymchurch Redoubt.
Description of option
MAINTAIN - DO MINIMUM (current annual maintenance reactive works to sea wall, and groyne field to maintain a standard of defence of 1 in 10, reducing overtime to 1 in 3).
Description of area affected by option
Residential, commercial and recreational areas of Dymchurch currently protected by seawall. There are also old timber groyne fields, which are generally in poor condition. The beach and foreshore are sandy although the former is only present over the southern half of the frontage. Under the current defence policy the standard of defence provided less than 1 in 10 years. Without the present level of maintenance some sections of the seawall are likely to fail within 5 years.
Impactcategory
Impactlikely? (Y/N)
Qualitative description of impacts
Quantitative assessment of
impacts(no.
units/monetary)
Scor
e
Mon
etar
yva
lue
century material is substituted by present day cement.
Landscape and visual amenity Y
Protection of cultural landmarks (such as churches, barns, etc.) (also considered in historical environment) and of Romney Marsh (also considered in land use).
Because this option does not include replacement of the groyne field, in the long term there may be erosion of beach at Dymchurch, which is a key feature in the landscape and amenity of the area.
86/86
Socialimpacts
Recreation Y
Protection of slipways at Dymchurch and High Knocke, Romney, Hythe and Dymchurch Railway, MW’s amusement park, Martello Tower 24, two caravan parks a Holiday Village and promenade and beach access to a standard of protection to 1 in 10 years, reducing to 1 in 3 over time.
No loss of recreation in the short and medium term.
- 0
Health and safety Y
Health and safety issues would no longer be an issue as defences are repaired.
12/12
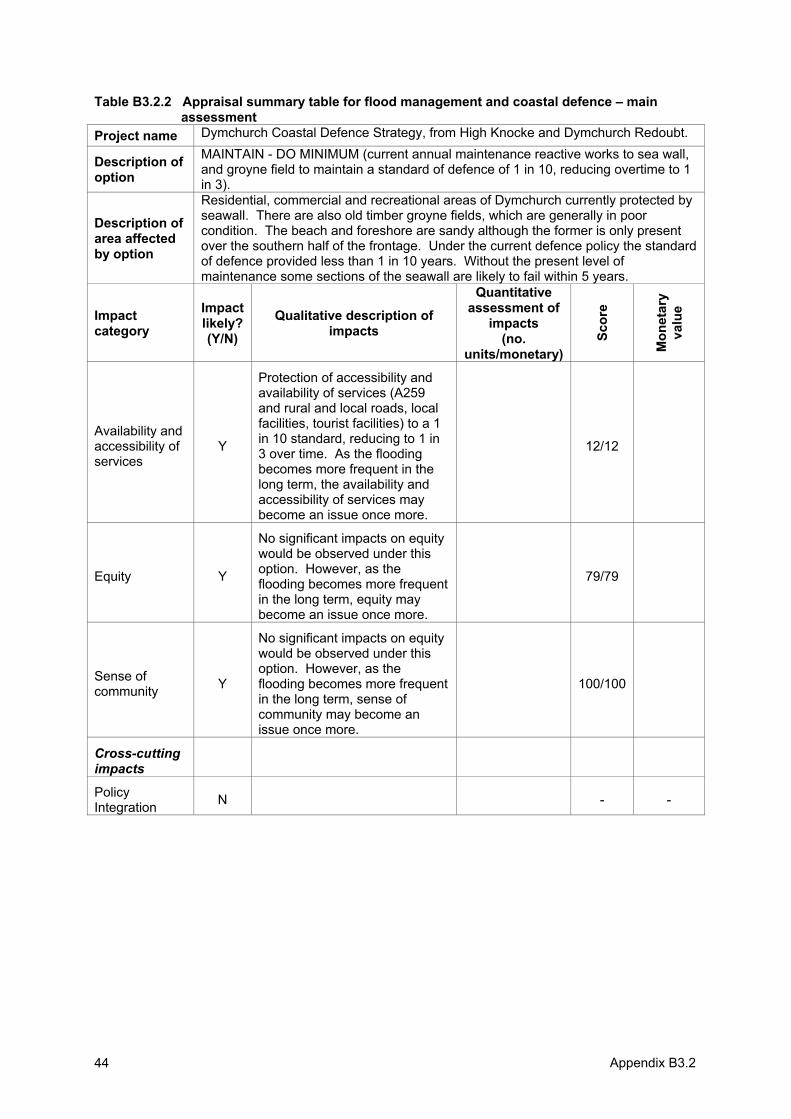
Appendix B3.244
Table B3.2.2 Appraisal summary table for flood management and coastal defence – main assessment
Project name Dymchurch Coastal Defence Strategy, from High Knocke and Dymchurch Redoubt.
Description of option
MAINTAIN - DO MINIMUM (current annual maintenance reactive works to sea wall, and groyne field to maintain a standard of defence of 1 in 10, reducing overtime to 1 in 3).
Description of area affected by option
Residential, commercial and recreational areas of Dymchurch currently protected by seawall. There are also old timber groyne fields, which are generally in poor condition. The beach and foreshore are sandy although the former is only present over the southern half of the frontage. Under the current defence policy the standard of defence provided less than 1 in 10 years. Without the present level of maintenance some sections of the seawall are likely to fail within 5 years.
Impactcategory
Impactlikely? (Y/N)
Qualitative description of impacts
Quantitative assessment of
impacts(no.
units/monetary)
Scor
e
Mon
etar
yva
lue
Availability and accessibility of services
Y
Protection of accessibility and availability of services (A259 and rural and local roads, local facilities, tourist facilities) to a 1 in 10 standard, reducing to 1 in 3 over time. As the flooding becomes more frequent in the long term, the availability and accessibility of services may become an issue once more.
12/12
Equity Y
No significant impacts on equity would be observed under this option. However, as the flooding becomes more frequent in the long term, equity may become an issue once more.
79/79
Sense of community Y
No significant impacts on equity would be observed under this option. However, as the flooding becomes more frequent in the long term, sense of community may become an issue once more.
100/100
Cross-cuttingimpacts
Policy Integration N - -
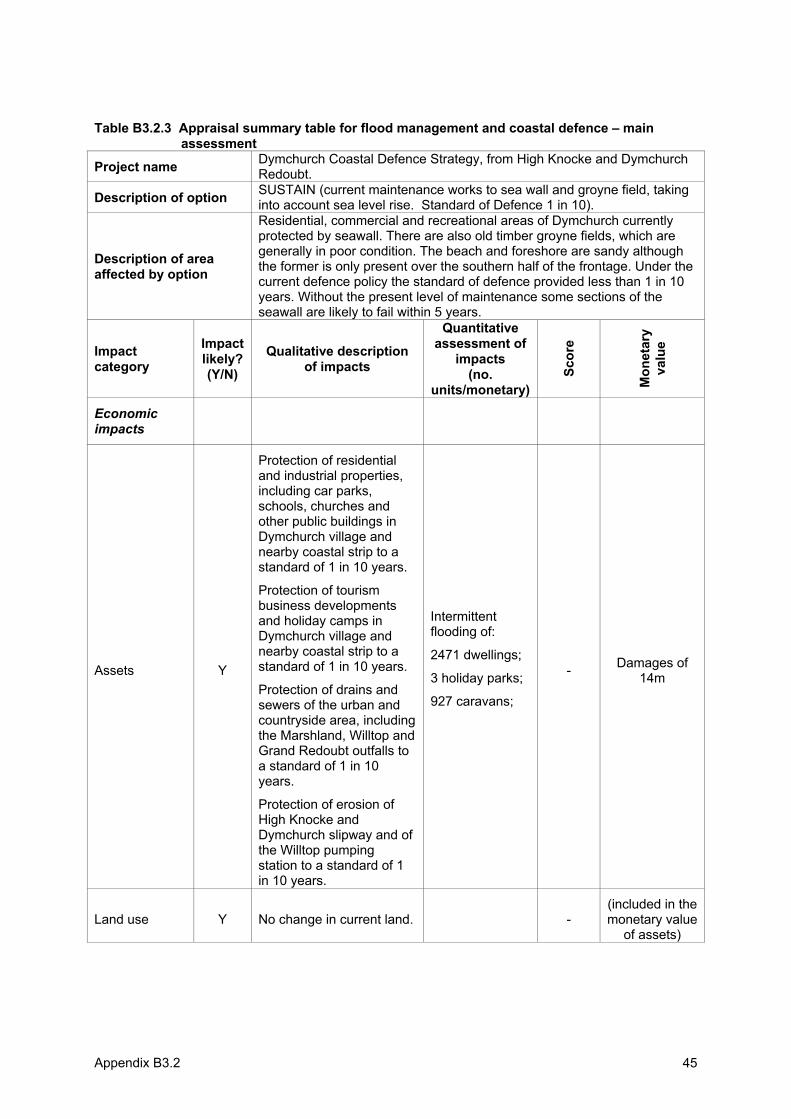
Appendix B3.2 45
Table B3.2.3 Appraisal summary table for flood management and coastal defence – main assessment
Project name Dymchurch Coastal Defence Strategy, from High Knocke and Dymchurch Redoubt.
Description of option SUSTAIN (current maintenance works to sea wall and groyne field, taking into account sea level rise. Standard of Defence 1 in 10).
Description of area affected by option
Residential, commercial and recreational areas of Dymchurch currently protected by seawall. There are also old timber groyne fields, which are generally in poor condition. The beach and foreshore are sandy although the former is only present over the southern half of the frontage. Under the current defence policy the standard of defence provided less than 1 in 10 years. Without the present level of maintenance some sections of the seawall are likely to fail within 5 years.
Impactcategory
Impactlikely? (Y/N)
Qualitative description of impacts
Quantitative assessment of
impacts(no.
units/monetary)
Scor
e
Mon
etar
yva
lue
Economicimpacts
Assets Y
Protection of residential and industrial properties, including car parks, schools, churches and other public buildings in Dymchurch village and nearby coastal strip to a standard of 1 in 10 years.
Protection of tourism business developments and holiday camps in Dymchurch village and nearby coastal strip to a standard of 1 in 10 years.
Protection of drains and sewers of the urban and countryside area, including the Marshland, Willtop and Grand Redoubt outfalls to a standard of 1 in 10 years.
Protection of erosion of High Knocke and Dymchurch slipway and of the Willtop pumping station to a standard of 1 in 10 years.
Intermittentflooding of:
2471 dwellings;
3 holiday parks;
927 caravans;
- Damages of 14m
Land use Y No change in current land. - (included in the monetary value
of assets)
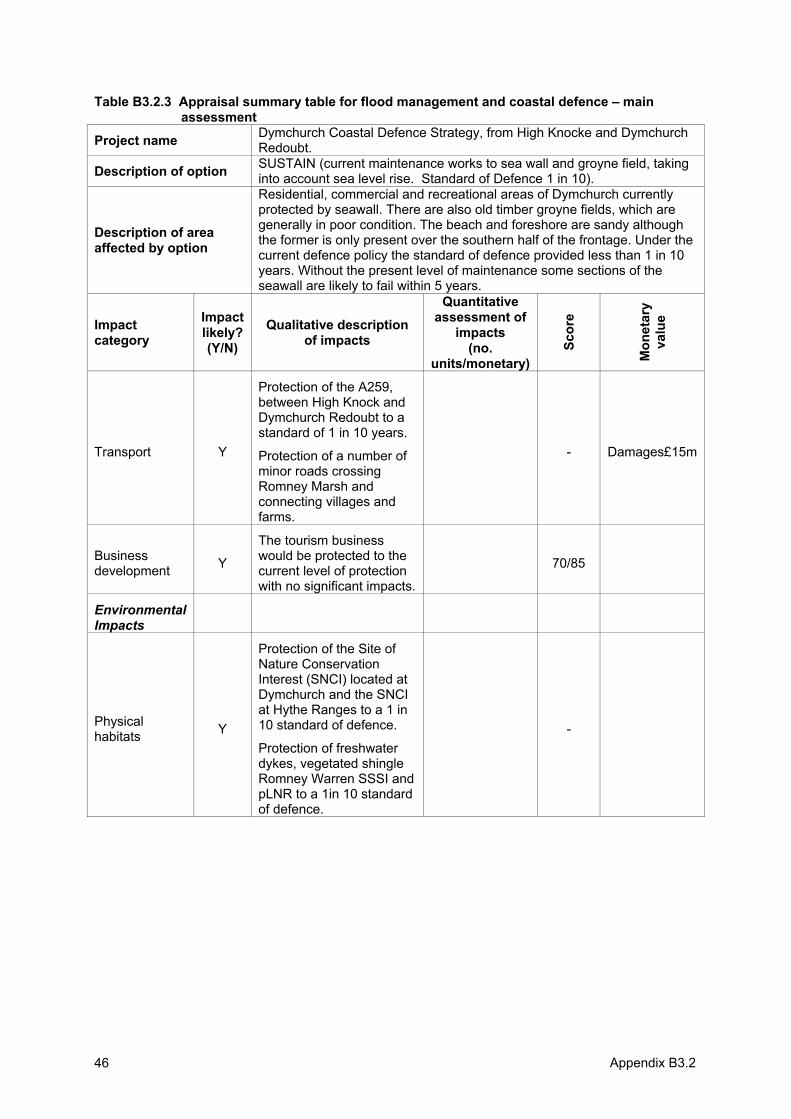
Appendix B3.246
Table B3.2.3 Appraisal summary table for flood management and coastal defence – main assessment
Project name Dymchurch Coastal Defence Strategy, from High Knocke and Dymchurch Redoubt.
Description of option SUSTAIN (current maintenance works to sea wall and groyne field, taking into account sea level rise. Standard of Defence 1 in 10).
Description of area affected by option
Residential, commercial and recreational areas of Dymchurch currently protected by seawall. There are also old timber groyne fields, which are generally in poor condition. The beach and foreshore are sandy although the former is only present over the southern half of the frontage. Under the current defence policy the standard of defence provided less than 1 in 10 years. Without the present level of maintenance some sections of the seawall are likely to fail within 5 years.
Impactcategory
Impactlikely? (Y/N)
Qualitative description of impacts
Quantitative assessment of
impacts(no.
units/monetary)
Scor
e
Mon
etar
yva
lue
Transport Y
Protection of the A259, between High Knock and Dymchurch Redoubt to a standard of 1 in 10 years.
Protection of a number of minor roads crossing Romney Marsh and connecting villages and farms.
- Damages£15m
Businessdevelopment Y
The tourism business would be protected to the current level of protection with no significant impacts.
70/85
EnvironmentalImpacts
Physical habitats Y
Protection of the Site of Nature Conservation Interest (SNCI) located at Dymchurch and the SNCI at Hythe Ranges to a 1 in 10 standard of defence.
Protection of freshwater dykes, vegetated shingle Romney Warren SSSI and pLNR to a 1in 10 standard of defence.
-
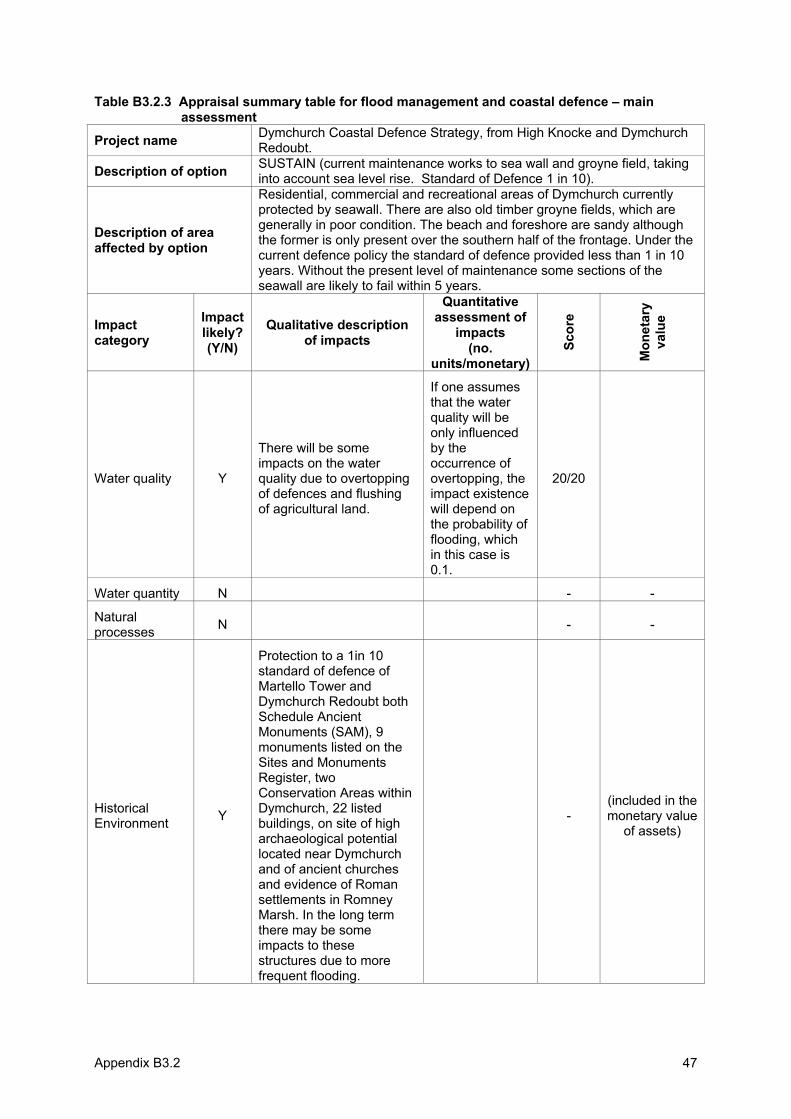
Appendix B3.2 47
Table B3.2.3 Appraisal summary table for flood management and coastal defence – main assessment
Project name Dymchurch Coastal Defence Strategy, from High Knocke and Dymchurch Redoubt.
Description of option SUSTAIN (current maintenance works to sea wall and groyne field, taking into account sea level rise. Standard of Defence 1 in 10).
Description of area affected by option
Residential, commercial and recreational areas of Dymchurch currently protected by seawall. There are also old timber groyne fields, which are generally in poor condition. The beach and foreshore are sandy although the former is only present over the southern half of the frontage. Under the current defence policy the standard of defence provided less than 1 in 10 years. Without the present level of maintenance some sections of the seawall are likely to fail within 5 years.
Impactcategory
Impactlikely? (Y/N)
Qualitative description of impacts
Quantitative assessment of
impacts(no.
units/monetary)
Scor
e
Mon
etar
yva
lue
Water quality Y
There will be some impacts on the water quality due to overtopping of defences and flushing of agricultural land.
If one assumes that the water quality will be only influenced by the occurrence of overtopping, the impact existence will depend on the probability of flooding, which in this case is 0.1.
20/20
Water quantity N - -
Naturalprocesses N - -
HistoricalEnvironment Y
Protection to a 1in 10 standard of defence of Martello Tower and Dymchurch Redoubt both Schedule Ancient Monuments (SAM), 9 monuments listed on the Sites and Monuments Register, two Conservation Areas within Dymchurch, 22 listed buildings, on site of high archaeological potential located near Dymchurch and of ancient churches and evidence of Roman settlements in Romney Marsh. In the long term there may be some impacts to these structures due to more frequent flooding.
- (included in the monetary value
of assets)
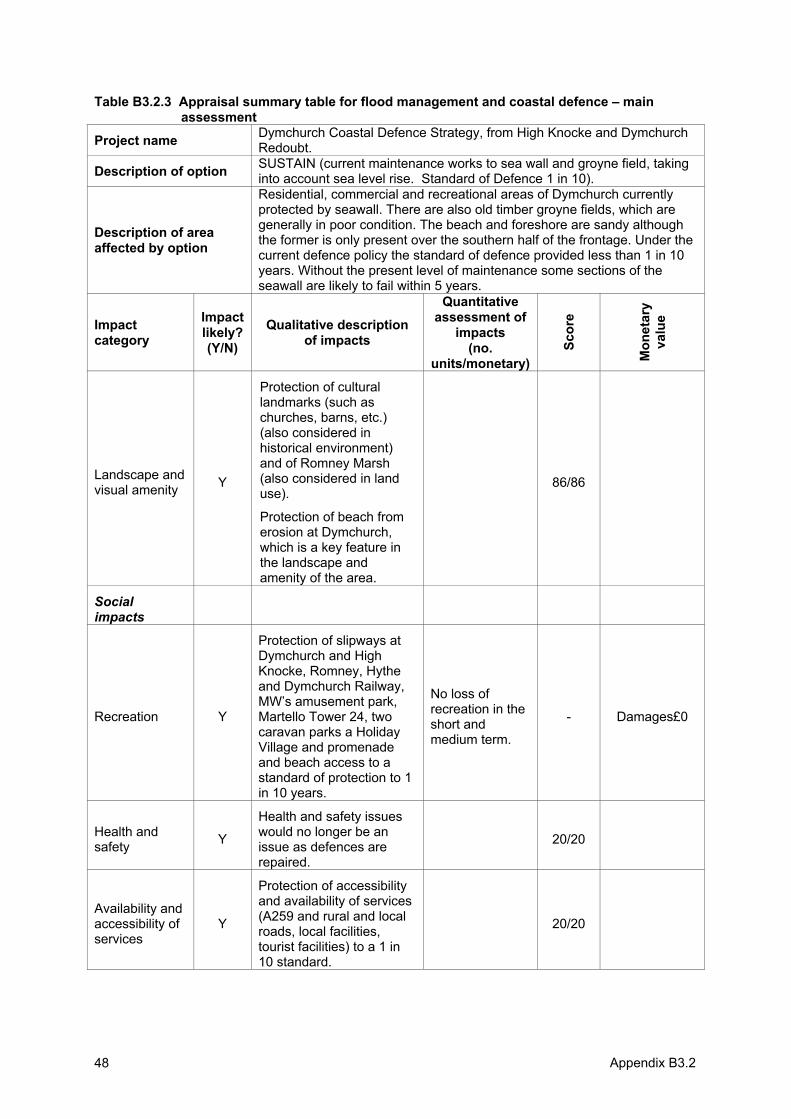
Appendix B3.248
Table B3.2.3 Appraisal summary table for flood management and coastal defence – main assessment
Project name Dymchurch Coastal Defence Strategy, from High Knocke and Dymchurch Redoubt.
Description of option SUSTAIN (current maintenance works to sea wall and groyne field, taking into account sea level rise. Standard of Defence 1 in 10).
Description of area affected by option
Residential, commercial and recreational areas of Dymchurch currently protected by seawall. There are also old timber groyne fields, which are generally in poor condition. The beach and foreshore are sandy although the former is only present over the southern half of the frontage. Under the current defence policy the standard of defence provided less than 1 in 10 years. Without the present level of maintenance some sections of the seawall are likely to fail within 5 years.
Impactcategory
Impactlikely? (Y/N)
Qualitative description of impacts
Quantitative assessment of
impacts(no.
units/monetary)
Scor
e
Mon
etar
yva
lue
Landscape and visual amenity Y
Protection of cultural landmarks (such as churches, barns, etc.) (also considered in historical environment) and of Romney Marsh (also considered in land use).
Protection of beach from erosion at Dymchurch, which is a key feature in the landscape and amenity of the area.
86/86
Socialimpacts
Recreation Y
Protection of slipways at Dymchurch and High Knocke, Romney, Hythe and Dymchurch Railway, MW’s amusement park, Martello Tower 24, two caravan parks a Holiday Village and promenade and beach access to a standard of protection to 1 in 10 years.
No loss of recreation in the short and medium term.
- Damages£0
Health and safety Y
Health and safety issues would no longer be an issue as defences are repaired.
20/20
Availability and accessibility of services
Y
Protection of accessibility and availability of services (A259 and rural and local roads, local facilities, tourist facilities) to a 1 in 10 standard.
20/20

Appendix B3.2 49
Table B3.2.3 Appraisal summary table for flood management and coastal defence – main assessment
Project name Dymchurch Coastal Defence Strategy, from High Knocke and Dymchurch Redoubt.
Description of option SUSTAIN (current maintenance works to sea wall and groyne field, taking into account sea level rise. Standard of Defence 1 in 10).
Description of area affected by option
Residential, commercial and recreational areas of Dymchurch currently protected by seawall. There are also old timber groyne fields, which are generally in poor condition. The beach and foreshore are sandy although the former is only present over the southern half of the frontage. Under the current defence policy the standard of defence provided less than 1 in 10 years. Without the present level of maintenance some sections of the seawall are likely to fail within 5 years.
Impactcategory
Impactlikely? (Y/N)
Qualitative description of impacts
Quantitative assessment of
impacts(no.
units/monetary)
Scor
e
Mon
etar
yva
lue
Equity Y No significant impacts on equity would be observed under this option.
86/86
Sense of community Y
No significant impacts on equity would be observed under this option
100/100
Cross-cuttingimpacts
Policy integration N - -
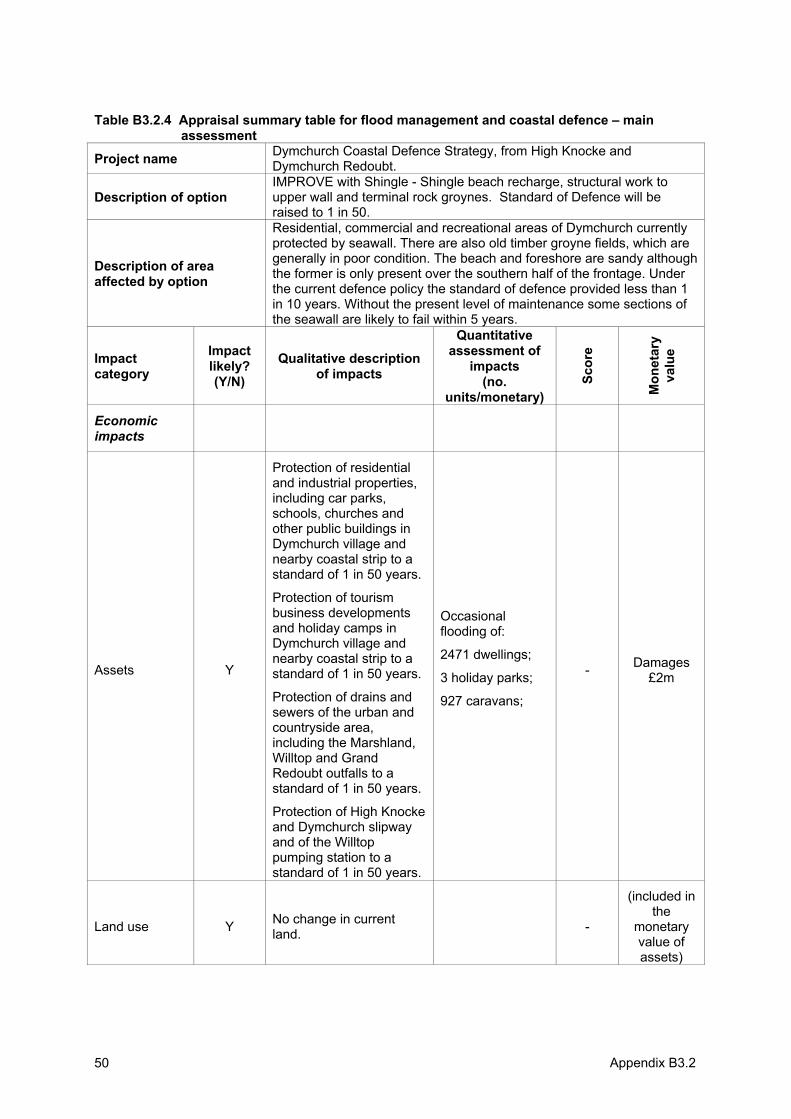
Appendix B3.250
Table B3.2.4 Appraisal summary table for flood management and coastal defence – main assessment
Project name Dymchurch Coastal Defence Strategy, from High Knocke and Dymchurch Redoubt.
Description of option IMPROVE with Shingle - Shingle beach recharge, structural work to upper wall and terminal rock groynes. Standard of Defence will be raised to 1 in 50.
Description of area affected by option
Residential, commercial and recreational areas of Dymchurch currently protected by seawall. There are also old timber groyne fields, which are generally in poor condition. The beach and foreshore are sandy although the former is only present over the southern half of the frontage. Under the current defence policy the standard of defence provided less than 1 in 10 years. Without the present level of maintenance some sections of the seawall are likely to fail within 5 years.
Impactcategory
Impactlikely? (Y/N)
Qualitative description of impacts
Quantitative assessment of
impacts(no.
units/monetary)
Scor
e
Mon
etar
yva
lue
Economicimpacts
Assets Y
Protection of residential and industrial properties, including car parks, schools, churches and other public buildings in Dymchurch village and nearby coastal strip to a standard of 1 in 50 years.
Protection of tourism business developments and holiday camps in Dymchurch village and nearby coastal strip to a standard of 1 in 50 years.
Protection of drains and sewers of the urban and countryside area, including the Marshland, Willtop and Grand Redoubt outfalls to a standard of 1 in 50 years.
Protection of High Knocke and Dymchurch slipway and of the Willtop pumping station to a standard of 1 in 50 years.
Occasionalflooding of:
2471 dwellings;
3 holiday parks;
927 caravans;
- Damages£2m
Land use Y No change in current land. -
(included in the
monetaryvalue of assets)
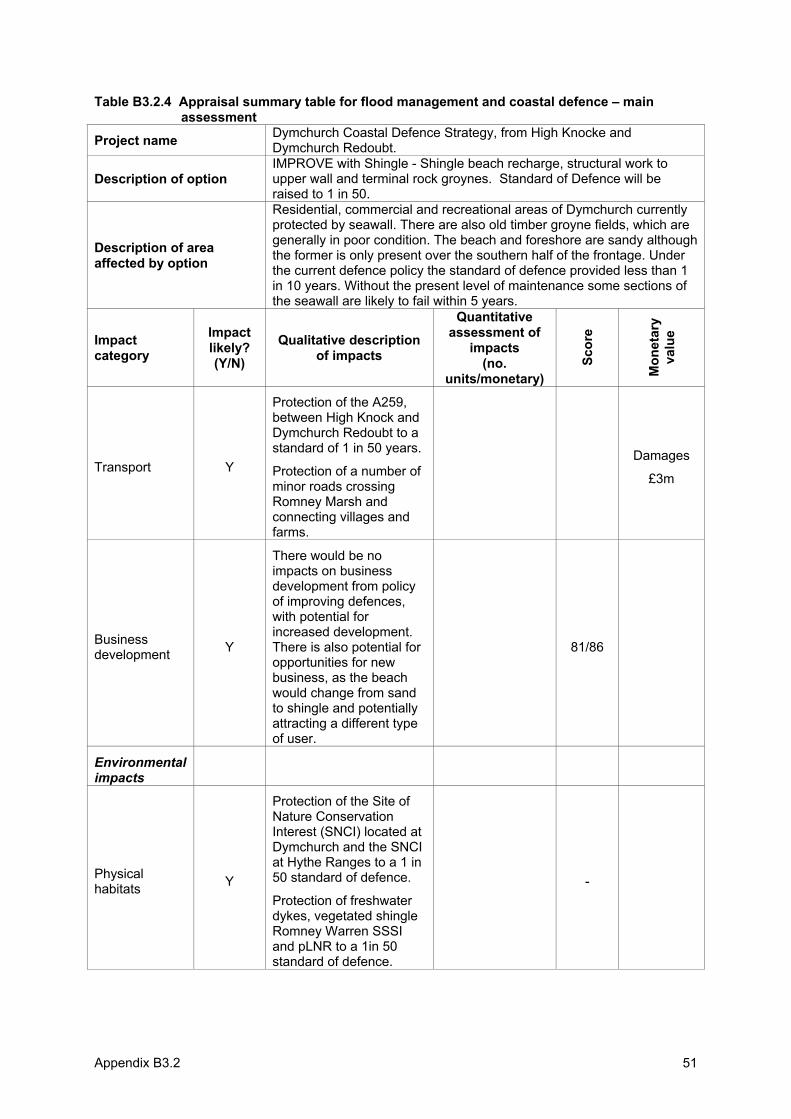
Appendix B3.2 51
Table B3.2.4 Appraisal summary table for flood management and coastal defence – main assessment
Project name Dymchurch Coastal Defence Strategy, from High Knocke and Dymchurch Redoubt.
Description of option IMPROVE with Shingle - Shingle beach recharge, structural work to upper wall and terminal rock groynes. Standard of Defence will be raised to 1 in 50.
Description of area affected by option
Residential, commercial and recreational areas of Dymchurch currently protected by seawall. There are also old timber groyne fields, which are generally in poor condition. The beach and foreshore are sandy although the former is only present over the southern half of the frontage. Under the current defence policy the standard of defence provided less than 1 in 10 years. Without the present level of maintenance some sections of the seawall are likely to fail within 5 years.
Impactcategory
Impactlikely? (Y/N)
Qualitative description of impacts
Quantitative assessment of
impacts(no.
units/monetary)
Scor
e
Mon
etar
yva
lue
Transport Y
Protection of the A259, between High Knock and Dymchurch Redoubt to a standard of 1 in 50 years.
Protection of a number of minor roads crossing Romney Marsh and connecting villages and farms.
Damages
£3m
Businessdevelopment Y
There would be no impacts on business development from policy of improving defences, with potential for increased development. There is also potential for opportunities for new business, as the beach would change from sand to shingle and potentially attracting a different type of user.
81/86
Environmentalimpacts
Physical habitats Y
Protection of the Site of Nature Conservation Interest (SNCI) located at Dymchurch and the SNCI at Hythe Ranges to a 1 in 50 standard of defence.
Protection of freshwater dykes, vegetated shingle Romney Warren SSSI and pLNR to a 1in 50 standard of defence.
-
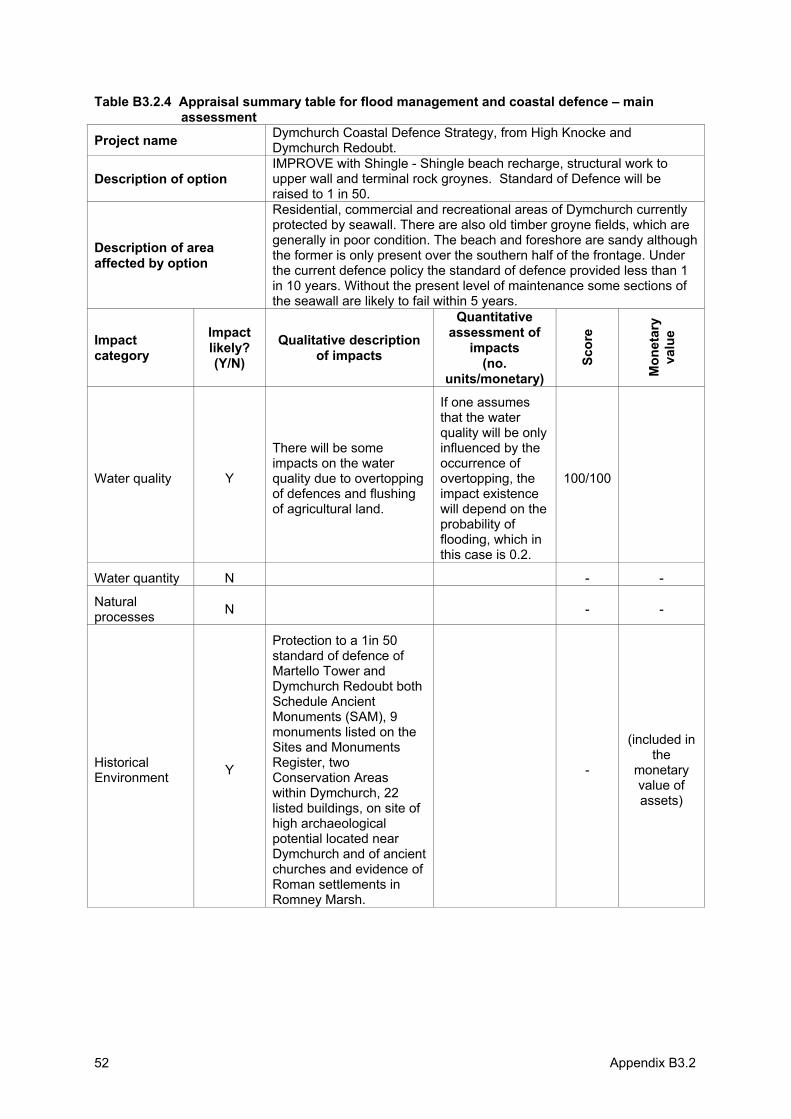
Appendix B3.252
Table B3.2.4 Appraisal summary table for flood management and coastal defence – main assessment
Project name Dymchurch Coastal Defence Strategy, from High Knocke and Dymchurch Redoubt.
Description of option IMPROVE with Shingle - Shingle beach recharge, structural work to upper wall and terminal rock groynes. Standard of Defence will be raised to 1 in 50.
Description of area affected by option
Residential, commercial and recreational areas of Dymchurch currently protected by seawall. There are also old timber groyne fields, which are generally in poor condition. The beach and foreshore are sandy although the former is only present over the southern half of the frontage. Under the current defence policy the standard of defence provided less than 1 in 10 years. Without the present level of maintenance some sections of the seawall are likely to fail within 5 years.
Impactcategory
Impactlikely? (Y/N)
Qualitative description of impacts
Quantitative assessment of
impacts(no.
units/monetary)
Scor
e
Mon
etar
yva
lue
Water quality Y
There will be some impacts on the water quality due to overtopping of defences and flushing of agricultural land.
If one assumes that the water quality will be only influenced by the occurrence of overtopping, the impact existence will depend on the probability of flooding, which in this case is 0.2.
100/100
Water quantity N - -
Naturalprocesses N - -
HistoricalEnvironment Y
Protection to a 1in 50 standard of defence of Martello Tower and Dymchurch Redoubt both Schedule Ancient Monuments (SAM), 9 monuments listed on the Sites and Monuments Register, two Conservation Areas within Dymchurch, 22 listed buildings, on site of high archaeological potential located near Dymchurch and of ancient churches and evidence of Roman settlements in Romney Marsh.
-
(included in the
monetaryvalue of assets)
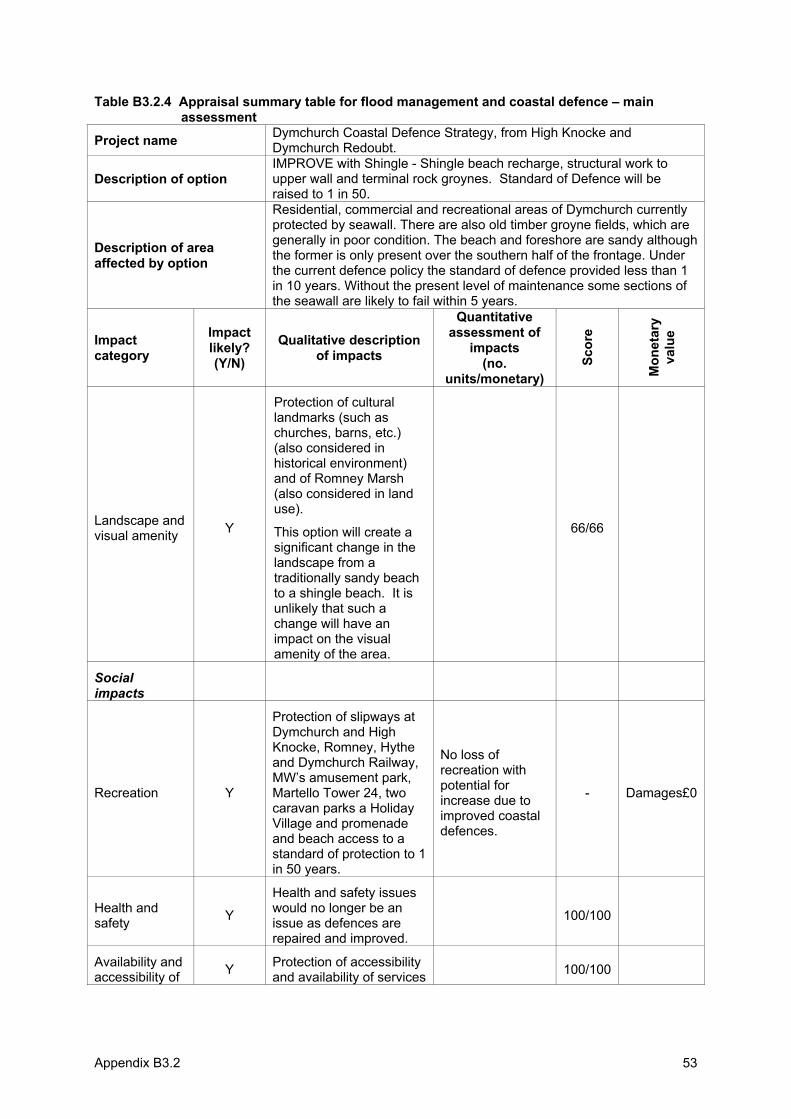
Appendix B3.2 53
Table B3.2.4 Appraisal summary table for flood management and coastal defence – main assessment
Project name Dymchurch Coastal Defence Strategy, from High Knocke and Dymchurch Redoubt.
Description of option IMPROVE with Shingle - Shingle beach recharge, structural work to upper wall and terminal rock groynes. Standard of Defence will be raised to 1 in 50.
Description of area affected by option
Residential, commercial and recreational areas of Dymchurch currently protected by seawall. There are also old timber groyne fields, which are generally in poor condition. The beach and foreshore are sandy although the former is only present over the southern half of the frontage. Under the current defence policy the standard of defence provided less than 1 in 10 years. Without the present level of maintenance some sections of the seawall are likely to fail within 5 years.
Impactcategory
Impactlikely? (Y/N)
Qualitative description of impacts
Quantitative assessment of
impacts(no.
units/monetary)
Scor
e
Mon
etar
yva
lue
Landscape and visual amenity Y
Protection of cultural landmarks (such as churches, barns, etc.) (also considered in historical environment) and of Romney Marsh (also considered in land use).
This option will create a significant change in the landscape from a traditionally sandy beach to a shingle beach. It is unlikely that such a change will have an impact on the visual amenity of the area.
66/66
Socialimpacts
Recreation Y
Protection of slipways at Dymchurch and High Knocke, Romney, Hythe and Dymchurch Railway, MW’s amusement park, Martello Tower 24, two caravan parks a Holiday Village and promenade and beach access to a standard of protection to 1 in 50 years.
No loss of recreation with potential for increase due to improved coastal defences.
- Damages£0
Health and safety Y
Health and safety issues would no longer be an issue as defences are repaired and improved.
100/100
Availability and accessibility of Y Protection of accessibility
and availability of services 100/100
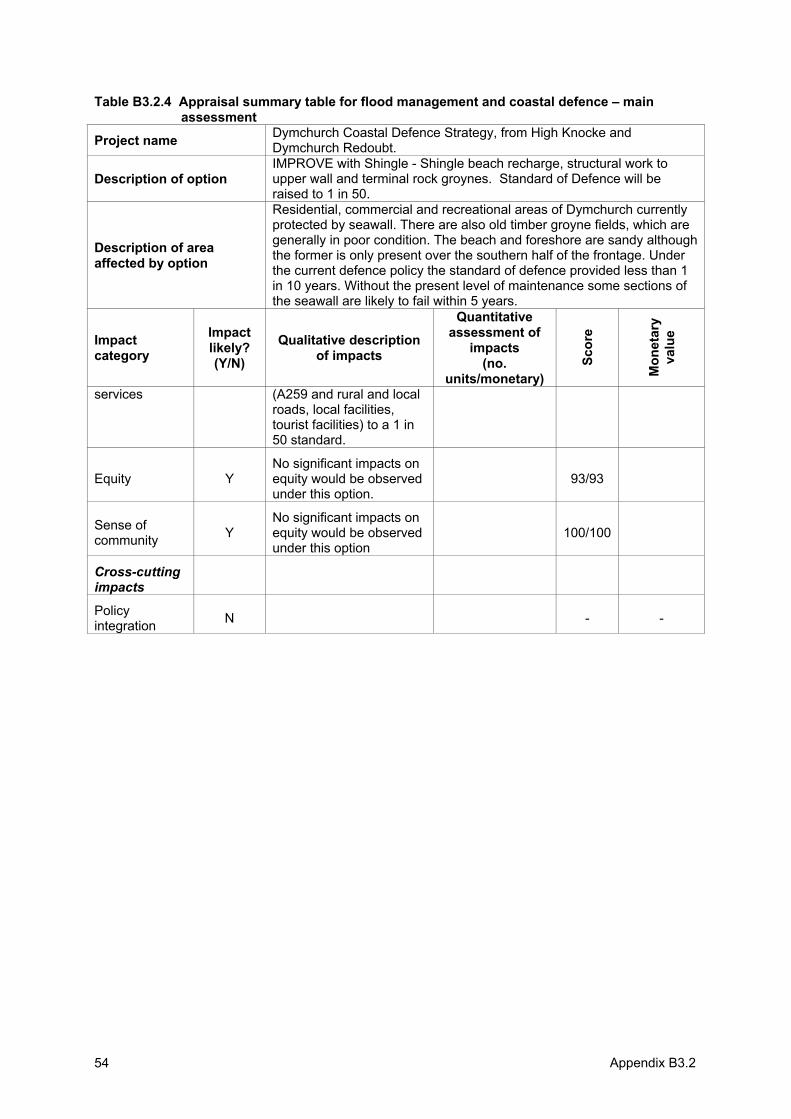
Appendix B3.254
Table B3.2.4 Appraisal summary table for flood management and coastal defence – main assessment
Project name Dymchurch Coastal Defence Strategy, from High Knocke and Dymchurch Redoubt.
Description of option IMPROVE with Shingle - Shingle beach recharge, structural work to upper wall and terminal rock groynes. Standard of Defence will be raised to 1 in 50.
Description of area affected by option
Residential, commercial and recreational areas of Dymchurch currently protected by seawall. There are also old timber groyne fields, which are generally in poor condition. The beach and foreshore are sandy although the former is only present over the southern half of the frontage. Under the current defence policy the standard of defence provided less than 1 in 10 years. Without the present level of maintenance some sections of the seawall are likely to fail within 5 years.
Impactcategory
Impactlikely? (Y/N)
Qualitative description of impacts
Quantitative assessment of
impacts(no.
units/monetary)
Scor
e
Mon
etar
yva
lue
services (A259 and rural and local roads, local facilities, tourist facilities) to a 1 in 50 standard.
Equity Y No significant impacts on equity would be observed under this option.
93/93
Sense of community Y
No significant impacts on equity would be observed under this option
100/100
Cross-cuttingimpacts
Policy integration N - -
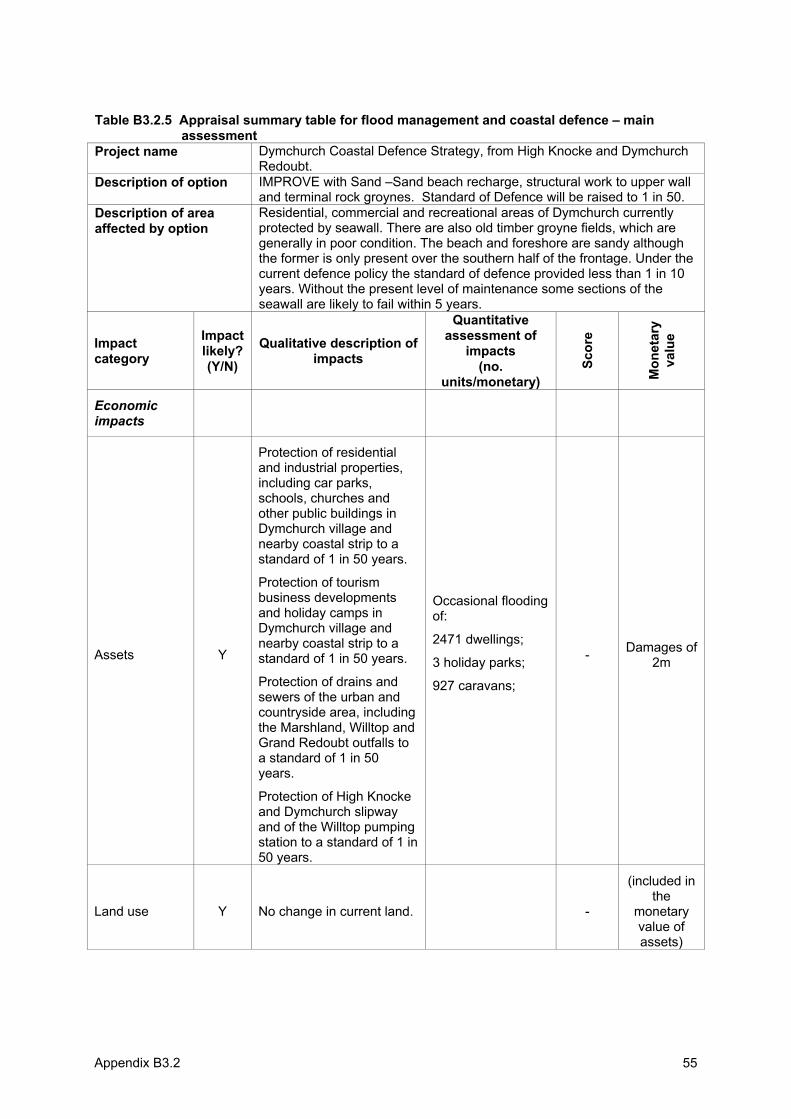
Appendix B3.2 55
Table B3.2.5 Appraisal summary table for flood management and coastal defence – main assessment
Project name Dymchurch Coastal Defence Strategy, from High Knocke and Dymchurch Redoubt.
Description of option IMPROVE with Sand –Sand beach recharge, structural work to upper wall and terminal rock groynes. Standard of Defence will be raised to 1 in 50.
Description of area affected by option
Residential, commercial and recreational areas of Dymchurch currently protected by seawall. There are also old timber groyne fields, which are generally in poor condition. The beach and foreshore are sandy although the former is only present over the southern half of the frontage. Under the current defence policy the standard of defence provided less than 1 in 10 years. Without the present level of maintenance some sections of the seawall are likely to fail within 5 years.
Impactcategory
Impactlikely? (Y/N)
Qualitative description of impacts
Quantitative assessment of
impacts(no.
units/monetary)
Scor
e
Mon
etar
yva
lue
Economicimpacts
Assets Y
Protection of residential and industrial properties, including car parks, schools, churches and other public buildings in Dymchurch village and nearby coastal strip to a standard of 1 in 50 years.
Protection of tourism business developments and holiday camps in Dymchurch village and nearby coastal strip to a standard of 1 in 50 years.
Protection of drains and sewers of the urban and countryside area, including the Marshland, Willtop and Grand Redoubt outfalls to a standard of 1 in 50 years.
Protection of High Knocke and Dymchurch slipway and of the Willtop pumping station to a standard of 1 in 50 years.
Occasional flooding of:
2471 dwellings;
3 holiday parks;
927 caravans;
- Damages of 2m
Land use Y No change in current land. -
(included in the
monetaryvalue of assets)
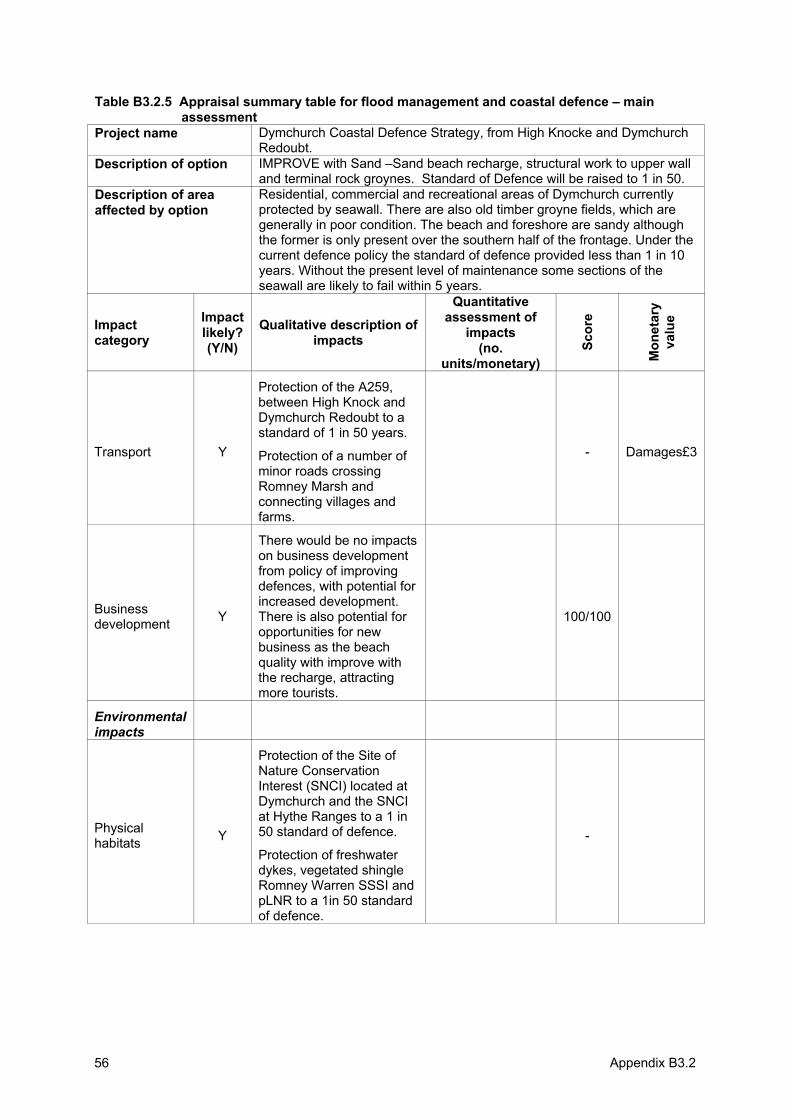
Appendix B3.256
Table B3.2.5 Appraisal summary table for flood management and coastal defence – main assessment
Project name Dymchurch Coastal Defence Strategy, from High Knocke and Dymchurch Redoubt.
Description of option IMPROVE with Sand –Sand beach recharge, structural work to upper wall and terminal rock groynes. Standard of Defence will be raised to 1 in 50.
Description of area affected by option
Residential, commercial and recreational areas of Dymchurch currently protected by seawall. There are also old timber groyne fields, which are generally in poor condition. The beach and foreshore are sandy although the former is only present over the southern half of the frontage. Under the current defence policy the standard of defence provided less than 1 in 10 years. Without the present level of maintenance some sections of the seawall are likely to fail within 5 years.
Impactcategory
Impactlikely? (Y/N)
Qualitative description of impacts
Quantitative assessment of
impacts(no.
units/monetary)
Scor
e
Mon
etar
yva
lue
Transport Y
Protection of the A259, between High Knock and Dymchurch Redoubt to a standard of 1 in 50 years.
Protection of a number of minor roads crossing Romney Marsh and connecting villages and farms.
- Damages£3
Businessdevelopment Y
There would be no impacts on business development from policy of improving defences, with potential for increased development.There is also potential for opportunities for new business as the beach quality with improve with the recharge, attracting more tourists.
100/100
Environmentalimpacts
Physical habitats Y
Protection of the Site of Nature Conservation Interest (SNCI) located at Dymchurch and the SNCI at Hythe Ranges to a 1 in 50 standard of defence.
Protection of freshwater dykes, vegetated shingle Romney Warren SSSI and pLNR to a 1in 50 standard of defence.
-
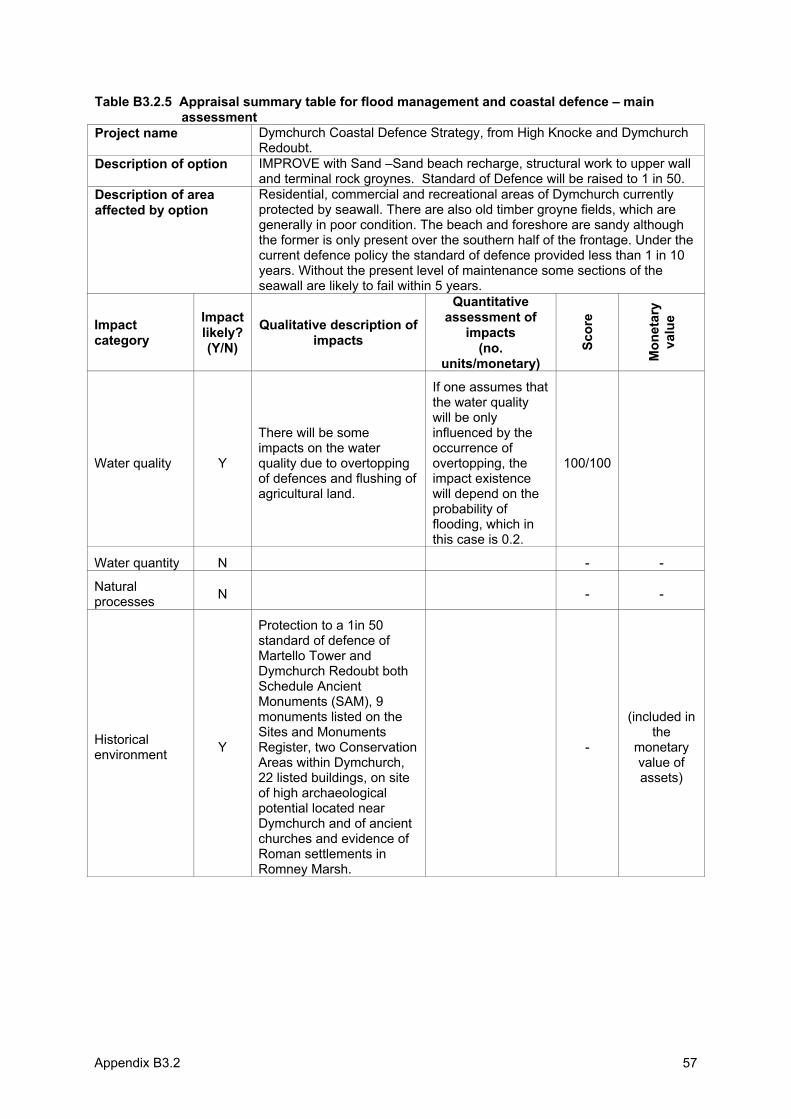
Appendix B3.2 57
Table B3.2.5 Appraisal summary table for flood management and coastal defence – main assessment
Project name Dymchurch Coastal Defence Strategy, from High Knocke and Dymchurch Redoubt.
Description of option IMPROVE with Sand –Sand beach recharge, structural work to upper wall and terminal rock groynes. Standard of Defence will be raised to 1 in 50.
Description of area affected by option
Residential, commercial and recreational areas of Dymchurch currently protected by seawall. There are also old timber groyne fields, which are generally in poor condition. The beach and foreshore are sandy although the former is only present over the southern half of the frontage. Under the current defence policy the standard of defence provided less than 1 in 10 years. Without the present level of maintenance some sections of the seawall are likely to fail within 5 years.
Impactcategory
Impactlikely? (Y/N)
Qualitative description of impacts
Quantitative assessment of
impacts(no.
units/monetary)
Scor
e
Mon
etar
yva
lue
Water quality Y
There will be some impacts on the water quality due to overtopping of defences and flushing of agricultural land.
If one assumes that the water quality will be only influenced by the occurrence of overtopping, the impact existence will depend on the probability of flooding, which in this case is 0.2.
100/100
Water quantity N - -
Naturalprocesses N - -
Historicalenvironment Y
Protection to a 1in 50 standard of defence of Martello Tower and Dymchurch Redoubt both Schedule Ancient Monuments (SAM), 9 monuments listed on the Sites and Monuments Register, two Conservation Areas within Dymchurch, 22 listed buildings, on site of high archaeological potential located near Dymchurch and of ancient churches and evidence of Roman settlements in Romney Marsh.
-
(included in the
monetaryvalue of assets)
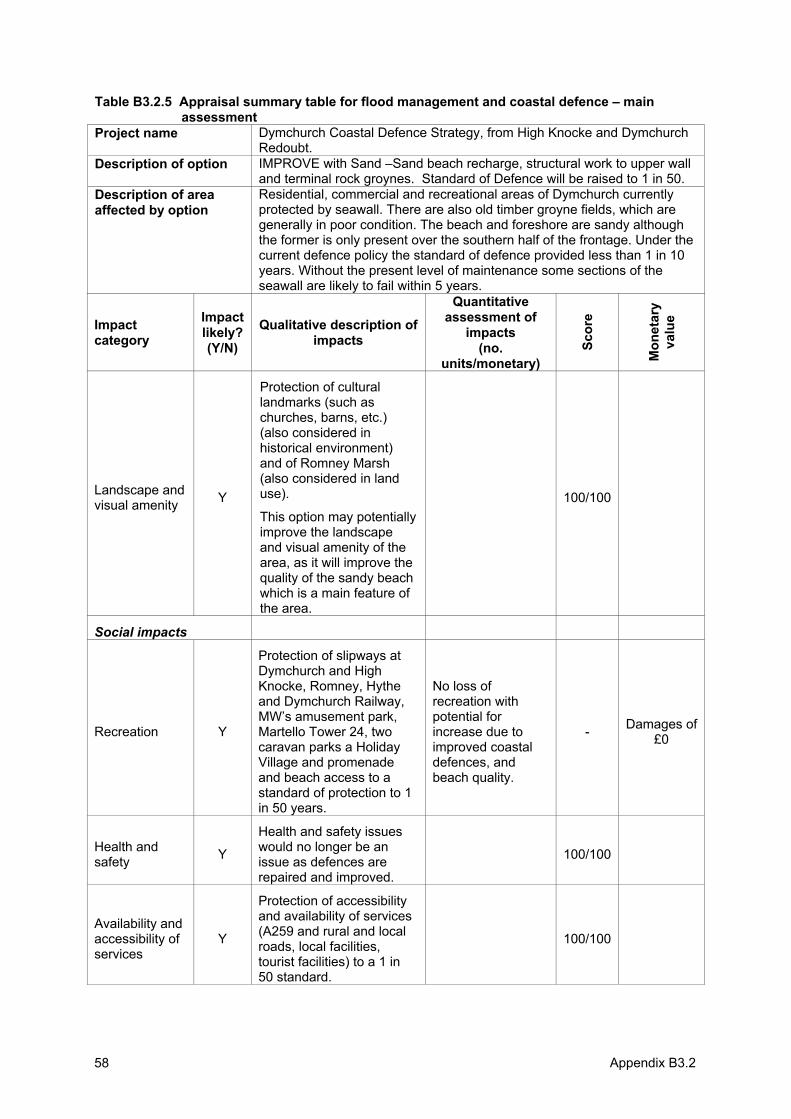
Appendix B3.258
Table B3.2.5 Appraisal summary table for flood management and coastal defence – main assessment
Project name Dymchurch Coastal Defence Strategy, from High Knocke and Dymchurch Redoubt.
Description of option IMPROVE with Sand –Sand beach recharge, structural work to upper wall and terminal rock groynes. Standard of Defence will be raised to 1 in 50.
Description of area affected by option
Residential, commercial and recreational areas of Dymchurch currently protected by seawall. There are also old timber groyne fields, which are generally in poor condition. The beach and foreshore are sandy although the former is only present over the southern half of the frontage. Under the current defence policy the standard of defence provided less than 1 in 10 years. Without the present level of maintenance some sections of the seawall are likely to fail within 5 years.
Impactcategory
Impactlikely? (Y/N)
Qualitative description of impacts
Quantitative assessment of
impacts(no.
units/monetary)
Scor
e
Mon
etar
yva
lue
Landscape and visual amenity Y
Protection of cultural landmarks (such as churches, barns, etc.) (also considered in historical environment) and of Romney Marsh (also considered in land use).
This option may potentially improve the landscape and visual amenity of the area, as it will improve the quality of the sandy beach which is a main feature of the area.
100/100
Social impacts
Recreation Y
Protection of slipways at Dymchurch and High Knocke, Romney, Hythe and Dymchurch Railway, MW’s amusement park, Martello Tower 24, two caravan parks a Holiday Village and promenade and beach access to a standard of protection to 1 in 50 years.
No loss of recreation with potential for increase due to improved coastal defences, and beach quality.
- Damages of £0
Health and safety Y
Health and safety issues would no longer be an issue as defences are repaired and improved.
100/100
Availability and accessibility of services
Y
Protection of accessibility and availability of services (A259 and rural and local roads, local facilities, tourist facilities) to a 1 in 50 standard.
100/100
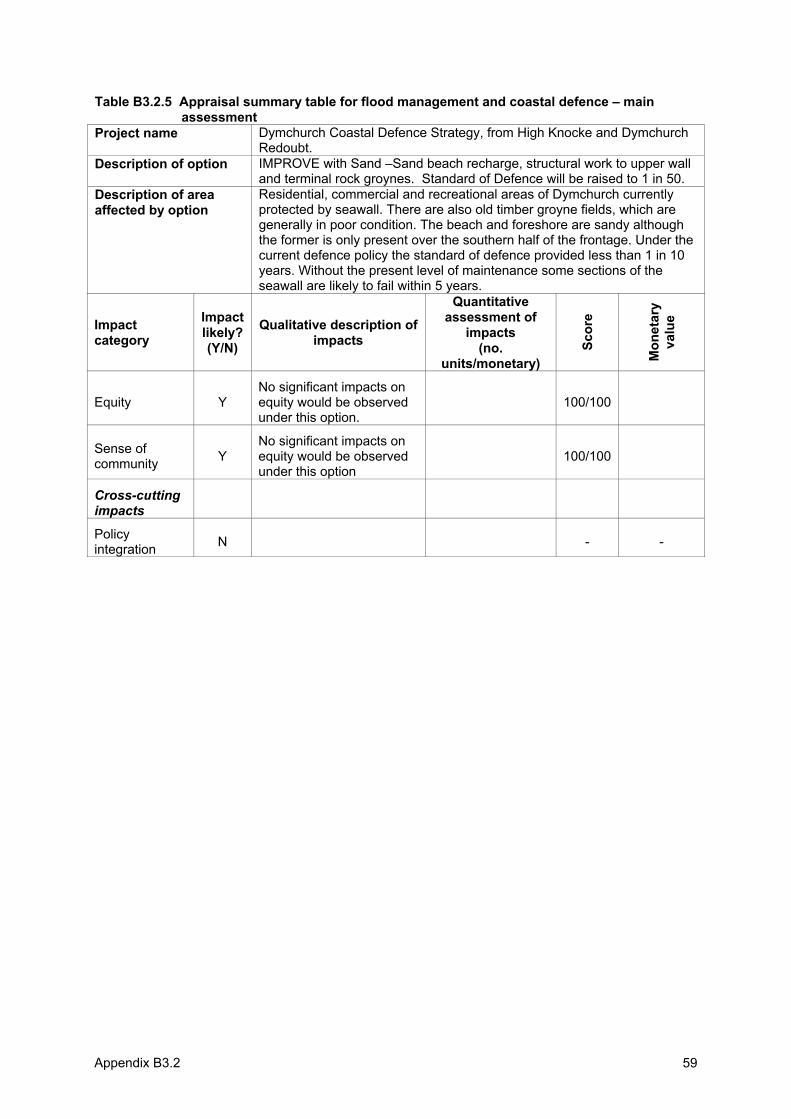
Appendix B3.2 59
Table B3.2.5 Appraisal summary table for flood management and coastal defence – main assessment
Project name Dymchurch Coastal Defence Strategy, from High Knocke and Dymchurch Redoubt.
Description of option IMPROVE with Sand –Sand beach recharge, structural work to upper wall and terminal rock groynes. Standard of Defence will be raised to 1 in 50.
Description of area affected by option
Residential, commercial and recreational areas of Dymchurch currently protected by seawall. There are also old timber groyne fields, which are generally in poor condition. The beach and foreshore are sandy although the former is only present over the southern half of the frontage. Under the current defence policy the standard of defence provided less than 1 in 10 years. Without the present level of maintenance some sections of the seawall are likely to fail within 5 years.
Impactcategory
Impactlikely? (Y/N)
Qualitative description of impacts
Quantitative assessment of
impacts(no.
units/monetary)
Scor
e
Mon
etar
yva
lue
Equity Y No significant impacts on equity would be observed under this option.
100/100
Sense of community Y
No significant impacts on equity would be observed under this option
100/100
Cross-cuttingimpacts
Policy integration N - -
Joint Defra/EA Flood and Coastal Erosion Risk Management R&D Programme
Annex B.4:
Case study no.4:
Assessment of the River Chet flood alleviation scheme
R&D Project Record FD2013/PR2
Produced: November 2004

ii
Statement of use This report provides guidance on the use of MCA and ASTs to assist in the appraisal of flood and coastal erosion risk management projects, strategies and policies. It should be noted that it does not constitute official government policy or guidance, which is unlikely to be available until work to develop the methodology and identify appropriate sources of data has been undertaken through pilot studies.
This report may be downloaded from the Defra/EA R&D Programme website (http://www.defra.gov.uk/environ.fcd/research), use the search tool located on the project information and publications page. Copies are held by all EA Regional Information Centres, contact The Environment Agency’s National Customer Contact Centre by emailing [email protected] or by telephoning 08708506506.
Dissemination Status Internal: Released internally External: Released to public domain
Keywords: Multi criteria analysis, MCA, appraisal summary table, AST, decision rule
Research contractor contact details: Lead contractor: Risk & Policy Analysts Ltd (RPA), Farthing Green House, 1 Beccles Road, Loddon, Norfolk, NR14 6LT (Tel: 01508 528465; Fax: 01508 520758; www.rpaltd.co.uk). The project director was Meg Postle, the project manager for RPA was John Ash with research support from Susana Dias and other members of RPA staff.
The research team also included: Colin Green (Flood Hazard Research Centre, Middlesex University); Alan Pearman (University of Leeds); Ron Janssen (The Institute of Environmental Studies, Free University, Amsterdam), Terry Oakes and Hugh Payne (Independent Consultants)
Acknowledgements The assistance of those providing information for the case studies is gratefully acknowledged.
Defra project manager: Matt Crossman, Defra, 3D Ergon House, Horseferry Rd, London, SW1P 2AL. Email: [email protected]
Publishing organisation DefraFlood Management Division Ergon House Horseferry Road London SW1P 2AL Tel: 020 7238 3000 Fax: 020 7238 6187 www.defra.gov.uk/environ/fcd
â Crown copyright (Defra); 2005
Copyright in the typographical arrangement and design rests with the Crown. This publication (excluding the logo) may be reproduced free of charge in any format or medium provided that it is reproduced accurately and not used in a misleading context. The material must be acknowledged as Crown copyright with the title and source of the publication specified. The views expressed in this document are not necessarily those of Defra or the Environment Agency. Its officers, servants or agents accept no liability whatsoever for any loss or damage arising from the interpretation or use of the information, or reliance on views contained herein.
Published by the Department for Environment, Food and Rural Affairs. Printed in the UK, March 2005 on recycled material containing 80% post-consumer waste and 20% totally chlorine free virgin pulp.
PB No. 10734/PR2 ISBN 0-85521-146-6
Section 1: Introduction 1
1. Introduction In May 2001 Broadland Environmental Services Limited (BESL) was awarded a long-term contract by the Environment Agency to improve and maintain flood defences in Broadland. The Agency’s approach to flood alleviation in Broadland was adopted in the 1990’s and is based on a strategy consisting mainly of back strengthening and erosion protection and reducing the risks of bank breaching. BESL has recently updated this strategy and it now sets the scene for how this and future improvement schemes are designed, programmed and carried out.Recent detailed surveys and monitoring confirm that improvements are needed to flood defences for the left bank of the River Chet (Chedgrave Common and Hardley Marshes). However, the BESL is also concerned with flood alleviation work on the opposite bank of the river, Compartment 22.
The River Chet is a navigable, embanked, tidal river, 7m to 20 m wide, and relatively deep. This report presents the MCA-based project appraisal process for the River Chet, part of Compartment 22, south bank from Pyes Mill to Nogdam End.
Our interest in the River Chet Defence Scheme is based on it being local scheme project that has been facing problems relating to conflict stakeholders. There seems to exist significant controversy in relation to which options to consider for appraisal. The information reported here is based on the following main documents:
• EA (1996a): Broadland Flood Alleviation Strategy Study, Bank Strengthening and Erosion Protection, Compartment 22 (Burgh Norton) Detailed Appraisal;
• EA (1996b): Broadland Compartment 22, Local Environmental Assessment, Final Report; and
• Halcrow (2003): draft Environmental Statement for the flood alleviation improvements for AU 2.
1.1 Summary of the project area
The River Chet runs for approximately 3.5 miles, from the Town of Loddon until it joins the River Yare, between Cantley and Reedham. The river is narrow in places, wooded at first, then as it nears Hardley Cross is becomes more canal like, with extensive grazing marshes and big skies.
The River Chet case study comprises the south bank of the River Chet from Pyes Mill to Nogdam End, which is part of Compartment 22 - Burgh Norton - of the Broadland Flood Alleviation Strategy. Also part of this Compartment is the right hand bank of the River Yare from the Chet to Haddiscoe Cut, Haddiscoe Cut south west bank, and the River Waveney left bank from Haddiscoe Cut to Burgh St Peter (EA, 1996). The flood and coastal defence management in the Broadland is covered under the Broadland Flood Alleviation Strategy (BFAS).
Section 1: Introduction 2
Compartment 22 is typical of Broadland, land use is almost 100% agriculture and the land is very low lying. The area is particularly susceptible to flooding, either from high freshwater river flows or more frequently high sea levels (EA, 1996).
The two main natural features to be highlighted and that would be threatened by flooding in the south bank of the River Chet are:
• the fresh water soke dykes which support a varied marginal and aquatic flora, including reed sweet grass, common reed, common duckweed and ivy-leave duckweed; and
• wet woodland which occurs along the Chet Valley
Ronds (area between channel and the floodbank) are a local feature and provide a vital flood defence function in that they minimise erosion of the floodbank and provide additional water holding capacity during the high flows.
The River Chet, as part of Broadland, is one of the few remaining areas of lowland river valley grassland in Britain and considered to be ecologically unique in Europe. Characteristic species in the floodbank include common reed, common couch, creeping thistle, spear thistle, cleavers, nettle and bramble. Furthermore, the vegetation along the landward berm of the floodbank (i.e. the folding) is typically dominated by common reed along with creeping thistle, hemlock, nettle, false oat grass and couch grass. Notable species include marsh sow thistle and stands of marsh mallow. Notable habitats along the folding include occasional wet hallows, with areas of turf and saltmarsh in some sections. There are no nature conservation sites within the study area and the area has been designated an ESA by MAFF. However, Species Actions Plans exist for species present in the soke dykes, such as the water vole and floating water plantain. It is unclear at this point whether this species are present in the soke dykes of the River Chet.
Finally, it is worth noting that there are no schedule Ancient Monuments in the study area and there are no archaeological sites of interest.
1.2 Existing defences
In general, the existing frontline defences comprise earth embankments (floodbank), with a mixture of reed ronds, and a variety of erosion protection measures, such as piling, protecting some areas.
The embankments are generally in poor condition, being susceptible to seepage and, on occasion, to failure that can lead to breaching (NRA, 1995a in EA, 1996b). In addition, the floodbanks have settled since they were last improved and are now at risk of being overtopped by flood water on an event with a return period of once every five years or less (EA, 1996b).
Section 1: Introduction 3
The defences in some areas are also threatened by undermining due to erosion at the edge of the river channel. Within the River Chet the erosion protection comprises of high level steel and timber piling along much of the riverbank, with some areas of unprotected reed rond. In many cases, the timber/steel piling is nearing the end of its useful life (residual life less than 10 years) and scour out of the bank behind is occurring. In other areas, the unprotected reed rond is rapidly eroding leaving the floodbank unprotected (EA, 1996b).
There is a double dyke intersection and crosswall at the upstream end of Nogdam End. The majority of the bank is made up of a narrow crest and steep backface, making it vulnerable to breaching when overtopped (Halcrow, 2003).
The overall standard of flood defence has progressively reduced due to settlement, age and the combined effects of erosion, corrosion and sea level rise. The standard of defence in the all Compartment varies from 1 in 1.5 to 1 in 5 years (EA, 1996a).
1.3 The policy framework
The Environment Agency’s approach for flood and coastal defence of the Broadland was adopted in the 1990’s in the Broadland Flood Alleviation Strategy (BFAS). The general aim of erosion protection and bank strengthening is to sustain the existing flood defences in the area for the next 50 years, i.e. to improve and subsequently maintain their condition without raising the long term standard of protection they provide (EA, 1996a).
In 2001, Broadland Environmental Services Limited (BESL) was commissioned by the Environment Agency (the Agency) in 2001 to carry out the Broadland Flood Alleviation Project, a long-term 20-year programme of sustainable flood defence maintenance and improvements.
Because the River Chet case study is part of the Broadland, its policy framework is somewhat different from the remaining case studies. Schemes under the BFAS do not follow the traditional flood and coastal defence project appraisal norms, namely in respect of funding allocation which comes directly from the government grant allocated to the Broadland area, rather than for individually justified schemes.
The BFAS constituted a high level assessment, using Cost Benefit Analysis (CBA) as a decision-aiding tool. The BFAS proved conclusively, by consideration of loss avoidance, that the undertaking of works in the whole area is economically justified. Predicted future flooding patterns indicate that construction should start in the most seaward compartments of which Compartment 22 is one (EA, 1996a).
Under the Strategy, local flood alleviation schemes were subsequently developed for each compartment and a preferred flood defence option was recommended. Alternatives were subject to further environmental assessment through the production of non-statutory Local Environmental Assessment (LEA)
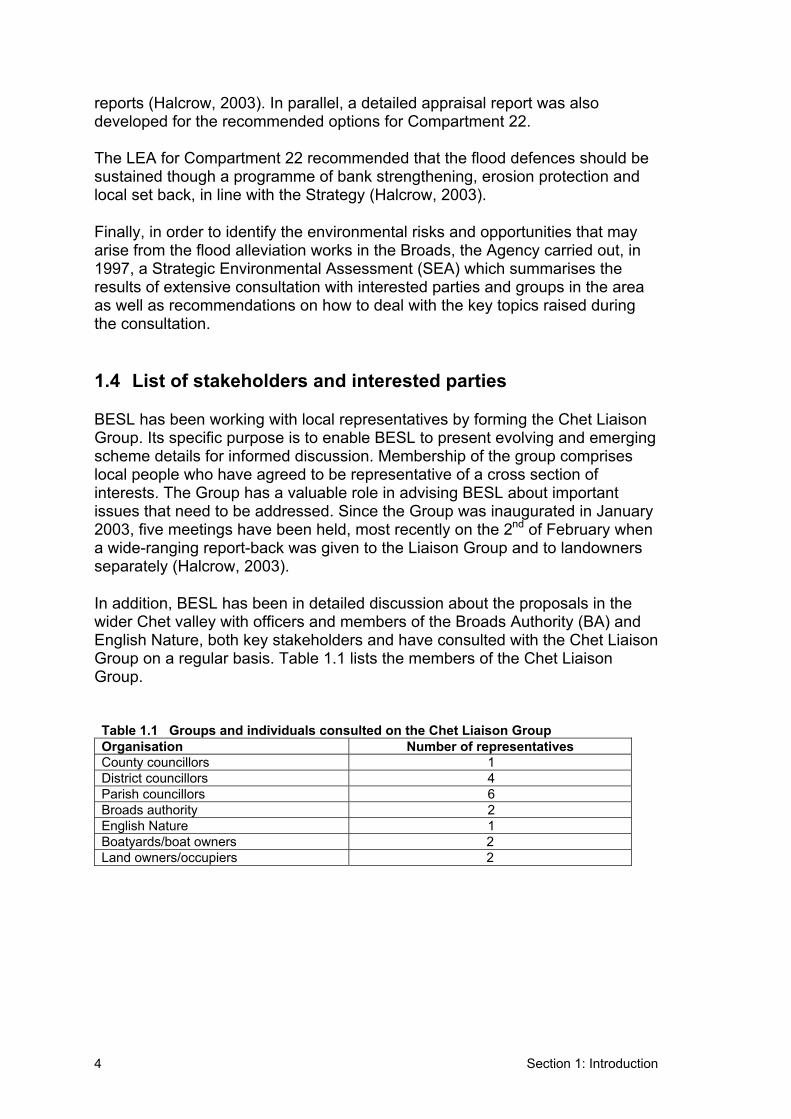
Section 1: Introduction 4
reports (Halcrow, 2003). In parallel, a detailed appraisal report was also developed for the recommended options for Compartment 22.
The LEA for Compartment 22 recommended that the flood defences should be sustained though a programme of bank strengthening, erosion protection and local set back, in line with the Strategy (Halcrow, 2003).
Finally, in order to identify the environmental risks and opportunities that may arise from the flood alleviation works in the Broads, the Agency carried out, in 1997, a Strategic Environmental Assessment (SEA) which summarises the results of extensive consultation with interested parties and groups in the area as well as recommendations on how to deal with the key topics raised during the consultation.
1.4 List of stakeholders and interested parties
BESL has been working with local representatives by forming the Chet Liaison Group. Its specific purpose is to enable BESL to present evolving and emerging scheme details for informed discussion. Membership of the group comprises local people who have agreed to be representative of a cross section of interests. The Group has a valuable role in advising BESL about important issues that need to be addressed. Since the Group was inaugurated in January 2003, five meetings have been held, most recently on the 2nd of February when a wide-ranging report-back was given to the Liaison Group and to landowners separately (Halcrow, 2003).
In addition, BESL has been in detailed discussion about the proposals in the wider Chet valley with officers and members of the Broads Authority (BA) and English Nature, both key stakeholders and have consulted with the Chet Liaison Group on a regular basis. Table 1.1 lists the members of the Chet Liaison Group.
Table 1.1 Groups and individuals consulted on the Chet Liaison Group Organisation Number of representatives County councillors 1 District councillors 4 Parish councillors 6 Broads authority 2 English Nature 1 Boatyards/boat owners 2 Land owners/occupiers 2
Section 2: Definition of objectives and management options 5
2. Definition of objectives and management options
The BFAS defined both long term and short-term objectives for the Broads.The long-term objectives were (EA, 1996a):
• to sustain the integrity of the flood defences for the period of the strategy (50 years) therefore all current defended land will continue to be protected;
• to ensure that all works undertaken as part of the strategy are sustainable; • to promote conservation of the natural environment; • to ensure continuation of navigation of the Broads, where flood defences
may impact.
The short-term objectives were (EA, 1996a):
• to secure the defences within Compartment 22 so that the existing standard of defence is sustained for the next 15 years;
• to ensure that the existing flood defence structures are stabilised to meet accepted factors of safety; and
• to undertake works that mitigate the effects of continued erosion of the berm.
The Detailed Appraisal Report for Compartment 22 mentioned in section 1.3 (EA, 1996a) developed the findings and recommendations of the BFAS to give a detailed appraisal of flood alleviation works required for the next 50 years.Within this report, compartment wide issues, existing flood defence deficiencies, proposed solutions, constraints and detailed cost estimates are identified. Benefit scenarios were not developed since they had been fully covered by and unchanged from the BFAS.
For the River Chet (right hand bank) the options considered in Detailed Appraisal Study were (EA, 1996a):
• sustain along the existing line - the floodbanks would be widened to become more secure, and would be raised by 375 mm above average defence level of 1.3m AOD to counter effects of settlement and sea level rise over a 15 year period. This would necessitate moving the soke dyke behind the bank, and widening it;
• sustain along set back line of defence - this option involves setting back the bank landward from its existing position; and
• management retreat existing hard defences would be removed strategically, the bank in this area would be reprofiled and the river would be allowed to erode and accrete naturally until it met higher ground.Eventually the existing floodbanks would be eroded, and they would also continue to settle.
Section 2: Definition of objectives and management options 6
For the preferred option, and due to extensive amount of erosion protection required for the river, the Detail Appraisal Study (EA, 1996a) proposed to locally set back the bank from the most upstream point of Compartment 22 (near Loddon) to Nogdam End. The Cross bank at Nogdam End would need to be strengthened, and strengthening and erosion works along the existing line would continue downstream to Nogdam End. The bank would be set back a maximum of 25 m from the line of the river, including any existing rond. It was envisaged that a haul road would be constructed behind the works, and a new soke dyke would be created, set back from the new floodbank to allow for working area.
The Detailed Appraisal Study (EA, 1996a) does not consider the benefit scenarios of each option because these have already been covered in the BFAS. A detailed review of the Flood Alleviation Strategy makes clear that, although considerations about the benefits of each option were contemplated and a contingent valuation (CV) survey was carried out for recreational and amenity impacts, these considerations were not included in the assessment of options. The benefits valued for each option consisted of solely the damages avoided by doing something as opposed to doing nothing. This is a valid approach but totally ignores the majority of environmental and social benefits of options that, although not easily valued in monetary terms, should be taken into account in decision-making.
Recently, the BFAS has been being reviewed by BESL, this in parallel with the development of flood alleviation schemes for a number of Broad’s rivers, including the Chet. This revised BFAS is still not in the public domain.
Following from the BFAS, BESL divided the right hand bank of the River Chet into two different assessment units (AU):
• AU 1, running from Pyes Mill to Nogdam End (3.4 km) • AU 2, running from Nogdam End to the Yare confluence.
For AU 2, BESL proposes the following flood defence works:
• set back floodbank from Nogdam End to Ferry Road (including crosswall); and,
• maintain defences as existing from Ferry Road to the Yare confluence.
These proposals went through public consultation in 2002, and the planning application was submitted in February 2004.
For AU 1 the process has been less straightforward.
BESL investigated the following options for flood defence from Pyes Mill to Nogdam End:
• do something - mostly reactive maintenance works. This option is still being considered for the short term;
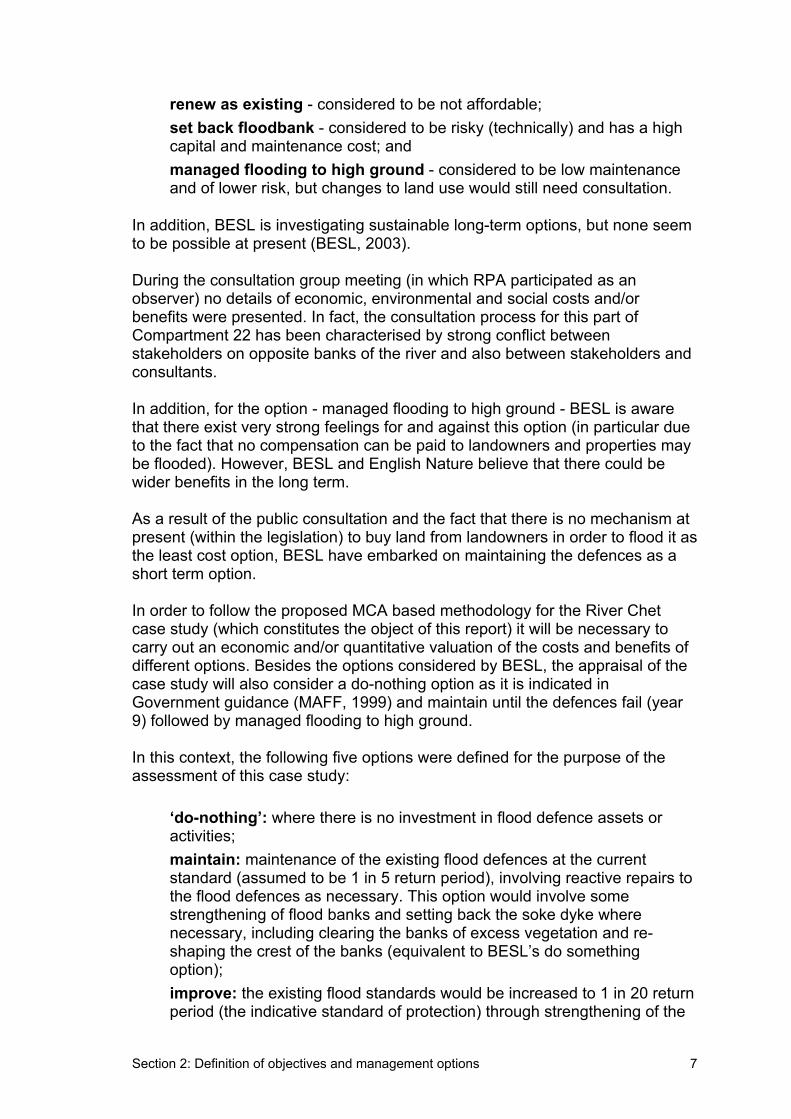
Section 2: Definition of objectives and management options 7
• renew as existing - considered to be not affordable; • set back floodbank - considered to be risky (technically) and has a high
capital and maintenance cost; and • managed flooding to high ground - considered to be low maintenance
and of lower risk, but changes to land use would still need consultation.
In addition, BESL is investigating sustainable long-term options, but none seem to be possible at present (BESL, 2003).
During the consultation group meeting (in which RPA participated as an observer) no details of economic, environmental and social costs and/or benefits were presented. In fact, the consultation process for this part of Compartment 22 has been characterised by strong conflict between stakeholders on opposite banks of the river and also between stakeholders and consultants.
In addition, for the option - managed flooding to high ground - BESL is aware that there exist very strong feelings for and against this option (in particular due to the fact that no compensation can be paid to landowners and properties may be flooded). However, BESL and English Nature believe that there could be wider benefits in the long term.
As a result of the public consultation and the fact that there is no mechanism at present (within the legislation) to buy land from landowners in order to flood it as the least cost option, BESL have embarked on maintaining the defences as a short term option.
In order to follow the proposed MCA based methodology for the River Chet case study (which constitutes the object of this report) it will be necessary to carry out an economic and/or quantitative valuation of the costs and benefits of different options. Besides the options considered by BESL, the appraisal of the case study will also consider a do-nothing option as it is indicated in Government guidance (MAFF, 1999) and maintain until the defences fail (year 9) followed by managed flooding to high ground.
In this context, the following five options were defined for the purpose of the assessment of this case study:
• ‘do-nothing’: where there is no investment in flood defence assets or activities;
• maintain: maintenance of the existing flood defences at the current standard (assumed to be 1 in 5 return period), involving reactive repairs to the flood defences as necessary. This option would involve some strengthening of flood banks and setting back the soke dyke where necessary, including clearing the banks of excess vegetation and re-shaping the crest of the banks (equivalent to BESL’s do something option);
• improve: the existing flood standards would be increased to 1 in 20 return period (the indicative standard of protection) through strengthening of the
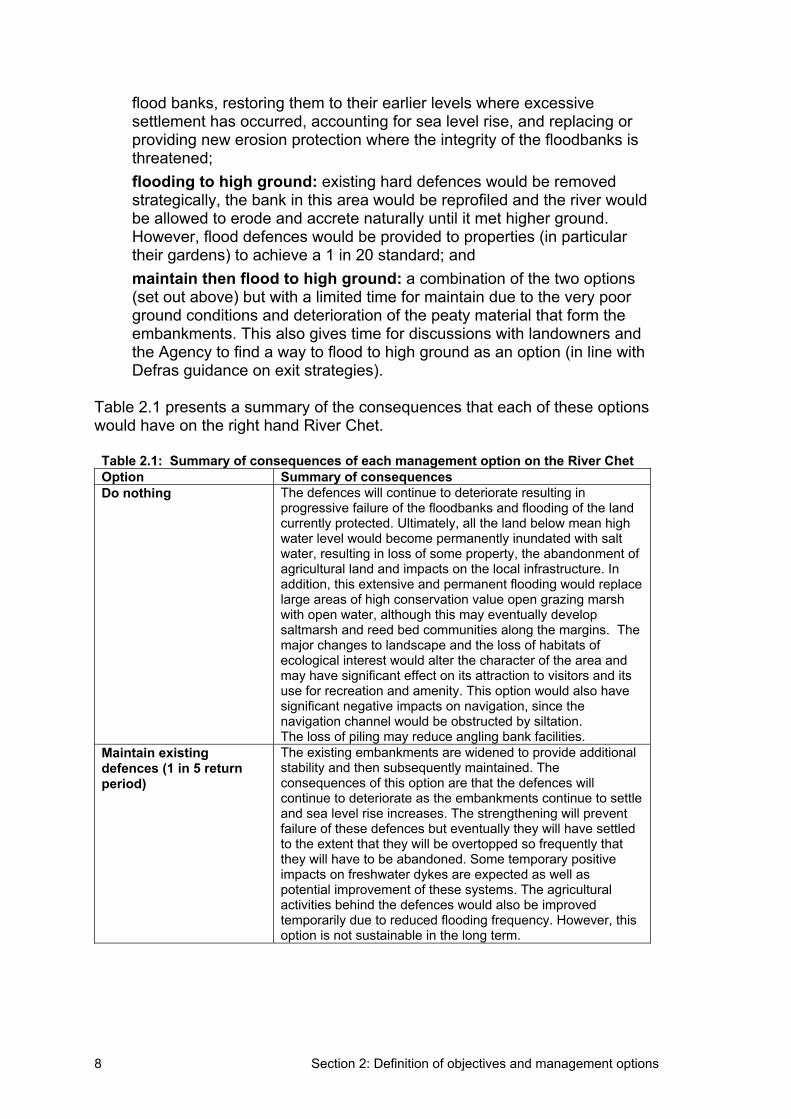
Section 2: Definition of objectives and management options 8
flood banks, restoring them to their earlier levels where excessive settlement has occurred, accounting for sea level rise, and replacing or providing new erosion protection where the integrity of the floodbanks is threatened;
• flooding to high ground: existing hard defences would be removed strategically, the bank in this area would be reprofiled and the river would be allowed to erode and accrete naturally until it met higher ground.However, flood defences would be provided to properties (in particular their gardens) to achieve a 1 in 20 standard; and
• maintain then flood to high ground: a combination of the two options (set out above) but with a limited time for maintain due to the very poor ground conditions and deterioration of the peaty material that form the embankments. This also gives time for discussions with landowners and the Agency to find a way to flood to high ground as an option (in line with Defras guidance on exit strategies).
Table 2.1 presents a summary of the consequences that each of these options would have on the right hand River Chet.
Table 2.1: Summary of consequences of each management option on the River Chet Option Summary of consequences Do nothing The defences will continue to deteriorate resulting in
progressive failure of the floodbanks and flooding of the land currently protected. Ultimately, all the land below mean high water level would become permanently inundated with salt water, resulting in loss of some property, the abandonment of agricultural land and impacts on the local infrastructure. In addition, this extensive and permanent flooding would replace large areas of high conservation value open grazing marsh with open water, although this may eventually develop saltmarsh and reed bed communities along the margins. The major changes to landscape and the loss of habitats of ecological interest would alter the character of the area and may have significant effect on its attraction to visitors and its use for recreation and amenity. This option would also have significant negative impacts on navigation, since the navigation channel would be obstructed by siltation.The loss of piling may reduce angling bank facilities.
Maintain existing defences (1 in 5 return period)
The existing embankments are widened to provide additional stability and then subsequently maintained. The consequences of this option are that the defences will continue to deteriorate as the embankments continue to settle and sea level rise increases. The strengthening will prevent failure of these defences but eventually they will have settled to the extent that they will be overtopped so frequently that they will have to be abandoned. Some temporary positive impacts on freshwater dykes are expected as well as potential improvement of these systems. The agricultural activities behind the defences would also be improved temporarily due to reduced flooding frequency. However, this option is not sustainable in the long term.
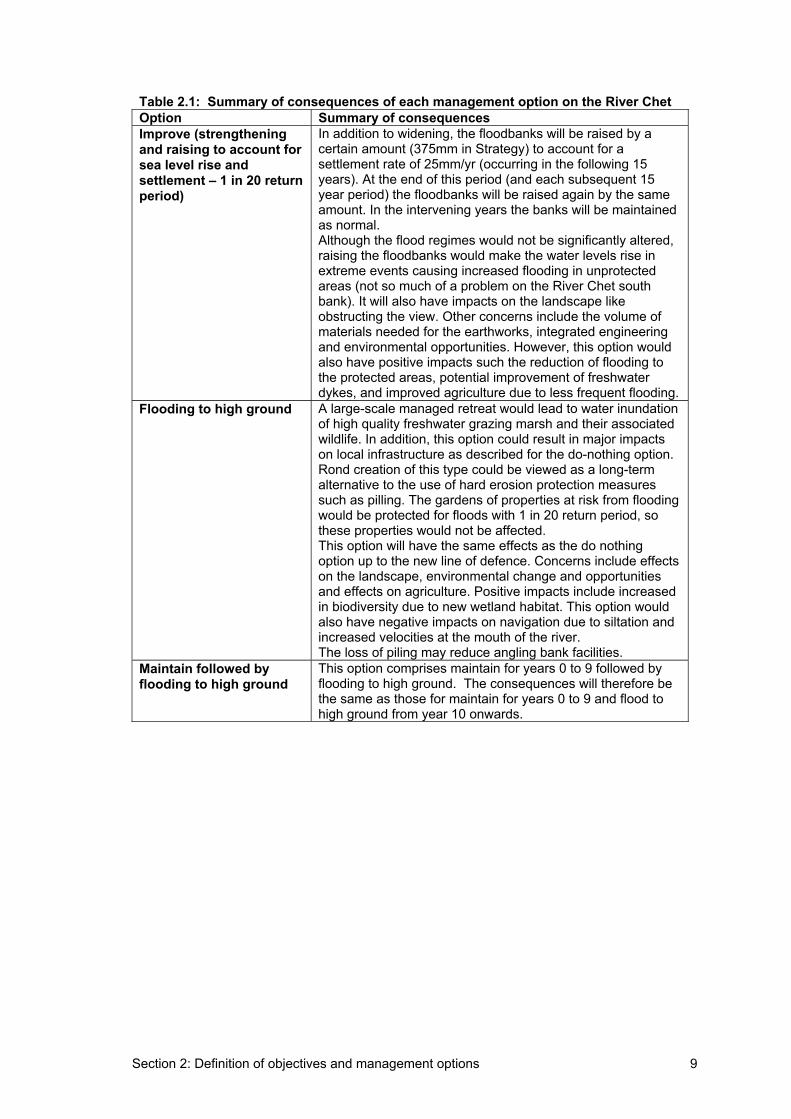
Section 2: Definition of objectives and management options 9
Table 2.1: Summary of consequences of each management option on the River Chet Option Summary of consequences Improve (strengthening and raising to account for sea level rise and settlement – 1 in 20 return period)
In addition to widening, the floodbanks will be raised by a certain amount (375mm in Strategy) to account for a settlement rate of 25mm/yr (occurring in the following 15 years). At the end of this period (and each subsequent 15 year period) the floodbanks will be raised again by the same amount. In the intervening years the banks will be maintained as normal.Although the flood regimes would not be significantly altered, raising the floodbanks would make the water levels rise in extreme events causing increased flooding in unprotected areas (not so much of a problem on the River Chet south bank). It will also have impacts on the landscape like obstructing the view. Other concerns include the volume of materials needed for the earthworks, integrated engineering and environmental opportunities. However, this option would also have positive impacts such the reduction of flooding to the protected areas, potential improvement of freshwater dykes, and improved agriculture due to less frequent flooding.
Flooding to high ground A large-scale managed retreat would lead to water inundation of high quality freshwater grazing marsh and their associated wildlife. In addition, this option could result in major impacts on local infrastructure as described for the do-nothing option. Rond creation of this type could be viewed as a long-term alternative to the use of hard erosion protection measures such as pilling. The gardens of properties at risk from flooding would be protected for floods with 1 in 20 return period, so these properties would not be affected. This option will have the same effects as the do nothing option up to the new line of defence. Concerns include effects on the landscape, environmental change and opportunities and effects on agriculture. Positive impacts include increased in biodiversity due to new wetland habitat. This option would also have negative impacts on navigation due to siltation and increased velocities at the mouth of the river. The loss of piling may reduce angling bank facilities.
Maintain followed by flooding to high ground
This option comprises maintain for years 0 to 9 followed by flooding to high ground. The consequences will therefore be the same as those for maintain for years 0 to 9 and flood to high ground from year 10 onwards.
Section 3: Structuring the problem 10
3. Structuring the problem This section breaks down the problem into its component parts, identifying the set of impacts and associated criteria that will be used to make the decision. In other words it carries out a screening exercise for the Chet, south bank.
3.1 Summary of the screening exercise
This screening exercise is used to determine (i) which categories are relevant, (ii) which categories will be appraised by assigning monetary value to impacts and (iii) which will be appraised by assigning a score to the impacts. Relevant categories are those where there is a difference in the impacts of the options being appraised.
The screening and definition of potential impacts for the River Chet was based on the Local Impact Assessment for Compartment 22 (EA, 1996b), on the draft Environmental Statement for the flood alleviation improvements for AU 2 (Halcrow, 2003) and other sources of information such as conversations with local people and area maps etc. The Assessment Summary Table for High Level Screening (AST – S) is presented in Annex 1 of this report. Table 3.1 summarises the results of the screening exercise.
The high level screening exercise highlighted the fact that the vast majority of impacts of the options are related to environmental impacts, i.e. water quality, physical habitats and landscape and visual amenity, and, to a lesser extent, economic impacts, especially with regard to business development because of loss of boating activity.
The number of impact categories being assessed through monetary valuation is smaller than the number of impact categories being assessed through scoring.Moreover, when monetary valuation has been undertaken, such as for assets and land use, values have been found considerably low. In the former case, it is because only four gardens are expected to be affected while the main housing buildings are not expected to be affected from flooding, in the latter case, because valuation has been based on ESA payments.
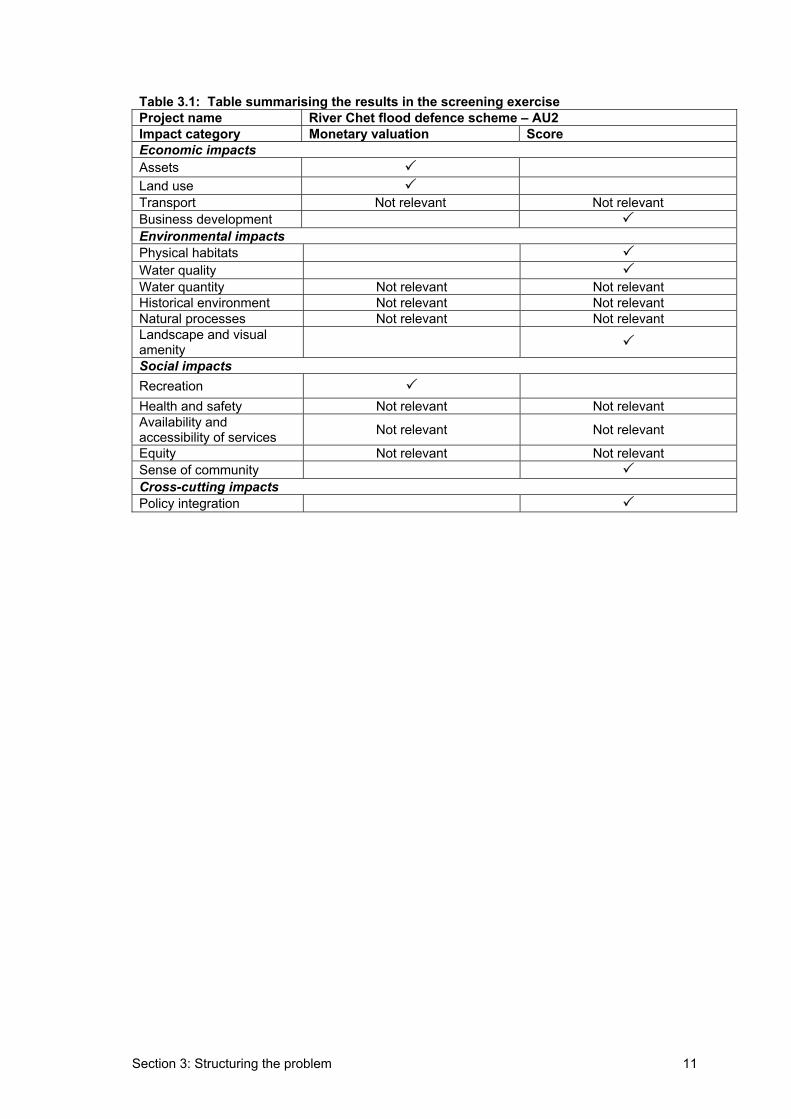
Section 3: Structuring the problem 11
Table 3.1: Table summarising the results in the screening exercise Project name River Chet flood defence scheme – AU2 Impact category Monetary valuation Score Economic impactsAssetsLand useTransport Not relevant Not relevantBusiness development Environmental impactsPhysical habitats Water quality Water quantity Not relevant Not relevant Historical environment Not relevant Not relevant Natural processes Not relevant Not relevant Landscape and visual amenitySocial impacts RecreationHealth and safety Not relevant Not relevantAvailability and accessibility of services Not relevant Not relevant
Equity Not relevant Not relevantSense of community Cross-cutting impactsPolicy integration
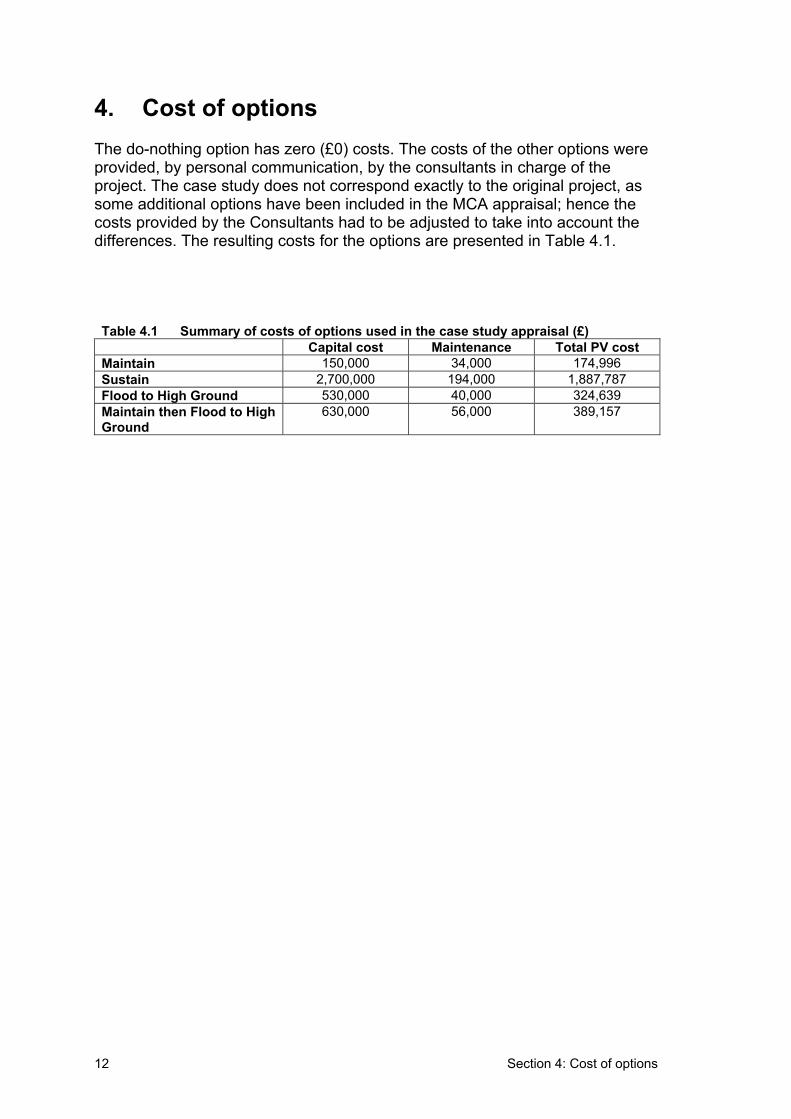
Section 4: Cost of options 12
4. Cost of options The do-nothing option has zero (£0) costs. The costs of the other options were provided, by personal communication, by the consultants in charge of the project. The case study does not correspond exactly to the original project, as some additional options have been included in the MCA appraisal; hence the costs provided by the Consultants had to be adjusted to take into account the differences. The resulting costs for the options are presented in Table 4.1.
Table 4.1 Summary of costs of options used in the case study appraisal (£) Capital cost Maintenance Total PV cost
Maintain 150,000 34,000 174,996 Sustain 2,700,000 194,000 1,887,787 Flood to High Ground 530,000 40,000 324,639 Maintain then Flood to High Ground
630,000 56,000 389,157
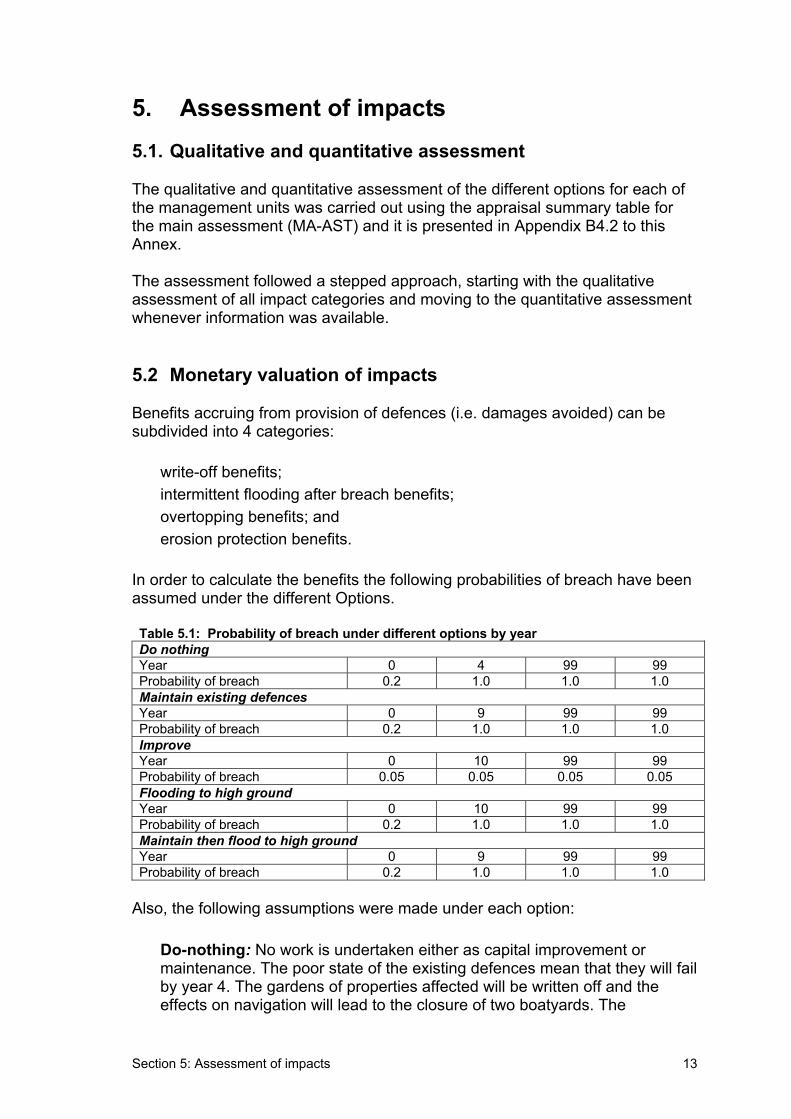
Section 5: Assessment of impacts 13
5. Assessment of impacts 5.1. Qualitative and quantitative assessment
The qualitative and quantitative assessment of the different options for each of the management units was carried out using the appraisal summary table for the main assessment (MA-AST) and it is presented in Appendix B4.2 to this Annex.
The assessment followed a stepped approach, starting with the qualitative assessment of all impact categories and moving to the quantitative assessment whenever information was available.
5.2 Monetary valuation of impacts
Benefits accruing from provision of defences (i.e. damages avoided) can be subdivided into 4 categories:
• write-off benefits; • intermittent flooding after breach benefits; • overtopping benefits; and • erosion protection benefits.
In order to calculate the benefits the following probabilities of breach have been assumed under the different Options.
Table 5.1: Probability of breach under different options by year Do nothing Year 0 4 99 99 Probability of breach 0.2 1.0 1.0 1.0 Maintain existing defences Year 0 9 99 99 Probability of breach 0.2 1.0 1.0 1.0 ImproveYear 0 10 99 99 Probability of breach 0.05 0.05 0.05 0.05 Flooding to high ground Year 0 10 99 99 Probability of breach 0.2 1.0 1.0 1.0 Maintain then flood to high ground Year 0 9 99 99 Probability of breach 0.2 1.0 1.0 1.0
Also, the following assumptions were made under each option:
• Do-nothing: No work is undertaken either as capital improvement or maintenance. The poor state of the existing defences mean that they will fail by year 4. The gardens of properties affected will be written off and the effects on navigation will lead to the closure of two boatyards. The
Section 5: Assessment of impacts 14
freshwater habitat will be lost but the new flooded area will be similar to Hardley Flood and therefore has the potential to develop greater conservation value equivalent to an SSSI. There will be a reduction in boating activity (assumed to be 50%) due to siltation and navigation being more difficult for larger boats;
• Maintain: Under maintain, work is undertaken to strengthen and repair the defences until this becomes impossible in year 9. After year 9, therefore, the option reverts to do-nothing. This means that the gardens and agricultural land are written-off and that recreational trips are also lost. The write-off costs are the same as for do-nothing, but occur further into the future such that the Present Value damages are reduced;
• Sustain: Under sustain, there would be negligible damages to gardens, while the agricultural land and recreational use of the area would be protected to a 1 in 20 year standard;
• Flood to High Ground: Under the flood to high ground option, there would be negligible impacts on gardens as defences would be provided to properties. Recreation would be affected to a degree but some dredging would be undertaken to maintain navigation channels but not to the same depth as at present. Agricultural land would be written-off following breaching of the defences in year 4;
• Maintain then Flood to High Ground: This option would involve maintaining the defences until they can no longer be maintained and then reverting to the flood to high ground option such that further breaching of the defences is managed. This would result in negligible damages to properties, as these would again be protected by the construction of defences. Recreation would be protected by the dredging of navigation channels. Agricultural land would be written-off, but over a longer time period, with breaching not expected to occur until year 9.
5.2.1 Write-off benefits
Assets
On the River Chet there are approximately five residential complexes along the road between Heckingham and Loddon, with additional properties at Nogdam End. Of these, 4 properties (in particular their gardens) are at risk from flooding under the do nothing option, thus, they will be written-off. The Multi-Coloured Manual (Penning-Rowsell et al., 2003) notes that gardens make up for 2.3% of the total value of properties. The Property Register for Loddon shows an average value per property of £168,399. Thus, the value to be written-off is around £15,500.
Land use
Almost all of the adjacent land to the River Chet south bank is under the Environmental Sensitive Area Scheme. Table 4.2 shows the areas of agricultural land flooded for each ESA Tier.
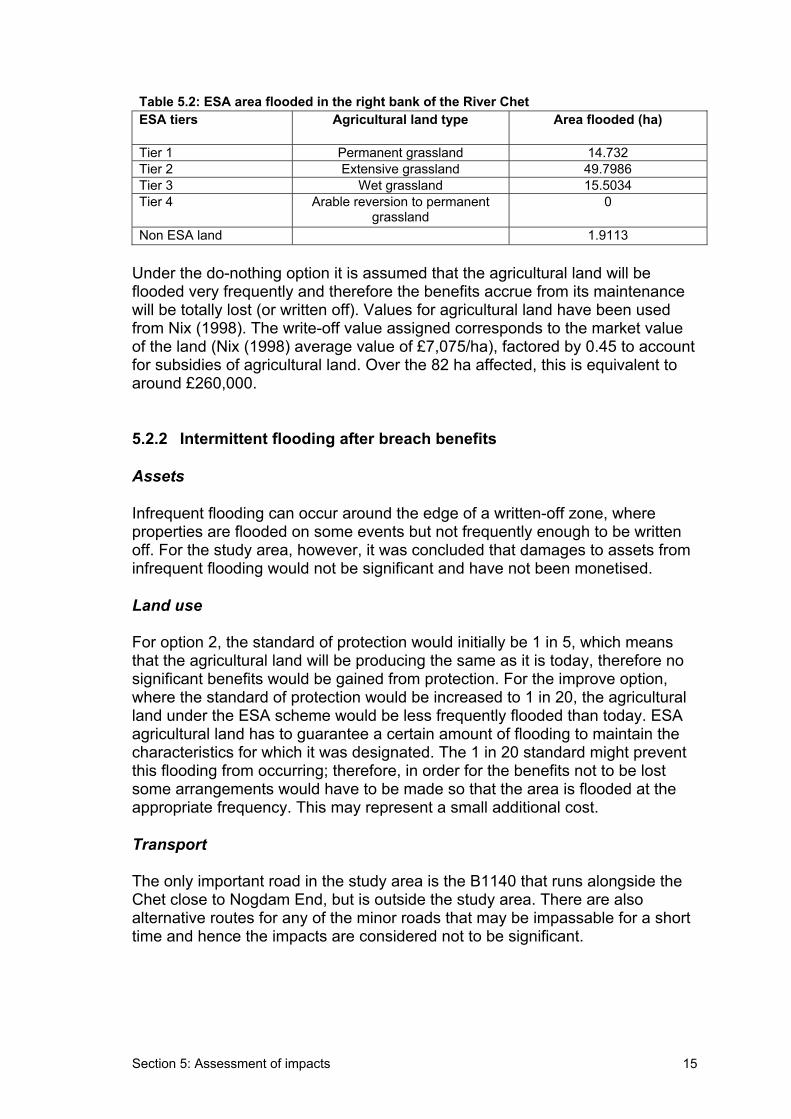
Section 5: Assessment of impacts 15
Table 5.2: ESA area flooded in the right bank of the River Chet ESA tiers Agricultural land type Area flooded (ha)
Tier 1 Permanent grassland 14.732 Tier 2 Extensive grassland 49.7986 Tier 3 Wet grassland 15.5034 Tier 4 Arable reversion to permanent
grassland0
Non ESA land 1.9113
Under the do-nothing option it is assumed that the agricultural land will be flooded very frequently and therefore the benefits accrue from its maintenance will be totally lost (or written off). Values for agricultural land have been used from Nix (1998). The write-off value assigned corresponds to the market value of the land (Nix (1998) average value of £7,075/ha), factored by 0.45 to account for subsidies of agricultural land. Over the 82 ha affected, this is equivalent to around £260,000.
5.2.2 Intermittent flooding after breach benefits
Assets
Infrequent flooding can occur around the edge of a written-off zone, where properties are flooded on some events but not frequently enough to be written off. For the study area, however, it was concluded that damages to assets from infrequent flooding would not be significant and have not been monetised.
Land use
For option 2, the standard of protection would initially be 1 in 5, which means that the agricultural land will be producing the same as it is today, therefore no significant benefits would be gained from protection. For the improve option, where the standard of protection would be increased to 1 in 20, the agricultural land under the ESA scheme would be less frequently flooded than today. ESA agricultural land has to guarantee a certain amount of flooding to maintain the characteristics for which it was designated. The 1 in 20 standard might prevent this flooding from occurring; therefore, in order for the benefits not to be lost some arrangements would have to be made so that the area is flooded at the appropriate frequency. This may represent a small additional cost.
Transport
The only important road in the study area is the B1140 that runs alongside the Chet close to Nogdam End, but is outside the study area. There are also alternative routes for any of the minor roads that may be impassable for a short time and hence the impacts are considered not to be significant.
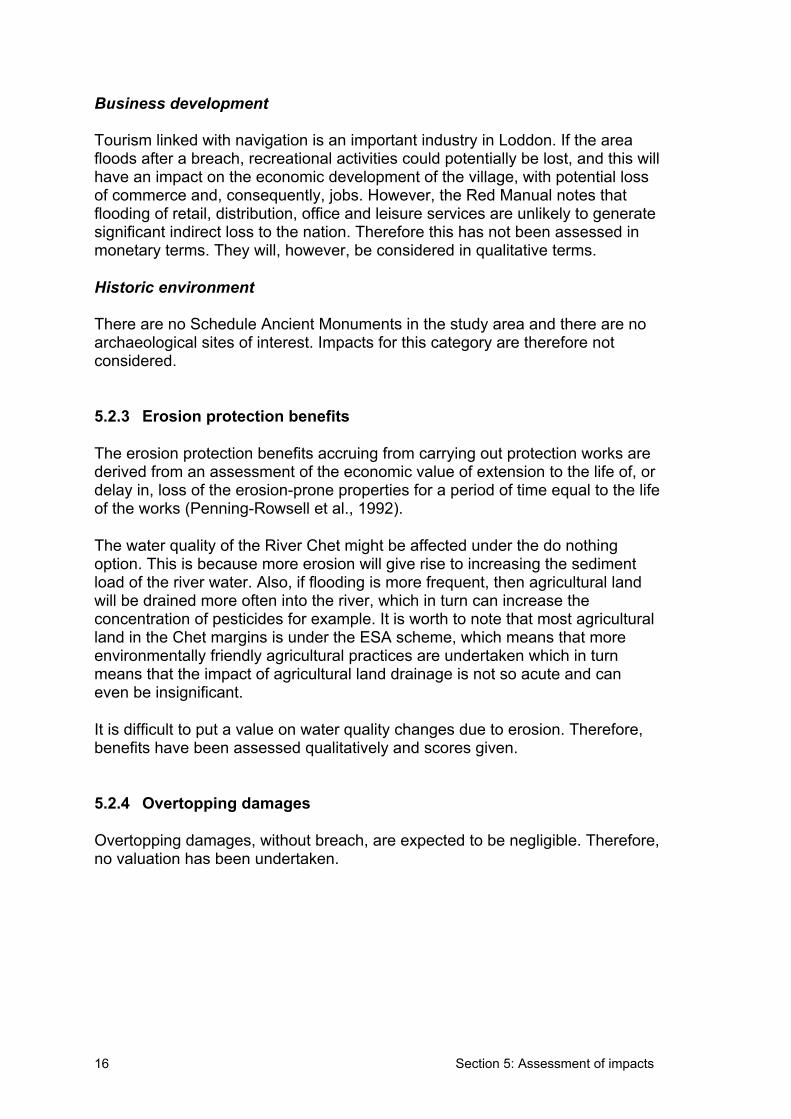
Section 5: Assessment of impacts 16
Business development
Tourism linked with navigation is an important industry in Loddon. If the area floods after a breach, recreational activities could potentially be lost, and this will have an impact on the economic development of the village, with potential loss of commerce and, consequently, jobs. However, the Red Manual notes that flooding of retail, distribution, office and leisure services are unlikely to generate significant indirect loss to the nation. Therefore this has not been assessed in monetary terms. They will, however, be considered in qualitative terms.
Historic environment
There are no Schedule Ancient Monuments in the study area and there are no archaeological sites of interest. Impacts for this category are therefore not considered.
5.2.3 Erosion protection benefits
The erosion protection benefits accruing from carrying out protection works are derived from an assessment of the economic value of extension to the life of, or delay in, loss of the erosion-prone properties for a period of time equal to the life of the works (Penning-Rowsell et al., 1992).
The water quality of the River Chet might be affected under the do nothing option. This is because more erosion will give rise to increasing the sediment load of the river water. Also, if flooding is more frequent, then agricultural land will be drained more often into the river, which in turn can increase the concentration of pesticides for example. It is worth to note that most agricultural land in the Chet margins is under the ESA scheme, which means that more environmentally friendly agricultural practices are undertaken which in turn means that the impact of agricultural land drainage is not so acute and can even be insignificant.
It is difficult to put a value on water quality changes due to erosion. Therefore, benefits have been assessed qualitatively and scores given.
5.2.4 Overtopping damages
Overtopping damages, without breach, are expected to be negligible. Therefore, no valuation has been undertaken.
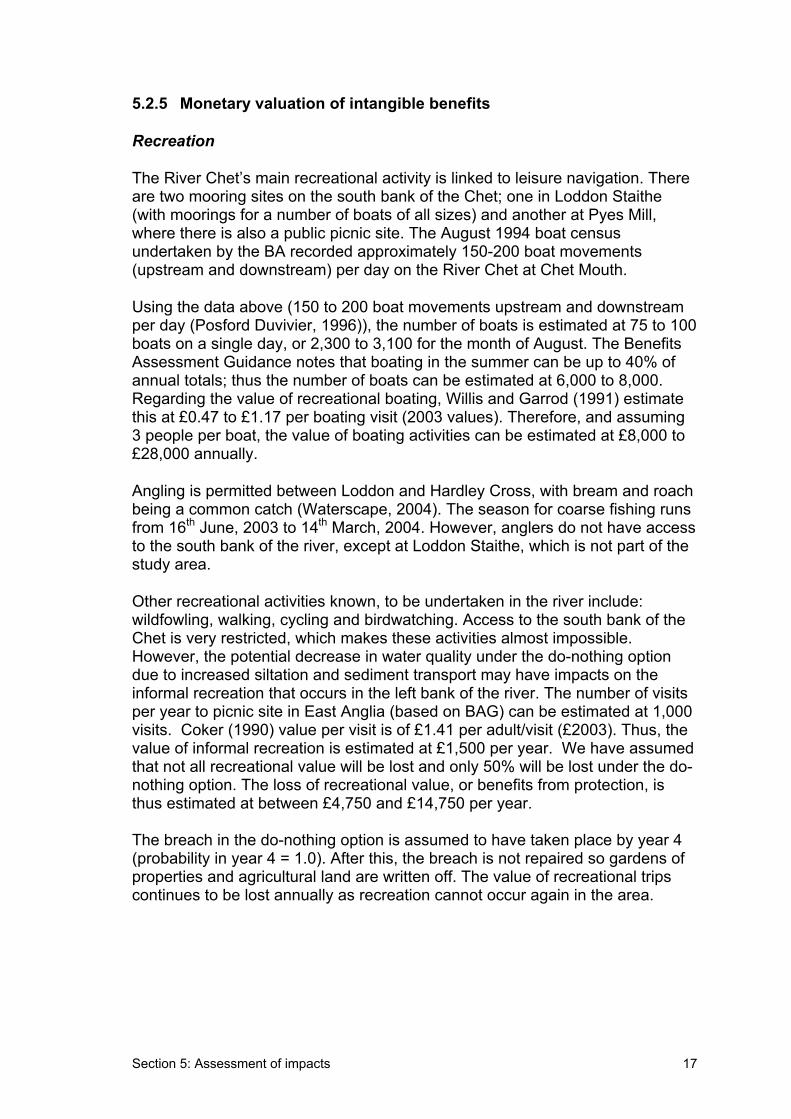
Section 5: Assessment of impacts 17
5.2.5 Monetary valuation of intangible benefits
Recreation
The River Chet’s main recreational activity is linked to leisure navigation. There are two mooring sites on the south bank of the Chet; one in Loddon Staithe (with moorings for a number of boats of all sizes) and another at Pyes Mill, where there is also a public picnic site. The August 1994 boat census undertaken by the BA recorded approximately 150-200 boat movements (upstream and downstream) per day on the River Chet at Chet Mouth.
Using the data above (150 to 200 boat movements upstream and downstream per day (Posford Duvivier, 1996)), the number of boats is estimated at 75 to 100 boats on a single day, or 2,300 to 3,100 for the month of August. The Benefits Assessment Guidance notes that boating in the summer can be up to 40% of annual totals; thus the number of boats can be estimated at 6,000 to 8,000.Regarding the value of recreational boating, Willis and Garrod (1991) estimate this at £0.47 to £1.17 per boating visit (2003 values). Therefore, and assuming 3 people per boat, the value of boating activities can be estimated at £8,000 to £28,000 annually.
Angling is permitted between Loddon and Hardley Cross, with bream and roach being a common catch (Waterscape, 2004). The season for coarse fishing runs from 16th June, 2003 to 14th March, 2004. However, anglers do not have access to the south bank of the river, except at Loddon Staithe, which is not part of the study area.
Other recreational activities known, to be undertaken in the river include: wildfowling, walking, cycling and birdwatching. Access to the south bank of the Chet is very restricted, which makes these activities almost impossible.However, the potential decrease in water quality under the do-nothing option due to increased siltation and sediment transport may have impacts on the informal recreation that occurs in the left bank of the river. The number of visits per year to picnic site in East Anglia (based on BAG) can be estimated at 1,000 visits. Coker (1990) value per visit is of £1.41 per adult/visit (£2003). Thus, the value of informal recreation is estimated at £1,500 per year. We have assumed that not all recreational value will be lost and only 50% will be lost under the do-nothing option. The loss of recreational value, or benefits from protection, is thus estimated at between £4,750 and £14,750 per year.
The breach in the do-nothing option is assumed to have taken place by year 4 (probability in year 4 = 1.0). After this, the breach is not repaired so gardens of properties and agricultural land are written off. The value of recreational trips continues to be lost annually as recreation cannot occur again in the area.
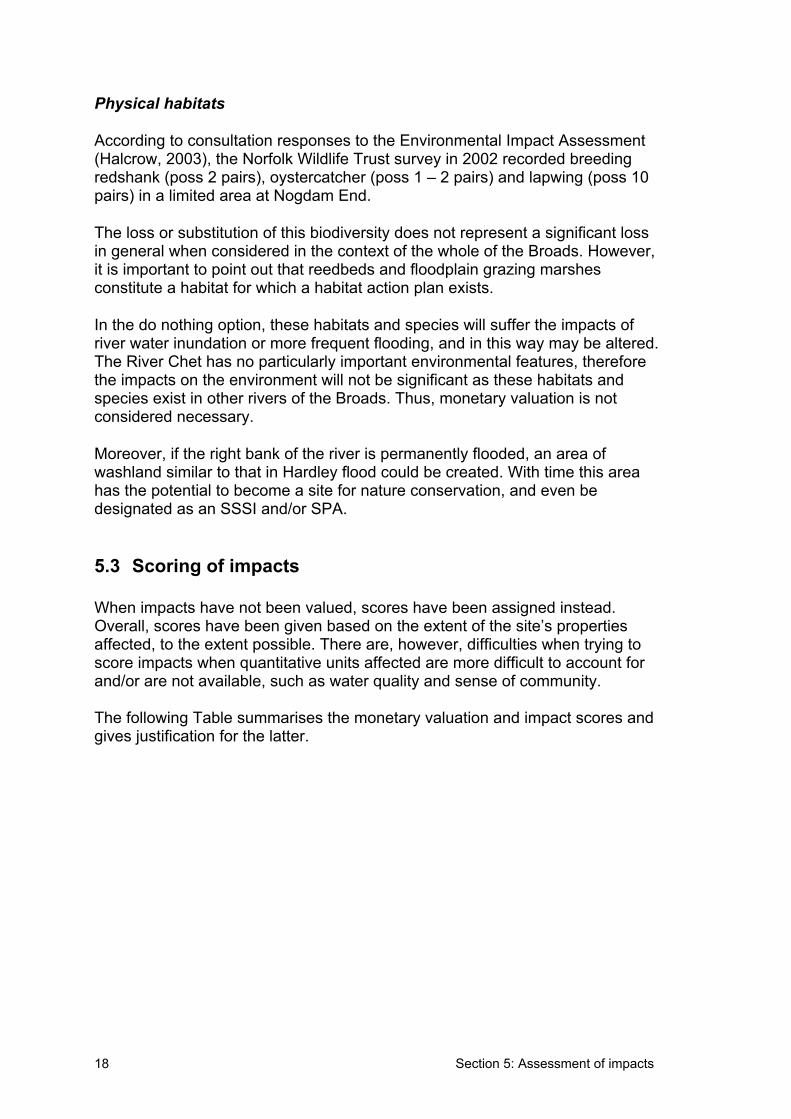
Section 5: Assessment of impacts 18
Physical habitats
According to consultation responses to the Environmental Impact Assessment(Halcrow, 2003), the Norfolk Wildlife Trust survey in 2002 recorded breeding redshank (poss 2 pairs), oystercatcher (poss 1 – 2 pairs) and lapwing (poss 10 pairs) in a limited area at Nogdam End.
The loss or substitution of this biodiversity does not represent a significant loss in general when considered in the context of the whole of the Broads. However, it is important to point out that reedbeds and floodplain grazing marshes constitute a habitat for which a habitat action plan exists.
In the do nothing option, these habitats and species will suffer the impacts of river water inundation or more frequent flooding, and in this way may be altered. The River Chet has no particularly important environmental features, therefore the impacts on the environment will not be significant as these habitats and species exist in other rivers of the Broads. Thus, monetary valuation is not considered necessary.
Moreover, if the right bank of the river is permanently flooded, an area of washland similar to that in Hardley flood could be created. With time this area has the potential to become a site for nature conservation, and even be designated as an SSSI and/or SPA.
5.3 Scoring of impacts
When impacts have not been valued, scores have been assigned instead.Overall, scores have been given based on the extent of the site’s properties affected, to the extent possible. There are, however, difficulties when trying to score impacts when quantitative units affected are more difficult to account for and/or are not available, such as water quality and sense of community.
The following Table summarises the monetary valuation and impact scores and gives justification for the latter.
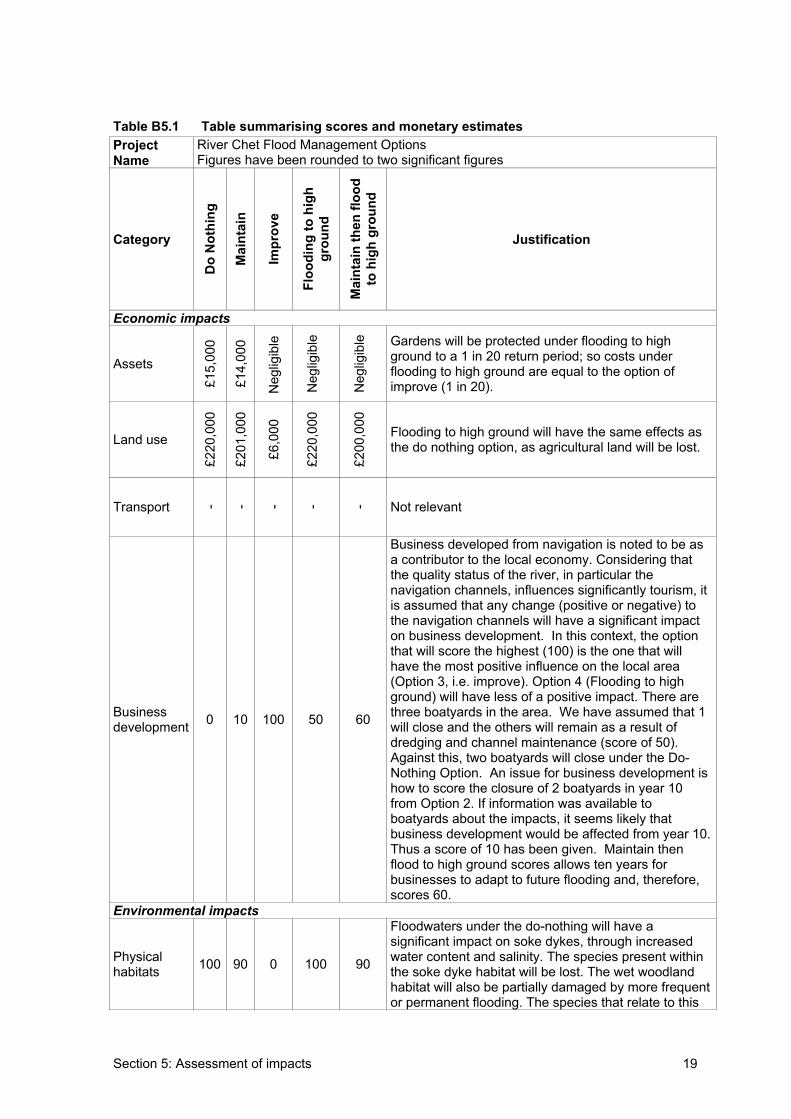
Section 5: Assessment of impacts 19
Table B5.1 Table summarising scores and monetary estimates ProjectName
River Chet Flood Management Options Figures have been rounded to two significant figures
Category
Do
Not
hing
Mai
ntai
n
Impr
ove
Floo
ding
to h
igh
grou
nd
Mai
ntai
n th
en fl
ood
to h
igh
grou
nd
Justification
Economic impacts
Assets
£15,
000
£14,
000
Neg
ligib
le
Neg
ligib
le
Neg
ligib
le Gardens will be protected under flooding to high ground to a 1 in 20 return period; so costs under flooding to high ground are equal to the option of improve (1 in 20).
Land use
£220
,000
£201
,000
£6,0
00
£220
,000
£200
,000
Flooding to high ground will have the same effects as the do nothing option, as agricultural land will be lost.
Transport - - - - - Not relevant
Businessdevelopment 0 10 100 50 60
Business developed from navigation is noted to be as a contributor to the local economy. Considering that the quality status of the river, in particular the navigation channels, influences significantly tourism, it is assumed that any change (positive or negative) to the navigation channels will have a significant impact on business development. In this context, the option that will score the highest (100) is the one that will have the most positive influence on the local area (Option 3, i.e. improve). Option 4 (Flooding to high ground) will have less of a positive impact. There are three boatyards in the area. We have assumed that 1 will close and the others will remain as a result of dredging and channel maintenance (score of 50). Against this, two boatyards will close under the Do-Nothing Option. An issue for business development is how to score the closure of 2 boatyards in year 10 from Option 2. If information was available to boatyards about the impacts, it seems likely that business development would be affected from year 10. Thus a score of 10 has been given. Maintain then flood to high ground scores allows ten years for businesses to adapt to future flooding and, therefore, scores 60.
Environmental impacts
Physical habitats 100 90 0 100 90
Floodwaters under the do-nothing will have a significant impact on soke dykes, through increased water content and salinity. The species present within the soke dyke habitat will be lost. The wet woodland habitat will also be partially damaged by more frequent or permanent flooding. The species that relate to this
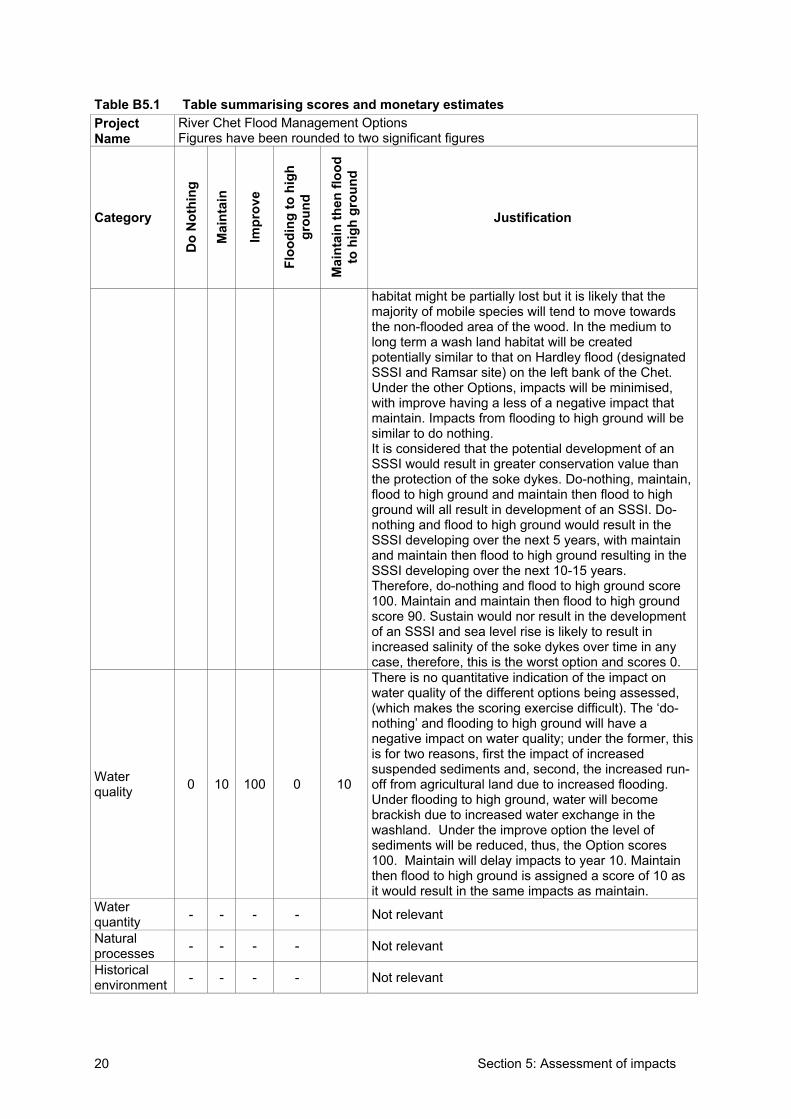
Section 5: Assessment of impacts 20
Table B5.1 Table summarising scores and monetary estimates ProjectName
River Chet Flood Management Options Figures have been rounded to two significant figures
Category
Do
Not
hing
Mai
ntai
n
Impr
ove
Floo
ding
to h
igh
grou
nd
Mai
ntai
n th
en fl
ood
to h
igh
grou
nd
Justification
habitat might be partially lost but it is likely that the majority of mobile species will tend to move towards the non-flooded area of the wood. In the medium to long term a wash land habitat will be created potentially similar to that on Hardley flood (designated SSSI and Ramsar site) on the left bank of the Chet. Under the other Options, impacts will be minimised, with improve having a less of a negative impact that maintain. Impacts from flooding to high ground will be similar to do nothing. It is considered that the potential development of an SSSI would result in greater conservation value than the protection of the soke dykes. Do-nothing, maintain, flood to high ground and maintain then flood to high ground will all result in development of an SSSI. Do-nothing and flood to high ground would result in the SSSI developing over the next 5 years, with maintain and maintain then flood to high ground resulting in the SSSI developing over the next 10-15 years. Therefore, do-nothing and flood to high ground score 100. Maintain and maintain then flood to high ground score 90. Sustain would nor result in the development of an SSSI and sea level rise is likely to result in increased salinity of the soke dykes over time in any case, therefore, this is the worst option and scores 0.
Waterquality 0 10 100 0 10
There is no quantitative indication of the impact on water quality of the different options being assessed, (which makes the scoring exercise difficult). The ‘do-nothing’ and flooding to high ground will have a negative impact on water quality; under the former, this is for two reasons, first the impact of increased suspended sediments and, second, the increased run-off from agricultural land due to increased flooding. Under flooding to high ground, water will become brackish due to increased water exchange in the washland. Under the improve option the level of sediments will be reduced, thus, the Option scores 100. Maintain will delay impacts to year 10. Maintain then flood to high ground is assigned a score of 10 as it would result in the same impacts as maintain.
Waterquantity - - - - Not relevant
Naturalprocesses - - - - Not relevant
Historicalenvironment - - - - Not relevant
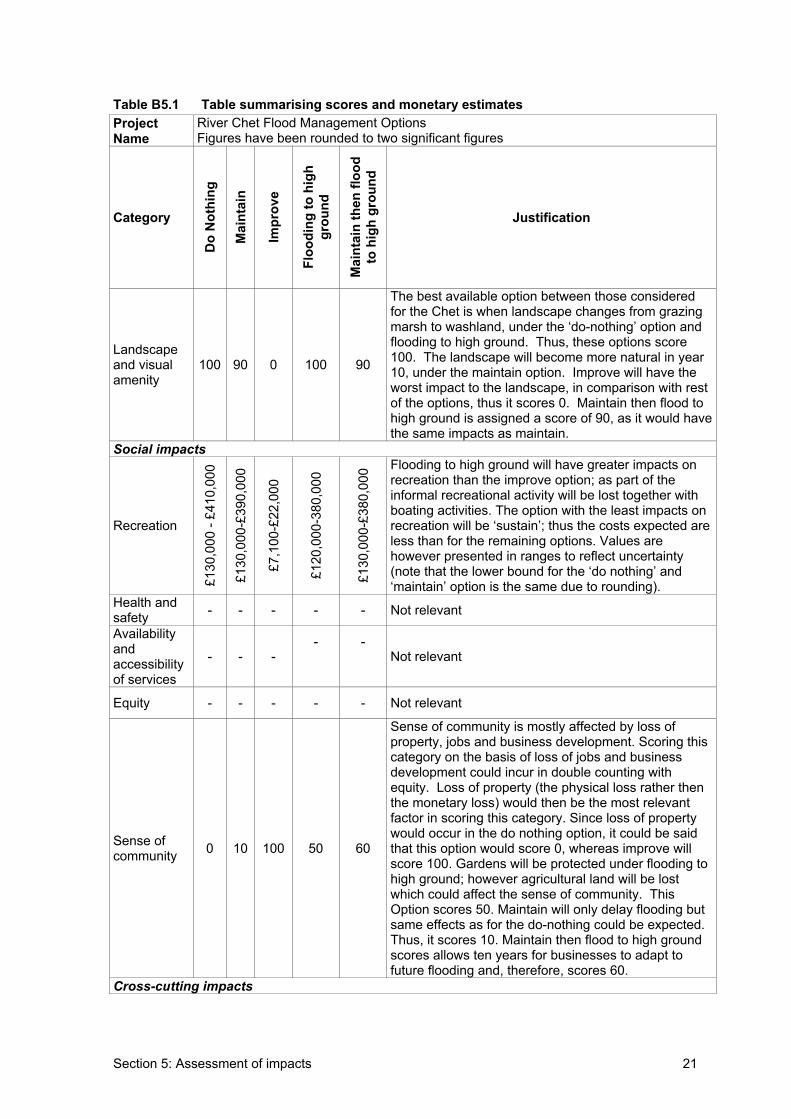
Section 5: Assessment of impacts 21
Table B5.1 Table summarising scores and monetary estimates ProjectName
River Chet Flood Management Options Figures have been rounded to two significant figures
Category D
o N
othi
ng
Mai
ntai
n
Impr
ove
Floo
ding
to h
igh
grou
nd
Mai
ntai
n th
en fl
ood
to h
igh
grou
nd
Justification
Landscapeand visual amenity
100 90 0 100 90
The best available option between those considered for the Chet is when landscape changes from grazing marsh to washland, under the ‘do-nothing’ option and flooding to high ground. Thus, these options score 100. The landscape will become more natural in year 10, under the maintain option. Improve will have the worst impact to the landscape, in comparison with rest of the options, thus it scores 0. Maintain then flood to high ground is assigned a score of 90, as it would have the same impacts as maintain.
Social impacts
Recreation
£130
,000
- £4
10,0
00
£130
,000
-£39
0,00
0
£7,1
00-£
22,0
00
£120
,000
-380
,000
£130
,000
-£38
0,00
0 Flooding to high ground will have greater impacts on recreation than the improve option; as part of the informal recreational activity will be lost together with boating activities. The option with the least impacts on recreation will be ‘sustain’; thus the costs expected are less than for the remaining options. Values are however presented in ranges to reflect uncertainty (note that the lower bound for the ‘do nothing’ and ‘maintain’ option is the same due to rounding).
Health and safety - - - - - Not relevant
Availability andaccessibility of services
- - - - -
Not relevant
Equity - - - - - Not relevant
Sense of community 0 10 100 50 60
Sense of community is mostly affected by loss of property, jobs and business development. Scoring this category on the basis of loss of jobs and business development could incur in double counting with equity. Loss of property (the physical loss rather then the monetary loss) would then be the most relevant factor in scoring this category. Since loss of property would occur in the do nothing option, it could be said that this option would score 0, whereas improve will score 100. Gardens will be protected under flooding to high ground; however agricultural land will be lost which could affect the sense of community. This Option scores 50. Maintain will only delay flooding but same effects as for the do-nothing could be expected. Thus, it scores 10. Maintain then flood to high ground scores allows ten years for businesses to adapt to future flooding and, therefore, scores 60.
Cross-cutting impacts
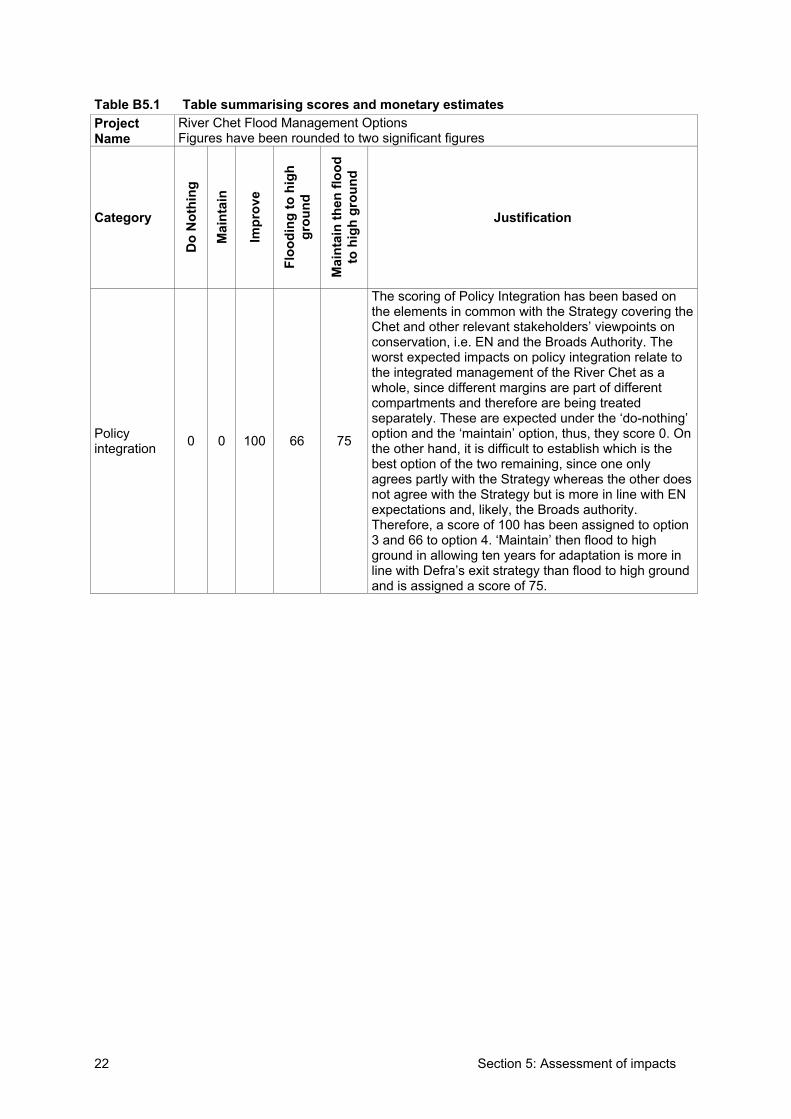
Section 5: Assessment of impacts 22
Table B5.1 Table summarising scores and monetary estimates ProjectName
River Chet Flood Management Options Figures have been rounded to two significant figures
Category
Do
Not
hing
Mai
ntai
n
Impr
ove
Floo
ding
to h
igh
grou
nd
Mai
ntai
n th
en fl
ood
to h
igh
grou
nd
Justification
Policy integration 0 0 100 66 75
The scoring of Policy Integration has been based on the elements in common with the Strategy covering the Chet and other relevant stakeholders’ viewpoints on conservation, i.e. EN and the Broads Authority. The worst expected impacts on policy integration relate to the integrated management of the River Chet as a whole, since different margins are part of different compartments and therefore are being treated separately. These are expected under the ‘do-nothing’ option and the ‘maintain’ option, thus, they score 0. On the other hand, it is difficult to establish which is the best option of the two remaining, since one only agrees partly with the Strategy whereas the other does not agree with the Strategy but is more in line with EN expectations and, likely, the Broads authority. Therefore, a score of 100 has been assigned to option 3 and 66 to option 4. ‘Maintain’ then flood to high ground in allowing ten years for adaptation is more in line with Defra’s exit strategy than flood to high ground and is assigned a score of 75.
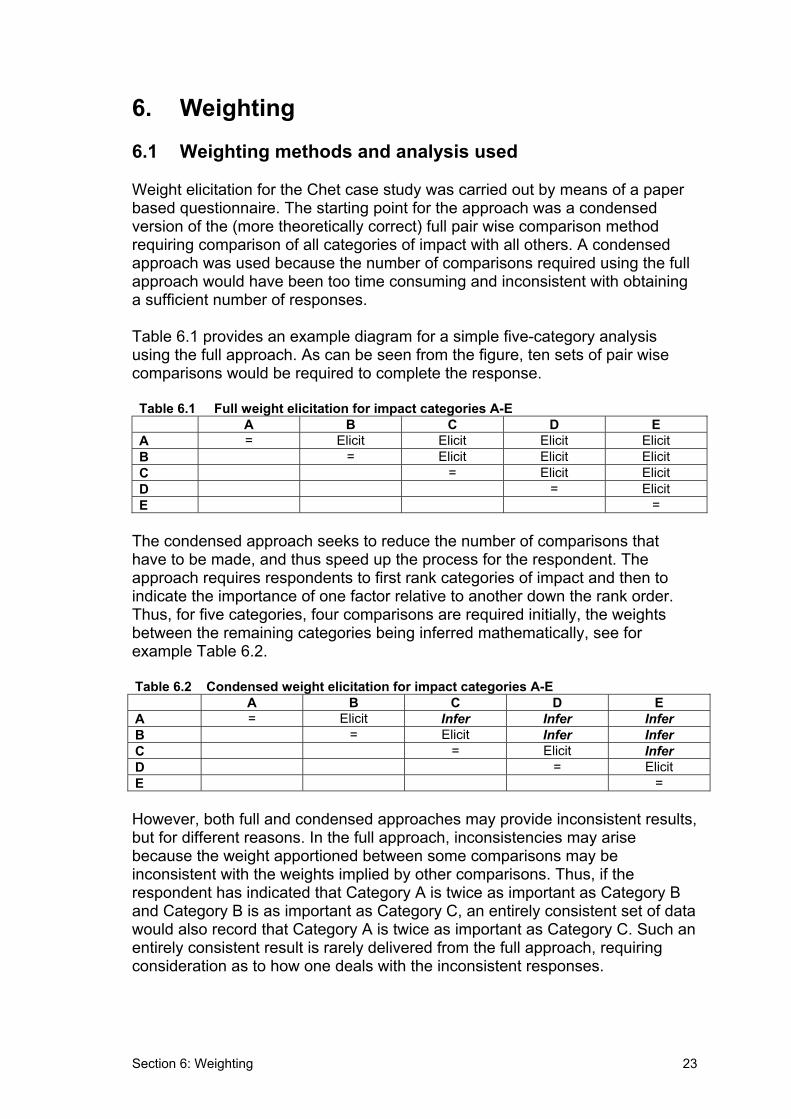
Section 6: Weighting 23
6. Weighting
6.1 Weighting methods and analysis used
Weight elicitation for the Chet case study was carried out by means of a paper based questionnaire. The starting point for the approach was a condensed version of the (more theoretically correct) full pair wise comparison method requiring comparison of all categories of impact with all others. A condensed approach was used because the number of comparisons required using the full approach would have been too time consuming and inconsistent with obtaining a sufficient number of responses.
Table 6.1 provides an example diagram for a simple five-category analysis using the full approach. As can be seen from the figure, ten sets of pair wise comparisons would be required to complete the response.
Table 6.1 Full weight elicitation for impact categories A-E A B C D E A = Elicit Elicit Elicit Elicit B = Elicit Elicit Elicit C = Elicit Elicit D = Elicit E =
The condensed approach seeks to reduce the number of comparisons that have to be made, and thus speed up the process for the respondent. The approach requires respondents to first rank categories of impact and then to indicate the importance of one factor relative to another down the rank order.Thus, for five categories, four comparisons are required initially, the weights between the remaining categories being inferred mathematically, see for example Table 6.2.
However, both full and condensed approaches may provide inconsistent results, but for different reasons. In the full approach, inconsistencies may arise because the weight apportioned between some comparisons may be inconsistent with the weights implied by other comparisons. Thus, if the respondent has indicated that Category A is twice as important as Category B and Category B is as important as Category C, an entirely consistent set of data would also record that Category A is twice as important as Category C. Such an entirely consistent result is rarely delivered from the full approach, requiring consideration as to how one deals with the inconsistent responses.
Table 6.2 Condensed weight elicitation for impact categories A-E A B C D E A = Elicit Infer Infer Infer B = Elicit Infer Infer C = Elicit InferD = Elicit E =
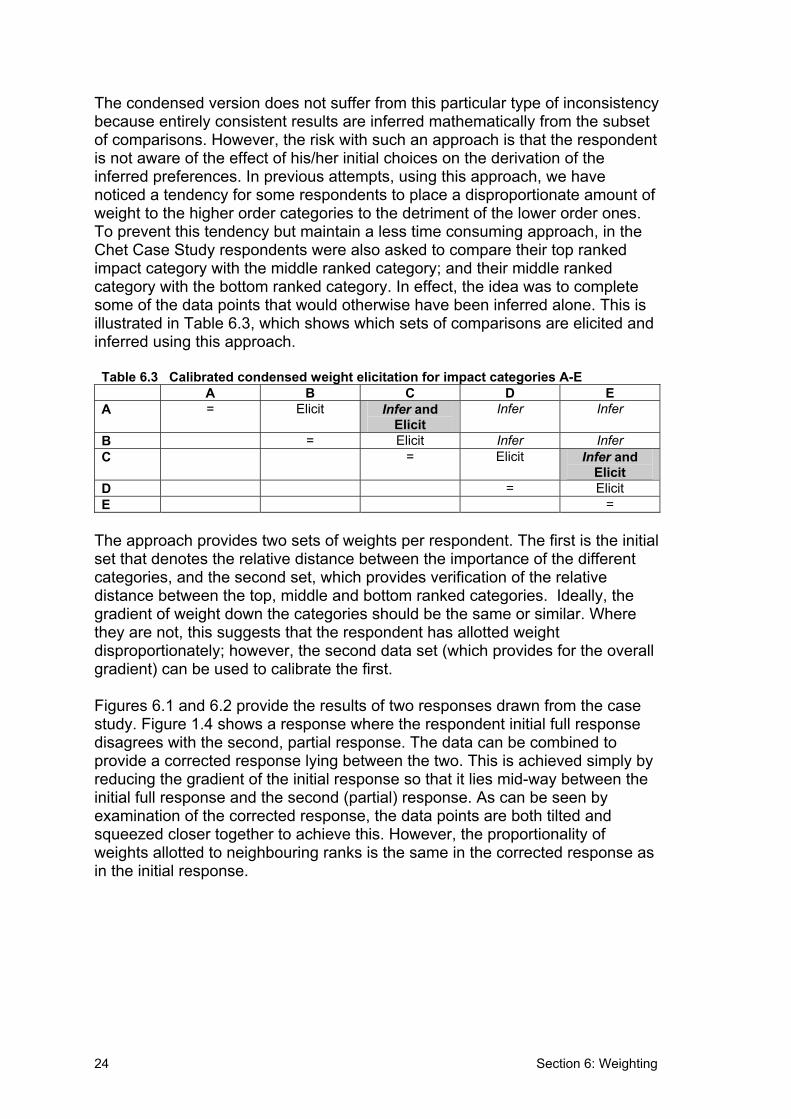
Section 6: Weighting 24
The condensed version does not suffer from this particular type of inconsistency because entirely consistent results are inferred mathematically from the subset of comparisons. However, the risk with such an approach is that the respondent is not aware of the effect of his/her initial choices on the derivation of the inferred preferences. In previous attempts, using this approach, we have noticed a tendency for some respondents to place a disproportionate amount of weight to the higher order categories to the detriment of the lower order ones. To prevent this tendency but maintain a less time consuming approach, in the Chet Case Study respondents were also asked to compare their top ranked impact category with the middle ranked category; and their middle ranked category with the bottom ranked category. In effect, the idea was to complete some of the data points that would otherwise have been inferred alone. This is illustrated in Table 6.3, which shows which sets of comparisons are elicited and inferred using this approach.
Table 6.3 Calibrated condensed weight elicitation for impact categories A-E A B C D E A = Elicit Infer and
ElicitInfer Infer
B = Elicit Infer Infer C = Elicit Infer and
ElicitD = Elicit E =
The approach provides two sets of weights per respondent. The first is the initial set that denotes the relative distance between the importance of the different categories, and the second set, which provides verification of the relative distance between the top, middle and bottom ranked categories. Ideally, the gradient of weight down the categories should be the same or similar. Where they are not, this suggests that the respondent has allotted weight disproportionately; however, the second data set (which provides for the overall gradient) can be used to calibrate the first.
Figures 6.1 and 6.2 provide the results of two responses drawn from the case study. Figure 1.4 shows a response where the respondent initial full response disagrees with the second, partial response. The data can be combined to provide a corrected response lying between the two. This is achieved simply by reducing the gradient of the initial response so that it lies mid-way between the initial full response and the second (partial) response. As can be seen by examination of the corrected response, the data points are both tilted and squeezed closer together to achieve this. However, the proportionality of weights allotted to neighbouring ranks is the same in the corrected response as in the initial response.
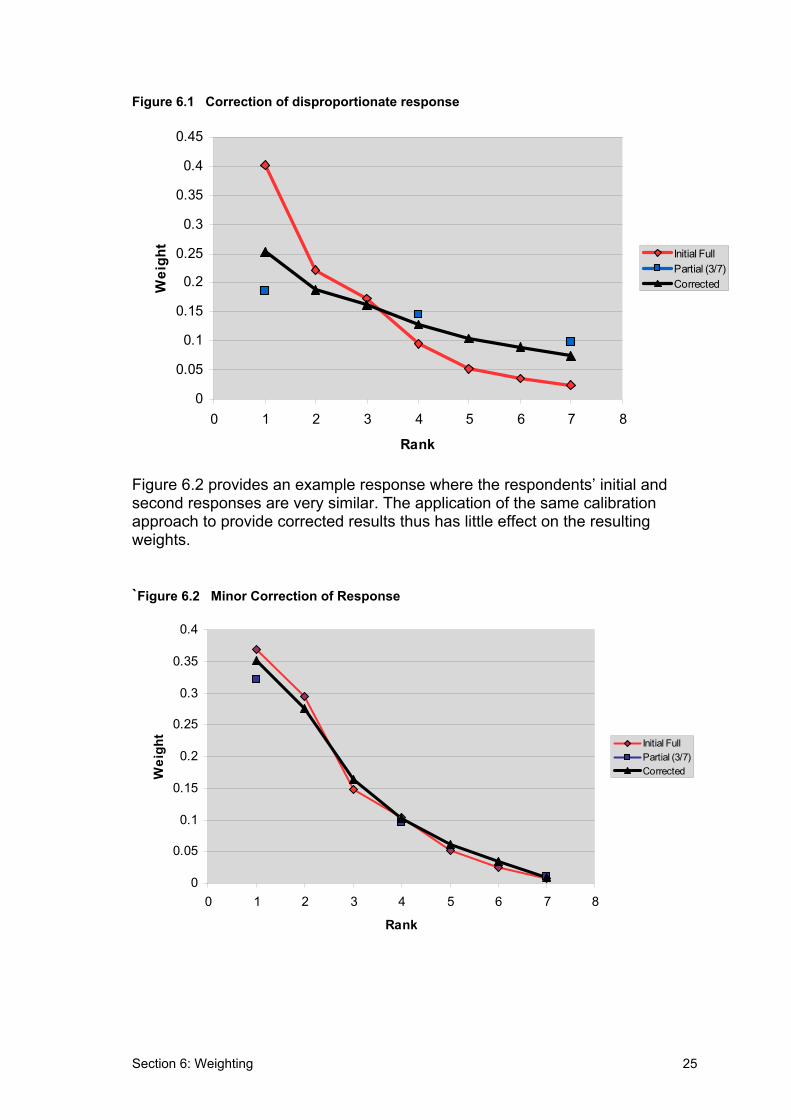
Section 6: Weighting 25
Figure 6.1 Correction of disproportionate response
0
0.05
0.1
0.15
0.2
0.25
0.3
0.35
0.4
0.45
0 1 2 3 4 5 6 7 8
Rank
Wei
ght
Initial FullPartial (3/7)Corrected
Figure 6.2 provides an example response where the respondents’ initial and second responses are very similar. The application of the same calibration approach to provide corrected results thus has little effect on the resulting weights.
`Figure 6.2 Minor Correction of Response
0
0.05
0.1
0.15
0.2
0.25
0.3
0.35
0.4
0 1 2 3 4 5 6 7 8
Rank
Wei
ght
Initial FullPartial (3/7)Corrected
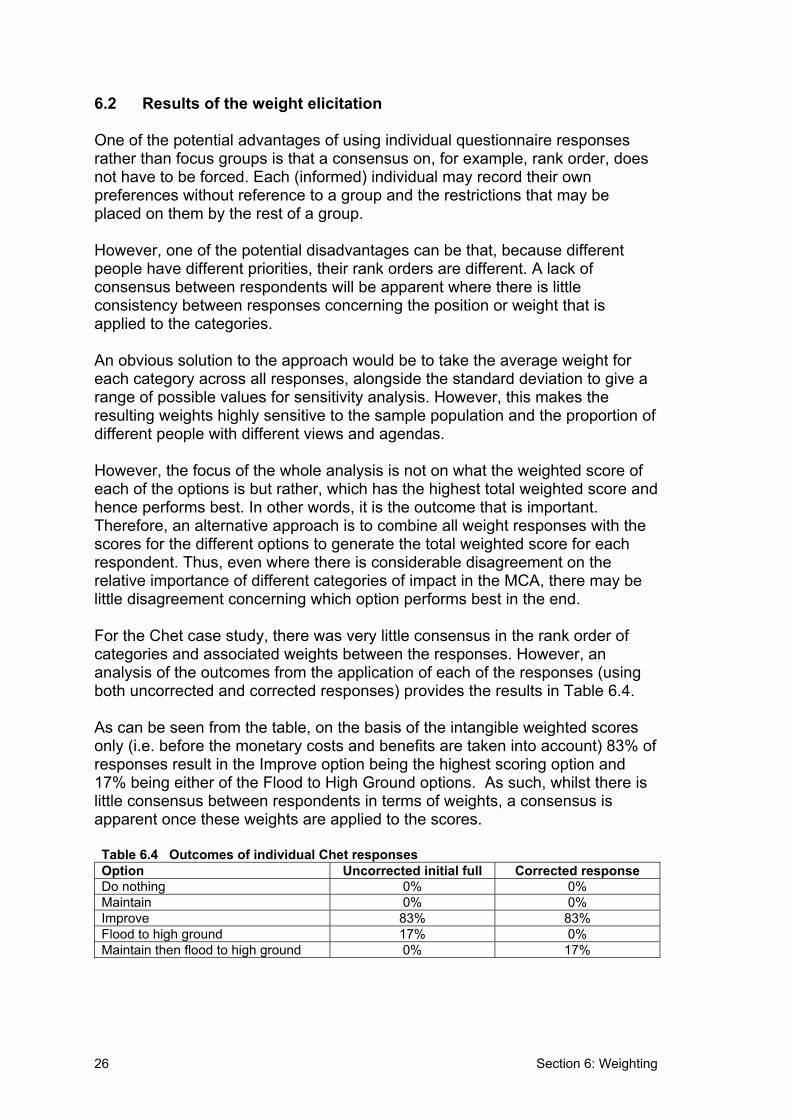
Section 6: Weighting 26
6.2 Results of the weight elicitation
One of the potential advantages of using individual questionnaire responses rather than focus groups is that a consensus on, for example, rank order, does not have to be forced. Each (informed) individual may record their own preferences without reference to a group and the restrictions that may be placed on them by the rest of a group.
However, one of the potential disadvantages can be that, because different people have different priorities, their rank orders are different. A lack of consensus between respondents will be apparent where there is little consistency between responses concerning the position or weight that is applied to the categories.
An obvious solution to the approach would be to take the average weight for each category across all responses, alongside the standard deviation to give a range of possible values for sensitivity analysis. However, this makes the resulting weights highly sensitive to the sample population and the proportion of different people with different views and agendas.
However, the focus of the whole analysis is not on what the weighted score of each of the options is but rather, which has the highest total weighted score and hence performs best. In other words, it is the outcome that is important.Therefore, an alternative approach is to combine all weight responses with the scores for the different options to generate the total weighted score for each respondent. Thus, even where there is considerable disagreement on the relative importance of different categories of impact in the MCA, there may be little disagreement concerning which option performs best in the end.
For the Chet case study, there was very little consensus in the rank order of categories and associated weights between the responses. However, an analysis of the outcomes from the application of each of the responses (using both uncorrected and corrected responses) provides the results in Table 6.4.
As can be seen from the table, on the basis of the intangible weighted scores only (i.e. before the monetary costs and benefits are taken into account) 83% of responses result in the Improve option being the highest scoring option and 17% being either of the Flood to High Ground options. As such, whilst there is little consensus between respondents in terms of weights, a consensus is apparent once these weights are applied to the scores.
Table 6.4 Outcomes of individual Chet responses Option Uncorrected initial full Corrected response Do nothing 0% 0% Maintain 0% 0% Improve 83% 83% Flood to high ground 17% 0% Maintain then flood to high ground 0% 17%
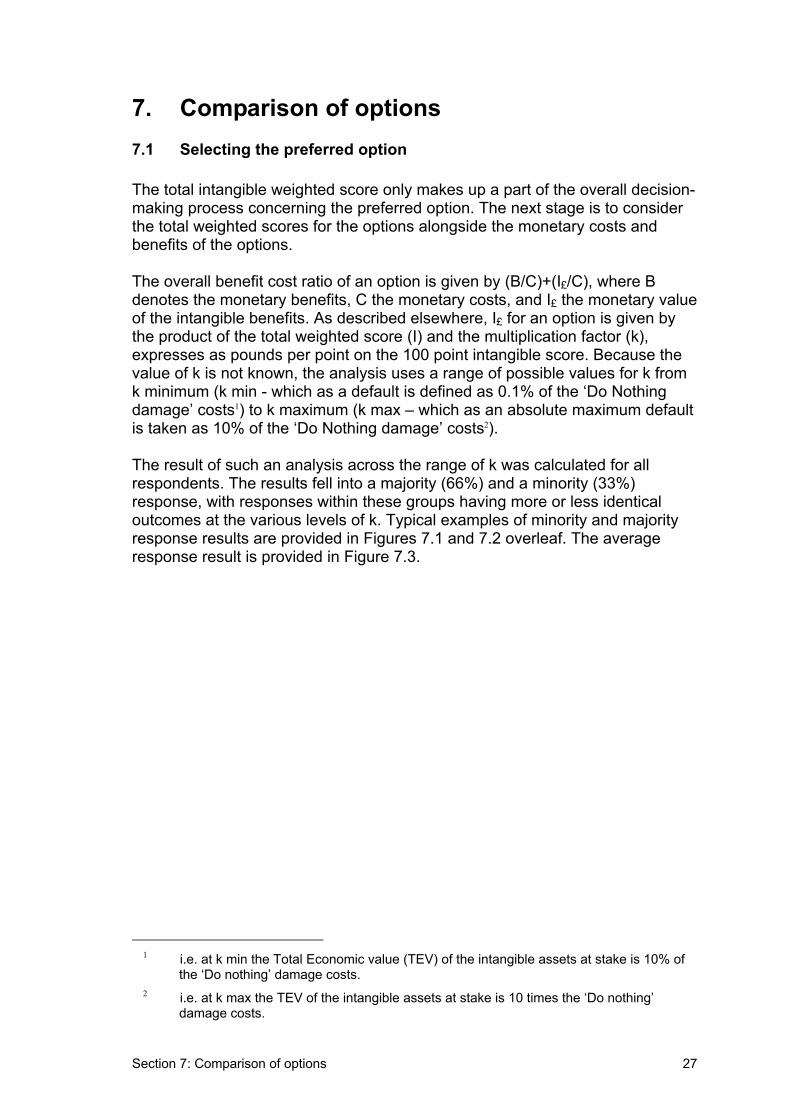
Section 7: Comparison of options 27
7. Comparison of options 7.1 Selecting the preferred option
The total intangible weighted score only makes up a part of the overall decision- making process concerning the preferred option. The next stage is to consider the total weighted scores for the options alongside the monetary costs and benefits of the options.
The overall benefit cost ratio of an option is given by (B/C)+(I£/C), where B denotes the monetary benefits, C the monetary costs, and I£ the monetary value of the intangible benefits. As described elsewhere, I£ for an option is given by the product of the total weighted score (I) and the multiplication factor (k), expresses as pounds per point on the 100 point intangible score. Because the value of k is not known, the analysis uses a range of possible values for k from k minimum (k min - which as a default is defined as 0.1% of the ‘Do Nothing damage’ costs1) to k maximum (k max – which as an absolute maximum default is taken as 10% of the ‘Do Nothing damage’ costs2).
The result of such an analysis across the range of k was calculated for all respondents. The results fell into a majority (66%) and a minority (33%) response, with responses within these groups having more or less identical outcomes at the various levels of k. Typical examples of minority and majority response results are provided in Figures 7.1 and 7.2 overleaf. The average response result is provided in Figure 7.3.
1 i.e. at k min the Total Economic value (TEV) of the intangible assets at stake is 10% of
the ‘Do nothing’ damage costs. 2 i.e. at k max the TEV of the intangible assets at stake is 10 times the ‘Do nothing’
damage costs.
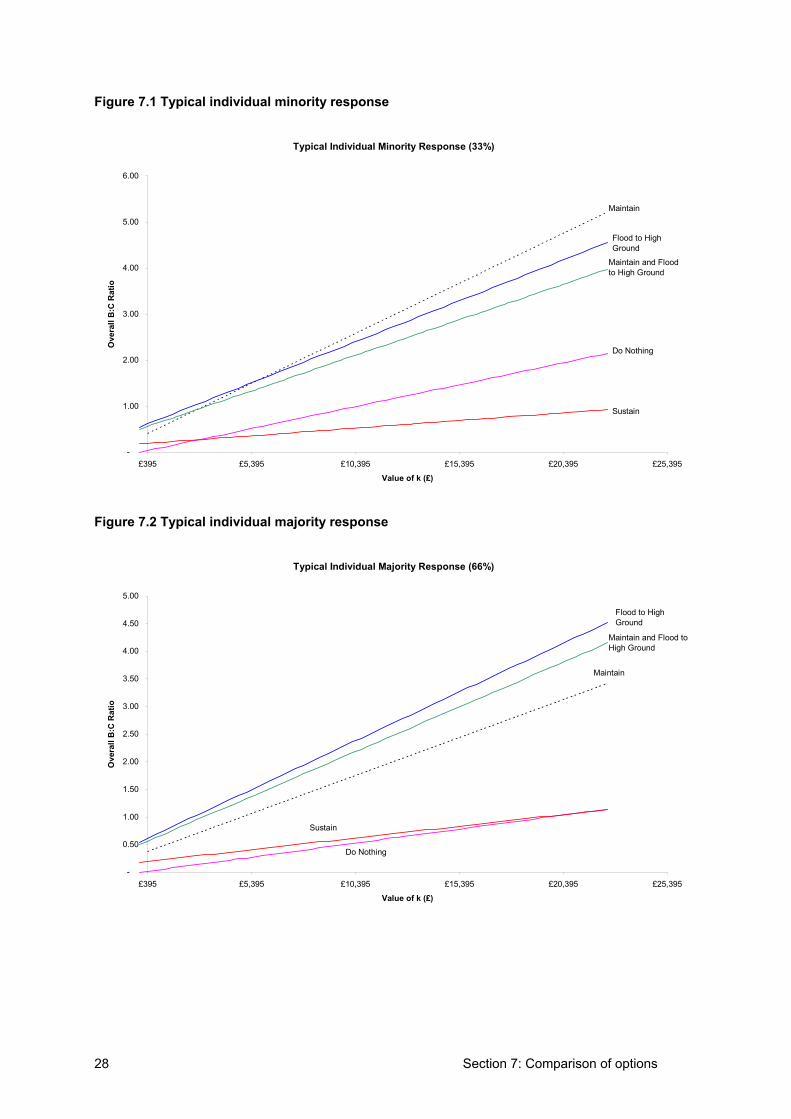
Section 7: Comparison of options 28
Figure 7.1 Typical individual minority response
Typical Individual Minority Response (33%)
-
1.00
2.00
3.00
4.00
5.00
6.00
£395 £5,395 £10,395 £15,395 £20,395 £25,395
Value of k (£)
Ove
rall
B:C
Rat
io
Flood to High Ground
Maintain and Flood to High Ground
Maintain
Do Nothing
Sustain
Figure 7.2 Typical individual majority response
Typical Individual Majority Response (66%)
-
0.50
1.00
1.50
2.00
2.50
3.00
3.50
4.00
4.50
5.00
£395 £5,395 £10,395 £15,395 £20,395 £25,395
Value of k (£)
Ove
rall
B:C
Rat
io
Flood to High Ground
Maintain and Flood to High Ground
Maintain
Do Nothing
Sustain
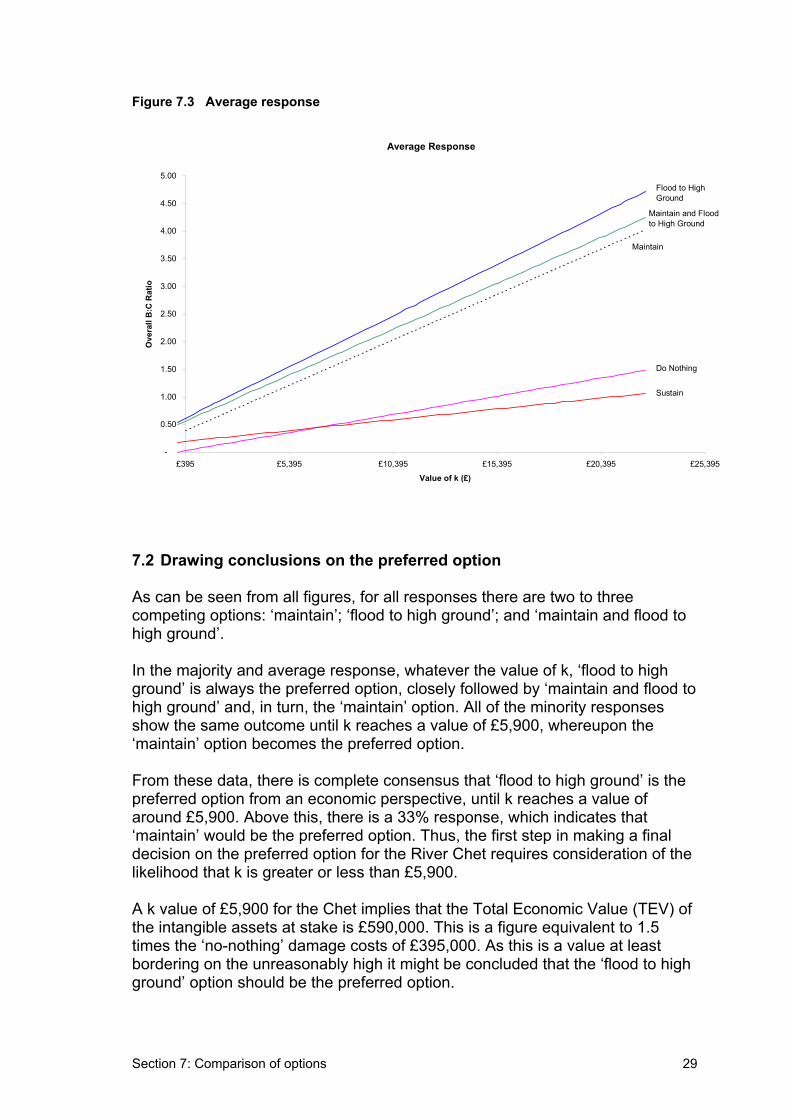
Section 7: Comparison of options 29
Figure 7.3 Average response
Average Response
-
0.50
1.00
1.50
2.00
2.50
3.00
3.50
4.00
4.50
5.00
£395 £5,395 £10,395 £15,395 £20,395 £25,395
Value of k (£)
Ove
rall
B:C
Rat
io
Flood to High Ground
Maintain and Flood to High Ground
Maintain
Do Nothing
Sustain
7.2 Drawing conclusions on the preferred option
As can be seen from all figures, for all responses there are two to three competing options: ‘maintain’; ‘flood to high ground’; and ‘maintain and flood to high ground’.
In the majority and average response, whatever the value of k, ‘flood to high ground’ is always the preferred option, closely followed by ‘maintain and flood to high ground’ and, in turn, the ‘maintain’ option. All of the minority responses show the same outcome until k reaches a value of £5,900, whereupon the ‘maintain’ option becomes the preferred option.
From these data, there is complete consensus that ‘flood to high ground’ is the preferred option from an economic perspective, until k reaches a value of around £5,900. Above this, there is a 33% response, which indicates that ‘maintain’ would be the preferred option. Thus, the first step in making a final decision on the preferred option for the River Chet requires consideration of the likelihood that k is greater or less than £5,900.
A k value of £5,900 for the Chet implies that the Total Economic Value (TEV) of the intangible assets at stake is £590,000. This is a figure equivalent to 1.5 times the ‘no-nothing’ damage costs of £395,000. As this is a value at least bordering on the unreasonably high it might be concluded that the ‘flood to high ground’ option should be the preferred option.
Section 7: References 30
8. References BESL (2003): Presentation of the stakeholder meeting
BESL (2002): Broadland Flood Alleviation Project: Rivers Chet, Yare and Waveney – Consultation Document, Broadland Environmental Services Limited and Environment Agency, 2002.
Environment Agency (1996a): Broadland Flood Alleviation Strategy Study – Bank Strengthening and Erosion Protection Compartment 22 (Burgh Norton): Detailed Appraisal, Report prepared by Posford Duvivier for the Environment Agency (Anglian Region), September 1996.
Environment Agency (1996b): Broadland Compartment 22 Local Environmental Assessment – Final Report, Report prepared by Posford Duvivier for the Environment Agency (Anglian Region), September 1996.
Posford Duvivier 1996. Broadland Flood Alleviation Strategy Study – Bank Strengthening and Erosion Protection Compartment 22 (Burgh Norton) Detailed Appraisal. Prepared for the Environment Agency
Waterscape (2004): Waterways Guide – River Chet, information available in the Internet(http://www.waterscape.com/waterwausguide/waterways/River_Chet/River_Chet.html)
Willis K and Garrod G 1991. Valuing open access recreation on inland waterways: on-site recreation surveys and selection effects, Countryside Change Working Paper 14, University of Newcastle. Regional Studies Vol 25 (6) pp 511-524
Appendix B4.1 31
Appendix B4.1
Appraisal summary table for high level screening – S-AST for the River Chet flood alleviation scheme
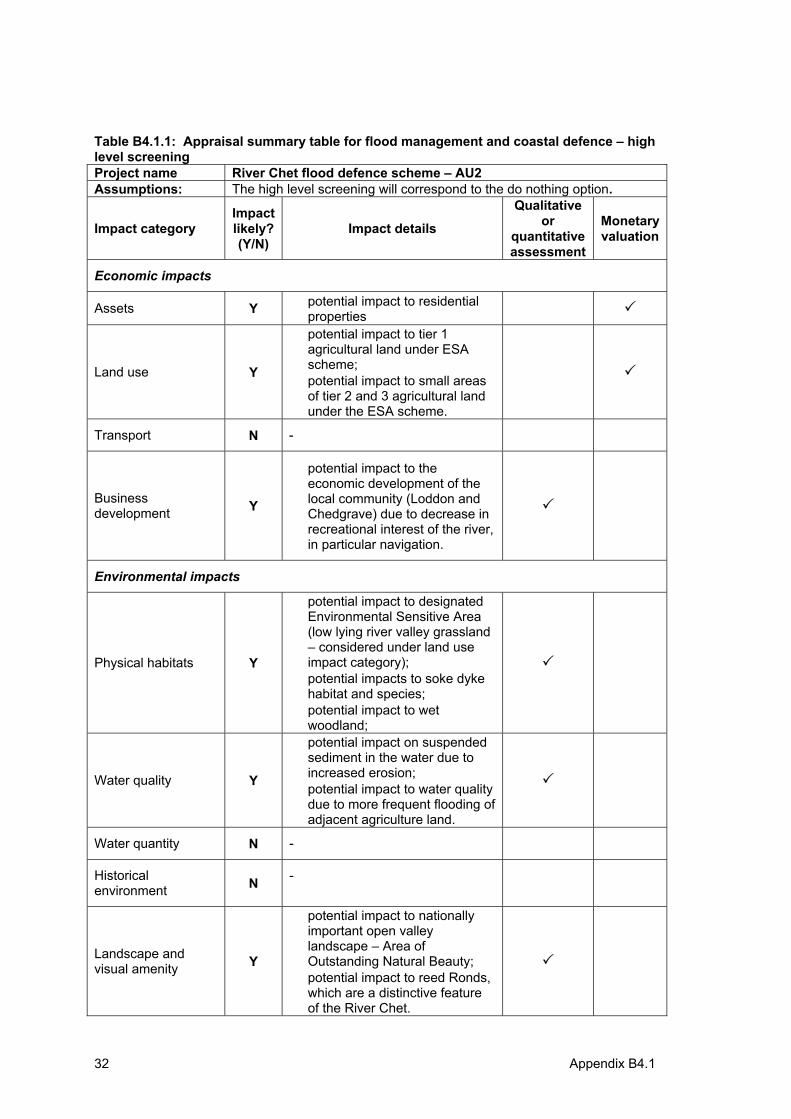
Appendix B4.1 32
Table B4.1.1: Appraisal summary table for flood management and coastal defence – high level screening Project name River Chet flood defence scheme – AU2 Assumptions: The high level screening will correspond to the do nothing option.
Impact category Impactlikely? (Y/N)
Impact details
Qualitative or
quantitative assessment
Monetary valuation
Economic impacts
Assets Y • potential impact to residential properties
Land use Y
• potential impact to tier 1 agricultural land under ESA scheme;
• potential impact to small areas of tier 2 and 3 agricultural land under the ESA scheme.
Transport N -
Businessdevelopment Y
• potential impact to the economic development of the local community (Loddon and Chedgrave) due to decrease in recreational interest of the river, in particular navigation.
Environmental impacts
Physical habitats Y
• potential impact to designated Environmental Sensitive Area (low lying river valley grassland – considered under land use impact category);
• potential impacts to soke dyke habitat and species;
• potential impact to wet woodland;
Water quality Y
• potential impact on suspended sediment in the water due to increased erosion;
• potential impact to water quality due to more frequent flooding of adjacent agriculture land.
Water quantity N -
Historicalenvironment N -
Landscape and visual amenity Y
• potential impact to nationally important open valley landscape – Area of Outstanding Natural Beauty;
• potential impact to reed Ronds, which are a distinctive feature of the River Chet.
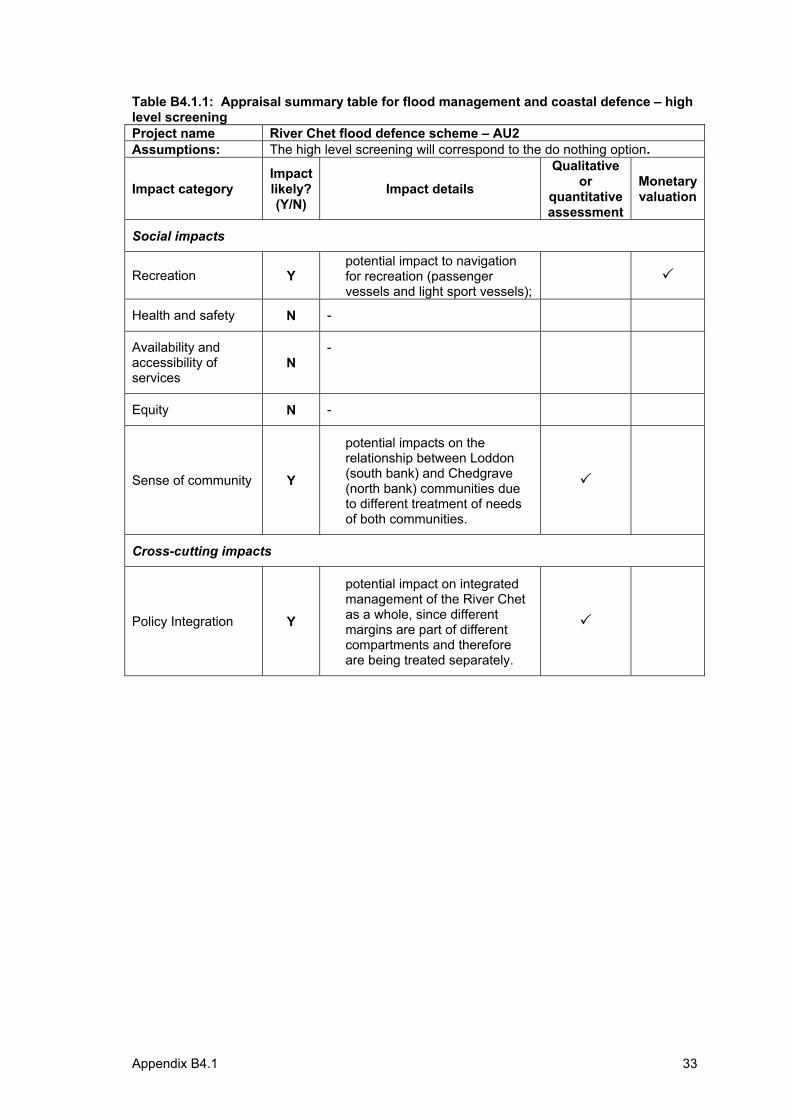
Appendix B4.1 33
Table B4.1.1: Appraisal summary table for flood management and coastal defence – high level screening Project name River Chet flood defence scheme – AU2 Assumptions: The high level screening will correspond to the do nothing option.
Impact category Impactlikely? (Y/N)
Impact details
Qualitative or
quantitative assessment
Monetary valuation
Social impacts
Recreation Y• potential impact to navigation
for recreation (passenger vessels and light sport vessels);
Health and safety N -
Availability and accessibility of services
N-
Equity N -
Sense of community Y
• potential impacts on the relationship between Loddon (south bank) and Chedgrave (north bank) communities due to different treatment of needs of both communities.
Cross-cutting impacts
Policy Integration Y
• potential impact on integrated management of the River Chet as a whole, since different margins are part of different compartments and therefore are being treated separately.
Appendix B4.2 34
Appendix B4.2:
Appraisal summary table for main assessment –MA-AST for the River Chet flood alleviation scheme
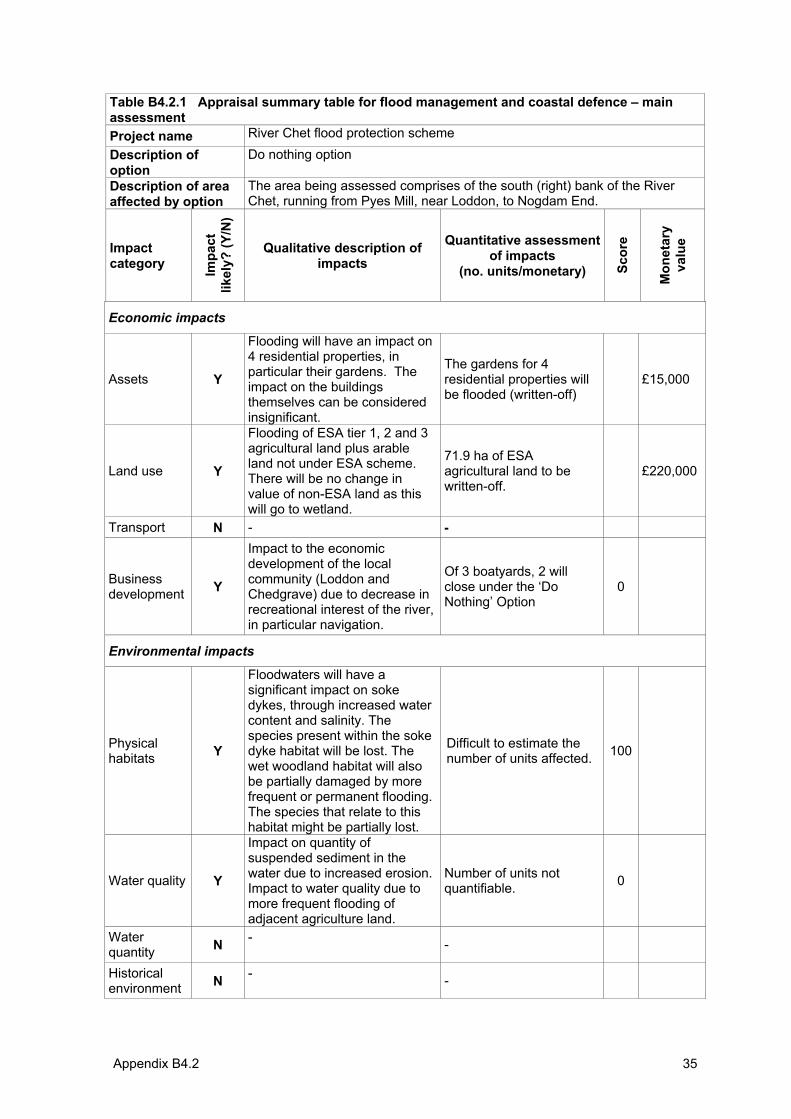
Appendix B4.2 35
Table B4.2.1 Appraisal summary table for flood management and coastal defence – main assessmentProject name River Chet flood protection scheme Description of option
Do nothing option
Description of area affected by option
The area being assessed comprises of the south (right) bank of the River Chet, running from Pyes Mill, near Loddon, to Nogdam End.
Impactcategory Im
pact
likel
y? (Y
/N)
Qualitative description of impacts
Quantitative assessment of impacts
(no. units/monetary) Scor
e
Mon
etar
yva
lue
Economic impacts
Assets Y
Flooding will have an impact on 4 residential properties, in particular their gardens. The impact on the buildings themselves can be considered insignificant.
The gardens for 4 residential properties will be flooded (written-off)
£15,000
Land use Y
Flooding of ESA tier 1, 2 and 3 agricultural land plus arable land not under ESA scheme. There will be no change in value of non-ESA land as this will go to wetland.
71.9 ha of ESA agricultural land to be written-off.
£220,000
Transport N - -
Businessdevelopment Y
Impact to the economic development of the local community (Loddon and Chedgrave) due to decrease in recreational interest of the river, in particular navigation.
Of 3 boatyards, 2 will close under the ‘Do Nothing’ Option
0
Environmental impacts
Physical habitats Y
Floodwaters will have a significant impact on soke dykes, through increased water content and salinity. The species present within the soke dyke habitat will be lost. The wet woodland habitat will also be partially damaged by more frequent or permanent flooding. The species that relate to this habitat might be partially lost.
Difficult to estimate the number of units affected. 100
Water quality Y
Impact on quantity of suspended sediment in the water due to increased erosion. Impact to water quality due to more frequent flooding of adjacent agriculture land.
Number of units not quantifiable. 0
Waterquantity N - -
Historicalenvironment N - -
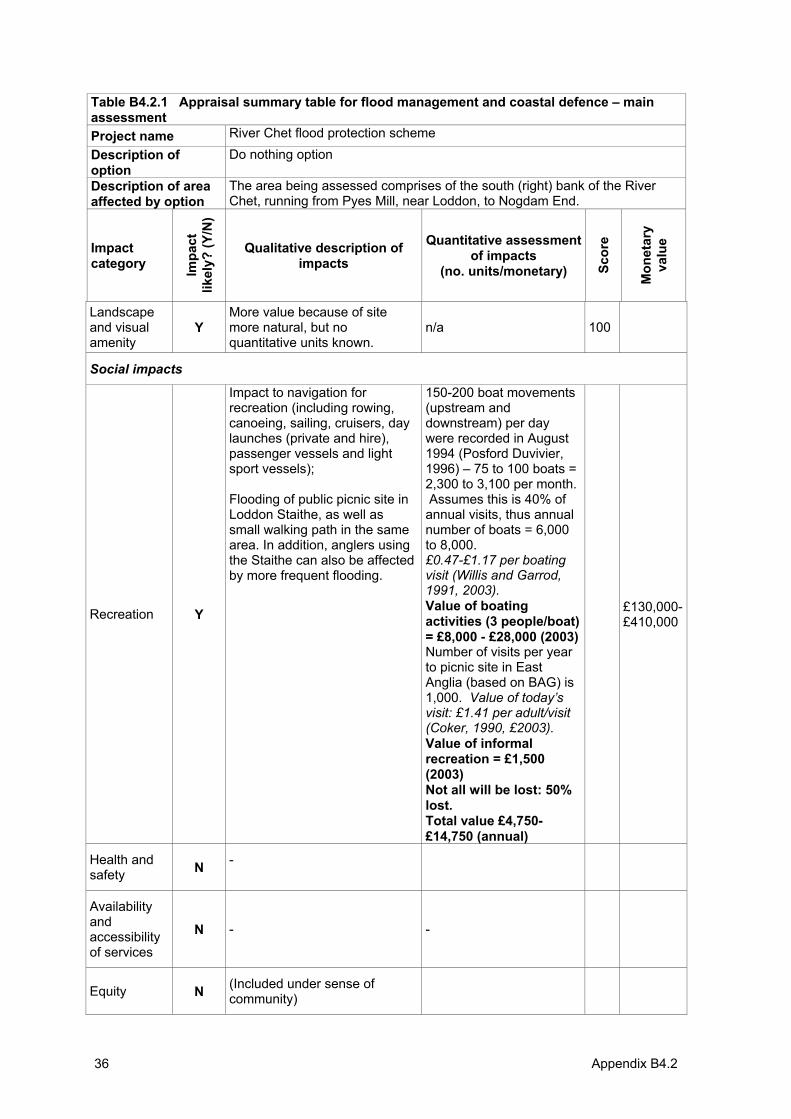
Appendix B4.2 36
Table B4.2.1 Appraisal summary table for flood management and coastal defence – main assessmentProject name River Chet flood protection scheme Description of option
Do nothing option
Description of area affected by option
The area being assessed comprises of the south (right) bank of the River Chet, running from Pyes Mill, near Loddon, to Nogdam End.
Impactcategory Im
pact
likel
y? (Y
/N)
Qualitative description of impacts
Quantitative assessment of impacts
(no. units/monetary) Scor
e
Mon
etar
yva
lue
Landscapeand visual amenity
YMore value because of site more natural, but no quantitative units known.
n/a 100
Social impacts
Recreation Y
Impact to navigation for recreation (including rowing, canoeing, sailing, cruisers, day launches (private and hire), passenger vessels and light sport vessels);
Flooding of public picnic site in Loddon Staithe, as well as small walking path in the same area. In addition, anglers using the Staithe can also be affected by more frequent flooding.
150-200 boat movements (upstream and downstream) per day were recorded in August 1994 (Posford Duvivier, 1996) – 75 to 100 boats = 2,300 to 3,100 per month. Assumes this is 40% of annual visits, thus annual number of boats = 6,000 to 8,000. £0.47-£1.17 per boating visit (Willis and Garrod, 1991, 2003). Value of boating activities (3 people/boat) = £8,000 - £28,000 (2003) Number of visits per year to picnic site in East Anglia (based on BAG) is 1,000. Value of today’s visit: £1.41 per adult/visit (Coker, 1990, £2003). Value of informal recreation = £1,500 (2003)Not all will be lost: 50% lost.Total value £4,750-£14,750 (annual)
£130,000-£410,000
Health and safety N -
Availability andaccessibility of services
N - -
Equity N (Included under sense of community)
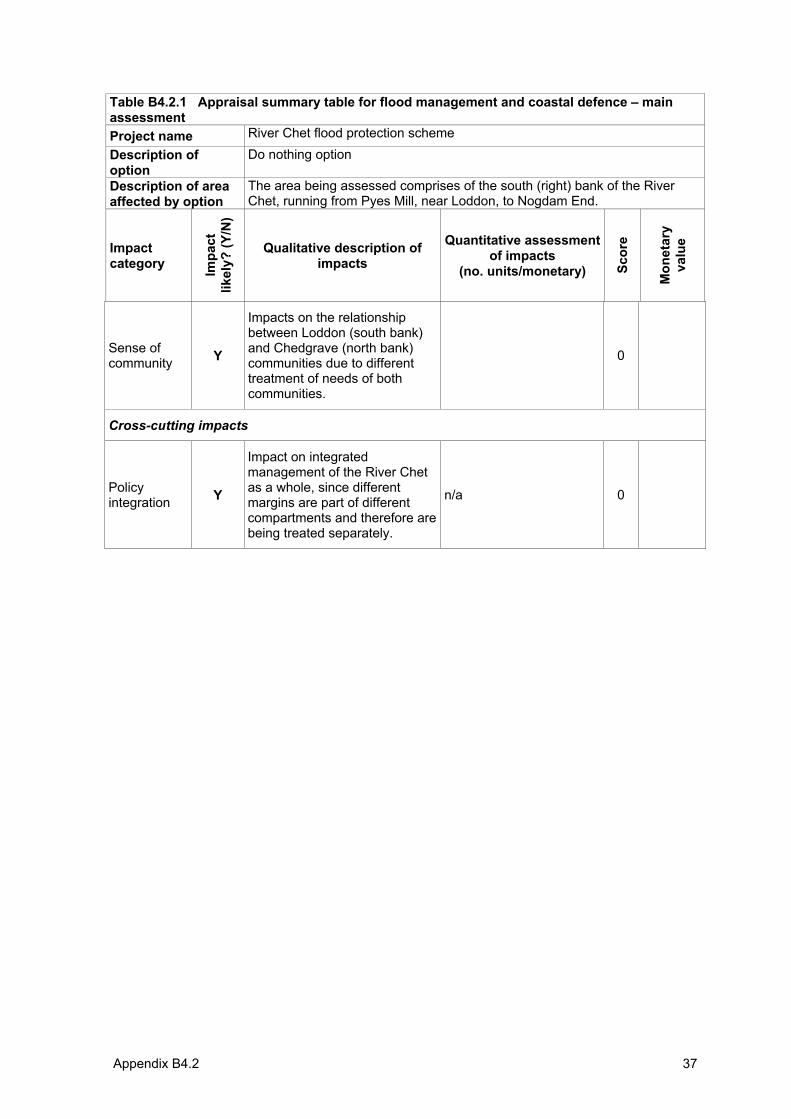
Appendix B4.2 37
Table B4.2.1 Appraisal summary table for flood management and coastal defence – main assessmentProject name River Chet flood protection scheme Description of option
Do nothing option
Description of area affected by option
The area being assessed comprises of the south (right) bank of the River Chet, running from Pyes Mill, near Loddon, to Nogdam End.
Impactcategory Im
pact
likel
y? (Y
/N)
Qualitative description of impacts
Quantitative assessment of impacts
(no. units/monetary) Scor
e
Mon
etar
yva
lue
Sense of community Y
Impacts on the relationship between Loddon (south bank) and Chedgrave (north bank) communities due to different treatment of needs of both communities.
0
Cross-cutting impacts
Policy integration Y
Impact on integrated management of the River Chet as a whole, since different margins are part of different compartments and therefore are being treated separately.
n/a 0
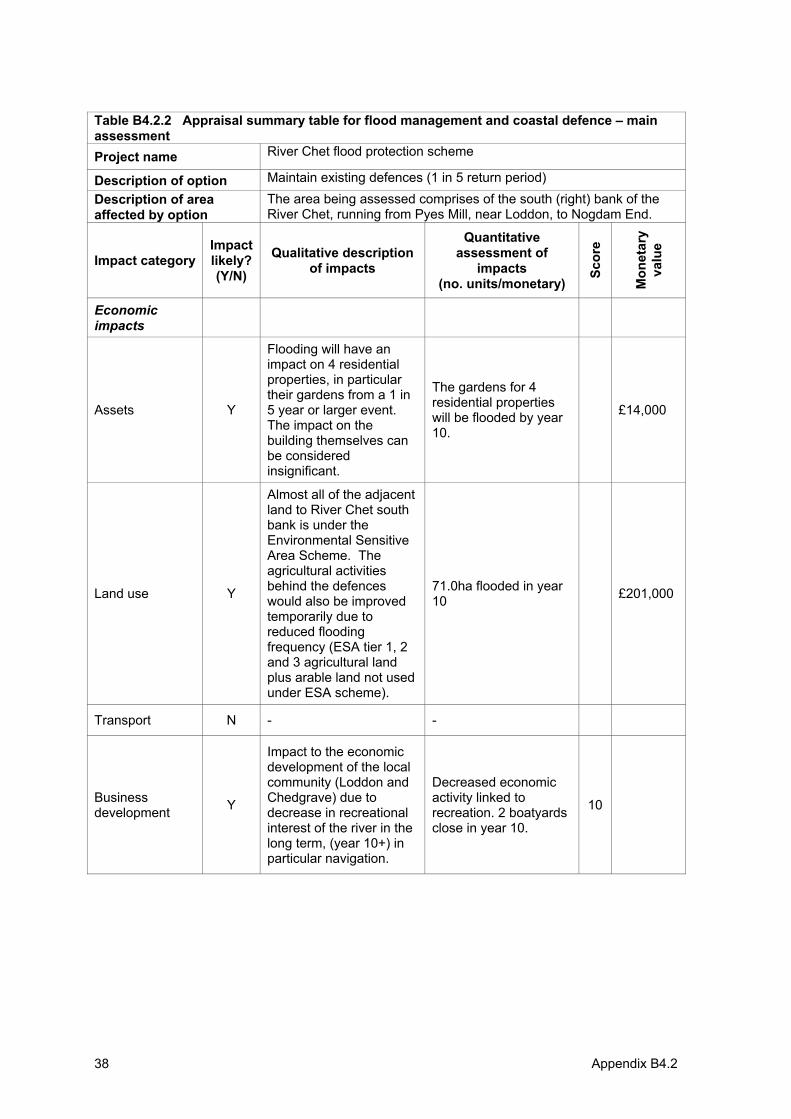
Appendix B4.2 38
Table B4.2.2 Appraisal summary table for flood management and coastal defence – main assessmentProject name River Chet flood protection scheme
Description of option Maintain existing defences (1 in 5 return period) Description of area affected by option
The area being assessed comprises of the south (right) bank of the River Chet, running from Pyes Mill, near Loddon, to Nogdam End.
Impact category Impactlikely? (Y/N)
Qualitative description of impacts
Quantitative assessment of
impacts(no. units/monetary)
Scor
e
Mon
etar
yva
lue
Economicimpacts
Assets Y
Flooding will have an impact on 4 residential properties, in particular their gardens from a 1 in 5 year or larger event.The impact on the building themselves can be considered insignificant.
The gardens for 4 residential properties will be flooded by year 10.
£14,000
Land use Y
Almost all of the adjacent land to River Chet south bank is under the Environmental Sensitive Area Scheme. The agricultural activities behind the defences would also be improved temporarily due to reduced flooding frequency (ESA tier 1, 2 and 3 agricultural land plus arable land not used under ESA scheme).
71.0ha flooded in year 10 £201,000
Transport N - -
Businessdevelopment Y
Impact to the economic development of the local community (Loddon and Chedgrave) due to decrease in recreational interest of the river in the long term, (year 10+) in particular navigation.
Decreased economic activity linked to recreation. 2 boatyards close in year 10.
10
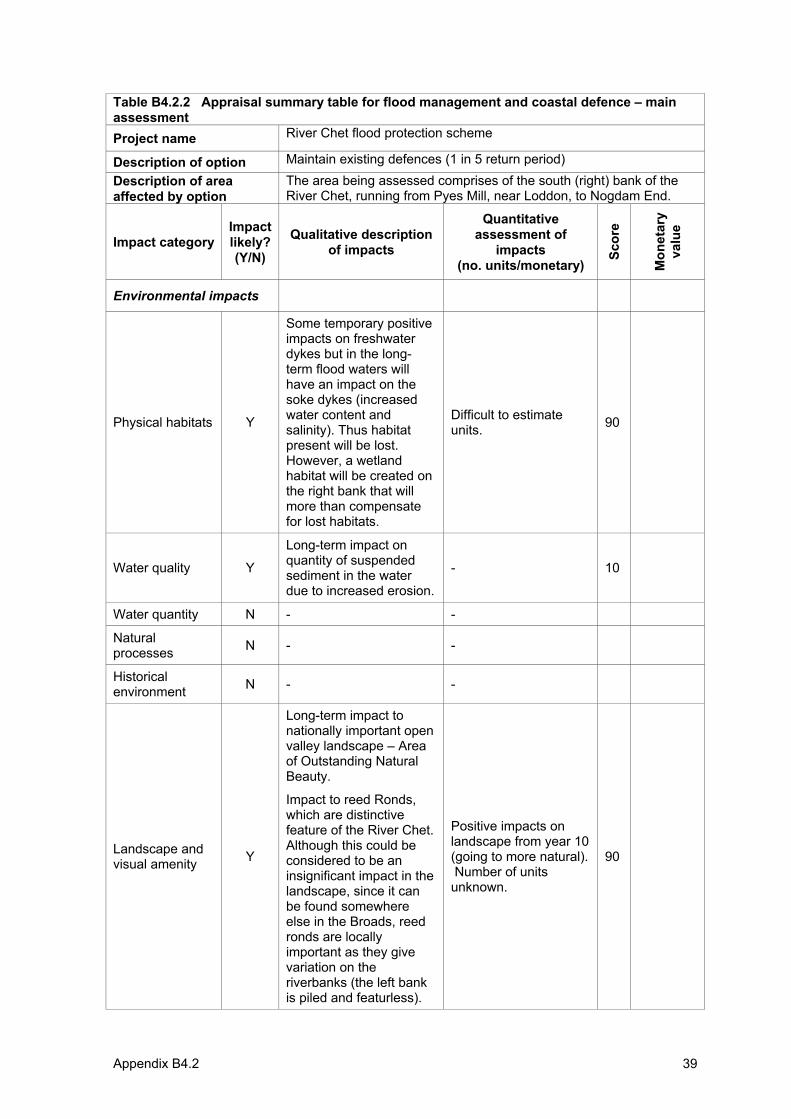
Appendix B4.2 39
Table B4.2.2 Appraisal summary table for flood management and coastal defence – main assessmentProject name River Chet flood protection scheme
Description of option Maintain existing defences (1 in 5 return period) Description of area affected by option
The area being assessed comprises of the south (right) bank of the River Chet, running from Pyes Mill, near Loddon, to Nogdam End.
Impact category Impactlikely? (Y/N)
Qualitative description of impacts
Quantitative assessment of
impacts(no. units/monetary)
Scor
e
Mon
etar
yva
lue
Environmental impacts
Physical habitats Y
Some temporary positive impacts on freshwater dykes but in the long-term flood waters will have an impact on the soke dykes (increased water content and salinity). Thus habitat present will be lost. However, a wetland habitat will be created on the right bank that will more than compensate for lost habitats.
Difficult to estimate units. 90
Water quality Y
Long-term impact on quantity of suspended sediment in the water due to increased erosion.
- 10
Water quantity N - -
Naturalprocesses N - -
Historicalenvironment N - -
Landscape and visual amenity Y
Long-term impact to nationally important open valley landscape – Area of Outstanding Natural Beauty.
Impact to reed Ronds, which are distinctive feature of the River Chet. Although this could be considered to be an insignificant impact in the landscape, since it can be found somewhere else in the Broads, reed ronds are locally important as they give variation on the riverbanks (the left bank is piled and featurless).
Positive impacts on landscape from year 10 (going to more natural). Number of units unknown.
90
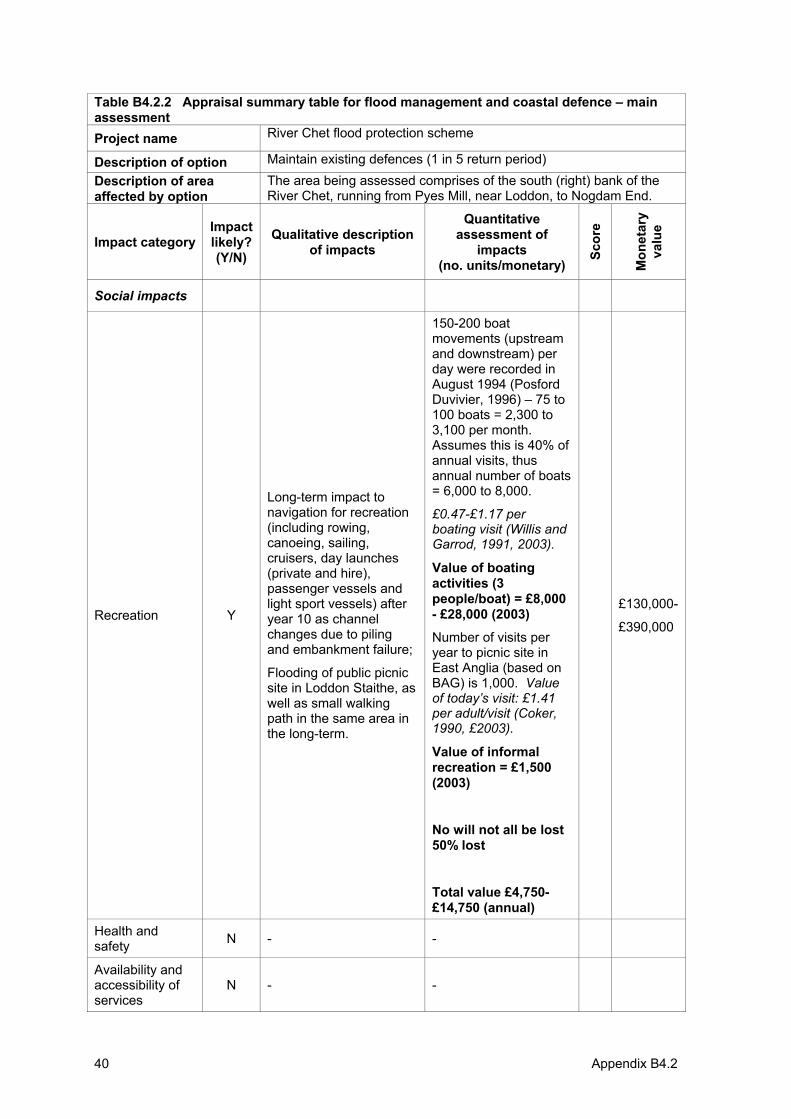
Appendix B4.2 40
Table B4.2.2 Appraisal summary table for flood management and coastal defence – main assessmentProject name River Chet flood protection scheme
Description of option Maintain existing defences (1 in 5 return period) Description of area affected by option
The area being assessed comprises of the south (right) bank of the River Chet, running from Pyes Mill, near Loddon, to Nogdam End.
Impact category Impactlikely? (Y/N)
Qualitative description of impacts
Quantitative assessment of
impacts(no. units/monetary)
Scor
e
Mon
etar
yva
lue
Social impacts
Recreation Y
Long-term impact to navigation for recreation (including rowing, canoeing, sailing, cruisers, day launches (private and hire), passenger vessels and light sport vessels) after year 10 as channel changes due to piling and embankment failure;
Flooding of public picnic site in Loddon Staithe, as well as small walking path in the same area in the long-term.
150-200 boat movements (upstream and downstream) per day were recorded in August 1994 (Posford Duvivier, 1996) – 75 to 100 boats = 2,300 to 3,100 per month.Assumes this is 40% of annual visits, thus annual number of boats = 6,000 to 8,000.
£0.47-£1.17 per boating visit (Willis and Garrod, 1991, 2003).
Value of boating activities (3 people/boat) = £8,000 - £28,000 (2003)
Number of visits per year to picnic site in East Anglia (based on BAG) is 1,000. Valueof today’s visit: £1.41 per adult/visit (Coker, 1990, £2003).
Value of informal recreation = £1,500 (2003)
No will not all be lost 50% lost
Total value £4,750-£14,750 (annual)
£130,000-
£390,000
Health and safety N - -
Availability and accessibility of services
N - -
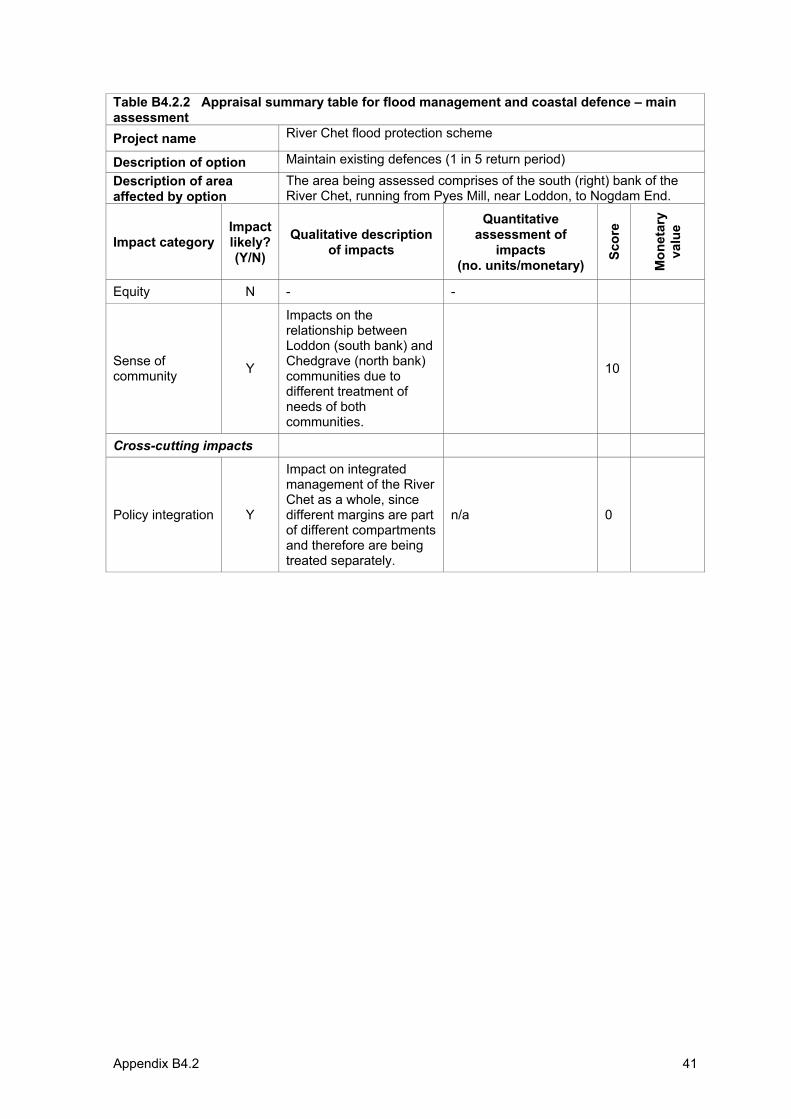
Appendix B4.2 41
Table B4.2.2 Appraisal summary table for flood management and coastal defence – main assessmentProject name River Chet flood protection scheme
Description of option Maintain existing defences (1 in 5 return period) Description of area affected by option
The area being assessed comprises of the south (right) bank of the River Chet, running from Pyes Mill, near Loddon, to Nogdam End.
Impact category Impactlikely? (Y/N)
Qualitative description of impacts
Quantitative assessment of
impacts(no. units/monetary)
Scor
e
Mon
etar
yva
lue
Equity N - -
Sense of community Y
Impacts on the relationship between Loddon (south bank) and Chedgrave (north bank) communities due to different treatment of needs of both communities.
10
Cross-cutting impacts
Policy integration Y
Impact on integrated management of the River Chet as a whole, since different margins are part of different compartments and therefore are being treated separately.
n/a 0
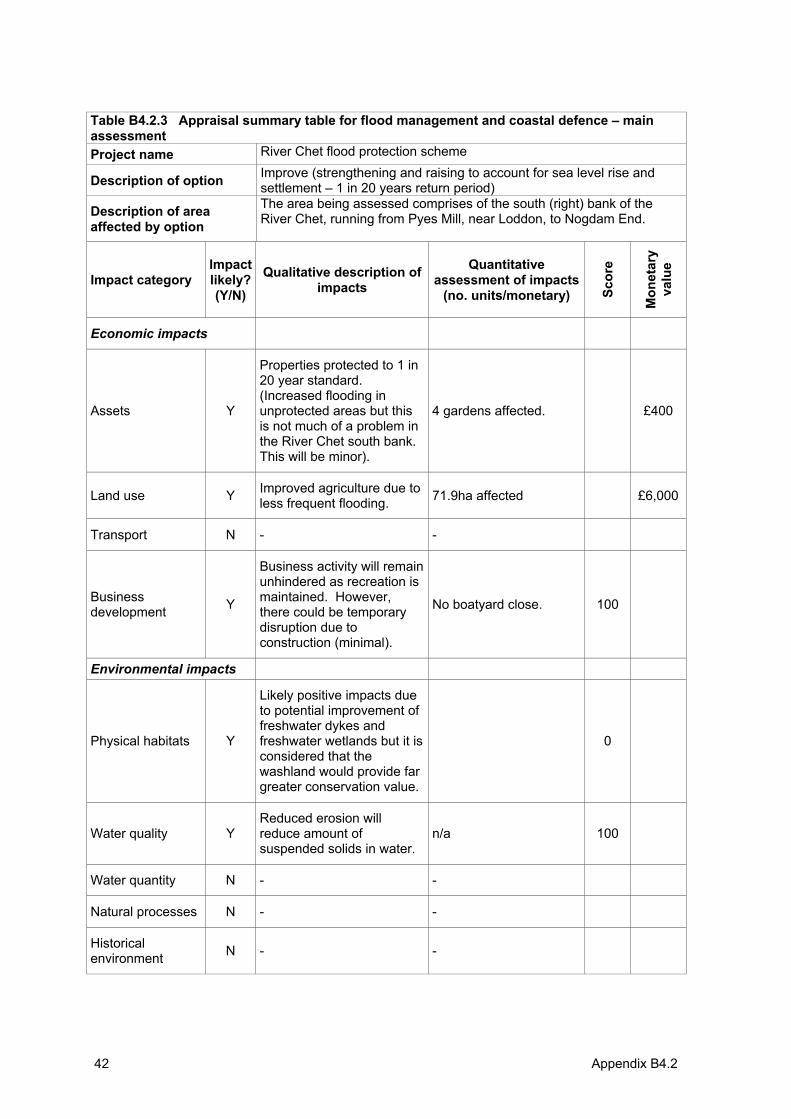
Appendix B4.2 42
Table B4.2.3 Appraisal summary table for flood management and coastal defence – main assessmentProject name River Chet flood protection scheme
Description of option Improve (strengthening and raising to account for sea level rise and settlement – 1 in 20 years return period)
Description of area affected by option
The area being assessed comprises of the south (right) bank of the River Chet, running from Pyes Mill, near Loddon, to Nogdam End.
Impact category Impactlikely? (Y/N)
Qualitative description of impacts
Quantitative assessment of impacts
(no. units/monetary) Scor
e
Mon
etar
yva
lue
Economic impacts
Assets Y
Properties protected to 1 in 20 year standard.(Increased flooding in unprotected areas but this is not much of a problem in the River Chet south bank.This will be minor).
4 gardens affected. £400
Land use Y Improved agriculture due to less frequent flooding. 71.9ha affected £6,000
Transport N - -
Businessdevelopment Y
Business activity will remain unhindered as recreation is maintained. However, there could be temporary disruption due to construction (minimal).
No boatyard close. 100
Environmental impacts
Physical habitats Y
Likely positive impacts due to potential improvement of freshwater dykes and freshwater wetlands but it is considered that the washland would provide far greater conservation value.
0
Water quality Y Reduced erosion will reduce amount of suspended solids in water.
n/a 100
Water quantity N - -
Natural processes N - -
Historicalenvironment N - -
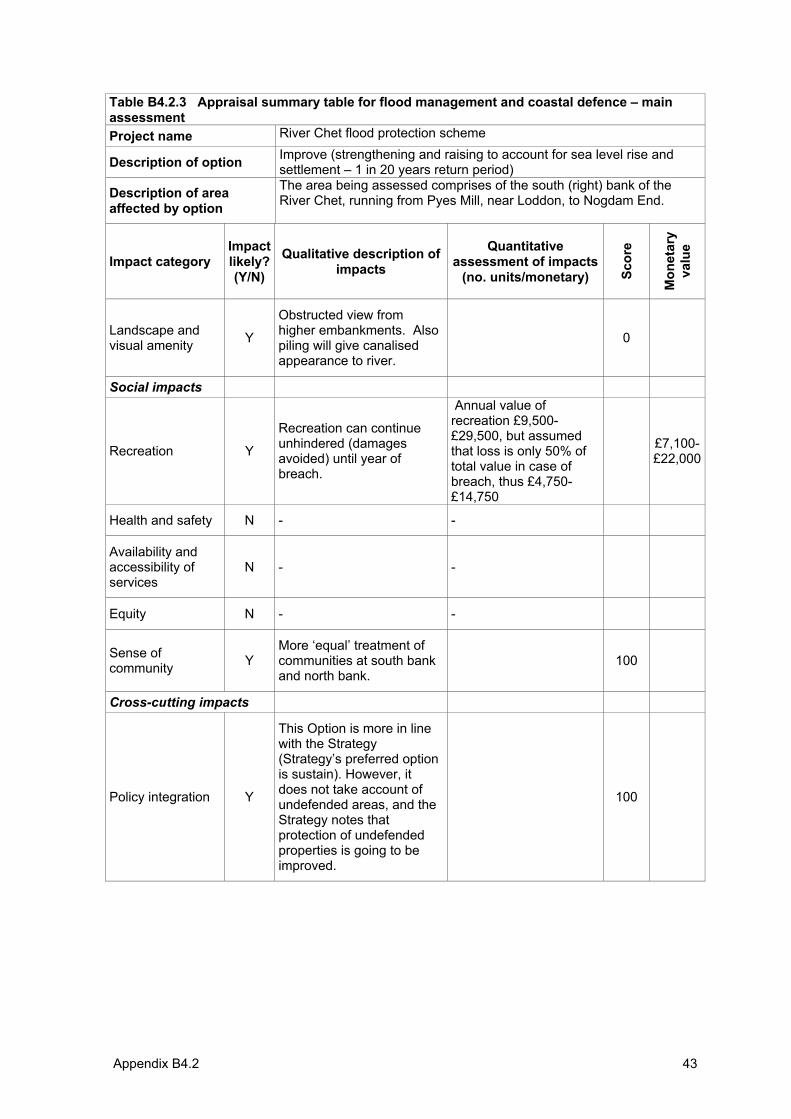
Appendix B4.2 43
Table B4.2.3 Appraisal summary table for flood management and coastal defence – main assessmentProject name River Chet flood protection scheme
Description of option Improve (strengthening and raising to account for sea level rise and settlement – 1 in 20 years return period)
Description of area affected by option
The area being assessed comprises of the south (right) bank of the River Chet, running from Pyes Mill, near Loddon, to Nogdam End.
Impact category Impactlikely? (Y/N)
Qualitative description of impacts
Quantitative assessment of impacts
(no. units/monetary) Scor
e
Mon
etar
yva
lue
Landscape and visual amenity Y
Obstructed view from higher embankments. Also piling will give canalised appearance to river.
0
Social impacts
Recreation Y
Recreation can continue unhindered (damages avoided) until year of breach.
Annual value of recreation £9,500-£29,500, but assumed that loss is only 50% of total value in case of breach, thus £4,750-£14,750
£7,100-£22,000
Health and safety N - -
Availability and accessibility of services
N - -
Equity N - -
Sense of community Y
More ‘equal’ treatment of communities at south bank and north bank.
100
Cross-cutting impacts
Policy integration Y
This Option is more in line with the Strategy (Strategy’s preferred option is sustain). However, it does not take account of undefended areas, and the Strategy notes that protection of undefended properties is going to be improved.
100
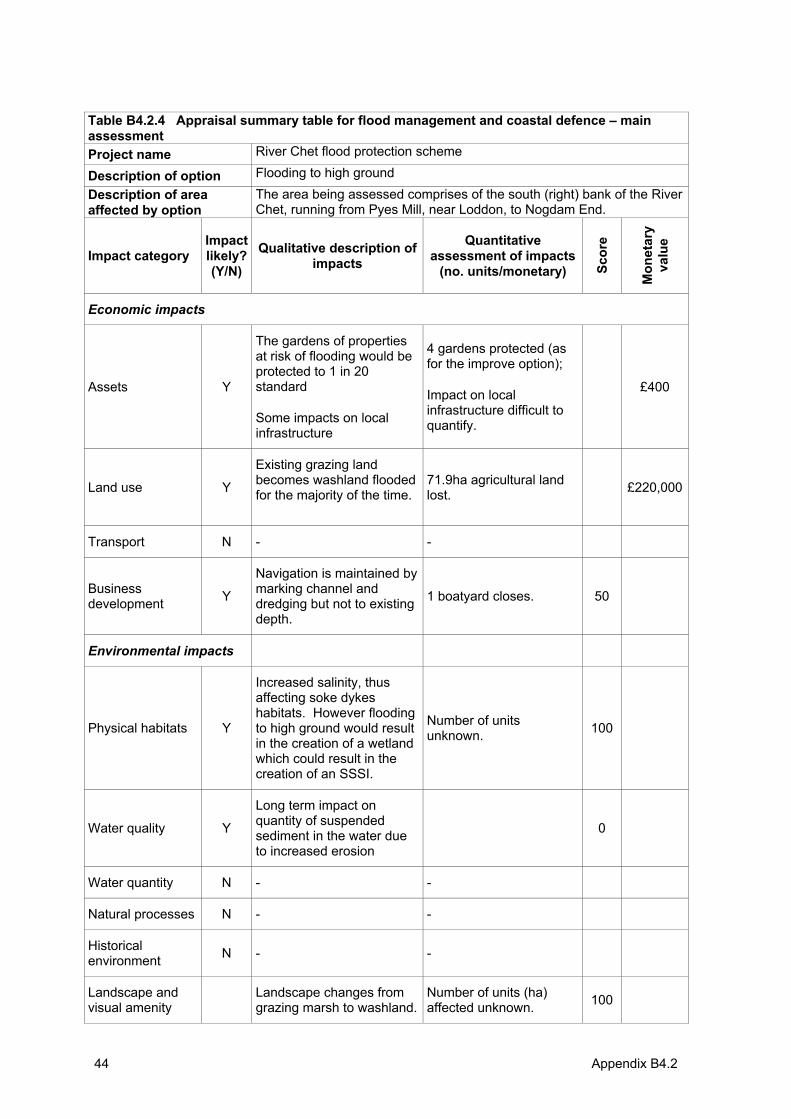
Appendix B4.2 44
Table B4.2.4 Appraisal summary table for flood management and coastal defence – main assessmentProject name River Chet flood protection scheme
Description of option Flooding to high ground Description of area affected by option
The area being assessed comprises of the south (right) bank of the River Chet, running from Pyes Mill, near Loddon, to Nogdam End.
Impact category Impactlikely? (Y/N)
Qualitative description of impacts
Quantitative assessment of impacts
(no. units/monetary) Scor
e
Mon
etar
yva
lue
Economic impacts
Assets Y
The gardens of properties at risk of flooding would be protected to 1 in 20 standard
Some impacts on local infrastructure
4 gardens protected (as for the improve option);
Impact on local infrastructure difficult to quantify.
£400
Land use Y
Existing grazing land becomes washland flooded for the majority of the time.
71.9ha agricultural land lost. £220,000
Transport N - -
Businessdevelopment Y
Navigation is maintained by marking channel and dredging but not to existing depth.
1 boatyard closes. 50
Environmental impacts
Physical habitats Y
Increased salinity, thus affecting soke dykes habitats. However flooding to high ground would result in the creation of a wetland which could result in the creation of an SSSI.
Number of units unknown. 100
Water quality Y
Long term impact on quantity of suspended sediment in the water due to increased erosion
0
Water quantity N - -
Natural processes N - -
Historicalenvironment N - -
Landscape and visual amenity
Landscape changes from grazing marsh to washland.
Number of units (ha) affected unknown. 100
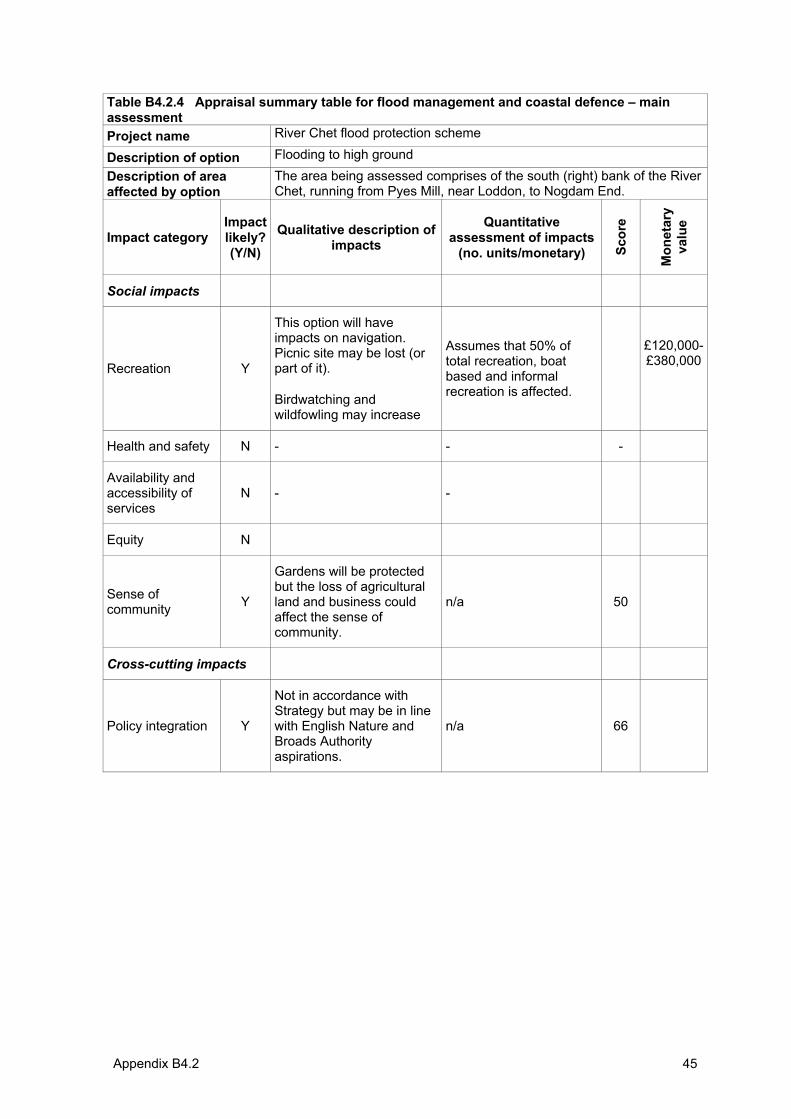
Appendix B4.2 45
Table B4.2.4 Appraisal summary table for flood management and coastal defence – main assessmentProject name River Chet flood protection scheme
Description of option Flooding to high ground Description of area affected by option
The area being assessed comprises of the south (right) bank of the River Chet, running from Pyes Mill, near Loddon, to Nogdam End.
Impact category Impactlikely? (Y/N)
Qualitative description of impacts
Quantitative assessment of impacts
(no. units/monetary) Scor
e
Mon
etar
yva
lue
Social impacts
Recreation Y
This option will have impacts on navigation.Picnic site may be lost (or part of it).
Birdwatching and wildfowling may increase
Assumes that 50% of total recreation, boat based and informal recreation is affected.
£120,000-£380,000
Health and safety N - - -
Availability and accessibility of services
N - -
Equity N
Sense of community Y
Gardens will be protected but the loss of agricultural land and business could affect the sense of community.
n/a 50
Cross-cutting impacts
Policy integration Y
Not in accordance with Strategy but may be in line with English Nature and Broads Authority aspirations.
n/a 66
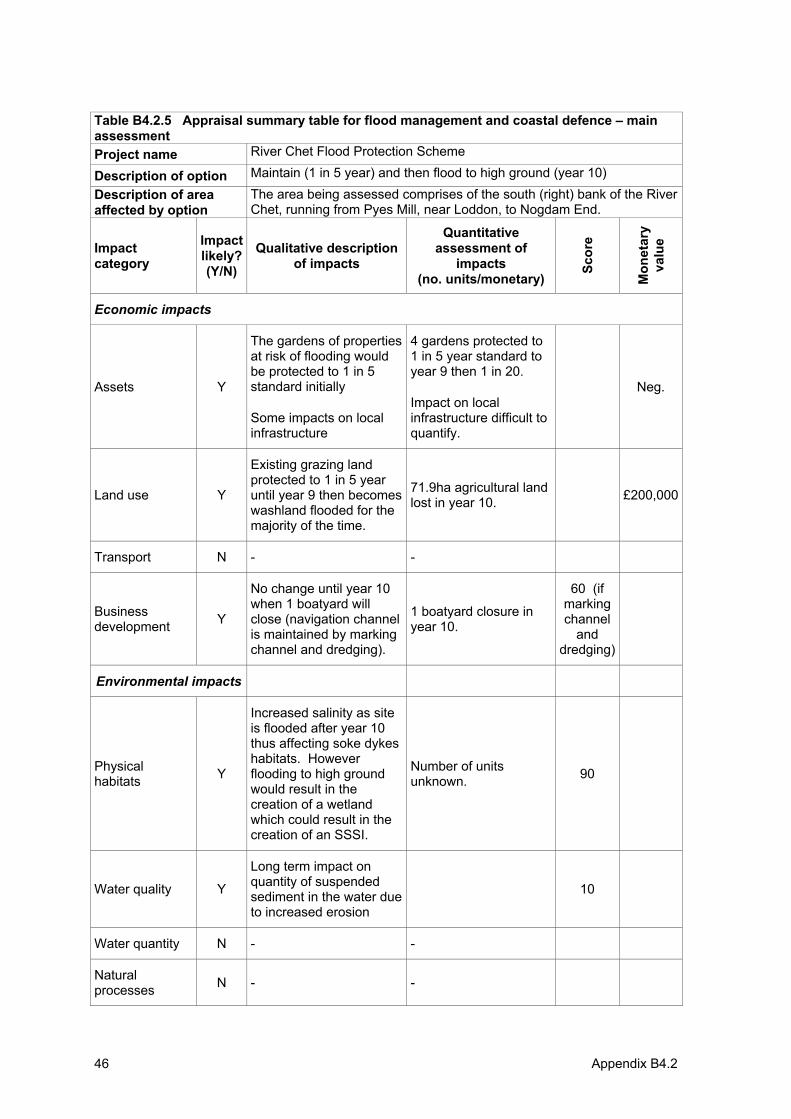
Appendix B4.2 46
Table B4.2.5 Appraisal summary table for flood management and coastal defence – main assessmentProject name River Chet Flood Protection Scheme
Description of option Maintain (1 in 5 year) and then flood to high ground (year 10) Description of area affected by option
The area being assessed comprises of the south (right) bank of the River Chet, running from Pyes Mill, near Loddon, to Nogdam End.
Impactcategory
Impactlikely? (Y/N)
Qualitative description of impacts
Quantitative assessment of
impacts(no. units/monetary)
Scor
e
Mon
etar
yva
lue
Economic impacts
Assets Y
The gardens of properties at risk of flooding would be protected to 1 in 5 standard initially
Some impacts on local infrastructure
4 gardens protected to 1 in 5 year standard to year 9 then 1 in 20.
Impact on local infrastructure difficult to quantify.
Neg.
Land use Y
Existing grazing land protected to 1 in 5 year until year 9 then becomes washland flooded for the majority of the time.
71.9ha agricultural land lost in year 10. £200,000
Transport N - -
Businessdevelopment Y
No change until year 10 when 1 boatyard will close (navigation channel is maintained by marking channel and dredging).
1 boatyard closure in year 10.
60 (if markingchannel
anddredging)
Environmental impacts
Physical habitats Y
Increased salinity as site is flooded after year 10 thus affecting soke dykes habitats. However flooding to high ground would result in the creation of a wetland which could result in the creation of an SSSI.
Number of units unknown. 90
Water quality Y
Long term impact on quantity of suspended sediment in the water due to increased erosion
10
Water quantity N - -
Naturalprocesses N - -
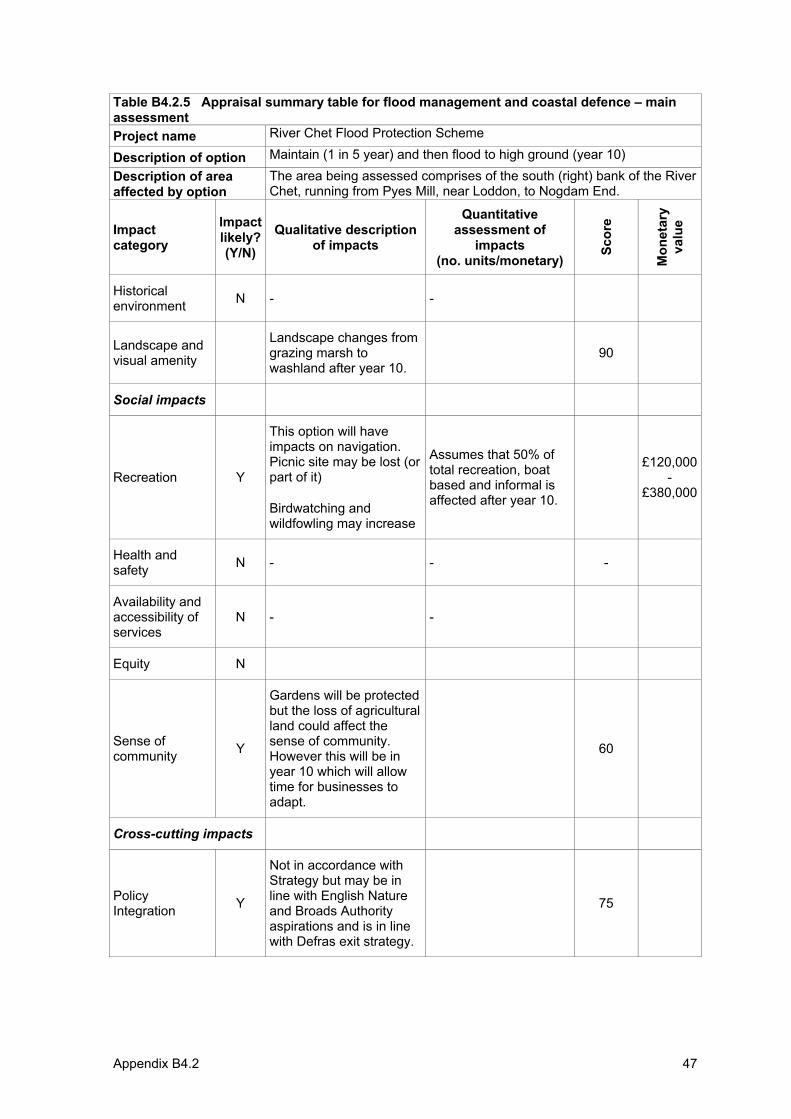
Appendix B4.2 47
Table B4.2.5 Appraisal summary table for flood management and coastal defence – main assessmentProject name River Chet Flood Protection Scheme
Description of option Maintain (1 in 5 year) and then flood to high ground (year 10) Description of area affected by option
The area being assessed comprises of the south (right) bank of the River Chet, running from Pyes Mill, near Loddon, to Nogdam End.
Impactcategory
Impactlikely? (Y/N)
Qualitative description of impacts
Quantitative assessment of
impacts(no. units/monetary)
Scor
e
Mon
etar
yva
lue
Historicalenvironment N - -
Landscape and visual amenity
Landscape changes from grazing marsh to washland after year 10.
90
Social impacts
Recreation Y
This option will have impacts on navigation.Picnic site may be lost (or part of it)
Birdwatching and wildfowling may increase
Assumes that 50% of total recreation, boat based and informal is affected after year 10.
£120,000-
£380,000
Health and safety N - - -
Availability and accessibility of services
N - -
Equity N
Sense of community Y
Gardens will be protected but the loss of agricultural land could affect the sense of community.However this will be in year 10 which will allow time for businesses to adapt.
60
Cross-cutting impacts
Policy Integration Y
Not in accordance with Strategy but may be in line with English Nature and Broads Authority aspirations and is in line with Defras exit strategy.
75
Joint Defra/EA Flood and Coastal Erosion Risk Management R&D Programme
Annex B.5:
Case study no.5:
Assessment of the Humber Estuary shoreline management plan
R&D Project Record FD2013/PR2
Produced: November 2004

ii
Statement of use This report provides guidance on the use of MCA and ASTs to assist in the appraisal of flood and coastal erosion risk management projects, strategies and policies. It should be noted that it does not constitute official government policy or guidance, which is unlikely to be available until work to develop the methodology and identify appropriate sources of data has been undertaken through pilot studies.
This report may be downloaded from the Defra/EA R&D Programme website (http://www.defra.gov.uk/environ.fcd/research), use the search tool located on the project information and publications page. Copies are held by all EA Regional Information Centres, contact The Environment Agency’s National Customer Contact Centre by emailing [email protected] or by telephoning 08708506506.
Dissemination Status Internal: Released internally External: Released to public domain
Keywords: Multi criteria analysis, MCA, appraisal summary table, AST, decision rule
Research contractor contact details: Lead contractor: Risk & Policy Analysts Ltd (RPA), Farthing Green House, 1 Beccles Road, Loddon, Norfolk, NR14 6LT (Tel: 01508 528465; Fax: 01508 520758; www.rpaltd.co.uk). The project director was Meg Postle, the project manager for RPA was John Ash with research support from Susana Dias and other members of RPA staff.
The research team also included: Colin Green (Flood Hazard Research Centre, Middlesex University); Alan Pearman (University of Leeds); Ron Janssen (The Institute of Environmental Studies, Free University, Amsterdam), Terry Oakes and Hugh Payne (Independent Consultants)
Acknowledgements The assistance of those providing information for the case studies is gratefully acknowledged.
Defra project manager: Matt Crossman, Defra, 3D Ergon House, Horseferry Rd, London, SW1P 2AL. Email: [email protected]
Publishing organisation DefraFlood Management Division Ergon House Horseferry Road London SW1P 2AL Tel: 020 7238 3000 Fax: 020 7238 6187 www.defra.gov.uk/environ/fcd
â Crown copyright (Defra); 2005
Copyright in the typographical arrangement and design rests with the Crown. This publication (excluding the logo) may be reproduced free of charge in any format or medium provided that it is reproduced accurately and not used in a misleading context. The material must be acknowledged as Crown copyright with the title and source of the publication specified. The views expressed in this document are not necessarily those of Defra or the Environment Agency. Its officers, servants or agents accept no liability whatsoever for any loss or damage arising from the interpretation or use of the information, or reliance on views contained herein.
Published by the Department for Environment, Food and Rural Affairs. Printed in the UK, March 2005 on recycled material containing 80% post-consumer waste and 20% totally chlorine free virgin pulp.
PB No. 10734/PR2 ISBN 0-85521-146-6
Section 1: Introduction 1
1. Introduction The Humber case study is based on the economic appraisal undertaken for the Humber Estuary shoreline management plan stage 2 study. This appraisal was undertaken by RPA in association with Black & Veatch for the Environment Agency in 2003. This approach included the completion of Appraisal Summary Tables (ASTs) to ensure that the non-quantified impacts were fully identified and could influence decision-making. For this case study, management unit 6 is used to investigate how the inclusion of multi-criteria analysis may have affected the decision.
1.1 Summary of the project area
Management Unit 6 runs from South Ferriby Cliff to North Killingholme and is mainly comprised of medium grade agricultural land for up to 3km inland. The main settlement in the area is Barton-upon-Humber. Clay pits immediately behind the defences between Chowder Ness and New Holland are important environmental and recreation sites, with some designated for their environmental value. There are also a number of small industrial areas, including New Holland Dock. The area is categorised as land use band C, with an indicative standard of 1:10 to 1:100 (taken from FCDPAG3).
1.2 Existing defences
About half of the defences between South Ferriby and New Holland Dock provide protection against a 1 in 50 year event. Around Barton Creek, some lengths of the defences give significantly lower standards. East of New Holland Dock, around 70% of the defences protect against an event with a return period of 1 in 20 years. In 50 years, the standard of defence is expected to fall such that about 50% of the defence will no longer protect against a 1 in 10 year event. The overall condition of the defences is fair to good. There is concern that erosion of mudflats may threaten the stability of the defences. There are also some lengths where the crest level of the embankment is low (Environment Agency, 2000).
1.3 The policy framework
The Humber Estuary Shoreline Management Plan (SMP) was published in September 2000 (Environment Agency, 2000). This sets out the Environment Agency’s vision for managing the flood defences of the Humber Estuary. The SMP has since been further developed in a Stage 2 study, which attempts to provide fully justified decisions on the policy for each management unit. For management unit 6, the SMP identifies that an appraisal is required to determine whether moving the line locally would be worthwhile. Elsewhere, the existing defences will generally be held on their present alignment until a length needs to be repaired or improved.
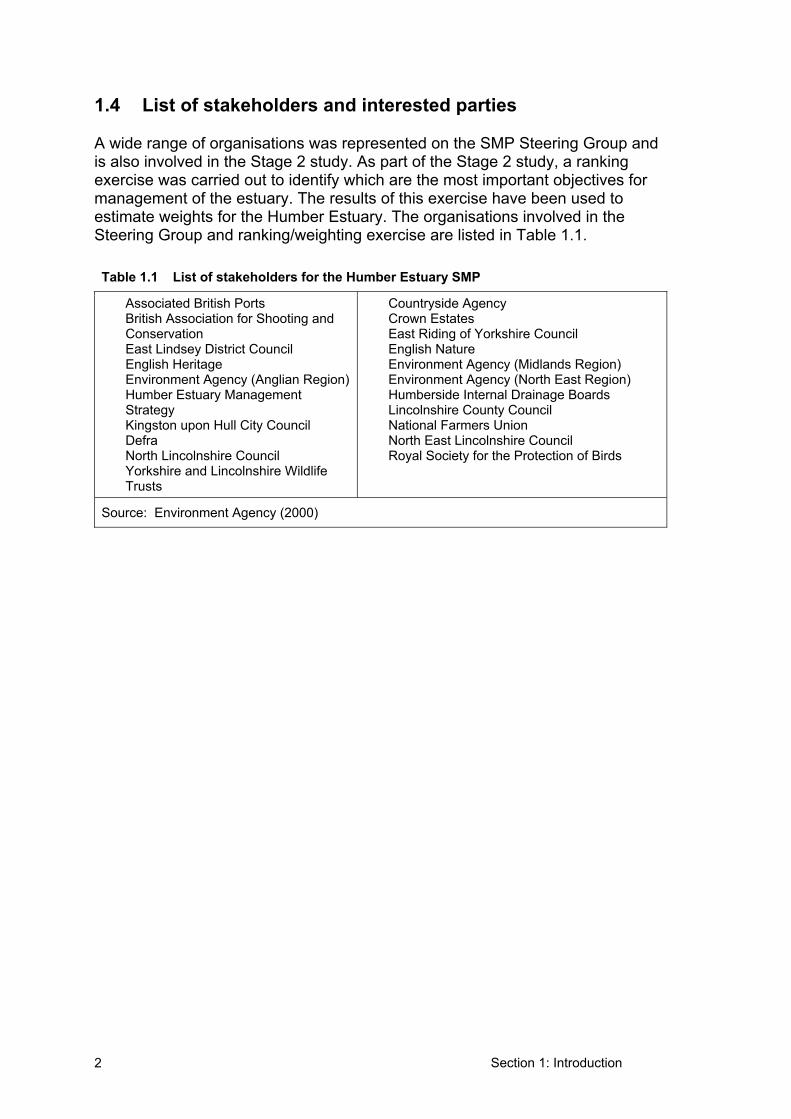
Section 1: Introduction 2
1.4 List of stakeholders and interested parties
A wide range of organisations was represented on the SMP Steering Group and is also involved in the Stage 2 study. As part of the Stage 2 study, a ranking exercise was carried out to identify which are the most important objectives for management of the estuary. The results of this exercise have been used to estimate weights for the Humber Estuary. The organisations involved in the Steering Group and ranking/weighting exercise are listed in Table 1.1.
Table 1.1 List of stakeholders for the Humber Estuary SMP
• Associated British Ports • British Association for Shooting and
Conservation• East Lindsey District Council • English Heritage • Environment Agency (Anglian Region) • Humber Estuary Management
Strategy• Kingston upon Hull City Council • Defra• North Lincolnshire Council • Yorkshire and Lincolnshire Wildlife
Trusts
• Countryside Agency • Crown Estates • East Riding of Yorkshire Council • English Nature • Environment Agency (Midlands Region) • Environment Agency (North East Region) • Humberside Internal Drainage Boards • Lincolnshire County Council • National Farmers Union • North East Lincolnshire Council • Royal Society for the Protection of Birds
Source: Environment Agency (2000)
Section 2: Definition of objectives and management options 3
2. Definition of objectives and management options
In the Humber Estuary SMP Stage 2, three options are assessed for Management Unit 6: • Option 1: Do-nothing; • Option 2: Hold the Line (low standard of 1:10); and • Option 3: Hold the Line (high standard of 1:100).
For the case study, the Humber Estuary is to be assessed at the strategy level, such that five options will be assessed: • Option 1: Do-nothing; • Option 2: Maintain: standard of defence decreases from current level of
1:20 to a maintainable level of 1:10. The standard of defence decreases to 1:10 by year 9 due to the condition of the defences and to 1:5 by the end of the time horizon (due to sea level rise) (assumed to be equivalent to the ‘hold the line (low standard) option from the Humber Estuary SMP Stage 2);
• Option 3: Sustain: standard of defence is sustained at 1:20 throughout the 100 year time horizon;
• Option 4: Improve 1:50: standard of defence is improved to 1:100 throughout the 100 year time horizon; and
• Option 5: Improve 1:100: standard of defence is improved to 1:300 throughout the 100 time horizon) (assumed to be equivalent to the ‘hold the line (high standard) option from the Humber Estuary SMP Stage 2).
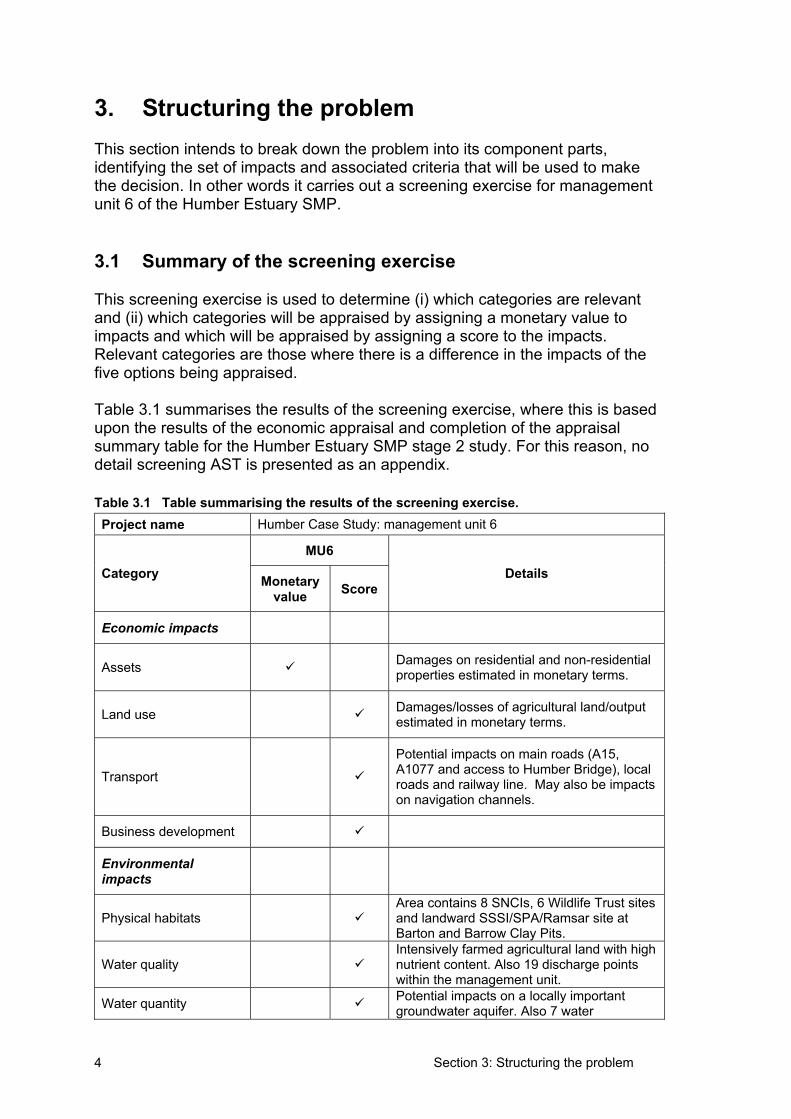
Section 3: Structuring the problem 4
3. Structuring the problem This section intends to break down the problem into its component parts, identifying the set of impacts and associated criteria that will be used to make the decision. In other words it carries out a screening exercise for management unit 6 of the Humber Estuary SMP.
3.1 Summary of the screening exercise
This screening exercise is used to determine (i) which categories are relevant and (ii) which categories will be appraised by assigning a monetary value to impacts and which will be appraised by assigning a score to the impacts. Relevant categories are those where there is a difference in the impacts of the five options being appraised.
Table 3.1 summarises the results of the screening exercise, where this is based upon the results of the economic appraisal and completion of the appraisal summary table for the Humber Estuary SMP stage 2 study. For this reason, no detail screening AST is presented as an appendix.
Table 3.1 Table summarising the results of the screening exercise. Project name Humber Case Study: management unit 6
MU6Category Monetary
value ScoreDetails
Economic impacts
Assets Damages on residential and non-residential properties estimated in monetary terms.
Land use Damages/losses of agricultural land/output estimated in monetary terms.
Transport
Potential impacts on main roads (A15, A1077 and access to Humber Bridge), local roads and railway line. May also be impacts on navigation channels.
Business development
Environmentalimpacts
Physical habitats Area contains 8 SNCIs, 6 Wildlife Trust sites and landward SSSI/SPA/Ramsar site at Barton and Barrow Clay Pits.
Water quality Intensively farmed agricultural land with high nutrient content. Also 19 discharge points within the management unit.
Water quantity Potential impacts on a locally important groundwater aquifer. Also 7 water
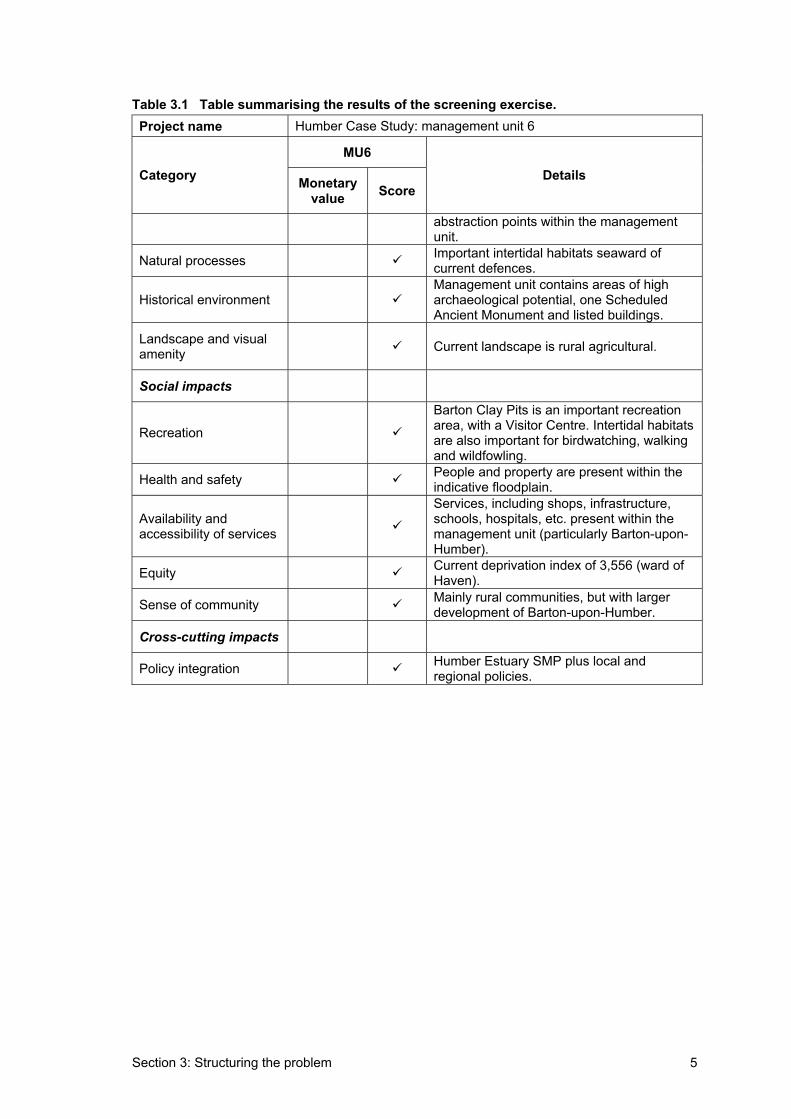
Section 3: Structuring the problem 5
Table 3.1 Table summarising the results of the screening exercise. Project name Humber Case Study: management unit 6
MU6Category Monetary
value ScoreDetails
abstraction points within the management unit.
Natural processes Important intertidal habitats seaward of current defences.
Historical environmentManagement unit contains areas of high archaeological potential, one Scheduled Ancient Monument and listed buildings.
Landscape and visual amenity Current landscape is rural agricultural.
Social impacts
Recreation
Barton Clay Pits is an important recreation area, with a Visitor Centre. Intertidal habitats are also important for birdwatching, walking and wildfowling.
Health and safety People and property are present within the indicative floodplain.
Availability and accessibility of services
Services, including shops, infrastructure, schools, hospitals, etc. present within the management unit (particularly Barton-upon-Humber).
Equity Current deprivation index of 3,556 (ward of Haven).
Sense of community Mainly rural communities, but with larger development of Barton-upon-Humber.
Cross-cutting impacts
Policy integration Humber Estuary SMP plus local and regional policies.
Section 4: Costs of options 6
4. Costs of options The do-nothing option has zero (£0) costs. The costs of the other options are: • Option 2: Maintain: £26,744,000; • Option 3: Sustain (1:20): £40,000,000; • Option 4: Improve (1:50): £48,000,000; and • Option 5: Improve (1:100): £59,279,000.
All of these cost estimates include optimism bias (at 60%). The costs of the sustain and improve 1:50 options have been estimated specifically for this case study, while the costs for maintain and improve 1:100 are taken from the Humber Estuary SMP Stage 2 economic appraisal.
Section 5: Assessment of impacts 7
5. Assessment of impacts 5.1. Qualitative and quantitative assessment
The qualitative and quantitative assessment of the different options for each of the management units was carried out using the appraisal summary table for the main assessment (MA-AST) and it is presented in Appendix B5.1 to this Annex. A Summary AST for the main assessment (Summary MA-AST) is presented in Table 5.1, below.
The assessment followed a stepped approach, starting with the qualitative assessment of all impact categories and moving to the quantitative assessment whenever information was available.
5.2 Monetary valuation of impacts
Monetary estimation of damages from flooding has been undertaken for the category of assets only. All other categories are assigned a score. The approaches used are in accordance with those set out in FCDAPG3 and the PAG3 spreadsheets have been used to provide the present value (i.e. discounted) estimates of damages over the 100-year time horizon.
5.2.1 Option 1: ‘do-nothing’
The ‘do-nothing’ option assumes that there will be a breach in the defences by year 10, with a current probability of breaching of 0.1. A breach would result in inundation of much of the area, such that 1,615 residential properties, 100 non-residential properties and 1,085 ha of agricultural land would be written off1. Sea level rise would result in the number of properties written off by year 99 (the end of the 100 year time horizon for the economic assessment) increasing to 1,730 residential properties, 103 non-residential properties and 1,221 ha of agricultural land.
Around the area written-off, there are additional residential and non-residential properties, and agricultural land that would face intermittent flooding and, hence, damages. The number of properties and area of land affected on different return period events are shown in Table 5.2.
1 Write-off is assumed to occur where flooding is more frequent than once every three years.
Agricultural land written-off, is assumed to be converted to a different land use type (such as saltmarsh or mudflat). As it is not possible to place a relative value on these different land uses, the write-off cost for agricultural land is not included in the damages of the do-nothing option.

Section 5: Assessment of impacts8
Table 5.1 Summary appraisal summary table - main assessment (summary MA-AST) Project name: Humber Estuary SMP – Strategy
Description of area affected: Management unit 6 (South Ferriby Cliff to North Killingholme)
Impactcategory
Option 1: ‘Do-nothing’
Option 2: Maintain
Option 3: Sustain
Option 4: Improve 1:50
Option 5: Improve 1:100
Economic impacts
Assets
Inundationwritten off of 1,730 residential properties and 103 non-residential.
Almost 2,000 residences and more than 100 industrialproperties would be flooded intermittently.
Assets will be protected.
Assets will be protected.
Assets will be protected.
Land use
1,221ha of agricultural land written off by year 99.
1,221ha of agricultural land flooded.
Impact on agricultural land following a breach.
Small impact on agricultural land following a breach.
Small impact on agricultural land following a breach.
Transport
Loss of A15 (includingaccess to Humber Bridge), A1077, railway line and local access roads. Navigationchannels in estuary could also be affected.
The A15, A1077, railway line and local access roads will be flooded fairly regularly. No impact on navigationchannels.
Roads and railways protected but flooded every 20 years, which may lead to seriousdisruption.
Roads and railways and navigationchannel would be protected.
Roads and railways and navigationchannel would be protected.
Businessdevelopment
Loss of so many residential and non-residentialproperties will mean that the area is no longer viable for many businesses.
Almost all businesses will be affected at some time by flooding.
The impacts on future business developmentonly significant for businesses whose investmentplanningexceeds 20 years.
Businessdevelopmentshould be largelyunaffected
Businessdevelopmentshould be largelyunaffected
Environmentalimpacts
Physicalhabitats
Loss of 8 SNCIs, 6 Wildlife Trust sites and landward SSSI/SPA/Ramsar site. Development of new intertidal habitat
Designated sites would be flooded fairly frequently.Loss of 60ha of intertidal habitat as a result of coastal squeeze.
Loss of 60ha of intertidal habitat as a result of coastal squeeze
Loss of 60ha of intertidalhabitat as a result of coastalsqueeze.Potentialimpact on integrity of SPA.
Loss of 60ha of intertidalhabitat as a result of coastalsqueeze.Potentialimpact on integrity of SPA.
Water quality
Flooding of agricultural land and STW will result in reduction in water quality. Loss of 19 discharge points.
Water quality will generally be maintained, but release of pollutants every 10 years.
Water quality will generally be maintained but release of pollutants every 20 years.
Water quality will generally be maintained.
Water quality will generally be maintained.
Water quantity Impact on Protection of water Potential Protection of Protection of
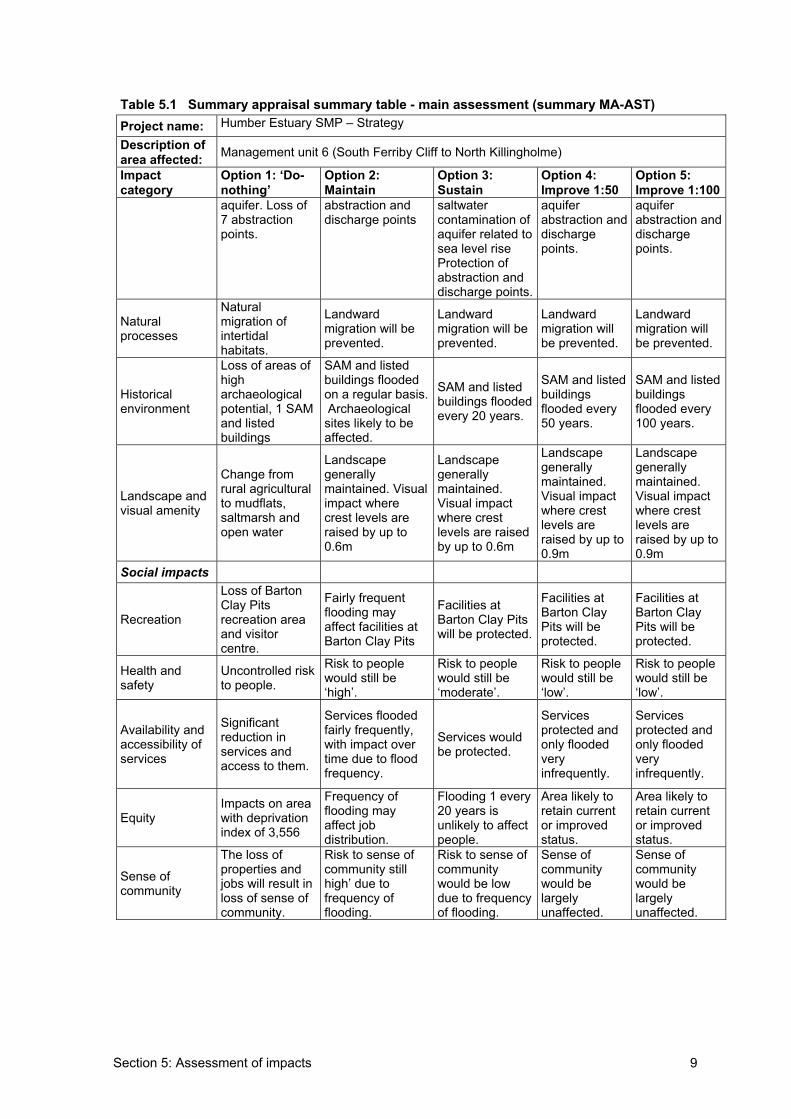
Section 5: Assessment of impacts 9
Table 5.1 Summary appraisal summary table - main assessment (summary MA-AST) Project name: Humber Estuary SMP – Strategy
Description of area affected: Management unit 6 (South Ferriby Cliff to North Killingholme)
Impactcategory
Option 1: ‘Do-nothing’
Option 2: Maintain
Option 3: Sustain
Option 4: Improve 1:50
Option 5: Improve 1:100
aquifer. Loss of 7 abstraction points.
abstraction and discharge points
saltwater contamination of aquifer related to sea level rise Protection of abstraction and discharge points.
aquiferabstraction and dischargepoints.
aquiferabstraction and dischargepoints.
Naturalprocesses
Naturalmigration of intertidalhabitats.
Landward migration will be prevented.
Landward migration will be prevented.
Landward migration will be prevented.
Landward migration will be prevented.
Historicalenvironment
Loss of areas of higharchaeologicalpotential, 1 SAM and listed buildings
SAM and listed buildings flooded on a regular basis. Archaeological sites likely to be affected.
SAM and listed buildings flooded every 20 years.
SAM and listed buildingsflooded every 50 years.
SAM and listed buildingsflooded every 100 years.
Landscape and visual amenity
Change from rural agricultural to mudflats, saltmarsh and open water
Landscapegenerallymaintained. Visual impact where crest levels are raised by up to 0.6m
Landscapegenerallymaintained.Visual impact where crest levels are raised by up to 0.6m
Landscapegenerallymaintained.Visual impact where crest levels are raised by up to 0.9m
Landscapegenerallymaintained.Visual impact where crest levels are raised by up to 0.9m
Social impacts
Recreation
Loss of Barton Clay Pits recreation area and visitor centre.
Fairly frequent flooding may affect facilities at Barton Clay Pits
Facilities at Barton Clay Pits will be protected.
Facilities at Barton Clay Pits will be protected.
Facilities at Barton Clay Pits will be protected.
Health and safety
Uncontrolled risk to people.
Risk to people would still be ‘high’.
Risk to people would still be ‘moderate’.
Risk to people would still be ‘low’.
Risk to people would still be ‘low’.
Availability and accessibility of services
Significantreduction in services and access to them.
Services flooded fairly frequently, with impact over time due to flood frequency.
Services would be protected.
Servicesprotected and only flooded veryinfrequently.
Servicesprotected and only flooded veryinfrequently.
EquityImpacts on area with deprivation index of 3,556
Frequency of flooding may affect job distribution.
Flooding 1 every 20 years is unlikely to affect people.
Area likely to retain current or improved status.
Area likely to retain current or improved status.
Sense of community
The loss of properties and jobs will result in loss of sense of community.
Risk to sense of community still high’ due to frequency of flooding.
Risk to sense of communitywould be low due to frequency of flooding.
Sense of communitywould be largelyunaffected.
Sense of communitywould be largelyunaffected.
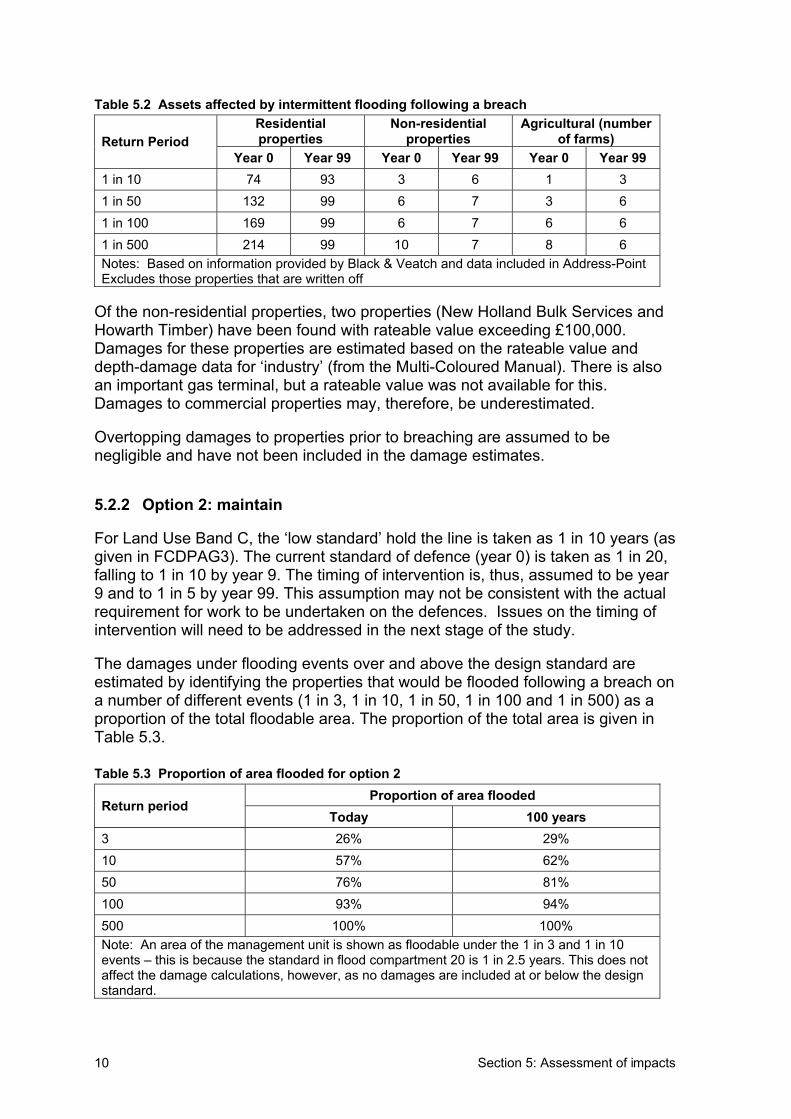
Section 5: Assessment of impacts10
Table 5.2 Assets affected by intermittent flooding following a breach Residentialproperties
Non-residentialproperties
Agricultural (number of farms) Return Period
Year 0 Year 99 Year 0 Year 99 Year 0 Year 99 1 in 10 74 93 3 6 1 3 1 in 50 132 99 6 7 3 6 1 in 100 169 99 6 7 6 6 1 in 500 214 99 10 7 8 6 Notes: Based on information provided by Black & Veatch and data included in Address-Point Excludes those properties that are written off
Of the non-residential properties, two properties (New Holland Bulk Services and Howarth Timber) have been found with rateable value exceeding £100,000. Damages for these properties are estimated based on the rateable value and depth-damage data for ‘industry’ (from the Multi-Coloured Manual). There is also an important gas terminal, but a rateable value was not available for this.Damages to commercial properties may, therefore, be underestimated.
Overtopping damages to properties prior to breaching are assumed to be negligible and have not been included in the damage estimates.
5.2.2 Option 2: maintain
For Land Use Band C, the ‘low standard’ hold the line is taken as 1 in 10 years (as given in FCDPAG3). The current standard of defence (year 0) is taken as 1 in 20, falling to 1 in 10 by year 9. The timing of intervention is, thus, assumed to be year 9 and to 1 in 5 by year 99. This assumption may not be consistent with the actual requirement for work to be undertaken on the defences. Issues on the timing of intervention will need to be addressed in the next stage of the study.
The damages under flooding events over and above the design standard are estimated by identifying the properties that would be flooded following a breach on a number of different events (1 in 3, 1 in 10, 1 in 50, 1 in 100 and 1 in 500) as a proportion of the total floodable area. The proportion of the total area is given in Table 5.3.
Table 5.3 Proportion of area flooded for option 2 Proportion of area flooded
Return period Today 100 years
3 26% 29% 10 57% 62% 50 76% 81% 100 93% 94% 500 100% 100% Note: An area of the management unit is shown as floodable under the 1 in 3 and 1 in 10 events – this is because the standard in flood compartment 20 is 1 in 2.5 years. This does not affect the damage calculations, however, as no damages are included at or below the design standard.
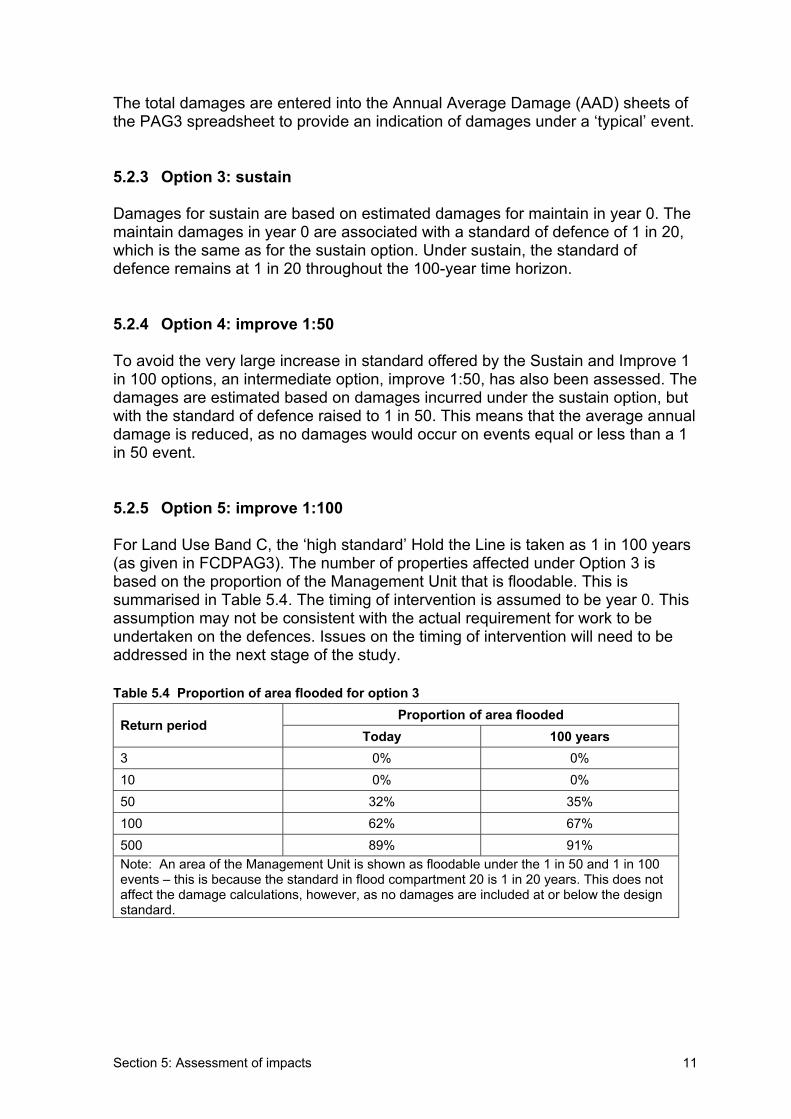
Section 5: Assessment of impacts 11
The total damages are entered into the Annual Average Damage (AAD) sheets of the PAG3 spreadsheet to provide an indication of damages under a ‘typical’ event.
5.2.3 Option 3: sustain
Damages for sustain are based on estimated damages for maintain in year 0. The maintain damages in year 0 are associated with a standard of defence of 1 in 20, which is the same as for the sustain option. Under sustain, the standard of defence remains at 1 in 20 throughout the 100-year time horizon.
5.2.4 Option 4: improve 1:50
To avoid the very large increase in standard offered by the Sustain and Improve 1 in 100 options, an intermediate option, improve 1:50, has also been assessed. The damages are estimated based on damages incurred under the sustain option, but with the standard of defence raised to 1 in 50. This means that the average annual damage is reduced, as no damages would occur on events equal or less than a 1 in 50 event.
5.2.5 Option 5: improve 1:100
For Land Use Band C, the ‘high standard’ Hold the Line is taken as 1 in 100 years (as given in FCDPAG3). The number of properties affected under Option 3 is based on the proportion of the Management Unit that is floodable. This is summarised in Table 5.4. The timing of intervention is assumed to be year 0. This assumption may not be consistent with the actual requirement for work to be undertaken on the defences. Issues on the timing of intervention will need to be addressed in the next stage of the study.
Table 5.4 Proportion of area flooded for option 3 Proportion of area flooded
Return period Today 100 years
3 0% 0% 10 0% 0% 50 32% 35% 100 62% 67% 500 89% 91% Note: An area of the Management Unit is shown as floodable under the 1 in 50 and 1 in 100 events – this is because the standard in flood compartment 20 is 1 in 20 years. This does not affect the damage calculations, however, as no damages are included at or below the design standard.
Section 5: Assessment of impacts12
5.3 Scoring of impacts
Management Unit 6 of the Humber Estuary shoreline management plan – stage 2 study has been used as a case study for the MCA project and for which a scoring system based on characteristic recovery time has been developed. The aim was to identify a scoring system that reflects the impacts of a flood on each category and where the scores can be calculated numerically using a more flood-focussed basis.
The scores for the Humber case study have been assigned using the basis of ‘recovery times’, where these are the minimum time required between events for impacts on that category to be reduced to zero. If a flood occurs before there has been time for full recovery, the impacts would be much greater than if the next flood event occurs several years after full recovery has been achieved. This approach allows the standard of defence provided by each option to be directly reflected in the score. For each category, it is necessary to determine two factors in order to be able to assign a score: • characteristic of the category that is affected by flooding; and • recovery time of that characteristic.
The characteristic is a measure of the amount of a particular category affected and could relate to an area, a number, etc. The recovery time is linked to the amount of years after the flood that the effects would continue to be felt. Once these two factors have been identified (or estimated), the scores can be calculated automatically using the same approach as is used in the Asset AAD worksheet of the FCDPAG3 spreadsheets.
The categories and their characteristic recovery times (ChaRT)
The scores for Management Unit 6 of the Humber Estuary SMP-Stage 2 case study have been calculated using a similar approach to that used in the Asset AAD worksheet of the FCDPAG3 spreadsheets. The characteristic recovery time (ChaRT) is used as the basis for estimating the consequence of flooding for each of the return period flood events. The score for each option is based upon the annual average damage as calculated by the worksheet. The worst performing option (that with the highest average annual damage) is assigned a score of zero. The best performing option (that with the lowest average annual damage), is assigned a score of 100. The remaining options are assigned a score according to the damage they would cause in relation to the best and worst options.
The characteristics and recovery times used to estimate the ChaRT scores for the Humber case study are given in Table 5.5.
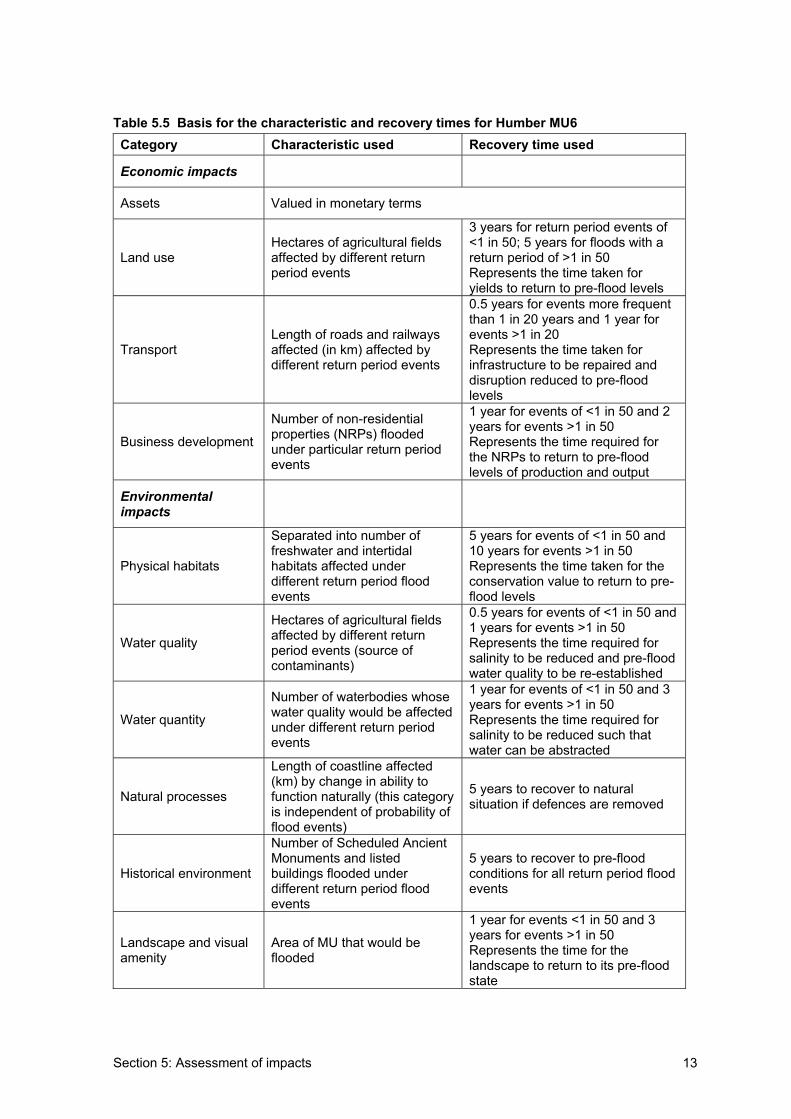
Section 5: Assessment of impacts 13
Table 5.5 Basis for the characteristic and recovery times for Humber MU6 Category Characteristic used Recovery time used
Economic impacts
Assets Valued in monetary terms
Land use Hectares of agricultural fields affected by different return period events
3 years for return period events of <1 in 50; 5 years for floods with a return period of >1 in 50 Represents the time taken for yields to return to pre-flood levels
TransportLength of roads and railways affected (in km) affected by different return period events
0.5 years for events more frequent than 1 in 20 years and 1 year for events >1 in 20 Represents the time taken for infrastructure to be repaired and disruption reduced to pre-flood levels
Business development
Number of non-residential properties (NRPs) flooded under particular return period events
1 year for events of <1 in 50 and 2 years for events >1 in 50 Represents the time required for the NRPs to return to pre-flood levels of production and output
Environmentalimpacts
Physical habitats
Separated into number of freshwater and intertidal habitats affected under different return period flood events
5 years for events of <1 in 50 and 10 years for events >1 in 50 Represents the time taken for the conservation value to return to pre-flood levels
Water quality
Hectares of agricultural fields affected by different return period events (source of contaminants)
0.5 years for events of <1 in 50 and 1 years for events >1 in 50 Represents the time required for salinity to be reduced and pre-flood water quality to be re-established
Water quantity
Number of waterbodies whose water quality would be affected under different return period events
1 year for events of <1 in 50 and 3 years for events >1 in 50 Represents the time required for salinity to be reduced such that water can be abstracted
Natural processes
Length of coastline affected (km) by change in ability to function naturally (this category is independent of probability of flood events)
5 years to recover to natural situation if defences are removed
Historical environment
Number of Scheduled Ancient Monuments and listed buildings flooded under different return period flood events
5 years to recover to pre-flood conditions for all return period flood events
Landscape and visual amenity
Area of MU that would be flooded
1 year for events <1 in 50 and 3 years for events >1 in 50 Represents the time for the landscape to return to its pre-flood state
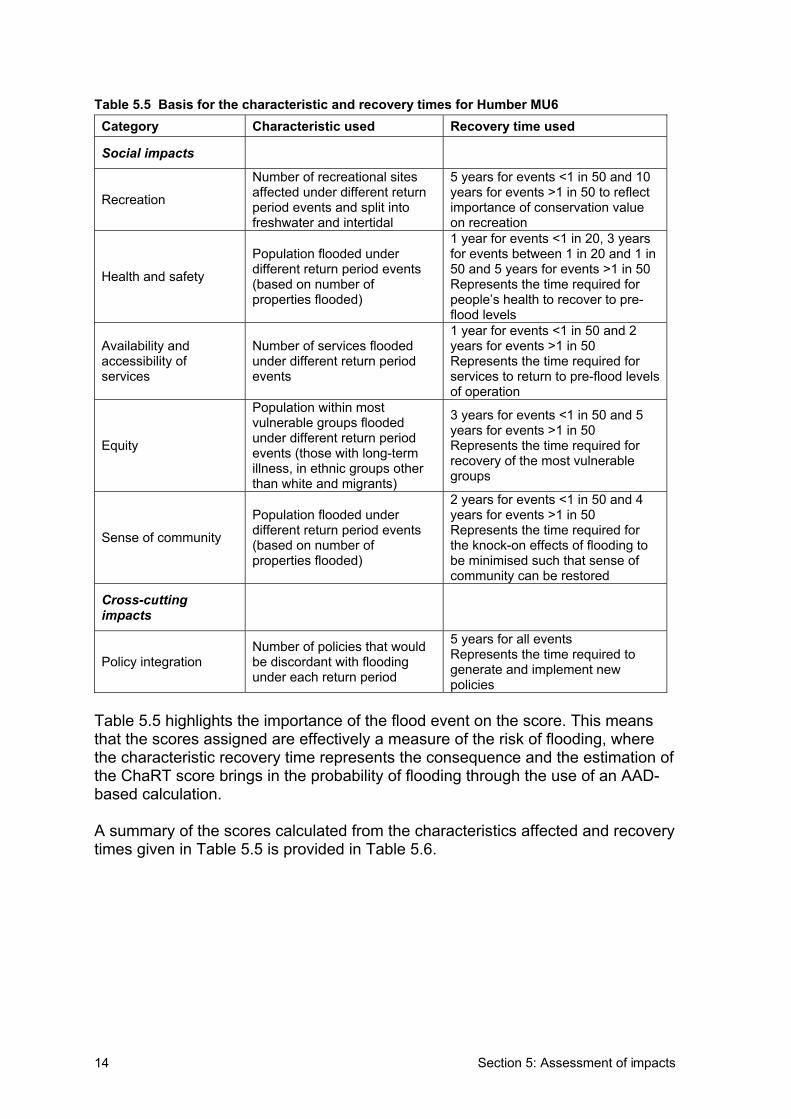
Section 5: Assessment of impacts14
Table 5.5 Basis for the characteristic and recovery times for Humber MU6 Category Characteristic used Recovery time used
Social impacts
Recreation
Number of recreational sites affected under different return period events and split into freshwater and intertidal
5 years for events <1 in 50 and 10 years for events >1 in 50 to reflect importance of conservation value on recreation
Health and safety
Population flooded under different return period events (based on number of properties flooded)
1 year for events <1 in 20, 3 years for events between 1 in 20 and 1 in 50 and 5 years for events >1 in 50 Represents the time required for people’s health to recover to pre-flood levels
Availability and accessibility of services
Number of services flooded under different return period events
1 year for events <1 in 50 and 2 years for events >1 in 50 Represents the time required for services to return to pre-flood levels of operation
Equity
Population within most vulnerable groups flooded under different return period events (those with long-term illness, in ethnic groups other than white and migrants)
3 years for events <1 in 50 and 5 years for events >1 in 50 Represents the time required for recovery of the most vulnerable groups
Sense of community
Population flooded under different return period events (based on number of properties flooded)
2 years for events <1 in 50 and 4 years for events >1 in 50 Represents the time required for the knock-on effects of flooding to be minimised such that sense of community can be restored
Cross-cuttingimpacts
Policy integration Number of policies that would be discordant with flooding under each return period
5 years for all events Represents the time required to generate and implement new policies
Table 5.5 highlights the importance of the flood event on the score. This means that the scores assigned are effectively a measure of the risk of flooding, where the characteristic recovery time represents the consequence and the estimation of the ChaRT score brings in the probability of flooding through the use of an AAD-based calculation.
A summary of the scores calculated from the characteristics affected and recovery times given in Table 5.5 is provided in Table 5.6.
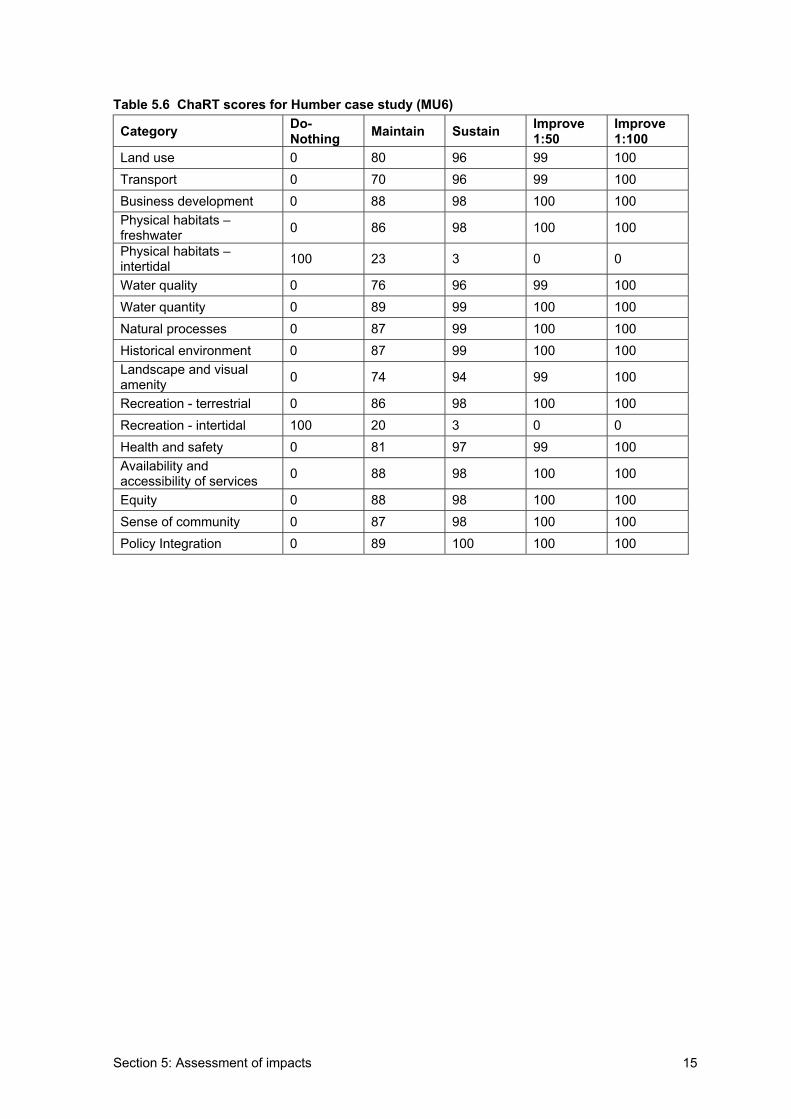
Section 5: Assessment of impacts 15
Table 5.6 ChaRT scores for Humber case study (MU6)
Category Do-Nothing Maintain Sustain Improve
1:50Improve 1:100
Land use 0 80 96 99 100 Transport 0 70 96 99 100 Business development 0 88 98 100 100 Physical habitats – freshwater 0 86 98 100 100
Physical habitats – intertidal 100 23 3 0 0
Water quality 0 76 96 99 100 Water quantity 0 89 99 100 100 Natural processes 0 87 99 100 100 Historical environment 0 87 99 100 100 Landscape and visual amenity 0 74 94 99 100
Recreation - terrestrial 0 86 98 100 100 Recreation - intertidal 100 20 3 0 0 Health and safety 0 81 97 99 100 Availability and accessibility of services 0 88 98 100 100
Equity 0 88 98 100 100 Sense of community 0 87 98 100 100 Policy Integration 0 89 100 100 100
Section 6: Weighting 16
6. Weighting
6.1 Elicitation of weights
As part of the selection of managed realignment sites for the Humber Estuary strategy, stakeholders on the project stakeholder group were asked to rank the scheme objectives in terms of which they considered to be most important and which least important. The sample size was relatively small (based on 12 responses) and was intended to identify which objectives were most/least important to facilitate comparison of qualitative impacts, rather than to assign a specific weight. However, a review of this data has allowed an indicative set of weights to be identified.
Due to the coarseness of the ranking exercise and the small number of responses, it has only been possible to assign weights to the impact types (i.e. economic, environmental, social and cross-cutting impacts). The weights have been identified, by following these steps: 1. the number of objectives within each impact type were summed; 2. the number of objectives ranked as being of ‘high’ importance by impact
type were identified; 3. the number of responses identifying each objective as being of importance
were summed; 4. normalisation of responses was undertaken by dividing the number of
responses for each impact type by the total number of responses that was possible to give an initial percentage. This was then revised so that the total of the weights was 100%; and
5. the proportion that each impact type makes up of the overall total (as a percentage) is assumed to equal the weight assigned by members of the Humber Estuary strategy stakeholder group.
The weights elicited in this manner are: • economic impacts: 20%; • environmental impacts: 17%; • social impacts: 8%; and • cross-cutting impacts: 55%.
The spread of weights is very interesting and probably reflects the particular interests of the respondents (where most were national organisations represented on the stakeholder group by local representatives). The weight for social impacts is particularly low but there were no responses from local stakeholders (other than local councils). If people living in and around the Humber Estuary had been involved in the ranking exercise, the weight for social impacts may have been different. It is important to note that the elicitation of weights was not the intention of the ranking exercise, thus, the weights presented here do not reflect actual weights for the Humber Estuary strategy and are likely to include a considerable degree of uncertainty.
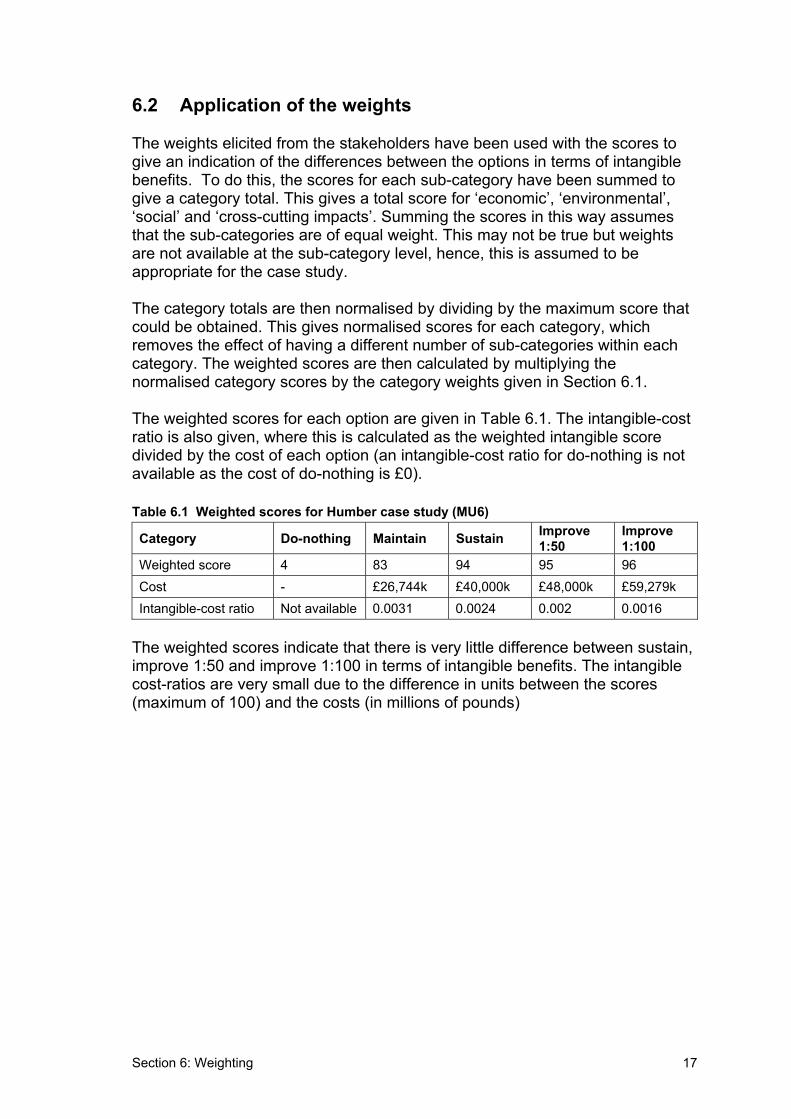
Section 6: Weighting 17
6.2 Application of the weights
The weights elicited from the stakeholders have been used with the scores to give an indication of the differences between the options in terms of intangible benefits. To do this, the scores for each sub-category have been summed to give a category total. This gives a total score for ‘economic’, ‘environmental’, ‘social’ and ‘cross-cutting impacts’. Summing the scores in this way assumes that the sub-categories are of equal weight. This may not be true but weights are not available at the sub-category level, hence, this is assumed to be appropriate for the case study.
The category totals are then normalised by dividing by the maximum score that could be obtained. This gives normalised scores for each category, which removes the effect of having a different number of sub-categories within each category. The weighted scores are then calculated by multiplying the normalised category scores by the category weights given in Section 6.1.
The weighted scores for each option are given in Table 6.1. The intangible-cost ratio is also given, where this is calculated as the weighted intangible score divided by the cost of each option (an intangible-cost ratio for do-nothing is not available as the cost of do-nothing is £0).
Table 6.1 Weighted scores for Humber case study (MU6)
Category Do-nothing Maintain Sustain Improve 1:50
Improve 1:100
Weighted score 4 83 94 95 96 Cost - £26,744k £40,000k £48,000k £59,279k Intangible-cost ratio Not available 0.0031 0.0024 0.002 0.0016
The weighted scores indicate that there is very little difference between sustain, improve 1:50 and improve 1:100 in terms of intangible benefits. The intangible cost-ratios are very small due to the difference in units between the scores (maximum of 100) and the costs (in millions of pounds)
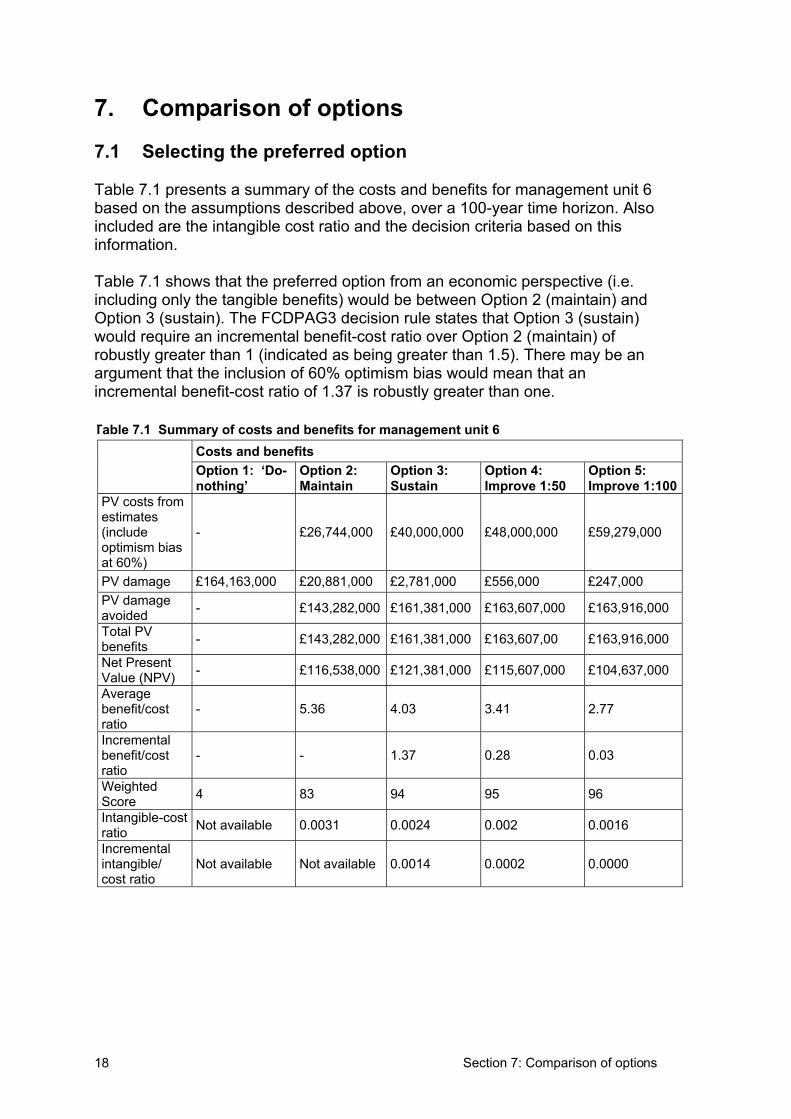
Section 7: Comparison of options18
7. Comparison of options
7.1 Selecting the preferred option
Table 7.1 presents a summary of the costs and benefits for management unit 6 based on the assumptions described above, over a 100-year time horizon. Also included are the intangible cost ratio and the decision criteria based on this information.
Table 7.1 shows that the preferred option from an economic perspective (i.e. including only the tangible benefits) would be between Option 2 (maintain) and Option 3 (sustain). The FCDPAG3 decision rule states that Option 3 (sustain) would require an incremental benefit-cost ratio over Option 2 (maintain) of robustly greater than 1 (indicated as being greater than 1.5). There may be an argument that the inclusion of 60% optimism bias would mean that an incremental benefit-cost ratio of 1.37 is robustly greater than one.
Table 7.1 Summary of costs and benefits for management unit 6 Costs and benefitsOption 1: ‘Do-nothing’
Option 2:Maintain
Option 3:Sustain
Option 4:Improve 1:50
Option 5:Improve 1:100
PV costs from estimates(includeoptimism bias at 60%)
- £26,744,000 £40,000,000 £48,000,000 £59,279,000
PV damage £164,163,000 £20,881,000 £2,781,000 £556,000 £247,000 PV damage avoided - £143,282,000 £161,381,000 £163,607,000 £163,916,000
Total PV benefits - £143,282,000 £161,381,000 £163,607,00 £163,916,000
Net Present Value (NPV) - £116,538,000 £121,381,000 £115,607,000 £104,637,000
Averagebenefit/costratio
- 5.36 4.03 3.41 2.77
Incrementalbenefit/costratio
- - 1.37 0.28 0.03
WeightedScore 4 83 94 95 96
Intangible-costratio Not available 0.0031 0.0024 0.002 0.0016
Incrementalintangible/cost ratio
Not available Not available 0.0014 0.0002 0.0000
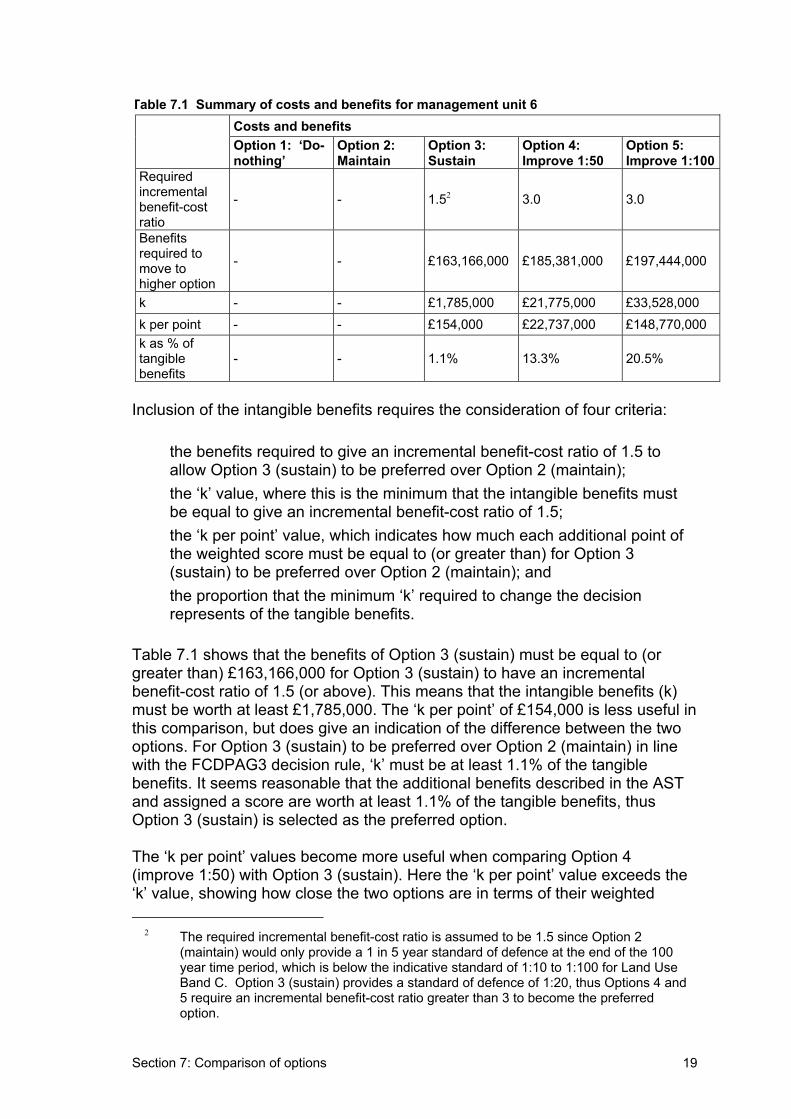
Section 7: Comparison of options 19
Table 7.1 Summary of costs and benefits for management unit 6 Costs and benefitsOption 1: ‘Do-nothing’
Option 2:Maintain
Option 3:Sustain
Option 4:Improve 1:50
Option 5:Improve 1:100
Requiredincrementalbenefit-costratio
- - 1.52 3.0 3.0
Benefitsrequired to move to higher option
- - £163,166,000 £185,381,000 £197,444,000
k - - £1,785,000 £21,775,000 £33,528,000 k per point - - £154,000 £22,737,000 £148,770,000 k as % of tangiblebenefits
- - 1.1% 13.3% 20.5%
Inclusion of the intangible benefits requires the consideration of four criteria:
• the benefits required to give an incremental benefit-cost ratio of 1.5 to allow Option 3 (sustain) to be preferred over Option 2 (maintain);
• the ‘k’ value, where this is the minimum that the intangible benefits must be equal to give an incremental benefit-cost ratio of 1.5;
• the ‘k per point’ value, which indicates how much each additional point of the weighted score must be equal to (or greater than) for Option 3 (sustain) to be preferred over Option 2 (maintain); and
• the proportion that the minimum ‘k’ required to change the decision represents of the tangible benefits.
Table 7.1 shows that the benefits of Option 3 (sustain) must be equal to (or greater than) £163,166,000 for Option 3 (sustain) to have an incremental benefit-cost ratio of 1.5 (or above). This means that the intangible benefits (k) must be worth at least £1,785,000. The ‘k per point’ of £154,000 is less useful in this comparison, but does give an indication of the difference between the two options. For Option 3 (sustain) to be preferred over Option 2 (maintain) in line with the FCDPAG3 decision rule, ‘k’ must be at least 1.1% of the tangible benefits. It seems reasonable that the additional benefits described in the AST and assigned a score are worth at least 1.1% of the tangible benefits, thus Option 3 (sustain) is selected as the preferred option.
The ‘k per point’ values become more useful when comparing Option 4 (improve 1:50) with Option 3 (sustain). Here the ‘k per point’ value exceeds the ‘k’ value, showing how close the two options are in terms of their weighted 2 The required incremental benefit-cost ratio is assumed to be 1.5 since Option 2
(maintain) would only provide a 1 in 5 year standard of defence at the end of the 100 year time period, which is below the indicative standard of 1:10 to 1:100 for Land Use Band C. Option 3 (sustain) provides a standard of defence of 1:20, thus Options 4 and 5 require an incremental benefit-cost ratio greater than 3 to become the preferred option.
Section 7: Comparison of options20
intangible score. Here, the ‘k per point’ must be at least £22,737,000 for Option 4 (improve 1:50) to be preferred over Option 3 (sustain). The intangible benefits are not likely to be this significant and Option 3 (sustain) is confirmed as the preferred option.
7.2 Use of the comparator table for the Humber case study
To move from maintain to sustain, the intangible benefits must be worth at least £1.8 million. Sustain scores an additional 11 points over maintain on the weighted score. Each of these 11 points has to be worth £155,000 for Sustain to be preferred over Maintain. The additional points are made up as follows:
• economic impacts: 3 points (land use, transport and business development);
• environmental impacts: 2 points (water quality, water quantity, natural processes and historical environment); and
• cross-cutting impacts: 6 points.
The two options have the same weighted score for social impacts.
The score calculator sheet shows that drainage is likely to be affected on 256 ha-yrs under sustain and (one average) 1,649 ha-yrs for maintain3. If the damages relate to a change from bad to very bad drainage, or a value per ha of £100 to £200 from the comparator table, the benefits provided by the sustain option can be calculated as £139,000 to £279,000. This is the lowest value change from the comparator table and indicates that the benefits for sustain over maintain are likely to be at least equal to the minimum value required to make sustain the preferred option.
Damages under maintain for transport are given as 2.075 km-yrs, while for sustain the damages are 0.3 km-yrs 4. The comparator table does not give an indication of costs in kilometres, but, if delays are proportional to the length of railway track affected, the sustain option would have to reduce delays compared with maintain by, at least, 1,940 minutes (or 32.3 hours). This is equivalent to 19 minutes per year. The Multi-Coloured Manual gives approximate delays of: • up to and including 10 year return period: 0 hours; • up to and including 25 year return period: 12 hours; • up to and including 50 year return period: 24 hours; • up to and including 100 year return period: 48 hours; and • up to and including 200 year return period: 96 hours. 3 The score calculator multiplies area affected by recovery time in years, giving a unit that
reflects both area affected and the years during which time it is recovering from the effects of a flood over the 100 year time horizon.
4 The score calculator multiplies km of road/railway affected by year of recovery, giving a unit that can be expressed as km-yrs.
Section 7: Comparison of options 21
Sustain provides a 1 in 20 standard of defence while maintain provides 1 in 20 standard falling to 1 in 5. Therefore, three events greater than 1 in 10 and less than (or equal to) a 1 in 20 year return period would account for the required difference between the two options. This is not unreasonable within a 100-time horizon.
The comparator table suggests that indirect damages to industrial and commercial premises may be 30% of direct losses. The damages to NRPs are estimated at 50% of the residential damages, such that damages to NRPs from the maintain option can be estimated at £10.4 million and from the sustain option at £1.4 million. If the indirect damages are 30% of the direct losses, the indirect damages would be worth an estimated £3.1 million under the maintain option and just £0.4 million under the sustain option – a difference of £2.7 million. This far exceeds the £155,000 required per point and even the £1.8 million difference between the two options. Thus, it appears that the sustain option is likely to be preferred over the maintain option when the additional intangible benefits are taken into account.
Further benefits relate to the environmental impacts, particularly water quality and landscape, and to crosscutting impacts. The difference in crosscutting impacts is the most significant (accounting for 6 weighted score points). Sustain is likely to be in line with most policies whereas maintain also most certainly will not be. However, no comparator value is available here.
Overall, therefore, it appears that sustain is robustly preferred over maintain and that the intangible benefits are likely to be worth considerably more than the £1.8 million required to increase the incremental benefit-cost ratio to 1.5.
Section 8: References22
8. References BV (2003): Humber Estuary SEA Draft Appraisal, version 2.0.
BV (2003): Humber Estuary SEA Draft Appraisal, MU Appraisal Tables, version1.0.
Environment Agency (2000): The Humber Estuary Shoreline Management Plan, September 2000.
Environment Agency (2003): Flood Event Contours, map of each Management Unit for current water levels and water levels in 50 years, scale varies from 1:28,000 to 1:130,000, provided by Black & Veatch.
Land Registry Internet Site: http://www.landreg.gov.uk/ppr/interactive/ppr_ualbs.asp.
MAFF (now Defra) (1999): Flood and Coastal Defence Project Appraisal Guidance Economic Appraisal, FCDPAG3, December 1999.
Middlesex University Flood Hazard Research Centre (2003): The Benefits of Flood and Coastal Defence: Techniques and Data for 2003 (Multi-Coloured Manual), draft.
Nix J (2003): Farm Management Pocketbook, 34th Edition (2004), Imperial College at Wye, September 2003.
Office of the Deputy Prime Minister (ODPM) Internet Site:http://wwww.odpm.gov.uk/stellent/groups/odpm_planning/documents/source/odpm_plan_source_609426.doc.
RPA (2004): The Appraisal of Human-Related Intangible Impacts of Flooding, final report for Defra (FD2005/TR) August 2004.
Valuation Agency Office Internet Site: http://open.voa.gov.uk/rating/irlw_2000.list.
Appendix B5.1 23
Appendix B5.1
Appraisal summary table for main assessment – MA-AST for the Humber Estuary SMP – management unit 6
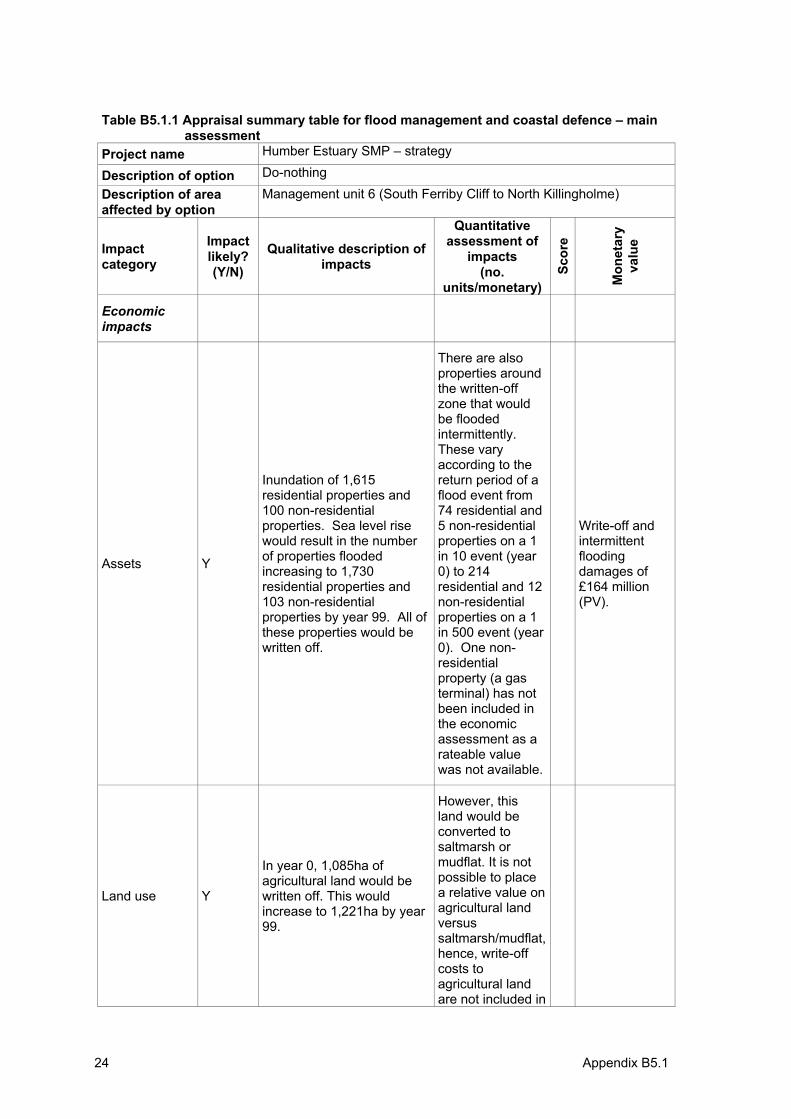
24 Appendix B5.1
Table B5.1.1 Appraisal summary table for flood management and coastal defence – main assessment
Project name Humber Estuary SMP – strategy
Description of option Do-nothingDescription of area affected by option
Management unit 6 (South Ferriby Cliff to North Killingholme)
Impactcategory
Impactlikely? (Y/N)
Qualitative description of impacts
Quantitative assessment of
impacts(no.
units/monetary)
Scor
e
Mon
etar
yva
lue
Economicimpacts
Assets Y
Inundation of 1,615 residential properties and 100 non-residential properties. Sea level rise would result in the number of properties flooded increasing to 1,730 residential properties and 103 non-residential properties by year 99. All of these properties would be written off.
There are also properties around the written-off zone that would be flooded intermittently. These vary according to the return period of a flood event from 74 residential and 5 non-residential properties on a 1 in 10 event (year 0) to 214 residential and 12 non-residentialproperties on a 1 in 500 event (year 0). One non-residentialproperty (a gas terminal) has not been included in the economic assessment as a rateable value was not available.
Write-off and intermittentfloodingdamages of £164 million (PV).
Land use Y
In year 0, 1,085ha of agricultural land would be written off. This would increase to 1,221ha by year 99.
However, this land would be converted to saltmarsh or mudflat. It is not possible to place a relative value on agricultural land versussaltmarsh/mudflat,hence, write-off costs to agricultural land are not included in
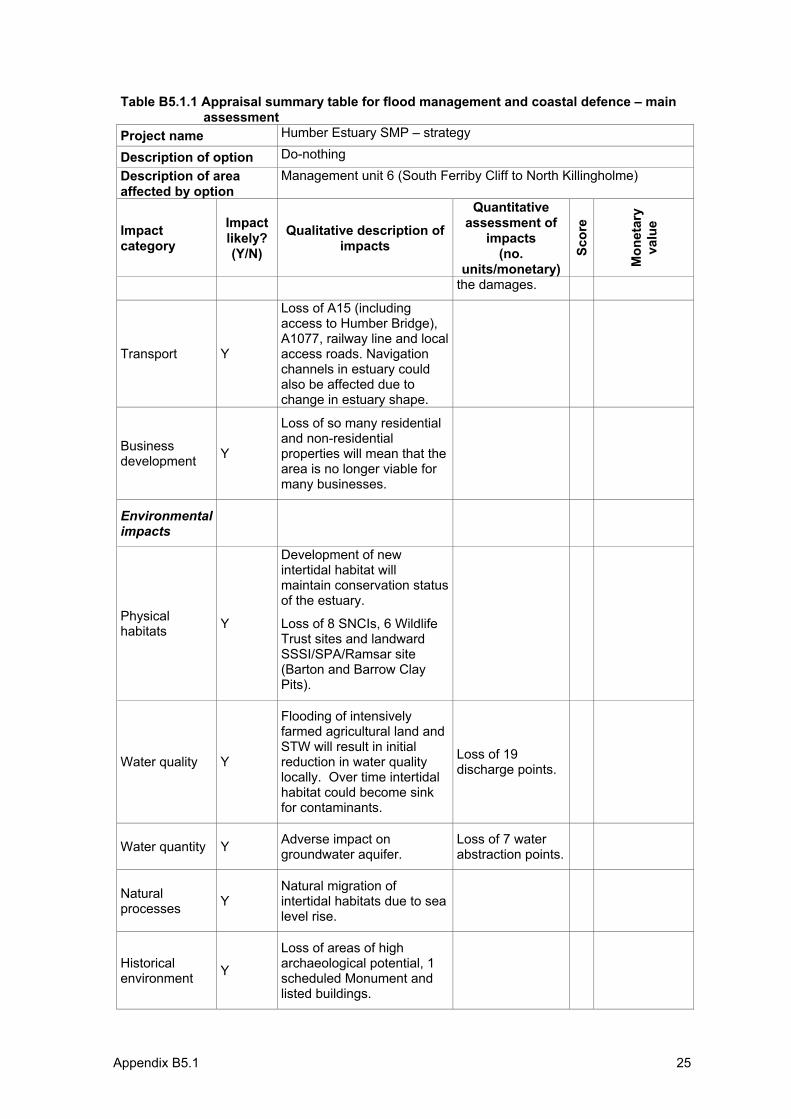
Appendix B5.1 25
Table B5.1.1 Appraisal summary table for flood management and coastal defence – main assessment
Project name Humber Estuary SMP – strategy
Description of option Do-nothingDescription of area affected by option
Management unit 6 (South Ferriby Cliff to North Killingholme)
Impactcategory
Impactlikely? (Y/N)
Qualitative description of impacts
Quantitative assessment of
impacts(no.
units/monetary)
Scor
e
Mon
etar
yva
lue
the damages.
Transport Y
Loss of A15 (including access to Humber Bridge), A1077, railway line and local access roads. Navigation channels in estuary could also be affected due to change in estuary shape.
Businessdevelopment Y
Loss of so many residential and non-residential properties will mean that the area is no longer viable for many businesses.
Environmentalimpacts
Physical habitats Y
Development of new intertidal habitat will maintain conservation status of the estuary.
Loss of 8 SNCIs, 6 Wildlife Trust sites and landward SSSI/SPA/Ramsar site (Barton and Barrow Clay Pits).
Water quality Y
Flooding of intensively farmed agricultural land and STW will result in initial reduction in water quality locally. Over time intertidal habitat could become sink for contaminants.
Loss of 19 discharge points.
Water quantity Y Adverse impact on groundwater aquifer.
Loss of 7 water abstraction points.
Naturalprocesses Y
Natural migration of intertidal habitats due to sea level rise.
Historicalenvironment Y
Loss of areas of high archaeological potential, 1 scheduled Monument and listed buildings.
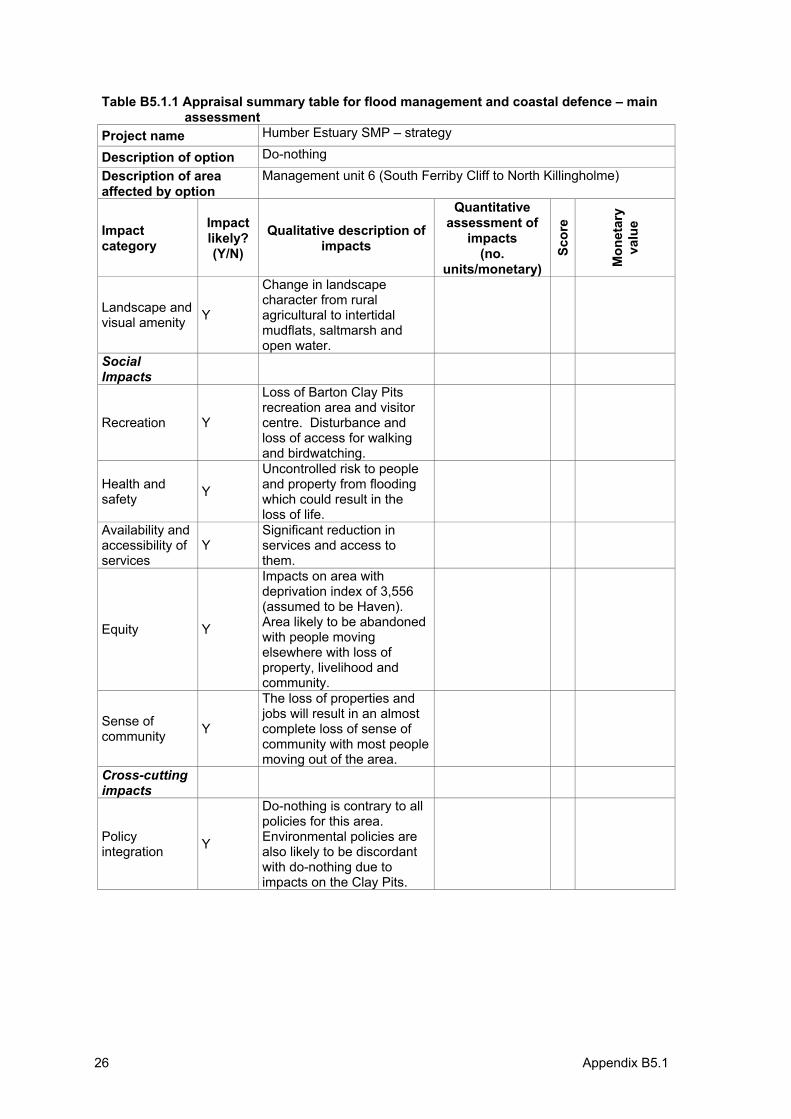
26 Appendix B5.1
Table B5.1.1 Appraisal summary table for flood management and coastal defence – main assessment
Project name Humber Estuary SMP – strategy
Description of option Do-nothingDescription of area affected by option
Management unit 6 (South Ferriby Cliff to North Killingholme)
Impactcategory
Impactlikely? (Y/N)
Qualitative description of impacts
Quantitative assessment of
impacts(no.
units/monetary)
Scor
e
Mon
etar
yva
lue
Landscape and visual amenity Y
Change in landscape character from rural agricultural to intertidal mudflats, saltmarsh and open water.
SocialImpacts
Recreation Y
Loss of Barton Clay Pits recreation area and visitor centre. Disturbance and loss of access for walking and birdwatching.
Health and safety Y
Uncontrolled risk to people and property from flooding which could result in the loss of life.
Availability and accessibility of services
YSignificant reduction in services and access to them.
Equity Y
Impacts on area with deprivation index of 3,556 (assumed to be Haven).Area likely to be abandoned with people moving elsewhere with loss of property, livelihood and community.
Sense of community Y
The loss of properties and jobs will result in an almost complete loss of sense of community with most people moving out of the area.
Cross-cuttingimpacts
Policy integration Y
Do-nothing is contrary to all policies for this area. Environmental policies are also likely to be discordant with do-nothing due to impacts on the Clay Pits.
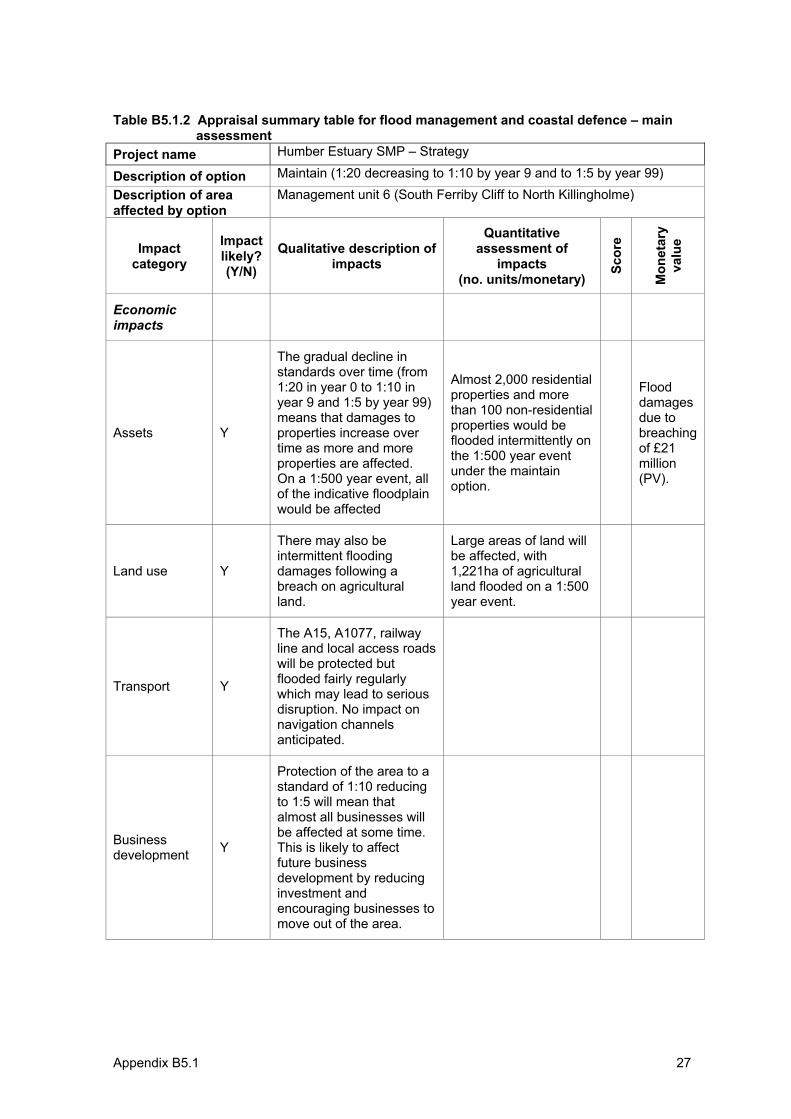
Appendix B5.1 27
Table B5.1.2 Appraisal summary table for flood management and coastal defence – main assessment
Project name Humber Estuary SMP – Strategy
Description of option Maintain (1:20 decreasing to 1:10 by year 9 and to 1:5 by year 99) Description of area affected by option
Management unit 6 (South Ferriby Cliff to North Killingholme)
Impactcategory
Impactlikely? (Y/N)
Qualitative description of impacts
Quantitative assessment of
impacts(no. units/monetary)
Scor
e
Mon
etar
yva
lue
Economicimpacts
Assets Y
The gradual decline in standards over time (from 1:20 in year 0 to 1:10 in year 9 and 1:5 by year 99) means that damages to properties increase over time as more and more properties are affected.On a 1:500 year event, all of the indicative floodplain would be affected
Almost 2,000 residential properties and more than 100 non-residential properties would be flooded intermittently on the 1:500 year event under the maintain option.
Flooddamagesdue to breachingof £21 million(PV).
Land use Y
There may also be intermittent flooding damages following a breach on agricultural land.
Large areas of land will be affected, with 1,221ha of agricultural land flooded on a 1:500 year event.
Transport Y
The A15, A1077, railway line and local access roads will be protected but flooded fairly regularly which may lead to serious disruption. No impact on navigation channels anticipated.
Businessdevelopment Y
Protection of the area to a standard of 1:10 reducing to 1:5 will mean that almost all businesses will be affected at some time. This is likely to affect future business development by reducing investment and encouraging businesses to move out of the area.
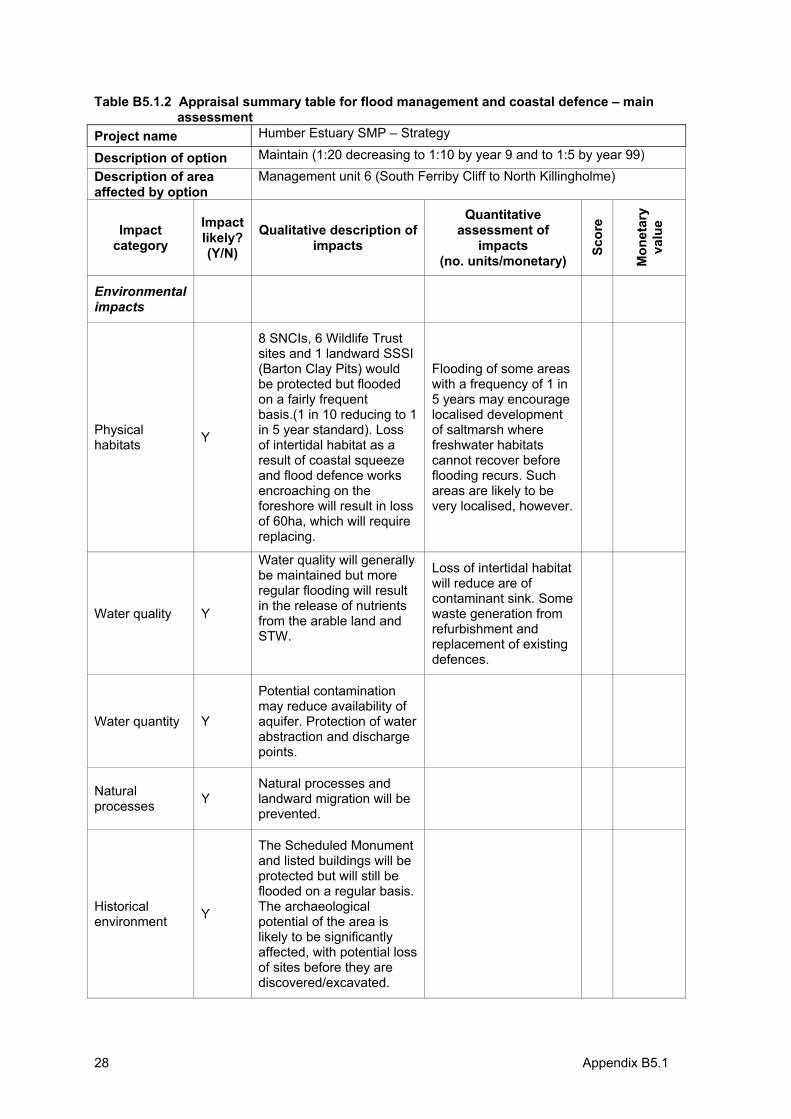
28 Appendix B5.1
Table B5.1.2 Appraisal summary table for flood management and coastal defence – main assessment
Project name Humber Estuary SMP – Strategy
Description of option Maintain (1:20 decreasing to 1:10 by year 9 and to 1:5 by year 99) Description of area affected by option
Management unit 6 (South Ferriby Cliff to North Killingholme)
Impactcategory
Impactlikely? (Y/N)
Qualitative description of impacts
Quantitative assessment of
impacts(no. units/monetary)
Scor
e
Mon
etar
yva
lue
Environmentalimpacts
Physical habitats Y
8 SNCIs, 6 Wildlife Trust sites and 1 landward SSSI (Barton Clay Pits) would be protected but flooded on a fairly frequent basis.(1 in 10 reducing to 1 in 5 year standard). Loss of intertidal habitat as a result of coastal squeeze and flood defence works encroaching on the foreshore will result in loss of 60ha, which will require replacing.
Flooding of some areas with a frequency of 1 in 5 years may encourage localised development of saltmarsh where freshwater habitats cannot recover before flooding recurs. Such areas are likely to be very localised, however.
Water quality Y
Water quality will generally be maintained but more regular flooding will result in the release of nutrients from the arable land and STW.
Loss of intertidal habitat will reduce are of contaminant sink. Some waste generation from refurbishment and replacement of existing defences.
Water quantity Y
Potential contamination may reduce availability of aquifer. Protection of water abstraction and discharge points.
Naturalprocesses Y
Natural processes and landward migration will be prevented.
Historicalenvironment Y
The Scheduled Monument and listed buildings will be protected but will still be flooded on a regular basis. The archaeological potential of the area is likely to be significantly affected, with potential loss of sites before they are discovered/excavated.
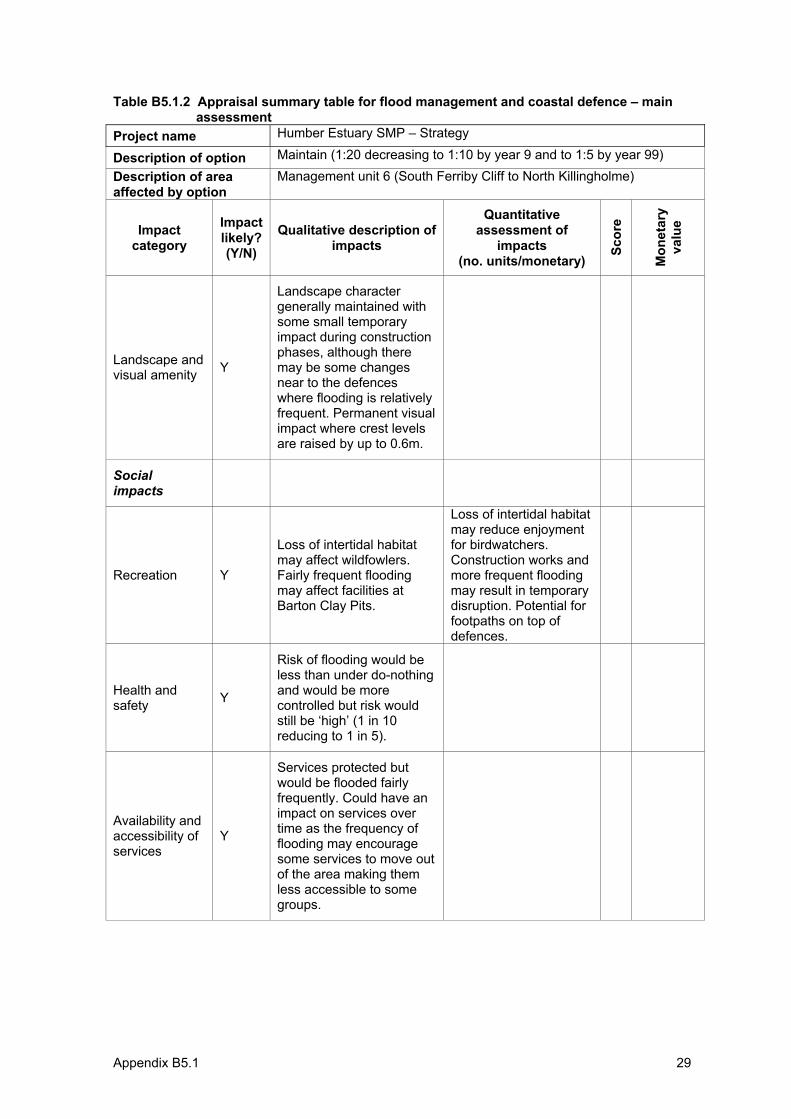
Appendix B5.1 29
Table B5.1.2 Appraisal summary table for flood management and coastal defence – main assessment
Project name Humber Estuary SMP – Strategy
Description of option Maintain (1:20 decreasing to 1:10 by year 9 and to 1:5 by year 99) Description of area affected by option
Management unit 6 (South Ferriby Cliff to North Killingholme)
Impactcategory
Impactlikely? (Y/N)
Qualitative description of impacts
Quantitative assessment of
impacts(no. units/monetary)
Scor
e
Mon
etar
yva
lue
Landscape and visual amenity Y
Landscape character generally maintained with some small temporary impact during construction phases, although there may be some changes near to the defences where flooding is relatively frequent. Permanent visual impact where crest levels are raised by up to 0.6m.
Socialimpacts
Recreation Y
Loss of intertidal habitat may affect wildfowlers. Fairly frequent flooding may affect facilities at Barton Clay Pits.
Loss of intertidal habitat may reduce enjoyment for birdwatchers.Construction works and more frequent flooding may result in temporary disruption. Potential for footpaths on top of defences.
Health and safety Y
Risk of flooding would be less than under do-nothing and would be more controlled but risk would still be ‘high’ (1 in 10 reducing to 1 in 5).
Availability and accessibility of services
Y
Services protected but would be flooded fairly frequently. Could have an impact on services over time as the frequency of flooding may encourage some services to move out of the area making them less accessible to some groups.
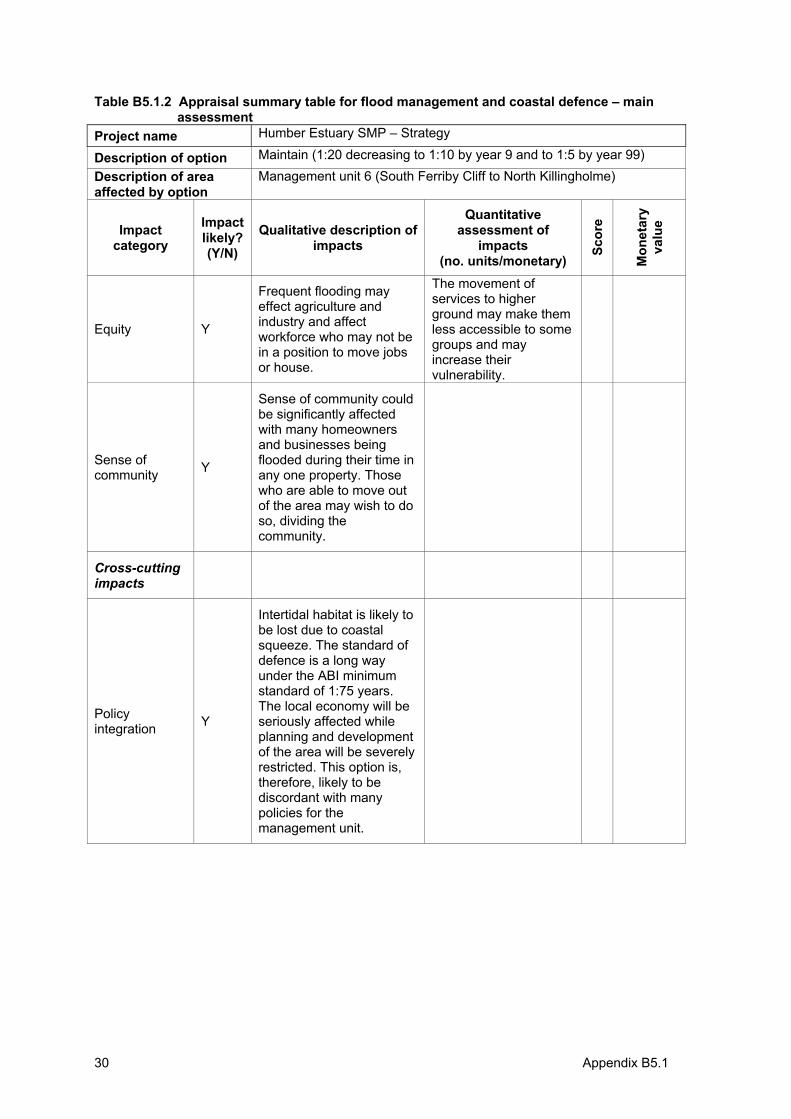
30 Appendix B5.1
Table B5.1.2 Appraisal summary table for flood management and coastal defence – main assessment
Project name Humber Estuary SMP – Strategy
Description of option Maintain (1:20 decreasing to 1:10 by year 9 and to 1:5 by year 99) Description of area affected by option
Management unit 6 (South Ferriby Cliff to North Killingholme)
Impactcategory
Impactlikely? (Y/N)
Qualitative description of impacts
Quantitative assessment of
impacts(no. units/monetary)
Scor
e
Mon
etar
yva
lue
Equity Y
Frequent flooding may effect agriculture and industry and affect workforce who may not be in a position to move jobs or house.
The movement of services to higher ground may make them less accessible to some groups and may increase their vulnerability.
Sense of community Y
Sense of community could be significantly affected with many homeowners and businesses being flooded during their time in any one property. Those who are able to move out of the area may wish to do so, dividing the community.
Cross-cuttingimpacts
Policy integration Y
Intertidal habitat is likely to be lost due to coastal squeeze. The standard of defence is a long way under the ABI minimum standard of 1:75 years. The local economy will be seriously affected while planning and development of the area will be severely restricted. This option is, therefore, likely to be discordant with many policies for the management unit.
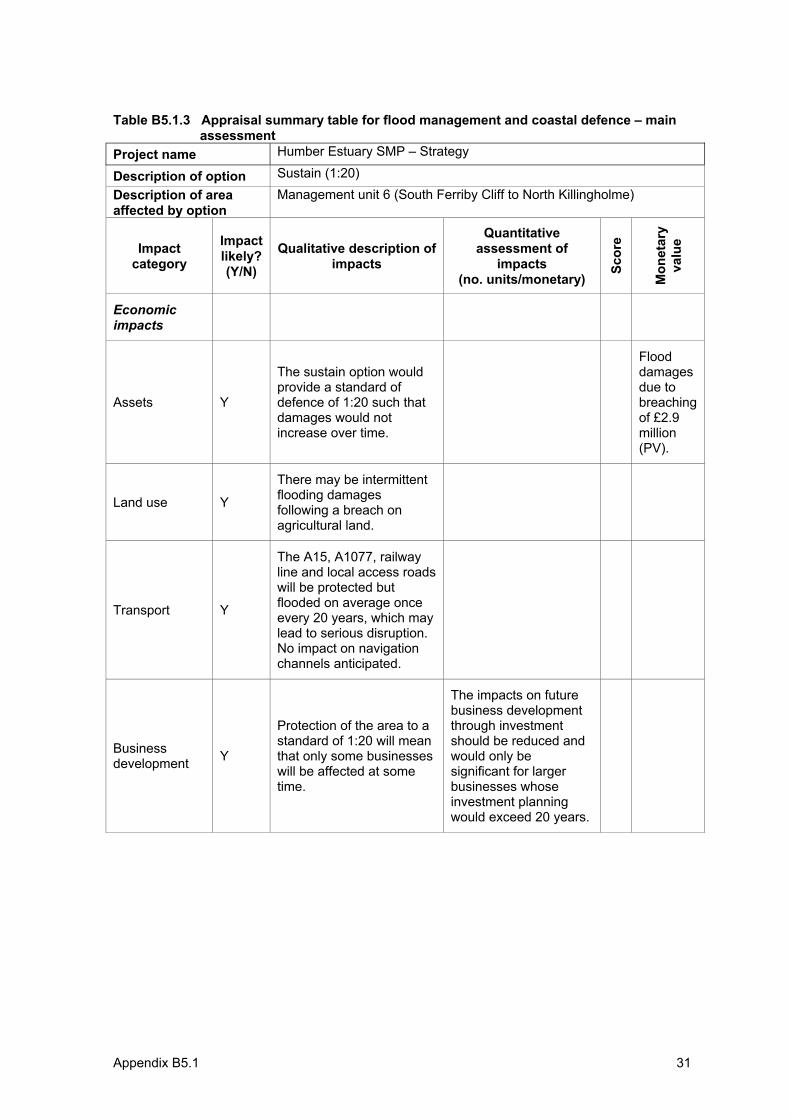
Appendix B5.1 31
Table B5.1.3 Appraisal summary table for flood management and coastal defence – main assessment
Project name Humber Estuary SMP – Strategy
Description of option Sustain (1:20) Description of area affected by option
Management unit 6 (South Ferriby Cliff to North Killingholme)
Impactcategory
Impactlikely? (Y/N)
Qualitative description of impacts
Quantitative assessment of
impacts(no. units/monetary)
Scor
e
Mon
etar
yva
lue
Economicimpacts
Assets Y
The sustain option would provide a standard of defence of 1:20 such that damages would not increase over time.
Flooddamagesdue to breachingof £2.9 million(PV).
Land use Y
There may be intermittent flooding damages following a breach on agricultural land.
Transport Y
The A15, A1077, railway line and local access roads will be protected but flooded on average once every 20 years, which may lead to serious disruption. No impact on navigation channels anticipated.
Businessdevelopment Y
Protection of the area to a standard of 1:20 will mean that only some businesses will be affected at some time.
The impacts on future business development through investment should be reduced and would only be significant for larger businesses whose investment planning would exceed 20 years.
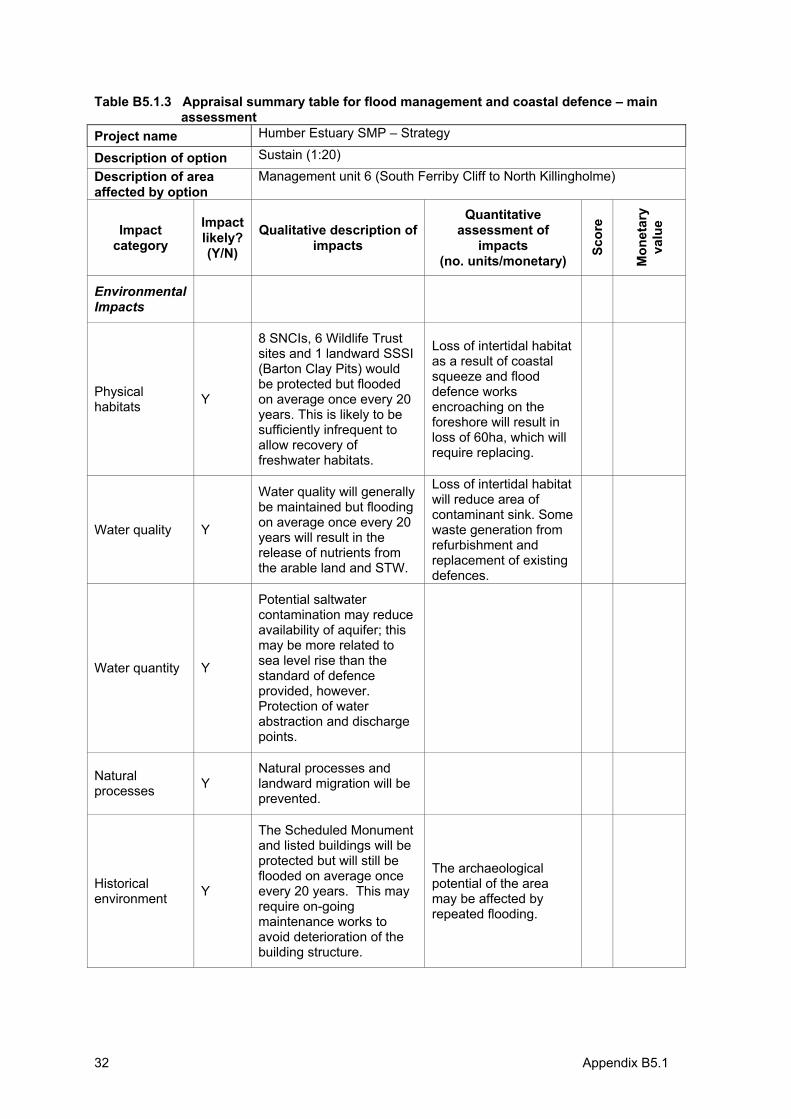
32 Appendix B5.1
Table B5.1.3 Appraisal summary table for flood management and coastal defence – main assessment
Project name Humber Estuary SMP – Strategy
Description of option Sustain (1:20) Description of area affected by option
Management unit 6 (South Ferriby Cliff to North Killingholme)
Impactcategory
Impactlikely? (Y/N)
Qualitative description of impacts
Quantitative assessment of
impacts(no. units/monetary)
Scor
e
Mon
etar
yva
lue
EnvironmentalImpacts
Physical habitats Y
8 SNCIs, 6 Wildlife Trust sites and 1 landward SSSI (Barton Clay Pits) would be protected but flooded on average once every 20 years. This is likely to be sufficiently infrequent to allow recovery of freshwater habitats.
Loss of intertidal habitat as a result of coastal squeeze and flood defence works encroaching on the foreshore will result in loss of 60ha, which will require replacing.
Water quality Y
Water quality will generally be maintained but flooding on average once every 20 years will result in the release of nutrients from the arable land and STW.
Loss of intertidal habitat will reduce area of contaminant sink. Some waste generation from refurbishment and replacement of existing defences.
Water quantity Y
Potential saltwater contamination may reduce availability of aquifer; this may be more related to sea level rise than the standard of defence provided, however. Protection of water abstraction and discharge points.
Naturalprocesses Y
Natural processes and landward migration will be prevented.
Historicalenvironment Y
The Scheduled Monument and listed buildings will be protected but will still be flooded on average once every 20 years. This may require on-going maintenance works to avoid deterioration of the building structure.
The archaeological potential of the area may be affected by repeated flooding.
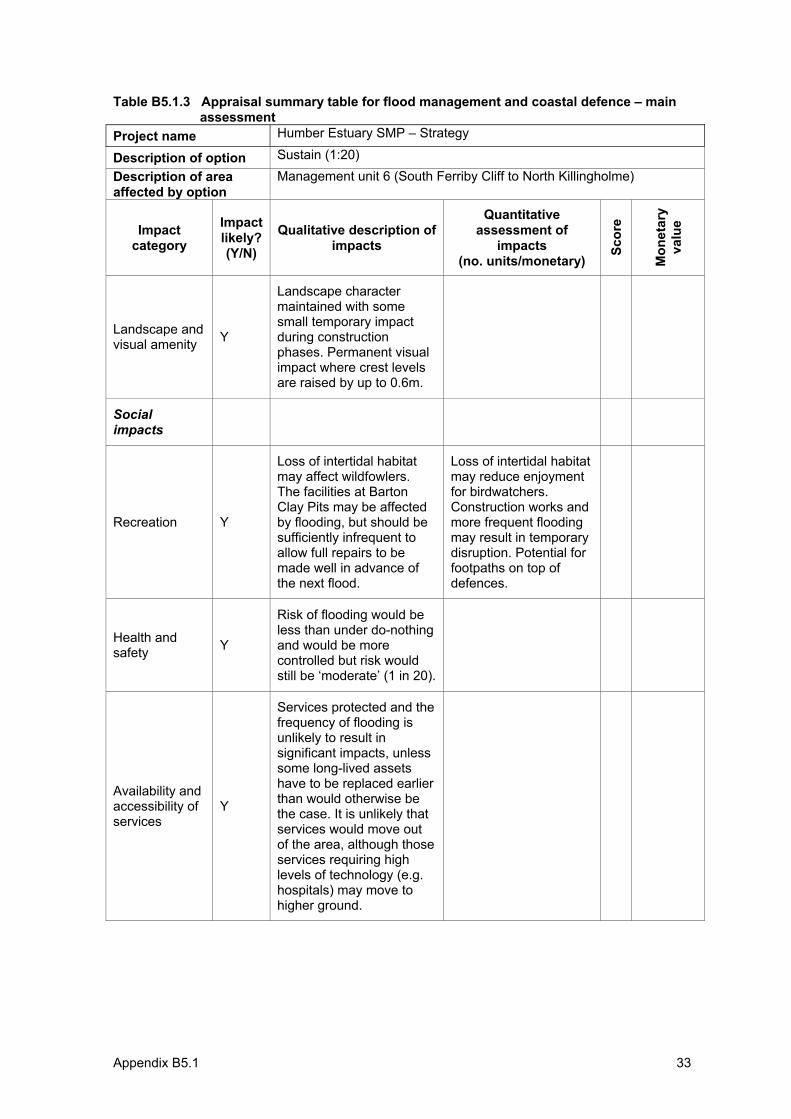
Appendix B5.1 33
Table B5.1.3 Appraisal summary table for flood management and coastal defence – main assessment
Project name Humber Estuary SMP – Strategy
Description of option Sustain (1:20) Description of area affected by option
Management unit 6 (South Ferriby Cliff to North Killingholme)
Impactcategory
Impactlikely? (Y/N)
Qualitative description of impacts
Quantitative assessment of
impacts(no. units/monetary)
Scor
e
Mon
etar
yva
lue
Landscape and visual amenity Y
Landscape character maintained with some small temporary impact during construction phases. Permanent visual impact where crest levels are raised by up to 0.6m.
Socialimpacts
Recreation Y
Loss of intertidal habitat may affect wildfowlers. The facilities at Barton Clay Pits may be affected by flooding, but should be sufficiently infrequent to allow full repairs to be made well in advance of the next flood.
Loss of intertidal habitat may reduce enjoyment for birdwatchers.Construction works and more frequent flooding may result in temporary disruption. Potential for footpaths on top of defences.
Health and safety Y
Risk of flooding would be less than under do-nothing and would be more controlled but risk would still be ‘moderate’ (1 in 20).
Availability and accessibility of services
Y
Services protected and the frequency of flooding is unlikely to result in significant impacts, unless some long-lived assets have to be replaced earlier than would otherwise be the case. It is unlikely that services would move out of the area, although those services requiring high levels of technology (e.g. hospitals) may move to higher ground.
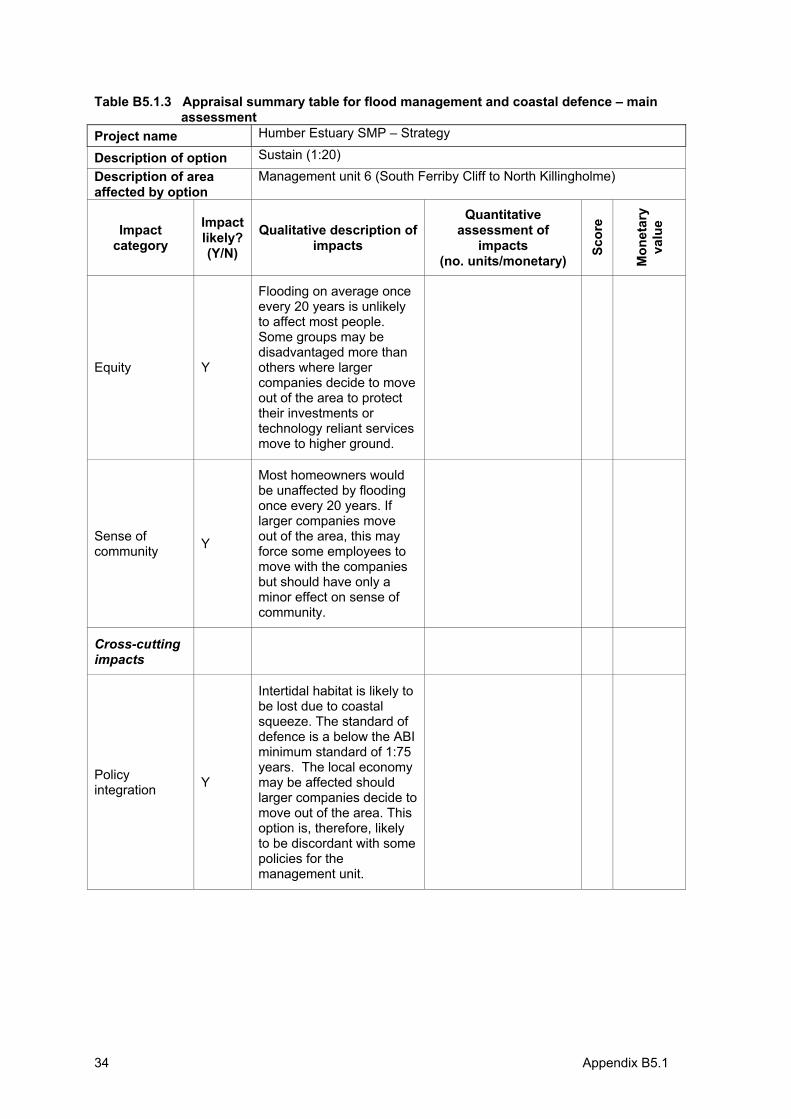
34 Appendix B5.1
Table B5.1.3 Appraisal summary table for flood management and coastal defence – main assessment
Project name Humber Estuary SMP – Strategy
Description of option Sustain (1:20) Description of area affected by option
Management unit 6 (South Ferriby Cliff to North Killingholme)
Impactcategory
Impactlikely? (Y/N)
Qualitative description of impacts
Quantitative assessment of
impacts(no. units/monetary)
Scor
e
Mon
etar
yva
lue
Equity Y
Flooding on average once every 20 years is unlikely to affect most people. Some groups may be disadvantaged more than others where larger companies decide to move out of the area to protect their investments or technology reliant services move to higher ground.
Sense of community Y
Most homeowners would be unaffected by flooding once every 20 years. If larger companies move out of the area, this may force some employees to move with the companies but should have only a minor effect on sense of community.
Cross-cuttingimpacts
Policy integration Y
Intertidal habitat is likely to be lost due to coastal squeeze. The standard of defence is a below the ABI minimum standard of 1:75 years. The local economy may be affected should larger companies decide to move out of the area. This option is, therefore, likely to be discordant with some policies for the management unit.
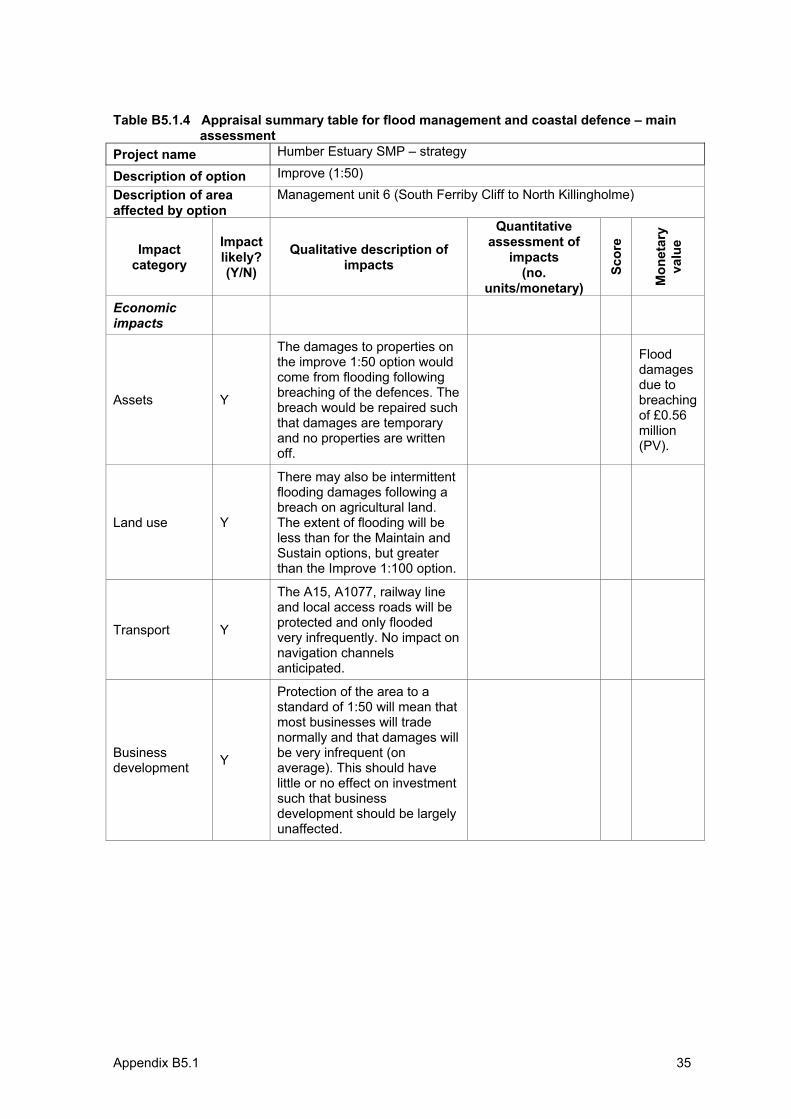
Appendix B5.1 35
Table B5.1.4 Appraisal summary table for flood management and coastal defence – main assessment
Project name Humber Estuary SMP – strategy
Description of option Improve (1:50) Description of area affected by option
Management unit 6 (South Ferriby Cliff to North Killingholme)
Impactcategory
Impactlikely? (Y/N)
Qualitative description of impacts
Quantitative assessment of
impacts(no.
units/monetary)
Scor
e
Mon
etar
yva
lue
Economicimpacts
Assets Y
The damages to properties on the improve 1:50 option would come from flooding following breaching of the defences. The breach would be repaired such that damages are temporary and no properties are written off.
Flooddamagesdue to breachingof £0.56 million(PV).
Land use Y
There may also be intermittent flooding damages following a breach on agricultural land. The extent of flooding will be less than for the Maintain and Sustain options, but greater than the Improve 1:100 option.
Transport Y
The A15, A1077, railway line and local access roads will be protected and only flooded very infrequently. No impact on navigation channels anticipated.
Businessdevelopment Y
Protection of the area to a standard of 1:50 will mean that most businesses will trade normally and that damages will be very infrequent (on average). This should have little or no effect on investment such that business development should be largely unaffected.
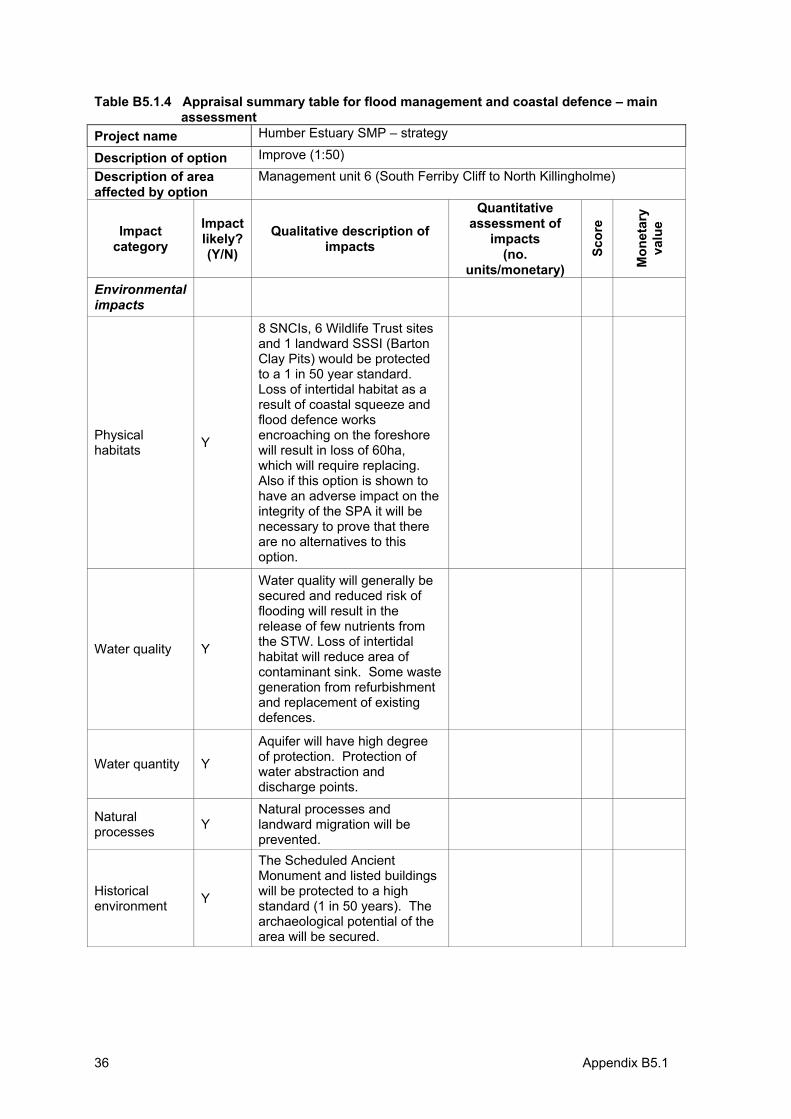
36 Appendix B5.1
Table B5.1.4 Appraisal summary table for flood management and coastal defence – main assessment
Project name Humber Estuary SMP – strategy
Description of option Improve (1:50) Description of area affected by option
Management unit 6 (South Ferriby Cliff to North Killingholme)
Impactcategory
Impactlikely? (Y/N)
Qualitative description of impacts
Quantitative assessment of
impacts(no.
units/monetary)
Scor
e
Mon
etar
yva
lue
Environmentalimpacts
Physical habitats Y
8 SNCIs, 6 Wildlife Trust sites and 1 landward SSSI (Barton Clay Pits) would be protected to a 1 in 50 year standard. Loss of intertidal habitat as a result of coastal squeeze and flood defence works encroaching on the foreshore will result in loss of 60ha, which will require replacing. Also if this option is shown to have an adverse impact on the integrity of the SPA it will be necessary to prove that there are no alternatives to this option.
Water quality Y
Water quality will generally be secured and reduced risk of flooding will result in the release of few nutrients from the STW. Loss of intertidal habitat will reduce area of contaminant sink. Some waste generation from refurbishment and replacement of existing defences.
Water quantity Y
Aquifer will have high degree of protection. Protection of water abstraction and discharge points.
Naturalprocesses Y
Natural processes and landward migration will be prevented.
Historicalenvironment Y
The Scheduled Ancient Monument and listed buildings will be protected to a high standard (1 in 50 years). The archaeological potential of the area will be secured.
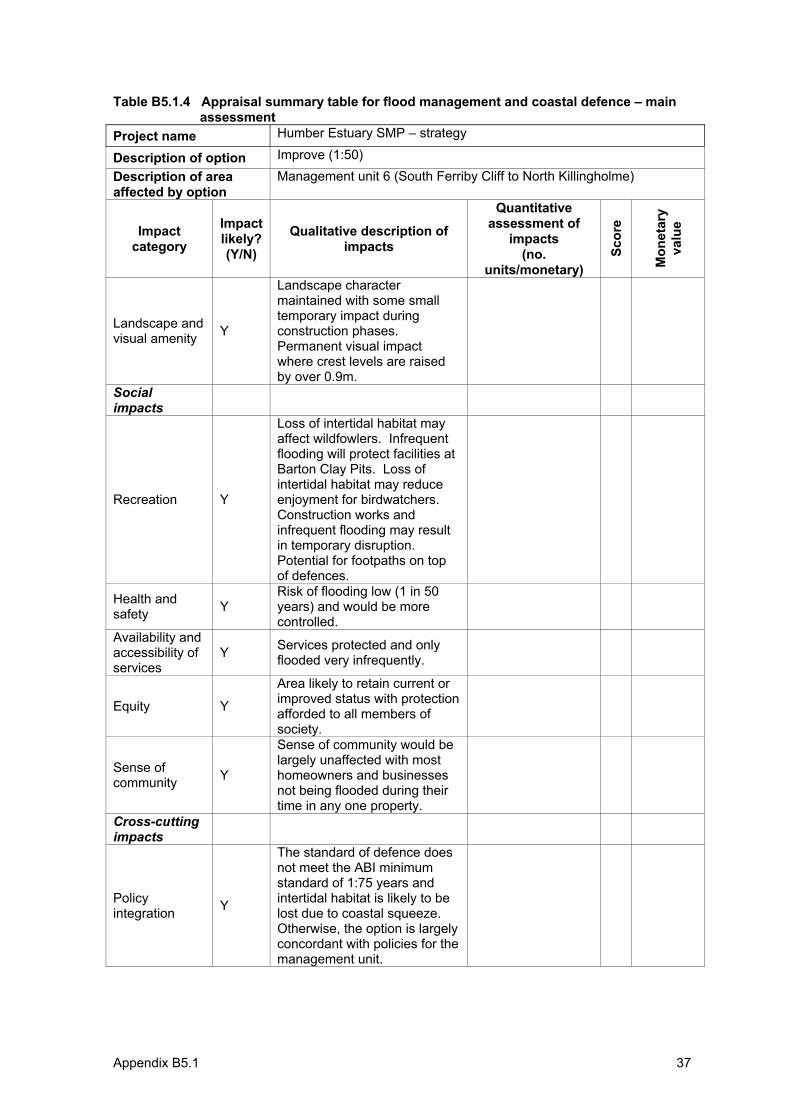
Appendix B5.1 37
Table B5.1.4 Appraisal summary table for flood management and coastal defence – main assessment
Project name Humber Estuary SMP – strategy
Description of option Improve (1:50) Description of area affected by option
Management unit 6 (South Ferriby Cliff to North Killingholme)
Impactcategory
Impactlikely? (Y/N)
Qualitative description of impacts
Quantitative assessment of
impacts(no.
units/monetary)
Scor
e
Mon
etar
yva
lue
Landscape and visual amenity Y
Landscape character maintained with some small temporary impact during construction phases.Permanent visual impact where crest levels are raised by over 0.9m.
Socialimpacts
Recreation Y
Loss of intertidal habitat may affect wildfowlers. Infrequent flooding will protect facilities at Barton Clay Pits. Loss of intertidal habitat may reduce enjoyment for birdwatchers.Construction works and infrequent flooding may result in temporary disruption.Potential for footpaths on top of defences.
Health and safety Y
Risk of flooding low (1 in 50 years) and would be more controlled.
Availability and accessibility of services
Y Services protected and only flooded very infrequently.
Equity Y
Area likely to retain current or improved status with protection afforded to all members of society.
Sense of community Y
Sense of community would be largely unaffected with most homeowners and businesses not being flooded during their time in any one property.
Cross-cuttingimpacts
Policy integration Y
The standard of defence does not meet the ABI minimum standard of 1:75 years and intertidal habitat is likely to be lost due to coastal squeeze. Otherwise, the option is largely concordant with policies for the management unit.
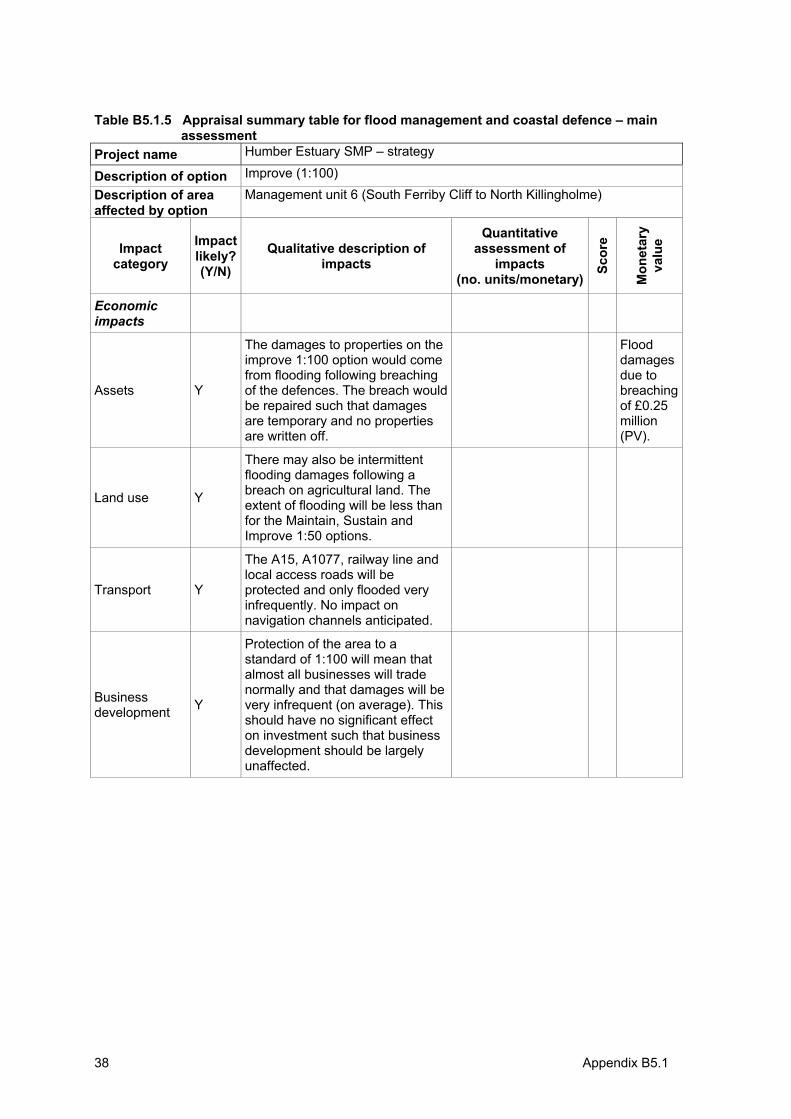
38 Appendix B5.1
Table B5.1.5 Appraisal summary table for flood management and coastal defence – main assessment
Project name Humber Estuary SMP – strategy
Description of option Improve (1:100) Description of area affected by option
Management unit 6 (South Ferriby Cliff to North Killingholme)
Impactcategory
Impactlikely? (Y/N)
Qualitative description of impacts
Quantitative assessment of
impacts(no. units/monetary)
Scor
e
Mon
etar
yva
lue
Economicimpacts
Assets Y
The damages to properties on the improve 1:100 option would come from flooding following breaching of the defences. The breach would be repaired such that damages are temporary and no properties are written off.
Flooddamagesdue to breachingof £0.25 million(PV).
Land use Y
There may also be intermittent flooding damages following a breach on agricultural land. The extent of flooding will be less than for the Maintain, Sustain and Improve 1:50 options.
Transport Y
The A15, A1077, railway line and local access roads will be protected and only flooded very infrequently. No impact on navigation channels anticipated.
Businessdevelopment Y
Protection of the area to a standard of 1:100 will mean that almost all businesses will trade normally and that damages will be very infrequent (on average). This should have no significant effect on investment such that business development should be largely unaffected.
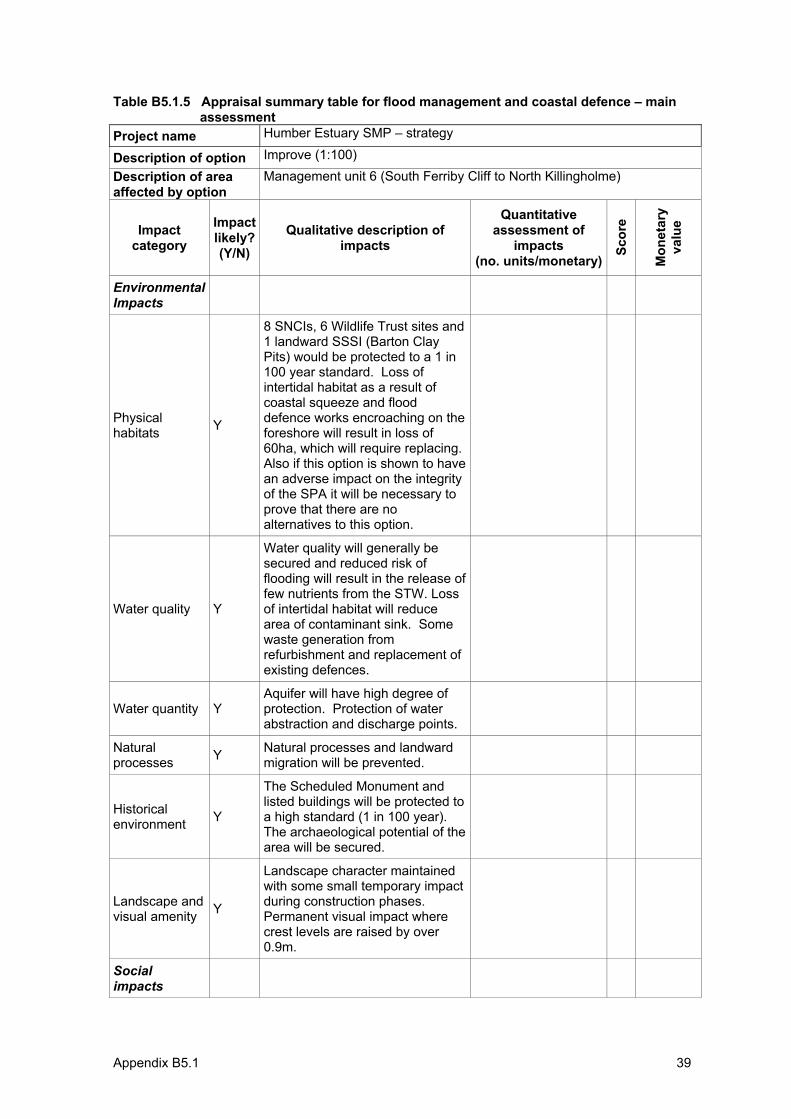
Appendix B5.1 39
Table B5.1.5 Appraisal summary table for flood management and coastal defence – main assessment
Project name Humber Estuary SMP – strategy
Description of option Improve (1:100) Description of area affected by option
Management unit 6 (South Ferriby Cliff to North Killingholme)
Impactcategory
Impactlikely? (Y/N)
Qualitative description of impacts
Quantitative assessment of
impacts(no. units/monetary)
Scor
e
Mon
etar
yva
lue
EnvironmentalImpacts
Physical habitats Y
8 SNCIs, 6 Wildlife Trust sites and 1 landward SSSI (Barton Clay Pits) would be protected to a 1 in 100 year standard. Loss of intertidal habitat as a result of coastal squeeze and flood defence works encroaching on the foreshore will result in loss of 60ha, which will require replacing. Also if this option is shown to have an adverse impact on the integrity of the SPA it will be necessary to prove that there are no alternatives to this option.
Water quality Y
Water quality will generally be secured and reduced risk of flooding will result in the release of few nutrients from the STW. Loss of intertidal habitat will reduce area of contaminant sink. Some waste generation from refurbishment and replacement of existing defences.
Water quantity Y Aquifer will have high degree of protection. Protection of water abstraction and discharge points.
Naturalprocesses Y Natural processes and landward
migration will be prevented.
Historicalenvironment Y
The Scheduled Monument and listed buildings will be protected to a high standard (1 in 100 year). The archaeological potential of the area will be secured.
Landscape and visual amenity Y
Landscape character maintained with some small temporary impact during construction phases.Permanent visual impact where crest levels are raised by over 0.9m.
Socialimpacts
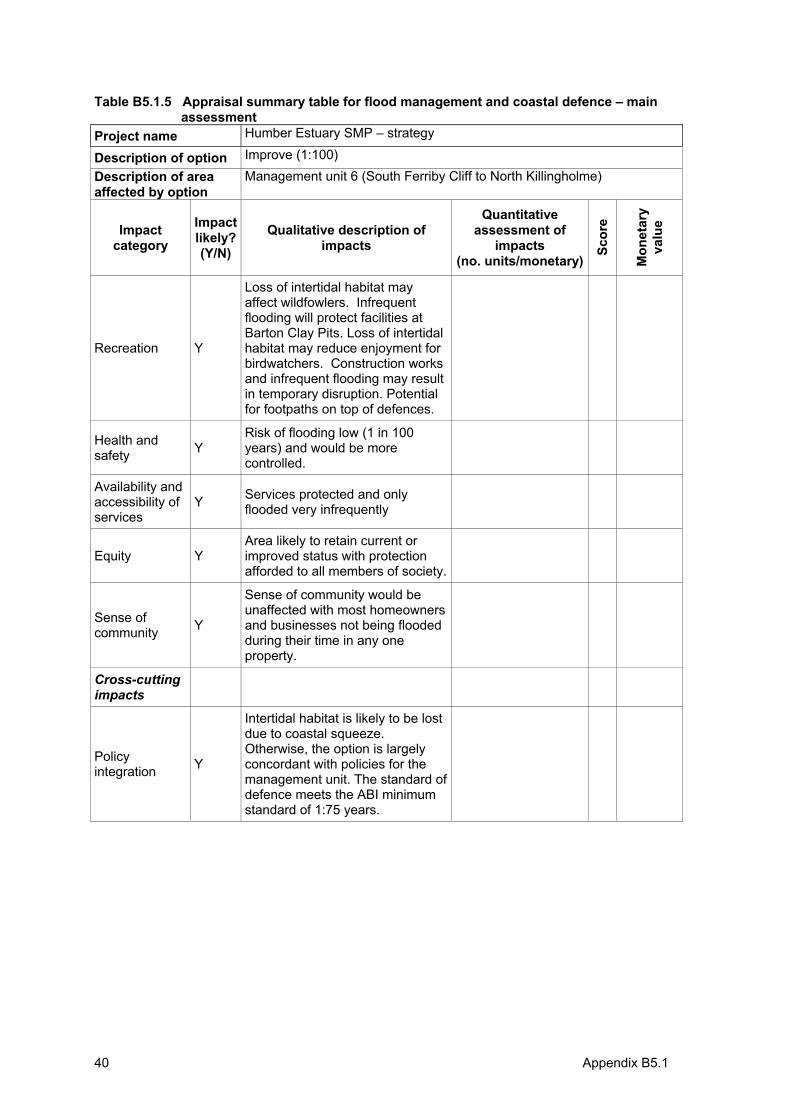
40 Appendix B5.1
Table B5.1.5 Appraisal summary table for flood management and coastal defence – main assessment
Project name Humber Estuary SMP – strategy
Description of option Improve (1:100) Description of area affected by option
Management unit 6 (South Ferriby Cliff to North Killingholme)
Impactcategory
Impactlikely? (Y/N)
Qualitative description of impacts
Quantitative assessment of
impacts(no. units/monetary)
Scor
e
Mon
etar
yva
lue
Recreation Y
Loss of intertidal habitat may affect wildfowlers. Infrequent flooding will protect facilities at Barton Clay Pits. Loss of intertidal habitat may reduce enjoyment for birdwatchers. Construction works and infrequent flooding may result in temporary disruption. Potential for footpaths on top of defences.
Health and safety Y
Risk of flooding low (1 in 100 years) and would be more controlled.
Availability and accessibility of services
Y Services protected and only flooded very infrequently
Equity Y Area likely to retain current or improved status with protection afforded to all members of society.
Sense of community Y
Sense of community would be unaffected with most homeowners and businesses not being flooded during their time in any one property.
Cross-cuttingimpacts
Policy integration Y
Intertidal habitat is likely to be lost due to coastal squeeze. Otherwise, the option is largely concordant with policies for the management unit. The standard of defence meets the ABI minimum standard of 1:75 years.
Joint Defra/EA Flood and Coastal Erosion Risk Management R&D Programme
Annex B.6:
Case study no.6:
Assessment of the Lower Don strategy study
R&D Project Record FD2013/PR2
Produced: November 2004

ii
Statement of use This report provides guidance on the use of MCA and ASTs to assist in the appraisal of flood and coastal erosion risk management projects, strategies and policies. It should be noted that it does not constitute official government policy or guidance, which is unlikely to be available until work to develop the methodology and identify appropriate sources of data has been undertaken through pilot studies.
This report may be downloaded from the Defra/EA R&D Programme website (http://www.defra.gov.uk/environ.fcd/research), use the search tool located on the project information and publications page. Copies are held by all EA Regional Information Centres, contact The Environment Agency’s National Customer Contact Centre by emailing [email protected] or by telephoning 08708506506.
Dissemination Status Internal: Released internally External: Released to public domain
Keywords: Multi criteria analysis, MCA, appraisal summary table, AST, decision rule
Research contractor contact details: Lead contractor: Risk & Policy Analysts Ltd (RPA), Farthing Green House, 1 Beccles Road, Loddon, Norfolk, NR14 6LT (Tel: 01508 528465; Fax: 01508 520758; www.rpaltd.co.uk). The project director was Meg Postle, the project manager for RPA was John Ash with research support from Susana Dias and other members of RPA staff.
The research team also included: Colin Green (Flood Hazard Research Centre, Middlesex University); Alan Pearman (University of Leeds); Ron Janssen (The Institute of Environmental Studies, Free University, Amsterdam), Terry Oakes and Hugh Payne (Independent Consultants)
Acknowledgements The assistance of those providing information for the case studies is gratefully acknowledged.
Defra project manager: Matt Crossman, Defra, 3D Ergon House, Horseferry Rd, London, SW1P 2AL. Email: [email protected]
Publishing organisation DefraFlood Management Division Ergon House Horseferry Road London SW1P 2AL Tel: 020 7238 3000 Fax: 020 7238 6187 www.defra.gov.uk/environ/fcd
â Crown copyright (Defra); 2005
Copyright in the typographical arrangement and design rests with the Crown. This publication (excluding the logo) may be reproduced free of charge in any format or medium provided that it is reproduced accurately and not used in a misleading context. The material must be acknowledged as Crown copyright with the title and source of the publication specified. The views expressed in this document are not necessarily those of Defra or the Environment Agency. Its officers, servants or agents accept no liability whatsoever for any loss or damage arising from the interpretation or use of the information, or reliance on views contained herein.
Published by the Department for Environment, Food and Rural Affairs. Printed in the UK, March 2005 on recycled material containing 80% post-consumer waste and 20% totally chlorine free virgin pulp.
PB No. 10734/PR2 ISBN 0-85521-146-6
Section 1: Introduction 1
1. Introduction This report presents the MCA-based project appraisal process for part of the Lower Don Flood Defence Strategy Study. This strategy assessment was based on the original appraisal process carried out on behalf of the Environment Agency (EA).
The information reported here is based on the following document:
Atkins (2004): Lower Don strategy study - draft report, report produced for the Environment Agency North East Region, March 2004.
This strategy study is associated and linked with the Upper Don strategy plan, and they both will provide the overall framework for flood protection in the Don catchment.
The appraisal approach followed in this strategy study is in many ways similar to the one followed in the MCA-based approach, in particular in relation to the following points:
• it bases the option appraisal on strategic objectives and sub-objectives and covers very similar issues to those covered in the impact types and categories used in the Assessment Summary Tables (ASTs) prepared for the MCA-based methodology; and
• it uses a simple scoring system to assess each of the proposed options in relation to each of the strategic objectives and sub-objectives.
These characteristics were used to illustrate key issues arising from the current flood defence appraisal process and these are tackled in the MCA-based approach.
Acknowledging that government guidance recommends a 100-year time horizon, the time horizon chosen for this strategy is 50 years. This is because of a number of external factors such as development of robust climate change predictions, changes in government policy and legislation, and stakeholder acceptability (Atkins, 2004). In addition, the policies and measures developed for the next 50 years and the prioritised 5-year programme of works are considered not to change should the 100-year appraisal period be adopted (Atkins, 2004).
1.1 Summary of the project area
The area covered by the Lower Don Strategy Study includes the River Don between Doncaster and Goole. Wheatley has been taken as the upstream limit of the study for the right bank and the confluence of the Ea Beck with the River Don has been taken for the left bank. The downstream limit is Goole, located at the confluence with the River Ouse. Figure 1.1 illustrates the area being considered.
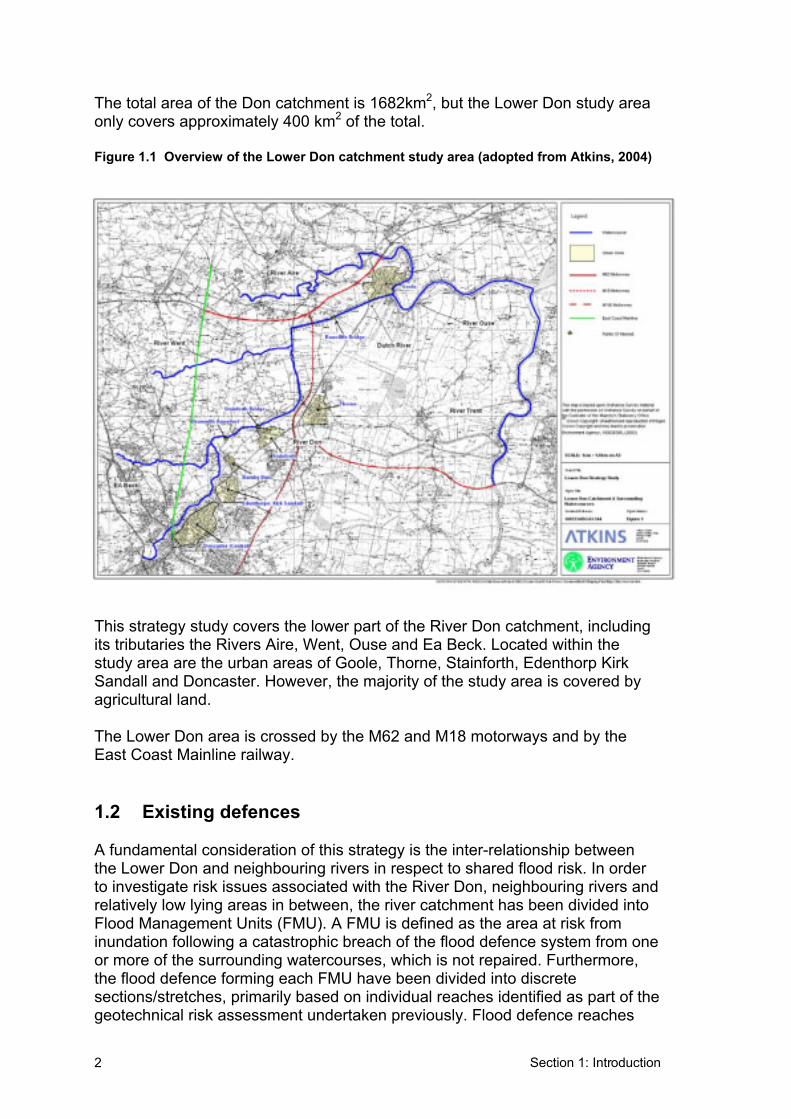
Section 1: Introduction2
The total area of the Don catchment is 1682km2, but the Lower Don study area only covers approximately 400 km2 of the total.
Figure 1.1 Overview of the Lower Don catchment study area (adopted from Atkins, 2004)
This strategy study covers the lower part of the River Don catchment, including its tributaries the Rivers Aire, Went, Ouse and Ea Beck. Located within the study area are the urban areas of Goole, Thorne, Stainforth, Edenthorp Kirk Sandall and Doncaster. However, the majority of the study area is covered by agricultural land.
The Lower Don area is crossed by the M62 and M18 motorways and by the East Coast Mainline railway.
1.2 Existing defences
A fundamental consideration of this strategy is the inter-relationship between the Lower Don and neighbouring rivers in respect to shared flood risk. In order to investigate risk issues associated with the River Don, neighbouring rivers and relatively low lying areas in between, the river catchment has been divided into Flood Management Units (FMU). A FMU is defined as the area at risk from inundation following a catastrophic breach of the flood defence system from one or more of the surrounding watercourses, which is not repaired. Furthermore, the flood defence forming each FMU have been divided into discrete sections/stretches, primarily based on individual reaches identified as part of the geotechnical risk assessment undertaken previously. Flood defence reaches
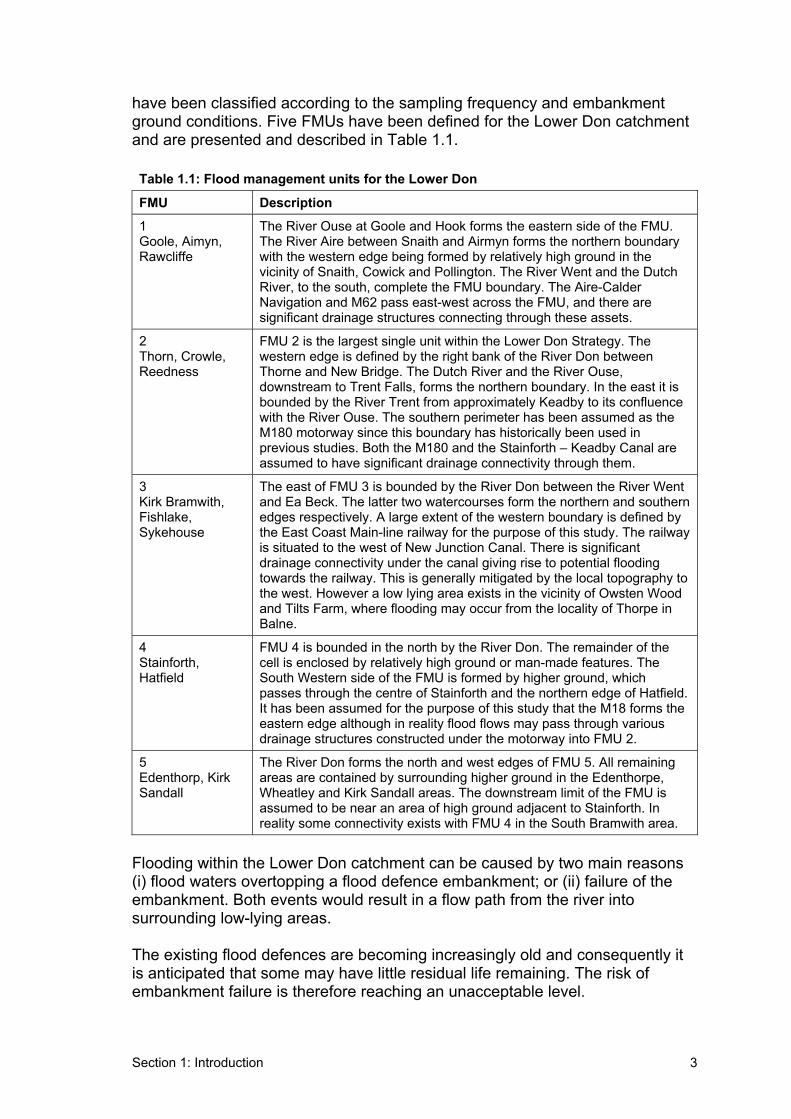
Section 1: Introduction 3
have been classified according to the sampling frequency and embankment ground conditions. Five FMUs have been defined for the Lower Don catchment and are presented and described in Table 1.1.
Table 1.1: Flood management units for the Lower Don
FMU Description
1Goole, Aimyn, Rawcliffe
The River Ouse at Goole and Hook forms the eastern side of the FMU.The River Aire between Snaith and Airmyn forms the northern boundary with the western edge being formed by relatively high ground in the vicinity of Snaith, Cowick and Pollington. The River Went and the Dutch River, to the south, complete the FMU boundary. The Aire-Calder Navigation and M62 pass east-west across the FMU, and there are significant drainage structures connecting through these assets.
2Thorn, Crowle, Reedness
FMU 2 is the largest single unit within the Lower Don Strategy. The western edge is defined by the right bank of the River Don between Thorne and New Bridge. The Dutch River and the River Ouse, downstream to Trent Falls, forms the northern boundary. In the east it is bounded by the River Trent from approximately Keadby to its confluence with the River Ouse. The southern perimeter has been assumed as the M180 motorway since this boundary has historically been used in previous studies. Both the M180 and the Stainforth – Keadby Canal are assumed to have significant drainage connectivity through them.
3Kirk Bramwith, Fishlake,Sykehouse
The east of FMU 3 is bounded by the River Don between the River Went and Ea Beck. The latter two watercourses form the northern and southern edges respectively. A large extent of the western boundary is defined by the East Coast Main-line railway for the purpose of this study. The railway is situated to the west of New Junction Canal. There is significant drainage connectivity under the canal giving rise to potential flooding towards the railway. This is generally mitigated by the local topography to the west. However a low lying area exists in the vicinity of Owsten Wood and Tilts Farm, where flooding may occur from the locality of Thorpe in Balne.
4Stainforth,Hatfield
FMU 4 is bounded in the north by the River Don. The remainder of the cell is enclosed by relatively high ground or man-made features. The South Western side of the FMU is formed by higher ground, which passes through the centre of Stainforth and the northern edge of Hatfield. It has been assumed for the purpose of this study that the M18 forms the eastern edge although in reality flood flows may pass through various drainage structures constructed under the motorway into FMU 2.
5Edenthorp, Kirk Sandall
The River Don forms the north and west edges of FMU 5. All remaining areas are contained by surrounding higher ground in the Edenthorpe, Wheatley and Kirk Sandall areas. The downstream limit of the FMU is assumed to be near an area of high ground adjacent to Stainforth. In reality some connectivity exists with FMU 4 in the South Bramwith area.
Flooding within the Lower Don catchment can be caused by two main reasons (i) flood waters overtopping a flood defence embankment; or (ii) failure of the embankment. Both events would result in a flow path from the river into surrounding low-lying areas.
The existing flood defences are becoming increasingly old and consequently it is anticipated that some may have little residual life remaining. The risk of embankment failure is therefore reaching an unacceptable level.
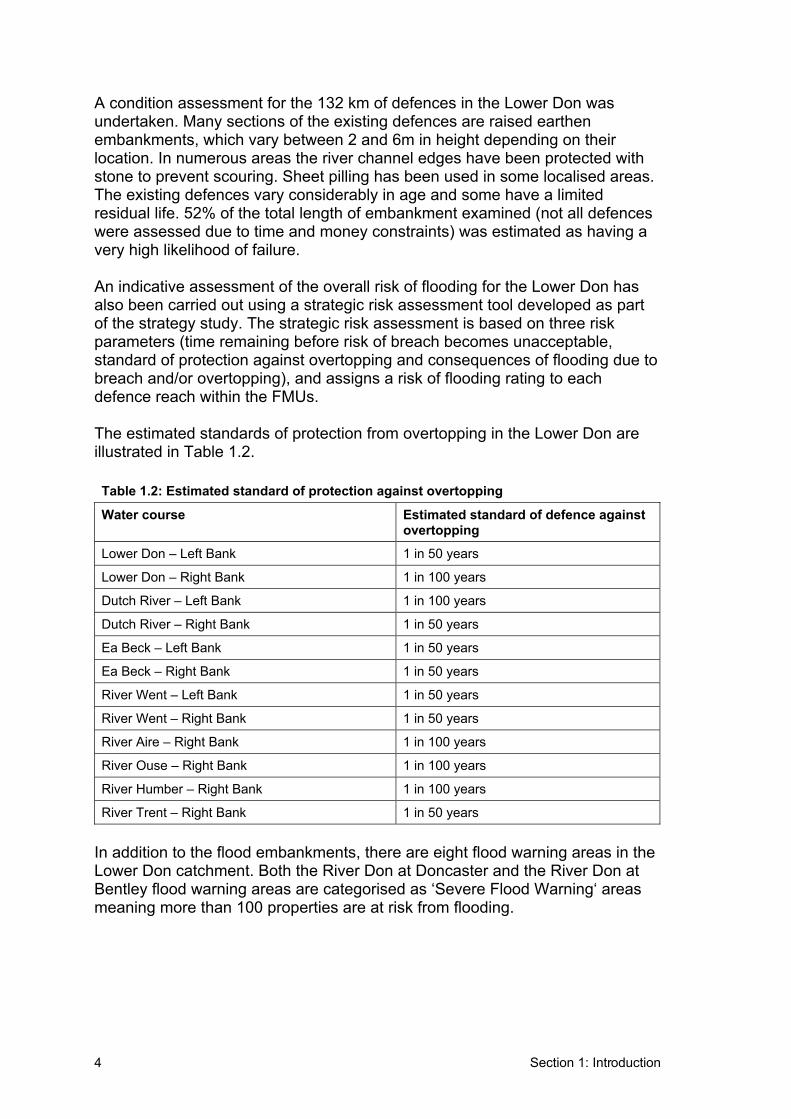
Section 1: Introduction4
A condition assessment for the 132 km of defences in the Lower Don was undertaken. Many sections of the existing defences are raised earthen embankments, which vary between 2 and 6m in height depending on their location. In numerous areas the river channel edges have been protected with stone to prevent scouring. Sheet pilling has been used in some localised areas. The existing defences vary considerably in age and some have a limited residual life. 52% of the total length of embankment examined (not all defences were assessed due to time and money constraints) was estimated as having a very high likelihood of failure.
An indicative assessment of the overall risk of flooding for the Lower Don has also been carried out using a strategic risk assessment tool developed as part of the strategy study. The strategic risk assessment is based on three risk parameters (time remaining before risk of breach becomes unacceptable, standard of protection against overtopping and consequences of flooding due to breach and/or overtopping), and assigns a risk of flooding rating to each defence reach within the FMUs.
The estimated standards of protection from overtopping in the Lower Don are illustrated in Table 1.2.
Table 1.2: Estimated standard of protection against overtopping
Water course Estimated standard of defence against overtopping
Lower Don – Left Bank 1 in 50 years
Lower Don – Right Bank 1 in 100 years
Dutch River – Left Bank 1 in 100 years
Dutch River – Right Bank 1 in 50 years
Ea Beck – Left Bank 1 in 50 years
Ea Beck – Right Bank 1 in 50 years
River Went – Left Bank 1 in 50 years
River Went – Right Bank 1 in 50 years
River Aire – Right Bank 1 in 100 years
River Ouse – Right Bank 1 in 100 years
River Humber – Right Bank 1 in 100 years
River Trent – Right Bank 1 in 50 years
In addition to the flood embankments, there are eight flood warning areas in the Lower Don catchment. Both the River Don at Doncaster and the River Don at Bentley flood warning areas are categorised as ‘Severe Flood Warning‘ areas meaning more than 100 properties are at risk from flooding.

Section 1: Introduction 5
1.3 The policy framework
The Lower Don strategy study has links to many other strategic documents and plans. It follows from the Lower Don preliminary strategic report (PSR), it is associated and linked with the Upper Don strategy plan and has been running in parallel with the Lower Don strategic environmental assessment (SEA).
The Lower Don strategy study sits within the large scale catchment plans, therefore will also have major links with the forthcoming catchment flood management plan for the River Don. This will provide a large scale strategic planning framework for the integrated management of flood risk to people and the developed and natural environment in a sustainable manner.
1.4 List of stakeholders and interested parties
At the present stage of the Lower Don strategy study there is no indication that consultation has been undertaken, other than reference to the fact that stakeholders may or may not oppose the selection of the options. Moreover, no reference is made to a communication plan for future consultation.
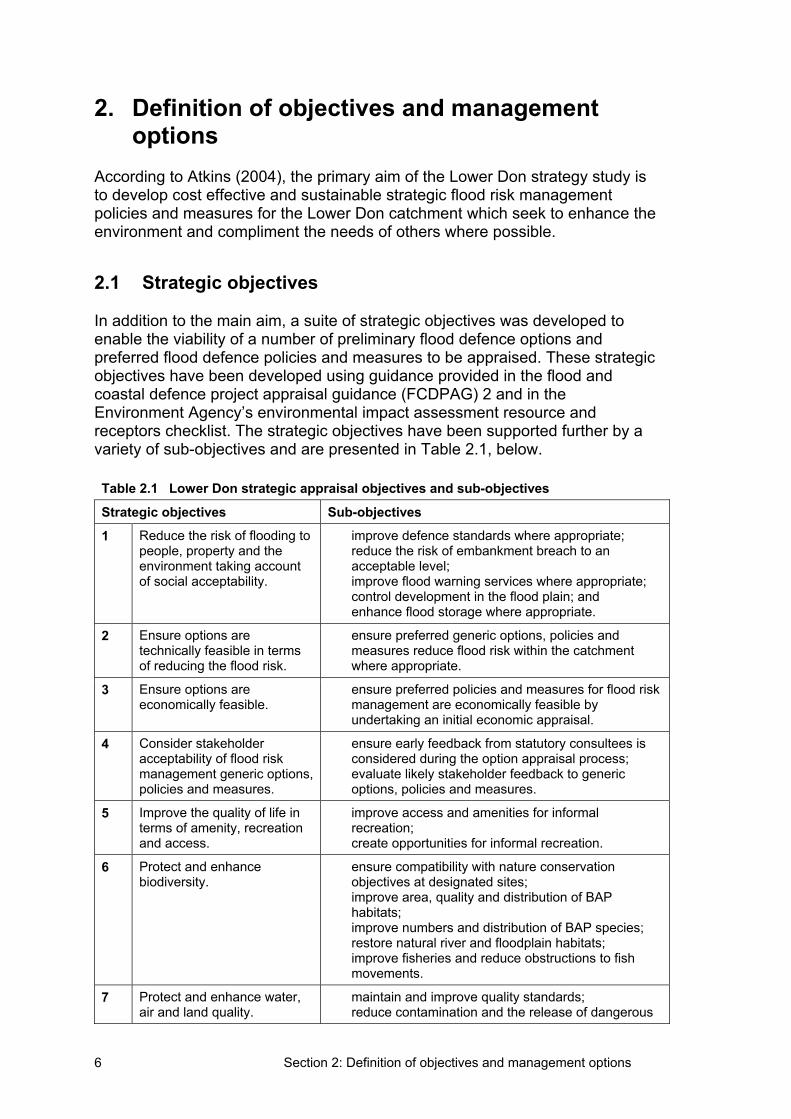
Section 2: Definition of objectives and management options 6
2. Definition of objectives and management options
According to Atkins (2004), the primary aim of the Lower Don strategy study is to develop cost effective and sustainable strategic flood risk management policies and measures for the Lower Don catchment which seek to enhance the environment and compliment the needs of others where possible.
2.1 Strategic objectives
In addition to the main aim, a suite of strategic objectives was developed to enable the viability of a number of preliminary flood defence options and preferred flood defence policies and measures to be appraised. These strategic objectives have been developed using guidance provided in the flood and coastal defence project appraisal guidance (FCDPAG) 2 and in the Environment Agency’s environmental impact assessment resource and receptors checklist. The strategic objectives have been supported further by a variety of sub-objectives and are presented in Table 2.1, below.
Table 2.1 Lower Don strategic appraisal objectives and sub-objectives
Strategic objectives Sub-objectives
1 Reduce the risk of flooding to people, property and the environment taking account of social acceptability.
• improve defence standards where appropriate; • reduce the risk of embankment breach to an
acceptable level; • improve flood warning services where appropriate; • control development in the flood plain; and • enhance flood storage where appropriate.
2 Ensure options are technically feasible in terms of reducing the flood risk.
• ensure preferred generic options, policies and measures reduce flood risk within the catchment where appropriate.
3 Ensure options are economically feasible.
• ensure preferred policies and measures for flood risk management are economically feasible by undertaking an initial economic appraisal.
4 Consider stakeholder acceptability of flood risk management generic options, policies and measures.
• ensure early feedback from statutory consultees is considered during the option appraisal process;
• evaluate likely stakeholder feedback to generic options, policies and measures.
5 Improve the quality of life in terms of amenity, recreation and access.
• improve access and amenities for informal recreation;
• create opportunities for informal recreation.
6 Protect and enhance biodiversity.
• ensure compatibility with nature conservation objectives at designated sites;
• improve area, quality and distribution of BAP habitats;
• improve numbers and distribution of BAP species; • restore natural river and floodplain habitats; • improve fisheries and reduce obstructions to fish
movements.
7 Protect and enhance water, air and land quality.
• maintain and improve quality standards; • reduce contamination and the release of dangerous
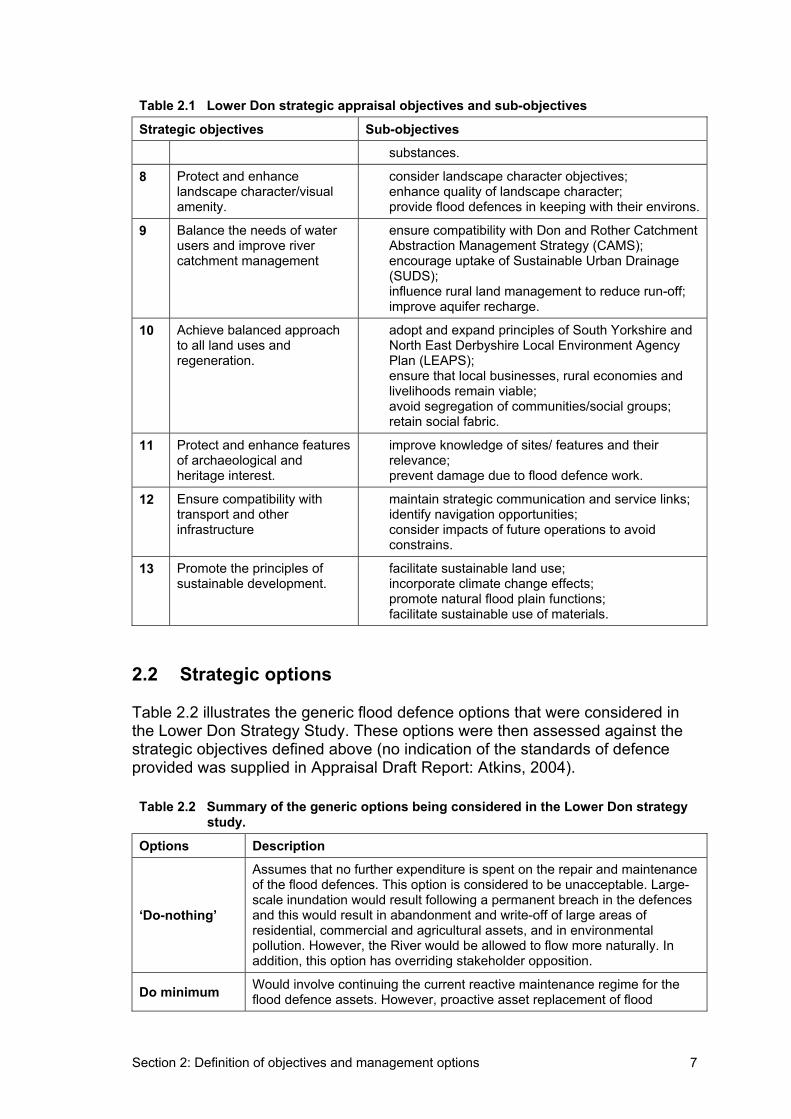
Section 2: Definition of objectives and management options 7
Table 2.1 Lower Don strategic appraisal objectives and sub-objectives
Strategic objectives Sub-objectives
substances.
8 Protect and enhance landscape character/visual amenity.
• consider landscape character objectives; • enhance quality of landscape character; • provide flood defences in keeping with their environs.
9 Balance the needs of water users and improve river catchment management
• ensure compatibility with Don and Rother Catchment Abstraction Management Strategy (CAMS);
• encourage uptake of Sustainable Urban Drainage (SUDS);
• influence rural land management to reduce run-off; • improve aquifer recharge.
10 Achieve balanced approach to all land uses and regeneration.
• adopt and expand principles of South Yorkshire and North East Derbyshire Local Environment Agency Plan (LEAPS);
• ensure that local businesses, rural economies and livelihoods remain viable;
• avoid segregation of communities/social groups; • retain social fabric.
11 Protect and enhance features of archaeological and heritage interest.
• improve knowledge of sites/ features and their relevance;
• prevent damage due to flood defence work.
12 Ensure compatibility with transport and other infrastructure
• maintain strategic communication and service links; • identify navigation opportunities; • consider impacts of future operations to avoid
constrains.
13 Promote the principles of sustainable development.
• facilitate sustainable land use; • incorporate climate change effects; • promote natural flood plain functions; • facilitate sustainable use of materials.
2.2 Strategic options
Table 2.2 illustrates the generic flood defence options that were considered in the Lower Don Strategy Study. These options were then assessed against the strategic objectives defined above (no indication of the standards of defence provided was supplied in Appraisal Draft Report: Atkins, 2004).
Table 2.2 Summary of the generic options being considered in the Lower Don strategy study.
Options Description
‘Do-nothing’
Assumes that no further expenditure is spent on the repair and maintenance of the flood defences. This option is considered to be unacceptable. Large-scale inundation would result following a permanent breach in the defences and this would result in abandonment and write-off of large areas of residential, commercial and agricultural assets, and in environmental pollution. However, the River would be allowed to flow more naturally. In addition, this option has overriding stakeholder opposition.
Do minimum Would involve continuing the current reactive maintenance regime for the flood defence assets. However, proactive asset replacement of flood
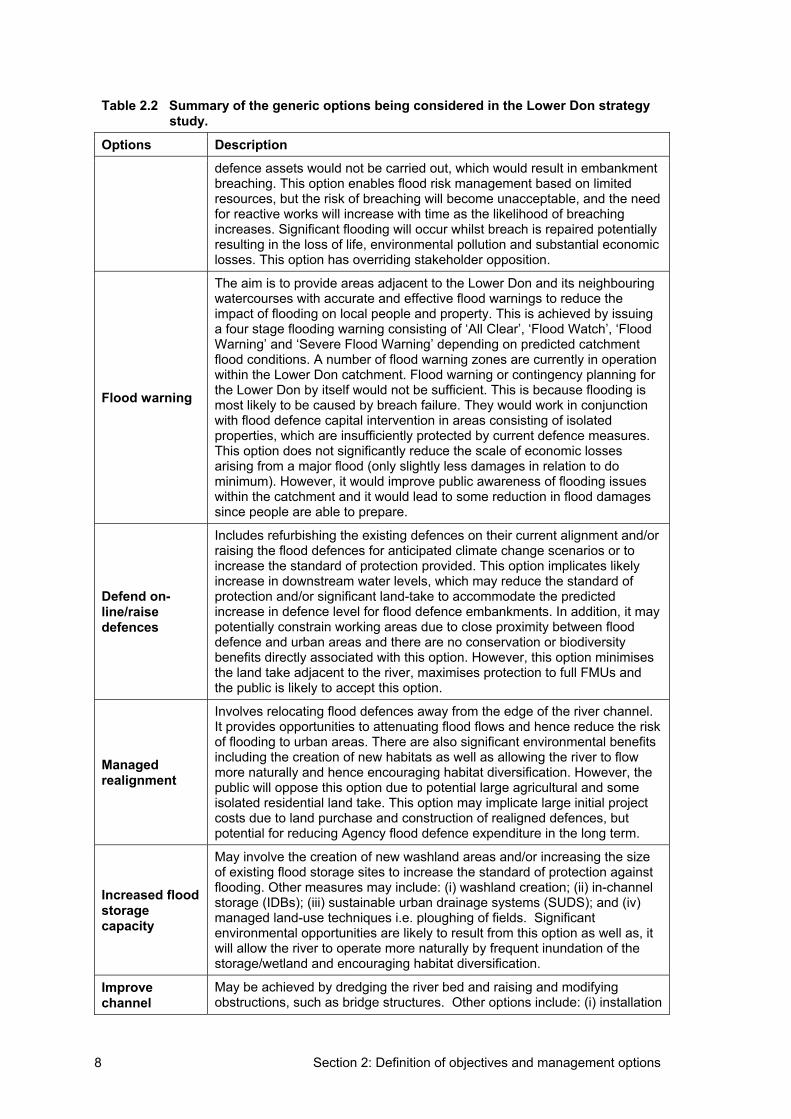
Section 2: Definition of objectives and management options 8
Table 2.2 Summary of the generic options being considered in the Lower Don strategy study.
Options Description
defence assets would not be carried out, which would result in embankment breaching. This option enables flood risk management based on limited resources, but the risk of breaching will become unacceptable, and the need for reactive works will increase with time as the likelihood of breaching increases. Significant flooding will occur whilst breach is repaired potentially resulting in the loss of life, environmental pollution and substantial economic losses. This option has overriding stakeholder opposition.
Flood warning
The aim is to provide areas adjacent to the Lower Don and its neighbouring watercourses with accurate and effective flood warnings to reduce the impact of flooding on local people and property. This is achieved by issuing a four stage flooding warning consisting of ‘All Clear’, ‘Flood Watch’, ‘Flood Warning’ and ‘Severe Flood Warning’ depending on predicted catchment flood conditions. A number of flood warning zones are currently in operation within the Lower Don catchment. Flood warning or contingency planning for the Lower Don by itself would not be sufficient. This is because flooding is most likely to be caused by breach failure. They would work in conjunction with flood defence capital intervention in areas consisting of isolated properties, which are insufficiently protected by current defence measures. This option does not significantly reduce the scale of economic losses arising from a major flood (only slightly less damages in relation to do minimum). However, it would improve public awareness of flooding issues within the catchment and it would lead to some reduction in flood damages since people are able to prepare.
Defend on-line/raisedefences
Includes refurbishing the existing defences on their current alignment and/or raising the flood defences for anticipated climate change scenarios or to increase the standard of protection provided. This option implicates likely increase in downstream water levels, which may reduce the standard of protection and/or significant land-take to accommodate the predicted increase in defence level for flood defence embankments. In addition, it may potentially constrain working areas due to close proximity between flood defence and urban areas and there are no conservation or biodiversity benefits directly associated with this option. However, this option minimises the land take adjacent to the river, maximises protection to full FMUs and the public is likely to accept this option.
Managedrealignment
Involves relocating flood defences away from the edge of the river channel. It provides opportunities to attenuating flood flows and hence reduce the risk of flooding to urban areas. There are also significant environmental benefits including the creation of new habitats as well as allowing the river to flow more naturally and hence encouraging habitat diversification. However, the public will oppose this option due to potential large agricultural and some isolated residential land take. This option may implicate large initial project costs due to land purchase and construction of realigned defences, but potential for reducing Agency flood defence expenditure in the long term.
Increased flood storagecapacity
May involve the creation of new washland areas and/or increasing the size of existing flood storage sites to increase the standard of protection against flooding. Other measures may include: (i) washland creation; (ii) in-channel storage (IDBs); (iii) sustainable urban drainage systems (SUDS); and (iv) managed land-use techniques i.e. ploughing of fields. Significant environmental opportunities are likely to result from this option as well as, it will allow the river to operate more naturally by frequent inundation of the storage/wetland and encouraging habitat diversification.
Improve channel
May be achieved by dredging the river bed and raising and modifying obstructions, such as bridge structures. Other options include: (i) installation
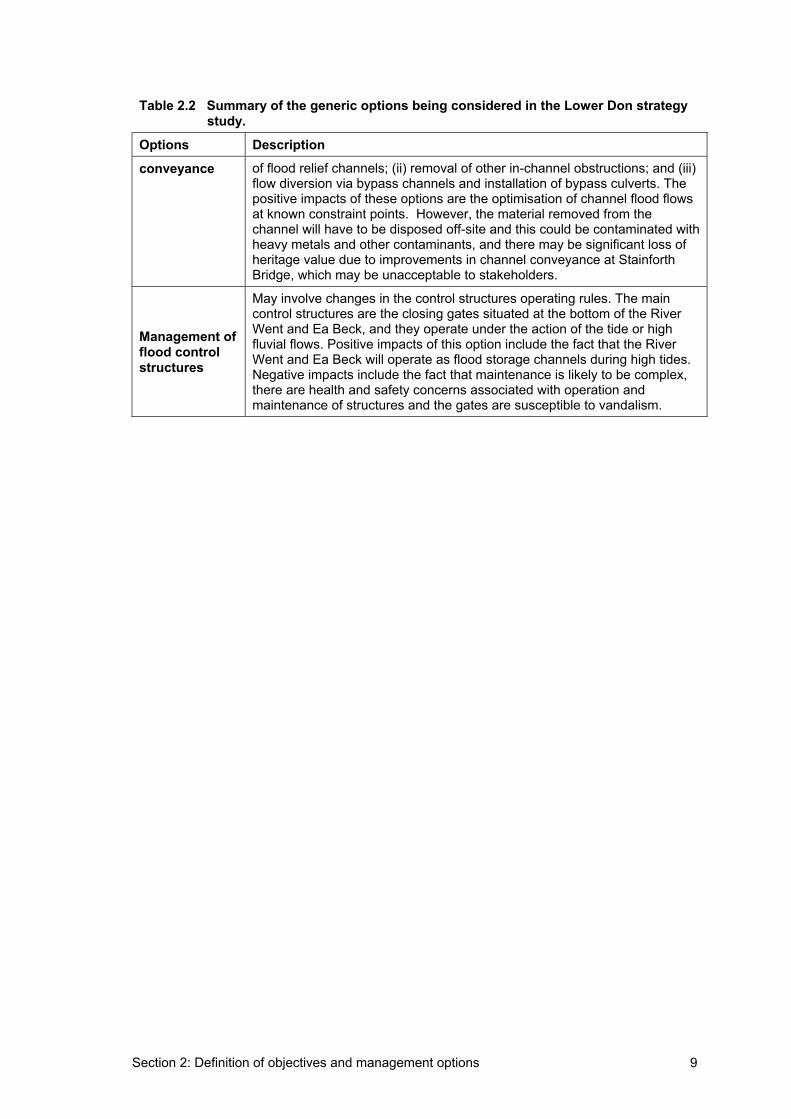
Section 2: Definition of objectives and management options 9
Table 2.2 Summary of the generic options being considered in the Lower Don strategy study.
Options Description
conveyance of flood relief channels; (ii) removal of other in-channel obstructions; and (iii) flow diversion via bypass channels and installation of bypass culverts. The positive impacts of these options are the optimisation of channel flood flows at known constraint points. However, the material removed from the channel will have to be disposed off-site and this could be contaminated with heavy metals and other contaminants, and there may be significant loss of heritage value due to improvements in channel conveyance at Stainforth Bridge, which may be unacceptable to stakeholders.
Management of flood control structures
May involve changes in the control structures operating rules. The main control structures are the closing gates situated at the bottom of the River Went and Ea Beck, and they operate under the action of the tide or high fluvial flows. Positive impacts of this option include the fact that the River Went and Ea Beck will operate as flood storage channels during high tides. Negative impacts include the fact that maintenance is likely to be complex, there are health and safety concerns associated with operation and maintenance of structures and the gates are susceptible to vandalism.
Section 3: Structuring the problem10
3. Structuring the problem This section intends to break down the problem into its component parts, identifying the set of impacts and associated criteria that will be used to make the decision. There was not enough background information to be able to complete an AST for high level screening (AST-FMDC-S) for the Lower Don strategy study. It was possible, however, to link the assessment criteria used in the original assessment with the assessment criteria used for the MCA-based approach, and in this way organise the flood problem.
The approach used in the strategy study for the Lower Don has some similarities with the approach used in the MCA-based methodology. The original appraisal for the Lower Don strategy uses the strategic objectives as the assessment criteria and these are fairly similar to the impact types and categories used in the MCA-based approach. In addition, the original appraisal uses a scoring approach to select a preferred strategic option.
Given the similarities, an attempt was made to use as much of the available information and transform it to use it in the MCA-based approach.
In order to start fitting the existing information into the MCA-based process it is necessary to link each of the strategic objectives and sub-objectives to one of the impact categories used in the assessment summary Table. Table 3.1, overleaf, illustrates these links. Some of the strategic objectives included sub-objectives that corresponded to different impact categories. For this reason the sub-objectives were separated out to be distributed among the impact categories.
For the impact categories ‘assets’, ‘land use’ and ‘availability and accessibility of services’ no suitable link/similarity was found with any of the objectives and/sub-objectives. From the information available it is reasonable to conclude that the different options will not have an impact on the availability and accessibility to services. In what concerns the impact on assets and land use these will most certainly occur and on the original strategy study they are covered under the economic appraisal.
For the remaining impact categories there are corresponding objectives and sub-objectives. These can be considered to be the intangible impacts of the appraisal, i.e. those that cannot be assessed in monetary terms.
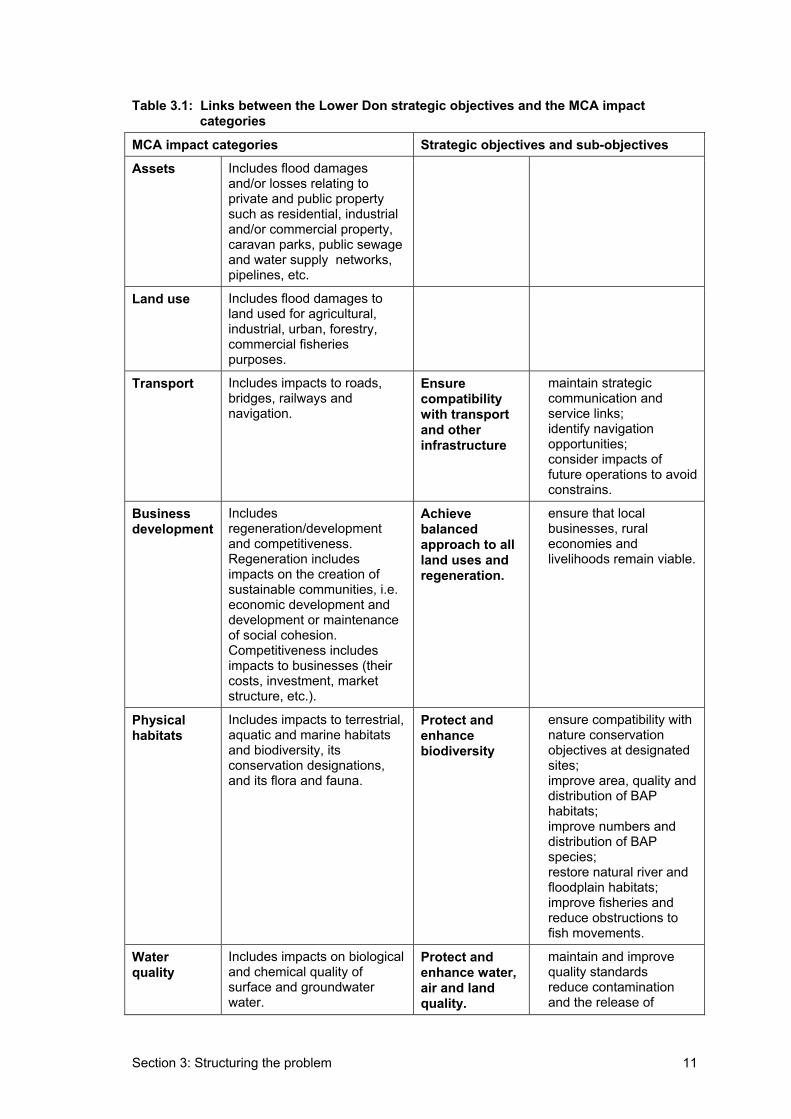
Section 3: Structuring the problem 11
Table 3.1: Links between the Lower Don strategic objectives and the MCA impact categories
MCA impact categories Strategic objectives and sub-objectives
Assets Includes flood damages and/or losses relating to private and public property such as residential, industrial and/or commercial property, caravan parks, public sewage and water supply networks, pipelines, etc.
Land use Includes flood damages to land used for agricultural, industrial, urban, forestry, commercial fisheries purposes.
Transport Includes impacts to roads, bridges, railways and navigation.
Ensurecompatibility with transport and other infrastructure
• maintain strategic communication and service links;
• identify navigation opportunities;
• consider impacts of future operations to avoid constrains.
Businessdevelopment
Includesregeneration/developmentand competitiveness. Regeneration includes impacts on the creation of sustainable communities, i.e. economic development and development or maintenance of social cohesion. Competitiveness includes impacts to businesses (their costs, investment, market structure, etc.).
Achieve balancedapproach to all land uses and regeneration.
• ensure that local businesses, rural economies and livelihoods remain viable.
Physical habitats
Includes impacts to terrestrial, aquatic and marine habitats and biodiversity, its conservation designations, and its flora and fauna.
Protect and enhancebiodiversity
• ensure compatibility with nature conservation objectives at designated sites;
• improve area, quality and distribution of BAP habitats;
• improve numbers and distribution of BAP species;
• restore natural river and floodplain habitats;
• improve fisheries and reduce obstructions to fish movements.
Waterquality
Includes impacts on biological and chemical quality of surface and groundwater water.
Protect and enhance water, air and land quality.
• maintain and improve quality standards
• reduce contamination and the release of
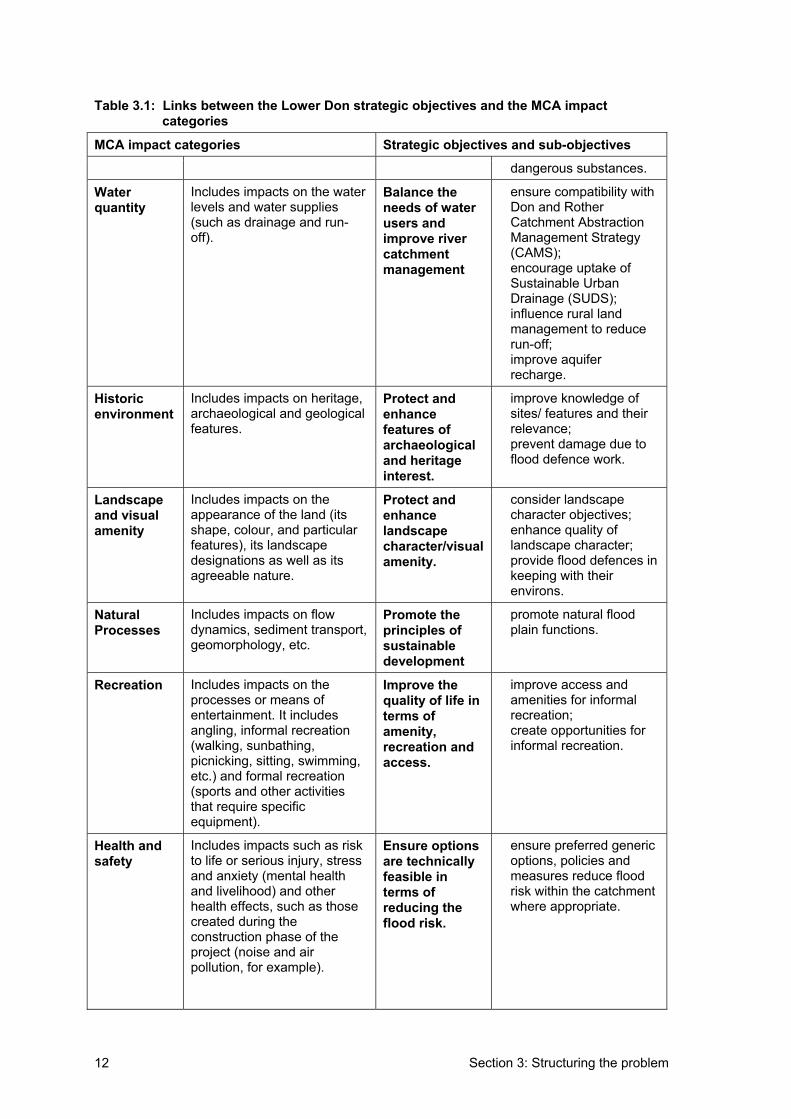
Section 3: Structuring the problem 12
Table 3.1: Links between the Lower Don strategic objectives and the MCA impact categories
MCA impact categories Strategic objectives and sub-objectives
dangerous substances.
Waterquantity
Includes impacts on the water levels and water supplies (such as drainage and run-off).
Balance the needs of water users and improve river catchmentmanagement
• ensure compatibility with Don and Rother Catchment Abstraction Management Strategy (CAMS);
• encourage uptake of Sustainable Urban Drainage (SUDS);
• influence rural land management to reduce run-off;
• improve aquifer recharge.
Historicenvironment
Includes impacts on heritage, archaeological and geological features.
Protect and enhancefeatures of archaeologicaland heritage interest.
• improve knowledge of sites/ features and their relevance;
• prevent damage due to flood defence work.
Landscapeand visual amenity
Includes impacts on the appearance of the land (its shape, colour, and particular features), its landscape designations as well as its agreeable nature.
Protect and enhancelandscapecharacter/visual amenity.
• consider landscape character objectives;
• enhance quality of landscape character;
• provide flood defences in keeping with their environs.
NaturalProcesses
Includes impacts on flow dynamics, sediment transport, geomorphology, etc.
Promote the principles of sustainabledevelopment
• promote natural flood plain functions.
Recreation Includes impacts on the processes or means of entertainment. It includes angling, informal recreation (walking, sunbathing, picnicking, sitting, swimming, etc.) and formal recreation (sports and other activities that require specific equipment).
Improve the quality of life in terms of amenity, recreation and access.
• improve access and amenities for informal recreation;
• create opportunities for informal recreation.
Health and safety
Includes impacts such as risk to life or serious injury, stress and anxiety (mental health and livelihood) and other health effects, such as those created during the construction phase of the project (noise and air pollution, for example).
Ensure options are technically feasible in terms of reducing the flood risk.
• ensure preferred generic options, policies and measures reduce flood risk within the catchment where appropriate.
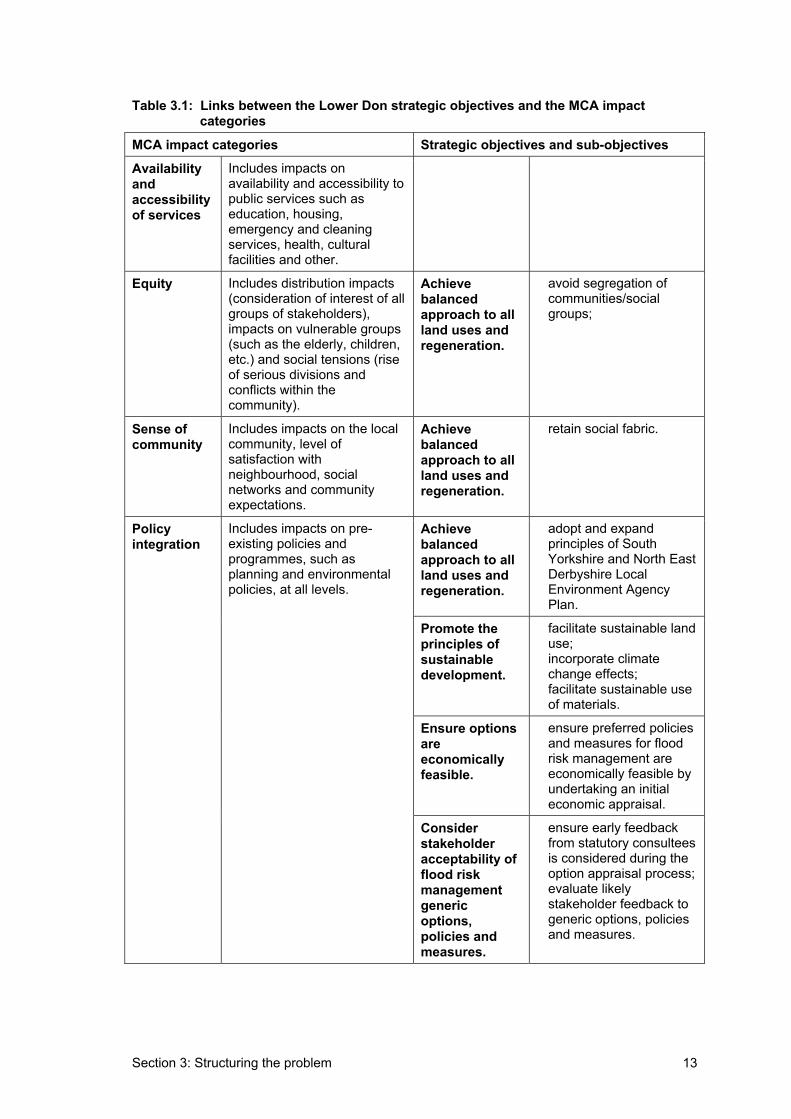
Section 3: Structuring the problem 13
Table 3.1: Links between the Lower Don strategic objectives and the MCA impact categories
MCA impact categories Strategic objectives and sub-objectives
Availability andaccessibility of services
Includes impacts on availability and accessibility to public services such as education, housing, emergency and cleaning services, health, cultural facilities and other.
Equity Includes distribution impacts (consideration of interest of all groups of stakeholders), impacts on vulnerable groups (such as the elderly, children, etc.) and social tensions (rise of serious divisions and conflicts within the community).
Achieve balancedapproach to all land uses and regeneration.
• avoid segregation of communities/socialgroups;
Sense of community
Includes impacts on the local community, level of satisfaction with neighbourhood, social networks and community expectations.
Achieve balancedapproach to all land uses and regeneration.
• retain social fabric.
Achieve balancedapproach to all land uses and regeneration.
• adopt and expand principles of South Yorkshire and North East Derbyshire Local Environment Agency Plan.
Promote the principles of sustainabledevelopment.
• facilitate sustainable land use;
• incorporate climate change effects;
• facilitate sustainable use of materials.
Ensure options areeconomically feasible.
• ensure preferred policies and measures for flood risk management are economically feasible by undertaking an initial economic appraisal.
Policy integration
Includes impacts on pre-existing policies and programmes, such as planning and environmental policies, at all levels.
Considerstakeholderacceptability of flood risk managementgenericoptions,policies and measures.
• ensure early feedback from statutory consultees is considered during the option appraisal process;
• evaluate likely stakeholder feedback to generic options, policies and measures.
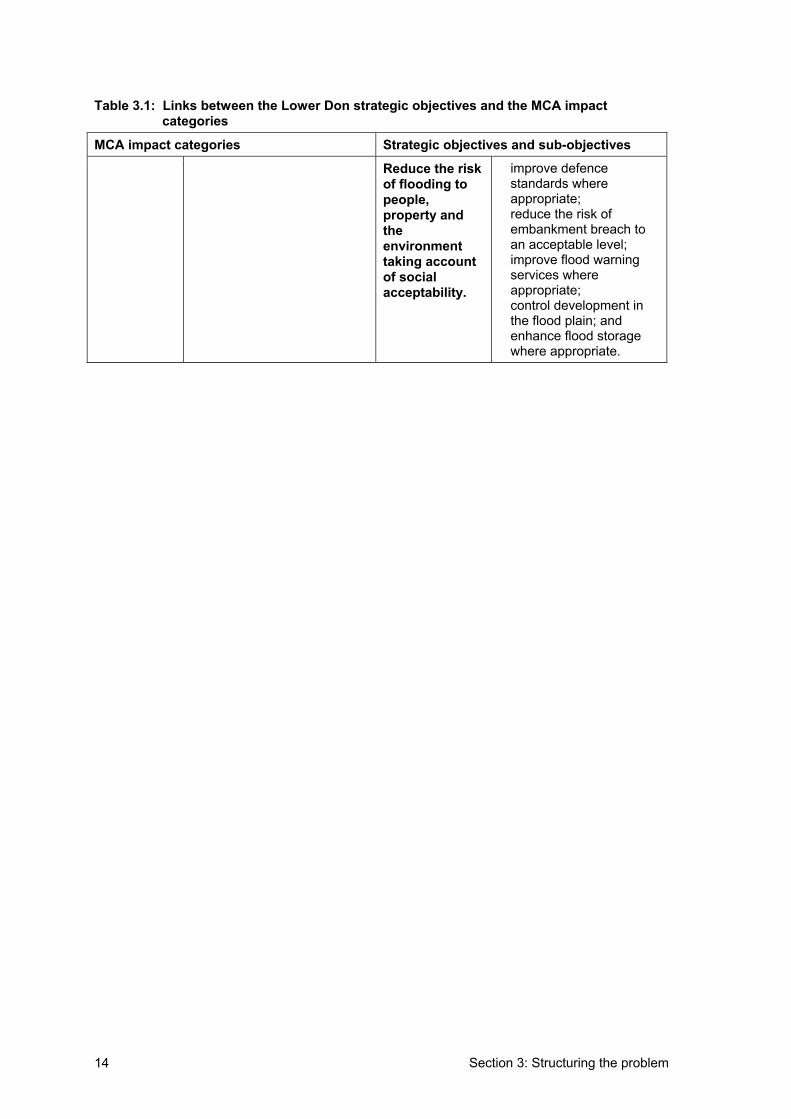
Section 3: Structuring the problem 14
Table 3.1: Links between the Lower Don strategic objectives and the MCA impact categories
MCA impact categories Strategic objectives and sub-objectives
Reduce the risk of flooding to people,property and theenvironment taking account of social acceptability.
• improve defence standards where appropriate;
• reduce the risk of embankment breach to an acceptable level;
• improve flood warning services where appropriate;
• control development in the flood plain; and
• enhance flood storage where appropriate.
Section 4: Assessment of impacts 15
4. Assessment of impacts A substantial part of the Lower Don catchment and adjoining areas contain relatively low-lying land with very little topographic variation. There is a very significant risk of flooding within these areas situated within watercourses. The available benefits must therefore be shared between the adjoining watercourses to avoid overestimation through double counting.
4.1 Monetary valuation of impacts
All of the following information was obtained from the Lower Don strategy study draft report (Atkins, 2004).
An indicative benefit-cost ratio has been calculated for each of the FMUs to determine whether future flood defence investment is worthwhile. This calculation was based on maximum available benefits, assuming asset write- off, and the total present value flood defence costs anticipated across the life of the strategy.
The Lower Don draft report states that the monetary assessment of impacts is an initial assessment and it is recognised that a more detailed economic appraisal will be carried out during the next project stages. Consideration will need to be given to some complex issues including defining flood inundation areas and associated flooding depths for different flooding scenarios. In addition, further hydraulic modelling and breach risk information will be required to enable a comprehensive appraisal to take place.
4.1.1 Write-off benefits
Write-off values of residential, industrial and agricultural assets were assessed during the appraisal of benefits. It has been assumed that a breach occurs in the first year of the strategy period and the flood management unit is completely inundated. This will result in abandonment of the flood management unit and all assets are consequently written-off.
Assets
Write-off values for residential properties were estimated using address point data examined using Map info software to determine the number of properties per post-code area within each flood management area. The average house price for each postcode was retrieved from the Land Registry website. A summary of the number of properties and overall property value per FMU is given in Table 4.1.
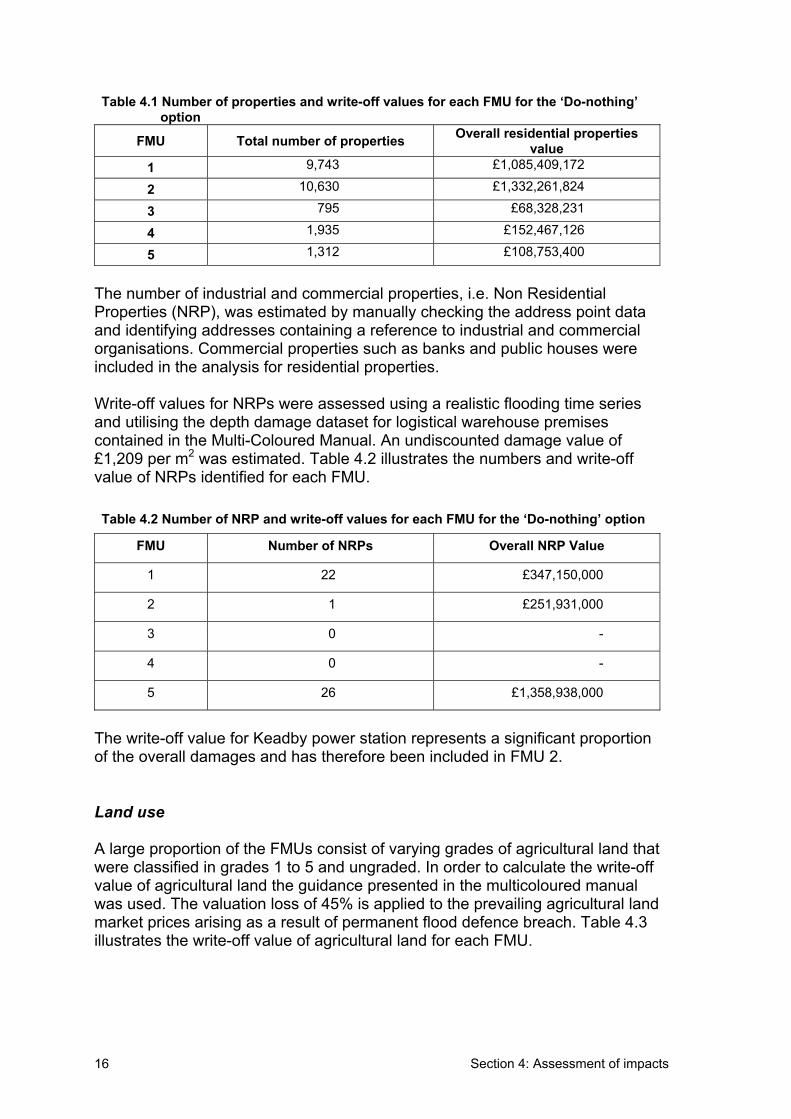
Section 4: Assessment of impacts 16
Table 4.1 Number of properties and write-off values for each FMU for the ‘Do-nothing’ option
FMU Total number of properties Overall residential properties value
1 9,743 £1,085,409,172
2 10,630 £1,332,261,824
3 795 £68,328,231
4 1,935 £152,467,126
5 1,312 £108,753,400
The number of industrial and commercial properties, i.e. Non Residential Properties (NRP), was estimated by manually checking the address point data and identifying addresses containing a reference to industrial and commercial organisations. Commercial properties such as banks and public houses were included in the analysis for residential properties.
Write-off values for NRPs were assessed using a realistic flooding time series and utilising the depth damage dataset for logistical warehouse premises contained in the Multi-Coloured Manual. An undiscounted damage value of £1,209 per m2 was estimated. Table 4.2 illustrates the numbers and write-off value of NRPs identified for each FMU.
Table 4.2 Number of NRP and write-off values for each FMU for the ‘Do-nothing’ option
FMU Number of NRPs Overall NRP Value
1 22 £347,150,000
2 1 £251,931,000
3 0 -
4 0 -
5 26 £1,358,938,000
The write-off value for Keadby power station represents a significant proportion of the overall damages and has therefore been included in FMU 2.
Land use
A large proportion of the FMUs consist of varying grades of agricultural land that were classified in grades 1 to 5 and ungraded. In order to calculate the write-off value of agricultural land the guidance presented in the multicoloured manual was used. The valuation loss of 45% is applied to the prevailing agricultural land market prices arising as a result of permanent flood defence breach. Table 4.3 illustrates the write-off value of agricultural land for each FMU.
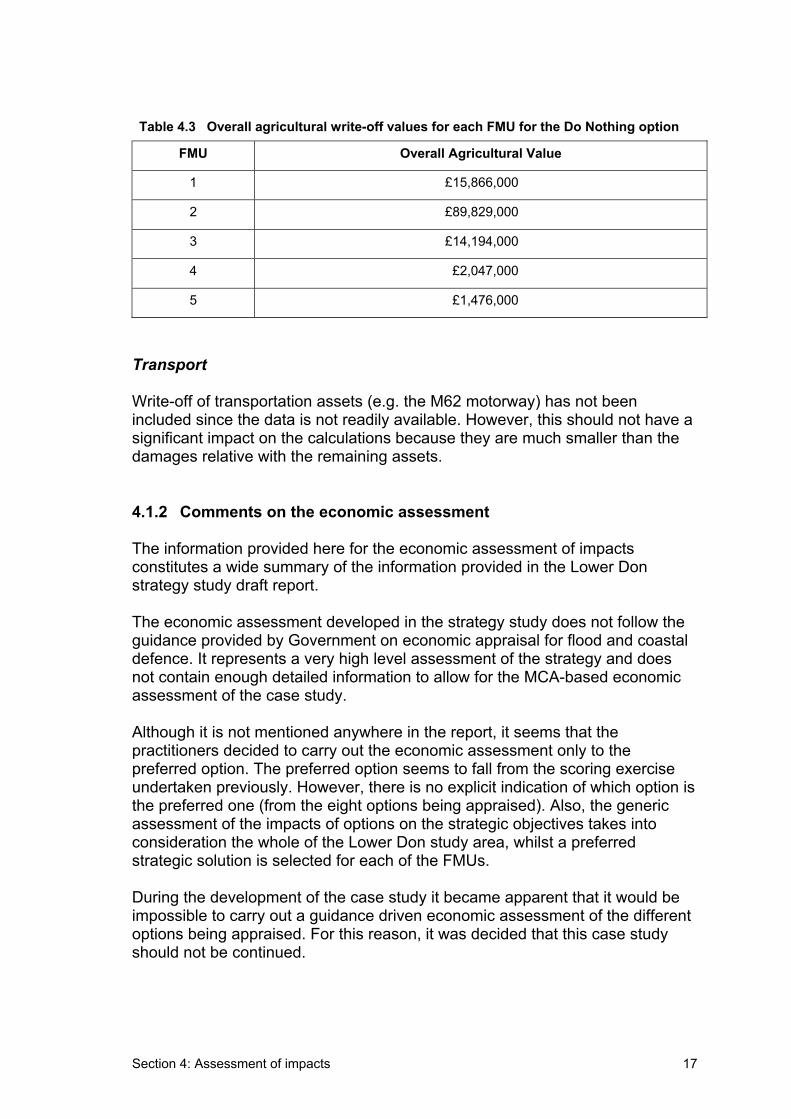
Section 4: Assessment of impacts 17
Table 4.3 Overall agricultural write-off values for each FMU for the Do Nothing option
FMU Overall Agricultural Value
1 £15,866,000
2 £89,829,000
3 £14,194,000
4 £2,047,000
5 £1,476,000
Transport
Write-off of transportation assets (e.g. the M62 motorway) has not been included since the data is not readily available. However, this should not have a significant impact on the calculations because they are much smaller than the damages relative with the remaining assets.
4.1.2 Comments on the economic assessment
The information provided here for the economic assessment of impacts constitutes a wide summary of the information provided in the Lower Don strategy study draft report.
The economic assessment developed in the strategy study does not follow the guidance provided by Government on economic appraisal for flood and coastal defence. It represents a very high level assessment of the strategy and does not contain enough detailed information to allow for the MCA-based economic assessment of the case study.
Although it is not mentioned anywhere in the report, it seems that the practitioners decided to carry out the economic assessment only to the preferred option. The preferred option seems to fall from the scoring exercise undertaken previously. However, there is no explicit indication of which option is the preferred one (from the eight options being appraised). Also, the generic assessment of the impacts of options on the strategic objectives takes into consideration the whole of the Lower Don study area, whilst a preferred strategic solution is selected for each of the FMUs.
During the development of the case study it became apparent that it would be impossible to carry out a guidance driven economic assessment of the different options being appraised. For this reason, it was decided that this case study should not be continued.
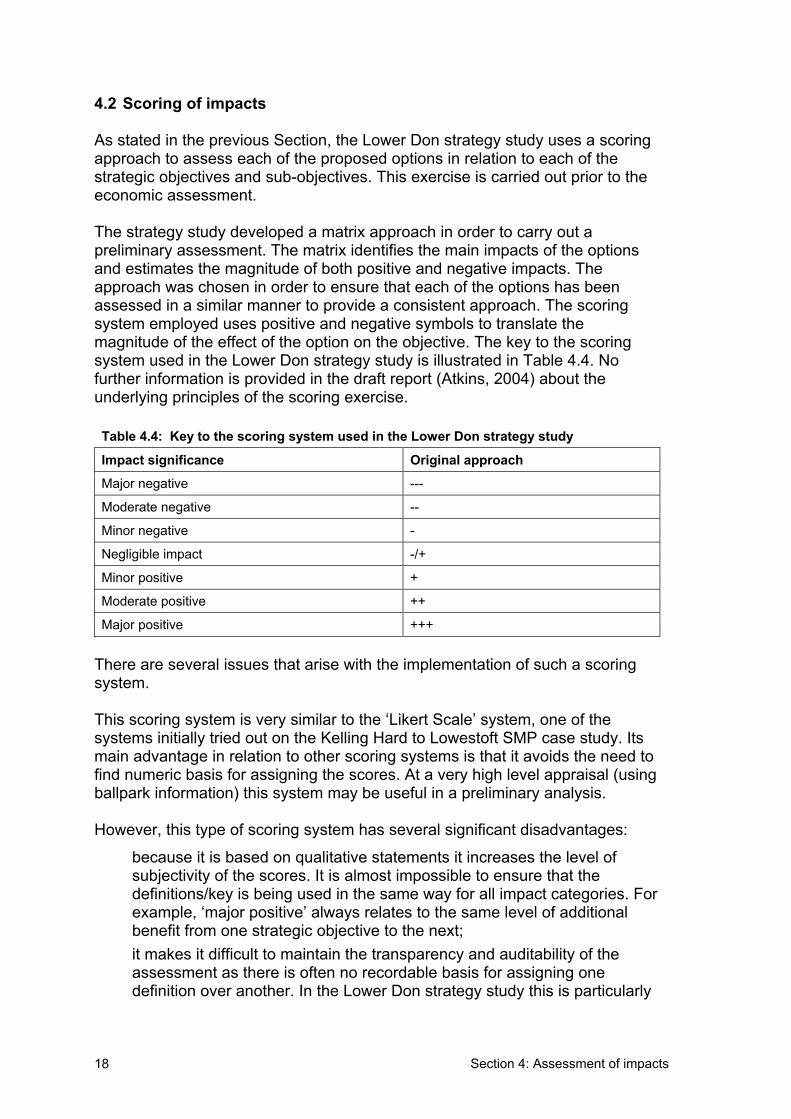
Section 4: Assessment of impacts 18
4.2 Scoring of impacts
As stated in the previous Section, the Lower Don strategy study uses a scoring approach to assess each of the proposed options in relation to each of the strategic objectives and sub-objectives. This exercise is carried out prior to the economic assessment.
The strategy study developed a matrix approach in order to carry out a preliminary assessment. The matrix identifies the main impacts of the options and estimates the magnitude of both positive and negative impacts. The approach was chosen in order to ensure that each of the options has been assessed in a similar manner to provide a consistent approach. The scoring system employed uses positive and negative symbols to translate the magnitude of the effect of the option on the objective. The key to the scoring system used in the Lower Don strategy study is illustrated in Table 4.4. No further information is provided in the draft report (Atkins, 2004) about the underlying principles of the scoring exercise.
Table 4.4: Key to the scoring system used in the Lower Don strategy study
Impact significance Original approach
Major negative ---
Moderate negative --
Minor negative -
Negligible impact -/+
Minor positive +
Moderate positive ++
Major positive +++
There are several issues that arise with the implementation of such a scoring system.
This scoring system is very similar to the ‘Likert Scale’ system, one of the systems initially tried out on the Kelling Hard to Lowestoft SMP case study. Its main advantage in relation to other scoring systems is that it avoids the need to find numeric basis for assigning the scores. At a very high level appraisal (using ballpark information) this system may be useful in a preliminary analysis.
However, this type of scoring system has several significant disadvantages:
• because it is based on qualitative statements it increases the level of subjectivity of the scores. It is almost impossible to ensure that the definitions/key is being used in the same way for all impact categories. For example, ‘major positive’ always relates to the same level of additional benefit from one strategic objective to the next;
• it makes it difficult to maintain the transparency and auditability of the assessment as there is often no recordable basis for assigning one definition over another. In the Lower Don strategy study this is particularly
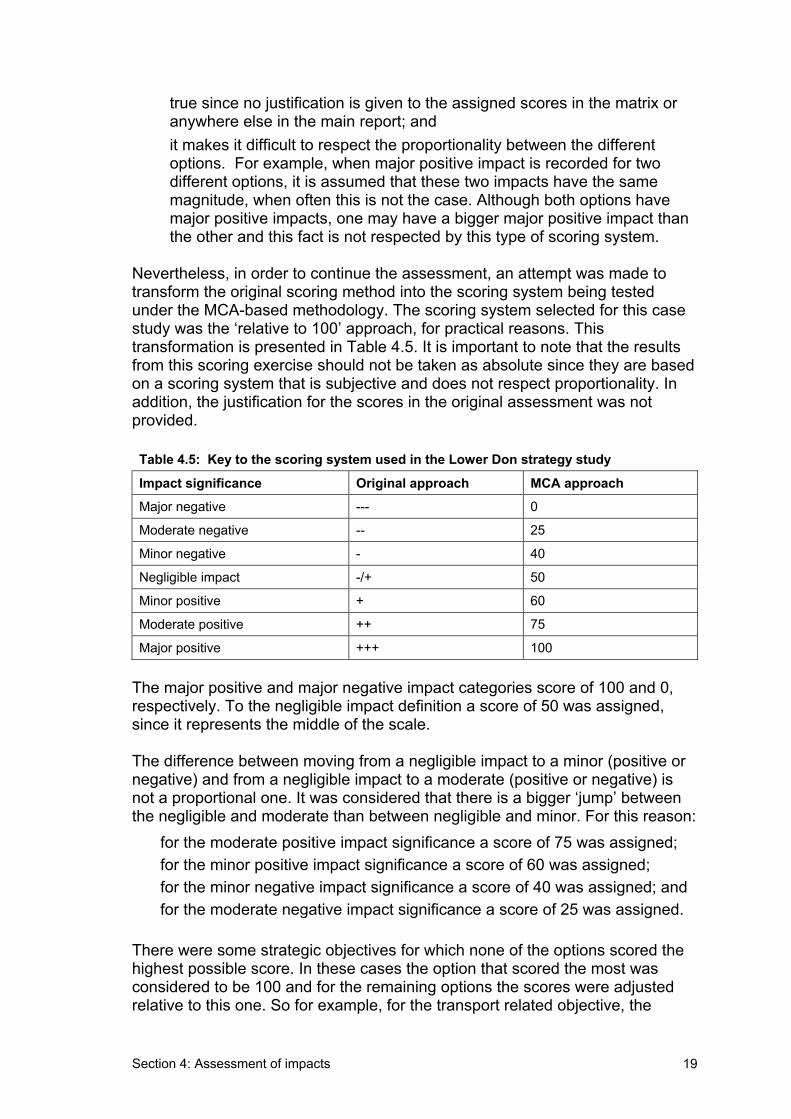
Section 4: Assessment of impacts 19
true since no justification is given to the assigned scores in the matrix or anywhere else in the main report; and
• it makes it difficult to respect the proportionality between the different options. For example, when major positive impact is recorded for two different options, it is assumed that these two impacts have the same magnitude, when often this is not the case. Although both options have major positive impacts, one may have a bigger major positive impact than the other and this fact is not respected by this type of scoring system.
Nevertheless, in order to continue the assessment, an attempt was made to transform the original scoring method into the scoring system being tested under the MCA-based methodology. The scoring system selected for this case study was the ‘relative to 100’ approach, for practical reasons. This transformation is presented in Table 4.5. It is important to note that the results from this scoring exercise should not be taken as absolute since they are based on a scoring system that is subjective and does not respect proportionality. In addition, the justification for the scores in the original assessment was not provided.
Table 4.5: Key to the scoring system used in the Lower Don strategy study
Impact significance Original approach MCA approach
Major negative --- 0
Moderate negative -- 25
Minor negative - 40
Negligible impact -/+ 50
Minor positive + 60
Moderate positive ++ 75
Major positive +++ 100
The major positive and major negative impact categories score of 100 and 0, respectively. To the negligible impact definition a score of 50 was assigned, since it represents the middle of the scale.
The difference between moving from a negligible impact to a minor (positive or negative) and from a negligible impact to a moderate (positive or negative) is not a proportional one. It was considered that there is a bigger ‘jump’ between the negligible and moderate than between negligible and minor. For this reason: • for the moderate positive impact significance a score of 75 was assigned; • for the minor positive impact significance a score of 60 was assigned; • for the minor negative impact significance a score of 40 was assigned; and • for the moderate negative impact significance a score of 25 was assigned.
There were some strategic objectives for which none of the options scored the highest possible score. In these cases the option that scored the most was considered to be 100 and for the remaining options the scores were adjusted relative to this one. So for example, for the transport related objective, the
Section 4: Assessment of impacts 20
highest scoring options were option 5 and 6 (both with ‘moderate positive’). This means that in normal circumstances it would score 75, however this 75 was adjusted to 100 to reflect the fact that these were the highest scoring options. Options 4, 7 and 8 all scored ‘minor positive’ (or 60), which is 15 points different from ‘moderate positive’ (75), therefore these options were scored 85, and so on.
In addition, several strategic objectives and sub-objectives fell in to the policy integration impact category. In this case, each objective was considered as an impact sub-category with equal weight, which was scored. Once all the impact sub-categories had been scored, the scores were added up and adjusted so that the highest scoring option would score 100 and the others would score proportionally in relation to the best one.
The scoring classification given to the objective was assumed to be attributable to the sub-objectives.
Section 5: Conclusions 21
5. Conclusions
One of the main aims of applying the MCA-based approach to the Lower Don strategy study was to test the methodology on a riverine high-level project. The idea was to examine whether the impact types and categories that constitute the ASTs were as suitable for river projects as they are for coastal projects as well as whether the scoring approach was as practicable to apply.
Although it was not possible to continue with this case study, it is believed that it achieved its purpose.
It is obvious from the information presented above that the impact types and categories are suitable to river projects. The decision criteria used in the original appraisal for the Lower Don (the strategic objectives) were based on the same sources of information as the impact categories used in the MCA-based approach and therefore were very easy to include in the assessment summary tables. The case study also shows that, although river and coastal projects may have significantly different natures, they can both be assessed using the flood management and coastal defence ASTs. The differences between these two types of projects will be reflected by the impact categories that will be relevant for the assessment. For example, water quantity is an impact category that is not usually relevant for a coastal problem, however it is fundamental for a river project.
Although it was not possible to apply the MCA-based scoring system (ChaRT) to this case, a rough reasoning over the case study shows that if the information usually collected for this type of project were available it would enable the implementation of the ChaRT system.
Section 6: References22
6. References Atkins (2004): Lower Don strategy study - draft report, report produced for the Environment Agency North East Region, March 2004.
FCDPAG 2. Flood and Coastal Defence Appraisal Guidance – Strategic Planning and Appraisal, London HMSO

Joint Defra/EA Flood and Coastal Erosion Risk Management R&D Programme
Annex B.7:
Case study no.7:
Assessment of the Newbiggin-by-the-Sea coast protection strategy
R&D Project Record FD2013/PR2
Produced: November 2004

ii
Statement of use This report provides guidance on the use of MCA and ASTs to assist in the appraisal of flood and coastal erosion risk management projects, strategies and policies. It should be noted that it does not constitute official government policy or guidance, which is unlikely to be available until work to develop the methodology and identify appropriate sources of data has been undertaken through pilot studies.
This report may be downloaded from the Defra/EA R&D Programme website (http://www.defra.gov.uk/environ.fcd/research), use the search tool located on the project information and publications page. Copies are held by all EA Regional Information Centres, contact The Environment Agency’s National Customer Contact Centre by emailing [email protected] or by telephoning 08708506506.
Dissemination Status Internal: Released internally External: Released to public domain
Keywords: Multi criteria analysis, MCA, appraisal summary table, AST, decision rule
Research contractor contact details: Lead contractor: Risk & Policy Analysts Ltd (RPA), Farthing Green House, 1 Beccles Road, Loddon, Norfolk, NR14 6LT (Tel: 01508 528465; Fax: 01508 520758; www.rpaltd.co.uk). The project director was Meg Postle, the project manager for RPA was John Ash with research support from Susana Dias and other members of RPA staff.
The research team also included: Colin Green (Flood Hazard Research Centre, Middlesex University); Alan Pearman (University of Leeds); Ron Janssen (The Institute of Environmental Studies, Free University, Amsterdam), Terry Oakes and Hugh Payne (Independent Consultants)
Acknowledgements The assistance of those providing information for the case studies is gratefully acknowledged.
Defra project manager: Matt Crossman, Defra, 3D Ergon House, Horseferry Rd, London, SW1P 2AL. Email: [email protected]
Publishing organisation DefraFlood Management Division Ergon House Horseferry Road London SW1P 2AL Tel: 020 7238 3000 Fax: 020 7238 6187 www.defra.gov.uk/environ/fcd
â Crown copyright (Defra); 2005
Copyright in the typographical arrangement and design rests with the Crown. This publication (excluding the logo) may be reproduced free of charge in any format or medium provided that it is reproduced accurately and not used in a misleading context. The material must be acknowledged as Crown copyright with the title and source of the publication specified. The views expressed in this document are not necessarily those of Defra or the Environment Agency. Its officers, servants or agents accept no liability whatsoever for any loss or damage arising from the interpretation or use of the information, or reliance on views contained herein.
Published by the Department for Environment, Food and Rural Affairs. Printed in the UK, March 2005 on recycled material containing 80% post-consumer waste and 20% totally chlorine free virgin pulp.
PB No. 10734/PR2 ISBN 0-85521-146-6
Section 1: Introduction 1
1. Introduction This report presents the MCA-based project appraisal process for the Newbiggin-by-the-Sea Coast Protection Strategy. This strategy assessment was based on the original appraisal process carried out for Wansbeck District Council in December 2003, which short-listed a number of defence options for Newbiggin Bay.
The information reported here is based on the following documents:
• Newbiggin Bay Coast Defence Strategy: Project Appraisal Report (Atkins, 2003a); and
• Newbiggin Seaside Strategy Draft Final Report (Atkins, 2003b).
1.1 Summary of the project area
Newbiggin-by-the-Sea is situated on the Northumberland coastline within Wansbeck District Council’s (WDC) boundary. The village faces Newbiggin Bay, which is predominantly south-east facing and bounded by two rocky headlands, Church Point (north) and Spital Carrs (south). Main features at this frontage are a narrow sandy beach, the Southwest Promenade on the south side of the frontage and the Bridge Street sea wall. The entire bay is at risk from erosion, and part of the village is a flood risk zone.
Newbiggin lies within the Northumberland Shore SSSI, the Northumberland Coast Special Protection Area (SPA), and is recognised as a Ramsar site. Newbiggin is also part of the North Northumberland Heritage Coast designation.
There are two main environmental issues relating to the protection of Newbiggin bay:
• the effect of any proposed works on the intertidal bird feeding area in the north of the bay; and
• the covering of the geological SSSI in the south of the bay with sediment.
1.2 Existing defences
Historically Newbiggin beach was a recreational attraction due to the wide sandy beach. However, since the 1920s the beach has eroded, and this has necessitated sea walls to be constructed around the bay to provide protection from erosion and inundation. However, the beach has continued to erode and a significant quantity of beach material has been lost from the central areas of the bay. Monitoring has established an erosion rate of 0.2m/yr of the sand and clay levels in the centre of the bay.
Section 1: Introduction 2
The area surrounding Newbiggin has been extensively mined (both on land and offshore). This has been suggested as the cause of the subsidence in the area. Since the 1960s the bed of the bay has subsided 1-2m, leading to the redistribution of sediment throughout the bay (Atkins, 1996; 1998). Wave propagation into the bay has been altered by the subsidence, with an increase in wave height of approximately 10-15% in the last twenty years (UKCIP02). Waves approaching Newbiggin are typically from the North East, and extreme off-shore wave heights can exceed 8m. The impact of these waves maintains the erosive influence in the bay.
Newbiggin is currently protected by a variety of coastal defences. The northern part of the bay is protected by the Bridge Street stepped concrete sea wall, constructed in 1984. This provides protection against flooding and from erosive processes. The standard of protection offered is greater than 1 in 200 against overtopping. However, if there is a continued removal process of beach material, the base of the structure will be undermined. An estimate of the remaining life of the seawall has been given as 5 years (WDC).
The Southwest Promenade rock revetment was built in 1992; however, it is poor condition due to storm damage. Presently existing revetment stones can be displaced by storms with a 1 in 1 year return period. The standard of protection against complete collapse of the wall is in excess of 1 in 20 years.Nevertheless, continued erosion will reduce this standard to 1 in 10.
In terms of flooding, currently overtopping of the Southwest Promenade does not cause flooding. It is estimated that a 1 in 10 year storm will cause structural damage behind the revetment. However, if beach levels are allowed to continue to reduce, in five years this will decrease to a 1 in 1 year storm event.
1.3 The policy framework
The St. Abb’s Head to the River Tyne Shoreline Management Plan, is the policy document that covers this stretch of coastline. The preferred policy option identified in the SMP for the area is to hold the line.
Other policies with relevance for this case study include (Atkins, 2003b):
• on the planning policy context, the Regional Planning Guidance for the North East, the Northumberland Structure Plan and the Wansbeck Local Plan; and
• on the regeneration context, the Regional Economic Strategy, the Northumberland Strategic Partnership Strategy and Action Plan, the South East Northumberland and North Tyneside Regeneration Initiative, the Framework for Tourism Development and the Wansbeck District Council Tourism Strategy.
Section 1: Introduction 3
1.4 Stakeholders and interested parties
Consultation was undertaken by the consultants with statutory and non-statutory consultees throughout the project, with particular emphasis given to consultation with the general public and affected bay users. The consultation with stakeholders was carried out through meetings and letters with all interested parties. In addition, a public exhibition was also undertaken in October 2003.
According to the Draft PAR (Atkins, 2003), all of the concerns and comments were addressed in the Environmental Scoping Report.
Due to time restrictions, it was not possible for RPA to consult the consultation files for this particular case study.
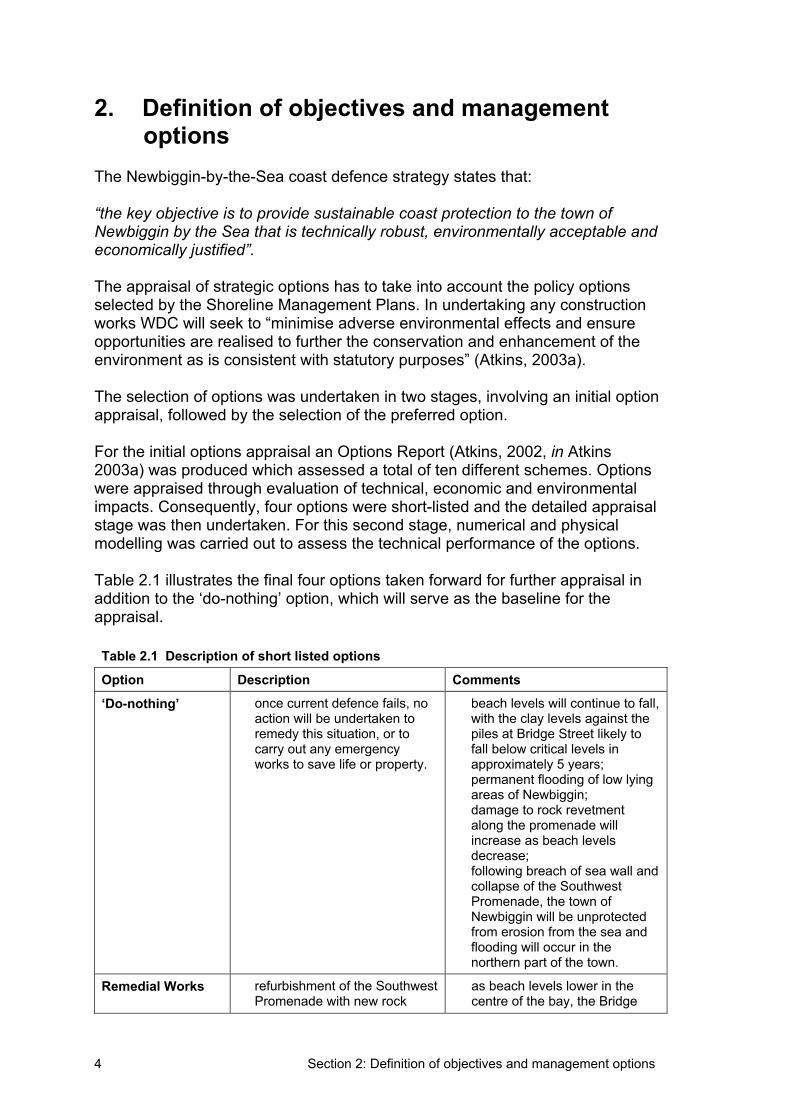
Section 2: Definition of objectives and management options 4
2. Definition of objectives and management options
The Newbiggin-by-the-Sea coast defence strategy states that:
“the key objective is to provide sustainable coast protection to the town of Newbiggin by the Sea that is technically robust, environmentally acceptable and economically justified”.
The appraisal of strategic options has to take into account the policy options selected by the Shoreline Management Plans. In undertaking any construction works WDC will seek to “minimise adverse environmental effects and ensure opportunities are realised to further the conservation and enhancement of the environment as is consistent with statutory purposes” (Atkins, 2003a).
The selection of options was undertaken in two stages, involving an initial option appraisal, followed by the selection of the preferred option.
For the initial options appraisal an Options Report (Atkins, 2002, in Atkins 2003a) was produced which assessed a total of ten different schemes. Options were appraised through evaluation of technical, economic and environmental impacts. Consequently, four options were short-listed and the detailed appraisal stage was then undertaken. For this second stage, numerical and physical modelling was carried out to assess the technical performance of the options.
Table 2.1 illustrates the final four options taken forward for further appraisal in addition to the ‘do-nothing’ option, which will serve as the baseline for the appraisal.
Table 2.1 Description of short listed options
Option Description Comments
‘Do-nothing’ • once current defence fails, no action will be undertaken to remedy this situation, or to carry out any emergency works to save life or property.
• beach levels will continue to fall, with the clay levels against the piles at Bridge Street likely to fall below critical levels in approximately 5 years;
• permanent flooding of low lying areas of Newbiggin;
• damage to rock revetment along the promenade will increase as beach levels decrease;
• following breach of sea wall and collapse of the Southwest Promenade, the town of Newbiggin will be unprotected from erosion from the sea and flooding will occur in the northern part of the town.
Remedial Works • refurbishment of the Southwest Promenade with new rock
• as beach levels lower in the centre of the bay, the Bridge
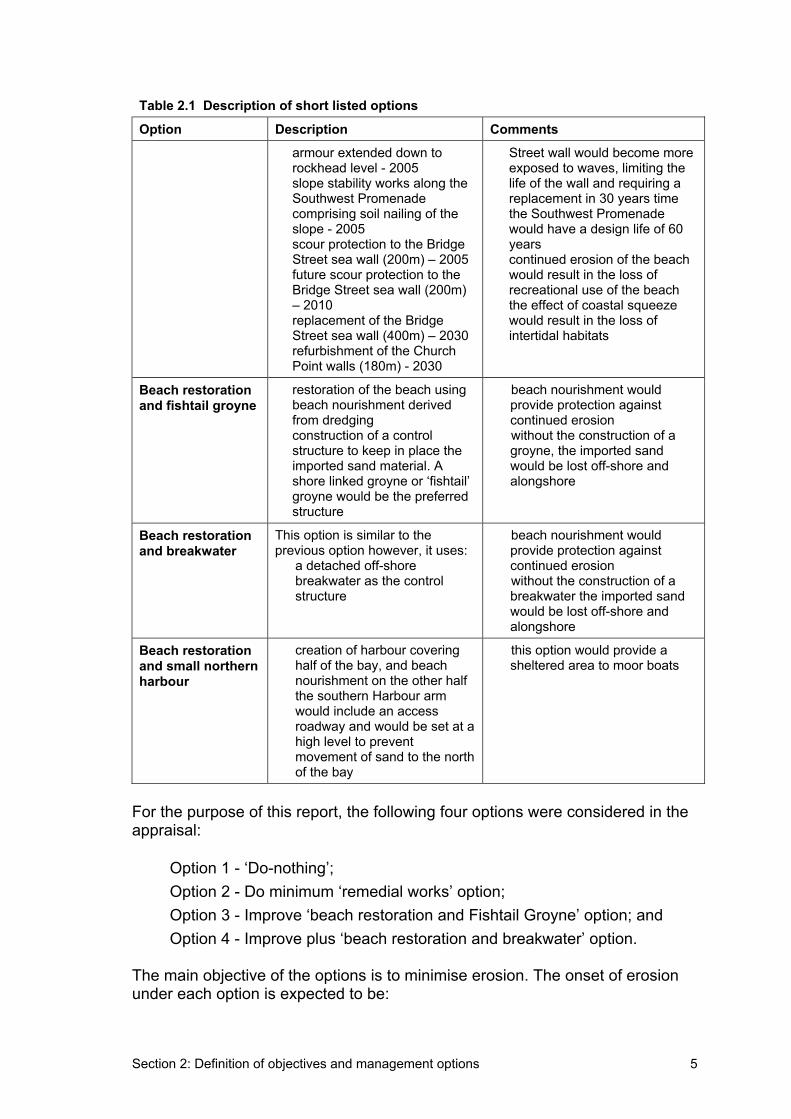
Section 2: Definition of objectives and management options 5
Table 2.1 Description of short listed options
Option Description Comments
armour extended down to rockhead level - 2005
• slope stability works along the Southwest Promenade comprising soil nailing of the slope - 2005
• scour protection to the Bridge Street sea wall (200m) – 2005
• future scour protection to the Bridge Street sea wall (200m) – 2010
• replacement of the Bridge Street sea wall (400m) – 2030
• refurbishment of the Church Point walls (180m) - 2030
Street wall would become more exposed to waves, limiting the life of the wall and requiring a replacement in 30 years time
• the Southwest Promenade would have a design life of 60 years
• continued erosion of the beach would result in the loss of recreational use of the beach
• the effect of coastal squeeze would result in the loss of intertidal habitats
Beach restoration and fishtail groyne
• restoration of the beach using beach nourishment derived from dredging
• construction of a control structure to keep in place the imported sand material. A shore linked groyne or ‘fishtail’ groyne would be the preferred structure
• beach nourishment would provide protection against continued erosion
• without the construction of a groyne, the imported sand would be lost off-shore and alongshore
Beach restoration and breakwater
This option is similar to the previous option however, it uses: • a detached off-shore
breakwater as the control structure
• beach nourishment would provide protection against continued erosion
• without the construction of a breakwater the imported sand would be lost off-shore and alongshore
Beach restoration and small northern harbour
• creation of harbour covering half of the bay, and beach nourishment on the other half
• the southern Harbour arm would include an access roadway and would be set at a high level to prevent movement of sand to the north of the bay
• this option would provide a sheltered area to moor boats
For the purpose of this report, the following four options were considered in the appraisal:
• Option 1 - ‘Do-nothing’; • Option 2 - Do minimum ‘remedial works’ option; • Option 3 - Improve ‘beach restoration and Fishtail Groyne’ option; and • Option 4 - Improve plus ‘beach restoration and breakwater’ option.
The main objective of the options is to minimise erosion. The onset of erosion under each option is expected to be:

Section 2: Definition of objectives and management options 6
• Option 1: erosion generally begins in year 1 (for some categories the onset of erosion is later than year 1, due to the location of particular characteristics as given in Table 5.1);
• Option 2: erosion is delayed until year 30, whereupon the option reverts to do-nothing;
• Option 3: erosion is delayed until year 100; and • Option 4: erosion is delayed until year 100.
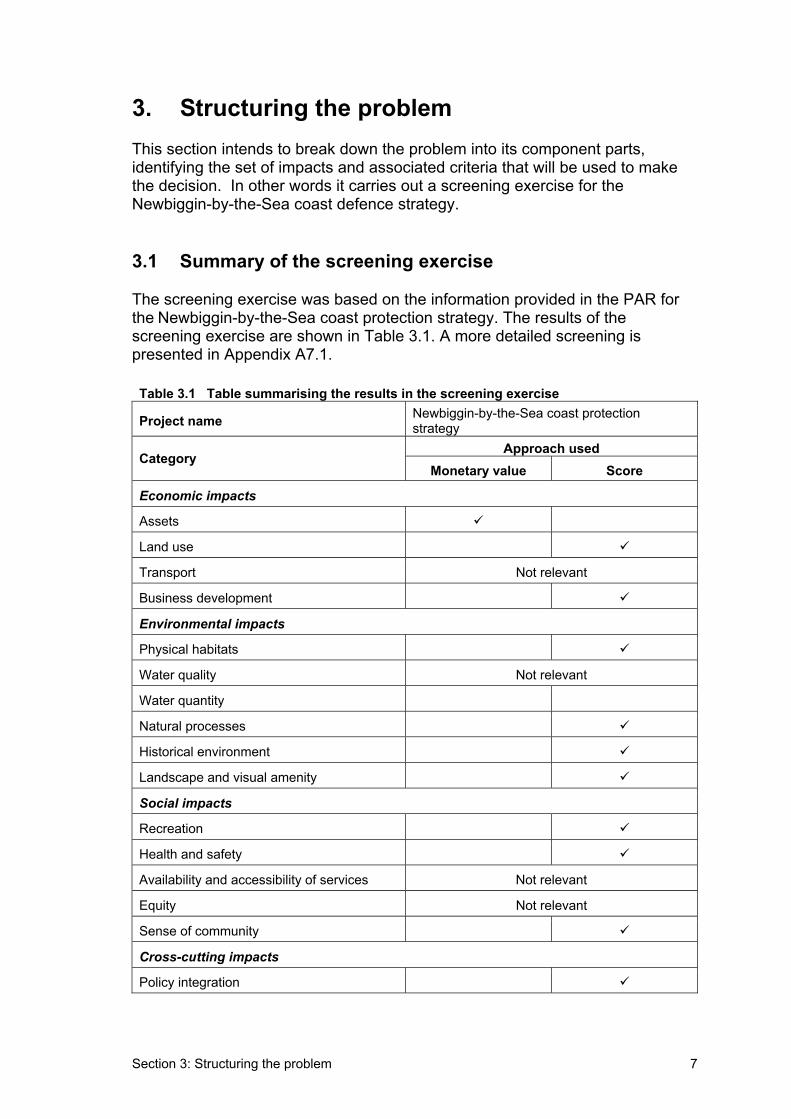
Section 3: Structuring the problem 7
3. Structuring the problem This section intends to break down the problem into its component parts, identifying the set of impacts and associated criteria that will be used to make the decision. In other words it carries out a screening exercise for the Newbiggin-by-the-Sea coast defence strategy.
3.1 Summary of the screening exercise
The screening exercise was based on the information provided in the PAR for the Newbiggin-by-the-Sea coast protection strategy. The results of the screening exercise are shown in Table 3.1. A more detailed screening is presented in Appendix A7.1.
Table 3.1 Table summarising the results in the screening exercise
Project name Newbiggin-by-the-Sea coast protection strategy
Approach used Category
Monetary value Score
Economic impacts
Assets
Land use
Transport Not relevant
Business development
Environmental impacts
Physical habitats
Water quality Not relevant
Water quantity
Natural processes
Historical environment
Landscape and visual amenity
Social impacts
Recreation
Health and safety
Availability and accessibility of services Not relevant
Equity Not relevant
Sense of community
Cross-cutting impacts
Policy integration

Section 3: Structuring the problem 8
As it can be seen from Table 3.1, the only impact category being valued in monetary terms is ‘Assets’. All other categories will be assessed using the ChaRT scoring system, devised for erosion (see Section 5).
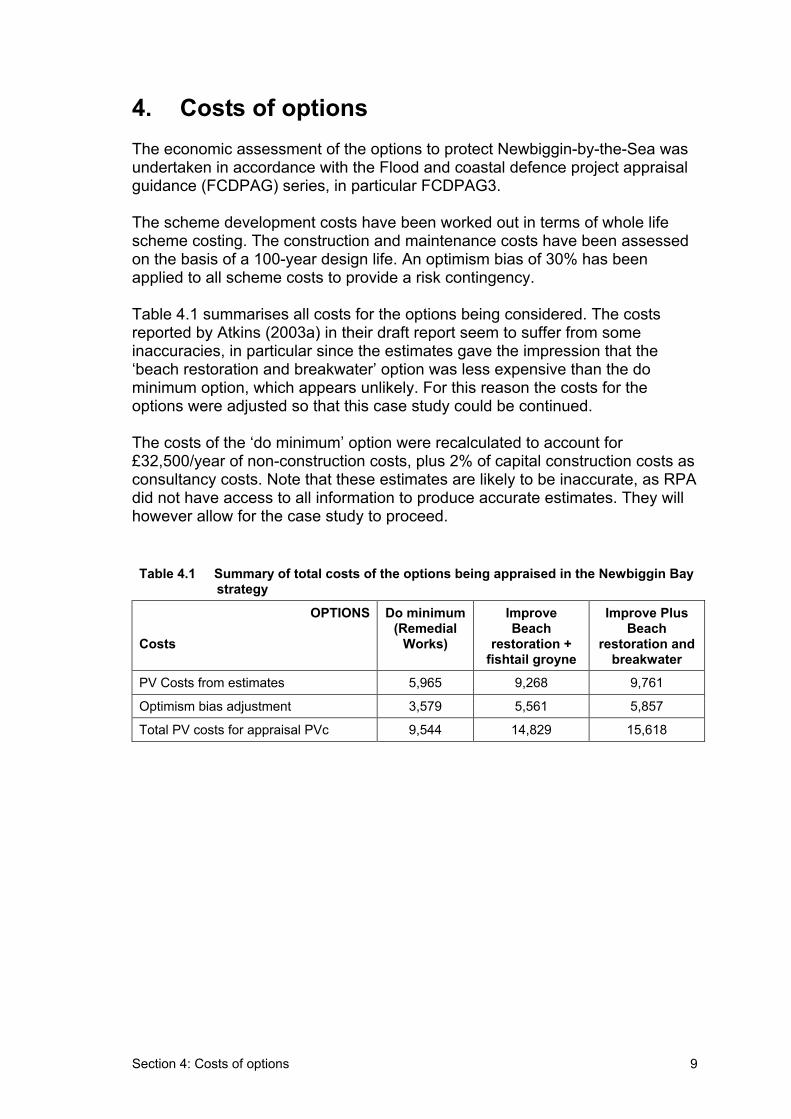
Section 4: Costs of options 9
4. Costs of options The economic assessment of the options to protect Newbiggin-by-the-Sea was undertaken in accordance with the Flood and coastal defence project appraisal guidance (FCDPAG) series, in particular FCDPAG3.
The scheme development costs have been worked out in terms of whole life scheme costing. The construction and maintenance costs have been assessed on the basis of a 100-year design life. An optimism bias of 30% has been applied to all scheme costs to provide a risk contingency.
Table 4.1 summarises all costs for the options being considered. The costs reported by Atkins (2003a) in their draft report seem to suffer from some inaccuracies, in particular since the estimates gave the impression that the ‘beach restoration and breakwater’ option was less expensive than the do minimum option, which appears unlikely. For this reason the costs for the options were adjusted so that this case study could be continued.
The costs of the ‘do minimum’ option were recalculated to account for £32,500/year of non-construction costs, plus 2% of capital construction costs as consultancy costs. Note that these estimates are likely to be inaccurate, as RPA did not have access to all information to produce accurate estimates. They will however allow for the case study to proceed.
Table 4.1 Summary of total costs of the options being appraised in the Newbiggin Bay strategy
OPTIONS
Costs
Do minimum (Remedial
Works)
Improve Beach
restoration + fishtail groyne
Improve Plus Beach
restoration and breakwater
PV Costs from estimates 5,965 9,268 9,761
Optimism bias adjustment 3,579 5,561 5,857
Total PV costs for appraisal PVc 9,544 14,829 15,618
Section 5: Assessment of impacts 10
5. Assessment of impacts 5.1 Qualitative and quantitative assessment
The qualitative and quantitative assessment of the different options for each of the management units was carried out using the appraisal summary table for the main assessment (MA-AST) and it is presented in Appendix B7.2 to this Annex.
The assessment followed a stepped approach, starting with the qualitative assessment of all impact categories and moving to the quantitative assessment whenever information was available.
5.2 Monetary valuation of impacts
As it has been said before, the majority of impacts are due to erosion. For simplification in this case study, it is assumed properties that may be affected by flooding will first be eroded, hence, no flooding damages are calculated. Erosion along the frontage will result in:
• loss of promenade and adjacent residential and commercial properties; • loss of 529 residential properties from erosion over next 20 years; and • loss of 56 commercial properties from erosion next 20 years.
The average property value in Newbiggin area is £69,692 (Land Registry Site Jan-March 2004) such that the total loss of residential and commercial properties is estimated at £40.8 million over the next 20 years (PV).
5.3 Scoring of impacts
Impacts of the options have been scored using a ChaRT-type approach, where the scores are based on the numbers of a defined characteristic and the recovery time following flooding. As this case study relates to erosion, the approach has been refined so that the damages are based on the time when the characteristics would be lost as a result of erosion. The scores are calculated using the ‘Erosion’ worksheet of the FCDPAG3 spreadsheet allowing the delay provided by each option to be taken into consideration.
The characteristics used are summarised in Table 5.1. Recovery times are not relevant where erosion is the problem rather the delay provided by the options that determines differences between them in terms of damages. Where this delay is greater than the onset of erosion for the option (e.g. due to the particular characteristics being set back from the coastline immediately at threat), the time that erosion is expected to affect the characteristic in question is given in Table 5.1. It is also important to know if the impacts are one-offs (e.g. erosion of a property) or recur annually (e.g. loss of access to for recreation). This is also reported in Table 5.1
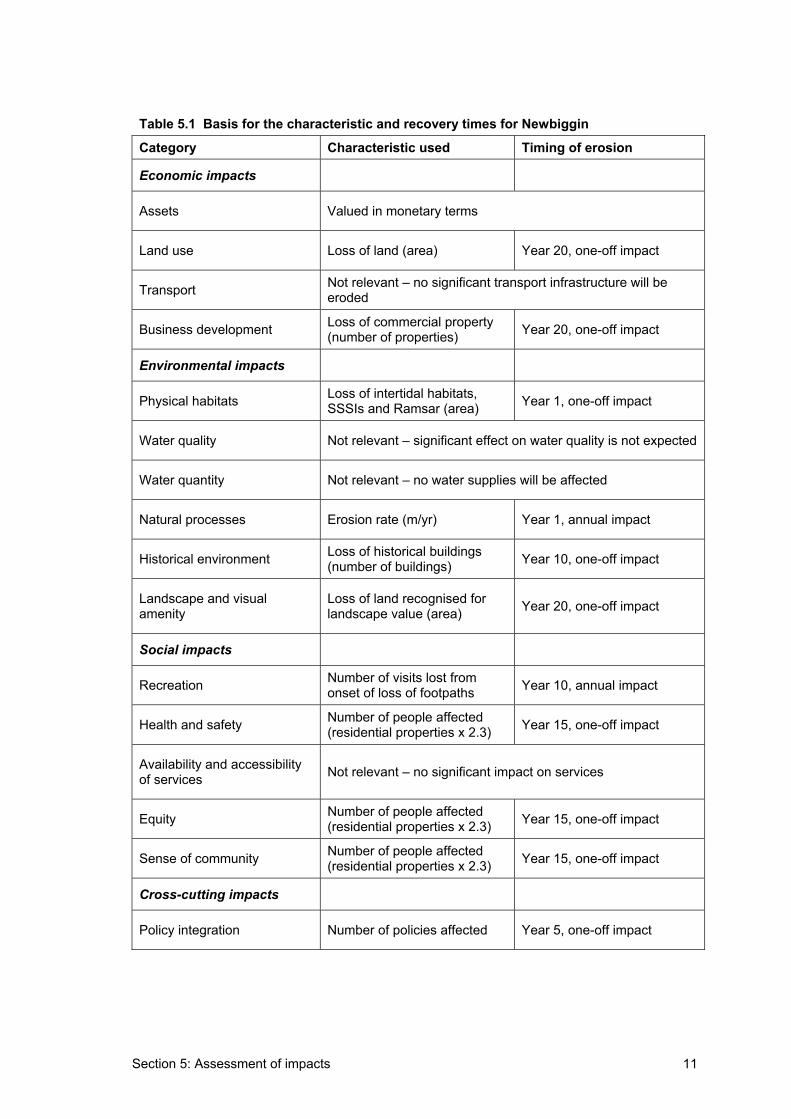
Section 5: Assessment of impacts 11
Table 5.1 Basis for the characteristic and recovery times for Newbiggin
Category Characteristic used Timing of erosion
Economic impacts
Assets Valued in monetary terms
Land use Loss of land (area) Year 20, one-off impact
Transport Not relevant – no significant transport infrastructure will be eroded
Business development Loss of commercial property (number of properties) Year 20, one-off impact
Environmental impacts
Physical habitats Loss of intertidal habitats, SSSIs and Ramsar (area) Year 1, one-off impact
Water quality Not relevant – significant effect on water quality is not expected
Water quantity Not relevant – no water supplies will be affected
Natural processes Erosion rate (m/yr) Year 1, annual impact
Historical environment Loss of historical buildings (number of buildings) Year 10, one-off impact
Landscape and visual amenity
Loss of land recognised for landscape value (area) Year 20, one-off impact
Social impacts
Recreation Number of visits lost from onset of loss of footpaths Year 10, annual impact
Health and safety Number of people affected (residential properties x 2.3) Year 15, one-off impact
Availability and accessibility of services Not relevant – no significant impact on services
Equity Number of people affected (residential properties x 2.3) Year 15, one-off impact
Sense of community Number of people affected (residential properties x 2.3) Year 15, one-off impact
Cross-cutting impacts
Policy integration Number of policies affected Year 5, one-off impact
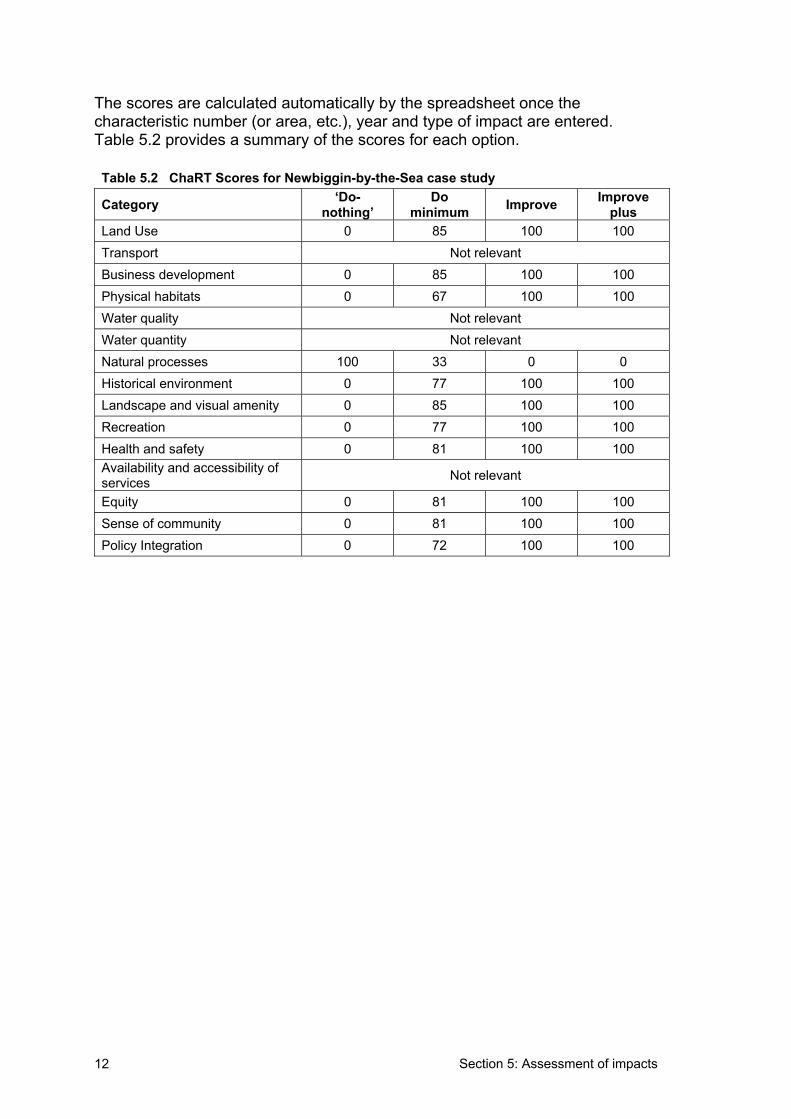
Section 5: Assessment of impacts 12
The scores are calculated automatically by the spreadsheet once the characteristic number (or area, etc.), year and type of impact are entered.Table 5.2 provides a summary of the scores for each option.
Table 5.2 ChaRT Scores for Newbiggin-by-the-Sea case study
Category ‘Do-nothing’
Dominimum Improve Improve
plusLand Use 0 85 100 100 Transport Not relevant Business development 0 85 100 100 Physical habitats 0 67 100 100 Water quality Not relevant Water quantity Not relevant Natural processes 100 33 0 0 Historical environment 0 77 100 100 Landscape and visual amenity 0 85 100 100 Recreation 0 77 100 100 Health and safety 0 81 100 100 Availability and accessibility of services Not relevant
Equity 0 81 100 100 Sense of community 0 81 100 100 Policy Integration 0 72 100 100
Section 6: Weighting and comparison of options 13
6. Weighting and comparison of options 6.1 Source of weights
In all cases, the Constrained Random Weight Generator (CRWG) was used to calculate minimum, maximum and average total weighted scores and total weighted incremental scores for the options under consideration. These, along with interpretation, are provided in the summary tables for each management unit.
6.2 Comparison of options
Table 6.1 provides a summary table of monetary costs and benefits and scores for Newbiggin.
From the Table, Option 2: Do minimum is the option with the highest benefit-cost ratio and, hence, is the starting option for the appraisal. The next highest options are Options 3 and 4 (improve and Improve+ Sub-options), which represent sub-options. To be justified over Option 2: Do minimum, both of these options must achieve an incremental benefit-cost ratio of 1.5. Neither of the Improve sub-options, achieve this and require additional intangible benefits to achieve the criterion, with Option 3 requiring an additional £5,804,500 and Option 4 an additional £6,988,000 of intangible benefit.
In considering the options, the first observation that should be made is that both of the Improve options score exactly the same on the intangible scoring index. As such, Option 4 can never have a higher intangible benefit than Option 3. This combined with the fact that Option 4 requires a higher level of additional benefit than Option 3 to reach the criterion, means that Option 4 can never be preferred over Option 3. The remainder of the appraisal is thus focussed on whether Option 3 is likely to be preferred over Option 2.
Analysis with the CRWG provides the lower, middle and upper bound estimates of the intangible incremental benefit of Option 3 relative to Option 2 expressed in units on the scoring index. These are 10.7, 18.1 and 23.6 respectively.
Combining these with the magnitude of the additional benefits required to reach the 1.5 criterion suggests that the value of a point on the index (k in pounds) would have to be, at very least, greater than £246,261 (where this reflects the maximum incremental benefit score achievable with the most favourable weight combination - however realistic/unrealistic this is). If the value of a single point (k) were taken as being £246,261, this implies that the total value of the intangible assets being considered in the 100 point scoring appraisal would have to be greater than 100 x £246,261. In other words, if Option 3: Improve were to be the preferred option, this would imply that the total value of intangible assets considered in the AST and scoring matrix would have to be greater than £24,626,100 at the very least. This is a value in excess of the total PV damage costs of the ‘do-nothing’ option of £20,505,000, which represent maximum

Section 6: Weighting and comparison of options 14
possible benefits of protection at Newbiggin valued under the traditional monetary approach to economic value. In other words, for Option 3: Improve to be preferred, the intangible assets at Newbiggin would have to have a value of at least 1.25 times those of the assets valued under the traditional monetary approach to economic value. As this is very unlikely to be the case, it is concluded that Option 3: Improve is not justified.
Option 2: Do minimum is the preferred Option.
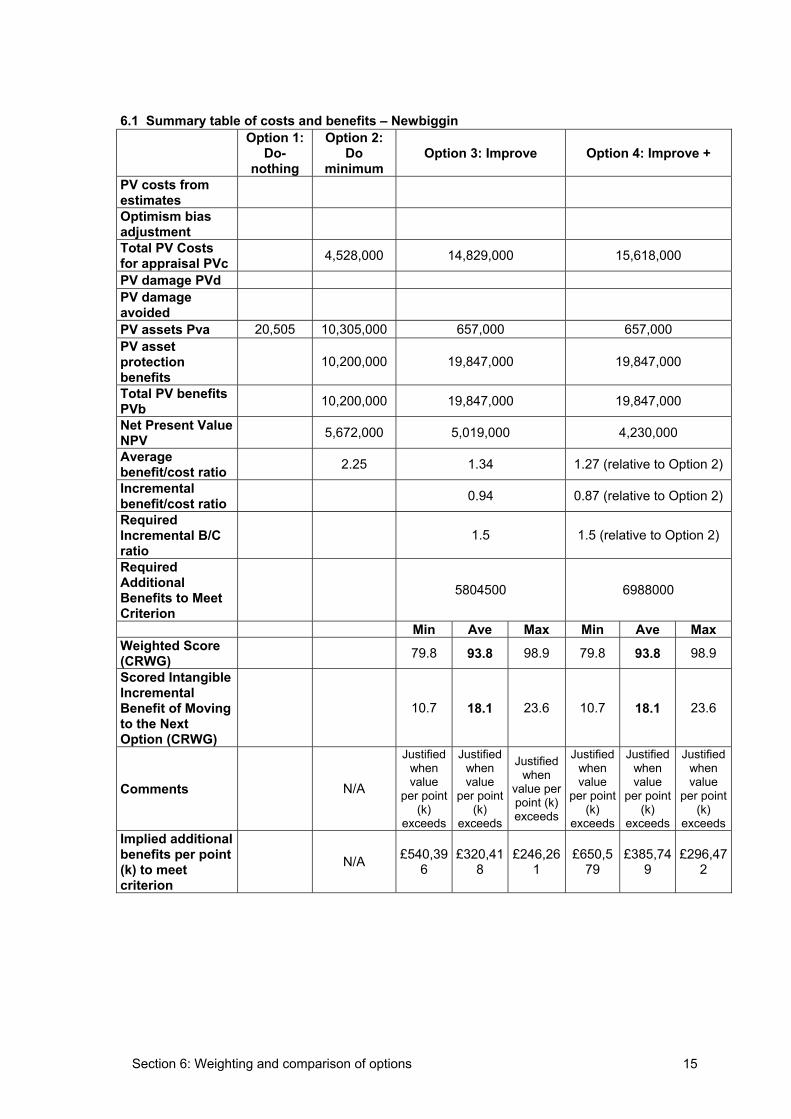
Section 6: Weighting and comparison of options 15
6.1 Summary table of costs and benefits – Newbiggin Option 1:
Do-nothing
Option 2: Do
minimumOption 3: Improve Option 4: Improve +
PV costs from estimates
Optimism bias adjustment
Total PV Costs for appraisal PVc 4,528,000 14,829,000 15,618,000
PV damage PVd PV damage avoided
PV assets Pva 20,505 10,305,000 657,000 657,000 PV asset protectionbenefits
10,200,000 19,847,000 19,847,000
Total PV benefits PVb 10,200,000 19,847,000 19,847,000
Net Present Value NPV 5,672,000 5,019,000 4,230,000
Average benefit/cost ratio 2.25 1.34 1.27 (relative to Option 2)
Incrementalbenefit/cost ratio 0.94 0.87 (relative to Option 2)
RequiredIncremental B/C ratio
1.5 1.5 (relative to Option 2)
RequiredAdditionalBenefits to Meet Criterion
5804500 6988000
Min Ave Max Min Ave Max Weighted Score (CRWG) 79.8 93.8 98.9 79.8 93.8 98.9
Scored Intangible IncrementalBenefit of Moving to the Next Option (CRWG)
10.7 18.1 23.6 10.7 18.1 23.6
Comments N/A
Justifiedwhen value
per point (k)
exceeds
Justifiedwhen value
per point (k)
exceeds
Justifiedwhen
value per point (k) exceeds
Justifiedwhen value
per point (k)
exceeds
Justifiedwhen value
per point (k)
exceeds
Justifiedwhen value
per point (k)
exceedsImplied additional benefits per point (k) to meet criterion
N/A £540,396
£320,418
£246,261
£650,579
£385,749
£296,472
Section 7: References 16
7. References Atkins 2003a. Newbiggin Bay Coast Defence Strategy Project Appraisal Report – Consultation Draft, Report produced for Wansbeck District Council, December 2003.
Atkins 2003. Newbiggin Seaside Strategy – Draft Final Report, report produced for Wansbeck District Council, December 2003.
Atkins 1998. Newbiggin Bay Coastal Feasibilty Study, Final report, 1998. prepared for Wansbeck District Council
Atkins 1996. Newbiggin Bay Coastal Processes Study, Final report, February 1996. prepared for Wansbeck District Council
UKCIP02 Climate Change Scenarios for the United Kingdom: The UKCIP02 Scientific Report, April 2002
Appendix 7.1 17
Appendix A7.1:
Appraisal summary table for high-level Screening – S-AST for the Newbiggin-by-the-Sea coast protection strategy
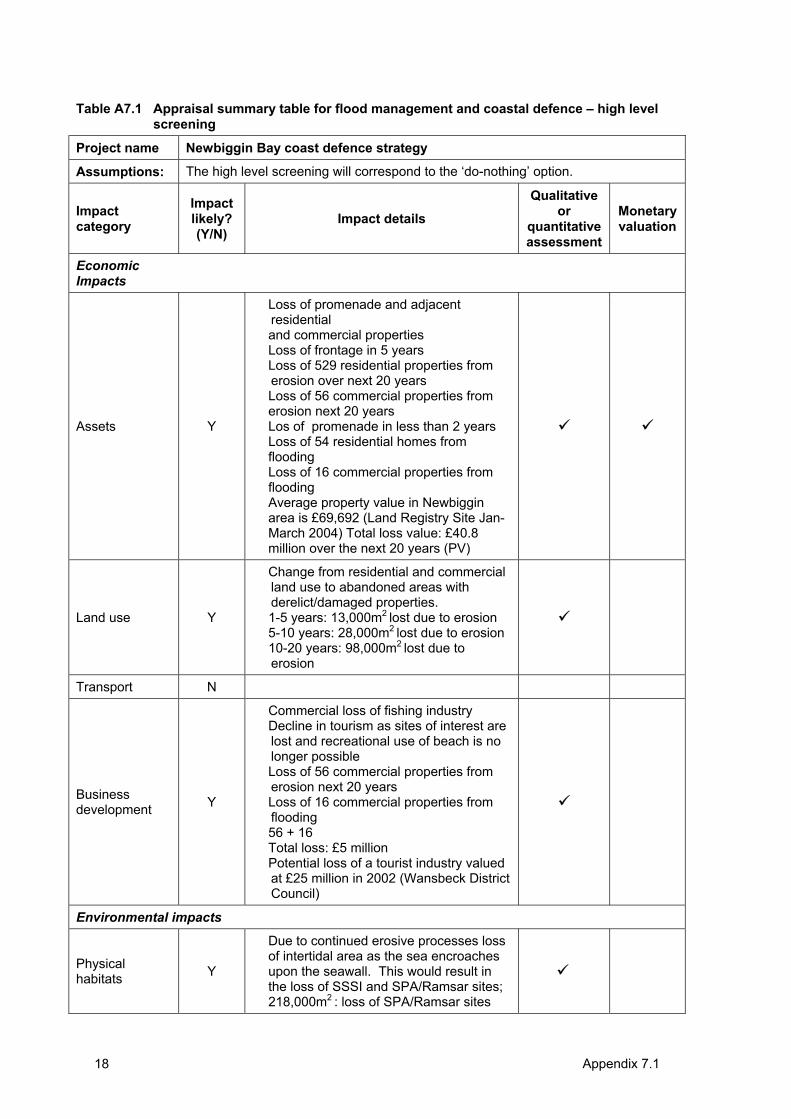
Appendix 7.118
Table A7.1 Appraisal summary table for flood management and coastal defence – high level screening
Project name Newbiggin Bay coast defence strategy
Assumptions: The high level screening will correspond to the ‘do-nothing’ option.
Impactcategory
Impactlikely? (Y/N)
Impact details
Qualitative or
quantitative assessment
Monetary valuation
EconomicImpacts
Assets Y
• Loss of promenade and adjacent residentialand commercial properties
• Loss of frontage in 5 years • Loss of 529 residential properties from
erosion over next 20 years • Loss of 56 commercial properties from
erosion next 20 years • Los of promenade in less than 2 years • Loss of 54 residential homes from
flooding• Loss of 16 commercial properties from
flooding• Average property value in Newbiggin
area is £69,692 (Land Registry Site Jan-March 2004) Total loss value: £40.8 million over the next 20 years (PV)
Land use Y
• Change from residential and commercial land use to abandoned areas with derelict/damaged properties.
• 1-5 years: 13,000m2 lost due to erosion • 5-10 years: 28,000m2 lost due to erosion • 10-20 years: 98,000m2 lost due to
erosion
Transport N
Businessdevelopment Y
• Commercial loss of fishing industry • Decline in tourism as sites of interest are
lost and recreational use of beach is no longer possible
• Loss of 56 commercial properties from erosion next 20 years
• Loss of 16 commercial properties from flooding
• 56 + 16 • Total loss: £5 million • Potential loss of a tourist industry valued
at £25 million in 2002 (Wansbeck District Council)
Environmental impacts
Physical habitats Y
• Due to continued erosive processes loss of intertidal area as the sea encroaches upon the seawall. This would result in the loss of SSSI and SPA/Ramsar sites;
• 218,000m2 : loss of SPA/Ramsar sites
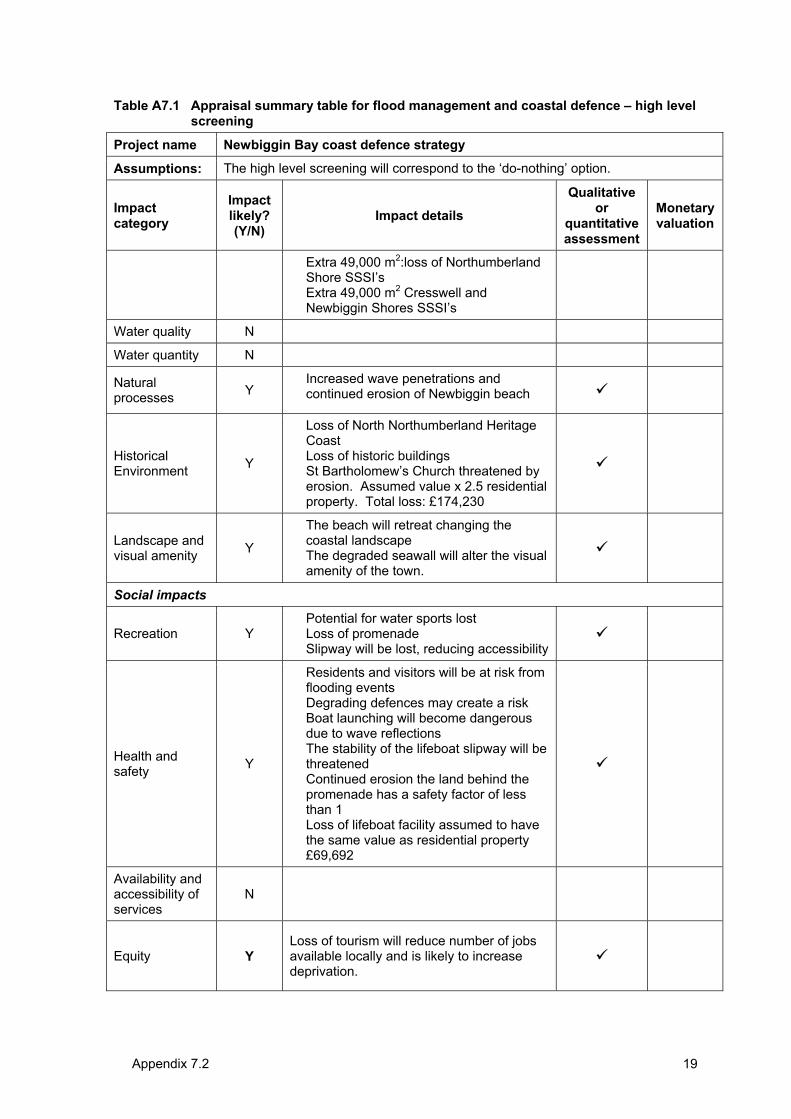
Appendix 7.2 19
Table A7.1 Appraisal summary table for flood management and coastal defence – high level screening
Project name Newbiggin Bay coast defence strategy
Assumptions: The high level screening will correspond to the ‘do-nothing’ option.
Impactcategory
Impactlikely? (Y/N)
Impact details
Qualitative or
quantitative assessment
Monetary valuation
• Extra 49,000 m2:loss of Northumberland Shore SSSI’s
• Extra 49,000 m2 Cresswell and Newbiggin Shores SSSI’s
Water quality N
Water quantity N
Naturalprocesses Y
• Increased wave penetrations and continued erosion of Newbiggin beach
HistoricalEnvironment Y
• Loss of North Northumberland Heritage Coast
• Loss of historic buildings • St Bartholomew’s Church threatened by
erosion. Assumed value x 2.5 residential property. Total loss: £174,230
Landscape and visual amenity Y
• The beach will retreat changing the coastal landscape
• The degraded seawall will alter the visual amenity of the town.
Social impacts
Recreation Y • Potential for water sports lost • Loss of promenade • Slipway will be lost, reducing accessibility
Health and safety Y
• Residents and visitors will be at risk from flooding events
• Degrading defences may create a risk • Boat launching will become dangerous
due to wave reflections • The stability of the lifeboat slipway will be
threatened• Continued erosion the land behind the
promenade has a safety factor of less than 1
• Loss of lifeboat facility assumed to have the same value as residential property £69,692
Availability and accessibility of services
N
Equity YLoss of tourism will reduce number of jobs available locally and is likely to increase deprivation.
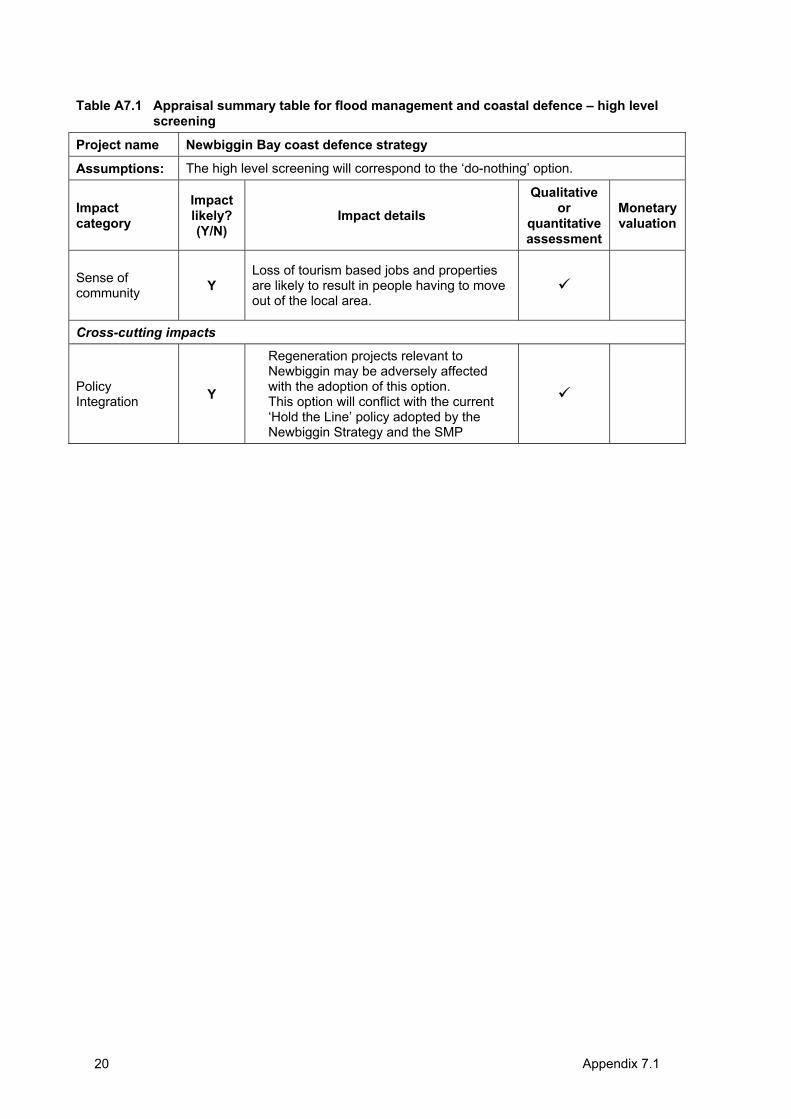
Appendix 7.120
Table A7.1 Appraisal summary table for flood management and coastal defence – high level screening
Project name Newbiggin Bay coast defence strategy
Assumptions: The high level screening will correspond to the ‘do-nothing’ option.
Impactcategory
Impactlikely? (Y/N)
Impact details
Qualitative or
quantitative assessment
Monetary valuation
Sense of community Y
Loss of tourism based jobs and properties are likely to result in people having to move out of the local area.
Cross-cutting impacts
Policy Integration Y
• Regeneration projects relevant to Newbiggin may be adversely affected with the adoption of this option.
• This option will conflict with the current ‘Hold the Line’ policy adopted by the Newbiggin Strategy and the SMP
Appendix 7.2 21
Appendix A7.2:
Appraisal summary table for main assessment – MA-AST for the Newbiggin-by-the-Sea coast protection strategy
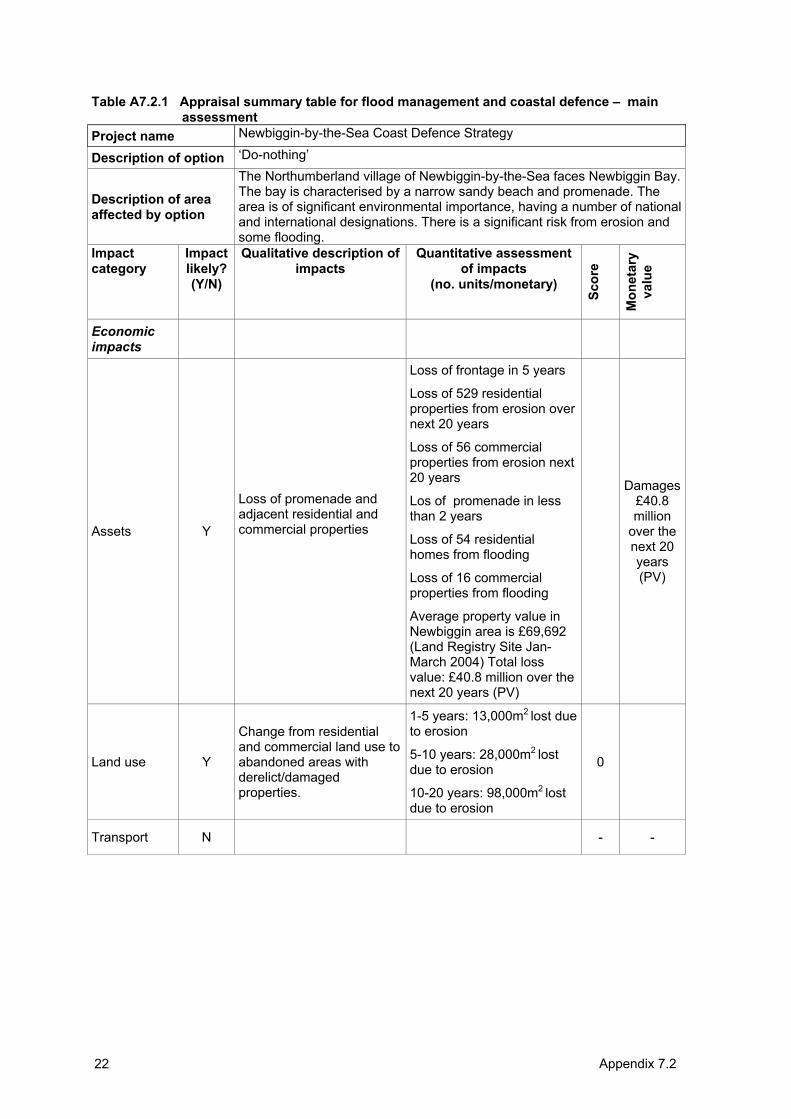
Appendix 7.2 22
Table A7.2.1 Appraisal summary table for flood management and coastal defence – main assessment
Project name Newbiggin-by-the-Sea Coast Defence Strategy
Description of option ‘Do-nothing’
Description of area affected by option
The Northumberland village of Newbiggin-by-the-Sea faces Newbiggin Bay. The bay is characterised by a narrow sandy beach and promenade. The area is of significant environmental importance, having a number of national and international designations. There is a significant risk from erosion and some flooding.
Impactcategory
Impactlikely? (Y/N)
Qualitative description of impacts
Quantitative assessment of impacts
(no. units/monetary)
Scor
e
Mon
etar
yva
lue
Economicimpacts
Assets Y
Loss of promenade and adjacent residential and commercial properties
Loss of frontage in 5 years
Loss of 529 residential properties from erosion over next 20 years
Loss of 56 commercial properties from erosion next 20 years
Los of promenade in less than 2 years
Loss of 54 residential homes from flooding
Loss of 16 commercial properties from flooding
Average property value in Newbiggin area is £69,692 (Land Registry Site Jan-March 2004) Total loss value: £40.8 million over the next 20 years (PV)
Damages£40.8million
over the next 20 years(PV)
Land use Y
Change from residential and commercial land use to abandoned areas with derelict/damagedproperties.
1-5 years: 13,000m2 lost due to erosion
5-10 years: 28,000m2 lostdue to erosion
10-20 years: 98,000m2 lostdue to erosion
0
Transport N - -
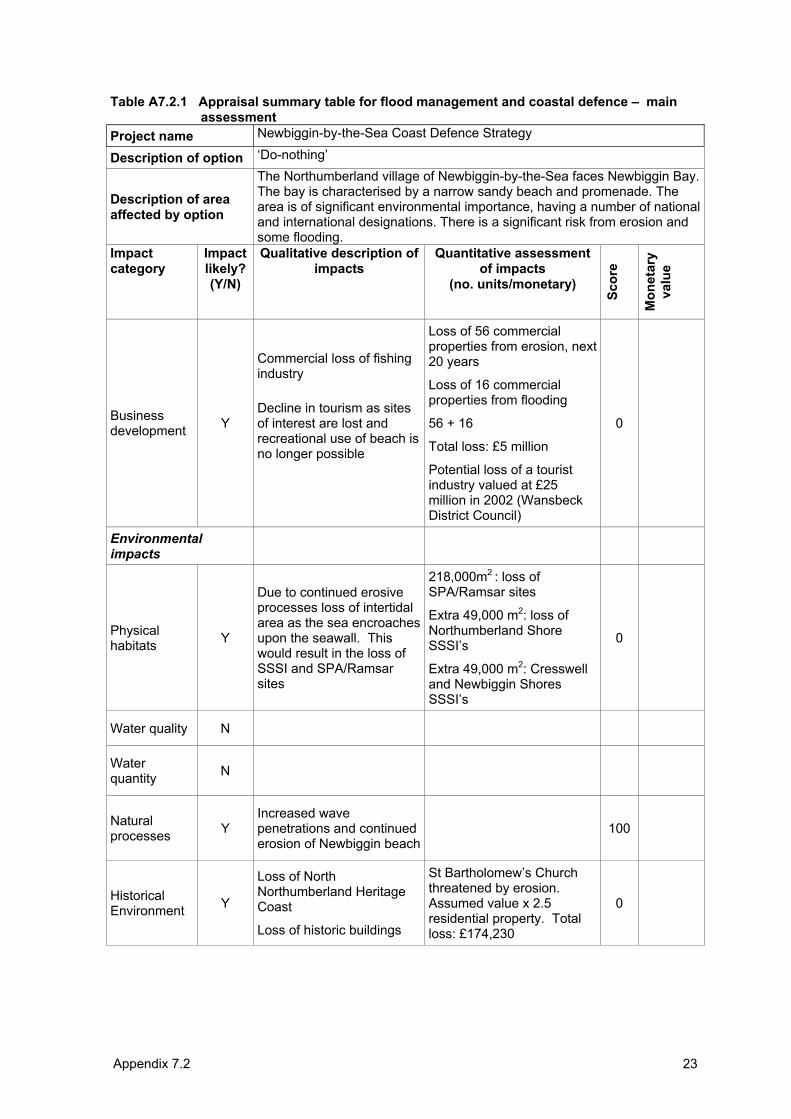
Appendix 7.2 23
Table A7.2.1 Appraisal summary table for flood management and coastal defence – main assessment
Project name Newbiggin-by-the-Sea Coast Defence Strategy
Description of option ‘Do-nothing’
Description of area affected by option
The Northumberland village of Newbiggin-by-the-Sea faces Newbiggin Bay. The bay is characterised by a narrow sandy beach and promenade. The area is of significant environmental importance, having a number of national and international designations. There is a significant risk from erosion and some flooding.
Impactcategory
Impactlikely? (Y/N)
Qualitative description of impacts
Quantitative assessment of impacts
(no. units/monetary)
Scor
e
Mon
etar
yva
lue
Businessdevelopment Y
Commercial loss of fishing industry
Decline in tourism as sites of interest are lost and recreational use of beach is no longer possible
Loss of 56 commercial properties from erosion, next 20 years
Loss of 16 commercial properties from flooding
56 + 16
Total loss: £5 million
Potential loss of a tourist industry valued at £25 million in 2002 (Wansbeck District Council)
0
Environmentalimpacts
Physical habitats Y
Due to continued erosive processes loss of intertidal area as the sea encroaches upon the seawall. This would result in the loss of SSSI and SPA/Ramsar sites
218,000m2 : loss of SPA/Ramsar sites
Extra 49,000 m2: loss of Northumberland Shore SSSI’s
Extra 49,000 m2: Cresswell and Newbiggin Shores SSSI’s
0
Water quality N
Waterquantity N
Naturalprocesses Y
Increased wave penetrations and continued erosion of Newbiggin beach
100
HistoricalEnvironment Y
Loss of North Northumberland Heritage Coast
Loss of historic buildings
St Bartholomew’s Church threatened by erosion.Assumed value x 2.5 residential property. Total loss: £174,230
0
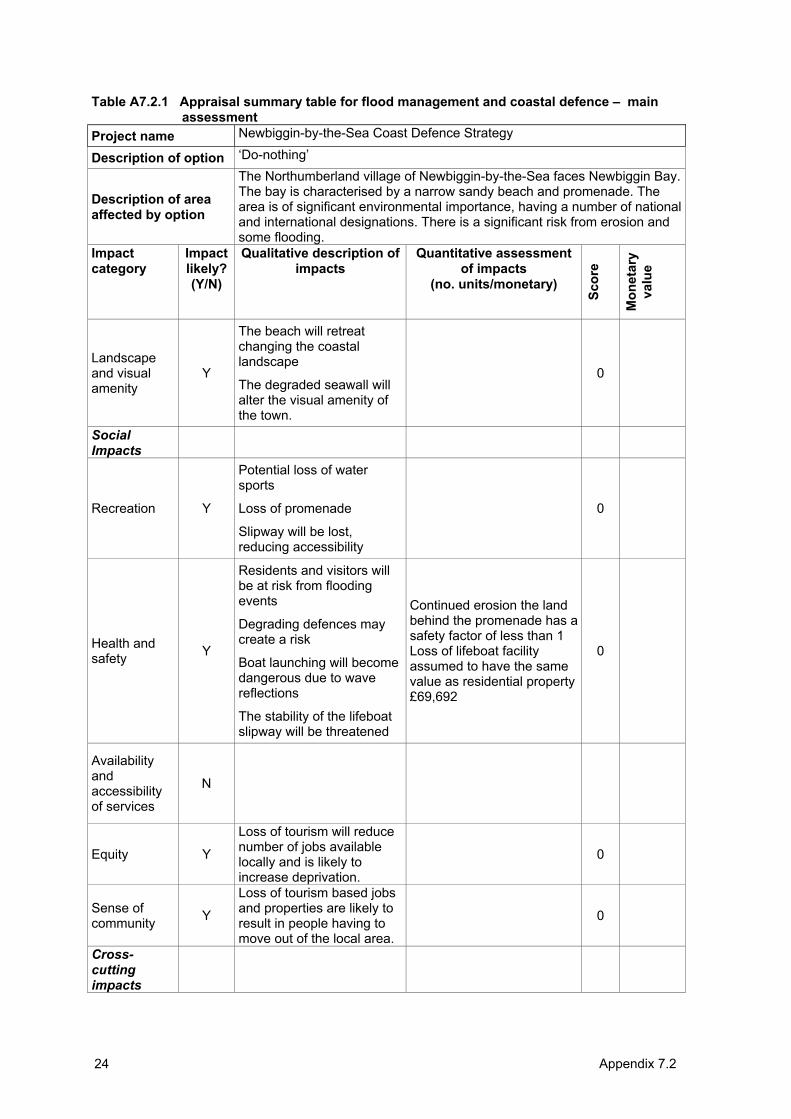
Appendix 7.2 24
Table A7.2.1 Appraisal summary table for flood management and coastal defence – main assessment
Project name Newbiggin-by-the-Sea Coast Defence Strategy
Description of option ‘Do-nothing’
Description of area affected by option
The Northumberland village of Newbiggin-by-the-Sea faces Newbiggin Bay. The bay is characterised by a narrow sandy beach and promenade. The area is of significant environmental importance, having a number of national and international designations. There is a significant risk from erosion and some flooding.
Impactcategory
Impactlikely? (Y/N)
Qualitative description of impacts
Quantitative assessment of impacts
(no. units/monetary)
Scor
e
Mon
etar
yva
lue
Landscapeand visual amenity
Y
The beach will retreat changing the coastal landscape
The degraded seawall will alter the visual amenity of the town.
0
SocialImpacts
Recreation Y
Potential loss of water sports
Loss of promenade
Slipway will be lost, reducing accessibility
0
Health and safety Y
Residents and visitors will be at risk from flooding events
Degrading defences may create a risk
Boat launching will become dangerous due to wave reflections
The stability of the lifeboat slipway will be threatened
Continued erosion the land behind the promenade has a safety factor of less than 1 Loss of lifeboat facility assumed to have the same value as residential property £69,692
0
Availability andaccessibility of services
N
Equity Y
Loss of tourism will reduce number of jobs available locally and is likely to increase deprivation.
0
Sense of community Y
Loss of tourism based jobs and properties are likely to result in people having to move out of the local area.
0
Cross-cuttingimpacts
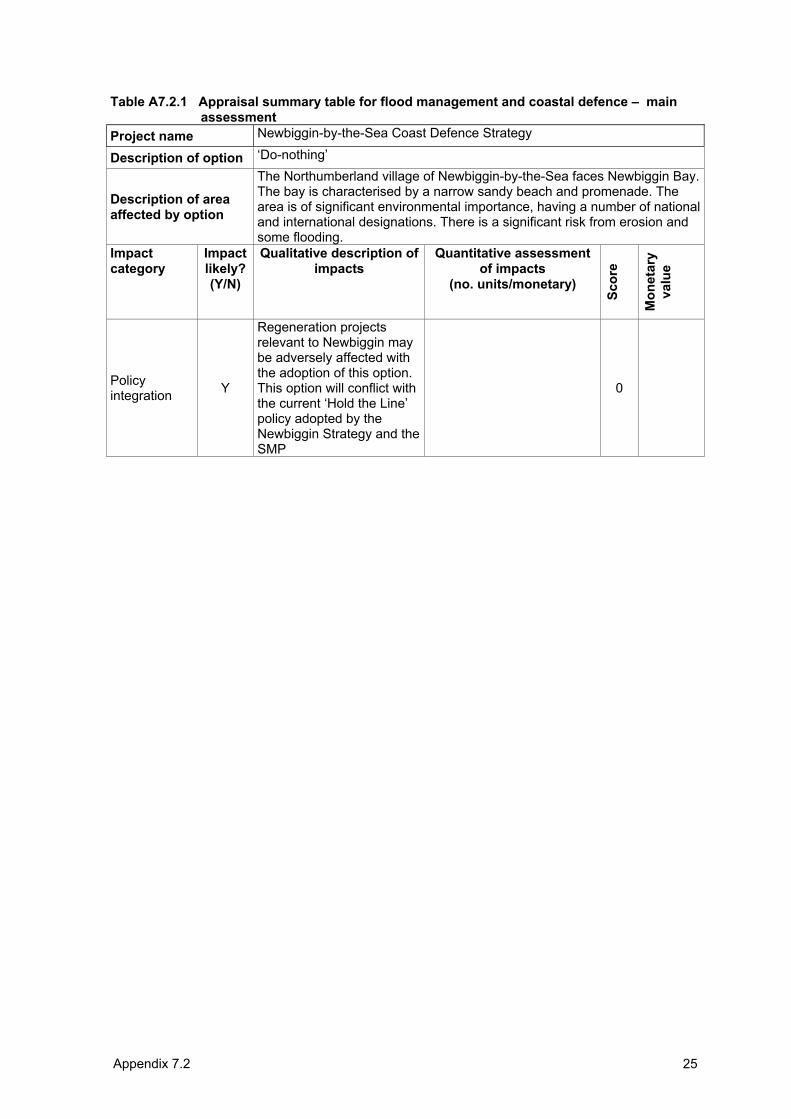
Appendix 7.2 25
Table A7.2.1 Appraisal summary table for flood management and coastal defence – main assessment
Project name Newbiggin-by-the-Sea Coast Defence Strategy
Description of option ‘Do-nothing’
Description of area affected by option
The Northumberland village of Newbiggin-by-the-Sea faces Newbiggin Bay. The bay is characterised by a narrow sandy beach and promenade. The area is of significant environmental importance, having a number of national and international designations. There is a significant risk from erosion and some flooding.
Impactcategory
Impactlikely? (Y/N)
Qualitative description of impacts
Quantitative assessment of impacts
(no. units/monetary)
Scor
e
Mon
etar
yva
lue
Policy integration Y
Regeneration projects relevant to Newbiggin may be adversely affected with the adoption of this option.This option will conflict with the current ‘Hold the Line’ policy adopted by the Newbiggin Strategy and the SMP
0
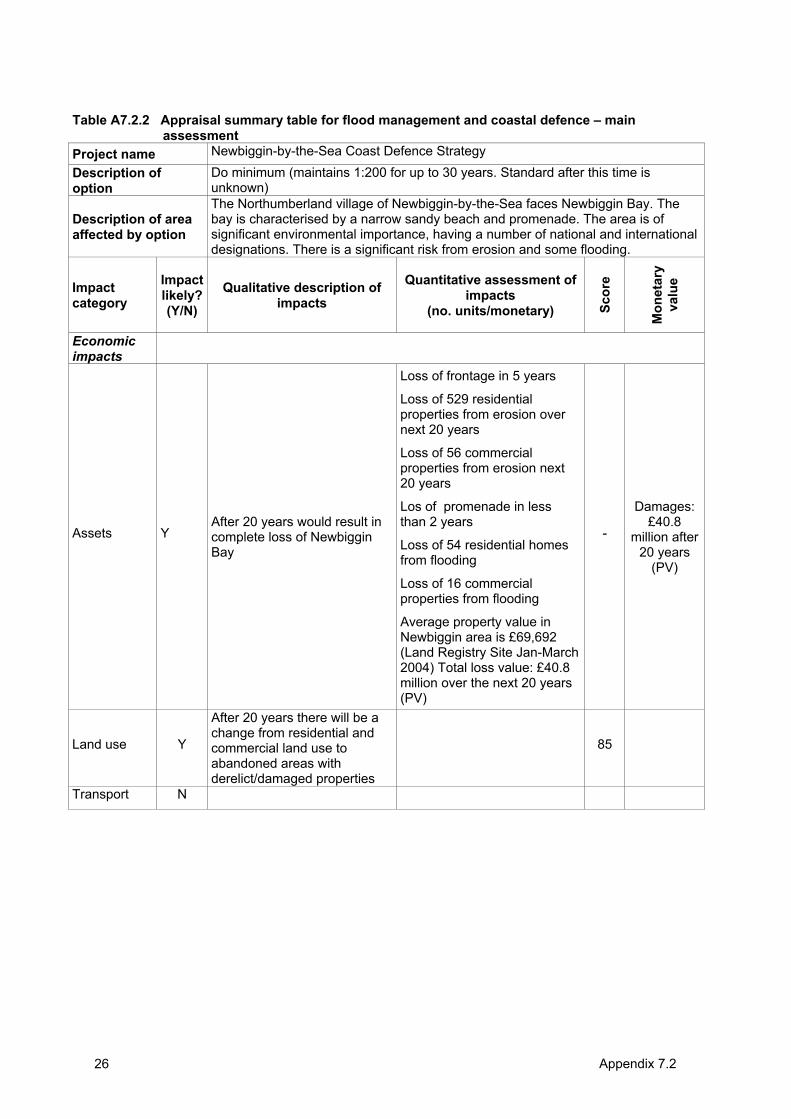
Appendix 7.2 26
Table A7.2.2 Appraisal summary table for flood management and coastal defence – main assessment
Project name Newbiggin-by-the-Sea Coast Defence Strategy Description of option
Do minimum (maintains 1:200 for up to 30 years. Standard after this time is unknown)
Description of area affected by option
The Northumberland village of Newbiggin-by-the-Sea faces Newbiggin Bay. The bay is characterised by a narrow sandy beach and promenade. The area is of significant environmental importance, having a number of national and international designations. There is a significant risk from erosion and some flooding.
Impactcategory
Impactlikely? (Y/N)
Qualitative description of impacts
Quantitative assessment of impacts
(no. units/monetary) Scor
e
Mon
etar
yva
lue
Economicimpacts
Assets YAfter 20 years would result in complete loss of Newbiggin Bay
Loss of frontage in 5 years
Loss of 529 residential properties from erosion over next 20 years
Loss of 56 commercial properties from erosion next 20 years
Los of promenade in less than 2 years
Loss of 54 residential homes from flooding
Loss of 16 commercial properties from flooding
Average property value in Newbiggin area is £69,692 (Land Registry Site Jan-March 2004) Total loss value: £40.8 million over the next 20 years (PV)
-
Damages:£40.8
million after 20 years
(PV)
Land use Y
After 20 years there will be a change from residential and commercial land use to abandoned areas with derelict/damaged properties
85
Transport N
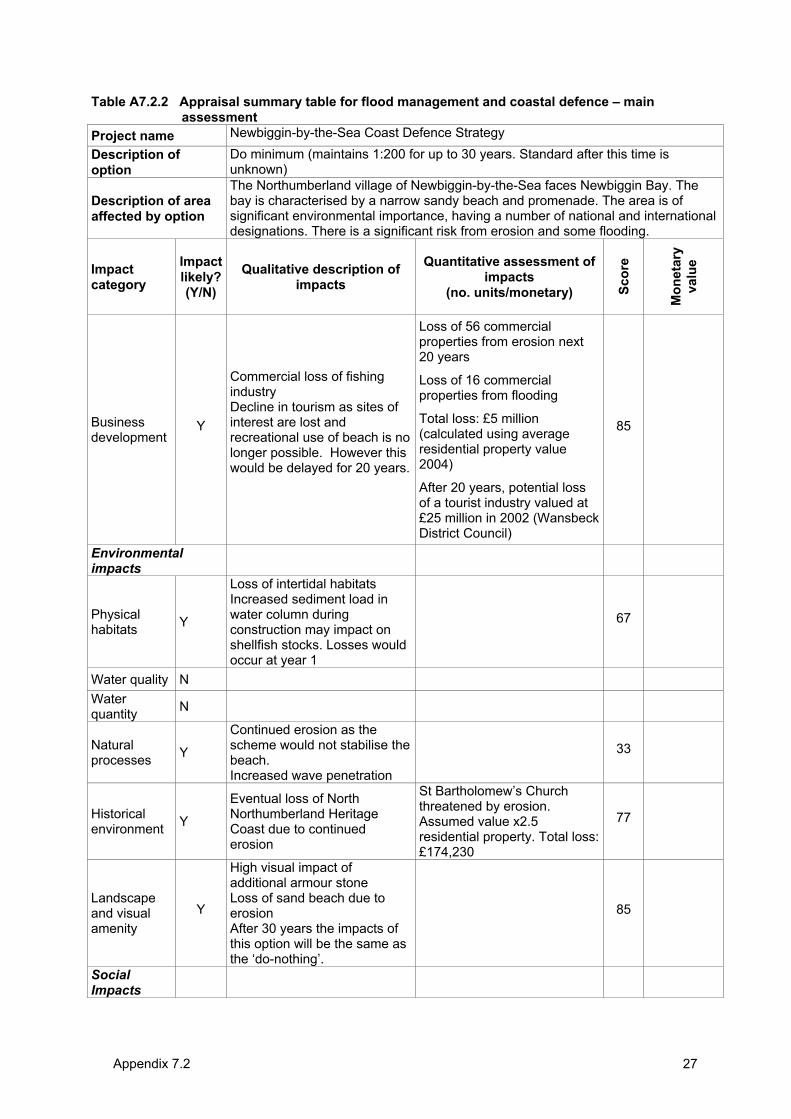
Appendix 7.2 27
Table A7.2.2 Appraisal summary table for flood management and coastal defence – main assessment
Project name Newbiggin-by-the-Sea Coast Defence Strategy Description of option
Do minimum (maintains 1:200 for up to 30 years. Standard after this time is unknown)
Description of area affected by option
The Northumberland village of Newbiggin-by-the-Sea faces Newbiggin Bay. The bay is characterised by a narrow sandy beach and promenade. The area is of significant environmental importance, having a number of national and international designations. There is a significant risk from erosion and some flooding.
Impactcategory
Impactlikely? (Y/N)
Qualitative description of impacts
Quantitative assessment of impacts
(no. units/monetary) Scor
e
Mon
etar
yva
lue
Businessdevelopment
Y
Commercial loss of fishing industryDecline in tourism as sites of interest are lost and recreational use of beach is no longer possible. However this would be delayed for 20 years.
Loss of 56 commercial properties from erosion next 20 years
Loss of 16 commercial properties from flooding
Total loss: £5 million (calculated using average residential property value 2004)
After 20 years, potential loss of a tourist industry valued at £25 million in 2002 (Wansbeck District Council)
85
Environmentalimpacts
Physical habitats Y
Loss of intertidal habitats Increased sediment load in water column during construction may impact on shellfish stocks. Losses would occur at year 1
67
Water quality N
Waterquantity N
Naturalprocesses Y
Continued erosion as the scheme would not stabilise the beach.Increased wave penetration
33
Historicalenvironment Y
Eventual loss of North Northumberland Heritage Coast due to continued erosion
St Bartholomew’s Church threatened by erosion. Assumed value x2.5 residential property. Total loss: £174,230
77
Landscapeand visual amenity
Y
High visual impact of additional armour stoneLoss of sand beach due to erosionAfter 30 years the impacts of this option will be the same as the ‘do-nothing’.
85
SocialImpacts
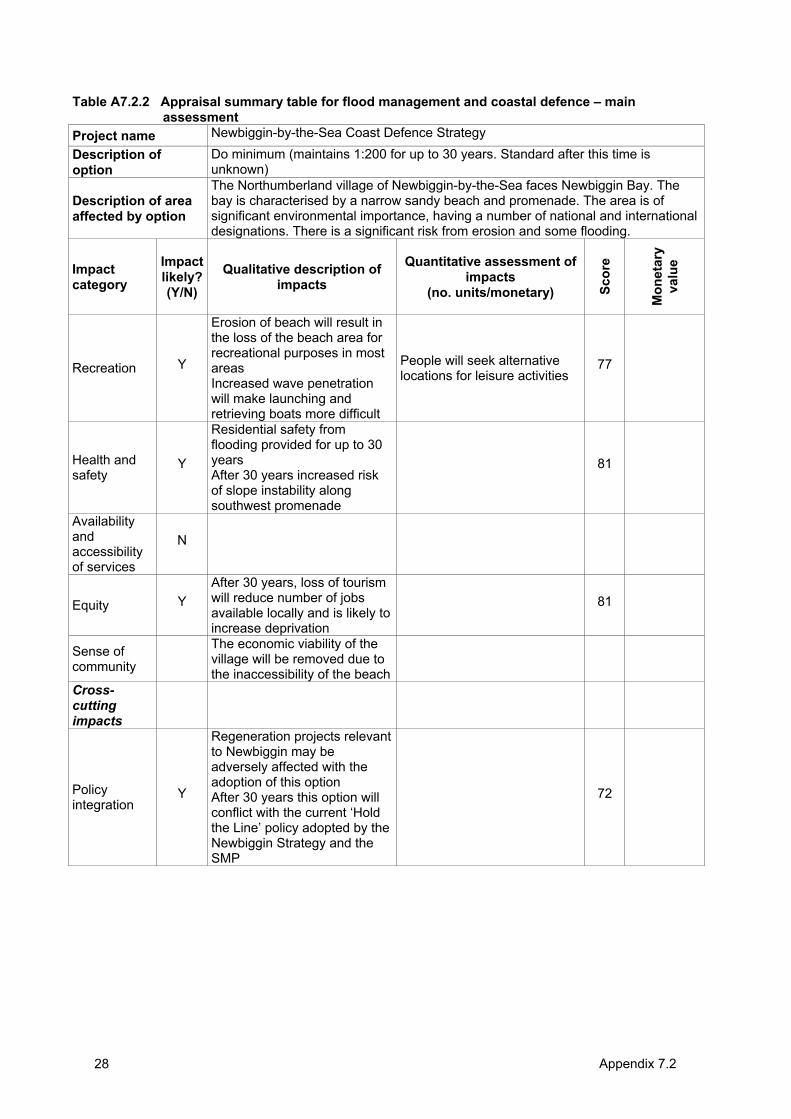
Appendix 7.2 28
Table A7.2.2 Appraisal summary table for flood management and coastal defence – main assessment
Project name Newbiggin-by-the-Sea Coast Defence Strategy Description of option
Do minimum (maintains 1:200 for up to 30 years. Standard after this time is unknown)
Description of area affected by option
The Northumberland village of Newbiggin-by-the-Sea faces Newbiggin Bay. The bay is characterised by a narrow sandy beach and promenade. The area is of significant environmental importance, having a number of national and international designations. There is a significant risk from erosion and some flooding.
Impactcategory
Impactlikely? (Y/N)
Qualitative description of impacts
Quantitative assessment of impacts
(no. units/monetary) Scor
e
Mon
etar
yva
lue
Recreation Y
Erosion of beach will result in the loss of the beach area for recreational purposes in most areasIncreased wave penetration will make launching and retrieving boats more difficult
People will seek alternative locations for leisure activities
77
Health and safety
Y
Residential safety from flooding provided for up to 30 yearsAfter 30 years increased risk of slope instability along southwest promenade
81
Availability andaccessibility of services
N
Equity YAfter 30 years, loss of tourism will reduce number of jobs available locally and is likely to increase deprivation
81
Sense of community
The economic viability of the village will be removed due to the inaccessibility of the beach
Cross-cuttingimpacts
Policy integration
Y
Regeneration projects relevant to Newbiggin may be adversely affected with the adoption of this option After 30 years this option will conflict with the current ‘Hold the Line’ policy adopted by the Newbiggin Strategy and the SMP
72
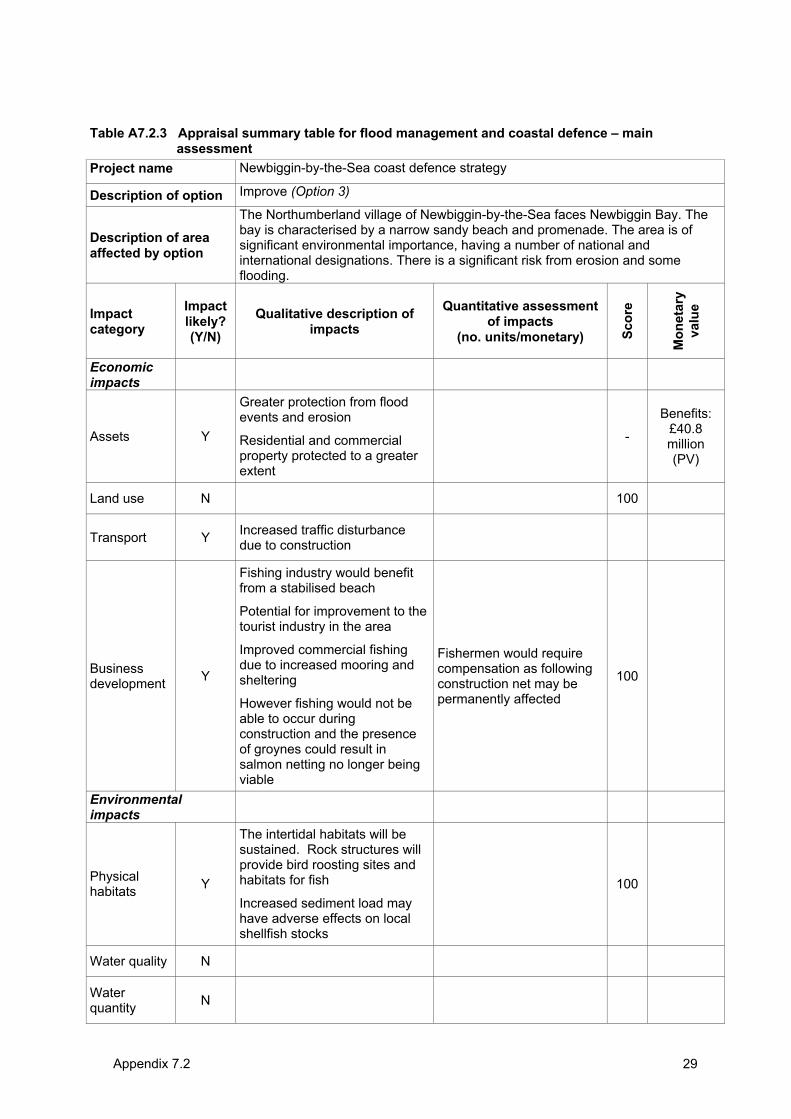
Appendix 7.2 29
Table A7.2.3 Appraisal summary table for flood management and coastal defence – main assessment
Project name Newbiggin-by-the-Sea coast defence strategy
Description of option Improve (Option 3)
Description of area affected by option
The Northumberland village of Newbiggin-by-the-Sea faces Newbiggin Bay. The bay is characterised by a narrow sandy beach and promenade. The area is of significant environmental importance, having a number of national and international designations. There is a significant risk from erosion and some flooding.
Impactcategory
Impactlikely? (Y/N)
Qualitative description of impacts
Quantitative assessment of impacts
(no. units/monetary) Scor
e
Mon
etar
yva
lue
Economicimpacts
Assets Y
Greater protection from flood events and erosion
Residential and commercial property protected to a greater extent
-
Benefits:£40.8million(PV)
Land use N 100
Transport Y Increased traffic disturbance due to construction
Businessdevelopment Y
Fishing industry would benefit from a stabilised beach
Potential for improvement to the tourist industry in the area
Improved commercial fishing due to increased mooring and sheltering
However fishing would not be able to occur during construction and the presence of groynes could result in salmon netting no longer being viable
Fishermen would require compensation as following construction net may be permanently affected
100
Environmentalimpacts
Physical habitats Y
The intertidal habitats will be sustained. Rock structures will provide bird roosting sites and habitats for fish
Increased sediment load may have adverse effects on local shellfish stocks
100
Water quality N
Waterquantity N
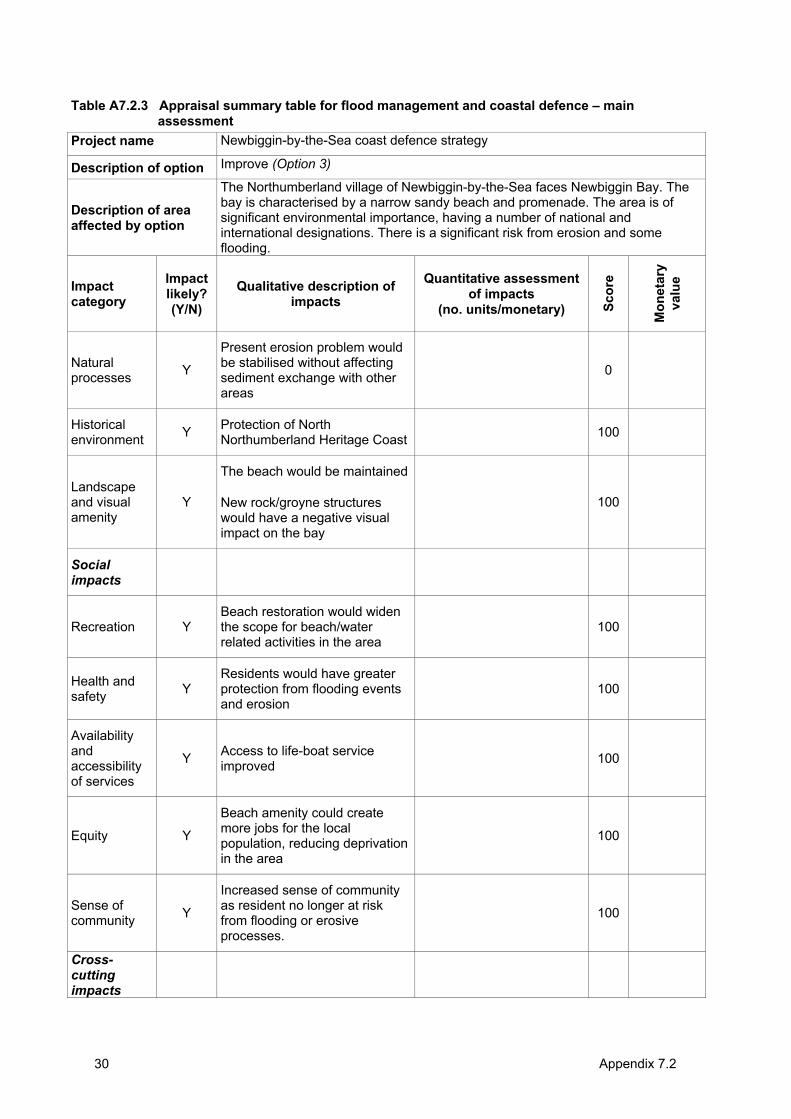
Appendix 7.2 30
Table A7.2.3 Appraisal summary table for flood management and coastal defence – main assessment
Project name Newbiggin-by-the-Sea coast defence strategy
Description of option Improve (Option 3)
Description of area affected by option
The Northumberland village of Newbiggin-by-the-Sea faces Newbiggin Bay. The bay is characterised by a narrow sandy beach and promenade. The area is of significant environmental importance, having a number of national and international designations. There is a significant risk from erosion and some flooding.
Impactcategory
Impactlikely? (Y/N)
Qualitative description of impacts
Quantitative assessment of impacts
(no. units/monetary) Scor
e
Mon
etar
yva
lue
Naturalprocesses Y
Present erosion problem would be stabilised without affecting sediment exchange with other areas
0
Historicalenvironment Y Protection of North
Northumberland Heritage Coast 100
Landscapeand visual amenity
Y
The beach would be maintained
New rock/groyne structures would have a negative visual impact on the bay
100
Socialimpacts
Recreation Y Beach restoration would widen the scope for beach/water related activities in the area
100
Health and safety Y
Residents would have greater protection from flooding events and erosion
100
Availability andaccessibility of services
Y Access to life-boat service improved 100
Equity Y
Beach amenity could create more jobs for the local population, reducing deprivation in the area
100
Sense of community Y
Increased sense of community as resident no longer at risk from flooding or erosive processes.
100
Cross-cuttingimpacts
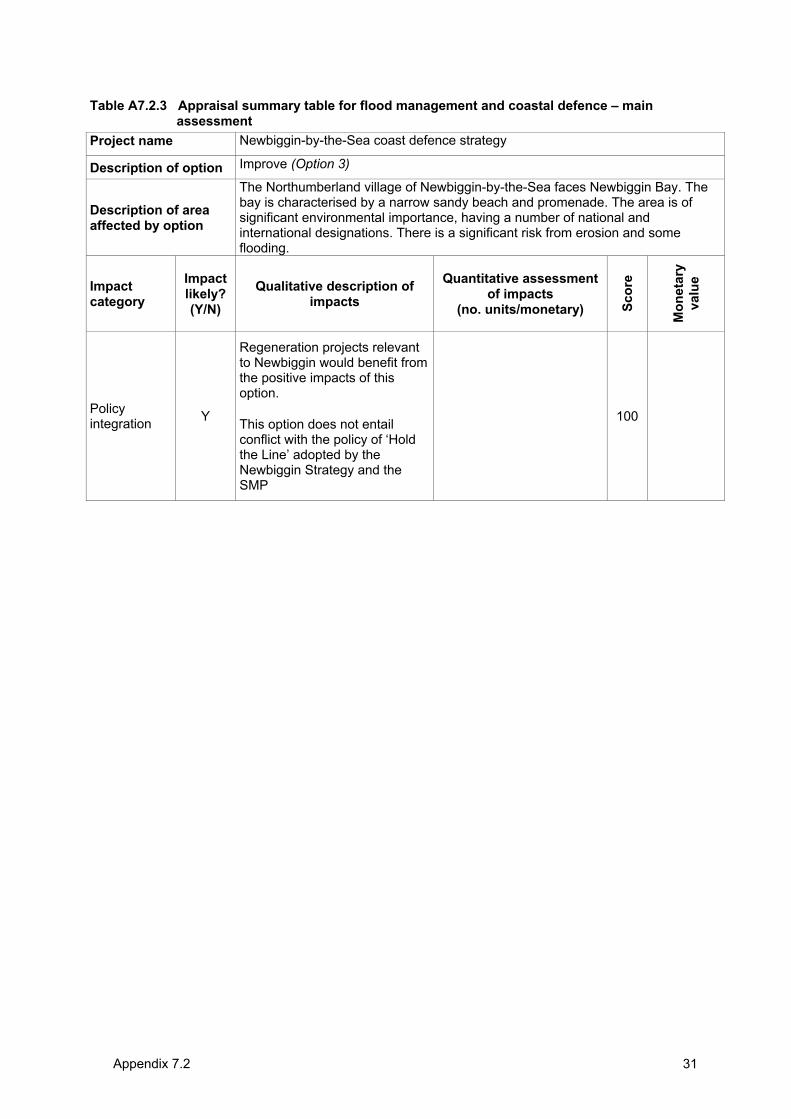
Appendix 7.2 31
Table A7.2.3 Appraisal summary table for flood management and coastal defence – main assessment
Project name Newbiggin-by-the-Sea coast defence strategy
Description of option Improve (Option 3)
Description of area affected by option
The Northumberland village of Newbiggin-by-the-Sea faces Newbiggin Bay. The bay is characterised by a narrow sandy beach and promenade. The area is of significant environmental importance, having a number of national and international designations. There is a significant risk from erosion and some flooding.
Impactcategory
Impactlikely? (Y/N)
Qualitative description of impacts
Quantitative assessment of impacts
(no. units/monetary) Scor
e
Mon
etar
yva
lue
Policy integration Y
Regeneration projects relevant to Newbiggin would benefit from the positive impacts of this option.
This option does not entail conflict with the policy of ‘Hold the Line’ adopted by the Newbiggin Strategy and the SMP
100
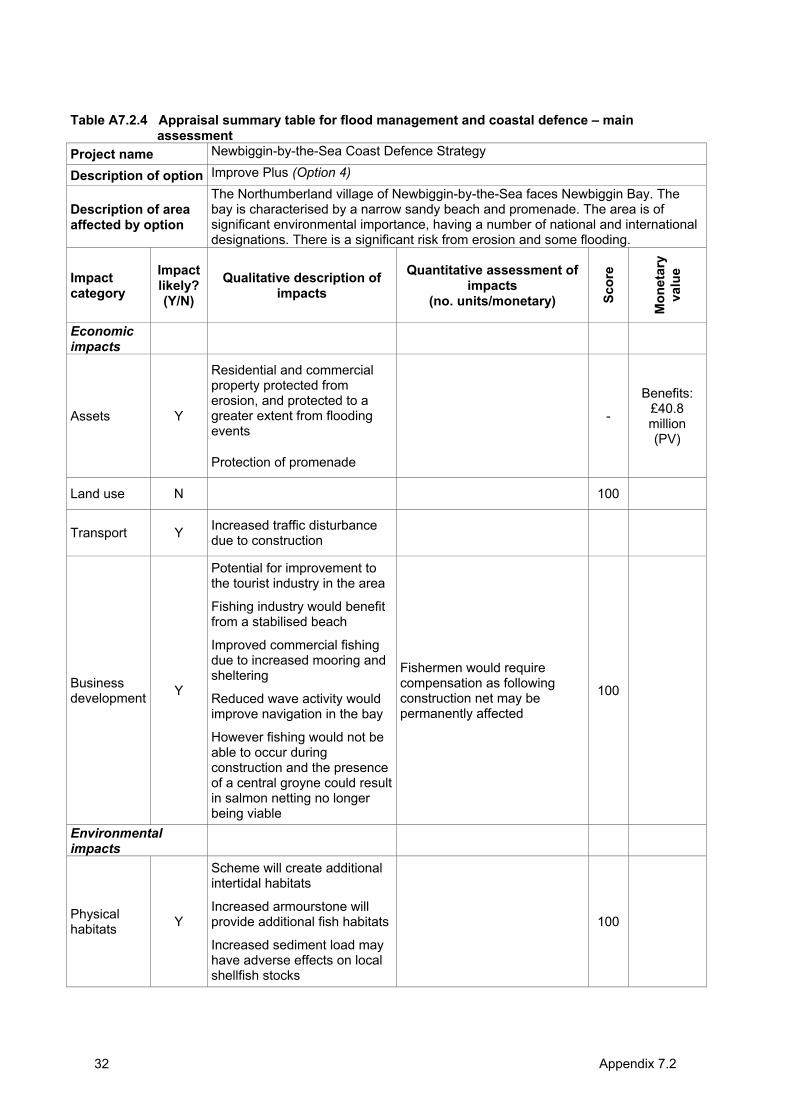
Appendix 7.2 32
Table A7.2.4 Appraisal summary table for flood management and coastal defence – main assessment
Project name Newbiggin-by-the-Sea Coast Defence Strategy
Description of option Improve Plus (Option 4)
Description of area affected by option
The Northumberland village of Newbiggin-by-the-Sea faces Newbiggin Bay. The bay is characterised by a narrow sandy beach and promenade. The area is of significant environmental importance, having a number of national and international designations. There is a significant risk from erosion and some flooding.
Impactcategory
Impactlikely? (Y/N)
Qualitative description of impacts
Quantitative assessment of impacts
(no. units/monetary) Scor
e
Mon
etar
yva
lue
Economicimpacts
Assets Y
Residential and commercial property protected from erosion, and protected to a greater extent from flooding events
Protection of promenade
-
Benefits:£40.8million(PV)
Land use N 100
Transport Y Increased traffic disturbance due to construction
Businessdevelopment Y
Potential for improvement to the tourist industry in the area
Fishing industry would benefit from a stabilised beach
Improved commercial fishing due to increased mooring and sheltering
Reduced wave activity would improve navigation in the bay
However fishing would not be able to occur during construction and the presence of a central groyne could result in salmon netting no longer being viable
Fishermen would require compensation as following construction net may be permanently affected
100
Environmentalimpacts
Physical habitats Y
Scheme will create additional intertidal habitats
Increased armourstone will provide additional fish habitats
Increased sediment load may have adverse effects on local shellfish stocks
100
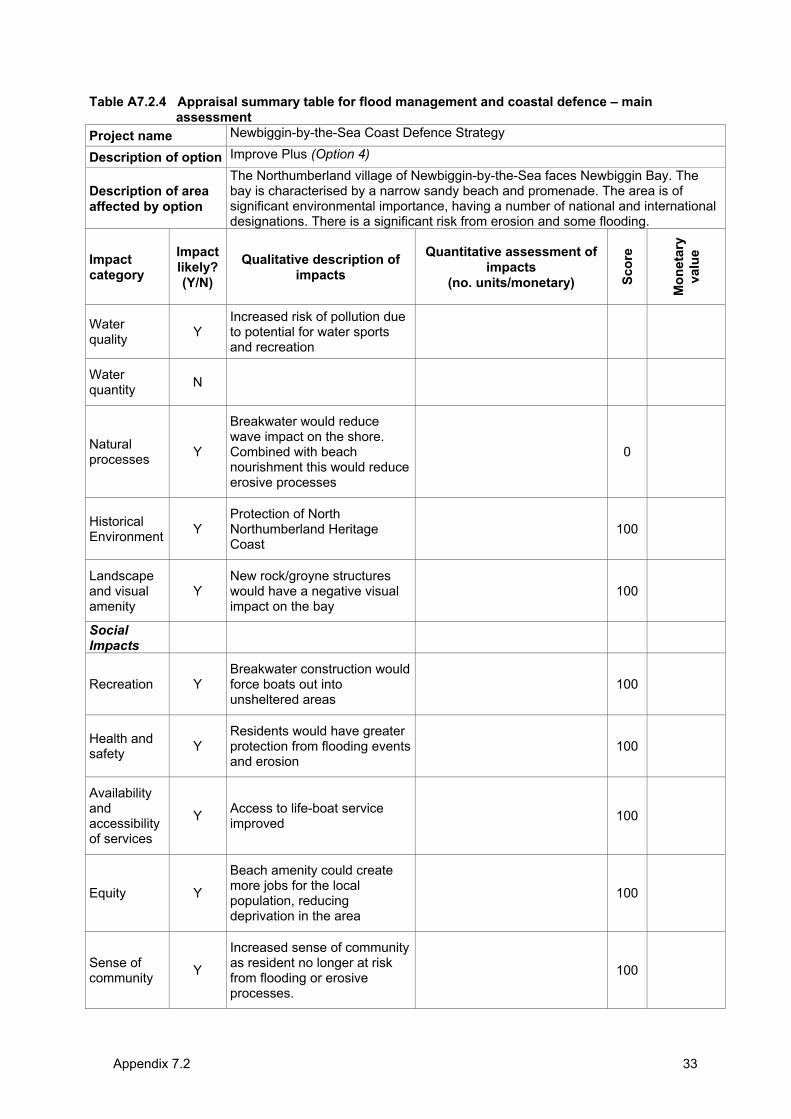
Appendix 7.2 33
Table A7.2.4 Appraisal summary table for flood management and coastal defence – main assessment
Project name Newbiggin-by-the-Sea Coast Defence Strategy
Description of option Improve Plus (Option 4)
Description of area affected by option
The Northumberland village of Newbiggin-by-the-Sea faces Newbiggin Bay. The bay is characterised by a narrow sandy beach and promenade. The area is of significant environmental importance, having a number of national and international designations. There is a significant risk from erosion and some flooding.
Impactcategory
Impactlikely? (Y/N)
Qualitative description of impacts
Quantitative assessment of impacts
(no. units/monetary) Scor
e
Mon
etar
yva
lue
Waterquality Y
Increased risk of pollution due to potential for water sports and recreation
Waterquantity N
Naturalprocesses Y
Breakwater would reduce wave impact on the shore.Combined with beach nourishment this would reduce erosive processes
0
HistoricalEnvironment Y
Protection of North Northumberland Heritage Coast
100
Landscapeand visual amenity
YNew rock/groyne structures would have a negative visual impact on the bay
100
SocialImpacts
Recreation Y Breakwater construction would force boats out into unsheltered areas
100
Health and safety Y
Residents would have greater protection from flooding events and erosion
100
Availability andaccessibility of services
Y Access to life-boat service improved 100
Equity Y
Beach amenity could create more jobs for the local population, reducing deprivation in the area
100
Sense of community Y
Increased sense of community as resident no longer at risk from flooding or erosive processes.
100
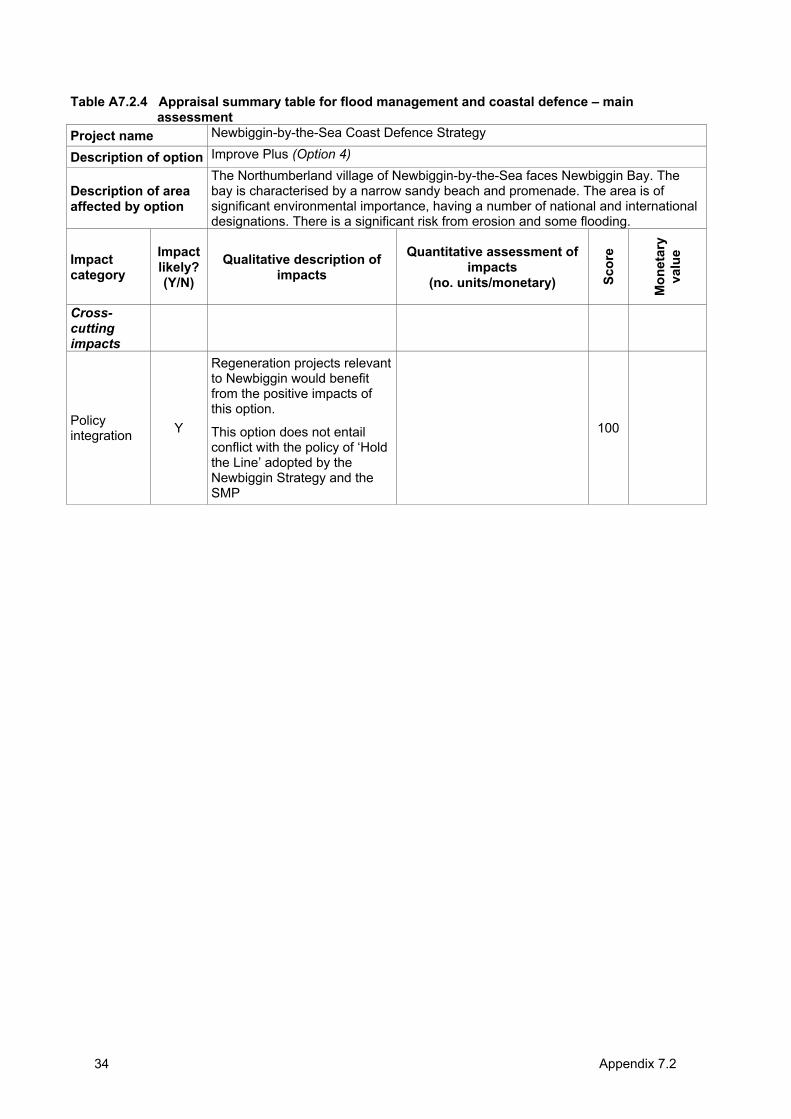
Appendix 7.2 34
Table A7.2.4 Appraisal summary table for flood management and coastal defence – main assessment
Project name Newbiggin-by-the-Sea Coast Defence Strategy
Description of option Improve Plus (Option 4)
Description of area affected by option
The Northumberland village of Newbiggin-by-the-Sea faces Newbiggin Bay. The bay is characterised by a narrow sandy beach and promenade. The area is of significant environmental importance, having a number of national and international designations. There is a significant risk from erosion and some flooding.
Impactcategory
Impactlikely? (Y/N)
Qualitative description of impacts
Quantitative assessment of impacts
(no. units/monetary) Scor
e
Mon
etar
yva
lue
Cross-cuttingimpacts
Policy integration Y
Regeneration projects relevant to Newbiggin would benefit from the positive impacts of this option.
This option does not entail conflict with the policy of ‘Hold the Line’ adopted by the Newbiggin Strategy and the SMP
100
Joint Defra/EA Flood and Coastal Erosion Risk Management R&D Programme
Annex C:
Report of the workshop on approaches to scoring in the context of the MCA component of the economic appraisal for flood and coastal erosion risk management
R&D Project Record FD2013/PR2
Produced: November 2004

ii
Statement of use This report provides guidance on the use of MCA and ASTs to assist in the appraisal of flood and coastal erosion risk management projects, strategies and policies. It should be noted that it does not constitute official government policy or guidance, which is unlikely to be available until work to develop the methodology and identify appropriate sources of data has been undertaken through pilot studies.
This report may be downloaded from the Defra/EA R&D Programme website (http://www.defra.gov.uk/environ.fcd/research), use the search tool located on the project information and publications page. Copies are held by all EA Regional Information Centres, contact The Environment Agency’s National Customer Contact Centre by emailing [email protected] or by telephoning 08708506506.
Dissemination Status Internal: Released internally External: Released to public domain
Keywords: Multi criteria analysis, MCA, appraisal summary table, AST, decision rule
Research contractor contact details: Lead contractor: Risk & Policy Analysts Ltd (RPA), Farthing Green House, 1 Beccles Road, Loddon, Norfolk, NR14 6LT (Tel: 01508 528465; Fax: 01508 520758; www.rpaltd.co.uk). The project director was Meg Postle, the project manager for RPA was John Ash with research support from Susana Dias and other members of RPA staff.
The research team also included: Colin Green (Flood Hazard Research Centre, Middlesex University); Alan Pearman (University of Leeds); Ron Janssen (The Institute of Environmental Studies, Free University, Amsterdam), Terry Oakes and Hugh Payne (Independent Consultants)
Acknowledgements The assistance of those providing information for the case studies is gratefully acknowledged.
Defra project manager: Matt Crossman, Defra, 3D Ergon House, Horseferry Rd, London, SW1P 2AL. Email: [email protected]
Publishing organisation DefraFlood Management Division Ergon House Horseferry Road London SW1P 2AL Tel: 020 7238 3000 Fax: 020 7238 6187 www.defra.gov.uk/environ/fcd
â Crown copyright (Defra); 2005
Copyright in the typographical arrangement and design rests with the Crown. This publication (excluding the logo) may be reproduced free of charge in any format or medium provided that it is reproduced accurately and not used in a misleading context. The material must be acknowledged as Crown copyright with the title and source of the publication specified. The views expressed in this document are not necessarily those of Defra or the Environment Agency. Its officers, servants or agents accept no liability whatsoever for any loss or damage arising from the interpretation or use of the information, or reliance on views contained herein.
Published by the Department for Environment, Food and Rural Affairs. Printed in the UK, March 2005 on recycled material containing 80% post-consumer waste and 20% totally chlorine free virgin pulp.
PB No. 10734/PR2 ISBN 0-85521-146-6
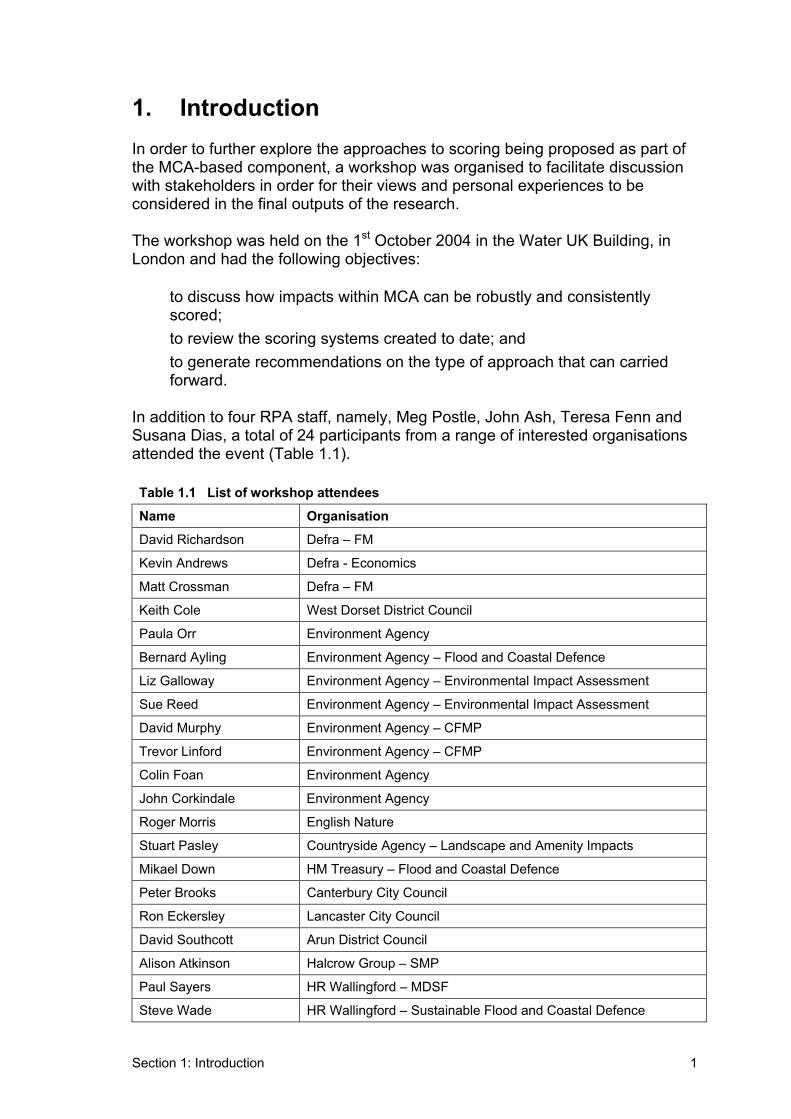
Section 1: Introduction 1
1. Introduction In order to further explore the approaches to scoring being proposed as part of the MCA-based component, a workshop was organised to facilitate discussion with stakeholders in order for their views and personal experiences to be considered in the final outputs of the research.
The workshop was held on the 1st October 2004 in the Water UK Building, in London and had the following objectives:
• to discuss how impacts within MCA can be robustly and consistently scored;
• to review the scoring systems created to date; and • to generate recommendations on the type of approach that can carried
forward.
In addition to four RPA staff, namely, Meg Postle, John Ash, Teresa Fenn and Susana Dias, a total of 24 participants from a range of interested organisations attended the event (Table 1.1).
Table 1.1 List of workshop attendees
Name Organisation
David Richardson Defra – FM
Kevin Andrews Defra - Economics
Matt Crossman Defra – FM
Keith Cole West Dorset District Council
Paula Orr Environment Agency
Bernard Ayling Environment Agency – Flood and Coastal Defence
Liz Galloway Environment Agency – Environmental Impact Assessment
Sue Reed Environment Agency – Environmental Impact Assessment
David Murphy Environment Agency – CFMP
Trevor Linford Environment Agency – CFMP
Colin Foan Environment Agency
John Corkindale Environment Agency
Roger Morris English Nature
Stuart Pasley Countryside Agency – Landscape and Amenity Impacts
Mikael Down HM Treasury – Flood and Coastal Defence
Peter Brooks Canterbury City Council
Ron Eckersley Lancaster City Council
David Southcott Arun District Council
Alison Atkinson Halcrow Group – SMP
Paul Sayers HR Wallingford – MDSF
Steve Wade HR Wallingford – Sustainable Flood and Coastal Defence

Section 1: Introduction2
Jackie Leslie WS Atkins – Water
Katie Prebble Black & Veatch Consulting
Colin Green Middlesex University (FHRC)
The agenda for the day is shown in Table 1.2.
Table 1.2 Workshop timetable
Time Function Speaker
9h30 – 9h45 Coffee and Registration
9h45 – 10h00 Introduction Matthew Crossman (Defra)
10h00 – 10h20 Presentation on the MCA methodology John Ash (RPA)
10h20 – 10h40 General discussion.
10h40 – 10h55 Presentation on the First Round of Scoring Approaches
Teresa Fenn (RPA)
10h55 – 11h20 Coffee break
11h20 – 12h35 First Breakout Session – Applying the First Round of Scoring Approaches
12h35 – 13h00 Feedback from First Breakout Session
13h00 – 14h00 Lunch
14h00 – 14h15 Presentation on the Second Round of Scoring Approaches
Teresa Fenn (RPA)
14h30 – 15h15 Second Breakout Session – Identifying Characteristics and Recovery Times
15h15 – 16h15 Feedback from Second Breakout Session
16h15 – 16h30 Wrap Up Meg Postle/John Ash (RPA)
The workshop was divided into three main parts:
• in the first part of the morning there were two main presentations to introduce the context of the workshop and inform the participants about the progress achieved in developing the MCA-based methodology. This was followed by an open discussion about the methodology itself;
• in the second part of the morning, there was another presentation that introduced the participants to the first set of scoring approaches and set the context for the first breakout session. After the first breakout session, there was time for feedback and discussion; and
• the afternoon commenced with a presentation on the second set of scoring approaches and the setting of the second breakout session. After the second breakout session, there was time for feedback and discussion.
Section 2: Morning session 3
2. Morning session The first presentation was given by Matthew Crossman from Defra on the context and setting of the MCA project, as well as a brief summary of the progress of the project so far.
This introduction was followed by a presentation by John Ash from RPA. The first part of his presentation provided the aims and objectives of the MCA project and the context in which the MCA-based approach has been developed. The second part of his presentation introduced the MCA-based methodology, the key issues it is trying to resolve and the status of its development at present, including a brief summary of the case study work that had been carried out. Finally, he briefly ran through the different steps of the proposed approach and set out the challenges for the day.
Teresa Fenn (RPA) followed, with a talk on the approaches to scoring trialled in the first set of case studies. She started her presentation with the aims and objectives of scoring and then briefly summarised four different scoring approaches, namely, the ‘zero to 100’ approach, the ‘relative to 100’ approach, the ‘likert scale’ approach and the ‘across unit’ approach. Finally, Teresa summarised the findings from the application of the scoring approaches to the first set of cases studies, in terms of:
• being based on objective information; • avoiding double counting; • allowing for both small and large differences; • respecting the proportionality of impacts; • taking account of uncertainty; and • being based on same/similar information as used to estimate monetary
values.
2.1 Breakout session 1
The introductory presentations were followed by the first breakout session of the day. The objective of the first breakout session was to apply the ‘zero to 100’ and ‘relative to 100’ approaches to a case study, in order for the participants to discuss the advantages and disadvantages of such scoring systems.
The attendees were divided into four different groups, two of which (groups 1 and 3) were tasked with applying the ‘zero to 100’ approach, whilst the other two (groups 2 and 4) were tasked with applying the ‘relative to 100’ system. The composition of each of the groups is presented in Appendix C1.1.
The participants were provided with a handout setting out the task, some background information on both the scoring approach to be applied and the case study itself (i.e. summary of project area and geography of the area,
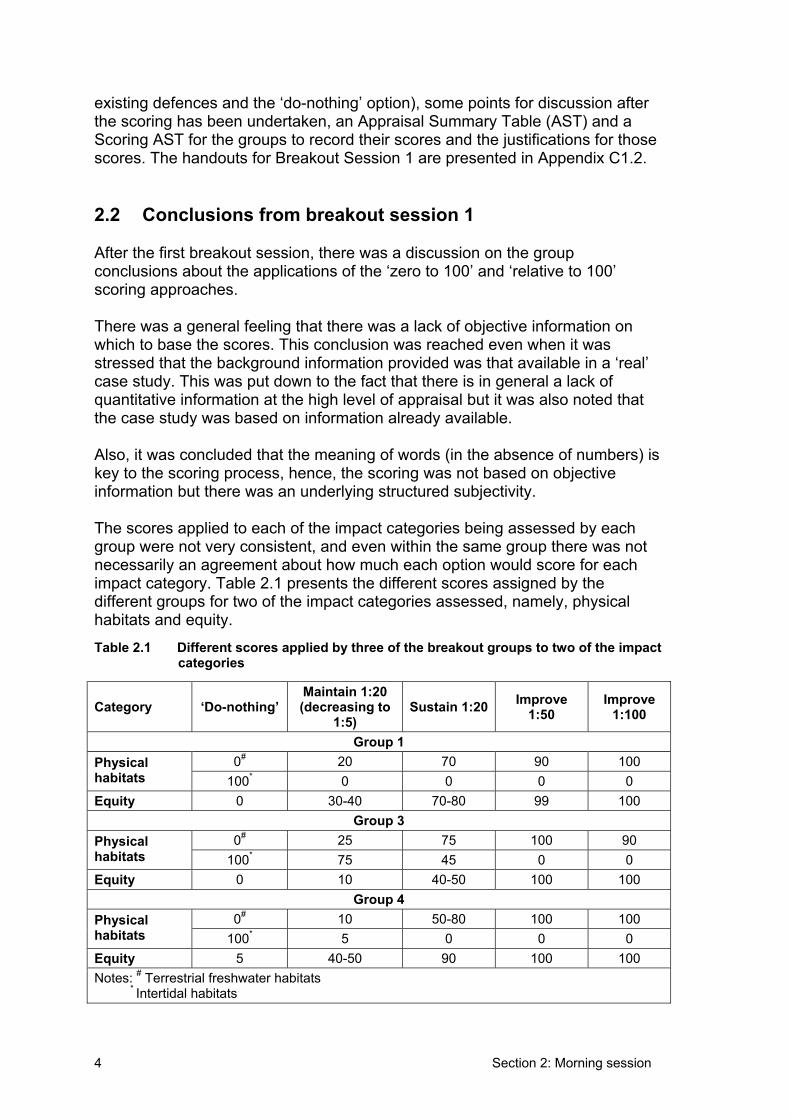
Section 2: Morning session4
existing defences and the ‘do-nothing’ option), some points for discussion after the scoring has been undertaken, an Appraisal Summary Table (AST) and a Scoring AST for the groups to record their scores and the justifications for those scores. The handouts for Breakout Session 1 are presented in Appendix C1.2.
2.2 Conclusions from breakout session 1
After the first breakout session, there was a discussion on the group conclusions about the applications of the ‘zero to 100’ and ‘relative to 100’ scoring approaches.
There was a general feeling that there was a lack of objective information on which to base the scores. This conclusion was reached even when it was stressed that the background information provided was that available in a ‘real’ case study. This was put down to the fact that there is in general a lack of quantitative information at the high level of appraisal but it was also noted that the case study was based on information already available.
Also, it was concluded that the meaning of words (in the absence of numbers) is key to the scoring process, hence, the scoring was not based on objective information but there was an underlying structured subjectivity.
The scores applied to each of the impact categories being assessed by each group were not very consistent, and even within the same group there was not necessarily an agreement about how much each option would score for each impact category. Table 2.1 presents the different scores assigned by the different groups for two of the impact categories assessed, namely, physical habitats and equity.
Table 2.1 Different scores applied by three of the breakout groups to two of the impact categories
Category ‘Do-nothing’ Maintain 1:20 (decreasing to
1:5) Sustain 1:20 Improve
1:50Improve
1:100
Group 1 0# 20 70 90 100 Physical
habitats 100* 0 0 0 0 Equity 0 30-40 70-80 99 100
Group 3 0# 25 75 100 90 Physical
habitats 100* 75 45 0 0 Equity 0 10 40-50 100 100
Group 4 0# 10 50-80 100 100 Physical
habitats 100* 5 0 0 0 Equity 5 40-50 90 100 100 Notes: # Terrestrial freshwater habitats
* Intertidal habitats
Section 2: Morning session 5
As can be seen in Table 2.1, the scores provided by different groups for the same impact category under the same option can vary considerably. For example, the scores for impacts on equity under the Maintain option vary from 10 to between 40 and 50. Some groups felt more confident in providing ranges of scores in order to deal with uncertainty. This was more often the case when dealing with the social impact categories, where arguably the uncertainty is larger, than with the environmental categories. It is also interesting to note that the scores for the physical habitats category are closer together between groups.
The point was also made that although scoring of categories in relation to options was sometimes difficult, there was much less difficulty in ranking the options. This is made clear in Table 2.1 by the fact that there is a consistency between groups in which is the best and the worst option. Another interesting conclusion is that even those groups that were supposed to be applying the ‘relative to 100’ approach generally ended up applying scores between zero and 100 (this is because at least one option generally resulted in a ‘loss’ of something which needed the worst score possible, i.e. zero).
It was also agreed that, overall, the scoring systems were easy to use and that it would be easy to apply sensitivity analysis to the scores in order to test their importance to the selection of the preferred option.
In relation to the issue of double counting, it was agreed that there was the potential for it to occur. However, it could be dealt with by using more precise definitions of what each impact category includes and potentially breaking down some of the impact categories. It is believed that some of the issues that were raised in relation to the definitions of impact categories stemmed on one hand, from the lack of familiarity with the definitions but also because the exercise was focused on four of these impact categories, with a tendency to ignore the remaining 12 categories. For example, the recreation aspects of physical habitats are assessed under the recreation impact category rather then under the physical habitats category.
The potential need to collapse some of the impact categories in order to avoid double counting was also voiced by some participants. This was particularly the case for the ‘sense of community’ and ‘equity’ impact categories as well as ‘business development’.
The attendees agreed that the scoring approaches trialled allowed for marginal changes between options to be captured in the scores. There seemed to be no particular concern in relation to this issue. Proportionality between scores of different options did not seem to raise any concerns, as long as the problem is broken down, i.e. the impact categories are divided into sub-categories.
In relation to the issue of transparency, there was agreement that the use of scoring ASTs would ensure that the reasons behind the scoring would be clear and available for each individual impact criteria. There was, however, some
Section 2: Morning session6
concern relating to transparency in the overall assessment, i.e. how to bring the individual criteria together. Most participants agreed that transparency was
being maintained by the fact that there was space for recording the justifications for the scores.
There was some concern that the scores were impact based rather than risk based. It was evident that the focus of attention was not on the differences between options but on the impact of each option in absolute terms. Also, the scoring approach did not explicitly take probabilities into account, even if probability was considered implicitly in an ad hoc manner. The question of how to include probability in such scoring systems was raised.
When asked whether the group would be willing to validate the scores in a decision-making situation, there were mixed feelings. Some of the groups were not concerned about the subjectivity of such scores; others were concerned given the uncertainty and subjectivity of the numbers.
It is believed that the fact that the scoring exercise was performed in a group meant that the people were, in general, reasonably satisfied with the scores. This could mean that scoring by committee, i.e. carry out the scoring of a project in a group, could be another viable scoring approach.
Section 3: Afternoon session 7
3. Afternoon session The afternoon session started with a second presentation by Teresa Fenn on the approaches to scoring trialled in the second set of case studies. Following from her first presentation, Teresa introduced the different levels at which the assessment of projects was undertaken, providing definitions for SMP level, Strategy and Scheme level, and went on to focus on the strategy level appraisal. In the second part of the presentation, Teresa introduced and summarised a new approach to scoring based on characteristics and recovery times, the ‘ChaRT’ scoring system.
Although no time was allocated for discussion after the presentation, some concern arose from the definitions of the three levels of appraisal, i.e. high level, strategy and scheme. It became clear that there is not one ‘universally’ accepted definition for each of these levels and what they include. This is important and needs to be explored further as a clear understanding of different levels of the appraisal is vital.
3.1 Breakout session 2
The afternoon presentation and discussion were followed by the second breakout session of the day. The objective of the second breakout session was to apply the ‘ChaRT’ scoring approach to the Humber Estuary (Management Unit 6) case study, in order for the participants to discuss the advantages and disadvantages of the ChaRT scoring system and in particular compare it to the approaches used in the morning.
The attendees were, once again, separated into the four groups and were tasked with defining a characteristic that represented each impact category under assessment and, secondly, the time it would take a characteristic to recover after the flood.
The participants were provided with a handout setting out the task, some background information on the scoring approach to be applied, some points for discussion for after the scoring had been undertaken, a Characteristic Summary Table and a Recovery Time Summary Table to record the results of their exercise. The handouts for Breakout Session 2 are presented in Appendix C1.3.
3.2 Conclusions from breakout session 2
The second breakout session did not run as smoothly as the session in the morning. It became apparent right from the start of the session that only a few of the attendees could fully understand the exercise. The participants still seemed to be trying to use scoring, rather then trying to define a characteristic and recovery time for each flood event as had been proposed. There was also some confusion between the definition of ‘flood event return period’ and the
Section 3: Afternoon session 8
different options being appraised. People were taking the return periods as if they were the options rather than as possible flood events under a no defence situation.
Some of the participants also felt uncomfortable with the naming of a ‘characteristic’ to represent the impact category. The same problem was found for ‘recovery time’. There was concern among some of the attendees that one characteristic only would limit the assessment of the impact category. In fact in group 3, participants thought there was a need to define 3 or 4 characteristics for each impact category, and this was after the category itself was divided into many subcategories. In this case, it was almost impossible to convey to the participants the need to focus on one characteristic that reflects the critical element for measuring the difference between the options. There was also some concern in relation to the definition of recovery times. For example, for the historical environment, the fact that an important site or monument might never fully recover from the flood, created some problems when defining a recovery time.
After some discussion it was considered that the word ‘vulnerability’ may be a more appropriate name for recovery time, whilst for ‘characteristic’ there was no obvious conclusion.
It is believed that for the participants to truly understand the concepts behind the ChaRT system they needed some familiarity with the tools and concepts used in current project appraisal such as the guidance provided by FCDPAG 3 and its spreadsheets, the concepts of annual average damage, flood return period and probability.
For these reasons, the scoring approaches used in the morning seemed more acceptable in the sense that they were easy to understand and better reflected the uncertainty attached to the scores. There was concern that with ChaRT a number (being a characteristic or recovery time) was trying to be attached to the impact category at any cost, in the same way that CBA always tries to value those impacts that are not easily valued.
It was interesting to note that, for those people with some direct experience of dealing with flood and coastal defence appraisals, the concepts proposed for the ChaRT system were less of a concern and in general the system was accepted as a viable option, in particular because it reflected a more risk based approach to the whole process.
At the end of the second breakout session Teresa Fenn demonstrated briefly how the results for the characteristics and recovery times for the four impact categories could be introduced in the ‘ChaRT spreadsheets’ and the scores calculated from these.
Section 4: Conclusions from the workshop 9
4. Conclusions from the workshop The workshop was successful in highlighting the problems that surround the different scoring approaches. However, it did not give a clear indication of which approach is the preferred one and should be carried forward.
There are three possible quantitative scoring approaches:
• the ‘zero to 100’ scoring system; • the ‘ChaRT’ scoring approach, in particular for the strategy level of
appraisal1; and • the ‘scoring by committee’ approach.
It is believed that at this stage it would be better to go forward with all three scoring methodologies, being aware of their advantages and disadvantages, and leave the decision about which scoring systems should be used until after they have been trialled in pilot projects. Only when trying different scoring systems in real time situations, with those applying them fully aware of all the flood and coastal issues and concepts, can one system or combination of systems be recommended.
1 Although this may need to be modified in order to take into consideration ‘vulnerability’ instead
of ‘recoverability’ into account.
Appendix C1.1 10
Appendix C1.1:
Breakout session groups’ composition
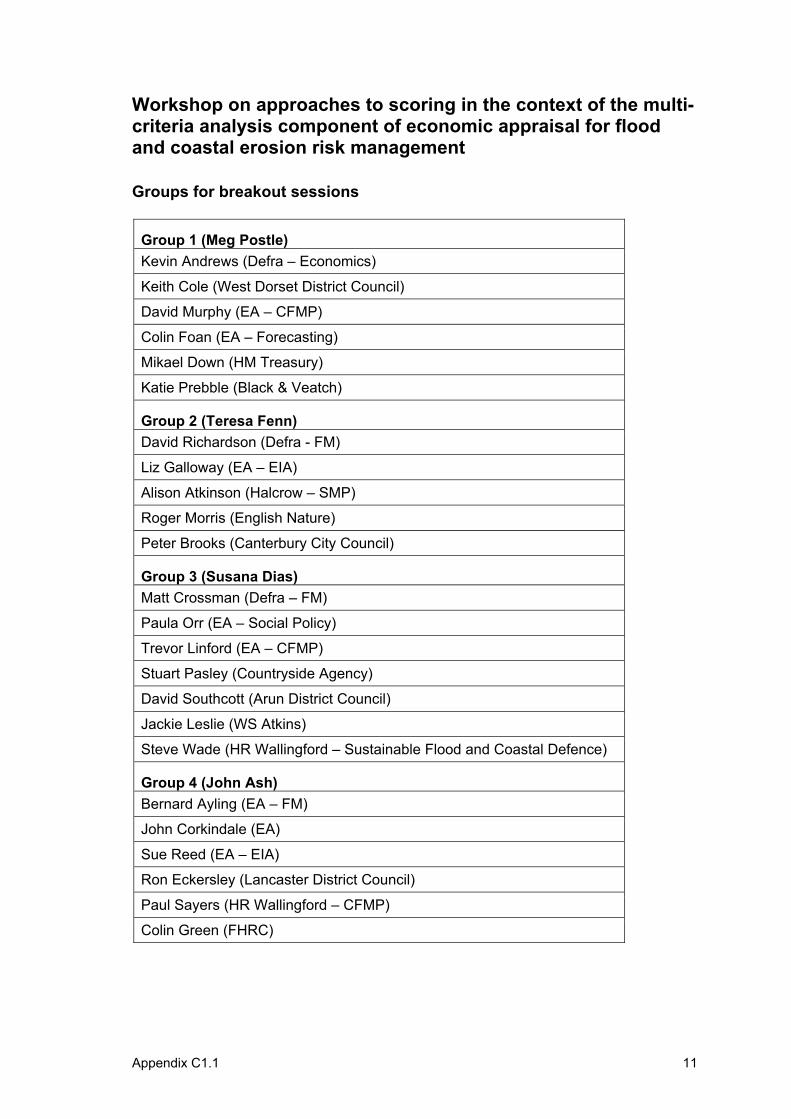
Appendix C1.1 11
Workshop on approaches to scoring in the context of the multi-criteria analysis component of economic appraisal for flood and coastal erosion risk management
Groups for breakout sessions
Group 1 (Meg Postle) Kevin Andrews (Defra – Economics)
Keith Cole (West Dorset District Council)
David Murphy (EA – CFMP)
Colin Foan (EA – Forecasting)
Mikael Down (HM Treasury)
Katie Prebble (Black & Veatch)
Group 2 (Teresa Fenn) David Richardson (Defra - FM)
Liz Galloway (EA – EIA)
Alison Atkinson (Halcrow – SMP)
Roger Morris (English Nature)
Peter Brooks (Canterbury City Council)
Group 3 (Susana Dias) Matt Crossman (Defra – FM)
Paula Orr (EA – Social Policy)
Trevor Linford (EA – CFMP)
Stuart Pasley (Countryside Agency)
David Southcott (Arun District Council)
Jackie Leslie (WS Atkins)
Steve Wade (HR Wallingford – Sustainable Flood and Coastal Defence)
Group 4 (John Ash) Bernard Ayling (EA – FM)
John Corkindale (EA)
Sue Reed (EA – EIA)
Ron Eckersley (Lancaster District Council)
Paul Sayers (HR Wallingford – CFMP)
Colin Green (FHRC)

Appendix C1.2 12
Appendix C1.2:
Handouts for breakout session 1
Appendix C1.2 13
Breakout session 1:
Groups 1 & 3
Applying the ‘Zero to 100’ quantitative scoring approach
Task
Using the 0 to 100 scoring system, the first task is to score the Humber Estuary Case Study (Management Unit 6) based on the qualitative and quantitative information provided in the Appraisal Summary Table (AST). The scoring will be applied to four impact categories, two representing environmental issues (‘physical habitats’ and ‘historical environment’) and two representing social issues (‘equity’ and ‘sense of community’).
A Scoring AST is provided for you to record the scores and the justifications for the scores given.
Points for discussion
Once the scoring is finished, consider the following points:
• Is the scoring based on objective information? • Is double counting avoided? • Does the system allow for small and large difference to be reflected in the
scores?• Does the approach reflect proportionality of impacts? • Does the approach take account of the uncertainty in the scoring?• Are the scores based on same/similar information as used to estimate the
monetary damages (and benefits) (i.e., risk of flooding, flood damages and probability)?
• Does it ensure transparency and stakeholder acceptability?
14 Appendix C1.2
Breakout session 1:
Groups 2 & 4
Applying the ‘100 relative’ quantitative scoring approach
Task
Using the 100 relative scoring system, the first task is to score the Humber Estuary Case Study (Management Unit 6) based on the qualitative and quantitative information provided in the Appraisal Summary Table (AST). The scoring will be applied to four impact categories, two representing environmental issues (‘physical habitats’ and ‘historical environment’) and two representing social issues (‘equity’ and ‘sense of community’).
A Scoring AST is provided for you to record the scores and the justifications for the scores given.
Points for discussion
Once the scoring is finished, consider the following points:
• Is the scoring based on objective information? • Is double counting avoided? • Does the system allow for small and large difference to be reflected in the
scores?• Does the approach reflect proportionality of impacts? • Does the approach take account of the uncertainty in the scoring?• Are the scores based on same/similar information as used to estimate the
monetary damages (and benefits) (i.e., risk of flooding, flood damages and probability)?
• Does it ensure transparency and stakeholder acceptability?
Background Information
The ‘100 relative’ scoring approach:
In the ‘100 relative’ scoring system the best performing option is given a score of 100. All other options are then scored relative to the best performing option such that the worst performing option is not fixed at a score of zero.
Appendix C1.2 15
Summary of the project area:
Management Unit 6 of the Humber Estuary Case Study runs from South Ferriby Cliff to North Killingholme and is mainly comprised of medium grade agricultural land for up to 3km inland. The main settlement in the area is Barton-upon-Humber. Clay pits immediately behind the defences between Chowder Ness and New Holland are important environmental and recreation sites, with some designated for their environmental value. There are also a number of small industrial areas, including New Holland Dock. The area is categorised as Land Use Band C, with an indicative standard of 1:10 to 1:1002.
Existing defences
About half of the defences between South Ferriby and New Holland Dock provide protection against a 1 in 50 year event. Around Barton Creek, some lengths of the defences give significantly lower standards. East of New Holland Dock, around 70% of the defences protect against an event with a return period of 1 in 20 years. In 50 years, the standard of defence is expected to fall such that about 50% of the defences will no longer protect against a 1 in 10 year event. The overall condition of the defences is fair to good. There is concern that erosion of mudflats may threaten the stability of the defences. There are also some lengths where the crest level of the embankment is low.
The ‘do-nothing’ option
The ‘do-nothing’ option assumes that there will be a breach in the defences by year 10, with a current probability of breaching of 0.1. A breach would result in inundation of much of the area, such that 1,615 residential properties, 100 non-residential properties and 1,085 ha of agricultural land would be written off. Sea level rise would result in the number of properties written off by year 99 increasing to 1,730 residential properties, 103 non-residential properties and 1,221 ha of agricultural land. Around the area written-off, there are additional residential and non-residential properties, and agricultural land that would face intermittent flooding and, hence, damages.
Geography of the area
Management Unit 6 is very flat, such that a large area is flooded on all flood events. Modelling of the area shows that the following proportions of the management unit would be flooded under different return period events:
2 According to the Flood and Coastal Defence Project Appraisal Guidance (FCDPAG 3),
indicative standards for flood and coastal defence are provided for five different land use bands (A to E) as an aid to authorities to help in establishing the range of options to be considered in the appraisal. Land use band C corresponds to typically large areas of high-grade agricultural land and/or environmental assets of national significance requiring protection with some properties also at risk, including caravans and temporary structures.
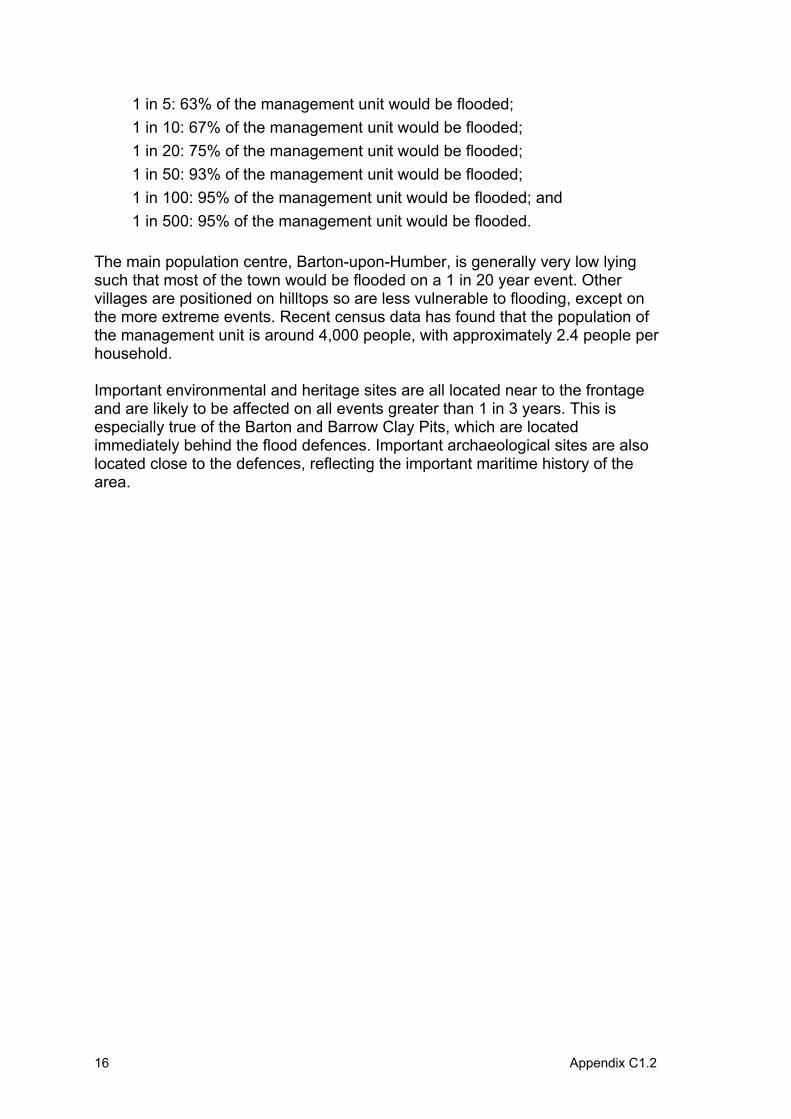
16 Appendix C1.2
• 1 in 5: 63% of the management unit would be flooded; • 1 in 10: 67% of the management unit would be flooded; • 1 in 20: 75% of the management unit would be flooded; • 1 in 50: 93% of the management unit would be flooded; • 1 in 100: 95% of the management unit would be flooded; and • 1 in 500: 95% of the management unit would be flooded.
The main population centre, Barton-upon-Humber, is generally very low lying such that most of the town would be flooded on a 1 in 20 year event. Other villages are positioned on hilltops so are less vulnerable to flooding, except on the more extreme events. Recent census data has found that the population of the management unit is around 4,000 people, with approximately 2.4 people per household.
Important environmental and heritage sites are all located near to the frontage and are likely to be affected on all events greater than 1 in 3 years. This is especially true of the Barton and Barrow Clay Pits, which are located immediately behind the flood defences. Important archaeological sites are also located close to the defences, reflecting the important maritime history of the area.
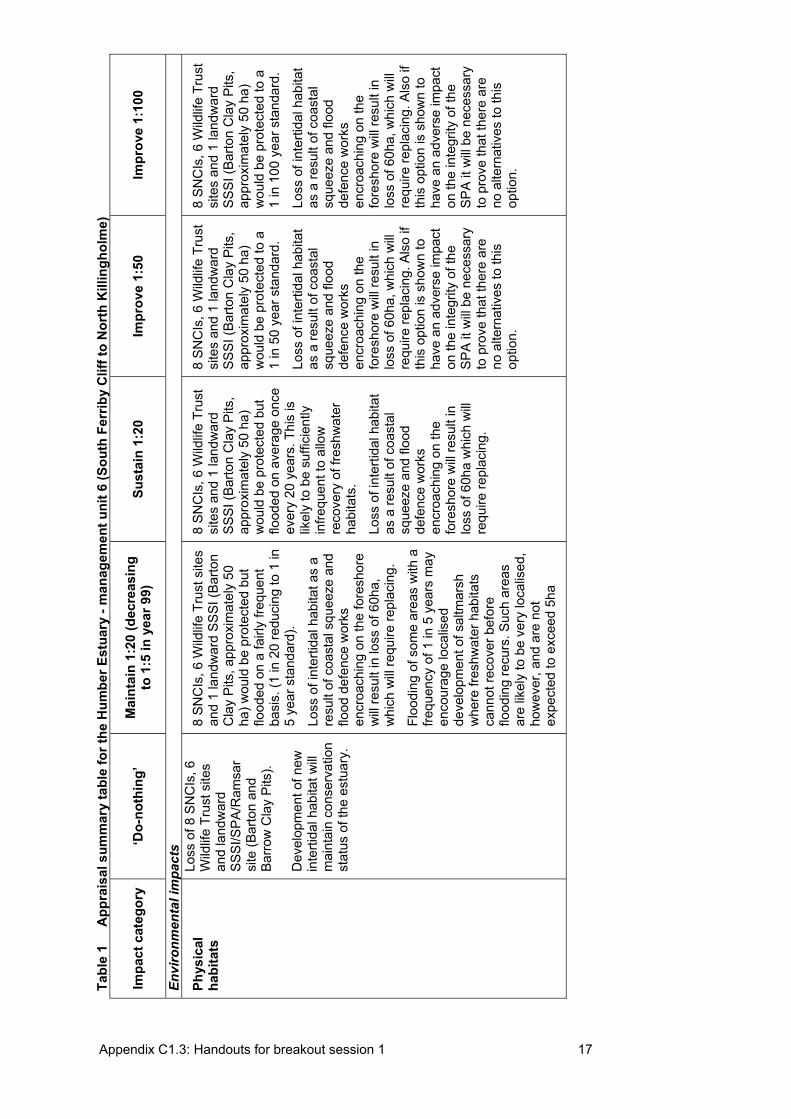
Tabl
e 1
A
ppra
isal
sum
mar
y ta
ble
for t
he H
umbe
r Est
uary
- m
anag
emen
t uni
t 6 (S
outh
Fer
riby
Clif
f to
Nor
th K
illin
ghol
me)
Impa
ct c
ateg
ory
‘Do-
noth
ing’
M
aint
ain
1:20
(dec
reas
ing
to 1
:5 in
yea
r 99)
Su
stai
n 1:
20
Impr
ove
1:50
Im
prov
e 1:
100
Envi
ronm
enta
l im
pact
s
Phys
ical
ha
bita
ts
Loss
of 8
SN
CIs
, 6
Wild
life
Trus
t site
s an
d la
ndw
ard
SS
SI/S
PA
/Ram
sar
site
(Bar
ton
and
Bar
row
Cla
y P
its).
Dev
elop
men
t of n
ew
inte
rtida
l hab
itat w
ill m
aint
ain
cons
erva
tion
stat
us o
f the
est
uary
.
8 S
NC
Is, 6
Wild
life
Trus
t site
s an
d 1
land
war
d S
SS
I (B
arto
n C
lay
Pits
, app
roxi
mat
ely
50
ha) w
ould
be
prot
ecte
d bu
t flo
oded
on
a fa
irly
frequ
ent
basi
s. (1
in 2
0 re
duci
ng to
1 in
5
year
sta
ndar
d).
Loss
of i
nter
tidal
hab
itat a
s a
resu
lt of
coa
stal
squ
eeze
and
flo
od d
efen
ce w
orks
en
croa
chin
g on
the
fore
shor
e w
ill re
sult
in lo
ss o
f 60h
a,
whi
ch w
ill re
quire
repl
acin
g.
Floo
ding
of s
ome
area
s w
ith a
fre
quen
cy o
f 1 in
5 y
ears
may
en
cour
age
loca
lised
de
velo
pmen
t of s
altm
arsh
w
here
fres
hwat
er h
abita
ts
cann
ot re
cove
r bef
ore
flood
ing
recu
rs. S
uch
area
s ar
e lik
ely
to b
e ve
ry lo
calis
ed,
how
ever
, and
are
not
ex
pect
ed to
exc
eed
5ha
8 S
NC
Is, 6
Wild
life
Trus
t si
tes
and
1 la
ndw
ard
SS
SI (
Bar
ton
Cla
y P
its,
appr
oxim
atel
y 50
ha)
w
ould
be
prot
ecte
d bu
t flo
oded
on
aver
age
once
ev
ery
20 y
ears
. Thi
s is
lik
ely
to b
e su
ffici
ently
in
frequ
ent t
o al
low
re
cove
ry o
f fre
shw
ater
ha
bita
ts.
Loss
of i
nter
tidal
hab
itat
as a
resu
lt of
coa
stal
sq
ueez
e an
d flo
od
defe
nce
wor
ks
encr
oach
ing
on th
e fo
resh
ore
will
resu
lt in
lo
ss o
f 60h
a w
hich
will
re
quire
repl
acin
g.
8 S
NC
Is, 6
Wild
life
Trus
t si
tes
and
1 la
ndw
ard
SS
SI (
Bar
ton
Cla
y P
its,
appr
oxim
atel
y 50
ha)
w
ould
be
prot
ecte
d to
a
1 in
50
year
sta
ndar
d.
Loss
of i
nter
tidal
hab
itat
as a
resu
lt of
coa
stal
sq
ueez
e an
d flo
od
defe
nce
wor
ks
encr
oach
ing
on th
e fo
resh
ore
will
resu
lt in
lo
ss o
f 60h
a, w
hich
will
requ
ire re
plac
ing.
Als
o if
this
opt
ion
is s
how
n to
ha
ve a
n ad
vers
e im
pact
on
the
inte
grity
of t
he
SP
A it
will
be n
eces
sary
to
pro
ve th
at th
ere
are
no a
ltern
ativ
es to
this
op
tion.
8 S
NC
Is, 6
Wild
life
Trus
t si
tes
and
1 la
ndw
ard
SS
SI (
Bar
ton
Cla
y P
its,
appr
oxim
atel
y 50
ha)
w
ould
be
prot
ecte
d to
a
1 in
100
yea
r sta
ndar
d.
Loss
of i
nter
tidal
hab
itat
as a
resu
lt of
coa
stal
sq
ueez
e an
d flo
od
defe
nce
wor
ks
encr
oach
ing
on th
e fo
resh
ore
will
resu
lt in
lo
ss o
f 60h
a, w
hich
will
requ
ire re
plac
ing.
Als
o if
this
opt
ion
is s
how
n to
ha
ve a
n ad
vers
e im
pact
on
the
inte
grity
of t
he
SP
A it
will
be n
eces
sary
to
pro
ve th
at th
ere
are
no a
ltern
ativ
es to
this
op
tion.
Appendix C1.3: Handouts for breakout session 1 17
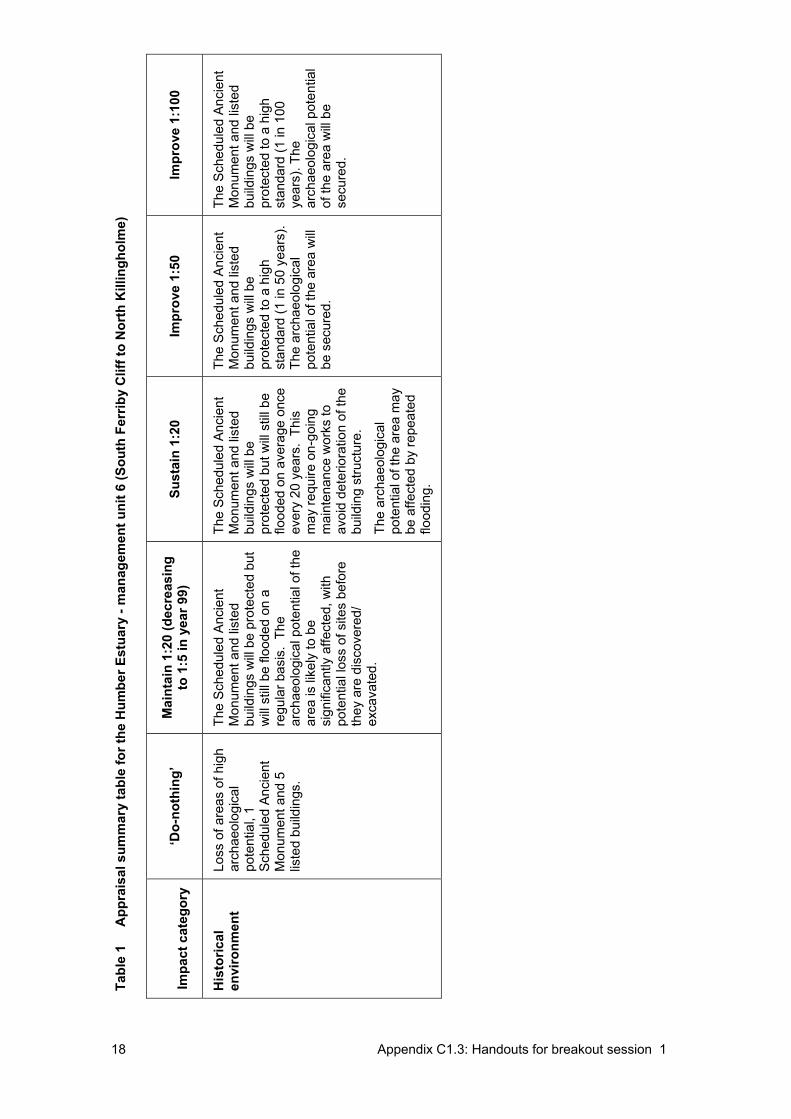
Tabl
e 1
A
ppra
isal
sum
mar
y ta
ble
for t
he H
umbe
r Est
uary
- m
anag
emen
t uni
t 6 (S
outh
Fer
riby
Clif
f to
Nor
th K
illin
ghol
me)
Impa
ct c
ateg
ory
‘Do-
noth
ing’
M
aint
ain
1:20
(dec
reas
ing
to 1
:5 in
yea
r 99)
Su
stai
n 1:
20
Impr
ove
1:50
Im
prov
e 1:
100
His
toric
al
envi
ronm
ent
Loss
of a
reas
of h
igh
arch
aeol
ogic
al
pote
ntia
l, 1
Sch
edul
ed A
ncie
nt
Mon
umen
t and
5
liste
d bu
ildin
gs.
The
Sch
edul
ed A
ncie
nt
Mon
umen
t and
list
ed
build
ings
will
be p
rote
cted
but
w
ill s
till b
e flo
oded
on
a re
gula
r bas
is.
The
arch
aeol
ogic
al p
oten
tial o
f the
ar
ea is
like
ly to
be
sign
ifica
ntly
affe
cted
, with
po
tent
ial l
oss
of s
ites
befo
re
they
are
dis
cove
red/
ex
cava
ted.
The
Sch
edul
ed A
ncie
nt
Mon
umen
t and
list
ed
build
ings
will
be
prot
ecte
d bu
t will
still
be
flood
ed o
n av
erag
e on
ce
ever
y 20
yea
rs.
This
m
ay re
quire
on-
goin
g m
aint
enan
ce w
orks
to
avoi
d de
terio
ratio
n of
the
build
ing
stru
ctur
e.
The
arch
aeol
ogic
al
pote
ntia
l of t
he a
rea
may
be
affe
cted
by
repe
ated
flo
odin
g.
The
Sch
edul
ed A
ncie
nt
Mon
umen
t and
list
ed
build
ings
will
be
prot
ecte
d to
a h
igh
stan
dard
(1 in
50
year
s).
The
arch
aeol
ogic
al
pote
ntia
l of t
he a
rea
will
be s
ecur
ed.
The
Sch
edul
ed A
ncie
nt
Mon
umen
t and
list
ed
build
ings
will
be
prot
ecte
d to
a h
igh
stan
dard
(1 in
100
ye
ars)
. The
ar
chae
olog
ical
pot
entia
l of
the
area
will
be
secu
red.
18 Appendix C1.3: Handouts for breakout session 1
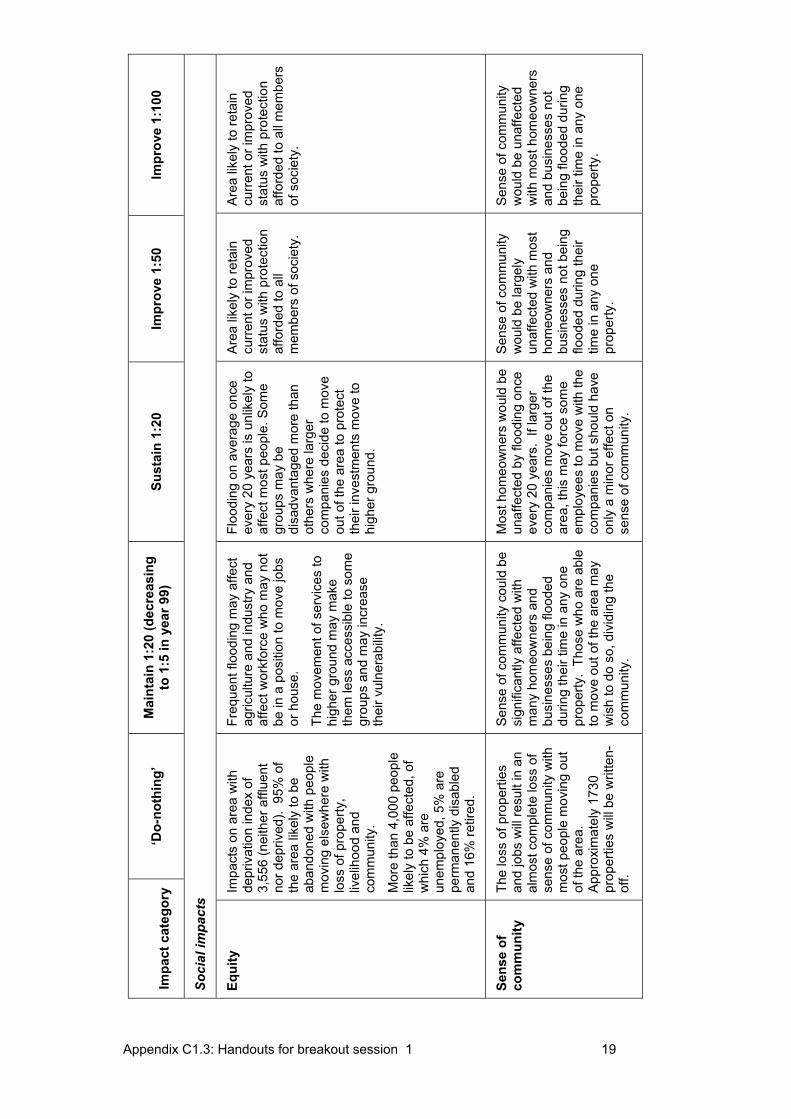
Impa
ct c
ateg
ory
‘Do-
noth
ing’
M
aint
ain
1:20
(dec
reas
ing
to 1
:5 in
yea
r 99)
Su
stai
n 1:
20
Impr
ove
1:50
Im
prov
e 1:
100
Soci
al im
pact
s
Equi
ty
Impa
cts
on a
rea
with
de
priv
atio
n in
dex
of
3,55
6 (n
eith
er a
fflue
nt
nor d
epriv
ed).
95%
of
the
area
like
ly to
be
aban
done
d w
ith p
eopl
e m
ovin
g el
sew
here
with
lo
ss o
f pro
perty
, liv
elih
ood
and
com
mun
ity.
Mor
e th
an 4
,000
peo
ple
likel
y to
be
affe
cted
, of
whi
ch 4
% a
re
unem
ploy
ed, 5
% a
re
perm
anen
tly d
isab
led
and
16%
retir
ed.
Freq
uent
floo
ding
may
affe
ct
agric
ultu
re a
nd in
dust
ry a
nd
affe
ct w
orkf
orce
who
may
not
be
in a
pos
ition
to m
ove
jobs
or
hou
se.
The
mov
emen
t of s
ervi
ces
to
high
er g
roun
d m
ay m
ake
them
less
acc
essi
ble
to s
ome
grou
ps a
nd m
ay in
crea
se
thei
r vul
nera
bilit
y.
Floo
ding
on
aver
age
once
ev
ery
20 y
ears
is u
nlik
ely
to
affe
ct m
ost p
eopl
e. S
ome
grou
ps m
ay b
e di
sadv
anta
ged
mor
e th
an
othe
rs w
here
larg
er
com
pani
es d
ecid
e to
mov
e ou
t of t
he a
rea
to p
rote
ct
thei
r inv
estm
ents
mov
e to
hi
gher
gro
und.
Are
a lik
ely
to re
tain
cu
rren
t or i
mpr
oved
st
atus
with
pro
tect
ion
affo
rded
to a
ll m
embe
rs o
f soc
iety
.
Are
a lik
ely
to re
tain
cu
rren
t or i
mpr
oved
st
atus
with
pro
tect
ion
affo
rded
to a
ll m
embe
rs
of s
ocie
ty.
Sens
e of
co
mm
unity
Th
e lo
ss o
f pro
perti
es
and
jobs
will
resu
lt in
an
alm
ost c
ompl
ete
loss
of
sens
e of
com
mun
ity w
ith
mos
t peo
ple
mov
ing
out
of th
e ar
ea.
App
roxi
mat
ely
1730
pr
oper
ties
will
be w
ritte
n-of
f.
Sen
se o
f com
mun
ity c
ould
be
sign
ifica
ntly
affe
cted
with
m
any
hom
eow
ners
and
bu
sine
sses
bei
ng fl
oode
d du
ring
thei
r tim
e in
any
one
pr
oper
ty.
Thos
e w
ho a
re a
ble
to m
ove
out o
f the
are
a m
ay
wis
h to
do
so, d
ivid
ing
the
com
mun
ity.
Mos
t hom
eow
ners
wou
ld b
e un
affe
cted
by
flood
ing
once
ev
ery
20 y
ears
. If
larg
er
com
pani
es m
ove
out o
f the
ar
ea, t
his
may
forc
e so
me
empl
oyee
s to
mov
e w
ith th
e co
mpa
nies
but
sho
uld
have
on
ly a
min
or e
ffect
on
sens
e of
com
mun
ity.
Sen
se o
f com
mun
ity
wou
ld b
e la
rgel
y un
affe
cted
with
mos
t ho
meo
wne
rs a
nd
busi
ness
es n
ot b
eing
flo
oded
dur
ing
thei
r tim
e in
any
one
pr
oper
ty.
Sen
se o
f com
mun
ity
wou
ld b
e un
affe
cted
w
ith m
ost h
omeo
wne
rs
and
busi
ness
es n
ot
bein
g flo
oded
dur
ing
thei
r tim
e in
any
one
pr
oper
ty.
Appendix C1.3: Handouts for breakout session 1 19
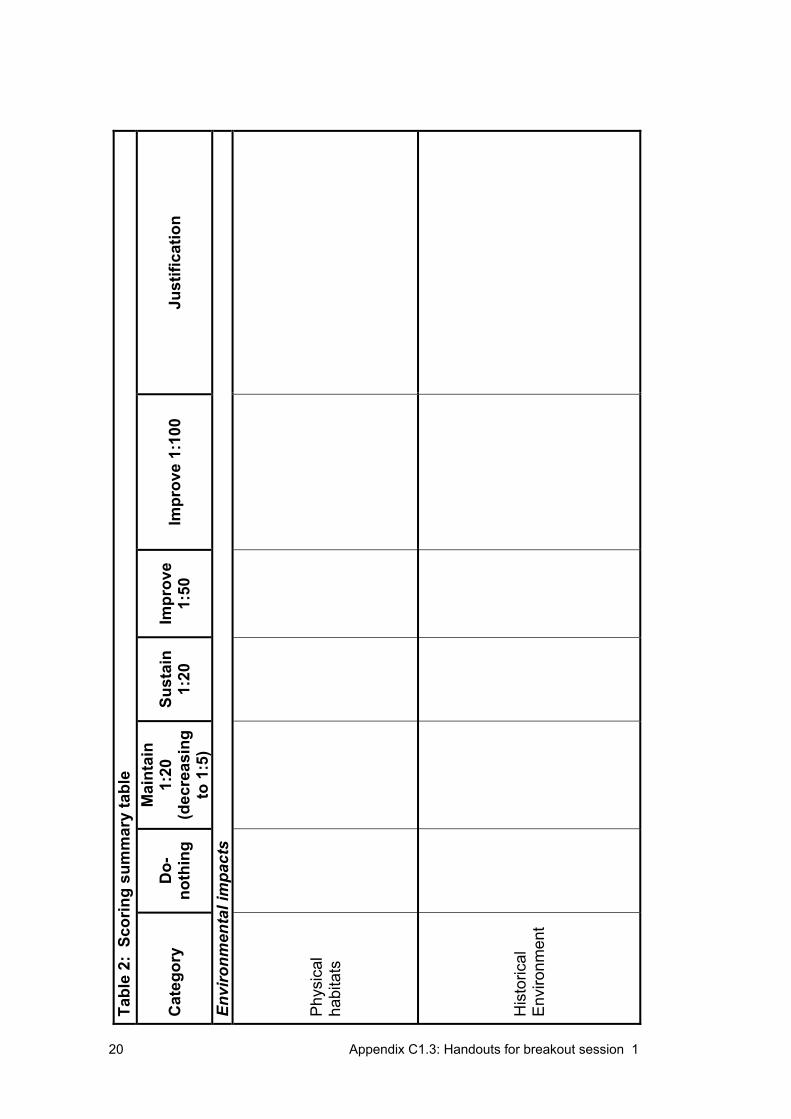
Tabl
e 2:
Sco
ring
sum
mar
y ta
ble
Cat
egor
y D
o-no
thin
g
Mai
ntai
n1:
20(d
ecre
asin
gto
1:5
)
Sust
ain
1:20
Impr
ove
1:50
Impr
ove
1:10
0 Ju
stifi
catio
n
Envi
ronm
enta
l im
pact
s
Phy
sica
lha
bita
ts
His
toric
alE
nviro
nmen
t
20 Appendix C1.3: Handouts for breakout session 1
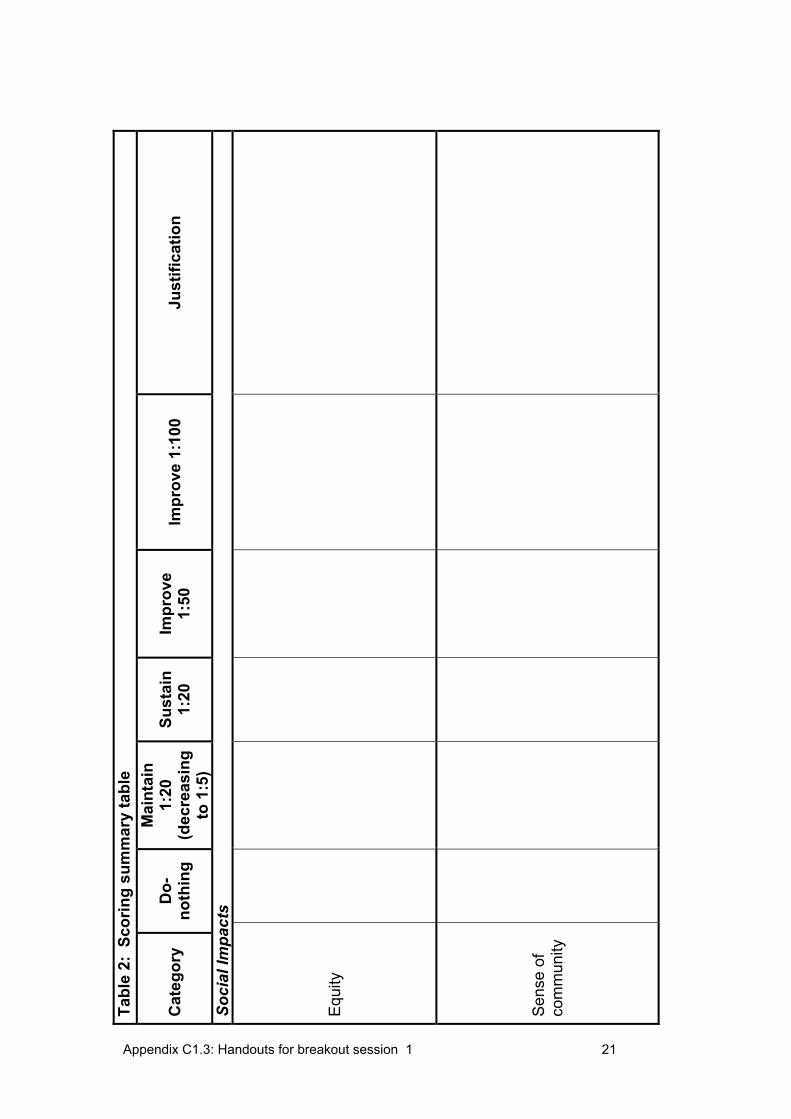
Tabl
e 2:
Sco
ring
sum
mar
y ta
ble
Cat
egor
y D
o-no
thin
g
Mai
ntai
n1:
20(d
ecre
asin
gto
1:5
)
Sust
ain
1:20
Impr
ove
1:50
Impr
ove
1:10
0 Ju
stifi
catio
n
Soci
al Im
pact
s
Equ
ity
Sen
se o
f co
mm
unity
Appendix C1.3: Handouts for breakout session 1 21

Appendix C1.3 22
Appendix C1.3:
Handouts for breakout session 2
Appendix C1.3 23
Breakout session:
Groups 1, 2, 3 & 4
Identifying characteristics and recovery times
Task:
Taking into consideration the background information and the conclusions from the scoring exercise preformed in the morning:
• identify the most appropriate characteristics of the category that is affected by flooding; and
• identify recovery time of that characteristic for each of the options being considered.
For this task use the characteristic and recovery time Tables provided.
Points for discussion
Once the scoring is finished, consider the following points:
• Is the scoring based on objective information? • Is double counting avoided? • Does the system allow for small and large difference to be reflected in the
scores?• Does the approach reflect proportionality of impacts? • Does the approach take account of the uncertainty in the scoring?• Are the scores based on same/similar information as used to estimate the
monetary damages (and benefits) (i.e., risk of flooding, flood damages and probability)? And
• Does it ensure transparency and stakeholder acceptability?
Appendix C1.3 24
Background information:
The aim of the ChaRT scoring system is to reflect the impacts of a flood on each category, with the scores calculated numerically using a more flood-focussed basis.
For each impact category, it is necessary to determine two factors in order to be able to assign a score:
• characteristic of the category that is affected by flooding, i.e. a measure of the amount of a particular category affected and could relate to an area, a number, etc.; and
• recovery time of that characteristic, which is defined as the minimum time required between events for impacts on that category to be reduced to zero. From this definition, it can be deduced that if a flood occurs before there has been time for full recovery, the impacts of an option would be much greater than if the next flood event occurs several years after full recovery has been achieved.
Once these two factors have been identified (or estimated), the scores can be calculated automatically using the same approach as is used in the Asset AAD worksheet of the FCDPAG 3 spreadsheets
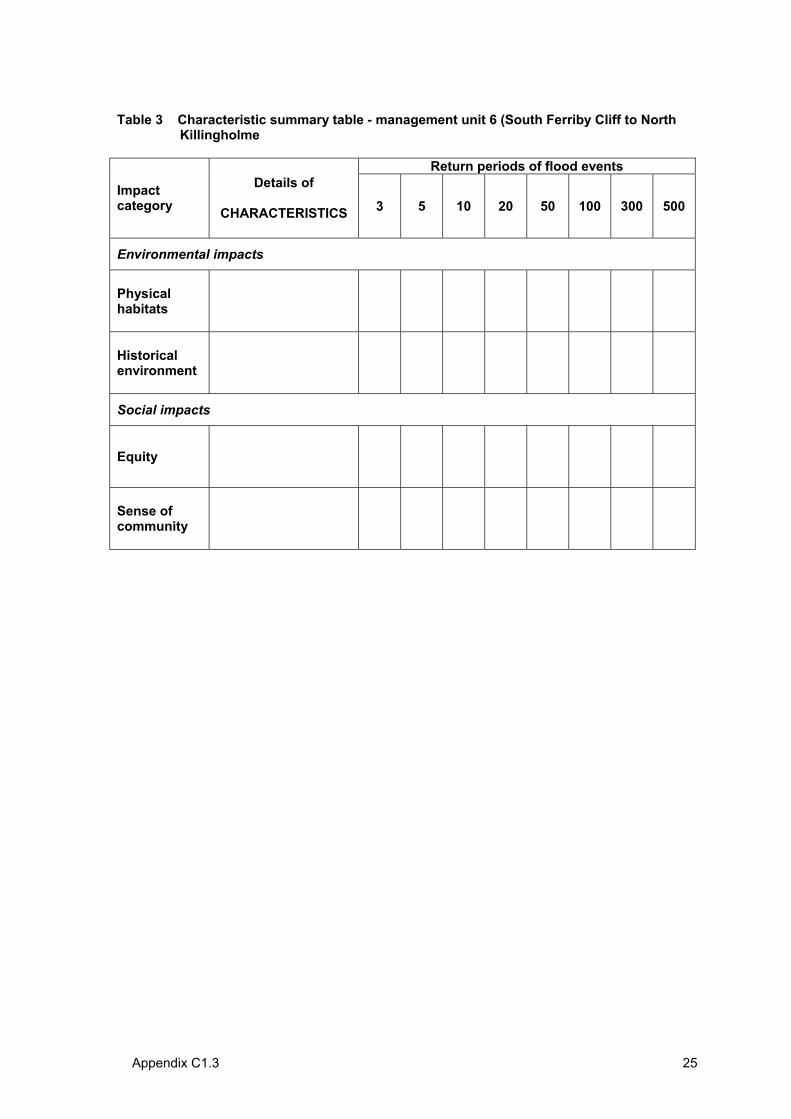
Appendix C1.3 25
Table 3 Characteristic summary table - management unit 6 (South Ferriby Cliff to North Killingholme
Return periods of flood events
Impactcategory
Details of
CHARACTERISTICS 3 5 10 20 50 100 300 500
Environmental impacts
Physical habitats
Historical environment
Social impacts
Equity
Sense of community
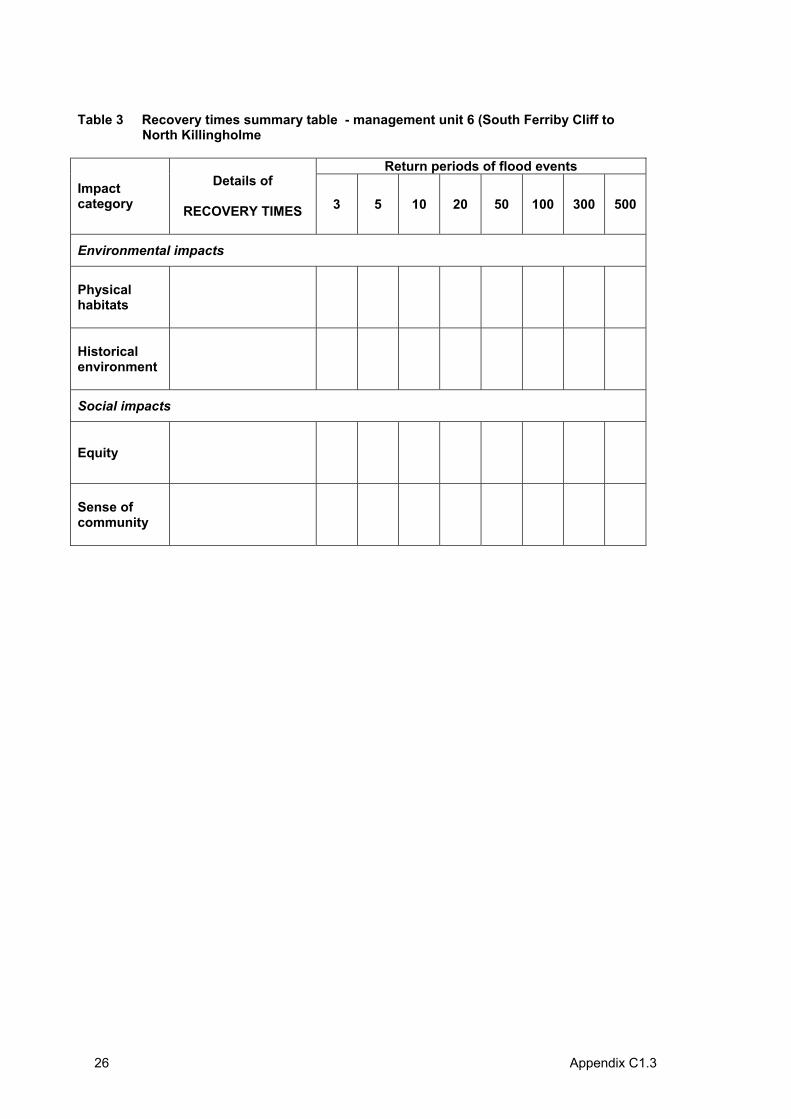
Appendix C1.3 26
Table 3 Recovery times summary table - management unit 6 (South Ferriby Cliff to North Killingholme
Return periods of flood events Impactcategory
Details of
RECOVERY TIMES 3 5 10 20 50 100 300 500
Environmental impacts
Physical habitats
Historical environment
Social impacts
Equity
Sense of community