irrigation management
TRANSCRIPT


This page intentionally left blank


CABI is a trading name of CAB International
CABI Head Offi ce CABI North American Offi ceNosworthy Way 875 Massachusetts AvenueWallingford 7th FloorOxfordshire OX10 8DE Cambridge, MA 02139UK USA
Tel: +44 (0)1491 832111 Tel: +1 617 395 4056Fax: +44 (0)1491 833508 Fax: +1 617 354 6875E-mail: [email protected] E-mail: [email protected]:www.cabi.org
© M.A. Burton 2010. All rights reserved. No part of this publication may be reproduced in any form or by any means, electronically, mechanically, by photocopying, recording or otherwise, without the prior permission of the copyright owners.
A catalogue record for this book is available from the British Library, London, UK.
Library of Congress Cataloging-in-Publication Data
Burton, Martin, Dr. Irrigation management: principles and practices/M.A. Burton. p. cm. Includes bibliographical references and index. ISBN: 978-1-84593-516-0 (alk. paper) 1. Irrigation–Management. 2. Drainage–Management. I. Title.
TC812.B87 2010 333.91’3–dc22
2009033245
ISBN: 978 1 84593 516 0
Commissioning editor: Nigel Farrar Production editor: Shankari Wilford
Typeset by SPi, Pondicherry, India.Printed and bound in the UK by CPI Antony Rowe Ltd.
About the Author vii
Preface ix
1 Introduction 1
2 Components of Irrigation and Drainage Systems 11
3 Management 36
4 Operation of the Main System 64
5 Operation at the On-Farm Level 122
6 Maintenance 180
7 Training 218
8 Irrigation Management Transfer and Organizational Restructuring 248
9 Performance Assessment, Monitoring and Evaluation 293
References 347
Appendix 1. Scheduling Irrigation Water Exercise 351
Appendix 2. Checklist for Assessing the Performance of Water Users 359 Associations or Federations of Water Users Associations
Index 369
Contents
v

This page intentionally left blank
vii
My interest in irrigation management stems back to an assignment in 1977 as a junior professional on the East Java Design Team, Indonesia, working as part of a team helping to modernize the operation and maintenance (O&M) procedures for the East Java Irrigation Service. For 18 months I worked with an experienced Indonesian colleague, Arief Effendi, in the Mojokerto office inspecting all irrigation and drainage systems in the 32,000 ha com-mand area, and then worked with the O&M engineers and technicians to introduce updated O&M procedures for these systems. At the same time we worked with the Juru Pengairan(Irrigation Service water master), village leaders and the jogotirto (village water master) of the 108 ha Blendren tertiary unit on measures to improve on-farm operation and main-tenance. I am indebted to Arief Effendi and our colleagues in Mojokerto for sharing their knowledge and experience with me, and hope that in some small way this book repays the debt I own them.
This interest in irrigation and drainage management developed over the years with vari-ous assignments as an O&M Engineer and a return to East Java as the Training Officer on the World Bank-funded East Java Irrigation Project, where I again worked with Arief Effendi and two colleagues, Bin Yali and Satrio, on organizing training courses for Irrigation Service sub-section office staff and water masters in one irrigation district of 140,000 ha command area. This training programme was novel at the time in its focus on practical classroom exercises and practical fieldwork, with the trainers travelling to work with the staff in their offices and on their systems rather than the trainees travelling to a central training centre. The concept was considered to be successful and expanded under subsequent World Bank projects to other regions in Indonesia.
In 1986 I joined the staff of the Institute of Irrigation Studies at the University of Southampton to lecture in management, operation and maintenance of irrigation and drainage schemes on the MSc Irrigation Engineering course. I quickly learnt that not everyone shared my enthusiasm for irrigation and drainage management, and that designing and building schemes was considered more interesting and challenging. It was, however, noticeable over the 14 years I spent at the University how this attitude changed, and how those attending the MSc course and associated short courses had a growing concern and interest in improving the management of irrigation and drainage schemes.
While teaching at Southampton I was aware that I needed to better understand general management, and therefore studied for an MBA at Henley Management College. This devel-oped my awareness and understanding of management and administration systems, and
About the Author
viii About the Author
led to work in restructuring of government-run irrigation and drainage agencies. I am sure that this is an area where we will see significant changes in the coming years, as government agencies modernize to meet the challenges we are facing in irrigation and water resources management.
Acknowledgements are due to many people over the years. To Robert Chambers in the initial instance for his work in the 1980s on irrigation management, and the identification of ‘blind spots’, which included main system management, night irrigation, and incentives and motivation for managers. Also thanks to my many professional colleagues in consulting engineers Mott MacDonald and later at the University of Southampton in the Institute of Irrigation and Development Studies. I am grateful to Alan Beadle, Mike Snell, Melvyn Kay and Tim Jackson for comments on initial drafts of this book, and to Masood Khan, Ian Smout, Don Brown, Mark Svendsen, Ian Carruthers, Rien Bos, Hector Malano, Charles Abernethy, Flip Wester, Laurence Smith, Jerry Neville, David Molden, Hammond Murray-Rust, Ian Anderson, Sam Johnston III and Joop Stoutjesdijk for their contribution over the years to my understanding of irrigation management. I am indebted to Dr Safwat Abdel-Dayem for never letting me forget that it is irrigation and drainage, and that for many schemes drainage is sometimes the central issue for sustainable irrigated agriculture.
Martin BurtonItchen Stoke
July 2009
ix
There is increasing pressure worldwide on available water resources. These pressures arise from a number of factors, including growing populations, increased wealth and urbanization, increased industrialization, and demands from society and environmental groups for safe-guards to protect water resources and the aquatic environment. In many locations climate change is adding to these pressures.
In many countries irrigated agriculture consumes a large proportion of the available water resources, often over 70% of the total. There is considerable pressure to release water for other uses, and as a sector, irrigated agriculture will have to increase its efficiency and productivity of water use. A new era is dawning for water management in the irrigated agriculture sec-tor, where the management effort and returns to management are required, recognized and rewarded.
This book draws on the author’s experience and work over 30 years and in some 28 countries in the management, operation and maintenance of irrigation and drainage schemes. The book provides knowledge for management of irrigation and drainage sys-tems in the 21st century, covering the traditional technical areas related to system opera-tion and maintenance and expanding managerial, institutional and organizational aspects related to the changing political, social and economic environment. It lays emphasis on the management of irrigation as a business enterprise, moving management thinking out of traditional public sector mindsets to more customer-focused, performance-oriented service delivery.
A significant proportion of the irrigation and drainage systems worldwide are manually operated gravity systems managed by government agencies with large numbers of water users farming relatively small landholdings. The total area worldwide in this category is over 165 million ha, which is over 60% of the total area irrigated worldwide. It is in such systems where improvements in management are most required, and in which the most substantial benefits can be obtained.
The book seeks to provide practical guidelines to improve the three key processes of management, operation and maintenance of such systems. In the management context it deals with institutional issues, such as water law, and management structures and management processes, including establishing and working with water users associations, restructur-ing irrigation and drainage agencies, fee setting and cost recovery. In the operation con-text the book provides practical guidance on key operation processes, including irrigation
Preface

x Preface
scheduling at main system and on-farm level, and performance management tools. In the maintenance context it covers maintenance management processes, including maintenance identification, planning, budgeting, implementation, supervision and recording. Asset management is increasingly used as a tool for maintenance management, and is covered in some detail.
©Martin Burton 2010. Irrigation Management: Principles and Practices (Martin Burton) 1
1
Introduction
This chapter looks at the historical develop-ment of irrigation and the pressure that this development has placed on the world’s water resources. The issues facing irrigation and the associated development of water resources are discussed and the role that irrigation management can play in addressing these is outlined.
Historical Development
Irrigation and drainage development
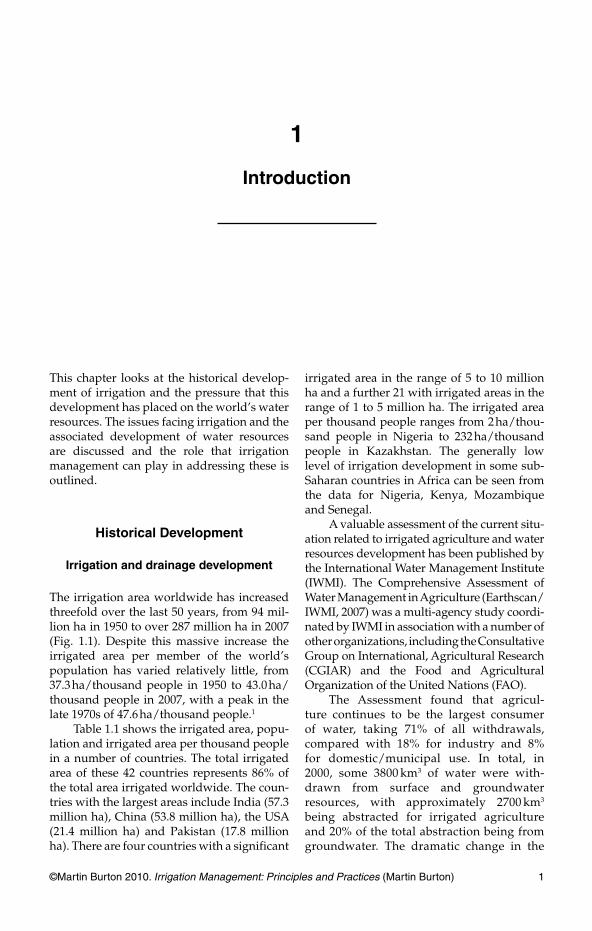
The irrigation area worldwide has increased threefold over the last 50 years, from 94 mil-lion ha in 1950 to over 287 million ha in 2007 (Fig. 1.1). Despite this massive increase the irrigated area per member of the world’s population has varied relatively little, from 37.3 ha/thousand people in 1950 to 43.0 ha/thousand people in 2007, with a peak in the late 1970s of 47.6 ha/thousand people.1
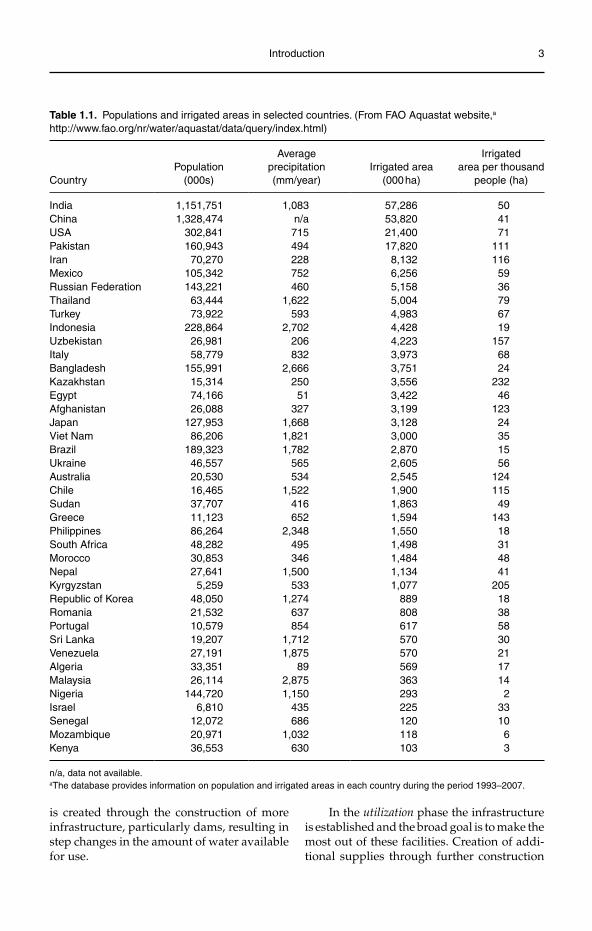
Table 1.1 shows the irrigated area, popu-lation and irrigated area per thousand people in a number of countries. The total irrigated area of these 42 countries represents 86% of the total area irrigated worldwide. The coun-tries with the largest areas include India (57.3 million ha), China (53.8 million ha), the USA (21.4 million ha) and Pakistan (17.8 million ha). There are four countries with a significant
irrigated area in the range of 5 to 10 million ha and a further 21 with irrigated areas in the range of 1 to 5 million ha. The irrigated area per thousand people ranges from 2 ha/thou-sand people in Nigeria to 232 ha/thousand people in Kazakhstan. The generally low level of irrigation development in some sub-Saharan countries in Africa can be seen from the data for Nigeria, Kenya, Mozambique and Senegal.
A valuable assessment of the current situ-ation related to irrigated agriculture and water resources development has been published by the International Water Management Institute (IWMI). The Comprehensive Assessment of Water Management in Agriculture (Earthscan/IWMI, 2007) was a multi-agency study coordi-nated by IWMI in association with a number of other organizations, including the Consultative Group on International, Agricultural Research (CGIAR) and the Food and Agricultural Organization of the United Nations (FAO).
The Assessment found that agricul-ture continues to be the largest consumer of water, taking 71% of all withdrawals, compared with 18% for industry and 8% for domestic/municipal use. In total, in 2000, some 3800 km3 of water were with-drawn from surface and groundwater resources, with approximately 2700 km3
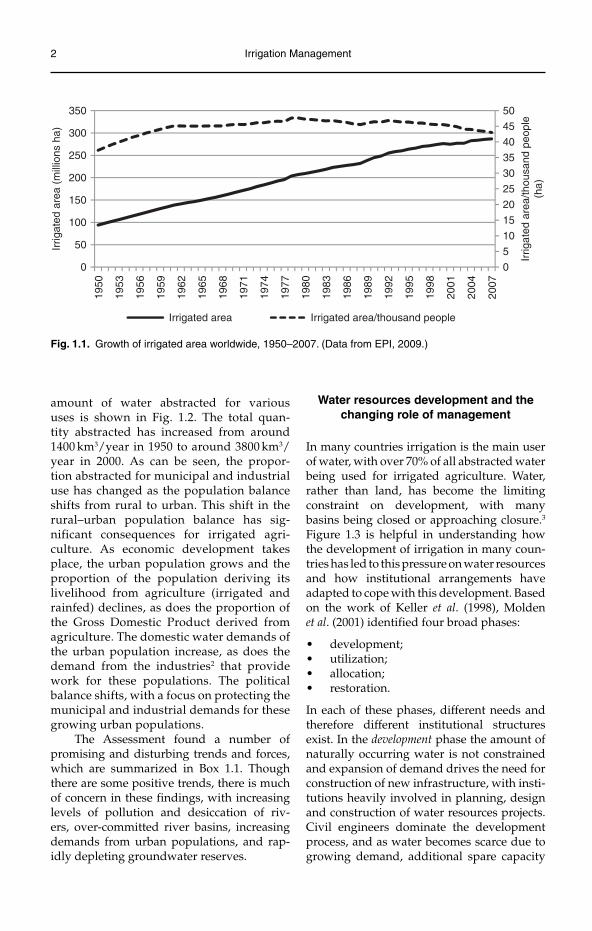
being abstracted for irrigated agriculture and 20% of the total abstraction being from groundwater. The dramatic change in the
2 Irrigation Management
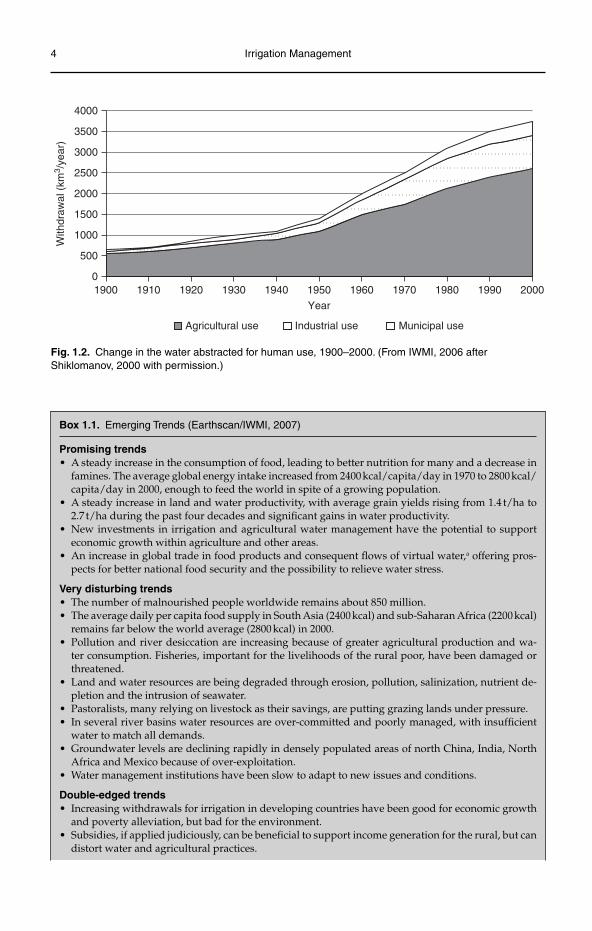
amount of water abstracted for various uses is shown in Fig. 1.2. The total quan-tity abstracted has increased from around 1400 km3/year in 1950 to around 3800 km3/year in 2000. As can be seen, the propor-tion abstracted for municipal and industrial use has changed as the population balance shifts from rural to urban. This shift in the rural–urban population balance has sig-nificant consequences for irrigated agri-culture. As economic development takes place, the urban population grows and the proportion of the population deriving its livelihood from agriculture (irrigated and rainfed) declines, as does the proportion of the Gross Domestic Product derived from agriculture. The domestic water demands of the urban population increase, as does the demand from the industries2 that provide work for these populations. The political balance shifts, with a focus on protecting the munici pal and industrial demands for these growing urban populations.
The Assessment found a number of promising and disturbing trends and forces, which are summarized in Box 1.1. Though there are some positive trends, there is much of concern in these findings, with increasing levels of pollution and desiccation of riv-ers, over-committed river basins, increasing demands from urban populations, and rap-idly depleting groundwater reserves.
Water resources development and the changing role of management
In many countries irrigation is the main user of water, with over 70% of all abstracted water being used for irrigated agriculture. Water, rather than land, has become the limiting constraint on development, with many basins being closed or approaching closure.3
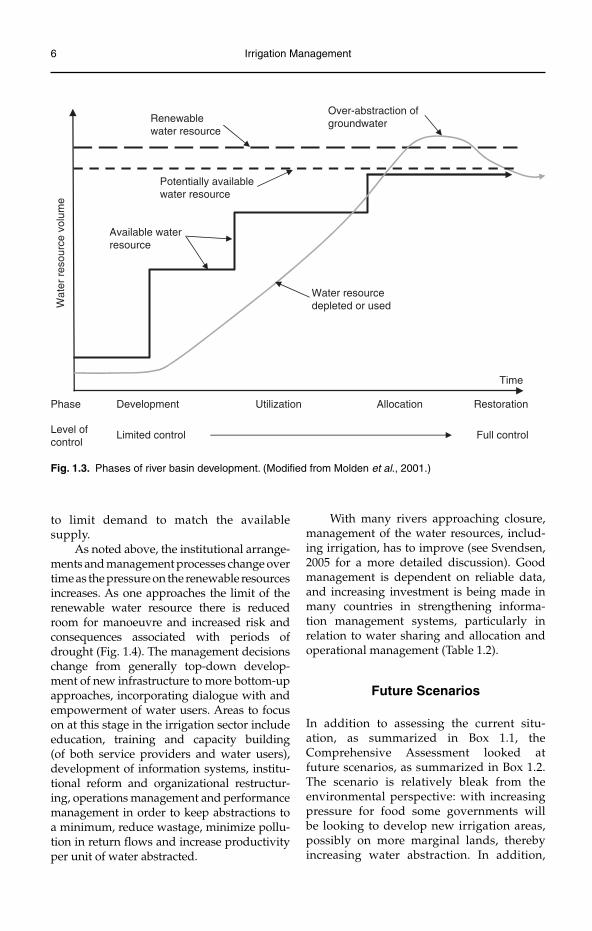
Figure 1.3 is helpful in understanding how the development of irrigation in many coun-tries has led to this pressure on water resources and how institutional arrangements have adapted to cope with this development. Based on the work of Keller et al. (1998), Molden et al. (2001) identified four broad phases:
development;•utilization;•allocation;•restoration.•
In each of these phases, different needs and therefore different institutional structures exist. In the development phase the amount of naturally occurring water is not constrained and expansion of demand drives the need for construction of new infrastructure, with insti-tutions heavily involved in planning, design and construction of water resources projects. Civil engineers dominate the development process, and as water becomes scarce due to growing demand, additional spare capacity
0
5
10
15
20
25
30
35
40
45
50
0
50
100
150
200
250
300
35019
50
1953
1956
1959
1962
1965
1968
1971
1974
1977
1980
1983
1986
1989
1992
1995
1998
2001
2004
2007
Irrig
ated
are
a/th
ousa
nd p
eopl
e(h
a)
Irrig
ated
are
a (m
illio
ns h
a)
Irrigated area Irrigated area/thousand people
Fig. 1.1. Growth of irrigated area worldwide, 1950–2007. (Data from EPI, 2009.)
Introduction 3
Table 1.1. Populations and irrigated areas in selected countries. (From FAO Aquastat website,a
http://www.fao.org/nr/water/aquastat/data/query/index.html)
CountryPopulation
(000s)
Average precipitation(mm/year)
Irrigated area(000 ha)
Irrigatedarea per thousand
people (ha)
India 1,151,751 1,083 57,286 50China 1,328,474 n/a 53,820 41USA 302,841 715 21,400 71Pakistan 160,943 494 17,820 111Iran 70,270 228 8,132 116Mexico 105,342 752 6,256 59Russian Federation 143,221 460 5,158 36Thailand 63,444 1,622 5,004 79Turkey 73,922 593 4,983 67Indonesia 228,864 2,702 4,428 19Uzbekistan 26,981 206 4,223 157Italy 58,779 832 3,973 68Bangladesh 155,991 2,666 3,751 24Kazakhstan 15,314 250 3,556 232Egypt 74,166 51 3,422 46Afghanistan 26,088 327 3,199 123Japan 127,953 1,668 3,128 24Viet Nam 86,206 1,821 3,000 35Brazil 189,323 1,782 2,870 15Ukraine 46,557 565 2,605 56Australia 20,530 534 2,545 124Chile 16,465 1,522 1,900 115Sudan 37,707 416 1,863 49Greece 11,123 652 1,594 143Philippines 86,264 2,348 1,550 18South Africa 48,282 495 1,498 31Morocco 30,853 346 1,484 48Nepal 27,641 1,500 1,134 41Kyrgyzstan 5,259 533 1,077 205Republic of Korea 48,050 1,274 889 18Romania 21,532 637 808 38Portugal 10,579 854 617 58Sri Lanka 19,207 1,712 570 30Venezuela 27,191 1,875 570 21Algeria 33,351 89 569 17Malaysia 26,114 2,875 363 14Nigeria 144,720 1,150 293 2Israel 6,810 435 225 33Senegal 12,072 686 120 10Mozambique 20,971 1,032 118 6Kenya 36,553 630 103 3
n/a, data not available.aThe database provides information on population and irrigated areas in each country during the period 1993–2007.
is created through the construction of more infrastructure, particularly dams, resulting in step changes in the amount of water available for use.
In the utilization phase the infrastructure is established and the broad goal is to make the most out of these facilities. Creation of addi-tional supplies through further construction
4 Irrigation Management
0
500
1000
1500
2000
2500
3000
3500
4000
1900 1910 1920 1930 1940 1950 1960 1970 1980 1990 2000
With
draw
al (
km3 /
year
)
Year
Municipal useIndustrial useAgricultural use
Fig. 1.2. Change in the water abstracted for human use, 1900–2000. (From IWMI, 2006 after Shiklomanov, 2000 with permission.)
Box 1.1. Emerging Trends (Earthscan/IWMI, 2007)
Promising trends A steady increase in the consumption of food, leading to better nutrition for many and a decrease in •famines. The average global energy intake increased from 2400 kcal/capita/day in 1970 to 2800 kcal/capita/day in 2000, enough to feed the world in spite of a growing population. A steady increase in land and water productivity, with average grain yields rising from 1.4 t/ha to •2.7 t/ha during the past four decades and signifi cant gains in water productivity. New investments in irrigation and agricultural water management have the potential to support •economic growth within agriculture and other areas. An increase in global trade in food products and consequent fl ows of virtual water,• a offering pros-pects for better national food security and the possibility to relieve water stress.
Very disturbing trendsThe number of malnourished people worldwide remains about 850 million.• The average daily per capita food supply in South Asia (2400 kcal) and sub-Saharan Africa (2200 kcal) •remains far below the world average (2800 kcal) in 2000. Pollution and river desiccation are increasing because of greater agricultural production and wa-•ter consumption. Fisheries, important for the livelihoods of the rural poor, have been damaged or threatened. Land and water resources are being degraded through erosion, pollution, salinization, nutrient de-•pletion and the intrusion of seawater.Pastoralists, many relying on livestock as their savings, are putting grazing lands under pressure.• In several river basins water resources are over-committed and poorly managed, with insuffi cient •water to match all demands. Groundwater levels are declining rapidly in densely populated areas of north China, India, North •Africa and Mexico because of over-exploitation.Water management institutions have been slow to adapt to new issues and conditions.•
Double-edged trends Increasing withdrawals for irrigation in developing countries have been good for economic growth •and poverty alleviation, but bad for the environment. Subsidies, if applied judiciously, can be benefi cial to support income generation for the rural, but can •distort water and agricultural practices.
Introduction 5
The growing demand of cities and industries for water offers possibilities for employment and in-•come, but it also shifts water out of agriculture, puts extra strain on rural communities and pollutes water. Fish and meat consumption is rising, increasing the reliance on aquaculture and industrial live-•stock production, with some positive well-being and income benefi ts but greater pressure on water resources and the environment.
And emerging forces The climate is changing, which will affect existing temperatures and patterns of precipitation. Agri-•culture nearer the equator – where most poor countries are situated – will be affected most. Globalization continues over the long run, providing opportunities for commercial and high-value •agriculture but posing challenges for rural development. Urbanization increases the demand for water, generates more wastewater and changes patterns of •demand for agricultural products, all affecting agricultural practices. Higher energy prices increase the costs of pumping water, applying fertilizers and transporting •products. Greater reliance on bioenergy is affecting food crop prices and water used by agriculture. Perceptions and thinking about water are changing, with more attention to green water• b resources (in the soil), not just to blue waterc resources (in lakes, rivers and aquifers). More attention is also being given to ecosystem and integrated approaches and to understanding •how forces outside water for agriculture infl uence both water and agriculture.
aVirtual water is the water used to produce food products. If 1t of grain requires 2t of water to grow, importing 1t of grain is equivalent to importing 2t of water.bGreen water is the term applied to water provided by rainfall, stored in the root zone and consumed by natural vegetation and rainfed agriculture.cBlue water refers to the runoff from rainfall, which is stored in lakes, wetlands and aquifers.
activities is constrained, and thus increased attention is paid to water management to conserve water and optimize productivity of available water. In this phase institutions are primarily concerned with management within discrete units for irrigation, water supply, industry, hydroelectric power, etc.
In the allocation phase, when closure starts as depletion approaches the poten-tial available water, there is limited scope for further development. Various measures are taken to maximize the productivity of water and managing demand becomes an issue. With little opportunity for making real water savings, reallocation of the available water from lower- to higher-value uses takes place. Institutions are primarily involved in allocation, conflict resolution and regula-tion, with several management and regula-tory functions gaining prominence, such as inter-sectoral allocation and water trading. Coordination between the different, compet-ing interests becomes an issue and moves are made for coordinating river basin manage-ment forums to resolve conflict and facilitate management.
In the restoration phase efforts are made to restore the river basin to a balance with its renewable resources. In many cases water is abstracted beyond the renewable resource; this is particularly the case with groundwater where the resource is mined and groundwater levels fall year-on-year. Measures here may include taking irrigated areas out of produc-tion and limiting further population growth and industrial development in the river basin. Some technical interventions may be possible in this phase, such as inter-basin transfers, but regulation (particularly enforcement) and management are most prominent. Political involvement is also required where tough decisions are needed to return the basin to a balanced situation.
Thus in the early stages of river basin development the focus is on planning and construction of infrastructure to increase the quantity of the renewable resource made available for use. Over time the focus changes to management rather than con-struction, initially with measures to match supply with the increasing demand (sup-ply management) and later with measures
6 Irrigation Management
Renewablewater resource
Potentially available water resource
Water resource depleted or used
UtilizationDevelopment Allocation
Wat
er r
esou
rce
volu
me
Time
Limited control Full control
Restoration
Available waterresource
Phase
Level ofcontrol
Over-abstraction ofgroundwater
Fig. 1.3. Phases of river basin development. (Modified from Molden et al., 2001.)
to limit demand to match the available supply.
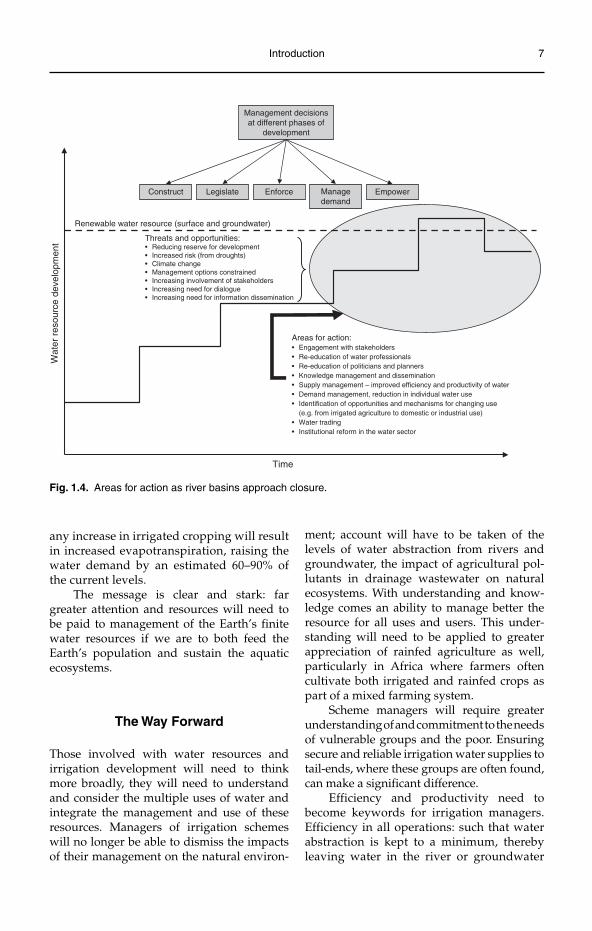
As noted above, the institutional arrange-ments and management processes change over time as the pressure on the renewable resources increases. As one approaches the limit of the renewable water resource there is reduced room for manoeuvre and increased risk and consequences associated with periods of drought (Fig. 1.4). The management decisions change from generally top-down develop-ment of new infrastructure to more bottom-up approaches, incorporating dialogue with and empowerment of water users. Areas to focus on at this stage in the irrigation sector include education, training and capacity building (of both service providers and water users), development of information systems, institu-tional reform and organizational restructur-ing, operations management and performance management in order to keep abstractions to a minimum, reduce wastage, minimize pollu-tion in return flows and increase productivity per unit of water abstracted.
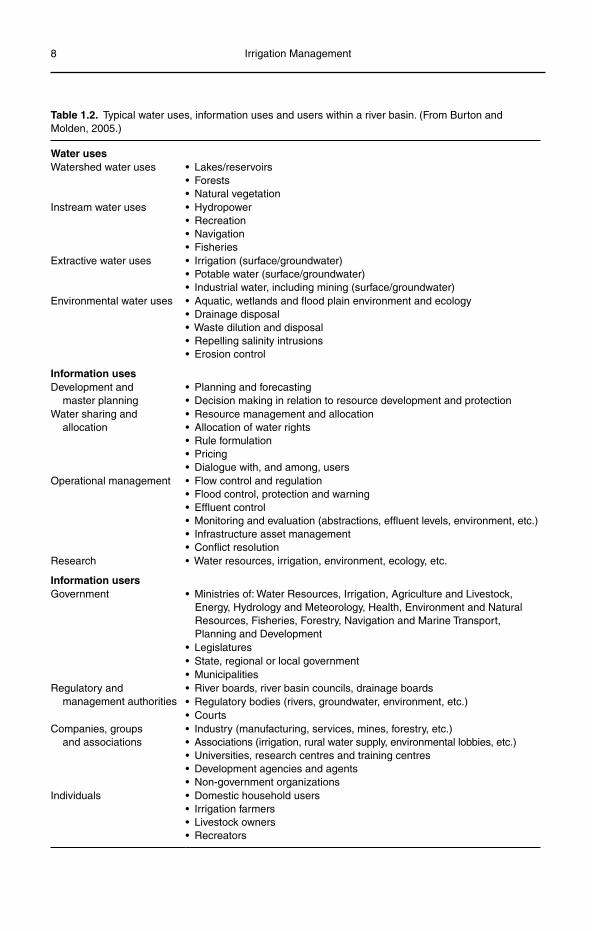
With many rivers approaching closure, management of the water resources, includ-ing irrigation, has to improve (see Svendsen, 2005 for a more detailed discussion). Good management is dependent on reliable data, and increasing investment is being made in many countries in strengthening informa-tion management systems, particularly in relation to water sharing and allocation and operational management (Table 1.2).
Future Scenarios
In addition to assessing the current situ-ation, as summarized in Box 1.1, the Comprehensive Assessment looked at future scenarios, as summarized in Box 1.2. The scenario is relatively bleak from the environmental perspective: with increasing pressure for food some governments will be looking to develop new irrigation areas, possibly on more marginal lands, thereby increasing water abstraction. In addition,
Introduction 7
any increase in irrigated cropping will result in increased evapotranspiration, raising the water demand by an estimated 60–90% of the current levels.
The message is clear and stark: far greater attention and resources will need to be paid to management of the Earth’s finite water resources if we are to both feed the Earth’s population and sustain the aquatic ecosystems.
The Way Forward
Those involved with water resources and irrigation development will need to think more broadly, they will need to understand and consider the multiple uses of water and integrate the management and use of these resources. Managers of irrigation schemes will no longer be able to dismiss the impacts of their management on the natural environ-
Fig. 1.4. Areas for action as river basins approach closure.
Renewable water resource (surface and groundwater)
Time
Wat
er r
esou
rce
deve
lopm
ent
Management decisionsat different phases of
development
EmpowerManagedemand
EnforceLegislateConstruct
Areas for action: • Engagement with stakeholders• Re-education of water professionals• Re-education of politicians and planners• Knowledge management and dissemination• Supply management – improved efficiency and productivity of water• Demand management, reduction in individual water use• Identification of opportunities and mechanisms for changing use
(e.g. from irrigated agriculture to domestic or industrial use)• Water trading• Institutional reform in the water sector
Threats and opportunities:• Reducing reserve for development• Increased risk (from droughts)• Climate change• Management options constrained• Increasing involvement of stakeholders• Increasing need for dialogue• Increasing need for information dissemination
ment; account will have to be taken of the levels of water abstraction from rivers and groundwater, the impact of agricultural pol-lutants in drainage wastewater on natural ecosystems. With understanding and know-ledge comes an ability to manage better the resource for all uses and users. This under-standing will need to be applied to greater appreciation of rainfed agriculture as well, particularly in Africa where farmers often cultivate both irrigated and rainfed crops as part of a mixed farming system.
Scheme managers will require greater understanding of and commitment to the needs of vulnerable groups and the poor. Ensuring secure and reliable irrigation water supplies to tail-ends, where these groups are often found, can make a significant difference.
Efficiency and productivity need to become keywords for irrigation managers. Efficiency in all operations: such that water abstraction is kept to a minimum, thereby leaving water in the river or groundwater
8 Irrigation Management
Table 1.2. Typical water uses, information uses and users within a river basin. (From Burton and Molden, 2005.)
Water usesWatershed water uses • Lakes/reservoirs
• Forests• Natural vegetation
Instream water uses • Hydropower• Recreation• Navigation• Fisheries
Extractive water uses • Irrigation (surface/groundwater)• Potable water (surface/groundwater)• Industrial water, including mining (surface/groundwater)
Environmental water uses • Aquatic, wetlands and flood plain environment and ecology• Drainage disposal• Waste dilution and disposal• Repelling salinity intrusions• Erosion control
Information usesDevelopment and
master planning• Planning and forecasting• Decision making in relation to resource development and protection
Water sharing and allocation
• Resource management and allocation• Allocation of water rights• Rule formulation• Pricing• Dialogue with, and among, users
Operational management • Flow control and regulation• Flood control, protection and warning• Effluent control• Monitoring and evaluation (abstractions, effluent levels, environment, etc.)• Infrastructure asset management• Conflict resolution
Research • Water resources, irrigation, environment, ecology, etc.
Information usersGovernment • Ministries of: Water Resources, Irrigation, Agriculture and Livestock,
Energy, Hydrology and Meteorology, Health, Environment and Natural Resources, Fisheries, Forestry, Navigation and Marine Transport, Planning and Development
• Legislatures• State, regional or local government• Municipalities
Regulatory and management authorities
• River boards, river basin councils, drainage boards• Regulatory bodies (rivers, groundwater, environment, etc.)• Courts
Companies, groups and associations
• Industry (manufacturing, services, mines, forestry, etc.)• Associations (irrigation, rural water supply, environmental lobbies, etc.)• Universities, research centres and training centres• Development agencies and agents• Non-government organizations
Individuals • Domestic household users• Irrigation farmers• Livestock owners• Recreators
Introduction 9
for the environment, and water is delivered where, when and in the quantity required. Improving scheduling procedures to make better use of rainfall is one way of reducing river or groundwater abstraction, particu-larly in the humid tropics. Waste needs to be reduced in all parts of the supply chain, whether it is caused by over-irrigation of the farm plot by the farmer, a failure to reduce flows at night in the main systems when water is not required by farmers, or poor storage and loss of harvested crops. The focus needs to change from a narrow per-spective on, say canal conveyance efficien-cies, to a broader perspective such that as much as possible of the water abstracted for irrigation is converted into useable product at the point of use. In this context proper irrigation scheduling coupled with adequate control and measuring structures may be more relevant than focusing simply on con-veyance losses.
Productivity will need to improve, though irrigation scheme managers will need to focus on more than just the physical pro-ductivity of water (the more ‘crop per drop’ approach). While the physical productivity of water is important, and generally within the control of scheme managers and farmers, con-sideration needs to be taken of the economic water productivity (the value of agricultural water production per unit of water) and
the agricultural water productivity (the net gains from all uses of water for agriculture, including crops, fisheries, livestock, forestry, firewood, etc.). Improving these facets of pro-ductivity will involve improving the support given for inputs and supporting processes other than irrigation water and drainage water removal, such as credit, input provi-sion, agricultural machinery and marketing.
With the increasing pressure on land and water resources to produce increasing quanti-ties of agricultural produce, the need for better educated, informed and motivated manag-ers in the irrigation sector is evident, whether they are the head of an irrigation district, the manager of an irrigation scheme, the executive director of a water users association or a farmer. Reforms are taking place in many countries through the process of irrigation management transfer, giving more rights and responsibilities to water users for the management, operation and maintenance of all, or parts of, their irriga-tion and drainage systems. In many countries these changes need to be matched by reforms to state agencies responsible for water resources and irrigation development and management, and correspondingly in the education and training institutions that feed young profes-sionals into these agencies and the sector in general. As Robert Chambers advocated in the 1980s (Chambers, 1988; Box 1.3), a new cadre of irrigation managers is required, with enhanced
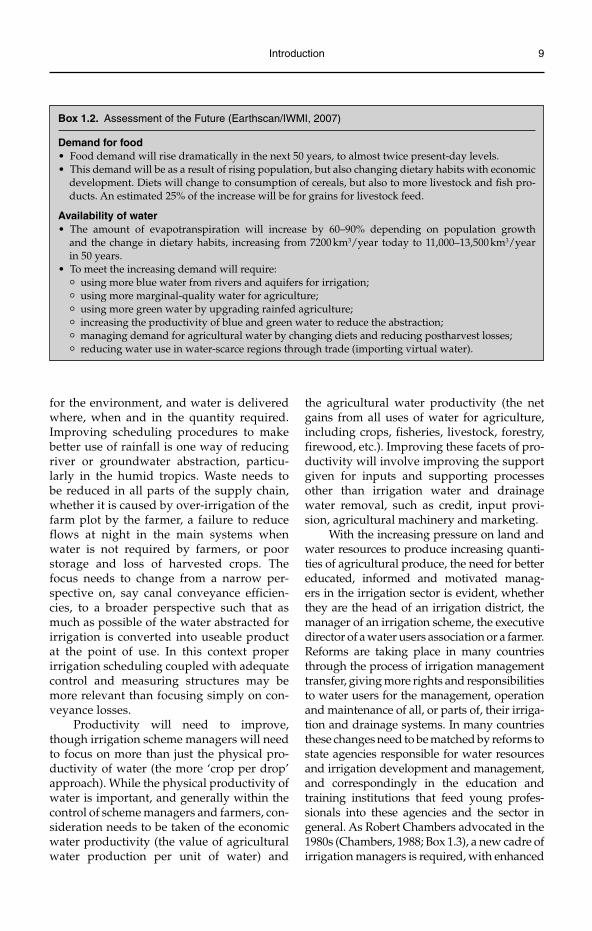
Box 1.2. Assessment of the Future (Earthscan/IWMI, 2007)
Demand for foodFood demand will rise dramatically in the next 50 years, to almost twice present-day levels.•This demand will be as a result of rising population, but also changing dietary habits with economic •development. Diets will change to consumption of cereals, but also to more livestock and fi sh pro-ducts. An estimated 25% of the increase will be for grains for livestock feed.
Availability of waterThe amount of evapotranspiration will increase by 60–90% depending on population growth •and the change in dietary habits, increasing from 7200 km3/year today to 11,000–13,500 km3/yearin 50 years.To meet the increasing demand will require:•
° using more blue water from rivers and aquifers for irrigation;
° using more marginal-quality water for agriculture;
° using more green water by upgrading rainfed agriculture;
° increasing the productivity of blue and green water to reduce the abstraction;
° managing demand for agricultural water by changing diets and reducing postharvest losses;
° reducing water use in water-scarce regions through trade (importing virtual water).
10 Irrigation Management
knowledge, skills, status and remuneration for the important work that they do. The irrigation manager in the 21st century will need to:
understand the wider agricultural and •water resources issues associated in using water for agriculture;understand the importance and value •the natural ecosystems within which irri-gated agriculture lies and upon which it depends;manage irrigation systems to provide •reliable, adequate, timely and equitable irrigation water supply, and associated drainage water removal;manage water, in all its forms, to the •bene fit of all communities and the nat-ural ecosystem;understand and accept the concept of •service provision, and the need to liaise and work with water users in the provi-sion of a responsible and fair service in
return for timely and adequate payment of the service fee;understand the wider dimensions of irri-•gated agriculture, from catchment man-agement through to marketing, and work towards enhancing efficiency and produc-tivity in all parts of the supply chain;understand and treat irrigated farm-•ing as a business, to which the sup-ply of irrigation water and removal of drainage water in a reliable, timely and adequate manner makes a significant contribution to the success or failure of the enterprise.
It is hoped that the information provided in this book will assist in addressing these issues and contribute to developing the nec-essary understanding, knowledge and skills required for effective and productive man-agement, operation and maintenance of irri-gation and drainage schemes.
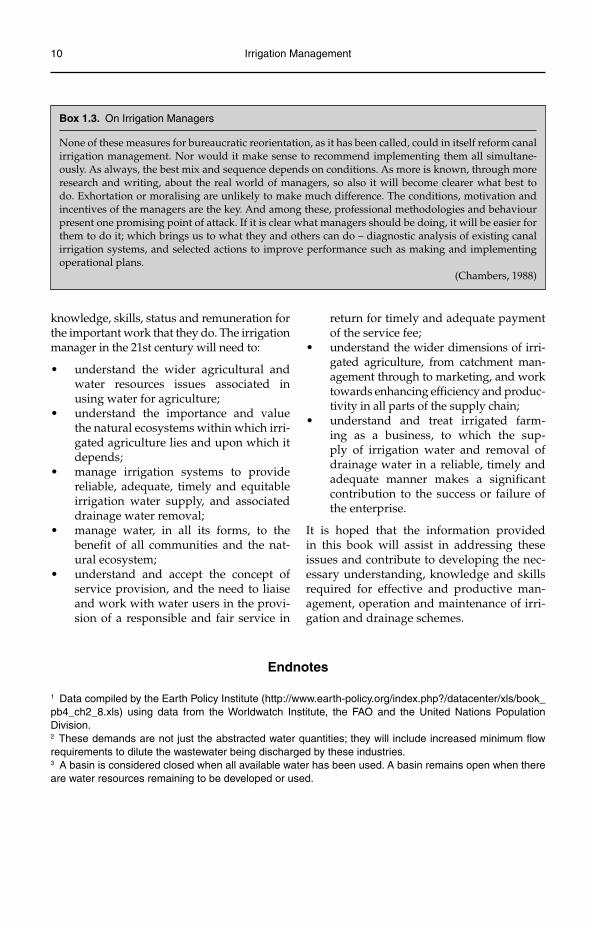
Box 1.3. On Irrigation Managers
None of these measures for bureaucratic reorientation, as it has been called, could in itself reform canal irrigation management. Nor would it make sense to recommend implementing them all simultane-ously. As always, the best mix and sequence depends on conditions. As more is known, through more research and writing, about the real world of managers, so also it will become clearer what best to do. Exhortation or moralising are unlikely to make much difference. The conditions, motivation and incentives of the managers are the key. And among these, professional methodologies and behaviour present one promising point of attack. If it is clear what managers should be doing, it will be easier for them to do it; which brings us to what they and others can do – diagnostic analysis of existing canal irrigation systems, and selected actions to improve performance such as making and implementing operational plans.
(Chambers, 1988)
Endnotes
1 Data compiled by the Earth Policy Institute (http://www.earth-policy.org/index.php?/datacenter/xls/book_pb4_ch2_8.xls) using data from the Worldwatch Institute, the FAO and the United Nations Population Division.2 These demands are not just the abstracted water quantities; they will include increased minimum flow requirements to dilute the wastewater being discharged by these industries.3 A basin is considered closed when all available water has been used. A basin remains open when there are water resources remaining to be developed or used.
©Martin Burton 2010. Irrigation Management: Principles and Practices (Martin Burton) 11
2
Components of Irrigation and Drainage Systems
Irrigation and drainage is a complex mixture of technical, institutional, economic, social and environmental processes. This chapter outlines the different elements of these proc-esses and how they interact.
Overview
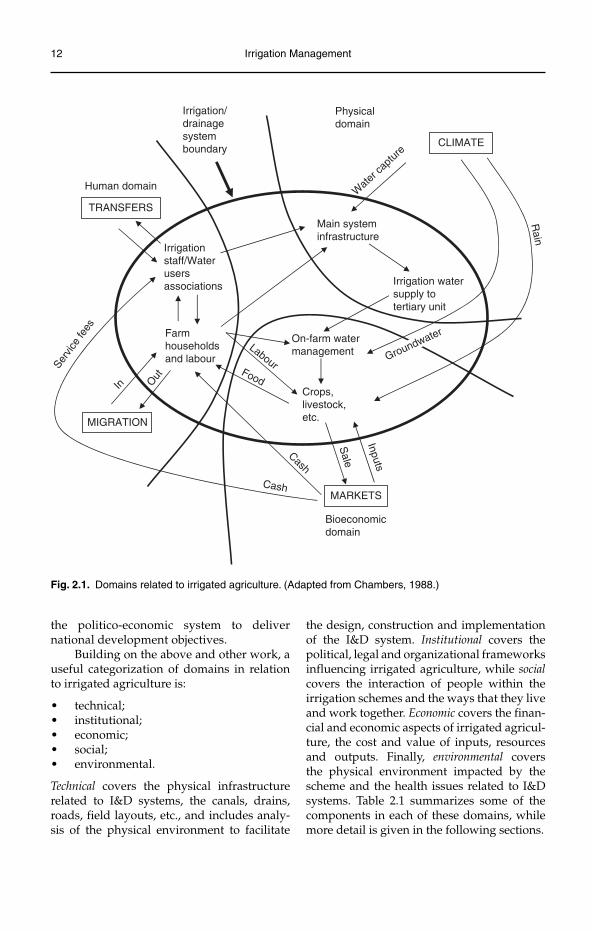
Chambers (1988) identified irrigation and drainage schemes (I&D schemes)1 as a com-plex mixture of physical, human and bioeco-nomic domains. Figure 2.1 outlines these domains, the activities involved and their interactions. In the physical domain we are dealing with the climate, soils and physi-cal infrastructure. In the human domain we are dealing with the irrigation agency personnel and with farmers, their families and other stakeholders. In the bioeconomic domain we are dealing with the crops, live-stock and markets. Overlying these three domains are the political, economic and legal domains.
Those involved with irrigation develop-ment need to be aware of, and understand, all these domains, and know which factors they can control and which are out of their control and influence. Politicians and government officials, for example, have control over the political, economic and legal domains, and have the ability to set the direction in terms
of political input, legislation and economic policy to support the irrigated agriculture sector. Managers of irrigation systems have control over the physical domain, and can organize the capture and distribution of water. Within the human domain the irriga-tion staff are under the control of the system manager, while the farm households and labour are under the control of the water users themselves. The bioeconomic domain is influenced by the market and govern-ment policies, such as for subsidies and food pricing.
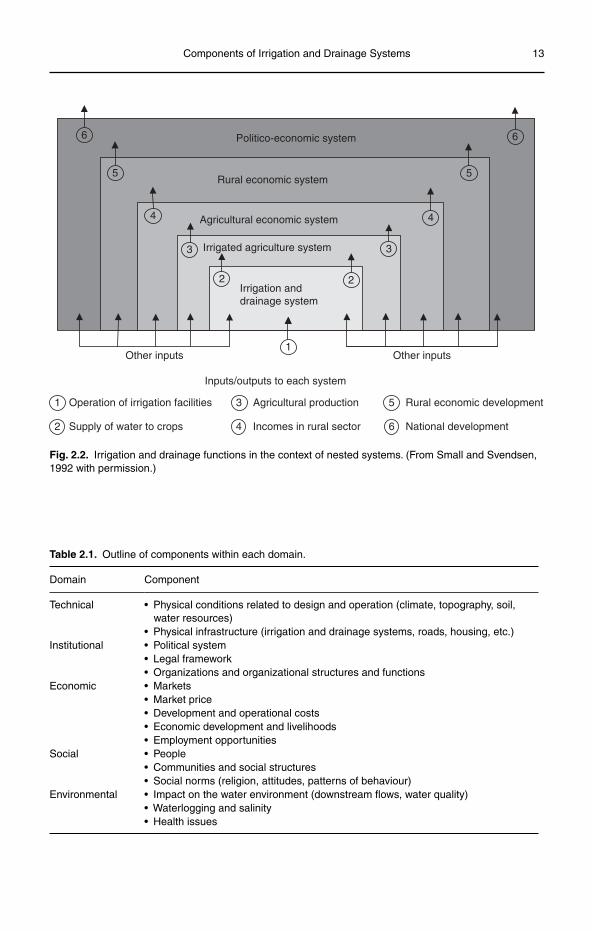
Using a systems approach, Small and Svendsen (1992) separated the various com-ponents involved in irrigated agriculture into a series of nested systems (Fig. 2.2). The systems approach focuses on the inputs, pro-cesses, outputs and impacts at different levels. The nested system begins with the outputs of the irrigation and drainage system (I&D system) (supply of water to crops) feeding in as one of the inputs (along with the land, labour, seed, fertilizer, etc.) to the irrigated agriculture system. The outputs in the form of agricultural production from this system feed into the agricultural economic sys-tem and with other inputs (traders, market price, etc.) provide inputs (incomes) into the rural economic system. Together with other income, such as off-farm labour, and expend-iture, the rural economic system feeds into
12 Irrigation Management
the politico-economic system to deliver national development objectives.
Building on the above and other work, a useful categorization of domains in relation to irrigated agriculture is:
technical;•institutional;•economic;•social;•environmental.•
Technical covers the physical infrastructure related to I&D systems, the canals, drains, roads, field layouts, etc., and includes analy-sis of the physical environment to facilitate
the design, construction and implementation of the I&D system. Institutional covers the political, legal and organizational frameworks influencing irrigated agriculture, while socialcovers the interaction of people within the irrigation schemes and the ways that they live and work together. Economic covers the finan-cial and economic aspects of irrigated agricul-ture, the cost and value of inputs, resources and outputs. Finally, environmental covers the physical environment impacted by the scheme and the health issues related to I&D systems. Table 2.1 summarizes some of the components in each of these domains, while more detail is given in the following sections.
Irrigationstaff/Waterusersassociations
Farmhouseholdsand labour
Main systeminfrastructure
Irrigation watersupply totertiary unit
Crops,livestock,etc.
CLIMATE
MIGRATION
MARKETS
Physicaldomain
Bioeconomicdomain
Human domain
Irrigation/drainagesystemboundary
TRANSFERS
Food
Sale
In
Labour
Cash
Out
Rain
Wate
r cap
ture
On-farm watermanagement
Inputs
Serv
ice fe
es
Cash
Groundwater
Fig. 2.1. Domains related to irrigated agriculture. (Adapted from Chambers, 1988.)
Components of Irrigation and Drainage Systems 13
Irrigation anddrainage system
Irrigated agriculture system
Agricultural economic system
Rural economic system
Politico-economic system 66
55
4 4
33
22
1Other inputsOther inputs
Inputs/outputs to each system
Operation of irrigation facilities
National development
Rural economic developmentAgricultural production
Incomes in rural sectorSupply of water to crops
1
2
5
6
3
4
Fig. 2.2. Irrigation and drainage functions in the context of nested systems. (From Small and Svendsen, 1992 with permission.)
Table 2.1. Outline of components within each domain.
Domain Component
Technical • Physical conditions related to design and operation (climate, topography, soil, water resources)
• Physical infrastructure (irrigation and drainage systems, roads, housing, etc.)Institutional • Political system
• Legal framework• Organizations and organizational structures and functions
Economic • Markets• Market price• Development and operational costs• Economic development and livelihoods• Employment opportunities
Social • People• Communities and social structures• Social norms (religion, attitudes, patterns of behaviour)
Environmental • Impact on the water environment (downstream flows, water quality)• Waterlogging and salinity• Health issues
14 Irrigation Management
Technical Domain
The technical domain for I&D schemes covers both physical aspects and the technical pro-cesses involved in developing the scheme.
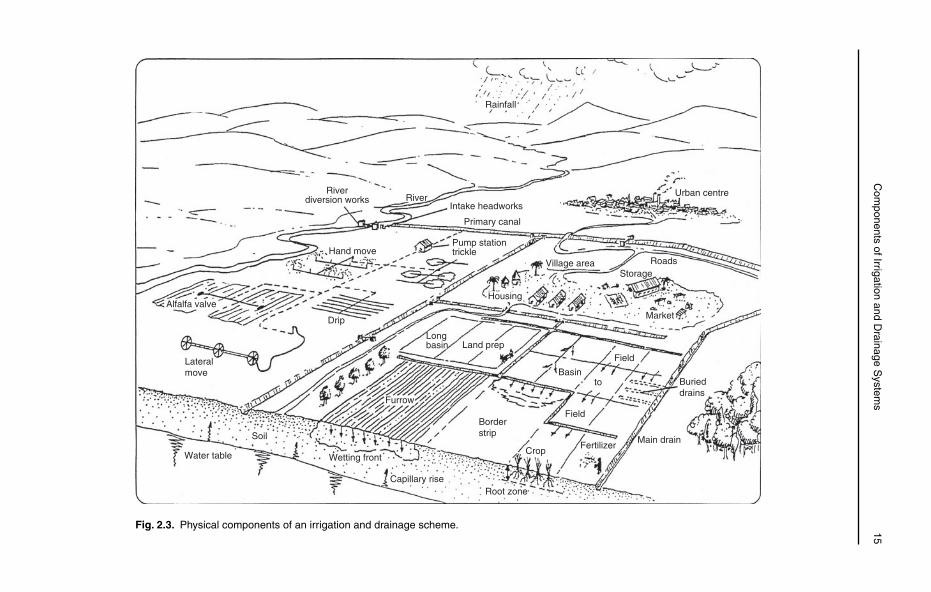
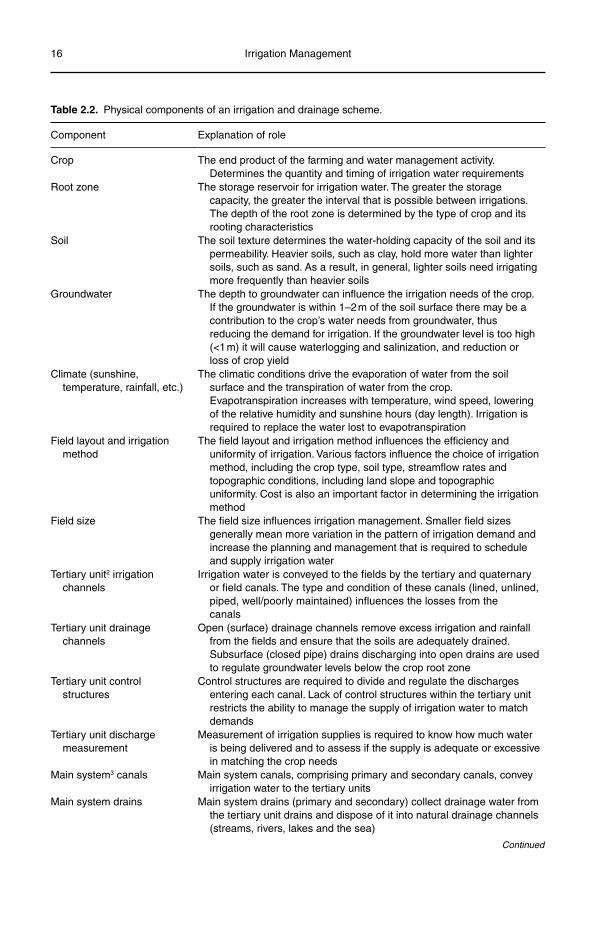
The physical components of an I&D scheme are shown in Fig. 2.3. The main com-ponents from the water management perspec-tive, starting from the field level and working up to the water source, are summarized in Table 2.2.
A more detailed breakdown of the physi-cal infrastructure components for I&D systems is outlined in Table 2.3. The various structures that exist in an I&D system can broadly be divided into conveyance, control and ancillary.Conveyance structures include siphon under-passes, culverts and aqueducts, while control structures include cross and head regulators, and measuring structures. Ancillary struc-tures comprise bridges, access points, bathing points, etc. Control structures form an impor-tant part of the operation of the irrigation sys-tem as they are the means by which water is managed and distributed in a controlled and regulated manner according to need.
Institutional Domain
The institutional domain covers the political, legal and organizational aspects related to irrigated agriculture.
Politics and politicians play a large part in irrigation development and irrigated agri-culture, as agricultural production and rural livelihoods are key areas of political inter-est. This interest can be either beneficial or harmful depending on the context. Political support for the irrigated agriculture sector can result in measures to improve availabil-ity of inputs, access to markets and market prices. It can also be beneficial in allocating funds, either for capital investment for new schemes or rehabilitation of existing schemes, or for scheme management, operation and maintenance. Strong political support is also required to introduce, revise or update legis-lation, particularly in relation to the transfer of the management of I&D systems to water users associations (WUAs). In this context
political influence can be harmful where poli-ticians interfere in the setting and levying of irrigation and drainage service fees, either by setting an unreasonable cap on the service fee that can be levied, or by suggesting dur-ing election periods that water users need not pay such service fees. In essence, a strong irrigation sector depends on strong and con-sistent political support; where this support is missing or muted it is likely that the irrigation sector will have difficulties, principally in adequately funding the management, opera-tion and maintenance of I&D schemes.
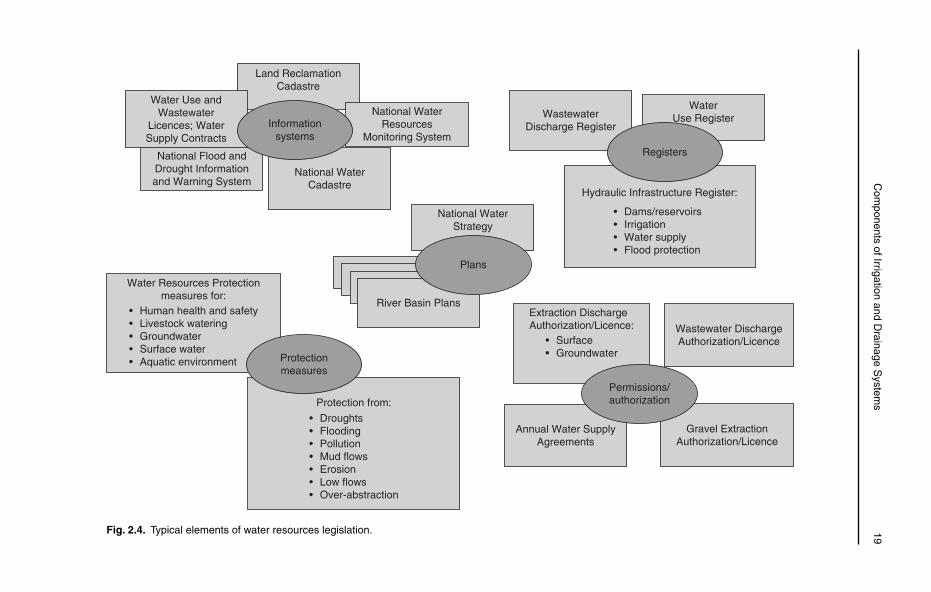
The irrigation sector is usually covered by legislation in the form of all or some of the following: Water Resources Law, Irrigation and Drainage Law, Water Users Association Law, Public Health Law, Environment Law, Tax Code, Civil Code and Employment Law. The water resources legislation covers the abstraction and use of water resources (Fig. 2.4), while the irrigation and drainage legisla-tion covers the use of these water resources for irrigation and the drainage of agricultural lands. WUA legislation is more recent and covers the establishment of water users asso-ciations, and will involve changes in the water resources, irrigation and drainage legislation and the tax code. Public health and envi-ronment legislation generally relates to the impacts of irrigation and drainage, and will look to control its adverse impacts through regulation on wastewater discharge, pollut-ants, limiting of standing water, etc. The tax code will detail the tax regulations related to the irrigation and drainage sector, and is of particular interest to water users associations in terms of whether they have to charge sales tax (VAT) on the services they provide, and property tax on the infrastructure assets. The civil code and employment legislation are generally applicable within society.
The number of organizations involved in irrigated agriculture, their structure and functions have significant bearing on irri-gated agriculture. The types and functions of organizations involved vary from country to country, but generally include the following:
Ministry (or Department)• 4 of Agriculture;Ministry (or Department) of Water •Resources;
C
omponents of Irrigation and D
rainage System
s 15
Water table
Soil
Wetting front
Capillary riseRoot zone
CropFertilizer
Main drain
Burieddrains
Field
Field
Basin
Borderstrip
Land prep
Furrow
Drip
Hand move
Riverdiversion works River
Intake headworks
Primary canal
Pump stationtrickle
Village area
Housing
RoadsStorage
Market
Urban centre
Rainfall
Lateralmove
Alfalfa valve
Longbasin
to
Fig. 2.3. Physical components of an irrigation and drainage scheme.
16 Irrigation Management
Table 2.2. Physical components of an irrigation and drainage scheme.
Component Explanation of role
Crop The end product of the farming and water management activity. Determines the quantity and timing of irrigation water requirements
Root zone The storage reservoir for irrigation water. The greater the storage capacity, the greater the interval that is possible between irrigations. The depth of the root zone is determined by the type of crop and its rooting characteristics
Soil The soil texture determines the water-holding capacity of the soil and its permeability. Heavier soils, such as clay, hold more water than lighter soils, such as sand. As a result, in general, lighter soils need irrigating more frequently than heavier soils
Groundwater The depth to groundwater can influence the irrigation needs of the crop. If the groundwater is within 1–2 m of the soil surface there may be a contribution to the crop’s water needs from groundwater, thus reducing the demand for irrigation. If the groundwater level is too high (<1 m) it will cause waterlogging and salinization, and reduction or loss of crop yield
Climate (sunshine, temperature, rainfall, etc.)
The climatic conditions drive the evaporation of water from the soil surface and the transpiration of water from the crop. Evapotranspiration increases with temperature, wind speed, lowering of the relative humidity and sunshine hours (day length). Irrigation is required to replace the water lost to evapotranspiration
Field layout and irrigation method
The field layout and irrigation method influences the efficiency and uniformity of irrigation. Various factors influence the choice of irrigation method, including the crop type, soil type, streamflow rates and topographic conditions, including land slope and topographic uniformity. Cost is also an important factor in determining the irrigation method
Field size The field size influences irrigation management. Smaller field sizes generally mean more variation in the pattern of irrigation demand and increase the planning and management that is required to schedule and supply irrigation water
Tertiary unit2 irrigation channels
Irrigation water is conveyed to the fields by the tertiary and quaternary or field canals. The type and condition of these canals (lined, unlined, piped, well/poorly maintained) influences the losses from the canals
Tertiary unit drainage channels
Open (surface) drainage channels remove excess irrigation and rainfall from the fields and ensure that the soils are adequately drained. Subsurface (closed pipe) drains discharging into open drains are used to regulate groundwater levels below the crop root zone
Tertiary unit control structures
Control structures are required to divide and regulate the discharges entering each canal. Lack of control structures within the tertiary unit restricts the ability to manage the supply of irrigation water to match demands
Tertiary unit discharge measurement
Measurement of irrigation supplies is required to know how much water is being delivered and to assess if the supply is adequate or excessive in matching the crop needs
Main system3 canals Main system canals, comprising primary and secondary canals, convey irrigation water to the tertiary units
Main system drains Main system drains (primary and secondary) collect drainage water from the tertiary unit drains and dispose of it into natural drainage channels (streams, rivers, lakes and the sea)
Continued
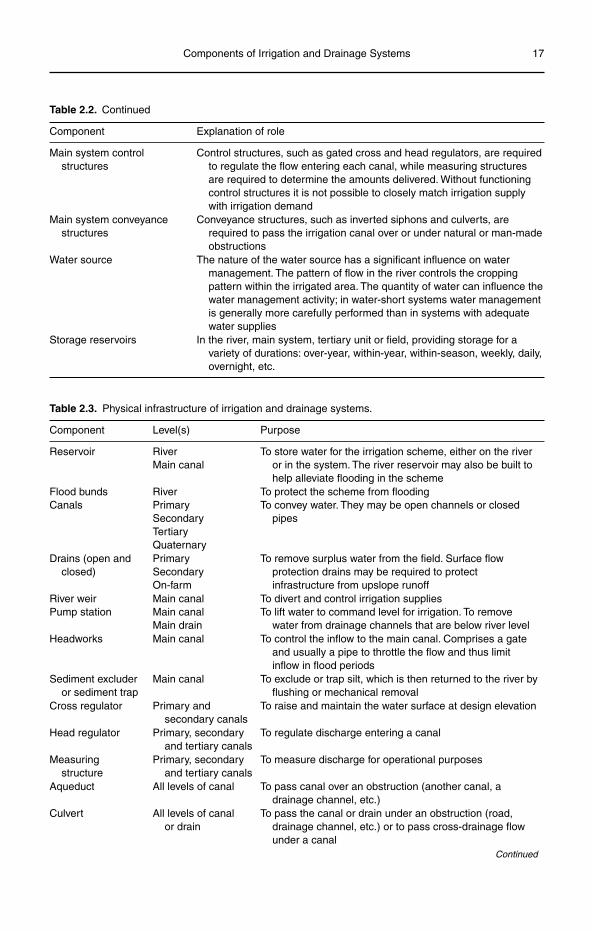
Components of Irrigation and Drainage Systems 17
Table 2.2. Continued
Component Explanation of role
Main system control structures
Control structures, such as gated cross and head regulators, are required to regulate the flow entering each canal, while measuring structures are required to determine the amounts delivered. Without functioning control structures it is not possible to closely match irrigation supply with irrigation demand
Main system conveyance structures
Conveyance structures, such as inverted siphons and culverts, are required to pass the irrigation canal over or under natural or man-madeobstructions
Water source The nature of the water source has a significant influence on water management. The pattern of flow in the river controls the cropping pattern within the irrigated area. The quantity of water can influence the water management activity; in water-short systems water management is generally more carefully performed than in systems with adequate water supplies
Storage reservoirs In the river, main system, tertiary unit or field, providing storage for a variety of durations: over-year, within-year, within-season, weekly, daily, overnight, etc.
Table 2.3. Physical infrastructure of irrigation and drainage systems.
Component Level(s) Purpose
Reservoir RiverMain canal
To store water for the irrigation scheme, either on the river or in the system. The river reservoir may also be built to help alleviate flooding in the scheme
Flood bundsCanals
RiverPrimarySecondaryTertiaryQuaternary
To protect the scheme from floodingTo convey water. They may be open channels or closed
pipes
Drains (open and closed)
PrimarySecondaryOn-farm
To remove surplus water from the field. Surface flow protection drains may be required to protect infrastructure from upslope runoff
River weirPump station
Main canalMain canalMain drain
To divert and control irrigation suppliesTo lift water to command level for irrigation. To remove
water from drainage channels that are below river levelHeadworks Main canal To control the inflow to the main canal. Comprises a gate
and usually a pipe to throttle the flow and thus limit inflow in flood periods
Sediment excluder or sediment trap
Main canal To exclude or trap silt, which is then returned to the river by flushing or mechanical removal
Cross regulator Primary and secondary canals
To raise and maintain the water surface at design elevation
Head regulator Primary, secondary and tertiary canals
To regulate discharge entering a canal
Measuring structure
Primary, secondary and tertiary canals
To measure discharge for operational purposes
Aqueduct All levels of canal To pass canal over an obstruction (another canal, a drainage channel, etc.)
Culvert All levels of canal or drain
To pass the canal or drain under an obstruction (road, drainage channel, etc.) or to pass cross-drainage flow under a canal
Continued
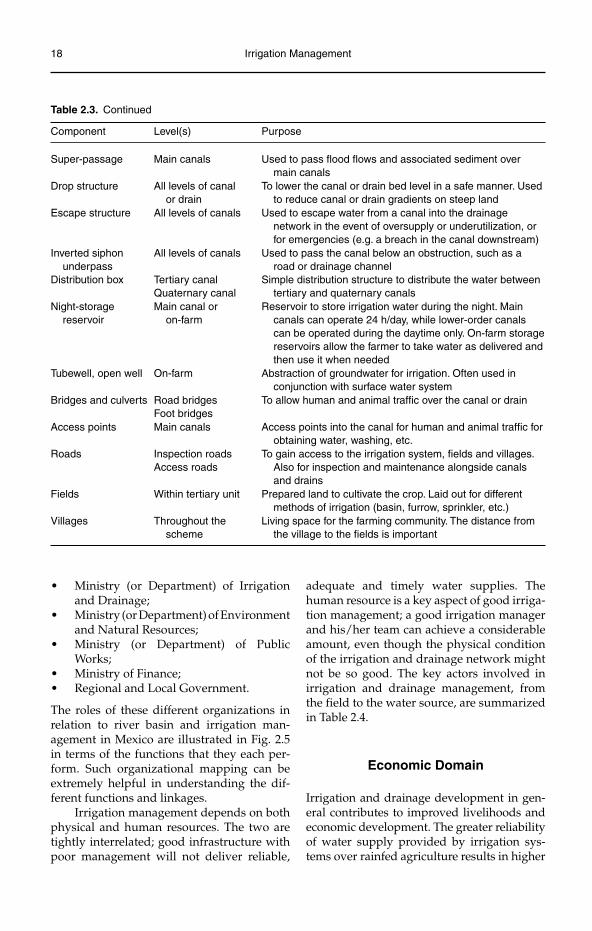
18 Irrigation Management
Table 2.3. Continued
Component Level(s) Purpose
Super-passage Main canals Used to pass flood flows and associated sediment over main canals
Drop structure All levels of canal or drain
To lower the canal or drain bed level in a safe manner. Used to reduce canal or drain gradients on steep land
Escape structure All levels of canals Used to escape water from a canal into the drainage network in the event of oversupply or underutilization, or for emergencies (e.g. a breach in the canal downstream)
Inverted siphon underpass
Distribution box
All levels of canals
Tertiary canalQuaternary canal
Used to pass the canal below an obstruction, such as a road or drainage channel
Simple distribution structure to distribute the water between tertiary and quaternary canals
Night-storage reservoir
Main canal or on-farm
Reservoir to store irrigation water during the night. Main canals can operate 24 h/day, while lower-order canals can be operated during the daytime only. On-farm storage reservoirs allow the farmer to take water as delivered and then use it when needed
Tubewell, open well On-farm Abstraction of groundwater for irrigation. Often used in conjunction with surface water system
Bridges and culverts Road bridgesFoot bridges
To allow human and animal traffic over the canal or drain
Access points Main canals Access points into the canal for human and animal traffic for obtaining water, washing, etc.
Roads Inspection roadsAccess roads
To gain access to the irrigation system, fields and villages. Also for inspection and maintenance alongside canals and drains
Fields Within tertiary unit Prepared land to cultivate the crop. Laid out for different methods of irrigation (basin, furrow, sprinkler, etc.)
Villages Throughout the scheme
Living space for the farming community. The distance from the village to the fields is important
Ministry (or Department) of Irrigation •and Drainage;Ministry (or Department) of Environment •and Natural Resources;Ministry (or Department) of Public •Works;Ministry of Finance;•Regional and Local Government.•
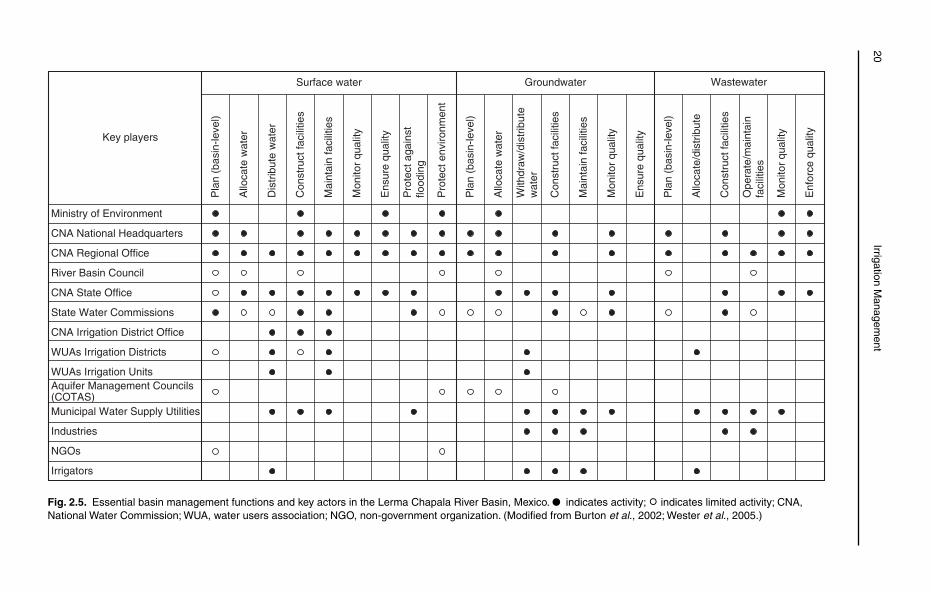
The roles of these different organizations in relation to river basin and irrigation man-agement in Mexico are illustrated in Fig. 2.5 in terms of the functions that they each per-form. Such organizational mapping can be extremely helpful in understanding the dif-ferent functions and linkages.
Irrigation management depends on both physical and human resources. The two are tightly interrelated; good infrastructure with poor management will not deliver reliable,
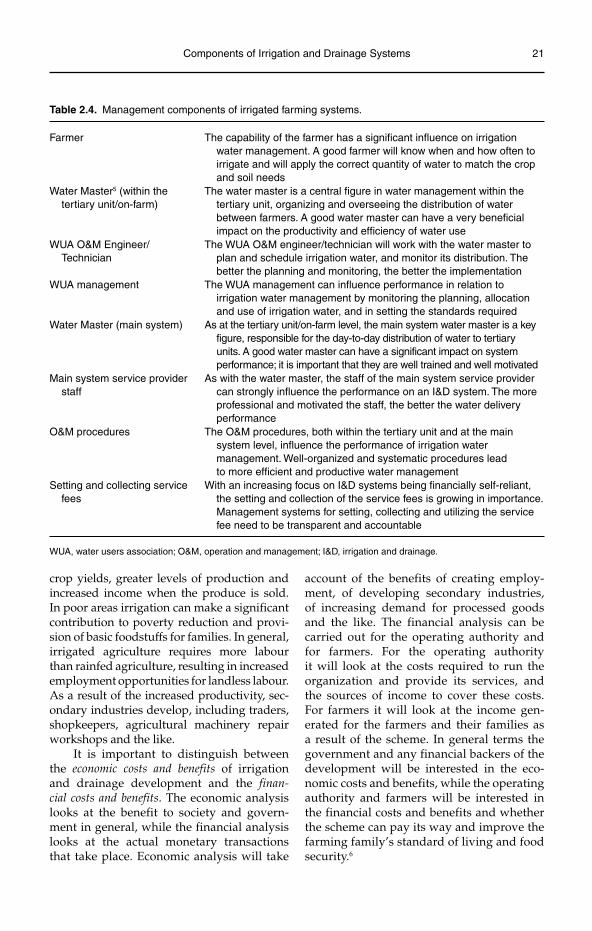
adequate and timely water supplies. The human resource is a key aspect of good irriga-tion management; a good irrigation manager and his/her team can achieve a considerable amount, even though the physical condition of the irrigation and drainage network might not be so good. The key actors involved in irrigation and drainage management, from the field to the water source, are summarized in Table 2.4.
Economic Domain
Irrigation and drainage development in gen-eral contributes to improved livelihoods and economic development. The greater reliability of water supply provided by irrigation sys-tems over rainfed agriculture results in higher
C
omponents of Irrigation and D
rainage System
s 19
WaterUse RegisterWastewater
Discharge Register
Hydraulic Infrastructure Register:
• Dams/reservoirs• Irrigation• Water supply• Flood protection
Registers
Water Resources Protectionmeasures for:
• Human health and safety• Livestock watering• Groundwater• Surface water• Aquatic environment
Protection from:
• Droughts• Flooding• Pollution• Mud flows• Erosion• Low flows• Over-abstraction
Protectionmeasures
Land ReclamationCadastre
National WaterResources
Monitoring System
National WaterCadastre
Water Use andWastewater
Licences; WaterSupply Contracts
National Flood andDrought Informationand Warning System
Informationsystems
National WaterStrategy
Plans
Annual Water SupplyAgreements
Extraction DischargeAuthorization/Licence:
Gravel ExtractionAuthorization/Licence
Wastewater DischargeAuthorization/Licence
Permissions/authorization
• Surface• Groundwater
River Basin Plans
Fig. 2.4. Typical elements of water resources legislation.
20Irrigation M
anagement
Surface water WastewaterGroundwater
Key players
Pla
n (b
asin
-leve
l)
Allo
cate
wat
er
Dis
trib
ute
wat
er
Con
stru
ct fa
cilit
ies
Mai
ntai
n fa
cilit
ies
Mon
itor
qual
ity
Ens
ure
qual
ity
Pro
tect
aga
inst
flood
ing
Pro
tect
env
ironm
ent
Pla
n (b
asin
-leve
l)
Allo
cate
wat
er
With
draw
/dis
trib
ute
wat
er
Con
stru
ct fa
cilit
ies
Mai
ntai
n fa
cilit
ies
Mon
itor
qual
ity
Ens
ure
qual
ity
Pla
n (b
asin
-leve
l)
Allo
cate
/dis
trib
ute
Con
stru
ct fa
cilit
ies
Ope
rate
/mai
ntai
nfa
cilit
ies
Mon
itor
qual
ity
Enf
orce
qua
lity
Ministry of Environment
CNA National Headquarters
CNA Regional Office
River Basin Council
CNA State Office
State Water Commissions
CNA Irrigation District Office
WUAs Irrigation Districts
WUAs Irrigation UnitsAquifer Management Councils(COTAS)Municipal Water Supply Utilities
Industries
NGOs
Irrigators
Fig. 2.5. Essential basin management functions and key actors in the Lerma Chapala River Basin, Mexico. ● indicates activity; ° indicates limited activity; CNA, National Water Commission; WUA, water users association; NGO, non-government organization. (Modified from Burton et al., 2002; Wester et al., 2005.)
Components of Irrigation and Drainage Systems 21
crop yields, greater levels of production and increased income when the produce is sold. In poor areas irrigation can make a significant contribution to poverty reduction and provi-sion of basic foodstuffs for families. In general, irrigated agriculture requires more labour than rainfed agriculture, resulting in increased employment opportunities for landless labour. As a result of the increased productivity, sec-ondary industries develop, including traders, shopkeepers, agricultural machinery repair workshops and the like.
It is important to distinguish between the economic costs and benefits of irrigation and drainage development and the finan-cial costs and benefits. The economic analysis looks at the benefit to society and govern-ment in general, while the financial analysis looks at the actual monetary transactions that take place. Economic analysis will take
account of the bene fits of creating employ-ment, of developing secondary industries, of increasing demand for processed goods and the like. The financial analysis can be carried out for the operating authority and for farmers. For the operating authority it will look at the costs required to run the organization and provide its services, and the sources of income to cover these costs. For farmers it will look at the income gen-erated for the farmers and their families as a result of the scheme. In general terms the government and any financial backers of the development will be interested in the eco-nomic costs and benefits, while the operating authority and farmers will be interested in the financial costs and benefits and whether the scheme can pay its way and improve the farming family’s standard of living and food security.6
Table 2.4. Management components of irrigated farming systems.
Farmer The capability of the farmer has a significant influence on irrigation water management. A good farmer will know when and how often to irrigate and will apply the correct quantity of water to match the crop and soil needs
Water Master5 (within the tertiary unit/on-farm)
The water master is a central figure in water management within the tertiary unit, organizing and overseeing the distribution of water between farmers. A good water master can have a very beneficial impact on the productivity and efficiency of water use
WUA O&M Engineer/Technician
The WUA O&M engineer/technician will work with the water master to plan and schedule irrigation water, and monitor its distribution. The better the planning and monitoring, the better the implementation
WUA management The WUA management can influence performance in relation to irrigation water management by monitoring the planning, allocation and use of irrigation water, and in setting the standards required
Water Master (main system) As at the tertiary unit/on-farm level, the main system water master is a key figure, responsible for the day-to-day distribution of water to tertiary units. A good water master can have a significant impact on system performance; it is important that they are well trained and well motivated
Main system service provider staff
As with the water master, the staff of the main system service provider can strongly influence the performance on an I&D system. The more professional and motivated the staff, the better the water delivery performance
O&M procedures The O&M procedures, both within the tertiary unit and at the main system level, influence the performance of irrigation water management. Well-organized and systematic procedures lead to more efficient and productive water management
Setting and collecting service fees
With an increasing focus on I&D systems being financially self-reliant, the setting and collection of the service fees is growing in importance. Management systems for setting, collecting and utilizing the service fee need to be transparent and accountable
WUA, water users association; O&M, operation and management; I&D, irrigation and drainage.
22 Irrigation Management
Allied to the potential financial ben-efits arising from irrigated agriculture are increased costs to cover the expenditure required to manage, operate and maintain the I&D system. Unfortunately governments and farmers in many countries are still reluctant to cover the real costs of managing, operating and maintaining these systems (MOM costs) despite the obvious financial and social ben-efits arising from them. For the last 20 years, significant sums of money have been invested in rehabilitating I&D systems, only for them to fail again several years later due to inade-quate investment in maintenance. In an effort to overcome the difficulties of adequately funding management, operation and main-tenance, some governments have transferred the management of the schemes or parts of the schemes to the water users, in the belief that as the direct beneficiaries they will be willing to cover the real MOM costs. However, despite being prepared to cover the costs of seeds, machinery hire, fuel and the like, farmers in some countries still have difficulty in accept-ing that they should pay the real cost for pro-viding irrigation water and drainage water removal. This is one of the biggest challenges facing the irrigation and drainage sector.
Social Domain
Farming within I&D schemes requires more social cohesion, cooperation and discipline than rainfed farming. Water users need to collaborate to share the available water supplies; in many systems fairness or equity of allocation and dis-tribution is valued more highly than adequacy of supply.7 In general, where the social cohe-sion is strong irrigation is productive, while where the social cohesion is weak irrigation suffers. Successful traditional hydraulic socie-ties, such as the Chagga on Mount Kilimanjaro, some hill tribes in Nepal and the Balinese with their Subak irrigation, have long-standing social norms and rules for irrigation, to which all users subscribe.
This ability to work together and enforce compliance with a set of agreed rules is not apparent in all I&D schemes, and becomes more difficult to engender the
larger the scheme becomes. In the larger schemes the social domain will encompass the management and staff of the organiza-tion responsible for managing the main sys-tem as well as the farming community. The nature of the relationship between these two social groups will have a direct bear-ing on the nature and quality of the service provided. Where there is corruption and/or lack of transparency the service delivery may be good to some farmers but poor to others, with high levels of distrust between the two groups. Where there is account-ability, openness, trust and communication between the two groups service delivery will be measurably better, and productivity consequently higher.
Environmental Domain
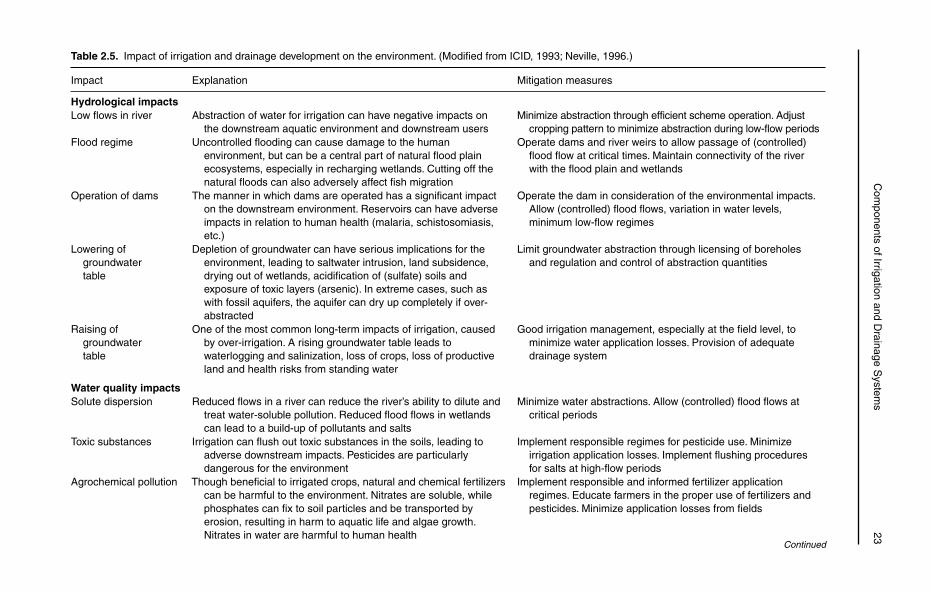
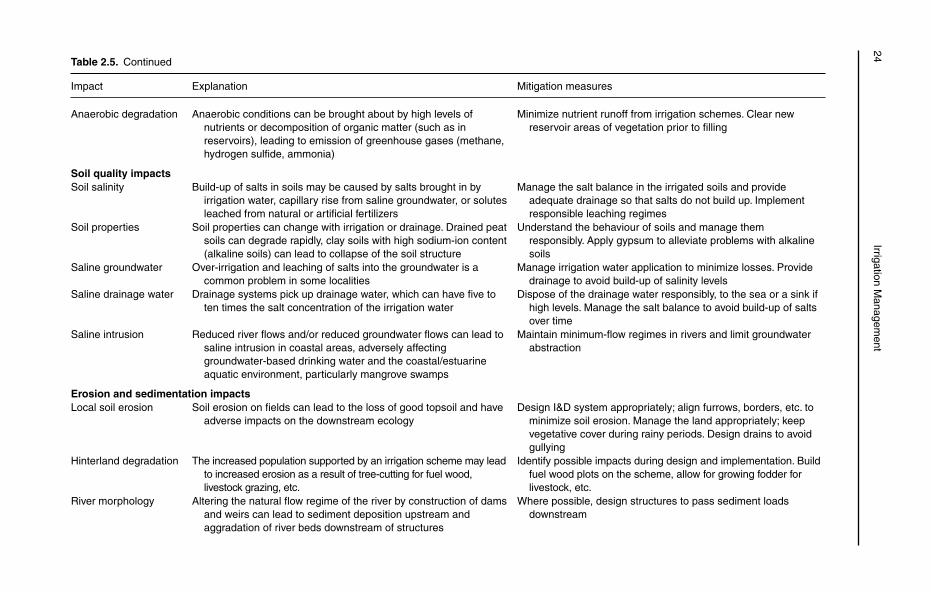
Interest in the environmental domain focuses on the impacts of irrigation and drainage development on the natural environment, as well as the potential impact of external factors on the scheme. The impacts of the scheme on the environment are generally most extreme when the scheme is first developed, though poor operation can be very harmful, particu-larly in the excessive abstraction and applica-tion of irrigation water and/or excessive use of pesticides and fertilizers.
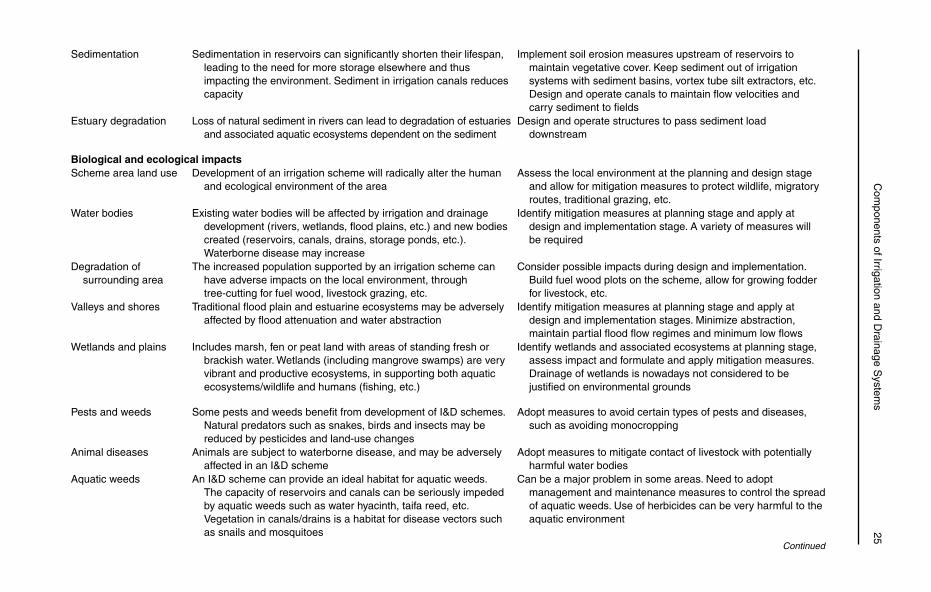
The main environmental impacts include (Table 2.5):
land degradation within the scheme;•degradation of water quality, both in sur-•face and groundwater;groundwater depletion;•ecological degradation.•
As can be seen from Table 2.5, responsible management can help to significantly reduce the adverse environmental impacts of I&D schemes. In summary such measures include:
keeping river and groundwater abstrac-•tion to an absolute minimum by efficient operation and effective maintenance of the system;keeping drainage water flow to an abso-•lute minimum through controlled appli-cation of irrigation water;
C
omponents of Irrigation and D
rainage System
s 23
Table 2.5. Impact of irrigation and drainage development on the environment. (Modified from ICID, 1993; Neville, 1996.)
Impact Explanation Mitigation measures
Hydrological impactsLow flows in river Abstraction of water for irrigation can have negative impacts on
the downstream aquatic environment and downstream usersMinimize abstraction through efficient scheme operation. Adjust
cropping pattern to minimize abstraction during low-flow periodsFlood regime Uncontrolled flooding can cause damage to the human
environment, but can be a central part of natural flood plain ecosystems, especially in recharging wetlands. Cutting off the natural floods can also adversely affect fish migration
Operate dams and river weirs to allow passage of (controlled) flood flow at critical times. Maintain connectivity of the river with the flood plain and wetlands
Operation of dams The manner in which dams are operated has a significant impact on the downstream environment. Reservoirs can have adverse impacts in relation to human health (malaria, schistosomiasis, etc.)
Operate the dam in consideration of the environmental impacts. Allow (controlled) flood flows, variation in water levels, minimum low-flow regimes
Lowering of groundwater table
Depletion of groundwater can have serious implications for the environment, leading to saltwater intrusion, land subsidence, drying out of wetlands, acidification of (sulfate) soils and exposure of toxic layers (arsenic). In extreme cases, such as with fossil aquifers, the aquifer can dry up completely if over-abstracted
Limit groundwater abstraction through licensing of boreholes and regulation and control of abstraction quantities
Raising of groundwater table
One of the most common long-term impacts of irrigation, caused by over-irrigation. A rising groundwater table leads to waterlogging and salinization, loss of crops, loss of productive land and health risks from standing water
Good irrigation management, especially at the field level, to minimize water application losses. Provision of adequate drainage system
Water quality impactsSolute dispersion Reduced flows in a river can reduce the river’s ability to dilute and
treat water-soluble pollution. Reduced flood flows in wetlands can lead to a build-up of pollutants and salts
Minimize water abstractions. Allow (controlled) flood flows at critical periods
Toxic substances Irrigation can flush out toxic substances in the soils, leading to adverse downstream impacts. Pesticides are particularly dangerous for the environment
Implement responsible regimes for pesticide use. Minimize irrigation application losses. Implement flushing procedures for salts at high-flow periods
Agrochemical pollution Though beneficial to irrigated crops, natural and chemical fertilizers can be harmful to the environment. Nitrates are soluble, while phosphates can fix to soil particles and be transported by erosion, resulting in harm to aquatic life and algae growth. Nitrates in water are harmful to human health
Implement responsible and informed fertilizer application regimes. Educate farmers in the proper use of fertilizers and pesticides. Minimize application losses from fields
Continued
24Irrigation M
anagement
Table 2.5. Continued
Impact Explanation Mitigation measures
Anaerobic degradation Anaerobic conditions can be brought about by high levels of nutrients or decomposition of organic matter (such as in reservoirs), leading to emission of greenhouse gases (methane, hydrogen sulfide, ammonia)
Minimize nutrient runoff from irrigation schemes. Clear new reservoir areas of vegetation prior to filling
Soil quality impactsSoil salinity Build-up of salts in soils may be caused by salts brought in by
irrigation water, capillary rise from saline groundwater, or solutes leached from natural or artificial fertilizers
Manage the salt balance in the irrigated soils and provide adequate drainage so that salts do not build up. Implement responsible leaching regimes
Soil properties Soil properties can change with irrigation or drainage. Drained peat soils can degrade rapidly, clay soils with high sodium-ion content (alkaline soils) can lead to collapse of the soil structure
Understand the behaviour of soils and manage them responsibly. Apply gypsum to alleviate problems with alkaline soils
Saline groundwater Over-irrigation and leaching of salts into the groundwater is a common problem in some localities
Manage irrigation water application to minimize losses. Provide drainage to avoid build-up of salinity levels
Saline drainage water Drainage systems pick up drainage water, which can have five to ten times the salt concentration of the irrigation water
Dispose of the drainage water responsibly, to the sea or a sink if high levels. Manage the salt balance to avoid build-up of salts over time
Saline intrusion Reduced river flows and/or reduced groundwater flows can lead to saline intrusion in coastal areas, adversely affecting groundwater-based drinking water and the coastal/estuarine aquatic environment, particularly mangrove swamps
Maintain minimum-flow regimes in rivers and limit groundwater abstraction
Erosion and sedimentation impactsLocal soil erosion Soil erosion on fields can lead to the loss of good topsoil and have
adverse impacts on the downstream ecologyDesign I&D system appropriately; align furrows, borders, etc. to
minimize soil erosion. Manage the land appropriately; keep vegetative cover during rainy periods. Design drains to avoid gullying
Hinterland degradation The increased population supported by an irrigation scheme may lead to increased erosion as a result of tree-cutting for fuel wood, livestock grazing, etc.
Identify possible impacts during design and implementation. Build fuel wood plots on the scheme, allow for growing fodder for livestock, etc.
River morphology Altering the natural flow regime of the river by construction of dams and weirs can lead to sediment deposition upstream and aggradation of river beds downstream of structures
Where possible, design structures to pass sediment loads downstream
C
omponents of Irrigation and D
rainage System
s 25
Sedimentation Sedimentation in reservoirs can significantly shorten their lifespan, leading to the need for more storage elsewhere and thus impacting the environment. Sediment in irrigation canals reduces capacity
Implement soil erosion measures upstream of reservoirs to maintain vegetative cover. Keep sediment out of irrigation systems with sediment basins, vortex tube silt extractors, etc. Design and operate canals to maintain flow velocities and carry sediment to fields
Estuary degradation Loss of natural sediment in rivers can lead to degradation of estuaries and associated aquatic ecosystems dependent on the sediment
Design and operate structures to pass sediment load downstream
Biological and ecological impactsScheme area land use Development of an irrigation scheme will radically alter the human
and ecological environment of the areaAssess the local environment at the planning and design stage
and allow for mitigation measures to protect wildlife, migratory routes, traditional grazing, etc.
Water bodies Existing water bodies will be affected by irrigation and drainage development (rivers, wetlands, flood plains, etc.) and new bodies created (reservoirs, canals, drains, storage ponds, etc.). Waterborne disease may increase
Identify mitigation measures at planning stage and apply at design and implementation stage. A variety of measures will be required
Degradation of surrounding area
The increased population supported by an irrigation scheme can have adverse impacts on the local environment, through tree-cutting for fuel wood, livestock grazing, etc.
Consider possible impacts during design and implementation. Build fuel wood plots on the scheme, allow for growing fodder for livestock, etc.
Valleys and shores Traditional flood plain and estuarine ecosystems may be adversely affected by flood attenuation and water abstraction
Identify mitigation measures at planning stage and apply at design and implementation stages. Minimize abstraction, maintain partial flood flow regimes and minimum low flows
Wetlands and plains Includes marsh, fen or peat land with areas of standing fresh or brackish water. Wetlands (including mangrove swamps) are very vibrant and productive ecosystems, in supporting both aquatic ecosystems/wildlife and humans (fishing, etc.)
Identify wetlands and associated ecosystems at planning stage, assess impact and formulate and apply mitigation measures. Drainage of wetlands is nowadays not considered to be justified on environmental grounds
Pests and weeds Some pests and weeds benefit from development of I&D schemes. Natural predators such as snakes, birds and insects may be reduced by pesticides and land-use changes
Adopt measures to avoid certain types of pests and diseases, such as avoiding monocropping
Animal diseases Animals are subject to waterborne disease, and may be adversely affected in an I&D scheme
Adopt measures to mitigate contact of livestock with potentially harmful water bodies
Aquatic weeds An I&D scheme can provide an ideal habitat for aquatic weeds. The capacity of reservoirs and canals can be seriously impeded by aquatic weeds such as water hyacinth, taifa reed, etc. Vegetation in canals/drains is a habitat for disease vectors such as snails and mosquitoes
Can be a major problem in some areas. Need to adopt management and maintenance measures to control the spread of aquatic weeds. Use of herbicides can be very harmful to the aquatic environment
Continued
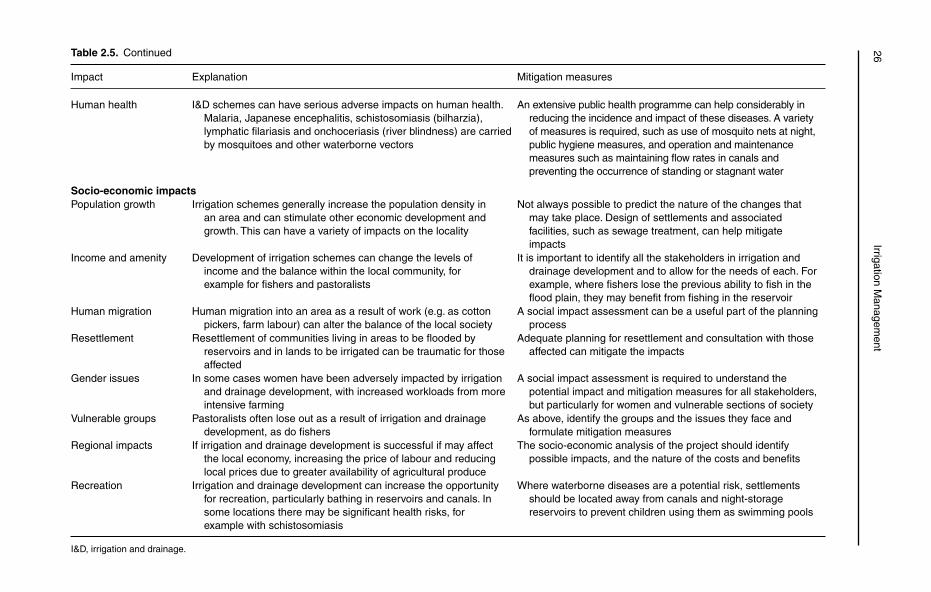
26Irrigation M
anagement
Table 2.5. Continued
Impact Explanation Mitigation measures
Human health I&D schemes can have serious adverse impacts on human health. Malaria, Japanese encephalitis, schistosomiasis (bilharzia), lymphatic filariasis and onchoceriasis (river blindness) are carried by mosquitoes and other waterborne vectors
An extensive public health programme can help considerably in reducing the incidence and impact of these diseases. A variety of measures is required, such as use of mosquito nets at night, public hygiene measures, and operation and maintenance measures such as maintaining flow rates in canals and preventing the occurrence of standing or stagnant water
Socio-economic impactsPopulation growth Irrigation schemes generally increase the population density in
an area and can stimulate other economic development and growth. This can have a variety of impacts on the locality
Not always possible to predict the nature of the changes that may take place. Design of settlements and associated facilities, such as sewage treatment, can help mitigate impacts
Income and amenity Development of irrigation schemes can change the levels of income and the balance within the local community, for example for fishers and pastoralists
It is important to identify all the stakeholders in irrigation and drainage development and to allow for the needs of each. For example, where fishers lose the previous ability to fish in the flood plain, they may benefit from fishing in the reservoir
Human migration Human migration into an area as a result of work (e.g. as cotton pickers, farm labour) can alter the balance of the local society
A social impact assessment can be a useful part of the planning process
Resettlement Resettlement of communities living in areas to be flooded by reservoirs and in lands to be irrigated can be traumatic for those affected
Adequate planning for resettlement and consultation with those affected can mitigate the impacts
Gender issues In some cases women have been adversely impacted by irrigation and drainage development, with increased workloads from more intensive farming
A social impact assessment is required to understand the potential impact and mitigation measures for all stakeholders, but particularly for women and vulnerable sections of society
Vulnerable groups Pastoralists often lose out as a result of irrigation and drainage development, as do fishers
As above, identify the groups and the issues they face and formulate mitigation measures
Regional impacts If irrigation and drainage development is successful if may affect the local economy, increasing the price of labour and reducing local prices due to greater availability of agricultural produce
The socio-economic analysis of the project should identify possible impacts, and the nature of the costs and benefits
Recreation Irrigation and drainage development can increase the opportunity for recreation, particularly bathing in reservoirs and canals. In some locations there may be significant health risks, for example with schistosomiasis
Where waterborne diseases are a potential risk, settlements should be located away from canals and night-storage reservoirs to prevent children using them as swimming pools
I&D, irrigation and drainage.
Components of Irrigation and Drainage Systems 27
minimizing the level of pesticide and fer-•tilizer in drainage water though control-led application and controlled irrigation;controlling application of irrigation water •at field level to avoid over-irrigation con-tributing to rising groundwater levels and subsequent salinization of the land;reducing losses from irrigation canals •through measures such as canal lining and timely maintenance;reducing health risks through a know-•ledge and application of measures to alleviate health risks, such as avoiding areas of standing water (for mosquito control) and health education for farmers and their families.
Phases of Development
As noted above there are different phases involved in the development of I&D schemes. It is useful to look at the activities involved in these different phases as they can have a sig-nificant bearing on how the scheme is man-aged, operated and maintained.
Six relatively distinct phases can be identified:
planning;•design;•construction;•operation;•maintenance and asset management;•rehabilitation.•
Overlying these phases is a support network, generally comprising government agency personnel for large schemes and community leaders for smaller schemes.
Support network
The support network encompasses a vari-ety of activities that permit the execution of the above processes. Support encompasses the organizational structure that is present through which the scheme is identified, planned, designed, implemented and oper-ated. Support activities include resource acquisition, personnel management, financ-
ing and general management, including con-tracting-out of services.
In order for an I&D scheme to be devel-oped some form of organization needs to exist to conceive of the idea and follow it through to completion. This can be a group of farmers or a government agency, a combination of the two, or a private enterprise. The essential fea-ture is that some element of cooperation and organization is required to realize the project.8
Planning
Planning is the process of identification of the potential for irrigation and selection of the best approach for its development. Planning will look at the feasibility of the development in technical, economic, physical, social, institu-tional and environmental aspects. Questions to be asked will include the following.
Can it be done?•How will it be done?•What are the objectives for the devel-•opment?What will it cost, who will pay and is it •economic?What are the likely consequences and •impacts of the development?What will be the benefits, and how will •they be distributed among the various stakeholders?How will it be managed, operated and •maintained?Will it be sustainable?•
Though the planning stage is crucial to the long-term success of the scheme, it is often the case that insufficient time and resources are spent on it. It is also the stage at which the least is known about the scheme, its people and the environment in which it will have to function.
It is important at this stage to be clear about the objectives for the development, whether it is for political, economic, finan-cial or social purposes. Some schemes are established for political or social purposes (to settle areas and/or to resettle farm-ers from overpopulated areas). While such schemes might be uneconomic, they are considered a political necessity. In general I&D
28 Irrigation Management
systems are developed for economic pur-poses, often with a focus on poverty allevia-tion or ensuring security of livelihoods in drought-prone areas. Other schemes, such as those in the private sector (e.g. sugar estates), are developed for the financial benefits they can generate.
In the planning stage a feasibility study will be carried out to ascertain the feasibility and likely cost and benefits of the develop-ment. The feasibility study will include:
semi-detailed topographic surveys;•soil surveys;•soil mechanics survey and analysis at •locations of significant structures;mapping of the project area;•data collection and analysis of the cli-•mate and water resources (quantity and quality);determination of suitable crop types, •availability of markets, costs of inputs and prices of outputs;social surveys to ascertain the pre-•project conditions and needs of the rural community;institutional development studies to •ascertain the current and required insti-tutional framework;environmental impact study;•outline designs with cost estimates;•implementation development options •and timeframes;economic and financial analysis.•
An important part of irrigation development, especially in areas with existing agriculture, is the active participation of the intended beneficiaries and other stakeholders in the development process. Failure to involve ben-eficiaries and other stakeholders at the plan-ning stage has been found to have serious and detrimental effects on the subsequent stages of development and the scheme’s long-term sustainability.
Land consolidation is an important issue in some locations, which should be considered and investigated at the planning stage. Though considered preferable from a technical viewpoint, bringing a farmer’s individual plots together in one location may require considerable resources (survey-ing, consulting and negotiating with farm-
ers, etc.) and may face strong resistance from farmers.
Design
Once the development has been planned full designs will be prepared. These may require further data collection. The design stage may include the following:
detailed topographic surveys;•design of scheme layout, including •headworks, canals, drains, control and measurement structures, flood control measures, villages, water supply and roads;determination of the cropping pattern;•selection of irrigation method (surface, •sprinkler, drip);estimation of crop and irrigation water •requirements, leading to canal sizing and hydraulic design of all structures;estimation of surface runoff leading to •drain sizing;costing;•preparation of tender documents (speci-•fication, bills of quantities and album of drawings);implementation work planning (with •realistic timeframe);specification of the scheme’s organiza-•tion, management, operation and main-tenance, and preparation of a manual for such.
The design work is often carried out by con-sultants procured through a process of com-petitive bidding, generally based on quality and experience of previous work, and cost. The consultant prepares the designs together with the bill of quantities, an estimate of the likely cost (termed the Engineer’s Estimate) and the specification. The work is put out to tender and similar criteria (quality, expe-rience and cost) used to select a contractor to carry out the work. Water users should be involved in the design and procurement process, particularly for schemes that are to be managed by farmers, or projects where rehabilitation is being carried out within the tertiary unit.
Components of Irrigation and Drainage Systems 29
Construction
Once finances have been secured, designs completed and contracts tendered and awarded, construction can commence. Procurement of suitable contractors is impor-tant. Construction may include the following processes:
establishing effective construction super-•vision personnel and procedures;establishing a construction camp;•site clearance;•setting out of the works;•agreement with farmers on construction •timing and methods (to avoid disruption to farming activities, where possible);construction of infrastructure (canals, •drains, structures, roads, villages, etc.);supervision and checking that the works •comply with the specification;measurement of work done;•preparation of as-built drawings, opera-•tion and maintenance (O&M) manuals and training of O&M staff;certification for payment (monthly and •final);commissioning (the contractor is respon-•sible for rectifying defects arising dur-ing the commissioning period, usually 12 months);handing over of the completed scheme.•
Different procedures will be followed depend-ing on whether the scheme is constructed by a contractor or by the developer with assistance from the beneficiaries. Generally speaking, large-scale irrigation schemes are constructed by a contractor, small-scale irrigation schemes through beneficiary participation.
Operation
Operation of the system can be by the ben-eficiaries, a government agency or a private enterprise. Again size often determines who operates the system; small systems are easier for farmers to run, government often runs the larger-scale systems. In the large-scale systems the government may oper-ate the primary and secondary canals (the
main system), while farmers operate the system ‘below the outlet’ within the terti-ary unit. In a private development the man-agement company will manage the whole enterprise.
For operation, a set of procedures, rules and regulations will be required if the I&D system is to operate efficiently and conflict is to be avoided. Procedures will be required to plan and manage the water distribution as the irrigation water demand is constantly changing. Operation activities will include:
planning cropping patterns;•determining crop and irrigation water •demands;estimating available irrigation supply;•making adjustments to match supply •and demand;making water allocations;•reporting and record-keeping;•monitoring and evaluating performance;•liaising with water users;•conflict resolution.•
Maintenance and asset management
Maintenance and asset management are an integral part of scheme operation, without which the system will deteriorate and pro-ductivity decline. Despite the very close relationship between performance and the physical condition of the system, it is often the case that inadequate funds are allocated for maintenance. Maintenance activities will include:
identification and reporting of mainte-•nance needs;prioritizing, planning and budgeting for •maintenance;carrying out maintenance;•monitoring and evaluation of work •done;payment;•liaising with farmers on maintenance;•reporting on work carried out.•
As the terms suggest, asset management relates to the management over time of the system’s assets. It looks at the short-, medium- and
30 Irrigation Management
long-term maintenance, repair and replace-ment of the system’s physical assets and the income stream required to sustain the system at the required service level. Asset manage-ment includes:
identifying and quantifying a system’s •assets (lengths of canals/drains, num-bers, types and sizes of structures, etc.);assessing the condition and performance •of the assets and their component parts;creating an asset database;•discussing with water users and agree-•ing on target standards, levels of service and costs;formulating an asset management plan •with details of operational and capital expenditure over time (typically 20–25 years, in 5-year packages) and associated service fee charges;implementing, over time, the asset man-•agement plan;monitoring and evaluation of imple men-•tation.
Rehabilitation
A further process, which has become all too common, is the rehabilitation of I&D systems, arising from the failure to properly operate and maintain schemes. A distinction needs to be drawn between rehabilitation projectsand modernization projects or programmes. The focus of rehabilitation projects is to repair the system, and in most aspects will return the system to its original designed state, while the focus of modernization projects is pri-marily to upgrade components of the sys-tem, such as providing automatic control structures, automated flow measurement, changes in field irrigation methods or operat-ing procedures. Rehabilitation projects often give reasonable economic returns, with pos-sible improvements in agricultural produc-tion being achieved through relatively small investments as existing infrastructure is taken as ‘sunk costs’ from which benefits arise but no charge is made to the rehabilitation project.
Rehabilitation projects may appear eco-nomically favourable, but often this is because
the ‘without-project’ case is taken to be con-tinued poor performance – to have properly maintained the system in the first place would have provided better economic returns as: (i) production would not have been lost over time due to the decline in the physical condi-tion of the system and difficulties in supplying irrigation water or removing excess drainage water; and (ii) it costs more to repair and reha-bilitate physical systems than it does to main-tain them (‘a stitch in time saves nine’). There are also the social implications associated with allowing a system to deteriorate, with tail-enders suffering the most from inadequate water supplies due to poor physical condition of canals and structures.
Despite covenants in loan agreements that government will provide adequate funds for MOM following completion of the reha-bilitation project, and preparation of detailed O&M manuals and maintenance costings, it is common to find that rehabilitated schemes need further rehabilitation after some years due to inadequate funds for system main-tenance. In developed countries asset man-agement planning has been developed and is now an established process for ensuring timely maintenance and replacement of phys-ical infrastructure, thereby avoiding the need for expensive rehabilitation. It is to be hoped that such approaches will be used in devel-oping countries, so that the depressing cycle of construction, deterioration, rehabilitation, deterioration and further rehabilitation is finally ended. Asset management planning is discussed in some detail in Chapter 6.
Irrigation Methods
The method used to apply the irrigation water to the crop has an important bearing on the management and performance of an I&D scheme. There are four principal methods, which can be subdivided into a number of variations and modifications. The basic clas-sification is given below.
1. Surface irrigation:• uncontrolled flooding, wild flooding;• controlled flooding;
Components of Irrigation and Drainage Systems 31
° basin,
° contour levee,
° border,
° furrow,
° corrugation.2. Sprinkler irrigation.3. Trickle (drip) irrigation.4. Subsurface irrigation.
Each of these irrigation methods has its own advantages and disadvantages, and is suited to particular physical conditions such as crop type, soils, land slope, water avail-ability, etc. and also to other factors such as availability of funds, labour costs and labour availability.
Surface irrigation
Surface irrigation methods are the oldest and most widely used methods of water applica-tion. According to the FAO (1989) 95% of the irrigated area in the world uses surface irriga-tion methods. Surface irrigation methods can be used for most crops, but are not recom-mended for highly permeable soils or steep slopes. In their basic form they are the least expensive of the possible systems, though costs rise if land-forming measures such as land levelling are required.
The main advantages of surface irri-gation methods are that land preparation is relatively straightforward, they are rela-tively easy to operate and maintain, are not affected by wind conditions, generally have low energy costs, and can be highly efficient under skilled management. They are less effi-cient than sprinkler and drip irrigation, and require more skilled operation if the water is to be applied uniformly to the land surface without undue losses.
The efficiency of the water application is highly dependent on the knowledge and skill of the farmer. It is often thought that farm-ers are very experienced in surface irriga-tion methods simply because they have been practising them for years. However, in many countries it is rare for farmers to evaluate their irrigation application by assessing the soil moisture status in the root zone before
and after irrigation. It is therefore difficult to know if an excessive quantity of water has been applied and lost to deep percolation below the root zone; a farmer may well have been over-irrigating for many years with-out knowing it. Experience in using surface irrigation methods and skill in their use are therefore different; significant improvements in a scheme’s water-use efficiency and pro-ductivity can be gained through assessment of farmers’ actual application practices fol-lowed by training should their practices be found to be poor or inefficient.
Uncontrolled flooding
Uncontrolled flooding is the oldest and sim-plest irrigation practice, with water being diverted from natural streams and distrib-uted over the land without any land-forming measures. The method is very basic, easy to set up and operate, and low-cost in terms of time and resources consumed. As a consequence of this simplicity and low level of inputs crop yields are generally poor, but may be suited to some situations, such as occur in parts of Africa where farmers plant in the moist soil as flood waters recede.
Controlled flooding
BASIN IRRIGATION Basin irrigation is the most common form of irrigation due to its sim-plicity. The land is divided by ridged earth bunds to form basins and water turned into the basin from a quaternary or field channel. The land within each basin is then levelled to allow uniform irrigation application.
The method is well suited to smallholder irrigation where farmers have small land-holdings and grow a variety of crops, but is equally suited to large mechanized farms where laser-controlled land grading and large stream sizes are possible. Row crops can be grown in the basin on ridges; this is often termed furrow-in-basin irrigation.
For dry foot crops the water is turned into the basin and the water ponded before the supply is closed off and the next basin filled. To avoid deep percolation losses the basin should be filled quickly, large stream sizes are therefore required. In rice systems
32 Irrigation Management
the water is often turned into one basin and then flows through a series of basins before discharging into the field drain. In this case land preparation and puddling9 of the soil are required to reduce the deep percolation losses. Puddling of the soil can reduce deep percolation losses from 10 mm/day down to 1–2 mm/day.
CONTOUR LEVEES This method is similar to basin irrigation but is used on hillsides and steeply sloping land. The basins are cut into the slope and run along the contour to form a terrace. For dry foot crops water is applied and held in the basin until the required depth has been applied. For paddy rice, water usu-ally flows from basin to basin, though care has to be taken to avoid gullying and cutting back into the terraces.
BORDER STRIP IRRIGATION With border strip irrigation,10 land with a gentle and uniform slope is divided into parallel strips of land separated by earth ridges. Water is let into the border strip and flows down the slope. The end of the strip can be closed (borders with-out runoff) or open (borders with runoff). To achieve uniform irrigation application the border should not have a cross slope. The border strip can vary in size from 60 to 800 m in length and from 3 to 30 m in width depend-ing on the soil type, the slope, the available stream size and farming practices.
The method can be used for irrigation of close-growing crops on most soils, and water application efficiency can be good under skilled management.
FURROW IRRIGATION Furrow irrigation is the most common method for irrigating row crops such as maize, sugarbeet, potatoes, sun-flower, vegetables, orchards and vineyards. In this method water flows down or across the slope of the field and infiltrates into the soil. Unlike border strip irrigation furrow irri-gation can be practised where there is a cross slope on the land.
The method is applicable to most soil types, except those which are highly perme-able or easily erodible. Erosion is a key con-cern with this method; slopes are limited to
2% in arid climates and only 0.3% in humid climates with intense rainfalls. Care should be taken where salinity is a problem as salts tend to accumulate on the tops of the ridges. In these cases the plants are positioned on the sides of the ridges.
The furrow size depends on the method used to form the ridges but varies from 0.25 to 0.40 m in depth and from 0.15 to 0.30 m ridge width, with spacing between furrows of 0.75–1.0 m. The spacing of the furrows is governed by the soil type; on lighter (coarser) soils the furrows should be closer together as the lateral movement of water in the soil is significantly less than the vertical move-ment. On heavier soils water moves laterally as well as horizontally and furrows can be more widely spaced. The length of the fur-row depends on the soil type, stream size, land slope and required irrigation depth, and can range from 60 to 300 m, with the shorter lengths being used on light (coarse-textured) soils and longer furrows on heavier (fine- textured) soils.
With good land preparation and skilled water application the water application effi-ciency can be high with furrow irrigation. Labour requirements can be greater than for other irrigation methods.
CORRUGATION IRRIGATION With this method water flows in small corrugations (channels) pressed into the soil in a similar manner to furrow irrigation. The method is suitable for irrigation of close-growing crops such as bar-ley and wheat.
Sprinkler irrigation
Sprinkler irrigation is used on about 5% of the irrigated land worldwide. The method is flex-ible and can be adapted to suit most soil types and terrains, though it does not function well under windy conditions. It can also be used for frost protection, and application of fertil-izers and pesticides.
A major drawback is the initial cost of the equipment and the energy costs required for pumping. A further constraint is the need for relatively good-quality water, particularly
Components of Irrigation and Drainage Systems 33
in relation to sodium and chlorite. Measured against this is the relative efficiency of appli-cation (about 75% compared with surface irri-gation’s estimated 60%) and generally lower water requirements than surface irrigation methods.
The sprinkler system consists of sprin-klers or other sprinkler devices operating under pressure, a pump unit and a water distribution network, often comprising buried pipes. There are different sprinkler devices, including revolving head sprinklers (single- and multiple-nozzle sprinklers), fixed head sprinklers, nozzle lines and perforated pipes, and a number of different sprinkler systems classified according to their mobility. These include the following (Kay, 1983).
Portable systems:•
° hand-moved systems;
° lateral-move systems.Solid set or permanent systems.•Semi-permanent systems.•Mobile raingun systems:•
° hose-pull system;
° hose-reel system;
° rainguns.Perforated pipes or spraylines:•
° stationary spraylines;
° oscillating spraylines;
° rotating spraylines.Mobile lateral systems:•
° centre-pivot systems;
° side-move systems.
Trickle (drip) irrigation
Trickle irrigation was developed initially for irrigation of glasshouse crops but has been adapted and extended for use with field crops. The trickle/drip irrigation system usually consists of a pump, filter, flowmeter and pressure gauge, fertilizer injector, valves, pipe networks (main, sub-main and laterals) and emitters.
It is the least used system worldwide, used on an estimated 0.1% of irrigated land. As the name suggests, the method comprises trickling or dripping small quantities of water from a pipe onto the soil surface next to the plant. Because the rate of application is low
almost all the water is absorbed into the soil, there is little or no runoff. If the application rate and frequency of irrigation are matched to a crop’s needs the application efficiency can be very high, potentially around 90%. In addition the system can be used to apply fer-tilizers direct to the crop’s root zone.
The system is not without its drawbacks, however. The equipment and setting up costs can be high, and there can be significant problems with blocking of the emitters from sand and silt, chemical precipitation from the water and algae.
Subsurface irrigation
With subsurface irrigation, as the name implies, irrigation water is applied below the ground surface. The water reaches the plant either through buried pipes or drains, or through seepage from irrigation or drainage canals. Subsurface irrigation is successfully practised in some humid areas, for example in the Netherlands. The use of this method in arid regions can cause serious salinity problems.
Drainage Systems
Drainage is often treated as the poor relation to irrigation. However, if it is not adequately catered for in the development of an irriga-tion system its absence can result in loss of agricultural production and potential failure of the scheme.
Drainage is required for a number of reasons:
to make new lands available for agri-•culture;to remove excess surface water following •irrigation or rainfall;to prevent or reduce waterlogging;•to control salinity levels in the root zone.•
Due to environmental considerations drain-age of wetlands and marshes is less prevalent nowadays than it once was. In some coun-tries, such as Guyana and the Netherlands, drainage is a prerequisite to agriculture, either
34 Irrigation Management
irrigated or rainfed. In such locations the operation and maintenance of the drainage systems takes priority over that for the irriga-tion network. Basic drainage is required on irrigation systems to remove surface runoff and rainfall, to avoid the water ponding and causing damage to the crops. More elaborate drainage systems are required where over-irrigation and seepage losses from canals lead to a raising of the groundwater table and the occurrence of waterlogging in the irrigated area. Further elaboration is required where there is a need to control salinity levels in the root zone, caused either by a build-up of salts brought in by the irrigation water or through capillary rise from saline groundwater.
Waterlogging of soils restricts the root-ing depth of the crops to the aerated zone above the water table. Other consequences of waterlogged soils are that they have a poorer soil structure, lower soil strength, increased susceptibility to damage by compaction, and a reduced availability of nitrogen. An addi-tional problem is that toxic waste products are produced under the anaerobic condi-tions that exist in waterlogged soils, such that some compounds (e.g. ferric or manganese) that are not harmful under aerated conditions are converted to soluble toxic compounds (e.g. ferrous or manganous).
The benefits of drainage can therefore be summarized as:
improved aeration of the soil, permitting •optimum agricultural production;improved soil structure resulting from •drier soils;leaching of unwanted salts from the root •zone;
leaching of certain soils (acid sulfate •soils) to control soil acidity.
There are three main types of drainage system:
surface drainage, comprising open drains •to remove excess irrigation or rainfall;subsurface drainage, comprising a matrix •of horizontal buried pipes set at 1–2 m below the surface and connected to deep open drains;pumped drainage, in which deep tube-•wells are used to draw down the ground-water, and saline water from tubewells is discharged into open surface drains.
The open drain network mirrors the irriga-tion canal network, with field drains pick-ing up the irrigation and rainfall runoff and discharging into secondary and primary drains, before discharging either back into the river or to a sink. The subsurface drains are designed to prevent the groundwater table rising into the crop’s root zone, and are typically buried at 1–2 m depth at a spacing of between 20 and 50 m depending on the hydraulic conductivity of the soil. Tubewells for pumped drainage are located at spac-ings that are also determined based on the hydraulic conductivity of the soil, and oper-ate by drawing water out of the soil to cre-ate a cone of depression extending around the tubewell. Depending on the quality of the pumped water, it is reused directly for irrigation, or it is pumped into the irriga-tion canals and mixed with irrigation water to reduce the salinity levels, or it is pumped into the drainage network and disposed of away from the irrigated area.
Endnotes
1 The term ‘irrigation and drainage system’ (I&D system) refers to the network of irrigation and drainage chan-nels, including structures. The term ‘irrigation and drainage scheme’ (I&D scheme) refers to the total irrigation and drainage complex, the irrigation and drainage system, the irrigated land, villages, roads, etc.2 There are different terminologies used worldwide for the tertiary unit. Other terminologies include on-farm and watercourse unit.3 Again different terminologies are used worldwide for the main system. The term ‘off-farm’ is commonly used in Eastern Europe and Central Asia.4 Whether it is a full ministry or a department within another ministry depends on the country.5 There are many different terms for this person/position, including ditch rider, water bailiff, mirab (Central Asia), ulu-ulu (Indonesia, within the tertiary unit), Juru Pengairan (Indonesia, at the main system level).

Components of Irrigation and Drainage Systems 35
6 Note that where the operating authority relies on income from service fees, it will be interested in the financial well-being of the farmers and the farmers’ ability to pay the service fees.7 The Warabandi system used in northern India and Pakistan is based primarily on equitable distribution of available water supplies, rather than the quantity of the supply (see Chapter 4 for more details).8 A project is a time-bounded activity for the development or rehabilitation of an I&D system.9 Puddling is the mechanical breaking down of the soil structure into small particles by ploughing and work-ing the land with water ponded on the land. The working of the land creates a hard pan at 30–40 cm depth, and the fine soil particles settle and form a barrier to downward water flow.10 Also termed border checks or strip checks.
36 ©Martin Burton 2010. Irrigation Management: Principles and Practices (Martin Burton)
3
Management
Management is an essential component in any enterprise, but is not always given the consideration it deserves in the irrigation and drainage sector. Manuals are often written for operation and maintenance but tend to cover the technical aspects of operating and maintaining the irrigation and drainage system (I&D system), and do not address other management issues such as accounting and finance, adminis-tration procedures, financing, staff recruit-ment, human resource development and training.
This chapter sets out the elements of management in the irrigation and drainage sector, starting with a definition of management and the identification of the various management functions. This is followed by a discussion on the different management frameworks that exist and how these frameworks affect the approach to managing I&D systems. The different management functions includ-ing operation and maintenance, account-ing and finance, staffing, administration, legal issues and public relations are then indi vidually discussed in more detailed, together with a discussion on management information systems. The increasingly important role of the irrigation and drainage service fee is also discussed in some detail.
Management Functions
Management can be described as (Jurriens, 1991):
The organised use of resources, in a given envi-ronment, for the planning, operation and moni-toring of certain tasks to convert inputs into outputs according to set objectives.
Figure 3.1 shows the relationship between the key management processes involved in con-verting inputs into outputs. These processes can apply at different levels within the irriga-tion and drainage sector; at the national level the objectives may be to increase agricultural production and farmer livelihoods, at the sys-tem level the objectives will be to supply irri-gation water in a reliable, adequate and timely manner to suit farmers’ needs, and similarly to remove drainage water in an adequate and timely manner. To achieve the stated object-ives plans have to be prepared; these may be longer-term at the national level, and seasonal or annual at the system level. The timespan for implementation will similarly vary, with the focus at system level being on the sea-sonal or annual cycle. Measurements need to be made of key performance indicators to see if the implementation is proceeding according to plan, and adjustments made as necessary. At the end of the cycle an evaluation should be carried out to ascertain if the objectives
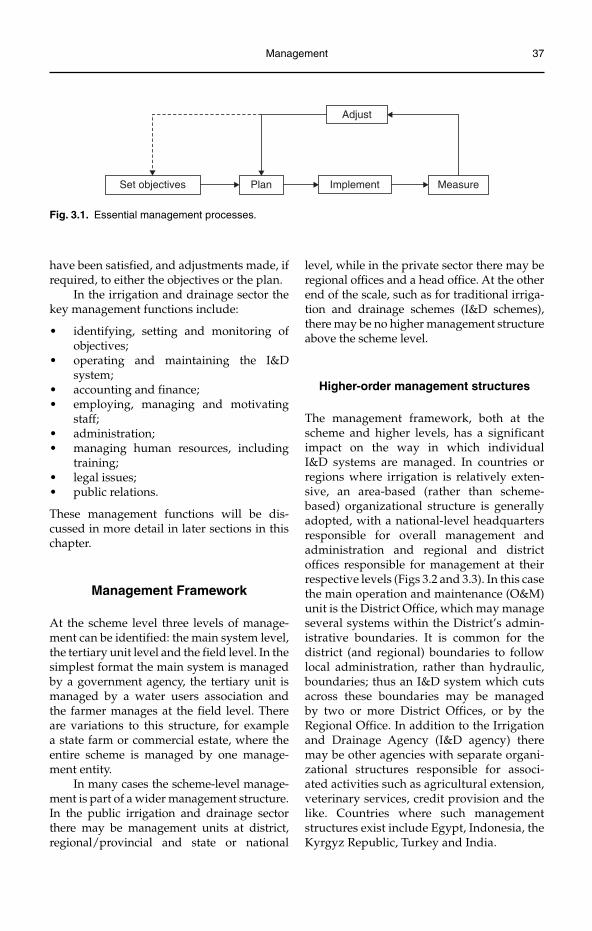
Management 37
have been satisfied, and adjustments made, if required, to either the objectives or the plan.
In the irrigation and drainage sector the key management functions include:
identifying, setting and monitoring of •objectives;operating and maintaining the I&D •system;accounting and finance;•employing, managing and motivating •staff;administration;•managing human resources, including •training;legal issues;•public relations.•
These management functions will be dis-cussed in more detail in later sections in this chapter.
Management Framework
At the scheme level three levels of manage-ment can be identified: the main system level, the tertiary unit level and the field level. In the simplest format the main system is managed by a government agency, the tertiary unit is managed by a water users association and the farmer manages at the field level. There are variations to this structure, for example a state farm or commercial estate, where the entire scheme is managed by one manage-ment entity.
In many cases the scheme-level manage-ment is part of a wider management structure. In the public irrigation and drainage sector there may be management units at district, regional/provincial and state or national
level, while in the private sector there may be regional offices and a head office. At the other end of the scale, such as for traditional irriga-tion and drainage schemes (I&D schemes), there may be no higher management structure above the scheme level.
Higher-order management structures
The management framework, both at the scheme and higher levels, has a significant impact on the way in which individual I&D systems are managed. In countries or regions where irrigation is relatively exten-sive, an area-based (rather than scheme-based) organizational structure is generally adopted, with a national-level headquarters responsible for overall management and administration and regional and district offices responsible for management at their respective levels (Figs 3.2 and 3.3). In this case the main operation and maintenance (O&M) unit is the District Office, which may manage several systems within the District’s admin-istrative boundar ies. It is common for the district (and regional) boundaries to follow local administration, rather than hydraulic, boundaries; thus an I&D system which cuts across these boundar ies may be managed by two or more District Offices, or by the Regional Office. In addition to the Irrigation and Drainage Agency (I&D agency) there may be other agencies with separate organi-zational structures responsible for associ-ated activities such as agricultural extension, veterinary services, credit provision and the like. Countries where such management structures exist include Egypt, Indonesia, the Kyrgyz Republic, Turkey and India.
Set objectives Implement MeasurePlan
Adjust
Fig. 3.1. Essential management processes.
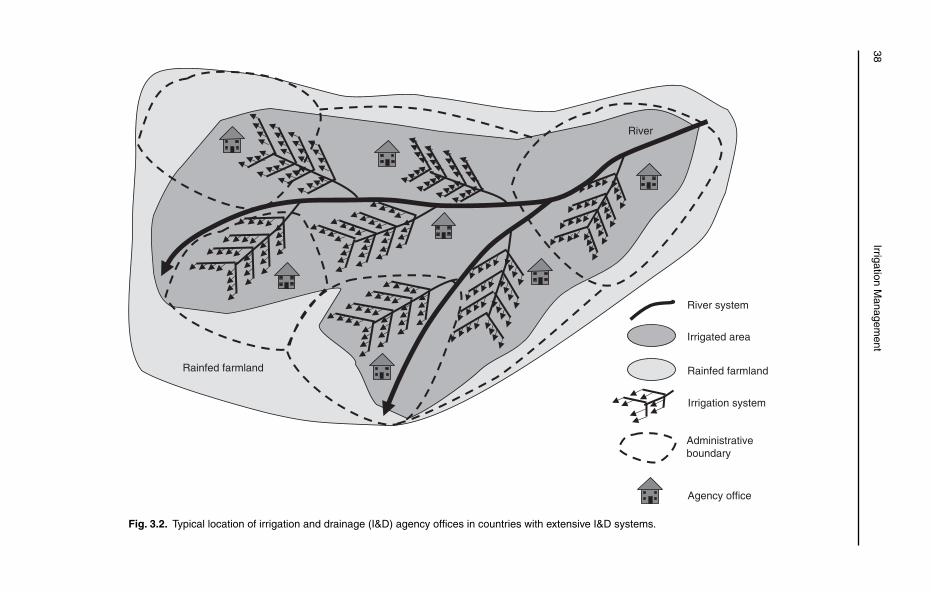
38Irrigation M
anagement
Irrigated area
River
Agency office
Rainfed farmland
River system
Administrativeboundary
Irrigation system
Rainfed farmland
Fig. 3.2. Typical location of irrigation and drainage (I&D) agency offices in countries with extensive I&D systems.
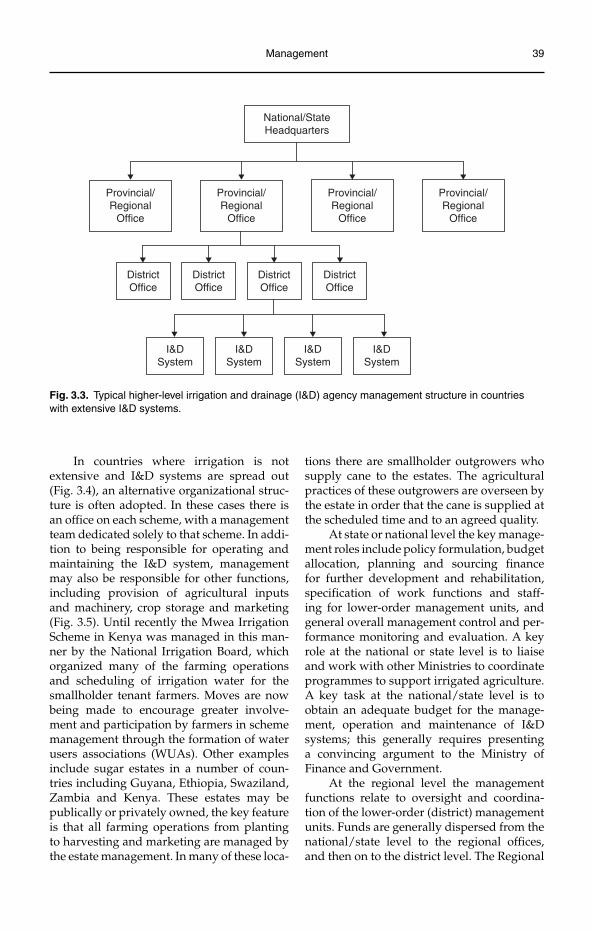
Management 39
In countries where irrigation is not extensive and I&D systems are spread out (Fig. 3.4), an alternative organizational struc-ture is often adopted. In these cases there is an office on each scheme, with a management team dedicated solely to that scheme. In addi-tion to being responsible for operating and maintaining the I&D system, management may also be responsible for other functions, including provision of agricultural inputs and machinery, crop storage and marketing (Fig. 3.5). Until recently the Mwea Irrigation Scheme in Kenya was managed in this man-ner by the National Irrigation Board, which organized many of the farming operations and scheduling of irrigation water for the smallholder tenant farmers. Moves are now being made to encourage greater involve-ment and participation by farmers in scheme management through the formation of water users associations (WUAs). Other examples include sugar estates in a number of coun-tries including Guyana, Ethiopia, Swaziland, Zambia and Kenya. These estates may be publically or privately owned, the key feature is that all farming operations from planting to harvesting and marketing are managed by the estate management. In many of these loca-
tions there are smallholder outgrowers who supply cane to the estates. The agricultural practices of these outgrowers are overseen by the estate in order that the cane is supplied at the scheduled time and to an agreed quality.
At state or national level the key manage-ment roles include policy formulation, budget allocation, planning and sourcing finance for further development and re habilitation, specification of work functions and staff-ing for lower-order management units, and general overall management control and per-formance monitoring and evaluation. A key role at the national or state level is to liaise and work with other Ministries to coordinate programmes to support irrigated agriculture. A key task at the national/state level is to obtain an adequate budget for the manage-ment, operation and maintenance of I&D systems; this generally requires presenting a convincing argument to the Ministry of Finance and Government.
At the regional level the management functions relate to oversight and coordina-tion of the lower-order (district) management units. Funds are generally dispersed from the national/state level to the regional offices, and then on to the district level. The Regional
National/StateHeadquarters
Provincial/RegionalOffice
Provincial/RegionalOffice
Provincial/RegionalOffice
Provincial/RegionalOffice
DistrictOffice
DistrictOffice
DistrictOffice
DistrictOffice
I&DSystem
I&DSystem
I&DSystem
I&DSystem
Fig. 3.3. Typical higher-level irrigation and drainage (I&D) agency management structure in countries with extensive I&D systems.
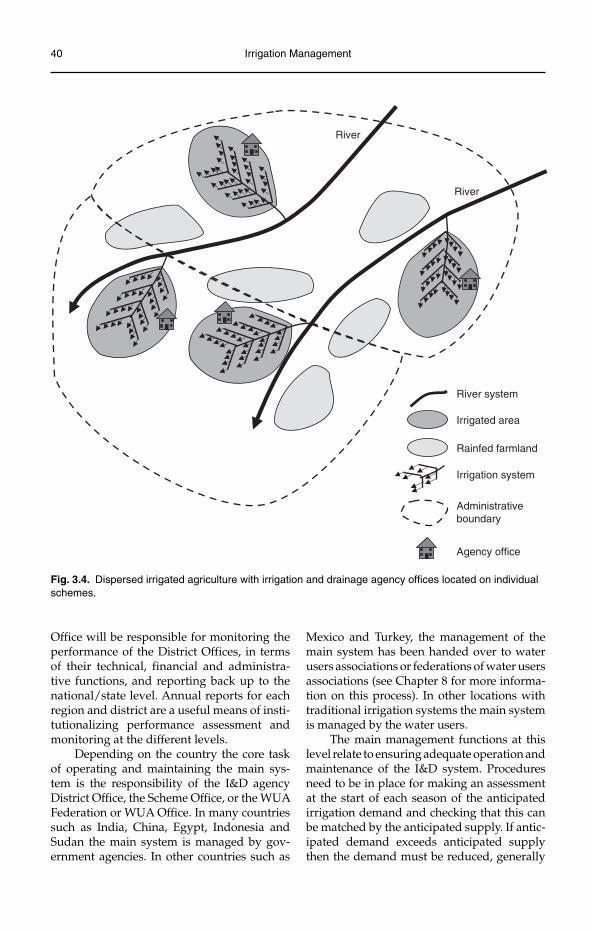
40 Irrigation Management
Office will be responsible for monitoring the performance of the District Offices, in terms of their technical, financial and administra-tive functions, and reporting back up to the national/state level. Annual reports for each region and district are a useful means of insti-tutionalizing performance assessment and monitoring at the different levels.
Depending on the country the core task of operating and maintaining the main sys-tem is the responsibility of the I&D agency District Office, the Scheme Office, or the WUA Federation or WUA Office. In many countries such as India, China, Egypt, Indonesia and Sudan the main system is managed by gov-ernment agencies. In other countries such as
Mexico and Turkey, the management of the main system has been handed over to water users associations or federations of water users associations (see Chapter 8 for more informa-tion on this process). In other locations with traditional irrigation systems the main system is managed by the water users.
The main management functions at this level relate to ensuring adequate operation and maintenance of the I&D system. Procedures need to be in place for making an assessment at the start of each season of the anticipated irrigation demand and checking that this can be matched by the anticipated supply. If antic-ipated demand exceeds anticipated supply then the demand must be reduced, generally
Irrigated area
River
Agency office
River system
Administrativeboundary
Irrigation system
Rainfed farmland
River
Fig. 3.4. Dispersed irrigated agriculture with irrigation and drainage agency offices located on individual schemes.
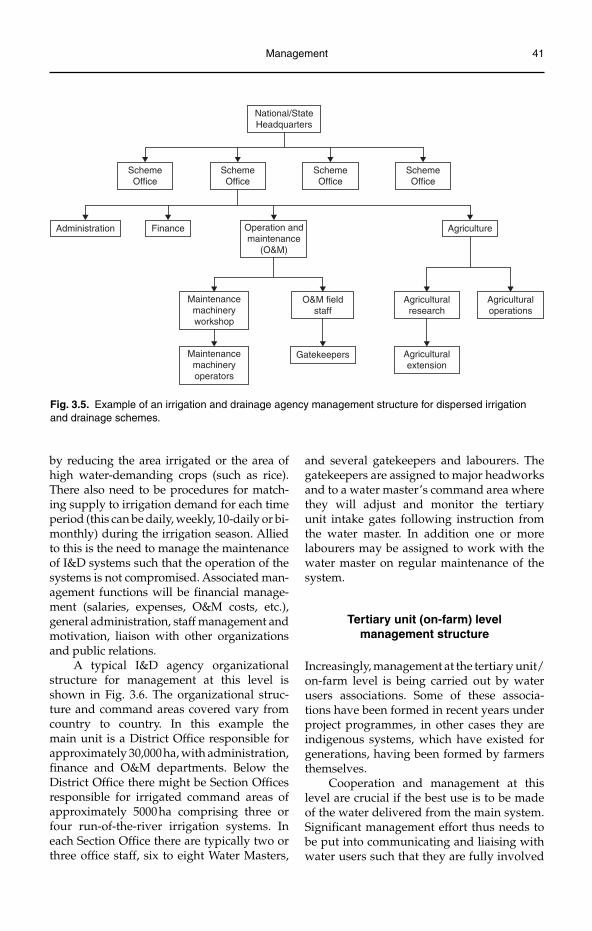
Management 41
by reducing the area irrigated or the area of high water-demanding crops (such as rice). There also need to be procedures for match-ing supply to irrigation demand for each time period (this can be daily, weekly, 10-daily or bi-monthly) during the irrigation season. Allied to this is the need to manage the maintenance of I&D systems such that the operation of the systems is not compromised. Associated man-agement functions will be financial manage-ment (salaries, expenses, O&M costs, etc.), general administration, staff management and motivation, liaison with other organizations and public relations.
A typical I&D agency organizational structure for management at this level is shown in Fig. 3.6. The organizational struc-ture and command areas covered vary from country to country. In this example the main unit is a District Office responsible for approximately 30,000 ha, with administration, finance and O&M departments. Below the District Office there might be Section Offices responsible for irrigated command areas of approximately 5000 ha comprising three or four run-of-the-river irrigation systems. In each Section Office there are typically two or three office staff, six to eight Water Masters,
and several gatekeepers and labourers. The gatekeepers are assigned to major headworks and to a water master’s command area where they will adjust and monitor the tertiary unit intake gates following instruction from the water master. In addition one or more labourers may be assigned to work with the water master on regular maintenance of the system.
Tertiary unit (on-farm) level management structure
Increasingly, management at the tertiary unit/on-farm level is being carried out by water users associations. Some of these associa-tions have been formed in recent years under project programmes, in other cases they are indigenous systems, which have existed for generations, having been formed by farmers themselves.
Cooperation and management at this level are crucial if the best use is to be made of the water delivered from the main system. Significant management effort thus needs to be put into communicating and liaising with water users such that they are fully involved
Maintenancemachineryworkshop
Administration
National/StateHeadquarters
SchemeOffice
SchemeOffice
SchemeOffice
SchemeOffice
Finance Operation andmaintenance
(O&M)
Agriculture
O&M fieldstaff
Agriculturalresearch
Agriculturaloperations
Maintenancemachineryoperators
Gatekeepers Agriculturalextension
Fig. 3.5. Example of an irrigation and drainage agency management structure for dispersed irrigation and drainage schemes.
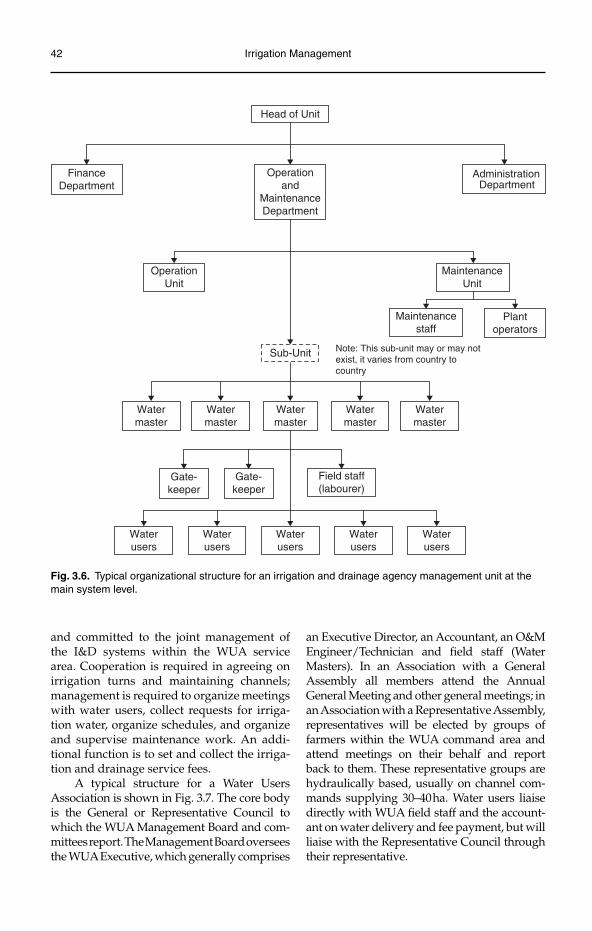
42 Irrigation Management
and committed to the joint management of the I&D systems within the WUA service area. Cooperation is required in agreeing on irrigation turns and maintaining channels; management is required to organize meetings with water users, collect requests for irriga-tion water, organize schedules, and organize and supervise maintenance work. An addi-tional function is to set and collect the irriga-tion and drainage service fees.
A typical structure for a Water Users Association is shown in Fig. 3.7. The core body is the General or Representative Council to which the WUA Management Board and com-mittees report. The Management Board oversees the WUA Executive, which generally comprises
FinanceDepartment
Head of Unit
AdministrationDepartment
Operationand
MaintenanceDepartment
OperationUnit
MaintenanceUnit
Gate-keeper
Maintenancestaff
Plantoperators
Waterusers
Waterusers
Waterusers
Waterusers
Waterusers
Gate-keeper
Sub-Unit
Field staff(labourer)
Watermaster
Watermaster
Watermaster
Watermaster
Watermaster
Note: This sub-unit may or may notexist, it varies from country tocountry
Fig. 3.6. Typical organizational structure for an irrigation and drainage agency management unit at the main system level.
an Executive Director, an Accountant, an O&M Engineer/Technician and field staff (Water Masters). In an Association with a General Assembly all members attend the Annual General Meeting and other general meetings; in an Association with a Representative Assembly, representatives will be elected by groups of farmers within the WUA command area and attend meetings on their behalf and report back to them. These representative groups are hydraulically based, usually on channel com-mands supplying 30–40 ha. Water users liaise directly with WUA field staff and the account-ant on water delivery and fee payment, but will liaise with the Representative Council through their representative.
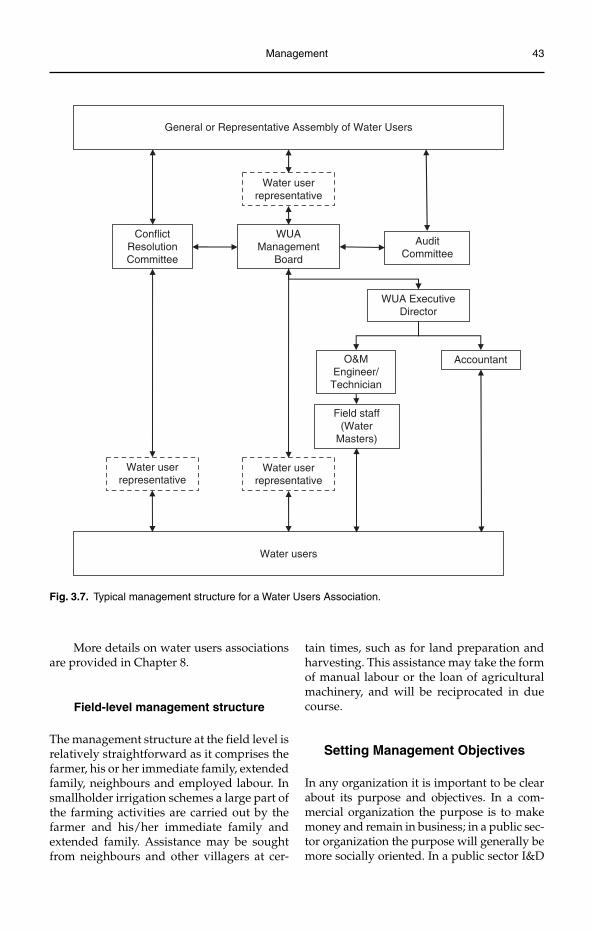
Management 43
More details on water users associations are provided in Chapter 8.
Field-level management structure
The management structure at the field level is relatively straightforward as it comprises the farmer, his or her immediate family, extended family, neighbours and employed labour. In smallholder irrigation schemes a large part of the farming activities are carried out by the farmer and his/her immediate family and extended family. Assistance may be sought from neighbours and other villagers at cer-
WUA ExecutiveDirector
AccountantO&MEngineer/Technician
AuditCommittee
ConflictResolutionCommittee
Field staff(Water
Masters)
General or Representative Assembly of Water Users
WUAManagement
Board
Water users
Water userrepresentative
Water userrepresentative
Water userrepresentative
Fig. 3.7. Typical management structure for a Water Users Association.
tain times, such as for land preparation and harvesting. This assistance may take the form of manual labour or the loan of agricultural machinery, and will be reciprocated in due course.
Setting Management Objectives
In any organization it is important to be clear about its purpose and objectives. In a com-mercial organization the purpose is to make money and remain in business; in a public sec-tor organization the purpose will generally be more socially oriented. In a public sector I&D
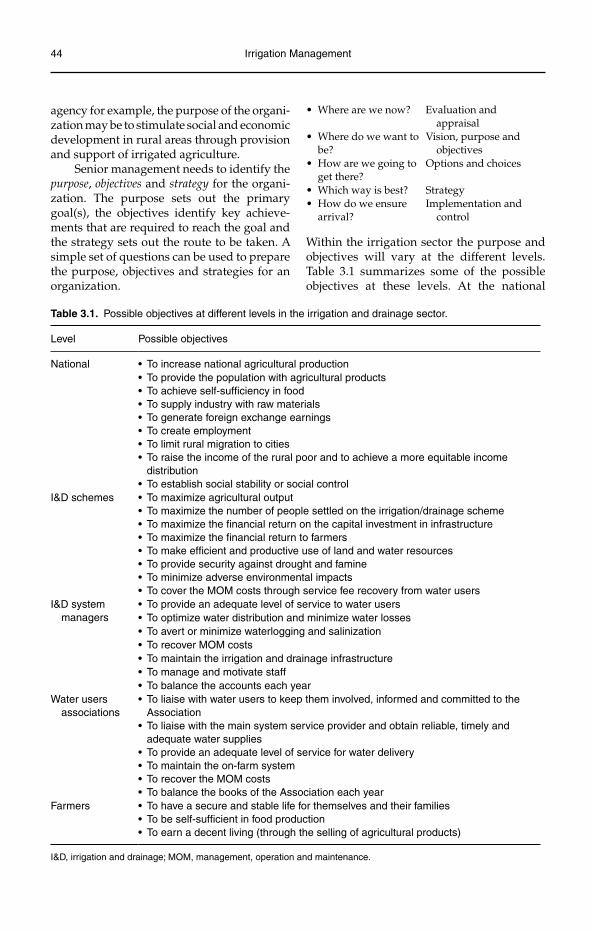
44 Irrigation Management
agency for example, the purpose of the organi-zation may be to stimulate social and economic development in rural areas through provision and support of irrigated agriculture.
Senior management needs to identify the purpose, objectives and strategy for the organi-zation. The purpose sets out the primary goal(s), the objectives identify key achieve-ments that are required to reach the goal and the strategy sets out the route to be taken. A simple set of questions can be used to prepare the purpose, objectives and strategies for an organization.
Table 3.1. Possible objectives at different levels in the irrigation and drainage sector.
Level Possible objectives
National • To increase national agricultural production• To provide the population with agricultural products• To achieve self-sufficiency in food• To supply industry with raw materials• To generate foreign exchange earnings• To create employment• To limit rural migration to cities• To raise the income of the rural poor and to achieve a more equitable income
distribution• To establish social stability or social control
I&D schemes • To maximize agricultural output• To maximize the number of people settled on the irrigation/drainage scheme• To maximize the financial return on the capital investment in infrastructure• To maximize the financial return to farmers• To make efficient and productive use of land and water resources• To provide security against drought and famine• To minimize adverse environmental impacts• To cover the MOM costs through service fee recovery from water users
I&D system managers
• To provide an adequate level of service to water users• To optimize water distribution and minimize water losses• To avert or minimize waterlogging and salinization• To recover MOM costs• To maintain the irrigation and drainage infrastructure• To manage and motivate staff• To balance the accounts each year
Water users associations
• To liaise with water users to keep them involved, informed and committed to theAssociation
• To liaise with the main system service provider and obtain reliable, timely and adequate water supplies
• To provide an adequate level of service for water delivery• To maintain the on-farm system• To recover the MOM costs• To balance the books of the Association each year
Farmers • To have a secure and stable life for themselves and their families• To be self-sufficient in food production• To earn a decent living (through the selling of agricultural products)
I&D, irrigation and drainage; MOM, management, operation and maintenance.
• Where are we now? Evaluation and appraisal
• Where do we want to be?
Vision, purpose and objectives
• How are we going to get there?
Options and choices
• Which way is best? Strategy• How do we ensure
arrival?Implementation and control
Within the irrigation sector the purpose and objectives will vary at the different levels. Table 3.1 summarizes some of the possible objectives at these levels. At the national
Management 45
level government may be interested in using its (often scarce) land and water resources to satisfy a number of objectives. On the one hand it may support irrigation development to increase agricultural production and cre-ate employment and sustain the livelihoods of rural communities. On the other, it may wish to generate income and create employ-ment by licensing commercial estates to pro-duce agricultural products for industry and export.
Similar objectives will exist at the regional and district level. In countries where responsibility for rural development has been devolved to the regions or districts, the devel-opment of irrigation can be a major political objective at this level.
For individual I&D schemes the objec-tives may vary, depending on a variety of factors including its intended purpose (small-holder or estate), design and location. Some schemes are designed for ‘protective irriga-tion’ to sustain smallholder farmers in arid zones where droughts threaten livelihoods; other schemes are designed to provide com-mercial agricultural opportunities and to grow the local economy. Some schemes are concerned primarily with irrigation; in other schemes flood protection, drainage and pro-tection from waterlogging and salinization are important.
For managers of I&D systems the primary objective is to provide an adequate level of service. This will require that irrigation water is provided in a reliable, adequate and timely manner, as efficiently and cost-effectively as possible, with equal opportunity for all users, irrespective of their status or location on the scheme. Associated with this service delivery is the recovery of service fees, where due, which will contribute to the costs for oper-ating and maintaining the system. The sys-tem manager will have additional objectives associated with his/her managerial function, including managing and motivating staff, balancing the accounts each year and liaising with water users and other entities.
The objectives for the water users asso-ciation are similar to those of the I&D system manager in terms of the operation and main-tenance and cost recovery functions. However, an overriding objective must be to liaise and
work with water users such that the associa-tion functions as a democratic, accountable and transparent organization, fully supported by all water users.
The objectives for farmers will vary depending on the circumstances. In some locations the main aim is survival; irrigation can provide reliable water supplies where rainfall is sparse, erratic or unreliable. In other locations income from irrigated agriculture may be competing with alternative forms of income and will thus need to be remunerative for the farmer for it to be an attractive option.
Figure 3.8 shows a linked hierarchy of objectives at different levels. Understanding such linkages, as with the nested systems outlined in Chapter 2, helps to understand where interventions can be made to improve the performance of I&D schemes.
Key Management Functions for System Operation and
Maintenance
Detailed discussion on processes and proced-ures for system operation and maintenance is provided in Chapters 4, 5 and 6. The sec-tions below summarize some key manage-ment principles and processes underlying the proper management, operation and mainten-ance of I&D systems.
Service delivery
At the centre of the management philosophy should be the principle of service delivery. This is particularly important in relation to the recovery of the irrigation service fee. Good service delivery is more likely to result in good levels of fee recovery; poor service delivery will almost certainly result in poor levels of fee recovery.
Figure 3.9 shows the core elements of service delivery, comprising the service deliv-ery to the water user for which a service fee is paid to the service provider. The rights and responsibilities of each party are con-tained in the Service Agreement. The Service
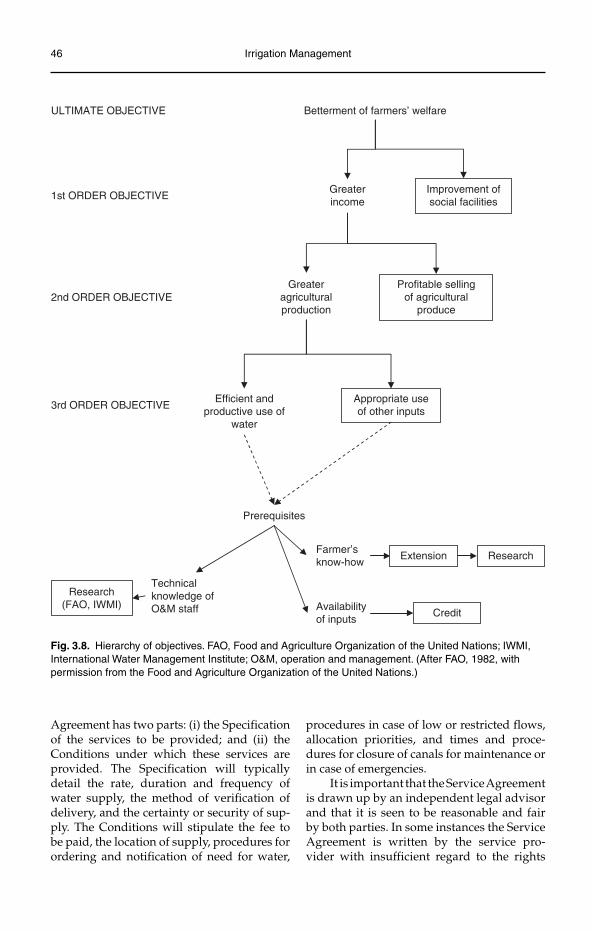
46 Irrigation Management
Agreement has two parts: (i) the Specification of the services to be provided; and (ii) the Conditions under which these services are provided. The Specification will typically detail the rate, duration and frequency of water supply, the method of verification of delivery, and the certainty or security of sup-ply. The Conditions will stipulate the fee to be paid, the location of supply, procedures for ordering and notification of need for water,
procedures in case of low or restricted flows, allocation priorities, and times and proce-dures for closure of canals for maintenance or in case of emergencies.
It is important that the Service Agreement is drawn up by an independent legal advisor and that it is seen to be reasonable and fair by both parties. In some instances the Service Agreement is written by the service pro-vider with insufficient regard to the rights
Improvement ofsocial facilities
ULTIMATE OBJECTIVE
3rd ORDER OBJECTIVE
1st ORDER OBJECTIVE
2nd ORDER OBJECTIVE
Prerequisites
Greateragriculturalproduction
Availabilityof inputs
Farmer’sknow-how
Betterment of farmers’ welfare
Greaterincome
ResearchExtension
Appropriate useof other inputs
Efficient andproductive use of
water
Profitable sellingof agricultural
produce
Credit
Research(FAO, IWMI)
Technicalknowledge ofO&M staff
Fig. 3.8. Hierarchy of objectives. FAO, Food and Agriculture Organization of the United Nations; IWMI, International Water Management Institute; O&M, operation and management. (After FAO, 1982, with permission from the Food and Agriculture Organization of the United Nations.)
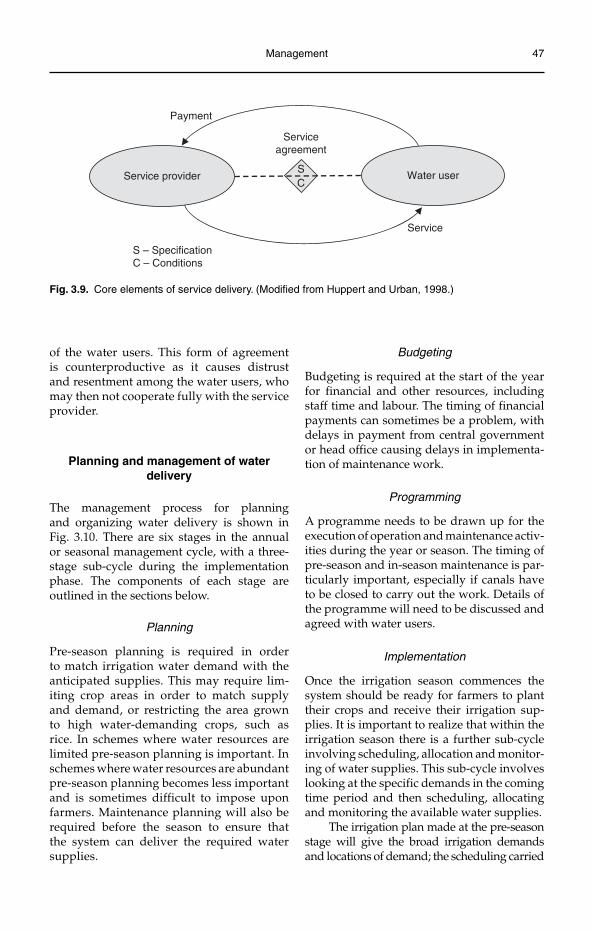
Management 47
of the water users. This form of agreement is counterproductive as it causes distrust and resentment among the water users, who may then not cooperate fully with the service provider.
Planning and management of water delivery
The management process for planning and organizing water delivery is shown in Fig. 3.10. There are six stages in the annual or seasonal management cycle, with a three-stage sub-cycle during the implementation phase. The components of each stage are outlined in the sections below.
Planning
Pre-season planning is required in order to match irrigation water demand with the anticipated supplies. This may require lim-iting crop areas in order to match supply and demand, or restricting the area grown to high water-demanding crops, such as rice. In schemes where water resources are limited pre-season planning is important. In schemes where water resources are abundant pre-season planning becomes less important and is sometimes difficult to impose upon farmers. Maintenance planning will also be required before the season to ensure that the system can deliver the required water supplies.
Budgeting
Budgeting is required at the start of the year for financial and other resources, including staff time and labour. The timing of financial payments can sometimes be a problem, with delays in payment from central government or head office causing delays in implementa-tion of maintenance work.
Programming
A programme needs to be drawn up for the execution of operation and maintenance activ-ities during the year or season. The timing of pre-season and in-season maintenance is par-ticularly important, especially if canals have to be closed to carry out the work. Details of the programme will need to be discussed and agreed with water users.
Implementation
Once the irrigation season commences the system should be ready for farmers to plant their crops and receive their irrigation sup-plies. It is important to realize that within the irrigation season there is a further sub-cycle involving scheduling, allocation and monitor-ing of water supplies. This sub-cycle involves looking at the specific demands in the coming time period and then scheduling, allocating and monitoring the available water supplies.
The irrigation plan made at the pre-season stage will give the broad irrigation demands and locations of demand; the scheduling carried
SC
Payment
Service
S – SpecificationC – Conditions
Serviceagreement
Service provider Water user
Fig. 3.9. Core elements of service delivery. (Modified from Huppert and Urban, 1998.)
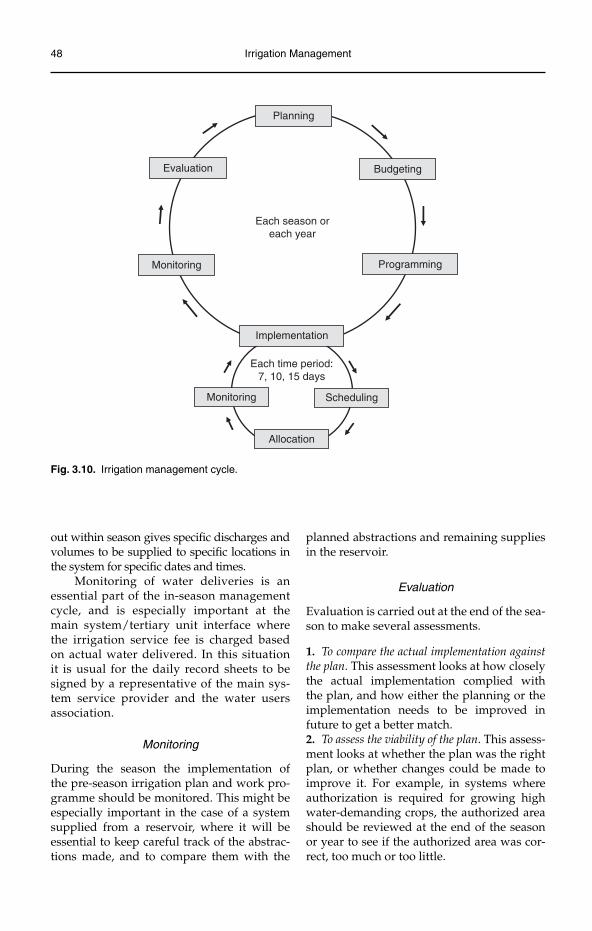
48 Irrigation Management
out within season gives specific discharges and volumes to be supplied to specific locations in the system for specific dates and times.
Monitoring of water deliveries is an essential part of the in-season management cycle, and is especially important at the main system/tertiary unit interface where the irrigation service fee is charged based on actual water delivered. In this situation it is usual for the daily record sheets to be signed by a representative of the main sys-tem service provider and the water users association.
Monitoring
During the season the implementation of the pre-season irrigation plan and work pro-gramme should be monitored. This might be especially important in the case of a system supplied from a reservoir, where it will be essential to keep careful track of the abstrac-tions made, and to compare them with the
planned abstractions and remaining supplies in the reservoir.
Evaluation
Evaluation is carried out at the end of the sea-son to make several assessments.
1. To compare the actual implementation against the plan. This assessment looks at how closely the actual implementation complied with the plan, and how either the planning or the implementation needs to be improved in future to get a better match.2. To assess the viability of the plan. This assess-ment looks at whether the plan was the right plan, or whether changes could be made to improve it. For example, in systems where authorization is required for growing high water-demanding crops, the authorized area should be reviewed at the end of the season or year to see if the authorized area was cor-rect, too much or too little.
Allocation
Monitoring Scheduling
Each time period:7, 10, 15 days
Planning
Budgeting
Programming
Implementation
Monitoring
Evaluation
Each season oreach year
Fig. 3.10. Irrigation management cycle.
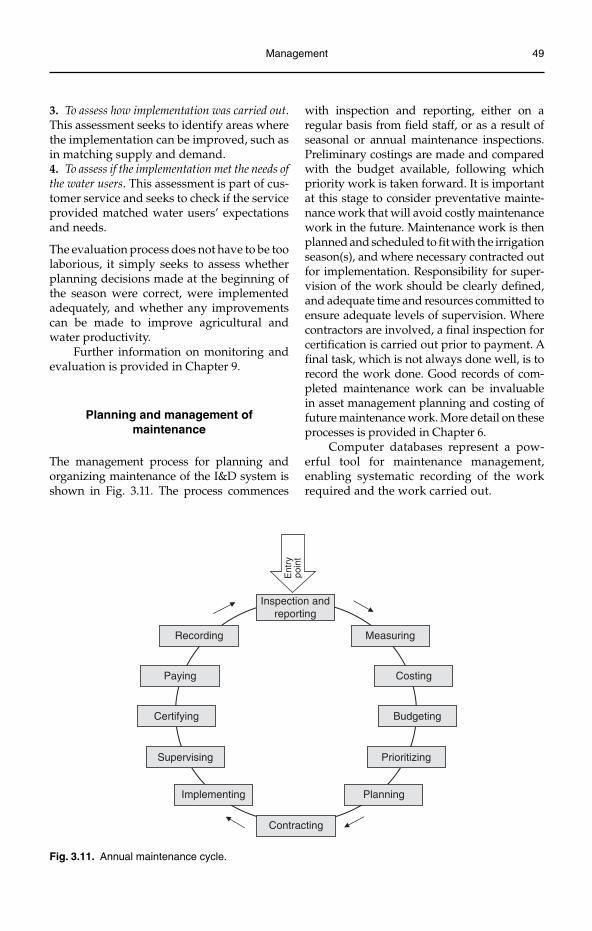
Management 49
3. To assess how implementation was carried out.This assessment seeks to identify areas where the implementation can be improved, such as in matching supply and demand.4. To assess if the implementation met the needs of the water users. This assessment is part of cus-tomer service and seeks to check if the service provided matched water users’ expectations and needs.
The evaluation process does not have to be too laborious, it simply seeks to assess whether planning decisions made at the beginning of the season were correct, were implemented adequately, and whether any improvements can be made to improve agricultural and water productivity.
Further information on monitoring and evaluation is provided in Chapter 9.
Planning and management of maintenance
The management process for planning and organizing maintenance of the I&D system is shown in Fig. 3.11. The process commences
with inspection and reporting, either on a regular basis from field staff, or as a result of seasonal or annual maintenance inspections. Preliminary costings are made and compared with the budget available, following which priority work is taken forward. It is important at this stage to consider preventative mainte-nance work that will avoid costly maintenance work in the future. Maintenance work is then planned and scheduled to fit with the irrigation season(s), and where ne cessary contracted out for implementation. Responsibility for super-vision of the work should be clearly defined, and adequate time and resources committed to ensure adequate levels of supervision. Where contractors are involved, a final inspection for certification is carried out prior to payment. A final task, which is not always done well, is to record the work done. Good records of com-pleted maintenance work can be invaluable in asset management planning and costing of future maintenance work. More detail on these processes is provided in Chapter 6.
Computer databases represent a pow-erful tool for maintenance management, enabling systematic recording of the work required and the work carried out.
Inspection andreporting
Costing
Budgeting
Prioritizing
Planning
Contracting
Implementing
Supervising
Certifying
Paying
Recording Measuring
Ent
rypo
int
Fig. 3.11. Annual maintenance cycle.
50 Irrigation Management
Management Records and Information Systems
Management information systems and records are an essential feature of the management of I&D schemes. For an irrigation service pro-vider the management records and informa-tion system might include:
topographic maps of the command •area;maps of the I&D system(s);•schematic maps of the I&D system(s) •showing key features (canals, control structures, command areas, etc.);schematic operational diagrams show-•ing planned and supplied discharges, crop areas, etc. (see Chapter 4 for examples);forms for recording crop areas, dis-•charges, climatic data, etc.;a maintenance register and forms for •recording maintenance work required and implemented (see Chapter 6 for examples);an asset register for all infrastructure;•engineering drawings of all the assets;•administrative records;•staff records (personal details, salary, •annual reports, etc.);financial accounts and records.•
For a water users association the management records are less extensive and might include:
minutes of meetings;•copies of the WUA registration •documents;a map of the irrigation scheme, showing •the boundaries, canals, drains, structure locations and, if applicable, the repre-sentative zones;if available, a full cadastral map showing •all landholdings and their sizes;a register of members, with the names •and landholding areas and locations for each member – details will also need to be kept for non-members if they require irrigation water supplies;accounts records including a cash book, •a register showing the irrigation fees paid and an accounts book showing the income and expenditure;
an asset register, detailing the lengths of •canals and drains and the type and char-acteristics of all infrastructure;a maintenance register showing the •maintenance work required and completed.
The design of an efficient management information system can add greatly to management productivity and efficiency. Figure 3.12 provides an example of the type of data that might be collected and processed to pass information up the management hier-archy. It is important that the amount of data passed on up the hierarchy is appropriate to that level. It is not sensible, for example, to send information on irrigation supplies to individual tertiary units up to the pro-vincial level, these data should be kept at the section and district level. However, summarized information on abstractions from rivers for irrigation systems will be of interest and use at the provincial level. The frequency of the reporting is also impor-tant, and, as shown in Fig. 3.12, will vary according to the type of data collected and their use. In this example rainfall, river and canals flows are collected daily by the Water Master, summarized each 10 days and passed on to the Section Office, who in turn pass it on to the District Office each month. In contrast, data during a severe flood might be sent daily (or even hourly) to all levels.
Computers and appropriate computer software play an important role in manage-ment information systems. At the simplest level spreadsheets provide a simple and effective means of storing, summarizing and presenting data. Proprietary databases are now readily available and can be relatively easily programmed to enter, process, store and present data for individual situations. Alternatively, specialist database software can be purchased for specific applications such as processing, analysing and presenting data on rainfall, river and canal discharges, cropping, etc.
Geographic Information Systems (GIS) and remote sensing are increasingly impor-tant tools for data collection, processing, analysis and presentation in the irrigation and drainage sector. In some instances where
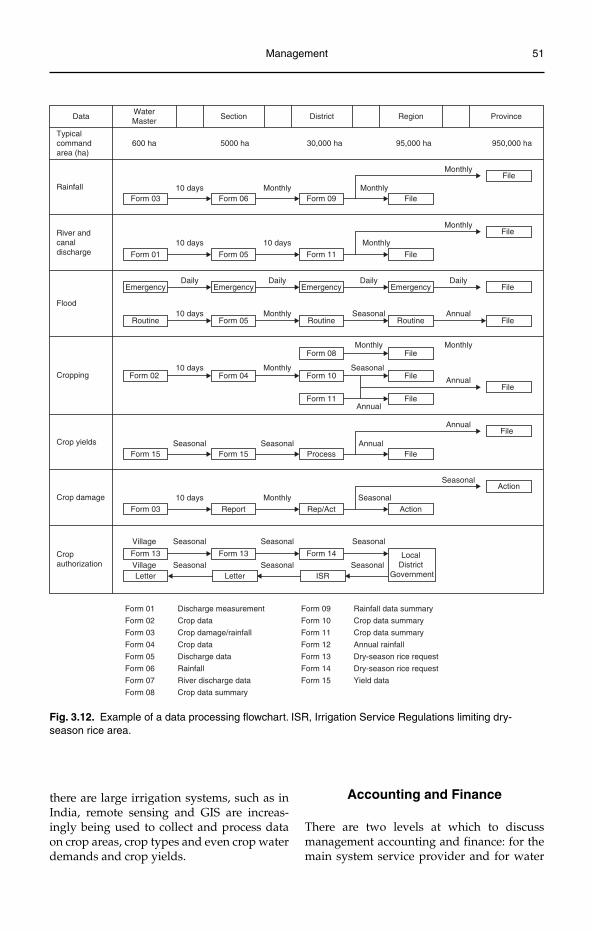
Management 51
DataWaterMaster
Typicalcommandarea (ha)
Section District Region Province
600 ha 5000 ha 30,000 ha 95,000 ha 950,000 ha
MonthlyFile
Monthly
Monthly
Monthly
Monthly
10 days
10 days
10 days10 days
Form 03 Form 06 Form 09 File
MonthlyFile
Form 01 Form 05 Form 11 File
DailyDailyDailyDailyFile
Routine Form 05
Emergency Emergency Emergency Emergency
Seasonal AnnualRoutine Routine File
Form 08 File
File
File
File
Monthly Monthly
10 days Monthly SeasonalForm 02 Form 04 Form 10 Annual
File
Rainfall
River and canaldischarge
Flood
Cropping
Form 11Annual
AnnualFile
Seasonal Seasonal AnnualForm 15 Form 15 Process
SeasonalAction
Form 03 Report Rep/Act Action
Form 13 Form 13 Form 14
10 days Monthly Seasonal
Village Seasonal Seasonal Seasonal
Village Seasonal Seasonal SeasonalLetter Letter ISR
Form 01
Form 02
Form 03
Form 04
Form 05
Form 06
Form 07
Form 08
Discharge measurement
Crop data
Crop damage/rainfall
Crop data
Discharge data
Rainfall
River discharge data
Crop data summary
Form 09
Form 10
Form 11
Form 12
Form 13
Form 14
Form 15
Rainfall data summary
Crop data summary
Crop data summary
Annual rainfall
Dry-season rice request
Dry-season rice request
Yield data
Crop yields
Crop damage
Cropauthorization
LocalDistrict
Government
Fig. 3.12. Example of a data processing flowchart. ISR, Irrigation Service Regulations limiting dry-season rice area.
there are large irrigation systems, such as in India, remote sensing and GIS are increas-ingly being used to collect and process data on crop areas, crop types and even crop water demands and crop yields.
Accounting and Finance
There are two levels at which to discuss management accounting and finance: for the main system service provider and for water
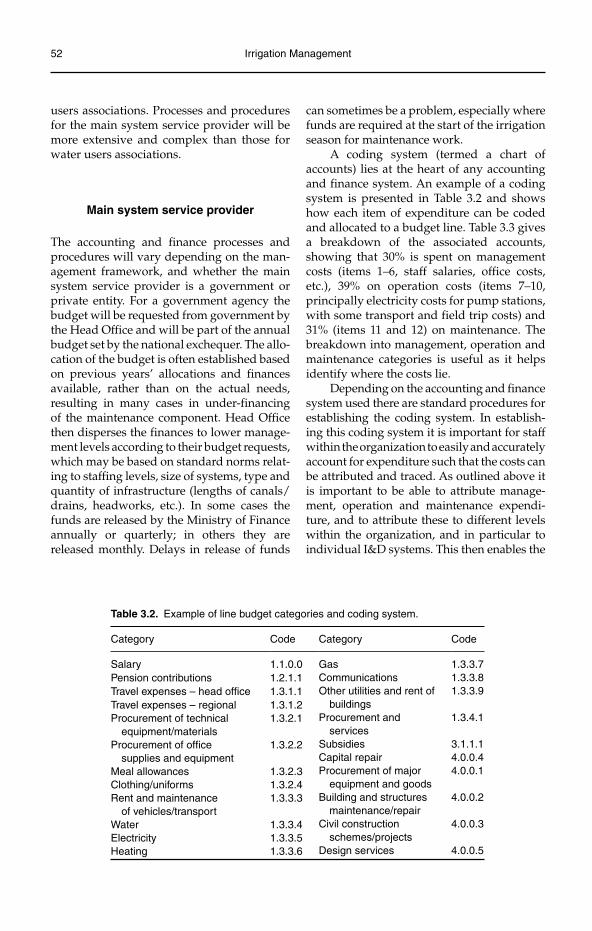
52 Irrigation Management
users associations. Processes and procedures for the main system service provider will be more extensive and complex than those for water users associations.
Main system service provider
The accounting and finance processes and procedures will vary depending on the man-agement framework, and whether the main system service provider is a government or private entity. For a government agency the budget will be requested from government by the Head Office and will be part of the annual budget set by the national ex chequer. The allo-cation of the budget is often established based on previous years’ allocations and finances available, rather than on the actual needs, resulting in many cases in under-financing of the maintenance component. Head Office then disperses the finances to lower manage-ment levels according to their budget requests, which may be based on standard norms relat-ing to staffing levels, size of systems, type and quantity of infrastructure (lengths of canals/drains, headworks, etc.). In some cases the funds are released by the Ministry of Finance annually or quarterly; in others they are released monthly. Delays in release of funds
can sometimes be a problem, especially where funds are required at the start of the irrigation season for maintenance work.
A coding system (termed a chart of accounts) lies at the heart of any accounting and finance system. An example of a coding system is presented in Table 3.2 and shows how each item of expenditure can be coded and allocated to a budget line. Table 3.3 gives a breakdown of the associated accounts, showing that 30% is spent on management costs (items 1–6, staff salaries, office costs, etc.), 39% on operation costs (items 7–10, principally electricity costs for pump stations, with some transport and field trip costs) and 31% (items 11 and 12) on maintenance. The breakdown into management, operation and maintenance categories is useful as it helps identify where the costs lie.
Depending on the accounting and finance system used there are standard procedures for establishing the coding system. In establish-ing this coding system it is important for staff within the organization to easily and accurately account for expenditure such that the costs can be attributed and traced. As outlined above it is important to be able to attribute manage-ment, operation and maintenance expendi-ture, and to attribute these to different levels within the organization, and in particular to individual I&D systems. This then enables the
Table 3.2. Example of line budget categories and coding system.
Category Code Category Code
Salary 1.1.0.0 GasCommunicationsOther utilities and rent of buildingsProcurement and servicesSubsidiesCapital repairProcurement of major equipment and goodsBuilding and structures maintenance/repairCivil construction schemes/projectsDesign services
1.3.3.71.3.3.81.3.3.9
1.3.4.1
3.1.1.14.0.0.44.0.0.1
4.0.0.2
4.0.0.3
4.0.0.5
Pension contributions 1.2.1.1Travel expenses – head office 1.3.1.1Travel expenses – regionalProcurement of technical equipment/materialsProcurement of office supplies and equipmentMeal allowancesClothing/uniformsRent and maintenance of vehicles/transportWaterElectricityHeating
1.3.1.21.3.2.1
1.3.2.2
1.3.2.31.3.2.41.3.3.3
1.3.3.41.3.3.51.3.3.6
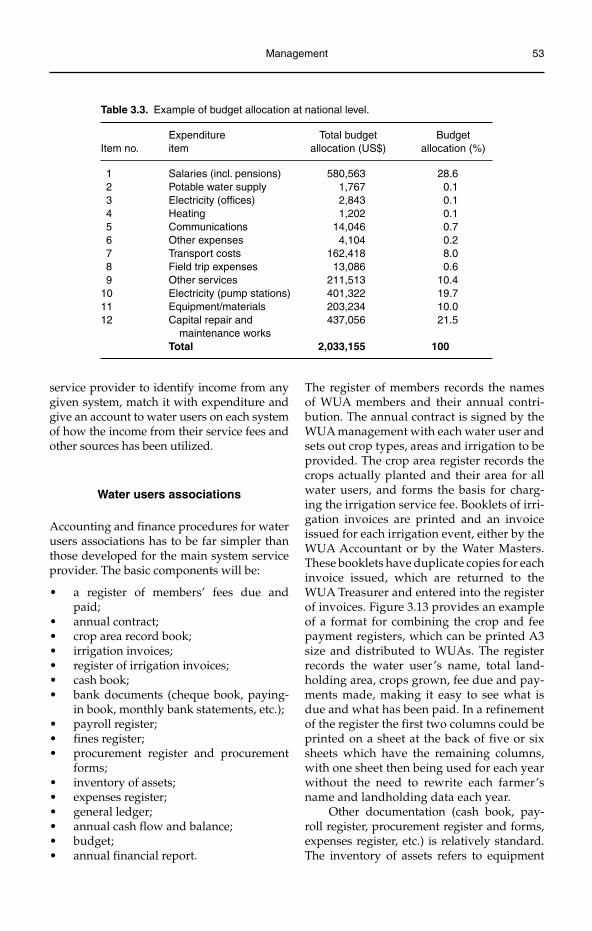
Management 53
service provider to identify income from any given system, match it with expenditure and give an account to water users on each system of how the income from their service fees and other sources has been utilized.
Water users associations
Accounting and finance procedures for water users associations has to be far simpler than those developed for the main system service provider. The basic components will be:
a register of members’ fees due and •paid;annual contract;•crop area record book;•irrigation invoices;•register of irrigation invoices;•cash book;•bank documents (cheque book, paying-•in book, monthly bank statements, etc.);payroll register;•fines register;•procurement register and procurement •forms;inventory of assets;•expenses register;•general ledger;•annual cash flow and balance;•budget;•annual financial report.•
The register of members records the names of WUA members and their annual contri-bution. The annual contract is signed by the WUA management with each water user and sets out crop types, areas and irrigation to be provided. The crop area register records the crops actually planted and their area for all water users, and forms the basis for charg-ing the irrigation service fee. Booklets of irri-gation invoices are printed and an invoice issued for each irrigation event, either by the WUA Accountant or by the Water Masters. These booklets have duplicate copies for each invoice issued, which are returned to the WUA Treasurer and entered into the register of invoices. Figure 3.13 provides an example of a format for combining the crop and fee payment registers, which can be printed A3 size and distributed to WUAs. The register records the water user’s name, total land-holding area, crops grown, fee due and pay-ments made, making it easy to see what is due and what has been paid. In a refinement of the register the first two columns could be printed on a sheet at the back of five or six sheets which have the remaining columns, with one sheet then being used for each year without the need to rewrite each farmer’s name and landholding data each year.
Other documentation (cash book, pay-roll register, procurement register and forms, expenses register, etc.) is relatively standard. The inventory of assets refers to equipment
Table 3.3. Example of budget allocation at national level.
Expenditure Total budget BudgetItem no. item allocation (US$) allocation (%)
1 Salaries (incl. pensions) 580,563 28.6 2 Potable water supply 1,767 0.1 3 Electricity (offices) 2,843 0.1 4 Heating 1,202 0.1 5 Communications 14,046 0.7 6 Other expenses 4,104 0.2 7 Transport costs 162,418 8.0 8 Field trip expenses 13,086 0.6 9 Other services 211,513 10.410 Electricity (pump stations) 401,322 19.711 Equipment/materials 203,234 10.012 Capital repair and 437,056 21.5 maintenance works
Total 2,033,155 100
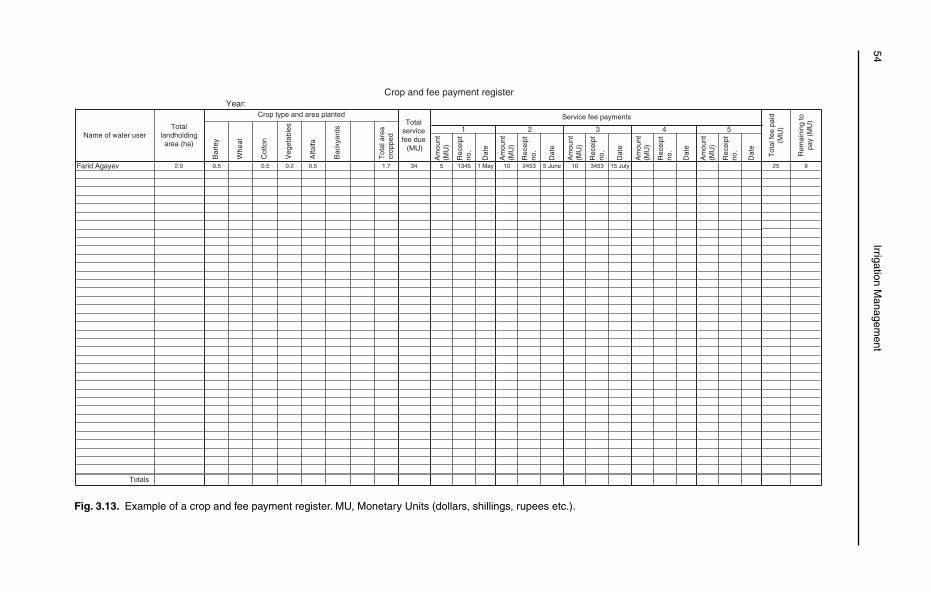
Year:
Am
ount
(MU
)
Rec
eipt
no.
Dat
e
Am
ount
(MU
)
Rec
eipt
no.
Dat
e
Am
ount
(MU
)
Rec
eipt
no.
Dat
e
Am
ount
(MU
)
Rec
eipt
no.
Dat
e
Am
ount
(MU
)
Rec
eipt
no.
Dat
e
Farid Agayev 2.0 0.5 0.5 0.2 0.5 1.7 34 5 1345 1 May 10 2453 5 June 10 3453 15 July 25 9
Totals
Whe
at
5
Crop and fee payment register
Name of water userTotal
landholdingarea (ha)
Crop type and area plantedTotal
servicefee due
(MU)
Veg
etab
les
Tot
al fe
e pa
id(M
U)
Tot
al a
rea
crop
ped
1
Bar
ley
Bac
kyar
ds 3
Rem
aini
ng to
pay
(MU
)
2
Cot
ton
4
Service fee payments
Alfa
lfa
Fig. 3.13. Example of a crop and fee payment register. MU, Monetary Units (dollars, shillings, rupees etc.).
54Irrigation M
anagement
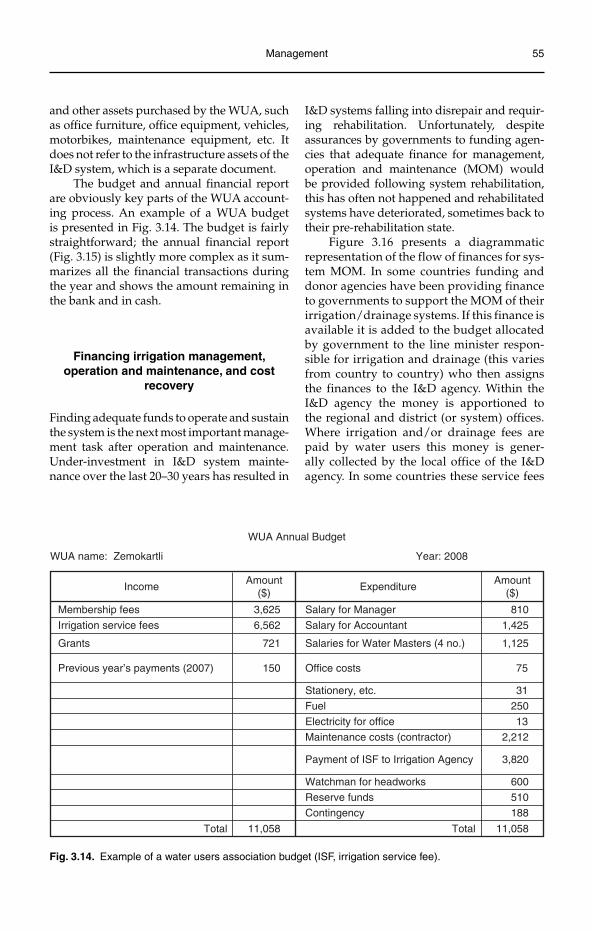
Management 55
and other assets purchased by the WUA, such as office furniture, office equipment, vehicles, motorbikes, maintenance equipment, etc. It does not refer to the infrastructure assets of the I&D system, which is a separate document.
The budget and annual financial report are obviously key parts of the WUA account-ing process. An example of a WUA budget is presented in Fig. 3.14. The budget is fairly straightforward; the annual financial report (Fig. 3.15) is slightly more complex as it sum-marizes all the financial transactions during the year and shows the amount remaining in the bank and in cash.
Financing irrigation management, operation and maintenance, and cost
recovery
Finding adequate funds to operate and sustain the system is the next most important manage-ment task after operation and maintenance. Under-investment in I&D system mainte-nance over the last 20–30 years has resulted in
I&D systems falling into disrepair and requir-ing rehabilitation. Unfortunately, despite assurances by governments to funding agen-cies that adequate finance for management, operation and maintenance (MOM) would be provided following system rehabilitation, this has often not happened and rehabilitated systems have deteriorated, sometimes back to their pre-rehabilitation state.
Figure 3.16 presents a diagrammatic representation of the flow of finances for sys-tem MOM. In some countries funding and donor agencies have been providing finance to governments to support the MOM of their irrigation/drainage systems. If this finance is available it is added to the budget allocated by government to the line minister respon-sible for irrigation and drainage (this varies from country to country) who then assigns the finances to the I&D agency. Within the I&D agency the money is apportioned to the regional and district (or system) offices. Where irrigation and/or drainage fees are paid by water users this money is gener-ally collected by the local office of the I&D agency. In some countries these service fees
WUA name: Zemokartli Year: 2008
810
721Grants
ExpenditureAmount
($)
1,425
1,125
IncomeAmount
($)
Membership fees 3,625
Irrigation service fees 6,562
Previous year’s payments (2007)
Salaries for Water Masters (4 no.)
Salary for Manager
Salary for Accountant
150 Office costs 75
31Stationery, etc.
250Fuel
Electricity for office 13
Maintenance costs (contractor) 2,212
Payment of ISF to Irrigation Agency 3,820
Watchman for headworks 600
510Reserve funds
188Contingency
11,058Total11,058Total
WUA Annual Budget
Fig. 3.14. Example of a water users association budget (ISF, irrigation service fee).
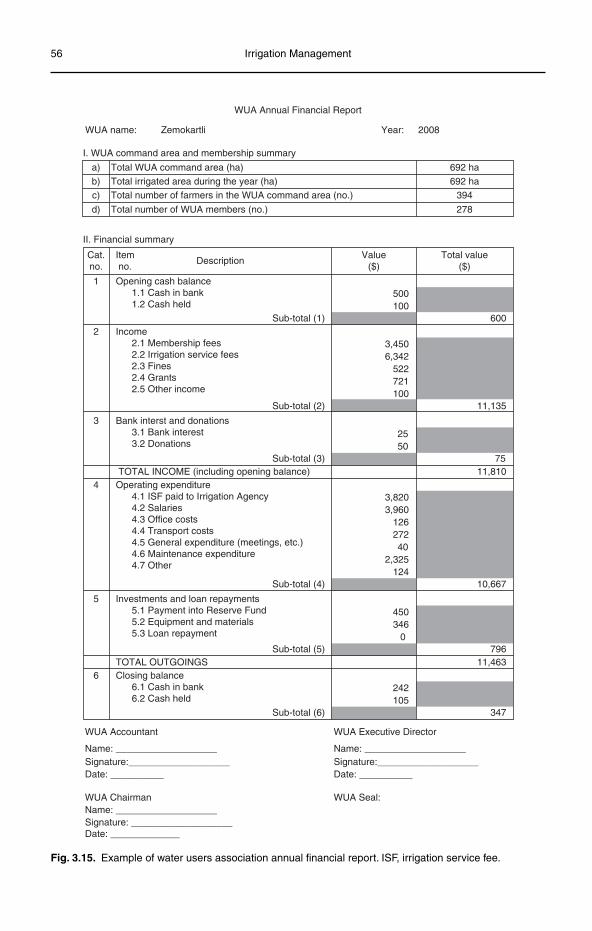
WUA name: Zemokartli Year: 2008
I. WUA command area and membership summary
692 ha
692 ha
a) Total WUA command area (ha)
b) Total irrigated area during the year (ha)
c) Total number of farmers in the WUA command area (no.)
d) Total number of WUA members (no.) 278
394
Cat.no.
Itemno.
DescriptionValue
($)Total value
($)
500100
Sub-total (1) 600
3,4506,342
522721100
Sub-total (2) 11,135
2550
Sub-total (3) 75 TOTAL INCOME (including opening balance) 11,810
3,8203,960
12627240
2,325124
Sub-total (4) 10,667
450346
0Sub-total (5) 796
TOTAL OUTGOINGS 11,463
1 Opening cash balance 1.1 Cash in bank 1.2 Cash held
2 Income 2.1 Membership fees 2.2 Irrigation service fees 2.3 Fines 2.4 Grants 2.5 Other income
3 Bank interst and donations 3.1 Bank interest 3.2 Donations
4 Operating expenditure 4.1 ISF paid to Irrigation Agency 4.2 Salaries 4.3 Office costs 4.4 Transport costs 4.5 General expenditure (meetings, etc.) 4.6 Maintenance expenditure 4.7 Other
5 Investments and loan repayments 5.1 Payment into Reserve Fund 5.2 Equipment and materials 5.3 Loan repayment
6 Closing balance 6.1 Cash in bank 6.2 Cash held
242105
Sub-total (6) 347
WUA Accountant WUA Executive Director
Name: ___________________Name: ___________________Signature:___________________ Signature:___________________Date: __________ Date: __________
WUA Chairman WUA Seal:Name: ___________________Signature: ___________________Date: _____________
WUA Annual Financial Report
II. Financial summary
Fig. 3.15. Example of water users association annual financial report. ISF, irrigation service fee.
56 Irrigation Management
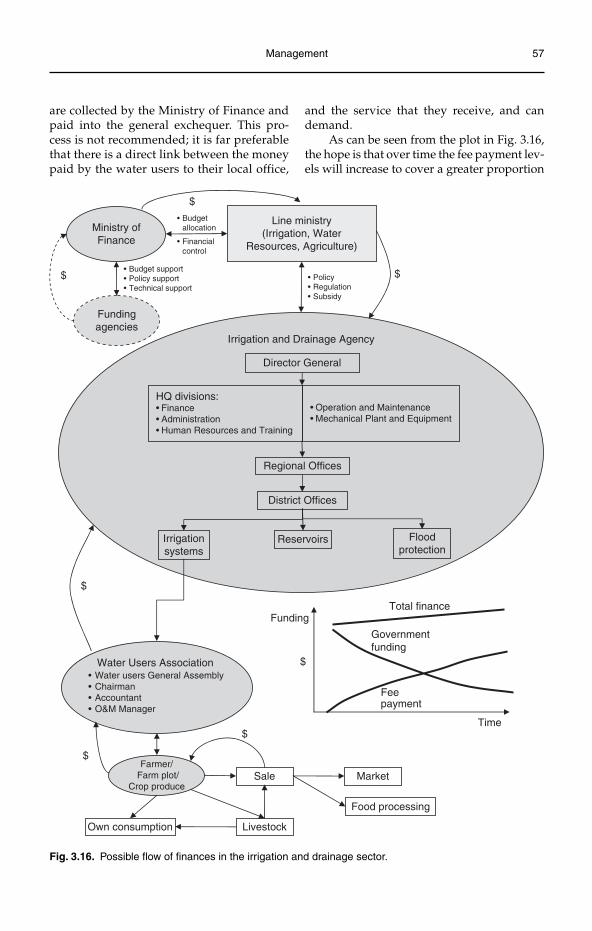
Management 57
are collected by the Ministry of Finance and paid into the general exchequer. This pro-cess is not recommended; it is far preferable that there is a direct link between the money paid by the water users to their local office,
and the service that they receive, and can demand.
As can be seen from the plot in Fig. 3.16, the hope is that over time the fee payment lev-els will increase to cover a greater proportion
Water Users Association • Water users General Assembly• Chairman• Accountant• O&M Manager
$
$Farmer/
Farm plot/Crop produce
Market
Livestock
Food processing
Sale
Own consumption
$
Line ministry(Irrigation, Water
Resources, Agriculture)
• Policy• Regulation• Subsidy
Ministry ofFinance
• Budget support• Policy support• Technical support
$
$
$
Governmentfunding
Feepayment
Time
Director General
Irrigationsystems
Reservoirs Floodprotection
• Operation and Maintenance• Mechanical Plant and Equipment
HQ divisions:• Finance• Administration• Human Resources and Training
Fundingagencies
$
Funding
Irrigation and Drainage Agency
Total finance
District Offices
Regional Offices
• Budget allocation
• Financial control
Fig. 3.16. Possible flow of finances in the irrigation and drainage sector.
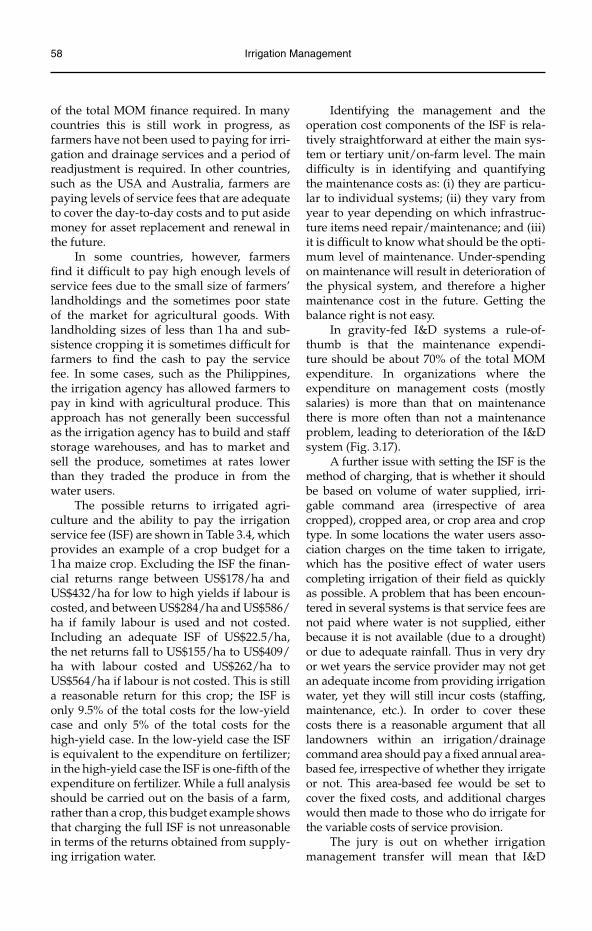
58 Irrigation Management
of the total MOM finance required. In many countries this is still work in progress, as farmers have not been used to paying for irri-gation and drainage services and a period of readjustment is required. In other countries, such as the USA and Australia, farmers are paying levels of service fees that are adequate to cover the day-to-day costs and to put aside money for asset replacement and renewal in the future.
In some countries, however, farmers find it difficult to pay high enough levels of service fees due to the small size of farmers’ landholdings and the sometimes poor state of the market for agricultural goods. With landholding sizes of less than 1 ha and sub-sistence cropping it is sometimes difficult for farmers to find the cash to pay the service fee. In some cases, such as the Philippines, the irrigation agency has allowed farmers to pay in kind with agricultural produce. This approach has not generally been successful as the irrigation agency has to build and staff storage warehouses, and has to market and sell the produce, sometimes at rates lower than they traded the produce in from the water users.
The possible returns to irrigated agri-culture and the ability to pay the irrigation service fee (ISF) are shown in Table 3.4, which provides an example of a crop budget for a 1 ha maize crop. Excluding the ISF the finan-cial returns range between US$178/ha and US$432/ha for low to high yields if labour is costed, and between US$284/ha and US$586/ha if family labour is used and not costed. Including an adequate ISF of US$22.5/ha, the net returns fall to US$155/ha to US$409/ha with labour costed and US$262/ha to US$564/ha if labour is not costed. This is still a reasonable return for this crop; the ISF is only 9.5% of the total costs for the low-yield case and only 5% of the total costs for the high-yield case. In the low-yield case the ISF is equivalent to the expenditure on fertilizer; in the high-yield case the ISF is one-fifth of the expenditure on fertilizer. While a full analysis should be carried out on the basis of a farm, rather than a crop, this budget example shows that charging the full ISF is not unreasonable in terms of the returns obtained from supply-ing irrigation water.
Identifying the management and the operation cost components of the ISF is rela-tively straightforward at either the main sys-tem or tertiary unit/on-farm level. The main difficulty is in identifying and quantifying the maintenance costs as: (i) they are particu-lar to individual systems; (ii) they vary from year to year depending on which infrastruc-ture items need repair/maintenance; and (iii) it is difficult to know what should be the opti-mum level of maintenance. Under-spending on maintenance will result in deterioration of the physical system, and therefore a higher maintenance cost in the future. Getting the balance right is not easy.
In gravity-fed I&D systems a rule-of-thumb is that the maintenance expendi-ture should be about 70% of the total MOM expenditure. In organizations where the expenditure on management costs (mostly salaries) is more than that on maintenance there is more often than not a maintenance problem, leading to deterioration of the I&D system (Fig. 3.17).
A further issue with setting the ISF is the method of charging, that is whether it should be based on volume of water supplied, irri-gable command area (irrespective of area cropped), cropped area, or crop area and crop type. In some locations the water users asso-ciation charges on the time taken to irrigate, which has the positive effect of water users completing irrigation of their field as quickly as possible. A problem that has been encoun-tered in several systems is that service fees are not paid where water is not supplied, either because it is not available (due to a drought) or due to adequate rainfall. Thus in very dry or wet years the service provider may not get an adequate income from providing irrigation water, yet they will still incur costs (staffing, maintenance, etc.). In order to cover these costs there is a reasonable argument that all landowners within an irrigation/drainage command area should pay a fixed annual area-based fee, irrespective of whether they irrigate or not. This area-based fee would be set to cover the fixed costs, and additional charges would then made to those who do irrigate for the variable costs of service provision.
The jury is out on whether irrigation management transfer will mean that I&D
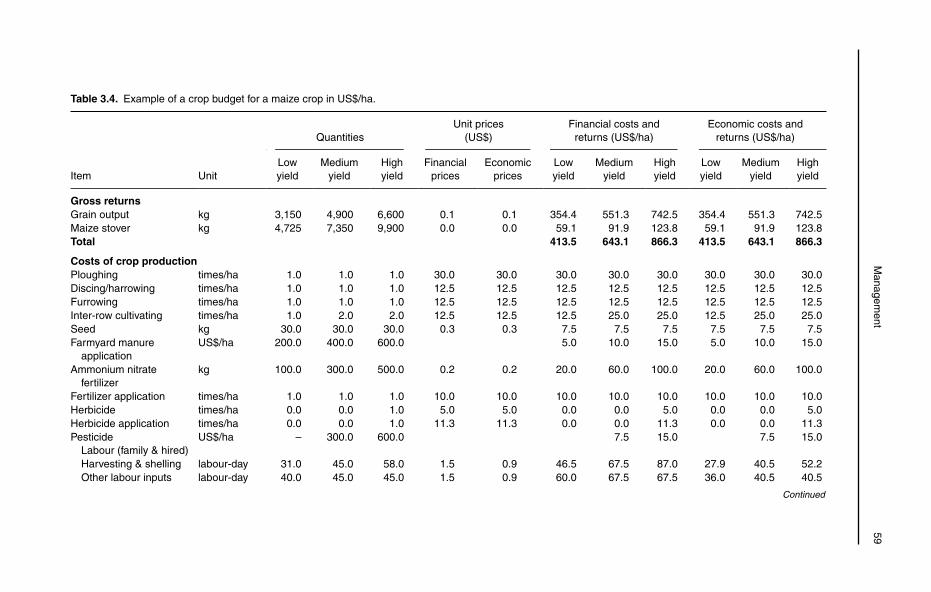
M
anagement
59
Continued
Table 3.4. Example of a crop budget for a maize crop in US$/ha.
Item Unit
QuantitiesUnit prices
(US$)Financial costs and
returns (US$/ha)Economic costs and
returns (US$/ha)
Lowyield
Mediumyield
Highyield
Financialprices
Economicprices
Low yield
Mediumyield
Highyield
Low yield
Mediumyield
Highyield
Gross returnsGrain output kg 3,150 4,900 6,600 0.1 0.1 354.4 551.3 742.5 354.4 551.3 742.5Maize stover kg 4,725 7,350 9,900 0.0 0.0 59.1 91.9 123.8 59.1 91.9 123.8Total 413.5 643.1 866.3 413.5 643.1 866.3
Costs of crop productionPloughing times/ha 1.0 1.0 1.0 30.0 30.0 30.0 30.0 30.0 30.0 30.0 30.0Discing/harrowing times/ha 1.0 1.0 1.0 12.5 12.5 12.5 12.5 12.5 12.5 12.5 12.5Furrowing times/ha 1.0 1.0 1.0 12.5 12.5 12.5 12.5 12.5 12.5 12.5 12.5Inter-row cultivating times/ha 1.0 2.0 2.0 12.5 12.5 12.5 25.0 25.0 12.5 25.0 25.0Seed kg 30.0 30.0 30.0 0.3 0.3 7.5 7.5 7.5 7.5 7.5 7.5Farmyard manure application
US$/ha 200.0 400.0 600.0 5.0 10.0 15.0 5.0 10.0 15.0
Ammonium nitrate fertilizer
kg 100.0 300.0 500.0 0.2 0.2 20.0 60.0 100.0 20.0 60.0 100.0
Fertilizer application times/ha 1.0 1.0 1.0 10.0 10.0 10.0 10.0 10.0 10.0 10.0 10.0Herbicide times/ha 0.0 0.0 1.0 5.0 5.0 0.0 0.0 5.0 0.0 0.0 5.0Herbicide application times/ha 0.0 0.0 1.0 11.3 11.3 0.0 0.0 11.3 0.0 0.0 11.3Pesticide Labour (family & hired)
US$/ha – 300.0 600.0 7.5 15.0 7.5 15.0
Harvesting & shelling labour-day 31.0 45.0 58.0 1.5 0.9 46.5 67.5 87.0 27.9 40.5 52.2 Other labour inputs labour-day 40.0 45.0 45.0 1.5 0.9 60.0 67.5 67.5 36.0 40.5 40.5
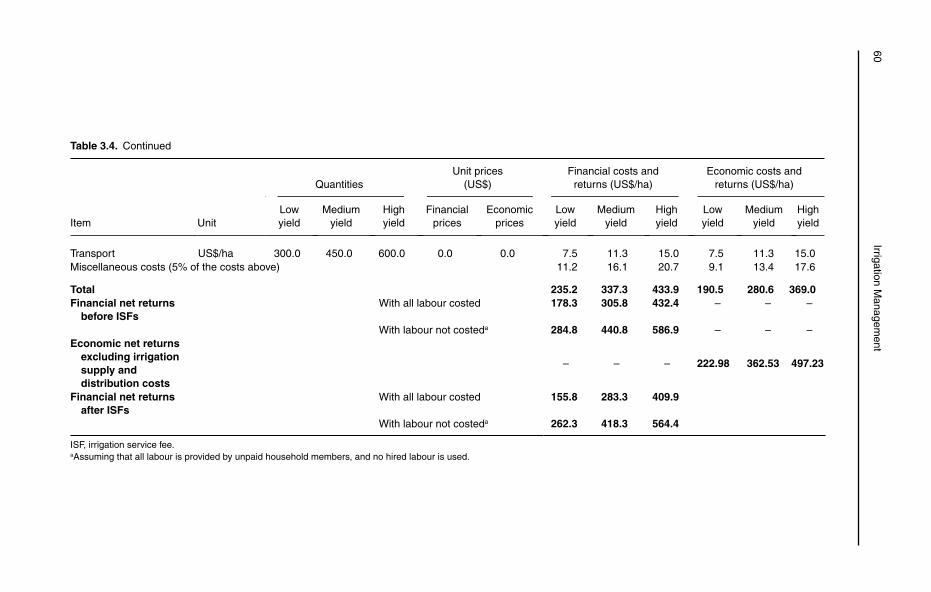
60Irrigation M
anagement
Table 3.4. Continued
Item Unit
QuantitiesUnit prices
(US$)Financial costs and
returns (US$/ha)Economic costs and
returns (US$/ha)
Lowyield
Mediumyield
Highyield
Financialprices
Economicprices
Low yield
Mediumyield
Highyield
Low yield
Mediumyield
Highyield
Transport US$/ha 300.0 450.0 600.0 0.0 0.0 7.5 11.3 15.0 7.5 11.3 15.0Miscellaneous costs (5% of the costs above) 11.2 16.1 20.7 9.1 13.4 17.6
Total 235.2 337.3 433.9 190.5 280.6 369.0Financial net returns before ISFs
With all labour costed 178.3 305.8 432.4 – – –
With labour not costeda 284.8 440.8 586.9 – – –Economic net returns excluding irrigation supply and
distribution costs
– – – 222.98 362.53 497.23
Financial net returns after ISFs
With all labour costed 155.8 283.3 409.9
With labour not costeda 262.3 418.3 564.4
ISF, irrigation service fee.aAssuming that all labour is provided by unpaid household members, and no hired labour is used.
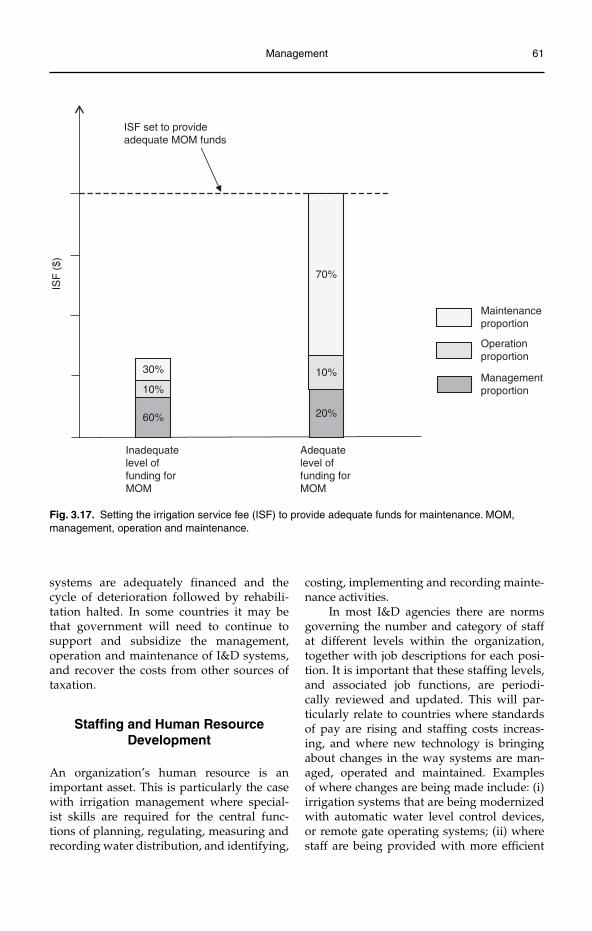
Management 61
systems are adequately financed and the cycle of deterioration followed by rehabili-tation halted. In some countries it may be that government will need to continue to support and subsidize the management, operation and maintenance of I&D systems, and recover the costs from other sources of taxation.
Staffing and Human Resource Development
An organization’s human resource is an important asset. This is particularly the case with irrigation management where special-ist skills are required for the central func-tions of planning, regulating, measuring and recording water distribution, and identifying,
costing, implementing and recording mainte-nance activities.
In most I&D agencies there are norms governing the number and category of staff at different levels within the organization, together with job descriptions for each posi-tion. It is important that these staffing levels, and associated job functions, are periodi-cally reviewed and updated. This will par-ticularly relate to countries where standards of pay are rising and staffing costs increas-ing, and where new technology is bringing about changes in the way systems are man-aged, operated and maintained. Examples of where changes are being made include: (i) irrigation systems that are being modernized with automatic water level control devices, or remote gate operating systems; (ii) where staff are being provided with more efficient
ISF
($)
Inadequatelevel offunding forMOM
60%
ISF set to provideadequate MOM funds
20%
10%
10%30%
70%
Managementproportion
Adequatelevel offunding forMOM
Operationproportion
Maintenanceproportion
Fig. 3.17. Setting the irrigation service fee (ISF) to provide adequate funds for maintenance. MOM, management, operation and maintenance.
62 Irrigation Management
transport (motorbikes, instead of bicycles or travel by foot); and (iii) where computers are being introduced for data collection, process-ing and analysis.
In some countries the attitude towards human resource development (HRD) within the irrigation agency is still quite poor, with a reliance on top-down management and lit-tle encouragement, motivation or training for staff. The work is often seen as repetitious and therefore not requiring any significant inputs into staff motivation and training. Sadly, the significant HRD lessons learned over the last 20–30 years in the business and industrial sectors do not appear to be recognized or applied in the irrigation and drainage sector. This will need to change if irrigation agen-cies are to be made leaner and fitter for pur-pose, especially in relation to service delivery and customer satisfaction. If water users are expected to pay more for their water delivery and removal services they will expect far bet-ter levels of service and accountability than is the case in some situations at present.
Further discussion on training is pro-vided in Chapter 7.
Administration
Efficient administration processes and proce-dures are the oil in any organization’s machin-ery. Typical administrative responsibilities for an I&D agency include:
procedures for recording, handling, stor-•ing and retrieving correspondence – this will include procedures for referencing all incoming correspondence, together with procedures for directing it to the responsible person for action and a track-ing system to ensure that it is acted upon in good time;procedures for organizing staff travel •and payment of relevant per diems and allowances;procedures for office communication, •and communication between other offices within the organization;provision of support services, including •secretarial support, IT support, draughts-men, drivers and the like;
provision of meeting and conference •facilities, and procedures for organizing and running meetings and conferences;procedures for procuring office supplies •and for office maintenance;printing and reproduction facilities;•procedures for procuring equipment, •spare parts, materials, supplies and sup-port services;procedures for storing and inventory con-•trol of equipment, supplies and materials.
For water users associations the procedures are much simpler, and relate mainly to ensur-ing that the association’s books are kept safe, the office is adequately maintained and meet-ings properly organized, with adequate notice being given, minutes kept and information disseminated to water users.
Legal Issues
There are a number of areas where legal issues occur, for an irrigation and drainage agency, for a water users association or for individual water users. These include:
drafting of new, or redrafting of existing, •legislation to establish water users asso-ciations and transfer management, oper-ation and maintenance to water users;drafting of new, or redrafting of existing, •legislation on the water law – this may include establishment of water rights for individuals and groups of water users, establishment of river basin councils, establishment of new agencies for water resources management;drafting of service agreements between •service providers and water users;enforcement of service agreements in •the civil courts, either by water users in relation to lack of service delivery, or by service providers in relation to failure by water users to pay service fees;enforcement of penalties for unauthor-•ized abstraction or use of irrigation water, or damage to irrigation and drain-age infrastructure, applied for either by main system service providers on water users associations or individual users, or
Management 63
by water users associations on individual water users;action to obtain usufruct rights or full •legal title to physical irrigation and drainage infrastructure;advice and lobbying to protect water •users associations from some elements of taxation, including property taxes for physical infrastructure and VAT on membership and service fees.
In a large I&D agency there may be a small legal team, or a legal specialist, who will be engaged to advise on legal matters. For water users associations, legal advice is often provided as part of a WUA establishment project. In Kyrgyzstan the recently formed National Union of Water Users Associations has engaged a legal specialist to advise indi-vidual associations on procedures for taking over responsibility for the management of main system canals from the I&D agency.
Public Relations
Good public relations (often shortened to ‘PR’) are a useful management tool for any organization. For water users associations, good public relations are particularly useful in the early days of forming and establishing the WUA, and are often a key component of any WUA-related project. Promotion of the WUA concept on television and radio, and through newspapers, improves the understanding of WUAs and helps in gaining support for these new management entities. Promotion to gain acceptance and support of the WUA concept by politicians has to be a major public rela-tions exercise of any WUA project, and should continue to be part of WUA activities after the project has finished. When established, WUAs need good public relations in order to ensure their access and rights to water, and to ensure that they are taken seriously as a voice for the irrigation community. Prior to the for-
mation of WUAs the government line agency responsible for irrigation and drainage will have protected the water rights for irrigation water users. With management transfer these line agencies are less closely involved, and WUAs need to be aware that they must now protect their own interests.
Good public relations are essential for WUA management. They must communi-cate, liaise and work closely with water users if they are to retain the support of the water users. Good communication and liaison is the glue that binds these associations; if it is weak or non-existent then the association will fail.
For the I&D agency good public rela-tions with water users associations and water users makes life easier and irrigated agriculture more productive. Irrigation and drainage service delivery differs from domestic water supply and provision of electricity in several important ways. First, irrigation is an open-access resource, which is very difficult to police and protect full-time (especially at night). Second, irrigation and drainage is often fundamental to peo-ple’s livelihoods, it is not an option as may be the case with electricity. Third, whereas domestic water supply and electricity can be provided on demand, this is rarely the case with irrigation; close cooperation and com-munication is required between the user and the supplier if supplies are to be reliable, adequate and timely. Good irrigation and drainage service delivery is about working in partnership with water users, not in con-flict with them.
Good public relations are useful for the I&D agency in liaising and working with other government agencies and organiza-tions, such as local and regional governments, and national government. Good public rela-tions can strengthen the position and stand-ing of the I&D agency; similarly, poor public relations can weaken its standing in the com-munity, and within government.
64 ©Martin Burton 2010. Irrigation Management: Principles and Practices (Martin Burton)
This chapter describes the fundamentals of operation at the main system level, and the processes and procedures followed where the design of the system has dictated how the system is operated. The chapter begins with a discussion on different forms of irrigation scheduling, and provides a framework for cat-egorizing different forms of scheduling. This is followed by discussion of different control sys-tems, as it is these systems that dictate how the system can be operated. Discharge measure-ment is then discussed, followed by discussion of how the flow in canals should be regulated to avoid fluctuations in canal levels and water delivery. Next an outline of the procedures for planning and monitoring of water distribution at the main system level is given, followed by examples of different processes and proce-dures for operation of the main system.
Overview
Operation of irrigation systems can use-fully be divided into three levels: (i) the main system, comprising primary and sec-ondary canals; (ii) the tertiary unit or on-farm system, comprising the tertiary and quaternary canals; and (iii) the field level, comprising the field channels and ditches. The drainage system mirrors these divi-sions, though there is generally not much
operation involved unless there is pumped drainage.
The reason for dividing the operation into these three levels is that the management is different, both in terms of the organizations and people involved and in terms of the pro-cesses and procedures. Generally the main system is managed by a government agency, though this is changing as systems are being transferred to management by water users associations (WUAs) or federations of WUAs. The next management unit is the tertiary unit or on-farm level, which is generally managed by water users, either directly if they own or farm all the land at this level, or by groups of water users through WUAs or similar farmer groups. The lowest management level is the field, where the farmer manages the applica-tion to the land of the water provided by the other two management levels.
There are a number of approaches used worldwide for operation at the main sys-tem level. The operational processes and procedures used depend on decisions made at the design stage and will include consid-eration of:
the number, capability and cost of staff-•ing available;the finances available for construction of •the irrigation and drainage system;the anticipated finances available for •management, operation and maintenance;
4
Operation of the Main System
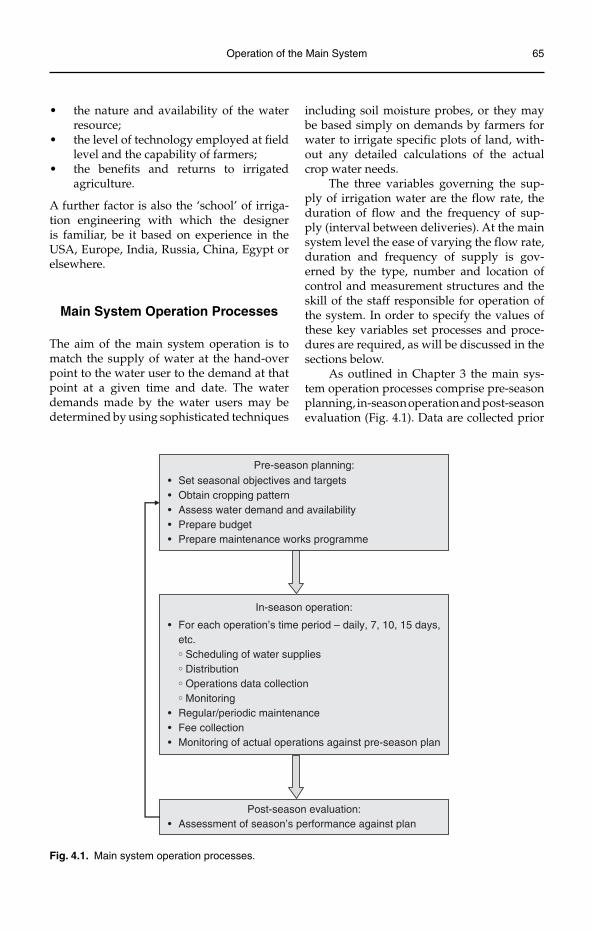
Operation of the Main System 65
the nature and availability of the water •resource;the level of technology employed at field •level and the capability of farmers;the benefits and returns to irrigated •agriculture.
A further factor is also the ‘school’ of irriga-tion engineering with which the designer is familiar, be it based on experience in the USA, Europe, India, Russia, China, Egypt or elsewhere.
Main System Operation Processes
The aim of the main system operation is to match the supply of water at the hand-over point to the water user to the demand at that point at a given time and date. The water demands made by the water users may be determined by using sophisticated techniques
including soil moisture probes, or they may be based simply on demands by farmers for water to irrigate specific plots of land, with-out any detailed calculations of the actual crop water needs.
The three variables governing the sup-ply of irrigation water are the flow rate, the duration of flow and the frequency of sup-ply (interval between deliveries). At the main system level the ease of varying the flow rate, duration and frequency of supply is gov-erned by the type, number and location of control and measurement structures and the skill of the staff responsible for operation of the system. In order to specify the values of these key variables set processes and proce-dures are required, as will be discussed in the sections below.
As outlined in Chapter 3 the main sys-tem operation processes comprise pre-season planning, in-season operation and post- season evaluation (Fig. 4.1). Data are collected prior
Pre-season planning:• Set seasonal objectives and targets• Obtain cropping pattern • Assess water demand and availability• Prepare budget • Prepare maintenance works programme
In-season operation:
• For each operation’s time period – daily, 7, 10, 15 days, etc.
° Scheduling of water supplies° Distribution° Operations data collection° Monitoring
• Regular/periodic maintenance• Fee collection• Monitoring of actual operations against pre-season plan
Post-season evaluation:• Assessment of season’s performance against plan
Fig. 4.1. Main system operation processes.
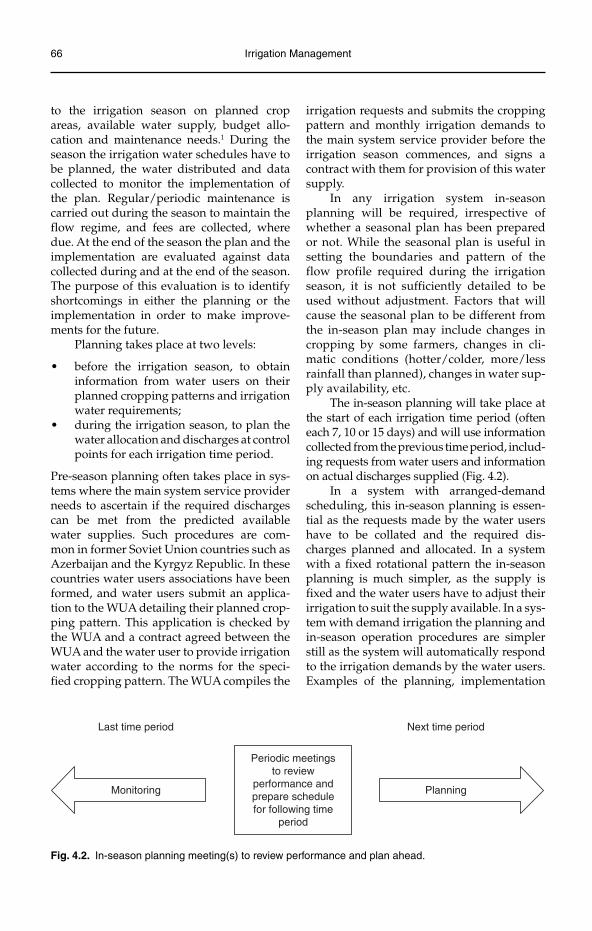
66 Irrigation Management
to the irrigation season on planned crop areas, available water supply, budget allo-cation and maintenance needs.1 During the season the irrigation water schedules have to be planned, the water distributed and data collected to monitor the implementation of the plan. Regular/periodic maintenance is carried out during the season to maintain the flow regime, and fees are collected, where due. At the end of the season the plan and the implementation are evaluated against data collected during and at the end of the season. The purpose of this evaluation is to identify shortcomings in either the planning or the implementation in order to make improve-ments for the future.
Planning takes place at two levels:
before the irrigation season, to obtain •information from water users on their planned cropping patterns and irrigation water requirements;during the irrigation season, to plan the •water allocation and discharges at control points for each irrigation time period.
Pre-season planning often takes place in sys-tems where the main system service provider needs to ascertain if the required discharges can be met from the predicted available water supplies. Such procedures are com-mon in former Soviet Union countries such as Azerbaijan and the Kyrgyz Republic. In these countries water users associations have been formed, and water users submit an applica-tion to the WUA detailing their planned crop-ping pattern. This application is checked by the WUA and a contract agreed between the WUA and the water user to provide irrigation water according to the norms for the speci-fied cropping pattern. The WUA compiles the
irrigation requests and submits the cropping pattern and monthly irrigation demands to the main system service provider before the irrigation season commences, and signs a contract with them for provision of this water supply.
In any irrigation system in-season planning will be required, irrespective of whether a seasonal plan has been prepared or not. While the seasonal plan is useful in setting the boundaries and pattern of the flow profile required during the irrigation season, it is not sufficiently detailed to be used without adjustment. Factors that will cause the seasonal plan to be different from the in-season plan may include changes in cropping by some farmers, changes in cli-matic conditions (hotter/colder, more/less rainfall than planned), changes in water sup-ply availability, etc.
The in-season planning will take place at the start of each irrigation time period (often each 7, 10 or 15 days) and will use information collected from the previous time period, includ-ing requests from water users and information on actual discharges supplied (Fig. 4.2).
In a system with arranged-demand scheduling, this in-season planning is essen-tial as the requests made by the water users have to be collated and the required dis-charges planned and allocated. In a system with a fixed rotational pattern the in-season planning is much simpler, as the supply is fixed and the water users have to adjust their irrigation to suit the supply available. In a sys-tem with demand irrigation the planning and in-season operation procedures are simpler still as the system will automatically respond to the irrigation demands by the water users. Examples of the planning, implementation
Periodic meetingsto review
performance andprepare schedulefor following time
period
PlanningMonitoring
Next time periodLast time period
Fig. 4.2. In-season planning meeting(s) to review performance and plan ahead.
Operation of the Main System 67
and monitoring procedures for these differ-ent approaches are given at the end of this chapter.
During the irrigation season irrigation supplies will need to change in order to match the changing crop water demands. In non-automated systems this requires that the main system service provider collects data on the irrigation demands on a regular basis and then prepares a schedule to match sup-ply and demand. In some schemes the irri-gation demands are determined by the main system service provider based on the farm-ers’ cropping patterns; in other schemes the irrigation demands are prepared by the water users and given to the main system service provider at intervals during the crop season. The frequency of the changes to the schedule varies from scheme to scheme; in some cases schedules are prepared daily, in others they are prepared each 7, 10 or 15 days. In the Goulburn–Murray scheme in Australia for example, water users submit requests when they need water, with a lead in time of 2–3 days required for the main system service provider to schedule and deliver the requested water. In East Java, Indonesia, cropping pattern data are collected in one 10-day time period based on which a schedule is prepared for the next 10-day time period. In the Goulburn–Murray scheme irrigation water supplies are varying throughout the scheme on a daily basis, in the East Java case the discharges are changed once each 10 days and then held at those val-ues over the 10-day period. There is a signifi-cant difference in the amount of management effort that goes into these two different, but similar processes.
It is necessary to monitor and record the water allocation during the irrigation season in order to:
know what water has been allocated •where, and if the planned allocations have been made;know what fee to charge the water user •or group of water users for irrigation water delivered;feed back into the planning process for •the next time period;monitor and evaluate operational •performance.
Monitoring and recording of discharges as part of the fee collection process is one of the main tasks of water masters in many irriga-tion systems. Monitoring and recording infor-mation for operation performance assessment is increasingly important. Table 4.1 outlines the range of operating and monitoring pro-cedures for different types of system, and the relationship between the design of the sys-tem and the level of operations management required.
It is important that proper systems are established for recording discharges. These will include standardized forms, printing of stage–discharge charts or discharge tables for measuring structures, and procedures for joint recording of measurements taken between the water user(s) and the service provider’s field staff to avoid disputes over the readings and quantities taken. An exam-ple of a standardized recording form is pro-vided in Fig. 4.3, while Fig. 4.4 is a schematic map showing the performance of the system in relation to the delivery performance ratio (DPR).
Figure 4.3 is used to record the base data required to schedule irrigation water for the time period under consideration (10 days, 11–20 July), for 15 tertiary units on one secondary canal (B3) with four water users associations. The base data include the area irrigated, the requested discharge and duration. The planned allocation is then pre-pared based on the available water supply; in this example there is sufficient water and the planned allocation is able to match the requests. When the time period is over, the actual average discharge and flow durations are recorded for each offtake and the DPR (actual/planned) calculated. The planned discharge, actual discharge and DPR can then be entered in the relevant boxes on the schematic diagram of the system (Fig. 4.4), and colour coding used to highlight the pat-tern of the DPR (blue – excessive supply, green – adequate supply, red – inadequate supply).
Further examples of such recording and processing forms are provided at the end of this chapter on the procedures used in East Java, Indonesia, using the relative area method of main system operation.
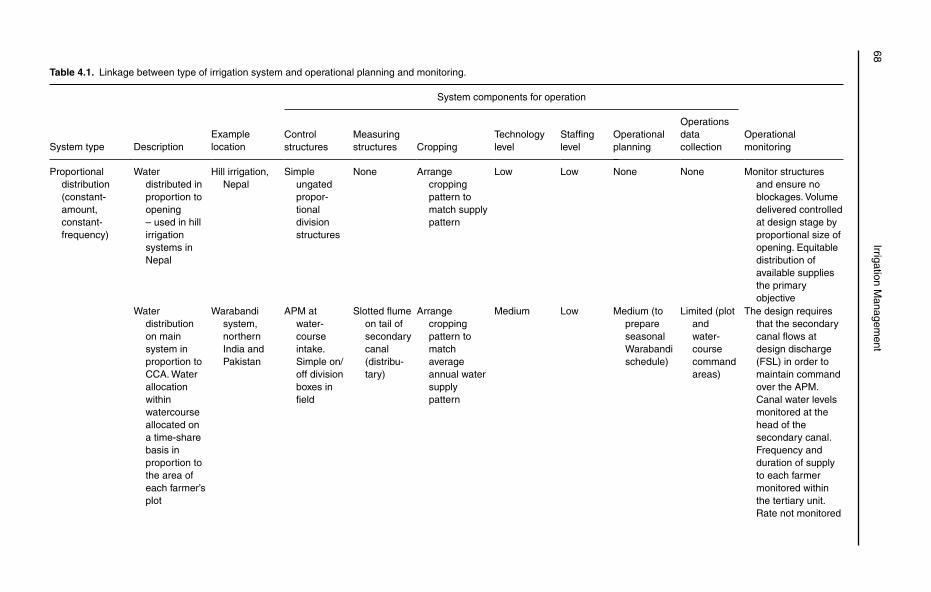
Table 4.1. Linkage between type of irrigation system and operational planning and monitoring.
System type DescriptionExamplelocation
System components for operation
Operational monitoring
Controlstructures
Measuring structures Cropping
Technology level
Staffinglevel
Operational planning
Operations datacollection
Proportional distribution (constant-amount,constant-frequency)
Water distributed in proportion to opening– used in hill irrigation systems in Nepal
Hill irrigation, Nepal
Simpleungatedpropor-tionaldivisionstructures
None Arrange croppingpattern to match supply pattern
Low Low None None Monitor structures and ensure no blockages. Volume delivered controlled at design stage by proportional size of opening. Equitable distribution of available supplies the primary objective
Water distribution on main system in proportion to CCA. Water allocationwithinwatercourse allocated on a time-share basis in proportion to the area of each farmer’s plot
Warabandi system,northern India and Pakistan
APM at water-courseintake. Simple on/off division boxes in field
Slotted flume on tail of secondary canal(distribu-tary)
Arrange croppingpattern to matchaverage annual water supplypattern
Medium Low Medium (to prepareseasonalWarabandi schedule)
Limited (plot andwater-coursecommandareas)
The design requires that the secondary canal flows at design discharge (FSL) in order to maintain command over the APM. Canal water levels monitored at the head of the secondary canal. Frequency and duration of supply to each farmer monitored within the tertiary unit. Rate not monitored
68Irrigation M
anagement
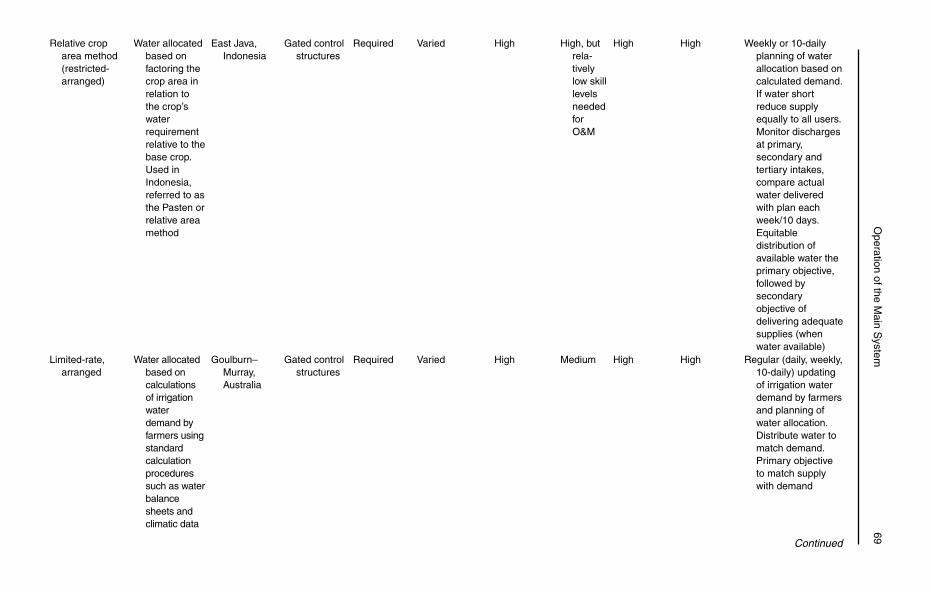
O
peration of the Main S
ystem
69Relative crop
area method (restricted-arranged)
Water allocated based on factoring the crop area in relation to the crop’s water requirementrelative to the base crop. Used in Indonesia,referred to as the Pasten or relative area method
East Java, Indonesia
Gated control structures
Required Varied High High, but rela-tively low skill levels neededfor O&M
High High Weekly or 10-daily planning of water allocation based on calculated demand. If water short reduce supply equally to all users. Monitor discharges at primary, secondary and tertiary intakes, compare actual water delivered with plan each week/10 days. Equitable distribution of available water the primary objective, followed by secondary objective of delivering adequate supplies (when water available)
Limited-rate, arranged
Water allocated based on calculations of irrigation water demand by farmers using standard calculation procedures such as water balance sheets and climatic data
Goulburn–Murray, Australia
Gated control structures
Required Varied High Medium High High Regular (daily, weekly, 10-daily) updating of irrigation water demand by farmers and planning of water allocation. Distribute water to match demand. Primary objective to match supply with demand
Continued
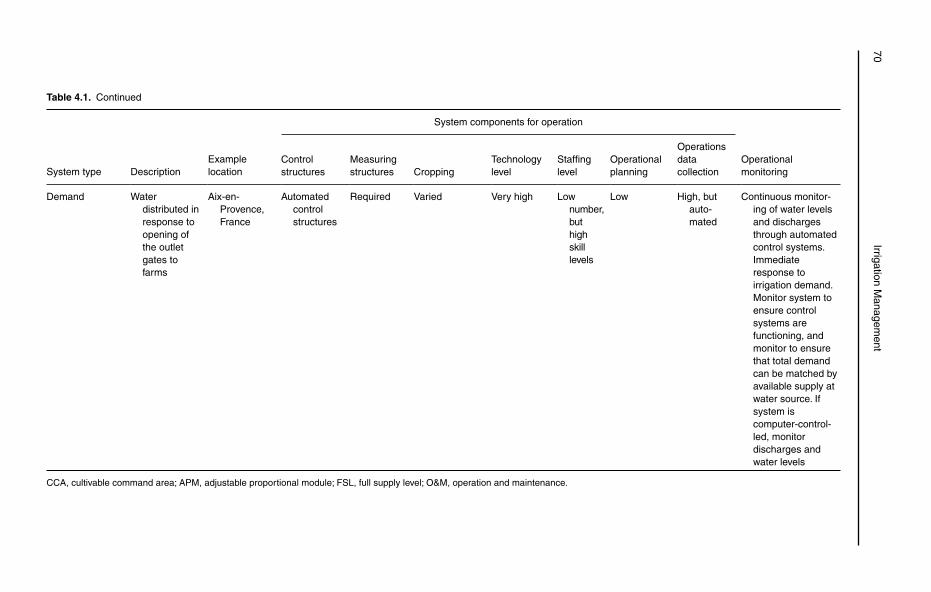
Table 4.1. Continued
System type DescriptionExamplelocation
System components for operation
Operational monitoring
Controlstructures
Measuring structures Cropping
Technology level
Staffinglevel
Operational planning
Operations datacollection
Demand Water distributed in response to opening of the outlet gates to farms
Aix-en-Provence, France
Automated controlstructures
Required Varied Very high Low number, but high skill levels
Low High, but auto-mated
Continuous monitor-ing of water levels and discharges through automated control systems. Immediateresponse to irrigation demand. Monitor system to ensure control systems are functioning, and monitor to ensure that total demand can be matched by available supply at water source. If system is computer-control-led, monitor discharges and water levels
CCA, cultivable command area; APM, adjustable proportional module; FSL, full supply level; O&M, operation and maintenance.
70Irrigation M
anagement
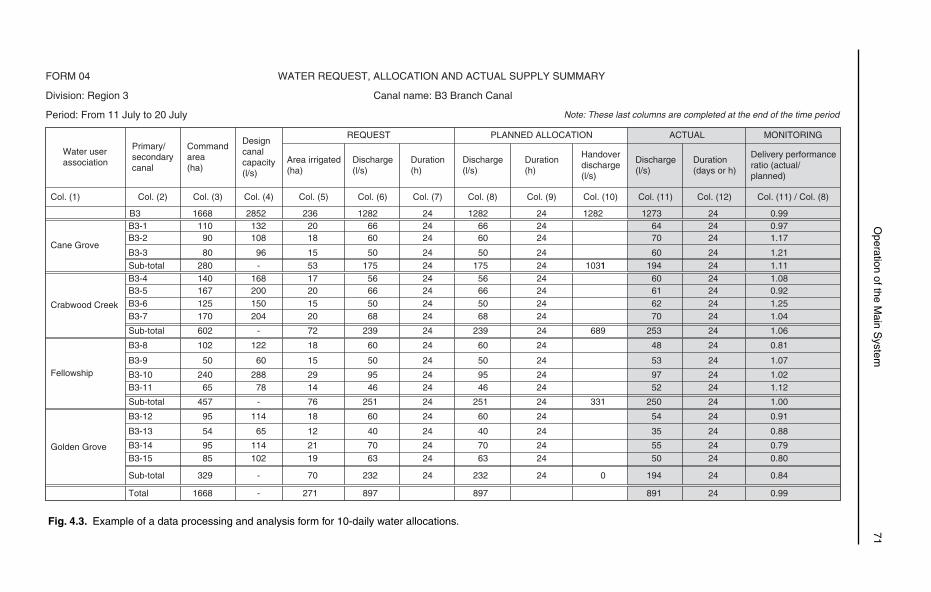
O
peration of the Main S
ystem
71
FORM 04 WATER REQUEST, ALLOCATION AND ACTUAL SUPPLY SUMMARY
Division: Region 3 Canal name: B3 Branch Canal
Period: From 11 July to 20 July Note: These last columns are completed at the end of the time period
PLANNED ALLOCATIONREQUEST ACTUAL MONITORING
Water userassociation
Primary/secondarycanal
Commandarea(ha)
Designcanalcapacity(l/s)
Area irrigated(ha)
Discharge(l/s)
Duration(h)
Discharge(l/s)
Duration(h)
Handoverdischarge(l/s)
Discharge(l/s)
Duration(days or h)
Delivery performanceratio (actual/planned)
Col. (10) Col. (11) Col. (12) Col. (11) / Col. (8)
1282 1273 24 0.9964 24 0.97
Col. (1) Col. (2) Col. (3) Col. (4) Col. (5) Col. (6) Col. (7) Col. (8) Col. (9)
B3 1668 2852 236 1282 24 24B3-1 110 132 20 66 24 24B3-2 90 108 18 60 24 24 70 24 1.17
60 24 1.21 Cane Grove
194 24 1.11 60 24 1.0861 24 0.92 62 24 1.25 70 24 1.04
Crabwood Creek
253 24 1.06
48 24 0.81
53 24 1.07
97 24 1.02 52 24 1.12
Fellowship
250 24 1.00
54 24 0.91
35 24 0.88
55 24 0.79 50 24 0.80
Golden Grove
194 24 0.84
B3-3 80 96 15 50 24 24Sub-total 280 - 53 175 24 24 10311B3-4 140 168 17 56 24 24B3-5 167 200 20 66 24 24B3-6 125 150 15 50 24 24B3-7 170 204 20 68 24 24
Sub-total 602 - 72 239 24 24 689
B3-8 102 122 18 60 24 24
B3-9 50 60 15 50 24 24
B3-10 240 288 29 95 24 24B3-11 65 78 14 46 24 24
Sub-total 457 - 76 251 24 24 331
B3-12 95 114 18 60 24 24
B3-13 54 65 12 40 24 24
B3-14 95 114 21 70 24 24B3-15 85 102 19 63 24 24
Sub-total 329 - 70 232 24 24 0
Total 1668 - 271 897
12826660
5017556665068
239
60
50
9546
251
60
40
7063
232
897 891 24 0.99
Fig. 4.3. Example of a data processing and analysis form for 10-daily water allocations.
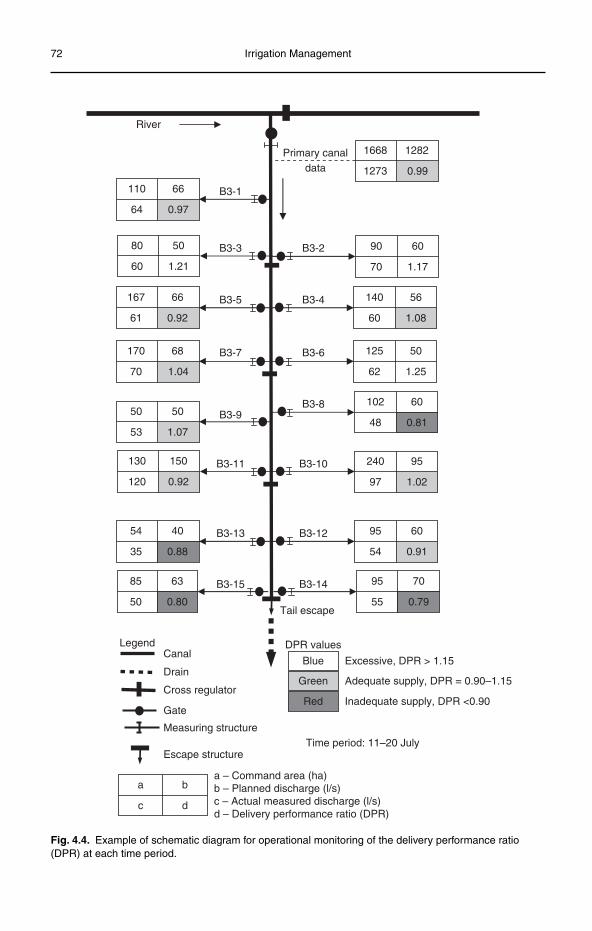
72 Irrigation Management
River
110 66
64 0.97
80 50
60 1.21
85 63
50 0.80
54 40
35 0.88
130 150
120 0.92
50 50
53 1.07
170 68
70 1.04
167 66
61 0.92
1668Primary canaldata
B3-1
B3-3
B3-5
B3-7
B3-9
B3-11
B3-13
B3-15
B3-2
B3-4
B3-6
B3-8
B3-10
B3-12
B3-14
Tail escape
DPR valuesLegend
Blue
Green
Red
Excessive, DPR > 1.15Canal
Drain
Cross regulator
Gate
Measuring structure
Escape structure
a – Command area (ha)b – Planned discharge (l/s)c – Actual measured discharge (l/s)d – Delivery performance ratio (DPR)
Time period: 11–20 July
a b
c d
Adequate supply, DPR = 0.90–1.15
Inadequate supply, DPR <0.90
1282
1273 0.99
90 60
70 1.17
95 70
55 0.79
95 60
54 0.91
240 95
97 1.02
102 60
48 0.81
125 50
62 1.25
140 56
60 1.08
Fig. 4.4. Example of schematic diagram for operational monitoring of the delivery performance ratio (DPR) at each time period.
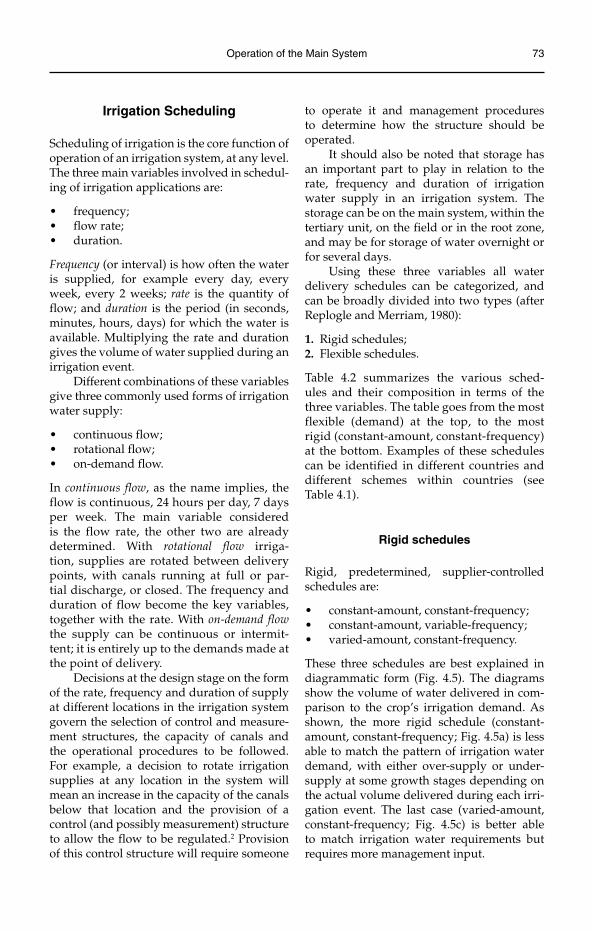
Operation of the Main System 73
Irrigation Scheduling
Scheduling of irrigation is the core function of operation of an irrigation system, at any level. The three main variables involved in schedul-ing of irrigation applications are:
frequency;•flow rate;•duration.•
Frequency (or interval) is how often the water is supplied, for example every day, every week, every 2 weeks; rate is the quantity of flow; and duration is the period (in seconds, minutes, hours, days) for which the water is available. Multiplying the rate and duration gives the volume of water supplied during an irrigation event.
Different combinations of these variables give three commonly used forms of irrigation water supply:
continuous flow;•rotational flow;•on-demand flow.•
In continuous flow, as the name implies, the flow is continuous, 24 hours per day, 7 days per week. The main variable considered is the flow rate, the other two are already determined. With rotational flow irriga-tion, supplies are rotated between delivery points, with canals running at full or par-tial discharge, or closed. The frequency and duration of flow become the key variables, together with the rate. With on-demand flowthe supply can be continuous or intermit-tent; it is entirely up to the demands made at the point of delivery.
Decisions at the design stage on the form of the rate, frequency and duration of supply at different locations in the irrigation system govern the selection of control and measure-ment structures, the capacity of canals and the operational procedures to be followed. For example, a decision to rotate irrigation supplies at any location in the system will mean an increase in the capacity of the canals below that location and the provision of a control (and possibly measurement) structure to allow the flow to be regulated.2 Provision of this control structure will require someone
to operate it and management procedures to determine how the structure should be operated.
It should also be noted that storage has an important part to play in relation to the rate, frequency and duration of irrigation water supply in an irrigation system. The storage can be on the main system, within the tertiary unit, on the field or in the root zone, and may be for storage of water overnight or for several days.
Using these three variables all water delivery schedules can be categorized, and can be broadly divided into two types (after Replogle and Merriam, 1980):
1. Rigid schedules;2. Flexible schedules.
Table 4.2 summarizes the various sched-ules and their composition in terms of the three variables. The table goes from the most flexible (demand) at the top, to the most rigid (constant-amount, constant-frequency) at the bottom. Examples of these schedules can be identified in different countries and different schemes within countries (see Table 4.1).
Rigid schedules
Rigid, predetermined, supplier-controlled schedules are:
constant-amount, constant-frequency;•constant-amount, variable-frequency;•varied-amount, constant-frequency.•
These three schedules are best explained in diagrammatic form (Fig. 4.5). The diagrams show the volume of water delivered in com-parison to the crop’s irrigation demand. As shown, the more rigid schedule (constant-amount, constant-frequency; Fig. 4.5a) is less able to match the pattern of irrigation water demand, with either over-supply or under-supply at some growth stages depending on the actual volume delivered during each irri-gation event. The last case (varied-amount, constant-frequency; Fig. 4.5c) is better able to match irrigation water requirements but requires more management input.
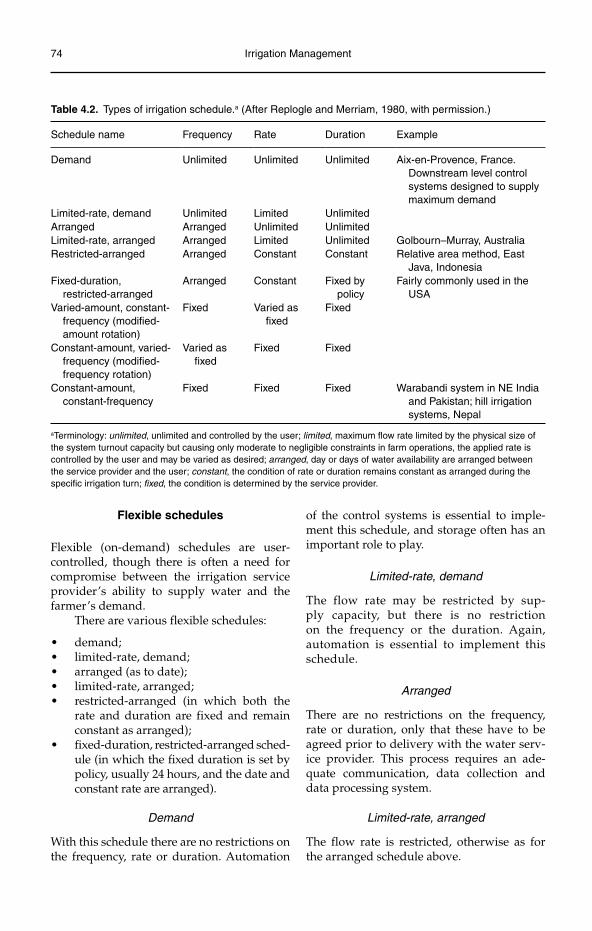
74 Irrigation Management
Flexible schedules
Flexible (on-demand) schedules are user-controlled, though there is often a need for compromise between the irrigation service provider’s ability to supply water and the farmer’s demand.
There are various flexible schedules:
demand;•limited-rate, demand;•arranged (as to date);•limited-rate, arranged;•restricted-arranged (in which both the •rate and duration are fixed and remain constant as arranged);fixed-duration, restricted-arranged sched-•ule (in which the fixed duration is set by policy, usually 24 hours, and the date and constant rate are arranged).
Demand
With this schedule there are no restrictions on the frequency, rate or duration. Automation
of the control systems is essential to imple-ment this schedule, and storage often has an important role to play.
Limited-rate, demand
The flow rate may be restricted by sup-ply capacity, but there is no restriction on the frequency or the duration. Again, automation is essential to implement this schedule.
Arranged
There are no restrictions on the frequency, rate or duration, only that these have to be agreed prior to delivery with the water serv-ice provider. This process requires an ade-quate communication, data collection and data processing system.
Limited-rate, arranged
The flow rate is restricted, otherwise as for the arranged schedule above.
Table 4.2. Types of irrigation schedule.a (After Replogle and Merriam, 1980, with permission.)
Schedule name Frequency Rate Duration Example
Demand Unlimited Unlimited Unlimited Aix-en-Provence, France. Downstream level control systems designed to supply maximum demand
Limited-rate, demand Unlimited Limited UnlimitedArranged Arranged Unlimited UnlimitedLimited-rate, arranged Arranged Limited Unlimited Golbourn–Murray, AustraliaRestricted-arranged Arranged Constant Constant Relative area method, East
Java, IndonesiaFixed-duration,
restricted-arrangedArranged Constant Fixed by
policyFairly commonly used in the
USAVaried-amount, constant-
frequency (modified-amount rotation)
Fixed Varied as fixed
Fixed
Constant-amount, varied-frequency (modified-frequency rotation)
Varied as fixed
Fixed Fixed
Constant-amount,constant-frequency
Fixed Fixed Fixed Warabandi system in NE India and Pakistan; hill irrigation systems, Nepal
aTerminology: unlimited, unlimited and controlled by the user; limited, maximum flow rate limited by the physical size of the system turnout capacity but causing only moderate to negligible constraints in farm operations, the applied rate is controlled by the user and may be varied as desired; arranged, day or days of water availability are arranged between the service provider and the user; constant, the condition of rate or duration remains constant as arranged during the specific irrigation turn; fixed, the condition is determined by the service provider.
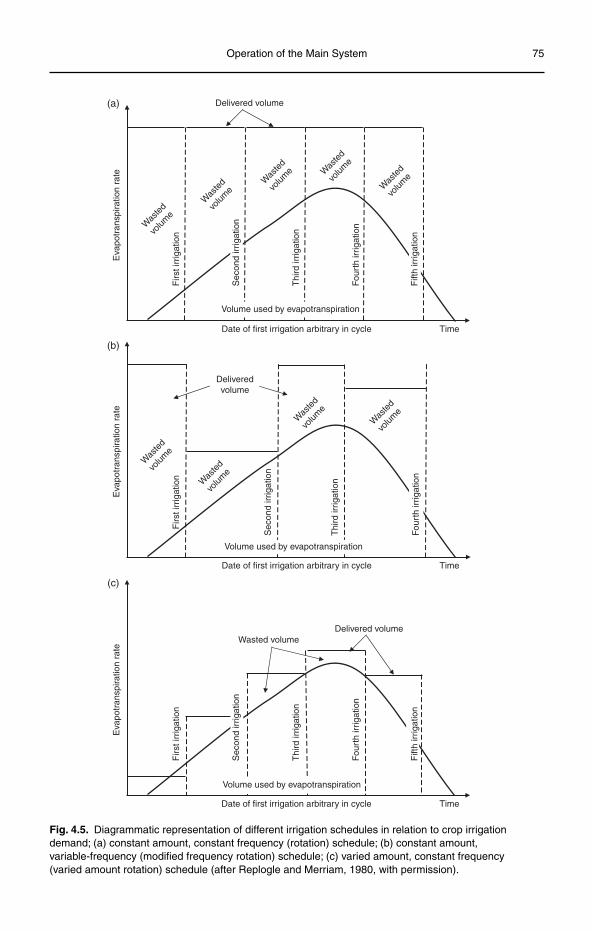
Operation of the Main System 75
Date of first irrigation arbitrary in cycle
(a)
Firs
t irr
igat
ion
Thi
rd ir
rigat
ion
Fou
rth
irrig
atio
n
Eva
potr
ansp
iratio
n ra
te
Time
Delivered volume
Was
ted
volum
eW
aste
d
volum
e
Was
ted
volum
e
Was
ted
volum
e
Was
ted
volum
e
Volume used by evapotranspiration
Sec
ond
irrig
atio
n
Fift
h irr
igat
ion
(b)
Firs
t irr
igat
ion
Thi
rd ir
rigat
ion
Eva
potr
ansp
iratio
n ra
te
Was
ted
volum
eW
aste
d
volum
e
Was
ted
volum
eW
aste
d
volum
e
Sec
ond
irrig
atio
n
Date of first irrigation arbitrary in cycle Time
Deliveredvolume
Volume used by evapotranspiration
Fou
rth
irrig
atio
n
(c)
Eva
potr
ansp
iratio
n ra
te
Firs
t irr
igat
ion
Thi
rd ir
rigat
ion
Fou
rth
irrig
atio
n
Sec
ond
irrig
atio
n
Fift
h irr
igat
ion
Wasted volume
Date of first irrigation arbitrary in cycle Time
Delivered volume
Volume used by evapotranspiration
Fig. 4.5. Diagrammatic representation of different irrigation schedules in relation to crop irrigation demand; (a) constant amount, constant frequency (rotation) schedule; (b) constant amount, variable-frequency (modified frequency rotation) schedule; (c) varied amount, constant frequency (varied amount rotation) schedule (after Replogle and Merriam, 1980, with permission).
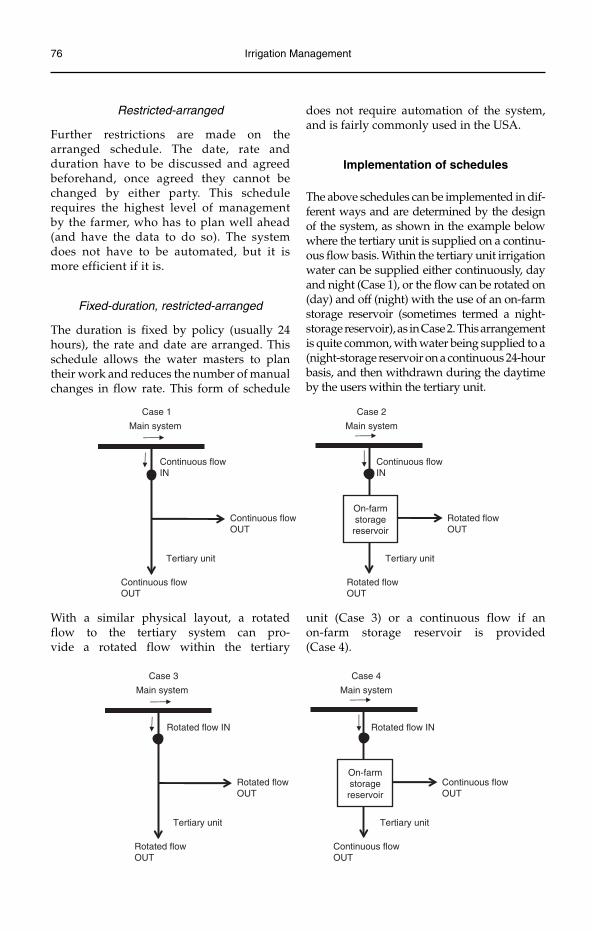
76 Irrigation Management
Restricted-arranged
Further restrictions are made on the arranged schedule. The date, rate and duration have to be discussed and agreed beforehand, once agreed they cannot be changed by either party. This schedule requires the highest level of management by the farmer, who has to plan well ahead (and have the data to do so). The system does not have to be automated, but it is more efficient if it is.
Fixed-duration, restricted-arranged
The duration is fixed by policy (usually 24 hours), the rate and date are arranged. This schedule allows the water masters to plan their work and reduces the number of manual changes in flow rate. This form of schedule
does not require automation of the system, and is fairly commonly used in the USA.
Implementation of schedules
The above schedules can be implemented in dif-ferent ways and are determined by the design of the system, as shown in the example below where the tertiary unit is supplied on a continu-ous flow basis. Within the tertiary unit irrigation water can be supplied either continuously, day and night (Case 1), or the flow can be rotated on (day) and off (night) with the use of an on-farm storage reservoir (sometimes termed a night-storage reservoir), as in Case 2. This arrangement is quite common, with water being supplied to a (night-storage reservoir on a continuous 24-hour basis, and then withdrawn during the daytime by the users within the tertiary unit.
Rotated flowOUT
Main system
Tertiary unit
Rotated flowOUT
Rotated flow IN Rotated flow IN
Tertiary unit
Continuous flowOUT
Continuous flowOUT
Main system
On-farmstoragereservoir
Case 3 Case 4
Continuous flowOUT
Main system
Tertiary unit
Continuous flowOUT
Continuous flowIN
Continuous flowIN
Tertiary unit
Rotated flowOUT
Rotated flowOUT
Main system
On-farmstoragereservoir
Case 1 Case 2
With a similar physical layout, a rotated flow to the tertiary system can pro-vide a rotated flow within the tertiary
unit (Case 3) or a continuous flow if an on-farm storage reservoir is provided (Case 4).
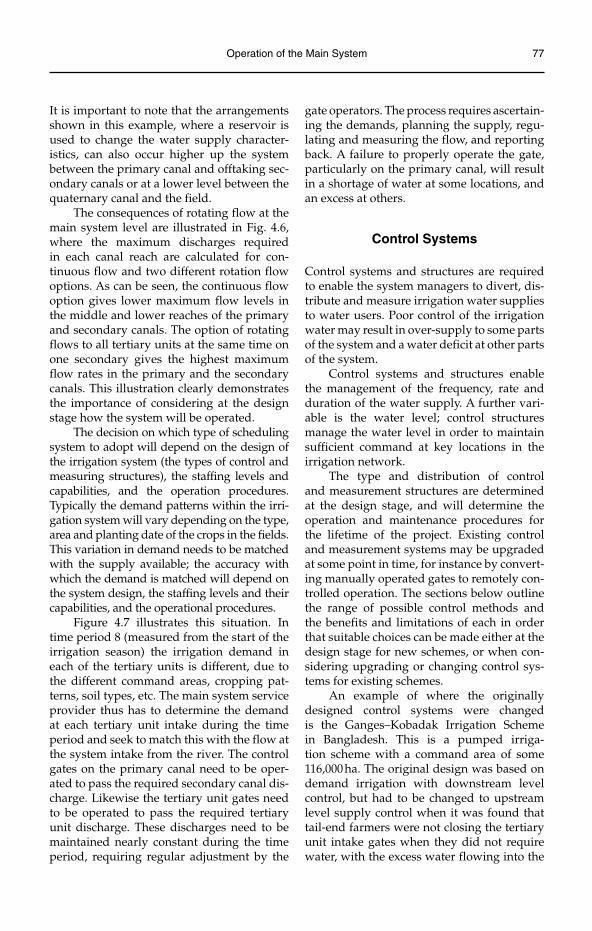
Operation of the Main System 77
It is important to note that the arrangements shown in this example, where a reservoir is used to change the water supply character-istics, can also occur higher up the system between the primary canal and offtaking sec-ondary canals or at a lower level between the quaternary canal and the field.
The consequences of rotating flow at the main system level are illustrated in Fig. 4.6, where the maximum discharges required in each canal reach are calculated for con-tinuous flow and two different rotation flow options. As can be seen, the continuous flow option gives lower maximum flow levels in the middle and lower reaches of the primary and secondary canals. The option of rotating flows to all tertiary units at the same time on one secondary gives the highest maximum flow rates in the primary and the secondary canals. This illustration clearly demonstrates the importance of considering at the design stage how the system will be operated.
The decision on which type of scheduling system to adopt will depend on the design of the irrigation system (the types of control and measuring structures), the staffing levels and capabilities, and the operation procedures. Typically the demand patterns within the irri-gation system will vary depending on the type, area and planting date of the crops in the fields. This variation in demand needs to be matched with the supply available; the accuracy with which the demand is matched will depend on the system design, the staffing levels and their capabilities, and the operational procedures.
Figure 4.7 illustrates this situation. In time period 8 (measured from the start of the irrigation season) the irrigation demand in each of the tertiary units is different, due to the different command areas, cropping pat-terns, soil types, etc. The main system service provider thus has to determine the demand at each tertiary unit intake during the time period and seek to match this with the flow at the system intake from the river. The control gates on the primary canal need to be oper-ated to pass the required secondary canal dis-charge. Likewise the tertiary unit gates need to be operated to pass the required tertiary unit discharge. These discharges need to be maintained nearly constant during the time period, requiring regular adjustment by the
gate operators. The process requires ascertain-ing the demands, planning the supply, regu-lating and measuring the flow, and reporting back. A failure to properly operate the gate, particularly on the primary canal, will result in a shortage of water at some locations, and an excess at others.
Control Systems
Control systems and structures are required to enable the system managers to divert, dis-tribute and measure irrigation water supplies to water users. Poor control of the irrigation water may result in over-supply to some parts of the system and a water deficit at other parts of the system.
Control systems and structures enable the management of the frequency, rate and duration of the water supply. A further vari-able is the water level; control structures manage the water level in order to maintain sufficient command at key locations in the irrigation network.
The type and distribution of control and measurement structures are determined at the design stage, and will determine the operation and maintenance procedures for the lifetime of the project. Existing control and measurement systems may be upgraded at some point in time, for instance by convert-ing manually operated gates to remotely con-trolled operation. The sections below outline the range of possible control methods and the benefits and limitations of each in order that suitable choices can be made either at the design stage for new schemes, or when con-sidering upgrading or changing control sys-tems for existing schemes.
An example of where the originally designed control systems were changed is the Ganges–Kobadak Irrigation Scheme in Bangladesh. This is a pumped irriga-tion scheme with a command area of some 116,000 ha. The original design was based on demand irrigation with downstream level control, but had to be changed to upstream level supply control when it was found that tail-end farmers were not closing the tertiary unit intake gates when they did not require water, with the excess water flowing into the
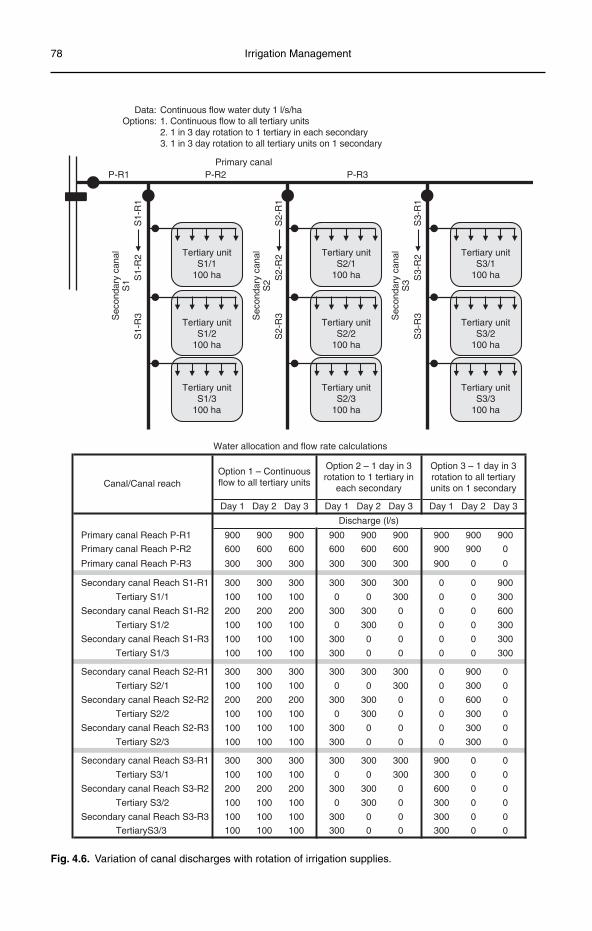
78 Irrigation Management
Data: Continuous flow water duty 1 l/s/ha Options: 1. Continuous flow to all tertiary units 2. 1 in 3 day rotation to 1 tertiary in each secondary 3. 1 in 3 day rotation to all tertiary units on 1 secondary
Tertiary unitS1/1
100 ha
Tertiary unitS1/2
100 ha
Tertiary unitS1/3
100 ha
Tertiary unitS2/1
100 ha
Tertiary unitS2/2
100 ha
Tertiary unitS2/3
100 ha
Tertiary unitS3/1
100 ha
Tertiary unitS3/2
100 ha
Tertiary unitS3/3
100 ha
Primary canal
Sec
onda
ry c
anal
S1
S1-
R1
S1-
R2
S1-
R3
P-R1 P-R2 P-R3
Sec
onda
ry c
anal
S2
S2-
R1
S2-
R2
S2-
R3 Sec
onda
ry c
anal
S3
S3-
R1
S3-
R2
S3-
R3
Water allocation and flow rate calculations
Primary canal Reach P-R1
Primary canal Reach P-R2
Primary canal Reach P-R3
Secondary canal Reach S1-R1
Secondary canal Reach S1-R2
Secondary canal Reach S1-R3
Secondary canal Reach S2-R1
Secondary canal Reach S2-R2
Secondary canal Reach S2-R3
Secondary canal Reach S3-R1
Secondary canal Reach S3-R2
Secondary canal Reach S3-R3
Day 1 Day 2 Day 3Day 1 Day 2 Day 3Day 1 Day 2 Day 3
900 900 900 900 900 900 900 900 900
600 600 600 600 600 600 900 900 0
300 300 300 300 300 300 900 0 0
300 300 300 300 300 300 0 0 900
Tertiary S1/1 100 100 100 0 0 300 0 0 300
200 200 200 300 300 0 0 0 600
Tertiary S1/2 100 100 100 0 300 0 0 0 300
100 100 100 300 0 0 0 0 300
Tertiary S1/3 100 100 100 300 0 0 0 0 300
300 300 300 300 300 300 0 900 0
Tertiary S2/1 100 100 100 0 0 300 0 300 0
200 200 200 300 300 0 0 600 0
Tertiary S2/2 100 100 100 0 300 0 0 300 0
100 100 100 300 0 0 0 300 0
Tertiary S2/3 100 100 100 300 0 0 0 300 0
300 300 300 300 300 300 900 0 0
Tertiary S3/1 100 100 100 0 0 300 300 0 0
200 200 200 300 300 0 600 0 0
Tertiary S3/2 100 100 100 0 300 0 300 0 0
100 100 100 300 0 0 300 0 0
TertiaryS3/3 100 100 100 300 0 0 300 0 0
Discharge (l/s)
Canal/Canal reachOption 1 – Continuousflow to all tertiary units
Option 2 – 1 day in 3rotation to 1 tertiary in
each secondary
Option 3 – 1 day in 3rotation to all tertiaryunits on 1 secondary
Fig. 4.6. Variation of canal discharges with rotation of irrigation supplies.
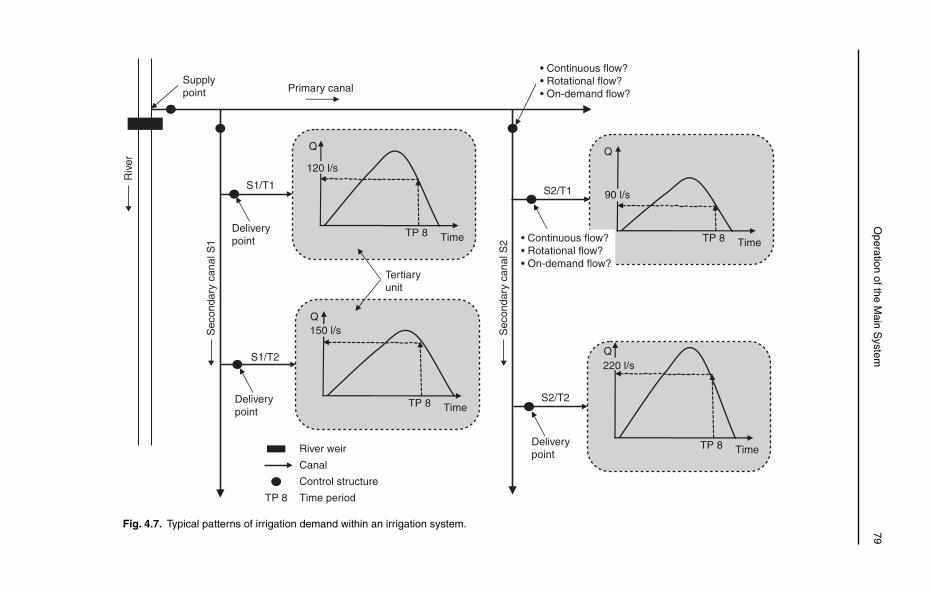
O
peration of the Main S
ystem
79
Primary canal
TimeTP 8
Q
S1/T1
Deliverypoint
Supplypoint
Riv
er
Sec
onda
ry c
anal
S1
TimeTP 8
Q
S1/T2
Delivery point
TimeTP 8
Q
S2/T1
TimeTP 8
Q
S2/T2
Delivery point
Control structure
Canal
• Continuous flow?• Rotational flow?• On-demand flow?
Tertiaryunit
Sec
onda
ry c
anal
S2
River weir
Time periodTP 8
150 l/s
120 l/s
• Continuous flow?• Rotational flow?• On-demand flow?
90 l/s
220 l/s
Fig. 4.7. Typical patterns of irrigation demand within an irrigation system.
80 Irrigation Management
drainage system. This resulted in excessive pumping of irrigation water in some periods (at a cost of some US$10,000/day). The re-engineering of the system to upstream level supply control was relatively straightfor-ward, but did mean that more management effort was required to schedule and regulate the water supplies.
Control loops
Figure 4.8 shows generalized control loops in an irrigation system for system management and control structures. The management con-trol loop starts with calculating the demand, adjustment to match the supply available, setting of control structures, monitoring the distribution, evaluation of planned with actual distribution and collection of data for the next time period. For the control structures the control loop moves from the present set-ting to the required setting, either by means of manual adjustment by an operator or auto-mated adjustment based on downstream or upstream water level changes.
Systems, structures and equipment
Control systems are separate from control struc-tures. Various types of structure may be used for the same system and different systems may use similar structures. When consider-ing changes to a control system account must be taken of the structures currently used in the canal system and whether these may be improved or need to be replaced. The equip-ment necessary for water control in open channel systems includes the following.
Hand- or motor-operated gates:•° overfl ow gates as head or cross
regulators;° undershot (orifi ce type) gates as head
cross regulators;° power supply, electric controllers,
motors.Automatic water level control:•° self-regulating gates;° automatic motor-operated gates.
Flow rate control:•° proportional – fl ow dividers, fi xed or
adjustable;° manual;° automatic.Measuring equipment:•° gate setting sensors;° water level sensors;° fl ow measuring systems (weirs, fl umes,
etc.);° interfaces, for display, processing or
transmission.
Canal control systems
Canal control systems vary from those with upstream control, which are supply-oriented, to those with downstream control that are demand-oriented. The different canal control systems available for the operation of main and secondary irrigation systems are listed below and briefly described in the following sections and Table 4.3.
Fixed upstream control.•Gated upstream control:•° with fl ow rate control;° with water level control;° with structures for manual operation;° with structures for automatic opera-
tion.Downstream control with level-top canals.•Upstream and downstream combined •control.Centralized control:•° with non-responsive scheduling;° with responsive, arranged delivery.Responsive systems for sloping canals:•° general;° with local independent controllers;° with dynamic regulation.Pressurized system.•
The control system does not necessarily define the water distribution method (schedul-ing), although downstream control tends to be flexible and demand-oriented and upstream control is usually associated with more rigid supply-oriented water delivery.
The level of technology required for each control system varies. Fixed upstream control
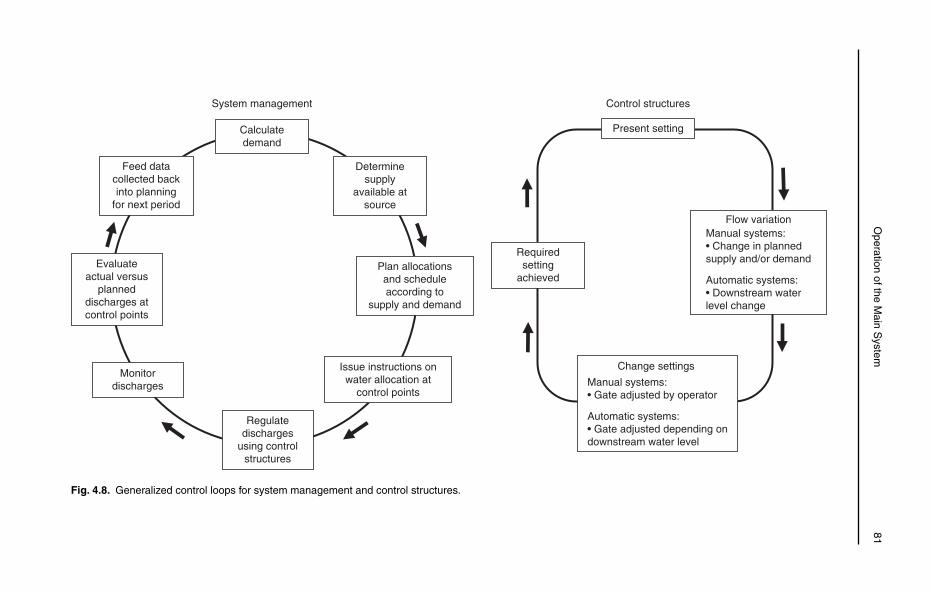
O
peration of the Main S
ystem
81
Monitordischarges
Regulatedischarges
using controlstructures
Evaluateactual versus
planneddischarges atcontrol points
Calculatedemand
Determinesupply
available atsource
Plan allocationsand scheduleaccording to
supply and demand
Issue instructions onwater allocation at
control points
Feed datacollected backinto planning
for next period
Present setting
Flow variationManual systems: • Change in planned supply and/or demand
Automatic systems:• Downstream water level change
Change settings
Manual systems: • Gate adjusted by operator
Automatic systems: • Gate adjusted depending ondownstream water level
Requiredsetting
achieved
System management Control structures
Fig. 4.8. Generalized control loops for system management and control structures.
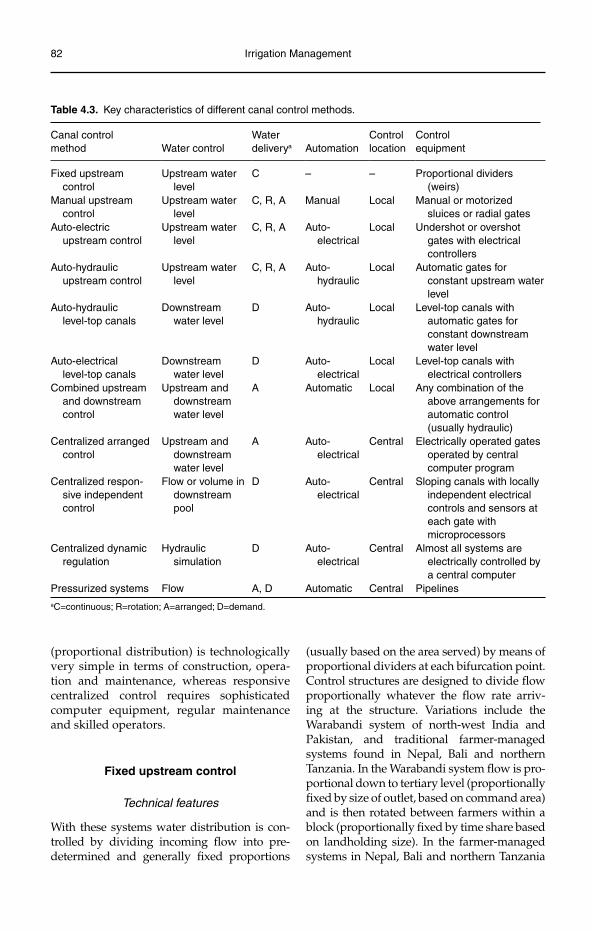
82 Irrigation Management
Table 4.3. Key characteristics of different canal control methods.
Canal control method Water control
Water deliverya Automation
Controllocation
Controlequipment
Fixed upstream control
Upstream water level
C – – Proportional dividers (weirs)
Manual upstream control
Upstream water level
C, R, A Manual Local Manual or motorized sluices or radial gates
Auto-electric upstream control
Upstream water level
C, R, A Auto-electrical
Local Undershot or overshot gates with electrical controllers
Auto-hydraulic upstream control
Upstream water level
C, R, A Auto-hydraulic
Local Automatic gates for constant upstream water level
Auto-hydraulic level-top canals
Downstream water level
D Auto-hydraulic
Local Level-top canals with automatic gates for constant downstream water level
Auto-electrical level-top canals
Downstream water level
D Auto-electrical
Local Level-top canals with electrical controllers
Combined upstream and downstream control
Upstream and downstream water level
A Automatic Local Any combination of the above arrangements for automatic control (usually hydraulic)
Centralized arranged control
Upstream and downstream water level
A Auto-electrical
Central Electrically operated gates operated by central computer program
Centralized respon-sive independent control
Flow or volume in downstream pool
D Auto-electrical
Central Sloping canals with locally independent electrical controls and sensors at each gate with microprocessors
Centralized dynamic regulation
Hydraulic simulation
D Auto-electrical
Central Almost all systems are electrically controlled by a central computer
Pressurized systems Flow A, D Automatic Central PipelinesaC=continuous; R=rotation; A=arranged; D=demand.
(proportional distribution) is technologically very simple in terms of construction, opera-tion and maintenance, whereas responsive centralized control requires sophisticated computer equipment, regular maintenance and skilled operators.
Fixed upstream control
Technical features
With these systems water distribution is con-trolled by dividing incoming flow into pre-determined and generally fixed proportions
(usually based on the area served) by means of proportional dividers at each bifurcation point. Control structures are designed to divide flow proportionally whatever the flow rate arriv-ing at the structure. Variations include the Warabandi system of north-west India and Pakistan, and traditional farmer-managed systems found in Nepal, Bali and northern Tanzania. In the Warabandi system flow is pro-portional down to tertiary level (proportionally fixed by size of outlet, based on command area) and is then rotated between farmers within a block (proportionally fixed by time share based on landholding size). In the farmer-managed systems in Nepal, Bali and northern Tanzania
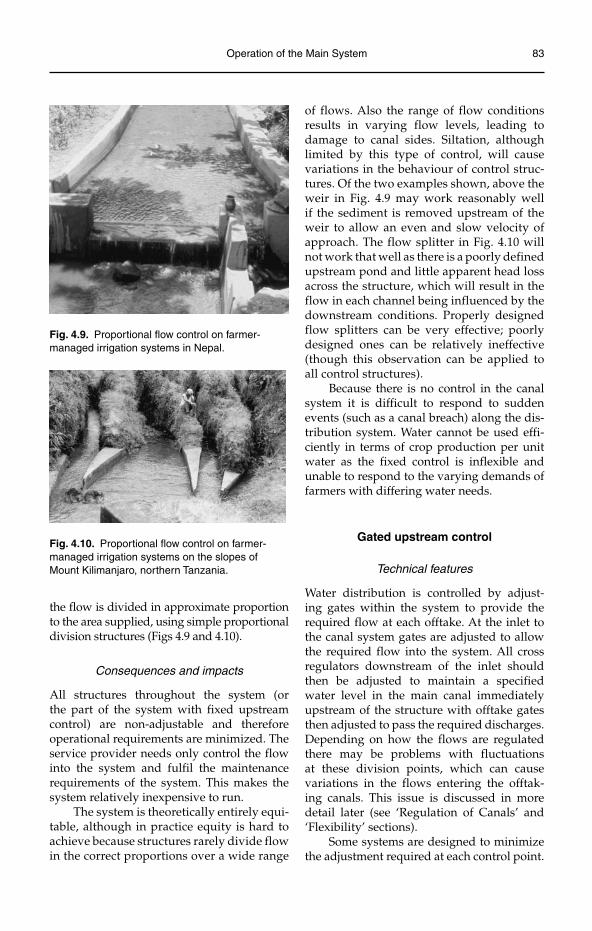
Operation of the Main System 83
the flow is divided in approximate proportion to the area supplied, using simple proportional division structures (Figs 4.9 and 4.10).
Consequences and impacts
All structures throughout the system (or the part of the system with fixed upstream control) are non-adjustable and therefore operational requirements are minimized. The service provider needs only control the flow into the system and fulfil the maintenance requirements of the system. This makes the system relatively inexpensive to run.
The system is theoretically entirely equi-table, although in practice equity is hard to achieve because structures rarely divide flow in the correct proportions over a wide range
Fig. 4.9. Proportional flow control on farmer-managed irrigation systems in Nepal.
Fig. 4.10. Proportional flow control on farmer-managed irrigation systems on the slopes of Mount Kilimanjaro, northern Tanzania.
of flows. Also the range of flow conditions results in varying flow levels, leading to damage to canal sides. Siltation, although limited by this type of control, will cause variations in the behaviour of control struc-tures. Of the two examples shown, above the weir in Fig. 4.9 may work reasonably well if the sediment is removed upstream of the weir to allow an even and slow velocity of approach. The flow splitter in Fig. 4.10 will not work that well as there is a poorly defined upstream pond and little apparent head loss across the structure, which will result in the flow in each channel being influenced by the downstream conditions. Properly designed flow splitters can be very effective; poorly designed ones can be relatively ineffective (though this observation can be applied to all control structures).
Because there is no control in the canal system it is difficult to respond to sudden events (such as a canal breach) along the dis-tribution system. Water cannot be used effi-ciently in terms of crop production per unit water as the fixed control is inflexible and unable to respond to the varying demands of farmers with differing water needs.
Gated upstream control
Technical features
Water distribution is controlled by adjust-ing gates within the system to provide the required flow at each offtake. At the inlet to the canal system gates are adjusted to allow the required flow into the system. All cross regulators downstream of the inlet should then be adjusted to maintain a specified water level in the main canal immediately upstream of the structure with offtake gates then adjusted to pass the required discharges. Depending on how the flows are regulated there may be problems with fluctuations at these division points, which can cause variations in the flows entering the offtak-ing canals. This issue is discussed in more detail later (see ‘Regulation of Canals’ and ‘Flexibility’ sections).
Some systems are designed to minimize the adjustment required at each control point.
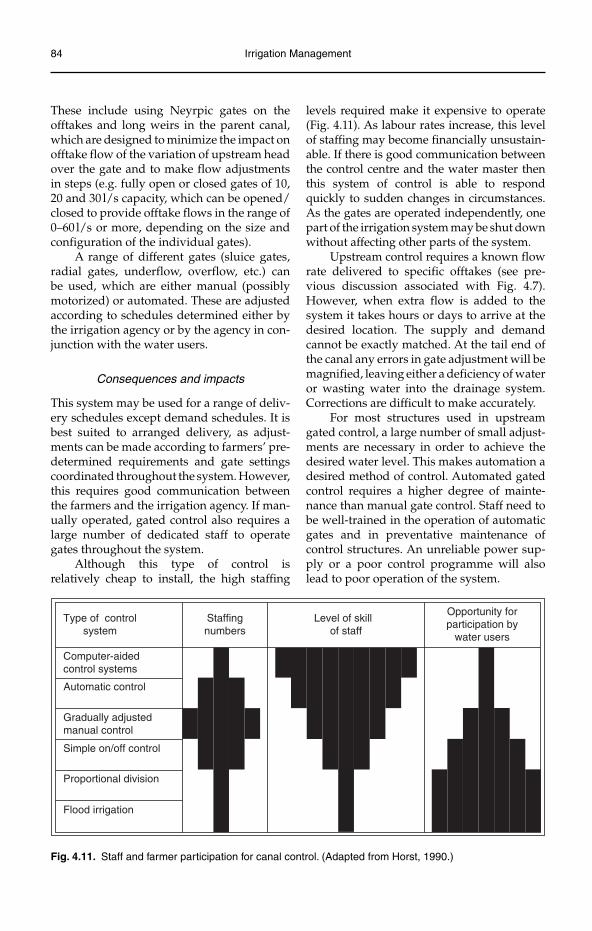
84 Irrigation Management
These include using Neyrpic gates on the offtakes and long weirs in the parent canal, which are designed to minimize the impact on offtake flow of the variation of upstream head over the gate and to make flow adjustments in steps (e.g. fully open or closed gates of 10, 20 and 30 l/s capacity, which can be opened/closed to provide offtake flows in the range of 0–60 l/s or more, depending on the size and configuration of the individual gates).
A range of different gates (sluice gates, radial gates, underflow, overflow, etc.) can be used, which are either manual (possibly motorized) or automated. These are adjusted according to schedules determined either by the irrigation agency or by the agency in con-junction with the water users.
Consequences and impacts
This system may be used for a range of deliv-ery schedules except demand schedules. It is best suited to arranged delivery, as adjust-ments can be made according to farmers’ pre-determined requirements and gate settings coordinated throughout the system. However, this requires good communication between the farmers and the irrigation agency. If man-ually operated, gated control also requires a large number of dedicated staff to operate gates throughout the system.
Although this type of control is relatively cheap to install, the high staffing
levels required make it expensive to operate (Fig. 4.11). As labour rates increase, this level of staffing may become financially unsustain-able. If there is good communication between the control centre and the water master then this system of control is able to respond quickly to sudden changes in circumstances. As the gates are operated independently, one part of the irrigation system may be shut down without affecting other parts of the system.
Upstream control requires a known flow rate delivered to specific offtakes (see pre-vious discussion associated with Fig. 4.7). However, when extra flow is added to the system it takes hours or days to arrive at the desired location. The supply and demand cannot be exactly matched. At the tail end of the canal any errors in gate adjustment will be magnified, leaving either a deficiency of water or wasting water into the drainage system. Corrections are difficult to make accurately.
For most structures used in upstream gated control, a large number of small adjust-ments are necessary in order to achieve the desired water level. This makes automation a desired method of control. Automated gated control requires a higher degree of mainte-nance than manual gate control. Staff need to be well-trained in the operation of automatic gates and in preventative maintenance of control structures. An unreliable power sup-ply or a poor control programme will also lead to poor operation of the system.
Type of controlsystem
Staffingnumbers
Level of skillof staff
Opportunity forparticipation by
water users
Computer-aidedcontrol systems
Automatic control
Gradually adjusted manual control
Simple on/off control
Proportional division
Flood irrigation
Fig. 4.11. Staff and farmer participation for canal control. (Adapted from Horst, 1990.)
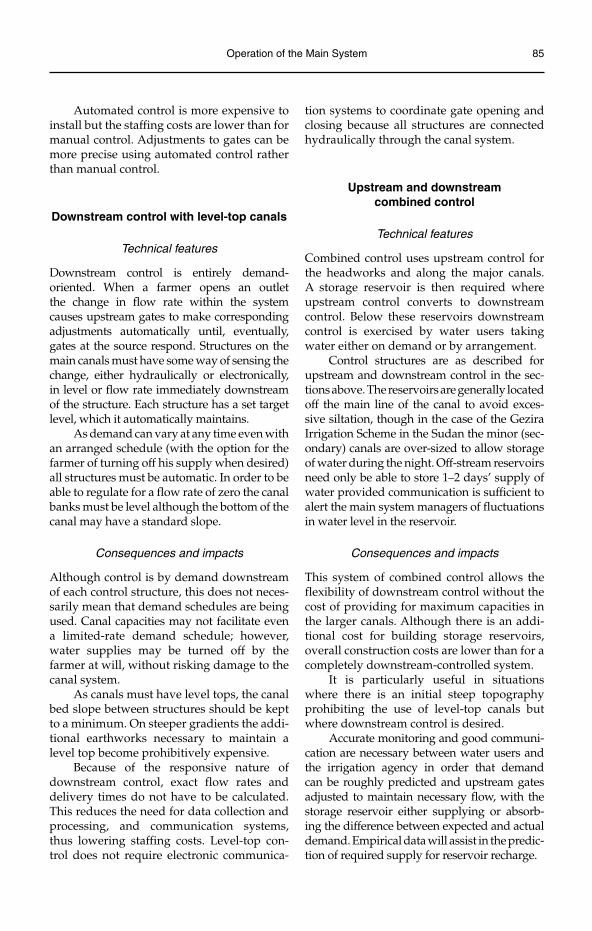
Operation of the Main System 85
Automated control is more expensive to install but the staffing costs are lower than for manual control. Adjustments to gates can be more precise using automated control rather than manual control.
Downstream control with level-top canals
Technical features
Downstream control is entirely demand-oriented. When a farmer opens an outlet the change in flow rate within the system causes upstream gates to make corresponding adjustments automatically until, eventually, gates at the source respond. Structures on the main canals must have some way of sensing the change, either hydraulically or electronically, in level or flow rate immediately downstream of the structure. Each structure has a set target level, which it automatically maintains.
As demand can vary at any time even with an arranged schedule (with the option for the farmer of turning off his supply when desired) all structures must be automatic. In order to be able to regulate for a flow rate of zero the canal banks must be level although the bottom of the canal may have a standard slope.
Consequences and impacts
Although control is by demand downstream of each control structure, this does not neces-sarily mean that demand schedules are being used. Canal capacities may not facilitate even a limited-rate demand schedule; however, water supplies may be turned off by the farmer at will, without risking damage to the canal system.
As canals must have level tops, the canal bed slope between structures should be kept to a minimum. On steeper gradients the addi-tional earthworks necessary to maintain a level top become prohibitively expensive.
Because of the responsive nature of downstream control, exact flow rates and delivery times do not have to be calculated. This reduces the need for data collection and processing, and communication systems, thus lowering staffing costs. Level-top con-trol does not require electronic communica-
tion systems to coordinate gate opening and closing because all structures are connected hydraulically through the canal system.
Upstream and downstream combined control
Technical features
Combined control uses upstream control for the headworks and along the major canals. A storage reservoir is then required where upstream control converts to downstream control. Below these reservoirs downstream control is exercised by water users taking water either on demand or by arrangement.
Control structures are as described for upstream and downstream control in the sec-tions above. The reservoirs are generally located off the main line of the canal to avoid exces-sive siltation, though in the case of the Gezira Irrigation Scheme in the Sudan the minor (sec-ondary) canals are over-sized to allow storage of water during the night. Off-stream reservoirs need only be able to store 1–2 days’ supply of water provided communication is sufficient to alert the main system managers of fluctuations in water level in the reservoir.
Consequences and impacts
This system of combined control allows the flexibility of downstream control without the cost of providing for maximum capacities in the larger canals. Although there is an addi-tional cost for building storage reservoirs, overall construction costs are lower than for a completely downstream-controlled system.
It is particularly useful in situations where there is an initial steep topography prohibiting the use of level-top canals but where downstream control is desired.
Accurate monitoring and good communi-cation are necessary between water users and the irrigation agency in order that demand can be roughly predicted and upstream gates adjusted to maintain necessary flow, with the storage reservoir either supplying or absorb-ing the difference between expected and actual demand. Empirical data will assist in the predic-tion of required supply for reservoir recharge.
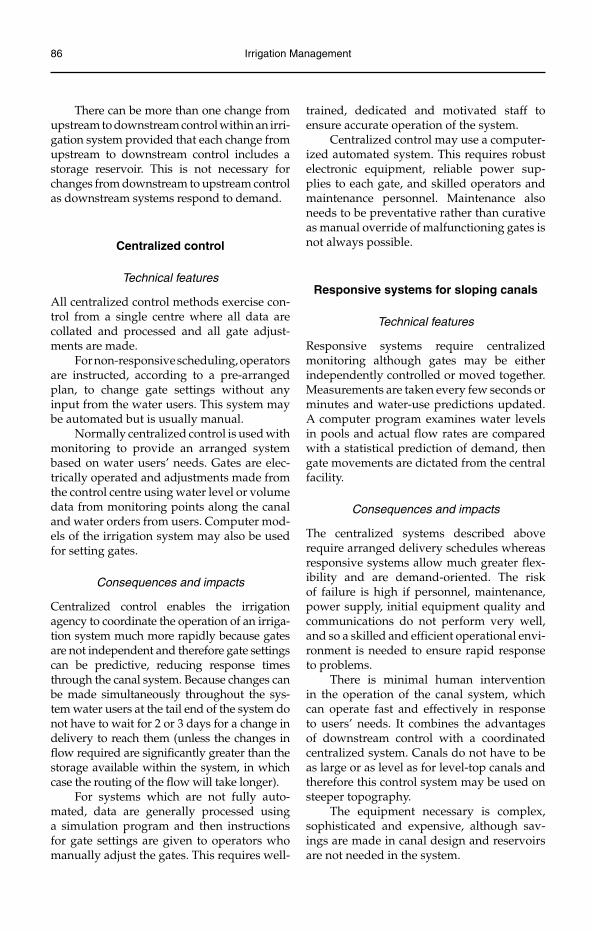
86 Irrigation Management
There can be more than one change from upstream to downstream control within an irri-gation system provided that each change from upstream to downstream control includes a storage reservoir. This is not necessary for changes from downstream to upstream control as downstream systems respond to demand.
Centralized control
Technical features
All centralized control methods exercise con-trol from a single centre where all data are collated and processed and all gate adjust-ments are made.
For non-responsive scheduling, operators are instructed, according to a pre-arranged plan, to change gate settings without any input from the water users. This system may be automated but is usually manual.
Normally centralized control is used with monitoring to provide an arranged system based on water users’ needs. Gates are elec-trically operated and adjustments made from the control centre using water level or volume data from monitoring points along the canal and water orders from users. Computer mod-els of the irrigation system may also be used for setting gates.
Consequences and impacts
Centralized control enables the irrigation agency to coordinate the operation of an irriga-tion system much more rapidly because gates are not independent and therefore gate settings can be predictive, reducing response times through the canal system. Because changes can be made simultaneously throughout the sys-tem water users at the tail end of the system do not have to wait for 2 or 3 days for a change in delivery to reach them (unless the changes in flow required are significantly greater than the storage available within the system, in which case the routing of the flow will take longer).
For systems which are not fully auto-mated, data are generally processed using a simulation program and then instructions for gate settings are given to operators who manually adjust the gates. This requires well-
trained, dedicated and motivated staff to ensure accurate operation of the system.
Centralized control may use a computer-ized automated system. This requires robust electronic equipment, reliable power sup-plies to each gate, and skilled operators and maintenance personnel. Maintenance also needs to be preventative rather than curative as manual override of malfunctioning gates is not always possible.
Responsive systems for sloping canals
Technical features
Responsive systems require centralized monitoring although gates may be either independently controlled or moved together. Measurements are taken every few seconds or minutes and water-use predictions updated. A computer program examines water levels in pools and actual flow rates are compared with a statistical prediction of demand, then gate movements are dictated from the central facility.
Consequences and impacts
The centralized systems described above require arranged delivery schedules whereas responsive systems allow much greater flex-ibility and are demand-oriented. The risk of failure is high if personnel, maintenance, power supply, initial equipment quality and communications do not perform very well, and so a skilled and efficient operational envi-ronment is needed to ensure rapid response to problems.
There is minimal human intervention in the operation of the canal system, which can operate fast and effectively in response to users’ needs. It combines the advantages of downstream control with a coordinated centralized system. Canals do not have to be as large or as level as for level-top canals and therefore this control system may be used on steeper topography.
The equipment necessary is complex, sophisticated and expensive, although sav-ings are made in canal design and reservoirs are not needed in the system.
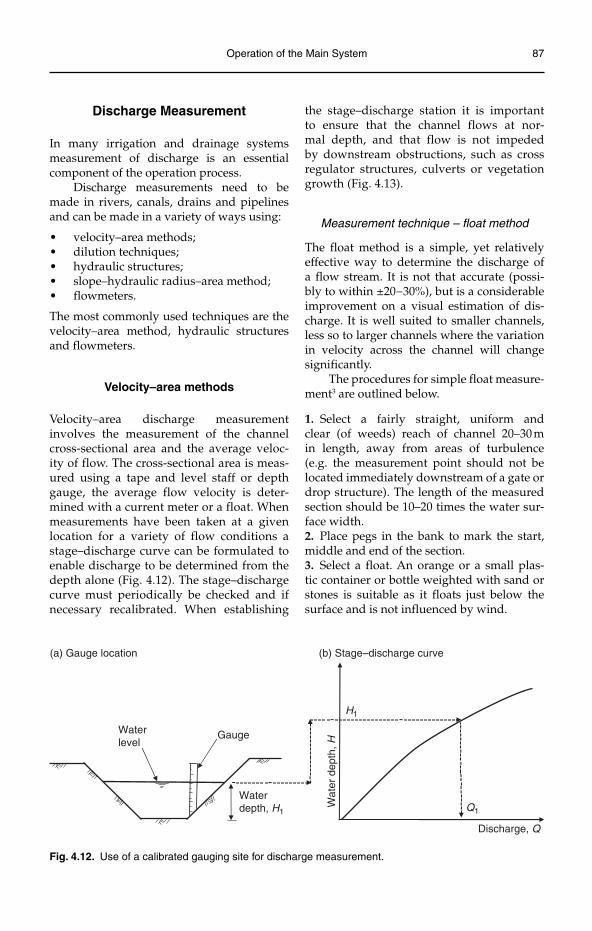
Operation of the Main System 87
Discharge Measurement
In many irrigation and drainage systems measurement of discharge is an essential component of the operation process.
Discharge measurements need to be made in rivers, canals, drains and pipelines and can be made in a variety of ways using:
velocity–area methods;•dilution techniques;•hydraulic structures;•slope–hydraulic radius–area method;•flowmeters.•
The most commonly used techniques are the velocity–area method, hydraulic structures and flowmeters.
Velocity–area methods
Velocity–area discharge measurement involves the measurement of the channel cross-sectional area and the average veloc-ity of flow. The cross-sectional area is meas-ured using a tape and level staff or depth gauge, the average flow velocity is deter-mined with a current meter or a float. When measurements have been taken at a given location for a variety of flow conditions a stage–discharge curve can be formulated to enable discharge to be determined from the depth alone (Fig. 4.12). The stage–discharge curve must periodically be checked and if necessary recalibrated. When establishing
the stage–discharge station it is important to ensure that the channel flows at nor-mal depth, and that flow is not impeded by downstream obstructions, such as cross regulator structures, culverts or vegetation growth (Fig. 4.13).
Measurement technique – float method
The float method is a simple, yet relatively effective way to determine the discharge of a flow stream. It is not that accurate (possi-bly to within ±20−30%), but is a considerable improvement on a visual estimation of dis-charge. It is well suited to smaller channels, less so to larger channels where the variation in velocity across the channel will change significantly.
The procedures for simple float measure-ment3 are outlined below.
1. Select a fairly straight, uniform and clear (of weeds) reach of channel 20–30 m in length, away from areas of turbulence (e.g. the measurement point should not be located immediately downstream of a gate or drop structure). The length of the measured section should be 10–20 times the water sur-face width.2. Place pegs in the bank to mark the start, middle and end of the section.3. Select a float. An orange or a small plas-tic container or bottle weighted with sand or stones is suitable as it floats just below the surface and is not influenced by wind.
GaugeWaterlevel
Discharge, Q
Q1
H1
Waterdepth, H1
Wat
er d
epth
, H
(a) Gauge location (b) Stage–discharge curve
Fig. 4.12. Use of a calibrated gauging site for discharge measurement.
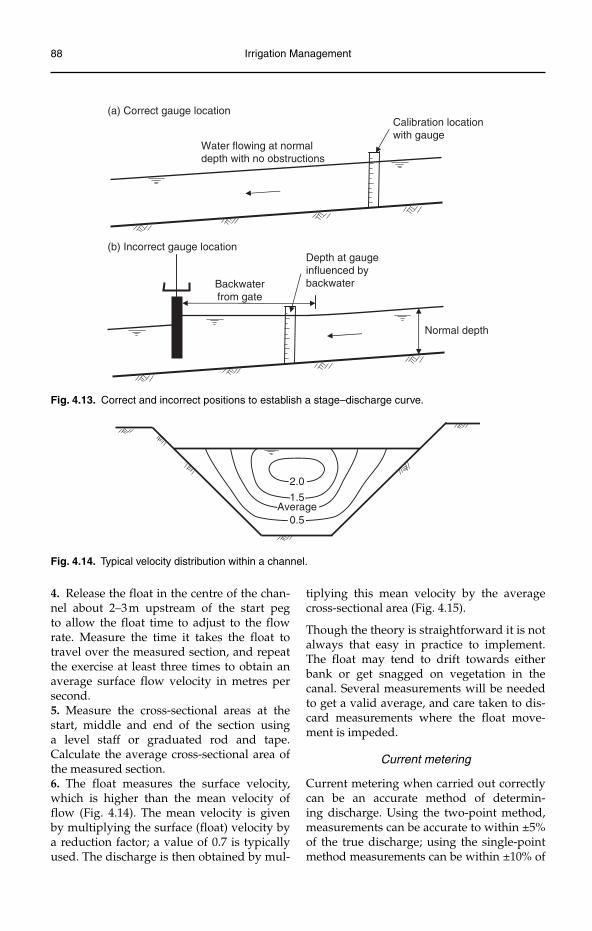
88 Irrigation Management
(b) Incorrect gauge location
(a) Correct gauge location
Water flowing at normaldepth with no obstructions
Calibration locationwith gauge
Depth at gaugeinfluenced bybackwater
Normal depth
Backwaterfrom gate
Fig. 4.13. Correct and incorrect positions to establish a stage–discharge curve.
2.0
1.5
0.5Average
Fig. 4.14. Typical velocity distribution within a channel.
4. Release the float in the centre of the chan-nel about 2–3 m upstream of the start peg to allow the float time to adjust to the flow rate. Measure the time it takes the float to travel over the measured section, and repeat the exercise at least three times to obtain an average surface flow velocity in metres per second.5. Measure the cross-sectional areas at the start, middle and end of the section using a level staff or graduated rod and tape. Calculate the average cross-sectional area of the measured section.6. The float measures the surface velocity, which is higher than the mean velocity of flow (Fig. 4.14). The mean velocity is given by multiplying the surface (float) velocity by a reduction factor; a value of 0.7 is typically used. The discharge is then obtained by mul-
tiplying this mean velocity by the average cross-sectional area (Fig. 4.15).
Though the theory is straightforward it is not always that easy in practice to implement. The float may tend to drift towards either bank or get snagged on vegetation in the canal. Several measurements will be needed to get a valid average, and care taken to dis-card measurements where the float move-ment is impeded.
Current metering
Current metering when carried out correctly can be an accurate method of determin-ing discharge. Using the two-point method, measurements can be accurate to within ±5% of the true discharge; using the single-point method measurements can be within ±10% of
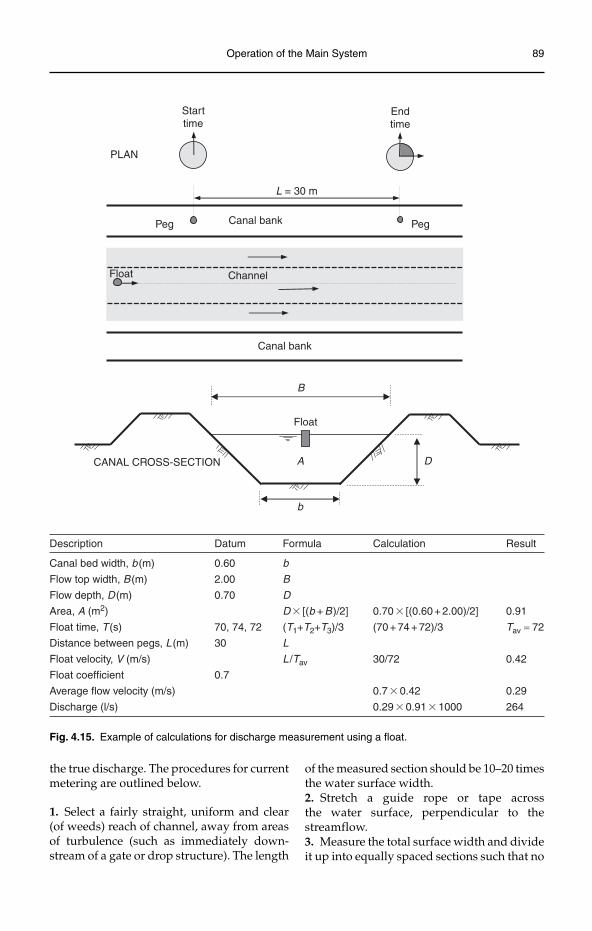
Operation of the Main System 89
L = 30 m
Float
Canal bankPeg Peg
Canal bank
Channel
Starttime
Endtime
PLAN
CANAL CROSS-SECTION
B
b
DA
Float
Description Datum Formula Calculation Result
Canal bed width, b (m)
Flow top width, B (m)
Flow depth, D (m)
Area, A (m2)
Float time, T (s)
Distance between pegs, L (m)
Float velocity, V (m/s)
Float coefficient
Average flow velocity (m/s)
Discharge (l/s)
b
B
D
D � [(b + B )/2]
(T1+T2+T3)/3
L
L /Tav
0.70 � [(0.60 + 2.00)/2]
(70 + 74 + 72)/3
30/72
0.7 � 0.42
0.29 � 0.91 � 1000
0.91
Tav = 72
0.42
0.29
264
0.60
2.00
0.70
70, 74, 72
30
0.7
Fig. 4.15. Example of calculations for discharge measurement using a float.
the true discharge. The procedures for current metering are outlined below.
1. Select a fairly straight, uniform and clear (of weeds) reach of channel, away from areas of turbulence (such as immediately down-stream of a gate or drop structure). The length
of the measured section should be 10–20 times the water surface width.2. Stretch a guide rope or tape across the water surface, perpendicular to the streamflow.3. Measure the total surface width and divide it up into equally spaced sections such that no
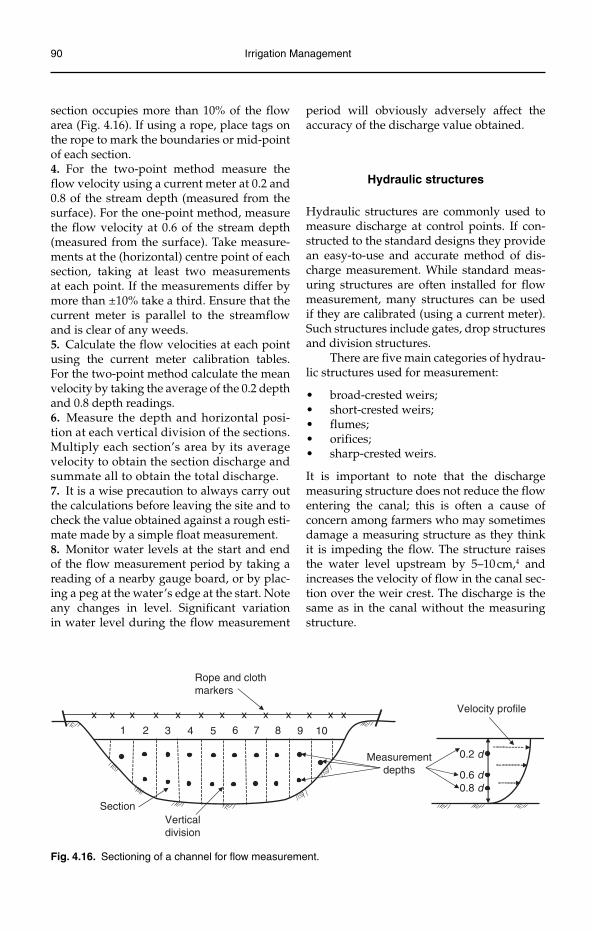
90 Irrigation Management
section occupies more than 10% of the flow area (Fig. 4.16). If using a rope, place tags on the rope to mark the boundaries or mid-point of each section.4. For the two-point method measure the flow velocity using a current meter at 0.2 and 0.8 of the stream depth (measured from the surface). For the one-point method, measure the flow velocity at 0.6 of the stream depth (measured from the surface). Take measure-ments at the (horizontal) centre point of each section, taking at least two measurements at each point. If the measurements differ by more than ±10% take a third. Ensure that the current meter is parallel to the streamflow and is clear of any weeds.5. Calculate the flow velocities at each point using the current meter calibration tables. For the two-point method calculate the mean velocity by taking the average of the 0.2 depth and 0.8 depth readings.6. Measure the depth and horizontal posi-tion at each vertical division of the sections. Multiply each section’s area by its average velocity to obtain the section discharge and summate all to obtain the total discharge.7. It is a wise precaution to always carry out the calculations before leaving the site and to check the value obtained against a rough esti-mate made by a simple float measurement.8. Monitor water levels at the start and end of the flow measurement period by taking a reading of a nearby gauge board, or by plac-ing a peg at the water’s edge at the start. Note any changes in level. Significant variation in water level during the flow measurement
period will obviously adversely affect the accuracy of the discharge value obtained.
Hydraulic structures
Hydraulic structures are commonly used to measure discharge at control points. If con-structed to the standard designs they provide an easy-to-use and accurate method of dis-charge measurement. While standard meas-uring structures are often installed for flow measurement, many structures can be used if they are calibrated (using a current meter). Such structures include gates, drop structures and division structures.
There are five main categories of hydrau-lic structures used for measurement:
broad-crested weirs;•short-crested weirs;•flumes;•orifices;•sharp-crested weirs.•
It is important to note that the discharge measuring structure does not reduce the flow entering the canal; this is often a cause of concern among farmers who may sometimes damage a measuring structure as they think it is impeding the flow. The structure raises the water level upstream by 5–10 cm,4 and increases the velocity of flow in the canal sec-tion over the weir crest. The discharge is the same as in the canal without the measuring structure.
Fig. 4.16. Sectioning of a channel for flow measurement.
Rope and clothmarkers
1 2 3 4 5 6 7 8 9 10
xx x x xx xx x xx x
0.2 d
0.6 d0.8 d
Velocity profile
Measurementdepths
SectionVerticaldivision
x
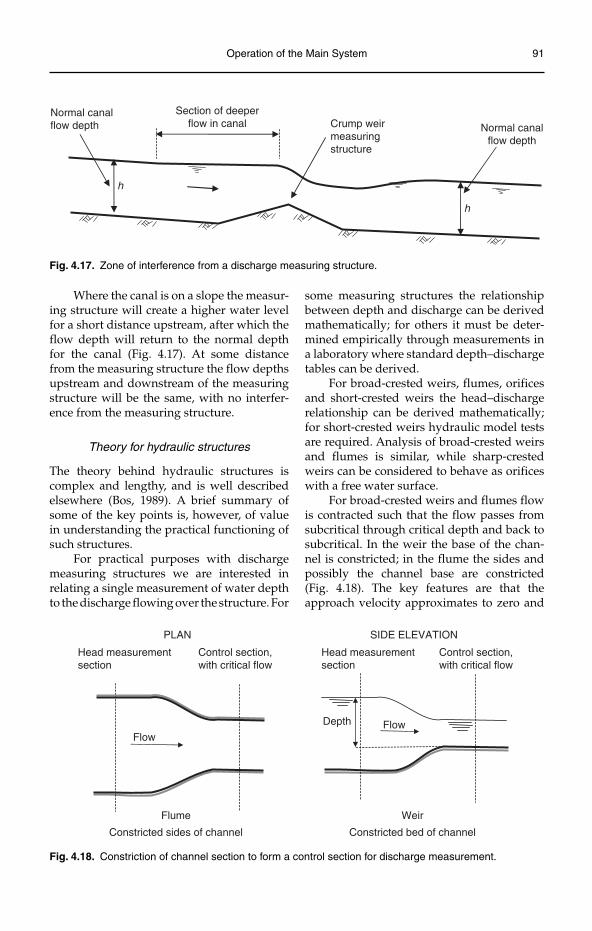
Operation of the Main System 91
Where the canal is on a slope the measur-ing structure will create a higher water level for a short distance upstream, after which the flow depth will return to the normal depth for the canal (Fig. 4.17). At some distance from the measuring structure the flow depths upstream and downstream of the measuring structure will be the same, with no interfer-ence from the measuring structure.
Theory for hydraulic structures
The theory behind hydraulic structures is complex and lengthy, and is well described elsewhere (Bos, 1989). A brief summary of some of the key points is, however, of value in understanding the practical functioning of such structures.
For practical purposes with discharge measuring structures we are interested in relating a single measurement of water depth to the discharge flowing over the structure. For
some measuring structures the relationship between depth and discharge can be derived mathematically; for others it must be deter-mined empirically through measurements in a laboratory where standard depth–discharge tables can be derived.
For broad-crested weirs, flumes, orifices and short-crested weirs the head–discharge relationship can be derived mathematically; for short-crested weirs hydraulic model tests are required. Analysis of broad-crested weirs and flumes is similar, while sharp-crested weirs can be considered to behave as orifices with a free water surface.
For broad-crested weirs and flumes flow is contracted such that the flow passes from subcritical through critical depth and back to subcritical. In the weir the base of the chan-nel is constricted; in the flume the sides and possibly the channel base are constricted (Fig. 4.18). The key features are that the approach velocity approximates to zero and
h
Normal canalflow depth
Section of deeperflow in canal
h
Normal canalflow depth
Crump weirmeasuringstructure
Fig. 4.17. Zone of interference from a discharge measuring structure.
Fig. 4.18. Constriction of channel section to form a control section for discharge measurement.
Head measurementsection
Constricted sides of channel
Weir
Control section,with critical flow
Flume
Head measurementsection
Control section,with critical flow
FlowFlowDepth
Constricted bed of channel
PLAN SIDE ELEVATION
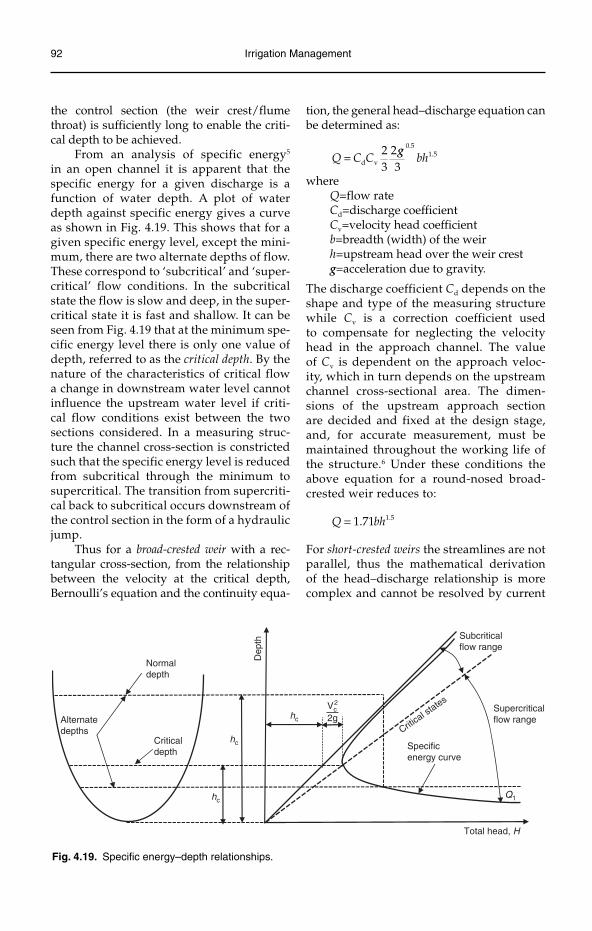
92 Irrigation Management
the control section (the weir crest/flume throat) is sufficiently long to enable the criti-cal depth to be achieved.
From an analysis of specific energy5
in an open channel it is apparent that the specific energy for a given discharge is a function of water depth. A plot of water depth against specific energy gives a curve as shown in Fig. 4.19. This shows that for a given specific energy level, except the mini-mum, there are two alternate depths of flow. These correspond to ‘subcritical’ and ‘super-critical’ flow conditions. In the subcritical state the flow is slow and deep, in the super-critical state it is fast and shallow. It can be seen from Fig. 4.19 that at the minimum spe-cific energy level there is only one value of depth, referred to as the critical depth. By the nature of the characteristics of critical flow a change in downstream water level cannot influence the upstream water level if criti-cal flow conditions exist between the two sections considered. In a measuring struc-ture the channel cross-section is constricted such that the specific energy level is reduced from subcritical through the minimum to supercritical. The transition from supercriti-cal back to subcritical occurs downstream of the control section in the form of a hydraulic jump.
Thus for a broad-crested weir with a rec-tangular cross-section, from the relationship between the velocity at the critical depth, Bernoulli’s equation and the continuity equa-
tion, the general head–discharge equation can be determined as:
0.51.5
d v
2 2=
3 3Q C C bh
g
whereQ=flow rateCd=discharge coefficientCv=velocity head coefficientb=breadth (width) of the weirh=upstream head over the weir crestg=acceleration due to gravity.
The discharge coefficient Cd depends on the shape and type of the measuring structure while Cv is a correction coefficient used to compensate for neglecting the velocity head in the approach channel. The value of Cv is dependent on the approach veloc-ity, which in turn depends on the upstream channel cross-sectional area. The dimen-sions of the upstream approach section are decided and fixed at the design stage, and, for accurate measurement, must be maintained throughout the working life of the structure.6 Under these conditions the above equation for a round-nosed broad-crested weir reduces to:
1.51.71Q bh=
For short-crested weirs the streamlines are not parallel, thus the mathematical derivation of the head–discharge relationship is more complex and cannot be resolved by current
hc
hc
hc
Critica
l states
Total head, H
Alternatedepths
Q1
Subcriticalflow range
Supercriticalflow range
Criticaldepth
Normaldepth
Dep
th
Vc2
2g
Specificenergy curve
Fig. 4.19. Specific energy–depth relationships.
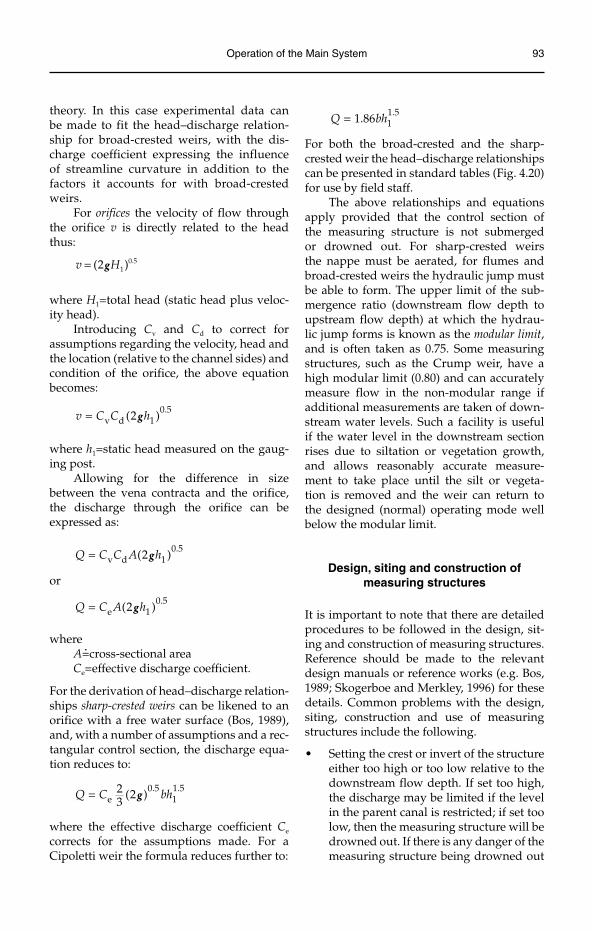
Operation of the Main System 93
theory. In this case experimental data can be made to fit the head–discharge relation-ship for broad-crested weirs, with the dis-charge coefficient expressing the influence of streamline curvature in addition to the factors it accounts for with broad-crested weirs.
For orifices the velocity of flow through the orifice v is directly related to the head thus:
= 0.51(2 )v Hg
where H1=total head (static head plus veloc-ity head).
Introducing Cv and Cd to correct for assumptions regarding the velocity, head and the location (relative to the channel sides) and condition of the orifice, the above equation becomes:
0.5v d 1(2 )v C C h= g
where h1=static head measured on the gaug-ing post.
Allowing for the difference in size between the vena contracta and the orifice, the discharge through the orifice can be expressed as:
0.5v d 1(2 )Q C C A h= g
or
0.5e 1(2 )Q C A h= g
whereA=cross-sectional areaCe=effective discharge coefficient.
For the derivation of head–discharge relation-ships sharp-crested weirs can be likened to an orifice with a free water surface (Bos, 1989), and, with a number of assumptions and a rec-tangular control section, the discharge equa-tion reduces to:
= 0.5 1.5e 1
2 (2 )3
Q C bhg
where the effective discharge coefficient Ce
corrects for the assumptions made. For a Cipoletti weir the formula reduces further to:
= 1.511.86Q bh
For both the broad-crested and the sharp-crested weir the head–discharge relationships can be presented in standard tables (Fig. 4.20) for use by field staff.
The above relationships and equations apply provided that the control section of the measuring structure is not submerged or drowned out. For sharp-crested weirs the nappe must be aerated, for flumes and broad-crested weirs the hydraulic jump must be able to form. The upper limit of the sub-mergence ratio (downstream flow depth to upstream flow depth) at which the hydrau-lic jump forms is known as the modular limit,and is often taken as 0.75. Some measuring structures, such as the Crump weir, have a high modular limit (0.80) and can accurately measure flow in the non-modular range if additional measurements are taken of down-stream water levels. Such a facility is useful if the water level in the downstream section rises due to siltation or vegetation growth, and allows reasonably accurate measure-ment to take place until the silt or vegeta-tion is removed and the weir can return to the designed (normal) operating mode well below the modular limit.
Design, siting and construction of measuring structures
It is important to note that there are detailed procedures to be followed in the design, sit-ing and construction of measuring structures. Reference should be made to the relevant design manuals or reference works (e.g. Bos, 1989; Skogerboe and Merkley, 1996) for these details. Common problems with the design, siting, construction and use of measuring structures include the following.
Setting the crest or invert of the structure •either too high or too low relative to the downstream flow depth. If set too high, the discharge may be limited if the level in the parent canal is restricted; if set too low, then the measuring structure will be drowned out. If there is any danger of the measuring structure being drowned out
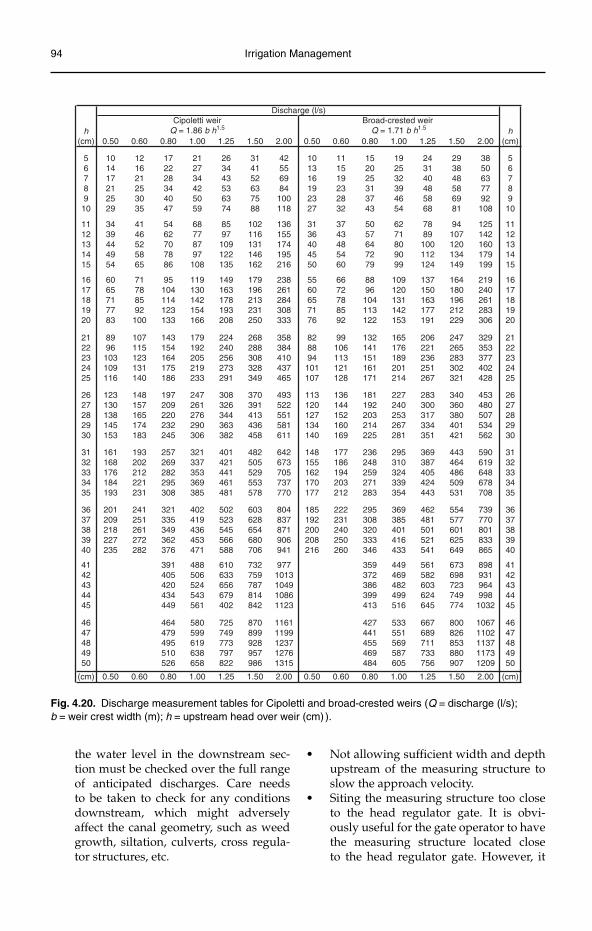
94 Irrigation Management
h(cm)
h(cm)1.50 2.000.50 0.60 0.80 1.00 1.251.50 2.000.50 0.60 0.80 1.00 1.25
5678910
101417212529
121621253035
172228344047
212734425059
263443536374
314152637588
42556984100118
101316192327
111519232832
152025313743
192532394654
243140485868
293848586981
3850637792108
5678910
1112131415
3439444954
4146525865
5462707886
68778797
108
8597
109122135
102116131146162
136155174195216
3136404550
3743485460
5057647279
6271809099
7889100112124
94107120134149
125142160179199
1112131415
1617181920
6065717783
71788592100
95104114123133
119130142154166
149163178193208
179196213231250
238261284308333
5560657176
6672788592
8896104113122
109120131142153
137150163177191
164180196212229
219240261283306
1617181920
2122232425
8996103109116
107115123131140
143154164175186
179192205219233
224240256273291
268288308328349
358384410437465
828894
101107
99106113121128
132141151161171
165176189201214
206221236251267
247265283302321
329353377402428
2122232425
2627282930
123130138145153
148157165174183
197209220232245
247261276290306
308326344363382
370391413436458
493522551581611
113120127134140
136144152160169
181192203214225
227240253267281
283300317334351
340360380401421
453480507534562
2627282930
3132333435
161168176184193
193202212221231
257269282295308
321337353369385
401421441461481
482505529553578
642673705737770
148155162170177
177186194203212
236248259271283
295310324339354
369387405424443
443464486509531
590619648678708
3132333435
3637383940
4142434445
4647484950
4647484950
464479495510526
10671102113711731209
800826853880907
667689711733756
533551569587605
427441455469484
11611199123712761315
870899928957986
725749773797822
580599619638658
391405420434449
488506524543561
359372386399413
449469482499516
4142434445
898931964998
1032
673698723749774
561582603624645
9771013104910861123
732759787814842
610633656679402
201209218227235
241251261272282
321335349362376
402419436453471
502523545566588
603628654680706
804837871906941
185192200208216
222231240250260
295308320333346
369385401416433
462481501521541
554577601625649
739770801833865
3637383940
1.50 2.00 (cm)(cm) 0.50 0.60 0.80 1.00 1.25 1.50 2.00 0.50 0.60 0.80 1.00 1.25
Discharge (l/s)Cipoletti weir
Q = 1.86 b h1.5Broad-crested weir
Q = 1.71 b h1.5
Fig. 4.20. Discharge measurement tables for Cipoletti and broad-crested weirs (Q = discharge (l/s); b = weir crest width (m); h = upstream head over weir (cm) ).
the water level in the downstream sec-tion must be checked over the full range of anticipated discharges. Care needs to be taken to check for any conditions downstream, which might adversely affect the canal geometry, such as weed growth, siltation, culverts, cross regula-tor structures, etc.
Not allowing sufficient width and depth •upstream of the measuring structure to slow the approach velocity.Siting the measuring structure too close •to the head regulator gate. It is obvi-ously useful for the gate operator to have the measuring structure located close to the head regulator gate. However, it
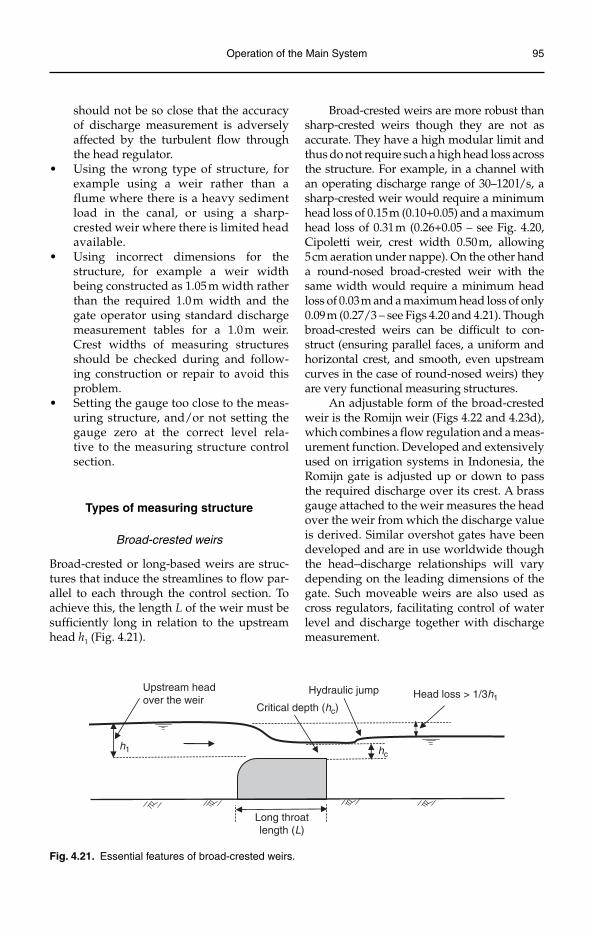
Operation of the Main System 95
should not be so close that the accuracy of discharge measurement is adversely affected by the turbulent flow through the head regulator.Using the wrong type of structure, for •example using a weir rather than a flume where there is a heavy sediment load in the canal, or using a sharp-crested weir where there is limited head available.Using incorrect dimensions for the •structure, for example a weir width being constructed as 1.05 m width rather than the required 1.0 m width and the gate operator using standard discharge measurement tables for a 1.0 m weir. Crest widths of measuring structures should be checked during and follow-ing construction or repair to avoid this problem.Setting the gauge too close to the meas-•uring structure, and/or not setting the gauge zero at the correct level rela-tive to the measuring structure control section.
Types of measuring structure
Broad-crested weirs
Broad-crested or long-based weirs are struc-tures that induce the streamlines to flow par-allel to each through the control section. To achieve this, the length L of the weir must be sufficiently long in relation to the upstream head h1 (Fig. 4.21).
Broad-crested weirs are more robust than sharp-crested weirs though they are not as accurate. They have a high modular limit and thus do not require such a high head loss across the structure. For example, in a channel with an operating discharge range of 30–120 l/s, a sharp-crested weir would require a minimum head loss of 0.15 m (0.10+0.05) and a maximum head loss of 0.31 m (0.26+0.05 – see Fig. 4.20, Cipoletti weir, crest width 0.50 m, allowing 5 cm aeration under nappe). On the other hand a round-nosed broad-crested weir with the same width would require a minimum head loss of 0.03 m and a maximum head loss of only 0.09 m (0.27/3 – see Figs 4.20 and 4.21). Though broad-crested weirs can be difficult to con-struct (ensuring parallel faces, a uniform and horizontal crest, and smooth, even upstream curves in the case of round-nosed weirs) they are very functional measuring structures.
An adjustable form of the broad-crested weir is the Romijn weir (Figs 4.22 and 4.23d), which combines a flow regulation and a meas-urement function. Developed and extensively used on irrigation systems in Indonesia, the Romijn gate is adjusted up or down to pass the required discharge over its crest. A brass gauge attached to the weir measures the head over the weir from which the discharge value is derived. Similar overshot gates have been developed and are in use worldwide though the head–discharge relationships will vary depending on the leading dimensions of the gate. Such moveable weirs are also used as cross regulators, facilitating control of water level and discharge together with discharge measurement.
Hydraulic jump
Long throatlength (L)
Upstream headover the weir
h1
Critical depth (hc)
hc
Head loss > 1/3h1
Fig. 4.21. Essential features of broad-crested weirs.
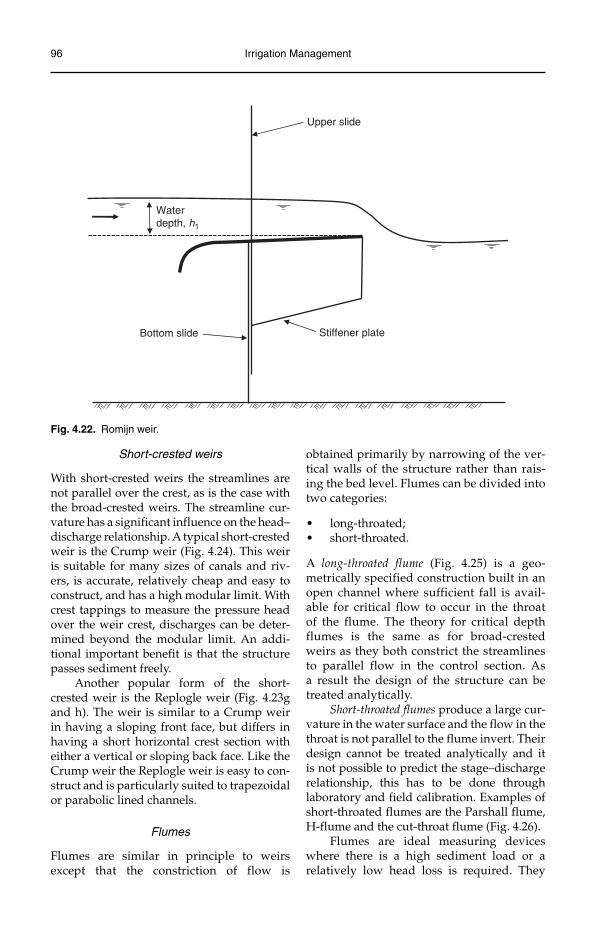
96 Irrigation Management
Short-crested weirs
With short-crested weirs the streamlines are not parallel over the crest, as is the case with the broad-crested weirs. The streamline cur-vature has a significant influence on the head–discharge relationship. A typical short-crested weir is the Crump weir (Fig. 4.24). This weir is suitable for many sizes of canals and riv-ers, is accurate, relatively cheap and easy to construct, and has a high modular limit. With crest tappings to measure the pressure head over the weir crest, discharges can be deter-mined beyond the modular limit. An addi-tional important benefit is that the structure passes sediment freely.
Another popular form of the short-crested weir is the Replogle weir (Fig. 4.23g and h). The weir is similar to a Crump weir in having a sloping front face, but differs in having a short horizontal crest section with either a vertical or sloping back face. Like the Crump weir the Replogle weir is easy to con-struct and is particularly suited to trapezoidal or parabolic lined channels.
Flumes
Flumes are similar in principle to weirs except that the constriction of flow is
obtained primarily by narrowing of the ver-tical walls of the structure rather than rais-ing the bed level. Flumes can be divided into two categories:
long-throated;•short-throated.•
A long-throated flume (Fig. 4.25) is a geo-metrically specified construction built in an open channel where sufficient fall is avail-able for critical flow to occur in the throat of the flume. The theory for critical depth flumes is the same as for broad-crested weirs as they both constrict the streamlines to parallel flow in the control section. As a result the design of the structure can be treated analytically.
Short-throated flumes produce a large cur-vature in the water surface and the flow in the throat is not parallel to the flume invert. Their design cannot be treated analytically and it is not possible to predict the stage–discharge relationship, this has to be done through laboratory and field calibration. Examples of short-throated flumes are the Parshall flume, H-flume and the cut-throat flume (Fig. 4.26).
Flumes are ideal measuring devices where there is a high sediment load or a relatively low head loss is required. They
Bottom slide
Upper slide
Stiffener plate
Waterdepth, h1
Fig. 4.22. Romijn weir.
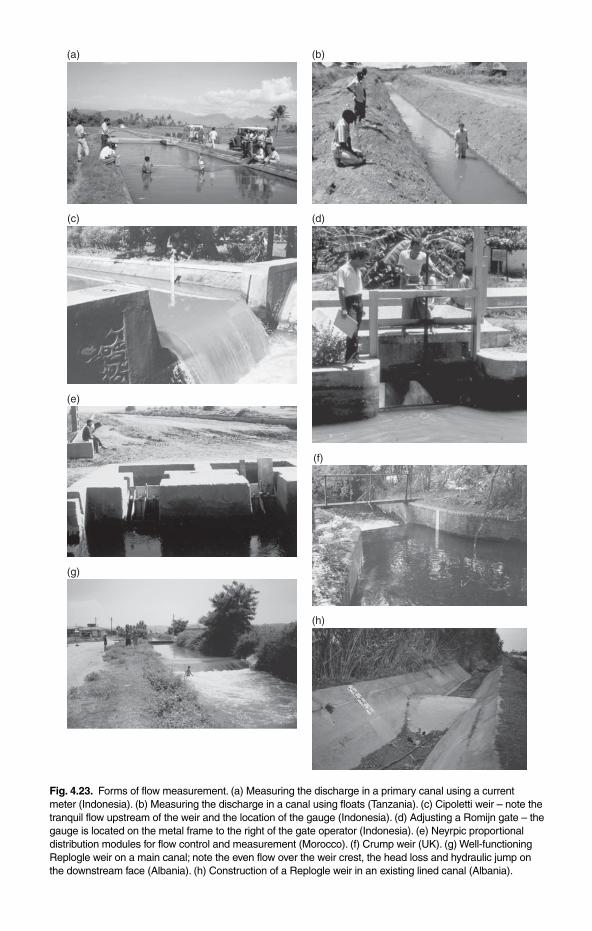
(a) (b)
(c) (d)
(e)
(g)
(f)
(h)
Fig. 4.23. Forms of flow measurement. (a) Measuring the discharge in a primary canal using a current meter (Indonesia). (b) Measuring the discharge in a canal using floats (Tanzania). (c) Cipoletti weir – note the tranquil flow upstream of the weir and the location of the gauge (Indonesia). (d) Adjusting a Romijn gate – the gauge is located on the metal frame to the right of the gate operator (Indonesia). (e) Neyrpic proportional distribution modules for flow control and measurement (Morocco). (f) Crump weir (UK). (g) Well-functioning Replogle weir on a main canal; note the even flow over the weir crest, the head loss and hydraulic jump on the downstream face (Albania). (h) Construction of a Replogle weir in an existing lined canal (Albania).
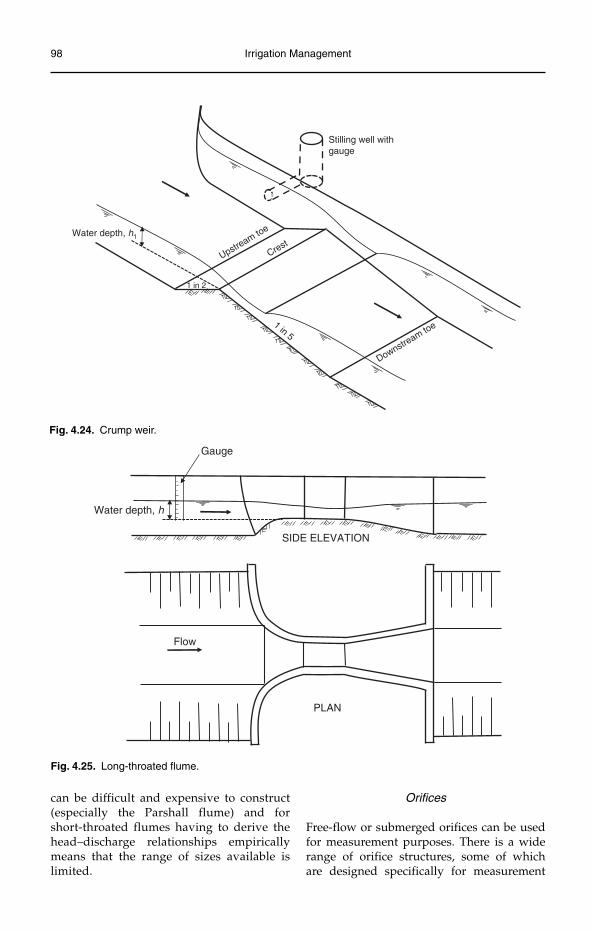
98 Irrigation Management
Stilling well withgauge
1 in 2
?
?
?
1 in 5
Water depth, h1
CrestUpstre
am toe
Downstream to
e
Fig. 4.24. Crump weir.
Flow
PLAN
Gauge
Water depth, h
SIDE ELEVATION
Fig. 4.25. Long-throated flume.
can be difficult and expensive to construct (especially the Parshall flume) and for short-throated flumes having to derive the head–discharge relationships empirically means that the range of sizes available is limited.
Orifices
Free-flow or submerged orifices can be used for measurement purposes. There is a wide range of orifice structures, some of which are designed specifically for measurement
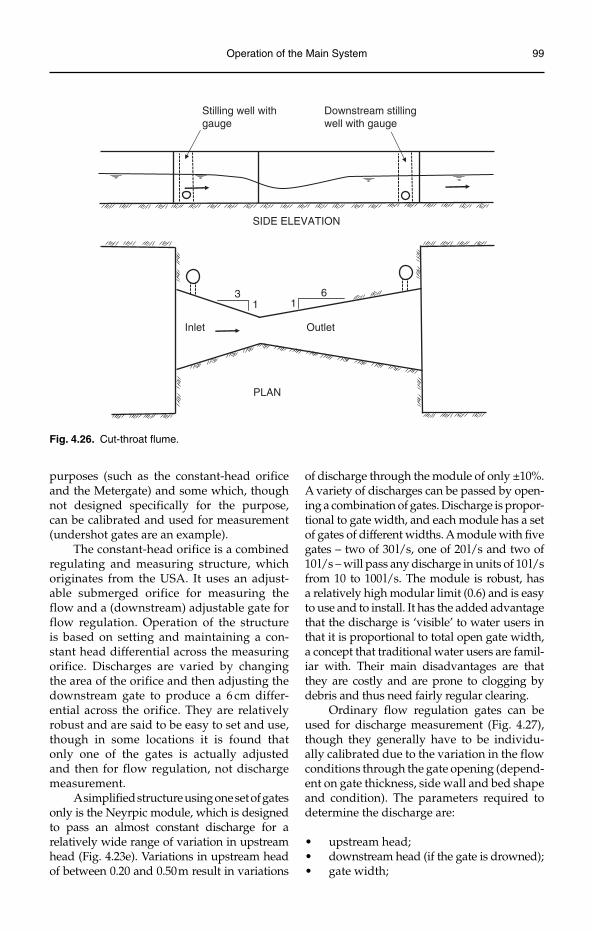
Operation of the Main System 99
SIDE ELEVATION
Stilling well withgauge
Downstream stillingwell with gauge
Inlet Outlet
31
61
PLAN
Fig. 4.26. Cut-throat flume.
purposes (such as the constant-head orifice and the Metergate) and some which, though not designed specifically for the purpose, can be calibrated and used for measurement (undershot gates are an example).
The constant-head orifice is a combined regulating and measuring structure, which originates from the USA. It uses an adjust-able submerged orifice for measuring the flow and a (downstream) adjustable gate for flow regulation. Operation of the structure is based on setting and maintaining a con-stant head differential across the measuring orifice. Discharges are varied by changing the area of the orifice and then adjusting the downstream gate to produce a 6 cm differ-ential across the orifice. They are relatively robust and are said to be easy to set and use, though in some locations it is found that only one of the gates is actually adjusted and then for flow regulation, not discharge measurement.
A simplified structure using one set of gates only is the Neyrpic module, which is designed to pass an almost constant discharge for a relatively wide range of variation in upstream head (Fig. 4.23e). Variations in upstream head of between 0.20 and 0.50 m result in variations
of discharge through the module of only ±10%. A variety of discharges can be passed by open-ing a combination of gates. Discharge is propor-tional to gate width, and each module has a set of gates of different widths. A module with five gates – two of 30 l/s, one of 20 l/s and two of 10 l/s – will pass any discharge in units of 10 l/s from 10 to 100 l/s. The module is robust, has a relatively high modular limit (0.6) and is easy to use and to install. It has the added advantage that the discharge is ‘visible’ to water users in that it is proportional to total open gate width, a concept that traditional water users are famil-iar with. Their main disadvantages are that they are costly and are prone to clogging by debris and thus need fairly regular clearing.
Ordinary flow regulation gates can be used for discharge measurement (Fig. 4.27), though they generally have to be individu-ally calibrated due to the variation in the flow conditions through the gate opening (depend-ent on gate thickness, side wall and bed shape and condition). The parameters required to determine the discharge are:
upstream head;•downstream head (if the gate is drowned);•gate width;•
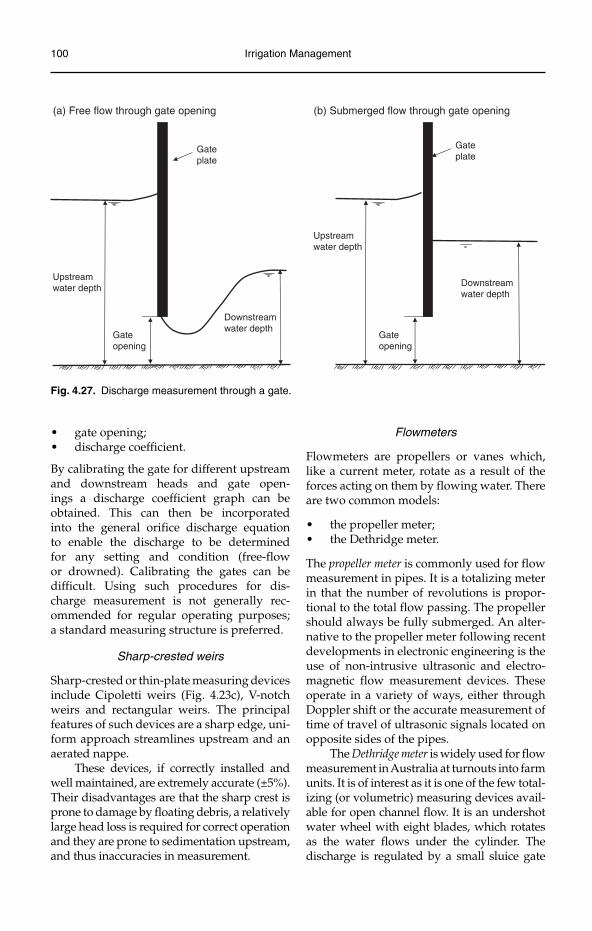
100 Irrigation Management
gate opening;•discharge coefficient.•
By calibrating the gate for different upstream and downstream heads and gate open-ings a discharge coefficient graph can be obtained. This can then be incorporated into the general orifice discharge equation to enable the discharge to be determined for any setting and condition (free-flow or drowned). Calibrating the gates can be difficult. Using such procedures for dis-charge measurement is not generally rec-ommended for regular operating purposes; a standard measuring structure is preferred.
Sharp-crested weirs
Sharp-crested or thin-plate measuring devices include Cipoletti weirs (Fig. 4.23c), V-notch weirs and rectangular weirs. The principal features of such devices are a sharp edge, uni-form approach streamlines upstream and an aerated nappe.
These devices, if correctly installed and well maintained, are extremely accurate (±5%). Their disadvantages are that the sharp crest is prone to damage by floating debris, a relatively large head loss is required for correct operation and they are prone to sedimentation upstream, and thus inaccuracies in measurement.
Flowmeters
Flowmeters are propellers or vanes which, like a current meter, rotate as a result of the forces acting on them by flowing water. There are two common models:
the propeller meter;•the Dethridge meter.•
The propeller meter is commonly used for flow measurement in pipes. It is a totalizing meter in that the number of revolutions is propor-tional to the total flow passing. The propeller should always be fully submerged. An alter-native to the propeller meter following recent developments in electronic engineering is the use of non-intrusive ultrasonic and electro-magnetic flow measurement devices. These operate in a variety of ways, either through Doppler shift or the accurate measurement of time of travel of ultrasonic signals located on opposite sides of the pipes.
The Dethridge meter is widely used for flow measurement in Australia at turnouts into farm units. It is of interest as it is one of the few total-izing (or volumetric) measuring devices avail-able for open channel flow. It is an undershot water wheel with eight blades, which rotates as the water flows under the cylinder. The discharge is regulated by a small sluice gate
Gateopening
Downstreamwater depth
Upstreamwater depth
Gateopening
Downstreamwater depth
Upstreamwater depth
(a) Free flow through gate opening (b) Submerged flow through gate opening
Gateplate
Gateplate
Fig. 4.27. Discharge measurement through a gate.
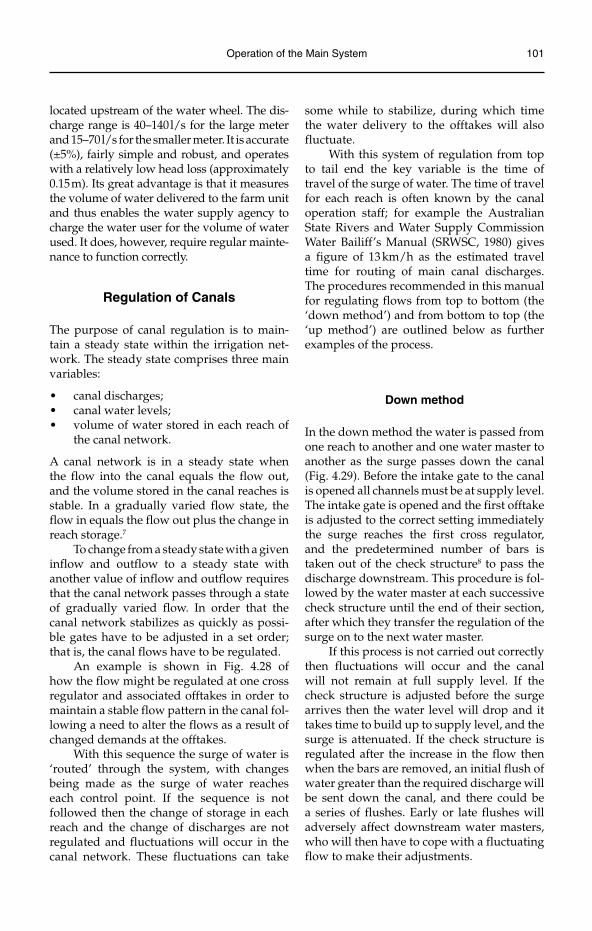
Operation of the Main System 101
located upstream of the water wheel. The dis-charge range is 40–140 l/s for the large meter and 15–70 l/s for the smaller meter. It is accurate (±5%), fairly simple and robust, and operates with a relatively low head loss (approximately 0.15 m). Its great advantage is that it measures the volume of water delivered to the farm unit and thus enables the water supply agency to charge the water user for the volume of water used. It does, however, require regular mainte-nance to function correctly.
Regulation of Canals
The purpose of canal regulation is to main-tain a steady state within the irrigation net-work. The steady state comprises three main variables:
canal discharges;•canal water levels;•volume of water stored in each reach of •the canal network.
A canal network is in a steady state when the flow into the canal equals the flow out, and the volume stored in the canal reaches is stable. In a gradually varied flow state, the flow in equals the flow out plus the change in reach storage.7
To change from a steady state with a given inflow and outflow to a steady state with another value of inflow and outflow requires that the canal network passes through a state of gradually varied flow. In order that the canal network stabilizes as quickly as possi-ble gates have to be adjusted in a set order; that is, the canal flows have to be regulated.
An example is shown in Fig. 4.28 of how the flow might be regulated at one cross regulator and associated offtakes in order to maintain a stable flow pattern in the canal fol-lowing a need to alter the flows as a result of changed demands at the offtakes.
With this sequence the surge of water is ‘routed’ through the system, with changes being made as the surge of water reaches each control point. If the sequence is not followed then the change of storage in each reach and the change of discharges are not regulated and fluctuations will occur in the canal network. These fluctuations can take
some while to stabilize, during which time the water delivery to the offtakes will also fluctuate.
With this system of regulation from top to tail end the key variable is the time of travel of the surge of water. The time of travel for each reach is often known by the canal operation staff; for example the Australian State Rivers and Water Supply Commission Water Bailiff’s Manual (SRWSC, 1980) gives a figure of 13 km/h as the estimated travel time for routing of main canal discharges. The procedures recommended in this manual for regulating flows from top to bottom (the ‘down method’) and from bottom to top (the ‘up method’) are outlined below as further examples of the process.
Down method
In the down method the water is passed from one reach to another and one water master to another as the surge passes down the canal (Fig. 4.29). Before the intake gate to the canal is opened all channels must be at supply level. The intake gate is opened and the first offtake is adjusted to the correct setting immediately the surge reaches the first cross regulator, and the predetermined number of bars is taken out of the check structure8 to pass the discharge downstream. This procedure is fol-lowed by the water master at each successive check structure until the end of their section, after which they transfer the regulation of the surge on to the next water master.
If this process is not carried out correctly then fluctuations will occur and the canal will not remain at full supply level. If the check structure is adjusted before the surge arrives then the water level will drop and it takes time to build up to supply level, and the surge is attenuated. If the check structure is regulated after the increase in the flow then when the bars are removed, an initial flush of water greater than the required discharge will be sent down the canal, and there could be a series of flushes. Early or late flushes will adversely affect downstream water masters, who will then have to cope with a fluctuating flow to make their adjustments.
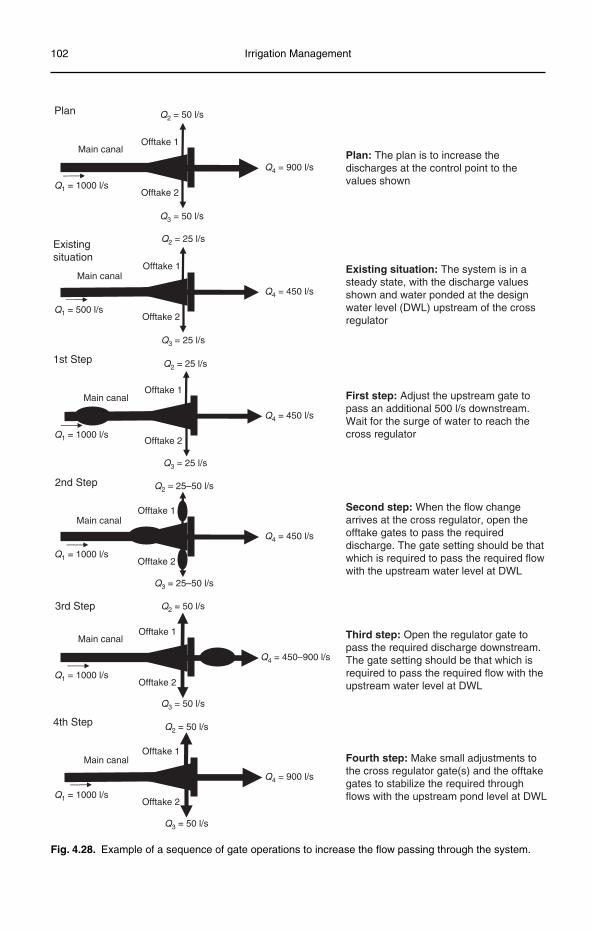
102 Irrigation Management
Offtake 1
Existingsituation
Q2 = 25 l/s
Main canal
Q1 = 500 l/s
Q3 = 25 l/s
Q4 = 450 l/s
Offtake 2
Offtake 1
Q2 = 25–50 l/s
Main canal
Q1 = 1000 l/s
Q3 = 25–50 l/s
Q4 = 450 l/s
Offtake 2
2nd Step
Offtake 1
Q2 = 50 l/s
Q1 = 1000 l/s
Q3 = 50 l/s
Q4 = 450–900 l/s
Offtake 2
Main canal
3rd Step
Offtake 1
Q2 = 50 l/s
Q1 = 1000 l/s
Q4 = 900 l/s
Offtake 2
Main canal
4th Step
Q3 = 50 l/s
Offtake 1
Q2 = 50 l/s
Q1 = 1000 l/s
Q3 = 50 l/s
Q4 = 900 l/s
Offtake 2
Main canal
Plan
Plan: The plan is to increase thedischarges at the control point to thevalues shown
Existing situation: The system is in asteady state, with the discharge valuesshown and water ponded at the designwater level (DWL) upstream of the crossregulator
First step: Adjust the upstream gate topass an additional 500 l/s downstream.Wait for the surge of water to reach thecross regulator
Second step: When the flow changearrives at the cross regulator, open theofftake gates to pass the requireddischarge. The gate setting should be thatwhich is required to pass the required flowwith the upstream water level at DWL
Third step: Open the regulator gate topass the required discharge downstream.The gate setting should be that which isrequired to pass the required flow with theupstream water level at DWL
Fourth step: Make small adjustments tothe cross regulator gate(s) and the offtakegates to stabilize the required throughflows with the upstream pond level at DWL
Offtake 1
Q2 = 25 l/s
Q1 = 1000 l/s
Q3 = 25 l/s
Q4 = 450 l/s
Offtake 2
Main canal
1st Step
Fig. 4.28. Example of a sequence of gate operations to increase the flow passing through the system.
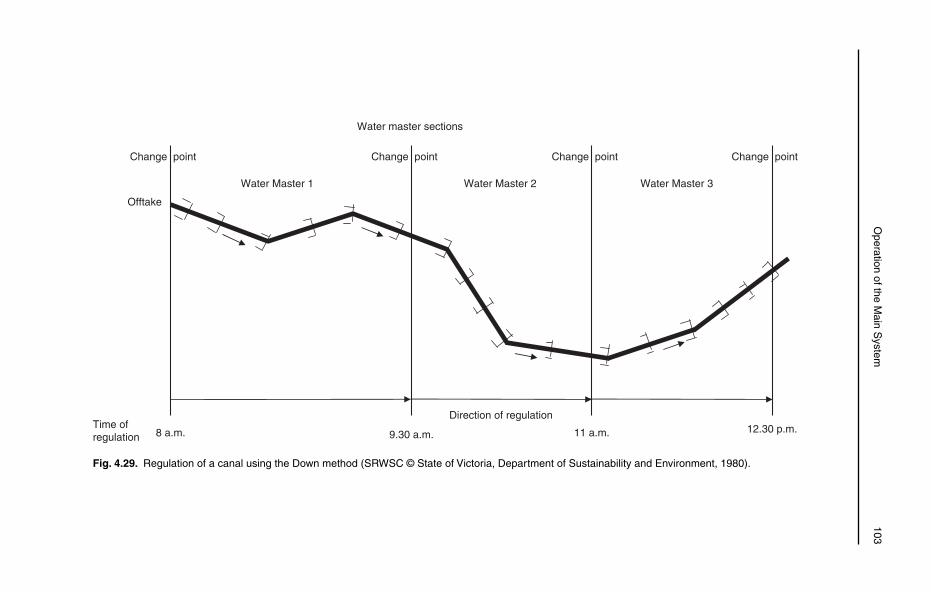
O
peration of the Main S
ystem
103
Change point Change point Change point Change point
Direction of regulation
Water master sections
Water Master 3Water Master 2Water Master 1
Time of regulation
Offtake
8 a.m. 9.30 a.m. 11 a.m. 12.30 p.m.
Fig. 4.29. Regulation of a canal using the Down method (SRWSC © State of Victoria, Department of Sustainability and Environment, 1980).
104 Irrigation Management
Up method
In the up method the required numbers of bars are removed from the downstream check structure to allow the required discharge to pass downstream. The water master must then move as quickly (and safely) as pos-sible to the next upstream check to remove the required number of bars there, to replace the flow just released at the previous (down-stream) check. This procedure is repeated up the canal to the intake, where the volume of water released at the lowest check structure is replaced by opening the intake gate to the required setting. Speed is of the essence in the up method if the size of the fluctuations in the canal reaches is to be kept to a minimum.
Down and up method
The down method requires a long time to pass the surge of water down the system. This time can be considerably reduced by combin-ing the down and up methods of canal regu-lation. This method requires that the water masters coordinate their actions,9 starting their adjustments such that the water master moving upstream meets with the water mas-ter moving downstream at the same time at the change point.
The process is shown in Fig. 4.30. The first water master regulates his check struc-tures in succession moving downstream, and at the same time the next water master regu-lates his checks moving upstream to meet the first water master at the prescribed time. A similar process is followed by the third and fourth water masters, and the fifth and sixth water masters, with the start and meet-ing times being agreed by the water masters beforehand based on their experience of travel times within their systems.
This method is considerably quicker than the down method alone, and results in less fluctuations than the up method alone. Keeping the time to change the control struc-
ture settings to a minimum is essential if the canal flows are changed each day, as it then leaves time for the water masters to carry out their other work.
Flexibility
The flow in a canal is very rarely steady. Fluctuations occur for a variety of reasons, including changes in the flow at the intake, gate adjustments or inflow from drainage. If the configuration of the control structures at bifurcation points is not designed correctly these fluctuations can have an adverse impact on the flows throughout the system. To describe the impact of these fluctuations the term flexibility is used (which is defined in the Equation at the bottom of the page).
The two principal control configurations (Fig. 4.31) are orifices (e.g. undershot gates) and weirs (e.g. overshot gates, or fixed-crest cross regulators). For orifices the discharge is a function to the power 0.5 of the head over the structure; for a weir the discharge is a function to the power 1.5 of the head over the structure. Thus the flexibility can be written in terms of the head over the structure:
p
o
1.5
1.5
hF
h=
where
ho = upstream head over the offtaking structure
hp = upstream head over the parent canal structure.
In this configuration where the control struc-tures on the offtaking and ongoing parent canal are the same and the crest or sills are at the same level then the flexibility is equal to 1, and the fluctuations in the offtaking canal will match those in the ongoing parent canal (Fig. 4.31a).
If, however, the control structures are different then the fluctuations in the offtak-
o o
ds ds
dRate of change of discharge for the offtaking canalFlexibility,
Rate of change of the ongoing parent canal d
//
Q QF
Q Q= =
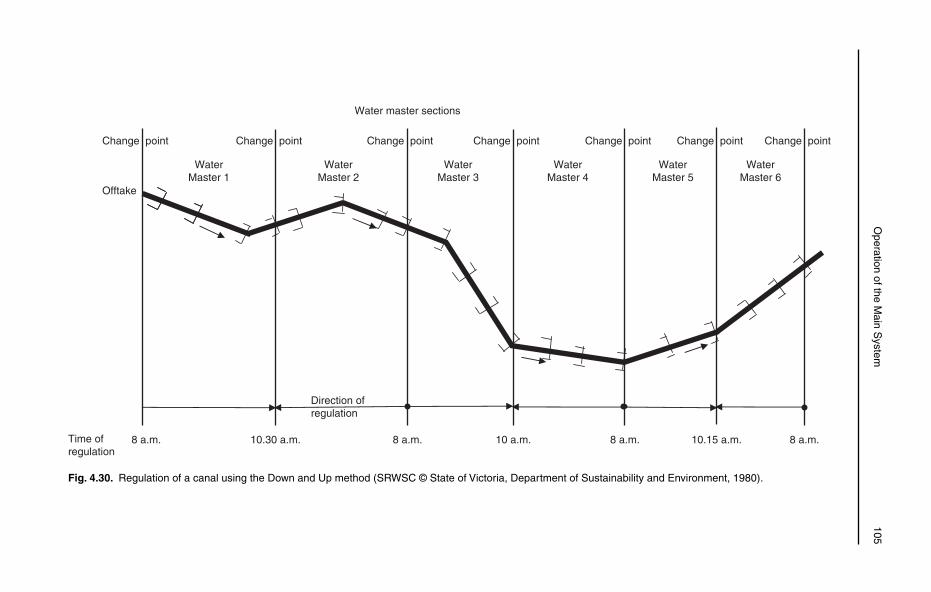
O
peration of the Main S
ystem
105
WaterMaster 6
WaterMaster 1
WaterMaster 2
WaterMaster 3
WaterMaster 4
WaterMaster 5
Time ofregulation
Offtake
8 a.m. 8 a.m. 8 a.m.
Change point Change point Change point Change point Change point Change point Change point
Direction ofregulation
8 a.m.
Water master sections
10.30 a.m. 10.15 a.m.10 a.m.
Fig. 4.30. Regulation of a canal using the Down and Up method (SRWSC © State of Victoria, Department of Sustainability and Environment, 1980).
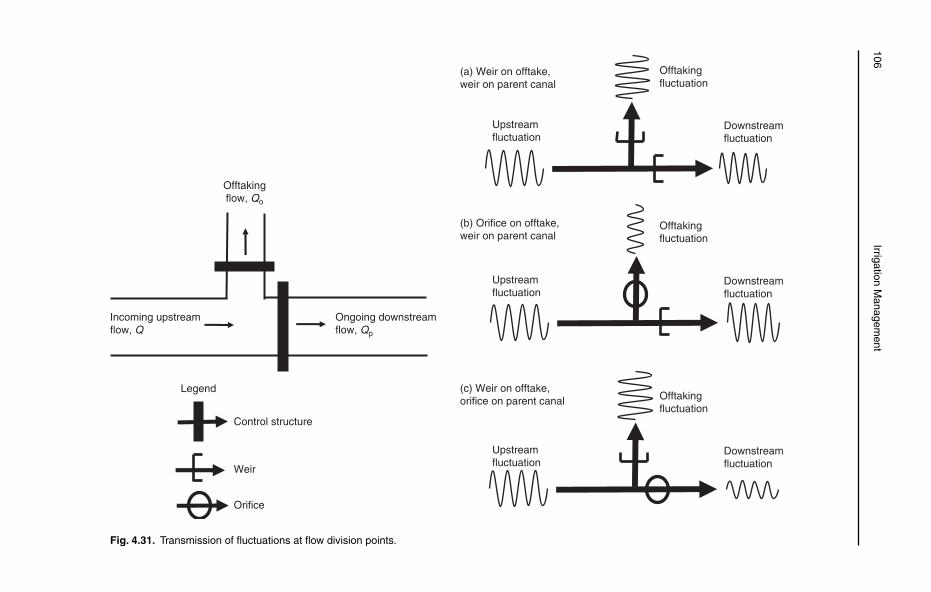
106Irrigation M
anagement
Ongoing downstreamflow, Qp
Incoming upstreamflow, Q
Offtakingflow, Qo
Control structure
Weir
Orifice
Upstreamfluctuation
Downstreamfluctuation
Offtakingfluctuation
Upstreamfluctuation
Downstreamfluctuation
Offtakingfluctuation
Upstreamfluctuation
Downstreamfluctuation
Offtakingfluctuation
Legend
(a) Weir on offtake, weir on parent canal
(b) Orifice on offtake, weir on parent canal
(c) Weir on offtake, orifice on parent canal
Fig. 4.31. Transmission of fluctuations at flow division points.
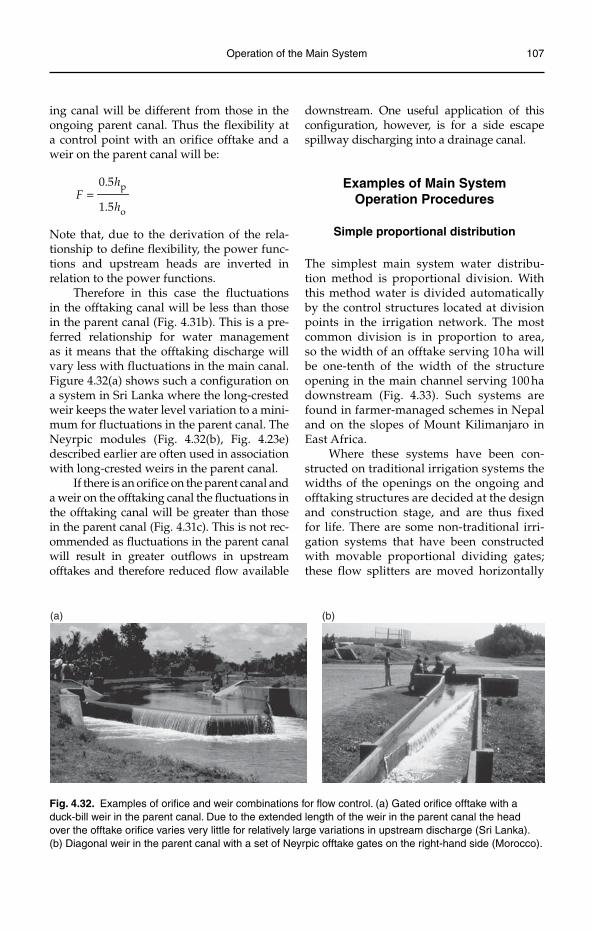
Operation of the Main System 107
ing canal will be different from those in the ongoing parent canal. Thus the flexibility at a control point with an orifice offtake and a weir on the parent canal will be:
p
o
0.5
1.5
hF
h=
Note that, due to the derivation of the rela-tionship to define flexibility, the power func-tions and upstream heads are inverted in relation to the power functions.
Therefore in this case the fluctuations in the offtaking canal will be less than those in the parent canal (Fig. 4.31b). This is a pre-ferred relationship for water management as it means that the offtaking discharge will vary less with fluctuations in the main canal. Figure 4.32(a) shows such a configuration on a system in Sri Lanka where the long-crested weir keeps the water level variation to a mini-mum for fluctuations in the parent canal. The Neyrpic modules (Fig. 4.32(b), Fig. 4.23e) described earlier are often used in association with long-crested weirs in the parent canal.
If there is an orifice on the parent canal and a weir on the offtaking canal the fluctuations in the offtaking canal will be greater than those in the parent canal (Fig. 4.31c). This is not rec-ommended as fluctuations in the parent canal will result in greater outflows in upstream offtakes and therefore reduced flow available
downstream. One useful application of this configuration, however, is for a side escape spillway discharging into a drainage canal.
Examples of Main System Operation Procedures
Simple proportional distribution
The simplest main system water distribu-tion method is proportional division. With this method water is divided automatically by the control structures located at division points in the irrigation network. The most common division is in proportion to area, so the width of an offtake serving 10 ha will be one-tenth of the width of the structure opening in the main channel serving 100 ha downstream (Fig. 4.33). Such systems are found in farmer-managed schemes in Nepal and on the slopes of Mount Kilimanjaro in East Africa.
Where these systems have been con-structed on traditional irrigation systems the widths of the openings on the ongoing and offtaking structures are decided at the design and construction stage, and are thus fixed for life. There are some non-traditional irri-gation systems that have been constructed with movable proportional dividing gates; these flow splitters are moved horizontally
(a) (b)
Fig. 4.32. Examples of orifice and weir combinations for flow control. (a) Gated orifice offtake with a duck-bill weir in the parent canal. Due to the extended length of the weir in the parent canal the head over the offtake orifice varies very little for relatively large variations in upstream discharge (Sri Lanka). (b) Diagonal weir in the parent canal with a set of Neyrpic offtake gates on the right-hand side (Morocco).
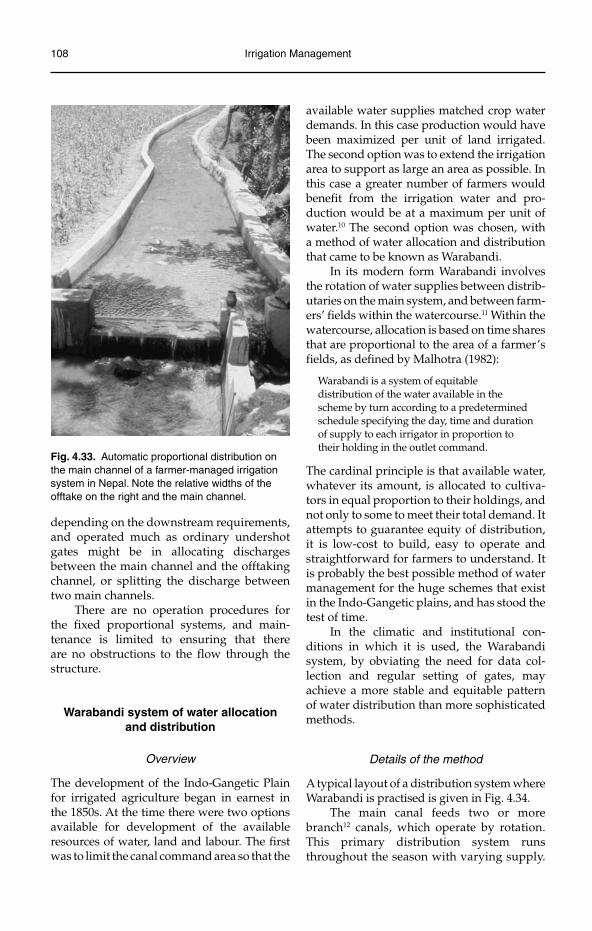
108 Irrigation Management
Fig. 4.33. Automatic proportional distribution on the main channel of a farmer-managed irrigation system in Nepal. Note the relative widths of the offtake on the right and the main channel.
depending on the downstream requirements, and operated much as ordinary undershot gates might be in allocating discharges between the main channel and the offtaking channel, or splitting the discharge between two main channels.
There are no operation procedures for the fixed proportional systems, and main-tenance is limited to ensuring that there are no obstructions to the flow through the structure.
Warabandi system of water allocation and distribution
Overview
The development of the Indo-Gangetic Plain for irrigated agriculture began in earnest in the 1850s. At the time there were two options available for development of the available resources of water, land and labour. The first was to limit the canal command area so that the
available water supplies matched crop water demands. In this case production would have been maximized per unit of land irrigated. The second option was to extend the irrigation area to support as large an area as possible. In this case a greater number of farmers would benefit from the irrigation water and pro-duction would be at a maximum per unit of water.10 The second option was chosen, with a method of water allocation and distribution that came to be known as Warabandi.
In its modern form Warabandi involves the rotation of water supplies between distrib-utaries on the main system, and between farm-ers’ fields within the watercourse.11 Within the watercourse, allocation is based on time shares that are proportional to the area of a farmer’s fields, as defined by Malhotra (1982):
Warabandi is a system of equitable distribution of the water available in the scheme by turn according to a predetermined schedule specifying the day, time and duration of supply to each irrigator in proportion to their holding in the outlet command.
The cardinal principle is that available water, whatever its amount, is allocated to cultiva-tors in equal proportion to their holdings, and not only to some to meet their total demand. It attempts to guarantee equity of distribution, it is low-cost to build, easy to operate and straightforward for farmers to understand. It is probably the best possible method of water management for the huge schemes that exist in the Indo-Gangetic plains, and has stood the test of time.
In the climatic and institutional con-ditions in which it is used, the Warabandi system, by obviating the need for data col-lection and regular setting of gates, may achieve a more stable and equitable pattern of water distribution than more sophisticated methods.
Details of the method
A typical layout of a distribution system where Warabandi is practised is given in Fig. 4.34.
The main canal feeds two or more branch12 canals, which operate by rotation. This primary distribution system runs throughout the season with varying supply.
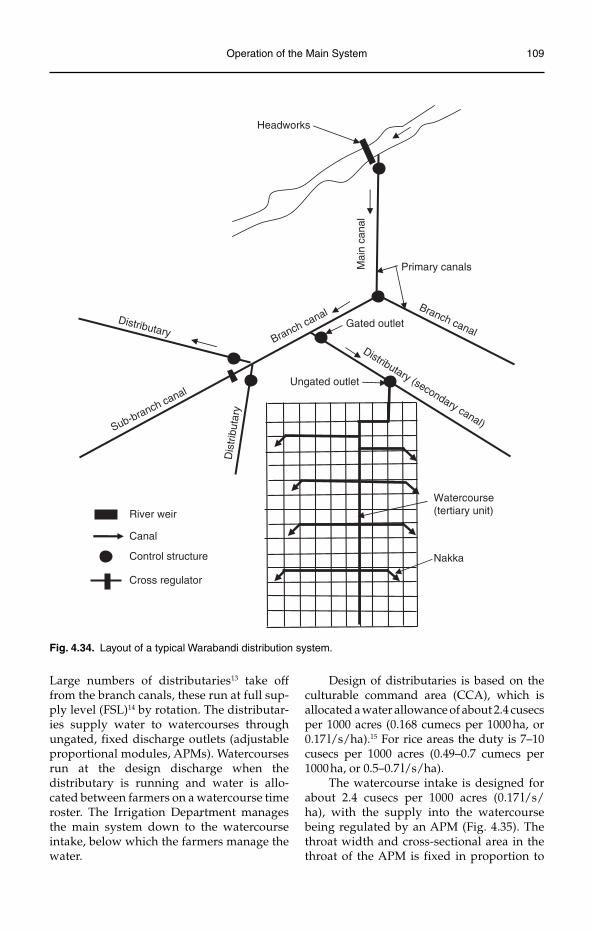
Operation of the Main System 109
Mai
n ca
nal
Headworks
Primary canals
Branch canalBranch canal
Distributary (secondary canal)
Distributary
Dis
trib
utar
y
Sub-branch canalUngated outlet
Watercourse(tertiary unit)
Nakka
Gated outlet
Control structure
Canal
River weir
Cross regulator
Fig. 4.34. Layout of a typical Warabandi distribution system.
Large numbers of distributaries13 take off from the branch canals, these run at full sup-ply level (FSL)14 by rotation. The distributar-ies supply water to watercourses through ungated, fixed discharge outlets (adjustable proportional modules, APMs). Watercourses run at the design discharge when the distributary is running and water is allo-cated between farmers on a watercourse time roster. The Irrigation Department manages the main system down to the watercourse intake, below which the farmers manage the water.
Design of distributaries is based on the culturable command area (CCA), which is allocated a water allowance of about 2.4 cusecs per 1000 acres (0.168 cumecs per 1000 ha, or 0.17 l/s/ha).15 For rice areas the duty is 7–10 cusecs per 1000 acres (0.49–0.7 cumecs per 1000 ha, or 0.5–0.7 l/s/ha).
The watercourse intake is designed for about 2.4 cusecs per 1000 acres (0.17 l/s/ha), with the supply into the watercourse being regulated by an APM (Fig. 4.35). The throat width and cross-sectional area in the throat of the APM is fixed in proportion to
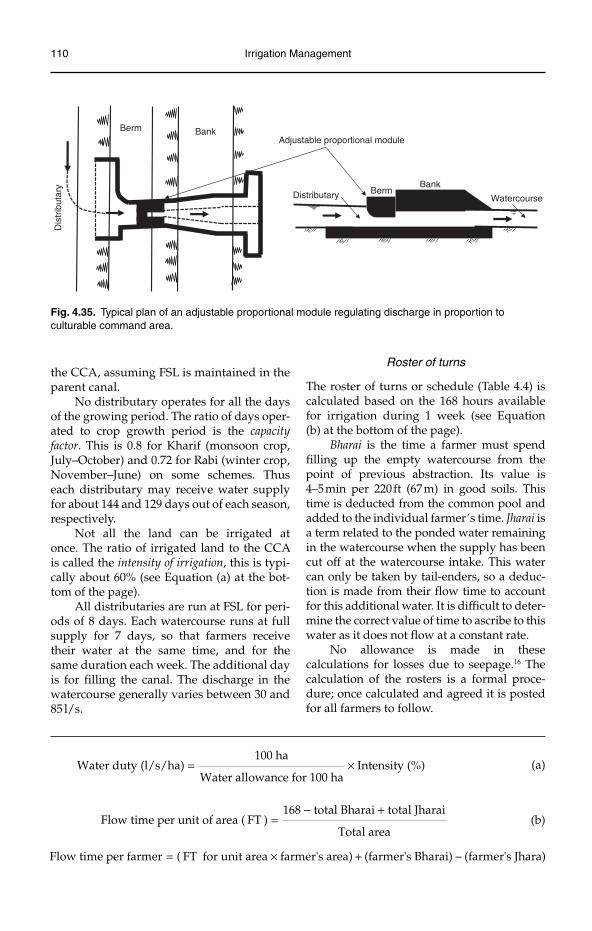
110 Irrigation Management
the CCA, assuming FSL is maintained in the parent canal.
No distributary operates for all the days of the growing period. The ratio of days oper-ated to crop growth period is the capacityfactor. This is 0.8 for Kharif (monsoon crop, July–October) and 0.72 for Rabi (winter crop, November–June) on some schemes. Thus each distributary may receive water supply for about 144 and 129 days out of each season, respectively.
Not all the land can be irrigated at once. The ratio of irrigated land to the CCA is called the intensity of irrigation, this is typi-cally about 60% (see Equation (a) at the bot-tom of the page).
All distributaries are run at FSL for peri-ods of 8 days. Each watercourse runs at full supply for 7 days, so that farmers receive their water at the same time, and for the same duration each week. The additional day is for filling the canal. The discharge in the watercourse generally varies between 30 and 85 l/s.
Roster of turns
The roster of turns or schedule (Table 4.4) is calculated based on the 168 hours available for irrigation during 1 week (see Equation (b) at the bottom of the page).
Bharai is the time a farmer must spend filling up the empty watercourse from the point of previous abstraction. Its value is 4–5 min per 220 ft (67 m) in good soils. This time is deducted from the common pool and added to the individual farmer’s time. Jharai is a term related to the ponded water remaining in the watercourse when the supply has been cut off at the watercourse intake. This water can only be taken by tail-enders, so a deduc-tion is made from their flow time to account for this additional water. It is difficult to deter-mine the correct value of time to ascribe to this water as it does not flow at a constant rate.
No allowance is made in these calculations for losses due to seepage.16 The calculation of the rosters is a formal proce-dure; once calculated and agreed it is posted for all farmers to follow.
Fig. 4.35. Typical plan of an adjustable proportional module regulating discharge in proportion to culturable command area.
BankBermAdjustable proportional module
BankBermDistributary
Dis
trib
utar
y
Watercourse
100 haWater duty (l/s/ha) Intensity (%)
Water allowance for 100 ha= × (a)
168 total Bharai total JharaiFlow time per unit of area ( FT )
Total area
− += (b)
Flow time per farmer ( FT for unit area farmer's area) (farmer's Bharai) (farmer's Jhara)= × + −
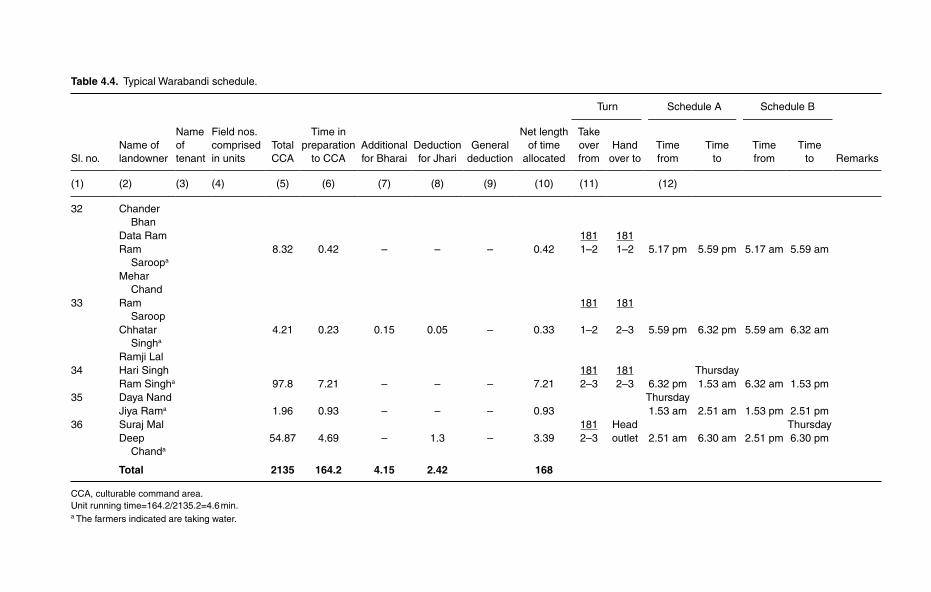
Table 4.4. Typical Warabandi schedule.
Turn Schedule A Schedule B
Sl. no.Name of landowner
Nameoftenant
Field nos. comprised in units
Total CCA
Time in preparation
to CCAAdditionalfor Bharai
Deductionfor Jhari
General deduction
Net length of time
allocated
Take over from
Handover to
Timefrom
Timeto
Timefrom
Timeto Remarks
(1) (2) (3) (4) (5) (6) (7) (8) (9) (10) (11) (12)
32 Chander Bhan
Data Ram 181 181Ram
Saroopa
8.32 0.42 – – – 0.42 1–2 1–2 5.17 pm 5.59 pm 5.17 am 5.59 am
MeharChand
33 Ram Saroop
181 181
ChhatarSingha
4.21 0.23 0.15 0.05 – 0.33 1–2 2–3 5.59 pm 6.32 pm 5.59 am 6.32 am
Ramji Lal34 Hari Singh 181 181 Thursday
Ram Singha 97.8 7.21 – – – 7.21 2–3 2–3 6.32 pm 1.53 am 6.32 am 1.53 pm35 Daya Nand Thursday
Jiya Rama 1.96 0.93 – – – 0.93 1.53 am 2.51 am 1.53 pm 2.51 pm36 Suraj Mal 181 Head Thursday
DeepChanda
54.87 4.69 – 1.3 – 3.39 2–3 outlet 2.51 am 6.30 am 2.51 pm 6.30 pm
Total 2135 164.2 4.15 2.42 168
CCA, culturable command area.Unit running time=164.2/2135.2=4.6 min.a The farmers indicated are taking water.
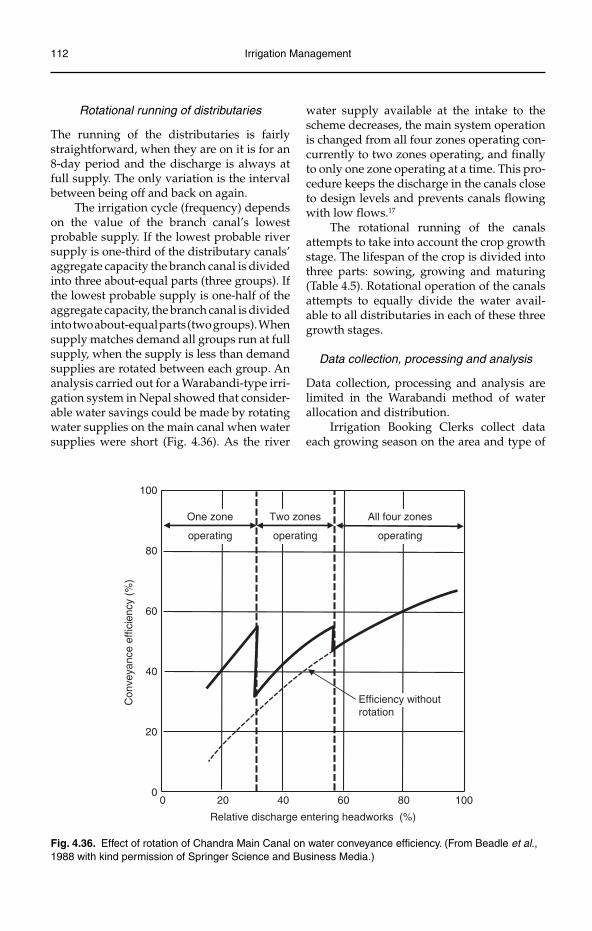
112 Irrigation Management
Rotational running of distributaries
The running of the distributaries is fairly straightforward, when they are on it is for an 8-day period and the discharge is always at full supply. The only variation is the interval between being off and back on again.
The irrigation cycle (frequency) depends on the value of the branch canal’s lowest probable supply. If the lowest probable river supply is one-third of the distributary canals’ aggregate capacity the branch canal is divided into three about-equal parts (three groups). If the lowest probable supply is one-half of the aggregate capacity, the branch canal is divided into two about-equal parts (two groups). When supply matches demand all groups run at full supply, when the supply is less than demand supplies are rotated between each group. An analysis carried out for a Warabandi-type irri-gation system in Nepal showed that consider-able water savings could be made by rotating water supplies on the main canal when water supplies were short (Fig. 4.36). As the river
water supply available at the intake to the scheme decreases, the main system operation is changed from all four zones operating con-currently to two zones operating, and finally to only one zone operating at a time. This pro-cedure keeps the discharge in the canals close to design levels and prevents canals flowing with low flows.17
The rotational running of the canals attempts to take into account the crop growth stage. The lifespan of the crop is divided into three parts: sowing, growing and maturing (Table 4.5). Rotational operation of the canals attempts to equally divide the water avail-able to all distributaries in each of these three growth stages.
Data collection, processing and analysis
Data collection, processing and analysis are limited in the Warabandi method of water allocation and distribution.
Irrigation Booking Clerks collect data each growing season on the area and type of
One zone
operating
Two zones
operating
0
Con
veya
nce
effic
ienc
y (%
)
All four zones
operating
Relative discharge entering headworks (%)
100
80
60
40
20
0 10080604020
Efficiency withoutrotation
Fig. 4.36. Effect of rotation of Chandra Main Canal on water conveyance efficiency. (From Beadle et al.,1988 with kind permission of Springer Science and Business Media.)
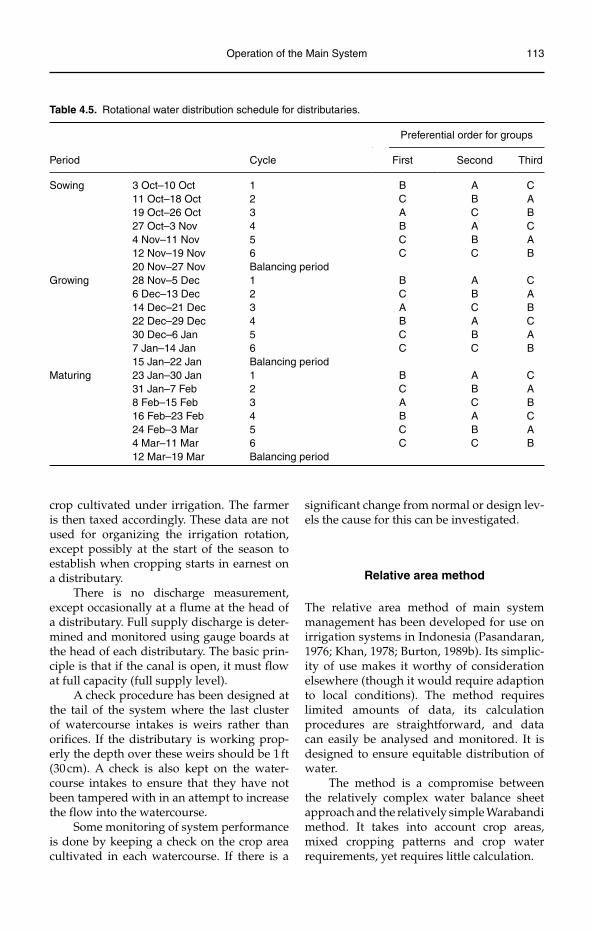
Operation of the Main System 113
crop cultivated under irrigation. The farmer is then taxed accordingly. These data are not used for organizing the irrigation rotation, except possibly at the start of the season to establish when cropping starts in earnest on a distributary.
There is no discharge measurement, except occasionally at a flume at the head of a distributary. Full supply discharge is deter-mined and monitored using gauge boards at the head of each distributary. The basic prin-ciple is that if the canal is open, it must flow at full capacity (full supply level).
A check procedure has been designed at the tail of the system where the last cluster of watercourse intakes is weirs rather than orifices. If the distributary is working prop-erly the depth over these weirs should be 1 ft (30 cm). A check is also kept on the water-course intakes to ensure that they have not been tampered with in an attempt to increase the flow into the watercourse.
Some monitoring of system performance is done by keeping a check on the crop area cultivated in each watercourse. If there is a
significant change from normal or design lev-els the cause for this can be investigated.
Relative area method
The relative area method of main system management has been developed for use on irrigation systems in Indonesia (Pasandaran, 1976; Khan, 1978; Burton, 1989b). Its simplic-ity of use makes it worthy of consideration elsewhere (though it would require adaption to local conditions). The method requires limited amounts of data, its calculation procedures are straightforward, and data can easily be analysed and monitored. It is designed to ensure equitable distribution of water.
The method is a compromise between the relatively complex water balance sheet approach and the relatively simple Warabandi method. It takes into account crop areas, mixed cropping patterns and crop water requirements, yet requires little calculation.
Table 4.5. Rotational water distribution schedule for distributaries.
Period Cycle
Preferential order for groups
First Second Third
Sowing 3 Oct–10 Oct 1 B A C11 Oct–18 Oct 2 C B A19 Oct–26 Oct 3 A C B27 Oct–3 Nov 4 B A C4 Nov–11 Nov 5 C B A12 Nov–19 Nov 6 C C B20 Nov–27 Nov Balancing period
Growing 28 Nov–5 Dec 1 B A C6 Dec–13 Dec 2 C B A14 Dec–21 Dec 3 A C B22 Dec–29 Dec 4 B A C30 Dec–6 Jan 5 C B A7 Jan–14 Jan 6 C C B15 Jan–22 Jan Balancing period
Maturing 23 Jan–30 Jan 1 B A C31 Jan–7 Feb 2 C B A8 Feb–15 Feb 3 A C B16 Feb–23 Feb 4 B A C24 Feb–3 Mar 5 C B A4 Mar–11 Mar 6 C C B12 Mar–19 Mar Balancing period
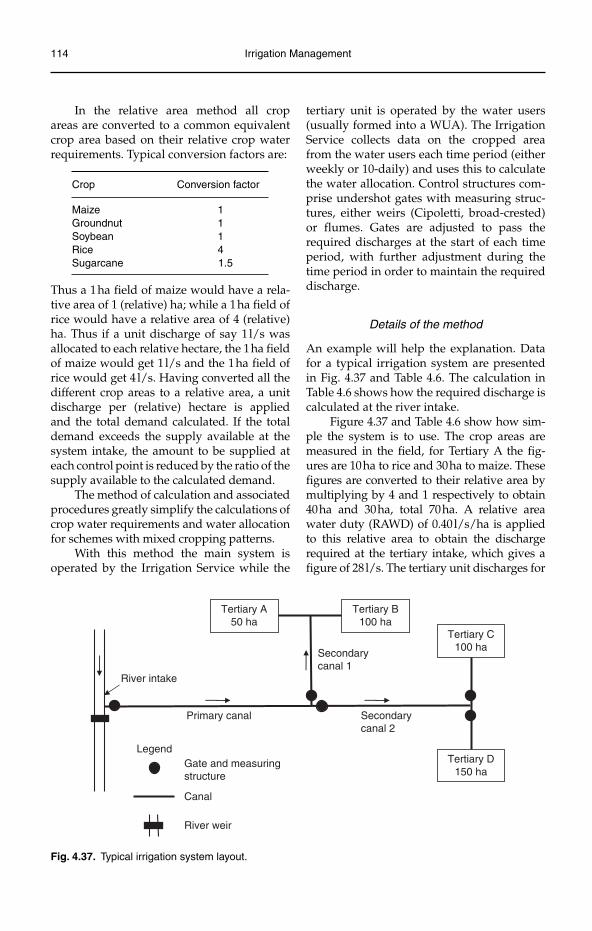
114 Irrigation Management
In the relative area method all crop areas are converted to a common equivalent crop area based on their relative crop water requirements. Typical conversion factors are:
Crop Conversion factor
Maize 1Groundnut 1Soybean 1Rice 4Sugarcane 1.5
Thus a 1 ha field of maize would have a rela-tive area of 1 (relative) ha; while a 1 ha field of rice would have a relative area of 4 (relative) ha. Thus if a unit discharge of say 1 l/s was allocated to each relative hectare, the 1 ha field of maize would get 1 l/s and the 1 ha field of rice would get 4 l/s. Having converted all the different crop areas to a relative area, a unit discharge per (relative) hectare is applied and the total demand calculated. If the total demand exceeds the supply available at the system intake, the amount to be supplied at each control point is reduced by the ratio of the supply available to the calculated demand.
The method of calculation and associated procedures greatly simplify the calculations of crop water requirements and water allocation for schemes with mixed cropping patterns.
With this method the main system is operated by the Irrigation Service while the
tertiary unit is operated by the water users (usually formed into a WUA). The Irrigation Service collects data on the cropped area from the water users each time period (either weekly or 10-daily) and uses this to calculate the water allocation. Control structures com-prise undershot gates with measuring struc-tures, either weirs (Cipoletti, broad-crested) or flumes. Gates are adjusted to pass the required discharges at the start of each time period, with further adjustment during the time period in order to maintain the required discharge.
Details of the method
An example will help the explanation. Data for a typical irrigation system are presented in Fig. 4.37 and Table 4.6. The calculation in Table 4.6 shows how the required discharge is calculated at the river intake.
Figure 4.37 and Table 4.6 show how sim-ple the system is to use. The crop areas are measured in the field, for Tertiary A the fig-ures are 10 ha to rice and 30 ha to maize. These figures are converted to their relative area by multiplying by 4 and 1 respectively to obtain 40 ha and 30 ha, total 70 ha. A relative area water duty (RAWD) of 0.40 l/s/ha is applied to this relative area to obtain the discharge required at the tertiary intake, which gives a figure of 28 l/s. The tertiary unit discharges for
Primary canal
Tertiary D150 ha
Tertiary C100 ha
Tertiary B100 ha
Tertiary A50 ha
River intake
Secondarycanal 2
Secondarycanal 1
Gate and measuringstructure
Canal
Legend
River weir
Fig. 4.37. Typical irrigation system layout.
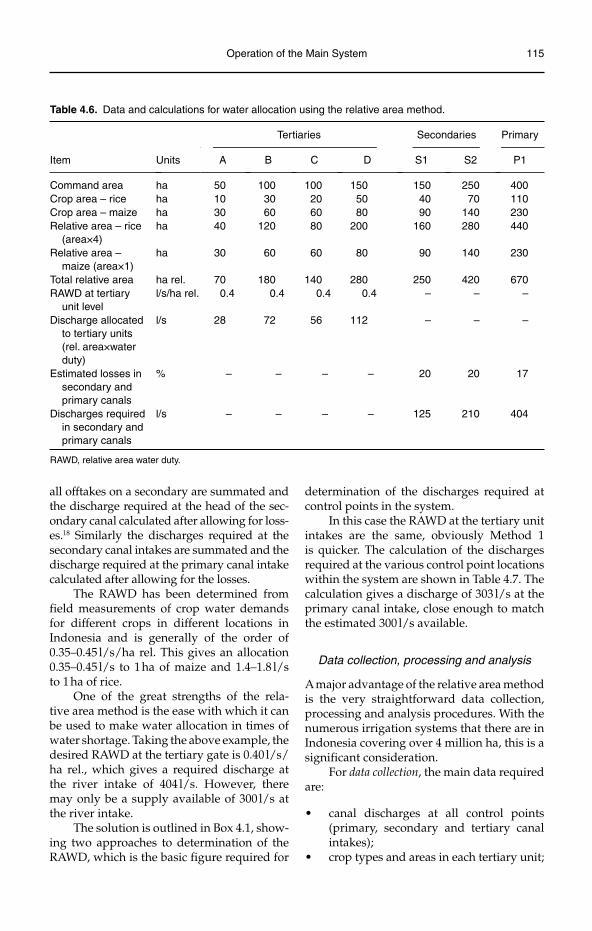
Operation of the Main System 115
all offtakes on a secondary are summated and the discharge required at the head of the sec-ondary canal calculated after allowing for loss-es.18 Similarly the discharges required at the secondary canal intakes are summated and the discharge required at the primary canal intake calculated after allowing for the losses.
The RAWD has been determined from field measurements of crop water demands for different crops in different locations in Indonesia and is generally of the order of 0.35–0.45 l/s/ha rel. This gives an allocation 0.35–0.45 l/s to 1 ha of maize and 1.4–1.8 l/s to 1 ha of rice.
One of the great strengths of the rela-tive area method is the ease with which it can be used to make water allocation in times of water shortage. Taking the above example, the desired RAWD at the tertiary gate is 0.40 l/s/ha rel., which gives a required discharge at the river intake of 404 l/s. However, there may only be a supply available of 300 l/s at the river intake.
The solution is outlined in Box 4.1, show-ing two approaches to determination of the RAWD, which is the basic figure required for
determination of the discharges required at control points in the system.
In this case the RAWD at the tertiary unit intakes are the same, obviously Method 1 is quicker. The calculation of the discharges required at the various control point locations within the system are shown in Table 4.7. The calculation gives a discharge of 303 l/s at the primary canal intake, close enough to match the estimated 300 l/s available.
Data collection, processing and analysis
A major advantage of the relative area method is the very straightforward data collection, processing and analysis procedures. With the numerous irrigation systems that there are in Indonesia covering over 4 million ha, this is a significant consideration.
For data collection, the main data required are:
canal discharges at all control points •(primary, secondary and tertiary canal intakes);crop types and areas in each tertiary unit;•
Table 4.6. Data and calculations for water allocation using the relative area method.
Item Units
Tertiaries Secondaries Primary
A B C D S1 S2 P1
Command area ha 50 100 100 150 150 250 400Crop area – rice ha 10 30 20 50 40 70 110Crop area – maize ha 30 60 60 80 90 140 230Relative area – rice
(area×4)ha 40 120 80 200 160 280 440
Relative area – maize (area×1)
ha 30 60 60 80 90 140 230
Total relative area ha rel. 70 180 140 280 250 420 670RAWD at tertiary
unit levell/s/ha rel. 0.4 0.4 0.4 0.4 – – –
Discharge allocated to tertiary units (rel. area×water duty)
l/s 28 72 56 112 – – –
Estimated losses in secondary and primary canals
% – – – – 20 20 17
Discharges required in secondary and primary canals
l/s – – – – 125 210 404
RAWD, relative area water duty.
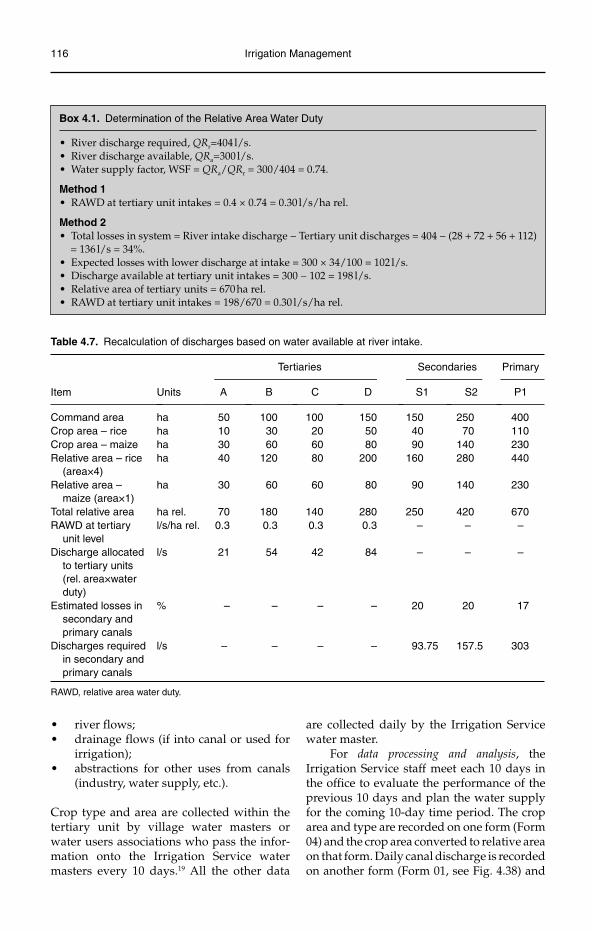
116 Irrigation Management
Table 4.7. Recalculation of discharges based on water available at river intake.
Item Units
Tertiaries Secondaries Primary
A B C D S1 S2 P1
Command area ha 50 100 100 150 150 250 400Crop area – rice ha 10 30 20 50 40 70 110Crop area – maize ha 30 60 60 80 90 140 230Relative area – rice
(area×4)ha 40 120 80 200 160 280 440
Relative area – maize (area×1)
ha 30 60 60 80 90 140 230
Total relative area ha rel. 70 180 140 280 250 420 670RAWD at tertiary
unit levell/s/ha rel. 0.3 0.3 0.3 0.3 – – –
Discharge allocated to tertiary units (rel. area×water duty)
l/s 21 54 42 84 – – –
Estimated losses in secondary and primary canals
% – – – – 20 20 17
Discharges required in secondary and primary canals
l/s – – – – 93.75 157.5 303
RAWD, relative area water duty.
Box 4.1. Determination of the Relative Area Water Duty
River discharge required, • QRr=404 l/s.River discharge available, • QRa=300 l/s.Water supply factor, WSF = • QRa/QRr = 300/404 = 0.74.
Method 1RAWD at tertiary unit intakes = 0.4 × 0.74 = 0.30 l/s/ha rel.•
Method 2Total losses in system = River intake discharge − Tertiary unit discharges = 404 − (28 + 72 + 56 + 112) •= 136 l/s = 34%.Expected losses with lower discharge at intake = 300 × 34/100 = 102 l/s.•Discharge available at tertiary unit intakes = 300 − 102 = 198 l/s.•Relative area of tertiary units = 670 ha rel.•RAWD at tertiary unit intakes = 198/670 = 0.30 l/s/ha rel.•
river flows;•drainage flows (if into canal or used for •irrigation);abstractions for other uses from canals •(industry, water supply, etc.).
Crop type and area are collected within the tertiary unit by village water masters or water users associations who pass the infor-mation onto the Irrigation Service water masters every 10 days.19 All the other data
are collected daily by the Irrigation Service water master.
For data processing and analysis, the Irrigation Service staff meet each 10 days in the office to evaluate the performance of the previous 10 days and plan the water supply for the coming 10-day time period. The crop area and type are recorded on one form (Form 04) and the crop area converted to relative area on that form. Daily canal discharge is recorded on another form (Form 01, see Fig. 4.38) and
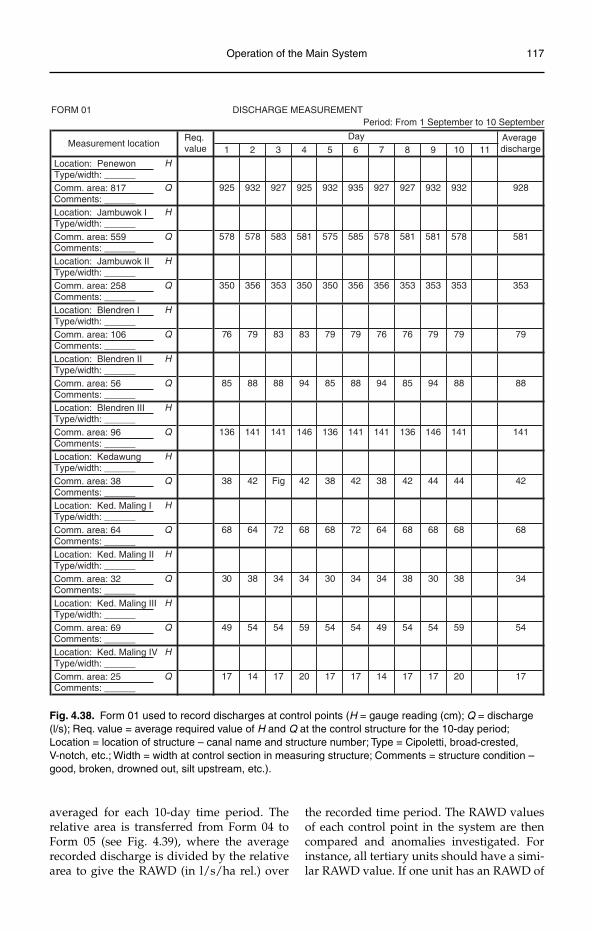
Operation of the Main System 117
DISCHARGE MEASUREMENTFORM 01Period: From 1 September to 10 September
Location: PenewonType/width: ______
H
Comm. area: 817 Comments: ______
Q
Location: Jambuwok IType/width: ______
H
Comm. area: 559 Comments: ______
Q
Location: Jambuwok IIType/width: ______
H
Comm. area: 258Comments: ______
Q
Location: Blendren IType/width: ______
H
Comm. area: 106Comments: ______
Q
Location: Blendren IIType/width: ______
H
Comm. area: 56Comments: ______
Q
Location: Blendren IIIType/width: ______
H
Comm. area: 96Comments: ______
Q
Location: KedawungType/width: ______
H
Comm. area: 38Comments: ______
Q
Location: Ked. Maling IType/width: ______
H
Comm. area: 64Comments: ______
Q
Location: Ked. Maling IIType/width: ______
H
Comm. area: 32Comments: ______
Q
Location: Ked. Maling IIIType/width: ______
H
Comm. area: 69Comments: ______
Q
Location: Ked. Maling IVType/width: ______
H
Comm. area: 25Comments: ______
Q
1 2 3 4 5 6 7 8 9 10 11
925 932 927 925 932 935 927 927 932 932 928
578 578 583 581 575 585 578 581 581 578 581
350 356 353 350 350 356 356 353 353 353 353
76 79 83 83 79 79 76 76 79 79 79
85 88 88 94 85 88 94 85 94 88 88
136 141 141 146 136 141 141 136 146 141 141
38 42 Fig 42 38 42 38 42 44 44 42
68 64 72 68 68 72 64 68 68 68 68
30 38 34 34 30 34 34 38 30 38 34
49 54 54 59 54 54 49 54 54 59 54
17 14 17 20 17 17 14 17 17 20 17
Measurement locationReq.value
Day Averagedischarge
Fig. 4.38. Form 01 used to record discharges at control points (H = gauge reading (cm); Q = discharge (l/s); Req. value = average required value of H and Q at the control structure for the 10-day period; Location = location of structure – canal name and structure number; Type = Cipoletti, broad-crested, V-notch, etc.; Width = width at control section in measuring structure; Comments = structure condition – good, broken, drowned out, silt upstream, etc.).
averaged for each 10-day time period. The relative area is transferred from Form 04 to Form 05 (see Fig. 4.39), where the average recorded discharge is divided by the relative area to give the RAWD (in l/s/ha rel.) over
the recorded time period. The RAWD values of each control point in the system are then compared and anomalies investigated. For instance, all tertiary units should have a simi-lar RAWD value. If one unit has an RAWD of
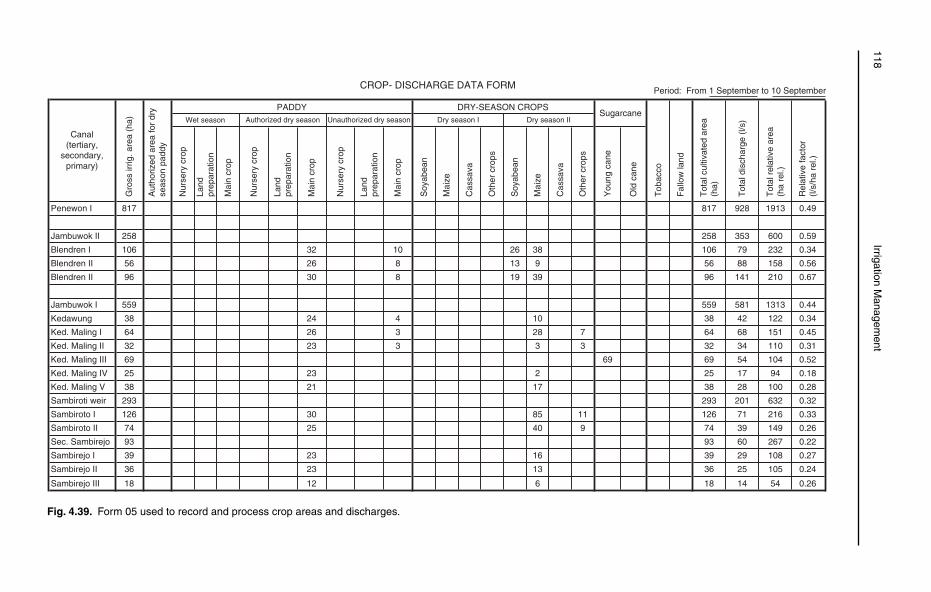
118Irrigation M
anagement
Period: From 1 September to 10 September
38261032
913826
3919830
10424
23 2
21 17
30
25
23 16
23 13
Penewon I 817
Jambuwok II 258
Blendren I 106
Blendren II 56
Blendren II 96
Jambuwok I 559
Kedawung 38
Ked. Maling I 64
Ked. Maling II 32
Ked. Maling III 69
Ked. Maling IV 25
Ked. Maling V 38
Sambiroti weir 293
Sambiroto I 126
Sambiroto II 74
Sec. Sambirejo 93
Sambirejo I 39
Sambirejo II 36
Sambirejo III 18 12 6
817 928 1913 0.49
258 353 600 0.59
106 79 232 0.34
56 88 158 0.56
96 141 210 0.67
559 581 1313 0.44
38 42 122 0.34
0.451516864728326
0.31
0.52
110343233323
104546969
25 17 94 0.18
38 28 100 0.28
293 201 632 0.32
0.33216711261185
0.261493974940
93 60 267 0.22
39 29 108 0.27
36 25 105 0.24
18 14 54 0.26
CROP- DISCHARGE DATA FORM
Dry season IIDry season I
Canal(tertiary,
secondary,primary)
Nur
sery
cro
p
Land
prep
arat
ion
Mai
n cr
op
Nur
sery
cro
p
Land
prep
arat
ion
Mai
n cr
op
Nur
sery
cro
p
Land
prep
arat
ion
Mai
n cr
op
Soy
abea
n
Mai
ze
Cas
sava
Oth
er c
rops
Soy
abea
n
Mai
ze
Cas
sava
Oth
er c
rops
You
ng c
ane
Old
can
e
Tob
acco
Fal
low
land
Tot
al c
ultiv
ated
are
a(h
a)
Tot
al d
isch
arge
(l/s
)
Rel
ativ
e fa
ctor
(l/s/
ha r
el.)
Tot
al r
elat
ive
area
(ha
rel.)
Gro
ss ir
rig. a
rea
(ha)
Aut
horiz
ed a
rea
for
dry
seas
on p
addy
PADDY DRY-SEASON CROPSSugarcane
Wet season Authorized dry season Unauthorized dry season
Fig. 4.39. Form 05 used to record and process crop areas and discharges.
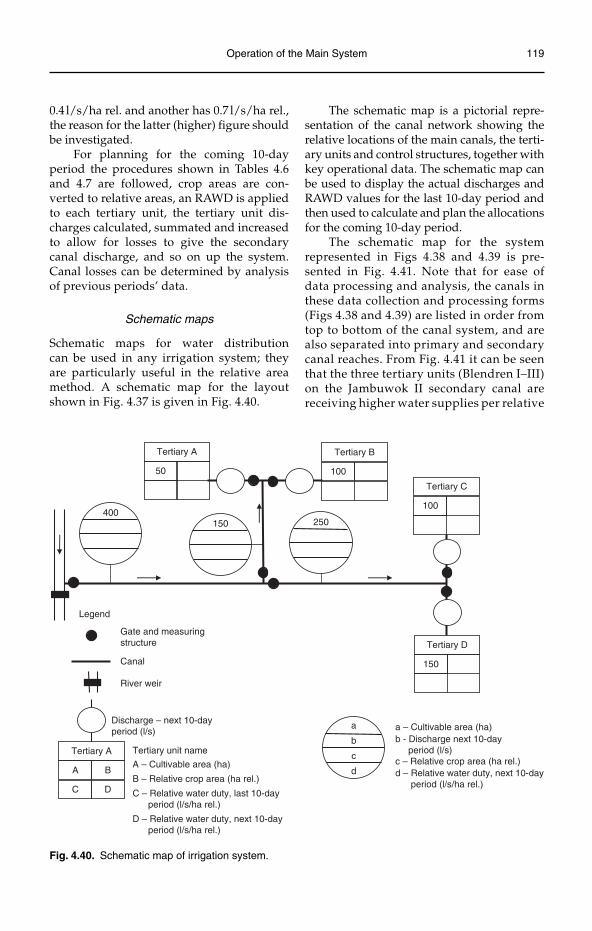
Operation of the Main System 119
0.4 l/s/ha rel. and another has 0.7 l/s/ha rel., the reason for the latter (higher) figure should be investigated.
For planning for the coming 10-day period the procedures shown in Tables 4.6 and 4.7 are followed, crop areas are con-verted to relative areas, an RAWD is applied to each tertiary unit, the tertiary unit dis-charges calculated, summated and increased to allow for losses to give the secondary canal discharge, and so on up the system. Canal losses can be determined by analysis of previous periods’ data.
Schematic maps
Schematic maps for water distribution can be used in any irrigation system; they are particularly useful in the relative area method. A schematic map for the layout shown in Fig. 4.37 is given in Fig. 4.40.
The schematic map is a pictorial repre-sentation of the canal network showing the relative locations of the main canals, the terti-ary units and control structures, together with key operational data. The schematic map can be used to display the actual discharges and RAWD values for the last 10-day period and then used to calculate and plan the allocations for the coming 10-day period.
The schematic map for the system represented in Figs 4.38 and 4.39 is pre-sented in Fig. 4.41. Note that for ease of data processing and analysis, the canals in these data collection and processing forms (Figs 4.38 and 4.39) are listed in order from top to bottom of the canal system, and are also separated into primary and secondary canal reaches. From Fig. 4.41 it can be seen that the three tertiary units (Blendren I–III) on the Jambuwok II secondary canal are receiving higher water supplies per relative
Gate and measuringstructure
Canal
Legend
50
Tertiary A
100
Tertiary B
100
Tertiary C
150
Tertiary D
400150 250
Tertiary unit name
A
Tertiary A
B
C D
A – Cultivable area (ha)
B – Relative crop area (ha rel.)
C – Relative water duty, last 10-day period (l/s/ha rel.)
D – Relative water duty, next 10-day period (l/s/ha rel.)
Discharge – next 10-dayperiod (l/s)
a a – Cultivable area (ha) b - Discharge next 10-day period (l/s)
d – Relative water duty, next 10-day period (l/s/ha rel.)
c – Relative crop area (ha rel.)
b
c
d
River weir
Fig. 4.40. Schematic map of irrigation system.
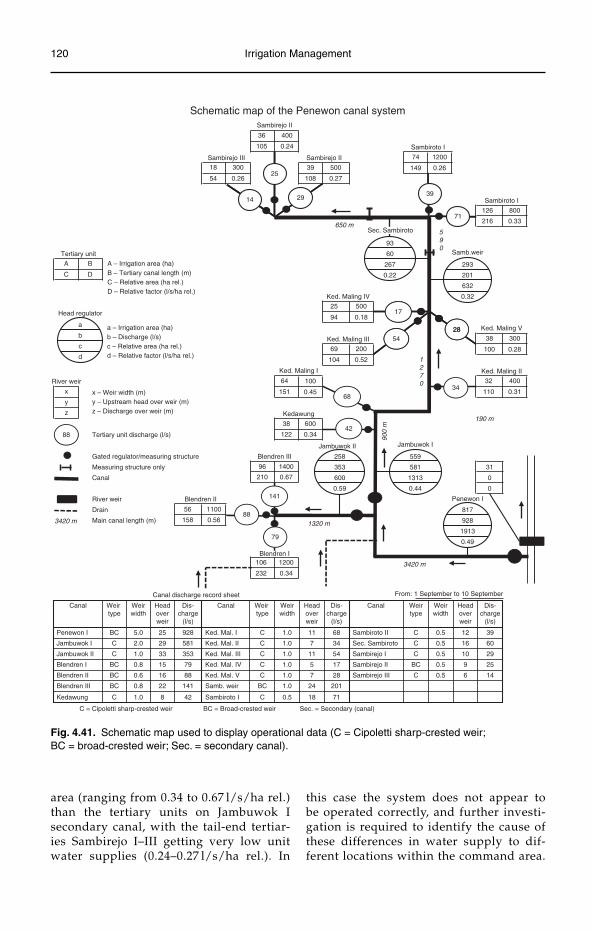
120 Irrigation Management
area (ranging from 0.34 to 0.67 l/s/ha rel.) than the tertiary units on Jambuwok I secondary canal, with the tail-end tertiar-ies Sambirejo I–III getting very low unit water supplies (0.24–0.27 l/s/ha rel.). In
this case the system does not appear to be operated correctly, and further investi-gation is required to identify the cause of these differences in water supply to dif-ferent locations within the command area.
Schematic map of the Penewon canal system
Sambiroto I
Sambirejo II
36 400
105 0.24
18 300 39 500 149 0.26
Sambirejo III Sambirejo II 74 1200
54 0.26 108 0.27
Sambiroto I
126 800
216 0.33
93
Tertiary unit 60
A – Irrigation area (ha)B – Tertiary canal length (m)C – Relative area (ha rel.)D – Relative factor (l/s/ha rel.)
A B
C D
267 293
0.22 201
632
0.32Ked. Maling IV
Head regulator25 500
94 0.18
a – Irrigation area (ha)b – Discharge (l/s)c – Relative area (ha rel.)d – Relative factor (l/s/ha rel.)
Ked. Maling V
Ked. Maling III
Ked. Maling I
38 300
100 0.2869 200
104 0.52d
a
b
c
1439
28
17
54
29
Ked. Maling II
River weir
x x – Weir width (m)y – Upstream head over weir (m)z – Discharge over weir (m)
64 100
151 0.45
32 400
110 0.31
y
z Kedawung
38 600
0.34122Tertiary unit discharge (l/s)
Gated regulator/measuring structure
140096Measuring structure only
Canal 210 0.67
Blendren III 258 559
353 581 31
600 1313 0
0.59 0.44 0
River weir Blendren II
817Drain 56 1100
Main canal length (m) 158 0.56 928
1913
0.49
Blendren I106 1200
232 0.34
Canal discharge record sheet From: 1 September to 10 September
Weirtype
Weirwidth
Headoverweir
Dis-charge
(l/s)
Weirtype
Weirwidth
Headoverweir
Dis-charge
(l/s)
Weirtype
Weirwidth
Headoverweir
Dis-charge
(l/s)
Sambiroto II C 0.5 12 39
Sec. Sambiroto C 0.5 16 60
Sambirejo I C 0.5 10 29
Sambirejo II BC 0.5 9 25
Sambirejo III C 0.5 6 14
25 928
29 581
33 353
15 79
16 88
22 141
8 42
Penewon I BC 5.0 Ked. Mal. I C 1.0 11 68
Jambuwok I C 2.0 Ked. Mal. II C 1.0 7 34
Jambuwok II C 1.0 Ked. Mal. III C 1.0 11 54
Blendren I BC 0.8 Ked. Mal. IV C 1.0 5 17
Blendren II BC 0.6 Ked. Mal. V C 1.0 7 28
Blendren III BC 0.8 Samb. weir BC 1.0 24 201
Kedawung C 1.0 Sambiroto I C 0.5 18 71
C = Cipoletti sharp-crested weir BC = Broad-crested weir Sec. = Secondary (canal)
Canal Canal Canal
25
71
28
34
88
141
79
68
42
3420 m
1320 m
900
m
190 m
1270
590
650 m
3420 m
88
Penewon I
Jambuwok IJambuwok II
Samb.weir
Sec. Sambiroto
Fig. 4.41. Schematic map used to display operational data (C = Cipoletti sharp-crested weir; BC = broad-crested weir; Sec. = secondary canal).
Operation of the Main System 121
In Fig. 4.41 colour coding the Relative Factor (unit water supply, l/s/ha rel.), as outlined in Fig. 4.4, can be used to high-light the variation in water supplies across the system.
The representation of data in a schematic diagram format is sometimes easier for opera-tional staff to understand than data presented in tables, and is also useful where the operation planning and monitoring is computer-based.
Endnotes
1 Maintenance planning is an integral part of operation planning. More details on maintenance planning are provided in Chapter 6.2 The exception to this is where storage is provided, such as with the on-line enlarged minor (secondary) canals in the Gezira Irrigation Scheme in Sudan, or with night-storage reservoirs. See later section on rotated flows.3 It is worth noting that there are detailed manuals on how to carry out accurate flow measurement using floats. In this case there is a range of float sizes for different channel depths and a range of reduction fac-tors. These methods have generally been superseded by the advent of current meters.4 The head loss across the structure can be more in locations where there is sufficient head available.5 Defined as the average energy per unit of water at a channel section with respect to the channel bottom.6 Sediment removal upstream of the structure is thus required periodically to maintain the intended upstream cross-section and to reduce the approach velocity.7 The change in reach storage can be positive or negative.8 In these systems the check structures (cross regulators) have stop logs or bars, which are used to regu-late the flow and maintain supply level.9 This is achieved by using walkie-talkies or mobile phones.10 An additional benefit to covering a larger area was that more income could be generated from water taxes.11 Tertiary unit.12 Primary canals.13 Secondary canals.14 Full supply level (FSL) means that when the canal flows the discharge is such that the canal runs full, at the design depth. This maintains the required head over the fixed discharge outlets to obtain the design flow through offtaking outlets.15 Cusecs=cubic feet per second (ft3/s); cumecs=cubic metres per second (m3/s).16 This is somewhat surprising, with those in the tail reaches being most affected, though the allowance for Jharai is some compensation.17 When canals flow with low discharges the wetted perimeter per unit discharge is high, and losses are correspondingly high.18 Secondary canal discharge = summation of tertiary canal discharges divided by the losses factor = (100 − % losses)/100.19 The 10-day time period breaks down into three time periods per month. In a 30-day month there are three 10-day time periods, in 31-day months there are two 10-day time periods and one 11-day time period.
122 ©Martin Burton 2010. Irrigation Management: Principles and Practices (Martin Burton)
This chapter details the procedures for opera-tion within the tertiary unit at the on-farm level. The building blocks for formulating irrigation schedules are presented, includ-ing identification of soil types and their water-holding capacity, estimation of crop evapotranspiration rates and determination of crop and irrigation water requirements. Losses of irrigation water within the tertiary unit are discussed together with measures to reduce these losses and improve irrigation efficiency and productivity. Procedures for organizing the rotation of irrigation water supplies are discussed together with worked examples.
Irrigated Soils
The physical and chemical composition of the soil is fundamental to irrigated agricul-ture. Soils are made up principally of solids, liquids and gaseous materials. The main solids are the soil or rock particles but there is also organic matter, such as plant roots, and mineral deposits, such as gypsum. The liquid content comprises water, dis-solved minerals and soluble organic matter. The liquid fills the voids between the solid particles in the soil matrix. The gaseous or vapour portion is mainly air and occupies
the space not occupied by the solid or liquid elements. It is important to have air in the root system as most crops, other than rice, require aeration of their roots. If there is no air, such as when the soil is waterlogged, most plants will perish, or suffer reductions in yield.
Soil texture
The texture of a soil depends on: (i) the size; and (ii) the distribution of the soil particles.
Thus soils can be described as:
General Soil Particle terminology terminology size
Coarse Sand 0.05–2 mmMedium Silt 0.002–0.05 mmFine Clay <0.002 mm
The coarse, medium and fine terminolo-gies are also sometimes referred to as light, medium and heavy, respectively.
There are different terminologies for classifying soils according to its texture, or mix of different soil particle sizes. Figure 5.1 shows one internationally recognized clas-sification system, the US Department of Agriculture (USDA) soil textural triangle. Using this terminology the soil can be classi-fied into 12 categories as:
5
Operation at the On-Farm Level
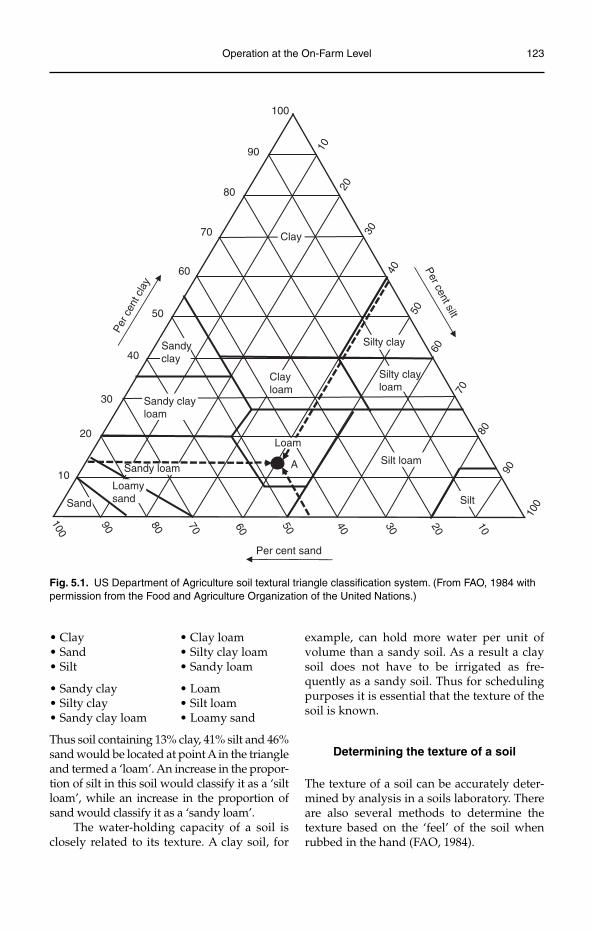
Operation at the On-Farm Level 123
Per cent silt
Per c
ent c
lay
Per cent sand
10
20
30
40
50
60
70
80
90
100
10
20
30
40
50
60
70
80
90
100
102030405060708090
100
Clayloam
Silty clayloam
Silty clay
Clay
Sandy loam
LoamysandSand
Silt loam
Silt
Loam
Sandy clayloam
A
Sandyclay
Fig. 5.1. US Department of Agriculture soil textural triangle classification system. (From FAO, 1984 with permission from the Food and Agriculture Organization of the United Nations.)
• Clay • Clay loam• Sand • Silty clay loam• Silt • Sandy loam
• Sandy clay • Loam• Silty clay • Silt loam• Sandy clay loam • Loamy sand
Thus soil containing 13% clay, 41% silt and 46% sand would be located at point A in the triangle and termed a ‘loam’. An increase in the propor-tion of silt in this soil would classify it as a ‘silt loam’, while an increase in the proportion of sand would classify it as a ‘sandy loam’.
The water-holding capacity of a soil is closely related to its texture. A clay soil, for
example, can hold more water per unit of volume than a sandy soil. As a result a clay soil does not have to be irrigated as fre-quently as a sandy soil. Thus for scheduling purposes it is essential that the texture of the soil is known.
Determining the texture of a soil
The texture of a soil can be accurately deter-mined by analysis in a soils laboratory. There are also several methods to determine the texture based on the ‘feel’ of the soil when rubbed in the hand (FAO, 1984).
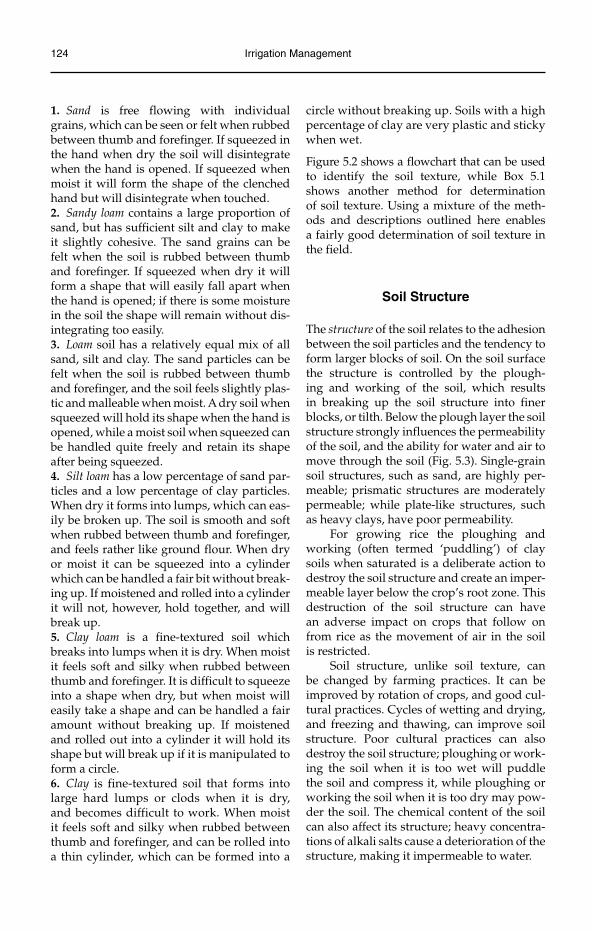
124 Irrigation Management
1. Sand is free flowing with individual grains, which can be seen or felt when rubbed between thumb and forefinger. If squeezed in the hand when dry the soil will disintegrate when the hand is opened. If squeezed when moist it will form the shape of the clenched hand but will disintegrate when touched.2. Sandy loam contains a large proportion of sand, but has sufficient silt and clay to make it slightly cohesive. The sand grains can be felt when the soil is rubbed between thumb and forefinger. If squeezed when dry it will form a shape that will easily fall apart when the hand is opened; if there is some moisture in the soil the shape will remain without dis-integrating too easily.3. Loam soil has a relatively equal mix of all sand, silt and clay. The sand particles can be felt when the soil is rubbed between thumb and forefinger, and the soil feels slightly plas-tic and malleable when moist. A dry soil when squeezed will hold its shape when the hand is opened, while a moist soil when squeezed can be handled quite freely and retain its shape after being squeezed.4. Silt loam has a low percentage of sand par-ticles and a low percentage of clay particles. When dry it forms into lumps, which can eas-ily be broken up. The soil is smooth and soft when rubbed between thumb and forefinger, and feels rather like ground flour. When dry or moist it can be squeezed into a cylinder which can be handled a fair bit without break-ing up. If moistened and rolled into a cylinder it will not, however, hold together, and will break up.5. Clay loam is a fine-textured soil which breaks into lumps when it is dry. When moist it feels soft and silky when rubbed between thumb and forefinger. It is difficult to squeeze into a shape when dry, but when moist will easily take a shape and can be handled a fair amount without breaking up. If moistened and rolled out into a cylinder it will hold its shape but will break up if it is manipulated to form a circle.6. Clay is fine-textured soil that forms into large hard lumps or clods when it is dry, and becomes difficult to work. When moist it feels soft and silky when rubbed between thumb and forefinger, and can be rolled into a thin cylinder, which can be formed into a
circle without breaking up. Soils with a high percentage of clay are very plastic and sticky when wet.
Figure 5.2 shows a flowchart that can be used to identify the soil texture, while Box 5.1 shows another method for determination of soil texture. Using a mixture of the meth-ods and descriptions outlined here enables a fairly good determination of soil texture in the field.
Soil Structure
The structure of the soil relates to the adhesion between the soil particles and the tendency to form larger blocks of soil. On the soil surface the structure is controlled by the plough-ing and working of the soil, which results in breaking up the soil structure into finer blocks, or tilth. Below the plough layer the soil structure strongly influences the permeability of the soil, and the ability for water and air to move through the soil (Fig. 5.3). Single-grain soil structures, such as sand, are highly per-meable; prismatic structures are moderately permeable; while plate-like structures, such as heavy clays, have poor permeability.
For growing rice the ploughing and working (often termed ‘puddling’) of clay soils when saturated is a deliberate action to destroy the soil structure and create an imper-meable layer below the crop’s root zone. This destruction of the soil structure can have an adverse impact on crops that follow on from rice as the movement of air in the soil is restricted.
Soil structure, unlike soil texture, can be changed by farming practices. It can be improved by rotation of crops, and good cul-tural practices. Cycles of wetting and drying, and freezing and thawing, can improve soil structure. Poor cultural practices can also destroy the soil structure; ploughing or work-ing the soil when it is too wet will puddle the soil and compress it, while ploughing or working the soil when it is too dry may pow-der the soil. The chemical content of the soil can also affect its structure; heavy concentra-tions of alkali salts cause a deterioration of the structure, making it impermeable to water.
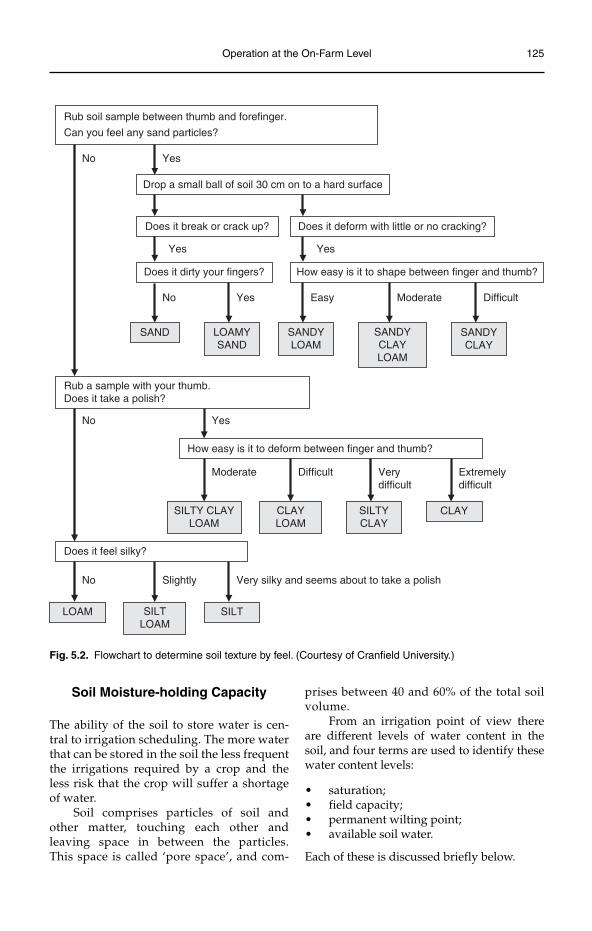
Operation at the On-Farm Level 125
Rub soil sample between thumb and forefinger.
Can you feel any sand particles?
YesNo
Drop a small ball of soil 30 cm on to a hard surface
Does it break or crack up? Does it deform with little or no cracking?
How easy is it to shape between finger and thumb?
How easy is it to deform between finger and thumb?
Rub a sample with your thumb.Does it take a polish?
Does it feel silky?
Very silky and seems about to take a polish
SAND LOAMYSAND
SANDYLOAM
SANDYCLAYLOAM
SANDYCLAY
SILTY CLAYLOAM
CLAYLOAM
SILTYCLAY
CLAY
SILTLOAM
SILTLOAM
Does it dirty your fingers?
YesNo DifficultEasy Moderate
YesNo
No
Yes Yes
Verydifficult
Moderate Difficult Extremely difficult
Slightly
Fig. 5.2. Flowchart to determine soil texture by feel. (Courtesy of Cranfield University.)
Soil Moisture-holding Capacity
The ability of the soil to store water is cen-tral to irrigation scheduling. The more water that can be stored in the soil the less frequent the irrigations required by a crop and the less risk that the crop will suffer a shortage of water.
Soil comprises particles of soil and other matter, touching each other and leaving space in between the particles. This space is called ‘pore space’, and com-
prises between 40 and 60% of the total soil volume.
From an irrigation point of view there are different levels of water content in the soil, and four terms are used to identify these water content levels:
saturation;•field capacity;•permanent wilting point;•available soil water.•
Each of these is discussed briefly below.
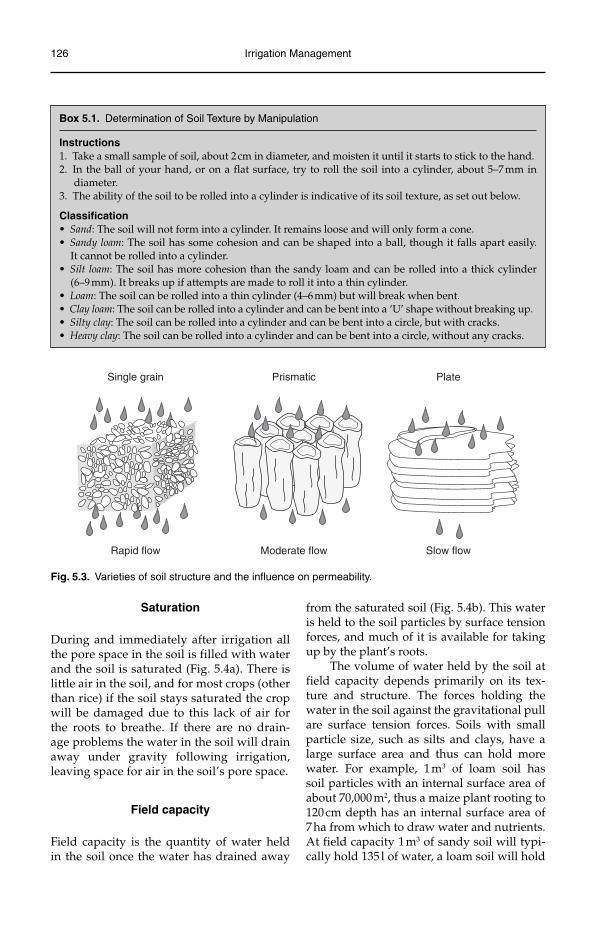
126 Irrigation Management
Saturation
During and immediately after irrigation all the pore space in the soil is filled with water and the soil is saturated (Fig. 5.4a). There is little air in the soil, and for most crops (other than rice) if the soil stays saturated the crop will be damaged due to this lack of air for the roots to breathe. If there are no drain-age problems the water in the soil will drain away under gravity following irrigation, leaving space for air in the soil’s pore space.
Field capacity
Field capacity is the quantity of water held in the soil once the water has drained away
from the saturated soil (Fig. 5.4b). This water is held to the soil particles by surface tension forces, and much of it is available for taking up by the plant’s roots.
The volume of water held by the soil at field capacity depends primarily on its tex-ture and structure. The forces holding the water in the soil against the gravitational pull are surface tension forces. Soils with small particle size, such as silts and clays, have a large surface area and thus can hold more water. For example, 1 m3 of loam soil has soil particles with an internal surface area of about 70,000 m2, thus a maize plant rooting to 120 cm depth has an internal surface area of 7 ha from which to draw water and nutrients. At field capacity 1 m3 of sandy soil will typi-cally hold 135 l of water, a loam soil will hold
Box 5.1. Determination of Soil Texture by Manipulation
Instructions1. Take a small sample of soil, about 2 cm in diameter, and moisten it until it starts to stick to the hand.2. In the ball of your hand, or on a flat surface, try to roll the soil into a cylinder, about 5–7 mm in
diameter.3. The ability of the soil to be rolled into a cylinder is indicative of its soil texture, as set out below.
ClassificationSand• : The soil will not form into a cylinder. It remains loose and will only form a cone.Sandy loam• : The soil has some cohesion and can be shaped into a ball, though it falls apart easily. It cannot be rolled into a cylinder.Silt loam• : The soil has more cohesion than the sandy loam and can be rolled into a thick cylinder (6–9 mm). It breaks up if attempts are made to roll it into a thin cylinder.Loam• : The soil can be rolled into a thin cylinder (4–6 mm) but will break when bent.Clay loam• : The soil can be rolled into a cylinder and can be bent into a ‘U’ shape without breaking up.Silty clay• : The soil can be rolled into a cylinder and can be bent into a circle, but with cracks.Heavy clay• : The soil can be rolled into a cylinder and can be bent into a circle, without any cracks.
Single grain Prismatic Plate
Moderate flow Slow flowRapid flow
Fig. 5.3. Varieties of soil structure and the influence on permeability.
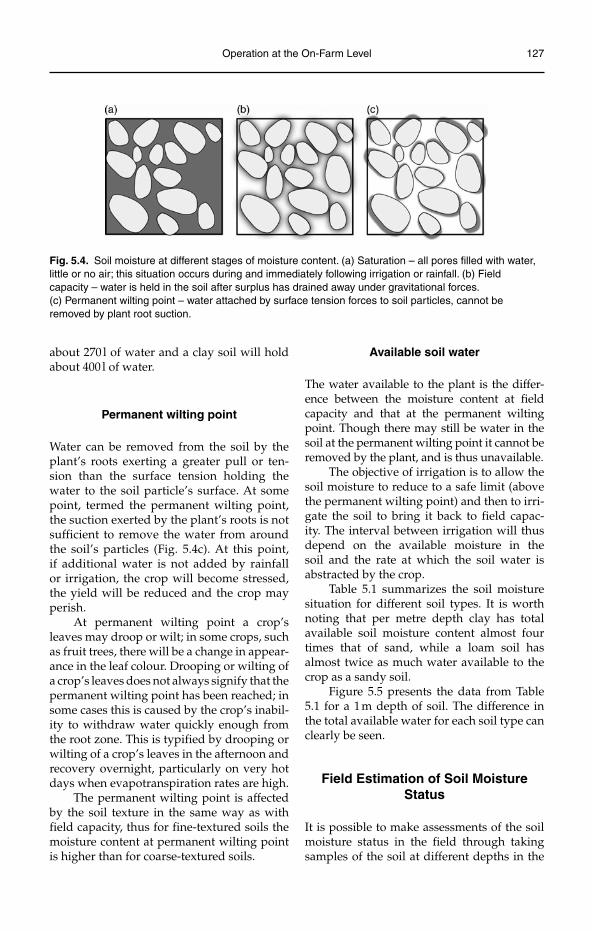
Operation at the On-Farm Level 127
about 270 l of water and a clay soil will hold about 400 l of water.
Permanent wilting point
Water can be removed from the soil by the plant’s roots exerting a greater pull or ten-sion than the surface tension holding the water to the soil particle’s surface. At some point, termed the permanent wilting point, the suction exerted by the plant’s roots is not sufficient to remove the water from around the soil’s particles (Fig. 5.4c). At this point, if additional water is not added by rainfall or irrigation, the crop will become stressed, the yield will be reduced and the crop may perish.
At permanent wilting point a crop’s leaves may droop or wilt; in some crops, such as fruit trees, there will be a change in appear-ance in the leaf colour. Drooping or wilting of a crop’s leaves does not always signify that the permanent wilting point has been reached; in some cases this is caused by the crop’s inabil-ity to withdraw water quickly enough from the root zone. This is typified by drooping or wilting of a crop’s leaves in the afternoon and recovery overnight, particularly on very hot days when evapotranspiration rates are high.
The permanent wilting point is affected by the soil texture in the same way as with field capacity, thus for fine-textured soils the moisture content at permanent wilting point is higher than for coarse-textured soils.
Available soil water
The water available to the plant is the differ-ence between the moisture content at field capacity and that at the permanent wilting point. Though there may still be water in the soil at the permanent wilting point it cannot be removed by the plant, and is thus unavailable.
The objective of irrigation is to allow the soil moisture to reduce to a safe limit (above the permanent wilting point) and then to irri-gate the soil to bring it back to field capac-ity. The interval between irrigation will thus depend on the available moisture in the soil and the rate at which the soil water is abstracted by the crop.
Table 5.1 summarizes the soil moisture situation for different soil types. It is worth noting that per metre depth clay has total available soil moisture content almost four times that of sand, while a loam soil has almost twice as much water available to the crop as a sandy soil.
Figure 5.5 presents the data from Table 5.1 for a 1 m depth of soil. The difference in the total available water for each soil type can clearly be seen.
Field Estimation of Soil Moisture Status
It is possible to make assessments of the soil moisture status in the field through taking samples of the soil at different depths in the
Fig. 5.4. Soil moisture at different stages of moisture content. (a) Saturation – all pores filled with water, little or no air; this situation occurs during and immediately following irrigation or rainfall. (b) Field capacity – water is held in the soil after surplus has drained away under gravitational forces. (c) Permanent wilting point – water attached by surface tension forces to soil particles, cannot be removed by plant root suction.
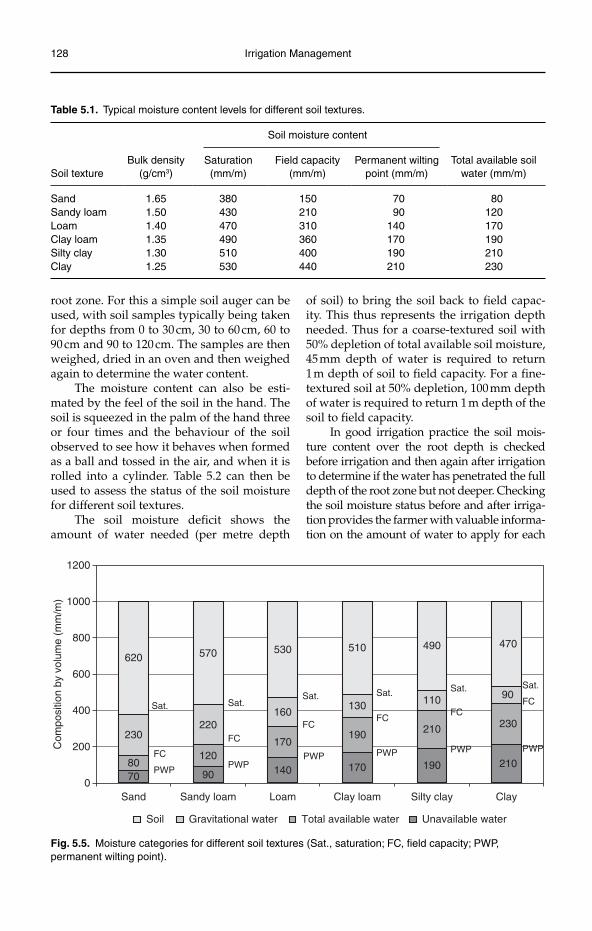
128 Irrigation Management
root zone. For this a simple soil auger can be used, with soil samples typically being taken for depths from 0 to 30 cm, 30 to 60 cm, 60 to 90 cm and 90 to 120 cm. The samples are then weighed, dried in an oven and then weighed again to determine the water content.
The moisture content can also be esti-mated by the feel of the soil in the hand. The soil is squeezed in the palm of the hand three or four times and the behaviour of the soil observed to see how it behaves when formed as a ball and tossed in the air, and when it is rolled into a cylinder. Table 5.2 can then be used to assess the status of the soil moisture for different soil textures.
The soil moisture deficit shows the amount of water needed (per metre depth
of soil) to bring the soil back to field capac-ity. This thus represents the irrigation depth needed. Thus for a coarse-textured soil with 50% depletion of total available soil moisture, 45 mm depth of water is required to return 1 m depth of soil to field capacity. For a fine-textured soil at 50% depletion, 100 mm depth of water is required to return 1 m depth of the soil to field capacity.
In good irrigation practice the soil mois-ture content over the root depth is checked before irrigation and then again after irrigation to determine if the water has penetrated the full depth of the root zone but not deeper. Checking the soil moisture status before and after irriga-tion provides the farmer with valuable informa-tion on the amount of water to apply for each
Table 5.1. Typical moisture content levels for different soil textures.
Soil textureBulk density
(g/cm3)
Soil moisture content
Total available soil water (mm/m)
Saturation (mm/m)
Field capacity (mm/m)
Permanent wilting point (mm/m)
Sand 1.65 380 150 70 80Sandy loam 1.50 430 210 90 120Loam 1.40 470 310 140 170Clay loam 1.35 490 360 170 190Silty clay 1.30 510 400 190 210Clay 1.25 530 440 210 230
70 90 140 170 190 21080120
170190 210 230
230220
160130 110 90
620 570 530 510 490 470
0
200
400
600
800
1000
1200
Sand Sandy loam Loam Clay loam Silty clay Clay
Com
posi
tion
by v
olum
e (m
m/m
)
Soil Gravitational water Total available water Unavailable water
PWP
FC
Sat.Sat.
FC
PWP
Sat.
FC
PWP
Sat.
FC
PWP
Sat.
FC
Sat.
FC
PWPPWP
Fig. 5.5. Moisture categories for different soil textures (Sat., saturation; FC, field capacity; PWP, permanent wilting point).
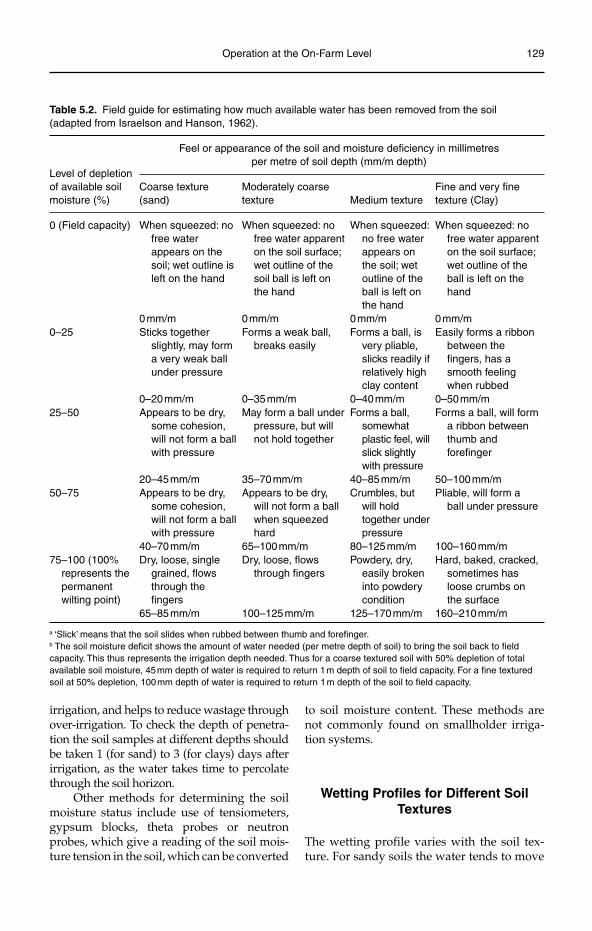
Operation at the On-Farm Level 129
Table 5.2. Field guide for estimating how much available water has been removed from the soil (adapted from Israelson and Hanson, 1962).
Level of depletion of available soil moisture (%)
Feel or appearance of the soil and moisture deficiency in millimetres per metre of soil depth (mm/m depth)
Coarse texture (sand)
Moderately coarse texture Medium texture
Fine and very fine texture (Clay)
0 (Field capacity) When squeezed: no free water appears on the soil; wet outline is left on the hand
When squeezed: no free water apparent on the soil surface; wet outline of the soil ball is left on the hand
When squeezed: no free water appears on the soil; wet outline of the ball is left on the hand
When squeezed: no free water apparent on the soil surface; wet outline of the ball is left on the hand
0 mm/m 0 mm/m 0 mm/m 0 mm/m0–25 Sticks together
slightly, may form a very weak ball under pressure
Forms a weak ball, breaks easily
Forms a ball, is very pliable, slicks readily if relatively high clay content
Easily forms a ribbon between the fingers, has a smooth feeling when rubbed
0–20 mm/m 0–35 mm/m 0–40 mm/m 0–50 mm/m25–50 Appears to be dry,
some cohesion, will not form a ball with pressure
May form a ball under pressure, but will not hold together
Forms a ball, somewhat plastic feel, will slick slightly with pressure
Forms a ball, will form a ribbon between thumb and forefinger
20–45 mm/m 35–70 mm/m 40–85 mm/m 50–100 mm/m50–75 Appears to be dry,
some cohesion, will not form a ball with pressure
Appears to be dry, will not form a ball when squeezed hard
Crumbles, but will hold together under pressure
Pliable, will form a ball under pressure
40–70 mm/m 65–100 mm/m 80–125 mm/m 100–160 mm/m75–100 (100%
represents the permanent wilting point)
Dry, loose, single grained, flows through the fingers
Dry, loose, flows through fingers
Powdery, dry, easily broken into powdery condition
Hard, baked, cracked, sometimes has loose crumbs on the surface
65–85 mm/m 100–125 mm/m 125–170 mm/m 160–210 mm/m
a ‘Slick’ means that the soil slides when rubbed between thumb and forefinger.b The soil moisture deficit shows the amount of water needed (per metre depth of soil) to bring the soil back to field capacity. This thus represents the irrigation depth needed. Thus for a coarse textured soil with 50% depletion of total available soil moisture, 45 mm depth of water is required to return 1 m depth of soil to field capacity. For a fine textured soil at 50% depletion, 100 mm depth of water is required to return 1 m depth of the soil to field capacity.
irrigation, and helps to reduce wastage through over-irrigation. To check the depth of penetra-tion the soil samples at different depths should be taken 1 (for sand) to 3 (for clays) days after irrigation, as the water takes time to percolate through the soil horizon.
Other methods for determining the soil moisture status include use of tensiometers, gypsum blocks, theta probes or neutron probes, which give a reading of the soil mois-ture tension in the soil, which can be converted
to soil moisture content. These methods are not commonly found on smallholder irriga-tion systems.
Wetting Profiles for Different Soil Textures
The wetting profile varies with the soil tex-ture. For sandy soils the water tends to move
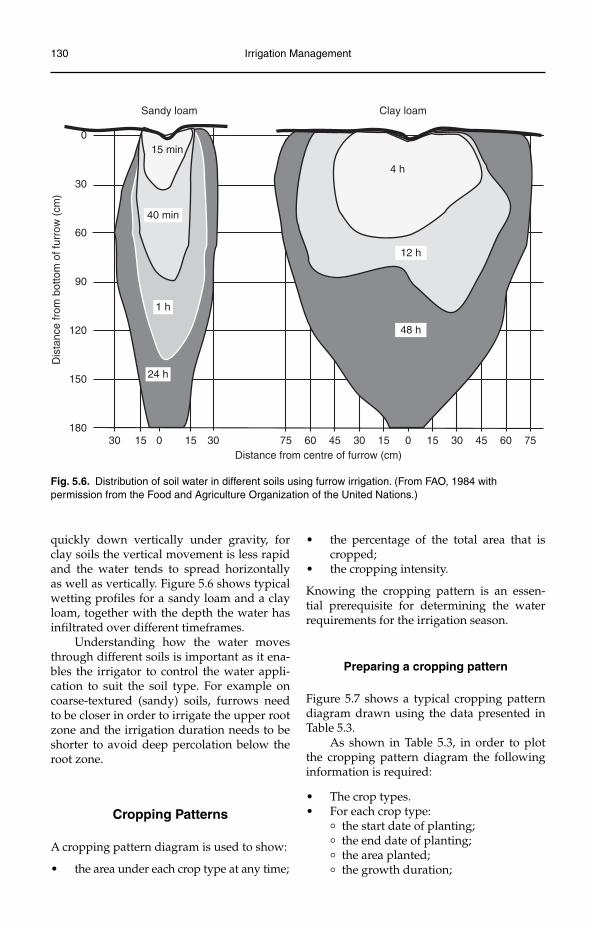
130 Irrigation Management
quickly down vertically under gravity, for clay soils the vertical movement is less rapid and the water tends to spread horizontally as well as vertically. Figure 5.6 shows typical wetting profiles for a sandy loam and a clay loam, together with the depth the water has infiltrated over different timeframes.
Understanding how the water moves through different soils is important as it ena-bles the irrigator to control the water appli-cation to suit the soil type. For example on coarse-textured (sandy) soils, furrows need to be closer in order to irrigate the upper root zone and the irrigation duration needs to be shorter to avoid deep percolation below the root zone.
Cropping Patterns
A cropping pattern diagram is used to show:
the area under each crop type at any time;•
the percentage of the total area that is •cropped;the cropping intensity.•
Knowing the cropping pattern is an essen-tial prerequisite for determining the water requirements for the irrigation season.
Preparing a cropping pattern
Figure 5.7 shows a typical cropping pattern diagram drawn using the data presented in Table 5.3.
As shown in Table 5.3, in order to plot the cropping pattern diagram the following information is required:
The crop types.•For each crop type:•
° the start date of planting;
° the end date of planting;
° the area planted;
° the growth duration;
Sandy loam Clay loam
0
30
60
90
120
150
18030 15 0 15 30 30 15 0 15 30 45 6075 60 45 75
Distance from centre of furrow (cm)
Dis
tanc
e fr
om b
otto
m o
f fur
row
(cm
)
15 min
40 min
1 h
24 h
4 h
12 h
48 h
Fig. 5.6. Distribution of soil water in different soils using furrow irrigation. (From FAO, 1984 with permission from the Food and Agriculture Organization of the United Nations.)
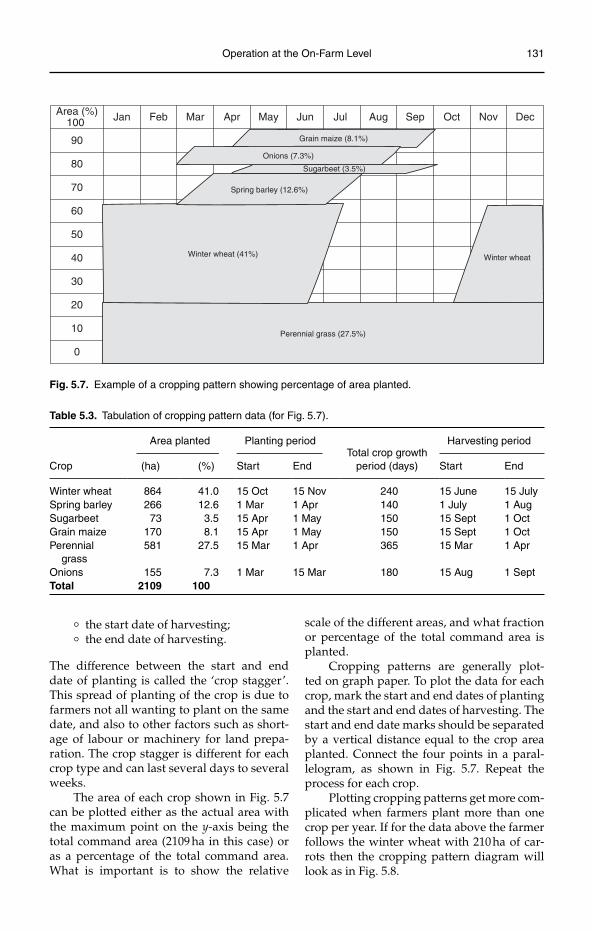
Operation at the On-Farm Level 131
Area (%)100 Jan Feb Mar Apr May Jun Jul Aug Sep Oct Nov Dec
90
80
70
60
50
40
30
20
10
0
Grain maize (8.1%)
Onions (7.3%)
Sugarbeet (3.5%)
Spring barley (12.6%)
Winter wheat (41%)
Perennial grass (27.5%)
Winter wheat
Fig. 5.7. Example of a cropping pattern showing percentage of area planted.
° the start date of harvesting;
° the end date of harvesting.
The difference between the start and end date of planting is called the ‘crop stagger’. This spread of planting of the crop is due to farmers not all wanting to plant on the same date, and also to other factors such as short-age of labour or machinery for land prepa-ration. The crop stagger is different for each crop type and can last several days to several weeks.
The area of each crop shown in Fig. 5.7 can be plotted either as the actual area with the maximum point on the y-axis being the total command area (2109 ha in this case) or as a percentage of the total command area. What is important is to show the relative
scale of the different areas, and what fraction or percentage of the total command area is planted.
Cropping patterns are generally plot-ted on graph paper. To plot the data for each crop, mark the start and end dates of planting and the start and end dates of harvesting. The start and end date marks should be separated by a vertical distance equal to the crop area planted. Connect the four points in a paral-lelogram, as shown in Fig. 5.7. Repeat the process for each crop.
Plotting cropping patterns get more com-plicated when farmers plant more than one crop per year. If for the data above the farmer follows the winter wheat with 210 ha of car-rots then the cropping pattern diagram will look as in Fig. 5.8.
Table 5.3. Tabulation of cropping pattern data (for Fig. 5.7).
Crop
Area planted Planting periodTotal crop growth
period (days)
Harvesting period
(ha) (%) Start End Start End
Winter wheat 864 41.0 15 Oct 15 Nov 240 15 June 15 JulySpring barley 266 12.6 1 Mar 1 Apr 140 1 July 1 AugSugarbeet 73 3.5 15 Apr 1 May 150 15 Sept 1 OctGrain maize 170 8.1 15 Apr 1 May 150 15 Sept 1 OctPerennial
grass581 27.5 15 Mar 1 Apr 365 15 Mar 1 Apr
Onions 155 7.3 1 Mar 15 Mar 180 15 Aug 1 SeptTotal 2109 100
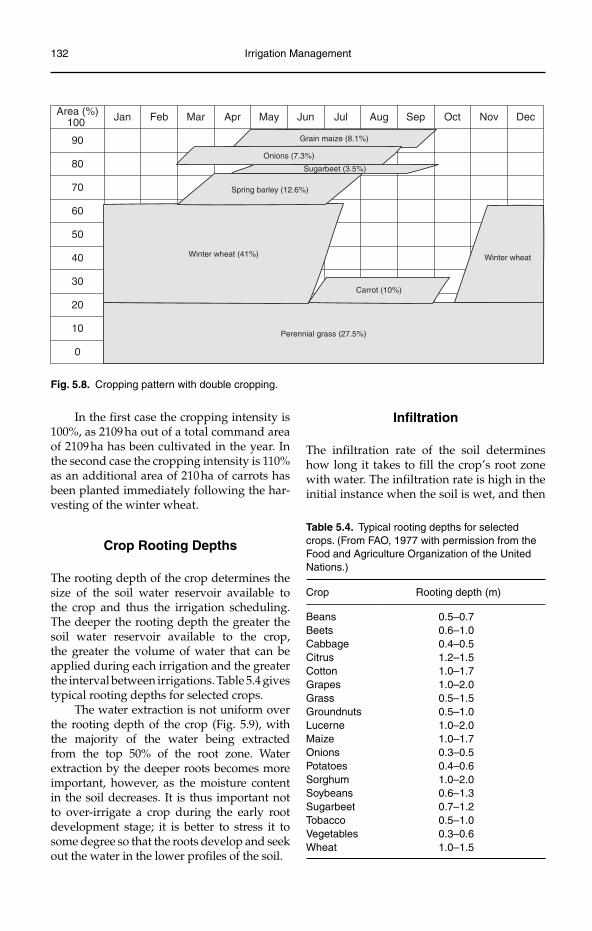
132 Irrigation Management
In the first case the cropping intensity is 100%, as 2109 ha out of a total command area of 2109 ha has been cultivated in the year. In the second case the cropping intensity is 110% as an additional area of 210 ha of carrots has been planted immediately following the har-vesting of the winter wheat.
Crop Rooting Depths
The rooting depth of the crop determines the size of the soil water reservoir available to the crop and thus the irrigation scheduling. The deeper the rooting depth the greater the soil water reservoir available to the crop, the greater the volume of water that can be applied during each irrigation and the greater the interval between irrigations. Table 5.4 gives typical rooting depths for selected crops.
The water extraction is not uniform over the rooting depth of the crop (Fig. 5.9), with the majority of the water being extracted from the top 50% of the root zone. Water extraction by the deeper roots becomes more important, however, as the moisture content in the soil decreases. It is thus important not to over- irrigate a crop during the early root development stage; it is better to stress it to some degree so that the roots develop and seek out the water in the lower profiles of the soil.
Area (%)100 Jan Feb Mar Apr May Jun Jul Aug Sep Oct Nov Dec
90
80
70
60
50
40
30
20
10
0
Grain maize (8.1%)
Onions (7.3%)
Sugarbeet (3.5%)
Spring barley (12.6%)
Winter wheat (41%)
Perennial grass (27.5%)
Winter wheat
Carrot (10%)
Fig. 5.8. Cropping pattern with double cropping.
Table 5.4. Typical rooting depths for selected crops. (From FAO, 1977 with permission from the Food and Agriculture Organization of the United Nations.)
Crop Rooting depth (m)
Beans 0.5–0.7Beets 0.6–1.0Cabbage 0.4–0.5Citrus 1.2–1.5Cotton 1.0–1.7Grapes 1.0–2.0Grass 0.5–1.5Groundnuts 0.5–1.0Lucerne 1.0–2.0Maize 1.0–1.7Onions 0.3–0.5Potatoes 0.4–0.6Sorghum 1.0–2.0Soybeans 0.6–1.3Sugarbeet 0.7–1.2Tobacco 0.5–1.0Vegetables 0.3–0.6Wheat 1.0–1.5
Infiltration
The infiltration rate of the soil determines how long it takes to fill the crop’s root zone with water. The infiltration rate is high in the initial instance when the soil is wet, and then
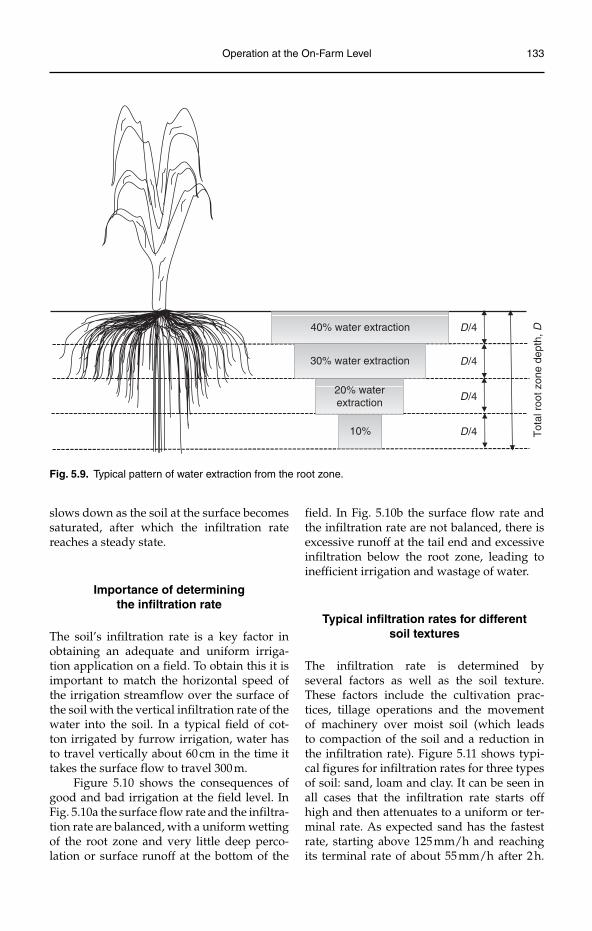
Operation at the On-Farm Level 133
slows down as the soil at the surface becomes saturated, after which the infiltration rate reaches a steady state.
Importance of determining the infiltration rate
The soil’s infiltration rate is a key factor in obtaining an adequate and uniform irriga-tion application on a field. To obtain this it is important to match the horizontal speed of the irrigation streamflow over the surface of the soil with the vertical infiltration rate of the water into the soil. In a typical field of cot-ton irrigated by furrow irrigation, water has to travel vertically about 60 cm in the time it takes the surface flow to travel 300 m.
Figure 5.10 shows the consequences of good and bad irrigation at the field level. In Fig. 5.10a the surface flow rate and the infiltra-tion rate are balanced, with a uniform wetting of the root zone and very little deep perco-lation or surface runoff at the bottom of the
field. In Fig. 5.10b the surface flow rate and the infiltration rate are not balanced, there is excessive runoff at the tail end and excessive infiltration below the root zone, leading to inefficient irrigation and wastage of water.
Typical infiltration rates for different soil textures
The infiltration rate is determined by several factors as well as the soil texture. These factors include the cultivation prac-tices, tillage operations and the movement of machinery over moist soil (which leads to compaction of the soil and a reduction in the infiltration rate). Figure 5.11 shows typi-cal figures for infiltration rates for three types of soil: sand, loam and clay. It can be seen in all cases that the infiltration rate starts off high and then attenuates to a uniform or ter-minal rate. As expected sand has the fastest rate, starting above 125 mm/h and reaching its terminal rate of about 55 mm/h after 2 h.
40% water extraction
30% water extraction
20% waterextraction
10%
D/4
D/4
D/4
D/4 Tot
al r
oot z
one
dept
h, D
Fig. 5.9. Typical pattern of water extraction from the root zone.
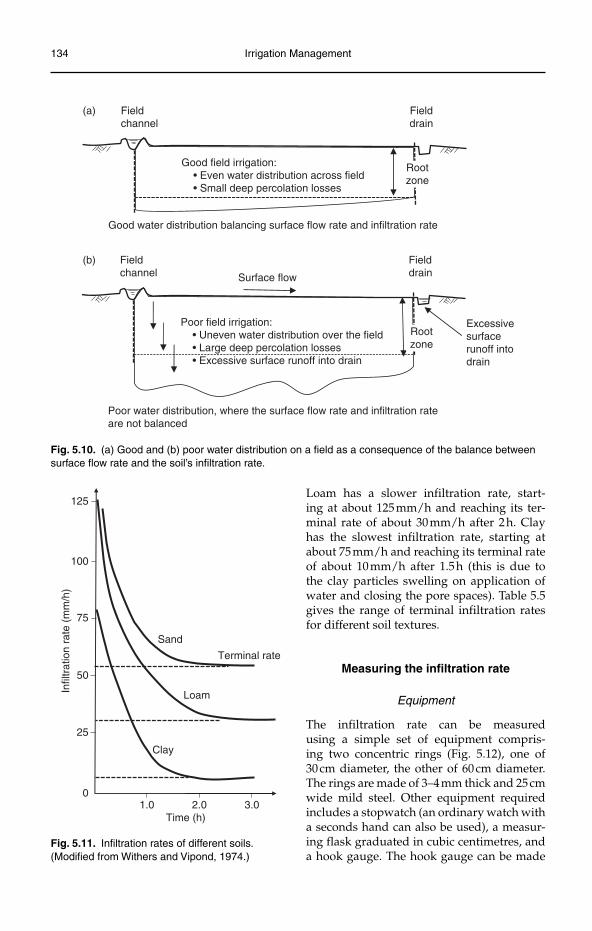
134 Irrigation Management
Poor field irrigation: • Uneven water distribution over the field • Large deep percolation losses • Excessive surface runoff into drain
Fieldchannel
Fielddrain
Good water distribution balancing surface flow rate and infiltration rate
(a)
(b)
Poor water distribution, where the surface flow rate and infiltration rate are not balanced
Good field irrigation: • Even water distribution across field • Small deep percolation losses
Fieldchannel
Fielddrain
Rootzone
Surface flow
Excessivesurfacerunoff intodrain
Rootzone
Fig. 5.10. (a) Good and (b) poor water distribution on a field as a consequence of the balance between surface flow rate and the soil’s infiltration rate.
0
Sand
Infil
trat
ion
rate
(m
m/h
)
Time (h)
25
50
100
125
75
Loam
Clay
Terminal rate
1.0 2.0 3.0
Fig. 5.11. Infiltration rates of different soils. (Modified from Withers and Vipond, 1974.)
Loam has a slower infiltration rate, start-ing at about 125 mm/h and reaching its ter-minal rate of about 30 mm/h after 2 h. Clay has the slowest infiltration rate, starting at about 75 mm/h and reaching its terminal rate of about 10 mm/h after 1.5 h (this is due to the clay particles swelling on application of water and closing the pore spaces). Table 5.5 gives the range of terminal infiltration rates for different soil textures.
Measuring the infiltration rate
Equipment
The infiltration rate can be measured using a simple set of equipment compris-ing two concentric rings (Fig. 5.12), one of 30 cm diameter, the other of 60 cm diameter. The rings are made of 3–4 mm thick and 25 cm wide mild steel. Other equipment required includes a stopwatch (an ordinary watch with a seconds hand can also be used), a measur-ing flask graduated in cubic centimetres, and a hook gauge. The hook gauge can be made
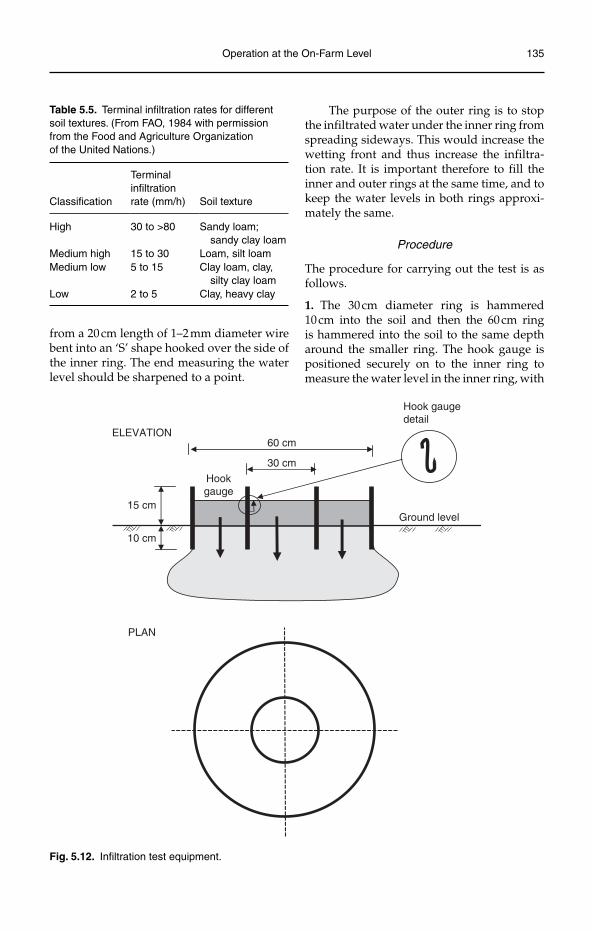
Operation at the On-Farm Level 135
Table 5.5. Terminal infiltration rates for different soil textures. (From FAO, 1984 with permission from the Food and Agriculture Organization of the United Nations.)
Classification
Terminal infiltration rate (mm/h) Soil texture
High 30 to >80 Sandy loam; sandy clay loam
Medium high 15 to 30 Loam, silt loamMedium low 5 to 15 Clay loam, clay,
silty clay loamLow 2 to 5 Clay, heavy clay
The purpose of the outer ring is to stop the infiltrated water under the inner ring from spreading sideways. This would increase the wetting front and thus increase the infiltra-tion rate. It is important therefore to fill the inner and outer rings at the same time, and to keep the water levels in both rings approxi-mately the same.
Procedure
The procedure for carrying out the test is as follows.
1. The 30 cm diameter ring is hammered 10 cm into the soil and then the 60 cm ring is hammered into the soil to the same depth around the smaller ring. The hook gauge is positioned securely on to the inner ring to measure the water level in the inner ring, with
Hook gaugedetail
ELEVATION
PLAN
Ground level
60 cm
15 cm
10 cm
30 cm
Hookgauge
Fig. 5.12. Infiltration test equipment.
from a 20 cm length of 1–2 mm diameter wire bent into an ‘S’ shape hooked over the side of the inner ring. The end measuring the water level should be sharpened to a point.
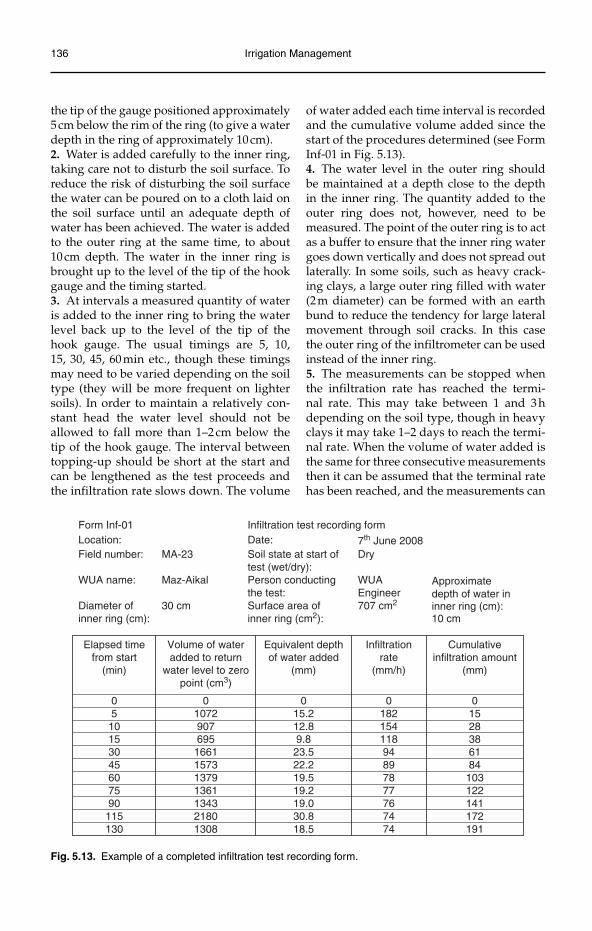
136 Irrigation Management
the tip of the gauge positioned approximately 5 cm below the rim of the ring (to give a water depth in the ring of approximately 10 cm).2. Water is added carefully to the inner ring, taking care not to disturb the soil surface. To reduce the risk of disturbing the soil surface the water can be poured on to a cloth laid on the soil surface until an adequate depth of water has been achieved. The water is added to the outer ring at the same time, to about 10 cm depth. The water in the inner ring is brought up to the level of the tip of the hook gauge and the timing started.3. At intervals a measured quantity of water is added to the inner ring to bring the water level back up to the level of the tip of the hook gauge. The usual timings are 5, 10, 15, 30, 45, 60 min etc., though these timings may need to be varied depending on the soil type (they will be more frequent on lighter soils). In order to maintain a relatively con-stant head the water level should not be allowed to fall more than 1–2 cm below the tip of the hook gauge. The interval between topping-up should be short at the start and can be lengthened as the test proceeds and the infiltration rate slows down. The volume
of water added each time interval is recorded and the cumulative volume added since the start of the procedures determined (see Form Inf-01 in Fig. 5.13).4. The water level in the outer ring should be maintained at a depth close to the depth in the inner ring. The quantity added to the outer ring does not, however, need to be measured. The point of the outer ring is to act as a buffer to ensure that the inner ring water goes down vertically and does not spread out laterally. In some soils, such as heavy crack-ing clays, a large outer ring filled with water (2 m diameter) can be formed with an earth bund to reduce the tendency for large lateral movement through soil cracks. In this case the outer ring of the infiltrometer can be used instead of the inner ring.5. The measurements can be stopped when the infiltration rate has reached the termi-nal rate. This may take between 1 and 3 h depending on the soil type, though in heavy clays it may take 1–2 days to reach the termi-nal rate. When the volume of water added is the same for three consecutive measurements then it can be assumed that the terminal rate has been reached, and the measurements can
test (wet/dry):Dry
the test: WUAEngineer
Diameter of inner ring (cm):
Form Inf-01 Infiltration test recording formLocation: Date: 7th June 2008 Field number: MA-23 Soil state at start of
WUA name: Maz-Aikal Person conducting
30 cm Surface area ofinner ring (cm2):
707 cm2
Approximatedepth of water ininner ring (cm):10 cm
Elapsed timefrom start
(min)
Volume of wateradded to return
water level to zeropoint (cm3)
Equivalent depthof water added
(mm)
Infiltrationrate
(mm/h)
Cumulativeinfiltration amount
(mm)
0 0 0 0 05 1072 15.2 182 1510 907 12.8 154 2815 695 9.8 118 3830 1661 23.5 94 6145 1573 22.2 89 8460 1379 19.5 78 10375 1361 19.2 77 12290 1343 19.0 76 141
115 2180 30.8 74 172130 1308 18.5 74 191
Fig. 5.13. Example of a completed infiltration test recording form.
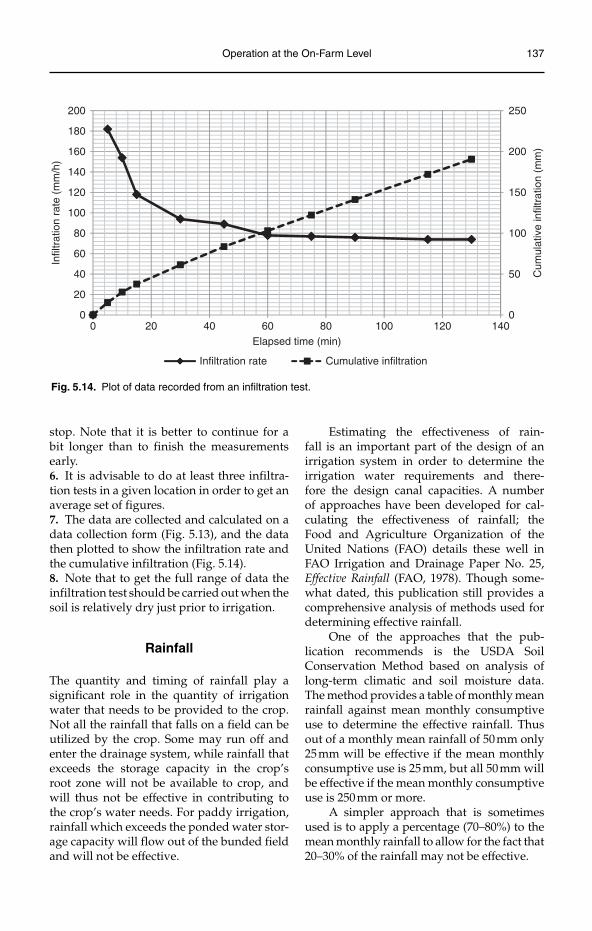
Operation at the On-Farm Level 137
stop. Note that it is better to continue for a bit longer than to finish the measurements early.6. It is advisable to do at least three infiltra-tion tests in a given location in order to get an average set of figures.7. The data are collected and calculated on a data collection form (Fig. 5.13), and the data then plotted to show the infiltration rate and the cumulative infiltration (Fig. 5.14).8. Note that to get the full range of data the infiltration test should be carried out when the soil is relatively dry just prior to irrigation.
Rainfall
The quantity and timing of rainfall play a significant role in the quantity of irrigation water that needs to be provided to the crop. Not all the rainfall that falls on a field can be u tilized by the crop. Some may run off and enter the drainage system, while rainfall that exceeds the storage capacity in the crop’s root zone will not be available to crop, and will thus not be effective in contributing to the crop’s water needs. For paddy irrigation, rainfall which exceeds the ponded water stor-age capacity will flow out of the bunded field and will not be effective.
Estimating the effectiveness of rain-fall is an important part of the design of an irrigation system in order to determine the irrigation water requirements and there-fore the design canal capacities. A number of approaches have been developed for cal-culating the effectiveness of rainfall; the Food and Agriculture Organization of the United Nations (FAO) details these well in FAO Irrigation and Drainage Paper No. 25, Effective Rainfall (FAO, 1978). Though some-what dated, this publication still provides a comprehensive analysis of methods used for determining effective rainfall.
One of the approaches that the pub-lication recommends is the USDA Soil Conservation Method based on analysis of long-term climatic and soil moisture data. The method provides a table of monthly mean rainfall against mean monthly consumptive use to determine the effective rainfall. Thus out of a monthly mean rainfall of 50 mm only 25 mm will be effective if the mean monthly consumptive use is 25 mm, but all 50 mm will be effective if the mean monthly consumptive use is 250 mm or more.
A simpler approach that is sometimes used is to apply a percentage (70–80%) to the mean monthly rainfall to allow for the fact that 20–30% of the rainfall may not be effective.
0
50
100
150
200
250
0
20
40
60
80
100
120
140
160
180
200
0 20 40 60 80 100 120 140
Cum
ulat
ive
infil
trat
ion
(mm
)
Infil
trat
ion
rate
(m
m/h
)
Elapsed time (min)
Infiltration rate Cumulative infiltration
Fig. 5.14. Plot of data recorded from an infiltration test.
138 Irrigation Management
For day-to-day scheduling, account has to be taken of the actual rainfall that has taken place and is likely to take place. Keeping a water balance sheet for each irrigated field (or group of fields with the same crop and soil characteristics) is an effective way of monitoring the contribu-tion from rainfall to a crop’s water require-ments. If it has rained the irrigation schedule should be amended to allow for the rainfall, and the irrigation water conserved. This is particularly important where irrigation water comes from a storage reservoir, or is pumped. In addition, if rain is forecast irri-gation might be delayed to make the most use of the rainfall when it occurs. Very lit-tle of the rainfall occurring immediately following full irrigation of a crop will be effective.
The quantity and timing of rainfall have another impact that is often not fully appre-ciated. In more humid regions rainfall may be adequate and irrigation is provided to supplement rainfall. In more arid regions rainfall is inadequate and irrigation is essen-tial if crops are to be grown. The perception of irrigation in these two situations is sig-nificantly different. In the arid region irri-gation is highly valued as crops cannot be grown without it. In the more humid region farmers will endeavour to utilize rainfall as much as possible and avoid having to irri-gate, especially if they have to pay for the irrigation water. These different perceptions can have significant repercussions on how irrigation water is managed and used by farmers.
Evapotranspiration
Water is consumed through evaporation from the soil surface and transpiration through the crop’s leaves. The combined term is called evapotranspiration. The rate at which water evapotranspires governs the amount of irriga-tion water required and the frequency of irri-gation. The evapotranspiration rate is usually measured in units of mm/day, representing the volume of water that has evapotranspired over a given area.
Factors influencing evapotranspiration
The factors influencing the rate of transpira-tion from the crop and evaporation from the soil surface include:
sunlight;•temperature;•humidity;•wind;•degree of canopy development.•
The influence of these different factors is sum-marized below.
Length of sunlight hours• : Long sunshine hours increase the water evapotranspired.Intensity of sunlight• : Intense sunshine increases the evapotranspiration rate.Temperature• : High temperatures increase the evapotranspiration rate.Humidity• : Low humidity increases the evapotranspiration rate.Wind speed• : High wind speeds increase the evapotranspiration rate.Canopy development• : The more the canopy cover (leaf area) the greater the transpira-tion from the crop, and the less the evap-oration from the soil surface. The greater the canopy cover the greater the amount of sunlight intercepted by the leaves and the greater the photosynthesis.
The behaviour of the plant is governed by the relationship between the soil, plant and the atmosphere. When there is sufficient water in the soil and the transpiration rate is low the stomata of the plant open at dawn and water is lost during the day by transpiration. This loss will be matched by the uptake of water from the soil through the roots and plant stem, without causing any stress to the plant. Photosynthesis will take place and the plant will grow. At night the stomata will close and there will be little water loss from the plant.
As the moisture is taken out, either by evaporation from the soil surface or by tran-spiration through the crop’s leaves, the soil dries and the rate of water supply from the soil reduces and cannot match the demand placed on it by the climatic conditions. At this point the rate of leaf expansion is slowed and the stomata may close to conserve water, leading to the characteristic wilting of the
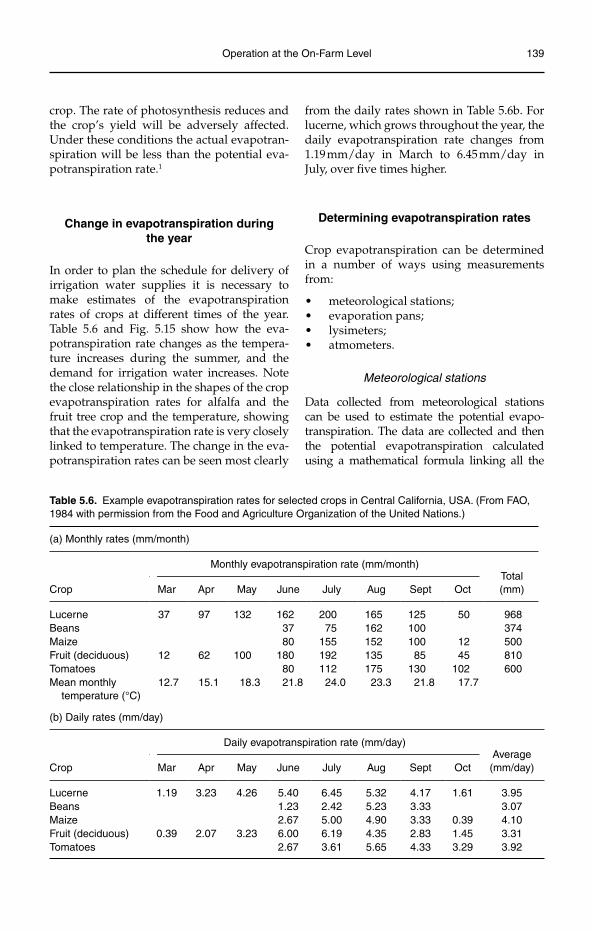
Operation at the On-Farm Level 139
crop. The rate of photosynthesis reduces and the crop’s yield will be adversely affected. Under these conditions the actual evapotran-spiration will be less than the potential eva-potranspiration rate.1
Change in evapotranspiration during the year
In order to plan the schedule for delivery of irrigation water supplies it is necessary to make estimates of the evapotranspiration rates of crops at different times of the year. Table 5.6 and Fig. 5.15 show how the eva-potranspiration rate changes as the tempera-ture increases during the summer, and the demand for irrigation water increases. Note the close relationship in the shapes of the crop evapotranspiration rates for alfalfa and the fruit tree crop and the temperature, showing that the evapotranspiration rate is very closely linked to temperature. The change in the eva-potranspiration rates can be seen most clearly
from the daily rates shown in Table 5.6b. For lucerne, which grows throughout the year, the daily evapotranspiration rate changes from 1.19 mm/day in March to 6.45 mm/day in July, over five times higher.
Determining evapotranspiration rates
Crop evapotranspiration can be determined in a number of ways using measurements from:
meteorological stations;•evaporation pans;•lysimeters;•atmometers.•
Meteorological stations
Data collected from meteorological stations can be used to estimate the potential evapo-transpiration. The data are collected and then the potential evapotranspiration calculated using a mathematical formula linking all the
Table 5.6. Example evapotranspiration rates for selected crops in Central California, USA. (From FAO, 1984 with permission from the Food and Agriculture Organization of the United Nations.)
(a) Monthly rates (mm/month)
Crop
Monthly evapotranspiration rate (mm/month)Total(mm)Mar Apr May June July Aug Sept Oct
Lucerne 37 97 132 162 200 165 125 50 968Beans 37 75 162 100 374Maize 80 155 152 100 12 500Fruit (deciduous) 12 62 100 180 192 135 85 45 810Tomatoes 80 112 175 130 102 600Mean monthly
temperature (°C)12.7 15.1 18.3 21.8 24.0 23.3 21.8 17.7
(b) Daily rates (mm/day)
Crop
Daily evapotranspiration rate (mm/day)Average (mm/day)Mar Apr May June July Aug Sept Oct
Lucerne 1.19 3.23 4.26 5.40 6.45 5.32 4.17 1.61 3.95Beans 1.23 2.42 5.23 3.33 3.07Maize 2.67 5.00 4.90 3.33 0.39 4.10Fruit (deciduous) 0.39 2.07 3.23 6.00 6.19 4.35 2.83 1.45 3.31Tomatoes 2.67 3.61 5.65 4.33 3.29 3.92
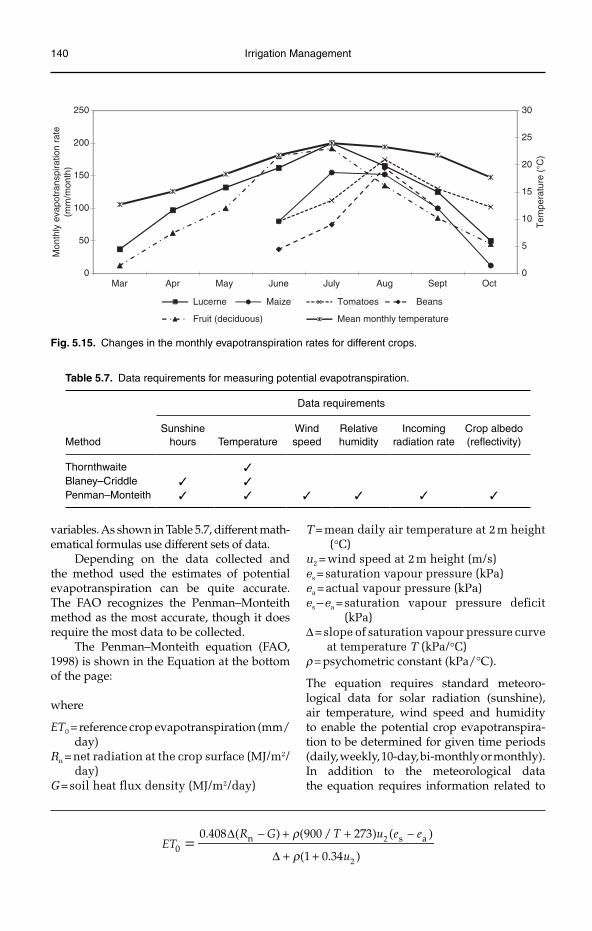
140 Irrigation Management
variables. As shown in Table 5.7, different math-ematical formulas use different sets of data.
Depending on the data collected and the method used the estimates of potential evapotranspiration can be quite accurate. The FAO recognizes the Penman–Monteith method as the most accurate, though it does require the most data to be collected.
The Penman–Monteith equation (FAO, 1998) is shown in the Equation at the bottom of the page:
where
ET0 = reference crop evapotranspiration (mm/day)
Rn =net radiation at the crop surface (MJ/m2/day)
G=soil heat flux density (MJ/m2/day)
T=mean daily air temperature at 2 m height (°C)
u2 =wind speed at 2 m height (m/s)es =saturation vapour pressure (kPa)ea =actual vapour pressure (kPa)es –ea =saturation vapour pressure deficit
(kPa)∆=slope of saturation vapour pressure curve
at temperature T (kPa/°C)r = psychometric constant (kPa/°C).
The equation requires standard meteoro-logical data for solar radiation (sunshine), air temperature, wind speed and humidity to enable the potential crop evapotranspira-tion to be determined for given time periods (daily, weekly, 10-day, bi-monthly or monthly). In addition to the meteorological data the equation requires information related to
∆ − + + −
∆ + += 2
2
n s a0
0.408 ( ) (900 / 273) ( )
(1 0.34 )
R G T u e eET
u
r
r
Table 5.7. Data requirements for measuring potential evapotranspiration.
Method
Data requirements
Sunshinehours Temperature
Windspeed
Relative humidity
Incomingradiation rate
Crop albedo (reflectivity)
Thornthwaite ✓
Blaney–Criddle ✓ ✓
Penman–Monteith ✓ ✓ ✓ ✓ ✓ ✓
0
5
10
15
20
25
30
0
50
100
150
200
250
Mar Apr May June July Aug Sept Oct
Tem
pera
ture
(°C
)
Mon
thly
eva
potr
ansp
iratio
n ra
te(m
m/m
onth
)
Lucerne BeansMaize Tomatoes
Fruit (deciduous) Mean monthly temperature
Fig. 5.15. Changes in the monthly evapotranspiration rates for different crops.
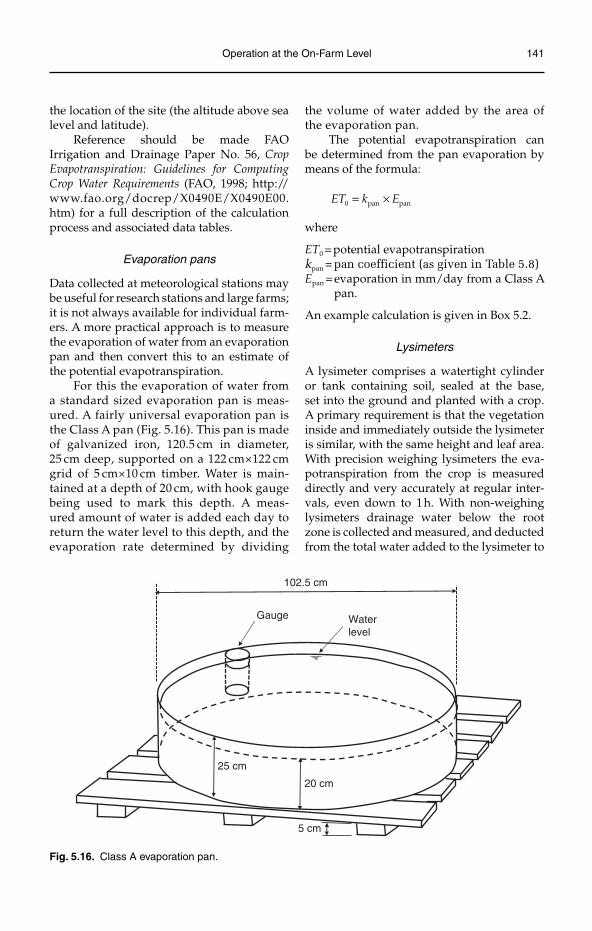
Operation at the On-Farm Level 141
the location of the site (the altitude above sea level and latitude).
Reference should be made FAO Irrigation and Drainage Paper No. 56, Crop Evapotranspiration: Guidelines for Computing Crop Water Requirements (FAO, 1998; http://www.fao.org/docrep/X0490E/X0490E00.htm) for a full description of the calculation process and associated data tables.
Evaporation pans
Data collected at meteorological stations may be useful for research stations and large farms; it is not always available for individual farm-ers. A more practical approach is to measure the evaporation of water from an evaporation pan and then convert this to an estimate of the potential evapotranspiration.
For this the evaporation of water from a standard sized evaporation pan is meas-ured. A fairly universal evaporation pan is the Class A pan (Fig. 5.16). This pan is made of galvanized iron, 120.5 cm in diameter, 25 cm deep, supported on a 122 cm×122 cm grid of 5 cm×10 cm timber. Water is main-tained at a depth of 20 cm, with hook gauge being used to mark this depth. A meas-ured amount of water is added each day to return the water level to this depth, and the evaporation rate determined by dividing
the volume of water added by the area of the evaporation pan.
The potential evapotranspiration can be determined from the pan evaporation by means of the formula:
= ×0 pan panET k E
where
ET0 = potential evapotranspirationkpan =pan coefficient (as given in Table 5.8)Epan = evaporation in mm/day from a Class A
pan.
An example calculation is given in Box 5.2.
Lysimeters
A lysimeter comprises a watertight cylinder or tank containing soil, sealed at the base, set into the ground and planted with a crop. A primary requirement is that the vegetation inside and immediately outside the lysimeter is similar, with the same height and leaf area. With precision weighing lysimeters the eva-potranspiration from the crop is measured directly and very accurately at regular inter-vals, even down to 1 h. With non-weighing lysimeters drainage water below the root zone is collected and measured, and deducted from the total water added to the lysimeter to
Gauge Waterlevel
102.5 cm
5 cm
25 cm
20 cm
Fig. 5.16. Class A evaporation pan.
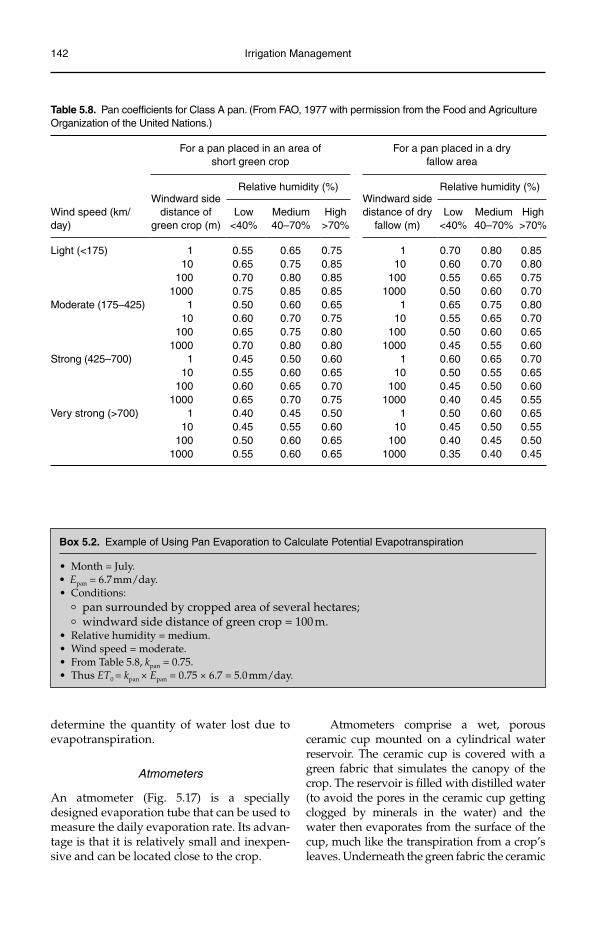
142 Irrigation Management
Table 5.8. Pan coefficients for Class A pan. (From FAO, 1977 with permission from the Food and Agriculture Organization of the United Nations.)
Wind speed (km/day)
For a pan placed in an area of short green crop
For a pan placed in a dry fallow area
Windward side distance of
green crop (m)
Relative humidity (%)Windward side distance of dry
fallow (m)
Relative humidity (%)
Low <40%
Medium40–70%
High>70%
Low <40%
Medium40–70%
High>70%
Light (<175) 1 0.55 0.65 0.75 1 0.70 0.80 0.8510 0.65 0.75 0.85 10 0.60 0.70 0.80
100 0.70 0.80 0.85 100 0.55 0.65 0.751000 0.75 0.85 0.85 1000 0.50 0.60 0.70
Moderate (175–425) 1 0.50 0.60 0.65 1 0.65 0.75 0.8010 0.60 0.70 0.75 10 0.55 0.65 0.70
100 0.65 0.75 0.80 100 0.50 0.60 0.651000 0.70 0.80 0.80 1000 0.45 0.55 0.60
Strong (425–700) 1 0.45 0.50 0.60 1 0.60 0.65 0.7010 0.55 0.60 0.65 10 0.50 0.55 0.65
100 0.60 0.65 0.70 100 0.45 0.50 0.601000 0.65 0.70 0.75 1000 0.40 0.45 0.55
Very strong (>700) 1 0.40 0.45 0.50 1 0.50 0.60 0.6510 0.45 0.55 0.60 10 0.45 0.50 0.55
100 0.50 0.60 0.65 100 0.40 0.45 0.50 1000 0.55 0.60 0.65 1000 0.35 0.40 0.45
Box 5.2. Example of Using Pan Evaporation to Calculate Potential Evapotranspiration
Month = July.•E• pan = 6.7 mm/day.Conditions:•
° pan surrounded by cropped area of several hectares;
° windward side distance of green crop = 100 m.Relative humidity = medium.•Wind speed = moderate.•From Table 5.8, • kpan = 0.75.Thus• ET0 = kpan × Epan = 0.75 × 6.7 = 5.0 mm/day.
determine the quantity of water lost due to evapotranspiration.
Atmometers
An atmometer (Fig. 5.17) is a specially designed evaporation tube that can be used to measure the daily evaporation rate. Its advan-tage is that it is relatively small and inexpen-sive and can be located close to the crop.
Atmometers comprise a wet, porous ceramic cup mounted on a cylindrical water reservoir. The ceramic cup is covered with a green fabric that simulates the canopy of the crop. The reservoir is filled with distilled water (to avoid the pores in the ceramic cup getting clogged by minerals in the water) and the water then evaporates from the surface of the cup, much like the transpiration from a crop’s leaves. Underneath the green fabric the ceramic
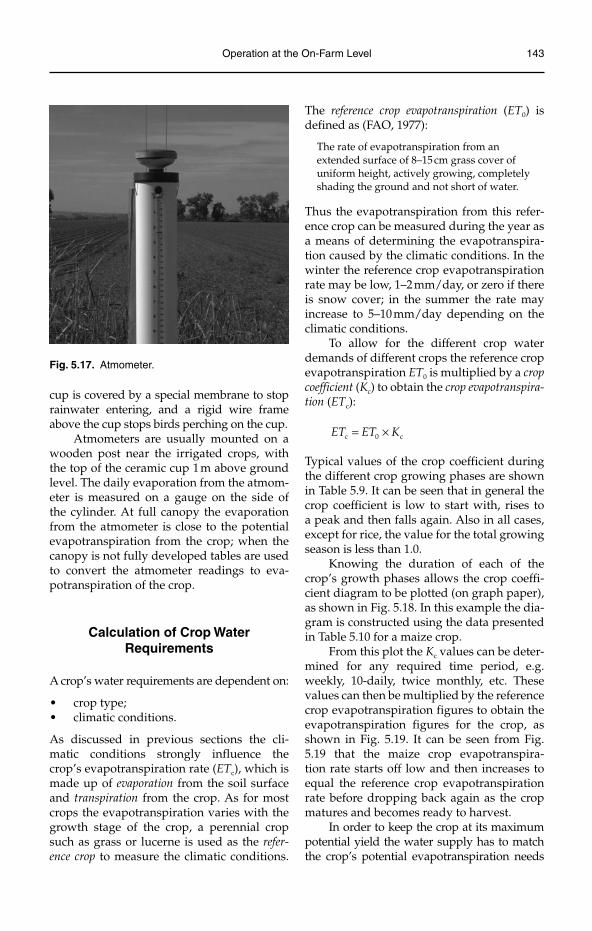
Operation at the On-Farm Level 143
cup is covered by a special membrane to stop rainwater entering, and a rigid wire frame above the cup stops birds perching on the cup.
Atmometers are usually mounted on a wooden post near the irrigated crops, with the top of the ceramic cup 1 m above ground level. The daily evaporation from the atmom-eter is measured on a gauge on the side of the cylinder. At full canopy the evaporation from the atmometer is close to the potential evapotranspiration from the crop; when the canopy is not fully developed tables are used to convert the atmometer readings to eva-potranspiration of the crop.
Calculation of Crop Water Requirements
A crop’s water requirements are dependent on:
crop type;•climatic conditions.•
As discussed in previous sections the cli-matic conditions strongly influence the crop’s evapotranspiration rate (ETc), which is made up of evaporation from the soil surface and transpiration from the crop. As for most crops the evapotranspiration varies with the growth stage of the crop, a perennial crop such as grass or lucerne is used as the refer-ence crop to measure the climatic conditions.
Fig. 5.17. Atmometer.
The reference crop evapotranspiration (ET0) is defined as (FAO, 1977):
The rate of evapotranspiration from an extended surface of 8–15 cm grass cover of uniform height, actively growing, completely shading the ground and not short of water.
Thus the evapotranspiration from this refer-ence crop can be measured during the year as a means of determining the evapotranspira-tion caused by the climatic conditions. In the winter the reference crop evapotranspiration rate may be low, 1–2 mm/day, or zero if there is snow cover; in the summer the rate may increase to 5–10 mm/day depending on the climatic conditions.
To allow for the different crop water demands of different crops the reference crop evapotranspiration ET0 is multiplied by a crop coefficient (Kc) to obtain the crop evapotranspira-tion (ETc):
c 0 cET ET K= ×
Typical values of the crop coefficient during the different crop growing phases are shown in Table 5.9. It can be seen that in general the crop coefficient is low to start with, rises to a peak and then falls again. Also in all cases, except for rice, the value for the total growing season is less than 1.0.
Knowing the duration of each of the crop’s growth phases allows the crop coeffi-cient diagram to be plotted (on graph paper), as shown in Fig. 5.18. In this example the dia-gram is constructed using the data presented in Table 5.10 for a maize crop.
From this plot the Kc values can be deter-mined for any required time period, e.g. weekly, 10-daily, twice monthly, etc. These values can then be multiplied by the reference crop evapotranspiration figures to obtain the evapotranspiration figures for the crop, as shown in Fig. 5.19. It can be seen from Fig. 5.19 that the maize crop evapotranspira-tion rate starts off low and then increases to equal the reference crop evapotranspiration rate before dropping back again as the crop matures and becomes ready to harvest.
In order to keep the crop at its maximum potential yield the water supply has to match the crop’s potential evapotranspiration needs
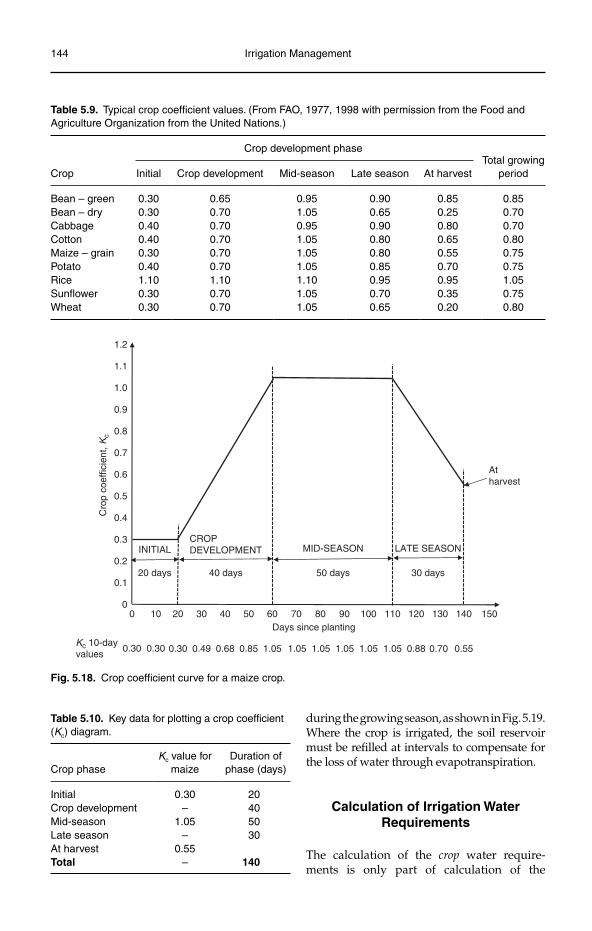
144 Irrigation Management
Table 5.9. Typical crop coefficient values. (From FAO, 1977, 1998 with permission from the Food and Agriculture Organization from the United Nations.)
Crop
Crop development phaseTotal growing
periodInitial Crop development Mid-season Late season At harvest
Bean – green 0.30 0.65 0.95 0.90 0.85 0.85Bean – dry 0.30 0.70 1.05 0.65 0.25 0.70Cabbage 0.40 0.70 0.95 0.90 0.80 0.70Cotton 0.40 0.70 1.05 0.80 0.65 0.80Maize – grain 0.30 0.70 1.05 0.80 0.55 0.75Potato 0.40 0.70 1.05 0.85 0.70 0.75Rice 1.10 1.10 1.10 0.95 0.95 1.05Sunflower 0.30 0.70 1.05 0.70 0.35 0.75Wheat 0.30 0.70 1.05 0.65 0.20 0.80
INITIAL
1.2
Days since planting
Atharvest
CROPDEVELOPMENT LATE SEASON
Kc 10-dayvalues
1.1
1.0
0.9
0.8
0.7
Cro
p co
effic
ient
, Kc
0.6
0.5
0.4
0.3
0.2
0.1
010 20 30 40 50 60 70 80 90 100 110 120 130 140 1500
20 days 40 days 50 days 30 days
0.30 0.49 0.68 0.85 1.05 1.05 1.05 1.05 1.05 1.05 0.88 0.70 0.550.300.30
MID-SEASON
Fig. 5.18. Crop coefficient curve for a maize crop.
Table 5.10. Key data for plotting a crop coefficient (Kc) diagram.
Crop phaseKc value for
maizeDuration of
phase (days)
Initial 0.30 20Crop development – 40Mid-season 1.05 50Late season – 30At harvest 0.55Total – 140
during the growing season, as shown in Fig. 5.19. Where the crop is irrigated, the soil reservoir must be refilled at intervals to compensate for the loss of water through evapotranspiration.
Calculation of Irrigation Water Requirements
The calculation of the crop water require-ments is only part of calculation of the
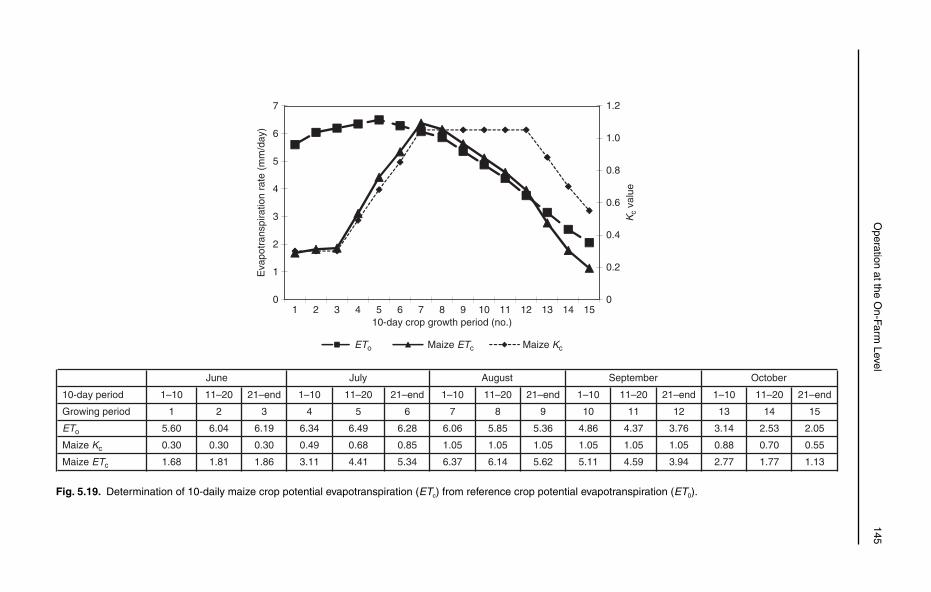
O
peration at the On-Farm
Level 145
10-day period
Growing period
ETo
Maize Kc
Maize ETc
1–10 11–20 21–end 1–10 11–20 21–end 1–10 11–20 21–end 1–10 11–20 21–end 1–10
1 2 3 4 5 6 7 8 9 10 11 12 13 14 15
5.60 6.04 6.19 6.34 6.49 6.28 6.06 5.85 5.36 4.86 4.37 3.76 3.14
0.30 0.30 0.30 0.49 0.68 0.85 1.05 1.05 1.05 1.05 1.05 1.05 0.88 0.70
1.68 1.81 1.86 3.11 4.41 5.34 6.37 6.14 5.62 5.11 4.59 3.94 2.77
11–20 21–end
2.53 2.05
0.55
1.77 1.13
OctoberSeptemberAugustJulyJune
0
0.2
0.4
0.6
0.8
1.0
1.2
0
1
2
3
4
5
6
7
1 2 3 4 5 6 7 8 9 10 11 12 13 14 15
Kc
valu
e
Eva
potr
ansp
iratio
n ra
te (
mm
/day
)
10-day crop growth period (no.)
ETo Maize ETc Maize Kc
Fig. 5.19. Determination of 10-daily maize crop potential evapotranspiration (ETc) from reference crop potential evapotranspiration (ET0).
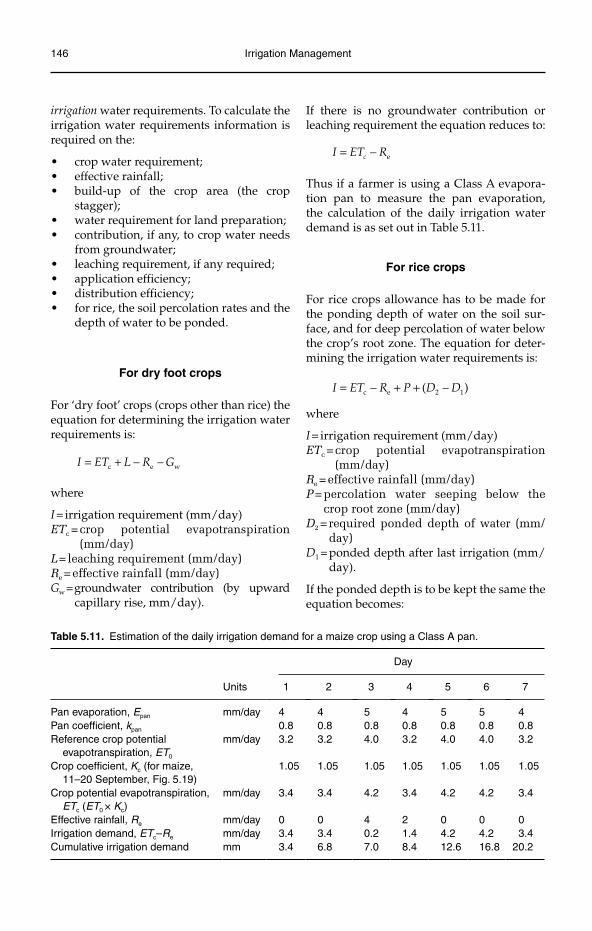
146 Irrigation Management
irrigation water requirements. To calculate the irrigation water requirements information is required on the:
crop water requirement;•effective rainfall;•build-up of the crop area (the crop •stagger);water requirement for land preparation;•contribution, if any, to crop water needs •from groundwater;leaching requirement, if any required;•application efficiency;•distribution efficiency;•for rice, the soil percolation rates and the •depth of water to be ponded.
For dry foot crops
For ‘dry foot’ crops (crops other than rice) the equation for determining the irrigation water requirements is:
c e wI ET L R G= + − −
where
I= irrigation requirement (mm/day)ETc = crop potential evapotranspiration
(mm/day)L = leaching requirement (mm/day)Re = effective rainfall (mm/day)Gw = groundwater contribution (by upward
capillary rise, mm/day).
If there is no groundwater contribution or leaching requirement the equation reduces to:
ecI ET R= −
Thus if a farmer is using a Class A evapora-tion pan to measure the pan evaporation, the calculation of the daily irrigation water demand is as set out in Table 5.11.
For rice crops
For rice crops allowance has to be made for the ponding depth of water on the soil sur-face, and for deep percolation of water below the crop’s root zone. The equation for deter-mining the irrigation water requirements is:
c e 2 1( )I ET R P D D= − + + −
where
I = irrigation requirement (mm/day)ETc = crop potential evapotranspiration
(mm/day)Re = effective rainfall (mm/day)P = percolation water seeping below the
crop root zone (mm/day)D2 = required ponded depth of water (mm/
day)D1 = ponded depth after last irrigation (mm/
day).
If the ponded depth is to be kept the same the equation becomes:
Table 5.11. Estimation of the daily irrigation demand for a maize crop using a Class A pan.
Units
Day
1 2 3 4 5 6 7
Pan evaporation, Epan mm/day 4 4 5 4 5 5 4Pan coefficient, kpan 0.8 0.8 0.8 0.8 0.8 0.8 0.8Reference crop potential
evapotranspiration, ET0
mm/day 3.2 3.2 4.0 3.2 4.0 4.0 3.2
Crop coefficient, Kc (for maize, 11–20 September, Fig. 5.19)
1.05 1.05 1.05 1.05 1.05 1.05 1.05
Crop potential evapotranspiration, ETc (ET0 × Kc)
mm/day 3.4 3.4 4.2 3.4 4.2 4.2 3.4
Effective rainfall, Re mm/day 0 0 4 2 0 0 0Irrigation demand, ETc–Re mm/day 3.4 3.4 0.2 1.4 4.2 4.2 3.4Cumulative irrigation demand mm 3.4 6.8 7.0 8.4 12.6 16.8 20.2
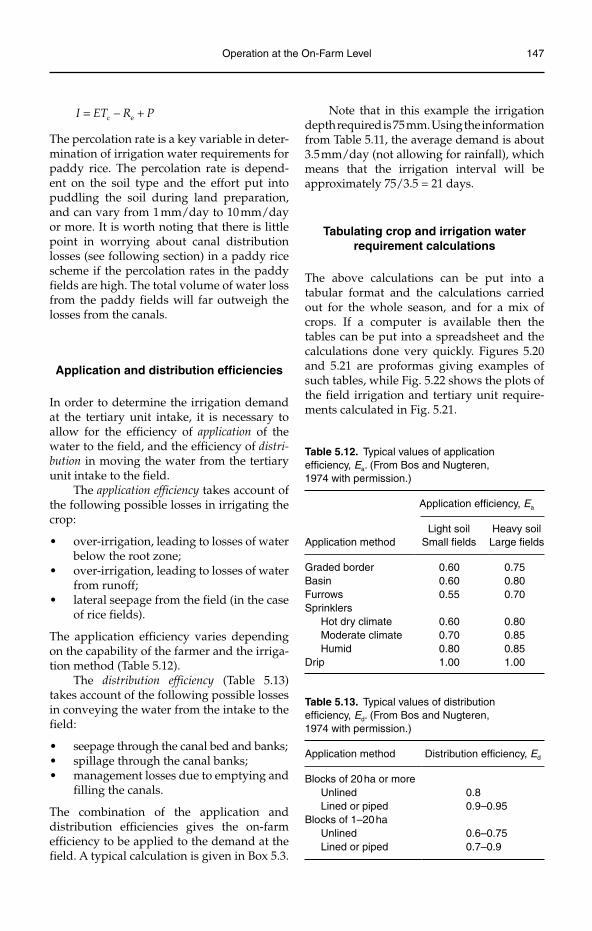
Operation at the On-Farm Level 147
c eI ET R P= − +
The percolation rate is a key variable in deter-mination of irrigation water requirements for paddy rice. The percolation rate is depend-ent on the soil type and the effort put into puddling the soil during land preparation, and can vary from 1 mm/day to 10 mm/day or more. It is worth noting that there is little point in worrying about canal distribution losses (see following section) in a paddy rice scheme if the percolation rates in the paddy fields are high. The total volume of water loss from the paddy fields will far outweigh the losses from the canals.
Application and distribution efficiencies
In order to determine the irrigation demand at the tertiary unit intake, it is necessary to allow for the efficiency of application of the water to the field, and the efficiency of distri-bution in moving the water from the tertiary unit intake to the field.
The application efficiency takes account of the following possible losses in irrigating the crop:
over-irrigation, leading to losses of water •below the root zone;over-irrigation, leading to losses of water •from runoff;lateral seepage from the field (in the case •of rice fields).
The application efficiency varies depending on the capability of the farmer and the irriga-tion method (Table 5.12).
The distribution efficiency (Table 5.13) takes account of the following possible losses in conveying the water from the intake to the field:
seepage through the canal bed and banks;•spillage through the canal banks;•management losses due to emptying and •filling the canals.
The combination of the application and distribution efficiencies gives the on-farm efficiency to be applied to the demand at the field. A typical calculation is given in Box 5.3.
Table 5.12. Typical values of application efficiency, Ea. (From Bos and Nugteren, 1974 with permission.)
Application method
Application efficiency, Ea
Light soilSmall fields
Heavy soilLarge fields
Graded border 0.60 0.75Basin 0.60 0.80Furrows 0.55 0.70Sprinklers
Hot dry climate 0.60 0.80Moderate climate 0.70 0.85Humid 0.80 0.85
Drip 1.00 1.00
Note that in this example the irrigation depth required is 75 mm. Using the information from Table 5.11, the average demand is about 3.5 mm/day (not allowing for rainfall), which means that the irrigation interval will be approximately 75/3.5 = 21 days.
Tabulating crop and irrigation water requirement calculations
The above calculations can be put into a tabular format and the calculations carried out for the whole season, and for a mix of crops. If a computer is available then the tables can be put into a spreadsheet and the calculations done very quickly. Figures 5.20 and 5.21 are proformas giving examples of such tables, while Fig. 5.22 shows the plots of the field irrigation and tertiary unit require-ments calculated in Fig. 5.21.
Table 5.13. Typical values of distribution efficiency, Ed. (From Bos and Nugteren, 1974 with permission.)
Application method Distribution efficiency, Ed
Blocks of 20 ha or moreUnlined 0.8Lined or piped 0.9–0.95
Blocks of 1–20 haUnlined 0.6–0.75Lined or piped 0.7–0.9
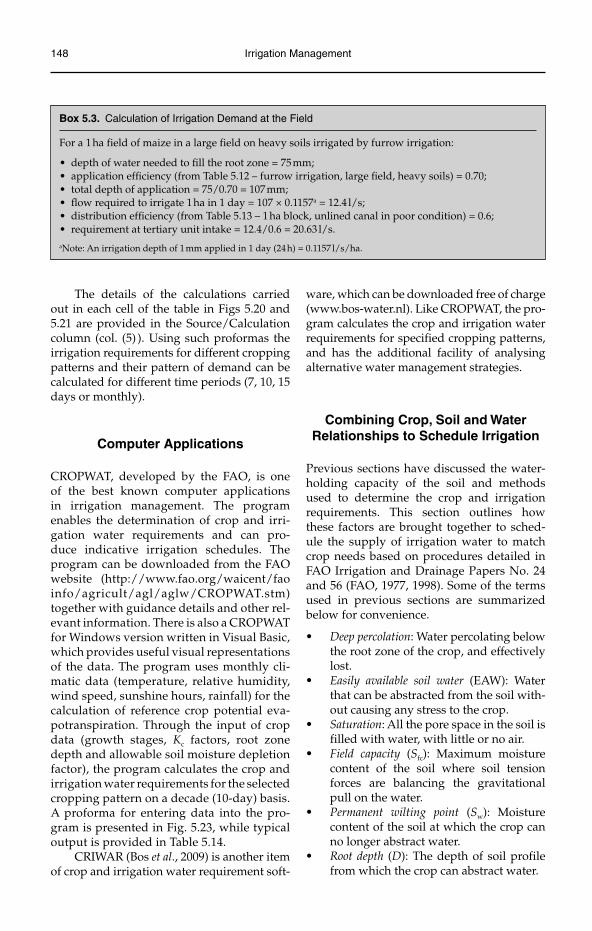
148 Irrigation Management
The details of the calculations carried out in each cell of the table in Figs 5.20 and 5.21 are provided in the Source/Calculation column (col. (5) ). Using such proformas the irrigation requirements for different cropping patterns and their pattern of demand can be calculated for different time periods (7, 10, 15 days or monthly).
Computer Applications
CROPWAT, developed by the FAO, is one of the best known computer applications in irrigation management. The program enables the determination of crop and irri-gation water requirements and can pro-duce indicative irrigation schedules. The program can be downloaded from the FAO website (http://www.fao.org/waicent/faoinfo/agricult/agl/aglw/CROPWAT.stm) together with guidance details and other rel-evant information. There is also a CROPWAT for Windows version written in Visual Basic, which provides useful visual representations of the data. The program uses monthly cli-matic data (temperature, relative humidity, wind speed, sunshine hours, rainfall) for the calculation of reference crop potential eva-potranspiration. Through the input of crop data (growth stages, Kc factors, root zone depth and allowable soil moisture depletion factor), the program calculates the crop and irrigation water requirements for the selected cropping pattern on a decade (10-day) basis. A proforma for entering data into the pro-gram is presented in Fig. 5.23, while typical output is provided in Table 5.14.
CRIWAR (Bos et al., 2009) is another item of crop and irrigation water requirement soft-
ware, which can be downloaded free of charge (www.bos-water.nl). Like CROPWAT, the pro-gram calculates the crop and irrigation water requirements for specified cropping patterns, and has the additional facility of analysing alternative water management strategies.
Combining Crop, Soil and Water Relationships to Schedule Irrigation
Previous sections have discussed the water-holding capacity of the soil and methods used to determine the crop and irrigation requirements. This section outlines how these factors are brought together to sched-ule the supply of irrigation water to match crop needs based on procedures detailed in FAO Irrigation and Drainage Papers No. 24 and 56 (FAO, 1977, 1998). Some of the terms used in previous sections are summarized below for convenience.
Deep percolation• : Water percolating below the root zone of the crop, and effectively lost.Easily available soil water• (EAW): Water that can be abstracted from the soil with-out causing any stress to the crop.Saturation• : All the pore space in the soil is filled with water, with little or no air.Field capacity• (Sfc): Maximum moisture content of the soil where soil tension forces are balancing the gravitational pull on the water.Permanent wilting point• (Sw): Moisture content of the soil at which the crop can no longer abstract water.Root depth• (D): The depth of soil profile from which the crop can abstract water.
Box 5.3. Calculation of Irrigation Demand at the Field
For a 1 ha field of maize in a large field on heavy soils irrigated by furrow irrigation:
depth of water needed to fi ll the root zone = 75 mm;•application effi ciency (from Table 5.12 – furrow irrigation, large fi eld, heavy soils) = 0.70;•total depth of application = 75/0.70 = 107 mm;•fl ow required to irrigate 1 ha in 1 day = 107 × 0.1157• a = 12.4 l/s;distribution effi ciency (from Table 5.13 – 1 ha block, unlined canal in poor condition) = 0.6;•requirement at tertiary unit intake = 12.4/0.6 = 20.63 l/s.•
aNote: An irrigation depth of 1 mm applied in 1 day (24 h) = 0.1157 l/s/ha.
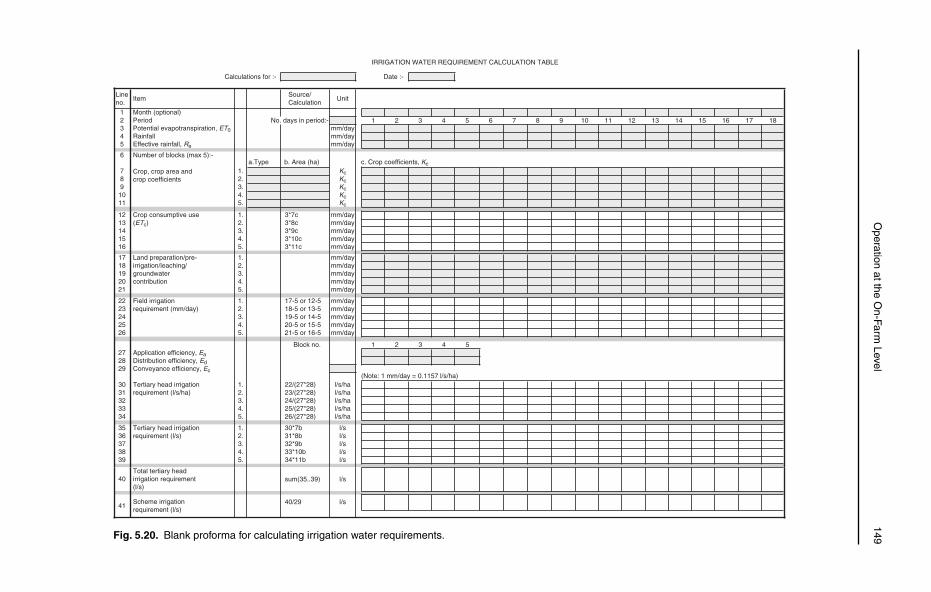
O
peration at the On-Farm
Level 149
Calculations for :- Date :-
Lineno.
Item UnitSource/Calculation
Month (optional)Period
mm/dayPotential evapotranspiration, ET0Rainfall mm/dayEffective rainfall, Re mm/day
Number of blocks (max 5):-a.Type b. Area (ha) c. Crop coefficients, Kc
KcKcKcKcKc
mm/day3*7cmm/day3*8cmm/day3*9cmm/day3*10cmm/day3*11c
mm/daymm/daymm/daymm/daymm/day
mm/day17-5 or 12-5mm/day18-5 or 13-5mm/day19-5 or 14-5mm/day20-5 or 15-5mm/day21-5 or 16-5
No. days in period:- 1 2 3 4 5 6 7 8 9 10 11 12 13 14 15 16 17 18
Block no. 1 2 3 4 5Application efficiency, EaDistribution efficiency, EdConveyance efficiency, Ec
(Note: 1 mm/day = 0.1157 l/s/ha)l/s/ha22/(27*28)l/s/ha23/(27*28)l/s/ha24/(27*28)l/s/ha25/(27*28)l/s/ha26/(27*28)
l/s30*7bl/s31*8bl/s32*9bl/s33*10bl/s34*11b
1.2.3.4.5.
1.2.3.4.5.
1.2.3.4.5.
1.2.3.4.5.
1.2.3.4.5.
1.2.3.4.5.
Tertiary head irrigationrequirement (l/s)
IRRIGATION WATER REQUIREMENT CALCULATION TABLE
Crop, crop area andcrop coefficients
Crop consumptive use (ETc)
Land preparation/pre- irrigation/leaching/groundwatercontribution
Field irrigation requirement (mm/day)
Tertiary head irrigationrequirement (l/s/ha)
Total tertiary head irrigation requirement (l/s)
12345
6
7891011
1213141516
1718192021
2223242526
272829
3031323334
3536373839
40
41Scheme irrigationrequirement (l/s)
sum(35..39) l/s
40/29 l/s
Fig. 5.20. Blank proforma for calculating irrigation water requirements.
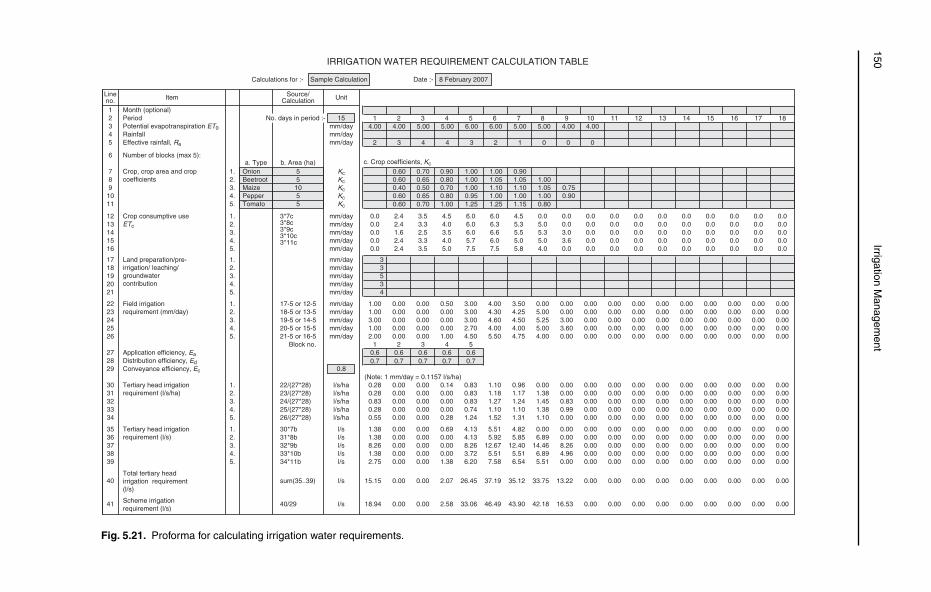
150 Irrigation M
anagement
Calculations for :- Sample Calculation Date :- 8 February 2007
Source/Calculation Unit
15mm/day3mm/daymm/day
Lineno. Item
1 Month (optional)2 Period
4 Rainfall5 Effective rainfall, Re
6 Number of blocks (max 5):
7 Kc8 Kc9 Kc10 Kc11
a. Type b. Area (ha) c. Crop coefficients, Kc
Onion 5Beetroot 5Maize 10Pepper 5Tomato 5 Kc
mm/day3*7c3*8c3*9c3*10c3*11c
12mm/day13mm/day14mm/day15mm/day16
17 mm/day 318 mm/day 319 mm/day 520 mm/day 321 mm/day 4
mm/day22mm/day23mm/day24mm/day25mm/day21-5 or 16-5
20-5 or 15-519-5 or 14-518-5 or 13-517-5 or 12-5
26
27 Application efficiency, Ea28 Distribution efficiency, Ed29 Conveyance efficiency, Ec 0.8
l/s/ha22/(27*28)30l/s/ha23/(27*28)31l/s/ha24/(27*28)32l/s/ha25/(27*28)33l/s/ha26/(27*28)34
l/s30*7b35l/s31*8b36l/s32*9b37l/s33*10b38l/s34*11b
1.2.3.4.5.
1.2.3.4.5.
1.2.3.4.5.
1.2.3.4.5.
1.2.3.4.5.
1.2.3.4.5.39
40Total tertiary headirrigation requirement(l/s)
41 Scheme irrigationrequirement (l/s)
sum(35..39) l/s
40/29 l/s
1 2 3 4 5 6 7 8 9 10 11 12 13 14 15 16 17 184.00 4.00 5.00 5.00 6.00 6.00 5.00 5.00 4.00 4.00
2 3 4 4 3 2 1 0 0 0
0.60 0.70 0.90 1.00 1.00 0.900.60 0.65 0.80 1.00 1.05 1.05 1.000.40 0.50 0.70 1.00 1.10 1.10 1.05 0.750.60 0.65 0.80 0.95 1.00 1.00 1.00 0.900.60 0.70 1.00 1.25 1.25 1.15 0.80
0.0 2.4 3.5 4.5 6.0 6.0 4.5 0.0 0.0 0.0 0.0 0.0 0.0 0.00.0 2.4 3.3 4.0 6.0 6.3 5.3 5.0 0.0 0.0 0.0 0.0 0.0 0.00.0 1.6 2.5 3.5 6.0 6.6 5.5 5.3 3.0 0.0 0.0 0.0 0.0 0.00.0 2.4 3.3 4.0 5.7 6.0 5.0 5.0 3.6 0.0 0.0 0.0 0.0 0.00.0 2.4 3.5 5.0 7.5 7.5 5.8 4.0 0.0 0.0 0.0 0.0 0.0 0.0
0.00.00.00.00.0
0.00.00.00.00.0
0.00.00.00.00.0
0.00.00.00.00.0
1.00 0.00 0.00 0.50 3.00 4.00 3.50 0.00 0.001.00 0.00 0.00 0.00 3.00 4.30 4.25 5.00 0.003.00 0.00 0.00 0.00 3.00 4.60 4.50 5.25 3.001.00 0.00 0.00 0.00 2.70 4.00 4.00 5.00 3.602.00 0.00 0.00 1.00 4.50 5.50 4.75 4.00 0.00
0.000.000.000.000.00
0.000.000.000.000.00
0.000.000.000.000.00
0.000.000.000.000.00
0.000.000.000.000.00
0.000.000.000.000.00
0.000.000.000.000.00
0.000.000.000.000.00
0.000.000.000.000.00
Block no. 1 2 3 4 50.6 0.6 0.6 0.6 0.60.7 0.7 0.7 0.7 0.7
(Note: 1 mm/day = 0.1157 l/s/ha)0.28 0.00 0.00 0.14 0.83 1.10 0.96 0.00 0.000.28 0.00 0.00 0.00 0.83 1.18 1.17 1.38 0.000.83 0.00 0.00 0.00 0.83 1.27 1.24 1.45 0.830.28 0.00 0.00 0.00 0.74 1.10 1.10 1.38 0.990.55 0.00 0.00 0.28 1.24 1.52 1.31 1.10 0.00
0.000.000.000.000.00
0.000.000.000.000.00
0.000.000.000.000.00
0.000.000.000.000.00
0.000.000.000.000.00
0.000.000.000.000.00
0.000.000.000.000.00
0.000.000.000.000.00
0.000.000.000.000.00
0.000.000.000.000.00
0.000.000.000.000.00
0.000.000.000.000.00
0.000.000.000.000.00
0.000.000.000.000.00
0.000.000.000.000.00
0.000.000.000.000.00
0.000.000.000.000.00
1.38 0.00 0.00 0.69 4.13 5.51 4.82 0.00 0.00 0.001.38 0.00 0.00 0.00 4.13 5.92 5.85 6.89 0.00 0.008.26 0.00 0.00 0.00 8.26 12.67 12.40 14.46 8.26 0.001.38 0.00 0.00 0.00 3.72 5.51 5.51 6.89 4.96 0.002.75 0.00 0.00 1.38 6.20 7.58 6.54 5.51 0.00 0.00
15.15 0.00 0.00 2.07 26.45 37.19 35.12 33.75 13.22 0.00 0.00 0.00
18.94 0.00 0.00 2.58 33.06 46.49 43.90 42.18 16.53 0.00 0.00 0.00
0.00 0.00 0.00 0.00 0.00 0.00
0.00 0.00 0.00 0.00 0.00 0.00
Tertiary head irrigationrequirement (l/s)
IRRIGATION WATER REQUIREMENT CALCULATION TABLE
Crop, crop area and cropcoefficients
Crop consumptive useETc
Land preparation/pre- irrigation/ leaching/ groundwatercontribution
Field irrigation requirement (mm/day)
Tertiary head irrigationrequirement (l/s/ha)
Potential evapotranspiration ET0
No. days in period :-
Fig. 5.21. Proforma for calculating irrigation water requirements.
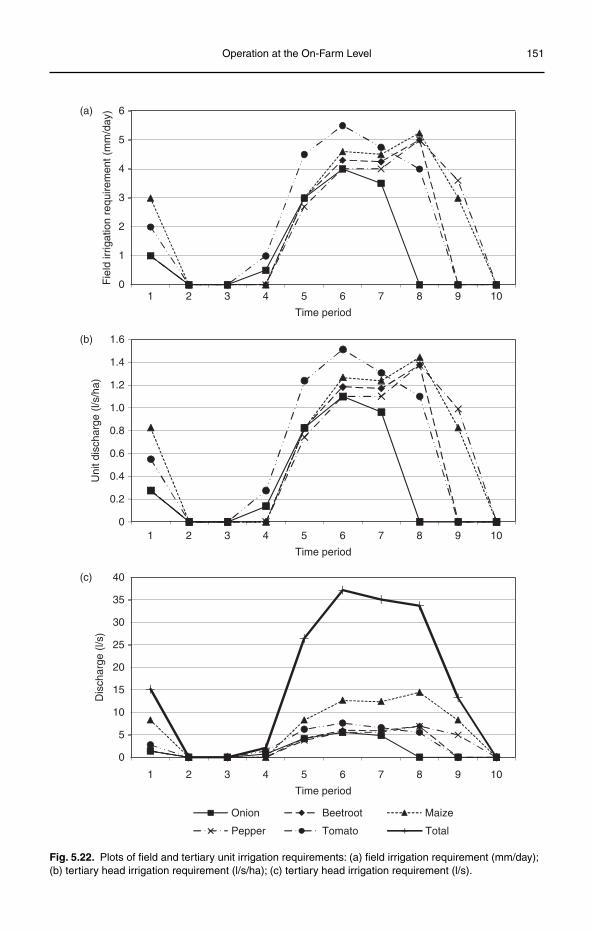
Operation at the On-Farm Level 151
0
1
2
3
4
5
6
1 2 3 4 5 6 7 8 9 10
Fie
ld ir
rigat
ion
requ
irem
ent (
mm
/day
)
Time period
1 2 3 4 5 6 7 8 9 10
Time period
1 2 3 4 5 6 7 8 9 10
Time period
0
0.2
0.4
0.6
0.8
1.0
1.2
1.4
1.6
Uni
t dis
char
ge (
l/s/h
a)
0
5
10
15
20
25
30
35
40
(a)
(b)
(c)
Dis
char
ge (
l/s)
Onion Beetroot Maize
Pepper Tomato Total
Fig. 5.22. Plots of field and tertiary unit irrigation requirements: (a) field irrigation requirement (mm/day); (b) tertiary head irrigation requirement (l/s/ha); (c) tertiary head irrigation requirement (l/s).
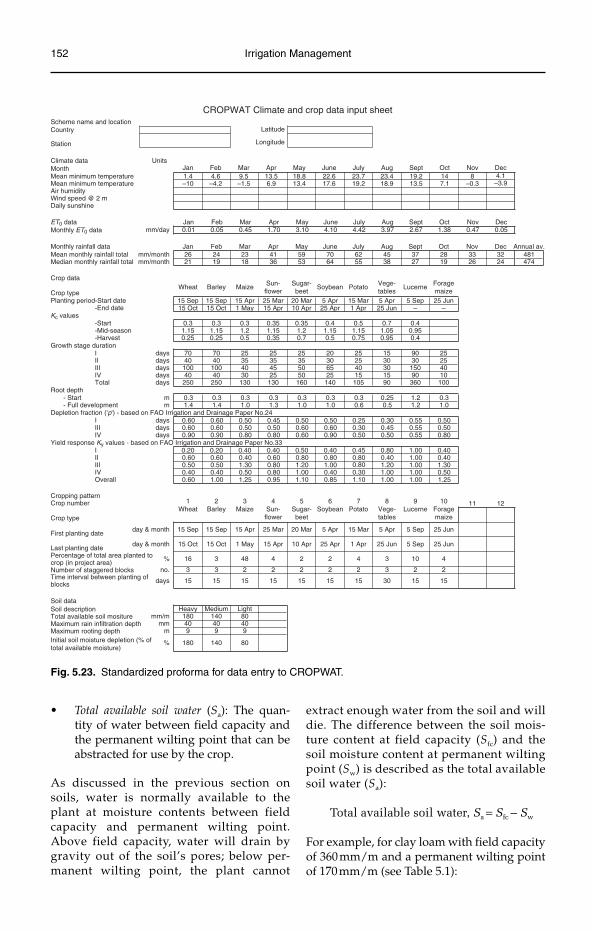
152 Irrigation Management
CROPWAT Climate and crop data input sheetScheme name and locationCountry Latitude
Station Longitude
Climate data UnitsMonth
23.423.722.618.813.59.54.61.4Mean minimum temperature18.919.217.613.46.9–1.5–4.2–10Mean minimum temperature
Jan Feb Mar Apr May June July Aug Sept Oct Nov Dec19.2 14 8 4.113.5 7.1 –0.3 –3.9
Air humidityWind speed @ 2 mDaily sunshine
ET0 data
Monthly rainfall data
Monthly ET0 data mm/day 0.01 0.05 0.45 1.70 3.10 4.10 4.42 3.97
Mean monthly rainfall total mm/month 26 24 23 41 59 70 62 45Median monthly rainfall total mm/month 21 19 18 36 53 64 55
Jan Feb Mar Apr May June July Aug Sept Oct Nov Dec2.67 1.38 0.47 0.05
Jan Feb Mar Apr May June July Aug Sept Oct Nov Dec Annual av.37 28 33 32 481
38 27 19 26 24 474
Crop data
Crop type
Sun-flower
Sugar-beet
Soybean Potato Vege-tables
Lucerne Foragemaize
25 Mar15 Apr15 Sep15 SepPlanting period-Start date
Wheat Barley Maize
-End date 15 Oct 15 Oct20 Mar 5 Apr 15 Mar 5 Apr 5 Sep 25 Jun
1 May 15 Apr 10 Apr 25 Apr 1 Apr 25 Jun – –Kc values
-Start 0.3 0.3 0.3 0.35 0.35 0.4 0.5 0.7 0.4-Mid-season 1.15 1.15 1.2 1.15 1.2 1.15 1.15 1.05 0.95-Harvest 0.25 0.25 0.5 0.35 0.7 0.5 0.75 0.95 0.4
Growth stage durationI days 70 70 25 25 25 20 25 15 90 25II days 40 40 35 35 35 30 25 30 30 25III days 100 100 40 45 50 65 40 30 150 40IV days 40 40 30 25 50 25 15 15 90 10Total days 250 250 130 130 160 140 105 90 360 100
Root depth 0.31.20.250.30.30.30.30.30.30.3m- Start
1.2 1.0Depletion fraction ('p') - based on FAO Irrigation and Drainage Paper No.24
- Full development m 1.4 1.4 1.0 1.3 1.0 1.0 0.6 0.5
I days 0.60 0.60 0.50 0.45 0.50 0.50 0.25 0.30 0.55 0.50III days 0.60 0.60 0.50 0.50 0.60 0.60 0.30 0.45 0.55 0.50IV days 0.90 0.90 0.80 0.80 0.60 0.90 0.50 0.50 0.55 0.80
Yield response Ky values - based on FAO Irrigation and Drainage Paper No.330.401.000.800.450.400.500.400.400.200.20I0.401.000.400.80
0.800.800.800.600.400.600.60II
1.301.001.201.001.200.801.300.500.50III0.501.001.000.300.401.000.800.500.400.40IV1.251.001.001.100.851.100.951.251.000.60Overall
Cropping patternCrop number
Crop type
First planting dateday & month 15 Sep 15 Sep 15 Apr 25 Mar
Last planting dateday & month 15 Oct 15 Oct 1 May 15 Apr
Percentage of total area planted to
Time interval between planting of blocks
1Wheat
2Barley
3Maize
4Sun-flower
5Sugar-beet
6Soybean
7Potato
8Vege-tables
9Lucerne
10Foragemaize
11 12
20 Mar 5 Apr 15 Mar 5 Apr 5 Sep 25 Jun
10 Apr 25 Apr 1 Apr 25 Jun 5 Sep 25 Jun
crop (in project area)% 16 3 48 4 2 2 4 3 10 4
Number of staggered blocks no. 3 3 2 2 2 2 2 3 2 2
days 15 15 15 15 15 15 15 30 15 15
Soil dataSoil description
Initial soil moisture depletion (% of total available moisture)
Heavy Medium LightTotal available soil mositure mm/m 180 140 80Maximum rain infiltration depth mm 40 40 40Maximum rooting depth m 9 9 9
% 180 140 80
Fig. 5.23. Standardized proforma for data entry to CROPWAT.
Total available soil water• (Sa): The quan-tity of water between field capacity and the permanent wilting point that can be abstracted for use by the crop.
As discussed in the previous section on soils, water is normally available to the plant at moisture contents between field capacity and permanent wilting point. Above field capacity, water will drain by gravity out of the soil’s pores; below per-manent wilting point, the plant cannot
extract enough water from the soil and will die. The difference between the soil mois-ture content at field capacity (Sfc) and the soil moisture content at permanent wilting point (Sw) is described as the total available soil water (Sa):
Total available soil water, Sa = Sfc − Sw
For example, for clay loam with field capacity of 360 mm/m and a permanent wilting point of 170 mm/m (see Table 5.1):
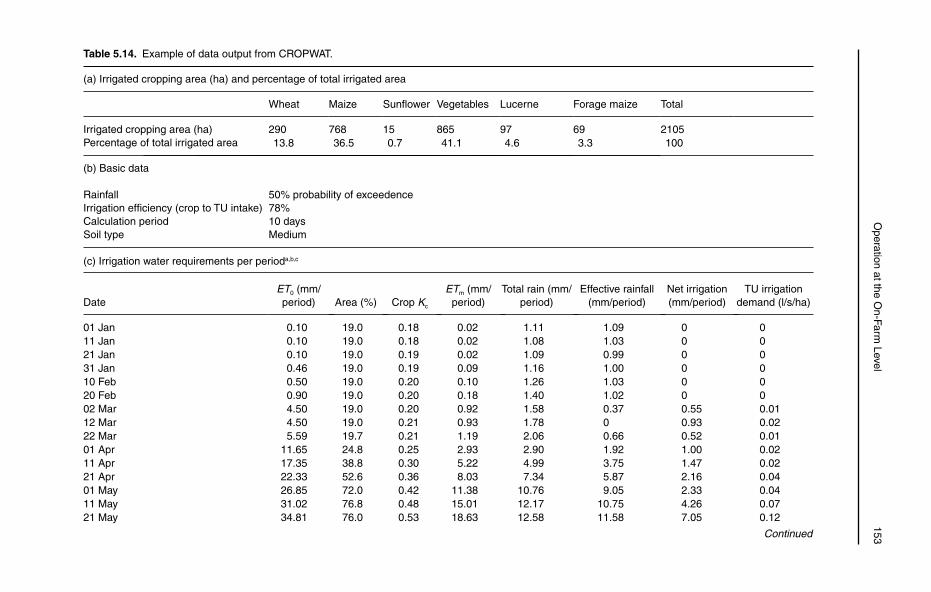
O
peration at the On-Farm
Level 153
Table 5.14. Example of data output from CROPWAT.
(a) Irrigated cropping area (ha) and percentage of total irrigated area
Irrigated cropping area (ha)Percentage of total irrigated area
Wheat Maize Sunflower Vegetables Lucerne Forage maize Total
290 768 15 865 97 69 2105 13.8 36.5 0.7 41.1 4.6 3.3 100
(b) Basic data
RainfallIrrigation efficiency (crop to TU intake)Calculation periodSoil type
50% probability of exceedence78%10 daysMedium
(c) Irrigation water requirements per perioda,b,c
DateET0 (mm/period) Area (%) Crop Kc
ETm (mm/period)
Total rain (mm/period)
Effective rainfall (mm/period)
Net irrigation (mm/period)
TU irrigation demand (l/s/ha)
01 Jan 0.10 19.0 0.18 0.02 1.11 1.09 0 011 Jan 0.10 19.0 0.18 0.02 1.08 1.03 0 021 Jan 0.10 19.0 0.19 0.02 1.09 0.99 0 031 Jan 0.46 19.0 0.19 0.09 1.16 1.00 0 010 Feb 0.50 19.0 0.20 0.10 1.26 1.03 0 020 Feb 0.90 19.0 0.20 0.18 1.40 1.02 0 002 Mar 4.50 19.0 0.20 0.92 1.58 0.37 0.55 0.0112 Mar 4.50 19.0 0.21 0.93 1.78 0 0.93 0.0222 Mar 5.59 19.7 0.21 1.19 2.06 0.66 0.52 0.0101 Apr 11.65 24.8 0.25 2.93 2.90 1.92 1.00 0.0211 Apr 17.35 38.8 0.30 5.22 4.99 3.75 1.47 0.0221 Apr 22.33 52.6 0.36 8.03 7.34 5.87 2.16 0.0401 May 26.85 72.0 0.42 11.38 10.76 9.05 2.33 0.0411 May 31.02 76.8 0.48 15.01 12.17 10.75 4.26 0.0721 May 34.81 76.0 0.53 18.63 12.58 11.58 7.05 0.12
Continued
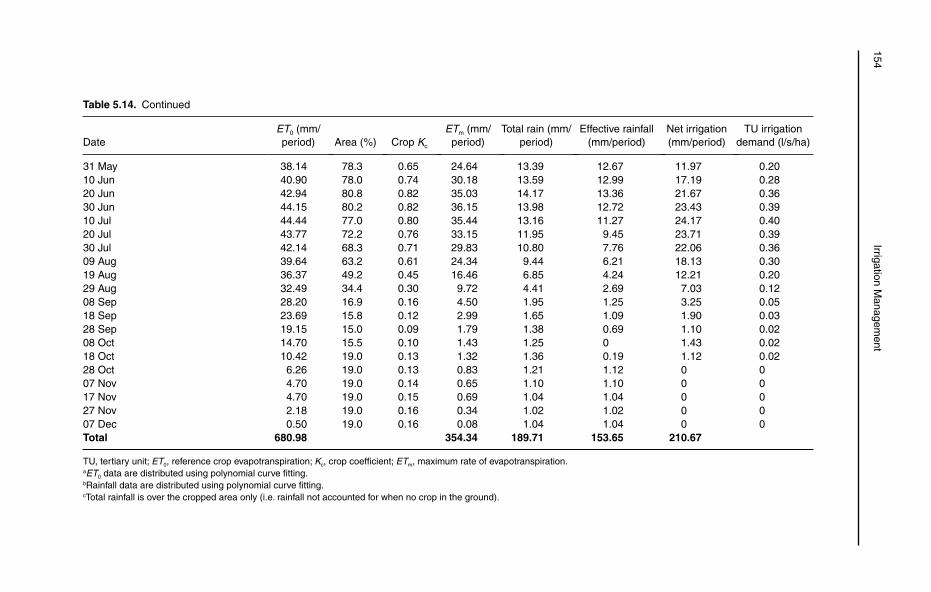
154 Irrigation M
anagement
Table 5.14. Continued
DateET0 (mm/period) Area (%) Crop Kc
ETm (mm/period)
Total rain (mm/period)
Effective rainfall (mm/period)
Net irrigation (mm/period)
TU irrigation demand (l/s/ha)
31 May 38.14 78.3 0.65 24.64 13.39 12.67 11.97 0.2010 Jun 40.90 78.0 0.74 30.18 13.59 12.99 17.19 0.2820 Jun 42.94 80.8 0.82 35.03 14.17 13.36 21.67 0.3630 Jun 44.15 80.2 0.82 36.15 13.98 12.72 23.43 0.3910 Jul 44.44 77.0 0.80 35.44 13.16 11.27 24.17 0.4020 Jul 43.77 72.2 0.76 33.15 11.95 9.45 23.71 0.3930 Jul 42.14 68.3 0.71 29.83 10.80 7.76 22.06 0.3609 Aug 39.64 63.2 0.61 24.34 9.44 6.21 18.13 0.3019 Aug 36.37 49.2 0.45 16.46 6.85 4.24 12.21 0.2029 Aug 32.49 34.4 0.30 9.72 4.41 2.69 7.03 0.1208 Sep 28.20 16.9 0.16 4.50 1.95 1.25 3.25 0.0518 Sep 23.69 15.8 0.12 2.99 1.65 1.09 1.90 0.0328 Sep 19.15 15.0 0.09 1.79 1.38 0.69 1.10 0.0208 Oct 14.70 15.5 0.10 1.43 1.25 0 1.43 0.0218 Oct 10.42 19.0 0.13 1.32 1.36 0.19 1.12 0.0228 Oct 6.26 19.0 0.13 0.83 1.21 1.12 0 007 Nov 4.70 19.0 0.14 0.65 1.10 1.10 0 017 Nov 4.70 19.0 0.15 0.69 1.04 1.04 0 027 Nov 2.18 19.0 0.16 0.34 1.02 1.02 0 007 Dec 0.50 19.0 0.16 0.08 1.04 1.04 0 0Total 680.98 354.34 189.71 153.65 210.67
TU, tertiary unit; ET0, reference crop evapotranspiration; Kc, crop coefficient; ETm, maximum rate of evapotranspiration.aET0 data are distributed using polynomial curve fitting.bRainfall data are distributed using polynomial curve fitting.cTotal rainfall is over the cropped area only (i.e. rainfall not accounted for when no crop in the ground).
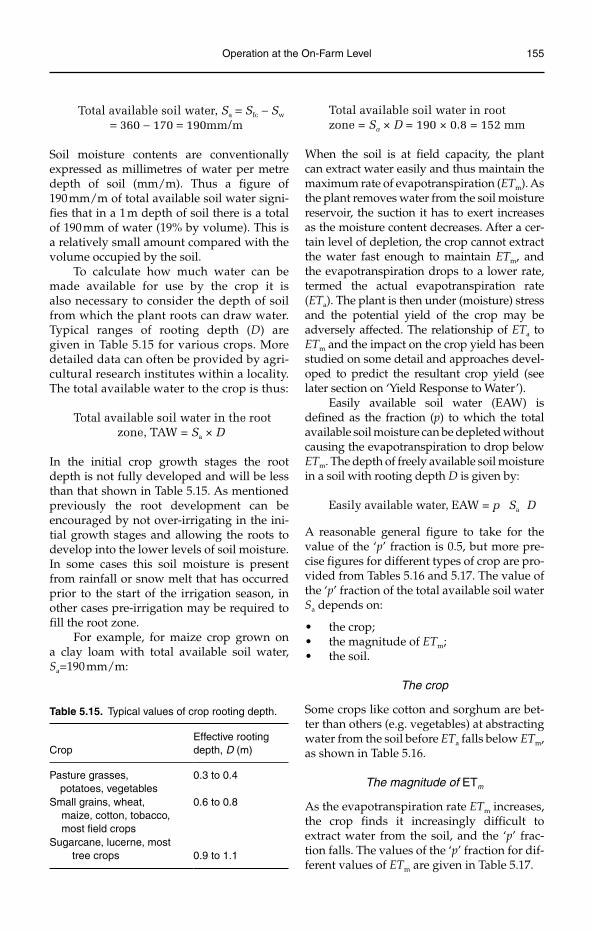
Operation at the On-Farm Level 155
Total available soil water, Sa = Sfc − Sw
= 360 − 170 = 190mm/m
Soil moisture contents are conventionally expressed as millimetres of water per metre depth of soil (mm/m). Thus a figure of 190 mm/m of total available soil water signi-fies that in a 1 m depth of soil there is a total of 190 mm of water (19% by volume). This is a relatively small amount compared with the volume occupied by the soil.
To calculate how much water can be made available for use by the crop it is also necessary to consider the depth of soil from which the plant roots can draw water. Typical ranges of rooting depth (D) are given in Table 5.15 for various crops. More detailed data can often be provided by agri-cultural research institutes within a locality. The total available water to the crop is thus:
Total available soil water in the root zone, TAW = Sa × D
In the initial crop growth stages the root depth is not fully developed and will be less than that shown in Table 5.15. As mentioned previously the root development can be encouraged by not over-irrigating in the ini-tial growth stages and allowing the roots to develop into the lower levels of soil moisture. In some cases this soil moisture is present from rainfall or snow melt that has occurred prior to the start of the irrigation season, in other cases pre-irrigation may be required to fill the root zone.
For example, for maize crop grown on a clay loam with total available soil water, Sa=190 mm/m:
Table 5.15. Typical values of crop rooting depth.
CropEffective rooting depth, D (m)
Pasture grasses, potatoes, vegetables
0.3 to 0.4
Small grains, wheat, maize, cotton, tobacco, most field crops
0.6 to 0.8
Sugarcane, lucerne, most tree crops 0.9 to 1.1
Total available soil water in root zone = Sa × D = 190 × 0.8 = 152 mm
When the soil is at field capacity, the plant can extract water easily and thus maintain the maximum rate of evapotranspiration (ETm). As the plant removes water from the soil moisture reservoir, the suction it has to exert increases as the moisture content decreases. After a cer-tain level of depletion, the crop cannot extract the water fast enough to maintain ETm, and the evapotranspiration drops to a lower rate, termed the actual evapotranspiration rate (ETa). The plant is then under (moisture) stress and the potential yield of the crop may be adversely affected. The relationship of ETa to ETm and the impact on the crop yield has been studied on some detail and approaches devel-oped to predict the resultant crop yield (see later section on ‘Yield Response to Water’).
Easily available soil water (EAW) is defined as the fraction (p) to which the total available soil moisture can be depleted without causing the evapotranspiration to drop below ETm. The depth of freely available soil moisture in a soil with rooting depth D is given by:
Easily available water, EAW = p Sa D
A reasonable general figure to take for the value of the ‘p’ fraction is 0.5, but more pre-cise figures for different types of crop are pro-vided from Tables 5.16 and 5.17. The value of the ‘p’ fraction of the total available soil water Sa depends on:
the crop;•the magnitude of • ETm;the soil.•
The crop
Some crops like cotton and sorghum are bet-ter than others (e.g. vegetables) at abstracting water from the soil before ETa falls below ETm,as shown in Table 5.16.
The magnitude of ETm
As the evapotranspiration rate ETm increases, the crop finds it increasingly difficult to extract water from the soil, and the ‘p’ frac-tion falls. The values of the ‘p’ fraction for dif-ferent values of ETm are given in Table 5.17.
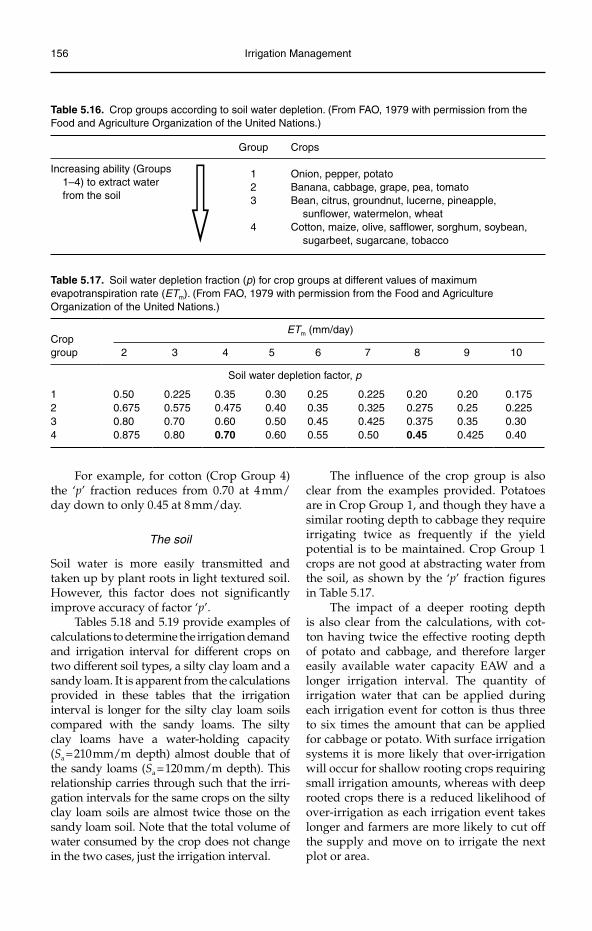
156 Irrigation Management
Table 5.16. Crop groups according to soil water depletion. (From FAO, 1979 with permission from the Food and Agriculture Organization of the United Nations.)
Group Crops
Increasing ability (Groups 1–4) to extract water from the soil
1 Onion, pepper, potato2 Banana, cabbage, grape, pea, tomato3 Bean, citrus, groundnut, lucerne, pineapple,
sunflower, watermelon, wheat4 Cotton, maize, olive, safflower, sorghum, soybean,
sugarbeet, sugarcane, tobacco
Table 5.17. Soil water depletion fraction (p) for crop groups at different values of maximum evapotranspiration rate (ETm). (From FAO, 1979 with permission from the Food and Agriculture Organization of the United Nations.)
Cropgroup
ETm (mm/day)
2 3 4 5 6 7 8 9 10
Soil water depletion factor, p
1 0.50 0.225 0.35 0.30 0.25 0.225 0.20 0.20 0.1752 0.675 0.575 0.475 0.40 0.35 0.325 0.275 0.25 0.2253 0.80 0.70 0.60 0.50 0.45 0.425 0.375 0.35 0.304 0.875 0.80 0.70 0.60 0.55 0.50 0.45 0.425 0.40
For example, for cotton (Crop Group 4) the ‘p’ fraction reduces from 0.70 at 4 mm/day down to only 0.45 at 8 mm/day.
The soil
Soil water is more easily transmitted and taken up by plant roots in light textured soil. However, this factor does not significantly improve accuracy of factor ‘p’.
Tables 5.18 and 5.19 provide examples of calculations to determine the irrigation demand and irrigation interval for different crops on two different soil types, a silty clay loam and a sandy loam. It is apparent from the calculations provided in these tables that the irrigation interval is longer for the silty clay loam soils compared with the sandy loams. The silty clay loams have a water-holding capacity (Sa = 210 mm/m depth) almost double that of the sandy loams (Sa = 120 mm/m depth). This relationship carries through such that the irri-gation intervals for the same crops on the silty clay loam soils are almost twice those on the sandy loam soil. Note that the total volume of water consumed by the crop does not change in the two cases, just the irrigation interval.
The influence of the crop group is also clear from the examples provided. Potatoes are in Crop Group 1, and though they have a similar rooting depth to cabbage they require irrigating twice as frequently if the yield potential is to be maintained. Crop Group 1 crops are not good at abstracting water from the soil, as shown by the ‘p’ fraction figures in Table 5.17.
The impact of a deeper rooting depth is also clear from the calculations, with cot-ton having twice the effective rooting depth of potato and cabbage, and therefore larger easily available water capacity EAW and a longer irrigation interval. The quantity of irrigation water that can be applied during each irrigation event for cotton is thus three to six times the amount that can be applied for cabbage or potato. With surface irrigation systems it is more likely that over-irrigation will occur for shallow rooting crops requiring small irrigation amounts, whereas with deep rooted crops there is a reduced likelihood of over-irrigation as each irrigation event takes longer and farmers are more likely to cut off the supply and move on to irrigate the next plot or area.
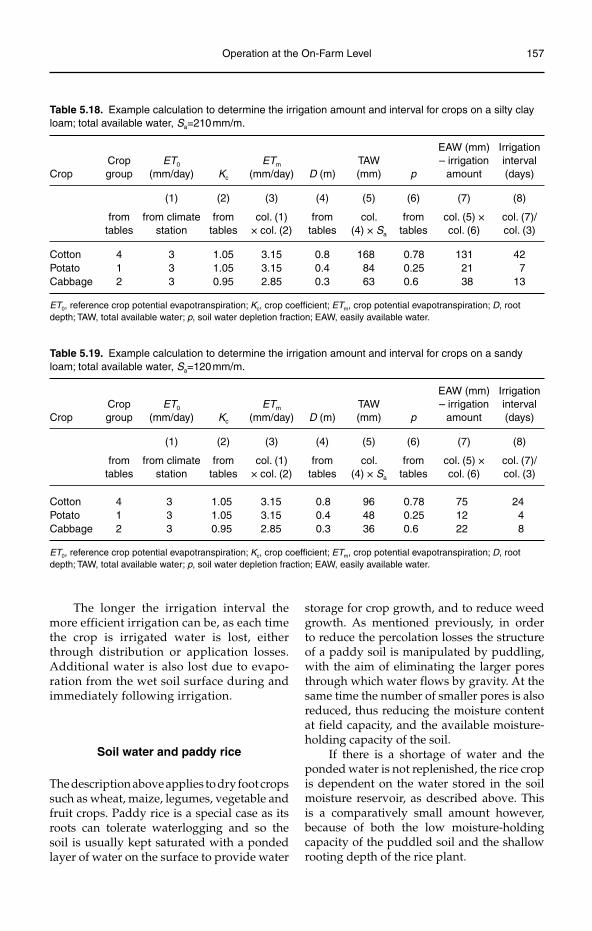
Operation at the On-Farm Level 157
Table 5.18. Example calculation to determine the irrigation amount and interval for crops on a silty clay loam; total available water, Sa=210 mm/m.
CropCropgroup
ET0
(mm/day) Kc
ETm
(mm/day) D (m)TAW (mm) p
EAW (mm) – irrigation
amount
Irrigation interval (days)
(1) (2) (3) (4) (5) (6) (7) (8)
from tables
from climate station
fromtables
col. (1) × col. (2)
fromtables
col. (4) × Sa
fromtables
col. (5) × col. (6)
col. (7)/col. (3)
Cotton 4 3 1.05 3.15 0.8 168 0.78 131 42Potato 1 3 1.05 3.15 0.4 84 0.25 21 7Cabbage 2 3 0.95 2.85 0.3 63 0.6 38 13
ET0, reference crop potential evapotranspiration; Kc, crop coefficient; ETm, crop potential evapotranspiration; D, root depth; TAW, total available water; p, soil water depletion fraction; EAW, easily available water.
Table 5.19. Example calculation to determine the irrigation amount and interval for crops on a sandy loam; total available water, Sa=120 mm/m.
CropCropgroup
ET0
(mm/day) Kc
ETm
(mm/day) D (m)TAW (mm) p
EAW (mm) – irrigation
amount
Irrigation interval (days)
(1) (2) (3) (4) (5) (6) (7) (8)
from tables
from climate station
fromtables
col. (1) × col. (2)
fromtables
col. (4) × Sa
fromtables
col. (5) × col. (6)
col. (7)/col. (3)
Cotton 4 3 1.05 3.15 0.8 96 0.78 75 24Potato 1 3 1.05 3.15 0.4 48 0.25 12 4Cabbage 2 3 0.95 2.85 0.3 36 0.6 22 8
ET0, reference crop potential evapotranspiration; Kc, crop coefficient; ETm, crop potential evapotranspiration; D, root depth; TAW, total available water; p, soil water depletion fraction; EAW, easily available water.
The longer the irrigation interval the more efficient irrigation can be, as each time the crop is irrigated water is lost, either through distribution or application losses. Additional water is also lost due to evapo-ration from the wet soil surface during and immediately following irrigation.
Soil water and paddy rice
The description above applies to dry foot crops such as wheat, maize, legumes, vegetable and fruit crops. Paddy rice is a special case as its roots can tolerate waterlogging and so the soil is usually kept saturated with a ponded layer of water on the surface to provide water
storage for crop growth, and to reduce weed growth. As mentioned previously, in order to reduce the percolation losses the structure of a paddy soil is manipulated by puddling, with the aim of eliminating the larger pores through which water flows by gravity. At the same time the number of smaller pores is also reduced, thus reducing the moisture content at field capacity, and the available moisture-holding capacity of the soil.
If there is a shortage of water and the ponded water is not replenished, the rice crop is dependent on the water stored in the soil moisture reservoir, as described above. This is a comparatively small amount however, because of both the low moisture-holding capacity of the puddled soil and the shallow rooting depth of the rice plant.
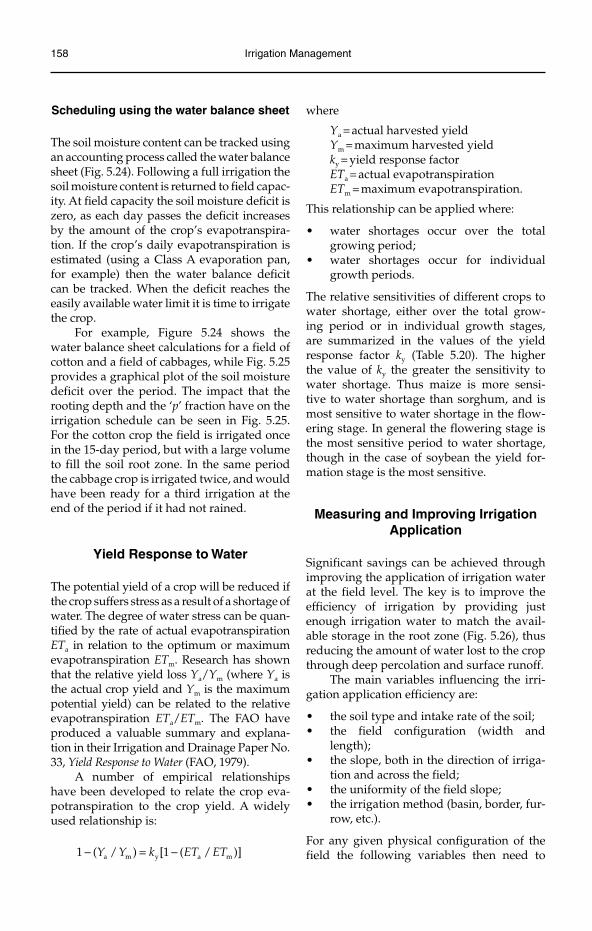
158 Irrigation Management
Scheduling using the water balance sheet
The soil moisture content can be tracked using an accounting process called the water balance sheet (Fig. 5.24). Following a full irrigation the soil moisture content is returned to field capac-ity. At field capacity the soil moisture deficit is zero, as each day passes the deficit increases by the amount of the crop’s evapotranspira-tion. If the crop’s daily evapotranspiration is estimated (using a Class A evaporation pan, for example) then the water balance deficit can be tracked. When the deficit reaches the easily available water limit it is time to irrigate the crop.
For example, Figure 5.24 shows the water balance sheet calculations for a field of cotton and a field of cabbages, while Fig. 5.25 provides a graphical plot of the soil moisture deficit over the period. The impact that the rooting depth and the ‘p’ fraction have on the irrigation schedule can be seen in Fig. 5.25. For the cotton crop the field is irrigated once in the 15-day period, but with a large volume to fill the soil root zone. In the same period the cabbage crop is irrigated twice, and would have been ready for a third irrigation at the end of the period if it had not rained.
Yield Response to Water
The potential yield of a crop will be reduced if the crop suffers stress as a result of a shortage of water. The degree of water stress can be quan-tified by the rate of actual evapotranspiration ETa in relation to the optimum or maximum evapotranspiration ETm. Research has shown that the relative yield loss Ya/Ym (where Ya is the actual crop yield and Ym is the maximum potential yield) can be related to the relative evapotranspiration ETa/ETm. The FAO have produced a valuable summary and explana-tion in their Irrigation and Drainage Paper No. 33, Yield Response to Water (FAO, 1979).
A number of empirical relationships have been developed to relate the crop eva-potranspiration to the crop yield. A widely used relationship is:
a m y a m1 ( / ) [1 ( / )]Y Y k ET ET− = −
where
Ya = actual harvested yieldYm = maximum harvested yieldky = yield response factorETa = actual evapotranspirationETm = maximum evapotranspiration.
This relationship can be applied where:
water shortages occur over the total •growing period;water shortages occur for individual •growth periods.
The relative sensitivities of different crops to water shortage, either over the total grow-ing period or in individual growth stages, are summarized in the values of the yield response factor ky (Table 5.20). The higher the value of ky the greater the sensitivity to water shortage. Thus maize is more sensi-tive to water shortage than sorghum, and is most sensitive to water shortage in the flow-ering stage. In general the flowering stage is the most sensitive period to water shortage, though in the case of soybean the yield for-mation stage is the most sensitive.
Measuring and Improving Irrigation Application
Significant savings can be achieved through improving the application of irrigation water at the field level. The key is to improve the efficiency of irrigation by providing just enough irrigation water to match the avail-able storage in the root zone (Fig. 5.26), thus reducing the amount of water lost to the crop through deep percolation and surface runoff.
The main variables influencing the irri-gation application efficiency are:
the soil type and intake rate of the soil;•the field configuration (width and •length);the slope, both in the direction of irriga-•tion and across the field;the uniformity of the field slope;•the irrigation method (basin, border, fur-•row, etc.).
For any given physical configuration of the field the following variables then need to
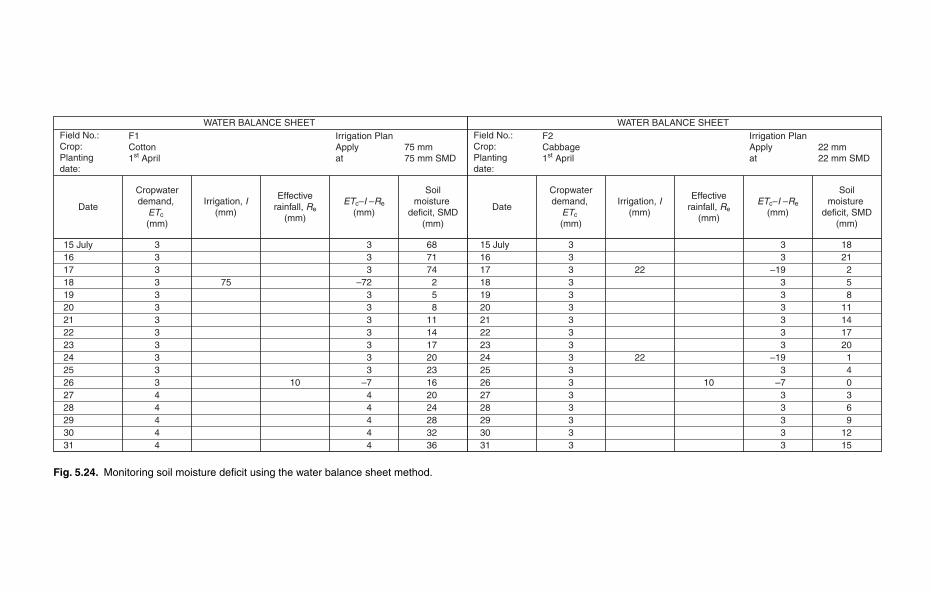
WATER BALANCE SHEET Field No.:Crop: Plantingdate:
F1Cotton1st April
Irrigation PlanApplyat
75 mm75 mm SMD
Date
Cropwaterdemand,
ETc
(mm)
Irrigation, I(mm)
Effectiverainfall, Re
(mm)
ETc–I –Re
(mm)
Soilmoisture
deficit, SMD(mm)
15 July 3 15 July 3 1816 3 16 3 2117 3 17 3 22 218 3 75 18 3 519 3 19 3 820 3 20 3 1121 3 21 3 1422 3 22 3 1723 3 23 3 2024 3 24 3 22 125 3 25 3 426 3 10 26 3 10 027 4 27 3 328 4 28 3 629 4 29 3 930 4 30 3 1231 4
333
–723333333
–744444
687174258
1114172023162024283236 31 3
33
–19333333
–193
–733333 15
WATER BALANCE SHEET Field No.:Crop: Plantingdate:
F2Cabbage1st April
Irrigation PlanApplyat
22 mm22 mm SMD
Date
Cropwaterdemand,
ETc
(mm)
Irrigation, I(mm)
Effectiverainfall, Re
(mm)
ETc–I –Re
(mm)
Soilmoisture
deficit, SMD(mm)
Fig. 5.24. Monitoring soil moisture deficit using the water balance sheet method.
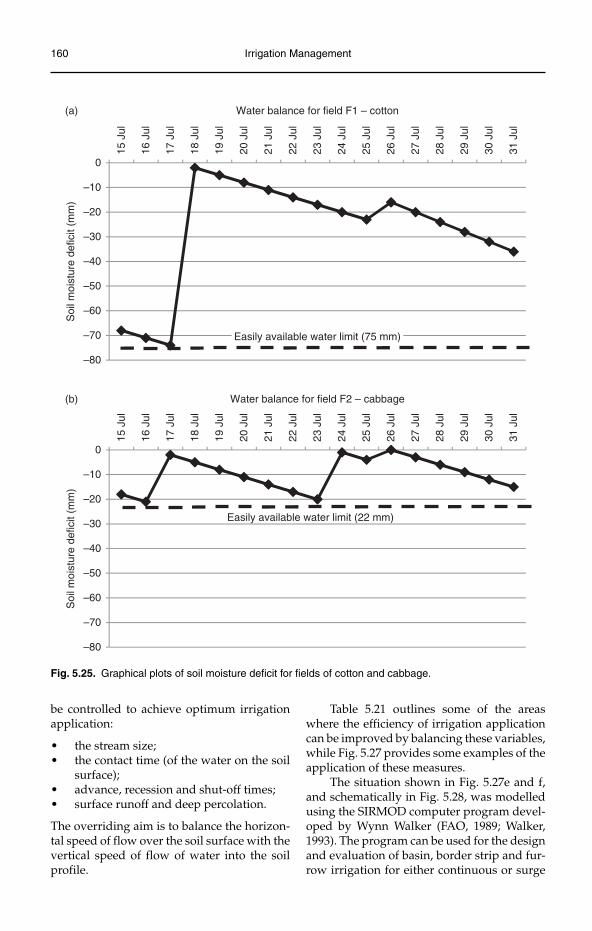
160 Irrigation Management
–80
–70
–60
–50
–40
–30
–20
–10
0
15 J
ul
16 J
ul
17 J
ul
18 J
ul
19 J
ul
20 J
ul
21 J
ul
22 J
ul
23 J
ul
24 J
ul
25 J
ul
26 J
ul
27 J
ul
28 J
ul
29 J
ul
30 J
ul
31 J
ul
15 J
ul
16 J
ul
17 J
ul
18 J
ul
19 J
ul
20 J
ul
21 J
ul
22 J
ul
23 J
ul
24 J
ul
25 J
ul
26 J
ul
27 J
ul
28 J
ul
29 J
ul
30 J
ul
31 J
ul
Soi
l moi
stur
e de
ficit
(mm
)
–80
–70
–60
–50
–40
–30
–20
–10
0
Soi
l moi
stur
e de
ficit
(mm
)
Water balance for field F1 – cotton(a)
(b) Water balance for field F2 – cabbage
Easily available water limit (22 mm)
Easily available water limit (75 mm)
Fig. 5.25. Graphical plots of soil moisture deficit for fields of cotton and cabbage.
be controlled to achieve optimum irrigation application:
the stream size;•the contact time (of the water on the soil •surface);advance, recession and shut-off times;•surface runoff and deep percolation.•
The overriding aim is to balance the horizon-tal speed of flow over the soil surface with the vertical speed of flow of water into the soil profile.
Table 5.21 outlines some of the areas where the efficiency of irrigation application can be improved by balancing these variables, while Fig. 5.27 provides some examples of the application of these measures.
The situation shown in Fig. 5.27e and f, and schematically in Fig. 5.28, was modelled using the SIRMOD computer program devel-oped by Wynn Walker (FAO, 1989; Walker, 1993). The program can be used for the design and evaluation of basin, border strip and fur-row irrigation for either continuous or surge
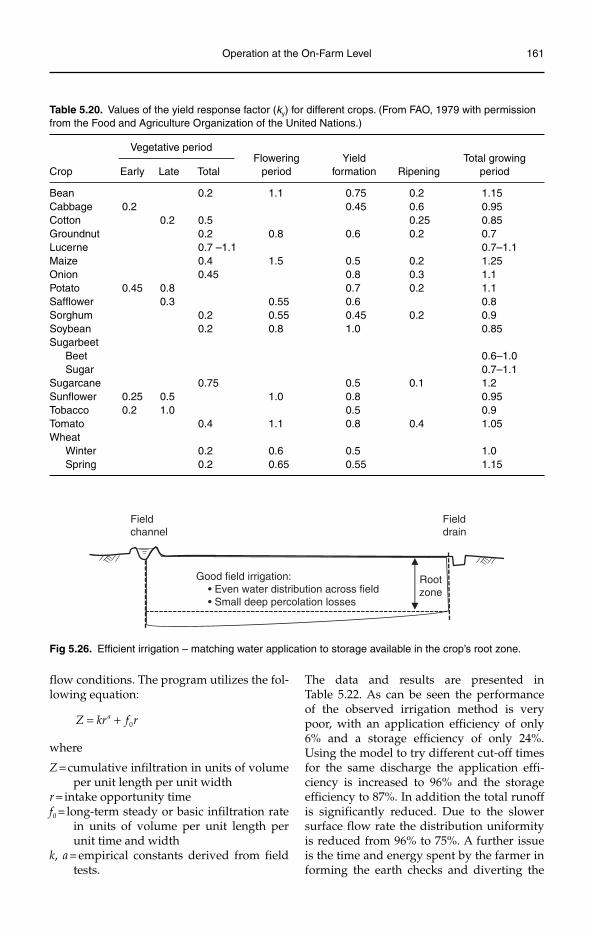
Operation at the On-Farm Level 161
Good field irrigation: • Even water distribution across field • Small deep percolation losses
Fieldchannel
Fielddrain
Rootzone
Fig 5.26. Efficient irrigation – matching water application to storage available in the crop’s root zone.
flow conditions. The program utilizes the fol-lowing equation:
0aZ kr f r= +
where
Z = cumulative infiltration in units of volume per unit length per unit width
r = intake opportunity timef0 = long-term steady or basic infiltration rate
in units of volume per unit length per unit time and width
k, a = empirical constants derived from field tests.
The data and results are presented in Table 5.22. As can be seen the performance of the observed irrigation method is very poor, with an application efficiency of only 6% and a storage efficiency of only 24%. Using the model to try different cut-off times for the same discharge the application effi-ciency is increased to 96% and the storage efficiency to 87%. In addition the total runoff is significantly reduced. Due to the slower surface flow rate the distribution uniformity is reduced from 96% to 75%. A further issue is the time and energy spent by the farmer in forming the earth checks and diverting the
Table 5.20. Values of the yield response factor (ky) for different crops. (From FAO, 1979 with permission from the Food and Agriculture Organization of the United Nations.)
Crop
Vegetative periodFlowering
periodYield
formation RipeningTotal growing
periodEarly Late Total
Bean 0.2 1.1 0.75 0.2 1.15Cabbage 0.2 0.45 0.6 0.95Cotton 0.2 0.5 0.25 0.85Groundnut 0.2 0.8 0.6 0.2 0.7Lucerne 0.7 –1.1 0.7–1.1Maize 0.4 1.5 0.5 0.2 1.25Onion 0.45 0.8 0.3 1.1Potato 0.45 0.8 0.7 0.2 1.1Safflower 0.3 0.55 0.6 0.8Sorghum 0.2 0.55 0.45 0.2 0.9Soybean 0.2 0.8 1.0 0.85Sugarbeet
Beet 0.6–1.0Sugar 0.7–1.1
Sugarcane 0.75 0.5 0.1 1.2Sunflower 0.25 0.5 1.0 0.8 0.95Tobacco 0.2 1.0 0.5 0.9Tomato 0.4 1.1 0.8 0.4 1.05Wheat
Winter 0.2 0.6 0.5 1.0Spring 0.2 0.65 0.55 1.15
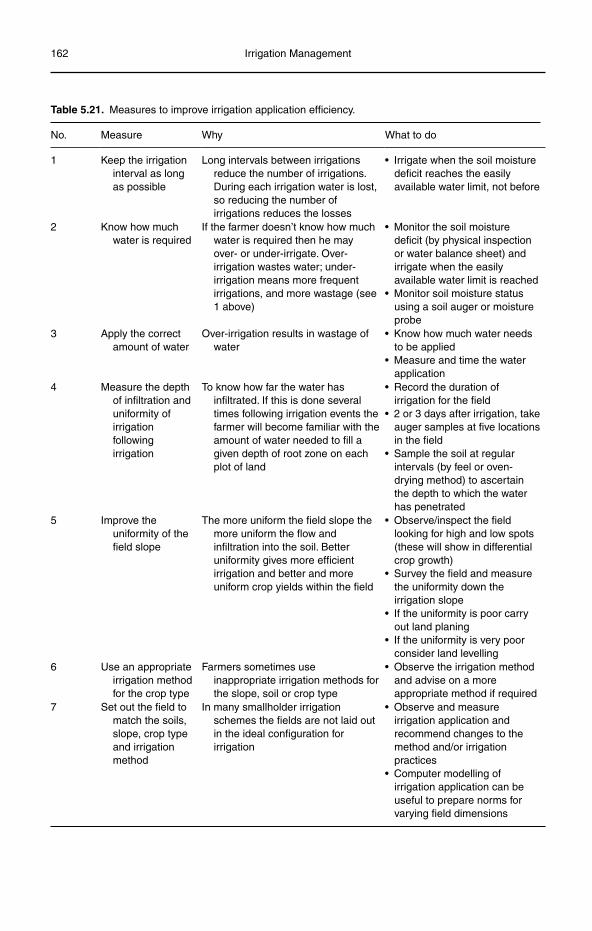
162 Irrigation Management
Table 5.21. Measures to improve irrigation application efficiency.
No. Measure Why What to do
1 Keep the irrigation interval as long as possible
Long intervals between irrigations reduce the number of irrigations. During each irrigation water is lost, so reducing the number of irrigations reduces the losses
• Irrigate when the soil moisture deficit reaches the easily available water limit, not before
2 Know how much water is required
If the farmer doesn’t know how much water is required then he may over- or under-irrigate. Over-irrigation wastes water; under-irrigation means more frequent irrigations, and more wastage (see 1 above)
• Monitor the soil moisture deficit (by physical inspection or water balance sheet) and irrigate when the easily available water limit is reached
• Monitor soil moisture status using a soil auger or moisture probe
3 Apply the correct amount of water
Over-irrigation results in wastage of water
• Know how much water needs to be applied
• Measure and time the water application
4 Measure the depth of infiltration and uniformity of irrigation following irrigation
To know how far the water has infiltrated. If this is done several times following irrigation events the farmer will become familiar with the amount of water needed to fill a given depth of root zone on each plot of land
• Record the duration of irrigation for the field
• 2 or 3 days after irrigation, take auger samples at five locations in the field
• Sample the soil at regular intervals (by feel or oven-drying method) to ascertain the depth to which the water has penetrated
5 Improve the uniformity of the field slope
The more uniform the field slope the more uniform the flow and infiltration into the soil. Better uniformity gives more efficient irrigation and better and more uniform crop yields within the field
• Observe/inspect the field looking for high and low spots (these will show in differential crop growth)
• Survey the field and measure the uniformity down the irrigation slope
• If the uniformity is poor carry out land planing
• If the uniformity is very poor consider land levelling
6 Use an appropriate irrigation method for the crop type
Farmers sometimes use inappropriate irrigation methods for the slope, soil or crop type
• Observe the irrigation method and advise on a more appropriate method if required
7 Set out the field to match the soils, slope, crop type and irrigation method
In many smallholder irrigation schemes the fields are not laid out in the ideal configuration for irrigation
• Observe and measure irrigation application and recommend changes to the method and/or irrigation practices
• Computer modelling of irrigation application can be useful to prepare norms for varying field dimensions
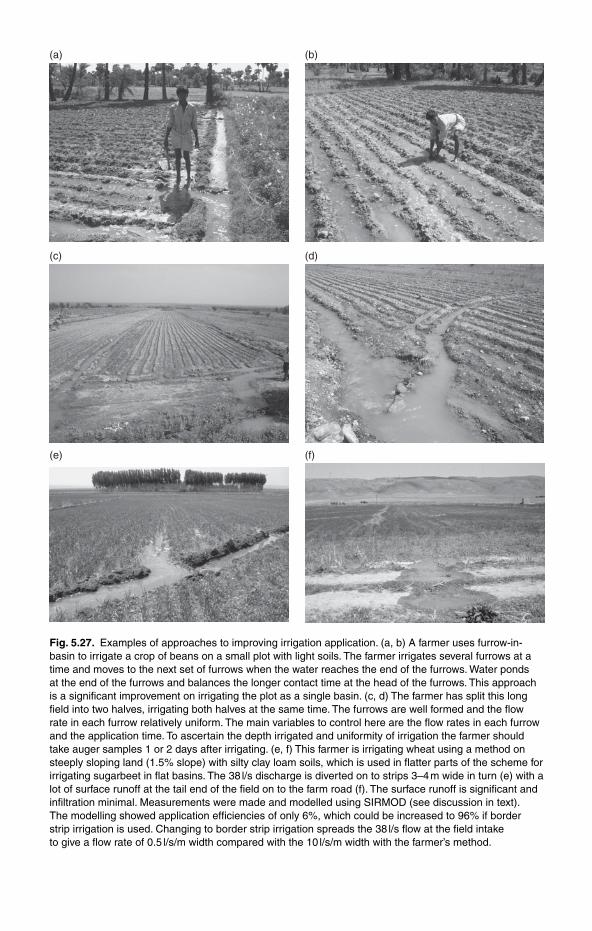
Fig. 5.27. Examples of approaches to improving irrigation application. (a, b) A farmer uses furrow-in-basin to irrigate a crop of beans on a small plot with light soils. The farmer irrigates several furrows at a time and moves to the next set of furrows when the water reaches the end of the furrows. Water ponds at the end of the furrows and balances the longer contact time at the head of the furrows. This approach is a significant improvement on irrigating the plot as a single basin. (c, d) The farmer has split this long field into two halves, irrigating both halves at the same time. The furrows are well formed and the flow rate in each furrow relatively uniform. The main variables to control here are the flow rates in each furrow and the application time. To ascertain the depth irrigated and uniformity of irrigation the farmer should take auger samples 1 or 2 days after irrigating. (e, f) This farmer is irrigating wheat using a method on steeply sloping land (1.5% slope) with silty clay loam soils, which is used in flatter parts of the scheme for irrigating sugarbeet in flat basins. The 38 l/s discharge is diverted on to strips 3–4 m wide in turn (e) with a lot of surface runoff at the tail end of the field on to the farm road (f). The surface runoff is significant and infiltration minimal. Measurements were made and modelled using SIRMOD (see discussion in text). The modelling showed application efficiencies of only 6%, which could be increased to 96% if border strip irrigation is used. Changing to border strip irrigation spreads the 38 l/s flow at the field intake to give a flow rate of 0.5 l/s/m width compared with the 10 l/s/m width with the farmer’s method.
(a) (b)
(c) (d)
(e) (f)
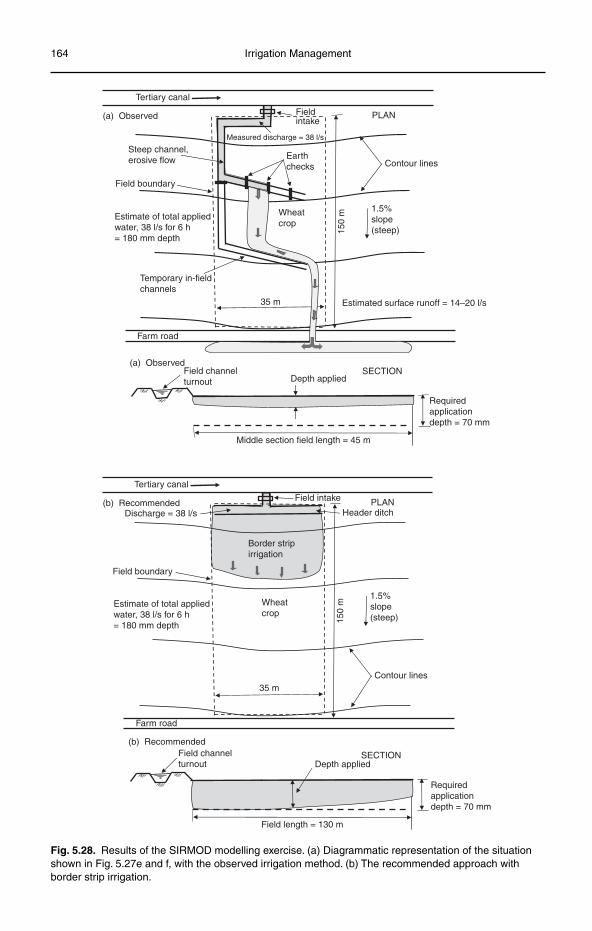
164 Irrigation Management
Fig. 5.28. Results of the SIRMOD modelling exercise. (a) Diagrammatic representation of the situation shown in Fig. 5.27e and f, with the observed irrigation method. (b) The recommended approach with border strip irrigation.
Depth appliedField channel turnout
Requiredapplicationdepth = 70 mm
Middle section field length = 45 m
SECTION(a) Observed
Estimated surface runoff = 14–20 l/s
1.5%slope(steep)
Steep channel,erosive flow
Fieldintake
Measured discharge = 38 l/s
Earth checks
Wheatcrop
Estimate of total appliedwater, 38 l/s for 6 h= 180 mm depth
Tertiary canal
35 m
150
mFarm road
(a) Observed
Field boundary
PLAN
Temporary in-fieldchannels
Contour lines
Depth appliedField channel turnout
Requiredapplicationdepth = 70 mm
Field length = 130 m
SECTION
(b) Recommended
1.5%slope(steep)
Field intake
Discharge = 38 l/s
Wheatcrop
Estimate of total applied water, 38 l/s for 6 h= 180 mm depth
Tertiary canal
35 m
150
m
Farm road
(b) Recommended
Field boundary
PLAN
Border stripirrigation
Header ditch
Contour lines
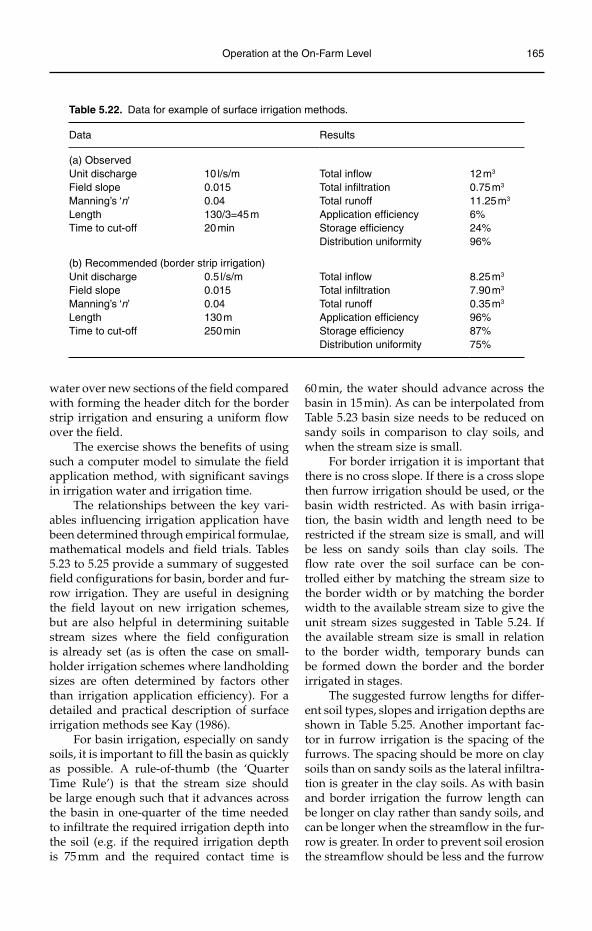
Operation at the On-Farm Level 165
Table 5.22. Data for example of surface irrigation methods.
Data Results
(a) ObservedUnit discharge 10 l/s/m Total inflow 12 m3
Field slope 0.015 Total infiltration 0.75 m3
Manning’s ‘n’ 0.04 Total runoff 11.25 m3
Length 130/3=45 m Application efficiency 6%Time to cut-off 20 min Storage efficiency 24%
Distribution uniformity 96%
(b) Recommended (border strip irrigation)Unit discharge 0.5 l/s/m Total inflow 8.25 m3
Field slope 0.015 Total infiltration 7.90 m3
Manning’s ‘n’ 0.04 Total runoff 0.35 m3
Length 130 m Application efficiency 96%Time to cut-off 250 min Storage efficiency 87%
Distribution uniformity 75%
water over new sections of the field compared with forming the header ditch for the border strip irrigation and ensuring a uniform flow over the field.
The exercise shows the benefits of using such a computer model to simulate the field application method, with significant savings in irrigation water and irrigation time.
The relationships between the key vari-ables influencing irrigation application have been determined through empirical formulae, mathematical models and field trials. Tables 5.23 to 5.25 provide a summary of suggested field configurations for basin, border and fur-row irrigation. They are useful in designing the field layout on new irrigation schemes, but are also helpful in determining suitable stream sizes where the field configuration is already set (as is often the case on small-holder irrigation schemes where landholding sizes are often determined by factors other than irrigation application efficiency). For a detailed and practical description of surface irrigation methods see Kay (1986).
For basin irrigation, especially on sandy soils, it is important to fill the basin as quickly as possible. A rule-of-thumb (the ‘Quarter Time Rule’) is that the stream size should be large enough such that it advances across the basin in one-quarter of the time needed to infiltrate the required irrigation depth into the soil (e.g. if the required irrigation depth is 75 mm and the required contact time is
60 min, the water should advance across the basin in 15 min). As can be interpolated from Table 5.23 basin size needs to be reduced on sandy soils in comparison to clay soils, and when the stream size is small.
For border irrigation it is important that there is no cross slope. If there is a cross slope then furrow irrigation should be used, or the basin width restricted. As with basin irriga-tion, the basin width and length need to be restricted if the stream size is small, and will be less on sandy soils than clay soils. The flow rate over the soil surface can be con-trolled either by matching the stream size to the border width or by matching the border width to the available stream size to give the unit stream sizes suggested in Table 5.24. If the available stream size is small in relation to the border width, temporary bunds can be formed down the border and the border irrigated in stages.
The suggested furrow lengths for differ-ent soil types, slopes and irrigation depths are shown in Table 5.25. Another important fac-tor in furrow irrigation is the spacing of the furrows. The spacing should be more on clay soils than on sandy soils as the lateral infiltra-tion is greater in the clay soils. As with basin and border irrigation the furrow length can be longer on clay rather than sandy soils, and can be longer when the streamflow in the fur-row is greater. In order to prevent soil erosion the streamflow should be less and the furrow
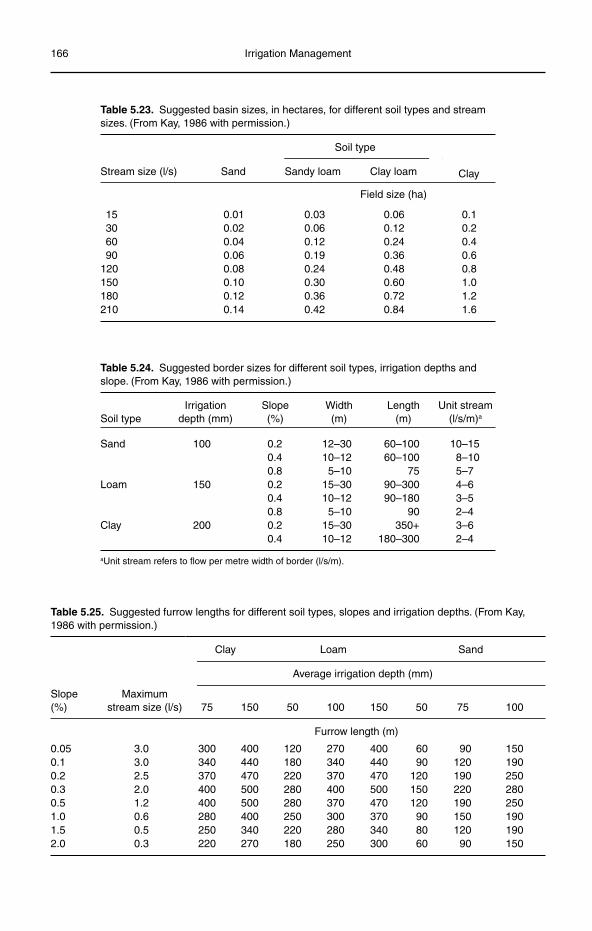
166 Irrigation Management
Table 5.24. Suggested border sizes for different soil types, irrigation depths and slope. (From Kay, 1986 with permission.)
Soil typeIrrigation
depth (mm)Slope(%)
Width(m)
Length(m)
Unit stream (l/s/m)a
Sand 100 0.2 12–30 60–100 10–150.4 10–12 60–100 8–100.8 5–10 75 5–7
Loam 150 0.2 15–30 90–300 4–60.4 10–12 90–180 3–50.8 5–10 90 2–4
Clay 200 0.2 15–30 350+ 3–6 0.4 10–12 180–300 2–4
aUnit stream refers to flow per metre width of border (l/s/m).
Table 5.23. Suggested basin sizes, in hectares, for different soil types and stream sizes. (From Kay, 1986 with permission.)
Soil type
Stream size (l/s) Sand Sandy loam Clay loam Clay
Field size (ha)
15 0.01 0.03 0.06 0.1 30 0.02 0.06 0.12 0.2 60 0.04 0.12 0.24 0.4 90 0.06 0.19 0.36 0.6120 0.08 0.24 0.48 0.8150 0.10 0.30 0.60 1.0180 0.12 0.36 0.72 1.2210 0.14 0.42 0.84 1.6
Table 5.25. Suggested furrow lengths for different soil types, slopes and irrigation depths. (From Kay, 1986 with permission.)
Clay Loam Sand
Average irrigation depth (mm)
Slope(%)
Maximum stream size (l/s) 75 150 50 100 150 50 75 100
Furrow length (m)
0.05 3.0 300 400 120 270 400 60 90 1500.1 3.0 340 440 180 340 440 90 120 1900.2 2.5 370 470 220 370 470 120 190 2500.3 2.0 400 500 280 400 500 150 220 2800.5 1.2 400 500 280 370 470 120 190 2501.0 0.6 280 400 250 300 370 90 150 1901.5 0.5 250 340 220 280 340 80 120 1902.0 0.3 220 270 180 250 300 60 90 150
Operation at the On-Farm Level 167
length shorter on steeper slopes. The avail-able flow can be divided into equal furrow flow sizes by use of a header ditch, such that a flow of, say, 15 l/s is divided into a furrow flow of 3 l/s for five furrows.
Determining irrigation application requirements
The following section outlines how the irri-gation application can be measured in the field. The technique is very straightforward. Measurements can be carried out by one team on two to three plots in 1 day.
The following equipment is required:
small measuring weir or flume;•measuring tape (30 or 50 m);•soil auger;•5 l bucket;•infiltrometer rings;•measuring flask;•stopwatch, or a watch with a seconds •hand;wooden pegs;•hammer.•
Approach
There are three parts to the process:
determination of the soil texture;•determination of the soil’s infiltration •characteristics;determination of the contact time and •infiltration amount on the field.
Part 1: Determine the soil texture
The starting point for irrigation is the soil tex-ture. The steps to be followed to determine soil texture are outlined below.
1. Take a sample of the soil and ascertain its textural class following the guidelines given in Fig. 5.2 or Box 5.1. Alternatively, send sam-ples of the soil to the laboratory for determi-nation of the textural class.2. Knowing the soil textural class determines the soil moisture characteristics – field capac-
ity, permanent wilting point and total avail-able soil water (see Table 5.1). Alternatively, these characteristics can be determined in the laboratory.3. Knowing the soil textural class ascertains the likely infiltration profile and rates (see Fig. 5.11 and Table 5.5).
Part 2: Determine the soil’s infiltration characteristics
The rate at which the water infiltrates into the soil governs the duration of irrigation and the irrigation stream size. The infiltration rate is relatively easy to ascertain as follows.
1. Set up the infiltration rings in the field. Locate the rings away from the top and tail ends of the field where the soil might have been compacted by farm equipment.2. Measure the infiltration rate and obtain the infiltration curve and the terminal infiltration rate.3. Repeat the test in at least two other loca-tions in the field to obtain an average for the field.4. Check that the figures are in the range pre-dicted for the soil texture (see Part 1 above).
Part 3: Determine the contact time and infiltration amount within the field
It is a relatively simple exercise to determine the contact time and amount of irrigation water infiltrated into the soil at different loca-tions in the field. The steps are outlined below and illustrated in Figure 5.29.
1. Locate a typical field that is ready for irrigation.2. Before the irrigation commences place pegs at regular measured intervals down the length of the field. Five measurement points are generally sufficient in the direction of irriga-tion, so if the field is 200 m long then the pegs should be spaced at 0, 50, 100, 150, 200 m. At least three lines of pegs should be set out in the field, and measurements taken along each line to get the average for the field. With furrow irrigation fields are often irrigated in blocks of five to ten furrows at a time, therefore set up lines of pegs in three separate blocks.
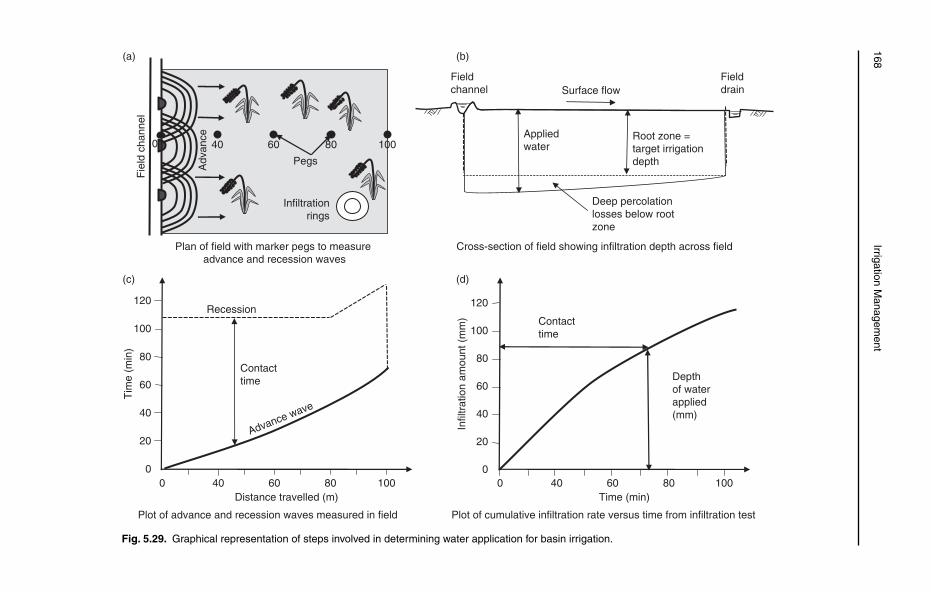
168 Irrigation M
anagement
Fig. 5.29. Graphical representation of steps involved in determining water application for basin irrigation.
Plan of field with marker pegs to measure advance and recession waves
(c)
(a)
(d)
(b)
Infiltrationrings
Fie
ld c
hann
el
Adv
ance
0 10040 60 80
Pegs
Fieldchannel
FielddrainSurface flow
Appliedwater
Root zone = target irrigationdepth
Deep percolationlosses below rootzone
Cross-section of field showing infiltration depth across field
0
Distance travelled (m)
20
40
Tim
e (m
in)
60
80
100
120
Contacttime
Recession
Advance wave
0 10040 60 80
Plot of advance and recession waves measured in field
Infil
trat
ion
amou
nt (
mm
) Contacttime
Time (min)0 10040 60 80
Depthof waterapplied(mm)
0
20
40
60
80
100
120
Plot of cumulative infiltration rate versus time from infiltration test
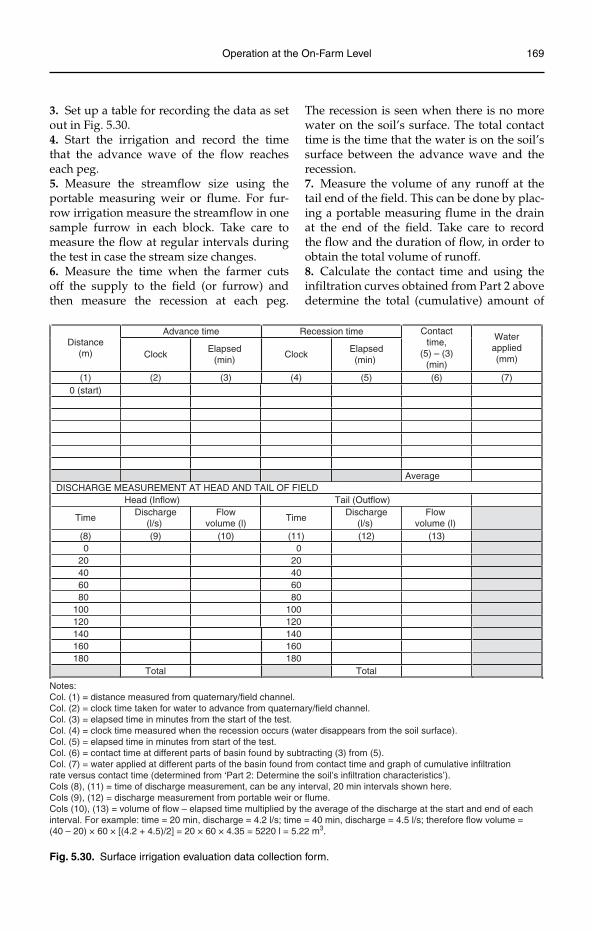
Operation at the On-Farm Level 169
Advance time Recession timeDistance
(m) ClockElapsed
(min)Clock
Elapsed(min)
Contacttime,
(5) – (3)(min)
Waterapplied(mm)
(1) (2) (3) (4) (5) (6) (7)0 (start)
AverageDISCHARGE MEASUREMENT AT HEAD AND TAIL OF FIELD
Tail (Outflow)Head (Inflow)
TimeDischarge
(l/s)Flow
volume (l)Time
Discharge(l/s)
Flowvolume (l)
(8) (9) (10) (11) (12) (13)0
20406080
100120140160180
020406080
100120140160180
Total Total
Notes:Col. (1) = distance measured from quaternary/field channel.Col. (2) = clock time taken for water to advance from quaternary/field channel. Col. (3) = elapsed time in minutes from the start of the test. Col. (4) = clock time measured when the recession occurs (water disappears from the soil surface). Col. (5) = elapsed time in minutes from start of the test. Col. (6) = contact time at different parts of basin found by subtracting (3) from (5). Col. (7) = water applied at different parts of the basin found from contact time and graph of cumulative infiltration rate versus contact time (determined from ‘Part 2: Determine the soil’s infiltration characteristics’). Cols (8), (11) = time of discharge measurement, can be any interval, 20 min intervals shown here. Cols (9), (12) = discharge measurement from portable weir or flume. Cols (10), (13) = volume of flow – elapsed time multiplied by the average of the discharge at the start and end of eachinterval. For example: time = 20 min, discharge = 4.2 l/s; time = 40 min, discharge = 4.5 l/s; therefore flow volume =(40 – 20) × 60 × [(4.2 + 4.5)/2] = 20 × 60 × 4.35 = 5220 l = 5.22 m3.
Fig. 5.30. Surface irrigation evaluation data collection form.
3. Set up a table for recording the data as set out in Fig. 5.30.4. Start the irrigation and record the time that the advance wave of the flow reaches each peg.5. Measure the streamflow size using the portable measuring weir or flume. For fur-row irrigation measure the streamflow in one sample furrow in each block. Take care to measure the flow at regular intervals during the test in case the stream size changes.6. Measure the time when the farmer cuts off the supply to the field (or furrow) and then measure the recession at each peg.
The recession is seen when there is no more water on the soil’s surface. The total contact time is the time that the water is on the soil’s surface between the advance wave and the recession.7. Measure the volume of any runoff at the tail end of the field. This can be done by plac-ing a portable measuring flume in the drain at the end of the field. Take care to record the flow and the duration of flow, in order to obtain the total volume of runoff.8. Calculate the contact time and using the infiltration curves obtained from Part 2 above determine the total (cumulative) amount of
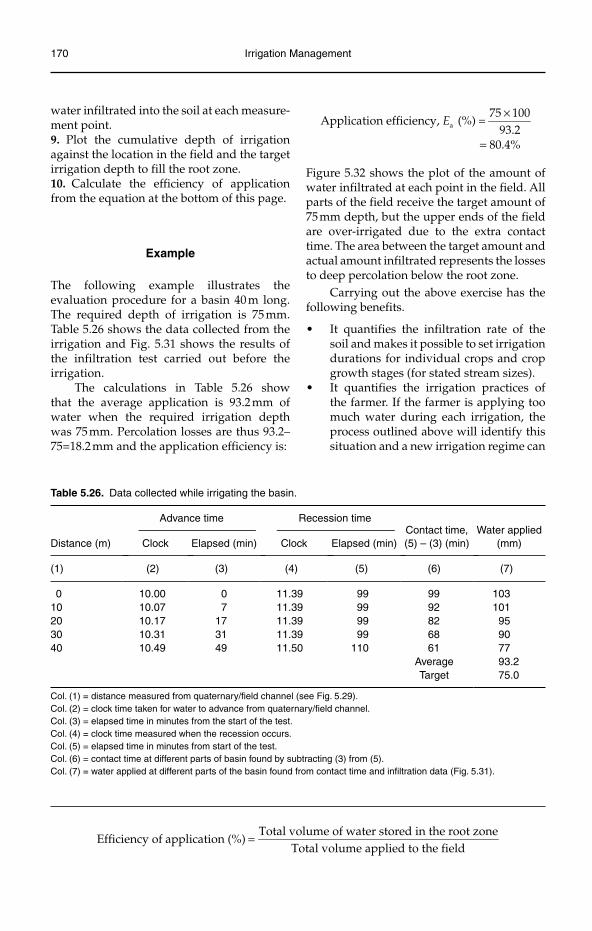
170 Irrigation Management
water infiltrated into the soil at each measure-ment point.9. Plot the cumulative depth of irrigation against the location in the field and the target irrigation depth to fill the root zone.10. Calculate the efficiency of application from the equation at the bottom of this page.
Example
The following example illustrates the evaluation procedure for a basin 40 m long. The requ ired depth of irrigation is 75 mm. Table 5.26 shows the data collected from the irrigation and Fig. 5.31 shows the results of the infiltration test carried out before the irrigation.
The calculations in Table 5.26 show that the average application is 93.2 mm of water when the required irrigation depth was 75 mm. Percolation losses are thus 93.2–75=18.2 mm and the application efficiency is:
×
=
a
75 100Application efficiency, (%) =
93.280.4%
E
Figure 5.32 shows the plot of the amount of water infiltrated at each point in the field. All parts of the field receive the target amount of 75 mm depth, but the upper ends of the field are over-irrigated due to the extra contact time. The area between the target amount and actual amount infiltrated represents the losses to deep percolation below the root zone.
Carrying out the above exercise has the following benefits.
It quantifies the infiltration rate of the •soil and makes it possible to set irrigation durations for individual crops and crop growth stages (for stated stream sizes).It quantifies the irrigation practices of •the farmer. If the farmer is applying too much water during each irrigation, the process outlined above will identify this situation and a new irrigation regime can
Table 5.26. Data collected while irrigating the basin.
Distance (m)
Advance time Recession timeContact time, (5) – (3) (min)
Water applied (mm)Clock Elapsed (min) Clock Elapsed (min)
(1) (2) (3) (4) (5) (6) (7)
0 10.00 0 11.39 99 99 10310 10.07 7 11.39 99 92 10120 10.17 17 11.39 99 82 9530 10.31 31 11.39 99 68 9040 10.49 49 11.50 110 61 77
Average 93.2Target 75.0
Col. (1) = distance measured from quaternary/field channel (see Fig. 5.29).Col. (2) = clock time taken for water to advance from quaternary/field channel.Col. (3) = elapsed time in minutes from the start of the test.Col. (4) = clock time measured when the recession occurs.Col. (5) = elapsed time in minutes from start of the test.Col. (6) = contact time at different parts of basin found by subtracting (3) from (5).Col. (7) = water applied at different parts of the basin found from contact time and infiltration data (Fig. 5.31).
Total volume of water stored in the root zoneEfficiency of application (%)
Total volume applied to the field=
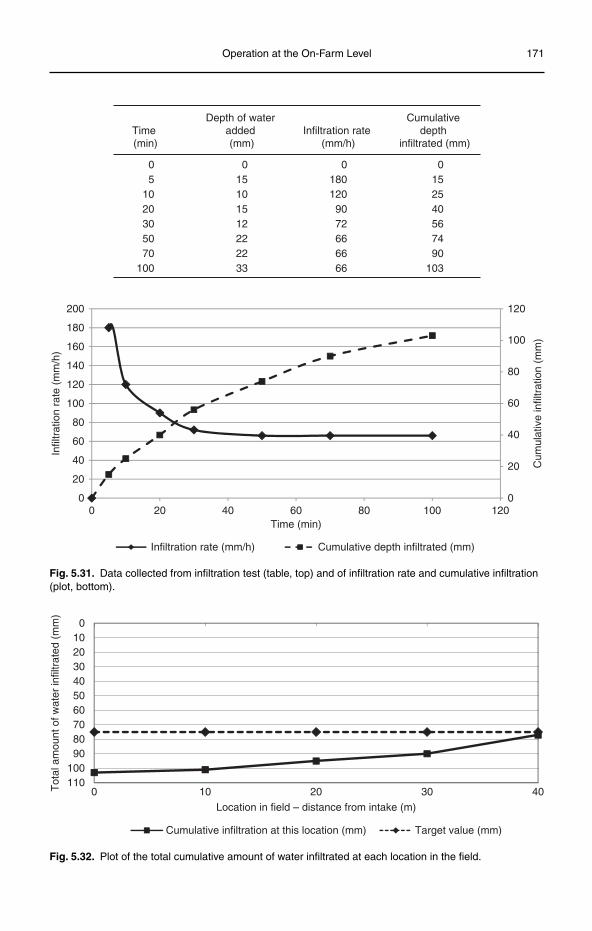
Operation at the On-Farm Level 171
Time(min)
Depth of water added(mm)
Infiltration rate (mm/h)
Cumulativedepth
infiltrated (mm)
05
1020305070
100
015101512222233
01801209072666666
0152540567490
103
0
20
40
60
80
100
120
0
20
40
60
80
100
120
140
160
180
200
Cum
ulat
ive
infil
trat
ion
(mm
)
Infil
trat
ion
rate
(m
m/h
)
0 20 40 60Time (min)
80 100 120
Infiltration rate (mm/h) Cumulative depth infiltrated (mm)
Fig. 5.31. Data collected from infiltration test (table, top) and of infiltration rate and cumulative infiltration (plot, bottom).
0102030405060708090
100110
403020100Tot
al a
mou
nt o
f wat
er in
filtr
ated
(m
m)
Location in field – distance from intake (m)
Cumulative infiltration at this location (mm) Target value (mm)
Fig. 5.32. Plot of the total cumulative amount of water infiltrated at each location in the field.
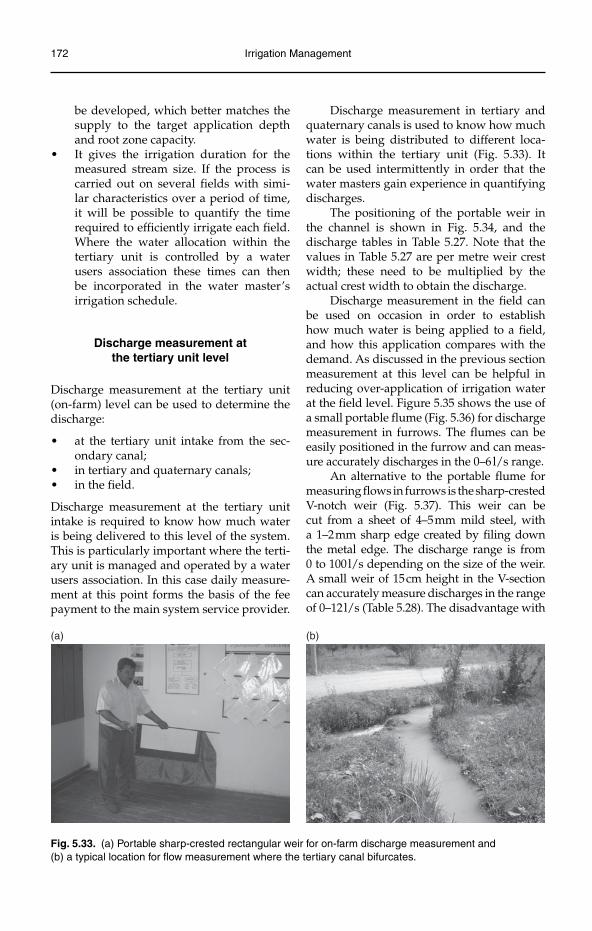
172 Irrigation Management
Fig. 5.33. (a) Portable sharp-crested rectangular weir for on-farm discharge measurement and (b) a typical location for flow measurement where the tertiary canal bifurcates.
(a) (b)
be developed, which better matches the supply to the target application depth and root zone capacity.It gives the irrigation duration for the •measured stream size. If the process is carried out on several fields with simi-lar characteristics over a period of time, it will be possible to quantify the time required to efficiently irrigate each field. Where the water allocation within the tertiary unit is controlled by a water users association these times can then be incorporated in the water master’s irrigation schedule.
Discharge measurement at the tertiary unit level
Discharge measurement at the tertiary unit (on-farm) level can be used to determine the discharge:
at the tertiary unit intake from the sec-•ondary canal;in tertiary and quaternary canals;•in the field.•
Discharge measurement at the tertiary unit intake is required to know how much water is being delivered to this level of the system. This is particularly important where the terti-ary unit is managed and operated by a water users association. In this case daily measure-ment at this point forms the basis of the fee payment to the main system service provider.
Discharge measurement in tertiary and quaternary canals is used to know how much water is being distributed to different loca-tions within the tertiary unit (Fig. 5.33). It can be used intermittently in order that the water masters gain experience in quantifying discharges.
The positioning of the portable weir in the channel is shown in Fig. 5.34, and the discharge tables in Table 5.27. Note that the values in Table 5.27 are per metre weir crest width; these need to be multiplied by the actual crest width to obtain the discharge.
Discharge measurement in the field can be used on occasion in order to establish how much water is being applied to a field, and how this application compares with the demand. As discussed in the previous section measurement at this level can be helpful in reducing over-application of irrigation water at the field level. Figure 5.35 shows the use of a small portable flume (Fig. 5.36) for discharge measurement in furrows. The flumes can be easily positioned in the furrow and can meas-ure accurately discharges in the 0–6 l/s range.
An alternative to the portable flume for measuring flows in furrows is the sharp-crested V-notch weir (Fig. 5.37). This weir can be cut from a sheet of 4–5 mm mild steel, with a 1–2 mm sharp edge created by filing down the metal edge. The discharge range is from 0 to 100 l/s depending on the size of the weir. A small weir of 15 cm height in the V-section can accurately measure discharges in the range of 0–12 l/s (Table 5.28). The disadvantage with
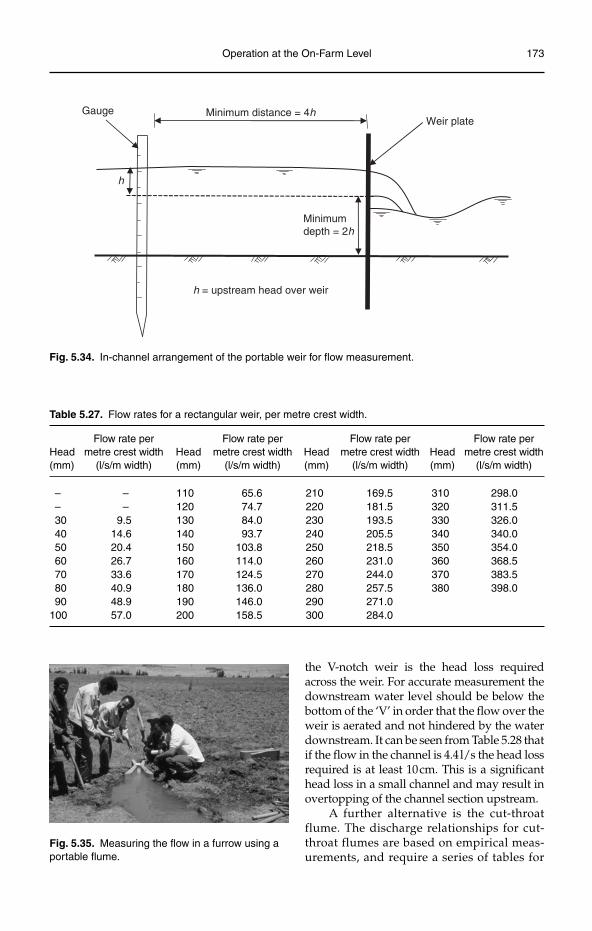
Operation at the On-Farm Level 173
GaugeWeir plate
Minimumdepth = 2h
h
Minimum distance = 4h
h = upstream head over weir
Fig. 5.34. In-channel arrangement of the portable weir for flow measurement.
Table 5.27. Flow rates for a rectangular weir, per metre crest width.
Head(mm)
Flow rate per metre crest width
(l/s/m width)Head(mm)
Flow rate per metre crest width
(l/s/m width)Head(mm)
Flow rate per metre crest width
(l/s/m width)Head(mm)
Flow rate per metre crest width
(l/s/m width)
– – 110 65.6 210 169.5 310 298.0 – – 120 74.7 220 181.5 320 311.5 30 9.5 130 84.0 230 193.5 330 326.0 40 14.6 140 93.7 240 205.5 340 340.0 50 20.4 150 103.8 250 218.5 350 354.0 60 26.7 160 114.0 260 231.0 360 368.5 70 33.6 170 124.5 270 244.0 370 383.5 80 40.9 180 136.0 280 257.5 380 398.0 90 48.9 190 146.0 290 271.0100 57.0 200 158.5 300 284.0
Fig. 5.35. Measuring the flow in a furrow using a portable flume.
the V-notch weir is the head loss required across the weir. For accurate measurement the downstream water level should be below the bottom of the ‘V’ in order that the flow over the weir is aerated and not hindered by the water downstream. It can be seen from Table 5.28 that if the flow in the channel is 4.4 l/s the head loss required is at least 10 cm. This is a significant head loss in a small channel and may result in overtopping of the channel section upstream.
A further alternative is the cut-throat flume. The discharge relationships for cut-throat flumes are based on empirical meas-urements, and require a series of tables for
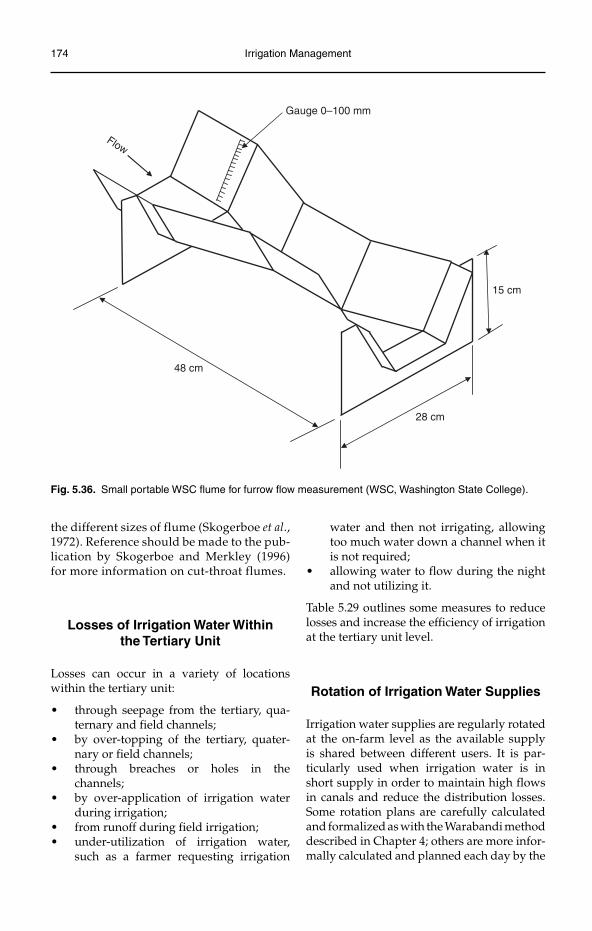
174 Irrigation Management
the different sizes of flume (Skogerboe et al., 1972). Reference should be made to the pub-lication by Skogerboe and Merkley (1996) for more information on cut-throat flumes.
Losses of Irrigation Water Within the Tertiary Unit
Losses can occur in a variety of locations within the tertiary unit:
through seepage from the tertiary, qua-•ternary and field channels;by over-topping of the tertiary, quater-•nary or field channels;through breaches or holes in the •channels;by over-application of irrigation water •during irrigation;from runoff during field irrigation;•under-utilization of irrigation water, •such as a farmer requesting irrigation
water and then not irrigating, allowing too much water down a channel when it is not required;allowing water to flow during the night •and not utilizing it.
Table 5.29 outlines some measures to reduce losses and increase the efficiency of irrigation at the tertiary unit level.
Rotation of Irrigation Water Supplies
Irrigation water supplies are regularly rotated at the on-farm level as the available supply is shared between different users. It is par-ticularly used when irrigation water is in short supply in order to maintain high flows in canals and reduce the distribution losses. Some rotation plans are carefully calculated and formalized as with the Warabandi method described in Chapter 4; others are more infor-mally calculated and planned each day by the
15 cm
28 cm
Flow
Gauge 0–100 mm
48 cm
Fig. 5.36. Small portable WSC flume for furrow flow measurement (WSC, Washington State College).
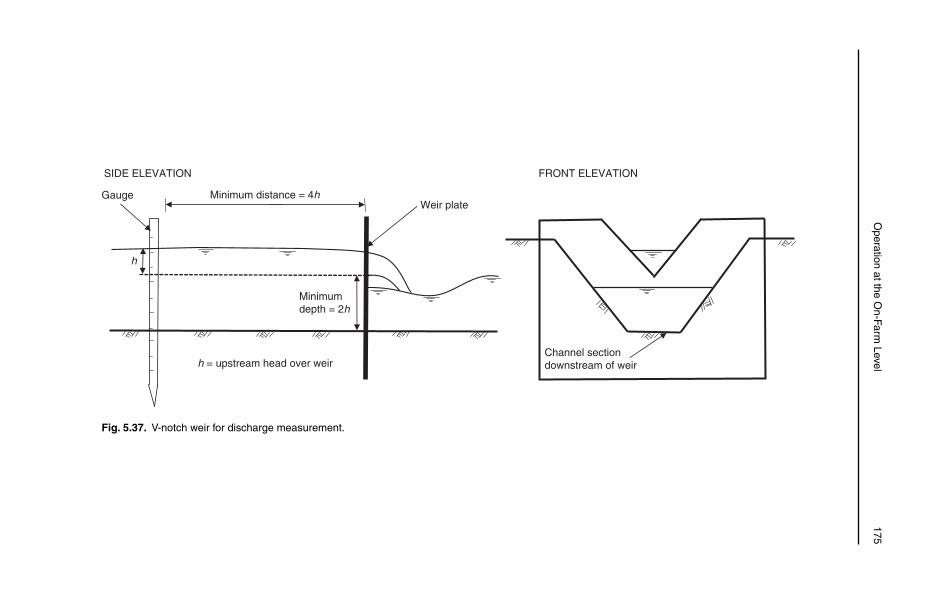
O
peration at the On-Farm
Level 175
Fig. 5.37. V-notch weir for discharge measurement.
GaugeWeir plate
Minimumdepth = 2h
h
Minimum distance = 4h
h = upstream head over weir
SIDE ELEVATION FRONT ELEVATION
Channel section downstream of weir
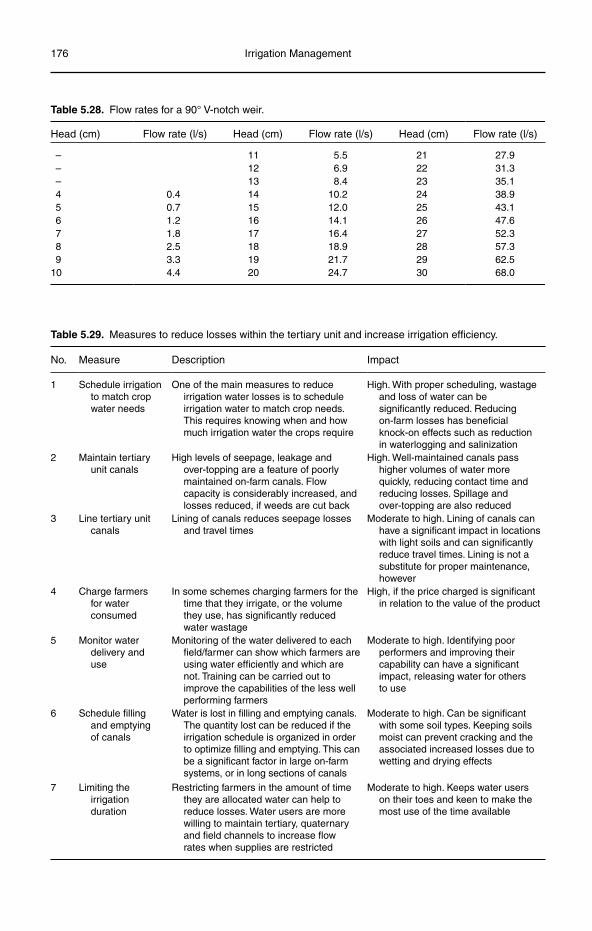
176 Irrigation Management
Table 5.28. Flow rates for a 90° V-notch weir.
Head (cm) Flow rate (l/s) Head (cm) Flow rate (l/s) Head (cm) Flow rate (l/s)
– 11 5.5 21 27.9 – 12 6.9 22 31.3 – 13 8.4 23 35.1 4 0.4 14 10.2 24 38.9 5 0.7 15 12.0 25 43.1 6 1.2 16 14.1 26 47.6 7 1.8 17 16.4 27 52.3 8 2.5 18 18.9 28 57.3 9 3.3 19 21.7 29 62.510 4.4 20 24.7 30 68.0
Table 5.29. Measures to reduce losses within the tertiary unit and increase irrigation efficiency.
No. Measure Description Impact
1 Schedule irrigation to match crop water needs
One of the main measures to reduce irrigation water losses is to schedule irrigation water to match crop needs. This requires knowing when and how much irrigation water the crops require
High. With proper scheduling, wastage and loss of water can be significantly reduced. Reducing on-farm losses has beneficial knock-on effects such as reduction in waterlogging and salinization
2 Maintain tertiary unit canals
High levels of seepage, leakage and over-topping are a feature of poorly maintained on-farm canals. Flow capacity is considerably increased, and losses reduced, if weeds are cut back
High. Well-maintained canals pass higher volumes of water more quickly, reducing contact time and reducing losses. Spillage and over-topping are also reduced
3 Line tertiary unit canals
Lining of canals reduces seepage losses and travel times
Moderate to high. Lining of canals can have a significant impact in locations with light soils and can significantly reduce travel times. Lining is not a substitute for proper maintenance, however
4 Charge farmers for water consumed
In some schemes charging farmers for the time that they irrigate, or the volume they use, has significantly reduced water wastage
High, if the price charged is significant in relation to the value of the product
5 Monitor water delivery and use
Monitoring of the water delivered to each field/farmer can show which farmers are using water efficiently and which are not. Training can be carried out to improve the capabilities of the less well performing farmers
Moderate to high. Identifying poor performers and improving their capability can have a significant impact, releasing water for others to use
6 Schedule filling and emptying of canals
Water is lost in filling and emptying canals. The quantity lost can be reduced if the irrigation schedule is organized in order to optimize filling and emptying. This can be a significant factor in large on-farm systems, or in long sections of canals
Moderate to high. Can be significant with some soil types. Keeping soils moist can prevent cracking and the associated increased losses due to wetting and drying effects
7 Limiting the irrigation duration
Restricting farmers in the amount of time they are allocated water can help to reduce losses. Water users are more willing to maintain tertiary, quaternary and field channels to increase flow rates when supplies are restricted
Moderate to high. Keeps water users on their toes and keen to make the most use of the time available
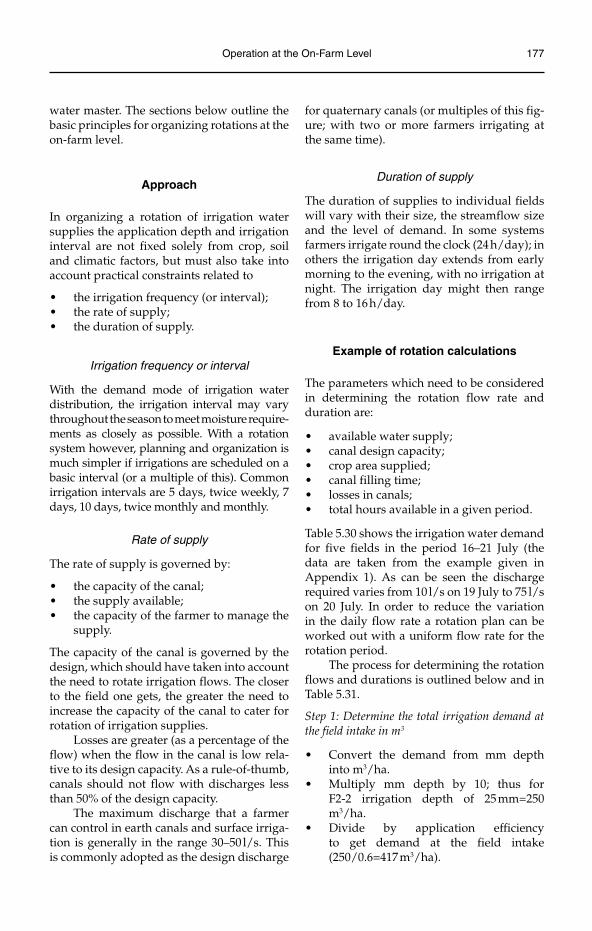
Operation at the On-Farm Level 177
water master. The sections below outline the basic principles for organizing rotations at the on-farm level.
Approach
In organizing a rotation of irrigation water supplies the application depth and irrigation interval are not fixed solely from crop, soil and climatic factors, but must also take into account practical constraints related to
the irrigation frequency (or interval);•the rate of supply;•the duration of supply.•
Irrigation frequency or interval
With the demand mode of irrigation water distribution, the irrigation interval may vary throughout the season to meet moisture require-ments as closely as possible. With a rotation system however, planning and organization is much simpler if irrigations are scheduled on a basic interval (or a multiple of this). Common irrigation intervals are 5 days, twice weekly, 7 days, 10 days, twice monthly and monthly.
Rate of supply
The rate of supply is governed by:
the capacity of the canal;•the supply available;•the capacity of the farmer to manage the •supply.
The capacity of the canal is governed by the design, which should have taken into account the need to rotate irrigation flows. The closer to the field one gets, the greater the need to increase the capacity of the canal to cater for rotation of irrigation supplies.
Losses are greater (as a percentage of the flow) when the flow in the canal is low rela-tive to its design capacity. As a rule-of-thumb, canals should not flow with discharges less than 50% of the design capacity.
The maximum discharge that a farmer can control in earth canals and surface irriga-tion is generally in the range 30–50 l/s. This is commonly adopted as the design discharge
for quaternary canals (or multiples of this fig-ure; with two or more farmers irrigating at the same time).
Duration of supply
The duration of supplies to individual fields will vary with their size, the streamflow size and the level of demand. In some systems farmers irrigate round the clock (24 h/day); in others the irrigation day extends from early morning to the evening, with no irrigation at night. The irrigation day might then range from 8 to 16 h/day.
Example of rotation calculations
The parameters which need to be considered in determining the rotation flow rate and duration are:
available water supply;•canal design capacity;•crop area supplied;•canal filling time;•losses in canals;•total hours available in a given period.•
Table 5.30 shows the irrigation water demand for five fields in the period 16–21 July (the data are taken from the example given in Appendix 1). As can be seen the discharge required varies from 10 l/s on 19 July to 75 l/s on 20 July. In order to reduce the variation in the daily flow rate a rotation plan can be worked out with a uniform flow rate for the rotation period.
The process for determining the rotation flows and durations is outlined below and in Table 5.31.
Step 1: Determine the total irrigation demand at the field intake in m3
Convert the demand from mm depth •into m3/ha.Multiply mm depth by 10; thus for •F2-2 irrigation depth of 25 mm=250 m3/ha.Divide by application efficiency •to get demand at the field intake (250/0.6=417 m3/ha).
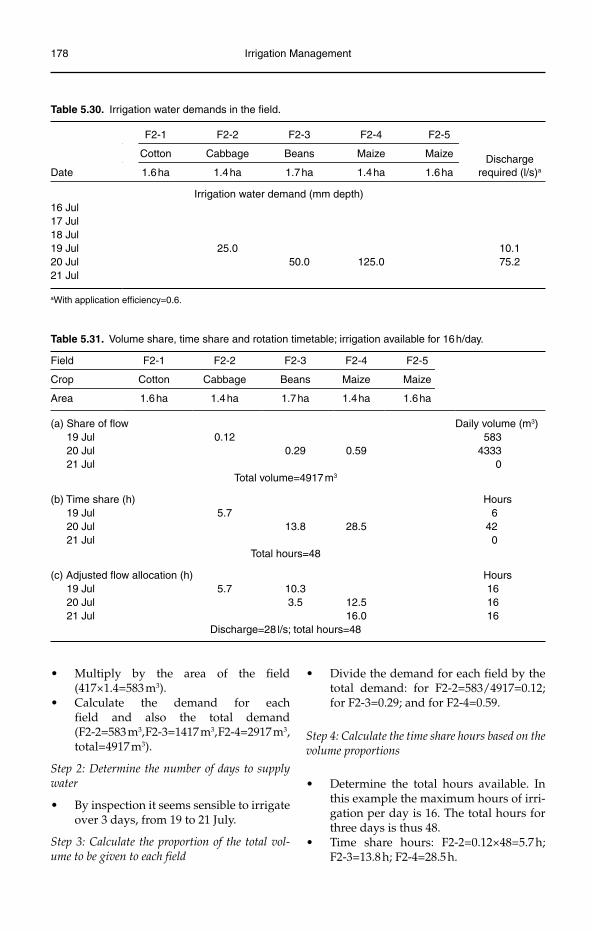
178 Irrigation Management
Table 5.31. Volume share, time share and rotation timetable; irrigation available for 16 h/day.
Field F2-1 F2-2 F2-3 F2-4 F2-5
Crop Cotton Cabbage Beans Maize Maize
Area 1.6 ha 1.4 ha 1.7 ha 1.4 ha 1.6 ha
(a) Share of flow Daily volume (m3)19 Jul 0.12 58320 Jul 0.29 0.59 433321 Jul 0
Total volume=4917 m3
(b) Time share (h) Hours19 Jul 5.7 620 Jul 13.8 28.5 4221 Jul 0
Total hours=48
(c) Adjusted flow allocation (h) Hours19 Jul 5.7 10.3 1620 Jul 3.5 12.5 1621 Jul 16.0 16
Discharge=28 l/s; total hours=48
Table 5.30. Irrigation water demands in the field.
Date
F2-1 F2-2 F2-3 F2-4 F2-5
Dischargerequired (l/s)a
Cotton Cabbage Beans Maize Maize
1.6 ha 1.4 ha 1.7 ha 1.4 ha 1.6 ha
Irrigation water demand (mm depth)16 Jul17 Jul18 Jul19 Jul 25.0 10.120 Jul 50.0 125.0 75.221 Jul
aWith application efficiency=0.6.
Multiply by the area of the field •(417×1.4=583 m3).Calculate the demand for each •field and also the total demand (F2-2=583 m3, F2-3=1417 m3, F2-4=2917 m3,total=4917 m3).
Step 2: Determine the number of days to supply water
By inspection it seems sensible to irrigate •over 3 days, from 19 to 21 July.
Step 3: Calculate the proportion of the total vol-ume to be given to each field
Divide the demand for each field by the •total demand: for F2-2=583/4917=0.12; for F2-3=0.29; and for F2-4=0.59.
Step 4: Calculate the time share hours based on the volume proportions
Determine the total hours available. In •this example the maximum hours of irri-gation per day is 16. The total hours for three days is thus 48.Time share hours: F2-2=0.12×48=5.7 h; •F2-3=13.8 h; F2-4=28.5 h.
Operation at the On-Farm Level 179
Step 5: Calculate the flow rate required during the rotation period
Flow rate, • Q=volume/time; thus Q=4917×1000/(48×3600)=28.5 l/s.
Step 6: Adjust the time share over the 3 days, with a maximum of 16 h/day
There is no set formula for this; it is a •question of looking at the relative deliv-ery volumes and time shares and decid-ing how to split the flow.
In this case: on day 1 irrigate F2-2 for •5.7 h and F2-3 for 10.3 h; on day 2 irrigate F2-3 for 3.5 h and F2-4 for 12.5 h; on day 3 irrigate F2-4 for 16 h.
Step 7: Check that the volumes delivered match those required
Multiply the flow rate by the flow dur-•ation; thus for F2-2 = 28.5×5.7×3600/1000 = 583 m3. Correct value.
Endnote
1 The potential evapotranspiration rate is the rate at which the crop will consume water when sufficient water is available in the crop’s root zone.
180 ©Martin Burton 2010. Irrigation Management: Principles and Practices (Martin Burton)
6
Maintenance
This chapter details processes and procedures for identifying, planning, costing, prioritizing, implementing and recording maintenance work on irrigation and drainage systems (I&D systems). Maintenance needs are dis-cussed and the maintenance cycle detailed with its component parts. Typical mainte-nance machinery and equipment are identi-fied. The increasingly important topic of asset management is introduced and a detailed account given of the processes and proce-dures involved.
Introduction
The need for maintenance
An I&D system which is inadequately main-tained will fall into disrepair. Gates will become inoperable, measuring structures will drown out, canals and drains will silt up, veg-etation will block canals and drains, canals will overtop and breach. As a result irrigation water supplies will become irregular, unreli-able, untimely, inadequate and uncontrolled. Drainage water removal will be hindered, leading to a rise in the groundwater table and salinization. The ultimate consequences of a lack of maintenance are a reduction in crop yields and overall crop production, leading to
a reduction in farmers’ incomes and the abil-ity to pay the service fees (Fig. 6.1).
Unless preventative action is taken an I&D system will deteriorate over time as a result of natural forces, as well as from human and animal activities. The forces acting on the physical infrastructure include: rainfall; wind; erosion by surface runoff, flow of water in canals and drains; transportation and deposi-tion of silt in rivers, canals and drains; vegeta-tive growth in and around canals, drains and structures; rodents and burrowing animals (in embankments); human and animal traffic across canals and drains; corrosion and rust-ing of gates; biological degradation of organic matter (e.g. wooden gates); thermal expan-sion and contraction.
The main reason why this natural process of deterioration is allowed to occur unchecked is often the lack of adequate funds for mainte-nance. It is not the only cause, however. Other factors include: a lack of understanding of the need and priorities for maintenance; poorly defined maintenance procedures; lack of staff training in the identification, reporting and processing of maintenance requirements; poor allocation of available resources, incor-rect or undefined maintenance priorities; poor supervision and monitoring of main-tenance work; poor design and construction of the system, or parts thereof, in the initial instance; and poor operation practices.
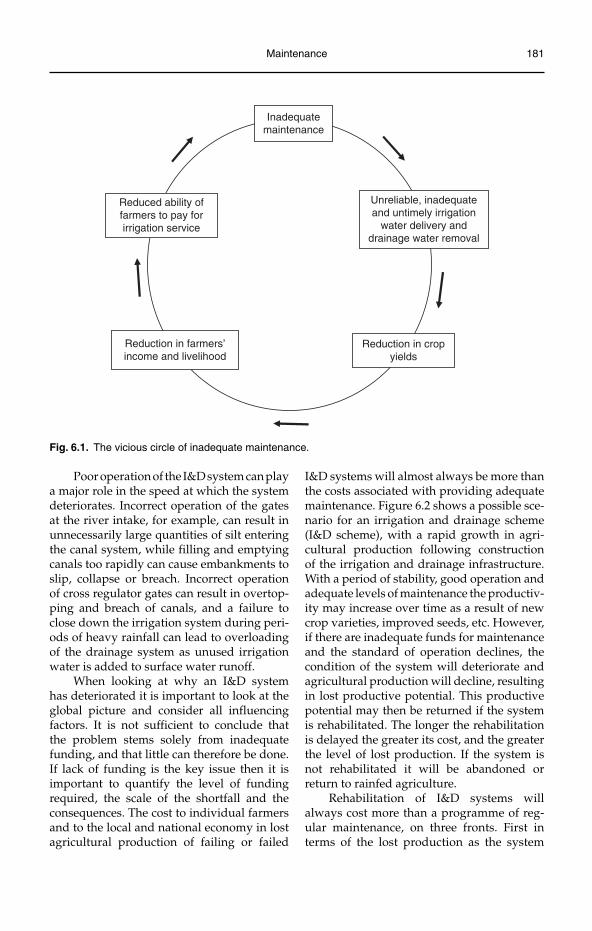
Maintenance 181
Poor operation of the I&D system can play a major role in the speed at which the system deteriorates. Incorrect operation of the gates at the river intake, for example, can result in unnecessarily large quantities of silt entering the canal system, while filling and emptying canals too rapidly can cause embankments to slip, collapse or breach. Incorrect operation of cross regulator gates can result in overtop-ping and breach of canals, and a failure to close down the irrigation system during peri-ods of heavy rainfall can lead to overloading of the drainage system as unused irrigation water is added to surface water runoff.
When looking at why an I&D system has deteriorated it is important to look at the global picture and consider all influencing factors. It is not sufficient to conclude that the problem stems solely from inadequate funding, and that little can therefore be done. If lack of funding is the key issue then it is important to quantify the level of funding required, the scale of the shortfall and the consequences. The cost to individual farmers and to the local and national economy in lost agricultural production of failing or failed
I&D systems will almost always be more than the costs associated with providing adequate maintenance. Figure 6.2 shows a possible sce-nario for an irrigation and drainage scheme (I&D scheme), with a rapid growth in agri-cultural production following construction of the irrigation and drainage infrastructure. With a period of stability, good operation and adequate levels of maintenance the productiv-ity may increase over time as a result of new crop varieties, improved seeds, etc. However, if there are inadequate funds for maintenance and the standard of operation declines, the condition of the system will deteriorate and agricultural production will decline, resulting in lost productive potential. This productive potential may then be returned if the system is rehabilitated. The longer the rehabilitation is delayed the greater its cost, and the greater the level of lost production. If the system is not rehabilitated it will be abandoned or return to rainfed agriculture.
Rehabilitation of I&D systems will always cost more than a programme of reg-ular maintenance, on three fronts. First in terms of the lost production as the system
Inadequatemaintenance
Unreliable, inadequateand untimely irrigation
water delivery anddrainage water removal
Reduction in cropyields
Reduction in farmers’income and livelihood
Reduced ability offarmers to pay forirrigation service
Fig. 6.1. The vicious circle of inadequate maintenance.
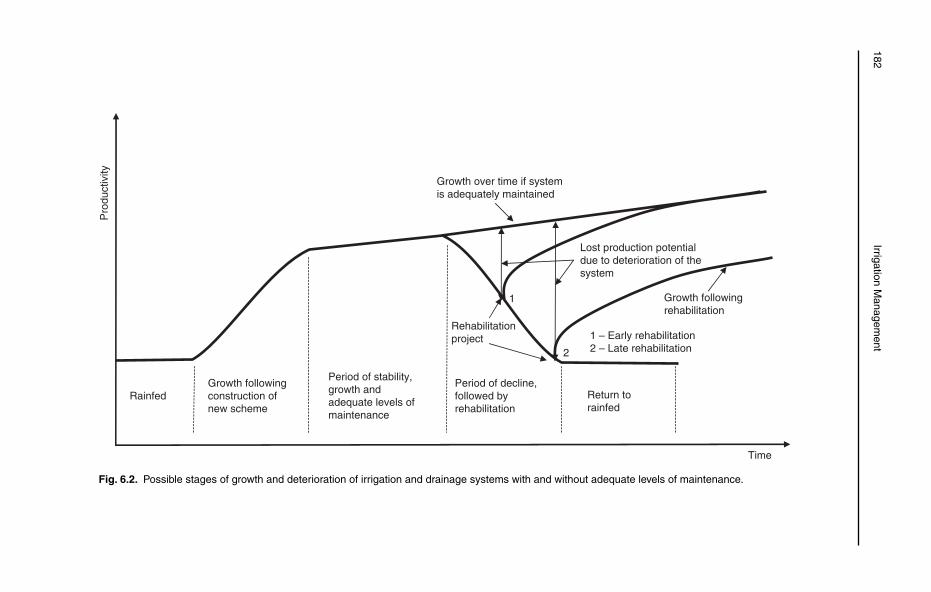
182 Irrigation M
anagement
Pro
duct
ivity
Time
Growth followingrehabilitation
Period of decline,followed byrehabilitation
Growth following construction of new scheme
Period of stability, growth and adequate levels of maintenance
Return torainfed
Rainfed
Growth over time if systemis adequately maintained
Rehabilitationproject
Lost production potentialdue to deterioration of thesystem
1
2
1 – Early rehabilitation2 – Late rehabilitation
Fig. 6.2. Possible stages of growth and deterioration of irrigation and drainage systems with and without adequate levels of maintenance.
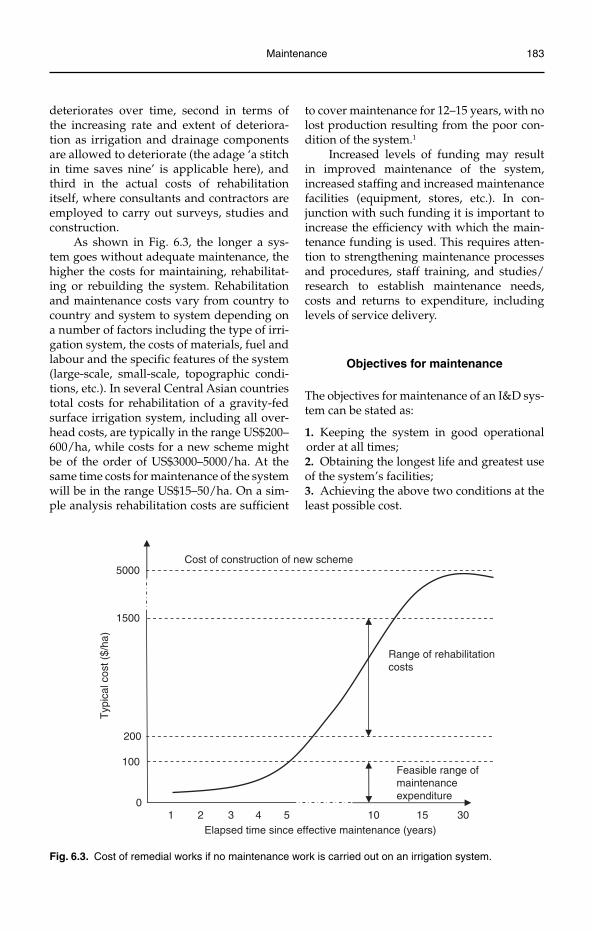
Maintenance 183
deteriorates over time, second in terms of the increasing rate and extent of deteriora-tion as irrigation and drainage components are allowed to deteriorate (the adage ‘a stitch in time saves nine’ is applicable here), and third in the actual costs of rehabilitation itself, where consultants and contractors are employed to carry out surveys, studies and construction.
As shown in Fig. 6.3, the longer a sys-tem goes without adequate maintenance, the higher the costs for maintaining, rehabilitat-ing or rebuilding the system. Rehabilitation and maintenance costs vary from country to country and system to system depending on a number of factors including the type of irri-gation system, the costs of materials, fuel and labour and the specific features of the system (large-scale, small-scale, topographic condi-tions, etc.). In several Central Asian countries total costs for rehabilitation of a gravity-fed surface irrigation system, including all over-head costs, are typically in the range US$200–600/ha, while costs for a new scheme might be of the order of US$3000–5000/ha. At the same time costs for maintenance of the system will be in the range US$15–50/ha. On a sim-ple analysis rehabilitation costs are sufficient
to cover maintenance for 12–15 years, with no lost production resulting from the poor con-dition of the system.1
Increased levels of funding may result in improved maintenance of the system, increased staffing and increased maintenance facilities (equipment, stores, etc.). In con-junction with such funding it is important to increase the efficiency with which the main-tenance funding is used. This requires atten-tion to strengthening maintenance processes and procedures, staff training, and studies/research to establish maintenance needs, costs and returns to expenditure, including levels of service delivery.
Objectives for maintenance
The objectives for maintenance of an I&D sys-tem can be stated as:
1. Keeping the system in good operational order at all times;2. Obtaining the longest life and greatest use of the system’s facilities;3. Achieving the above two conditions at the least possible cost.
Cost of construction of new scheme
1500
Range of rehabilitationcosts
100
10
32 4 15 30
200
5000
Elapsed time since effective maintenance (years)
Typ
ical
cos
t ($/
ha)
Feasible range ofmaintenanceexpenditure
5 10
Fig. 6.3. Cost of remedial works if no maintenance work is carried out on an irrigation system.
184 Irrigation Management
Maintenance Categories
Maintenance can be classified into six main categories:
routine;•periodic;•annual;•emergency;•deferred;•preventative.•
Maintenance work can be carried out under these categories by one, or a combination, of the following:
direct labour, either as individual labour-•ers responsible for certain sections or components of the I&D system or as maintenance gangs – this labour may be employed full- or part-time;contractors;•local communities.•
Routine maintenance
Routine or day-to-day maintenance is small maintenance work that is carried out on a reg-ular basis. It is usually carried out by manual labour. Such work includes, but is not limited to, the following:
minor repairs to earth embankments – •small gullies from rainfall runoff, animal damage, machinery damage, cracks and small seepage holes;clearance of silt in canals and drains near •structures, especially near gates, measur-ing structures and siphons;clearance of floating rubbish from canals •and structures, rubbish screens and gate wells;removal and cutting back of vegetation •from within canals and drains, from embankments (trees and bushes) and from around structures;greasing and oiling of gates.•
Routine maintenance work is usually done by a gatekeeper, maintenance labourer or by farmers working individually or in groups.
Periodic maintenance
Periodic maintenance is small-scale, often preventative, maintenance work that does not pose any immediate threat to the func-tioning of the system. Such work may require skilled labour or machinery and should be carried out at intervals during the irrigation season, as required. This work includes but is not limited to the following:
repairs to concrete canal lining and •structures;repairs and maintenance to wood and •metal works, in particular gates;repairs to measuring structures, and •in stallation of gauges;repairs to canal embankments if there is •leakage or overtopping;painting of metal and woodwork;•repairs to machinery such as pumps and •engines;access road upkeep.•
Some of this work could be carried out though small contracts but can also be done by an in-house maintenance team. This team might comprise a foreman, concrete/masonry arti-sans, carpenters, fitters/mechanics, main-tenance plant operators and labourers. The maintenance team would be mobile and have a pick-up truck and possibly some mainte-nance plant such as an excavator.
Annual maintenance
Annual maintenance is work that is planned as a result of maintenance inspections, which is too large or on too wide a scale for peri-odic maintenance work. It could also include work related to the improvement of the sys-tem rather than maintenance. Contractors are generally hired to carry out this work.
The maintenance work is carried out when the canals or drains are not in use, either at the end or the beginning of the irri-gation season. Such work includes but is not limited to the following:
major desilting work in main canals and •drains;repair of canal lining;•
Maintenance 185
repair of headworks and canal/drain •structures;maintenance of canal embankments, •service roads and flood bunds;repair or replacement of equipment, •gates, pumps, motors, etc.
Emergency maintenance
Emergency maintenance is work that can-not be planned for and is carried out as the need arises. The uncertainty of what and where the problems are going to be makes coping with the problems difficult. Flexibility of working practices throughout the system is required as a result. Work in this category may include:
temporary repairs to river, canal or flood •bund embankments in the event of a breach or possible breach;preventative work to avoid structure •failure, or temporary repair as a result of a structure failure;work to alleviate flooding, landslides or •mud flows.
The nature of the work requires it to be car-ried out quickly. Prompt action minimizes the extent of any damage and of the repair work required. Good communication systems are extremely useful in these circumstances, for example with a canal breach to communicate with the headworks to close down or reduce the intake discharge.
Carrying out a risk assessment for the scheme to identify areas where emergencies might occur can save time, resources and expense when these events actually occur. The risk assessment will review historical emergency events, inspect the site and talk with scheme staff and water users to iden-tify areas of risk and measures to prevent, mitigate or deal with them if they occur. This might, for example, take the form of storing sand and sandbags in villages near areas of river prone to overtopping during extreme river flow periods, maintaining a list and contact details of village headmen, and organizing a practice emergency call-out with the villagers.
Deferred maintenance
Deferred maintenance is work that has been identified following inspection of the infra-structure but which is either of low priority or cannot be carried out due to lack of sufficient funds. The work is recorded in the mainte-nance register and periodically reviewed. Some of this work may be related to system improvements such as:
improved footbridge crossings, road •culverts;improvements to access along canal •embankments.
The phrase ‘deferred maintenance’ is also sometimes used to refer to work carried out under rehabilitation projects, where mainte-nance work has been ‘deferred’ and carried out under the rehabilitation project.
Preventative maintenance
Preventative maintenance is work that, if carried out, will result in preventing more expensive maintenance or repair work at a later date. A classic example of preventa-tive maintenance is the prevention of seep-age around or under hydraulic structures; if seepage is identified and remedial action taken in good time, the collapse of the struc-ture can be prevented, saving considerable expense.
Priority areas for preventative mainte-nance include:
checking for seepage around or under •structures, especially if there is a high pressure head across the structure;grading of embankments and canal/•drain inspection/access roads to avoid ponding of water and gullying;closing river intake gates before high •flood levels in the river, both to avoid excessive discharges in the canal and intake of water with high sediment loads;painting of metal and wood components, •particularly gates and gate frames.
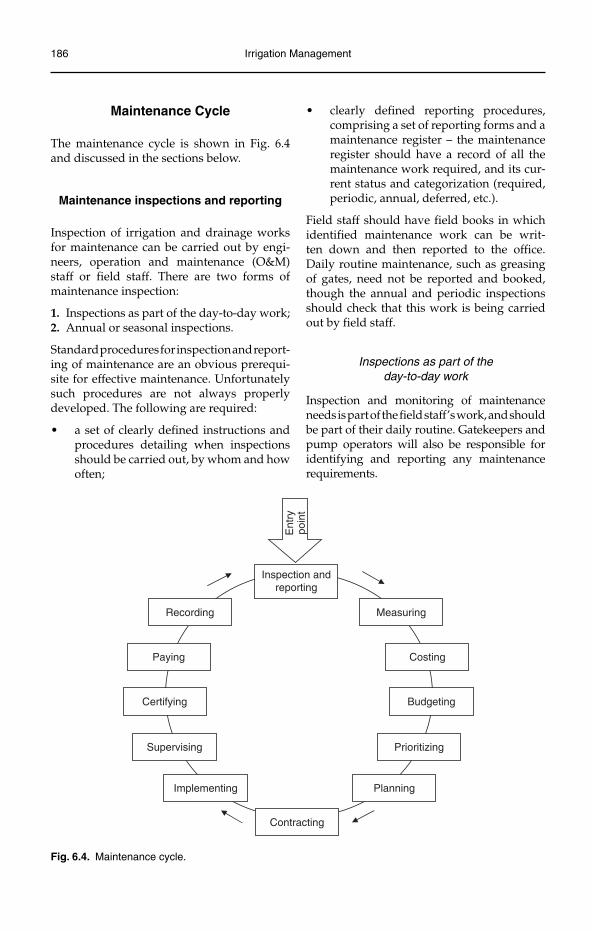
186 Irrigation Management
Maintenance Cycle
The maintenance cycle is shown in Fig. 6.4 and discussed in the sections below.
Maintenance inspections and reporting
Inspection of irrigation and drainage works for maintenance can be carried out by engi-neers, operation and maintenance (O&M) staff or field staff. There are two forms of maintenance inspection:
1. Inspections as part of the day-to-day work;2. Annual or seasonal inspections.
Standard procedures for inspection and report-ing of maintenance are an obvious prerequi-site for effective maintenance. Unfortunately such procedures are not always properly developed. The following are required:
a set of clearly defined instructions and •procedures detailing when inspections should be carried out, by whom and how often;
clearly defined reporting procedures, •comprising a set of reporting forms and a maintenance register – the maintenance register should have a record of all the maintenance work required, and its cur-rent status and categorization (required, periodic, annual, deferred, etc.).
Field staff should have field books in which identified maintenance work can be writ-ten down and then reported to the office. Daily routine maintenance, such as greasing of gates, need not be reported and booked, though the annual and periodic inspections should check that this work is being carried out by field staff.
Inspections as part of the day-to-day work
Inspection and monitoring of maintenance needs is part of the field staff’s work, and should be part of their daily routine. Gatekeepers and pump operators will also be responsible for identifying and reporting any maintenance requirements.
Fig. 6.4. Maintenance cycle.
Inspection andreporting
Ent
rypo
int
Costing
Budgeting
Prioritizing
Planning
Contracting
Implementing
Supervising
Certifying
Paying
Recording Measuring
Maintenance 187
Any maintenance requirements observed by these staff that they cannot carry out should be reported and recorded in the main-tenance register. In the case of emergency maintenance the field staff should take action immediately, and do what they can to get help in dealing with the emergency.
The sort of maintenance needs that should be looked for during the irrigation season is listed in Table 6.1.
Annual or seasonal inspections
Annual or seasonal maintenance inspections should be carried out by experienced engi-neers. There should be one pre-season inspec-tion to identify work that has to be carried out before the irrigation season starts, and one inspection at the end of the season that iden-tifies work that may need to be contracted out and completed before the following irrigation season commences.
Ideally the annual or seasonal inspec-tions should take place under two conditions: (i) when the canals are empty of water; and (ii) when the canals are flowing at design capacity. Inspection when the canals are empty enables inspection of infrastructure below the normal water line, while inspection when the canals are full and flowing at design capacity allows assessment of the carrying capacity of the canals, and the functioning of conveyance, control and measuring structures. For drains similar practices apply, with inspections when the drains are relatively dry and when they are flowing full. Efforts should be made to inspect the drainage system during or immediately after periods of heavy rainfall and runoff.
Points to look for during the annual/sea-sonal inspection are presented in Table 6.2.
Maintenance reporting
A key part of both the day-to-day and annual inspections is the recording of the maintenance work required and the details of when, how and by whom it was carried out when it has been dealt with. For this purpose a Maintenance Register is useful in order to:
help in processing the data collected on •maintenance requirements;assist in prioritizing and allocating main-•tenance work;record the maintenance work carried out •in a transparent and accountable format.
As discussed above, the maintenance work is identified in the field and the work required measured and quantified. To assist in the meas-urement and quantification a Maintenance Work Sheet can be used (Fig. 6.5), or alterna-tively the data can be recorded in a notebook.
The data collected from the field (meas-urements and quantities) can be recorded in the maintenance register and data entered on the unit costs of the work items to determine the total estimated cost of the work (Fig. 6.6). The work can then be prioritized and a deci-sion made as to who will do the work (in-house maintenance team, contracted labour, contrac-tor, local community voluntary labour, etc.).
Once the work has been completed details of the work done will be recorded, including the sum paid, the name of the con-tractor and the date completed.
A maintenance coding system is required for creating a computer database of mainte-nance work and can simplify the maintenance work identification and recording process. The coding system can be divided into the main categories of work, such as:
A Control structures B Measuring structures C Canals D Drains E Conveyance structures F Access/inspection roads G Buildings
with further sub-division providing more detail for main categories, such as for control structures:
Component a b c
A1 Gate spindle Grease Straighten Replace
A2 Gate nut Repair Replace –
A3 Gate plate Paint Repair Replace
A4 Gate frame Paint Repair Replace
A5 Masonry Repair Replace –
A6 Concrete Repair Replace –
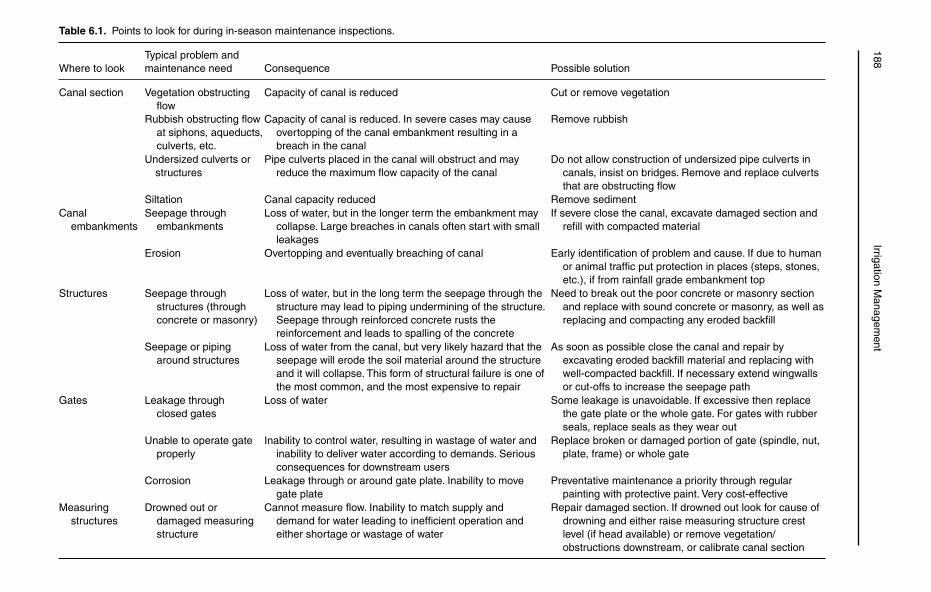
188 Irrigation M
anagement
Table 6.1. Points to look for during in-season maintenance inspections.
Where to lookTypical problem and maintenance need Consequence Possible solution
Canal section Vegetation obstructing flow
Rubbish obstructing flow at siphons, aqueducts, culverts, etc.
Capacity of canal is reduced
Capacity of canal is reduced. In severe cases may cause overtopping of the canal embankment resulting in a breach in the canal
Cut or remove vegetation
Remove rubbish
Undersized culverts or structures
Pipe culverts placed in the canal will obstruct and may reduce the maximum flow capacity of the canal
Do not allow construction of undersized pipe culverts in canals, insist on bridges. Remove and replace culverts that are obstructing flow
Siltation Canal capacity reduced Remove sedimentCanal
embankmentsSeepage through
embankmentsLoss of water, but in the longer term the embankment may
collapse. Large breaches in canals often start with small leakages
If severe close the canal, excavate damaged section and refill with compacted material
Erosion Overtopping and eventually breaching of canal Early identification of problem and cause. If due to human or animal traffic put protection in places (steps, stones, etc.), if from rainfall grade embankment top
Structures Seepage through structures (through concrete or masonry)
Loss of water, but in the long term the seepage through the structure may lead to piping undermining of the structure. Seepage through reinforced concrete rusts the reinforcement and leads to spalling of the concrete
Need to break out the poor concrete or masonry section and replace with sound concrete or masonry, as well as replacing and compacting any eroded backfill
Seepage or piping around structures
Loss of water from the canal, but very likely hazard that the seepage will erode the soil material around the structure and it will collapse. This form of structural failure is one of the most common, and the most expensive to repair
As soon as possible close the canal and repair by excavating eroded backfill material and replacing with well-compacted backfill. If necessary extend wingwalls or cut-offs to increase the seepage path
Gates Leakage through closed gates
Loss of water Some leakage is unavoidable. If excessive then replace the gate plate or the whole gate. For gates with rubber seals, replace seals as they wear out
Unable to operate gate properly
Inability to control water, resulting in wastage of water and inability to deliver water according to demands. Serious consequences for downstream users
Replace broken or damaged portion of gate (spindle, nut, plate, frame) or whole gate
Corrosion Leakage through or around gate plate. Inability to move gate plate
Preventative maintenance a priority through regular painting with protective paint. Very cost-effective
Measuring structures
Drowned out or damaged measuring structure
Cannot measure flow. Inability to match supply and demand for water leading to inefficient operation and either shortage or wastage of water
Repair damaged section. If drowned out look for cause of drowning and either raise measuring structure crest level (if head available) or remove vegetation/obstructions downstream, or calibrate canal section
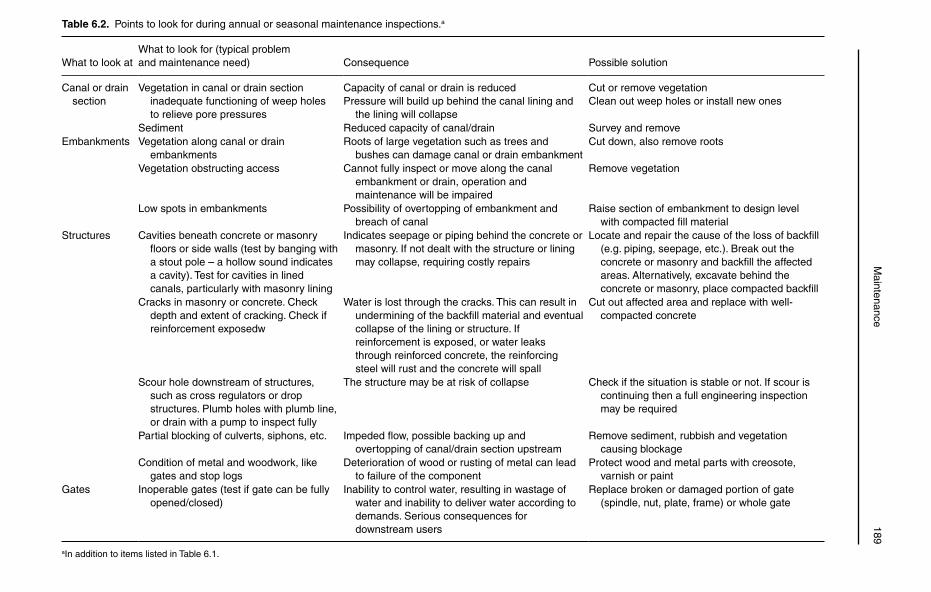
M
aintenance 189
Table 6.2. Points to look for during annual or seasonal maintenance inspections.a
What to look atWhat to look for (typical problem and maintenance need) Consequence Possible solution
Canal or drain section
Vegetation in canal or drain section inadequate functioning of weep holes
to relieve pore pressures
Capacity of canal or drain is reducedPressure will build up behind the canal lining and
the lining will collapse
Cut or remove vegetationClean out weep holes or install new ones
Sediment Reduced capacity of canal/drain Survey and removeEmbankments Vegetation along canal or drain
embankmentsRoots of large vegetation such as trees and
bushes can damage canal or drain embankmentCut down, also remove roots
Vegetation obstructing access Cannot fully inspect or move along the canal embankment or drain, operation and maintenance will be impaired
Remove vegetation
Low spots in embankments Possibility of overtopping of embankment and breach of canal
Raise section of embankment to design level with compacted fill material
Structures Cavities beneath concrete or masonry floors or side walls (test by banging with a stout pole – a hollow sound indicates a cavity). Test for cavities in lined canals, particularly with masonry lining
Indicates seepage or piping behind the concrete or masonry. If not dealt with the structure or lining may collapse, requiring costly repairs
Locate and repair the cause of the loss of backfill (e.g. piping, seepage, etc.). Break out the concrete or masonry and backfill the affected areas. Alternatively, excavate behind the concrete or masonry, place compacted backfill
Cracks in masonry or concrete. Check depth and extent of cracking. Check if reinforcement exposedw
Water is lost through the cracks. This can result in undermining of the backfill material and eventual collapse of the lining or structure. If reinforcement is exposed, or water leaks through reinforced concrete, the reinforcing steel will rust and the concrete will spall
Cut out affected area and replace with well-compacted concrete
Scour hole downstream of structures, such as cross regulators or drop structures. Plumb holes with plumb line, or drain with a pump to inspect fully
The structure may be at risk of collapse Check if the situation is stable or not. If scour is continuing then a full engineering inspection may be required
Partial blocking of culverts, siphons, etc. Impeded flow, possible backing up and overtopping of canal/drain section upstream
Remove sediment, rubbish and vegetation causing blockage
Condition of metal and woodwork, like gates and stop logs
Deterioration of wood or rusting of metal can lead to failure of the component
Protect wood and metal parts with creosote, varnish or paint
Gates Inoperable gates (test if gate can be fully opened/closed)
Inability to control water, resulting in wastage of water and inability to deliver water according to demands. Serious consequences for downstream users
Replace broken or damaged portion of gate (spindle, nut, plate, frame) or whole gate
aIn addition to items listed in Table 6.1.
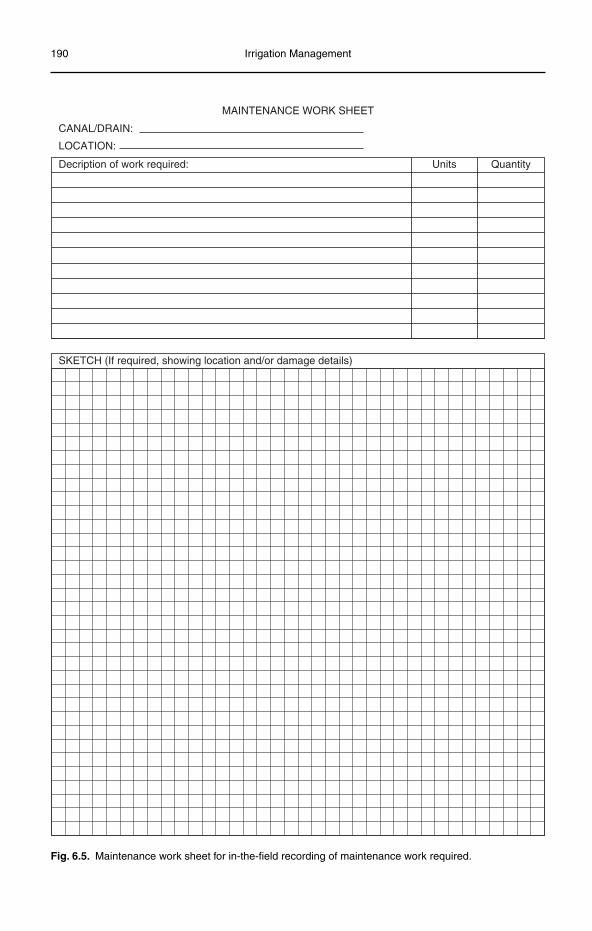
190 Irrigation Management
MAINTENANCE WORK SHEET
Decription of work required:
SKETCH (If required, showing location and/or damage details)
Units Quantity
CANAL/DRAIN:
LOCATION:
Fig. 6.5. Maintenance work sheet for in-the-field recording of maintenance work required.
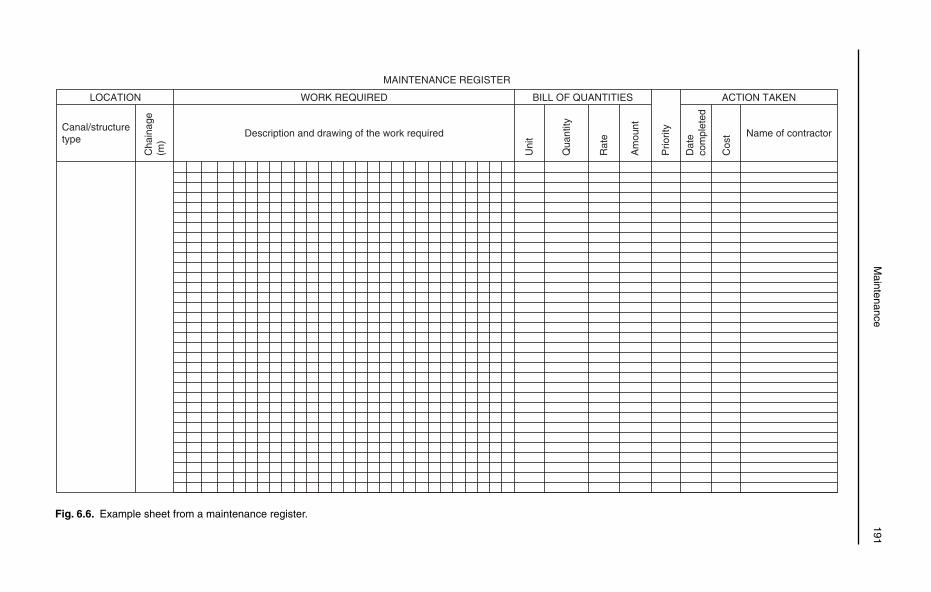
M
aintenance 191
ACTION TAKENBILL OF QUANTITIESWORK REQUIREDLOCATION
MAINTENANCE REGISTER
Description and drawing of the work required Name of contractor
Cos
t
Dat
eco
mpl
eted
Prio
rity
Am
ount
Rat
e
Qua
ntity
Uni
t
Cha
inag
e(m
)
Canal/structuretype
Fig. 6.6. Example sheet from a maintenance register.
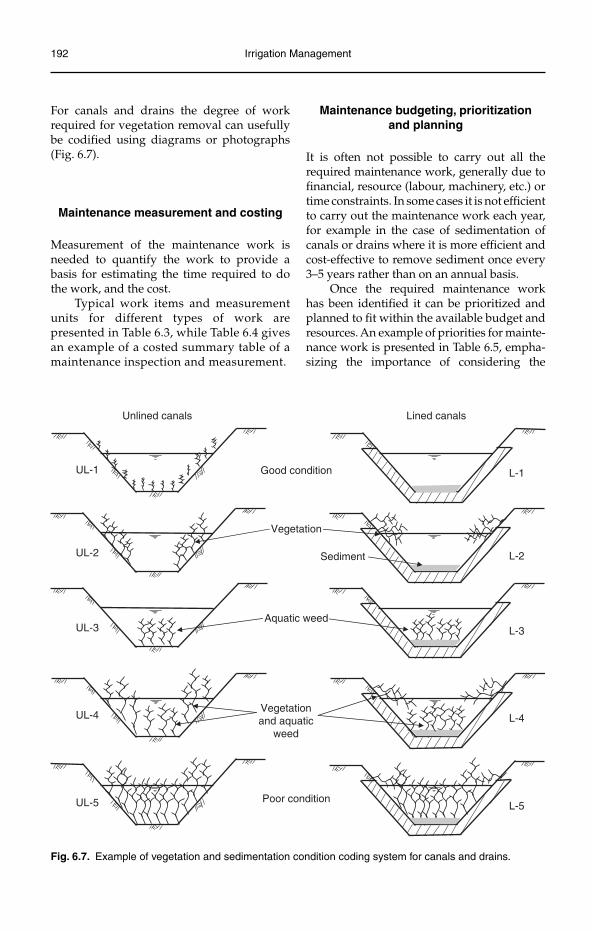
192 Irrigation Management
For canals and drains the degree of work required for vegetation removal can usefully be codified using diagrams or photographs (Fig. 6.7).
Maintenance measurement and costing
Measurement of the maintenance work is needed to quantify the work to provide a basis for estimating the time required to do the work, and the cost.
Typical work items and measurement units for different types of work are presented in Table 6.3, while Table 6.4 gives an example of a costed summary table of a maintenance inspection and measurement.
Maintenance budgeting, prioritization and planning
It is often not possible to carry out all the required maintenance work, generally due to financial, resource (labour, machinery, etc.) or time constraints. In some cases it is not efficient to carry out the maintenance work each year, for example in the case of sedimentation of canals or drains where it is more efficient and cost-effective to remove sediment once every 3–5 years rather than on an annual basis.
Once the required maintenance work has been identified it can be prioritized and planned to fit within the available budget and resources. An example of priorities for mainte-nance work is presented in Table 6.5, empha-sizing the importance of considering the
Vegetation
Unlined canals
Good condition
Poor condition
Lined canals
UL-2
Aquatic weedUL-3
Vegetationand aquatic
weed
UL-4
UL-5
L-1UL-1
L-5
L-3
L-4
L-2Sediment
Fig. 6.7. Example of vegetation and sedimentation condition coding system for canals and drains.
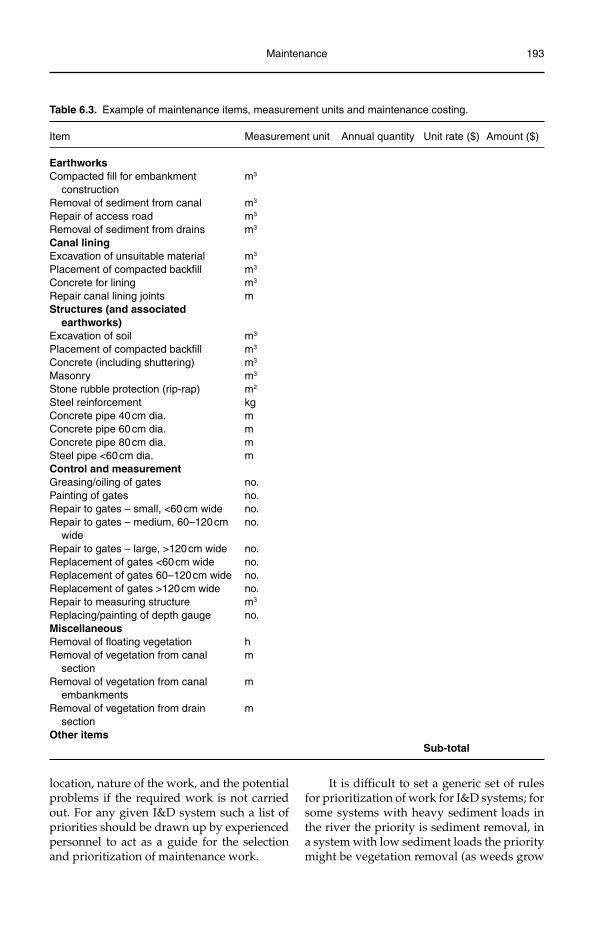
Maintenance 193
Table 6.3. Example of maintenance items, measurement units and maintenance costing.
Item Measurement unit Annual quantity Unit rate ($) Amount ($)
EarthworksCompacted fill for embankment
constructionm3
Removal of sediment from canal m3
Repair of access road m3
Removal of sediment from drains m3
Canal liningExcavation of unsuitable material m3
Placement of compacted backfill m3
Concrete for lining m3
Repair canal lining joints mStructures (and associated
earthworks)Excavation of soil m3
Placement of compacted backfill m3
Concrete (including shuttering) m3
Masonry m3
Stone rubble protection (rip-rap) m2
Steel reinforcement kgConcrete pipe 40 cm dia. mConcrete pipe 60 cm dia. mConcrete pipe 80 cm dia. mSteel pipe <60 cm dia. mControl and measurementGreasing/oiling of gates no.Painting of gates no.Repair to gates – small, <60 cm wide no.Repair to gates – medium, 60–120 cm
wideno.
Repair to gates – large, >120 cm wide no.Replacement of gates <60 cm wide no.Replacement of gates 60–120 cm wide no.Replacement of gates >120 cm wide no.Repair to measuring structure m3
Replacing/painting of depth gauge no.MiscellaneousRemoval of floating vegetation hRemoval of vegetation from canal
sectionm
Removal of vegetation from canal embankments
m
Removal of vegetation from drain section
m
Other items Sub-total
location, nature of the work, and the potential problems if the required work is not carried out. For any given I&D system such a list of priorities should be drawn up by experienced personnel to act as a guide for the selection and prioritization of maintenance work.
It is difficult to set a generic set of rules for prioritization of work for I&D systems; for some systems with heavy sediment loads in the river the priority is sediment removal, in a system with low sediment loads the priority might be vegetation removal (as weeds grow
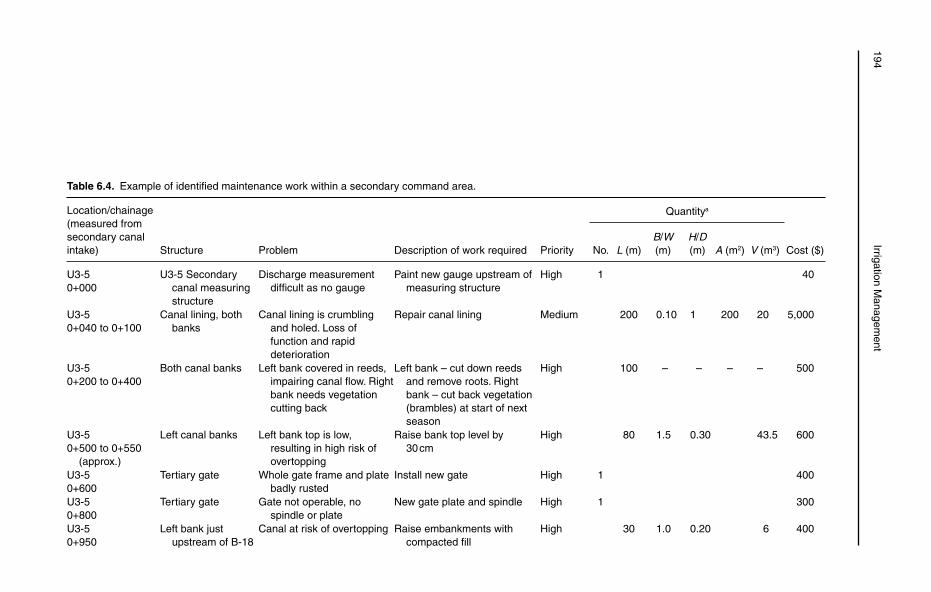
194 Irrigation M
anagement
Table 6.4. Example of identified maintenance work within a secondary command area.
Location/chainage(measured from secondary canal intake) Structure Problem Description of work required Priority
Quantitya
Cost ($)No. L (m)B/W(m)
H/D(m) A (m2) V (m3)
U3-50+000
U3-5 Secondary canal measuring structure
Discharge measurement difficult as no gauge
Paint new gauge upstream of measuring structure
High 1 40
U3-50+040 to 0+100
Canal lining, both banks
Canal lining is crumbling and holed. Loss of function and rapid deterioration
Repair canal lining Medium 200 0.10 1 200 20 5,000
U3-50+200 to 0+400
Both canal banks Left bank covered in reeds, impairing canal flow. Right bank needs vegetation cutting back
Left bank – cut down reeds and remove roots. Right bank – cut back vegetation (brambles) at start of next season
High 100 – – – – 500
U3-50+500 to 0+550
(approx.)
Left canal banks Left bank top is low, resulting in high risk of overtopping
Raise bank top level by 30 cm
High 80 1.5 0.30 43.5 600
U3-50+600
Tertiary gate Whole gate frame and plate badly rusted
Install new gate High 1 400
U3-50+800
Tertiary gate Gate not operable, no spindle or plate
New gate plate and spindle High 1 300
U3-50+950
Left bank just upstream of B-18
Canal at risk of overtopping Raise embankments with compacted fill
High 30 1.0 0.20 6 400
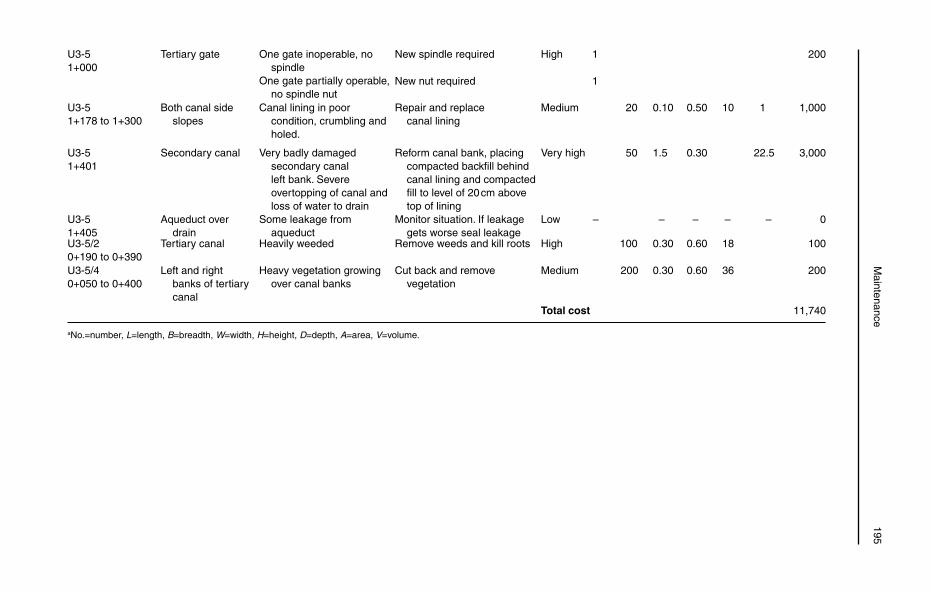
M
aintenance 195
U3-51+000
Tertiary gate One gate inoperable, no spindle
One gate partially operable, no spindle nut
New spindle required High 1 200
New nut required 1
U3-51+178 to 1+300
Both canal side slopes
Canal lining in poor condition, crumbling and holed.
Repair and replace canal lining
Medium 20 0.10 0.50 10 1 1,000
U3-51+401
Secondary canal Very badly damaged secondary canal left bank. Severe overtopping of canal and loss of water to drain
Reform canal bank, placing compacted backfill behind canal lining and compacted fill to level of 20 cm above top of lining
Very high 50 1.5 0.30 22.5 3,000
U3-51+405
Aqueduct over drain
Some leakage from aqueduct
Monitor situation. If leakage gets worse seal leakage
Low – – – – – 0
U3-5/20+190 to 0+390
Tertiary canal Heavily weeded Remove weeds and kill roots High 100 0.30 0.60 18 100
U3-5/40+050 to 0+400
Left and right banks of tertiary canal
Heavy vegetation growing over canal banks
Cut back and remove vegetation
Medium 200 0.30 0.60 36 200
Total cost 11,740
aNo.=number, L=length, B=breadth, W=width, H=height, D=depth, A=area, V=volume.
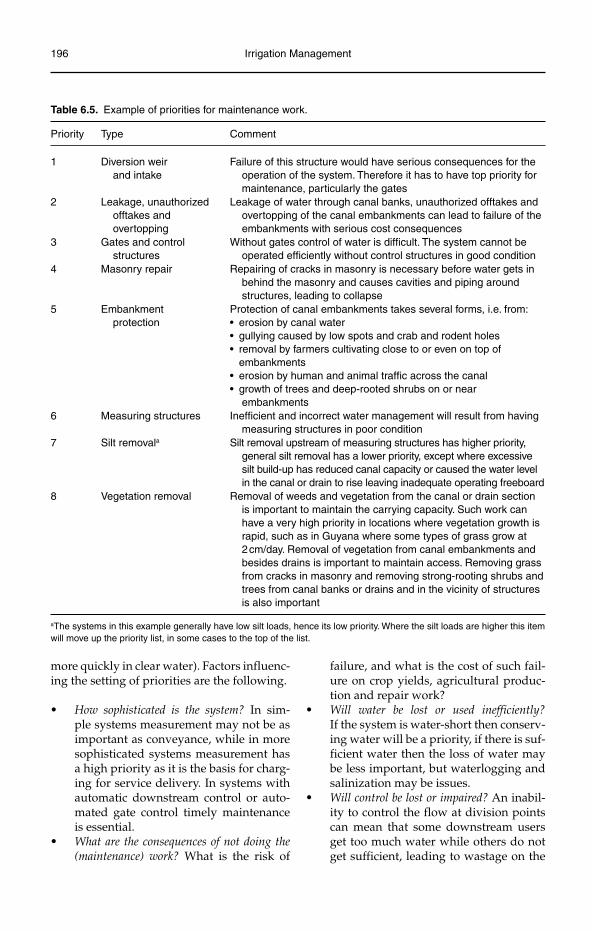
196 Irrigation Management
more quickly in clear water). Factors influenc-ing the setting of priorities are the following.
How sophisticated is the system?• In sim-ple systems measurement may not be as important as conveyance, while in more sophisticated systems measurement has a high priority as it is the basis for charg-ing for service delivery. In systems with automatic downstream control or auto-mated gate control timely maintenance is essential.What are the consequences of not doing the •(maintenance) work? What is the risk of
failure, and what is the cost of such fail-ure on crop yields, agricultural produc-tion and repair work?Will water be lost or used inefficiently?•If the system is water-short then conserv-ing water will be a priority, if there is suf-ficient water then the loss of water may be less important, but waterlogging and salinization may be issues.Will control be lost or impaired?• An inabil-ity to control the flow at division points can mean that some downstream users get too much water while others do not get sufficient, leading to wastage on the
Table 6.5. Example of priorities for maintenance work.
Priority Type Comment
1 Diversion weir and intake
Failure of this structure would have serious consequences for the operation of the system. Therefore it has to have top priority for maintenance, particularly the gates
2 Leakage, unauthorized offtakes and overtopping
Leakage of water through canal banks, unauthorized offtakes and overtopping of the canal embankments can lead to failure of the embankments with serious cost consequences
3 Gates and control structures
Without gates control of water is difficult. The system cannot be operated efficiently without control structures in good condition
4 Masonry repair Repairing of cracks in masonry is necessary before water gets in behind the masonry and causes cavities and piping around structures, leading to collapse
5 Embankment protection
Protection of canal embankments takes several forms, i.e. from:• erosion by canal water• gullying caused by low spots and crab and rodent holes• removal by farmers cultivating close to or even on top of
embankments• erosion by human and animal traffic across the canal• growth of trees and deep-rooted shrubs on or near
embankments6 Measuring structures Inefficient and incorrect water management will result from having
measuring structures in poor condition7 Silt removala Silt removal upstream of measuring structures has higher priority,
general silt removal has a lower priority, except where excessive silt build-up has reduced canal capacity or caused the water level in the canal or drain to rise leaving inadequate operating freeboard
8 Vegetation removal Removal of weeds and vegetation from the canal or drain section is important to maintain the carrying capacity. Such work can have a very high priority in locations where vegetation growth is rapid, such as in Guyana where some types of grass grow at 2 cm/day. Removal of vegetation from canal embankments and besides drains is important to maintain access. Removing grass from cracks in masonry and removing strong-rooting shrubs and trees from canal banks or drains and in the vicinity of structures is also important
aThe systems in this example generally have low silt loads, hence its low priority. Where the silt loads are higher this item will move up the priority list, in some cases to the top of the list.
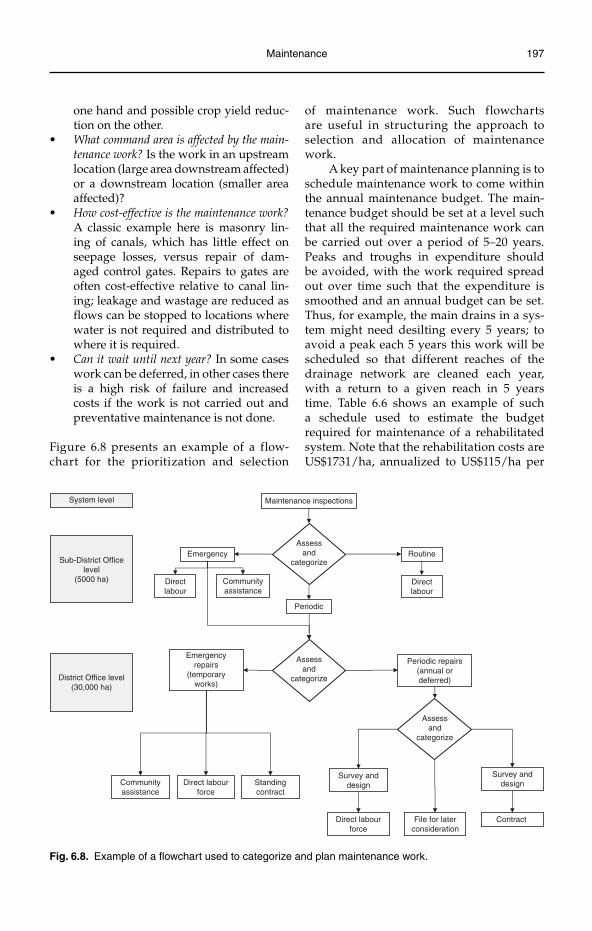
Maintenance 197
one hand and possible crop yield reduc-tion on the other.What command area is affected by the main-•tenance work? Is the work in an upstream location (large area downstream affected) or a downstream location (smaller area affected)?How cost-effective is the maintenance work?•A classic example here is masonry lin-ing of canals, which has little effect on seepage losses, versus repair of dam-aged control gates. Repairs to gates are often cost-effective relative to canal lin-ing; leakage and wastage are reduced as flows can be stopped to locations where water is not required and distributed to where it is required.Can it wait until next year?• In some cases work can be deferred, in other cases there is a high risk of failure and increased costs if the work is not carried out and preventative maintenance is not done.
Figure 6.8 presents an example of a flow-chart for the prioritization and selec tion
of maintenance work. Such flow charts are useful in structuring the approach to selection and allocation of maintenance work.
A key part of maintenance planning is to schedule maintenance work to come within the annual maintenance budget. The main-tenance budget should be set at a level such that all the required maintenance work can be carried out over a period of 5–20 years. Peaks and troughs in expenditure should be avoided, with the work required spread out over time such that the expenditure is smoothed and an annual budget can be set. Thus, for example, the main drains in a sys-tem might need desilting every 5 years; to avoid a peak each 5 years this work will be scheduled so that different reaches of the drainage network are cleaned each year, with a return to a given reach in 5 years time. Table 6.6 shows an example of such a schedule used to estimate the budget required for maintenance of a rehabilitated system. Note that the rehabilitation costs are US$1731/ha, annualized to US$115/ha per
Maintenance inspections
Periodic
Emergency
District Office level(30,000 ha)
Periodic repairs(annual ordeferred)
Emergencyrepairs
(temporaryworks)
Standingcontract
Direct labourforce
Communityassistance
Survey anddesign
Survey anddesign
ContractFile for laterconsideration
Direct labourforce
Sub-District Officelevel
(5000 ha)
RoutineAssess
andcategorize
Assessand
categorize
Assessand
categorize
Directlabour
Directlabour
Communityassistance
System level
Fig. 6.8. Example of a flowchart used to categorize and plan maintenance work.
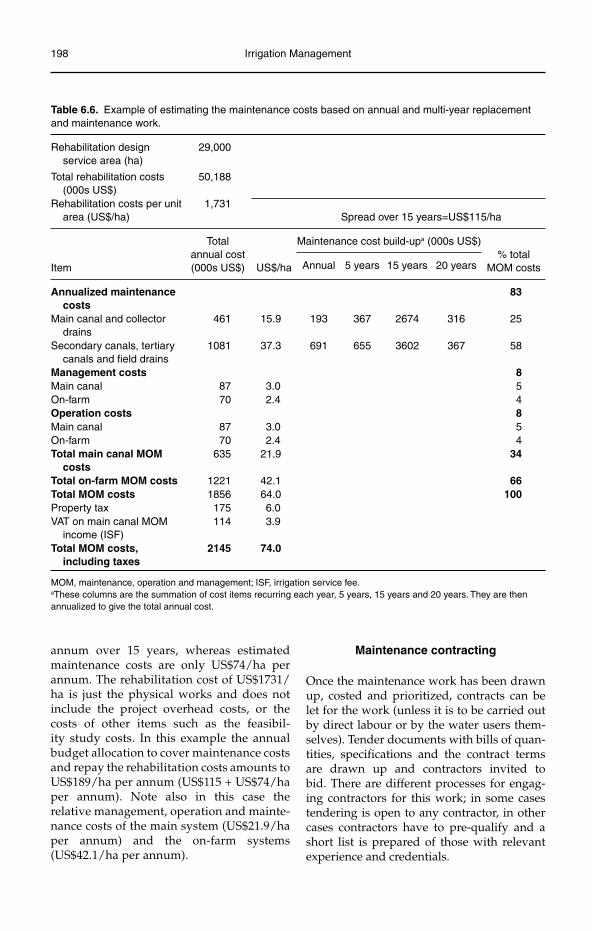
198 Irrigation Management
Table 6.6. Example of estimating the maintenance costs based on annual and multi-year replacement and maintenance work.
Rehabilitation design service area (ha)
29,000
Total rehabilitation costs (000s US$)
50,188
Rehabilitation costs per unit area (US$/ha)
1,731Spread over 15 years=US$115/ha
Item
Total annual cost (000s US$) US$/ha
Maintenance cost build-upa (000s US$)% total
MOM costsAnnual 5 years 15 years 20 years
Annualized maintenance costs
83
Main canal and collector drains
461 15.9 193 367 2674 316 25
Secondary canals, tertiary canals and field drains
1081 37.3 691 655 3602 367 58
Management costs 8Main canal 87 3.0 5On-farm 70 2.4 4Operation costs 8Main canal 87 3.0 5On-farm 70 2.4 4Total main canal MOM
costs635 21.9 34
Total on-farm MOM costs 1221 42.1 66Total MOM costs 1856 64.0 100Property tax 175 6.0VAT on main canal MOM
income (ISF)114 3.9
Total MOM costs, including taxes
2145 74.0
MOM, maintenance, operation and management; ISF, irrigation service fee.aThese columns are the summation of cost items recurring each year, 5 years, 15 years and 20 years. They are then annualized to give the total annual cost.
annum over 15 years, whereas estimated maintenance costs are only US$74/ha per annum. The rehabilitation cost of US$1731/ha is just the physical works and does not include the project overhead costs, or the costs of other items such as the feasibil-ity study costs. In this example the annual budget allocation to cover maintenance costs and repay the rehabilitation costs amounts to US$189/ha per annum (US$115 + US$74/ha per annum). Note also in this case the relative management, operation and mainte-nance costs of the main system (US$21.9/ha per annum) and the on-farm systems (US$42.1/ha per annum).
Maintenance contracting
Once the maintenance work has been drawn up, costed and prioritized, contracts can be let for the work (unless it is to be carried out by direct labour or by the water users them-selves). Tender documents with bills of quan-tities, specifications and the contract terms are drawn up and contractors invited to bid. There are different processes for engag-ing contractors for this work; in some cases tendering is open to any contractor, in other cases contractors have to pre-qualify and a short list is prepared of those with relevant experience and credentials.
Maintenance 199
It will be important to include guidance in the contract and penalty clauses to ensure that the contractor takes due account of the constraints that it will be working under. This may include ensuring that irrigation water supplies are maintained to water users during the maintenance period, and that the mainte-nance work is completed before the start of the irrigation season. Delays in re-opening canals can have serious financial consequences for farmers, and must be avoided. Ideally the con-tract should allow for compensation payments to be made to farmers where water supplies are delayed or impaired, or allowance made in the contract for compensation payments to farmers where diversion channels are built on their land to bypass construction work.
In some cases a long-term framework contract might be let, which will state the general type of work and invite the contractor to submit rates for stated types of work. The contractor will then be given specific work to be carried out each year, based on these rates. Such contracts are usually let for several years at a time, and enable the client to budget for the cost of the work and call on the contractor in case emergency work is required.
Contracting out maintenance work is increasingly being used in many countries as the private-sector contracting industry strengthens; formerly it was only government agencies that had the financial resources to purchase construction machinery and equip-ment. Contracting out maintenance work can have financial benefits over direct labour maintenance work provided that the tender-ing process is open and transparent, and there is a vibrant contracting sector where competi-tive bidding exists.
Implementation and supervision of maintenance work
Once the maintenance work is underway it is important that it is properly supervised, whether the work is carried out by direct labour or by a contractor. All relevant persons should be involved in the supervision process – if the work is being carried out at the on-farm level then farmers should be informed of the nature of the work so that they can keep an
eye on the work, as well as the formal super-vising body, which might be the water users association management team. At the main system level the field staff should be kept informed of the work that is being carried out, and should take a keen interest in ensur-ing that the work is done properly and to an adequate standard.2 For some of the smaller work the field staff may be delegated to carry out the day-to-day supervision, for more major works the engineer will be responsible for day-to-day supervision. For large main-tenance works a full-time supervisor may be placed on site.
A key role of authorized supervision personnel will be authorizing interim (often monthly) payments for maintenance work carried out by contractors. The procedures for measurement and authorization of these interim payments need to be clearly specified in the contract.
The timing of carrying out the mainte-nance work is important. Considerations to be taken into account include the following.
The cropping season• : If possible, mainte-nance and construction work should be avoided during the irrigation season. Where this is not possible (e.g. due to a short interval between cropping seasons) agreement must be reached with water users on procedures to minimize the dis-ruption caused by maintenance work.The climate• : It is advisable to avoid adverse climatic seasons, such as rainy seasons when access is difficult, flood periods or winter when fresh laid con-crete can be damaged by frost and freez-ing conditions.The availability of labour• : If it is intended that work is to be carried out with com-munity assistance, then the work has to be timed to avoid peak agricultural labour demands.
Certification and payment for maintenance work
Following completion of the work it must be certified as having been completed, and completed to the specified standard. Such
200 Irrigation Management
certification will usually involve a final inspection of the completed works, following which payment will be made. It is increas-ingly the case that water users are involved in the identification of maintenance work required on the main system, and also in the certification of the work done. This involve-ment increases transparency and account-ability and enables the water users to see how, where and for what the service fees are being used.
Recording maintenance work done
It is important to record that maintenance work has been carried out, and to document the time that the work has taken, where it was located, who carried it out and how much it cost. These data can then be used to build up a database of the type and cost of work car-ried out; this will be of considerable assist-ance in the planning and costing of future maintenance work. The maintenance register should be completed to show these data.
In practice it is often disappointing to see how little recording of maintenance work is carried out. If better use is to be made of available funds then proper recording of maintenance work is a fundamental compo-nent of improved maintenance management systems.
The maintenance ‘bicycle’
Figure 6.9 shows the ‘maintenance bicycle’ linking the various elements related to main-tenance management. The key processes and categories of maintenance are linked by the organizational framework and its processes and procedures, with the direction set by the organization (the irrigation and drainage service provider – a government agency, pri-vate entity or water users association). Social and political will and finance are important factors in the ‘pedal power’ driving main-tenance, while the vision and direction can be identified through studies and research, avoiding or mitigating where possible natu-ral hazards.
Maintenance Plant and Equipment
The main items of maintenance plant and equipment are listed in Table 6.7 together with a summary of their main uses.
Asset Management
Overview
The term asset management originates from the business and finance sector. Formerly it applied to the assets of a business or trad-ing company, but has been adapted to apply to the physical assets of engineering infra-structure, such as roads, railways, bridges, water supply pipelines, canals and drains. Asset management is in wide usage by util-ity companies in Europe, North America, Australia and New Zealand. A fundamen-tal principle behind asset management is that assets such as canals and drains serve a function from which benefits can be derived. Maintaining or enhancing this function results in sustained or enhanced benefits, either financial or social. Asset management can be defined as:
A structured and auditable process for planning, implementing and monitoring investment in the maintenance of built infra-structure to provide users with a sustainable and defined level of service.
Asset management planning identifies asset stock (canals, drains, structures, roads, build-ings, etc.) and quantifies its condition and performance. From the assessment of the asset condition and level of performance estimates can be made of the investment required to:
maintain the existing asset condition and •system performance;enhance or extend asset condition and •system performance.
Asset management planning is at the core of planning for long-term investment and expenditure in irrigation and drainage infra-structure (Burton et al., 1996). Asset manage-ment planning seeks to relate investment and expenditure to specified, user-defined levels of service. The process (Fig. 6.10) involves
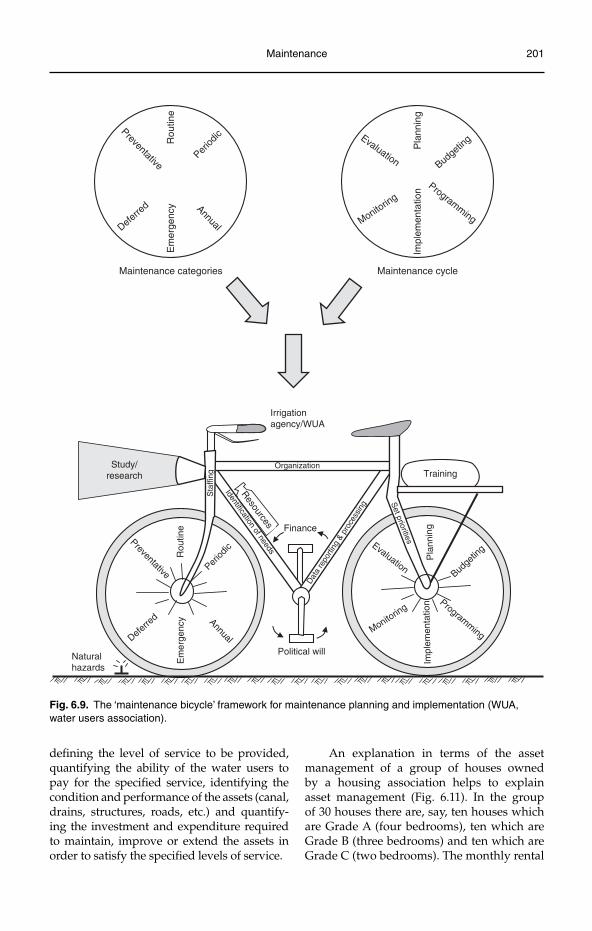
Maintenance 201
defining the level of service to be provided, quantifying the ability of the water users to pay for the specified service, identifying the condition and performance of the assets (canal, drains, structures, roads, etc.) and quantify-ing the investment and expenditure required to maintain, improve or extend the assets in order to satisfy the specified levels of service.
An explanation in terms of the asset management of a group of houses owned by a housing association helps to explain asset management (Fig. 6.11). In the group of 30 houses there are, say, ten houses which are Grade A (four bedrooms), ten which are Grade B (three bedrooms) and ten which are Grade C (two bedrooms). The monthly rental
Pla
nnin
g
Budge
ting
Programming
Impl
emen
tatio
n
Monitorin
g
EvaluationR
outin
e
Period
ic
Annual
Em
erge
ncy
Deferre
d
Preventative
Maintenance cycleMaintenance categories
Rou
tine
Period
ic
Annual
Em
erge
ncy
Deferre
d
Preventative
Identification of needs
Irrigationagency/WUA
Study/research
Dat
a re
porti
ng &
pro
cess
ing
Organization
Naturalhazards
Political will
Finance
Training
Budge
ting
Programming
Impl
emen
tatio
n
Monitorin
g
Evaluation
Pla
nnin
g
Sta
ffing
Set priorities
Resources
Fig. 6.9. The ‘maintenance bicycle’ framework for maintenance planning and implementation (WUA, water users association).
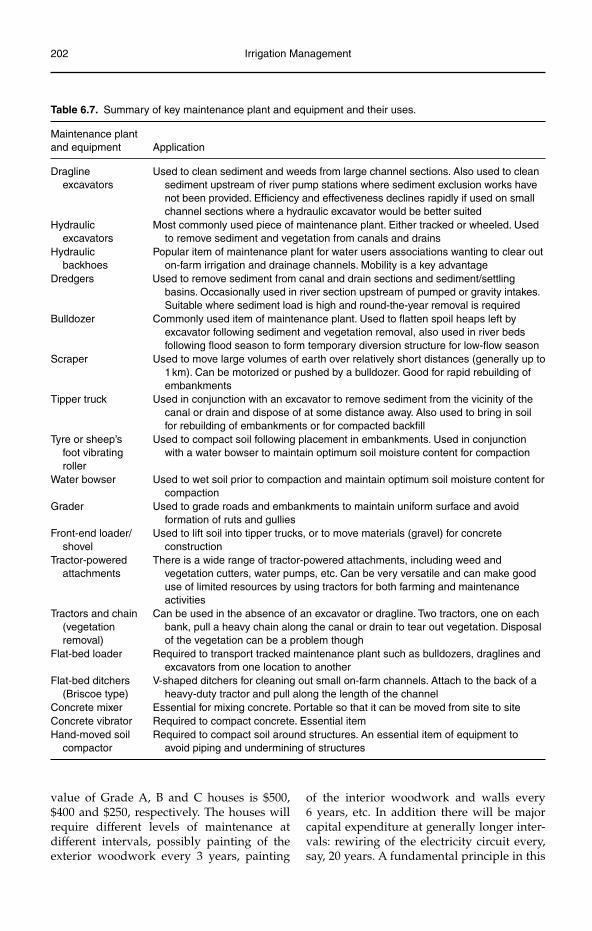
202 Irrigation Management
value of Grade A, B and C houses is $500, $400 and $250, respectively. The houses will require different levels of maintenance at different intervals, possibly painting of the exterior woodwork every 3 years, painting
of the interior woodwork and walls every 6 years, etc. In addition there will be major capital expenditure at generally longer inter-vals: rewiring of the electricity circuit every, say, 20 years. A fundamental principle in this
Table 6.7. Summary of key maintenance plant and equipment and their uses.
Maintenance plant and equipment Application
Dragline excavators
Used to clean sediment and weeds from large channel sections. Also used to clean sediment upstream of river pump stations where sediment exclusion works have not been provided. Efficiency and effectiveness declines rapidly if used on small channel sections where a hydraulic excavator would be better suited
Hydraulic excavators
Most commonly used piece of maintenance plant. Either tracked or wheeled. Used to remove sediment and vegetation from canals and drains
Hydraulic backhoes
Popular item of maintenance plant for water users associations wanting to clear out on-farm irrigation and drainage channels. Mobility is a key advantage
Dredgers Used to remove sediment from canal and drain sections and sediment/settling basins. Occasionally used in river section upstream of pumped or gravity intakes. Suitable where sediment load is high and round-the-year removal is required
Bulldozer Commonly used item of maintenance plant. Used to flatten spoil heaps left by excavator following sediment and vegetation removal, also used in river beds following flood season to form temporary diversion structure for low-flow season
Scraper Used to move large volumes of earth over relatively short distances (generally up to 1 km). Can be motorized or pushed by a bulldozer. Good for rapid rebuilding of embankments
Tipper truck Used in conjunction with an excavator to remove sediment from the vicinity of the canal or drain and dispose of at some distance away. Also used to bring in soil for rebuilding of embankments or for compacted backfill
Tyre or sheep’s foot vibrating roller
Used to compact soil following placement in embankments. Used in conjunction with a water bowser to maintain optimum soil moisture content for compaction
Water bowser Used to wet soil prior to compaction and maintain optimum soil moisture content for compaction
Grader Used to grade roads and embankments to maintain uniform surface and avoid formation of ruts and gullies
Front-end loader/shovel
Used to lift soil into tipper trucks, or to move materials (gravel) for concrete construction
Tractor-powered attachments
There is a wide range of tractor-powered attachments, including weed and vegetation cutters, water pumps, etc. Can be very versatile and can make good use of limited resources by using tractors for both farming and maintenance activities
Tractors and chain (vegetation removal)
Can be used in the absence of an excavator or dragline. Two tractors, one on each bank, pull a heavy chain along the canal or drain to tear out vegetation. Disposal of the vegetation can be a problem though
Flat-bed loader Required to transport tracked maintenance plant such as bulldozers, draglines and excavators from one location to another
Flat-bed ditchers (Briscoe type)
V-shaped ditchers for cleaning out small on-farm channels. Attach to the back of a heavy-duty tractor and pull along the length of the channel
Concrete mixer Essential for mixing concrete. Portable so that it can be moved from site to siteConcrete vibrator Required to compact concrete. Essential itemHand-moved soil
compactorRequired to compact soil around structures. An essential item of equipment to
avoid piping and undermining of structures
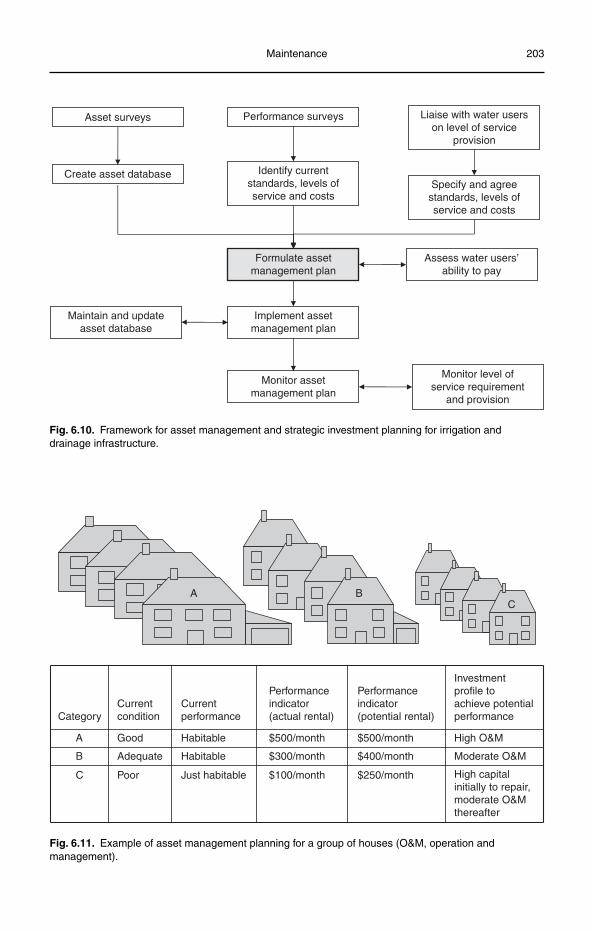
Maintenance 203
Asset surveys
Create asset database
Performance surveys
Identify currentstandards, levels ofservice and costs
Liaise with water userson level of service
provision
Specify and agreestandards, levels ofservice and costs
Implement assetmanagement plan
Monitor assetmanagement plan
Maintain and updateasset database
Monitor level ofservice requirement
and provision
Formulate assetmanagement plan
Assess water users’ability to pay
Fig. 6.10. Framework for asset management and strategic investment planning for irrigation and drainage infrastructure.
CategoryCurrentcondition
Currentperformance
Performanceindicator(actual rental)
Performanceindicator(potential rental)
Investmentprofile toachieve potentialperformance
A Good Habitable $500/month $500/month High O&M
B Adequate Habitable $300/month $400/month Moderate O&M
C Poor Just habitable $100/month $250/month High capitalinitially to repair,moderate O&Mthereafter
A BC
Fig. 6.11. Example of asset management planning for a group of houses (O&M, operation and management).
204 Irrigation Management
process is that the income from rental is able to cover these costs, including an allowance for management overheads. It may also be that the housing association at some stage decides to modernize the houses by provid-ing new kitchens. This modernization will enhance the level of service provided to the tenants for which an increased rental may then be charged.
A similar process can be applied to irriga-tion and drainage infrastructure. The function and value of the infrastructure can be assessed and the infrastructure categorized according to the potential level of service that it can pro-vide (ability to deliver water to match crop demands).3 The level of expenditure required to keep the system operational over time at a specified level can be ascertained and the fee level to be charged to water users deter-mined. If further investment is made in the irrigation or drainage system and the sys-tem is modernized, then the fee level can be changed to reflect the increased level of serv-ice provision. For example, the conversion of a system with manually operated gates to a system with automatic level control gates will increase the level of service by facilitating water distribution on-demand, thereby better matching supply and demand and facilitat-ing enhanced agricultural production. There will be capital expenditure to remove and replace the control structures while the day-to-day operation costs may be reduced due to the saving of labour costs. The balance of the costs and savings will need to be determined by discounting over a 10–20 year timeframe to ascertain if the irrigation service fee level needs to be increased or decreased to pay for the changes made. Table 6.8 shows con-ceptual relationships between level of invest-ment, canal control systems, level of service, O&M costs, and potential income levels. The level of service potential outlined in Table 6.8 assumes a close relationship between the control infrastructure and the management capability.
The interacting factors of asset condi-tion and performance, current and desired levels of service are incorporated into the asset management plan and the investment over time calculated. The resultant expendi-ture profile (Fig. 6.12) is compared with
the ability of the water users to pay, and in some cases the standard of the desired level of service may need to be reduced to match the users’ ability to cover the planned expenditure.
The asset management plan is then implemented through shorter-term imple-mentation plans, often of 5 years duration. The asset database will be upgraded as work is carried out, and the implementation of the plan and the level of service provision will be monitored.
Asset management can be used by the owners and managers of infrastructure as part of the process of assessing, monitor-ing and maintaining the value and utility of the assets. It can also be used by regulatory authorities where publicly owned infrastruc-ture has been sold, franchised or transferred to non-governmental bodies. Such infrastruc-ture often serves a monopoly function (deliv-ery of irrigation water, potable water supply and sanitation, etc.), and the government has a duty of care to ensure that the infrastruc-ture is properly managed and sustained over time. Failure on the part of government in this respect may mean that the management entity ‘mines’ the value of the assets by fail-ing to invest sufficiently in the infrastructure over time, leading to failure of the system in the longer term.
An important current application of asset management is in the process of transferring the management, operation and maintenance of the I&D system to water users associations. Applying asset management procedures at the transfer stage can have important ben-efits, including: identification and audit of all infrastructural assets; identification of water users’ desired level of service; identi-fication of the cost of maintaining the system over time commensurate with the agreed level of service provision; understanding by the water users of the relationship between infrastructure condition and system perform-ance; and development and ownership by water users and irrigation service provider of the relationship between fee payment and service provision.
A word of caution is required. Asset management is a management tool; how it is used, and how effective it is, depends entirely
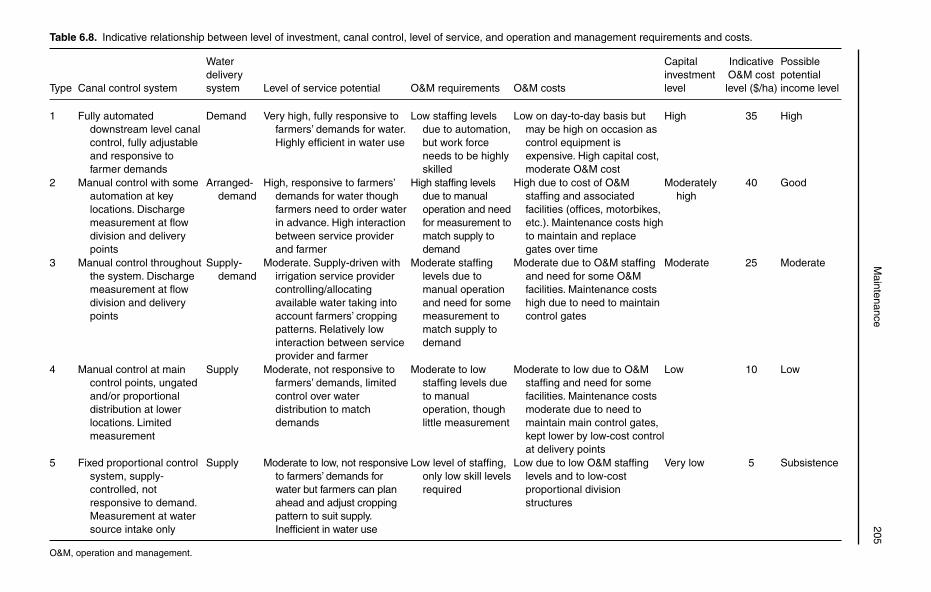
M
aintenance 205
Table 6.8. Indicative relationship between level of investment, canal control, level of service, and operation and management requirements and costs.
Type Canal control system
Water delivery system Level of service potential O&M requirements O&M costs
Capitalinvestment level
Indicative O&M cost level ($/ha)
Possible potentialincome level
1 Fully automated downstream level canal control, fully adjustable and responsive to farmer demands
Demand Very high, fully responsive to farmers’ demands for water. Highly efficient in water use
Low staffing levels due to automation, but work force needs to be highly skilled
Low on day-to-day basis but may be high on occasion as control equipment is expensive. High capital cost, moderate O&M cost
High 35 High
2 Manual control with some automation at key locations. Discharge measurement at flow division and delivery points
Arranged-demand
High, responsive to farmers’ demands for water though farmers need to order water in advance. High interaction between service provider and farmer
High staffing levels due to manual operation and need for measurement to match supply to demand
High due to cost of O&M staffing and associated facilities (offices, motorbikes, etc.). Maintenance costs high to maintain and replace gates over time
Moderately high
40 Good
3 Manual control throughout the system. Discharge measurement at flow division and delivery points
Supply-demand
Moderate. Supply-driven with irrigation service provider controlling/allocatingavailable water taking into account farmers’ cropping patterns. Relatively low interaction between service provider and farmer
Moderate staffing levels due to manual operation and need for some measurement to match supply to demand
Moderate due to O&M staffing and need for some O&M facilities. Maintenance costs high due to need to maintain control gates
Moderate 25 Moderate
4 Manual control at main control points, ungated and/or proportional distribution at lower locations. Limited measurement
Supply Moderate, not responsive to farmers’ demands, limited control over water distribution to match demands
Moderate to low staffing levels due to manual operation, though little measurement
Moderate to low due to O&M staffing and need for some facilities. Maintenance costs moderate due to need to maintain main control gates, kept lower by low-cost control at delivery points
Low 10 Low
5 Fixed proportional control system, supply-controlled, not responsive to demand. Measurement at water source intake only
Supply Moderate to low, not responsive to farmers’ demands for water but farmers can plan ahead and adjust cropping pattern to suit supply. Inefficient in water use
Low level of staffing, only low skill levels required
Low due to low O&M staffing levels and to low-cost proportional division structures
Very low 5 Subsistence
O&M, operation and management.
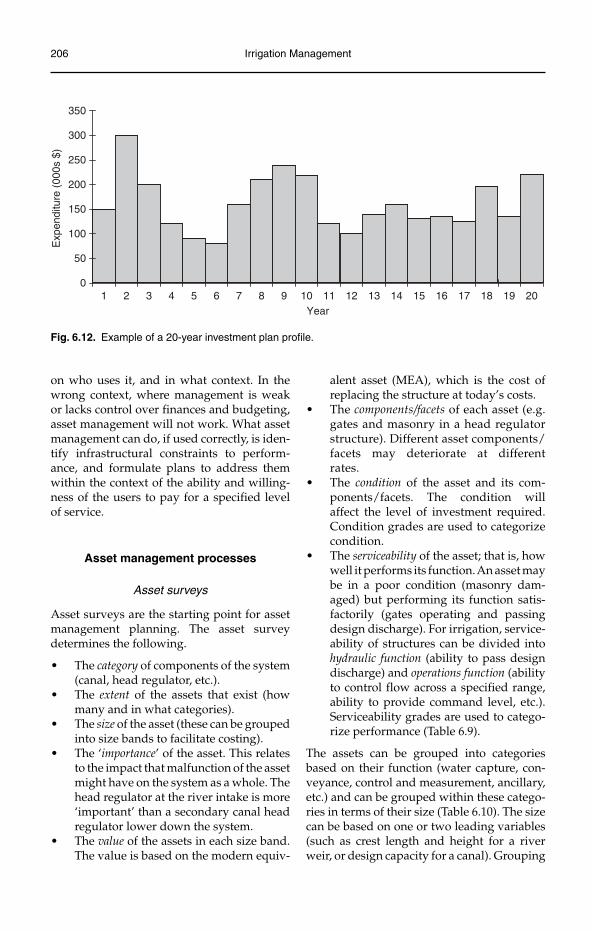
206 Irrigation Management
on who uses it, and in what context. In the wrong context, where management is weak or lacks control over finances and budgeting, asset management will not work. What asset management can do, if used correctly, is iden-tify infrastructural constraints to perform-ance, and formulate plans to address them within the context of the ability and willing-ness of the users to pay for a specified level of service.
Asset management processes
Asset surveys
Asset surveys are the starting point for asset management planning. The asset survey determines the following.
The• category of components of the system (canal, head regulator, etc.).The• extent of the assets that exist (how many and in what categories).The• size of the asset (these can be grouped into size bands to facilitate costing).The ‘• importance’ of the asset. This relates to the impact that malfunction of the asset might have on the system as a whole. The head regulator at the river intake is more ‘important’ than a secondary canal head regulator lower down the system.The• value of the assets in each size band. The value is based on the modern equiv-
alent asset (MEA), which is the cost of replacing the structure at today’s costs.The• components/facets of each asset (e.g. gates and masonry in a head regulator structure). Different asset components/facets may deteriorate at different rates.The• condition of the asset and its com-ponents/facets. The condition will affect the level of investment required. Condition grades are used to categorize condition.The• serviceability of the asset; that is, how well it performs its function. An asset may be in a poor condition (masonry dam-aged) but performing its function satis-factorily (gates operating and passing design discharge). For irrigation, service-ability of structures can be divided into hydraulic function (ability to pass design discharge) and operations function (ability to control flow across a specified range, ability to provide command level, etc.). Serviceability grades are used to catego-rize performance (Table 6.9).
The assets can be grouped into categories based on their function (water capture, con-veyance, control and measurement, ancillary, etc.) and can be grouped within these catego-ries in terms of their size (Table 6.10). The size can be based on one or two leading variables (such as crest length and height for a river weir, or design capacity for a canal). Grouping
0
50
100
150
200
250
300
350
1 2 3 4 5 6 7 8 9 10 11 12 13 14 15 16 17 18 19 20Year
Exp
endi
ture
(00
0s $
)
Fig. 6.12. Example of a 20-year investment plan profile.
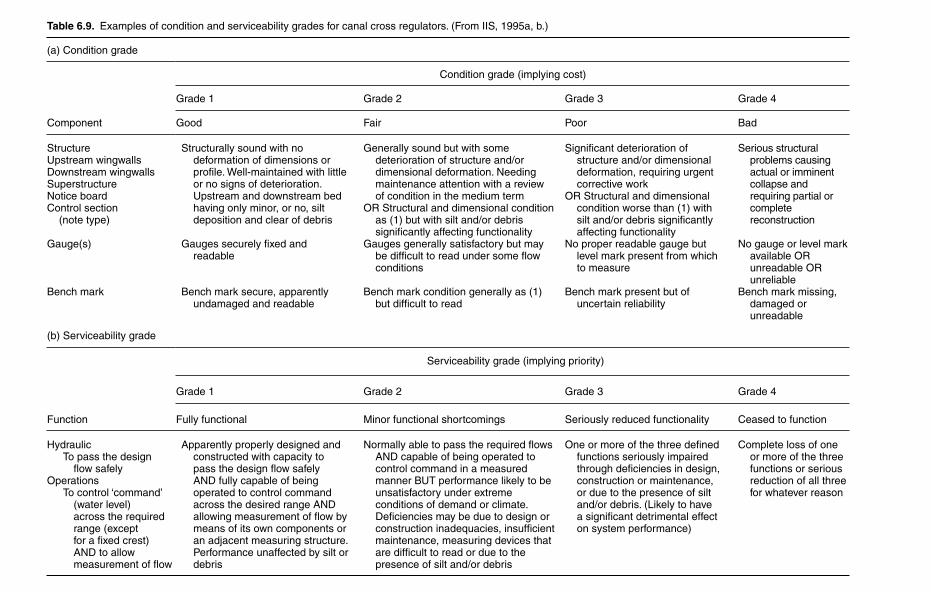
Table 6.9. Examples of condition and serviceability grades for canal cross regulators. (From IIS, 1995a, b.)
(a) Condition grade
Component
Condition grade (implying cost)
Grade 1 Grade 2 Grade 3 Grade 4
Good Fair Poor Bad
StructureUpstream wingwallsDownstream wingwallsSuperstructureNotice boardControl section
(note type)
Structurally sound with no deformation of dimensions or profile. Well-maintained with little or no signs of deterioration. Upstream and downstream bed having only minor, or no, silt deposition and clear of debris
Generally sound but with some deterioration of structure and/or dimensional deformation. Needing maintenance attention with a review of condition in the medium term
OR Structural and dimensional condition as (1) but with silt and/or debris significantly affecting functionality
Significant deterioration of structure and/or dimensional deformation, requiring urgent corrective work
OR Structural and dimensional condition worse than (1) with silt and/or debris significantly affecting functionality
Serious structural problems causing actual or imminent collapse and requiring partial or complete reconstruction
Gauge(s) Gauges securely fixed and readable
Gauges generally satisfactory but may be difficult to read under some flow conditions
No proper readable gauge but level mark present from which to measure
No gauge or level mark available OR unreadable OR unreliable
Bench mark Bench mark secure, apparently undamaged and readable
Bench mark condition generally as (1) but difficult to read
Bench mark present but of uncertain reliability
Bench mark missing, damaged or unreadable
(b) Serviceability grade
Function
Serviceability grade (implying priority)
Grade 1 Grade 2 Grade 3 Grade 4
Fully functional Minor functional shortcomings Seriously reduced functionality Ceased to function
HydraulicTo pass the design flow safely
OperationsTo control ‘command’
(water level) across the required range (except for a fixed crest) AND to allow measurement of flow
Apparently properly designed and constructed with capacity to pass the design flow safely AND fully capable of being operated to control command across the desired range AND allowing measurement of flow by means of its own components or an adjacent measuring structure. Performance unaffected by silt or debris
Normally able to pass the required flows AND capable of being operated to control command in a measured manner BUT performance likely to be unsatisfactory under extreme conditions of demand or climate. Deficiencies may be due to design or construction inadequacies, insufficient maintenance, measuring devices that are difficult to read or due to the presence of silt and/or debris
One or more of the three defined functions seriously impaired through deficiencies in design, construction or maintenance, or due to the presence of silt and/or debris. (Likely to have a significant detrimental effect on system performance)
Complete loss of one or more of the three functions or serious reduction of all three for whatever reason
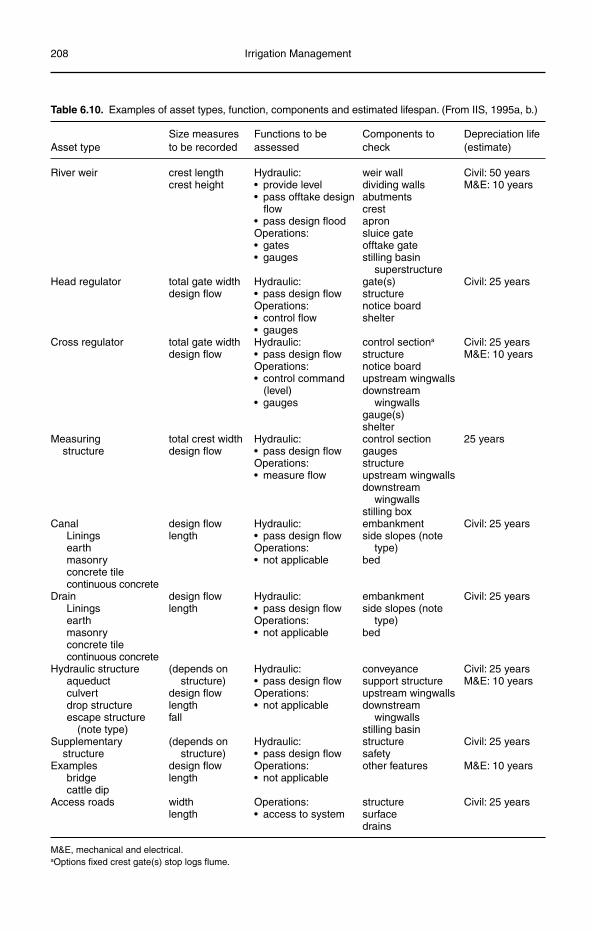
208 Irrigation Management
Table 6.10. Examples of asset types, function, components and estimated lifespan. (From IIS, 1995a, b.)
Asset typeSize measures to be recorded
Functions to be assessed
Components to check
Depreciation life (estimate)
River weir crest lengthcrest height
Hydraulic:• provide level• pass offtake design
flow• pass design floodOperations:• gates• gauges
weir walldividing wallsabutmentscrestapronsluice gateofftake gatestilling basin
superstructure
Civil: 50 yearsM&E: 10 years
Head regulator total gate widthdesign flow
Hydraulic:• pass design flowOperations:• control flow• gauges
gate(s)structurenotice boardshelter
Civil: 25 years
Cross regulator total gate widthdesign flow
Hydraulic:• pass design flowOperations:• control command
(level)• gauges
control sectiona
structurenotice boardupstream wingwallsdownstream
wingwallsgauge(s)shelter
Civil: 25 yearsM&E: 10 years
Measuring structure
total crest widthdesign flow
Hydraulic:• pass design flowOperations:• measure flow
control sectiongaugesstructureupstream wingwallsdownstream
wingwallsstilling box
25 years
CanalLiningsearthmasonryconcrete tilecontinuous concrete
design flowlength
Hydraulic:• pass design flowOperations:• not applicable
embankmentside slopes (note
type)bed
Civil: 25 years
DrainLiningsearthmasonryconcrete tilecontinuous concrete
design flowlength
Hydraulic:• pass design flowOperations:• not applicable
embankmentside slopes (note
type)bed
Civil: 25 years
Hydraulic structureaqueductculvertdrop structureescape structure (note type)
(depends on structure)
design flowlengthfall
Hydraulic:• pass design flowOperations:• not applicable
conveyancesupport structureupstream wingwallsdownstream
wingwallsstilling basin
Civil: 25 yearsM&E: 10 years
Supplementary structure
(depends on structure)
Hydraulic: • pass design flow
structuresafety
Civil: 25 years
Examplesbridgecattle dip
design flowlength
Operations:• not applicable
other features M&E: 10 years
Access roads widthlength
Operations:• access to system
structuresurfacedrains
Civil: 25 years
M&E, mechanical and electrical.aOptions fixed crest gate(s) stop logs flume.
Maintenance 209
in this way means that average costs can be determined for categories and size bands of assets for maintenance and for assessing the MEA value. The MEA value represents the cost, in today’s prices, of replacing the asset, and as such builds to give a complete valua-tion for the asset base.
To carry out the survey the asset surveyor first gathers available data (maps, design drawings, structure inventories, etc.) before starting on the field work. For the field work the surveyor generally commences at the top of the primary canal system and works down to the tail, then returning to survey each second-ary canal in turn. The distance along the canal is measured using a tape or measuring wheel, and condition and performance assessments made of each stretch of canal, and at each struc-ture. The level of detail collected depends on the resources available, in some cases full pro-files of the canal are measured each 100 m, in other cases, only observations are taken. For structures key measurements are taken (gate widths, height, etc.) and in some surveys full measurements are taken for all components/facets of each structure. Standard forms are used to record the survey data (Fig. 6.13). The survey may need to be carried out first with the canals flowing and then with them dry to cap-ture all the data required.
With the advent of digital cameras pho-tographs are increasing being used as an inte-gral part of the asset survey, both to record the condition of the asset and to use a part of the process of grading the condition and serviceability of the asset.
Asset database
Data collected from the asset survey need to be recorded in a systematic manner in the asset database. The asset database can be created using a spreadsheet, a standard database or a tailor-made database. A possible structure for such a relational database is presented in Fig. 6.14, with data on different aspects being entered and stored in separate, but related files. Photographs will form an important part of the database, and will act as a record to be able to assess the performance of the asset management programme by being able to vis-ually review asset condition over time.
Performance surveys
Performance surveys are required to assess the current and potential performance of both the I&D system and the I&D scheme. Strictly speaking those responsible for the assets are interested in the performance of the system (the network of canals, drains, structures) rather than that of the scheme (the physi-cal system plus the land plots and crops) as they have control over the performance of the system, but not, generally, over the perform-ance of the scheme as a whole. The exception would be where the system and scheme are under the control of one organization, such as on a privately run sugar estate.
For asset management planning, assess-ment of the performance of the system relates mainly to the delivery of, and removal of excess, water in a reliable, adequate, timely, equitable and cost-effective manner. For assessment of scheme performance addi-tional indicators such as crop production, crop yields and crop income are important. In some cases, such as in Australia where irrigation systems are equipped with accu-rate measuring structures, separation of the performance of the system and the scheme is feasible. In other irrigation systems where measurement of water at the system delivery point (the head of the secondary or tertiary canal) is not possible, or not well done, then the performance of the scheme, and sections within the scheme, is required as a proxy for assessing system performance.
Performance assessment is discussed in greater detail in Chapter 9. In the context of asset management planning it is important to distinguish between the performance con-straints arising from the condition of the infra-structure and those arising from the operationand use of the infrastructure. Asset manage-ment seeks to minimize infrastructural per-formance constraints in order that system performance is not constrained; it does not deal directly with operational issues.
Defining and agreeing on standards and levels of service provision
A key feature of the asset management planning process is to specify the desired
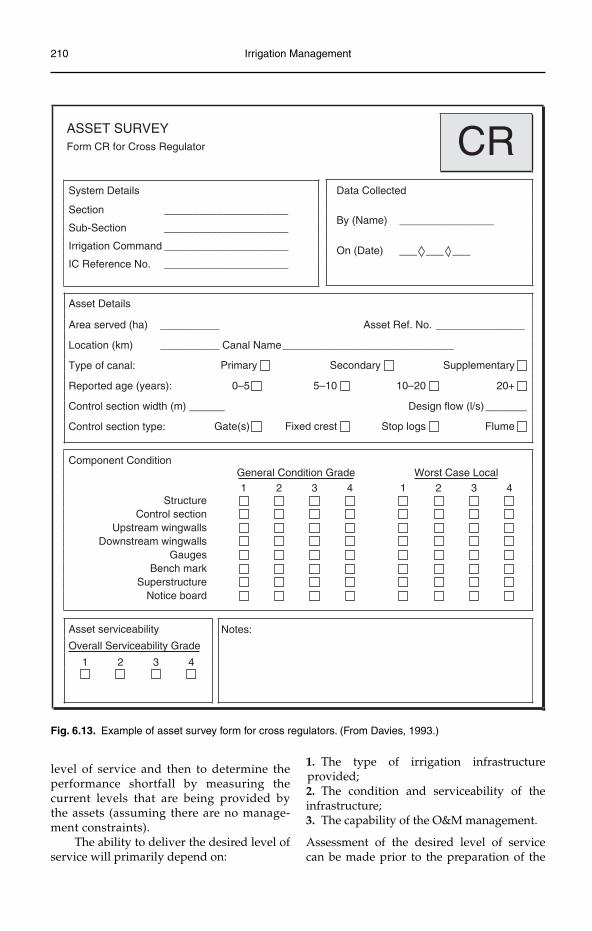
210 Irrigation Management
level of service and then to determine the performance shortfall by measuring the current levels that are being provided by the assets (assuming there are no manage-ment constraints).
The ability to deliver the desired level of service will primarily depend on:
1. The type of irrigation infrastructure provided;2. The condition and serviceability of the infrastructure;3. The capability of the O&M management.
Assessment of the desired level of service can be made prior to the preparation of the
Fig. 6.13. Example of asset survey form for cross regulators. (From Davies, 1993.)
ASSET SURVEYForm CR for Cross Regulator CRSystem Details
Section _____________________
Sub-Section _____________________
Irrigation Command _____________________
IC Reference No. _____________________
Data Collected
By (Name) ________________
On (Date) ___ ___ ___
Asset Details
_______________Asset Ref. No.__________Area served (ha)
______
Location (km) __________ Canal Name_____________________________
Type of canal: Primary
Reported age (years): 0–5
Control section width (m)
Control section type: Gate(s)
Secondary Supplementary
5–10
Fixed crest
Design flow (l/s)_______
Stop logs Flume
Component ConditionGeneral Condition Grade
10–20 20+
Worst Case Local43214321
Structure
Gauges
Control sectionUpstream wingwalls
Downstream wingwalls
Bench markSuperstructure
Notice board
Asset serviceability
Overall Serviceability Grade
1 2 3 4
Notes:
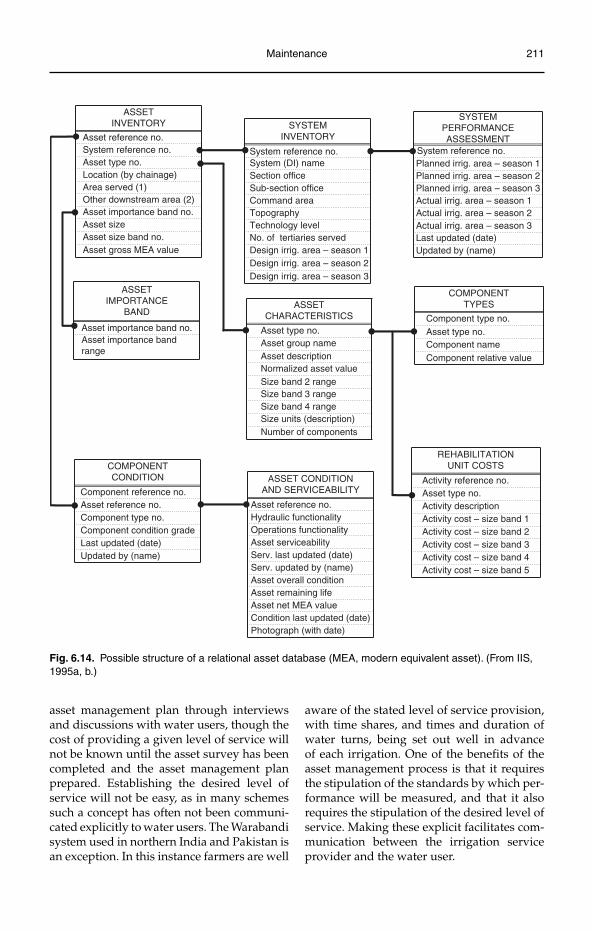
Maintenance 211
ASSETINVENTORY
Asset reference no.System reference no.
Asset type no.Location (by chainage)Area served (1)Other downstream area (2)Asset importance band no.Asset sizeAsset size band no.Asset gross MEA value
ASSETIMPORTANCE
BAND
Asset importance band no.Asset importance bandrange
COMPONENTCONDITION
Component reference no.Asset reference no.Component type no.Component condition gradeLast updated (date)Updated by (name)
SYSTEMINVENTORY
System reference no.System (DI) nameSection officeSub-section officeCommand areaTopographyTechnology levelNo. of tertiaries servedDesign irrig. area – season 1Design irrig. area – season 2Design irrig. area – season 3
ASSETCHARACTERISTICS
Asset type no.Asset group nameAsset descriptionNormalized asset valueSize band 2 rangeSize band 3 rangeSize band 4 rangeSize units (description)Number of components
ASSET CONDITIONAND SERVICEABILITY
Asset reference no.Hydraulic functionalityOperations functionalityAsset serviceabilityServ. last updated (date)Serv. updated by (name)Asset overall conditionAsset remaining lifeAsset net MEA valueCondition last updated (date)Photograph (with date)
SYSTEMPERFORMANCEASSESSMENT
System reference no.Planned irrig. area – season 1Planned irrig. area – season 2Planned irrig. area – season 3Actual irrig. area – season 1Actual irrig. area – season 2Actual irrig. area – season 3Last updated (date)Updated by (name)
COMPONENTTYPES
Component type no.Asset type no.Component nameComponent relative value
REHABILITATIONUNIT COSTS
Activity reference no.Asset type no.Activity descriptionActivity cost – size band 1Activity cost – size band 2Activity cost – size band 3Activity cost – size band 4Activity cost – size band 5
Fig. 6.14. Possible structure of a relational asset database (MEA, modern equivalent asset). (From IIS, 1995a, b.)
asset management plan through interviews and discussions with water users, though the cost of providing a given level of service will not be known until the asset survey has been completed and the asset management plan prepared. Establishing the desired level of service will not be easy, as in many schemes such a concept has often not been communi-cated explicitly to water users. The Warabandi system used in northern India and Pakistan is an exception. In this instance farmers are well
aware of the stated level of service provision, with time shares, and times and duration of water turns, being set out well in advance of each irrigation. One of the benefits of the asset management process is that it requires the stipulation of the standards by which per-formance will be measured, and that it also requires the stipulation of the desired level of service. Making these explicit facilitates com-munication between the irrigation service provider and the water user.
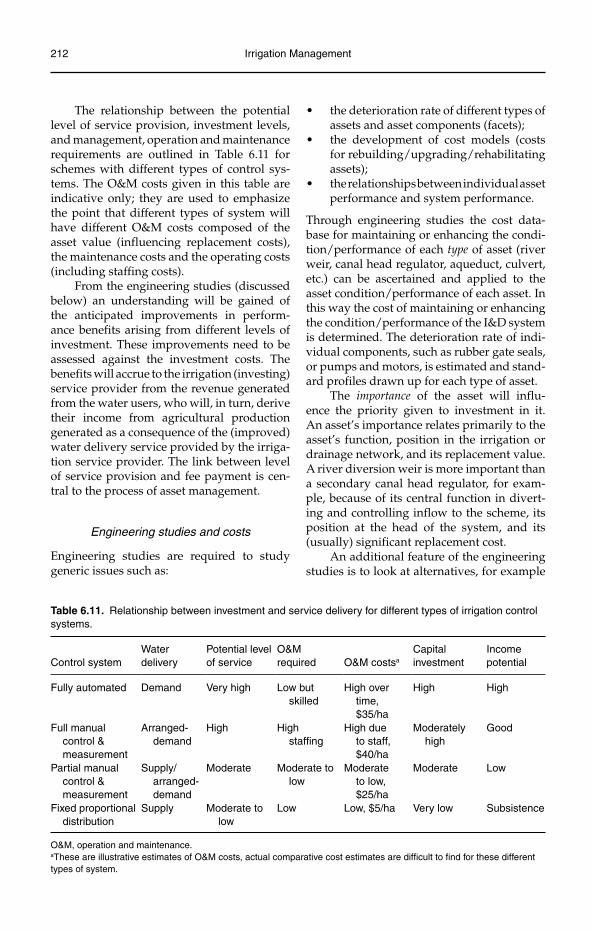
212 Irrigation Management
The relationship between the potential level of service provision, investment levels, and management, operation and maintenance requirements are outlined in Table 6.11 for schemes with different types of control sys-tems. The O&M costs given in this table are indicative only; they are used to emphasize the point that different types of system will have different O&M costs composed of the asset value (influencing replacement costs), the maintenance costs and the operating costs (including staffing costs).
From the engineering studies (discussed below) an understanding will be gained of the anticipated improvements in perform-ance benefits arising from different levels of investment. These improvements need to be assessed against the investment costs. The benefits will accrue to the irrigation (investing) service provider from the revenue generated from the water users, who will, in turn, derive their income from agricultural production generated as a consequence of the (improved) water delivery service provided by the irriga-tion service provider. The link between level of service provision and fee payment is cen-tral to the process of asset management.
Engineering studies and costs
Engineering studies are required to study generic issues such as:
the deterioration rate of different types of •assets and asset components (facets);the development of cost models (costs •for rebuilding/upgrading/rehabilitating assets);the relationships between individual asset •performance and system performance.
Through engineering studies the cost data-base for maintaining or enhancing the condi-tion/performance of each type of asset (river weir, canal head regulator, aqueduct, culvert, etc.) can be ascertained and applied to the asset condition/performance of each asset. In this way the cost of maintaining or enhancing the condition/performance of the I&D system is determined. The deterioration rate of indi-vidual components, such as rubber gate seals, or pumps and motors, is estimated and stand-ard profiles drawn up for each type of asset.
The importance of the asset will influ-ence the priority given to investment in it. An asset’s importance relates primarily to the asset’s function, position in the irrigation or drainage network, and its replacement value. A river diversion weir is more important than a secondary canal head regulator, for exam-ple, because of its central function in divert-ing and controlling inflow to the scheme, its position at the head of the system, and its (usually) significant replacement cost.
An additional feature of the engineering studies is to look at alternatives, for example
Table 6.11. Relationship between investment and service delivery for different types of irrigation control systems.
Control systemWater delivery
Potential level of service
O&Mrequired O&M costsa
Capitalinvestment
Incomepotential
Fully automated Demand Very high Low but skilled
High over time,$35/ha
High High
Full manual control & measurement
Arranged-demand
High High staffing
High due to staff, $40/ha
Moderately high
Good
Partial manual control & measurement
Supply/arranged-demand
Moderate Moderate to low
Moderate to low, $25/ha
Moderate Low
Fixed proportional distribution
Supply Moderate to low
Low Low, $5/ha Very low Subsistence
O&M, operation and maintenance.aThese are illustrative estimates of O&M costs, actual comparative cost estimates are difficult to find for these different types of system.
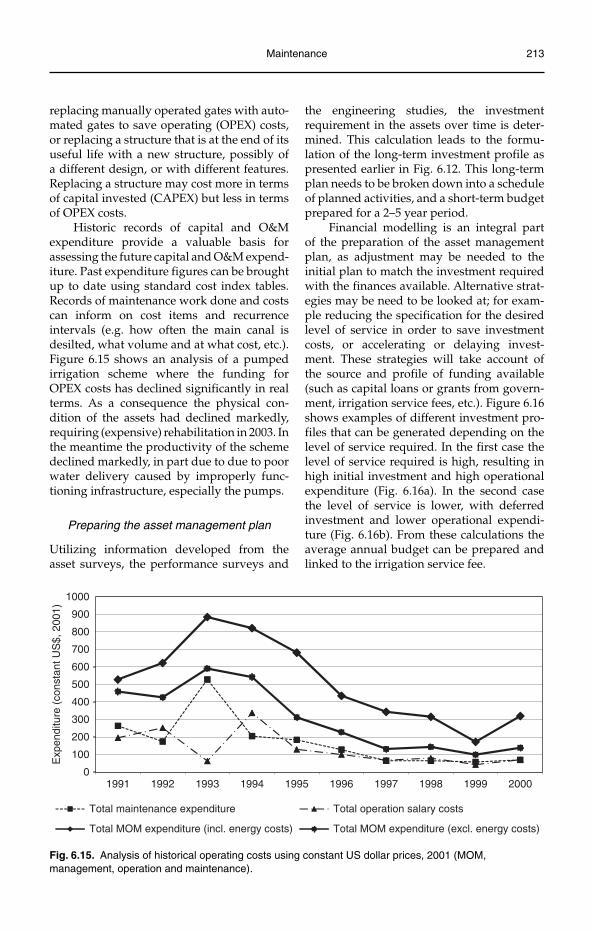
Maintenance 213
replacing manually operated gates with auto-mated gates to save operating (OPEX) costs, or replacing a structure that is at the end of its useful life with a new structure, possibly of a different design, or with different features. Replacing a structure may cost more in terms of capital invested (CAPEX) but less in terms of OPEX costs.
Historic records of capital and O&M expenditure provide a valuable basis for assessing the future capital and O&M expend-iture. Past expenditure figures can be brought up to date using standard cost index tables. Records of maintenance work done and costs can inform on cost items and recurrence intervals (e.g. how often the main canal is desilted, what volume and at what cost, etc.). Figure 6.15 shows an analysis of a pumped irrigation scheme where the funding for OPEX costs has declined significantly in real terms. As a consequence the physical con-dition of the assets had declined markedly, requiring (expensive) rehabilitation in 2003. In the meantime the productivity of the scheme declined markedly, in part due to due to poor water delivery caused by improperly func-tioning infrastructure, especially the pumps.
Preparing the asset management plan
Utilizing information developed from the asset surveys, the performance surveys and
the engineering studies, the investment requirement in the assets over time is deter-mined. This calculation leads to the formu-lation of the long-term investment profile as presented earlier in Fig. 6.12. This long-term plan needs to be broken down into a schedule of planned activities, and a short-term budget prepared for a 2–5 year period.
Financial modelling is an integral part of the preparation of the asset management plan, as adjustment may be needed to the initial plan to match the investment required with the finances available. Alternative strat-egies may be need to be looked at; for exam-ple reducing the specification for the desired level of service in order to save investment costs, or accelerating or delaying invest-ment. These strategies will take account of the source and profile of funding available (such as capital loans or grants from govern-ment, irrigation service fees, etc.). Figure 6.16 shows examples of different investment pro-files that can be generated depending on the level of service required. In the first case the level of service required is high, resulting in high initial investment and high operational expenditure (Fig. 6.16a). In the second case the level of service is lower, with deferred investment and lower operational expendi-ture (Fig. 6.16b). From these calculations the average annual budget can be prepared and linked to the irrigation service fee.
0
100
200
300
400
500
600
700
800
900
1000
1991 1992 1993 1994 1995 1996 1997 1998 1999 2000
Exp
endi
ture
(co
nsta
nt U
S$,
200
1)
Total maintenance expenditure Total operation salary costs
Total MOM expenditure (incl. energy costs) Total MOM expenditure (excl. energy costs)
Fig. 6.15. Analysis of historical operating costs using constant US dollar prices, 2001 (MOM, management, operation and maintenance).
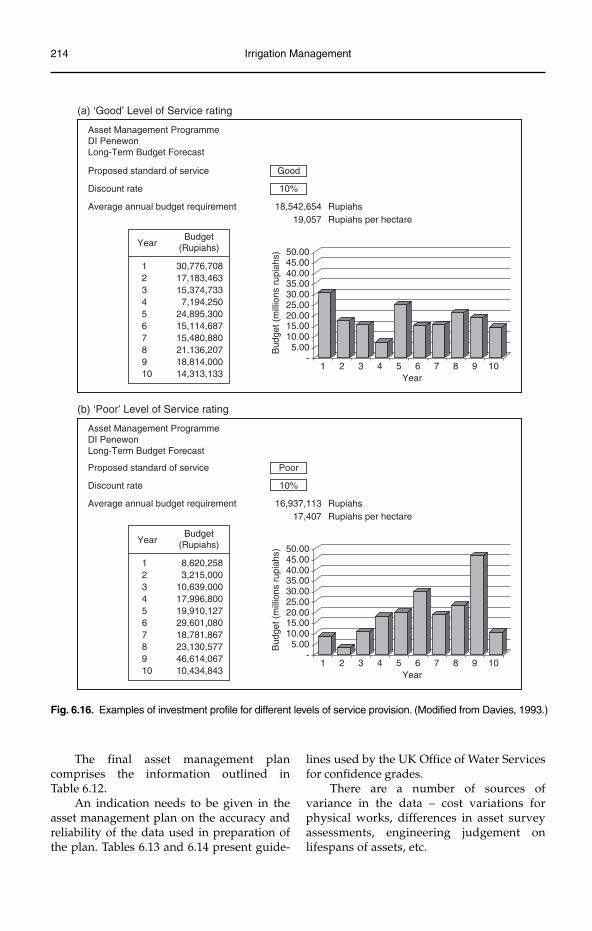
214 Irrigation Management
The final asset management plan comprises the information outlined in Table 6.12.
An indication needs to be given in the asset management plan on the accuracy and reliability of the data used in preparation of the plan. Tables 6.13 and 6.14 present guide-
lines used by the UK Office of Water Services for confidence grades.
There are a number of sources of variance in the data – cost variations for physical works, differences in asset survey assessments, engineering judgement on lifespans of assets, etc.
Fig. 6.16. Examples of investment profile for different levels of service provision. (Modified from Davies, 1993.)
(a) ‘Good’ Level of Service rating
Asset Management ProgrammeDI PenewonLong-Term Budget Forecast
Proposed standard of service Good
Discount rate 10%
Average annual budget requirement 18,542,654 Rupiahs19,057 Rupiahs per hectare
YearBudget
(Rupiahs)
12345678910
30,776,70817,183,46315,374,7337,194,250
24,895,30015,114,68715,480,88021,136,20718,814,00014,313,133
-5.00
10.0015.0020.0025.0030.0035.0040.0045.0050.00
1 2 3 4 5 6 7 8 9 10
Bud
get (
mill
ions
rup
iahs
)
Year
(b) ‘Poor’ Level of Service rating
Asset Management ProgrammeDI PenewonLong-Term Budget Forecast
Proposed standard of service Poor
Discount rate 10%
Average annual budget requirement 16,937,113 Rupiahs17,407 Rupiahs per hectare
YearBudget
(Rupiahs)
12345678910
8,620,2583,215,000
10,639,00017,996,80019,910,12729,601,08018,781,86723,130,57746,614,06710,434,843
-5.00
10.0015.0020.0025.0030.0035.0040.0045.0050.00
1 2 3 4 5 6 7 8 9 10
Bud
get (
mill
ions
rup
iahs
)
Year
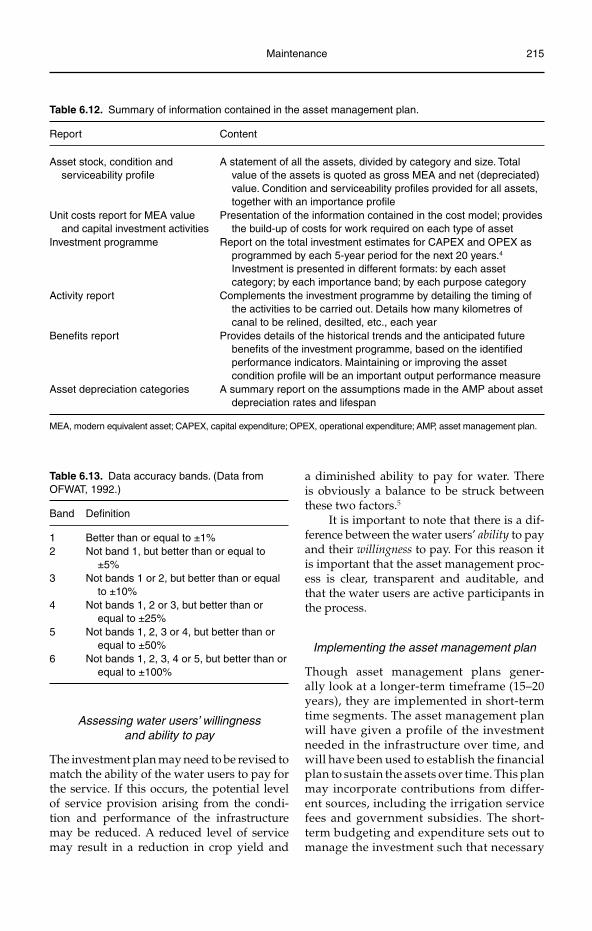
Maintenance 215
Assessing water users’ willingness and ability to pay
The investment plan may need to be revised to match the ability of the water users to pay for the service. If this occurs, the potential level of service provision arising from the condi-tion and performance of the infrastructure may be reduced. A reduced level of service may result in a reduction in crop yield and
Table 6.12. Summary of information contained in the asset management plan.
Report Content
Asset stock, condition and serviceability profile
A statement of all the assets, divided by category and size. Total value of the assets is quoted as gross MEA and net (depreciated) value. Condition and serviceability profiles provided for all assets, together with an importance profile
Unit costs report for MEA value and capital investment activities
Presentation of the information contained in the cost model; provides the build-up of costs for work required on each type of asset
Investment programme Report on the total investment estimates for CAPEX and OPEX as programmed by each 5-year period for the next 20 years.4
Investment is presented in different formats: by each asset category; by each importance band; by each purpose category
Activity report Complements the investment programme by detailing the timing of the activities to be carried out. Details how many kilometres of canal to be relined, desilted, etc., each year
Benefits report Provides details of the historical trends and the anticipated future benefits of the investment programme, based on the identified performance indicators. Maintaining or improving the asset condition profile will be an important output performance measure
Asset depreciation categories A summary report on the assumptions made in the AMP about asset depreciation rates and lifespan
MEA, modern equivalent asset; CAPEX, capital expenditure; OPEX, operational expenditure; AMP, asset management plan.
Table 6.13. Data accuracy bands. (Data from OFWAT, 1992.)
Band Definition
1 Better than or equal to ±1%2 Not band 1, but better than or equal to
±5%3 Not bands 1 or 2, but better than or equal
to ±10%4 Not bands 1, 2 or 3, but better than or
equal to ±25%5 Not bands 1, 2, 3 or 4, but better than or
equal to ±50%6 Not bands 1, 2, 3, 4 or 5, but better than or
equal to ±100%
a diminished ability to pay for water. There is obviously a balance to be struck between these two factors.5
It is important to note that there is a dif-ference between the water users’ ability to pay and their willingness to pay. For this reason it is important that the asset management proc-ess is clear, transparent and auditable, and that the water users are active participants in the process.
Implementing the asset management plan
Though asset management plans gener-ally look at a longer-term timeframe (15–20 years), they are implemented in short-term time segments. The asset management plan will have given a profile of the investment needed in the infrastructure over time, and will have been used to establish the financial plan to sustain the assets over time. This plan may incorporate contributions from differ-ent sources, including the irrigation service fees and government subsidies. The short-term budgeting and expenditure sets out to manage the investment such that necessary
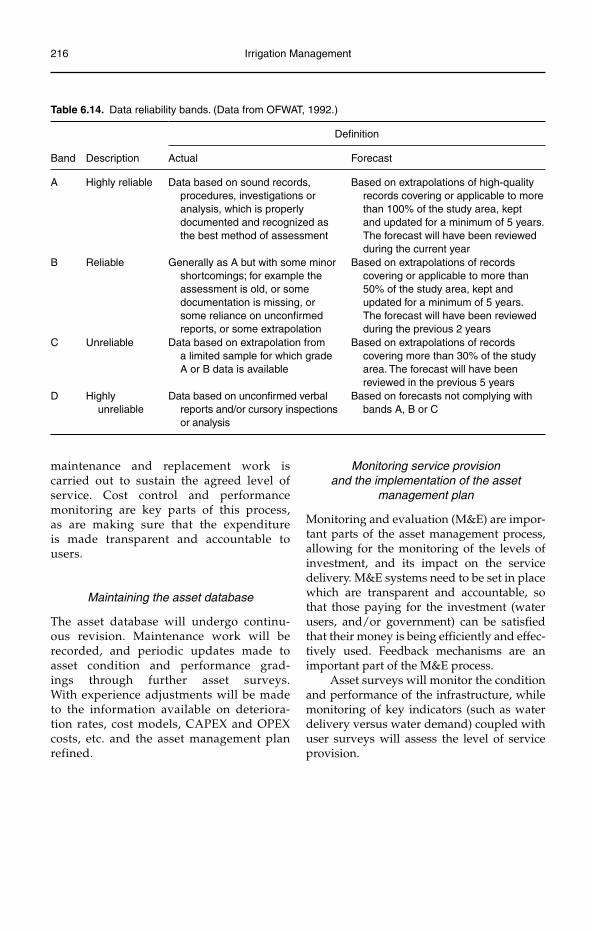
216 Irrigation Management
Table 6.14. Data reliability bands. (Data from OFWAT, 1992.)
Definition
Band Description Actual Forecast
A Highly reliable Data based on sound records, procedures, investigations or analysis, which is properly documented and recognized as the best method of assessment
Based on extrapolations of high-quality records covering or applicable to more than 100% of the study area, kept and updated for a minimum of 5 years. The forecast will have been reviewed during the current year
B Reliable Generally as A but with some minor shortcomings; for example the assessment is old, or some documentation is missing, or some reliance on unconfirmed reports, or some extrapolation
Based on extrapolations of records covering or applicable to more than 50% of the study area, kept and updated for a minimum of 5 years. The forecast will have been reviewed during the previous 2 years
C Unreliable Data based on extrapolation from a limited sample for which grade A or B data is available
Based on extrapolations of records covering more than 30% of the study area. The forecast will have been reviewed in the previous 5 years
D Highly unreliable
Data based on unconfirmed verbal reports and/or cursory inspections or analysis
Based on forecasts not complying with bands A, B or C
maintenance and replacement work is carried out to sustain the agreed level of service. Cost control and performance monitoring are key parts of this process, as are making sure that the expenditure is made transparent and accountable to users.
Maintaining the asset database
The asset database will undergo continu-ous revision. Maintenance work will be recorded, and periodic updates made to asset condition and performance grad-ings through further asset surveys. With experience adjustments will be made to the information available on deteriora-tion rates, cost models, CAPEX and OPEX costs, etc. and the asset management plan refined.
Monitoring service provision and the implementation of the asset
management plan
Monitoring and evaluation (M&E) are impor-tant parts of the asset management process, allowing for the monitoring of the levels of investment, and its impact on the service delivery. M&E systems need to be set in place which are transparent and accountable, so that those paying for the investment (water users, and/or government) can be satisfied that their money is being efficiently and effec-tively used. Feedback mechanisms are an important part of the M&E process.
Asset surveys will monitor the condition and performance of the infrastructure, while monitoring of key indicators (such as water delivery versus water demand) coupled with user surveys will assess the level of service provision.

Maintenance 217
Endnotes
1 In practice, a more detailed analysis would be required using discounted cash flows and net present values to make a true comparison of the alternatives.2 It is the field staff who will bear the brunt of criticism from water users if the maintenance work is not car-ried out properly.3 It is important to note that there are at least two aspects here: the condition and performance of the physi-cal infrastructure, and the performance of the people and organizations that operate the infrastructure. While asset management primarily focuses on the infrastructure, an assessment of the ability of manage-ment to use and operate the infrastructure is also required.4 The selected short- and long-term timeframes may vary depending on the situation.5 In practice this is not a direct one-to-one linkage, it has to be moderated by other factors.
218 ©Martin Burton 2010. Irrigation Management: Principles and Practices (Martin Burton)
7
Training
This chapter details the steps required in setting up and running training courses in the irrigation and drainage sector. Training is required for a wide range of personnel, from system managers to water users; and in a wide range of disciplines, from gen-eral management to specific and detailed technical procedures. Training principles and procedures are outlined together with more detailed information on key aspects such as carrying out a training needs analy-sis and organizing and running courses. Finally a detailed checklist is provided for setting up, running and costing training courses.
Overview
Training is an integral part of the effective functioning of any organization. Training is the process by which staff are taught the skills necessary to perform their job functions, such that they can carry out those functions effec-tively and efficiently. Poor or inadequate training of staff can be a major cause of poor performance within an organization.
Training is a difficult task, which requires specialist expertise to carry out effectively. It requires a thorough understanding of the subject matter and of the training needs of the participants. Preparation of targeted training
material and the use of appropriate train-ing methods are fundamental to successful training outcomes.
There is a wide range of training needs in the irrigation and drainage sector, ranging from training for management and adminis-tration staff through to technical training of engineers and field staff. A feature of irriga-tion and drainage is also the degree of human interaction that exists between the service provider and the water user; often irriga-tion and drainage training programmes will include training in liaising and working with people.
Training is often a major component of irrigation and drainage projects. In recent years there has been a trend towards incor-porating training into irrigation and drain-age rehabilitation projects, with the aim that the training will enable management to adequately manage, operate and main-tain irrigation and drainage systems such that rehabilitation is not required again at some future date. Institutional develop-ment is increasingly being allied to physi-cal rehabilitation projects, a key component of which is the formation and support of water users associations. In some countries reform is now also focusing on the main irri-gation and drainage service provider, with restructuring and reform of government-run irrigation and drainage agencies to provide a more effective and efficient service provi-
Training 219
sion to water users (see Chapter 8). In both cases, the formation and support of water users associations and the restructuring of irrigation and drainage agencies, training has a central role to play.
The forms of training required in the irri-gation and drainage sector are summarized in Table 7.1.
Training Principles
What is training?
In training, generally speaking, we are inter-ested in effecting change in a person’s behav-iour. We may want gauge readers to be more accurate with their gauge reading, we may want farmers to use less water and be more efficient with application of irrigation water to the fields. In order for that person to change their behaviour they must go through certain processes:
1. They must be aware that their perform-ance, or their situation, could be better;2. They must want to learn how to improve the situation;3. They must do some learning;4. They must implement what they have learnt.
The outcome of the training must be a change in performance of the activity for which the person has been trained (i.e. the gauges must be read more accurately, or irrigation water used more productively). Training is not edu-cation; in education the objective is improv-ing a person’s general level of knowledge, it is not always specific to a defined task or activity. Even if a person does not use their education we still feel that they, and society, have benefited. If a person has been trained and does not apply it, we consider that to be a loss, we could have spent the time and money on training someone who would apply it.
Training could thus be defined as:
The process of bringing about change in behaviour of an individual or group which results in improved performance in their work or situation.
Another important distinction can be drawn between education and training. In an edu-cational system, if a student does not achieve the required pass marks in the examinations it is the student who has failed, not the teacher (though the teaching may well have been poor!). However, if a trainee fails to achieve the desired level of performance at the end of a training programme then it is the trainer who has failed, not the trainee. For training, the content of the training programme must be such as to raise the trainee from a certain level of capability to another, higher level. The training programme must be designed and implemented to effect this change, and the responsibility for this rests with the trainer.
This leads on to the issue of training needs assessment. Training needs assessment can be summarized as:
Required knowledge and skills minusExisting knowledge and skills equals
Training need
Before the training course the trainee’s level of knowledge and ability should be ascertained and compared with the required level of knowl-edge and ability. The difference is the training need. Knowing the start and end points the most effective path to effect the desired change can be plotted. Different situations will require different routes. For example, for senior man-agement a series of lectures is effective in get-ting information across in a short time, with reinforcement through discussion sessions; for gatekeepers very short lectures (on basic prin-ciples) followed by demonstrations and field practicals are appropriate.
Training can effect changes in three broad, interrelated domains:
cognitive learning (• knowledge) – improve-ment in mental skills;psychomotor learning (• skills) – improve-ment in manual or physical skills;affective learning (• attitude) – growth in feelings or emotional capabilities.
These domains are more commonly referred to by trainers as KSA (Knowledge, Skills and Attitude), and effecting change in one or more of these domains is the goal of the training process.
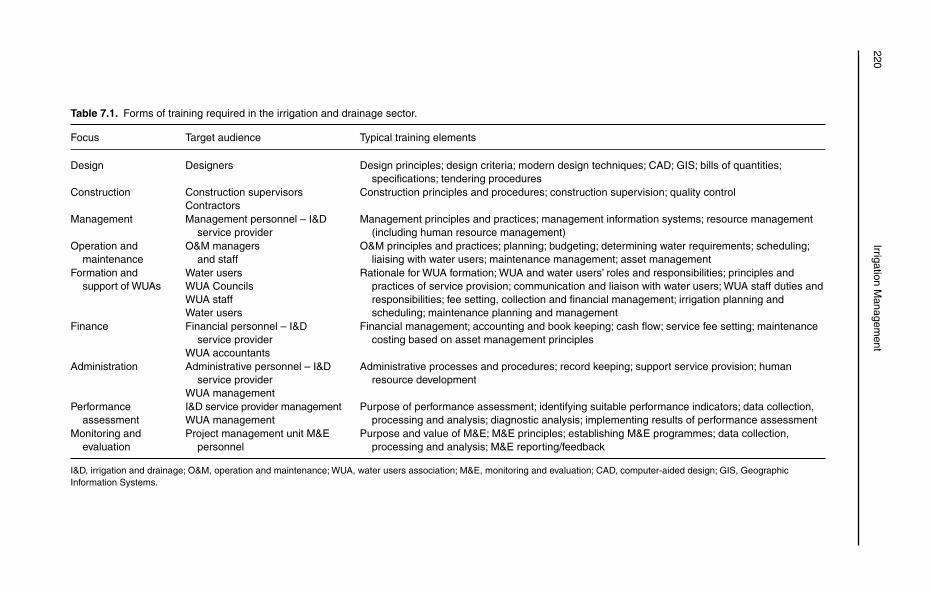
220Irrigation M
anagement
Table 7.1. Forms of training required in the irrigation and drainage sector.
Focus Target audience Typical training elements
Design Designers Design principles; design criteria; modern design techniques; CAD; GIS; bills of quantities; specifications; tendering procedures
Construction Construction supervisorsContractors
Construction principles and procedures; construction supervision; quality control
Management Management personnel – I&D service provider
Management principles and practices; management information systems; resource management (including human resource management)
Operation and maintenance
O&M managers and staff
O&M principles and practices; planning; budgeting; determining water requirements; scheduling; liaising with water users; maintenance management; asset management
Formation and support of WUAs
Water usersWUA CouncilsWUA staffWater users
Rationale for WUA formation; WUA and water users’ roles and responsibilities; principles and practices of service provision; communication and liaison with water users; WUA staff duties and responsibilities; fee setting, collection and financial management; irrigation planning and scheduling; maintenance planning and management
Finance Financial personnel – I&D service provider
WUA accountants
Financial management; accounting and book keeping; cash flow; service fee setting; maintenance costing based on asset management principles
Administration Administrative personnel – I&D service provider
WUA management
Administrative processes and procedures; record keeping; support service provision; human resource development
Performance assessment
I&D service provider managementWUA management
Purpose of performance assessment; identifying suitable performance indicators; data collection, processing and analysis; diagnostic analysis; implementing results of performance assessment
Monitoring and evaluation
Project management unit M&E personnel
Purpose and value of M&E; M&E principles; establishing M&E programmes; data collection, processing and analysis; M&E reporting/feedback
I&D, irrigation and drainage; O&M, operation and maintenance; WUA, water users association; M&E, monitoring and evaluation; CAD, computer-aided design; GIS, Geographic Information Systems.
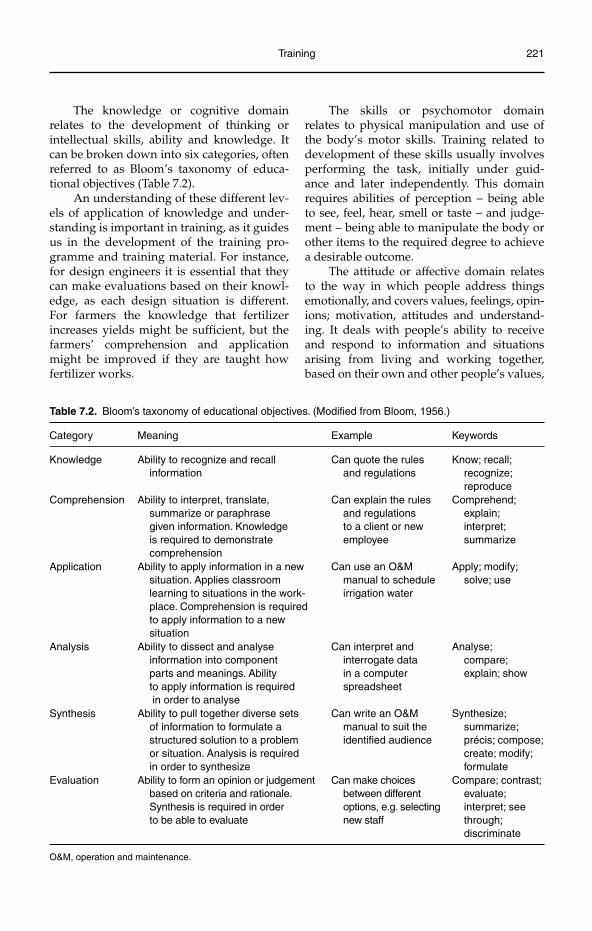
Training 221
The knowledge or cognitive domain relates to the development of thinking or intellectual skills, ability and knowledge. It can be broken down into six categories, often referred to as Bloom’s taxonomy of educa-tional objectives (Table 7.2).
An understanding of these different lev-els of application of knowledge and under-standing is important in training, as it guides us in the development of the training pro-gramme and training material. For instance, for design engineers it is essential that they can make evaluations based on their knowl-edge, as each design situation is different. For farmers the knowledge that fertilizer increases yields might be sufficient, but the farmers’ comprehension and application might be improved if they are taught how fertilizer works.
The skills or psychomotor domain relates to physical manipulation and use of the body’s motor skills. Training related to development of these skills usually involves performing the task, initially under guid-ance and later independently. This domain requires abilities of perception – being able to see, feel, hear, smell or taste – and judge-ment – being able to manipulate the body or other items to the required degree to achieve a desirable outcome.
The attitude or affective domain relates to the way in which people address things emotionally, and covers values, feelings, opin-ions; motivation, attitudes and understand-ing. It deals with people’s ability to receive and respond to information and situations arising from living and working together, based on their own and other people’s values,
Table 7.2. Bloom’s taxonomy of educational objectives. (Modified from Bloom, 1956.)
Category Meaning Example Keywords
Knowledge Ability to recognize and recall information
Can quote the rules and regulations
Know; recall; recognize; reproduce
Comprehension Ability to interpret, translate, summarize or paraphrase given information. Knowledge is required to demonstrate comprehension
Can explain the rules and regulations to a client or new employee
Comprehend; explain; interpret; summarize
Application Ability to apply information in a new situation. Applies classroom learning to situations in the work-place. Comprehension is required to apply information to a new situation
Can use an O&M manual to schedule irrigation water
Apply; modify; solve; use
Analysis Ability to dissect and analyse information into component parts and meanings. Ability to apply information is required in order to analyse
Can interpret and interrogate data in a computer spreadsheet
Analyse; compare; explain; show
Synthesis Ability to pull together diverse sets of information to formulate a structured solution to a problem or situation. Analysis is required in order to synthesize
Can write an O&M manual to suit the identified audience
Synthesize; summarize; précis; compose; create; modify; formulate
Evaluation Ability to form an opinion or judgement based on criteria and rationale. Synthesis is required in order to be able to evaluate
Can make choices between different options, e.g. selecting new staff
Compare; contrast; evaluate; interpret; see through; discriminate
O&M, operation and maintenance.
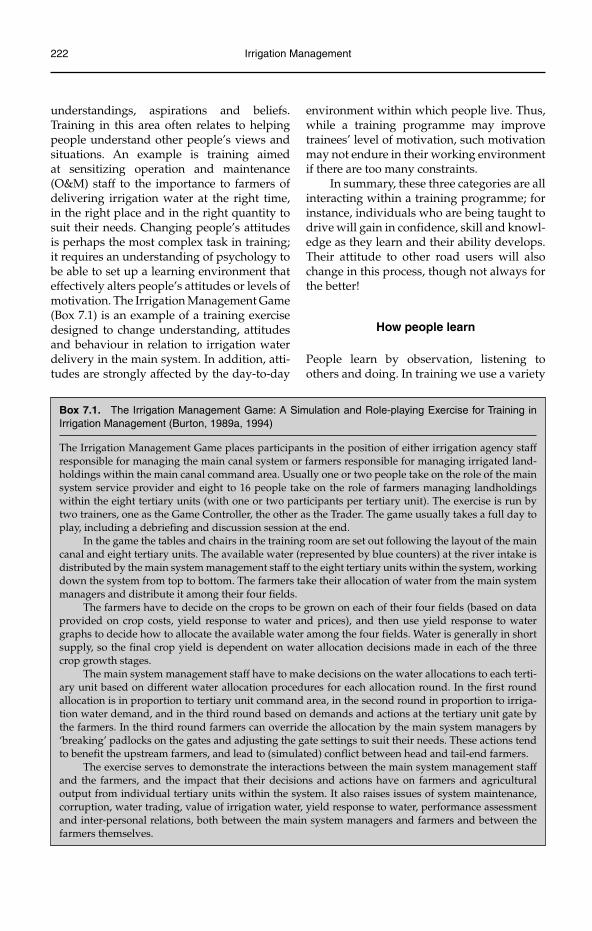
222 Irrigation Management
understandings, aspirations and beliefs. Training in this area often relates to helping people understand other people’s views and situations. An example is training aimed at sensitizing operation and maintenance (O&M) staff to the importance to farmers of delivering irrigation water at the right time, in the right place and in the right quantity to suit their needs. Changing people’s attitudes is perhaps the most complex task in training; it requires an understanding of psychology to be able to set up a learning environment that effectively alters people’s attitudes or levels of motivation. The Irrigation Management Game (Box 7.1) is an example of a training exercise designed to change understanding, attitudes and behaviour in relation to irrigation water delivery in the main system. In addition, atti-tudes are strongly affected by the day-to-day
environment within which people live. Thus, while a training programme may improve trainees’ level of motivation, such motivation may not endure in their working environment if there are too many constraints.
In summary, these three categories are all interacting within a training programme; for instance, individuals who are being taught to drive will gain in confidence, skill and knowl-edge as they learn and their ability develops. Their attitude to other road users will also change in this process, though not always for the better!
How people learn
People learn by observation, listening to others and doing. In training we use a variety
Box 7.1. The Irrigation Management Game: A Simulation and Role-playing Exercise for Training in Irrigation Management (Burton, 1989a, 1994)
The Irrigation Management Game places participants in the position of either irrigation agency staff responsible for managing the main canal system or farmers responsible for managing irrigated land-holdings within the main canal command area. Usually one or two people take on the role of the main system service provider and eight to 16 people take on the role of farmers managing landholdings within the eight tertiary units (with one or two participants per tertiary unit). The exercise is run by two trainers, one as the Game Controller, the other as the Trader. The game usually takes a full day to play, including a debriefing and discussion session at the end.
In the game the tables and chairs in the training room are set out following the layout of the main canal and eight tertiary units. The available water (represented by blue counters) at the river intake is distributed by the main system management staff to the eight tertiary units within the system, working down the system from top to bottom. The farmers take their allocation of water from the main system managers and distribute it among their four fields.
The farmers have to decide on the crops to be grown on each of their four fields (based on data provided on crop costs, yield response to water and prices), and then use yield response to water graphs to decide how to allocate the available water among the four fields. Water is generally in short supply, so the final crop yield is dependent on water allocation decisions made in each of the three crop growth stages.
The main system management staff have to make decisions on the water allocations to each terti-ary unit based on different water allocation procedures for each allocation round. In the first round allocation is in proportion to tertiary unit command area, in the second round in proportion to irriga-tion water demand, and in the third round based on demands and actions at the tertiary unit gate by the farmers. In the third round farmers can override the allocation by the main system managers by ‘breaking’ padlocks on the gates and adjusting the gate settings to suit their needs. These actions tend to benefit the upstream farmers, and lead to (simulated) conflict between head and tail-end farmers.
The exercise serves to demonstrate the interactions between the main system management staff and the farmers, and the impact that their decisions and actions have on farmers and agricultural output from individual tertiary units within the system. It also raises issues of system maintenance, corruption, water trading, value of irrigation water, yield response to water, performance assessment and inter-personal relations, both between the main system managers and farmers and between the farmers themselves.
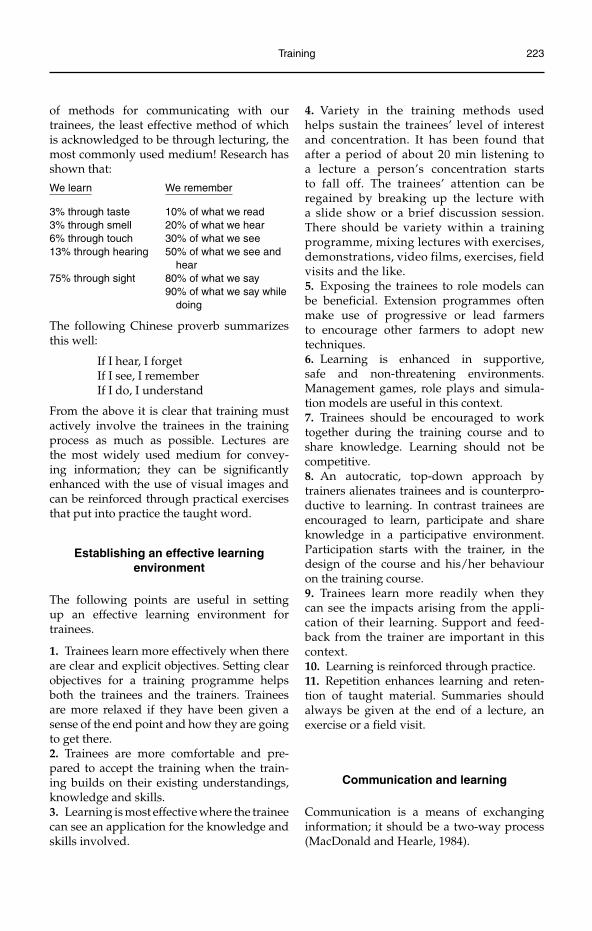
Training 223
of methods for communicating with our trainees, the least effective method of which is acknowledged to be through lecturing, the most commonly used medium! Research has shown that:
We learn We remember
3% through taste 10% of what we read3% through smell 20% of what we hear6% through touch 30% of what we see13% through hearing 50% of what we see and
hear75% through sight 80% of what we say 90% of what we say while
doing
The following Chinese proverb summarizes this well:
If I hear, I forget If I see, I remember If I do, I understand
From the above it is clear that training must actively involve the trainees in the training process as much as possible. Lectures are the most widely used medium for convey-ing information; they can be significantly enhanced with the use of visual images and can be reinforced through practical exercises that put into practice the taught word.
Establishing an effective learning environment
The following points are useful in setting up an effective learning environment for trainees.
1. Trainees learn more effectively when there are clear and explicit objectives. Setting clear objectives for a training programme helps both the trainees and the trainers. Trainees are more relaxed if they have been given a sense of the end point and how they are going to get there.2. Trainees are more comfortable and pre-pared to accept the training when the train-ing builds on their existing understandings, knowledge and skills.3. Learning is most effective where the trainee can see an application for the knowledge and skills involved.
4. Variety in the training methods used helps sustain the trainees’ level of interest and concentration. It has been found that after a period of about 20 min listening to a lecture a person’s concentration starts to fall off. The trainees’ attention can be regained by breaking up the lecture with a slide show or a brief discussion session. There should be variety within a training programme, mixing lectures with exercises, demonstrations, video films, exercises, field visits and the like.5. Exposing the trainees to role models can be beneficial. Extension programmes often make use of progressive or lead farmers to encourage other farmers to adopt new techniques.6. Learning is enhanced in supportive, safe and non-threatening environments. Management games, role plays and simula-tion models are useful in this context.7. Trainees should be encouraged to work together during the training course and to share knowledge. Learning should not be competitive.8. An autocratic, top-down approach by trainers alienates trainees and is counterpro-ductive to learning. In contrast trainees are encouraged to learn, participate and share knowledge in a participative environment. Participation starts with the trainer, in the design of the course and his/her behaviour on the training course.9. Trainees learn more readily when they can see the impacts arising from the appli-cation of their learning. Support and feed-back from the trainer are important in this context.10. Learning is reinforced through practice.11. Repetition enhances learning and reten-tion of taught material. Summaries should always be given at the end of a lecture, an exercise or a field visit.
Communication and learning
Communication is a means of exchanging information; it should be a two-way process (MacDonald and Hearle, 1984).
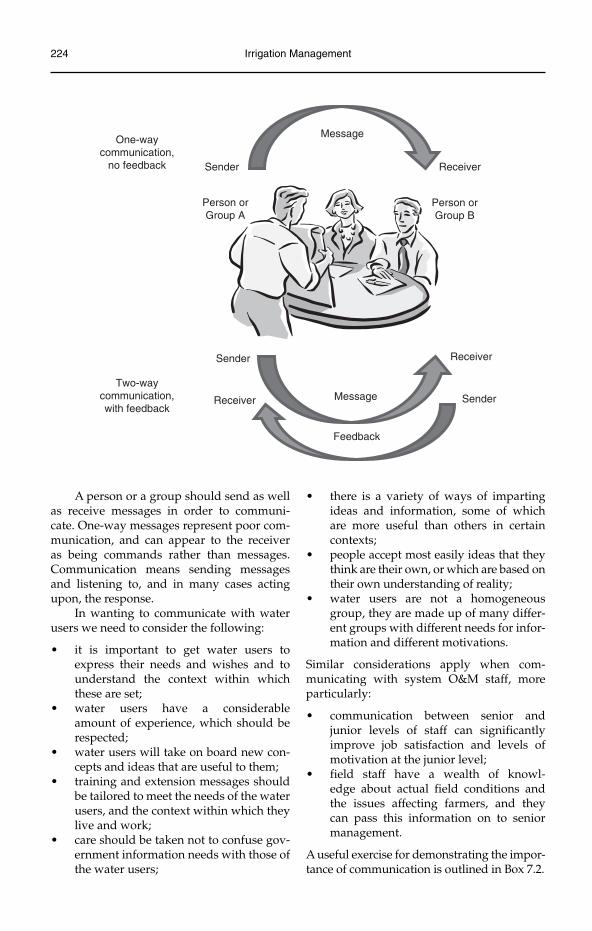
224 Irrigation Management
A person or a group should send as well as receive messages in order to communi-cate. One-way messages represent poor com-munication, and can appear to the receiver as being commands rather than messages. Communication means sending messages and listening to, and in many cases acting upon, the response.
In wanting to communicate with water users we need to consider the following:
it is important to get water users to •express their needs and wishes and to understand the context within which these are set;water users have a considerable •amount of experience, which should be respected;water users will take on board new con-•cepts and ideas that are useful to them;training and extension messages should •be tailored to meet the needs of the water users, and the context within which they live and work;care should be taken not to confuse gov-•ernment information needs with those of the water users;
there is a variety of ways of imparting •ideas and information, some of which are more useful than others in certain contexts;people accept most easily ideas that they •think are their own, or which are based on their own understanding of reality;water users are not a homogeneous •group, they are made up of many differ-ent groups with different needs for infor-mation and different motivations.
Similar considerations apply when com-municating with system O&M staff, more particularly:
communication between senior and •junior levels of staff can significantly improve job satisfaction and levels of motivation at the junior level;field staff have a wealth of knowl-•edge about actual field conditions and the issues affecting farmers, and they can pass this information on to senior management.
A useful exercise for demonstrating the impor-tance of communication is outlined in Box 7.2.
One-waycommunication,
no feedback Sender Receiver
Two-waycommunication,with feedback
Sender Receiver
SenderReceiver
Message
Feedback
Message
Person orGroup A
Person orGroup B
Training 225
Box 7.2. Communication Exercise
This simple yet effective communication exercise can be used to show the value of two-way commu-nication. It is applicable for all levels of trainee, but especially for extension staff and O&M field staff working with farmers.
Equipment and materialsThe exercise requires a table and chair for each pair of trainees, and two sets of five identical objects such as a pencil, a biro, a ruler, a piece of paper or card and a rubber.
The exerciseThe trainees are divided into pairs or small groups of five or six people and assigned to pairs of tables and chairs in different parts of the training room. The chairs are placed back-to-back with the tables in front of them and the five objects placed on each table. Two trainees are asked to sit down, back-to-back.
One of the trainees is designated as the Sender of the messages, the other as the Receiver. On the Sender’s table the five objects are set out in some positional order by the Trainer.
The Sender is then asked to describe to the Receiver the layout of the five objects on his/her table. The Receiver must then endeavour to replicate this layout on his/her table using the same objects fol-lowing the instructions received. Neither party is permitted to turn round and look at the other’s table, nor is the Receiver allowed to say anything other than ‘Message received’. If other members of the group are watching they should not interfere or give advice.
The first part of the exercise ends when the Sender has passed on all the information he/she wishes. The Sender and Receiver can then turn round and see how closely the layout on the Receiver’s table resembles that on the Sender’s table. Often it bears no resemblance at all!
In the second part of the exercise two new trainees sit down back-to-back and the Trainer rear-ranges the objects on the Sender’s table into a new layout. The exercise is repeated, except that this time the Receiver can ask questions to clarify the messages received. At the end of the exercise the trainees can turn round and view the outcome; generally it is an improvement on the first effort.
The exercise demonstrates:the value of receiving feedback in achieving the desired outcome (namely, the same layout on the •Receiver’s table as on the Sender’s);how different the Receiver’s image of the message can be from that of the Sender if the Sender does •not ask for and receive feedback.
Steps in Establishing Training Programmes
The following steps and associated activities can be identified in setting up a training pro-gramme for staff on an irrigation and drain-age scheme (Burton, 1986, 1988):
1. Establish training needs;2. Identify suitable trainers;3. Plan training programme and course struc-tures in detail;4. Prepare and test training material;5. Implement training programme;6. Monitor and evaluate the training given.
Step 1: Establish training needs
The first step of preparing a training pro-gramme is to identify who needs to be trained,
and what they need to be trained in. If this is not specified within the terms of reference for the training specialist, then he/she must carry out a detailed Training Needs Assessment (TNA’s are covered later in this chapter).
The TNA involves carrying out a survey of all staff within each organization under review (be it the irrigation service provider, water users association (WUA), extension service or related organization). This survey will ascertain the structure of the organi-zation, the numbers of staff at each level, age, educational background, current and required capabilities, etc. The process will require collecting secondary data (such the names, age, educational background, etc.), which will be held by the human resource department, and primary data through inter-views with individuals or groups at different levels within the organization. For exam-ple additional information required might
226 Irrigation Management
include procedures and operations manuals that stipulate the duties and responsibilities for each position within the organization.
The output of the TNA will be a Training Plan, which will detail who will be trained, and how that training will be accom-plished. A useful structure of a Training Plan is provided by answering the following questions.
Why?•
° Why is the training required?Who?•
° Who will be trained?
° Who will carry out the training?What?•
° What are the objectives of the training programme/course(s)?
° What are the desired outcomes?
° What are the training needs?
° What are the key features of the train-ing programme/course(s)?
° What are the training topics?
° What will it cost?How?•
° How will the training be imparted?
° How will the course be structured?Where?•
° Where will the training be carried out?When?•
° When will the training be carried out?
The Training Plan will outline the scale of the training to be carried out and the resources required. The variables which influence the scale and extent of the training proposed include:
the total time available for the training •programme;the time required for training each trainee;•the number of trainees;•the availability of suitable trainers;•the costs of training;•the budget available.•
Step 2: Identify suitable trainers
If the training is to be carried out in-house it is essential at the start of the training process to identify suitable trainers. Great care should be taken in the selection of these trainers, as the success of the training programme will rest
mainly on their shoulders. Criteria that may help in identifying suitable trainers include:
experienced at the level at which the •training is being carried out;having an interest in training and educa-•tion of others;an ability to communicate and empathize •with people;having an interest and willingness to share •information and knowledge with others;organized;•energetic, but also patient!•
As with other disciplines training is not something that everyone is capable of, some people are good at it, some are not. It is worth noting that there are also different roles on a training team, some people are interested in training but prefer a supporting, rather than lead role. Such people can be invaluable in managing the organization and running of the training programme, while the front-line trainers get on with the job of imparting knowledge, skills and understanding.
Step 3: Plan training programme and course structures in detail
The Training Plan should provide an outline of the training required by answering the questions set out in the section above. It will provide sufficient detail for management to decide on the training priorities and to allo-cate a training budget. Following this, indi-vidual training courses can be prepared in detail. For this the set of questions outlined above can be elaborated upon (Table 7.3).
Training methods
The trainees will have been identified in the Training Plan, together with an outline of the training course(s) required. In the detailed planning of each training course decisions will need to be made on the training methods to be used. These can include:
lectures/presentations;•case studies;•practical exercises;•site visits or field trips;•discussion groups;•
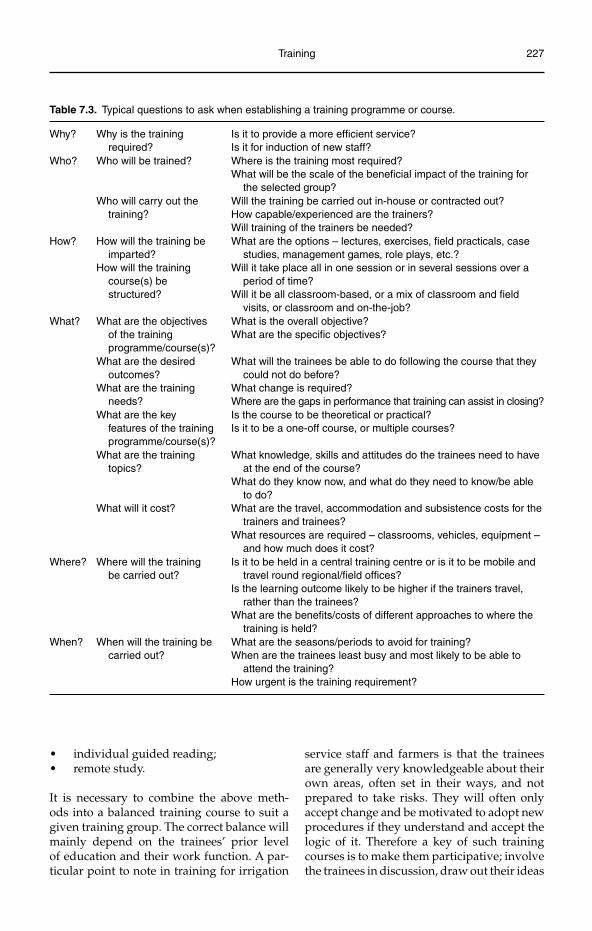
Training 227
individual guided reading;•remote study.•
It is necessary to combine the above meth-ods into a balanced training course to suit a given training group. The correct balance will mainly depend on the trainees’ prior level of education and their work function. A par-ticular point to note in training for irrigation
service staff and farmers is that the trainees are generally very knowledgeable about their own areas, often set in their ways, and not prepared to take risks. They will often only accept change and be motivated to adopt new procedures if they understand and accept the logic of it. Therefore a key of such training courses is to make them participative; involve the trainees in discussion, draw out their ideas
Table 7.3. Typical questions to ask when establishing a training programme or course.
Why? Why is the training required?
Is it to provide a more efficient service?Is it for induction of new staff?
Who? Who will be trained? Where is the training most required?What will be the scale of the beneficial impact of the training for
the selected group?Who will carry out the
training?Will the training be carried out in-house or contracted out?How capable/experienced are the trainers?Will training of the trainers be needed?
How? How will the training be imparted?
How will the training course(s) be structured?
What are the options – lectures, exercises, field practicals, case studies, management games, role plays, etc.?
Will it take place all in one session or in several sessions over a period of time?
Will it be all classroom-based, or a mix of classroom and field visits, or classroom and on-the-job?
What? What are the objectives of the training programme/course(s)?
What is the overall objective?What are the specific objectives?
What are the desired outcomes?
What are the training needs?
What will the trainees be able to do following the course that they could not do before?
What change is required?Where are the gaps in performance that training can assist in closing?
What are the key features of the training programme/course(s)?
Is the course to be theoretical or practical?Is it to be a one-off course, or multiple courses?
What are the training topics?
What will it cost?
What knowledge, skills and attitudes do the trainees need to have at the end of the course?
What do they know now, and what do they need to know/be able to do?
What are the travel, accommodation and subsistence costs for the trainers and trainees?
What resources are required – classrooms, vehicles, equipment – and how much does it cost?
Where? Where will the training be carried out?
Is it to be held in a central training centre or is it to be mobile and travel round regional/field offices?
Is the learning outcome likely to be higher if the trainers travel, rather than the trainees?
What are the benefits/costs of different approaches to where the training is held?
When? When will the training be carried out?
What are the seasons/periods to avoid for training?When are the trainees least busy and most likely to be able to
attend the training?How urgent is the training requirement?
228 Irrigation Management
and suggestions for improvements, and allow them to contribute to the training programme and in assisting others on the training course with the benefit of their experience.
Course and programme timetables
Individual training course timetables can be established once the training method and course content have been decided. A plan will need to be drawn up and made available to all those involved in the training programme prior to its implementation. A bar chart is the most effective form of plan, showing the dates of the course(s), the location and the number of trainees. Having decided on the dates it is important to notify the trainees in good time in order that they can make the necessary arrangements to attend.
A particular feature of training in irriga-tion and drainage is the timing of the train-ing in relation to the irrigation season. Some training has to be carried out during the off-season when O&M staff, WUA management and water users are not busy irrigating, while other training is best carried out during the irrigation season. Theoretical training can be carried out in the off-season, while practical training such as that related to flow measure-ment or field irrigation is best carried out in-season. If carrying out the training in-season the training period can be divided into sev-eral sessions (e.g. 1 or 2 days a week) such that participants can get on with their main work activities on the other days.
As noted earlier it is essential to provide variety in the presentation of the training material. A full day of lectures to people used to doing field work (such as water masters) can prove very tedious, for both the trainees and the trainers. It is also important to pro-vide short breaks with refreshments, and a good midday break with lunch provided.
More detailed information on planning, organizing and costing training courses is provided later in this chapter.
Step 4: Prepare and test training material
Preparation of training material can be a dif-ficult and time-consuming process. Training material might be required for the following.
1. The trainers: The trainers will need hand-books to use as references for their lectures, practical work, field visits, etc.2. The trainees: Trainees will require notes for each subject taught.3. Presentation: Training material may be required in the form of audio-visual displays, overhead projection slides, or computer-and-projector based presentations.
The quality and clarity of the presentation material are obviously key features here, espe-cially in the material used for lectures/pres-entations/exercises and the trainees’ notes.
The value of good graphics cannot be overemphasized; a good technical illustra-tor is invaluable. Cartoons can be a powerful method of conveying a message.
Once the training material has been pre-pared it is as well to test it, and the format of the training course, on a small scale prior to the start of the training programme. The train-ers must be careful to remain objective and to welcome constructive criticism. Changes are both easier and cheaper to make at this stage.
In some cases it can be useful to run through a training programme for middle or junior level staff with senior management in order that they can understand the training that will be carried out. This allows senior management to comment on the proposed training (the course structure, content, train-ing methods, etc.) and to develop a sense of ownership for the training.
Step 5: Implement training programme
The beginning of a new training programme is always difficult, but provided the organiza-tion has been well thought out and planned the problems encountered can be minimized. The early days of a new training course can be stressful for the trainers, but as they gain experience so their confidence grows (another reason for having trial runs).
Time should be allowed at the start of each training course for registration and ‘settling down’, followed by a welcome and introduc-tion to the training course. The introduction should detail the objectives of the course and the desired outcomes, and outline the struc-ture and contents of the course. If the course
Training 229
is residential, details of accommodation, per diems, etc. should be discussed at this stage. It is important to allow sufficient time for the introductory session. In some cases a pre-course test may be given to establish the train-ees’ current knowledge related to the topics in the training course. The same, or similar test, is then given at the end of the course to meas-ure the change in learning achieved.
Records should be kept of who has attended each training course; this is espe-cially important for training programmes where there are a number of courses, such as for establishing water users associations.
An integral part of the training course will be to obtain feedback from the partici-pants at the end of the course. This feedback can be obtained through a questionnaire and/or discussions on the training given. Feedback forms can be designed to cover a number of aspects, including training content, training methods, facilities, refreshments, accommo-dation, etc., together with requests for sug-gestions for improvement.
It is inevitable that the training mate-rial will require amendment in the light of experience using it. If the changes required are relatively minor it may be best to docu-ment proposed corrections and amendments over several courses and then implement the changes all in one go.
Step 6: Monitor and evaluate training given
The training programme will require moni-toring once it has started, to check that it is being implemented as planned. The effect of the training given can be monitored and, if necessary, changes made to the training mate-rial or course structure if the desired levels of ability are not being achieved.
The monitoring exercise should be carried out by members of the training team in order that they see for themselves the effect that their work is having. Post-course monitoring also helps to reinforce the training given as the trainees perceive that training is a continuous exercise, not just restricted to a training course.
Evaluation of the training programme is a separate exercise from monitoring as its
objective is to assess the success of the train-ing programme in bringing about a positive change in the trainees’ behaviour. Evaluation requires an objective and critical assessment of the training given.
In order to be able to evaluate the pro-gramme the amount of change brought about needs to be measured. For this reason it is advisable to prepare the evaluation proce-dures at the start of the training programme, and to test the situation before and after train-ing using the same parameters.
Evaluation should not be carried out by the same person or team that planned, prepared or ran the training programme or course. It should be carried out by an inde-pendent evaluator (or team), preferably by someone who has experience of training for similar situations. An important part of the evaluation will be measuring the success of the training against the objectives and outcomes set by those who designed and implemented the training programme or course.
If the evaluation exercise finds that desired levels of change or outcome are not being achieved following the training course, then the course should be amended and improved. As noted above, training is differ-ent from education; it sets out to bring about change in a person’s behaviour. If it fails to do that it is the training course that has failed, not the trainees, and the course must be amended accordingly.
Carrying Out a Training Needs Assessment
A TNA is a structured way to analyse the training needs of an organization. It provides the information required to enable planning of relevant and cost-effective training.
There are seven stages in carrying out a TNA (EDI, 1994):
1. Select assessors for the process;2. Define performance shortcomings;3. Identify how training can help;4. Set performance and skills standards;5. Determine current capabilities of personnel;6. Determine gaps in capabilities;7. Determine who to train and in what.
230 Irrigation Management
Stage 1: Select assessors to carry out the training needs assessment
The first stage in carrying out a TNA is to decide by whom it should be carried out. If it is related to a project the TNA is often car-ried out by an externally recruited Training Specialist. In a large organization with a well-established Human Resources and Training Department the TNA could be car-ried out by someone or a team from within the organization.
One benefit of employing an external person or team is that they may be more objec-tive, and may be able to elicit more informa-tion from employees on issues that they face within the organization.
Stage 2: Define performance shortcomings
The next stage in carrying out a TNA is to look at the purpose and objectives of the organization and identify areas where there are performance shortcomings, or where training can have a significant impact on performance. It is important, for example, to have well-trained accountants in water users associations.
It is useful at this stage to list out the objectives of the organization and to then identify the role and contribution made to these objectives by categories of staff at each level within the organization (i.e. identifying who does what, and what impact their actions have on performance). It will also be impor-tant at this stage to identify what is meant by ‘performance’, and how it is measured.
Stage 3: Identify how training can help
Shortfalls in the performance of an organiza-tion can be caused by factors that are not ame-nable to improvement through training. Four possible management levels can be identified within an organization.
Policy level• : This level is least amenable to solution by training. It involves policy
issues such as organizational structure, staffing, salaries, job functions, etc.Institutional level• : This relates to the organizational structure, functions and rules and regulations at different levels within the organization. It may be ame-nable to improvement through training interventions, especially if associated with organizational restructuring.Functional level• : This level (adminis-tration, technical or finance depart-ments) is amenable to improvements through training interventions, particu-larly of senior and middle level man-agement who may be responsible for reorganization/restructuring of their departments.Individual level• : This level is very ame-nable to improvement through training interventions, though recruitment policy may affect the level from which the train-ing must start. The TNA will look at indi-vidual and group capabilities and needs to assess skills, knowledge and attitude, level of motivation, salaries and condi-tions, etc. It will also need to take account of the quality of the personnel manage-ment processes and procedures within the organization.
In carrying out a TNA, account needs to be taken of the influence of these different man-agement levels on performance, and to sepa-rate out where training can, and cannot, help. It also needs to identify where training will be adversely affected by factors at other levels; for example if training is required as part of a project-funded organizational restructur-ing programme but is not fully supported by senior management.
Stage 4: Set performance and skills standards
A key part of the assessment process will be to establish the required level of performance for each individual or group. Having detailed job descriptions is essential at this stage; from these the required knowledge, skills and atti-tudes required to perform the defined job functions can be identified.
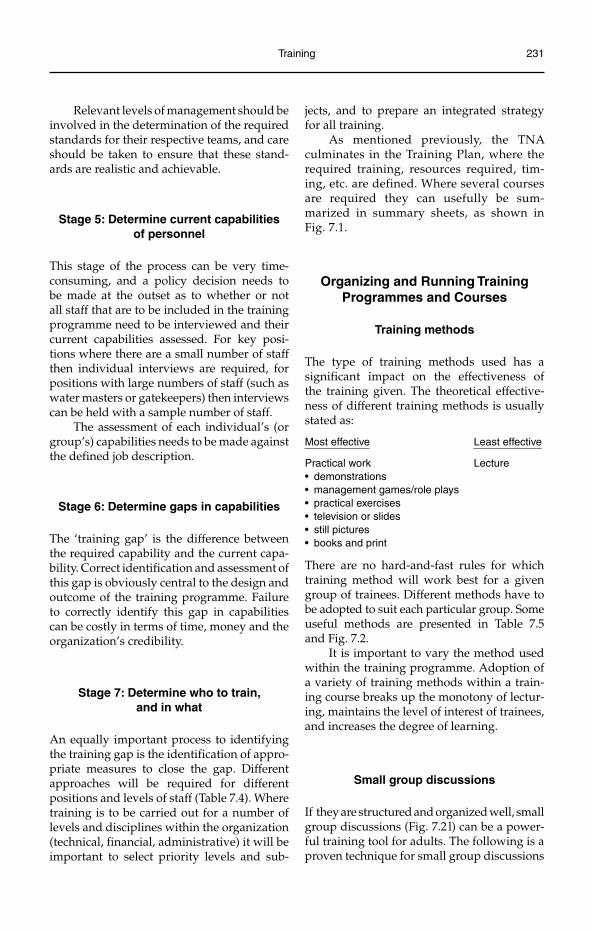
Training 231
Relevant levels of management should be involved in the determination of the required standards for their respective teams, and care should be taken to ensure that these stand-ards are realistic and achievable.
Stage 5: Determine current capabilities of personnel
This stage of the process can be very time-consuming, and a policy decision needs to be made at the outset as to whether or not all staff that are to be included in the training programme need to be interviewed and their current capabilities assessed. For key posi-tions where there are a small number of staff then individual interviews are required, for positions with large numbers of staff (such as water masters or gatekeepers) then interviews can be held with a sample number of staff.
The assessment of each individual’s (or group’s) capabilities needs to be made against the defined job description.
Stage 6: Determine gaps in capabilities
The ‘training gap’ is the difference between the required capability and the current capa-bility. Correct identification and assessment of this gap is obviously central to the design and outcome of the training programme. Failure to correctly identify this gap in capabilities can be costly in terms of time, money and the organization’s credibility.
Stage 7: Determine who to train, and in what
An equally important process to identifying the training gap is the identification of appro-priate measures to close the gap. Different approaches will be required for different positions and levels of staff (Table 7.4). Where training is to be carried out for a number of levels and disciplines within the organization (technical, financial, administrative) it will be important to select priority levels and sub-
jects, and to prepare an integrated strategy for all training.
As mentioned previously, the TNA culminates in the Training Plan, where the required training, resources required, tim-ing, etc. are defined. Where several courses are required they can usefully be sum-marized in summary sheets, as shown in Fig. 7.1.
Organizing and Running Training Programmes and Courses
Training methods
The type of training methods used has a significant impact on the effectiveness of the training given. The theoretical effective-ness of different training methods is usually stated as:
Most effective Least effective
Practical work Lecture• demonstrations • management games/role plays • practical exercises • television or slides • still pictures • books and print
There are no hard-and-fast rules for which training method will work best for a given group of trainees. Different methods have to be adopted to suit each particular group. Some useful methods are presented in Table 7.5 and Fig. 7.2.
It is important to vary the method used within the training programme. Adoption of a variety of training methods within a train-ing course breaks up the monotony of lectur-ing, maintains the level of interest of trainees, and increases the degree of learning.
Small group discussions
If they are structured and organized well, small group discussions (Fig. 7.2 l) can be a power-ful training tool for adults. The following is a proven technique for small group discussions
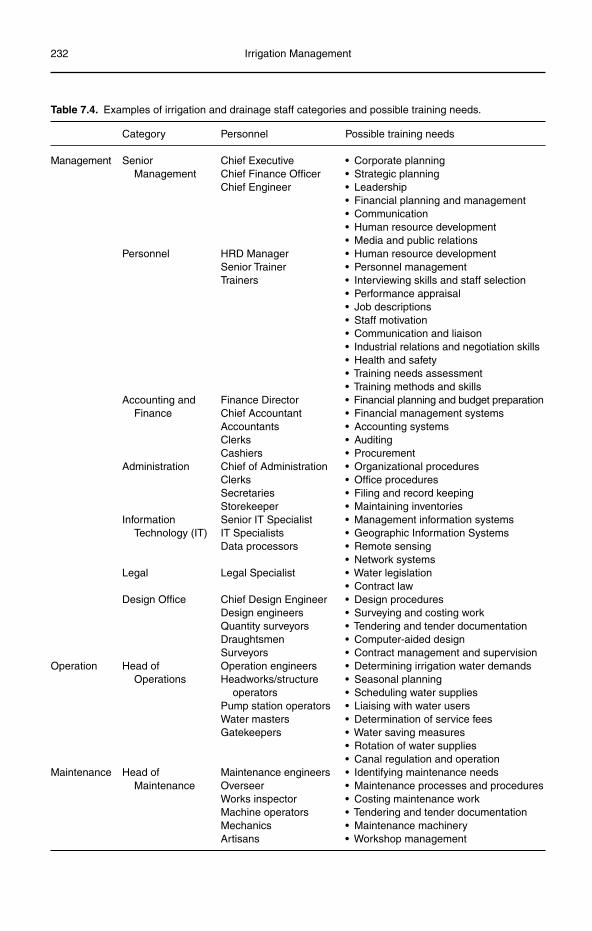
232 Irrigation Management
Table 7.4. Examples of irrigation and drainage staff categories and possible training needs.
Category Personnel Possible training needs
Management SeniorManagement
Chief Executive • Corporate planningChief Finance Officer • Strategic planningChief Engineer • Leadership
• Financial planning and management• Communication• Human resource development• Media and public relations
Personnel HRD Manager • Human resource developmentSenior Trainer • Personnel managementTrainers • Interviewing skills and staff selection
• Performance appraisal• Job descriptions• Staff motivation• Communication and liaison• Industrial relations and negotiation skills• Health and safety• Training needs assessment• Training methods and skills
Accounting and Finance
Finance Director • Financial planning and budget preparationChief Accountant • Financial management systemsAccountants • Accounting systemsClerks • AuditingCashiers • Procurement
Administration Chief of Administration • Organizational proceduresClerks • Office proceduresSecretaries • Filing and record keepingStorekeeper • Maintaining inventories
Information Technology (IT)
Senior IT SpecialistIT SpecialistsData processors
• Management information systems• Geographic Information Systems• Remote sensing• Network systems
Legal Legal Specialist • Water legislation• Contract law
Design Office Chief Design Engineer • Design proceduresDesign engineers • Surveying and costing workQuantity surveyors • Tendering and tender documentationDraughtsmen • Computer-aided designSurveyors • Contract management and supervision
Operation Head of Operations
Operation engineersHeadworks/structure
operatorsPump station operatorsWater mastersGatekeepers
• Determining irrigation water demands• Seasonal planning• Scheduling water supplies• Liaising with water users• Determination of service fees• Water saving measures• Rotation of water supplies• Canal regulation and operation
Maintenance Head of Maintenance
Maintenance engineers • Identifying maintenance needsOverseer • Maintenance processes and proceduresWorks inspector • Costing maintenance workMachine operators • Tendering and tender documentationMechanics • Maintenance machineryArtisans • Workshop management
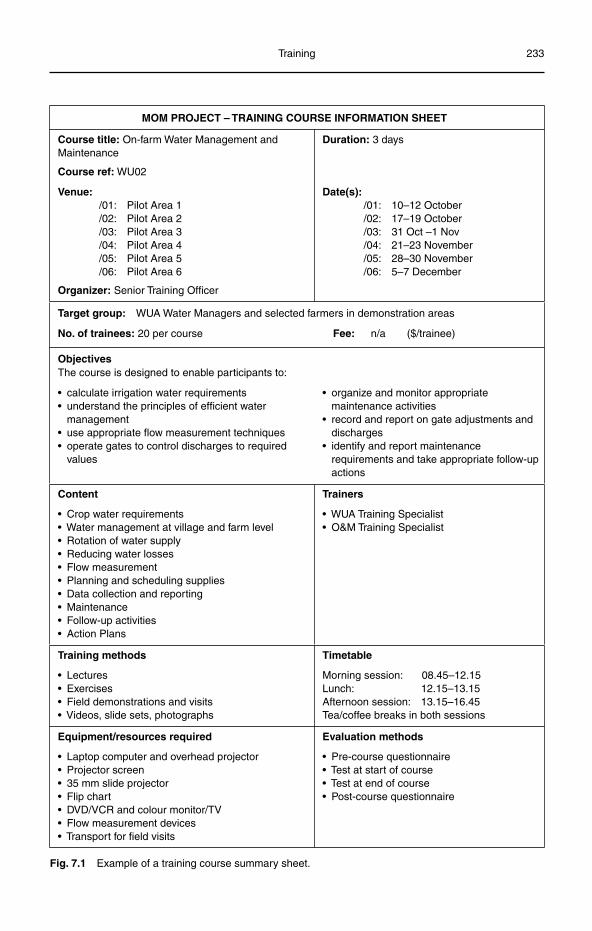
Training 233
MOM PROJECT – TRAINING COURSE INFORMATION SHEET
Course title: On-farm Water Management and Maintenance
Duration: 3 days
Course ref: WU02
Venue:/01: Pilot Area 1/02: Pilot Area 2/03: Pilot Area 3/04: Pilot Area 4/05: Pilot Area 5/06: Pilot Area 6
Organizer: Senior Training Officer
Date(s):/01: 10–12 October/02: 17–19 October/03: 31 Oct –1 Nov/04: 21–23 November/05: 28–30 November/06: 5–7 December
Target group: WUA Water Managers and selected farmers in demonstration areas
No. of trainees: 20 per course Fee: n/a ($/trainee)
ObjectivesThe course is designed to enable participants to:
• calculate irrigation water requirements• understand the principles of efficient water
management• use appropriate flow measurement techniques• operate gates to control discharges to required
values
• organize and monitor appropriate maintenance activities
• record and report on gate adjustments and discharges
• identify and report maintenance requirements and take appropriate follow-up actions
Content
• Crop water requirements• Water management at village and farm level• Rotation of water supply• Reducing water losses• Flow measurement• Planning and scheduling supplies• Data collection and reporting• Maintenance• Follow-up activities• Action Plans
Trainers
• WUA Training Specialist• O&M Training Specialist
Training methods
• Lectures• Exercises• Field demonstrations and visits• Videos, slide sets, photographs
Timetable
Morning session: 08.45–12.15Lunch: 12.15–13.15Afternoon session: 13.15–16.45Tea/coffee breaks in both sessions
Equipment/resources required
• Laptop computer and overhead projector• Projector screen• 35 mm slide projector• Flip chart• DVD/VCR and colour monitor/TV• Flow measurement devices• Transport for field visits
Evaluation methods
• Pre-course questionnaire• Test at start of course• Test at end of course• Post-course questionnaire
Fig. 7.1 Example of a training course summary sheet.
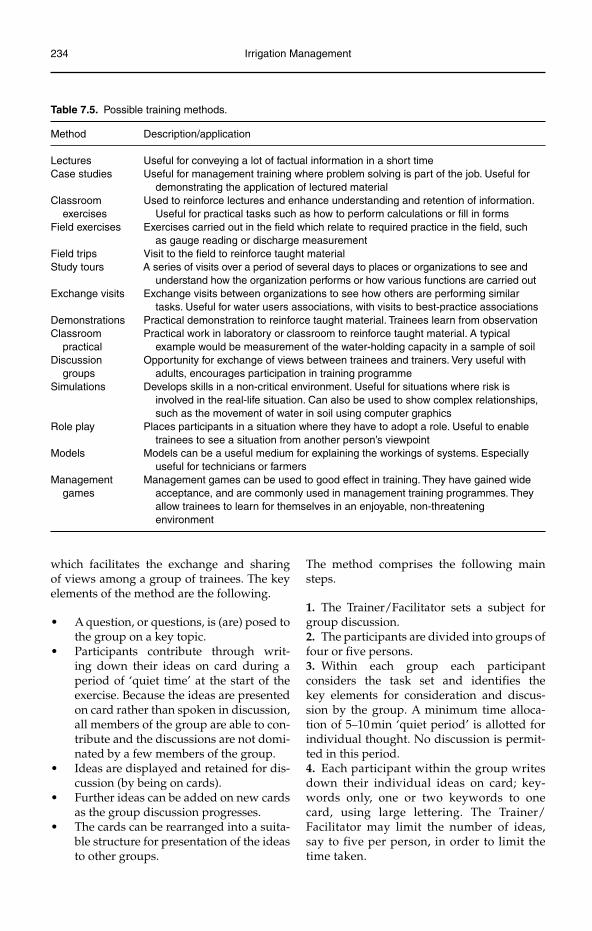
234 Irrigation Management
which facilitates the exchange and sharing of views among a group of trainees. The key elements of the method are the following.
A question, or questions, is (are) posed to •the group on a key topic.Participants contribute through writ-•ing down their ideas on card during a period of ‘quiet time’ at the start of the exercise. Because the ideas are presented on card rather than spoken in discussion, all members of the group are able to con-tribute and the discussions are not domi-nated by a few members of the group.Ideas are displayed and retained for dis-•cussion (by being on cards).Further ideas can be added on new cards •as the group discussion progresses.The cards can be rearranged into a suita-•ble structure for presentation of the ideas to other groups.
The method comprises the following main steps.
1. The Trainer/Facilitator sets a subject for group discussion.2. The participants are divided into groups of four or five persons.3. Within each group each participant considers the task set and identifies the key elements for consideration and discus-sion by the group. A minimum time alloca-tion of 5–10 min ‘quiet period’ is allotted for individual thought. No discussion is permit-ted in this period.4. Each participant within the group writes down their individual ideas on card; key-words only, one or two keywords to one card, using large lettering. The Trainer/Facilitator may limit the number of ideas, say to five per person, in order to limit the time taken.
Table 7.5. Possible training methods.
Method Description/application
Lectures Useful for conveying a lot of factual information in a short timeCase studies Useful for management training where problem solving is part of the job. Useful for
demonstrating the application of lectured materialClassroom
exercisesUsed to reinforce lectures and enhance understanding and retention of information.
Useful for practical tasks such as how to perform calculations or fill in formsField exercises Exercises carried out in the field which relate to required practice in the field, such
as gauge reading or discharge measurementField trips Visit to the field to reinforce taught materialStudy tours A series of visits over a period of several days to places or organizations to see and
understand how the organization performs or how various functions are carried outExchange visits Exchange visits between organizations to see how others are performing similar
tasks. Useful for water users associations, with visits to best-practice associationsDemonstrations Practical demonstration to reinforce taught material. Trainees learn from observationClassroom
practicalPractical work in laboratory or classroom to reinforce taught material. A typical
example would be measurement of the water-holding capacity in a sample of soilDiscussion
groupsOpportunity for exchange of views between trainees and trainers. Very useful with
adults, encourages participation in training programmeSimulations Develops skills in a non-critical environment. Useful for situations where risk is
involved in the real-life situation. Can also be used to show complex relationships, such as the movement of water in soil using computer graphics
Role play Places participants in a situation where they have to adopt a role. Useful to enable trainees to see a situation from another person’s viewpoint
Models Models can be a useful medium for explaining the workings of systems. Especially useful for technicians or farmers
Managementgames
Management games can be used to good effect in training. They have gained wide acceptance, and are commonly used in management training programmes. They allow trainees to learn for themselves in an enjoyable, non-threatening environment
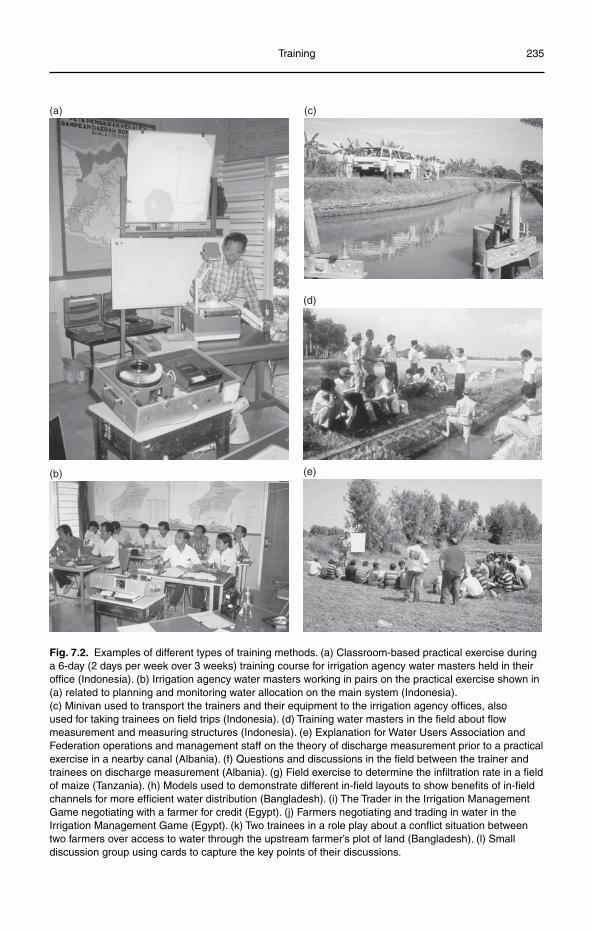
Training 235
Fig. 7.2. Examples of different types of training methods. (a) Classroom-based practical exercise during a 6-day (2 days per week over 3 weeks) training course for irrigation agency water masters held in their office (Indonesia). (b) Irrigation agency water masters working in pairs on the practical exercise shown in (a) related to planning and monitoring water allocation on the main system (Indonesia). (c) Minivan used to transport the trainers and their equipment to the irrigation agency offices, also used for taking trainees on field trips (Indonesia). (d) Training water masters in the field about flow measurement and measuring structures (Indonesia). (e) Explanation for Water Users Association and Federation operations and management staff on the theory of discharge measurement prior to a practical exercise in a nearby canal (Albania). (f) Questions and discussions in the field between the trainer and trainees on discharge measurement (Albania). (g) Field exercise to determine the infiltration rate in a field of maize (Tanzania). (h) Models used to demonstrate different in-field layouts to show benefits of in-field channels for more efficient water distribution (Bangladesh). (i) The Trader in the Irrigation Management Game negotiating with a farmer for credit (Egypt). (j) Farmers negotiating and trading in water in the Irrigation Management Game (Egypt). (k) Two trainees in a role play about a conflict situation between two farmers over access to water through the upstream farmer’s plot of land (Bangladesh). (l) Small discussion group using cards to capture the key points of their discussions.
(a)
(b)
(c)
(d)
(e)
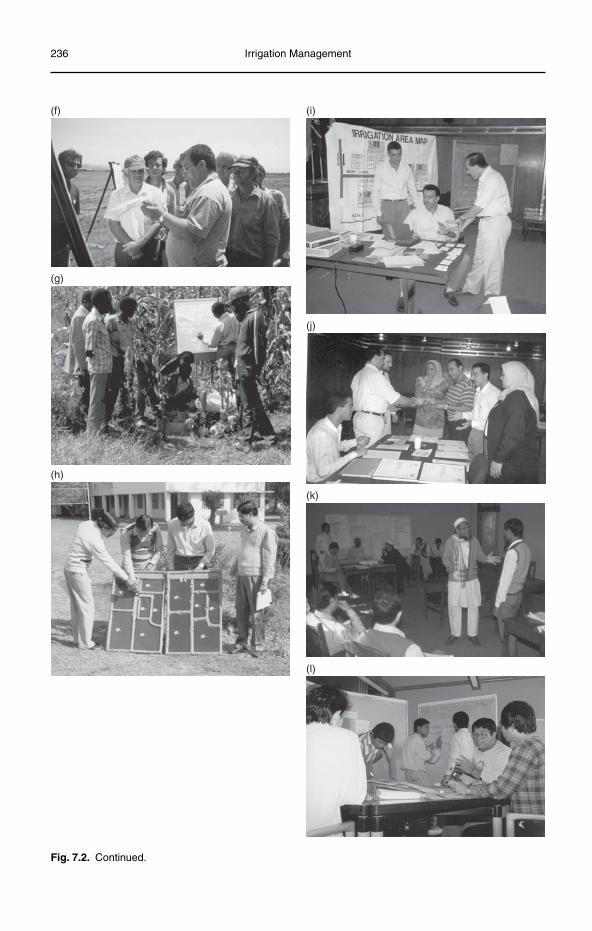
236 Irrigation Management
(h)
(i)
(j)
(k)
(l)
(f)
(g)
Fig. 7.2. Continued.
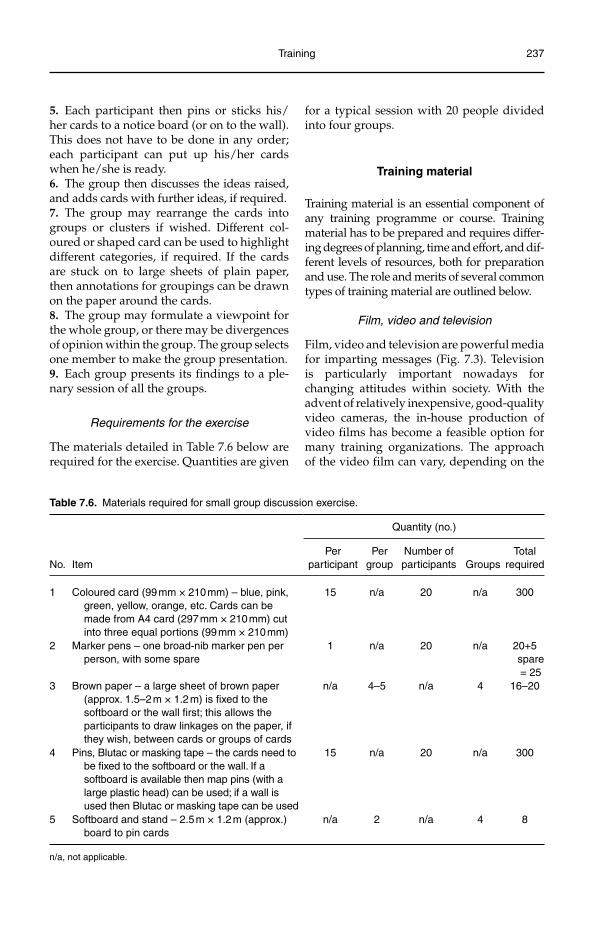
Training 237
5. Each participant then pins or sticks his/her cards to a notice board (or on to the wall). This does not have to be done in any order; each participant can put up his/her cards when he/she is ready.6. The group then discusses the ideas raised, and adds cards with further ideas, if required.7. The group may rearrange the cards into groups or clusters if wished. Different col-oured or shaped card can be used to highlight different categories, if required. If the cards are stuck on to large sheets of plain paper, then annotations for groupings can be drawn on the paper around the cards.8. The group may formulate a viewpoint for the whole group, or there may be divergences of opinion within the group. The group selects one member to make the group presentation.9. Each group presents its findings to a ple-nary session of all the groups.
Requirements for the exercise
The materials detailed in Table 7.6 below are required for the exercise. Quantities are given
for a typical session with 20 people divided into four groups.
Training material
Training material is an essential component of any training programme or course. Training material has to be prepared and requires differ-ing degrees of planning, time and effort, and dif-ferent levels of resources, both for preparation and use. The role and merits of several common types of training material are outlined below.
Film, video and television
Film, video and television are powerful media for imparting messages (Fig. 7.3). Television is particularly important nowadays for changing attitudes within society. With the advent of relatively inexpensive, good- quality video cameras, the in-house production of video films has become a feasible option for many training organizations. The approach of the video film can vary, depending on the
Table 7.6. Materials required for small group discussion exercise.
Quantity (no.)
No. ItemPer
participantPer
groupNumber of participants Groups
Total required
1 Coloured card (99 mm × 210 mm) – blue, pink, green, yellow, orange, etc. Cards can be made from A4 card (297 mm × 210 mm) cut into three equal portions (99 mm × 210 mm)
15 n/a 20 n/a 300
2 Marker pens – one broad-nib marker pen per person, with some spare
1 n/a 20 n/a 20+5 spare= 25
3 Brown paper – a large sheet of brown paper (approx. 1.5–2 m × 1.2 m) is fixed to the softboard or the wall first; this allows the participants to draw linkages on the paper, if they wish, between cards or groups of cards
n/a 4–5 n/a 4 16–20
4 Pins, Blutac or masking tape – the cards need to be fixed to the softboard or the wall. If a softboard is available then map pins (with a large plastic head) can be used; if a wall is used then Blutac or masking tape can be used
15 n/a 20 n/a 300
5 Softboard and stand – 2.5 m × 1.2 m (approx.) board to pin cards
n/a 2 n/a 4 8
n/a, not applicable.
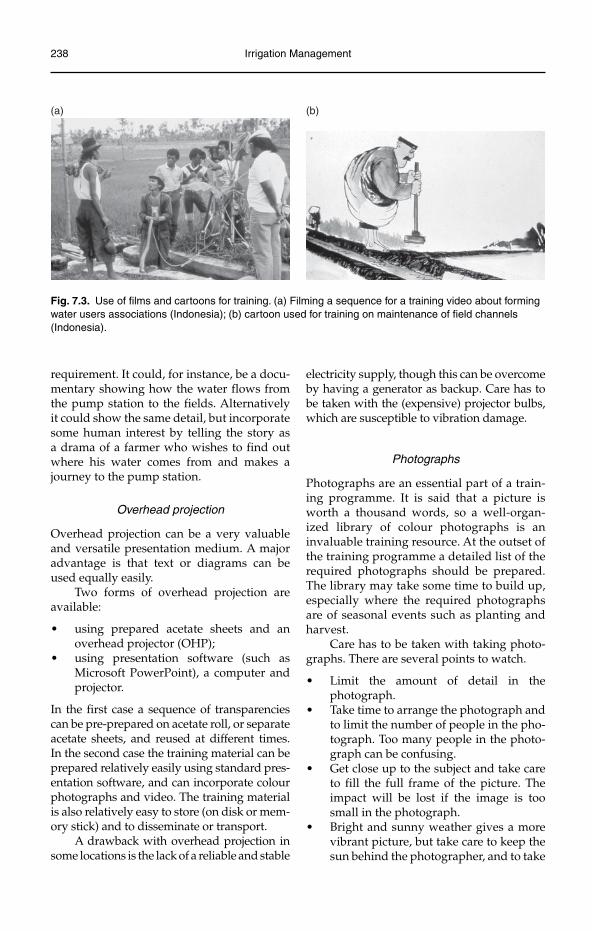
238 Irrigation Management
Fig. 7.3. Use of films and cartoons for training. (a) Filming a sequence for a training video about forming water users associations (Indonesia); (b) cartoon used for training on maintenance of field channels (Indonesia).
(a) (b)
requirement. It could, for instance, be a docu-mentary showing how the water flows from the pump station to the fields. Alternatively it could show the same detail, but incorporate some human interest by telling the story as a drama of a farmer who wishes to find out where his water comes from and makes a journey to the pump station.
Overhead projection
Overhead projection can be a very valuable and versatile presentation medium. A major advantage is that text or diagrams can be used equally easily.
Two forms of overhead projection are available:
using prepared acetate sheets and an •overhead projector (OHP);using presentation software (such as •Microsoft PowerPoint), a computer and projector.
In the first case a sequence of transparencies can be pre-prepared on acetate roll, or separate acetate sheets, and reused at different times. In the second case the training material can be prepared relatively easily using standard pres-entation software, and can incorporate colour photographs and video. The training material is also relatively easy to store (on disk or mem-ory stick) and to disseminate or transport.
A drawback with overhead projection in some locations is the lack of a reliable and stable
electricity supply, though this can be overcome by having a generator as backup. Care has to be taken with the (expensive) projector bulbs, which are susceptible to vibration damage.
Photographs
Photographs are an essential part of a train-ing programme. It is said that a picture is worth a thousand words, so a well-organ-ized library of colour photographs is an invaluable training resource. At the outset of the training programme a detailed list of the required photographs should be prepared. The library may take some time to build up, especially where the required photographs are of seasonal events such as planting and harvest.
Care has to be taken with taking photo-graphs. There are several points to watch.
Limit the amount of detail in the •photograph.Take time to arrange the photograph and •to limit the number of people in the pho-tograph. Too many people in the photo-graph can be confusing.Get close up to the subject and take care •to fill the full frame of the picture. The impact will be lost if the image is too small in the photograph.Bright and sunny weather gives a more •vibrant picture, but take care to keep the sun behind the photographer, and to take
Training 239
account of shadow caused by the sun-light. If necessary use a flash to highlight elements of the picture in shade.Take care to record and catalogue the •photographs with date, location and sub-ject matter.Take care to plan out the sequence of •photographs that are needed. A well-organized sequence can convey a lot of information; a poorly organized sequence may well confuse the audience.
Real objects
Real objects are the best training aid. For items such as pests and diseased crops speci-mens can be collected and stored in specimen jars for use in the classroom. For items such as gates and structures, field visits should be made.
Models
Models can be useful to represent something that may be too large or complex to see in practice (such as the whole of the scheme area) or to simulate the operation or behav-iour of the real object. For trainees with a limited education, physical models are most relevant; for more educated audiences com-puter models using colour graphics can be effective.
Simulation exercises or role plays
Simulation exercises or role plays such as the previously mentioned Irrigation Management Game can be a powerful medium for convey-ing otherwise difficult concepts and under-standings. They can, however, be difficult to formulate and to develop into a functional training tool, and will often require many trials and iterations to get right.
Flip chart
The flip chart is a valuable training aid for making records of points raised in discus-sion. They can also be pre-prepared to con-vey a message or tell a story. The number of sheets should be limited to about ten, too many and the audience will become bored. They are valuable where an OHP cannot be
used, such as in villages or the field where a reliable supply of electricity may not be available.
Posters
Posters are useful to convey and remind peo-ple of a specific message. They must attract people to read them; the use of diagrams and colour is helpful in this respect.
Presentation skills
Successful presentation of training material requires planning and adopting the right approach. Teaching adults differs from the teaching of children in several important respects.
1. Adults have to be motivated to learn. They are busy people with responsibilities, they cannot afford to ‘waste their time’ learning if it is not of benefit to them.2. Adults have a wide range of knowledge and experience, in some respects they will know more than the trainer about certain issues. They must be treated as equals and with respect. Trainers who lecture ‘down’ to adults will not remain in the job long!3. Adults have questions that they want answered, they expect to be able to discuss issues and obtain answers.4. Adults can often learn as much from each other as from the trainer, if the right envi-ronment is established. This raises the issue of the role of the trainer; he/she should see themselves as a facilitator of learning.
Planning of presentations
Planning is the key to successful presenta-tions. It involves the following processes:
selecting the topic to be covered;•establishing the objectives;•writing a lesson plan based on the objec-•tives and the time available (Box 7.3).
When preparing presentations it is often help-ful to ask the following questions.
Who are my audience?•What am I going to teach them? What do •they need to know?
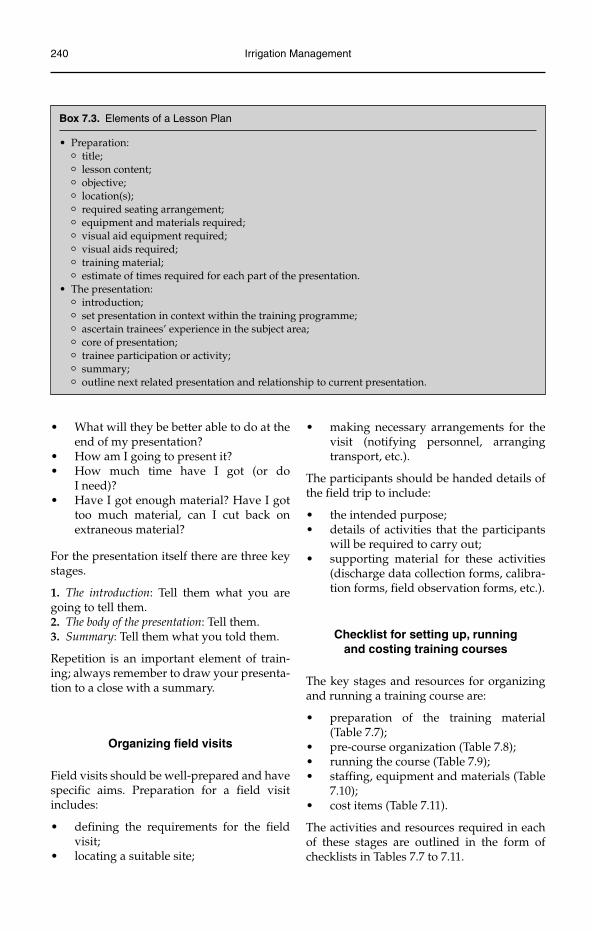
240 Irrigation Management
Box 7.3. Elements of a Lesson Plan
Preparation:•
° title;
° lesson content;
° objective;
° location(s);
° required seating arrangement;
° equipment and materials required;
° visual aid equipment required;
° visual aids required;
° training material;
° estimate of times required for each part of the presentation.The presentation:•
° introduction;
° set presentation in context within the training programme;
° ascertain trainees’ experience in the subject area;
° core of presentation;
° trainee participation or activity;
° summary;
° outline next related presentation and relationship to current presentation.
What will they be better able to do at the •end of my presentation?How am I going to present it?•How much time have I got (or do •I need)?Have I got enough material? Have I got •too much material, can I cut back on extraneous material?
For the presentation itself there are three key stages.
1. The introduction: Tell them what you are going to tell them.2. The body of the presentation: Tell them.3. Summary: Tell them what you told them.
Repetition is an important element of train-ing; always remember to draw your presenta-tion to a close with a summary.
Organizing field visits
Field visits should be well-prepared and have specific aims. Preparation for a field visit includes:
defining the requirements for the field •visit;locating a suitable site;•
making necessary arrangements for the •visit (notifying personnel, arranging transport, etc.).
The participants should be handed details of the field trip to include:
the intended purpose;•details of activities that the participants •will be required to carry out;supporting material for these activities •(discharge data collection forms, calibra-tion forms, field observation forms, etc.).
Checklist for setting up, running and costing training courses
The key stages and resources for organizing and running a training course are:
preparation of the training material •(Table 7.7);pre-course organization (Table 7.8);•running the course (Table 7.9);•staffing, equipment and materials (Table •7.10);cost items (Table 7.11).•
The activities and resources required in each of these stages are outlined in the form of checklists in Tables 7.7 to 7.11.
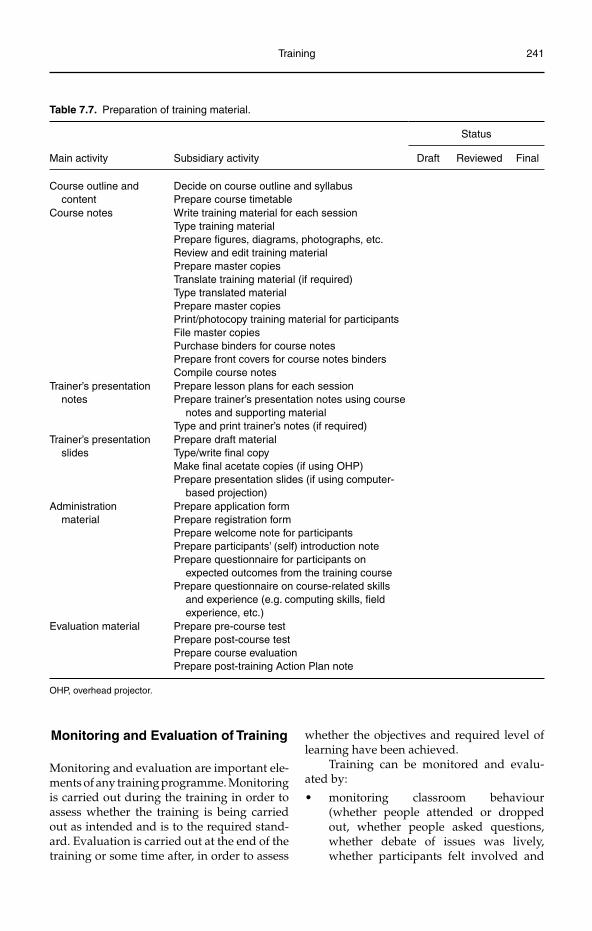
Training 241
Monitoring and Evaluation of Training
Monitoring and evaluation are important ele-ments of any training programme. Monitoring is carried out during the training in order to assess whether the training is being carried out as intended and is to the required stand-ard. Evaluation is carried out at the end of the training or some time after, in order to assess
whether the objectives and required level of learning have been achieved.
Training can be monitored and evalu-ated by:
monitoring classroom behaviour •(whether people attended or dropped out, whether people asked questions, whether debate of issues was lively, whether participants felt involved and
Table 7.7. Preparation of training material.
Main activity Subsidiary activity
Status
Draft Reviewed Final
Course outline and content
Decide on course outline and syllabusPrepare course timetable
Course notes Write training material for each sessionType training materialPrepare figures, diagrams, photographs, etc.Review and edit training materialPrepare master copiesTranslate training material (if required)Type translated materialPrepare master copiesPrint/photocopy training material for participantsFile master copiesPurchase binders for course notesPrepare front covers for course notes bindersCompile course notes
Trainer’s presentation notes
Prepare lesson plans for each sessionPrepare trainer’s presentation notes using course
notes and supporting materialType and print trainer’s notes (if required)
Trainer’s presentation slides
Prepare draft materialType/write final copyMake final acetate copies (if using OHP)Prepare presentation slides (if using computer-
based projection)Administration
materialPrepare application formPrepare registration formPrepare welcome note for participantsPrepare participants’ (self) introduction notePrepare questionnaire for participants on
expected outcomes from the training coursePrepare questionnaire on course-related skills
and experience (e.g. computing skills, field experience, etc.)
Evaluation material Prepare pre-course testPrepare post-course testPrepare course evaluationPrepare post-training Action Plan note
OHP, overhead projector.
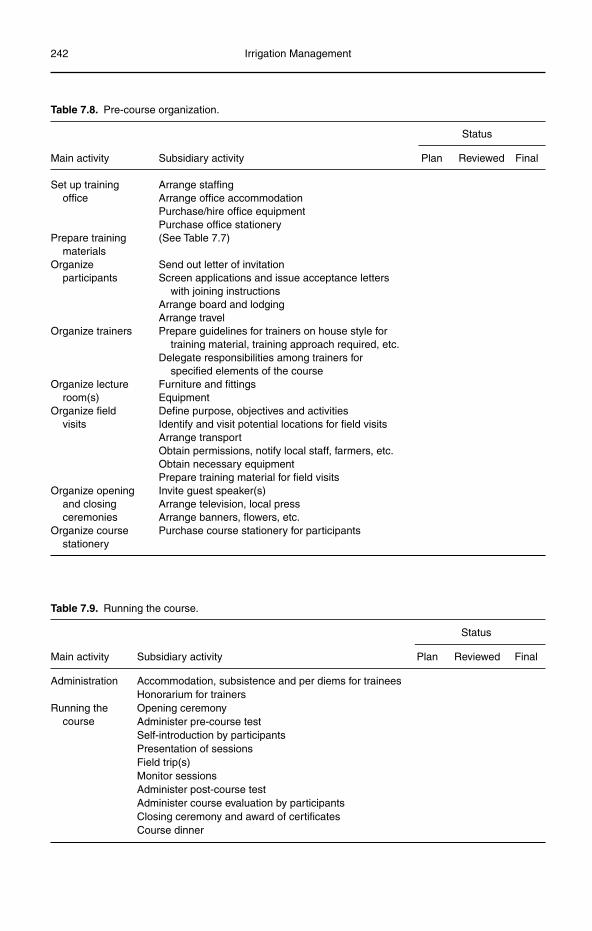
242 Irrigation Management
Table 7.9. Running the course.
Status
Main activity Subsidiary activity Plan Reviewed Final
Administration Accommodation, subsistence and per diems for traineesHonorarium for trainers
Running the course
Opening ceremonyAdminister pre-course testSelf-introduction by participantsPresentation of sessionsField trip(s)Monitor sessionsAdminister post-course testAdminister course evaluation by participantsClosing ceremony and award of certificatesCourse dinner
Table 7.8. Pre-course organization.
Status
Main activity Subsidiary activity Plan Reviewed Final
Set up training office
Arrange staffingArrange office accommodationPurchase/hire office equipmentPurchase office stationery
Prepare training materials
(See Table 7.7)
Organize participants
Send out letter of invitationScreen applications and issue acceptance letters
with joining instructionsArrange board and lodgingArrange travel
Organize trainers Prepare guidelines for trainers on house style for training material, training approach required, etc.
Delegate responsibilities among trainers for specified elements of the course
Organize lecture room(s)
Furniture and fittingsEquipment
Organize field visits
Define purpose, objectives and activitiesIdentify and visit potential locations for field visitsArrange transportObtain permissions, notify local staff, farmers, etc.Obtain necessary equipmentPrepare training material for field visits
Organize opening and closing ceremonies
Invite guest speaker(s)Arrange television, local pressArrange banners, flowers, etc.
Organize course stationery
Purchase course stationery for participants
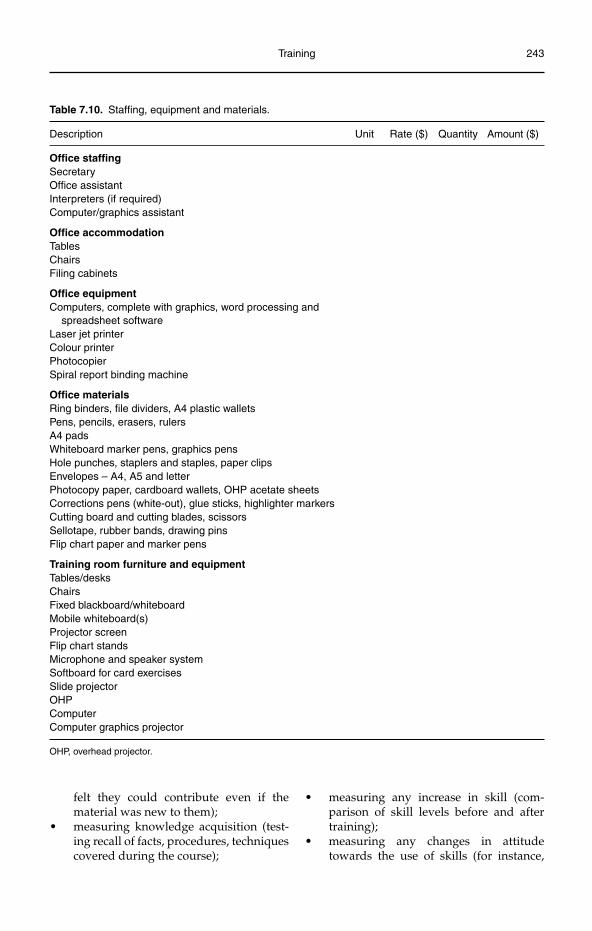
Training 243
Table 7.10. Staffing, equipment and materials.
Description Unit Rate ($) Quantity Amount ($)
Office staffingSecretaryOffice assistantInterpreters (if required)Computer/graphics assistant
Office accommodationTablesChairsFiling cabinets
Office equipmentComputers, complete with graphics, word processing and
spreadsheet softwareLaser jet printerColour printerPhotocopierSpiral report binding machine
Office materialsRing binders, file dividers, A4 plastic walletsPens, pencils, erasers, rulersA4 padsWhiteboard marker pens, graphics pensHole punches, staplers and staples, paper clipsEnvelopes – A4, A5 and letterPhotocopy paper, cardboard wallets, OHP acetate sheetsCorrections pens (white-out), glue sticks, highlighter markersCutting board and cutting blades, scissorsSellotape, rubber bands, drawing pinsFlip chart paper and marker pens
Training room furniture and equipmentTables/desksChairsFixed blackboard/whiteboardMobile whiteboard(s)Projector screenFlip chart standsMicrophone and speaker systemSoftboard for card exercisesSlide projectorOHPComputerComputer graphics projector
OHP, overhead projector.
felt they could contribute even if the material was new to them);measuring knowledge acquisition (test-•ing recall of facts, procedures, techniques covered during the course);
measuring any increase in skill (com-•parison of skill levels before and after training);measuring any changes in attitude •towards the use of skills (for instance,
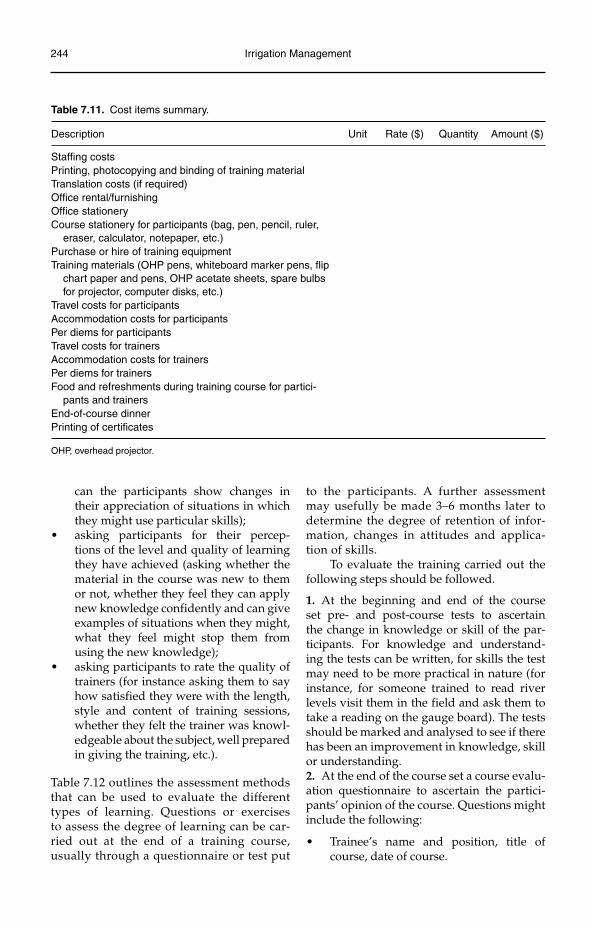
244 Irrigation Management
Table 7.11. Cost items summary.
Description Unit Rate ($) Quantity Amount ($)
Staffing costsPrinting, photocopying and binding of training materialTranslation costs (if required)Office rental/furnishingOffice stationeryCourse stationery for participants (bag, pen, pencil, ruler,
eraser, calculator, notepaper, etc.)Purchase or hire of training equipmentTraining materials (OHP pens, whiteboard marker pens, flip
chart paper and pens, OHP acetate sheets, spare bulbs for projector, computer disks, etc.)
Travel costs for participantsAccommodation costs for participantsPer diems for participantsTravel costs for trainersAccommodation costs for trainersPer diems for trainersFood and refreshments during training course for partici-
pants and trainersEnd-of-course dinnerPrinting of certificates
OHP, overhead projector.
can the participants show changes in their appreciation of situations in which they might use particular skills);asking participants for their percep-•tions of the level and quality of learning they have achieved (asking whether the material in the course was new to them or not, whether they feel they can apply new knowledge confidently and can give examples of situations when they might, what they feel might stop them from using the new knowledge);asking participants to rate the quality of •trainers (for instance asking them to say how satisfied they were with the length, style and content of training sessions, whether they felt the trainer was knowl-edgeable about the subject, well prepared in giving the training, etc.).
Table 7.12 outlines the assessment methods that can be used to evaluate the different types of learning. Questions or exercises to assess the degree of learning can be car-ried out at the end of a training course, usually through a questionnaire or test put
to the participants. A further assessment may usefully be made 3–6 months later to determine the degree of retention of infor-mation, changes in attitudes and applica-tion of skills.
To evaluate the training carried out the following steps should be followed.
1. At the beginning and end of the course set pre- and post-course tests to ascertain the change in knowledge or skill of the par-ticipants. For knowledge and understand-ing the tests can be written, for skills the test may need to be more practical in nature (for instance, for someone trained to read river levels visit them in the field and ask them to take a reading on the gauge board). The tests should be marked and analysed to see if there has been an improvement in knowledge, skill or understanding.2. At the end of the course set a course evalu-ation questionnaire to ascertain the partici-pants’ opinion of the course. Questions might include the following:
Trainee’s name and position, title of •course, date of course.
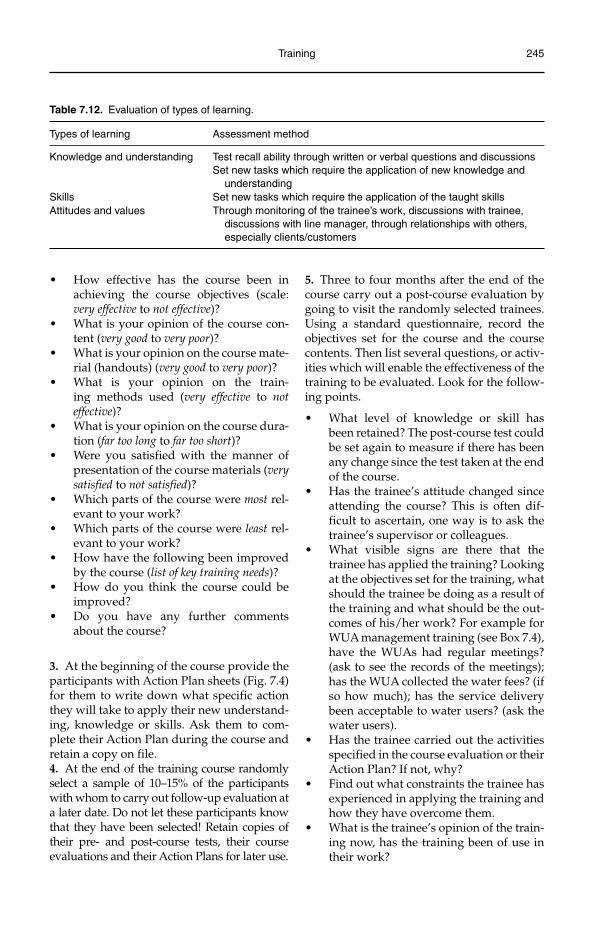
Training 245
Table 7.12. Evaluation of types of learning.
Types of learning Assessment method
Knowledge and understanding Test recall ability through written or verbal questions and discussionsSet new tasks which require the application of new knowledge and
understandingSkills Set new tasks which require the application of the taught skillsAttitudes and values Through monitoring of the trainee’s work, discussions with trainee,
discussions with line manager, through relationships with others, especially clients/customers
How effective has the course been in •achieving the course objectives (scale: very effective to not effective)?What is your opinion of the course con-•tent (very good to very poor)?What is your opinion on the course mate-•rial (handouts) (very good to very poor)?What is your opinion on the train-•ing methods used (very effective to noteffective)?What is your opinion on the course dura-•tion (far too long to far too short)?Were you satisfied with the manner of •presentation of the course materials (verysatisfied to not satisfied)?Which parts of the course were • most rel-evant to your work?Which parts of the course were • least rel-evant to your work?How have the following been improved •by the course (list of key training needs)?How do you think the course could be •improved?Do you have any further comments •about the course?
3. At the beginning of the course provide the participants with Action Plan sheets (Fig. 7.4) for them to write down what specific action they will take to apply their new understand-ing, knowledge or skills. Ask them to com-plete their Action Plan during the course and retain a copy on file.4. At the end of the training course randomly select a sample of 10–15% of the participants with whom to carry out follow-up evaluation at a later date. Do not let these participants know that they have been selected! Retain copies of their pre- and post-course tests, their course evaluations and their Action Plans for later use.
5. Three to four months after the end of the course carry out a post-course evaluation by going to visit the randomly selected trainees. Using a standard questionnaire, record the objectives set for the course and the course contents. Then list several questions, or activ-ities which will enable the effectiveness of the training to be evaluated. Look for the follow-ing points.
What level of knowledge or skill has •been retained? The post-course test could be set again to measure if there has been any change since the test taken at the end of the course.Has the trainee’s attitude changed since •attending the course? This is often dif-ficult to ascertain, one way is to ask the trainee’s supervisor or colleagues.What visible signs are there that the •trainee has applied the training? Looking at the objectives set for the training, what should the trainee be doing as a result of the training and what should be the out-comes of his/her work? For example for WUA management training (see Box 7.4), have the WUAs had regular meetings? (ask to see the records of the meetings); has the WUA collected the water fees? (if so how much); has the service delivery been acceptable to water users? (ask the water users).Has the trainee carried out the activities •specified in the course evaluation or their Action Plan? If not, why?Find out what constraints the trainee has •experienced in applying the training and how they have overcome them.What is the trainee’s opinion of the train-•ing now, has the training been of use in their work?
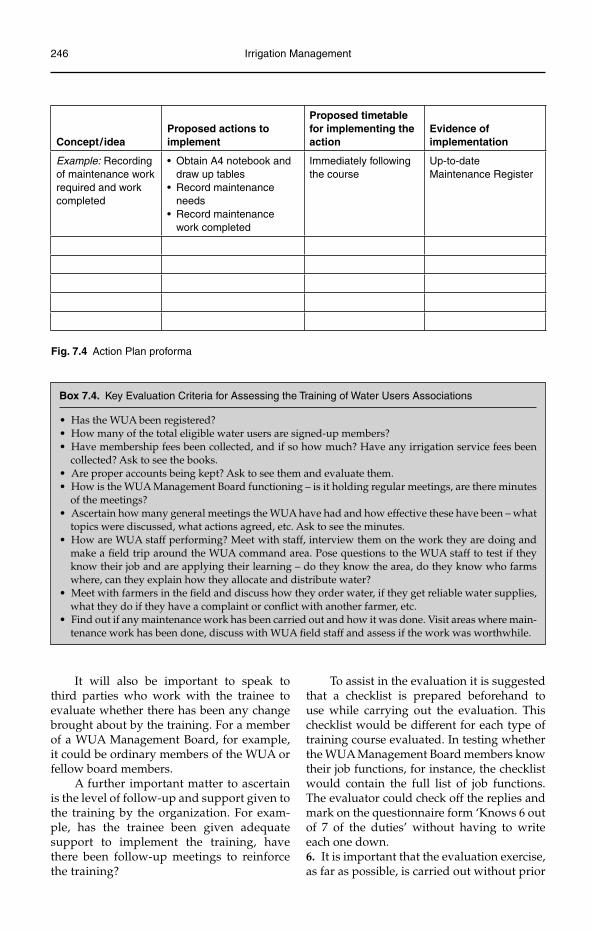
246 Irrigation Management
Concept/ ideaProposed actions to implement
Proposed timetable for implementing the action
Evidence of implementation
Example: Recording of maintenance work required and work completed
• Obtain A4 notebook and draw up tables
• Record maintenance needs
• Record maintenance work completed
Immediately following the course
Up-to-dateMaintenance Register
Fig. 7.4 Action Plan proforma
Box 7.4. Key Evaluation Criteria for Assessing the Training of Water Users Associations
Has the WUA been registered?•How many of the total eligible water users are signed-up members?•Have membership fees been collected, and if so how much? Have any irrigation service fees been •collected? Ask to see the books.Are proper accounts being kept? Ask to see them and evaluate them.•How is the WUA Management Board functioning – is it holding regular meetings, are there minutes •of the meetings?Ascertain how many general meetings the WUA have had and how effective these have been – what •topics were discussed, what actions agreed, etc. Ask to see the minutes.How are WUA staff performing? Meet with staff, interview them on the work they are doing and •make a fi eld trip around the WUA command area. Pose questions to the WUA staff to test if they know their job and are applying their learning – do they know the area, do they know who farms where, can they explain how they allocate and distribute water?Meet with farmers in the fi eld and discuss how they order water, if they get reliable water supplies, •what they do if they have a complaint or confl ict with another farmer, etc.Find out if any maintenance work has been carried out and how it was done. Visit areas where main-•tenance work has been done, discuss with WUA fi eld staff and assess if the work was worthwhile.
It will also be important to speak to third parties who work with the trainee to evaluate whether there has been any change brought about by the training. For a member of a WUA Management Board, for example, it could be ordinary members of the WUA or fellow board members.
A further important matter to ascertain is the level of follow-up and support given to the training by the organization. For exam-ple, has the trainee been given adequate support to implement the training, have there been follow-up meetings to reinforce the training?
To assist in the evaluation it is suggested that a checklist is prepared beforehand to use while carrying out the evaluation. This checklist would be different for each type of training course evaluated. In testing whether the WUA Management Board members know their job functions, for instance, the checklist would contain the full list of job functions. The evaluator could check off the replies and mark on the questionnaire form ‘Knows 6 out of 7 of the duties’ without having to write each one down.6. It is important that the evaluation exercise, as far as possible, is carried out without prior

Training 247
warning. This means arriving unannounced, going out to the field and interviewing staff, water users, etc. at random.7. When the full set of evaluations has been completed a final report should be prepared.
In any training evaluation report it is impor-tant to provide:
the objectives of the training, course syl-•labus, duration, target audience, number of courses held, location where courses were held, names of trainers and their organization;
how many people attended the course, •where they were from and their desig-nation, how many were expected, how many (if any) dropped out or failed to attend (and reasons);the results of pre- and post-course tests, •if any;the data and findings from the evaluation, •including examples of the evaluation ques-tionnaires or evaluation methods used;conclusions on the effectiveness of the •training and the training impact – whether the objectives set for the training were met, and to what degree.
248 ©Martin Burton 2010. Irrigation Management: Principles and Practices (Martin Burton)
8
Irrigation Management Transfer and Organizational Restructuring
This chapter deals with the topical issue of irrigation management transfer and the con-sequent restructuring of the way in which irri-gation and drainage systems (I&D systems) are managed, operated and maintained. The origins of the move to transfer management from government to water users are discussed together with a summary of experience to date, not all of which has been successful. Processes and procedures for transfer are out-lined and discussed and are then followed by a section on the emerging associated process of restructuring of government irrigation and drainage agencies (I&D agencies).
Irrigation Management Transfer
Background
The rapid increase of irrigated area in the 1970s and 1980s temporarily addressed the food crisis, but left governments with a heavy financial burden for the management, opera-tion and maintenance (MOM) of irrigation schemes. Though money was available for capital works from international develop-ment funding agencies (such as the World Bank), many governments have had serious difficulties in providing adequate recurrent funds to sustain I&D systems. In addition operation of the system by government
agencies has, in many cases, been poor, with operation and maintenance (O&M) staff poorly paid and poorly motivated. As a con-sequence of the failure to adequately operate and maintain them, the irrigation systems have fallen into disrepair, leaving many farm-ers with unreliable, inadequate and untimely supplies of irrigation water. Agricultural pro-duction and rural livelihoods have suffered, and the contribution to the national economy has declined.
Rehabilitation of existing schemes has been a feature of irrigation development since the late 1970s, with funding for capital works obtained from the international devel-opment agencies. Despite protocols between lending agencies and government requiring that government provide adequate funds for operation and maintenance, systems have continued to decline due to lack of recurrent funding. The lack of funds for O&M is such that in many countries rehabilitation is occur-ring of previously rehabilitated schemes.
To address this situation, and to improve the performance of the irrigation sector, a process of irrigation management transfer has been initiated. The top-down government-led technically driven developments of the 1970s and 1980s are giving way to bottom-up insti-tutionally driven initiatives, which seek to fully involve the water users in the acquisi-tion, management and use of water for irri-gated agriculture. The transfer of irrigation
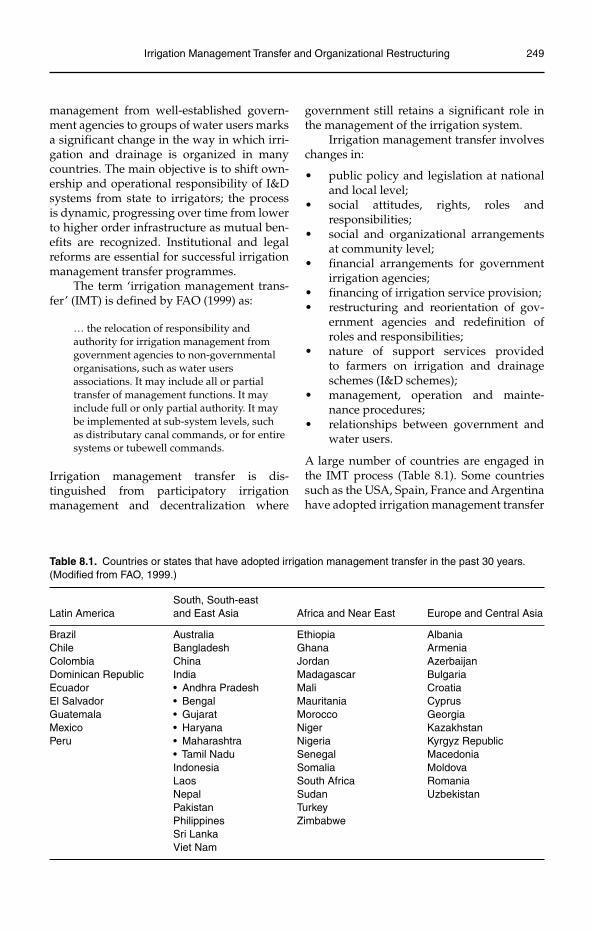
Irrigation Management Transfer and Organizational Restructuring 249
management from well-established govern-ment agencies to groups of water users marks a significant change in the way in which irri-gation and drainage is organized in many countries. The main objective is to shift own-ership and operational responsibility of I&D systems from state to irrigators; the process is dynamic, progressing over time from lower to higher order infrastructure as mutual ben-efits are recognized. Institutional and legal reforms are essential for successful irrigation management transfer programmes.
The term ‘irrigation management trans-fer’ (IMT) is defined by FAO (1999) as:
… the relocation of responsibility and authority for irrigation management from government agencies to non-governmental organisations, such as water users associations. It may include all or partial transfer of management functions. It may include full or only partial authority. It may be implemented at sub-system levels, such as distributary canal commands, or for entire systems or tubewell commands.
Irrigation management transfer is dis-tinguished from participatory irrigation management and decentralization where
government still retains a significant role in the management of the irrigation system.
Irrigation management transfer involves changes in:
public policy and legislation at national •and local level;social attitudes, rights, roles and •responsibilities;social and organizational arrangements •at community level;financial arrangements for government •irrigation agencies;financing of irrigation service provision;•restructuring and reorientation of gov-•ernment agencies and redefinition of roles and responsibilities;nature of support services provided •to farmers on irrigation and drainage schemes (I&D schemes);management, operation and mainte-•nance procedures;relationships between government and •water users.
A large number of countries are engaged in the IMT process (Table 8.1). Some countries such as the USA, Spain, France and Argentina have adopted irrigation management transfer
Table 8.1. Countries or states that have adopted irrigation management transfer in the past 30 years. (Modified from FAO, 1999.)
South, South-east Latin America and East Asia Africa and Near East Europe and Central Asia
Brazil Australia Ethiopia AlbaniaChile Bangladesh Ghana ArmeniaColombia China Jordan AzerbaijanDominican Republic India Madagascar BulgariaEcuador • Andhra Pradesh Mali CroatiaEl Salvador • Bengal Mauritania CyprusGuatemala • Gujarat Morocco GeorgiaMexico • Haryana Niger KazakhstanPeru • Maharashtra Nigeria Kyrgyz Republic • Tamil Nadu Senegal Macedonia Indonesia Somalia Moldova Laos South Africa Romania Nepal Sudan Uzbekistan Pakistan Turkey Philippines Zimbabwe Sri Lanka Viet Nam
250 Irrigation Management
processes for over 30 years while others are just starting. Some countries such as Chile, Mexico and China are well advanced in the process, while others such as some states in India, Sri Lanka, the Philippines and Indonesia have started but have to some degree stalled. There have been success sto-ries, such as Mexico and Turkey, and some failures, such as in Nepal.
The move to reduce the role of govern-ment in service provision has not been limited to the irrigation sector. Financial crises and poor progress with economic development in many developing countries has led to a rethinking of the role of government since the 1980s. At the heart of the debate on the role of the state in rural development have been the issues of effectiveness, efficiency and accountabil-ity1 (Carney, 1998). Wider economic thinking in market-led economies has led to an evalu-ation of government’s role in the provision of rural goods and services, ranging from seeds and fertilizer to veterinary and agricultural extension services.
In the 1980s there was increased research interest in traditional farmer-managed irriga-tion systems, with their comparative success often being used as justification for the trans-fer of government-run systems. Associated with these studies of farmer-managed irri-gation were studies of the institutional and social issues related to how farmers organ-ized themselves for irrigation. At this time Chambers (1988) identified three points of entry for action to improve performance:
operational plans;•rights, communications and farmers’ •participation;performance monitoring and computer •analysis.
In practice, with the advent of irrigation management transfer, the rights, commu-nications and farmers’ participation has to some degree overtaken the other two points of entry. Associated with this way of thinking was seminal work by Elinor Ostrom (1992) who outlined measures for ‘crafting’ self-governing irrigation systems. Ostrom’s work formed a sound basis for understanding the social interactions and institutions that
govern successful water user organizations. A significant part of her work focused on rules (rules-in-use, psychological contracts, rules and culture, conflict resolution, etc.). Supporting this understanding was work by Uphoff (1990), which focused on the activities related to irrigation in terms of water (acqui-sition, allocation, distribution, use, disposal), infrastructure (design, construction, O&M) and organization (decision making, resource mobilization, communication, conflict resolu-tion). Uphoff identified three ‘ships’ of water users associations as follows.
1. Membership: Definition of who should be members of the organization, and their roles and responsibilities.2. Leadership: The calibre of the leadership mobilized from the farming community is the single most important factor in the effec-tive and equitable functioning of water user associations (WUAs).3. Ownership: Identification of the need for farmers to identify the irrigation system as ‘theirs’, and to take responsibility for it.
The experience gained during the 1980s and 1990s with irrigation management transfer resulted in the publication of guidelines for the transfer of irrigation management serv-ices (FAO, 1999). This comprehensive piece of work provides detailed guidelines for the IMT process, broken down into four phases:
mobilization of support;•strategic planning;•resolution of key policy issues;•planning and implementation.•
The document outlines several phases of insti-tutional development, with Phase 1 covering the need to identify the performance gap and to look at alternative options for bridging the gap. Phase 2 then discusses organizing the strategic change process, covering iden-tification of stakeholders, identification of major issues, and identification and setting of objectives. Phase 3 involves investigation of the key policy issues related to financing, legal framework for transfer, extent of serv-ices/goods/infrastructure transferred, and ensuring accountability. Phase 4 outlines the development of the IMT plan, covering
Irrigation Management Transfer and Organizational Restructuring 251
irrigation agency restructuring, forming and supporting water users associations, and measures to improve the condition of irriga-tion infrastructure.
One area that has not been adequately studied and understood is the varying ability of different communities and societies to adopt and make successful community-based management organizations. In some societies working together for the common good is an accepted norm; in others people are highly individualistic, tending to look after their own and their immediate family’s own inter-ests, sometimes at the expense of others. The factors that influence the ability and willing-ness of communities to work together on the management of I&D systems are a complex mix including local social history, social cul-ture, value systems, the natural environment, access to water and other resources, and influence and interaction with external forces (including government).
Components of irrigation management transfer
There are three main components to irriga-tion management transfer:
1. Changes in the legislation related to water resources and irrigation and drainage management;2. Formation of water users associations and transfer of management, operation and main-tenance functions from government to water users;3. Restructuring of government agencies responsible for water resources and irrigation and drainage management.
Changes to the legislation are an essential prerequisite for irrigation management trans-fer to allow formal recognition of water users associations as legitimate partners in the management of I&D schemes.
Formation of functional and effective water users associations is at the core of irrigation management transfer. The proc-ess of formation, establishment and support requires strong political will and support, in
addition to significant resources during the formation and establishment phases. Though irrigation management transfer should result in savings to government in the long term, in the short term additional finance and resources will be required if the process is to be successful. Under-financed and poorly resourced transfer programmes have not been successful.
Finally, the government water resources and/or I&D agencies need to be restruc-tured and reorganized to reflect the changes brought about by irrigation management transfer. These agencies need to adapt to withdrawal from the management of I&D systems to a greater regulatory and supervi-sory role. As part of the process there is often a downsizing of government staff, especially of lower-order O&M staff; this downsizing needs to be handled with care and considera-tion for the individuals involved. In addition there will be new functions and responsi-bilities within these organizations as they are modernized and their systems updated to cater for their changing role. Training is therefore a central part of the restructuring process.
Change management
Irrigation management transfer is one of the largest change management programmes many countries will have experienced, yet lit-tle is spoken about change management in the irrigation and drainage literature, and even less reference made to the wealth of knowl-edge and experience in this discipline. A pos-sible reason for this might be that change management is part of general management theory and in the main refers to business and industrial organizations, though it has sig-nificant application in relation to irrigation management transfer.
In the business sector it is recognized that if an organization is to remain competi-tive then some organizational changes are required each year, and more major changes required each 4–5 years. Early warning signs that changes are needed within an organiza-tion include (Lorange and Nelson, 1987):
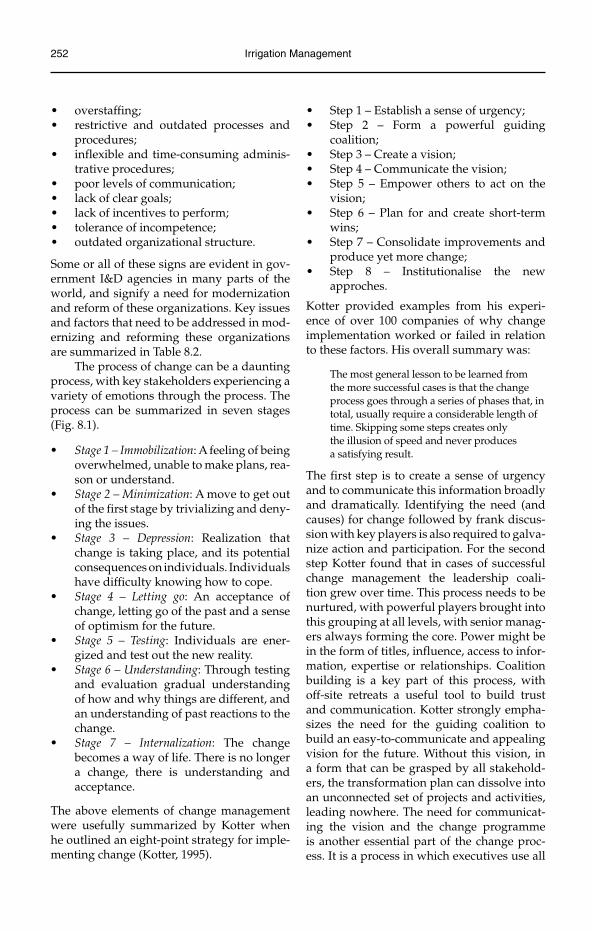
252 Irrigation Management
overstaffing;•restrictive and outdated processes and •procedures;inflexible and time-consuming adminis-•trative procedures;poor levels of communication;•lack of clear goals;•lack of incentives to perform;•tolerance of incompetence;•outdated organizational structure.•
Some or all of these signs are evident in gov-ernment I&D agencies in many parts of the world, and signify a need for modernization and reform of these organizations. Key issues and factors that need to be addressed in mod-ernizing and reforming these organizations are summarized in Table 8.2.
The process of change can be a daunting process, with key stakeholders experiencing a variety of emotions through the process. The process can be summarized in seven stages (Fig. 8.1).
Stage 1 – Immobilization• : A feeling of being overwhelmed, unable to make plans, rea-son or understand.Stage 2 – Minimization• : A move to get out of the first stage by trivializing and deny-ing the issues.Stage 3 – Depression• : Realization that change is taking place, and its potential consequences on individuals. Individuals have difficulty knowing how to cope.Stage 4 – Letting go• : An acceptance of change, letting go of the past and a sense of optimism for the future.Stage 5 – Testing• : Individuals are ener-gized and test out the new reality.Stage 6 – Understanding• : Through testing and evaluation gradual understanding of how and why things are different, and an understanding of past reactions to the change.Stage 7 – Internalization• : The change becomes a way of life. There is no longer a change, there is understanding and acceptance.
The above elements of change management were usefully summarized by Kotter when he outlined an eight-point strategy for imple-menting change (Kotter, 1995).
Step 1 – Establish a sense of urgency;•Step 2 – Form a powerful guiding •coalition;Step 3 – Create a vision;•Step 4 – Communicate the vision;•Step 5 – Empower others to act on the •vision;Step 6 – Plan for and create short-term •wins;Step 7 – Consolidate improvements and •produce yet more change;Step 8 – Institutionalise the new •approches.
Kotter provided examples from his experi-ence of over 100 companies of why change implementation worked or failed in relation to these factors. His overall summary was:
The most general lesson to be learned from the more successful cases is that the change process goes through a series of phases that, in total, usually require a considerable length of time. Skipping some steps creates only the illusion of speed and never produces a satisfying result.
The first step is to create a sense of urgency and to communicate this information broadly and dramatically. Identifying the need (and causes) for change followed by frank discus-sion with key players is also required to galva-nize action and participation. For the second step Kotter found that in cases of successful change management the leadership coali-tion grew over time. This process needs to be nurtured, with powerful players brought into this grouping at all levels, with senior manag-ers always forming the core. Power might be in the form of titles, influence, access to infor-mation, expertise or relationships. Coalition building is a key part of this process, with off-site retreats a useful tool to build trust and communication. Kotter strongly empha-sizes the need for the guiding coalition to build an easy-to-communicate and appealing vision for the future. Without this vision, in a form that can be grasped by all stakehold-ers, the transformation plan can dissolve into an unconnected set of projects and activities, leading nowhere. The need for communicat-ing the vision and the change programme is another essential part of the change proc-ess. It is a process in which executives use all
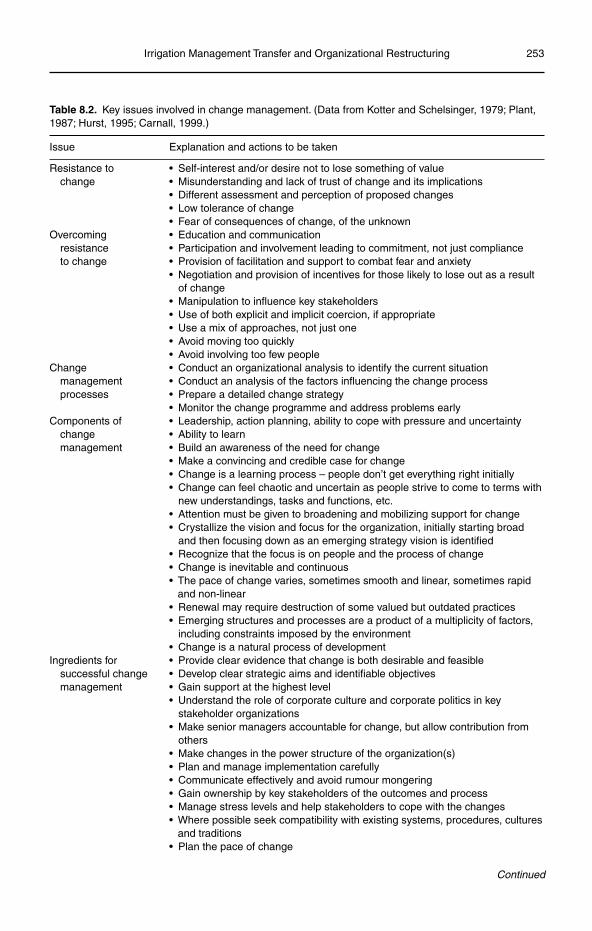
Irrigation Management Transfer and Organizational Restructuring 253
Table 8.2. Key issues involved in change management. (Data from Kotter and Schelsinger, 1979; Plant, 1987; Hurst, 1995; Carnall, 1999.)
Issue Explanation and actions to be taken
Resistance to • Self-interest and/or desire not to lose something of value change • Misunderstanding and lack of trust of change and its implications • Different assessment and perception of proposed changes • Low tolerance of change • Fear of consequences of change, of the unknownOvercoming • Education and communication resistance • Participation and involvement leading to commitment, not just compliance to change • Provision of facilitation and support to combat fear and anxiety • Negotiation and provision of incentives for those likely to lose out as a result
of change • Manipulation to influence key stakeholders • Use of both explicit and implicit coercion, if appropriate • Use a mix of approaches, not just one • Avoid moving too quickly • Avoid involving too few peopleChange • Conduct an organizational analysis to identify the current situation management • Conduct an analysis of the factors influencing the change process processes • Prepare a detailed change strategy • Monitor the change programme and address problems earlyComponents of • Leadership, action planning, ability to cope with pressure and uncertainty change • Ability to learn management • Build an awareness of the need for change • Make a convincing and credible case for change • Change is a learning process – people don’t get everything right initially • Change can feel chaotic and uncertain as people strive to come to terms with
new understandings, tasks and functions, etc. • Attention must be given to broadening and mobilizing support for change • Crystallize the vision and focus for the organization, initially starting broad
and then focusing down as an emerging strategy vision is identified • Recognize that the focus is on people and the process of change • Change is inevitable and continuous • The pace of change varies, sometimes smooth and linear, sometimes rapid
and non-linear • Renewal may require destruction of some valued but outdated practices • Emerging structures and processes are a product of a multiplicity of factors,
including constraints imposed by the environment • Change is a natural process of developmentIngredients for • Provide clear evidence that change is both desirable and feasible successful change • Develop clear strategic aims and identifiable objectives management • Gain support at the highest level • Understand the role of corporate culture and corporate politics in key
stakeholder organizations • Make senior managers accountable for change, but allow contribution from
others • Make changes in the power structure of the organization(s) • Plan and manage implementation carefully • Communicate effectively and avoid rumour mongering • Gain ownership by key stakeholders of the outcomes and process • Manage stress levels and help stakeholders to cope with the changes • Where possible seek compatibility with existing systems, procedures, cultures
and traditions • Plan the pace of change
Continued
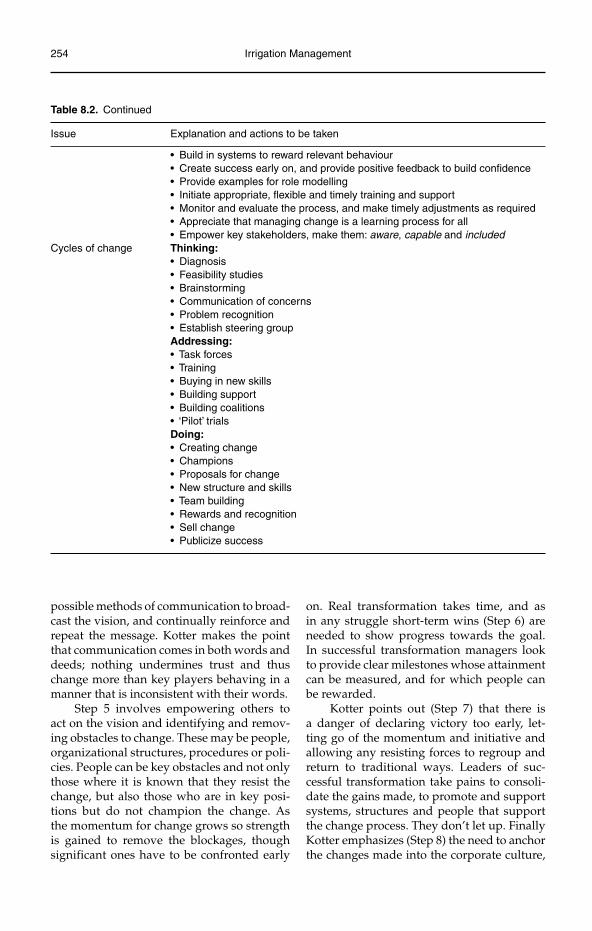
254 Irrigation Management
possible methods of communication to broad-cast the vision, and continually reinforce and repeat the message. Kotter makes the point that communication comes in both words and deeds; nothing undermines trust and thus change more than key players behaving in a manner that is inconsistent with their words.
Step 5 involves empowering others to act on the vision and identifying and remov-ing obstacles to change. These may be people, organizational structures, procedures or poli-cies. People can be key obstacles and not only those where it is known that they resist the change, but also those who are in key posi-tions but do not champion the change. As the momentum for change grows so strength is gained to remove the blockages, though significant ones have to be confronted early
on. Real transformation takes time, and as in any struggle short-term wins (Step 6) are needed to show progress towards the goal. In successful transformation managers look to provide clear milestones whose attainment can be measured, and for which people can be rewarded.
Kotter points out (Step 7) that there is a danger of declaring victory too early, let-ting go of the momentum and initiative and allowing any resisting forces to regroup and return to traditional ways. Leaders of suc-cessful transformation take pains to consoli-date the gains made, to promote and support systems, structures and people that support the change process. They don’t let up. Finally Kotter emphasizes (Step 8) the need to anchor the changes made into the corporate culture,
Table 8.2. Continued
Issue Explanation and actions to be taken
• Build in systems to reward relevant behaviour • Create success early on, and provide positive feedback to build confidence • Provide examples for role modelling • Initiate appropriate, flexible and timely training and support • Monitor and evaluate the process, and make timely adjustments as required • Appreciate that managing change is a learning process for all • Empower key stakeholders, make them: aware, capable and includedCycles of change Thinking: • Diagnosis • Feasibility studies • Brainstorming • Communication of concerns • Problem recognition • Establish steering group
Addressing: • Task forces • Training • Buying in new skills • Building support • Building coalitions • ‘Pilot’ trials
Doing: • Creating change • Champions • Proposals for change • New structure and skills • Team building • Rewards and recognition • Sell change • Publicize success
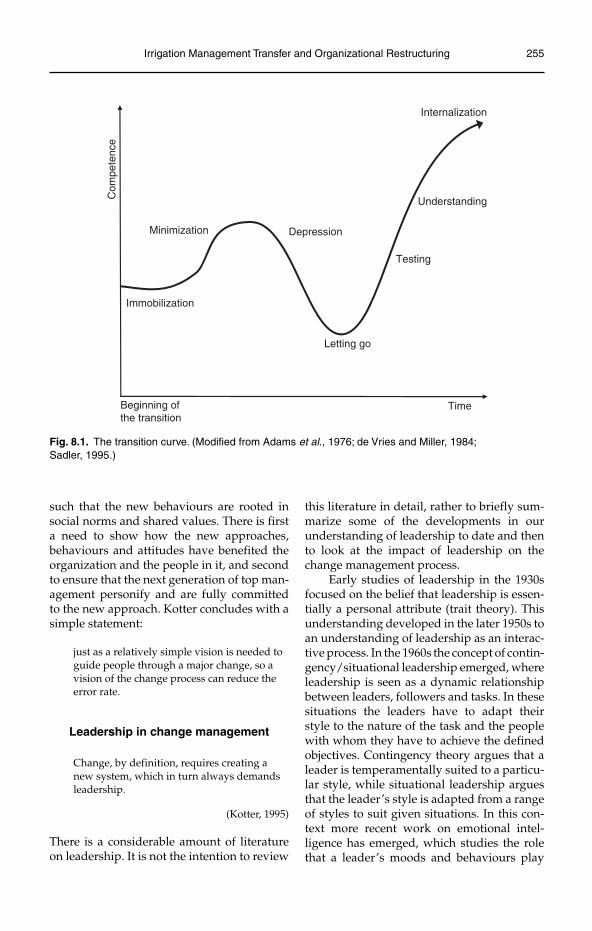
Irrigation Management Transfer and Organizational Restructuring 255
such that the new behaviours are rooted in social norms and shared values. There is first a need to show how the new approaches, behaviours and attitudes have benefited the organization and the people in it, and second to ensure that the next generation of top man-agement personify and are fully committed to the new approach. Kotter concludes with a simple statement:
just as a relatively simple vision is needed to guide people through a major change, so a vision of the change process can reduce the error rate.
Leadership in change management
Change, by definition, requires creating a new system, which in turn always demands leadership.
(Kotter, 1995)
There is a considerable amount of literature on leadership. It is not the intention to review
this literature in detail, rather to briefly sum-marize some of the developments in our understanding of leadership to date and then to look at the impact of leadership on the change management process.
Early studies of leadership in the 1930s focused on the belief that leadership is essen-tially a personal attribute (trait theory). This understanding developed in the later 1950s to an understanding of leadership as an interac-tive process. In the 1960s the concept of contin-gency/situational leadership emerged, where leadership is seen as a dynamic relationship between leaders, followers and tasks. In these situations the leaders have to adapt their style to the nature of the task and the people with whom they have to achieve the defined objectives. Contingency theory argues that a leader is temperamentally suited to a particu-lar style, while situational leadership argues that the leader’s style is adapted from a range of styles to suit given situations. In this con-text more recent work on emotional intel-ligence has emerged, which studies the role that a leader’s moods and behaviours play
Time
Immobilization
Minimization
Com
pete
nce
Depression
Letting go
Testing
Understanding
Internalization
Beginning of the transition
Fig. 8.1. The transition curve. (Modified from Adams et al., 1976; de Vries and Miller, 1984; Sadler, 1995.)
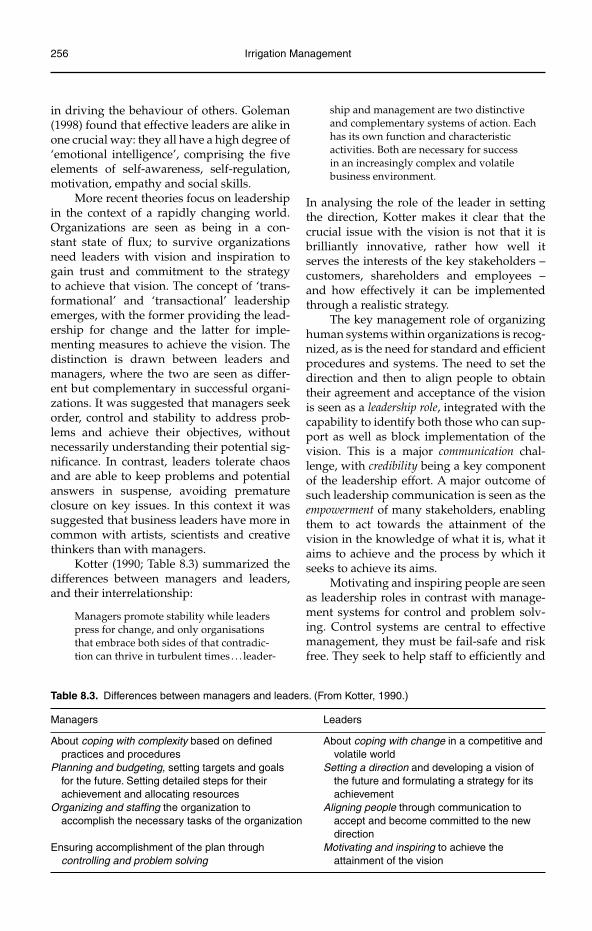
256 Irrigation Management
in driving the behaviour of others. Goleman (1998) found that effective leaders are alike in one crucial way: they all have a high degree of ‘emotional intelligence’, comprising the five elements of self-awareness, self-regulation, motivation, empathy and social skills.
More recent theories focus on leadership in the context of a rapidly changing world. Organizations are seen as being in a con-stant state of flux; to survive organizations need leaders with vision and inspiration to gain trust and commitment to the strategy to achieve that vision. The concept of ‘trans-formational’ and ‘transactional’ leadership emerges, with the former providing the lead-ership for change and the latter for imple-menting measures to achieve the vision. The distinction is drawn between leaders and managers, where the two are seen as differ-ent but complementary in successful organi-zations. It was suggested that managers seek order, control and stability to address prob-lems and achieve their objectives, without necessarily understanding their potential sig-nificance. In contrast, leaders tolerate chaos and are able to keep problems and potential answers in suspense, avoiding premature closure on key issues. In this context it was suggested that business leaders have more in common with artists, scientists and creative thinkers than with managers.
Kotter (1990; Table 8.3) summarized the differences between managers and leaders, and their interrelationship:
Managers promote stability while leaders press for change, and only organisations that embrace both sides of that contradic-tion can thrive in turbulent times . . . leader-
ship and management are two distinctive and complementary systems of action. Each has its own function and characteristic activities. Both are necessary for success in an increasingly complex and volatile business environment.
In analysing the role of the leader in setting the direction, Kotter makes it clear that the crucial issue with the vision is not that it is brilliantly innovative, rather how well it serves the interests of the key stakeholders – customers, shareholders and employees – and how effectively it can be implemented through a realistic strategy.
The key management role of organizing human systems within organizations is recog-nized, as is the need for standard and efficient procedures and systems. The need to set the direction and then to align people to obtain their agreement and acceptance of the vision is seen as a leadership role, integrated with the capability to identify both those who can sup-port as well as block implementation of the vision. This is a major communication chal-lenge, with credibility being a key component of the leadership effort. A major outcome of such leadership communication is seen as the empowerment of many stakeholders, enabling them to act towards the attainment of the vision in the knowledge of what it is, what it aims to achieve and the process by which it seeks to achieve its aims.
Motivating and inspiring people are seen as leadership roles in contrast with manage-ment systems for control and problem solv-ing. Control systems are central to effective management, they must be fail-safe and risk free. They seek to help staff to efficiently and
Table 8.3. Differences between managers and leaders. (From Kotter, 1990.)
Managers Leaders
About coping with complexity based on defined About coping with change in a competitive and practices and procedures volatile worldPlanning and budgeting, setting targets and goals Setting a direction and developing a vision of for the future. Setting detailed steps for their the future and formulating a strategy for its achievement and allocating resources achievementOrganizing and staffing the organization to Aligning people through communication to accomplish the necessary tasks of the organization accept and become committed to the new directionEnsuring accomplishment of the plan through Motivating and inspiring to achieve the
controlling and problem solving attainment of the vision
Irrigation Management Transfer and Organizational Restructuring 257
successfully complete routine jobs day after day. Leadership requires a burst of energy to galvanize change and implement new ways of doing things, involving stakeholders in the process to develop ownership and participa-tion. Through this process leadership is cre-ated across the organization at many levels as people work together to achieve the new reality. In this context the role of informal net-works that exist within organizations needs to be recognized and understood, they comprise a formidable source of support or obstruction for change initiatives.
In well-performing organizations man-agement and leadership are developed at multiple levels. In leading from the top, four key functions are:
setting direction through setting a realis-•tic vision and implementation strategy;aligning people through communication •of the vision and strategy;inspiring action by motivating and influ-•encing people;getting results by focusing energy on •strategically appropriate goals.
The important role of leadership in successful irrigation management transfer can be seen in the case of Mexico and Turkey, where the government and the I&D agency were fully behind the transfer process. In Kyrgyzstan the leadership came initially from politicians and was then taken up by the implementation project and the WUA Support Unit, and after 7 years of establishment is now being taken up by individual WUA Chairmen and Executive Directors who are making their own changes and innovations within their WUAs.2
Management processes checklist for irrigation management transfer
The framework provided by Kotter with his eight steps to transforming an organization provides a sound base on which to build a checklist of the key management processes associated with irrigation management trans-fer. The fundamental components are identi-fied as:
building change management structures;•effective leadership;•
vision;•clear strategies for change;•effective and widespread communication;•commitment to change;•building teams, networks and coalitions;•careful planning and target setting;•commitment of adequate resources;•active monitoring and evaluation;•reward systems for achievement;•a flexible and supportive management •control system.
The checklist presented in Fig. 8.2 was used by the author (Burton, 2003) to gather feed-back from 23 professionals with experi-ence in irrigation management transfer in a number of countries. The results of the sur-vey are presented in Fig. 8.3, showing the areas where the IMT processes were consid-ered by the respondents to have succeeded or failed. With each element of the checklist being marked out of 10, 11 of the 23 responses scored less than a total of 5.0, with a spread of stages receiving less than 5.0. In the bet-ter than average group, setting direction and making progress visible were found to be the weakest areas. The difficulty in making these assessments is shown by the different scores given for the same country – Nepal scores badly on three counts and well on one. This relates either to the time at which the assessor was involved with the IMT programme, or to particular schemes on which the IMT process was carried out.
The process provides a structured app-roach to assessing irrigation management transfer in the context of change management processes, and does highlight the weaknesses in the processes used in some countries to date. Better understanding of, and compli-ance with, fundamental change management processes is required if IMT programmes are to be successful.
Establishing and Supporting Water Users Associations
Overview
As discussed above, a number of countries have established water users associations,
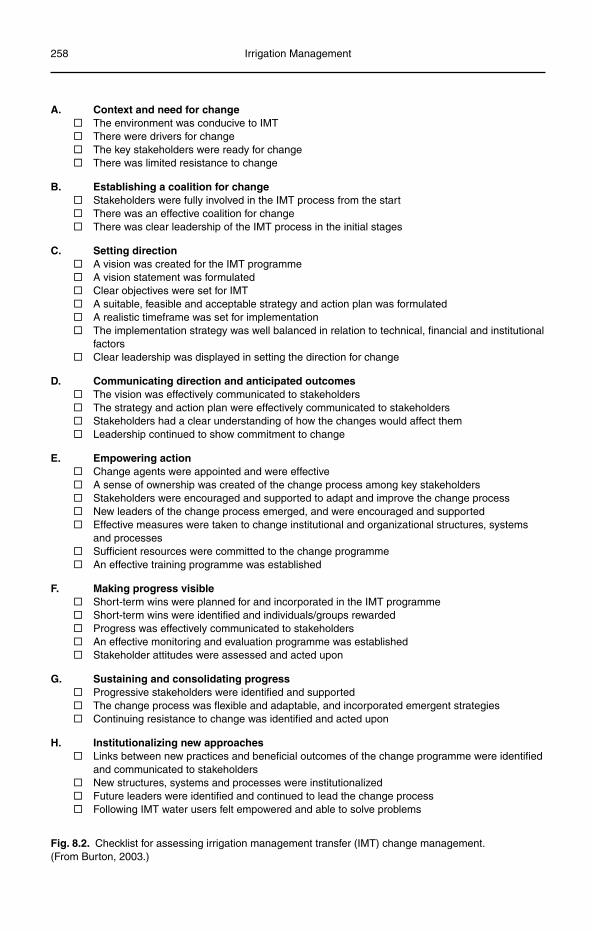
258 Irrigation Management
A. Context and need for change® The environment was conducive to IMT® There were drivers for change® The key stakeholders were ready for change® There was limited resistance to change
B. Establishing a coalition for change® Stakeholders were fully involved in the IMT process from the start® There was an effective coalition for change® There was clear leadership of the IMT process in the initial stages
C. Setting direction® A vision was created for the IMT programme® A vision statement was formulated® Clear objectives were set for IMT® A suitable, feasible and acceptable strategy and action plan was formulated® A realistic timeframe was set for implementation® The implementation strategy was well balanced in relation to technical, financial and institutional
factors® Clear leadership was displayed in setting the direction for change
D. Communicating direction and anticipated outcomes® The vision was effectively communicated to stakeholders® The strategy and action plan were effectively communicated to stakeholders® Stakeholders had a clear understanding of how the changes would affect them® Leadership continued to show commitment to change
E. Empowering action® Change agents were appointed and were effective® A sense of ownership was created of the change process among key stakeholders® Stakeholders were encouraged and supported to adapt and improve the change process® New leaders of the change process emerged, and were encouraged and supported® Effective measures were taken to change institutional and organizational structures, systems
and processes® Sufficient resources were committed to the change programme® An effective training programme was established
F. Making progress visible® Short-term wins were planned for and incorporated in the IMT programme® Short-term wins were identified and individuals/groups rewarded® Progress was effectively communicated to stakeholders® An effective monitoring and evaluation programme was established® Stakeholder attitudes were assessed and acted upon
G. Sustaining and consolidating progress® Progressive stakeholders were identified and supported® The change process was flexible and adaptable, and incorporated emergent strategies® Continuing resistance to change was identified and acted upon
H. Institutionalizing new approaches® Links between new practices and beneficial outcomes of the change programme were identified
and communicated to stakeholders® New structures, systems and processes were institutionalized® Future leaders were identified and continued to lead the change process® Following IMT water users felt empowered and able to solve problems
Fig. 8.2. Checklist for assessing irrigation management transfer (IMT) change management. (From Burton, 2003.)
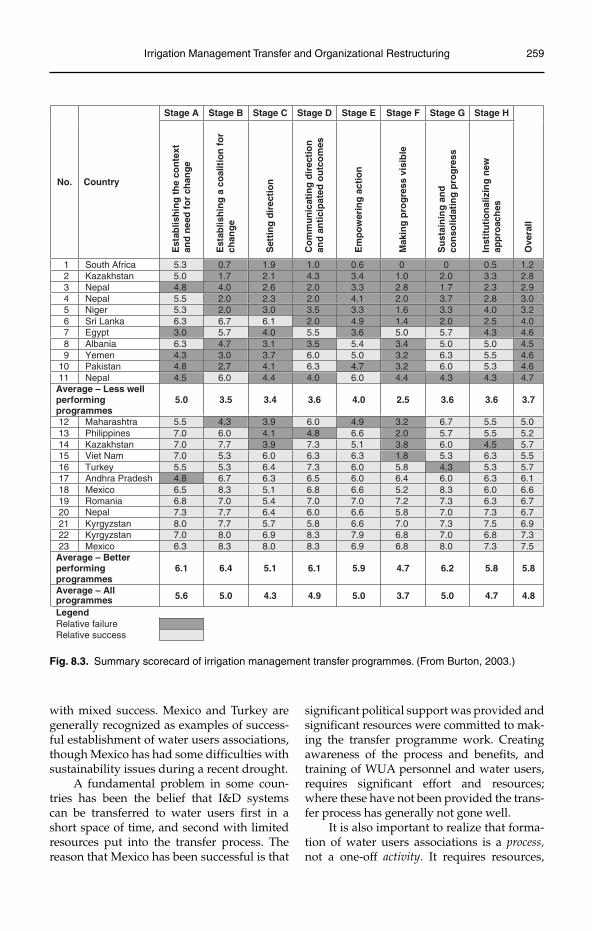
Irrigation Management Transfer and Organizational Restructuring 259
with mixed success. Mexico and Turkey are generally recognized as examples of success-ful establishment of water users associations, though Mexico has had some difficulties with sustainability issues during a recent drought.
A fundamental problem in some coun-tries has been the belief that I&D systems can be transferred to water users first in a short space of time, and second with limited resources put into the transfer process. The reason that Mexico has been successful is that
significant political support was provided and significant resources were committed to mak-ing the transfer programme work. Creating awareness of the process and benefits, and training of WUA personnel and water users, requires significant effort and resources; where these have not been provided the trans-fer process has generally not gone well.
It is also important to realize that forma-tion of water users associations is a process,not a one-off activity. It requires resources,
Stage A Stage B Stage C Stage D Stage E Stage F Stage G Stage H
Est
ablis
hin
g t
he
con
text
and
nee
d f
or
chan
ge
Est
ablis
hin
g a
co
alit
ion
fo
rch
ang
e
Set
tin
g d
irec
tio
n
Co
mm
un
icat
ing
dir
ecti
on
an
d a
nti
cip
ated
ou
tco
mes
Em
po
wer
ing
act
ion
Mak
ing
pro
gre
ss v
isib
le
Su
stai
nin
g a
nd
con
solid
atin
g p
rog
ress
Inst
itu
tio
nal
izin
g n
ewap
pro
ach
es
Ove
rall
5.3 0.7 1.9 1.0 0.6 0 0 0.5 1.2 5.0 1.7 2.1 4.3 3.4 1.0 2.0 3.3 2.8 4.8 4.0 2.6 2.0 3.3 2.8 1.7 2.3 2.9 5.5 2.0 2.3 2.0 4.1 2.0 3.7 2.8 3.0 5.3 2.0 3.0 3.5 3.3 1.6 3.3 4.0 3.2 6.3 6.7 6.1 2.0 4.9 1.4 2.0 2.5 4.0 3.0 5.7 4.0 5.5 3.6 5.0 5.7 4.3 4.6 6.3 4.7 3.1 3.5 5.4 3.4 5.0 5.0 4.5 4.3 3.0 3.7 6.0 5.0 3.2 6.3 5.5 4.6 4.8 2.7 4.1 6.3 4.7 3.2 6.0 5.3 4.6
No. Country
South AfricaKazakhstanNepalNepalNigerSri LankaEgyptAlbania
123456789 Yemen
10 Pakistan11 Nepal 4.5 6.0 4.4 4.0 6.0 4.4 4.3 4.3 4.7
Average – Less well performing programmes
5.5 4.3 3.9 6.0 4.9 3.2 6.7 5.5 5.0 7.0 6.0 4.1 4.8 6.6 2.0 5.7 5.5 5.2 7.0 7.7 3.9 7.3 5.1 3.8 6.0 4.5 5.7 7.0 5.3 6.0 6.3 6.3 1.8 5.3 6.3 5.5 5.5 5.3 6.4 7.3 6.0 5.8 4.3 5.3 5.7 4.8 6.7 6.3 6.5 6.0 6.4 6.0 6.3 6.1 6.5 8.3 5.1 6.8 6.6 5.2 8.3 6.0 6.6 6.8 7.0 5.4 7.0 7.0 7.2 7.3 6.3 6.7 7.3 7.7 6.4 6.0 6.6 5.8 7.0 7.3 6.7 8.0 7.7 5.7 5.8 6.6 7.0 7.3 7.5 6.9 7.0 8.0 6.9 8.3 7.9 6.8 7.0 6.8 7.3
12 Maharashtra13 Philippines14 Kazakhstan15 Viet Nam16 Turkey17 Andhra Pradesh18 Mexico19 Romania20 Nepal21 Kyrgyzstan22 Kyrgyzstan23 Mexico 6.3 8.3 8.0 8.3 6.9 6.8 8.0 7.3 7.5
Average – Better performing programmes Average – All programmes
5.0 3.5 3.4 3.6 4.0 2.5 3.6 3.6 3.7
6.1 6.4 5.1 6.1 5.9 4.7 6.2 5.8 5.8
5.6 5.0 4.3 4.9 5.0 3.7 5.0 4.7 4.8
LegendRelative failure Relative success
Fig. 8.3. Summary scorecard of irrigation management transfer programmes. (From Burton, 2003.)
260 Irrigation Management
planning and long-term commitment through the transformation process from a govern-ment-run I&D system to a farmer-run I&D system. In Turkey WUAs are still receiving advice and guidance from the government agency, some 10 years after the initial trans-formation process started.
The establishment of water users asso-ciations can be likened to a child growing up. In the early years a child needs guidance, tuition and support; as they grow up so they gain their own experiences and grow in con-fidence, until they reach adulthood when they can manage their own affairs (albeit with occasional reference/recourse to their parents!). As with a parent, the implementing agency can take considerable pride in seeing an independent, confident and competent WUA, providing good levels of service deliv-ery to water users.
As noted previously in the section on change management, there is a danger of declaring victory too early. The WUAs will continue to need support from governments and politicians to protect their interests, par-ticularly in relation to access to water sup-plies, taxation and access to good markets for their products.
Forming successful water users associations
Experience from several countries in forming successful water users associations shows the following.
A comprehensive enabling environment •is required, comprising:° strong, high-level political support and
commitment;° clear policy direction;° a sound legal base, incorporating a
legal basis for the new management entities and well-defined property and water rights.
Functioning markets for agricultural •produce.Roles, responsibilities and management •functions need to be clearly specified and delineated for all parties (government agencies, WUAs and water users).
It takes time and resources to establish •fully functioning, effective and sustaina-ble water users associations; 10–15 years is a typical time frame.Considerable effort is required in the •early stages to establish the water users associations. Water users may initially be distrustful of these organizations, for a variety of reasons, and need to be con-vinced of the benefits of forming them. Time spent convincing, rather than coerc-ing, farmers to form water users associa-tions is well spent.Water users are unlikely to form associa-•tions of their own accord, external sup-port is almost always required in the form of Community Organizers, Community Mobilizers, Support Units and the like. These personnel are provided through either a project or a government-sup-ported programme.The Support Unit personnel need to •carry out a significant amount of work in the early stages to explain and pro-mote the association. The support units may also need to assist in grouping water users together in hydraulic units, in mapping these units, identifying landholding plots, etc. Unless this work is done, and done well, at this stage it is unlikely that sustainable associations will be formed.Training of WUA personnel and water •users is a key activity once the association is formed and registered, and requires significant resources.Measures need to be in place for over-•sight of the association, both by the water users and by a government regula-tory authority. All processes need to be transparent and accountable.Processes and procedures need to be in •place for effective and timely conflict resolution.External support will continue to be •needed for the associations until they are fully able to stand on their own feet.
A useful list of key success factors for manage-ment transfer was developed by Frederiksen and Vissia (1998). This list comprised eight key factors with associated tasks (Table 8.4).
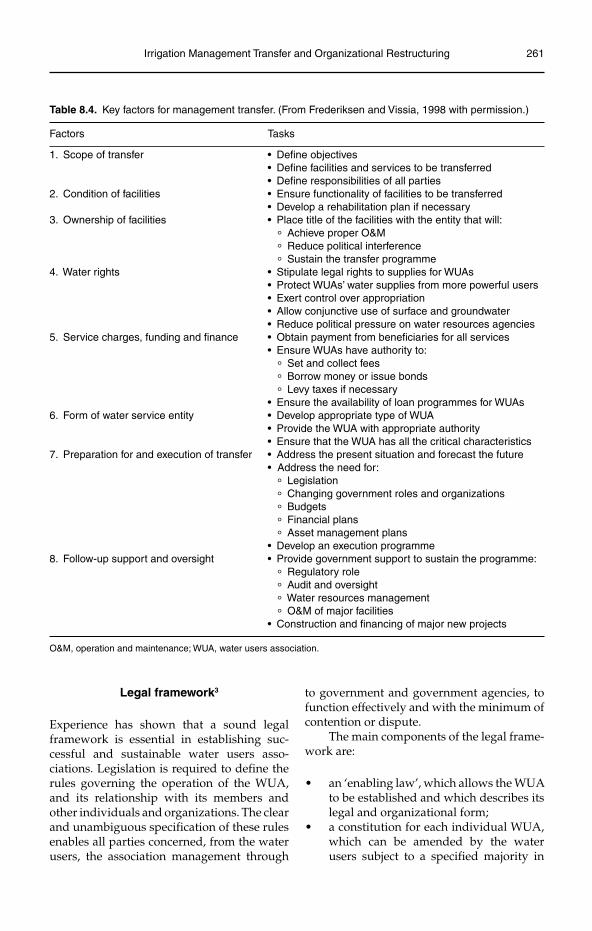
Irrigation Management Transfer and Organizational Restructuring 261
Table 8.4. Key factors for management transfer. (From Frederiksen and Vissia, 1998 with permission.)
Factors Tasks
1. Scope of transfer • Define objectives • Define facilities and services to be transferred • Define responsibilities of all parties2. Condition of facilities • Ensure functionality of facilities to be transferred • Develop a rehabilitation plan if necessary3. Ownership of facilities • Place title of the facilities with the entity that will:
° Achieve proper O&M
° Reduce political interference
° Sustain the transfer programme4. Water rights • Stipulate legal rights to supplies for WUAs • Protect WUAs’ water supplies from more powerful users • Exert control over appropriation • Allow conjunctive use of surface and groundwater • Reduce political pressure on water resources agencies5. Service charges, funding and finance • Obtain payment from beneficiaries for all services • Ensure WUAs have authority to:
° Set and collect fees
° Borrow money or issue bonds
° Levy taxes if necessary • Ensure the availability of loan programmes for WUAs6. Form of water service entity • Develop appropriate type of WUA • Provide the WUA with appropriate authority • Ensure that the WUA has all the critical characteristics7. Preparation for and execution of transfer • Address the present situation and forecast the future • Address the need for:
° Legislation
° Changing government roles and organizations
° Budgets
° Financial plans
° Asset management plans • Develop an execution programme8. Follow-up support and oversight • Provide government support to sustain the programme:
° Regulatory role
° Audit and oversight
° Water resources management
° O&M of major facilities • Construction and financing of major new projects
O&M, operation and maintenance; WUA, water users association.
Legal framework3
Experience has shown that a sound legal framework is essential in establishing suc-cessful and sustainable water users asso-ciations. Legislation is required to define the rules governing the operation of the WUA, and its relationship with its members and other individuals and organizations. The clear and unambiguous specification of these rules enables all parties concerned, from the water users, the association management through
to government and government agencies, to function effectively and with the minimum of contention or dispute.
The main components of the legal frame-work are:
an ‘enabling law’, which allows the WUA •to be established and which describes its legal and organizational form;a constitution for each individual WUA, •which can be amended by the water users subject to a specified majority in
262 Irrigation Management
favour of the proposed amendment and, in some cases, agreement by the state supervisory body;the operating rules prepared by the WUA •in accordance with its constitution and the WUA law.
It is necessary in drafting the law to achieve a balance between the rules contained in the primary legislation, the WUA law, and those contained in the constitution (statutes) and operating rules (by-laws). There is some argu-ment for most of the detail being provided in the constitution document, and less in the law. This may, however, have its problems in com-munities that are not familiar with legal forms, and has the potential for the constitution being drawn to favour certain parties. There is a case to be made in the public interest to specify minimum standards and conditions in the law to protect the rights of all potential members.
Some of the main components of the WUA legislation are outlined in the sections below (FAO, 2003, 2009).
Status, name and tasks of water users associations
The enabling law specifies that the WUAs are legal persons or enjoy legal personality. The law details the following.
The generic name to be used by WUAs •in order to identify it as a particular legal entity.The purpose or purposes of the WUA, its •boundaries of operation and its permit-ted tasks, functions and responsibilities. These may include:° abstraction and delivery of irrigation
water;° collection and disposal of drainage
water;° operation and maintenance of the I&D
system;° maintenance and repair of flood
defence works;° recovery of costs from water users.The form of the organization operating in •the public interest, or as a body of public law, on a non-profit or non-commercial basis.4
There is often discussion on whether the WUA should be able to carry out tasks other than those related to water delivery and removal. The consensus is that it should stick to its core function and leave other tasks, such as input supply and marketing, to other organi-zations, groups or individuals. Engagement in other activities dilutes the focus on water delivery and removal, and raises tax issues on the more commercially oriented functions of input supply and marketing.
Constitution of water users associations
The minimum content of the WUA constitu-tion is generally specified in the WUA law and may include:
the name of the WUA;•the location of the WUA;•description of the WUA service area by •reference to plans and maps;objects and purposes of the WUA’s •activity;structure and competences of manage-•ment organs of the WUA;the rights and duties of members of the •WUA;procedures for joining the WUA and for •termination of membership of the WUA;procedures for the calling of meetings of •the General Assembly;provisions on the setting fees in the •WUA;the responsibility of WUA members;•procedures for compensation for dam-•age to agricultural crops and agricultural plots of land to members of the WUA;conditions of termination activity (reor-•ganization and liquidation) of the WUA.
Participation
There are a number of issues surrounding participation in WUAs, as outlined below.
Voluntary or compulsory?• A key issue for the legislation to clarify is whether partici-pation in the WUA is voluntary or com-pulsory. In the case of land drainage or flood defence it is generally a requirement that all of those within the relevant com-mand area are required to be members.
Irrigation Management Transfer and Organizational Restructuring 263
The case may be less clear for irrigation in some areas, where farmers may choose to rely solely on rainfall for their agricul-tural activities. In some countries coercion to join an association is strongly resented, and cannot be applied. In all cases a WUA based on voluntary, engaged and active participation is likely to be more effective than one based on coercion.Membership• . Though it is common, it is not essential that participation in the WUA has to be by membership. Under the law the WUA could be given the right to dis-tribute irrigation water or manage the drainage of the land, and to levy a charge for the service provided to the landown-ers. The landowners might have the right to participate in governance of the WUA, for example by election of WUA offi-cials, but may not need to be members of the WUA per se. Membership is, how-ever, the general form of participation in WUAs, and has benefits of defined rights and responsibilities for the parties concerned. It is important to specify who has a legal right to membership, and if membership is voluntary to allow non-members to have access to the services.5
Membership rights• . In some countries membership is open to landowners only; tenants can participate through their landlords. This is not appropriate in countries where there are large numbers of farmers who use land on the basis of leases or other rights. Allowance can be made in the legislation for those with long-term use rights to be eligible for membership, while short-term tenants may be members with the agreement of the landowner. It is important to make clear, however, that the landowner and tenant cannot both be members of the WUA at the same time.
Rights, duties and responsibilities
The rights, duties and responsibilities of the relevant parties need to be specified in the WUA legislation. This will cover all relevant stakeholders – the water users, the WUA, the government agency, the regulatory authority.
There is good reason for specifying the mini-mum rights, duties and responsibilities in the WUA law rather than the constitution; these include the right to:
access a fair share of water, or benefit •from services provided by the WUA (such as drainage or flood protection);vote in WUA elections;•stand for office;•propose matters for discussion at meet-•ings and the General Assembly;inspect the WUA books and records.•
Associated with these rights are duties and responsibilities, which may include:
compliance with provisions of the consti-•tution and operating rules;payment of fees (on time);•permitting water to pass to other users •unhindered;access to land for operation and mainte-•nance purposes;compliance with decisions of WUA offi-•cials, staff and/or the General Meeting.
Procedures for establishing water users associations
The procedures for establishing WUAs need to be established in the legislation. This means setting out the steps for establishment and the people and organizations involved. The process requires specification of the following.
The initiative group• : A small group of self-elected people wishing to form a WUA.The Founding Committee• : A representa-tive group covering the service area of the proposed WUA. The main task of the Founding Committee is to consult with all water users and to prepare the documen-tation required to establish the WUA.Formulation of establishment documents• :This will include formulating the WUA constitution, identifying potential mem-bers of the WUA and their landholdings, obtaining maps of the service area and details of the infrastructure.Approval of draft establishment documents• :There are genuine public interest reasons
264 Irrigation Management
for requiring that the draft establishment documents are first approved by the state supervisory body before being submit-ted to the WUA members for approval. This is to ensure that the public interest is adequately protected and to assess the viability and sustainability of the WUA proposed in the documentation (e.g. are paid staffing levels too onerous for water users?).Establishment meeting• : This meeting is held with as many members as possible attending. The proposed WUA constitu-tion and establishment documentation are outlined and discussed. It is typi-cally a requirement that over 50% of the members approve the documentation, and that they own or use over 50% of the land in the WUA service area.6 The meet-ing will also elect WUA office holders and approve the initial budget and work plan.Formal legal establishment• : Following the establishment meeting the elected WUA officials lodge the establishment docu-ments with the relevant authority. This is usually the civil courts or the supervi-sory authority.Costs of establishment• : The legislation typi-cally allows for reasonable costs incurred by the founders to be reimbursed by the WUA.
Governance structure of water users associations
The WUA law needs to outline the institu-tional arrangements for the WUA. This will cover the following.
The structure of the organization• : This includes the general or representative assembly, management board, WUA chairperson, WUA executive and WUA sub-committees, WUA representatives, etc. Care has to be taken to ensure suf-ficient guidance in the legislation while allowing adequate flexibility for WUAs to adapt the institutional framework to their specific needs.Voting rights• : These need to be specified, are these to be one member–one vote, or based on landholding size?
Role of the general assembly, management •board and chairperson: In some cases the (elected) Chair of the Management Board is also the Executive Director of the Association, and therefore responsible for and involved in all matters related to the WUA. This has its benefits and draw-backs; the benefits being that a strong chairperson can drive the WUA forward and take action as required, the draw-back being that it concentrates too much power in one person. A preferable situ-ation is to have an elected Chairperson of the Board and a separate appointed Executive Director and staff.The role and procedures of the General •Assembly: The legislation will stipulate the role and procedures of the WUA General Assembly, which include:° electing the WUA Management Board,
committee members and other officers;° setting/approving the budget and
service fees;° approving the annual work plan and
irrigation plan;° receiving, reviewing and approving
the annual report and accounts;° adopting the operational rules of the
WUA;° amending the WUA constitution.The legislation will also specify the number of times the General Assembly should meet, the procedures for call-ing emergency meetings, the minimum numbers required to make a meeting quorate, voting procedures, etc. The leg-islation may also allow for representa-tion of water users and procedures for a Representative Assembly.The role and procedures for the Management •Board and sub-committees: The legislation should specify the procedures for the election of the Management Board and its duties and responsibilities. It is also helpful if the law specifies minimum and maximum number of members. The law may specify sub-committees for auditing WUA accounts and dispute resolution, the composition, procedures for appoint-ment/election of members; duties and responsibilities need to be defined.
Irrigation Management Transfer and Organizational Restructuring 265
Provisions for elected officials and staff• : The legislation will detail the provisions for elected officials and staff of the associa-tion, with provisions for election and re-election, terms of office, etc.WUA income• : The legislation will specify the possible sources of income for WUAs, such as:° membership fees;° service fees;° grants and subsidies;° gifts;° loans;° interest on savings.The list of possible sources on income will be specified in the law, the method of levying the membership and service fee will be detailed in the constitution or operating rules. There are a number of mechanisms for charging for the service fee, including on the bases of area, crop type and area, number of irrigations, number and duration of irrigations, etc.Record keeping and accounts• : Keeping of transparent and accountable records and accounts is of paramount importance to the sustainability of a WUA. The legisla-tion may specify the minimum level of record keeping that is required, which may include:
° a register of all members with their names and landholding details;
° a register showing water received and delivered;
° accounts books detailing sums due and sums paid;
° minutes of meetings (General or Representative Meetings, Manage ment Board meetings, meetings with other organizations, etc.);
° copies of any contracts entered into.Sanctions• : The legislation should specify the nature of offences against which action will be taken by the WUA, the process by which they will be addressed and the nature of the sanctions.Rights of WUAs• : The legislation will con-fer a number of additional legal rights on WUAs, which may include the right to:° use infrastructure;° impose sanctions and fines;° expel members;
° acquire access rights over land;° recover outstanding fees and charges.Liquidation• : The possibility of dissolution and liquidation needs to be covered by the legislation. The grounds for liquida-tion will be specified, as will the proce-dures following liquidation (e.g. who will take over the functions previously carried out by the WUA, who will own the infrastructure if it has been trans-ferred to the WUA, etc.). To avoid the risk of political interference or coercion formal notice should be issued to the WUA members to enable them to take legal action if they are not in agreement with the proposed liquidation.
Supervision of water users associations
In the public interest it is important that the government provide some oversight and monitoring of WUAs. This should not be too imposing, but at the same time must be effec-tive in being able to assess whether a WUA is functioning properly, and not failing. The WUA law will identify the supervisory body, typically a ministry or unit within a ministry, and will describe the extent of the supervi-sory body’s powers and the conditions under which it may intervene in a WUA’s affairs. The supervisory body will need to collect data and information on each WUA, and to report on a regular (annual) basis on WUA performance (see later section on monitoring of WUAs).
Merging of WUAs, Federations of WUAs and National Associations of WUAs
It is helpful if the legislation allows for the merging of WUAs to form larger WUAs, the formation of Federations of WUAs to man-age higher-order infrastructure and the abil-ity to form a National Association of WUAs. The Federation of WUAs will need to have an independent legal personality, with defined jurisdiction, roles and responsibilities; like-wise for the National Association of WUAs.
Consideration of other issues
In formulating WUA legislation it will be necessary to take into account other related
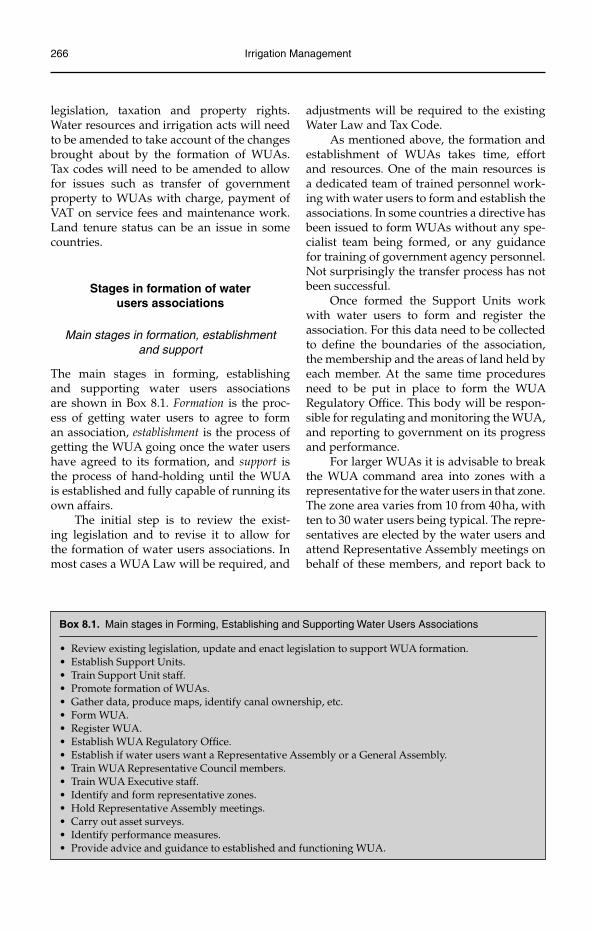
266 Irrigation Management
legislation, taxation and property rights. Water resources and irrigation acts will need to be amended to take account of the changes brought about by the formation of WUAs. Tax codes will need to be amended to allow for issues such as transfer of government property to WUAs with charge, payment of VAT on service fees and maintenance work. Land tenure status can be an issue in some countries.
Stages in formation of water users associations
Main stages in formation, establishment and support
The main stages in forming, establishing and supporting water users associations are shown in Box 8.1. Formation is the proc-ess of getting water users to agree to form an association, establishment is the process of getting the WUA going once the water users have agreed to its formation, and support is the process of hand-holding until the WUA is established and fully capable of running its own affairs.
The initial step is to review the exist-ing legislation and to revise it to allow for the formation of water users associations. In most cases a WUA Law will be required, and
adjustments will be required to the existing Water Law and Tax Code.
As mentioned above, the formation and establishment of WUAs takes time, effort and resources. One of the main resources is a dedicated team of trained personnel work-ing with water users to form and establish the associations. In some countries a directive has been issued to form WUAs without any spe-cialist team being formed, or any guidance for training of government agency personnel. Not surprisingly the transfer process has not been successful.
Once formed the Support Units work with water users to form and register the association. For this data need to be collected to define the boundaries of the association, the membership and the areas of land held by each member. At the same time procedures need to be put in place to form the WUA Regulatory Office. This body will be respon-sible for regulating and monitoring the WUA, and reporting to government on its progress and performance.
For larger WUAs it is advisable to break the WUA command area into zones with a representative for the water users in that zone. The zone area varies from 10 from 40 ha, with ten to 30 water users being typical. The repre-sentatives are elected by the water users and attend Representative Assembly meetings on behalf of these members, and report back to
Box 8.1. Main stages in Forming, Establishing and Supporting Water Users Associations
Review existing legislation, update and enact legislation to support WUA formation.•Establish Support Units.•Train Support Unit staff.•Promote formation of WUAs.•Gather data, produce maps, identify canal ownership, etc.•Form WUA.•Register WUA.•Establish WUA Regulatory Offi ce.•Establish if water users want a Representative Assembly or a General Assembly.•Train WUA Representative Council members.•Train WUA Executive staff.•Identify and form representative zones.•Hold Representative Assembly meetings.•Carry out asset surveys.•Identify performance measures.•Provide advice and guidance to established and functioning WUA.•
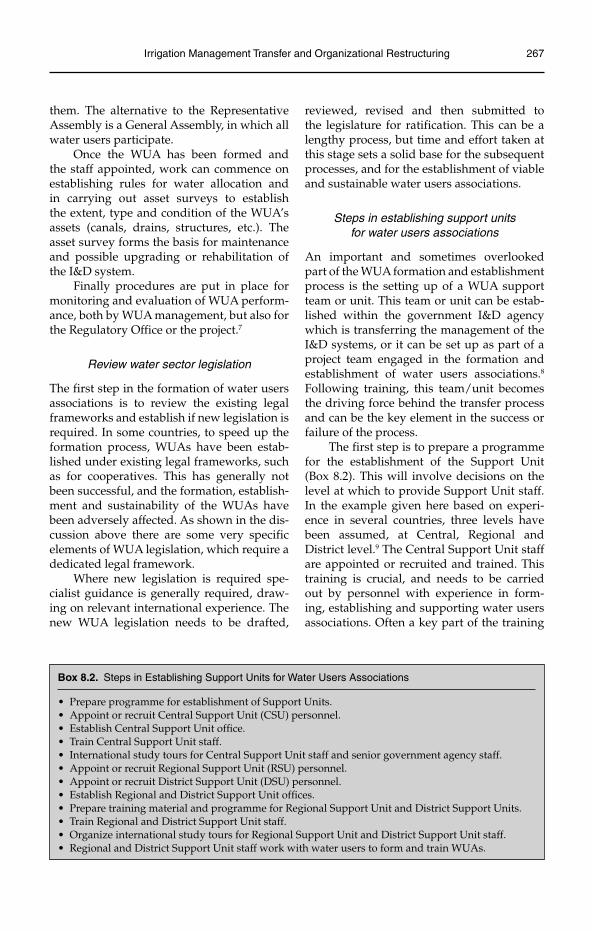
Irrigation Management Transfer and Organizational Restructuring 267
them. The alternative to the Representative Assembly is a General Assembly, in which all water users participate.
Once the WUA has been formed and the staff appointed, work can commence on establishing rules for water allocation and in carrying out asset surveys to establish the extent, type and condition of the WUA’s assets (canals, drains, structures, etc.). The asset survey forms the basis for maintenance and possible upgrading or rehabilitation of the I&D system.
Finally procedures are put in place for monitoring and evaluation of WUA perform-ance, both by WUA management, but also for the Regulatory Office or the project.7
Review water sector legislation
The first step in the formation of water users associations is to review the existing legal frameworks and establish if new legislation is required. In some countries, to speed up the formation process, WUAs have been estab-lished under existing legal frameworks, such as for cooperatives. This has generally not been successful, and the formation, establish-ment and sustainability of the WUAs have been adversely affected. As shown in the dis-cussion above there are some very specific elements of WUA legislation, which require a dedicated legal framework.
Where new legislation is required spe-cialist guidance is generally required, draw-ing on relevant international experience. The new WUA legislation needs to be drafted,
reviewed, revised and then submitted to the legislature for ratification. This can be a lengthy process, but time and effort taken at this stage sets a solid base for the subsequent processes, and for the establishment of viable and sustainable water users associations.
Steps in establishing support units for water users associations
An important and sometimes overlooked part of the WUA formation and establishment process is the setting up of a WUA support team or unit. This team or unit can be estab-lished within the government I&D agency which is transferring the management of the I&D systems, or it can be set up as part of a project team engaged in the formation and establishment of water users associations.8
Following training, this team/unit becomes the driving force behind the transfer process and can be the key element in the success or failure of the process.
The first step is to prepare a programme for the establishment of the Support Unit (Box 8.2). This will involve decisions on the level at which to provide Support Unit staff. In the example given here based on experi-ence in several countries, three levels have been assumed, at Central, Regional and District level.9 The Central Support Unit staff are appointed or recruited and trained. This training is crucial, and needs to be carried out by personnel with experience in form-ing, establishing and supporting water users associations. Often a key part of the training
Box 8.2. Steps in Establishing Support Units for Water Users Associations
Prepare programme for establishment of Support Units.•Appoint or recruit Central Support Unit (CSU) personnel.•Establish Central Support Unit offi ce.•Train Central Support Unit staff.•International study tours for Central Support Unit staff and senior government agency staff.•Appoint or recruit Regional Support Unit (RSU) personnel.•Appoint or recruit District Support Unit (DSU) personnel.•Establish Regional and District Support Unit offi ces.•Prepare training material and programme for Regional Support Unit and District Support Units.•Train Regional and District Support Unit staff.•Organize international study tours for Regional Support Unit and District Support Unit staff.•Regional and District Support Unit staff work with water users to form and train WUAs.•
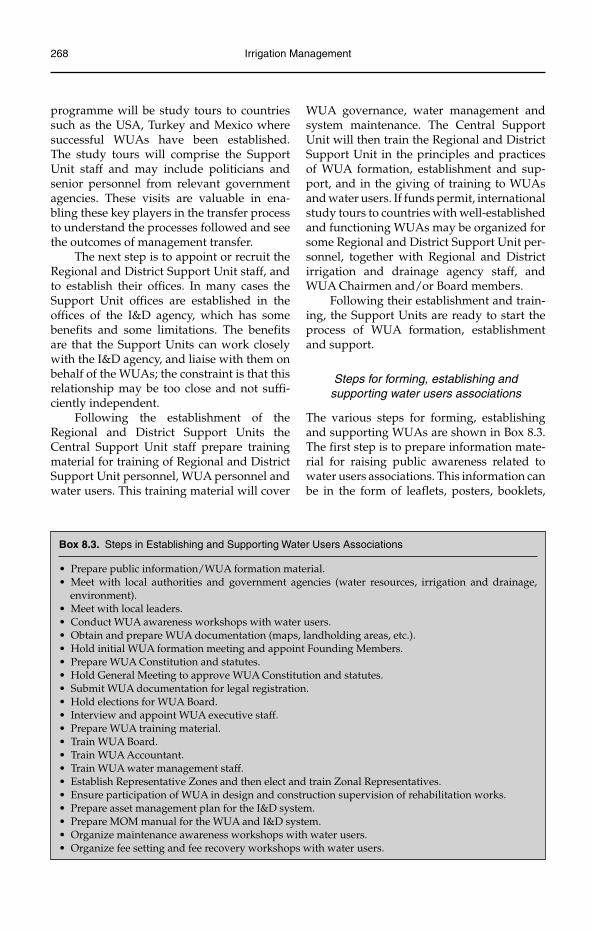
268 Irrigation Management
programme will be study tours to countries such as the USA, Turkey and Mexico where successful WUAs have been established. The study tours will comprise the Support Unit staff and may include politicians and senior personnel from relevant government agencies. These visits are valuable in ena-bling these key players in the transfer process to understand the processes followed and see the outcomes of management transfer.
The next step is to appoint or recruit the Regional and District Support Unit staff, and to establish their offices. In many cases the Support Unit offices are established in the offices of the I&D agency, which has some benefits and some limitations. The benefits are that the Support Units can work closely with the I&D agency, and liaise with them on behalf of the WUAs; the constraint is that this relationship may be too close and not suffi-ciently independent.
Following the establishment of the Regional and District Support Units the Central Support Unit staff prepare training material for training of Regional and District Support Unit personnel, WUA personnel and water users. This training material will cover
WUA governance, water management and system maintenance. The Central Support Unit will then train the Regional and District Support Unit in the principles and practices of WUA formation, establishment and sup-port, and in the giving of training to WUAs and water users. If funds permit, international study tours to countries with well-established and functioning WUAs may be organized for some Regional and District Support Unit per-sonnel, together with Regional and District irrigation and drainage agency staff, and WUA Chairmen and/or Board members.
Following their establishment and train-ing, the Support Units are ready to start the process of WUA formation, establishment and support.
Steps for forming, establishing and supporting water users associations
The various steps for forming, establishing and supporting WUAs are shown in Box 8.3. The first step is to prepare information mate-rial for raising public awareness related to water users associations. This information can be in the form of leaflets, posters, booklets,
Box 8.3. Steps in Establishing and Supporting Water Users Associations
Prepare public information/WUA formation material.•Meet with local authorities and government agencies (water resources, irrigation and drainage, • environment).Meet with local leaders.•Conduct WUA awareness workshops with water users.•Obtain and prepare WUA documentation (maps, landholding areas, etc.).•Hold initial WUA formation meeting and appoint Founding Members.•Prepare WUA Constitution and statutes.•Hold General Meeting to approve WUA Constitution and statutes.•Submit WUA documentation for legal registration.•Hold elections for WUA Board.•Interview and appoint WUA executive staff.•Prepare WUA training material.•Train WUA Board.•Train WUA Accountant.•Train WUA water management staff.•Establish Representative Zones and then elect and train Zonal Representatives.•Ensure participation of WUA in design and construction supervision of rehabilitation works.•Prepare asset management plan for the I&D system.•Prepare MOM manual for the WUA and I&D system.•Organize maintenance awareness workshops with water users.•Organize fee setting and fee recovery workshops with water users.•
Irrigation Management Transfer and Organizational Restructuring 269
etc. or radio and television broadcasts. The next step is to meet with local authorities and government agencies to inform them on the approach and benefits of forming WUAs, and to gain their support in the process.
The engagement with the I&D scheme begins with meeting local leaders and explain-ing the benefits and process of WUA forma-tion. With the support of the local leaders, awareness raising meetings are held with the water users with the aim to get them to sign up to the process. At this stage locally based com-munity motivators may be engaged to promote the WUA message and to obtain feedback and address concerns of the water users.
Information needs to be collected on the extent of the I&D system, the landhold-ings and the ownership of the landholdings. A key principle is that the WUA has clearly established hydraulic boundaries, with the area supplied solely from one or more water sources. A preliminary register of water users and their landholdings is drawn up and forms the basis for gaining signatures from land-owners to show their agreement to forming the association. In some countries it is a stipu-lation that more than a certain percentage of landowners agree to form the association (this can be as low as 51%), thus signatures are required as evidence of this agreement.
A group of Founding Members is appointed to organize and oversee the initial stages of the WUA formation process. This group is generally drawn from local leaders and respected water users within the pro-posed WUA command area. The Founding Members then work with the Support Unit to prepare the WUA Charter and statutes and to prepare the documentation required for registration of the WUA (such as a map of the command area, a list of WUA members with location and areas of their landholdings).
A General Meeting is held by the Founding Members to discuss the WUA Constitution and statutes with the members. Following agreement on the constitution and statutes the registration documents are formally submitted to the relevant authority (this is often the local magistrates court or Ministry of Justice office).
Following registration, the Founding Members with the assistance of the Support
Unit organize and hold elections for the WUA Management Board/Council. The WUA Management Board generally com-prises some five to 12 persons drawn from landowners within the WUA command area. In some cases the WUA charter allows or requires specific persons to be members of the Management Board, such as representa-tives or headmen from each village within the command area. The Management Board elects a Chairman/woman to chair the meetings and to represent the WUA. The Management Board will also appoint an executive to carry out the day-to-day tasks associated with the running of the association. This executive generally comprises an Executive Director, a Treasurer/Accountant, an O&M Engineer/Technician and Water Masters.
Following the establishment of the WUA the Support Unit commences the training pro-gramme. The training focuses on the different elements – governance, accounting, water management and maintenance. Training is carried out for: the WUA Management Board in duties and responsibilities; the WUA Accountant in financial and accounting proce-dures; the WUA Executive Director in his/her duties and responsibilities; the WUA O&M Engineer/Technician and Water Masters in water management and maintenance, and liaison/communication with water users. Additional training will be carried out for other elements of the management structure, such as the Audit Sub-Committee and the Conflict Resolution Committee.
In some cases a Representative Assembly rather than a General Assembly is formed by the WUA. If a Representative Assembly is formed, Representative Zones need to be identified and Zonal Representatives elected and trained. The zones should comprise dis-crete hydraulic units (e.g. comprising water users on one quaternary canal) with 30–40 water users in each zone.
The formation and establishment of WUAs may be associated with a programme or project for rehabilitation of the I&D sys-tem. If this is the case it is preferable that the WUA is formed before the rehabilitation works commence (particularly the planning and design phase) so that the WUA can par-ticipate in and guide the rehabilitation work.
270 Irrigation Management
This involvement of the WUAs from planning through to construction and implementation creates a strong sense of ownership for the physical infrastructure, and is a key part of the process of transferring the responsibility and sense of ownership for this infrastructure from government to water users.
Following the initial training there may be follow-up activities and training, such as that related to preparing asset management plans for the I&D system such that proper budgeting can be carried out for the main-tenance of the system. Additionally, if the WUA formation and establishment is part of a project, WUA management, operation and maintenance manuals may be prepared. These manuals can form the basis for more detailed training of WUA personnel.
Periodically, additional training or awareness-raising meetings may be organ-ized, such as meetings to inform water users how the WUA budget is prepared and the irrigation service fee set, and meetings on the importance and cost of maintenance work. These meetings may be run by the Support Unit staff, or by the WUA Executive Director or Chairman.
Establish a regulatory authority for the water users association
In the public interest government needs to maintain some oversight over the estab-lished water users associations. As discussed above in the section on legislation, the for-mation and outline structure of the supervi-sory body (hereafter referred to as the WUA Regulatory Authority) should be specified in the WUA law, and should be referred to in the constitution and operating rules of the association.
A typical process for establishing the WUA Regulatory Office is:
prepare legal framework (for WUA •Regulatory Authority);enact legislation/regulation to establish •the authority;recruit staff;•establish office;•monitor and report on WUAs.•
Typically the WUA Regulatory Authority comprises an office with two or three staff established in a relevant ministry, either agri-culture, water resources or irrigation. The purpose of the Regulatory Authority is to:
oversee the formation and establishment •of water users associations;maintain a complete register of the estab-•lishment documentation for each WUA (this will be in parallel to the documen-tation submitted to the relevant local authority or court to register the WUA);collect data, usually annually, from WUAs •(these data will be specified in the WUA law, and should be sufficient to moni-tor the progress and performance of each WUA);report on the performance of WUAs;•support water users and WUAs where •their rights are being threatened by other parties.
Other roles may include mediation in the event of disputes between water users and WUAs, and oversight of auditing of WUA accounts.
Due to the quantity of data that require processing each year the WUA Regulatory Authority will need to establish a computer-ized database. At the end of each cropping year the Regulatory Authority can send out standard data collection forms to be com-pleted and returned by each WUA. Where a WUA Support Unit has been established they can assist the WUAs in the collection of data and the completion of these forms. Possible data that might be requested are presented in Table 8.5 and includes information on WUA meetings, WUA personnel, WUA budget, water use, and expenditure and income related to the water delivery service. Where the WUA provides drainage services as well there may be additional data requested.
Management structure of water users associations
There are a number of variations for the man-agement structure of WUAs. A typical struc-ture is provided in Fig. 8.4.
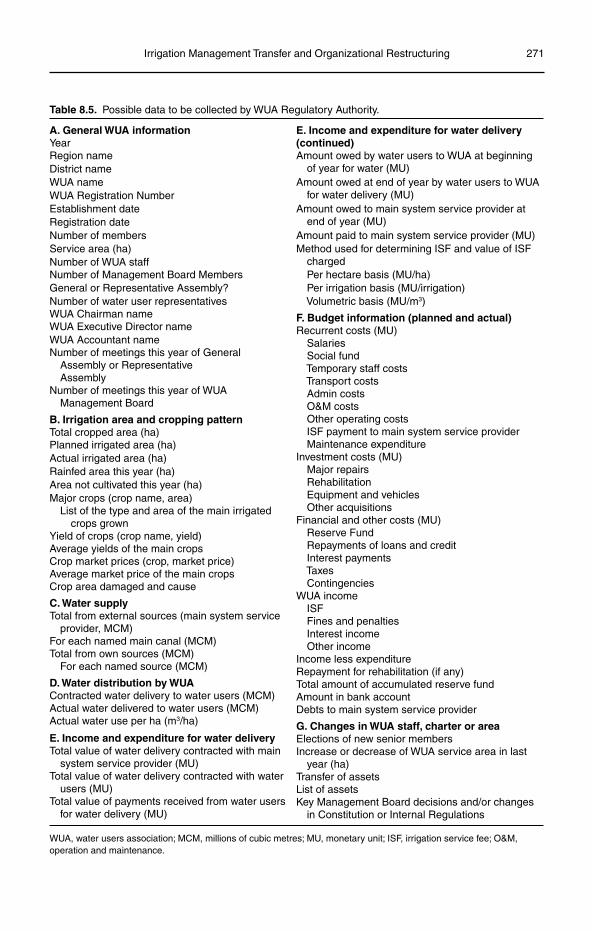
Irrigation Management Transfer and Organizational Restructuring 271
Table 8.5. Possible data to be collected by WUA Regulatory Authority.
A. General WUA informationYear
E. Income and expenditure for water delivery (continued)
Region name Amount owed by water users to WUA at beginning of year for water (MU)District name
WUA name Amount owed at end of year by water users to WUA for water delivery (MU)WUA Registration Number
Establishment date Amount owed to main system service provider at end of year (MU)Registration date
Number of members Amount paid to main system service provider (MU)Service area (ha) Method used for determining ISF and value of ISF
chargedNumber of WUA staffNumber of Management Board Members Per hectare basis (MU/ha)General or Representative Assembly? Per irrigation basis (MU/irrigation)Number of water user representatives Volumetric basis (MU/m3)
F. Budget information (planned and actual)Recurrent costs (MU) Salaries Social fund Temporary staff costs Transport costs Admin costs O&M costs Other operating costs ISF payment to main system service provider Maintenance expenditureInvestment costs (MU) Major repairs Rehabilitation Equipment and vehicles Other acquisitionsFinancial and other costs (MU) Reserve Fund Repayments of loans and credit Interest payments Taxes ContingenciesWUA income ISF Fines and penalties Interest income Other incomeIncome less expenditureRepayment for rehabilitation (if any)Total amount of accumulated reserve fundAmount in bank accountDebts to main system service provider
G. Changes in WUA staff, charter or areaElections of new senior membersIncrease or decrease of WUA service area in last year (ha)Transfer of assetsList of assetsKey Management Board decisions and/or changes in Constitution or Internal Regulations
WUA Chairman nameWUA Executive Director nameWUA Accountant nameNumber of meetings this year of General Assembly or Representative AssemblyNumber of meetings this year of WUA Management Board
B. Irrigation area and cropping patternTotal cropped area (ha)Planned irrigated area (ha)Actual irrigated area (ha)Rainfed area this year (ha)Area not cultivated this year (ha)Major crops (crop name, area)
List of the type and area of the main irrigated crops grown
Yield of crops (crop name, yield)Average yields of the main cropsCrop market prices (crop, market price)Average market price of the main cropsCrop area damaged and cause
C. Water supplyTotal from external sources (main system service provider, MCM)For each named main canal (MCM)Total from own sources (MCM) For each named source (MCM)
D. Water distribution by WUAContracted water delivery to water users (MCM)Actual water delivered to water users (MCM)Actual water use per ha (m3/ha)
E. Income and expenditure for water deliveryTotal value of water delivery contracted with main system service provider (MU)Total value of water delivery contracted with water users (MU)Total value of payments received from water users for water delivery (MU)
WUA, water users association; MCM, millions of cubic metres; MU, monetary unit; ISF, irrigation service fee; O&M, operation and maintenance.
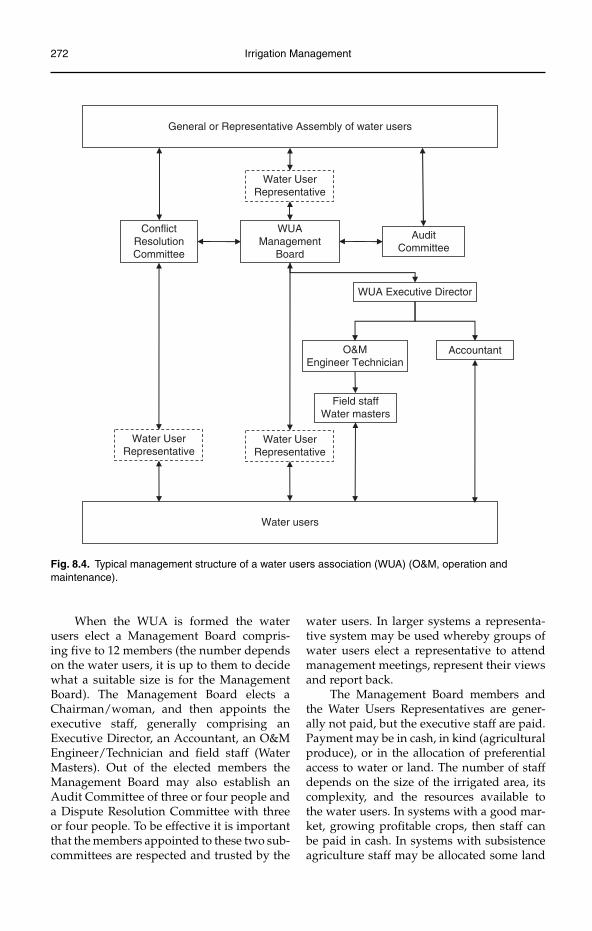
272 Irrigation Management
WUA Executive Director
AccountantO&MEngineer Technician
AuditCommittee
ConflictResolutionCommittee
Field staffWater masters
General or Representative Assembly of water users
WUAManagement
Board
Water users
Water UserRepresentative
Water UserRepresentative
Water UserRepresentative
Fig. 8.4. Typical management structure of a water users association (WUA) (O&M, operation and maintenance).
When the WUA is formed the water users elect a Management Board compris-ing five to 12 members (the number depends on the water users, it is up to them to decide what a suitable size is for the Management Board). The Management Board elects a Chairman/woman, and then appoints the executive staff, generally comprising an Executive Director, an Accountant, an O&M Engineer/Technician and field staff (Water Masters). Out of the elected members the Management Board may also establish an Audit Committee of three or four people and a Dispute Resolution Committee with three or four people. To be effective it is important that the members appointed to these two sub-committees are respected and trusted by the
water users. In larger systems a representa-tive system may be used whereby groups of water users elect a representative to attend management meetings, represent their views and report back.
The Management Board members and the Water Users Representatives are gener-ally not paid, but the executive staff are paid. Payment may be in cash, in kind (agricultural produce), or in the allocation of preferential access to water or land. The number of staff depends on the size of the irrigated area, its complexity, and the resources available to the water users. In systems with a good mar-ket, growing profitable crops, then staff can be paid in cash. In systems with subsistence agriculture staff may be allocated some land
Irrigation Management Transfer and Organizational Restructuring 273
or preferential access to water, or maybe paid in kind with agricultural produce.
The roles and responsibilities of the vari-ous personnel associated with water users associations are summarized below. Note that these duties and responsibilities are linked to the organizational structure outlined in Fig. 8.4. There are variations on this structure; for example, some WUAs may not have an O&M Engineer/Technician, the duties and responsibilities for this position might then be divided between the WUA Executive Director and the Water Masters.
WUA Chairman/woman and Management Board members
The WUA Chairman and Management Board members are responsible for the proper functioning of the WUA and for the per-formance of the WUA staff. Their main tasks include:
attending and chairing General or •Representative Meetings;attending and chairing WUA Manage-•ment Board meetings;receiving, checking and approving reports •on WUA activities, membership and performance from the WUA Executive Director;submitting the Annual Report to the •members, including reporting on WUA performance and finances, together with proposals for service fee levels for the coming year;liaising with external agencies on behalf •of the WUA;reviewing and adapting WUA by-laws •where requested by the General or Representative Assembly;agreeing on terms and conditions and •employing WUA staff.
WUA Conflict Resolution Committee members
The WUA Conflict Resolution Committee members are responsible for resolving disputes that may arise between the WUA Executive and water users, and disputes between water users. Their main tasks include:
bringing together the parties, taking •evidence, allowing presentations of information and facilitating discussion between affected parties;making and enforcing a judgement;•recording the procedures followed and •the judgement made;reporting to the WUA Management •Board and the WUA Annual General or Representative Assembly.
WUA Audit Committee members
The WUA Audit Committee members are responsible for auditing the WUA financial records on behalf of the membership. Their main tasks include:
receiving and checking the accounts each •year;verifying the accounts;•reporting to the WUA Management •Board and the WUA Annual General or Representative Assembly.
WUA Executive Director
The WUA Executive Director is responsible for the proper day-to-day functioning of the water user association. He/she reports to the WUA Chairman and Management Board and the members. His/her main tasks include:
representing the WUA in all matters •related to its day-to-day activities;preparing the annual work plan and •budget and proposed service fee;organizing regular meetings with the •Management Board, preparing the agenda and ensuring that minutes are taken;organizing and chairing seasonal meet-•ings with farmers to discuss operational issues including seasonal cropping plans, water supply availability, sys-tem operation and maintenance, service fee setting and payment, and dispute resolution;liaising with water users on timely pay-•ment of service fees, and enforcement of penalties and sanctions for non-payment;
274 Irrigation Management
liaising with the main system service •provider on water delivery and service fee collection and payment;overseeing water distribution and main-•tenance as managed by the WUA O&M Engineer/Technician and/or Water Masters;conducting seasonal walk-through •inspection of the I&D system with the WUA O&M Engineer/Technician, Water Masters and WUA Representatives;investigating farmers’ complaints and •taking appropriate action;as and when required, applying sanctions •in line with by-laws and regulations;liaising with governmental and non-•governmental bodies on issues related to WUA activities and water users’ concerns;engaging local contractors for main-•tenance work (as sanctioned by the Management Board);assessing scheme performance and •reporting back to the Management Board and water users;monitoring and oversight of WUA •accounts and financial administration;providing information as requested by •the WUA Regulatory Authority and other legitimate government agencies.
WUA O&M Engineer/Technician
The WUA O&M Engineer/Technician is responsible for the management, operation and maintenance of the I&D system. He/she reports to the WUA Executive Director. His/her main tasks include:
preparing a seasonal water allocation •plan for the service area based on the proposed cropping;advising water users on water availabil-•ity and allocation;receiving and recording requests for •water from water users;keeping operational records (e.g. dis-•charges, pump operating hours, water use and allocation, etc.);in association with the Water Masters, •preparing daily irrigation schedules;
identifying maintenance requirements •on a regular basis and through seasonal walk-through inspections;presenting matters relating to system •operation and maintenance to the Management Board and General/Representative Meetings/Assembly;assessing maintenance requirements, •estimating costs and preparing the main-tenance budget;coordinating and supervising mainte-•nance work;organizing communal labour for peri-•odic maintenance work;monitoring and evaluating performance •related to the operation and maintenance of the system.
WUA Accountant
The WUA Accountant is responsible for the financial management of the WUA. He/she reports to the WUA Executive Director and to the Management Board. His/her main tasks include:
collecting and recording membership •registrations and fees;collecting and recording irrigation serv-•ice fees,10 donations and fines;keeping and issuing receipts;•keeping cash and bank accounts;•keeping the WUA cheque book;•making payment on authorized procure-•ment of goods and services;keeping and recording invoices;•keeping the stock book;•preparing monthly accounts;•preparing seasonal and annual state-•ments of accounts;preparing annual and seasonal budgets;•arranging for seasonal or annual •auditing;reporting on financial matters to the •Management Board and General/Representative Meetings/Assembly.
WUA field staff (Water Masters)
The WUA field staff (Water Masters) are responsible for operation and maintenance of the system under the direction of the WUA O&M Engineer/Technician, liaising
Irrigation Management Transfer and Organizational Restructuring 275
with water users on a daily basis, and where possible resolving conflicts arising at field level. The Water Masters report to the WUA Executive Director. Their main tasks include:
receiving and recording requests for •water from water users;implementing the daily irrigation •schedule;advising farmers of their turns and •durations;monitoring and controlling irrigation •supplies according to the schedule;resolving disputes at field level, where •possible;liaising with water users in the field •and reporting back to the WUA O&M Engineer/Technician as appropriate;keeping field operational records (e.g. •discharges, pump operating hours, water use and allocation, etc.);inspecting the I&D system on a daily •basis and reporting any problems;assisting in organizing communal activi-•ties for periodic maintenance.
Water Users Representatives
The Water Users Representatives are respon-sible for representing the needs of farmers within their designated command area. They report to the water users in their zone or block. Their main tasks include:
liaising on behalf of zone/block water •users with the WUA Executive Director, O&M Engineer/Technician and Water Master on issues related to management, operation and maintenance of the irriga-tion system;representing the zone/block user group at •WUA Management Board and other meet-ings, and reporting back to water users;collecting data from landowners and ten-•ants within their zones/blocks on behalf of the WUA;communicating and liaising with zone/•block water users on behalf of the WUA;attending training sessions;•organizing and running information and •training sessions for farmers;
in association with WUA O&M Engineer/•Technician and Water Master, assisting farmers in the organization of water dis-tribution within the zone/block service area;in association with WUA O&M •Engineer/Technician and Water Master, identifying maintenance needs affecting the zone/block area;keeping records of water shortages, •water supply failures, power cuts, etc. affecting water delivery to farmers;assessing and maintaining records of •agricultural performance within the zone/block command area (this may be an optional requirement).
Training programmes for water users associations
Training is a central element in any pro-gramme to establish water users associa-tions. Key areas for training are summarized in Table 8.6. To establish and carry out these training programmes requires significant financial and human resources. Without these resources the training cannot be imple-mented, and without the training it is unlikely that the water users and the WUA personnel will fully understand the processes involved and be capable of carrying out the functions required of them.
Where the transfer programme is funded the training is typically implemented by the Support Unit, with training of the Central Support Unit being carried out by personnel experienced in WUA formation and support. As an adjunct to this training these experi-enced personnel will often also assist of the Central Support Unit in the preparation of the training material for the Regional and District Support Units, and that for the WUAs and water users. Once trained the Central Support Unit staff will train the Regional and District Support Unit staff, who in turn will train the WUA personnel and the water users.
Procedures for preparing and carry-ing out training are detailed in Chapter 7. It suffices to mention here that the training for
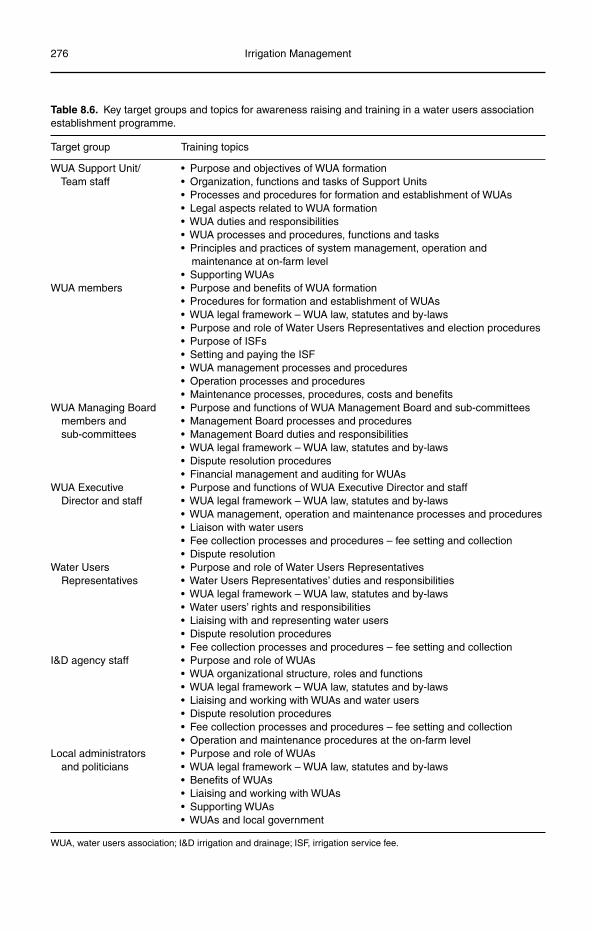
276 Irrigation Management
Table 8.6. Key target groups and topics for awareness raising and training in a water users association establishment programme.
Target group Training topics
WUA Support Unit/ • Purpose and objectives of WUA formation Team staff • Organization, functions and tasks of Support Units • Processes and procedures for formation and establishment of WUAs • Legal aspects related to WUA formation • WUA duties and responsibilities • WUA processes and procedures, functions and tasks • Principles and practices of system management, operation and maintenance at on-farm level • Supporting WUAsWUA members • Purpose and benefits of WUA formation • Procedures for formation and establishment of WUAs • WUA legal framework – WUA law, statutes and by-laws • Purpose and role of Water Users Representatives and election procedures • Purpose of ISFs • Setting and paying the ISF • WUA management processes and procedures • Operation processes and procedures • Maintenance processes, procedures, costs and benefitsWUA Managing Board • Purpose and functions of WUA Management Board and sub-committees members and • Management Board processes and procedures sub-committees • Management Board duties and responsibilities • WUA legal framework – WUA law, statutes and by-laws • Dispute resolution procedures • Financial management and auditing for WUAsWUA Executive • Purpose and functions of WUA Executive Director and staff Director and staff • WUA legal framework – WUA law, statutes and by-laws • WUA management, operation and maintenance processes and procedures • Liaison with water users • Fee collection processes and procedures – fee setting and collection • Dispute resolutionWater Users • Purpose and role of Water Users Representatives Representatives • Water Users Representatives’ duties and responsibilities • WUA legal framework – WUA law, statutes and by-laws • Water users’ rights and responsibilities • Liaising with and representing water users • Dispute resolution procedures • Fee collection processes and procedures – fee setting and collectionI&D agency staff • Purpose and role of WUAs • WUA organizational structure, roles and functions • WUA legal framework – WUA law, statutes and by-laws • Liaising and working with WUAs and water users • Dispute resolution procedures • Fee collection processes and procedures – fee setting and collection • Operation and maintenance procedures at the on-farm levelLocal administrators • Purpose and role of WUAs and politicians • WUA legal framework – WUA law, statutes and by-laws • Benefits of WUAs • Liaising and working with WUAs • Supporting WUAs • WUAs and local government
WUA, water users association; I&D irrigation and drainage; ISF, irrigation service fee.
Irrigation Management Transfer and Organizational Restructuring 277
the WUA personnel and water users must be practical, with the use of exercises and field work wherever possible. Water users will have limited tolerance for training material and methods which are too theoretical.
Factors to consider in establishing a water users association
The following are some key factors to con-sider in establishing effective and sustainable water users associations.
If there is an existing (traditional) water •users associations assess its performance. If it is functioning effectively, do not try to impose (external) structures, rules and regulations.Develop a phased development approach •if establishing new WUAs; do not try to do everything at once. The priority is to improve the water management, fol-lowed by fee collection, followed by improving maintenance.Keep the water users association as a •single-function organization focused on improving water management. If the association is successful, consid-eration may be given to branching out into provision of inputs, marketing, etc., but be careful not to lose sight of the core water management function. Consider carefully if these other func-tions might be better provided by other mechanisms.Ensure that the WUA management •remains open and transparent, and responsible to the membership at all times.In association with water users and •WUA management, set measurable and achievable targets, and provide feed-back on progress made. This creates a feeling of achievement, generates con-fidence and increases expectations and ambition.Allow sufficient time for WUAs to •become fully self-sustaining; 10–12 years is a reasonable timeframe.
Key factors in the success of a WUA •are the membership, the leadership and developing a sense of ownership. Good (or bad) leadership can make (or break) any organization; WUAs are no exception. Ownership of the I&D sys-tem by the members is central to suc-cess. Particular effort is required if the system has been designed, built and then managed by a government agency before being transferred to the water users.Continuing agency support is essential, •particularly in the early stages of WUA formation and establishment. Successful international examples of WUA estab-lishment following transfer (Mexico, Turkey) have all involved significant involvement by the government agency responsible for irrigation and drainage.
Reasons for failure of water users associations
At an international conference on irrigation management transfer held in Wuhan, China in September 1994 it was generally concluded that IMT, if properly executed, could benefit both farmers and the government, though a number of issue were identified that could adversely affect WUA formation and estab-lishment (Kloezen and Samad, 1995). Given below are some of the reasons why water users associations might fail.
Lack of time• : IMT needs to be carried out in carefully managed stages, and requires considerable time and support-ing effort.Lack of support/commitment• : Although most governments find IMT attrac-tive there is often only partial sup-port for the process, especially among politicians and senior government per-sonnel. Mixed messages and lack of support at crucial times can cripple IMT programmes.Failure to provide institutional support for •the IMT process: In some countries the
278 Irrigation Management
IMT process has taken the form of a gov-ernment instruction, with the expecta-tion that water users will spontaneously form water users associations. This is unlikely to happen, specialist WUA sup-port teams are required to initiate and support the IMT process.Inadequate legal framework• : Governments have not always formulated the requi-site policies and legal frameworks for IMT.Failure to upscale• : In many countries IMT has not progressed beyond the pilot stage.Focus on cost reduction, rather than •improved performance and service delivery:IMT is often initiated by government with a focus on reducing costs in the irri-gation and drainage sector, rather than on improving performance and service delivery. This results in a failure to invest adequately during the transfer process and to take advantage of the opportuni-ties offered by IMT.Lack of funds for system rehabilitation• : In many cases prior to IMT the I&D sys-tems are in a poor condition as govern-ment has not provided sufficient funds for system management, operation and maintenance. Newly formed water users associations need external support to repair or rehabilitate their systems if they are to provide adequate levels of service to water users.Failure to take account of farmers’ needs• :Often farmers’ needs, aspirations and capability to take over management are not adequately considered.Profitability of irrigated agriculture• :For IMT to be sustainable, irrigated agriculture needs to be profitable for farmers.Need to focus on sustainability• : Initially the focus is on the IMT process, attention then needs to be focused on ensuring the sustainability of the management of the transferred systems, especially in terms of service fee recovery and thereby sys-tem maintenance.Failure to adequately consider government •agency staff: A major issue during the
transfer process is the retrenchment of irrigation agency personnel, and the need for strategic reorientation of the irrigation agency from the role of service provider to a regulatory organization. Failure to adequately address this issue results in resentment, resistance to the IMT process, and possible sabotage of the process.Context specific nature of management• : It is recognized that post-turnover manage-ment systems are context-specific and dependent on a mixture of social, politi-cal, economic and technical factors.Transparency and accountability• : Manage-ment accountability, financial autonomy, water rights and property rights are vital ingredients to successful IMT.Evolutionary process• : IMT should be seen as a long-term evolutionary proc-ess, rather than a structural adjustment programme.
Monitoring progress with the formation and establishment of water users
associations
A list of typical activities involved in estab-lishing water users associations, together with associated performance indicators, is out-lined in Table 8.7. While progress with these activities will be monitored at the lower level a useful approach for senior management is to monitor progress through the use of mile-stones. Table 8.8 shows the milestones used for monitoring progress in Kyrgyzstan, while Fig. 8.5 provides a graphical plot of the data recorded. In this example, WUAs achieving Milestone 4 were eligible for rehabilitation work under the project.
Appendix 2 provides a checklist for making a rapid performance assessment of WUAs. The checklist covers the three main areas of institutional, financial and technical components of WUAs, and is intended for use where there is a large number of WUAs. It is important to note that the performance standards given are indicative and should be reviewed and adjusted to the standards expected in a given country.
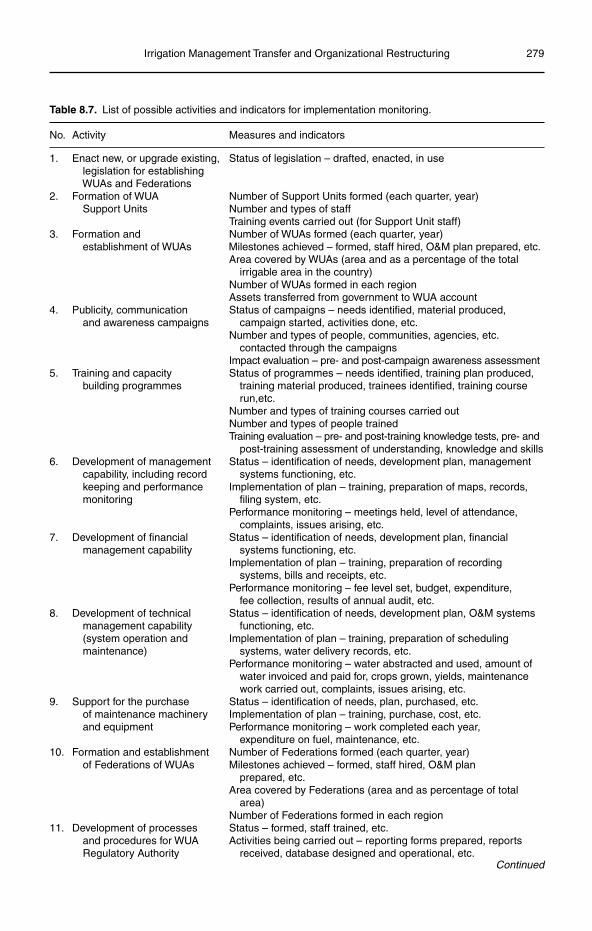
Irrigation Management Transfer and Organizational Restructuring 279
Table 8.7. List of possible activities and indicators for implementation monitoring.
No. Activity Measures and indicators
1. Enact new, or upgrade existing, Status of legislation – drafted, enacted, in use legislation for establishing WUAs and Federations
2. Formation of WUA Number of Support Units formed (each quarter, year) Support Units Number and types of staff Training events carried out (for Support Unit staff)3. Formation and Number of WUAs formed (each quarter, year) establishment of WUAs Milestones achieved – formed, staff hired, O&M plan prepared, etc. Area covered by WUAs (area and as a percentage of the total irrigable area in the country) Number of WUAs formed in each region Assets transferred from government to WUA account4. Publicity, communication Status of campaigns – needs identified, material produced, and awareness campaigns campaign started, activities done, etc. Number and types of people, communities, agencies, etc. contacted through the campaigns Impact evaluation – pre- and post-campaign awareness assessment5. Training and capacity Status of programmes – needs identified, training plan produced, building programmes training material produced, trainees identified, training course run,etc. Number and types of training courses carried out Number and types of people trained Training evaluation – pre- and post-training knowledge tests, pre- and post-training assessment of understanding, knowledge and skills6. Development of management Status – identification of needs, development plan, management capability, including record systems functioning, etc. keeping and performance Implementation of plan – training, preparation of maps, records, monitoring filing system, etc. Performance monitoring – meetings held, level of attendance, complaints, issues arising, etc.7. Development of financial Status – identification of needs, development plan, financial management capability systems functioning, etc. Implementation of plan – training, preparation of recording systems, bills and receipts, etc. Performance monitoring – fee level set, budget, expenditure, fee collection, results of annual audit, etc.8. Development of technical Status – identification of needs, development plan, O&M systems management capability functioning, etc. (system operation and Implementation of plan – training, preparation of scheduling maintenance) systems, water delivery records, etc. Performance monitoring – water abstracted and used, amount of water invoiced and paid for, crops grown, yields, maintenance work carried out, complaints, issues arising, etc.9. Support for the purchase Status – identification of needs, plan, purchased, etc. of maintenance machinery Implementation of plan – training, purchase, cost, etc. and equipment Performance monitoring – work completed each year, expenditure on fuel, maintenance, etc.10. Formation and establishment Number of Federations formed (each quarter, year) of Federations of WUAs Milestones achieved – formed, staff hired, O&M plan prepared, etc. Area covered by Federations (area and as percentage of total area) Number of Federations formed in each region11. Development of processes Status – formed, staff trained, etc. and procedures for WUA Activities being carried out – reporting forms prepared, reports Regulatory Authority received, database designed and operational, etc.
Continued
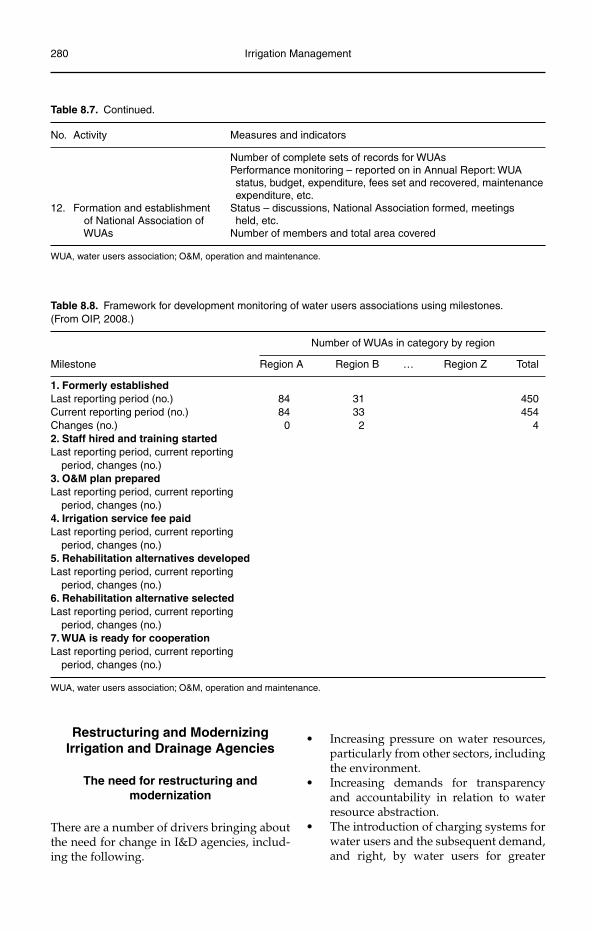
280 Irrigation Management
Restructuring and Modernizing Irrigation and Drainage Agencies
The need for restructuring and modernization
There are a number of drivers bringing about the need for change in I&D agencies, includ-ing the following.
Increasing pressure on water resources, •particularly from other sectors, including the environment.Increasing demands for transparency •and accountability in relation to water resource abstraction.The introduction of charging systems for •water users and the subsequent demand, and right, by water users for greater
Number of complete sets of records for WUAs Performance monitoring – reported on in Annual Report: WUA status, budget, expenditure, fees set and recovered, maintenance expenditure, etc.12. Formation and establishment Status – discussions, National Association formed, meetings of National Association of held, etc. WUAs Number of members and total area covered
WUA, water users association; O&M, operation and maintenance.
Table 8.8. Framework for development monitoring of water users associations using milestones.(From OIP, 2008.)
Number of WUAs in category by region
Milestone Region A Region B … Region Z Total
1. Formerly established Last reporting period (no.) 84 31 450Current reporting period (no.) 84 33 454Changes (no.) 0 2 42. Staff hired and training started Last reporting period, current reporting period, changes (no.) 3. O&M plan prepared Last reporting period, current reporting period, changes (no.) 4. Irrigation service fee paid Last reporting period, current reporting period, changes (no.) 5. Rehabilitation alternatives developed Last reporting period, current reporting period, changes (no.) 6. Rehabilitation alternative selected Last reporting period, current reporting period, changes (no.) 7. WUA is ready for cooperation Last reporting period, current reporting period, changes (no.)
WUA, water users association; O&M, operation and maintenance.
Table 8.7. Continued.
No. Activity Measures and indicators
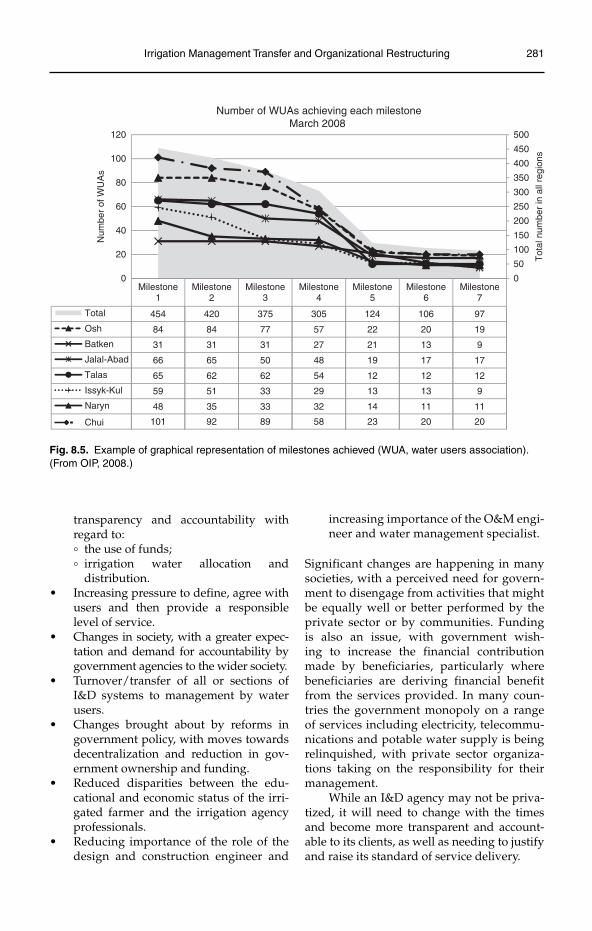
Irrigation Management Transfer and Organizational Restructuring 281
transparency and accountability with regard to:° the use of funds;° irrigation water allocation and
distribution.Increasing pressure to define, agree with •users and then provide a responsible level of service.Changes in society, with a greater expec-•tation and demand for accountability by government agencies to the wider society.Turnover/transfer of all or sections of •I&D systems to management by water users.Changes brought about by reforms in •government policy, with moves towards decentralization and reduction in gov-ernment ownership and funding.Reduced disparities between the edu-•cational and economic status of the irri-gated farmer and the irrigation agency professionals.Reducing importance of the role of the •design and construction engineer and
increasing importance of the O&M engi-neer and water management specialist.
Significant changes are happening in many societies, with a perceived need for govern-ment to disengage from activities that might be equally well or better performed by the private sector or by communities. Funding is also an issue, with government wish-ing to increase the financial contribution made by beneficiaries, particularly where beneficiaries are deriving financial benefit from the services provided. In many coun-tries the government monopoly on a range of services including electricity, telecommu-nications and potable water supply is being relinquished, with private sector organiza-tions taking on the responsibility for their management.
While an I&D agency may not be priva-tized, it will need to change with the times and become more transparent and account-able to its clients, as well as needing to justify and raise its standard of service delivery.
Milestone1
Milestone2
Milestone3
Milestone4
Milestone5
Milestone6
Milestone7
Total
Osh
Batken
Jalal-Abad
Talas
Issyk-Kul
Naryn
Chui
48
101
35
92
33
89
32
58
454 420 375 305 124 106 97
84 84 77 57 22 20 19
31 31 31 27 21 13 9
66 65 50 48 19 17 17
65 62 62 54 12 12 12
59 51 33 29 13 13 9
14
23
11
20
11
20
0
50
100
150
200
250
300
350
400
450
500
0
20
40
60
80
100
120
Tot
al n
umbe
r in
all
regi
ons
Num
ber
of W
UA
sNumber of WUAs achieving each milestone
March 2008
Fig. 8.5. Example of graphical representation of milestones achieved (WUA, water users association). (From OIP, 2008.)
282 Irrigation Management
Areas where change is required
There are a number of areas where change may be required. These may include changes to:
the legal status of the entity, from a •line agency to a parastatal or private company;the charter of the organization;•the staffing structure, staffing numbers, •employment procedures, training and capacity building;attitudes and behaviours of agency •personnel;financial and accounting systems;•management information systems;•accountability and reporting require-•ments.
Approach to change
The first step in the process is an acknowledge-ment that change is required, and an apprecia-tion that doing ‘business as usual’ is no longer a feasible option. The next step is to commis-sion a study to objectively review the organi-zation’s performance, identify the current and possible future operating environment and pressures, and make recommendations for change. Assistance may also be required to implement the change management process.
The approach and content of an insti-tutional and organizational analysis will vary depending on the circumstances. The following general steps are proposed based on experience with such analysis of several organizations.
Step 1: Specify clear terms of reference
It is important at the outset to specify clear terms of reference for the study. These should state the purpose and objectives of the study, and the boundaries.
Step 2: Put together a suitable team
Due to the diverse nature of functions within an I&D agency it is likely that a team of specialists will be required to carry out the study. Specialist functions will include:
institutional development; management, operation and maintenance; finance and eco-nomics; and human resource development, training and capacity building.
Step 3: Inception, data collection, processing and analysis
The first step in the implementation of the study is to formulate an approach to the work. A broad framework is to ask the fol-lowing questions.
Where are we now?•Where do we want to be?•How are we going to get there?•
The study can then be broken down into three parts, as summarized below and discussed in the following sections.
1. Strategic analysis:• analysis of the external environ-
ment within which the organization operates;
• analysis of the organization’s current internal functions;
• analysis of combined external and inter-nal environment.
2. Strategic planning:• formulation of desired future function
and structure;• formulation of options for future direc-
tion for the organization.3. Organizational transformation:
• detailed analysis of changes required, pathways and costs;
• preparation of an implementation plan.
STRATEGIC ANALYSIS Analysis of the external envi-ronment within which the organization operates.An initial starting point for the study is to understand the current environment within which the organization operates, and the pos-sible future environment. A PESTLE analysis is useful for this purpose.
Political• : An analysis of the political envi-ronment within which the organization has to operate. It will include an analysis of political trends and aspirations.Economic• : Assessment of the current and future economic environment, both
Irrigation Management Transfer and Organizational Restructuring 283
within and outside the irrigated agricul-tural sector. It will include investigation of economic trends within the country.Social• : An assessment of the social norms and expectations, particularly within the rural community and future possible changes.Technical• : An assessment of the current and possible future technical capability and context within which the organiza-tion must operate (level of technology, etc.).Legal• : An assessment of the current and future possible legal environment. This will in particular cover legislation related to the organization, and associated organizations such as line ministries and water users associations.Environmental• : An assessment of current and future environmental factors, partic-ularly in relation to water resources and agriculture.
The analysis will look at the key stakeholders with whom the organization interacts, their role and relative importance to the function-ing of the organization.
Analysis of the organization’s current inter-nal functions. A detailed analysis will be car-ried out of the organization’s current:
roles and responsibilities;•organizational structure;•staffing (roles, responsibilities, numbers, •salaries, etc.);operations procedures (water delivery, •maintenance, etc.);assets (infrastructure, equipment, etc.);•income, expenditure and financial •resources.
The analysis of essential water resources man-agement functions (as outlined in Chapter 2, Fig. 2.5) has a role to play in identifying the functions of the I&D agency and other key stakeholders.
Analysis of the combined external and internal environment. This analysis will draw together the external and internal analyses, and highlight the current strengths and weak-nesses of the organization, and the opportuni-ties for, and threats to, its future. This SWOT
analysis will form the basis for formulating future plans.
STRATEGIC PLANNING Formulation of desired future function and structure. Having gained an understanding of the current situation (Where are we now?), options for future directions (Where do we want to be?) will need to be inves-tigated. This process will be based around discussions with senior personnel within the organization and other key stakeholders to formulate broad criteria and objectives. Key factors to consider will include the following.
What will be the future functions of the •organization?What will be the duties and responsibili-•ties (and what will they not include)?How will the organization be financed?•What staffing and resources will it •require?
Formulation of options for future direction for the organization. Following the discussions above a number of options may evolve and require further investigation. Scenario formulation and analysis can be used to analyse each of these options. The scenario formulation will look at options related to the key variables, including:
legal status – whether a public, parastatal •or private entity;relationship with external bodies, includ-•ing line agencies, WUAs and water users;duties and responsibilities;•income and expenditure profiles;•physical system and organizational •modernization;staffing and salary levels;•working practices.•
Following discussion of the possible scenarios with the organization’s senior management and key stakeholders, the preferred future option will be selected.
ORGANIZATIONAL TRANSFORMATION Detailed anal-ysis of changes required, pathways and costs.Following selection of the future option, stra-tegic planning will be carried out to detail how the organization will achieve that state (How are we going to get there?). The analysis will cover:
284 Irrigation Management
required legal framework;•structure and functions at different •levels;staff duties and responsibilities and •working practices;staffing levels and salaries;•human resource development (capacity •building and training);linkages with related organizations •and individuals (e.g. WUAs and water users);income, expenditure and risk analysis;•differentiation between state-funded •functions (flood protection, drainage) and privately funded functions (irriga-tion water supply, on-farm drainage and water removal).
Preparation of implementation plan. The iden-tified changes will be incorporated into an implementation plan detailing:
the actions required;•the costs involved;•the resources required;•measures to gain acceptance of the •changes among the organization’s staff and key stakeholders;training and capacity building require-•ments and approaches.
Associated with this formulation a list of the work required (Table 8.9) and a work pro-gramme (Fig. 8.6) will be formulated. As shown in Table 8.9, information will be required on a wide range of topics, ranging from the organi-zational structure to the income-generating potential of irrigated agriculture and water users’ organizations. In situations where the organization is expected to be self-financing it is essential that a thorough analysis is carried out of the potential for water users to finance the services to be provided.
A useful tool in analysing the current situation in relation to the organization is a SWOT analysis (Table 8.10). Summarizing the organization’s key strengths and weak-nesses in the SWOT analysis provides infor-mation on the internal environment, while summarizing the key opportunities and
threats provides information on the exter-nal environment. From the example shown the major issues are a lack of finance for the organization; recently formed, weak water users associations; and poorly devel-oped markets and low returns to irrigated agriculture.
Restructuring an organization under these conditions is difficult, for this example the challenges include:
severely reduced budget allocation from •central government;badly deteriorating hydraulic systems •due to lack of adequate maintenance over the last 15 years;severely depleted mechanical mainte-•nance machinery and equipment, much of it past its useful life;low staff salaries;•ageing staff profile, with many staff near-•ing retirement and few new, younger staff joining the organization;low morale and motivation at some lev-•els within the organization.
Balanced against these challenges are some positive aspects:
the Agency is a professional organization •with a wealth of experience;despite the recent difficulties the Agency •retains much of its professionalism;though some staff have left or retired, the •organization still has very experienced personnel in key positions;the Agency has retained all its records •during periods of turmoil;though it could benefit from moderni-•zation through computerization, the Agency has a well-developed manage-ment information system.
Step 4: Formulation of options
The previous section has outlined how the analysis identifies the challenges facing an organization. In the case of the Agency repre-sented in the SWOT analysis above, the areas where changes may be beneficial include:
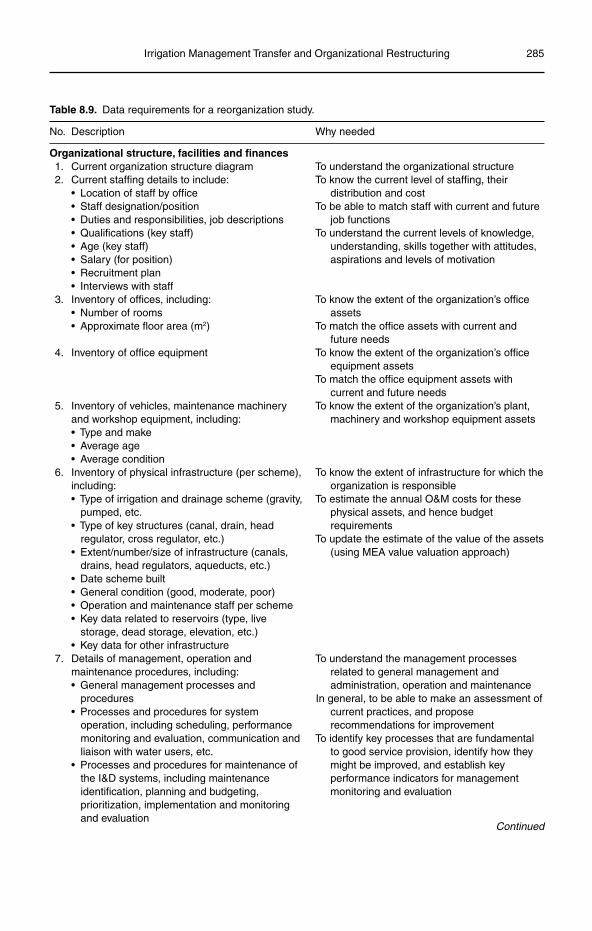
Irrigation Management Transfer and Organizational Restructuring 285
Table 8.9. Data requirements for a reorganization study.
No. Description Why needed
Organizational structure, facilities and finances 1. Current organization structure diagram To understand the organizational structure 2. Current staffing details to include: To know the current level of staffing, their
distribution and cost• Location of staff by office• Staff designation/position To be able to match staff with current and future
job functions• Duties and responsibilities, job descriptions• Qualifications (key staff) To understand the current levels of knowledge,
understanding, skills together with attitudes, aspirations and levels of motivation
• Age (key staff)• Salary (for position)• Recruitment plan• Interviews with staff
3. Inventory of offices, including: To know the extent of the organization’s office assets• Number of rooms
• Approximate floor area (m2) To match the office assets with current and future needs
4. Inventory of office equipment To know the extent of the organization’s office equipment assets
To match the office equipment assets with current and future needs
5. Inventory of vehicles, maintenance machinery and workshop equipment, including:• Type and make• Average age• Average condition
To know the extent of the organization’s plant, machinery and workshop equipment assets
6. Inventory of physical infrastructure (per scheme), including:
To know the extent of infrastructure for which the organization is responsible
• Type of irrigation and drainage scheme (gravity, pumped, etc.
To estimate the annual O&M costs for these physical assets, and hence budget requirements
To update the estimate of the value of the assets (using MEA value valuation approach)
• Type of key structures (canal, drain, head regulator, cross regulator, etc.)
• Extent/number/size of infrastructure (canals, drains, head regulators, aqueducts, etc.)
• Date scheme built• General condition (good, moderate, poor)• Operation and maintenance staff per scheme• Key data related to reservoirs (type, live
storage, dead storage, elevation, etc.)• Key data for other infrastructure
7. Details of management, operation and maintenance procedures, including:
To understand the management processes related to general management and
administration, operation and maintenance In general, to be able to make an assessment of
current practices, and propose recommendations for improvement
• General management processes and procedures
• Processes and procedures for system operation, including scheduling, performance monitoring and evaluation, communication and liaison with water users, etc.
• Processes and procedures for maintenance of the I&D systems, including maintenance identification, planning and budgeting, prioritization, implementation and monitoring and evaluation
To identify key processes that are fundamental to good service provision, identify how they might be improved, and establish key performance indicators for management monitoring and evaluation
Continued
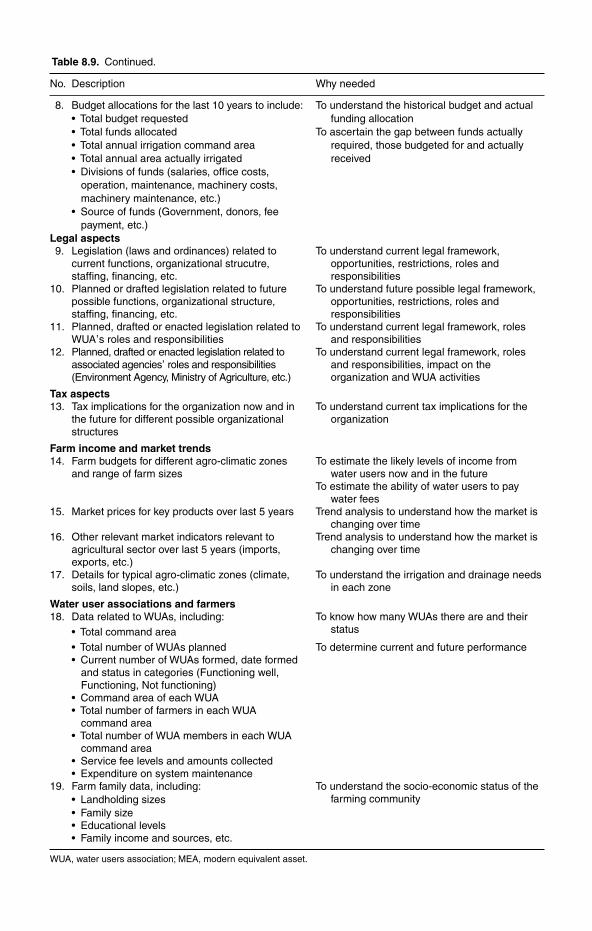
Table 8.9. Continued.
No. Description Why needed
8. Budget allocations for the last 10 years to include: To understand the historical budget and actual funding allocation• Total budget requested
• Total funds allocated To ascertain the gap between funds actually required, those budgeted for and actually received
• Total annual irrigation command area• Total annual area actually irrigated• Divisions of funds (salaries, office costs,
operation, maintenance, machinery costs, machinery maintenance, etc.)
• Source of funds (Government, donors, fee payment, etc.)
Legal aspects 9. Legislation (laws and ordinances) related to
current functions, organizational strucutre, staffing, financing, etc.
To understand current legal framework, opportunities, restrictions, roles and responsibilities
10. Planned or drafted legislation related to future possible functions, organizational structure, staffing, financing, etc.
To understand future possible legal framework, opportunities, restrictions, roles and responsibilities
11. Planned, drafted or enacted legislation related to WUA
,s roles and responsibilities
To understand current legal framework, roles and responsibilities
12. Planned, drafted or enacted legislation related to associated agencies
, roles and responsibilities
(Environment Agency, Ministry of Agriculture, etc.)
To understand current legal framework, roles and responsibilities, impact on the organization and WUA activities
Tax aspects13. Tax implications for the organization now and in
the future for different possible organizational structures
To understand current tax implications for the organization
Farm income and market trends14. Farm budgets for different agro-climatic zones
and range of farm sizes To estimate the likely levels of income from
water users now and in the future To estimate the ability of water users to pay
water fees15. Market prices for key products over last 5 years Trend analysis to understand how the market is
changing over time16. Other relevant market indicators relevant to
agricultural sector over last 5 years (imports, exports, etc.)
Trend analysis to understand how the market is changing over time
17. Details for typical agro-climatic zones (climate, soils, land slopes, etc.)
To understand the irrigation and drainage needs in each zone
Water user associations and farmers18. Data related to WUAs, including: To know how many WUAs there are and their
status• Total command area• Total number of WUAs planned To determine current and future performance• Current number of WUAs formed, date formed
and status in categories (Functioning well, Functioning, Not functioning)
• Command area of each WUA• Total number of farmers in each WUA
command area• Total number of WUA members in each WUA
command area• Service fee levels and amounts collected• Expenditure on system maintenance
19. Farm family data, including: To understand the socio-economic status of the farming community• Landholding sizes
• Family size• Educational levels• Family income and sources, etc.
WUA, water users association; MEA, modern equivalent asset.
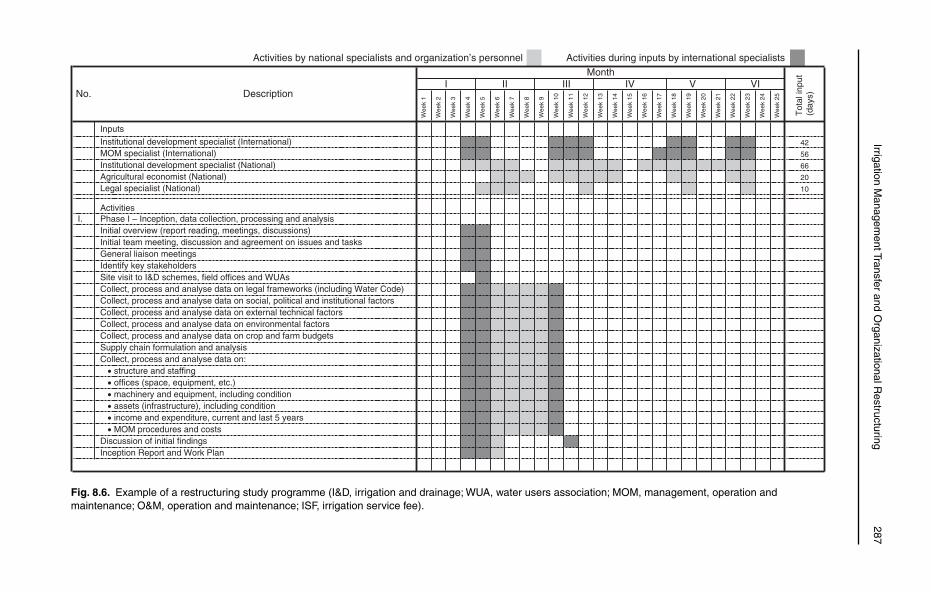
Irrigation M
anagement Transfer and O
rganizational Restructuring
287
Fig. 8.6. Example of a restructuring study programme (I&D, irrigation and drainage; WUA, water users association; MOM, management, operation and maintenance; O&M, operation and maintenance; ISF, irrigation service fee).
Activities by national specialists and organization’s personnel Activities during inputs by international specialists
Wee
k 1
Wee
k 2
Wee
k 3
Wee
k 4
Wee
k 5
Wee
k 6
Wee
k 7
Wee
k 8
Wee
k 9
Wee
k 10
Wee
k 11
Wee
k 12
Wee
k 13
Wee
k 14
Wee
k 15
Wee
k 16
Wee
k 17
Wee
k 18
Wee
k 19
Wee
k 20
Wee
k 21
Wee
k 22
Wee
k 23
Wee
k 24
Wee
k 25
Inputs
Institutional development specialist (International) 42
MOM specialist (International) 56
Institutional development specialist (National) 66
Agricultural economist (National) 20
Legal specialist (National) 10
ActivitiesI. Phase I – Inception, data collection, processing and analysis
Initial overview (report reading, meetings, discussions)Initial team meeting, discussion and agreement on issues and tasksGeneral liaison meetings Identify key stakeholdersSite visit to I&D schemes, field offices and WUAsCollect, process and analyse data on legal frameworks (including Water Code)Collect, process and analyse data on social, political and institutional factorsCollect, process and analyse data on external technical factorsCollect, process and analyse data on environmental factorsCollect, process and analyse data on crop and farm budgetsSupply chain formulation and analysisCollect, process and analyse data on:
• structure and staffing• offices (space, equipment, etc.)• machinery and equipment, including condition• assets (infrastructure), including condition• income and expenditure, current and last 5 years• MOM procedures and costs
Discussion of initial findings Inception Report and Work Plan
No. Description
Month
Tot
al in
put
(day
s)
I II III IV V VI
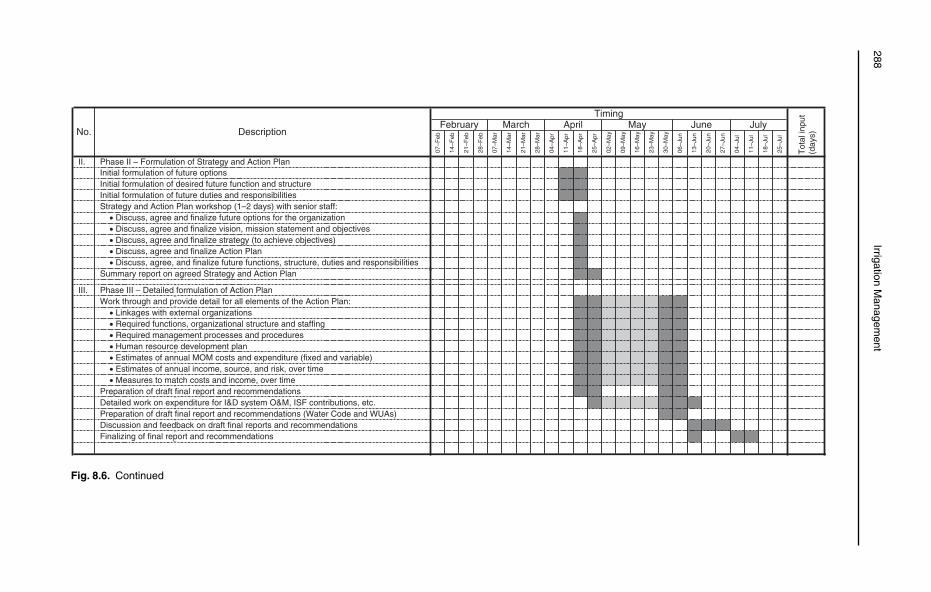
288Irrigation M
anagement
Fig. 8.6. Continued
07–F
eb
14–F
eb
21–F
eb
28–F
eb
07–M
ar
14–M
ar
21–M
ar
28–M
ar
04–A
pr
11–A
pr
18–A
pr
25–A
pr
02–M
ay
09–M
ay
16–M
ay
23–M
ay
30–M
ay
06–J
un
13–J
un
20–J
un
27–J
un
04–J
ul
11–J
ul
18–J
ul
25–J
ul
II. Phase II – Formulation of Strategy and Action PlanInitial formulation of future options Initial formulation of desired future function and structureInitial formulation of future duties and responsibilitiesStrategy and Action Plan workshop (1–2 days) with senior staff:
• Discuss, agree and finalize future options for the organization • Discuss, agree and finalize vision, mission statement and objectives • Discuss, agree and finalize strategy (to achieve objectives)• Discuss, agree and finalize Action Plan• Discuss, agree, and finalize future functions, structure, duties and responsibilities
Summary report on agreed Strategy and Action Plan
III. Phase III – Detailed formulation of Action PlanWork through and provide detail for all elements of the Action Plan:
• Linkages with external organizations• Required functions, organizational structure and staffing• Required management processes and procedures• Human resource development plan• Estimates of annual MOM costs and expenditure (fixed and variable)• Estimates of annual income, source, and risk, over time• Measures to match costs and income, over time
Preparation of draft final report and recommendations Detailed work on expenditure for I&D system O&M, ISF contributions, etc.Preparation of draft final report and recommendations (Water Code and WUAs)Discussion and feedback on draft final reports and recommendationsFinalizing of final report and recommendations
No. Description
Timing
Tot
al in
put
(day
s)
February March April May June July
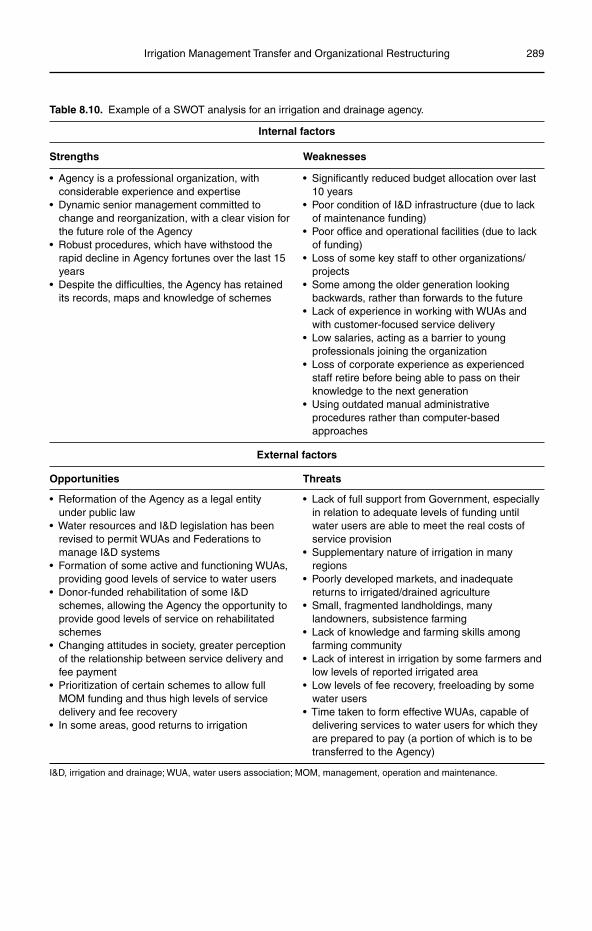
Irrigation Management Transfer and Organizational Restructuring 289
Table 8.10. Example of a SWOT analysis for an irrigation and drainage agency.
Internal factors
Strengths Weaknesses
• Agency is a professional organization, with considerable experience and expertise
• Significantly reduced budget allocation over last 10 years
• Dynamic senior management committed to change and reorganization, with a clear vision for the future role of the Agency
• Poor condition of I&D infrastructure (due to lack of maintenance funding)
• Poor office and operational facilities (due to lack of funding)
• Loss of some key staff to other organizations/projects
• Some among the older generation looking backwards, rather than forwards to the future
• Lack of experience in working with WUAs and with customer-focused service delivery
• Low salaries, acting as a barrier to young professionals joining the organization
• Loss of corporate experience as experienced staff retire before being able to pass on their knowledge to the next generation
• Using outdated manual administrative procedures rather than computer-based approaches
• Robust procedures, which have withstood the rapid decline in Agency fortunes over the last 15 years
• Despite the difficulties, the Agency has retained its records, maps and knowledge of schemes
External factors
Opportunities Threats
• Reformation of the Agency as a legal entity under public law
• Water resources and I&D legislation has been revised to permit WUAs and Federations to manage I&D systems
• Formation of some active and functioning WUAs, providing good levels of service to water users
• Donor-funded rehabilitation of some I&D schemes, allowing the Agency the opportunity to provide good levels of service on rehabilitated schemes
• Changing attitudes in society, greater perception of the relationship between service delivery and fee payment
• Prioritization of certain schemes to allow full MOM funding and thus high levels of service delivery and fee recovery
• In some areas, good returns to irrigation
• Lack of full support from Government, especially in relation to adequate levels of funding until water users are able to meet the real costs of service provision
• Supplementary nature of irrigation in many regions
• Poorly developed markets, and inadequate returns to irrigated/drained agriculture
• Small, fragmented landholdings, many landowners, subsistence farming
• Lack of knowledge and farming skills among farming community
• Lack of interest in irrigation by some farmers and low levels of reported irrigated area
• Low levels of fee recovery, freeloading by some water users
• Time taken to form effective WUAs, capable of delivering services to water users for which they are prepared to pay (a portion of which is to be transferred to the Agency)
I&D, irrigation and drainage; WUA, water users association; MOM, management, operation and maintenance.
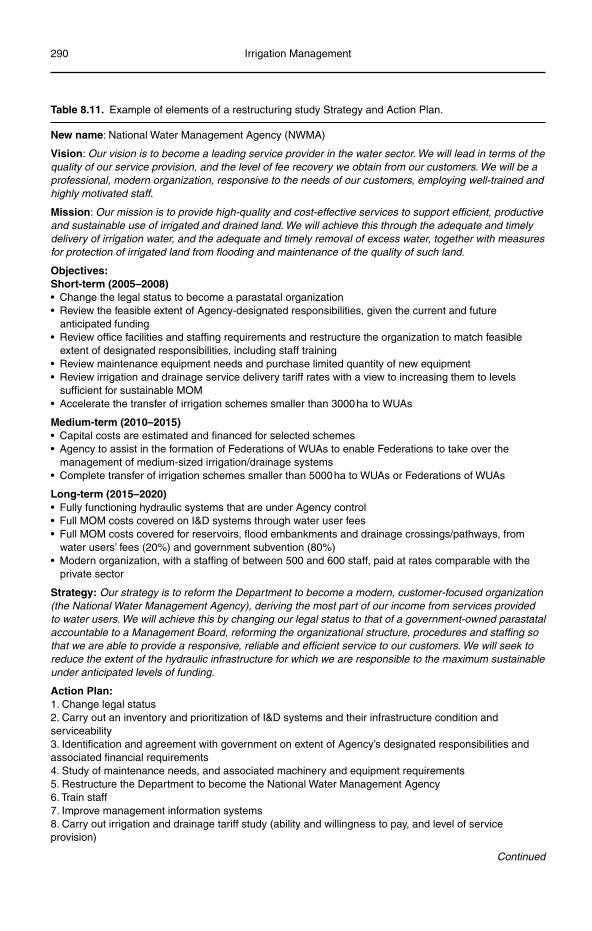
290 Irrigation Management
Table 8.11. Example of elements of a restructuring study Strategy and Action Plan.
New name: National Water Management Agency (NWMA)
Vision: Our vision is to become a leading service provider in the water sector. We will lead in terms of the quality of our service provision, and the level of fee recovery we obtain from our customers. We will be a professional, modern organization, responsive to the needs of our customers, employing well-trained and highly motivated staff.
Mission: Our mission is to provide high-quality and cost-effective services to support efficient, productive and sustainable use of irrigated and drained land. We will achieve this through the adequate and timely delivery of irrigation water, and the adequate and timely removal of excess water, together with measures for protection of irrigated land from flooding and maintenance of the quality of such land.
Objectives:Short-term (2005–2008)• Change the legal status to become a parastatal organization• Review the feasible extent of Agency-designated responsibilities, given the current and future
anticipated funding• Review office facilities and staffing requirements and restructure the organization to match feasible
extent of designated responsibilities, including staff training• Review maintenance equipment needs and purchase limited quantity of new equipment• Review irrigation and drainage service delivery tariff rates with a view to increasing them to levels
sufficient for sustainable MOM• Accelerate the transfer of irrigation schemes smaller than 3000 ha to WUAs
Medium-term (2010–2015)• Capital costs are estimated and financed for selected schemes• Agency to assist in the formation of Federations of WUAs to enable Federations to take over the
management of medium-sized irrigation/drainage systems• Complete transfer of irrigation schemes smaller than 5000 ha to WUAs or Federations of WUAs
Long-term (2015–2020)• Fully functioning hydraulic systems that are under Agency control• Full MOM costs covered on I&D systems through water user fees• Full MOM costs covered for reservoirs, flood embankments and drainage crossings/pathways, from
water users’ fees (20%) and government subvention (80%)• Modern organization, with a staffing of between 500 and 600 staff, paid at rates comparable with the
private sector
Strategy: Our strategy is to reform the Department to become a modern, customer-focused organization (the National Water Management Agency), deriving the most part of our income from services provided to water users. We will achieve this by changing our legal status to that of a government-owned parastatal accountable to a Management Board, reforming the organizational structure, procedures and staffing so that we are able to provide a responsive, reliable and efficient service to our customers. We will seek to reduce the extent of the hydraulic infrastructure for which we are responsible to the maximum sustainable under anticipated levels of funding.
Action Plan:1. Change legal status2. Carry out an inventory and prioritization of I&D systems and their infrastructure condition and serviceability3. Identification and agreement with government on extent of Agency’s designated responsibilities and associated financial requirements4. Study of maintenance needs, and associated machinery and equipment requirements5. Restructure the Department to become the National Water Management Agency6. Train staff7. Improve management information systems8. Carry out irrigation and drainage tariff study (ability and willingness to pay, and level of service provision)
Continued
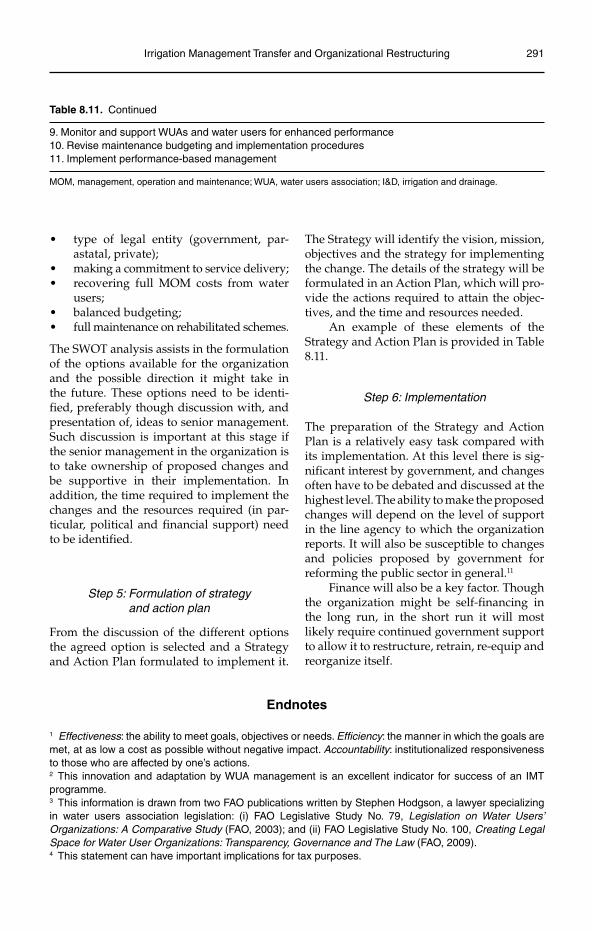
Irrigation Management Transfer and Organizational Restructuring 291
9. Monitor and support WUAs and water users for enhanced performance10. Revise maintenance budgeting and implementation procedures11. Implement performance-based management
MOM, management, operation and maintenance; WUA, water users association; I&D, irrigation and drainage.
Table 8.11. Continued
type of legal entity (government, par-•astatal, private);making a commitment to service delivery;•recovering full MOM costs from water •users;balanced budgeting;•full maintenance on rehabilitated schemes.•
The SWOT analysis assists in the formulation of the options available for the organization and the possible direction it might take in the future. These options need to be identi-fied, preferably though discussion with, and presentation of, ideas to senior management. Such discussion is important at this stage if the senior management in the organization is to take ownership of proposed changes and be supportive in their implementation. In addition, the time required to implement the changes and the resources required (in par-ticular, political and financial support) need to be identified.
Step 5: Formulation of strategy and action plan
From the discussion of the different options the agreed option is selected and a Strategy and Action Plan formulated to implement it.
The Strategy will identify the vision, mission, objectives and the strategy for implementing the change. The details of the strategy will be formulated in an Action Plan, which will pro-vide the actions required to attain the objec-tives, and the time and resources needed.
An example of these elements of the Strategy and Action Plan is provided in Table 8.11.
Step 6: Implementation
The preparation of the Strategy and Action Plan is a relatively easy task compared with its implementation. At this level there is sig-nificant interest by government, and changes often have to be debated and discussed at the highest level. The ability to make the proposed changes will depend on the level of support in the line agency to which the organization reports. It will also be susceptible to changes and policies proposed by government for reforming the public sector in general.11
Finance will also be a key factor. Though the organization might be self-financing in the long run, in the short run it will most likely require continued government support to allow it to restructure, retrain, re-equip and reorganize itself.
Endnotes
1 Effectiveness: the ability to meet goals, objectives or needs. Efficiency: the manner in which the goals are met, at as low a cost as possible without negative impact. Accountability: institutionalized responsiveness to those who are affected by one’s actions.2 This innovation and adaptation by WUA management is an excellent indicator for success of an IMT programme.3 This information is drawn from two FAO publications written by Stephen Hodgson, a lawyer specializing in water users association legislation: (i) FAO Legislative Study No. 79, Legislation on Water Users’ Organizations: A Comparative Study (FAO, 2003); and (ii) FAO Legislative Study No. 100, Creating Legal Space for Water User Organizations: Transparency, Governance and The Law (FAO, 2009).4 This statement can have important implications for tax purposes.

292 Irrigation Management
5 In this case the service charges to non-members may be greater than those for members, up to a maxi-mum specified level.6 Though this may be done by a show of hands, it is preferable and sometimes obligatory to obtain signa-tures from those who agree to the proposals.7 If the WUAs have been established as part of a project.8 Often WUA formation and establishment is part of a rehabilitation project.9 The terminology for these different administrative levels will vary from country to country.10 In some systems the Water Masters collect the service fee from water users, either at the time of irriga-tion or later. In general, in the interests of transparency and accountability it is preferable that the service fee payment is made in the WUA office to the accountant.11 Any such changes should have been picked up during the study and factored into the analysis and choice of option proposed.
9
Performance Assessment, Monitoring and Evaluation
This chapter provides a framework for per-formance assessment, emphasizing the importance of identifying the purpose and objectives of the performance assessment programme and going on to provide details of how such assessment can be carried out. Key performance indicators are detailed for management, operation and maintenance at the main system, on-farm and field level. This is followed with an outline of processes and procedures for project monitoring and evalu-ation (M&E), with details of two commonly used approaches, the logical framework and the results framework. The final section of the chapter introduces benchmarking, an increasingly widely used tool for compara-tive assessment of performance of irrigation and drainage schemes (I&D schemes), sys-tems and processes. A detailed example is provided to show how a benchmarking study can be implemented.
Introduction
Performance assessment is an integral com-ponent of management. In the context of irri-gation and drainage systems (I&D systems) performance assessment is carried out at dif-ferent levels by different entities. At the main system level the main system service provider
is interested in knowing how well water is being delivered, and whether the required fees are being recovered. At the on-farm level the water users association is interested in knowing how much water it is receiving, how well it is distributing the water and the level of fee recovery from water users. At the field level water users measure the performance of the association in delivering water, the output from their fields in terms of agricultural pro-duce, and the income that it generates when sold.
By measuring performance, at what-ever level, those responsible for management at that level are able to assess whether per-formance is satisfactory, or whether it can be improved. Through an assessment of the per-formance (and the associated process of diag-nostic analysis) the manager is able to identify areas where performance can be enhanced.
Monitoring and evaluation is a part of performance assessment, and is generally used in the context of project,1 rather than scheme, management. Monitoring is an inte-gral part of the management of an irriga-tion and drainage project, seeking to ensure that the project is on track to complete the assigned activities on time, within budget and to the quality required. Evaluation is car-ried out once the project has been completed and is used to assess whether the project has been successful in achieving its objectives.
©Martin Burton 2010. Irrigation Management: Principles and Practices (Martin Burton) 293
294 Irrigation Management
Information gained from evaluation of the project can then be fed back into the plan-ning, design and implementation of future projects.
Framework for Performance Assessment2
Overview
Prior to establishing procedures for assessing performance it is important to think through the various components of the process and to establish a framework for the assessment. The framework serves to define why the per-formance assessment is needed, what data are required, what methods of analysis will be used, who will use the information pro-vided, etc. Without a suitable framework the performance assessment programme may fail to collect all the necessary data, and may not provide the required information and understanding.
The framework is based on a series of questions (Fig. 9.1). The first stage, purpose and scope, looks at the broad scope of the performance assessment – who it is for, from whose viewpoint it is undertaken, who will carry it out, its type and extent. Once these are decided, the performance assessment programme can be designed, selecting suit-able criteria for the performance assess-ment, the performance indicators and the data that will be collected. The implemen-tation of the planned programme follows, with data being collected, processed and analysed. The final part of the programme is to act on the information provided, with a variety of actions possible, ranging from changes to long-term goals and strategy, to improvements in day-to-day procedures for system management, operation and maintenance.
Purpose and scope
The initial part of formulating a performance assessment programme is to decide on the purpose and scope of the performance assess-
ment. Key issues relate to who the assessment is for, from whose viewpoint, the type of assessment and the extent/boundaries. It is important that adequate time is spent on this part of the work as it structures the remaining stages.
Purpose
As with any project or task it is essential that the purpose and objectives of the performance assessment be defined at the outset. Three levels of objective setting can be identified:
rationale;•overall objective;•specific objectives.•
The rationale outlines the reason why a per-formance assessment programme is required. The overall objective details the overall aim of the performance assessment programme, while specific objectives may be required to provide further detail on how the overall objective will be achieved (Table 9.1).
Establishing the rationale and identify-ing the overall and specific objectives of the performance assessment programme are not always straightforward; care needs to be taken at this stage of planning to ensure that these objectives are clearly defined before proceeding further.
For whom?
The performance assessment can be carried out on behalf of a variety of stakeholders. These include:
government;•funding agencies;•irrigation and drainage service •providers;I&D system managers;•farmers;•research organizations.•
Who the assessment is for is closely linked to the purpose of the assessment.
From whose viewpoint?
The assessment may be carried out on behalf of one stakeholder or group of stakeholders
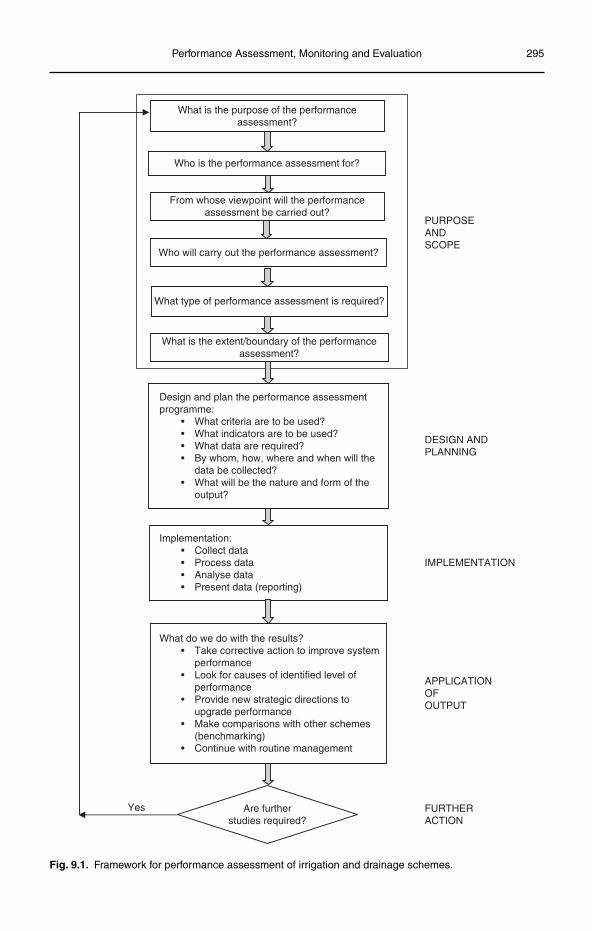
Performance Assessment, Monitoring and Evaluation 295
Implementation: • Collect data • Process data • Analyse data • Present data (reporting)
What is the purpose of the performanceassessment?
Who will carry out the performance assessment?
What type of performance assessment is required?
What is the extent/boundary of the performanceassessment?
Who is the performance assessment for?
Design and plan the performance assessmentprogramme: • What criteria are to be used? • What indicators are to be used? • What data are required? • By whom, how, where and when will the data be collected? • What will be the nature and form of the output?
What do we do with the results? • Take corrective action to improve system performance • Look for causes of identified level of performance • Provide new strategic directions to upgrade performance • Make comparisons with other schemes (benchmarking) • Continue with routine management
From whose viewpoint will the performanceassessment be carried out?
PURPOSEANDSCOPE
DESIGN ANDPLANNING
APPLICATIONOFOUTPUT
FURTHERACTION
IMPLEMENTATION
Are furtherstudies required?
Yes
Fig. 9.1. Framework for performance assessment of irrigation and drainage schemes.
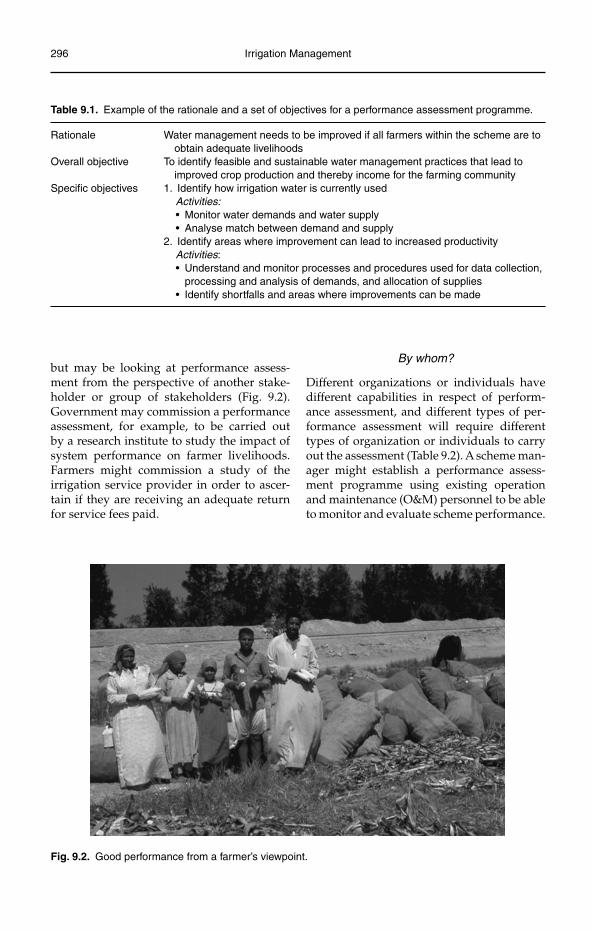
296 Irrigation Management
but may be looking at performance assess-ment from the perspective of another stake-holder or group of stakeholders (Fig. 9.2). Government may commission a performance assessment, for example, to be carried out by a research institute to study the impact of system performance on farmer livelihoods. Farmers might commission a study of the irrigation service provider in order to ascer-tain if they are receiving an adequate return for service fees paid.
By whom?
Different organizations or individuals have different capabilities in respect of perform-ance assessment, and different types of per-formance assessment will require different types of organization or individuals to carry out the assessment (Table 9.2). A scheme man-ager might establish a performance assess-ment programme using existing operation and maintenance (O&M) personnel to be able to monitor and evaluate scheme performance.
Table 9.1. Example of the rationale and a set of objectives for a performance assessment programme.
Rationale Water management needs to be improved if all farmers within the scheme are to obtain adequate livelihoods
Overall objective To identify feasible and sustainable water management practices that lead to improved crop production and thereby income for the farming community
Specific objectives 1. Identify how irrigation water is currently usedActivities:
• Monitor water demands and water supply • Analyse match between demand and supply 2. Identify areas where improvement can lead to increased productivity
Activities: • Understand and monitor processes and procedures used for data collection,
processing and analysis of demands, and allocation of supplies • Identify shortfalls and areas where improvements can be made
Fig. 9.2. Good performance from a farmer’s viewpoint.
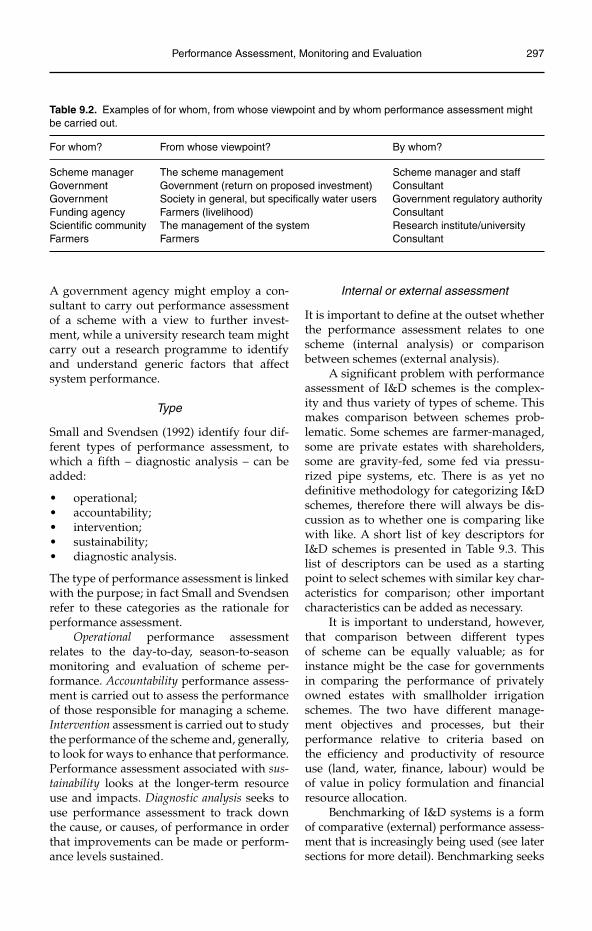
Performance Assessment, Monitoring and Evaluation 297
A government agency might employ a con-sultant to carry out performance assessment of a scheme with a view to further invest-ment, while a university research team might carry out a research programme to identify and understand generic factors that affect system performance.
Type
Small and Svendsen (1992) identify four dif-ferent types of performance assessment, to which a fifth – diagnostic analysis – can be added:
operational;•accountability;•intervention;•sustainability;•diagnostic analysis.•
The type of performance assessment is linked with the purpose; in fact Small and Svendsen refer to these categories as the rationale for performance assessment.
Operational performance assessment relates to the day-to-day, season-to-season monitoring and evaluation of scheme per-formance. Accountability performance assess-ment is carried out to assess the performance of those responsible for managing a scheme. Intervention assessment is carried out to study the performance of the scheme and, generally, to look for ways to enhance that performance. Performance assessment associated with sus-tainability looks at the longer-term resource use and impacts. Diagnostic analysis seeks to use performance assessment to track down the cause, or causes, of performance in order that improvements can be made or perform-ance levels sustained.
Internal or external assessment
It is important to define at the outset whether the performance assessment relates to one scheme (internal analysis) or comparison between schemes (external analysis).
A significant problem with performance assessment of I&D schemes is the complex-ity and thus variety of types of scheme. This makes comparison between schemes prob-lematic. Some schemes are farmer-managed, some are private estates with shareholders, some are gravity-fed, some fed via pressu-rized pipe systems, etc. There is as yet no definitive methodology for categorizing I&D schemes, therefore there will always be dis-cussion as to whether one is comparing like with like. A short list of key descriptors for I&D schemes is presented in Table 9.3. This list of descriptors can be used as a starting point to select schemes with similar key char-acteristics for comparison; other important characteristics can be added as necessary.
It is important to understand, however, that comparison between different types of scheme can be equally valuable; as for instance might be the case for governments in comparing the performance of privately owned estates with smallholder irrigation schemes. The two have different manage-ment objectives and processes, but their performance relative to criteria based on the efficiency and productivity of resource use (land, water, finance, labour) would be of value in policy formulation and financial resource allocation.
Benchmarking of I&D systems is a form of comparative (external) performance assess-ment that is increasingly being used (see later sections for more detail). Benchmarking seeks
Table 9.2. Examples of for whom, from whose viewpoint and by whom performance assessment might be carried out.
For whom? From whose viewpoint? By whom?
Scheme manager The scheme management Scheme manager and staffGovernment Government (return on proposed investment) ConsultantGovernment Society in general, but specifically water users Government regulatory authorityFunding agency Farmers (livelihood) ConsultantScientific community The management of the system Research institute/universityFarmers Farmers Consultant
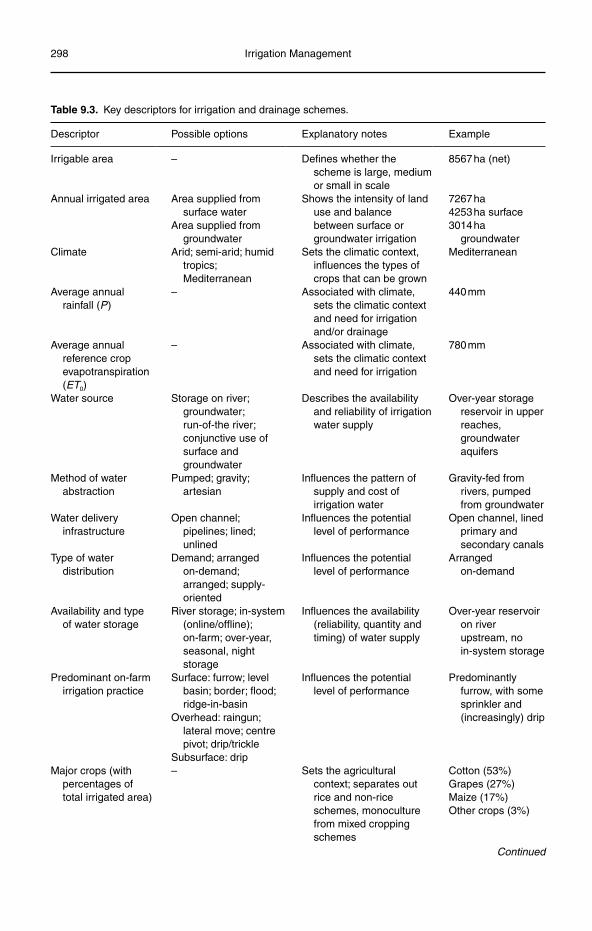
298 Irrigation Management
Table 9.3. Key descriptors for irrigation and drainage schemes.
Descriptor Possible options Explanatory notes Example
Irrigable area – Defines whether the scheme is large, medium or small in scale
8567 ha (net)
Annual irrigated area Area supplied from surface water
Area supplied from groundwater
Shows the intensity of land use and balance between surface or groundwater irrigation
7267 ha4253 ha surface3014 ha
groundwaterClimate Arid; semi-arid; humid
tropics; Mediterranean
Sets the climatic context, influences the types of crops that can be grown
Mediterranean
Average annual rainfall (P)
– Associated with climate, sets the climatic context and need for irrigation and/or drainage
440 mm
Average annual reference crop evapotranspiration (ET0)
– Associated with climate, sets the climatic context and need for irrigation
780 mm
Water source Storage on river; groundwater; run-of-the river; conjunctive use of surface and groundwater
Describes the availability and reliability of irrigation water supply
Over-year storage reservoir in upper reaches, groundwater aquifers
Method of water abstraction
Pumped; gravity; artesian
Influences the pattern of supply and cost of irrigation water
Gravity-fed from rivers, pumped from groundwater
Water delivery infrastructure
Open channel; pipelines; lined; unlined
Influences the potential level of performance
Open channel, lined primary and secondary canals
Type of water distribution
Demand; arranged on-demand; arranged; supply-oriented
Influences the potential level of performance
Arranged on-demand
Availability and type of water storage
River storage; in-system (online/offline); on-farm; over-year, seasonal, night storage
Influences the availability (reliability, quantity and timing) of water supply
Over-year reservoir on river upstream, no in-system storage
Predominant on-farm irrigation practice
Surface: furrow; level basin; border; flood; ridge-in-basin
Overhead: raingun; lateral move; centre pivot; drip/trickle
Subsurface: drip
Influences the potential level of performance
Predominantlyfurrow, with some sprinkler and (increasingly) drip
Major crops (with percentages of total irrigated area)
– Sets the agricultural context; separates out rice and non-rice schemes, monoculture from mixed cropping schemes
Cotton (53%)Grapes (27%)Maize (17%)Other crops (3%)
Continued
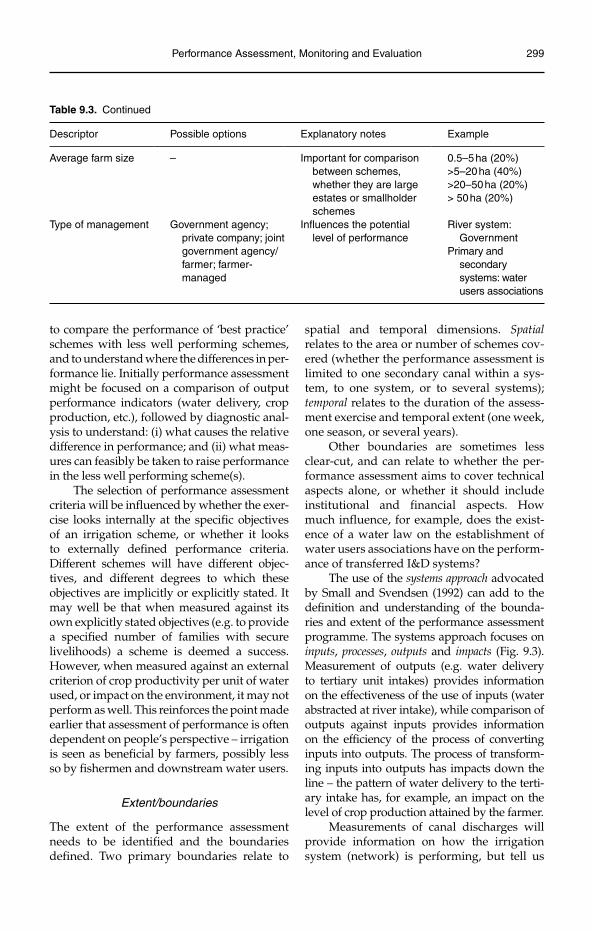
Performance Assessment, Monitoring and Evaluation 299
to compare the performance of ‘best practice’ schemes with less well performing schemes, and to understand where the differences in per-formance lie. Initially performance assessment might be focused on a comparison of output performance indicators (water delivery, crop production, etc.), followed by diagnostic anal-ysis to understand: (i) what causes the relative difference in performance; and (ii) what meas-ures can feasibly be taken to raise performance in the less well performing scheme(s).
The selection of performance assessment criteria will be influenced by whether the exer-cise looks internally at the specific objectives of an irrigation scheme, or whether it looks to externally defined performance criteria. Different schemes will have different objec-tives, and different degrees to which these objectives are implicitly or explicitly stated. It may well be that when measured against its own explicitly stated objectives (e.g. to provide a specified number of families with secure livelihoods) a scheme is deemed a success. However, when measured against an external criterion of crop productivity per unit of water used, or impact on the environment, it may not perform as well. This reinforces the point made earlier that assessment of performance is often dependent on people’s perspective – irrigation is seen as beneficial by farmers, possibly less so by fishermen and downstream water users.
Extent/boundaries
The extent of the performance assessment needs to be identified and the boundaries defined. Two primary boundaries relate to
spatial and temporal dimensions. Spatialrelates to the area or number of schemes cov-ered (whether the performance assessment is limited to one secondary canal within a sys-tem, to one system, or to several systems); temporal relates to the duration of the assess-ment exercise and temporal extent (one week, one season, or several years).
Other boundaries are sometimes less clear-cut, and can relate to whether the per-formance assessment aims to cover technical aspects alone, or whether it should include institutional and financial aspects. How much influence, for example, does the exist-ence of a water law on the establishment of water users associations have on the perform-ance of transferred I&D systems?
The use of the systems approach advocated by Small and Svendsen (1992) can add to the definition and understanding of the bounda-ries and extent of the performance assessment programme. The systems approach focuses on inputs, processes, outputs and impacts (Fig. 9.3). Measurement of outputs (e.g. water delivery to tertiary unit intakes) provides information on the effectiveness of the use of inputs (water abstracted at river intake), while comparison of outputs against inputs provides information on the efficiency of the process of converting inputs into outputs. The process of transform-ing inputs into outputs has impacts down the line – the pattern of water delivery to the terti-ary intake has, for example, an impact on the level of crop production attained by the farmer.
Measurements of canal discharges will provide information on how the irrigation system (network) is performing, but tell us
Table 9.3. Continued
Descriptor Possible options Explanatory notes Example
Average farm size – Important for comparison between schemes, whether they are large estates or smallholder schemes
0.5–5 ha (20%)>5–20 ha (40%)>20–50 ha (20%)> 50 ha (20%)
Type of management Government agency; private company; joint government agency/farmer; farmer-managed
Influences the potential level of performance
River system: Government
Primary and secondary systems: water users associations
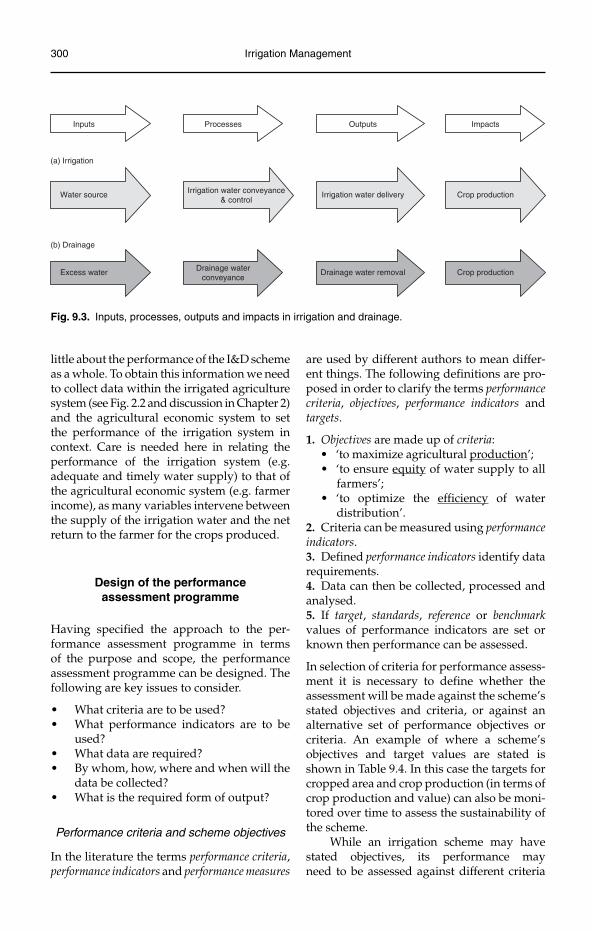
300 Irrigation Management
Inputs
(a) Irrigation
(b) Drainage
Processes Outputs Impacts
Excess water Drainage waterconveyance
Drainage water removal Crop production
Water source Irrigation water conveyance& control
Irrigation water delivery Crop production
Fig. 9.3. Inputs, processes, outputs and impacts in irrigation and drainage.
little about the performance of the I&D scheme as a whole. To obtain this information we need to collect data within the irrigated agriculture system (see Fig. 2.2 and discussion in Chapter 2) and the agricultural economic system to set the performance of the irrigation system in context. Care is needed here in relating the performance of the irrigation system (e.g. adequate and timely water supply) to that of the agricultural economic system (e.g. farmer income), as many variables intervene between the supply of the irrigation water and the net return to the farmer for the crops produced.
Design of the performance assessment programme
Having specified the approach to the per-formance assessment programme in terms of the purpose and scope, the performance assessment programme can be designed. The following are key issues to consider.
What criteria are to be used?•What performance indicators are to be •used?What data are required?•By whom, how, where and when will the •data be collected?What is the required form of output?•
Performance criteria and scheme objectives
In the literature the terms performance criteria,performance indicators and performance measures
are used by different authors to mean differ-ent things. The following definitions are pro-posed in order to clarify the terms performancecriteria, objectives, performance indicators and targets.
1. Objectives are made up of criteria: ‘to maximize agricultural • production’; ‘to ensure • equity of water supply to all
farmers’; ‘to optimize the • efficiency of water
distribution’.2. Criteria can be measured using performanceindicators.3. Defined performance indicators identify data requirements.4. Data can then be collected, processed and analysed.5. If target, standards, reference or benchmarkvalues of performance indicators are set or known then performance can be assessed.
In selection of criteria for performance assess-ment it is necessary to define whether the assessment will be made against the scheme’s stated objectives and criteria, or against an alternative set of performance objectives or criteria. An example of where a scheme’s objectives and target values are stated is shown in Table 9.4. In this case the targets for cropped area and crop production (in terms of crop production and value) can also be moni-tored over time to assess the sustainability of the scheme.
While an irrigation scheme may have stated objectives, its performance may need to be assessed against different criteria
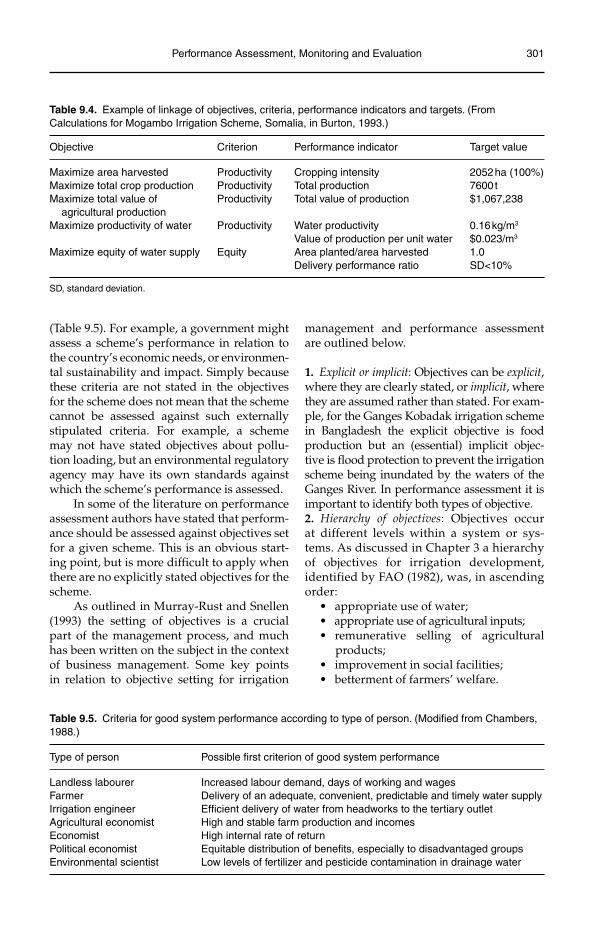
Performance Assessment, Monitoring and Evaluation 301
(Table 9.5). For example, a government might assess a scheme’s performance in relation to the country’s economic needs, or environmen-tal sustainability and impact. Simply because these criteria are not stated in the objectives for the scheme does not mean that the scheme cannot be assessed against such externally stipulated criteria. For example, a scheme may not have stated objectives about pollu-tion loading, but an environmental regulatory agency may have its own standards against which the scheme’s performance is assessed.
In some of the literature on performance assessment authors have stated that perform-ance should be assessed against objectives set for a given scheme. This is an obvious start-ing point, but is more difficult to apply when there are no explicitly stated objectives for the scheme.
As outlined in Murray-Rust and Snellen (1993) the setting of objectives is a crucial part of the management process, and much has been written on the subject in the context of business management. Some key points in relation to objective setting for irrigation
management and performance assessment are outlined below.
1. Explicit or implicit: Objectives can be explicit,where they are clearly stated, or implicit, where they are assumed rather than stated. For exam-ple, for the Ganges Kobadak irrigation scheme in Bangladesh the explicit objective is food production but an (essential) implicit objec-tive is flood protection to prevent the irrigation scheme being inundated by the waters of the Ganges River. In performance assessment it is important to identify both types of objective.2. Hierarchy of objectives: Objectives occur at different levels within a system or sys-tems. As discussed in Chapter 3 a hierarchy of objectives for irrigation development, identified by FAO (1982), was, in ascending order:
appropriate use of water;• appropriate use of agricultural inputs;• remunerative selling of agricultural •
products; improvement in social facilities;• betterment of farmers’ welfare.•
Table 9.4. Example of linkage of objectives, criteria, performance indicators and targets. (From Calculations for Mogambo Irrigation Scheme, Somalia, in Burton, 1993.)
Objective Criterion Performance indicator Target value
Maximize area harvested Productivity Cropping intensity 2052 ha (100%)Maximize total crop production Productivity Total production 7600 tMaximize total value of Productivity Total value of production $1,067,238
agricultural production Maximize productivity of water Productivity Water productivity 0.16 kg/m3
Value of production per unit water $0.023/m3
Maximize equity of water supply Equity Area planted/area harvested 1.0 Delivery performance ratio SD<10%
SD, standard deviation.
Table 9.5. Criteria for good system performance according to type of person. (Modified from Chambers, 1988.)
Type of person Possible first criterion of good system performance
Landless labourer Increased labour demand, days of working and wagesFarmer Delivery of an adequate, convenient, predictable and timely water supplyIrrigation engineer Efficient delivery of water from headworks to the tertiary outletAgricultural economist High and stable farm production and incomesEconomist High internal rate of returnPolitical economist Equitable distribution of benefits, especially to disadvantaged groupsEnvironmental scientist Low levels of fertilizer and pesticide contamination in drainage water
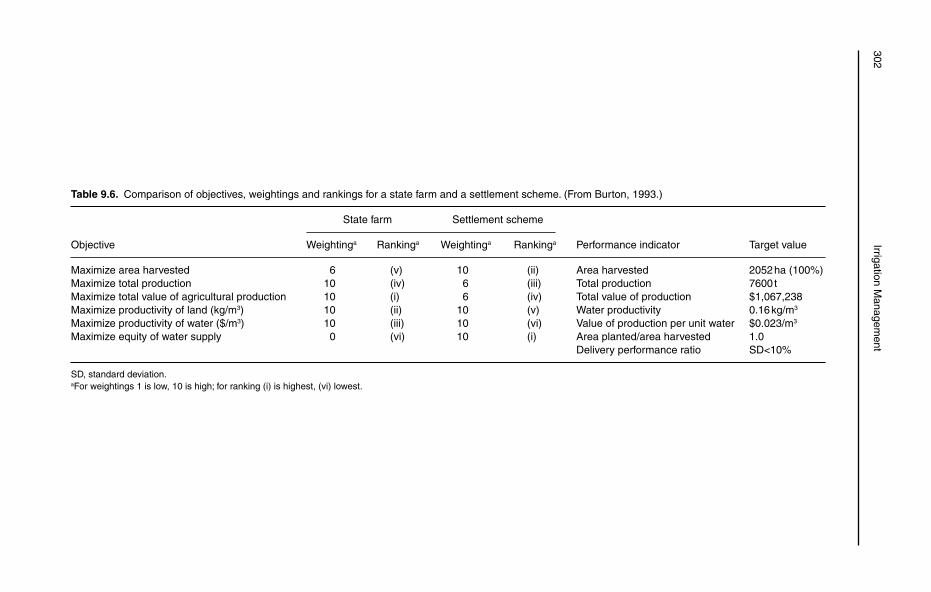
302Irrigation M
anagement
Table 9.6. Comparison of objectives, weightings and rankings for a state farm and a settlement scheme. (From Burton, 1993.)
State farm Settlement scheme
Objective Weightinga Rankinga Weightinga Rankinga Performance indicator Target value
Maximize area harvested 6 (v) 10 (ii) Area harvested 2052 ha (100%)Maximize total production 10 (iv) 6 (iii) Total production 7600 tMaximize total value of agricultural production 10 (i) 6 (iv) Total value of production $1,067,238Maximize productivity of land (kg/m3) 10 (ii) 10 (v) Water productivity 0.16 kg/m3
Maximize productivity of water ($/m3) 10 (iii) 10 (vi) Value of production per unit water $0.023/m3
Maximize equity of water supply 0 (vi) 10 (i) Area planted/area harvested 1.0 Delivery performance ratio SD<10%
SD, standard deviation.aFor weightings 1 is low, 10 is high; for ranking (i) is highest, (vi) lowest.
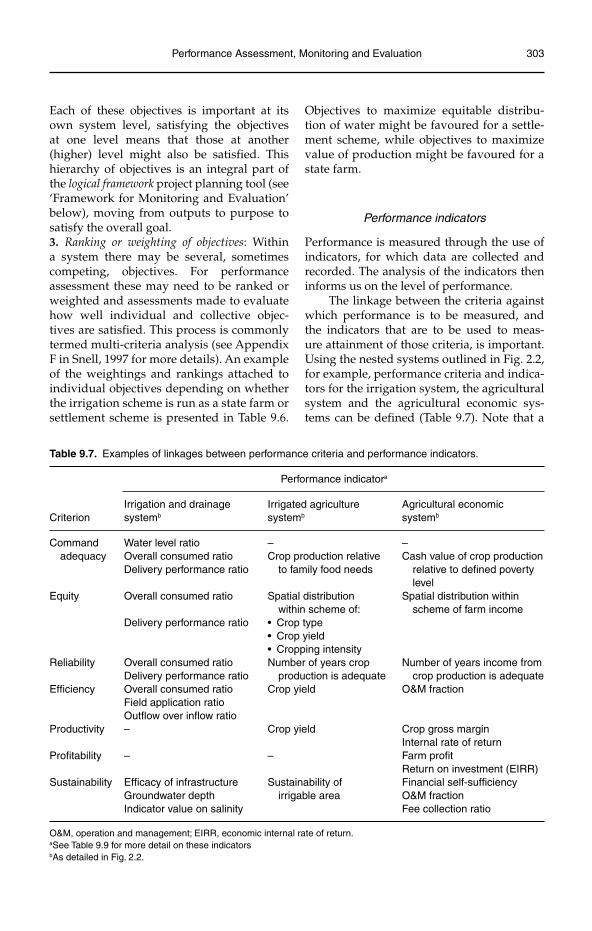
Performance Assessment, Monitoring and Evaluation 303
Each of these objectives is important at its own system level, satisfying the objectives at one level means that those at another (higher) level might also be satisfied. This hierarchy of objectives is an integral part of the logical framework project planning tool (see ‘Framework for Monitoring and Evaluation’ below), moving from outputs to purpose to satisfy the overall goal.3. Ranking or weighting of objectives: Within a system there may be several, sometimes competing, objectives. For performance assessment these may need to be ranked or weighted and assessments made to evaluate how well individual and collective objec-tives are satisfied. This process is commonly termed multi- criteria analysis (see Appendix F in Snell, 1997 for more details). An example of the weightings and rankings attached to individual objectives depending on whether the irrigation scheme is run as a state farm or settlement scheme is presented in Table 9.6.
Objectives to maximize equitable distribu-tion of water might be favoured for a settle-ment scheme, while objectives to maximize value of production might be favoured for a state farm.
Performance indicators
Performance is measured through the use of indicators, for which data are collected and recorded. The analysis of the indicators then informs us on the level of performance.
The linkage between the criteria against which performance is to be measured, and the indicators that are to be used to meas-ure attainment of those criteria, is important. Using the nested systems outlined in Fig. 2.2, for example, performance criteria and indica-tors for the irrigation system, the agricultural system and the agricultural economic sys-tems can be defined (Table 9.7). Note that a
Table 9.7. Examples of linkages between performance criteria and performance indicators.
Performance indicatora
Irrigation and drainage Irrigated agriculture Agricultural economicCriterion systemb systemb systemb
Command Water level ratio – – adequacy Overall consumed ratio Crop production relative Cash value of crop production Delivery performance ratio to family food needs relative to defined poverty levelEquity Overall consumed ratio Spatial distribution Spatial distribution within within scheme of: scheme of farm income Delivery performance ratio • Crop type • Crop yield • Cropping intensity Reliability Overall consumed ratio Number of years crop Number of years income from Delivery performance ratio production is adequate crop production is adequateEfficiency Overall consumed ratio Crop yield O&M fraction Field application ratio Outflow over inflow ratio Productivity – Crop yield Crop gross margin Internal rate of returnProfitability – – Farm profit Return on investment (EIRR)Sustainability Efficacy of infrastructure Sustainability of Financial self-sufficiency Groundwater depth irrigable area O&M fraction Indicator value on salinity Fee collection ratio
O&M, operation and management; EIRR, economic internal rate of return.aSee Table 9.9 for more detail on these indicatorsbAs detailed in Fig. 2.2.
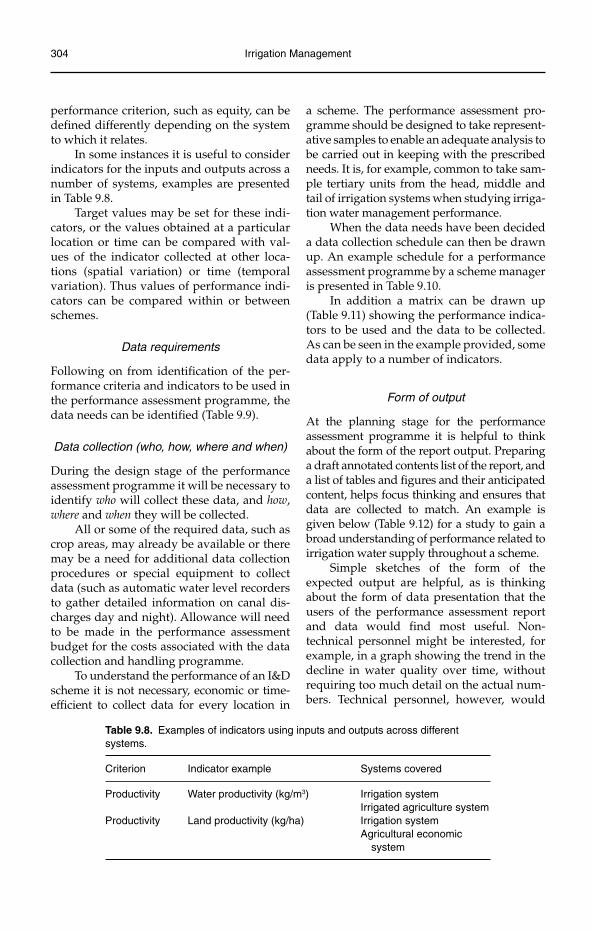
304 Irrigation Management
performance criterion, such as equity, can be defined differently depending on the system to which it relates.
In some instances it is useful to consider indicators for the inputs and outputs across a number of systems, examples are presented in Table 9.8.
Target values may be set for these indi-cators, or the values obtained at a particular location or time can be compared with val-ues of the indicator collected at other loca-tions (spatial variation) or time (temporal variation). Thus values of performance indi-cators can be compared within or between schemes.
Data requirements
Following on from identification of the per-formance criteria and indicators to be used in the performance assessment programme, the data needs can be identified (Table 9.9).
Data collection (who, how, where and when)
During the design stage of the performance assessment programme it will be necessary to identify who will collect these data, and how,where and when they will be collected.
All or some of the required data, such as crop areas, may already be available or there may be a need for additional data collection procedures or special equipment to collect data (such as automatic water level recorders to gather detailed information on canal dis-charges day and night). Allowance will need to be made in the performance assessment budget for the costs associated with the data collection and handling programme.
To understand the performance of an I&D scheme it is not necessary, economic or time-efficient to collect data for every location in
a scheme. The performance assessment pro-gramme should be designed to take represent-ative samples to enable an adequate analysis to be carried out in keeping with the prescribed needs. It is, for example, common to take sam-ple tertiary units from the head, middle and tail of irrigation systems when studying irriga-tion water management performance.
When the data needs have been decided a data collection schedule can then be drawn up. An example schedule for a performance assessment programme by a scheme manager is presented in Table 9.10.
In addition a matrix can be drawn up (Table 9.11) showing the performance indica-tors to be used and the data to be collected. As can be seen in the example provided, some data apply to a number of indicators.
Form of output
At the planning stage for the performance assessment programme it is helpful to think about the form of the report output. Preparing a draft annotated contents list of the report, and a list of tables and figures and their anticipated content, helps focus thinking and ensures that data are collected to match. An example is given below (Table 9.12) for a study to gain a broad understanding of performance related to irrigation water supply throughout a scheme.
Simple sketches of the form of the expected output are helpful, as is thinking about the form of data presentation that the users of the performance assessment report and data would find most useful. Non-technical personnel might be interested, for example, in a graph showing the trend in the decline in water quality over time, without requiring too much detail on the actual num-bers. Technical personnel, however, would
Table 9.8. Examples of indicators using inputs and outputs across different systems.
Criterion Indicator example Systems covered
Productivity Water productivity (kg/m3) Irrigation system Irrigated agriculture systemProductivity Land productivity (kg/ha) Irrigation system Agricultural economic
system
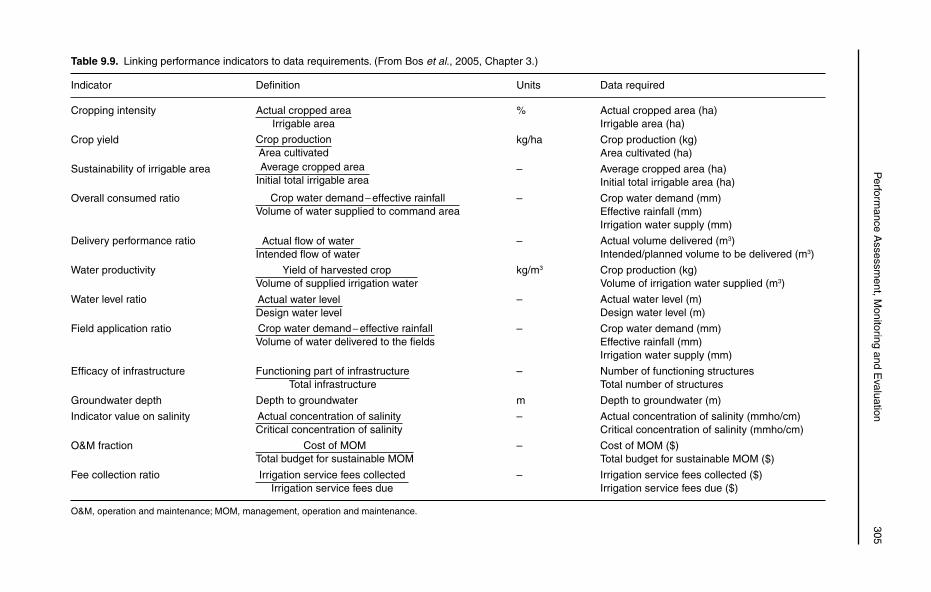
P
erformance A
ssessment, M
onitoring and Evaluation
305Table 9.9. Linking performance indicators to data requirements. (From Bos et al., 2005, Chapter 3.)
Indicator Definition Units Data required
Cropping intensity Actual cropped areaIrrigable area
% Actual cropped area (ha) Irrigable area (ha)
Crop yield Crop productionArea cultivated
kg/ha Crop production (kg) Area cultivated (ha)
Sustainability of irrigable area Average cropped areaInitial total irrigable area
– Average cropped area (ha) Initial total irrigable area (ha)
Overall consumed ratio Crop water demand − effective rainfallVolume of water supplied to command area
– Crop water demand (mm) Effective rainfall (mm) Irrigation water supply (mm)
Delivery performance ratio Actual flow of waterIntended flow of water
– Actual volume delivered (m3) Intended/planned volume to be delivered (m3)
Water productivity Yield of harvested cropVolume of supplied irrigation water
kg/m3 Crop production (kg) Volume of irrigation water supplied (m3)
Water level ratio Actual water levelDesign water level
– Actual water level (m) Design water level (m)
Field application ratio Crop water demand − effective rainfallVolume of water delivered to the fields
– Crop water demand (mm) Effective rainfall (mm) Irrigation water supply (mm)
Efficacy of infrastructure Functioning part of infrastructureTotal infrastructure
– Number of functioning structures Total number of structures
Groundwater depth Depth to groundwater m Depth to groundwater (m)
Indicator value on salinity Actual concentration of salinityCritical concentration of salinity
– Actual concentration of salinity (mmho/cm) Critical concentration of salinity (mmho/cm)
O&M fraction Cost of MOMTotal budget for sustainable MOM
– Cost of MOM ($) Total budget for sustainable MOM ($)
Fee collection ratio Irrigation service fees collectedIrrigation service fees due
– Irrigation service fees collected ($) Irrigation service fees due ($)
O&M, operation and maintenance; MOM, management, operation and maintenance.
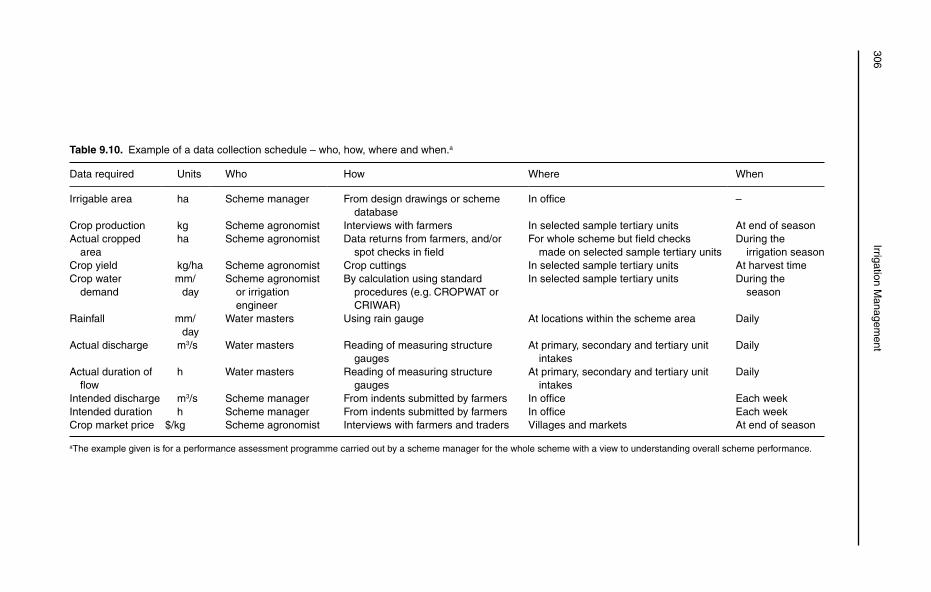
306Irrigation M
anagement
Table 9.10. Example of a data collection schedule – who, how, where and when.a
Data required Units Who How Where When
Irrigable area ha Scheme manager From design drawings or scheme database
In office –
Crop production kg Scheme agronomist Interviews with farmers In selected sample tertiary units At end of seasonActual cropped area
ha Scheme agronomist Data returns from farmers, and/or spot checks in field
For whole scheme but field checks made on selected sample tertiary units
During the irrigation season
Crop yield kg/ha Scheme agronomist Crop cuttings In selected sample tertiary units At harvest timeCrop water demand
mm/ day
Scheme agronomist or irrigation engineer
By calculation using standard procedures (e.g. CROPWAT or CRIWAR)
In selected sample tertiary units During the season
Rainfall mm/ day
Water masters Using rain gauge At locations within the scheme area Daily
Actual discharge m3/s Water masters Reading of measuring structure gauges
At primary, secondary and tertiary unit intakes
Daily
Actual duration of flow
h Water masters Reading of measuring structure gauges
At primary, secondary and tertiary unit intakes
Daily
Intended discharge m3/s Scheme manager From indents submitted by farmers In office Each weekIntended duration h Scheme manager From indents submitted by farmers In office Each weekCrop market price $/kg Scheme agronomist Interviews with farmers and traders Villages and markets At end of season
aThe example given is for a performance assessment programme carried out by a scheme manager for the whole scheme with a view to understanding overall scheme performance.
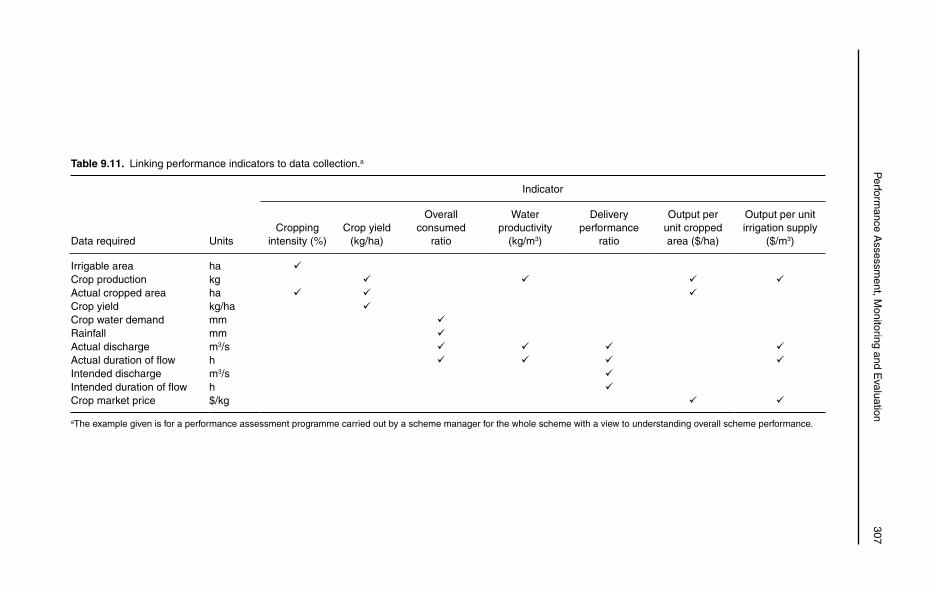
P
erformance A
ssessment, M
onitoring and Evaluation
307
Table 9.11. Linking performance indicators to data collection.a
Indicator
Data required UnitsCropping
intensity (%)Crop yield
(kg/ha)
Overall consumed
ratio
Water productivity
(kg/m3)
Delivery performance
ratio
Output per unit cropped area ($/ha)
Output per unit irrigation supply
($/m3)
Irrigable area ha ¸Crop production kg ¸ ¸ ¸ ¸Actual cropped area ha ¸ ¸ ¸Crop yield kg/ha ¸Crop water demand mm ¸Rainfall mm ¸Actual discharge m3/s ¸ ¸ ¸ ¸Actual duration of flow h ¸ ¸ ¸ ¸Intended discharge m3/s ¸Intended duration of flow h ¸Crop market price $/kg ¸ ¸
aThe example given is for a performance assessment programme carried out by a scheme manager for the whole scheme with a view to understanding overall scheme performance.
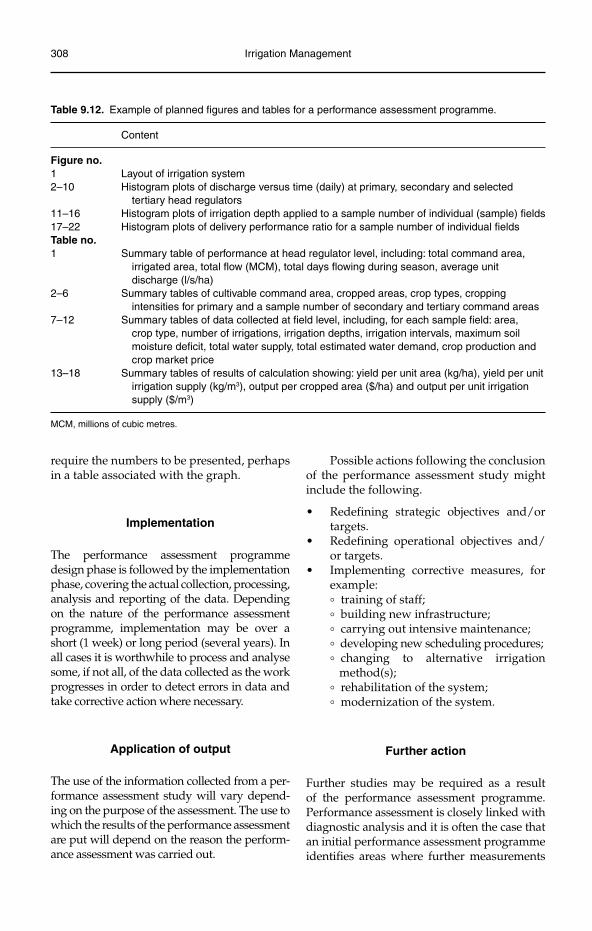
308 Irrigation Management
require the numbers to be presented, perhaps in a table associated with the graph.
Implementation
The performance assessment programme design phase is followed by the implementation phase, covering the actual collection, processing, analysis and reporting of the data. Depending on the nature of the performance assessment programme, implementation may be over a short (1 week) or long period (several years). In all cases it is worthwhile to process and analyse some, if not all, of the data collected as the work progresses in order to detect errors in data and take corrective action where necessary.
Application of output
The use of the information collected from a per-formance assessment study will vary depend-ing on the purpose of the assessment. The use to which the results of the performance assessment are put will depend on the reason the perform-ance assessment was carried out.
Possible actions following the conclusion of the performance assessment study might include the following.
Redefining strategic objectives and/or •targets.Redefining operational objectives and/•or targets.Implementing corrective measures, for •example:° training of staff;° building new infrastructure;° carrying out intensive maintenance;° developing new scheduling procedures;° changing to alternative irrigation
method(s);° rehabilitation of the system;° modernization of the system.
Further action
Further studies may be required as a result of the performance assessment programme. Performance assessment is closely linked with diagnostic analysis and it is often the case that an initial performance assessment programme identifies areas where further measurements
Table 9.12. Example of planned figures and tables for a performance assessment programme.
Content
Figure no.1 Layout of irrigation system2–10 Histogram plots of discharge versus time (daily) at primary, secondary and selected
tertiary head regulators11–16 Histogram plots of irrigation depth applied to a sample number of individual (sample) fields17–22 Histogram plots of delivery performance ratio for a sample number of individual fieldsTable no.1 Summary table of performance at head regulator level, including: total command area, irrigated area, total flow (MCM), total days flowing during season, average unit
discharge (l/s/ha)2–6 Summary tables of cultivable command area, cropped areas, crop types, cropping intensities for primary and a sample number of secondary and tertiary command areas7–12 Summary tables of data collected at field level, including, for each sample field: area, crop type, number of irrigations, irrigation depths, irrigation intervals, maximum soil
moisture deficit, total water supply, total estimated water demand, crop production and crop market price
13–18 Summary tables of results of calculation showing: yield per unit area (kg/ha), yield per unit irrigation supply (kg/m3), output per cropped area ($/ha) and output per unit irrigation
supply ($/m3)
MCM, millions of cubic metres.
Performance Assessment, Monitoring and Evaluation 309
and data collection are required in order to identify the root causes of problems and constraints.
Where performance assessment identi-fies the root cause of a problem or constraint, further studies may be required to implement measures to alleviate the problem, such as, for example, field surveys for the planning and design of a drainage system to relieve waterlogging.
Performance Assessment at Different Levels
As discussed previously, performance assess-ment can take place at different levels:
at the sector level when assessing how •irrigation and drainage is performing in comparison with the objectives set for the sector, and in comparison with other uses of water;at the scheme level when assessing how •individual schemes are performing against their own explicitly or implicitly stated objectives, or when assessing the performance of different schemes against themselves;at main system level where the perform-•ance of the water delivery service is assessed;at the on-farm level where the perform-•ance of the on-farm water delivery, water use and water application is assessed.3
The purpose of assessment at these different levels, and possible indicators to be used to assess performance, are briefly outlined in the following sections. It is important to note that the approach adopted here is that water delivery and water removal are taken as the primary function; other functions such as maintenance, fee recovery and the like are subsidiary to the prime function. Fee recovery, for example, is important in order that management staff can be employed and maintenance work carried out, with the end product that water is delivered to the crops’ root zone at the right time and in the right quantity to match the crops’ needs.
Sector level
At the sector level performance assessment is focused on the productivity of financial investment in the irrigation and drainage sector and on the productivity and effi-ciency of water use. In many countries and river basins there is increasing pressure on the available water resources, and an increasing need to justify the use of water for agricultural use against other uses, such as for domestic, industrial, environmental or navigation use. Assessment at this level is generally carried out by government, either through the water resource agency or by consultants.
Scheme level
At the scheme level performance assessment is focused on the outputs, outcomes and impacts of the I&D scheme. Outputs will generally focus on crop produc-tion, while outcomes will generally focus on protecting livelihoods and financial benefits to the farming community. The interest in impacts may range from the environmental impact of the scheme to its wider impact on the rural and national economy.
Table 9.13 presents key indicators that can be used for performance assessment at this level, with indicators covering a range of domains, including agricultural produc-tion, irrigation water delivery, drainage water removal, finance, and environmental protection.
Main system level
At the main system level performance assessment is focused on water delivery, which will depend on the management, operation and maintenance processes and procedures of the main system service provider. Table 9.14 summarizes the key indicators that can be used for assessing main system water delivery performance.
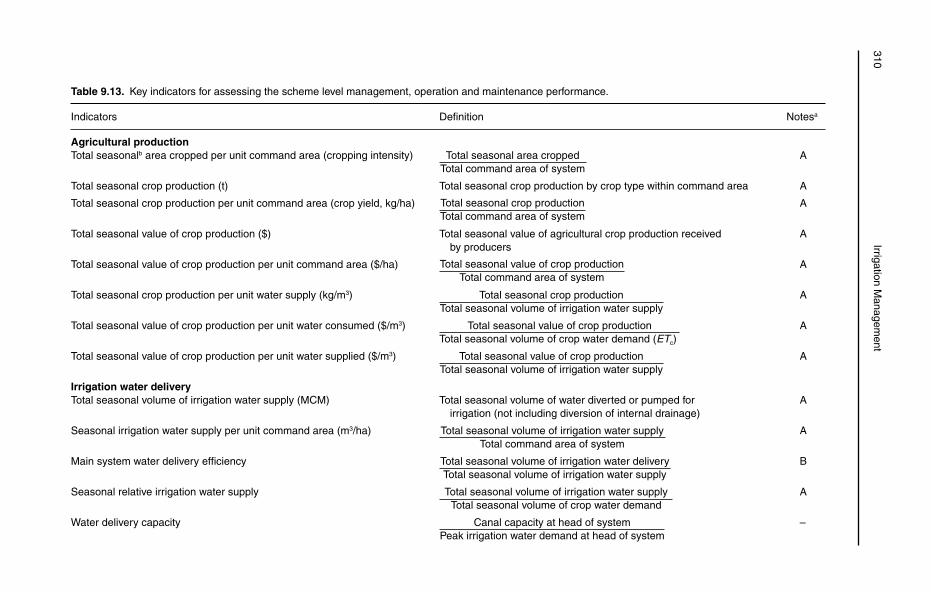
310Irrigation M
anagement
Table 9.13. Key indicators for assessing the scheme level management, operation and maintenance performance.
Indicators Definition Notesa
Agricultural productionTotal seasonalb area cropped per unit command area (cropping intensity) Total seasonal area cropped
Total command area of system A
Total seasonal crop production (t) Total seasonal crop production by crop type within command area A
Total seasonal crop production per unit command area (crop yield, kg/ha) Total seasonal crop productionTotal command area of system
A
Total seasonal value of crop production ($) Total seasonal value of agricultural crop production received A by producers
Total seasonal value of crop production per unit command area ($/ha) Total seasonal value of crop productionTotal command area of system
A
Total seasonal crop production per unit water supply (kg/m3) Total seasonal crop productionTotal seasonal volume of irrigation water supply
A
Total seasonal value of crop production per unit water consumed ($/m3) Total seasonal value of crop productionTotal seasonal volume of crop water demand (ETc)
A
Total seasonal value of crop production per unit water supplied ($/m3) Total seasonal value of crop productionTotal seasonal volume of irrigation water supply
A
Irrigation water deliveryTotal seasonal volume of irrigation water supply (MCM) Total seasonal volume of water diverted or pumped for A
irrigation (not including diversion of internal drainage)
Seasonal irrigation water supply per unit command area (m3/ha) Total seasonal volume of irrigation water supplyTotal command area of system
A
Main system water delivery efficiency Total seasonal volume of irrigation water deliveryTotal seasonal volume of irrigation water supply
B
Seasonal relative irrigation water supply Total seasonal volume of irrigation water supplyTotal seasonal volume of crop water demand
A
Water delivery capacity Canal capacity at head of systemPeak irrigation water demand at head of system
–
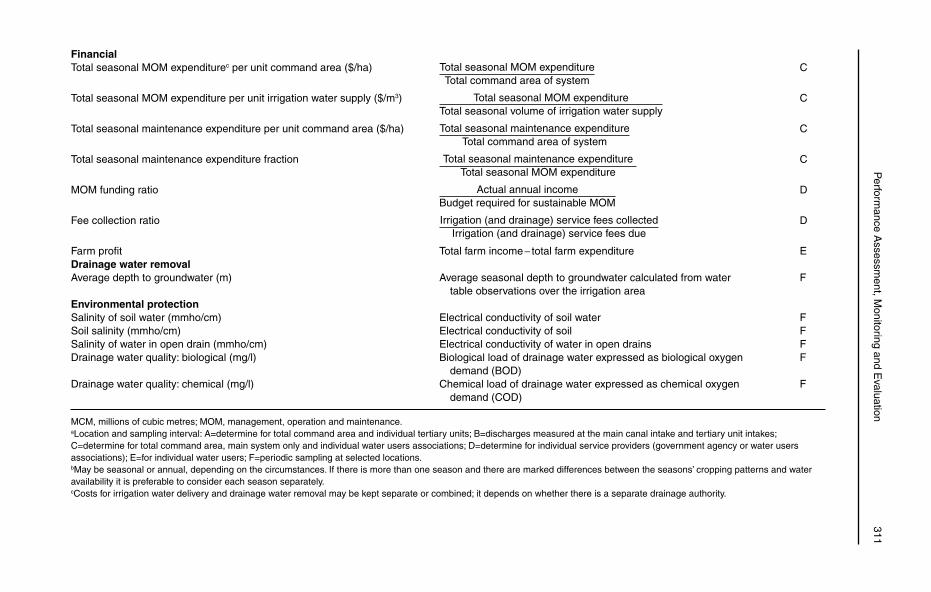
P
erformance A
ssessment, M
onitoring and Evaluation
311FinancialTotal seasonal MOM expenditurec per unit command area ($/ha) Total seasonal MOM expenditure
Total command area of system C
Total seasonal MOM expenditure per unit irrigation water supply ($/m3) Total seasonal MOM expenditureTotal seasonal volume of irrigation water supply
C
Total seasonal maintenance expenditure per unit command area ($/ha) Total seasonal maintenance expenditureTotal command area of system
C
Total seasonal maintenance expenditure fraction Total seasonal maintenance expenditureTotal seasonal MOM expenditure
C
MOM funding ratio Actual annual incomeBudget required for sustainable MOM
D
Fee collection ratio Irrigation (and drainage) service fees collectedIrrigation (and drainage) service fees due
D
Farm profit Total farm income − total farm expenditure EDrainage water removalAverage depth to groundwater (m) Average seasonal depth to groundwater calculated from water F
table observations over the irrigation area Environmental protectionSalinity of soil water (mmho/cm) Electrical conductivity of soil water FSoil salinity (mmho/cm) Electrical conductivity of soil FSalinity of water in open drain (mmho/cm) Electrical conductivity of water in open drains FDrainage water quality: biological (mg/l) Biological load of drainage water expressed as biological oxygen F
demand (BOD) Drainage water quality: chemical (mg/l) Chemical load of drainage water expressed as chemical oxygen F
demand (COD)
MCM, millions of cubic metres; MOM, management, operation and maintenance.aLocation and sampling interval: A=determine for total command area and individual tertiary units; B=discharges measured at the main canal intake and tertiary unit intakes; C=determine for total command area, main system only and individual water users associations; D=determine for individual service providers (government agency or water users associations); E=for individual water users; F=periodic sampling at selected locations.bMay be seasonal or annual, depending on the circumstances. If there is more than one season and there are marked differences between the seasons’ cropping patterns and water availability it is preferable to consider each season separately.cCosts for irrigation water delivery and drainage water removal may be kept separate or combined; it depends on whether there is a separate drainage authority.
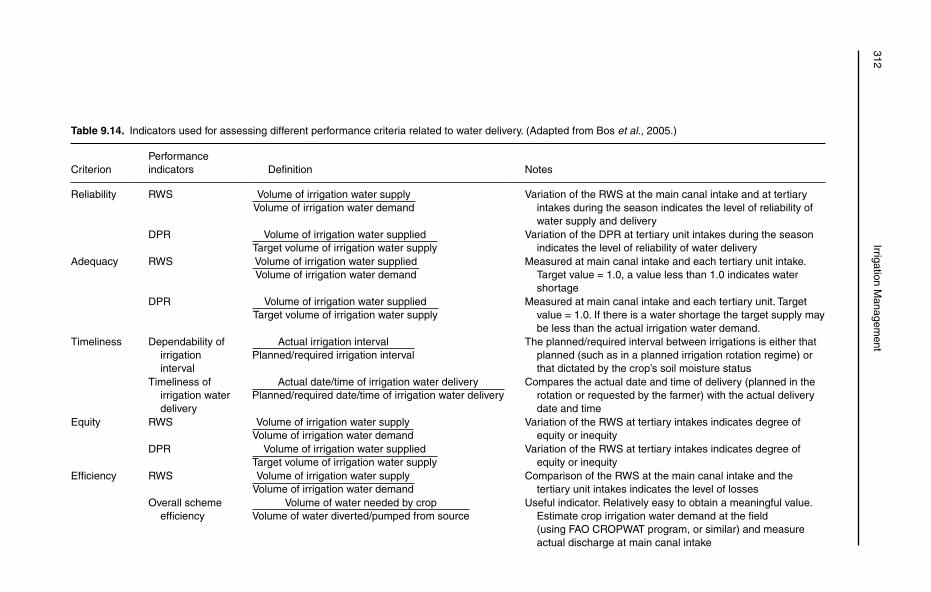
312Irrigation M
anagement
Table 9.14. Indicators used for assessing different performance criteria related to water delivery. (Adapted from Bos et al., 2005.)
CriterionPerformanceindicators Definition Notes
Reliability RWS Volume of irrigation water supplyVolume of irrigation water demand
Variation of the RWS at the main canal intake and at tertiary intakes during the season indicates the level of reliability of water supply and delivery
DPR Volume of irrigation water suppliedTarget volume of irrigation water supply
Variation of the DPR at tertiary unit intakes during the season indicates the level of reliability of water delivery
Adequacy RWS Volume of irrigation water suppliedVolume of irrigation water demand
Measured at main canal intake and each tertiary unit intake. Target value = 1.0, a value less than 1.0 indicates water shortage
DPR Volume of irrigation water suppliedTarget volume of irrigation water supply
Measured at main canal intake and each tertiary unit. Target value = 1.0. If there is a water shortage the target supply may be less than the actual irrigation water demand.
Timeliness Dependability of irrigation interval
Actual irrigation intervalPlanned/required irrigation interval
The planned/required interval between irrigations is either that planned (such as in a planned irrigation rotation regime) or that dictated by the crop’s soil moisture status
Timeliness of irrigation water delivery
Actual date/time of irrigation water deliveryPlanned/required date/time of irrigation water delivery
Compares the actual date and time of delivery (planned in the rotation or requested by the farmer) with the actual delivery date and time
Equity RWS Volume of irrigation water supplyVolume of irrigation water demand
Variation of the RWS at tertiary intakes indicates degree of equity or inequity
DPR Volume of irrigation water suppliedTarget volume of irrigation water supply
Variation of the RWS at tertiary intakes indicates degree of equity or inequity
Efficiency RWS Volume of irrigation water supplyVolume of irrigation water demand
Comparison of the RWS at the main canal intake and the tertiary unit intakes indicates the level of losses
Overall scheme efficiency
Volume of water needed by cropVolume of water diverted/pumped from source
Useful indicator. Relatively easy to obtain a meaningful value. Estimate crop irrigation water demand at the field (using FAO CROPWAT program, or similar) and measure actual discharge at main canal intake
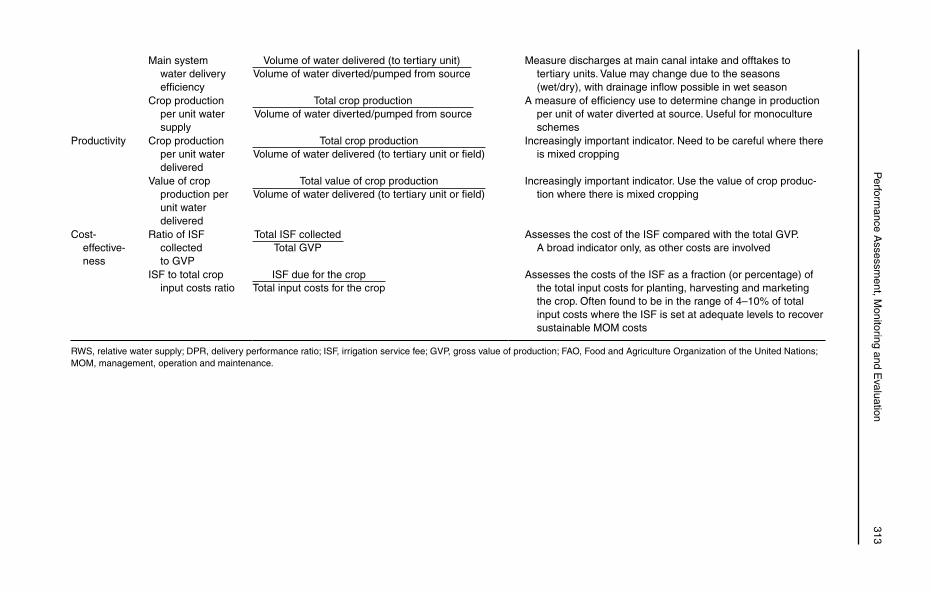
P
erformance A
ssessment, M
onitoring and Evaluation
313Main system
water delivery efficiency
Volume of water delivered (to tertiary unit)Volume of water diverted/pumped from source
Measure discharges at main canal intake and offtakes to tertiary units. Value may change due to the seasons (wet/dry), with drainage inflow possible in wet season
Crop production per unit water supply
Total crop productionVolume of water diverted/pumped from source
A measure of efficiency use to determine change in production per unit of water diverted at source. Useful for monoculture schemes
Productivity Crop production per unit water delivered
Total crop productionVolume of water delivered (to tertiary unit or field)
Increasingly important indicator. Need to be careful where there is mixed cropping
Value of crop production per unit water delivered
Total value of crop productionVolume of water delivered (to tertiary unit or field)
Increasingly important indicator. Use the value of crop produc-tion where there is mixed cropping
Cost-effective-ness
Ratio of ISF collectedto GVP
Total ISF collectedTotal GVP
Assesses the cost of the ISF compared with the total GVP. A broad indicator only, as other costs are involved
ISF to total crop input costs ratio
ISF due for the cropTotal input costs for the crop
Assesses the costs of the ISF as a fraction (or percentage) of the total input costs for planting, harvesting and marketing the crop. Often found to be in the range of 4–10% of total input costs where the ISF is set at adequate levels to recover sustainable MOM costs
RWS, relative water supply; DPR, delivery performance ratio; ISF, irrigation service fee; GVP, gross value of production; FAO, Food and Agriculture Organization of the United Nations; MOM, management, operation and maintenance.
314 Irrigation Management
On-farm level
At the on-farm level performance assessment is focused on water delivery from the tertiary unit intake to the farmers’ field(s), and water application by the farmer to the crops in the field. In some cases the performance assess-ment can be subdivided into the water deliv-ery function, often carried out by the water users association (WUA), and the water application function, generally carried out by the farmer. In these cases the assessment will look separately at the performance of the WUA and the performance of the farmer. Output from the field may be constrained by the performance of the farmer, or the WUA, or both, and might also be constrained by the water delivery pattern in the main system.
An example of a scoring system used for assessing the performance of water users associations is presented in Table 9.15. The indicators are divided into categories cov-ering institutional, financial and technical performance of the WUA. Scores are applied by the assessment team to each of the indica-tors based on the achievement against stated target values.4
One of the most detailed guides for assessing irrigation performance at field level is by Merriam and Keller (1978). A subsequent publication under the FAO Irrigation and Drainage Paper series (FAO, 1989) built on this work and provided computer models to assist in the design and evaluation of surface irriga-tion methods. The performance indicators are relatively straightforward (Table 9.16), assess-ing the water actually applied against the water required in the root zone. Measurement and determination of the value of the indica-tors is, however, less straightforward.
Framework for Monitoring and Evaluation5
Purpose and definition
Monitoring and evaluation are distinct but related activities, as can be seen from the fol-lowing definitions (Casley and Kumar, 1987; OECD, 2002).
Monitoring• is the continuous collection of data on specified indicators to assess for a development intervention (project, programme or policy), its implementa-tion in relation to activity schedules and expenditure of allocated funds, and its progress and achievements in relation to its objectives.Evaluation• is the periodic assessment of the design, implementation, outcomes and impact of a development intervention. It should assess the relevance and achieve-ment of objectives, the implementation performance in terms of effectiveness and efficiency, and the nature, distribution and sustainability of impacts.
The linkage between monitoring and evalua-tion takes various forms:
monitoring can raise issues for evalua-•tion, while evaluation results can indi-cate where new processes or activities need to be monitored;monitoring and evaluation are used •together by managers to identify and then diagnose problem areas;monitoring and evaluation often use the •same data, but use these data in different ways.
Monitoring compares actual progress with that planned for a project, and provides man-agers and others with regular updates on the progress made towards the final outputs and outcomes of the project. Good monitoring is dependent on an effective management infor-mation system, the design and implementa-tion of which is one of the first tasks when implementing a project.
Evaluation can take place either during project implementation or at the end. Project managers will need to evaluate the progress of a project and establish why targets are, or are not, being met. Formal evaluations may be required, such as are carried out by fund-ing agencies, for mid-term or final reviews to establish project progress and achievements against the stated targets. Mid-term evalua-tions can be important in identifying problem areas and measures to address such problems in good time. Ex-post evaluations can be car-ried out some while after completion of the project in order to measure the full impacts of
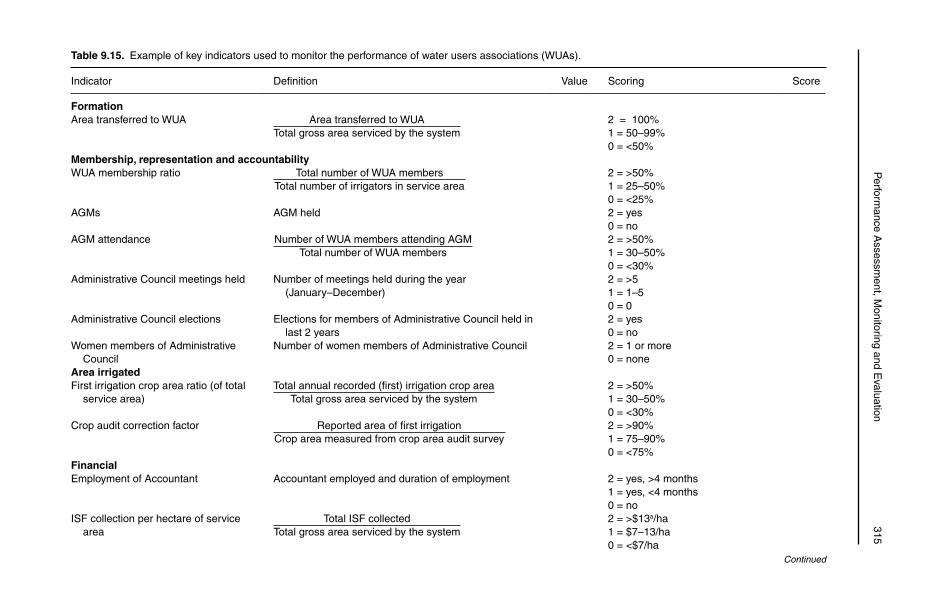
P
erformance A
ssessment, M
onitoring and Evaluation
315Table 9.15. Example of key indicators used to monitor the performance of water users associations (WUAs).
Indicator Definition Value Scoring Score
FormationArea transferred to WUA Area transferred to WUA
Total gross area serviced by the system2 = 100%1 = 50–99%0 = <50%
Membership, representation and accountabilityWUA membership ratio Total number of WUA members
Total number of irrigators in service area2 = >50%1 = 25–50%0 = <25%
AGMs AGM held 2 = yes0 = no
AGM attendance Number of WUA members attending AGMTotal number of WUA members
2 = >50%1 = 30–50%0 = <30%
Administrative Council meetings held Number of meetings held during the year (January–December)
2 = >51 = 1–50 = 0
Administrative Council elections Elections for members of Administrative Council held in last 2 years
2 = yes0 = no
Women members of Administrative Council
Number of women members of Administrative Council 2 = 1 or more0 = none
Area irrigatedFirst irrigation crop area ratio (of total
service area)Total annual recorded (first) irrigation crop area
Total gross area serviced by the system2 = >50%1 = 30–50%0 = <30%
Crop audit correction factor Reported area of first irrigationCrop area measured from crop area audit survey
2 = >90%1 = 75–90%0 = <75%
FinancialEmployment of Accountant Accountant employed and duration of employment 2 = yes, >4 months
1 = yes, <4 months0 = no
ISF collection per hectare of service area
Total ISF collectedTotal gross area serviced by the system
2 = >$13a/ha1 = $7–13/ha0 = <$7/ha
Continued
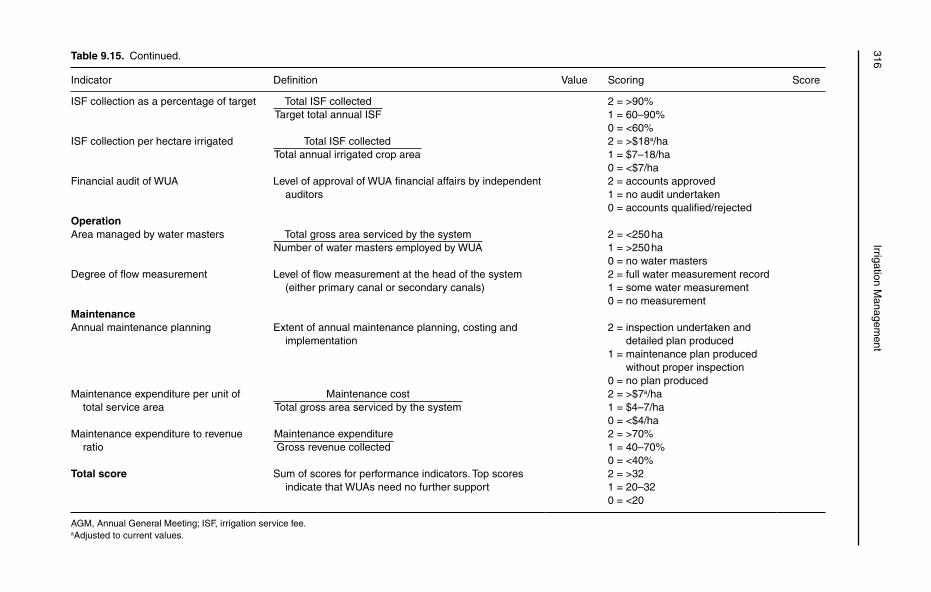
316Irrigation M
anagement
Table 9.15. Continued.
Indicator Definition Value Scoring Score
ISF collection as a percentage of target Total ISF collectedTarget total annual ISF
2 = >90%1 = 60–90%0 = <60%
ISF collection per hectare irrigated Total ISF collectedTotal annual irrigated crop area
2 = >$18a/ha1 = $7–18/ha0 = <$7/ha
Financial audit of WUA Level of approval of WUA financial affairs by independent auditors
2 = accounts approved1 = no audit undertaken0 = accounts qualified/rejected
OperationArea managed by water masters Total gross area serviced by the system
Number of water masters employed by WUA2 = <250 ha1 = >250 ha0 = no water masters
Degree of flow measurement Level of flow measurement at the head of the system (either primary canal or secondary canals)
2 = full water measurement record1 = some water measurement0 = no measurement
MaintenanceAnnual maintenance planning Extent of annual maintenance planning, costing and
implementation2 = inspection undertaken and
detailed plan produced1 = maintenance plan produced
without proper inspection0 = no plan produced
Maintenance expenditure per unit of total service area
Maintenance costTotal gross area serviced by the system
2 = >$7a/ha1 = $4–7/ha0 = <$4/ha
Maintenance expenditure to revenue ratio
Maintenance expenditureGross revenue collected
2 = >70%1 = 40–70%0 = <40%
Total score Sum of scores for performance indicators. Top scores indicate that WUAs need no further support
2 = >321 = 20–320 = <20
AGM, Annual General Meeting; ISF, irrigation service fee.aAdjusted to current values.
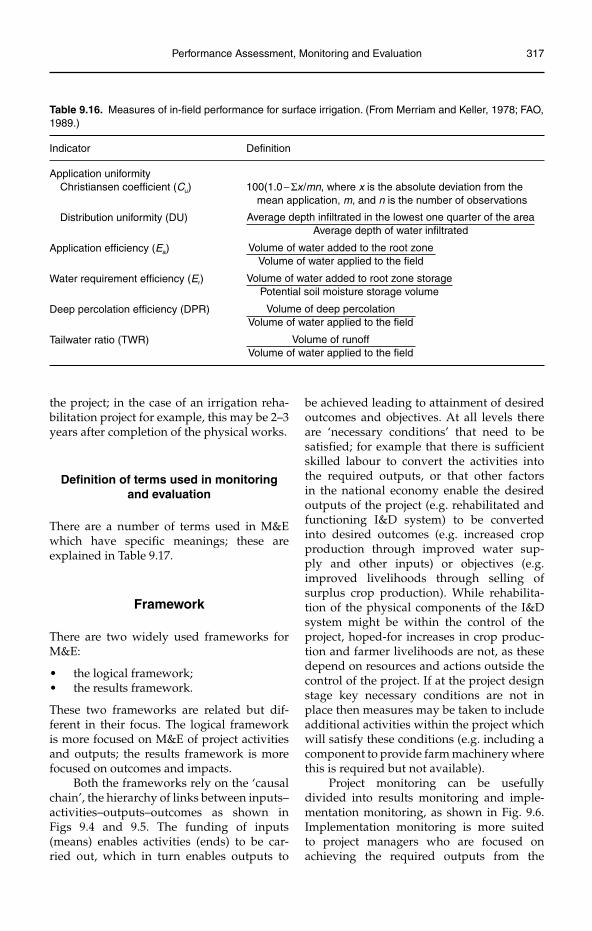
Performance Assessment, Monitoring and Evaluation 317
the project; in the case of an irrigation reha-bilitation project for example, this may be 2–3 years after completion of the physical works.
Definition of terms used in monitoring and evaluation
There are a number of terms used in M&E which have specific meanings; these are explained in Table 9.17.
Framework
There are two widely used frameworks for M&E:
the logical framework;•the results framework.•
These two frameworks are related but dif-ferent in their focus. The logical framework is more focused on M&E of project activities and outputs; the results framework is more focused on outcomes and impacts.
Both the frameworks rely on the ‘causal chain’, the hierarchy of links between inputs–activities–outputs–outcomes as shown in Figs 9.4 and 9.5. The funding of inputs (means) enables activities (ends) to be car-ried out, which in turn enables outputs to
be achieved leading to attainment of desired outcomes and objectives. At all levels there are ‘necessary conditions’ that need to be satisfied; for example that there is sufficient skilled labour to convert the activities into the required outputs, or that other factors in the national economy enable the desired outputs of the project (e.g. rehabilitated and functioning I&D system) to be converted into desired outcomes (e.g. increased crop production through improved water sup-ply and other inputs) or objectives (e.g. improved livelihoods through selling of surplus crop production). While rehabilita-tion of the physical components of the I&D system might be within the control of the project, hoped-for increases in crop produc-tion and farmer livelihoods are not, as these depend on resources and actions outside the control of the project. If at the project design stage key necessary conditions are not in place then measures may be taken to include additional activities within the project which will satisfy these conditions (e.g. including a component to provide farm machinery where this is required but not available).
Project monitoring can be usefully divided into results monitoring and imple-mentation monitoring, as shown in Fig. 9.6. Implementation monitoring is more suited to project managers who are focused on achieving the required outputs from the
Table 9.16. Measures of in-field performance for surface irrigation. (From Merriam and Keller, 1978; FAO, 1989.)
Indicator Definition
Application uniformity Christiansen coefficient (Cu) 100(1.0−Σx/mn, where x is the absolute deviation from the
mean application, m, and n is the number of observations
Distribution uniformity (DU) Average depth infiltrated in the lowest one quarter of the areaAverage depth of water infiltrated
Application efficiency (Ea) Volume of water added to the root zoneVolume of water applied to the field
Water requirement efficiency (Er) Volume of water added to root zone storagePotential soil moisture storage volume
Deep percolation efficiency (DPR) Volume of deep percolationVolume of water applied to the field
Tailwater ratio (TWR) Volume of runoffVolume of water applied to the field
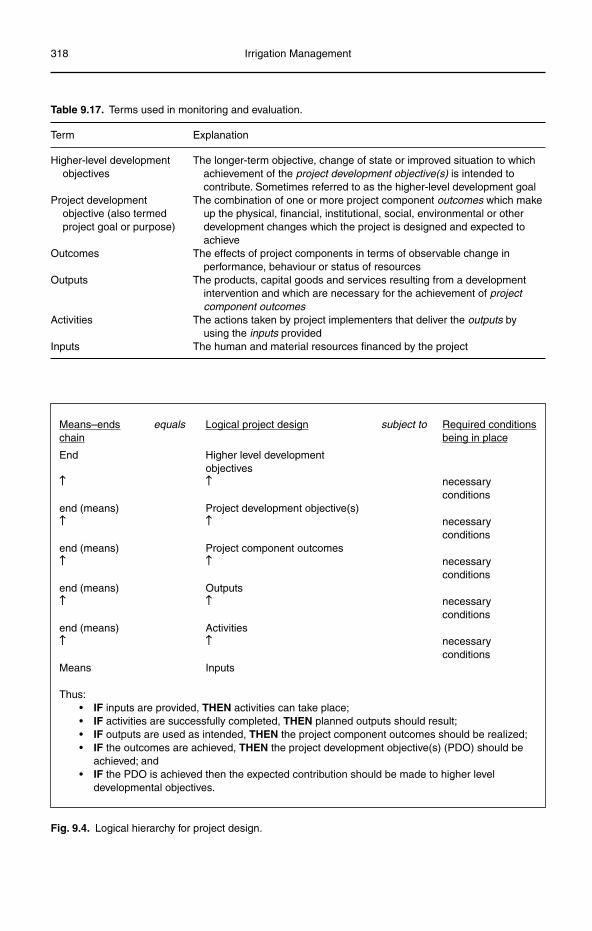
318 Irrigation Management
Table 9.17. Terms used in monitoring and evaluation.
Term Explanation
Higher-level development The longer-term objective, change of state or improved situation to whichobjectives achievement of the project development objective(s) is intended to
contribute. Sometimes referred to as the higher-level development goalProject development The combination of one or more project component outcomes which make
objective (also termed up the physical, financial, institutional, social, environmental or otherproject goal or purpose) development changes which the project is designed and expected to achieve
Outcomes The effects of project components in terms of observable change in performance, behaviour or status of resources
Outputs The products, capital goods and services resulting from a development intervention and which are necessary for the achievement of project
component outcomesActivities The actions taken by project implementers that deliver the outputs by
using the inputs providedInputs The human and material resources financed by the project
Means–ends equals Logical project design subject to Required conditionschain being in place
End Higher level development objectives ≠ ≠ necessary conditionsend (means) Project development objective(s) ≠ ≠ necessary conditionsend (means) Project component outcomes ≠ ≠ necessary conditionsend (means) Outputs ≠ ≠ necessary conditionsend (means) Activities ≠ ≠ necessary conditionsMeans Inputs
Thus:• IF inputs are provided, THEN activities can take place;• IF activities are successfully completed, THEN planned outputs should result;• IF outputs are used as intended, THEN the project component outcomes should be realized;• IF the outcomes are achieved, THEN the project development objective(s) (PDO) should be
achieved; and• IF the PDO is achieved then the expected contribution should be made to higher level
developmental objectives.
Fig. 9.4. Logical hierarchy for project design.
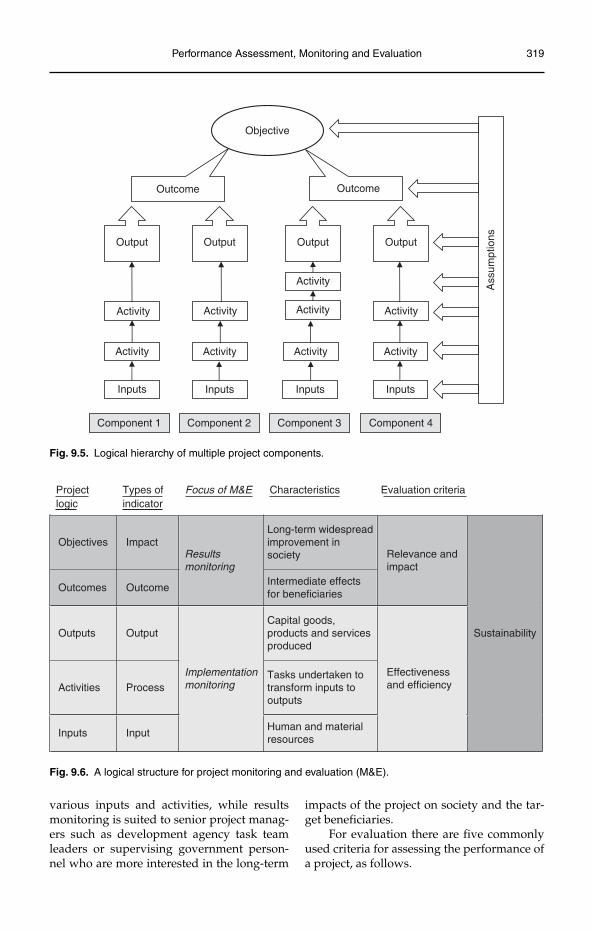
Performance Assessment, Monitoring and Evaluation 319
Activity Activity
ActivityActivityActivityActivity
Activity
Activity
Activity
InputsInputsInputsInputs
Objective
Output Output Output Output
Ass
umpt
ions
OutcomeOutcome
Component 1 Component 2 Component 3 Component 4
Fig. 9.5. Logical hierarchy of multiple project components.
Projectlogic
Types of indicator
Focus of M&E Characteristics Evaluation criteria
Objectives ImpactLong-term widespreadimprovement in society
Outcomes Outcome
Resultsmonitoring
Intermediate effectsfor beneficiaries
Relevance andimpact
Outputs OutputCapital goods,products and servicesproduced
Activities ProcessTasks undertaken totransform inputs tooutputs
Inputs Input
Implementationmonitoring
Human and materialresources
Effectivenessand efficiency
Sustainability
Fig. 9.6. A logical structure for project monitoring and evaluation (M&E).
various inputs and activities, while results monitoring is suited to senior project manag-ers such as development agency task team leaders or supervising government person-nel who are more interested in the long-term
impacts of the project on society and the tar-get beneficiaries.
For evaluation there are five commonly used criteria for assessing the performance of a project, as follows.
320 Irrigation Management
1. Impact: The effect of the project on its wider environment, and its contribution to the wider policy, sector or Country Assistance Strategy development objectives.2. Relevance: The appropriateness of proj-ect objectives to the problems intended to be addressed, and to the physical and policy envi-ronment within which the project operates.3. Effectiveness: How well the outputs contrib-uted to the achievement of project component outcomes and the overall project develop-ment objective(s), and how well assumed external conditions contributed to project achievements.4. Efficiency: Whether project outputs have been achieved at reasonable cost, i.e. how well inputs have been used in activities and converted into outputs.5. Sustainability: The likelihood that benefits produced by the project continue to flow after external funding has ended.
The role of these five criteria in relation to the project logic and types of indicator are shown in the last two columns of Figure 9.6.
The logical framework
The logical framework was developed in the 1960s as a tool to improve project planning and implementation, and has been adopted by a number of development agencies, includ-ing the World Bank, as a project planning and management tool. At the core of the process is the logical framework matrix (Table 9.18), which is used to summarize the thinking that has occurred in the planning of the project based on problem and stakeholder analysis. The matrix comprises four columns and six rows which show:
the hierarchy of project objectives (the •causal chain or project logic);the indicators and sources of data to •show how the project and its results will be monitored and evaluated;the assumptions and risks faced at each •level showing the necessary external conditions that need to be satisfied if the next level up is to be achieved.
The stages followed in project planning contributing to the logical framework analy-
sis are outlined in Box 9.1, while the sections below summarize the steps that are followed in formulating the logical framework matrix.
Identification of the target group
The first step is to identify the target group that the project intends to benefit, influence or change the behaviour of. The choice of the target group influences the approach of the project, the level of technology employed and the institutional and organizational arrange-ments that are required. Issues of status, access to resources, caste, ethnic status, gen-der, occupation/form of livelihood need to be considered and specified where appropriate.
Setting objectives
An objective states the desired state that is to be achieved through implementation of the project. There are three key objectives: (i) the higher-level development objective; (ii) the project development objective6 (PDO); and (iii) the intermediate objectives identi-fied for each project outcome. The PDO needs to specify the changes that can be expected in the target group, organization or location if the project is completed successfully, and must be a specific statement whose achieve-ment can be verified. It is important that the PDO is realistic, and does not overstate the aims of the project. For example, a rehabili-tation project will improve irrigation water delivery and thereby agricultural produc-tion; its impact on poverty eradication is less clear-cut, though this might be the higher-level objective in association with other interventions.
Identifying project outputs
Outputs are the result of the conversion of project inputs through the various project activities, and are a precondition for achieve-ment of the project objectives. Importantly the achievement of the specified outputs is within the control of the project management, for which they should be held accountable. It is important that outputs are: identified; quantified (in terms of quantity, quality, time and place); realistic; and feasible within the resources available. Often there are several
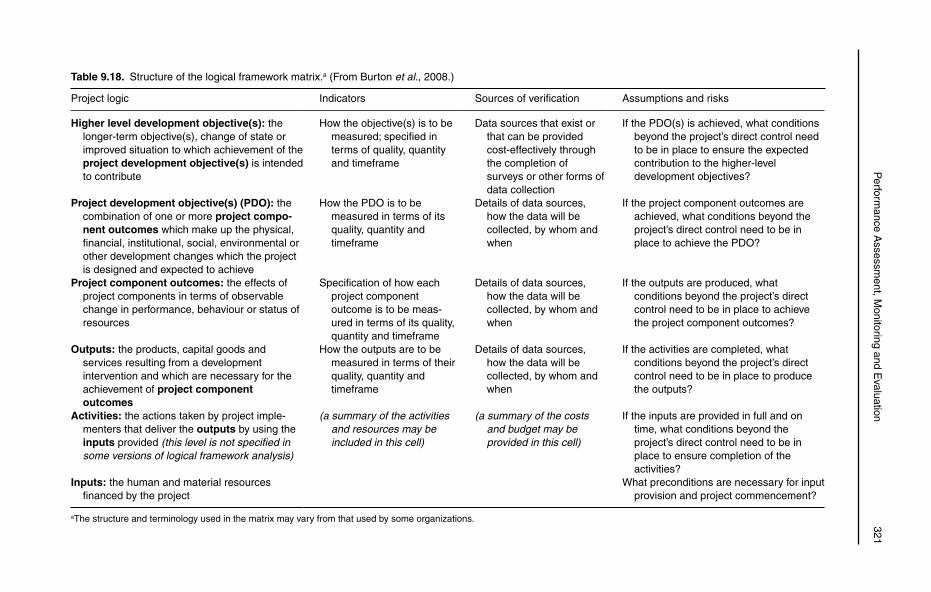
P
erformance A
ssessment, M
onitoring and Evaluation
321
Table 9.18. Structure of the logical framework matrix.a (From Burton et al., 2008.)
Project logic Indicators Sources of verification Assumptions and risks
Higher level development objective(s): the longer-term objective(s), change of state or improved situation to which achievement of the project development objective(s) is intended to contribute
How the objective(s) is to be measured; specified in terms of quality, quantity and timeframe
Data sources that exist or that can be provided cost-effectively through the completion of surveys or other forms of data collection
If the PDO(s) is achieved, what conditions beyond the project’s direct control need to be in place to ensure the expected contribution to the higher-level development objectives?
Project development objective(s) (PDO): the combination of one or more project compo-nent outcomes which make up the physical, financial, institutional, social, environmental or other development changes which the project is designed and expected to achieve
How the PDO is to be measured in terms of its quality, quantity and timeframe
Details of data sources, how the data will be collected, by whom and when
If the project component outcomes are achieved, what conditions beyond the project’s direct control need to be in place to achieve the PDO?
Project component outcomes: the effects of project components in terms of observable change in performance, behaviour or status of resources
Specification of how each project component outcome is to be meas-ured in terms of its quality, quantity and timeframe
Details of data sources, how the data will be collected, by whom and when
If the outputs are produced, what conditions beyond the project’s direct control need to be in place to achieve the project component outcomes?
Outputs: the products, capital goods and services resulting from a development intervention and which are necessary for the achievement of project component outcomes
How the outputs are to be measured in terms of their quality, quantity and timeframe
Details of data sources, how the data will be collected, by whom and when
If the activities are completed, what conditions beyond the project’s direct control need to be in place to produce the outputs?
Activities: the actions taken by project imple-menters that deliver the outputs by using the inputs provided (this level is not specified in some versions of logical framework analysis)
(a summary of the activities and resources may be included in this cell)
(a summary of the costs and budget may be provided in this cell)
If the inputs are provided in full and on time, what conditions beyond the project’s direct control need to be in place to ensure completion of the activities?
Inputs: the human and material resources financed by the project
What preconditions are necessary for input provision and project commencement?
aThe structure and terminology used in the matrix may vary from that used by some organizations.
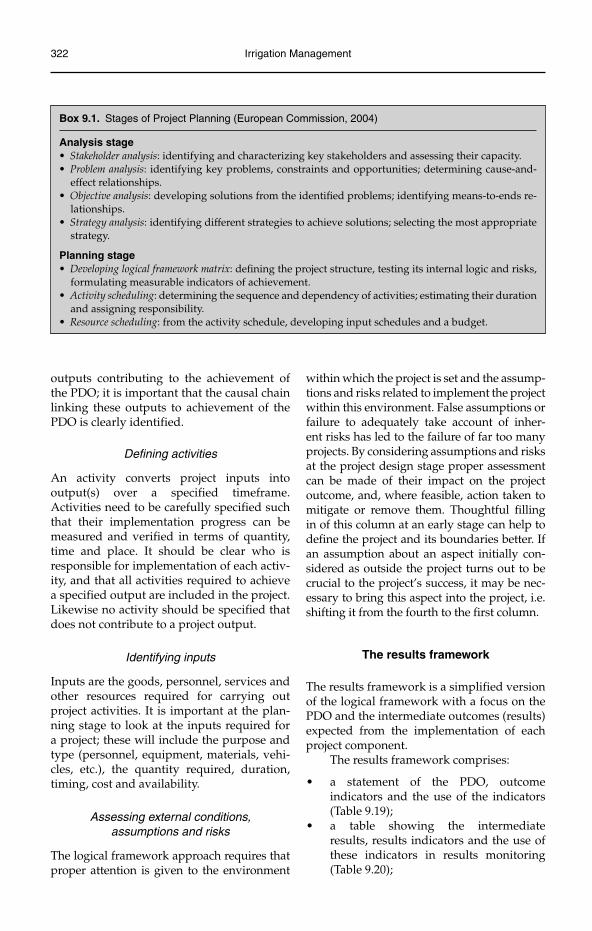
322 Irrigation Management
outputs contributing to the achievement of the PDO; it is important that the causal chain linking these outputs to achievement of the PDO is clearly identified.
Defining activities
An activity converts project inputs into output(s) over a specified timeframe. Activities need to be carefully specified such that their implementation progress can be measured and verified in terms of quantity, time and place. It should be clear who is responsible for implementation of each activ-ity, and that all activities required to achieve a specified output are included in the project. Likewise no activity should be specified that does not contribute to a project output.
Identifying inputs
Inputs are the goods, personnel, services and other resources required for carrying out project activities. It is important at the plan-ning stage to look at the inputs required for a project; these will include the purpose and type (personnel, equipment, materials, vehi-cles, etc.), the quantity required, duration, timing, cost and availability.
Assessing external conditions, assumptions and risks
The logical framework approach requires that proper attention is given to the environment
within which the project is set and the assump-tions and risks related to implement the project within this environment. False assumptions or failure to adequately take account of inher-ent risks has led to the failure of far too many projects. By considering assumptions and risks at the project design stage proper assessment can be made of their impact on the project outcome, and, where feasible, action taken to mitigate or remove them. Thoughtful filling in of this column at an early stage can help to define the project and its boundaries better. If an assumption about an aspect initially con-sidered as outside the project turns out to be crucial to the project’s success, it may be nec-essary to bring this aspect into the project, i.e. shifting it from the fourth to the first column.
The results framework
The results framework is a simplified version of the logical framework with a focus on the PDO and the intermediate outcomes (results) expected from the implementation of each project component.
The results framework comprises:
a statement of the PDO, outcome • indicators and the use of the indicators (Table 9.19);a table showing the intermediate •results, results indicators and the use of these indicators in results monitoring (Table 9.20);
Box 9.1. Stages of Project Planning (European Commission, 2004)
Analysis stageStakeholder analysis• : identifying and characterizing key stakeholders and assessing their capacity.Problem analysis• : identifying key problems, constraints and opportunities; determining cause-and-effect relationships.Objective analysis• : developing solutions from the identifi ed problems; identifying means-to-ends re-lationships.Strategy analysis• : identifying different strategies to achieve solutions; selecting the most appropriate strategy.
Planning stageDeveloping logical framework matrix• : defi ning the project structure, testing its internal logic and risks, formulating measurable indicators of achievement.Activity scheduling• : determining the sequence and dependency of activities; estimating their duration and assigning responsibility.Resource scheduling• : from the activity schedule, developing input schedules and a budget.
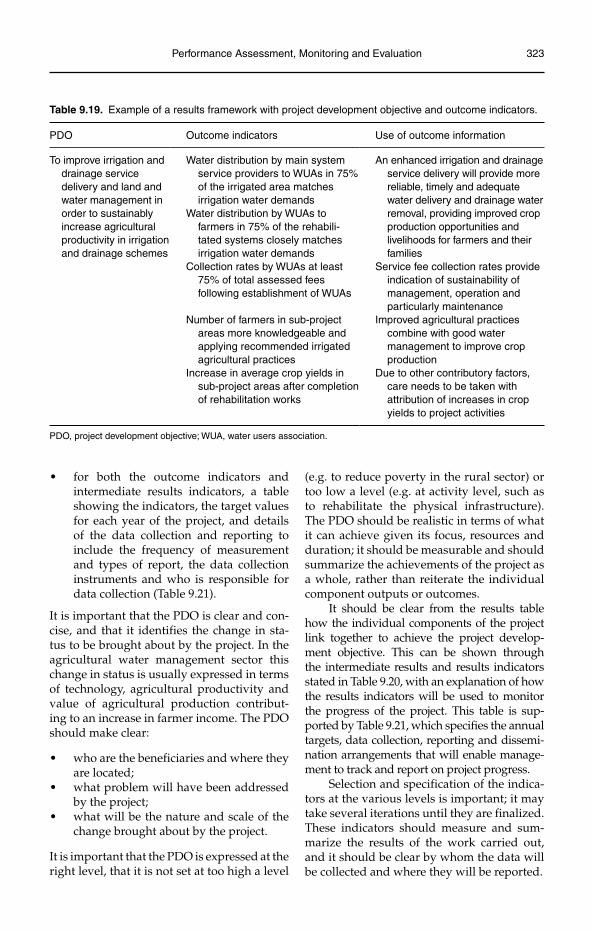
Performance Assessment, Monitoring and Evaluation 323
for both the outcome indicators and •intermediate results indicators, a table showing the indicators, the target values for each year of the project, and details of the data collection and reporting to include the frequency of measurement and types of report, the data collection instruments and who is responsible for data collection (Table 9.21).
It is important that the PDO is clear and con-cise, and that it identifies the change in sta-tus to be brought about by the project. In the agricultural water management sector this change in status is usually expressed in terms of technology, agricultural productivity and value of agricultural production contribut-ing to an increase in farmer income. The PDO should make clear:
who are the beneficiaries and where they •are located;what problem will have been addressed •by the project;what will be the nature and scale of the •change brought about by the project.
It is important that the PDO is expressed at the right level, that it is not set at too high a level
(e.g. to reduce poverty in the rural sector) or too low a level (e.g. at activity level, such as to rehabilitate the physical infrastructure). The PDO should be realistic in terms of what it can achieve given its focus, resources and duration; it should be measurable and should summarize the achievements of the project as a whole, rather than reiterate the individual component outputs or outcomes.
It should be clear from the results table how the individual components of the project link together to achieve the project develop-ment objective. This can be shown through the intermediate results and results indicators stated in Table 9.20, with an explanation of how the results indicators will be used to monitor the progress of the project. This table is sup-ported by Table 9.21, which specifies the annual targets, data collection, reporting and dissemi-nation arrangements that will enable manage-ment to track and report on project progress.
Selection and specification of the indica-tors at the various levels is important; it may take several iterations until they are finalized. These indicators should measure and sum-marize the results of the work carried out, and it should be clear by whom the data will be collected and where they will be reported.
Table 9.19. Example of a results framework with project development objective and outcome indicators.
PDO Outcome indicators Use of outcome information
To improve irrigation and drainage service delivery and land and water management in order to sustainably increase agricultural productivity in irrigation and drainage schemes
Water distribution by main system service providers to WUAs in 75% of the irrigated area matches irrigation water demands
Water distribution by WUAs to farmers in 75% of the rehabili-tated systems closely matches irrigation water demands
An enhanced irrigation and drainage service delivery will provide more reliable, timely and adequate water delivery and drainage water removal, providing improved crop production opportunities and livelihoods for farmers and their families
Collection rates by WUAs at least 75% of total assessed fees following establishment of WUAs
Service fee collection rates provide indication of sustainability of management, operation and particularly maintenance
Number of farmers in sub-project areas more knowledgeable and applying recommended irrigated agricultural practices
Improved agricultural practices combine with good water management to improve crop production
Increase in average crop yields in sub-project areas after completion of rehabilitation works
Due to other contributory factors, care needs to be taken with attribution of increases in crop yields to project activities
PDO, project development objective; WUA, water users association.
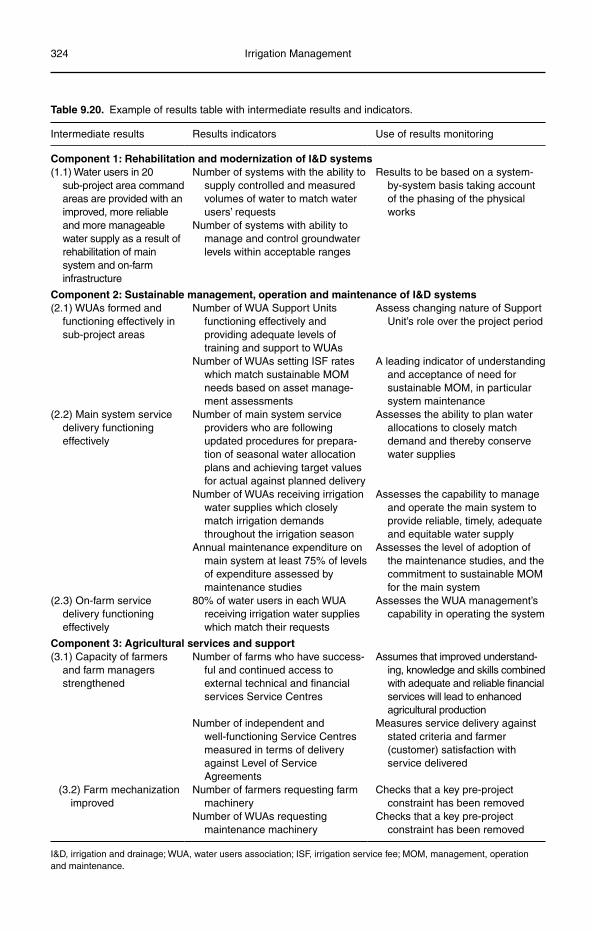
324 Irrigation Management
Table 9.20. Example of results table with intermediate results and indicators.
Intermediate results Results indicators Use of results monitoring
Component 1: Rehabilitation and modernization of I&D systems(1.1) Water users in 20
sub-project area command areas are provided with an improved, more reliable and more manageable water supply as a result of rehabilitation of main system and on-farm infrastructure
Number of systems with the ability to supply controlled and measured volumes of water to match water users’ requests
Number of systems with ability to manage and control groundwater levels within acceptable ranges
Results to be based on a system-by-system basis taking account of the phasing of the physical works
Component 2: Sustainable management, operation and maintenance of I&D systems(2.1) WUAs formed and
functioning effectively in sub-project areas
Number of WUA Support Units functioning effectively and providing adequate levels of training and support to WUAs
Assess changing nature of Support Unit’s role over the project period
Number of WUAs setting ISF rates which match sustainable MOM needs based on asset manage-ment assessments
A leading indicator of understanding and acceptance of need for sustainable MOM, in particular system maintenance
(2.2) Main system service delivery functioning effectively
Number of main system service providers who are following updated procedures for prepara-tion of seasonal water allocation plans and achieving target values for actual against planned delivery
Assesses the ability to plan water allocations to closely match demand and thereby conserve water supplies
Number of WUAs receiving irrigation water supplies which closely match irrigation demands throughout the irrigation season
Assesses the capability to manage and operate the main system to provide reliable, timely, adequate and equitable water supply
Annual maintenance expenditure on main system at least 75% of levels of expenditure assessed by maintenance studies
Assesses the level of adoption of the maintenance studies, and the commitment to sustainable MOM for the main system
(2.3) On-farm service delivery functioning effectively
80% of water users in each WUA receiving irrigation water supplies which match their requests
Assesses the WUA management’s capability in operating the system
Component 3: Agricultural services and support(3.1) Capacity of farmers
and farm managers strengthened
Number of farms who have success-ful and continued access to external technical and financial services Service Centres
Assumes that improved understand-ing, knowledge and skills combined with adequate and reliable financial services will lead to enhanced agricultural production
Number of independent and well-functioning Service Centres measured in terms of delivery against Level of Service Agreements
Measures service delivery against stated criteria and farmer (customer) satisfaction with service delivered
(3.2) Farm mechanization improved
Number of farmers requesting farm machinery
Checks that a key pre-project constraint has been removed
Number of WUAs requesting maintenance machinery
Checks that a key pre-project constraint has been removed
I&D, irrigation and drainage; WUA, water users association; ISF, irrigation service fee; MOM, management, operation and maintenance.
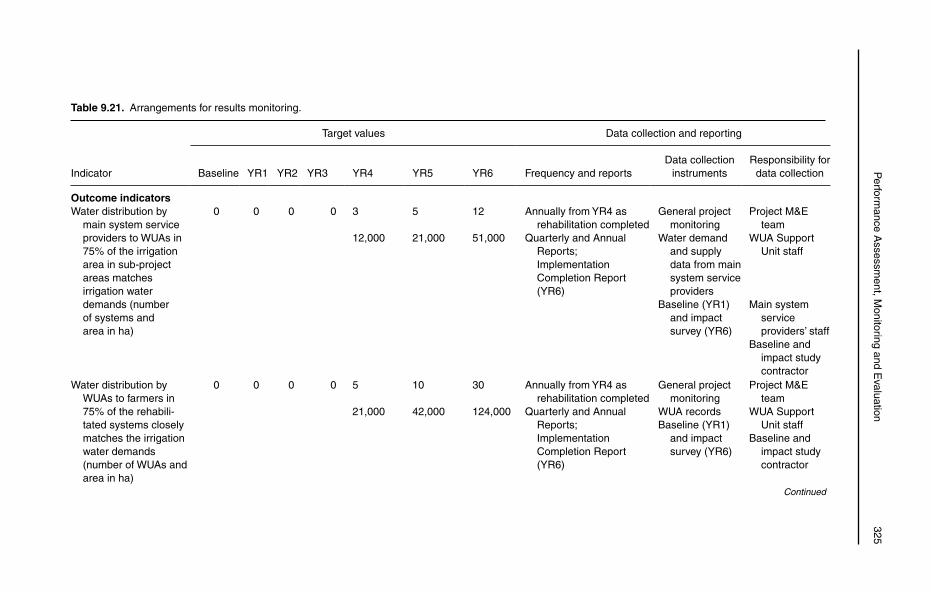
P
erformance A
ssessment, M
onitoring and Evaluation
325
Table 9.21. Arrangements for results monitoring.
Indicator
Target values Data collection and reporting
Baseline YR1 YR2 YR3 YR4 YR5 YR6 Frequency and reportsData collection
instrumentsResponsibility for
data collection
Outcome indicatorsWater distribution by
main system service providers to WUAs in 75% of the irrigation area in sub-project areas matches irrigation water demands (number of systems and area in ha)
0 0 0 0 3 5 12 Annually from YR4 as rehabilitation completed
General project monitoring
Project M&E team
12,000 21,000 51,000 Quarterly and Annual Reports; ImplementationCompletion Report (YR6)
Water demand and supply data from main system service providers
WUA Support Unit staff
Baseline (YR1) and impact survey (YR6)
Main system service providers’ staff
Baseline and impact study contractor
Water distribution by WUAs to farmers in 75% of the rehabili-tated systems closely matches the irrigation water demands (number of WUAs and area in ha)
0 0 0 0 5 10 30 Annually from YR4 as rehabilitation completed
General project monitoring
Project M&E team
21,000 42,000 124,000 Quarterly and Annual Reports; ImplementationCompletion Report (YR6)
WUA recordsBaseline (YR1)
and impact survey (YR6)
WUA Support Unit staff
Baseline and impact study contractor
Continued
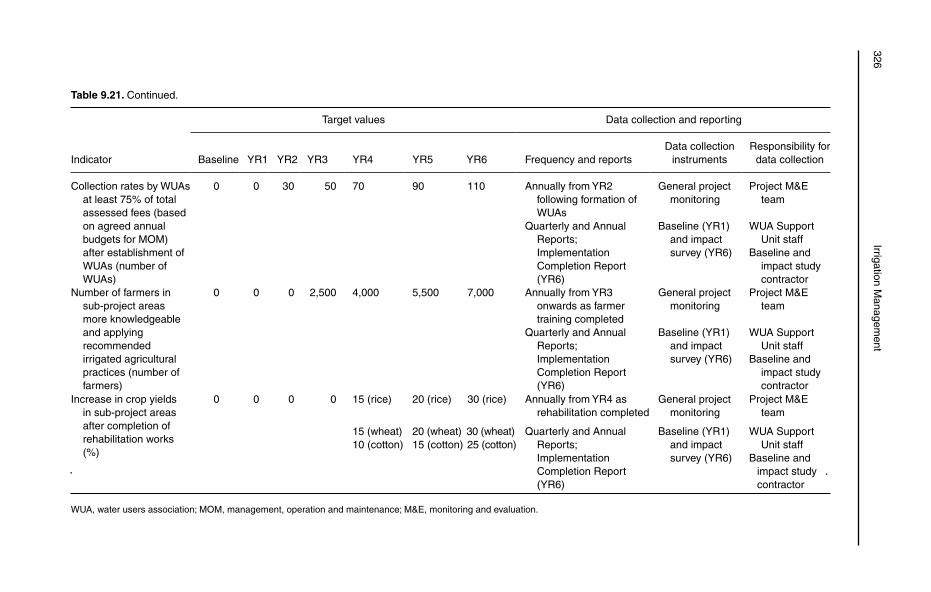
326Irrigation M
anagement
Table 9.21. Continued.
Indicator
Target values Data collection and reporting
Baseline YR1 YR2 YR3 YR4 YR5 YR6 Frequency and reportsData collection
instrumentsResponsibility for
data collection
Collection rates by WUAs at least 75% of total assessed fees (based on agreed annual budgets for MOM) after establishment of WUAs (number of WUAs)
0 0 30 50 70 90 110 Annually from YR2 following formation of WUAs
General project monitoring
Project M&E team
Quarterly and Annual Reports; ImplementationCompletion Report (YR6)
Baseline (YR1) and impact survey (YR6)
WUA Support Unit staff
Baseline and impact study contractor
Number of farmers in sub-project areas more knowledgeable and applying recommendedirrigated agricultural practices (number of farmers)
0 0 0 2,500 4,000 5,500 7,000 Annually from YR3 onwards as farmer training completed
General project monitoring
Project M&E team
Quarterly and Annual Reports; ImplementationCompletion Report (YR6)
Baseline (YR1) and impact survey (YR6)
WUA Support Unit staff
Baseline and impact study contractor
Increase in crop yields in sub-project areas after completion of rehabilitation works (%)
0 0 0 0 15 (rice) 20 (rice) 30 (rice) Annually from YR4 as rehabilitation completed
General project monitoring
Project M&E team
15 (wheat)10 (cotton)
20 (wheat)15 (cotton)
30 (wheat) 25 (cotton)
Quarterly and Annual Reports; ImplementationCompletion Report (YR6)
Baseline (YR1) and impact survey (YR6)
WUA Support Unit staff
Baseline and impact study contractor
WUA, water users association; MOM, management, operation and maintenance; M&E, monitoring and evaluation.
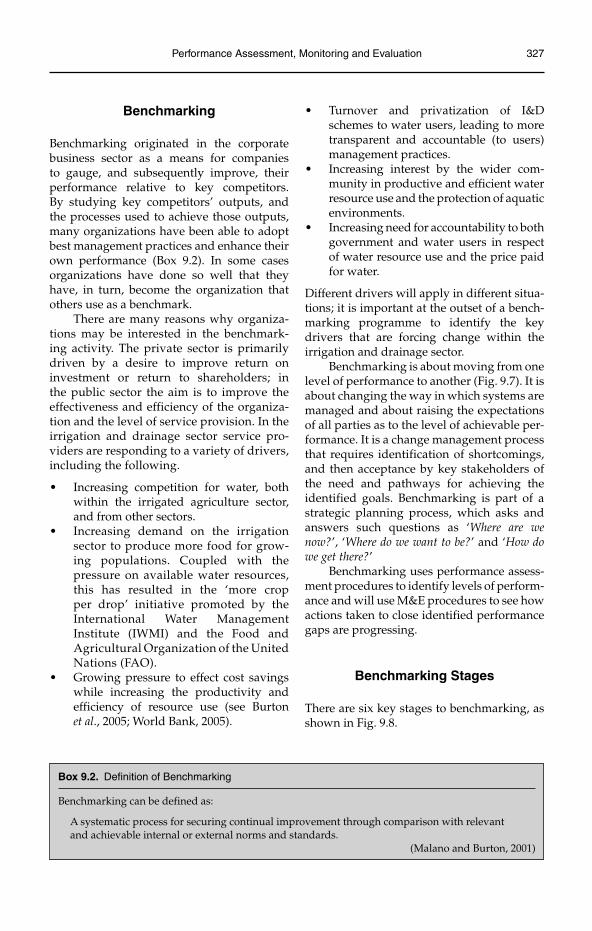
Performance Assessment, Monitoring and Evaluation 327
Benchmarking
Benchmarking originated in the corporate business sector as a means for companies to gauge, and subsequently improve, their performance relative to key competitors. By studying key competitors’ outputs, and the processes used to achieve those outputs, many organizations have been able to adopt best management practices and enhance their own performance (Box 9.2). In some cases organizations have done so well that they have, in turn, become the organization that others use as a benchmark.
There are many reasons why organiza-tions may be interested in the benchmark-ing activity. The private sector is primarily driven by a desire to improve return on investment or return to shareholders; in the public sector the aim is to improve the effectiveness and efficiency of the organiza-tion and the level of service provision. In the irrigation and drainage sector service pro-viders are responding to a variety of drivers, including the following.
Increasing competition for water, both •within the irrigated agriculture sector, and from other sectors.Increasing demand on the irrigation • sector to produce more food for grow-ing populations. Coupled with the pressure on available water resources, this has resulted in the ‘more crop per drop’ initiative promoted by the International Water Management Institute (IWMI) and the Food and Agricultural Organization of the United Nations (FAO).Growing pressure to effect cost savings •while increasing the productivity and efficiency of resource use (see Burton et al., 2005; World Bank, 2005).
Turnover and privatization of I&D •schemes to water users, leading to more transparent and accountable (to users) management practices.Increasing interest by the wider com-•munity in productive and efficient water resource use and the protection of aquatic environments.Increasing need for accountability to both •government and water users in respect of water resource use and the price paid for water.
Different drivers will apply in different situa-tions; it is important at the outset of a bench-marking programme to identify the key drivers that are forcing change within the irrigation and drainage sector.
Benchmarking is about moving from one level of performance to another (Fig. 9.7). It is about changing the way in which systems are managed and about raising the expectations of all parties as to the level of achievable per-formance. It is a change management process that requires identification of shortcomings, and then acceptance by key stakeholders of the need and pathways for achieving the identified goals. Benchmarking is part of a strategic planning process, which asks and answers such questions as ‘Where are we now?’, ‘Where do we want to be?’ and ‘How do we get there?’
Benchmarking uses performance assess-ment procedures to identify levels of perform-ance and will use M&E procedures to see how actions taken to close identified performance gaps are progressing.
Benchmarking Stages
There are six key stages to benchmarking, as shown in Fig. 9.8.
Box 9.2. Definition of Benchmarking
Benchmarking can be defined as:
A systematic process for securing continual improvement through comparison with relevant and achievable internal or external norms and standards.
(Malano and Burton, 2001)
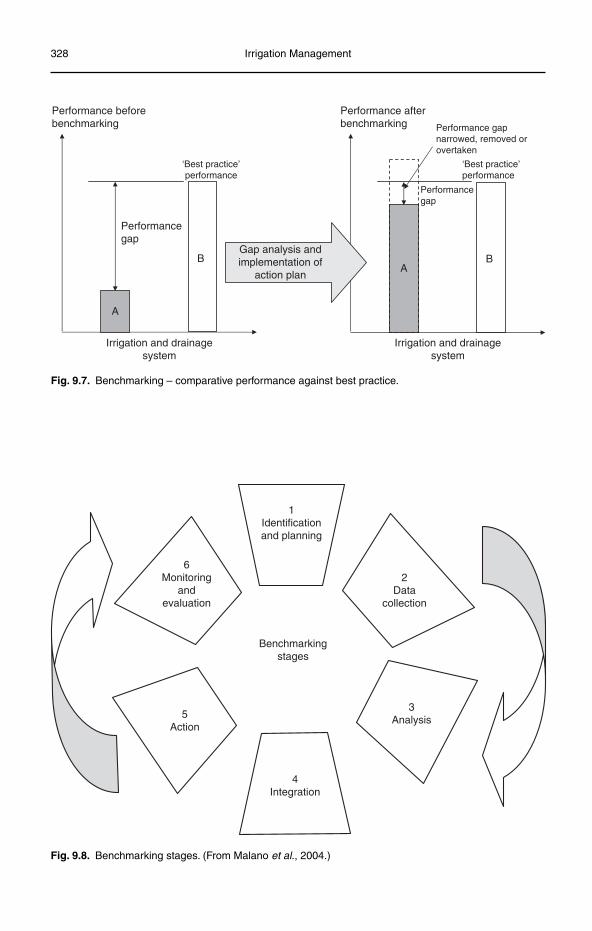
328 Irrigation Management
A
B
Performance beforebenchmarking
Irrigation and drainagesystem
Performancegap
AB
Performance afterbenchmarking
Irrigation and drainagesystem
Performancegap
Gap analysis andimplementation of
action plan
‘Best practice’performance
‘Best practice’performance
Performance gapnarrowed, removed orovertaken
Fig. 9.7. Benchmarking – comparative performance against best practice.
3Analysis
2Data
collection
5Action
6Monitoring
andevaluation
4Integration
Benchmarkingstages
1Identificationand planning
Fig. 9.8. Benchmarking stages. (From Malano et al., 2004.)
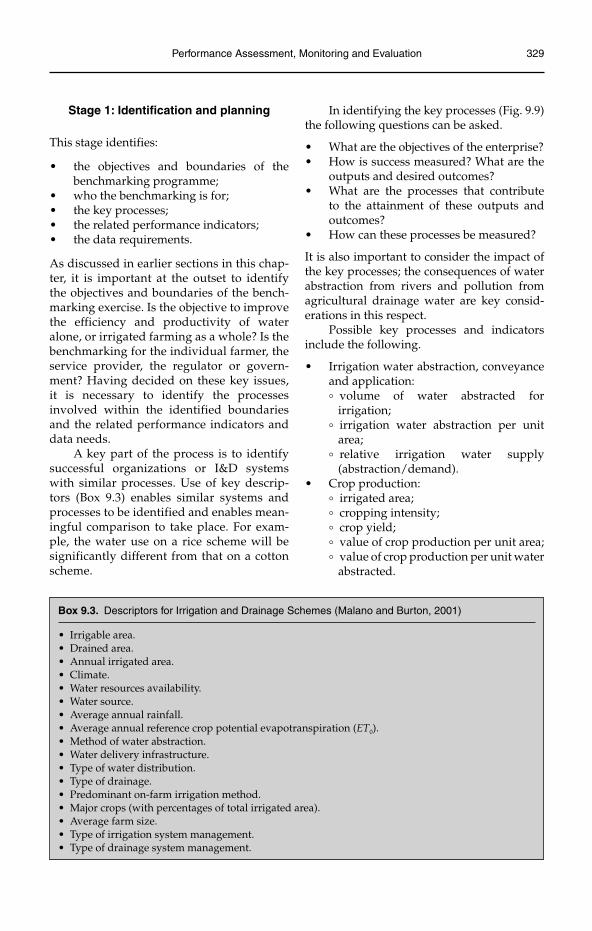
Performance Assessment, Monitoring and Evaluation 329
Stage 1: Identification and planning
This stage identifies:
the objectives and boundaries of the •benchmarking programme;who the benchmarking is for;•the key processes;•the related performance indicators;•the data requirements.•
As discussed in earlier sections in this chap-ter, it is important at the outset to identify the objectives and boundaries of the bench-marking exercise. Is the objective to improve the efficiency and productivity of water alone, or irrigated farming as a whole? Is the benchmarking for the individual farmer, the service provider, the regulator or govern-ment? Having decided on these key issues, it is necessary to identify the processes involved within the identified boundaries and the related performance indicators and data needs.
A key part of the process is to identify successful organizations or I&D systems with similar processes. Use of key descrip-tors (Box 9.3) enables similar systems and processes to be identified and enables mean-ingful comparison to take place. For exam-ple, the water use on a rice scheme will be significantly different from that on a cotton scheme.
In identifying the key processes (Fig. 9.9) the following questions can be asked.
What are the objectives of the enterprise?•How is success measured? What are the •outputs and desired outcomes?What are the processes that contribute •to the attainment of these outputs and outcomes?How can these processes be measured?•
It is also important to consider the impact of the key processes; the consequences of water abstraction from rivers and pollution from agricultural drainage water are key consid-erations in this respect.
Possible key processes and indicators include the following.
Irrigation water abstraction, conveyance •and application:° volume of water abstracted for
irrigation;° irrigation water abstraction per unit
area;° relative irrigation water supply
(abstraction/demand).Crop production:•° irrigated area;° cropping intensity;° crop yield;° value of crop production per unit area;° value of crop production per unit water
abstracted.
Box 9.3. Descriptors for Irrigation and Drainage Schemes (Malano and Burton, 2001)
Irrigable area.•Drained area.•Annual irrigated area.•Climate.•Water resources availability.•Water source.•Average annual rainfall.•Average annual reference crop potential evapotranspiration (• ET0).Method of water abstraction.•Water delivery infrastructure.•Type of water distribution.•Type of drainage.•Predominant on-farm irrigation method.•Major crops (with percentages of total irrigated area).•Average farm size.•Type of irrigation system management.•Type of drainage system management.•
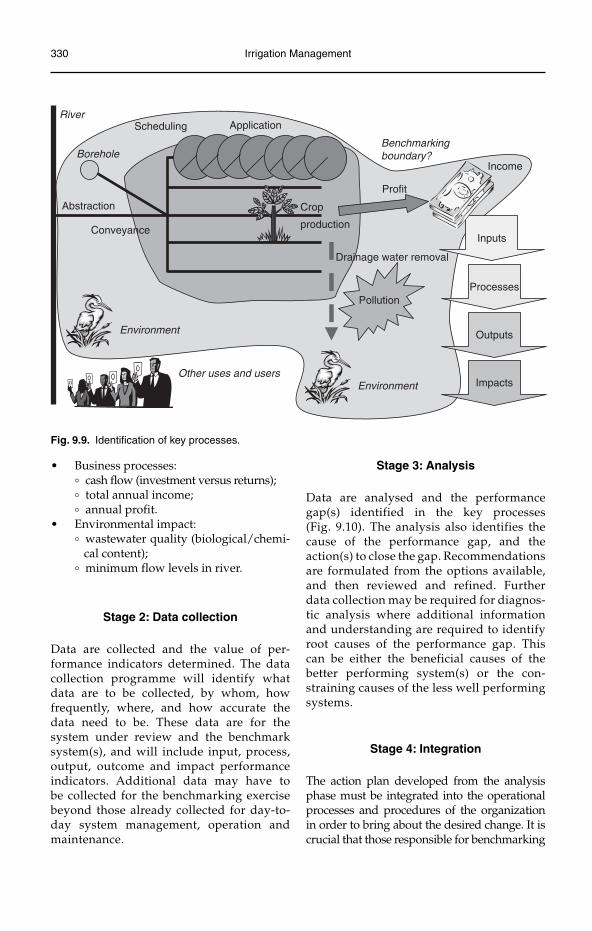
330 Irrigation Management
Business processes:•° cash flow (investment versus returns);° total annual income;° annual profit.Environmental impact:•° wastewater quality (biological/chemi-
cal content);° minimum flow levels in river.
Stage 2: Data collection
Data are collected and the value of per-formance indicators determined. The data collection programme will identify what data are to be collected, by whom, how frequently, where, and how accurate the data need to be. These data are for the system under review and the benchmark system(s), and will include input, process, output, outcome and impact performance indicators. Additional data may have to be collected for the benchmarking exercise beyond those already collected for day-to-day system management, operation and maintenance.
Stage 3: Analysis
Data are analysed and the performance gap(s) identified in the key processes (Fig. 9.10). The analysis also identifies the cause of the performance gap, and the action(s) to close the gap. Recommendations are formulated from the options available, and then reviewed and refined. Further data collection may be required for diagnos-tic analysis where additional information and understanding are required to identify root causes of the performance gap. This can be either the beneficial causes of the better performing system(s) or the con-straining causes of the less well performing systems.
Stage 4: Integration
The action plan developed from the analysis phase must be integrated into the operational processes and procedures of the organization in order to bring about the desired change. It is crucial that those responsible for benchmarking
Other uses and usersEnvironment
Environment
Pollution
Inputs
Income
Profit
Benchmarkingboundary?
Crop
production
Processes
Outputs
Impacts
Drainage water removal
Conveyance
Abstraction
Borehole
Scheduling ApplicationRiver
Fig. 9.9. Identification of key processes.
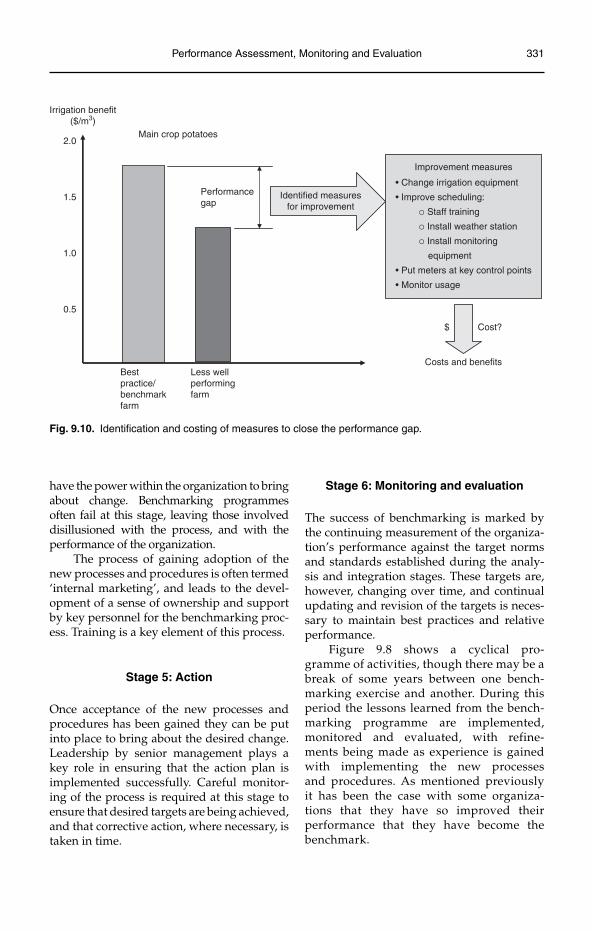
Performance Assessment, Monitoring and Evaluation 331
have the power within the organization to bring about change. Benchmarking programmes often fail at this stage, leaving those involved disillusioned with the process, and with the performance of the organization.
The process of gaining adoption of the new processes and procedures is often termed ‘internal marketing’, and leads to the devel-opment of a sense of ownership and support by key personnel for the benchmarking proc-ess. Training is a key element of this process.
Stage 5: Action
Once acceptance of the new processes and procedures has been gained they can be put into place to bring about the desired change. Leadership by senior management plays a key role in ensuring that the action plan is implemented successfully. Careful monitor-ing of the process is required at this stage to ensure that desired targets are being achieved, and that corrective action, where necessary, is taken in time.
Stage 6: Monitoring and evaluation
The success of benchmarking is marked by the continuing measurement of the organiza-tion’s performance against the target norms and standards established during the analy-sis and integration stages. These targets are, however, changing over time, and continual updating and revision of the targets is neces-sary to maintain best practices and relative performance.
Figure 9.8 shows a cyclical pro-gramme of activities, though there may be a break of some years between one bench-marking exercise and another. During this period the lessons learned from the bench-marking programme are implemented, monitored and evaluated, with refine-ments being made as experience is gained with implementing the new processes and procedures. As mentioned previously it has been the case with some organiza-tions that they have so improved their performance that they have become the benchmark.
Performancegap
Identified measuresfor improvement
Improvement measures
• Change irrigation equipment
• Improve scheduling:
° Staff training
° Install weather station
° Install monitoring
equipment
• Put meters at key control points
• Monitor usage
Irrigation benefit($/m3)
Bestpractice/benchmarkfarm
Less wellperformingfarm
2.0
1.5
0.5
1.0
Main crop potatoes
$ Cost?
Costs and benefits
Fig. 9.10. Identification and costing of measures to close the performance gap.
332 Irrigation Management
Example of benchmarking in Australia
The Australian National Committee of Irrigation and Drainage (ANCID) was one of the first organizations to implement a benchmarking programme in the irrigation and drainage sector. It began in 1998 with 33 schemes managed by irrigation service pro-viders and now has over 40 schemes in the programme, covering some 75% of the irri-gation water provider business in Australia. The total business distributes 18,000 Gl of water annually, providing water for some 2 million ha and generating an annual business turnover of AU$200 million (US$162 million) from a production base of some AU$7 billion (US$5.7 billion) (Alexander and Potter, 2004). The crops grown include rice, maize, grape vines, cotton, sugarcane, pasture, citrus and vegetables.
The benchmarking programme used 65 performance indicators:
system operation (• n = 12);business processes (• n = 25);financial management (• n = 14);environmental management (• n = 14).
These indicators have been formulated to fit with the ‘triple bottom line’ approach adopted by the industry, measuring performance in eco-nomic, environmental and social dimensions.
A key feature of the Australian bench-marking programme is the ‘three tier’ reporting of data to protect commercial con-fidentiality. Tier 1 collects data on general irri-gation water provision (‘Who we are’), Tier 2 collects data on performance (‘How we inter-act’) and Tier 3 collects data on confidential internal business performance benchmarking (‘How we improve’). The data are collected each year using a standard questionnaire, each contributor indicating what data can and cannot be released. The data are analysed and the report made available to all contributors, with anonymous data presented for others to compare their performance with. If a con-tributor wishes to obtain more information on the confidential data he/she writes to ANCID who forward his/her request on to the rel-evant contributor.
Figure 9.11 presents examples of the per-formance indicators used. As can be seen there
is a wide range in the values of each of the indicators, this is due to individual differences between the systems (the crop types, method of irrigation, lined/unlined canals, etc.). This highlights the importance of using the system descriptors (Box 9.3) to categorize systems to enable comparison of like with like.
The achievements of the benchmarking programme in Australia are summarized as (Alexander and Potter, 2004):
allowing comparison of the performance •of irrigation water providers relative to each other, both at the domestic and international level;providing a more progressive and account-•able image of the irrigation sector;monitoring the uptake and impact of •modern technology;improvement in record keeping and per-•formance analysis by service providers;availability of objective and reliable data •across a substantial part of the irrigation industry;adoption by businesses of the ANCID •benchmarking approach and formula-tion of their own inter-business bench-marking systems;more confident setting by business man-•agers of targets for water delivery effi-ciency, operation, health and safety, and resource use.
Example of Implementing a Benchmarking Programme
This section outlines the procedures fol-lowed for implementing a benchmarking programme. Using the framework outlined in the sections above, the key components of the benchmarking programme are now detailed.
Drivers of the benchmarking process
The key driver for benchmarking is the Government’s interest in institutional reform to facilitate improvements in irrigation and drainage service delivery in the public sector.
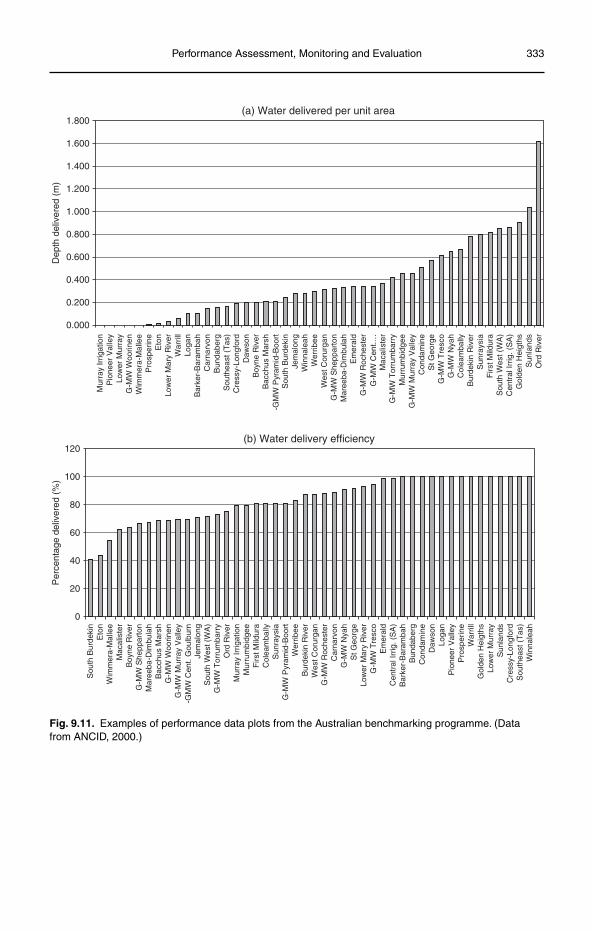
Performance Assessment, Monitoring and Evaluation 333
0.000
0.200
0.400
0.600
0.800
1.000
1.200
1.400
1.600
1.800
Mur
ray
Irrig
atio
nP
ione
er V
alle
yLo
wer
Mur
ray
G-M
W W
oorin
enW
imm
era-
Mal
lee
Pro
sper
ine
Eto
nLo
wer
Mar
y R
iver
War
rill
Loga
nB
arke
r-B
aram
bah
Car
narv
onB
unda
berg
Sou
thea
st (
Tas
)C
ress
y-Lo
ngfo
rdD
awso
nB
oyne
Riv
erB
acch
us M
arsh
-GM
W P
yram
id-B
oort
Sou
th B
urde
kin
Jem
alon
gW
inna
leah
Wer
ribee
Wes
t Cor
urga
nG
-MW
She
ppar
ton
Mar
eeba
-Dim
bula
hE
mer
ald
G-M
W R
oche
ster
G-M
W C
ent.…
Mac
alis
ter
G-M
W T
orru
mba
rry
Mur
rum
bidg
eeG
-MW
Mur
ray
Val
ley
Con
dam
ine
St G
eorg
eG
-MW
Tre
sco
G-M
W N
yah
Col
eam
bally
Bur
deki
n R
iver
Sun
rays
iaF
irst M
ildur
aS
outh
Wes
t (W
A)
Cen
tral
Irrig
. (S
A)
Gol
den
Hei
gths
Sun
land
sO
rd R
iver
Dep
th d
eliv
ered
(m
)
(a) Water delivered per unit area
0
20
40
60
80
100
120
Sou
th B
urde
kin
Eto
nW
imm
era-
Mal
lee
Mac
alis
ter
Boy
ne R
iver
G-M
W S
hepp
arto
nM
aree
ba-D
imbu
lah
Bac
chus
Mar
shG
-MW
Woo
rinen
G-M
W M
urra
y V
alle
y-G
MW
Cen
t. G
oulb
urn
Jem
alon
gS
outh
Wes
t (W
A)
G-M
W T
orru
mba
rry
Ord
Riv
erM
urra
y Ir
rigat
ion
Mur
rum
bidg
eeF
irst M
ildur
aC
olea
mba
llyS
unra
ysia
G-M
W P
yram
id-B
oort
Wer
ribee
Bur
deki
n R
iver
Wes
t Cor
urga
nG
-MW
Roc
hest
erC
arna
rvon
G-M
W N
yah
St G
eorg
eLo
wer
Mar
y R
iver
G-M
W T
resc
oE
mer
ald
Cen
tral
Irrig
. (S
A)
Bar
ker-
Bar
amba
hB
unda
berg
Con
dam
ine
Daw
son
Loga
nP
ione
er V
alle
yP
rosp
erin
eW
arril
lG
olde
n H
eigt
hsLo
wer
Mur
ray
Sun
land
sC
ress
y-Lo
ngfo
rdS
outh
east
(T
as)
Win
nale
ah
Per
cent
age
deliv
ered
(%
)
(b) Water delivery efficiency
Fig. 9.11. Examples of performance data plots from the Australian benchmarking programme. (Data from ANCID, 2000.)
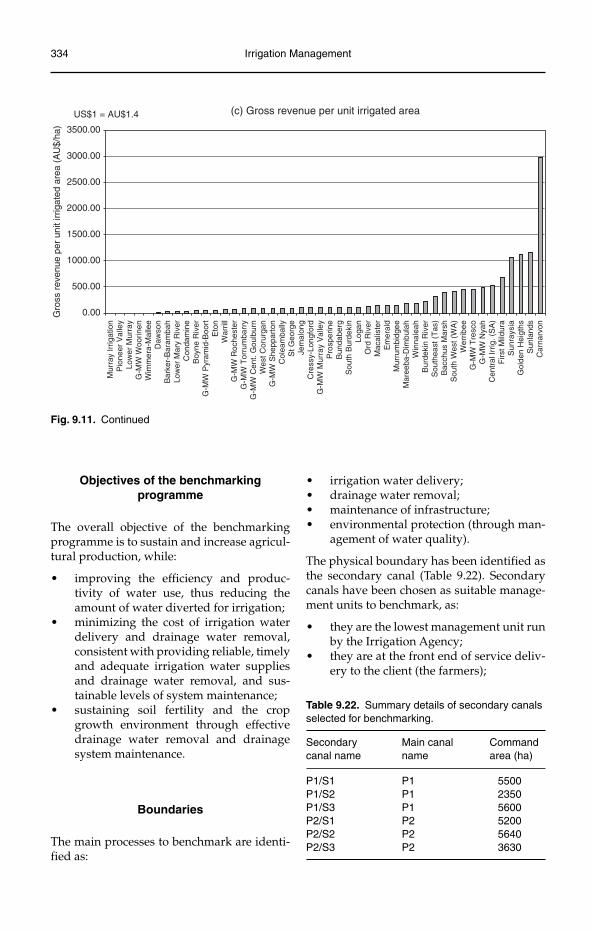
334 Irrigation Management
0.00
500.00
1000.00
1500.00
2000.00
2500.00
3000.00
3500.00
Mur
ray
Irrig
atio
nP
ione
er V
alle
yLo
wer
Mur
ray
G-M
W W
oorin
enW
imm
era-
Mal
lee
Daw
son
Bar
ker-
Bar
amba
hLo
wer
Mar
y R
iver
Con
dam
ine
Boy
ne R
iver
G-M
W P
yram
id-B
oort
Eto
nW
arril
lG
-MW
Roc
hest
erG
-MW
Tor
rum
barr
yG
-MW
Cen
t. G
oulb
urn
Wes
t Cor
urga
nG
-MW
She
ppar
ton
Col
eam
bally
St G
eorg
eJe
mal
ong
Cre
ssy-
Long
ford
G-M
W M
urra
y V
alle
yP
rosp
erin
eB
unda
berg
Sou
th B
urde
kin
Loga
nO
rd R
iver
Mac
alis
ter
Em
eral
dM
urru
mbi
dgee
Mar
eeba
-Dim
bula
hW
inna
leah
Bur
deki
n R
iver
Sou
thea
st (
Tas
)B
acch
us M
arsh
Sou
th W
est (
WA
)W
errib
eeG
-MW
Tre
sco
G-M
W N
yah
Cen
tral
Irrig
. (S
A)
Firs
t Mild
ura
Sun
rays
iaG
olde
n H
eigt
hsS
unla
nds
Car
narv
on
Gro
ss r
even
ue p
er u
nit i
rrig
ated
are
a (A
U$/
ha)
(c) Gross revenue per unit irrigated areaUS$1 = AU$1.4
Objectives of the benchmarking programme
The overall objective of the benchmarking programme is to sustain and increase agricul-tural production, while:
improving the efficiency and produc-•tivity of water use, thus reducing the amount of water diverted for irrigation;minimizing the cost of irrigation water •delivery and drainage water removal, consistent with providing reliable, timely and adequate irrigation water supplies and drainage water removal, and sus-tainable levels of system maintenance;sustaining soil fertility and the crop •growth environment through effective drainage water removal and drainage system maintenance.
Boundaries
The main processes to benchmark are identi-fied as:
irrigation water delivery;•drainage water removal;•maintenance of infrastructure;•environmental protection (through man-•agement of water quality).
The physical boundary has been identified as the secondary canal (Table 9.22). Secondary canals have been chosen as suitable manage-ment units to benchmark, as:
they are the lowest management unit run •by the Irrigation Agency;they are at the front end of service deliv-•ery to the client (the farmers);
Fig. 9.11. Continued
Table 9.22. Summary details of secondary canals selected for benchmarking.
Secondary Main canal Commandcanal name name area (ha)
P1/S1 P1 5500P1/S2 P1 2350P1/S3 P1 5600P2/S1 P2 5200P2/S2 P2 5640P2/S3 P2 3630
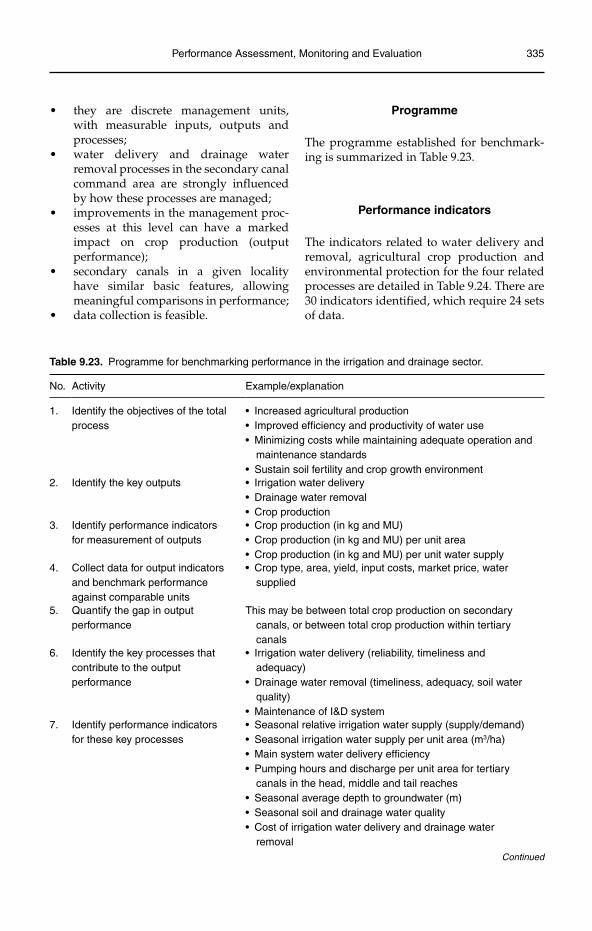
Performance Assessment, Monitoring and Evaluation 335
they are discrete management units, •with measurable inputs, outputs and processes;water delivery and drainage water •removal processes in the secondary canal command area are strongly influenced by how these processes are managed;improvements in the management proc-•esses at this level can have a marked impact on crop production (output performance);secondary canals in a given locality •have similar basic features, allowing meaningful comparisons in performance;data collection is feasible.•
Programme
The programme established for benchmark-ing is summarized in Table 9.23.
Performance indicators
The indicators related to water delivery and removal, agricultural crop production and environmental protection for the four related processes are detailed in Table 9.24. There are 30 indicators identified, which require 24 sets of data.
Table 9.23. Programme for benchmarking performance in the irrigation and drainage sector.
No. Activity Example/explanation
1. Identify the objectives of the total process
• Increased agricultural production• Improved efficiency and productivity of water use• Minimizing costs while maintaining adequate operation and
maintenance standards• Sustain soil fertility and crop growth environment
2. Identify the key outputs • Irrigation water delivery• Drainage water removal• Crop production
3. Identify performance indicators for measurement of outputs
• Crop production (in kg and MU)• Crop production (in kg and MU) per unit area• Crop production (in kg and MU) per unit water supply
4. Collect data for output indicators and benchmark performance against comparable units
• Crop type, area, yield, input costs, market price, water supplied
5. Quantify the gap in output performance
This may be between total crop production on secondary canals, or between total crop production within tertiary canals
6. Identify the key processes that contribute to the output performance
• Irrigation water delivery (reliability, timeliness and adequacy)
• Drainage water removal (timeliness, adequacy, soil water quality)
• Maintenance of I&D system7. Identify performance indicators
for these key processes• Seasonal relative irrigation water supply (supply/demand)• Seasonal irrigation water supply per unit area (m3/ha)• Main system water delivery efficiency• Pumping hours and discharge per unit area for tertiary
canals in the head, middle and tail reaches• Seasonal average depth to groundwater (m)• Seasonal soil and drainage water quality• Cost of irrigation water delivery and drainage water
removalContinued
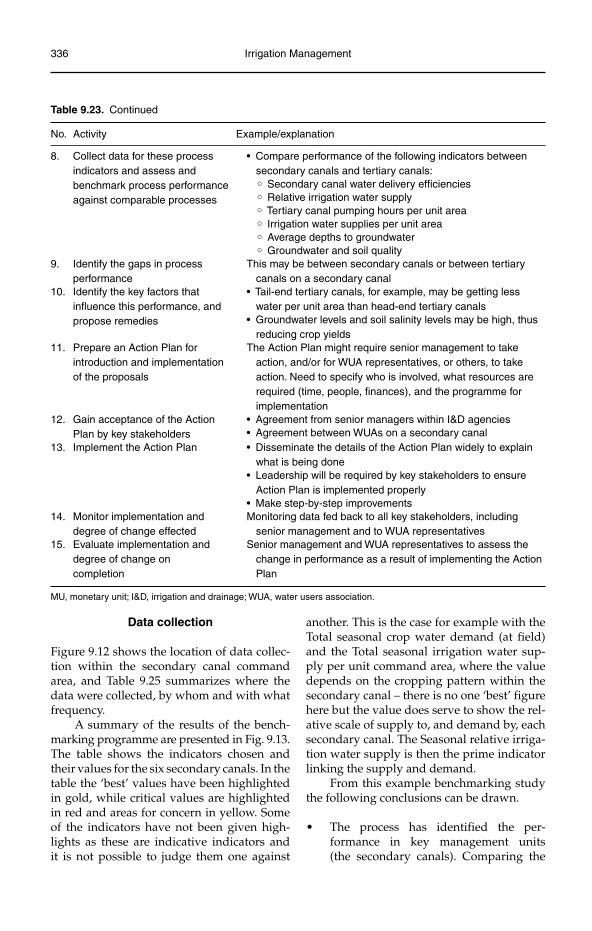
336 Irrigation Management
Table 9.23. Continued
No. Activity Example/explanation
8. Collect data for these process indicators and assess and benchmark process performance against comparable processes
• Compare performance of the following indicators between secondary canals and tertiary canals:° Secondary canal water delivery efficiencies° Relative irrigation water supply° Tertiary canal pumping hours per unit area° Irrigation water supplies per unit area° Average depths to groundwater° Groundwater and soil quality
9. Identify the gaps in process performance
This may be between secondary canals or between tertiary canals on a secondary canal
10. Identify the key factors that influence this performance, and propose remedies
• Tail-end tertiary canals, for example, may be getting less water per unit area than head-end tertiary canals
• Groundwater levels and soil salinity levels may be high, thus reducing crop yields
11. Prepare an Action Plan for introduction and implementation of the proposals
The Action Plan might require senior management to take action, and/or for WUA representatives, or others, to take action. Need to specify who is involved, what resources are required (time, people, finances), and the programme for implementation
12. Gain acceptance of the Action Plan by key stakeholders
• Agreement from senior managers within I&D agencies• Agreement between WUAs on a secondary canal
13. Implement the Action Plan • Disseminate the details of the Action Plan widely to explain what is being done
• Leadership will be required by key stakeholders to ensure Action Plan is implemented properly
• Make step-by-step improvements14. Monitor implementation and
degree of change effectedMonitoring data fed back to all key stakeholders, including
senior management and to WUA representatives15. Evaluate implementation and
degree of change on completion
Senior management and WUA representatives to assess the change in performance as a result of implementing the Action Plan
MU, monetary unit; I&D, irrigation and drainage; WUA, water users association.
Data collection
Figure 9.12 shows the location of data collec-tion within the secondary canal command area, and Table 9.25 summarizes where the data were collected, by whom and with what frequency.
A summary of the results of the bench-marking programme are presented in Fig. 9.13. The table shows the indicators chosen and their values for the six secondary canals. In the table the ‘best’ values have been highlighted in gold, while critical values are highlighted in red and areas for concern in yellow. Some of the indicators have not been given high-lights as these are indicative indicators and it is not possible to judge them one against
another. This is the case for example with the Total seasonal crop water demand (at field) and the Total seasonal irrigation water sup-ply per unit command area, where the value depends on the cropping pattern within the secondary canal – there is no one ‘best’ figure here but the value does serve to show the rel-ative scale of supply to, and demand by, each secondary canal. The Seasonal relative irriga-tion water supply is then the prime indicator linking the supply and demand.
From this example benchmarking study the following conclusions can be drawn.
The process has identified the per-•formance in key management units (the secondary canals). Comparing the
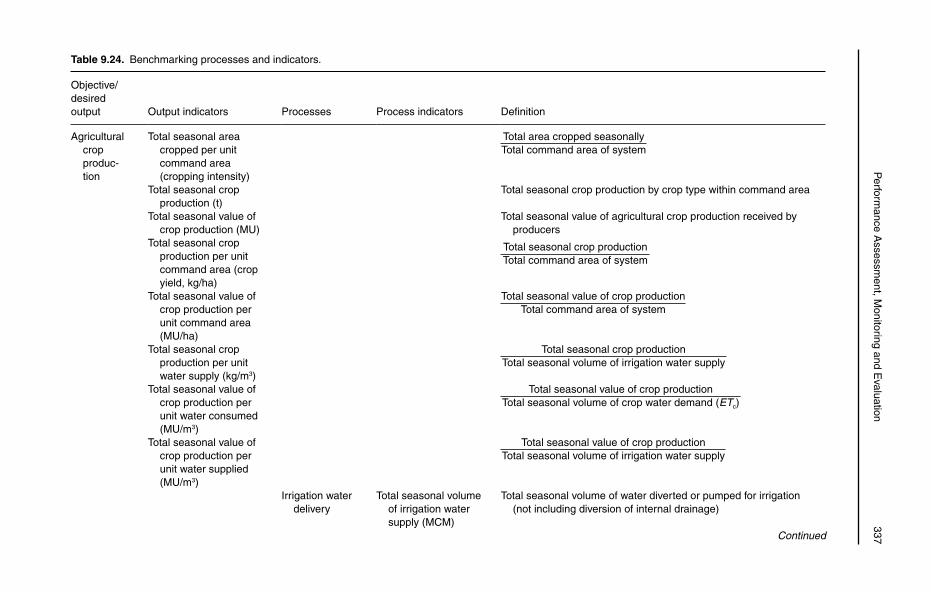
P
erformance A
ssessment, M
onitoring and Evaluation
337Table 9.24. Benchmarking processes and indicators.
Objective/desiredoutput Output indicators Processes Process indicators Definition
Agricultural cropproduc-tion
Total seasonal area cropped per unit command area (cropping intensity)
Total area cropped seasonallyTotal command area of system
Total seasonal crop production (t)
Total seasonal crop production by crop type within command area
Total seasonal value of crop production (MU)
Total seasonal value of agricultural crop production received by producers
Total seasonal crop production per unit command area (crop yield, kg/ha)
Total seasonal crop productionTotal command area of system
Total seasonal value of crop production per unit command area (MU/ha)
Total seasonal value of crop productionTotal command area of system
Total seasonal crop production per unit water supply (kg/m3)
Total seasonal crop productionTotal seasonal volume of irrigation water supply
Total seasonal value of crop production per unit water consumed (MU/m3)
Total seasonal value of crop productionTotal seasonal volume of crop water demand (ETc)
Total seasonal value of crop production per unit water supplied (MU/m3)
Total seasonal value of crop productionTotal seasonal volume of irrigation water supply
Irrigation water delivery
Total seasonal volume of irrigation water supply (MCM)
Total seasonal volume of water diverted or pumped for irrigation (not including diversion of internal drainage)
Continued
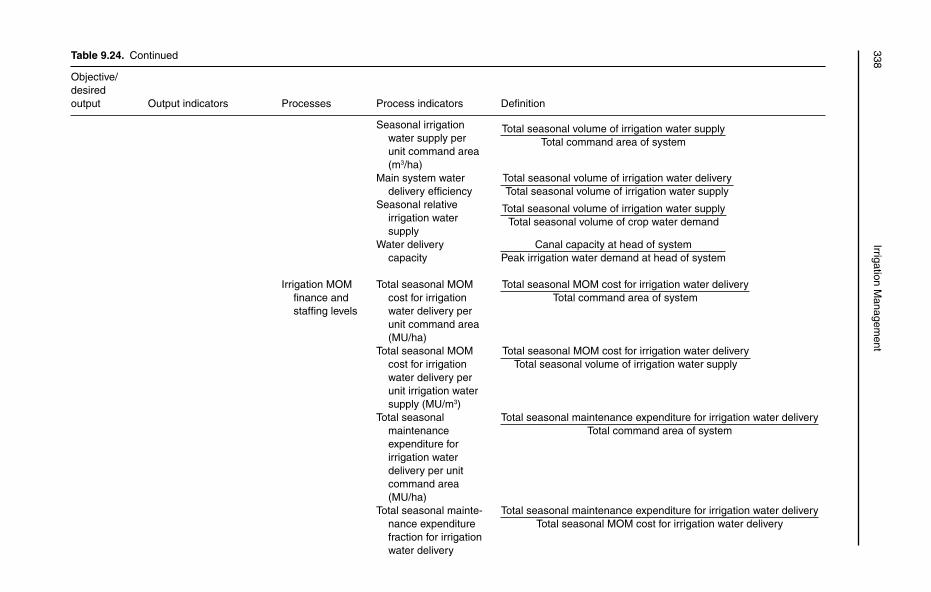
338Irrigation M
anagement
Table 9.24. Continued
Objective/desiredoutput Output indicators Processes Process indicators Definition
Seasonal irrigation water supply per unit command area (m3/ha)
Total seasonal volume of irrigation water supplyTotal command area of system
Main system water delivery efficiency
Total seasonal volume of irrigation water deliveryTotal seasonal volume of irrigation water supply
Seasonal relative irrigation water supply
Total seasonal volume of irrigation water supplyTotal seasonal volume of crop water demand
Water delivery capacity
Canal capacity at head of systemPeak irrigation water demand at head of system
Irrigation MOM finance and staffing levels
Total seasonal MOM cost for irrigation water delivery per unit command area (MU/ha)
Total seasonal MOM cost for irrigation water deliveryTotal command area of system
Total seasonal MOM cost for irrigation water delivery per unit irrigation water supply (MU/m3)
Total seasonal MOM cost for irrigation water deliveryTotal seasonal volume of irrigation water supply
Total seasonal maintenanceexpenditure for irrigation water delivery per unit command area (MU/ha)
Total seasonal maintenance expenditure for irrigation water deliveryTotal command area of system
Total seasonal mainte-nance expenditure fraction for irrigation water delivery
Total seasonal maintenance expenditure for irrigation water deliveryTotal seasonal MOM cost for irrigation water delivery
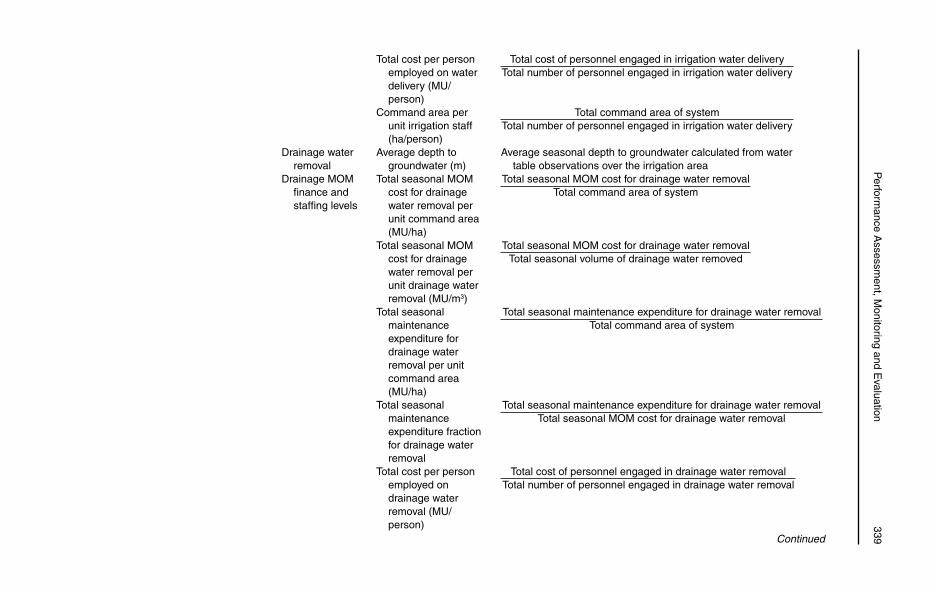
P
erformance A
ssessment, M
onitoring and Evaluation
339Continued
Total cost per person employed on water delivery (MU/person)
Total cost of personnel engaged in irrigation water deliveryTotal number of personnel engaged in irrigation water delivery
Command area per unit irrigation staff (ha/person)
Total command area of systemTotal number of personnel engaged in irrigation water delivery
Drainage water removal
Average depth to groundwater (m)
Average seasonal depth to groundwater calculated from water table observations over the irrigation area
Drainage MOM finance and staffing levels
Total seasonal MOM cost for drainage water removal per unit command area (MU/ha)
Total seasonal MOM cost for drainage water removalTotal command area of system
Total seasonal MOM cost for drainage water removal per unit drainage water removal (MU/m3)
Total seasonal MOM cost for drainage water removalTotal seasonal volume of drainage water removed
Total seasonal maintenanceexpenditure for drainage water removal per unit command area (MU/ha)
Total seasonal maintenance expenditure for drainage water removalTotal command area of system
Total seasonal maintenanceexpenditure fraction for drainage water removal
Total seasonal maintenance expenditure for drainage water removalTotal seasonal MOM cost for drainage water removal
Total cost per person employed on drainage water removal (MU/person)
Total cost of personnel engaged in drainage water removalTotal number of personnel engaged in drainage water removal
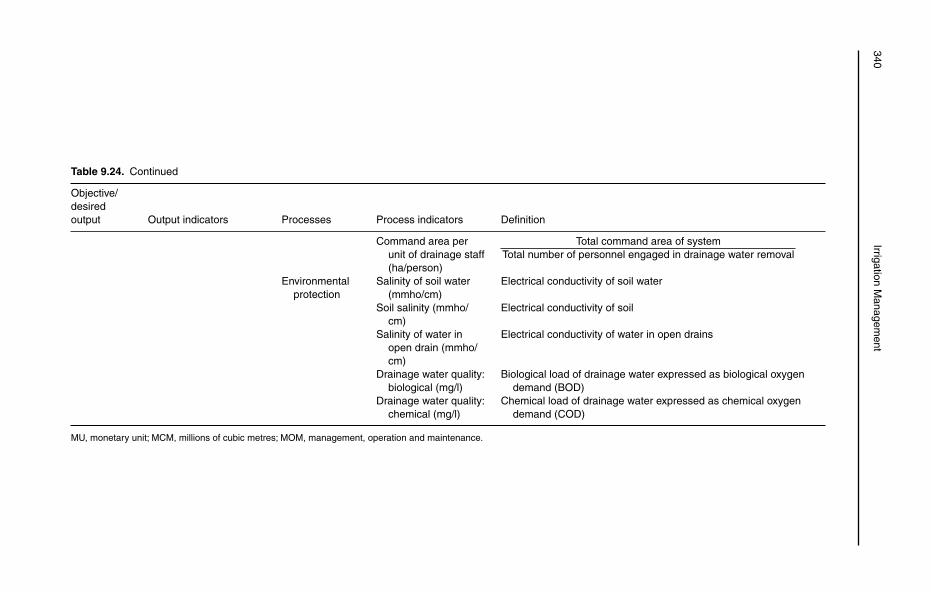
340Irrigation M
anagement
Table 9.24. Continued
Objective/desiredoutput Output indicators Processes Process indicators Definition
Command area per unit of drainage staff (ha/person)
Total command area of systemTotal number of personnel engaged in drainage water removal
Environmental protection
Salinity of soil water (mmho/cm)
Electrical conductivity of soil water
Soil salinity (mmho/cm)
Electrical conductivity of soil
Salinity of water in open drain (mmho/cm)
Electrical conductivity of water in open drains
Drainage water quality: biological (mg/l)
Biological load of drainage water expressed as biological oxygen demand (BOD)
Drainage water quality: chemical (mg/l)
Chemical load of drainage water expressed as chemical oxygen demand (COD)
MU, monetary unit; MCM, millions of cubic metres; MOM, management, operation and maintenance.
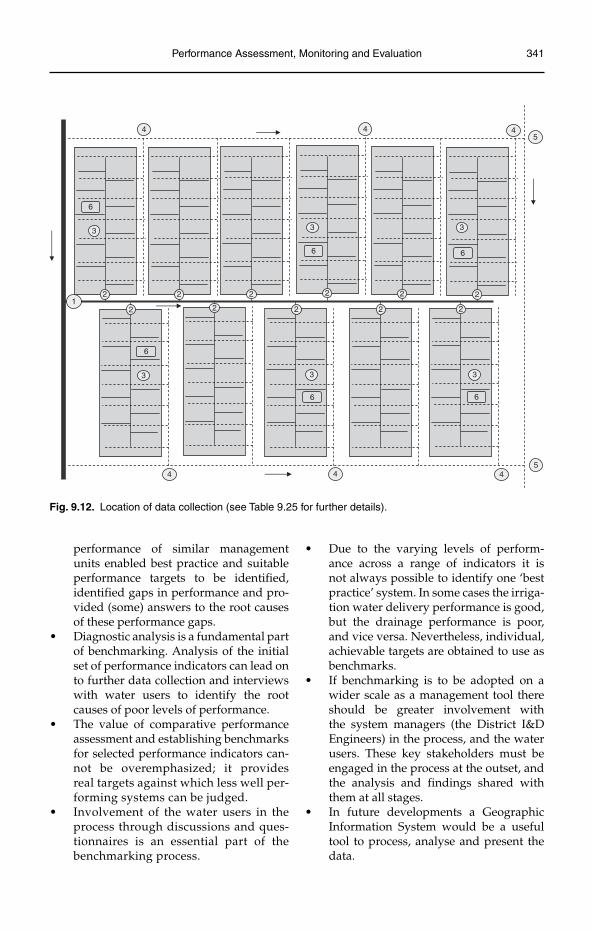
Performance Assessment, Monitoring and Evaluation 341
performance of similar management units enabled best practice and suitable performance targets to be identified, identified gaps in performance and pro-vided (some) answers to the root causes of these performance gaps.Diagnostic analysis is a fundamental part •of benchmarking. Analysis of the initial set of performance indicators can lead on to further data collection and interviews with water users to identify the root causes of poor levels of performance.The value of comparative performance •assessment and establishing benchmarks for selected performance indicators can-not be overemphasized; it provides real targets against which less well per-forming systems can be judged.Involvement of the water users in the •process through discussions and ques-tionnaires is an essential part of the benchmarking process.
Due to the varying levels of perform-•ance across a range of indicators it is not always possible to identify one ‘best practice’ system. In some cases the irriga-tion water delivery performance is good, but the drainage performance is poor, and vice versa. Nevertheless, individual, achievable targets are obtained to use as benchmarks.If benchmarking is to be adopted on a •wider scale as a management tool there should be greater involvement with the system managers (the District I&D Engineers) in the process, and the water users. These key stakeholders must be engaged in the process at the outset, and the analysis and findings shared with them at all stages.In future developments a Geographic •Information System would be a useful tool to process, analyse and present the data.
Fig. 9.12. Location of data collection (see Table 9.25 for further details).
2
2
2
2
2
2
2 2
2
2
21
3
3
3
3
3
3
4
4
44
4 4
5
5
6
6
66
6
6
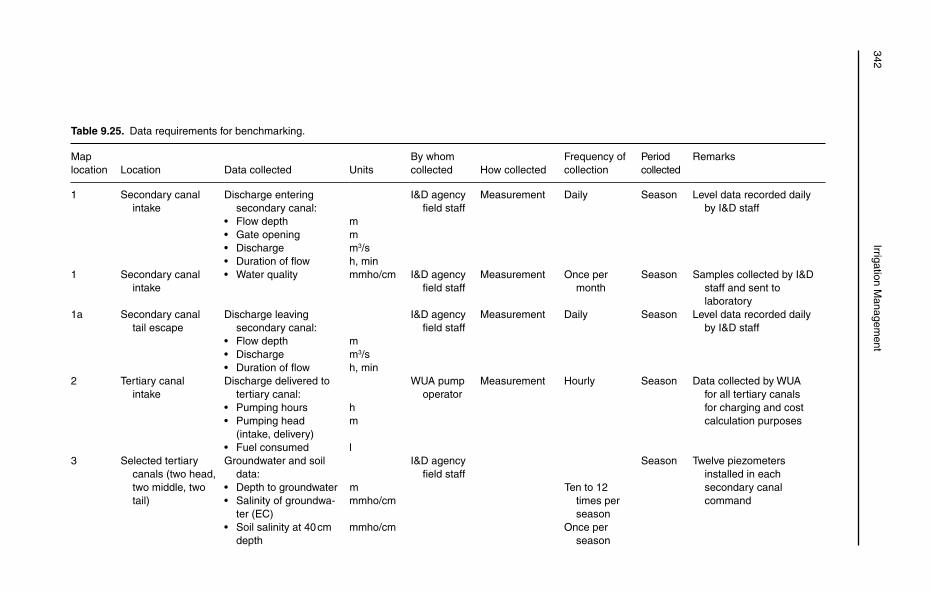
342Irrigation M
anagement
Table 9.25. Data requirements for benchmarking.
Maplocation Location Data collected Units
By whom collected How collected
Frequency of collection
Period collected
Remarks
1 Secondary canal intake
Discharge entering secondary canal:
I&D agency field staff
Measurement Daily Season Level data recorded daily by I&D staff
• Flow depth m• Gate opening m• Discharge m3/s• Duration of flow h, min
1 Secondary canal intake
• Water quality mmho/cm I&D agency field staff
Measurement Once per month
Season Samples collected by I&D staff and sent to laboratory
1a Secondary canal tail escape
Discharge leaving secondary canal:
I&D agency field staff
Measurement Daily Season Level data recorded daily by I&D staff
• Flow depth m• Discharge m3/s• Duration of flow h, min
2 Tertiary canal intake
Discharge delivered to tertiary canal:
WUA pump operator
Measurement Hourly Season Data collected by WUA for all tertiary canals for charging and cost calculation purposes
• Pumping hours h• Pumping head
(intake, delivery)m
• Fuel consumed l3 Selected tertiary
canals (two head, two middle, two tail)
Groundwater and soil data:
I&D agency field staff
Season Twelve piezometers installed in each secondary canal command
• Depth to groundwater m Ten to 12 times per season
• Salinity of groundwa-ter (EC)
mmho/cm
• Soil salinity at 40 cm depth
mmho/cm Once per season
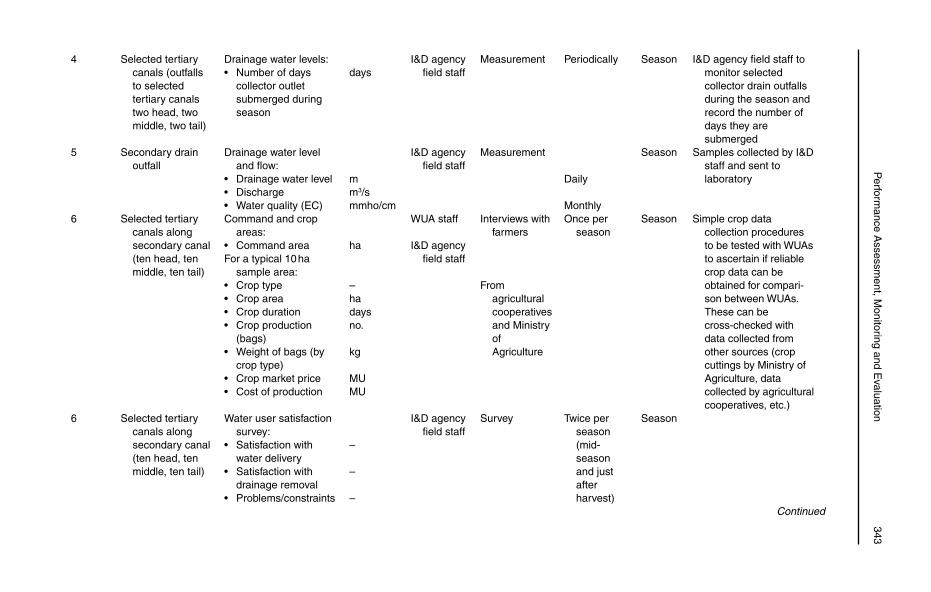
P
erformance A
ssessment, M
onitoring and Evaluation
343
Continued
4 Selected tertiary canals (outfalls to selected tertiary canals two head, two middle, two tail)
Drainage water levels: I&D agency field staff
Measurement Periodically Season I&D agency field staff to monitor selected collector drain outfalls during the season and record the number of days they are submerged
• Number of days collector outlet submerged during season
days
5 Secondary drain outfall
Drainage water level and flow:
I&D agency field staff
Measurement Season Samples collected by I&D staff and sent to laboratory• Drainage water level m Daily
• Discharge m3/s• Water quality (EC) mmho/cm Monthly
6 Selected tertiary canals along secondary canal (ten head, ten middle, ten tail)
Command and crop areas:
WUA staff Interviews with farmers
Once per season
Season Simple crop datacollection procedures to be tested with WUAs to ascertain if reliable crop data can be obtained for compari-son between WUAs. These can be cross-checked with data collected from other sources (crop cuttings by Ministry of Agriculture, data collected by agricultural cooperatives, etc.)
• Command area ha I&D agency field staffFor a typical 10 ha
sample area:• Crop type – From
agricultural cooperatives and Ministry ofAgriculture
• Crop area ha• Crop duration days• Crop production
(bags)no.
• Weight of bags (by crop type)
kg
• Crop market price MU• Cost of production MU
6 Selected tertiary canals along secondary canal (ten head, ten middle, ten tail)
Water user satisfaction survey:
I&D agency field staff
Survey Twice per season(mid-seasonand just afterharvest)
Season
• Satisfaction with water delivery
–
• Satisfaction with drainage removal
–
• Problems/constraints –
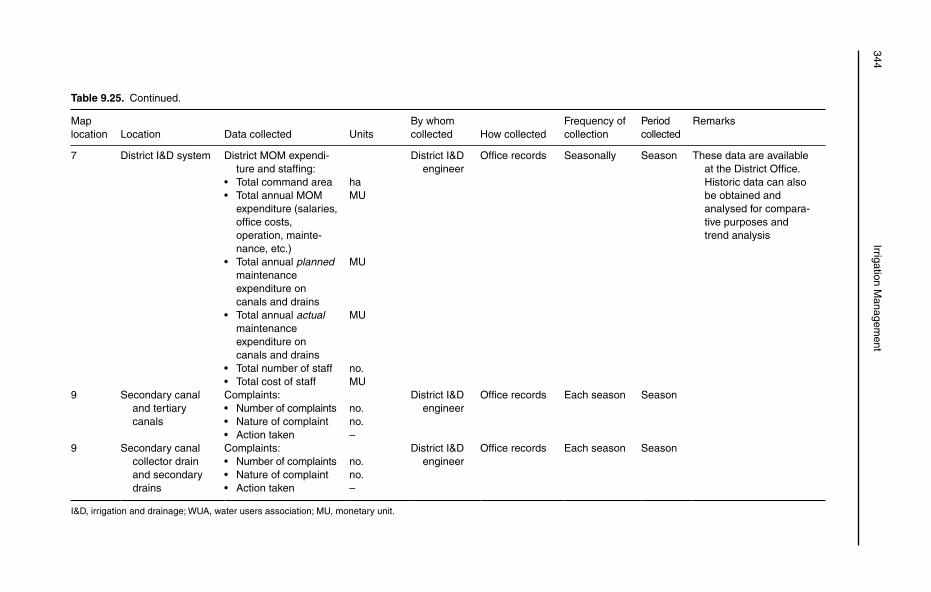
344Irrigation M
anagement
Table 9.25. Continued.
Maplocation Location Data collected Units
By whom collected How collected
Frequency of collection
Period collected
Remarks
7 District I&D system District MOM expendi-ture and staffing:
District I&D engineer
Office records Seasonally Season These data are available at the District Office. Historic data can also be obtained and analysed for compara-tive purposes and trend analysis
• Total command area ha• Total annual MOM
expenditure (salaries, office costs, operation, mainte-nance, etc.)
MU
• Total annual plannedmaintenanceexpenditure on canals and drains
MU
• Total annual actualmaintenanceexpenditure on canals and drains
MU
• Total number of staff no.• Total cost of staff MU
9 Secondary canal and tertiary canals
Complaints: District I&D engineer
Office records Each season Season• Number of complaints no.• Nature of complaint no.• Action taken –
9 Secondary canal collector drain and secondary drains
Complaints: District I&D engineer
Office records Each season Season• Number of complaints no.• Nature of complaint no.• Action taken –
I&D, irrigation and drainage; WUA, water users association; MU, monetary unit.
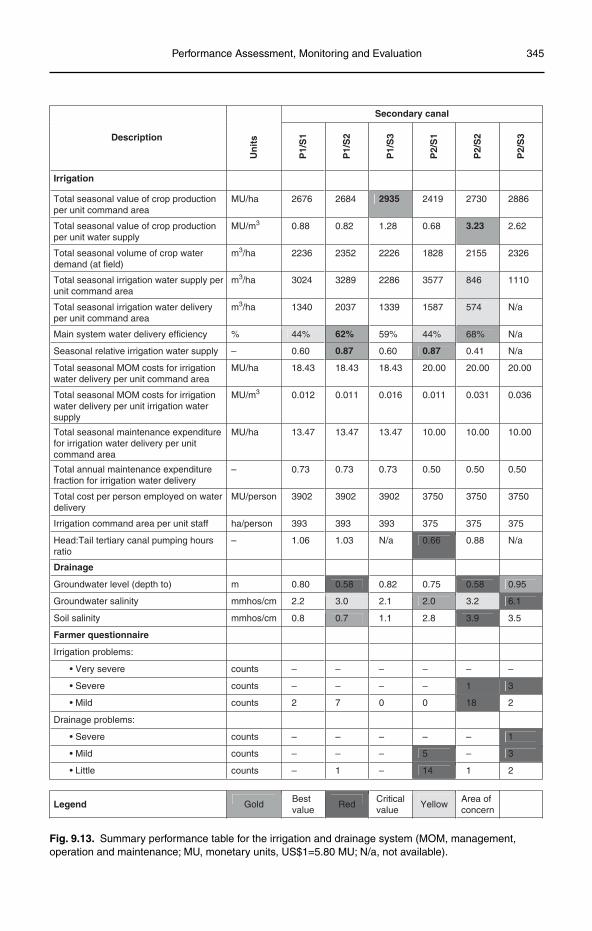
Performance Assessment, Monitoring and Evaluation 345
Secondary canal
Description
Un
its
P1/
S1
P1/
S2
P1/
S3
P2/
S1
P2/
S2
P2/
S3
Irrigation
Total seasonal value of crop productionper unit command area
MU/ha
Total seasonal value of crop productionper unit water supply
MU/m3
Total seasonal volume of crop waterdemand (at field)
m3/ha
Total seasonal irrigation water supply perunit command area
m3/ha
Total seasonal irrigation water deliveryper unit command area
m3/ha
Main system water delivery efficiency %
Seasonal relative irrigation water supply –
Total seasonal MOM costs for irrigationwater delivery per unit command area
Total seasonal MOM costs for irrigationwater delivery per unit irrigation watersupply
MU/m3
MU/ha
Total seasonal maintenance expenditurefor irrigation water delivery per unitcommand area
MU/ha
Total annual maintenance expenditurefraction for irrigation water delivery
Total cost per person employed on waterdelivery
Head:Tail tertiary canal pumping hoursratio
Irrigation command area per unit staff ha/person
–
Drainage
Groundwater level (depth to) m
mmhos/cmGroundwater salinity
mmhos/cmSoil salinity
Farmer questionnaire
Irrigation problems:
counts• Very severe
counts• Severe
counts• Mild
Drainage problems:
counts• Severe
counts• Mild
counts• Little
–
MU/person
0.88
2676
3024
1340
44%
0.60
2236
18.43
0.012
393
1.06
0.80
2.2
0.8
–
–
2
–
–
–
13.47
0.73
3902
0.82
2684
3289
2037
62%
0.87
2352
18.43
0.011
1.03
–
–
7
–
–
1
13.47
0.73
3902
393
0.58
3.0
0.7
2935
1.28
2286
1339
59%
0.60
2226
18.43
0.016
N/a
–
–
0
–
–
–
13.47
0.73
3902
393
0.82
2.1
1.1
0.68
3577
1587
44%
0.87
2419
1828
20.00
0.011
2.0
–
–
0
–
5
10.00
0.50
3750
375
0.66
0.75
2.8
14
3.23
2730
2155
846
574
68%
0.41
20.00
0.031
0.58
3.2
–
1
–
–
10.00
0.50
3750
375
0.88
3.9
18
1
2.62
2886
2326
1110
N/a
N/a
N/a
20.00
0.036
0.95
6.1
–
3
1
3
10.00
0.50
3750
375
N/a
3.5
2
2
LegendBestvalue
Gold Red YellowCriticalvalue
Area ofconcern
Fig. 9.13. Summary performance table for the irrigation and drainage system (MOM, management, operation and maintenance; MU, monetary units, US$1=5.80 MU; N/a, not available).

346 Irrigation Management
Endnotes
1 Project management is time-bounded and requires that specified activities are carried out within a given timeframe to deliver specific outputs.2 Adapted from Chapter 2 written by the author in Bos, M.G., Burton, M.A. and Molden, D.J. (eds) Irrigation Performance Assessment: Practical Guidelines (Bos et al., 2005).3 If required, the on-farm level could be further subdivided into on-farm and in-field.4 Note that some of these target values are specific to this example; they should be reviewed and adapted for other situations. Where monetary units are used it is important that the target figures are updated annu-ally to allow for inflation.5 This section has been adapted from A Toolkit for Monitoring and Evaluation of Agricultural Water Management Projects, written by the author in association with Laurence Smith and Julienne Roux for the Agriculture and Rural Development Division of the World Bank (Burton et al., 2008).6 Also referred to as the Purpose in some organizations.
References
Adams, J., Hayes, J. and Hopson, B. (1976) Transitions – Understanding and Managing Personal Change.Martin Robertson, Oxford, UK.
Alexander, P.J. and Potter, M.O. (2004) Benchmarking of Australian irrigation water provider businesses. In: Special Issue – Benchmarking in the Irrigation and Drainage Sector. Irrigation and Drainage 53(2), 165–174.
ANCID (2000) 1998/99 Australian Irrigation Water Provider – Benchmarking Report. Australian National Committee on Irrigation and Drainage, Victoria, Australia.
Beadle, A.D., Burton, M.A., Smout, I.K. and Snell, M.J. (1988) Integration of engineering, institutional and social requirements into rehabilitation design – a case study from Nepal. Irrigation and Drainage Systems 2(1), 79–92.
Bloom, B.S. (1956) Taxonomy of Educational Objectives, Handbook I: The Cognitive Domain. David McKay Co. Inc., New York.
Bos, M.G. (1989) Discharge Measurement Structures. ILRI Publication No. 20. International Institute for Land Reclamation and Improvement, Wageningen, The Netherlands.
Bos, M.G. and Nugteren, J. (1974) On Irrigation Efficiencies. ILRI Publication No. 19. International Institute for Land Reclamation and Improvement, Wageningen, The Netherlands.
Bos, M.G., Burton, M.A. and Molden, D. (2005) Irrigation and Drainage Performance Assessment: Practical Guidelines. CAB International, Wallingford, UK.
Bos, M.G., Keslik, R.A.L., Allen, R.G. and Molden, D. (2009) Water Requirements for Irrigation and the Environment. Springer, Dordrecht, The Netherlands.
Burton, M.A. (1986) Training Programmes for Irrigation Staff. ODI/IIMI Irrigation Management Network Paper No. 86/1d. Overseas Development Institute, London.
Burton, M.A. (1988) Improving Water Management in Developing Countries: A Question of Training. ODI/IIMI Irrigation Management Network Paper No. 88/1b. Overseas Development Institute, London.
Burton, M.A. (1989a) Experiences with the Irrigation Management Game. Irrigation and Drainage Systems3, 217–228.
Burton, M.A. (1989b) Putting theory into practice: simplified scheduling procedures for smallholder irrigation schemes. In: Rydzewski, J.R. and Ward, C.F. (eds) Irrigation: Theory and Practice. Pentech Press, London, pp. 514–526.
Burton, M.A. (1993) A simulation approach to irrigation water management. PhD thesis, University of Southampton, Southampton, UK.
Burton, M.A. (1994) The Irrigation Management Game: a role playing exercise for training in irrigation management. Irrigation and Drainage Systems 7, 305–318.
Burton, M.A. (2003) Irrigation management transfer: a study of change management. MBA dissertation, Henley Management College, Henley, UK.
347
348 References
Burton, M.A. and Molden, D. (2005) Making sound decisions: information needs for basin water man-agement. In: Svendsen, M. (ed.) Irrigation and River Basin Management: Options for Governance and Institutions. CAB International, Wallingford, UK, pp. 125–144.
Burton, M.A., Kingdom, W.D. and Welch, J.W. (1996) Strategic investment planning for irrigation – the ‘Asset Management’ approach. Irrigation and Drainage Systems 10, 207–226.
Burton, M.A., Wester, P. and Scott, C. (2002) Safeguarding the needs of locally managed irrigation in the water scarce Lerma-Chapala river basin, Mexico. In: Proceedings of the 18th International Congress on Irrigation and Drainage, Montreal, Canada, 21–28 July (CD-ROM). International Commission on Irrigation and Drainage, New Delhi, R5.03.
Burton, M.A., Malano, H. and Makin, I. (2005) Benchmarking for improved performance in irrigation and drainage. In: Shaping the Future of Water for Agriculture: A Sourcebook for Investment in Agricultural Water Management. World Bank, Washington, DC, pp. 299–305.
Burton, M.A., Smith, L. and Roux, J. (2008) Toolkit for Monitoring and Evaluation of Agricultural Water Management Projects. Agricultural and Rural Development Division, World Bank, Washington, DC.
Carnall, C.A. (1999) Managing Change in Organisations, 3rd edn. FT/Prentice Hall, Harlow, UK.Carney, D. (1998) Changing Public and Private Roles in Agricultural Service Provision. Overseas Development
Institute, London.Casley, D. and Kumar, K. (1987) Project Monitoring and Evaluation in Agriculture, A Joint Study. World Bank,
International Fund for Agricultural Development and Food and Agriculture Organization of the United Nations. Johns Hopkins University Press, Baltimore, Maryland.
Chambers, R. (1988) Managing Canal Irrigation: Practical Analysis from South Asia. Cambridge University Press, Cambridge, UK.
Davies, A. (1993) An asset management programme for irrigation agencies in Indonesia. MSc dissertation, Institute of Irrigation Studies, University of Southampton, Southampton, UK.
de Vries, K. and Miller, D. (1984) The Neurotic Organisation. Jossey-Bass, New York.Earthscan/IWMI (2007) Water for Food, Water for Life: A Comprehensive Assessment of Water Management in
Agriculture. Earthscan, London and International Water Management Institute, Colombo.EDI (1994) Irrigation Training in the Public Sector; Guidelines for Preparing Strategies and Programs, 2nd edn.
Economic Development Institute, World Bank, Washington, DC.EPI (2009) Data Center. Food and Agriculture. World Irrigated Area and Irrigated Area per Thousand
People, 1950–2007. Earth Policy Institute, Washington, DC (available at http://www.earth-policy.org/index.php?/datacenter/xls/book_pb4_ch2_8.xls).
European Commission (2004) Aid Delivery Methods – Volume 1: Project Cycle Management Guidelines.EuropeAid Cooperation Office, European Commission, Brussels.
FAO (1977) Crop Water Requirements. FAO Irrigation and Drainage Paper No. 24 (Doorenbos, J. and Pruitt, W.O.). Food and Agriculture Organization of the United Nations, Rome.
FAO (1978) Effective Rainfall. FAO Irrigation and Drainage Paper No. 25 (Dastane, N.G.). Food and Agriculture Organization of the United Nations, Rome.
FAO (1979) Yield Response to Water. FAO Irrigation and Drainage Paper No. 33 (Doorenbos, J. and Kassam, A.H.). Food and Agriculture Organization of the United Nations, Rome.
FAO (1982) Organization, Operation and Maintenance of Irrigation Schemes. FAO Irrigation and Drainage Paper No. 40 (Sagardoy, J.A., Bottrall, A. and Uittenbogaard, G.O.). Food and Agricultural Organization of the United Nations, Rome.
FAO (1984) Irrigation Practice and Water Management. FAO Irrigation and Drainage Paper No. 1, Revision 1(Doneen, L.D. and Westcot, D.W.). Food and Agriculture Organization of the United Nations, Rome.
FAO (1989) Guidelines for Designing and Evaluating Surface Irrigation Systems. FAO Irrigation and Drainage Paper No. 45 (Walker, W.). Food and Agriculture Organization of the United Nations, Rome.
FAO (1998) Crop Evapotranspiration: Guidelines for Computing Crop Water Requirements. FAO Irrigation and Drainage Paper No. 56 (Allen, R., Pereira, L., Raes, D. and Smith, M.). Food and Agriculture Organization of the United Nations, Rome.
FAO (1999) Transfer of Irrigation Management Services. FAO Irrigation and Drainage Paper No. 58 (Vermillion, D. and Sagardoy, J.A.). Food and Agriculture Organization of the United Nations, Rome.
FAO (2003) Legislation on Water Users’ Organizations: A Comparative Analysis. FAO Legislative Study No. 79(Hodgson, S.). Food and Agriculture Organization of the United Nations, Rome.
FAO (2009) Creating Legal Space for Water User Organizations: Transparency, Governance and the Law. FAO Legislative Study No. 100 (Hodgson, S.). Food and Agriculture Organization of the United Nations, Rome.
References 349
Frederiksen, H.D. and Vissia, R.I. (1998) Considerations in Formulating the Transfer of Services in the Water Sector. International Water Management Institute, Colombo.
Goleman, D. (1998) What makes a leader? Harvard Business Review 76, November/December, 93.Horst, L. (1990) Interactions Between Technical Infrastructure and Management. ODI/IIMI Irrigation Management
Network Paper No. 90/3b. Overseas Development Institute, London.Huppert, W. and Urban, K. (1998) Analysing Service Provision: Instruments for Development Cooperation
Illustrated by Examples from Irrigation. GTZ Publication No. 263. Deutsche Gesellschaft fur Technische Zusammenarbeit GmbH, Eschborn, Germany.
Hurst, D.K. (1995) Crisis and Renewal. Harvard Business School Press, Cambridge, Massachusetts.ICID (1993) ICID Environmental Checklist to Identify Environmental Effects of Irrigation, Drainage and Flood
Control Projects. International Commission on Irrigation and Drainage, New Delhi.IIS (1995a) Asset Management Procedures for Irrigation Schemes – Final Report. Institute of Irrigation Studies,
University of Southampton, Southampton, UK.IIS (1995b) Preliminary Guidelines for the Preparation of an Asset Management Plan for Irrigation Infrastructure.
Institute of Irrigation Studies, University of Southampton, Southampton, UK.Israelson, O.W. and Hansen, V.E. (1962) Irrigation Principles and Practices, 3rd edn. John Wiley and Sons,
New York.IWMI (2006) Water for Food, Water for Life: Insights from a Comprehensive Assessment of Water
Management in Agriculture. Presented at Stockholm World Water Week, 20–26 August 2006. International Water Management Institute, Colombo.
Jurriens, M. (1991) Rehabilitation and Management of Irrigation Projects – Short Course Lecture Notes. Institute of Irrigation Studies, University of Southampton, United Kingdom.
Kay, M. (1983) Sprinkler Irrigation: Equipment and Practice. Batsford Academic and Educational Ltd, London.
Kay, M. (1986) Surface Irrigation: Systems and Practices. Cranfield Press, Bedford, UK.Keller, J., Keller, A. and Davids, G. (1998) River basin development phases and implications of closure.
Journal of Applied Irrigation Science 33(2), 145–163.Khan, M.H. (1978) Improving irrigation operation in East Java. In: Transactions of the 10th ICID Congress,
Athens. International Commission on Irrigation and Drainage, New Delhi.Kloezen, W. and Samad, M. (1995) Synthesis of Issues Discussed at the International Conference on Irrigation
Management Transfer. Short Report Series on Locally Managed Irrigation, Report No. 12. International Irrigation Management Institute, Colombo.
Kotter, J.P. (1990) What leaders really do. Harvard Business Review; reprinted in 2001 in Best of HBR,December, 85–96.
Kotter, J.P. (1995) Leading change: why transformation efforts fail. Harvard Business Review, March/April, 59–67.
Kotter, J.P. and Schelsinger, L.A. (1979) Choosing strategies for change. Harvard Business Review, March/April, 106–113.
Lorange, P. and Nelson, G. (1987) Strategic Control. West Publications, San Francisco, California.MacDonald, I. and Hearle, D. (1984) Communication Skills for Rural Development. Evans Brothers Ltd, London.Malano, H. and Burton, M. (2001) Guidelines for Benchmarking Performance in the Irrigation and Drainage Sector.
Food and Agriculture Organization of the United Nations, Rome and the International Programme for Technology and Research in Irrigation and Drainage, Rome.
Malano, H., Burton, M. and Makin, I. (2004) Benchmarking performance in the irrigation and drainage sec-tor: a tool for change. In: Special Issue – Benchmarking in the Irrigation and Drainage Sector. Irrigationand Drainage 53(2), 119–134.
Malhotra, S.P. (1982) The Warabandi System and Its Infrastructure. Central Board of Irrigation and Power Publication No. 157. Central Board of Irrigation and Power, New Delhi.
Merriam, J.L. and Keller, J. (1978) Farm Irrigation System Evaluation: A Guide to Management. Utah State University, Logan, Utah.
Molden, D., Sakthivadivel, R. and Samad, M. (2001) Accounting for changes in water use and the need for institutional adaptation. In: Abernathy, C.L. (ed.) Intersectoral Management of River Basins. International Water Management Institute, Colombo, pp. 73–88.
Murray-Rust, D.H. and Snellen, W.B. (1993) Irrigation System Performance Assessment and Diagnosis. Joint IIMI/ILRI/IHEE Publication. International Irrigation Management Institute, Colombo.
Neville, D.F.J. (1996) Environmental Impact Assessment course notes. Institute of Irrigation and Drainage Studies, University of Southampton, Southampton, UK.
350 References
OECD (2002) Glossary of Key Terms in Evaluation and Results-based Management. Organisation for Economic Co-operation and Development, Paris.
OFWAT (1992) Strategic Business Plan (AMP2) Manual. Office of Water Services, Birmingham, UK.OIP (2008) Project Status Report, Quarter 1, Project Implementation Unit, On-Farm Irrigation Project,
Kyrgyz Republic. Prepared by Project Implementation Unit for World Bank Missions, Bishkek.Ostrom, E. (1992) Crafting Institutions for Self-governing Irrigation Systems. Institute for Contemporary
Studies Press, San Francisco, California.Pasandaran, E. (1976) Water management decision making in the Pekalen Sampean Irrigation Project,
East Java, Indonesia. In: Taylor, D.C. and Wickham, T.H. (eds) Irrigation Policy and the Management of Irrigation Systems in South East Asia. Agricultural Development Council, Bangkok, pp. 47–60.
Plant, R. (1987) Managing Change and Making It Stick. Fontana/Collins, London.Replogle, J.A. and Merriam, J.L. (1980) Scheduling and management of irrigation water delivery systems.
In: Irrigation – Challenges of the 80s, Proceedings of the ASAE Second National Irrigation Symposium,Lincoln, Nebraska, 20–23 October. American Society of Agricultural Engineers, St Joseph, Michigan, pp. 112–126.
Sadler, P. (1995) Managing Change. Kogan Page, London.Shiklomanov, I. (2000) Appraisal and assessment of world water resources. Water International 25(1), 11–32.Skogerboe, G.V. and Merkley, G.P. (1996) Irrigation Maintenance and Operations Learning Process. Water
Resources Publications, Highland Ranch, Colorado.Skogerboe, G.V., Bennet, R.S. and Walker, W.R. (1972) Selection and Installation of Cut-throat Flumes for
Measuring Irrigation and Drainage Water. Technical Bulletin No. 120. Experiment Station, Colorado State University, Fort Collins, Colorado.
Small, L.E. and Svendsen, M. (1992) A Framework for Assessing Irrigation Performance. IFPRI Working Papers on Irrigation Performance No. 1. International Food Policy Research Institute, Washington, DC.
Snell, M.J. (1997) Cost Benefit Analysis for Engineers and Planners. Thomas Telford, London.SRWSC (1980) Water Bailiff’s Manual. State Rivers and Water Supply Commission, Victoria, Australia.Svendsen, M. (ed.) (2005) Irrigation and River Basin Management: Options for Governance and Institutions.
CAB International, Wallingford, UK.Uphoff, N. (1990) Farmer participation in improving irrigation system management for sustainable agricul-
ture in Asia. Paper presented at FAO Regional Workshop on Improved Irrigation System Performance for Sustainable Agriculture, Bangkok, 22–26 October. Food and Agriculture Organization of the United Nations, Rome, 38 pp.
Walker, W.R. (1993) SIRMOD: Surface Irrigation Simulation Software, Version 2.1. Utah State University, Logan, Utah.
Wester, P., Scott, C.A. and Burton, M.A. (2005) River basin closure and institutional change in Mexico’s Lerma-Chapala basin. In: Svendsen, M. (ed.) Irrigation and River Basin Management: Options for Governance and Institutions. CAB International, Wallingford, UK, pp. 125–144.
Withers, B. and Vipond, S. (1974) Irrigation: Design and Practice. B.T. Batsford Ltd, London.World Bank (2005) Shaping the Future of Water for Agriculture: A Sourcebook for Investment in Agricultural
Water Management. Agricultural and Rural Development Division, World Bank, Washington, DC.
©Martin Burton 2010. Irrigation Management: Principles and Practices (Martin Burton) 351
Appendix 1
Scheduling Irrigation Water Exercise
Overview
This exercise builds on the theory outlined in Chapter 5 to outline the procedures for sched-uling irrigation water within the tertiary unit (on-farm) command area. The exercise uses an example of scheduling for five fields within the command area over a 16-day period and shows how to:
determine the irrigation demands for •each field;determine when each field needs to be •irrigated;organize an irrigation schedule to irri-•gate the fields in turn;organize an irrigation schedule to match •the inflow available from the secondary canal.
Background Information
The irrigation command area is shown in Fig. A1.1. The command area comprises five blocks of land, each fed by a quaternary channel. Each block is divided into irrigated fields belonging to individual farmers, with an average field size of 1.3 ha. There are three soil textures in the command area, sandy loam, clay loam and clay, each with different moisture-holding characteristics.
The key data for each block of land are summarized in Table A1.1, while Table A1.2 provides the key data for Block F2. The calcu-lations below show the procedures for sched-uling the irrigation supplies to the five fields in this block for a 15-day period in July. Table A1.3 provides data on the effective rainfall, the reference crop potential evapotranspira-tion (ET0) and the crop evapotranspiration (ETc) for the two crop coefficient (Kc) values at this growth stage of 0.95 and 1.05. Table A1.4 gives the soil moisture deficit in the Block F2 fields at the start of the scheduling time period.
Procedure for Determining the Irrigation Schedule for Block F-2
The procedure for determining the irrigation schedule for Block F-2 is set out below.
Step 1: Calculate crop evapotranspirationCalculate• ETc by multiplying ET0 by the Kc for this growth stage given in Table A1.2. In this example there are only two sets of ETc figures as the mid-season Kc figures are similar for cotton and maize (1.05) and for beans and cabbage (0.95).° Multiply Table A1.2, col. (7) by Table
A1.3, col. (2) to produce Table A1.3, cols (3) and (4).
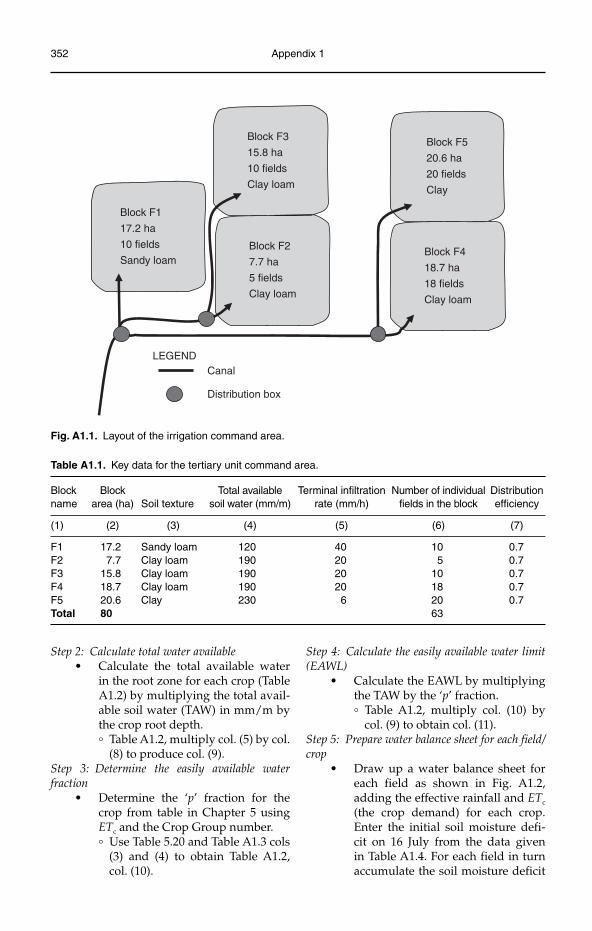
352 Appendix 1
Block F1
17.2 ha
10 fields
Sandy loam
Block F5
20.6 ha
20 fields
Clay
Block F3
15.8 ha
10 fields
Clay loam
Block F2
7.7 ha
5 fields
Clay loam
Block F4
18.7 ha
18 fields
Clay loam
Canal
Distribution box
LEGEND
Fig. A1.1. Layout of the irrigation command area.
Table A1.1. Key data for the tertiary unit command area.
Block name
Block area (ha) Soil texture
Total available soil water (mm/m)
Terminal infiltration rate (mm/h)
Number of individual fields in the block
Distribution efficiency
(1) (2) (3) (4) (5) (6) (7)
F1 17.2 Sandy loam 120 40 10 0.7F2 7.7 Clay loam 190 20 5 0.7F3 15.8 Clay loam 190 20 10 0.7F4 18.7 Clay loam 190 20 18 0.7F5 20.6 Clay 230 6 20 0.7Total 80 63
Step 2: Calculate total water availableCalculate the total available water •in the root zone for each crop (Table A1.2) by multiplying the total avail-able soil water (TAW) in mm/m by the crop root depth.° Table A1.2, multiply col. (5) by col.
(8) to produce col. (9).Step 3: Determine the easily available water fraction
Determine the ‘• p’ fraction for the crop from table in Chapter 5 using ETc and the Crop Group number.° Use Table 5.20 and Table A1.3 cols
(3) and (4) to obtain Table A1.2, col. (10).
Step 4: Calculate the easily available water limit (EAWL)
Calculate the EAWL by multiplying •the TAW by the ‘p’ fraction.° Table A1.2, multiply col. (10) by
col. (9) to obtain col. (11).Step 5: Prepare water balance sheet for each field/crop
Draw up a water balance sheet for •each field as shown in Fig. A1.2, adding the effective rainfall and ETc
(the crop demand) for each crop. Enter the initial soil moisture defi-cit on 16 July from the data given in Table A1.4. For each field in turn accumulate the soil moisture deficit
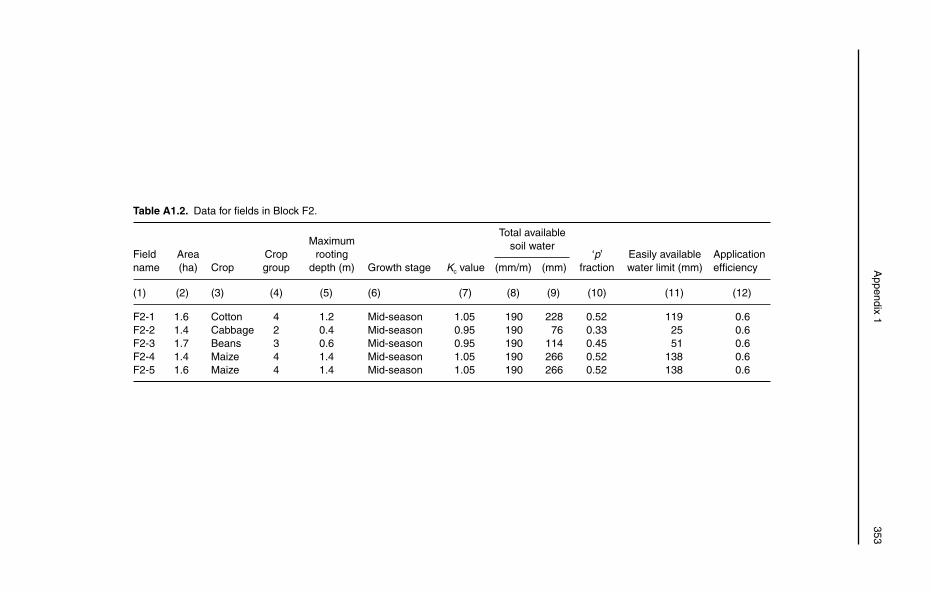
A
ppendix 1 353
Table A1.2. Data for fields in Block F2.
Fieldname
Area(ha) Crop
Cropgroup
Maximum rooting
depth (m) Growth stage Kc value
Total available soil water
‘p’fraction
Easily available water limit (mm)
Applicationefficiency(mm/m) (mm)
(1) (2) (3) (4) (5) (6) (7) (8) (9) (10) (11) (12)
F2-1 1.6 Cotton 4 1.2 Mid-season 1.05 190 228 0.52 119 0.6F2-2 1.4 Cabbage 2 0.4 Mid-season 0.95 190 76 0.33 25 0.6F2-3 1.7 Beans 3 0.6 Mid-season 0.95 190 114 0.45 51 0.6F2-4 1.4 Maize 4 1.4 Mid-season 1.05 190 266 0.52 138 0.6F2-5 1.6 Maize 4 1.4 Mid-season 1.05 190 266 0.52 138 0.6
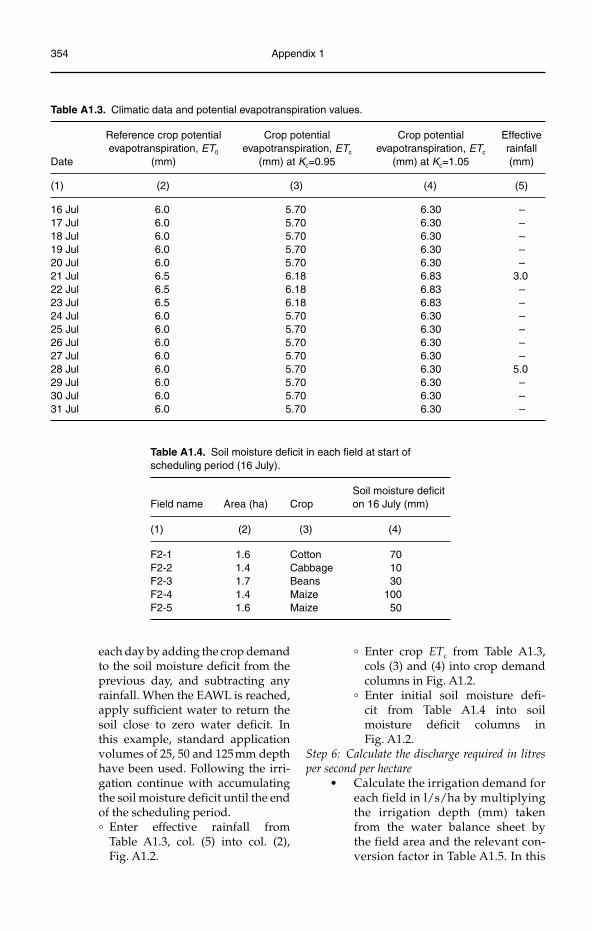
354 Appendix 1
Table A1.3. Climatic data and potential evapotranspiration values.
Date
Reference crop potential evapotranspiration, ET0
(mm)
Crop potential evapotranspiration, ETc
(mm) at Kc=0.95
Crop potential evapotranspiration, ETc
(mm) at Kc=1.05
Effective rainfall (mm)
(1) (2) (3) (4) (5)
16 Jul 6.0 5.70 6.30 –17 Jul 6.0 5.70 6.30 –18 Jul 6.0 5.70 6.30 –19 Jul 6.0 5.70 6.30 –20 Jul 6.0 5.70 6.30 –21 Jul 6.5 6.18 6.83 3.022 Jul 6.5 6.18 6.83 –23 Jul 6.5 6.18 6.83 –24 Jul 6.0 5.70 6.30 –25 Jul 6.0 5.70 6.30 –26 Jul 6.0 5.70 6.30 –27 Jul 6.0 5.70 6.30 –28 Jul 6.0 5.70 6.30 5.029 Jul 6.0 5.70 6.30 –30 Jul 6.0 5.70 6.30 –31 Jul 6.0 5.70 6.30 –
Table A1.4. Soil moisture deficit in each field at start of scheduling period (16 July).
Soil moisture deficit Field name Area (ha) Crop on 16 July (mm)
(1) (2) (3) (4)
F2-1 1.6 Cotton 70F2-2 1.4 Cabbage 10F2-3 1.7 Beans 30F2-4 1.4 Maize 100F2-5 1.6 Maize 50
each day by adding the crop demand to the soil moisture deficit from the previous day, and subtracting any rainfall. When the EAWL is reached, apply sufficient water to return the soil close to zero water deficit. In this example, standard application volumes of 25, 50 and 125 mm depth have been used. Following the irri-gation continue with accumulating the soil moisture deficit until the end of the scheduling period.° Enter effective rainfall from
Table A1.3, col. (5) into col. (2), Fig. A1.2.
° Enter crop ETc from Table A1.3, cols (3) and (4) into crop demand columns in Fig. A1.2.
° Enter initial soil moisture defi-cit from Table A1.4 into soil moisture deficit columns in Fig. A1.2.
Step 6: Calculate the discharge required in litres per second per hectare
Calculate the irrigation demand for •each field in l/s/ha by multiplying the irrigation depth (mm) taken from the water balance sheet by the field area and the relevant con-version factor in Table A1.5. In this
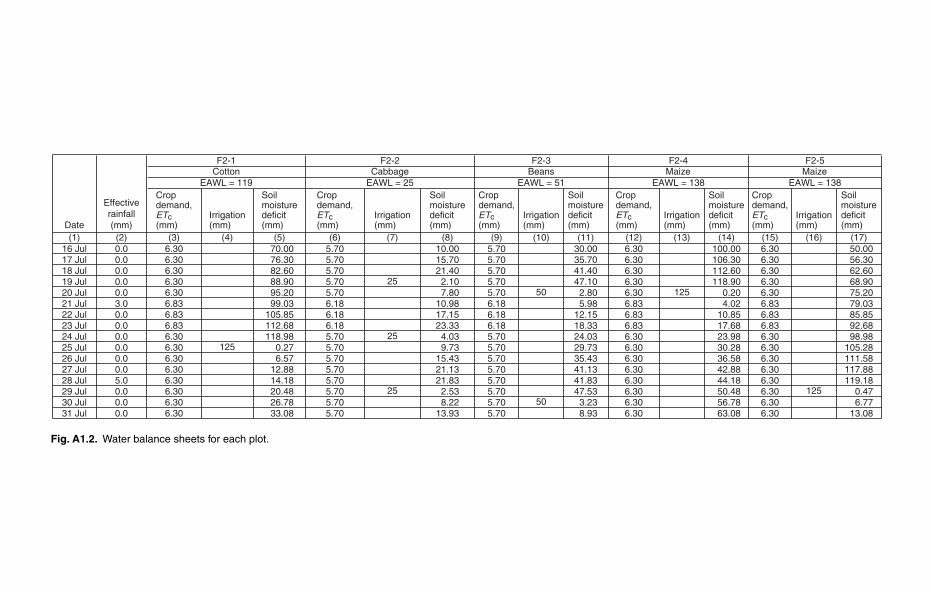
Cropdemand,ETc(mm)
Irrigation(mm)
Soilmoisturedeficit(mm)
Cropdemand,ETc(mm)
Irrigation(mm)
Soilmoisturedeficit(mm)
Cropdemand,ETc(mm)
Irrigation(mm)
Soilmoisturedeficit(mm)
Cropdemand,ETc(mm)
Irrigation(mm)
Soilmoisturedeficit(mm)
Cropdemand,ETc(mm)
Irrigation(mm)
Soilmoisturedeficit(mm)
6.306.306.306.306.306.836.836.836.306.306.306.306.306.306.306.30
70.0076.3082.6088.9095.2099.03
105.85112.68118.98
0.276.57
12.8814.1820.4826.7833.08
10.0015.7021.40
2.107.80
10.9817.1523.33
4.039.73
15.4321.1321.83
2.538.22
13.93
30.0035.7041.4047.10
2.805.98
12.1518.3324.0329.7335.4341.1341.8347.53
3.238.93
100.00106.30112.60118.90
0.204.02
10.8517.6823.9830.2836.5842.8844.1850.4856.7863.08
50.0056.3062.6068.9075.2079.0385.8592.6898.98
105.28111.58117.88119.18
0.476.77
13.08
5.705.705.705.705.706.186.186.185.705.705.705.705.705.705.705.70
5.705.705.705.705.706.186.186.185.705.705.705.705.705.705.705.70
6.306.306.306.306.306.836.836.836.306.306.306.306.306.306.306.30
6.306.306.306.306.306.836.836.836.306.306.306.306.306.306.306.30
0.00.00.00.00.03.00.00.00.00.00.00.05.00.00.00.0
16 Jul17 Jul18 Jul19 Jul20 Jul21 Jul22 Jul23 Jul24 Jul25 Jul26 Jul27 Jul28 Jul29 Jul30 Jul31 Jul
2550 125
(16) (17)
25125
(1) (2) (3) (4) (5) (6) (7) (8) (9) (10) (11) (12) (13) (14) (15)
25 12550
EAWL = 25MaizeMaizeBeansCabbageCotton
Date
Effectiverainfall(mm)
F2-1 F2-2
EAWL = 119 EAWL = 51 EAWL = 138 EAWL = 138
F2-5F2-4F2-3
Fig. A1.2. Water balance sheets for each plot.
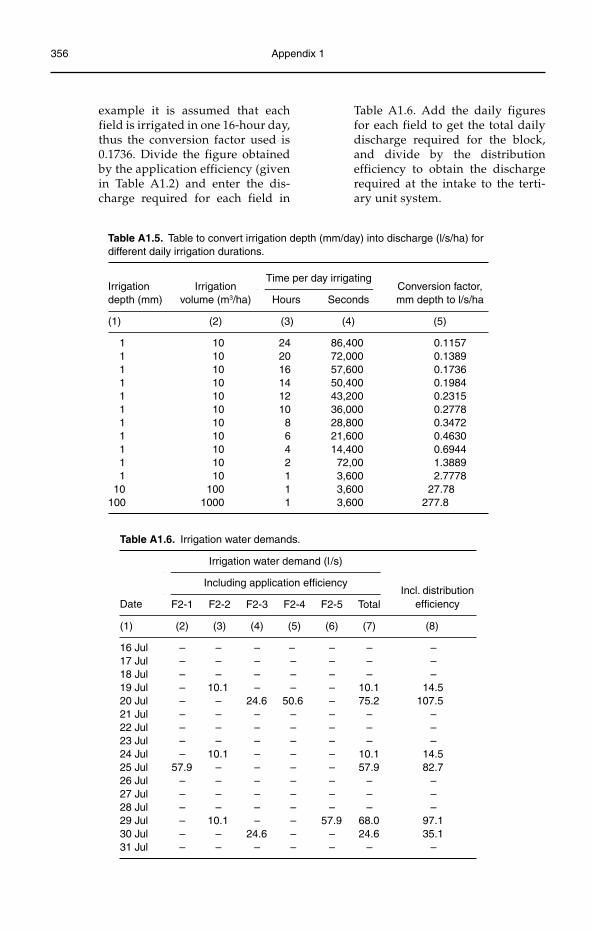
356 Appendix 1
example it is assumed that each field is irrigated in one 16-hour day, thus the conversion factor used is 0.1736. Divide the figure obtained by the application efficiency (given in Table A1.2) and enter the dis-charge required for each field in
Table A1.6. Add the daily figures for each field to get the total daily discharge required for the block, and divide by the distribution efficiency to obtain the discharge required at the intake to the terti-ary unit system.
Table A1.5. Table to convert irrigation depth (mm/day) into discharge (l/s/ha) for different daily irrigation durations.
Irrigation depth (mm)
Irrigation volume (m3/ha)
Time per day irrigatingConversion factor, mm depth to l/s/haHours Seconds
(1) (2) (3) (4) (5)
1 10 24 86,400 0.11571 10 20 72,000 0.13891 10 16 57,600 0.17361 10 14 50,400 0.19841 10 12 43,200 0.23151 10 10 36,000 0.27781 10 8 28,800 0.34721 10 6 21,600 0.46301 10 4 14,400 0.69441 10 2 72,00 1.38891 10 1 3,600 2.7778
10 100 1 3,600 27.78100 1000 1 3,600 277.8
Table A1.6. Irrigation water demands.
Irrigation water demand (l /s)
Including application efficiencyIncl. distribution
Date F2-1 F2-2 F2-3 F2-4 F2-5 Total efficiency
(1) (2) (3) (4) (5) (6) (7) (8)
16 Jul – – – – – – –17 Jul – – – – – – –18 Jul – – – – – – –19 Jul – 10.1 – – – 10.1 14.520 Jul – – 24.6 50.6 – 75.2 107.521 Jul – – – – – – –22 Jul – – – – – – –23 Jul – – – – – – –24 Jul – 10.1 – – – 10.1 14.525 Jul 57.9 – – – – 57.9 82.726 Jul – – – – – – –27 Jul – – – – – – –28 Jul – – – – – – –29 Jul – 10.1 – – 57.9 68.0 97.130 Jul – – 24.6 – – 24.6 35.131 Jul – – – – – – –
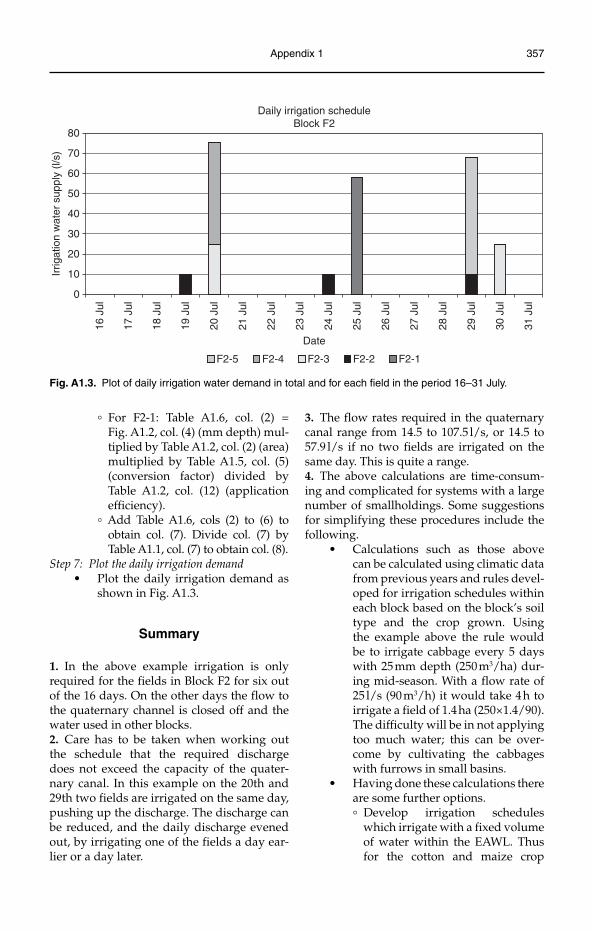
Appendix 1 357
° For F2-1: Table A1.6, col. (2) = Fig. A1.2, col. (4) (mm depth) mul-tiplied by Table A1.2, col. (2) (area) multiplied by Table A1.5, col. (5) (conversion factor) divided by Table A1.2, col. (12) (application efficiency).
° Add Table A1.6, cols (2) to (6) to obtain col. (7). Divide col. (7) by Table A1.1, col. (7) to obtain col. (8).
Step 7: Plot the daily irrigation demandPlot the daily irrigation demand as •shown in Fig. A1.3.
Summary
1. In the above example irrigation is only required for the fields in Block F2 for six out of the 16 days. On the other days the flow to the quaternary channel is closed off and the water used in other blocks.2. Care has to be taken when working out the schedule that the required discharge does not exceed the capacity of the quater-nary canal. In this example on the 20th and 29th two fields are irrigated on the same day, pushing up the discharge. The discharge can be reduced, and the daily discharge evened out, by irrigating one of the fields a day ear-lier or a day later.
3. The flow rates required in the quaternary canal range from 14.5 to 107.5 l/s, or 14.5 to 57.9 l/s if no two fields are irrigated on the same day. This is quite a range.4. The above calculations are time-consum-ing and complicated for systems with a large number of smallholdings. Some suggestions for simplifying these procedures include the following.
Calculations such as those above •can be calculated using climatic data from previous years and rules devel-oped for irrigation schedules within each block based on the block’s soil type and the crop grown. Using the example above the rule would be to irrigate cabbage every 5 days with 25 mm depth (250 m3/ha) dur-ing mid-season. With a flow rate of 25 l/s (90 m3/h) it would take 4 h to irrigate a field of 1.4 ha (250×1.4/90). The difficulty will be in not applying too much water; this can be over-come by cultivating the cabbages with furrows in small basins.Having done these calculations there •are some further options.° Develop irrigation schedules
which irrigate with a fixed volume of water within the EAWL. Thus for the cotton and maize crop
0
10
20
30
40
50
60
70
80
16 J
ul
17 J
ul
18 J
ul
19 J
ul
20 J
ul
21 J
ul
22 J
ul
23 J
ul
24 J
ul
25 J
ul
26 J
ul
27 J
ul
28 J
ul
29 J
ul
30 J
ul
31 J
ul
Irrig
atio
n w
ater
sup
ply
(l/s)
Date
Daily irrigation scheduleBlock F2
F2-5 F2-4 F2-3 F2-2 F2-1
Fig. A1.3. Plot of daily irrigation water demand in total and for each field in the period 16–31 July.
358 Appendix 1
a rule could be to irrigate each 30 days with 180 mm (1800 m3/ha). This would replenish the water lost by evapotranspiration (at about 6 mm/day) and would ensure that the crop does not reach the EAWL. With a flow rate of 50 l/s (180 m3/h) it would take 10 h to irrigate a 1 ha field (or 16 hours for fields F2-1 and F2-5, and 14 hours for F2-4, in the example).
° Devise a rotation schedule which uses a constant inflow to the block. With a total evapotranspiration demand of about 6.2 mm/day and a total area of 7.7 ha for Block F-2 the daily water demand is 477.4 m3/day (0.0062×10,000×7.7), or 796 m3/day if the application
efficiency (0.6) is taken into account. Irrigating for 14 hours (50,400 s) per day would thus require a flow rate of 16 l/s (796/50,400), or 23 l/s including the distribution effi-ciency (0.7).
5. The calculations shown above can thus be used as a guide to developing a workable irrigation schedule that fits with the farming practices and yet which is based on calcu-lated demands based on the climatic condi-tions, the soil type and the rooting depths of the crops.6. The exercise serves to demonstrate how complicated it is to schedule irrigation water to match crop needs where there is a large number of landholdings and that simplified procedures need to be developed based on the procedures outlined in this example.
©Martin Burton 2010. Irrigation Management: Principles and Practices (Martin Burton) 359
Appendix 2
Checklist for Assessing the Performance of Water Users Associations or Federations
of Water Users Associations
Introduction
This checklist summarizes the characteristics of successful water users associations (WUAs) or federations of WUAs. The checklist can be used to make a rapid assessment of the per-formance of an Association or Federation. It is anticipated that the assessment will be more qualitative than quantitative, with data acquired through short interviews with WUA and Federation staff. The checklist is provided as Table A2.1 and the suggested standards for each measure as Table A2.2, following the dis-cussion below.
Categories
The performance of a WUA or Federation can be assessed in the following areas:
general management;•finance;•water management;•asset management and maintenance;•level of service provision.•
General management
General management relates to the effective-ness of the WUA or Federation Chairman
and staff in managing the WUA or Federation. Performance relates to the per-sonal skills of the WUA/Federation man-agers, and to the institutional arrangements that have been established within the WUA/Federation. The key indicators of performance are:
level of membership;•General Assembly attendance;•regular weekly meetings;•management style;•liaison and communication with water •users;level of facilities;•level of democracy.•
Level of membership
The number of water users within the com-mand area who are members of the asso-ciation is an indicator of the viability and success of the WUA/Federation. If the level of service provided and the degree of control exercised by the WUA/Federation are high, then one can expect the membership level to be high.
In some areas the farmers do not want to join the Association but do pay for water. In these locations the fee recovery rate may be a better indicator of performance.
360 Appendix 2
General/Representative Assembly attendance
The number of water users or representa-tives attending the General or Representative Assembly is a crucial indicator of the viability of the WUA/Federation. The level of discus-sion and issues raised within the Assembly are also indicators of success/viability.
Regular weekly meetings
The regularity, attendance and content of discussions at WUA/Federation weekly meetings are indicators of success. Well-attended, regular meetings with vibrant discussion at which important manage-ment decisions are made are indicators of success/viability.
Management style
The management style of the WUA/Federation Chairman and the commit-tee influences the success/viability of the organization. A strong leader who gains consensus can be good; a dominating leader who refuses to allow discussion and debate can be bad.
Liaison and communication with water users
The WUA/Federation belongs to the water users; it is essential that the WUA/Federation management maintains close links with the water users and keeps them informed. The degree of communication/liaison can be assessed through speaking with the water users to see how informed they are about WUA/Federation activities.
Level of facilities
The level of facilities owned by the WUA/Federation will influence performance. The facilities required include:
office accommodation;•tables and chairs;•motorcycles;•radios, mobile phones;•maps;•records of command areas and assets •within the irrigation and drainage system;
computers and printer, or typewriter;•filing cabinets;•records (water indents, fees paid, mem-•bership register, asset register, etc.).
Level of democracy/participation
A valuable indicator of the performance of the Association is the level of democracy and participation exhibited within the WUA/Federation. Information needs to be obtained by questioning farmers on their level of knowledge of, involvement and participation in the affairs of the WUA/Federation, and the degree to which the WUA/Federation man-agement liaises with them and allows them to participate.
Finance
The financial situation and financial manage-ment of the WUA/Federation are central to the long-term sustainability of the WUA/Federation. The indicators of performance in respect of financial matters include:
setting of the irrigation service fee (ISF);•level of fee recovery – numbers •contributing;level of fee recovery – amount •contributed;the audit report.•
Setting of the irrigation service fee
The ISF should be set by the WUA/Federation in relation to the identified needs of the WUA/Federation. These will include:
salaries for WUA/Federation staff;•costs of maintaining facilities (offices, •electricity, rental, stationery, etc.);costs of maintaining equipment and •plant (motorcycles, maintenance plant, etc.);operation costs (pumping costs, motor-•cycle costs, etc.);maintenance costs.•
Initially the WUA/Federation may set the fee based on recommendations made by the WUA Support Unit, or external body. Over time this should change to a more needs-
Appendix 2 361
based assessment based on the above items. At the start of each year the total opera-tional needs of the WUA/Federation should be determined and divided by one of the following:
1. The total area irrigated, to obtain the ISF per hectare;2. The total number of water users, to obtain the ISF per irrigator;3. The total number of estimated irriga-tions (based on total area times the average number of irrigations), to obtain the ISF per irrigation.
Thus if the total estimated cost is $3000 for a 300 ha command area with 200 water users and an average number of 1.5 irrigations per hectare, the cost per water user will be $10/ha, $15/person or $6.67/irrigation.
Level of fee recovery – numbers contributing
The number of members paying their ISF is a good indicator of success. Records should be kept of water users who take water but do not pay.
Level of fee recovery – amount contributed
The total ISF collected in relation to the esti-mated annual requirement for management, operation and maintenance of the system is a good indicator of long-term viability of the WUA/Federation.
The audit report
The audit report summarizes the financial performance of the Association. The audit covers checks of: the annual budget, the crop book, the membership book, the membership receipt forms, the irrigation book, the irriga-tion invoices/receipts, the payroll, the main-tenance expenditure statements, the cash book and the bank statements.
Water management
The sustainability of the WUA/Federation rests in the long term on the effectiveness of
the water management practices – if these are poor then water users will not get a good level of service and will eventually stop pay-ing their ISF. The indicators for water man-agement performance are:
pre-season irrigation planning;•pre-season irrigation agreements;•in-season irrigation planning;•in-season irrigation implementation;•in-season irrigation monitoring and •evaluation;discharge measurement;•end-of season performance evaluation.•
Pre-season irrigation planning
The WUA/Federation should work with the water users to plan the irrigation sea-son. This is especially important where the irrigation area is supplied from a reservoir or river where water is in short supply. The degree of pre-season planning and the seriousness with which it is carried out are important indicators of WUA/Federation viability.
Pre-season irrigation agreements
Arising from the pre-season plans the WUA/Federation should discuss the anticipated water supply situation relative to the planned cropped area and agree policies and strate-gies for the coming season. These should include:
what to do in times of water scarcity •(rotation plans, etc.);what to do when it rains;•rules on priority allocations;•agreements to cooperate between WUAs.•
In-season irrigation planning
The extent and adequacy of weekly in-sea-son irrigation planning is a strong indica-tor of the viability of a WUA/Federation. Irrigation indents should be made each week by the farmers to the WUA Water Master and passed up the system to the WUA/Federation where allocations should be made based on the available water supplies.
362 Appendix 2
In-season irrigation implementation
The implementation of the weekly irrigation plan is central to the whole irrigation man-agement process, and is the most important indicator for assessing water management. In far too many cases a plan is made on paper but the actual implementation is never car-ried out. Thus the management perform-ance ratio (ratio of actual supply divided by planned supply) is the prime water manage-ment performance indicator.
In-season irrigation monitoring and evaluation
The level of monitoring and evaluation car-ried out by the WUA/Federation of the in-season irrigation allocation, scheduling and actual supply is a useful indicator of WUA/Federation performance. The area irrigated in relation to the total command area (the crop-ping intensity) should also be used.
Discharge measurement
The accuracy and extent of discharge moni-toring, data processing and analysis indicate the management performance of the WUA/Federation.
End-of season performance evaluation
At the end of the season the WUA/Federation should carry out an evaluation of the perform-ance of the irrigation system, and its manage-ment of that system. The extent to which this is done, and the extent to which the lessons learnt are applied, is an indicator of manage-ment competence.
Asset management and maintenance
The productivity of the irrigation system is dependent on the ability of the irrigation infrastructure to deliver the right amount of water at the right place and the right time, in accordance with the irrigation plan. Knowledge of the asset base, its type, extent and condition and maintenance require-ment is an essential part of the manage-
ment pro cess. The following are therefore important:
asset database;•pre-season maintenance plan;•annual maintenance identification, • costing, planning, implementation and recording;total maintenance expenditure;•degree of control and measurement;•overall infrastructure condition.•
Asset database
In order to manage the water the WUA/Federation must know what assets it has, and the condition of those assets. Without opera-tional control and measurement structures the WUA/Federation cannot distribute water according to the irrigation plan.
Pre-season maintenance plan
An important management task is to carry out a pre-season maintenance inspection to document the maintenance requirement prior to the start of the irrigation season. Following this inspection a maintenance plan must be drawn up and costed, and the maintenance work implemented before the start of the irri-gation season.
Annual maintenance identification, costing, planning, implementation and recording
An annual maintenance plan must be drawn up by the WUA/Federation. This plan will be made from experience during the irriga-tion season and a full inspection while the irrigation system is operational, plus a full inspection at the end of the season when the canals are dry. The maintenance requirement will be identified, costed, prioritized, selected (in relation to the available budget) and implemented (either through direct labour or through tendered contracts). The extent to which such work is done is an indication of the management capability of the WUA/Federation.
Total maintenance expenditure
The total expenditure on maintenance in rela-tion to (i) the irrigable command area, (ii) the
Appendix 2 363
collected revenue and (iii) the total estimated management, operation and maintenance (cost) need, provides an indication of the sustainability of the irrigation system, and the management’s ability to organize mainte-nance work.
Degree of control and measurement
The capability to control and measure the irrigation water supplies is an important fac-tor in the management of the available water supplies. The greater the level of control and measurement, the higher the level of service achievable.
Overall infrastructure condition
Allied to the control and measurement capa-bility is the ability of the physical infrastruc-ture to convey the available water supply and dispose of excess drainage water. Systems in poor physical condition will be less managea-ble and have higher losses. Heavy vegetation in channels is of particular concern in this respect, and a useful indicator of the WUA/Federation’s capabilities.
Level of service provision
As stated previously, the WUA/Federation is an organization that is there to provide water users with service – the delivery of irrigation water and removal of surplus drainage water. The concept of level of service provision is central to the success of the WUA/Federation. Measures of the level of service provided can be gained from assessing:
knowledge by water users of WUA/•Federation activities;satisfaction with level of service •provided;number of registered complaints during •season.
Knowledge by water users of Association/Federation activities
An indication of the level of communication and the level of service provided to water users can be gained from questioning water users to ascertain their knowledge of WUA/Federation activities. If the knowledge levels are low then the level of service provision may also be low.
Satisfaction with level of service provided
Questioning water users on the level of serv-ice provision that they receive in relation to obtaining irrigation water when they want and in the quantity that they require is an important part of the evaluation of water management. Measurement of the farmers’ perception of the value for money of the level of service that they receive is also useful.
Number of registered complaints during season
The WUA/Federation should have a sys-tem for registering and dealing with com-plaints from water users. The number and nature of the complaints, and the action taken to address these complaints, provides an indicator of the level of service being provided.
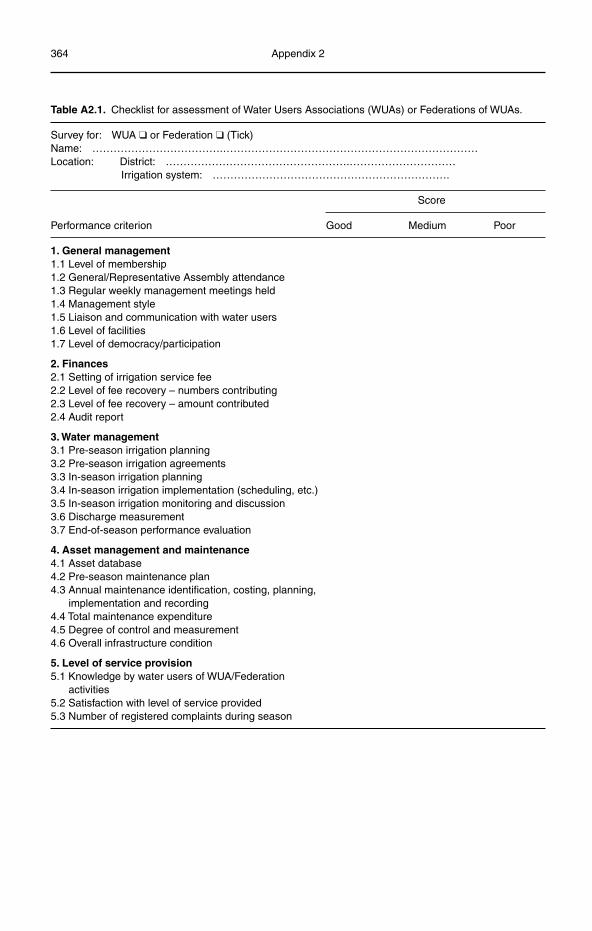
364 Appendix 2
Table A2.1. Checklist for assessment of Water Users Associations (WUAs) or Federations of WUAs.
Survey for: WUA ❑ or Federation ❑ (Tick)Name: ……………………………….………………………………………………………………Location: District: …………………………………………….………………………… Irrigation system: ………………………………………………………….
Score
Performance criterion Good Medium Poor
1. General management 1.1 Level of membership 1.2 General/Representative Assembly attendance 1.3 Regular weekly management meetings held 1.4 Management style 1.5 Liaison and communication with water users 1.6 Level of facilities 1.7 Level of democracy/participation
2. Finances 2.1 Setting of irrigation service fee 2.2 Level of fee recovery – numbers contributing 2.3 Level of fee recovery – amount contributed 2.4 Audit report
3. Water management 3.1 Pre-season irrigation planning 3.2 Pre-season irrigation agreements 3.3 In-season irrigation planning 3.4 In-season irrigation implementation (scheduling, etc.) 3.5 In-season irrigation monitoring and discussion 3.6 Discharge measurement 3.7 End-of-season performance evaluation
4. Asset management and maintenance 4.1 Asset database 4.2 Pre-season maintenance plan 4.3 Annual maintenance identification, costing, planning,
implementation and recording 4.4 Total maintenance expenditure 4.5 Degree of control and measurement 4.6 Overall infrastructure condition
5. Level of service provision 5.1 Knowledge by water users of WUA/Federation
activities 5.2 Satisfaction with level of service provided 5.3 Number of registered complaints during season
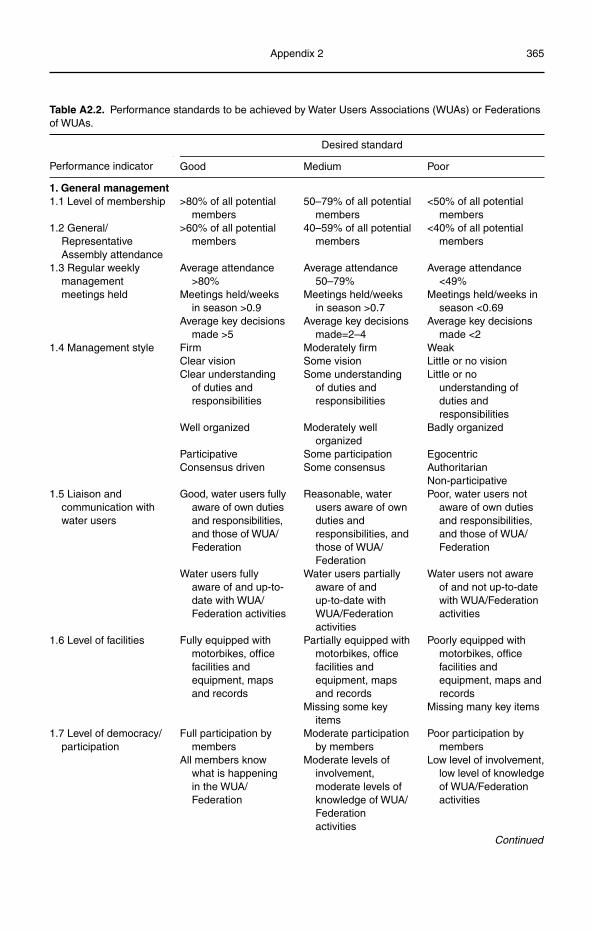
Appendix 2 365
Table A2.2. Performance standards to be achieved by Water Users Associations (WUAs) or Federations of WUAs.
Desired standard
Performance indicator Good Medium Poor
1. General management1.1 Level of membership >80% of all potential
members50–79% of all potential
members<50% of all potential
members1.2 General/
Representative Assembly attendance
>60% of all potential members
40–59% of all potential members
<40% of all potential members
1.3 Regular weekly managementmeetings held
Average attendance >80%
Average attendance 50–79%
Average attendance <49%
Meetings held/weeks in season >0.9
Meetings held/weeks in season >0.7
Meetings held/weeks in season <0.69
Average key decisions made >5
Average key decisions made=2–4
Average key decisions made <2
1.4 Management style Firm Moderately firm WeakClear vision Some vision Little or no visionClear understanding
of duties and responsibilities
Some understanding of duties and responsibilities
Little or no understanding of duties and responsibilities
Well organized Moderately well organized
Badly organized
Participative Some participation EgocentricConsensus driven Some consensus Authoritarian
Non-participative1.5 Liaison and
communication with water users
Good, water users fully aware of own duties and responsibilities, and those of WUA/Federation
Reasonable, water users aware of own duties and responsibilities, and those of WUA/Federation
Poor, water users not aware of own duties and responsibilities, and those of WUA/Federation
Water users fully aware of and up-to-date with WUA/Federation activities
Water users partially aware of and up-to-date with WUA/Federation activities
Water users not aware of and not up-to-date with WUA/Federation activities
1.6 Level of facilities Fully equipped with motorbikes, office facilities and equipment, maps and records
Partially equipped with motorbikes, office facilities and equipment, maps and records
Poorly equipped with motorbikes, office facilities and equipment, maps and records
Missing some key items
Missing many key items
1.7 Level of democracy/participation
Full participation by members
Moderate participation by members
Poor participation by members
All members know what is happening in the WUA/Federation
Moderate levels of involvement, moderate levels of knowledge of WUA/Federation activities
Low level of involvement, low level of knowledge of WUA/Federation activities
Continued
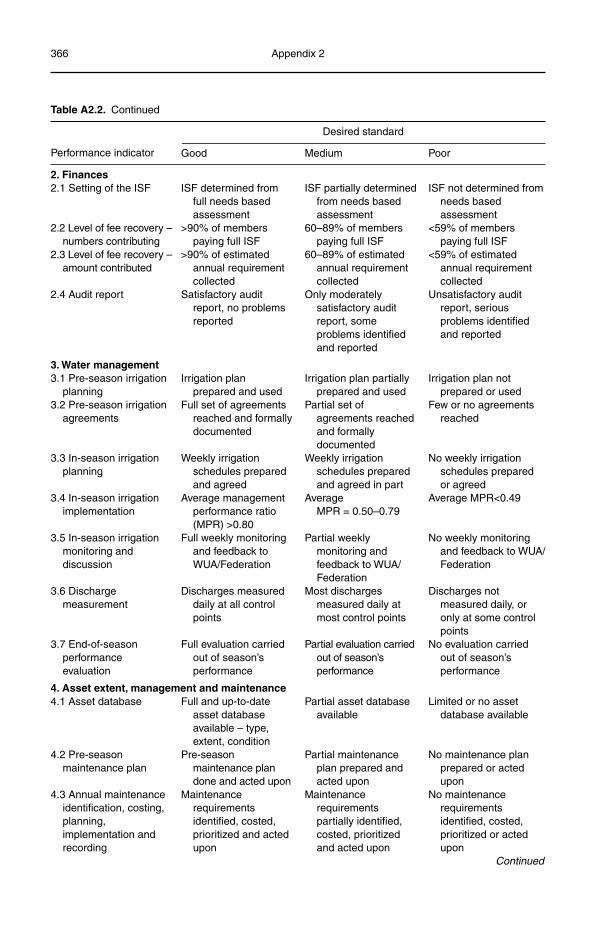
366 Appendix 2
Table A2.2. Continued
Desired standard
Performance indicator Good Medium Poor
2. Finances2.1 Setting of the ISF ISF determined from
full needs based assessment
ISF partially determined from needs based assessment
ISF not determined from needs based assessment
2.2 Level of fee recovery – numbers contributing
>90% of members paying full ISF
60–89% of members paying full ISF
<59% of members paying full ISF
2.3 Level of fee recovery – amount contributed
>90% of estimated annual requirement collected
60–89% of estimated annual requirement collected
<59% of estimated annual requirement collected
2.4 Audit report Satisfactory audit report, no problems reported
Only moderately satisfactory audit report, some problems identified and reported
Unsatisfactory audit report, serious problems identified and reported
3. Water management3.1 Pre-season irrigation
planningIrrigation plan
prepared and usedIrrigation plan partially
prepared and usedIrrigation plan not
prepared or used3.2 Pre-season irrigation
agreementsFull set of agreements
reached and formally documented
Partial set of agreements reached and formally documented
Few or no agreements reached
3.3 In-season irrigation planning
Weekly irrigation schedules prepared and agreed
Weekly irrigation schedules prepared and agreed in part
No weekly irrigation schedules prepared or agreed
3.4 In-season irrigation implementation
Average management performance ratio (MPR) >0.80
Average MPR = 0.50–0.79
Average MPR<0.49
3.5 In-season irrigation monitoring and discussion
Full weekly monitoring and feedback to WUA/Federation
Partial weekly monitoring and feedback to WUA/Federation
No weekly monitoring and feedback to WUA/Federation
3.6 Discharge measurement
Discharges measured daily at all control points
Most discharges measured daily at most control points
Discharges not measured daily, or only at some control points
3.7 End-of-season performance evaluation
Full evaluation carried out of season’s performance
Partial evaluation carried out of season’s performance
No evaluation carried out of season’s performance
4. Asset extent, management and maintenance4.1 Asset database Full and up-to-date
asset database available – type, extent, condition
Partial asset database available
Limited or no asset database available
4.2 Pre-season maintenance plan
Pre-season maintenance plan done and acted upon
Partial maintenance plan prepared and acted upon
No maintenance plan prepared or acted upon
4.3 Annual maintenance identification, costing, planning,implementation and recording
Maintenancerequirementsidentified, costed, prioritized and acted upon
Maintenancerequirementspartially identified, costed, prioritized and acted upon
No maintenance requirementsidentified, costed, prioritized or acted upon
Continued
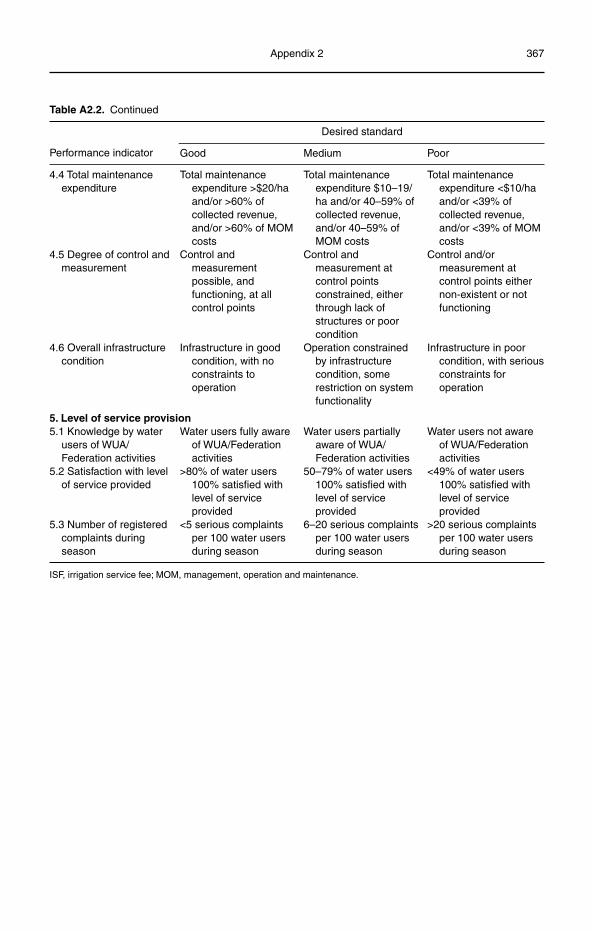
Appendix 2 367
Table A2.2. Continued
Desired standard
Performance indicator Good Medium Poor
4.4 Total maintenance expenditure
Total maintenance expenditure >$20/ha and/or >60% of collected revenue, and/or >60% of MOM costs
Total maintenance expenditure $10–19/ha and/or 40–59% of collected revenue, and/or 40–59% of MOM costs
Total maintenance expenditure <$10/ha and/or <39% of collected revenue, and/or <39% of MOM costs
4.5 Degree of control and measurement
Control and measurementpossible, and functioning, at all control points
Control and measurement at control points constrained, either through lack of structures or poor condition
Control and/or measurement at control points either non-existent or not functioning
4.6 Overall infrastructure condition
Infrastructure in good condition, with no constraints to operation
Operation constrained by infrastructure condition, some restriction on system functionality
Infrastructure in poor condition, with serious constraints for operation
5. Level of service provision5.1 Knowledge by water
users of WUA/Federation activities
Water users fully aware of WUA/Federation activities
Water users partially aware of WUA/Federation activities
Water users not aware of WUA/Federation activities
5.2 Satisfaction with level of service provided
>80% of water users 100% satisfied with level of service provided
50–79% of water users 100% satisfied with level of service provided
<49% of water users 100% satisfied with level of service provided
5.3 Number of registered complaints during season
<5 serious complaints per 100 water users during season
6–20 serious complaints per 100 water users during season
>20 serious complaints per 100 water users during season
ISF, irrigation service fee; MOM, management, operation and maintenance.

This page intentionally left blank
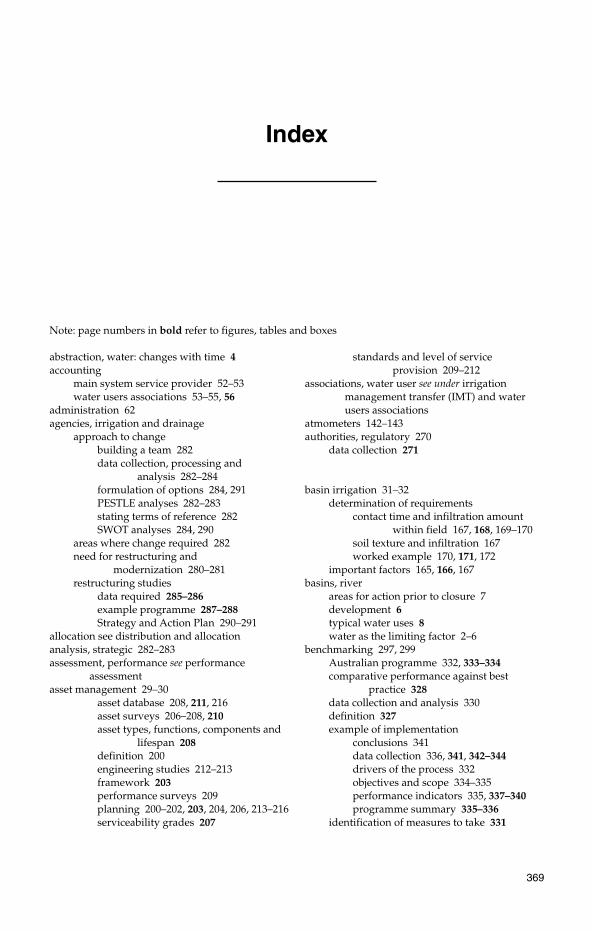
369
Index
abstraction, water: changes with time 4accounting
main system service provider 52–53water users associations 53–55, 56
administration 62agencies, irrigation and drainage
approach to changebuilding a team 282data collection, processing and
analysis 282–284formulation of options 284, 291PESTLE analyses 282–283stating terms of reference 282SWOT analyses 284, 290
areas where change required 282need for restructuring and
modernization 280–281restructuring studies
data required 285–286example programme 287–288Strategy and Action Plan 290–291
allocation see distribution and allocationanalysis, strategic 282–283assessment, performance see performance
assessmentasset management 29–30
asset database 208, 211, 216asset surveys 206–208, 210asset types, functions, components and
lifespan 208definition 200engineering studies 212–213framework 203performance surveys 209planning 200–202, 203, 204, 206, 213–216serviceability grades 207
standards and level of service provision 209–212
associations, water user see under irrigation management transfer (IMT) and water users associations
atmometers 142–143authorities, regulatory 270
data collection 271
basin irrigation 31–32determination of requirements
contact time and infiltration amount within field 167, 168, 169–170
soil texture and infiltration 167worked example 170, 171, 172
important factors 165, 166, 167basins, river
areas for action prior to closure 7development 6typical water uses 8water as the limiting factor 2–6
benchmarking 297, 299Australian programme 332, 333–334comparative performance against best
practice 328data collection and analysis 330definition 327example of implementation
conclusions 341data collection 336, 341, 342–344drivers of the process 332objectives and scope 334–335performance indicators 335, 337–340programme summary 335–336
identification of measures to take 331
Note: page numbers in bold refer to figures, tables and boxes
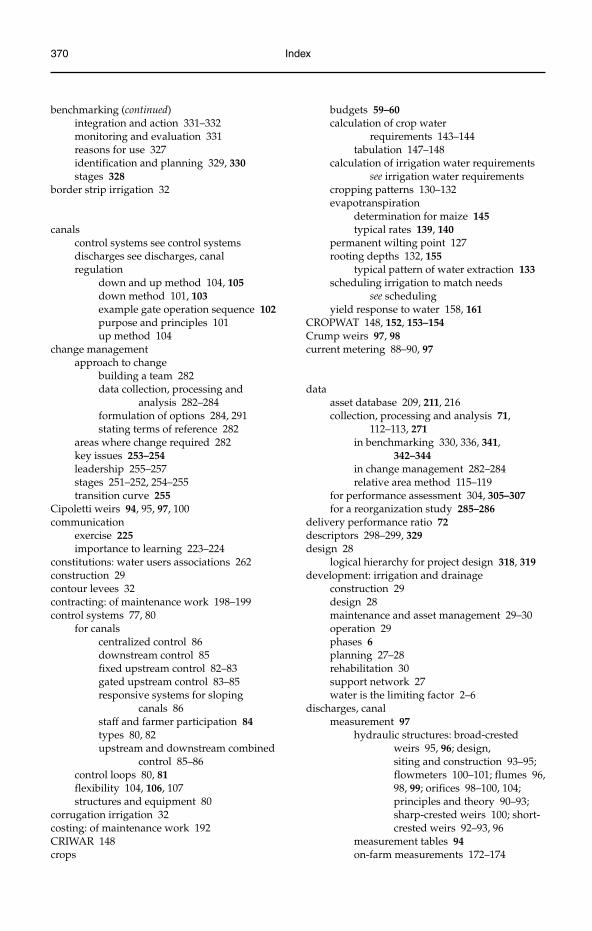
370 Index
benchmarking (continued)integration and action 331–332monitoring and evaluation 331reasons for use 327identification and planning 329, 330stages 328
border strip irrigation 32
canalscontrol systems see control systemsdischarges see discharges, canalregulation
down and up method 104, 105down method 101, 103example gate operation sequence 102purpose and principles 101up method 104
change managementapproach to change
building a team 282data collection, processing and
analysis 282–284formulation of options 284, 291stating terms of reference 282
areas where change required 282key issues 253–254leadership 255–257stages 251–252, 254–255transition curve 255
Cipoletti weirs 94, 95, 97, 100communication
exercise 225importance to learning 223–224
constitutions: water users associations 262construction 29contour levees 32contracting: of maintenance work 198–199control systems 77, 80
for canalscentralized control 86downstream control 85fixed upstream control 82–83gated upstream control 83–85responsive systems for sloping
canals 86staff and farmer participation 84types 80, 82upstream and downstream combined
control 85–86control loops 80, 81flexibility 104, 106, 107structures and equipment 80
corrugation irrigation 32costing: of maintenance work 192CRIWAR 148crops
budgets 59–60calculation of crop water
requirements 143–144tabulation 147–148
calculation of irrigation water requirements see irrigation water requirements
cropping patterns 130–132evapotranspiration
determination for maize 145typical rates 139, 140
permanent wilting point 127rooting depths 132, 155
typical pattern of water extraction 133scheduling irrigation to match needs
see schedulingyield response to water 158, 161
CROPWAT 148, 152, 153–154Crump weirs 97, 98current metering 88–90, 97
dataasset database 209, 211, 216collection, processing and analysis 71,
112–113, 271in benchmarking 330, 336, 341,
342–344in change management 282–284relative area method 115–119
for performance assessment 304, 305–307for a reorganization study 285–286
delivery performance ratio 72descriptors 298–299, 329design 28
logical hierarchy for project design 318, 319development: irrigation and drainage
construction 29design 28maintenance and asset management 29–30operation 29phases 6planning 27–28rehabilitation 30support network 27water is the limiting factor 2–6
discharges, canalmeasurement 97
hydraulic structures: broad-crested weirs 95, 96; design, siting and construction 93–95; flowmeters 100–101; flumes 96, 98, 99; orifices 98–100, 104; principles and theory 90–93; sharp-crested weirs 100; short-crested weirs 92–93, 96
measurement tables 94on-farm measurements 172–174
Index 371
velocity-area methods 87–90variation 77, 78
discussions, small group 231, 237distribution and allocation
application and distribution efficiencies 147
relative area methoddata collection, processing and
analysis 115–119details of the method 114–115principle 113–114schematic maps 119–121typical layout 114 (fig)
simple proportional 107–108Warabandi system 108
efficiency 8environment
impact and mitigation of irrigation schemes 22, 23–26, 27
equipment see plant and equipmentevaluation see under performance assessmentevaporation pans 141, 142evapotranspiration
definition 138determination
atmometers 142–143evaporation pans 141, 142example for maize 145lysimeters 141–142meteorological stations 139–141
influencing factors 138–139irrigation scheduling exercise 351, 354seasonal changes 139, 140typical rates for selected crops 139
farmer-managed schemes: improvement of performance 250
field capacity 126–127finances 55–61
Audit Committees 273financial modelling 213government difficulties with funding
irrigation 248historical operating cost analysis 213investment profiles: examples 206, 214level of service versus level of investment
and costs 205, 212maintenance
budget and scheduling 197–198costing and budgeting 192–193,
194–195, 198flexibility 104, 106, 107floats: for discharge measurement 87–88, 97
example calculations 89
floodingcontrolled 31–32uncontrolled 31
flowmeters 100–101flumes 96, 98, 99
portable flumes 172, 173–174furrow irrigation 32
games: used in training 222, 239communication exercise 225
Goulburn-Murray scheme 67governance: water users associations 264–265
historychanging role of management in water
resources development 2–6irrigation and drainage development 1–2
human resources 61–62hydraulic structures: for discharge measurement
see under discharges, canal
infiltration see under soilinformation: records and information
systems 50–51infrastructure, physical 17–18inspections 185–187
points to check 188, 189International Water Management Institute (IWMI)
study of irrigation situation worldwide 1–2, 4–5, 9
irrigation and drainage schemesdefinition 11economic domain 18, 21–22environmental domain 22, 23–26, 27institutional domain 18, 19, 20, 37–41key descriptors 298–299, 329management components 21nested systems of components 11, 13outputs 11–12physical components 15, 16–17physical infrastructure 17–18related domains 12social domain 22technical domain 14types of components 12, 13
Irrigation Management Game 222irrigation management transfer (IMT)
change managementkey issues 253–254stages 251–252, 254–255transition curve 255
changes required 249components 251countries engaged in IMT 249–250
372 Index
irrigation management transfer (IMT) (continued) summary scorecard of programme
success 259definition (FAO) 249FAO guidelines 250–251key success factors and associated tasks 261management process checklist 257, 258reasons 248reasons for failure 277–278water users associations see water users
associationsirrigation methods 30–33irrigation water requirements: calculation
application and distribution efficiencies 147data required 144, 146dry foot crops 146irrigation demand at the field 148rice crops 146–147software for determination of water
requirements 148, 152, 153–154tabulation 147–148, 149, 150, 151
leadershipdifferences in roles between leaders and
managers 256–257styles and attributes 255–256
learningeffective learning environment 223importance of communication 223–224methods 222–223
legislation 19legal framework for water users associations
constitution 262governance structure 264–265mergers 265overview 261–262participation 262–263procedures for establishment 263–264rights, duties, responsibilities 263status, name and tasks 262supervision 265
legal issues 62–63level of service versus costs 205logical framework see under planninglosses: of irrigation water 174
prevention and reduction 176lysimeters 141–142
maintenance 29–30annual 184–185certification and payment 199consequences of inadequate
maintenance 181, 182contracting 198–199
cycleannual 49‘bicycle’ 201inspections 185–187, 188, 189overview 185
emergency 185implementation, supervision and
records 199–200measurement and costing 192, 198
examples 193, 194–195objectives 183periodic 184planning and management of 49plant and equipment see plant
and equipmentpreventative 185prioritization 192–193, 196–197reasons for neglect 180rehabilitation versus maintenance 181, 183reporting 187, 192
maintenance register example 191vegetation and sedimentation condition
coding system 192work sheet 190
routine 184scheduling according to budget 197–198vicious cycle of inadequate maintenance 181
management see also distribution and allocation; scheduling
accounting 51–55administration 62asset management see under asset
managementof change see change managementcomponents 21efficiency 10field-level 43financing 55–61framework
high-order structure 37–41functions 36–37
key functions 45–47by government
problems 248transfer of management to water users
see irrigation management transfer (IMT)
human resources 61–62legal issues 62–63levels 64objectives 43–45on-farm 41–43planning and management of maintenance
see maintenanceproductivity 10public relations 63
Index 373
records and information systems 50–51of water users associations see under water
users associationsmaps, schematic 119–121measurement
of discharges see under discharges, canalof maintenance required 192
mergers: water users associations 265meteorological stations 139–141metering, current 88–90, 97moisture, soil see under soilmonitoring see under performance assessment
objectives 43–45, 301, 303for state farm and settlement scheme 302
operationcanal regulation 101–104consequences of poor operation 181control systems see control systemsdischarge measurements see under discharges,
canalmain system
processes 65simple proportional
distribution 107–108orifices 98–100, 104outputs: of irrigation and drainage schemes 11–12
Penman–Monteith method for evapotranspiration 140
performance assessmentbenchmarking 297, 299
Australian programme 332, 333–334comparative performance against best
practice 328data collection and analysis 330definition 327example programmes: conclusions 336,
341; data collection 336, 341, 342–344; drivers of the process 332; objectives and scope 334–335; performance indicators 335, 337–340;summary 335–336
identification of measures to take 331integration and action 331–332reasons for use 327stage 1: identification and planning
329, 330stages 328
criteria 300–301, 303data requirements and collection 304,
305–307extent/boundaries 299–300
framework 294, 295implementation, application and further
action 308–309internal versus external 297, 299levels
main system 309, 312–313on-farm 313scheme 309, 310–311sector 309
measures and indicators 279–280, 303–304, 315–316, 317, 323, 324
milestones 281monitoring and evaluation 72
arrangements for results monitoring 325–326
in the benchmarking process 331the causal chain 317, 318, 319commonly used evaluation
criteria 319–320definition of terms 318evaluation 293–294key indicators 315–316project M&E: logical structure 319purpose and definition 314, 317results monitoring versus implementa-
tion monitoring 317, 319purpose 294, 296–297rationale and objectives 296relevance to organization 293report output 304, 308results framework
components 322–323example 323indicators 323, 324
summary performance table 53surveys 209types 297water users associations see under water users
associationspermanent wilting point 127PESTLE analysis 282–283planning 27–28
of different types of system 68–70in-season 66–67logical framework for project planning
assessment of project environment 322defining activities and indentifying
inputs 322logical framework matrix 320, 321project outputs 320, 322stages of planning 322target group and objectives 320
monitoring of delivery performance ratio 72pre-season 65–66strategic 283of training presentations 239–240
374 Index
planning (continued)of water delivery 47–49of weekly water allocation 71
plant and equipmentmain items and their uses 202
presentations: for training 239–240public relations 63
rainfall 137–138register, maintenance 191regulation: of canals see under canalsregulatory authorities 270
data collection 271rehabilitation 30, 248relative area method see under distribution
and allocationReplogle weirs 97restructuring, organizational see under agencies,
irrigation and drainageRomijn weirs 95, 96, 97rotation: of irrigation supply 174, 177–179
scheduling 67combining crop, soil and water relationships
crop factors 155–156principles 152, 155soil factors 156–157soil water and paddy rice 157terminology 148, 152use of water balance sheet 159, 160
example of data processing and analysis form 71
flexible schedules 74, 76implementation 76–77irrigation application efficiency 158–160, 162,
163, 165–167SIRMOD modelling 160–161, 164, 165
irrigation water scheduling exercisebackground 351calculations required 351–354, 356–357climatic data and potential
evapotranspiration 354daily irrigation schedule 357irrigation depth to discharge
conversion 356irrigation water demands 356key data 352, 353layout of irrigation command
area 352soil moisture deficit 354summary 357–358water balance sheets 355
of maintenance work 197–198patterns of irrigation demand 79rigid schedules 73
rotation of supply at on-farm level 174, 177–179
schedule types 73, 74, 75types of irrigation water supply 73Warabandi system 110, 111water balance sheet 158, 159
self-governing systems: improvement 250service delivery 45–47
core elements 47simple proportional distribution 107–108SIRMOD modelling 160–161, 164, 165software 148, 152, 153–154, 160–161, 164, 165soil
field capacity 126–127importance of physical and chemical
composition 122infiltration rate 167
importance of determining the rate 133measurement: equipment 134–135;
procedure 135–137; typical records 136, 137
significance 132–133typical rates for different soil
textures 133–134, 135moisture
available water 127estimations in the field 127–129moisture categories for different soil
textures 128wetting profiles for different soil
textures 129–130saturation 126, 127structure 124
and permeability 126texture
determination 123–124, 125, 126effect on permanent wilting point 127USDA soil textural triangle
classification 122–123sprinkler irrigation 32–33subsurface irrigation 33supply, water
types 73variables involved 65
SWOT analysis 284, 289
trainingdefinition 219domains 221–222ensuring effective learning 223identification of suitable trainers 226materials
film, video and television 237–238flip charts and posters 239objects and models 239overhead projection 238
Index 375
photographs 238–239preparation and testing 228, 241for small group discussions 237
methodscommunication exercise 225field trips 240role playing, games and simulations
222, 239selection 226–228small group discussions 231, 234, 237theoretical effectiveness 231types 234, 235–236
monitoring and evaluation 229, 241, 243–247objectives 219, 221overview 218–220presentations 239–240programmes
establishment: questions to ask 227example course summary sheet 233implementation 228–229lesson plan elements 240pre-course organization 242preparation and testing of
materials 228timetabling 228
staffing, equipment and materials 243, 244of support units for water users
associations 267–268timetabling: of training 228Training Needs Assessment 225–226
needs according to staff categories 232stages 229–231
types of training required 220for water users associations 275–277
transformation, organizational 283–284trickle irrigation 33
velocity-area methods: discharge measurement 87–90
Warabandi systemdata collection, processing and
analysis 112–113overview 108rotational running of distributaries 112, 113schedule 110, 111typical layout 108–110
water balance sheets 158, 159, 160Water Masters 274–275water users associations
accounting 53–55, 56conditions for success 260formation, establishment and support 257,
259–260establishment of support units 267–268key factors to consider 277main stages: overview 266–267review of water sector legislation 267steps required 268–270
legal frameworkconstitution 262governance structure 264–265overview 261–262participation 262–263procedures for establishment 263–264rights, duties, responsibilities 263status, name and tasks 262supervision 265
managementAccountant 274Audit Committee 273Conflict Resolution Committee 273Executive Director 273–274field staff (Water Masters) 274–275Management Board 272–273O&M Engineer/Technician 274typical structure 272Water Users Representatives 275
performance assessment 278asset management 365–366checklist 360finance 364general management 359–360,
363–364measures and indicators 279–280milestones 280, 281performance standards 361–363service provision 366–367water management 364–365
reasons for failure 277–278regulatory authority 270
data collection 271training programmes 275–2767
Water Users Representatives 275weirs 97, 98, 104
broad-crested 92, 93, 95, 96discharge measurement tables 94
portable weirs 172–173, 175, 176sharp-crested 100; see also Cipoletti weirsshort-crested 92–93, 96
willingness to pay 215work sheet: for maintenance reporting 190