irrigation management transfer support se
TRANSCRIPT
STRATEGIC INITIATIVES PROFILE
I. STRATEGIC INITIATIVES PROFILE
1. Name of the Project: Irrigation Management Transfer Support Services
2. Contact Person/Project Team
a. Bayani P. Ofrecio - Acting Manager, Operations Department
b. Leo L. Gallego - Acting Manager, Institutional Development Div c. Heartie E. Navarro - CDO IV d. RicardoC. Lopez-CDO III
3. Project Description
Irrigation Management Transfer has three major stages namely: (1) Organization and Development; (2) Capability Building Programs for IDP Implementers and Irrigators Associations (lA); and (3) Irrigation Management Transfer (IMT).
lA Organization and development is the process of organizing farmer beneficiaries into functional, cohesive and strong irrigators association to enable them of taking over partial or full management of the irrigation system. The farmers are organized according to water source or hydrologic boundaries. There are five levels of organization within the system. The first level of the organization is the Turn out Service Area Group (TSAG) where members are farmers within the turnout service area that draw water from such turn outs (TO). The second level is the lA which is the consolidation of TSAG within the lateral. The third level is the Federation of lA (FIA) or consolidation of lAs at the system level. The fourth level is the RCIA or the Regional Confederation of Irrigators Association (RCIA). The highest and last level is the National Confederation of Irrigators Association (NCIA), which is the consolidation of RCIAs nationwide.
Capability Building Programs are provided for the NIA IDP staff and officers and members of the lAs. Trainings are given to the IDP staff to enhance their knowledge and skills in organization and development of lAs. lA trainings are provided to leaders and members of the lA to enable them to effectively manage the operation and maintenance of their irrigation system.
Irrigation Management Transfer refers to the transfer of the management, the operation and maintenance (O &M) of the National Irrigation Systems (NIS) to the lAs, wholly or partially, depending on the size of the NIS and the capacity of the lA. The IMT process aims to develop functional, cohesive and viable lA to make them capable of recognizing their capacity and mobilizing their members to manage the 0 & M of the NIS. The objectives of the IMT program are the following:
1. Develop and institutionalize a strong and dynamic partnership between the NIA and the lAs for the delivery and efficient irrigation service to irrigated farmers.
2. Duly organized, registered, functional and self-reliant lAs capable and willing to operate and maintain the NISs, wholly or partially
3. Improved performance of the NIS and delivery of irrigation service, in terms of equitable water distribution, timely and reliable water deliveries.
Project Milestone (CY 2017 Program)
Presented in Table I is the result of the IDP program, which is the Irrigation Management Transfer or IMT. This table shows the Agency as well as regional targets, and IMT accomplishment as of September 2017.
NATIONAL IRRIGATION ADMINISTRATION STRATEGIC INITIATIVES PROFILE
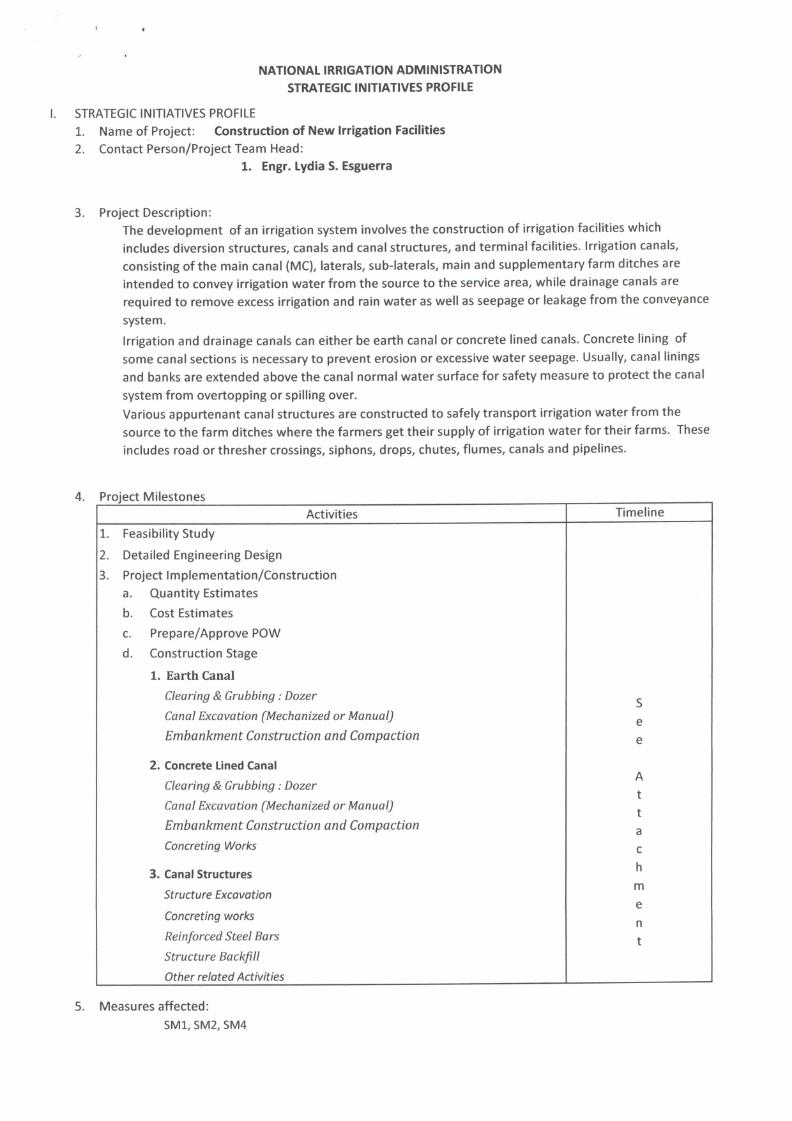
STRATEGIC INITIATIVES PROFILE 1. Name of Project: Construction of New Irrigation Facilities 2. Contact Person/Project Team Head:
1. Engr. Lydia S. Esguerra
3. Project Description: The development of an irrigation system involves the construction of irrigation facilities which includes diversion structures, canals and canal structures, and terminal facilities. Irrigation canals, consisting of the main canal (MC), laterals, sub-laterals, main and supplementary farm ditches are intended to convey irrigation water from the source to the service area, while drainage canals are required to remove excess irrigation and rain water as well as seepage or leakage from the conveyance system. Irrigation and drainage canals can either be earth canal or concrete lined canals. Concrete lining of some canal sections is necessary to prevent erosion or excessive water seepage. Usually, canal linings and banks are extended above the canal normal water surface for safety measure to protect the canal system from overtopping or spilling over. Various appurtenant canal structures are constructed to safely transport irrigation water from the source to the farm ditches where the farmers get their supply of irrigation water for their farms. These includes road or thresher crossings, siphons, drops, chutes, flumes, canals and pipelines.
4. Project Milestones Activities Timeline
1. Feasibility Study 2. Detailed Engineering Design 3. Project Implementation/Construction
a. Quantity Estimates b. Cost Estimates c. Prepare/Approve POW d. Construction Stage
1. Earth Canal Clearing & Grubbing : Dozer
Canal Excavation (Mechanized or Manual)
Embankment Construction and Compaction
2. Concrete Lined Canal Clearing & Grubbing : Dozer
Canal Excavation [Mechanized or Manual)
Embankment Construction and Compaction
Concreting Works
3. Canal Structures Structure Excavation
Concreting works
Reinforced Steel Bars
Structure Backfill
Other related Activities
S e e
A t t a c h m e n t
5. Measures affected: SMI, SM2, SM4
T
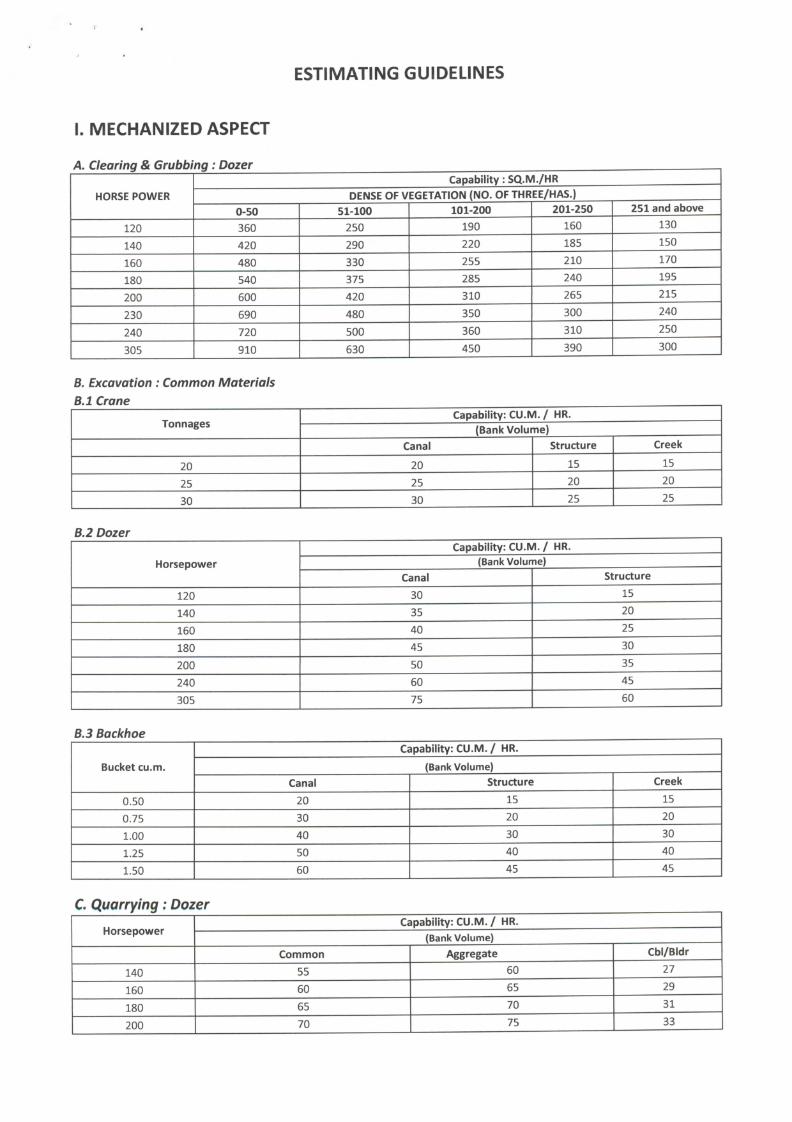
ESTIMATING GUIDELINES
I. MECHANIZED ASPECT A. Clearing & Grubbing: Dozer
HORSE POWER
Capability: SQ.M./HR
HORSE POWER DENSE OF VEGETATION (NO. OF THREE/HAS.) HORSE POWER
0-50 51-100 101-200 201-250 251 and above
120 360 250 190 160 130
140 420 290 220 185 150
160 480 330 255 210 170
180 540 375 285 240 195
200 600 420 310 265 215
230 690 480 350 300 240
240 720 500 360 310 250
305 910 630 450 390 300
B. Excavation : Common Materials B.l Crane
Tonnages Capability: CU.M. / HR.
Tonnages (Bank Volume)
Canal Structure Creek
20 20 15 15
25 25 20 20
30 30 25 25
B.2 Dozer
Horsepower
Capability: CU.M. / HR.
Horsepower (Bank Volume) Horsepower
Canal Structure
120 30 15
140 35 20
160 40 25
180 45 30
200 50 35
240 60 45
305 75 60
B.3 Backhoe
Bucket cu.m.
Capability: CU.M. / HR.
Bucket cu.m. (Bank Volume) Bucket cu.m.
Canal Structure Creek
0.50 20 15 15
0.75 30 20 20
1.00 40 30 30
1.25 50 40 40
1.50 60 45 45
C. Quarrying: Dozer Horsepower
Capability: CU.M. / HR. Horsepower
(Bank Volume)
Common Aggregate Cbl/Bldr
140 55 60 27
160 60 65 29
180 65 70 3 1
200 70 75 33
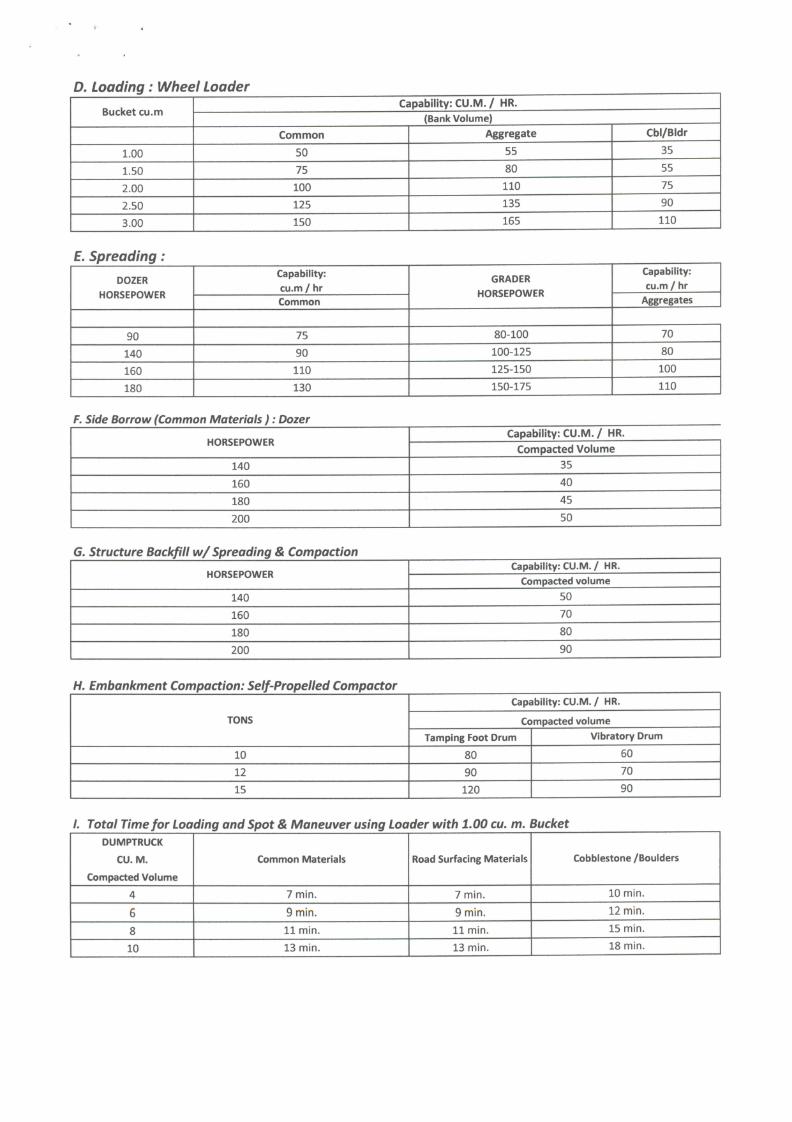
D. Loading: Wlieel Loader Bucket cu.m
Capability: CU.M. / HR. Bucket cu.m
(Bank Volume)
Common Aggregate Cbl/Bldr
1.00 50 55 35
1.50 75 80 55
2.00 100 110 75
2.50 125 135 90
3.00 150 165 110
E. Spreading: DOZER
HORSEPOWER
Capability: cu.m / hr
GRADER HORSEPOWER
Capability: cu.m / hr
DOZER HORSEPOWER
Common
GRADER HORSEPOWER
Aggregates
90 75 80-100 70
140 90 100-125 80
160 110 125-150 100
180 130 150-175 110
F. Side Borrow (Common Materials ): Dozer
HORSEPOWER Capability: CU.M. / HR.
HORSEPOWER Compacted Volume
140 35
160 40
180 45
200 50
G. Structure Backfill w/ Spreading & Compaction
HORSEPOWER Capability: CU.M. / HR.
HORSEPOWER Compacted volume
140 50
160 70
180 80
200 90
H. Embankment Compaction: Self-Propelled Compactor
TONS
Capability: CU.M. / HR.
TONS Compacted volume TONS
Tamping Foot Drum vibratory Drum
10 80 60
12 90 70
15 120 90
/. Total Time for Loading and Spot & Maneuver using Loader with 1,00 cu. m. Bucket DUMPTRUCK
CU. M.
Compacted Volume
Common Materials Road Surfacing Materials Cobblestone /Boulders
4 7 m i n . 7 m i n . 10 min.
6 9 m i n . 9 m i n . 12 min.
8 11 m i n . 11 min . 15 min.
10 13 m i n . 13 m i n . 18 min.
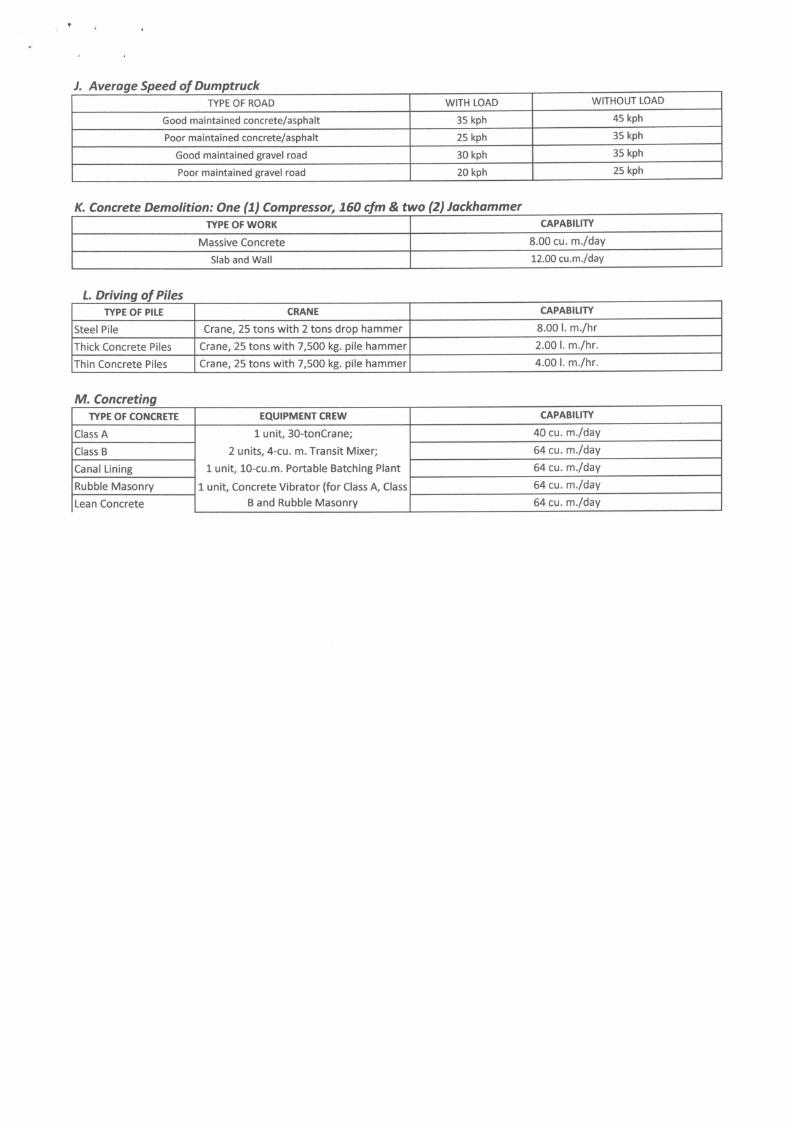
J. Average Speed of Dumptruck TYPE OF ROAD WITH LOAD WITHOUT LOAD
Good maintained concrete/asphalt 35 kph 45 kph
Poor maintained concrete/asphalt 25 kph 35 kph
Good maintained gravel road 30 kph 35 kph
Poor maintained gravel road 20 kph 25 kph
K. Concrete Demolition: One (1) Compressor, 160 cfm & two (2) Jackhammer TYPE OF WORK CAPABILITY
Massive Concrete 8.00 cu. m./day
Slab and Wall 12.00 cu.m./day
L Driving of Piles TYPE OF PILE CRANE CAPABILITY
Steel Pile Crane, 25 tons with 2 tons drop hammer 8.00 1. m./hr
Thick Concrete Piles Crane, 25 tons w i t h 7,500 kg. pile hammer 2.00 1. m./hr.
Thin Concrete Piles Crane, 25 tons w i t h 7,500 kg. pile hammer 4.00 1. m./hr.
M. Concreting TYPE OF CONCRETE EQUIPMENT CREW CAPABILITY
Class A 1 unit , 30-tonCrane;
2 units, 4-cu. m. Transit Mixer;
1 unit , 10-cu.m. Portable Batching Plant
1 unit . Concrete Vibrator (for Class A, Class
B and Rubble Masonry
40 cu. m./day
Class B
1 unit , 30-tonCrane;
2 units, 4-cu. m. Transit Mixer;
1 unit , 10-cu.m. Portable Batching Plant
1 unit . Concrete Vibrator (for Class A, Class
B and Rubble Masonry
64 cu. m./day
Canal Lining
1 unit , 30-tonCrane;
2 units, 4-cu. m. Transit Mixer;
1 unit , 10-cu.m. Portable Batching Plant
1 unit . Concrete Vibrator (for Class A, Class
B and Rubble Masonry
64 cu. m./day
Rubble Masonry
1 unit , 30-tonCrane;
2 units, 4-cu. m. Transit Mixer;
1 unit , 10-cu.m. Portable Batching Plant
1 unit . Concrete Vibrator (for Class A, Class
B and Rubble Masonry
64 cu. m./day
Lean Concrete
1 unit , 30-tonCrane;
2 units, 4-cu. m. Transit Mixer;
1 unit , 10-cu.m. Portable Batching Plant
1 unit . Concrete Vibrator (for Class A, Class
B and Rubble Masonry 64 cu. m./day
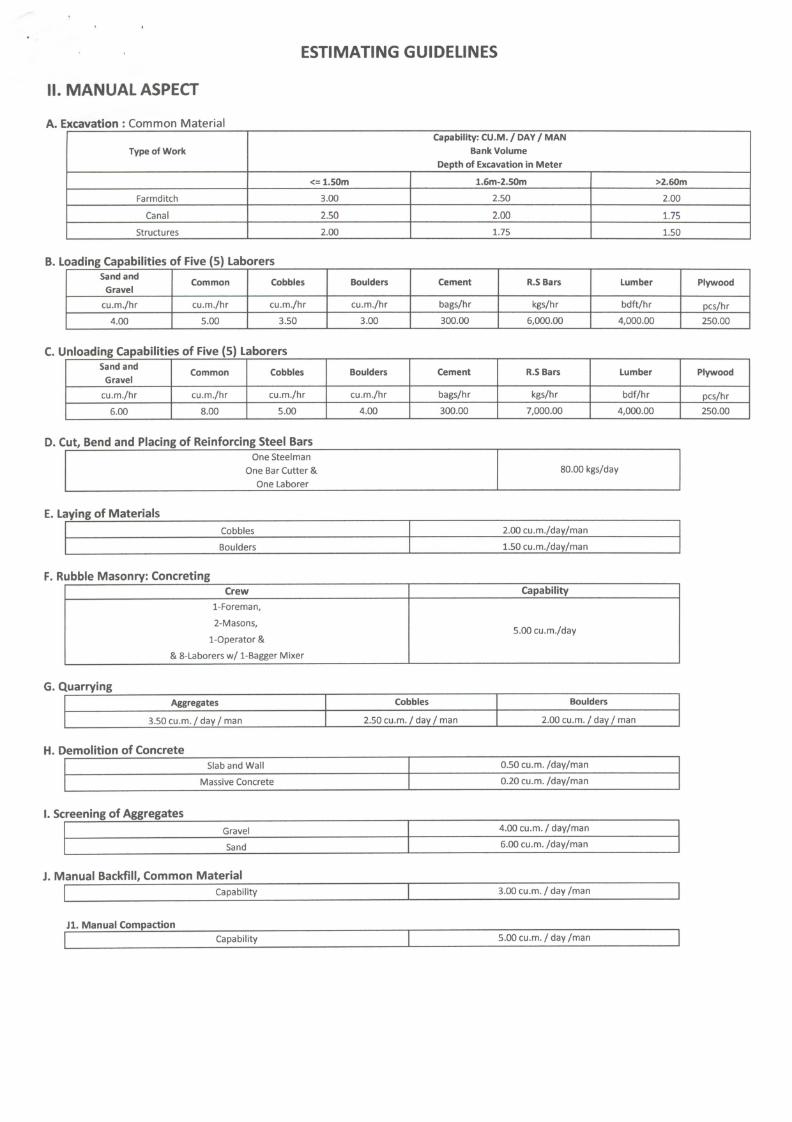
ESTIMATING GUIDELINES
II. MANUAL ASPECT A. Excavation : Common Material
Type of Work Capability: CU.M. / DAY / MAN
Bank Volume Depth of Excavation in Meter
<= 1.50m 1.6m-2.50m >2.60m Farmditch 3.00 2.50 2.00
Canal 2.50 2.00 1.75 Structures 2.00 1.75 1.50
B. Loading Capabilities of Five (5) Laborers Sand and
Gravel Common Cobbles Boulders Cement R.S Bars Lumber Plywood
cu.m./hr cu.m./hr cu.m./hr cu.m./hr bags/hr kgs/hr bdft/hr pcs/hr 4.00 5.00 3.50 3.00 300.00 6,000.00 4,000.00 250.00
C. Unloading Capabilities of Five (5) Laborers Sand and
Gravel Common Cobbles Boulders Cement R.S Bars Lumber Plywood
cu.m./hr cu.m./hr cu.m./hr cu.m./hr bags/hr kgs/hr bdf/hr pcs/hr 6.00 8.00 5.00 4.00 300.00 7,000.00 4,000.00 250.00
D. Cut, Bend and Placing of Reinforcing Steel Bars One Steelman
One Bar Cutter & One Laborer
80.00 kgs/day
E. Laying of Materials Cobbles 2.00 cu.m./day/man
Boulders 1.50 cu.m./day/man
F. Rubble Masonry: Concreting Crew Capability
1- Foreman, 2- Masons,
l-Operator & & 8-Laborers w/ 1-Bagger Mixer
5.00 cu.m./day
G. Quarrying Aggregates Cobbles Boulders
3.50 cu.m./day/man 2.50 cu.m. /day/man 2.00 cu.m./day/man
H. Demolition of Concrete Slab and Wall 0.50 cu.m./day/man
Massive Concrete 0.20 cu.m. /day/man
1. Screening of Aggregates Gravel 4.00 cu.m. / day/man
Sand 6.00 cu.m. /day/man
J. Manual Backfill, Common Material Capability 3.00 cu.m. / day /man
Jl. Manual Connpaction Capability 5.00 cu.m./day/man
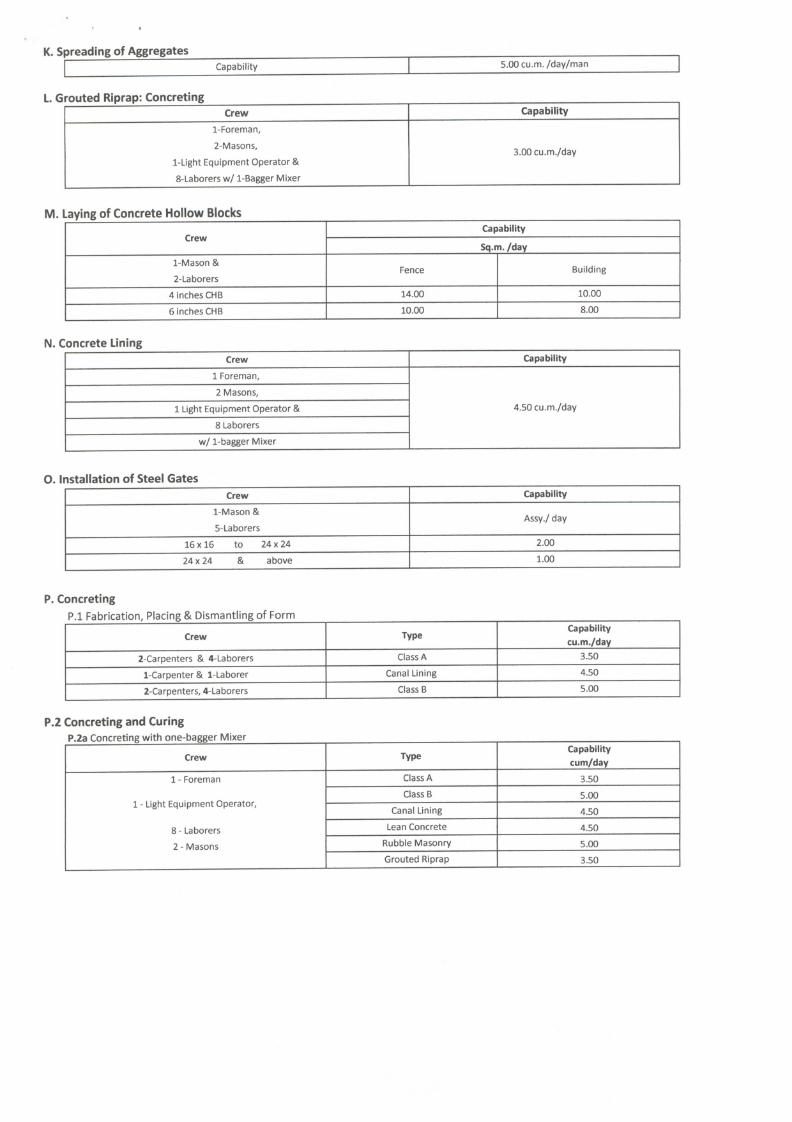
K. Spreading of Aggregates Capability 5.00 cu.m. /day/man
L. Grouted Riprap: Concreting Crew Capability
l-Foreman, 2-Masons, 2-Masons,
3.00 cu.m./day l-LJght Equipment Operator &
3.00 cu.m./day
8-Laborers w/ 1-Bagger Mixer
M. Laying of Concrete Hollow Blocks
Crew Capability
Crew Sq.m./day
1- Mason & 2- Laborers
Fence Building
4 inches CHB 14.00 10.00 6 inches CHB 10.00 8.00
N. Concrete Lining Crew Capability
1 Foreman, 2 Masons,
1 Light Equipment Operator & 4.50 cu.m./day 8 Laborers
w/ 1-bagger Mixer
O. Installation of Steel Gates Crew Capability
l-Mason & Assy./ day
5-La borers Assy./ day
16 X 16 to 24 X 24 2.00 24 X 24 & above 1.00
P. Concreting P.l Fabrication, Placing & Dismantling of Form
Crew Type Capability cu.m./day
2-Carpenters & 4-Laborers Class A 3.50 1-Carpenter& 1-Laborer Canal Lining 4.50 2-Carpenters, 4-Laborers Class B 5.00
Concreting and Curing P.2a Concreting with one-bagger Mixer
Crew Type Capability cum/day
1 - Foreman
1 - Light Equipment Operator,
8-Laborers 2- Masons
Class A 3.50 1 - Foreman
1 - Light Equipment Operator,
8-Laborers 2- Masons
Class B 5.00
1 - Foreman
1 - Light Equipment Operator,
8-Laborers 2- Masons
Canal Lining 4.50
1 - Foreman
1 - Light Equipment Operator,
8-Laborers 2- Masons
Lean Concrete 4.50
1 - Foreman
1 - Light Equipment Operator,
8-Laborers 2- Masons Rubble Masonry 5.00
1 - Foreman
1 - Light Equipment Operator,
8-Laborers 2- Masons
Grouted Riprap 3.50
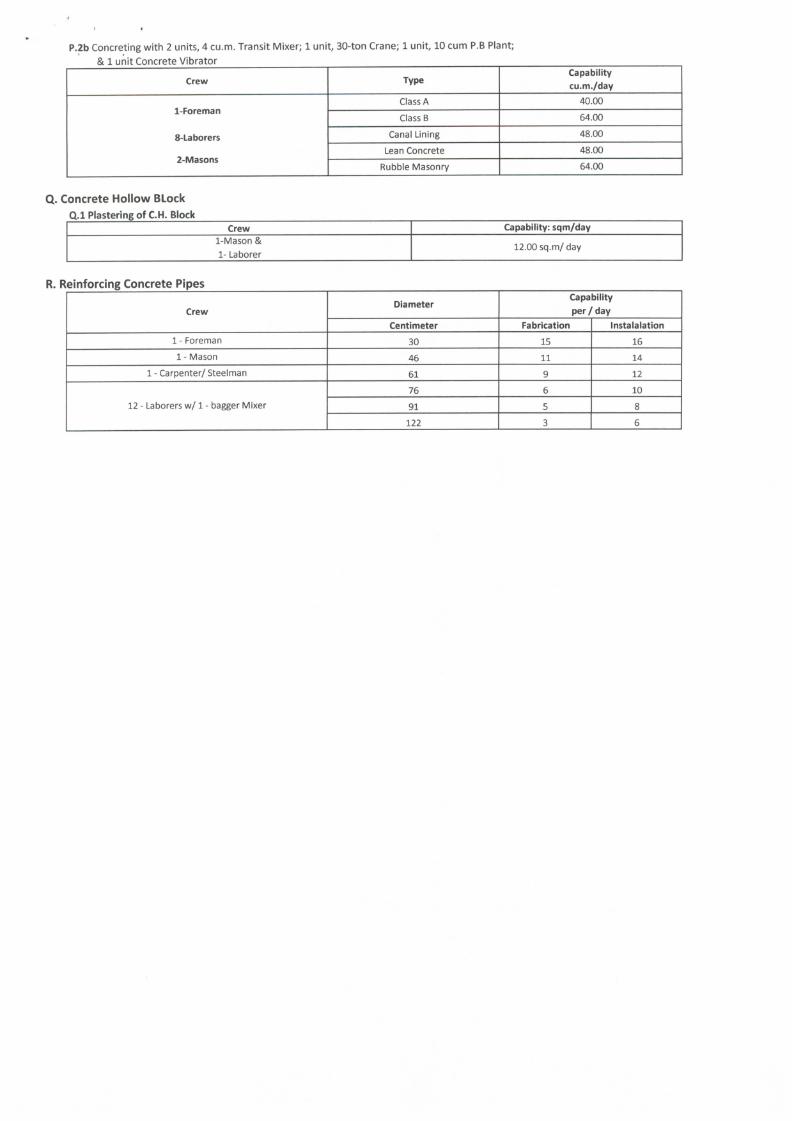
P.2b Concreting with 2 units, 4 cu.m. Transit Mixer; 1 unit, 30-ton Crane; 1 unit, 10 cum P.B Plant; & 1 unit Concrete Vibrator
Crew Type Capability cu.m./day
1-Foreman Class A 40.00
1-Foreman Class B 64.00
8-Laborers Canal Lining 48.00
2-Masons Lean Concrete 48.00
2-Masons Rubble Masonry 64.00
Q. Concrete Hollow Block
Crew Capability: sqm/day l-Mason & 1- Laborer
12.00 sq.m/day
R. Reinforcing Concrete Pipes
Crew Diameter Capability
per / day Crew Centimeter Fabrication Instalalation
1 - Foreman 30 15 16 1 - Mason 46 11 14
1 - Carpenter/ Steelman 61 9 12
12 - Laborers w/ 1 - bagger Mixer 76 6 10
12 - Laborers w/ 1 - bagger Mixer 91 5 8 12 - Laborers w/ 1 - bagger Mixer
122 3 6
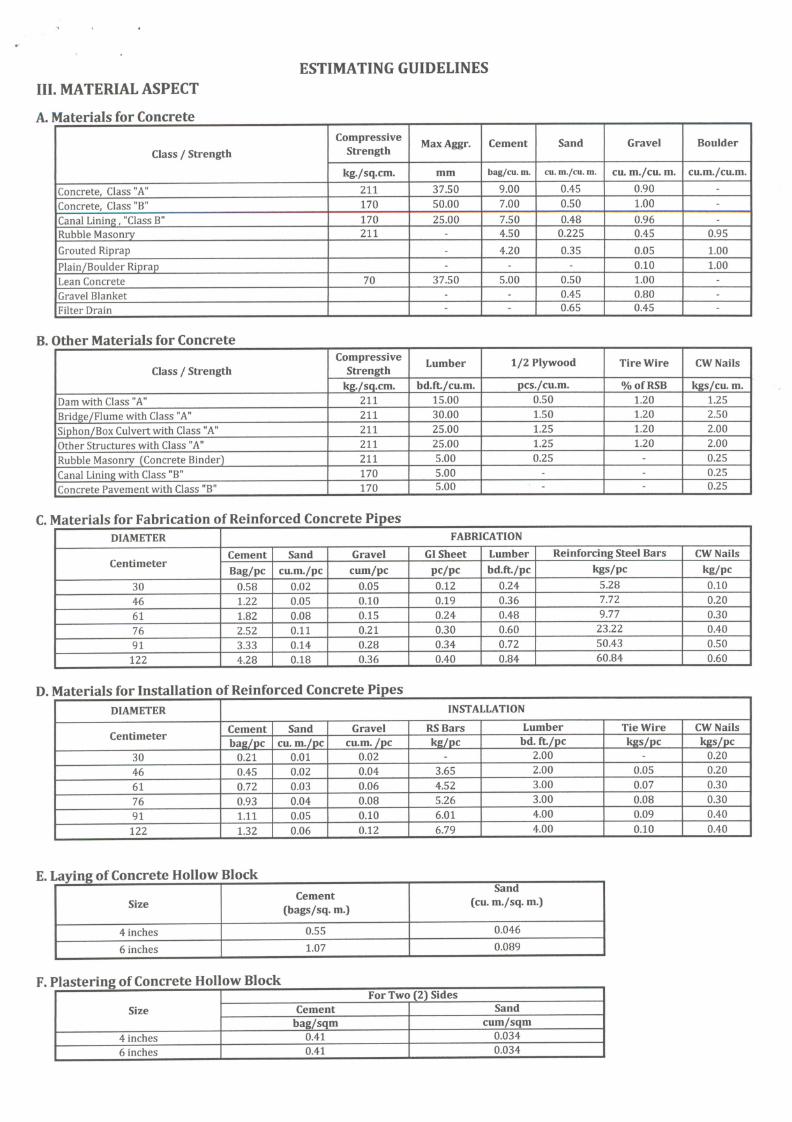
ESTIMATING GUIDELINES III. MATERIAL ASPECT
A. Materials for Concrete
Class / Strength Compressive
strength Max Aggr. Cement Sand Gravel Boulder Class / Strength
kg./sq.cm. mm bag/cu. m. cu. m./cu. m. cu. m./cu. m. cu.m./cu.m. Concrete, Class "A" 211 37.50 9.00 0.45 0.90 -Concrete, Class "B" 170 50.00 7.00 0.50 1.00 -Canal Lining, "Class B" 170 25.00 7.50 0.48 0.96 -Rubble Masonry 211 - 4.50 0.225 0.45 0.95 Grouted Riprap - 4.20 0.35 0.05 1.00 Plain/Boulder Riprap - - - 0.10 1.00 Lean Concrete 70 37.50 5.00 0.50 1.00 -Gravel Blanket - - 0.45 0.80 Filter Drain - - 0.65 0.45 -
Other Materials for Concrete
Class / Strength Compressive
Strength Lumber 1/2 Plyvi ood Tire Wire CW Nails Class / Strength kg./sq.cm. bd.ft./cu.m. pcs./cu.m. %ofRSB kgs/cu. m.
Dam with Class "A" 211 15.00 0.50 1.20 1.25 Bridge/Flume with Class "A" 211 30.00 1.50 1.20 2.50 Siphon/Box Culvert with Class "A" 211 25.00 1.25 1.20 2.00 Other Structures with Class "A" 211 25.00 1.25 1.20 2.00 Rubble Masonry (Concrete Binder) 211 5.00 0.25 - 0.25 Canal Lining with Class "B" 170 5.00 - - 0.25 Concrete Pavement with Class "B" 170 5.00 - - 0.25
C. Materials for Fabrication of Reinforced Concrete Pipes DIAMETER FABRICATION
Centimeter Cement Sand Gravel GI Sheet Lumber Reinforcing Steel Bars CW Nails
Centimeter Bag/pc cu.m./pc cum/pc pc/pc bd.ft./pc kgs/pc kg/pc
30 0.58 0.02 0.05 0.12 0.24 5.28 0.10 46 1.22 0.05 0.10 0.19 0.36 7.72 0.20 61 1.82 0.08 0.15 0.24 0.48 9.77 0.30 76 2.52 0.11 0.21 0.30 0.60 23.22 0.40 91 3.33 0.14 0.28 0.34 0.72 50.43 0.50
122 4.28 0.18 0.36 0.40 0.84 60.84 0.60
D. Materials for Installation of Reinforced Concrete Pipes DIAMETER INSTALLATION
Centimeter Cement Sand Gravel RS Bars Lumber Tie Wire CW Nails Centimeter bag/pc cu. m./pc cu.m. /pc kg/pc bd. ft./pc kgs/pc kgs/pc
30 0.21 0.01 0.02 2.00 0.20 46 0.45 0.02 0.04 3.65 2.00 0.05 0.20 61 0.72 0.03 0.06 4.52 3.00 0.07 0.30 76 0.93 0.04 0.08 5.26 3.00 0.08 0.30 91 1.11 0.05 0.10 6.01 4.00 0.09 0.40
122 1.32 0.06 0.12 6.79 4.00 0.10 0.40
Laying of Concrete Hollow Block
Size Cement
(bags/sq. m.)
Sand (cu. m./sq. m.)
4 inches 0.55 0.046 6 inches 1.07 0.089
F. Plastering of Concrete Hoi ow Block
Size For Two (2) Sides
Size Cement Sand Size bag/sqm cum/sqm
4 inches 0.41 0.034 6 inches 0.41 0.034
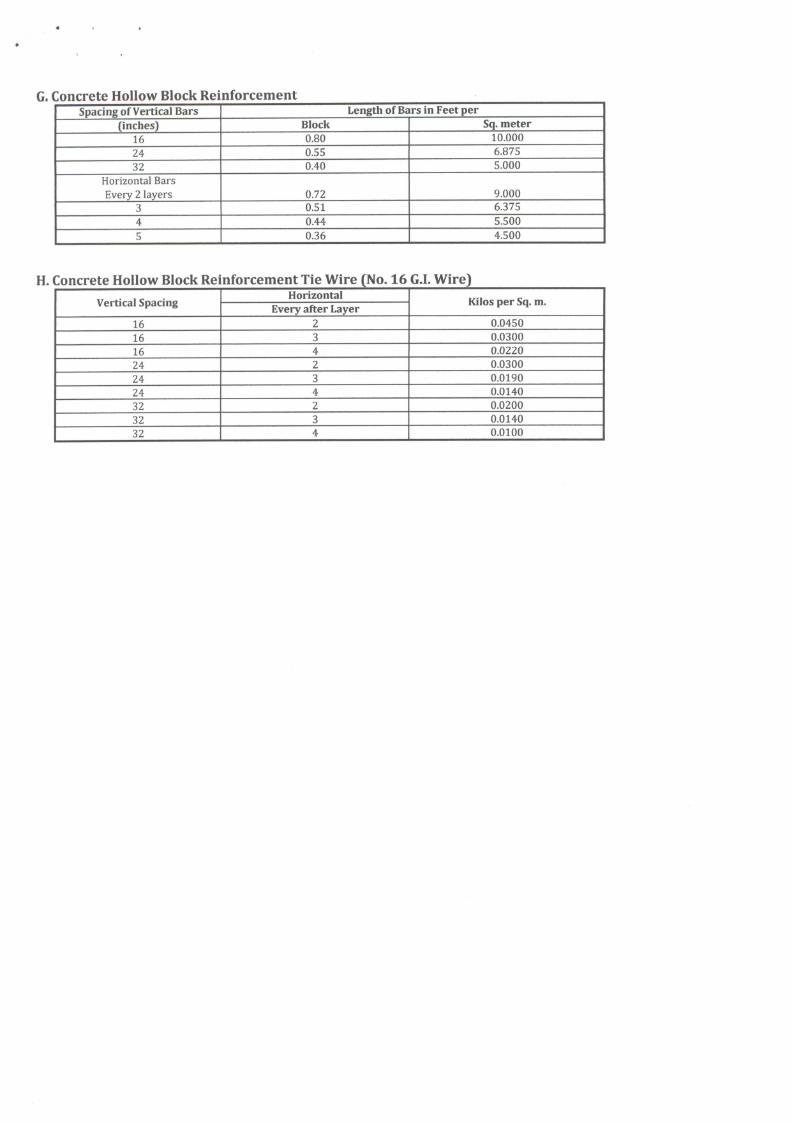
Concrete Hollow Block Re nforcement Spacing of Vertical Bars Length of Bars in Feet per
(inches) Block Sq. meter 16 0.80 10.000 24 0.55 6.875 32 0.40 5.000
Horizontal Bars Every 2 layers 0.72 9.000
3 0.51 6.375 4 0.44 5.500 5 0.36 4.500
Concrete Hollow Block Rei nforcement Tie Wire (No. 16 G.I. Wire) Vertical Spacing Horizontal
Kilos per Sq. m. Vertical Spacing Every after Layer Kilos per Sq. m.
16 2 0.0450 16 3 0.0300 16 4 0.0220 24 2 0.0300 24 3 0.0190 24 4 0.0140 32 2 0.0200 32 3 0.0140 32 4 0.0100
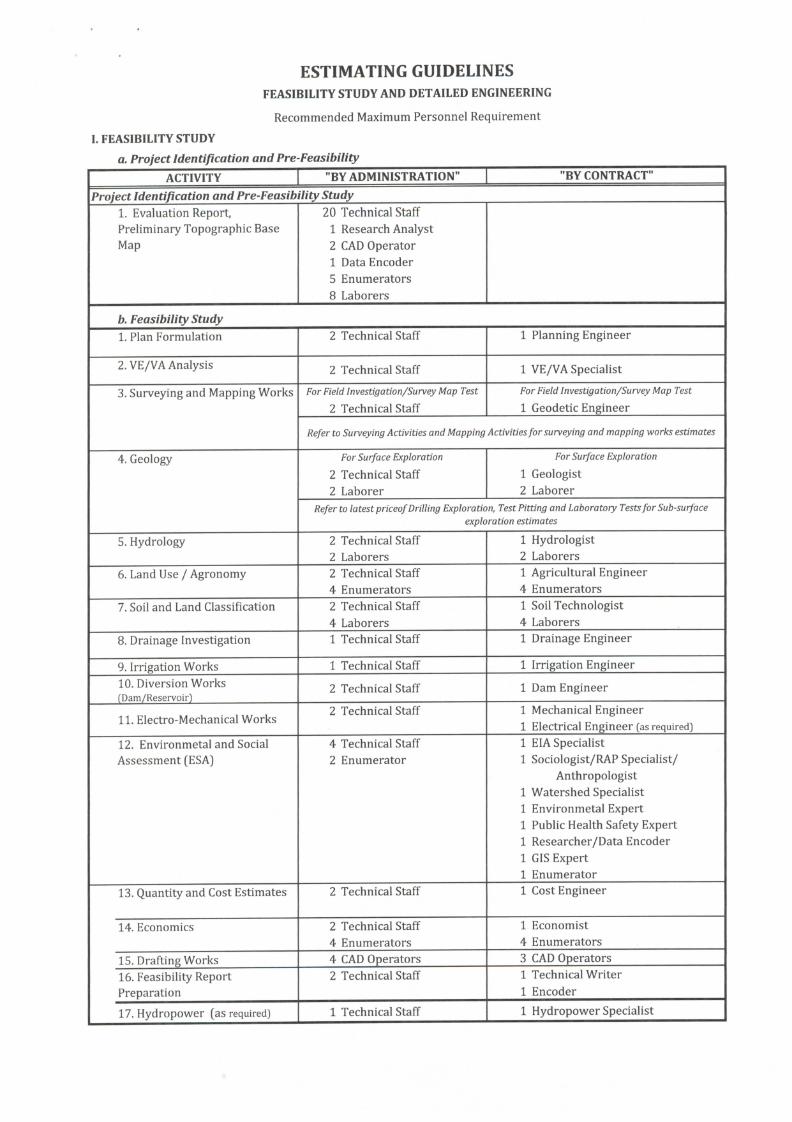
ESTIMATING GUIDELINES FEASIBILITY STUDY AND DETAILED ENGINEERING
Recommended Maximum Personnel Requirement I. FEASIBILITY STUDY
a. Project Identification and Pre-Feasibility ACTIVITY 1 "BY ADMINISTRATION" 1 "BY CONTRACT"
Project Identification and Pre-Feasibility Study 1. Evaluation Report, Preliminary Topographic Base Map
20 Technical Staff 1 Research Analyst 2 CAD Operator 1 Data Encoder 5 Enumerators 8 Laborers
b. Feasibility Study 1. Plan Formulation 2 Technical Staff 1 Planning Engineer
2. VE/VA Analysis 2 Technical Staff 1 VE/VA Specialist 3. Surveying and Mapping Works For Field Investigation/Survey Map Test
2 Technical Staff For Field Investigation/Survey Map Test
1 Geodetic Engineer Refer to Surveying Activities and Mapping Activities for surveying and mapping works estimates
4. Geology For Surface Exploration
2 Technical Staff 2 Laborer
For Surface Exploration
1 Geologist 2 Laborer
Refer to latest priceof Drilling Exploration, Test Pitting and Laboratory Tests for Sub-surface exploration estimates
5. Hydrology 2 Technical Staff 2 Laborers
1 Hydrologist 2 Laborers
6. Land Use / Agronomy 2 Technical Staff 4 Enumerators
1 Agricultural Engineer 4 Enumerators
7. Soil and Land Classification 2 Technical Staff 4 Laborers
1 Soil Technologist 4 Laborers
8. Drainage Investigation 1 Technical Staff 1 Drainage Engineer
9. Irrigation Works 1 Technical Staff 1 Irrigation Engineer 10. Diversion Works [Dam/Reservoir] 2 Technical Staff 1 Dam Engineer
11. Electro-Mechanical Works 2 Technical Staff 1 Mechanical Engineer 1 Electrical Engineer [as required]
12. Environmetal and Social Assessment (ESA)
4 Technical Staff 2 Enumerator
1 EIASpeciahst 1 Sociologist/RAP Specialist/
Anthropologist 1 Watershed Specialist 1 Environmetal Expert 1 Public Health Safety Expert 1 Researcher/Data Encoder 1 GIS Expert 1 Enumerator
13. Quantity and Cost Estimates 2 Technical Staff 1 Cost Engineer
14. Economics 2 Technical Staff 4 Enumerators
1 Economist 4 Enumerators
15. Drafting Works 4 CAD Operators 3 CAD Operators 16. Feasibility Report Preparation
2 Technical Staff 1 Technical Writer 1 Encoder
17. Hydropower (as required) 1 Technical Staff 1 Hydropower Specialist
•4
ESTIMATING GUIDELINES FEASIBILITY STUDY AND DETAILED ENGINEERING
Recommended Maximum Personnel Requirement
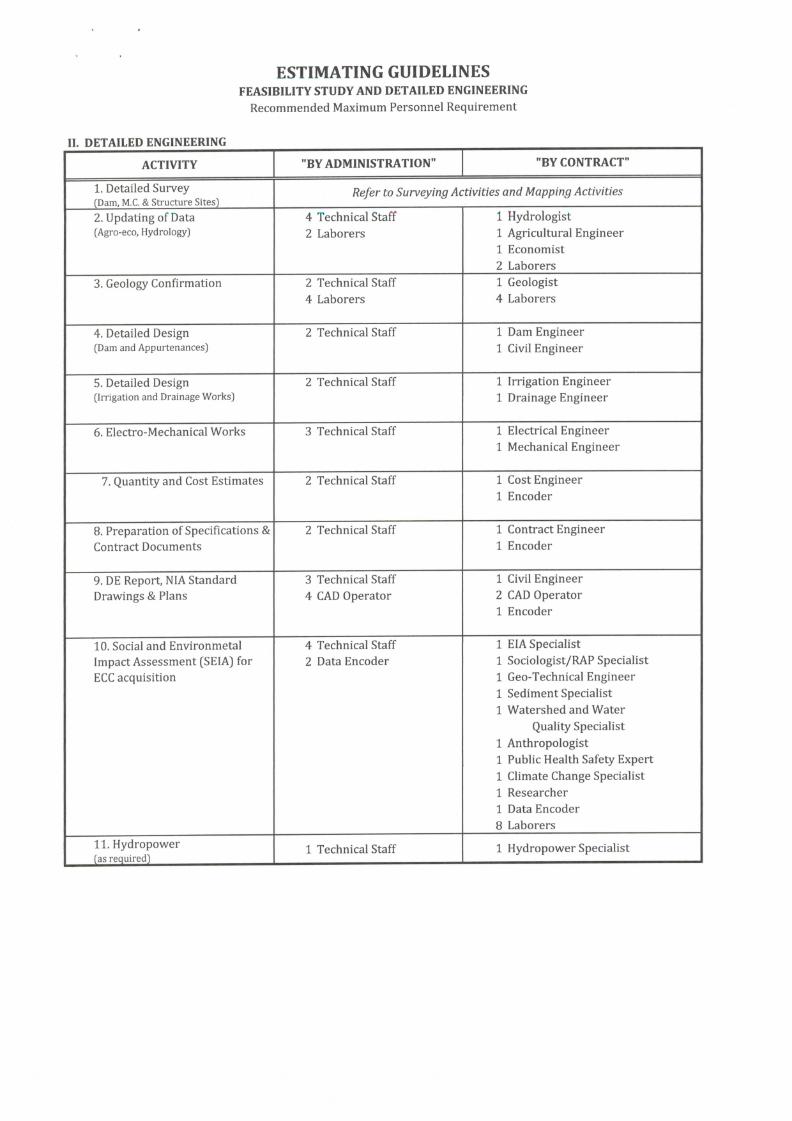
II. DETAILED ENGINEERING
ACTIVITY "BY ADMINISTRATION" "BY CONTRACT"
1. Detailed Survey [Dam, M.C. & Structure Sites]
Refer to Surveying Activities and Mapping Activities
2. Updating of Data (Agro-eco, Hydrology]
4 Technical Staff 2 Laborers
1 Hydrologist 1 Agricultural Engineer 1 Economist 2 Laborers
3. Geology Confirmation 2 Technical Staff 4 Laborers
1 Geologist 4 Laborers
4. Detailed Design [Dam and Appurtenances]
2 Technical Staff 1 Dam Engineer 1 Civil Engineer
5. Detailed Design [Irrigation and Drainage Works]
2 Technical Staff 1 Irrigation Engineer 1 Drainage Engineer
6. Electro-Mechanical Works 3 Technical Staff 1 Electrical Engineer 1 Mechanical Engineer
7. Quantity and Cost Estimates 2 Technical Staff 1 Cost Engineer 1 Encoder
8. Preparation of Specifications & Contract Documents
2 Technical Staff 1 Contract Engineer 1 Encoder
9. DE Report, NIA Standard Drawings & Plans
3 Technical Staff 4 CAD Operator
1 Civil Engineer 2 CAD Operator 1 Encoder
10. Social and Environmetal Impact Assessment (SEIA) for ECC acquisition
4 Technical Staff 2 Data Encoder
1 EIASpeciahst 1 Sociologist/RAP Specialist 1 Geo-Technical Engineer 1 Sediment SpeciaHst 1 Watershed and Water
Quality Specialist 1 Anthropologist 1 Public Health Safety Expert 1 Climate Change Specialist 1 Researcher 1 Data Encoder 8 Laborers
11. Hydropower [as required] 1 Technical Staff 1 Hydropower Specialist
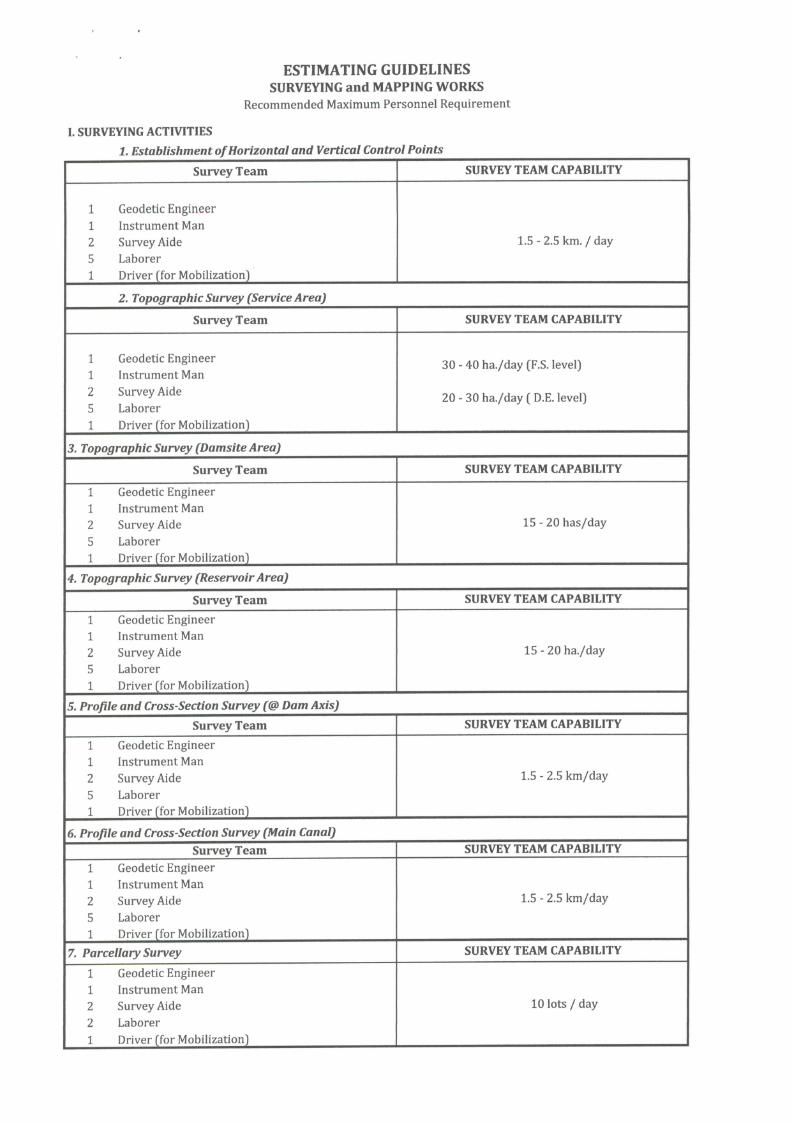
ESTIMATING GUIDELINES SURVEYING and MAPPING WORKS
Recommended Maximum Personnel Requirement
I. SURVEYING ACTIVITIES L Establishment of Horizontal and Vertical Control Points
Survey Team SURVEY TEAM CAPABILITY
1 Geodetic Engineer 1 Instrument Man 2 Survey Aide 5 Laborer 1 Driver (for Mobilization)
1.5 - 2.5 km. / day
2. Topographic Survey (Service Area)
Survey Team SURVEY TEAM CAPABILITY
1 Geodetic Engineer 1 Instrument Man 2 Survey Aide 5 Laborer 1 Driver (for Mobilization)
30 - 40 ha./day (F.S. level)
20 - 30 ha./day (D.E. level)
3. Topographic Survey (Damsite Area)
Survey Team SURVEY TEAM CAPABILITY
1 Geodetic Engineer 1 Instrument Man 2 Survey Aide 5 Laborer 1 Driver (for Mobilization)
15-20 has/day
4. Topographic Survey (Reservoir Area)
Survey Team SURVEY TEAM CAPABILITY 1 Geodetic Engineer 1 Instrument Man 2 Survey Aide 5 Laborer 1 Driver (for Mobilization)
15 - 20 ha./day
5. Profile and Cross-Section Survey (@ Dam Axis) Survey Team SURVEY TEAM CAPABILITY
1 Geodetic Engineer 1 Instrument Man 2 Survey Aide 5 Laborer 1 Driver (for Mobilization)
1.5 - 2.5 km/day
6. Profile and Cross-Section Survey (Main Canal) Survey Team SURVEY TEAM CAPABILITY
1 Geodetic Engineer 1 Instrument Man 2 Survey Aide 5 Laborer 1 Driver (for Mobilization)
1.5 - 2.5 km/day
7. Parcellary Survey SURVEY TEAM CAPABILITY
1 Geodetic Engineer 1 Instrument Man 2 Survey Aide 2 Laborer 1 Driver (for Mobilization)
10 lots / day
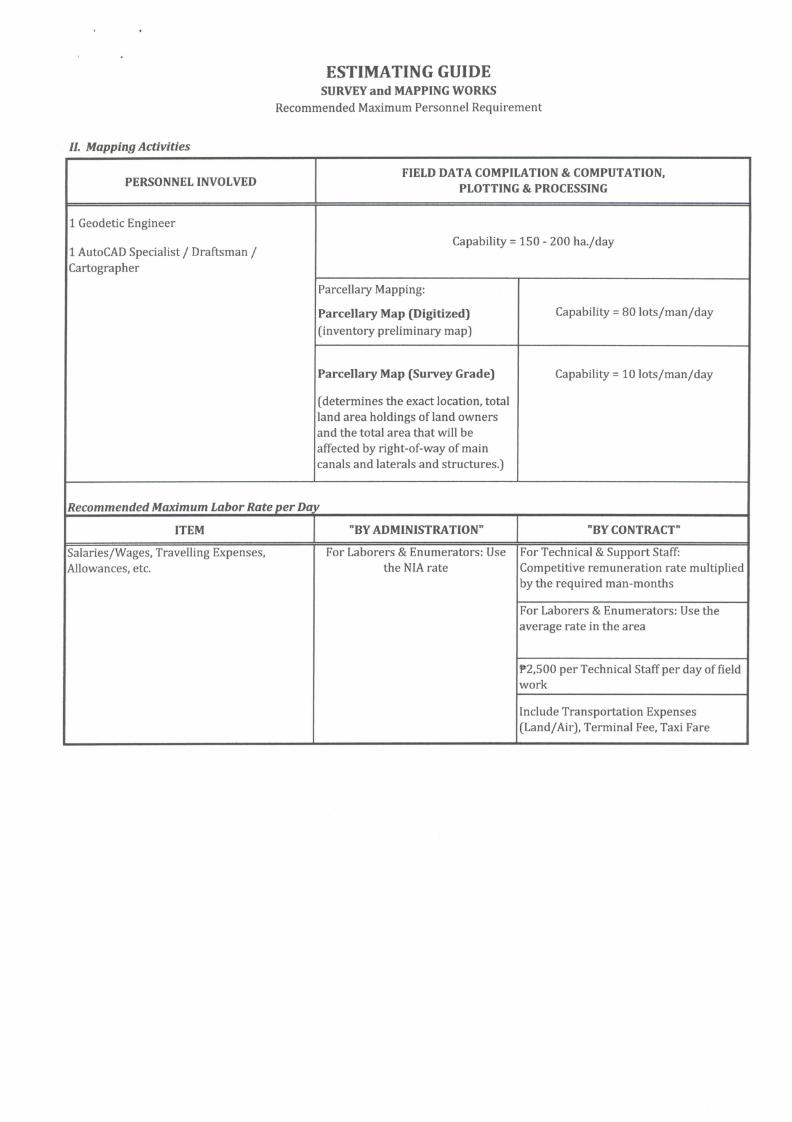
ESTIMATING GUIDE SURVEY and MAPPING WORKS
Recommended Maximum Personnel Requirement
//. Mapping Activities
PERSONNEL INVOLVED FIELD DATA COMPILATION & COMPUTATION,
PLOTTING & PROCESSING
1 Geodetic Engineer
1 AutoCAD Specialist / Draftsman / Cartographer
Capability = 150 - 200 ha./day 1 Geodetic Engineer
1 AutoCAD Specialist / Draftsman / Cartographer
Parcellary Mapping: Parcellary Map (Digitized) (inventory preliminary map)
Capability = 80 lots/man/day
1 Geodetic Engineer
1 AutoCAD Specialist / Draftsman / Cartographer
Parcellary Map (Survey Grade)
(determines the exact location, total land area holdings of land owners and the total area that will be affected by right-of-way of main canals and laterals and structures.)
Capability =10 lots/man/day
Recommended Maximum Labor Rate per Da^ y
ITEM "BY ADMINISTRATION" "BY CONTRACT"
Salaries/Wages, Travelling Expenses, Allowances, etc.
For Laborers & Enumerators: Use the NIA rate
For Technical & Support Staff: Competitive remuneration rate multiplied by the required man-months
Salaries/Wages, Travelling Expenses, Allowances, etc.
For Laborers & Enumerators: Use the NIA rate
For Laborers & Enumerators: Use the average rate in the area
Salaries/Wages, Travelling Expenses, Allowances, etc.
For Laborers & Enumerators: Use the NIA rate
P2,500 per Technical Staff per day of field work
Salaries/Wages, Travelling Expenses, Allowances, etc.
For Laborers & Enumerators: Use the NIA rate
Include Transportation Expenses (Land/Air), Terminal Fee, Taxi Fare
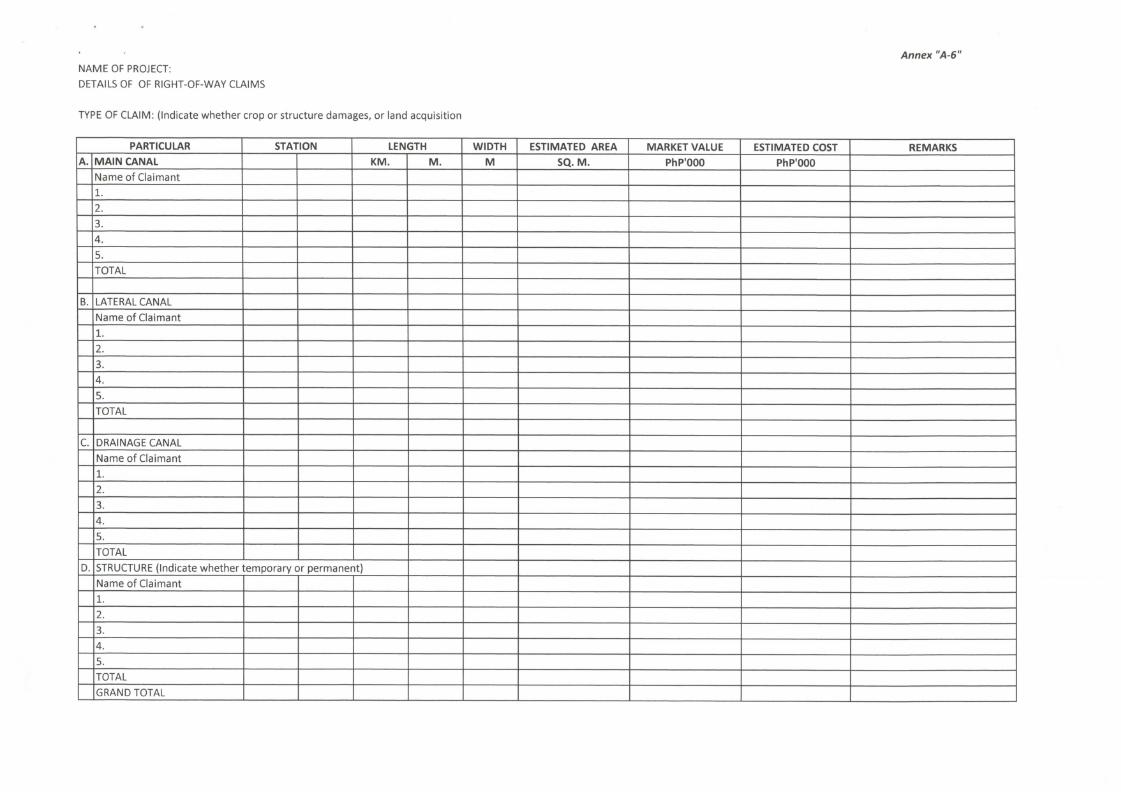
Annex "A-6" NAME OF PROJECT: DETAILS OF OF RIGHT-OF-WAY CLAIMS
TYPE OF CLAIM: (Indicate whether crop or structure damages, or land acquisition
PARTICULAR STATION LENGTH WIDTH ESTIMATED AREA MARKET VALUE ESTIMATED COST REMARKS A. MAIN CANAL KM. M. M SQ. M. PhP'OOO PhP'OOO
Name of Claimant 1. 2. 3. 4. 5. TOTAL
B. LATERAL CANAL Name of Claimant 1. 2. 3. 4. 5. TOTAL
C. DRAINAGE CANAL Name of Claimant 1. 2. 3. 4. 5. TOTAL
D. STRUCTURE (Indicate whether temporary or permanent) Name of Claimant 1. 2. 3. 4. 5. TOTAL GRAND TOTAL
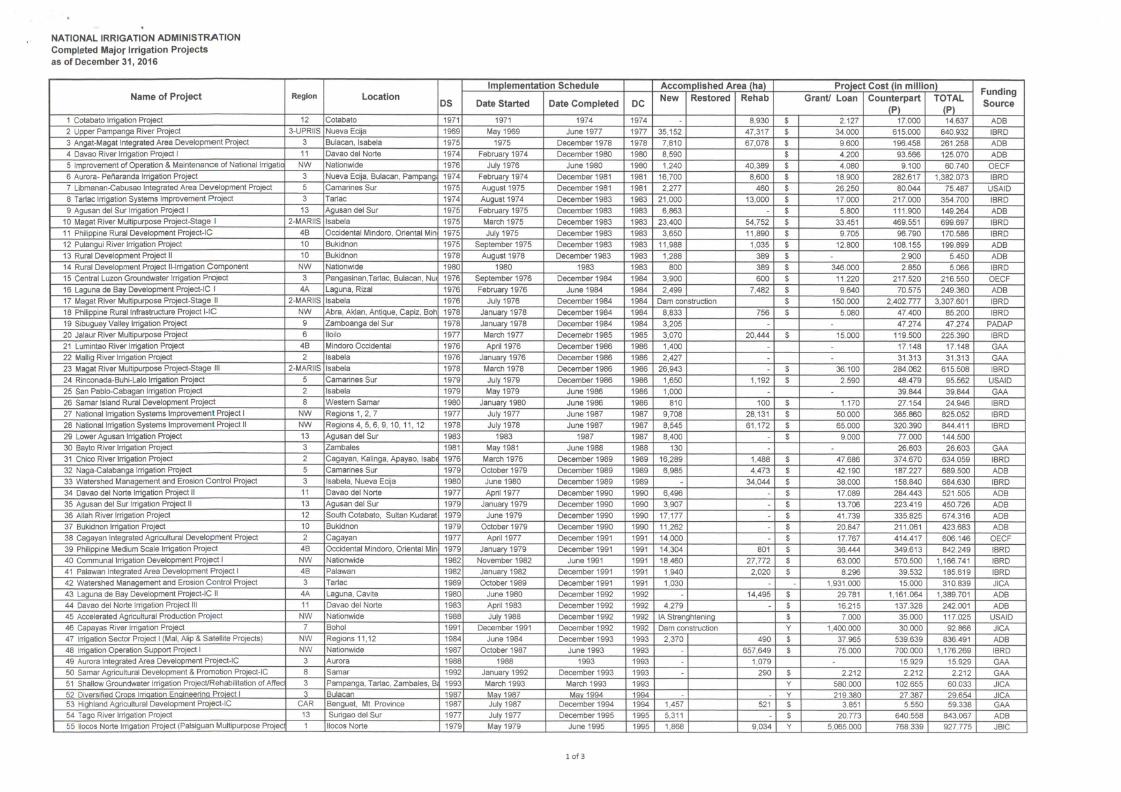
NATIONAL IRRIGATION ADMINISTRATION Completed Major Irrigation Projects as of December 31, 2016
Name of Project Region Location Implementation Schedule Accomplished Area (ha) Project Cost (in million) Funding
Source Name of Project Region Location DS Date Started Date Completed DC New Restored Rehab Grant/ Loan Counterpart
(P) TOTAL
(P)
Funding Source
1 Cotabato Irrigation Project 12 Cotabato 1971 1971 1974 1974 8,930 $ 2.127 17.000 14.637 ADB 2 Upper Pampanga River Project 3-UPRIIS Nueva Ecija 1969 May 1969 June 1977 1977 35,152 47,317 $ 34.000 615.000 840.932 IBRD 3 Angat-Magat Integrated Area Development Project 3 Bulacan, Isabela 1975 1975 December 1978 1978 7,810 67,078 $ 9.600 196.458 261.258 ADB 4 Davao River Irrigation Project 1 11 Davao del Norte 1974 February 1974 December 1980 1980 8,590 $ 4.200 93.566 125.070 ADB 5 Improvement of Operation & Maintenance of National Irrigatio NW Nationwide 1976 July 1976 June 1980 1980 1,240 40,389 $ 4.080 9.100 60.740 OECF 6 Aurora- Peflaranda Irrigation Project 3 Nueva Ecija, Bulacan, Pampang; 1974 February 1974 December 1981 1981 16,700 8,600 $ 18.900 282.617 1,382.073 IBRD 7 Libmanan-Cabusao Integrated Area Development Project 5 Camarines Sur 1975 August 1975 December 1981 1981 2,277 460 $ 26.250 80.044 75.487 USAID 8 Tariac Irrigation Systems Improvement Project 3 Tariac 1974 August 1974 December 1983 1983 21,000 13,000 $ 17.000 217.000 354.700 IBRD 9 Agusan del Sur Irrigation Project 1 13 Agusan del Sur 1975 February 1975 December 1983 1983 6,863 $ 5.800 111.900 149.264 ADB
10 Magat River Multipurpose Project-Stage 1 2-MARIIS Isabela 1975 March 1975 December 1983 1983 23,400 54,752 $ 33.451 469.551 699.697 IBRD 11 Philippine Rural Development Project-IC 4B Occidental Mindoro, Oriental Min 1975 July 1975 December 1983 1983 3,650 11,890 $ 9.705 96.790 170.586 IBRD 12 Pulangui River Irrigation Project 10 Bukidnon 1975 September 1975 December 1983 1983 11,988 1,035 $ 12.800 108.155 199.899 ADB 13 Rural Development Project II 10 Bukidnon 1978 August 1978 December 1983 1983 1,288 389 $ 2.900 5.450 ADB 14 Rural Development Project ll-lrrigation Component NW Nationwide 1980 1980 1983 1983 800 389 $ 346.000 2.850 5.066 IBRD 15 Central Luzon Groundwater Irrigation Project 3 Pangasinan,Tariac, Bulacan, Nu< 1976 September 1976 December 1984 1984 3.900 600 $ 11.220 217.520 216.550 OECF 16 Laguna de Bay Development Project-IC 1 4A Laguna, Rizal 1976 Febmary 1976 June 1984 1984 2,499 7,482 $ 9.640 70.575 249.360 ADB 17 Magat River Multipurpose Project-Stage II 2-MARIIS Isabela 1976 July 1976 December 1984 1984 Dam construction $ 150.000 2,402.777 3,307.601 IBRD 18 Philippine Rural Infrastructure Project l-IC NW Abra, Akian, Antique, Capiz, Boh 1978 January 1978 December 1984 1984 8,833 756 $ 5.080 47.400 85.200 IBRD 19 Sibuguey Valley Irrigation Project 9 Zamboanga del Sur 1978 January 1978 December 1984 1984 3,205 47.274 47.274 PADAP 20 Jalaur River Multipurpose Project 6 lloilo 1977 March 1977 Decemebr 1985 1985 3,070 20,444 $ 15,000 119.500 225.390 IBRD 21 Lumintao River Irrigation Project 4B Mindoro Occidental 1976 April 1976 December 1986 1986 1,400 - 17.148 17.148 GAA 22 Mallig River Imgation Project 2 Isabela 1976 January 1976 December 1986 1986 2,427 31.313 31.313 GAA 23 Magat River Multipurpose Project-Stage III 2-MARIIS Isabela 1978 March 1978 December 1986 1986 26,943 - $ 36.100 284.062 615.508 IBRD 24 Rinconada-Buhi-Lalo Imgation Project 5 Camarines Sur 1979 July 1979 December 1986 1986 1,650 1,192 $ 2.590 48.479 95.562 USAID 25 San Pablo-Cabagan Irrigation Project 2 Isabela 1979 May 1979 June 1986 1986 1,000 39.844 39.844 GAA 26 Samar Island Rural Development Project 8 Western Samar 1980 January 1980 June 1986 1986 810 100 $ 1.170 27.154 24.946 IBRD 27 National Imgation Systems Improvement Project 1 NW Regions 1, 2, 7 1977 July 1977 June 1987 1987 9,708 28,131 $ 50.000 365.860 825.052 IBRD 28 National Imgation Systems Improvement Project II NW Regions 4, 5, 6, 9, 10, 11, 12 1978 July 1978 June 1987 1987 8,545 61,172 $ 65.000 320.390 844.411 IBRD 29 Lower Agusan Irrigation Project 13 Agusan del Sur 1983 1983 1987 1987 8,400 $ 9.000 77.000 144.500 30 Bayto River Irrigation Project 3 Zambales 1981 May 1981 June 1988 1988 130 26.603 26.603 GAA 31 Chico River Irrigation Project 2 Cagayan, Kalinga, Apayao, lsab€ 1976 March 1976 December 1989 1989 16.289 1,488 $ 47.686 374.670 634.059 IBRD 32 Naga-Calabanga Irrigation Project 5 Camarines Sur 1979 October 1979 December 1989 1989 6,985 4,473 $ 42.190 187.227 689.500 ADB 33 Watershed Management and Erosion Control Project 3 Isabela, Nueva Ecija 1980 June 1980 December 1989 1989 - 34,044 $ 38.000 158.840 684.630 IBRD 34 Davao del Norte Irrigation Project II 11 Davao del Norte 1977 April 1977 December 1990 1990 6,496 $ 17.089 284.443 521.505 ADB 35 Agusan del Sur Irrigation Project II 13 Agusan del Sur 1979 January 1979 December 1990 1990 3,907 - $ 13.706 223.419 450.726 ADB 36 Allah River Irrigation Project 12 South Cotabato, Sultan Kudarat 1979 June 1979 December 1990 1990 17,177 - $ 41.739 335.825 674.316 ADB 37 Bukidnon Irrigation Project 10 Bukidnon 1979 October 1979 December 1990 1990 11,262 $ 20.847 211.061 423.683 ADB 38 Cagayan Integrated Agricultural Development Project 2 Cagayan 1977 April 1977 December 1991 1991 14,000 $ 17.767 414.417 606.146 OECF 39 Philippine Medium Scale Irrigation Project 4B Occidental Mindoro, Oriental Min 1979 January 1979 December 1991 1991 14,304 801 $ 36.444 349.613 842.249 IBRD 40 Communal Irrigation Development Project 1 NW Nationwide 1982 November 1982 June 1991 1991 18,460 27,772 $ 63.000 570.500 1,166.741 IBRD 41 Palawan Integrated Area Development Project 1 4B Palawan 1982 January 1982 December 1991 1991 1,940 2,020 $ 8.296 39.532 185.619 IBRD 42 Watershed Management and Erosion Control Project 3 Tariac 1989 October 1989 December 1991 1991 1,030 1,931.000 15.000 310.839 JICA 43 Laguna de Bay Development Project-IC II 4A Laguna, Cavite 1980 June 1980 December 1992 1992 - 14.495 $ 29.781 1,161.064 1,389.701 ADB 44 Davao del Norte Irrigation Project III 11 Davao del Norte 1983 April 1983 December 1992 1992 4,279 - $ 16.215 137.328 242.001 ADB 45 Accelerated Agricultural Production Project NW Nationwide 1988 July 1988 December 1992 1992 lA Strenghtening $ 7.000 35.000 117.025 USAID 46 Capayas River Irrigation Project 7 Bohol 1991 December 1991 December 1992 1992 Dam constRJction Y 1,400.000 30.000 92.866 JICA 47 Irrigation Sector Project 1 (Mai, Alip & Satellite Projects) NW Regions 11,12 1984 June 1984 December 1993 1993 2,370 490 $ 37.965 539.639 836.491 ADB 48 Irrigation Operation Support Project 1 NW Nationwide 1987 October 1987 June 1993 1993 657,649 $ 75.000 700.000 1,176.269 IBRD 49 Aurora Integrated Area Development Project-IC 3 Aurora 1988 1988 1993 1993 1,079 15.929 15.929 GAA 50 Samar Agricultural Development & Promotion Project-IC 8 Samar 1992 January 1992 December 1993 1993 290 $ 2.212 2.212 2.212 GAA 51 Shallow Groundwater Irrigation Project/Rehabilitation of Affec 3 Pampanga, Tariac, Zambales, B 1993 March 1993 March 1993 1993 Y 580.000 102.655 60.033 JICA 52 Diversified Crops Irriaation Enaineerinq Project 1 3 Bulacan 1987 May 1987 May 1994 1994 Y 219.380 27.387 29.654 JICA 53 Highland Agricultural Development Project-IC CAR Benguet, Mt. Province 1987 July 1987 December 1994 1994 1,457 521 $ 3.851 5,550 59.338 GAA 54 Tago River Irrigation Project 13 Surigao del Sur 1977 July 1977 December 1995 1995 5,311 $ 20.773 640.558 843.067 ADB 55 llocos Norte Irrigation Project (Palsiguan Multipurpose Projec 1 llocos Norte 1979 May 1979 June 1995 1995 1,868 9,034 Y 5,065.000 768.339 927.775 JBIC
l o f 3
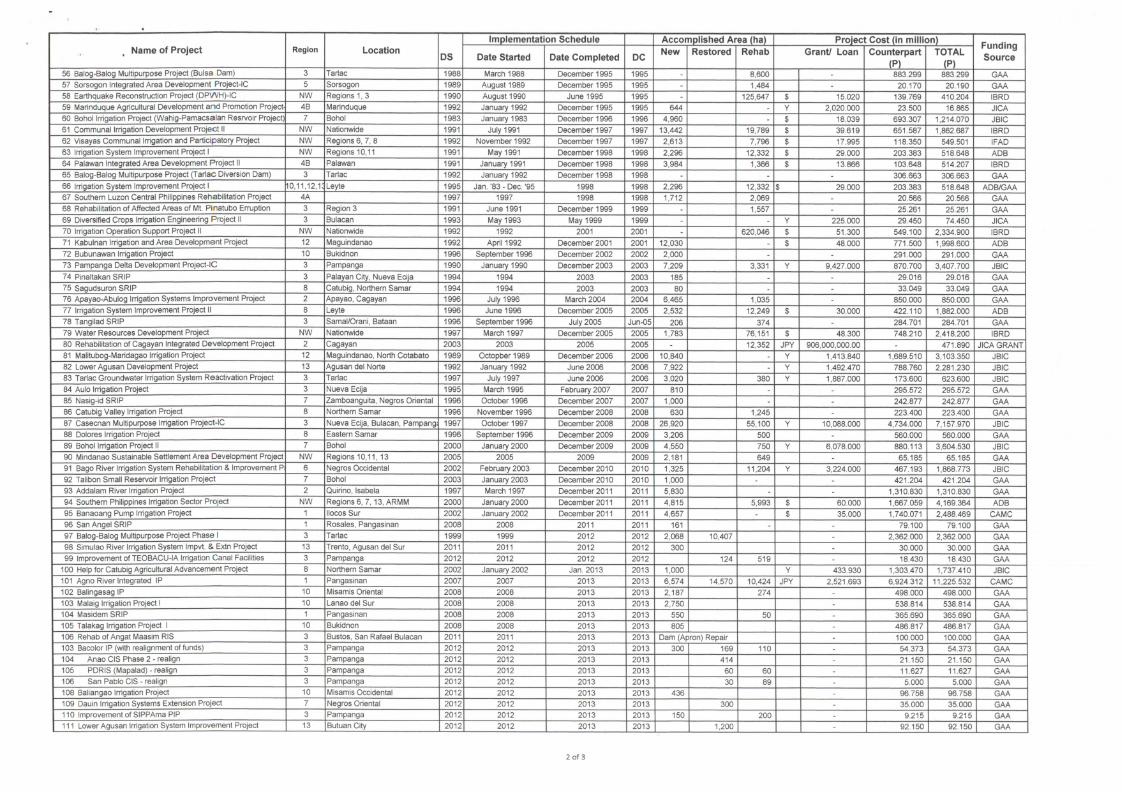
Name of Project Region Location DS
Implementation Schedule Accomplished Area (ha) Project Cost (in million) Funding Source Name of Project Region Location
DS Date Started Date Completed DC New Restored Rehab Grant/ Loan Counterpart (P)
TOTAL (P)
Funding Source
56 Balog-Balog Multipurpose Project (Bulsa Dam) 3 Tariac 1988 March 1988 December 1995 1995 8,600 883.299 883.299 GAA 57 Sorsogon Integrated Area Development Project-IC 5 Sorsogon 1989 August 1989 December 1995 1995 1,484 - 20.170 20.190 GAA 58 Earthquake Reconstruction Project (DPWH)-IC NW Regions 1, 3 1990 August 1990 June 1995 1995 125,647 $ 15.020 139.769 410,204 IBRD 59 Marinduque Agricultural Development and Promotion Project- 4B Marinduque 1992 January 1992 December 1995 1995 644 Y 2,020.000 23.500 16.865 JICA 60 Bohol Irrigation Project (Wahig-Pamacsalan Resrvoir Project) 7 Bohol 1983 January 1983 December 1996 1996 4,960 - $ 18.039 693.307 1,214,070 JBIC 61 Communal Irrigation Development Project II NW Nationwide 1991 July 1991 December 1997 1997 13,442 19,789 $ 39.619 651.587 1,862.687 IBRD 62 Visayas Communal Irrigation and Participatory Project NW Regions 6, 7, 8 1992 November 1992 December 1997 1997 2,613 7,796 $ 17.995 118.350 549,501 IFAD 63 Irrigation System Improvement Project 1 NW Regions 10,11 1991 May 1991 December 1998 1998 2,296 12,332 $ 29.000 203.383 518.648 ADB 64 Palawan Integrated Area Development Project II 4B Palawan 1991 January 1991 December 1998 1998 3,984 1,366 $ 13,866 103.648 514.207 IBRD 65 Balog-Balog Multipurpose Project (Tariac Diversion Dam) 3 Tariac 1992 January 1992 December 1998 1998 306.663 306.663 GAA 66 Irrigation System Improvement Project 1 10,11,12,1 • Leyte 1995 Jan. '83 - Dec. '95 1998 1998 2,296 12,332 $ 29.000 203.383 518.648 ADB/GAA 67 Southern Luzon Central Philippines Rehabilitation Project 4A 1997 1997 1998 1998 1,712 2,069 20.566 20.566 GAA 68 Rehabilitation of Affected Areas of Mt. Pinatubo Erruption 3 Region 3 1991 June 1991 December 1999 1999 1,557 25.261 25.261 GAA 69 Diversified Crops Irrigation Engineering Project II 3 Bulacan 1993 May 1993 May 1999 1999 Y 225.000 29.450 74.450 JICA 70 Irrigation Operation Support Project II NW Nationwide 1992 1992 2001 2001 620,046 $ 51.300 549.100 2,334.900 IBRD 71 Kabulnan Irrigation and Area Development Project 12 Maguindanao 1992 April 1992 December 2001 2001 12,030 $ 48.000 771.500 1,998.600 ADB 72 Bubunawan Irrigation Project 10 Bukidnon 1996 September 1996 December 2002 2002 2,000 291.000 291.000 GAA 73 Pampanga Delta Development Project-IC 3 Pampanga 1990 January 1990 December 2003 2003 7,209 3,331 Y 9,427.000 870.700 3,407.700 JBIC 74 Pinaltakan SRIP 3 Palayan City, Nueva Ecija 1994 1994 2003 2003 185 29.016 29.016 GAA 75 Sagudsuron SRIP 8 Catubig, Northern Samar 1994 1994 2003 2003 80 - 33.049 33.049 GAA 76 Apayao-Abulog Irrigation Systems Improvement Project 2 Apayao, Cagayan 1996 July 1996 March 2004 2004 6,465 1,035 - 850.000 850.000 GAA 77 Irrigation System Improvement Project II 8 Leyte 1996 June 1996 December 2005 2005 2,532 12,249 $ 30.000 422.110 1,882.000 ADB 78 Tangilad SRIP 3 Samal/Orani, Bataan 1996 September 1996 July 2005 Jun-05 206 374 284.701 284.701 GAA 79 Water Resources Development Project NW Nationwide 1997 March 1997 December 2005 2005 1,783 76,151 $ 48.300 748.210 2,418.200 IBRD 80 Rehabilitation of Cagayan Integrated Development Project 2 Cagayan 2003 2003 2005 2005 12,352 JPY 906,000,000.00 - 471.890 JICA GRANT 81 Malitubog-Maridagao Irrigation Project 12 Maguindanao, North Cotabato 1989 Octopber1989 December 2006 2006 10,840 Y 1,413.840 1,689.510 3,103.350 JBIC 82 Lower Agusan Development Project 13 Agusan del Norte 1992 January 1992 June 2006 2006 7,922 Y 1,492.470 788.760 2,281.230 JBIC 83 Tariac Groundwater Irrigation System Reactivation Project 3 Tariac 1997 July 1997 June 2006 2006 3,020 380 Y 1,887.000 173.600 623.600 JBIC 84 Aulo Irrigation Project 3 Nueva Ecija 1995 March 1995 February 2007 2007 810 295.572 295.572 GAA 85 Nasig-id SRIP 7 Zamboanguita, Negros Oriental 1996 October 1996 December 2007 2007 1,000 242.877 242.877 GAA 86 Catubig Valley Irrigation Project 8 Northern Samar 1996 November 1996 December 2008 2008 630 1,245 223.400 223.400 GAA 87 Casecnan Multipurpose Irrigation Project-IC 3 Nueva Ecija, Bulacan, Pampangi 1997 October 1997 December 2008 2008 26,920 55,100 Y 10,088.000 4,734.000 7,157.970 JBIC 88 Dolores Irrigation Project 8 Eastern Samar 1996 September 1996 December 2009 2009 3,206 500 - 560.000 560.000 GAA 89 Bohol Irrigation Project II 7 Bohol 2000 January 2000 December 2009 2009 4,550 750 Y 6,078.000 880.113 3,604.530 JBIC 90 Mindanao Sustainable Settlement Area Development Project NW Regions 10,11, 13 2005 2005 2009 2009 2,181 649 65.185 65.185 GAA 91 Bago River Imgation System Rehabilitation & Improvement P 6 Negros Occidental 2002 February 2003 December 2010 2010 1,325 11,204 Y 3,224.000 467.193 1,868.773 JBIC 92 Talibon Small Reservoir Imgation Project 7 Bohol 2003 January 2003 December 2010 2010 1,000 - - 421.204 421.204 GAA 93 Addalam River Irrigation Project 2 Quirino, Isabela 1997 March 1997 December 2011 2011 5,830 1,310.830 1,310.830 GAA 94 Southern Philippines Imgation Sector Project NW Regions 6, 7, 13, ARMM 2000 January 2000 December 2011 2011 4,815 5,993 $ 60.000 1,667.059 4,169.364 ADB 95 Banaoang Pump Irrigation Project 1 llocos Sur 2002 January 2002 December 2011 2011 4,657 $ 35.000 1,740.071 2,488.469 CAMC 96 San Angel SRIP 1 Resales, Pangasinan 2008 2008 2011 2011 161 79.100 79.100 GAA 97 Balog-Balog Multipurpose Project Phase 1 3 Tariac 1999 1999 2012 2012 2,068 10,407 - 2,362.000 2,362.000 GAA 98 Simulao River Irrigation System Impvt. & Extn Project 13 Trento, Agusan del Sur 2011 2011 2012 2012 300 - 30.000 30.000 GAA 99 Improvement of TEOBACU-IA Irrigation Canal Facilities 3 Pampanga 2012 2012 2012 2012 124 519 - 18.430 18.430 GAA
100 Help for Catubig Agricultural Advancement Project 8 Northem Samar 2002 January 2002 Jan. 2013 2013 1,000 Y 433.930 1,303.470 1,737.410 JBIC 101 Agno River Integrated IP 1 Pangasinan 2007 2007 2013 2013 6,574 14,570 10,424 JPY 2,521.693 6,924.312 11,225.532 CAMC 102 Balingasag IP 10 Misamis Oriental 2008 2008 2013 2013 2,187 274 498.000 498.000 GAA 103 Malaig Irrigation Project 1 10 Lanao del Sur 2008 2008 2013 2013 2,750 538.814 538.814 GAA 104 Masidem SRIP 1 Pangasinan 2008 2008 2013 2013 550 50 365.690 365.690 GAA 105 Talakag Irrigation Project 1 10 Bukidnon 2008 2008 2013 2013 805 486.817 486.817 GAA 106 Rehab of Angat Maasim RIS 3 Bustos, San Rafael Bulacan 2011 2011 2013 2013 Dam (Apron) Repair - 100.000 100.000 GAA 103 Bacolor IP (with realignment of funds) 3 Pampanga 2012 2012 2013 2013 300 169 110 - 54.373 54.373 GAA 104 Anao CIS Phase 2 - realign 3 Pampanga 2012 2012 2013 2013 414 - 21.150 21.150 GAA 105 PDRIS (Mapalad) - realign 3 Pampanga 2012 2012 2013 2013 60 60 - 11.627 11.627 GAA 106 San Pablo CIS - realign 3 Pampanga 2012 2012 2013 2013 30 89 5.000 5.000 GAA 108 Baliangao Irrigation Project 10 Misamis Occidental 2012 2012 2013 2013 436 96.758 96.758 GAA 109 Dauin Irrigation Systems Extension Project 7 Negros Oriental 2012 2012 2013 2013 300 - 35.000 35.000 GAA 110 Improvement of SIPPAma PIP 3 Pampanga 2012 2012 2013 2013 150 200 9.215 9.215 GAA 111 Lower Agusan Irrigation System Improvement Project 13 Butuan City 2012 2012 2013 2013 1,200 - 92.150 92.150 GAA
2 of 3
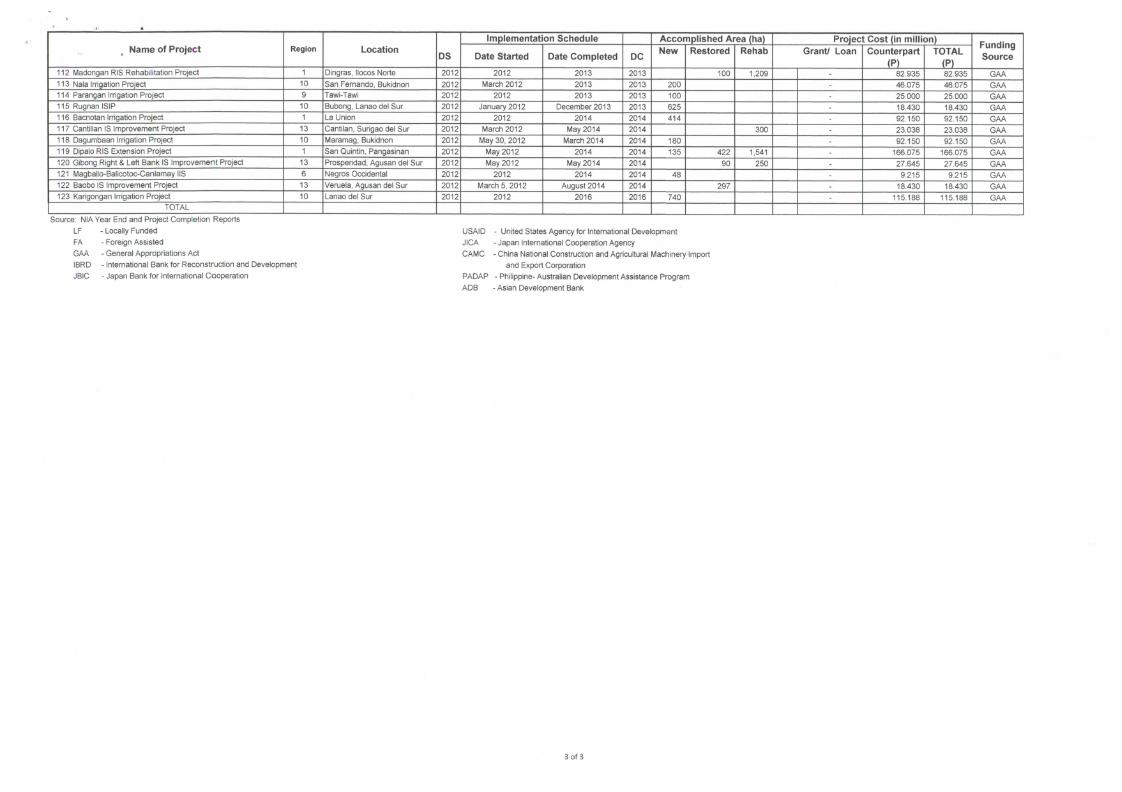
Name of Project Region Location DS
Implementation Schedule Accomplished Area (ha) Project Cost (in million) Funding Source
Name of Project Region Location DS Date Started Date Completed DC New Restored Rehab Grant/ Loan Counterpart
(P) TOTAL
(P)
Funding Source
112 Madongan RIS Rehabilitation Project 1 Dingras, llocos Norte 2012 2012 2013 2013 100 1,209 82.935 82.935 GAA 113 Nala Irrigation Project 10 San Fernando, Bukidnon 2012 March 2012 2013 2013 200 - 46.075 46.075 GAA 114 Parangan Irrigation Project 9 Tawi-Tawi 2012 2012 2013 2013 100 25.000 25.000 GAA 115 Rugnan ISIP 10 Bubong, Lanao del Sur 2012 January 2012 December 2013 2013 625 18.430 18.430 GAA 116 Bacnotan Irrigation Project 1 La Union 2012 2012 2014 2014 414 92.150 92.150 GAA 117 Cantillan IS Improvement Project 13 Cantilan, Surigao del Sur 2012 March 2012 May 2014 2014 300 23.038 23.038 GAA 118 Dagumbaan Irrigation Project 10 Maramag, Bukidnon 2012 May 30, 2012 March 2014 2014 180 92.150 92.150 GAA 119 Dipalo RIS Extension Project 1 San Quintin, Pangasinan 2012 May 2012 2014 2014 135 422 1,541 166.075 166.075 GAA 120 Gibong Right & Left Bank IS Improvement Project 13 Prosperidad, Agusan del Sur 2012 May 2012 May 2014 2014 90 250 27.645 27.645 GAA 121 Magballo-Balicotoc-Canlamay IIS 6 Negros Occidental 2012 2012 2014 2014 48 9.215 9.215 GAA 122 Baobo IS Improvement Project 13 Veruela, Agusan del Sur 2012 March 5, 2012 August 2014 2014 297 18.430 18.430 GAA 123 Karigongan Irrigation Project 10 Lanao del Sur 2012 2012 2016 2016 740 115.188 115.188 GAA
TOTAL Source. NIA Year End and Project Completion Reports
LF - Locally Funded FA - Foreign Assisted GAA - General Appropriations Act IBRD - International Bank for Reconstruction and Development JBIC - Japan Bank for International Cooperation
USAID - United States Agency for International Development JICA - Japan International Cooperation Agency CAMC - China National Construction and Agricultural Machinery Import
and Export Corporation PADAP - Philippine- Australian Development Assistance Program ADB - Asian Development Bank
3 of 3
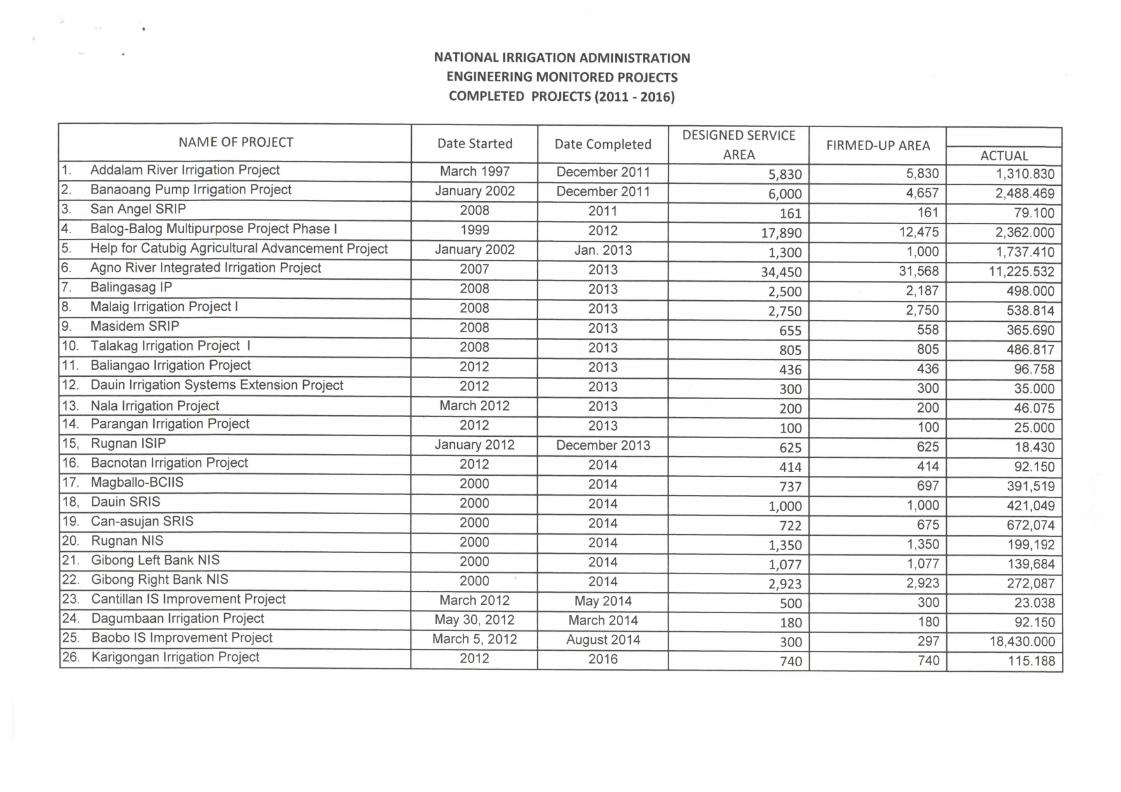
NATIONAL IRRIGATION ADMINISTRATION ENGINEERING MONITORED PROJECTS COMPLETED PROJECTS (2011 - 2016)
NAME OF PROJECT Date Started Date Completed DESIGNED SERVICE
AREA FIRMED-UP AREA NAME OF PROJECT Date Started Date Completed
DESIGNED SERVICE AREA
FIRMED-UP AREA ACTUAL
1. Addalam River Irrigation Project March 1997 December 2011 5,830 5,830 1,310.830 2. Banaoang Pump Irrigation Project January 2002 December 2011 6,000 4,657 2,488.469 3. San Angel SRIP 2008 2011 161 161 79.100 4. Balog-Balog Multipurpose Project Phase 1 1999 2012 17,890 12,475 2,362.000 5. Help for Catubig Agricultural Advancement Project January 2002 Jan. 2013 1,300 1,000 1,737.410 6. Agno River Integrated Irrigation Project 2007 2013 34,450 31,568 11,225.532 7. Balingasag IP 2008 2013 2,500 2,187 498.000 8. Malaig Irrigation Project 1 2008 2013 2,750 2,750 538.814 9. Masidem SRIP 2008 2013 655 558 365.690 10. Talakag Irrigation Project 1 2008 2013 805 805 486.817 11. Baliangao Irrigation Project 2012 2013 436 436 96.758 12. Dauin Irrigation Systems Extension Project 2012 2013 300 300 35.000 13. Mala Irrigation Project March 2012 2013 200 200 46.075 14. Parangan Irrigation Project 2012 2013 100 100 25.000 15, Rugnan ISIP January 2012 December 2013 625 625 18.430 16. Bacnotan Irrigation Project 2012 2014 414 414 92.150 17. Magballo-BCIIS 2000 2014 737 697 391,519 18, Dauin SRIS 2000 2014 1,000 1,000 421,049 19. Can-asujan SRIS 2000 2014 722 675 672,074 20. Rugnan NIS 2000 2014 1,350 1,350 199,192 21. Gibong Left Bank NIS 2000 2014 1,077 1,077 139,684 22. Gibong Right Bank NIS 2000 2014 2,923 2,923 272,087 23. Cantillan IS Improvement Project March 2012 May 2014 500 300 23.038 24. Dagumbaan Irrigation Project May 30, 2012 March 2014 180 180 92.150 25. Baobo IS Improvement Project March 5, 2012 August 2014 300 297 18,430.000 26. Karigongan Irrigation Project 2012 2016 740 740 115.188