aquater software as a dss for irrigation management in semi-arid mediterranean areas
TRANSCRIPT
205
Ital. J. Agron. / Riv. Agron., 2010, 5:205-215
* Corresponding Author: Tel. +39 02 50316611; Fax: +39 02 50316575. E-mail address: [email protected]
AbstractIrrigation management at district or regional scale can be dealt using ecological process-based models and remotesensing data. Simulation crop models simulate at a certain time step the main biophysical variables determiningcrop photosynthesis and water consumption rates. The research consists in an integrated approach to combine fielddata, simulation crop model and remote sensing information. Detailed data sets related to topography, soil, climateand land cover were collected and organized into a Geographic Information System, which is routinely updatedwith remotely sensed images. The code implementation of these two models allows for an improvement of simula-tion reliability for the crop types considered in the present study in Mediterranean area. Remote sensing imagesdetected by optical and radar satellite sensors at different spatial scales (from 10 to 50 m) have been collected overthe analyzed crop cycles. Therefore, remote sensing information about land use and leaf area index (LAI) are as-similated dynamically by the model, to increase the effectiveness of simulation.The integration of crop and water dynamics models with the updated remote sensing information is a Decision Sup-port Systems, AQUATER software, able to integrate remote sensing images, to estimate crop and soil variables re-lated to drought, and subsequently to assimilate these variables into a simulation model at district scale. The sig-nificant final outputs are estimated values of evapotranspiration, plant water status and drought indicators. The pre-sent work describes the structure of AQUATER software and reports some application results over 2006 and 2007cropping seasons in Capitanata, South-East Italy. This region has been divided in simulation units cropped by toma-to (Lycopersicon lycopersicum L.), sugar beet (Beta vulgaris L. var. saccharifera) and durum wheat (Triticum du-rum Desf.). Two types of comparison have been carried out: (i) between some tomato observed and simulated da-ta, and (ii) between “LAI Forcing” and “No LAI Forcing” simulated data. LAI Forcing data have been detectedby remote sensing over the crop cycle and over the whole region. The model showed a relevant coherence betweenobserved and simulated data (RRMSE = 32, 55, 30% for above ground biomass, LAI and soil water content, re-spectively). In the case of the application of the LAI Forcing procedure, since simulated LAI are lower than theobserved values, as a consequence, simulation results underestimate.
Key-words: simulation model, field crops, leaf area index, decision support system, tomato. sugar beet, durum wheat.
1. Introduction
Irrigation scheduling is an increasing concernrelated to the expected returns and the contin-uous decreasing of the water source availabili-ty, especially in Mediterranean environment andin those characterized by water limited avail-ability (Tuberosa et al., 2007). Being the wateruse efficiency the overall aim in such areas, ir-rigation scheduling is an important decisionproblem in agriculture that has a major effect
on yield, environment and gross margin in wa-ter limited areas (Mateos et al., 2002). Precipi-tation decreasing (Piccarreta et al., 2006) and in-dustrial and civil water demand, especially indevelopment areas, involve a source limited use.Moreover this topic has an increasing impor-tance according to the climate change forecast(Alcamo et al., 2007). The agricultural econom-ic sustainability mainly in Mediterranean envi-ronments, in terms of food production and high
AQUATER Software as a DSS for Irrigation Management in Semi-Arid Mediterranean Areas
Marco Acutis*1, Alessia Perego1, Ettore Bernardoni1, Michele Rinaldi2
1Dipartimento di Produzioni Vegetali, Università di MilanoVia Celoria 2, 20133 Milano, Italy
2CRA – Unità di Ricerca per i Sistemi Colturali degli Ambienti caldo-aridiVia Celso Ulpiani 5, 70125 Bari, Italy
Received: 27 July 2009. Accepted: 6 November 2009.
quality research, most frequently forces the ir-rigation water requirement. In semi-arid re-gions, among the most common crops, only du-rum wheat crops and autumn-winter cereals donot require water supply (even if in NorthernAfrica they are often irrigated, Oweis et al.,1998); in fact, others herbaceous and tree cropsprovide sufficient economic results only if irri-gated (e.g. for tomato crop, Lycopersicon ly-copersicum L., see Rinaldi et al., 2007b). The re-duction of water availability and the increase ofits cost can be faced only with rational man-agement of the water resources that includes theprevention of water wasting and losses, but al-so the use of all the technical resources to in-crease the global water use efficiency. One ofthe key points for improving the water use ef-ficiency is to develop a procedure for optimalirrigation scheduling, where irrigation timingand volumes are calculated in a way to avoid atthe same time plant water stress and losses dueto water percolation below the rooted zone.
At field scale it is possible to obtain an op-timal irrigation scheduling through the compi-lation of hydrologic balance, also with help ofsimple software (Raes et al., 2006) or throughthe direct measure of the soil water content orthe water potential in soil.
It is difficult to extend this methods at larg-er scales, mainly for the lack of informationabout land use and crop management. In thiscase, procedures related to water managementare based on Decision Support Systems (Matonet al., 2005). Large scale water management em-ploy models and Geographical Information Sys-tem-based approaches can be used to predictwater demand for agriculture (Knox et al., 1996;Hartkamp et al., 1999). Two types of models areavailable: (i) models which provide an estima-tion based on plant water requirements (Her-rero and Casterad, 1999; Mateos et al., 2002;Weatherhead and Knox, 2002) and (ii) modelswhich estimate irrigation demand taking intoaccount farmers’ practices (Weatherhead andKnox, 2000; Leenhardt et al., 2004a). MODER-ATO is one of the latter models, proposed byBergez et al. (2001, 2002), in which irrigationpractices, strategies and decisions have been for-malized by a set of decision rules.
The crop water stress are also detectable byremote sensing. The most well-known method,is through the measurement of the surface tem-
perature of the vegetation cover. The correla-tion between the surface temperature and wa-ter stress relies on the fact that, when a croptranspires, the evaporated water cools the leavesreaching a surface temperature sometimes be-low the ambient air temperature (Mendez-Bar-roso et al., 2008). Moran et al. (1994) devel-oped the water deficit index (WDI). This indexcombines the normalized difference vegetationindex (NDVI) and the surface temperature ofthe foliage to determine water deficit condi-tions in a field with partial vegetation cover.Mendez-Barroso et al., (2008), according tosuch approach, processed four LANDSAT im-ages in order to estimate the spatial and tem-poral distribution of water deficit index inwheat.
Since crops water requirement is a funda-mental variable to be taken into account, it isuseful to employ remote sensing data to be in-tegrated with pedological maps and meteoro-logical data available in real time. Remote sens-ing images are able to provide estimated valuesof crop biomass (Launay and Guerif, 2005),Leaf Area Index (LAI), (Hoffmann andBlomberg, 2004) and detect land use at certaintime steps (Blaes et al., 2005). Moreover theyare suitable to provide estimated sowing dateand water content in the top soil layer of 5 cm(Wagner et al., 2009). All these information canbe summarized into a simulation crop model toimprove simulation (Dente et al., 2006; 2008), asan innovated DSS, dealing with real-time ob-tained data, identifying water stress risk condi-tion and potential water requirement for crops.
The present work is part of a workpackageof AQUATER project (Rinaldi et al., 2005),which develops an integrated methodologicalapproach in order to improve irrigation watermanagement and provide strategies at territor-ial scale, employing remote sensing and ob-served data, in Mediterranean area, character-ized by irrigated high-value cropping systems.The developed approach could be deployed interritorial planning as decisional support tool. Itis based on innovative technologies such as re-mote sensing, simulation crop models, GIS (Ge-ographical Information System) to handle dis-tributed meteorological, soil and crop parame-ters. The model, as an innovated DSS, deals newobtained data when they get available.
The aim of this study is to outline the
Acutis M., Perego A., Bernardoni E., Rinaldi M.
206
AQUATER software for management of waterresources for irrigation in Mediterranean crop-ping systems.
2. Materials and methods
2.1 Model overview
The AQUATER software has been developedfor the water management optimization inMediterranean field cropping systems. Such cropsimulation model implements several alternativesfor each processes, using approach already wellknown and largely validated in the scientific lit-erature and used for practical application.
The software implementation requires anobject oriented language; the software develop-ment was based on the Unified Modelling Lan-guage (UML) that has demonstrated to be anexcellent base for handle complex multiple cellmodels (Ferrara and Rana, 2006). The softwareis developed employing, when possible, existingfree modules and components. The softwareframe derives from the integration of inter-changeable and extensible components (Rizzoliet al., 2005). Moreover the model is an Orient-ed Objective Program (OOP) being a set of co-operating objects. In OOP, each object is capa-ble of receiving input data, processing data, andsending output data to other objects as an in-dependent unit with a distinct task. Such pro-gramming ensures a strict modularity of the sim-ulation model. The software has been developedfor “COM” environment using VB6 languageand is in development their porting in “Net” en-vironment using VBNet and C# programming
languages. The software has to respect severalrequirements not yet completely developed.New requirements can be added, while otherscan get not necessary.
The reliability to describe different HRUs(Hydrologic Response Units), characterized byspecific soil, crop types and weather data, is thefirst requirement for a territorial scale softwareanalysis (Flügel, 2006). HRUs, even not geo-graphically contiguous, can be characterized bythe same data set. Table 1 shows a set of softwarerequirements, divided in functional categories.
2.2 Simulated processes
AQUATER software simulates the crop growthand development, on the basis of STAMINAmodel (Acutis et al., 2007; Richter et al., 2006).The model is based on gross assimilation of CO2and on maintenance and growth respiration toget the final net carbon assimilation. This kindof simulation tools are known as the “School ofde Wit” crop models (van Ittersum et al., 2003)such as SUCROS (Van Keulen et al., 1982) andthe derived WOFOST (Van Keulen and Wolf,1986; Boogaard et al., 1998). Respect to SUCROS and WOFOST, STAMINA model hasbeen improved for the simulation of the seedgermination and emergence, implementing thespecific software module “GEme” (Bechini etal., 2004) and for better details in the simula-tion of radiation interception within the canopy.Effect of water stress (1) is simulated accordingto Sinclair (1986) and Richter et al. (2001), asfollows:
Ital. J. Agron. / Riv. Agron., 2010, 5:205-215
207
Table 1. Functional requirements of the software.
Data access Modelling Output report “What-if” analysis
Specific soil parameters Crop water requirement Water requirement and Evaluation of crop and and meteorological data using FAO56 methodology water supplied at water management based have to be provided to or direct estimation of territorial scale on historical data each HRU (Hydrological crop resistanceResponse Unit)
Real time updating of Soil water dynamics Production of shape –meteorological data using: cascading; ISBA; files for the main water
Richards’ equation. and crop variables
Real time access to Development and growth Real time HRU specific –remote information for of main Mediterranean alerts of water stress LAI forcing field crops condition
fstress = –––––––––––––––– – 1 1 + exp {– fd(θrel)}
2 (1)
where fstress is a reduction factor of the grossCO2 assimilation, θrel is the ratio between theactual soil water content and the soil water con-tent at saturation and fd is a specific factor(range 4-14) depending by crop, sensitivity towater stress and development stage. The modelsimulates root water uptake allowing compen-sation of the different water availability at dif-ferent depth in soil. Moreover it is character-ized by three options to simulate water redis-tribution into the soil; default option is the fi-nite difference resolution of the Richards’ equa-tion according to van Dam and Feddes (2000),as in the SWAP model. This simulation offersthe best performance in the soil water contentsimulation, according to their robust physicalbasis, and is supported by a high number of re-searches and application, so can be preferred toothers options. Richards’ main limitation is re-lated to the long time required for simulation,taking very long time when the number of hy-drologic units to simulate is large. The applica-tion of the finite difference Richards’ equationsolution to one hydrologic unit, for one grow-ing season is about 30’’, using a 2 GHz Pentiumdual core processor. Alternatively, two other ap-proaches are available: the cascading (tipping-bucket model) and the ISBA approach (Noil-han and Planton, 1989). ISBA is based on forc-ing–restoring of soil water content and can bederived from the Richards’ equation with somesimplification: soil is divided in two layers, thefirst one of few centimeters (usually 10), subjectto evaporation process, and the second one of100 cm. ISBA cannot simulate the effect of rootgrowth in depth and the effects of a shallow wa-ter table (usually it is not the case in Mediter-ranean environments). Even though cascadingapproach is not physically-based, it is adequatewhen there is not shallow water table and soilprofile is quiet homogeneous. Moreover cas-cading approach is not well suitable in soil withlow permeability.
2.3 Decision Support System
The Decision Support System (DSS) has beenconceived in the AQUATER simulation modelintegrated with a GIS software. The requiredcomponents have been added to the simulationAQUATER in order to link the simulationmodel to the GIS software, to map the inputand output data and to read the database (soil
climate, crop and management). The model canread the data stored in shape files (*.SHP for-mat, as defined by ESRI company and used inall the GIS softwares) and to update them withthe data concerning the different variables. Inaddition, in the DSS software a tool for the maprepresentation has been included.
2.4 Real time access to remote detection infor-mation for forcing and assimilation
Remote sensing (RS) information can be usedin simulation analysis. When land cover data,LAI and crop sowing (or transplanting) date areavailable, remote detection information can beused in forcing procedure, based on LAI de-tected values. Then AQUATER model com-putes a new value of leaves weight, as a func-tion of the specific leaf area (SLA) simulatedvalue; from leaf weight the biomass of the dif-ferent organs of the plant is computed thoroughpartition coefficients of dry matter among thedifferent plant organs (that model compute foreach phenological development stage), and con-sequently, the total plant biomass. The modelforces the calculation when LAI data are pro-vided by RS. Anyway the effectiveness of thisapproach is under evaluation, because errors oc-curring in RS detection. The crop pertaining toeach HRU is an external input, based on groundinformation or on the basis of remote sensinginformation. Since errors in the identification ofthe crop can occur, model is able to restart whenimage analysis indicates that the crop effective-ly present in a specific HRU is not the one as-signed as input.
2.5 The areas of the case study
The studied have been identified in CapitanataPlain (Apulia region). Here several field trialshave been carried out. Capitanata Plain, cover-ing more than 4000 km2, an experiment was setup including a number of ground measurementsof meteorological, soil and vegetation variablesat satellite overpass. Ground measurementswere made on specific fields in order to cali-brate and test procedures for assimilating RSdata, while RS measurements were made overthe whole experimental area in order to ex-trapolate assimilation procedures to CapitanataPlain area. The data set used in such model ap-plication is related to 2006-2007 cropping sea-sons of durum wheat (Triticum durum Desf.),
Acutis M., Perego A., Bernardoni E., Rinaldi M.
208
sugar beet (Beta vulgaris L. var. saccharifera)and tomato (Lycopersicum esculentum L.). Themodel runs over meteorological site-observeddata in order to validate soil water content,above ground biomass and LAI output. Soilcharacterization has been carried out applyinga combined approach, linking multivariate geo-statistical technique of cokriging with an algo-rithm of clustering, based on nonparametricdensity estimate, according to which a cluster isdefined as a region surrounding a local maxi-mum of the multivariate probability densityfunction (Rinaldi et al., 2007a). Pedological andsoil organic matter data of the rooted topsoil(0-0.40 m depth), textural and hydrological pa-rameters, were all submitted to a normalizingtransformation, and then analyzed by the mul-tivariate geostatistical technique of cokriging(Castrignanò et al., 2010). The application of theclustering approach to the (co)kriged variables,produced the subdivision of the land into 8 dis-tinct classes.
3. Results and discussion
3.1 Model calibration and validation
Since AQUATER crop model has been devel-oped on the basis of STAMINA, some STA-MINA application results are reminded here.Such crop growth model has been used in pre-vious application in Southern Italy underdrought conditions and for irrigated field crops.Richter et al. (2006), report good evaluation in-dexes of the comparison “simulated vs. mea-sured” with the model used in this research forautumnal sugar beet. This species is hard to bemodeled, nevertheless the modeling efficiencyfor plant and root biomass resulted very satis-factory (R2 = 0.99). This consideration is applic-able also to the simulation of leaf area expan-sion. The values related to sugar beet irrigatedaccording to different irrigation scheduling andwith different water stress levels, confirmed themodel capability to simulate sugar beet also inwater stress conditions, nevertheless modellingefficiency for LAI fall down quickly. In this sit-uation the assimilation and forcing of LAI de-riving from external information could improvethe model performance.
Finally the STAMINA model simulates ade-quately a long-term experiment (sunflower and
durum wheat), highlighting the validity of pro-posed approach, not specific for a crop, but thatcan be used in several cropping systems sce-narios (Richter et al., 2006). To simulate newcrops, the model needs some input crop para-meters (phenological intervals, photosynthesisefficiency, dry matter partition), specific for eachnew crop the user want simulate.
3.2 LAI forcing
In order to evaluate preliminarily the effective-ness of LAI forcing in AQUATER model ap-plication, the experimental data previously usedin the calibration phase on autumnal sugar beethave been examined. In particular, data fromseveral field trials carried out in Foggia in the2000/01 and 2001/02 campaigns were used forthe calibration (with and without LAI forcing).The criteria to choose the LAI data for testingthe effect of forcing was based on the avail-ability of remote sensing images in subsequentyears.
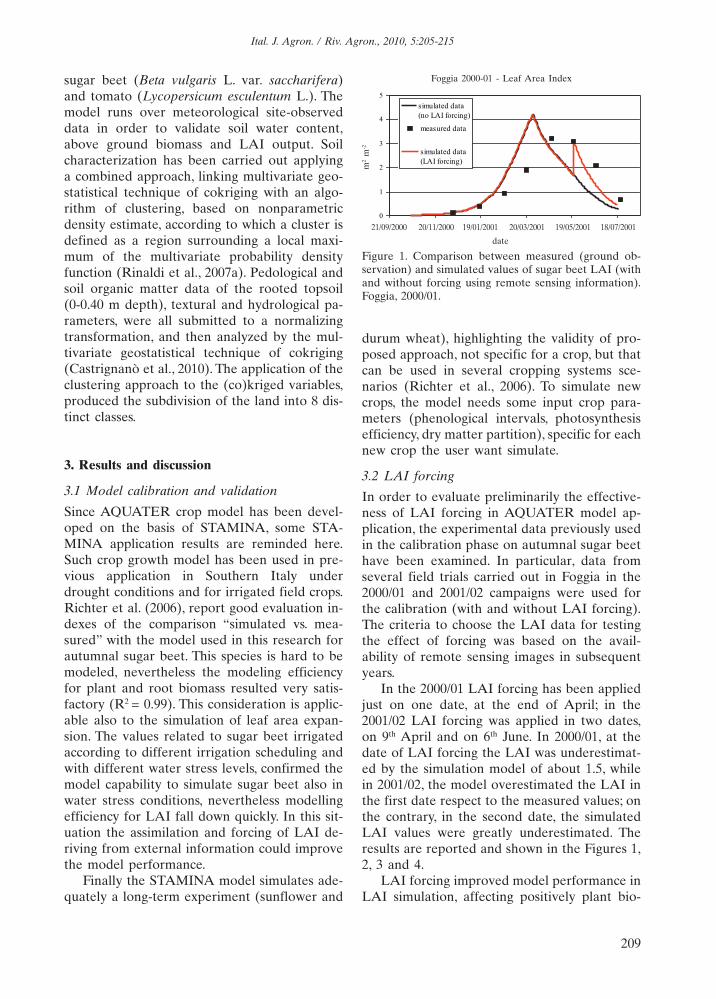
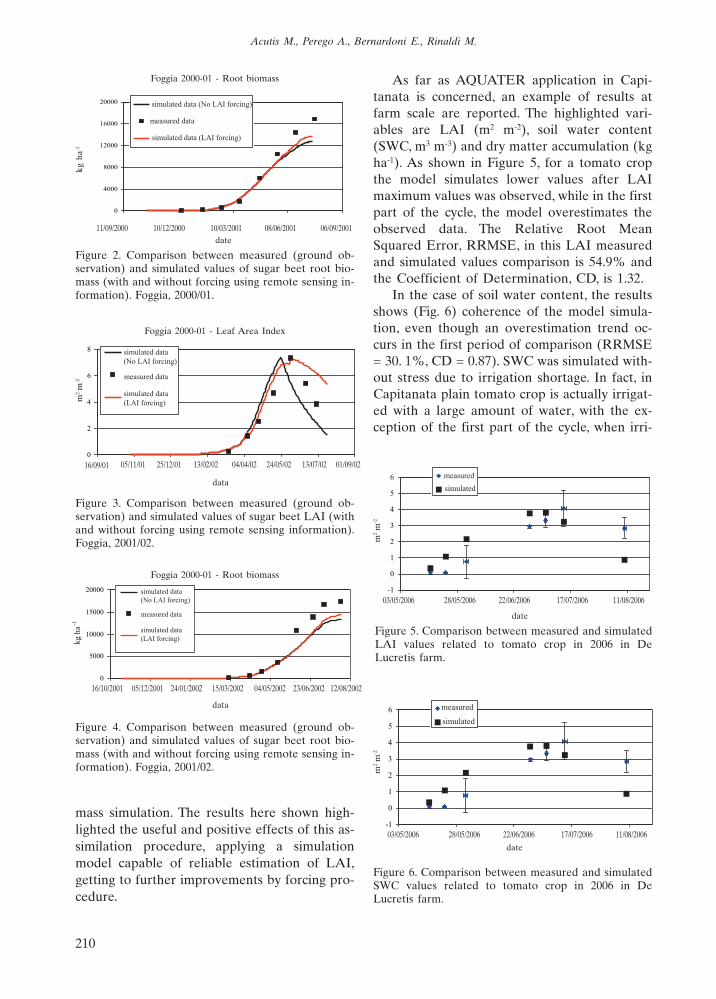
In the 2000/01 LAI forcing has been appliedjust on one date, at the end of April; in the2001/02 LAI forcing was applied in two dates,on 9th April and on 6th June. In 2000/01, at thedate of LAI forcing the LAI was underestimat-ed by the simulation model of about 1.5, whilein 2001/02, the model overestimated the LAI inthe first date respect to the measured values; onthe contrary, in the second date, the simulatedLAI values were greatly underestimated. Theresults are reported and shown in the Figures 1,2, 3 and 4.
LAI forcing improved model performance inLAI simulation, affecting positively plant bio-
Ital. J. Agron. / Riv. Agron., 2010, 5:205-215
209
0
1
2
3
4
5simulated data(no LAI forcing)
measured data
simulated data(LAI forcing)
Figure 1. Comparison between measured (ground ob-servation) and simulated values of sugar beet LAI (withand without forcing using remote sensing information).Foggia, 2000/01.
Foggia 2000-01 - Leaf Area Index
date
m2
m-2
21/09/2000 20/11/2000 19/01/2001 20/03/2001 19/05/2001 18/07/2001
mass simulation. The results here shown high-lighted the useful and positive effects of this as-similation procedure, applying a simulationmodel capable of reliable estimation of LAI,getting to further improvements by forcing pro-cedure.
As far as AQUATER application in Capi-tanata is concerned, an example of results atfarm scale are reported. The highlighted vari-ables are LAI (m2 m-2), soil water content(SWC, m3 m-3) and dry matter accumulation (kgha-1). As shown in Figure 5, for a tomato cropthe model simulates lower values after LAImaximum values was observed, while in the firstpart of the cycle, the model overestimates theobserved data. The Relative Root MeanSquared Error, RRMSE, in this LAI measuredand simulated values comparison is 54.9% andthe Coefficient of Determination, CD, is 1.32.
In the case of soil water content, the resultsshows (Fig. 6) coherence of the model simula-tion, even though an overestimation trend oc-curs in the first period of comparison (RRMSE= 30. 1%, CD = 0.87). SWC was simulated with-out stress due to irrigation shortage. In fact, inCapitanata plain tomato crop is actually irrigat-ed with a large amount of water, with the ex-ception of the first part of the cycle, when irri-
Acutis M., Perego A., Bernardoni E., Rinaldi M.
210
0
4000
8000
12000
16000
20000 simulated data (No LAI forcing)
measured data
simulated data (LAI forcing)
Figure 2. Comparison between measured (ground ob-servation) and simulated values of sugar beet root bio-mass (with and without forcing using remote sensing in-formation). Foggia, 2000/01.
0
2
4
6
8 simulated data (No LAI forcing)
measured data
simulated data (LAI forcing)
Figure 3. Comparison between measured (ground ob-servation) and simulated values of sugar beet LAI (withand without forcing using remote sensing information).Foggia, 2001/02.
0
5000
10000
15000
20000
ah gk 1-
simulated data (No LAI forcing)
measured data
simulated data (LAI forcing)
Figure 4. Comparison between measured (ground ob-servation) and simulated values of sugar beet root bio-mass (with and without forcing using remote sensing in-formation). Foggia, 2001/02.
-1
0
1
2
3
4
5
6 measured
simulated
Figure 6. Comparison between measured and simulatedSWC values related to tomato crop in 2006 in De Lucretis farm.
-1
0
1
2
3
4
5
6 measured
simulated
Figure 5. Comparison between measured and simulatedLAI values related to tomato crop in 2006 in De Lucretis farm.
date
data
data
date
date
kg h
a-1m
2 m
-2
11/09/2000 10/12/2000 10/03/2001 08/06/2001 06/09/2001
16/09/01 05/11/01 25/12/01 13/02/02 04/04/02 24/05/02 13/07/02 01/09/02
Foggia 2000-01 - Root biomass
Foggia 2000-01 - Leaf Area Index
Foggia 2000-01 - Root biomass
16/10/2001 05/12/2001 24/01/2002 15/03/2002 04/05/2002 23/06/2002 12/08/2002
m2
m-2
m2
m-2
03/05/2006 28/05/2006 22/06/2006 17/07/2006 11/08/2006
03/05/2006 28/05/2006 22/06/2006 17/07/2006 11/08/2006
3.3 Spatial application
The model has been applied at Capitanata Plainthat was first divided in simulation cells, as si-mulation units, previously identified by takinginto account cropping systems. The three mostrepresentative crops are tomato, sugar beet anddurum wheat.
Here some results of the model applicationare reported, in particular of sugar beet and du-rum wheat. The model has run with no forcingLAI values and subsequently applying such val-ues, obtained by remote sensing detection.
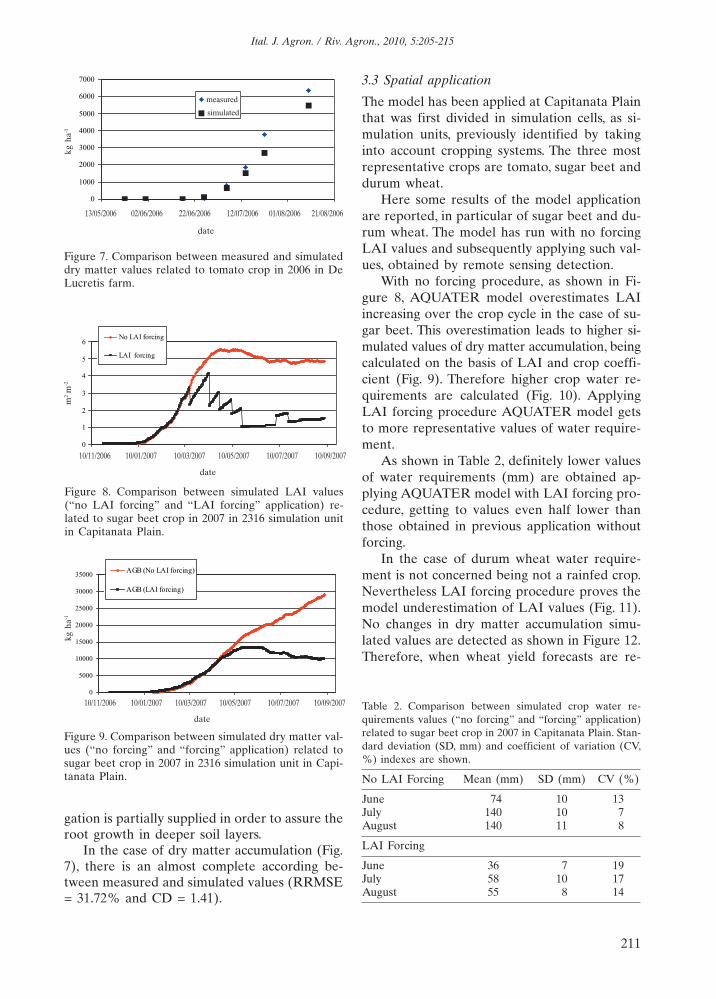
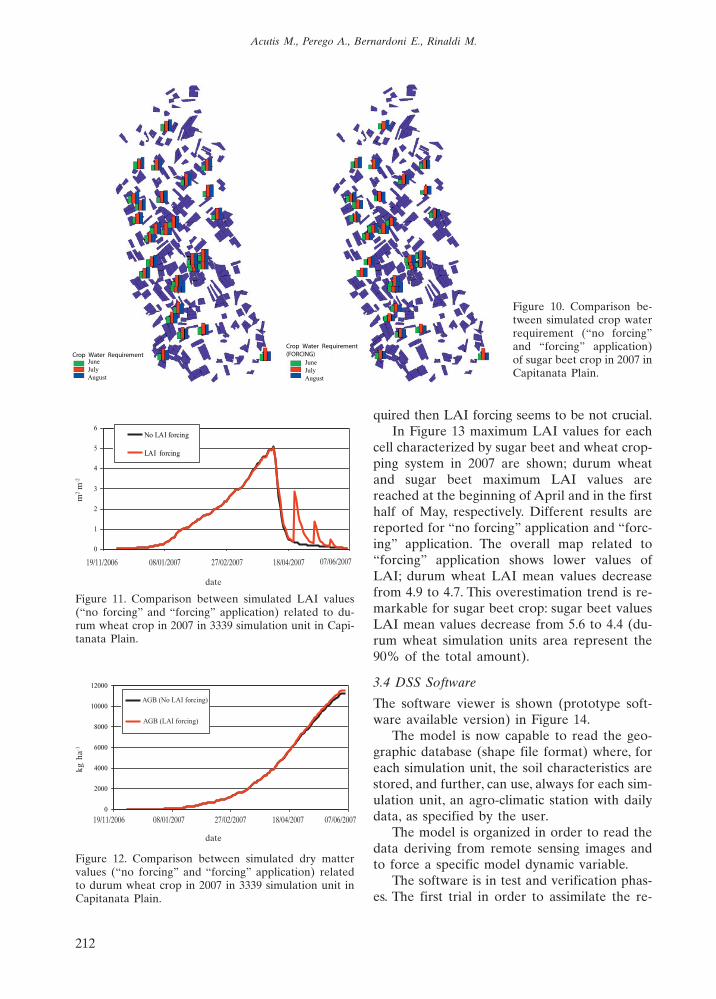
With no forcing procedure, as shown in Fi-gure 8, AQUATER model overestimates LAIincreasing over the crop cycle in the case of su-gar beet. This overestimation leads to higher si-mulated values of dry matter accumulation, beingcalculated on the basis of LAI and crop coeffi-cient (Fig. 9). Therefore higher crop water re-quirements are calculated (Fig. 10). ApplyingLAI forcing procedure AQUATER model getsto more representative values of water require-ment.
As shown in Table 2, definitely lower valuesof water requirements (mm) are obtained ap-plying AQUATER model with LAI forcing pro-cedure, getting to values even half lower thanthose obtained in previous application withoutforcing.
In the case of durum wheat water require-ment is not concerned being not a rainfed crop.Nevertheless LAI forcing procedure proves themodel underestimation of LAI values (Fig. 11).No changes in dry matter accumulation simu-lated values are detected as shown in Figure 12.Therefore, when wheat yield forecasts are re-
Ital. J. Agron. / Riv. Agron., 2010, 5:205-215
211
0
1000
2000
3000
4000
5000
6000
7000
measured
simulated
Figure 7. Comparison between measured and simulateddry matter values related to tomato crop in 2006 in DeLucretis farm.
Table 2. Comparison between simulated crop water re-quirements values (“no forcing” and “forcing” application)related to sugar beet crop in 2007 in Capitanata Plain. Stan-dard deviation (SD, mm) and coefficient of variation (CV,%) indexes are shown.
No LAI Forcing Mean (mm) SD (mm) CV (%)
June 74 10 13July 140 10 7August 140 11 8
LAI Forcing
June 36 7 19July 58 10 17August 55 8 14
Figure 8. Comparison between simulated LAI values(“no LAI forcing” and “LAI forcing” application) re-lated to sugar beet crop in 2007 in 2316 simulation unitin Capitanata Plain.
0
1
2
3
4
5
6No LAI forcing
LAI forcing
0
5000
10000
15000
20000
25000
30000
35000AGB (No LAI forcing)
AGB (LAI forcing)
Figure 9. Comparison between simulated dry matter val-ues (“no forcing” and “forcing” application) related tosugar beet crop in 2007 in 2316 simulation unit in Capi-tanata Plain.
gation is partially supplied in order to assure theroot growth in deeper soil layers.
In the case of dry matter accumulation (Fig.7), there is an almost complete according be-tween measured and simulated values (RRMSE= 31.72% and CD = 1.41).
date
date
date
13/05/2006 02/06/2006 22/06/2006 12/07/2006 01/08/2006 21/08/2006
kg h
a-1m
2 m
-2
10/11/2006 10/01/2007 10/03/2007 10/05/2007 10/07/2007 10/09/2007
kg h
a-1
10/11/2006 10/01/2007 10/03/2007 10/05/2007 10/07/2007 10/09/2007
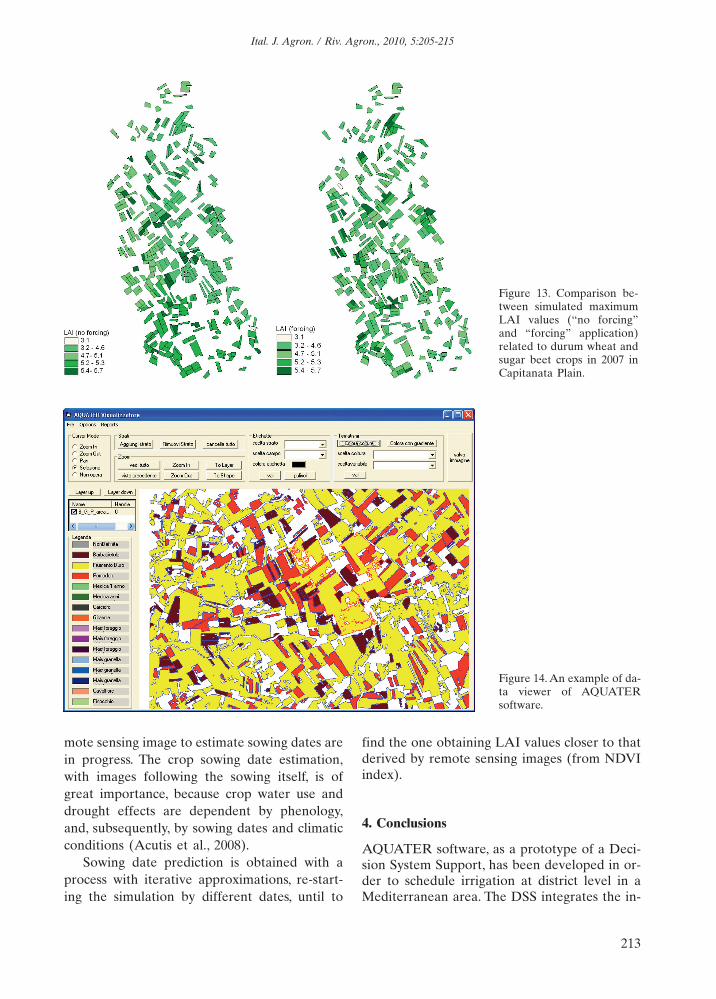
quired then LAI forcing seems to be not crucial.In Figure 13 maximum LAI values for each
cell characterized by sugar beet and wheat crop-ping system in 2007 are shown; durum wheatand sugar beet maximum LAI values arereached at the beginning of April and in the firsthalf of May, respectively. Different results arereported for “no forcing” application and “forc-ing” application. The overall map related to“forcing” application shows lower values ofLAI; durum wheat LAI mean values decreasefrom 4.9 to 4.7. This overestimation trend is re-markable for sugar beet crop: sugar beet valuesLAI mean values decrease from 5.6 to 4.4 (du-rum wheat simulation units area represent the90% of the total amount).
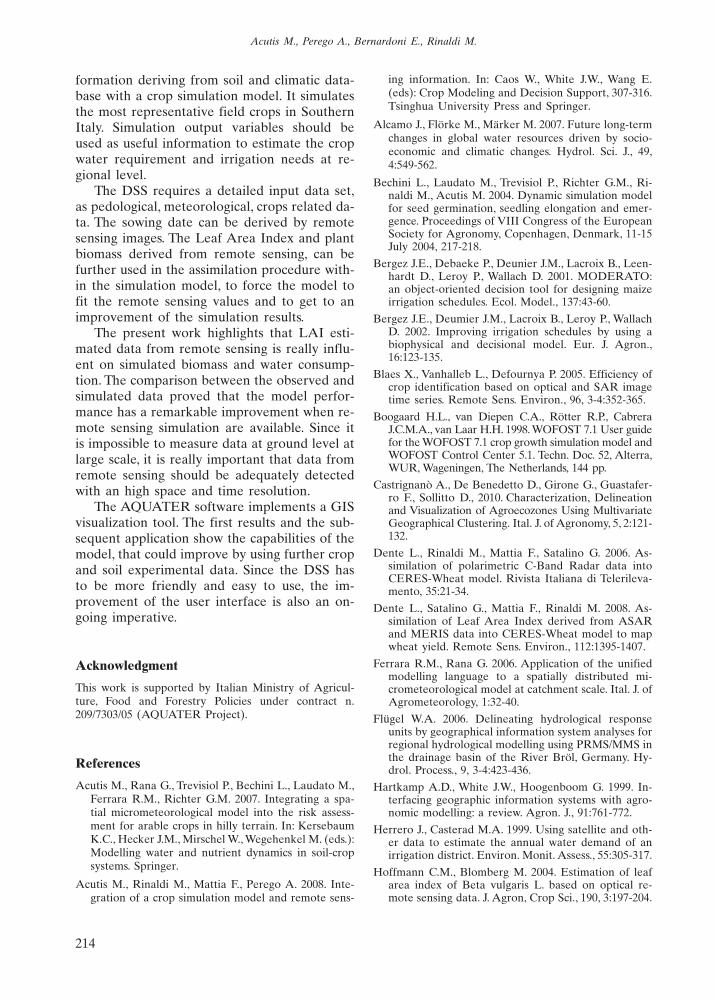
3.4 DSS Software
The software viewer is shown (prototype soft-ware available version) in Figure 14.
The model is now capable to read the geo-graphic database (shape file format) where, foreach simulation unit, the soil characteristics arestored, and further, can use, always for each sim-ulation unit, an agro-climatic station with dailydata, as specified by the user.
The model is organized in order to read thedata deriving from remote sensing images andto force a specific model dynamic variable.
The software is in test and verification phas-es. The first trial in order to assimilate the re-
Acutis M., Perego A., Bernardoni E., Rinaldi M.
212
Crop Water RequirementJuneJulyAugust
Crop Water RequirementJuneJulyAugust
JuneJulyAugust
Crop Water Requirement(FORCING)
JuneJulyAugust
Crop Water Requirement(FORCING)
Figure 10. Comparison be-tween simulated crop waterrequirement (“no forcing”and “forcing” application)of sugar beet crop in 2007 inCapitanata Plain.
0
1
2
3
4
5
6No LAI forcing
LAI forcing
0
2000
4000
6000
8000
10000
12000
AGB (No LAI forcing)
AGB (LAI forcing)
Figure 12. Comparison between simulated dry mattervalues (“no forcing” and “forcing” application) relatedto durum wheat crop in 2007 in 3339 simulation unit inCapitanata Plain.
Figure 11. Comparison between simulated LAI values(“no forcing” and “forcing” application) related to du-rum wheat crop in 2007 in 3339 simulation unit in Capi-tanata Plain.
date
date
m2
m-2
kg h
a-1
19/11/2006 08/01/2007 27/02/2007 18/04/2007 07/06/2007
19/11/2006 08/01/2007 27/02/2007 18/04/2007 07/06/2007
mote sensing image to estimate sowing dates arein progress. The crop sowing date estimation,with images following the sowing itself, is ofgreat importance, because crop water use anddrought effects are dependent by phenology,and, subsequently, by sowing dates and climaticconditions (Acutis et al., 2008).
Sowing date prediction is obtained with aprocess with iterative approximations, re-start-ing the simulation by different dates, until to
find the one obtaining LAI values closer to thatderived by remote sensing images (from NDVIindex).
4. Conclusions
AQUATER software, as a prototype of a Deci-sion System Support, has been developed in or-der to schedule irrigation at district level in aMediterranean area. The DSS integrates the in-
Ital. J. Agron. / Riv. Agron., 2010, 5:205-215
213
Figure 13. Comparison be-tween simulated maximumLAI values (“no forcing”and “forcing” application)related to durum wheat andsugar beet crops in 2007 inCapitanata Plain.
Figure 14. An example of da-ta viewer of AQUATERsoftware.
formation deriving from soil and climatic data-base with a crop simulation model. It simulatesthe most representative field crops in SouthernItaly. Simulation output variables should beused as useful information to estimate the cropwater requirement and irrigation needs at re-gional level.
The DSS requires a detailed input data set,as pedological, meteorological, crops related da-ta. The sowing date can be derived by remotesensing images. The Leaf Area Index and plantbiomass derived from remote sensing, can befurther used in the assimilation procedure with-in the simulation model, to force the model tofit the remote sensing values and to get to animprovement of the simulation results.
The present work highlights that LAI esti-mated data from remote sensing is really influ-ent on simulated biomass and water consump-tion. The comparison between the observed andsimulated data proved that the model perfor-mance has a remarkable improvement when re-mote sensing simulation are available. Since itis impossible to measure data at ground level atlarge scale, it is really important that data fromremote sensing should be adequately detectedwith an high space and time resolution.
The AQUATER software implements a GISvisualization tool. The first results and the sub-sequent application show the capabilities of themodel, that could improve by using further cropand soil experimental data. Since the DSS hasto be more friendly and easy to use, the im-provement of the user interface is also an on-going imperative.
Acknowledgment
This work is supported by Italian Ministry of Agricul-ture, Food and Forestry Policies under contract n.209/7303/05 (AQUATER Project).
References
Acutis M., Rana G., Trevisiol P., Bechini L., Laudato M.,Ferrara R.M., Richter G.M. 2007. Integrating a spa-tial micrometeorological model into the risk assess-ment for arable crops in hilly terrain. In: KersebaumK.C., Hecker J.M., Mirschel W., Wegehenkel M. (eds.):Modelling water and nutrient dynamics in soil-cropsystems. Springer.
Acutis M., Rinaldi M., Mattia F., Perego A. 2008. Inte-gration of a crop simulation model and remote sens-
ing information. In: Caos W., White J.W., Wang E.(eds): Crop Modeling and Decision Support, 307-316.Tsinghua University Press and Springer.
Alcamo J., Flörke M., Märker M. 2007. Future long-termchanges in global water resources driven by socio-economic and climatic changes. Hydrol. Sci. J., 49,4:549-562.
Bechini L., Laudato M., Trevisiol P., Richter G.M., Ri-naldi M., Acutis M. 2004. Dynamic simulation modelfor seed germination, seedling elongation and emer-gence. Proceedings of VIII Congress of the EuropeanSociety for Agronomy, Copenhagen, Denmark, 11-15July 2004, 217-218.
Bergez J.E., Debaeke P., Deunier J.M., Lacroix B., Leen-hardt D., Leroy P., Wallach D. 2001. MODERATO:an object-oriented decision tool for designing maizeirrigation schedules. Ecol. Model., 137:43-60.
Bergez J.E., Deumier J.M., Lacroix B., Leroy P., WallachD. 2002. Improving irrigation schedules by using abiophysical and decisional model. Eur. J. Agron.,16:123-135.
Blaes X., Vanhalleb L., Defournya P. 2005. Efficiency ofcrop identification based on optical and SAR imagetime series. Remote Sens. Environ., 96, 3-4:352-365.
Boogaard H.L., van Diepen C.A., Rötter R.P., CabreraJ.C.M.A., van Laar H.H. 1998. WOFOST 7.1 User guidefor the WOFOST 7.1 crop growth simulation model andWOFOST Control Center 5.1. Techn. Doc. 52, Alterra,WUR, Wageningen, The Netherlands, 144 pp.
Castrignanò A., De Benedetto D., Girone G., Guastafer-ro F., Sollitto D., 2010. Characterization, Delineationand Visualization of Agroecozones Using MultivariateGeographical Clustering. Ital. J. of Agronomy, 5, 2:121-132.
Dente L., Rinaldi M., Mattia F., Satalino G. 2006. As-similation of polarimetric C-Band Radar data intoCERES-Wheat model. Rivista Italiana di Telerileva-mento, 35:21-34.
Dente L., Satalino G., Mattia F., Rinaldi M. 2008. As-similation of Leaf Area Index derived from ASARand MERIS data into CERES-Wheat model to mapwheat yield. Remote Sens. Environ., 112:1395-1407.
Ferrara R.M., Rana G. 2006. Application of the unifiedmodelling language to a spatially distributed mi-crometeorological model at catchment scale. Ital. J. ofAgrometeorology, 1:32-40.
Flügel W.A. 2006. Delineating hydrological responseunits by geographical information system analyses forregional hydrological modelling using PRMS/MMS inthe drainage basin of the River Bröl, Germany. Hy-drol. Process., 9, 3-4:423-436.
Hartkamp A.D., White J.W., Hoogenboom G. 1999. In-terfacing geographic information systems with agro-nomic modelling: a review. Agron. J., 91:761-772.
Herrero J., Casterad M.A. 1999. Using satellite and oth-er data to estimate the annual water demand of anirrigation district. Environ. Monit. Assess., 55:305-317.
Hoffmann C.M., Blomberg M. 2004. Estimation of leafarea index of Beta vulgaris L. based on optical re-mote sensing data. J. Agron, Crop Sci., 190, 3:197-204.
Acutis M., Perego A., Bernardoni E., Rinaldi M.
214
Knox J.W., Weatherhead E.K., Bradley R.I. 1996. Map-ping the spatial distribution of volumetric irrigationwater requirements for main crop potatoes in Eng-land and Wales. Agric. Water Manage., 31:1-15.
Launay M., Guerif M. 2005. Assimilating remote sens-ing data into a crop model to improve predictive per-formance for spatial applications. Agr. Ecosyst. Env-iron., 111, 1-4:321-339.
Leenhardt D., Trouvat J.L., Gonzales G., Pérarnaud V.,Prats S., Bergez J.E. 2004. Estimating irrigation de-mand for water management on a regional scale. I.ADEAUMIS, a simulation platform based on bio-de-cisional modelling and spatial information. Agr. Wa-ter Manage., 68:207-232.
Mateos L., Lopez-Cortijo I., Sagardoy J. 2002. SIMIS: theFAO decision support system for irrigation schememanagement. Agr. Water Manage., 56:193-206.
Maton L., Leenhardt D., Goulard M., Bergez J.E. 2005.Assessing the irrigation strategies over a wide geo-graphical area from structural data about farmingsystems. Agr. Syst., 86, 3:293-311.
Méndez-Barroso L.M., Garatuza-Payàn J., Vivoni E.R.2008. Quantifying water stress on wheat using remotesensing in the Yaqui Valley, Sonora, Mexico. Agr. Wa-ter Manage., 95:725-736.
Moran S., Clarke T.R., Inoue Y., Vidal A. 1994. Esti-mating crop water deficit using the relation betweensurface-air temperature and spectral vegetation in-dex. Remote Sens. of Environ., 46:246-263.
Noilhan J., Planton S. 1989. A simple parameterizationof land surface processes for meteorological models,Mon. Wea. Rev., 117:536-549.
Oweis T., Pala M., Ryan J. 1998. Stabilizing rainfed wheatyields with supplemental irrigation and nitrogen in aMediterranean climate. Agron. J., 90, 5:672-681.
Piccarreta M., Capolongo D., Boenzi F. 2006. Trendanalysis of precipitation and drought in Basilicatafrom 1923 to 2000 within a Southern Italy context.Int. J. Climatol., 24:907-922.
Raes D., Geerts S., Kipkorir E., Wellens J., Sahli A. 2006.Simulation of yield decline as a result of water stresswith a robust soil water balance model. Agr. WaterManage., 81, 3:335-357.
Richter G.M., Jaggard K.W., Mitchell R.A.C. 2001. Mod-elling radiation interception and radiation use effi-ciency for sugar beet under variable climatic stress.Agric. Forest Meteorol., 109:13-25.
Richter G.M., Rana G., Ferrara R.M., Ventrella D.,Acutis M., Trevisiol P., Laudato M., Gusberti D.,Mayer Th., Baggeley N., Morris J., Holmes A., TrawickP., Dailey A.G., Robbins P., Simota C., Whitmore A.P.,Powlson D.S. 2006. Stability and Mitigation of Arable
Systems in Hilly Landscapes (EU-QLK-5-CT-2002-01313). Report to the European Commission, Brussels.
Rinaldi M., Castrignanò A., Mastrorilli M., Rana G.,Ventrella D., Acutis M., D’Urso G., Mattia F. 2005.Decision support systems to manage water resourcesat irrigation district level in Southern Italy using re-mote sensing information. An integrated Project(AQUATER). Proc. of Earth Observation, 10-11 De-cember 2005, Napoli (I), 107-114.
Rinaldi M., Campi P., Castellini M., Ferrara R.M., Fio-rentino C., Garofalo P., Satalino G. 2007a. AQUATERproject: the measurement campaign in Capitanata plainof soil-plant-atmosphere continuum. Proceedings of 5th
International Symposium on Retrieval of Bio- and Geo-physical Parameters from SAR Data for Land Appli-cations, 25-28 September, Bari (I), pdf P_05.
Rinaldi M., Ventrella D., Gagliano C. 2007b. Compari-son of nitrogen and irrigation strategies in tomato us-ing CROPGRO model. A case study from SouthernItaly. Agr. Water Manage., 87:91-105.
Rizzoli A.E., Athanasiadis I.N., Donatelli M., Huber D.,Muetzelfeldt R. 2005. Overall architectural design ofSeamFrame. SEAMLESS report no. 7.
Sinclair T.R. 1986. Water and nitrogen limitations in soy-bean grain production. Part I. Model development.Field Crops Res., 15:125-141.
Tuberosa R., Giuliani S., Parry M.A.J., Araus J.L. 2007.Improving water use efficiency in Mediterraneanagriculture: what limits the adoption of new tech-nologies? Ann. Appl. Biol., 150, 2:157-162.
van Dam J.C., Feddes R.A. 2000. Numerical simulation ofinfiltration, evaporation and shallow groundwater lev-els with the Richards equation. J. Hydrol., 233:72-85.
van Ittersum M.K., Leffelaar P.A., Van Keulen H.,Kropff M.J., Bastiaans L., Goudriaan L. 2003. On ap-proaches and applications of the Wageningen cropmodels. Eur. J. of Agronomy, 18:201-234.
van Keulen H., Penning de Vries F.W.T., Drees E.M. 1982.A summary model for crop growth. In: Penning deVries, F.W.T., Van Laar, H.H. (eds.), Simulation of PlantGrowth and Crop Production. Simulation Monographs.Pudoc, Wageningen, The Netherlands, 87-98.
van Keulen H., Wolf J. 1986. Modelling of agriculturalproduction: weather soils and crops. SimulationMonographs. Pudoc, Wageningen, The Netherlands,80-86.
Wagner W., Verhoest N.E.C., Ludwig R., Tedesco M.2009. Remote sensing in hydrological sciences. Hy-drol. Earth Syst. Sci., 13:813-817.
Weatherhead E.K., Knox J.W. 2000. Predicting and map-ping the future demand for irrigation water in Eng-land and Wales. Agr. Water Manage., 43, 2:203-218.
Ital. J. Agron. / Riv. Agron., 2010, 5:205-215
215