investor presentation – first half 2022 - danske bank
TRANSCRIPT

Investor PresentationFirst half 2022

Investor Presentation – First half 2022
1
Agenda
01. Danske Bank – brief overview 2 – 7
02. Financial highlights – first half 2022 8 – 14
03. Business & Product Units 15 – 19
04. ESG, Sustainability, Financial Crime Prevention 20 – 28
05. Credit Quality & Impairments 29 – 37
06. Capital 38 – 41
07. Funding & Liquidity 42 – 46
08. Credit & ESG Ratings 47 – 50
09. Tax & Material extraordinary items 51 – 53
10. Contact info 54

Investor Presentation – First half 2022
2
We are a Nordic universal bank with strong regional roots
Note: Share of Group lending is before loan impairment charges and excludes Large Corporates & Institutions (17%) and Asset Finance (3%)* Asset Management in LC&I
Norway (AAA)Challenger position
Market share: 6%Share of Group lending: 11%
GDP growth 2022E: 3.6% Unemployment 2022E: 1.8%Leading central bank rate: 1.25%
Denmark (AAA)Market leader
Market share: 25%Share of Group lending: 46%
GDP growth 2022E: 3.5%Unemployment 2022E: 2.5%Leading central bank rate: -0.10%
Finland (AA+) 3rd largest
Market share: 10%Share of Group lending: 8%
GDP growth 2022E: 1.5% Unemployment 2022E: 6.4%Leading central bank rate: 0%
Sweden (AAA)Challenger position
Market share: 6%Share of Group lending: 12%
GDP growth 2022E: 1.1% Unemployment 2022E: 7.4%Leading central bank rate: 0.75%
Northern Ireland (AA)Market leader
Market share Personal: 19%, Business: 27%Share of Group lending: 3%
3.3 mpersonal and business customers
2,100+large corporate and institutional customers
21,000+employees in 10 countries
Assets under Management DKK 700bn*
Deposits>DKK 1,100 bn
Loans>DKK 1,800 bn
743 743
397234
6791,156
167
Bank mortgages
Bank loans
Senior & NPS bonds
Loans Funding
Deposits
Covered bonds
RD mortgages Issued RD bonds
1,819
2,300
Sound funding structure (DKK bn)
33
Investor Presentation – First half 2022
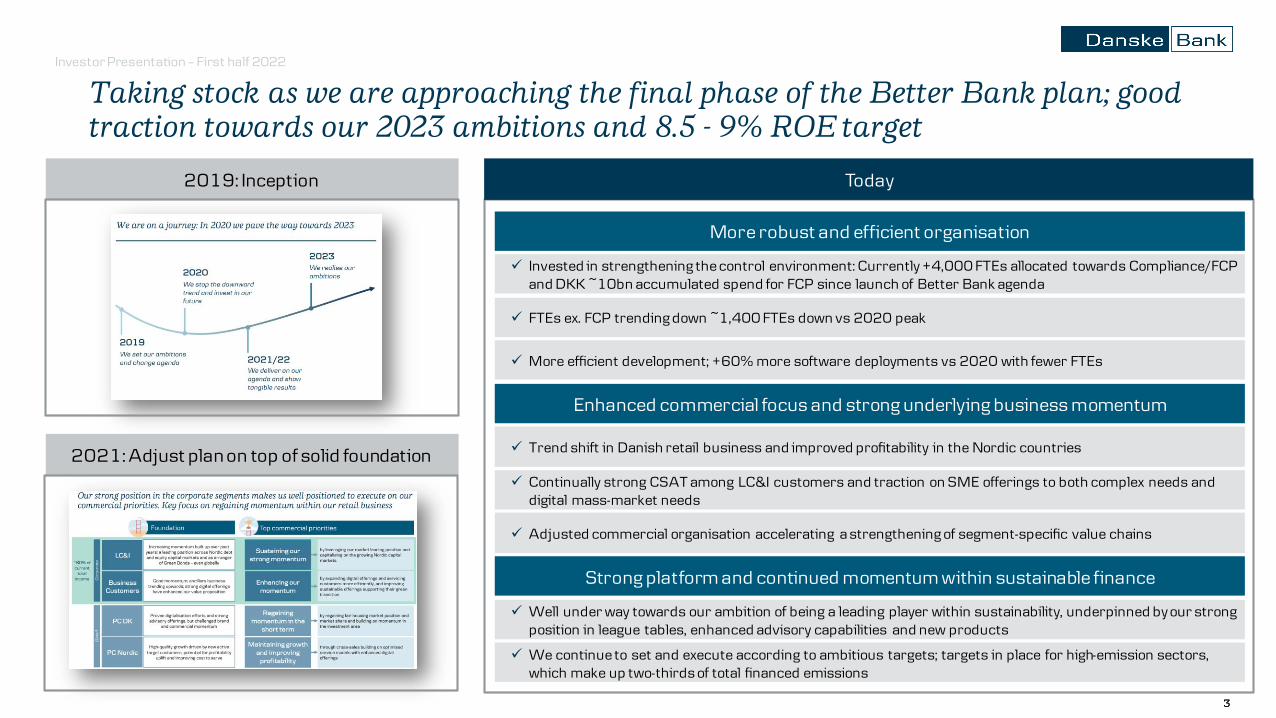
Taking stock as we are approaching the final phase of the Better Bank plan; good traction towards our 2023 ambitions and 8.5 - 9% ROE target
Enhanced commercial focus and strong underlying business momentum
Trend shift in Danish retail business and improved profitability in the Nordic countries
Continually strong CSAT among LC&I customers and traction on SME offerings to both complex needs and digital mass-market needs
Adjusted commercial organisation accelerating a strengthening of segment-specific value chains
Well under way towards our ambition of being a leading player within sustainability, underpinned by our strong position in league tables, enhanced advisory capabilities and new products
We continue to set and execute according to ambitious targets; targets in place for high-emission sectors, which make up two-thirds of total financed emissions
Strong platform and continued momentum within sustainable finance
Invested in strengthening the control environment: Currently +4,000 FTEs allocated towards Compliance/FCP and DKK ~10bn accumulated spend for FCP since launch of Better Bank agenda
More efficient development; +60% more software deployments vs 2020 with fewer FTEs
FTEs ex. FCP trending down ~1,400 FTEs down vs 2020 peak
More robust and efficient organisation
2019: Inception
2021: Adjust plan on top of solid foundation
Today

Investor Presentation – First half 2022
4
Traction towards targets remains positive across our sustainability indicators
xx% vs. 20XX, X,XXX X,X m
Employee
well-being &
diversity
More than 35% women in senior leadership positions and an employee engagement score of 77
33% women
75
engagement score
Responsible
investing
DKK 150bn in funds that have sustainability objectives 1) and DKK 50bn invested in the green transition by Danica Pension
DKK 53.4bn *
in sust. funds (art. 9)
DKK 33.5bn *
by Danica Pension
Sustainable
financing
DKK 300bn in sustainable financing – and setting Paris Agreement aligned climate targets for our lending portfolio
DKK 247bn *
+ 2030 emission targets
disclosed for shipping,
utilities and oil & gas
Governance &
integrity
Over 95% of employees trained annually in risk and compliance
96% trained
2023
Targets
Latest
status
* indicates
Q2 update
Sustainable finance Sustainable operations Impact initiatives
Environmental
footprint
Reducing our CO2
emissions by 40% compared to 2019, towards 60% by 2030
– 69%
for 2021 2)
Entrepreneur-
ship
10,000 start-ups & scale-ups supported with growth and impact tools, services and expertise (since 2016)
6,881*
Financial
confidence
2m people supported with financial literacy tools and expertise (since 2018)
1.8 m*
1) This is a 2030 target to have at least DKK 150bn in investment funds that have sustainability objectives (article 9 funds).
2) Over-performance in 2021 was related to COVID-19 and reductions in travel.
Investor Presentation – First half 2022
5
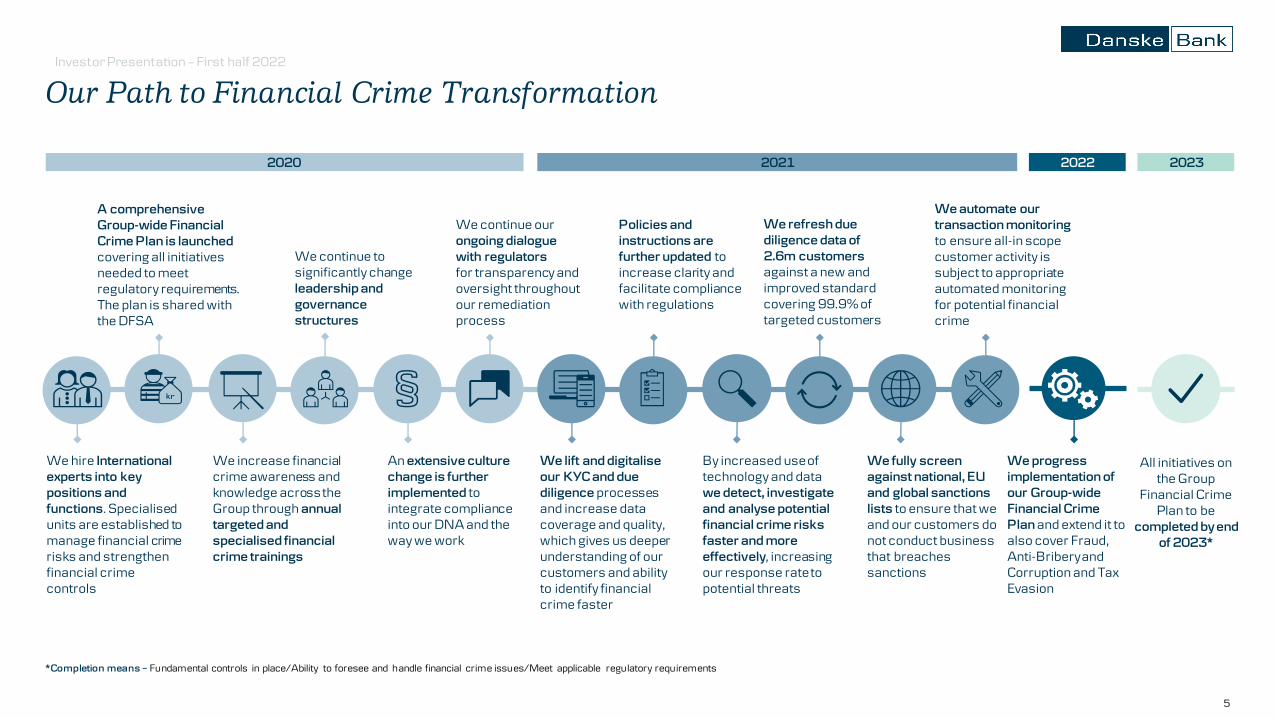
Our Path to Financial Crime Transformation
We hire International experts into key positions and functions. Specialised units are established to manage financial crime risks and strengthen financial crime controls
A comprehensive Group-wide Financial Crime Plan is launched covering all initiatives needed to meet regulatory requirements. The plan is shared with the DFSA
We increase financial crime awareness and knowledge across the Group through annual targeted and specialised financial crime trainings
We continue to significantly change leadership and governance structures
We continue our ongoing dialogue with regulators for transparency and oversight throughout our remediation process
An extensive culture change is further implemented to integrate compliance into our DNA and the way we work
We lift and digitalise our KYC and due diligence processes and increase data coverage and quality, which gives us deeper understanding of our customers and ability to identify financial crime faster
By increased use of technology and data we detect, investigate and analyse potential financial crime risks faster and more effectively, increasing our response rate to potential threats
We refresh due diligence data of2.6m customers against a new and improved standard covering 99.9% of targeted customers
We fully screen against national, EU and global sanctions lists to ensure that we and our customers do not conduct business that breaches sanctions
We automate our transaction monitoring to ensure all-in scope customer activity is subject to appropriate automated monitoring for potential financial crime
All initiatives on the Group
Financial Crime Plan to be
completed by end of 2023*
2020 2021 2022 2023
*Completion means – Fundamental controls in place/Ability to foresee and handle financial crime issues/Meet applicable regulatory requirements
Policies and instructions are further updated to increase clarity and facilitate compliance with regulations
We progress implementation of our Group-wide Financial Crime Plan and extend it to also cover Fraud, Anti-Bribery and Corruption and Tax Evasion

66
Investor Presentation – First half 2022
Nordic macroeconomic data
FinlandNorwaySwedenDenmarkEU-27
Real GDP, constant prices (index 2005 = 100)
Consumer spending (%-change from same period 2019)
Property prices (index 2005 = 100)
Apartment prices (index 2005 = 100)
Inflation (%)
Unemployment (%)
Source: Danske Bank Macro Research

77
Investor Presentation – First half 2022
Net profit outlook for 2022*: We expect net profit to be in the range of DKK 10-12 bn, driven by volume growth and continued solid credit quality
* Note – The outlook is subject to uncertainty and depends on economic conditions.
Income
We expect costs in 2022 to reflect continued focus on cost management and to be around DKK 25.5 billion due to sustained elevated remediation costs. The outlook does not include any effects from a potential settlement of the Estonia matter in 2022 and from alternative approaches in order to accelerate the timeline for the debt collection issue
Loan impairments are expected to be below normalised level, given our overall strong credit quality
We expect net profit to be in the range of DKK 10-12 bn, including the gains from MobilePay, Danske Bank International and Danica Norway
Expenses
We continue to expect income from core banking activities to be higher in 2022, as higher net interest income driven by good economic activity will more than offset lower capital market and investment related fee income.Net income from insurance business and trading activities are expected below normalized levels based on significant lower income in the first six month of the year and a modest recovery in income in the second half of the year subject to market conditions. The degree of uncertainty is higher than usual
Net profit*
Impairments
Revised
10 July 2022
Revised
10 July 2022
Maintained
Revised
10 July 2022
Financial highlights – first half 2022

Investor Presentation – First half 2022
9
H1 highlights – business momentum continues, despite turbulent conditions for rates business. Credit quality remains strong with limited impairments and healthy provisions
• Despite the uncertain operating environment, we have continued to execute on our strategy and support customers, resulting in continued commercial momentum and underlying efficiency gains
• Core banking income supported by commercial momentum, and our resilient business model mitigated the impact from turbulent financial markets in certain areas of our business
• Fixed income business and certain investment products in Danica significantly impacted by rapid increase in interest rates
• Macro outlook and geopolitical uncertainty did not affect our customers significantly in H1, and loan impairment charges continued to be low, underpinning the strong credit quality with limited risky CRE exposures and PMAs in place across sectors
• The outlook for FY 2022 was revised on 10 July on account of the lower than expected financial markets related income in H1 and based on a modest recovery in H2, subject to financial markets conditions
475
2,116
1,470 502311
OtherH1-21 PBT, core
NII
58
ImpairmentsFee Trading
450
Insurance business
Expenses H1-22 PBT, core
-1,020
7,783
23
5,854
Prof it development H1-22 vs H1-21 (DKK m)
Financial metrics
60.0
67.1
C/I (%) CET1 (%)
18.0
17.1
7.0
5.2
ROE (%)
Danica NO
Highlights
H1-22H1-21
1,800
1,819
-10
1,810
61
1,880RD fair value
Lending (DKK bn)

Financial results – first half 2022
1010
Income from core banking activities up 2% y-o-y driven by improved NII trend; trading and insurance income significantly impacted by rates; credit quality remain robust
Key points, H122 vs H121
Key points, Q222 vs Q122
• Net interest income uplift from deposit repricing initiatives implemented during 2021 and contribution from continually improving trend in lending volumes as well as recent rate hikes in Norway, Sweden and N. Ireland
• Fee income remained activity offset lower ECM activity and investment related fees
• Trading & insurance income significantly impacted by the rapidly rising interest rates, e.g. through valuation adjustments
• Stable cost development despite legal costs associated with the Estonia matter and a continually elevated level of remediation costs
• Strong credit quality continue to lead to single-name reversals while macro models and additional PMAs mitigate tail risk
• NII up q-o-q benefitting from recent rate hikes, as well as continued lending growth particular for corporate clients
• Fee income lower, driven mainly by seasonality effects (high refinancing in Q1) as well as reduced capital markets and investmentrelated fees
• LC&I trading income and Danica impacted by adverse financial markets with significant impact from our rates business and in the investment result in Danica, as well as valuation adjustments
• Total expenses on par with Q1 despite additional remediation and legal costs, underpinning the progress improving underlying efficiency
• Strong credit quality led to continually low impairments despite added PMAs and additional adjustment of macro models as lending book, including potentially exposed industries, shows negligible impact of current uncertainties
Income statement and key f igures (DKK m)
H1 22 H1 21 Index Q2 22 Q122 Index
Net interest income 11,440 10,965 104 5,810 5,630 103
Net fee income 6,537 6,595 99 3,157 3,379 93
Net trading income 175 2,291 8 -390 565 -
Net income from insurance business -38 982 - -122 84 -
Other income 959 457 210 291 669 43
Total income 19,073 21,291 90 8,746 10,327 85
Expenses 12,793 12,770 100 6,421 6,371 101
Profit before loan impairment charges 6,280 8,521 74 2,325 3,955 59
Loan impairment charges 426 737 58 192 234 82
Profit before tax, core 5,854 7,783 75 2,133 3,721 57
Profit before tax, Non-core 17 17 100 31 -14 -
Profit before tax 5,871 7,801 75 2,164 3,707 58
Tax 1,320 1,869 71 458 862 53
Net profit 4,551 5,932 77 1,705 2,845 60

1111
Investor Presentation – First half 2022
Deposit margin
Q1 22
130
Lending volume
47
Lending margin
-87
-55
Deposit volume
Internal Bank / FTP
-11
268
5,630
5,810-29
-81
FX + Day effect
Q2 22Interest related fees
Other
NII: Positive volumes and improving credit demand coupled with full effect from repricing initiatives continue to support the improving NII trend
Net interest income, YTD-22 vs YTD-21 (DKK m)
-403458
Lending volume
Lending margin
11,440
-100
193
Interest related fees
-53
Other
-161
FX + Day effect
H122Internal Bank / FTP
-222
Deposit margin
763
Deposit volume
10,965
H121
Margin development (bp)
Net interest income, Q222 / Q1 22 (DKK m)
• Net interest income continued the positive trend, supported by lending volumes which increased y-o-y across all Nordic segments. Additional effect from the implemented deposit repricing initiatives along with higher short-term rates provided further support for deposit margins
• Q-o-Q: Higher lending and effects from recent deposit repricing initiatives coupled with interest rate hikes support the positive trend, driven primarily by Northern Ireland and our corporate customers.
Highlights
Q320 Q420 Q121 Q221 Q321 Q421 Q122 Q222
PC lending 0.95 0.92 0.90 0.91 0.91 0.86 0.85 0.85
PC deposit 0.17 0.06 0.14 0.12 0.16 0.17 0.18 0.23
BC lending 1.14 1.15 1.14 1.13 1.11 1.12 1.12 1.15
BC deposit 0.46 0.34 0.34 0.31 0.36 0.38 0.40 0.48
LC&I lending 1.06 1.12 1.13 1.15 1.14 1.10 1.11 1.14
LC&I deposit 0.33 0.23 0.19 0.16 0.23 0.23 0.23 0.26

1212
Investor Presentation – First half 2022
Fee: Fee performance remain strong in core banking activities, mitigating impact from lower AuM and financial markets headwinds
Highlights
Capital markets
Activity-driven fees / money transfers, accounts etc.
Lending and guarantees
Investment fees
Net fee income, YTD and QoQ
2,528 2,629
1,233 1,295
1,459 1,352
655804
1,8801,563
951929
6691,051
318351
YTD-22 YTD-21 Q2-22 Q1 22
6,537 6,595
3,379
3,157
CapitalMarkets
Investment fees
Money transfers,account fee,cash managementand other fees
Lending &guarantees
• Y-o-Y: Excl. landmark ECM deal, income is largely in line with H1-21, despite conditions and slowdown in market
• Q-o-Q: Adverse financial market conditions have accelerated slightly QoQ.
• Y-o-Y: Up 8%, as the high level of remortgaging activity countered a slowdown in housing market
• Q-o-Q: -19% from a very strong Q1, where most of our refinancing activity happens
• Y-o-Y: Held up well despite lower asset under management and reduced investment appetite among our customers
• Y-o-Y: Up 20% from continually strong trend for everyday banking services at LC&I & BC (FX and cash mngmt.) combined with continued strong general customer activity

1313
Investor Presentation – First half 2022
Trading: Continued support to customers through extraordinary fixed income market conditions; trading income negative in Q2, driven by losses in Rates & Credit at LC&I
Highlights Net trading income (DKK m)
126
1,758
867
220
105
116
243
136
109
134
-105
177
-242
137
-209-143
127
-740-130-99
H1-21H1-22
0
94
Q1 22
-66 29
Q2-22
175
2,291
565
-390
North. IrelandGroup Functions BC PC xVA LC&I ex. xVALC&I
Northern Ireland
Group Functions
• Extraordinarily high volatility, wider credit spreads and lower liquidity in core Nordic fixed income markets led to losses in fixed income market making inventory but also trading losses as spreads used for hedging widened
• Somewhat mitigated by higher income in Currencies
• Rate increases drove mark-to-market movements on the hedging portfolio
• Bond portfolios negatively affected by market value adjustments of Danish mortgage bond investments
• Note that H1-21 included a gain of DKK 0.2 bn related to the sale of shares in VISA

1414
Investor Presentation – First half 2022
3.1 3.1 3.1 3.1 3.2 3.3 3.5 3.64
18
19
2
0
1
20
3
Q221 Q421Q321
18.4
Q222
18.5
Q420
18.1
Q320 Q121
19.318.9
Q122
18.818.8
19.5
Expenses: Underlying progress on efficiency despite continually high remediation costs
0.8
0.4
0.40.4
0.8
0.4
Transfor-
mation
Legal
costs etc.
0.1
Underlying
savings
(incl.
Inflation)
~25.5
2022
0.1
Transfor-
mation
MobilePay
/ DB Lux.
0.2
MobilePay
/ DB Lux.
0.2
Legal
costs etc.
~23.5
Remediation
costs*
One-offs2021
reported
costs
Remediation
costs*
0.1
0.1
Res. fee
and SE
bank tax
Res. fee
and SE
bank tax
25.6
0.1
Underlying
savings
(incl.
Inflation)
2023
• Progress on structural cost take-out despite ramp-up of AML/compliance and remediation work, as well as SE bank tax. Other costs up, due to a partly normalisation of travelling, higher amortisation costs, and IT expenses including one-off related to re-contracting
• Number of FTEs continued to decline. Adjusting for AML/FCP, FTEs are down 7% from peak in Q3 20, reflecting efficiency gains and underlying improvement
• Lower FTEs and underlying cost savings support trajectory towards 2023 target as the elevated remediation costs and legal costs etc. from 2022 are being reduced to more normalised level
Highlights
622
219
172
291
211
167
280
H1-21 Staff cost ex.
severance
One-offs OtherTransfor-
mation
87
12,793
Severance AML /
Compliance
Legacy
remediation
Regulatory
costs, incl.
SE bank tax
12,770
H1-22
FTEs (#,thousand)
FTEs AML/Financial Crime Prevention FTEs
Expenses, H1-22 vs H1-21 (DKK m)
Expense trajectory towards 2023 (DKK bn)
*Related to legacy debt collection

Business & Product Units
Investor Presentation – First half 2022
16
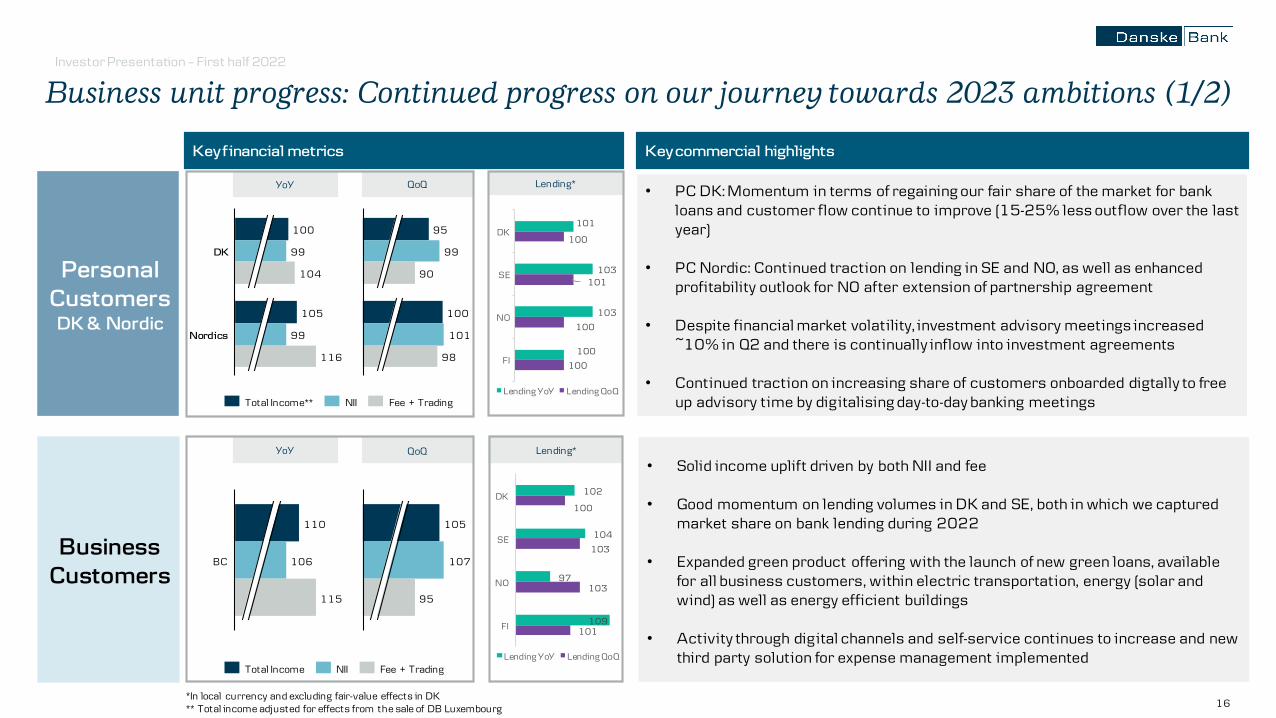
QoQ• PC DK: Momentum in terms of regaining our fair share of the market for bank
loans and customer flow continue to improve (15-25% less outflow over the last year)
• PC Nordic: Continued traction on lending in SE and NO, as well as enhanced profitability outlook for NO after extension of partnership agreement
• Despite financial market volatility, investment advisory meetings increased ~10% in Q2 and there is continually inflow into investment agreements
• Continued traction on increasing share of customers onboarded digtally to free up advisory time by digitalising day-to-day banking meetings
Business unit progress: Continued progress on our journey towards 2023 ambitions (1/2)
Business Customers
Personal CustomersDK & Nordic
Key f inancial metrics Key commercial highlights
• Solid income uplift driven by both NII and fee
• Good momentum on lending volumes in DK and SE, both in which we capturedmarket share on bank lending during 2022
• Expanded green product offering with the launch of new green loans, available for all business customers, within electric transportation, energy (solar and wind) as well as energy efficient buildings
• Activity through digital channels and self-service continues to increase and new third party solution for expense management implemented
101
103
103
100
100
101
100
100
DK
SE
NO
FI
Lending YoY Lending QoQ
YoY Lending*
102
104
97
109
100
103
103
101
DK
SE
NO
FI
Lending YoY Lending QoQ
Lending*
*In local currency and excluding fair-value effects in DK** Total income adjusted for effects from the sale of DB Luxembourg
Nordics
DK
100
99
104
105
99
116
Total Income** Fee + TradingNII
99
95
98
101
90
100
QoQYoY
110
115
BC 106
Total Income Fee + TradingNII
105
107
95

Investor Presentation – First half 2022
17
Lending General Banking
Business unit progress: Continued progress on our journey towards 2023 ambitions (2/2)
Key f inancial metrics (index) Business highlights
Danica Pension
• Underlying business develops positively as more customers choose Danica Pension, yet the financial performance of Danica Pension was negatively affected by the turbulence in the financial markets in the first half of 2022
• Negative investment results for life insurance products where Danica Pension has the investment risk primarily driven by valuation effects
• In the health and accident business, the underlying result was positively affected by a fall in claims of 25% over the last three years and improved recovery rates, driven by preventive efforts. However, the investment result decreased considerably from the level in the first half of 2021, which included a provision for pension yield tax of DKK 200 million
0.4
1.3
-0.8
-0.3
H1-22 H1-21
Result, lifeinsurance
H&A
105
86
86
93
Premiums,insurancecontracts
AuM
YoY QoQ
H1 22/ H1 21 (DKKbn) Q2-22/Q1-22 (DKKbn) Premiums and AuM
-0.1
0.5
-0.4-0.3
Q2-22 Q1-22
Result, lifeinsurance
H&A
LC&I
• Significant lending growth as we supported customers with credit since access to capital markets funding was limited as well as a successful strategic focus on institutional lending
• Tier 1 LC&I franchise underpinned by number one position in Merger Market M&A league table and number one in Bloomberg league table for arrangers of both sustainability-linked loans and sustainable bonds
• Slowdown in ECM activity and extraordinarily challenging financial markets conditions within fixed income
• Solid investment fee despite lower AuM from financial market turmoil
-1 0 1 2 3 4 5 6 7 8
H1-22
H1-21
Q2-22
Q1-22
NII Fee Trading ex. xVA xVA
Income breakdown (DKKbn)
124
111
Lending YoY
Lending QoQ

Investor Presentation – First half 2022
18
Business Unit Progress: Continued progress on our journey towards 2023 ambitions (3/3)
Key f inancial metric (index) Business highlights
• Strong performance in core banking lines supported by UK rate hikes and strongcredit quality
• Market expectations for further interest rate increases has led to mark-to-market movements on the hedging portfolio leading to lower trading income
Northern Ireland
H1 22/ H1 21 Q2-22/Q1-22 Lending
99
124
127
Fee NII Total income
151
117
116
Total income NII Fee
100
104
Lending YoY
Lending QoQ

1919
Investor Presentation – First half 2022
111 10686
68
1-2 yrs 3-4 yrs 5 yrs+ Fixed rate
Realkredit Danmark portfolio overview: Continued strong credit quality with decreasing LTVs and continued improving trend for higher margin products
1 In addition, we charge 30 bp of the bond price for refinancing of 1- and 2-year floaters and 20 bp for floaters of 3 or more years (booked as net fee income).
Repayment Interest-only
143 138118
101
1-2 yrs 3-4 yrs Fixed rate5 yrs+
Adjustable rate1165
156 153 148 144 146 142134
124113 110 104
95 92 89 8475 72 69 67 64 69
Q1Q2 Q3Q1 Q3Q3 Q4 Q4Q2 Q1 Q2 Q3 Q4 Q1 Q2 Q4 Q2Q1 Q3 Q4 Q1 Q2
2017 2018 2020
Stock of loans:DKK 448 bn (450bn)
New lending:DKK 26 bn (33bn)
47.5%(49%)
52.5%(51%)
Variable rate (6m-10 yrs)
Fixed rate (10 yrs-30 yrs)
52%(51%)
48%(49%)
Interest-only
Repayment
50%(45%)
50%(55%)
57%(63%)
43%(37%
Portfolio facts, Realkredit Danmark, Q2 22
• Approx. 321,397 loans (residential and commercial)• Average LTV ratio of 48% (46% for retail, 51% for commercial)• We comply with all five requirements of the supervisory diamond for Danish
mortgage credit institutions• 708 loans in 3- and 6-month arrears (-8% since Q1-22)• 7 repossessed properties (Q1-22: 3)• DKK 6 bn in loans with an LTV ratio >100%, including
DKK 4 bn covered by a public guaranteeLTV ratio limit at origination (legal requirement)
• Residential: 80%• Commercial: 60%
2019 2021
Highlights
Total RD loan port folio of FlexLån® F1-F4 (DKK bn)
Retail loans, Realkredit Danmark, Q2 22 (%)
Retail mortgage margins, LTV of 80%, owner-occupied (bp)
( ) = Q1-22
‘22

Sustainability

21
Sustainability is an integrated element of our corporate strategy and our corporate targets
Danske Bank’s 2023 sustainability strategy aim to drive
change by utilising the power of finance
• Focus areas reflect material
sustainability issues
• Calibrated against stakeholder
expectations
• Supports our Better
Bank agenda and transformation KPIs
• Embedding
sustainability in core business processes
• Leadership ambition
on sustainable finance
Sustainability critical in Better
Bank plan to improve bank for all
stakeholders by 2023
On average among top two
banks for customer
satisfaction in everything
we do
Women in leadership pos.
An employee engagement
score of 77
Operate sustainably,
ethically and
transparently
RoE of 8.5-9% and a
cost/income ratio in the
mid-50s
Customers
Society
Employees
Investors
Selected highlights

Investor Presentation – First half 2022
22
Setting 2030 emissions reduction targets for three key
sectors:
• Shipping: 20-30% relative to shipping volumes
• Utilities: 30% per kWh of power generation
• Oil and Gas –upstream: 50% in lending exposure
Joined the Partnership for Biodiversity Accounting
Financials (PBAF)
• To support measurement of impact from corporate lending and investment on nature and ecosystems
Continued progress on sustainable finance in Q2 – highlights from the first half year
Sustainability linked loan for Chr. Hansen
• Providing a sustainability linked loan to help one of the world’s most sustainable companies achieve their sustainability targets
New attractive energy renovation loan
• Updated home loan for energy improvements in DK in response to rising energy prices
• Attractive annual variable interest rate – currently at 0.99%
#1 among Nordic Arrangers in Bloomberg’s Global League
table
• Danske Bank continues to rank number one among Nordic arrangers in the Bloomberg’s Global League Table
Enhanced sustainable investment offerings
• Continued strengthening of offerings, translating into new sustainability-related customer mandates
• Awarded for “Best Sustainable Player” by the large Swedish Fund Selector “Söderberg & Partners”

Investor Presentation – First half 2022
23
On sustainable finance, Danske Bank aspires to Nordic leadership – our sustainable finance framework has been developed to drive and integrate that ambition
1) As defined by commitments to Net-Zero Banking Alliance, Net-Zero Asset Owner Alliance and Net-Zero Asset Managers Initiative
Group ambition for
Sustainable financeBe a leading bank in the Nordics on sustainable finance and the leading bank in Denmark
KPIs and targets Group KPIs
• Business and
commercial
KPIs
Sustainable financing:
• DKK 300bn in sustainable financing by 2023
• Paris-aligned corporate lending book; setting climate targets by 2023
• Net-Zero Bank by 2050 1)
Sustainable investing:
• Danica Pension: DKK 50bn invested in the green transition by 2023 and 100bn by 2030
• Asset mgmt.: DKK 150bn in art. 9 by 2030
• Net-Zero Asset Owner & Manager by 2050 1)
Guiding
principles
Align societal and business
goals
Engage and partner with
stakeholders
Measure and improve
impact
Enable our customers’
sustainability journey
Key execution
leversAdvice Products & solutions Risk Management
Critical enablers Governance Data & insightsIT enablement &
BWOW
Training &
competencies
Communication &
transparency
Regulatory
implementationCommercial integration Portfolio management and financial steering

24
Deep dive: Overview of ESG integration in Danske Bank’s lending operationsMultiple types of approaches are implemented to consider ESG factors both at company and portfolio levels
1. Position statements
Our position statements are a key tool for aligning
with societal goals and communicating our approach
to selected themes and sectors with elevated ESG
risks
2. Single-name ESG analysis
ESG analysis is conducted for all large corporate
clients using an internally prepared ESG risk tool
Tool is developed around the concept of financial
materiality i.e. how the financial performance of the
company might be affected by environmental and
social trends, legislation and factors
External sources for the tool include:
3. Portfolio-level ESG analysis
First decarbonisation targets covering high-emitting
sectors published – based on first carbon emission
analysis of the loan book
Carbon disclosures for key sectors published in
“Climate and TCFD progress update” report in June
2021
Financially material ESG
factors
ESG risk exposure and
management
ESG controversies
Climate-related financial
risks and opportunities
Climate
change
Human
rights
AgricultureArms &
defence
Fossil
fuels
ForestryMining &
metals
25
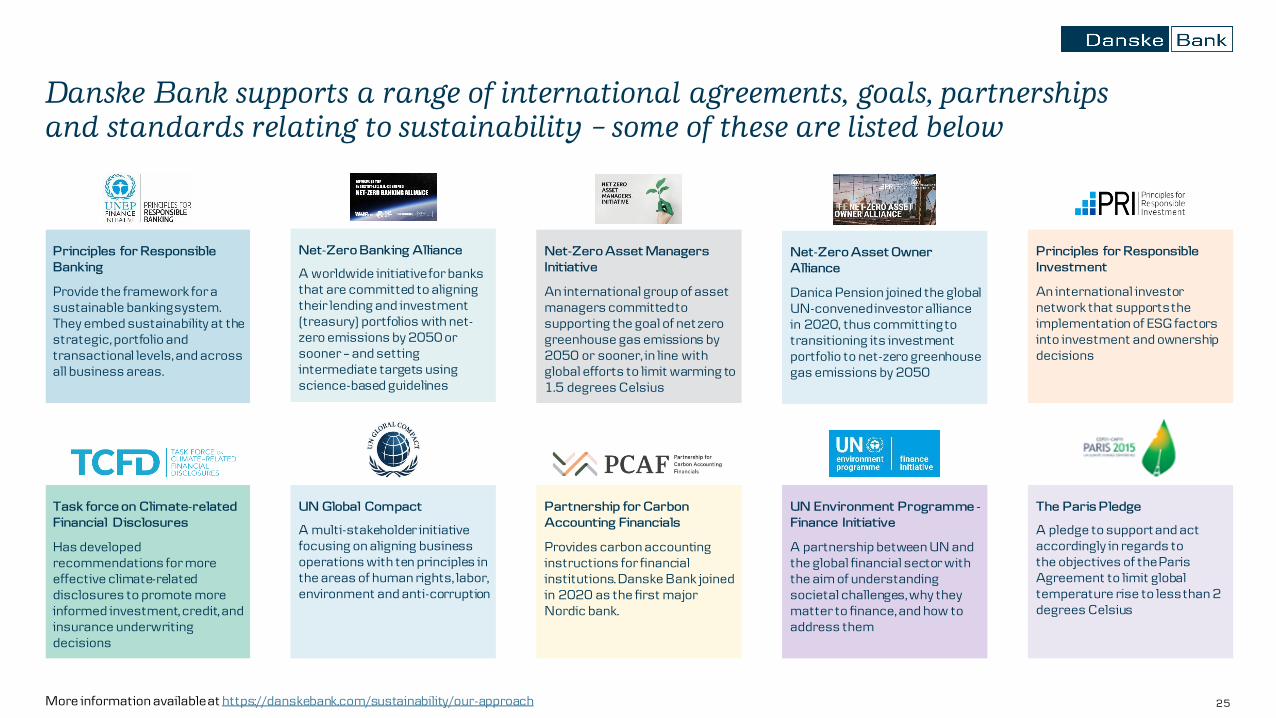
Danske Bank supports a range of international agreements, goals, partnerships and standards relating to sustainability – some of these are listed below
More information available at https://danskebank.com/sustainability/our-approach
Principles for Responsible
Investment
An international investor network that supports the implementation of ESG factors into investment and ownership decisions
UN Global Compact
A multi-stakeholder initiative focusing on aligning business operations with ten principles in the areas of human rights, labor, environment and anti-corruption
The Paris Pledge
A pledge to support and act accordingly in regards to the objectives of the Paris Agreement to limit global temperature rise to less than 2 degrees Celsius
Principles for Responsible
Banking
Provide the framework for a sustainable banking system. They embed sustainability at the strategic, portfolio and transactional levels, and across all business areas.
Task force on Climate-related
Financial Disclosures
Has developed recommendations for more effective climate-related disclosures to promote more informed investment, credit, and insurance underwriting decisions
Net-Zero Asset Owner
Alliance
Danica Pension joined the global UN-convened investor alliance in 2020, thus committing to transitioning its investment portfolio to net-zero greenhouse gas emissions by 2050
Partnership for Carbon
Accounting Financials
Provides carbon accounting instructions for financial institutions. Danske Bank joined in 2020 as the first major Nordic bank.
UN Environment Programme -
Finance Initiative
A partnership between UN and the global financial sector with the aim of understanding societal challenges, why they matter to finance, and how to address them
Net-Zero Asset Managers
Initiative
An international group of asset managers committed to supporting the goal of net zero greenhouse gas emissions by 2050 or sooner, in line with global efforts to limit warming to 1.5 degrees Celsius
Net-Zero Banking Alliance
A worldwide initiative for banks that are committed to aligning their lending and investment (treasury) portfolios with net-zero emissions by 2050 or sooner – and setting intermediate targets using science-based guidelines

Investor Presentation – First half 2022
26
Financial Crime prevention - increase in number of full-time employees
* The 3,600 employees is the total of full-time employees working with financial crime prevention across Danske Bank Group ** Includes all Group Compliance staff across Financial Crime, Regulatory Compliance etc., excluding Northern Bank
~3,600 Full-time employees dedicated to the
financial crime prevention agenda*
Gro
up
hea
dc
ou
nt
Sec
ond
Lin
eh
ead
cou
nt
127Employees working in Group Compliance**
202020192018201720162015 2021 2022
7 Employees working in Financial Crime Compliance
Revamped Code of Conduct
Culture council
Bonuses and
compensat ions
Enhanced
Whistleblowing
Programme
New training programs Tone from the top New performance metrics
Change in Culture

Investor Presentation – First half 2022
27
Committee governance for Compliance Risks
Conduct and Compliance Committee
• Board level committee that oversees the Bank’s management of conduct and reputational risk, compliance and financial crime as well as other matters delegated by the Board
• Responsible for reviewing all relevant Board owned policies concerning compliance, prior to Board approval
Compliance Risk Committee
• Second Line Committee responsible for providing oversight and challenge of the management of compliance and conduct risk on behalf of the ELT
• The committee reports to the Group All Risk Committee
• Chaired by the Chief Compliance Officer of Danske Bank
Financial Crime Remediation SteeringCommittee
• Provides governance structure and delivery oversight of the Group’s Financial Crime Plan
• Supported by a Group FC Project Management Office to track and challenge progress across Business Units
• Chaired by the Chief Compliance Officer of Danske Bank

Investor Presentation – First half 2022
28
Regulatory Engagements
• We engage in ongoing dialogue with our regulators through regular meetings with the Financial Supervisory Authority (FSA) and Supervisory College to ensure aligned expectations and transparency between our regulators and the Bank
• We provide regular updates and engage in frequent interactions with the Danish FSA on our financial crime transformational progress and remediation work and proactively share our remediation status with other Nordic regulators
• We track closely all regulatory inspections and continue to work through regulatory orders we receive in an open and transparent way with our regulators. Regulatory deliverables are formally documented and progress is frequently communicated to relevant regulators
• The Bank has completed and closed a number of orders received from inspections following the Estonia case and is progressing in addressing orders received in relation to subsequent AML inspections
• All remaining orders and recommendations from regulators are incorporated and prioritised in our Financial Crime Plan. We carry out targeted actions to rectify these issues and track them closely to completion. The Bank also addresses topics that are not highlighted in the inspection findings but noted by the Danish FSA
• The Danish FSA, as well as other relevant FSAs, carry out supervisory oversight of the Bank’s remediation work
• Our recalibrated Financial Crime Plan was submitted to the Danish FSA in November 2021 (its completion date of December 2023 remained unchanged) - the Danish FSA follows its implementation closely. Our other supervisors receive updates on an ad-hoc basis
• The Danish FSA carries out extensive supervisory oversight of the Bank’s financial crime transformation programme. Implementation of the Bank’s substantial remediation work is overseen by an Independent Expert assigned by the Danish FSA
Ongoing Dialogue
Supervisory Oversight
Regulatory Inspections

Credit quality & Impairments

3030
Investor Presentation – First half 2022
Impairments: Continually strong credit quality and prudent buffers in place; modest macro-charges albeit updated outlook
PMAs
• Credit quality remains strong with positive underlying trends
• Macro scenarios have been updated and additional PMAs put in place to reflect increasing downside risk from inflation and interest rates, resulting in modest charges due to the provisions already booked in Q4-21 and Q1-22
• PMAs now stand at DKK 6 bn with additional overlays related to exposures within construction and building materials. PMAs also include DKK 250m established in PC DK to account for potential lower recovery for debt collection legacy cases
Impairment charges by category* (DKK bn)
Allowance account by stages (DKK bn)
Highlights
1.7
0.2
0.5
0.5
0.7
0.1
1.4
-0.5
Q1 2021 Q3 2021
0.2
Q1 2020 Q2 2020 Q3 2020
0.2
Q2 2021
1.1
Q4 2020 Q4 2021 Q1 2022 Q2 2022
4.3
1.0
0.8
0.5 0.2
-0.2
-0.2
Credit quality deterioration: outside oil & gas
Credit quality deterioration: oil & gas
Macroeconomic adjustments
Post-model adjustments
15.2 15.914.2
12.9 13.4 13.3 13.3 12.4
9.9 9.9
7.57.5
7.2
7.4 6.9 7.0 6.76.8
6.7 6.8
2.22.3 2.2 2.2 2.3
2.7
3.1 3.1
23.6
Q1 2020
1.51.5 22.6
Q2 2020 Q1 2021Q3 2020 Q2 2021Q4 2020 Q3 2021 Q4 2021 Q1 2022 Q2 2022
24.124.9
22.5 22.5 22.2 21.9
19.8 19.8
Stage 2 ECLStage 1 ECL Stage 3 ECL
4.0
6.4
0.9 0.91.3
0.91.2
1.5
1.7
0.3
0.6
1.5
1.3
1.4
0.9
1.2
1.0
0.20.2
2019
0.4
2020 2021
0.1
0.0
Q1 22
0.2
0.0
0.0
Q2 22
6.3
5.4
6.0
Capital Goods
Agriculture
CRE
Oil & Gas
Construction & building materials
Model changes
Personal Customers
Others

3131
Investor Presentation – First half 2022
Overall strong credit quality in portfolios exposed to current macro developments
CRE: Generally low exposure to property development activities
Agriculture: Well-provisioned agriculture bookRetail customers: Strong household finances and
mortgage back-book mainly fixed rates for +5 years
DKK 301 bn in gross exposure and ECL ~1%DKK 66 bn in gross exposure of which 51% RD and average stage 3 coverage ratio of 81% in Nordics
60% 14%
1%
0%24%
DK SE NO FI LC&I / Other
48% of RD back-book are fixed-rate mortgages, and of the variable rates ~70% are fixed for 5 years
48% 37%
0% 50% 100%
Fixed F5s Other
46%
54%
LTV Home equity
• Historical lending growth modest (-3% 3Y-CAGR in non-resi. since Q1-19, +3% in resi.) given caps and concentration limits within sub-segments and markets, as well as for single-names, limiting downside risks
• Due to our conservative approach, our SE exposure has remained stable, despite market growth, and book is well-diversified with lower concentration risk over the past years
• The group’s credit underwriting standards maintain strong focus on cash flows, interest rate sensitivity, LTV and the ability to withstand significant stress.
• PMAs of DKK 1.4 bn made to cover uncertainties regarding the affect of rapid interest rate increases and macroeconomic situation
• The credit quality of the portfolio has improved over the past few years, recovering from legacy exposures from the financial crisis
• The current credit risk appetite takes into account the volatility of the sector and remains in place. Furthermore, the group maintains strong underwriting standards on LTV, interest-only loans and interest rate sensitivity
• Post-model adjustments of DKK 1 bn have been made for potential future portfolio detoriation due to uncertainties such as African Swine Fewer (ASF), Chinese imports and the RU/UA war
• Average LTVs have been decreasing over the past year supported by increasing house prices
• Affordability measures in general look strong, and both affordability and debt-to-income (DTI) levels remain stable overall
• Portfolio uncertainty risks are being mitigated by continuous monitoring and review of underwriting standards covering interest rate-related stress of affordability and other measures
• Low near-term refinancing risk on RD flex loans.• Post-model adjustments related to personal
customers total DKK 1.5 bn
34% 18% 15% 34%
Crops Dairy Pig breeding Mixed operations
47% 27% 13% 7% 6%
DK SE NO FI LC&I / Other
55% 41% 4%
Non-residential Residential Property dev.
Segment gross exposure
Country gross exposure
Segment gross exposure
Country gross exposure
RD back-book Avg. LTV RD-retail

3232
Investor Presentation – First half 2022
Lending by segment1
Q2 22 (%) Credit exposure by industry Q2 22 (%)
1. Total lending before loan impairment charges.
Strong footprint within retail lending
Total lending
of DKK 1,819 bn
26%
19%32%
15%
2%
3%
3%
0%
Personal Customers DK
Personal Customer Nordic
Business Customers
Asset Finance
LC&I General Banking
LC&I Other
Northern Ireland
Group Functions
37.111.4
10.17.6
5.13.43.3
2.72.52.42.11.71.71.51.41.11.11.00.90.60.60.5
Capital goods
Personal customers
Public institutions Commercial property
Co-ops & Non-profitFinancials
Consumer goods Utilities and infrastructure
Agriculture Services Construction and buildingPulp, paper and chemicals Pharma and medical devicesShipping, oil and gas
Social services
Retailing Automotive
Telecom and media Other commercials Transportation Hotels and leisure Metals and mining Total credit exposure
of DKK 2,600 bn

3333
Investor Presentation – First half 2022
Allowance
account
Gross credit
exposure
Allowance as % of gross
exposure Source: credit file -> IR data
Personal customers 1.5 971 0.15%
Agriculture 1.0 66 1.46%
Commercial property 1.5 301 0.49% Stage 1
Shipping, oil and gas 0.2 41 0.37% Stage 2
Services 0.2 64 0.26% Stage 3
Other 2.5 1,177 0.21%
Total 6.8 2,620 0.26%
Allowance account by business unit (DKK bn)
Credit quality: Low level of actual credit deterioration
35.9 33.941.0 39.3
33.625.9 25.0
12.9 13.4
13.3 13.312.4
9.9 9.9
Q1 2021Q4 2020 Q4 2021Q2 2021 Q3 2021
34.9
Q1 2022 Q222
48.854.3
47.452.6
46.0
35.8
Net exposureIndividual allowance account
5.1 5.9 5.7 5.6 5.7 5.5 5.8
10.0 10.1 10.3 10.4 10.2 9.8 9.8
5.8 5.5 5.5 5.4 5.23.6 3.4
Q3 2021 Q12022Q1 2021
20.6
Q4 2020 Q2 2021 Q4 2021 Q22022
22.8 23.3 23.3 23.0 22.719.8
PC BC LC&I Other (Non-core)N.I.
Stage 2 and 3 as % of net exposure
Breakdown of stage 2 allowance account and exposure (DKK bn)
Allowance account by business unit (DKK bn)
Gross stage 3 loans (DKK bn)
8.7
5.5
1.4
1.0
0
1
2
3
4
0
1
2
3
4
5
6
7
8
9
10
11
Q3 2020 Q2 2021Q1 2020 Q1 2021 Q2 2022Q2 2020 Q4 2020 Q3 2021 Q4 2021 Q1 2022
Stage 2 net exposure (% of Total, lhs)
Stage 3 net exposure (% of Total, rhs)

3434
Investor Presentation – First half 2022
Fossil fuels (coal and oil) exposure
• This page shows the current exposure to fossil fuels and includes customers involved in production, refining, and distribution (including shipping) of oil as well as utilities producing heat or power with coal.
• The exposure to oil majors will decrease by 50% by 2030 against 2020 levels. Our customers in the distribution and refining segments are generally progressing well on the transition, for instance by refineries switching to biofuels in refining or by gas stations investing in infrastructure for charging of electric vehicles. Within oil-related exposures, the main risk lies with exposures other than oil majors. Since the end of 2019, these net exposures have been actively brought down 55% and are down by 11% from Q2 last year.
• Power & heating utilities should reduce emissions per unit of electricity or heating by 30% by 2030 against 2020 levels. This entails an accelerated phase-out of coal.
• The exposure shown on this page is to utility customers with any coal-based production (DKK 34.3 bn.) and hereof more than 5% of revenues from coal fired power production (1.5 bn.). For most customers, the use of coal is limited to a few remaining production facilities which are expected to phase-out in the coming years. Exposures have increased somewhat from the beginning of the year due to short-term financing needs driven by volatile energy markets.
33%
28%
Fossil Fuels Exposure (Coal and Oil)
Key points, Q2 22
Segment Net exposure
(DKK m)
Crude and Product Tankers 3,046
Distribution and refining 8,411
Oil-related exposure 10,530
Oil majors 3,748
Offshore and services 6,782
Power and heating utilities
with any coal-based production
34,280
Hereof customers with more
than 5% revenue from coal
1,453
Total fossil fuel exposure 56,267
Group gross credit exposure
(DKK 2,623 bn)
Oil-related net credit exposure, DKK bn: Development (excl. majors)
-55%
4.6
15.1
7.6 7.5 6.9 6.8
6.8
Q4 2019 Q2 21 Q3 21 Q4 21 Q1 22 Q2 22
Of which covered by collateral
2.1%
Fossil fuels exposure Other
-11%
-0.5%

3535
Investor Presentation – First half 2022
• Total oil-related exposure* increased by DKK 0.1bn from the preceding. Danske Bank has actively reduced its net oil-related exposure (excluding oil majors) by 55% since Q4-19.
• Accumulated impairments at LC&I remains in par compared to the preceding quarter.
• Most of the oil-related exposure is managed by specialist teams for customer relationship and credit management at LC&I.
• African Swine Fewer (ASF), which spread to Germany in Q3 2020, Covid-19, Chinese imports, and the RU/UA war is causing uncertainty for the industry. Therefore, post-model adjustments of DKK 1bn are reserved to cover uncertainties.
• Agriculture is generally affected by increased production costs as well as increased prices on crops as a result of the war in Ukraine. The pork price rise from a low to a more average level, but the elevated cost of especially feed keeps most pig farmers below the breakeven point. The milk price keeps rising and is expected to stay high for the rest of 2022, resulting in high earnings for the dairy segment despite increased input costs.
• Total accumulated impairments amounted to DKK 2.2bn by the end of Q2-22, against DKK 2,7bn in Q1-22, the decrease observed is mainly related to redistribution of post-model adjustments.
Credit exposure: Limited and well-impaired exposure to agriculture and oil
* The credit exposure is reported as part of the shipping, oil and gas industry in our financial statements.
Agriculture exposure
Agriculture by segment, Q2 22 (DKK m)
Oil-related exposure
Oil-related exposure, Q2 22 (DKK m)
Share of Group net exposure
2022Q2
Share of Group net Stage 3
exposure 2022Q2Expected credit loss 2022Q1
0% 9% 776
Gross credit
exposure
Portion
from RD
Expected credit
loss
Net credit
exposure
Stage 3
coverage ratio
Personal Customers 2 911 1 377 23 2 888 14%
Growing of crops, cereals, etc. 1 163 875 9 1 154 12%
Dairy 85 9 2 83 100%
Pig breeding 401 372 0 401 100%
Mixed operations etc. 1 262 121 12 1 250 100%
Business Customers 50 360 31 137 2 036 48 324 86%
Growing of crops, cereals, etc. 20 839 15 860 529 20 310 86%
Dairy 8 646 5 623 684 7 962 85%
Pig breeding 9 416 7 064 463 8 952 79%
Mixed operations etc. 11 460 2 590 360 11 101 99%
LC&I 8 498 1 473 79 8 419 98%
Northern Ireland 4 381 - 71 4 310 100%
Others 222 - 0 222 -
Total 66 372 33 988 2 209 64 163 85%
Share of Group net
exposure 2022Q2
Share of Group net Stage 3
exposure 2022Q2Expected credit loss 2022Q1
2% 11% 2 661
Gross credit exposure Expected credit loss Net credit exposure
LC&I 11 162 779 10 383
Oil majors 3 742 1 3 741
Oil service 3 283 140 3 143
Offshore 4 137 638 3 499
Personal Customers 1 0 1
Oil majors 0 0 0
Oil service 1 0 1
Offshore - - -
Business Customers 153 8 145
Oil majors 6 0 6
Oil service 146 8 138
Offshore 1 0 1
Others 1 0 1
Total 11 318 788 10 530

3636
Investor Presentation – First half 2022
• Total gross exposure increased slightly, and was up by DKK 0.1bn from the preceding quarter.
• Accumulated impairments increased by DKK 0.4bn in Q2-22 compared to previous quarter mainly due to PMAs being allocated to the industry to cover the uncertainties caused by rising commodity and energy prices.
Credit exposure: Limited exposure to transportation and higher focus on construction and building materials sector
• Total gross exposure* slightly decreased by DKK 0.1bn from the previous quarter.
• Accumulated impairments amounted to DKK 0.4bn in Q2-22, which is a slight increase compared to previous quarter.
• Our exposure to passenger air transport remains limited at DKK 0.2bn.
* The numbers do not include exposure to businesses that are hit by a second wave impact, e.g. airports and service companies.
Transportat ion exposure
Transportat ion by segment, Q2 22 (DKK m)
Construct ion and Building materials
Construct ion and Building materials by segment, Q2 22 (DKK m)
Gross credit exposure Expected credit loss Net credit exposure
Freight transport8 442 150 8 292
Passenger transport 7 428 232 7 196
- of which air transport 173 29 283
Postal services 973 4 968
Total 16 842 386 16 456
Gross credit exposure Expected credit loss Net credit exposure
Construction - Contractors15 130 599 14 531
Construction - Craftsmen 9 165 351 8 814
Building products 16 027 111 15 916
Building materials 5 487 18 5 468
Building materials distributors 8 827 153 8 673
Total 54 635 1 232 53 402
Share of Group net exposure 2022Q2
Share of Group net
Stage 3 exposure
2022Q2
Expected credit loss
2022Q1
2% 3% 799
Share of Group net exposure 2022Q2
Share of Group net
Stage 3 exposure
2022Q2
Expected credit loss
2022Q1
1% 2% 260
3737
Investor Presentation – First half 2022
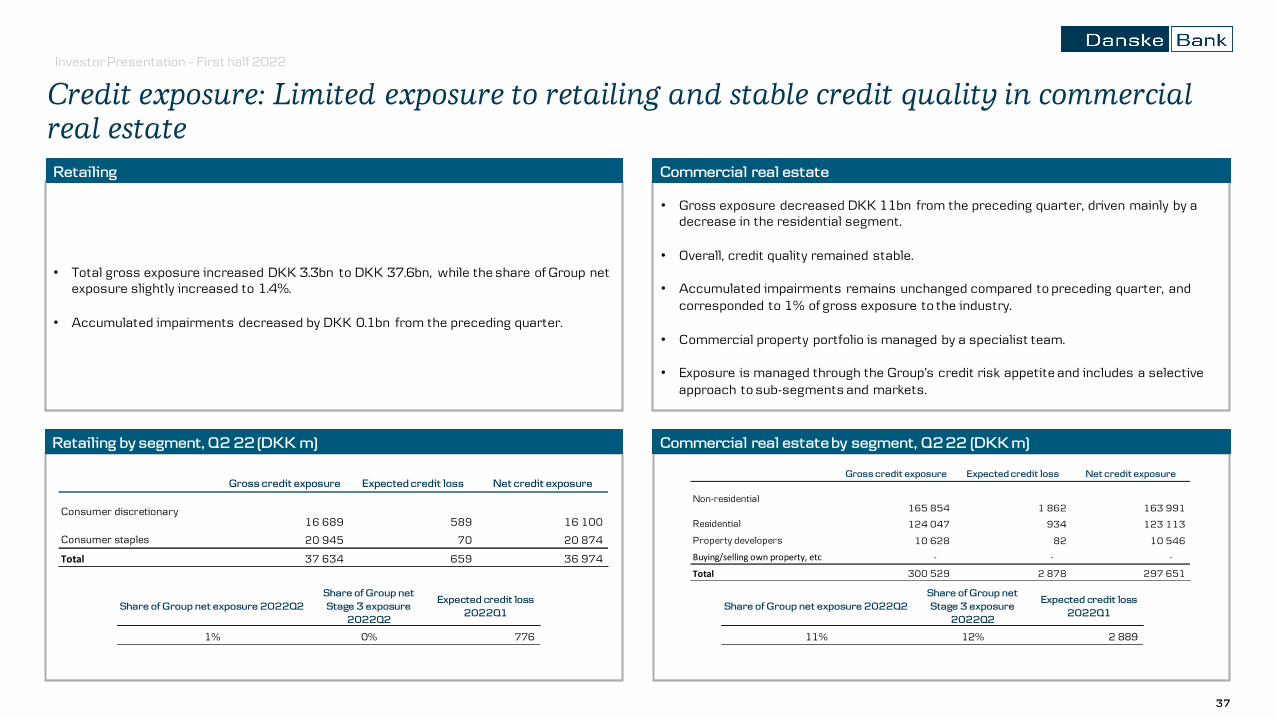
• Gross exposure decreased DKK 11bn from the preceding quarter, driven mainly by a decrease in the residential segment.
• Overall, credit quality remained stable.
• Accumulated impairments remains unchanged compared to preceding quarter, and corresponded to 1% of gross exposure to the industry.
• Commercial property portfolio is managed by a specialist team.
• Exposure is managed through the Group’s credit risk appetite and includes a selective approach to sub-segments and markets.
Credit exposure: Limited exposure to retailing and stable credit quality in commercial real estate
• Total gross exposure increased DKK 3.3bn to DKK 37.6bn, while the share of Group net exposure slightly increased to 1.4%.
• Accumulated impairments decreased by DKK 0.1bn from the preceding quarter.
Retailing
Retailing by segment, Q2 22 (DKK m)
Commercial real estate
Commercial real estate by segment, Q2 22 (DKK m)
Gross credit exposure Expected credit loss Net credit exposure
Consumer discretionary16 689 589 16 100
Consumer staples 20 945 70 20 874
Total 37 634 659 36 974
Share of Group net exposure 2022Q2
Share of Group net
Stage 3 exposure
2022Q2
Expected credit loss
2022Q1
11% 12% 2 889
Share of Group net exposure 2022Q2
Share of Group net
Stage 3 exposure
2022Q2
Expected credit loss
2022Q1
1% 0% 776
Gross credit exposure Expected credit loss Net credit exposure
Non-residential165 854 1 862 163 991
Residential 124 047 934 123 113
Property developers 10 628 82 10 546
Buying/selling own property, etc - - -
Total 300 529 2 878 297 651

Capital

3939
Investor Presentation – First half 2022
Capital rat ios, under Basel III/CRR (%)
Capital: Strong capital base; CET1 capital ratio of 17.1% (buffer of 4.5%)
Current capital buf fer structure (%)
18.3 17.7 17.1 16.9
12.0
2.2 2.3 1.8 1.8
2.4 2.42.4 2.4
2.0
Q2 2022 reported
21.3
2020 reported
23.0
2021 reported
Q2 2022 fully loaded*
1.5
Fully phased-in regulatory
requirement**
22.421.1
18.9
4.5
3.0
2.5
Q2 2022
2.4
0.212.6
At the end of June 2022, the trigger point for MDA restrictions was 12.6%
2.6
1.9
14.4
* Based on fully phased-in rules including fully phased-in impact of IFRS 9. ** Pro forma fully phased-in min. CET1 req. in June 2023 of 4.5%, capital conservation buffer of 2.5%, SIFI buffer requirement of 3%, countercyclical buffer of 2.0% and CET1 component of Pillar II requirement.
Countercyclical capital buffer
CET1 min req.
Capital conservation buffer
SIFI buffer
CET1 Pillar II req.
CET1 target (above 16%)
CET1 Q2 2022 (17.1%)
Tier 2 CET1Hybrid T1/AT1 Pillar II component (total 3.4%)
CET1 (%) Total REA (DKK bn)
0.2
0.2
0.1
Net profit after dividend
REA effect adjusted for FX
Q1 2022 Q1 2022
0.1
Danica deduction FX & Other
17.6
17.13
7
Q1 2022 Q2 2022
857
Credit risk
1
Counterparty risk Market risk
862

4040
Investor Presentation – First half 2022
REA, CET1, prof it and distribut ion (DKK bn; %)
Common Equit y Tier 1, 2008 – 2022 H1 (DKK bn)
1. The decline in CET1 capital in 2018 is due mainly to Danica Pension’s acquisition of SEB Pension Danmark which led to a higher deduction in Group regulatory capital. 2. Before goodwill impairment charges 3. Based on year-end communicated distributions. 2017 is adjusted for cancelled buy-back. 2019 is adjusted for cancelled dividend. *Subject to company announcemen t 02 2022
Strong CET1 capital build-up since 2008; Available Distributable Items (ADI) well in excess of DKK 100 bn
2008 2009 2010 2011 2012 2013 2014 2015 2016 2017 2018 2019 2020 2021 2022 H1
REA 960 834 844 906 819 852 865 834 815 753 748 767 784 860 862
CET1 ratio 8.1% 9.5% 10.1% 11.8% 14.5% 14.7% 15.1% 16.1% 16.3% 17.6% 17.0% 17.3% 18.3% 17.7% 17.1%
Net profit 1.0 1.7 3.7 1.7 4.7 7.1 13.02 17.72 19.9 20.9 15.0 15.1 4.6 12.9 4.6
Distribution to shareholders3 0 0 0 0 0 2.0 10.5 17.1 18.9 16.3 7.6 0 1.7 6.5* 0
Total assets 3,544 3,098 3,214 3,424 3,485 3,227 3,453 3,293 3,484 3,540 3,578 3,761 4,109 3,936 4,074
77 79 85107
119 126 130 134 133 133 127 133144 152 147
2010 20172008 20142009 20132011 2012 2015 2016 20181 2019 2020 2021 2022 H1
+DKK 70 bn

4141
Investor Presentation – First half 2022
• The Group has to meet a MREL requirement and a subordination requirement, both adjusted for Realkredit Danmark (RD)
• The subordination requirement is the higher of 2x(P1 + P2) + CBR or 8% TLOF
• The Group’s MREL requirement (total resolution requirement) is DKK 305bn incl. RD’s capital and debt buffer requirement (DKK 39bn) and the combined buffer requirement (DKK 43bn). Excess MREL funds are DKK 21bn
• The Group’s subordination requirement is DKK 248bn incl. RD’s capital requirement (DKK 24bn). Excess subordinated MREL funds are DKK 33bn
• This figure shows the Group’s MREL and subordination requirement pr. 1 January 2022, which constitutes the fully-phased in requirements, i.e. no interim target.
• Requirements will, however, be impacted by any changes to the CCyB.
MREL and subordinat ion requirement* and eligible funds; Q2 2022;
DKK bn (% of Group REA)Comments
Fully compliant with MREL and subordination requirement; expect to cover MREL need with both preferred and non-preferred senior
*Including Realkredit Danmark’s (RD) capital and debt buffer requirements
97(11.3%)
MREL
requirement
incl. CBR
248(28.8%)
45(5.2%)
184(21.3%)
97(11.3%)
MREL funds
184(21.3%)
Subordination
requirement
Subordinated
MREL funds
305(35.4%)
326(37.8%)
281(32.6%)
+21(+2.4%)
+33(+3.8%)
PS > 1y NPS > 1y CET1, AT1, T2

Funding & Liquidity

4343
Investor Presentation – First half 2022
Loan port folio and long-term funding, Q2 22 (DKK bn) Funding sources* (%)
Funding structure and sources: Danish mortgage system is fully pass-through
743 743
397234
6791,156
167
2,300
Loans
Bank loans
1,819
Deposits
Funding
Senior & NPS bonds
Bank mortgagesCovered bonds
RD mortgages Issued RD bonds
13%
1% 0%
58%
9% 8%
2%
10%
13%
0%
-2%
59%
10%8%
2%
10%
Senior & NPS
Deposits credit inst.
CD & CP Repos, net
Deposits EquityCovered bonds
Subord. debt
Q1-22
Q2-22
Short-term funding Long-term funding
* Figures are rounded

4444
Investor Presentation – First half 2022
Senior debt1
by currency, end-Q2 2022
Covered bonds by currency, end-Q2 2022 Largest funding programmes, end-Q2 2022
1. Including senior preferred and non-preferred debt
Funding programmes and currencies
43%
66%
0%
56%
3%
3%
0%
26%
51%
23%EUR
SEK
NOK
Total DKK 143 bn
46%
38%
7% 4%
4%
2%
USD
NOK
EUR
SEK
GBP
Other
Total DKK 179 bn
Utilisation
EMTN Programme
Limit – EUR 35bn
Global Covered Bond
Limit – EUR 30bn
US Commercial Paper
Limit – USD 6bn
US MTN (144A)
Limit – USD 20 bn
NEU Commercial Paper
Limit – EUR 10bn
UK Certificate of Deposit
Limit – USD 15bn
ECP Programme
Limit – EUR 13bn

4545
Investor Presentation – First half 2022
Funding and liquidity: LCR compliant at 155%
* Spread over 3M EURIBOR.
156 160154 151 155
161 164 159155
Q4 2021Q4 2020 Q2 2021Q2 2020 Q1 2021Q3 2020 Q1 2021 Q3 2021 Q2 2021
100
3224 2628
10 11
2432
7
69bp56bp
2023: DKK 84 bn
13bp
2024: DKK 66 bn
39bp
2025: DKK 44 bn
10bp
173bp
13bp
99bp109bp
Cov. bonds Senior Non-Preferred Senior
69
100
79 75
32
70-90
2018 2019 20212020 2022E
Funding plan Completed
37
2211
167
3021
30bp
45bp
40bp
Redemptions 2022: DKK 83 bn
20**
156bp
Redeemed 2022: DKK 50 bn
New 2022:DKK 32 bn
1
26bp
30bp
189bp
13bp
114bp
Cov. bonds Non-Preferred SeniorSenior
Changes in funding,* 2022 (DKK bn and bp)
Maturing funding,* 2023–2025 (DKK bn and bp)
Long-term funding excl. RD (DKK bn)***
Liquidit y coverage rat io (%)
*** Includes covered bonds, senior, non-preferred senior and capital instruments, excl. RD .
4646
Investor Presentation – First half 2022
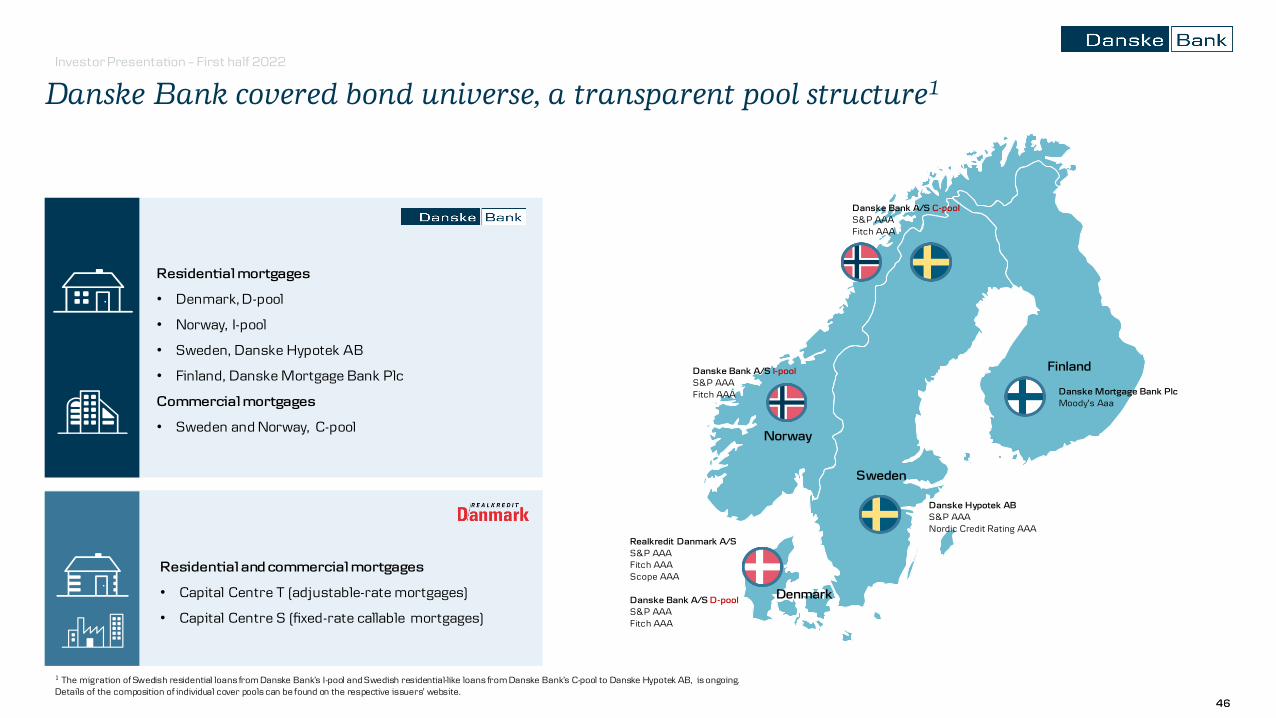
Danske Bank covered bond universe, a transparent pool structure1
Residential and commercial mortgages
• Capital Centre T (adjustable-rate mortgages)
• Capital Centre S (fixed-rate callable mortgages)
Residential mortgages
• Denmark, D-pool
• Norway, I-pool
• Sweden, Danske Hypotek AB
• Finland, Danske Mortgage Bank Plc
Commercial mortgages
• Sweden and Norway, C-pool
Finland
Sweden
Norway
Denmark
Danske Bank A/S I-pool S&P AAAFitch AAA
Realkredit Danmark A/SS&P AAAFitch AAAScope AAA
Danske Bank A/S D-pool S&P AAAFitch AAA
Danske Mortgage Bank Plc Moody’s Aaa
Danske Hypotek ABS&P AAANordic Credit Rating AAA
Danske Bank A/S C-pool S&P AAAFitch AAA
1 The migration of Swedish residential loans from Danske Bank’s I-pool and Swedish residential-like loans from Danske Bank’s C-pool to Danske Hypotek AB, is ongoing. Details of the composition of individual cover pools can be found on the respective issuers’ website.

Credit & ESG Ratings

4848
Investor Presentation – First half 2022
Danske Bank’s credit ratings
Fitch Moody’s Scope S&P
AAA Aaa AAA AAA
AA+ Aa1 AA+ AA+
AA Aa2 AA AA
AA- Aa3 AA- AA-
A+ A1 A+ A+
A A2 A A
A- A3 A- A-
BBB+ Baa1 BBB+ BBB+
BBB Baa2 BBB BBB
BBB- Baa3 BBB- BBB-
BB+ Ba1 BB+ BB+
Inv
es
tm
en
t g
ra
de
Sp
ec
ula
tiv
e g
ra
de
Senior unsecured debt
Tier 2 subordinated debtAdditional Tier 1 capital instruments
Fitch rated covered bonds – RD, Danske BankMoody’s rated covered bonds – Danske Mortgage BankScope rated covered bonds – RD
Non-preferred senior debt
Counterparty ratingS&P rated covered bonds – RD, Danske Bank, Danske Hypotek
Long-term instrument rat ings Credit rat ings remain unchanged in Q2 2022
Credit ratings remain unchanged in Q2 2022, and include the first round of fallout from the Russia/Ukraine war.
S&P’s Negative outlook on Danske Bank reflects S&P’s concern about the fallout from the Estonia case.
Fitch and Moody’s have Stable outlooks on Danske Bank, which incorporate the economic uncertainty relating to the fallout from the corona crisis and the financial uncertainty relating to the Estonia case.

4949
Investor Presentation – First half 2022
Danske Bank’s ESG ratings
1 CDP: Carbon Disclosure Project – primary focus is on climate change / management, also linked to TCF
Q2 2022 Q1 2022 End 2021 End 2020 End 2019 Range
B 200 companies, out of the 13,126 analysed, made the climate change A List in 2021
B B B C A to F (A highest rating)
C+ Prime Decile rank: 1 (300 banks rated)C+ is the highest rating assigned
C Prime C Prime C+ Prime C Prime A+ to D- (A+ highest rating)Decile rank of 1 indicates a higher ESG performance, while decile rank of 10 indicates a lower ESG performance
BBB MSCI rates 189 banks:AAA 4%AA 32%A 26%BBB 21%BB 12%B 5%CCC 0%
BBB BBB BB B AAA to CCC (AAA highest rating)
Medium Risk Rank in Diversified Banks 122/416Rank in Banks 341/1003
Medium Risk Medium Risk High Risk Medium Risk Negligible to Severe risk(1 = lowest risk)
61 Rank in Sector 10/31Rank n Region 155/1613Rank in Universe 175/4889
61 61 64 59 100 to 0 (100 highest rating)
We have chosen to focus on five providers based on their importance to our investors
Q2 2022: ISS ESG upgrades Danske Bank
On the 16 June 2022, ISS ESG raised its rating to C+ Prime from C Prime after reassessing its Staff and Suppliers, Environmental Management, Products and Services and Eco-efficiency rating factors; increasing the rating in each category by one notch. Consequently, the ISS ESG Performance Score increased to 58.18 from 56.19 resulting in the C+ Prime rating.

5050
Investor Presentation – First half 2022
AnchorSACP1 31 2 4
Extraordinary external support
Potential CRA
adjustment2
Issuer rating+ = + =+ + +
bbb+ -1+1 +1 0 00A+
(Negative)
SACP1
a-
=
1=Business Position, 2=Capital & Earnings, 3=Risk Position, 4=Funding & Liquidity
ALAC
+2
+
Macro profile
31 2 4Quali-tative
factors
Gov. support
Issuerrating
+ =
Strong
Plusba2a3 a1 baa3 -1 +1
+
1=Asset Risk, 2=Capital, 3=Profitability, 4=Funding Structure, 5=Liquid resources
BCA3
baa2
5
baa2A3
(Stable)
+LGF4
+1
+ + + + =Affiliate support
0
+ +
Operating environment
21 3 5Support
Rating FloorIssuer rating5=
aa- aa+ a+ a- No Floor
+
1=Company Profile, 2=Management/Strategy, 3=Risk Appetite, 4=Asset Quality, 5=Profitability, 6=Capitalisation, 7=Funding/Liquidity
6
a
4
aA
(Stable)
Viability Rating
a
+ + + + + 7
a+
+ =
Three distinct methods for rating banks
1 Stand-Alone Credit Profile. 2 Comparable ratings analysis. 3 Baseline Credit Assessment. 4 Loss Given Failure. 5 Issuer rating is the higher of the Viability Rating and Support Rating Floor.
Danske Bank’s ratingRating methodology

Tax & Material one-offs

5252
Investor Presentation – First half 2022
Tax
• The actual tax rate of 26.1% (excluding prior-year's adjustments) is higher than the Danish rate of 22% -due primarily to the tax effect from tax exempt income/expenses
• Adjusted tax rate of 22% corresponds to the Danish rate of 22% due to the differences in statuary tax rates in the various countries offsets each other
• The permanent non-taxable difference derives from tax-exempt income/expenses, such as value adjustments on shares
Actual and adjusted tax rates (DKK m) Tax drivers, Q2 2022
Q222 Q122 Q421 Q321 Q221
Profit before tax 2,164 3,707 4,500 4,270 3,747
Permanent non-taxable difference 408 435 994 22 108
Adjusted pre-tax profit, Group 2,572 4,142 5,494 4,293 3,855
Tax according to P&L 458 862 846 936 955
Taxes from previous years 106 57 367 10 120
Adjusted tax 565 919 1,213 924 729
Adjusted tax rate 22.0% 22.2% 22.1% 21.5% 22.2%
Actual-/Effective tax rate 21.2% 23.2% 18.8% 21.9% 25.5%
Actual/-Effective tax rate exclusive one- offs & prior year reg.
26.1% 24.8% 27.0% 21.6% 22.9%

5353
Investor Presentation – First half 2022
Material extraordinary items in 2022
One-off itemsEffect
(DKK m)
P&L line affected
Gain from sale of international private banking activities in Luxembourg 421 Other income (pre-tax)
Gain from sale of Danica Norway 415 Net income from insurance (tax exempt)
PMA for potential lower recovery rate from debt collection -250 Impairments
Q1
Q2

5454
Investor Presentation – First half 2022
Claus Ingar Jensen
Head of IR Mobile +45 25 42 43 70 [email protected]
Patrick Laii Skydsgaard
Chief IR OfficerMobile +45 24 20 89 [email protected]
Contacts
Nicolai Brun Tvernø
Chief IR OfficerMobile +45 31 33 35 47 [email protected]
Olav Jørgensen
Chief IR OfficerMobile +45 52 15 02 94 [email protected]
Rasmus Sejer Broch
Chief Funding Manager,Group Treasury
Direct +45 45 12 81 05Mobile +45 40 28 09 [email protected]
Thomas Halkjær Jørgensen
Chief Funding Manager,Group Treasury
Direct +45 12 83 94Mobile +45 25 42 53 [email protected]
Kimberly Bauner
Head of Group TreasuryMobile +46 73 700 19 [email protected]
Bent Callisen
Head of Group Funding, Group Treasury
Direct +45 45 12 84 08Mobile: +45 30 10 23 [email protected]
Investor Relations Group Treasury and Funding

5555
Investor Presentation – First half 2022
Important Not ice
This presentation does not constitute or form part of and should not be construed as, an offer to sell or issue or the solici tation of an offer to buy or acquire securities of Danske Bank A/S in any jurisdiction, including the United States, or an inducement to enter into investment activity. No part of this presentation, nor the fact of its distribution, should form the basis of, or be relied on in connection with, any contract or commitment or investment decision whatsoever. The securities referred to herein have not been, and will not be, registered under the Securities Act of 1933, as amended (“Securities Act”), and may no t be offered or sold in the United States absent registration or an applicable exemption from the registration requirements of the Securities Act.
This presentation contains forward-looking statements that reflect management’s current views with respect to certain future events and potential financial performance. Although Danske Bank believes that the expectations reflected in such forward-looking statements are reasonable, no assurance can be given that such expectations will prove to have been correct. Accordingly, results could differ materially from those set out in the forward-looking statements as a result of various factors many of which are beyond Danske Bank’s control.
This presentation does not imply that Danske Bank has undertaken to revise these forward-looking statements, beyond what is required by applicable law or applicable stock exchange regulations if and when circumstances arise that will lead to changes compared to the date when these statements were provided.
Disclaimer