investment02172020.pdf - cal poly pomona foundation
TRANSCRIPT
The open proceedings of this meeting are being recorded
CAL POLY POMONA FOUNDATION, INC.
CALIFORNIA STATE POLYTECHNIC UNIVERSITY, POMONA
INVESTMENT COMMITTEE MEETING
Monday, February 17, 2020 2:00 pm – 3:00 pm
Building #55 – Executive Conference Room
AGENDA
I. ACKNOWLEDGEMENT OF MEMBERS OF THE PUBLIC who may or may not be commenting on a specific item or making a general comment.
II. CONSENSUS ACTION ITEMS PAGE Consensus Action Items: Items in this section are considered to be routine and acted on by the committee in one motion. Each item of the Consent agenda approved by the committee shall be deemed to have been considered in full and adopted as recommended. Any committee member may request that a consent item be removed from the consent agenda to be considered as a separate action item. If no additional information is requested, the approval vote will be taken without discussion
1. Minutes of November 19, 2019 Meeting Daniel Montplaisir 2 - 3 ACTION: Approval
III. ACTION ITEMS
2. Investment Report – 2nd Quarter 2019-2020 David Prenovost 4 - 48 ACTION: Approval Andrew Price
IV. INFORMATION ITEMS The following items provide information and reports by management staff to the committee. Staff and committee may engage in discussion on any item if requested by committee member or staff member. 3. Stochastic Study VEBA Trust David Prenovost 49-57 4. CalPERS Public Agency Valuation Reports David Prenovost 58-68 5. Investment Advisor Request for Proposal Update David Prenovost 69
V. OPEN FORUM
1

2

3
Memorandum
Date: February 6, 2020
To: Investment Committee
Cal Poly Pomona Foundation, Inc.
From: David F. Prenovost Senior Managing Director/CFO
Subject: INVESTMENT HIGHLIGHTS – Second Quarter 2019-20
The Foundation’s General Investment Policy 131 requires a comprehensive quarterly report of the investment portfolio’s performance be provided to the members of the Investment Committee and Board of Directors at each regularly scheduled meeting. GENERAL INVESTMENT PORTFOLIO The General Investment Portfolio (Portfolio) has a current market value of $28.6 million at December 31, 2019 and is over weighted by 4% in Equities, 1% in Alternatives and underweighted by 5% in Fixed Income. The portion managed by Graystone Consulting has a current market value of $27.6 million, earned 3.98% versus 3.76% for the fiscal year to date, please see Graystone’s and the Common Fund’s reports for further information.
Per the Foundation’s Policy # 133, only the quarterly yield is distributed; for the 1st quarter the yield was 1.0% or 100 basis points and the Foundation programs received $138,980; for the 2nd quarter the yield was 1.08% or 108 basis points and the Foundation programs received $117,955; (net of Foundation quarterly fee of 0.125% or twelve and a half basis points). The Foundation programs are categorized by the duration of the programs: short term (1 - 3 years), mid-term (4 - 7 years), or long term (7+ years). The cash balances in these programs as of December 31, 2019 are as follows:
Short term - $3,973,044 Mid-term - $2,028,058 Long term - $3,945,872
The Foundation received capital call notices and has contributed $232,500 against its commitment of $250,000 to Capital Partners IV and $689,625 against its commitment of $750,000 to Capital Private Equity Partners VII. The value of the Non-Marketable Investments are $497,160, please see Common Fund Summary Investment and Performance Reports for further details.
4

The total Alternative Investment in Innovation Way infrastructure is $489,088. Per the terms of the investment agreement, the Foundation charged $8,909 year-to-date for fiscal year 2019-20. This investment repaid $300,000 in the first quarter of fiscal year 2019-20. Recommended Action: The members of the Investment Committee have reviewed the comprehensive quarterly investment report and believe the report is in compliance with the investment policy and recommends the quarterly investment report be presented to the Board of Directors at their next regularly scheduled meeting. PASSED AND ADOPTED THIS 12th DAY OF FEBRUARY 2020.
By:
Dr. Lea Dopson, Chair Investment Committee
5
December Review
Capital Markets Commentary
6
Past performance is no guarantee of future results. Estimates of future performance are based on assumptions that may not be realized. This material is not a solicitation of any offer to buy or sell any security or other financial instrument or to participate in any trading strategy. Please refer to important information, disclosures and qualifications at the end of this material.
WEALTH MANAGEMENT INVESTMENT RESOURCES | CHARTBOOK | QUARTER IN REVIEW
Quarter in Review—4Q 2019 As of January 1, 2019
Source: Morgan Stanley Wealth Management Investment Resources Market Research & Strategy Team
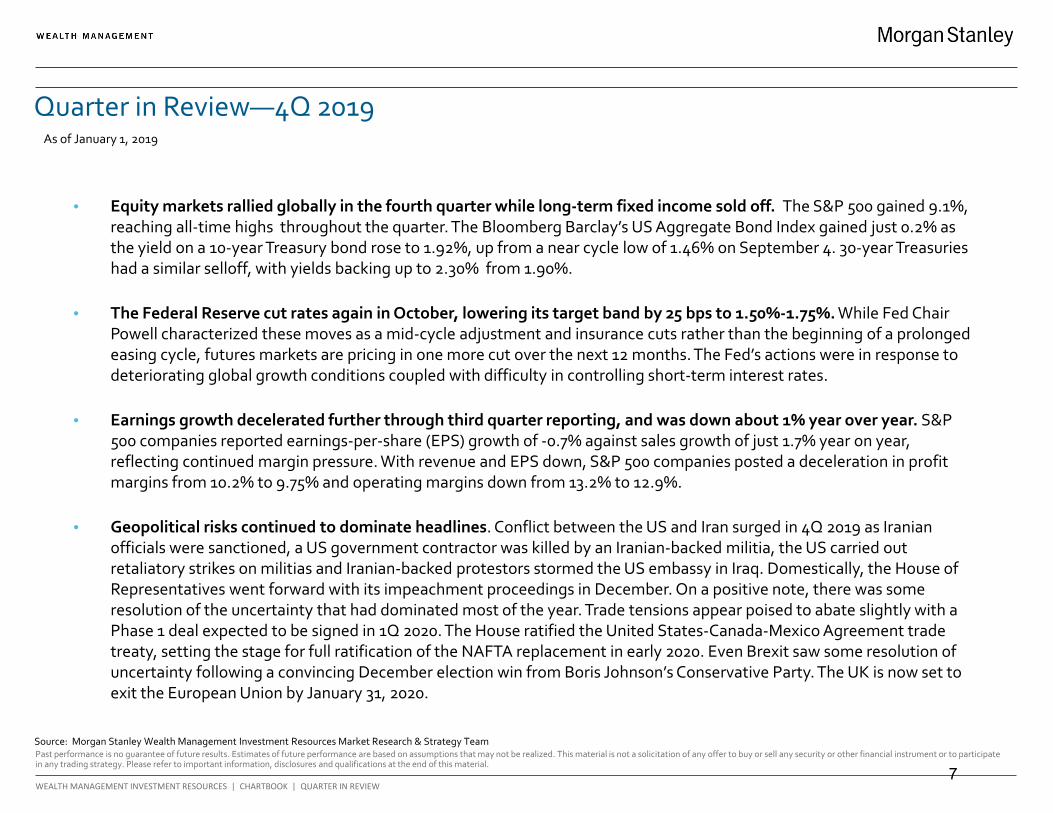
• Equity markets rallied globally in the fourth quarter while long-term fixed income sold off. The S&P 500 gained 9.1%,reaching all-time highs throughout the quarter. The Bloomberg Barclay’s US Aggregate Bond Index gained just 0.2% asthe yield on a 10-year Treasury bond rose to 1.92%, up from a near cycle low of 1.46% on September 4. 30-year Treasuries had a similar selloff, with yields backing up to 2.30% from 1.90%.
• The Federal Reserve cut rates again in October, lowering its target band by 25 bps to 1.50%-1.75%. While Fed ChairPowell characterized these moves as a mid-cycle adjustment and insurance cuts rather than the beginning of a prolongedeasing cycle, futures markets are pricing in one more cut over the next 12 months. The Fed’s actions were in response todeteriorating global growth conditions coupled with difficulty in controlling short-term interest rates.
• Earnings growth decelerated further through third quarter reporting, and was down about 1% year over year. S&P500 companies reported earnings-per-share (EPS) growth of -0.7% against sales growth of just 1.7% year on year,reflecting continued margin pressure. With revenue and EPS down, S&P 500 companies posted a deceleration in profitmargins from 10.2% to 9.75% and operating margins down from 13.2% to 12.9%.
• Geopolitical risks continued to dominate headlines. Conflict between the US and Iran surged in 4Q 2019 as Iranianofficials were sanctioned, a US government contractor was killed by an Iranian-backed militia, the US carried outretaliatory strikes on militias and Iranian-backed protestors stormed the US embassy in Iraq. Domestically, the House ofRepresentatives went forward with its impeachment proceedings in December. On a positive note, there was someresolution of the uncertainty that had dominated most of the year. Trade tensions appear poised to abate slightly with aPhase 1 deal expected to be signed in 1Q 2020. The House ratified the United States-Canada-Mexico Agreement trade treaty, setting the stage for full ratification of the NAFTA replacement in early 2020. Even Brexit saw some resolution ofuncertainty following a convincing December election win from Boris Johnson’s Conservative Party. The UK is now set toexit the European Union by January 31, 2020.
7
Past performance is no guarantee of future results. Estimates of future performance are based on assumptions that may not be realized. This material is not a solicitation of any offer to buy or sell any security or other financial instrument or to participate in any trading strategy. Please refer to important information, disclosures and qualifications at the end of this material.
WEALTH MANAGEMENT INVESTMENT RESOURCES | CHARTBOOK | QUARTER IN REVIEW
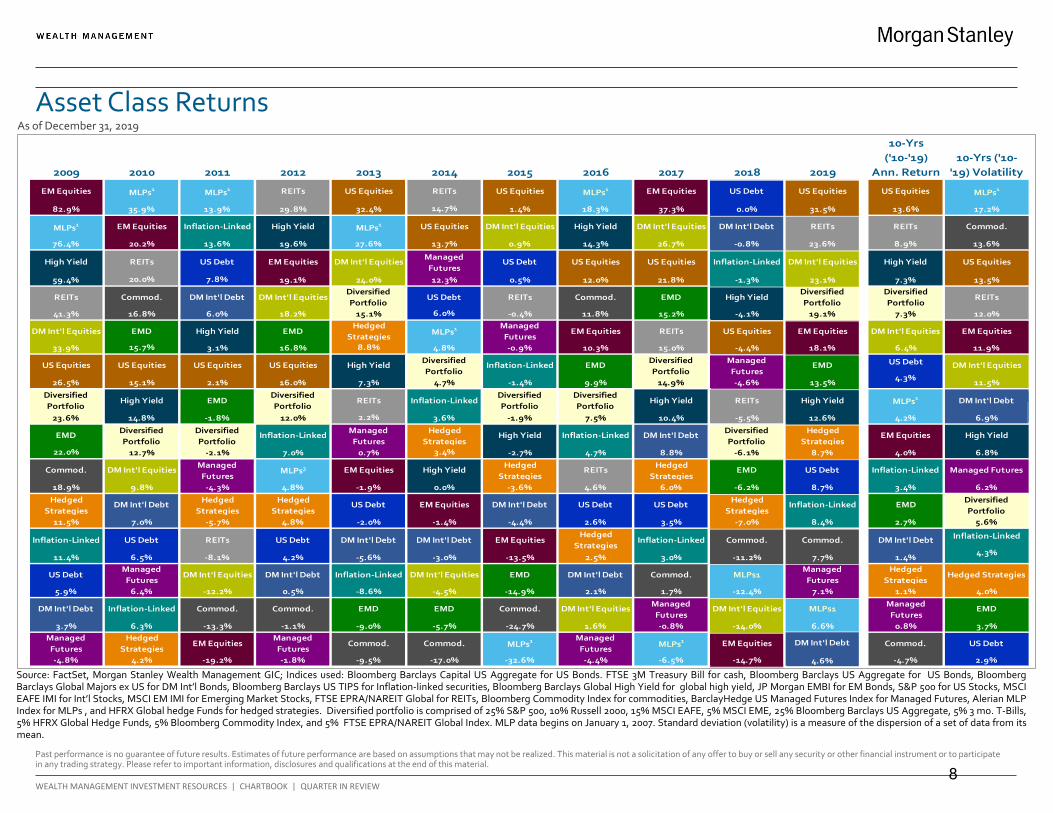
Asset Class Returns As of December 31, 2019
Source: FactSet, Morgan Stanley Wealth Management GIC; Indices used: Bloomberg Barclays Capital US Aggregate for US Bonds. FTSE 3M Treasury Bill for cash, Bloomberg Barclays US Aggregate for US Bonds, Bloomberg Barclays Global Majors ex US for DM Int’l Bonds, Bloomberg Barclays US TIPS for Inflation-linked securities, Bloomberg Barclays Global High Yield for global high yield, JP Morgan EMBI for EM Bonds, S&P 500 for US Stocks, MSCI EAFE IMI for Int’l Stocks, MSCI EM IMI for Emerging Market Stocks, FTSE EPRA/NAREIT Global for REITs, Bloomberg Commodity Index for commodities, BarclayHedge US Managed Futures Index for Managed Futures, Alerian MLP Index for MLPs , and HFRX Global hedge Funds for hedged strategies. Diversified portfolio is comprised of 25% S&P 500, 10% Russell 2000, 15% MSCI EAFE, 5% MSCI EME, 25% Bloomberg Barclays US Aggregate, 5% 3 mo. T-Bills, 5% HFRX Global Hedge Funds, 5% Bloomberg Commodity Index, and 5% FTSE EPRA/NAREIT Global Index. MLP data begins on January 1, 2007. Standard deviation (volatility) is a measure of the dispersion of a set of data from its mean.
2009 2010 2011 2012 2013 2014 2015 2016 2017 2018 2019
82.9% 35.9% 13.9% 29.8% 32.4% 14.7% 1.4% 18.3% 37.3% 0.0% 13.6% 17.2%
76.4% 20.2% 13.6% 19.6% 27.6% 13.7% 0.9% 14.3% 26.7% 8.9% 13.6%
59.4% 20.0% 7.8% 19.1% 24.0% 12.3% 0.5% 12.0% 21.8% -1.3% 7.3% 13.5%
41.3% 16.8% 6.0% 18.2% 15.1% 6.0% -0.4% 11.8% 15.2% -4.1% 7.3% 12.0%
33.9% 15.7% 3.1% 16.8% 8.8% 4.8% -0.9% 10.3% 15.0% -4.4% 6.4% 11.9%
US Debt
26.5% 15.1% 2.1% 16.0% 7.3% 4.7% -1.4% 9.9% 14.9% -4.6% 11.5%
23.6% 14.8% -1.8% 12.0% 2.2% 3.6% -1.9% 7.5% 10.4% -5.5% 4.2% 6.9%
22.0% 12.7% -2.1% 7.0% 0.7% 3.4% -2.7% 4.7% 8.8% 4.0% 6.8%
18.9% 9.8% -4.3% 4.8% -1.9% 0.0% -3.6% 4.6% 6.0% 3.4% 6.2%
11.5% 7.0% -5.7% 4.8% -2.0% -1.4% -4.4% 2.6% 3.5% 8.4% 2.7% 5.6%
Inflation-Linked
11.4% 6.5% -8.1% 4.2% -5.6% -3.0% -13.5% 2.5% 3.0% 1.4%
5.9% 6.4% -12.2% 0.5% -8.6% -4.5% -14.9% 2.1% 1.7% 1.1% 4.0%
3.7% 6.3% -13.3% -1.1% -9.0% -5.7% -24.7% 1.6% -0.8% 6.6% 0.8% 3.7%
-4.8% 4.2% -19.2% -1.8% -9.5% -17.0% -32.6% -4.4% -6.5% 4.6% -4.7% 2.9%
18.1%
Managed Futures
Diversified Portfolio
Managed Futures
High Yield
EMD
DM Int'l Equities
US Equities
REITs
Diversified Portfolio
Inflation-LinkedEM Equities US Equities
High Yield
US Equities
EMD
Managed Futures
-0.8%
Commod.
High Yield
EMD
Diversified Portfolio
Inflation-Linked
DM Int'l Equities
Diversified Portfolio
US Equities
High Yield
DM Int'l Debt DM Int'l Equities
EMD
DM Int'l Equities
High Yield
EM Equities US Debt
EMD
Diversified Portfolio
Inflation-Linked
REITs
Managed Futures
Diversified Portfolio
4.3%
Hedged Strategies
DM Int'l Debt
DM Int'l Equities
Managed Futures
Managed Futures
Hedged Strategies
Managed Futures
MLPs1
US Debt
EM Equities
Hedged Strategies
Commod.
MLPs1
4.3%
Inflation-Linked
US Debt
EMD
Commod.
-11.2%
-7.0%
-14.0%
DM Int'l Debt
Inflation-Linked
DM Int'l Debt
REITs
Diversified Portfolio
EMD
-6.2%
Managed Futures
7.1%
US Equities
High Yield
EMD
MLPs1
Diversified Portfolio
REITs
Inflation-Linked
Hedged Strategies
10-Yrs ('10-'19) Volatility
MLPs1
REITs
Commod.
EM Equities
US Equities
DM Int'l Equities
High Yield
DM Int'l Debt
10-Yrs ('10-'19)
Ann. Return
DM Int'l Equities
EM Equities
US DebtMLPs1 REITs
Hedged Strategies
EM Equities
EM Equities
REITs
Diversified Portfolio
US Debt
US Debt
REITs Commod.
MLPs1 High Yield MLPs1
MLPs1
REITs
EMD
High Yield
US Equities
DM Int'l Equities
REITs
EM Equities MLPs1 US Equities
US Equities
Diversified Portfolio
EMD
Inflation-Linked
DM Int'l Debt
US Debt
Inflation-Linked
MLPs1
DM Int'l Debt
Hedged Strategies
DM Int'l Debt
High Yield
Diversified Portfolio
DM Int'l Equities Inflation-Linked
Commod. DM Int'l Equities MLPs²
Commod.
Hedged Strategies
US Debt
Managed Futures
Hedged Strategies
US Debt
EM Equities
Commod.
Managed Futures
DM Int'l Debt
DM Int'l DebtManaged
Futures
Commod.
EMD
DM Int'l Equities
Hedged Strategies
REITs DM Int'l DebtUS Debt
Hedged Strategies
EMD
EM Equities
Diversified Portfolio
Managed Futures
Inflation-Linked
US Equities
Commod.Hedged
Strategies
Commod.
MLPs1
High Yield
US Equities
Commod.
EM Equities
Hedged Strategies
Managed Futures
US Debt
High Yield
12.6%
US Equities
31.5%
REITs
Diversified Portfolio
DM Int'l Equities
23.1%
23.6%
8.7%
EM Equities
-6.1%
Inflation-Linked DM Int'l Debt
High Yield
REITs
-14.7%
19.1%
EMD
13.5%
Hedged Strategies
8.7%
Commod.
7.7%
US Debt
Inflation-Linked
-12.4%
EM Equities
DM Int'l Equities
US Equities
MLPs1
DM Int'l Debt
8
WEALTH MANAGEMENT INVESTMENT RESOURCES | CHARTBOOK | 2020 OUTLOOK
Past performance is no guarantee of future results. Estimates of future performance are based on assumptions that may not be realized. This material is not a solicitation of any offer to buy or sell any security or other financial instrument or to participate in any trading strategy. Please refer to important information, disclosures and qualifications at the end of this material.
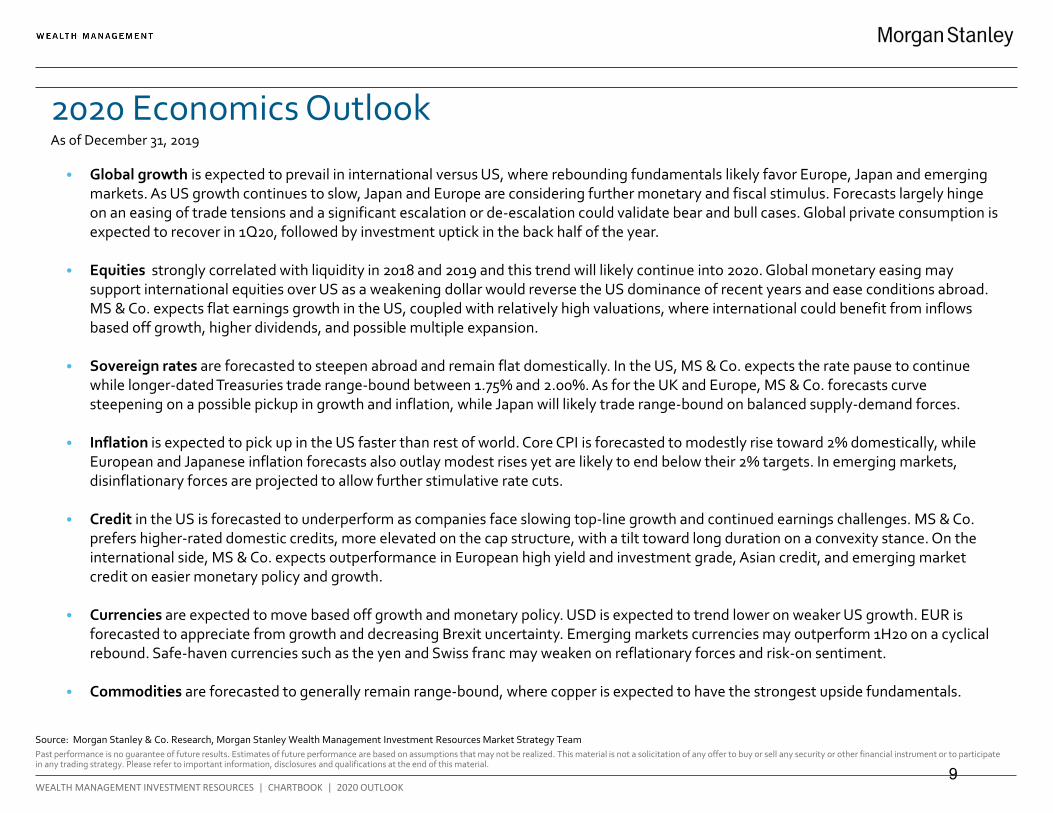
• Global growth is expected to prevail in international versus US, where rebounding fundamentals likely favor Europe, Japan and emergingmarkets. As US growth continues to slow, Japan and Europe are considering further monetary and fiscal stimulus. Forecasts largely hingeon an easing of trade tensions and a significant escalation or de-escalation could validate bear and bull cases. Global private consumption isexpected to recover in 1Q20, followed by investment uptick in the back half of the year.
• Equities strongly correlated with liquidity in 2018 and 2019 and this trend will likely continue into 2020. Global monetary easing maysupport international equities over US as a weakening dollar would reverse the US dominance of recent years and ease conditions abroad.MS & Co. expects flat earnings growth in the US, coupled with relatively high valuations, where international could benefit from inflowsbased off growth, higher dividends, and possible multiple expansion.
• Sovereign rates are forecasted to steepen abroad and remain flat domestically. In the US, MS & Co. expects the rate pause to continuewhile longer-dated Treasuries trade range-bound between 1.75% and 2.00%. As for the UK and Europe, MS & Co. forecasts curvesteepening on a possible pickup in growth and inflation, while Japan will likely trade range-bound on balanced supply-demand forces.
• Inflation is expected to pick up in the US faster than rest of world. Core CPI is forecasted to modestly rise toward 2% domestically, whileEuropean and Japanese inflation forecasts also outlay modest rises yet are likely to end below their 2% targets. In emerging markets,disinflationary forces are projected to allow further stimulative rate cuts.
• Credit in the US is forecasted to underperform as companies face slowing top-line growth and continued earnings challenges. MS & Co.prefers higher-rated domestic credits, more elevated on the cap structure, with a tilt toward long duration on a convexity stance. On theinternational side, MS & Co. expects outperformance in European high yield and investment grade, Asian credit, and emerging marketcredit on easier monetary policy and growth.
• Currencies are expected to move based off growth and monetary policy. USD is expected to trend lower on weaker US growth. EUR isforecasted to appreciate from growth and decreasing Brexit uncertainty. Emerging markets currencies may outperform 1H20 on a cyclicalrebound. Safe-haven currencies such as the yen and Swiss franc may weaken on reflationary forces and risk-on sentiment.
• Commodities are forecasted to generally remain range-bound, where copper is expected to have the strongest upside fundamentals.
Source: Morgan Stanley & Co. Research, Morgan Stanley Wealth Management Investment Resources Market Strategy Team
2020 Economics Outlook As of December 31, 2019
9
WEALTH MANAGEMENT INVESTMENT RESOURCES | CHARTBOOK | 2020 OUTLOOK
Past performance is no guarantee of future results. Estimates of future performance are based on assumptions that may not be realized. This material is not a solicitation of any offer to buy or sell any security or other financial instrument or to participate in any trading strategy. Please refer to important information, disclosures and qualifications at the end of this material.
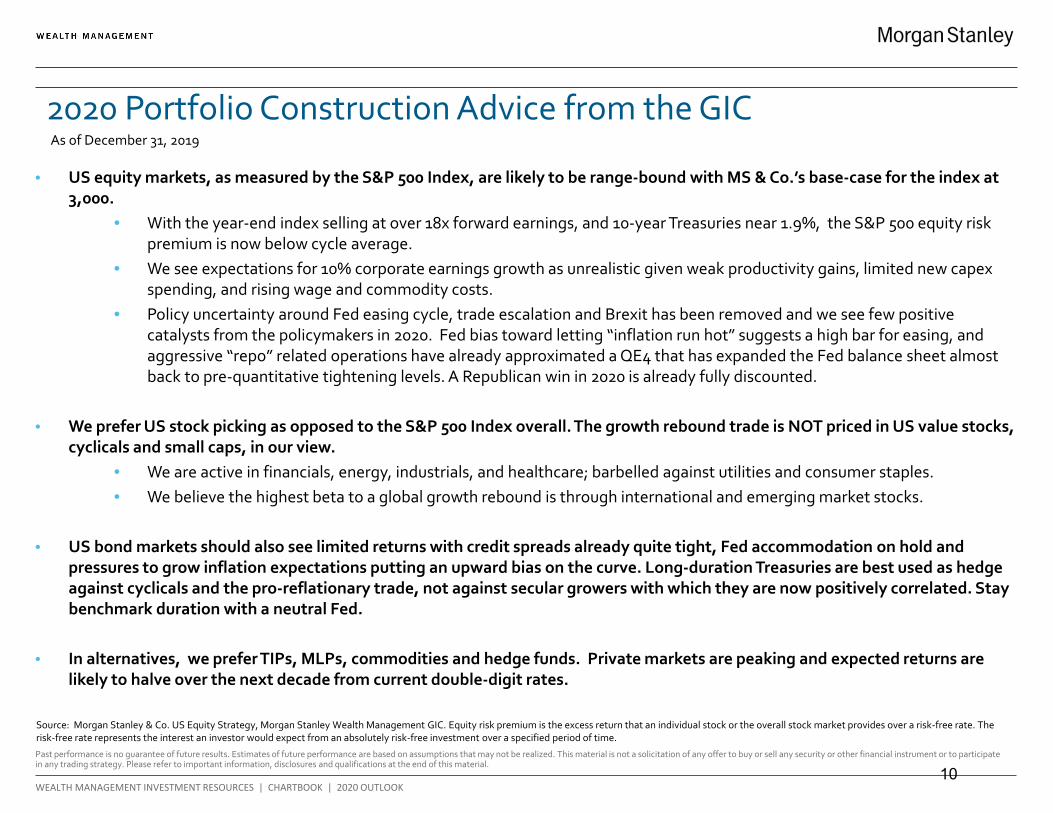
2020 Portfolio Construction Advice from the GIC
• US equity markets, as measured by the S&P 500 Index, are likely to be range-bound with MS & Co.’s base-case for the index at3,000.
• With the year-end index selling at over 18x forward earnings, and 10-year Treasuries near 1.9%, the S&P 500 equity riskpremium is now below cycle average.
• We see expectations for 10% corporate earnings growth as unrealistic given weak productivity gains, limited new capexspending, and rising wage and commodity costs.
• Policy uncertainty around Fed easing cycle, trade escalation and Brexit has been removed and we see few positivecatalysts from the policymakers in 2020. Fed bias toward letting “inflation run hot” suggests a high bar for easing, andaggressive “repo” related operations have already approximated a QE4 that has expanded the Fed balance sheet almostback to pre-quantitative tightening levels. A Republican win in 2020 is already fully discounted.
• We prefer US stock picking as opposed to the S&P 500 Index overall. The growth rebound trade is NOT priced in US value stocks,cyclicals and small caps, in our view.
• We are active in financials, energy, industrials, and healthcare; barbelled against utilities and consumer staples.• We believe the highest beta to a global growth rebound is through international and emerging market stocks.
• US bond markets should also see limited returns with credit spreads already quite tight, Fed accommodation on hold andpressures to grow inflation expectations putting an upward bias on the curve. Long-duration Treasuries are best used as hedgeagainst cyclicals and the pro-reflationary trade, not against secular growers with which they are now positively correlated. Staybenchmark duration with a neutral Fed.
• In alternatives, we prefer TIPs, MLPs, commodities and hedge funds. Private markets are peaking and expected returns arelikely to halve over the next decade from current double-digit rates.
As of December 31, 2019
Source: Morgan Stanley & Co. US Equity Strategy, Morgan Stanley Wealth Management GIC. Equity risk premium is the excess return that an individual stock or the overall stock market provides over a risk-free rate. The risk-free rate represents the interest an investor would expect from an absolutely risk-free investment over a specified period of time.
10
Past performance is no guarantee of future results. Estimates of future performance are based on assumptions that may not be realized. This material is not a solicitation of any offer to buy or sell any security or other financial instrument or to participate in any trading strategy. Please refer to important information, disclosures and qualifications at the end of this material.
WEALTH MANAGEMENT INVESTMENT RESOURCES | CHARTBOOK | QUARTER IN REVIEW
S&P 500 Index
Financials Tech. Healthcare Industrials EnergyConsumer
Disc.Consumer
StaplesComms Utilities Materials Real Estate
S&P Weight 100.0% 12.8% 23.3% 14.1% 9.2% 4.4% 9.8% 7.1% 10.6% 3.3% 2.6% 2.9%
YTD Return 31.5% 32.1% 50.3% 20.8% 29.4% 11.8% 27.9% 27.6% 32.7% 26.3% 24.6% 29.0%
4Q 2019 Return 9.1% 10.5% 14.4% 14.4% 5.5% 5.5% 4.5% 3.5% 9.0% 0.8% 6.4% -0.5%
Ret. since Top (October 2007)
167.8 36.4 348.1 257.2 139.8 6.5 299.6 216.4 79.2 151.1 87.8 111.2
Ret. since Low(March 2009)
498.5 644.8 838.9 475.9 559.0 95.0 825.1 343.7 242.3 339.5 347.3 683.0
Beta to S&P 500 1.00 1.37 1.12 0.74 1.20 1.03 1.12 0.58 0.64 0.43 1.24 1.20
Fwd. P/E Ratio 18.2x 13.4x 21.8x 16.2x 16.9x 17.7x 22.2x 20.2x 18.8x 19.9x 18.4x 19.9x
10-Yr Average 14.9x 12.2x 15.1x 14.4x 15.2x 19.0x 17.3x 17.2x 14.7x 15.6x 14.5x 17.7x
PB Ratio 3.3 1.4 7.7 4.2 5.0 1.6 8.1 5.8 3.4 2.2 1.8 3.6
10-Yr Average 2.7 1.3 4.0 3.7 3.2 1.9 3.5 4.3 2.2 1.8 2.7 2.9
Dividend Yield 1.9% 2.0% 1.4% 1.7% 1.9% 3.5% 1.2% 2.8% 1.3% 3.2% 2.0% 3.0%
10-Yr Average 2.0% 1.7% 1.3% 1.8% 2.1% 2.5% 1.3% 2.8% 4.7% 3.8% 2.1% N/A
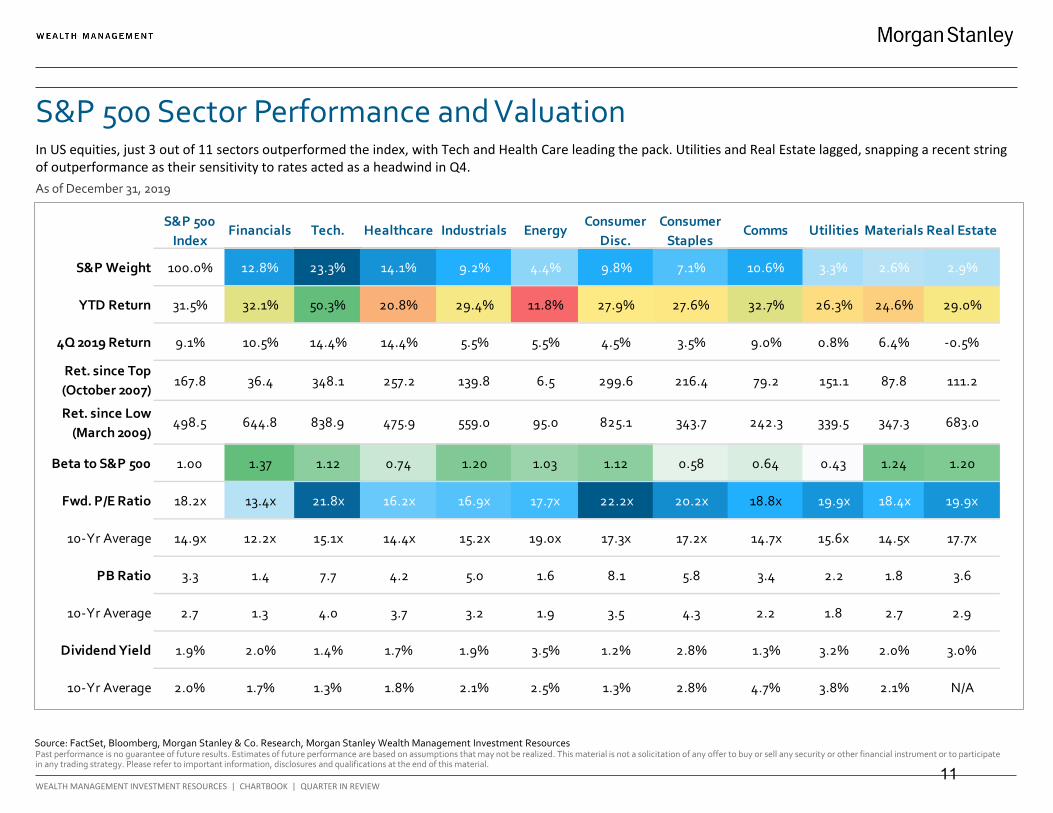
S&P 500 Sector Performance and Valuation
Source: FactSet, Bloomberg, Morgan Stanley & Co. Research, Morgan Stanley Wealth Management Investment Resources
As of December 31, 2019
In US equities, just 3 out of 11 sectors outperformed the index, with Tech and Health Care leading the pack. Utilities and Real Estate lagged, snapping a recent string of outperformance as their sensitivity to rates acted as a headwind in Q4.
11
Past performance is no guarantee of future results. Estimates of future performance are based on assumptions that may not be realized. This material is not a solicitation of any offer to buy or sell any security or other financial instrument or to participate in any trading strategy. Please refer to important information, disclosures and qualifications at the end of this material.
WEALTH MANAGEMENT INVESTMENT RESOURCES | CHARTBOOK | 2020 OUTLOOK
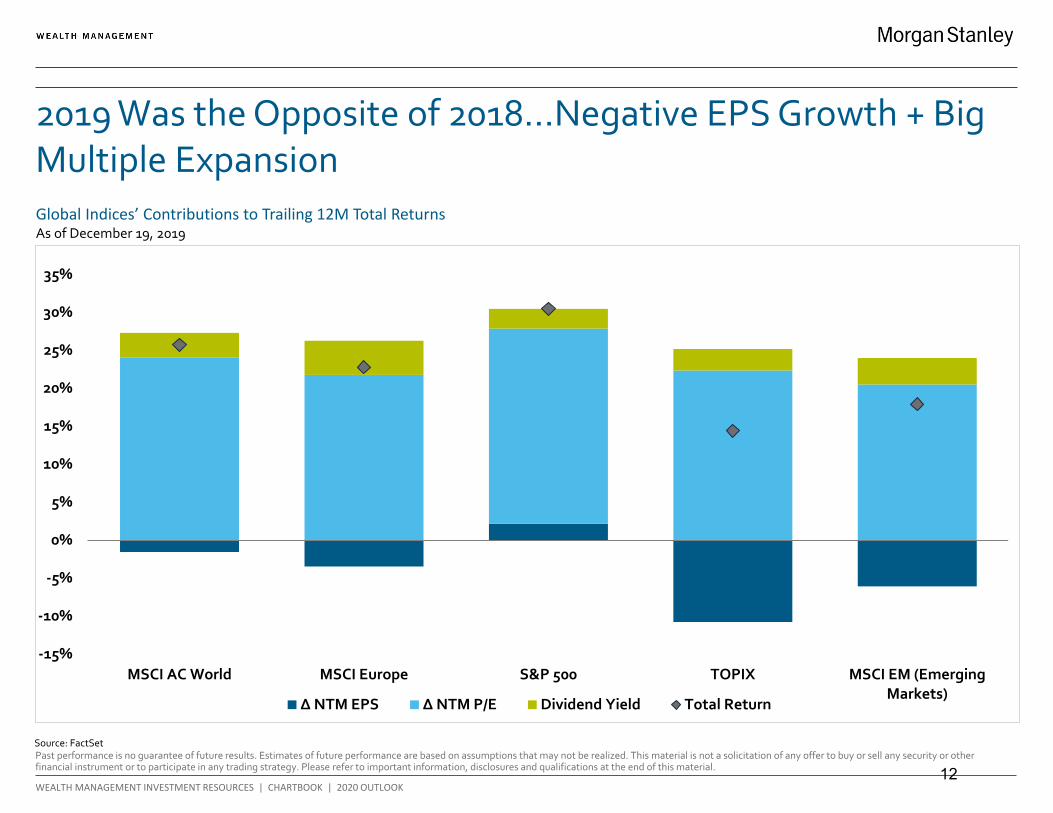
2019 Was the Opposite of 2018…Negative EPS Growth + Big Multiple Expansion
-15%
-10%
-5%
0%
5%
10%
15%
20%
25%
30%
35%
MSCI AC World MSCI Europe S&P 500 TOPIX MSCI EM (EmergingMarkets)
Δ NTM EPS Δ NTM P/E Dividend Yield Total Return
Source: FactSet
Global Indices’ Contributions to Trailing 12M Total Returns As of December 19, 2019
12

Past performance is no guarantee of future results. Estimates of future performance are based on assumptions that may not be realized. This material is not a solicitation of any offer to buy or sell any security or other financial instrument or to participate in any trading strategy. Please refer to important information, disclosures and qualifications at the end of this material.
WEALTH MANAGEMENT INVESTMENT RESOURCES | CHARTBOOK | 2020 OUTLOOK
A Decent Rebound Is Quickly Getting Priced in – Leaving Limited Upside Potential for 2020
-10%
-6%
-2%
2%
6%
10%
-20%
-10%
0%
10%
20%
30%
2011 2012 2013 2014 2015 2016 2017 2018 2019
Y/Y MSCI All Country World (LS) Y/Y Global Composite PMI (RS)
Source: Bloomberg
MSCI All Country World vs. Global Composite PMI As of December 2019
13
Past performance is no guarantee of future results. Estimates of future performance are based on assumptions that may not be realized. This material is not a solicitation of any offer to buy or sell any security or other financial instrument or to participate in any trading strategy. Please refer to important information, disclosures and qualifications at the end of this material.
WEALTH MANAGEMENT INVESTMENT RESOURCES | CHARTBOOK | 2020 OUTLOOK
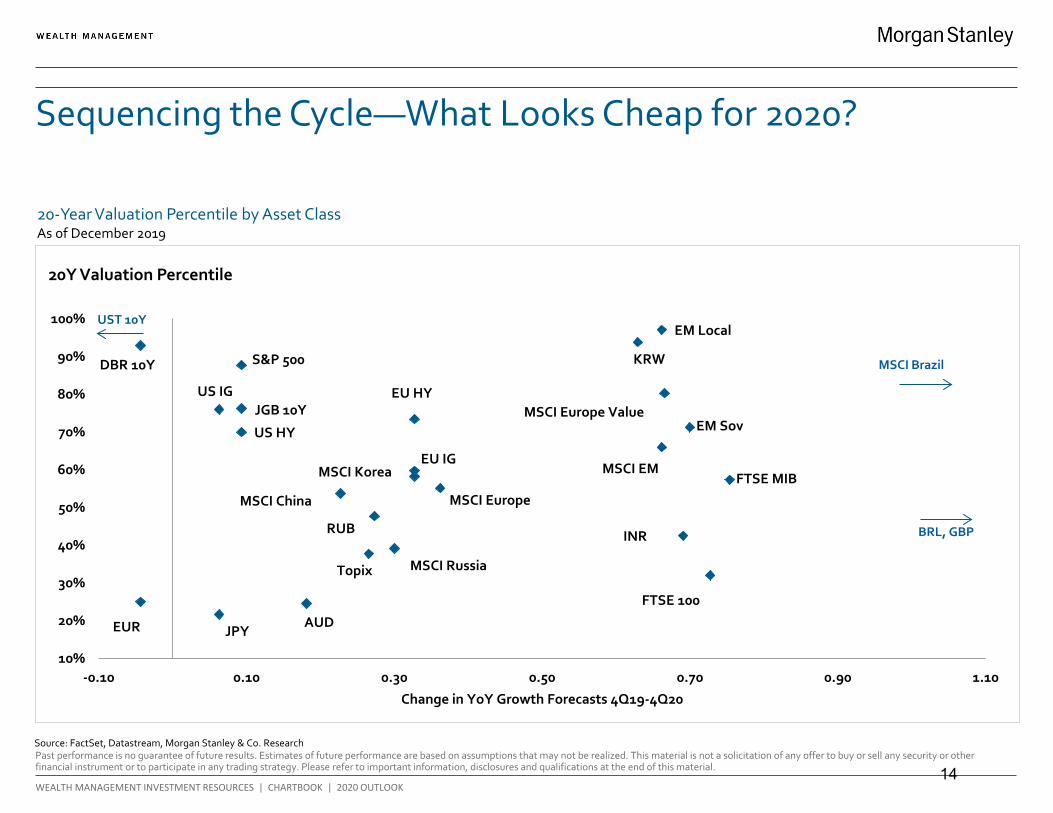
Sequencing the Cycle—What Looks Cheap for 2020?
S&P 500
MSCI Europe
Topix
MSCI EM
JPY EUR
DBR 10Y
JGB 10Y
EM Local
US IG
US HY
EU IG
EU HY
EM Sov
MSCI China
MSCI Korea
RUB
FTSE 100
FTSE MIB
AUD
MSCI Russia
INR
KRW
MSCI Europe Value
10%
20%
30%
40%
50%
60%
70%
80%
90%
100%
-0.10 0.10 0.30 0.50 0.70 0.90 1.10
Change in YoY Growth Forecasts 4Q19-4Q20
20Y Valuation Percentile
MSCI Brazil
BRL, GBP
UST 10Y
Source: FactSet, Datastream, Morgan Stanley & Co. Research
20-Year Valuation Percentile by Asset ClassAs of December 2019
14
Past performance is no guarantee of future results. Estimates of future performance are based on assumptions that may not be realized. This material is not a solicitation of any offer to buy or sell any security or other financial instrument or to participate in any trading strategy. Please refer to important information, disclosures and qualifications at the end of this material.
WEALTH MANAGEMENT INVESTMENT RESOURCES | CHARTBOOK | 2020 OUTLOOK
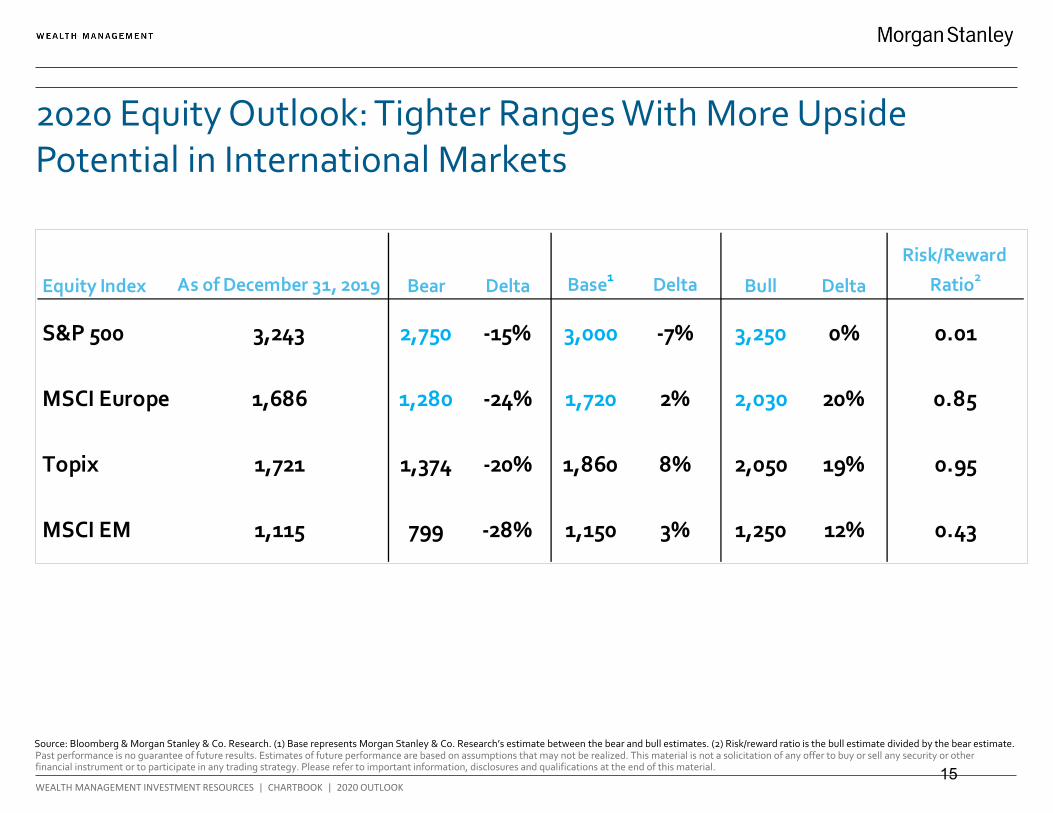
2020 Equity Outlook: Tighter Ranges With More Upside Potential in International Markets
Equity Index As of December 31, 2019 Bear Delta Base1 Delta Bull Delta
Risk/Reward
Ratio2
S&P 500 3,243 2,750 -15% 3,000 -7% 3,250 0% 0.01
MSCI Europe 1,686 1,280 -24% 1,720 2% 2,030 20% 0.85
Topix 1,721 1,374 -20% 1,860 8% 2,050 19% 0.95
MSCI EM 1,115 799 -28% 1,150 3% 1,250 12% 0.43
Source: Bloomberg & Morgan Stanley & Co. Research. (1) Base represents Morgan Stanley & Co. Research’s estimate between the bear and bull estimates. (2) Risk/reward ratio is the bull estimate divided by the bear estimate.
15
GLOBAL INVESTMENT COMMITTEE I TOPICS IN PORTFOLIO CONSTRUCTION
Past performance is no guarantee of future results. Estimates of future performance are based on assumptions that may not be realized. This material is not a solicitation of any offer to buy or sell any security or other financial instrument or to participate in any trading strategy. Please refer to important information, disclosures and qualifications at the end of this material.
30%
35%
40%
45%
50%
55%
10%
14%
18%
22%
Jan
'90
Aug
'91
Mar
'93
Oct
'94
May
'96
Dec
'97
Jul '
99
Feb
'01
Sep
'02
Apr
'04
Nov
'05
Jun
'07
Jan
'09
Aug
'10
Mar
'12
Oct
'13
May
'15
Dec
'16
Jul '
18
US RecessionLargest Five S&P 500 Companies (Left Axis)Largest 25 S&P Companies (Right Axis) 78.5%
43.1%37.9%
33.3% 33.3% 33.3%
0%
10%
20%
30%
40%
50%
60%
70%
80%
90%
Large Growth Momentum
Capitalization-WeightedEqual-Weighted
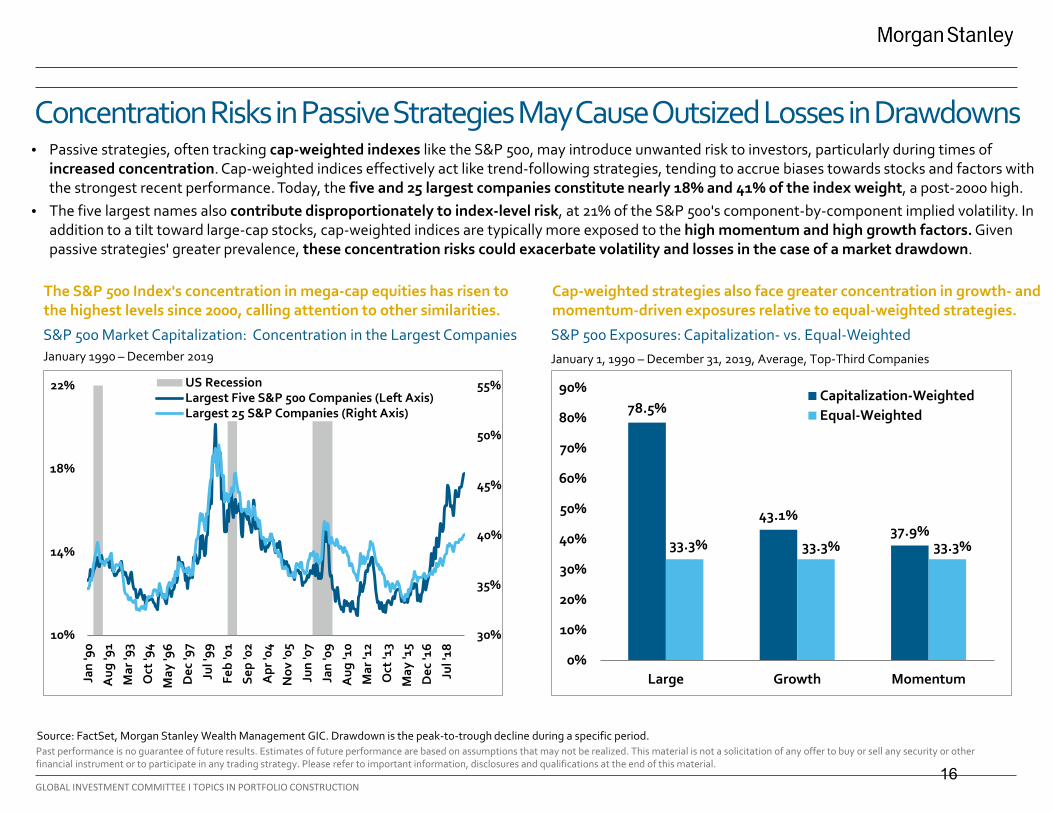
• Passive strategies, often tracking cap-weighted indexes like the S&P 500, may introduce unwanted risk to investors, particularly during times ofincreased concentration. Cap-weighted indices effectively act like trend-following strategies, tending to accrue biases towards stocks and factors withthe strongest recent performance. Today, the five and 25 largest companies constitute nearly 18% and 41% of the index weight, a post-2000 high.
• The five largest names also contribute disproportionately to index-level risk, at 21% of the S&P 500's component-by-component implied volatility. Inaddition to a tilt toward large-cap stocks, cap-weighted indices are typically more exposed to the high momentum and high growth factors. Givenpassive strategies' greater prevalence, these concentration risks could exacerbate volatility and losses in the case of a market drawdown.
Source: FactSet, Morgan Stanley Wealth Management GIC. Drawdown is the peak-to-trough decline during a specific period.
Concentration Risks in Passive Strategies May Cause Outsized Losses in Drawdowns
S&P 500 Market Capitalization: Concentration in the Largest Companies January 1990 – December 2019
Cap-weighted strategies also face greater concentration in growth- and momentum-driven exposures relative to equal-weighted strategies.
The S&P 500 Index's concentration in mega-cap equities has risen to the highest levels since 2000, calling attention to other similarities.
S&P 500 Exposures: Capitalization- vs. Equal-Weighted
January 1, 1990 – December 31, 2019, Average, Top-Third Companies
16
Past performance is no guarantee of future results. Estimates of future performance are based on assumptions that may not be realized. This material is not a solicitation of any offer to buy or sell any security or other financial instrument or to participate in any trading strategy. Please refer to important information, disclosures and qualifications at the end of this material.
WEALTH MANAGEMENT INVESTMENT RESOURCES | CHARTBOOK | QUARTER IN REVIEW
93336
0
200
400
600
800
1,000
1,200
1,400
1,600
1,800
2,000
0
100
200
300
400
500
600
700
2001 2004 2007 2010 2013 2016 2019
Bas
is P
oint
s
Bas
is P
oint
s
Investment Grade (Left Axis)
High Yield (Right Axis)
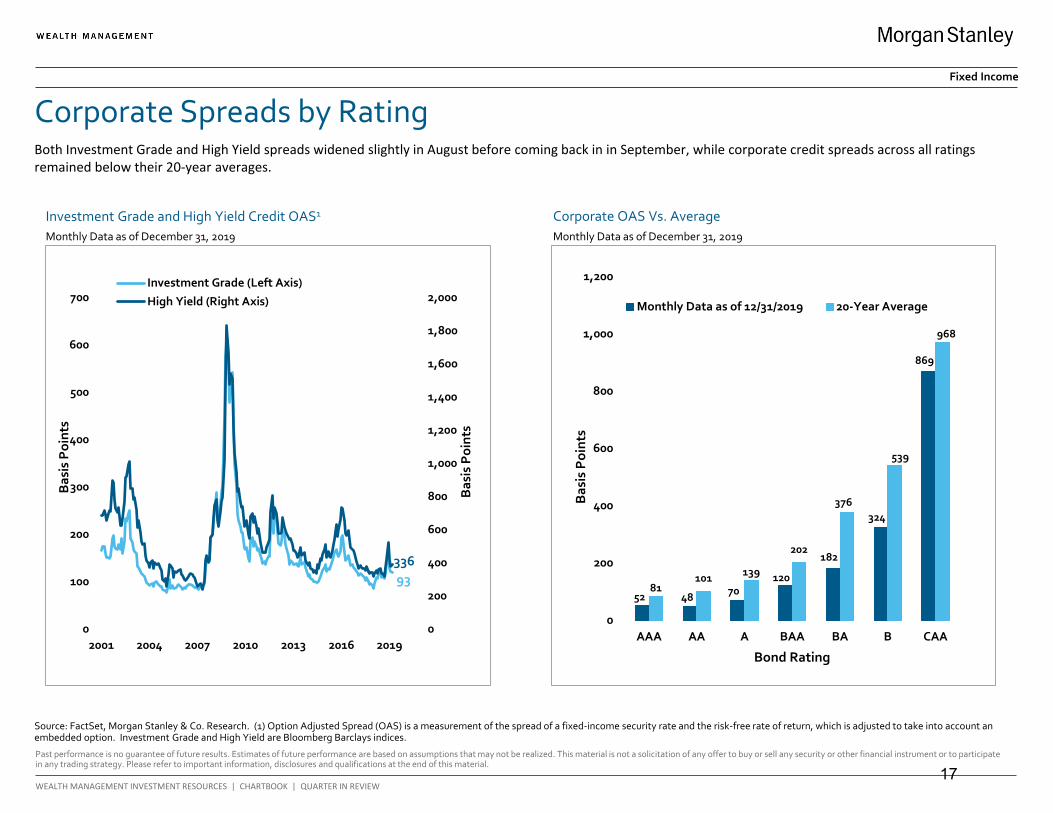
Corporate Spreads by Rating
Corporate OAS Vs. Average Investment Grade and High Yield Credit OAS1
Source: FactSet, Morgan Stanley & Co. Research. (1) Option Adjusted Spread (OAS) is a measurement of the spread of a fixed-income security rate and the risk-free rate of return, which is adjusted to take into account an embedded option. Investment Grade and High Yield are Bloomberg Barclays indices.
Monthly Data as of December 31, 2019 Monthly Data as of December 31, 2019
52 48 70120
182
324
869
81101 139
202
376
539
968
0
200
400
600
800
1,000
1,200
AAA AA A BAA BA B CAA
Bas
is P
oint
s
Bond Rating
Monthly Data as of 12/31/2019 20-Year Average
Fixed Income
Both Investment Grade and High Yield spreads widened slightly in August before coming back in in September, while corporate credit spreads across all ratings remained below their 20-year averages.
17
Past performance is no guarantee of future results. Estimates of future performance are based on assumptions that may not be realized. This material is not a solicitation of any offer to buy or sell any security or other financial instrument or to participate in any trading strategy. Please refer to important information, disclosures and qualifications at the end of this material.
WEALTH MANAGEMENT INVESTMENT RESOURCES | CHARTBOOK | WEEKLY DIGEST
GIC Recommendations: Summary As of January 8, 2020
Source: Morgan Stanley Wealth Management GIC
Portfolio Construction
• Risk markets begin the year where they left off. We think strong 4Q rally in risk assets is due to four things: 1) Fed, ECB and BOJ expanding balance sheetsaggressively; 2) progress on Brexit and trade; 3) early indications that the global economy is troughing, most notably PMIs in China and Europe; and 4)valuations have rebounded sharply from the very cheap levels last summer.
• 4Q breakout in global equity markets suggests secular bull market has begun next leg. While equity markets are now pricing a strong rebound in growth,we think the rally can continue as long as the central banks’ balance sheet expansion persists at current rates of $100 billion per month. Valuations look“fair” assuming volatility stays low and could even go higher.
• Inflation may not be that far away. With central banks seemingly unafraid of inflation and fiscal policy on the rise, inflation risks are growing. This is goodfor nominal GDP growth and in line with our global reflation theme, but many portfolios may not be prepared for it. Our portfolios are more aligned with aworld of eventual rising inflation with overweight to US value and international stocks. We will look to hedge our portfolios from rising inflation during2020 as opportunities arise.
• The US will likely lag the global recovery. International economies are more levered to global trade improving while the US is still dealing with the fadingfiscal stimulus enacted in 2018 and corporate margin pressures. Capital spending has disappointed and is unlikely to bounce back much as US corporatesdelever until earnings growth returns. We forecast just 3 percent EPS growth for the S&P 500 in 2020. Meanwhile, international earnings growth looksbetter next year relative to the US, particularly in Japan, Brazil, and South Korea.
• Our view has been consistent over the past year to favor quality growth at a reasonable price and Value. Our only underweights within equities are in USgrowth and small/mid caps. Japan and Europe are our favored regions given their greater leverage to global growth recovery and trade deal. We also likeselect EM. We remain underweight credit.
• US overweights: Utilities, Staples & Financials. US underweights: Tech & Consumer Discretionary. We still prefer large cap to small and value to growth.We have been expecting a rotation from defensives to cyclicals once the Fed got ahead of the slowdown. That may have begun last month but is likelyahead of itself if rates are topping again. Avoid profitless growth stocks and maintain some bond proxies for potential 1H growth disappointments.
18
Morgan Stanley Wealth Management is the trade name of Morgan Stanley Smith Barney LLC, a registered broker-dealer in the United States.
The sole purpose of this material is to inform, and it in no way is intended to be an ofer or solicitation to purchase or sell any security, other investment or service, or to attract any funds or deposits. Investments mentioned may not be suitable for all clients. Any product discussed herein may be purchased only after a client has carefully reviewed the ofering memorandum and executed the subscription documents. Morgan Stanley Wealth Management has not considered the actual or desired investment objectives, goals, strategies, guidelines, or factual circumstances of any investor in any fund(s). Before making any investment, each investor should carefully consider the risks associated with the investment, as discussed in the applicable ofering memorandum, and make a determination based upon their own particular circumstances, that the investment is consistent with their investment objectives and risk tolerance. Morgan Stanley Smith Barney LLC ofers investment program services through a variety of investment programs, which are opened pursuant to written client agreements. Each program ofers investment managers, funds and features that are not available in other programs; conversely, some investment managers, funds or investment strategies may be available in more than one program.
Morgan Stanley’s investment advisory programs may require a minimum asset level and, depending on your specifc investment objectives and fnancial position, may not be suitable for you. Please see the Morgan Stanley Smith Barney LLC program disclosure brochure (the “Morgan Stanley ADV”) for more information in the investment advisory programs available. The Morgan Stanley ADV is available at www.morganstanley.com/ADV. Sources of Data. Information in this material in this report has been obtained from sources that we believe to be reliable, but we do not guarantee its accuracy, completeness or timeliness. Third-party data providers make no warranties or representations relating to the accuracy, completeness or timeliness of the data they provide and are not liable for any damages relating to this data. All opinions included in this material constitute the Firm’s judgment as of the date of this material and are subject to change without notice . This material was not prepared by the research departments of Morgan Stanley & Co. LLC or Morgan Stanley Smith Barney LLC. Some historical fgures may be revised due to newly identifed programs, frm restatements, etc.
Global Investment Manager Analysis (GIMA) Focus List, Approved List and Tactical Opportunities List; Watch Policy. GIMA uses two methods to evaluate investment products in applicable advisory programs: Focus (and investment products meeting this standard are described as being on the Focus List) and Approved (and investment products meeting this standard are described as being on the Approved List). In general, Focus entails a more thorough evaluation of an investment product than Approved. Sometimes an investment product may be evaluated using the Focus List process but then placed on the Approved List instead of the Focus List. Investment products may move from the Focus List to the Approved List, or vice versa. GIMA may also determine that an investment product no longer meets the criteria under either process and will no longer be recommended in investment advisory programs (in which case the investment product is given a “Not Approved” status). GIMA has a ‘Watch” policy and may describe a Focus List or Approved List investment product as being on “Watch” if GIMA identifes specifc areas that (a) merit further evaluation by GIMA and (b) may, but are not certain to, result in the investment product becoming “Not Approved.” The Watch period depends on the length of time needed for GIMA to conduct its evaluation and for the investment manager or fund to address any concerns. Certain investment products on either the Focus List or Approved List may also be recommended for the Tactical Opportunities List based in part on tactical opportunities existing at a given time. The investment products on the Tactical Opportunities List change over time. For more information on the Focus List, Approved List, Tactical Opportunities List and Watch processes, please see the applicable Form ADV Disclosure Document for Morgan Stanley Wealth Management. Your Financial Advisor or Private Wealth Advisor can also provide upon request a copy of a publication entitled “Manager Selection Process.”
The Global Investment Committee is a group of seasoned investment professionals who meet regularly to discuss the global economy and markets. The committee determines the investment outlook that guides our advice to clients. They continually monitor developing economic and market conditions, review tactical outlooks and recommend model portfolio weightings, as well as produce a suite of strategy, analysis, commentary, portfolio positioning suggestions and other reports and broadcasts.
The GIC Asset Allocation Models are not available to be directly implemented as part of an investment advisory service and should not be regarded as a recommendation of any Morgan Stanley investment advisory service. The GIC Asset Allocation Models do not represent actual trading or any type of account or any type of investment strategies and none of the fees or other expenses (e .g. commissions, mark-ups, mark-downs, advisory fees, fund expenses) associated with actual trading or accounts are refected in the GIC Asset Allocation Models which, when compounded over a period of years, would decrease returns.
Adverse Active Alpha (AAA) is a patented screening and scoring process designed to help identify high-quality equity and fxed income managers with characteristics that may lead to future outperformance relative to index and peers. While highly ranked managers performed well as a group in our Adverse Active Alpha model back tests, not all of the managers will outperform. Please note that this data may be derived from back-testing, which has the beneft of hindsight. In addition, highly ranked managers can have difering risk profles that might not be suitable for all investors. Our view is that Adverse Active Alpha is a good starting point and should be used in conjunction with other information. Morgan Stanley Wealth Management’s qualitative and quantitative investment manager due diligence process are equally important factors for investors when considering managers for use through an investment advisory program. Factors including, but not limited to, manager turnover and changes to investment process can partially or fully negate a positive Adverse Active Alpha ranking. Additionally, highly ranked managers can have difering risk profles that might not be
DISCLOSURES 19
suitable for all investors. For more information on AAA, please see the Adverse Active Alpha Ranking Model and Selecting Managers with Adverse Active Alpha whitepapers. The whitepaper are available from your Financial Advisor or Private Wealth Advisor. ADVERSE ACTIVE ALPHA is a registered service mark of Morgan Stanley and/or its afliates. U.S. Pat. No. 8,756,098 applies to the Adverse Active Alpha system and/or methodology.
The Global Investment Manager Analysis (GIMA) Services Only Apply to Certain Investment Advisory Programs GIMA evaluates certain investment products for the purposes of some – but not all – of Morgan Stanley Smith Barney LLC’s investment advisory programs (as described in more detail in the applicable Form ADV Disclosure Document for Morgan Stanley Wealth Management). If youdo not invest through one of these investment advisory programs, Morgan Stanley Wealth Management is not obligated to provide you notice of any GIMA Status changes even though it may give notice to clients in other programs.
Strategy May Be Available as a Separately Managed Account or Mutual Fund Strategies are sometimes available in Morgan Stanley Wealth Management investment advisory programs both in the form of a separately managed account (“SMA”) and a mutual fund. These may have diferent expenses and investment minimums. Your Financial Advisor or Private Wealth Advisor can provide more information on whether any particular strategy is available in more than one form in a particular investment advisory program. In most Morgan Stanley Wealth Management investment advisory accounts, fees are deducted quarterly and have a compounding efect on performance. For example, on an advisory account with a 3% annual fee, if the gross annual performance is 6.00%, the compounding efect of the fees will result in a net performance of approximately 3.93% after one year, 1 after three years, and 21.23% after fve years. Conficts of Interest: GIMA’s goal is to provide professional, objective evaluations in support of the Morgan Stanley Wealth Management investment advisory programs. We have policies and procedures to help us meet this goal. However, our business is subject to various conficts of interest. For example, ideas and suggestions for which investment products should be evaluated by GIMA come from a variety of sources, including our Morgan Stanley Wealth Management Financial Advisors and their direct or indirect managers, and other business persons within Morgan Stanley Wealth Management or its afliates. Such persons may have an ongoing business relationship with certain investment managers or mutual fund companies whereby they, Morgan Stanley Wealth Management or its afliates receive compensation from, or otherwise related to, those investment managers or mutual funds. For example, a Financial Advisor may suggest that GIMA evaluates an investment manager or fund in which a portion of his or her clients’ assets are already invested. While such a recommendation is permissible, GIMA is responsible for the opinions expressed by GIMA. See the conficts of interest section in the applicable Form ADV Disclosure Document for Morgan Stanley Wealth Management for a discussion of other types of conficts that may be relevant to GIMA’s evaluation of managers and funds. In addition, Morgan Stanley Wealth Management, MS & Co., managers and their afliates provide a variety of services (including research, brokerage, asset management, trading, lending and investment banking services) for each other and for various clients, including issuers of securities that may be recommended for purchase or sale by clients or are otherwise held in client accounts, and managers in various advisory programs. Morgan Stanley Wealth Management, managers, MS & Co., and their afliates receive compensation and fees in connection with these services. Morgan Stanley Wealth Management believes that the nature and range of clients to which such services are rendered is such that it would be inadvisable to exclude categorically all of these companies from an account .
Morgan Stanley charges each fund family we ofer a mutual fund support fee, also called a “revenue-sharing payment,” on client account holdings in fund families according to a tiered rate that increases along with the management fee of the fund so that lower management fee funds pay lower rates than those with higher management fees.
Consider Your Own Investment Needs: The model portfolios and strategies discussed in the material are formulated based on general client characteristics including risk tolerance . This material is not intended to be a client-specifc suitability analysis or recommendation, or ofer to participate in any investment. Therefore, clients should not use this profle as the sole basis for investment decisions. They should consider all relevant information, including their existing portfolio, investment objectives, risk tolerance, liquidity needs and investment time horizon. Such a suitability determination may lead to asset allocation results that are materially diferent from the asset allocation shown in this profle. Talk to your Financial Advisor about what would be a suitable asset allocation for you, whether CGCM is a suitable program for you.
No obligation to notify – Morgan Stanley Wealth Management has no obligation to notify you when the model portfolios, strategies, or any other information, in this material changes.
Please consider the investment objectives, risks, fees, and charges and expenses of mutual funds, ETFs, closed end funds, unit investment trusts, and variable insurance products carefully before investing. The prospectus contains this and other information about each fund. To obtain a prospectus, contact your Financial Advisor or Private Wealth Advisor or visit the Morgan Stanley website at www.morganstanley.com. Please read it carefully before investing.
An investment in a money market fund is not insured or guaranteed by the Federal Deposit Insurance Corporation or any other government agency. Although the Fund seeks to preserve the value of your investment at $1.00 per share, it is possible to lose money by investing in the fund.
The type of mutual funds and ETFs discussed in this presentation utilizes nontraditional or complex investment strategies and /or derivatives. Examples of these types of funds include those that utilize
DISCLOSURES 20
one or more of the below noted investment strategies or categories or which seek exposure to the following markets: (1) commodities (e .g., agricultural, energy and metals), currency, precious metals; (2) managed futures; (3) leveraged, inverse or inverse leveraged; (4) bear market, hedging, long-short equity, market neutral; (5) real estate; (6) volatility (seeking exposure to the CBOE VIX Index). Investors should keep in mind that while mutual funds and ETFs may, at times, utilize nontraditional investment options and strategies, they should not be equated with unregistered privately ofered alternative investments. Because of regulatory limitations, mutual funds and ETFs that seek alternative-like investment exposure must utilize a more limited investment universe. As a result, investment returns and portfolio characteristics of alternative mutual funds and ETFs may vary from traditional hedge funds pursuing similar investment objectives. Moreover, traditional hedge funds have limited liquidity with long “lock-up” periods allowing them to pursue investment strategies without having to factor in the need to meet client redemptions and ETFs trade on an exchange . On the other hand, mutual funds typically must meet daily client redemptions. This difering liquidity profle can have a material impact on the investment returns generated by a mutual or ETF pursuing an alternative investing strategy compared with a traditional hedge fund pursuing the same strategy.
Nontraditional investment options and strategies are often employed by a portfolio manager to further a fund’s investment objective and to help ofset market risks . However, these features may be complex, making it more difcult to understand the fund’s essential characteristics and risks, and how it will perform in diferent market environments and over various periods of time. They may also expose the fund to increased volatility and unanticipated risks particularly when used in complex combinations and/or accompanied by the use of borrowing or “leverage.”
KEY ASSET CLASS CONSIDERATIONS AND OTHER RISKS
Investing in the markets entails the risk of market volatility. The value of all types of investments, including stocks, mutual funds, exchange-traded funds (“ETFs”), closed-end funds, and unit investment trusts, may increase or decrease over varying time periods. To the extent the investments depicted herein represent international securities, you should be aware that there may be additional risks associated with international investing, including foreign economic, political, monetary and/or legal factors, changing currency exchange rates, foreign taxes, and diferences in fnancial and accounting standards. These risks may be magnifed in emerging markets and frontier markets. Small- and mid-capitalization companies may lack the fnancial resources, product diversifcation and competitive strengths of larger companies. In addition, the securities of small- and mid-capitalization companies may not trade as readily as, and be subject to higher volatility than, those of larger, more established companies. The value of fxed income securities will fuctuate and, upon a sale, may be worth more or less than their original cost or maturity value. Bonds are subject to interest rate risk, call risk, reinvestment risk, liquidity risk, and credit risk of the issuer. High yield bonds are subject to additional risks such as increased risk of default and greater volatility because of the lower credit quality of the issues. In the case of municipal bonds, income is generally exempt from federal income taxes. Some income may be subject to state and local taxes and to the federal alternative minimum tax. Capital gains, if any, are subject to tax. Treasury Infation Protection Securities’ (TIPS) coupon payments and underlying principal are automatically increased to compensate for infation by tracking the consumer price index (CPI). While the real rate of return is guaranteed, TIPS tend to ofer a low return. Because the return of TIPS is linked to infation, TIPS may signifcantly underperform versus conventional U.S. Treasuries in times of low infation. There is no guarantee that investors will receive par if TIPS are sold prior to maturity. The returns on a portfolio consisting primarily of environmental, social, and governance-aware investments (“ESG”) may be lower or higher than a portfolio that is more diversifed or where decisions are based solely on investment considerations. Because ESG criteria exclude some investments, investors may not be able to take advantage of the same opportunities or market trends as investors that do not use such criteria. The companies identifed and investment examples are for illustrative purposes only and should not be deemed a recommendation to purchase , hold or sell any securities or investment products. They are intended to demonstrate the approaches taken by managers who focus on ESG criteria in their investment strategy. There can be no guarantee that a client's account will be managed as described herein. Options and margin trading involve substantial risk and are not suitable for all investors. Besides the general investment risk of holding securities that may decline in value and the possible loss of principal invested, closed-end funds may have additional risks related to declining market prices relative to net asset values (NAVs), active manager underperformance and potential leverage. Closed-end funds, unlike open-end funds, are not continuously ofered. There is a one-time public ofering and once issued, shares of closed-end funds are sold in the open market through a stock exchange. NAV is total assets less total liabilities divided by the number of shares outstanding. At the time an investor purchases shares of a closed-end fund, shares may have a market price that is above or below NAV. Portfolios that invest a large percentage of assets in only one industry sector (or in only a few sectors) are more vulnerable to price fuctuation than those that diversify among a broad range of sectors.
Alternative investments often are speculative and include a high degree of risk. Investors could lose all or a substantial amount of their investment. Alternative investments are suitable only for eligible, long-term investors who are willing to forgo liquidity and put capital at risk for an indefnite period of time. They may be highly illiquid and can engage in leverage and other speculative practices that may increase the volatility and risk of loss. Alternative Investments typically have higher fees than traditional investments. Investors should carefully review and consider potential risks before investing. Certain of these risks may include but are not limited to: Loss of all or a substantial portion of the investment due to leveraging, short-selling, or other speculative practices; Lack of liquidity in that there may be no secondary market for a fund; Volatility of returns; Restrictions on transferring interests in a fund; Potential lack of diversifcation and resulting higher risk due to concentration of trading authority when a single advisor is utilized; Absence of information regarding valuations and pricing; Complex tax structures and delays in tax reporting; Less regulation and higher fees than mutual funds; Risks associated with the operations, personnel, and processes of the manager; and Risks associated with cybersecurity. As a diversifed global fnancial services frm, Morgan Stanley Wealth Management engages in a broad spectrum of activities including fnancial advisory services, investment management activities, sponsoring and managing private investment
DISCLOSURES 21
funds, engaging in broker-dealer transactions and principal securities, commodities and foreign exchange transactions, research publication, and other activities. In the ordinary course of its business, Morgan Stanley Wealth Management therefore engages in activities where Morgan Stanley Wealth Management’s interests may confict with the interests of its clients , including the private investment funds it manages. Morgan Stanley Wealth Management can give no assurance that conficts of interest will be resolved in favor of its clients or any such fund. All expressions of opinion are subject to change without notice and are not intended to be a forecast of future events or results. Further, opinions expressed herein may difer from the opinions expressed by Morgan Stanley Wealth Management and/or other businesses/afliates of Morgan Stanley Wealth Management. This is not a "research report" as defned by FINRA Rule 2241 or a "debt research report" as defned by FINRA Rule 2242 and was not prepared by the Research Departments of Morgan Stanley Smith Barney LLC or Morgan Stanley & Co. LLC or its afliates. Certain information contained herein may constitute forward-looking statements. Due to various risks and uncertainties, actual events, results or the performance of a fund may difer materially from those refected or contemplated in such forward-looking statements. Clients should carefully consider the investment objectives, risks, charges, and expenses of a fund before investing. While the HFRI indices are frequently used, they have limitations (some of which are typical of other widely used indices). These limitations include survivorship bias (the returns of the indices may not be representative of all the hedge funds in the universe because of the tendency of lower performing funds to leave the index); heterogeneity (not all hedge funds are alike or comparable to one another, and the index may not accurately refect the performance of a described style); and limited data (many hedge funds do not report to indices, and the index may omit funds, the inclusion of which might signifcantly afect the performance shown. The HFRI indices are based on information self-reported by hedge fund managers that decide on their own, at any time, whether or not they want to provide, or continue to provide, information to HFR Asset Management, L.L.C. Results for funds that go out of business are included in the index until the date that they cease operations . Therefore, these indices may not be complete or accurate representations of the hedge fund universe, and may be biased in several ways. Composite index results are shown for illustrative purposes and do not represent the performance of a specifc investment. Individual funds have specifc tax risks related to their investment programs that will vary from fund to fund. Clients should consult their own tax and legal advisors as Morgan Stanley Wealth Management does not provide tax or legal advice. Interests in alternative investment products are ofered pursuant to the terms of the applicable ofering memorandum, are distributed by Morgan Stanley Wealth Management and certain of its afliates, and (1) are not FDIC-insured, (2) are not deposits or other obligations of Morgan Stanley Wealth Management or any of its afliates, (3) are not guaranteed by Morgan Stanley Wealth Management and its afliates, and (4) involve investment risks, including possible loss of principal. Morgan Stanley Wealth Management is a registered broker-dealer, not a bank. This material is not to be reproduced or distributed to any other persons (other than professional advisors of the investors or prospective investors , as applicable, receiving this material) and is intended solely for the use of the persons to whom it has been delivered. This material is not for distribution to the general public. Past performance is no guarantee of future results. Actual results may vary. SIPC insurance does not apply to precious metals, other commodities, or traditional alternative investments. In Consulting Group’s advisory programs, alternative investments are limited to US-registered mutual funds, separate account strategies and exchange-traded funds (ETFs) that seek to pursue alternative investment strategies or returns utilizing publicly traded securities. Investment products in this category may employ various investment strategies and techniques for both hedging and more speculative purposes such as short -selling, leverage, derivatives and options, which can increase volatility and the risk of investment loss. Alternative investments are not suitable for all investors. As a diversifed global fnancial services frm, Morgan Stanley Wealth Management engages in a broad spectrum of activities including fnancial advisory services, investment management activities, sponsoring and managing private investment funds, engaging in broker-dealer transactions and principal securities, commodities and foreign exchange transactions, research publication, and other activities. In the ordinary course of its business, Morgan Stanley Wealth Management therefore engages in activities where Morgan Stanley Wealth Management’s interests may confict with the interests of its clients , including the private investment funds it manages. Morgan Stanley Wealth Management can give no assurance that conficts of interest will be resolved in favor of its clients or any such fund. Alternative investments involve complex tax structures, tax inefcient investing, and delays in distributing important tax information. Individual funds have specifc risks related to their investment programs that will vary from fund to fund. Clients should consult their own tax and legal advisors as Morgan Stanley Wealth Management does not provide tax or legal advice.
A majority of Alternative Investment managers reviewed and selected by GIMA pay or cause to be paid an ongoing fee for distribution from their management fees to Morgan Stanley Wealth Management in connection with Morgan Stanley Wealth Management clients that purchase an interest in an Alternative Investment and in some instances pay these fees on the investments held by advisory clients. Morgan Stanley Wealth Management rebates such fees that are received and attributable to an investment held by an advisory client and retains the fees paid in connection with investments held by brokerage clients. Morgan Stanley Wealth Management has a confict of interest in ofering alternative investments because Morgan Stanley Wealth Management or our afliates , in most instances, earn more money in your account from your investments in alternative investments than from other investment options.
It should be noted that the majority of hedge fund indexes are comprised of hedge fund manager returns. This is in contrast to traditional indexes, which are comprised of individual securities in the various market segments they represent and ofer complete transparency as to membership and construction methodology. As such, some believe that hedge fund index returns have certain biases that are not present in traditional indexes. Some of these biases infate index performance, while others may skew performance negatively. However, many studies indicate that overall hedge fund index performance has been biased to the upside. Some studies suggest performance has been infated by up to 260 basis points or more annually depending on the types of biases included and the time period studied. Although there are numerous potential biases that could afect hedge fund returns, we identify some of the more common ones throughout this paper.
Self-selection bias results when certain manager returns are not included in the index returns and may result in performance being skewed up or down . Because hedge funds are private placements, hedge fund managers are able to decide which fund returns they want to report and are able to opt out of reporting to the various databases . Certain hedge fund managers may choose only to report
DISCLOSURES 22
returns for funds with strong returns and opt out of reporting returns for weak performers. Other hedge funds that close may decide to stop reporting in order to retain secrecy, which may cause a downward bias in returns.
Survivorship bias results when certain constituents are removed from an index. This often results from the closure of funds due to poor performance, “blow ups,” or other such events. As such, this bias typically results in performance being skewed higher. As noted, hedge fund index performance biases can result in positive or negative skew. However, it would appear that the skew is more often positive. While it is difcult to quantify the efects precisely, investors should be aware that idiosyncratic factors may be giving hedge fund index returns an artifcial “lift” or upwards bias.
Hedge Funds of Funds and many funds of funds are private investment vehicles restricted to certain qualifed private and institutional investors. They are often speculative and include a high degree of risk. Investors can lose all or a substantial amount of their investment. They may be highly illiquid, can engage in leverage and other speculative practices that may increase volatility and the risk of loss, and may be subject to large investment minimums and initial lockups. They involve complex tax structures, tax-inefcient investing and delays in distributing important tax information. Categorically, hedge funds and funds of funds have higher fees and expenses than traditional investments, and such fees and expenses can lower the returns achieved by investors. Funds of funds have an additional layer of fees over and above hedge fund fees that will ofset returns. An investment in an exchange-traded fund involves risks similar to those of investing in a broadly based portfolio of equity securities traded on an exchange in the relevant securities market, such as market fuctuations caused by such factors as economic and political developments, changes in interest rates and perceived trends in stock and bond prices. An investment in a target date portfolio is subject to the risks attendant to the underlying funds in which it invests, in these portfolios the funds are the Consulting Group Capital Market funds. A target date portfolio is geared to investors who will retire and/or require income at an approximate year. The portfolio is managed to meet the investor’s goals by the pre-established year or “target date.” A target date portfolio will transition its invested assets from a more aggressive portfolio to a more conservative portfolio as the target date draws closer . An investment in the target date portfolio is not guaranteed at any time, including, before or after the target date is reached. Managed futures investments are speculative, involve a high degree of risk, use signifcant leverage, are generally illiquid, have substantial charges, subject investors to conficts of interest, and are suitable only for the risk capital portion of an investor’s portfolio. Managed futures investments do not replace equities or bonds but rather may act as a complement in a well diversifed portfolio. Managed Futures are complex and not appropriate for all investors. Rebalancing does not protect against a loss in declining fnancial markets. There may be a potential tax implication with a rebalancing strategy.
Asset allocation and diversifcation do not assure a proft or protect against loss in declining fnancial markets. Past performance is no guarantee of future results. Actual results may vary.
Tax laws are complex and subject to change. Morgan Stanley Smith Barney LLC (“Morgan Stanley”), its afliates and Morgan Stanley Financial Advisors and Private Wealth Advisors do not provide tax or legal advice and are not “fduciaries” (under ERISA, the Internal Revenue Code or otherwise) with respect to the services or activities described herein except as otherwise provided in writing by Morgan Stanley and/or as described at www.morganstanley.com/disclosures/dol. Individuals are encouraged to consult their tax and legal advisors (a) before establishing a retirement plan or account, and (b) regarding any potential tax, ERISA and related consequences of any investments made under such plan or account.
Annuities and insurance products are ofered in conjunction with Morgan Stanley Smith Barney LLC’s licensed insurance agency afliates.
Indices are unmanaged and investors cannot directly invest in them. They are not subject to expenses or fees and are often comprised of securities and other investment instruments the liquidity of which is not restricted. A particular investment product may consist of securities signifcantly diferent than those in any index referred to herein . Composite index results are shown for illustrative purposes only, generally do not represent the performance of a specifc investment, may not, for a variety of reasons, be a suitable comparison or benchmark for a particular investment and may not necessarily refect the actual investment strategy or objective of a particular investment. Consequently, comparing an investment to a particular index may be of limited use.
This material is not a fnancial plan and does not create an investment advisory relationship between you and your Morgan Stanley Financial Advisor. We are not your fduciary either under the Employee Retirement Income Security Act of 1974 (ERISA) or the Internal Revenue Code of 1986, and any information in this report is not intended to form the primary basis for any investment decision by you, or an investment advice or recommendation for either ERISA or Internal Revenue Code purposes. Morgan Stanley Private Wealth Management will only prepare a fnancial plan at your specifc request using Private Wealth Management approved fnancial planning signature.
We may act in the capacity of a broker or that of an advisor. As your broker, we are not your fduciary and our interests may not always be identical to yours. Please consult with your Private Wealth Advisor to discuss our obligations to disclose to you any conficts we may from time to time have and our duty to act in your best interest. We may be paid both by you and by others who compensate us based on what you buy. Our compensation, including that of your Private Wealth Advisor, may vary by product and over time.
Investment and services ofered through Morgan Stanley Private Wealth Management, a division of Morgan Stanley Smith Barney LLC, Member SIPC.
DISCLOSURES 23
Investment, insurance and annuity products ofered through Morgan Stanley Smith Barney LLC are: NOT FDIC INSURED | MAY LOSE VALUE | NOT BANK GUARANTEED | NOT A BANK DEPOSIT | NOT INSURED BY ANY FEDERAL GOVERNMENT AGENCY
Morgan Stanley Smith Barney LLC is a registered Broker/Dealer, Member SIPC, and not a bank. Where appropriate, Morgan Stanley Smith Barney LLC has entered into arrangements with banks and other third parties to assist in ofering certain banking related products and services.
For index, indicator and survey defnitions referenced in this report please visit the following: https://www.morganstanley.com/wealth-investmentsolutions/wmir-defnitions
GLOBAL INVESTMENT COMMITTEE (GIC) ASSET ALLOCATION MODELS: The Asset Allocation Models are created by Morgan Stanley Wealth Management’s GIC.
HYPOTHETICAL MODEL PERFORMANCE (GROSS): Hypothetical model performance results do not refect the investment or performance of an actual portfolio following a GIC Strategy, but simply refect actual historical performance of selected indices on a real-time basis over the specifed period of time representing the GIC’s strategic and tactical allocations as of the date of this report . The past performance shown here is simulated performance based on benchmark indices, not investment results from an actual portfolio or actual trading. There can be large diferences between hypothetical and actual performance results achieved by a particular asset allocation or trading strategy. Hypothetical performance results do not represent actual trading and are generally designed with the beneft of hindsight. Actual performance results of accounts vary due to, for example, market factors (such as liquidity) and client-specifc factors (such as investment vehicle selection, timing of contributions and withdrawals, restrictions and rebalancing schedules). Clients would not necessarily have obtained the performance results shown here if they had invested in accordance with any GIC Asset Allocation Model for the periods indicated. Despite the limitations of hypothetical performance, these hypothetical performance results allow clients and Financial Advisors to obtain a sense of the risk/return trade-of of diferent asset allocation constructs. The hypothetical performance results in this report are calculated using the returns of benchmark indices for the asset classes , and not the returns of securities, fund or other investment products. Models may contain allocations to Hedge Funds, Private Equity and Private Real Estate. The benchmark indices for these asset classes are not issued on a daily basis. When calculating model performance on a day for which no benchmark index data is issued, we have assumed straight line growth between the index levels issued before and after that date.
FEES REDUCE THE PERFORMANCE OF ACTUAL ACCOUNTS: None of the fees or other expenses (e.g. commissions, mark-ups, mark-downs, fees) associated with actual trading or accounts are refected in the GIC Asset Allocation Models. The GIC Asset Allocation Models and any model performance included in this presentation are intended as educational materials . Were a client to use these models in connection with investing, any investment decisions made would be subject to transaction and other costs which, when compounded over a period of years, would decrease returns. Information regarding Morgan Stanley’s standard advisory fees is available in the Form ADV Part 2, which is available at www.morganstanley.com/adv. The following hypothetical illustrates the compound efect fees have on investment returns: For example, if a portfolio’s annual rate of return is 15% for 5 years and the account pays 50 basis points in fees per annum, the gross cumulative fve-year return would be 101.1% and the fve-year return net of fees would be 96.8%. Fees and/or expenses would apply to clients who invest in investments in an account based on these asset allocations, and would reduce clients’ returns. The impact of fees and/or expenses can be material.
Variable annuities are long-term investments designed for retirement purposes and may be subject to market fuctuations, investment risk, and possible loss of principal. All guarantees, including optional benefts, are based on the fnancial strength and claims-paying ability of the issuing insurance company and do not apply to the underlying investment options. Optional riders may not be able to be purchased in combination and are available at an additional cost. Some optional riders must be elected at time of purchase. Optional riders may be subject to specifc limitations, restrictions, holding periods, costs, and expenses as specifed by the insurance company in the annuity contract. If you are investing in a variable annuity through a tax-advantaged retirement plan such as an IRA, you will get no additional tax advantage from the variable annuity. Under these circumstances, you should only consider buying a variable annuity because of its other features, such as lifetime income payments and death benefts protection. Taxable distributions (and certain deemed distributions) are subject to ordinary income tax and, if taken prior to age 59½, may be subject to a 10% federal income tax penalty. Early withdrawals will reduce the death beneft and cash surrender value.
Equity securities may fuctuate in response to news on companies, industries, market conditions and general economic environment. Ultrashort-term fxed income asset class is comprised of fxed income securities with high quality, very short maturities. They are therefore subject to the risks associated with debt securities such as credit and interest rate risk .
Master Limited Partnerships (MLPs) are limited partnerships or limited liability companies that are taxed as partnerships and whose interests (limited partnership units or limited liability company units) are traded on securities exchanges like shares of common stock. Currently, most MLPs operate in the energy, natural resources or real estate sectors. Investments in MLP interests are subject to the risks generally applicable to companies in the energy and natural resources sectors, including commodity pricing risk, supply and demand risk, depletion risk and exploration risk. Individual MLPs
DISCLOSURES 24
are publicly traded partnerships that have unique risks related to their structure. These include, but are not limited to, their reliance on the capital markets to fund growth, adverse ruling on the current tax treatment of distributions (typically mostly tax deferred), and commodity volume risk. The potential tax benefts from investing in MLPs depend on their being treated as partnerships for federal income tax purposes and, if the MLP is deemed to be a corporation, then its income would be subject to federal taxation at the entity level, reducing the amount of cash available for distribution to the fund which could result in a reduction of the fund’s value. MLPs carry interest rate risk and may underperform in a rising interest rate environment. MLP funds accrue deferred income taxes for future tax liabilities associated with the portion of MLP distributions considered to be a tax -deferred return of capital and for any net operating gains as well as capital appreciation of its investments; this deferred tax liability is refected in the daily NAV, and, as a result, the MLP fund’s after-tax performance could difer signifcantly from the underlying assets even if the pre-tax performance is closely tracked.
Investing in commodities entails signifcant risks. Commodity prices may be afected by a variety of factors at any time, including but not limited to, (i) changes in supply and demand relationships, (ii) governmental programs and policies, (iii) national and international political and economic events, war and terrorist events, (iv) changes in interest and exchange rates, (v) trading activities in commodities and related contracts, (vi) pestilence, technological change and weather, and (vii) the price volatility of a commodity. In addition, the commodities markets are subject to temporary distortions or other disruptions due to various factors, including lack of liquidity, participation of speculators and government intervention. Physical precious metals are non-regulated products. Precious metals are speculative investments, which may experience short-term and long term price volatility. The value of precious metals investments may fuctuate and may appreciate or decline, depending on market conditions. Unlike bonds and stocks, precious metals do not make interest or dividend payments. Therefore, precious metals may not be suitable for investors who require current income. Precious metals are commodities that should be safely stored, which may impose additional costs on the investor.
REITs investing risks are similar to those associated with direct investments in real estate: property value fuctuations, lack of liquidity, limited diversifcation and sensitivity to economic factors such as interest rate changes and market recessions. Risks of private real estate include: illiquidity; a long-term investment horizon with a limited or nonexistent secondary market; lack of transparency; volatility (risk of loss); and leverage. Principal is returned on a monthly basis over the life of a mortgage-backed security. Principal prepayment can signifcantly afect the monthly income stream and the maturity of any type of MBS, including standard MBS, CMOs and Lottery Bonds. Asset-backed securities generally decrease in value as a result of interest rate increases, but may beneft less than other fxed-income securities from declining interest rates, principally because of prepayments.
Yields are subject to change with economic conditions. Yield is only one factor that should be considered when making an investment decision. Credit ratings are subject to change. Duration, the most commonly used measure of bond risk, quantifes the efect of changes in interest rates on the price of a bond or bond portfolio. The longer the duration, the more sensitive the bond or portfolio would be to changes in interest rates. The majority of $25 and $1000 par preferred securities are “callable” meaning that the issuer may retire the securities at specifc prices and dates prior to maturity. Interest/dividend payments on certain preferred issues may be deferred by the issuer for periods of up to 5 to 10 years, depending on the particular issue. The investor would still have income tax liability even though payments would not have been received. Price quoted is per $25 or $1,000 share, unless otherwise specifed. Current yield is calculated by multiplying the coupon by par value divided by the market price. The initial interest rate on a foating-rate security may be lower than that of a fxed-rate security of the same maturity because investors expect to receive additional income due to future increases in the foating security’s underlying reference rate. The reference rate could be an index or an interest rate. However, there can be no assurance that the reference rate will increase. Some foating-rate securities may be subject to call risk. The market value of convertible bonds and the underlying common stock(s) will fuctuate and after purchase may be worth more or less than original cost. If sold prior to maturity, investors may receive more or less than their original purchase price or maturity value, depending on market conditions. Callable bonds may be redeemed by the issuer prior to maturity. Additional call features may exist that could afect yield. Some $25 or $1000 par preferred securities are QDI (Qualifed Dividend Income) eligible. Information on QDI eligibility is obtained from third party sources. The dividend income on QDI eligible preferreds qualifes for a reduced tax rate. Many traditional ‘dividend paying’ perpetual preferred securities (traditional preferreds with no maturity date) are QDI eligible. In order to qualify for the preferential tax treatment all qualifying preferred securities must be held by investors for a minimum period – 91 days during a 180 day window period, beginning 90 days before the ex-dividend date.
Companies paying dividends can reduce or cut payouts at any time.
Nondiversifcation: For a portfolio that holds a concentrated or limited number of securities, a decline in the value of these investments would cause the portfolio’s overall value to decline to a greater degree than a less concentrated portfolio. The indices selected by Morgan Stanley Wealth Management to measure performance are representative of broad asset classes. Morgan Stanley Wealth Management retains the right to change representative indices at any time. Because of their narrow focus, sector investments tend to be more volatile than investments that diversify across many sectors and companies.
Growth investing does not guarantee a proft or eliminate risk. The stocks of these companies can have relatively high valuations. Because of these high valuations, an investment in a growth stock can be more risky than an investment in a company with more modest growth expectations. Value investing does not guarantee a proft or eliminate risk. Not all companies whose stocks are
DISCLOSURES 25
considered to be value stocks are able to turn their business around or successfully employ corrective strategies which would result in stock prices that do not rise as initially expected .Any type of continuous or periodic investment plan does not assure a proft and does not protect against loss in declining markets. Since such a plan involves continuous investment in securities regardless of fuctuating price levels of such securities, the investor should consider his fnancial ability to continue his purchases through periods of low price levels .This material is disseminated in the United States of America by Morgan Stanley Smith Barney LLC. Morgan Stanley Wealth Management is not acting as a municipal advisor to any municipal entity or obligated person within the meaning of Section 15B of the Securities Exchange Act (the “Municipal Advisor Rule”) and the opinions or views contained herein are not intended to be , and do not constitute, advice within the meaning of the Municipal Advisor Rule. This material, or any portion thereof, may not be reprinted, sold or redistributed without the written consent of Morgan Stanley Smith Barney LLC.© 2020 Morgan Stanley Smith Barney LLC. Member SIPC.
DISCLOSURES 26
Investment Results As of December 31, 2019
1999 Avenue of the Stars, Suite 2400 Los Angeles, CA 90067
Cal Poly Pomona General Investment Portfolio
Andrew B. Price, CIMA® (310) 788-2043 Managing Director, Wealth Management Institutional Consulting Director [email protected]
Karin Longhurst, CTFA (310) 788-2156Senior Vice PresidentSenior Institutional Consultant [email protected]
Todd Au, CIMA® (707) 571-5704Senior Investment Management Consultant [email protected]
3562 Round Barn Circle Santa Rosa, CA 95403
27
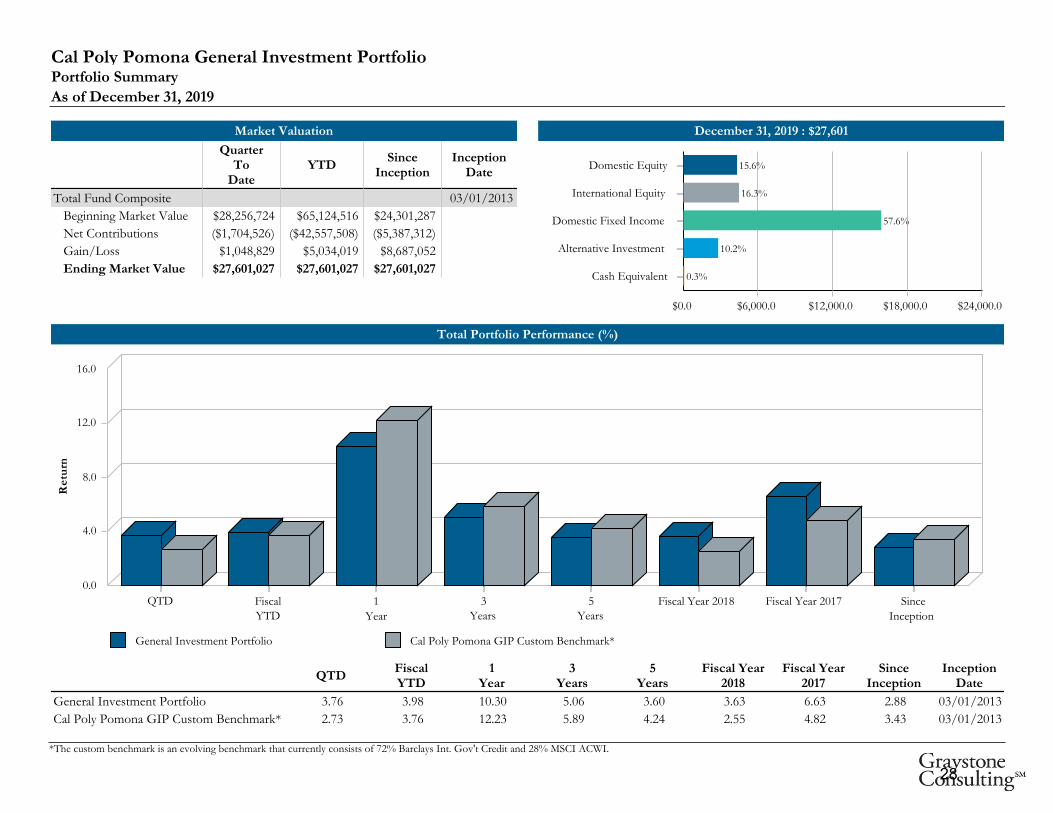
Market Valuation
QuarterTo
DateYTD
SinceInception
InceptionDate
Total Fund Composite 03/01/2013
Beginning Market Value $28,256,724 $65,124,516 $24,301,287
Net Contributions ($1,704,526) ($42,557,508) ($5,387,312)
Gain/Loss $1,048,829 $5,034,019 $8,687,052
Ending Market Value $27,601,027 $27,601,027 $27,601,027
December 31, 2019 : $27,601
$0.0 $6,000.0 $12,000.0 $18,000.0 $24,000.0
Cash Equivalent
Alternative Investment
Domestic Fixed Income
International Equity
Domestic Equity
0.3%
10.2%
57.6%
16.3%
15.6%
Total Portfolio Performance (%)
General Investment Portfolio Cal Poly Pomona GIP Custom Benchmark*
0.0
4.0
8.0
12.0
16.0
Ret
urn
QTD Fiscal YTD
1Year
3Years
5Years
Fiscal Year 2018 Fiscal Year 2017 SinceInception
QTDFiscalYTD
1Year
3Years
5Years
Fiscal Year2018
Fiscal Year2017
SinceInception
InceptionDate
General Investment Portfolio 3.76 3.98 10.30 5.06 3.60 3.63 6.63 2.88 03/01/2013
Cal Poly Pomona GIP Custom Benchmark* 2.73 3.76 12.23 5.89 4.24 2.55 4.82 3.43 03/01/2013
Cal Poly Pomona General Investment PortfolioPortfolio SummaryAs of December 31, 2019
*The custom benchmark is an evolving benchmark that currently consists of 72% Barclays Int. Gov't Credit and 28% MSCI ACWI.
28
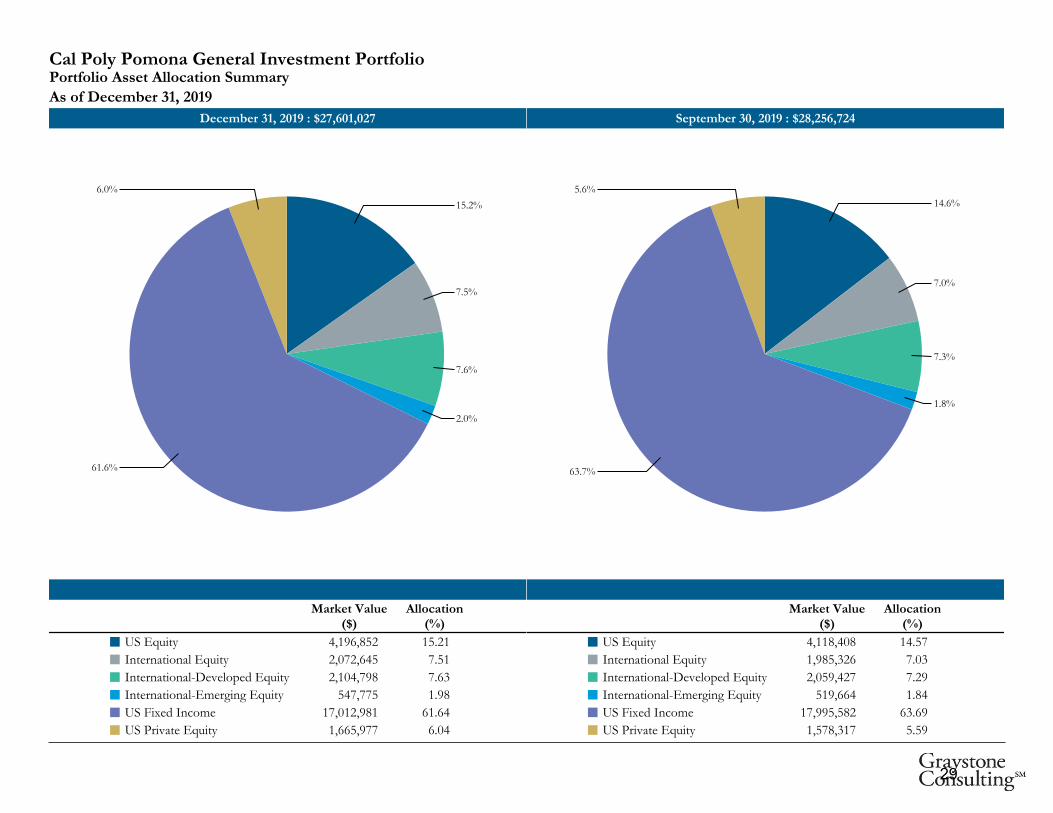
December 31, 2019 : $27,601,027
15.2%
7.5%
7.6%
2.0%
6.0%
61.6%
September 30, 2019 : $28,256,724
14.6%
7.0%
7.3%
1.8%
5.6%
63.7%
Market Value($)
Allocation(%)
US Equity 4,196,852 15.21¢
International Equity 2,072,645 7.51¢
International-Developed Equity 2,104,798 7.63¢
International-Emerging Equity 547,775 1.98¢
US Fixed Income 17,012,981 61.64¢
US Private Equity 1,665,977 6.04¢
Market Value($)
Allocation(%)
US Equity 4,118,408 14.57¢
International Equity 1,985,326 7.03¢
International-Developed Equity 2,059,427 7.29¢
International-Emerging Equity 519,664 1.84¢
US Fixed Income 17,995,582 63.69¢
US Private Equity 1,578,317 5.59¢
Cal Poly Pomona General Investment PortfolioPortfolio Asset Allocation SummaryAs of December 31, 2019
29
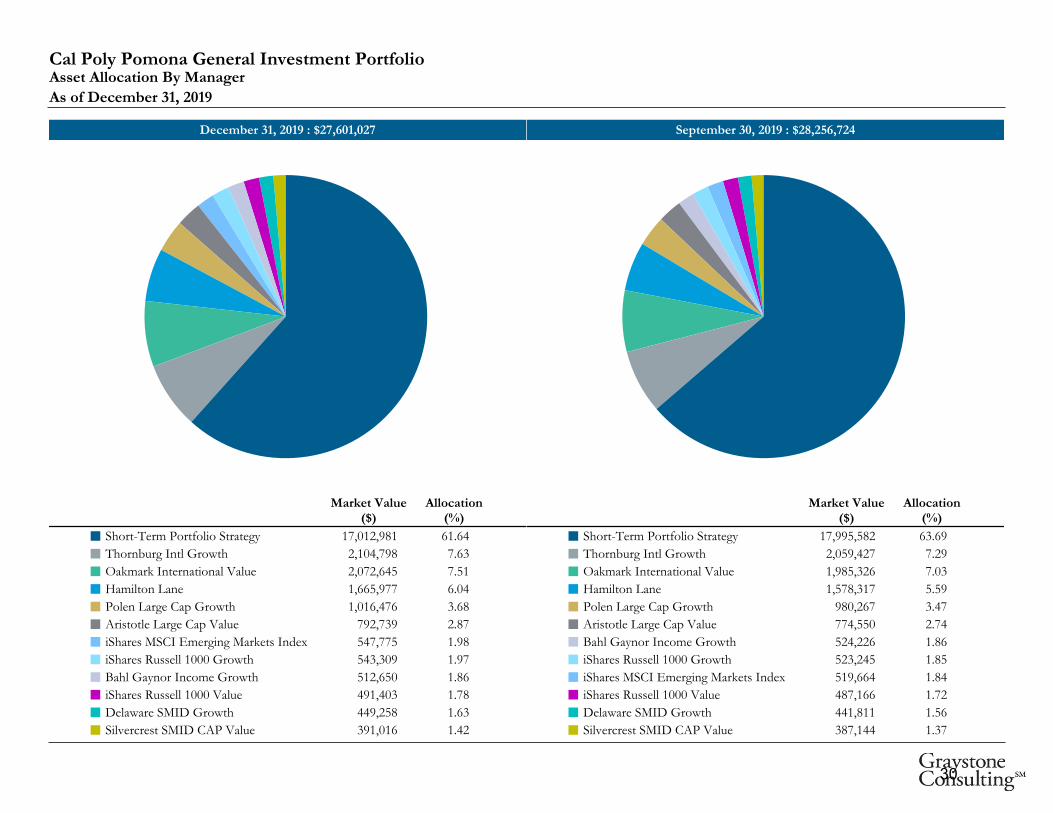
December 31, 2019 : $27,601,027 September 30, 2019 : $28,256,724
Market Value($)
Allocation(%)
Short-Term Portfolio Strategy 17,012,981 61.64¢
Thornburg Intl Growth 2,104,798 7.63¢
Oakmark International Value 2,072,645 7.51¢
Hamilton Lane 1,665,977 6.04¢
Polen Large Cap Growth 1,016,476 3.68¢
Aristotle Large Cap Value 792,739 2.87¢
iShares MSCI Emerging Markets Index 547,775 1.98¢
iShares Russell 1000 Growth 543,309 1.97¢
Bahl Gaynor Income Growth 512,650 1.86¢
iShares Russell 1000 Value 491,403 1.78¢
Delaware SMID Growth 449,258 1.63¢
Silvercrest SMID CAP Value 391,016 1.42¢
Market Value($)
Allocation(%)
Short-Term Portfolio Strategy 17,995,582 63.69¢
Thornburg Intl Growth 2,059,427 7.29¢
Oakmark International Value 1,985,326 7.03¢
Hamilton Lane 1,578,317 5.59¢
Polen Large Cap Growth 980,267 3.47¢
Aristotle Large Cap Value 774,550 2.74¢
Bahl Gaynor Income Growth 524,226 1.86¢
iShares Russell 1000 Growth 523,245 1.85¢
iShares MSCI Emerging Markets Index 519,664 1.84¢
iShares Russell 1000 Value 487,166 1.72¢
Delaware SMID Growth 441,811 1.56¢
Silvercrest SMID CAP Value 387,144 1.37¢
Cal Poly Pomona General Investment PortfolioAsset Allocation By Manager
As of December 31, 2019
30
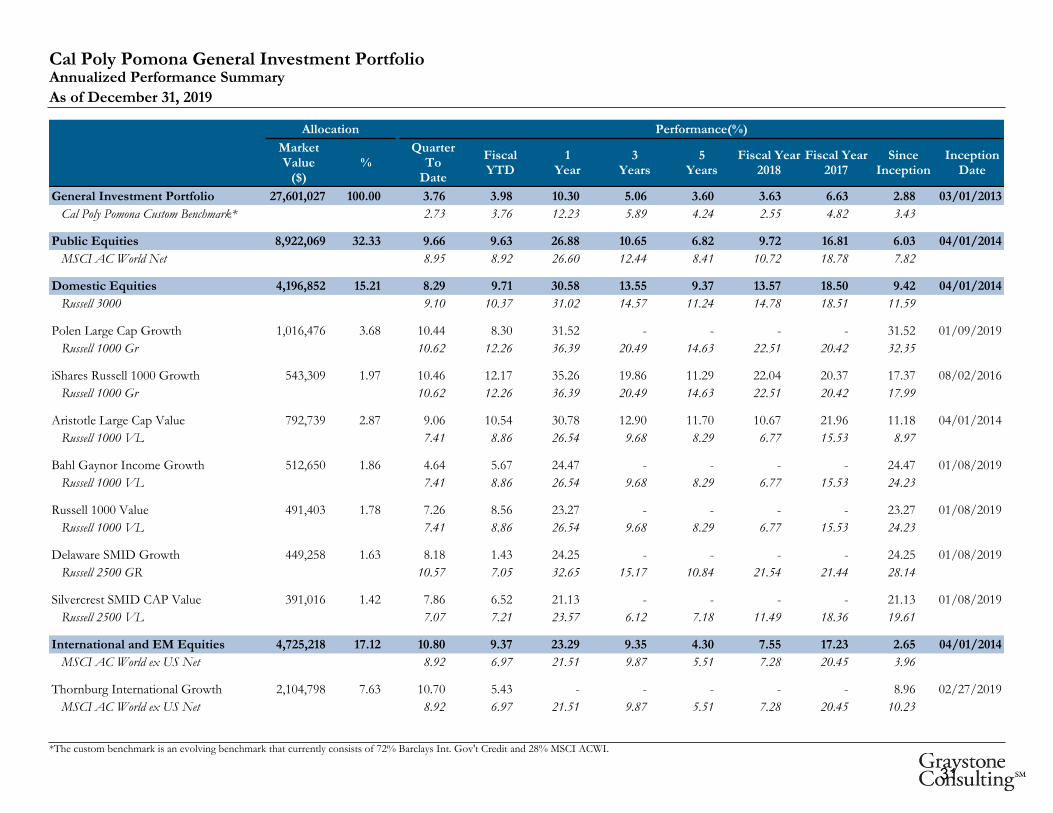
Allocation
MarketValue
($)%
Performance(%)
QuarterTo
Date
FiscalYTD
1Year
3Years
5Years
Fiscal Year2018
Fiscal Year2017
SinceInception
InceptionDate
General Investment Portfolio 27,601,027 100.00 3.76 3.98 10.30 5.06 3.60 3.63 6.63 2.88 03/01/2013
Cal Poly Pomona Custom Benchmark* 2.73 3.76 12.23 5.89 4.24 2.55 4.82 3.43
Public Equities 8,922,069 32.33 9.66 9.63 26.88 10.65 6.82 9.72 16.81 6.03 04/01/2014
MSCI AC World Net 8.95 8.92 26.60 12.44 8.41 10.72 18.78 7.82
Domestic Equities 4,196,852 15.21 8.29 9.71 30.58 13.55 9.37 13.57 18.50 9.42 04/01/2014
Russell 3000 9.10 10.37 31.02 14.57 11.24 14.78 18.51 11.59
Polen Large Cap Growth 1,016,476 3.68 10.44 8.30 31.52 - - - - 31.52 01/09/2019
Russell 1000 Gr 10.62 12.26 36.39 20.49 14.63 22.51 20.42 32.35
iShares Russell 1000 Growth 543,309 1.97 10.46 12.17 35.26 19.86 11.29 22.04 20.37 17.37 08/02/2016
Russell 1000 Gr 10.62 12.26 36.39 20.49 14.63 22.51 20.42 17.99
Aristotle Large Cap Value 792,739 2.87 9.06 10.54 30.78 12.90 11.70 10.67 21.96 11.18 04/01/2014
Russell 1000 VL 7.41 8.86 26.54 9.68 8.29 6.77 15.53 8.97
Bahl Gaynor Income Growth 512,650 1.86 4.64 5.67 24.47 - - - - 24.47 01/08/2019
Russell 1000 VL 7.41 8.86 26.54 9.68 8.29 6.77 15.53 24.23
Russell 1000 Value 491,403 1.78 7.26 8.56 23.27 - - - - 23.27 01/08/2019
Russell 1000 VL 7.41 8.86 26.54 9.68 8.29 6.77 15.53 24.23
Delaware SMID Growth 449,258 1.63 8.18 1.43 24.25 - - - - 24.25 01/08/2019
Russell 2500 GR 10.57 7.05 32.65 15.17 10.84 21.54 21.44 28.14
Silvercrest SMID CAP Value 391,016 1.42 7.86 6.52 21.13 - - - - 21.13 01/08/2019
Russell 2500 VL 7.07 7.21 23.57 6.12 7.18 11.49 18.36 19.61
International and EM Equities 4,725,218 17.12 10.80 9.37 23.29 9.35 4.30 7.55 17.23 2.65 04/01/2014
MSCI AC World ex US Net 8.92 6.97 21.51 9.87 5.51 7.28 20.45 3.96
Thornburg International Growth 2,104,798 7.63 10.70 5.43 - - - - - 8.96 02/27/2019
MSCI AC World ex US Net 8.92 6.97 21.51 9.87 5.51 7.28 20.45 10.23
Cal Poly Pomona General Investment PortfolioAnnualized Performance Summary
As of December 31, 2019
*The custom benchmark is an evolving benchmark that currently consists of 72% Barclays Int. Gov't Credit and 28% MSCI ACWI.
31
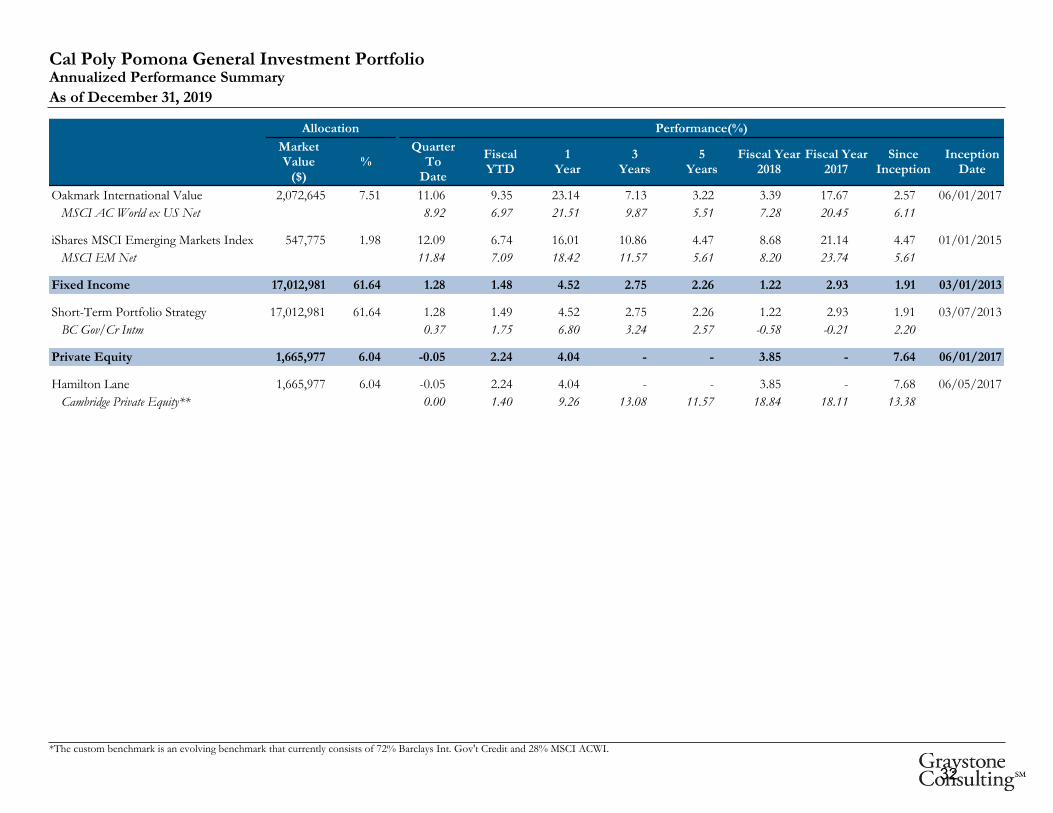
Cal Poly Pomona General Investment PortfolioAnnualized Performance Summary
As of December 31, 2019
Allocation
MarketValue
($)%
Performance(%)
QuarterTo
Date
FiscalYTD
1Year
3Years
5Years
Fiscal Year2018
Fiscal Year2017
SinceInception
InceptionDate
Oakmark International Value 2,072,645 7.51 11.06 9.35 23.14 7.13 3.22 3.39 17.67 2.57 06/01/2017
MSCI AC World ex US Net 8.92 6.97 21.51 9.87 5.51 7.28 20.45 6.11
iShares MSCI Emerging Markets Index 547,775 1.98 12.09 6.74 16.01 10.86 4.47 8.68 21.14 4.47 01/01/2015
MSCI EM Net 11.84 7.09 18.42 11.57 5.61 8.20 23.74 5.61
Fixed Income 17,012,981 61.64 1.28 1.48 4.52 2.75 2.26 1.22 2.93 1.91 03/01/2013
Short-Term Portfolio Strategy 17,012,981 61.64 1.28 1.49 4.52 2.75 2.26 1.22 2.93 1.91 03/07/2013
BC Gov/Cr Intm 0.37 1.75 6.80 3.24 2.57 -0.58 -0.21 2.20
Private Equity 1,665,977 6.04 -0.05 2.24 4.04 - - 3.85 - 7.64 06/01/2017
Hamilton Lane 1,665,977 6.04 -0.05 2.24 4.04 - - 3.85 - 7.68 06/05/2017
Cambridge Private Equity** 0.00 1.40 9.26 13.08 11.57 18.84 18.11 13.38
*The custom benchmark is an evolving benchmark that currently consists of 72% Barclays Int. Gov't Credit and 28% MSCI ACWI.
32
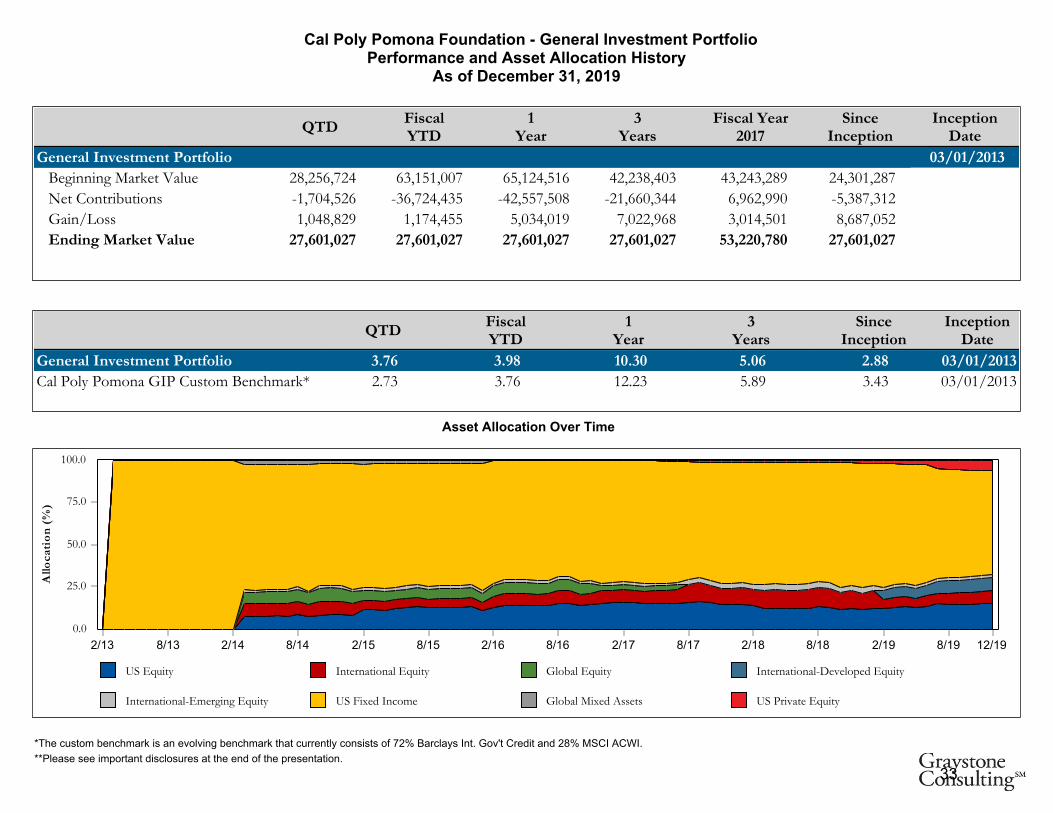
Asset Allocation Over Time
QTDFiscalYTD
1Year
3Years
Fiscal Year2017
SinceInception
InceptionDate
General Investment Portfolio 03/01/2013
Beginning Market Value 28,256,724 63,151,007 65,124,516 42,238,403 43,243,289 24,301,287
Net Contributions -1,704,526 -36,724,435 -42,557,508 -21,660,344 6,962,990 -5,387,312
Gain/Loss 1,048,829 1,174,455 5,034,019 7,022,968 3,014,501 8,687,052
Ending Market Value 27,601,027 27,601,027 27,601,027 27,601,027 53,220,780 27,601,027
QTDFiscalYTD
1Year
3Years
SinceInception
InceptionDate
General Investment Portfolio 3.76 3.98 10.30 5.06 2.88 03/01/2013
Cal Poly Pomona GIP Custom Benchmark* 2.73 3.76 12.23 5.89 3.43 03/01/2013
US Equity International Equity Global Equity International-Developed Equity
International-Emerging Equity US Fixed Income Global Mixed Assets US Private Equity
0.0
25.0
50.0
75.0
100.0
Allo
cati
on
(%)
2/13 8/13 2/14 8/14 2/15 8/15 2/16 8/16 2/17 8/17 2/18 8/18 2/19 8/19 12/19
Cal Poly Pomona Foundation - General Investment PortfolioPerformance and Asset Allocation History
As of December 31, 2019
*The custom benchmark is an evolving benchmark that currently consists of 72% Barclays Int. Gov't Credit and 28% MSCI ACWI.
**Please see important disclosures at the end of the presentation.
33
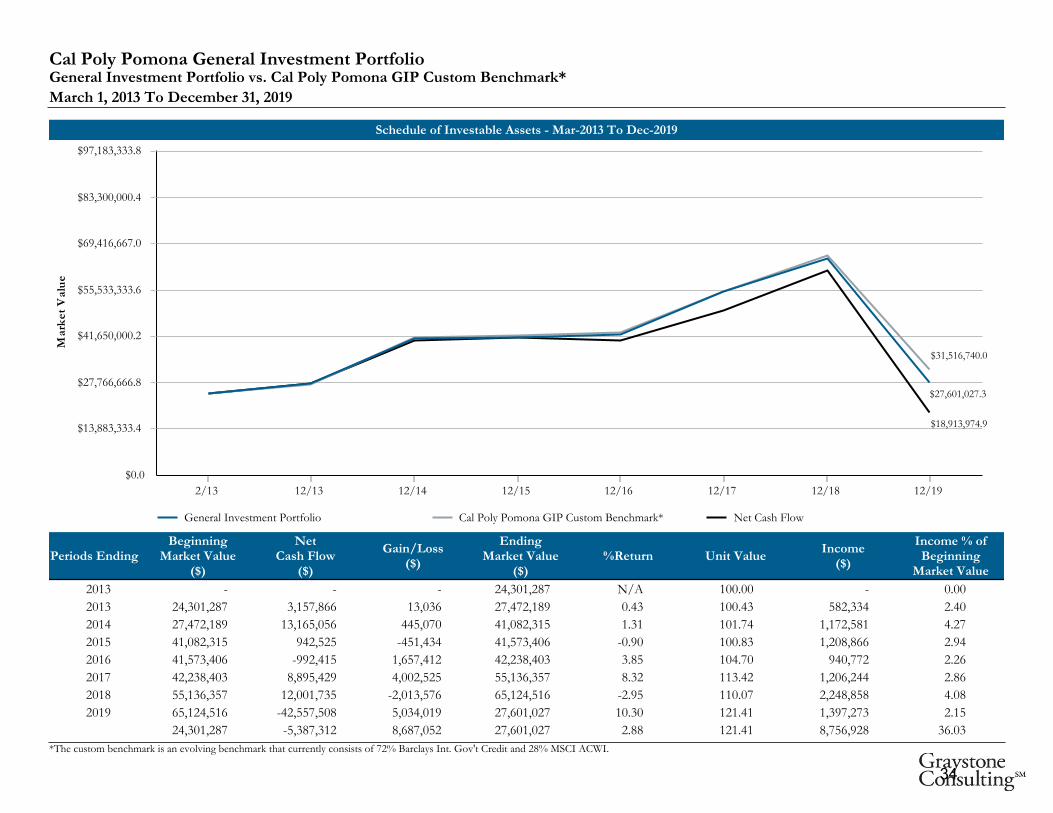
Schedule of Investable Assets - Mar-2013 To Dec-2019
General Investment Portfolio Cal Poly Pomona GIP Custom Benchmark* Net Cash Flow
$0.0
$13,883,333.4
$27,766,666.8
$41,650,000.2
$55,533,333.6
$69,416,667.0
$83,300,000.4
$97,183,333.8
Mar
ket
Val
ue
2/13 12/13 12/14 12/15 12/16 12/17 12/18 12/19
$18,913,974.9
$31,516,740.0
$27,601,027.3
Periods EndingBeginning
Market Value($)
NetCash Flow
($)
Gain/Loss($)
EndingMarket Value
($)%Return Unit Value
Income($)
Income % ofBeginning
Market Value
2013 - - - 24,301,287 N/A 100.00 - 0.00
2013 24,301,287 3,157,866 13,036 27,472,189 0.43 100.43 582,334 2.40
2014 27,472,189 13,165,056 445,070 41,082,315 1.31 101.74 1,172,581 4.27
2015 41,082,315 942,525 -451,434 41,573,406 -0.90 100.83 1,208,866 2.94
2016 41,573,406 -992,415 1,657,412 42,238,403 3.85 104.70 940,772 2.26
2017 42,238,403 8,895,429 4,002,525 55,136,357 8.32 113.42 1,206,244 2.86
2018 55,136,357 12,001,735 -2,013,576 65,124,516 -2.95 110.07 2,248,858 4.08
2019 65,124,516 -42,557,508 5,034,019 27,601,027 10.30 121.41 1,397,273 2.15
24,301,287 -5,387,312 8,687,052 27,601,027 2.88 121.41 8,756,928 36.03
Cal Poly Pomona General Investment PortfolioGeneral Investment Portfolio vs. Cal Poly Pomona GIP Custom Benchmark*
March 1, 2013 To December 31, 2019
*The custom benchmark is an evolving benchmark that currently consists of 72% Barclays Int. Gov't Credit and 28% MSCI ACWI.
34
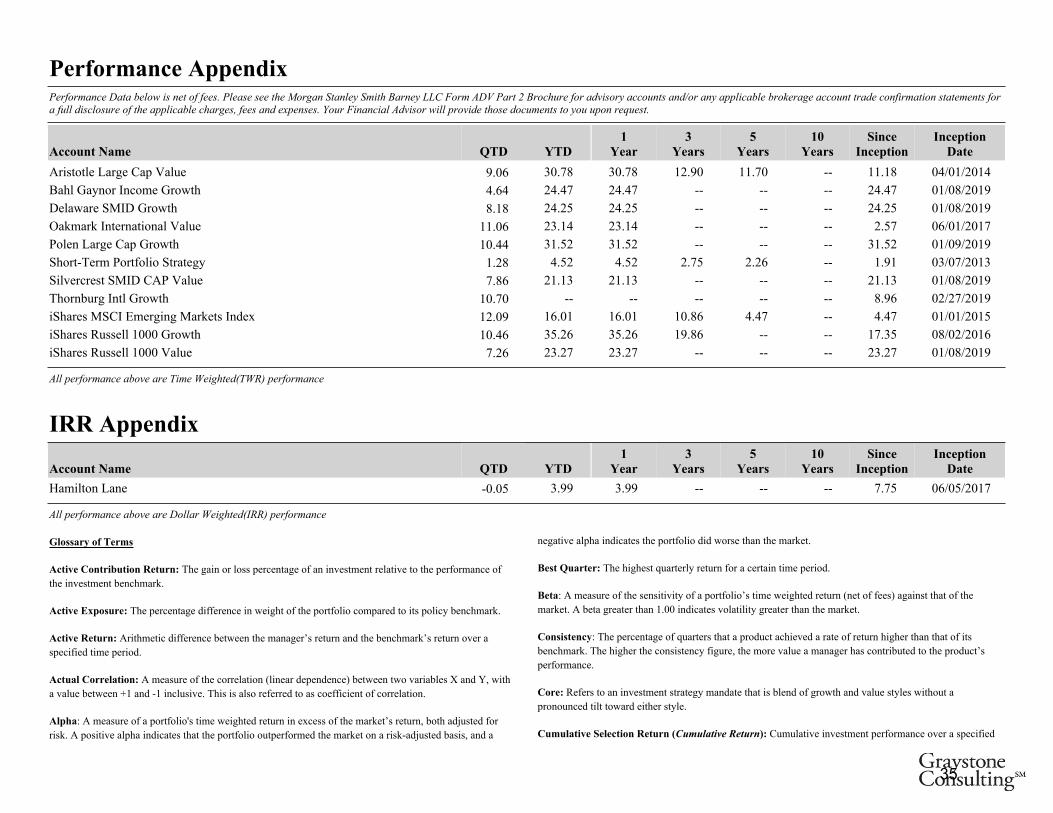
Account Name YTD1
Year3
Years5
Years10
YearsSince
InceptionInception
Date
Performance Appendix
QTD
Performance Data below is net of fees. Please see the Morgan Stanley Smith Barney LLC Form ADV Part 2 Brochure for advisory accounts and/or any applicable brokerage account trade confirmation statements fora full disclosure of the applicable charges, fees and expenses. Your Financial Advisor will provide those documents to you upon request.
Aristotle Large Cap Value 30.78 30.78 12.90 11.70 -- 11.18 04/01/20149.06
Bahl Gaynor Income Growth 24.47 24.47 -- -- -- 24.47 01/08/20194.64
Delaware SMID Growth 24.25 24.25 -- -- -- 24.25 01/08/20198.18
Oakmark International Value 23.14 23.14 -- -- -- 2.57 06/01/201711.06
Polen Large Cap Growth 31.52 31.52 -- -- -- 31.52 01/09/201910.44
Short-Term Portfolio Strategy 4.52 4.52 2.75 2.26 -- 1.91 03/07/20131.28
Silvercrest SMID CAP Value 21.13 21.13 -- -- -- 21.13 01/08/20197.86
Thornburg Intl Growth -- -- -- -- -- 8.96 02/27/201910.70
iShares MSCI Emerging Markets Index 16.01 16.01 10.86 4.47 -- 4.47 01/01/201512.09
iShares Russell 1000 Growth 35.26 35.26 19.86 -- -- 17.35 08/02/201610.46
iShares Russell 1000 Value 23.27 23.27 -- -- -- 23.27 01/08/20197.26
All performance above are Time Weighted(TWR) performance
QTDAccount Name YTD1
Year3
Years5
Years10
YearsSince
InceptionInception
Date
IRR Appendix
Hamilton Lane 3.99 3.99 -- -- -- 7.75 06/05/2017-0.05
All performance above are Dollar Weighted(IRR) performance
Glossary of Terms
Active Contribution Return: The gain or loss percentage of an investment relative to the performance of
the investment benchmark.
Active Exposure: The percentage difference in weight of the portfolio compared to its policy benchmark.
Active Return: Arithmetic difference between the manager’s return and the benchmark’s return over a
specified time period.
Actual Correlation: A measure of the correlation (linear dependence) between two variables X and Y, with
a value between +1 and -1 inclusive. This is also referred to as coefficient of correlation.
Alpha: A measure of a portfolio's time weighted return in excess of the market’s return, both adjusted for
risk. A positive alpha indicates that the portfolio outperformed the market on a risk-adjusted basis, and a
negative alpha indicates the portfolio did worse than the market.
negative alpha indicates the portfolio did worse than the market.
Best Quarter: The highest quarterly return for a certain time period.
Beta: A measure of the sensitivity of a portfolio’s time weighted return (net of fees) against that of the
market. A beta greater than 1.00 indicates volatility greater than the market.
Consistency: The percentage of quarters that a product achieved a rate of return higher than that of its
benchmark. The higher the consistency figure, the more value a manager has contributed to the product’s
performance.
Core: Refers to an investment strategy mandate that is blend of growth and value styles without a
pronounced tilt toward either style.
Cumulative Selection Return (Cumulative Return): Cumulative investment performance over a specified
period of time.
35

period of time.
Distribution Rate: The most recent distribution paid, annualized, and then divided by the current market
price. Distribution rate may consist of investment income, short-term capital gains, long-term capital gains,
and/or return of capital.
Down Market Capture: The ratio of average portfolio returns over the benchmark during periods of
negative benchmark return. Lower values indicate better product performance.
Downside Risk: A measure similar to standard deviation, but focuses only on the negative movements of
the return series. It is calculated by taking the standard deviation of the negative quarterly set of returns. The
higher the value, the more risk the product has.
Downside Semi Deviation: A statistical calculation that measures the volatility of returns below a
minimum acceptable return. This return measure isolates the negative portion of volatility: the larger the
number, the greater the volatility.
Drawdown: A drawdown is the peak-to-trough decline during a specific period of an investment, fund or
commodity.
Excess over Benchmark: The percentage gain or loss of an investment relative to the investment's
benchmark.
Excess Return: Arithmetic difference between the manager’s return and the risk-free return over a specified
time period.
Growth: A diversified investment strategy which includes investment selections that have capital
appreciation as the primary goal, with little or no dividend payouts. These strategies can include
reinvestment in expansion, acquisitions, and/or research and development opportunities.
Growth of Dollar: The aggregate amount an investment has gained or lost over a certain time period, also
referred to as Cumulative Return, stated in terms of the amount to which an initial dollar investment would
have grown over the given time period.
Investment Decision Process (IDP): A model for structuring the investment process and implementing the
correct attribution methodologies. The IDP includes every decision made concerning the division of the
assets under management over the various asset categories. To analyze each decision‘s contribution to the
total return, a modeling approach must measure the marginal value of every individual decision. In this
respect, the hierarchy of the decisions becomes very important. We therefore use the IDP model, which
serves as a proper foundation for registering the decisions and relating them to each other.
Information Ratio: Measured by dividing the active rate of return by the tracking error. The higher the
Information Ratio, the more value-added contribution by the manager.
Jensen’s Alpha: The Jensen's alpha measure is a risk-adjusted performance measure that represents theaverage return on a portfolio or investment above or below that predicted by the capital asset pricing model(CAPM) given the portfolio's or investment's beta and the average market return. This metric is alsocommonly referred to as alpha..
Kurtosis: A statistical measure that is used to describe the distribution, or skewness, of observed dataaround the mean, sometimes referred to as the volatility of volatility.
around the mean, sometimes referred to as the volatility of volatility.
Maximum Drawdown: The drawdown is defined as the percent retrenchment from a fund's peak to thefund's trough value. It is in effect from the time the fund's retrenchment begins until a new fund high isreached. The maximum drawdown encompasses both the period from the fund's peak to the fund's valley(length), and the time from the fund's valley to a new fund high (recovery). It measures the largestpercentage drawdown that has occurred in any fund's data record.
Modern Portfolio Theory (MPT): An investment analysis theory on how risk-averse investors canconstruct portfolios to optimize or maximize expected return based on a given level of market risk,emphasizing that risk is an inherent part of higher reward.
Mutual Fund (MF): An investment program funded by shareholders that trade in diversified holdings andis professionally managed.
Peer Group: A combination of funds that share the same investment style combined as a group forcomparison purposes.
Peer/ Plan Sponsor Universe: A combination of asset pools of total plan investments by specific sponsorand plan types for comparison purposes.
Performance Ineligible Assets: Performance returns are not calculated for certain assets because accuratevaluations and transaction data for these assets are not processed or maintained by us. Common examples ofthese include life insurance, some annuities and some assets held externally.
Performance Statistics: A generic term for various measures of investment performance measurementterms.
Portfolio Characteristics: A generic term for various measures of investment portfolio characteristics.
Preferred Return: A term used in the private equity (PE) world, and also referred to as a “Hurdle Rate.” Itrefers to the threshold return that the limited partners of a private equity fund must receive, prior to the PEfirm receiving its carried interest or "carry."
Ratio of Cumulative Wealth: A defined ratio of the Cumulative Return of the portfolio divided by theCumulative Return of the benchmark for a certain time period.
Regression Based Analysis: A statistical process for estimating the relationships among variables. Itincludes many techniques for modeling and analyzing several variables, when the focus is on therelationship between a dependent variable and one or more independent variables
Residual Correlation: Within returns-based style analysis, residual correlation refers to the portion of astrategy’s return pattern that cannot be explained by its correlation to the asset-class benchmarks to which itis being compared.
Return: A rate of investment performance for the specified period.
Rolling Percentile Ranking: A measure of an investment portfolio’s ranking versus a peer group for aspecific rolling time period (i.e. Last 3 Years, Last 5 years, etc.).
R-Squared: The percentage of a portfolio's performance explained by the behavior of the appropriatebenchmark. High R-Squared means a higher correlation of the portfolio's performance to the appropriatebenchmark.
SA/CF (Separate Account/Comingled Fund): Represents an acronym for Separate Account andCommingled Fund investment vehicles.
Sector Benchmark: A market index that serves as a proxy for a sector within an asset class.
36

Sharpe Ratio: Represents the excess rate of return over the risk free return divided by the standarddeviation of the excess return. The result is the absolute rate of return per unit of risk. The higher the value,the better the product’s historical risk-adjusted performance results in.
Standard Deviation: A statistical measure of the range of a portfolio's performance; the variability of areturn around its average return over a specified time period.
Total Fund Benchmark: The policy benchmark for a complete asset pool that could consist of multipleinvestment mandates.
Total Fund Composite: The aggregate of multiple portfolios within an asset pool or household.
Tracking Error: A measure of standard deviation for a portfolio's investment performance, relative to theperformance of an appropriate market benchmark.
Treynor Ratio: A ratio that divides the excess return (above the risk free rate) by the portfolio’s beta toarrive at a unified measure of risk adjusted return. It is generally used to rank portfolios, funds andbenchmarks. A higher ratio is indicative of higher returns per unit of market risk. This measurement canhelp determine if the portfolio is reaching its goal of increasing returns while managing market risk.
Up Market Capture: The ratio of average portfolio returns over the benchmark during periods of positivebenchmark return. Higher values indicate better product performance.
Upside Semi Deviation: A statistical calculation that measures the volatility of returns above an acceptablereturn. This return measure isolates the positive portion of volatility: the larger the number, the greater thevolatility.
Value: A diversified investment strategy that includes investment selections which tend to trade at a lowerprice relative to its dividends, earnings, and sales. Common attributes are stocks that include high dividend,low price-to-book ratio, and/or low price-to-earnings ratio.
Worst Quarter: The lowest rolling quarterly return for a certain time period.
Information Disclosures
Performance results are annualized for time periods greater than one year and include all cash and cash
equivalents, realized and unrealized capital gains and losses, and dividends, interest and income. The
investment results depicted herein represent historical performance. As a result of recent market activity,
current performance may vary from the figures shown. Past performance is not a guarantee of future
results.
Please see the Morgan Stanley Smith Barney LLC Form ADV Part 2 Brochure for advisory accounts
and/or any applicable brokerage account trade confirmation statements for a full disclosure of the
applicable charges, fees and expenses. Your Financial Advisor will provide those documents to you upon
request.
Benchmark indices and blends included in this material are for informational purposes only, are
provided solely as a comparison tool and may not reflect the underlying composition and/or investment
objective(s) associated with the account(s). Indices are unmanaged and not available for direct
investment. Index returns do not take into account fees or other charges. Such fees and charges would
reduce performance.
The performance data shown reflects past performance, which does not guarantee future results.
The performance data shown reflects past performance, which does not guarantee future results.
Investment return and principal will fluctuate so that an investor’s shares when redeemed may be worth
more or less than original cost. Please note, current performance may be higher or lower than the
performance data shown. For up to date month-end performance information, please contact your
Financial Advisor or visit the funds’ company website.
Investors should carefully consider the fund’s investment objectives, risks, charges and expenses before
investing. The prospectus and, if available the summary prospectus, contains this and other information
that should be read carefully before investing. Investors should review the information in the prospectus
carefully. To obtain a prospectus, please contact your Financial Advisor or visit the funds’ company
website.
Past performance is no guarantee of future results.
Investing involves market risk, including possible loss of principal. Growth investing does not guarantee a
profit or eliminate risk. The stocks of these companies can have relatively high valuations. Because of these
high valuations, an investment in a growth stock can be more risky than an investment in a company with
more modest growth expectations. Value investing involves the risk that the market may not recognize that
securities are undervalued and they may not appreciate as anticipated. Small and mid-capitalization
companies may lack the financial resources, product diversification and competitive strengths of larger
companies. The securities of small capitalization companies may not trade as readily as, and be subject to
higher volatility than those of larger, more established companies. Bond funds and bond holdings have the
same interest rate, inflation and credit risks that are associated with the underlying bonds owned by the
funds. The return of principal in bond funds, and in funds with significant bond holdings, is not guaranteed.
International securities’ prices may carry additional risks, including foreign economic, political, monetary
and/or legal factors, changing currency exchange rates, foreign taxes and differences in financial and
accounting standards. International investing may not be for everyone. These risks may be magnified in
emerging markets. Alternative investments, including private equity funds, real estate funds, hedge funds,
managed futures funds, and funds of hedge funds, private equity, and managed futures funds, are
speculative and entail significant risks that can include losses due to leveraging or\other speculative
investment practices, lack of liquidity, volatility of returns, restrictions on transferring interests in a fund,
potential lack of diversification, absence and/or delay of information regarding valuations and pricing,
complex tax structures and delays in tax reporting, less regulation and higher fees than mutual funds and
risks associated with the operations, personnel and processes of the advisor. Master Limited Partnerships
(MLPs) are limited partnerships or limited liability companies that are taxed as partnerships and whose
interests (limited partnership units or limited liability company units) are traded on securities exchanges like
shares of common stock. Currently, most MLPs operate in the energy, natural resources or real estate
sectors. Investments in MLP interests are subject to the risks generally applicable to companies in the
energy and natural resources sectors, including commodity pricing risk, supply and demand risk, depletion
risk and exploration risk; and MLP interests in the real estate sector are subject to special risks, including
interest rate and property value fluctuations, as well as risks related to general and economic conditions.
Because of their narrow focus, MLPs maintain exposure to price volatility of commodities and/or
underlying assets and tend to be more volatile than investments that diversify across many sectors and
companies. MLPs are also subject to additional risks including: investors having limited control and rights
to vote on matters affecting the MLP, limited access to capital, cash flow risk, lack of liquidity, dilution risk,
conflict of interests, and limited call rights related to acquisitions.
Mortgage backed securities also involve prepayment risk, in that faster or slower prepayments than
expected on underlying mortgage loans can dramatically alter the yield-to-maturity of a mortgage-backed
security and prepayment risk includes the possibility that a fund may invest the proceeds at generally lower
interest rates.
37

interest rates.
Tax managed funds may not meet their objective of being tax-efficient.
Real estate investments are subject to special risks, including interest rate and property value fluctuations,
as well as risks related to general and economic conditions. High yield fixed income securities, also known
as “junk bonds”, are considered speculative, involve greater risk of default and tend to be more volatile than
investment grade fixed income securities.
Credit quality is a measure of a bond issuer’s creditworthiness, or ability to repay interest and principal to
bondholders in a timely manner. The credit ratings shown are based on security rating as provided by
Standard & Poor’s, Moody’s and/or Fitch, as applicable. Credit ratings are issued by the rating agencies for
the underlying securities in the fund and not the fund itself, and the credit quality of the securities in the
fund does not represent the stability or safety of the fund. Credit ratings shown range from AAA, being the
highest, to D, being the lowest based on S&P and Fitch’s classification (the equivalent of Aaa and C,
respectively, by Moody(s). Ratings of BBB or higher by S&P and Fitch (Baa or higher by Moody’s) are
considered to be investment grade-quality securities. If two or more of the agencies have assigned different
ratings to a security, the highest rating is applied. Securities that are not rated by all three agencies are listed
as “NR”.
“Alpha tilt strategies comprise a core holding of stocks that mimic a benchmark type index such as theS&P 500 to which additional securities are added to help tilt the fund toward potentially outperforming themarket in an effort to enhance overall investment returns. Tilt strategies are subject to significant timingrisk and could potentially expose investors to extended periods of underperformance.”
Custom Account Index: The Custom Account Index is an investment benchmark based on your historical
target allocations and/or manager selection that you may use to evaluate the performance of your account.
The Custom Account index does take into consideration certain changes that may have occurred in your
portfolio since the inception of your account, i.e., asset class and/or manager changes. However, in some
circumstances, it may not be an appropriate benchmark for use with your specific account composition. For
detailed report of the historical composition of this blend please contact your Financial Advisor.
Peer Groups
Peer Groups are a collection of similar investment strategies that essentially group investment products that
share the same investment approach. Peer Groups are used for comparison purposes to compare and
illustrate a clients investment portfolio versus its peer across various quantitative metrics like performance
and risk. Peer Group comparison is conceptually another form of benchmark comparison whereby the
actual investment can be ranked versus its peer across various quantitative metrics.
All Peer Group data are provided by Investment Metrics, LLC.
The URL below provides all the definitions and methodology about the various Peer Groups
https://www.invmetrics.com/style-peer-groups
Peer Group Ranking Methodology
A percentile rank denotes the value of a product in which a certain percent of observations fall within a peer
group. The range of percentile rankings is between 1 and 100, where 1 represents a high statistical value and
100 represents a low statistical value.
The 30th percentile, for example, is the value in which 30% of the highest observations may be found, the
The 30th percentile, for example, is the value in which 30% of the highest observations may be found, the
65th percentile is the value in which 65% of the highest observations may be found, and so on.
Percentile rankings are calculated based on a normalized distribution ranging from 1 to 100 for all products
in each peer group, where a ranking of 1 denotes a high statistical value and a ranking of 100 denotes a low
statistical value. It is important to note that the same ranking methodology applies to all statistics, implying
that a ranking of 1 will always mean highest value across all statistics.
For example, consider a risk/return assessment using standard deviation as a measure of risk. A percentile
ranking equal to 1 for return denotes highest return, whereas a percentile ranking of 1 for standard deviation
denotes highest risk among peers.
In addition, values may be used to demonstrate quartile rankings. For example, the third quartile is also
known as the 75th percentile, and the median is the 50th percentile.
Alternatives
Graystone Consulting is a business of Morgan Stanley Smith Barney LLC. (“Morgan Stanley”) Thismaterial is not to be reproduced or distributed to any other persons (other than professional advisors of theinvestors) and is intended solely for the use of the persons to whom it has been delivered. This material isnot for distribution to the general public.
The sole purpose of this material is to inform, and it in no way is intended to be an offer or solicitation topurchase or sell any security, other investment or service, or to attract any funds or deposits. Investmentsmentioned may not be suitable for all clients. Any product discussed herein may be purchased only after aclient has carefully reviewed the offering memorandum and executed the subscription documents. MorganStanley has not considered the actual or desired investment objectives, goals, strategies, guidelines, orfactual circumstances of any investor in any fund(s). Before making any investment, each investor shouldcarefully consider the risks associated with the investment, as discussed in the applicable offeringmemorandum, and make a determination based upon their own particular circumstances, that the investmentis consistent with their investment objectives and risk tolerance.
This information is being provided as a service of your Graystone Institutional Consultant and does notsupersede or replace your Morgan Stanley customer statement. The information is as of the date(s) notedand subject to daily market fluctuation. Your interests in Alternative Investments, which may have beenpurchased through us, are generally not held here, and are generally not covered by SIPC. The informationprovided to you: 1) is included as a service to you, valuations for certain products may not be available; 2)is derived from you or another external source for which we are not responsible, and may have beenmodified to take into consideration capital calls or distributions to the extent applicable; 3) may not reflectactual shares, share prices or values; 4) may include invested or distributed amounts in addition to a fairvalue estimate; and 5) should not be relied upon for tax reporting purposes. Notwithstanding the foregoing,1) to the extent this report displays Alternative Investment positions within a Morgan Stanley IndividualRetirement Account (“IRA”), such positions are held by Morgan Stanley Smith Barney LLC as thecustodian of your Morgan Stanley IRA; and 2) if your Alternative Investment positon(s) is held by us and isregistered pursuant to the Securities Act of 1933, as amended, your Alternative Investment position(s) iscovered by SIPC.
Alternatives may be either traditional alternative investment vehicles or non-traditional alternative strategyvehicles. Traditional alternative investment vehicles may include, but are not limited to, Hedge Funds,Fund of Funds (both registered and unregistered), Exchange Funds, Private Equity Funds, Private CreditFunds, Real Estate Funds, and Managed Futures Funds. Non-traditional alternative strategy vehicles mayinclude, but are not limited to, Open or Closed End Mutual Funds, Exchange-Traded and Closed-EndFunds, Unit Investment Trusts, exchange listed Real Estate Investment Trusts (REITs), and Master LimitedPartnerships (MLPs). These non-traditional alternative strategy vehicles also seek alternative-like exposurebut have significant differences from traditional alternative investment vehicles. Non-traditional alternativestrategy vehicles may behave like, have characteristics of, or employ various investment strategies andtechniques for both hedging and more speculative purposes such as short-selling, leverage, derivatives, and38

techniques for both hedging and more speculative purposes such as short-selling, leverage, derivatives, andoptions, which can increase volatility and the risk of investment loss. Characteristics such as correlation totraditional markets, investment strategy, and market sector exposure can play a role in the classification of atraditional security being classified as alternative.
Traditional alternative investment vehicles are illiquid and usually are not valued daily. The estimatedvaluation provided will be as of the most recent date available and will be included in summaries of yourassets. Such valuation may not be the most recent provided by the fund in which you are invested. Norepresentation is made that the valuation is a market value or that the interest could be liquidated at thisvalue. We are not required to take any action with respect to your investment unless valid instructions arereceived from you in a timely manner. Some positions reflected herein may not represent interests in thefund, but rather redemption proceeds withheld by the issuer pending final valuations which are not subjectto the investment performance of the fund and may or may not accrue interest for the length of thewithholding. Morgan Stanley does not engage in an independent valuation of your alternative investmentassets. Morgan Stanley provides periodic information to you including the market value of an alternativeinvestment vehicle based on information received from the management entity of the alternative investmentvehicle or another service provider.
Traditional alternative investment vehicles often are speculative and include a high degree of risk. .Investors should carefully review and consider potential risks before investing. Certain of these risks mayinclude but are not limited to:• Loss of all or a substantial portion of the investment due to leveraging, short-selling, or other speculative practices;• Lack of liquidity in that there may be no secondary market for afund;• Volatility of returns;• Restrictions on transferring interests in a fund;• Potential lack of diversificationand resulting higher risk due to concentration of trading authority when a single advisor is utilized;•Absence of information regarding valuations and pricing;• Complex tax structures and delays in taxreporting;• Less regulation and higher fees than mutual funds; and• Risks associated with the operations,personnel, and processes of the manager. As a diversified global financial services firm, Morgan StanleyWealth Management engages in a broad spectrum of activities including financial advisory services,investment management activities, sponsoring and managing private investment funds, engaging in broker-dealer transactions and principal securities, commodities and foreign exchange transactions, researchpublication, and other activities. In the ordinary course of its business, Morgan Stanley Wealth Managementtherefore engages in activities where Morgan Stanley Wealth Management’s interests may conflict with theinterests of its clients, including the private investment funds it manages. Morgan Stanley WealthManagement can give no assurance that conflicts of interest will be resolved in favor of its clients or anysuch fund.
Indices are unmanaged and investors cannot directly invest in them. Composite index results are shown forillustrative purposes and do not represent the performance of a specific investment. Past performance is noguarantee of future results. Actual results may vary. Diversification does not assure a profit or protectagainst loss in a declining market. Any performance or related information presented has not been adjustedto reflect the impact of the additional fees paid to a placement agent by an investor (for Morgan Stanleyplacement clients, a one-time upfront Placement Fee of up to 3%, and for Morgan Stanley investmentadvisory clients, an annual advisory fee of up to 2.5%), which would result in a substantial reduction in thereturns if such fees were incorporated.
For most investment advisory clients, the program account will be charged an asset-based wrap fee everyquarter (“the Fee”). In general, the Fee covers investment advisory services and reporting. In addition to theFee, clients will pay the fees and expenses of any funds in which their account is invested. Fund fees andexpenses are charged directly to the pool of assets the fund invests in and impact the valuations. Clientsmust understand that these fees and expenses are an additional cost and will not be included in the Feeamount in the account statements.
As fees are deducted quarterly, the compounding effect will be to increase the impact of the fees by anamount directly related to the gross account performance. For example, for an account with an initial valueof $100,000 and a 2.5% annual fee, if the gross performance is 5% per year over a three year period, thecompounding effect of the fees will result in a net annual compound rate of return of approximately 2.40%per year over a three year period, and the total value of the client’s portfolio at the end of the three yearperiod would be approximately $115,762.50 without the fees and $107,372.63 with the fees. Please see theapplicable Morgan Stanley Smith Barney LLC Form ADV Part 2A for more information including a
applicable Morgan Stanley Smith Barney LLC Form ADV Part 2A for more information including adescription of the fee schedule. It is available at www.morganstanley.com/ADV<http://www.morganstanley.com/ADV> <http://www.morganstanley.com/ADV> or from your FinancialAdvisor/Private Wealth Advisor.
Alternative investments involve complex tax structures, tax inefficient investing, and delays in distributingimportant tax information. Individual funds have specific risks related to their investment programs that willvary from fund to fund. Clients should consult their own tax and legal advisors as Morgan Stanley does notprovide tax or legal advice. Interests in alternative investment products are offered pursuant to the terms ofthe applicable offering memorandum, are distributed by Morgan Stanley Smith Barney LLC and certain ofits affiliates, and (1) are not FDIC-insured, (2) are not deposits or other obligations of Morgan Stanley orany of its affiliates, (3) are not guaranteed by Morgan Stanley and its affiliates, and (4) involve investmentrisks, including possible loss of principal. Morgan Stanley Smith Barney LLC is a registered broker-dealer,not a bank.
SIPC insurance does not apply to precious metals, other commodities, or traditional alternative investments.
© 2018 Morgan Stanley Smith Barney LLC. Member SIPC.
Money Market Funds
You could lose money in Money Market Funds. Although MMFs classified as government funds (i.e.,MMFs that invest 99.5% of total assets in cash and/or securities backed by the U.S government) and retailfunds (i.e., MMFs open to natural person investors only) seek to preserve value at $1.00 per share, theycannot guarantee they will do so. The price of other MMFs will fluctuate and when you sell shares they maybe worth more or less than originally paid. MMFs may impose a fee upon sale or temporarily suspend salesif liquidity falls below required minimums. During suspensions, shares would not be available forpurchases, withdrawals, check writing or ATM debits. A MMF investment is not insured or guaranteed bythe Federal Deposit Insurance Corporation or other government agency.
39
This document is for institutional use only and redistribution is expressly prohibited.
Summary Investment Report
Cal Poly Pomona Foundation
All Accounts
July 1, 2019 - December 31, 2019
40
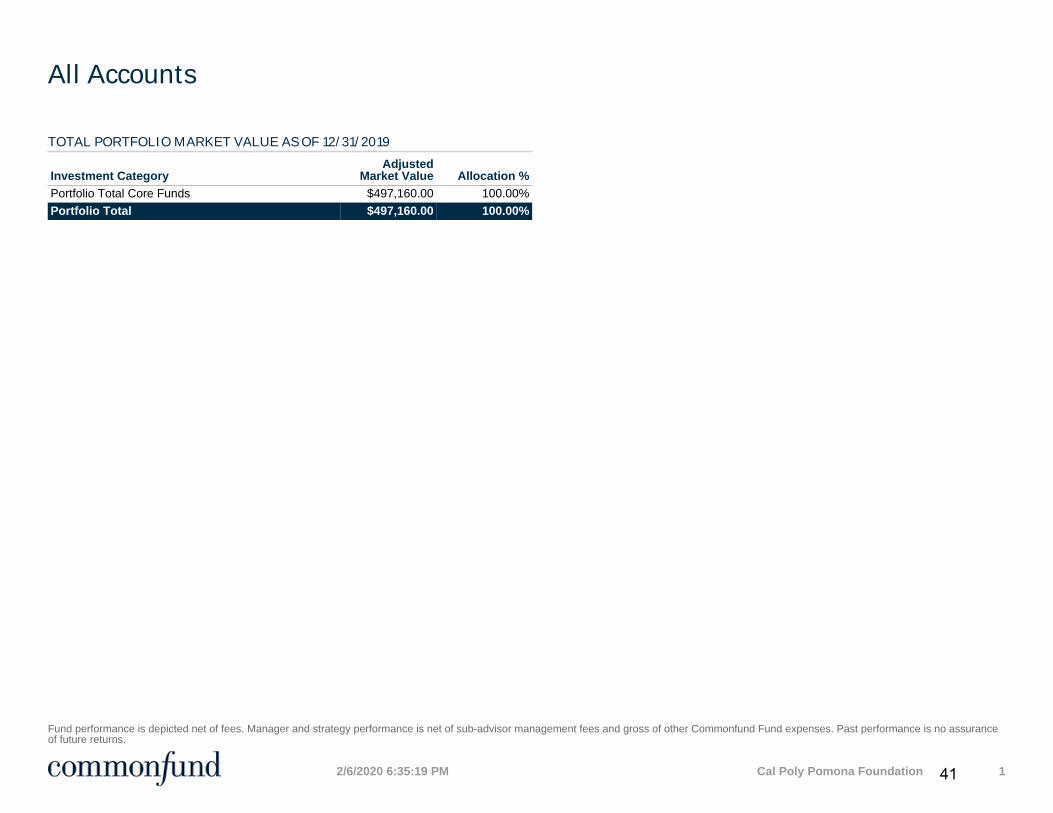
TOTAL PORTFOLIO MARKET VALUE AS OF 12/31/2019
Investment CategoryAdjusted
Market Value Allocation %Portfolio Total Core Funds $497,160.00 100.00%Portfolio Total $497,160.00 100.00%
All Accounts
Fund performance is depicted net of fees. Manager and strategy performance is net of sub-advisor management fees and gross of other Commonfund Fund expenses. Past performance is no assuranceof future returns.
2/6/2020 6:35:19 PM Cal Poly Pomona Foundation 141
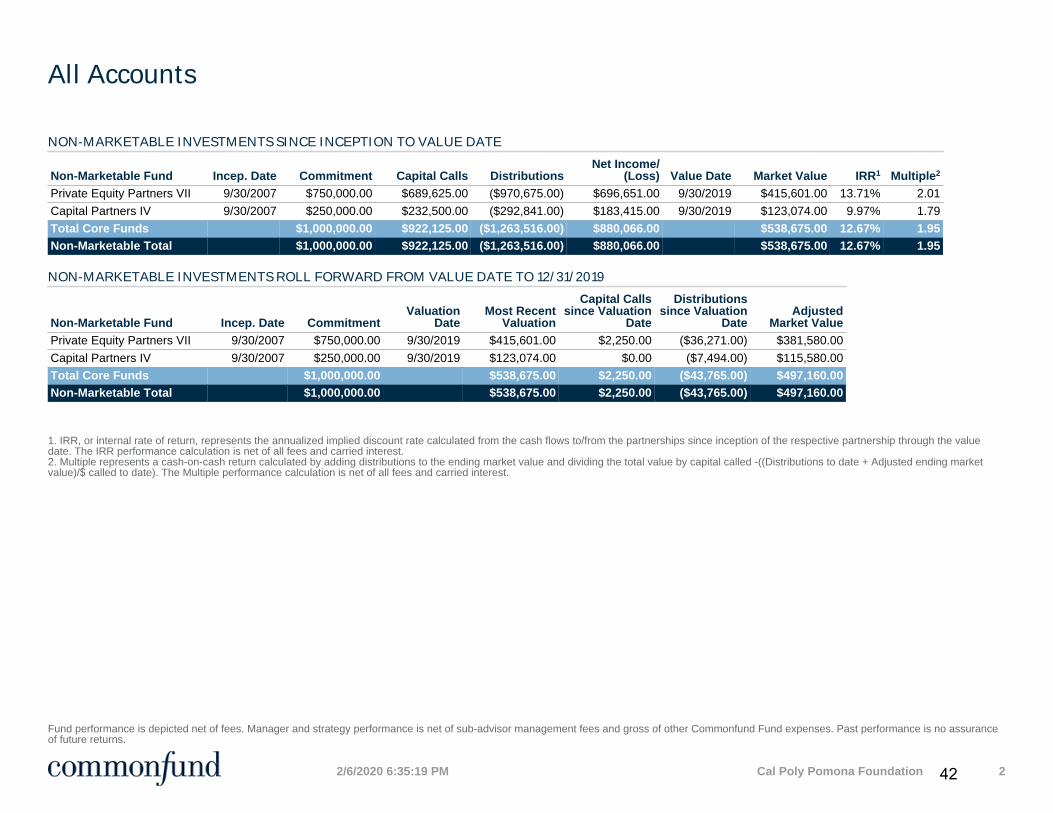
NON-MARKETABLE INVESTMENTS SINCE INCEPTION TO VALUE DATE
Non-Marketable Fund Incep. Date Commitment Capital Calls DistributionsNet Income/
(Loss) Value Date Market Value IRR1 Multiple2
Private Equity Partners VII 9/30/2007 $750,000.00 $689,625.00 ($970,675.00) $696,651.00 9/30/2019 $415,601.00 13.71% 2.01Capital Partners IV 9/30/2007 $250,000.00 $232,500.00 ($292,841.00) $183,415.00 9/30/2019 $123,074.00 9.97% 1.79Total Core Funds $1,000,000.00 $922,125.00 ($1,263,516.00) $880,066.00 $538,675.00 12.67% 1.95Non-Marketable Total $1,000,000.00 $922,125.00 ($1,263,516.00) $880,066.00 $538,675.00 12.67% 1.95
NON-MARKETABLE INVESTMENTS ROLL FORWARD FROM VALUE DATE TO 12/31/2019
Non-Marketable Fund Incep. Date CommitmentValuation
DateMost Recent
Valuation
Capital Callssince Valuation
Date
Distributionssince Valuation
DateAdjusted
Market ValuePrivate Equity Partners VII 9/30/2007 $750,000.00 9/30/2019 $415,601.00 $2,250.00 ($36,271.00) $381,580.00Capital Partners IV 9/30/2007 $250,000.00 9/30/2019 $123,074.00 $0.00 ($7,494.00) $115,580.00Total Core Funds $1,000,000.00 $538,675.00 $2,250.00 ($43,765.00) $497,160.00Non-Marketable Total $1,000,000.00 $538,675.00 $2,250.00 ($43,765.00) $497,160.00
1. IRR, or internal rate of return, represents the annualized implied discount rate calculated from the cash flows to/from the partnerships since inception of the respective partnership through the valuedate. The IRR performance calculation is net of all fees and carried interest.2. Multiple represents a cash-on-cash return calculated by adding distributions to the ending market value and dividing the total value by capital called -((Distributions to date + Adjusted ending market value)/$ called to date). The Multiple performance calculation is net of all fees and carried interest.
All Accounts
Fund performance is depicted net of fees. Manager and strategy performance is net of sub-advisor management fees and gross of other Commonfund Fund expenses. Past performance is no assuranceof future returns.
2/6/2020 6:35:19 PM Cal Poly Pomona Foundation 242
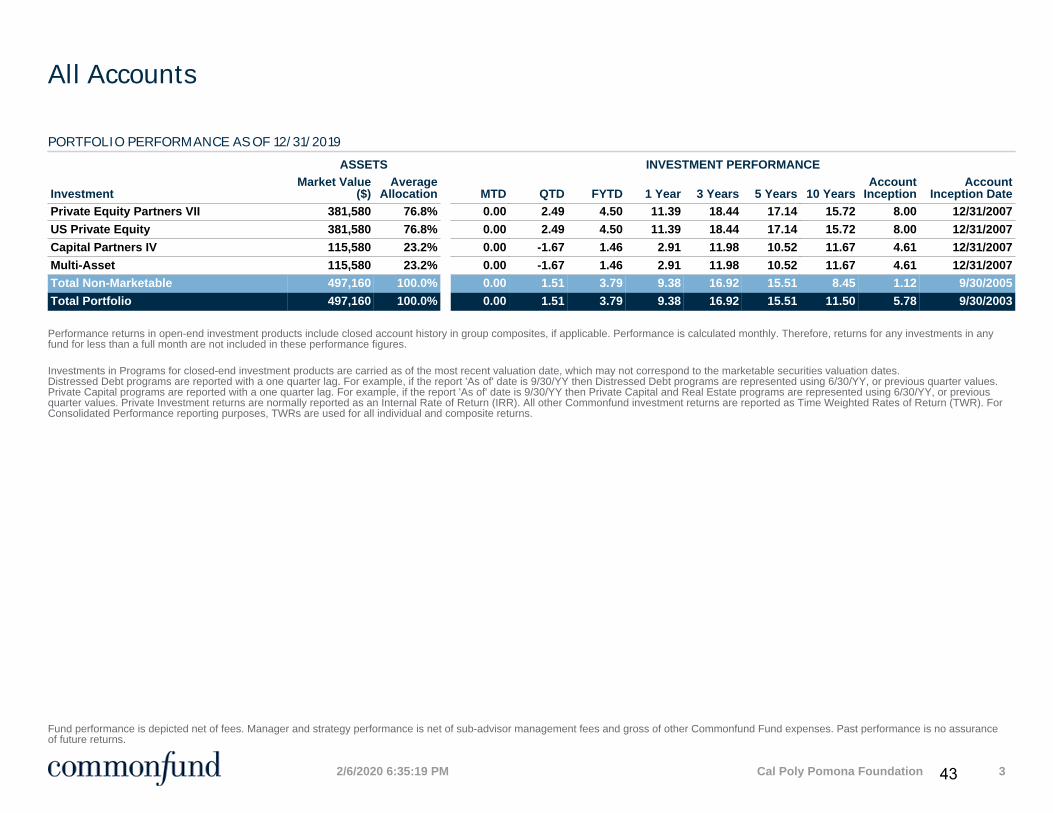
PORTFOLIO PERFORMANCE AS OF 12/31/2019
ASSETS INVESTMENT PERFORMANCE
InvestmentMarket Value
($)Average
Allocation
MTD QTD FYTD 1 Year 3 Years 5 Years 10 YearsAccount
InceptionAccount
Inception DatePrivate Equity Partners VII 381,580 76.8% 0.00 2.49 4.50 11.39 18.44 17.14 15.72 8.00 12/31/2007US Private Equity 381,580 76.8% 0.00 2.49 4.50 11.39 18.44 17.14 15.72 8.00 12/31/2007Capital Partners IV 115,580 23.2% 0.00 -1.67 1.46 2.91 11.98 10.52 11.67 4.61 12/31/2007Multi-Asset 115,580 23.2% 0.00 -1.67 1.46 2.91 11.98 10.52 11.67 4.61 12/31/2007Total Non-Marketable 497,160 100.0% 0.00 1.51 3.79 9.38 16.92 15.51 8.45 1.12 9/30/2005Total Portfolio 497,160 100.0% 0.00 1.51 3.79 9.38 16.92 15.51 11.50 5.78 9/30/2003
Performance returns in open-end investment products include closed account history in group composites, if applicable. Performance is calculated monthly. Therefore, returns for any investments in anyfund for less than a full month are not included in these performance figures.
Investments in Programs for closed-end investment products are carried as of the most recent valuation date, which may not correspond to the marketable securities valuation dates.Distressed Debt programs are reported with a one quarter lag. For example, if the report 'As of' date is 9/30/YY then Distressed Debt programs are represented using 6/30/YY, or previous quarter values.Private Capital programs are reported with a one quarter lag. For example, if the report 'As of' date is 9/30/YY then Private Capital and Real Estate programs are represented using 6/30/YY, or previousquarter values. Private Investment returns are normally reported as an Internal Rate of Return (IRR). All other Commonfund investment returns are reported as Time Weighted Rates of Return (TWR). ForConsolidated Performance reporting purposes, TWRs are used for all individual and composite returns.
All Accounts
Fund performance is depicted net of fees. Manager and strategy performance is net of sub-advisor management fees and gross of other Commonfund Fund expenses. Past performance is no assuranceof future returns.
2/6/2020 6:35:19 PM Cal Poly Pomona Foundation 343
Commonfund Important Notes
PERFORMANCE | OPEN-END INVESTMENT PRODUCTSUnless otherwise indicated, performance of open-end Investment Products shown is unaudited, net of applicable management, performance and other fees and expenses, presumes reinvestment of earnings and excludes investor specific sales and other charges. Fees may be modified or waived for certain investors. Please refer to an Investment Product’s Prospectus or the Investment Manager’s Form ADV Part 2A for more information regarding the
Investment Product’s fees, charges and expenses. An investor’s actual performance and actual fees may differ from the performance information shown due to, among other factors, capital contributions and withdrawals or redemptions, different share classes and eligibility to participate in “new issues.”
PERFORMANCE | CLOSED-END INVESTMENT PRODUCTSUnless otherwise indicated, performance of closed-end Investment Products shown is net of all fees and any carried interest and excludes commitments by the applicable general partner and any limited partners that do not pay a management fee. Each Investment Product’s Internal Rate of Return (“IRR”) should be evaluated in light of the information and risks disclosed in the respective Prospectus. Certain investors in an Investment Product may receive a management fee and management fee discount; performance data herein reflects the weighted average blended management fee applicable to actual limited partners of such vehicles. Return information is calculated on a dollar-weighted (e.g., internal rate of return), since inception basis. There can be no assurance that unrealized investments ultimately will be realized at the valuations used in calculating IRRs or Net Multiples or that the calculated IRRs will be obtained. Actual realized returns will depend on, among other factors, future operating results, the value of assets and market conditions at the time of disposition, any related transaction costs and the timing and manner of sale. Certain Investment Products use leverage to finance investments, which may involve a high degree of financial risk. Such Borrowings has the potential to enhance overall returns that exceed the Investment Product’s cost of
borrowed funds; however, borrowings will further diminish returns (or increase losses on capital) to the extent overall returns are less than the Investment Product’s cost of borrowed funds. Where applicable, returns take into
consideration the reinvestment or “recycling” of investment proceeds.
ADVISORY SERVICESAdvisory services, including those described under the trade name “Commonfund Strategic Solutions,” are generally provided by Comanco or, on occasion, by CCI and subject to an investment advisory agreements. Comanco’s and
CCI’s Form ADV Part 2A will be provided upon request.
BENCHMARKS AND FINANCIAL INDICESBenchmarks and financial indices are shown for illustrative purposes only. They provide general market data that serves as point of reference to compare the performance of Investment Product’s with the performance of other
securities that make up a particular market. Such benchmark and indices are not available for direct investment and their performance does not reflect the expenses associated with the management of an actual portfolio, the actual cost of investing in the instruments that comprise it or other fees. An Investment Product’s investment objective is not restricted to the securities and instruments comprising any one index. No representation is made that any benchmark or index is an appropriate measure for comparison. For a list of commonly used indices, please visit www.commonfund.org/important-disclosures. This list may not represent all available indices or those indices used in this material.
Past performance is not indicative of future results. An investor may lose all or a substantial portion of their investment in an Investment Product.
Interests in Commonfund funds and those offered by Commonfund’s affiliates are placed by Commonfund Securities, Inc., a member FINRA, SIPC.
www.commonfund.org/important-disclosures
2/6/2020 6:35:19 PM Cal Poly Pomona Foundation 444
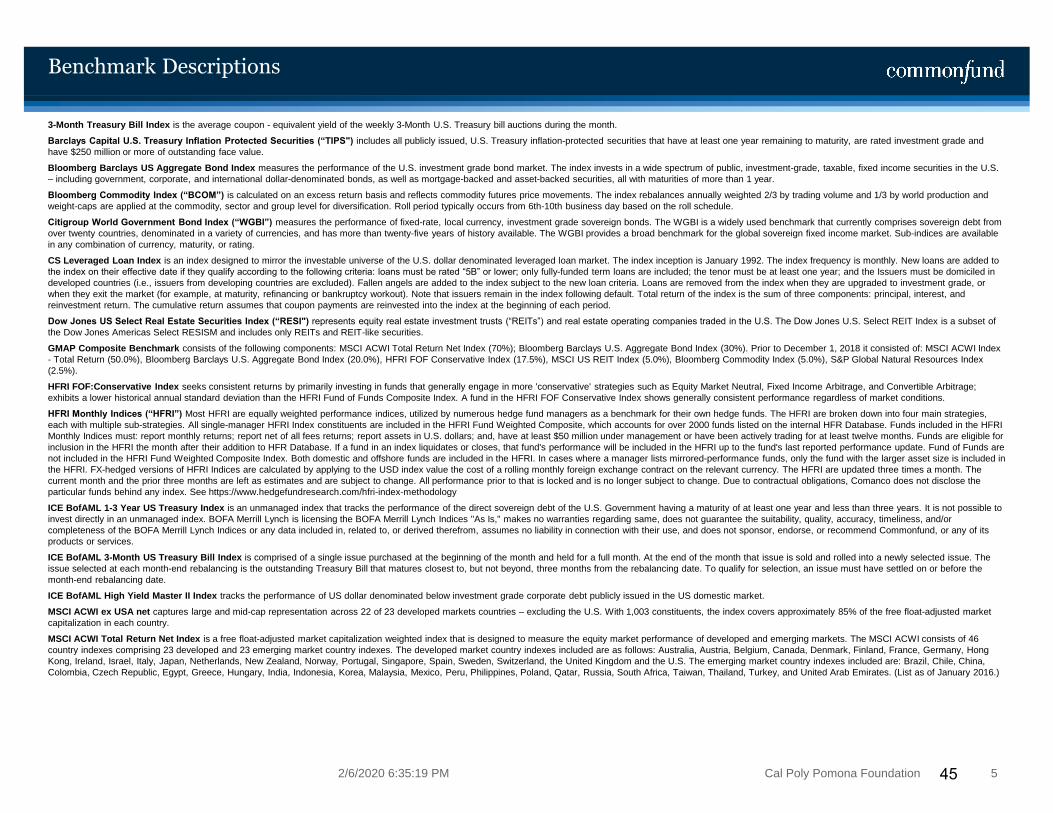
Benchmark Descriptions
3-Month Treasury Bill Index is the average coupon - equivalent yield of the weekly 3-Month U.S. Treasury bill auctions during the month.
Barclays Capital U.S. Treasury Inflation Protected Securities (“TIPS") includes all publicly issued, U.S. Treasury inflation-protected securities that have at least one year remaining to maturity, are rated investment grade and have $250 million or more of outstanding face value.
Bloomberg Barclays US Aggregate Bond Index measures the performance of the U.S. investment grade bond market. The index invests in a wide spectrum of public, investment-grade, taxable, fixed income securities in the U.S. – including government, corporate, and international dollar-denominated bonds, as well as mortgage-backed and asset-backed securities, all with maturities of more than 1 year.
Bloomberg Commodity Index (“BCOM”) is calculated on an excess return basis and reflects commodity futures price movements. The index rebalances annually weighted 2/3 by trading volume and 1/3 by world production and weight-caps are applied at the commodity, sector and group level for diversification. Roll period typically occurs from 6th-10th business day based on the roll schedule.
Citigroup World Government Bond Index (“WGBI”) measures the performance of fixed-rate, local currency, investment grade sovereign bonds. The WGBI is a widely used benchmark that currently comprises sovereign debt from over twenty countries, denominated in a variety of currencies, and has more than twenty-five years of history available. The WGBI provides a broad benchmark for the global sovereign fixed income market. Sub-indices are available in any combination of currency, maturity, or rating.
CS Leveraged Loan Index is an index designed to mirror the investable universe of the U.S. dollar denominated leveraged loan market. The index inception is January 1992. The index frequency is monthly. New loans are added to the index on their effective date if they qualify according to the following criteria: loans must be rated “5B” or lower; only fully-funded term loans are included; the tenor must be at least one year; and the Issuers must be domiciled in developed countries (i.e., issuers from developing countries are excluded). Fallen angels are added to the index subject to the new loan criteria. Loans are removed from the index when they are upgraded to investment grade, or when they exit the market (for example, at maturity, refinancing or bankruptcy workout). Note that issuers remain in the index following default. Total return of the index is the sum of three components: principal, interest, and reinvestment return. The cumulative return assumes that coupon payments are reinvested into the index at the beginning of each period.
Dow Jones US Select Real Estate Securities Index (“RESI") represents equity real estate investment trusts (“REITs”) and real estate operating companies traded in the U.S. The Dow Jones U.S. Select REIT Index is a subset of the Dow Jones Americas Select RESISM and includes only REITs and REIT-like securities.
GMAP Composite Benchmark consists of the following components: MSCI ACWI Total Return Net Index (70%); Bloomberg Barclays U.S. Aggregate Bond Index (30%). Prior to December 1, 2018 it consisted of: MSCI ACWI Index - Total Return (50.0%), Bloomberg Barclays U.S. Aggregate Bond Index (20.0%), HFRI FOF Conservative Index (17.5%), MSCI US REIT Index (5.0%), Bloomberg Commodity Index (5.0%), S&P Global Natural Resources Index (2.5%).
HFRI FOF:Conservative Index seeks consistent returns by primarily investing in funds that generally engage in more 'conservative' strategies such as Equity Market Neutral, Fixed Income Arbitrage, and Convertible Arbitrage; exhibits a lower historical annual standard deviation than the HFRI Fund of Funds Composite Index. A fund in the HFRI FOF Conservative Index shows generally consistent performance regardless of market conditions.
HFRI Monthly Indices (“HFRI”) Most HFRI are equally weighted performance indices, utilized by numerous hedge fund managers as a benchmark for their own hedge funds. The HFRI are broken down into four main strategies, each with multiple sub-strategies. All single-manager HFRI Index constituents are included in the HFRI Fund Weighted Composite, which accounts for over 2000 funds listed on the internal HFR Database. Funds included in the HFRI Monthly Indices must: report monthly returns; report net of all fees returns; report assets in U.S. dollars; and, have at least $50 million under management or have been actively trading for at least twelve months. Funds are eligible for inclusion in the HFRI the month after their addition to HFR Database. If a fund in an index liquidates or closes, that fund's performance will be included in the HFRI up to the fund's last reported performance update. Fund of Funds are not included in the HFRI Fund Weighted Composite Index. Both domestic and offshore funds are included in the HFRI. In cases where a manager lists mirrored-performance funds, only the fund with the larger asset size is included in the HFRI. FX-hedged versions of HFRI Indices are calculated by applying to the USD index value the cost of a rolling monthly foreign exchange contract on the relevant currency. The HFRI are updated three times a month. The current month and the prior three months are left as estimates and are subject to change. All performance prior to that is locked and is no longer subject to change. Due to contractual obligations, Comanco does not disclose the particular funds behind any index. See https://www.hedgefundresearch.com/hfri-index-methodology
ICE BofAML 1-3 Year US Treasury Index is an unmanaged index that tracks the performance of the direct sovereign debt of the U.S. Government having a maturity of at least one year and less than three years. It is not possible to invest directly in an unmanaged index. BOFA Merrill Lynch is licensing the BOFA Merrill Lynch Indices "As Is," makes no warranties regarding same, does not guarantee the suitability, quality, accuracy, timeliness, and/or completeness of the BOFA Merrill Lynch Indices or any data included in, related to, or derived therefrom, assumes no liability in connection with their use, and does not sponsor, endorse, or recommend Commonfund, or any of its products or services.
ICE BofAML 3-Month US Treasury Bill Index is comprised of a single issue purchased at the beginning of the month and held for a full month. At the end of the month that issue is sold and rolled into a newly selected issue. The issue selected at each month-end rebalancing is the outstanding Treasury Bill that matures closest to, but not beyond, three months from the rebalancing date. To qualify for selection, an issue must have settled on or before the month-end rebalancing date.
ICE BofAML High Yield Master II Index tracks the performance of US dollar denominated below investment grade corporate debt publicly issued in the US domestic market.
MSCI ACWI ex USA net captures large and mid-cap representation across 22 of 23 developed markets countries – excluding the U.S. With 1,003 constituents, the index covers approximately 85% of the free float-adjusted market capitalization in each country.
MSCI ACWI Total Return Net Index is a free float-adjusted market capitalization weighted index that is designed to measure the equity market performance of developed and emerging markets. The MSCI ACWI consists of 46 country indexes comprising 23 developed and 23 emerging market country indexes. The developed market country indexes included are as follows: Australia, Austria, Belgium, Canada, Denmark, Finland, France, Germany, Hong Kong, Ireland, Israel, Italy, Japan, Netherlands, New Zealand, Norway, Portugal, Singapore, Spain, Sweden, Switzerland, the United Kingdom and the U.S. The emerging market country indexes included are: Brazil, Chile, China, Colombia, Czech Republic, Egypt, Greece, Hungary, India, Indonesia, Korea, Malaysia, Mexico, Peru, Philippines, Poland, Qatar, Russia, South Africa, Taiwan, Thailand, Turkey, and United Arab Emirates. (List as of January 2016.)
2/6/2020 6:35:19 PM Cal Poly Pomona Foundation 545
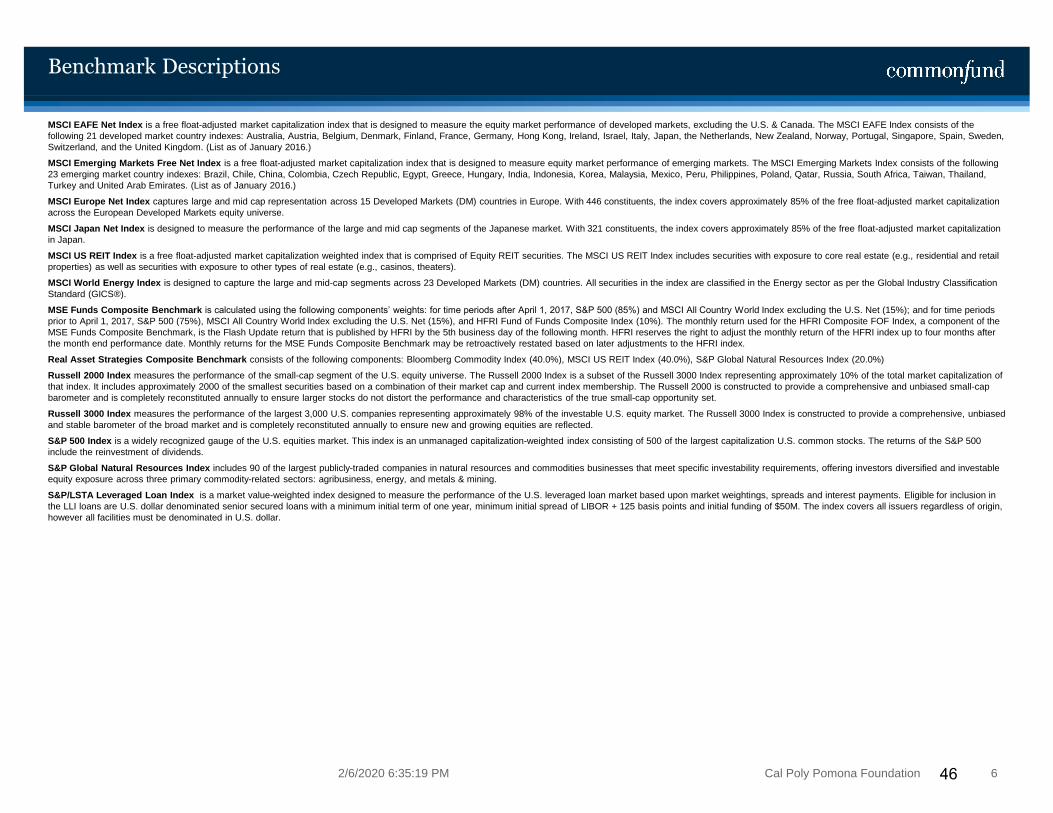
Benchmark Descriptions
MSCI EAFE Net Index is a free float-adjusted market capitalization index that is designed to measure the equity market performance of developed markets, excluding the U.S. & Canada. The MSCI EAFE Index consists of the following 21 developed market country indexes: Australia, Austria, Belgium, Denmark, Finland, France, Germany, Hong Kong, Ireland, Israel, Italy, Japan, the Netherlands, New Zealand, Norway, Portugal, Singapore, Spain, Sweden, Switzerland, and the United Kingdom. (List as of January 2016.)
MSCI Emerging Markets Free Net Index is a free float-adjusted market capitalization index that is designed to measure equity market performance of emerging markets. The MSCI Emerging Markets Index consists of the following 23 emerging market country indexes: Brazil, Chile, China, Colombia, Czech Republic, Egypt, Greece, Hungary, India, Indonesia, Korea, Malaysia, Mexico, Peru, Philippines, Poland, Qatar, Russia, South Africa, Taiwan, Thailand, Turkey and United Arab Emirates. (List as of January 2016.)
MSCI Europe Net Index captures large and mid cap representation across 15 Developed Markets (DM) countries in Europe. With 446 constituents, the index covers approximately 85% of the free float-adjusted market capitalization across the European Developed Markets equity universe.
MSCI Japan Net Index is designed to measure the performance of the large and mid cap segments of the Japanese market. With 321 constituents, the index covers approximately 85% of the free float-adjusted market capitalization in Japan.
MSCI US REIT Index is a free float‐adjusted market capitalization weighted index that is comprised of Equity REIT securities. The MSCI US REIT Index includes securities with exposure to core real estate (e.g., residential and retail properties) as well as securities with exposure to other types of real estate (e.g., casinos, theaters).
MSCI World Energy Index is designed to capture the large and mid-cap segments across 23 Developed Markets (DM) countries. All securities in the index are classified in the Energy sector as per the Global Industry Classification Standard (GICS®).
MSE Funds Composite Benchmark is calculated using the following components’ weights: for time periods after April 1, 2017, S&P 500 (85%) and MSCI All Country World Index excluding the U.S. Net (15%); and for time periods prior to April 1, 2017, S&P 500 (75%), MSCI All Country World Index excluding the U.S. Net (15%), and HFRI Fund of Funds Composite Index (10%). The monthly return used for the HFRI Composite FOF Index, a component of the MSE Funds Composite Benchmark, is the Flash Update return that is published by HFRI by the 5th business day of the following month. HFRI reserves the right to adjust the monthly return of the HFRI index up to four months after the month end performance date. Monthly returns for the MSE Funds Composite Benchmark may be retroactively restated based on later adjustments to the HFRI index.
Real Asset Strategies Composite Benchmark consists of the following components: Bloomberg Commodity Index (40.0%), MSCI US REIT Index (40.0%), S&P Global Natural Resources Index (20.0%)
Russell 2000 Index measures the performance of the small-cap segment of the U.S. equity universe. The Russell 2000 Index is a subset of the Russell 3000 Index representing approximately 10% of the total market capitalization of that index. It includes approximately 2000 of the smallest securities based on a combination of their market cap and current index membership. The Russell 2000 is constructed to provide a comprehensive and unbiased small-cap barometer and is completely reconstituted annually to ensure larger stocks do not distort the performance and characteristics of the true small-cap opportunity set.
Russell 3000 Index measures the performance of the largest 3,000 U.S. companies representing approximately 98% of the investable U.S. equity market. The Russell 3000 Index is constructed to provide a comprehensive, unbiased and stable barometer of the broad market and is completely reconstituted annually to ensure new and growing equities are reflected.
S&P 500 Index is a widely recognized gauge of the U.S. equities market. This index is an unmanaged capitalization-weighted index consisting of 500 of the largest capitalization U.S. common stocks. The returns of the S&P 500 include the reinvestment of dividends.
S&P Global Natural Resources Index includes 90 of the largest publicly-traded companies in natural resources and commodities businesses that meet specific investability requirements, offering investors diversified and investable equity exposure across three primary commodity-related sectors: agribusiness, energy, and metals & mining.
S&P/LSTA Leveraged Loan Index is a market value-weighted index designed to measure the performance of the U.S. leveraged loan market based upon market weightings, spreads and interest payments. Eligible for inclusion in the LLI loans are U.S. dollar denominated senior secured loans with a minimum initial term of one year, minimum initial spread of LIBOR + 125 basis points and initial funding of $50M. The index covers all issuers regardless of origin, however all facilities must be denominated in U.S. dollar.
2/6/2020 6:35:19 PM Cal Poly Pomona Foundation 646
This document is for institutional use only and redistribution is expressly prohibited.
This communication has been approved for distribution in the UK by Commonfund UK Limited, which is authorised and regulated by the UK Financial Conduct Authority. Only certain services provided by Commonfund UK Limited are regulated by the UK Financial Conduct Authority. Please contact the London office for further information on these services.
Wilton, ConnecticutTel 203 563 5000
New York, New York Tel 646 348 9201
San Francisco, CaliforniaTel 415 433 8800
London, United KingdomTel +44 20 7887 1540
Beijing, ChinaTel +86 10 5829 1878
www.commonfund.org
47
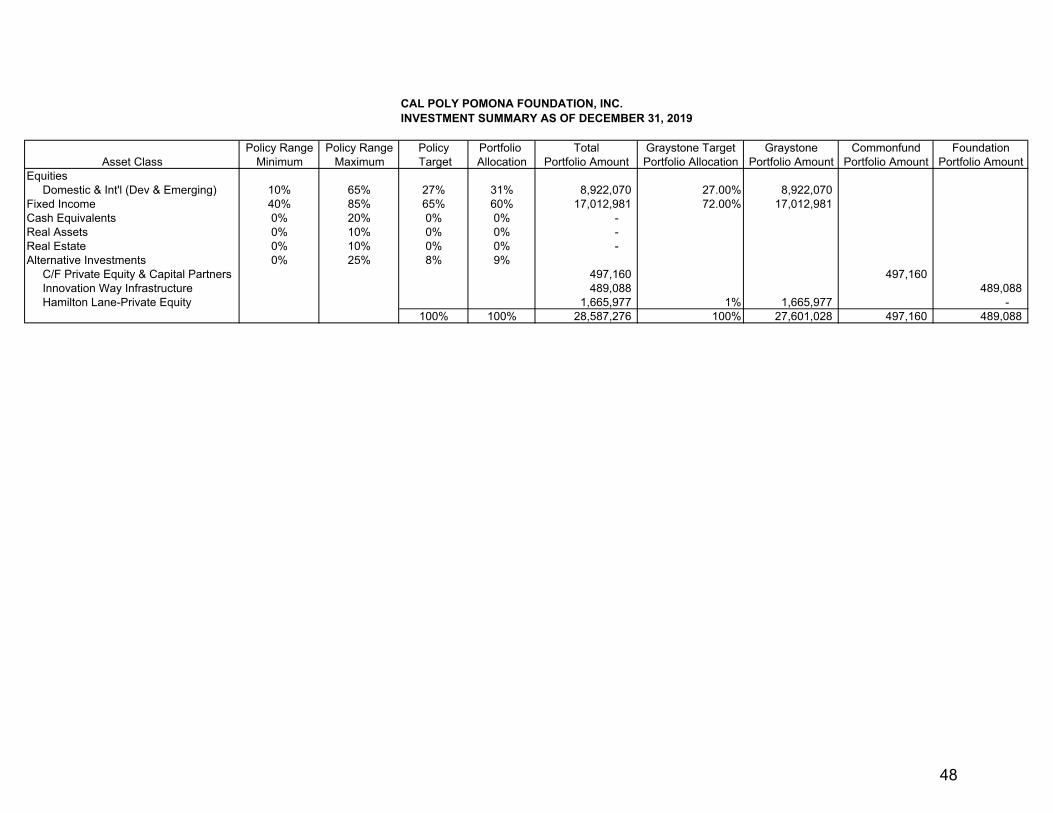
CAL POLY POMONA FOUNDATION, INC.INVESTMENT SUMMARY AS OF DECEMBER 31, 2019
Policy Range Policy Range Policy Portfolio Total Graystone Target Graystone Commonfund FoundationAsset Class Minimum Maximum Target Allocation Portfolio Amount Portfolio Allocation Portfolio Amount Portfolio Amount Portfolio Amount
Equities Domestic & Int'l (Dev & Emerging) 10% 65% 27% 31% 8,922,070 27.00% 8,922,070 Fixed Income 40% 85% 65% 60% 17,012,981 72.00% 17,012,981 Cash Equivalents 0% 20% 0% 0% - Real Assets 0% 10% 0% 0% - Real Estate 0% 10% 0% 0% - Alternative Investments 0% 25% 8% 9% C/F Private Equity & Capital Partners 497,160 497,160 Innovation Way Infrastructure 489,088 489,088 Hamilton Lane-Private Equity 1,665,977 1% 1,665,977 -
100% 100% 28,587,276 100% 27,601,028 497,160 489,088
48
Memorandum
Date: February 3, 2020
To: Investment Committee
Cal Poly Pomona Foundation, Inc. From: David F. Prenovost
Senior Managing Director/CFO Subject: STOCHASTIC TRUST PROJECT STUDY–RETIREE MEDICAL BENEFITS TRUST
As you may recall, the Foundation contributes $1.0 million to the Auxiliaries Multiple Employer VEBA (since the fall of 2010) in an effort to reduce the interest costs associated with the Foundation’s obligation. At June 30, 2019, the Foundation’s Plan Fiduciary Net Position (i.e. Fair Value of Assets) is $9,773,833 and the AAL (Actuarially Accrued Liability) is $17,144,176 and the Net OPEB Liability is $7,370,343 or 57% funded. In our previous 2018 Stochastic study, the Trust could become fully-funded in fiscal year 2022/23, however in the 2019 study, the estimated fully funded status will be achieved in fiscal year 2022/23 and 85% funded in fiscal year 2021/22. Foundation management believes we should continue to contribute $1.0 million annually to the Auxiliaries Multiple Employer VEBA until such time as the invested assets of the Trust are actuarially sufficient to offset the AAL, please see the enclosed Stochastic Trust Project Study for further details regarding funding this obligation.
49
Mr. David Prenovost Chief Financial Officer Cal Poly Pomona Foundation, Inc. 3801 West Temple Avenue, Building 55 Pomona, CA 91768-4038
Dear David:
Re: Cal Poly Pomona Retiree Medical Benefits Trust
We are pleased to present our cash flow and asset projections based on our latest actuarial valuations as of July 1, 2019. Projections are based on deterministic and stochastic modeling using 50,000 Monte Carlo simulations on return on assets after July 1, 2019 and projected liabilities from July 1, 2019. Please note that projection results are estimates only, and that actual future results may be significantly different.
Background
The Foundation provides lifetime postretirement medical coverage to employees who were hired prior to March 1, 2009 and retired from the Foundation with at least age 50 and 10 years of service. Benefits vary based on years of service at retirement. The Foundation has adopted a policy to prefund this obligation by contributing $1,000,000 annually until a certain level of funding of the Present Value of Future Benefits is achieved. In addition, the Foundation will no longer withdraw funds for reimbursements until 85% or 100% funded status is achieved.
As in our previous study, the Foundation made the decision to utilize stochastic modeling to obtain long-term funding projections based on the current benefit provisions of the Plan, which are described in our latest GASB 75 report dated January 13, 2020.
We have performed the analysis assuming two different funding objectives – suspending expected payments and contributing $1,000,000 annually until a funded ratio of 100% or 85% is achieved, where the funded ratio equals assets divided by the present value of future (pre- and post-Medicare) benefits and administrative expenses.
50
Project Steps
The key steps of the project have been:
1. We based this study on the latest actuarial valuation results as of July 1, 2019, which used participant data, plan provisions, and assumptions as of that date. This included a 75-year projection of benefit payouts, administrative expenses and liabilities. Note, we did not include implicit subsidies in benefit projections, since these benefits are not expected to be paid by trust assets.
2. We assumed that in late July or early August of each year, for the next several years, the Foundation will contribute $1,000,000 to the Trust, benefit payments will be withdrawn in late March, and benefit payment withdrawals will only commence after the Plan is:
Scenario 1: Reaches 100% Funded Ratio
Scenario 2: Reached 85% Funded Ratio
3. We developed a stochastic model that utilizes Monte-Carlo simulations to generate 50,000 75-year asset projections to assess the probability of funding levels as of July 1, 2029 (i.e., 10 years from the valuation date).
Additional Assumptions
Unless stated otherwise in this report, actuarial assumptions/plan provisions used in the study are as described in our FY20 GASB 75 Disclosure report dated January 13, 2020, which utilizes a GASB 75 measurement date of June 30,2019.
We assumed that Trust assets are expected to earn an average geometric return of 6.50% per year net of investment expenses with a standard deviation of 8.45% (provided by the Trust’s investment advisor). We assumed an administrative expense of $250 per participant claim projected to the end of the life of the plan, and the administrative expense is assumed to increase by 2.00% per year. Asset returns are modeled by a log-normal distribution. We did not include the "implicit subsidy" (as defined in ASOP 6) in the benefits payments.
In this 2019 study, the funded ratio targets of 85% and 100% are projected be achieved by July 1, 2022 and July 1, 2023, respectively, assuming $1,000,000 per year Trust contributions, no benefit payment withdrawals before the target ratio is reached, and a fixed 6.50% return on assets.
Of the expenses paid by trust assets, administrative expenses are those charged by Keenan and Benefit Trust and investment expenses are those charged by Morgan Stanley.
51
Some Key Findings
Before running the stochastic simulations, we performed deterministic projections assuming the Trust will earn 6.5% returns each year (net of investment expenses) and assuming no liability gains or losses. In order to reach a 100% funded ratio, the Foundation would need to contribute three years of $1,000,000 annually plus a final contribution of $1,304,000 in FY2022/23. To reach 85% funded ratio, the Foundation would need to contribute two years of $1,000,000 annually plus a final contribution of $550,000 in FY2021/22.
Contribution Schedule
Fiscal Year
100% Funding Target
85% Funding Target
2019/20 $1.00 M $1.00 M 2020/21 $1.00 M $1.00 M 2021/22 $1.00 M $0.55 M 2022/23 $1.30 M -
The main reason for using the stochastic approach for this study, as in the previous study, was to quantify the likelihood of various outcomes. Attached Exhibit 2 shows these outcomes and related information. While the Trust can become overfunded if asset returns exceed expectations, our understanding is the Trust Agreement provides that any surplus assets can be used to pay medical premiums for active employees, which mitigates this concern.
Other, Non-Investment, Risks
The scope of this study has been limited to investment risk. In other words, we are assuming that the projected retiree benefits will not vary from the projections developed in our July 1, 2019 actuarial valuation. Only investment returns are assumed to vary. However, in reality, there is variability (i.e. risk) in projected future benefit payments. These projected payments will vary based on changes in plan provisions or experience other than that assumed, in particular with health care costs and future trend. When these risks are combined with investment risk, the overall risk is greater. Either or both of these could raise (or lower) payouts significantly. If desired, we can discuss approaches to model these other risks.
52

Attached Exhibits
The following Exhibits appear at the end of this report.
Exhibit 1 shows the projected total present value of future benefits and administrative expenses based on our latest valuation on July 1, 2019.
Exhibit 2 shows the funded ratio based on a ten-year projection using stochastic modeling. This table shows the funded status at the end of ten years under both target scenarios (100% and 85% funded ratios). The stochastic model assumes a 6.50% expected rate of return with 8.45% of volatility on assets.
Exhibits 3 and 4 show a 75-year projection of assets and benefit payouts using a deterministic model. These charts show both a 100% and 85% target funded ratio goal where contribution and benefit payment schedules will vary between the two funded ratio goals. Both deterministic models assume a fixed 6.50% rate of return and no volatility on assets.
* * * * * * * * * *
We will also be happy to provide any additional information that may be useful to you. I, the undersigned, is a Member of the American Academy of Actuaries and are qualified to render the information contained herein.
Sincerely,
Nicolay Consulting Group
_________________________
Gary E. Cline, ASA, EA, MAAA
53
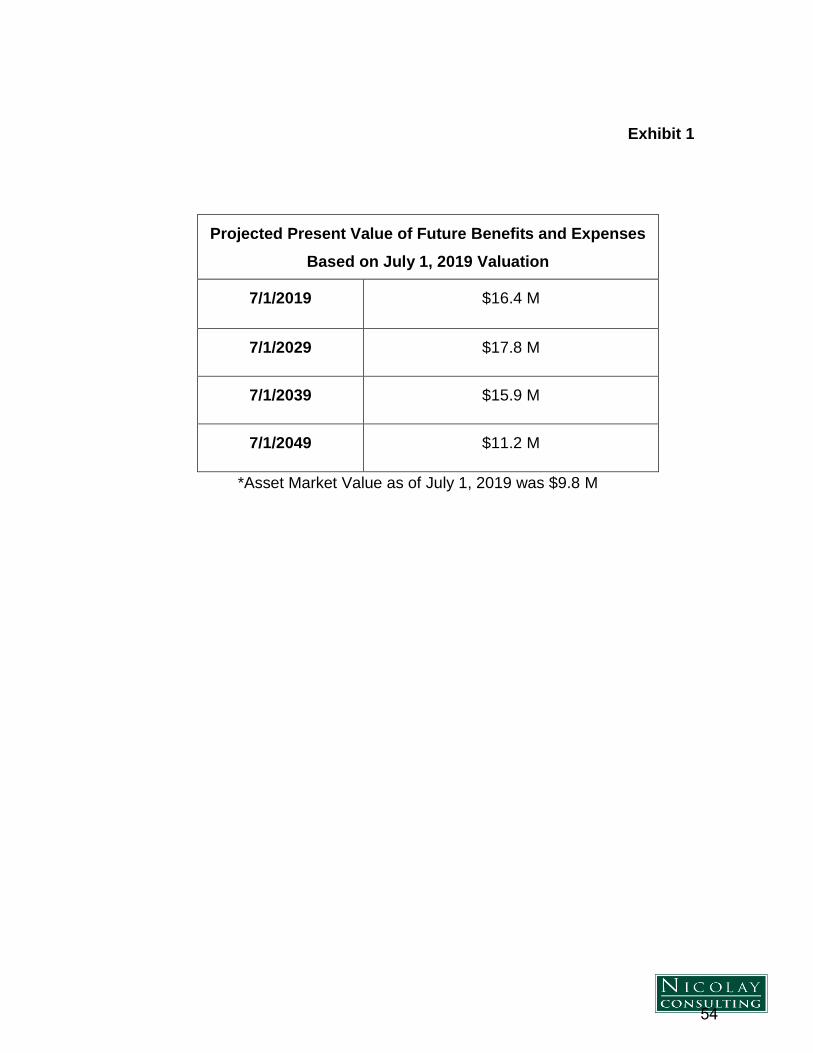
Exhibit 1
Projected Present Value of Future Benefits and Expenses
Based on July 1, 2019 Valuation
7/1/2019 $16.4 M
7/1/2029 $17.8 M
7/1/2039 $15.9 M
7/1/2049 $11.2 M
*Asset Market Value as of July 1, 2019 was $9.8 M
54
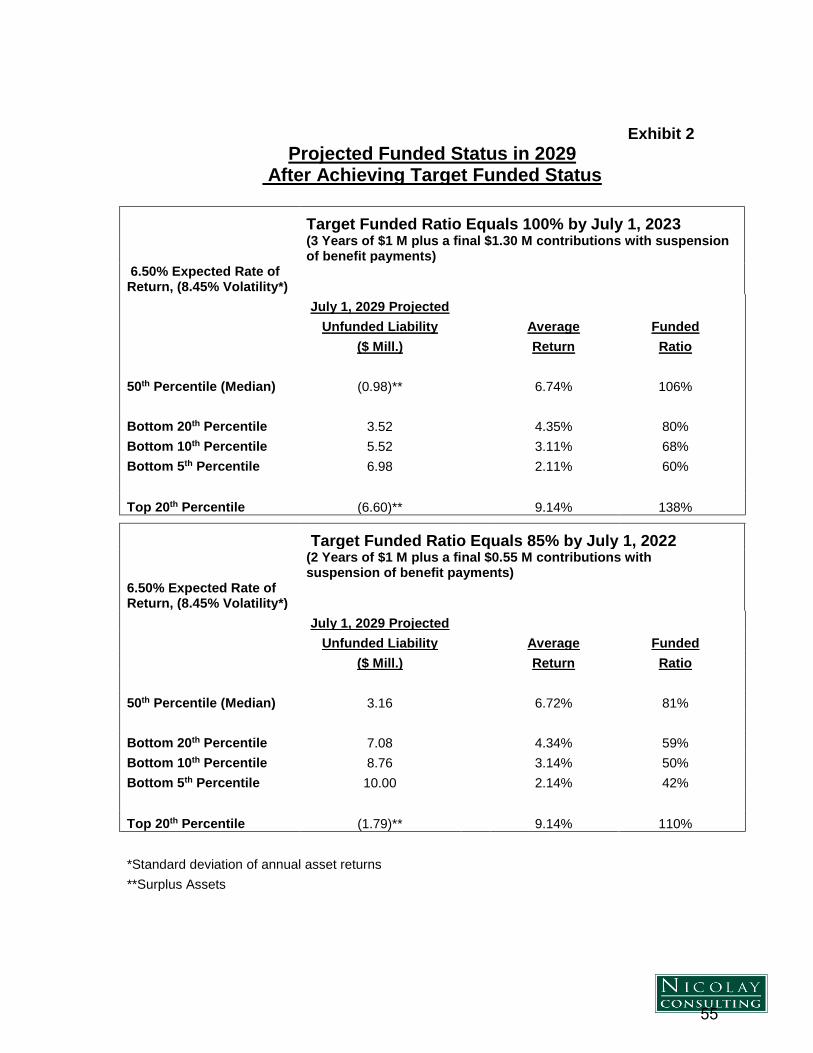
Exhibit 2
Projected Funded Status in 2029 After Achieving Target Funded Status
Target Funded Ratio Equals 100% by July 1, 2023
(3 Years of $1 M plus a final $1.30 M contributions with suspension of benefit payments)
6.50% Expected Rate of Return, (8.45% Volatility*) July 1, 2029 Projected
Unfunded Liability Average Funded
($ Mill.) Return Ratio
50th Percentile (Median) (0.98)** 6.74% 106% Bottom 20th Percentile 3.52 4.35% 80% Bottom 10th Percentile 5.52 3.11% 68% Bottom 5th Percentile 6.98 2.11% 60% Top 20th Percentile (6.60)** 9.14% 138%
Target Funded Ratio Equals 85% by July 1, 2022
(2 Years of $1 M plus a final $0.55 M contributions with suspension of benefit payments)
6.50% Expected Rate of Return, (8.45% Volatility*)
July 1, 2029 Projected
Unfunded Liability Average Funded
($ Mill.) Return Ratio
50th Percentile (Median) 3.16 6.72% 81% Bottom 20th Percentile 7.08 4.34% 59% Bottom 10th Percentile 8.76 3.14% 50% Bottom 5th Percentile 10.00 2.14% 42% Top 20th Percentile (1.79)** 9.14% 110%
*Standard deviation of annual asset returns **Surplus Assets
55
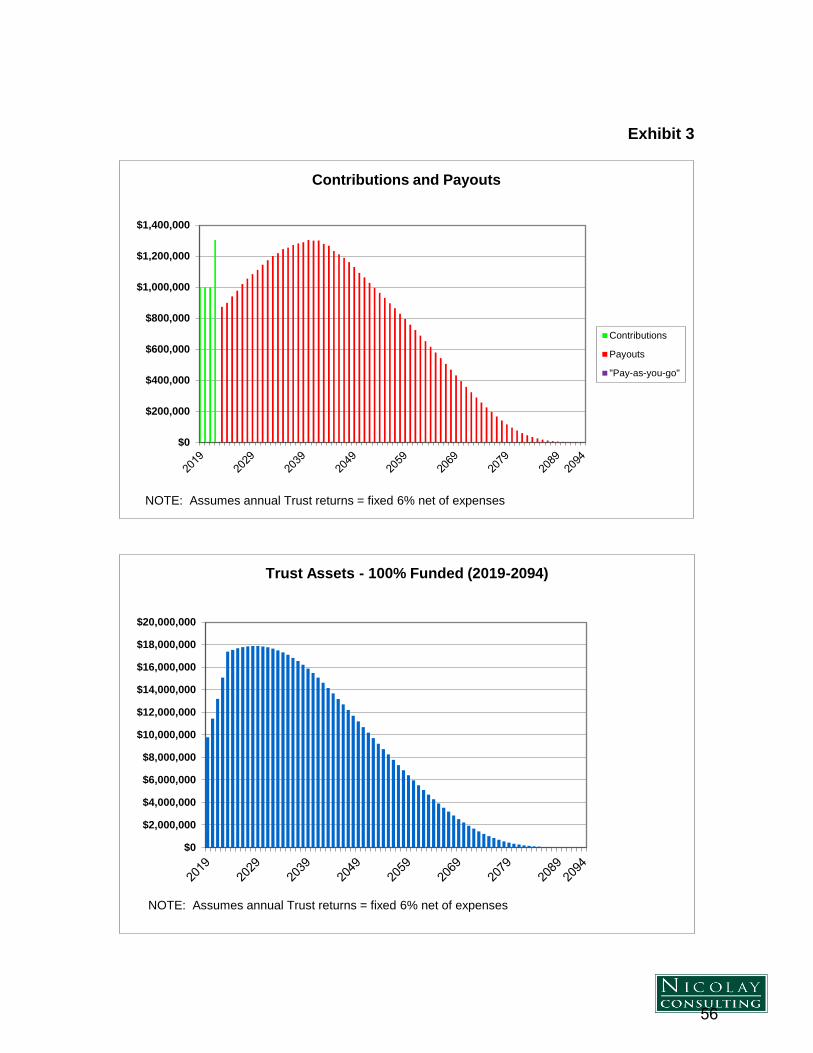
Exhibit 3
$0
$200,000
$400,000
$600,000
$800,000
$1,000,000
$1,200,000
$1,400,000
Contributions and Payouts
Contributions
Payouts
"Pay-as-you-go"
NOTE: Assumes annual Trust returns = fixed 6% net of expenses
$0
$2,000,000
$4,000,000
$6,000,000
$8,000,000
$10,000,000
$12,000,000
$14,000,000
$16,000,000
$18,000,000
$20,000,000
Trust Assets - 100% Funded (2019-2094)
NOTE: Assumes annual Trust returns = fixed 6% net of expenses
56
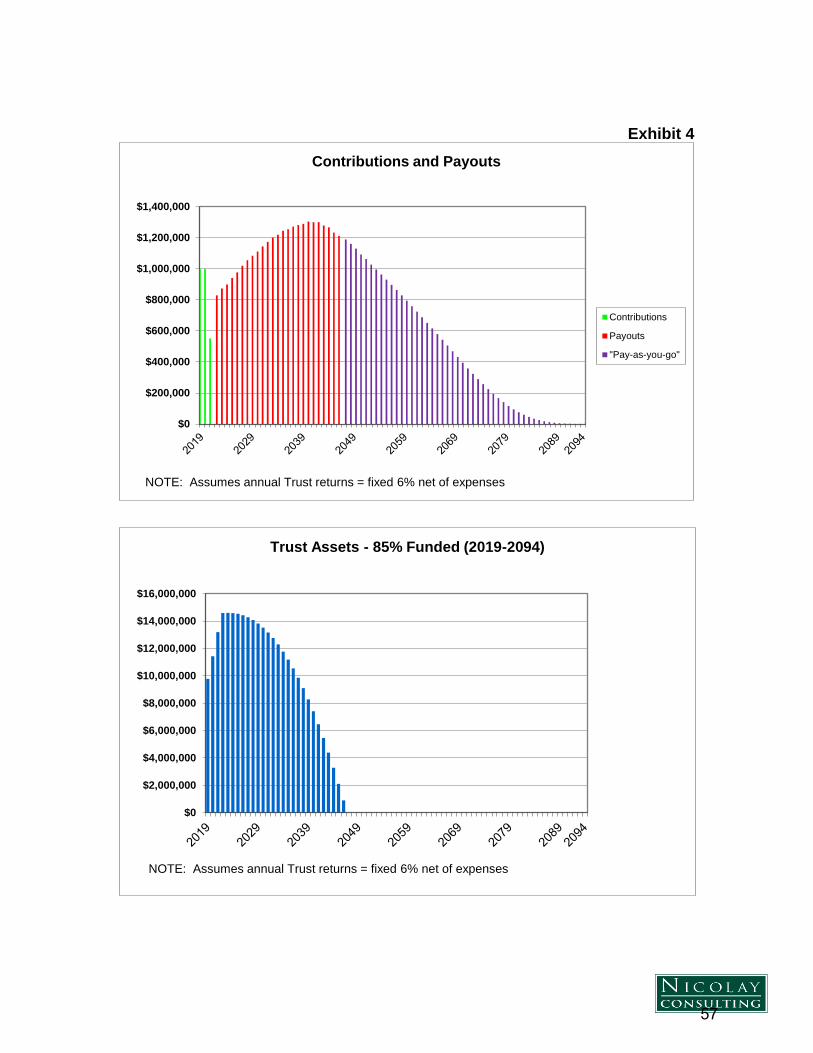
Exhibit 4
$0
$200,000
$400,000
$600,000
$800,000
$1,000,000
$1,200,000
$1,400,000
Contributions and Payouts
Contributions
Payouts
"Pay-as-you-go"
NOTE: Assumes annual Trust returns = fixed 6% net of expenses
$0
$2,000,000
$4,000,000
$6,000,000
$8,000,000
$10,000,000
$12,000,000
$14,000,000
$16,000,000
Trust Assets - 85% Funded (2019-2094)
NOTE: Assumes annual Trust returns = fixed 6% net of expenses
57
Memorandum Date: January 30, 2020 To: Investment Committee Cal Poly Pomona Foundation, Inc. From: David F. Prenovost Senior Managing Director/CFO Subject: CalPERS Public Agency Valuation Reports for Foundation with Selected Pages
from Each Valuation Report Enclosure: (1) First Tier Plan (2) Second Tier Plan (3) PEPA Miscellaneous Plan The California Public Employee Retirement System (CalPERS) released new financial reports for the FY ending June 30, 2018, which details the finances of CalPERS pension plans of contracting public agencies on that date. Specific information related to the Cal Poly Pomona Foundation pension plans can be located on the CalPERS website under the Public Agency Valuation Report section. On that site one can locate detailed reports showing the financial status for each of the three Cal Poly Pomona Foundation pension plan tiers with established 2020-21 FY employer contribution rates, among other important pension plan data.
Miscellaneous First Tier Plan is based on the 2% at 55 formula with an estimated funding level of 81.5 percent. The projected employer contribution rate for FY 2019-20 is 12.48% of covered payroll. However, when combined with the minimum required payment for the Unfunded Accrued Liability (UAL), the rate as a percentage of payroll exceeds 24%.
Miscellaneous Second Tier Plan is based on 2% at 60 formula with an estimated funding level of 98.1% percent. The projected employer contribution rate for FY 2019-20 is 9.25%.
PERPA Miscellaneous Plan based on 2% at 62 formula with an estimated funding level of 97%. The projected employer contribution rate for FY 2019-20 is 8.05%
Cal Poly Pomona Foundation management continues to take pro-active steps to pay down its UAL by making payments above the minimum required payments toward the UAL obligation for all 3 rate plans, which helps ensure these plans remain financially viable for the foreseeable future, please see attached CalPERS miscellaneous first tier plan alternative seven-year amortization schedule for UAL.
58
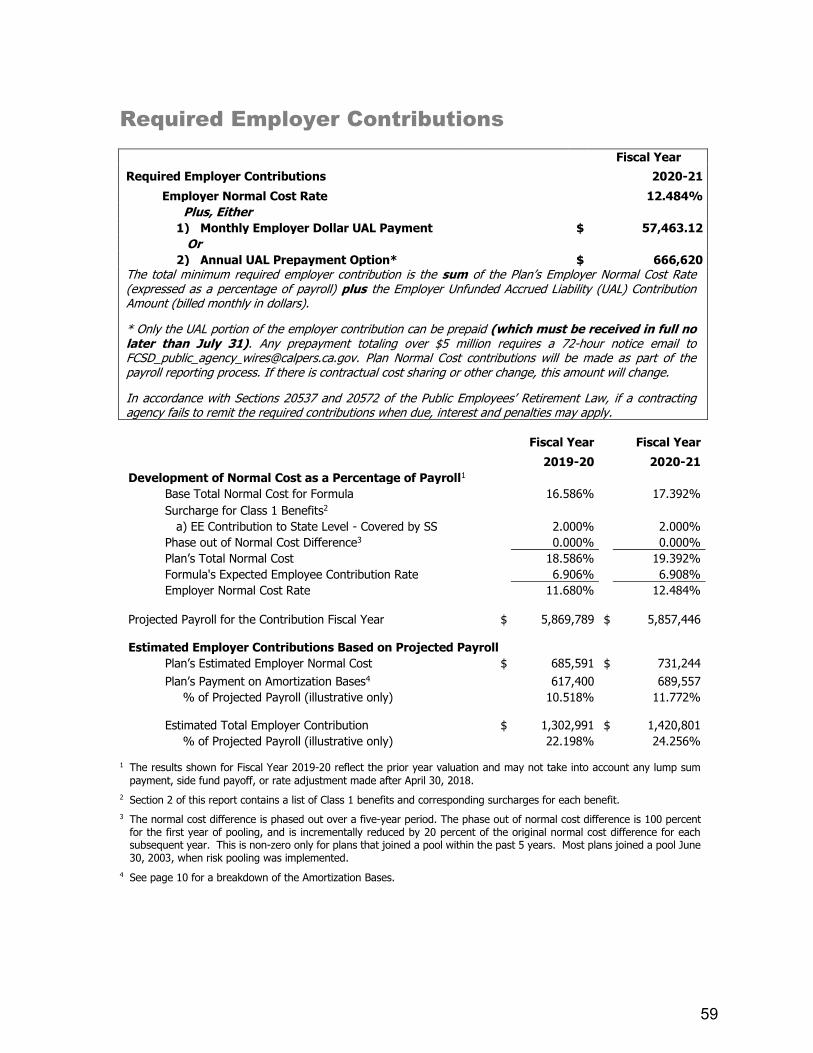
Required Employer Contributions
Fiscal Year
Required Employer Contributions
2020-21
Employer Normal Cost Rate 12.484%
Plus, Either
1) Monthly Employer Dollar UAL Payment $ 57,463.12
Or
2) Annual UAL Prepayment Option* $ 666,620 The total minimum required employer contribution is the sum of the Plan’s Employer Normal Cost Rate (expressed as a percentage of payroll) plus the Employer Unfunded Accrued Liability (UAL) Contribution Amount (billed monthly in dollars).
* Only the UAL portion of the employer contribution can be prepaid (which must be received in full no later than July 31). Any prepayment totaling over $5 million requires a 72-hour notice email to [email protected]. Plan Normal Cost contributions will be made as part of the payroll reporting process. If there is contractual cost sharing or other change, this amount will change.
In accordance with Sections 20537 and 20572 of the Public Employees’ Retirement Law, if a contracting agency fails to remit the required contributions when due, interest and penalties may apply.
Fiscal Year Fiscal Year
2019-20 2020-21
Development of Normal Cost as a Percentage of Payroll1
Base Total Normal Cost for Formula 16.586% 17.392%
Surcharge for Class 1 Benefits2
a) EE Contribution to State Level - Covered by SS 2.000% 2.000%
Phase out of Normal Cost Difference3 0.000% 0.000%
Plan’s Total Normal Cost 18.586% 19.392%
Formula's Expected Employee Contribution Rate 6.906% 6.908%
Employer Normal Cost Rate 11.680% 12.484%
Projected Payroll for the Contribution Fiscal Year $ 5,869,789 $ 5,857,446
Estimated Employer Contributions Based on Projected Payroll
Plan’s Estimated Employer Normal Cost $ 685,591 $ 731,244
Plan’s Payment on Amortization Bases4 617,400 689,557
% of Projected Payroll (illustrative only) 10.518% 11.772%
Estimated Total Employer Contribution $ 1,302,991 $ 1,420,801
% of Projected Payroll (illustrative only) 22.198% 24.256%
1 The results shown for Fiscal Year 2019-20 reflect the prior year valuation and may not take into account any lump sum
payment, side fund payoff, or rate adjustment made after April 30, 2018.
2 Section 2 of this report contains a list of Class 1 benefits and corresponding surcharges for each benefit.
3 The normal cost difference is phased out over a five-year period. The phase out of normal cost difference is 100 percent for the first year of pooling, and is incrementally reduced by 20 percent of the original normal cost difference for each subsequent year. This is non-zero only for plans that joined a pool within the past 5 years. Most plans joined a pool June 30, 2003, when risk pooling was implemented.
4 See page 10 for a breakdown of the Amortization Bases.
59
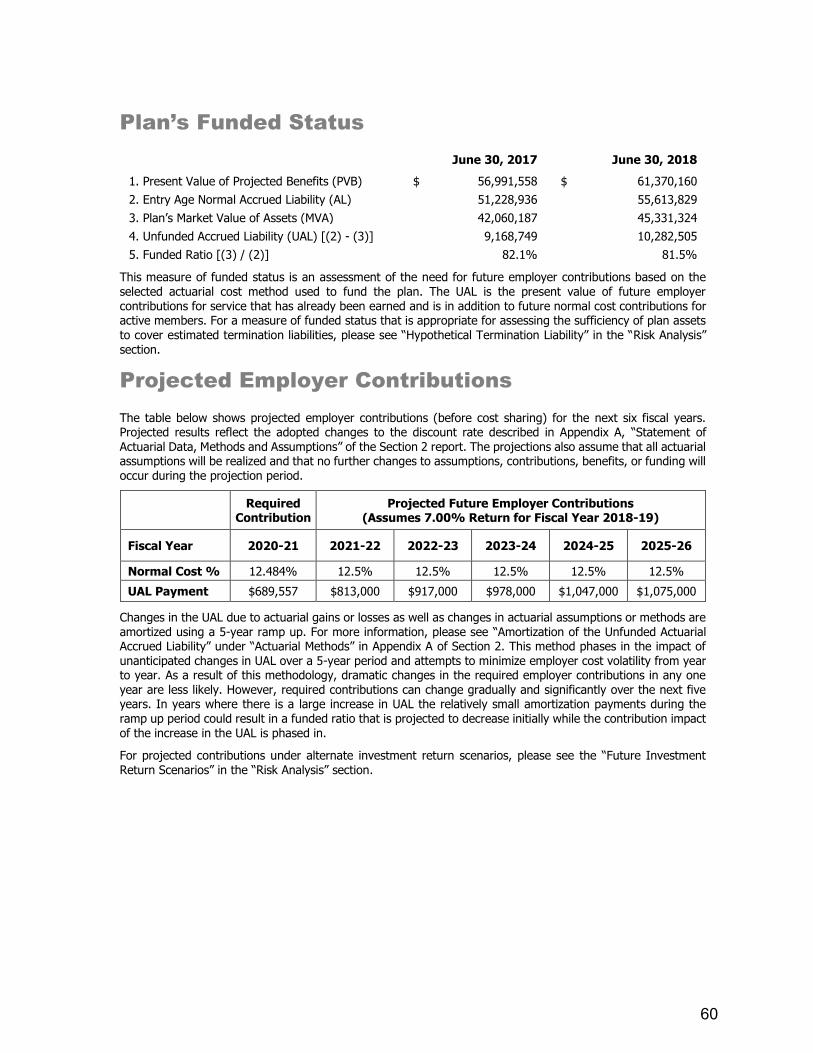
Plan’s Funded Status
June 30, 2017 June 30, 2018
1. Present Value of Projected Benefits (PVB) $ 56,991,558 $ 61,370,160
2. Entry Age Normal Accrued Liability (AL) 51,228,936 55,613,829
3. Plan’s Market Value of Assets (MVA) 42,060,187 45,331,324
4. Unfunded Accrued Liability (UAL) [(2) - (3)] 9,168,749 10,282,505
5. Funded Ratio [(3) / (2)] 82.1% 81.5%
This measure of funded status is an assessment of the need for future employer contributions based on the selected actuarial cost method used to fund the plan. The UAL is the present value of future employer contributions for service that has already been earned and is in addition to future normal cost contributions for active members. For a measure of funded status that is appropriate for assessing the sufficiency of plan assets
to cover estimated termination liabilities, please see “Hypothetical Termination Liability” in the “Risk Analysis” section.
Projected Employer Contributions
The table below shows projected employer contributions (before cost sharing) for the next six fiscal years. Projected results reflect the adopted changes to the discount rate described in Appendix A, “Statement of Actuarial Data, Methods and Assumptions” of the Section 2 report. The projections also assume that all actuarial assumptions will be realized and that no further changes to assumptions, contributions, benefits, or funding will occur during the projection period.
Required
Contribution Projected Future Employer Contributions
(Assumes 7.00% Return for Fiscal Year 2018-19)
Fiscal Year 2020-21 2021-22 2022-23 2023-24 2024-25 2025-26
Normal Cost % 12.484% 12.5% 12.5% 12.5% 12.5% 12.5%
UAL Payment $689,557 $813,000 $917,000 $978,000 $1,047,000 $1,075,000
Changes in the UAL due to actuarial gains or losses as well as changes in actuarial assumptions or methods are amortized using a 5-year ramp up. For more information, please see “Amortization of the Unfunded Actuarial Accrued Liability” under “Actuarial Methods” in Appendix A of Section 2. This method phases in the impact of unanticipated changes in UAL over a 5-year period and attempts to minimize employer cost volatility from year to year. As a result of this methodology, dramatic changes in the required employer contributions in any one year are less likely. However, required contributions can change gradually and significantly over the next five years. In years where there is a large increase in UAL the relatively small amortization payments during the ramp up period could result in a funded ratio that is projected to decrease initially while the contribution impact of the increase in the UAL is phased in.
For projected contributions under alternate investment return scenarios, please see the “Future Investment Return Scenarios” in the “Risk Analysis” section.
60
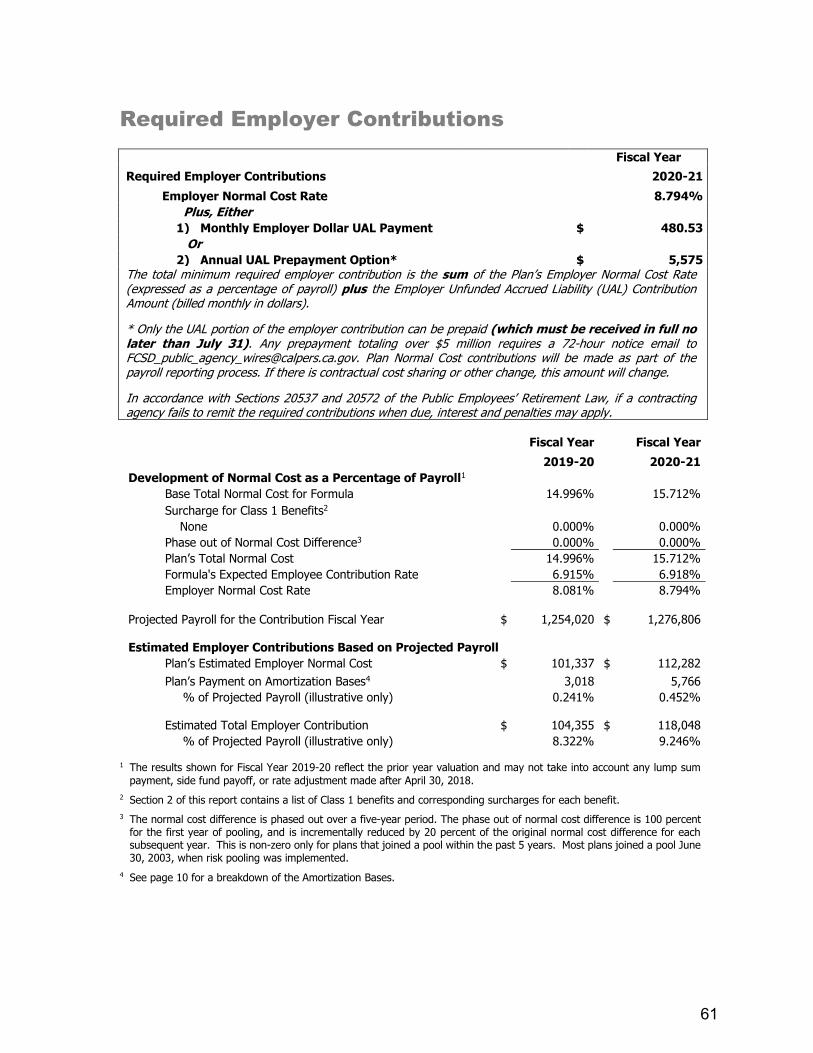
Required Employer Contributions
Fiscal Year
Required Employer Contributions
2020-21
Employer Normal Cost Rate 8.794%
Plus, Either
1) Monthly Employer Dollar UAL Payment $ 480.53
Or
2) Annual UAL Prepayment Option* $ 5,575 The total minimum required employer contribution is the sum of the Plan’s Employer Normal Cost Rate (expressed as a percentage of payroll) plus the Employer Unfunded Accrued Liability (UAL) Contribution Amount (billed monthly in dollars).
* Only the UAL portion of the employer contribution can be prepaid (which must be received in full no later than July 31). Any prepayment totaling over $5 million requires a 72-hour notice email to [email protected]. Plan Normal Cost contributions will be made as part of the payroll reporting process. If there is contractual cost sharing or other change, this amount will change.
In accordance with Sections 20537 and 20572 of the Public Employees’ Retirement Law, if a contracting agency fails to remit the required contributions when due, interest and penalties may apply.
Fiscal Year Fiscal Year
2019-20 2020-21
Development of Normal Cost as a Percentage of Payroll1
Base Total Normal Cost for Formula 14.996% 15.712%
Surcharge for Class 1 Benefits2
None 0.000% 0.000%
Phase out of Normal Cost Difference3 0.000% 0.000%
Plan’s Total Normal Cost 14.996% 15.712%
Formula's Expected Employee Contribution Rate 6.915% 6.918%
Employer Normal Cost Rate 8.081% 8.794%
Projected Payroll for the Contribution Fiscal Year $ 1,254,020 $ 1,276,806
Estimated Employer Contributions Based on Projected Payroll
Plan’s Estimated Employer Normal Cost $ 101,337 $ 112,282
Plan’s Payment on Amortization Bases4 3,018 5,766
% of Projected Payroll (illustrative only) 0.241% 0.452%
Estimated Total Employer Contribution $ 104,355 $ 118,048
% of Projected Payroll (illustrative only) 8.322% 9.246%
1 The results shown for Fiscal Year 2019-20 reflect the prior year valuation and may not take into account any lump sum
payment, side fund payoff, or rate adjustment made after April 30, 2018.
2 Section 2 of this report contains a list of Class 1 benefits and corresponding surcharges for each benefit.
3 The normal cost difference is phased out over a five-year period. The phase out of normal cost difference is 100 percent for the first year of pooling, and is incrementally reduced by 20 percent of the original normal cost difference for each subsequent year. This is non-zero only for plans that joined a pool within the past 5 years. Most plans joined a pool June 30, 2003, when risk pooling was implemented.
4 See page 10 for a breakdown of the Amortization Bases.
61
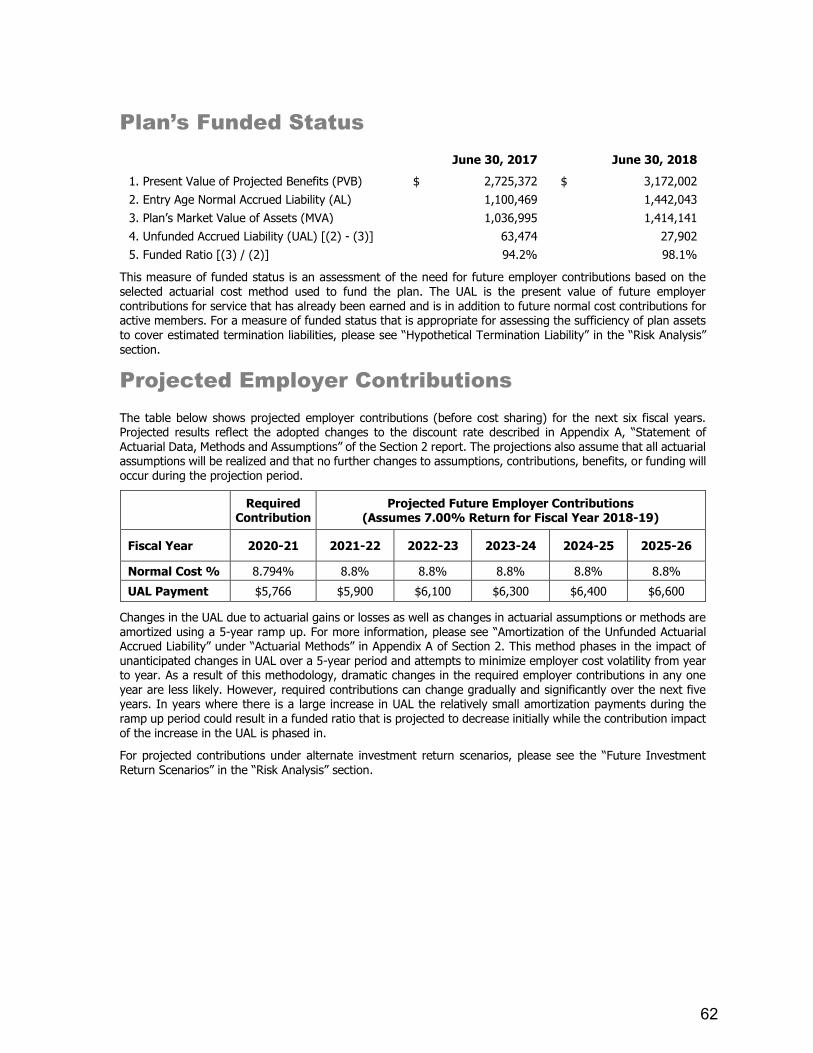
Plan’s Funded Status
June 30, 2017 June 30, 2018
1. Present Value of Projected Benefits (PVB) $ 2,725,372 $ 3,172,002
2. Entry Age Normal Accrued Liability (AL) 1,100,469 1,442,043
3. Plan’s Market Value of Assets (MVA) 1,036,995 1,414,141
4. Unfunded Accrued Liability (UAL) [(2) - (3)] 63,474 27,902
5. Funded Ratio [(3) / (2)] 94.2% 98.1%
This measure of funded status is an assessment of the need for future employer contributions based on the selected actuarial cost method used to fund the plan. The UAL is the present value of future employer contributions for service that has already been earned and is in addition to future normal cost contributions for active members. For a measure of funded status that is appropriate for assessing the sufficiency of plan assets
to cover estimated termination liabilities, please see “Hypothetical Termination Liability” in the “Risk Analysis” section.
Projected Employer Contributions
The table below shows projected employer contributions (before cost sharing) for the next six fiscal years. Projected results reflect the adopted changes to the discount rate described in Appendix A, “Statement of Actuarial Data, Methods and Assumptions” of the Section 2 report. The projections also assume that all actuarial assumptions will be realized and that no further changes to assumptions, contributions, benefits, or funding will occur during the projection period.
Required
Contribution Projected Future Employer Contributions
(Assumes 7.00% Return for Fiscal Year 2018-19)
Fiscal Year 2020-21 2021-22 2022-23 2023-24 2024-25 2025-26
Normal Cost % 8.794% 8.8% 8.8% 8.8% 8.8% 8.8%
UAL Payment $5,766 $5,900 $6,100 $6,300 $6,400 $6,600
Changes in the UAL due to actuarial gains or losses as well as changes in actuarial assumptions or methods are amortized using a 5-year ramp up. For more information, please see “Amortization of the Unfunded Actuarial Accrued Liability” under “Actuarial Methods” in Appendix A of Section 2. This method phases in the impact of unanticipated changes in UAL over a 5-year period and attempts to minimize employer cost volatility from year to year. As a result of this methodology, dramatic changes in the required employer contributions in any one year are less likely. However, required contributions can change gradually and significantly over the next five years. In years where there is a large increase in UAL the relatively small amortization payments during the ramp up period could result in a funded ratio that is projected to decrease initially while the contribution impact of the increase in the UAL is phased in.
For projected contributions under alternate investment return scenarios, please see the “Future Investment Return Scenarios” in the “Risk Analysis” section.
62
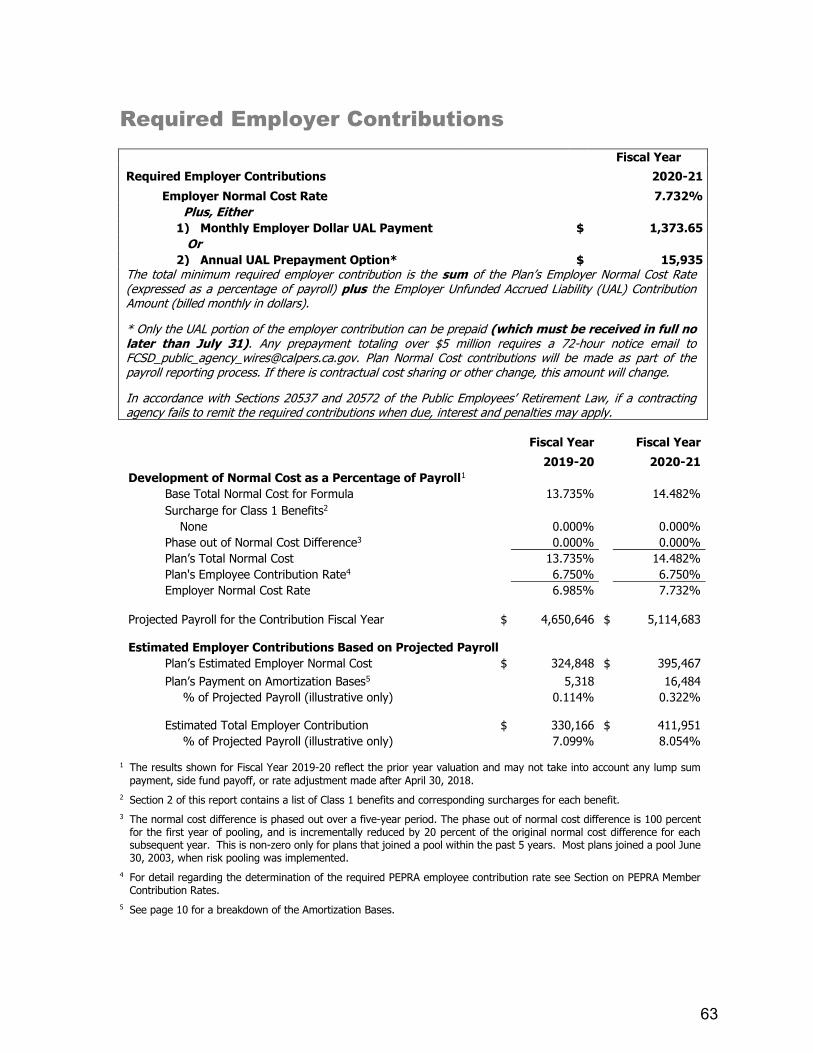
Required Employer Contributions
Fiscal Year
Required Employer Contributions
2020-21
Employer Normal Cost Rate 7.732%
Plus, Either
1) Monthly Employer Dollar UAL Payment $ 1,373.65
Or
2) Annual UAL Prepayment Option* $ 15,935 The total minimum required employer contribution is the sum of the Plan’s Employer Normal Cost Rate (expressed as a percentage of payroll) plus the Employer Unfunded Accrued Liability (UAL) Contribution Amount (billed monthly in dollars).
* Only the UAL portion of the employer contribution can be prepaid (which must be received in full no later than July 31). Any prepayment totaling over $5 million requires a 72-hour notice email to [email protected]. Plan Normal Cost contributions will be made as part of the payroll reporting process. If there is contractual cost sharing or other change, this amount will change.
In accordance with Sections 20537 and 20572 of the Public Employees’ Retirement Law, if a contracting agency fails to remit the required contributions when due, interest and penalties may apply.
Fiscal Year Fiscal Year
2019-20 2020-21
Development of Normal Cost as a Percentage of Payroll1
Base Total Normal Cost for Formula 13.735% 14.482%
Surcharge for Class 1 Benefits2
None 0.000% 0.000%
Phase out of Normal Cost Difference3 0.000% 0.000%
Plan’s Total Normal Cost 13.735% 14.482%
Plan's Employee Contribution Rate4 6.750% 6.750%
Employer Normal Cost Rate 6.985% 7.732%
Projected Payroll for the Contribution Fiscal Year $ 4,650,646 $ 5,114,683
Estimated Employer Contributions Based on Projected Payroll
Plan’s Estimated Employer Normal Cost $ 324,848 $ 395,467
Plan’s Payment on Amortization Bases5 5,318 16,484
% of Projected Payroll (illustrative only) 0.114% 0.322%
Estimated Total Employer Contribution $ 330,166 $ 411,951
% of Projected Payroll (illustrative only) 7.099% 8.054%
1 The results shown for Fiscal Year 2019-20 reflect the prior year valuation and may not take into account any lump sum
payment, side fund payoff, or rate adjustment made after April 30, 2018.
2 Section 2 of this report contains a list of Class 1 benefits and corresponding surcharges for each benefit.
3 The normal cost difference is phased out over a five-year period. The phase out of normal cost difference is 100 percent for the first year of pooling, and is incrementally reduced by 20 percent of the original normal cost difference for each subsequent year. This is non-zero only for plans that joined a pool within the past 5 years. Most plans joined a pool June 30, 2003, when risk pooling was implemented.
4 For detail regarding the determination of the required PEPRA employee contribution rate see Section on PEPRA Member Contribution Rates.
5 See page 10 for a breakdown of the Amortization Bases.
63
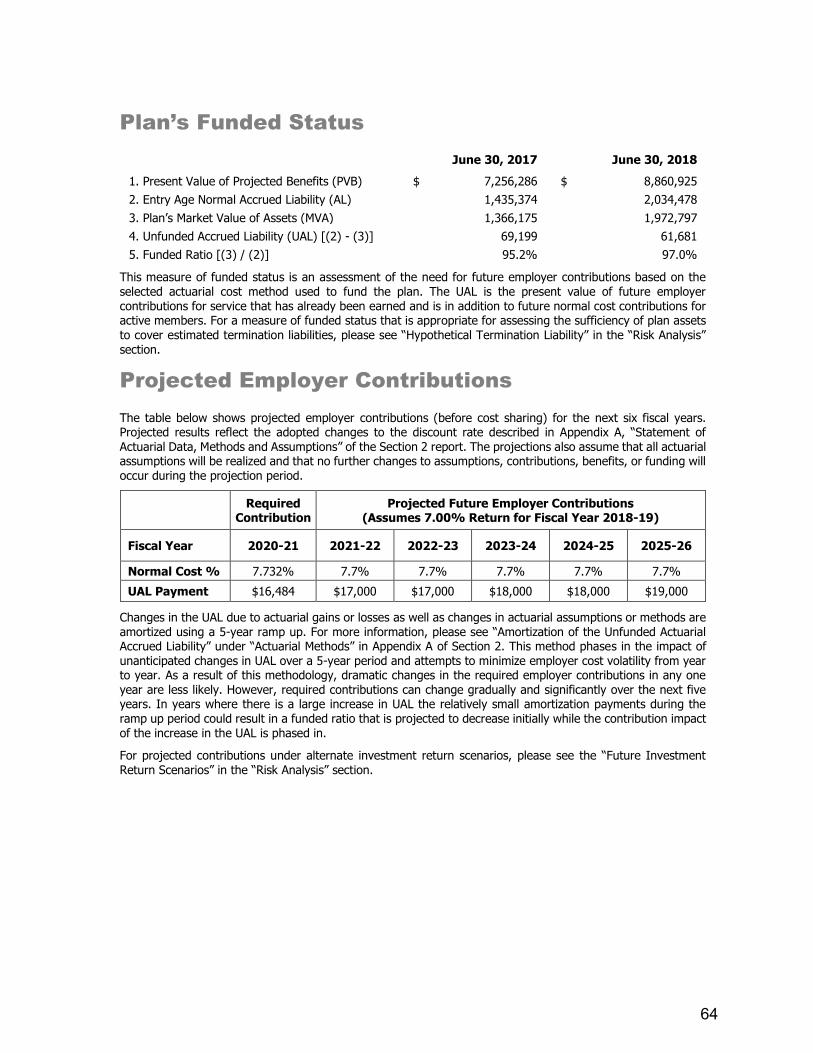
Plan’s Funded Status
June 30, 2017 June 30, 2018
1. Present Value of Projected Benefits (PVB) $ 7,256,286 $ 8,860,925
2. Entry Age Normal Accrued Liability (AL) 1,435,374 2,034,478
3. Plan’s Market Value of Assets (MVA) 1,366,175 1,972,797
4. Unfunded Accrued Liability (UAL) [(2) - (3)] 69,199 61,681
5. Funded Ratio [(3) / (2)] 95.2% 97.0%
This measure of funded status is an assessment of the need for future employer contributions based on the selected actuarial cost method used to fund the plan. The UAL is the present value of future employer contributions for service that has already been earned and is in addition to future normal cost contributions for active members. For a measure of funded status that is appropriate for assessing the sufficiency of plan assets
to cover estimated termination liabilities, please see “Hypothetical Termination Liability” in the “Risk Analysis” section.
Projected Employer Contributions
The table below shows projected employer contributions (before cost sharing) for the next six fiscal years. Projected results reflect the adopted changes to the discount rate described in Appendix A, “Statement of Actuarial Data, Methods and Assumptions” of the Section 2 report. The projections also assume that all actuarial assumptions will be realized and that no further changes to assumptions, contributions, benefits, or funding will occur during the projection period.
Required
Contribution Projected Future Employer Contributions
(Assumes 7.00% Return for Fiscal Year 2018-19)
Fiscal Year 2020-21 2021-22 2022-23 2023-24 2024-25 2025-26
Normal Cost % 7.732% 7.7% 7.7% 7.7% 7.7% 7.7%
UAL Payment $16,484 $17,000 $17,000 $18,000 $18,000 $19,000
Changes in the UAL due to actuarial gains or losses as well as changes in actuarial assumptions or methods are amortized using a 5-year ramp up. For more information, please see “Amortization of the Unfunded Actuarial Accrued Liability” under “Actuarial Methods” in Appendix A of Section 2. This method phases in the impact of unanticipated changes in UAL over a 5-year period and attempts to minimize employer cost volatility from year to year. As a result of this methodology, dramatic changes in the required employer contributions in any one year are less likely. However, required contributions can change gradually and significantly over the next five years. In years where there is a large increase in UAL the relatively small amortization payments during the ramp up period could result in a funded ratio that is projected to decrease initially while the contribution impact of the increase in the UAL is phased in.
For projected contributions under alternate investment return scenarios, please see the “Future Investment Return Scenarios” in the “Risk Analysis” section.
64
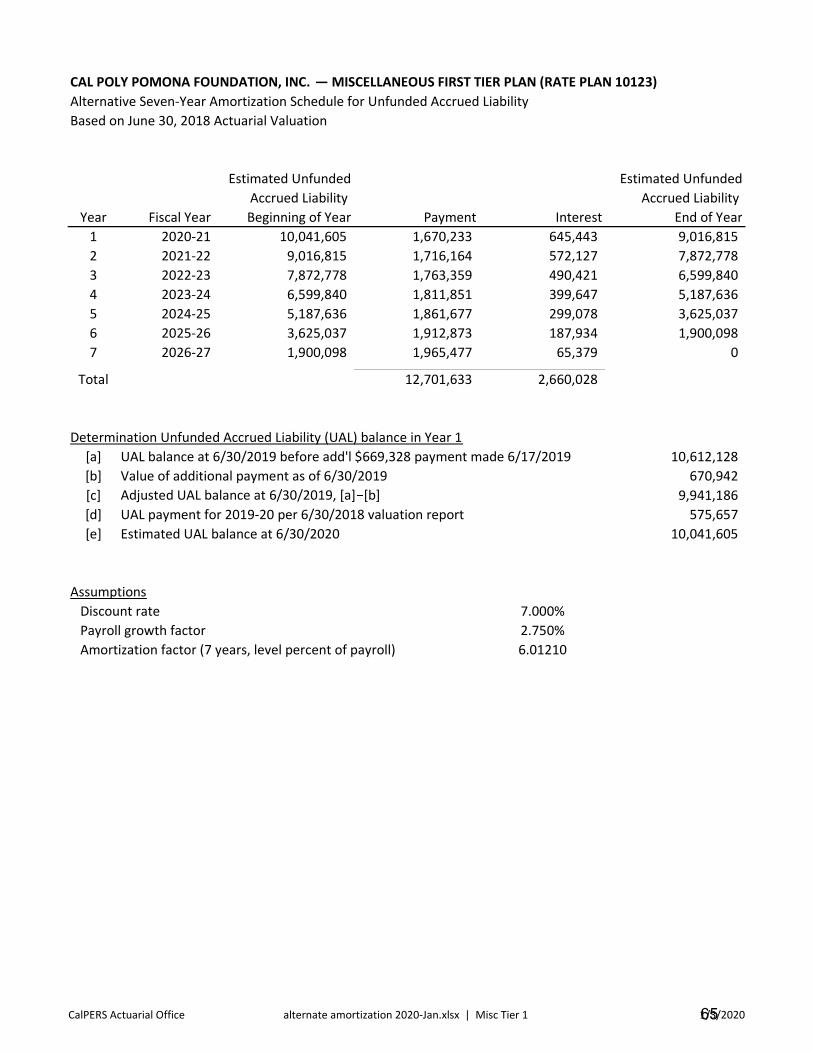
CAL POLY POMONA FOUNDATION, INC. — MISCELLANEOUS FIRST TIER PLAN (RATE PLAN 10123)Alternative Seven-Year Amortization Schedule for Unfunded Accrued LiabilityBased on June 30, 2018 Actuarial Valuation
Estimated Unfunded Estimated UnfundedAccrued Liability Accrued Liability
Year Fiscal Year Beginning of Year Payment Interest End of Year1 2020-21 10,041,605 1,670,233 645,443 9,016,8152 2021-22 9,016,815 1,716,164 572,127 7,872,7783 2022-23 7,872,778 1,763,359 490,421 6,599,8404 2023-24 6,599,840 1,811,851 399,647 5,187,6365 2024-25 5,187,636 1,861,677 299,078 3,625,0376 2025-26 3,625,037 1,912,873 187,934 1,900,0987 2026-27 1,900,098 1,965,477 65,379 0
Total 12,701,633 2,660,028
Determination Unfunded Accrued Liability (UAL) balance in Year 1[a] UAL balance at 6/30/2019 before add'l $669,328 payment made 6/17/2019 10,612,128[b] Value of additional payment as of 6/30/2019 670,942[c] Adjusted UAL balance at 6/30/2019, [a]−[b] 9,941,186[d] UAL payment for 2019-20 per 6/30/2018 valuation report 575,657[e] Estimated UAL balance at 6/30/2020 10,041,605
AssumptionsDiscount rate 7.000%Payroll growth factor 2.750%Amortization factor (7 years, level percent of payroll) 6.01210
CalPERS Actuarial Office alternate amortization 2020-Jan.xlsx | Misc Tier 1 1/3/202065
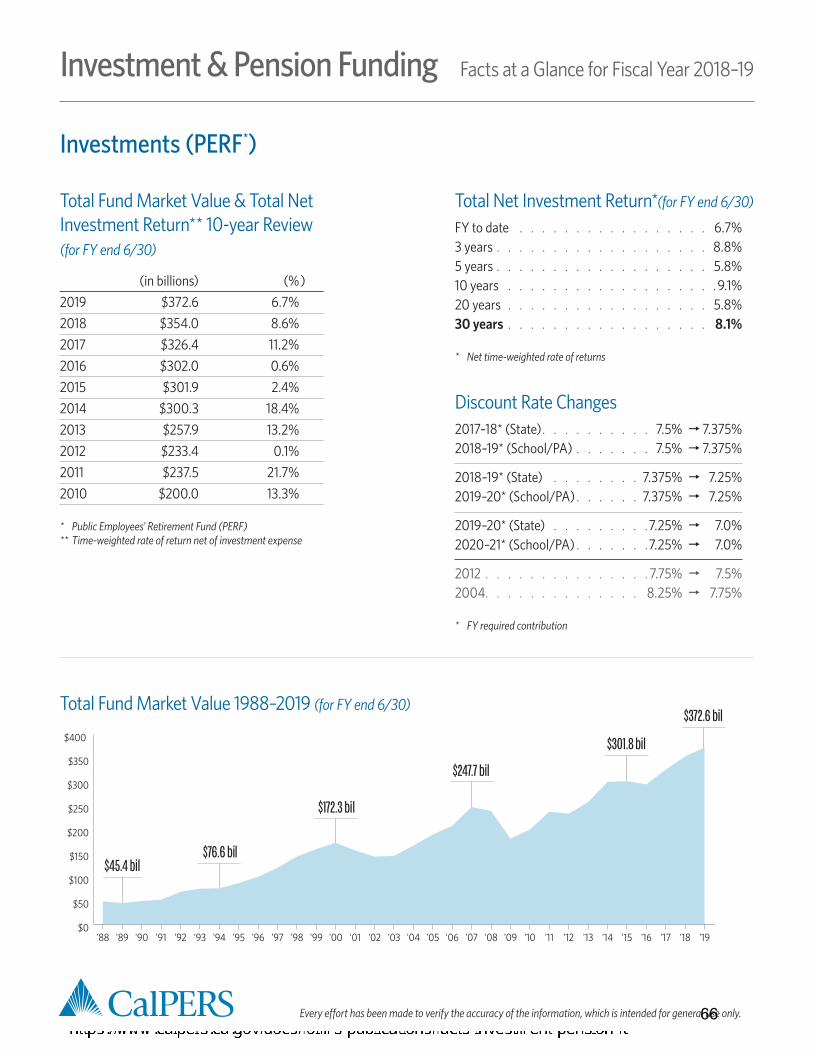
Every effort has been made to verify the accuracy of the information, which is intended for general use only.
Facts at a Glance for Fiscal Year 2018–19Investment & Pension Funding
Investments (PERF*)
Total Fund Market Value & Total Net Investment Return** 10-year Review (for FY end 6/30)
(in billions) (% ) 2019 $372.6 6.7%2018 $354.0 8.6%2017 $326.4 11.2%2016 $302.0 0.6%2015 $301.9 2.4%2014 $300.3 18.4%2013 $257.9 13.2% 2012 $233.4 0.1% 2011 $237.5 21.7%2010 $200.0 13.3%
* Public Employees' Retirement Fund (PERF) ** Time-weighted rate of return net of investment expense
Total Net Investment Return*(for FY end 6/30) FY to date 6.7%3 years 8.8%5 years 5.8%10 years 9.1%20 years 5.8%30 years 8.1%
* Net time-weighted rate of returns
Discount Rate Changes 2017-18* (State) 7.5% � 7.375%2018-19* (School/PA) 7.5% � 7.375%
2018-19* (State) 7.375% � 7.25%2019-20* (School/PA) 7.375% � 7.25%
2019-20* (State) 7.25% � 7.0%2020-21* (School/PA) 7.25% � 7.0%
2012 7.75% � 7.5%2004 8.25% � 7.75%
* FY required contribution
Total Fund Market Value 1988–2019 (for FY end 6/30)
$45.4 bil
$301.8 bil
$172.3 bil
$76.6 bil
$372.6 bil
$247.7 bil
$0
$50
$100
$150
$200
$250
$300
$350
$400
'19'18'17'16'15'14'13'12'11'10'09'08'07'06'05'04'03'02'01'00'99'98'97'96'95'94'93'92'91'90'89'88
66
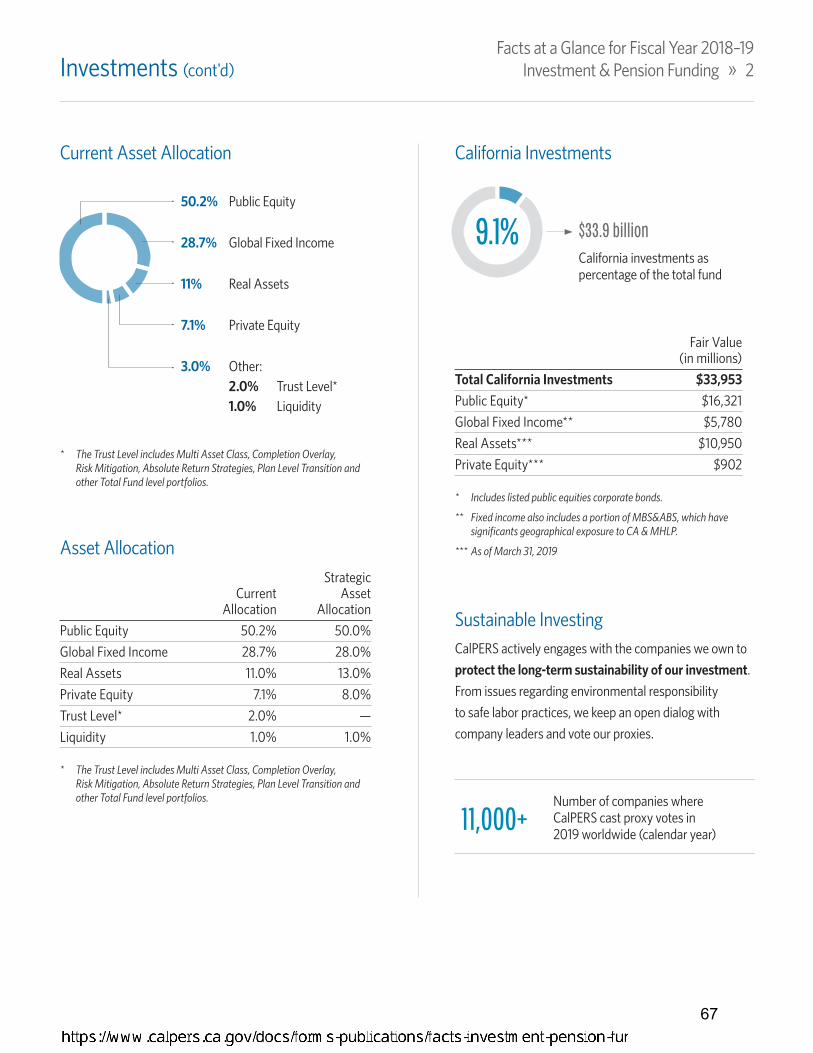
Investments (cont'd)Facts at a Glance for Fiscal Year 2018–19
Investment & Pension Funding » 2
Current Asset Allocation
29+11+7+3+50+H50.2% Public Equity
28.7% Global Fixed Income
11% Real Assets
7.1% Private Equity
3.0% Other: 2.0% Trust Level* 1.0% Liquidity
Asset Allocation Strategic Current Asset Allocation Allocation Public Equity 50.2% 50.0%Global Fixed Income 28.7% 28.0%Real Assets 11.0% 13.0%Private Equity 7.1% 8.0%Trust Level* 2.0% —Liquidity 1.0% 1.0%
* The Trust Level includes Multi Asset Class, Completion Overlay, Risk Mitigation, Absolute Return Strategies, Plan Level Transition and other Total Fund level portfolios.
California Investments
90+10+H 9.1%California investments as percentage of the total fund
$33.9 billion
Fair Value (in millions)Total California Investments $33,953 Public Equity* $16,321 Global Fixed Income** $5,780Real Assets*** $10,950 Private Equity*** $902
* Includes listed public equities corporate bonds.
** Fixed income also includes a portion of MBS&ABS, which have significants geographical exposure to CA & MHLP.
*** As of March 31, 2019
Sustainable InvestingCalPERS actively engages with the companies we own to protect the long-term sustainability of our investment. From issues regarding environmental responsibility to safe labor practices, we keep an open dialog with company leaders and vote our proxies.
11,000+Number of companies where CalPERS cast proxy votes in 2019 worldwide (calendar year)
* The Trust Level includes Multi Asset Class, Completion Overlay, Risk Mitigation, Absolute Return Strategies, Plan Level Transition and other Total Fund level portfolios.
67

Facts at a Glance for Fiscal Year 2018–19Investment & Pension Funding » 3Pension Funding
Funded Status of Retirement Plans by Member Category
State School PA Total
2017–18 69.5% * 68.6% * 70.4% * 69.8%*2016–17 65.8% * 68.7% * 69.5% * 68.0%*
2015–16 62.3% 67.8% 66.2% 68.3%
2014–15 69.4% 77.5% 74.5% 73.1%
2013–14 72.1% 82.0% 77.9% 76.3%
2012–13 66.1% 76.2% 70.5% 69.8%
2011–12 66.1% 75.4% 70.1% 69.6%
* Based on a 7.0% discount rate and includes the terminated agency pooland 1959 survivor benefit plan.
Contributions, 10-Year Review (in thousands) Employer Member Investment
Contributions Contributions & Other Income
2018–19 $15,612,678 $4,664,618 $22,969,6642017–18 $19,917,796 * $4,415,129 $27,448,098
2016–17 $12,329,837 $4,214,578 $32,977,020
2015–16 10,892,489 4,015,754 1,548,442
2014–15 9,997,705 3,826,072 6,702,997
2013–14 8,777,602 3,775,038 45,598,044
2012–13 8,123,833 3,897,078 30,291,983
2011–12 7,772,913 3,598,437 (196,014)
2010–11 7,465,397 3,600,089 43,907,436
2009–10 6,955,049 3,378,867 25,577,529
* Amount includes an additional $6 billion dollar contribution by the state.
Funded Status Total PERF*
30+70+H 70.2%
2017–18**
30+70+H 71%
2018–19***
* These totals include Public Employees' RetirementFund (PERF) and the terminated agency pool and 1959 survivor benefit plan.
** Based on the CAFR for FY 2018-19 using a discount rate of 7.25% for schools, 7% for PAs and state. The funded status is estimated to be 69.8% if using a 7.0% discount rate.
*** Estimate based on using a 7.0% discount rate and includes the additional payments from the state of nearly $10 billion for the state and school plans.
Total Employer Contributions
43+41+16+H$15.6bil
School districts and Charter Schools$2.5 billion / 16%
State of California$6.7 billion / 43%
Public agencies$6.4 billion / 41%
Shared ResponsibilityEvery dollar paid to CalPERS retirees comes from three sources*:
29+13+58+H$1
Investment earnings 58¢
CalPERS employers 29¢
CalPERS members 13¢
* Income over the last 20 years. 68
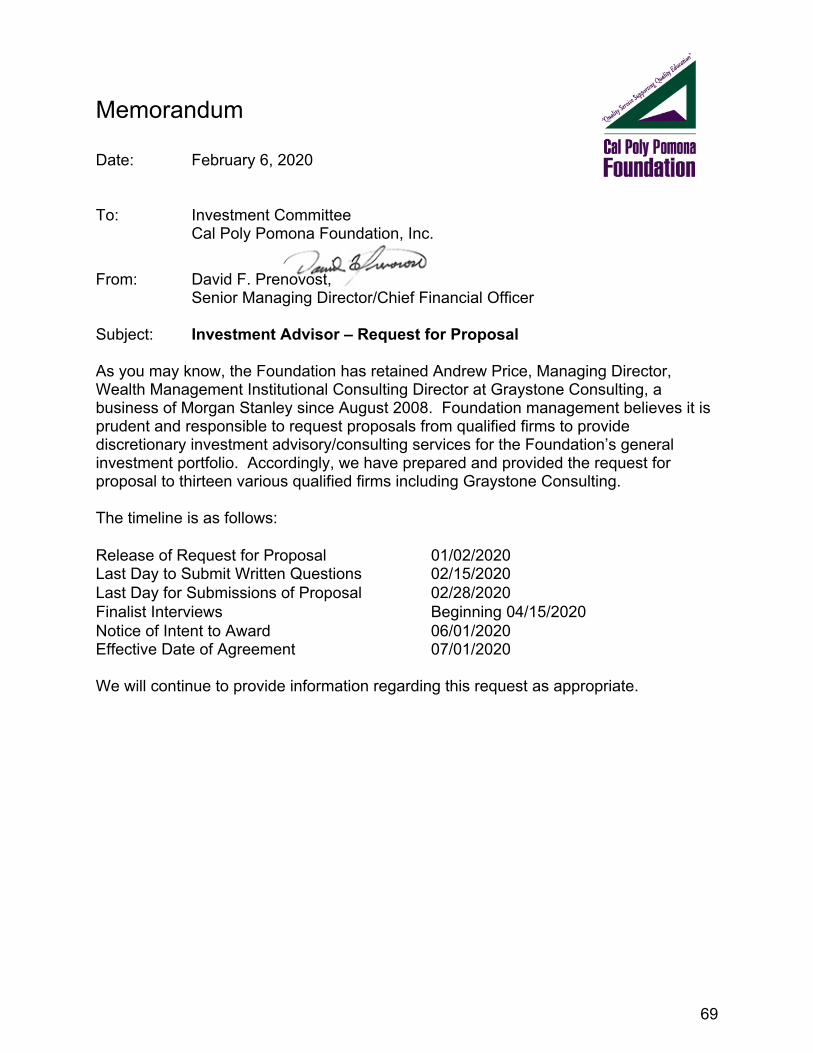
Memorandum Date: February 6, 2020 To: Investment Committee Cal Poly Pomona Foundation, Inc.
From: David F. Prenovost, Senior Managing Director/Chief Financial Officer Subject: Investment Advisor – Request for Proposal As you may know, the Foundation has retained Andrew Price, Managing Director, Wealth Management Institutional Consulting Director at Graystone Consulting, a business of Morgan Stanley since August 2008. Foundation management believes it is prudent and responsible to request proposals from qualified firms to provide discretionary investment advisory/consulting services for the Foundation’s general investment portfolio. Accordingly, we have prepared and provided the request for proposal to thirteen various qualified firms including Graystone Consulting. The timeline is as follows: Release of Request for Proposal 01/02/2020 Last Day to Submit Written Questions 02/15/2020 Last Day for Submissions of Proposal 02/28/2020 Finalist Interviews Beginning 04/15/2020 Notice of Intent to Award 06/01/2020 Effective Date of Agreement 07/01/2020 We will continue to provide information regarding this request as appropriate.
69