investigative skills
TRANSCRIPT
Page 1
Investigative Skills
Name: ________________________
Class: ________________________
Date: ________________________
Time: 46 minutes
Marks: 45 marks
Comments:
Page 2
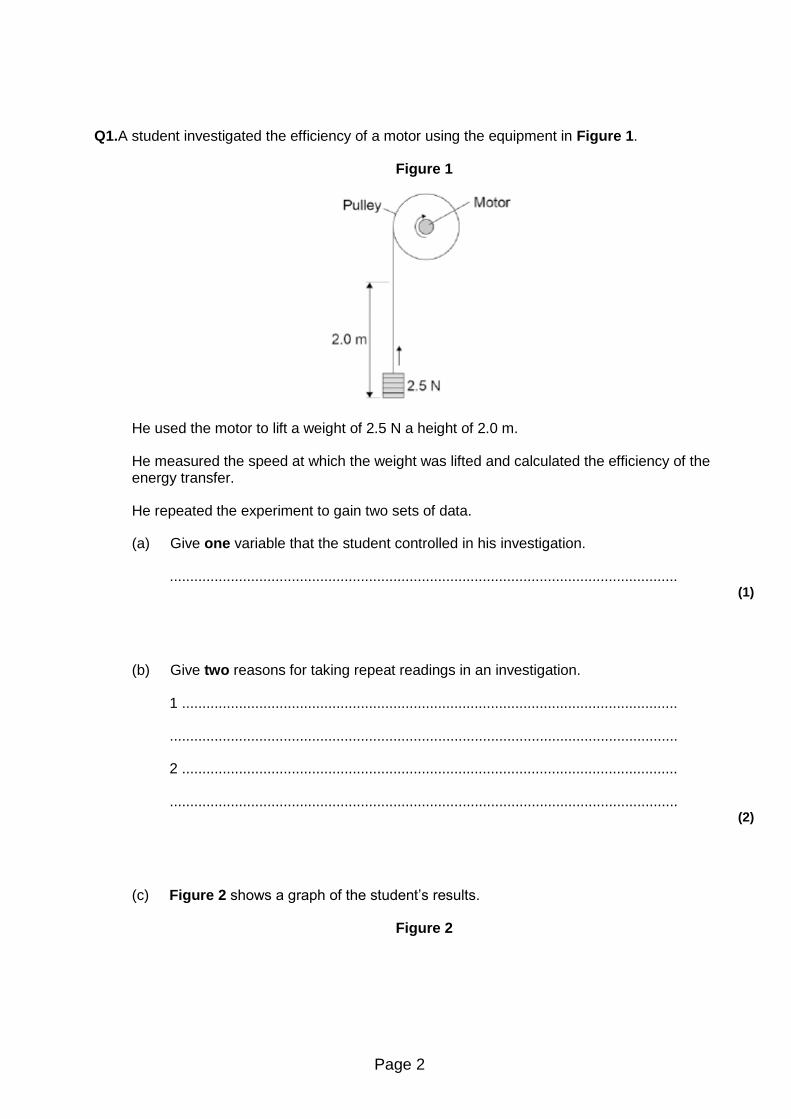
Q1.A student investigated the efficiency of a motor using the equipment in Figure 1.
Figure 1
He used the motor to lift a weight of 2.5 N a height of 2.0 m.
He measured the speed at which the weight was lifted and calculated the efficiency of the energy transfer.
He repeated the experiment to gain two sets of data.
(a) Give one variable that the student controlled in his investigation.
............................................................................................................................. (1)
(b) Give two reasons for taking repeat readings in an investigation.
1 ..........................................................................................................................
.............................................................................................................................
2 ..........................................................................................................................
............................................................................................................................. (2)
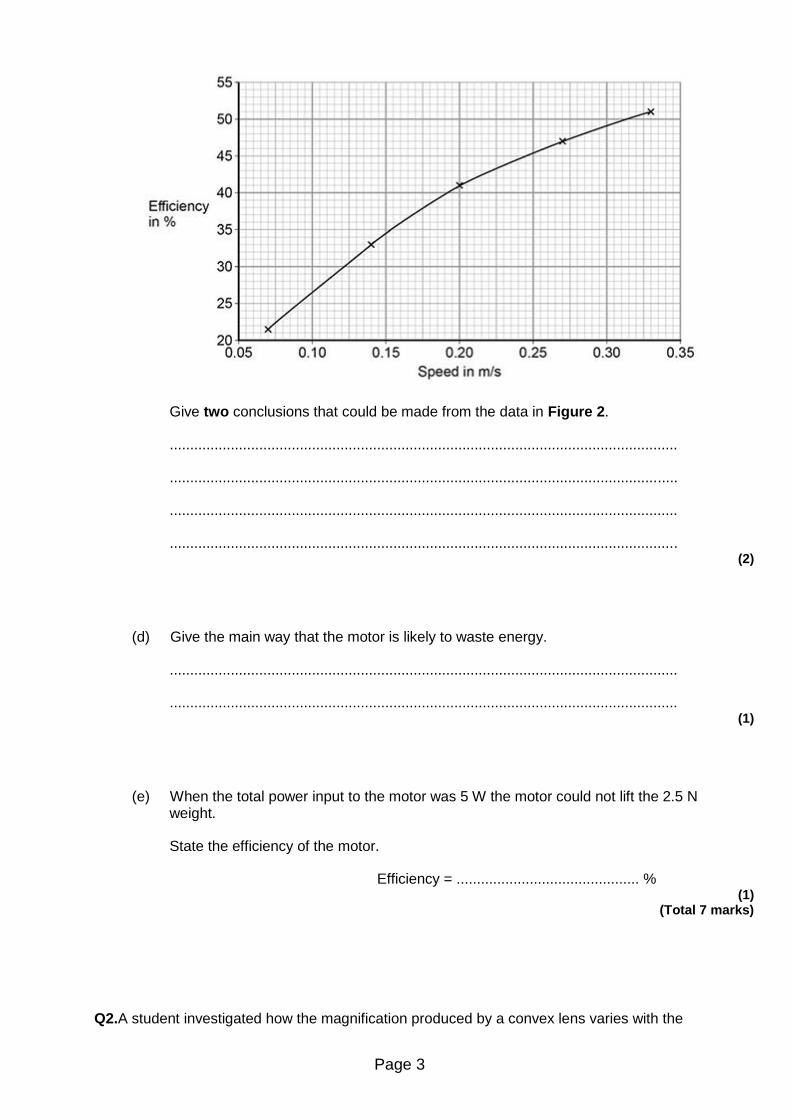
(c) Figure 2 shows a graph of the student’s results.
Figure 2
Page 3
Give two conclusions that could be made from the data in Figure 2.
.............................................................................................................................
.............................................................................................................................
.............................................................................................................................
............................................................................................................................. (2)
(d) Give the main way that the motor is likely to waste energy.
.............................................................................................................................
............................................................................................................................. (1)
(e) When the total power input to the motor was 5 W the motor could not lift the 2.5 N weight.
State the efficiency of the motor.
Efficiency = ............................................. % (1)
(Total 7 marks)
Q2.A student investigated how the magnification produced by a convex lens varies with the
Page 4
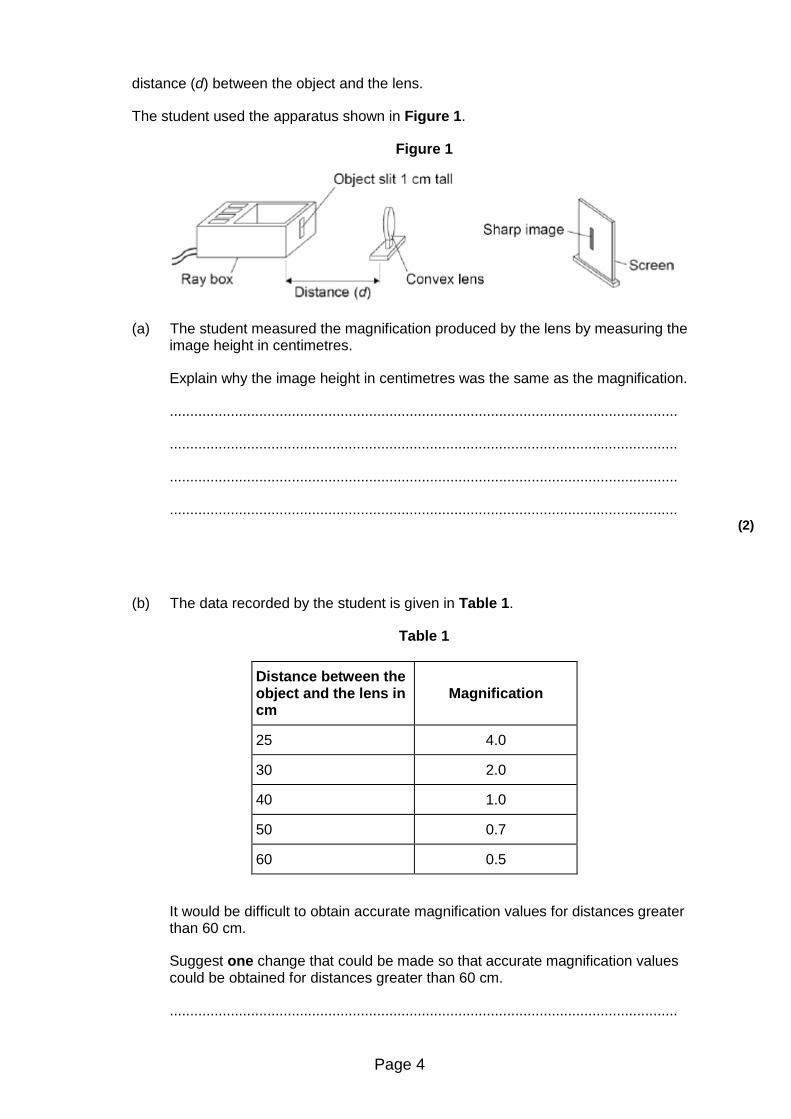
distance (d) between the object and the lens.
The student used the apparatus shown in Figure 1.
Figure 1
(a) The student measured the magnification produced by the lens by measuring the image height in centimetres.
Explain why the image height in centimetres was the same as the magnification.
.............................................................................................................................
.............................................................................................................................
.............................................................................................................................
............................................................................................................................. (2)
(b) The data recorded by the student is given in Table 1.
Table 1
Distance between the object and the lens in cm
Magnification
25 4.0
30 2.0
40 1.0
50 0.7
60 0.5
It would be difficult to obtain accurate magnification values for distances greater than 60 cm.
Suggest one change that could be made so that accurate magnification values could be obtained for distances greater than 60 cm.
.............................................................................................................................
Page 5
............................................................................................................................. (1)
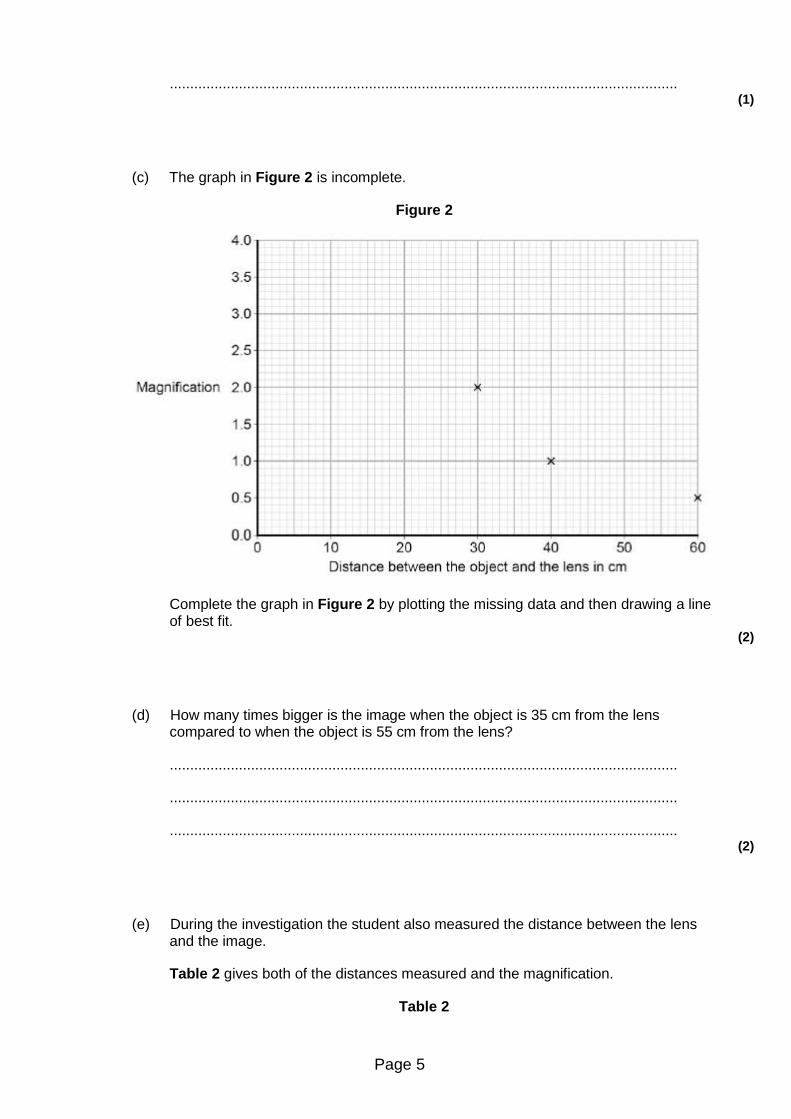
(c) The graph in Figure 2 is incomplete.
Figure 2
Complete the graph in Figure 2 by plotting the missing data and then drawing a line of best fit.
(2)
(d) How many times bigger is the image when the object is 35 cm from the lens compared to when the object is 55 cm from the lens?
.............................................................................................................................
.............................................................................................................................
............................................................................................................................. (2)
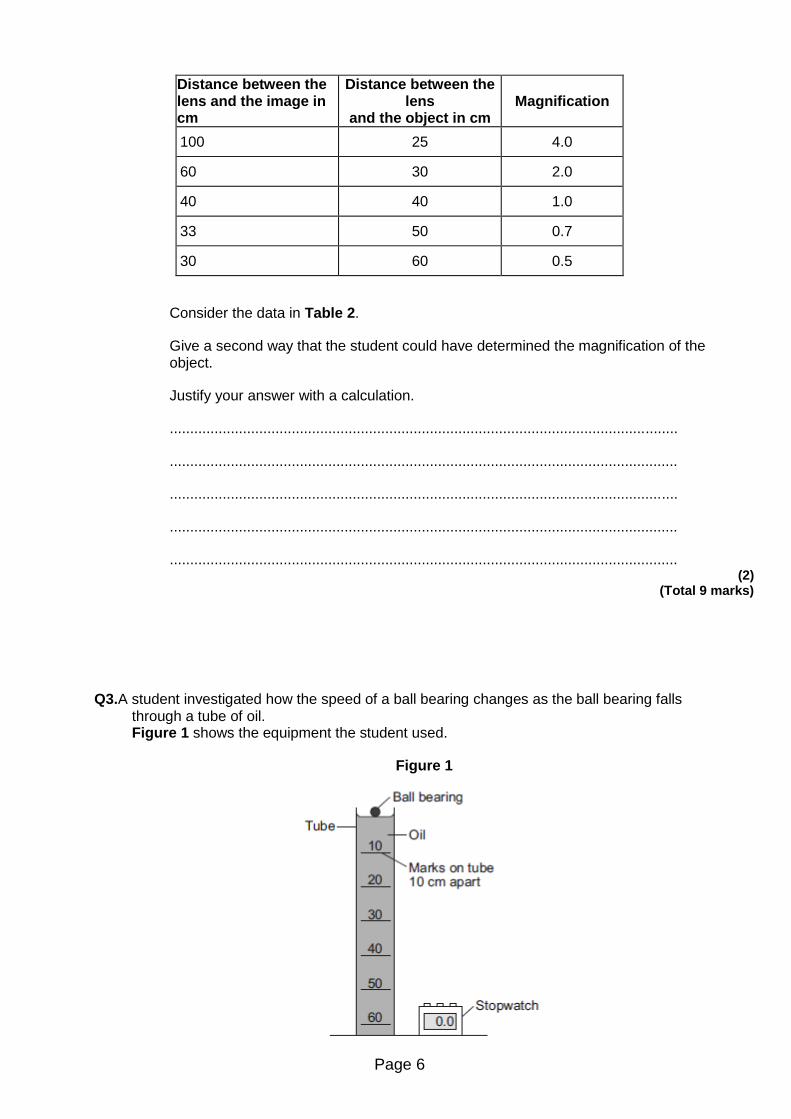
(e) During the investigation the student also measured the distance between the lens and the image.
Table 2 gives both of the distances measured and the magnification.
Table 2
Page 6
Distance between the lens and the image in cm
Distance between the lens
and the object in cm Magnification
100 25 4.0
60 30 2.0
40 40 1.0
33 50 0.7
30 60 0.5
Consider the data in Table 2.
Give a second way that the student could have determined the magnification of the object.
Justify your answer with a calculation.
.............................................................................................................................
.............................................................................................................................
.............................................................................................................................
.............................................................................................................................
............................................................................................................................. (2)
(Total 9 marks)
Q3.A student investigated how the speed of a ball bearing changes as the ball bearing falls through a tube of oil. Figure 1 shows the equipment the student used.
Figure 1
Page 7
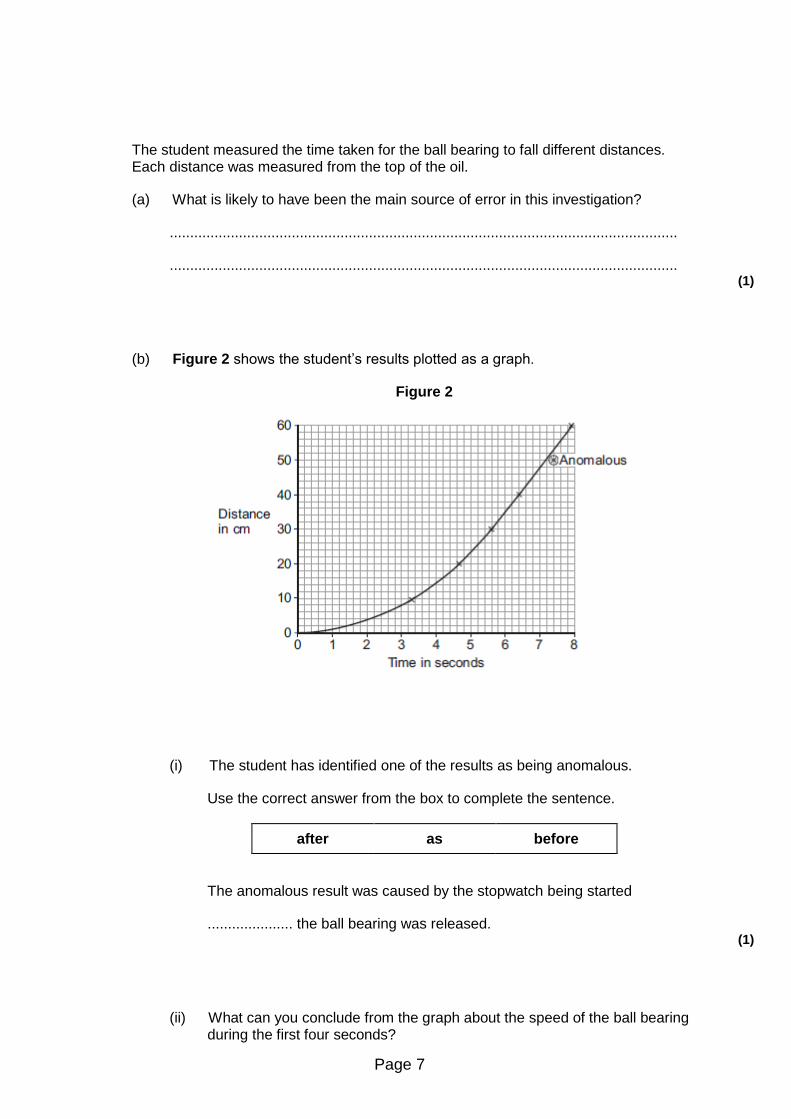
The student measured the time taken for the ball bearing to fall different distances. Each distance was measured from the top of the oil.
(a) What is likely to have been the main source of error in this investigation?
.............................................................................................................................
............................................................................................................................. (1)
(b) Figure 2 shows the student’s results plotted as a graph.
Figure 2
(i) The student has identified one of the results as being anomalous.
Use the correct answer from the box to complete the sentence.
after as before
The anomalous result was caused by the stopwatch being started
..................... the ball bearing was released. (1)
(ii) What can you conclude from the graph about the speed of the ball bearing during the first four seconds?
Page 8
...................................................................................................................
................................................................................................................... (1)
(iii) The graph shows that the ball bearing reached its terminal velocity.
Describe how the graph would be used to calculate the terminal velocity of the ball bearing.
...................................................................................................................
................................................................................................................... (1)
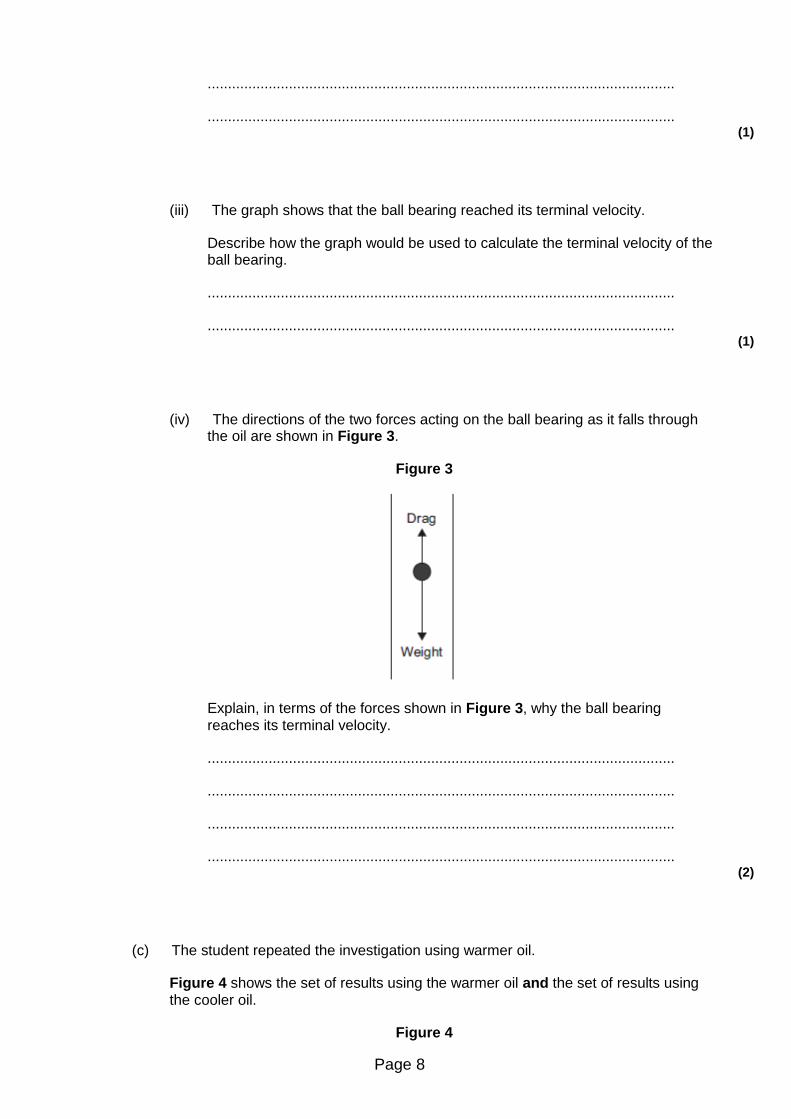
(iv) The directions of the two forces acting on the ball bearing as it falls through the oil are shown in Figure 3.
Figure 3
Explain, in terms of the forces shown in Figure 3, why the ball bearing reaches its terminal velocity.
...................................................................................................................
...................................................................................................................
...................................................................................................................
................................................................................................................... (2)
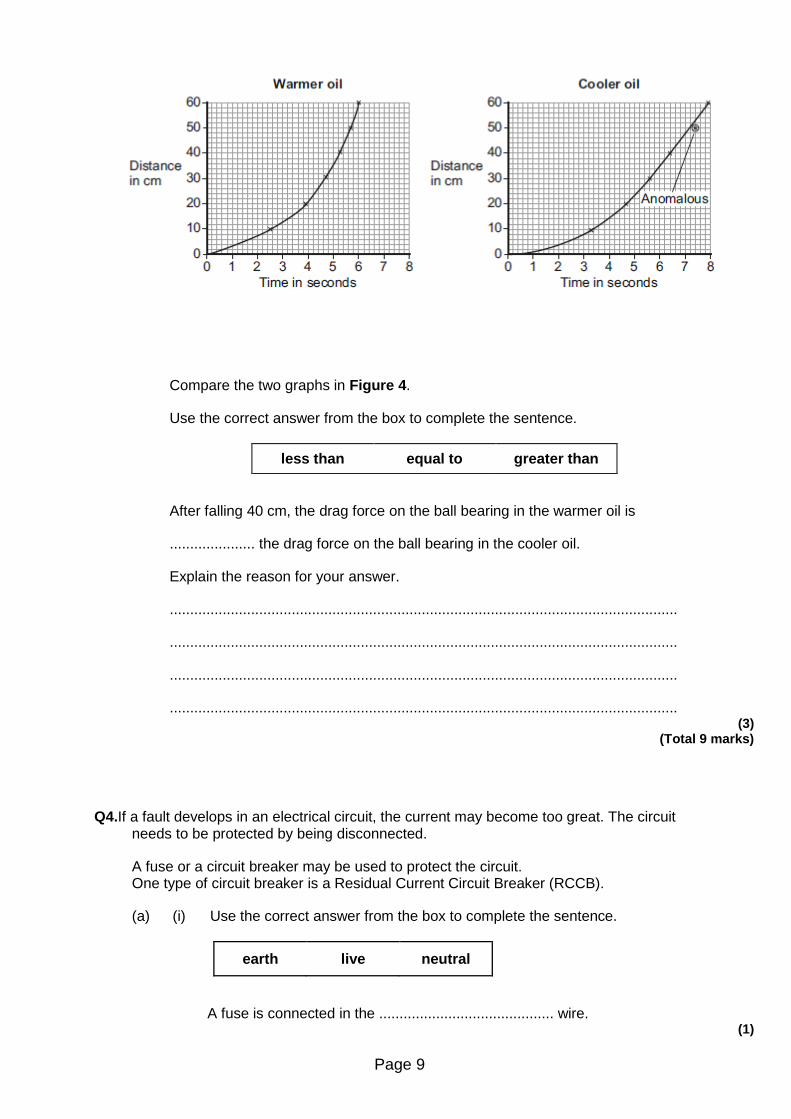
(c) The student repeated the investigation using warmer oil.
Figure 4 shows the set of results using the warmer oil and the set of results using the cooler oil.
Figure 4
Page 9
Compare the two graphs in Figure 4.
Use the correct answer from the box to complete the sentence.
less than equal to greater than
After falling 40 cm, the drag force on the ball bearing in the warmer oil is
..................... the drag force on the ball bearing in the cooler oil.
Explain the reason for your answer.
.............................................................................................................................
.............................................................................................................................
.............................................................................................................................
............................................................................................................................. (3)
(Total 9 marks)
Q4.If a fault develops in an electrical circuit, the current may become too great. The circuit needs to be protected by being disconnected.
A fuse or a circuit breaker may be used to protect the circuit. One type of circuit breaker is a Residual Current Circuit Breaker (RCCB).
(a) (i) Use the correct answer from the box to complete the sentence.
earth live neutral
A fuse is connected in the ........................................... wire. (1)
Page 10
(ii) Use the correct answer from the box to complete the sentence.
are bigger are cheaper react faster
RCCBs are sometimes preferred to fuses because they ........................................... .
(1)
(iii) RCCBs operate by detecting a difference in the current between two wires.
Use the correct answer from the box to complete the sentence.
earth and live earth and neutral live and neutral
The two wires are the .............................................................................. wires. (1)
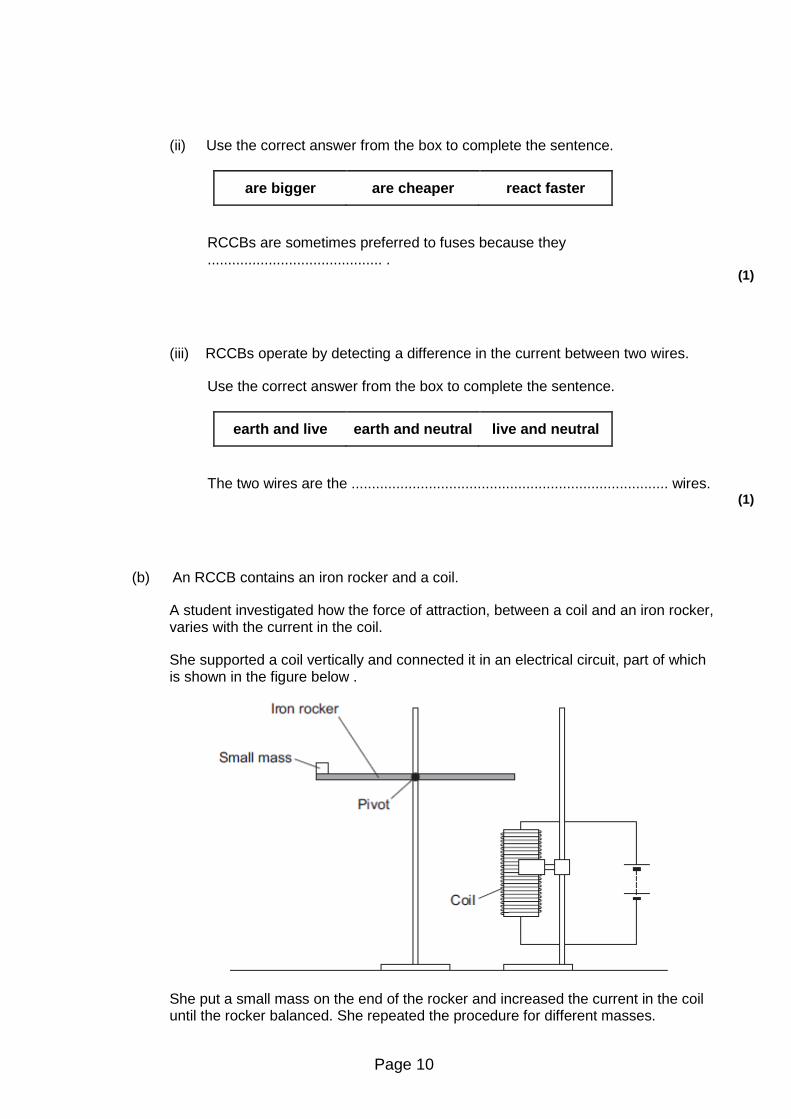
(b) An RCCB contains an iron rocker and a coil.
A student investigated how the force of attraction, between a coil and an iron rocker, varies with the current in the coil.
She supported a coil vertically and connected it in an electrical circuit, part of which is shown in the figure below .
She put a small mass on the end of the rocker and increased the current in the coil until the rocker balanced. She repeated the procedure for different masses.
Page 11
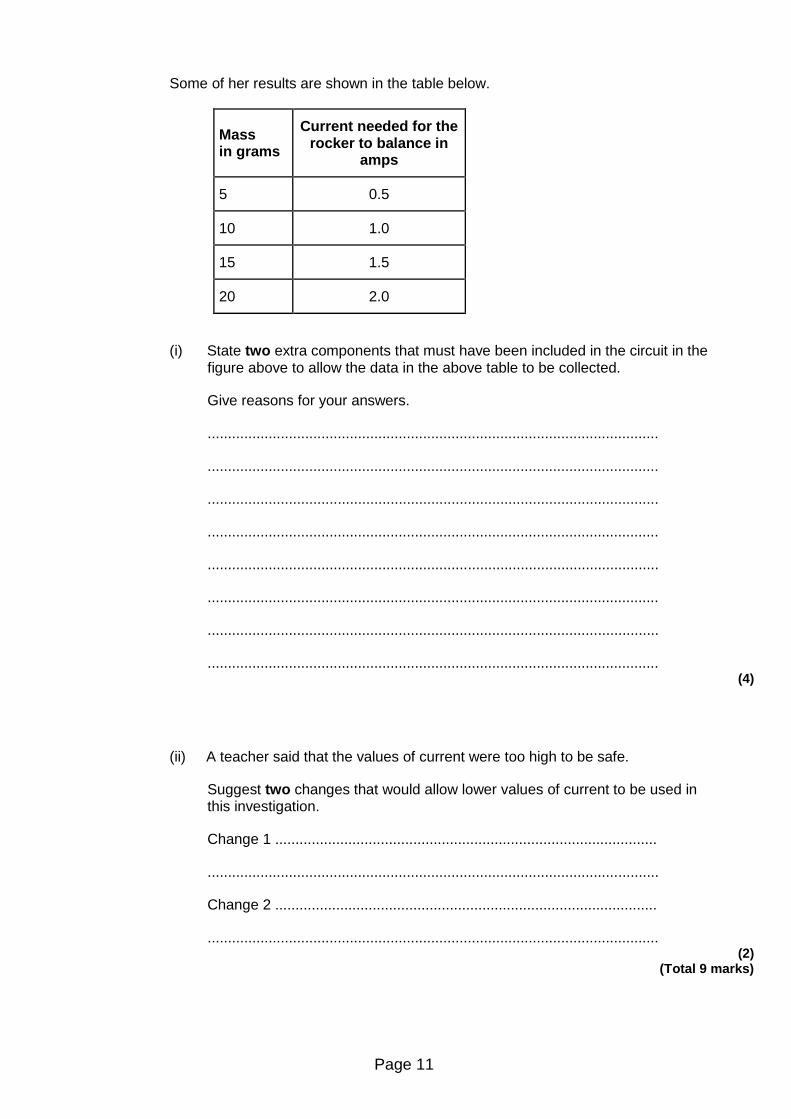
Some of her results are shown in the table below.
Mass in grams
Current needed for the rocker to balance in
amps
5 0.5
10 1.0
15 1.5
20 2.0
(i) State two extra components that must have been included in the circuit in the figure above to allow the data in the above table to be collected.
Give reasons for your answers.
...............................................................................................................
...............................................................................................................
...............................................................................................................
...............................................................................................................
...............................................................................................................
...............................................................................................................
...............................................................................................................
............................................................................................................... (4)
(ii) A teacher said that the values of current were too high to be safe.
Suggest two changes that would allow lower values of current to be used in this investigation.
Change 1 ..............................................................................................
...............................................................................................................
Change 2 ..............................................................................................
............................................................................................................... (2)
(Total 9 marks)
Page 12
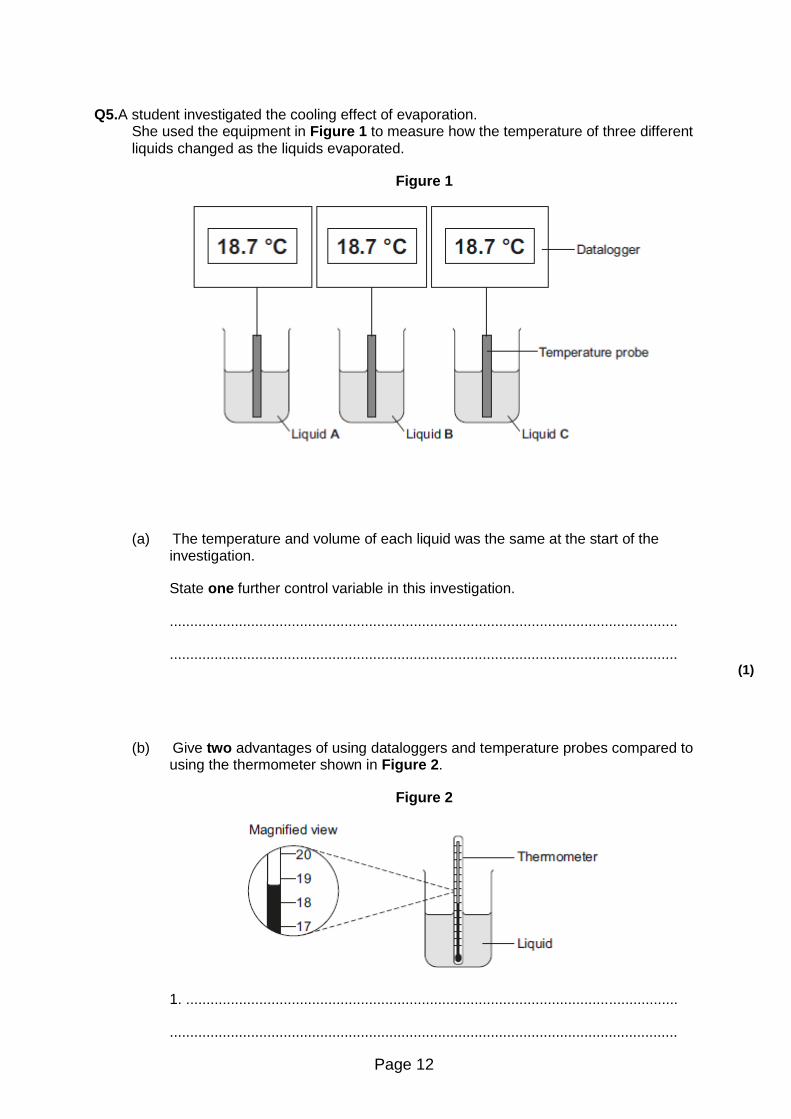
Q5.A student investigated the cooling effect of evaporation. She used the equipment in Figure 1 to measure how the temperature of three different liquids changed as the liquids evaporated.
Figure 1
(a) The temperature and volume of each liquid was the same at the start of the investigation.
State one further control variable in this investigation.
.............................................................................................................................
............................................................................................................................. (1)
(b) Give two advantages of using dataloggers and temperature probes compared to using the thermometer shown in Figure 2.
Figure 2
1. .........................................................................................................................
.............................................................................................................................
Page 13
2. .........................................................................................................................
............................................................................................................................. (2)
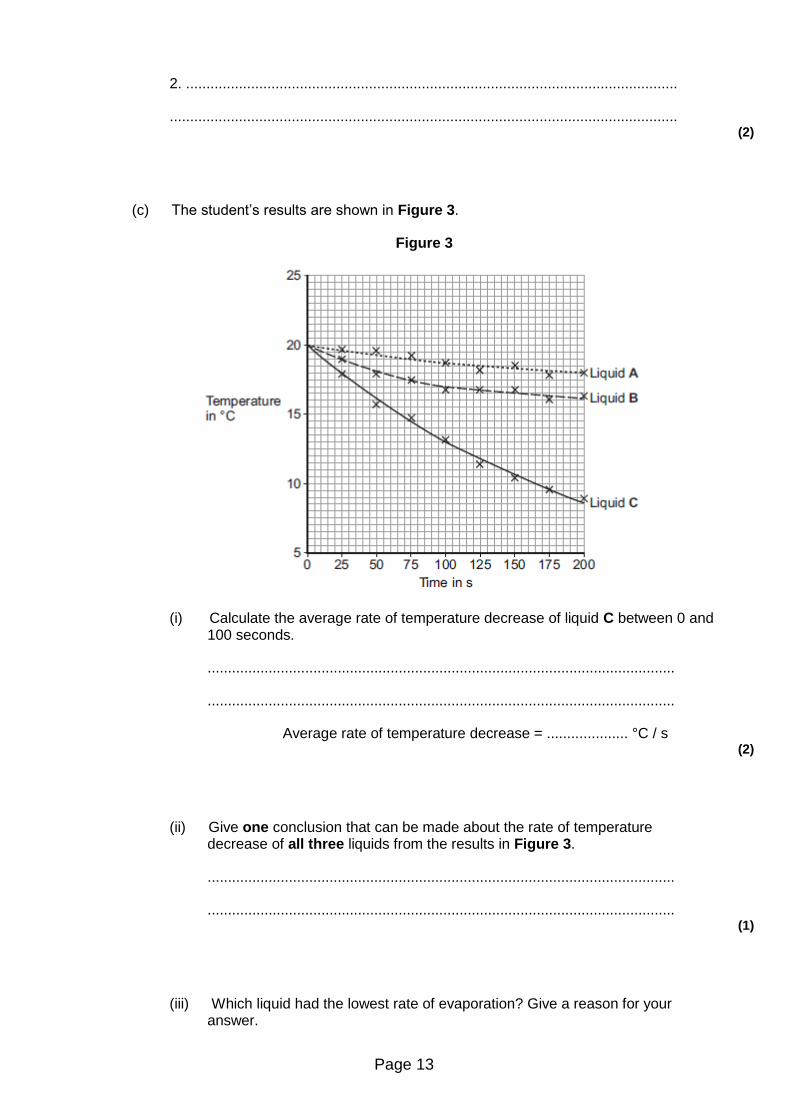
(c) The student’s results are shown in Figure 3.
Figure 3
(i) Calculate the average rate of temperature decrease of liquid C between 0 and 100 seconds.
...................................................................................................................
...................................................................................................................
Average rate of temperature decrease = .................... °C / s (2)
(ii) Give one conclusion that can be made about the rate of temperature decrease of all three liquids from the results in Figure 3.
...................................................................................................................
................................................................................................................... (1)
(iii) Which liquid had the lowest rate of evaporation? Give a reason for your answer.
Page 14
Liquid ........................................................................................................
Reason ......................................................................................................
................................................................................................................... (1)
(iv) A second student did the same investigation but using a smaller volume of liquid than the first student.
All other variables were kept the same.
What effect would this have on the results of the second student’s investigation?
...................................................................................................................
................................................................................................................... (1)
(d) Explain how the evaporation of a liquid causes the temperature of the remaining liquid to decrease.
.............................................................................................................................
.............................................................................................................................
.............................................................................................................................
.............................................................................................................................
.............................................................................................................................
.............................................................................................................................
.............................................................................................................................
............................................................................................................................. (3)
(Total 11 marks)
Page 15
M1.(a) weight (lifted)
or
height (lifted) 1
(b) any two from:
• calculate a mean • spot anomalies • reduce the effect of random errors
2
(c) as speed increases, the efficiency increases 1
(but) graph tends towards a constant value
or
appears to reach a limit
accept efficiency cannot be greater than 100% 1
(d) heating the surroundings 1
(e) 0 (%) 1
[7]
M2.(a) magnification = 1

Page 16
dividing by an object height of 1 cm gives the same (numerical) value 1
(b) accept anything practical that would work eg:
use a taller object
use a (travelling) microscope
attach a scale to the screen and use a magnifying glass 1
(c) both points plotted correctly 1
correct line of best fit drawn
a curve passing through all points (within ½ square), judge by eye
1
(d) values of 1.4 and 0.6 extracted from the graph 1
2.33 times bigger
accept any number between 2.3 and 2.5 inclusive 1
(e) by dividing the distance between the lens and the image by the distance between the lens and the object
1
at least one correct calculation and comparison eg 100÷25 = 4 which is the same as the measured magnification
1
[9]
M3.(a) starting / stopping the stopwatch
Page 17
human error is insufficient
reaction time is insufficient
or timing over the smaller distances
accept not timing accurately
do not accept references to measuring distance incorrectly 1
(b) (i) before 1
(ii) increasing
accept accelerating
it is not constant is insufficient
it is less than after four seconds is insufficient
it reaches a constant speed negates 1
(iii) calculate the gradient of the straight/steepest/constant section
accept gradient of any section after 5.5 seconds/30 cm 1
(iv) drag (force) increases (as the ball bearing gets faster)
accept frictional/upward force for drag 1
(until) drag (force) = weight or (until) resultant force is zero
accept upward force = downward force
accept till forces are balanced 1
(c) less than 1
ball bearing increases speed at a greater rate
accept it travels the same distance in less time
or ball bearing has a greater acceleration
accept the ball bearing is going faster
Page 18
or terminal velocity has not been reached
1
so resultant force must be greater or as weight is the same (the drag must be less)
accept warmer oil has a lower density/viscosity for 1 mark if neither of the two reason marks score
1
[9]
M4.(a) (i) live 1
(ii) react faster 1
(iii) live and neutral 1
(b) (i) ammeter 1
to measure current
accept to measure amps 1
plus any one from:
• variable resistor (1) to vary current (1)
accept variable power supply
accept change or control
• switch (1) to stop apparatus getting hot / protect battery or to reset equipment (1)
• fuse (1) to break circuit if current is too big (1)
2
Page 19
(ii) any two from:
• use smaller mass(es) • move mass closer to pivot • reduce gap between coil and rocker • more turns (on coil)coil / loop • iron core in coil
accept use smaller weight(s) 2
[9]
M5.(a) surface area or duration of experiment
accept shape of beaker
size of beaker is insufficient 1
(b) any two from:
• takes readings automatically
ignore easier or takes readings for you
• takes readings more frequently • reduces / no instrument reading error
ignore human error
• higher resolution
allow better resolution
• don't need to remove probe to take reading • more accurate
2
(c) (i) 0.07 (°C/s)
allow 1 mark for obtaining a temperature drop of 7 (°C)
allow 1 mark for an answer between 0.068 and 0.069 (°C/s) 2
(ii) rate of temperature change is greater at the start
accept rate of evaporation is greater at the start
Page 20
or rate of temperature change decreases
allow rate of evaporation decreases
allow temperature decreases faster at the start 1
(iii) A
reason only scores if A is chosen
lower temperature decrease (over 200 seconds)
accept lower gradient 1
(iv) no effect (as rate of evaporation is unchanged)
allow larger temperature change (per second as mass of liquid is lower)
1
(d) particles with more energy
accept particles with higher speeds 1
leave the (surface of the) liquid 1
(which) reduces the average (kinetic) energy (of the remaining particles)
allow reference to the total energy of the liquid reducing 1
[11]