ap® biology investigative labs:
TRANSCRIPT
AP® Biology investigAtive lABs:An Inquiry-Based Approach
x2 = o − e( )2
e∑
Teacher Manual
Teacher Manual
AP Biology Investigative Labs:An Inquiry-Based Approach
The College BoardNew York, NY
■ ABouT The College BoArdThe College Board is a mission-driven not-for-profit organization that connects students to college success and opportunity. Founded in 1900, the College Board was created to expand access to higher education. Today, the membership association is made up of over 6,000 of the world’s leading educational institutions and is dedicated to promoting excellence and equity in education. Each year, the College Board helps more than seven million students prepare for a successful transition to college through programs and services in college readiness and college success—including the SAT® and the Advanced Placement Program®. The organization also serves the education community through research and advocacy on behalf of students, educators and schools.
For further information, visit www.collegeboard.org.
■ AP® equity and Access PolicyThe College Board strongly encourages educators to make equitable access a guiding principle for their AP programs by giving all willing and academically prepared students the opportunity to participate in AP. We encourage the elimination of barriers that restrict access to AP for students from ethnic, racial and socioeconomic groups that have been traditionally underserved. Schools should make every effort to ensure their AP classes reflect the diversity of their student population. The College Board also believes that all students should have access to academically challenging course work before they enroll in AP classes, which can prepare them for AP success. It is only through a commitment to equitable preparation and access that true equity and excellence can be achieved.
The College Board acknowledges all the third party content that has been included in these materials and respects the Intellectual Property rights of others. If we have incorrectly attributed a source or overlooked a publisher, please contact us.
Page S121: Reprinted with permission from Micklos and Freyer, DNA Science 2e, © 2003 Cold Spring Harbor Laboratory Press.
Page A26: Chart from “The Inquiry Matrix” by Julie Grady, from The Science Teacher, November 2010. ©National Science Teachers Association. Used by permission of NSTA and the author.
FAST PLANTS® is a registered trademark of Wisconsin Alumni Research Foundation.
Editorial inquiries concerning this book should be directed to The College Board, 45 Columbus Avenue, New York, New York 10023-6992.
Second Printing
© 2012 The College Board. College Board, Advanced Placement Program, AP, AP Central, and the acorn logo are registered trademarks of the College Board. All other products and services may be trademarks of their respective owners. (Visit the College Board on the Web: www.collegeboard.org.)
2 3 4 5

Dedication iii
Dedication
On January 4, 2011, after a long, dignified, and courageous battle with pancreatic cancer, the AP Biology community lost a great educator, mentor, and friend, Kim Foglia. Her dedication to helping teachers and students and sharing activities and labs was unparalleled. She was a major supporter of the redesign of the AP Biology course and made significant contributions to the new lab manual. In honor of her vision, dedication, authorship, and contributions, the College Board would like to dedicate AP Biology Investigative Labs: An Inquiry-Based Approach to Kim Foglia.

This page is intentionally left blank.

Contents v
Contents
Acknowledgments..................................................................................................................... vii
■ For the TeacherPreface.......................................................................................................................................... ixIntroduction...............................................................................................................................T1Chapter 1:.How.to.Use.This.Lab.Manual..............................................................................T3Chapter 2:.The.Labs.at.a.Glance...........................................................................................T11Chapter 3:.Creating.Student-Directed,.Inquiry-Based.Lab.Investigations.....................T17Chapter 4:.Managing.the.Investigative.Experience............................................................T23Chapter 5:.Teaching.Quantitative.Skills.in.AP®.Biology...................................................T27Chapter 6:.Written,.Verbal,.and.Graphic.Communication...............................................T39Chapter 7:.Making.AP.Biology.Inclusive.for.All.Learners................................................T43
■ For the StudentIntroduction................................................................................................................................S1.Chapter.1:.What.Is.Inquiry?......................................................................................................S3.Chapter.2:.Written,.Verbal,.and.Graphic.Information..........................................................S5.Chapter.3:.Quantitative.Reasoning.in.AP.Biology................................................................S9
■ Big Idea 1: EvolutionIntroduction.............................................................................................................................T47Investigation 1:.Artificial.Selection,.Teacher.Version.......................................................T49Investigation 1:.Artificial.Selection,.Student.Version........................................................ S17Investigation 2:.Mathematical.Modeling:.Hardy-Weinberg,.Teacher.Version..............T59Investigation 2:.Mathematical.Modeling:.Hardy-Weinberg,.Student.Version............... S25Investigation 3:.Comparing.DNA.Sequences.to.Understand.Evolutionary.Relationships.with.BLAST,.Teacher.Version................................................................................................T69Investigation 3:.Comparing.DNA.Sequences.to.Understand.Evolutionary.Relationships.with.BLAST,.Student.Version................................................................................................ S41
■ Big Idea 2: Cellular Processes: Energy and CommunicationIntroduction.............................................................................................................................T79Investigation 4:.Diffusion.and.Osmosis,.Teacher.Version................................................T81Investigation 4:.Diffusion.and.Osmosis,.Student.Version................................................ S51

vi Contents
Investigation 5:.Photosynthesis,.Teacher.Version..............................................................T95Investigation 5:.Photosynthesis,.Student.Version.............................................................. S61Investigation 6:.Cellular.Respiration,.Teacher.Version...................................................T107Investigation 6:.Cellular.Respiration,.Student.Version..................................................... S71
■ Big Idea 3: Genetics and Information TransferIntroduction...........................................................................................................................T121Investigation 7:.Cell.Division:.Mitosis.and.Meiosis,.Teacher.Version..........................T123Investigation 7:.Cell.Division:.Mitosis.and.Meiosis,.Student.Version............................ S83Investigation 8:.Biotechnology:.Bacterial.Transformation,.Teacher.Version..............T143Investigation 8:.Biotechnology:.Bacterial.Transformation,.Student.Version................. S97Investigation 9:.Biotechnology:.Restriction.Enzyme.Analysis.of.DNA,.Teacher.Version.....................................................................................................................T161Investigation 9:.Biotechnology:.Restriction.Enzyme.Analysis.of.DNA,.Student.Version...................................................................................................................... S111
■ Big Idea 4: InteractionsIntroduction...........................................................................................................................T175Investigation 10:.Energy.Dynamics,.Teacher.Version....................................................T177Investigation 10:.Energy.Dynamics,.Student.Version..................................................... S125Investigation 11:.Transpiration,.Teacher.Version............................................................T189Investigation 11:.Transpiration,.Student.Version............................................................ S135Investigation 12:.Fruit.Fly.Behavior,.Teacher.Version....................................................T203Investigation 12:.Fruit.Fly.Behavior,.Student.Version.................................................... S145Investigation 13:.Enzyme.Activity,.Teacher.Version.......................................................T215Investigation 13:.Enzyme.Activity,.Student.Version....................................................... S153
Appendix A:.AP.Biology.Equations.and.Formulas..............................................................A1Appendix B:.Constructing.Line.Graphs................................................................................A3Appendix C:.AP.Biology.Concepts.at.a.Glance................................................................. A19Appendix D:.Matrix.for.Assessing.and.Planning.Scientific.Inquiry.(MAPSI).............. A25
Acknowledgments vii
Acknowledgments
The College Board would like to acknowledge the following individuals and committees for their commitment and dedication toward the completion of this project:
■ Lab authors and Major Contributors• Stacy Baker, Convent of the Sacred Heart, New York, NY
• Spencer Benson, University of Maryland, College Park, MD
• Elizabeth Cowles, Eastern Connecticut State University, Willimantic, CT
• Arthur Eisenkraft, University of Massachusetts, Boston, MA
• Kim Foglia, Division Avenue Senior High School, Levittown, New York
• A. Daniel Johnson, Wake Forest University, Winston-Salem, NC
• John Jungck, Beloit College, Beloit, WI
• John Jack Kay, Iolani High School, Honolulu, HI
• Sue Offner, Lexington High School, Lexington, MA
• Peggy O’Neill Skinner, The Bush School, Seattle, WA
• Sharon Radford, The Paideia School, Atlanta, GA
• Gordon Uno, University of Oklahoma, Norman, OK
• Brad Williamson, University of Kansas, Lawrence, KS
• Julianne Zedalis, The Bishop’s School, La Jolla, CA
■ aP Lab ManuaL Vision teaMIn 2010, the College Board convened a group of subject matter and laboratory investigation experts to provide a model of excellence for what the investigative labs should be in AP science courses. These individuals worked diligently to create a vision for exemplary AP science labs that would serve to assist teachers in facilitating inquiry-based and student-directed investigative work. This vision also serves as the input for professional development and resource materials that will support the new course and lab investigations. • Arthur Eisenkraft, University of Massachusetts, Boston, MA
• Eugenia Etkina, Rutgers University, Piscataway, NJ
• Nivedita Ganguly, University of Tennessee, Knoxville, TN
• Dolores Gende, Parish Episcopal School, Dallas, TX
• Peggy O’Neill Skinner, The Bush School, Seattle, WA
• Susan Singer, Carleton College, Northfield, MN
• Angelica Stacy, University of California, Berkeley, CA
• Peter Strom, Rutgers University, New Brunswick, NJ

viii Acknowledgments
• Gordon Uno, University of Oklahoma, Norman, OK
• Dave Yaron, Carnegie Mellon University, Pittsburgh, PA
■ other Contributors• AP Biology Commission
• AP Biology Consultants
• AP Biology Curriculum Development and Assessment Committee
• AP Biology Development Committee
• AP Biology Focus Group Participants
• AP Biology Lab Manual Reviewers
• AP Biology Lab Pilot Teachers
• AP Biology Readers
• Authors and Contributors of the 1990 AP Biology Lab Manual (and subsequent editions)
• BioPhase Committee
• College Board Science Academic Advisory Committee
Preface ix
Preface
■ The AP® Biology CurriCulum FrAmeworkThe revised Advanced Placement® Biology course shifts from a traditional teacher-directed “content coverage” model of instruction to one that focuses on helping students gain enduring understandings of biological concepts and the scientific evidence that supports them. This approach enables students to spend more time understanding biological concepts while developing reasoning skills essential to the science practices used throughout their study of biology. A practice is a way to coordinate knowledge and skills in order to accomplish a goal or task. The science practices, as noted in the AP Biology Curriculum Framework, enable students to establish lines of evidence, and use them to develop and refine testable explanations and predictions of natural phenomena. Because content, inquiry, and reasoning are equally important in AP Biology, each learning objective combines content with inquiry and reasoning skills described in the science practices.
The key concepts and related content that define the revised AP Biology course and exam are organized around four underlying principles called the big ideas, which are as follows:
Big Idea 1: The process of evolution drives the diversity and unity of life.Big Idea 2: Biological systems utilize free energy and molecular building blocks to
grow, to reproduce, and to maintain dynamic homeostasis.Big Idea 3: Living systems store, retrieve, transmit, and respond to information
essential to life processes.Big Idea 4: Biological systems interact, and these systems and their interactions
possess complex properties.These four big ideas will be referred to as evolution, cellular processes: energy and
communication, genetics and information transfer, and interactions, respectively, for the sake of brevity. The big ideas encompass the core scientific principles, theories, and processes governing organisms and biological systems. For each big idea, enduring understandings incorporate the core concepts that students should retain from the learning experience.
A more student-directed, inquiry-based lab experience supports the AP Biology course revision and curricular requirements by providing opportunities for students to design plans for experiments, data collection, application of mathematical routines, and refinement of testable explanations and predictions. Such a lab experience reinforces the revised curriculum’s focus on quantitative skills.
The suite of laboratory investigations within the new lab manual supports the recommendation by the National Science Foundation (NSF) that science teachers build into their curriculum opportunities for students to develop skills in communication, teamwork, critical thinking, and commitment to lifelong learning (Waterman 2008, NSF 1996). These labs will allow teachers to develop and use investigations they design based on their own experiences as an investigator and teacher. The manual’s engaging, inquiry-
x Preface
based approach will inspire students to investigate meaningful questions about the real world. The investigations are organized under the four big ideas, and are integrated into the curriculum. They align with best practices and the goals of laboratory learning reported in America’s Lab Report1. The goals are as follows:• Mastery of subject matter
• Development of scientific reasoning
• Understanding of the complexity and ambiguity of empirical work
• Development of practical skills
• Understanding of the nature of science
• Interest in science and science learning
• Development of teamwork abilities
■ Development of the lab investigationsTo create a model of excellence for the lab component in AP science courses, the College Board worked in conjunction with the AP Lab Manual Vision Team and AP Biology Lab Development Team to create an innovative vision and approach to lab investigations. Both teams of subject matter experts consisted of AP Biology teachers and higher education faculty members, as well as experts in the fields of inquiry instruction, quantitative skill application, and lab investigations. Collectively, they created AP Biology Investigative Labs: An Inquiry-Based Approach. The labs in this manual support the concepts, content, and science practices within the revised AP Biology course.
1 America’s Lab Report looks at a range of questions about how laboratory experiences fit into U.S. high schools, and investigates factors that influence a high school laboratory experience, looking closely at what currently takes place and what the goals of those experiences are and should be.
Introduction T1
Introduction
■ goAls oF The lABorATory invesTigATionsThe instructional strategies that underlie the labs in this manual abandon the traditional teacher-directed content coverage model in favor of one that focuses on student-directed experimentation and inquiry. This approach enables students to identify the questions they want to answer, design experiments to test hypotheses, conduct investigations, analyze data, and communicate their results. As a result, they are able to concentrate on understanding concepts and developing the reasoning skills essential to the practices used in the study of biology.
■ how to use the lab investigations in your AP Biology CourseThe revised AP Biology course emphasizes depth over breadth of content. The scope of the course affords educators time to develop students’ conceptual understanding and engage them in inquiry-based learning experiences. It also enables teachers to spend time differentiating instruction and targeting the learning styles and interests of their students. This lab manual contains 13 student-directed, inquiry-based labs to offer at least three laboratory investigation options for each big idea. Because inquiry-based labs typically take more time than traditional labs, the number of required labs has been reduced from 12 to a minimum of eight. As per the AP Biology Course Audit requirements, teachers are required to devote 25 percent of instructional time to lab investigations, and this translates into a minimum of two investigations per big idea.
Instructors have the option of using the labs in this manual or updating their existing labs to make them inquiry based and student directed. Chapter 3 in this manual provides ideas for lab modifications. Implementing inquiry-based labs should not require a significant investment in new equipment.
Teachers and their students may perform the labs in any order. Each lab includes a section that explains alignment to the curriculum framework, and offers suggestions for when during the instructional year to conduct the lab. Each lab also includes a section about assessing students’ understanding and work. Chapter 6 provides additional suggestions for ways for students to present their lab results, and for you to evaluate students’ work.
■ what is inquiry?Instructional practices that involve modeling the behavior of a scientist at work qualify as inquiry because the student conducts an authentic scientific investigation (Johnson 2009). It is unreasonable to think that every part of a particular lab in AP Biology will be completely student directed. However, as written, the labs lead to student-directed, inquiry-based investigations. The four levels of inquiry, adapted from Herron2, are as follows:
2 Herron, M.D. (1971). The nature of scientific inquiry, School Review, 79(2), 171–212.
T2 Introduction
• Confirmation: Students confirm a principle through an activity in which the results are known in advance.
• Structured: Students investigate a teacher-presented question through a prescribed procedure.
• Guided: Students investigate a teacher-presented question using student-designed/selected procedures.
• Open: Students investigate topic-related questions that are formulated through student-designed/selected procedures.
In student-directed, inquiry-based laboratory investigations, students model the behavior of scientists by discovering knowledge for themselves as they observe and explore. Beginning with observations, students employ a variety of methods to answer questions that they have posed. These include conducting laboratory and field investigations; manipulating software simulations, models, and data sets; and exploring meaningful online research (Waterman 2008). By designing experiments to test hypotheses, analyze data, and communicate results and conclusions, students learn that a scientific method of investigation is cyclic, not linear; each observation or experimental result raises new questions about how the world works (Johnson 2009), thus leading to open-ended investigations. Students also appreciate that inquiry requires identification of assumptions, use of critical and logical thinking, and consideration of alternative explanations (National Committee on Science Education Standards and Assessment and National Research Council 1996, 23).
Inquiry-based instruction encourages students to make connections between concepts and big ideas and allows scaffolding of both concepts and science practices to increase students’ knowledge and skills, thus promoting deeper learning (see Appendix C for the science practices). As students work through their investigations, the teacher asks probing, follow-up questions to assess students’ thinking processes, understanding of concepts, and misconceptions. Teachers can modify these and other labs to be more or less inquiry based to meet their students’ needs. New challenges arise as students ask their own questions and perform their own experiments. By their very nature, inquiry-based investigations take longer to conduct, and additional materials and classroom space may be required. No new major lab equipment purchases are needed to conduct any of the labs in this manual, however. Students can work in small groups and share resources. If students do not achieve results at first, they may troubleshoot their experimental design, perhaps repeating a procedure several times before obtaining meaningful data. If time is a concern, instead ask your students what problems/errors they encountered, how these problems/errors could be avoided, and how the experiment would be different if it were to be repeated. Meaningful data are the goal, but students must be able to articulate nonmeaningful data and explain their causes. This is true science at its best. When students have the opportunity to mimic the practices of professional scientists, the benefits of an inquiry-based laboratory program far outweigh any challenges.
Chapter 1 T3
Chapter 1:
how to Use this Lab Manual The lab period is a time for students to compare and refine their procedures, conduct their own experiments, and collect and analyze the data they obtain. This lab manual includes teacher and student versions of 13 student-directed, inquiry-based investigations that complement the curriculum framework for the revised course. The labs are categorized under the four big ideas, but they can be conducted in any order.
Although a “lab first” approach provides an opportunity for students to grapple with concepts on their own (Johnson 2009), you can introduce difficult concepts through lecture and discussion first, following with lab activities that range in difficulty and foster skills development. You are encouraged to develop your own inquiry-based labs, but be sure that the labs extend beyond confirmation, the first level of inquiry. If you want to modify a standard teacher-directed lab protocol, such as one included in the College Board’s 2001 AP Biology Lab Manual, you can eliminate the step-by-step procedure and instead ask students to develop their own procedure as a prelab activity. A template with a specific example is provided in Chapter 3 of this manual.
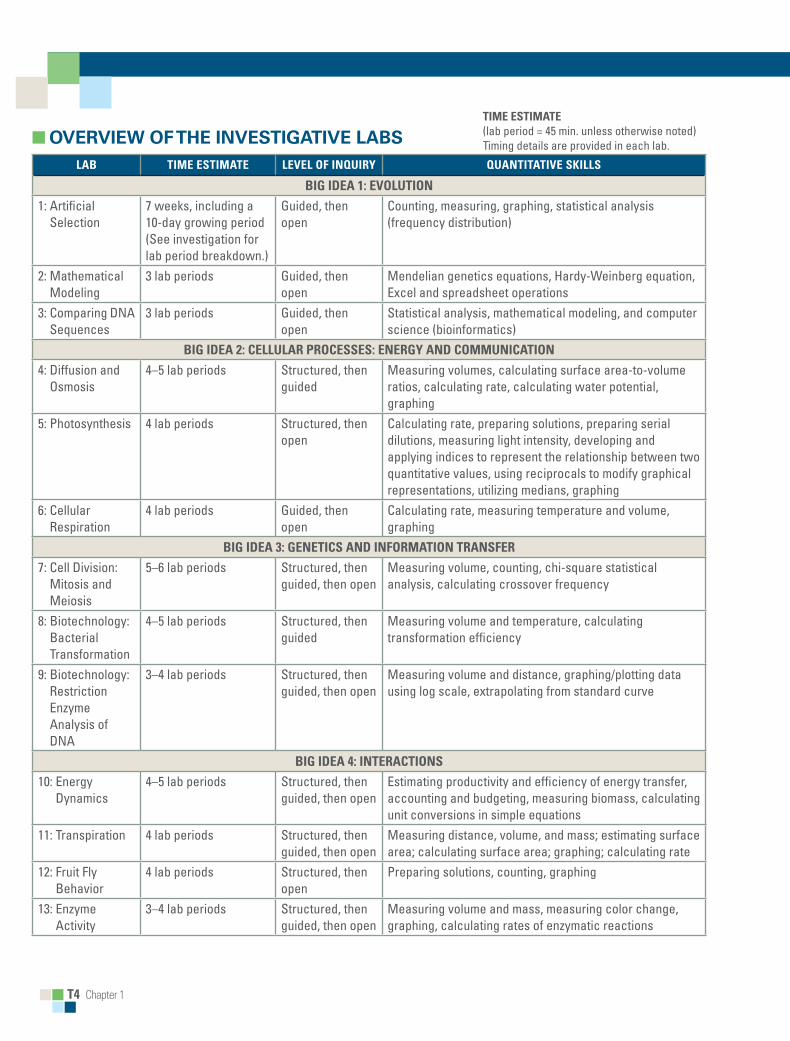
The following charts provide an overview of the investigative labs and a mapping to the curriculum framework. These charts are designed to help you decide the order in which to introduce the labs. Regardless of your approach, the key is to engage students in the investigative process of science: discovering knowledge for themselves in a self-reflective, organized manner.
T4 Chapter 1
Time esTimATe (lab period = 45 min. unless otherwise noted) Timing details are provided in each lab.■ OverviewOftheinvestigativeLabs
lAB Time esTimATe level oF inquiry quAnTiTATive skills
Big iDeA 1: evoluTion
1: Artificial Selection
7 weeks, including a 10-day growing period (See investigation for lab period breakdown.)
Guided, then open
Counting, measuring, graphing, statistical analysis (frequency distribution)
2: Mathematical Modeling
3 lab periods Guided, then open
Mendelian genetics equations, Hardy-Weinberg equation, Excel and spreadsheet operations
3: Comparing DNA Sequences
3 lab periods Guided, then open
Statistical analysis, mathematical modeling, and computer science (bioinformatics)
Big iDeA 2: CellulAr ProCesses: energy AnD CommuniCATion
4: Diffusion and Osmosis
4–5 lab periods Structured, then guided
Measuring volumes, calculating surface area-to-volume ratios, calculating rate, calculating water potential, graphing
5: Photosynthesis 4 lab periods Structured, then open
Calculating rate, preparing solutions, preparing serial dilutions, measuring light intensity, developing and applying indices to represent the relationship between two quantitative values, using reciprocals to modify graphical representations, utilizing medians, graphing
6: Cellular Respiration
4 lab periods Guided, then open
Calculating rate, measuring temperature and volume, graphing
Big iDeA 3: geneTiCs AnD inFormATion TrAnsFer
7: Cell Division: Mitosis and Meiosis
5–6 lab periods Structured, then guided, then open
Measuring volume, counting, chi-square statistical analysis, calculating crossover frequency
8: Biotechnology: Bacterial Transformation
4–5 lab periods Structured, then guided
Measuring volume and temperature, calculating transformation efficiency
9: Biotechnology: Restriction Enzyme Analysis of DNA
3–4 lab periods Structured, then guided, then open
Measuring volume and distance, graphing/plotting data using log scale, extrapolating from standard curve
Big iDeA 4: inTerACTions
10: Energy Dynamics
4–5 lab periods Structured, then guided, then open
Estimating productivity and efficiency of energy transfer, accounting and budgeting, measuring biomass, calculating unit conversions in simple equations
11: Transpiration 4 lab periods Structured, then guided, then open
Measuring distance, volume, and mass; estimating surface area; calculating surface area; graphing; calculating rate
12: Fruit Fly Behavior
4 lab periods Structured, then open
Preparing solutions, counting, graphing
13: Enzyme Activity
3–4 lab periods Structured, then guided, then open
Measuring volume and mass, measuring color change, graphing, calculating rates of enzymatic reactions
Chapter 1 T5
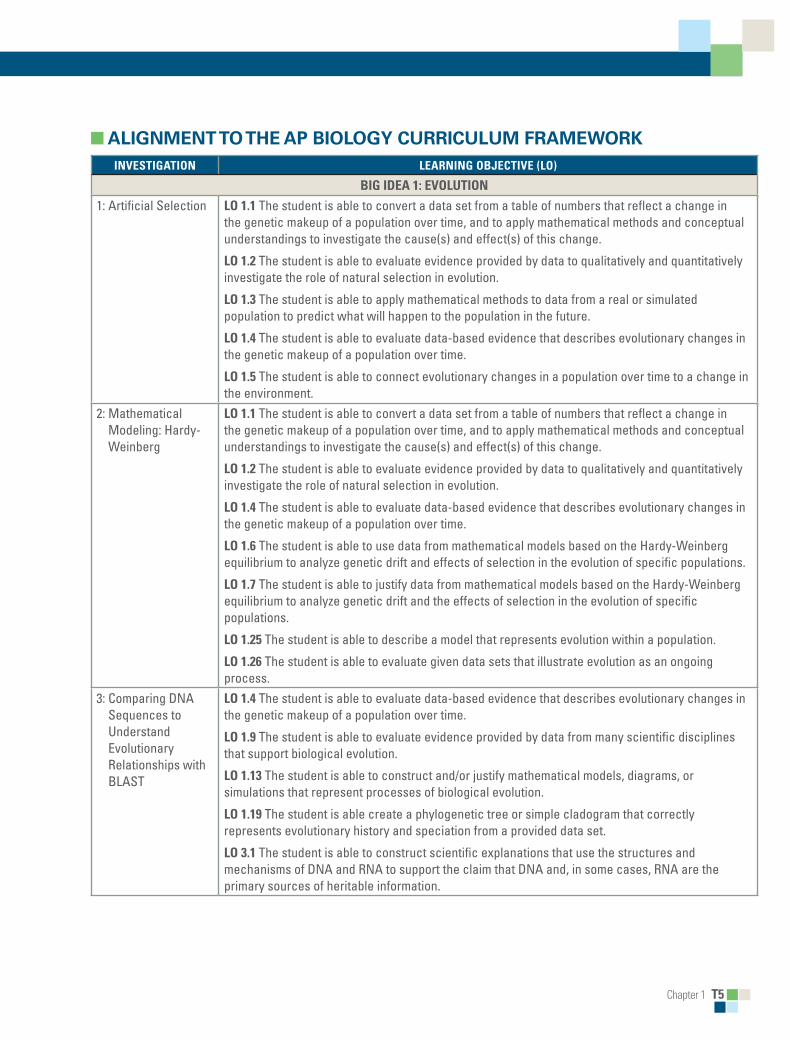
■ aLignmenttOtheaPbiOLOgyCurriCuLumframewOrkinvesTigATion leArning oBjeCTive (lo)
Big iDeA 1: evoluTion
1: Artificial Selection lo 1.1 The student is able to convert a data set from a table of numbers that reflect a change in the genetic makeup of a population over time, and to apply mathematical methods and conceptual understandings to investigate the cause(s) and effect(s) of this change.
lo 1.2 The student is able to evaluate evidence provided by data to qualitatively and quantitatively investigate the role of natural selection in evolution.
lo 1.3 The student is able to apply mathematical methods to data from a real or simulated population to predict what will happen to the population in the future.
lo 1.4 The student is able to evaluate data-based evidence that describes evolutionary changes in the genetic makeup of a population over time.
lo 1.5 The student is able to connect evolutionary changes in a population over time to a change in the environment.
2: Mathematical Modeling: Hardy-Weinberg
lo 1.1 The student is able to convert a data set from a table of numbers that reflect a change in the genetic makeup of a population over time, and to apply mathematical methods and conceptual understandings to investigate the cause(s) and effect(s) of this change.
lo 1.2 The student is able to evaluate evidence provided by data to qualitatively and quantitatively investigate the role of natural selection in evolution.
lo 1.4 The student is able to evaluate data-based evidence that describes evolutionary changes in the genetic makeup of a population over time.
lo 1.6 The student is able to use data from mathematical models based on the Hardy-Weinberg equilibrium to analyze genetic drift and effects of selection in the evolution of specific populations.
lo 1.7 The student is able to justify data from mathematical models based on the Hardy-Weinberg equilibrium to analyze genetic drift and the effects of selection in the evolution of specific populations.
lo 1.25 The student is able to describe a model that represents evolution within a population.
lo 1.26 The student is able to evaluate given data sets that illustrate evolution as an ongoing process.
3: Comparing DNA Sequences to Understand Evolutionary Relationships with BLAST
lo 1.4 The student is able to evaluate data-based evidence that describes evolutionary changes in the genetic makeup of a population over time.
lo 1.9 The student is able to evaluate evidence provided by data from many scientific disciplines that support biological evolution.
lo 1.13 The student is able to construct and/or justify mathematical models, diagrams, or simulations that represent processes of biological evolution.
lo 1.19 The student is able create a phylogenetic tree or simple cladogram that correctly represents evolutionary history and speciation from a provided data set.
lo 3.1 The student is able to construct scientific explanations that use the structures and mechanisms of DNA and RNA to support the claim that DNA and, in some cases, RNA are the primary sources of heritable information.
T6 Chapter 1
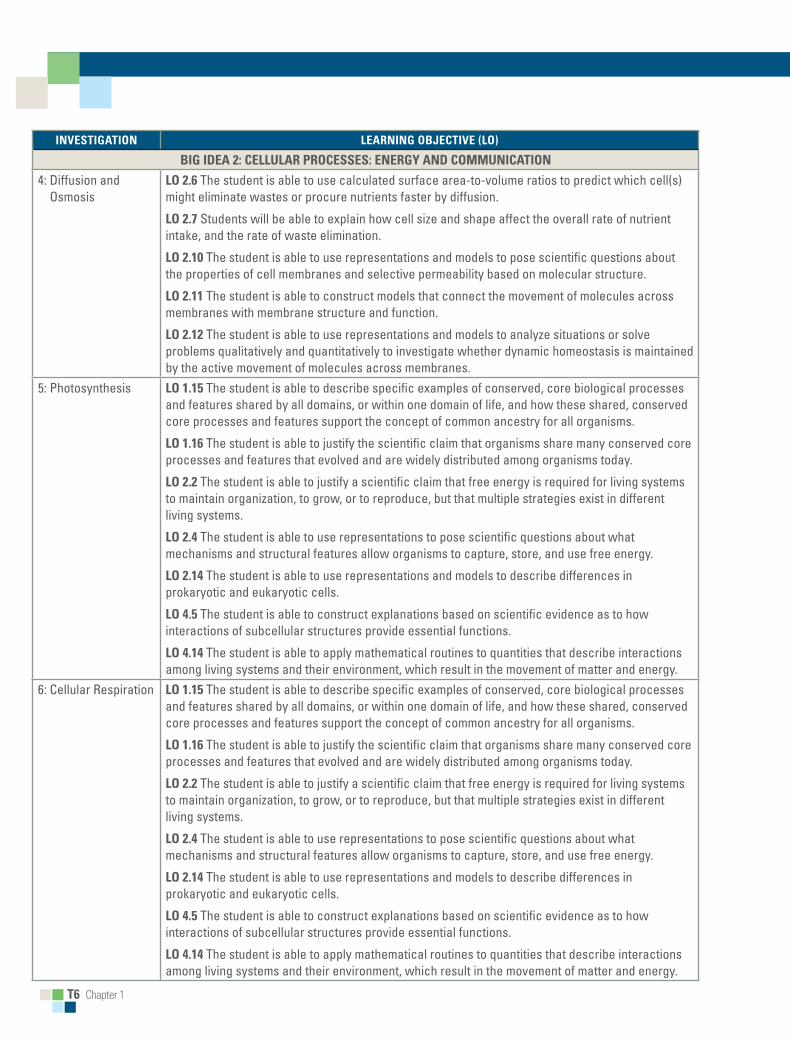
invesTigATion leArning oBjeCTive (lo)
Big iDeA 2: CellulAr ProCesses: energy AnD CommuniCATion
4: Diffusion and Osmosis
lo 2.6 The student is able to use calculated surface area-to-volume ratios to predict which cell(s) might eliminate wastes or procure nutrients faster by diffusion.
lo 2.7 Students will be able to explain how cell size and shape affect the overall rate of nutrient intake, and the rate of waste elimination.
lo 2.10 The student is able to use representations and models to pose scientific questions about the properties of cell membranes and selective permeability based on molecular structure.
lo 2.11 The student is able to construct models that connect the movement of molecules across membranes with membrane structure and function.
lo 2.12 The student is able to use representations and models to analyze situations or solve problems qualitatively and quantitatively to investigate whether dynamic homeostasis is maintained by the active movement of molecules across membranes.
5: Photosynthesis lo 1.15 The student is able to describe specific examples of conserved, core biological processes and features shared by all domains, or within one domain of life, and how these shared, conserved core processes and features support the concept of common ancestry for all organisms.
lo 1.16 The student is able to justify the scientific claim that organisms share many conserved core processes and features that evolved and are widely distributed among organisms today.
lo 2.2 The student is able to justify a scientific claim that free energy is required for living systems to maintain organization, to grow, or to reproduce, but that multiple strategies exist in different living systems.
lo 2.4 The student is able to use representations to pose scientific questions about what mechanisms and structural features allow organisms to capture, store, and use free energy.
lo 2.14 The student is able to use representations and models to describe differences in prokaryotic and eukaryotic cells.
lo 4.5 The student is able to construct explanations based on scientific evidence as to how interactions of subcellular structures provide essential functions.
lo 4.14 The student is able to apply mathematical routines to quantities that describe interactions among living systems and their environment, which result in the movement of matter and energy.
6: Cellular Respiration lo 1.15 The student is able to describe specific examples of conserved, core biological processes and features shared by all domains, or within one domain of life, and how these shared, conserved core processes and features support the concept of common ancestry for all organisms.
lo 1.16 The student is able to justify the scientific claim that organisms share many conserved core processes and features that evolved and are widely distributed among organisms today.
lo 2.2 The student is able to justify a scientific claim that free energy is required for living systems to maintain organization, to grow, or to reproduce, but that multiple strategies exist in different living systems.
lo 2.4 The student is able to use representations to pose scientific questions about what mechanisms and structural features allow organisms to capture, store, and use free energy.
lo 2.14 The student is able to use representations and models to describe differences in prokaryotic and eukaryotic cells.
lo 4.5 The student is able to construct explanations based on scientific evidence as to how interactions of subcellular structures provide essential functions.
lo 4.14 The student is able to apply mathematical routines to quantities that describe interactions among living systems and their environment, which result in the movement of matter and energy.
Chapter 1 T7
invesTigATion leArning oBjeCTive (lo)
Big iDeA 3: geneTiCs AnD inFormATion TrAnsFer
7: Cell Division: Mitosis and Meiosis
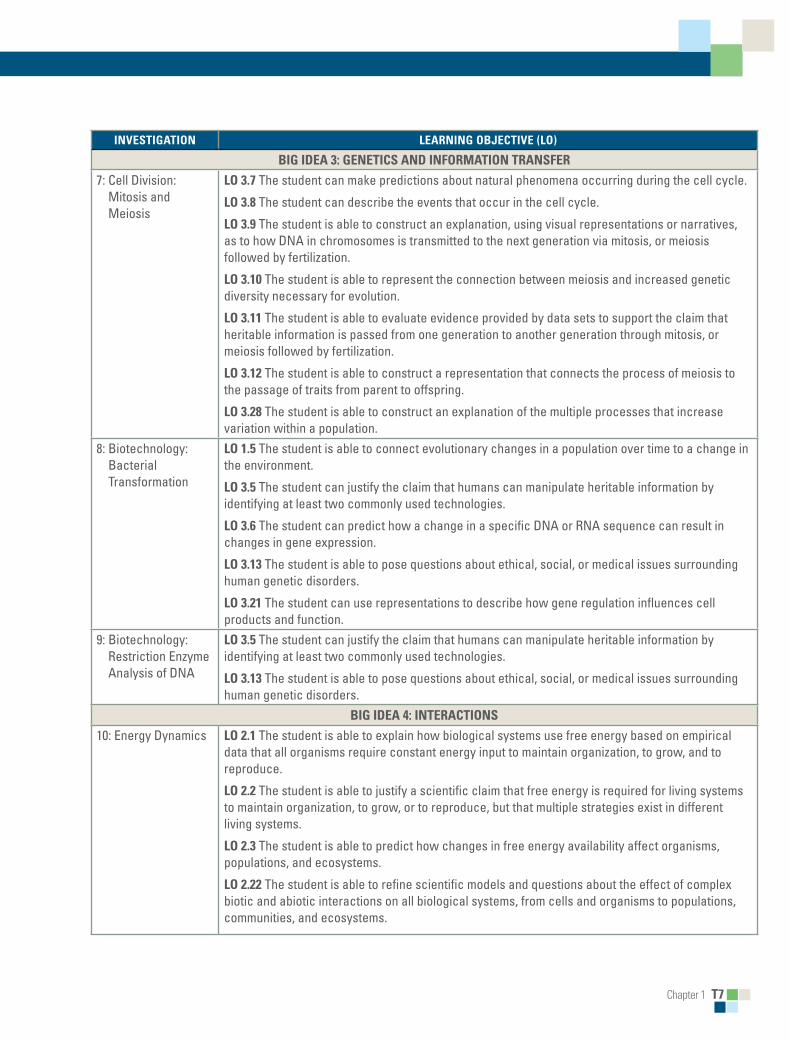
lo 3.7 The student can make predictions about natural phenomena occurring during the cell cycle.
lo 3.8 The student can describe the events that occur in the cell cycle.
lo 3.9 The student is able to construct an explanation, using visual representations or narratives, as to how DNA in chromosomes is transmitted to the next generation via mitosis, or meiosis followed by fertilization.
lo 3.10 The student is able to represent the connection between meiosis and increased genetic diversity necessary for evolution.
lo 3.11 The student is able to evaluate evidence provided by data sets to support the claim that heritable information is passed from one generation to another generation through mitosis, or meiosis followed by fertilization.
lo 3.12 The student is able to construct a representation that connects the process of meiosis to the passage of traits from parent to offspring.
lo 3.28 The student is able to construct an explanation of the multiple processes that increase variation within a population.
8: Biotechnology: Bacterial Transformation
lo 1.5 The student is able to connect evolutionary changes in a population over time to a change in the environment.
lo 3.5 The student can justify the claim that humans can manipulate heritable information by identifying at least two commonly used technologies.
lo 3.6 The student can predict how a change in a specific DNA or RNA sequence can result in changes in gene expression.
lo 3.13 The student is able to pose questions about ethical, social, or medical issues surrounding human genetic disorders.
lo 3.21 The student can use representations to describe how gene regulation influences cell products and function.
9: Biotechnology: Restriction Enzyme Analysis of DNA
lo 3.5 The student can justify the claim that humans can manipulate heritable information by identifying at least two commonly used technologies.
lo 3.13 The student is able to pose questions about ethical, social, or medical issues surrounding human genetic disorders.
Big iDeA 4: inTerACTions
10: Energy Dynamics lo 2.1 The student is able to explain how biological systems use free energy based on empirical data that all organisms require constant energy input to maintain organization, to grow, and to reproduce.
lo 2.2 The student is able to justify a scientific claim that free energy is required for living systems to maintain organization, to grow, or to reproduce, but that multiple strategies exist in different living systems.
lo 2.3 The student is able to predict how changes in free energy availability affect organisms, populations, and ecosystems.
lo 2.22 The student is able to refine scientific models and questions about the effect of complex biotic and abiotic interactions on all biological systems, from cells and organisms to populations, communities, and ecosystems.
T8 Chapter 1
invesTigATion leArning oBjeCTive (lo)
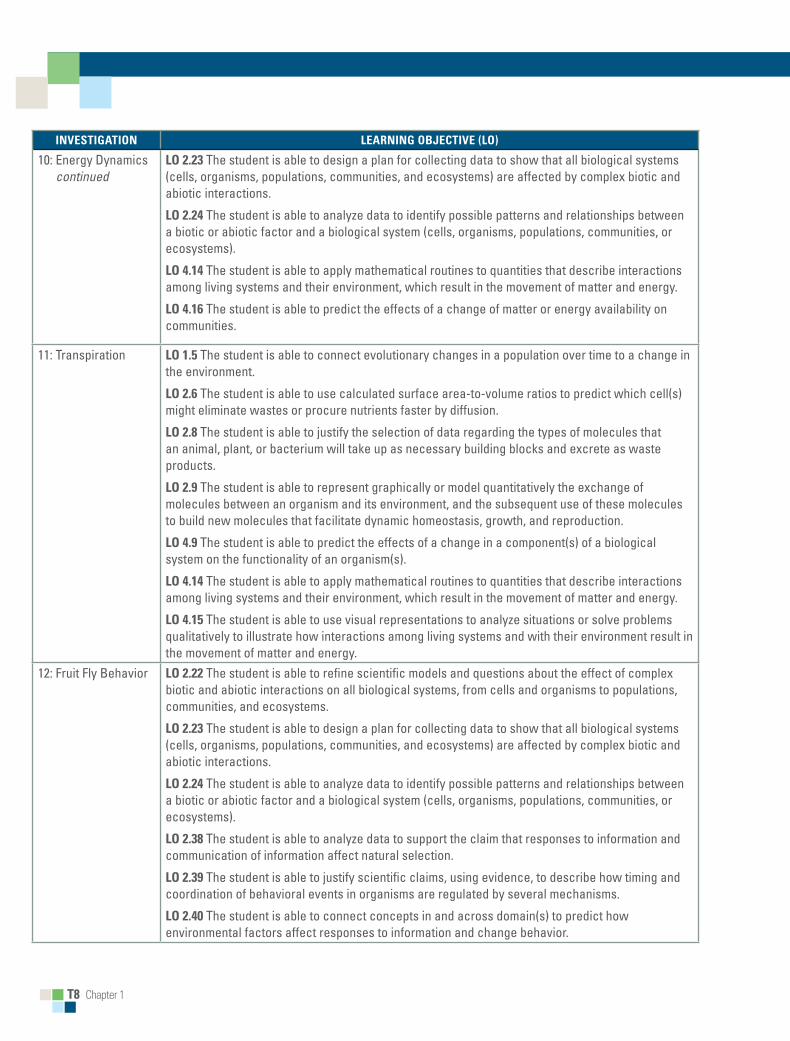
10: Energy Dynamics continued
lo 2.23 The student is able to design a plan for collecting data to show that all biological systems (cells, organisms, populations, communities, and ecosystems) are affected by complex biotic and abiotic interactions.
lo 2.24 The student is able to analyze data to identify possible patterns and relationships between a biotic or abiotic factor and a biological system (cells, organisms, populations, communities, or ecosystems).
lo 4.14 The student is able to apply mathematical routines to quantities that describe interactions among living systems and their environment, which result in the movement of matter and energy.
lo 4.16 The student is able to predict the effects of a change of matter or energy availability on communities.
11: Transpiration lo 1.5 The student is able to connect evolutionary changes in a population over time to a change in the environment.
lo 2.6 The student is able to use calculated surface area-to-volume ratios to predict which cell(s) might eliminate wastes or procure nutrients faster by diffusion.
lo 2.8 The student is able to justify the selection of data regarding the types of molecules that an animal, plant, or bacterium will take up as necessary building blocks and excrete as waste products.
lo 2.9 The student is able to represent graphically or model quantitatively the exchange of molecules between an organism and its environment, and the subsequent use of these molecules to build new molecules that facilitate dynamic homeostasis, growth, and reproduction.
lo 4.9 The student is able to predict the effects of a change in a component(s) of a biological system on the functionality of an organism(s).
lo 4.14 The student is able to apply mathematical routines to quantities that describe interactions among living systems and their environment, which result in the movement of matter and energy.
lo 4.15 The student is able to use visual representations to analyze situations or solve problems qualitatively to illustrate how interactions among living systems and with their environment result in the movement of matter and energy.
12: Fruit Fly Behavior lo 2.22 The student is able to refine scientific models and questions about the effect of complex biotic and abiotic interactions on all biological systems, from cells and organisms to populations, communities, and ecosystems.
lo 2.23 The student is able to design a plan for collecting data to show that all biological systems (cells, organisms, populations, communities, and ecosystems) are affected by complex biotic and abiotic interactions.
lo 2.24 The student is able to analyze data to identify possible patterns and relationships between a biotic or abiotic factor and a biological system (cells, organisms, populations, communities, or ecosystems).
lo 2.38 The student is able to analyze data to support the claim that responses to information and communication of information affect natural selection.
lo 2.39 The student is able to justify scientific claims, using evidence, to describe how timing and coordination of behavioral events in organisms are regulated by several mechanisms.
lo 2.40 The student is able to connect concepts in and across domain(s) to predict how environmental factors affect responses to information and change behavior.
Chapter 1 T9
invesTigATion leArning oBjeCTive (lo)
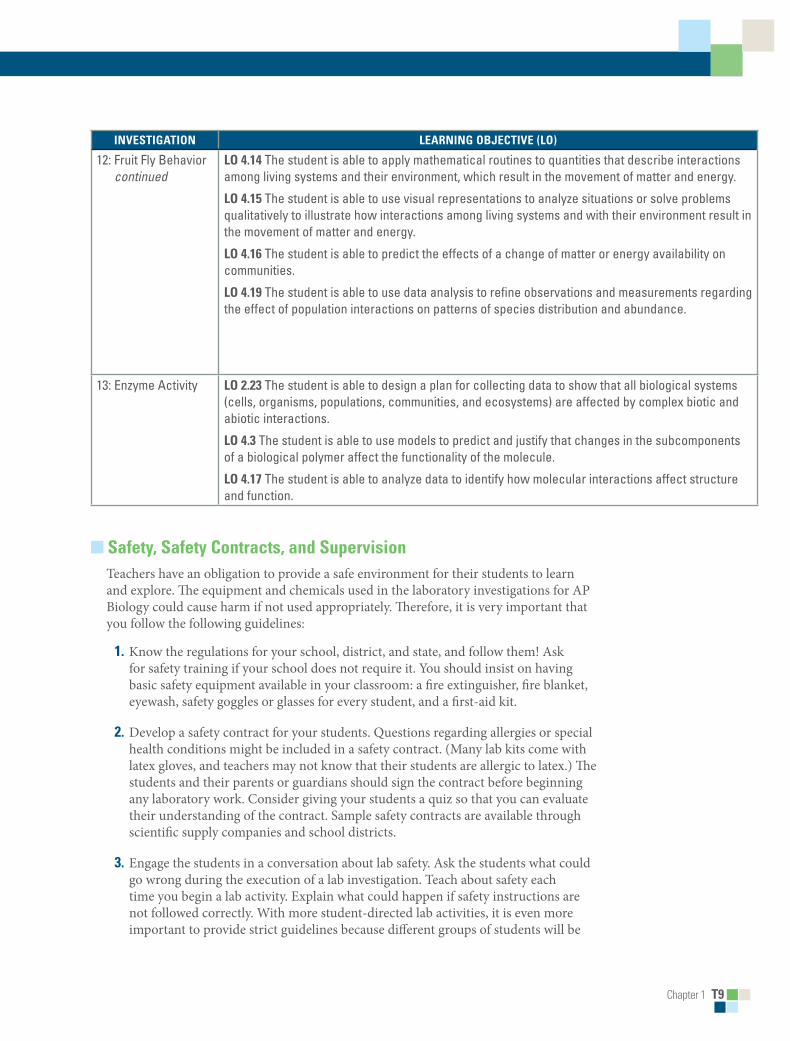
12: Fruit Fly Behavior continued
lo 4.14 The student is able to apply mathematical routines to quantities that describe interactions among living systems and their environment, which result in the movement of matter and energy.
lo 4.15 The student is able to use visual representations to analyze situations or solve problems qualitatively to illustrate how interactions among living systems and with their environment result in the movement of matter and energy.
lo 4.16 The student is able to predict the effects of a change of matter or energy availability on communities.
lo 4.19 The student is able to use data analysis to refine observations and measurements regarding the effect of population interactions on patterns of species distribution and abundance.
13: Enzyme Activity lo 2.23 The student is able to design a plan for collecting data to show that all biological systems (cells, organisms, populations, communities, and ecosystems) are affected by complex biotic and abiotic interactions.
lo 4.3 The student is able to use models to predict and justify that changes in the subcomponents of a biological polymer affect the functionality of the molecule.
lo 4.17 The student is able to analyze data to identify how molecular interactions affect structure and function.
■ safety, safety Contracts, and supervisionTeachers have an obligation to provide a safe environment for their students to learn and explore. The equipment and chemicals used in the laboratory investigations for AP Biology could cause harm if not used appropriately. Therefore, it is very important that you follow the following guidelines:
1. Know the regulations for your school, district, and state, and follow them! Ask for safety training if your school does not require it. You should insist on having basic safety equipment available in your classroom: a fire extinguisher, fire blanket, eyewash, safety goggles or glasses for every student, and a first-aid kit.
2. Develop a safety contract for your students. Questions regarding allergies or special health conditions might be included in a safety contract. (Many lab kits come with latex gloves, and teachers may not know that their students are allergic to latex.) The students and their parents or guardians should sign the contract before beginning any laboratory work. Consider giving your students a quiz so that you can evaluate their understanding of the contract. Sample safety contracts are available through scientific supply companies and school districts.
3. Engage the students in a conversation about lab safety. Ask the students what could go wrong during the execution of a lab investigation. Teach about safety each time you begin a lab activity. Explain what could happen if safety instructions are not followed correctly. With more student-directed lab activities, it is even more important to provide strict guidelines because different groups of students will be

T10 Chapter 1
doing different activities, and using different materials and equipment. Students should never embark on a new activity, or use new chemicals or a new approach, without notifying the teacher.
4. Be consistent with enforcing the safety guidelines.
■ materials and equipmentThis course presents a college-level biology curriculum, and the equipment needed for the labs in this guide is reasonable. Your school district should support you and your classroom in order to provide an adequate learning environment in which to conduct laboratory investigations. Each laboratory investigation in this guide includes a list of materials and equipment, and it is assumed that each class has access to basic lab equipment (e.g., beakers, pipettes, and balances) in addition to some specialized equipment, such as gel boxes for electrophoresis. However, it is recognized that many classes do not have access to more expensive equipment, such as probes and sensors with computer interfaces. For labs utilizing such equipment, a lower-cost alternative is provided so that all students can initiate and follow through on their own investigations.
Biotechnology companies often have equipment for classrooms to borrow. Local colleges or universities may allow your students to borrow equipment or complete a lab as a field trip on their campus, or they may even donate their old equipment to your school. Some schools have partnerships with local businesses that can help with laboratory equipment and materials.
Chapter 2 T11
Chapter 2:
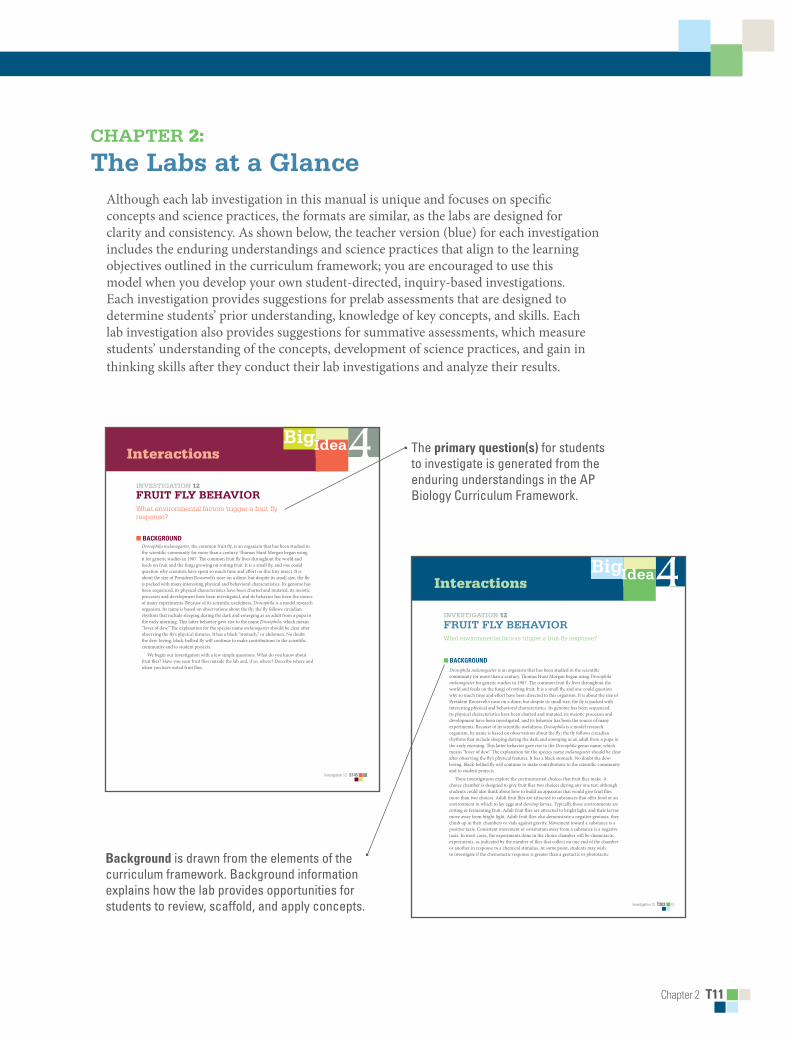
the Labs at a Glance Although each lab investigation in this manual is unique and focuses on specific concepts and science practices, the formats are similar, as the labs are designed for clarity and consistency. As shown below, the teacher version (blue) for each investigation includes the enduring understandings and science practices that align to the learning objectives outlined in the curriculum framework; you are encouraged to use this model when you develop your own student-directed, inquiry-based investigations. Each investigation provides suggestions for prelab assessments that are designed to determine students’ prior understanding, knowledge of key concepts, and skills. Each lab investigation also provides suggestions for summative assessments, which measure students’ understanding of the concepts, development of science practices, and gain in thinking skills after they conduct their lab investigations and analyze their results.
The primary question(s) for students to investigate is generated from the enduring understandings in the AP Biology Curriculum Framework.
Background is drawn from the elements of the curriculum framework. Background information explains how the lab provides opportunities for students to review, scaffold, and apply concepts.
BigIdea4
Investigation 12 T203
Interactions
INVESTIGATION 12
FRUIT FLY BEHAVIORWhat environmental factors trigger a fruit fly response?
■ BACKGROUNDDrosophila melanogaster is an organism that has been studied in the scientific community for more than a century. Thomas Hunt Morgan began using Drosophila melanogaster for genetic studies in 1907. The common fruit fly lives throughout the world and feeds on the fungi of rotting fruit. It is a small fly, and one could question why so much time and effort have been directed to this organism. It is about the size of President Roosevelt’s nose on a dime, but despite its small size, the fly is packed with interesting physical and behavioral characteristics. Its genome has been sequenced, its physical characteristics have been charted and mutated, its meiotic processes and development have been investigated, and its behavior has been the source of many experiments. Because of its scientific usefulness, Drosophila is a model research organism. Its name is based on observations about the fly; the fly follows circadian rhythms that include sleeping during the dark and emerging as an adult from a pupa in the early morning. This latter behavior gave rise to the Drosophila genus name, which means “lover of dew.” The explanation for the species name melanogaster should be clear after observing the fly’s physical features. It has a black stomach. No doubt the dew-loving, black-bellied fly will continue to make contributions to the scientific community and to student projects.
These investigations explore the environmental choices that fruit flies make. A choice chamber is designed to give fruit flies two choices during any one test, although students could also think about how to build an apparatus that would give fruit flies more than two choices. Adult fruit flies are attracted to substances that offer food or an environment in which to lay eggs and develop larvae. Typically those environments are rotting or fermenting fruit. Adult fruit flies are attracted to bright light, and their larvae move away from bright light. Adult fruit flies also demonstrate a negative geotaxis; they climb up in their chambers or vials against gravity. Movement toward a substance is a positive taxis. Consistent movement or orientation away from a substance is a negative taxis. In most cases, the experiments done in the choice chamber will be chemotactic experiments, as indicated by the number of flies that collect on one end of the chamber or another in response to a chemical stimulus. At some point, students may wish to investigate if the chemotactic response is greater than a geotactic or phototactic
BigIdea
Investigation 12 S145
Interactions 4INVESTIGATION 12
FRUIT FLY BEHAVIORWhat environmental factors trigger a fruit fly response?
■■ BACKGROUNDDrosophila melanogaster, the common fruit fly, is an organism that has been studied in the scientific community for more than a century. Thomas Hunt Morgan began using it for genetic studies in 1907. The common fruit fly lives throughout the world and feeds on fruit and the fungi growing on rotting fruit. It is a small fly, and one could question why scientists have spent so much time and effort on this tiny insect. It is about the size of President Roosevelt’s nose on a dime, but despite its small size, the fly is packed with many interesting physical and behavioral characteristics. Its genome has been sequenced, its physical characteristics have been charted and mutated, its meiotic processes and development have been investigated, and its behavior has been the source of many experiments. Because of its scientific usefulness, Drosophila is a model research organism. Its name is based on observations about the fly; the fly follows circadian rhythms that include sleeping during the dark and emerging as an adult from a pupa in the early morning. This latter behavior gave rise to the name Drosophila, which means “lover of dew.” The explanation for the species name melanogaster should be clear after observing the fly’s physical features. It has a black “stomach,” or abdomen. No doubt the dew-loving, black-bellied fly will continue to make contributions to the scientific community and to student projects.
We begin our investigation with a few simple questions. What do you know about fruit flies? Have you seen fruit flies outside the lab and, if so, where? Describe where and when you have noted fruit flies.
3p0

T12 Chapter 2
For the Student Manual version, the learning objectives appear in more student-friendly vernacular.
T206 Investigation 12
■ ALIGNMENT TO THE AP BIOLOGY CURRICULUM FRAMEWORK This investigation can be conducted during the study of concepts pertaining to interactions (big idea 4) or to cellular processes (big idea 2), specifically the capture, use, and storage of free energy. In addition, some of the questions are likely to connect to big idea 1 if students explore the evolution of observed behaviors. As always, it is important to make connections between big ideas and enduring understandings, regardless of where in the curriculum the lab is taught. The concepts align with the enduring understandings and learning objectives from the AP Biology Curriculum Framework, as indicated below.
■ Enduring Understandings• 2D1: Reinforce the concept that all biological systems from cells and organisms to
populations, communities, and ecosystems are affected by complex biotic and abiotic interactions involving exchange of matter and free energy.
• 2E3: Timing and coordination of behavior are regulated by various mechanisms and are important in natural selection.
• 4A6: Interactions among living systems and with their environment result in the movement of matter and energy.
• 4B4: Interactions between and within populations influence patterns of species distribution and abundance.
■ Learning Objectives• The student is able to refine scientific models and questions about the effect of
complex biotic and abiotic interactions on all biological systems from cells and organisms to populations, communities, and ecosystems (2D1 & SP 1.3, SP 3.2).
• The student is able to design a plan for collecting data to show that all biological systems (cells, organisms, populations, communities, and ecosystems) are affected by complex biotic and abiotic interactions (2D1 & SP 4.2, SP 7.2).
• The student is able to analyze data to identify possible patterns and relationships between a biotic or an abiotic factor and a biological system (cells, organisms, populations, communities, or ecosystems) (2D1 & SP 5.1).
• The student is able to analyze data to support the claim that response to information and communication of information affect natural selection (2E3 & SP 5.1).
• The student is able to justify claims, using evidence, to describe how timing and coordination of behavioral events in organisms are regulated by several mechanisms (2E3 & SP 6.1).
• The student is able to connect concepts in and across domain(s) to predict how environmental factors affect response to information and change behavior (2E3 & SP 7.2).
• The student is able to apply mathematical routines to quantities that describe interactions among living systems and their environment that result in the movement of matter and energy (4A6 & SP 2.2).
S146■■Investigation 12
■■ Learning■Objectives• To investigate the relationship between a model organism, Drosophila, and its
response to different environmental conditions
• To design a controlled experiment to explore environmental factors that either attract or repel Drosophila in the laboratory setting
• To analyze data collected in an experiment in order to identify possible patterns and relationships between environmental factors and a living organism
• To work collaboratively with others in the design and analysis of a controlled experiment
• To connect and apply concepts (With the fruit fly as the focal organism, your investigation could pull together many topics, such as genetics, animal behavior, development, plant and animal structures from cells to organs, cell communication, fruit ripening, fermentation, and evolution.)
■■ General■Safety■Precautions• Do not add substances to the choice chamber unless your teacher has approved them.
• If the substance you add is flammable, such as ethanol, use precaution and do not conduct your experiment near a heat source or flame.
• Many of the substances used in this experiment are food items, but you should not consume any of them.
• Fruit flies are living organisms that should not be released to the environment. After all the investigations are complete, flies should be tapped into a “morgue” through a funnel. The morgue typically is a 150-mL beaker that contains about 50 mL of salad oil or 70% alcohol.
learning objectives indicate what students should know and be able to do as they conduct their laboratory investigations. In the Teacher Manual, the learning objectives come directly from the AP Biology Curriculum Framework. Each learning objective integrates science practices with specific concepts and enduring understandings outlined in the curriculum framework.
Chapter 2 T13
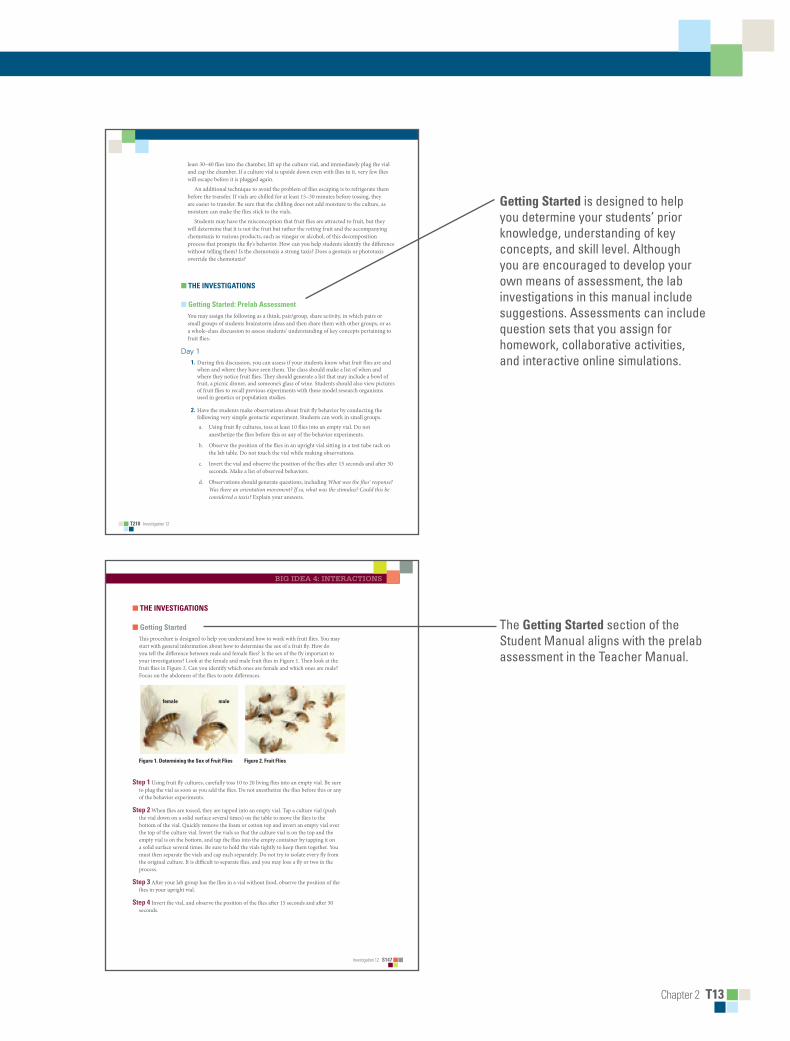
getting started is designed to help you determine your students’ prior knowledge, understanding of key concepts, and skill level. Although you are encouraged to develop your own means of assessment, the lab investigations in this manual include suggestions. Assessments can include question sets that you assign for homework, collaborative activities, and interactive online simulations.
Investigation 12 S147
BIG IDEA 4: INTERACTIONS
■■ THE■INVESTIGATIONS
■■ Getting■StartedThis procedure is designed to help you understand how to work with fruit flies. You may start with general information about how to determine the sex of a fruit fly. How do you tell the difference between male and female flies? Is the sex of the fly important to your investigations? Look at the female and male fruit flies in Figure 1. Then look at the fruit flies in Figure 2. Can you identify which ones are female and which ones are male? Focus on the abdomen of the flies to note differences.
Figure■1.■Determining■the■Sex■of■Fruit■Flies■ Figure■2.■Fruit■Flies
Step■1 Using fruit fly cultures, carefully toss 10 to 20 living flies into an empty vial. Be sure to plug the vial as soon as you add the flies. Do not anesthetize the flies before this or any of the behavior experiments.
Step■2 When flies are tossed, they are tapped into an empty vial. Tap a culture vial (push the vial down on a solid surface several times) on the table to move the flies to the bottom of the vial. Quickly remove the foam or cotton top and invert an empty vial over the top of the culture vial. Invert the vials so that the culture vial is on the top and the empty vial is on the bottom, and tap the flies into the empty container by tapping it on a solid surface several times. Be sure to hold the vials tightly to keep them together. You must then separate the vials and cap each separately. Do not try to isolate every fly from the original culture. It is difficult to separate flies, and you may lose a fly or two in the process.
Step■3 After your lab group has the flies in a vial without food, observe the position of the flies in your upright vial.
Step■4 Invert the vial, and observe the position of the flies after 15 seconds and after 30 seconds.
malefemale
T210 Investigation 12
least 30–40 flies into the chamber, lift up the culture vial, and immediately plug the vial and cap the chamber. If a culture vial is upside down even with flies in it, very few flies will escape before it is plugged again.
An additional technique to avoid the problem of flies escaping is to refrigerate them before the transfer. If vials are chilled for at least 15–30 minutes before tossing, they are easier to transfer. Be sure that the chilling does not add moisture to the culture, as moisture can make the flies stick to the vials.
Students may have the misconception that fruit flies are attracted to fruit, but they will determine that it is not the fruit but rather the rotting fruit and the accompanying chemotaxis to various products, such as vinegar or alcohol, of this decomposition process that prompts the fly’s behavior. How can you help students identify the difference without telling them? Is the chemotaxis a strong taxis? Does a geotaxis or phototaxis override the chemotaxis?
■ THE INVESTIGATIONS
■ Getting Started: Prelab AssessmentYou may assign the following as a think, pair/group, share activity, in which pairs or small groups of students brainstorm ideas and then share them with other groups, or as a whole-class discussion to assess students’ understanding of key concepts pertaining to fruit flies:
Day 1 1. During this discussion, you can assess if your students know what fruit flies are and
when and where they have seen them. The class should make a list of when and where they notice fruit flies. They should generate a list that may include a bowl of fruit, a picnic dinner, and someone’s glass of wine. Students should also view pictures of fruit flies to recall previous experiments with these model research organisms used in genetics or population studies.
2. Have the students make observations about fruit fly behavior by conducting the following very simple geotactic experiment. Students can work in small groups.
a. Using fruit fly cultures, toss at least 10 flies into an empty vial. Do not anesthetize the flies before this or any of the behavior experiments.
b. Observe the position of the flies in an upright vial sitting in a test tube rack on the lab table. Do not touch the vial while making observations.
c. Invert the vial and observe the position of the flies after 15 seconds and after 30 seconds. Make a list of observed behaviors.
d. Observations should generate questions, including What was the flies’ response? Was there an orientation movement? If so, what was the stimulus? Could this be considered a taxis? Explain your answers.
The getting started section of the Student Manual aligns with the prelab assessment in the Teacher Manual.

T14 Chapter 2
In the Student Manual, Procedure is the first, more teacher-directed part of the investigation. This preliminary investigation familiarizes students with the subject matter, and prepares them for the student-directed part of the investigation.
S148■■Investigation 12
Step■5 What was the flies’ response? Did most/all of the flies move in the same general direction? If so, this might be an “orientation movement,” which is a movement that is in response to some stimulus. Based on how you manipulated the vial, to what stimulus might the flies be responding? Do you think that they were responding to some chemical change in the vial? Did your observations generate other questions? Explain your answers.
■■ ProcedureAnimals move in response to many different stimuli. A chemotaxis is a movement in response to the presence of a chemical stimulus. The organism may move toward or away from the chemical stimulus. What benefit would an organism gain by responding to chemicals in their environment? A phototactic response is a movement in response to light. A geotactic response is a movement in response to gravity.
You will investigate fruit fly movement using a choice chamber that exposes the flies to different substances that you insert into the chamber. Because flies are very common in households (in fact, fruit flies live almost everywhere that humans live), think about using foods or condiments that might result in a positive or a negative chemotactic response from the flies. What foods or condiments do you think would attract or repel flies? Why? Do fruit flies exhibit a response to light or to gravity? How can you alter the chamber to investigate those variables?
Step■1 Prepare a choice chamber by labeling both ends with a marker — one end “A” and the other “B” (see Figure 3). Cut the bottom of the bottles, dry the interior thoroughly, and tape them together. Remove any paper labels.
tape■holding■■bottles■together
A B
Figure■3.■Choice■Chamber
Place a cap on one end of a chamber before adding flies. Insert a small funnel in the open end of the chamber and place the chamber upright on the capped end. Tap 20–30 fruit flies into the choice chamber using the funnel.
In the Teacher Manual, Designing and Conducting independent investigations provides suggestions for guiding your students through the student-directed portion of the investigation.
Investigation 12 T211
BIG IDEA 4: INTERACTIONS
■ Designing and Conducting Independent Investigations
Day 2When developing their own investigations, students should choose substances to test that are interesting to them. They may have experiences with fruit flies in their home and can think about what attracts flies. They also may want to find a substance that would repel a fly. They can bring substances from home to test, but make sure they obtain your permission to use the substances before they conduct their tests. The students should work in groups to determine the chemotactic response to various food items. They should share and graphically illustrate their results.
Days 3–4+The following are suggestions for the student-directed lab activities based on questions students ask during their preliminary study of the fruit flies. Their questions might include the following: Does the age of a fruit fly affect the speed of their negative geotactic response? What wavelengths of light stimulate a phototactic response in fruit flies?
Possible investigations generated from students’ observations and questions include the following. However, it is suggested that students generate their own questions to explore.
• From an ingredient list, select substances (such as vinegar) that students think might be affecting fly behavior. Isolate the materials and give the flies a choice.
• Determine if the sex of the fly makes a difference in their choice. (An F1 population of flies with white-eyed males and red-eyed females could be made available.)
• Determine if the sight of the material makes a difference by covering up the cotton ball in parafilm.
• Find the effect of light by changing the light source at different ends of the chamber or by studying how flies make choices in different colors of light. (Different ends of the chambers could be wrapped in transparent colored films or acetate.)
• Determine if the ripeness of the fruit makes a difference. For example, ripe bananas could be compared to green bananas.
• Determine if fruit flies are attracted to or repelled by carbon dioxide by placing pieces of Alka-Seltzer in moist cotton balls.
• Determine the effect of age or the developmental stage of the fruit fly on choice by using newly emerged flies in the chamber and/or the third instar larva on a glass slide.
• Work with different mutants of fruit flies to determine if vestigial or white-eyed flies (or other mutants) make the same choices. Determine if the Adh-negative mutant affects the flies’ response to alcohol. Determine if mutant eye colors (white, cinnabar, brown) affect the flies’ response to light.
• Are there other organisms that respond like fruit flies? Can you think of any organisms that respond differently?
Students should verify the results of their experiment by conducting several trials and changing the position of the substances at the ends of the chamber.

Chapter 2 T15
S150■■Investigation 12
■■ Designing■and■Conducting■Your■InvestigationNow that you have discovered the preferences for individual substances, design an experiment using the choice chamber to compare the preferences of fruit flies to all test substances or the chemotactic responses of your flies. Create a table that includes the results comparing all of the substances you tested.
The following are questions that you could investigate; however, as you worked through the beginning of this lab, you should have developed your own question and an investigation to answer that question:• Are all substances equally attractive or repellant to the fruit flies?
• Which substances do fruit flies prefer the most?
• Which substances do fruit flies prefer the least?
• Do preferred substances have any characteristic in common?
• What other factors might affect whether or not the fruit flies moved from one part of your choice chamber to another?
• Do you think that it is the fruit itself that attracts the flies? Should they be called fruit flies or something else?
• Some experiments could be designed using fruit fly larvae. Do larvae respond the same way that adults respond? Are there other factors in the environment that affect the choice?
• What factors must be controlled in an experiment about environmental variables and behavior?
• What is the difference among phototaxis, chemotaxis, and geotaxis? Do fruit flies demonstrate all of them?
• Does a phototactic response override a chemotactic response?
• Does the age of the fruit fly change its geotactic response?
• Are there other organisms that respond the same as fruit flies? Are there other organisms that respond differently from fruit flies?
■■ Analyzing■ResultsLook for patterns in fly behavior based on the number and ratio of fruit flies on different ends of your choice chamber. How will you determine which of the substances stimulate the greatest negative chemotactic response and positive chemotactic response? Do you see any patterns about materials or forces to which fruit flies are attracted?
Develop a method for sharing your results and conclusions to classmates — and then share them!
In the Student Manual, Analyzing results prompts further thought and discussion about causes and effects and patterns noted during the investigation, and evaluating results leads students to reflect on their investigative methods, draw conclusions, and make note of potential follow-up investigations.
Designing and Conducting your investigation is the student-directed, inquiry-based portion of the investigation. It typically begins with questions that students might want to investigate. Students should strive to connect the questions that they pose, the hypothesis that they generate, or the results of their investigations with the central biological concepts and big ideas most related with their experiment.
T16 Chapter 2
T212 Investigation 12
■ Summative AssessmentThis section describes suggestions for assessing students’ understanding of the concepts presented in the investigation, but you are encouraged to develop your own methods of postlab assessment. Each student (or group of students) should present data from a repeated, controlled experiment with graphic representation and quantitative analysis of fruit fly choices.
1. Have students record their experimental design, procedures, data, results, and conclusions in a lab notebook, or have them construct a mini-poster to share with their classmates.
2. Revisit the learning objectives for the investigation and develop strategies (e.g., questions or activities) that can help determine whether or not the learning objective has been met. For example, one learning objective is The student is able to analyze data to identify possible patterns and relationships between a biotic or abiotic factor and a biological system (2D1 and 5.1). The student might be asked to complete a data grid of choice for fruit flies, analyze the data, and draw conclusions. Table 1 is an example of a data table that students could construct for themselves as they use the choice chamber (x = number of flies at one of the two ends of the chamber). The students may need to adjust the table to indicate multiple trials.
Table 1. Fruit Fly Choices
Substance 1 2 3 4 5 6 7
A A B A B A B A B A B A B A B
1 X X2 X X X3 X X X X X4 X X X X X X5 X X X X X X X X6 X X X X X X X X7 X X X X X X X X X X
3. Complete a chi-square analysis of the results to determine if the distribution of the flies is significant.
4. Released AP Exams have several multiple-choice and free-response (essay) questions based on the concepts studied in this investigation. One good example is the free-response question about Bursatella leachii (sea slug) from the 1997 AP Biology Exam.These questions could be used to assess students’ understanding.
Investigation 12 T213
BIG IDEA 4: INTERACTIONS
■ Where Can Students Go from Here?One possible extension for this investigation is to ask students to identify another organism that behaves similarly to the fruit fly and one that they expect would behave differently. For example, students could substitute ladybugs, houseflies, or mealworms for fruit flies and construct choice chambers using other substances that they think might be attractive to these organisms.
■ SUPPLEMENTAL RESOURCES
www.fruitfly.org The Berkeley Drosophila Genome Project includes links to images and other resources for teachers and students. Teachers should consider looking through this website before beginning the lab to appreciate the breadth of information about Drosophila.
Flagg, Raymond. The Carolina Drosophila Manual. Burlington, NC: Carolina Biological Supply Company, 1988.
This is a useful manual that comes with each Drosophila culture order from Carolina. It may be ordered separately (order number 45-2620 from Carolina Biological Supply Company). Excellent photographs help teachers and students identify different mutants and give guidance for sexing the flies.
http://www.Flybase.org This is a classic database of Drosophila genes and genomes used extensively by researchers and educators. This resource is cited on many other sites, including the Berkeley Drosophila Genome Project. It is a general database that could be used by teachers or students who would like to have more information about any particular mutant.
Gargano, Julia Warner, Ian Martin, Poonam Bhandari, and Michael S. Grotewiel. Rapid iterative negative geotaxis (RING): a new method for assessing age-related locomotor decline in Drosophila. Experimental Gerontology 40, no. 5 (May 2005): 386–395.
Fruit flies’ negative geotaxis response declines with age. This resource would be helpful for teachers or students who have designed experiments that use the age of the fruit fly as a variable.
http://www.hhmi.org The Howard Hughes Medical Center includes multiple resources for teachers about fruit flies. This is a general resource that could lead to ideas for experiments or general information about fruit flies before the class begins the experiments. It includes links to other resources for general information and the scope of research about Drosophila. This resource includes very accessible material that would be helpful as a teacher begins the experiments.
The summative Assessment section (Teacher Manual) offers suggestions for evaluating students’ understanding of the concepts, development of science practices, and gain in thinking skills after students conduct their lab investigations and analyze their results.
Many of the investigations also provide suggestions for extending the investigation(s) (where Can students go from here?). These suggestions appear in both the Teacher Manual and Student Manual versions of the labs.
Chapter 3 T17
Chapter 3:
Creating Student-Directed, Inquiry-Based Lab Investigations
Laboratory investigations should engage students, promote critical thinking and active learning, and encourage collaboration among students and between student and teacher (Johnson 2009). The focus of the laboratory experience is not on students achieving predetermined results, but on students making their own observations, raising questions, and strategizing how to investigate them.
The benefits to students of conducting their own investigations outweigh any disadvantages. Advantages include more rapid development of thinking processes and application skills. The biggest disadvantage is the amount of time that may be required for students to conduct their own investigations. With this in mind, it is important to provide students with a timeline for each lab, with options that allow them to perform sections of the lab if finding adequate time is problematic.
■ how to Begin Creating a student-Directed, inquiry-Based labIn Inquiry and the National Science Education Standards: a Guide for Teaching and Learning, the National Research Council (NRC) identifies the following five essential responsibilities of learners conducting inquiry-based labs:
1. Engaging in scientifically oriented questions
2. Giving priority to evidence in responding to questions
3. Formulating explanations from evidence
4. Connecting explanations to scientific knowledge
5. Communicating and justifying explanations
When creating a new lab or modifying a familiar one to be more student directed, inquiry based, and open ended, you should consider these five expectations of students. In addition, when creating a new inquiry-based lab investigation or modifying a familiar lab, you need to identify how the investigation aligns with concepts and science practices outlined in the curriculum framework. You should consider what prior knowledge and skills students must have to perform the investigation, what skills the lab develops, and how the investigation connects back to and builds upon concepts that the student has studied previously.
You also should provide students with guidelines and/or procedures for using particular instruments and equipment. This can be accomplished through prelab demonstrations, online tutorials, or other appropriate methods. In addition, you must consider any safety and housekeeping issues, and determine if the school has resources (e.g., materials, supplies, computers, or other equipment) to conduct a particular investigation. The following table is useful for identifying components and challenges when creating a new student-directed, inquiry-based lab or modifying a familiar one.

T18 Chapter 3
■ one way to Develop a new inquiry-Based investigation Concept:
Big idea focused on:
Enduring understanding(s) addressed:
Goal (What will students learn?):
Resources available to help teach this concept:
Resources needed to help teach this concept:
Some instructional activities that I currently use that could work with this concept:
Lab to be used to support this concept:
Learning objective(s) addressed:
Science practices tied to the learning objective(s):
The level of inquiry reached in this lab (e.g., confirmation, structured, guided, open):
The lab/quantitative skills that my students will need in order to successfully complete this lab:

Chapter 3 T19
The content knowledge that my students will need in order to successfully complete this lab:
To help students develop these skills, I will sequence instruction in the following way:
The challenges I foresee:
Some possible solutions to these challenges:
You can use the four-level inquiry model and the NRC’s five expectations of students as a tool for a simple, yet effective, method of transitioning your traditional labs to inquiry. Begin by exploring the lab you want to modify. Think about the following question as you read the lab: What characteristics make this lab “cookbook” rather than inquiry? Once you have a list of characteristics, write down three to five that you’d like to modify. It’s a good idea to incorporate the NRC inquiry model into this step. Ask yourself, At what inquiry level is the lab currently? Toward what inquiry level do I want the lab to move? Remember, the important thing is that you’re making small changes that will provide your students with inquiry experiences.
Eventually, you may choose to move to a more thorough model. The Matrix for Assessing and Planning Scientific Inquiry (MAPSI) is an inquiry model that describes inquiry labs as specific tasks along a continuum that address four cognitive processes and their subprocesses (see Appendix D). MAPSI is a particularly useful tool for AP science teachers, as each of the cognitive processes and subprocesses addresses two or more of the science practices. If you modify your traditional labs with MAPSI as your guide, you will be addressing several science practices.
■ The next steps The investigations in this manual support concepts, enduring understandings, and science practices described in the curriculum framework. Many of the labs are new, while others are modifications of familiar labs that have been revised to reflect the shift toward more student-directed and inquiry-based investigations. The following table shows how the current Lab 11: Transpiration differs from Lab 9: Transpiration from the College Board’s 2001 AP Biology Lab Manual. The differences highlight elements that should be considered when creating an inquiry-based investigation.
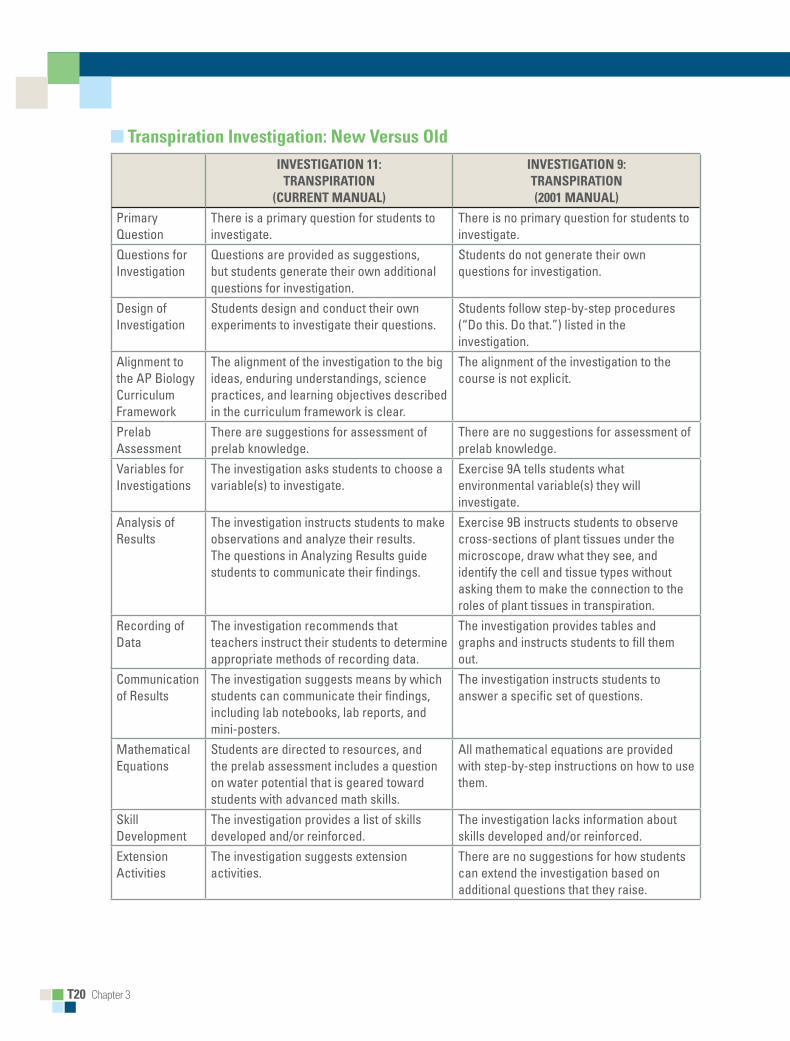
T20 Chapter 3
■ Transpiration investigation: new versus oldinvesTigATion 11:
TrAnsPirATion (CurrenT mAnuAl)
invesTigATion 9: TrAnsPirATion (2001 mAnuAl)
Primary Question
There is a primary question for students to investigate.
There is no primary question for students to investigate.
Questions for Investigation
Questions are provided as suggestions, but students generate their own additional questions for investigation.
Students do not generate their own questions for investigation.
Design of Investigation
Students design and conduct their own experiments to investigate their questions.
Students follow step-by-step procedures (“Do this. Do that.”) listed in the investigation.
Alignment to the AP Biology Curriculum Framework
The alignment of the investigation to the big ideas, enduring understandings, science practices, and learning objectives described in the curriculum framework is clear.
The alignment of the investigation to the course is not explicit.
Prelab Assessment
There are suggestions for assessment of prelab knowledge.
There are no suggestions for assessment of prelab knowledge.
Variables for Investigations
The investigation asks students to choose a variable(s) to investigate.
Exercise 9A tells students what environmental variable(s) they will investigate.
Analysis of Results
The investigation instructs students to make observations and analyze their results. The questions in Analyzing Results guide students to communicate their findings.
Exercise 9B instructs students to observe cross-sections of plant tissues under the microscope, draw what they see, and identify the cell and tissue types without asking them to make the connection to the roles of plant tissues in transpiration.
Recording of Data
The investigation recommends that teachers instruct their students to determine appropriate methods of recording data.
The investigation provides tables and graphs and instructs students to fill them out.
Communication of Results
The investigation suggests means by which students can communicate their findings, including lab notebooks, lab reports, and mini-posters.
The investigation instructs students to answer a specific set of questions.
Mathematical Equations
Students are directed to resources, and the prelab assessment includes a question on water potential that is geared toward students with advanced math skills.
All mathematical equations are provided with step-by-step instructions on how to use them.
Skill Development
The investigation provides a list of skills developed and/or reinforced.
The investigation lacks information about skills developed and/or reinforced.
Extension Activities
The investigation suggests extension activities.
There are no suggestions for how students can extend the investigation based on additional questions that they raise.

Chapter 3 T21
■ Assessing student understandingLearning occurs most effectively at “teachable moments,” and when one thinks of a good teacher, one often does so in terms of such experiences. As a student-directed investigation progresses, you should circulate among the student groups and ask probing questions to provoke students’ thinking (e.g., How are you changing the temperature? How are you recording the temperature?). You may also ask about data and evidence (e.g., Is there an alternative way to organize the data? Is there some reason the data may not be accurate? What data are important to collect? What are you hoping to find out? How will you communicate your results?). This strategy will allow you to diagnose and address any misconceptions immediately, and to assess the depth of student understanding of key concepts.

This page is intentionally left blank.
Chapter 4 T23
Chapter 4:
Managing the Investigative experience
■ The role of the Teacher in inquiry-Based instructionEffective inquiry-based instruction requires the teacher to guide and facilitate laboratory investigations, making the lab experience a vital, engaging component of the course experience. You must be careful not to know (or reveal) the results of the experiments, but rather be genuinely interested in student discoveries and conclusions. The classroom atmosphere should be one where students feel comfortable to observe, hypothesize, predict, and explore new concepts. You must consider any constraints, such as the following:• Space: Where, when, and how will the experiment be performed? Space is often
the limiting factor for student-directed, inquiry-based experiences, especially when students extend the lab and begin to ask their own questions. Determine if parts of the experiment can be performed outside the classroom. For example, plants can be grown at home and brought in for the experiment in order to save space.
• Experimental organism(s): The experimental organism needs to be readily available. For example, insects can be caught or cultured, and plants can be grown on site. Many classrooms have resources for mice or snakes, but be aware of regulations involving the care and safety of laboratory organisms. Some states have rigorous guidelines, such as not using vertebrate animals for experiments in the classroom. You should demonstrate a respect for all life and insist that your students do the same.
• Access to materials and equipment: Students may need to coordinate the sharing of materials and equipment, and/or coordinate with the teacher for access to specialized equipment. Also, they may need to understand the permutations of a student-directed lab, and the need for variations in materials.
You must also model the actions and behavior expected of students (e.g., wear safety glasses or goggles when appropriate, admit when you do not know the answer to a question, refer to books or websites to obtain information, ask questions, and communicate clearly). In short, you should model inquiry as an ongoing, lifelong process.
■ Conducting inquiry-Based labsFirst, determine students’ prior skills and understanding of the key concepts that are addressed in the lab. Most students come to AP Biology with some practical skills (e.g., using a balance, graduated cylinder, ruler, or microscope) and laboratory experience, but the experience may have consisted of demonstrations or investigations with known or expected outcomes, rather than investigations that were inquiry based. The laboratory exercises in this guide might begin with teacher-directed demonstrations of the techniques involved, but lead to questions that students can investigate by designing and conducting their own follow-up experiment(s). It is crucial that students not skip the
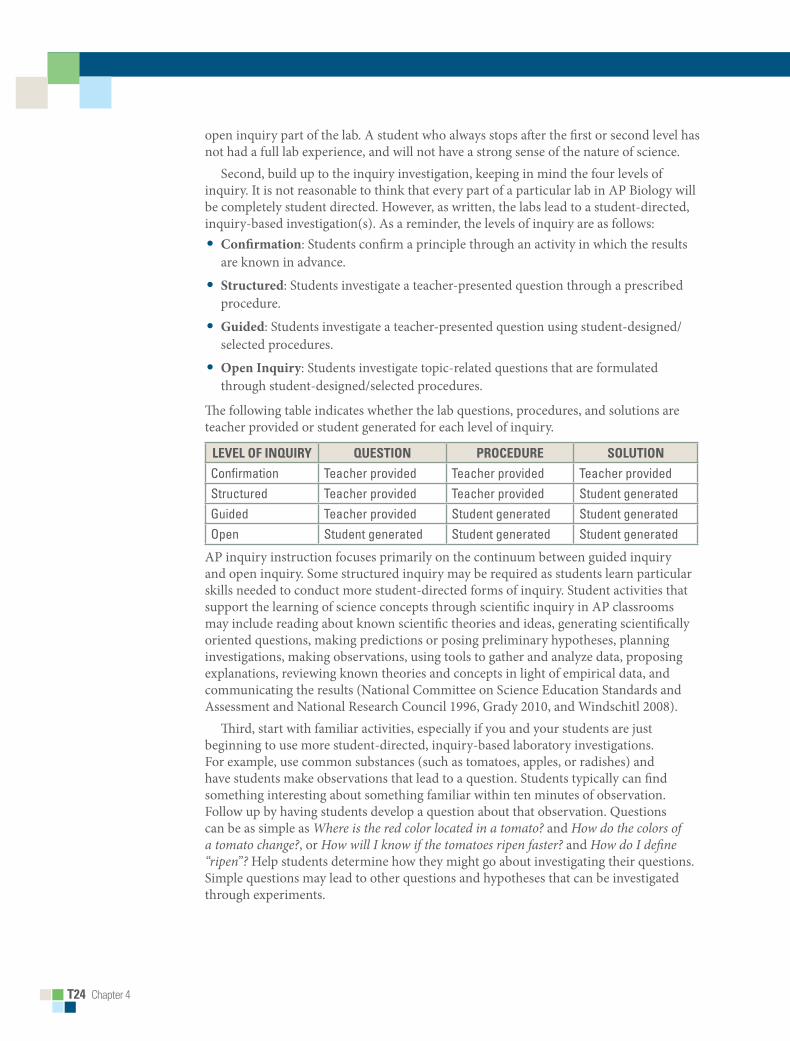
T24 Chapter 4
open inquiry part of the lab. A student who always stops after the first or second level has not had a full lab experience, and will not have a strong sense of the nature of science.
Second, build up to the inquiry investigation, keeping in mind the four levels of inquiry. It is not reasonable to think that every part of a particular lab in AP Biology will be completely student directed. However, as written, the labs lead to a student-directed, inquiry-based investigation(s). As a reminder, the levels of inquiry are as follows:• Confirmation: Students confirm a principle through an activity in which the results
are known in advance.
• Structured: Students investigate a teacher-presented question through a prescribed procedure.
• Guided: Students investigate a teacher-presented question using student-designed/selected procedures.
• Open Inquiry: Students investigate topic-related questions that are formulated through student-designed/selected procedures.
The following table indicates whether the lab questions, procedures, and solutions are teacher provided or student generated for each level of inquiry.
level oF inquiry quesTion ProCeDure soluTion
Confirmation Teacher provided Teacher provided Teacher providedStructured Teacher provided Teacher provided Student generatedGuided Teacher provided Student generated Student generatedOpen Student generated Student generated Student generated
AP inquiry instruction focuses primarily on the continuum between guided inquiry and open inquiry. Some structured inquiry may be required as students learn particular skills needed to conduct more student-directed forms of inquiry. Student activities that support the learning of science concepts through scientific inquiry in AP classrooms may include reading about known scientific theories and ideas, generating scientifically oriented questions, making predictions or posing preliminary hypotheses, planning investigations, making observations, using tools to gather and analyze data, proposing explanations, reviewing known theories and concepts in light of empirical data, and communicating the results (National Committee on Science Education Standards and Assessment and National Research Council 1996, Grady 2010, and Windschitl 2008).
Third, start with familiar activities, especially if you and your students are just beginning to use more student-directed, inquiry-based laboratory investigations. For example, use common substances (such as tomatoes, apples, or radishes) and have students make observations that lead to a question. Students typically can find something interesting about something familiar within ten minutes of observation. Follow up by having students develop a question about that observation. Questions can be as simple as Where is the red color located in a tomato? and How do the colors of a tomato change?, or How will I know if the tomatoes ripen faster? and How do I define “ripen”? Help students determine how they might go about investigating their questions. Simple questions may lead to other questions and hypotheses that can be investigated through experiments.
Chapter 4 T25
■ Preparing the studentModel the inquiry process. As students begin their investigations, you can help them by modeling inquiry as they work through their experimental design. Before students begin the lab, you can ask them about the structure of their investigation. Discuss the following terms:• Hypothesis: The simplest form of a hypothesis is an If … then format. Ask students
what they are trying to determine with their experiment, and how they will know if their hypothesis is supported. For example, We know that tomatoes are fruits, that many fruits produce ethylene, and that ethylene promotes fruit ripening. If tomatoes produce ethylene, then placing them in a container that traps ethylene will cause the tomatoes to ripen faster.
• Procedure: Ask students for the reason behind the lab setup. Have them explain how their procedure will answer the question posed by their hypothesis. Questions to consider include What kind of information will the procedure give? How will the information be provided? What about reproducibility? Are enough trials being done to have confidence in the results? In the example above, a student could ask, How many tomatoes do I need to use? What kind of container? Is the size of the container important? How will I know if the tomatoes ripen faster?
• Variables: What variables are being controlled? Many students know that controls are necessary, but they do not really understand how to allow the manipulation of just one variable at a time. Probe more deeply as to which variable is being controlled and how. For example, in this investigation questions could be Do I need to control for mass of the tomatoes, or volume of containers, or both? How?
• Data collection: Provide sample data, if needed, and ask what the data mean and how the results support an answer(s) to the question posed.
• Claims and evidence: Students should make and justify claims about unnatural phenomena based on evidence produced through reasoning and scientific practices.
After the lab, explore with students the results of their investigation. Do the discrepancies or results lead to more questions? What are they? These questions may form the basis for additional independent follow-up experiments. With these follow-up experiments, you can determine whether your students have acquired the practical skills of measurement and use of equipment.
■ Teaching Techniques for inquiry-Based labsInquiry requires that students learn to ask questions, pursue answers, and understand that instead of finding answers, they may have more questions as the result of their investigations. The following sentences and phrases, taken from specific free-response questions in the AP Biology Exam that pertain to the lab experience, give a sense of what students should know and be able to demonstrate after completing a laboratory investigation of their own design. These statements provide good prompts for teachers to use as they guide students in their own inquiry. These phrases indicate what students should understand and be able to demonstrate for each of their laboratory activities:

T26 Chapter 4
• Explain the purpose of each step of your procedure.
• Describe how you could determine whether …
• Summarize the pattern.
• Choose one of the variables that you identified, and design a controlled experiment to test …
• Explain how the concept is used to account for .
• Describe variables that were not controlled in the experiment, and describe how those variables might have affected the outcome of the experiment.
• Describe a method to determine…
• Indicate the results you expect for both the control and the experimental groups.
• Describe the results depicted in the graph.
• Describe the essential features of an experimental apparatus that could be used to measure …
• Graph the data … On the same axis, graph additional lines representing … (a prediction)
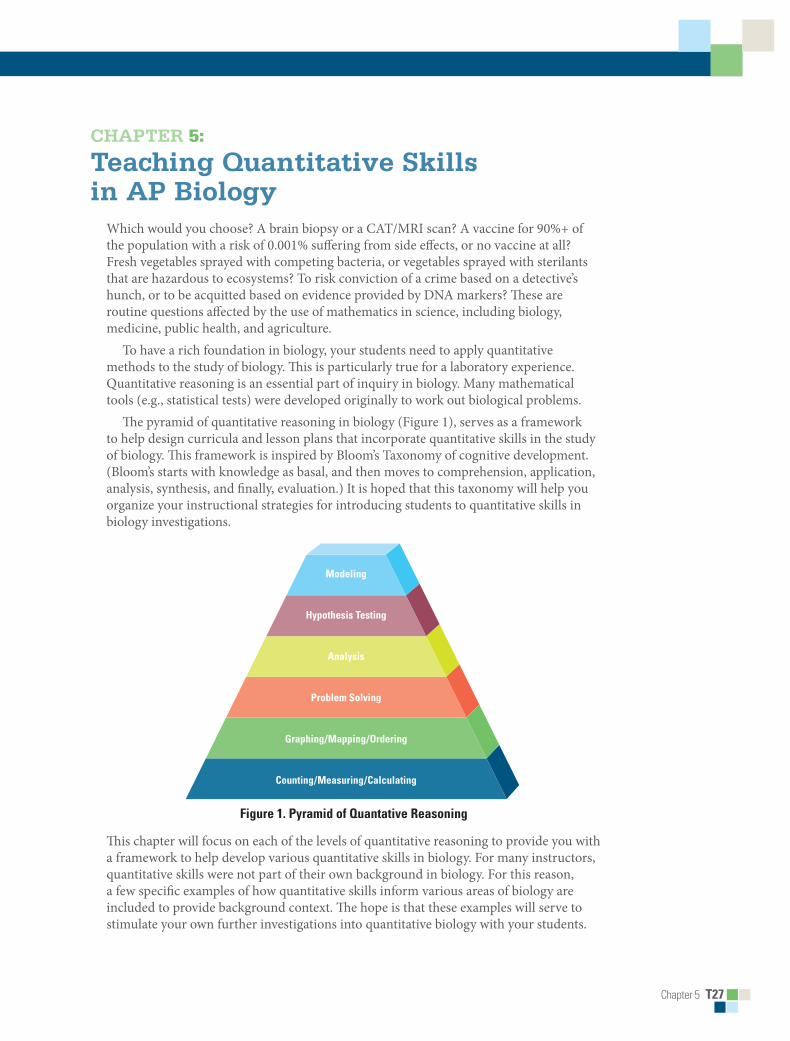
Chapter 5 T27
Chapter 5:
teaching Quantitative Skills in ap Biology
Which would you choose? A brain biopsy or a CAT/MRI scan? A vaccine for 90%+ of the population with a risk of 0.001% suffering from side effects, or no vaccine at all? Fresh vegetables sprayed with competing bacteria, or vegetables sprayed with sterilants that are hazardous to ecosystems? To risk conviction of a crime based on a detective’s hunch, or to be acquitted based on evidence provided by DNA markers? These are routine questions affected by the use of mathematics in science, including biology, medicine, public health, and agriculture.
To have a rich foundation in biology, your students need to apply quantitative methods to the study of biology. This is particularly true for a laboratory experience. Quantitative reasoning is an essential part of inquiry in biology. Many mathematical tools (e.g., statistical tests) were developed originally to work out biological problems.
The pyramid of quantitative reasoning in biology (Figure 1), serves as a framework to help design curricula and lesson plans that incorporate quantitative skills in the study of biology. This framework is inspired by Bloom’s Taxonomy of cognitive development. (Bloom’s starts with knowledge as basal, and then moves to comprehension, application, analysis, synthesis, and finally, evaluation.) It is hoped that this taxonomy will help you organize your instructional strategies for introducing students to quantitative skills in biology investigations.
Bio_Intro_Lab01_01
Counting/Measuring/Calculating
Graphing/Mapping/Ordering
Problem Solving
Analysis
Hypothesis Testing
Modeling
Figure 1. Pyramid of quantative reasoning
This chapter will focus on each of the levels of quantitative reasoning to provide you with a framework to help develop various quantitative skills in biology. For many instructors, quantitative skills were not part of their own background in biology. For this reason, a few specific examples of how quantitative skills inform various areas of biology are included to provide background context. The hope is that these examples will serve to stimulate your own further investigations into quantitative biology with your students.
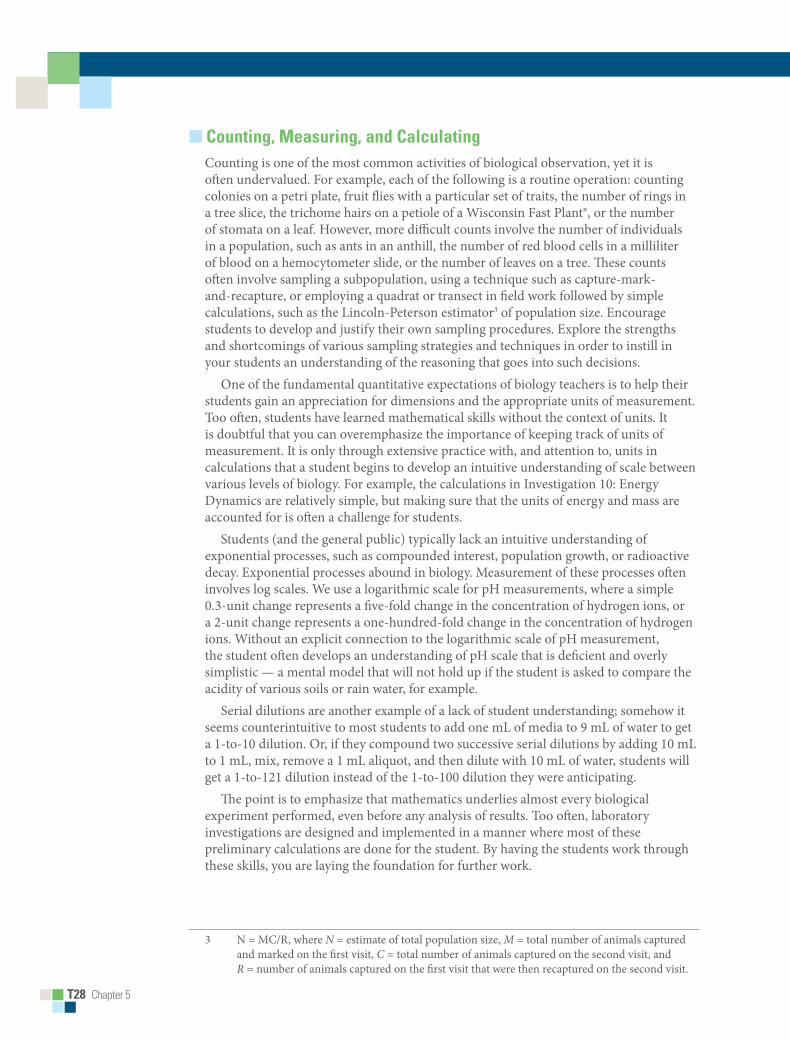
T28 Chapter 5
■ Counting, measuring, and CalculatingCounting is one of the most common activities of biological observation, yet it is often undervalued. For example, each of the following is a routine operation: counting colonies on a petri plate, fruit flies with a particular set of traits, the number of rings in a tree slice, the trichome hairs on a petiole of a Wisconsin Fast Plant®, or the number of stomata on a leaf. However, more difficult counts involve the number of individuals in a population, such as ants in an anthill, the number of red blood cells in a milliliter of blood on a hemocytometer slide, or the number of leaves on a tree. These counts often involve sampling a subpopulation, using a technique such as capture-mark-and-recapture, or employing a quadrat or transect in field work followed by simple calculations, such as the Lincoln-Peterson estimator3 of population size. Encourage students to develop and justify their own sampling procedures. Explore the strengths and shortcomings of various sampling strategies and techniques in order to instill in your students an understanding of the reasoning that goes into such decisions.
One of the fundamental quantitative expectations of biology teachers is to help their students gain an appreciation for dimensions and the appropriate units of measurement. Too often, students have learned mathematical skills without the context of units. It is doubtful that you can overemphasize the importance of keeping track of units of measurement. It is only through extensive practice with, and attention to, units in calculations that a student begins to develop an intuitive understanding of scale between various levels of biology. For example, the calculations in Investigation 10: Energy Dynamics are relatively simple, but making sure that the units of energy and mass are accounted for is often a challenge for students.
Students (and the general public) typically lack an intuitive understanding of exponential processes, such as compounded interest, population growth, or radioactive decay. Exponential processes abound in biology. Measurement of these processes often involves log scales. We use a logarithmic scale for pH measurements, where a simple 0.3-unit change represents a five-fold change in the concentration of hydrogen ions, or a 2-unit change represents a one-hundred-fold change in the concentration of hydrogen ions. Without an explicit connection to the logarithmic scale of pH measurement, the student often develops an understanding of pH scale that is deficient and overly simplistic — a mental model that will not hold up if the student is asked to compare the acidity of various soils or rain water, for example.
Serial dilutions are another example of a lack of student understanding; somehow it seems counterintuitive to most students to add one mL of media to 9 mL of water to get a 1-to-10 dilution. Or, if they compound two successive serial dilutions by adding 10 mL to 1 mL, mix, remove a 1 mL aliquot, and then dilute with 10 mL of water, students will get a 1-to-121 dilution instead of the 1-to-100 dilution they were anticipating.
The point is to emphasize that mathematics underlies almost every biological experiment performed, even before any analysis of results. Too often, laboratory investigations are designed and implemented in a manner where most of these preliminary calculations are done for the student. By having the students work through these skills, you are laying the foundation for further work.
3 N = MC/R, where N = estimate of total population size, M = total number of animals captured and marked on the first visit, C = total number of animals captured on the second visit, and R = number of animals captured on the first visit that were then recaptured on the second visit.
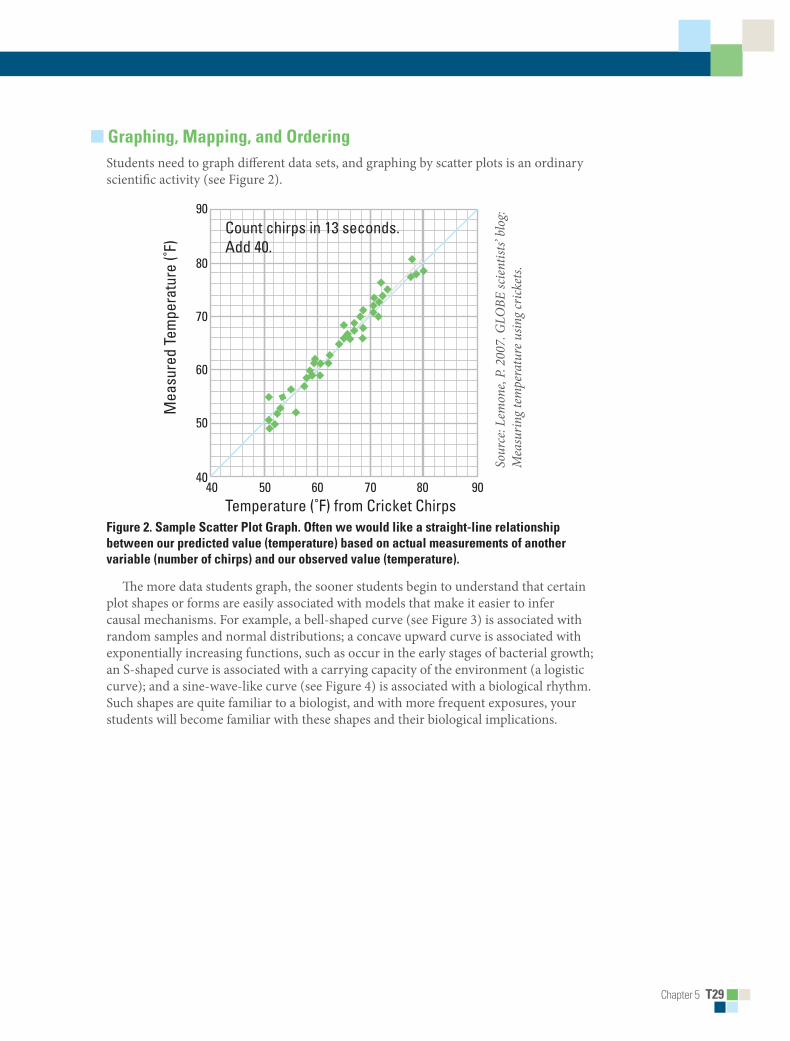
Chapter 5 T29
■ graphing, mapping, and orderingStudents need to graph different data sets, and graphing by scatter plots is an ordinary scientific activity (see Figure 2).
Sour
ce: L
emon
e, P.
200
7. G
LOBE
scie
ntist
s’ bl
og:
Mea
surin
g tem
pera
ture
usin
g cric
kets.
Temperature (˚F) from Cricket Chirps
Count chirps in 13 seconds.Add 40.
Mea
sure
d Te
mpe
ratu
re (˚
F)
40 50 60 70 80 90
90
80
70
60
50
40
Figure 2. sample scatter Plot graph. often we would like a straight-line relationship between our predicted value (temperature) based on actual measurements of another variable (number of chirps) and our observed value (temperature).
The more data students graph, the sooner students begin to understand that certain plot shapes or forms are easily associated with models that make it easier to infer causal mechanisms. For example, a bell-shaped curve (see Figure 3) is associated with random samples and normal distributions; a concave upward curve is associated with exponentially increasing functions, such as occur in the early stages of bacterial growth; an S-shaped curve is associated with a carrying capacity of the environment (a logistic curve); and a sine-wave-like curve (see Figure 4) is associated with a biological rhythm. Such shapes are quite familiar to a biologist, and with more frequent exposures, your students will become familiar with these shapes and their biological implications.
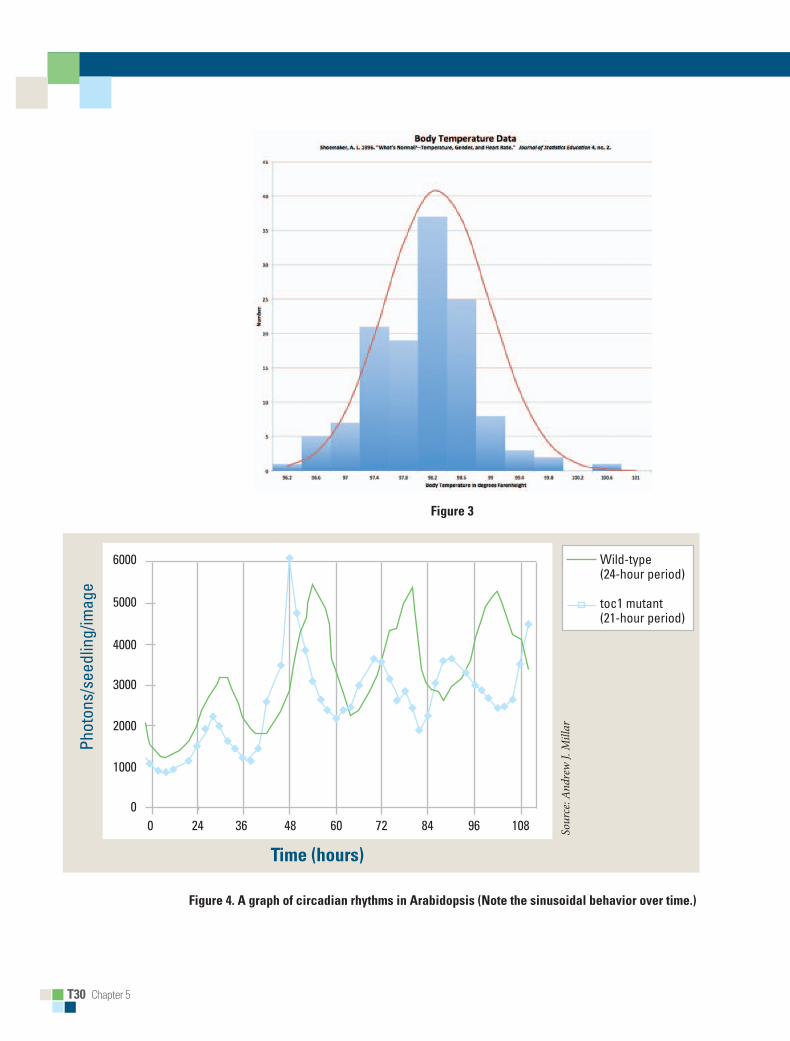
T30 Chapter 5
Figure 3
Figure 4. A graph of circadian rhythms in Arabidopsis (note the sinusoidal behavior over time.)
Time (hours)
Wild-type (24-hour period)
toc1 mutant (21-hour period)
Phot
ons/
seed
ling/
imag
e
0 24 36 48 60 72 84 96 108
6000
5000
4000
3000
2000
1000
0
Sour
ce: A
ndre
w J.
Mill
ar
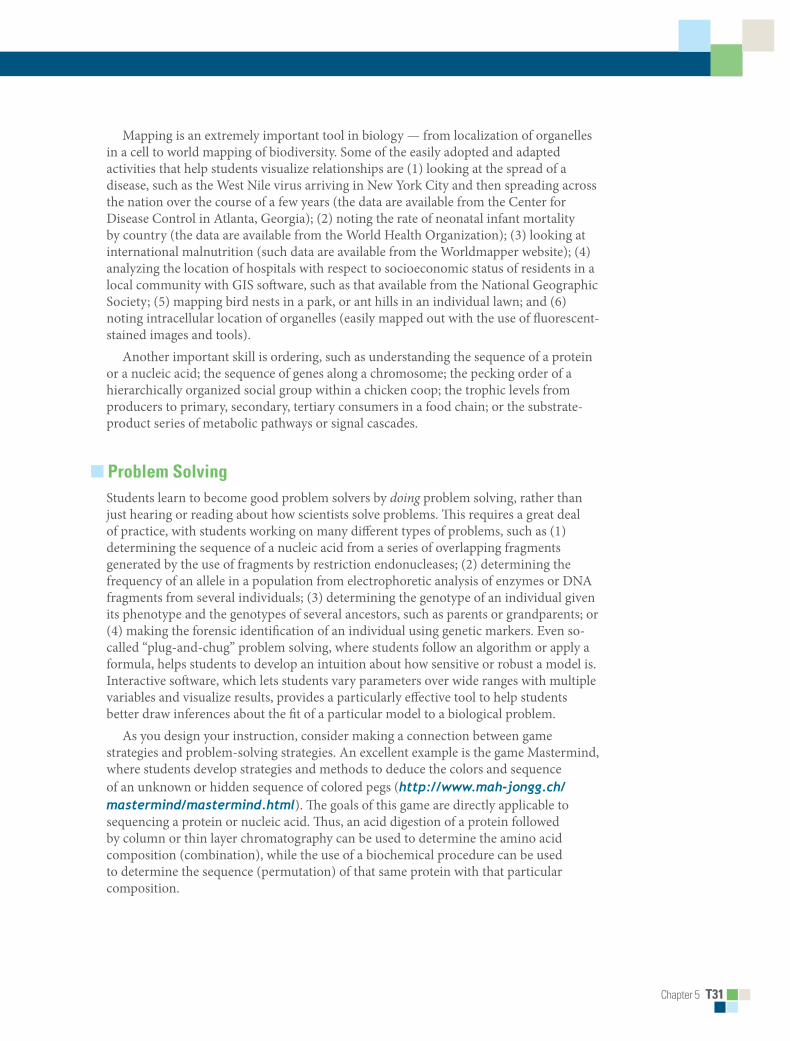
Chapter 5 T31
Mapping is an extremely important tool in biology — from localization of organelles in a cell to world mapping of biodiversity. Some of the easily adopted and adapted activities that help students visualize relationships are (1) looking at the spread of a disease, such as the West Nile virus arriving in New York City and then spreading across the nation over the course of a few years (the data are available from the Center for Disease Control in Atlanta, Georgia); (2) noting the rate of neonatal infant mortality by country (the data are available from the World Health Organization); (3) looking at international malnutrition (such data are available from the Worldmapper website); (4) analyzing the location of hospitals with respect to socioeconomic status of residents in a local community with GIS software, such as that available from the National Geographic Society; (5) mapping bird nests in a park, or ant hills in an individual lawn; and (6) noting intracellular location of organelles (easily mapped out with the use of fluorescent-stained images and tools).
Another important skill is ordering, such as understanding the sequence of a protein or a nucleic acid; the sequence of genes along a chromosome; the pecking order of a hierarchically organized social group within a chicken coop; the trophic levels from producers to primary, secondary, tertiary consumers in a food chain; or the substrate-product series of metabolic pathways or signal cascades.
■ Problem solvingStudents learn to become good problem solvers by doing problem solving, rather than just hearing or reading about how scientists solve problems. This requires a great deal of practice, with students working on many different types of problems, such as (1) determining the sequence of a nucleic acid from a series of overlapping fragments generated by the use of fragments by restriction endonucleases; (2) determining the frequency of an allele in a population from electrophoretic analysis of enzymes or DNA fragments from several individuals; (3) determining the genotype of an individual given its phenotype and the genotypes of several ancestors, such as parents or grandparents; or (4) making the forensic identification of an individual using genetic markers. Even so-called “plug-and-chug” problem solving, where students follow an algorithm or apply a formula, helps students to develop an intuition about how sensitive or robust a model is. Interactive software, which lets students vary parameters over wide ranges with multiple variables and visualize results, provides a particularly effective tool to help students better draw inferences about the fit of a particular model to a biological problem.
As you design your instruction, consider making a connection between game strategies and problem-solving strategies. An excellent example is the game Mastermind, where students develop strategies and methods to deduce the colors and sequence of an unknown or hidden sequence of colored pegs (http://www.mah-jongg.ch/mastermind/mastermind.html). The goals of this game are directly applicable to sequencing a protein or nucleic acid. Thus, an acid digestion of a protein followed by column or thin layer chromatography can be used to determine the amino acid composition (combination), while the use of a biochemical procedure can be used to determine the sequence (permutation) of that same protein with that particular composition.
T32 Chapter 5
As students work through various problems, it is important for them to discuss the heuristics or algorithms that they are developing. Likewise, they should share visual tools, such as concept maps, Punnett squares, forked-lined diagrams, pedigrees, maps, graphs, trees, charts, and tables that help them identify goals, patterns, wrong avenues, or blind alleys; eliminate possibilities; or search for alternatives.
■ AnalysisHow does one prepare students for discovering meaningful patterns in the masses of biological information that are readily available in public databases (and that grow larger every day)? One such area emphasized in the current AP Biology laboratory investigations is bioinformatics. In Investigation 3: Comparing DNA Sequences to Understand Evolutionary Relationships with BLAST, students will use the Basic Local Alignment Search Tool (BLAST) to collect information to construct cladograms. A cladogram, also called a phylogenetic tree, is a visualization of the evolutionary relatedness of species.
If we use BLAST to compare several genes and use the information to construct cladograms, which parameters are likely to produce a relevant result? If we construct a multiple sequence alignment, how much do we affect our result by our choice of what counts as a chemically similar side chain of an amino acid in a protein? What if we assign different penalties for opening or closing a gap, or use different length chains for the size of gaps? Do the databases change sufficiently in a given time, so that we get a very different result from day to day? What if we use a different database? Is the database well curated and annotated? These are all questions that are relevant to BLAST analysis, or any study involving a public database.
One biologically important example that illustrates some of the quantitative issues in constructing meaningful patterns from complex data sets is evolutionary tree construction from nucleic acid or protein sequences. Phylogenetic analysis of human mitochondrial DNA has allowed us to construct a history of human migration from Africa, to track down the origins of AIDS, and to produce more effective flu vaccines. Phylogenetic analysis is a particularly good mathematical tool to make sense of enormous data sets. Working through this type of analysis allows students to evaluate how the different biological assumptions of mutation rate, adaptation, conservation of characters, parallelism, and convergence affect our construction and interpretation of ancestry, or of any organism.
Do we construct phylogenetic trees from distances (measures of similarity or difference of sequences) or characters (deletions, or structural features like alpha helices)? It is important for students to develop their own metrics for determining the distances between two or more sequences. Doing this allows students to see how the sensitivity of our inference of similarity or dissimilarity is dependent upon the metric used.
Every phylogenetic tree is a hypothesis. How do we interpret the tree? How many trees could be constructed from the same data with a similar degree of fit? How do we visualize a tree? Science education researchers have examined how students interpret phylogenetic trees. The mathematical distinction between geometry and topology are particularly useful here. A tree is like a baby’s mobile, with various baby animals dangling above the crib. We can swivel the mobile in the air, or lay the tree down flat

Chapter 5 T33
on a table without changing its topology — the links are the same even though which components are next to each other can vary greatly depending upon which nodes we swivel. On the other hand, we can change the topology by simply switching which pendant from which we hang a particular animal.
The use of statistics is widespread in biology. Some examples include (1) examining whether the heights or weights of individuals are normally distributed, (2) testing with a chi-squared goodness-of-fit test whether the results of a dihybrid testcross fit a ratio such as 1:1:1:1, (3) using a student’s T-test to see whether two distributions are different from one another, (4) testing whether bird nests are randomly distributed spatially in a prairie or woods, and (5) visually testing the correlation of two variables with linear regression to infer whether a causal relationship might exist (with all of the precautions of not confusing correlation and causation). Your students will employ some of these uses of statistics in Investigation 2: Mathematical Modeling: Hardy-Weinberg. Powerful statistical packages, spreadsheets, and many Web tools are readily available to compute these statistics.
Thus, your focus should not be on teaching computation, but should instead be on helping students develop the skills for using statistics to inform their investigations. For example, students should select appropriate tests before data are collected in order to inform experimental design. They should consider, for example, whether the sample size is sufficiently large to test the hypotheses, how to minimize type I (false positive) and type II (false negative) errors, and whether outliers should be included. Statistics builds on all of the counting, measuring, graphing, data mining, analysis, and problem solving previously described; statistics also facilitates the development of keen judgment to deal with the ambiguous and unwarranted assumptions that are typical of an investigation. As with problem solving, it is essential that students practice and work with several different types of problems that employ statistical analysis of data.
■ hypothesis TestingHypothesis testing is informed with statistical analysis, which helps to distinguish between multiple working hypotheses. Students just beginning to design and carry out their own investigations tend to propose only a single hypothesis as a causal model. However, nature is not always so cooperative. It is important that students, as they develop more expert inquiry skills, learn to propose and investigate all possibilities for a particular phenomenon wherever possible, and to design experiments to eliminate all but one competing hypothesis. Within this manual there are several labs in which students will engage in hypothesis testing. However, discrete examples for application can be used to prepare students.
Here’s an example: Leopard frogs have polymorphic patterns on their skins designated as pipiens, mottled, burnsi, or kandiyohi phenotypes. How are these patterns inherited? In a classic study, Steven C. Anderson and E. Peter Volpe (Anderson and Volpe 1958) reported the results from experiments to determine how skin pattern is inherited in leopard frogs.
The segregation observed in the progeny of the cross, kandiyohi female x burnsi male, was 15 kandiyohi, 11 burnsi, 10 pipiens, and 14 mottled burnsi (see Figure 5). The reciprocal cross, burnsi female x kandiyohi male, yielded 10 kandiyohi, 7 burnsi, 8 pipiens, and 5 mottled burnsi (see Figure 6). Neither of these ratios differs significantly
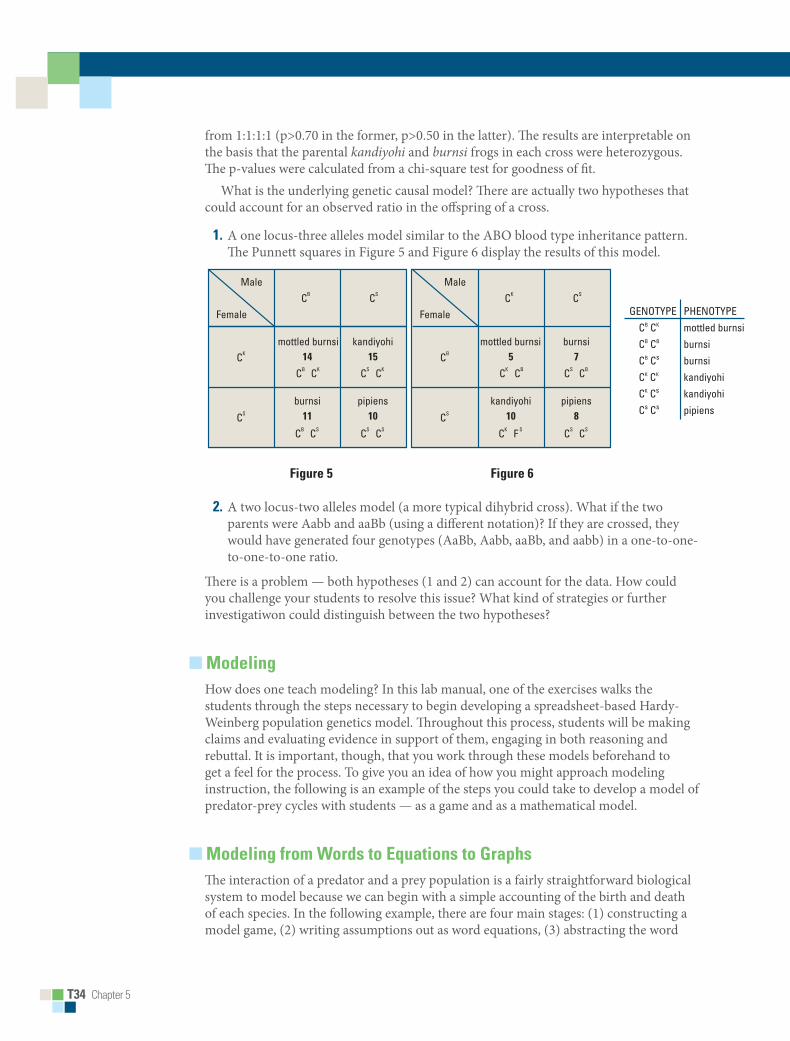
T34 Chapter 5
from 1:1:1:1 (p>0.70 in the former, p>0.50 in the latter). The results are interpretable on the basis that the parental kandiyohi and burnsi frogs in each cross were heterozygous. The p-values were calculated from a chi-square test for goodness of fit.
What is the underlying genetic causal model? There are actually two hypotheses that could account for an observed ratio in the offspring of a cross.
1. A one locus-three alleles model similar to the ABO blood type inheritance pattern. The Punnett squares in Figure 5 and Figure 6 display the results of this model.
Male
Female
kandiyohi15
CB CS
CS
CB CS CS
CK
CK
CK
CS
CB CS
pipiens10
mottled burnsi14
burnsi11
Male
Female
burnsi7
CK CS
CS
CK F S CS
CB
CB
CB
CS
CK CS
pipiens8
mottled burnsi5
kandiyohi10
GENOTYPE
CB CK
CB CB
CB Cs
CK CK
CK Cs
Cs Cs
PHENOTYPE
mottled burnsi
burnsi
burnsi
kandiyohi
kandiyohi
pipiens
Figure 5 Figure 6
2. A two locus-two alleles model (a more typical dihybrid cross). What if the two parents were Aabb and aaBb (using a different notation)? If they are crossed, they would have generated four genotypes (AaBb, Aabb, aaBb, and aabb) in a one-to-one-to-one-to-one ratio.
There is a problem — both hypotheses (1 and 2) can account for the data. How could you challenge your students to resolve this issue? What kind of strategies or further investigatiwon could distinguish between the two hypotheses?
■ modelingHow does one teach modeling? In this lab manual, one of the exercises walks the students through the steps necessary to begin developing a spreadsheet-based Hardy-Weinberg population genetics model. Throughout this process, students will be making claims and evaluating evidence in support of them, engaging in both reasoning and rebuttal. It is important, though, that you work through these models beforehand to get a feel for the process. To give you an idea of how you might approach modeling instruction, the following is an example of the steps you could take to develop a model of predator-prey cycles with students — as a game and as a mathematical model.
■ modeling from words to equations to graphsThe interaction of a predator and a prey population is a fairly straightforward biological system to model because we can begin with a simple accounting of the birth and death of each species. In the following example, there are four main stages: (1) constructing a model game, (2) writing assumptions out as word equations, (3) abstracting the word
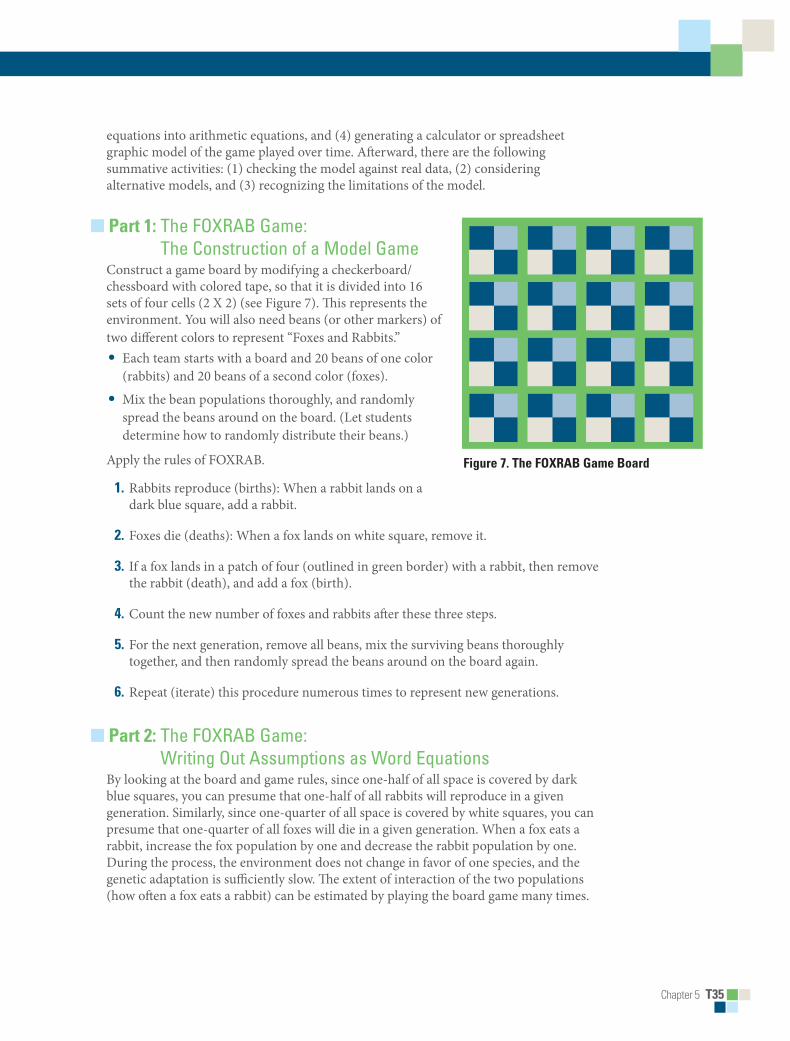
Chapter 5 T35
equations into arithmetic equations, and (4) generating a calculator or spreadsheet graphic model of the game played over time. Afterward, there are the following summative activities: (1) checking the model against real data, (2) considering alternative models, and (3) recognizing the limitations of the model.
■ Part 1: The FOXRAB Game:The Construction of a Model Game
Construct a game board by modifying a checkerboard/chessboard with colored tape, so that it is divided into 16 sets of four cells (2 X 2) (see Figure 7). This represents the environment. You will also need beans (or other markers) of two different colors to represent “Foxes and Rabbits.”• Each team starts with a board and 20 beans of one color
(rabbits) and 20 beans of a second color (foxes).
• Mix the bean populations thoroughly, and randomly spread the beans around on the board. (Let students determine how to randomly distribute their beans.)
Apply the rules of FOXRAB.
1. Rabbits reproduce (births): When a rabbit lands on a dark blue square, add a rabbit.
2. Foxes die (deaths): When a fox lands on white square, remove it.
3. If a fox lands in a patch of four (outlined in green border) with a rabbit, then remove the rabbit (death), and add a fox (birth).
4. Count the new number of foxes and rabbits after these three steps.
5. For the next generation, remove all beans, mix the surviving beans thoroughly together, and then randomly spread the beans around on the board again.
6. Repeat (iterate) this procedure numerous times to represent new generations.
■ Part 2: The FOXRAB Game: Writing Out Assumptions as Word Equations
By looking at the board and game rules, since one-half of all space is covered by dark blue squares, you can presume that one-half of all rabbits will reproduce in a given generation. Similarly, since one-quarter of all space is covered by white squares, you can presume that one-quarter of all foxes will die in a given generation. When a fox eats a rabbit, increase the fox population by one and decrease the rabbit population by one. During the process, the environment does not change in favor of one species, and the genetic adaptation is sufficiently slow. The extent of interaction of the two populations (how often a fox eats a rabbit) can be estimated by playing the board game many times.
Figure 7. The FoXrAB game Board
T36 Chapter 5
Some less obvious assumptions that students may raise include a number of assumptions about the environment and the behavior of each population, such as the following:• The prey population finds ample food at all times.
• The food supply of the predator population (which makes fertility, reproduction, and survival possible) depends entirely on the prey population.
• The rate of change of a population is proportional to its size.
Generally, these assumptions will not affect the basic generation of a model because they are embedded implicitly.
■ Part 3: The FOXRAB Game: Abstracting the Word Equations into Arithmetic Equations
Word equation (1): The change in the rabbit population is equal to plus one-half the original number of rabbits minus an estimate of the interaction between rabbits and foxes in this environment.
Arithmetic equation (1): ΔR = +(1/2)Ri – (1/40)RiFi
Where Ri is the initial number of rabbits and Fi is the initial number of foxes, ΔR is the change in the size of the rabbit population.
Similarly, word equation (2): The change in the fox population is equal to minus one-quarter the original number of foxes plus an estimate of the interaction between rabbits and foxes in this environment.
Arithmetic equation (2): ΔF = -(1/4)Fi + (1/40)RiFi
As before, Fi is the initial number of foxes and Ri is the initial number of rabbits. Similarly, ΔF is the change in the size of the fox population.
■ Part 4: The FOXRAB Game: Generating a Calculator or Spreadsheet Graphic Model of the Game Played over Time
The next step of this model-building process would be to have the students create a calculator or spreadsheet graphic model. Spreadsheets are particularly appropriate for this work. Simply reinterpret the two arithmetic equations into a spreadsheet form to calculate the change in the rabbit and the fox populations. If each row of the spreadsheet represents a single generation, you can model multiple generations by using the results from the previous row to calculate the next row, thereby iterating the same generational process that students went through in the physical game version of the model.
Have the students construct a variety of graphs, such as the following, from the spreadsheet or calculator results to develop a deeper understanding of the model:• Number of foxes vs. generation number
• Number of rabbits vs. generation number
• A combination of the two graphs (i.e., with two y-axes) to see coupled oscillations
• A graph of foxes versus rabbits to examine/observe cycles

Chapter 5 T37
Some questions that you might pursue with students include the following:
1. What is the sensitivity to different initial conditions? (That is, starting with different numbers of foxes and rabbits, what is the impact of slightly perturbing the system?)
2. If you start with the same numbers as in your first experiment, do your results look the same?
3. In reality, some rabbits and foxes may die, or be infertile for other reasons. Should we treat such factors as random or not? How might we incorporate them into the game versus in the model?
4. In general, how can we modify the above equations to make a model with the realistic outcomes of the board game?
5. How does the model change if the board configuration changes?
■ why model?The following are five pragmatic uses for models in biology4:
1. Simple models help biologists explore complex systems.
2. Models can be used to explore various possibilities.
3. Models can lead to the development of conceptual frameworks.
4. Models can make accurate predictions.
5. Models can generate explanations.
But why engage students in modeling? The University of Wisconsin’s Project MUSE: Modeling for Understanding in Science Education proposes that students work at the following four levels of problem solving:
1. Model-Less Problem Solving
2. Model-Using Problem Solving
3. Model-Revising Problem Solving
4. Model-Building Problem Solving
The MUSE taxonomy helps us recognize that as students learn to build models, they also develop an enhanced ability to solve problems at an expert level, rather than at a novice level. Students who use models develop a much better sense of epistemology (how do we know that we know), and they are able to transfer their modeling insights to other subject areas (Svoboda 2010). The impact of working with models on student learning makes modeling instruction well worth the time invested.
4 Jay Odenbaugh, “The strategy of model building in population biology,” Biology and Philosophy 21 (2006): 607–621.
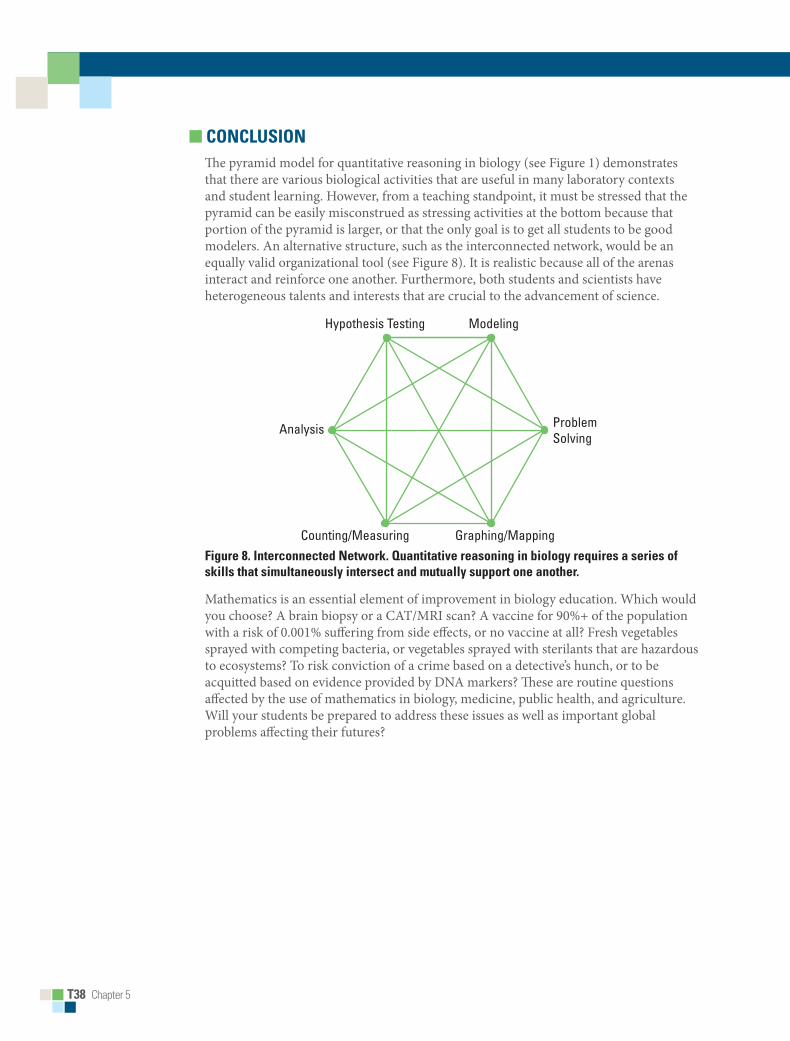
T38 Chapter 5
■ ConClusion The pyramid model for quantitative reasoning in biology (see Figure 1) demonstrates that there are various biological activities that are useful in many laboratory contexts and student learning. However, from a teaching standpoint, it must be stressed that the pyramid can be easily misconstrued as stressing activities at the bottom because that portion of the pyramid is larger, or that the only goal is to get all students to be good modelers. An alternative structure, such as the interconnected network, would be an equally valid organizational tool (see Figure 8). It is realistic because all of the arenas interact and reinforce one another. Furthermore, both students and scientists have heterogeneous talents and interests that are crucial to the advancement of science.
Hypothesis Testing Modeling
ProblemSolving
Analysis
Counting/Measuring Graphing/MappingFigure 8. interconnected network. quantitative reasoning in biology requires a series of skills that simultaneously intersect and mutually support one another.
Mathematics is an essential element of improvement in biology education. Which would you choose? A brain biopsy or a CAT/MRI scan? A vaccine for 90%+ of the population with a risk of 0.001% suffering from side effects, or no vaccine at all? Fresh vegetables sprayed with competing bacteria, or vegetables sprayed with sterilants that are hazardous to ecosystems? To risk conviction of a crime based on a detective’s hunch, or to be acquitted based on evidence provided by DNA markers? These are routine questions affected by the use of mathematics in biology, medicine, public health, and agriculture. Will your students be prepared to address these issues as well as important global problems affecting their futures?
Chapter 6 T39
Chapter 6:
Written, Verbal, and Graphic Communication
For laboratory investigations to be positive learning experiences, students must be able to communicate their experimental results to peers. Communication begins with small-group or class discussions of the primary question(s) and possible means of exploring answers. This tactic helps students understand the relationship among their hypotheses, procedures, and results, while allowing them to consider potential sources of errors and changes in methodology. Since many of the laboratory investigations described in this guide contain suggestions for additional study, discussing a given experiment serves as a launching pad for independent work, culminating in a formal presentation and summative assessment.
Suggestions for presentations are described below. A combination of methods allows for flexibility in the classroom; not all investigations merit a lab report, mini-poster, or inclusion in a portfolio. However, students conducting an independent investigation, either alone or in a small group, should learn how to organize and present their work in an appropriate, formal manner. Students should be encouraged to choose a means of presentation that effectively describes their question for investigation, background information, hypothesis, experimental results, conclusions, and literature cited. Regardless of the format in which students present their work, an opportunity for peer review should be provided.
■ Peer reviewPeer review provides an opportunity for students to ask critical questions. Students who question the work of others sharpen their own thinking skills in the process. The nature of the review can mirror what is called scientific argumentation. It focuses on the experimental design, data, and conclusions, but not on the personalities of the scientists. At first, students may need guidance, perhaps beginning with a list of questions (such as the following) to consider as they review others’ work:• Equivalency of sources for comparison:
Is there the same amount of material (e.g., tissue) in each experiment? How was the amount of material measured? Dry weight? Wet weight? Was the activity (e.g., reaction) reported per unit measure? Was the experimental procedure repeated several times? Was the sample size sufficient?
• Confounding variables: What conditions were controlled in the experiment? How were these conditions controlled? Were any variables overlooked?
T40 Chapter 6
• Results and conclusions: Are the results significant? Do they support or refute the original hypothesis? Are the results reproducible? Are the conclusions supported by the data? Are there alternative conclusions? What additional questions can be asked that lend themselves to further investigation?
Different experiments will undoubtedly lead to different questions. However, knowing that their work will be reviewed by peers will encourage students to plan and execute lab investigations on their own.
■ mini-Posters and PresentationsAt scientific conferences, many experiments are presented as posters. However, requiring students to construct detailed posters for every lab investigation would be very time consuming. An alternative is to have students prepare “mini-posters” that confer a degree of authenticity to their investigative process, and incorporate peer review. The materials used to create mini-posters are easily accessible; students can use file folders and sticky notes rather than large poster boards. Mini-posters are an effective way for students to articulate the essential elements of their research clearly and briefly: title; abstract; introduction with primary question, background context, and hypothesis; methodology; results, including graphs, tables, charts, and statistical analysis; conclusions and discussion; and literature cited.
Poster work can be done by groups or by individuals. To conserve time, one strategy is to divide the class in half by groups. Half of the groups stay with their posters to explain their original work, while the other half play the part of a critical audience. To guide this audience, the teacher provides a one-page rubric for scoring each poster. This audience of evaluators circulates around the room, and after a few rounds, the groups switch places; the poster presenters become the critical audience, and the evaluators become presenters. Before formal evaluation by the teacher, students revise their posters based on peer review. More information can be found at http://www.nabt.org/blog/2010/05/04/mini-posters-authentic-peer-review-in-the-classroom.
■ lab notebooks/lab PortfoliosNotebooks and portfolios make for easy assessment of a student’s work. A lab notebook should contain information necessary for making a formal report, including a prelab experimental outline. Before students conduct their investigations, the teacher must review each group’s experimental design to identify any safety issues, and to ensure that the student-directed investigation is challenging and aligns with the goals of inquiry and conceptual context (Johnson 2009). The prelab outline should contain the following information:• Members of work group
• Primary question for investigation
• Background observations and contextual information
• Hypothesis and rationale for the investigation
Chapter 6 T41
• Experimental design — strategies for testing hypothesis, using appropriate controls and variables
• Materials required
• Safety issues
In addition, for each investigation the lab notebook should contain the following:• Results, including graphs, tables, drawings or diagrams, statistical analysis
• Conclusions and discussion — Was the hypothesis supported? What additional questions remain for further investigation? Are there alternative interpretations or conclusions?
• References
After the initial lab, you may choose to evaluate laboratory notebooks randomly, thus lessening the grading load. Such random checking keeps the responsibility on the students to enter their work carefully and completely.
Portfolios typically contain representative work chosen by the student that shows evidence of learning, plus a narrative by the student that reflects on that evidence and ties it together (Johnson 2009). A lab portfolio might contain finished lab reports, notes on individual projects, library research, essays, excerpts from exams, and reflections on particular lab experiences and the problems that were encountered, as well as connections with other parts of the course, or a combination of these elements. Although portfolios provide a means for the teacher to monitor students’ progress over an extended period, finding the time needed to help students learn to showcase their work and to find an appropriate way to evaluate students’ work can present a challenge.
■ lab reports/PapersA formal report, or paper, provides an effective method for students to organize their work, and prepares them for doing research papers in scientific journals. A formal report would include several elements in addition to the information in the lab notebook, such as an introduction that may be prefaced by an abstract, and perhaps a discussion before the conclusion. The introduction gives a context for the experiment, and the discussion may include information from other sources that pertain to the experiment. Advantages of this type of report include the experience in writing clearly, as well as the opportunities for students to reflect on their work. Many teachers use a rubric, such as the following, for evaluation.
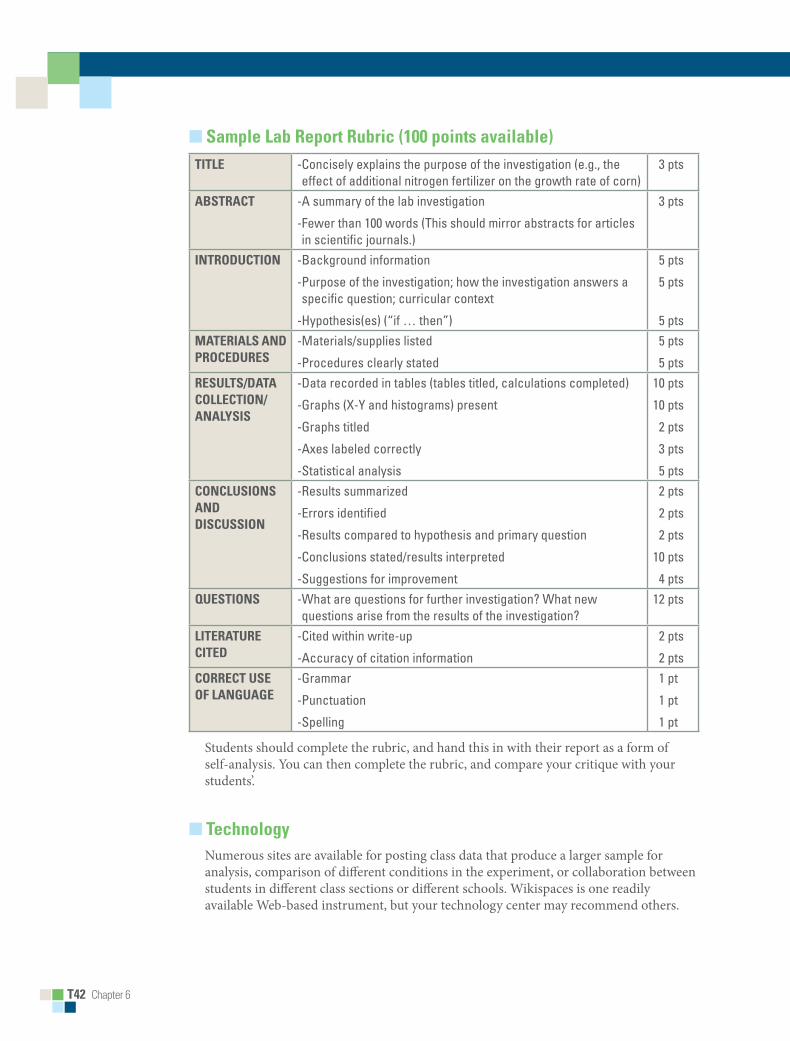
T42 Chapter 6
■ sample lab report rubric (100 points available)TiTle - Concisely explains the purpose of the investigation (e.g., the
effect of additional nitrogen fertilizer on the growth rate of corn) 3 pts
ABsTrACT -A summary of the lab investigation
- Fewer than 100 words (This should mirror abstracts for articles in scientific journals.)
3 pts
inTroDuCTion -Background information
- Purpose of the investigation; how the investigation answers a specific question; curricular context
-Hypothesis(es) (“if … then”)
5 pts
5 pts
5 ptsmATeriAls AnD ProCeDures
-Materials/supplies listed
-Procedures clearly stated
5 pts
5 ptsresulTs/DATA ColleCTion/AnAlysis
- Data recorded in tables (tables titled, calculations completed)
-Graphs (X-Y and histograms) present
-Graphs titled
-Axes labeled correctly
-Statistical analysis
10 pts
10 pts
2 pts
3 pts
5 ptsConClusions AnD DisCussion
-Results summarized
-Errors identified
- Results compared to hypothesis and primary question
-Conclusions stated/results interpreted
-Suggestions for improvement
2 pts
2 pts
2 pts
10 pts
4 ptsquesTions - What are questions for further investigation? What new
questions arise from the results of the investigation?12 pts
liTerATure CiTeD
-Cited within write-up
-Accuracy of citation information
2 pts
2 ptsCorreCT use oF lAnguAge
-Grammar
-Punctuation
-Spelling
1 pt
1 pt
1 pt
Students should complete the rubric, and hand this in with their report as a form of self-analysis. You can then complete the rubric, and compare your critique with your students’.
■ TechnologyNumerous sites are available for posting class data that produce a larger sample for analysis, comparison of different conditions in the experiment, or collaboration between students in different class sections or different schools. Wikispaces is one readily available Web-based instrument, but your technology center may recommend others.
Chapter 7 T43
Chapter 7:
Making ap Biology Inclusive for all Learners
■ safetyAll students, including those with learning differences, must have the opportunity to participate in the laboratory investigations. The inclusion of students with special needs can be implemented successfully when you are given proper materials to assist students in the lab (as needed), and are provided with support from professionals who specialize in various disabilities.
The primary concern for teachers is the safety of students in the lab. Because you may need to spend more time with a special-needs student, attention should be given to the number of students you will supervise during lab activities. You should know and adhere to the laboratory occupancy load limit. These limits are based on building and fire safety codes, the size and design of the laboratory, the teaching facility, and chemical/physical/biological hazards. Accidents are more likely to happen when limits are ignored. Having special-needs students in the lab may require that the load limit be reduced to ensure that you can give proper supervision to all students in the lab.
A team of educators (counselors, science teachers, special-education teachers, and school administrators) should discuss reducing the teacher/student ratio. When needed, teacher aides should accompany students in the lab. Special equipment should be made available to assist the students, as recommended by the team of educators making these decisions.
■ AccommodationsBoth physical and nonphysical accommodations that enhance learning can be made for students with special needs. The most common special needs relate to (1) vision, (2) mobility, (3) learning and attention, (4) hearing, and (5) health. Consultation with educational professionals who specialize in the particular need is important. Awareness of organizations such as DO-IT (Disabilities, Opportunities, Internetworking, and Technology) can provide teachers with information about working in the laboratory/classroom with students with special needs. Many students with learning issues have individualized education programs (IEPs), which can guide the accommodations.You may want to consider including the following suggestions:• Students with vision impairments might benefit greatly from enhanced verbal
descriptions and demonstrations. Lab equipment can be purchased with Braille instructions, promoting independent participation for visually impaired students. Students with visual challenges might also benefit from preferential seating that allows them to see demonstrations more easily. If possible, you should provide students with raised-line drawings and tactile models for illustrations. You might also consider using technology to increase accessibility to the lab experience. For example, video cameras attached to a computer or television monitor can be used to enlarge microscope images.
T44 Chapter 7
• Students who have mobility challenges may need a wheelchair-accessible field site. You should keep the lab uncluttered, and make sure that aisles are wide enough for wheelchair movement. Students often can see a demonstration better if a mirror is placed above the instructor. Lab adaptations are available for students with mobility problems to assist them in most lab activities. You will need to know a student’s limitations before planning a successful lab experience.
• Students with hearing difficulty might benefit from preferential seating near you when you give demonstrations. It is also helpful to provide hearing-impaired students with written instructions prior to the lab, and to use instructor captioning when showing videos and DVDs.
• Students who have learning and attention disabilities may need a combination of oral, written, and pictorial instruction. Scaffolding instruction increases learning, and safety issues and procedural instructions may need to be repeated. Having audio-taped instructions may be helpful to allow students to hear them as often as needed for comprehension. Some students who have attention difficulties need frequent breaks to allow them to move around and refocus. Providing students with preferential seating to avoid distractions is also helpful. Students with reading and writing deficiencies often require more time to prepare for lessons and to complete the follow-up activities. Students with learning and attention disabilities sometimes benefit greatly from the use of technology, such as scanning and speaking pens that help with reading. Other students might benefit from using laptops to take notes during class.
• You should be knowledgeable of students with health issues, such as allergies or insulin-dependent diabetes. Care should be taken to avoid risking a student’s health because of exposure to chemicals or allergens while conducting laboratory investigations.
■ universal DesignCreating a laboratory environment that is universal in design should address most concerns and accommodations for students with disabilities. In addition, most of the suggested changes should improve learning opportunities for all students in the lab. You should be proactive whenever possible by implementing accommodations, including the following:• Providing both written and oral directions
• Giving students adequate time to prepare for labs and to complete follow-up activities
• Making the aisles wide enough for wheelchairs
• Installing a mirror above the area where demonstrations are performed
• Using tables that can be adjusted for height

Chapter 7/References T45
■ Developing a Community of learnersYou must foster the creation of a learning environment that includes and respects all students. For example, creating cooperative learning groups provides students with the opportunity to share their knowledge and skills, and to learn from each other. This is particularly advantageous for special-needs students. An inclusive learning environment also provides a variety of types of learning opportunities that accommodate differences in background knowledge, and address the needs of visual, auditory, and kinesthetic learners.
Teachers may find it helpful to talk with students to discover firsthand what accommodations they need to make their lab experience successful. By modeling attitudes and behaviors expected from students, you can develop activities that help all students build meaningful academic and personal relationships.
■ reFerenCesCounsel of State Science Supervisors. “General Lab Safety Recommendations.”
n.d. Accessed September 8, 2010. http://www.csss-science.org/recommendations.shtml
Ost, David H. 1987. “Models, Modeling and the Teaching of Science and Mathematics.” School Science and Mathematics 87 (5): 363–370.
Grady, J. 2010. “The Inquiry Matrix.” The Science Teacher 21 (1): 32–37.
Johnson, A. D. 2009. 40 Inquiry Exercises for the College Biology Lab. Arlington, VA: NSTA Press.
Lemone, P. 2007. GLOBE scientists’ blog: Measuring temperature using crickets. http://blog.globe.gov/sciblog/2007/10/05/measuring-temperature-using-crickets/
National Committee on Science Education Standards and Assessment and National Research Council. 1996. National Science Education Standards. Washington, D.C.: The National Academic Press.
NSELA (National Science Education Leadership Association). 2009. “Occupancy Loads in School Science Laboratories.” October 21. Accessed September 5, 2010. http://www.nsela.org/index.php?option=com_content&view=article&id=71:psoc cupan cy&catid=37:ps&Itemid=60
NSTA (National Science Teachers Association). “The Integral Role of Laboratory Investigations in Science Instruction.” n.d. Accessed September 5, 2010. http://www.nsta.org/about/positions/laboratory.aspx
Olseon, Steve, and Susan Loucks-Horsley, eds. 2000. Inquiry and the National Science Education Standards: A Guide for Teaching and Learning. Washington, D.C.: The National Academic Press.

T46 Chapter 7/References
Svoboda, Julia Marie. 2010. Modeling Science: Supporting a More Authentic Epistemology of Science. PhD diss., University of California, Davis. ProQuest (AAT 3422753).
University of Washington. 2009. “Making Science Labs Accessible to Students with Disabilities.” March 3. Accessed September 8, 2010. http://www.washington.edu/doit/Brochures/Academics/science_lab.html
Waterman, M., and E. Stanley. 2008. Biological Inquiry: A Workbook of Investigative Cases for Campbell and Reece Biology. 8th ed. San Francisco, CA: Benjamin Cummings.
Windschitl, M. 2008. “What Is Inquiry? A Framework for Thinking About Authentic Scientific Practice in the Classroom.” In Science as Inquiry in the Secondary Setting, eds. J. Luft, R. L. Bell and J. Gess-Newsome, 1–20. Arlington, VA: NSTA Press.

Introduction S1
Introduction■■ GoalS■of■the■laboratory■InveStIGatIonSKnowing a collection of facts about biology is beneficial only if you can use that information to understand and investigate a particular aspect of the natural world. AP® Biology lab investigations allow you to explore the natural world, and provide opportunities for you to choose to study what interests you most about each concept. Science is about the process of investigating, and should be a central part of your experience in AP Biology. Performing labs also gives you insight into the nature of science, and helps you appreciate the investigations and processes that result in the collection of facts that your textbook and your teacher often present to you.
This suite of AP Biology laboratory investigations helps you gain enduring understandings of biological concepts and the scientific evidence that supports them. The investigations allow you to develop and apply practices and skills used by scientists. You make observations, ask questions, and then design plans for experiments, data collection, application of mathematical routines, and refinement of testable explanations and predictions. As you work through your experiments, your teacher will ask follow-up questions to assess how well you understand key concepts. Finally, you will communicate your findings and your interpretation of them to your classmates and instructor(s).
For each investigation in this manual, you will find the following:• Background information and clear learning objectives for each investigation
• Prelab questions, activities, software simulations, and other supplemental resources
• “Checklists” of prior skills and skills that will be developed
• Tips for designing and conducting investigations
• Safety concerns
• Lists of materials and supplies
• Methods of analyzing and evaluating results
• Means of communicating results and conclusions
• Postlab questions and activities
• Suggestions for extending the investigation(s)

This page is intentionally left blank.
Chapter 1 S3
Chapter 1:
What Is Inquiry?How do we know what we know? Inquiry begins with observations you make about the natural world — a bare spot under a tree, a bird chirping repeatedly, or an unusual spot on your skin. If you follow such observations by a question, such as What is causing that?, you have begun an inquiry. Inquiry-based laboratory investigations allow you to discover information for yourself, and model the behavior of scientists as you observe and explore. Through inquiry, you use a variety of methods to answer questions you raise. These methods include laboratory and field investigations; manipulation of software simulations, models, and data sets; and meaningful online research. By designing experiments to test hypotheses, analyze data, and communicate results and conclusions, you appreciate that a scientific method of investigation is cyclic, not linear; each observation or experimental result raises new questions about how the world works, thus leading to open-ended investigations.
There are four levels of inquiry that lead to the student question. It is not reasonable to think that every part of a particular lab in AP Biology will be completely student directed. However, as written, the labs lead to a student-directed, inquiry-based investigation(s). The four levels of inquiry are as follows:• Confirmation. At this level, you confirm a principle through an activity in which the
results are known in advance.
• Structured Inquiry. At this level, you investigate a teacher-presented question through a prescribed procedure.
• Guided Inquiry. At this level, you investigate a teacher-presented question using procedures that you design/select.
• Open Inquiry. At this level, you investigate topic-related questions that are formulated through procedures that you design/select.
As you work on your investigations, your teacher may walk around the room and ask probing questions to provoke your thinking (e.g., How are you changing the temperature? How are you recording the temperature?). Your teacher may also ask about data and evidence (e.g., Is there an alternative way to organize the data? Is there some reason the data may not be accurate? What data are important to collect? What are you hoping to find out? How will you communicate your results?). This strategy will allow your teacher to diagnose and address any misconceptions immediately.

This page is intentionally left blank.

Chapter 2 S5
Chapter 2:
Written, Verbal, and Graphic Communication
Experimental results must be communicated to peers to have value. To understand the relationship among your hypothesis, procedures, and results, you should first take part in an informal small-group or class discussion of the experiment, including possible errors, changes in procedures, and alternative explanations for your data. Since many of the laboratory experiences described in this manual contain suggestions for further investigation, discussion of a given experiment can be a launching pad for independent work, culminating in a formal written report, poster, or oral presentation. Some possibilities for more permanent presentations are described below.
■■ Mini-Posters■and■Presentations■At scientific conferences, many experiments are presented orally or via posters. Posters provide the advantage of clarity and brevity that articulate the essential elements of the research. In a class, an alternative to the standard oral presentation or a full-sized poster is a mini-poster session, which requires fewer materials and less time than a formal presentation. You can include the most important elements of a full-sized poster, present your work, and get feedback from your classmates in an informal setting. The essential elements of a mini-poster are as follows:• Title
• Abstract
• Introduction with primary question, background context, and hypothesis
• Methodology
• Results, including graphs, tables, charts, and statistical analyses
• Conclusions, or your interpretation of your results based on your hypothesis
• Literature cited
An example of a mini-poster session can be found at http://www.nabt.org/blog/2010/05/04/mini-posters-authentic-peer-review-in-the-classroom. Such a session allows you to evaluate information on your own, and then discuss it with other students, mimicking authentic presentations and peer review.

S6■■Chapter 2
■■ lab■notebooks/PortfoliosA lab notebook allows you to organize your work so that you have the information for a more formal report. Your lab notebook should contain the information necessary for making a formal report, which may include a prelab experimental outline with the following information:• Members of work group
• Primary question for investigation
• Background observations and contextual information
• Hypothesis and rationale for the investigation
• Experimental design — strategies for testing hypothesis, using appropriate controls and variables
• Materials required
• Safety issues
• Procedure in sufficient detail so that someone could replicate your results
In addition, your lab notebook should contain the following:• Results, including graphs, tables, drawings or diagrams, and statistical analysis
• Conclusion and discussion — Was the hypothesis supported? What additional questions remain for further investigation?
• References
A lab portfolio might contain finished lab reports, notes on individual projects, library research, reflections on particular lab experiences, and connections with other parts of the course, or a combination of these elements as requested by your teacher.
■■ lab■reports/PapersA formal report or paper provides an effective method for you to organize your work, and mimics papers in scientific journals. Your teacher might provide a rubric for what information should be included. This type of report gives you writing experience and opportunities to reflect on your work. (Refer to page 10 for tips on constructing informative graphs to include in your report.) A sample rubric showing what your teacher will be looking for in your lab reports can be found at http://www.biologycorner.com/worksheets/labreport_rubric.html.
You also can see a good example of a descriptive lab report, “Examination of Protozoan Cultures to Determine Cellular Structure and Motion Pattern,” at http://www.ncsu.edu/labwrite/res/labreport/sampledescriptlab.html.
Chapter 2 S7
■■ technologyThere are numerous websites for posting class data, which can then provide a larger sample for analysis, comparison of different conditions in the experiment, or collaboration between students in different class sections and different schools. Your school’s technology or media center personnel may recommend appropriate Web-based options.
■■ GraphsA graph is a visual representation of your data, and you want your graph to be as clear as possible to the reader for interpretation. First, you have to decide whether to use a scatter plot in order to draw a “best fit” line through data points, a bar graph, or some other representation with appropriate units. Use a line graph if your data are continuous (e.g., the appearance of product over time in an enzyme reaction). If your data are discontinuous (e.g., the amount of water consumption in different high schools), use a bar graph. Your teacher might have other suggestions.
A graph must have a title that informs the reader about the experiment. Labeling a graph as simply “Graph Number Four” doesn’t tell the reader anything about the experiment, or the results. In comparison, the title “The Effect of Different Concentrations of Auxin on Root Growth” tells the reader exactly what was being measured. Make sure each line or bar on your graph is easily identifiable by the reader.
Axes must be clearly labeled with units. • The x-axis shows the independent variable. Time is an example of an independent
variable. Other possibilities for an independent variable might be light intensity, or the concentration of a hormone or nutrient.
• The y-axis denotes the dependent variable, or what is being affected by the condition (independent variable) shown on the x-axis.
• Intervals must be uniform. For example, if one square on the x-axis equals five minutes, each interval must be the same and not change to ten minutes or one minute. If there is a break in the graph, such as a time course over which little happens for an extended period, note this with a break in the axis and a corresponding break in the data line.
• For clarity, you do not have to label each interval. You can label every five or ten intervals, or whatever is appropriate.
• Label the x-axis and y-axis so that a reader can easily see the information.

S8■■Chapter 2
More than one condition of an experiment may be shown on a graph using different lines. For example, you can compare the appearance of a product in an enzyme reaction at different temperatures on the same graph. In this case, each line must be clearly differentiated from the others — by a label, a different style, or color indicated by a key. These techniques provide an easy way to compare the results of your experiments.
Be clear as to whether your data start at the origin (0,0) or not. Do not extend your line to the origin if your data do not start there. In addition, do not extend your line beyond your last data point (extrapolation) unless you clearly indicate by a dashed line (or some other demarcation) that this is your prediction about what may happen.
For more detailed information about graphs, see Appendix B: Constructing Line Graphs.
Chapter 3 S9
Chapter 3:
Quantitative reasoning in ap® Biology
Which would you choose? A brain biopsy or a CAT/MRI scan? A vaccine for 90%+ of the population with a risk of 0.001% suffering from side effects, or no vaccine at all? Fresh vegetables sprayed with competing bacteria, or vegetables sprayed with sterilants that are hazardous to ecosystems? To risk conviction of a crime based on a detective’s hunch, or to be acquitted based on evidence provided by DNA markers? These are routine questions affected by the use of mathematics in science, including biology, medicine, public health, and agriculture.
To have a rich foundation in biology, you need to include and apply quantitative methods to the study of biology. This is particularly true for a laboratory experience. Quantitative reasoning is an essential part of inquiry in biology. Many mathematical tools (e.g., statistical tests) were developed originally to work out biological problems.
Mathematics can help biologists (and biology students) grasp and work out problems that are otherwise:• Too big (such as the biosphere)
• Too slow (macroevolution)
• Too remote in time (early extinctions)
• Too complex (human brain)
• Too small (molecular structures and interactions)
• Too fast (photosynthesis)
• Too remote in space (life in extreme environments)
• Too dangerous or unethical (how infectious agents interact with human populations)
The laboratory investigations in this manual were chosen to provide you with an opportunity to do biology — to explore your own questions and try to find answers to those questions. Many of the investigations provide a preliminary, guided exploration to introduce you to a way of looking at a biology problem, or method for studying it, providing just enough familiarity with the topics so that you can begin asking your own questions and investigating them. An essential part of that exploration includes an introduction to various quantitative skills — mathematical routines, concepts, methods, or operations used to interpret information, solve problems, and make decisions — that you will need in order to explore the investigative topic adequately.
The quantitative skills you’ll apply as you carry out the investigations in this lab manual are for the most part the same skills you have been acquiring in your mathematics courses. For many of the skills required in these labs, you already understand how to do the math, and these investigations simply extend the application of those math skills. Your teacher can help to guide you as you supplement and review the quantitative skills required for the various laboratory investigations in this manual.

S10■■Chapter 3
To conceptually organize the scope and nature of the skills involved, refer to Figure 1:
Bio_Intro_Lab01_01
Counting/Measuring/Calculating
Graphing/Mapping/Ordering
Problem Solving
Analysis
Hypothesis Testing
Modeling
figure■1.■Pyramid■of■Quantitative■reasoning
The figure graphically organizes the quantitative skills featured in this lab manual. The skills labeled on the bottom of the pyramid are generally less complex, and require the application of standard procedures. As you move up the pyramid, the applications become more complex as you try to make sense out of data and biological phenomena. One of the important lessons about quantitative reasoning is that real data are “messy.” The increasing complexity as you move up this pyramid does not necessarily indicate that the mathematical operations themselves are more complex. Good, first approximations of mathematical models often require only simple arithmetic. This chapter describes how the quantitative skills listed in the pyramid are applied when answering questions generated by various lab topics in this manual.
■■ Counting,■Measuring,■and■CalculatingAt this point in your education, you may not feel that counting, measuring, and calculating represent much in the way of a “skill.” And you’d be right in a theoretical world. The problem is that your investigation will explore the real world of biology, and that is messy.
For example, Investigation 1: Artificial Selection presents the problem of selection of quantitative variation in a population of plants. You identify a trait that can be quantified (counted), and then measure the variation in the population of plants by

Chapter 3 S11
counting. This is not always as easy as it sounds. You will notice that some of the plants in your population are more hairy than others, so this is the trait you select. What do you count? All the hairs? Some of the hairs on specific parts of the plant? On how many plants? After observing one of your plants more closely, you see that it has very few (if any) hairs, but another plant has hundreds. These hairs are small. You have a limited amount of time to make your counts. How do you sample the population? After discussion with your lab partner(s), you and your class decide to count just the hairs on the first true leaf ’s petiole (stalk attaching the blade to the stem) — a much smaller and more reasonable amount to count, but you’ll still need to work out whether or not it is a representative sample.
Measuring phenomena in the real world presents similar challenges. Investigation 10: Energy Dynamics introduces you to energy dynamics by measuring the biomass of growing organisms. How do you measure the mass of a small caterpillar? What about the water in the organism? Is water included in “biomass”? It is your challenge to come up with solutions to these problems, and to define all measurements carefully so that someone could measure in the same way you did and replicate the experiment. Perhaps you could measure a quantity of caterpillars and sacrifice a few caterpillars to estimate how much the “wet mass” of a caterpillar is biomass, and how much is water. You will have to perform relatively simple calculations, including percentages, ratios, averages, and means.
Nearly every lab investigation requires these kinds of operations and decisions. What is different about this manual is that the decisions are up to you. The manual doesn’t make the decisions for you. There are almost always a number of reasonable, productive solutions to such problems. Make sure that your decisions are reasonable and provide a good solution to the problem you are studying.
Precision needed in the experiment is also a consideration and a decision you have to make. Increasing precision requires more time and resources. How precise do your data need to be for you to support or reject your hypothesis?
■■ ■Graphing,■Mapping,■and■ordering:■histograms■of■■variation■and/or■energy■flow■DiagramsTo build on the previous two examples, consider how the data counted and measured should be represented — not numerically, but with graphs or diagrams. For example, consider the examination of the variation of a quantitative trait in a population of plants. How do you best represent these data? If you count the hairs (trichomes) in a population of 150 plants, do you present each data point on a graph, or do you compile the data into an overall picture? If all data points are the same, then there would be no need to present data graphically, but the messy reality is that the counts likely could vary from 0 to more than 50 hairs per plant. For this reason, a histogram (see Figure 2) is often used to represent the variability and distribution of population data.
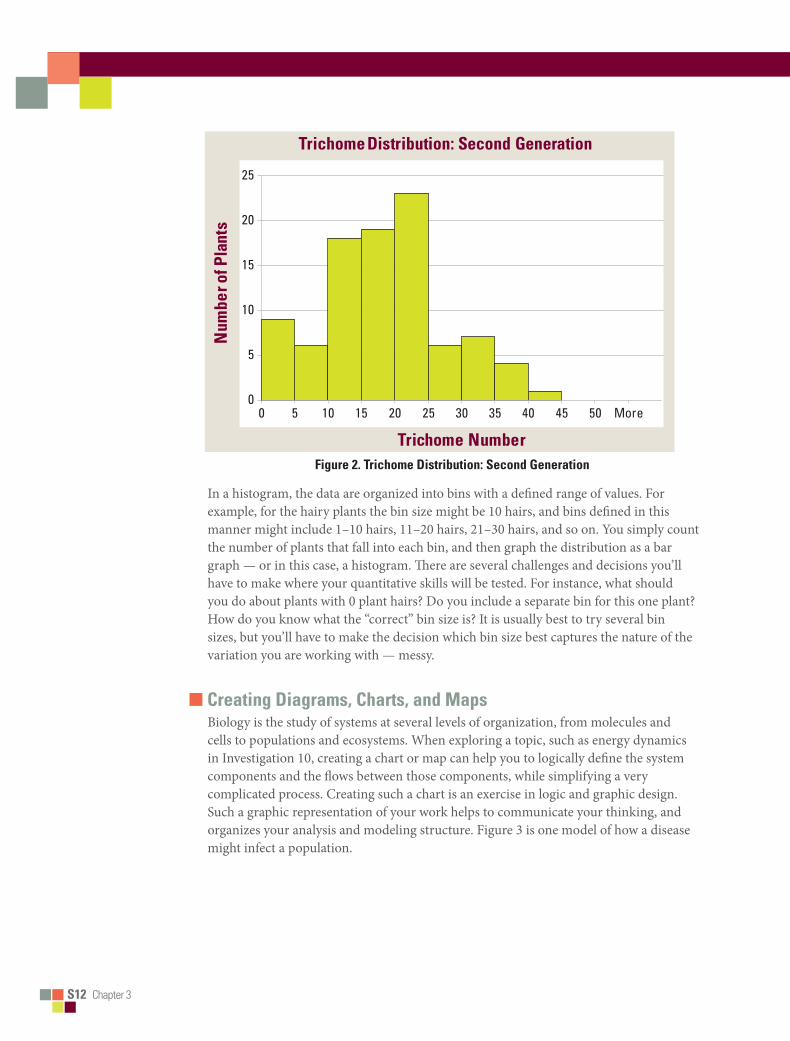
S12■■Chapter 3
Trichome Distribution: Second Generation
0
5
10
15
20
25
0 5 10 15 20 25 30 35 40 45 50 More
Num
ber o
f Pla
nts
Trichome Numberfigure■2.■trichome■Distribution:■Second■Generation
In a histogram, the data are organized into bins with a defined range of values. For example, for the hairy plants the bin size might be 10 hairs, and bins defined in this manner might include 1–10 hairs, 11–20 hairs, 21–30 hairs, and so on. You simply count the number of plants that fall into each bin, and then graph the distribution as a bar graph — or in this case, a histogram. There are several challenges and decisions you’ll have to make where your quantitative skills will be tested. For instance, what should you do about plants with 0 plant hairs? Do you include a separate bin for this one plant? How do you know what the “correct” bin size is? It is usually best to try several bin sizes, but you’ll have to make the decision which bin size best captures the nature of the variation you are working with — messy.
■■ Creating■Diagrams,■Charts,■and■MapsBiology is the study of systems at several levels of organization, from molecules and cells to populations and ecosystems. When exploring a topic, such as energy dynamics in Investigation 10, creating a chart or map can help you to logically define the system components and the flows between those components, while simplifying a very complicated process. Creating such a chart is an exercise in logic and graphic design. Such a graphic representation of your work helps to communicate your thinking, and organizes your analysis and modeling structure. Figure 3 is one model of how a disease might infect a population.
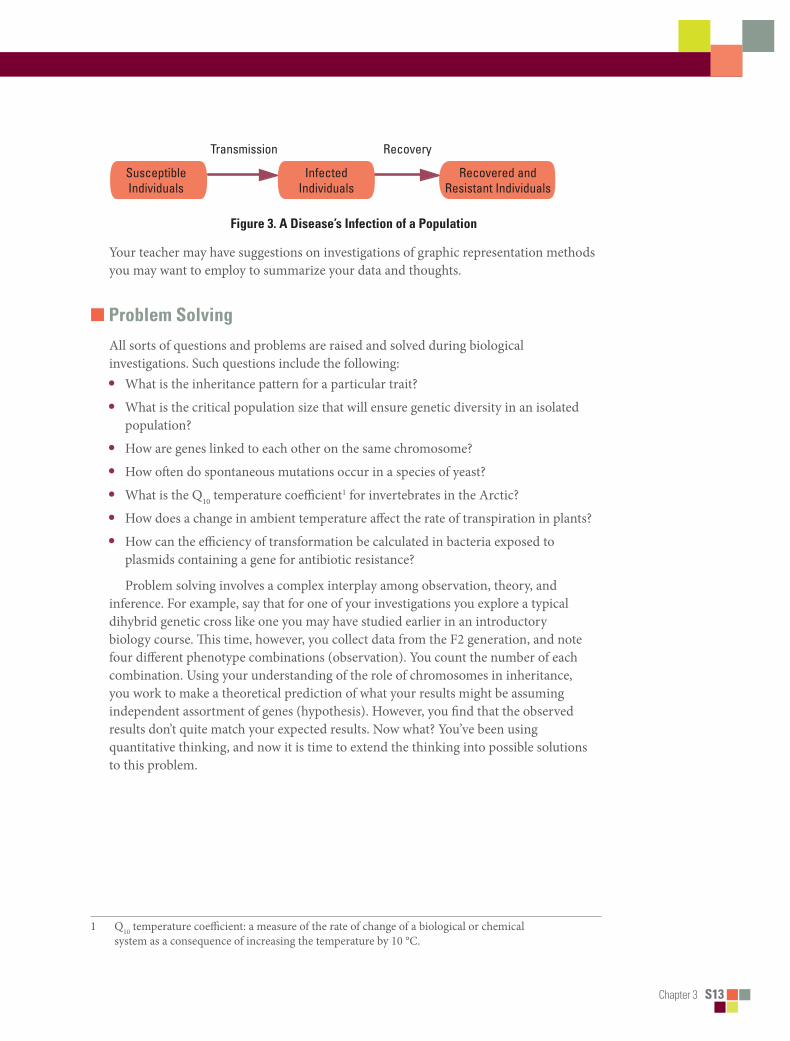
Chapter 3 S13
Transmission Recovery
Recovered andResistant Individuals
InfectedIndividuals
SusceptibleIndividuals
figure■3.■a■Disease’s■Infection■of■a■Population
Your teacher may have suggestions on investigations of graphic representation methods you may want to employ to summarize your data and thoughts.
■■ Problem■Solving
All sorts of questions and problems are raised and solved during biological investigations. Such questions include the following: • What is the inheritance pattern for a particular trait?
• What is the critical population size that will ensure genetic diversity in an isolated population?
• How are genes linked to each other on the same chromosome?
• How often do spontaneous mutations occur in a species of yeast?
• What is the Q10 temperature coefficient1 for invertebrates in the Arctic?
• How does a change in ambient temperature affect the rate of transpiration in plants?
• How can the efficiency of transformation be calculated in bacteria exposed to plasmids containing a gene for antibiotic resistance?
Problem solving involves a complex interplay among observation, theory, and inference. For example, say that for one of your investigations you explore a typical dihybrid genetic cross like one you may have studied earlier in an introductory biology course. This time, however, you collect data from the F2 generation, and note four different phenotype combinations (observation). You count the number of each combination. Using your understanding of the role of chromosomes in inheritance, you work to make a theoretical prediction of what your results might be assuming independent assortment of genes (hypothesis). However, you find that the observed results don’t quite match your expected results. Now what? You’ve been using quantitative thinking, and now it is time to extend the thinking into possible solutions to this problem.
1 Q10 temperature coefficient: a measure of the rate of change of a biological or chemical system as a consequence of increasing the temperature by 10 °C.

S14■■Chapter 3
In this case, the deviation from expected may be due to random chance, or it may be due to a phenomenon known as linkage, where two genes are located close together on the same chromosome instead of on separate chromosomes. There is not enough space here to fully explore the strategies for solving such a problem, but realize that the challenge requires a different level of commitment on your part to work through the problem and solve it. Instead of the instructions for each lab investigation walking you through such problems step by step, this manual provides you with opportunities to explore problems you can solve on your own, which will give you a deeper learning experience.
■■ analysis■When you start to design your own investigations to answer your own questions, you may find that appropriate and adequate data analysis is a challenge. This is the result of having done too many investigations that have the analysis scripted for you. From the very first inkling of the question that you plan to investigate, you also should consider how you plan to analyze your data. Data analysis describes your data quantitatively. Descriptive statistics help to paint the picture of the variation in your data; the central tendencies, standard error, best-fit functions, and the confidence that you have collected enough data. Analysis helps you to make your case when arguing for your conclusion that your data meet accepted standards for reliability and validity. Data analysis is complex. Obviously, there is not enough space in this overview to do the topic justice, but do not let this deter you. Data analysis is an essential component of each investigation in this manual, and is integral to the communication process. Your teacher will be a valuable guide in this process.
■■ hypothesis■testingIn the investigations in this manual, you are asked to modify your question into an appropriate hypothesis. Your experimental design should provide evidence that will help you to conclude whether or not your hypothesis should be accepted. Part of the evidence needed to produce such a conclusion is based on a number of statistical tests that are designed for specific situations. You may be familiar with a statistical hypothesis test, such as a chi-square test or a T-test. These tests can help you to determine probability that the data you have sampled are significantly different from a theoretical population. You’ve undoubtedly read about such tests, as they are applied when testing new drug treatments or medical procedures. Your teacher can help guide you as you select the methods appropriate to your study. Deciding on the appropriate methods for hypothesis testing (statistical tests) before you carry out your experiment will greatly facilitate your experimental design.

Chapter 3 S15
■■ ModelingNot all biological research involves wet lab investigations2. Investigations also can involve a quantitative model. Quantitative models are often computer based. Thinking about and developing computer models may seem to be a new way of thinking and doing biology, but actually you’ve been constructing mental models of biological phenomena since you first began your study of biology. Models are simplifications of complex phenomena, and are important tools to help drive prediction and identify the important factors that are largely responsible for particular phenomena.
To develop a mathematical model, you must first define the relevant parameters or variables. For example, if you were creating a model of disease in a population, you might divide the population into three components: the part of the population that is susceptible but not infected, the part of the population that is infected, and the part of the population that has recovered from the disease. The probability of transmitting the infection and the probability for recovery are important parameters to define as well. The next step would be to graphically define these parameters and their relation to one another, as you did previously (see Figure 3).
With this graphic, you can imagine word equations that step through the process of a disease cycle in a population. These word equations can then be interpreted into the language of a spreadsheet to get something like Figure 4.
figure■4.■a■Disease■Cycle■in■a■Population
Sour
ce: S
hodo
r/Pr
ojec
t SU
CC
EED
wor
ksho
ps
2 Wet lab investigation: laboratories in which chemicals, drugs, or other material or biological matter are tested and analyzed requiring water, direct ventilation, and specialized piped utilities, as opposed to a computer-based lab.

S16■■Chapter 3
Models help to provide insight and guidance for an investigation. They help to focus the investigation on parameters that are most influential. Models have to be checked against real data. The assumptions and the limitations of any model should be explicitly articulated. Building models is a challenge, but it is a challenge that, when met, pays very large dividends in learning.
■■ referenCeSJohnson, A.D. 2009. 40 Inquiry Exercises for the College Biology Lab. Arlington, VA:
NSTA Press.
http://shodor.org/succeed/curriculum/apprenticeship/Modeling/Excel/LessonPlan2/ Microsoft Excel II activity, Project Succeed workshops, Shodor.
Waterman, M., and E. Stanley. 2008. Biological Inquiry: A Workbook of Investigative Cases for Campbell and Reece Biology. 8th ed. San Francisco, CA: Pearson/Benjamin Cummings.
Big Idea 1 T47
BigIdea1Evolution
Evolution drives the diversity and unity of life. Supported by evidence from many scientific disciplines, Darwin’s theory of evolution states that heritable variations occur in individuals in a population; because of competition for resources,
individuals with more favorable phenotypes are more likely to survive and reproduce, thus passing traits to offspring. The number of surviving offspring in a population is a measure of evolutionary success.
The long-term survival of a species depends on a diverse gene pool because the environment acts upon phenotypes through natural selection. Sources of genetic variations include mutations in DNA, recombination of genes during meiosis, and human-directed processes, such as artificial selection and genetic engineering. However, does genetic variation guarantee that a population will evolve? One way to test if a population is evolving is to apply mathematical procedures to calculate changes in allele and genotype frequencies.
According to the Hardy-Weinberg equilibrium principle, if a population meets certain requirements, the frequencies of alleles and genotypes will remain constant from generation to generation. By calculating the genetic makeup of a population that is not evolving, based on evidence of a certain gene locus, that scenario can be compared to data from a real population. Differences may suggest that the real population is evolving — and then the question is What is causing that evolution to occur?
One way to investigate evolutionary events is by comparing genome sequences from different species; more closely related species share more similarities in their DNA sequences. Phylogenetic trees and cladograms model evolutionary history, and represent traits that are either derived or lost because of natural selection. Cladograms can be constructed by using computer programs that measure relatedness among organisms and reflect current and emerging knowledge.
The suite of inquiry-based investigations in big idea 1 provides opportunities for students to ask questions, and explore answers, about evolution and the role of heritable information in the continuity of life (big idea 3).
■■ SynopSeS■of■The■InveSTIgaTIonSStudents have limited opportunities to explore real-time natural selection with multicellular organisms, and many laboratory investigations that model the process are either computer-based or structured simulations.
Investigation 1: Artificial Selection provides an alternative for students to investigate artificial selection. Just as Darwin relied on artificial selection in domesticated farm animals to make his case in On the Origin of Species, students explore possible advantages or disadvantages that selected traits might confer on individuals in different environmental conditions. Because artificial selection experiments require a relatively large population with ample phenotypic variation, the first step of the investigation is conducted at the class level, and begins with questions that center on artificial selection in agricultural crops and well-known examples of natural selection
T48■■Big Idea 1
and evolution, such as antibiotic resistance in bacteria (big idea 3). Once students identify the common features of these events (selection, rapid changes in populations, and genetic variations), they design and conduct a selection experiment based on observable traits in Wisconsin Fast Plants growing in the classroom. These quantitative traits include number of trichomes (plant hairs) and plant height. Students may benefit from having an understanding of evolution and natural selection prior to beginning this investigation.
Investigation 2: Mathematical Modeling: Hardy-Weinberg is a revision of Laboratory 8 (Population Genetics and Evolution) in the 2001 AP Biology Laboratory Manual. Students often find the study of population genetics challenging because most lab simulations in which students try to manipulate a population that is evolving are flawed, as the population is so small that genetic drift swamps any factors that promote evolution. Fortunately, the complexity of evolution in populations is illuminated by relatively simple mathematical equations, several of which are based on the Hardy-Weinberg (H-W) equilibrium formula. In this revised investigation, students manipulate data using a computer spreadsheet to build their own mathematical models derived from H-W to investigate allele inheritance patterns in a theoretically infinite population with inherent randomness. Students should begin this investigation after they have studied Mendelian genetics and have a solid understanding of alleles and genes, perhaps just as they start studying evolution.
In Investigation 3: Comparing DNA Sequences to Understand Evolutionary Relationships with BLAST, students use BLAST (Basic Local Alignment Search Tool) to compare several genes from different organisms, and then use the information to construct a cladogram (i.e., phylogenetic tree) to visualize evolutionary relatedness among species. The field of bioinformatics merges statistics, mathematical modeling, and computer science to analyze biological data; entire genomes can be compared quickly to detect genetic similarities and differences. Identifying the precise location and sequences of genes not only allows us to better understand evolutionary relationships among organisms, but it also helps us to better understand human genetic diseases. The investigation covers concepts that pertain to genetics (big idea 3), as well as evolution.
BigIdea
Investigation 1 T49
Evolution 1investigation 1
aRtiFiCiaL seLeCtionCan extreme selection change expression of a quantitative trait in a population in one generation?
■ BACKGROUNDThere are only a few possible laboratories available and appropriate for the high school classroom environment that can explore real-time natural selection with multicellular organisms. For reasons of time and resources, trying to measure natural selection is problematic. Many lab investigations that help students derive an understanding of natural selection are either computer simulations or structured simulations. However, a promising alternative is to have the students study and carry out an artificial selection investigation using Wisconsin Fast Plants (Brassica). Just as Darwin relied on examples of artificial selection in cattle, domestic pigeons, and other farm animals to make his case in On the Origin of Species, students can gain important insights into natural selection by studying artificial selection. In addition, this particular investigation on artificial selection provides an easy transition into student-generated explorations that look for possible advantages or disadvantages that selected traits might confer on individuals in different environmental conditions.
For the first part of the investigation, students will perform one round of artificial selection on a population of Wisconsin Fast Plants. First, they will identify and quantify several traits that vary in the population and that they can quantify easily. They then will perform artificial selection by cross-pollinating only selected plants. Students will collect the seeds, plant them, and then sample the second-generation population and see if it is different from the previous one. Their results will generate questions, and they will have a chance to test their own ideas about how selection works.

T50 Investigation 1
PREPARATION
Materials and Equipment
Per Class:• Lighting: light box systems (as per
the Wisconsin Fast Plants website, http://www.fastplants.org)
Per Team/Student:• Growing system: reused plastic soda or
water bottles• Wicking: #18 nylon mason twine• Fertilizer: Miracle-Gro Nursery Select
All Purpose Water-Soluble Plant Food, or Peters Professional with micronutrients
• Soil: Jiffy-Mix (soil mix, not potting soil)
• Vermiculite
• Fast Plants Seed (F2 Non-Purple Stem, Yellow-Green Leaf works well and provides additional options explained in The Investigations; it is available as item 158888 from Carolina Biological. Other seed stocks, such as the standard Fast Plants seeds that can be purchased from Carolina Biological or Nasco, work as well).
• Bee sticks for pollination• Digital cameras to record the
investigation• Plastic magnifiers• Laboratory notebook
■ Timing and Length of LabThe first part of this investigation, Procedure, minimally involves growing one generation of Wisconsin Fast Plants from seed to seed, followed by an additional 10-day growing period for the second generation of plants. The total time is approximately seven weeks. Almost all days will be short, with students taking care of plants and making notes. Occasionally, more time (5-10 minutes) will be needed — for planting, quantifying variation and selection, pollinating plants, and scoring the second generation.
The time needed to fully investigate questions generated by students in the second part of the investigation will need to be determined by you and your students. As in the first part, much of the work in the student-led part can be carried out in a part-time manner at the beginning and/or end of class. Another option would be after school.
■ Safety and HousekeepingWhen growing plants under lights, be careful to avoid any situation where water or fertilizer could come in contact with the electrical wires.
Investigation 1 T51
Big idea 1: evoLution
■ ALIGNmENT TO THE AP BIOLOGy CURRICULUmThis investigation can be conducted during the study of concepts pertaining to natural selection and evolution (big idea 1). As always, it is important to make connections between big ideas and enduring understandings, regardless of where in the curriculum the lab is taught. The concepts align with the enduring understandings and learning objectives from the AP Biology Curriculum Framework, as indicated below.
■ Enduring Understandings• 1A1: Natural selection is a major mechanism of evolution.
• 1A2: Natural selection acts on phenotypic variations in populations.
■ Learning Objectives• The student is able to convert a data set from a table of numbers that reflect a change
in the genetic makeup of a population over time and to apply mathematical methods and conceptual understandings to investigate the cause(s) and effect(s) of this change (1A1 & SP 1.5, SP 2.2).
• The student is able to evaluate evidence provided by data to qualitatively and quantitatively investigate the role of natural selection in evolution (1A1 & SP 2.2, SP 5.3).
• The student is able to apply mathematical methods to data from a real or simulated population to predict what will happen to the population in the future (1A1 & SP 2.2).
• The student is able to evaluate data-based evidence that describes evolutionary changes in the genetic makeup of a population over time (1A2 & SP 5.3).
• The student is able to connect evolutionary changes in a population over time to a change in the environment (1A1 & SP 7.1).
■ ARE STUDENTS READy TO COmPLETE A SUCCESSFUL INQUIRy-BASED, STUDENT-DIRECTED INVESTIGATION?It is great to implement this investigation at the beginning of the year. Students need minimal content background to begin this investigation and complete the first part of the lab. In general, students find this lab to be very accessible and enjoyable. For the most part, skills are developed as the lab progresses. However, essential to the success of this investigation is the student’s ability to make and record good observations. This is best done in a laboratory notebook.
T52 Investigation 1
■ Skills DevelopmentThe students can use this particular experience to build good laboratory notebook skills. A lab notebook should demonstrate originality and reflection while serving as a record of the investigator’s work. Planting, quantifying variation, recording images/drawings of that variation, maintaining plants, and recording results all make for prime lab notebook subject matter. By tending their own population of plants each day and recording daily observations, students develop their own particular style and rhythm of writing in the lab notebook. These activities require only about 10 minutes of class time and are essential to the student-led part of the investigation. While working through the Procedure, students naturally generate questions regarding the traits they are working with and the variations they observe. Often these questions are not recorded and are soon forgotten. Encourage the students to record the questions that come to them as they work intimately with these plants and to reflect on those questions in writing.
The instructor needs to decide when to start this investigation. The students may benefit from having an understanding of natural selection prior to beginning this lab, but this lab might best be used to introduce the concept of natural selection. Think about how you wish to approach this as an instructor.
■ Potential ChallengesAs with all long-term lab investigations, management of time and the calendar can be challenging. To coordinate with school calendars, start the investigation on a Monday or Tuesday. Make sure that the water reservoirs are full before every weekend. Keeping track of multiple sections and their various plants can present a challenge as well. You might want to consider smaller growth chambers for each class in order to keep the different populations separate.
In general, most classrooms have minimal plant pests, but if your classrooms have a large population of plants year-round, you may experience pest outbreaks in your Fast Plants. Soapy water sponged on the plants controls some pests, such as white flies. Insecticidal soap comes in ready-to-use spray or in concentrate, and it is safe to use indoors. Another safe way to control insect pests is summer horticultural oil. There are two kinds of summer oil, one extracted from neem seeds and one from citrus peels. Mix them according to the package label directions. Another option is dusting plants with diatomaceous earth, which is simply mined, powdered glass skeletons of marine diatoms, you can control soft-bodied pests like aphids. The powder is not harmful to humans or pets.
With this size of plant population students can sometimes get in one another’s way as they move plants in and out of growing areas. It is generally during these times that plants are damaged. Take care to minimize the movement of the plants or develop a system whereby the plants can be protected.
Trying to standardize trichome (plant hair) counting or measurement of other variable traits is another challenge. Present students with questions that will help them
Investigation 1 T53
Big idea 1: evoLution
develop both a procedure for counting hairs and a method to ensure the fidelity of the counts.
THE INVESTIGATIONS
■ Getting Started: Prelab AssessmentInvestigating biology requires a variety of skills. The skills reinforced and introduced vary across the laboratories in this manual. The skills emphasized in a laboratory dictate whether a prelab assessment is appropriate.
This particular investigation provides a lab environment, guidance, and a problem designed to help students understand how populations of organisms respond to selection. To gain the maximum benefit from this exercise, students should get started and not do too much background preparation so that they can build understanding from their own work.
■ Designing and Conducting Independent InvestigationsTo set the stage for student-centered investigations, consider presenting a number of probing questions to the class that center on artificial selection in agricultural crops or inadvertent natural selection, such as antibiotic resistance and pesticide resistance. Through questioning, focus on the common features of these events: extreme selection, rapid changes in populations, and preexisting variation in the population. Use questions to help students recognize appropriate quantitative traits in plants that are growing in the classroom. Likely you’ll need to ask questions to help students develop an understanding of quantitative traits that are polygenic. They usually have little problem coming up with a design for a selection experiment once they have an appropriate trait selected. In Fast Plants, appropriate traits include number of trichomes, amount of purple anthocyanin, and plant height.
Logistically, the first part of the lab requires quite a bit of coordination and sharing of duties among all students in the class. Artificial selection experiments require a relatively large population of plants with ample phenotypic variation. The numbers involved are not very workable for the individual student or even for a small group of students. For this reason, it is recommended that the first step of this lab be conducted at the class level. The minimal population size for part one is about 120–180 plants per class. Require each student in your class to care for enough plants to achieve this population size. This size of population will generally express adequate phenotypic variation for a trait, such as trichomes. Consider directing your students toward this trait because trichomes are quantifiable. There is no need to count every hair — just a sample. One possible sampling procedure would be to count the hairs along the edge of the right side

T54 Investigation 1
of the first true leaf. (See the following document for more information about Fast Plants: http://www.fastplants.org/pdf/activities/WFP_growth-development-06web.pdf.)
For the trichome trait, if the top 10% of hairy plants are selected, that will generate a selected parent stock of about 12–15 plants — an adequate number to produce the seed for the next generation.
Your students will need a magnifier to study trichomes. Don’t be surprised if many plants have few or no hairs. The hairs are often more visible if backlit and held against a dark background. Help your students develop a system to keep track of their counts. Somehow they will need to mark each individual plant. One possible method is to record the number of trichomes on a small plastic stake for each plant. Students record the number of hairs on a stake and place it near the appropriate plant. (Stakes can be created by cutting a plastic milk jug into 1 cm x 10 cm strips.)
As an instructor, you might consider utilizing Carolina Biological item 158888 for this investigation. This stock offers a unique advantage in addition to expressing some variation in hairiness. That is, it is heterozygous for two Mendelian traits, green/light green leaves and with anthocyanin (purple stems) and without anthocyanin. In other words, these are F1 plants from a dihybrid cross. By using this stock and carefully managing the pollination and the offspring, your class can begin two separate investigations with one seed generation. Your class can investigate artificial selection with the quantitative trait of hairiness or stem color, and with the same plant population you can raise an F2 generation of a dihybrid cross for a classical Mendelian investigation on genetics. The advantage is that the 90% of the population not selected for hairs can continue to be grown by the individual students to produce an F2 generation. The seed from this cross can be used in a genetic cross demonstration/experiment, as described in the Fast Plant publication “Who’s the Father?” (http://www.fastplants.org/pdf/WTF_di.pdf).
It is recommended that you build your own light racks and growing systems following the instructions available from the Wisconsin Fast Plant website. However, complete systems are available from supply companies. Light systems constructed by you are generally more cost effective than commercial products and can be custom designed for your room. Be sure to check with your school administration first.
Allow students to grapple with the data analysis and ways they will report their data. Refer students to Chapter 3 in their lab manual. In case they struggle, you might suggest that they graph the frequency distribution of the trait (the number of plants within a specific interval) by constructing histograms like Figures 1 and 2 in their report.
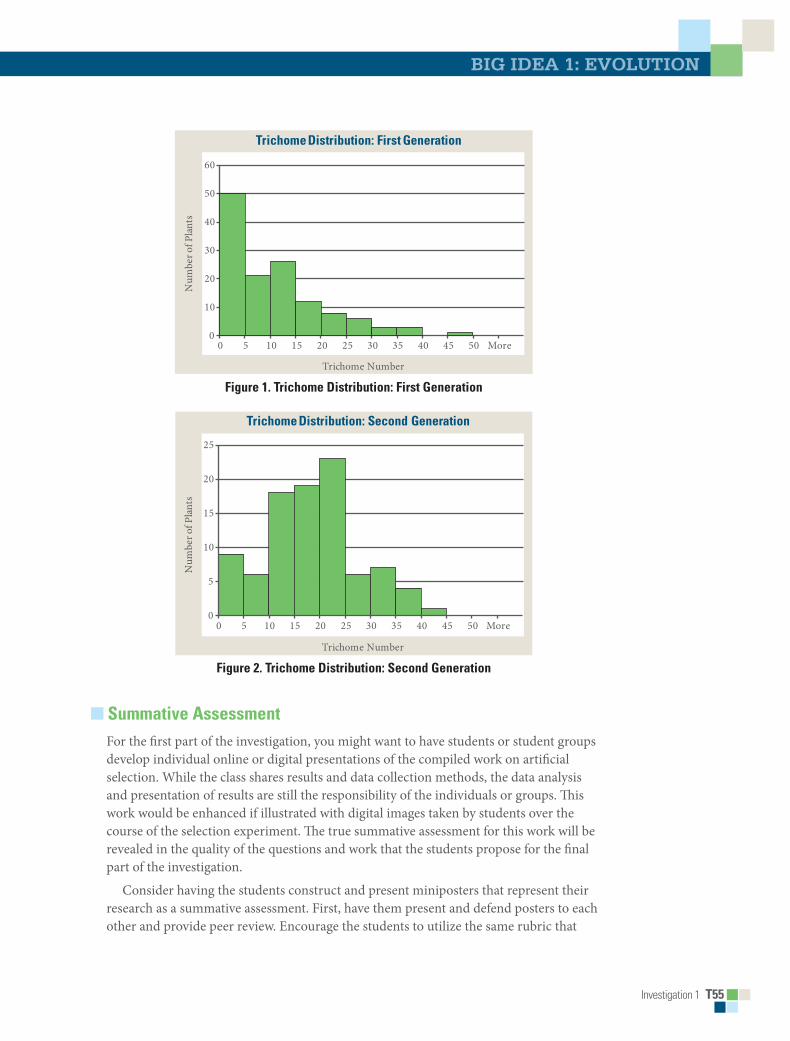
Investigation 1 T55
Big idea 1: evoLution
0
10
20
30
40
50
60
0 5 10 15 20 25 30 4035 45 50 More
Num
ber o
f Pla
nts
Trichome Number
Trichome Distribution: First Generation
Figure 1. Trichome Distribution: First Generation
Trichome Distribution: Second Generation
0
5
10
15
20
25
0 5 10 15 20 25 30 35 40 45 50 More
Num
ber o
f Pla
nts
Trichome Number
Figure 2. Trichome Distribution: Second Generation
■ Summative AssessmentFor the first part of the investigation, you might want to have students or student groups develop individual online or digital presentations of the compiled work on artificial selection. While the class shares results and data collection methods, the data analysis and presentation of results are still the responsibility of the individuals or groups. This work would be enhanced if illustrated with digital images taken by students over the course of the selection experiment. The true summative assessment for this work will be revealed in the quality of the questions and work that the students propose for the final part of the investigation.
Consider having the students construct and present miniposters that represent their research as a summative assessment. First, have them present and defend posters to each other and provide peer review. Encourage the students to utilize the same rubric that

T56 Investigation 1
you choose to evaluate their research project. Give them an opportunity to modify their posters before you evaluate the work with the same rubrics. (See the following website for a description of miniposters and the peer review process: http://www.nabt.org/blog/2010/05/04/mini-posters-authentic-peer-review-in-the-classroom/.)
Miniposters have an advantage over traditional posters by not requiring quite so much time. If the students are working in research teams, you might consider emulating a professional society’s poster session. When students put in this amount of work, it is appropriate to display their work publicly. Displaying posters in the science hall is an excellent way to provide a sense of authenticity to the research.
■ Where Can Students Go from Here?An essential component of this investigation is to take it beyond the simple selection experiment. With the skills and knowledge gained in the selection experiment, students should be able to design new experiments to investigate the adaptive characteristics of the trait they studied — particularly if they selected for a quantitative trait like trichomes. For instance, they could select for the amount of purple color in the plants. This would involve students designing a system that would “quantify” color and look into the possible function(s) of purple pigment. The Supplemental Resources section includes the descriptions of a number of very accessible investigations related to the work that students conduct in the first part of the lab. Encourage students to explore concepts such as phenotypic plasticity or herbivore responses to trichomes. Cabbage white butterfly (Pieris rapa) larvae make a good herbivore for such a study.
A commonly asked question is Why do these plants produce these small hairs? It must take energy to produce the hairs. Is there an environment in the natural world where the hairs might serve as an advantage for those plants that express them? This is the start of a hypothesis that students can investigate.
Students may have other questions to investigate as well. They should start with a question of their own regarding hairs or some other variable quantitative trait, such as plant height, stem color, or flower number. For instance, in a closely related plant, one investigation demonstrated that herbivore damage early in the plant’s development led to increased trichome numbers in later leaves. Could herbivore damage influence the hairy trait expression?
Several hypotheses have been proposed as a possible explanation for the role that trichomes play. One hypothesis is that trichomes provide a degree of protection from herbivores — either by discouraging herbivores, such as insect larvae, or by discouraging egg laying. A common herbivore that feeds on Fast Plants is the cabbage white butterfly. Students could choose a question related to the trichomes and their importance to a plant, such as one that explores the relationship between herbivory and hair production, or they could choose a different trait and design and carry out an investigation to answer a question related to it.

Investigation 1 T57
Big idea 1: evoLution
■ SUPPLEmENTAL RESOURCESThe following resources are presented to provide students and teachers with examples of research that focus specifically on the concepts and organisms in this laboratory. The hope is that students and teachers will find inspiration for their own work in these references. Agrawal, A. A., S. Y. Strauss, and M. J. Stout. 1999. Costs of Induced Responses and
Tolerance to Herbivory in Male and Female Fitness Components of Wild Radish. Evolution 53, no. 4 (August): 1093–1104.
Agren, Jon, and Douglas W. Schemske. 1993. The Cost of Defense Against Herbivores: An Experimental Study of Trichome Production in Brassica rapa. The American Naturalist 141, no. 2 (February): 338–350.
———. 1994. Evolution of Trichome Number in a Naturalized Population of Brassica rapa. The American Naturalist 143, no. 1 (January): 1–13.
Bidart-Bouzat, M., Gabriela, Richard Mithen, and May R. Berenbaum. 2005. Elevated CO2 Influences Herbivory-Induced Defense Responses of Arabidopsis thaliana. Oecologia 145, no. 3 (September): 415–424.
Callahan, Hilary S. 2005. Using Artificial Selection to Understand Plastic Plant Phenotypes. Integrative and Comparative Biology 45, no. 3 (June): 475–485.
Handley, R., B. Ekbom, and J. Agren. 2005. Variation in Trichome Density and Resistance Against a Specialist Insect Herbivore in Natural Populations of Arabidopsis thaliana. Ecological Entomology 30, no. 3 (June): 284–292.
Schmaedick, M. A., and A. M. Shelton. 2000. Arthropod Predators in Cabbage (Cruciferae) and Their Potential as Naturally Occurring Biological Control Agents for Pieris rapae (Lepidoptera: Pieridae). Canadian Entomologist 132, no. 5 (October): 655–675.
Siemens, David H., and Thomas Mitchell-Olds. 1998. Evolution of Pest-Induced Defenses in Brassica Plants: Tests of Theory. Ecology 79, no. 2 (March): 632–646.
Sleeman, Jonathan D., and Susan A. Dudley. 2001. Phenotypic Plasticity in Carbon Acquisition of Rapid Cycling Brassica rapa L. in Response to Light Quality and Water Availability. International Journal of Plant Sciences 162, no. 2 (March): 297–307.
Strauss, Sharon Y., David H. Siemens, Meika B. Decher, and Thomas Mitchell-Olds. 1999. Ecological Costs of Plant Resistance to Herbivores in the Currency of Pollination. Evolution 53, no. 4 (August): 1105–1113.
Traw, M. B., and T. E. Dawson. 2002. Differential Induction of Trichomes by Three Herbivores of Black Mustard. Oecologia 131, no. 4 (May): 526–532. DOI: 10.1007/s00442-002-0924-6.
Williams, Paul H., and Curtis B. Hill. 1986. Rapid-Cycling Populations of Brassica. Science 232, no. 4756, New Series (June 13): 1385–1389.

This page is intentionally left blank.

BigIdea
Investigation 1 S17
Evolution 1investigation 1
aRtiFiCiaL seLeCtionCan extreme selection change expression of a quantitative trait in a population in one generation?
■■ BACKGROUNDEvolution is a process that has existed throughout the history of life on Earth. One of the key driving forces of evolution is natural selection, which is differential reproduction in a population — some organisms in a population may reproduce more than others and leave more viable offspring in the next population or generation. Differential reproduction results in a population with a genetic makeup that is different from that of the previous population. Thus, populations may change over time. This process of change is evolution. With natural selection, environmental factors play a key role in determining which organisms reproduce and how many of their offspring survive. In artificial selection, humans determine which organisms reproduce, allowing some individuals to reproduce more than others. What will happen to a population of these organisms over time when exposed to artificial selection?
For the first part of this investigation, you and your classmates will perform one round of artificial selection on a population of Wisconsin Fast Plants. First, you will identify and quantify several traits that vary in the population and that you can quantify easily. You will then perform artificial selection by cross-pollinating only selected plants. You’ll collect the seeds, plant them, and then sample the second-generation population and see if it is different from the previous one. Your results will generate questions, and you then will have a chance to test your own ideas about how selection works.
■■ Learning■Objectives■• To investigate natural selection as a major mechanism of evolution
• To convert a data set from a table of numbers that reflects a change in the genetic makeup of a population over time and to apply mathematical methods and conceptual understandings to investigate the cause(s) and effect(s) of this change
• To apply mathematical methods to data from a real population to predict what will happen to the population in the future
• To investigate how natural selection acts on phenotypic variations in populations
• To evaluate data-based evidence that describes evolutionary changes in the genetic makeup of a population over time due to changes in the environment
• To design an investigation based on your observations and questions related to the importance of a single trait in the life history of a plant

S18■■Investigation 1
■■ General■Safety■PrecautionsWhen growing plants under lights, be careful to avoid any situation where water or fertilizer could come in contact with the electrical wires.
■■ THE■INVESTIGATIONS
■■ Getting■StartedIn On the Origin of Species, Charles Darwin used artificial selection — the kind of selection that is used to develop domestic breeds of animals and plants — as a way to understand and explain natural selection. Like natural selection, artificial selection requires variation in the population under selection. For selection to work, the variations must be inheritable. To conduct artificial selection, humans decide on a specific trait of a plant or animal to enhance or diminish and then select which individuals with that desired trait will breed, producing the next generation and the next population.
Materials
• Lighting: light box systems (grow lights)• Growing system: recycled plastic soda
or water bottles• Wicking: mason twine• Fertilizer: Miracle-Gro Nursery Select
All Purpose Water-Soluble Plant Food or Peters Professional with micronutri-ents
• Soil: Jiffy-Mix (soil mix, not potting soil)
• Vermiculite• Fast Plants seed (Carolina Biological
item 158888 works well and provides some additional options; it is
heterozygous for two Mendelian traits, green/light green leaves and with anthocyanin [purple stems] and without anthocyanin. Other seed stocks, such as the standard Fast Plants seeds that can be purchased from Carolina Biological or Nasco, work as well.)
• Bee sticks for pollination• Digital cameras to record the
investigation• Plastic magnifiers• Laboratory notebook
■■ ProcedureHow will you know if artificial selection has changed the genetic makeup of your population? That is one of the questions you will be trying to answer. You then will have a chance to test your own ideas about how selection works.
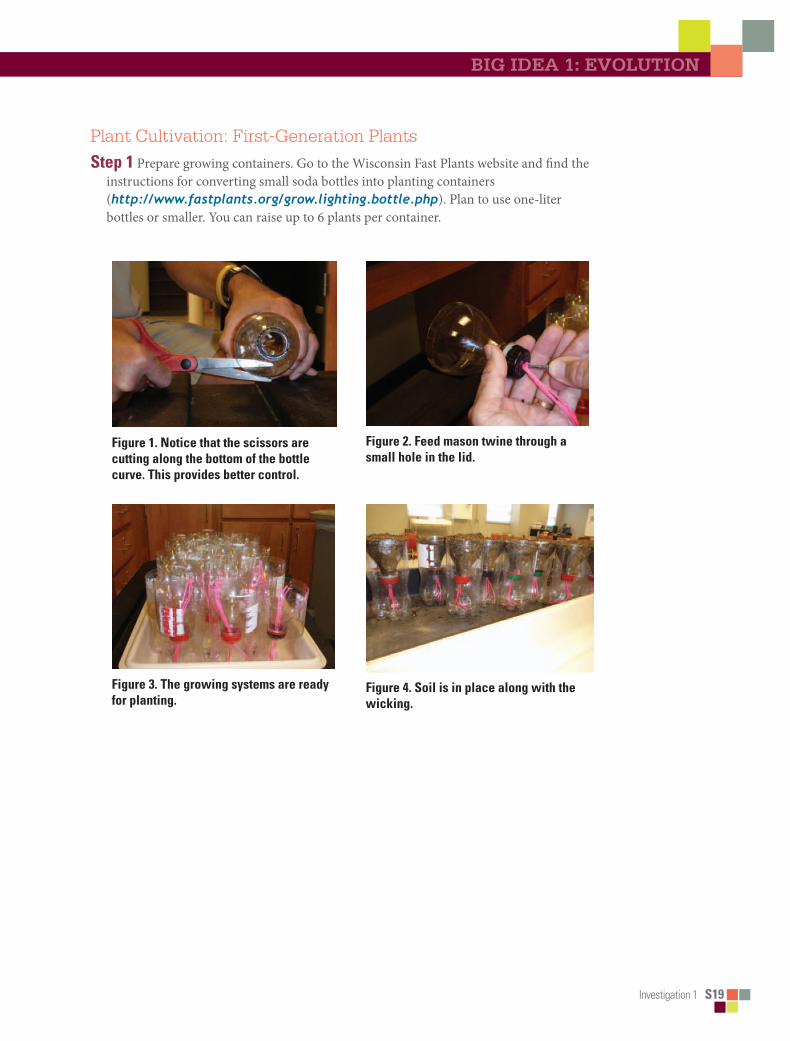
Investigation 1 S19
Big iDea 1: evoLUtion
Plant Cultivation: First-Generation PlantsStep■1 Prepare growing containers. Go to the Wisconsin Fast Plants website and find the
instructions for converting small soda bottles into planting containers (http://www.fastplants.org/grow.lighting.bottle.php). Plan to use one-liter bottles or smaller. You can raise up to 6 plants per container.
Figure■1.■Notice■that■the■scissors■are■cutting■along■the■bottom■of■the■bottle■curve.■This■provides■better■control.
Figure■2.■Feed■mason■twine■through■a■small■hole■in■the■lid.
Figure■3.■The■growing■systems■are■ready■for■planting.
Figure■4.■Soil■is■in■place■along■with■the■wicking.

S20■■Investigation 1
Figure■5.■Mix■fertilizer■—■one■bottle■cap■of■fertilizer■in■eight■liters■of■water.■Wet■the■soil■gently■until■water■drips■from■the■wicks.■Then■fill■the■reservoirs■with■the■dilute■fertilizer■solution.■Plant■the■seeds■carefully■—■about■six■to■a■bottle,■uniformly■spaced■on■the■surface,■not■buried■in■the■soil.
Figure■6.■Cover■with■a■light■layer■of■vermiculite.■Place■the■reservoirs■—■with■fertilizer■water,■seeds■on■the■surface■of■the■soil,■and■a■light■layer■of■vermiculite■■on■the■soil■—■under■the■lights.
Step■2 Each day, check your plants and make sure that the reservoirs are full, especially on Fridays. These reservoirs have enough volume to last a three-day weekend for small plants.
As your plants grow, record your observations daily. Also try to identify a trait that you could measure or observe reliably. Look for variation in the plants you are growing and describe any you see in your notebook. Observe your classmates’ plants as well. Are there also variations in their plants?
Note: Carefully read Steps 3–7 before the plants begin to flower.
Step■3 When the plants are about 7 to 12 days old (Figure 7), the class needs to choose 1–2 variable traits for artificial selection. Several variable traits can work for this. Compare your observations with those of other students. You want a trait that varies between plants in a single bottle but also varies between containers. The trait should not be something that is Yes or No, but rather something that varies within a range. That is, look for traits that you can score on a continuum (length, width, number, and so on).
If you and your classmates cannot identify a trait on your own, your teacher will provide additional guidance.
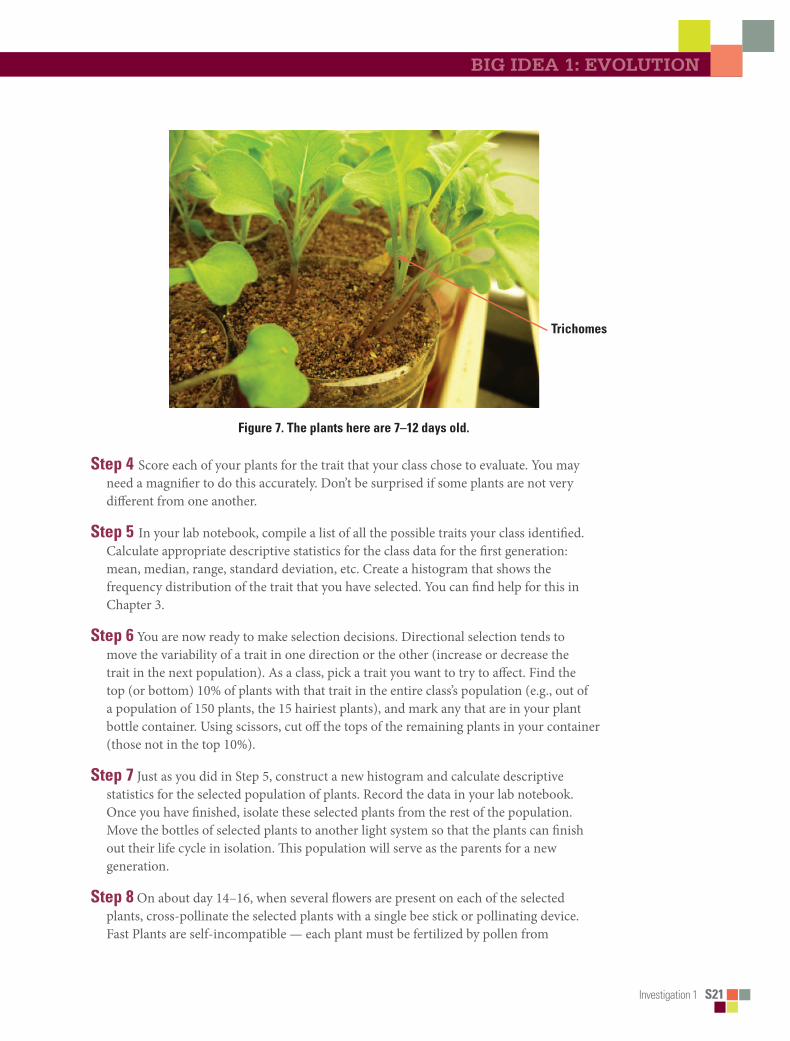
Investigation 1 S21
Big iDea 1: evoLUtion
Figure■7.■The■plants■here■are■7–12■days■old.
Step■4 Score each of your plants for the trait that your class chose to evaluate. You may need a magnifier to do this accurately. Don’t be surprised if some plants are not very different from one another.
Step■5 In your lab notebook, compile a list of all the possible traits your class identified. Calculate appropriate descriptive statistics for the class data for the first generation: mean, median, range, standard deviation, etc. Create a histogram that shows the frequency distribution of the trait that you have selected. You can find help for this in Chapter 3.
Step■6 You are now ready to make selection decisions. Directional selection tends to move the variability of a trait in one direction or the other (increase or decrease the trait in the next population). As a class, pick a trait you want to try to affect. Find the top (or bottom) 10% of plants with that trait in the entire class’s population (e.g., out of a population of 150 plants, the 15 hairiest plants), and mark any that are in your plant bottle container. Using scissors, cut off the tops of the remaining plants in your container (those not in the top 10%).
Step■7 Just as you did in Step 5, construct a new histogram and calculate descriptive statistics for the selected population of plants. Record the data in your lab notebook. Once you have finished, isolate these selected plants from the rest of the population. Move the bottles of selected plants to another light system so that the plants can finish out their life cycle in isolation. This population will serve as the parents for a new generation.
Step■8 On about day 14–16, when several flowers are present on each of the selected plants, cross-pollinate the selected plants with a single bee stick or pollinating device. Fast Plants are self-incompatible — each plant must be fertilized by pollen from
Trichomes

S22■■Investigation 1
another plant. Collect and distribute pollen from every flower on every plant in the selected population. Reserve this bee stick for only the selected population. Avoid contaminating with the pollen from the remaining Fast Plants. Pollinate flowers in the selected population for the next three days with the same bee stick. Be sure to record observations about pollination in your lab notebook. Likewise, with separate bee sticks you can pollinate the plants from the larger population, but be careful to keep them separate from the selected population.
Step■9 Maintain the plants through the rest of their life cycle. As the seedpods form be sure to limit each of the plants to 8 to 10 seedpods. Any more will likely result in poor seed quality. Once the seedpods start to turn yellow (about day 28–36), remove the fertilizer water from the reservoirs and allow the plants to dry for several days. After the plants and seedpods have dried (about a week later), harvest the seedpods from the selected population into a small paper bag for further drying. Be sure to record observations about the plants’ life cycle in your lab notebook.
Step■10 Continue to monitor, pollinate, and maintain your control plants throughout the rest of their life cycle. Just be careful to keep the original population and the selected population separate.
Plant Cultivation: Second-Generation PlantsStep■11 You should now have two populations of second-generation seeds: (1) a
population that is the offspring of the selected plants from generation one and (2) a population that is the offspring of the remaining plants from generation one. Take seeds from the selected population and plant them to grow the second generation of plants under conditions that are identical to those you used for generation one. Use new bottle containers or, if you choose to use the previous bottle systems, make sure that you thoroughly clean the systems and sterilize with a dilute (10%) bleach solution. Use new wicking cord and new soil. To get your seed, break open the seedpods into a small plastic petri dish lid.
Step■12 When the second-generation plants are about seven to 12 days old, reexamine the plants and score for the trait you selected. Score the plants at the same life history stage using the same method.
Step■13 Unless you plan on growing these plants for another generation (maybe another round of selection), you do not have to save these plants. You can discard them and clean up your growing equipment at this point.
Step■14 Compile, analyze, and graph the class data as you did for the first generation. What is the outcome of your artificial selection? Be sure to record this preliminary analysis in your notebook.

Investigation 1 S23
Big iDea 1: evoLUtion
■■ Analyzing■and■Evaluating■ResultsUp to this point of the investigation, your analysis has largely been descriptive, but your data should raise some questions. • Are the two populations/generations before and after selection actually different?
• Are the means significantly different?
• Should you use median or mean as a measure of central tendencies at this point in the investigation?
• Compare your two graphs from the two populations. The chapter on quantitative methods in this lab manual (Chapter 3) provides some guidance here. Consider constructing a bar graph to compare the mean number of hairs per generation. Include error bars, but first determine what is appropriate.
• What statistical test could you apply to help you define your confidence about whether these two populations are different?
• Compare the second population to the parent subpopulation of generation one. How do these two populations compare? How does this comparison differ from your other comparison?
As you carry out your analysis, be sure to include your rationale for the quantitative methods you have chosen in your discussion. Did evolution occur in your Fast Plant population? Justify your conclusion in your laboratory notebook.
■■ Designing■and■Conducting■Your■InvestigationIn the previous steps, you quantified a variable trait and then selected about 10% of the plants in the population that strongly expressed that trait. You isolated this subpopulation from the larger population during pollination and the rest of the life cycle. You then planted the resulting second generation of seeds, raised the plants to a similar life stage as the previous population, and scored the variation in the second-generation plants. During this long process, you recorded your observations, reflections, and perhaps some questions in your laboratory notebook.
As you worked, you likely started to think about questions of your own. You might want to know why the trait you tested is even variable to start with. How does it help the plants grow and survive? You might also have identified some other trait that you want to explore instead of the one the class chose.
Does one form or another of the trait offer an advantage in the natural world? How could you test this? Phenotypic variation is the result of the interaction of the genotypic variation with the variables in the environment. How much of the variation that you studied could be the result of environmental differences?
You and your class may decide to do this work as a class (to distribute the work involved) or work in small groups. You will report your work to the class and possibly to other AP® Biology classes in a manner agreed upon by you and your instructor. Posters,

S24■■Investigation 1
lab reports, online reports, and oral presentations are all possible effective means of submitting your work for review.
■■ Where■Can■You■Go■from■Here?An essential component of this investigation is to take it beyond the simple selection experiment. With the skills and knowledge gained in the selection experiment, you should be able to design new experiments to investigate the adaptive characteristics of the trait you studied.
Start with a question of your own regarding hairs or some other variable quantitative trait, such as plant height, stem color, or flower number. For instance, in a closely related plant, one investigation demonstrated that herbivore damage early in the plant’s development led to increased trichome numbers in later leaves. Could herbivore damage influence the hairy trait expression? Design and carry out an investigation to answer your question.
BigIdea
Investigation 2 T59
Evolution 1investigation 2
MatHeMatiCaL MoDeLing: HaRDY-WeinBeRg*How can mathematical models be used to investigate the relationship between allele frequencies in populations of organisms and evolutionary change?
■ BACKGROUND“Mathematics is biology’s next microscope, only better …” (Cohen 2004)
It is not hard to understand the value of microscope technology to biology and how this technology opened up entire new worlds of biological understanding. However, for some, it is not as easy to see the value of mathematics to the study of biology. Like the microscope, math and computers provide tools to explore the complexity of biology and biological systems, offering deeper insights to and understanding of what makes living systems work. Even the incredible complexity of evolution in populations is illuminated by relatively simple mathematical equations, several of which are based on the Hardy-Weinberg (H-W) equilibrium. Students (and their teachers) have traditionally found the topic of population genetics in an introductory biology class to be challenging, due in part to the fact that for the last couple of generations biology has been thought of as the science with only a minimal mathematics foundation — particularly in comparison to chemistry or physics. Modern biology, however, is vastly different.
One of the specific difficulties of the H-W null hypothesis is that it is the null hypothesis — it is what would happen to allele frequencies in the absence of any evolutionary parameter. This is counterintuitive for most students. H-W is the standard by which evolution can be measured. To that end, most simulations that try to create a population manipulated by students to model H-W are flawed from the beginning. Student classroom populations, by definition, are so small that genetic drift will swamp any other factors that the simulation is trying to model. By starting with a population that is modeled on a computer spreadsheet with explicit randomness, students are able to build their knowledge toward an inference on allele inheritance patterns in a theoretically infinite population. They do this by creating larger and larger populations to minimize fluctuations from the expected probabilities.
Having students build their own models (even if extensively guided by the teacher) is a requisite component to this investigation. It is during the model building, testing, and corrective phase of construction that the reflective and analytical skills of model building are learned. These skills, by their very nature, have a broad application to learning.
* Transitioned from the AP Biology Lab Manual (2001)

T60 Investigation 2
In this investigation, the students will build a spreadsheet that models how a hypothetical gene pool changes from one generation to the next. This model will allow for the exploration of parameters that affect allele frequencies, such as selection, mutation, and migration.
The second part of the investigation asks the students to generate their own questions regarding the evolution of allele frequencies in a population. Then students will explore possible answers to those questions by applying more sophisticated computer models. These models are available for free.
This investigation also provides an opportunity for students to review concepts they might have studied previously, including natural selection as the major mechanism of evolution; the relationship among genotype, phenotype, and natural selection; and fundamentals of classic Mendelian genetics.
Without an opportunity to build these skills, students, when faced with more sophisticated, prebuilt models, tend to click randomly, with no particular plan in mind, rather than use a systematic exploration of the model’s parameters and output. Likewise, without taking the time to develop modeling skills, students cannot fully appreciate the limitations and the strengths of modeling natural phenomena.
■ PREPARATION
Materials and Equipment
• Laboratory notebooks• Miniposters and miniposter supplies• Computers with spreadsheet software
like Microsoft® Excel, Macintosh® Num-bers, or OpenOffice Calc (An alternative to the installed spreadsheet software is an online spreadsheet, such as Google Docs Spreadsheet.) http://docs.google.com or Zoho Sheet http://www.zoho.com. In addition, you’ll need to download a more sophisticated simulation, such
as the ESTEEM module: Deme 1.0 or 2.0 at http://bioquest.org/esteem/esteem_result.php [You’ll need to register for the site, but it is free.] or Jon Herron’s Allelle1 at http://faculty.washington.edu/herronjc/SoftwareFolder/AlleleA1.html. An alternative is an online Web browser-based model at http://www.radford.edu/~rsheehy/Gen_flash/popgen/.)
■ Timing and Length of LabGenerally, the model building part of this investigation can be accomplished in two class periods (i.e., depending on school setting, class periods could be 45, 50, or 60 minutes in duration), with at least one additional class period required for model exploration. After completing the model exploration, the class should consider exploring applications of the null Hardy-Weinberg model in the real world by following up with the supertasters lab suggested in the section Where Can Students Go from Here?

Investigation 2 T61
Big iDea 1: evoLution
■ Safety and HousekeepingTypical laboratory safety concerns do not apply to computer modeling. However, there are some important things to consider when managing such work in the classroom. To avoid frustration, develop a system whereby the students periodically save their work. When developing and working out models, it is often a good idea to save each new version of the model with a different file name. That way, if a particular strategy doesn’t work, a student will not necessarily have to start over completely but can bring up a file that had the beginnings of a working model.
Encourage idea sharing but not necessarily file swapping. Students should generate their own work to get the maximal benefit from this exercise.
Finally, your students may be able to produce a rudimentary spreadsheet but have difficulty refining the sheet. Consider having these students rely on a hybrid approach — use the spreadsheet to generate the random samples, but use reliable pencil and paper to archive and graph the results.
The other issue to consider is the ease of digital reproduction and sharing. Without a doubt, the students will be able find a Hardy-Weinberg spreadsheet model on the Internet. Likewise, it will be easy for them to share with one another. Keep this in mind as you make the assignment, and consider having most of the work done in class if you have access to computers.
■ ALIGNmENT TO THE AP BIOLOGy CURRICULUm FRAmEWORKThe investigation will fit best with content from the process of evolution (big idea 1), but you’ll find that this lab will also fit nicely in genetics and information transfer (big idea 3), particularly after covering individual Mendelian inheritance patterns. As always, it is important to make connections between big ideas and enduring understandings, regardless of where in the curriculum the lab is taught. The concepts align with the enduring understandings and learning objectives from the AP Biology Curriculum Framework, as indicated below.
■ Enduring Understandings• 1A1: Natural selection is a major mechanism of evolution.
• 1A2: Natural selection acts on phenotypic variations in populations.
• 1A3: Evolutionary change is also driven by random processes.
• 1C3: Populations of organisms continue to evolve.

T62 Investigation 2
■ Learning Objectives• The student is able to convert a data set from a table of numbers that reflect a change
in the genetic makeup of a population over time and to apply mathematical methods and conceptual understandings to investigate the cause(s) and effect(s) of this change (1A1 & SP 1.5, SP 2.2).
• The student is able to apply mathematical methods to data from a real or simulated population to predict what will happen to the population in the future (1A1 & SP 2.2).
• The student is able to evaluate data-based evidence that describes evolutionary changes in the genetic makeup of a population over time (1A1 & SP 5.3).
• The student is able to use data from mathematical models based on the Hardy-Weinberg equilibrium to analyze genetic drift and effects of selection in the evolution of specific populations (1A3 & SP 1.4, SP 2.1).
• The student is able to justify data from mathematical models based on the Hardy-Weinberg equilibrium to analyze genetic drift and the effects of selection in the evolution of specific populations (1A3 & SP 2.1).
• The student is able to describe a model that represents evolution within a population (1C3 & SP 1.2).
• The student is able to evaluate given data sets that illustrate evolution as an ongoing process (1C3 & SP 5.3).
■ ARE STUDENTS READy TO COmPLETE A SUCCESSFUL INqUIRy-BASED, STUDENT-DIRECTED INvESTIGATION?Students will be challenged to think about an idealized life cycle of a population of hypothetical organisms that serves as the basis for the modeling exercise. You might wish to review life cycles, even though this topic is generally taught in elementary grades. It is not unusual for students to have an incomplete understanding of an organism’s life cycle.
Try working through an idealized life cycle and population as a class before the students view the investigation. Specifically, use the modeling guidelines and assumptions described in the student investigation as a road map for your instruction as you and your students try to conceptualize this idealized population. Use questions such as the following:• Can you describe the life cycle of an organism?
• How does this life cycle work in a population?
• How would you track one trait through a population’s life cycle?
• Can you describe an idealized life cycle that would work the best for keeping track of a genetic trait in a population?
Help the students arrive at the simplifying assumptions and modeling solutions.
Investigation 2 T63
Big iDea 1: evoLution
■ Skills DevelopmentFrom a biology standpoint, students should carry out this investigation after they have studied Mendelian genetics, perhaps just as they start studying evolution. They should have a good handle on the differences between genes and alleles. Traditional Hardy-Weinberg activities, such as those in Lab 8 of the AP Biology Lab Manual (2001) and exercises like the “M&M” lab (http://www.woodrow.org/teachers/bi/1994/hwintro.html), provide a useful transition for students as they enter into computer-based models. Students should also be familiar with Excel and spreadsheet operations.
■ Potential ChallengesStudents’ and teachers’ unfamiliarity with spreadsheet operations is a major limiting factor for this investigation. The degree of familiarity is difficult to measure. Generally, most students have been exposed to spreadsheets by the time they are in high school, but they typically have memorized the steps of their operations. Some of this will come back to them as they work on the spreadsheets, but unless they use spreadsheets often, most students will need quite a bit of help using the logic of IF statements.
There are many ways to create a spreadsheet model. For example, a simpler alternative to using the nested IF statements in the example model in the Student Manual is to use the function COUNTIF to count the AB string, plus COUNTIF again to count the BA string. While this may be more intuitive for some students, it does introduce a new, unique spreadsheet function. Encourage students to develop and find their own solutions to spreadsheet design.
One of the distinct advantages of using online spreadsheet applications is the ability to adjust the language of the spreadsheet to many different languages. The calculations are the same, but teachers and students can choose the language in which the instructions and navigation are displayed by changing the account settings.
As you work through building this spreadsheet you may encounter spreadsheet tools and functions that are not familiar to you. Today, there are many Web-based tutorials, some text based and some video, to help you learn these skills. For instance, typing “How to use the SUM tool in Excel video” will bring up several videos that will walk you through using the SUM tool.
T64 Investigation 2
■ THE INvESTIGATIONS
■ Getting Started: Prelab AssessmentInvestigating biology requires a variety of skills. The skills that are reinforced and introduced vary across the laboratories in this manual. The skills emphasized in a laboratory dictate whether a prelab assessment is appropriate.
This particular investigation provides a lab environment, guidance, and a problem designed to help students understand and develop the skill of modeling biological phenomena with computers. There are dozens of computer models already built and freely available. The idea of this laboratory is for students to experience the benefits of building their own model from scratch. To gain the maximum benefit from this exercise, students should not do too much background preparation. By building and exploring their own models, students should develop a more thorough understanding of how genes behave in populations.
Many classroom investigations of the Hardy-Weinberg equilibrium involve simulated populations, such as M&M candies or beans. Students can model gene inheritance in a simulated population and apply the H-W equation. While all models are simplifications and approximations, these particular models are generally based on such small populations that students often develop misconceptions regarding H-W equilibrium. However, for students who are simply stuck on how to get started, these pencil-and-paper simulations can provide good preparation for the computer modeling featured here.
■ Designing and Conducting Independent InvestigationsThe most important preparation teachers can do for this laboratory investigation is to work through the model building procedure themselves in their home or office. The author of this investigation has made this model dozens of times from scratch and usually learns something new, thinks of a different way to accomplish a task, or simply improves the model with every new build. Each time you work out this model with students you develop a richer repertoire of methods to apply to modeling. It is that rich environment that produces an authentic learning experience for students — a learning experience that transfers generally to a deeper understanding of the Hardy-Weinberg equilibrium and its application in population genetics. The following is a worked example of one version of the spreadsheet:
http://www.nabt.org/blog/2009/10/04/teaching-hardy-weinberg-and-population-genetics-using-spreadsheet-models-part-1/

Investigation 2 T65
Big iDea 1: evoLution
There are two ways to carry out the Designing and Conducting Independent Investigations section.
1. You can have the students build their models to explore other aspects of H-W equilibrium. This is suggested in the Student Manual. Have the students build models that explore selection and multigenerations, mutation, or migration. However, because students will have a limited skill set for working in the spreadsheet environment even at this point, this option might not be time effective.
2. The alternative is to have students move from their spreadsheet models to more sophisticated models available on the Internet to answer their own questions; see the suggested online options that follow. In this option, while the students are not building the model, they are applying their knowledge of models to explore questions about population genetics.
Options for More Advanced Modeling ExperiencesHave students generate their own questions regarding the evolution of allele frequencies in a population. Encourage them to experiment a bit with one of these more sophisticated and powerful models, trying out various combinations of changes to parameters or various extremes of one parameter at time. This is exploration, and it should allow the students to generate questions that have direct implications to the real world. Have them record their questions in their lab notebook. Encourage them to systematically investigate the consequences of changing variables (parameters) on the system they are studying — in this case, population genetics. From these questions have the students develop hypotheses that can be tested with the use of more sophisticated models — those that allow more easily manipulated parameters of population size, number of generations, selection (fitness), mutation, migration, and genetic drift.
Any number of computer-based Hardy-Weinberg simulations can be found with a Google search. Here are some suggestions:• Deme 1.0 and 2.0: Another Excel model with more sophistication than the model
you built in class, Deme 1.0 and 2.0 with documentation are available at http://bioquest.org/esteem/esteem_details.php?product_id=193, where you need to establish an account (free) before you can download it. It works in Excel just as the spreadsheet model you created earlier. See Figure 1.
• AlleleA1: Jon Herron from the University of Washington has created a simulation called AlleleA1 along with documentation. It is available for free at http://faculty.washington.edu/herronjc/SoftwareFolder/AlleleA1.html. See Figure 2.

T66 Investigation 2
Figure 1. Deme 1.0 Figure 2. AlleleA1
• Population genetics simulation program: Bob Sheely from Radford University has created a simulation and documentation in the form of a Web application. It is available for free at http://www.radford.edu/~rsheehy/Gen_flash/popgen/. See Figure 3.
Figure 3. Population Genetics Simulation Program
Investigation 2 T67
Big iDea 1: evoLution
■ Summative AssessmentThe ideal postlab assessment would be the application of model and theory to a real-world situation, such as that referenced in the section Where Can Students Go from Here? Be sure that all students/student teams treat their model spaces as experimental spaces. Have them propose, test, and analyze specific hypotheses and report these in a miniposter presentation that is designed to generate a rigorous peer review before the teacher evaluation.
■ Where Can Students Go from Here?The ultimate laboratory learning experience would be to develop a model and then try out that model in the real world. An excellent extension to the modeling and theory work in this laboratory would be to have the students work through the following laboratory reported in the ABLE Proceedings: “Supertasters — Updating the Taste Test for the A & P Laboratory.” There are few human traits that express the intermediate dominance necessary for testing for the null hypothesis. The supertaster trait described in this laboratory does express an intermediate phenotype; therefore, it creates an exemplary investigative population genetics laboratory.
■ SUPPLEmENTAL RESOURCESCohen, 2004, “Mathematics is Biology’s Next Microscope, Only Better; Biology Is
Mathematics’ Next Physics, Only Better.” PLoS Biol 2(12): e439. doi:10.1371/journal.pbio.0020439
McMahon, K. A. 2008. “Supertasters — Updating the Taste Test for the A & P Laboratory.” In Tested Studies for Laboratory Teaching, Vol. 29, ed. K. L. Clase, 398–405. Proceedings of the 29th Workshop/Conference of the Association for Biology Laboratory Education (ABLE).
Otto, S. P. and T. Day (2007). A Biologist’s Guide to Mathematical Modeling in Ecology and Evolution. Princeton University Press. http://www.zoology.ubc.ca/biomath/

This page is intentionally left blank.
BigIdea
Investigation 2 S25
Evolution 1investigation 2
MatHeMatiCaL MoDeLing: HaRDY-WeinBeRg*How can mathematical models be used to investigate the relationship between allele frequencies in populations of organisms and evolutionary change?
■■ BACKGROUNDEvolution occurs in populations of organisms and involves variation in the population, heredity, and differential survival. One way to study evolution is to study how the frequency of alleles in a population changes from generation to generation. In other words, you can ask What are the inheritance patterns of alleles, not just from two parental organisms, but also in a population? You can then explore how allele frequencies change in populations and how these changes might predict what will happen to a population in the future.
Mathematical models and computer simulations are tools used to explore the complexity of biological systems that might otherwise be difficult or impossible to study. Several models can be applied to questions about evolution. In this investigation, you will build a spreadsheet that models how a hypothetical gene pool changes from one generation to the next. This model will let you explore parameters that affect allele frequencies, such as selection, mutation, and migration.
The second part of the investigation asks you to generate your own questions regarding the evolution of allele frequencies in a population. Then you are asked to explore possible answers to those questions by applying more sophisticated computer models. These models are available for free.
This investigation also provides an opportunity for you to review concepts you might have studied previously, including natural selection as the major mechanism of evolution; the relationship among genotype, phenotype, and natural selection; and fundamentals of classic Mendelian genetics.
* Transitioned from the AP Biology Lab Manual (2001)

S26■■Investigation 2
Big iDea 1: evoLution
■■ Learning■Objectives• To use a data set that reflects a change in the genetic makeup of a population
over time and to apply mathematical methods and conceptual understandings to investigate the cause(s) and effect(s) of this change
• To apply mathematical methods to data from a real or simulated population to predict what will happen to the population in the future
• To evaluate data-based evidence that describes evolutionary changes in the genetic makeup of a population over time
• To use data from mathematical models based on the Hardy-Weinberg equilibrium to analyze genetic drift and the effect of selection in the evolution of specific populations
• To justify data from mathematical models based on the Hardy-Weinberg equilibrium to analyze genetic drift and the effects of selection in the evolution of specific populations
• To describe a model that represents evolution within a population
• To evaluate data sets that illustrate evolution as an ongoing process
■■ General■Safety■PrecautionsThere are some important things to remember when computer modeling in the classroom. To avoid frustration, periodically save your work. When developing and working out models, save each new version of the model with a different file name. That way, if a particular strategy doesn’t work, you will not necessarily have to start over completely but can bring up a file that had the beginnings of a working model.
If you have difficulty refining your spreadsheet, consider using the spreadsheet to generate the random samples and using pencil and paper to archive and graph the results.
As you work through building this spreadsheet you may encounter spreadsheet tools and functions that are not familiar to you. Today, there are many Web-based tutorials, some text based and some video, to help you learn these skills. For instance, typing “How to use the SUM tool in Excel video” will bring up several videos that will walk you through using the SUM tool.
Investigation 2 S27
Big iDea 1: evoLution
■■ THE■INVESTIGATIONS
■■ Getting■StartedThis particular investigation provides a lab environment, guidance, and a problem designed to help you understand and develop the skill of modeling biological phenomena with computers. There are dozens of computer models already built and available for free. The idea for this laboratory is for you to build your own from scratch. To obtain the maximum benefit from this exercise, you should not do too much background preparation. As you build your model and explore it, you should develop a more thorough understanding of how genes behave in population.
To help you begin, you might want to work with physical models of population genetics, such as simulations that your teacher can share with you. With these pencil-and-paper simulations, you can obtain some insights that may help you develop your computer model.
■■ ProcedureIt is easy to understand how microscopes opened up an entire new world of biological understanding. For some, it is not as easy to see the value of mathematics to the study of biology, but, like the microscope, math and computers provide tools to explore the complexity of biology and biological systems — providing deeper insights and understanding of what makes living systems work.
To explore how allele frequencies change in populations of organisms, you will first build a computer spreadsheet that models the changes in a hypothetical gene pool from one generation to the next. You need a basic familiarity with spreadsheet operations to complete this lab successfully. You may have taken a course that introduced you to spreadsheets before. If so, that will be helpful, and you may want to try to design and build your model on your own after establishing some guidelines and assumptions. Otherwise, you may need more specific guidance from your teacher. You can use almost any spreadsheet program available, including free online spreadsheet software such as Google Docs or Zoho (http://www.zoho.com), to complete the first section of your investigation.
In the second part of the investigation, you will use more sophisticated spreadsheet models or computer models to explore various aspects of evolution and alleles in populations. To understand how these complex tools work and their limitations, you first need to build a model of your own.
S28■■Investigation 2
Big iDea 1: evoLution
Building a Simple Mathematical ModelThe real world is infinitely complicated. To penetrate that complexity using model building, you must learn to make reasonable, simplifying assumptions about complex processes. For example, climate change models or weather forecasting models are simplifications of very complex processes — more than can be accounted for with even the most powerful computer. These models allow us to make predictions and test hypotheses about climate change and weather.
By definition, any model is a simplification of the real world. For that reason, you need to constantly evaluate the assumptions you make as you build a model, as well as evaluate the results of the model with a critical eye. This is actually one of the powerful benefits of a model — it forces you to think deeply about an idea.
There are many approaches to model building; in their book on mathematical modeling in biology, Otto and Day (2007) suggest the following steps:
1.Formulate the question.
2.Determine the basic ingredients.
3.Qualitatively describe the biological system.
4.Quantitatively describe the biological system.
5.Analyze the equations.
6.Perform checks and balances.
7.Relate the results back to the question.
As you work through the next section, record your thoughts, assumptions, and strategies on modeling in your laboratory notebook.
Step■1 Formulate the question. Think about a recessive Mendelian trait such as cystic fibrosis. Why do recessive alleles like cystic fibrosis stay in the human population? Why don’t they gradually disappear?
Now think about a dominant Mendelian trait such as polydactyly (more than five fingers on a single hand or toes on a foot) in humans. Polydactyly is a dominant trait, but it is not a common trait in most human populations. Why not?
How do inheritance patterns or allele frequencies change in a population? Our investigation begins with an exploration of answers to these simple questions.
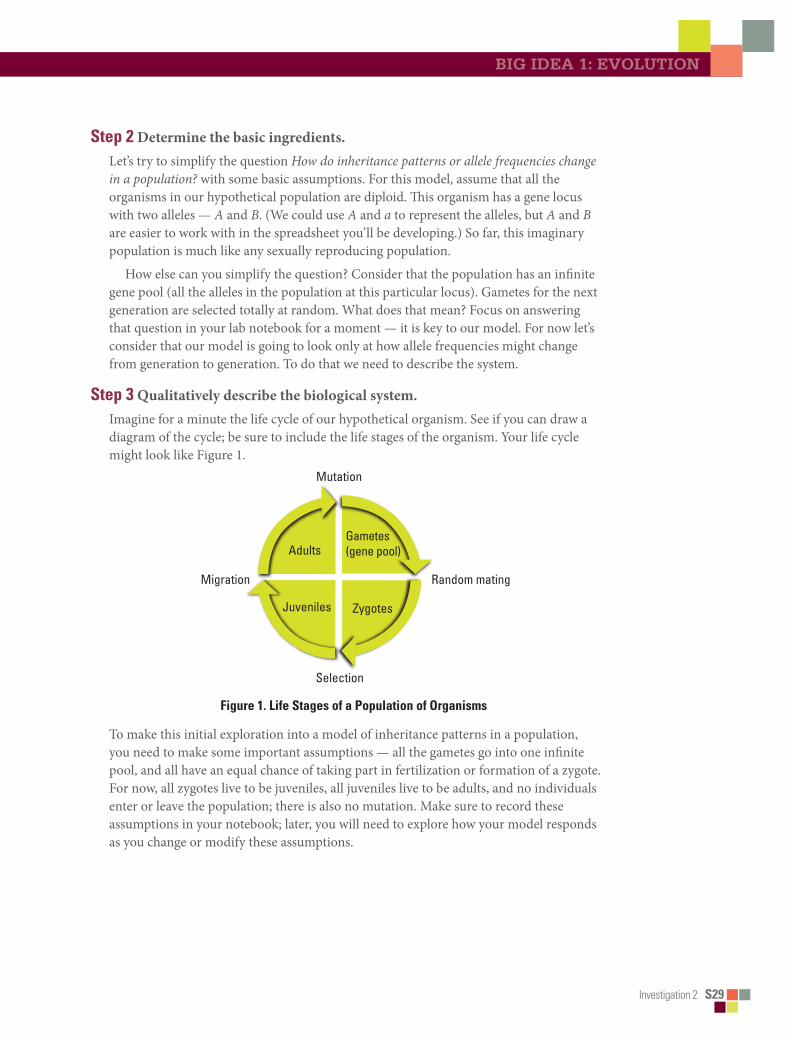
Investigation 2 S29
Big iDea 1: evoLution
Step■2 Determine the basic ingredients. Let’s try to simplify the question How do inheritance patterns or allele frequencies change in a population? with some basic assumptions. For this model, assume that all the organisms in our hypothetical population are diploid. This organism has a gene locus with two alleles — A and B. (We could use A and a to represent the alleles, but A and B are easier to work with in the spreadsheet you’ll be developing.) So far, this imaginary population is much like any sexually reproducing population.
How else can you simplify the question? Consider that the population has an infinite gene pool (all the alleles in the population at this particular locus). Gametes for the next generation are selected totally at random. What does that mean? Focus on answering that question in your lab notebook for a moment — it is key to our model. For now let’s consider that our model is going to look only at how allele frequencies might change from generation to generation. To do that we need to describe the system.
Step■3 Qualitatively describe the biological system. Imagine for a minute the life cycle of our hypothetical organism. See if you can draw a diagram of the cycle; be sure to include the life stages of the organism. Your life cycle might look like Figure 1.
Mutation
Adults
Zygotes
Gametes(gene pool)
Juveniles
Migration Random mating
Selection
Figure■1.■Life■Stages■of■a■Population■of■Organisms■
To make this initial exploration into a model of inheritance patterns in a population, you need to make some important assumptions — all the gametes go into one infinite pool, and all have an equal chance of taking part in fertilization or formation of a zygote. For now, all zygotes live to be juveniles, all juveniles live to be adults, and no individuals enter or leave the population; there is also no mutation. Make sure to record these assumptions in your notebook; later, you will need to explore how your model responds as you change or modify these assumptions.

S30■■Investigation 2
Big iDea 1: evoLution
Step■4 Quantitatively describe the biological system. Spreadsheets are valuable tools that allow us to ask What if? questions. They can repeatedly make a calculation based on the results of another calculation. They can also model the randomness of everyday events. Our goal is to model how allele frequencies change through one life cycle of this imaginary population in the spreadsheet. Use the diagram in Figure 1 as a guide to help you design the sequence and nature of your spreadsheet calculation.
Each part of the life cycle can be represented by a spreadsheet operation.
1.Set allele frequencies (assign a value to a cell).
2.Use the random function (RAND) to generate a random number which will be compared to the allele frequency from Step 1.
3.Compare the random number to allele frequency and assign the appropriate allele.
4.Repeat Steps 1–3 for the second allele.
5.Use the CONCATENATE function to combine the two alleles to form a zygote.
6.Copy this procedure (Steps 2–5) for multiple offspring.
Let’s get started. The first step is to randomly draw gametes from the gene pool to form a number of zygotes that will make up the next generation.
To begin this model, let’s define a couple of variables.
Let
p = the frequency of the A alleleand let q = the frequency of the B allele
Bring up the spreadsheet on your computer. The examples here are based on Microsoft® Excel, but almost any modern spreadsheet can work, including Google’s online Google Docs (https://docs.google.com) and Zoho’s online spreadsheet (http://www.zoho.com).
Hint: If you are familiar with spreadsheets, the RAND function, and using IF statements to create formulas in spreadsheets, you may want to skip ahead and try to build a model on your own. If these are not familiar to you, proceed with the following tutorial.
Somewhere in the upper left corner (in this case, cell D2), enter a value for the frequency of the A allele. This value should be between 0 and 1. Go ahead and type in labels in your other cells and, if you wish, shade the cells as well. This blue area will represent the gene pool for your model. (Highlight the area you wish to format with color, and right-click with your mouse in Excel to format.) This is a spreadsheet, so you can enter the value for the frequency of the B allele; however, when making a model it is best to have the spreadsheet do as many of the calculations as possible. All of the alleles in the gene pool are either A or B; therefore p + q = 1 and 1 - p = q. In cell D3, enter the formula to calculate the value of q.

Investigation 2 S31
Big iDea 1: evoLution
In spreadsheet lingo it is
=1-D2
Your spreadsheet now should look something like Figure 2.
■■Figure■2■
Let’s explore how one important spreadsheet function works before we incorporate it into our model. In a nearby empty cell, enter the function (we will remove it later).
=Rand()
Note that the parentheses have nothing between them. After hitting return, what do you find in the cell? If you are on a PC, try hitting the F9 key several times to force recalculation. On a Mac, enter cmd + or cmd =. What happens to the value in the cell? Describe your results in your lab notebook.
The RAND function returns random numbers between 0 and 1 in decimal format. This is a powerful feature of spreadsheets. It allows us to enter a sense of randomness to our calculations if it is appropriate — and here it is when we are “randomly” choosing gametes from a gene pool. Go ahead and delete the RAND function in the cell.
Let’s select two gametes from the gene pool. In cell E5, let’s generate a random number, compare it to the value of p, and then place either an A gamete or a B gamete in the cell. We’ll need two functions to do this, the RAND function and the IF function. Check the help menu if necessary.

S32■■Investigation 2
Big iDea 1: evoLution
Note that the function entered in cell E5 is
=IF(RAND()<=D$2,“A”, “B”)
Be sure to include the $ in front of the 2 in the cell address D2. It will save time later when you build onto this spreadsheet.
The formula in this cell basically says that if a random number between 0 and 1 is less than or equal to the value of p, then put an A gamete in this cell, or if it is not less than or equal to the value of p, put a B gamete in this cell. IF functions and RAND functions are very powerful tools when you try to build models for biology.
Now create the same formula in cell F5, making sure that it is formatted exactly like E5. When you have this completed, press the recalculate key to force a recalculation of your spreadsheet. If you have entered the functions correctly in the two cells, you should see changing values in the two cells. (This is part of the testing and retesting that you have to do while model building.) Your spreadsheet should look like Figure 3.
Try recalculating 10–20 times. Are your results consistent with what you expect? Do both cells (E5 and F5) change to A or B in the ratios you’d expect from your p value? Try changing your p value to 0.8 or 0.9. Does the spreadsheet still work as expected? Try lower p values. If you don’t get approximately the expected numbers, check and recheck your formulas now, while it is early in the process.
■■Figure■3

Investigation 2 S33
Big iDea 1: evoLution
You could stop here and just have the computer recalculate over and over — similar to tossing a coin. However, with just a few more steps, you can have a model that will create a small number or large number of gametes for the next generation, count the different genotypes of the zygotes, and graph the results.
Copy these two formulas in E5 and F5 down for about 16 rows to represent gametes that will form 16 offspring for the next generation, as in Figure 4. (To copy the formulas, click on the bottom right-hand corner of the cell and, with your finger pressed down on the mouse, drag the cell downward.)
Figure■4
We’ll put the zygotes in cell G5. The zygote is a combination of the two randomly selected gametes. In spreadsheet vernacular, you want to concatenate the values in the two cells. In cell G5 enter the function
=CONCATENATE(E5,F5)
Copy this formula down as far down as you have gametes, as in Figure 5 on the next page.

S34■■Investigation 2
Big iDea 1: evoLution
Figure■5
The next columns on the sheet, H, I, and J, are used for bookkeeping — that is, keeping track of the numbers of each zygote’s genotype. They are rather complex functions that use IF functions to help us count the different genotypes of the zygotes.
The function in cell H5 is
=IF(G5=“AA”,1,0)
This basically means that if the value in cell G5 is AA, then put a 1 in this cell; if not, then put a 0.
Enter the following very similar function in cell J5: =IF(G5=“BB”,1,0)• Can you interpret this formula?
• What does it say in English?
Your spreadsheet now should resemble Figure 6.

Investigation 2 S35
Big iDea 1: evoLution
Figure■6
Now let’s tackle the nested IF function. This is needed to test for either AB or BA.
In cell I5, enter the nested function:
=IF(G5=“AB”,1,(IF(G5=“BA”,1,0)))
This example requires an extra set of parentheses, which is necessary to nest functions. This function basically says that if the value in cell G5 is exactly equal to AB, then put a 1; if not, then if the value in cell G5 is exactly BA, put a 1; if it is neither, then put a 0 in this cell. Copy these three formulas down for all the rows in which you have produced gametes.
Enter the labels for the columns you’ve been working on — gametes in cell E4, zygote in cell G5, AA in cell H4, AB in cell I4, and BB in cell J4, as shown in Figure 7 on the next page.
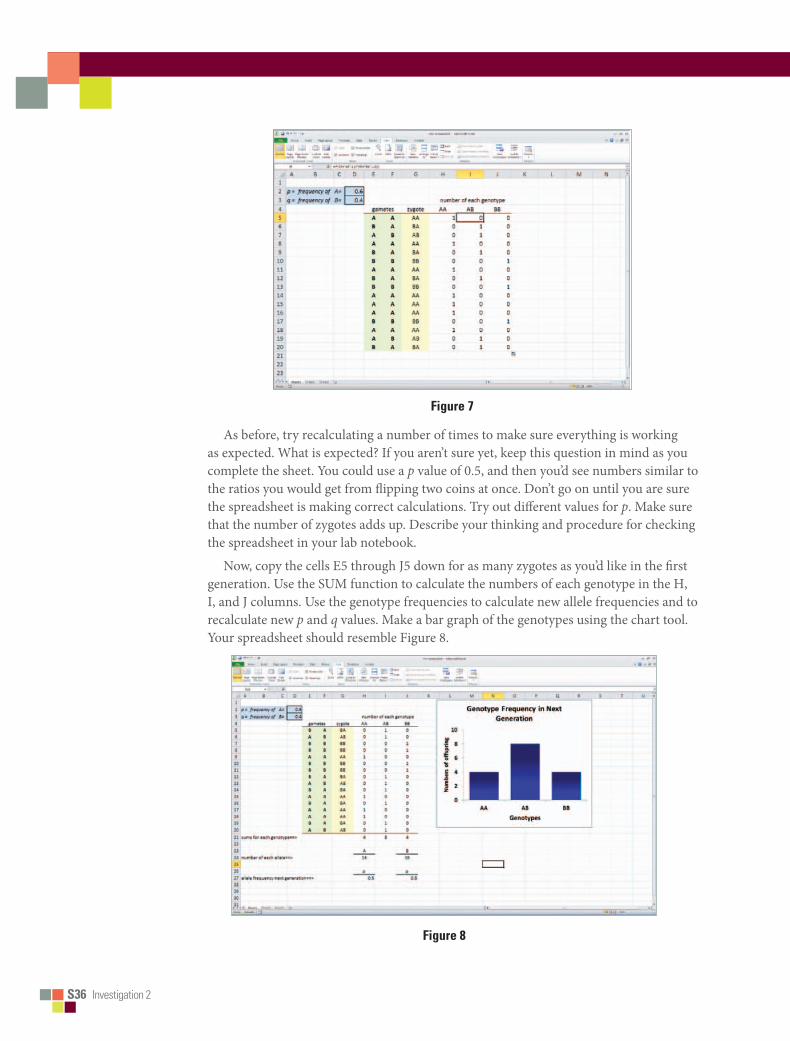
S36■■Investigation 2
Big iDea 1: evoLution
Figure■7
As before, try recalculating a number of times to make sure everything is working as expected. What is expected? If you aren’t sure yet, keep this question in mind as you complete the sheet. You could use a p value of 0.5, and then you’d see numbers similar to the ratios you would get from flipping two coins at once. Don’t go on until you are sure the spreadsheet is making correct calculations. Try out different values for p. Make sure that the number of zygotes adds up. Describe your thinking and procedure for checking the spreadsheet in your lab notebook.
Now, copy the cells E5 through J5 down for as many zygotes as you’d like in the first generation. Use the SUM function to calculate the numbers of each genotype in the H, I, and J columns. Use the genotype frequencies to calculate new allele frequencies and to recalculate new p and q values. Make a bar graph of the genotypes using the chart tool. Your spreadsheet should resemble Figure 8.
Figure■8
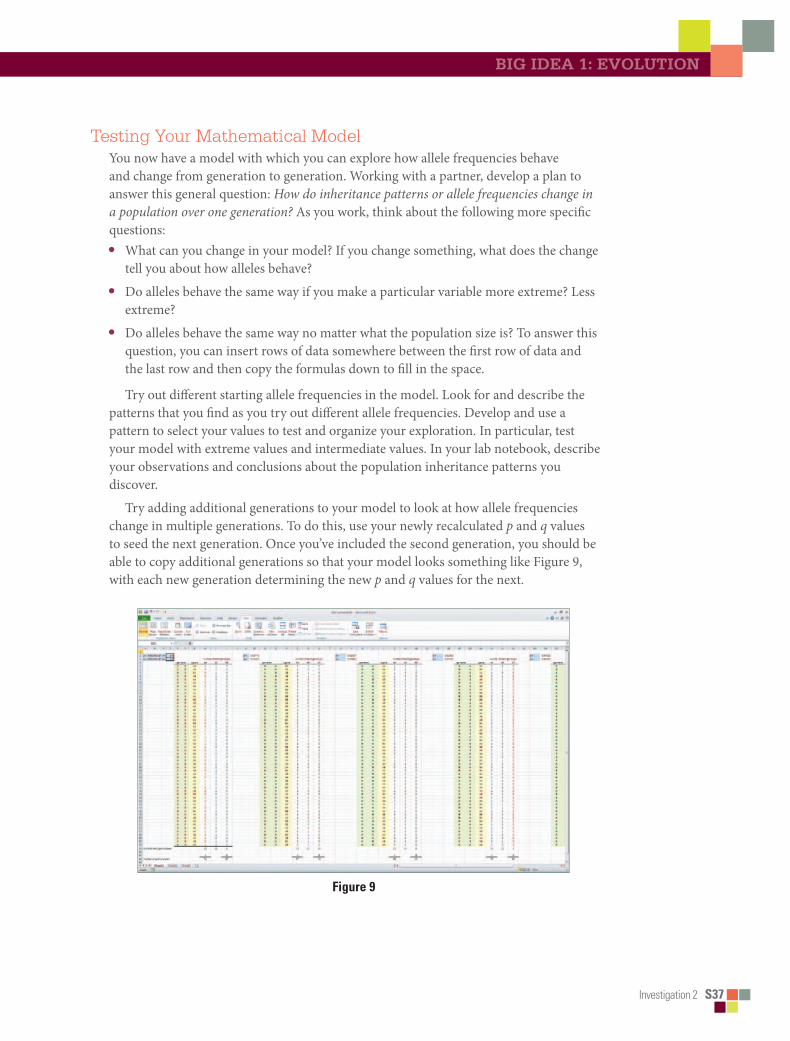
Investigation 2 S37
Big iDea 1: evoLution
Testing Your Mathematical ModelYou now have a model with which you can explore how allele frequencies behave and change from generation to generation. Working with a partner, develop a plan to answer this general question: How do inheritance patterns or allele frequencies change in a population over one generation? As you work, think about the following more specific questions:• What can you change in your model? If you change something, what does the change
tell you about how alleles behave?
• Do alleles behave the same way if you make a particular variable more extreme? Less extreme?
• Do alleles behave the same way no matter what the population size is? To answer this question, you can insert rows of data somewhere between the first row of data and the last row and then copy the formulas down to fill in the space.
Try out different starting allele frequencies in the model. Look for and describe the patterns that you find as you try out different allele frequencies. Develop and use a pattern to select your values to test and organize your exploration. In particular, test your model with extreme values and intermediate values. In your lab notebook, describe your observations and conclusions about the population inheritance patterns you discover.
Try adding additional generations to your model to look at how allele frequencies change in multiple generations. To do this, use your newly recalculated p and q values to seed the next generation. Once you’ve included the second generation, you should be able to copy additional generations so that your model looks something like Figure 9, with each new generation determining the new p and q values for the next.
Figure■9

S38■■Investigation 2
Big iDea 1: evoLution
Try to create a graph of p values over several generations, for different-sized populations. See if you can detect a pattern of how population size affects the inheritance pattern. Be sure to try out both large and small populations of offspring.
This model relies on the RAND function to randomly select gametes from an infinite gene pool. • What would happen if there were no randomness to this selection?
• What kind of pattern of genotypes would you expect in the next generation?
Creating a Formula that Predicts the Genotypes of the Next Generation
Here are two approaches to develop the formula. You might first try a graphical approach. Create a Punnet square, like Figure 10 and similar to what you might use to solve a Mendelian genetics problem. In this case, however, plot the values of p and q. Scale each side of the square based on the magnitude of the p or q values. Place this diagram in your lab notebook, and fill in the squares with variables and values, as in Figure 10.
p=.6 q=.4
p=.6
q=.4
Figure■10
Of course, you could also calculate the expected results for the next generation.
Remember that p + q = 1
The probability of two A alleles combining in one organism in the next generation is p2. The probability of two B alleles combining is q2. The probability of a combination of AB is p * q, as is the probability of combination of BA alleles, for a total of 2pq.
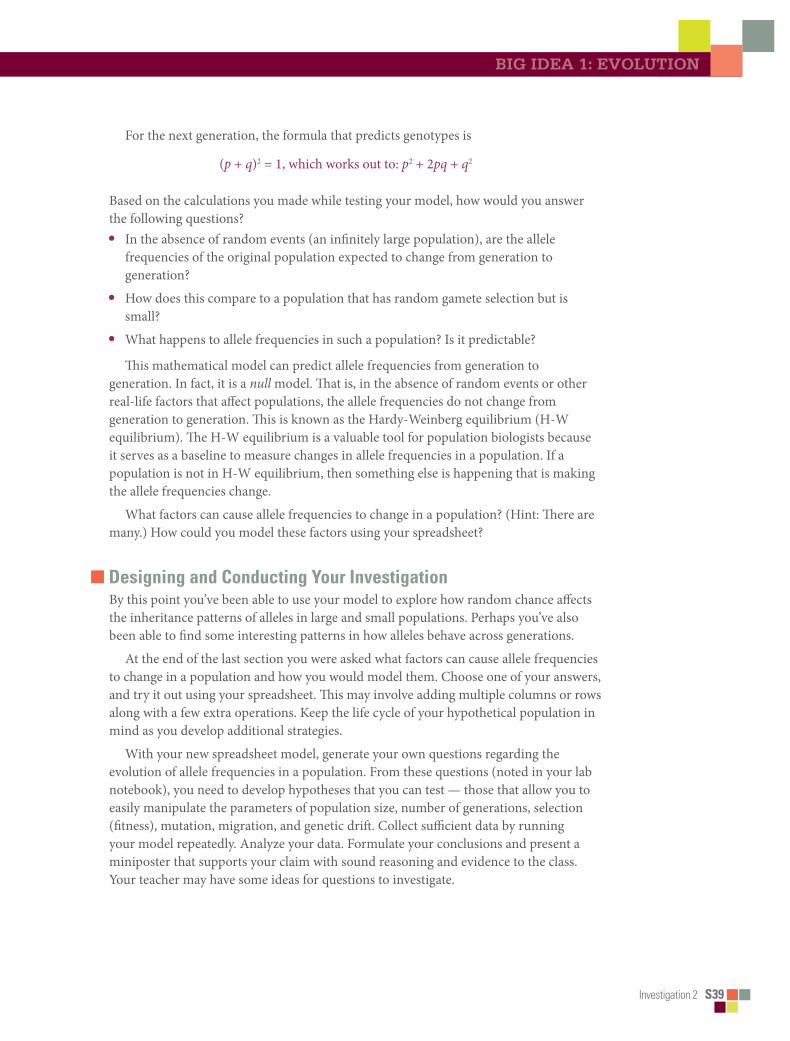
Investigation 2 S39
Big iDea 1: evoLution
For the next generation, the formula that predicts genotypes is
(p + q)2 = 1, which works out to: p2 + 2pq + q2
Based on the calculations you made while testing your model, how would you answer the following questions? • In the absence of random events (an infinitely large population), are the allele
frequencies of the original population expected to change from generation to generation?
• How does this compare to a population that has random gamete selection but is small?
• What happens to allele frequencies in such a population? Is it predictable?
This mathematical model can predict allele frequencies from generation to generation. In fact, it is a null model. That is, in the absence of random events or other real-life factors that affect populations, the allele frequencies do not change from generation to generation. This is known as the Hardy-Weinberg equilibrium (H-W equilibrium). The H-W equilibrium is a valuable tool for population biologists because it serves as a baseline to measure changes in allele frequencies in a population. If a population is not in H-W equilibrium, then something else is happening that is making the allele frequencies change.
What factors can cause allele frequencies to change in a population? (Hint: There are many.) How could you model these factors using your spreadsheet?
■■ Designing■and■Conducting■Your■InvestigationBy this point you’ve been able to use your model to explore how random chance affects the inheritance patterns of alleles in large and small populations. Perhaps you’ve also been able to find some interesting patterns in how alleles behave across generations.
At the end of the last section you were asked what factors can cause allele frequencies to change in a population and how you would model them. Choose one of your answers, and try it out using your spreadsheet. This may involve adding multiple columns or rows along with a few extra operations. Keep the life cycle of your hypothetical population in mind as you develop additional strategies.
With your new spreadsheet model, generate your own questions regarding the evolution of allele frequencies in a population. From these questions (noted in your lab notebook), you need to develop hypotheses that you can test — those that allow you to easily manipulate the parameters of population size, number of generations, selection (fitness), mutation, migration, and genetic drift. Collect sufficient data by running your model repeatedly. Analyze your data. Formulate your conclusions and present a miniposter that supports your claim with sound reasoning and evidence to the class. Your teacher may have some ideas for questions to investigate.

S40■■Investigation 2
■■ Where■Can■You■Go■from■Here?An excellent extension to this laboratory is the following investigation:
McMahon, K. A. 2008. Supertasters—Updating the Taste Test for the A & P Laboratory. Pages 398–405, in Tested Studies for Laboratory Teaching, Volume 29 (K.L. Clase, Editor). Proceedings of the 29th Workshop/Conference of the Association for Biology Laboratory Education (ABLE).
Your teacher will provide the lab, or you can google “ABLE proceedings + supertaster” to access the lab.
There are few human traits that express the intermediate dominance necessary for testing for the null hypothesis. The supertaster trait described in this laboratory does express an intermediate phenotype; therefore, it creates an exemplary investigative population genetics laboratory.
■■ REFERENCEOtto, S. P. and T. Day (2007). A Biologist’s Guide to Mathematical Modeling
in Ecology and Evolution. Princeton University Press. http://www.zoology.ubc.ca/biomath/

BigIdea
Investigation 3 T69
Evolution 1investigation 3
Comparing Dna sequenCes to unDerstanD evolutionary relationships with BlastHow can bioinformatics be used as a tool to determine evolutionary relationships and to better understand genetic diseases?
■■ BACKGROUNDBetween 1990–2003, scientists working on an international research project known as the Human Genome Project were able to identify and map the 20,000–25,000 genes that define a human being. The project also successfully mapped the genomes of other species, including the fruit fly, mouse, and Escherichia coli. The location and complete sequence of the genes in each of these species are available for anyone in the world to access via the Internet.
Why is this information important? Being able to identify the precise location and sequence of human genes will allow us to better understand genetic diseases. In addition, learning about the sequence of genes in other species helps us understand evolutionary relationships among organisms. Many of our genes are identical or similar to those found in other species.
Suppose you identify a single gene that is responsible for a particular disease in fruit flies. Is that same gene found in humans? Does it cause a similar disease? It would take nearly 10 years to read through the entire human genome to try to locate the same sequence of bases as that in fruit flies. This definitely isn’t practical, so a sophisticated technological method is required.
Bioinformatics is a field that combines statistics, mathematical modeling, and computer science to analyze biological data. Using bioinformatics methods, entire genomes can be quickly compared in order to detect genetic similarities and differences. An extremely powerful bioinformatics tool is BLAST, which stands for Basic Local Alignment Search Tool. Using BLAST, you can input a gene sequence of interest and search entire genomic libraries for identical or similar sequences in a matter of seconds.
In this laboratory investigation, students will use BLAST to compare several genes, and then use the information to construct a cladogram. A cladogram (also called a phylogenetic tree) is a visualization of the evolutionary relatedness of species. Figure 1 is a simple cladogram.
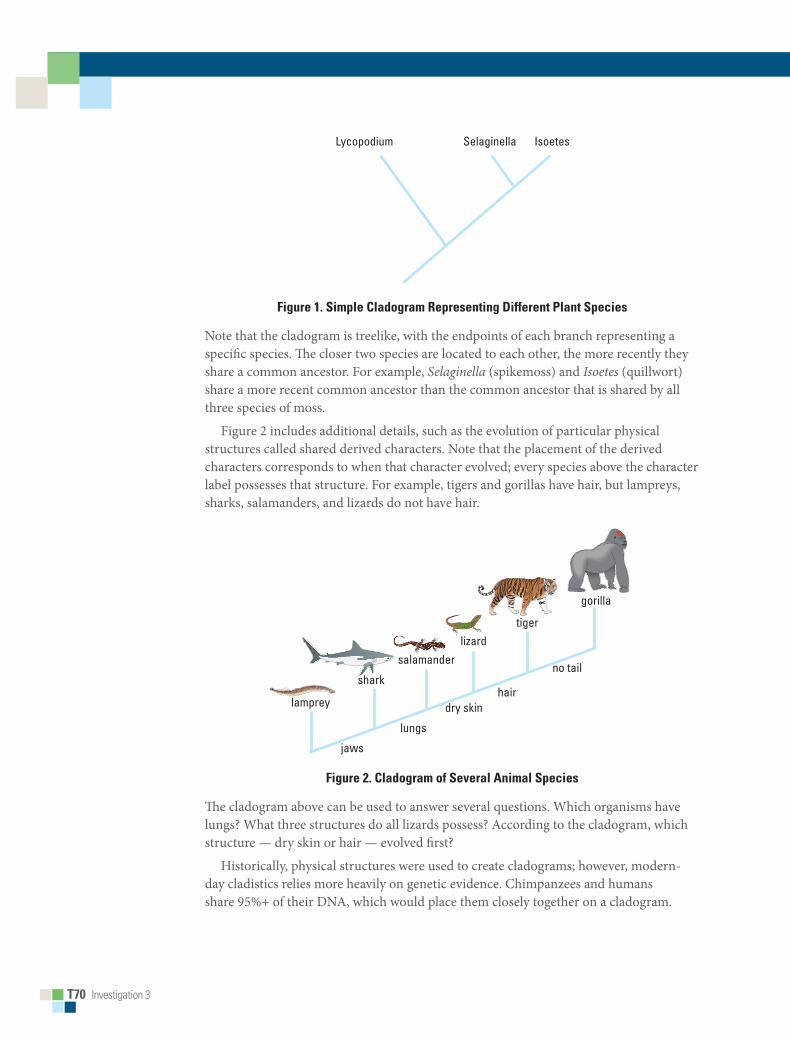
T70■■Investigation 3
Lycopodium Selaginella Isoetes
Figure■1.■Simple■Cladogram■Representing■Different■Plant■Species
Note that the cladogram is treelike, with the endpoints of each branch representing a specific species. The closer two species are located to each other, the more recently they share a common ancestor. For example, Selaginella (spikemoss) and Isoetes (quillwort) share a more recent common ancestor than the common ancestor that is shared by all three species of moss.
Figure 2 includes additional details, such as the evolution of particular physical structures called shared derived characters. Note that the placement of the derived characters corresponds to when that character evolved; every species above the character label possesses that structure. For example, tigers and gorillas have hair, but lampreys, sharks, salamanders, and lizards do not have hair.
jaws
lamprey
salamanderlizard
tiger
gorilla
shark
lungs
dry skinhair
no tail
Figure■2.■Cladogram■of■Several■Animal■Species
The cladogram above can be used to answer several questions. Which organisms have lungs? What three structures do all lizards possess? According to the cladogram, which structure — dry skin or hair — evolved first?
Historically, physical structures were used to create cladograms; however, modern-day cladistics relies more heavily on genetic evidence. Chimpanzees and humans share 95%+ of their DNA, which would place them closely together on a cladogram.

Investigation 3 T71
Big iDea 1: evolution
Humans and fruit flies share approximately 60% of their DNA, which would place them farther apart on a cladogram. Can you draw a cladogram that depicts the evolutionary relationship among humans, chimpanzees, fruit flies, and mosses?
■■ PREPARATION
Materials and EquipmentOne computer with Internet access per student or per group is needed to complete this investigation.
■■ Timing■and■Length■of■LabIt is recommended that teachers use a minimum of one hour of preparation time before the lab to download the gene files, review the screenshots, and practice uploading the gene files and analyzing the data. The prelab assessment can be completed in one 45-minute class period or assigned as homework the day before the lab. The summative assessment can be completed in one 45-minute class period.
■■ Safety■and■HousekeepingThere are no safety precautions associated with this investigation.
■■ ALIGNmENT■TO■THE■AP■BIOLOGy■CURRICULUm■FRAmEWORKThis investigation can be conducted while covering concepts pertaining to evolution (big idea 1) and/or genetics and information transfer (big idea 3). As always, it is important to make connections between big ideas and enduring understandings, regardless of where in the curriculum the lab is taught. The concepts align with the enduring understandings and learning objectives from the AP Biology Curriculum Framework, as indicated below.
■■ Enduring■Understandings• 1A2: Natural selection acts on phenotypic variations in populations.
• 1A4: Biological evolution is supported by scientific evidence from many disciplines, including mathematics.
• 1B2: Phylogenetic trees and cladograms are graphical representations (models) of evolutionary history that can be tested.
• 3A1: DNA, and in some cases RNA, is the primary source of heritable information.

T72■■Investigation 3
■■ Learning■Objectives• The student is able to evaluate data-based evidence that describes evolutionary
changes in the genetic makeup of a population over time (1A2 & SP 5.3).
• The student is able to evaluate evidence provided by data from many scientific disciplines that support biological evolution (1A4 & SP 5.3).
• The student is able to construct and/or justify mathematical models, diagrams, or simulations that represent processes of biological evolution (1A4 & SP 1.1, SP 1.2).
• The student is able to create a phylogenetic tree or simple cladogram that correctly represents evolutionary history and speciation from a provided data set (1B2 & SP 1.1).
• The student is able to construct scientific explanations that use the structures and mechanisms of DNA and RNA to support the claim that DNA, and in some cases RNA, is the primary source of heritable information (3A1 & SP 6.5).
■■ ■ARE■STUDENTS■READy■TO■COmPLETE■A■SUCCESSFUL■INqUIRy-BASED,■STUDENT-DIRECTED■INvESTIGATION?This investigation can be conducted while covering concepts pertaining to evolution. It is recommended that the students already have a solid of understanding of the structure and function of DNA and gene expression, specifically how the order of nucleotides in DNA codes for the production of proteins.
■■ Skills■DevelopmentStudents will develop the following skills:• Formulating, testing, and revising a hypothesis based on logic and evidence
• Using a sophisticated online bioinformatics program to analyze biological data
• Analyzing evolutionary patterns using morphological data and DNA analysis
• Analyzing preconstructed cladograms to demonstrate an understanding of evolutionary patterns
• Designing cladograms to depict evolutionary patterns
• Discussing and debating alternative interpretations of data based on evidence
■■ Potential■ChallengesThis lab is designed to be flexible and can be modified as desired. The amount of information on the BLAST website is a bit overwhelming — even for the scientists who use it on a frequent basis! Reassure students that a big part of this investigation is inquiry and exploration of the data provided and that they are not expected to know every detail of the BLAST program.

Investigation 3 T73
Big iDea 1: evolution
It is recommended that you use a computer projector to demonstrate the steps of the procedure and work through the first gene sequence with the entire class after you work through the steps yourself. After modeling the analysis of the first gene, the students should then continue the lab in groups.
Screenshots of each step in the procedure are provided in the Student Manual version of this lab. In addition to the screenshots, the following video tutorials may be helpful. However, please note that these tutorials do not match the exact procedures of this lab.• http://www.youtube.com/watch?v=HXEpBnUbAMo
• http://www.howcast.com/videos/359904-How-To-Use-NCBI-Blast
Additional videos can be found by searching “NCBI BLAST” on YouTube.
To help you and your students use BLAST, you might review the tutorials developed by NCBI at http://blast.ncbi.nlm.nih.gov/Blast.cgi?CMD=Web&PAGE_TYPE=BlastDocs.
■ 1.■Navigate to NCBI and the BLAST page as usual.
■ 2.■At the top, click “Help” to go to the BLAST Documentation Page.
■ 3.■Under the heading “About BLAST,” there is a handbook that has both novice-friendly sections as well as information for experienced users.
BLAST documentation can be viewed online as well as downloaded and distributed for educational purposes. There are practice data sets that teachers can use to demonstrate how to read the results, and all users are free to email or call the BLAST Help Line.
Those who want to dig deeper can visit the NCBI Educational Resources Web page (http://www.ncbi.nlm.nih.gov/education/) for videos, tutorials, project descriptions, and other tools designed for teaching.
This inquiry-based investigation has no definite right answer. This will frustrate some students. Reassure them that their performance in this investigation is based on the use of the data they collect to construct and test a reasonable hypothesis.
Students are unlikely to understand what BLAST is doing when it searches for sequence similarities. A simple analogy is the sticky note and the library. Tell students that they have a three-word phrase written on a sticky note. Their job is to go to the school library, look for every book that has that three-word phrase, and write down the exact page number and name of every book they find. Next, they must search for every book that has their three-word phrase, even if the spelling is not perfect. They must keep doing this until they find every last book that has a part of their three-word phrase. Their last chore is to put all the names and page numbers of the books they found in order, from most to least similar to their original phrase. If students are not impressed with the library analogy, tell them to use Google to search for a three-word phrase (with near matches) and categorize the hits for the entire Web. That is essentially what BLAST is doing in a few seconds.
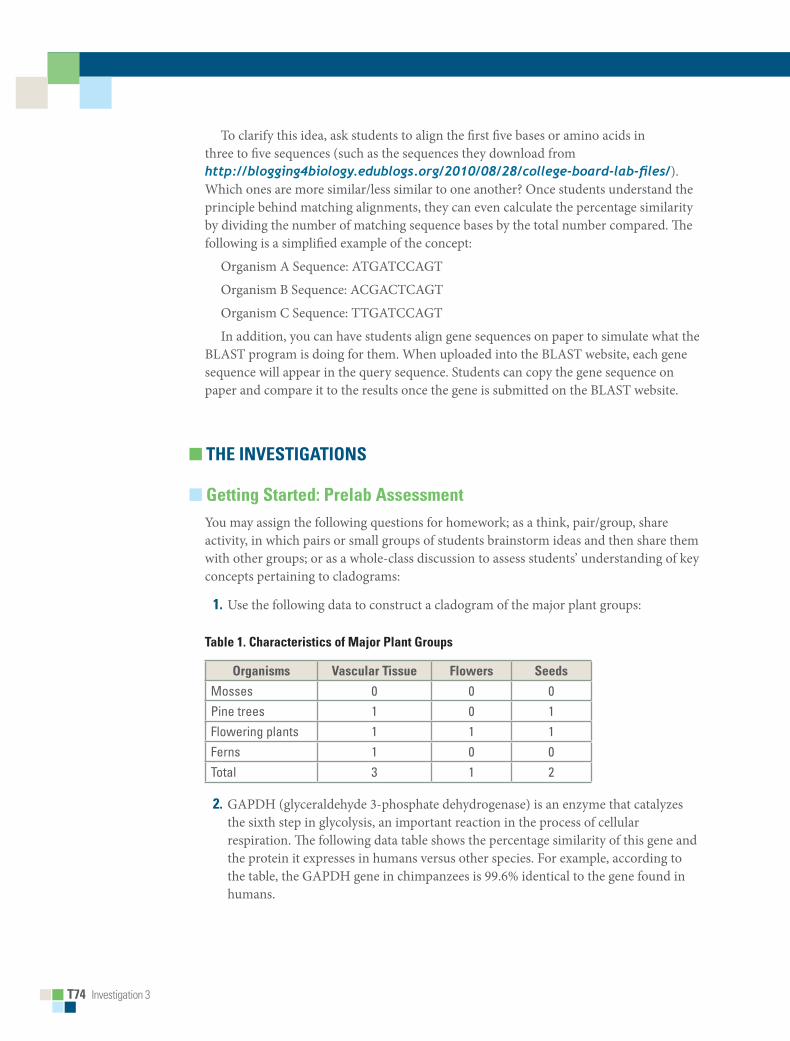
T74■■Investigation 3
To clarify this idea, ask students to align the first five bases or amino acids in three to five sequences (such as the sequences they download from http://blogging4biology.edublogs.org/2010/08/28/college-board-lab-files/). Which ones are more similar/less similar to one another? Once students understand the principle behind matching alignments, they can even calculate the percentage similarity by dividing the number of matching sequence bases by the total number compared. The following is a simplified example of the concept:
Organism A Sequence: ATGATCCAGT
Organism B Sequence: ACGACTCAGT
Organism C Sequence: TTGATCCAGT
In addition, you can have students align gene sequences on paper to simulate what the BLAST program is doing for them. When uploaded into the BLAST website, each gene sequence will appear in the query sequence. Students can copy the gene sequence on paper and compare it to the results once the gene is submitted on the BLAST website.
■■ THE■INvESTIGATIONS
■■ Getting■Started:■Prelab■AssessmentYou may assign the following questions for homework; as a think, pair/group, share activity, in which pairs or small groups of students brainstorm ideas and then share them with other groups; or as a whole-class discussion to assess students’ understanding of key concepts pertaining to cladograms:
■ 1.■Use the following data to construct a cladogram of the major plant groups:
Table■1.■Characteristics■of■major■Plant■Groups
Organisms vascular■Tissue Flowers Seeds
Mosses 0 0 0Pine trees 1 0 1Flowering plants 1 1 1Ferns 1 0 0Total 3 1 2
■ 2.■GAPDH (glyceraldehyde 3-phosphate dehydrogenase) is an enzyme that catalyzes the sixth step in glycolysis, an important reaction in the process of cellular respiration. The following data table shows the percentage similarity of this gene and the protein it expresses in humans versus other species. For example, according to the table, the GAPDH gene in chimpanzees is 99.6% identical to the gene found in humans.

Investigation 3 T75
Big iDea 1: evolution
Table■2.■■Percentage■Similarity■Between■the■GAPDH■Gene■and■Protein■in■Humans■and■■Other■Species
Species Gene■Percentage■Similarity
Protein■Percentage■Similarity
Chimpanzee (Pan troglodytes) 99.6% 100%Dog (Canis lupus familiaris) 91.3% 95.2%Fruit fly (Drosophila melanogaster) 72.4% 76.7%Roundworm (Caenorhabditis elegans) 68.2% 74.3%
a.■Why is the percentage similarity in the gene always lower than the percentage similarity in the protein for each of the species? (Hint: Recall how a gene is expressed to produce a protein.)
b.■Draw a cladogram depicting the evolutionary relationships among all five species (including humans) according to their percentage similarity in the GAPDH gene.
Online ActivitiesYou may also assign the following online activities:• “The Evolution of Flight in Birds” http://www.ucmp.berkeley.edu/education/explorations/reslab/flight/main.htm
This activity provides a real-world example of how cladograms are used to understand evolutionary relationships.• “What did T. rex taste like?” http://www.ucmp.berkeley.edu/education/explorations/tours/Trex/index.html
• “Journey into Phylogenetic Systematics” http://www.ucmp.berkeley.edu/clad/clad4.html
■■ Designing■and■Conducting■Independent■InvestigationsNow that students have completed this investigation, they should feel more comfortable using BLAST. The next step is to have students find and BLAST their own genes of interest. They might investigate something they have heard the name of, or you could ask them to think about and explore an enzyme or protein they studied before (e.g., DNA polymerase). They could look online for additional information to inform their questions (e.g., Are there diseases where DNA polymerase does not function normally? Do viruses make DNA polymerase?) Another option is to ask students to identify a disease that they know is related to proteins, such as spinocerebellar ataxia or various storage diseases. Search for the normal versus mutant versions of the protein or DNA. What is different about their sequences?

T76■■Investigation 3
To locate a gene, go to the Entrez Gene* section of the NCBI website (http://www.ncbi.nlm.nih.gov/gene) and search for the gene. Once you have found the gene on the website, copy the gene sequence and input it into a BLAST query. Ask students to determine the function of proteins in humans and then to predict if they will find the same protein (and related gene) in other organisms. Do students understand that BLAST analyses provide only one piece of evidence about speciation and the phylogenetic relationships of organisms? Is DNA evidence more or less important to evolutionary studies as compared to morphological evidence?
Example Procedure
■ 1.■On the Entrez Gene website, search “human actin.”
■ 2.■Click on the first link that appears and scroll down to the section “NCBI Reference Sequences.”
■ 3.■Under “mRNA and Proteins,” click on the first file name “NM 001100.3.”
■ 4.■ Just below the gene title, click on “FASTA.”
■ 5.■The nucleotide sequence displayed is that of the actin gene in humans.
■ 6.■Copy the gene sequence and go to the BLAST homepage (http://blast.ncbi.nlm.nih.gov/Blast.cgi).
■ 7.■Click on “nucleotide blast” under the Basic BLAST menu.
■ 8.■Paste the sequence into the box where it says “Enter Query Sequence.”
■ 9.■Give the query a title in the box provided if you plan on saving it for later.
■10.■Under “Choose Search Set,” select whether you want to search the human genome only, mouse genome only, or all genomes available.
■11.■Under “Program Selection,” choose whether you want highly similar sequences or somewhat similar sequences. Choosing somewhat similar sequences will provide you with more results.
■12.■Click BLAST.
*Entrez Gene is a global database of genetic information. When you use it, you search a number of databases for specific gene information. Entrez Gene is separate from BLAST in that it searches for a specific gene’s sequence. BLAST then compares the sequence of the single, specific gene with other sequences in the database. An example procedure of how Entrez Gene and BLAST work together is described in the following example.
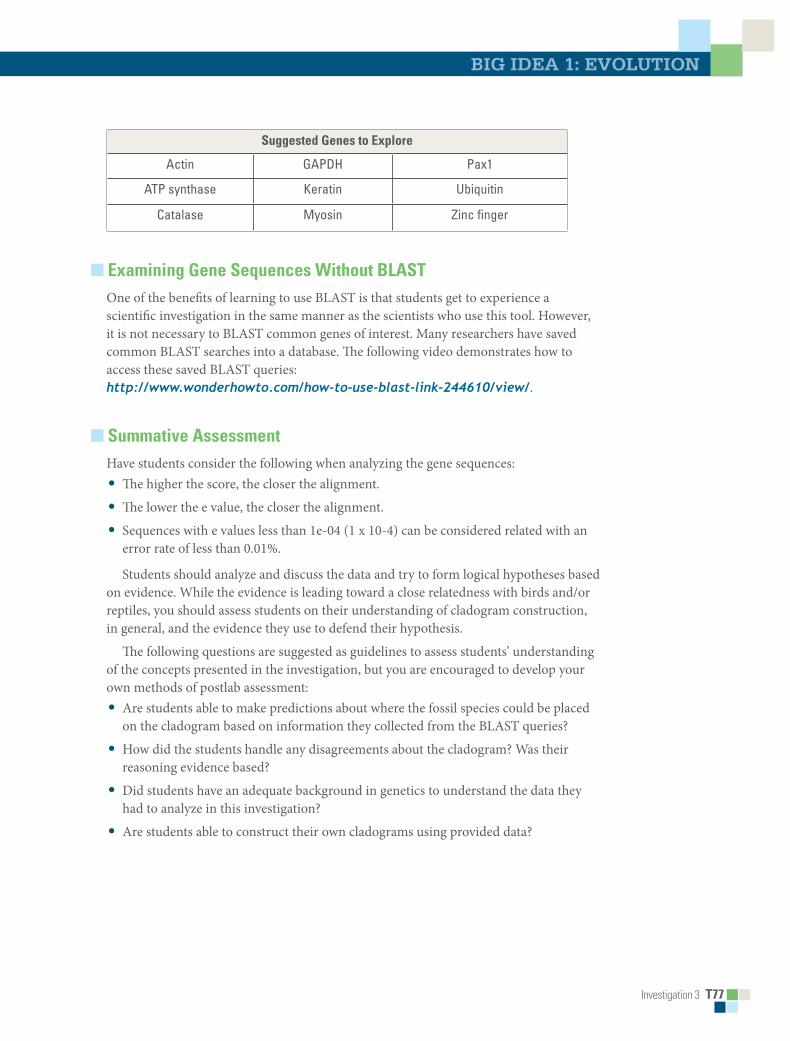
Investigation 3 T77
Big iDea 1: evolution
Suggested■Genes■to■Explore
Actin GAPDH Pax1
ATP synthase Keratin Ubiquitin
Catalase Myosin Zinc finger
■■ Examining■Gene■Sequences■Without■BLASTOne of the benefits of learning to use BLAST is that students get to experience a scientific investigation in the same manner as the scientists who use this tool. However, it is not necessary to BLAST common genes of interest. Many researchers have saved common BLAST searches into a database. The following video demonstrates how to access these saved BLAST queries: http://www.wonderhowto.com/how-to-use-blast-link-244610/view/.
■■ Summative■AssessmentHave students consider the following when analyzing the gene sequences:• The higher the score, the closer the alignment.
• The lower the e value, the closer the alignment.
• Sequences with e values less than 1e-04 (1 x 10⁻⁴) can be considered related with an error rate of less than 0.01%.
Students should analyze and discuss the data and try to form logical hypotheses based on evidence. While the evidence is leading toward a close relatedness with birds and/or reptiles, you should assess students on their understanding of cladogram construction, in general, and the evidence they use to defend their hypothesis.
The following questions are suggested as guidelines to assess students’ understanding of the concepts presented in the investigation, but you are encouraged to develop your own methods of postlab assessment:• Are students able to make predictions about where the fossil species could be placed
on the cladogram based on information they collected from the BLAST queries?
• How did the students handle any disagreements about the cladogram? Was their reasoning evidence based?
• Did students have an adequate background in genetics to understand the data they had to analyze in this investigation?
• Are students able to construct their own cladograms using provided data?

T78■■Investigation 3
Determine if students truly understand the evolutionary patterns seen in cladograms by asking them to include concepts such as speciation, extinction, and natural selection when describing a particular cladogram.
■■ SUPPLEmENTAL■RESOURCES
■■ Other■LabsAnother inquiry-based cladogram investigation that uses simple household items can be found at the following website: http://blogging4biology.edublogs.org/2010/08/26/cladogram-lab-activity/
This cladogram investigation also uses simple household items: http://www.pbs.org/wgbh/nova/teachers/activities/2905_link.html
This fun activity involves students creating cladograms to show the evolution of different types of music: http://www.cse.emory.edu/sciencenet/evolution/teacher%20projects/walton.pdf
■■ Online■ActivitiesThe following online activities are included in the Student Manual:
“The Evolution of Flight in Birds”: This activity provides a real-world example of how cladograms are used to understand evolutionary relationships: http://www.ucmp.berkeley.edu/education/explorations/reslab/flight/main.htm
“What did T. rex taste like?”: http://www.ucmp.berkeley.edu/education/explorations/tours/Trex/index.html
■■ ReferencesThe plant group cladogram table (and answer key) is available at http://petrifiedwoodmuseum.org/Taxonomy.htm
The following resources illustrate common misconceptions in reading and interpreting phylogenetic trees: Baum, David A., Stacey DeWitt Smith, and Samuel S. S. Donovan. “The Tree-Thinking
Challenge.” Science 310, no. 5750 (November 11, 2005): 979–980.
Baum, David A. and Susan Offner. “Phylogenetics & Tree-Thinking.” 70(4), (2008): 222–229.
Gregory, T. Ryan. “Understanding Evolutionary Trees.” Evolution: Education and Outreach 1 (2008): 121–137.
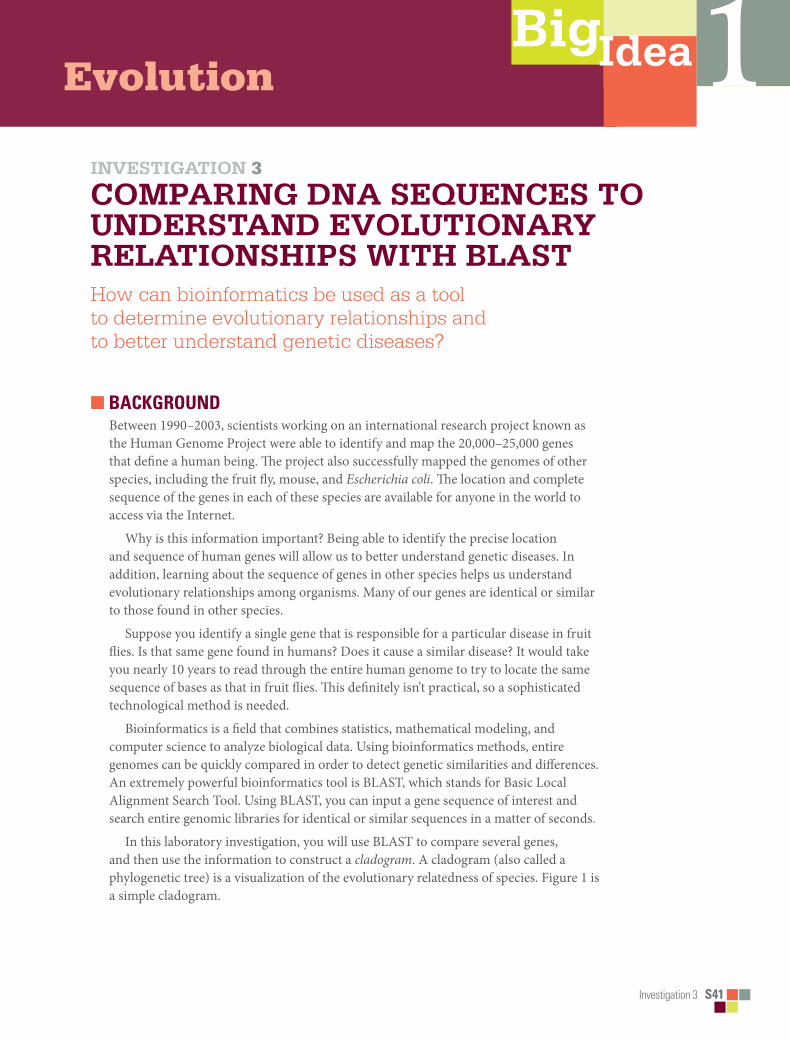
BigIdea
Investigation 3 S41
Evolution 1investigation 3
Comparing Dna sequenCes to unDerstanD evolutionary relationships with BlastHow can bioinformatics be used as a tool to determine evolutionary relationships and to better understand genetic diseases?
■■ BACKGROUNDBetween 1990–2003, scientists working on an international research project known as the Human Genome Project were able to identify and map the 20,000–25,000 genes that define a human being. The project also successfully mapped the genomes of other species, including the fruit fly, mouse, and Escherichia coli. The location and complete sequence of the genes in each of these species are available for anyone in the world to access via the Internet.
Why is this information important? Being able to identify the precise location and sequence of human genes will allow us to better understand genetic diseases. In addition, learning about the sequence of genes in other species helps us understand evolutionary relationships among organisms. Many of our genes are identical or similar to those found in other species.
Suppose you identify a single gene that is responsible for a particular disease in fruit flies. Is that same gene found in humans? Does it cause a similar disease? It would take you nearly 10 years to read through the entire human genome to try to locate the same sequence of bases as that in fruit flies. This definitely isn’t practical, so a sophisticated technological method is needed.
Bioinformatics is a field that combines statistics, mathematical modeling, and computer science to analyze biological data. Using bioinformatics methods, entire genomes can be quickly compared in order to detect genetic similarities and differences. An extremely powerful bioinformatics tool is BLAST, which stands for Basic Local Alignment Search Tool. Using BLAST, you can input a gene sequence of interest and search entire genomic libraries for identical or similar sequences in a matter of seconds.
In this laboratory investigation, you will use BLAST to compare several genes, and then use the information to construct a cladogram. A cladogram (also called a phylogenetic tree) is a visualization of the evolutionary relatedness of species. Figure 1 is a simple cladogram.
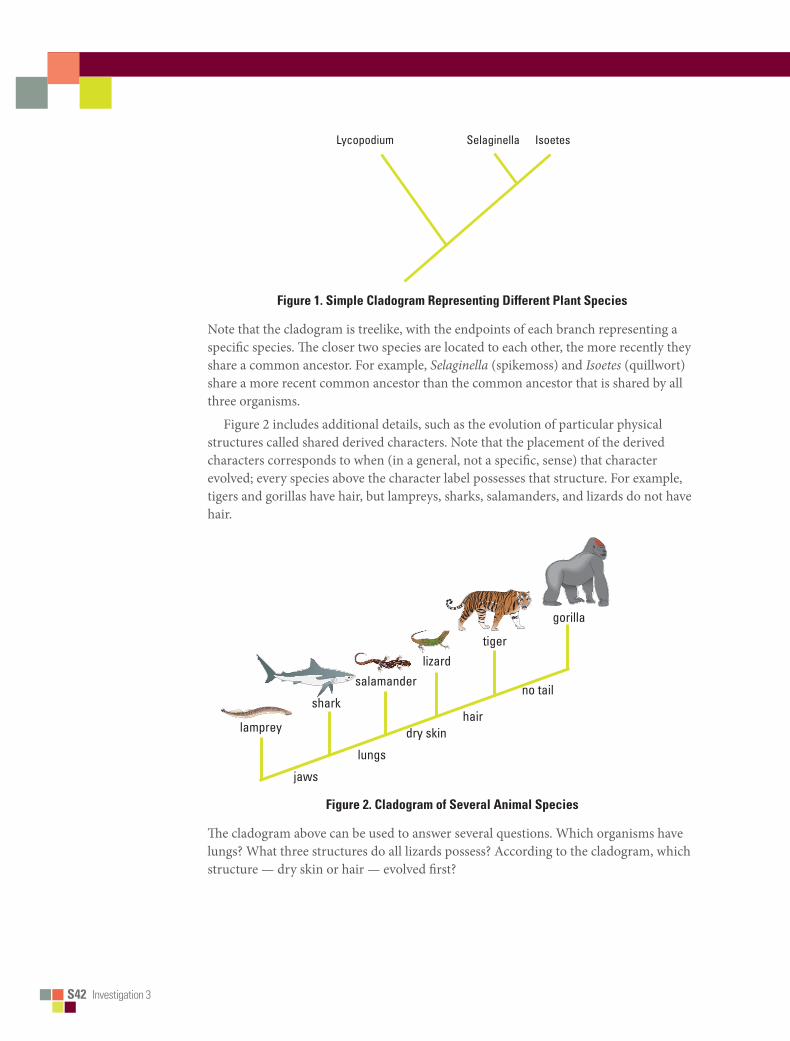
S42■■Investigation 3
Big iDea 1: evolution
Lycopodium Selaginella Isoetes
Figure■1.■Simple■Cladogram■Representing■Different■Plant■Species
Note that the cladogram is treelike, with the endpoints of each branch representing a specific species. The closer two species are located to each other, the more recently they share a common ancestor. For example, Selaginella (spikemoss) and Isoetes (quillwort) share a more recent common ancestor than the common ancestor that is shared by all three organisms.
Figure 2 includes additional details, such as the evolution of particular physical structures called shared derived characters. Note that the placement of the derived characters corresponds to when (in a general, not a specific, sense) that character evolved; every species above the character label possesses that structure. For example, tigers and gorillas have hair, but lampreys, sharks, salamanders, and lizards do not have hair.
■■■■■jaws
lamprey
salamanderlizard
tiger
gorilla
shark
lungs
dry skinhair
no tail
Figure■2.■Cladogram■of■Several■Animal■Species
The cladogram above can be used to answer several questions. Which organisms have lungs? What three structures do all lizards possess? According to the cladogram, which structure — dry skin or hair — evolved first?
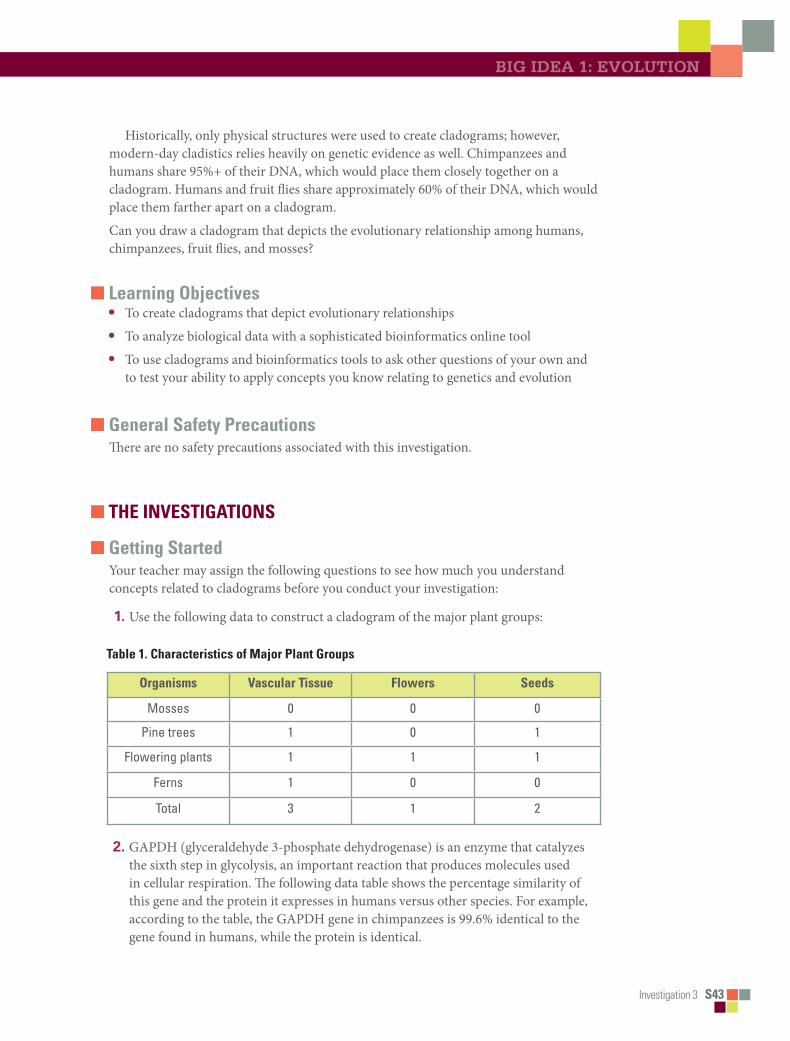
Investigation 3 S43
Big iDea 1: evolution
Historically, only physical structures were used to create cladograms; however, modern-day cladistics relies heavily on genetic evidence as well. Chimpanzees and humans share 95%+ of their DNA, which would place them closely together on a cladogram. Humans and fruit flies share approximately 60% of their DNA, which would place them farther apart on a cladogram.
Can you draw a cladogram that depicts the evolutionary relationship among humans, chimpanzees, fruit flies, and mosses?
■■ Learning■Objectives• To create cladograms that depict evolutionary relationships
• To analyze biological data with a sophisticated bioinformatics online tool
• To use cladograms and bioinformatics tools to ask other questions of your own and to test your ability to apply concepts you know relating to genetics and evolution
■■ General■Safety■PrecautionsThere are no safety precautions associated with this investigation.
■■ THE■INVESTIGATIONS
■■ Getting■StartedYour teacher may assign the following questions to see how much you understand concepts related to cladograms before you conduct your investigation:
1.Use the following data to construct a cladogram of the major plant groups:
Table■1.■Characteristics■of■Major■Plant■Groups
Organisms Vascular■Tissue Flowers Seeds
Mosses 0 0 0
Pine trees 1 0 1
Flowering plants 1 1 1
Ferns 1 0 0
Total 3 1 2
2.GAPDH (glyceraldehyde 3-phosphate dehydrogenase) is an enzyme that catalyzes the sixth step in glycolysis, an important reaction that produces molecules used in cellular respiration. The following data table shows the percentage similarity of this gene and the protein it expresses in humans versus other species. For example, according to the table, the GAPDH gene in chimpanzees is 99.6% identical to the gene found in humans, while the protein is identical.

S44■■Investigation 3
Big iDea 1: evolution
Table■2.■■Percentage■Similarity■Between■the■GAPDH■Gene■and■Protein■in■Humans■and■■Other■Species
Species Gene■Percentage■Similarity
Protein■Percentage■Similarity
Chimpanzee (Pan troglodytes) 99.6% 100%
Dog (Canis lupus familiaris) 91.3% 95.2%
Fruit fly (Drosophila melanogaster) 72.4% 76.7%
Roundworm (Caenorhabditis elegans) 68.2% 74.3%
a.Why is the percentage similarity in the gene always lower than the percentage similarity in the protein for each of the species? (Hint: Recall how a gene is expressed to produce a protein.)
b.Draw a cladogram depicting the evolutionary relationships among all five species (including humans) according to their percentage similarity in the GAPDH gene.
Online ActivitiesYou can also prepare for the lab by working through the following online activities:• “The Evolution of Flight in Birds”
http://www.ucmp.berkeley.edu/education/explorations/reslab/flight/main.htm This activity provides a real-world example of how cladograms are used to understand evolutionary relationships.
• “What did T. rex taste like?” http://www.ucmp.berkeley.edu/education/explorations/tours/Trex /index.html
• “Journey into Phylogenetic Systematics” http://www.ucmp.berkeley.edu/clad/clad4.html
■■ ProcedureA team of scientists has uncovered the fossil specimen in Figure 3 near Liaoning Province, China. Make some general observations about the morphology (physical structure) of the fossil, and then record your observations in your notebook.
Little is known about the fossil. It appears to be a new species. Upon careful examination of the fossil, small amounts of soft tissue have been discovered. Normally, soft tissue does not survive fossilization; however, rare situations of such preservation do occur. Scientists were able to extract DNA nucleotides from the tissue and use the information to sequence several genes. Your task is to use BLAST to analyze these genes and determine the most likely placement of the fossil species on Figure 4.
Figure■3.■Fossil■Specimen
©A
MN
H, M
ick
Ellis
on

Investigation 3 S45
Big iDea 1: evolution
heterotroph
vertebrae
fur
two specializedincisors
rodentsgreat apes
opposablethumbs
feathers
birdscrocodilians
palatal valve
crustaceans
two-parted limbs
insects
exposedmouthparts
Figure■4.■Fossil■Cladogram
Step■1 Form an initial hypothesis as to where you believe the fossil specimen should be placed on the cladogram based on the morphological observations you made earlier. Draw your hypothesis on Figure 4.
Step■2 Locate and download gene files. Download three gene files from the AP Biology Investigative Labs page at AP Central: http://apcentral.collegeboard.com/apc/members/courses/teachers_corner/218954.html.
Step■3 Upload the gene sequence into BLAST by doing the following:
a.Go to the BLAST homepage: http://blast.ncbi.nlm.nih.gov/Blast.cgi
b.Click on “Saved Strategies” from the menu at the top of the page.
Figure■5
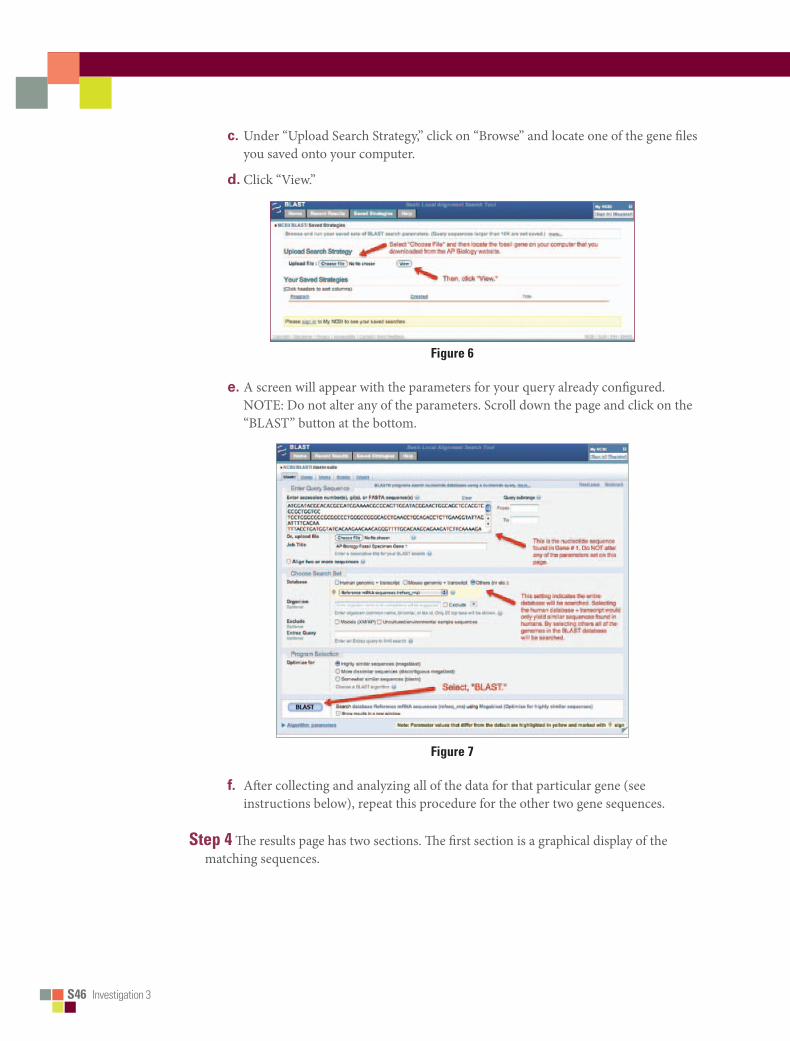
S46■■Investigation 3
Big iDea 1: evolution
c.Under “Upload Search Strategy,” click on “Browse” and locate one of the gene files you saved onto your computer.
d.Click “View.”
Figure■6
e.A screen will appear with the parameters for your query already configured. NOTE: Do not alter any of the parameters. Scroll down the page and click on the “BLAST” button at the bottom.
Figure■7
f. After collecting and analyzing all of the data for that particular gene (see instructions below), repeat this procedure for the other two gene sequences.
Step■4 The results page has two sections. The first section is a graphical display of the matching sequences.

Investigation 3 S47
Big iDea 1: evolution
Figure■8
Scroll down to the section titled “Sequences producing significant alignments.” The species in the list that appears below this section are those with sequences identical to or most similar to the gene of interest. The most similar sequences are listed first, and as you move down the list, the sequences become less similar to your gene of interest.
Figure■9
If you click on a particular species listed, you’ll get a full report that includes the classification scheme of the species, the research journal in which the gene was first reported, and the sequence of bases that appear to align with your gene of interest.

S48■■Investigation 3
Big iDea 1: evolution
Figure■10
If you click on a particular species listed, you’ll get a full report that includes the species’ classification scheme, the research journal in which the gene was first reported, and the sequence of bases that appear to align with your gene of interest.
If you click on the link titled “Distance tree of results,” you will see a cladogram with the species with similar sequences to your gene of interest placed on the cladogram according to how closely their matched gene aligns with your gene of interest.
■■ Analyzing■ResultsRecall that species with common ancestry will share similar genes. The more similar genes two species have in common, the more recent their common ancestor and the closer the two species will be located on a cladogram.
As you collect information from BLAST for each of the gene files, you should be thinking about your original hypothesis and whether the data support or cause you to reject your original placement of the fossil species on the cladogram.
For each BLAST query, consider the following:• The higher the score, the closer the alignment.
• The lower the e value, the closer the alignment.
• Sequences with e values less than 1e-04 (1 x 10⁻⁴) can be considered related with an error rate of less than 0.01%.
1.What species in the BLAST result has the most similar gene sequence to the gene of interest?
2.Where is that species located on your cladogram?
3.How similar is that gene sequence?
4.What species has the next most similar gene sequence to the gene of interest?
Based on what you have learned from the sequence analysis and what you know from the structure, decide where the new fossil species belongs on the cladogram with the other organisms. If necessary, redraw the cladogram you created before.

Investigation 3 S49
Big iDea 1: evolution
■■ Evaluating■ResultsCompare and discuss your cladogram with your classmates. Does everyone agree with the placement of the fossil specimen? If not, what is the basis of the disagreement?
On the main page of BLAST, click on the link “List All Genomic Databases.” How many genomes are currently available for making comparisons using BLAST? How does this limitation impact the proper analysis of the gene data used in this lab?
What other data could be collected from the fossil specimen to help properly identify its evolutionary history?
■■ Designing■and■Conducting■Your■InvestigationNow that you’ve completed this investigation, you should feel more comfortable using BLAST. The next step is to learn how to find and BLAST your own genes of interest. To locate a gene, you will go to the Entrez Gene website (http://www.ncbi.nlm.nih.gov/gene). Once you have found the gene on the website, you can copy the gene sequence and input it into a BLAST query.
Example ProcedureOne student’s starting question: What is the function of actin in humans? Do other organisms have actin? If so, which ones?
1.Go to the Entrez Gene website (http://www.ncbi.nlm.nih.gov/gene) and search for “human actin.”
2.Click on the first link that appears and scroll down to the section “NCBI Reference Sequences.”
3.Under “mRNA and Proteins,” click on the first file name. It will be named “NM 001100.3” or something similar. These standardized numbers make cataloging sequence files easier. Do not worry about the file number for now.
4.Just below the gene title click on “FASTA.” This is the name for a particular format for displaying sequences.
5.The nucleotide sequence displayed is that of the actin gene in humans.
6.Copy the entire gene sequence, and then go to the BLAST homepage (http://blast.ncbi.nlm.nih.gov/Blast.cgi).
7.Click on “nucleotide blast” under the Basic BLAST menu.
8.Paste the sequence into the box where it says “Enter Query Sequence.”
9.Give the query a title in the box provided if you plan on saving it for later.
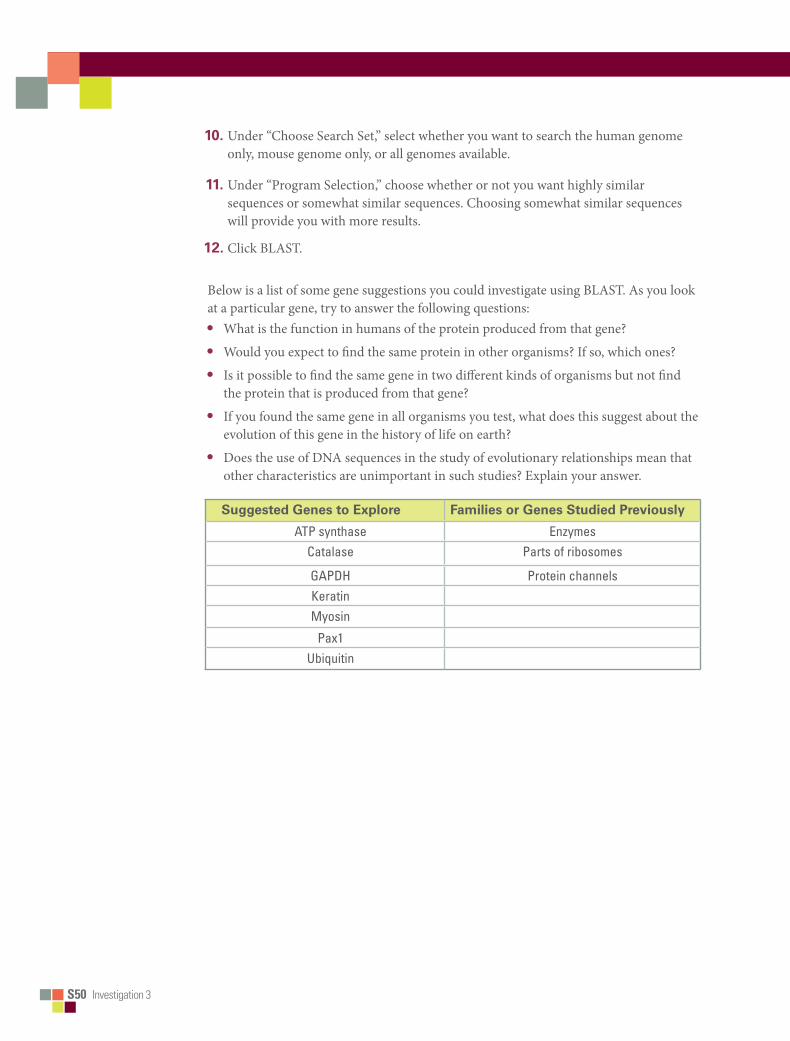
S50■■Investigation 3
10.Under “Choose Search Set,” select whether you want to search the human genome only, mouse genome only, or all genomes available.
11.Under “Program Selection,” choose whether or not you want highly similar sequences or somewhat similar sequences. Choosing somewhat similar sequences will provide you with more results.
12.Click BLAST.
Below is a list of some gene suggestions you could investigate using BLAST. As you look at a particular gene, try to answer the following questions: • What is the function in humans of the protein produced from that gene?
• Would you expect to find the same protein in other organisms? If so, which ones?
• Is it possible to find the same gene in two different kinds of organisms but not find the protein that is produced from that gene?
• If you found the same gene in all organisms you test, what does this suggest about the evolution of this gene in the history of life on earth?
• Does the use of DNA sequences in the study of evolutionary relationships mean that other characteristics are unimportant in such studies? Explain your answer.
SuggestedGenestoExplore FamiliesorGenesStudiedPreviously
ATP synthase EnzymesCatalase Parts of ribosomes
GAPDH Protein channelsKeratinMyosin
Pax1Ubiquitin
Big Idea 2 T79
BigIdea2Cellular Processes: Energy and Communication
Biological systems utilize free energy and molecular building blocks to grow, reproduce, and maintain dynamic homeostasis. Organisms have evolved various strategies to capture, use, and store free energy and other vital resources;
for example, autotrophic cells capture free energy through photosynthesis and chemosynthesis, whereas fermentation and cellular respiration harvest free energy from sugars to produce free energy carriers, such as ATP, that drive metabolic pathways in cells. Because deficiencies in free energy are detrimental to organisms, several questions emerge about these processes, including What factors affect the rate of photosynthesis and cellular respiration? and How can these changes be measured?
In addition to free energy, cells and organisms must exchange matter with the environment; for example, carbon moves from the environment to organisms, where it is incorporated into the sugars produced in photosynthesis. Membranes not only allow cells to maintain internal environments that differ from external environments, but the selectively permeable structure of cell membranes regulates the movement of molecules across them. The processes of osmosis, diffusion, and active transport help cells maintain dynamic homeostasis. Because cells must constantly exchange molecules with their environment, key questions include What factors affect the rate of diffusion and osmosis? How can these be tested? Why does a plant wilt when deprived of water? and Why can a plant recover from water loss when other organisms die from dehydration?
The suite of inquiry-based investigations in big idea 2 provides opportunities for students to ask questions, and explore answers, about photosynthesis, cellular respiration, and the movement of molecules across membranes — phenomena that will be studied further when students investigate transpiration in plants (big idea 4).
■■ SynopSeS■of■The■InveSTIgaTIonSMaterials must move through membranes of a cell for the cell to maintain its dynamic homeostasis, and this movement is regulated by selectively permeable membranes. The simplest form of movement is diffusion, in which solutes move from an area of high concentration to an area of low concentration. Like solutes, water also moves down its concentration gradient by osmosis.
In Investigation 4: Diffusion and Osmosis, students calculate surface area-to-volume ratios, and make predictions about which measurement — surface or volume — has the greater influence on the rate of diffusion. Next, students create artificial cells to model diffusion, followed by observation of osmosis in living cells and measurement of water potential in different types of plants. All sections of the investigation provide opportunities for students to design and conduct experiments to more deeply investigate questions that emerge from their observations and results. Students revisit the concepts of osmosis and water potential when they investigate transpiration in plants (big idea 4).
T80■■Big Idea 2
In Investigation 5: Photosynthesis, students learn how to measure the rate of photosynthesis indirectly by using the floating leaf disk procedure to gauge oxygen production. Photosynthesis is a strategy employed by autotrophs to capture light energy to build energy-rich carbohydrates. The process is summarized by the following reaction:
2H2O + CO2 + light → carbohydrate (CH2O) + O2 + H2O
To determine the rate of photosynthesis, one could measure the production of O2 or the consumption of CO2. The difficulty related to measuring the production of oxygen gas is compounded by the complementary process of aerobic respiration consuming oxygen as it is produced. Therefore, the rate of photosynthesis generally is calculated by measuring the consumption of carbon dioxide, but this requires expensive equipment and complex procedures. Students are asked to consider variables that might affect the rate of photosynthesis and the floating disk procedure itself. A number of questions emerge about the process that leads to independent student investigations. The investigation also provides an opportunity for students to apply concepts that they have studied previously, including enzymatic activity, cell structure and function (big idea 4), and the evolution of conserved core processes in plants (big idea 1).
Investigation 6: Cellular Respiration is a revision of Laboratory 5 (Cell Respiration) in the 2001 AP Biology Laboratory Manual and reflects the shift toward more student-directed and inquiry-based laboratory experiences as students explore factors that might affect the rate of cellular respiration in multicellular organisms. Heterotrophic organisms harvest free energy stored in carbon compounds produced by other organisms. In cellular respiration, free energy becomes available to drive metabolic pathways primarily by the conversion of ADP to ATP. If sufficient oxygen is available, glucose may be oxidized completely, as summarized by the following reaction:
C6H12O6 + 6O2(g) → 6CO2(g) + 6H2O + energy
To determine the rate of cellular respiration, one could measure the consumption of O2 during the oxidation of glucose, or the production of CO2. In this investigation, students assemble microrespirometers or use gas pressure sensors (probe system) to measure the relative volume (changes in pressure) as oxygen is consumed by germinating seeds. Once students learn how to measure the rate of cellular respiration, questions emerge about the process that leads to independent student investigations about factors that might affect the rate. This investigation can be conducted during the study of cellular processes, interactions (big idea 4), and even evolution (big idea 1) if students raise questions about cellular respiration as a conserved core process, or compare different processes such as C3, C4, and CAM plants and the environments in which they evolved.
BigIdea
Investigation 4 T81
Cellular Processes: Energy and Communication
2investigation 4
DiFFUsion anD osMosisWhat causes plants to wilt if they are not watered?
■ BACKGROUNDCells must move materials through membranes and throughout cytoplasm in order to maintain homeostasis. The movement is regulated because cellular membranes, including the plasma and organelle membranes, are selectively permeable. Membranes are phospholipid bilayers containing embedded proteins. The phospholipid fatty acids limit the movement of water because of their hydrophobic characteristics.
The cellular environment is aqueous, meaning that the solutes (e.g., salts, organic molecules) dissolve in water, which is the solvent. Water may pass freely through the membrane by osmosis or through specialized protein channels called aquaporins. Most ions move through protein channels, while larger molecules, such as carbohydrates, are carried by transport proteins.
The simplest form of movement is diffusion, in which solutes move from an area of high concentration to an area of low concentration; diffusion is directly related to molecular kinetic energy. Diffusion does not require energy input. The movement of a solute from an area of low concentration to an area of high concentration requires energy input in the form of ATP and protein carriers called pumps.
Water moves through membranes by diffusion; this process is called osmosis. Like solutes, water moves down its concentration gradient. Water moves from areas of high potential (high water concentration) and low solute concentration to areas of low potential (low water concentration) and high solute concentration. In walled cells, osmosis is affected not only by the solute concentration but also by the resistance to water movement in the cell by the cell wall. This resistance is called turgor pressure.
The terms hypertonic, hypotonic, and isotonic are used to describe solutions separated by selectively permeable membranes. A hypertonic solution has a higher solute concentration and a lower water potential as compared to the other solution; therefore, water will move into the hypertonic solution through the membrane. A hypotonic solution has a lower solute concentration and a higher water potential than the solution on the other side of the membrane; water will move down its concentration gradient into the other solution. Isotonic solutions have equal water potential.
The movement of solutes and water across cellular membranes is an overarching concept. Cells must maintain their internal environments and control solute movement. These concepts can be illustrated using model systems and living cells. Students will revisit the concepts of osmosis and water potential when they investigate transpiration in plants.
T82 Investigation 4
This investigation consists of three parts. It is recommended that students work through all three sections. In Procedure 1, students use artificial cells to study the relationship of surface area and volume. In Procedure 2, they create models of living cells to explore osmosis and diffusion. Students finish by observing osmosis in living cells (Procedure 3). All three sections of the investigation provide opportunities for students to design and conduct their own experiments.
■ Understanding Water PotentialIn nonwalled cells, such as animal cells, the movement of water into and out of a cell is affected by the relative solute concentration on either side of the plasma membrane. As water moves out of the cell, the cell shrinks or undergoes crenation; if water moves into the cell, it swells and may eventually burst or lyse. In walled cells, including fungal and plant cells, the presence of a cell wall prevents the cells from bursting as water enters; however, pressure builds up inside the cell and affects the rate of osmosis.
Water potential predicts which way water diffuses through plant tissues and is abbreviated by the Greek letter psi (ψ). Water potential is the free energy per mole of water and is calculated from two major components: (1) the solute potential (ψS), which is dependent on solute concentration, and (2) the pressure potential (ψP), which results from the exertion of pressure — either positive or negative (tension) — on a solution. The solute potential is also called the osmotic potential.
ψ = ψP + ψS
Water Potential = Pressure Potential + Solute Potential
Water moves from an area of higher water potential or higher free energy to an area of lower water potential or lower free energy. Water potential measures the tendency of water to diffuse from one compartment to another compartment.
The water potential of pure water in an open beaker is zero (ψ = 0) because both the solute and pressure potentials are zero (ψS = 0; ψP = 0). An increase in positive pressure raises the pressure potential and the water potential. The addition of solute to the water lowers the solute potential and therefore decreases the water potential. This means that a solution at atmospheric pressure has a negative water potential because of the solute.
The solute potential (ψS) = – iCRT, where i = the ionization constant, C = the molar concentration, R = the pressure constant (R = 0.0831 liter bars/mole-K), and T = the temperature in K (273 + °C).
A 0.15 M solution of sucrose at atmospheric pressure (ψP = 0) and 25°C has an osmotic potential of -3.7 bars and a water potential of -3.7 bars. A bar is a metric measure of pressure and is the same as 1 atmosphere at sea level. A 0.15 M NaCl solution contains 2 ions, Na+ and Cl-; therefore i = 2, and the water potential = -7.4 bars.
When a cell’s cytoplasm is separated from pure water by a selectively permeable membrane, water moves from the surrounding area, where the water potential is higher (ψ = 0), into the cell, where water potential is lower because of solutes in the cytoplasm (ψ is negative). It is assumed that the solute is not diffusing (Figure 1a). The movement of water into the cell causes the cell to swell, and the cell membrane pushes against the cell wall to produce an increase in pressure. This pressure, which counteracts the diffusion of water into the cell, is called turgor pressure.
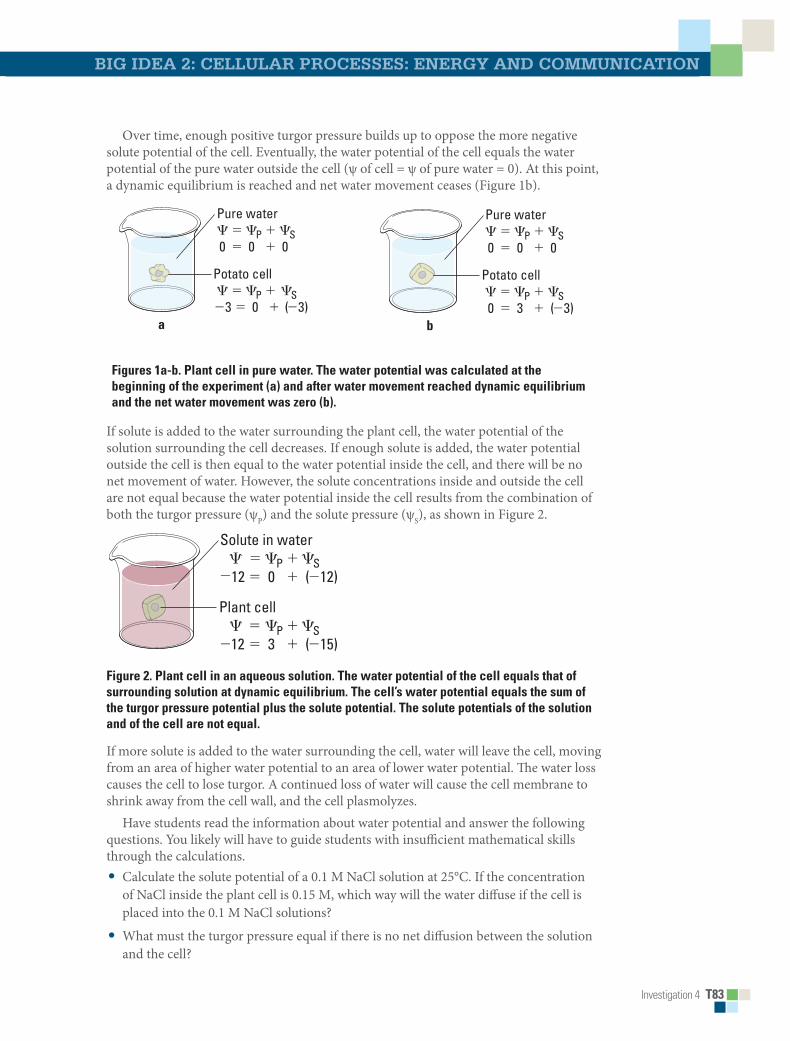
Investigation 4 T83
Big iDea 2: CellUlar ProCesses: energy anD CoMMUniCation
Over time, enough positive turgor pressure builds up to oppose the more negative solute potential of the cell. Eventually, the water potential of the cell equals the water potential of the pure water outside the cell (ψ of cell = ψ of pure water = 0). At this point, a dynamic equilibrium is reached and net water movement ceases (Figure 1b).
Bio_T_Lab04_01
a b
Bio_T_Lab04_01
a b
Figures 1a-b. Plant cell in pure water. The water potential was calculated at the beginning of the experiment (a) and after water movement reached dynamic equilibrium and the net water movement was zero (b).
If solute is added to the water surrounding the plant cell, the water potential of the solution surrounding the cell decreases. If enough solute is added, the water potential outside the cell is then equal to the water potential inside the cell, and there will be no net movement of water. However, the solute concentrations inside and outside the cell are not equal because the water potential inside the cell results from the combination of both the turgor pressure (ψP) and the solute pressure (ψS), as shown in Figure 2.
Bio_T_Lab04_02
Figure 2. Plant cell in an aqueous solution. The water potential of the cell equals that of surrounding solution at dynamic equilibrium. The cell’s water potential equals the sum of the turgor pressure potential plus the solute potential. The solute potentials of the solution and of the cell are not equal.
If more solute is added to the water surrounding the cell, water will leave the cell, moving from an area of higher water potential to an area of lower water potential. The water loss causes the cell to lose turgor. A continued loss of water will cause the cell membrane to shrink away from the cell wall, and the cell plasmolyzes.
Have students read the information about water potential and answer the following questions. You likely will have to guide students with insufficient mathematical skills through the calculations.• Calculate the solute potential of a 0.1 M NaCl solution at 25°C. If the concentration
of NaCl inside the plant cell is 0.15 M, which way will the water diffuse if the cell is placed into the 0.1 M NaCl solutions?
• What must the turgor pressure equal if there is no net diffusion between the solution and the cell?
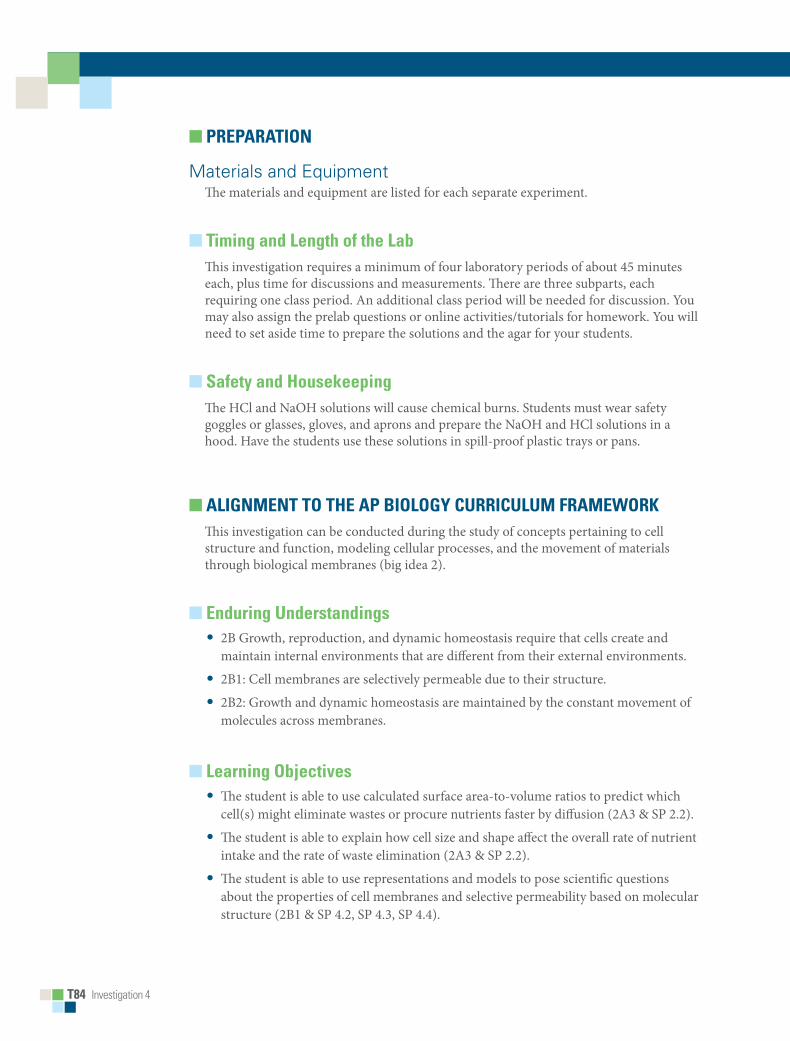
T84 Investigation 4
■ PREPARATION
Materials and EquipmentThe materials and equipment are listed for each separate experiment.
■ Timing and Length of the LabThis investigation requires a minimum of four laboratory periods of about 45 minutes each, plus time for discussions and measurements. There are three subparts, each requiring one class period. An additional class period will be needed for discussion. You may also assign the prelab questions or online activities/tutorials for homework. You will need to set aside time to prepare the solutions and the agar for your students.
■ Safety and HousekeepingThe HCl and NaOH solutions will cause chemical burns. Students must wear safety goggles or glasses, gloves, and aprons and prepare the NaOH and HCl solutions in a hood. Have the students use these solutions in spill-proof plastic trays or pans.
■ ALIGNmENT TO THE AP BIOLOGy CURRICULUm FRAmEWORKThis investigation can be conducted during the study of concepts pertaining to cell structure and function, modeling cellular processes, and the movement of materials through biological membranes (big idea 2).
■ Enduring Understandings• 2B Growth, reproduction, and dynamic homeostasis require that cells create and
maintain internal environments that are different from their external environments.
• 2B1: Cell membranes are selectively permeable due to their structure.
• 2B2: Growth and dynamic homeostasis are maintained by the constant movement of molecules across membranes.
■ Learning Objectives• The student is able to use calculated surface area-to-volume ratios to predict which
cell(s) might eliminate wastes or procure nutrients faster by diffusion (2A3 & SP 2.2).
• The student is able to explain how cell size and shape affect the overall rate of nutrient intake and the rate of waste elimination (2A3 & SP 2.2).
• The student is able to use representations and models to pose scientific questions about the properties of cell membranes and selective permeability based on molecular structure (2B1 & SP 4.2, SP 4.3, SP 4.4).
Investigation 4 T85
Big iDea 2: CellUlar ProCesses: energy anD CoMMUniCation
• The student is able to construct models that connect the movement of molecules across membranes with membrane structure and function (2B2 & SP 2.1, SP 2.2, SP 5.1).
• The student is able to use representations and models to analyze situations or solve problems qualitatively and quantitatively to investigate whether dynamic homeostasis is maintained by the active movement of molecules across membranes (2B1 & 2B2 & SP 2.2, SP 5.2, SP 5.3).
■ ARE STUDENTS READy TO COmPLETE A SUCCESSFUL INQUIRy-BASED, STUDENT-DIRECTED INVESTIGATION?The form and function of cells, organelles, and organisms is a central concept in biology. You can help students think about cell shape in relation to its function by providing examples. Epithelial cells in the small intestine have many microvilli that serve to increase the surface area. These cells take up nutrients from food and move the nutrients into the capillaries. An erythrocyte’s concave shape increases the rate of oxygen diffusion out of the cell and into the tissues. The elongated projection of the root hair — and the large number of them — greatly increases the surface area through which water and minerals pass into the root of a plant.
Students should understand that temperature influences molecular kinetic energy directly. They have made observations but may not have made the connections. Ask them to remember what happened to the sugar they added when they prepared an iced coffee drink versus hot coffee.
A more difficult concept for students to grasp is that molecular weight is inversely related to the rate of diffusion. Have students think about 10 dump trucks and 10 small cars at the opposite end zones of a football field. Then ask them to predict which vehicles will scatter faster across the field. Most will understand that large dump trucks move more slowly (have a lower kinetic energy) than the smaller cars.
■ Skills DevelopmentStudents will develop the following skills, which are reinforced in the transpiration investigation:• Calculating surface area and volume of a model cell
• Designing experiments to measure the rate of osmosis in model cells
• Designing experiments to measure water potential in plant cells
■ Potential ChallengesStudents struggle with the concepts of the random nature of diffusion (nondirectional) and kinetic energy. A good demonstration is to drop some coins over a table to show that they spread out in all directions; as the height increases (more kinetic energy), the coins spread out farther from each other.
T86 Investigation 4
Most students will comprehend that substances move from an area of high concentration to an area of low concentration but fail to realize that the diffusion rate is based on the concentration differences. Many students confuse concentration with the amount of a solution. A human skin cell in normal (isotonic) saline will not change its shape regardless of the amount of saline around it.
Students also think that molecules stop moving at equilibrium. This is not the case. Diffusion reaches a dynamic equilibrium, not a static equilibrium.
Water potential is a difficult concept for students to grasp. For students lacking sufficient mathematical skills, you likely will need to provide guidance as they work through the information and calculations on water potential. Solutes effectively prevent water from diffusing because the water is no longer “free.” Solutes are surrounded by hydration shells and reduce the concentration of water. Students have difficulty understanding how walled cells, such as plant cells, control their internal pressure using the central vacuole. They will need help comprehending how solutes reduce the free water in a system and therefore act to reduce the water potential.
The terms hypotonic, hypertonic, and isotonic are confusing until students realize that these are relative terms and refer to the solute concentration, rather than water concentration. Use the following online tutorials to help guide your students:
http://mw.concord.org/modeler/ http://www.phschool.com/science/biology_place/labbench/lab1/intro.html
■ THE INVESTIGATIONS
■ Getting Started: Prelab AssessmentYou may assign the following questions for homework; as a think, pair/group, share activity, in which pairs or small groups of students brainstorm ideas and then share them with other groups; or as a whole-class discussion to assess students’ understanding of key concepts pertaining to kinetic energy, osmosis, and diffusion:• What is kinetic energy and how does it differ from potential energy?
• What environmental factors affect kinetic energy and diffusion?
• Why do these factors alter diffusion rates? How do they affect rates?
• How are gradients important in diffusion and osmosis?
• What is the explanation for the fact that most cells are small and have cell membranes with many convolutions?
• Will water move into or out of a plant cell if the cell has a higher water potential than the surrounding environment?
• What would happen if you applied saltwater to a plant?
• How does a plant cell control its internal (turgor) pressure?

Investigation 4 T87
Big iDea 2: CellUlar ProCesses: energy anD CoMMUniCation
■ Procedure 1: Surface Area and Cell SizeBecause cell size and shape are important factors in determining the rate of diffusion, students begin their investigation of the movement of molecules across cell membranes by exploring the relationship between surface area and volume. Ask students to consider cell shapes, especially those involved with nutrient uptake; good examples include intestinal villi and root hair cells. Students should predict which measurement — surface area or volume — has the greater influence on the rate of diffusion. They should then calculate surface area-to-volume ratios and determine the diffusion depth and rate in agar.
Materials
• 2% agar containing the pH- indicator dye phenolphthalein
• 1% phenolphthalein solution• 0.1M NaOH• 0.1M HCl
• Squares of hard, thin plastic (from disposable plates); unserrated knives; or scalpels from dissection kits
• Metric rulers• Petri dishes or test tubes to hold the agar
cubes
■ Preparation Wear safety goggles or glasses when preparing these materials.
To prepare 2% agar with phenolphthalein, do the following:
1. Dissolve 1 g phenolphthalein in 100 mL of 95% ethanol to make a 1% solution.
2. Mix 20 g of agar with 1 L water; heat to near boiling or until solution is clear.
3. Cool the agar to ~55°C and add 10 mL 1% phenolphthalein; if the agar solution is clear, add dilute NaOH until the agar is bright pink.
4. Pour the agar into baking pans or shallow trays to 3 cm deep; let the agar cool overnight.
Have students make cubes (1 cm per side, 2 cm per side). Some students will think to make the pieces long and thin. Tip: If the agar loses its color, simply place into dilute NaOH for a few hours.
To prepare NaOH and HCl, do the following:
1. 0.1 M NaOH: Add 0.4 g of NaOH to 80 mL of H2O. Stir to dissolve and add water to 100 mL total volume. Store NaOH solutions in plastic bottles. Label Hazardous-Caustic Solution.
2. 0.1 M HCl: Add 0.83 mL of concentrated HCl (12.1 M) to H2O to bring to 100 mL total volume. Label Hazardous-Strong Acid.
An alternative method calls for mixing one packet of unflavored gelatin with 237 mL of water and adding 2.5 mL 1% phenolphthalein and a few drops of 0.1 M NaOH.
T88 Investigation 4
The solution should be bright pink. Pour the gelatin mixture into shallow pans, and refrigerate overnight. You may use white vinegar in place of the 0.1 M HCl.
■ Data AnalysisFrom the data, students should consider several questions:• Which surface area-to-volume ratio gave the fastest diffusion rate?
• Which surface area-to-volume ratio had the greatest diffusion depth?
• How might a cell’s shape influence the rate of diffusion?
• What factors affect the rate of diffusion and how can these be tested?
■ Designing and Conducting Independent InvestigationsUsing the provided materials, students design and conduct an experiment(s) to test the predictions they made regarding the relationship of surface area and volume in artificial cells to the diffusion rate using the phenolphthalein–NaOH agar and HCl solution.
Procedure 2: Modeling Diffusion and OsmosisStudents create models of living cells using dialysis tubing. Dialysis tubing contains pores that permit the passage of small ions and molecules, including water and glucose, but not larger molecules such as starch and proteins. Like cell membranes, dialysis tubing is selectively permeable. Students fill their model cells with different solutions and determine diffusion rates. Students then can investigate questions about the movement of water across cell membranes and use their model cells to explore osmosis in more depth.
Materials• 1 M sucrose • 1 M NaCl• 1 M glucose• 5% ovalbumin (egg white protein)• Dialysis tubing (5 pieces per group)
• Balances• 8 or 10 oz. drinking cups or beakers• Distilled water, volumetric pipettes,
and graduated cylinders for preparing dilutions
Note: 5% ovalbumin = 5 g/100 mL = 50 g/liter. The MW of ovalbumin is 45,000 g/mole. The molarity of a 5% solution = mole/45,000 g 3 50 g/liter = 0.0011 M.
■ Preparation
1. 1M sucrose: Dissolve 342.3 g of sucrose in 500 mL of H20; bring to 1 L total volume.
2. 1 M NaCl: Dissolve 58.4 g of NaCl in 500 mL of H20; bring to 1 L total volume.
3. 1 M glucose (dextrose): Dissolve 180.2 g of glucose in 500 mL of H20; bring to 1 L total volume.
Investigation 4 T89
Big iDea 2: CellUlar ProCesses: energy anD CoMMUniCation
4. 5% ovalbumin (if possible, store powder in the refrigerator to prevent clumping): Mix 50 g of ovalbumin with 500 mL of H20; bring to 1 L total volume.
To prepare dialysis tubing, cut dialysis tubing into 20-cm pieces; soak pieces in water. Extra dialysis tubing can be kept in 20% ethanol in the refrigerator to prevent bacterial growth.
Students use the dialysis tubing to model cells. The dialysis tubing is knotted in one end, filled with 10 mL solution, and knotted to close the tube. Make sure students leave enough space for water to diffuse into the tube. Tell students to keep the dialysis tubing moist.
■ Data AnalysisFrom the data, students should consider several questions.• What factors determine the rate and direction of osmosis?
• What would you predict if you used a starch solution instead of the protein?
• Can you diagram the flow of water based upon the contents of your model cell and the surrounding solution?
• When will the net osmosis rate equal zero in your model cells?
• Based upon your observations, can you predict the direction of osmosis in living cells when the cells are placed in various solutions?
• How is the dialysis tubing functionally different from a cellular membrane?
■ Designing and Conducting Independent InvestigationsHave students design five different pairs of solutions and make a prediction about diffusion; one pair — water in the dialysis tube placed into water — is the control. Have groups of students do replicate experiments. Students are surprised that the tube containing 5% albumin has no weight change when placed in water.
Procedure 3: Observing Osmosis in Living CellsIt is important that students observe and understand osmosis in living cells. A quick demonstration is to soak celery sticks in water and in 1 M NaCl and have students break the sticks. The sticks in water have high turgor pressure and break with a “snap,” and those in saltwater are limp and difficult to break. Ask students to explain how the sound (snap) is produced.
Materials• Elodea tips or Mnium hornum (moss)• Microscope slides and cover slips
• Microscopes• Solutions from Procedure 2

T90 Investigation 4
■ PreparationElodea tips can be purchased from biological supply companies; however, some states have restricted its use because of Elodea’s invasive nature. Moss (Mniun hornum) can be obtained from a greenhouse or from the woods. Have students observe and draw the cells at 400 X total magnification. The cell membrane shrinks away from the cell wall, and the central vacuole collapses when a high concentration of either sugar or salt is added; this process is called plasmolysis.
Ask students how they would measure the water potential in the different types of plants. This can be done by measuring/calculating the change in weight, change in length, or change in volume. The laboratory should be set up on one day and measured the next day.
■ Designing and Conducting Independent InvestigationsAsk students how they could measure water potential in plant cells. This can be done by measuring/calculating change in mass, change in length, or change in volume over time in plant sections from potatoes. You will prepare several solutions with different concentrations of sucrose; however, you will color-code the solutions with food coloring instead of labeling the concentrations for students. Students design an experiment to identify the concentrations of the sucrose solutions and then use the solutions to determine the water potential of the plant tissues.
Students should set up their investigations in one period (45–60 minutes) and conduct them the next day. Waiting too long causes the potato cores to become mushy.
Materials• Potatoes, sweet potatoes, or yams• Cork borers or french fry cutter• Balances• Metric rulers
• 8 or10 oz. drinking cups• Sucrose solutions of different
concentrations (0, 0.2, 0.4, 0.6, 0.8, 1.0 M)
■ PreparationPrepare 2,000 mL of 1.0 M sucrose. Use this 1.0 M stock solution to make 1,000 mL dilutions (0.2, 0.4, 0.6, and 0.8 M). Use a drop of food coloring to give each solution a different color. The quantities are sufficient for 24 students and can be adjusted for smaller classes.
Do not label the solutions for students!1.0 M: 684.6 g sucrose/2000 mL d-H200.8 M: 800 mL of 1.0 M to 200 mL d-H2O0.6 M: 600 mL of 1.0 M to 400 mL d-H2O0.4 M: 400 mL of 1.0 M to 600 mL d-H2O0.2 M: 200 mL of 1.0 M to 800 mL d-H2O
Investigation 4 T91
Big iDea 2: CellUlar ProCesses: energy anD CoMMUniCation
■ Alternative ExperimentsThis investigation consists of three parts. It is recommended that students work through all three sections. However, if time is an issue, the investigations can be modified.
Procedure 1 can be skipped; instead, ask your students to consider cell structure and function and have them calculate the surface area and volume of model cells. Procedure 1 can be integrated into the water potential experiment (Procedure 3) by cutting potato pieces into different sizes and comparing the size/weight changes.
Procedure 2 can by modified by having students choose among water, protein, and 1 M sucrose. The model cells can be prepared and left overnight in the second solution and weighed the next day, as long as there is sufficient space in the dialysis tubing bags. An alternative is to place thin celery sticks in the solutions overnight and ask students to measure how far the celery can bend without breaking the next day.
You can ask students to view videos that show the effect of salt or sugar solutions on plant cells. For example, see the following: http://www.csun.edu/scied/7-microscopy/elodea_plasmolysis/index.htm http://www.teachertube.com/viewVideo.php?video_id=135394
■ Summative Assessment
1. Review the learning objectives. You can use the learning objectives to generate analysis questions. Do the students’ answers to your questions suggest that they understand the concepts?
2. Review students’ experimental evidence. Did students make the appropriate measurements and graphs to analyze the data? Were they able to make simple volume and surface area calculations?
3. Have your students prepare laboratory notebooks; keep the first two pages blank for a table of contents. Students should record their experimental designs, data, graphs, results, and conclusions. They may use Excel to prepare the graphs.
4. Ask your students to use the principles of osmosis to explain how foods are preserved. For example, foods are prepared using high concentrations of salt or sugar (e.g., preserves, jams, jellies). The high solute potential in the solution prevents microbial growth.
5. Review water potential with your students; they will revisit the concept when exploring transpiration in plants.
■ Where Can Students Go from Here?Ask students if they think that fungal cells have turgor pressure. Then ask them to design an experiment to test their hypothesis.
T92 Investigation 4
■ SUPPLEmENTAL RESOURCES
■ molecular movement and membranes: Osmosis and DiffusionTaiz, Lincoln and Eduardo Zeiger. 2010. Unit One: Transport and Translocation of
Water and Solutes in Plant Physiology, 5th ed., pp. 67–159. Sinauer Associates, Inc., Sunderland, MA.
The unit covers water and cells, water balance in plants, and solute transport. The book is an excellent reference on plant physiology.
http://mw.concord.org/modeler/
http://www.phschool.com/science/biology_place/labbench/lab1/intro.htmlThe Molecular Workbench and Lab Bench laboratory online resources about diffusion
and osmosis are excellent prelaboratory resources. Both provide feedback with hints when students answer the questions.
http://www.nobelprize.org/nobel_prizes/chemistry/laureates/2003The Nobel Prize in Chemistry 2003 was awarded to Peter Agre and Roderick
MacKinnon for their work on aquaporins. The Nobel Prize website provides information about these protein channels and their roles in osmosis.
Kowles, Richard V. 2010. Regulation of water in plant cells. Bioscene: Journal of College Biology 36(1): 34–42.
This reference reviews water movement in plant cells and describes an experiment to measure water potential.
■ Additional Experiments and DemonstrationsConcannon, James P. and Patrick L. Brown. 2008. Transforming Osmosis: Labs to
address standards for inquiry. Science Activities: Classroom Projects and Curriculum Ideas: 45 (3): 23–25.
Sweeney, Ryan M., Lisa Martin-Hansen, Geeta Verma, and John Dunkhase. 2009. Embracing learners’ ideas about diffusion and osmosis: A Coupled-inquiry approach. Science Scope: 33(1): 38–45.
Friedrichsen, Patricia Meis and Amy Pallant. 2007. French fries, dialysis tubing & computer models: Teaching diffusion & osmosis through inquiry & modeling. The American Biology Teacher online February 2007, pp. 22–27.
http://www.nabt.org/websites/institution/File/pdfs/publications/abt/2007/069-02-0031.pdfThis resource has questions to help students apply their knowledge about osmosis to
everyday questions, such as how sorbitol affects the human digestive system.

Investigation 4 T93
Big iDea 2: CellUlar ProCesses: energy anD CoMMUniCation
■ Instructional Videoshttp://www.youtube.com/watch?v=2Th0PuORsWY&feature=relatedThis video demonstrates the diffusion of iodine through dialysis membrane into starch.
http://www.youtube.com/watch?v=xQ9DWem9l_8&feature=related
http://www.youtube.com/watch?v=DRHKq0piN0M&feature=relatedThese videos show the diffusion of glucose through dialysis membrane with explanation.
http://www.youtube.com/watch?v=VK-_YHakvho
http://www.youtube.com/watch?v=zHyfDGVNdvM&feature=related
These resources show plasmolysis in Elodea cells under the microscope.
http://www.youtube.com/watch?v=DpVbcJY4amA
http://www.youtube.com/watch?v=1vQzqk2hzj8&feature=relatedThese videos show an osmosis experiment in decalcified eggs (2 parts) using water and
corn syrup. They reveal ways to measure the egg sizes and make good observations about the water and corn syrup before and after the incubation period.

This page is intentionally left blank.
BigIdea
Investigation 4 S51
Cellular Processes: Energy and Communication
2investigation 4
DiFFUsion anD osMosisWhat causes plants to wilt if they are not watered?
■■ BACKGROUNDCells must move materials through membranes and throughout cytoplasm in order to maintain homeostasis. The movement is regulated because cellular membranes, including the plasma and organelle membranes, are selectively permeable. Membranes are phospholipid bilayers containing embedded proteins; the phospholipid fatty acids limit the movement of water because of their hydrophobic characteristics.
The cellular environment is aqueous, meaning that the solutes (e.g., salts, organic molecules) dissolve in water, which is the solvent. Water may pass slowly through the membrane by osmosis or through specialized protein channels called aquaporins. Aquaporins allow the water to move more quickly than it would through osmosis. Most other substances, such as ions, move through protein channels, while larger molecules, including carbohydrates, move through transport proteins.
The simplest form of movement is diffusion, in which solutes move from an area of high concentration to an area of low concentration; diffusion is directly related to molecular kinetic energy. Diffusion does not require energy input by cells. The movement of a solute from an area of low concentration to an area of high concentration requires energy input in the form of ATP and protein carriers called pumps.
Water moves through membranes by diffusion; the movement of water through membranes is called osmosis. Like solutes, water moves down its concentration gradient. Water moves from areas of high potential (high free water concentration) and low solute concentration to areas of low potential (low free water concentration) and high solute concentration. Solutes decrease the concentration of free water, since water molecules surround the solute molecules. The terms hypertonic, hypotonic, and isotonic are used to describe solutions separated by selectively permeable membranes. A hypertonic solution has a higher solute concentration and a lower water potential as compared to the other solution; therefore, water will move into the hypertonic solution through the membrane by osmosis. A hypotonic solution has a lower solute concentration and a higher water potential than the solution on the other side of the membrane; water will move down its concentration gradient into the other solution. Isotonic solutions have equal water potentials.

S52■Investigation 4
In nonwalled cells, such as animal cells, the movement of water into and out of a cell is affected by the relative solute concentration on either side of the plasma membrane. As water moves out of the cell, the cell shrinks; if water moves into the cell, it swells and may eventually burst. In walled cells, including fungal and plant cells, osmosis is affected not only by the solute concentration, but also by the resistance to water movement in the cell by the cell wall. This resistance is called turgor pressure. The presence of a cell wall prevents the cells from bursting as water enters; however, pressure builds up inside the cell and affects the rate of osmosis.
Water movement in plants is important in water transport from the roots into the shoots and leaves. You likely will explore this specialized movement called transpiration in another lab investigation.
■■ Understanding■Water■PotentialWater potential predicts which way water diffuses through plant tissues and is abbreviated by the Greek letter psi (ψ). Water potential is the free energy per mole of water and is calculated from two major components: (1) the solute potential (ψS), which is dependent on solute concentration, and (2) the pressure potential (ψP), which results from the exertion of pressure—either positive or negative (tension) — on a solution. The solute potential is also called the osmotic potential.
ψ = ψP + ψS
Water Potential = Pressure Potential + Solute Potential
Water moves from an area of higher water potential or higher free energy to an area of lower water potential or lower free energy. Water potential measures the tendency of water to diffuse from one compartment to another compartment.
The water potential of pure water in an open beaker is zero (ψ = 0) because both the solute and pressure potentials are zero (ψS = 0; ψP = 0). An increase in positive pressure raises the pressure potential and the water potential. The addition of solute to the water lowers the solute potential and therefore decreases the water potential. This means that a solution at atmospheric pressure has a negative water potential due to the solute.
The solute potential (ψS) = – iCRT, where i is the ionization constant, C is the molar concentration, R is the pressure constant (R = 0.0831 liter bars/mole-K), and T is the temperature in K (273 + °C).
A 0.15 M solution of sucrose at atmospheric pressure (ψP = 0) and 25°C has an osmotic potential of -3.7 bars and a water potential of -3.7 bars. A bar is a metric measure of pressure and is the same as 1 atmosphere at sea level. A 0.15 M NaCl solution contains 2 ions, Na+ and Cl-; therefore i = 2 and the water potential = -7.4 bars.
When a cell’s cytoplasm is separated from pure water by a selectively permeable membrane, water moves from the surrounding area, where the water potential is higher (ψ = 0), into the cell, where water potential is lower because of solutes in the cytoplasm
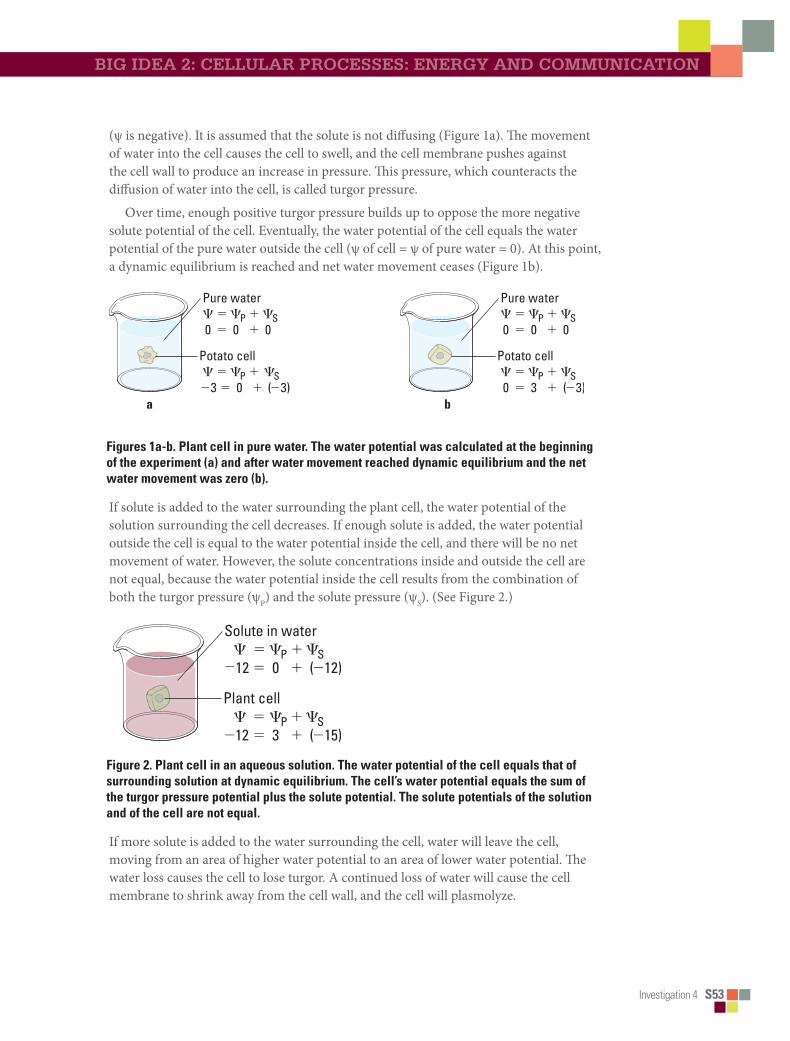
Investigation 4 S53
big iDea 2: CellUlar ProCesses: energy anD CoMMUniCation
(ψ is negative). It is assumed that the solute is not diffusing (Figure 1a). The movement of water into the cell causes the cell to swell, and the cell membrane pushes against the cell wall to produce an increase in pressure. This pressure, which counteracts the diffusion of water into the cell, is called turgor pressure.
Over time, enough positive turgor pressure builds up to oppose the more negative solute potential of the cell. Eventually, the water potential of the cell equals the water potential of the pure water outside the cell (ψ of cell = ψ of pure water = 0). At this point, a dynamic equilibrium is reached and net water movement ceases (Figure 1b).
Bio_T_Lab04_01
a b
Figures■1a-b.■Plant■cell■in■pure■water.■The■water■potential■was■calculated■at■the■beginning■of■the■experiment■(a)■and■after■water■movement■reached■dynamic■equilibrium■and■the■net■water■movement■was■zero■(b).■
If solute is added to the water surrounding the plant cell, the water potential of the solution surrounding the cell decreases. If enough solute is added, the water potential outside the cell is equal to the water potential inside the cell, and there will be no net movement of water. However, the solute concentrations inside and outside the cell are not equal, because the water potential inside the cell results from the combination of both the turgor pressure (ψP) and the solute pressure (ψS). (See Figure 2.)
Bio_T_Lab04_02
Figure■2.■Plant■cell■in■an■aqueous■solution.■The■water■potential■of■the■cell■equals■that■of■surrounding■solution■at■dynamic■equilibrium.■The■cell’s■water■potential■equals■the■sum■of■the■turgor■pressure■potential■plus■the■solute■potential.■The■solute■potentials■of■the■solution■and■of■the■cell■are■not■equal.■
If more solute is added to the water surrounding the cell, water will leave the cell, moving from an area of higher water potential to an area of lower water potential. The water loss causes the cell to lose turgor. A continued loss of water will cause the cell membrane to shrink away from the cell wall, and the cell will plasmolyze.

S54■Investigation 4
• Calculate the solute potential of a 0.1 M NaCl solution at 25°C. If the concentration of NaCl inside the plant cell is 0.15 M, which way will the water diffuse if the cell is placed into the 0.1 M NaCl solutions?
• What must the turgor pressure equal if there is no net diffusion between the solution and the cell?
■■ Learning■Objectives• To investigate the relationship among surface area, volume, and the rate of diffusion
• To design experiments to measure the rate of osmosis in a model system
• To investigate osmosis in plant cells
• To design an experiment to measure water potential in plant cells
• To analyze the data collected in the experiments and make predictions about molecular movement through cellular membranes
• To work collaboratively to design experiments and analyze results
• To connect the concepts of diffusion and osmosis to the cell structure and function
■■ General■Safety■PrecautionsYou must wear safety glasses or goggles, aprons, and gloves because you will be working with acids and caustic chemicals. The HCl and NaOH solutions will cause chemical burns, and you should use these solutions in spill-proof trays or pans. Follow your teacher’s instructions carefully. Do not work in the laboratory without your teacher’s supervision. Talk to your teacher if you have any questions or concerns about the experiments.
■■ THE■INVESTIGATIONSThis investigation consists of three parts. In Procedure 1, you use artificial cells to study the relationship of surface area and volume. In Procedure 2, you create models of living cells to explore osmosis and diffusion. You finish by observing osmosis in living cells (Procedure 3). All three sections of the investigation provide opportunities for you to design and conduct your own experiments.
■■ Getting■StartedThese questions are designed to help you understand kinetic energy, osmosis, and diffusion and to prepare for your investigations.• What is kinetic energy, and how does it differ from potential energy?
• What environmental factors affect kinetic energy and diffusion?

Investigation 4 S55
big iDea 2: CellUlar ProCesses: energy anD CoMMUniCation
• How do these factors alter diffusion rates?
• Why are gradients important in diffusion and osmosis?
• What is the explanation for the fact that most cells are small and have cell membranes with many convolutions?
• Will water move into or out of a plant cell if the cell has a higher water potential than the surrounding environment?
• What would happen if you applied saltwater to a plant?
• How does a plant cell control its internal (turgor) pressure?
■■ Procedure■1:■Surface Area and Cell SizeCell size and shape are important factors in determining the rate of diffusion. Think about cells with specialized functions, such as the epithelial cells that line the small intestine or plant root hairs.
• What is the shape of these cells?
• What size are the cells?
• How do small intestinal epithelial and root hair cells function in nutrient procurement?
Materials
• 2% agar containing NaOH and the pH-indicator dye phenolphthalein
• 1% phenolphthalein solution• 0.1M HCl• 0.1 M NaOH• Squares of hard, thin plastic (from
disposable plates); unserrated knives; or scalpels from dissection kits
• Metric rulers• Petri dishes and test tubes• 2% agar with phenolphthalein
preparation
Step■1 Place some phenolphthalein in two test tubes. Add 0.1 M HCl to one test tube, swirl to mix the solutions, and observe the color. Using the same procedure, add 0.1 M NaOH to the other test tube. Remember to record your observations as you were instructed.• Which solution is an acid?
• Which solution is a base?
• What color is the dye in the base? In the acid?
• What color is the dye when mixed with the base?

S56■Investigation 4
Step■2 Using a dull knife or a thin strip of hard plastic, cut three blocks of agar of different sizes.
These three blocks will be your models for cells.• What is the surface area of each of your three cells?
• What is the total volume of each of your cells?
• If you put each of the blocks into a solution, into which block would that solution diffuse throughout the entire block fastest? Slowest? How do you explain the difference?
■■ Alternative■MethodMix one packet of unflavored gelatin with 237 mL of water: add 2.5 mL 1% phenolphthalein and a few drops of 0.1 M NaOH. The solution should be bright pink. Pour the gelatin mixture into shallow pans and refrigerate overnight.
You may use white vinegar in place of the 0.1 M HCl.
■■ Designing■and■Conducting■Your■InvestigationUsing the materials listed earlier, design an experiment to test the predictions you just made regarding the relationship of surface area and volume in the artificial cells to the diffusion rate using the phenolphthalein–NaOH agar and the HCl solution. Once you have finished planning your experiment, have your teacher check your design. When you have an approved design, run your experiment and record your results. Do your experimental results support your predictions?
■■ Procedure■2:■Modeling Diffusion and Osmosis
You are in the hospital and need intravenous fluids. You read the label on the IV bag, which lists all of the solutes in the water. • Why is it important for an IV solution to have salts in it?
• What would happen if you were given pure water in an IV?
• How would you determine the best concentration of solutes to give a patient in need of fluids before you introduced the fluids into the patient’s body?
In this experiment, you will create models of living cells using dialysis tubing. Like cell membranes, dialysis tubing is made from a material that is selectively permeable to water and some solutes. You will fill your model cells with different solutions and determine the rate of diffusion.

Investigation 4 S57
big iDea 2: CellUlar ProCesses: energy anD CoMMUniCation
• How can you use weights of the filled cell models to determine the rate and direction of diffusion? What would be an appropriate control for the procedure you just described?
• Suppose you could test other things besides weights of the dialysis tubes. How could you determine the rates and directions of diffusion of water, sucrose, NaCl, glucose, and ovalbumin?
• Will protein diffuse? Will it affect the rate of diffusion of other molecules?
Materials
• Distilled or tap water• 1 M sucrose• 1 M NaCl• 1 M glucose
• 5% ovalbumin (egg white protein)• 20 cm-long dialysis tubing• Cups • Balances
Step■1 Choose up to four pairs of different solutions. One solution from each pair will be in the model cell of dialysis tubing, and the other will be outside the cell in the cup. Your fifth model cell will have water inside and outside; this is your control. Before starting, use your knowledge about solute gradients to predict whether the water will diffuse into or out of the cell. Make sure you label the cups to indicate what solution is inside the cell and inside the cup.
Step■2 Make dialysis tubing cells by tying a knot in one end of five pieces of dialysis tubing. Fill each “cell” with 10 mL of the solution you chose for the inside, and knot the other end, leaving enough space for water to diffuse into the cell.
Step■3 Weigh each cell, record the initial weight, and then place it into a cup filled with the second solution for that pair. Weigh the cell after 30 minutes and record the final weight.
Step■4 Calculate the percent change in weight using the following formula: (final – initial)/initial X 100. Record your results. • Which pair(s) that you tested did not have a change in weight? How can you explain
this?
• If you compared 1 M solutions, was a 1 M NaCl solution more or less hypertonic than a 1 M sucrose solution? What is your evidence? What about 1 M NaCl and 1 M glucose and 1 M sucrose?
• Does the protein solution have a high molarity? What is evidence for your conclusion?
• How could you test for the diffusion of glucose?
• Based on what you learned from your experiment, how could you determine the solute concentration inside a living cell?

S58■Investigation 4
■■ Designing■and■Conducting■Your■InvestigationLiving cell membranes are selectively permeable and contain protein channels that permit the passage of water and molecules. In some respects, the dialysis tubing you used is similar to a cell membrane, and you can use it to explore osmosis in greater depth. Think about the questions that came up as you worked through the investigation. What unanswered questions do you still have about osmosis that you could investigate further?
Using the available materials, design an investigation to answer one of your questions. Have your teacher check your design first. Remember to record your results, and be sure to use appropriate controls.
These questions can help jump-start your thinking. • What factors determine the rate and direction of osmosis?
• What would you predict if you used a starch solution instead of the protein?
• Can you diagram the flow of water based upon the contents of your model cell and the surrounding solution?
• When will the net osmosis rate equal zero in your model cells? Will it ever truly be zero?
• Based upon your observations, can you predict the direction of osmosis in living cells when the cells are placed in various solutions?
• How is the dialysis tubing functionally different from a cellular membrane?
■■ Procedure■3:■Observing Osmosis in Living CellsThe interactions between selectively permeable membranes, water, and solutes are important in cellular and organismal functions. For example, water and nutrients move from plant roots to the leaves and shoots because of differences in water potentials. Based upon what you know and what you have learned about osmosis, diffusion, and water potential in the course of your investigations, think about these questions.
• What would happen if you applied saltwater to the roots of a plant? Why?
• What are two different ways a plant could control turgor pressure, a name for internal water potential within its cells? Is this a sufficient definition for turgor pressure?
• Will water move into or out of a plant cell if the cell has a higher water potential than its surrounding environment?
Step■1 Start by looking at a single leaf blade from either Elodea (a water plant) or a leaf-like structure from Mnium hornum (a moss) under the light microscope. If you need assistance, your teacher will show you how to place specimens on a slide.
• Where is the cell membrane in relation to the cell wall? Can you see the two structures easily? Why or why not?
• What parts of the cell that you see control the water concentration inside the cell?

Investigation 4 S59
big iDea 2: CellUlar ProCesses: energy anD CoMMUniCation
Back in Procedure 2 you tested diffusion and osmosis properties of several solutions. Now you are going to determine how they affect plant cell turgor pressure.
• What changes do you expect to see when the cells are exposed to the solutions?
• How will you know if a particular treatment is increasing turgor pressure? If it is reducing turgor pressure?
• How could you determine which solution is isotonic to the cells?
Step■2 Test one of the four solutions from Procedure 2 and find out if what you predicted is what happens. When you are done, ask other students what they saw. Be sure to record all of your procedures, calculations, and observations.
■■ Designing■and■Conducting■Your■Investigation
Materials
• Potatoes, sweet potatoes, or yams• Cork borers or french fry cutter• Balances• Metric rulers
• Cups• Color-coded sucrose solutions of
different, but unlabeled, concentrations prepared by your teacher
Design an experiment to identify the concentrations of the sucrose solutions and use the solutions to determine the water potential of the plant tissues. (You might want to review the information on water potential described in Understanding Water Potential.) Use the following questions to guide your investigation:• How can you measure the plant pieces to determine the rate of osmosis?
• How would you calculate the water potential in the cells?
• Which solution had a water potential equal to that of the plant cells? How do you know?
• Was the water potential in the different plants the same?
• How does this compare to your previous determinations in the Elodea cells?
• What would your results be if the potato were placed in a dry area for several days before your experiment?
• When potatoes are in the ground, do they swell with water when it rains? If not, how do you explain that, and if so, what would be the advantage or disadvantage?

S60■Investigation 4
■■ Analyzing■Results
1.Why are most cells small, and why do they have cell membranes with many convolutions?
2.What organelles inside the cell have membranes with many convolutions? Why?
3.Do you think osmosis occurs when a cell is in an isotonic solution? Explain your reasoning.
■■ Where■Can■You■Go■from■Here?Do you think that fungal cells have turgor pressure? Design an experiment to test your hypothesis.
BigIdea
Investigation 5 T95
2Cellular Processes: Energy and Communication
investigation 5
PHotosYntHesisWhat factors affect the rate of photosynthesis in living leaves?
■ BACKGROUNDLiving systems require free energy and matter to maintain order, to grow, and to reproduce. Energy deficiencies are not only detrimental to individual organisms, but they cause disruptions at the population and ecosystem levels. Organisms employ various strategies that have been conserved through evolution to capture, use, and store free energy. Autotrophic organisms capture free energy from the environment through photosynthesis and chemosynthesis, whereas heterotrophic organisms harvest free energy from carbon compounds produced by other organisms. In multicellular plants, photosynthesis occurs in the chloroplasts within cells.
The process of photosynthesis occurs in a series of enzyme-mediated steps that capture light energy to build energy-rich carbohydrates. The process is summarized by the following reaction:
2 H2O + CO2 + light → carbohydrate (CH2O) + O2 + H2O
To determine the net rate of photosynthesis, one could measure one of the following:• Production of O2
• Consumption of CO2
The difficulty related to measuring the production of oxygen is compounded by the complementary process of aerobic respiration consuming oxygen as it is produced. Therefore, measuring oxygen production is equivalent to measuring net photosynthesis. A measurement of respiration in the same system allows one also to estimate the gross production.
Generally, the rate of photosynthesis is calculated by measuring the consumption of carbon dioxide. However, equipment and procedures to do this are generally beyond the reach of most introductory laboratories.
In Getting Started, students conduct prelab research on the process of photosynthesis and review concepts they may have studied previously — particularly concepts about the properties of light.
In the first part of the lab, students learn how to measure the rate of photosynthesis indirectly by using the floating leaf disk procedure to measure oxygen production. Alternatively, they could explore how to measure the rate of photosynthesis using various probes interfaced to computers.
In the floating leaf disk procedure, a vacuum is used to remove trapped air and infiltrate the interior of plant (leaf) disk samples with a solution containing bicarbonate ions that serve as a carbon source for photosynthesis. The infiltrated leaves sink in the
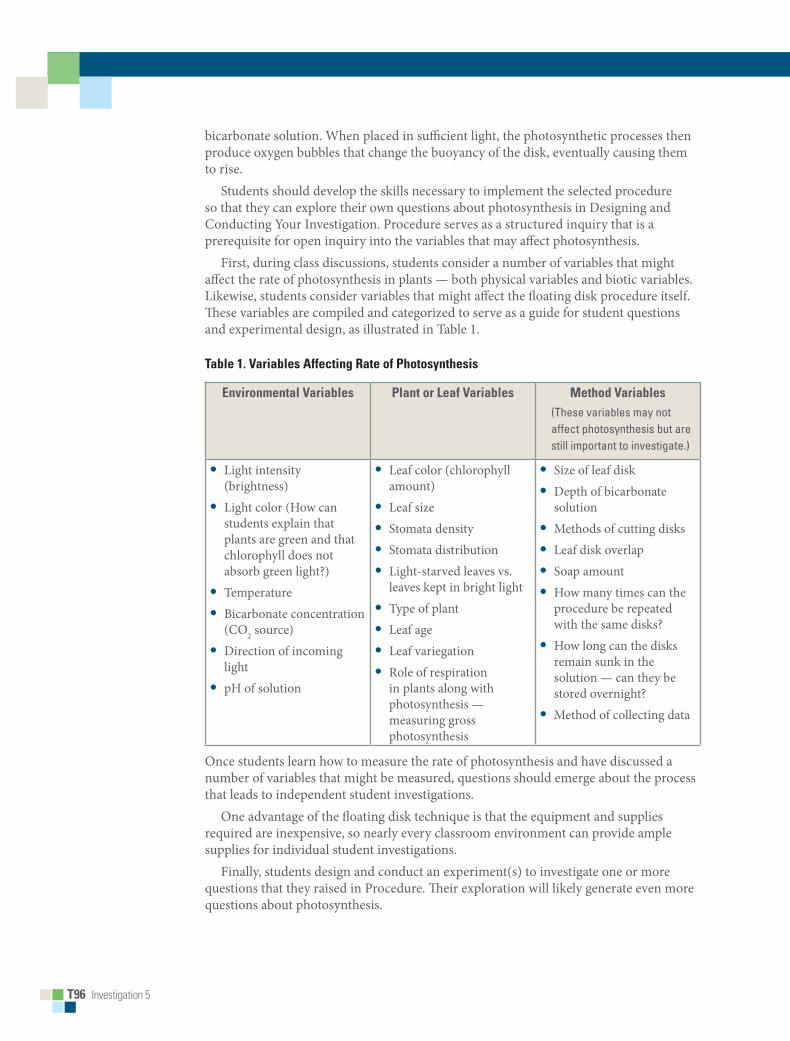
T96 Investigation 5
bicarbonate solution. When placed in sufficient light, the photosynthetic processes then produce oxygen bubbles that change the buoyancy of the disk, eventually causing them to rise.
Students should develop the skills necessary to implement the selected procedure so that they can explore their own questions about photosynthesis in Designing and Conducting Your Investigation. Procedure serves as a structured inquiry that is a prerequisite for open inquiry into the variables that may affect photosynthesis.
First, during class discussions, students consider a number of variables that might affect the rate of photosynthesis in plants — both physical variables and biotic variables. Likewise, students consider variables that might affect the floating disk procedure itself. These variables are compiled and categorized to serve as a guide for student questions and experimental design, as illustrated in Table 1.
Table 1. Variables Affecting Rate of Photosynthesis
Environmental Variables Plant or Leaf Variables Method Variables(These variables may not affect photosynthesis but are still important to investigate.)
• Light intensity (brightness)
• Light color (How can students explain that plants are green and that chlorophyll does not absorb green light?)
• Temperature• Bicarbonate concentration
(CO2 source)• Direction of incoming
light• pH of solution
• Leaf color (chlorophyll amount)
• Leaf size• Stomata density• Stomata distribution• Light-starved leaves vs.
leaves kept in bright light• Type of plant• Leaf age• Leaf variegation• Role of respiration
in plants along with photosynthesis — measuring gross photosynthesis
• Size of leaf disk• Depth of bicarbonate
solution• Methods of cutting disks• Leaf disk overlap• Soap amount• How many times can the
procedure be repeated with the same disks?
• How long can the disks remain sunk in the solution — can they be stored overnight?
• Method of collecting data
Once students learn how to measure the rate of photosynthesis and have discussed a number of variables that might be measured, questions should emerge about the process that leads to independent student investigations.
One advantage of the floating disk technique is that the equipment and supplies required are inexpensive, so nearly every classroom environment can provide ample supplies for individual student investigations.
Finally, students design and conduct an experiment(s) to investigate one or more questions that they raised in Procedure. Their exploration will likely generate even more questions about photosynthesis.
Investigation 5 T97
Big idea 2: Cellular ProCesses: energY and CommuniCation
For students who try but are unable to develop questions of their own, consider the following supplemental prompts:• What makes plants stop growing? Could any of these affect photosynthesis?
• Do all leaves look the same? What is different? Could these differences affect photosynthesis?
The lab also provides an opportunity for students to apply, review, and/or scaffold concepts that they have studied previously, including the relationship between cell structure and function (chloroplast); enzymatic activity (especially rubisco, if temperature as a variable is explored); strategies for capture, storage, and use of free energy; diffusion of gases across cell membranes; behavior of gases in solution; evolution of plants and photosynthesis (including an explanation of why plants don’t absorb green light); and the physical laws pertaining to the properties of buoyancy.
Note About Light Sources: A strong light source is necessary for success in this procedure. Some of the best results have been obtained when placing the cups of leaf disks on the bed of an overhead projector. Another inexpensive light source is the “work spotlights” that you can purchase from various retail stores, coupled with 100-watt equivalent compact fluorescent bulbs.
■ PREPARATiON
Materials and Equipment
• Baking soda (sodium bicarbonate)• Liquid soap (approximately 5 mL of
dishwashing liquid or similar soap in 250 mL of water)
• 2 plastic syringes without needles (10 mL or larger), available from biological and scientific supply companies or rather cheaply at large chain drugstores (ask for 10 mL oral medicine dispensers). It is a good idea to have extra syringes on hand, as some students may need more than two for their independent investigations.
• Living leaves [spinach, especially baby spinach from the produce section of the grocery story, or ivy (Hedera helix), which is perennially green and naturalized throughout the country]
• Hole punch• 2 clear plastic cups• Timer• Light source (Inexpensive light sources
include the clamp lights purchased at big-box stores coupled with 100-watt equivalent compact fluorescent bulbs. These lights do a great job of producing the low-heat, high-intensity light needed for this work.)
• Students invariably underestimate the various light parameters in this procedure. An important piece of equipment to include in any classroom when studying photosynthesis is a PAR meter (photosynthetically active radiation). A PAR meter counts photons in the PAR spectrum. A PAR meter will greatly facilitate experimental design. The sample graphs included in this lab investigation measured light intensity with an outdated measurement, the foot candle, which is a subjective measure of luminance not closely related to PAR flux.
T98 Investigation 5
■ Timing and Length of LabThe prelab questions and online preparation and review activities suggested in Getting Started can be assigned for homework.
The first part of the investigation requires one lab period of about 45 minutes to introduce the methods of either procedure. The second part, Designing and Conducting Your Investigation, requires approximately two lab periods of about 45 minutes each for students to conduct their own investigations. If interfaced sensors are available and students know how to use them, students can begin working on the procedure outlined in the first part. Another suggestion is to have students design their experiment(s) as a homework assignment; lab groups can communicate through various social networking sites or by email. Teachers also should dedicate a third lab period for students to share their results and conclusions with the class by appropriate means, such as a mini-poster session, an oral presentation, or a traditional lab report.
Students can work as pairs, trios, or small groups to accommodate different class sizes and equipment availability.
■ Safety and HousekeepingThe primary safety issues in this lab have to do with solutions near electric lights. Caution students to observe proper care with solutions near lights. Because students will be working in close proximity to exposed lightbulbs, be sure to require eye protection in the form of safety goggles. Moreover, some high-intensity light sources get extremely hot. If you are using these, advise students not to drip water on them (shatter hazard) or to lean against a light (burn hazard). Most but not all syringes are capable of withstanding the vacuum created in this procedure without failure. However, you should test the syringes beforehand.
■ ALiGNMENT TO THE AP BiOLOGy CURRiCULUM FRAMEwORKThis investigation can be conducted during the study of concepts pertaining to cellular processes (big idea 2), specifically, the capture, use, and storage of free energy, or interactions (big idea 4). In addition, some questions students are likely to raise connect to evolution (big idea 1). As always, it is important to make connections between big ideas and enduring understandings, regardless of where in the curriculum the lab is taught. The concepts align with the enduring understandings and learning objectives from the AP Biology Curriculum Framework, as indicated below.
■ Enduring Understandings• 1B1: Organisms share many conserved core processes and features that evolved and
are widely distributed among organisms today.
• 2A1: All living systems require constant input of free energy.
• 2A2: Organisms capture and store free energy for use in biological processes.
Investigation 5 T99
Big idea 2: Cellular ProCesses: energY and CommuniCation
• 2B3: Eukaryotic cells maintain internal membranes that partition the cell into specialized regions (e.g., chloroplasts).
• 4A2: The structure and function of subcellular components, and their interactions, provide essential cellular processes.
• 4A6: Interactions among living systems and with their environment result in the movement of matter and energy.
■ Learning Objectives• The student is able to describe specific examples of conserved core biological
processes and features shared by all domains or within one domain of life, and how these shared, conserved core processes and features support the concept of common ancestry for all organisms (1B1 & SP 7.2).
• The student is able to justify the scientific claim that organisms share many conserved core processes and features that evolved and are widely distributed among organisms today (1B1 & SP 6.1).
• The student is able to justify the scientific claim that free energy is required for living systems to maintain organization, to grow, or to reproduce, but that multiple strategies exist in different living systems (2A1 & SP 6.1).
• The student is able to use representations to pose scientific questions about what mechanisms and structural features allow organisms to capture, store, and use free energy (2A2 & SP 1.4, SP 3.1).
• The student is able to use representations and models to describe differences in prokaryotic and eukaryotic cells (2B3 & SP 1.4).
• The student is able to construct explanations based on scientific evidence as to how interactions of subcellular structures provide essential functions (4A2 & SP 6.2).
• The student is able to apply mathematical routines to quantities that describe interactions among living systems and their environment, which result in the movement of matter and energy (4A6 & SP 2.2).
■ ARE STUDENTS READy TO COMPLETE A SUCCESSFUL iNQUiRy-BASED, STUDENT-DiRECTED iNVESTiGATiON?Before students investigate photosynthesis, they should demonstrate an understanding of the following concepts related to the physical properties of light. The concepts may be scaffolded according to level of skills and conceptual understanding. • Measuring light intensity
• The inverse square law
• The wave nature of light (visible light spectrum, i.e., colors)
• Light as energy
T100 Investigation 5
This investigation reinforces the following skills:• Preparing solutions
• Preparing a serial dilution
• Measuring light intensity
• Developing and applying indices to represent the relationship between two quantitative values (e.g., an ET50 Index)
• Using reciprocals to modify graphical presentations
• Utilizing medians as a measure of central tendencies
• Constructing data tables and graphs
• Communicating results and conclusions
■ Skills Development Students will develop the following skills:• Applying the floating disk assay procedure to study photosynthesis or dissolved
oxygen or carbon dioxide sensors with computer interface
• Measuring/calculating rates of photosynthesis
■ Potential ChallengesStudents often come to biology with the misconception that plants undergo photosynthesis (only) and animals undergo cellular respiration. Students often forget that most plant cells also possess mitochondria and respire. In the final part of this investigation, students can explore the combined role of respiration and photosynthesis with experiments of their own design. For example, if a student places disks that have floated under light into a dark environment, plant respiration will consume the oxygen bubbles causing the disks to re-sink.
Students have a difficult time understanding the properties of light and how these properties can affect photosynthesis. The instructor may want to include a quick demonstration of the inverse square law and another quick demonstration on light absorbance.
If students have a solid understanding of the aforementioned concepts, they should be able to pose scientific questions about photosynthesis and design an experiment(s) around the effects of variables on the rate of photosynthesis. The skills and concepts may be taught through a variety of methods in an open-inquiry investigation, and photosynthetic rates may be measured by several means. Only the floating disk technique is described in the Student Manual, and alternative procedures may be equally and successfully substituted. For example, in the procedures outlined in the Student Manual, production of O2 gas in photosynthesis is measured, but students also can measure the production of CO2, or even simultaneous changes in volumes of both gases, depending on available equipment (e.g., gas sensor probes with computer interface).
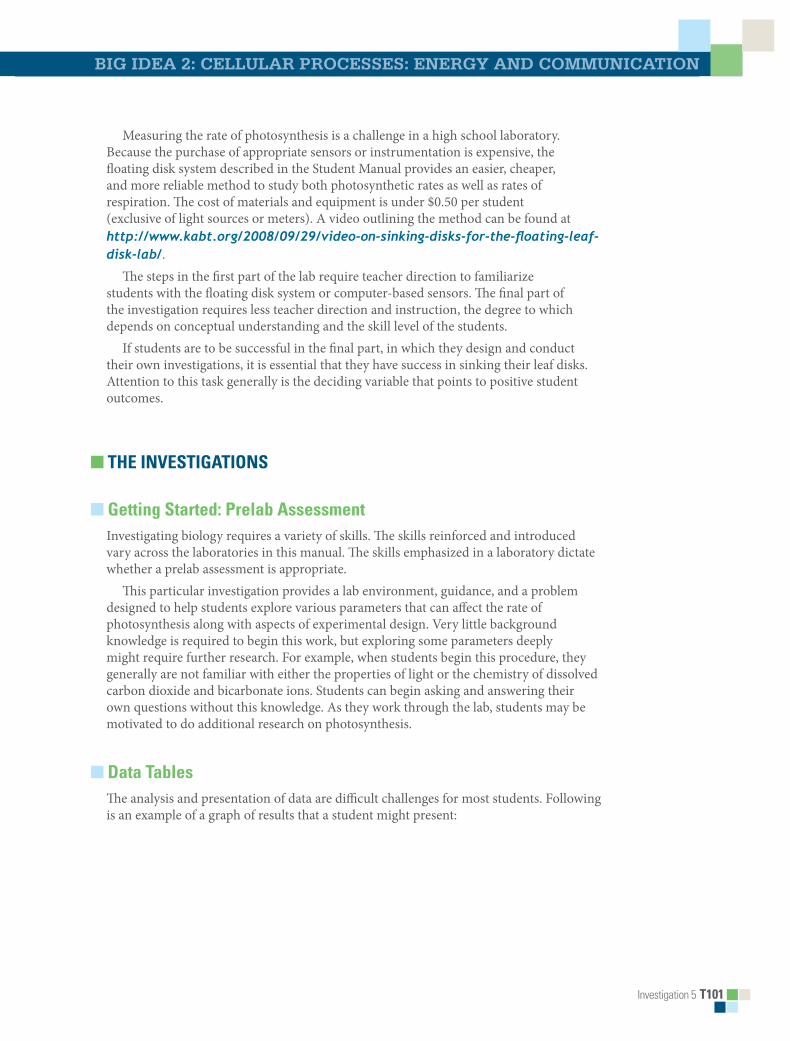
Investigation 5 T101
Big idea 2: Cellular ProCesses: energY and CommuniCation
Measuring the rate of photosynthesis is a challenge in a high school laboratory. Because the purchase of appropriate sensors or instrumentation is expensive, the floating disk system described in the Student Manual provides an easier, cheaper, and more reliable method to study both photosynthetic rates as well as rates of respiration. The cost of materials and equipment is under $0.50 per student (exclusive of light sources or meters). A video outlining the method can be found at http://www.kabt.org/2008/09/29/video-on-sinking-disks-for-the-floating-leaf-disk-lab/.
The steps in the first part of the lab require teacher direction to familiarize students with the floating disk system or computer-based sensors. The final part of the investigation requires less teacher direction and instruction, the degree to which depends on conceptual understanding and the skill level of the students.
If students are to be successful in the final part, in which they design and conduct their own investigations, it is essential that they have success in sinking their leaf disks. Attention to this task generally is the deciding variable that points to positive student outcomes.
■ THE iNVESTiGATiONS
■ Getting Started: Prelab AssessmentInvestigating biology requires a variety of skills. The skills reinforced and introduced vary across the laboratories in this manual. The skills emphasized in a laboratory dictate whether a prelab assessment is appropriate.
This particular investigation provides a lab environment, guidance, and a problem designed to help students explore various parameters that can affect the rate of photosynthesis along with aspects of experimental design. Very little background knowledge is required to begin this work, but exploring some parameters deeply might require further research. For example, when students begin this procedure, they generally are not familiar with either the properties of light or the chemistry of dissolved carbon dioxide and bicarbonate ions. Students can begin asking and answering their own questions without this knowledge. As they work through the lab, students may be motivated to do additional research on photosynthesis.
■ Data TablesThe analysis and presentation of data are difficult challenges for most students. Following is an example of a graph of results that a student might present:
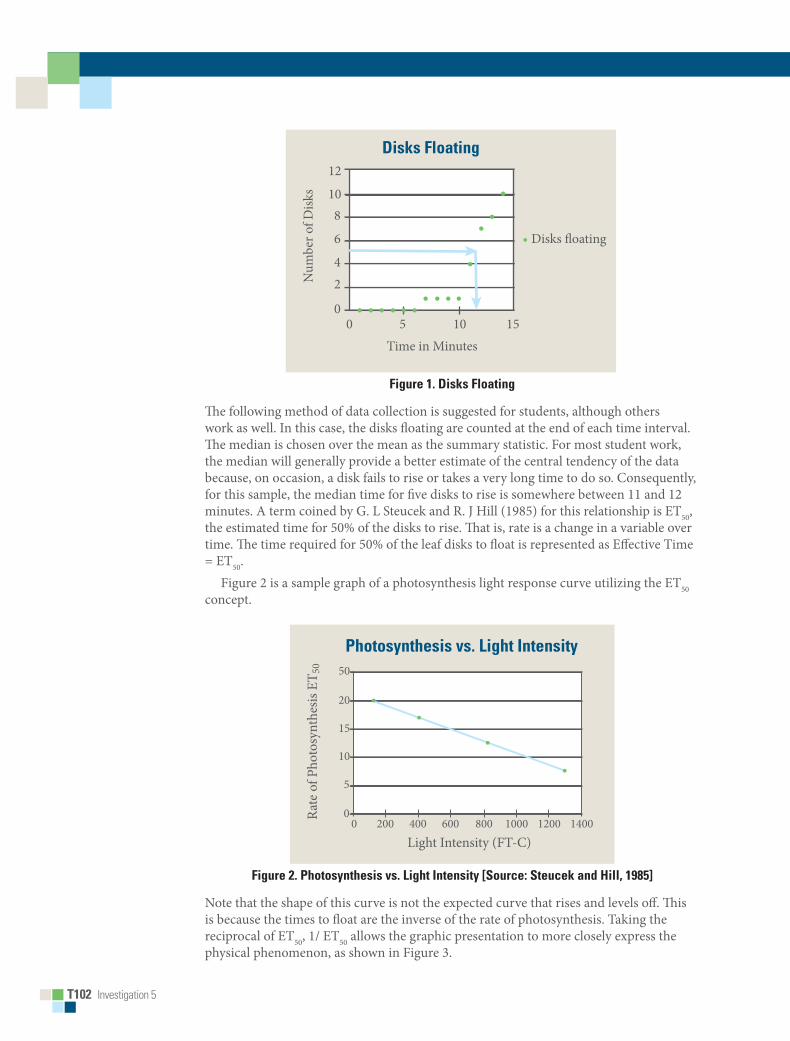
T102 Investigation 5
Disks Floating12
10
0
24
6
8
0 5 10 15Time in Minutes
Num
ber o
f Disk
s
Disks �oating
Figure 1. Disks Floating
The following method of data collection is suggested for students, although others work as well. In this case, the disks floating are counted at the end of each time interval. The median is chosen over the mean as the summary statistic. For most student work, the median will generally provide a better estimate of the central tendency of the data because, on occasion, a disk fails to rise or takes a very long time to do so. Consequently, for this sample, the median time for five disks to rise is somewhere between 11 and 12 minutes. A term coined by G. L Steucek and R. J Hill (1985) for this relationship is ET50, the estimated time for 50% of the disks to rise. That is, rate is a change in a variable over time. The time required for 50% of the leaf disks to float is represented as Effective Time = ET50.
Figure 2 is a sample graph of a photosynthesis light response curve utilizing the ET50 concept.
Photosynthesis vs. Light Intensity50
20
15
10
5
00 200 400 600 800 1000 1200 1400
Light Intensity (FT-C)
Rat
e of
Pho
tosy
nthe
sis E
T 50
Figure 2. Photosynthesis vs. Light intensity [Source: Steucek and Hill, 1985]
Note that the shape of this curve is not the expected curve that rises and levels off. This is because the times to float are the inverse of the rate of photosynthesis. Taking the reciprocal of ET50, 1/ ET50 allows the graphic presentation to more closely express the physical phenomenon, as shown in Figure 3.
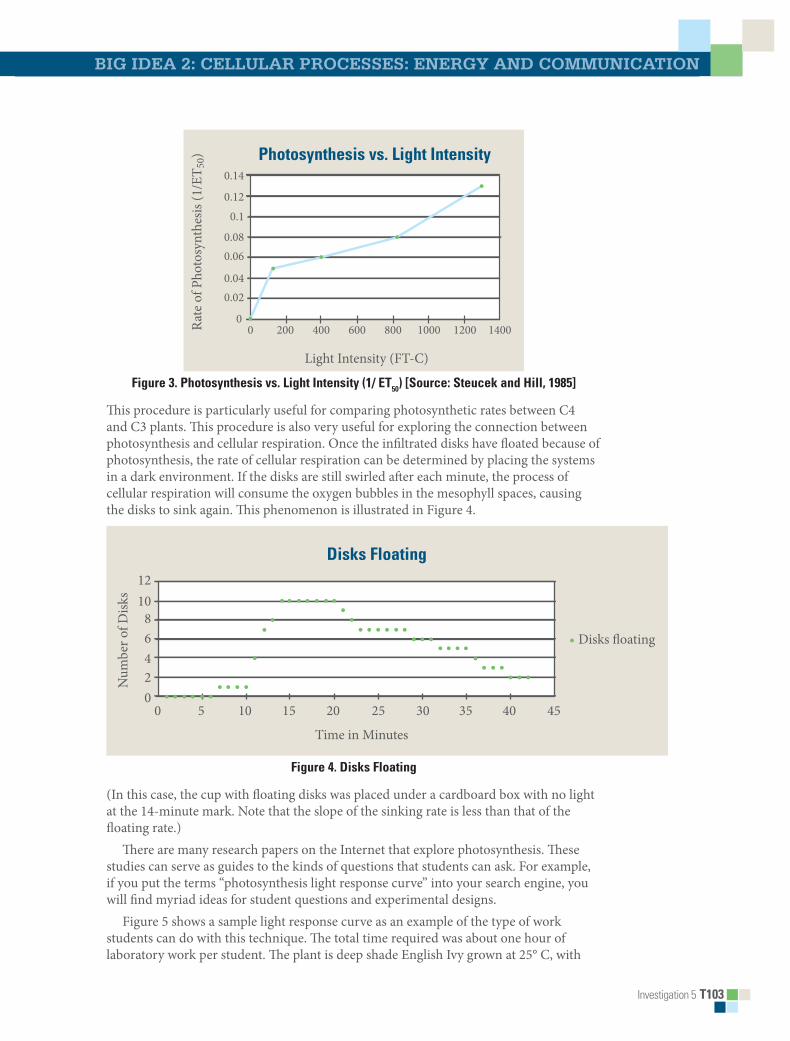
Investigation 5 T103
Big idea 2: Cellular ProCesses: energY and CommuniCation
Photosynthesis vs. Light Intensity0.14
0.12
0.080.06
0.040.02
0.1
00
Light Intensity (FT-C)
Rate
of P
hoto
synt
hesis
(1/E
T 50)
140012001000800600400200
Figure 3. Photosynthesis vs. Light intensity (1/ ET50) [Source: Steucek and Hill, 1985]
This procedure is particularly useful for comparing photosynthetic rates between C4 and C3 plants. This procedure is also very useful for exploring the connection between photosynthesis and cellular respiration. Once the infiltrated disks have floated because of photosynthesis, the rate of cellular respiration can be determined by placing the systems in a dark environment. If the disks are still swirled after each minute, the process of cellular respiration will consume the oxygen bubbles in the mesophyll spaces, causing the disks to sink again. This phenomenon is illustrated in Figure 4.
Disks Floating
1012
86420
0 5 10 15 20
Time in Minutes
Disks �oating
Num
ber o
f Disk
s
25 30 35 40 45
Figure 4. Disks Floating
(In this case, the cup with floating disks was placed under a cardboard box with no light at the 14-minute mark. Note that the slope of the sinking rate is less than that of the floating rate.)
There are many research papers on the Internet that explore photosynthesis. These studies can serve as guides to the kinds of questions that students can ask. For example, if you put the terms “photosynthesis light response curve” into your search engine, you will find myriad ideas for student questions and experimental designs.
Figure 5 shows a sample light response curve as an example of the type of work students can do with this technique. The total time required was about one hour of laboratory work per student. The plant is deep shade English Ivy grown at 25° C, with
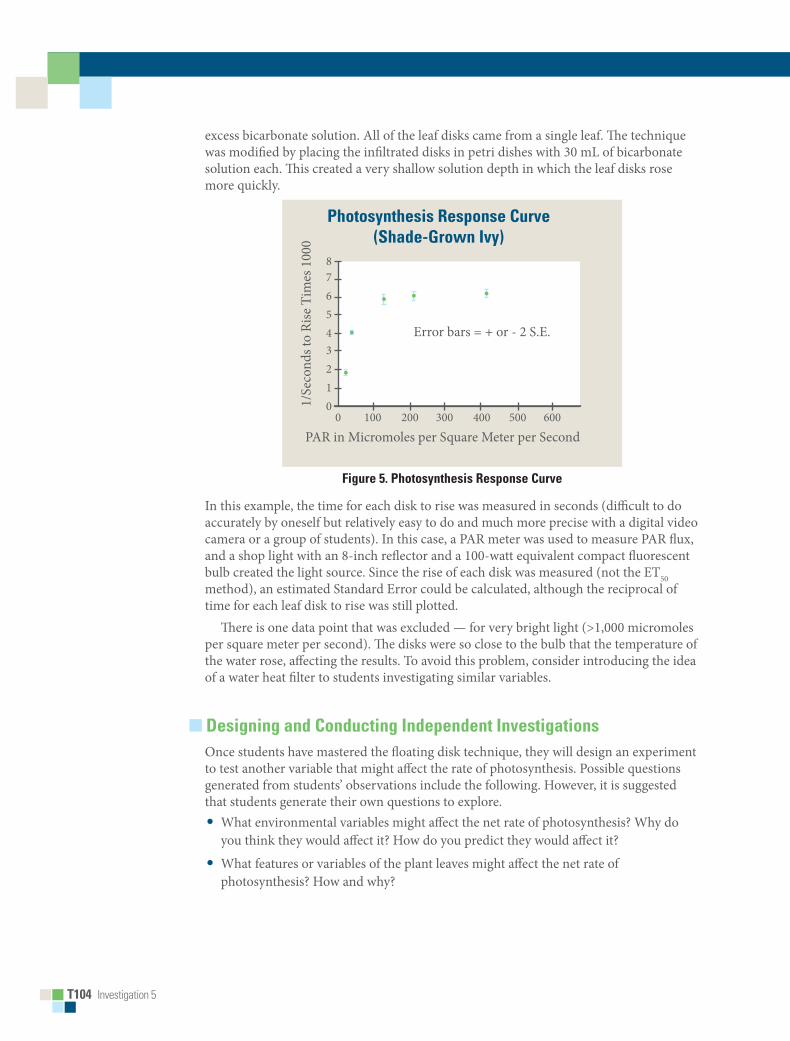
T104 Investigation 5
excess bicarbonate solution. All of the leaf disks came from a single leaf. The technique was modified by placing the infiltrated disks in petri dishes with 30 mL of bicarbonate solution each. This created a very shallow solution depth in which the leaf disks rose more quickly.
Photosynthesis Response Curve(Shade-Grown Ivy)
012345678
0 100 200 300 400 500 600
PAR in Micromoles per Square Meter per Second
Error bars = + or - 2 S.E.
1/Se
cond
s to
Rise
Tim
es 1
000
Figure 5. Photosynthesis Response Curve
In this example, the time for each disk to rise was measured in seconds (difficult to do accurately by oneself but relatively easy to do and much more precise with a digital video camera or a group of students). In this case, a PAR meter was used to measure PAR flux, and a shop light with an 8-inch reflector and a 100-watt equivalent compact fluorescent bulb created the light source. Since the rise of each disk was measured (not the ET50 method), an estimated Standard Error could be calculated, although the reciprocal of time for each leaf disk to rise was still plotted.
There is one data point that was excluded — for very bright light (>1,000 micromoles per square meter per second). The disks were so close to the bulb that the temperature of the water rose, affecting the results. To avoid this problem, consider introducing the idea of a water heat filter to students investigating similar variables.
■ Designing and Conducting independent investigationsOnce students have mastered the floating disk technique, they will design an experiment to test another variable that might affect the rate of photosynthesis. Possible questions generated from students’ observations include the following. However, it is suggested that students generate their own questions to explore.• What environmental variables might affect the net rate of photosynthesis? Why do
you think they would affect it? How do you predict they would affect it?
• What features or variables of the plant leaves might affect the net rate of photosynthesis? How and why?

Investigation 5 T105
Big idea 2: Cellular ProCesses: energY and CommuniCation
• Could the way you perform the procedure affect the outcome? If the outcome changes, does it mean the net rate of photosynthesis has changed? Why do you think that?
If students are truly stumped, you can give them some guidance. Tell students that leaves with hairy surfaces should be avoided and that ivy and spinach are among the plants that work well. Differences between plants may be one of the ideas that students want to investigate.
■ Summative AssessmentA particularly effective method of assessment involves the use of peer-reviewed laboratory notebooks and mini-posters (described in Chapter 6). With an appropriate lab investigation rubric, students can deliver feedback to each other that is not graded, providing valuable formative feedback during and after their investigations. The advantage of peer-review is that revisions can be encouraged before a grade is determined.
For this investigation the mini-poster has proven to be a very effective tool to evaluate individual or group work. The following are suggested as guidelines to assess students’ understanding of the concepts presented in the investigation, but you are encouraged to develop your own methods of postlab assessment:
1. Revisit the learning objectives. Based on students’ answers to the analysis questions, do you think students have met the objectives of the laboratory investigation?
2. Have students develop a list of common misconceptions or concepts that they had difficulty understanding about the process of photosynthesis before conducting their investigations.
3. Did students have sufficient mathematical skills to calculate the rate(s) of photosynthesis?
4. Released AP Exams have several multiple-choice and essay questions based on the concepts studied in this investigation. These could be used to assess your students’ understanding.
■ SUPPLEMENTAL RESOURES
■ Prelab Activitieshttp://mw2.concord.org/tmp.jnlp?address=http://mw2.concord.org/public/part2/photosynthesis/index.cml
This resource provides an interactive tutorial on the process of photosynthesis and the interaction with light.
T106 Investigation 5
■ Procedural ResourcesAP Biology Lab Manual, Lab 4: Plant Pigments and Photosynthesis, The College Board,
2001.
Although this laboratory protocol is teacher directed, students can use the resource to glean information about the process of photosynthesis as they design experiments to investigate factors that affect photosynthesis.
http://www.kabt.org/2008/09/29/video-on-sinking-disks-for-the-floating-leaf-disk-lab/
This video demonstrates the floating leaf disk technique.
http://www.elbiology.com/labtools/Leafdisk.html
This resource describes the leaf disk technique.
The following resources either offer variations of the floating disk technique or used the technique to provide evidence for research. All offer good ideas that can be adapted for student research. Try to obtain a copy of the Wickliff and Chasson (1964) paper. It is the earliest paper of which this author is aware that describes this technique, and it is perhaps the best. There are many ideas that can lead to good student projects.
W. K. Vencill and C. L. Foy, “Distribution of triazine-resistant smooth pigweed (Amaranthus hybridus) and common lambsquarters (Chenopodium album) in Virginia,” Weed Science 36, no. 4 (1988): 497–499.
F. Juliao and H. C. Butcher IV, “Further Improvements to the Steucek & Hill Assay of Photosynthesis,” The American Biology Teacher (1989): 174–176.
J. L. Wickliff and R. M. Chasson, “Measurement of photosynthesis in plant tissues using bicarbonate solutions,” BioScience 14, no. 3 (1964): 32–33.
G. L. Steucek and R. J. Hill, “Photosynthesis: I: An Assay Utilizing Leaf Disks,” The American Biology Teacher (1985): 96–99.
R. J. Hill and G. L. Steucek, “Photosynthesis: II. An Assay for Herbicide Resistance in Weeds,” The American Biology Teacher 47, no. 2 (1985): 99–102.

BigIdea
Investigation 5 S61
2Cellular Processes: Energy and Communication
investigation 5
PHotosYntHesisWhat factors affect the rate of photosynthesis in living leaves?
■■ BACKGROUNDPhotosynthesis fuels ecosystems and replenishes the Earth’s atmosphere with oxygen. Like all enzyme-driven reactions, the rate of photosynthesis can be measured by either the disappearance of substrate or the accumulation of product (or by-products).
The general summary equation for photosynthesis is
2 H2O + CO2 + light → carbohydrate (CH2O) + O2 + H2O
What could you measure to determine the rate of photosynthesis? • Production of O2 (How many moles of O2 are produced for one mole of sugar
synthesized?)or
• Consumption of CO2 (How many moles of CO2 are consumed for every mole of sugar synthesized?)
In this investigation, you will use a system that measures the accumulation of oxygen.
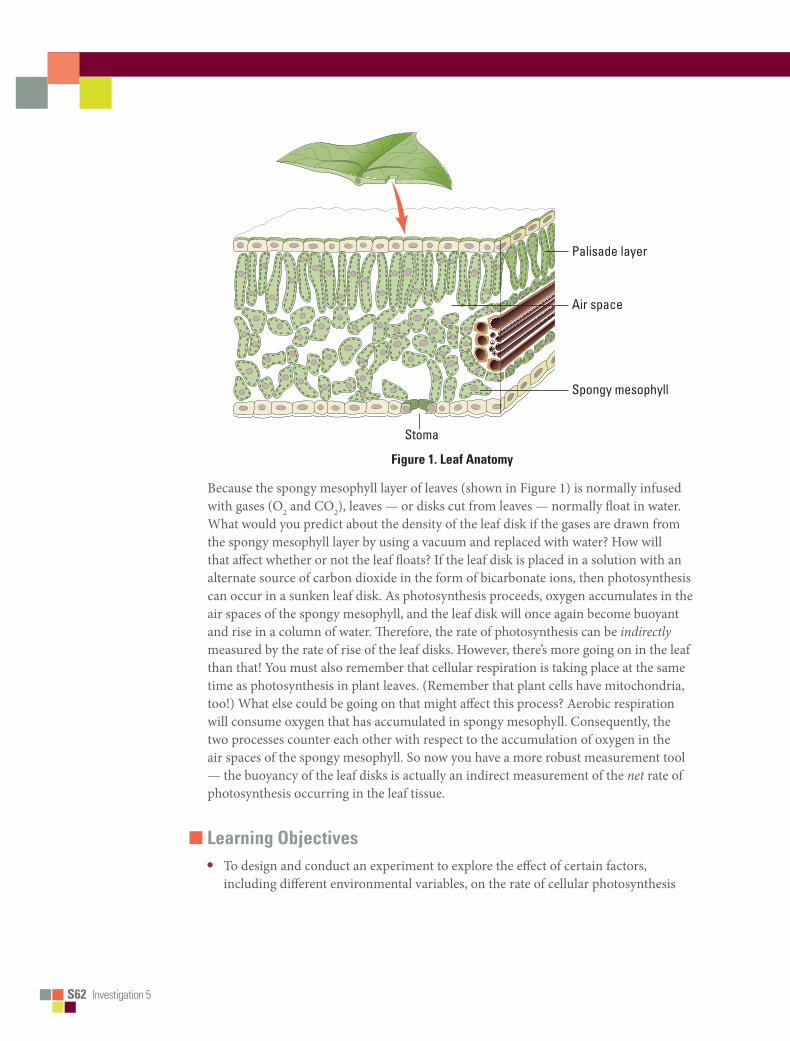
S62■■Investigation 5
Bio_S_Lab05_01
Stoma
Palisade layer
Spongy mesophyll
Air space
Figure■1.■Leaf■Anatomy
Because the spongy mesophyll layer of leaves (shown in Figure 1) is normally infused with gases (O2 and CO2), leaves — or disks cut from leaves — normally float in water. What would you predict about the density of the leaf disk if the gases are drawn from the spongy mesophyll layer by using a vacuum and replaced with water? How will that affect whether or not the leaf floats? If the leaf disk is placed in a solution with an alternate source of carbon dioxide in the form of bicarbonate ions, then photosynthesis can occur in a sunken leaf disk. As photosynthesis proceeds, oxygen accumulates in the air spaces of the spongy mesophyll, and the leaf disk will once again become buoyant and rise in a column of water. Therefore, the rate of photosynthesis can be indirectly measured by the rate of rise of the leaf disks. However, there’s more going on in the leaf than that! You must also remember that cellular respiration is taking place at the same time as photosynthesis in plant leaves. (Remember that plant cells have mitochondria, too!) What else could be going on that might affect this process? Aerobic respiration will consume oxygen that has accumulated in spongy mesophyll. Consequently, the two processes counter each other with respect to the accumulation of oxygen in the air spaces of the spongy mesophyll. So now you have a more robust measurement tool — the buoyancy of the leaf disks is actually an indirect measurement of the net rate of photosynthesis occurring in the leaf tissue.
■■ Learning■Objectives• To design and conduct an experiment to explore the effect of certain factors,
including different environmental variables, on the rate of cellular photosynthesis

Investigation 5 S63
big idea 2: Cellular ProCesses: energY and CommuniCation
• To connect and apply concepts, including the relationship between cell structure and function (chloroplasts); strategies for capture, storage, and use of free energy; diffusion of gases across cell membranes; and the physical laws pertaining to the properties and behaviors of gases
■■ General■Safety■PrecautionsYou must wear safety goggles or glasses, aprons, and gloves because you will be working in close proximity to exposed lightbulbs that can easily shatter.
Be careful to keep your solutions away from the electrical cord of your light source. Follow your teacher’s instructions.
If you investigate temperature as a variable in Designing and Conducting Your Investigation, there is no need to heat any solution beyond 50–60°C.
Most but not all syringes are capable of withstanding the vacuum created in this procedure without failure. However, you should test the syringes beforehand.
■■ THE■INVESTIGATIONS
■■ Getting■StartedTo study photosynthesis, review the properties of light and how it interacts with matter. In addition to your textbook, the Concord Consortium has a Java-based Web activity that will review the properties of light and the ways in which visible light interacts with matter in the process of photosynthesis. This multistep activity uses visualizations, animations, and a molecular modeling engine that does an excellent job of making abstract concepts understandable. To explore this activity, enter these terms in your search engine: “concord consortium molecular workbench photosynthesis.”
While going through this activity, record any questions in your laboratory notebook. These questions and others that occur to you while working through the steps in Procedure can serve as a basis for your own investigation in Designing and Conducting Your Investigation.
■■ Procedure■In this part of the lab, you will learn how the floating leaf disk technique can measure the rate of photosynthesis by testing a variable that you know affects photosynthesis. Later, you will apply this technique (or computer-based probes) to test a variable that you choose. It is important for you to develop a few skills during this part of the investigation in order to carry out your own investigation. For the floating disk technique, the most challenging skill is getting the disks to sink. Don’t just watch someone do this; make sure you can get the disks to sink as well.

S64■■Investigation 5
Materials
• Baking soda (sodium bicarbonate)• Liquid soap (approximately 5 mL of
dishwashing soap in 250 mL of water)• 2 plastic syringes without needle (10 mL
or larger)
• Living leaves (spinach, ivy, etc.)• Hole punch• 2 clear plastic cups• Timer• Light source
Figure■2.■Materials
When immersed in water, oxygen bubbles are usually trapped in the air spaces of the spongy mesophyll in the plant leaf. By creating a vacuum in this experimental procedure, the air bubbles can be drawn out of the spongy mesophyll, and the space is refilled by the surrounding solution. This allows the leaf disks to sink in the experimental solution. If the solution has bicarbonate ions and enough light, the leaf disk will begin to produce sugars and oxygen through the process of photosynthesis. Oxygen collects in the leaf as photosynthesis progresses, causing the leaf disks to float again. The length of time it takes for leaf disks to float again is a measure of the net rate of photosynthesis. This process is shown in Figure 3.
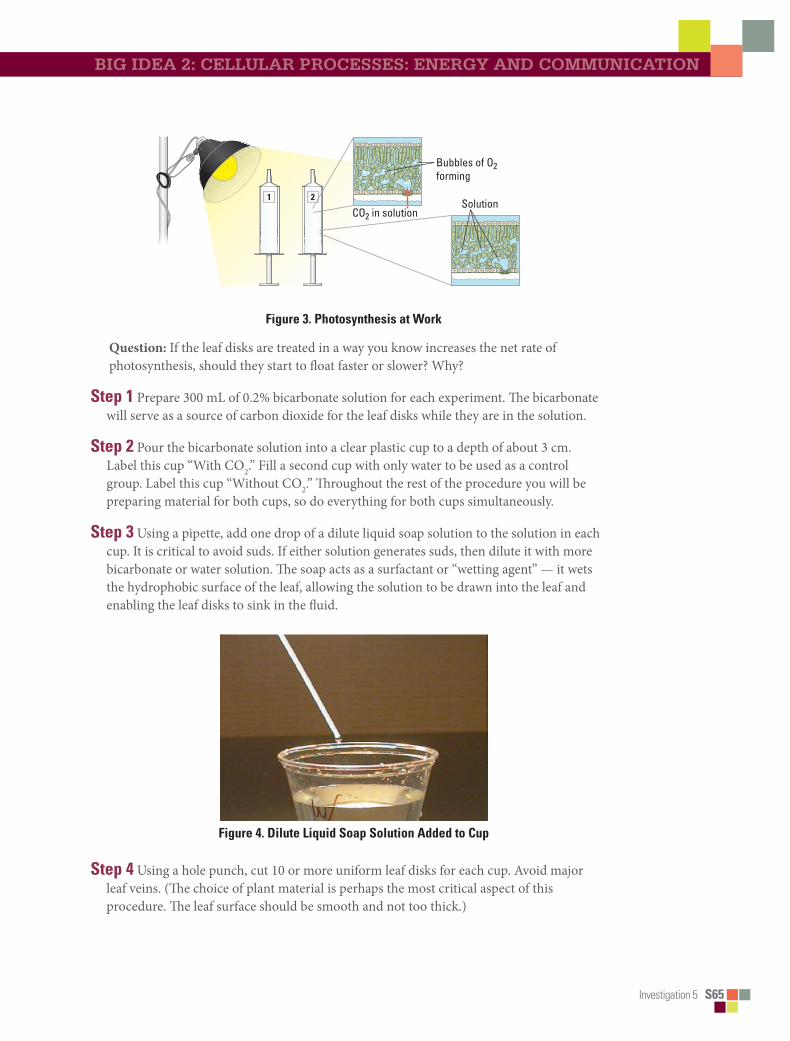
Investigation 5 S65
big idea 2: Cellular ProCesses: energY and CommuniCation
Bio_S_Lab05_03
CO2 in solutionSolution
Bubbles of O2forming
1 2
Figure■3.■Photosynthesis■at■Work■
Question: If the leaf disks are treated in a way you know increases the net rate of photosynthesis, should they start to float faster or slower? Why?
Step■1 Prepare 300 mL of 0.2% bicarbonate solution for each experiment. The bicarbonate will serve as a source of carbon dioxide for the leaf disks while they are in the solution.
Step■2 Pour the bicarbonate solution into a clear plastic cup to a depth of about 3 cm. Label this cup “With CO2.” Fill a second cup with only water to be used as a control group. Label this cup “Without CO2.” Throughout the rest of the procedure you will be preparing material for both cups, so do everything for both cups simultaneously.
Step■3 Using a pipette, add one drop of a dilute liquid soap solution to the solution in each cup. It is critical to avoid suds. If either solution generates suds, then dilute it with more bicarbonate or water solution. The soap acts as a surfactant or “wetting agent” — it wets the hydrophobic surface of the leaf, allowing the solution to be drawn into the leaf and enabling the leaf disks to sink in the fluid.
Figure■4.■Dilute■Liquid■Soap■Solution■Added■to■Cup
Step■4 Using a hole punch, cut 10 or more uniform leaf disks for each cup. Avoid major leaf veins. (The choice of plant material is perhaps the most critical aspect of this procedure. The leaf surface should be smooth and not too thick.)

S66■■Investigation 5
Figure■5.■Leaf■Disks
Step■5 Draw the gases out of the spongy mesophyll tissue and infiltrate the leaves with the sodium bicarbonate solution by performing the following steps:
a.Remove the piston or plunger from both syringes. Place the 10 leaf disks into each syringe barrel.
b.Replace the plunger, but be careful not to crush the leaf disks. Push in the plunger until only a small volume of air and leaf disk remain in the barrel (<10%).
c.Pull a small volume (5 cc) of sodium bicarbonate plus soap solution from your prepared cup into one syringe and a small volume of water plus soap into the other syringe. Tap each syringe to suspend the leaf disks in the solution. Make sure that, with the plunger inverted, the disks are suspended in the solution. Make sure no air remains. Move the plunger to get rid of air from the plunger before you attempt Step d.
d.You now want to create a vacuum in the plunger to draw the air out of the leaf tissue. This is the most difficult step to master. Once you learn to do this, you will be able to complete the entire exercise successfully. Create the vacuum by holding a finger over the narrow syringe opening while drawing back the plunger (see Figure 6a). Hold this vacuum for about 10 seconds. While holding the vacuum, swirl the leaf disks to suspend them in the solution. Now release the vacuum by letting the plunger spring back. The solution will infiltrate the air spaces in the leaf disk, causing the leaf disks to sink in the syringe. If the plunger does not spring back, you did not have a good vacuum, and you may need a different syringe. You may have to repeat this procedure two to three times in order to get the disks to sink. (If you have any difficulty getting your disks to sink after three tries, it is usually because there is not enough soap in the solution. Try adding a few more drops of soap to the cup and replacing the liquid in the syringe.) Placing the disks under vacuum more than three times can damage the disks.
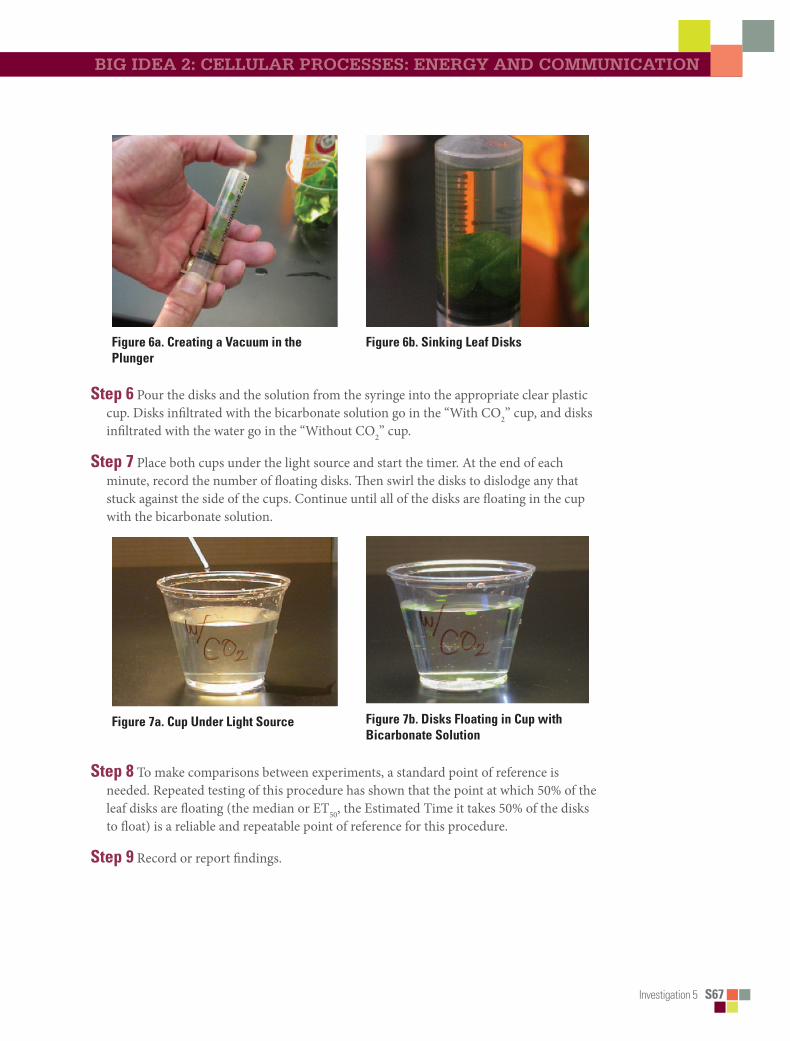
Investigation 5 S67
big idea 2: Cellular ProCesses: energY and CommuniCation
Figure■6a.■Creating■a■Vacuum■in■the■Plunger
Figure■6b.■Sinking■Leaf■Disks
Step■6 Pour the disks and the solution from the syringe into the appropriate clear plastic cup. Disks infiltrated with the bicarbonate solution go in the “With CO2” cup, and disks infiltrated with the water go in the “Without CO2” cup.
Step■7 Place both cups under the light source and start the timer. At the end of each minute, record the number of floating disks. Then swirl the disks to dislodge any that stuck against the side of the cups. Continue until all of the disks are floating in the cup with the bicarbonate solution.
Figure■7a.■Cup■Under■Light■Source Figure■7b.■Disks■Floating■in■Cup■with■Bicarbonate■Solution
Step■8 To make comparisons between experiments, a standard point of reference is needed. Repeated testing of this procedure has shown that the point at which 50% of the leaf disks are floating (the median or ET50, the Estimated Time it takes 50% of the disks to float) is a reliable and repeatable point of reference for this procedure.
Step■9 Record or report findings.

S68■■Investigation 5
■■ Designing■and■Conducting■Your■InvestigationWhat factors affect the rate of photosynthesis in living plants?
1.Once you have mastered the floating disk technique, you will design an experiment to test another variable that might affect the rate of photosynthesis. Some ideas include the following, but don’t limit yourself to just these:
• What environmental variables might affect the net rate of photosynthesis? Why do you think they would affect it? How do you predict they would affect it?
• What features or variables of the plant leaves might affect the net rate of photosynthesis? How and why?
• Could the way you perform the procedure affect the outcome? If the outcome changes, does it mean the net rate of photosynthesis has changed? Why do you think that?
Note: If you are truly stumped, your instructor can give you some guidance. Keep in mind that leaves with hairy surfaces should be avoided. Ivy and spinach work well, but many others do as well. Differences between plants may be one of the ideas that you want to investigate.
2.Use your results to prepare a lab report/mini-poster for a classroom peer review presentation. See Chapter 2 for guidance on this.
■■ Additional■Guidelines 1.Consider combining variables as a way to describe differences between different
plants. For instance, if you investigate how light intensity affects the rate of photosynthesis, you might generate a “photosynthesis light response curve”—the rate of photosynthesis at different light intensities. The shape of this curve may change for different plants or plants in different light environments. The “light response curve” is a form of measurement itself. How do you think a light response curve (the first variable) for a shade-grown leaf compares to that of a sun-grown leaf? In this situation, sun versus shade is the second variable. Comparing light response curves is a standard research technique in plant physiological ecology.
2.When you compare the ET50 across treatments, you will discover that there is an inverse relationship between ET50 and the rate of photosynthesis — ET50 goes down as rate of photosynthesis goes up, which plots a graph with a negative slope. This creates a seemingly backward graph when plotting your ET50 data across treatments, as shown in Figure 8a. To correct this representation and make a graph that shows increasing rates of photosynthesis with a positive slope, the ET50 term can be modified by taking its inverse, or 1/ET50. This creates a more traditional direct relationship graph, as shown in Figure 8b.

Investigation 5 S69
big idea 2: Cellular ProCesses: energY and CommuniCation
Rate of Photosynthesis
ET50
1/ET
50
Rate of Photosynthesis
■■■■■■Figure■8a.■Inverse■Relationship ■■■■■■■■■■■■■■■■■■■Figure■8b.■Direct■Relationship
3.Don’t forget to include other appropriate data analyses as you prepare and study your discussion and conclusions. In particular for this investigation, you should somehow indicate the variability in your data. The ET50 measurement is calculated from the median. To indicate the spread of your data, you could use error bars around the ET50 point that express that variation, or you might consider using “box and whisker” plots.

This page is intentionally left blank.

BigIdea
Investigation 6 T107
2Cellular Processes: Energy and Communication
investigation 6
CeLLULaR ResPiRation*What factors affect the rate of cellular respiration in multicellular organisms?
■ BACKGROUNDLiving systems require free energy and matter to maintain order, to grow, and to reproduce. Energy deficiencies are not only detrimental to individual organisms, but they cause disruptions at the population and ecosystem levels as well. Organisms employ various strategies that have been conserved through evolution to capture, use, and store free energy. Autotrophic organisms capture free energy from the environment through photosynthesis and chemosynthesis, whereas heterotrophic organisms harvest free energy from carbon compounds produced by other organisms. In cellular respiration, free energy becomes available to drive metabolic pathways vital to cellular processes primarily by the conversion of ADP → ATP. In eukaryotes, respiration occurs in the mitochondria within cells.
If sufficient oxygen is available, glucose may be oxidized completely in a series of enzyme-mediated steps, as summarized by the following reaction:
C6H12O6 + 6O2(g) → 6CO2(g) + 6H2O + energy
More specifically,
C6H12O6 + 6O2 (g) → 6CO2 (g) + 6H2O + 686 kilocalories of energymole of glucose oxidized
The chemical oxidation of glucose has important implications to the measurement of respiration. From the equation, if glucose is the energy source, then for every one molecule of oxygen consumed, one molecule of carbon dioxide is produced. To determine the rate of cellular respiration, one could measure any of the following:• Consumption of O2 during the oxidation of glucose (How many moles of O2 are
consumed when one mole of glucose is oxidized?)
• Production of CO2 during aerobic respiration (How many moles of CO2 are produced when one mole of glucose is oxidized?)
• Release of energy in the form of heat as one mole of glucose is oxidized
In Getting Started, students conduct prelab research on the process of cellular respiration and review concepts they may have studied previously.
* Transitioned from the AP Biology Lab Manual (2001)
T108 Investigation 6
In Procedures, students learn how to calculate the rate of cellular respiration by using a respirometer system (microrespirometers or gas pressure sensors with computer interface) that measures the relative volume (changes in pressure) as oxygen is consumed by germinating plant seeds at room temperature (20°C). As oxygen is consumed during respiration, it is normally replaced by CO2 gas at a ratio of one molecule of CO2 for each molecule of O2. Thus, one would expect no change in gas volume to result from this experiment. However, the CO2 produced is removed by potassium hydroxide (KOH), which reacts with CO2 to form solid potassium carbonate (K2CO3) through the following reaction:
CO2 + 2KOH → K2CO3 + H2O
As O2 is consumed, the overall gas volume in the respirometer decreases, and this change can be used to determine the rate of cellular respiration. Because respirometers are sensitive to changes in gas volume, they are also sensitive to changes in temperature and air pressure; thus, students need to use a control respirometer containing nonliving matter (e.g., glass beads) instead of germinating seeds to measure and correct for changes in temperature and pressure.
Once students learn how to measure the rate of cellular respiration, questions should emerge about the process that lead to investigation, including the following:• What is the difference, if any, in the rate of cellular respiration in germinating seeds
versus nongerminating seeds?
• Does the temperature of germinating seeds affect the rate of cellular respiration? Do plant seeds consume more oxygen at higher temperatures than at lower temperatures?
• Do germinating seeds just starting to germinate consume oxygen at a greater rate than seeds that have been germinating for several days (age dependence)?
• Do seeds, such as Wisconsin Fast Plant seeds (which store energy as oil), respire at a different rate from small grass seeds (which store energy as starch)?
• Do small seeds of spring flowers, weeds, or grasses respire at a different rate from seeds from summer, fall, or winter plants?
• Do seeds from monocot plants respire at different rates from dicot plants?
• Do available nutrients affect the rate of respiration in germinating seeds?
• Can the same respirometer system be used to measure the rate of respiration in small invertebrates, such as insects or earthworms?
• What problems would arise if students used a living, green plant instead of germinating seeds?
In Designing and Conducting Your Investigation, students design and conduct an experiment(s) to investigate one or more questions that they raised in Procedures. Their exploration will likely generate even more questions about cellular respiration.
The lab also provides an opportunity for students to apply, review, and/or scaffold concepts that they have studied previously, including the relationship between cell structure and function (mitochondria); enzymatic activity; strategies for capture, storage, and use of free energy; diffusion of gases across cell membranes; and the physical laws pertaining to the properties and behaviors of gases.
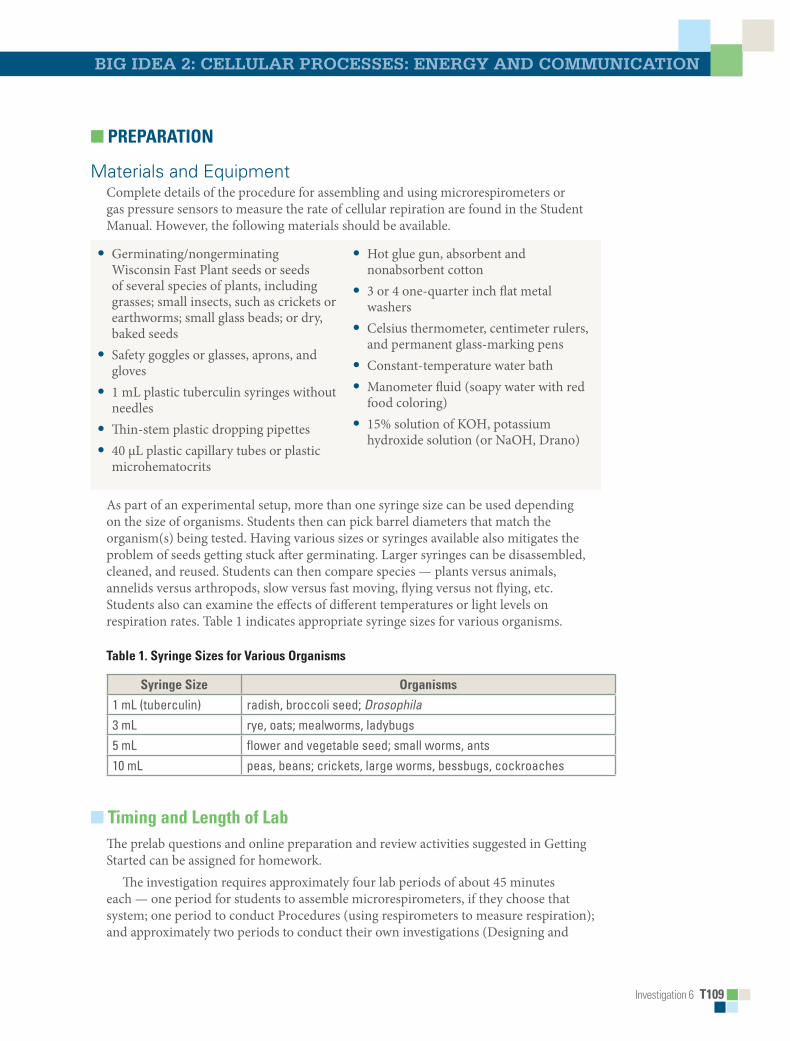
Investigation 6 T109
Big idea 2: CeLLULaR PRoCesses: eneRgy and CommUniCation
■ PREPARATION
Materials and EquipmentComplete details of the procedure for assembling and using microrespirometers or gas pressure sensors to measure the rate of cellular repiration are found in the Student Manual. However, the following materials should be available.
• Germinating/nongerminating Wisconsin Fast Plant seeds or seeds of several species of plants, including grasses; small insects, such as crickets or earthworms; small glass beads; or dry, baked seeds
• Safety goggles or glasses, aprons, and gloves
• 1 mL plastic tuberculin syringes without needles
• Thin-stem plastic dropping pipettes• 40 μL plastic capillary tubes or plastic
microhematocrits
• Hot glue gun, absorbent and nonabsorbent cotton
• 3 or 4 one-quarter inch flat metal washers
• Celsius thermometer, centimeter rulers, and permanent glass-marking pens
• Constant-temperature water bath• Manometer fluid (soapy water with red
food coloring)• 15% solution of KOH, potassium
hydroxide solution (or NaOH, Drano)
As part of an experimental setup, more than one syringe size can be used depending on the size of organisms. Students then can pick barrel diameters that match the organism(s) being tested. Having various sizes or syringes available also mitigates the problem of seeds getting stuck after germinating. Larger syringes can be disassembled, cleaned, and reused. Students can then compare species — plants versus animals, annelids versus arthropods, slow versus fast moving, flying versus not flying, etc. Students also can examine the effects of different temperatures or light levels on respiration rates. Table 1 indicates appropriate syringe sizes for various organisms.
Table 1. Syringe Sizes for Various Organisms
Syringe Size Organisms
1 mL (tuberculin) radish, broccoli seed; Drosophila3 mL rye, oats; mealworms, ladybugs5 mL flower and vegetable seed; small worms, ants10 mL peas, beans; crickets, large worms, bessbugs, cockroaches
■ Timing and Length of LabThe prelab questions and online preparation and review activities suggested in Getting Started can be assigned for homework.
The investigation requires approximately four lab periods of about 45 minutes each — one period for students to assemble microrespirometers, if they choose that system; one period to conduct Procedures (using respirometers to measure respiration); and approximately two periods to conduct their own investigations (Designing and

T110 Investigation 6
Conducting Your Investigation). If gas pressure sensors are available and students know how to use them, they can assemble them in about 10 minutes and proceed directly to Procedures. Alternatively, students can design their experiment(s) as a homework assignment, and lab groups can communicate through various social networking sites or by email. Teachers should allow time for students to share their results and conclusions with the class by appropriate means, such as a mini-poster session or traditional lab report. Students can work in pairs or small groups to accommodate different class sizes.
■ Safety and HousekeepingSafety goggles or glasses, aprons, and gloves must be worn because KOH (or the alternative, NaOH in Drano) is caustic. Keep the KOH solution in cotton, using a limited amount of KOH, inside the barrel of the syringe, and you’ll minimize accidental exposure to KOH. When charging the microrespirometers, point the capillary into a sink in case there is excess KOH that might be expelled from the capillary under pressure. Students must be careful when using the hot glue gun to seal microrespirometers. Students should be supervised at all times while working in the laboratory.
■ ALIGNmENT TO THE AP BIOLOGY CURRICULUm FRAmEwORKThis investigation can be conducted during the study of concepts pertaining to cellular processes (big idea 2) — specifically, the capture, use, and storage of free energy — or interactions (big idea 4). In addition, some questions students are likely to connect to evolution (big idea 1) if students explore cellular respiration — a conserved core process — in a variety of plants or insects. As always, it is important to make connections between big ideas and enduring understandings, regardless of where in the curriculum the lab is taught. The concepts align with the enduring understandings and learning objectives from the AP Biology Curriculum Framework, as indicated below.
■ Enduring Understandings• 1B1: Organisms share many conserved core processes and features that evolved and
are widely distributed among organisms today.
• 2A1: All living systems require constant input of free energy.
• 2A2: Organisms capture and store free energy for use in biological processes.
• 2B3: Eukaryotic cells maintain internal membranes that partition the cell into specialized regions (e.g., mitochondria).
• 4A2: The structure and function of subcellular components, and their interactions, provide essential cellular processes.
• 4A6: Interactions among living systems and with their environment result in the movement of matter and energy.

Investigation 6 T111
Big idea 2: CeLLULaR PRoCesses: eneRgy and CommUniCation
■ Learning Objectives• The student is able to describe specific examples of conserved core biological
processes and features shared by all domains or within one domain of life, and how these shared, conserved core processes and features support the concept of common ancestry for all organisms (1B1 & SP 7.2).
• The student is able to justify the scientific claim that organisms share many conserved core processes and features that evolved and are widely distributed among organisms today (1B1 & SP 6.1).
• The student is able to justify a scientific claim that free energy is required for living systems to maintain organization, to grow, or to reproduce, but that multiple strategies exist in different living systems (2A1 & SP 6.1).
• The student is able to use representations to pose scientific questions about what mechanisms and structural features allow organisms to capture, store, and use free energy (2A2 & SP 1.4, SP 3.1).
• The student is able to use representations and models to describe differences in prokaryotic and eukaryotic cells (2B3 & SP 1.4).
• The student is able to construct explanations based on scientific evidence as to how interactions of subcellular structures provide essential functions (4A2 & SP 6.2).
• The student is able to apply mathematical routines to quantities that describe interactions among living systems and their environment, which result in the movement of matter and energy (4A6 & SP 2.2).
■ ARE STUDENTS READY TO COmPLETE A SUCCESSFUL INQUIRY-BASED, STUDENT-DIRECTED INVESTIGATION?Before students investigate cellular respiration, they should be able to demonstrate understanding of the following concepts: • The relationship between cell structure and function (mitochondria)
• Enzymatic activity and the effects of environmental variables, such as temperature and pH, on enzyme-catalyzed reactions
• Strategies for capture, storage, and use of free energy
• Interdependence of photosynthesis and cellular respiration
• Aerobic respiration versus fermentation
• Diffusion of gases across cell membranes
These concepts may be scaffolded according to level of skills and conceptual understanding. For example, a number of physical laws relating to gases are important to understanding how the respirometer systems used in the investigation(s) measure
T112 Investigation 6
respiration rate. In particular, the laws are summarized in the general gas law, and students should be able to manipulate the equation PV = nRT, where
P = pressure of the gasV = volume of the gasn = number of molecules of the gasR = the gas constant (its value is fixed)T = temperature of the gasStudents can be directed to several online resources to review the gas laws, including
http://www.phschool.com/science/biology_place/labbench/lab5/intro.html, which offers activities to introduce key concepts pertaining to cellular respiration, and http://www.nclark.net/GasLaws, which provides myriad tutorials and animations to introduce or review the gas laws.
This investigation reinforces the following skills. (However, if students have not acquired these skills previously, the procedures in this lab will help students develop them.) • Preparing a constant temperature water bath
• Measuring volume and temperature using the metric system
• Constructing data tables and graphs
• Communicating results and conclusions
■ Skills DevelopmentStudents will develop the following skills:• Assembling and using microrespirometers or gas pressure sensors with computer
interface
• Measuring/calculating rates of cellular respiration
■ Potential Challenges Students often come to biology with the misconception that plants undergo photosynthesis (only) and animals undergo cellular respiration. Students are surprised to learn that most plant cells possess mitochondria and respire. The Procedures section, in which students measure the rate of respiration in germinating seeds, dispels the misconception.
If students have a solid understanding of the aforementioned concepts, they should be able to pose scientific questions about cellular respiration and design an experiment(s) around the effects of variables on the rate of respiration. The skills and concepts may be taught through a variety of methods in an open-inquiry investigation, and respiration rates may be measured by several means. Only two methods (microrespirometers or gas pressure sensors with computer interface) are described in the Student Manual, and alternative procedures may be equally and successfully substituted. For example, in the procedures outlined in the Student Manual, consumption of O2 gas in respiration is
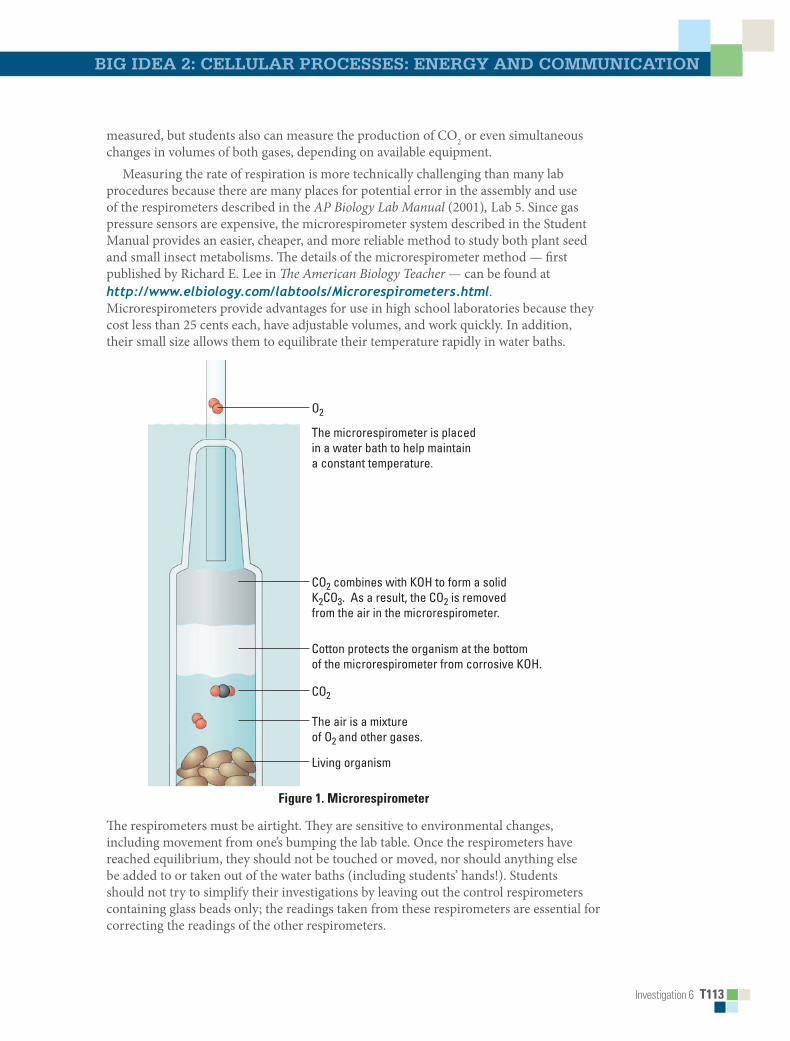
Investigation 6 T113
Big idea 2: CeLLULaR PRoCesses: eneRgy and CommUniCation
measured, but students also can measure the production of CO2 or even simultaneous changes in volumes of both gases, depending on available equipment.
Measuring the rate of respiration is more technically challenging than many lab procedures because there are many places for potential error in the assembly and use of the respirometers described in the AP Biology Lab Manual (2001), Lab 5. Since gas pressure sensors are expensive, the microrespirometer system described in the Student Manual provides an easier, cheaper, and more reliable method to study both plant seed and small insect metabolisms. The details of the microrespirometer method — first published by Richard E. Lee in The American Biology Teacher — can be found at http://www.elbiology.com/labtools/Microrespirometers.html. Microrespirometers provide advantages for use in high school laboratories because they cost less than 25 cents each, have adjustable volumes, and work quickly. In addition, their small size allows them to equilibrate their temperature rapidly in water baths.
Bio_T_Lab06_01
The microrespirometer is placed in a water bath to help maintain a constant temperature.
CO2 combines with KOH to form a solid K2CO3. As a result, the CO2 is removed from the air in the microrespirometer.
CO2
Cotton protects the organism at the bottom of the microrespirometer from corrosive KOH.
The air is a mixture of O2 and other gases.
O2
Living organism
Figure 1. microrespirometer
The respirometers must be airtight. They are sensitive to environmental changes, including movement from one’s bumping the lab table. Once the respirometers have reached equilibrium, they should not be touched or moved, nor should anything else be added to or taken out of the water baths (including students’ hands!). Students should not try to simplify their investigations by leaving out the control respirometers containing glass beads only; the readings taken from these respirometers are essential for correcting the readings of the other respirometers.

T114 Investigation 6
As stated previously, rates of cellular respiration also can be determined using gas pressure sensors with a computer interface. Instructions, tips, and suggestions for most accurate usage of these devices can be found in the instructions that are provided with the purchase of the equipment.
■ THE INVESTIGATIONS
■ Getting Started: Prelab AssessmentYou may assign the following questions for homework; as a think, pair/group, share activity, in which pairs or small groups of students brainstorm ideas and then share them with other groups; or as a whole-class discussion to assess students’ understanding of key concepts pertaining to cellular respiration:
1. Why is it necessary to correct the readings of the respirometers containing seeds with the readings taken from respirometers containing only glass beads? Your answer should refer to the concepts derived from the general gas law,
PV = nRT
2. What happens to the volume of the gas being measured (O2 consumption or CO2 production) when the temperature or pressure changes during the experiment? If pressure and temperature remain constant, will the volume of gas in the respirometers increase or decrease? Please explain. Hint: Several tutorials and animations explaining the general gas law are available online (e.g., http://www.nclark.net/GasLaws).
3. Imagine that you are given 25 germinating pea seeds that have been placed in boiling water for 5 minutes. You place these seeds in a respirometer and collect data. Predict the rate of oxygen consumption (i.e., cellular respiration) for these seeds, and explain your reasons.
4. Imagine that you are asked to measure the rate of respiration for a 25 g reptile and a 25 g mammal at 10°C. Predict how the results would compare and justify your prediction.
5. Imagine that you are asked to repeat the reptile/mammal comparison of oxygen consumption, but at a temperature of 22°C. Predict how these results would differ from the measurements made at 10°C, and explain your prediction in terms of metabolism.
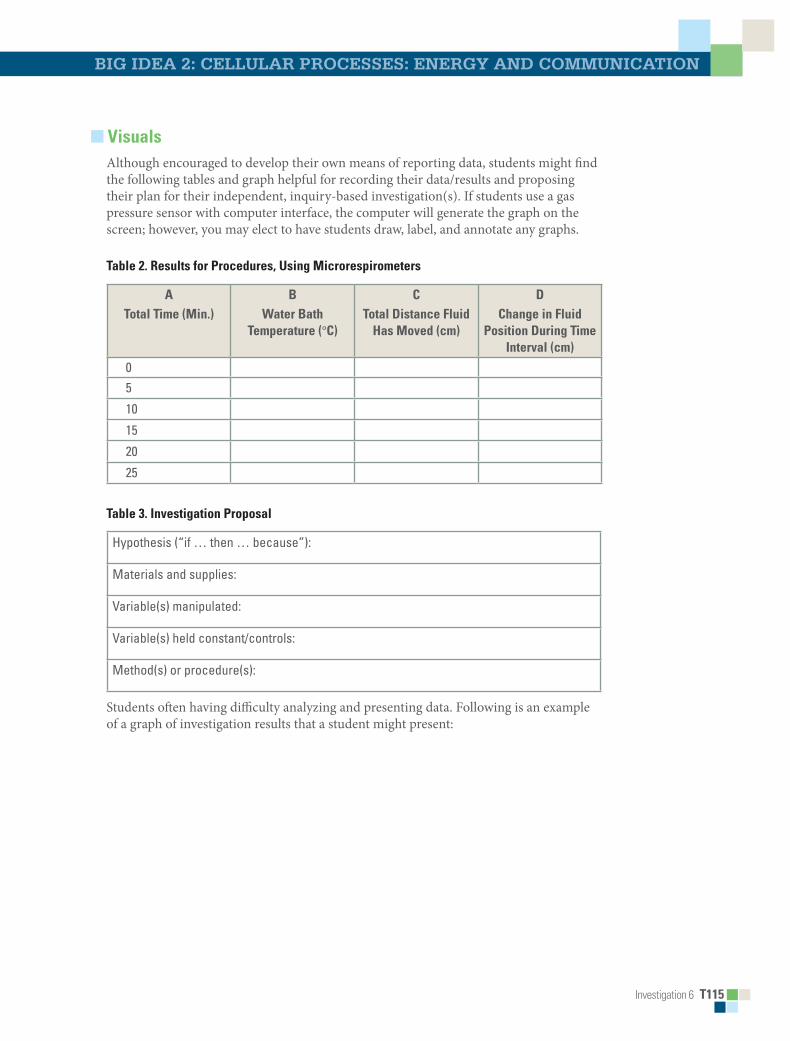
Investigation 6 T115
Big idea 2: CeLLULaR PRoCesses: eneRgy and CommUniCation
■ VisualsAlthough encouraged to develop their own means of reporting data, students might find the following tables and graph helpful for recording their data/results and proposing their plan for their independent, inquiry-based investigation(s). If students use a gas pressure sensor with computer interface, the computer will generate the graph on the screen; however, you may elect to have students draw, label, and annotate any graphs.
Table 2. Results for Procedures, Using microrespirometers
ATotal Time (min.)
Bwater Bath
Temperature (°C)
CTotal Distance Fluid
Has moved (cm)
DChange in Fluid
Position During Time Interval (cm)
05
10
15
20
25
Table 3. Investigation Proposal
Hypothesis (“if … then … because”):
Materials and supplies:
Variable(s) manipulated:
Variable(s) held constant/controls:
Method(s) or procedure(s):
Students often having difficulty analyzing and presenting data. Following is an example of a graph of investigation results that a student might present:
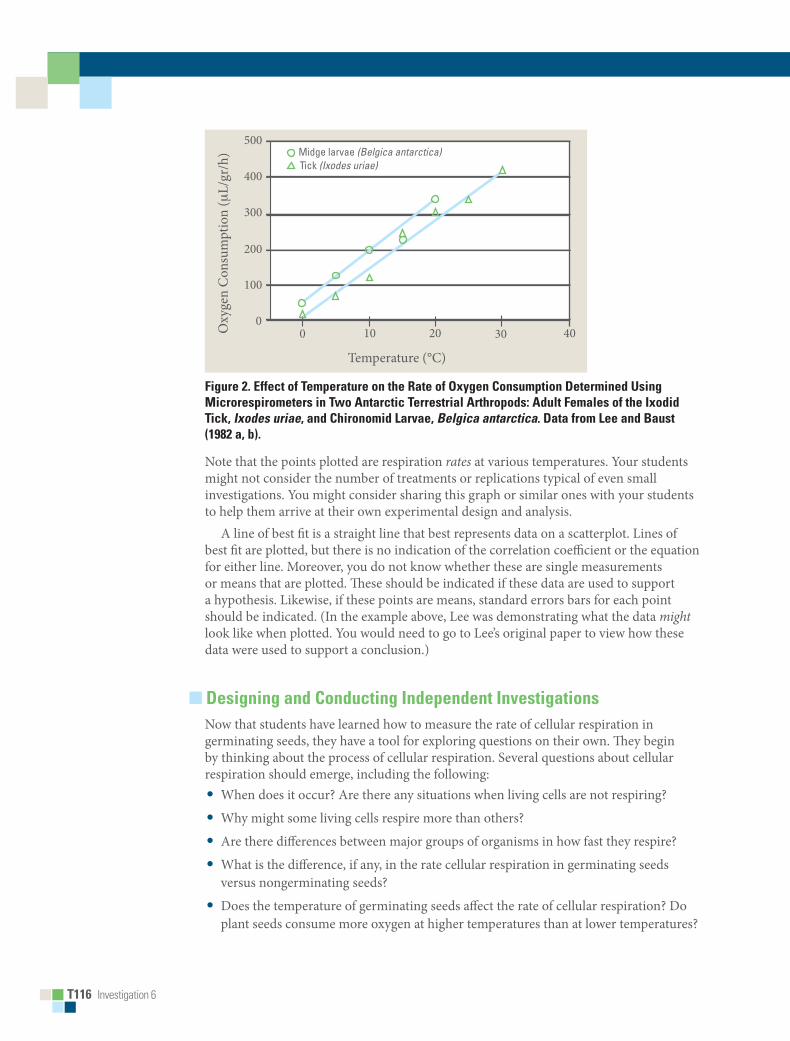
T116 Investigation 6
500
400
300
200
100
00 10 20
Temperature (°C)
Oxy
gen
Con
sum
ptio
n (μ
L/gr
/h)
30 40
Midge larvae (Belgica antarctica)Tick (Ixodes uriae)
Figure 2. Effect of Temperature on the Rate of Oxygen Consumption Determined Using microrespirometers in Two Antarctic Terrestrial Arthropods: Adult Females of the Ixodid Tick, Ixodes uriae, and Chironomid Larvae, Belgica antarctica. Data from Lee and Baust (1982 a, b).
Note that the points plotted are respiration rates at various temperatures. Your students might not consider the number of treatments or replications typical of even small investigations. You might consider sharing this graph or similar ones with your students to help them arrive at their own experimental design and analysis.
A line of best fit is a straight line that best represents data on a scatterplot. Lines of best fit are plotted, but there is no indication of the correlation coefficient or the equation for either line. Moreover, you do not know whether these are single measurements or means that are plotted. These should be indicated if these data are used to support a hypothesis. Likewise, if these points are means, standard errors bars for each point should be indicated. (In the example above, Lee was demonstrating what the data might look like when plotted. You would need to go to Lee’s original paper to view how these data were used to support a conclusion.)
■ Designing and Conducting Independent InvestigationsNow that students have learned how to measure the rate of cellular respiration in germinating seeds, they have a tool for exploring questions on their own. They begin by thinking about the process of cellular respiration. Several questions about cellular respiration should emerge, including the following:• When does it occur? Are there any situations when living cells are not respiring?
• Why might some living cells respire more than others?
• Are there differences between major groups of organisms in how fast they respire?
• What is the difference, if any, in the rate cellular respiration in germinating seeds versus nongerminating seeds?
• Does the temperature of germinating seeds affect the rate of cellular respiration? Do plant seeds consume more oxygen at higher temperatures than at lower temperatures?

Investigation 6 T117
Big idea 2: CeLLULaR PRoCesses: eneRgy and CommUniCation
• Do germinating seeds just starting to germinate consume oxygen at a greater rate than seeds that have been germinating for several days (age dependence)?
• Do seeds, such as Wisconsin Fast Plant seeds (which store energy as oil), respire at a different rate from small grass seeds (which store energy as starch)?
• Do small seeds of spring flowers, weeds, or grasses respire at a different rate from seeds from summer, fall, or winter plants?
• Do seeds from monocot plants respire at different rates from dicot plants?
• Do available nutrients affect the rate of respiration in germinating seeds?
• Can the same respirometer system be used to measure the rate of respiration in small invertebrates such as insects or earthworms?
Step 1 Students are asked to design an experiment to investigate one of their own questions about cellular respiration or one of the questions above, using microrespirometers or gas pressure sensors. When identifying their design, students should address the following: • What is the essential question being addressed?
• What assumptions are made about the question(s) being addressed? Can those assumptions be verified?
• Will the measurements you choose to make provide the necessary data to answer the question under study?
• Did you include a control in your experiment?
• What are possible sources of error in the experiment(s)?
Step 2 Students should make a hypothesis, which should include a prediction about the effect of the factor(s) they chose to investigate on the rate of cellular respiration.
Step 3 Then students conduct their experiment(s) and record data and any answers to their questions in their laboratory notebook.
Step 4 Students should record their data using appropriate methods, such as the example table provided in Visuals. They should then graph the results to show the effect of the factors/variables they investigated on the rate of cellular respiration. Students should calculate the rate(s) of cellular respiration for each factor/variable.
■ Summative AssessmentThe following are suggested as guidelines to assess students’ understanding of the concepts presented in the investigation, but you are encouraged to develop your own methods of postlab assessment:
1. Revisit the learning objectives. Based on students’ answers to the analysis questions, do you think students have met the objectives of the laboratory investigation?

T118 Investigation 6
2. As a result of this lab, did students demonstrate evidence of what they knew and could do within the context of the learning objectives?
3. Have students record their experimental design, procedures, data, results, and conclusions in a lab notebook or have them construct a mini-poster to share with their classmates.
4. Have students develop a list of concepts that they had difficulty understanding about the process of cellular respiration before conducting their investigations.
5. Did students have sufficient mathematical skills required to calculate the rate(s) of cellular respiration?
6. If you used the gas pressure sensors to measure O2 consumption or CO2 production, were students able to navigate through the computer interface to the lab investigation without much difficulty? If students had difficulty, ask them to teach each other how to use the equipment.
7. Did students have an adequate understanding of the general gas law as it applies to the concepts in this lab?
8. Released AP Exams have several multiple-choice and free-response (essay) questions based on the concepts studied in this investigation. These could be used to assess your students’ understanding.
■ where Can Students Go from Here?Students can explore answers to other questions that might have been raised as they conducted their experiment(s). For example, if they originally investigated the effect of temperature on metabolic rate in plant seeds, they might want to explore a different aspect, such as the effect of temperature on metabolic rate in small invertebrates, such as insects or earthworms, or the relationship between the mass of an organism and its rate of respiration.
Investigation 6 T119
Big idea 2: CeLLULaR PRoCesses: eneRgy and CommUniCation
■ SUPPLEmENTAL RESOURCES
■ Prelab Activitieshttp://www.phschool.com/science/biology_place/labbench/lab5/intro.html
This resource provides an interactive tutorial on the structure and function of mitochondria and the process of cellular respiration.
http://www.nclark.net/GasLaws
This resource provides myriad tutorials and animations that review the gas laws.
http://vcell.ndsu.edu/animations/
This resource introduces students to the concepts of cellular respiration. By walking through the still images and movie included for each topic, students are in control of choosing the learning style that best fits their needs.
■ Procedural ResourcesAP Biology Lab Manual, Lab 5: Cell Respiration, The College Board, 2001.
Although this laboratory protocol is teacher directed, students can use the resource to glean information about the process of cellular respiration as they design experiments to investigate factors, including environmental variables such as temperature, that affect the rate of respiration.
http://www.elbiology.com/labtools/Microrespirometers.html.
This resource describes the procedure and tips for assembling microrespirometers.
Lee, Richard E. “Using Microrespirometers to Measure O2 Consumption by Insects and Small Invertebrates.” The American Biology Teacher, vol. 57, no. 5, 284–85, 1995.
This resource provides information about the use of microrespirometers in measuring respiration rates in insects and small invertebrates such as crickets and earthworms.

This page is intentionally left blank.

BigIdea
Investigation 6 S71
2Cellular Processes: Energy and Communication
investigation 6
CeLLULaR ResPiRation*What factors affect the rate of cellular respiration in multicellular organisms?
■■ BACKGROUNDLiving systems require free energy and matter to maintain order, to grow, and to reproduce. Energy deficiencies are not only detrimental to individual organisms, but they cause disruptions at the population and ecosystem levels as well. Organisms employ various strategies that have been conserved through evolution to capture, use, and store free energy. Autotrophic organisms capture free energy from the environment through photosynthesis and chemosynthesis, whereas heterotrophic organisms harvest free energy from carbon compounds produced by other organisms. The process of cellular respiration harvests the energy in carbon compounds to produce ATP that powers most of the vital cellular processes. In eukaryotes, respiration occurs in the mitochondria within cells.
If sufficient oxygen is available, glucose may be oxidized completely in a series of enzyme-mediated steps, as summarized by the following reaction:
C6H12O6 + 6O2(g) → 6CO2(g) + 6H2O + energy
More specifically,
C6H12O6 + 6O2→ 6CO2 + 6H2O + 686 kilocalories of energymole of glucose oxidized
The chemical oxidation of glucose has important implications to the measurement of respiration. From the equation, if glucose is the energy source, then for every molecule of oxygen consumed, one molecule of carbon dioxide is produced.
Suppose you wanted to measure the overall rate of cellular respiration.
• What specific things could you measure?
• Which of these might be easier or harder to measure?
In Procedures, you will learn how to calculate the rate of cellular respiration by using a respirometer system (either microrespirometers or gas pressure sensors with computer interface). These measure relative volume (changes in pressure) as oxygen is consumed by germinating plant seeds. As oxygen gas is consumed during respiration, it is normally
* Transitioned from the AP Biology Lab Manual (2001)

S72■■Investigation 6
replaced by CO2 gas at a ratio of one molecule of CO2 for each molecule of O2. Thus, you would expect no change in gas volume to result from this experiment. However, in the following procedure the CO2 produced is removed by potassium hydroxide (KOH). KOH reacts with CO2 to form the solid potassium carbonate (K2CO3) through the following reaction:
CO2 + 2KOH → K2CO3 + H2O
Thus, as O2 is consumed, the overall gas volume in the respirometer decreases. The change in volume can be used to determine the rate of cellular respiration. Because respirometers are sensitive to changes in gas volume, they are also sensitive to changes in temperature and air pressure; thus, you need to use a control respirometer. What would be a good control for this procedure? Talk with another student for a minute, and come up with at least one possible control you could use.
As you work through Procedures, think about this question: What factors can affect the rate of cellular respiration? In Designing and Conducting Your Investigation, you will design and conduct an experiment(s) to investigate at least one of your responses to this question or some other question you have. Your exploration will likely generate even more questions about cellular respiration.
The investigation also provides an opportunity for you to apply and review concepts that you have studied previously, including the relationship between cell structure and function (mitochondria); enzymatic activity; strategies for capture, storage, and use of free energy; diffusion of gases across cell membranes; and the physical laws pertaining to the properties and behaviors of gases.
■■ Learning■Objectives• To learn how a respirometer system can be used to measure respiration rates in plant
seeds or small invertebrates, such as insects or earthworms
• To design and conduct an experiment to explore the effect of certain factors, including environmental variables, on the rate of cellular respiration
• To connect and apply concepts, including the relationship between cell structure and function (mitochondria); strategies for capture, storage, and use of free energy; diffusion of gases across cell membranes; and the physical laws pertaining to the properties and behaviors of gases
■■ General■Safety■PrecautionsYou must wear safety goggles or glasses, aprons, and gloves during this investigation(s) because KOH (or the alternative, NaOH in Drano) is caustic. Follow your teacher’s instructions when using the hot glue gun to seal microrespirometers. Do not work in the laboratory without your teacher’s supervision.
Investigation 6 S73
big idea 2: CeLLULaR PRoCesses: eneRgy and CommUniCation
■■ THE■INVESTIGATIONS
■■ Getting■StartedYour teacher may assign the following questions to see how much you understand concepts related to respiration before you design and conduct your own investigation:
1.Why is it necessary to correct the readings of the respirometers containing seeds with the readings taken from respirometers containing only glass beads? Your answer should refer to the concepts derived from the general gas law:
PV = nRT
Where
P = pressure of the gas
V = volume of the gas
n = number of moles of the gas
R = the gas constant (its value is fixed)
T = temperature of the gas
2.What happens to the volume of the gas being measured (O2 consumption or CO2 production) when the temperature or pressure changes during the experiment? If pressure and temperature remain constant, will the volume of gas in the respirometers increase or decrease? Please explain.
�Hint: Several tutorials and animations explaining the general gas law are available online (e.g., http://www.nclark.net/GasLaws).
3.Imagine that you are given 25 germinating pea seeds that have been placed in boiling water for five minutes. You place these seeds in a respirometer and collect data. Predict the rate of oxygen consumption (i.e., cellular respiration) for these seeds and explain your reasons.
4.Imagine that you are asked to measure the rate of respiration for a 25 g reptile and a 25 g mammal at 10°C. Predict how the results would compare, and justify your prediction.
5.Imagine that you are asked to repeat the reptile/mammal comparison of oxygen consumption, but at a temperature of 22°C. Predict how these results would differ from the measurements made at 10°C, and explain your prediction in terms of the metabolism of the animals.
6.What difficulties would there be if you used a living green plant in this investigation instead of germinating seeds?

S74■■Investigation 6
■■ Procedures■The rate of cellular respiration can be measured by several methods, and two reliable methods are detailed below. Your teacher will tell you which method you will use to measure the rate of respiration in germinating plant seeds at room temperature.
■■ Option■1:■■Using Microrespirometers to Measure the Rate of Cellular Respiration
Materials• Germinating/nongerminating
Wisconsin Fast Plants seeds or seeds of several species of plants, including grasses; small animals, such as crickets or earthworms; small glass beads; or dry, baked seeds
• Safety goggles or glasses, aprons, and gloves
• 1 mL plastic tuberculin syringes without needles
• Thin-stem plastic dropping pipettes• 40 µL plastic capillary tubes or plastic
microhematocrits
• Hot glue gun; absorbent and nonabsorbent cotton
• 3 or 4 one-quarter inch flat metal washers
• Celsius thermometer, centimeter rulers, permanent glass-marking pens
• Constant-temperature water bath• Manometer fluid (soapy water with red
food coloring)• 15% solution of KOH, potassium
hydroxide solution (or NaOH, Drano)
Figure■1.■Materials Figure■2.■Microrespirometer■Assembly
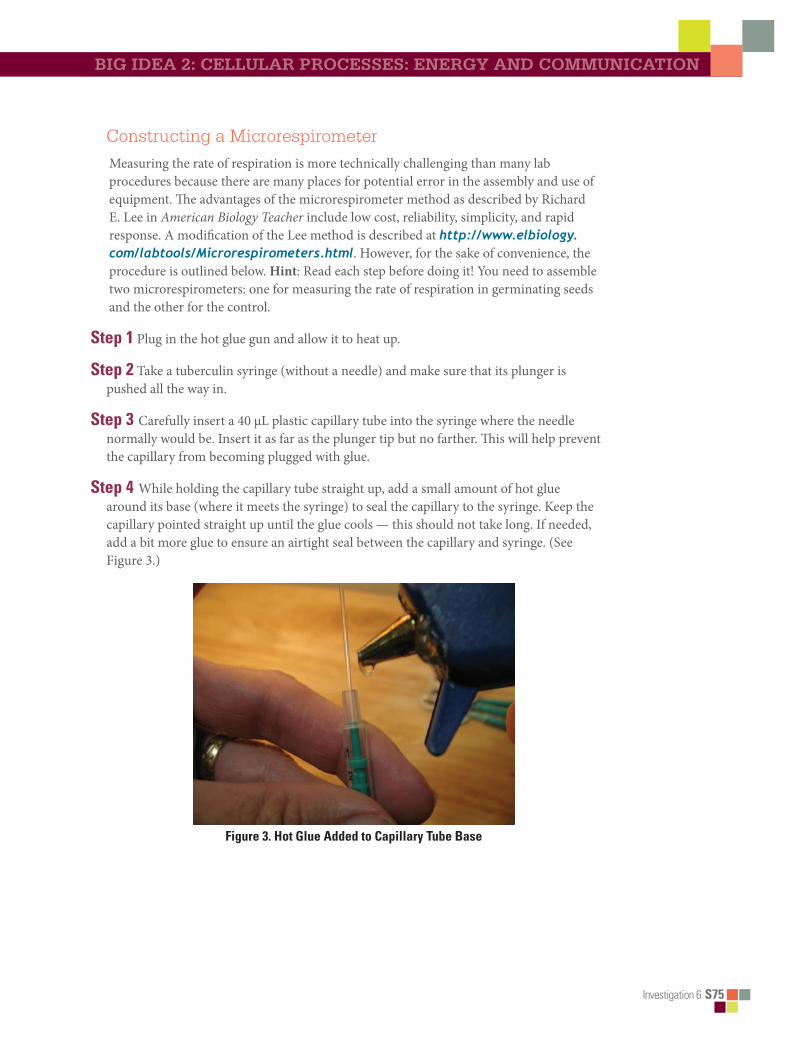
Investigation 6 S75
big idea 2: CeLLULaR PRoCesses: eneRgy and CommUniCation
Constructing a MicrorespirometerMeasuring the rate of respiration is more technically challenging than many lab procedures because there are many places for potential error in the assembly and use of equipment. The advantages of the microrespirometer method as described by Richard E. Lee in American Biology Teacher include low cost, reliability, simplicity, and rapid response. A modification of the Lee method is described at http://www.elbiology.com/labtools/Microrespirometers.html. However, for the sake of convenience, the procedure is outlined below. Hint: Read each step before doing it! You need to assemble two microrespirometers: one for measuring the rate of respiration in germinating seeds and the other for the control.
Step■1 Plug in the hot glue gun and allow it to heat up.
Step■2 Take a tuberculin syringe (without a needle) and make sure that its plunger is pushed all the way in.
Step■3 Carefully insert a 40 µL plastic capillary tube into the syringe where the needle normally would be. Insert it as far as the plunger tip but no farther. This will help prevent the capillary from becoming plugged with glue.
Step■4 While holding the capillary tube straight up, add a small amount of hot glue around its base (where it meets the syringe) to seal the capillary to the syringe. Keep the capillary pointed straight up until the glue cools — this should not take long. If needed, add a bit more glue to ensure an airtight seal between the capillary and syringe. (See Figure 3.)
Figure■3.■Hot■Glue■Added■to■Capillary■Tube■Base

S76■■Investigation 6
Step■5 After the glue has cooled, pull back on the plunger and make sure that the glue has not plugged the capillary. If the capillary is plugged, carefully remove the glue and capillary and start over.
Preparing the Microrespirometer
Step■1 Draw a small quantity of manometer fluid (soapy water with red food coloring) into the full length of the microrespirometer’s capillary tube. Then eject the fluid back out of the capillary. This coats the inside of the tube with a thin soapy film that helps prevent the manometer fluid from sticking.
Step■2 Carefully insert a small plug of absorbent cotton into the barrel of the microrespirometers, all the way into the 0 mL or cc mark. You can pack this cotton to the end with the barrel of a clean thin-stem pipette. (See Figure 4.)
Figure■4.■Cotton■Inserted■into■Microrespirometer■Barrel
Step■3 Add one small drop of 15% KOH (or NaOH, Drano) to the cotton in the microrespirometers. Do not add too much! CAUTION:�Make�sure�you�are�wearing�gloves�and�safety�goggles�to�protect�your�eyes�because�KOH�is�caustic.
Step■4 Add a small plug of nonabsorbent cotton on top of the absorbent cotton plug already inside the barrel of the microrespirometers. You can pack the cotton to the end with the barrel of a clean thin-stem pipette. (This nonabsorbent plug is needed to protect the seeds from the caustic KOH.)
Step■5 Slowly reinsert the syringe plunger. CAUTION:�Be�sure�to�point�the�capillary�tip�into�a�sink�or�container. There may be excess KOH in the syringe that might squirt from the end of the capillary. Push the plunger in until it reaches the cotton so that any excess KOH is removed.
Step■6 Remove the plunger to add seeds.

Investigation 6 S77
big idea 2: CeLLULaR PRoCesses: eneRgy and CommUniCation
Step■7 Add 0.5 mL of germinating seeds to the microrespirometers. Push the plunger in to the 1.0 mL mark. This creates a sealed microrespirometer chamber with a 1.0 mL volume.
Step■8 Place three to four washers around the barrel of the microrespirometers. The washers provide weight so that the microrespirometers will sink.
Step■9 Place the microrespirometers in a room temperature (about 20°C) water bath. You must maintain the temperature of the water bath for the experiment. Adjust the level of the water bath so that the capillary tube is sticking out of the water while the barrel of the microrespirometers is completely submerged. You will not be able to read the capillary tube easily unless it is out of the water. Make sure the top end of the capillary tube is open (not sealed).
Setting Up Your ControlBecause a microrespirometer is sensitive to changes in gas volume, it is also sensitive to changes in temperature and air pressure. To compensate for any changes, you will use control microrespirometers. The control respirometer is set up just like the microrespirometer except that it contains nonliving matter (e.g., small glass beads or dry, baked seeds) instead of germinating seeds.
Step■1 Add 0.5 mL of beads or baked seeds to the second microrespirometer you assembled. Reinsert the syringe plunger and push it to the 1.0 mL mark. This seals the chamber and creates a chamber that has the same volume as the experimental microrespirometer.
Step■2 Place three to four washers around the barrel of the control.
Step■3 Place the assembled control in the water bath next to the experimental microrespirometer. Adjust the level of the water bath so the capillary tube is sticking out of the water while the barrel of the control is completely submerged. In order to easily read the capillary tube, it must be out of the water. Make sure the top end of the capillary tube is open (not sealed).
The respirometers must be airtight, and they are sensitive to environmental changes, including bumping the lab table. Once the respirometers have reached equilibrium, they should not be touched or moved, nor should anything else be added to or taken out of the water baths (including your hands!).
Collecting Data
Step■1 Prepare a table like Table 1 to record your data and observations in your lab notebook. You will need to record data for both the experimental and control microrespirometers.
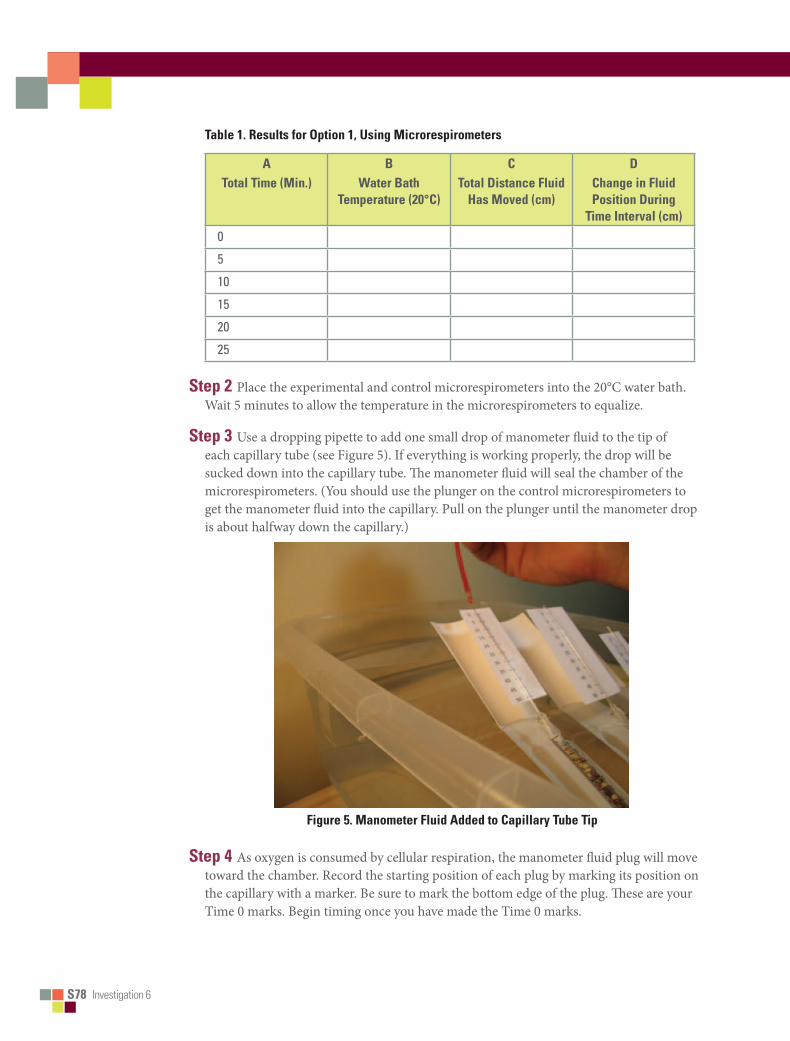
S78■■Investigation 6
Table■1.■Results■for■Option■1,■Using■Microrespirometers■
ATotal■Time■(Min.)
BWater■Bath■
Temperature■(20°C)
CTotal■Distance■Fluid■
Has■Moved■(cm)
DChange■in■Fluid■Position■During■
Time■Interval■(cm)
0
5
10
15
20
25
Step■2 Place the experimental and control microrespirometers into the 20°C water bath. Wait 5 minutes to allow the temperature in the microrespirometers to equalize.
Step■3 Use a dropping pipette to add one small drop of manometer fluid to the tip of each capillary tube (see Figure 5). If everything is working properly, the drop will be sucked down into the capillary tube. The manometer fluid will seal the chamber of the microrespirometers. (You should use the plunger on the control microrespirometers to get the manometer fluid into the capillary. Pull on the plunger until the manometer drop is about halfway down the capillary.)
Figure■5.■Manometer■Fluid■Added■to■Capillary■Tube■Tip
Step■4 As oxygen is consumed by cellular respiration, the manometer fluid plug will move toward the chamber. Record the starting position of each plug by marking its position on the capillary with a marker. Be sure to mark the bottom edge of the plug. These are your Time 0 marks. Begin timing once you have made the Time 0 marks.
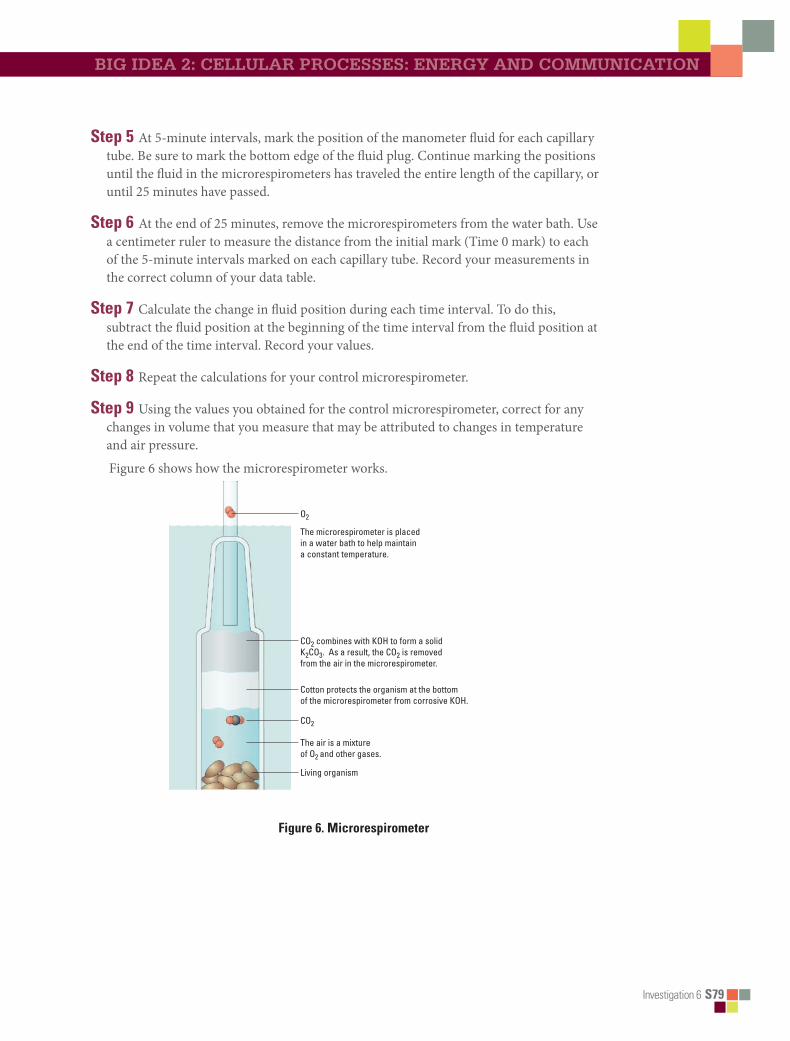
Investigation 6 S79
big idea 2: CeLLULaR PRoCesses: eneRgy and CommUniCation
Step■5 At 5-minute intervals, mark the position of the manometer fluid for each capillary tube. Be sure to mark the bottom edge of the fluid plug. Continue marking the positions until the fluid in the microrespirometers has traveled the entire length of the capillary, or until 25 minutes have passed.
Step■6 At the end of 25 minutes, remove the microrespirometers from the water bath. Use a centimeter ruler to measure the distance from the initial mark (Time 0 mark) to each of the 5-minute intervals marked on each capillary tube. Record your measurements in the correct column of your data table.
Step■7 Calculate the change in fluid position during each time interval. To do this, subtract the fluid position at the beginning of the time interval from the fluid position at the end of the time interval. Record your values.
Step■8 Repeat the calculations for your control microrespirometer.
Step■9 Using the values you obtained for the control microrespirometer, correct for any changes in volume that you measure that may be attributed to changes in temperature and air pressure.
Figure 6 shows how the microrespirometer works.
Bio_T_Lab06_01
The microrespirometer is placed in a water bath to help maintain a constant temperature.
CO2 combines with KOH to form a solid K2CO3. As a result, the CO2 is removed from the air in the microrespirometer.
CO2
Cotton protects the organism at the bottom of the microrespirometer from corrosive KOH.
The air is a mixture of O2 and other gases.
O2
Living organism
Figure■6.■Microrespirometer
S80■■Investigation 6
■■ Analyzing■Results
1.Use your data table to construct a graph. Your goal is to determine respiration rate. How should you plot your data? Which variable will be on the x-axis, and which will be on the y-axis?
2.From the graph, determine the rate of respiration for the germinating seeds at 20°C. Hint: Go back and think about what the units of measurement would be for respiration. How can you get a value with those units from your graph?
3.What additional questions can you explore about cellular respiration using the same respirometers from this experiment?
4.In the next part of this investigation, you will design and conduct your own experiments to answer questions that you raised in Procedures. Do you have any suggestions for improving the design of microrespirometers or procedure for measuring oxygen consumption/cellular respiration?
Option 2: Using Gas Pressure Sensors with Computer Interface to Measure the Rate of Cellular RespirationGas pressure sensors can be used to measure the rate of cellular respiration by measuring the amount of O2 consumed, the amount of CO2 produced, or both simultaneously. Your teacher will provide written instructions or perhaps ask you to download information from the manufacturer’s website or another online resource. If you are unfamiliar with the use of probes with a computer interface, you will need to spend time learning how to collect data using the equipment.
■■ General■Procedure
1.Use a gas pressure sensor to measure the rate of cellular respiration in germinating seeds at 20°C over a 25-minute time interval or as per instructed by your teacher.
2.What additional questions can you explore about cellular respiration from this experiment?
3.In the next part of this investigation, you will design and conduct your own experiments to answer questions that you raised in the first part of the investigation. Do you have any suggestions for improving the procedure provided for measuring oxygen consumption/cellular respiration using a gas pressure sensor with computer interface?
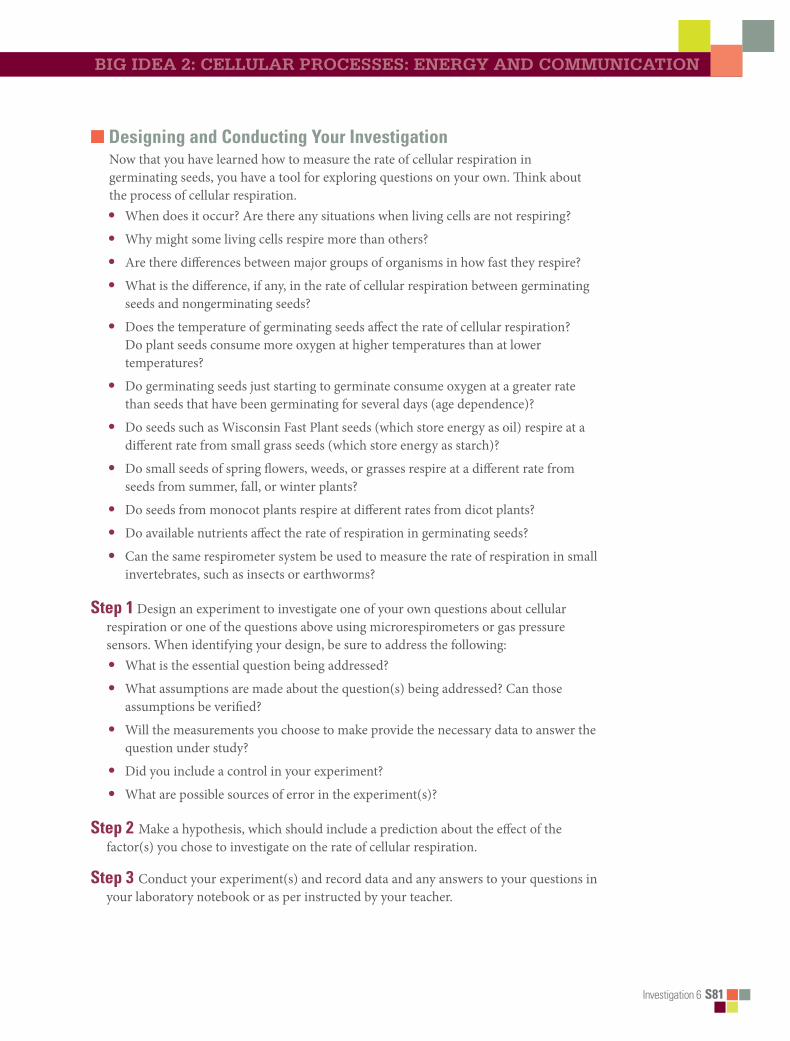
Investigation 6 S81
big idea 2: CeLLULaR PRoCesses: eneRgy and CommUniCation
■■ Designing■and■Conducting■Your■InvestigationNow that you have learned how to measure the rate of cellular respiration in germinating seeds, you have a tool for exploring questions on your own. Think about the process of cellular respiration.• When does it occur? Are there any situations when living cells are not respiring?
• Why might some living cells respire more than others?
• Are there differences between major groups of organisms in how fast they respire?
• What is the difference, if any, in the rate of cellular respiration between germinating seeds and nongerminating seeds?
• Does the temperature of germinating seeds affect the rate of cellular respiration? Do plant seeds consume more oxygen at higher temperatures than at lower temperatures?
• Do germinating seeds just starting to germinate consume oxygen at a greater rate than seeds that have been germinating for several days (age dependence)?
• Do seeds such as Wisconsin Fast Plant seeds (which store energy as oil) respire at a different rate from small grass seeds (which store energy as starch)?
• Do small seeds of spring flowers, weeds, or grasses respire at a different rate from seeds from summer, fall, or winter plants?
• Do seeds from monocot plants respire at different rates from dicot plants?
• Do available nutrients affect the rate of respiration in germinating seeds?
• Can the same respirometer system be used to measure the rate of respiration in small invertebrates, such as insects or earthworms?
Step■1 Design an experiment to investigate one of your own questions about cellular respiration or one of the questions above using microrespirometers or gas pressure sensors. When identifying your design, be sure to address the following:• What is the essential question being addressed?
• What assumptions are made about the question(s) being addressed? Can those assumptions be verified?
• Will the measurements you choose to make provide the necessary data to answer the question under study?
• Did you include a control in your experiment?
• What are possible sources of error in the experiment(s)?
Step■2 Make a hypothesis, which should include a prediction about the effect of the factor(s) you chose to investigate on the rate of cellular respiration.
Step■3 Conduct your experiment(s) and record data and any answers to your questions in your laboratory notebook or as per instructed by your teacher.

S82■■Investigation 6
Step■4 Record your data using appropriate methods, such as the example table provided in Procedures. Then graph the results to show the effect of the factors/variables you investigated on the rate of cellular respiration. Calculate the rate(s) of cellular respiration for each factor/variable.
■■ Analyzing■Results 1.Your teacher may suggest that you perform statistical analysis of your data,
comparing results of the experimental variable(s) to the controls. You should at least express the uncertainty of your measurements with error bars. You may want to review Chapter 3 for more information about statistical analysis.
2.How was the rate of cellular respiration affected by the experimental variable(s) you chose as compared to the control(s)?
3.Compare class data to explain how different variables affect rates of cellular respiration.
■■ Evaluating■Results 1.Was your initial hypothesis about the effect of your factor on the rate of cellular
respiration supported? Why or why not?
2.What were some challenges you had in performing your experiment? Did you make any incorrect assumptions?
3.Were you able to perform without difficulty the mathematical routines required to analyze your data? If not, what calculations were challenging or required help from your classmates or teacher?
■■ Where■Can■You■Go■from■Here?If time is available, ask your teacher if you can extend the investigation to explore answers to other questions that might have been raised as you conducted your experiment(s). For example, if you originally investigated the effect of temperature on metabolic rate in plant seeds, you might want to explore a different aspect, such as the effect of temperature on metabolic rate in small invertebrates, such as insects or earthworms, or the relationship between the mass of an organism and its rate of respiration.
Big Idea 3 T121
BigIdea3Genetics and Information Transfer
Genetic information provides for continuity of life, and, in most cases, this information is passed from parent to offspring via DNA. In eukaryotic organisms, heritable information is packed into chromosomes that are passed
to daughter cells by mitosis, a controlled mechanism that ensures that each daughter cell receives an identical and complete complement of chromosomes. Production of identical progeny allows organisms to grow, replace cells, and reproduce asexually. Sexual reproduction, however, involves the recombination of heritable information from both parents through the fusion of gametes during fertilization. Meiosis followed by fertilization provides a spectrum of possible phenotypes in offspring on which natural selection operates.
Changes in genetic information are the ultimate source of variability. Without variability, adaptation to changing environments is not possible. Some phenotypes are products of action from single genes, and these traits provided the experimental system through which Mendel was able to describe a model of inheritance. However, scientists soon realized that the inheritance patterns of many traits could not be explained by classical Mendelian genetics, and that mutations in DNA could be valuable tools for investigating how genes are transmitted, or how genes work. One such mutation — a white-eyed male fruit fly (Drosophila melanogaster) found in a culture of red-eyed fruit flies — led to the discovery of the chromosomal basis of inheritance, the underlying explanation that eluded Mendel. Today, biotechnology makes it possible for humans to directly engineer heritable changes in cells to yield novel protein products.
The suite of inquiry-based investigations in big idea 3 provides opportunities for students to ask questions, and explore answers, about the transmission of genetic information through mitosis and meiosis, the use of mutations to explore how genes work, and the techniques in biotechnology that allow us to manipulate DNA and create genetic profiles.
■■ SynopSeS■of■The■InveSTIgaTIonS
In Investigation 7: Cell Division: Mitosis and Meiosis, students begin by thinking about how they developed from a single-celled zygote to an organism with trillions of cells. After students model mitosis and review chromosome duplication and movement, they set up an independent investigation using onion bulb squashes and lectins to explore what substances in the environment might increase or decrease the rate of mitosis, and then they statistically analyze their results by calculating chi-square values. This part of the investigation raises questions about mitosis, and students are asked to formulate hypotheses about how chromosomes of cancer cells, such as HeLa cells, might appear in comparison to normal cells, and how those differences are related to the mitotic behavior of the cancer cells. After modeling meiosis and crossing-over events to increase genetic variation, students mimic the phenomenon of nondisjunction and its relationship to genetic disorders. In a final experiment, students measure cross-over frequencies and genetic outcomes in a fungus.
T122■■Big Idea 3
Investigation 8: Biotechnology: Bacterial Transformation is a revision of Laboratory 6A (Molecular Biology: Bacterial Transformation) in the 2001 AP Biology Lab Manual. The investigation begins with a question guaranteed to provoke student interest: Are genetically modified foods safe? One current argument is whether corn grown to express the Bt toxin (a pesticide) is safe for human consumption. Although genetic information can be changed through mutations in DNA or RNA and errors in information transfer, biotechnology makes it possible to engineer heritable changes to yield novel protein products, such as the Bt toxin. One technology, bacterial plasmid-based genetic transformation, enables students to manipulate genetic information in a laboratory setting to understand more fully how DNA operates. In this investigation, students will first acquire the tools to transform E. coli bacteria to express new genetic information using a plasmid system, and apply mathematical routines to calculate transformation efficiency. Students then have the opportunity to design and conduct an investigation to study transformation in more depth; for example, students can investigate whether bacteria take up more plasmids in some environmental conditions, and less in others. The investigation also provides students with the opportunity to review concepts that they have studied previously, including interactions between organisms and their environment (big idea 4), structure and function of cell membranes (big idea 2), and evolution and natural selection (big idea 1).
Investigation 9: Biotechnology: Restriction Enzyme Analysis of DNA, a revision of Laboratory 6B (Molecular Biology: Restriction Enzyme Cleavage of DNA and Electrophoresis) in the 2001 AP Biology Lab Manual, opens with two questions: Is that blood? and Are you sure that the hamburger you recently ate in the local fast-food restaurant was actually pure beef? Applications of DNA profiling extend beyond what we see on television crime shows; and in addition to confirming that often hamburger meat is a mixture of pork and other nonbeef products, DNA technology can be used to determine paternity and diagnose an inherited illness. To answer the question Whose blood is spattered on the floor? in the investigation’s crime scene scenario, students use restriction endonucleases and gel electrophoresis to create and analyze genetic “fingerprints.” By learning the fundamental skills involved in creating genetic profiles using gel electrophoresis, students acquire the tools to conduct more sophisticated biotechnology investigations. Because DNA testing makes it possible to profile ourselves genetically, the investigation raises questions about who owns our DNA and the information it carries.

BigIdea
Investigation 7 T123
3investigation 7
CeLL Division: Mitosis anD MeiosisHow do eukaryotic cells divide to produce genetically identical cells or to produce gametes with half the normal DNA?
■ BACKGROUNDOne of the characteristics of living things is the ability to replicate and pass on genetic information to the next generation. Cell division in individual bacteria and archaea usually occurs by binary fission. Mitochondria and chloroplasts also replicate by binary fission, which is evidence of the evolutionary relationship between these organelles and prokaryotes.
Cell division in eukaryotes is more complex. It requires the cell to manage a complicated process of duplicating the nucleus, other organelles, and multiple chromosomes. This process, called the cell cycle, is divided into three parts: interphase, mitosis, and cytokinesis (see Student Manual, page S83, Figure 1). In the first growth phase (G1), the cell grows and prepares to duplicate its DNA. In the synthesis phase (S), the chromosomes are replicated. In the second growth phase (G2), the cell prepares to divide. In mitosis, the duplicated chromosomes are separated into two nuclei. In most cases, mitosis is followed by cytokinesis, when the cytoplasm divides and organelles separate into daughter cells. This type of cell division is asexual and is important for growth, renewal, and repair of multicellular organisms.
Cell division is tightly controlled by complexes made of several specific proteins. These complexes contain enzymes called cyclin-dependent kinases (CDKs), which turn on or off the various processes that take place in cell division. CDK partners with a family of proteins called cyclins. One such complex is mitosis-promoting factor (MPF), sometimes called maturation-promoting factor, which contains cyclin A or B and cyclin-dependent kinase (CDK). (See Figure 1a.) CDK is activated when it is bound to cyclin, interacting with various other proteins that, in this case, allow the cell to proceed from G2 into mitosis. The levels of cyclin change during the cell cycle (Figure 1b). In most cases, cytokinesis follows mitosis.
Genetics and Information Transfer
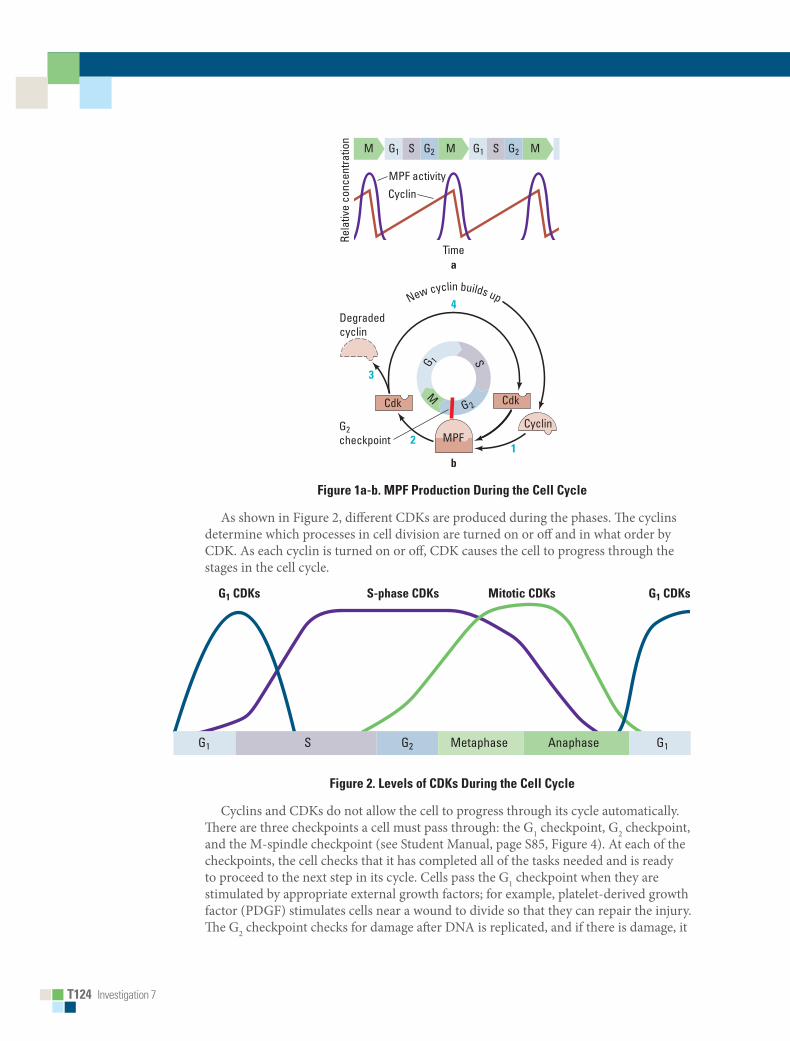
T124 Investigation 7
Bio_T_Lab07_02ab
NOTE: To keep proper relationships among elements, and to keepcircles concentric, a little more depth was needed than speci�ed.
G1M MS G2 G1 MS G2
MPF activityCyclin
Degradedcyclin
MPF
CdkCdk
Cyclin
Time
Rela
tive
conc
entra
tion
a
b
4
3
21
G2checkpoint
New cyclin builds up
G 1 S
G 2
M
Figure 1a-b. MPF Production During the Cell Cycle
As shown in Figure 2, different CDKs are produced during the phases. The cyclins determine which processes in cell division are turned on or off and in what order by CDK. As each cyclin is turned on or off, CDK causes the cell to progress through the stages in the cell cycle.
Figure 2. Levels of CDKs During the Cell Cycle
Cyclins and CDKs do not allow the cell to progress through its cycle automatically. There are three checkpoints a cell must pass through: the G1 checkpoint, G2 checkpoint, and the M-spindle checkpoint (see Student Manual, page S85, Figure 4). At each of the checkpoints, the cell checks that it has completed all of the tasks needed and is ready to proceed to the next step in its cycle. Cells pass the G1 checkpoint when they are stimulated by appropriate external growth factors; for example, platelet-derived growth factor (PDGF) stimulates cells near a wound to divide so that they can repair the injury. The G2 checkpoint checks for damage after DNA is replicated, and if there is damage, it
Bio_T_Lab07_03
NOTE: This art required less depth than speci�ed.
G1 G1G2S Metaphase Anaphase
G1 CDKs S-phase CDKs Mitotic CDKs G1 CDKs
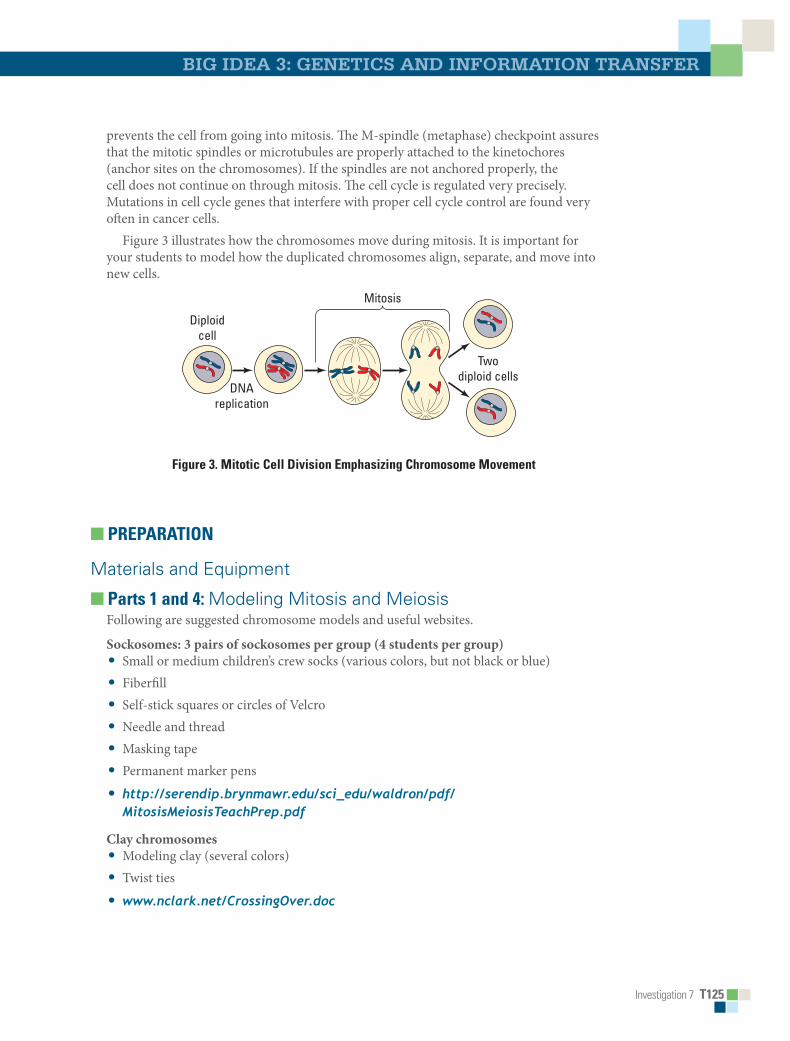
Investigation 7 T125
Big iDea 3: genetiCs anD inforMation transfer
prevents the cell from going into mitosis. The M-spindle (metaphase) checkpoint assures that the mitotic spindles or microtubules are properly attached to the kinetochores (anchor sites on the chromosomes). If the spindles are not anchored properly, the cell does not continue on through mitosis. The cell cycle is regulated very precisely. Mutations in cell cycle genes that interfere with proper cell cycle control are found very often in cancer cells.
Figure 3 illustrates how the chromosomes move during mitosis. It is important for your students to model how the duplicated chromosomes align, separate, and move into new cells.
Bio_T_Lab07_05
Diploidcell
Twodiploid cells
Mitosis
DNAreplication
Figure 3. Mitotic Cell Division Emphasizing Chromosome Movement
■ PREPARATION
Materials and Equipment
■ Parts 1 and 4: Modeling Mitosis and MeiosisFollowing are suggested chromosome models and useful websites.
Sockosomes: 3 pairs of sockosomes per group (4 students per group)• Small or medium children’s crew socks (various colors, but not black or blue) • Fiberfill • Self-stick squares or circles of Velcro • Needle and thread • Masking tape • Permanent marker pens
• http://serendip.brynmawr.edu/sci_edu/waldron/pdf/MitosisMeiosisTeachPrep.pdf
Clay chromosomes• Modeling clay (several colors)• Twist ties
• www.nclark.net/CrossingOver.doc

T126 Investigation 7
Pipe cleaners• Pink and blue pipe cleaners, cut into pieces about 3 cm long (one set has 11 pieces of
each color; one set per group) • 6 beads per set; two pipe cleaners fit through one bead snugly • Small plastic petri dishes or small plastic bags
• http://www.indiana.edu/~ensiweb/lessons/gen.mm.html
Pop-It Beads
■ Part 2: Effects of Environment on Mitosis• Onion sets or scallions; each scallion will produce about 10 root tips,
enough for three students • Jars with lids; 2 jars (one per treatment) for 6 students• Sand• Ethanol• Glacial acetic acid (17.4 M)• Hydrochloric acid• Carbol-fuschin (Ziehl-Neelson) stain• Lectin (phytohemagglutinin PHA-M from Phaseolus vulgaris)• Razor blades (one per student)• Forceps (one per student)• Dissection scissors• Dissection probes or needles• Slides, cover slips• Scientific cleaning wipes, such as Kimwipes• Coplin jars (one per group of 4 students)• Petri dish • Disposable gloves • Compound microscopes
■ Part 3: Cell Cycle Control• Karyotype pictures of normal and HeLa cells
■ Timing and Length of LabThis investigation requires a minimum of four lab periods of about 45 minutes each, plus time for a discussion on cell cycle control (Part 3). In addition, time is needed for students to discuss their results from Parts 2 and 5. Students can work in pairs or small groups for Parts 1 and 4.
Teacher preparation is needed to make the model chromosomes from socks or pipe cleaners. Onion bulb preparation will take one hour for the treatment and two hours (plus the 4–18 hour fixation time) for the root tips. This must be done a week ahead of

Investigation 7 T127
Big iDea 3: genetiCs anD inforMation transfer
the lab time. The root tips can be stored in 70% ethanol for several weeks. There is little preparation time for the Sordaria crosses if plates are purchased from a biological supply company.
■ Safety and HousekeepingThis laboratory investigation, especially Parts 1, 3, and 4, has a few safety concerns. Remind students to wear gloves and safety goggles or glasses when handling the chemicals and razor blades in Parts 2 and 5. To avoid injuries, students should use a pencil eraser rather than their thumbs to press down on the cover slips.
■ ALIGNMENT TO THE AP BIOLOGy CURRICULUM FRAMEwORKThis investigation pertains to the storage and transmission of genetic information (big idea 3). As always, it is important to make connections between big ideas and enduring understandings, regardless of where in the curriculum the lab is taught. The concepts align with the enduring understandings and learning objectives from the AP Biology Curriculum Framework, as indicated below.
■ Enduring Understandings• 3A1: DNA, and in some cases RNA, is the primary source of heritable information.• 3A2: In eukaryotes, heritable information is passed to the next generation via
processes that include the cell cycle and mitosis or meiosis plus fertilization.• 3A3: The chromosomal basis of inheritance provides an understanding of the pattern
of passage (transmission) of genes from parent to offspring.• 3C2: Biological systems have multiple processes that increase genetic variation.
■ Learning Objectives• The student can make predictions about natural phenomena occurring during the cell
cycle (3A2 & SP 6.4).• The student can describe the events that occur in the cell cycle (3A2 & SP 1.2).• The student is able to construct an explanation, using visual representations or
narratives, as to how DNA in chromosomes is transmitted to the next generation via mitosis, or meiosis followed by fertilization (3A2 & SP 6.2).
• The student is able to represent the connection between meiosis and increased genetic diversity necessary for evolution (3A2 & SP 7.1).
• The student is able to evaluate evidence provided by data sets to support the claim that heritable information is passed from one generation to another generation through mitosis, or meiosis followed by fertilization (3A2 & SP 5.3).
• The student is able to construct a representation that connects the process of meiosis to the passage of traits from parent to offspring (3A3 & SP 1.1, SP 7.2).
• The student is able to construct an explanation of the multiple processes that increase variation within a population (3C2 & SP 6.2).
T128 Investigation 7
■ ARE STUDENTS READy TO COMPLETE A SUCCESSFUL INQUIRy-BASED, STUDENT-DIRECTED INVESTIGATION?Before students begin these investigations, they should be able to demonstrate understanding of the following concepts. The concepts may be scaffolded according to level of skills and conceptual understanding. • Cellular structure and organelles• The purposes for cell division • The outcomes for mitosis and meiosis
In addition, this lab reinforces the following skills:• Use of a microscope to observe cell structure• Data collection
■ Skills DevelopmentStudents will develop the following skills: • Preparation of specimens for microscopic analyses• Data analysis and use of a statistical test• Calculation of crossover frequencies
■ Potential ChallengesMany students have memorized the stages of mitosis and meiosis without understanding the processes. These exercises emphasize the processes and results of cell division. You should have your students discuss the relationship between meiosis and evolution.
The equipment costs, besides the microscopes, are minimal. Model chromosomes and karyotype pictures can be reused. Safety issues are minimized by treating and fixing the onion root tips before having the students stain them.
■ THE INVESTIGATIONS
■ Getting Started: Prelab AssessmentThe replication of cells and organisms is a central concept in biology. Organisms must pass on their genetic material to their offspring. You can ask students how multicellular organisms grow during development and how they repair themselves and replace cells. A good example is what happens to epidermal (skin) cells to heal a cut.
Chromosome movement during mitosis and meiosis is not easily understood. Ask students to think about this scenario: You have a plate filled with cooked spaghetti, all tangled together. Next to it is a plate of cooked macaroni. Which will you be able to pull apart into individual pieces more easily? Which is more likely to be tangled? Which is more likely to be broken as you separate the pieces? The point is that condensed chromosomes like the more compact macaroni are much more easily and safely moved than are elongated chromosomes.
Investigation 7 T129
Big iDea 3: genetiCs anD inforMation transfer
Another difficulty that students have is understanding terms such as sister chromatids, tetrads, and chromosomes. Most diagrams of cells show duplicated chromosomes, meaning they are showing cells in G2 rather than in G1. You should explain that while the cells might have twice as much DNA in G2, they do not contain any more information, since the sister chromatids are copies.
Ask your students to consider whether they resemble any family member and describe how their parents’ genetic information was passed onto them through gametes. Crossing over during meiosis is a difficult concept to grasp and is best illustrated using simple models and Sordaria asci formation.
You may assign the following for homework; as a think, pair/group, share activity, in which pairs or small groups of students brainstorm ideas and then share them with other groups; or as a whole-class discussion to assess students’ understanding of key concepts pertaining to mitosis and meiosis:• How many cells are in your body? How were those cells produced from a single cell
called a zygote? How does the genetic information in one of your body cells compare to that found in other body cells?
• What are some advantages of asexual reproduction in plants? • What is the importance of the fact that DNA is replicated prior to cell division? • How do chromosomes move inside a cell during cell division?• How is the cell cycle controlled? What would happen if the control were defective?
■ Part 1: Modeling MitosisThe mitosis lab begins with a discussion section during which you ask your students to think about how they developed from a single-celled zygote to a 300-trillion-celled organism. How does the genetic information in a cell from your toe compare to the genetic information in a cell from your arm?
After the students have had a sufficient time to discuss this question, ask the following questions: What other purposes besides growth would require cell division? How do cells divide? What must happen to ensure successful cell division?
Write down the students’ answers on the whiteboard, but do not elaborate on their answers. The students will be expected to investigate these questions further throughout the lab.
Students can use sockosomes, Pop-It Beads, clay, or pipe cleaners to review chromosome duplication and movement.
■ Part 2: Effects of Environment on MitosisStudents will set up and analyze an experiment using onion bulbs based upon “A Scenario-Based Study of Root Tip Mitosis”1. The exerise is supported by the premise that lectins increase the rate of mitosis in the roots. Lectins are proteins that bind to specific carbohydrate groups. Help students to identify the different cell phases before doing their onion root tips squashes (Figure 4).
1 Bonner, J.M., “A Scenario-Based Study of Root Tip Mitosis.” Association for Biology Laboratory Education. (2010): Proceedings, 31:36–49. http://www.ableweb.org/proceedings/SPT--FullRecord.php?ResourceId=764.
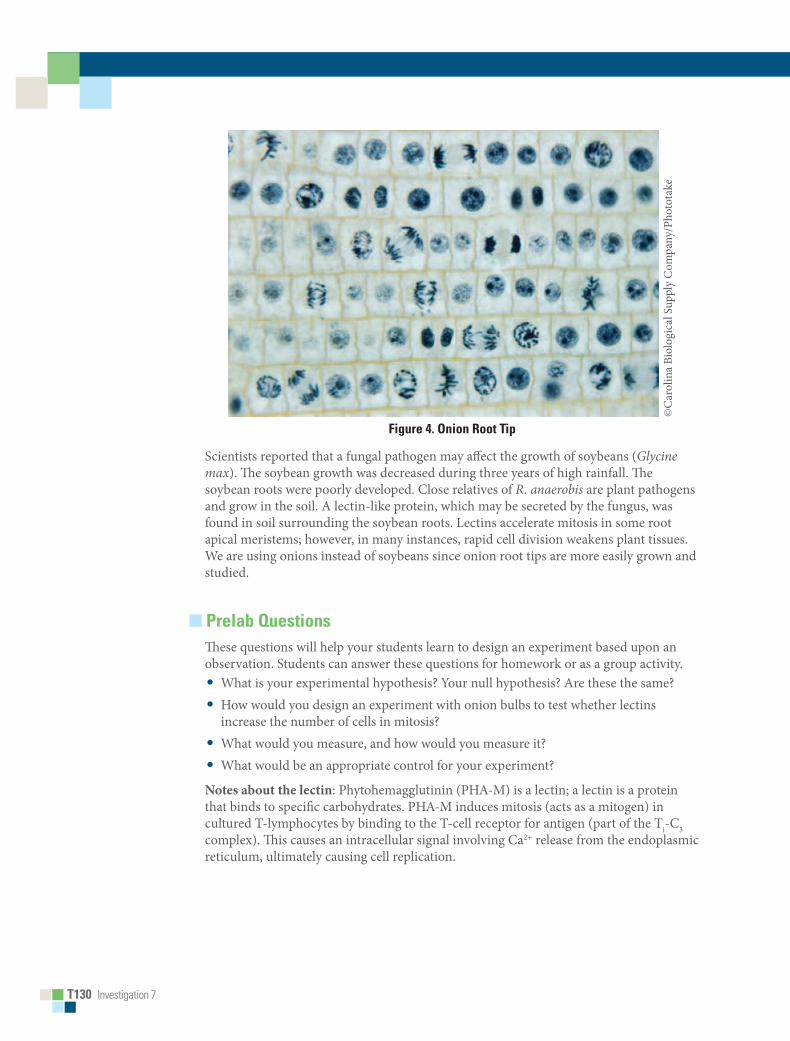
T130 Investigation 7
©C
arol
ina
Biol
ogic
al S
uppl
y C
ompa
ny/P
hoto
take
Figure 4. Onion Root Tip
Scientists reported that a fungal pathogen may affect the growth of soybeans (Glycine max). The soybean growth was decreased during three years of high rainfall. The soybean roots were poorly developed. Close relatives of R. anaerobis are plant pathogens and grow in the soil. A lectin-like protein, which may be secreted by the fungus, was found in soil surrounding the soybean roots. Lectins accelerate mitosis in some root apical meristems; however, in many instances, rapid cell division weakens plant tissues. We are using onions instead of soybeans since onion root tips are more easily grown and studied.
■ Prelab QuestionsThese questions will help your students learn to design an experiment based upon an observation. Students can answer these questions for homework or as a group activity. • What is your experimental hypothesis? Your null hypothesis? Are these the same?• How would you design an experiment with onion bulbs to test whether lectins
increase the number of cells in mitosis? • What would you measure, and how would you measure it? • What would be an appropriate control for your experiment?
Notes about the lectin: Phytohemagglutinin (PHA-M) is a lectin; a lectin is a protein that binds to specific carbohydrates. PHA-M induces mitosis (acts as a mitogen) in cultured T-lymphocytes by binding to the T-cell receptor for antigen (part of the Ti-C3 complex). This causes an intracellular signal involving Ca2+ release from the endoplasmic reticulum, ultimately causing cell replication.

Investigation 7 T131
Big iDea 3: genetiCs anD inforMation transfer
Materials• Onion sets; scallions work well • Jars with lids; 8–10 cm in diameter• Sand• Ethanol• Glacial acetic acid (17.4 M)• Hydrochloric acid (12 M)• Carbol-fuschin (Ziehl-Neelson) stain• Lectin (phytohemagglutinin PHA-M
from Phaseolus vulgaris)
• Razor blades• Forceps• Dissection scissors• Slides, cover slips• Scientific cleaning wipes• Coplin jars• Petri dish • Disposable gloves • Compound microscopes
Lectin: Dissolve 10 mg lectin in 200 mL H2O. Exposure to the lectin may cause irritation; wear gloves and weigh the lectin in a fume hood. Carnoy’s fixative: 125 mL glacial acetic acid mixed with 375 mL 95% ethanol You may treat the bulbs ahead of time and have your students prepare the chromosome squash slides. In this manner, they will not know which bulbs are treated with lectin and which ones are the controls. Treat the slides (Coplin jar) and the cover slips (dish) with 70% ethanol.
Preparing the Onion Root Tips 1. Fill two jars with 1.5 cm of fine sand. Label one jar “control”
and the other “lectin.”
2. Wet the sand in the control jar with H2O.
3. Wet the sand in the lectin jar with lectin solution (50–75 mL).
4. Prepare the bulblets by peeling of the dried outer skin.
5. Cut off the green leaves.
6. Cut off dried roots back to the bulb base with a razor blade.
7. Insert the bulblets into the sand until they touch the bottom of the jar.
8. Store the jars in the dark for one and a half to two days.
Harvesting the Onion Root Tips 1. Wearing gloves, remove the bulblets from the sand and rinse off the sand, with H2O.
2. Cut off the roots from each bulblet using fine dissection scissors.
3. Place cut root tips into Carnoy’s fixative for 4–18 hours.
4. Decant off fixative and rinse tips with 25 mL 70% ethanol.
5. Place tips in 70% ethanol and store covered at 4°C.

T132 Investigation 7
Preparing Chromosome SquashesYou can demonstrate the proper technique for the students. 1. Place the onion root tip in 1 M HCl for 4 minutes.
2. Transfer the tip to Carnoy’s fixative for 4 minutes.
3. Remove the slide from the Coplin jar containing 70% ethanol, dry with a scientific cleaning wipe, and label it.
4. Place the onion tip on the slide, and cut off the distal 2 mm portion of the tip; discard the remainder of the tip.
5. Cover the root tip piece with carbol-fuschin stain for 2 minutes.
6. Blot off excess stain and cover tip with 1–2 drops of H2O.
7. Gently tease the root tip apart with dissecting probes or needles. Place the cover slip over the root tip and cover the cover slip with a scientific cleaning wipe.
8. Firmly press down on the cover slip with your thumb or with the eraser end of a pencil. Do not twist the slide.
Counting Cells and Analyzing Data 1. Observe the cells at high magnification (400–500 X).
2. Look for well-stained, distinct cells.
3. Within the field of view, count the cells in each phase. Repeat the counts in two other root tips. Identification of these stages is prerequisite knowledge.
4. Collect the class data for each group, and calculate the mean and standard deviation for each group.
5. Compare the number of cells from each group in interphase and in mitosis.
6. Use a chi-square distribution test to statistically analyze the data.
■ Alternative ProcedureYou can mask root tips on prepared slides with masking tape and have the students count cells. Students can compare cells close to the end of the root tip to those farther from the end.
Table 1. Onion Root Tip Cell Phase Data; Treatment Group___________
Number of Cells
Tip Interphase Mitotic Total
1
2
3
Total

Investigation 7 T133
Big iDea 3: genetiCs anD inforMation transfer
Table 2. Table of Observed Values (o)
Interphase Mitosis Total
Control A B A + B
Treated C D C + D
Total A + C B + D A + B + C + D = N
1. Collect the class data and enter the values into Table 1; these are the observed values for the four groups.
2. Use the data from Table 1 to calculate the totals using the formulas found in Table 2. (For example, A equals the number of interphase cells in the control group.)
3. Use the totals from Table 2 to calculate the expected values (e) using the formulas from Table 3.
4. Enter the observed values (o) from Table 2 and expected values (e) from Table 3 for each group into Table 4. Calculate the chi-square (χ2) value for the data by adding together the numbers in the right column.
5. Compare this value to the critical value in Table 5.
Table 3. Table of Expected Values (e)
Interphase Mitosis
Control(A + B) (A + C)
N(A + B) (B + D)
N
Treated(C + D) (A + C)
N(C + D) (B + D)
N
Table 4. Calculation of Chi-Square Value
Group Observed (o) Expected (e) (o - e) (o - e)2 (o - e)2/e
Control Interphase
Control Mitosis
Treated Interphase
Treated Mitosis
Total of (o - e)2/e = chi-square (χ2) =

T134 Investigation 7
Table 5. Critical Values of the Chi-Square Distribution
Degrees of Freedom (DF)
Probability 1 2 3 4 5
0.05 3.84 5.99 7.82 9.49 11.1
0.01 6.64 9.21 11.3 13.2 15.1
0.001 10.8 13.8 16.3 18.5 20.5
1. The degrees of freedom (df) equals the number of treatment groups minus one multiplied by the number of phase groups minus one. In this case, there are two treatment groups (control, treated) and two phase groups (interphase, mitosis); therefore df = (2 - 1) (2 - 1) = 1.
2. The ρ value is 0.05, and the critical value is 3.84. If the calculated chi-square value is greater than or equal to this critical value, then the null hypothesis is rejected. If the calculated chi-square value is less than this critical value, the null hypothesis is not rejected.
■ SAMPLE DATA
Sample Table 2: Table of Observed Values (o)
Interphase Mitosis Total
Control 148 25 173
Treated 161 88 249
Total 309 113 422
Sample Table 3: Table of Expected Values (e)
Interphase Mitosis
Control 127 46
Treated 179 67
Sample Table 4: Calculation of Chi-Square Value
Group Observed (o) Expected (e) (o - e) (o - e)2 (o - e)2/e
Control Interphase 148 127 21 441 3.47
Control Mitosis 25 46 -21 441 9.59
Treated Interphase 161 182 -21 441 2.42
Treated Mitosis 88 67 21 441 6.58
Total of (o - e)2/e = chi-square (χ2) = 22.06
Since the calculated χ2 is greater than the table value, the null hypothesis (treatment has no effect) is rejected.
Investigation 7 T135
Big iDea 3: genetiCs anD inforMation transfer
■ Postlab ReviewThese questions can be answered in a report, as a group activity, or as homework. • What was the importance of collecting the class data? • Was there a significant difference between the groups?• Did the fungal pathogen lectin increase the number of cells in mitosis? • What other experiments should you perform to verify your findings?• Does an increased number of cells in mitosis mean that these cells are dividing faster
than the cells in the roots with a lower number of cells in mitosis? • What other way could you determine how fast the rate of mitosis is occurring in root
tips?
■ DESIGNING AND CONDUCTING INDEPENDENT INVESTIGATIONSStudents can design and conduct an investigation to determine what substances in the environment might increase or decrease the rate of mitosis. Consider, for example, abiotic soil factors such as salinity, temperature, and pH, or biotic factors, including roundworms, which might alter root growth.
■ Part 3: Loss of Cell Cycle Control in Cancer
Materials
• Karyotype pictures of normal and HeLa cells (Students can search for these on the Internet.)
■ Prelab Questions• Many of us have family members who have or have had cancer. Cancer occurs when
cells divide abnormally. There are many questions students should consider before beginning their investigation.
• How are normal cells and cancer cells different from each other?• What are the main causes of cancer? • How can we explain the fact that there so many different cancers, even in
the same types of cells or tissues?• How is the cell cycle controlled in normal cells? • What are cyclins and cyclin-dependent kinases? What do these proteins do in a cell? • What goes wrong during the cell cycle in cancer cells? • What makes some genes related to increased cancer risk? • Do you think that the chromosomes might be different between normal
and cancer cells?

T136 Investigation 7
Have your students form groups and ask each group to form a hypothesis as to how the chromosomes of a cancer cell might appear in comparison to a normal cell and how those differences are related to the behavior of the cancer cell.
Show your students a picture of cancer cells and ask them what they know about cancer. After your students are given time to share their knowledge, ask them to think about ways the cancer cells might be different from normal, healthy cells.
Inform your students that, in cancer cells, division is fundamentally different from that in normal cells, but do not inform the students as to why. Ask each group to form a hypothesis as to how the chromosomes of a normal cell might appear in comparison to a cancer cell.
Give each group pictures of chromosomes from normal and HeLa cells. The students should count the number of chromosomes found in each type of cell and discuss their appearance. Did the results match their hypothesis? If not, ask your students what type of information they might need to know in order to understand their results. If their results matched their hypothesis, ask them to identify what type of information they could find that would validate their conclusions.
Explain to your students that in normal cells mitosis is blocked if there is DNA damage. Ask them to consider what would happen if cells with mutated DNA replicated. More than 50% of human cancers have loss of p53 function; this protein blocks mitosis if there is DNA damage. P53 acts at the G1-S checkpoint and initiates DNA repair or apoptosis.
“But I’m Too Young!” is a case from The National Center for Case Study Teaching in Science. The case discusses cell cycle control as it relates to ovarian cancer and has additional references. (See http://sciencecases.lib.buffalo.edu/cs/collection/detail.asp?case_id=481&id=481.)
■ Postlab Questions You may pick some of these questions to help your students understand the underlying causes of cancer. • What happens in a normal cell if the DNA has mutations?• What would happen if cells with mutated DNA replicate? • How do cells monitor DNA integrity? • What went wrong in Henrietta Lacks’s cells? • How does infection with human papillomavirus virus increase the risk of cervical
cancer?
As an extension activity, you may assign The Immortal Life of Henrietta Lacks by Rebecca Skloot for reading. Ask students to complete some of the following questions and activities:• Should tissue be removed from a patient without his or her consent for research?• How was the HeLa cell line cultured?• What virus infected Henrietta Lacks and may have caused her cervical cancer?
What cellular process is affected by this virus?
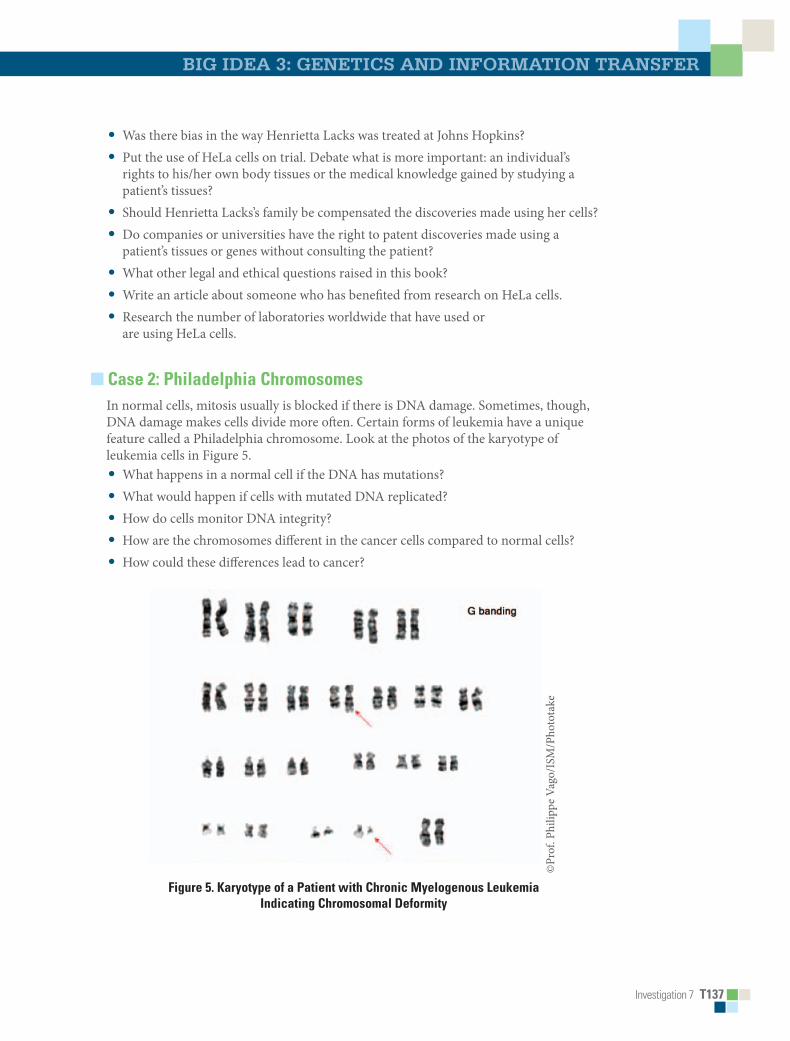
Investigation 7 T137
Big iDea 3: genetiCs anD inforMation transfer
• Was there bias in the way Henrietta Lacks was treated at Johns Hopkins?• Put the use of HeLa cells on trial. Debate what is more important: an individual’s
rights to his/her own body tissues or the medical knowledge gained by studying a patient’s tissues?
• Should Henrietta Lacks’s family be compensated the discoveries made using her cells? • Do companies or universities have the right to patent discoveries made using a
patient’s tissues or genes without consulting the patient? • What other legal and ethical questions raised in this book? • Write an article about someone who has benefited from research on HeLa cells. • Research the number of laboratories worldwide that have used or
are using HeLa cells.
■ Case 2: Philadelphia ChromosomesIn normal cells, mitosis usually is blocked if there is DNA damage. Sometimes, though, DNA damage makes cells divide more often. Certain forms of leukemia have a unique feature called a Philadelphia chromosome. Look at the photos of the karyotype of leukemia cells in Figure 5.• What happens in a normal cell if the DNA has mutations?• What would happen if cells with mutated DNA replicated? • How do cells monitor DNA integrity? • How are the chromosomes different in the cancer cells compared to normal cells?• How could these differences lead to cancer?
©Pr
of. P
hilip
pe V
ago/
ISM
/Pho
tota
ke
Figure 5. Karyotype of a Patient with Chronic Myelogenous Leukemia Indicating Chromosomal Deformity
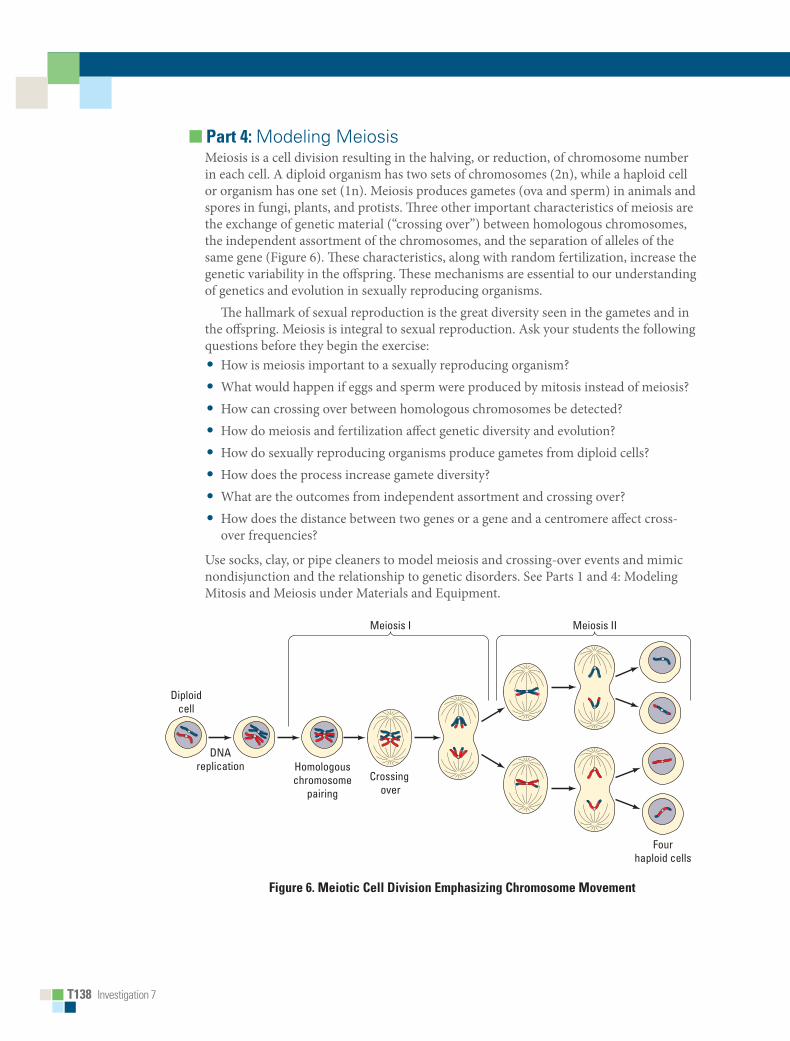
T138 Investigation 7
■ Part 4: Modeling MeiosisMeiosis is a cell division resulting in the halving, or reduction, of chromosome number in each cell. A diploid organism has two sets of chromosomes (2n), while a haploid cell or organism has one set (1n). Meiosis produces gametes (ova and sperm) in animals and spores in fungi, plants, and protists. Three other important characteristics of meiosis are the exchange of genetic material (“crossing over”) between homologous chromosomes, the independent assortment of the chromosomes, and the separation of alleles of the same gene (Figure 6). These characteristics, along with random fertilization, increase the genetic variability in the offspring. These mechanisms are essential to our understanding of genetics and evolution in sexually reproducing organisms.
The hallmark of sexual reproduction is the great diversity seen in the gametes and in the offspring. Meiosis is integral to sexual reproduction. Ask your students the following questions before they begin the exercise:• How is meiosis important to a sexually reproducing organism? • What would happen if eggs and sperm were produced by mitosis instead of meiosis? • How can crossing over between homologous chromosomes be detected? • How do meiosis and fertilization affect genetic diversity and evolution? • How do sexually reproducing organisms produce gametes from diploid cells? • How does the process increase gamete diversity? • What are the outcomes from independent assortment and crossing over? • How does the distance between two genes or a gene and a centromere affect cross-
over frequencies?
Use socks, clay, or pipe cleaners to model meiosis and crossing-over events and mimic nondisjunction and the relationship to genetic disorders. See Parts 1 and 4: Modeling Mitosis and Meiosis under Materials and Equipment.
Bio_S_Lab07_06
Diploidcell
Fourhaploid cells
Meiosis I
DNAreplication Homologous
chromosomepairing
Crossing over
Meiosis II
Figure 6. Meiotic Cell Division Emphasizing Chromosome Movement

Investigation 7 T139
Big iDea 3: genetiCs anD inforMation transfer
■ Part 5: Meiosis and Crossing Over in SordariaIn this experiment, students will measure crossover frequencies and genetic outcomes in a fungus. Your students will examine Sordaria fimicola asci produced by crossing wild type (black) with tan parents. Each ascus contains eight spores. Parental type asci have four black and four tan spores in a row (4:4 pattern), as shown in Figure 7. Recombinant asci will not have this pattern (Figure 8).
Figure 7. Meiosis with No Crossing Over
Figure 8. Meiosis with Crossing Over
■ Prelab QuestionsAssign the following questions as homework or as group discussion questions.• How do you explain the differences between the recombinant asci and
the parental types? • What meiotic event can account for this difference?• Using the model chromosomes from Part 4, predict the possible meiotic outcomes.
Materials • Culture plate containing Sordaria
perithecia, wild type X tan cross (one plate per 4–6 students)
• Toothpicks or scalpels
• Slides and cover slips• Scientific cleaning wipes• Compound microscopes

T140 Investigation 7
1. Place a drop of water onto the microscope slide.
2. Gently scrape some perithecia from the agar plate near where the two strains meet.
3. Place a cover slip over the perithecia and put a scientific cleaning wipe over the cover slip.
4. Gently press down on the cover slip using the eraser end of a pencil.
5. Count at least 50 asci, and score them as either parental or recombinant (crossing over).
6. Record your results in Table 6.
Table 6. Analysis of Results
Numberof
4:4
NumberofAsciShowing
Crossover
Total %AsciShowingCrossover
Dividedby2
GenetoCentromereDistance(mapunits)
The published map distance between the gene and the centromere is 26 map units. How did the class data compare with this distance? What can account for disparities between the class data and the published data?
■ Summative AssessmentThe following are suggested as guidelines to assess students’ understanding of the concepts presented in the investigation, but you are encouraged to develop your own methods of postlab assessment. Some of the tasks can be assigned for homework following completion of the investigation.
1. Revisit the learning objectives. Do you think your students have met these, based upon their answers to the analysis questions?
2. Did the students demonstrate evidence of what they knew, and can they apply their knowledge within the context of the learning objectives?
3. Students should record their experiments, including the design, methods, data, results, and conclusions in a laboratory notebook.
■ where Can Students Go from Here?
1. Have students act out the process of chromosome movement or prepare a video.
2. Students can research cancer and how carcinogens affect the cell cycle. A great study is the human papillomavirus (HPV), which probably caused Henrietta Lacks’s cancer. HPV blocks the tumor suppressor protein called retinoblastoma (Rb); Rb acts at the G1-S checkpoint to stop DNA synthesis. Rb binds to transcription factor
Investigation 7 T141
Big iDea 3: genetiCs anD inforMation transfer
E2F. E2F binds to the promoters of other transcription factors that allow the cell to proceed through mitosis. If the conditions are right, Rb is phosphorylated and dissociated from E2F. Other tumor suppressors included BRCA1 and BRCA2, which are associated with breast cancer. These genes can increase cancer risk if they are mutated (recessive mutations). Other cancer-related genes are called proto-oncogenes. These are associated with growth factor receptors. For example, c-sis is the β-chain of platelet-derived growth factor. When c-sis is mutated (dominant mutation), PDGF is overexpressed by cells. The simian sarcoma virus (SSV) carries the gene, so infection by SSV increases cancer risk.
3. Ask students to consider how much genetic variation there would be without crossing over.
4. Ask students what mechanisms of genetic change they have learned about in the investigation, and have them explain how each affects genetic diversity. These mechanisms include crossing over, independent assortment, segregation, nondisjunction, and random fertilization.
5. Do your students know what the basis is for genetic variability? The answer is in DNA sequence differences caused by mutations. These mutations can be caused either by damage to the DNA (usually from radiation or chemicals) or by a cell’s making a mistake as it copies its DNA. Most of the time, these “copy errors” are repaired.
■ SUPPLEMENTAL RESOURCES
■ Prelab Activitieshttp://bioweb.wku.edu/courses/biol121/Genetics/genetics.asp
This resource provides excellent pictures and videos to acquaint students with mitosis and meiosis. In addition, there is a link to a survey from the American Academy of Dermatology about sun exposure and skin cancer.
http://www.phschool.com/science/biology_place/labbench/lab3/intro.html This resource gives a review of mitosis and meiosis as well as quizzes.
http://www.pbs.org/wgbh/nova/baby/divi_flash.html This NOVA-linked site compares the chromosome movements and outcomes of mitosis and meiosis.
http://www.biology.arizona.edu/cell_bio/cell_bio.html The Cell Project provides diagrams and quizzes for mitosis and meiosis review.
http://iknow.net/cell_div_education.html iknow.net has movies on the cell cycle and plant cell mitosis. A bonus is the video of living amphibian lung cell mitosis.

T142 Investigation 7
■ Onion Root Tip http://www.biology.arizona.edu/cell_bio/activities/cell_cycle/cell_cycle.html
The Cell Project has onion cell pictures to help students classify the stages.
http://biologyjunction.com/mitosis_activity.htm The lab page provides pictures of onion cells undergoing mitosis.
■ Control of Cell Cycle http://nobelprize.org/educational/medicine/2001/
The Nobel Prize website discusses the discovery of cyclins and CDKs. There is an interactive game about cell cycle control.
http://outreach.mcb.harvard.edu/animations/checkpoints.swf
http://science.education.nih.gov/supplements/nih1/cancer/default.htm Both of these websites have good cell cycle animations. The NIH resource, Cell Biology and Cancer, has a section on cancer, the cell cycle, tumor suppressor genes, and oncogenes.
■ Other Resources http://www.cellsalive.com/toc_cellbio.htm
Cells Alive! has animations on mitosis, meiosis, the cell cycle, and apoptosis.
http://www.nclark.net/MitosisMeiosis This webpage displays an extensive list of online resources for mitosis and meiosis.
http://www.biology.arizona.edu/human_bio/activities/karyotyping/karyotyping.html This online activity from The Biology Project covers karyotype analyses in normal cells and in cells carrying a genetic defect.
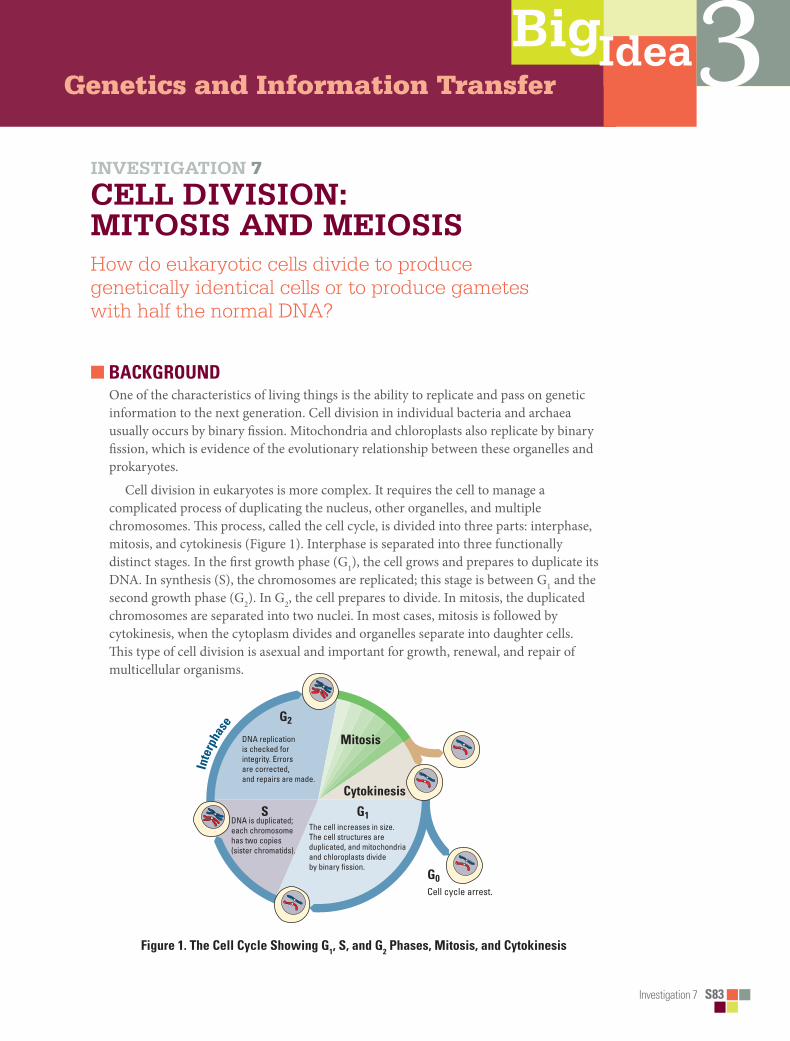
BigIdea
Investigation 7 S83
3investigation 7
CeLL Division: Mitosis anD MeiosisHow do eukaryotic cells divide to produce genetically identical cells or to produce gametes with half the normal DNA?
■ BACKGROUNDOne of the characteristics of living things is the ability to replicate and pass on genetic information to the next generation. Cell division in individual bacteria and archaea usually occurs by binary fission. Mitochondria and chloroplasts also replicate by binary fission, which is evidence of the evolutionary relationship between these organelles and prokaryotes.
Cell division in eukaryotes is more complex. It requires the cell to manage a complicated process of duplicating the nucleus, other organelles, and multiple chromosomes. This process, called the cell cycle, is divided into three parts: interphase, mitosis, and cytokinesis (Figure 1). Interphase is separated into three functionally distinct stages. In the first growth phase (G1), the cell grows and prepares to duplicate its DNA. In synthesis (S), the chromosomes are replicated; this stage is between G1 and the second growth phase (G2). In G2, the cell prepares to divide. In mitosis, the duplicated chromosomes are separated into two nuclei. In most cases, mitosis is followed by cytokinesis, when the cytoplasm divides and organelles separate into daughter cells. This type of cell division is asexual and important for growth, renewal, and repair of multicellular organisms.
Bio_T_Lab07_01
QU: OK to add callout ?Cyclebegins.
NOTE: Art with callouts requires greater size than speci�ed.
Mitosis
Cytokinesis
G1
G2
S
G0
The cell increases in size. The cell structures are duplicated, and mitochondria and chloroplasts divide by binary fission.
DNA is duplicated; each chromosome has two copies (sister chromatids).
DNA replication is checked for integrity. Errors are corrected, and repairs are made.
Cell cycle arrest.
Inte
rpha
se
Figure 1. The Cell Cycle Showing G1, S, and G2 Phases, Mitosis, and Cytokinesis
Genetics and Information Transfer
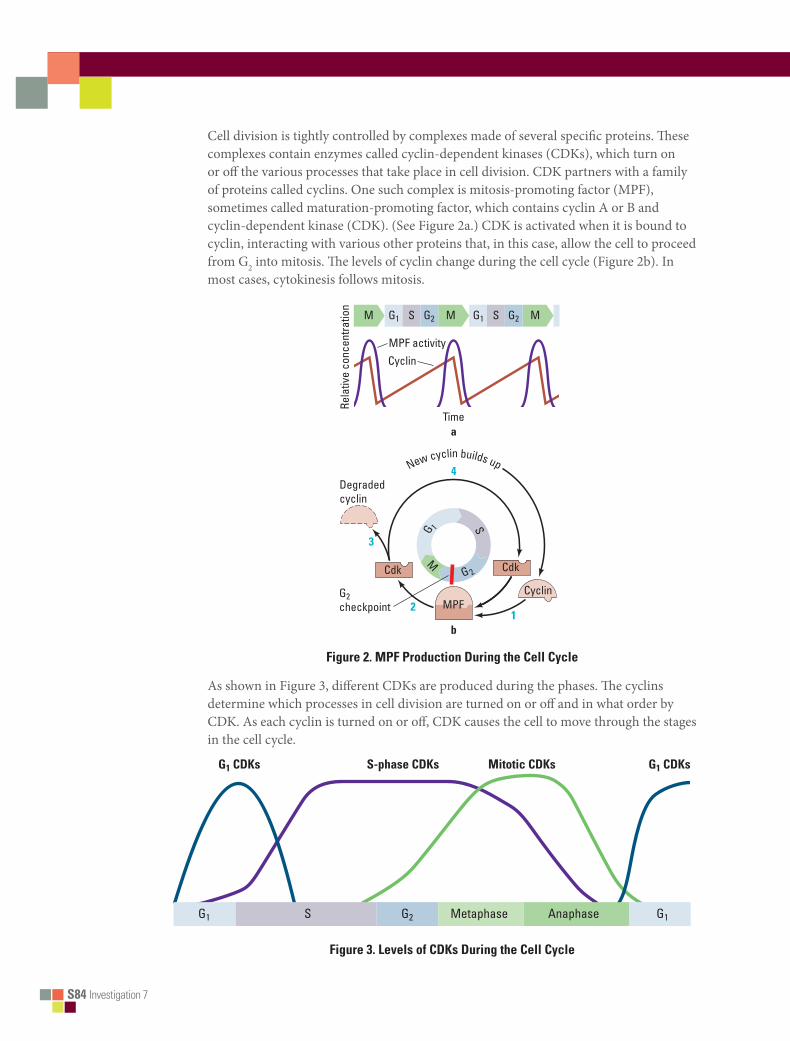
S84 Investigation 7
Cell division is tightly controlled by complexes made of several specific proteins. These complexes contain enzymes called cyclin-dependent kinases (CDKs), which turn on or off the various processes that take place in cell division. CDK partners with a family of proteins called cyclins. One such complex is mitosis-promoting factor (MPF), sometimes called maturation-promoting factor, which contains cyclin A or B and cyclin-dependent kinase (CDK). (See Figure 2a.) CDK is activated when it is bound to cyclin, interacting with various other proteins that, in this case, allow the cell to proceed from G2 into mitosis. The levels of cyclin change during the cell cycle (Figure 2b). In most cases, cytokinesis follows mitosis.
Bio_T_Lab07_02ab
NOTE: To keep proper relationships among elements, and to keepcircles concentric, a little more depth was needed than speci�ed.
G1M MS G2 G1 MS G2
MPF activityCyclin
Degradedcyclin
MPF
CdkCdk
Cyclin
Time
Rela
tive
conc
entra
tion
a
b
4
3
21
G2checkpoint
New cyclin builds up
G 1 S
G 2
M
Figure 2. MPF Production During the Cell Cycle
As shown in Figure 3, different CDKs are produced during the phases. The cyclins determine which processes in cell division are turned on or off and in what order by CDK. As each cyclin is turned on or off, CDK causes the cell to move through the stages in the cell cycle.
Figure 3. Levels of CDKs During the Cell Cycle
Bio_T_Lab07_03
NOTE: This art required less depth than speci�ed.
G1 G1G2S Metaphase Anaphase
G1 CDKs S-phase CDKs Mitotic CDKs G1 CDKs
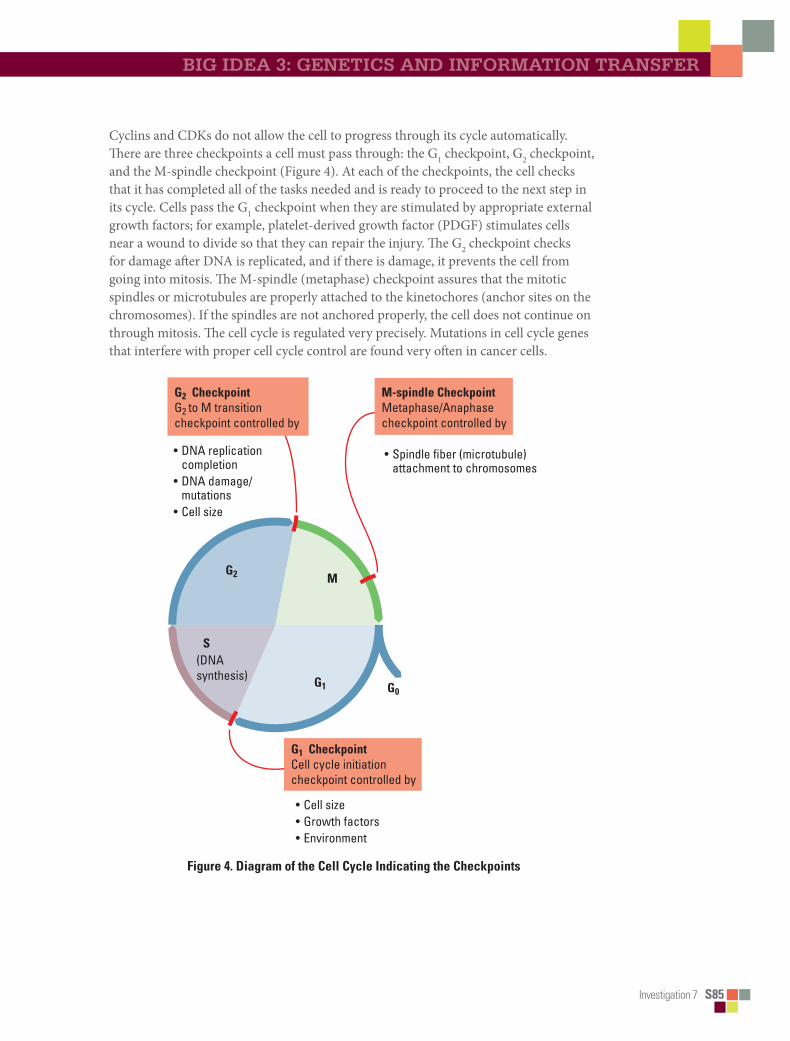
Investigation 7 S85
big iDea 3: genetiCs anD inforMation transfer
Cyclins and CDKs do not allow the cell to progress through its cycle automatically. There are three checkpoints a cell must pass through: the G1 checkpoint, G2 checkpoint, and the M-spindle checkpoint (Figure 4). At each of the checkpoints, the cell checks that it has completed all of the tasks needed and is ready to proceed to the next step in its cycle. Cells pass the G1 checkpoint when they are stimulated by appropriate external growth factors; for example, platelet-derived growth factor (PDGF) stimulates cells near a wound to divide so that they can repair the injury. The G2 checkpoint checks for damage after DNA is replicated, and if there is damage, it prevents the cell from going into mitosis. The M-spindle (metaphase) checkpoint assures that the mitotic spindles or microtubules are properly attached to the kinetochores (anchor sites on the chromosomes). If the spindles are not anchored properly, the cell does not continue on through mitosis. The cell cycle is regulated very precisely. Mutations in cell cycle genes that interfere with proper cell cycle control are found very often in cancer cells.
Bio_T_Lab07_04
QU: What does green circle at upper left represent? Can it be omitted?
NOTE: Less depth was needed than speci�ed.
NOTE: We designed this �gure to be consistent with Bio_T_Lab07_01.
M
G1
G2
G2 CheckpointG2 to M transition checkpoint controlled by
• DNA replication completion• DNA damage/ mutations • Cell size
• Cell size • Growth factors • Environment
• Spindle fiber (microtubule) attachment to chromosomes
M-spindle Checkpoint Metaphase/Anaphase checkpoint controlled by
G1 CheckpointCell cycle initiation checkpoint controlled by
S
G0
(DNAsynthesis)
Figure 4. Diagram of the Cell Cycle Indicating the Checkpoints

S86 Investigation 7
■ Learning Objectives• To describe the events in the cell cycle and how these events are controlled
• To explain how DNA is transmitted to the next generation via mitosis
• To explain how DNA is transmitted to the next generation via meiosis followed by fertilization
• To understand how meiosis and crossing over leads to increased genetic diversity, which is necessary for evolution
■ General Safety PrecautionsYou must be careful when preparing specimens for viewing under the compound microscope. Always cover the cover slip with a scientific cleaning wipe, such as a Kimwipe, and press down using a pencil eraser.
You should wear safety goggles or glasses and disposable gloves when handling the chemicals and razor blades in Parts 2 and 5. All materials should be disposed of properly as per your teacher’s instructions.
■ THE INVESTIGATIONS
■ Getting StartedThese questions are designed to see how well you understand and can explain the key concepts related to cell division before you begin your investigations.
1.How did you develop from a single-celled zygote to an organism with trillions of cells? How many mitotic cell divisions would it take for one zygote to grow into an organism with 100 trillion cells?
2.How is cell division important to a single-celled organism?
3.What must happen to ensure successful cell division?
4.How does the genetic information in one of your body cells compare to that found in other body cells?
5.What are some advantages of asexual reproduction in plants?
6.Why is it important for DNA to be replicated prior to cell division?
7. How do chromosomes move inside a cell during cell division?
8.How is the cell cycle controlled? What would happen if the control were defective?
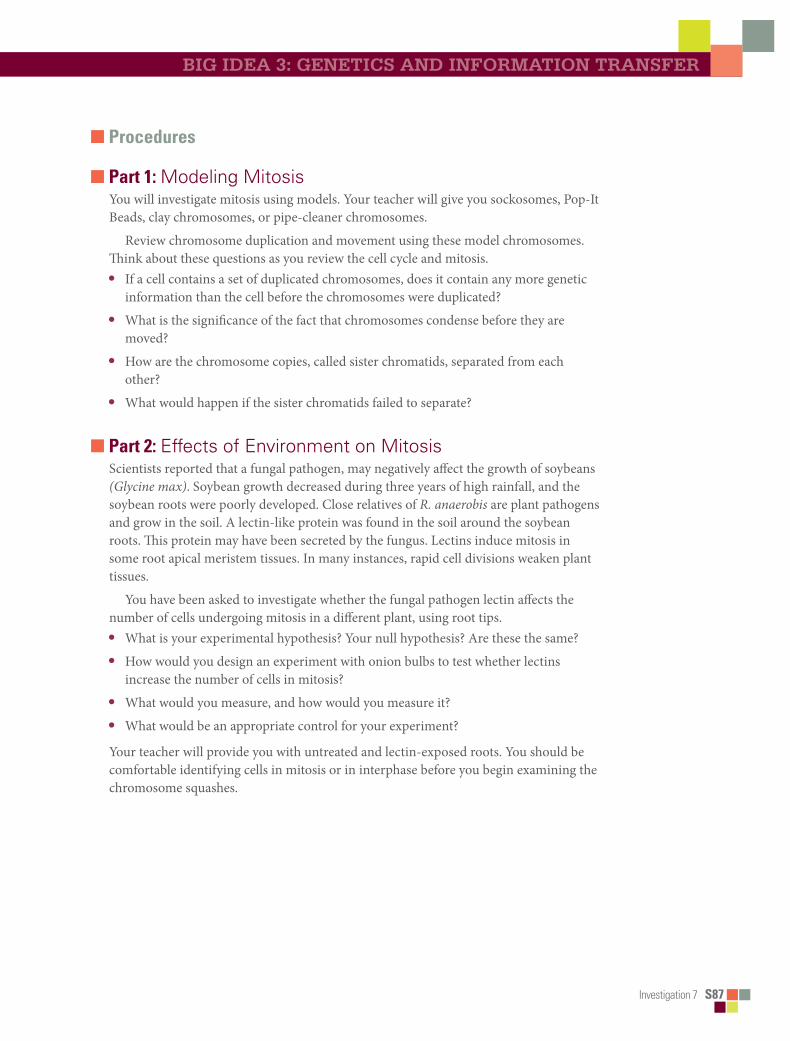
Investigation 7 S87
big iDea 3: genetiCs anD inforMation transfer
■ Procedures
■ Part 1: Modeling MitosisYou will investigate mitosis using models. Your teacher will give you sockosomes, Pop-It Beads, clay chromosomes, or pipe-cleaner chromosomes.
Review chromosome duplication and movement using these model chromosomes. Think about these questions as you review the cell cycle and mitosis. • If a cell contains a set of duplicated chromosomes, does it contain any more genetic
information than the cell before the chromosomes were duplicated?
• What is the significance of the fact that chromosomes condense before they are moved?
• How are the chromosome copies, called sister chromatids, separated from each other?
• What would happen if the sister chromatids failed to separate?
■ Part 2: Effects of Environment on MitosisScientists reported that a fungal pathogen, may negatively affect the growth of soybeans (Glycine max). Soybean growth decreased during three years of high rainfall, and the soybean roots were poorly developed. Close relatives of R. anaerobis are plant pathogens and grow in the soil. A lectin-like protein was found in the soil around the soybean roots. This protein may have been secreted by the fungus. Lectins induce mitosis in some root apical meristem tissues. In many instances, rapid cell divisions weaken plant tissues.
You have been asked to investigate whether the fungal pathogen lectin affects the number of cells undergoing mitosis in a different plant, using root tips. • What is your experimental hypothesis? Your null hypothesis? Are these the same?
• How would you design an experiment with onion bulbs to test whether lectins increase the number of cells in mitosis?
• What would you measure, and how would you measure it?
• What would be an appropriate control for your experiment?
Your teacher will provide you with untreated and lectin-exposed roots. You should be comfortable identifying cells in mitosis or in interphase before you begin examining the chromosome squashes.

S88 Investigation 7
Preparing Chromosome Squashes
1.Place the onion root tip in 1 M HCl for 4 minutes.
2.Transfer the tip to Carnoy’s fixative for 4 minutes.
3.Remove the slide from Coplin jar containing 70% ethanol, dry with a scientific cleaning wipe, and label it.
4.Place the tip on the slide and cut off the distal 2 mm portion of the tip; discard the remainder of the tip.
5.Cover the root tip piece with carbol-fuschin stain for 2 minutes.
6.Blot off excess stain and cover the tip with 1–2 drops of H2O.
7. Gently tease the root tip apart with dissecting probes or needles. Place the cover slip over the root tip and cover the cover slip with a scientific cleaning wipe.
8.Firmly press down on the cover slip with the eraser end of a pencil. Do not twist the slide, and be careful not to break the cover slip.
Counting Cells and Analyzing Data
1.Observe the cells at high magnification (400–500 X).
2.Look for well-stained, distinct cells.
3.Within the field of view, count the cells in each phase. Repeat the counts in two other root tips.
4.Collect the class data for each group, and calculate the mean and standard deviation for each group. You must make a table in your notebook for the class data.
5.Compare the number of cells from each group in interphase and in mitosis.
Table 1. Onion Root Tip Cell Phase Data; Treatment Group___________
Tip
Number of Cells
Interphase Mitotic Total
1
2
3
Total
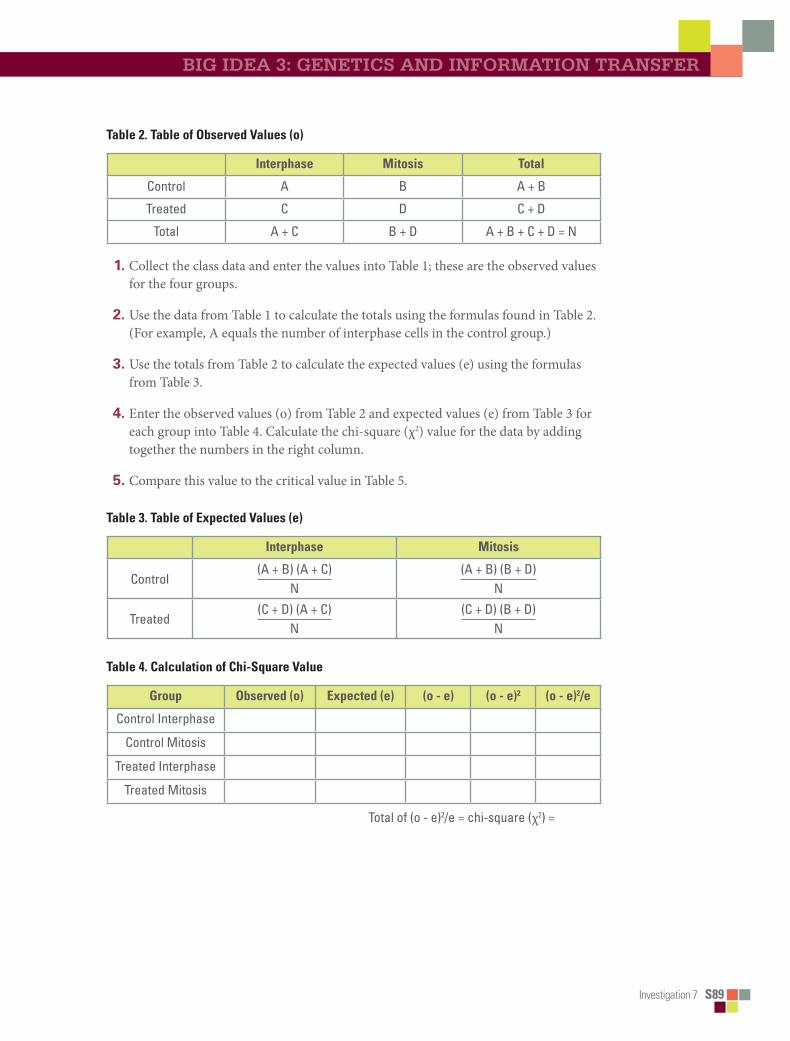
Investigation 7 S89
big iDea 3: genetiCs anD inforMation transfer
Table 2. Table of Observed Values (o)
Interphase Mitosis Total
Control A B A + B
Treated C D C + D
Total A + C B + D A + B + C + D = N
1.Collect the class data and enter the values into Table 1; these are the observed values for the four groups.
2.Use the data from Table 1 to calculate the totals using the formulas found in Table 2. (For example, A equals the number of interphase cells in the control group.)
3.Use the totals from Table 2 to calculate the expected values (e) using the formulas from Table 3.
4.Enter the observed values (o) from Table 2 and expected values (e) from Table 3 for each group into Table 4. Calculate the chi-square (χ2) value for the data by adding together the numbers in the right column.
5.Compare this value to the critical value in Table 5.
Table 3. Table of Expected Values (e)
Interphase Mitosis
Control(A + B) (A + C)
N(A + B) (B + D)
N
Treated(C + D) (A + C)
N(C + D) (B + D)
N
Table 4. Calculation of Chi-Square Value
Group Observed (o) Expected (e) (o - e) (o - e)2 (o - e)2/e
Control Interphase
Control Mitosis
Treated Interphase
Treated Mitosis
Total of (o - e)2/e = chi-square (χ2) =
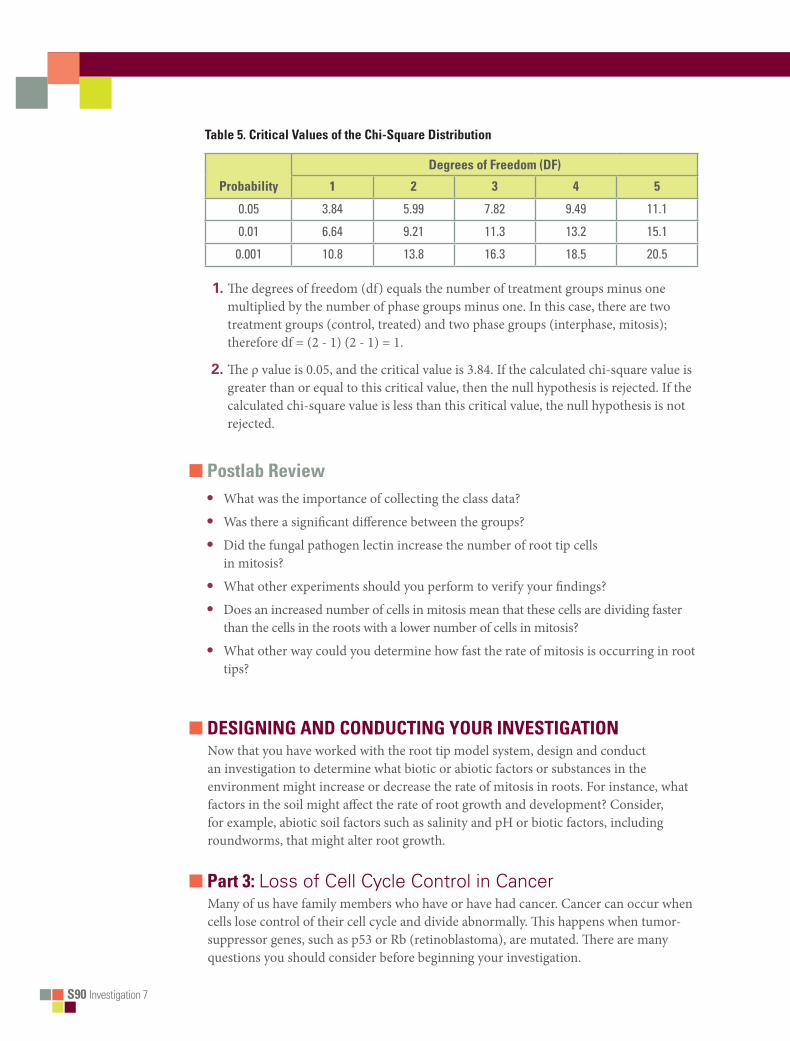
S90 Investigation 7
Table 5. Critical Values of the Chi-Square Distribution
Degrees of Freedom (DF)
Probability 1 2 3 4 5
0.05 3.84 5.99 7.82 9.49 11.1
0.01 6.64 9.21 11.3 13.2 15.1
0.001 10.8 13.8 16.3 18.5 20.5
1.The degrees of freedom (df) equals the number of treatment groups minus one multiplied by the number of phase groups minus one. In this case, there are two treatment groups (control, treated) and two phase groups (interphase, mitosis); therefore df = (2 - 1) (2 - 1) = 1.
2.The ρ value is 0.05, and the critical value is 3.84. If the calculated chi-square value is greater than or equal to this critical value, then the null hypothesis is rejected. If the calculated chi-square value is less than this critical value, the null hypothesis is not rejected.
■ Postlab Review• What was the importance of collecting the class data?
• Was there a significant difference between the groups?
• Did the fungal pathogen lectin increase the number of root tip cells in mitosis?
• What other experiments should you perform to verify your findings?
• Does an increased number of cells in mitosis mean that these cells are dividing faster than the cells in the roots with a lower number of cells in mitosis?
• What other way could you determine how fast the rate of mitosis is occurring in root tips?
■ DESIGNING AND CONDUCTING YOUR INVESTIGATIONNow that you have worked with the root tip model system, design and conduct an investigation to determine what biotic or abiotic factors or substances in the environment might increase or decrease the rate of mitosis in roots. For instance, what factors in the soil might affect the rate of root growth and development? Consider, for example, abiotic soil factors such as salinity and pH or biotic factors, including roundworms, that might alter root growth.
■ Part 3: Loss of Cell Cycle Control in CancerMany of us have family members who have or have had cancer. Cancer can occur when cells lose control of their cell cycle and divide abnormally. This happens when tumor-suppressor genes, such as p53 or Rb (retinoblastoma), are mutated. There are many questions you should consider before beginning your investigation.

Investigation 7 S91
big iDea 3: genetiCs anD inforMation transfer
■ Review from Part 1• How is the cell cycle controlled in normal cells?
• What are cyclins and cyclin-dependent kinases? What do these proteins do in a cell?
■ Prelab Questions for Part 3• How are normal cells and cancer cells different from each other?
• What are the main causes of cancer?
• What goes wrong during the cell cycle in cancer cells?
• What makes some genes responsible for an increased risk of certain cancers?
• Do you think that the chromosomes might be different between normal and cancer cells?
The last question is the focus of this part of the lab. With your group, form a hypothesis as to how the chromosomes of a cancer cell might appear in comparison to a normal cell and how those differences are related to the behavior of the cancer cell.
For each of the following cases, look at pictures of the chromosomes (karyotype) from normal human cells. Compare them to pictures of the chromosomes from cancer cells. For each case, count the number of chromosomes in each type of cell, and discuss their appearance. Then answer the following questions. • Do your observations support your hypothesis?
• If not, what type of information might you need to know in order to understand your observations?
• If yes, what type of information can you find that would validate your conclusions?
■ Case 1: HeLa cells HeLa cells are cervical cancer cells isolated from a woman named Henrietta Lacks. Her cells have been cultured since 1951 and used in numerous scientific experiments. Henrietta Lacks died from her cancer not long after her cells were isolated. Lacks’s cancer cells contain remnants of human papillomavirus (HPV), which we now know increases the risk of cervical cancer.• From your observations, what went wrong in Henrietta Lacks’s cervical cells that
made them cancerous?
• How does infection with human papillomavirus virus (HPV) increase the risk of cervical cancer?
Your teacher may ask you to read The Immortal Life of Henrietta Lacks by Rebecca Skloot. As you read it, think about the following questions: • Should tissue be removed from a patient without his or her consent for research?
• How was the HeLa cell line cultured?
• What virus infected Henrietta Lacks and may have caused her cervical cancer? What cellular process is affected by this virus?
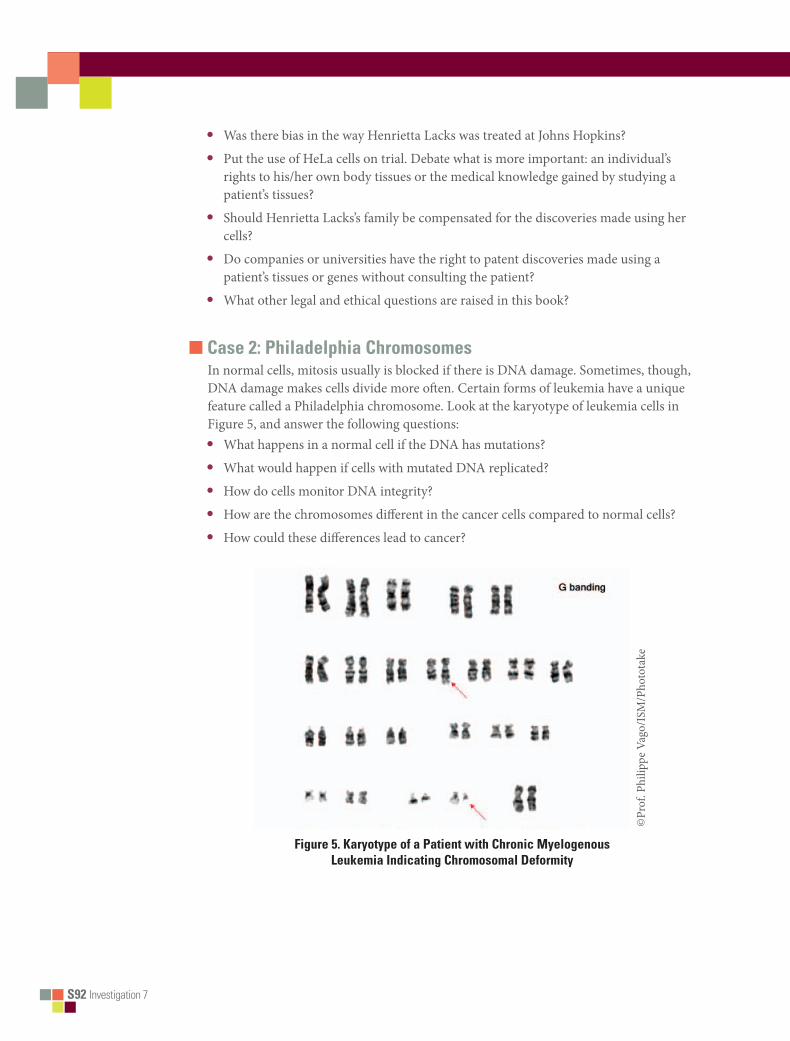
S92 Investigation 7
• Was there bias in the way Henrietta Lacks was treated at Johns Hopkins?
• Put the use of HeLa cells on trial. Debate what is more important: an individual’s rights to his/her own body tissues or the medical knowledge gained by studying a patient’s tissues?
• Should Henrietta Lacks’s family be compensated for the discoveries made using her cells?
• Do companies or universities have the right to patent discoveries made using a patient’s tissues or genes without consulting the patient?
• What other legal and ethical questions are raised in this book?
■ Case 2: Philadelphia ChromosomesIn normal cells, mitosis usually is blocked if there is DNA damage. Sometimes, though, DNA damage makes cells divide more often. Certain forms of leukemia have a unique feature called a Philadelphia chromosome. Look at the karyotype of leukemia cells in Figure 5, and answer the following questions:• What happens in a normal cell if the DNA has mutations?
• What would happen if cells with mutated DNA replicated?
• How do cells monitor DNA integrity?
• How are the chromosomes different in the cancer cells compared to normal cells?
• How could these differences lead to cancer?
©Pr
of. P
hilip
pe V
ago/
ISM
/Pho
tota
ke
Figure 5. Karyotype of a Patient with Chronic Myelogenous Leukemia Indicating Chromosomal Deformity
Investigation 7 S93
big iDea 3: genetiCs anD inforMation transfer
■ Part 4: Modeling MeiosisMeiosis resembles mitosis but serves a very different purpose. Meiosis is a cell division resulting in the halving, or reduction, of chromosome number in each cell. A diploid organism has two sets of chromosomes (2n), while a haploid cell or organism has one set (1n). Meiosis produces gametes (ova and sperm) in animals and spores in fungi, plants, and protists. Three other important characteristics of meiosis are the exchange of genetic material (“crossing over”) between homologous chromosomes, the independent assortment of the chromosomes, and the separation of alleles of the same gene (Figure 6). These characteristics, along with random fertilization, increase the genetic variability in the offspring. These mechanisms are essential to our understanding of genetics and evolution in sexually reproducing organisms.
The hallmark of sexual reproduction is the great diversity seen in the gametes and in the resulting offspring produced by fertilization. Meiosis is integral to this process because this type of cell division produces the sex cells, gametes. Before you begin the modeling exercise, your teacher will ask you to discuss these questions. • How do sexually reproducing organisms produce gametes from diploid progenitors?
• How does the process increase gamete diversity?
• What are the outcomes from independent assortment and crossing over?
• How does the distance between two genes or a gene and a centromere affect crossover frequencies?
Use the model chromosomes from Part 1 to explain meiosis and crossing-over events. During your investigation, answer the following questions:
• When is the DNA replicated during meiosis?
• Are homologous pairs of chromosomes exact copies of each other?
• What is crossing over?
• What physical constraints control crossover frequencies?
• What is meant by independent assortment?
• How can you calculate the possible number of different kinds of gametes?
• What happens if a homologous pair of chromosomes fails to separate, and how might this contribute to genetic disorders such as Down syndrome and cri du chat syndrome?
• How are mitosis and meiosis fundamentally different?

S94 Investigation 7
Bio_S_Lab07_06
Diploidcell
Fourhaploid cells
Meiosis I
DNAreplication Homologous
chromosomepairing
Crossing over
Meiosis II
Figure 6. Meiotic Cell Division Emphasizing Chromosome Movement
■ Part 5: Meiosis and Crossing Over in SordariaThe fungus Sordaria fimicola exchanges genetic material when two mycelia meet and fuse. The resulting zygote undergoes meiosis to produce asci; each ascus contains eight haploid spores. A single gene determines the spore color. (See Figures 7 and 8.)
A cross was made between wild type (+; black) and tan (tn) strains. The resulting zygote produces either parental type asci, which have four black and four tan spores in a row (4:4 pattern), or recombinant asci, which do not have this pattern. • How do you explain the differences between the recombinant asci and the parental
types?
• What meiotic event can account for this difference?
• Using the model chromosomes from Part 4, predict the possible meiotic outcomes.
1.Place a drop of water onto the microscope slide.
2.Gently scrape some perithecia from the agar plate near where the two strains meet.
3.Place a cover slip over the perithecia and put a scientific cleaning wipe over the cover slip.
4.Gently press down on the cover slip using the eraser end of a pencil.
5.Count at least 50 asci, and score them as either parental or recombinant (crossing over).
6.Enter the data in Table 3 and make the calculations. One map unit equals one percent recombination. The percent of asci showing recombination divided by 2 equals the map units separating the spore-color gene from the centromere. The percent of asci showing recombination is divided by 2 because only half of the spores in each ascus are the result of a crossing-over event.

Investigation 7 S95
big iDea 3: genetiCs anD inforMation transfer
Bio_S_Lab07_07
NOTE: With 10 pt type and the level of detail shown,art needs to be considerably larger than speci�ed size.
Mature peritheciumcontaining many asci
8Ascospores
Mycelium(fungus growswithin its food)
8Haploidnuclei
Cellpartitioning
Mitosis
Mitosis
Mitosis
Spore discharge
Filament
Ascospore
Meiosis
Fertilization
Mycelialfusion
4Haploidnuclei
Zygote(diploid)
Wild-typestrain
Mutantstrain
Ascus
Bio_S_Lab07_08
(tn)
(tn)
(+)(+)
Figure 7. Sordaria Life Cycle Figure 8: Sordaria Cross Plate
Table 3. Analysis of Results
Number of Asci Showing 4:4
Pattern
Number of Asci Showing
Crossover Total # of Asci
% Asci Showing Crossover
Divided by 2
Gene to Centromere
Distance (Map Units)

S96 Investigation 7
■ Evaluating Results 1.Why did you divide the percentage of asci showing crossover (recombinant) by 2?
2.The published map distance between the spore color gene and the centromere is 26 map units. How did the class data compare with this distance?
3.How can you account for any disparities between the class data and the published data?
4.Illustrate what happened during meiosis to produce the results you found.
5.Do you think the Philadelphia chromosome is a result of crossing over as seen in this part of the investigation or some other chromosomal abnormality? Explain your answer.
6.Do you think the cell cycle described for mitosis could be applied to meiosis as well? Explain your answer.
■ Where Can You Go from Here? 1.Can the same (or any) environmental factors you tested above affect the amount of
crossing over that occurs in Sordaria? How would you set up an experiment to test this? For example, how does humidity or pH affect the crossover frequency?
2.Revisit the learning objectives stated earlier. Do you better understand mitosis and meiosis? Could you teach this to another class?
3.How do the mechanisms of cell replication affect genetic diversity and evolution? Consider the mechanisms such as crossing over, independent assortment, segregation, nondisjunction, and random fertilization.
4.Prepare a video or write and produce a play about the process of chromosome movement.
5.Investigate how growth factors affect the cell cycle. This will help you review cell communication.
6.Research what tumor suppressors do in the cell cycle and which types of cancers may be caused by mutations in tumor suppressor genes. Specific examples include human papillomavirus (HPV), retinoblastoma protein (Rb), BRCA1 and BRCA2, and p53.
BigIdea
Investigation 8 T143
3Genetics and Information Transfer
investigation 8
BioteCHnoLogY: BaCteRiaL tRansFoRMation*How can we use genetic engineering techniques to manipulate heritable information?
■■ BACKGROUNDAre genetically modified foods safe? There is ongoing debate about whether it is safe to eat fruit and vegetables that are genetically modified to contain toxins that ward off pests. For instance, biotechnologists have succeeded in inserting a gene (Bt) from the bacterium Bacillus thuringiensis into the corn genome. When expressed, the Bt gene produces a toxin that kills caterpillars and controls earworms that damage corn — but is the corn safe for human consumption?
Genetic information passed from parent to offspring via DNA provides for continuity of life. In order for information in DNA to direct cellular activities, it must be transcribed into RNA. Some of the RNAs are used immediately for ribosomes or to control other cellular processes. Other RNAs are translated into proteins that have important roles in determining metabolism and development, i.e., cellular activities and phenotypes (traits). When the DNA of a cell changes, the RNAs and proteins they produce often change, which in turn changes how that cell functions.
DNA inside a cell can change several ways. It can be mutated, either spontaneously or after the DNA replication machinery makes an error. Biotechnologists may cause an intentional mutation in a cell’s own DNA as a way to change how that cell behaves. The most powerful tool biotechnologists have, though, is the ability to transfer DNA from one organism into another and make it function there. With this tool, they can make cells produce novel protein products that the cells did not make previously.
Stimulate student interest in the investigation by describing applications of genetic engineering. For example, insulin that people take to control their blood sugar levels is often made from engineered bacteria. Some vaccines, as well as enzymes used for manufacturing denim jeans, are also made using engineered cells. In the near future, engineered bacteria and other cells being developed could help clean up spilled oil or chemicals, produce fuel for cars and trucks, and even store excess carbon dioxide to help slow global climate change. Ask students to think of other possible applications of biotechnology. Remind students, however, that human manipulation of DNA raises several ethical, social, and medical issues, such as the safety of genetically modified foods.
The techniques required for gene transfer in higher plants and animals are complex, costly, and difficult even in the research laboratory. However, the techniques of gene transfer in Escherichia coli (E. coli) bacteria are simple and appropriate for the teaching and learning laboratory (Rapoza and Kreuzer 2004). One common technology,
* Transitioned from the AP Biology Lab Manual (2001)
T144■Investigation 8
bacterial plasmid-based genetic transformation, enables students to manipulate genetic information in a laboratory setting to understand more fully how DNA operates.
In this investigation, students will first acquire the tools to transform E. coli bacteria to express new genetic information using a plasmid system and apply mathematical routines to determine transformation efficiency. (Competent bacterial cells are able to take up exogenous genetic material and are capable of being transformed, and the procedure provided is designed to promote competence. An excellent preparation of competent cells will yield approximately 108 transformed colonies per microgram of plasmid; a poor preparation will yield approximately 104 or less transformed colonies per microgram of plasmid.) Students then have the opportunity to design and conduct individual experiments to explore transformation in more depth. For example, students can select a factor of their choice and explore its ability to induce mutations with observable phenotypes, or they can investigate if bacteria take up more plasmid in some environmental conditions and less in others. They also can explore answers to questions about plasmids and transformation that might have been raised during the initial investigation.
This investigation also provides students with the opportunity to review, connect, and apply concepts that they have studied previously, including cell structure of bacteria; structure and function of cell membranes, enzymes, and DNA and RNA; transcription and translation; the operon model of the regulation of gene expression; evolution and natural selection; and interactions between organisms and their environment.
Interspersed within each investigation are supplemental activities designed to keep students on track and to provide opportunities for them to take a deeper dive into the concepts. You may assign these activities for homework or ask students to do them as they work through the investigation.
■■ PREPARATION
Materials and EquipmentSupplies for plasmid transformation systems may be purchased in kits from commercial vendors or purchased individually, depending on your current inventory. A partial list of suppliers is provided in the Supplemental Resources section. At minimum, plasmids should contain the gene for ampicillin resistance (pAMP), as experimental procedures typically use ampicillin to select transformed cells. In addition, plasmids with colored marker genes like beta-GAL and fluorescence markers like green fluorescent protein (GFP) and its cousins make it possible to measure gene expression directly, to follow cell populations as they grow or move, and to find cells that have taken up a second plasmid that we cannot see easily. Thus, you have freedom in choosing a plasmid transformation system.
The following materials are included in a typical eight-station ampicillin-resistant plasmid system. The list will vary depending on the system used. Materials and supplies needed for each student workstation are provided in the student version of this investigation. Students are encouraged to set up their own workstations. Note that you might need additional materials such as agar plates and nutrient agar for the student inquiry investigations.

Investigation 8 T145
Big idea 3: genetiCs and inFoRMation tRansFeR
Materials Included in Eight-Station Kit
• E. coli (1 vial or slant)• Plasmid (pAMP), hydrated (20 μg)• Ampicillin, lyophilized (30 μg)• Transformation solution
(50mM CaCl2, pH 6), sterile (15 mL)• LB nutrient agar powder, sterile (to
make 500 mL) (20 g) or prepared agar
• LB nutrient broth, sterile (10 mL) • Pipettes, sterile (50)• Inoculation loops, sterile
(10 μL, packs of 10 loops)• Petri dishes, sterile, 60 mm
(packs of 20)• Multicolor 2.0 mL microcentrifuge
tubes (60)
Accessories Required but Not Included in Kit
• Microcentrifuge tube holders• Clock or watch to time 50 seconds• Microwave oven/water bath• Thermometer that reads 42°C• 1 L flask• 500 mL graduated cylinder• Distilled water
• Crushed ice and containers• 10% solution household bleach• Permanent marker pens• Masking tape• Biohazardous waste disposal bags or
plastic trash bags
Optional Accessories
• Micropipettes, adjustable volume, 2–20 μL (and pipette tips)
• Parafilm laboratory sealing film• 37°C incubator oven*
*If an incubator is not available, try using an electric blanket or construct a homemade incubator with a cardboard box and a low voltage lightbulb inside.
Otherwise, incubate agar plates with bacteria 48–72 hours at ambient room temperature. Another option is to use a seedling heating mat with thermostat available from garden supply catalogs; the advantage is that they are sealed against water damage and can be repur-posed for other lab activities, including their original purpose, germinating seeds.
Student Workstation
• E. coli starter plate • Poured agar plates 2 LB and 2 LB/amp• Transformation solution (CaCl2, pH 6.1)
kept ice cold• LB nutrient broth• Sterile inoculation loops
• 100–1000 μL sterile bulb pipettes• 1–10 μL micropipettes with sterile tips• Microcentrifuge tubes• Microcentrifuge tube holder/float• Container full of crushed ice• Marking pen
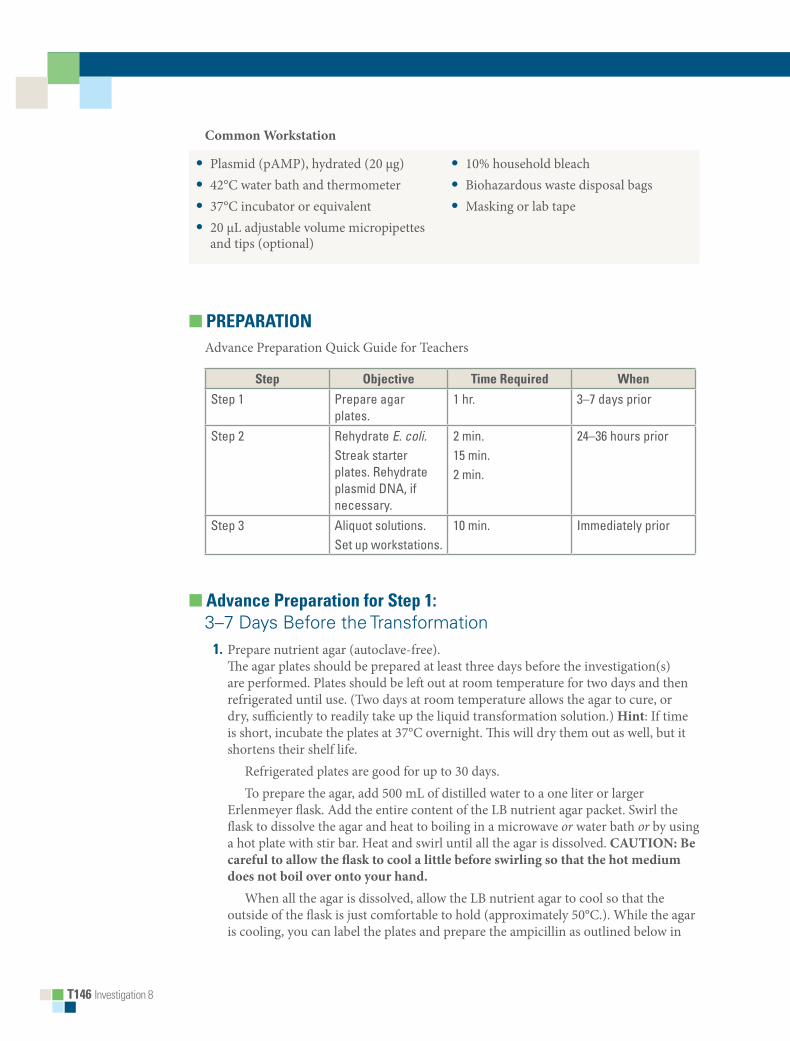
T146■Investigation 8
Common Workstation
• Plasmid (pAMP), hydrated (20 μg)• 42°C water bath and thermometer• 37°C incubator or equivalent• 20 μL adjustable volume micropipettes
and tips (optional)
• 10% household bleach• Biohazardous waste disposal bags• Masking or lab tape
■■ PREPARATIONAdvance Preparation Quick Guide for Teachers
Step Objective Time■Required When
Step 1 Prepare agar plates.
1 hr. 3–7 days prior
Step 2 Rehydrate E. coli.Streak starter plates. Rehydrate plasmid DNA, if necessary.
2 min.15 min.2 min.
24–36 hours prior
Step 3 Aliquot solutions.Set up workstations.
10 min. Immediately prior
■■ Advance■Preparation■for■Step■1:■3–7 Days Before the Transformation■ 1.■Prepare nutrient agar (autoclave-free).
The agar plates should be prepared at least three days before the investigation(s) are performed. Plates should be left out at room temperature for two days and then refrigerated until use. (Two days at room temperature allows the agar to cure, or dry, sufficiently to readily take up the liquid transformation solution.) Hint: If time is short, incubate the plates at 37°C overnight. This will dry them out as well, but it shortens their shelf life. Refrigerated plates are good for up to 30 days. To prepare the agar, add 500 mL of distilled water to a one liter or larger Erlenmeyer flask. Add the entire content of the LB nutrient agar packet. Swirl the flask to dissolve the agar and heat to boiling in a microwave or water bath or by using a hot plate with stir bar. Heat and swirl until all the agar is dissolved. CAUTION: Be careful to allow the flask to cool a little before swirling so that the hot medium does not boil over onto your hand. When all the agar is dissolved, allow the LB nutrient agar to cool so that the outside of the flask is just comfortable to hold (approximately 50°C.). While the agar is cooling, you can label the plates and prepare the ampicillin as outlined below in

Investigation 8 T147
Big idea 3: genetiCs and inFoRMation tRansFeR
Step 3. CAUTION: Do not let the agar cool so much that is begins to solidify. Keeping the flask with liquid agar in a water bath at 45–50°C can help prevent the agar from cooling too quickly. Preprepared nutrient agar also can be purchased. However, it will have to be melted before it can be poured into plates. To do this, the plastic bottles containing solid agar can be microwaved at a low temperature (such as using the “poultry defrost” option) for several minutes. Be sure to loosen the cap slightly to expel any air. At high microwave temperatures, the agar can boil over. Another option is to place the bottles in a hot water bath; however, this will take up to 45 minutes or so to melt the agar. CAUTION: Be careful when handling the bottle(s). They will get hot!
■ 2.■Prepare ampicillin.Ampicillin is either shipped dry in a small vial or already hydrated. If shipped dry, you need to hydrate the ampicillin. Do this by adding 3 mL of transformation solution to the vial to rehydrate the antibiotic. Use a sterile pipette. Note: Excessive heat (≥60°C) will destroy ampicillin. With this in mind, here’s the tricky part: the nutrient agar solidifies at 27°C, so you must be careful to monitor the cooling of the agar and then pour the plates from start to finish without interruption. Keeping the flask with liquid agar in a water bath set to 45–50°C can help prevent the agar from cooling too quickly. Before adding ampicillin to the flask of agar, make sure you can hold the flask in your bare hand (approximately 50°C). If your hand tolerates the temperature of the flask, so will the antibiotic!
■ 3.■Label plates.While the agar is cooling, reduce preparation time by labeling the plates. Label with a permanent marker on the bottom of each plate close to the edge. For each class using an eight-station kit, label 16 plates LB and 16 plates LB/amp.
■ 4.■Pour nutrient agar plates.First, pour LB nutrient agar into the 16 plates that are labeled LB. If you do not do this and add ampicillin to the flask with agar, you will not be able to make control plates containing just nutrient agar. Fill each plate to about one-third to one-half (approximately 12 mL) with agar and replace the lid. You may want to stack the plates and let them cool in the stacked configuration. Second, add the hydrated ampicillin to the remaining LB nutrient agar. Swirl briefly to mix. Pour into the 16 plates labeled LB/amp using the same technique.
Plates should set within 30 minutes.
■ 5.■Store the plates.After the plates have cured for two days at room temperature, they may be either used or stored by stacking them in a plastic sleeve bag slipped back down over them. The stack is then inverted, the bag taped closed, and the plates stored upside down at 4°C until used. (The plates are inverted to prevent condensation on the lid, which may drip onto the agar.)
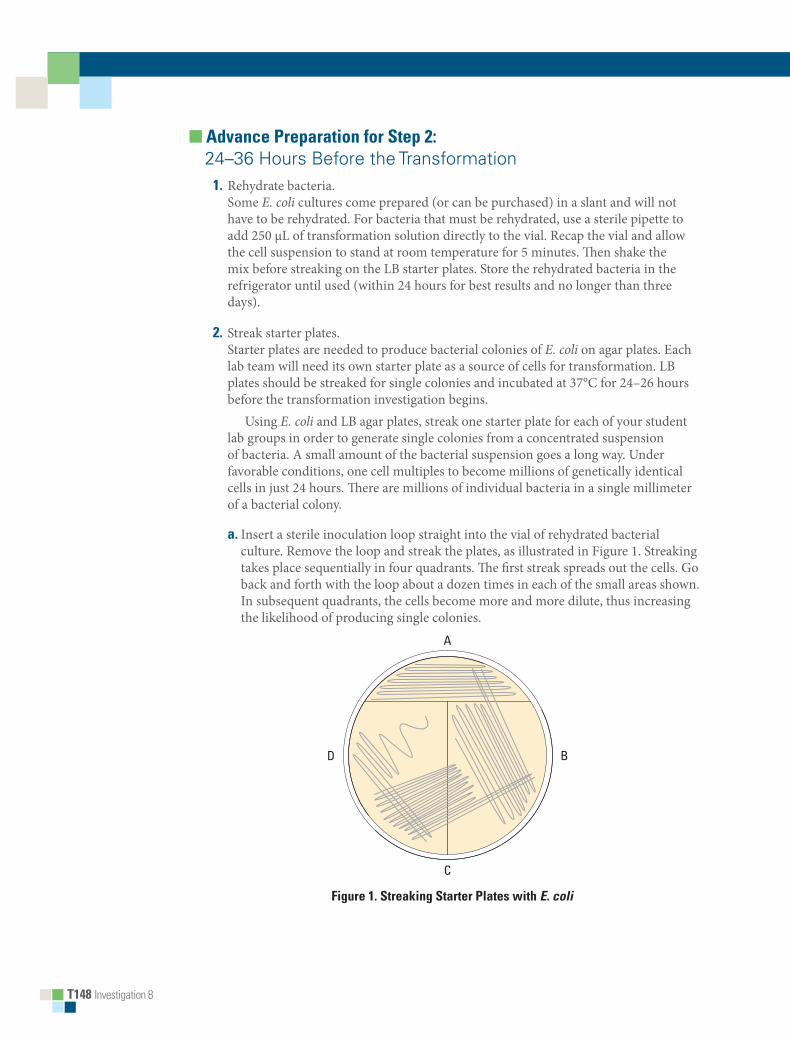
T148■Investigation 8
■■ Advance■Preparation■for■Step■2:■24–36 Hours Before the Transformation■ 1.■Rehydrate bacteria.
Some E. coli cultures come prepared (or can be purchased) in a slant and will not have to be rehydrated. For bacteria that must be rehydrated, use a sterile pipette to add 250 μL of transformation solution directly to the vial. Recap the vial and allow the cell suspension to stand at room temperature for 5 minutes. Then shake the mix before streaking on the LB starter plates. Store the rehydrated bacteria in the refrigerator until used (within 24 hours for best results and no longer than three days).
■ 2.■Streak starter plates.Starter plates are needed to produce bacterial colonies of E. coli on agar plates. Each lab team will need its own starter plate as a source of cells for transformation. LB plates should be streaked for single colonies and incubated at 37°C for 24–26 hours before the transformation investigation begins. Using E. coli and LB agar plates, streak one starter plate for each of your student lab groups in order to generate single colonies from a concentrated suspension of bacteria. A small amount of the bacterial suspension goes a long way. Under favorable conditions, one cell multiples to become millions of genetically identical cells in just 24 hours. There are millions of individual bacteria in a single millimeter of a bacterial colony.
a.■Insert a sterile inoculation loop straight into the vial of rehydrated bacterial culture. Remove the loop and streak the plates, as illustrated in Figure 1. Streaking takes place sequentially in four quadrants. The first streak spreads out the cells. Go back and forth with the loop about a dozen times in each of the small areas shown. In subsequent quadrants, the cells become more and more dilute, thus increasing the likelihood of producing single colonies.
Bio_T_Lab08_01 (per specs)
Bio_S_Lab08_03 (mis-labeled in pages?)
A
C
BD
Figure■1.■Streaking■Starter■Plates■with■E. coli
Investigation 8 T149
Big idea 3: genetiCs and inFoRMation tRansFeR
b.■For subsequent streaks, use as much of the surface area of the plate as possible. After the initial streak, rotate the plate approximately 45 degrees and start the second streak. Do not dip into the rehydrated bacteria a second time! Go into the previous streak about two times and then back and forth as shown for a total of about 10 times.
c.■Rotate the plate again and repeat streaking.
d.■Rotate the plate for the final time and make the final streak. Repeat steps a–c with the remaining LB plates for each student workstation. Although you can use the same inoculation loop for all starter plates, it is recommended that you use a new, sterile loop for each plate if you have enough. When you are finished with each plate, cover it immediately to avoid contamination.
e.■Place the plates upside down inside the incubator overnight at 37°C or at room temperature for 2–3 days if an incubator is unavailable. Use for transformation within 24–36 hours because bacteria must be actively growing to achieve high transformation efficiency. (Remember, bacterial growth is exponential.) Do not refrigerate before use. This will slow bacterial growth.
f.■ E. coli forms off-white colonies that are uniformly circular with smooth edges. Avoid using plates with contaminant colonies such as mold.
■ 3.■Prepare plasmid.The quantity of DNA is so small that the vial may appear empty. Tap the vial or spin it in a microcentrifuge to ensure that the DNA is not sticking to the cap. If the plasmid is not hydrated, refer to instructions that come with the sample. Store the vial of hydrated DNA in a refrigerator. Rehydrated plasmid should be used within 24 hours.
■■ Advance■Preparation■for■Step■3:■Immediately Before Transformation Investigation■ 1.■Aliquot solutions.
Each student workstation will need 1 mL of transformation solution and 1 mL of LB nutrient broth. You might have to aliquot these solutions into separate color-coded 2 mL microtubes. If the LB nutrient broth is aliquoted one day prior to the lab, it should be refrigerated. Make sure to label the tubes with permanent marker.
■ 2.■Set up student and common workstations.See the list of materials to be supplied at each workstation.
Some leftover materials can be combined and stored for future use. For example, extra salt solutions (CaCl2 in the case of this lab), solutions of DNA, and buffers can be stored in a refrigerator freezer. Where possible, standardize materials for use in multiple labs. This allows you to keep fewer items but larger quantities, giving some leeway for making extra as needed. However, if the plasmid goes through multiple freeze-thaw cycles in a frost-free freezer, the DNA in the plasmid can degrade. It is recommended that you check the shelf life of materials with the commercial vendor.

T150■Investigation 8
Another tip is to keep a running list of students’ experiments. After a couple of lab cycles, you should know what students are likely to want to use for their independent investigations, so you can have the materials on hand in advance. Although this seems counterintuitive because you want students to follow their curiosity, having certain materials available will cut down on time and costs.
■■ Timing■and■Length■of■LabConsider this investigation to be a learning module, not a typical teacher-directed “cookbook lab.” The investigation provides students myriad opportunities to develop biotech laboratory skills; as they work through the background information and answer questions, they are exploring concepts more deeply.
Day 1Allow approximately one class period (45–60 minutes) to preview the lab and let students work through the background information and prelab questions interspersed in the Getting Started section of the investigation. Alternatively, you can assign this material for homework.
Day 2Allow one class period (45–60 minutes) for students to transform cells and spread plates.
Day 3 It may take longer than 24 hours for students to be able to observe transformed cells. You will have to monitor the incubation conditions and bacterial growth/transformation.
Allow approximately one class period (45–60 minutes) for students to observe transformants and controls, analyze and interpret results, and calculate transformation efficiency. One option is to assign postlab assessment questions for homework, although student collaboration is recommended.
Day 4+Allow one or two class periods for students to design and conduct an independent investigation. Time will be needed for post experimental observation and data analysis. In addition, students should be given time to present their results to peers.
If students have performed colony transformation experiments before, they may review Procedure and proceed to the independent investigation(s). However, it is recommended that all students read the background information and work through Getting Started.
■■ Safety■and■Houskeeping• Students must apply basic sterile technique when working with and culturing
bacteria. Although the strain of E. coli and the DNA plasmid used in this investigation are not pathogenic, their handling requires appropriate microbiological procedures.
• Remind students to wash their hands when entering or leaving the lab area. They should not eat, drink, apply cosmetics, or use personal electronic devices in the work area.
Investigation 8 T151
Big idea 3: genetiCs and inFoRMation tRansFeR
• Work surfaces should be decontaminated with a 10% household bleach solution at least once a day and after any spill of viable material.
• All contaminated liquid or solid wastes are decontaminated before disposal. This can be done in an autoclave (20 minutes at 121°C) or in a 10% bleach solution (soaked for 20 minutes).
• Ampicillin may cause allergic reactions or irritation to the eyes, respiratory system, and skin. In case of contact with eyes, rinse immediately with plenty of water and seek medical advice. Wear suitable protective clothing. Since ampicillin is a member of the penicillin family of antibiotics, students (or teachers) with allergies to penicillin or to any other member of the penicillin family of antibiotics should avoid contact with ampicillin.
■■ ALIGNMENT■TO■THE■AP■BIOLOGY■CURRICULUM■FRAMEWORKThis investigation can be conducted during the study of concepts pertaining to the storage, retrieval, and transmission of genetic information (big idea 3), with a connection to evolution and natural selection (big idea 1). As always, it is important to make connections between big ideas and enduring understandings, regardless of where in the curriculum the lab is taught. The concepts align with the enduring understandings and learning objectives from the AP Biology Curriculum Framework, as indicated below.
■■ Enduring■Understandings• 1A2: Natural selection acts on phenotypic variations in populations.• 1C3: Populations of organisms continue to evolve.• 3A1: DNA, and in some cases RNA, is the primary source of heritable information.• 3B1: Gene regulation results in differential gene expression.• 3C1: Changes in genotype can result in changes in phenotype.• 3C2: Biological systems have multiple processes that increase genetic variation.
■■ Learning■Objectives• The student is able to connect evolutionary changes in a population over time to a
change in the environment (1A2 & SP 7.1).• The student is able to evaluate given data sets that illustrate evolution as an ongoing
process (1C3 & SP 5.3).• The student can justify the claim that humans can manipulate heritable information
by identifying at least two commonly used technologies (3A1 & SP 6.4).• The student can predict how a change in a specific DNA or RNA sequence can result
in changes in gene expression (3A1 & SP 6.4).• The student is able to pose questions about ethical, social, or medical issues
surrounding human genetic disorders [an application of genetic engineering] (3A3 & SP 3.1).
T152■Investigation 8
• The student can use representations to describe how gene regulation influences cell products and function (3B1 & SP 1.4).
• The student is able to predict how a change in genotype, when expressed as a phenotype, provides a variation that can be subject to natural selection (3C1 & SP 6.4, SP 7.2).
• The student is able to construct an explanation of the multiple processes that increase variation within a population (3C2 & SP 6.2).
■■ ■ARE■STUDENTS■READY■TO■COMPLETE■A■SUCCESSFUL■■INQUIRY-BASED,■STUDENT-DIRECTED■INVESTIGATION?This investigation reinforces the following skills:• Using pipettes (plastic bulb-type or other volumetric measuring devices)• Measuring temperature (°C)• Applying metric system • Applying quantitative skills
■■ Skills■DevelopmentStudents will develop the following skills:• Using sterile technique• Disposing properly of materials and solutions that come in contact with bacteria• Transferring bacterial colonies from agar plates to microtubes• Transforming bacterial cells with plasmid DNA• Delivering transformed cultures to agar plates• Applying mathematics to quantify transformation efficiency
■■ Potential■ChallengesWith any type of microbiology technique, including working with and culturing bacteria, it is important not to introduce contaminating microorganisms into the experiment. When students are working with the inoculation loops, pipettes, and agar plates, you should stress that the round circle at the end of the loop, the tip of the pipette, and the surface of the agar plate should not be touched or placed onto contaminating surfaces, such as bench tops. While some contamination will likely not ruin the investigation, students should practice sterile technique. You might consider having students do a dry run of the procedures to practice sterile technique before working with bacteria.
Best results are obtained if starter plates are fresh (24–36 hr growth), with bacterial colonies measuring about 1–1.5 mm in diameter. Refrigeration of cultured plates will significantly lower transformation efficiency. The optimum temperature for growing E. coli is 37°C.
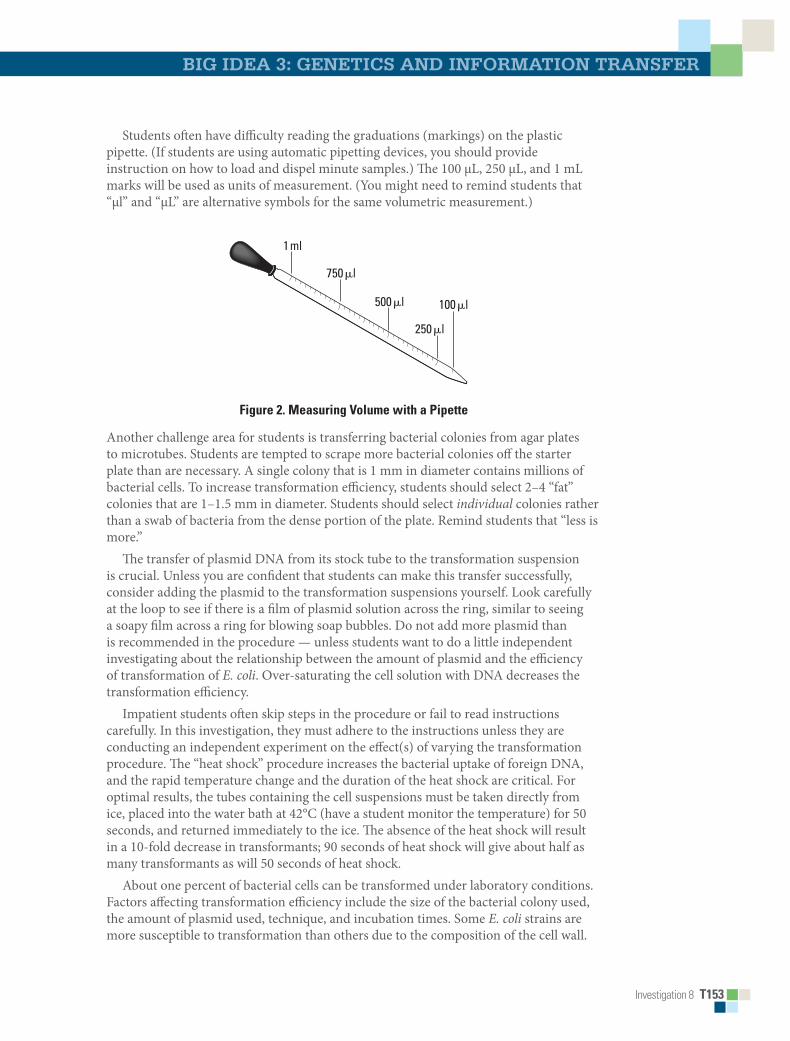
Investigation 8 T153
Big idea 3: genetiCs and inFoRMation tRansFeR
Students often have difficulty reading the graduations (markings) on the plastic pipette. (If students are using automatic pipetting devices, you should provide instruction on how to load and dispel minute samples.) The 100 μL, 250 μL, and 1 mL marks will be used as units of measurement. (You might need to remind students that “μl” and “μL” are alternative symbols for the same volumetric measurement.)
Bio_T_Lab08_02
750�l
500�l
250�l
100�l
1ml
Figure■2.■Measuring■Volume■with■a■Pipette
Another challenge area for students is transferring bacterial colonies from agar plates to microtubes. Students are tempted to scrape more bacterial colonies off the starter plate than are necessary. A single colony that is 1 mm in diameter contains millions of bacterial cells. To increase transformation efficiency, students should select 2–4 “fat” colonies that are 1–1.5 mm in diameter. Students should select individual colonies rather than a swab of bacteria from the dense portion of the plate. Remind students that “less is more.”
The transfer of plasmid DNA from its stock tube to the transformation suspension is crucial. Unless you are confident that students can make this transfer successfully, consider adding the plasmid to the transformation suspensions yourself. Look carefully at the loop to see if there is a film of plasmid solution across the ring, similar to seeing a soapy film across a ring for blowing soap bubbles. Do not add more plasmid than is recommended in the procedure — unless students want to do a little independent investigating about the relationship between the amount of plasmid and the efficiency of transformation of E. coli. Over-saturating the cell solution with DNA decreases the transformation efficiency.
Impatient students often skip steps in the procedure or fail to read instructions carefully. In this investigation, they must adhere to the instructions unless they are conducting an independent experiment on the effect(s) of varying the transformation procedure. The “heat shock” procedure increases the bacterial uptake of foreign DNA, and the rapid temperature change and the duration of the heat shock are critical. For optimal results, the tubes containing the cell suspensions must be taken directly from ice, placed into the water bath at 42°C (have a student monitor the temperature) for 50 seconds, and returned immediately to the ice. The absence of the heat shock will result in a 10-fold decrease in transformants; 90 seconds of heat shock will give about half as many transformants as will 50 seconds of heat shock.
About one percent of bacterial cells can be transformed under laboratory conditions. Factors affecting transformation efficiency include the size of the bacterial colony used, the amount of plasmid used, technique, and incubation times. Some E. coli strains are more susceptible to transformation than others due to the composition of the cell wall.

T154■Investigation 8
To improve transformation efficiency, one recommendation is to have students plate 10 percent of the final mix of transformed cells onto one plate, then spin down and plate the remaining 90 percent of cells onto a second plate. If transformation efficiency is low, and only a few cells take up DNA, this extra plate with more bacteria may have a few transformants. This extra step is helpful in demonstrating the effects of dilution on plating efficiency, too.
Despite all efforts, sometimes transformation is unsuccessful. If this happens, one suggestion is to use a random number generator to come up with imaginary colony counts for the purpose of working through the transformation efficiency calculations.
The last area of challenge for students is spreading transformants and controls to the agar plates. Delivering an excess of transformed culture to the plates is counterproductive because the plates may not absorb the additional liquid and spreading will be uneven. Transferring bacterial suspensions from the microtubes is tricky; the bacteria will settle at the bottom, but students can hold the top of a closed tube between the index finger and thumb of one hand and gently flick the bottom of the tube with the index finger of the other hand. (You should demonstrate this technique.) After transferring bacteria to an agar plate, the students should cover the plates with lids immediately after pipetting in the transformation culture and spreading the cells. They should spread the suspension evenly around the surface of the agar by quickly skating the flat surface of a new sterile loop back and forth across the plate surface. An alternative method is to use small sterile glass beads to spread the suspensions by gently rocking the beads across the surface of the agar.
Remind students to store their plates in the incubator upside down to prevent any condensation from dripping onto the agar.
■■ THE■INVESTIGATIONS
■■ Getting■Started:■Prelab■AssessmentThe Getting Started section of the investigation contains two sets of questions for preparing students and encourages them to ask their own questions about transformation and explore answers. You may assign the background material and prelab questions for homework; as a think, pair/group, share activity, in which pairs or small groups of students brainstorm ideas and then share them with other groups; or as a whole-class discussion.
Before beginning this investigation, students should have a solid understanding of the structure and function of DNA. You might want to take them through the discovery of transformation in 1928 by Frederick Griffith. Griffith was studying the bacterium Streptococcus pneumoniae, which causes pneumonia, the leading cause of death in the Western Hemisphere at the time of his research. Ask students to investigate Griffith’s experiments and their significance in identifying the “transforming principle,” later identified as DNA. Students can present their findings in the form of a poster or diagram with annotation.
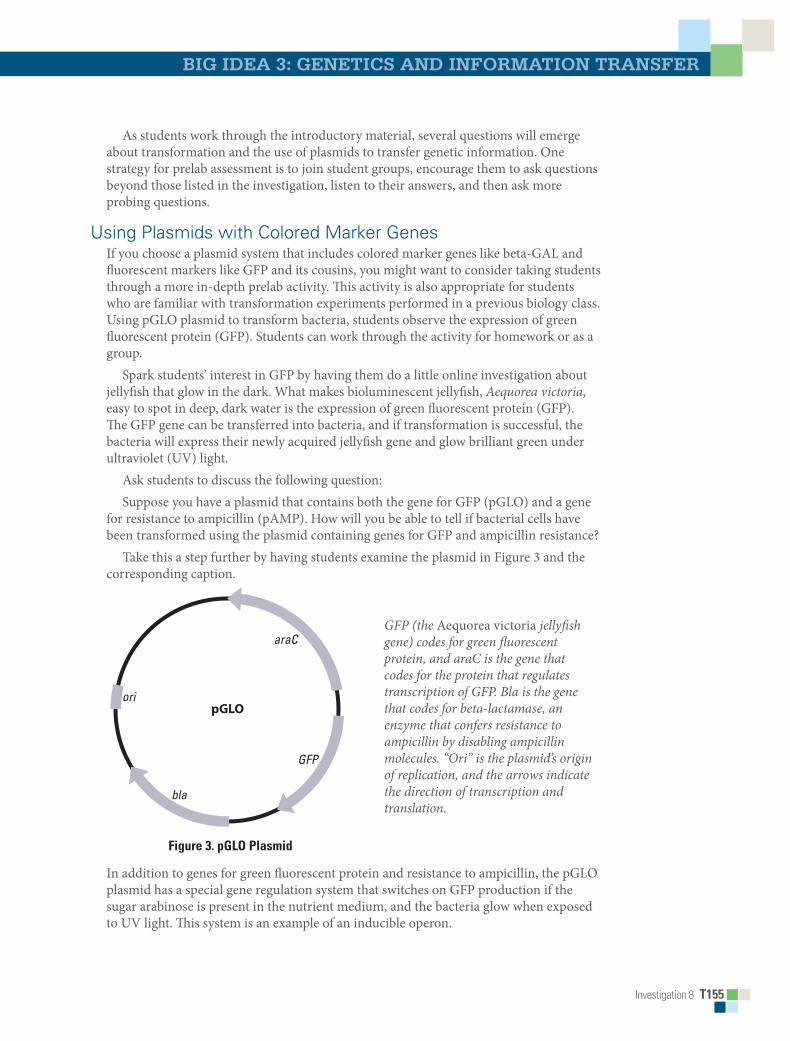
Investigation 8 T155
Big idea 3: genetiCs and inFoRMation tRansFeR
As students work through the introductory material, several questions will emerge about transformation and the use of plasmids to transfer genetic information. One strategy for prelab assessment is to join student groups, encourage them to ask questions beyond those listed in the investigation, listen to their answers, and then ask more probing questions.
Using Plasmids with Colored Marker GenesIf you choose a plasmid system that includes colored marker genes like beta-GAL and fluorescent markers like GFP and its cousins, you might want to consider taking students through a more in-depth prelab activity. This activity is also appropriate for students who are familiar with transformation experiments performed in a previous biology class. Using pGLO plasmid to transform bacteria, students observe the expression of green fluorescent protein (GFP). Students can work through the activity for homework or as a group.
Spark students’ interest in GFP by having them do a little online investigation about jellyfish that glow in the dark. What makes bioluminescent jellyfish, Aequorea victoria, easy to spot in deep, dark water is the expression of green fluorescent protein (GFP). The GFP gene can be transferred into bacteria, and if transformation is successful, the bacteria will express their newly acquired jellyfish gene and glow brilliant green under ultraviolet (UV) light.
Ask students to discuss the following question:Suppose you have a plasmid that contains both the gene for GFP (pGLO) and a gene
for resistance to ampicillin (pAMP). How will you be able to tell if bacterial cells have been transformed using the plasmid containing genes for GFP and ampicillin resistance?
Take this a step further by having students examine the plasmid in Figure 3 and the corresponding caption.
GFP (the Aequorea victoria jellyfish gene) codes for green fluorescent protein, and araC is the gene that codes for the protein that regulates transcription of GFP. Bla is the gene that codes for beta-lactamase, an enzyme that confers resistance to ampicillin by disabling ampicillin molecules. “Ori” is the plasmid’s origin of replication, and the arrows indicate the direction of transcription and translation.
Bio_T_Lab08_03
araC
GFP
bla
oripGLO
■■■■■■■■■■■■■■■■■■■■■Figure■3.■pGLO■Plasmid
In addition to genes for green fluorescent protein and resistance to ampicillin, the pGLO plasmid has a special gene regulation system that switches on GFP production if the sugar arabinose is present in the nutrient medium, and the bacteria glow when exposed to UV light. This system is an example of an inducible operon.

T156■Investigation 8
Using the information above, ask students to construct a diagram of the arabinose operon, showing the activity of the various components described in the presence of arabinose, and then in the absence of the sugar. The following questions can guide their thinking:• What evidence will indicate whether your attempts at performing a genetic
transformation are successful?• What will agar plates containing arabinose look like if they contain transformed cells?
Without arabinose?
■■ Designing■and■Conducting■Independent■InvestigationsThere are several directions in which students can go with their own investigations.■ 1.■Students can determine whether any satellite colonies have been transformed.
Do not tell them this in advance, but the majority of satellite colonies form when transformed cells release beta-lactamase (the enzyme encoded by the plasmid that degrades ampicillin) into the surrounding medium. Nontransformed bacteria can then survive and grow.
■ 2.■Students can vary the transformation process by altering the amount of DNA, ratio of transformation solutions, time for heat shock, or growth stage of bacteria.
■ 3.■Students can investigate the effects of mutations on gene expression and whether mutations affect plasmids. However, you must make sure that any mutagens students choose to explore are safe. There are several postulated or proven mutagens that students likely could handle safely, including the following:• Dilute hydrogen peroxide
• Caffeine
• UV light source (The bacteria must be kept in the dark to prevent DNA repair, and students must wear UV goggles.)
• Potassium nitrate (used in food preservation)
■ 4.■Can bacteria take up two different plasmids? This is an advanced investigation that requires two different plasmids. However, it can lead to very interesting outcomes because some pairs of plasmids are compatible, while others are not.
■ 5.■Does having this plasmid give the bacteria an advantage other than antibiotic resistance? Mix equal amounts of transformed bacteria with untransformed bacteria, and plate them together on one plate. Which colonies are bigger after 24 hours? Which colonies are more numerous? This investigation would tie nicely into labs on interspecific competition or natural selection.
Investigation 8 T157
Big idea 3: genetiCs and inFoRMation tRansFeR
■■ Summative■AssessmentStudents observe the results they obtained and record their observations in their lab notebook. The Analyzing Results section of the lab in the Student Manual provides several questions for consideration, but encourage students to come up with some of their own questions.
The following are suggested guidelines to assess students’ understanding of the concepts presented in the investigation, but you are encouraged to develop your own methods of postlab assessment. Some of the tasks can be assigned for homework following the completion of the investigation.
■ 1.■Have students record all their data, results, and conclusions in a lab notebook, formal paper, or mini-posters. Based on the students’ product, do you think students have met the learning objectives of the investigation?
■ 2.■As you visited the different lab groups, were they able to work through the various activities interspersed throughout the investigation without difficulty? What additional questions did students raise? Did they have ideas for how they could explore answers to their questions?
■ 3.■Did students have sufficient mathematical skills to calculate transformation efficiency?
■ 4.■What technical challenges did students have using the equipment required for the investigation? Have students list their challenge areas and discuss solutions.
■■ Where■Can■Students■Go■from■Here?The background to this investigation asks students to think about several applications of genetic transformation, including genetically modified food and possible ethical, social, or medical issues raised by the manipulation of DNA by biotechnology. Ask students to discuss why these issues are “issues.” What questions are posed by genetic engineering? Students also can respond to the quote from Michael Crichton’s novel and film Jurassic Park: “Just because science can do something doesn’t mean that it should.”
T158■Investigation 8
■■ SUPPLEMENTAL■RESOURCES
■■ Background■Information/Prelab■Activitieshttp://biology.arizona.edu
The University of Arizona Biology Project is an online interactive resource for learning biology, with an extensive molecular biology/biotechnology module.
Curriculum Module (Professional Development), AP Biology: From Gene to Protein—A Historical Perspective, College Board, 2010.This set of instructional strategies developed by AP Biology teachers takes students on an inquiry-based journey as they explore key discoveries that allowed scientists to identify DNA as the molecule of heredity and how it is able to store, retrieve, and transmit information necessary for living systems. Drawing their own conclusions, students explore the contributions of notable scientists, including Frederick Griffith, Hershey and Chase, Watson and Crick, and Meselson and Stahl. The instructional activities are examples of how teachers can engage students by accommodating their different learning styles, knowledge bases, and abilities and, at the same time, provide depth of content and skills.
http://dnalc.org. Dolan DNA Learning Center, Cold Spring Harbor.This resource provides myriad interactive activities for students to prepare students for conducting investigations using biotechnology practices, including DNA Subway and iPlant Collaborative.
Griffith, AJ, Natural plasmids of filamentous fungi, Microbiol. Rev. 1995 December 59(4), http://www.ncbi.nlm.nih.gov/pubmed/8531891
Johnson, A. Daniel, 40 Inquiry Exercises for the College Biology Lab, NSTA Press, Arlington, VA, 2009. This information provides great insight into developing student-directed, inquiry-based laboratory investigations for advanced students, while also providing strategies on how teachers can adapt their more teacher-directed labs into opportunities for independent exploration. Unit 3 in the manual, “DNA Isolation and Analysis,” provides exercises for more advanced students to use bioinformatics programs to study and manipulate DNA sequences.
http://phschool.com/science/biology_place Developed by Pearson Education, this interactive and informative resource allows students to visualize and apply their understanding of biological concepts. Designed for AP Biology students, Lab Bench connects laboratory procedures to key concepts.
Investigation 8 T159
Big idea 3: genetiCs and inFoRMation tRansFeR
■■ Procedural■ResourcesBio-Rad Biotechnology Explorer™ pGLO Bacterial Transformation Kit,
Catalog #166-003EDU, www.explorer.bio-rad.comThis guided inquiry-based curriculum module developed by Bio-Rad Laboratories is a source from which this investigation can be modified. Using pGLO plasmid to transform bacteria, students observe the expression of green fluorescent protein.
Rapoza, M., and H. Kruezer, Transformations: A Teacher’s Manual, publication from Carolina Biological Supply Company, Burlington, NC, 2004. http://www.carolina.com This resource, developed in cooperation with the Dolan DNA Learning Center of Cold Spring Harbor Laboratory, provides extensive background and procedural information for multiple transformation laboratory exercises. All of the plasmids described in the resource contain the gene for ampicillin resistance, and all of the experimental procedures use ampicillin to select transformed cells. Several of the plasmids contain an additional marker gene that causes the transformed cell to be colored, including pVIB, pGREEN, and pBLU.
■■ Resources■for■Extensions■of■InvestigationPlasmid isolation and purification are fairly simple processes that students might want to try. Chemicals, bacterial strains, culture media, and other supplies can be purchased from several commercial companies, including Carolina Biological (http://www.carolina.com) and Bio-Rad (http://explorer.bio-rad.com). Students can isolate specific plasmids of your choice and use them to transform bacteria that do not naturally contain the plasmid(s). Using the skills and knowledge obtained from this investigation, students can design an experiment to investigate whether or not their transformation was successful.

This page is intentionally left blank.
BigIdea
Investigation 8 S97
3Genetics and Information Transfer
investigation 8
BioteCHnoLogY: BaCteRiaL tRansFoRMation*How can we use genetic engineering techniques to manipulate heritable information?
■■ BACKGROUNDAre genetically modified foods safe? There is ongoing debate about whether it is safe to eat fruit and vegetables that are genetically modified to contain toxins that ward off pests. For instance, biotechnologists have succeeded in inserting a gene (Bt) from the bacterium Bacillus thuringiensis into the corn genome. When expressed, the Bt toxin kills caterpillars and controls earworms that damage corn, but is the corn safe for human consumption?
Genetic information passed from parent to offspring via DNA provides for continuity of life. In order for information in DNA to direct cellular activities, it must be transcribed into RNA. Some of the RNAs are used immediately for ribosomes or to control other cellular processes. Other RNAs are translated into proteins that have important roles in determining metabolism and development, i.e., cellular activities and phenotypes (traits). When the DNA of a cell changes, the RNAs and proteins they produce often change, which in turn changes how that cell functions.
DNA inside a cell can change several ways. It can be mutated, either spontaneously or after the DNA replication machinery makes an error. Biotechnologists may cause an intentional mutation in a cell’s own DNA as a way to change how that cell behaves. The most powerful tool biotechnologists have, though, is the ability to transfer DNA from one organism to another and make it function there. With this tool, they can make cells produce novel protein products the cells did not make previously.
Examples of this powerful tool are all around us. Insulin that people take to control their blood sugar levels is often made from engineered bacteria. Some vaccines, as well as enzymes used for manufacturing denim jeans, are also made using engineered cells. In the near future, engineered bacteria and other cells being developed could help clean up spilled oil or chemicals, produce fuel for cars and trucks, and even store excess carbon dioxide to help slow global climate change. Can you think of other possible applications of genetic engineering? However, biotechnology and human manipulation of DNA raise several ethical, social, and medical issues, such as the safety of genetically modified foods. Can you think of other issues to consider?
* Transitioned from the AP Biology Lab Manual (2001)
S98■Investigation 8
This biotechnology depends on plasmids, small circles of DNA that were found first in bacteria. Plasmids allow molecular biologists to manipulate genetic information in a laboratory setting to understand more fully how DNA operates. Plasmids also let us move DNA from one bacterium to another easily.
In this investigation, you will learn how to transform Escherichia coli (E. coli) bacteria with DNA it has not possessed before so that it expresses new genetic information. Bacterial cells that are able to take up exogenous (external) genetic material are said to be “competent” and are capable of being transformed. You also will calculate transformation efficiency to find out how well the E. coli took up the “foreign” DNA. Using these techniques, you will have the opportunity to explore the field of biotechnology further. You might want to explore the following questions:• What causes mutations in bacteria? Can mutations affect plasmids?
• What is the function of plasmids in bacteria?
• Do cells take up more plasmids in some conditions and less in others?
By learning and applying these fundamental skills, you will acquire the tools to conduct more sophisticated biotechnology investigations, including designing your own experiments to manipulate DNA.
This investigation also provides you with the opportunity to review, connect, and apply concepts that you have studied previously, including cell structure of bacteria; structure and function of cell membranes, enzymes, and DNA and RNA; transcription and translation; the operon model of the regulation of gene expression; evolution and natural selection; and interactions between organisms and their environment.
Interspersed within each investigation are supplemental activities designed to keep you on track and to provide opportunities for you to take a deeper dive into the concepts. Your teacher may assign these activities for homework or ask that you do them as you work through each investigation.
■■ Learning■Objectives• To demonstrate the universality of DNA and its expression
• To explore the concept of phenotype expression in organisms
• To explore how genetic information can be transferred from one organism to another
• To investigate how horizontal gene transfer is a mechanism by which genetic variation is increased in organisms
• To explore the relationship between environmental factors and gene expression
• To investigate the connection between the regulation of gene expression and observed differences between individuals in a population of organisms

Investigation 8 S99
Big idea 3: genetiCs and inFoRMation tRansFeR
■■ General■Safety■Precautions
Basic Sterile TechniqueWhen working with and culturing bacteria, it is important not to introduce contaminating bacteria or fungi into the experiment. Because these microorganisms are ubiquitous, i.e., you can find them everywhere — on fingertips, bench tops, lab tables, etc. — you must avoid these contaminating surfaces. When working with inoculation loops, bulb pipettes, micropipettes, and agar plates, do not touch the tips of them (or, in the case of agar, the surface itself) or place them directly onto contaminating surfaces. Be sure to wash your hands before beginning the procedure and after — and cover your sneezes. Do not eat, drink, apply cosmetics, or use personal electronic devices in the work area.
Working with E. coliThe host E. coli used in this investigation, plasmids, and the subsequent transformants created by their combination are not pathogenic (disease-causing) bacteria like the E. coli O157:H7 strain that has been in the news. However, handling E. coli requires appropriate microbiological and safety procedures. Your teacher will provide instructions, but these practices include, but are not limited to, the following:• Decontaminating work surfaces once a day and after any spill of viable material with
a 10% household bleach solution
• Decontaminating all contaminated liquid or solid wastes before disposal [This can be done in an autoclave (20 minutes at 121°C) or in a 10% bleach solution (soaked for 20 minutes).]
• Washing your hands after handling organisms containing recombinant DNA and before leaving the lab
• Wearing protective eyewear and disposable gloves
• Not eating, drinking, applying cosmetics, or using personal electronic devices, such as iPods and cell phones, in the work area
S100■Investigation 8
■■ THE■INVESTIGATIONS
■■ Getting■StartedDNA provides the instructions necessary for the survival, growth, and reproduction of an organism. When genetic information changes, either through natural processes or genetic engineering, the results may be observable in the organism. These changes may be advantageous for the long-term survival and evolution of a species, but it also may be disadvantageous to the individuals who possess the different genetic information.
In bacteria, genetic variation does not happen by mutation alone. It also can be introduced through the lateral (horizontal) transfer of genetic material between cells. Some bacteria undergo conjugation, which is direct cell-to-cell transfer. Other bacteria acquire DNA by transduction (viral transmission of genetic information). The third route is transformation, which is uptake of “naked” DNA from the environment outside the cell.
(You may have previously studied transformation in a different context. In an experiment conducted in 1928, Frederick Griffith, seeking a vaccine against a virulent strain of pneumonia, suggested that bacteria are capable of transferring genetic information through transformation. Little did Griffith know that his work would provide a foundation for genetic engineering and recombinant DNA technology in the 21st century.)
The concept of cell transformation raises the following questions, among others: • To transform an organism to express new genetic information, do you need to insert
the new gene into every cell in a multicellular organism or just one? Which organism is best suited for total genetic transformation — one composed of many cells or one composed of a single cell?
• Can a genetically transformed organism pass its new traits on to its offspring? To get this information, which would be a better candidate for your investigation — an organism in which each new generation develops and reproduces quickly or one that does this more slowly?
• Based on how you answered the first two sets of questions, what organism would be a good choice for investigating genetic transformation — a bacterium, earthworm, fish, or mouse?
If your answer to the last question is “bacterium,” you are on the right track. Genetic transformation of bacteria most often occurs when bacteria take up plasmids from their environment. Plasmids are not part of the main DNA of a bacterium. They are small, circular pieces of DNA that usually contain genes for one or more traits that may be beneficial to survival. Many plasmids contain genes that code for resistance to antibiotics like ampicillin and tetracycline. [Antibiotic-resistant bacteria are responsible for a number of human health concerns, such as methicillin-resistant Staphylococcus aureas (MRSA) infections.] Other plasmids code for an enzyme, toxin, or other protein that gives bacteria with that plasmid some survival advantage. In nature, bacteria may swap these beneficial plasmids from time to time. This process increases the variation

Investigation 8 S101
Big idea 3: genetiCs and inFoRMation tRansFeR
between bacteria — variation that natural selection can act on. In the laboratory, scientists use plasmids to insert “genes of interest” into an organism to change the organism’s phenotype, thus “transforming” the recipient cell. Using restriction enzymes, genes can be cut out of human, animal, or plant DNA and, using plasmids as vectors (carriers of genetic information), inserted into bacteria. If transformation is successful, the recipient bacteria will express the newly acquired genetic information in its phenotype (Figure 1).
Bio_S_Lab08_01
NOTE: Illustration requires less width than speci�ed.
Transformed cell
Recombinantplasmid E. coli host cell
Figure■1.■Transformation■of■Bacteria
In nature, the efficiency of transformation is low and limited to relatively few bacterial strains. Also, bacteria can take up DNA only at the end of logarithmic growth; at this time, the cells are said to be “competent.” In the lab, you have discovered several ways to increase the rate of transformation. Now, rather than just a few bacteria taking up a plasmid you want them to use, millions of bacteria can be transformed. The number of bacteria that take up a plasmid successfully is called the “transformation efficiency.” This is one of the values you will calculate in this lab unit.
In this investigation, you will use a predefined procedure to transform E. coli bacteria with a plasmid carrying a foreign gene. There are several different plasmids your instructor can choose from; you will be instructed about which one to work with for this unit.
E. coli is an ideal organism for the molecular geneticist to manipulate because it naturally inhabits the human colon and easily can be grown in a nutrient medium such as LB broth.
But what is E. coli’s natural or pre-transformation phenotype?
• Observe the colonies of E. coli grown on the starter LB/agar plate provided by your teacher to glean some information before you determine if any genetic transformation has occurred. What traits do you observe in pre-transformed bacteria? Record your observations in your laboratory notebook.

S102■Investigation 8
• Some bacteria are naturally resistant to antibiotics, but others are not. How could you use two LB/agar plates, some E. coli, and some ampicillin (an antibiotic) to determine how E. coli cells are affected by ampicillin?
• What would you expect your experimental results to indicate about the effect of ampicillin on the E. coli cells? Do you think that exposure to ampicillin will cause the E. coli cells to evolve resistance to ampicillin? Why or why not?
• How will you be able to tell if host E. coli cells have been genetically transformed? (Hint: You will need some information from your teacher about the plasmid you will be using.)
■■ ProcedureYour teacher will provide you with a plasmid containing one or more genes. The plasmid likely will contain the gene for resistance to ampicillin (pAMP), an antibiotic that is lethal to many bacteria, including E. coli cells. This transformation procedure involves the following three main steps to introduce the plasmid DNA into the E. coli cells and to provide an environment for the cells to express their newly acquired genes:
1.Adding CaCl2
2.“Heat shocking” the cells
3. Incubating the cells in nutrient broth for a short time before plating them on agar
Materials
Your Workstation• E. coli starter plate prepared by your
teacher• Poured agar plates prepared by your
teacher, most likely the following: • 2 LB agar plates• 2 LB/amp agar (LB agar contain-
ing ampicillin) plates• Transformation solution (CaCl2, pH 6.1)
kept ice cold• LB nutrient broth• Sterile inoculation loops• 100–1000 μL sterile bulb pipettes• 1–10 μL micropipettes with sterile tips• Microcentrifuge tubes
• Microcentrifuge tube holder/float• Container full of crushed ice• Marking pen
Common Workstation• DNA plasmid (most likely pAMP at
0.005 μg/µL)• 42°C water bath and thermometer• 37°C incubator• 20 μL adjustable-volume micropipettes
and tips (optional)• 10% household bleach• Biohazardous waste disposal bags• Masking or lab tape
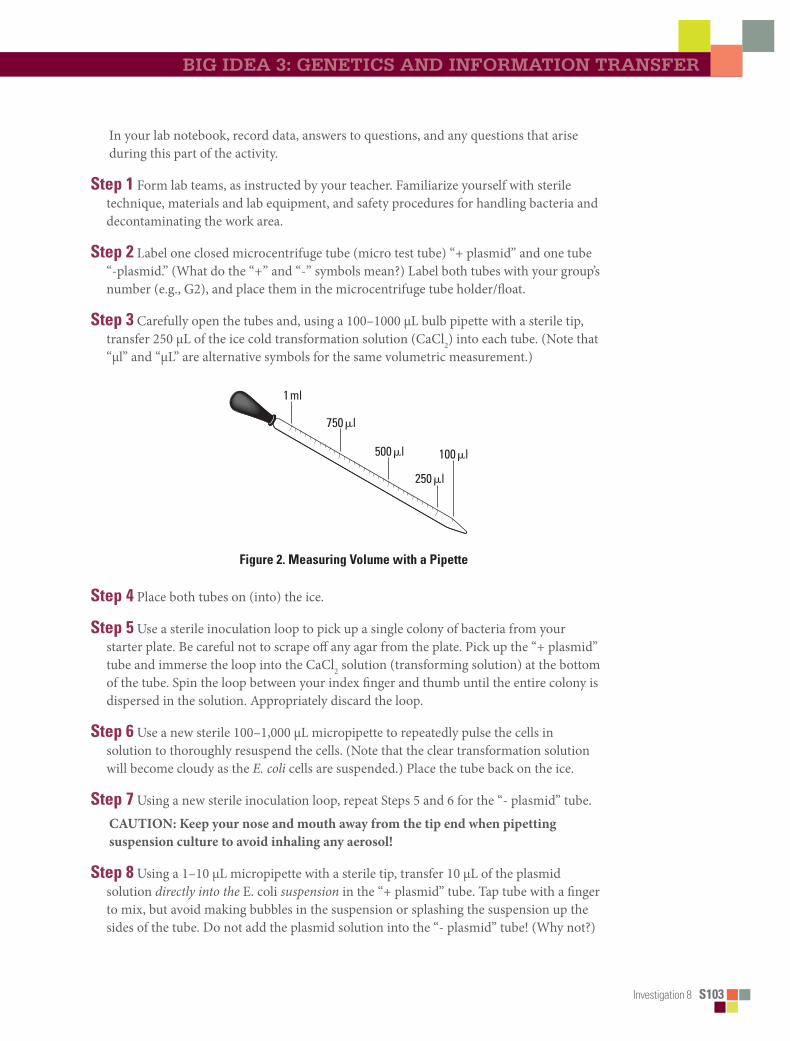
Investigation 8 S103
Big idea 3: genetiCs and inFoRMation tRansFeR
In your lab notebook, record data, answers to questions, and any questions that arise during this part of the activity.
Step■1 Form lab teams, as instructed by your teacher. Familiarize yourself with sterile technique, materials and lab equipment, and safety procedures for handling bacteria and decontaminating the work area.
Step■2 Label one closed microcentrifuge tube (micro test tube) “+ plasmid” and one tube “-plasmid.” (What do the “+” and “-” symbols mean?) Label both tubes with your group’s number (e.g., G2), and place them in the microcentrifuge tube holder/float.
Step■3 Carefully open the tubes and, using a 100–1000 μL bulb pipette with a sterile tip, transfer 250 μL of the ice cold transformation solution (CaCl2) into each tube. (Note that “μl” and “μL” are alternative symbols for the same volumetric measurement.)
Bio_T_Lab08_02
750�l
500�l
250�l
100�l
1ml
Figure■2.■Measuring■Volume■with■a■Pipette
Step■4 Place both tubes on (into) the ice.
Step■5 Use a sterile inoculation loop to pick up a single colony of bacteria from your starter plate. Be careful not to scrape off any agar from the plate. Pick up the “+ plasmid” tube and immerse the loop into the CaCl2 solution (transforming solution) at the bottom of the tube. Spin the loop between your index finger and thumb until the entire colony is dispersed in the solution. Appropriately discard the loop.
Step■6 Use a new sterile 100–1,000 μL micropipette to repeatedly pulse the cells in solution to thoroughly resuspend the cells. (Note that the clear transformation solution will become cloudy as the E. coli cells are suspended.) Place the tube back on the ice.
Step■7 Using a new sterile inoculation loop, repeat Steps 5 and 6 for the “- plasmid” tube.
CAUTION: Keep your nose and mouth away from the tip end when pipetting suspension culture to avoid inhaling any aerosol!
Step■8 Using a 1–10 μL micropipette with a sterile tip, transfer 10 μL of the plasmid solution directly into the E. coli suspension in the “+ plasmid” tube. Tap tube with a finger to mix, but avoid making bubbles in the suspension or splashing the suspension up the sides of the tube. Do not add the plasmid solution into the “- plasmid” tube! (Why not?)

S104■Investigation 8
Step■9 Incubate both tubes (“+ plasmid” and “- plasmid”) on ice for 10 minutes. Make sure the bottom of the tubes make contact with the ice.
Step■10 While the tubes are sitting on ice, label each of your agar plates on the bottom (not the lid) as directed by your teacher.
Step■11 Following the 10-minute incubation at 0°C, remove the tubes from the ice and “heat shock” the cells in the tubes. It is critical that the cells receive a sharp and distinct shock! Make sure the tubes are closed tightly! Place the tubes into a test tube holder/float, and dunk the tubes into the water bath, set at 42°C, for exactly 50 seconds. Make sure to push the tubes all the way down in the holder so that the bottom of the tubes with the suspension makes contact with the warm water.
Step■12 When the 50 seconds have passed, place both tubes back on ice. For best transformation results, the change from 0°C to 42°C and then back to 0°C must be rapid. Incubate the tubes on ice for an additional two minutes.
Step■13 Remove the holder containing the tubes from the ice and place on the lab counter. Using a 100–1,000 μL micropipette with sterile tip, transfer 250 μL of LB nutrient broth to the “+ plasmid” tube. Close the tube and gently tap with your finger to mix. Repeat with a new sterile micropipette for the “- plasmid” tube.
Step■14 Incubate each tube for 10 minutes at room temperature.
Step■15 Use a 10–1,000 μL micropipette with sterile tip to transfer 100 μL of the transformation (“+ plasmid”) and control (“- plasmid”) suspensions onto the appropriate LB and LB/Amp plates. Be sure to use a separate pipette for each of the four transfers.
Step■16 Using a new sterile inoculation loop for each plate, spread the suspensions evenly around the surface of the agar by quickly “skating” the flat surface of the sterile loop back and forth across the plate surface (Figure 3). Do not poke or make gashes in the agar! Your teacher might suggest that you use small sterile glass beads to spread the suspensions by gently rocking the beads across the surface of the agar. Allow the plates to set for 10 minutes.

Investigation 8 S105
Big idea 3: genetiCs and inFoRMation tRansFeR
Bio_S_Lab08_03
3 4
1 2
Figure■3.■Technique■for■Plating■Bacteria■on■Agar
Step■17 Stack your plates and tape them together. Place the stack upside down in the 37°C incubator for 24 hours or as per instructed by your teacher.
■■ Analyzing■ResultsThink about these questions before collecting data and analyzing your results. Be sure to record your answers in your laboratory notebook.
1.On which of the plates would you expect to find bacteria most like the original non-transformed E. coli colonies you initially observed? Why?
2.If there are any genetically transformed bacterial cells, on which plate(s) would they most likely be located? Again, why?
3.Which plates should be compared to determine if any genetic transformation has occurred? Why?
4.What barriers might hinder the acquisition of plasmids?
5.How can the procedures described above (addition of CI2 and “heat shocking”) help facilitate the introduction of plasmids into the E. coli cells?
Consider the amount of bacterial growth you see on each plate. What color are the colonies? How many bacterial colonies are on each plate? Additional questions you might want to consider include the following:
S106■Investigation 8
1.Do your results support your original predictions about the “+ plasmid” transformed E. coli cells versus “- plasmid” nontransformed cells?
2.Which of the traits that you originally observed for E. coli did not seem to become altered? Which traits seem now to be significantly different after performing the transformation procedure?
3.What evidence suggests that the changes were due to the transformation procedures you performed?
4.What advantage would there be for an organism to be able to turn on or off particular genes in response to certain conditions?
5.Was your attempt at performing a genetic transformation successful? If so, how successful?
By calculating transformation efficiency, you can measure the success of your transformation quantitatively.
■■ Calculating■Transformation■EfficiencyYour next task is to learn how to determine the extent to which you genetically transformed E. coli cells. This quantitative measurement is referred to as the transformation efficiency. What is the importance of quantifying how many cells have been transformed? In many applications, it is important to transform as many cells as possible. For example, in some forms of gene therapy, cells are collected from the patient, transformed in the laboratory, and then put back into the patient. The more cells that are transformed to produce the needed protein, the more likely the therapy will work.
Calculating transformation efficiency gives you an indication of how effective you were in getting plasmids carrying new information into host bacterial cells. In this example, transformation efficiency is a number that represents the total number of bacterial cells that express the gene for ampicillin resistance divided by the amount of DNA plasmid used in the experiment. The transformation efficiency is calculated using the following formula.
Transformation efficiency = Total number of colonies growing on the agar plateAmount of DNA spread on the agar plate (in μg)
What two pieces of information will you need to calculate the efficiency of your transformation? Be sure to record all calculations.

Investigation 8 S107
Big idea 3: genetiCs and inFoRMation tRansFeR
1.Calculate the total number of transformed cells.
Observe the number of colonies visible on your LB/amp plate. Do not open the plate! Each colony on the plate can be assumed to be derived from a single cell. As individual cells reproduce, more and more cells are formed and develop into what is termed a colony. Thus, the most direct way to determine the total number of bacteria that were transformed with the plasmid is to count the colonies on the plate.
2.Calculate the amount of plasmid DNA in the bacterial cells spread on the LB/amp plate.
You need two pieces of information to find out the amount of plasmid DNA in the bacterial cells spread on the LB/amp plate: a) the total amount of DNA with which you began the experiment and b) the fraction of the DNA in the bacteria that actually got spread onto the LB/amp plate.
Once you determine this information, you will multiply the total amount of plasmid DNA used in the transformation times the fraction of DNA you spread on the LB/amp plate.
a.Calculate the total amount (mass) of plasmid DNA.
The total amount (mass) of DNA with which you began the experiment is equal to the product of the concentration and the total volume used, or
DNA in μg = (concentration of DNA of μg/μL) x (volume of DNA in μL)
In this example, assume you used 10 μL of plasmid at a concentration of 0.005 pAMP μg/μL.
• Calculate the amount (mass) of plasmid DNA (pAMP) in μg per 1 μL of solution.
• Calculate the total amount of DNA used in this experiment.
How will you use this information?
b.Calculate the fraction of plasmid DNA that actually got spread onto the LB/amp plate.
Since not all the DNA you added to the bacterial cells will be transferred to the agar plate, you need to calculate what fraction of the DNA was actually spread onto the LB/amp plate.
Fraction of DNA used = Volume spread on the LB/amp plate (μL)Total sample volume in test tube (μL)

S108■Investigation 8
Calculate the fraction of plasmid DNA you spread on the LB/amp plate.
(Hint: Refer to the procedure and your notes. How many microliters of cells containing DNA did you spread onto the plate? What was the total volume of solution in the test tube? Did you add all the volumes?)
c.Calculate the micrograms of plasmid DNA that you spread on the LB/amp plate.
To answer this question, you multiply the total mass of plasmid DNA used times the fraction of plasmid DNA you spread on the LB/amp plate.
DNA spread in μg = Total amount of DNA used in μg x fraction of DNA used
What does this number tell you?
3.Calculate transformation efficiency.
Look at your calculations. Fill in the blanks with the correct numbers.
Number of colonies on the LB/amp plate:
Micrograms of plasmid DNA spread on the plate:
Now calculate the efficiency of the transformation.
Transformation efficiency = Total number of colonies growing on the agar plateAmount of DNA spread on the LB/amp plate (in μg)
4.What does this mean?
Transformation efficiency calculations result in very large, and very small, numbers. For both very large and very small numbers, scientists often use a mathematical shorthand referred to as scientific notation. For example, if the calculated transformation efficiency is 1,000 bacteria/μg of DNA, they often report this as 103 transformants/μg.
How would scientists report 10,000 transformants/μg in scientific notation?
Suppose scientists calculated an efficiency of 5,000 bacteria/μg of DNA. How would they report this in scientific notation?
a.Report your calculated transformation efficiency in scientific notation.
b.What does your calculation of transformation efficiency mean?
c.Biotechnologists generally agree that the transformation protocol that you have just completed has a transformation efficiency of between 8.0 x 10² and 7.0 x 10³ transformants per microgram of DNA. How does your transformation efficiency compare? What factors could explain a transformation efficiency that was greater or less than predicted?

Investigation 8 S109
Big idea 3: genetiCs and inFoRMation tRansFeR
■■ Evaluating■Results
1.What are some challenges you had in performing your investigation? Did you make any incorrect assumptions?
2.What are some possible sources of error in the transformation procedure? If you had to repeat the procedure, what are ways to minimize potential sources of error?
3.Were you able to perform without difficulty the mathematical routines required to calculate transformation efficiency? Which calculations, if any, were challenging or required help from your classmates or teacher?
4.Can you suggest other preliminary activities that would have better prepared you to tackle the investigation?
5.Does a bacterial cell take in a plasmid with genes the cell already possesses? If so, would this affect your calculations?
■■ Designing■and■Conducting■Your■InvestigationThink about these questions again for a minute.• What causes mutations in bacteria? Can mutations affect plasmids? How would you
be able to tell if any observed changes in phenotypes are due to the expression of genes carried on plasmids and are not attributed to a possible mutagen?
• Do bacteria take up more in plasmid in some conditions and less in others? What conditions favor uptake, and which ones inhibit it?
• What other questions do you have about plasmids and transformation?
You can either design an investigation focusing on the information below OR design one based on a question(s) or observation you had as you worked through the genetic transformation you just conducted. Be sure that your experiment applies the science skills you acquired as you worked through this investigation. Make sure that your teacher approves your plan.
You should have noted satellites around the transformed colonies. (Satellites are smaller colonies that grow around the larger transformed colony.) What observations can you make about the satellites? Do they look like transformed bacteria? How can you tell if the satellites contain the plasmid? Design and conduct an experiment to determine if the E. coli satellite colonies from your genetic transformation experiment are transformed, too. Available to you are the same chemicals, supplies, and equipment you used in the previous investigation.

S110■Investigation 8
■■ Where■Can■You■Go■from■Here?The background to this investigation asks you to think about several applications of genetic transformation, including genetically modified food and possible ethical, social, or medical issues raised by the manipulation of DNA by biotechnology. Why are these “issues”? What questions are posed by genetic engineering? In terms of what you have learned about biotechnology, how would you respond to the quote from Michael Crichton’s novel and film Jurassic Park: “Just because science can do something doesn’t mean that it should”?

BigIdea
Investigation 9 T161
3investigation 9
BioteCHnoLogY: RestRiCtion enZYMe anaLYsis oF Dna*How can we use genetic information to identify and profile individuals?
■■ The■Scenario“OMG! Is that blood?” Laurel nearly broke Marcus’s arm as she tried to push past him into the classroom.
Marcus grabbed the sleeve of her cardigan and yanked her back. “Don’t! Can’t you see the glass?” Laurel tried knocking his hand free, but the 6’4” varsity basketball captain held tight. He made her settle for looking from under his armpit.
Not that what she saw would make any sense. Their AP Biology lab looked like a riot scene. Four chairs and a potted plant were overturned in the center of the room, and broken pieces of glass were scattered across the floor along with several wet red drops. Plink … plink … plink. Marcus’s eyes were drawn to the teacher’s desk where droplets of brownish liquid fell from a paper cup and collected in a puddle on the linoleum.
“What happened?” Laurel asked. “Did somebody get hurt?” Laurel and her classmates had gathered in front of the door and strained to see inside Room 102.
Marcus inspected the scene and raised his right arm above his head, his fingers spread apart as if taking a shot from the free throw line. “Stay back!”
“Where’s Ms. Mason?” Laurel said. “She told me I could meet her before class to review for the quiz.”
“Okay, folks, keep it down.” Mr. Gladson, the teacher in the classroom next door, came into the hall. His white lab coat was streaked with several rust-colored stains. The pungent odor of formaldehyde permeated the corridor. “In case you haven’t noticed, the bell has rung.” He wiped his nose with a tissue and then tossed it into a nearby trash can. A girl’s fake shriek from inside the anatomy lab rose above the buzz of Marcus’s classmates.
“What’s going on?” Bobby’s high-pitched whine was unmistakable—and so was the scent of his bubble gum.
“I think something might’ve happened to Ms. Mason,” Marcus said. He dug around in his backpack and pulled out a magnifying glass. ”We’ve got a crime scene to process.”
“Go figure,” Laurel said. “Sherlock Holmes in a varsity jacket.”
Genetics and Information Transfer
* Transitioned from the AP Biology Lab Manual (2001)

T162■Investigation 9
For the next hour, Marcus and Laurel searched the classroom and discovered several pieces of “evidence” that Marcus described in his biology notebook:• Ten small drops on floor confirmed by Kastle-Meyer test to be blood• Shard of glass from a broken 500-mL Erlenmeyer flask, edge smeared with a reddish
stain• Paper cup with lipstick stains, presumed to be Ms. Mason’s, found on her desk• Wad of bubble gum stuck underneath overturned chair• Mr. Gladson’s discarded tissue recovered from trash can in hall outside Room 102• Bobby’s test on photosynthesis with large “F” scrawled in red ink on first page• Copy of email from Mr. Gladson to Ms. Mason asking her to give up position as
department chair
Marcus’s new game was afoot!
■■ BacKGroUnDApplications of DNA profiling extend beyond what we see on television crime shows. Are you sure that the hamburger you recently ate in the local fast-food restaurant was actually pure beef? DNA typing has revealed that often “hamburger” meat is a mixture of pork and other nonbeef meats, and some fast-food chains admit to adding soybeans to their “meat” products as protein fillers. In addition to confirming what you ate for lunch, DNA technology can be used to determine paternity, diagnose an inherited illness, and solve historical mysteries, such as the identity of the formerly anonymous individual buried at the Tomb of the Unknown Soldier in Washington, D.C.
DNA testing also makes it possible to profile ourselves genetically — which raises questions, including Who owns your DNA and the information it carries? This is not just a hypothetical question. The fate of dozens of companies, hundreds of patents, and billions of dollars’ worth of research and development money depend on the answer. Not only does this investigation provide an opportunity for students to learn and apply techniques used by scientists in creating genetic profiles, it raises questions that students can explore about the ethical, social, and medical issues surrounding the manipulation of genetic information.
In this investigation, students begin by familiarizing themselves with the procedure without running an actual gel electrophoresis. Then students will use restriction endonucleases and gel electrophoresis to analyze DNA sequences by creating genetic “fingerprints.” Students will apply mathematical routines to determine the approximate sizes of DNA fragments produced by restriction enzymes to solve the forensic mystery presented in the scenario. There are two parallel activities going on: conducting an investigation requiring technical skills and identifying likely suspects in the disappearance of the teacher. By learning and applying these fundamental skills, students acquire the tools to conduct more sophisticated biotechnology investigations.
4p10
3p4

Investigation 9 T163
Big iDea 3: genetiCs anD inFoRMation tRansFeR
■■ PreParaTion
Materials and EquipmentSupplies for this investigation can be purchased through several commercial vendors. A partial list of suppliers is provided in the Supplemental Resources section.
The materials described below are included in an eight-station kit and are sufficient for eight complete setups of the investigation. You can also purchase a less expensive four-station kit to accommodate smaller class sizes or pool leftover supplies.
A list of materials and supplies needed for each student work station is supplied in the student version of this investigation. Students are encouraged to set up their own work-stations. Note: Materials and instructions in the student version of this investigation are more generic to accommodate different vendors’ products.
Materials Included in Kit (Eight-Station)
• 20 μL vials of lambda DNA • 20 μL vials of lambda DNA cut with
EcoRI• 20 μL vials of lambda DNA cut with
HindIII• Optional: samples of lambda DNA cut
with other restrictions enzymes (see Supplemental Resources) to make “evi-dence” samples
• TAE buffer 50x concentrate
• Agarose• Disposable plastic needle-nose transfer
pipettes• Methylene blue gel and buffer stain• Staining trays• Disposable gloves• Semi-log graph paper and rulers• Dry lab activity sheets
Note: The DNA is often stabilized for storage at room temperature. However, if the DNA is to be kept for more than six weeks, it should be frozen or refrigerated. All other components may be stored at room temperature.
Materials Needed but Not Supplied
• Gel electrophoresis chambers and power supplies
• Masking tape (if needed to seal gel casting trays)
• Racks for holding samples• 1-L graduated cylinder for diluting and
measuring TAE buffer• Container for holding 5 L of 1x TAE
buffer
• 60°C water bath for keeping agarose liquid until poured into casting tray
• Microwave oven OR hot plate with stir bar OR boiling water bath for melting agarose
• Permanent markers• Distilled or deionized water• Aluminum foil
T164■Investigation 9
Optional Equipment
• Microcentrifuge for pooling DNA (or samples can be tapped to pool)
• White-light box or overhead projector for viewing stained gels (Note: Most
stained DNA fragments can be seen with the naked eye.)
• Plastic bag or container with lid if gels need to be stored overnight
■■ Preparation■of■Dna■“evidence”■SamplesAt minimum, you will have to prepare DNA “evidence” found at the mock crime scene from the blood spattered on the floor — Ms. Mason, Mr. Gladson, and Bobby. You might want to add other names to the list of suspects. (An alternative is to have a team of students create a mock crime scenario for other teams, with you providing appropriate “evidence” samples of DNA.) You will have to reserve a vial of lambda DNA cut with HindIII to serve as a marker, providing a set of RFLPs of known sizes (standard).
To make these evidence samples, you can use the vials of lambda DNA cut with EcoRI and HindIII and the “uncut” samples of lambda DNA provided in the kit. Remove the labels from the vials and replace them with new labels indicating the source of the sample, e.g., “Suspect 1,” “Suspect 2,” “Blood,” or “Ms. Mason,” “Mr. Gladson,” “Bobby,” “Principal.” You can purchase samples of lambda DNA cut with other restriction enzymes from commercial vendors, or you can combine a sample of lambda DNA cut with EcoRI with a sample cut with HindIII to mix things up. To be more tricky, give each student group DNA “evidence” that leads to different perpetrators, i.e., for one group, Bobby is guilty, whereas for another group, Mr. Gladson is the likely culprit. Since there is no single correct answer for “whodunit,” you can take the scenario in multiple directions.
■■ Pool■Small■Volumes■of■DnaDuring shipping, the small volume of DNA in each tube may become spread as a film around the storage tube wall or cap. Therefore, you should pool the DNA solutions at the bottom of their storage tubes by using one of the following methods:
■ 1.■Spin the tubes briefly in a microcentrifuge.
■ 2.■Spin the tubes briefly in a preparatory centrifuge, using adapter collars for 1.5 mL tubes.
■ 3.■Tap the base of the tubes sharply on the bench top.
Note: Methylene blue stain stain has been added to the DNA samples for better visualization.
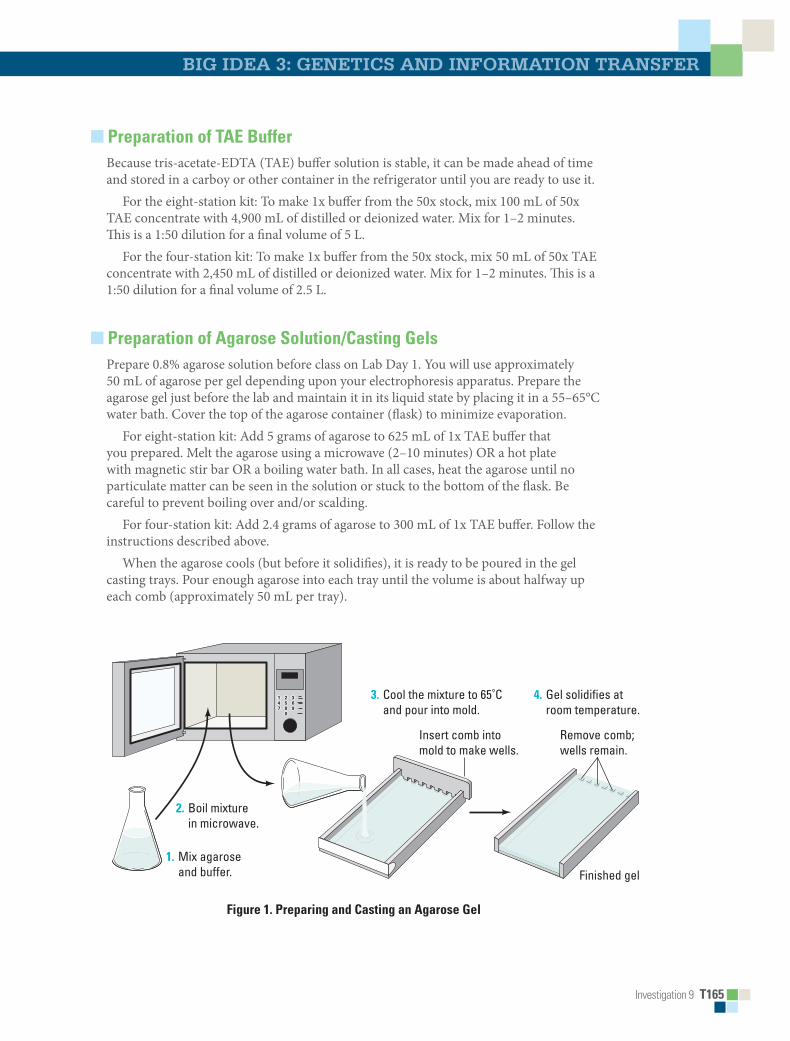
Investigation 9 T165
Big iDea 3: genetiCs anD inFoRMation tRansFeR
■■ Preparation■of■Tae■BufferBecause tris-acetate-EDTA (TAE) buffer solution is stable, it can be made ahead of time and stored in a carboy or other container in the refrigerator until you are ready to use it.
For the eight-station kit: To make 1x buffer from the 50x stock, mix 100 mL of 50x TAE concentrate with 4,900 mL of distilled or deionized water. Mix for 1–2 minutes. This is a 1:50 dilution for a final volume of 5 L.
For the four-station kit: To make 1x buffer from the 50x stock, mix 50 mL of 50x TAE concentrate with 2,450 mL of distilled or deionized water. Mix for 1–2 minutes. This is a 1:50 dilution for a final volume of 2.5 L.
■■ Preparation■of■agarose■Solution/casting■GelsPrepare 0.8% agarose solution before class on Lab Day 1. You will use approximately 50 mL of agarose per gel depending upon your electrophoresis apparatus. Prepare the agarose gel just before the lab and maintain it in its liquid state by placing it in a 55–65°C water bath. Cover the top of the agarose container (flask) to minimize evaporation.
For eight-station kit: Add 5 grams of agarose to 625 mL of 1x TAE buffer that you prepared. Melt the agarose using a microwave (2–10 minutes) OR a hot plate with magnetic stir bar OR a boiling water bath. In all cases, heat the agarose until no particulate matter can be seen in the solution or stuck to the bottom of the flask. Be careful to prevent boiling over and/or scalding.
For four-station kit: Add 2.4 grams of agarose to 300 mL of 1x TAE buffer. Follow the instructions described above.
When the agarose cools (but before it solidifies), it is ready to be poured in the gel casting trays. Pour enough agarose into each tray until the volume is about halfway up each comb (approximately 50 mL per tray).
Bio_T_Lab09_01
Mix agaroseand buffer.
1.
Boil mixturein microwave.
2.
Cool the mixture to 65˚Cand pour into mold.
3. Gel solidifies atroom temperature.
Insert comb intomold to make wells.
Remove comb;wells remain.
Finished gel
4.
Figure■1.■Preparing■and■casting■an■agarose■Gel
T166■Investigation 9
■■ adding■Methylene■Blue■Stain■to■agaroseAdding gel and buffer stain to the gel and buffer allows observers to faintly see many of the bands (DNA fragments) in the gel while the electrophoresis is running, and this is instructive for students. It also helps you to monitor the progress of the electrophoresis. You will still have to use the final stain to see all the bands more clearly.
The concentration of the stain added to the agarose/buffer is dependent on the voltage used for electrophoresis. The stain may be added to the entire volume of the agarose. Just add the drops of stain to the agarose, swirl to mix, and pour the gel immediately. Gels can be prepared one day ahead of the lab day, if necessary. Gels stained longer than one day tend to fade and lose their ability to stain DNA fragments during electrophoresis. Refer to Table 1 for addition of stain to either 300 mL or 600 mL of agarose. Stain can be added using the dropper bottle. If a calibrated pipette is available, the lid of the dropper bottle can be removed for quicker addition of larger volumes.
CAUTION: Although methylene blue stain is not toxic, we recommend that you and your students wear gloves to prevent staining of the skin.
Table■1.■adding■Methylene■Blue■Stain■to■agarose
Voltage agarose■Volume Stain■Volume
≤50 volts 300 mL 400 µL (10 drops)625 mL 760 µL (19 drops)
≥50 volts 300 mL 480 µL (12 drops)625 mL 1000 µL (25 drops)
■■ adding■Methylene■Blue■Stain■to■BufferIf you add stain to the gel, also add stain to the buffer. Use Table 2 to determine how much stain to add to either 500 mL or 2.6 L of 1x TAE electrophoresis buffer. However, if you plan to reuse the buffer, do not add stain to the buffer.
Table■2.■adding■Methylene■Blue■Stain■to■Buffer
Voltage Buffer■Volume Stain■Volume
≤50 volts 500 mL 500 µL (12 drops)2.6 L 2.6 mL (65 drops)
≥50 volts 500 mL 960 µL (24 drops)2.6 L 5 mL (125 drops)
■■ Staining■with■Final■StainMethylene blue stain is added to the gel and buffer in order to better visualize the bands (fragments) of DNA as they migrate through the agarose gel during electrophoresis. However, you will still have to do a final stain of the gel.
■ 1.■Use the final stain “as is.” Do not dilute it. Following electrophoresis, place the gel in the staining tray, and cover it with just enough stain to submerge the gel.

Investigation 9 T167
Big iDea 3: genetiCs anD inFoRMation tRansFeR
■ 2.■Use the methylene blue stain “as is.” If you allow the gel to stain for more than an hour, the gel will be difficult to destain. It is helpful to set a timer.
■ 3.■Pour the stain back into the bottle for reuse; stain can be used six to eight times.
■ 4.■Destain the gels by covering them with distilled or deionized water. Do not use tap water because the chlorine in tap water will cause the DNA bands to fade. Change the water two or three times over the course of 30–40 minutes. Bands that are not immediately present will become more visible with time. Maximum visibility is reached after five or more hours of destaining. Gels may be left overnight in a small volume (just enough to cover the gels) of distilled or deionized water. Gels left overnight in a large volume of water may destain too much.
■■ Timing■and■Length■of■Lab
Day Before the LabIt is recommended that you prepare the TAE buffer and 0.8% agarose the day before the lab. This will take approximately 15 minutes. You will also need to spend about 30 minutes setting up student work stations and gathering electrophoresis equipment, preparing DNA “evidence” samples, test tube racks, etc. If you prefer to cast agarose gels for students, it will take approximately 20 minutes to pour gels into casting trays. The TAE buffer is stable and can be prepared ahead of time and stored.
Lab Day 1Students will spend approximately 45 minutes reading the scenario and background material, working through several prelab activities, and familiarizing themselves with the procedure for gel electrophoresis. However, Getting Started can be assigned for homework. You can also have students view any of several online videos about DNA analysis using restriction enzymes and gel electrophoresis, including one on Carolina Biological Supply Company’s website, for homework. Look for the Biotechnology link on the “Teacher Resources: Carolina Videos” Web page (http://www.carolina.com), or direct students to YouTube for educational videos and/or animations about preparing, pouring, loading, and running a gel.
Allow approximately 20 minutes for students to practice pipetting and gel loading (optional) and loading DNA samples in the gels. (See the Potential Challenges section of this investigation.)
It will take anywhere from 45 minutes to 2 hours to run the gels for the independent investigation, depending on the recommended voltage for the particular electrophoresis apparatus. For example, if you are using a standard-sized Carolina gel box (which is approximately eight inches long), run the gels at 135 volts. Using Bio-Rad gel boxes can take up to several hours at 50 volts. If the gels are run at a voltage that is too high, there will likely be less separation of the DNA fragments. Since students are likely to leave the lab to attend another class(es), you should plan on supervising the progress of the electrophoresis, stain the gels (15–30 minutes), and then destain them (45 minutes to overnight). Another suggestion is to have students come back to the lab at the end of school to stain and destain their gels.
T168■Investigation 9
Lab Day 2 Allow approximately 45 to 60 minutes for students to analyze, process, and discuss their results. It is recommended that you ask students to write conclusions to the scenario to reveal “whodunit” based on motive, means, opportunity, and, of course, DNA evidence. This project can be assigned for homework, but students will enjoy sharing their stories.
■■ Safety■and■housekeepingInstruct students that they should never handle gels with their bare hands. An electrophoresis apparatus can be dangerous because it is filled with a highly conductive salt solution and uses DC current at a voltage strong enough to cause a small shock. Always turn the power supply switch “OFF” and wait 10 seconds before making any connection. Connect both supply leads to the power supply (black to black and red to red, just like when you jump-start a car battery) before turning on the power supply. After use, turn off the power supply, then disconnect both leads from the power supply. Remember, power supply on last … and off first.
■■ aLiGnMenT■To■The■aP■BioLoGY■cUrricULUM■FraMeWorKThis investigation can be conducted during the study of concepts pertaining to the storage, retrieval, and transmission of genetic information (big idea 3), with connections to evolution (e.g., gene sequencing and measuring genetic variation, which is key to natural selection and evolution). As always, it is important to make connections between big ideas and enduring understandings, regardless of where in the curriculum the lab is taught. The concepts align with the enduring understandings and learning objectives from the AP Biology Curriculum Framework, as indicated below.
■■ enduring■Understandings• 1C3: Populations of organisms continue to evolve. • 3A1: DNA, and in some cases RNA, is the primary source of heritable information.• 3A3: The chromosomal basis of inheritance provides an understanding of the pattern
of passage (transmission) of genes from parent to offspring.
■■ Learning■objectives• The student can justify the claim that humans can manipulate heritable information
by identifying at least two commonly used technologies (3A1 & SP 6.4).• The student is able to pose questions about ethical, social, or medical issues
surrounding human genetic disorders [an application of genetic engineering] (3A3 & SP 3.1).

Investigation 9 T169
Big iDea 3: genetiCs anD inFoRMation tRansFeR
■■ ■are■STUDenTS■reaDY■To■coMPLeTe■a■SUcceSSFUL■■inQUirY-BaSeD,■STUDenT-DirecTeD■inVeSTiGaTion?This investigation reinforces the following skills.• Using pipettes (plastic bulb-type or other volumetric measuring devices) and other
common lab equipment• Graphing and applying other quantitative skills
■■ Skills■DevelopmentStudents will develop the following skills:• Performing gel electrophoresis, a basic technique for separating DNA fragments
by size• Using more sophisticated mathematical practices, such as plotting data using the
log scale
■■ Potential■challengesA major challenge for teachers is determining what electrophoresis conditions (i.e., voltage and time) provide the best results for the particular type of equipment. Please make sure to check the manufacturer’s recommendations.
The biggest challenge for students is loading the small DNA samples into the wells. To save time, money, and resources, students should practice using either the plastic needle-nose pipettes provided or automatic pipettes before loading samples. Students will likely be a little nervous loading the samples, so you should show them how to use both hands to steady the pipette tip over the well. You should also caution students to not “punch through” the gel at the bottom of the well.• Practice gels: The day before the lab, make one to two gels in a spare gel tray or
rectangular plastic box using plain water and old agarose, old agar, or even unflavored gelatin (use three times the normal amount of gelatin called for on the package for a given volume of water). Put the comb in as usual, allow the gel to solidify, and then pull the comb out. Cover the gel with water and store refrigerated. These practice gels keep for a week and can be loaded and reloaded repeatedly by students; just use a plastic pipette and blow the practice samples out of the wells.
• Practice samples: Mix 10 drops of glycerol or corn syrup with 50 drops of water and one drop of blue food coloring. The final concentration of water may need to be more or less, depending on the density of the other liquids, so try pipetting the samples with your instruments.
Students should carefully read through the procedures before conducting the investigation, especially if this is the first time they have run an electrophoresis gel.
Despite the claim that they carefully loaded their samples into the wells of the gel, occasionally students will fail to get visible bands. If this happens, remind them that not all experiments work well all the time. Students must collect data from their gels, decide how to interpret and present their data, and make supportable conclusions.
T170■Investigation 9
However, there also is a key feature of inquiry labs that is not captured by this checklist: authenticity. Students are participating in activities that are part of the daily working life of professionals and are being asked to assume that role. Not every gel a biotechnologist runs is an experimental data point.
■■ The■inVeSTiGaTionS
■■ Getting■Started:■Prelab■assessmentThe Getting Started section of the student version of this investigation provides students with three activities to review or introduce key concepts and principles relating to restriction enzymes, DNA mapping using restriction enzymes, and analysis of DNA using gel electrophoresis. These activities encourage students to ask questions as they take a deeper dive into the concepts. You may assign these activities for homework or ask students to do them as they work through the investigation. Student lab groups can share questions they raise — and answers to questions they investigate — with other groups. You can follow up by asking more probing questions.
■■ ProceduresTo determine whose blood was on the classroom floor, students must first familiarize themselves with the techniques involved in creating genetic profiles using gel electrophoresis and calculating the sizes of restriction length polymorphisms (RFLPs). Students then analyze profiles resulting from an “ideal” or mock gel before running an actual gel.
■■ Designing■and■conducting■independent■investigationsStudents use their newly learned technical skills to design and conduct a procedure based on DNA evidence to determine whose blood is spattered on the classroom floor in the crime scene scenario. Creating DNA profiles, students narrow the list of suspects in the disappearance of Ms. Mason and ultimately determine “whodunit” based on motive, means, opportunity, and, of course, science.
There is no single correct answer to “whodunit” in the crime scene scenario provided. By preparing different samples of DNA “evidence,” you can take the scenario in multiple directions with multiple suspects. For example, Bobby could have cut himself on a flask he accidentally broke while tossing a basketball around the classroom. (This could present an opportunity to review lab safety.) Or Mr. Gladson, Ms. Mason’s rival for promotion to chair of the department, might have taken his disappointment a bit too far. Maybe Ms. Mason staged the scene as a hands-on quiz on processing a crime scene for her forensic science course.
The scenario is fictitious, and there is no reference to the teacher, Ms. Mason, having been murdered; she has simply disappeared. (Note: A reliable source reported that Ms. Mason recently was seen relaxing poolside at a resort following an exhausting year teaching AP Biology.)
Investigation 9 T171
Big iDea 3: genetiCs anD inFoRMation tRansFeR
■■ Where■can■Students■Go■from■here?Another suggestion, especially if conducted in concert with a civics class, would be to stage a mock trial at which the data are presented. For example, the defense would be required to argue for the unreliability of the data, while the prosecution would have to present it clearly. Or one of the suspects in the scenario could be brought to trial for his or her role in the disappearance of Ms. Mason.
■■ Summative■assessmentThe following are guidelines to assess students’ understanding of the concepts presented in the investigation, but you are encouraged to develop your own methods of postlab assessment. Some of the tasks can be assigned for homework following the completion of the investigation.
■ 1.■Have students record all their data, results, and conclusions in a lab notebook, formal paper, or mini-posters. Based on the students’ product, do you think students have met the learning objectives of the investigation?
■ 2.■As you visited the different lab groups, were they able to work through the various activities interspersed throughout the investigation without difficulty? What additional questions did students raise? Did they have ideas for how they could explore answers to their questions?
■ 3.■Were students able to plot data on semi-log paper, construct a standard curve, and then determine the approximately lengths (in bp) of unknown fragments using the standard curve?
■ 4.■What technical challenges did students have using the equipment required for the investigation? Have them list their challenge areas and discuss solutions.
■■ SUPPLeMenTaL■reSoUrceS
■■ Prelab■activitiesThe Getting Started section of the investigation contains myriad inquiry-based questions for preparing students, and encourages them to ask their own questions and explore answers. Interspersed within the investigation are activities designed to keep students on track and to provide opportunities for them to take a deeper dive into the concepts. You may assign these activities for homework or ask that students do them as they work through each part of the investigation.
http://biology.arizona.eduThe University of Arizona Biology Project is an online interactive resource for learning biology, with an extensive molecular biology/biotechnology module.

T172■Investigation 9
Curriculum Module (Professional Development), AP Biology: From Gene to Protein—A Historical Perspective, College Board, 2010.This set of instructional strategies developed by AP Biology teachers takes students on an inquiry-based journey as they explore key discoveries that allowed scientists to identify DNA as the molecule of heredity and how it is able to store, retrieve, and transmit information necessary for living systems. Drawing their own conclusions, students explore the contributions of notable scientists, including Frederick Griffith, Hershey and Chase, Watson and Crick, and Meselson and Stahl. The instructional activities are examples of how teachers can engage students by accommodating their different learning styles, knowledge bases, and abilities and, at the same time, provide depth of content and skills.
http://dnalc.org Dolan DNA Learning Center, Cold Spring Harbor.This resource provides myriad interactive activities for students to prepare students for conducting investigations using biotechnology practices, including DNA Subway and iPlant Collaborative.
http://phschool.com/science/biology_place Developed by Pearson Education, this interactive and informative resource allows students to visualize and apply their understanding of biological concepts. Designed for AP Biology students, LabBench connects laboratory procedures to key concepts.
■■ Procedural■resourcesMolecular Biology and Biotechnology: A Guide for Teachers, Carolina Biological
item RN-212240
http://www.neb.comNew England Biolabs has an extensive selection of DNA markers cut with several restriction enzymes, including HindIII, HaeIII, and BstEII, as well as standardized 1000-bp and 100-bp standards. NEB also sells ladder DNA made from plasmids (pBR322) and the Phi-Chi X174 virus, giving teachers options for “suspect” DNA samples in the crime scene scenario. The NEB catalog (both in print and online) is a treasure trove of information, including images of the precut DNAs. Their 1kb and 100bp ladders are particularly helpful for demonstrating the log relationship between mobility and size.
Restriction Enzyme Cleavage of DNA Kit, Carolina Biological (catalog number 21149), 2010. http://www.carolina.com The two resources above provide detailed background information and dry labs for teaching about restriction enzymes and gel electrophoresis.

Investigation 9 T173
Big iDea 3: genetiCs anD inFoRMation tRansFeR
■■ resources■for■extensions■of■investigationBiotechnology Explorer™ Forensic DNA Fingerprinting Kit, Catalog #166-0007EDU.
http://explorer.bio-rad.comThis resource provides an extensive curriculum of activities for students based on DNA fingerprinting. Teachers can “pick and choose” appropriate explorations depending on student interest and ability, including applications of PCR, VNTRs, and STRs.
Biotechnology Explorer™ Cloning Sequencing Explorer Series, Catalog #166-5000EDU. http://explorer.bio-rad.com This resource provides an extensive research project composed of eight lab modules which can be used separately or in a series for an entire six-to-eight-week project. Due to the modular natures of the series, some components are used in conjunction with other modules for a continuous workflow. The series modules are Nucleic Acid Extraction, GADPH PCR, Electrophoresis, PCR Kleen™ Spin Purification, Ligation and Transformation, Microbial Culturing, Aurum™ Plasmid Mini Purification, and Sequencing and Bioinformatics. The module is geared toward small class sizes of advanced students. The estimated price of the module is $1,400.
Brown, Betty, et al., Get a Clue, Destiny, University of North Carolina at Chapel Hill, 2006. https://www.bio-rad.com/cmc_upload/Products/-41683/Get_A_Clue_DESTINY.pdf This resource provides an extensive curriculum of activities for students based on DNA fingerprinting. Teachers can “pick and choose” appropriate explorations depending on student interest and ability, including dry labs to introduce PCR and VNTR/STR analysis.
Gattaca, Columbia Pictures, 1997, PG-13.The movie available on DVD transports us into a future society (Gattaca) defined by genetic discrimination when a genetically inferior man assumes the identity of a superior one in order to pursue his lifelong dream of space travel. The issues that are raised, including questions about the social and ethical implications of DNA analysis, provide fodder for discussion and debate.
http://innocenceproject.orgThis resource provides information on The Innocence Project (IP), an international litigation and public policy organization dedicated to exonerating wrongfully convicted individuals through DNA testing.
Johnson, A. Daniel, 40 Exercises for the College Biology Lab, NSTA Press, Arlington, VA, 2009. This information provides great insight into developing student-directed, inquiry-based laboratory investigations for advanced students, while also providing strategies on how teachers can adapt their more teacher-directed labs to provide opportunities for independent exploration. Unit 3 in the manual, “DNA Isolation and Analysis,” provides exercises for more advanced students to use bioinformatics programs to study and manipulate DNA sequences.

This page is intentionally left blank.
BigIdea
Investigation 9 S111
3investigation 9
BioteCHnoLogY: RestRiCtion enZYMe anaLYsis oF Dna*How can we use genetic information to identify and profile individuals?
■■ The■Scenario“OMG! Is that blood?” Laurel nearly broke Marcus’s arm as she tried to push past him into the classroom.
Marcus grabbed the sleeve of her cardigan and yanked her back. “Don’t! Can’t you see the glass?” Laurel tried knocking his hand free, but the 6’4” varsity basketball captain held tight. He made her settle for looking from under his armpit.
Not that what she saw would make any sense. Their AP Biology lab looked like a riot scene. Four chairs and a potted plant were overturned in the center of the room, and broken pieces of glass were scattered across the floor along with several wet red drops. Plink ... plink ... plink. Marcus’s eyes were drawn to the teacher’s desk where droplets of brownish liquid fell from a paper cup and collected in a puddle on the linoleum.
“What happened?” Laurel asked. “Did somebody get hurt?” Laurel and her classmates had gathered in front of the door and strained to see inside Room 102.
Marcus inspected the scene and raised his right arm above his head, his fingers spread apart as if taking a shot from the free throw line. “Stay back!”
“Where’s Ms. Mason?” Laurel said. “She told me I could meet her before class to review for the quiz.”
“Okay, folks, keep it down.” Mr. Gladson, the teacher in the classroom next door, came into the hall. His white lab coat was streaked with several rust-colored stains. The pungent odor of formaldehyde permeated the corridor. “In case you haven’t noticed, the bell has rung.” He wiped his nose with a tissue and then tossed it into a nearby trash can. A girl’s fake shriek from inside the anatomy lab rose above the buzz of Marcus’s classmates.
“What’s going on?” Bobby’s high-pitched whine was unmistakable — and so was the scent of his bubble gum.
“I think something might’ve happened to Ms. Mason,” Marcus said. He dug around in his backpack and pulled out a magnifying glass. ”We’ve got a crime scene to process.”
Genetics and Information Transfer
* Transitioned from the AP Biology Lab Manual (2001)
S112■■Investigation 9
“Go figure,” Laurel said. “Sherlock Holmes in a varsity jacket.”
For the next hour, Marcus and Laurel searched the classroom and discovered several pieces of “evidence” that Marcus described in his biology notebook:• Ten small drops on floor confirmed by Kastle-Meyer test to be blood
• Shard of glass from a broken 500-mL Erlenmeyer flask, edge smeared with a reddish stain
• Paper cup with lipstick stains, presumed to be Ms. Mason’s, found on her desk
• Wad of bubble gum stuck underneath overturned chair
• Mr. Gladson’s discarded tissue recovered from trash can in hall outside Room 102
• Bobby’s test on photosynthesis with large “F” scrawled in red ink on first page
• Copy of email from Mr. Gladson to Ms. Mason asking her to give up position as department chair
Marcus’s new game was afoot!
■■ BacKGroUnDApplications of DNA profiling extend beyond what we see on television crime shows. Are you sure that the hamburger you recently ate at the local fast-food restaurant was actually made from pure beef? DNA typing has revealed that often “hamburger” meat is a mixture of pork and other nonbeef meats, and some fast-food chains admit to adding soybeans to their “meat” products as protein fillers. In addition to confirming what you ate for lunch, DNA technology can be used to determine paternity, diagnose an inherited illness, and solve historical mysteries, such as the identity of the formerly anonymous individual buried at the Tomb of the Unknown Soldier in Washington, D.C.
DNA testing also makes it possible to profile ourselves genetically — which raises questions, including Who owns your DNA and the information it carries? This is not just a hypothetical question. The fate of dozens of companies, hundreds of patents, and billions of dollars’ worth of research and development money depend on the answer. Biotechnology makes it possible for humans to engineer heritable changes in DNA, and this investigation provides an opportunity for you to explore the ethical, social, and medical issues surrounding the manipulation of genetic information.
■■ Learning■objectivesIn this investigation, you will learn how to use restriction enzymes and gel electrophoresis to create genetic profiles. You will use these profiles to help Marcus and Laurel narrow the list of suspects in the disappearance of Ms. Mason.
■■ General■Safety■PrecautionsNever handle gels with your bare hands. An electrophoresis apparatus can be dangerous because it is filled with a highly conductive salt solution and uses DC current at a voltage strong enough to cause a small shock. Always turn the power supply switch
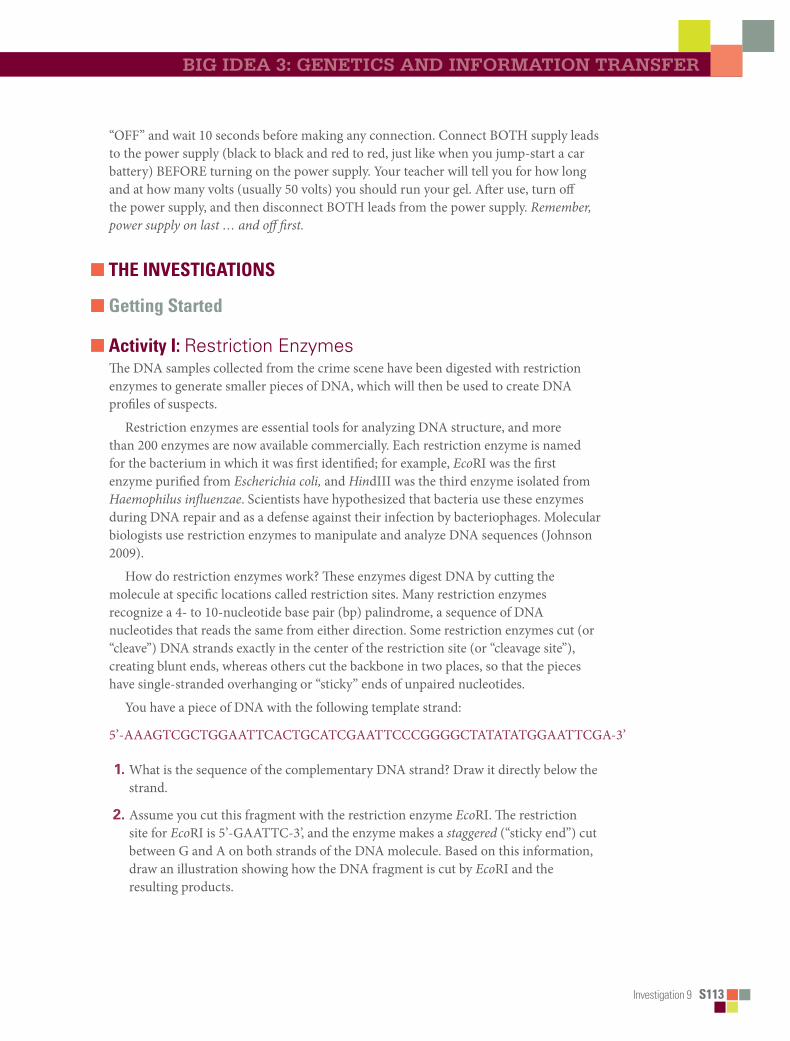
Investigation 9 S113
Big iDea 3: genetiCs anD inFoRMation tRansFeR
“OFF” and wait 10 seconds before making any connection. Connect BOTH supply leads to the power supply (black to black and red to red, just like when you jump-start a car battery) BEFORE turning on the power supply. Your teacher will tell you for how long and at how many volts (usually 50 volts) you should run your gel. After use, turn off the power supply, and then disconnect BOTH leads from the power supply. Remember, power supply on last … and off first.
■■ The■inVeSTiGaTionS
■■ Getting■Started
■■ activity■i:■Restriction EnzymesThe DNA samples collected from the crime scene have been digested with restriction enzymes to generate smaller pieces of DNA, which will then be used to create DNA profiles of suspects.
Restriction enzymes are essential tools for analyzing DNA structure, and more than 200 enzymes are now available commercially. Each restriction enzyme is named for the bacterium in which it was first identified; for example, EcoRI was the first enzyme purified from Escherichia coli, and HindIII was the third enzyme isolated from Haemophilus influenzae. Scientists have hypothesized that bacteria use these enzymes during DNA repair and as a defense against their infection by bacteriophages. Molecular biologists use restriction enzymes to manipulate and analyze DNA sequences (Johnson 2009).
How do restriction enzymes work? These enzymes digest DNA by cutting the molecule at specific locations called restriction sites. Many restriction enzymes recognize a 4- to 10-nucleotide base pair (bp) palindrome, a sequence of DNA nucleotides that reads the same from either direction. Some restriction enzymes cut (or “cleave”) DNA strands exactly in the center of the restriction site (or “cleavage site”), creating blunt ends, whereas others cut the backbone in two places, so that the pieces have single-stranded overhanging or “sticky” ends of unpaired nucleotides.
You have a piece of DNA with the following template strand:
5’-AAAGTCGCTGGAATTCACTGCATCGAATTCCCGGGGCTATATATGGAATTCGA-3’
1.What is the sequence of the complementary DNA strand? Draw it directly below the strand.
2.Assume you cut this fragment with the restriction enzyme EcoRI. The restriction site for EcoRI is 5’-GAATTC-3’, and the enzyme makes a staggered (“sticky end”) cut between G and A on both strands of the DNA molecule. Based on this information, draw an illustration showing how the DNA fragment is cut by EcoRI and the resulting products.
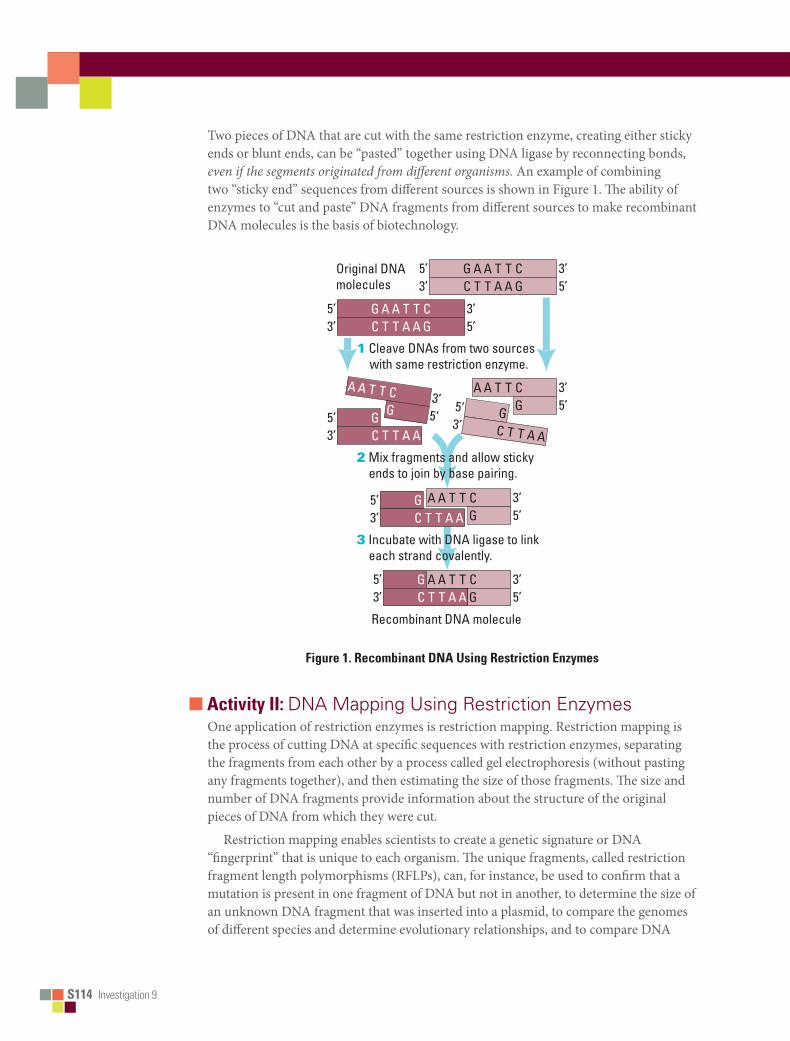
S114■■Investigation 9
Two pieces of DNA that are cut with the same restriction enzyme, creating either sticky ends or blunt ends, can be “pasted” together using DNA ligase by reconnecting bonds, even if the segments originated from different organisms. An example of combining two “sticky end” sequences from different sources is shown in Figure 1. The ability of enzymes to “cut and paste” DNA fragments from different sources to make recombinant DNA molecules is the basis of biotechnology.
Bio_S_Lab09_01
NOTE: With 10 pt type, a little more depth was needed than speci�ed.
1 Cleave DNAs from two sources with same restriction enzyme.
2 Mix fragments and allow sticky ends to join by base pairing.
3 Incubate with DNA ligase to link each strand covalently.
Original DNAmolecules
5’ G3’
3’5’C
AT
AT
TA
TA
CG
5’ G3’ C T T A A
5’ G3’ C T T A A
3’5’
A A T T CG
5’ G3’
3’5’C
AT
AT
TA
TA
CG
5’ G3’
3’5’
C
A
T
A
T
T
A
T
A
CG
3’5’
A A T T CG
Recombinant DNA molecule
5’ G3’ C T T A A
3’5’
A A T T CG
Figure■1.■recombinant■Dna■Using■restriction■enzymes■
■■ activity■ii:■DNA Mapping Using Restriction EnzymesOne application of restriction enzymes is restriction mapping. Restriction mapping is the process of cutting DNA at specific sequences with restriction enzymes, separating the fragments from each other by a process called gel electrophoresis (without pasting any fragments together), and then estimating the size of those fragments. The size and number of DNA fragments provide information about the structure of the original pieces of DNA from which they were cut.
Restriction mapping enables scientists to create a genetic signature or DNA “fingerprint” that is unique to each organism. The unique fragments, called restriction fragment length polymorphisms (RFLPs), can, for instance, be used to confirm that a mutation is present in one fragment of DNA but not in another, to determine the size of an unknown DNA fragment that was inserted into a plasmid, to compare the genomes of different species and determine evolutionary relationships, and to compare DNA
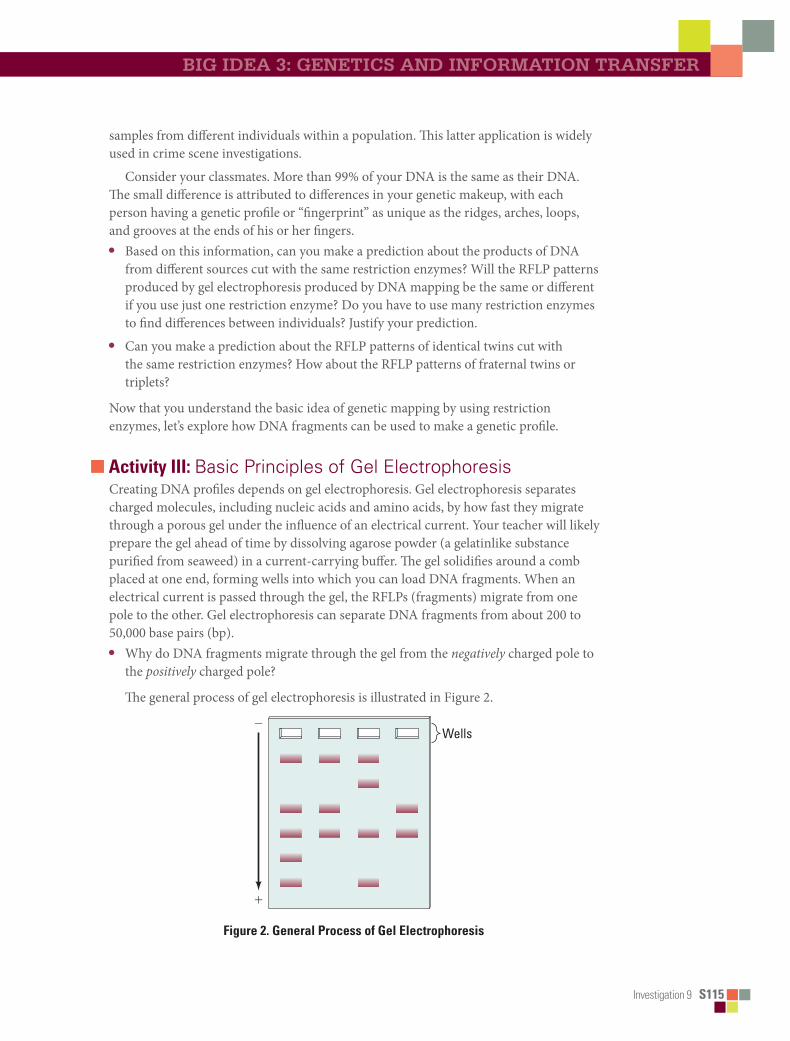
Investigation 9 S115
Big iDea 3: genetiCs anD inFoRMation tRansFeR
samples from different individuals within a population. This latter application is widely used in crime scene investigations.
Consider your classmates. More than 99% of your DNA is the same as their DNA. The small difference is attributed to differences in your genetic makeup, with each person having a genetic profile or “fingerprint” as unique as the ridges, arches, loops, and grooves at the ends of his or her fingers.• Based on this information, can you make a prediction about the products of DNA
from different sources cut with the same restriction enzymes? Will the RFLP patterns produced by gel electrophoresis produced by DNA mapping be the same or different if you use just one restriction enzyme? Do you have to use many restriction enzymes to find differences between individuals? Justify your prediction.
• Can you make a prediction about the RFLP patterns of identical twins cut with the same restriction enzymes? How about the RFLP patterns of fraternal twins or triplets?
Now that you understand the basic idea of genetic mapping by using restriction enzymes, let’s explore how DNA fragments can be used to make a genetic profile.
■■ activity■iii:■Basic Principles of Gel ElectrophoresisCreating DNA profiles depends on gel electrophoresis. Gel electrophoresis separates charged molecules, including nucleic acids and amino acids, by how fast they migrate through a porous gel under the influence of an electrical current. Your teacher will likely prepare the gel ahead of time by dissolving agarose powder (a gelatinlike substance purified from seaweed) in a current-carrying buffer. The gel solidifies around a comb placed at one end, forming wells into which you can load DNA fragments. When an electrical current is passed through the gel, the RFLPs (fragments) migrate from one pole to the other. Gel electrophoresis can separate DNA fragments from about 200 to 50,000 base pairs (bp).• Why do DNA fragments migrate through the gel from the negatively charged pole to
the positively charged pole?
The general process of gel electrophoresis is illustrated in Figure 2.
Bio_S_Lab09_02
NOTE: Less width was needed than speci�ed.
Wells
Figure■2.■General■Process■of■Gel■electrophoresis

S116■■Investigation 9
■■ Procedures
Learning to Use Gel ElectrophoresisTo determine whose blood was on the classroom floor crime scene, you will need to be familiar with the techniques involved in creating genetic profiles using gel electrophoresis. The steps in the general procedure are described below. After you familiarize yourself with the procedure, you will analyze DNA profiles resulting from an “ideal” or mock gel before using what you have learned to conduct an independent investigation. In Designing and Conducting Your Investigation, you will use these skills to narrow the list of suspects in the disappearance of Ms. Mason based on DNA evidence collected at the crime scene.
Materials
Your Workstation• 20 μL vials of DNA fragments prepared
using restriction enzymes • Rack for holding samples• 3 plastic bulb transfer pipettes (or simi-
lar devices)• Permanent marker• Gel electrophoresis chamber• Power supply
• Staining tray• Semi-log graph paper• Ruler
Common Workstation• 0.8% agarose solution (or gel, if pre-
pared by teacher)• 1 X TAE (tris-acetate-EDTA) buffer• Methylene blue stain
Record data and any answers to questions in your lab notebook.
Casting the Agarose GelBefore proceeding, your teacher will direct you to short online videos that show how to prepare an agarose gel, load DNA samples into the wells in the gel, and run an electrophoresis.
Step■1 Seal the ends of the gel-casting tray with tape, dams, or any other method appropriate for the gel box that you are using. Insert the well-forming comb. Place the gel-casting tray out of the way on the lab bench so that the agarose poured in the next step can set undisturbed. (Your teacher might cast the gel for you ahead of time.)
Step■2 Carefully pour the liquid gel into the casting tray to a depth of 5–6 mm. The gel should cover only about one-half the height of the comb teeth (Figure 3). While the gel is still liquid, use the tip of a pipette to remove any bubbles.

Investigation 9 S117
Big iDea 3: genetiCs anD inFoRMation tRansFeR
Bio_T_Lab09_01
Mix agaroseand buffer.
1.
Boil mixturein microwave.
2.
Cool the mixture to 65˚Cand pour into mold.
3. Gel solidifies atroom temperature.
Insert comb intomold to make wells.
Remove comb;wells remain.
Finished gel
4.
Figure■3.■casting■an■agarose■Gel
Step■3 The gel will become cloudy as it solidifies (15–20 minutes). Do not disturb or touch the gel while it is solidifying!
Step■4 When the agarose has set, carefully remove the ends of the casting tray and place the tray in the electrophoresis gel box so that the comb is at the negative (black) end.• Why do you place the wells at the negative end of the gel box?
• What is the chemical nature of DNA? Will the DNA fragments migrate toward the positive end of the gel box or toward the negative end?
Step■5 Fill the box with 1x TAE buffer, to a level that just covers the entire surface of the gel.
Step■6 Gently remove the comb, taking care not to rip the wells. Make sure that the sample wells left by the comb are completely submerged in the buffer.
Step■7 The gel is now ready to be loaded with your DNA samples. (If your teacher says that you will load the gel on another lab day, close the electrophoresis box to prevent drying of the gel.)
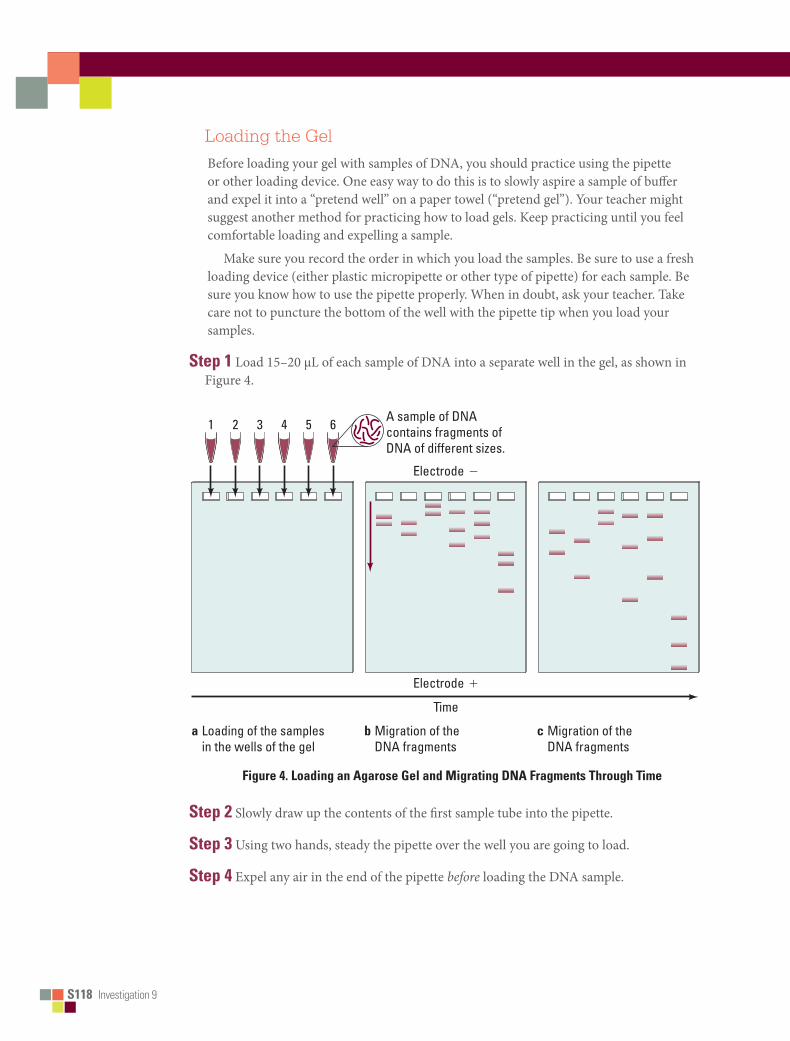
S118■■Investigation 9
Loading the GelBefore loading your gel with samples of DNA, you should practice using the pipette or other loading device. One easy way to do this is to slowly aspire a sample of buffer and expel it into a “pretend well” on a paper towel (“pretend gel”). Your teacher might suggest another method for practicing how to load gels. Keep practicing until you feel comfortable loading and expelling a sample.
Make sure you record the order in which you load the samples. Be sure to use a fresh loading device (either plastic micropipette or other type of pipette) for each sample. Be sure you know how to use the pipette properly. When in doubt, ask your teacher. Take care not to puncture the bottom of the well with the pipette tip when you load your samples.
Step■1 Load 15–20 μL of each sample of DNA into a separate well in the gel, as shown in Figure 4.
Bio_S_Lab09_04
NOTE: For 10 pt type and detail specified,more space was needed than specified.
A sample of DNAcontains fragments ofDNA of different sizes.
Loading of the samplesin the wells of the gel
1 2 3 4 5 6
Electrode
Time
Electrode
a Migration of theDNA fragments
b Migration of the DNA fragments
c
Figure■4.■Loading■an■agarose■Gel■and■Migrating■Dna■Fragments■Through■Time
Step■2 Slowly draw up the contents of the first sample tube into the pipette.
Step■3 Using two hands, steady the pipette over the well you are going to load.
Step■4 Expel any air in the end of the pipette before loading the DNA sample.

Investigation 9 S119
Big iDea 3: genetiCs anD inFoRMation tRansFeR
Step■5 Dip the pipette tip through the surface of the buffer, position it just inside the well, and slowly expel the mixture. Sucrose in the loading dye weighs down the sample, causing it to sink to the bottom of the well. Be careful not to puncture the bottom of the well with the pipette tip or reaspirate your sample up into the pipette.
Step■6 Draw the pipette tip out of the buffer.
Step■7 Using a clean loading device for each sample, load the remaining samples into their wells.
Electrophoresis
Step■1 Close the top of the electrophoresis chamber and then connect the electrical leads to an appropriate power supply, positive (+) electrode to positive (+) electrode (red to red) and negative (-) electrode to negative (-) electrode (black to black). Make sure both electrodes are connected to the same channel of the power supply, just as you would connect leads to jump-start a car battery — red to red and black to black.
CAUTION: Be sure to keep the power OFF until you connect all leads!
Step■2 Turn on the power supply and set the voltage as directed by your teacher. (It is recommended that you “run the gel” at 50 volts for approximately 2 hours. If you run the gel at a higher voltage for less time, the fragments migrate too quickly through the gel with less separation. Again, ask your teacher for assistance if needed.)
Step■3 Shortly after the current is applied, you should see loading dye moving through the gel toward the positive pole of the electrophoresis apparatus. (Note: The purplish-blue band in the loading dye migrates through the gel at the same rate as a DNA fragment approximately 300 base pairs long.)
Step■4 Allow the DNA to electrophorese until the loading dye band is about 1 cm from the end of the gel. Your teacher may monitor the progress of the electrophoresis in your absence if you have to attend another class.
Step■5 Turn off the power supply, disconnect the leads from the power supply, and remove the lid of the electrophoresis chamber.
Step■6 Carefully remove the casting tray and slide the gel into a staining tray labeled with the name of your group. • Measure in centimeters the distance that the purplish-blue loading dye has migrated
into the gel. Measure from the front edge of the well to the front edge of the dye band (also called the dye front).
• Be sure to record your data (in centimeters).
Step■7 Take your gel to your teacher for further staining instructions. Again, your teacher might monitor the staining procedure.

S120■■Investigation 9
■■ analyzing■results
Calculating the Sizes of Restriction Fragment Length Polymorphisms Mathematical formulas have been developed for describing the relationship between the molecular weight of a DNA fragment and its mobility (i.e., how far it migrates in the gel). In general, DNA fragments, like the ones in your evidence samples, migrate at rates inversely proportional to the log10 of their molecular weights. For simplicity’s sake, base pair length (bp) is substituted for molecular weight when determining the size of DNA fragments. Thus, the size in base pair length of a DNA fragment can be calculated using the distance the fragment travels through the gel. To calculate the base pair length, a DNA standard, composed of DNA fragments of known base pair length, is run on the same gel as the unknown fragments and is then used to create a standard curve. The standard curve, in this case a straight line, is created by graphing the distance each fragment traveled through the gel versus the log10 of its base pair length.
Creating the Standard CurveAs explained above, base pair (bp) length is substituted for molecular weight. Note that in plotting the standard curve, calculating the log10 of the base pair length of each fragment is unnecessary because the base pair size is plotted on the logarithmic axis of semi-log paper. Examine your stained gel on a light box or other surface that helps visualize the bands. • What observations can you make?
• What quantitative measurements can you make?
1.Examine the “ideal” or mock gel shown in Figure 5 that includes DNA samples that have been cut with three restriction enzymes, BamHI, EcoRI, and HindIII, to produce RFLPs (fragments). Sample D is DNA that has not been cut with enzyme(s). DNA cut with HindIII provides a set of fragments of known size and serves as a standard for comparison.
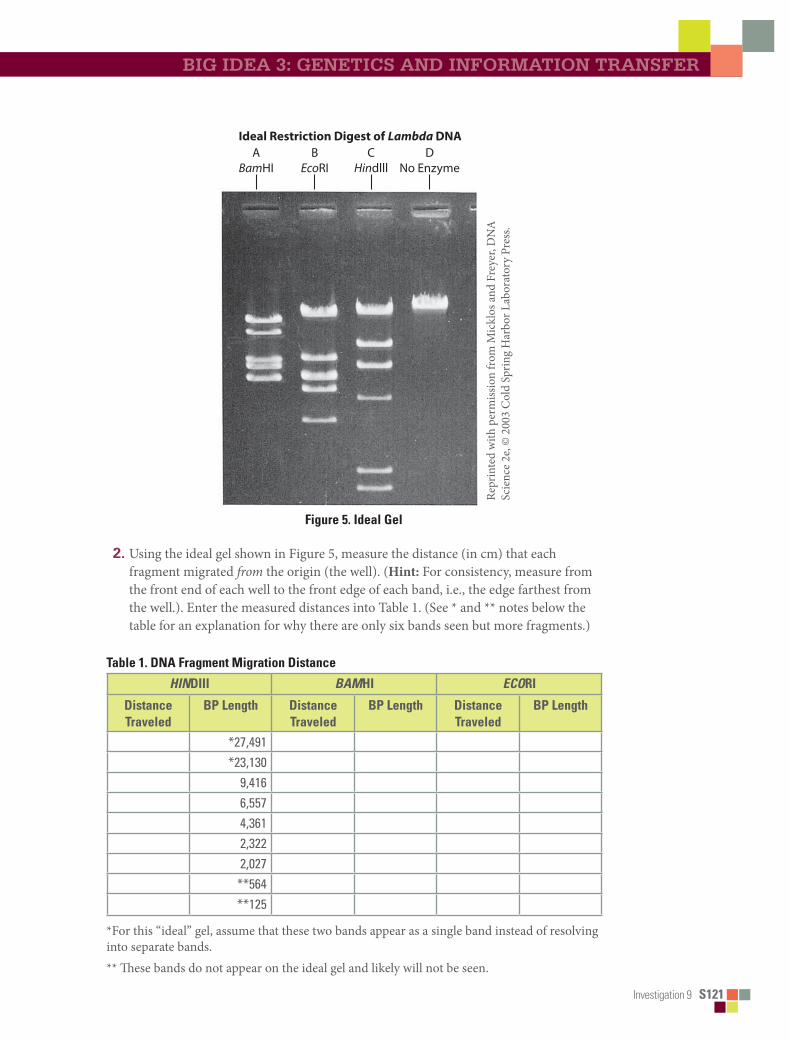
Investigation 9 S121
Big iDea 3: genetiCs anD inFoRMation tRansFeR
Repr
inte
d w
ith p
erm
issio
n fr
om M
ickl
os a
nd F
reye
r, D
NA
Sc
ienc
e 2e
, © 2
003
Col
d Sp
ring
Har
bor L
abor
ator
y Pr
ess.
Ideal Restriction Digest of Lambda DNAA
BamHIB
EcoRIC
HindlllD
No Enzyme
Figure■5.■ideal■Gel
2.Using the ideal gel shown in Figure 5, measure the distance (in cm) that each fragment migrated from the origin (the well). (Hint: For consistency, measure from the front end of each well to the front edge of each band, i.e., the edge farthest from the well.). Enter the measured distances into Table 1. (See * and ** notes below the table for an explanation for why there are only six bands seen but more fragments.)
Table■1.■Dna■Fragment■Migration■Distance
HinDiii Bamhi ECori
Distance■Traveled
BP■Length Distance■Traveled
BP■Length Distance■Traveled
BP■Length
*27,491*23,130
9,4166,5574,3612,3222,027
**564**125
*For this “ideal” gel, assume that these two bands appear as a single band instead of resolving into separate bands. ** These bands do not appear on the ideal gel and likely will not be seen.

S122■■Investigation 9
3.Plot the standard curve using the data from the DNA sample cut with HindIII. To do this, your teacher might ask you to graph the data directly using Excel with distance traveled as the (arithmetic) x-axis and the base pair (bp) length as the (logarithmic) y-axis. Based on this graph, why must the data be plotted using the log scale? You might want to plot the data again using semi-log paper.
Connect the data point with a best-fit line. However, you should ignore the point plotted for the 27,491bp/23,130 doublet. When using 0.8% agarose gel, these fragments appear as one. Congratulations! Your best-fit line is the standard curve.
4.Now use the standard curve to calculate the approximate sizes of the EcoRI and BamHI fragments. Using a ruler, how can you use the standard curve to calculate the sizes of unknown fragments?
■■ Designing■and■conducting■Your■investigationNow that you’ve learned about the techniques used to create DNA profiles or “fingerprints,” it’s time to apply the techniques as you investigate the disappearance of Ms. Mason. Your task is to design and conduct a procedure based on DNA evidence to determine whose blood is spattered on the classroom floor. The chief investigator (your teacher) will provide you with DNA evidence collected at the crime scene from the blood, Ms. Mason (saliva on her coffee cup), Mr. Gladson (tissue with which he wiped his nose), and Bobby (bubble gum). In addition, you will be given a sample of DNA cut with HindIII. Remember from your analysis of the “ideal” or mock gel that DNA cut with HindIII serves as a marker, providing a set of RFLPs of known sizes (standard).
■■ analyzing■resultsEvaluate your crime scene samples to determine whose blood was on the classroom floor. Because this case likely will go to trial, visual analysis (qualitative data) of the DNA profiles is not sufficient to identify a perpetrator. Based on your results, write the conclusion to the scenario to reveal “whodunit” based on motive, means, opportunity, and DNA evidence.
■■ evaluating■results 1.What are some possible challenges you had in performing your investigation?
2.What are some possible sources of error in the electrophoresis procedure? How can you minimize any potential sources of error?
Investigation 9 S123
Big iDea 3: genetiCs anD inFoRMation tRansFeR
■■ Thinking■about■Your■results 1.There are important social and ethical implications of DNA analysis. Already,
DNA testing can reveal the presence of markers of certain genetic diseases, such as Huntington’s. So, who should have access to your genetic profile? Health insurance companies? College admissions offices? Employers? What issues about confidentiality are raised by genetic testing? Who owns your DNA and its information?
2.Suppose a DNA test that predicted your chances of getting a disease, such as cancer, were available. You take the test for cancer, and the results say you have a two in three chance of getting cancer sometime in the next 20 years. Who should have access to this information? Your doctor? Health insurance companies? Employers? Would you want to know this information?
3.The Innocence Project (IP) is an international litigation and public policy organization dedicated to exonerating wrongfully convicted individuals through DNA testing. Three-quarters of DNA exoneration cases involve misidentification by witnesses. To date, nearly 300 people previously convicted of serious crimes in the U.S. have been exonerated by DNA testing. However, not everyone is in favor of the IP. One United States Supreme Court justice expressed concern that DNA testing poses risks to the criminal justice system, in which a person is judged by a jury of peers. What social and ethical issues are raised by using DNA evidence to re-examine old court decisions? What other arguments can you make (or find) against using DNA evidence for court cases?
4.With genetic engineering, biotechnicians can clip out beneficial genes from native plants in foreign countries and insert them into their crop plant relatives here in the United States, with great benefits to the latter — to prevent attack by insects, to increase productivity, or to allow the crops to be grown in colder climates. These benefits can be worth billions of dollars, but if the crops are grown in the United States, should countries where the native plants are located benefit from the bioengineering? Who owns the information in DNA? Who can profit from that information? Investigate this controversy on the Internet with examples drawn from different crops grown here in the U.S.

S124■■Investigation 9
■■ Where■can■You■Go■from■here?The following are suggestions for expanding your study of biotechnology.
1.Do you remember earlier when you read that more than 99% of your DNA is the same as another person’s DNA, and that the 1% difference is attributed to small differences in genetic code? Conduct independent research on how these small differences can be detected by molecular biologists. Begin by investigating unique repeat DNA sequences called variable tandem repeats (VNTRs), short tandem repeats (STRs), and single nucleotide polymorphisms (SNPs). Prepare a mini-poster presentation for your classmates illustrating how these small differences can be used to individualize DNA from different organisms, including humans. Are the differences between you and other individuals in the genes themselves? If so, how do you account for the fact that everyone needs the same genes to produce your cell components and your organs, such as your liver and lungs?
2.Often scientists have only a small amount of DNA available for analysis. The polymerase chain reaction (PCR) is another key technique that molecular biologists use to amplify a specific sequence of DNA. Developed by Kary Mullis in 1983, PCR produces millions of copies of a DNA sequence in a few hours, with the original sequence serving as the template for replication. PCR has a variety of applications, including DNA cloning, determining DNA-based phylogeny, diagnosing hereditary diseases, and identifying genetic fingerprints. Ask your teacher if you can learn to perform PCR. PCR usually requires a relatively expensive piece of equipment, a DNA thermocycler; however, you can investigate less expensive methods of PCR.
3.Select an episode of one of your favorite TV crime investigation shows that focuses on DNA as evidence. Compare TV science with real science.
Big Idea 4 T175
BigIdea4Interactions
Living systems from cells to ecosystems require free energy and matter to maintain order, grow, and reproduce, with organisms using various strategies to capture, use, and store free energy and other resources. Efficiency of energy transfer and
availability of resources influence activities in cells and organisms, and often affect a population’s stability in terms of size and genetic composition. The exchange of matter involves complex interactions between organisms and their environment, and these interactions can determine the distribution of organisms, their abundance, and their survival in an ecosystem.
Whether or not an organism can survive in its environment depends on its ability to respond to environmental change. Because competition for resources affects behavior of organisms, and often limits growth of populations, models allow for the prediction of the impact of change in an ecosystem’s biotic and abiotic factors. The study of energy flow and interactions between living organisms and with their environment leads to questions about the richness of life on Earth: Where do organisms live? How many organisms can live in a specific habitat?
The suite of inquiry-based investigations in big idea 4 provides opportunities for students to ask questions, and explore answers, about ecological phenomena, many of the cellular processes (e.g., photosynthesis and cellular respiration) described in big idea 2, and concepts presented in big idea 1 (evolution and natural selection).
■■ SynopSeS■of■The■InveSTIgaTIonS
Investigation 10: Energy Dynamics guides students in the exploration of energy in a model ecosystem by estimating (1) net primary productivity of Wisconsin Fast Plants growing under lights, and (2) the flow of energy from the plants to cabbage white butterflies as the larvae consume cabbage-family plants. These two exercises describe methods for estimating energy flow in a terrestrial ecosystem, and students are asked to apply the skills they acquire, including converting biomass measurements to energy units. Students record their questions and observations as they work through the investigation. Questions might include What is the role of energy in ecosystems? What factors affect plant productivity, the growth of cabbage white larvae, and the interactions of the organisms? How can energy be tracked in the model system? and Can the data collecting techniques be improved? The study of these model organisms and methods for estimating energy flow create a rich, accessible environment that facilitates student exploration of basic ecological concepts with respect to energy flow, the roles of producers and consumers, and the complex interactions between organisms in a community.
Investigation 11: Transpiration is a revision of Laboratory 9 (Transpiration) in the 2001 AP Biology Lab Manual. The revision reflects the changes in the overall AP Biology program, moving from a teacher-directed investigation to a guided, inquiry-based exploration of transpiration in plants. With a new twist, students begin by calculating leaf
T176■■Big Idea 4
surface area, and then determine the average number of stomata per square millimeter of leaf. Their data should generate several questions, including Are surface area and the number of stomata related to the rate of transpiration? Do all parts of a plant transpire? Do all plants transpire at the same rate? and Is there a relationship between habitats in which plants evolved to their rates of transpiration? Students design and conduct their own experiments to investigate answers to questions they generate about factors — such as environmental variables — that affect the rate of transpiration. The investigation provides an opportunity for students to review and apply concepts and science practices they have studied previously, including cell structure and function, the movement of molecules across membranes, and the exchange of matter between biological systems and with their environment.
In Investigation 12: Fruit Fly Behavior, students use Drosophila melanogaster as a model organism to explore chemotaxis and other observed behaviors. The fruit fly has been studied in depth by the scientific community; its genome has been sequenced, its physical characteristics charted, and its meiotic and developmental processes carefully researched. Although students typically become familiar with Drosophila while studying genetics, the fly also has been the source for many historical experiments in animal behavior. In this investigation, students begin by listing when and where they notice fruit flies — in a bowl of fruit, on a picnic table, and during the spring and summer — and then construct a choice chamber from a plastic water bottle to conduct a series of experiments to gather information about negative and positive responses to chemical stimuli. Students note patterns and ratios, and then design and conduct additional experiments based on unanswered questions from their initial series of experiments. The investigation provides students an opportunity to explore more deeply behaviors that underlie chemotaxis.
Investigation 13: Enzyme Activity provides new twists for Laboratory 2 (Enzyme Catalysis) in the 2001 AP Biology Lab Manual by taking students through a guided inquiry exploration of biotic and abiotic factors that influence the rates of enzymatic reactions. Students explore the catalytic activity of peroxidase, an enzyme that breaks down hydrogen peroxide, a toxic metabolic waste product of aerobic respiration, converting peroxide into water and oxygen gas. Guaiacol, an indicator, is used to measure the amount of oxygen released in the reaction. As students work through the investigation, they acquire skills to explore their own questions about enzymatic activity. Questions raised might include How will different pH buffers or temperatures affect reaction rates? and Which has a greater effect on the rate of reaction: changing the concentration of enzyme or the concentration of substrate? The investigation also provides students an opportunity to apply and review concepts they have studied previously, such as energy transfer, the levels of protein structure, and the role of enzymes in maintaining homeostasis.

Investigation 10 T177
BigIdeaInteractions 4
■ BACKGROUNDAlmost all life on this planet is powered, either directly or indirectly, by sunlight. Energy captured from sunlight drives the production of energy-rich organic compounds during the process of photosynthesis. These organic compounds create biomass. Gross productivity is a measure of the total energy captured. The net amount of energy captured and stored by the producers in a system is the system’s net productivity. In terrestrial systems, plants play the role of producer. Plants allocate that biomass (energy) to power processes or to be stored. Different plants have different strategies of energy allocation that reflect their role in various ecosystems. For example, annual weedy plants allocate a larger percentage of their annual biomass production to reproductive processes and seeds than do slower-growing perennials. As plants, the producers, are consumed or decomposed, the stored chemical energy powers additional individuals (the consumers) or trophic levels of the biotic community. Biotic systems run on energy much as economic systems run on money. Energy is generally in limited supply in most communities. Energy dynamics in a biotic community is fundamental to understanding ecological interactions.
There are numerous methods and techniques for studying energy dynamics in a biological community. Most are not accessible to the average classrooms, and the complexity of a typical community or ecosystem is so great that often students either are left with oversimplified models of the community or are confused by the overall complexity in the system. An alternate approach is to create a simple model system in the laboratory with a single producer species and a single consumer. The concepts learned by studying this system can then be extended to more complex, natural systems.
Note: This investigation, as written, requires an extended amount of time to conduct (approximately 2–3 weeks) based on the different components, with each building off previous explorations and results.
This laboratory investigation introduces methods for estimating net terrestrial productivity and secondary productivity in a laboratory setting using a model plant species, Wisconsin Fast Plants (Brassica rapa) (http://www.fastplants.org), and cabbage white butterflies (Pieris rapae). Methods for estimating the efficiency of transfer of energy from producer to consumer are also introduced. Together, these model organisms and methods create a rich, accessible research environment that facilitates
investigation 10
eneRgY DYnaMiCsWhat factors govern energy capture, allocation, storage, and transfer between producers and consumers in a terrestrial ecosystem?
T178 Investigation 10
student exploration of basic ecological concepts of energy flow, the role of producers, the role of primary consumers, and the complex interactions between organisms.
The first portion of this laboratory investigation, Getting Started, serves as a prelab activity designed to help students establish a context for energy dynamics in living systems. The analogy of accounting or budgeting provides the students with a useful tool to guide their questions and strategies for investigating those questions.
In Procedures, students develop the skills needed to monitor the biomass in growing plants and butterfly larvae. With the prelab work serving as a framework, the practical skill development, along with the insights that are gained growing the plants and butterfly larvae naturally, leads to focused, student-generated questions about the energy dynamics in the system. The skills acquired in Procedures are then put to use in the final part, Designing and Conducting Your Investigation.
In this final part, the students work in teams to investigate their own questions. They present the results of that work in a miniature classroom poster presentation that simulates the poster sessions at meetings of professional societies. How students present their work often depends on class structure; for example, you might prefer that students keep a laboratory notebook.
■ PREPARATION
Materials and Equipment
• Food dehydrator or drying oven• Electronic balance with 0.001 gram
precision (Less precise balances will work if a number of samples are grouped.)
• Digital cameras (or cell phone cameras)• Fast Plant growth chamber (lights) and
growing systems• Fast Plant seeds (~50–100 seeds)• Butterfly eggs (~20 eggs)• Soil mix
• 10-10-10 soluble fertilizer • Brussels sprouts, broccoli, cabbage• 10% bleach solution for cleanup of
growing systems• Honey to make honey water nectar
substitute for adult butterflies• Wicking cord for plant growth systems• Bee sticks (actual honeybee bodies
glued to toothpicks for pollinating Fast Plants)
Teachers can purchase a variety of packaged systems for growing plants and rearing butterflies, or they can construct their own. See the Wisconsin Fast Plants website for suggested plant-growing chambers and butterfly-rearing systems. Suggested growing systems are made from recycled one-liter plastic drink bottles. Recycled plastic deli containers work well for making the Brassica Barn or butterfly nursery. Each student team will need a Brassica Barn. Be aware that these instructions for rearing can be considered guidelines. You and your students are encouraged to try different growing systems and to develop your own.
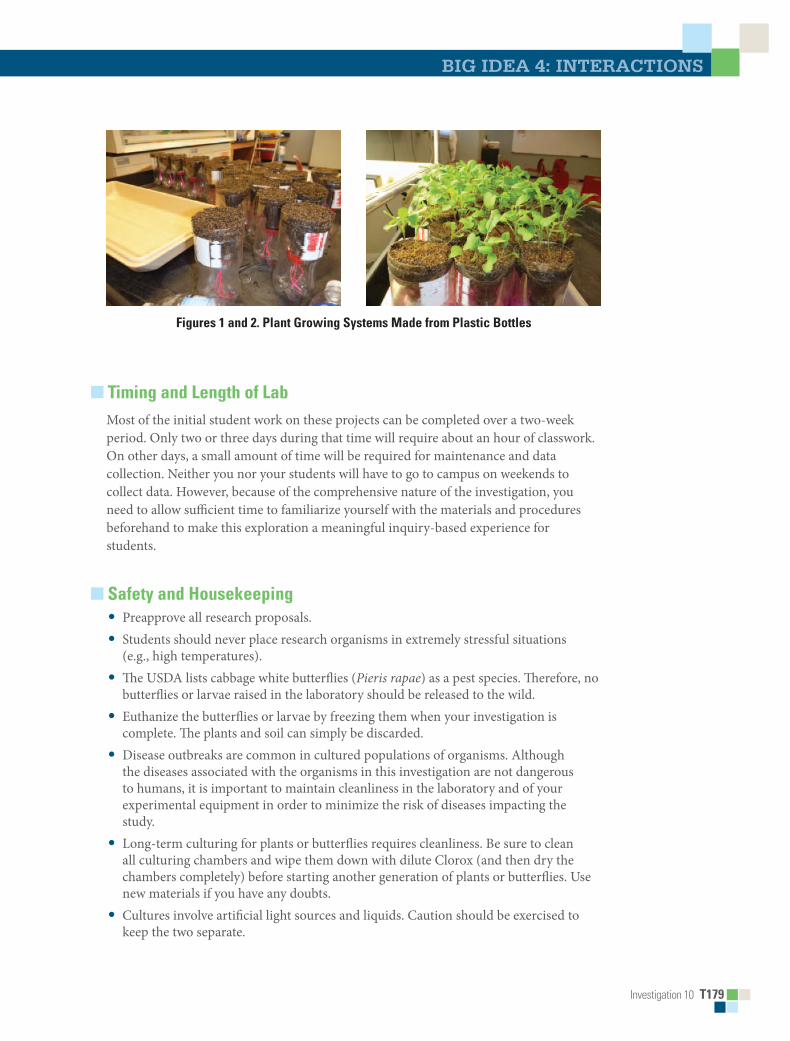
Investigation 10 T179
Big iDea 4: inteRaCtions
Figures 1 and 2. Plant Growing Systems Made from Plastic Bottles
■ Timing and Length of LabMost of the initial student work on these projects can be completed over a two-week period. Only two or three days during that time will require about an hour of classwork. On other days, a small amount of time will be required for maintenance and data collection. Neither you nor your students will have to go to campus on weekends to collect data. However, because of the comprehensive nature of the investigation, you need to allow sufficient time to familiarize yourself with the materials and procedures beforehand to make this exploration a meaningful inquiry-based experience for students.
■ Safety and Housekeeping• Preapprove all research proposals. • Students should never place research organisms in extremely stressful situations
(e.g., high temperatures). • The USDA lists cabbage white butterflies (Pieris rapae) as a pest species. Therefore, no
butterflies or larvae raised in the laboratory should be released to the wild.• Euthanize the butterflies or larvae by freezing them when your investigation is
complete. The plants and soil can simply be discarded.• Disease outbreaks are common in cultured populations of organisms. Although
the diseases associated with the organisms in this investigation are not dangerous to humans, it is important to maintain cleanliness in the laboratory and of your experimental equipment in order to minimize the risk of diseases impacting the study.
• Long-term culturing for plants or butterflies requires cleanliness. Be sure to clean all culturing chambers and wipe them down with dilute Clorox (and then dry the chambers completely) before starting another generation of plants or butterflies. Use new materials if you have any doubts.
• Cultures involve artificial light sources and liquids. Caution should be exercised to keep the two separate.

T180 Investigation 10
■ ALIGNMENT TO THE AP BIOLOGy CURRICULUM FRAMEwORKThis investigation will generally be conducted during the study of interactions (big idea 4). It could also be conducted during the study of cellular processes (big idea 2). In addition, some questions uncovered by students during the initial phase of the investigation will connect well with evolution and natural selection (big idea 1). As always, it is important to make connections between big ideas and enduring understandings, regardless of where in the curriculum the lab is taught. The concepts align with the enduring understandings and learning objectives from the AP Biology Curriculum Framework, as indicated below.
■ Enduring Understandings• 2A1: All living systems require constant input of free energy.• 2D1: All biological systems from cells and organisms to populations, communities,
and ecosystems are affected by complex biotic and abiotic interactions involving exchange of matter and free energy.
• 4A6: Interactions among living systems and with their environment result in the movement of matter and energy.
■ Learning Objectives• The student is able to explain how biological systems use free energy based on
empirical data that all organisms require constant energy input to maintain organization, to grow, and to reproduce (2A1 & SP 6.2).
• The student is able to justify a scientific claim that free energy is required for living systems to maintain organization, to grow, or to reproduce, but that multiple strategies exist in different living systems (2A1 & SP 6.1).
• The student is able to predict how changes in free energy availability affect organisms, populations, and ecosystems (2A1 & SP 6.4).
• The student is able to refine scientific models and questions about the effect of complex biotic and abiotic interactions on all biological systems from cells and organisms to populations, communities, and ecosystems (2D1 & SP 1.3, SP 3.2).
• The student is able to design a plan for collecting data to show that all biological systems are affected by complex biotic and abiotic interactions (2D1 & SP 4.2, SP 7.2).
• The student is able to analyze data to identify possible patterns and relationships between a biotic or an abiotic factor and a biological system (2D1 & SP 5.1).
• The student is able to apply mathematical routines to quantities that describe interactions among living systems and their environment, which result in the movement of matter and energy (4A6 & SP 2.2).
• The student is able to predict the effects of a change of matter or energy availability on communities (4A6 & SP 6.4).

Investigation 10 T181
Big iDea 4: inteRaCtions
■ Are Students Ready to Complete a Successful Inquiry-Based, Student-Directed Investigation?This investigation reinforces the following skills:• Growing and maintaining plants through an entire life cycle, from seed to seed
(Wisconsin Fast Plants are recommended.)• Caring for, providing food for, and maintaining a clean environment to culture
butterfly larvae• Keeping and maintaining accurate records of observations and measurements of
cultured organisms in a lab notebook• Measuring small mass quantities directly or by combining a number of low mass
objects and taking an average• Demonstrating basic accounting or budgeting skills — quantifying inputs and
resolving the outputs• Constructing energy flow diagrams• Organizing a work-flow timeline for several days (small daily tasks associated with
care of organisms)• Calculating unit conversions in simple equations• Reporting findings and conclusions in a peer-reviewed environment
If you choose to use lab notebooks to help assess student performance on this lab exercise, make sure that the students are completely informed about your expectations for this product. A well-designed rubric (see Chapter 6) is one important way to communicate your expectations. Likewise, before using a mini-poster presentation format for prelab and summative assessments, make sure students have had practice in producing successful mini-posters.
■ Skills DevelopmentStudents will develop the following skills:• Calculating, recording, and diagramming energy dynamics in a simple model system• Posing a scientific question regarding energy dynamics, allocation, or capture• Designing and carrying out an investigation to answer a question regarding energy
dynamics, allocation, or capture• Modeling energy dynamics quantitatively
■ Potential ChallengesStudents often don’t understand that the fresh weight of a food (for themselves or for other organisms) does not necessarily equal the biomass of that food. Students also should understand that all laboratory research organisms, including those that are considered pests, need to be treated with respect and handled appropriately. Thus, student investigations that create stressful situations for experimental animals (such as exposure of living larvae to high temperatures) should never be allowed.

T182 Investigation 10
■ THE INvESTIGATIONS
■ Getting Started: Prelab AssessmentYou may assign the following for homework; as a think, pair/group, share activity, in which pairs or small groups of students brainstorm ideas and then share them with other groups; or as a whole-class discussion to assess students’ understanding of key concepts pertaining to energy capture and use:
1. The economy of a business or household is somewhat like the energetics of a biological community. A well-run household or business creates a budget based on a careful accounting of money coming in and money going out. Likewise, the energy dynamics of a biological community can be modeled by accounting for the energy coming in and the energy going out through different members of the community. Keeping track of money is relatively straightforward — you count it. You count how much money is coming in and how much is going to various expenses and savings. How do you keep track of energy in living organisms? It is a challenge. Producers capture light energy and convert it into chemical energy stored in energy-rich molecules. These molecules have mass, so the energy in biological systems can be indirectly measured by mass — biomass. With your lab team, take a moment to brainstorm how you can account for energy use and transfer in a biological system in a manner similar to the way in which people account for money.
2. This investigation requires you to take care of and maintain healthy populations of living organisms — plants and animals. In fact, before you begin this investigation you will need to start both plant and animal cultures. Wisconsin Fast Plants and cabbage white butterflies are both easily raised in the classroom or laboratory. Neither takes up much time or equipment, but they both need to be tended regularly. As a lab team, discuss the care, maintenance, and proper disposal of the organisms you use in this lab. Prepare a schedule and divide up the responsibilities for long-term care and maintenance. (This includes taking care of animal wastes.) Check out online information about care and maintenance of the organisms from teachers like you at http://fastplants.ning.com/video/2038532:Video:13 and http://fastplants.ning.com/video/juan-enriquez-wants-to-grow.
3. This investigation culminates with the students generating and answering authentic research questions. These questions flow naturally from students when they are engaged in authentic inquiry. The more the classroom laboratories rely on inquiry, the greater the skill development of the students. To that end, students’ previous experiences solving problems and recording their work reflectively in a laboratory notebook are essential prelab skills. You will find that the investigation will go more smoothly if students are introduced early to Wisconsin Fast Plants and cabbage white butterfly larvae. Having students start, maintain, and record both plant and butterfly cultures through one life cycle, without using the organisms for experiments, will greatly facilitate successful completion of this investigation. (Figure 3 shows the butterfly life cycle.) The

Investigation 10 T183
Big iDea 4: inteRaCtions
increased familiarity with the organisms will prompt students to ask questions during the research component. In addition to developing students’ familiarity with the organisms, thereby easing completion of the lab, rearing one generation of each culture generates excess offspring of both plants and animals — numbers that are needed to complete this lab.
Adult
Egg
Pupa
Growth of larva
Figure 3. Butterfly Life Cycle
Estimating Net Primary Productivity (NPP) of Fast Plants
Step 1 Students should create a diagram to model energy capture and flow through a plant (see Figure 4). This will help their lab team design the data collection procedure that helps measure energy capture and flow in a plant.
Energy/Biomass in Plant (14 days)
kcallight energy kcal
respiration
biomass
kcal waste
Figure 4. Energy Flow Into and Out of a Plant
Steps 2–3 As a team, students will design their investigation to sample the biomass of an adequate number of plants early in the life cycle and then again later in the life cycle. Remind students that biomass is only the mass of the plant materials, not of the water in the plant. Make sure that the students’ procedures account for this. On Day 7 (about one-fifth of the way through a life cycle), students should remove approximately 10 plants from the soil, making sure to get all of the roots. They should carefully wash the soil from the roots while retaining as much of the root system as possible. They gently blot dry and then mass each plant in an aluminum foil weighing boat. (You may want to remind them not to forget to tare each boat.) Students should create a table in their lab notebook to organize the data collected on Fast Plants NPP. They should still have about

T184 Investigation 10
30 or 40 plants left in their population that will continue growing. Students should place the 10 plants and aluminum foil weighing boats in a drying oven or dehydrator at about 100°C for 48 hours. Students will describe this procedure in their lab notebook and then check with you for approval and suggestions. Students will record their observations, including the size and overall appearance of the Fast Plants, questions, reflections, and measurements daily in their notebook.
Step 4 Students should determine the dry mass in grams of each plant. This is the individual plant biomass. They should record their answers to the following questions in their lab notebooks (see Table 1):• What is the mean value for all the dry seven-day-old Fast Plants?• What percentage of the average mass of a living seven-day-old Fast Plant comes
from water?• What percentage comes from the dry mass (biomass)? (Note: You might want to
remind students that this percentage will be used later. Students should indicate in their notebooks the range or variation in the data set with appropriate analysis. In particular, they should consider range, standard deviation, and standard error.)
Table 1. Seven-Day-Old Fast Plants
Age wet mass/ 10 plants
Dry mass/ 10 plants
Percent biomass
Energy (g biomass x 4.35 kcal)/ 10 plants
Net primary productivity per day per plant
7 day 19.6 grams 4.2 grams 21.4% 18.27 kcal 0.26 kcal/day
Step 5 Students continue caring for and growing the remaining Fast Plants. For the remaining Fast Plants, they should describe the growth over time in their lab notebooks.
Step 6 On day 14, students repeat Steps 2–4 with 14-day-old plants and record their data in their lab notebooks (see Table 2).
Table 2. 14-Day-Old Fast Plants
Age wet mass/ 10 plants
Dry mass/ 10 plants
Percent biomass
Energy (g biomass x 4.35 kcal)/ 10 plants
Net primary productivity per day per plant
14 day 38.4 grams 9.3 grams 24.2% 40.46 kcal 0.29 kcal/day

Investigation 10 T185
Big iDea 4: inteRaCtions
Estimating Energy Flow Between Fast Plants Producers and Cabbage Butterfly Larvae
Step 1 Students create a diagram to model energy capture and flow through a plant, as in Step 1 in the previous procedure.
Step 2 Students mass one large, fresh brussels sprout. They should cut the sprout in half to expose the inner leaves to butterfly larvae and place these sprout halves into the Brassica Barn. (Remind them to remove all other plant materials in the Brassica Barn.) Students mass 8–12 4th instar larvae as a group and then determine the mean mass per individual larva. They should transfer all the larvae into the prepared Brassica Barn with the single brussels sprout cut in half.
Step 3 Students create a table in their lab notebooks to help organize the data collected, including estimates of the energy/biomass flow from plants to butterfly larvae (see Table 3). They collect, dry, and mass the frass (fecal material) produced by the larvae over the next three days. After three days of feeding, they mass the larvae as a group and then determine the mean mass per individual and the mean mass gained per day. Finally, students mass the remaining part of the brussels sprout and determine the amount of brussels sprout biomass consumed by each larva per day.
Table 3. Energy/Biomass Flow from Plants to Butterfly Larvae
Larva age (per 10 larvae) 12 days 15 days 3 days of growthwet mass of brussels sprouts 30 g 11 g 19 g consumedPlant percent biomass (dry/wet) 0.15 0.15 0.15Plant energy (wet mass x percent biomass x 4.35 kcal)
19.58 kcal 7.2 kcal 12.4 kcal consumed
Plant energy consumed per larvae (plant energy/10)
1.96 kcal 0.72 kcal 1.24 kcal consumed per individual
wet mass of 10 larvae 0.3 g 1.8 g 1.5 g gainedwet mass per individual 0.03 g 0.18 g 0.15 g gainedLarvae percent biomass (dry/wet) 0.15 0.15 0.15Energy production per individual (individual wet mass x percent biomass x 5.5 kcal/g)
0.02 kcal 0.15 kcal 0.12 kcal
Dry mass of the frass from 10 larvae -------- .5 g .5 g excretedFrass mass per individual -------- 0.05 g 0.05 g excretedFrass energy (waste) (frass mass x 4.76 kcal/g)
-------- .24 kcal .24 kcal excreted
Respiration estimate (plant energy consumed – frass waste energy production)
-------- -------- 0.88 kcal
Note: A large part of the mass of brussels sprouts comes from water. Because larvae obtain a lot of their water from the plants they eat, you cannot feed dry brussels sprouts
T186 Investigation 10
Figure 5. Ideas to Focus Questions
Ultimately, as you develop your own skills for managing and facilitating the research experience, you might decide to modify the investigation in the Student Manual or create your own version. You and your students will naturally arrive at workable procedures for monitoring energy or biomass in plants and animals. The Student Manual is set up only as an example to introduce skills. The ultimate goal is for you and your students to become a research team carrying out an authentic research experience.
The idea of developing mathematical models can be particularly challenging. The values for energy capture and transfer measured in Procedures can serve as a foundation for building a predictive, simple spreadsheet model in the final part of the investigation. The model could focus solely on plant growth or butterfly growth, or it could model the interaction between the two.
■ Summative AssessmentThe scientific community communicates its work to peers, largely relying on three modes of formal communication: peer-reviewed papers published in journals, paper presentations, and poster sessions at professional society meetings. Emulating scientific posters and poster sessions is a particularly effective assessment technique for students’ independent work. Posters foster creativity and economy of communication. In particular, the concept of a mini-poster, as described in the blog entry of the National Association of Biology Teachers (http://www.nabt.org/blog/2010/05/04/mini-posters-authentic-peer-review-in-the-classroom/), provides a useful, interactive assessment that takes place both during the session presentation and after the poster is reviewed and revised.
to the larvae. However, as you have seen with the Fast Plants, there is a difference between the biomass of a dry brussels sprout and its mass when it is fresh. Ask students to use the percentage of biomass in a living Fast Plant to estimate the amount of biomass in grams available in each fresh brussels sprout.
■ Designing and Conducting Independent InvestigationsDesigning and Conducting Your Investigation aims to provide an accessible entry point for students as they study the energetics of two model organisms. Together, these two organisms can provide a simple model of ecosystem energetics. This section is fairly explicit about procedure while not providing explicit descriptions of how to record or analyze the data that are collected. Likewise, the students are expected to make observations, to use resources to learn more about the organisms they are studying, and to ask questions while carrying out the procedures. With the tools/skills and questions developed in Procedures, the students are expected (singly or in groups) to carry out their own research or to develop a mathematical model of the energetics of these model organisms in Designing and Conducting Your Investigation.
Just as the students need to build their skills for this laboratory within a scaffold, you should consider that you may need to do the same. Thus, you may consider that you, too, are developing a skill set to help students to investigate their own questions. If you have never worked with these specific organisms, you might want to consider simplifying your first assignments. One suggestion is to limit the students to growing and maintaining these organisms through an entire life cycle while recording daily observations in a laboratory notebook. In this manner, you will learn valuable skills for managing the classroom environment for long-term work and will develop a familiarity with the organisms that is essential as you help students find their own questions. For the first year, you may not feel comfortable dedicating the time beyond becoming familiar with simply growing these organisms. As you develop an understanding for the organisms and how your own students interact with them, you can then proceed to more authentic research.
Help students ask the “right” question in the “right” way. A good question should be focused in such a way that the path to the answer is implicit within the question. The advantage of using live organisms cared for by students is that questions naturally arise. Resist the urge to answer students’ questions; rather, encourage your students to work out answers for themselves. Figure 5, a flow chart/concept map of the investigation, may aid you in helping your students focus on some ideas for research. Also consult the supplemental resources listed at the end of this investigation. There you will find many examples of research that answer ecological questions using these two organisms as models.

Investigation 10 T187
Big iDea 4: inteRaCtions
Light energy
Energy allocation
Photosynthetic rateEnergy efficiency
Energy in reproduction
Plant color and productivity
A mathematical modelof
herbivory and plant production
Herbivory response
Life stage feeding preference
Feeding on old vs. young leaves
Growth trajectory
Frass study Respiration
Mathematical modelof
butterfly growth
Selectivity of food choice(energy efficiency)
Food choice and glucosinolades
Trichome defense Phenotype plasticity
Herbivory toleranceDefense timingEarly herbivory vs. late
Carbon dioxide levels and productivity
Develop a mathematical model of plant growth
Energy storage
Leaf area
Growth trajectories
Limits to productivity:space
soil volumeother plants
Respiration
Fast Plants
Respiration
Cabbage White
WasteWaste
Figure 5. Ideas to Focus Questions
Ultimately, as you develop your own skills for managing and facilitating the research experience, you might decide to modify the investigation in the Student Manual or create your own version. You and your students will naturally arrive at workable procedures for monitoring energy or biomass in plants and animals. The Student Manual is set up only as an example to introduce skills. The ultimate goal is for you and your students to become a research team carrying out an authentic research experience.
The idea of developing mathematical models can be particularly challenging. The values for energy capture and transfer measured in Procedures can serve as a foundation for building a predictive, simple spreadsheet model in the final part of the investigation. The model could focus solely on plant growth or butterfly growth, or it could model the interaction between the two.
■ Summative AssessmentThe scientific community communicates its work to peers, largely relying on three modes of formal communication: peer-reviewed papers published in journals, paper presentations, and poster sessions at professional society meetings. Emulating scientific posters and poster sessions is a particularly effective assessment technique for students’ independent work. Posters foster creativity and economy of communication. In particular, the concept of a mini-poster, as described in the blog entry of the National Association of Biology Teachers (http://www.nabt.org/blog/2010/05/04/mini-posters-authentic-peer-review-in-the-classroom/), provides a useful, interactive assessment that takes place both during the session presentation and after the poster is reviewed and revised.
T188 Investigation 10
During a scientific poster presentation, the authors stand in front of their poster and answer questions from peers about their work. The task of the teacher is to design a situation in the classroom that re-creates the poster session environment.
Generally, it is ideal to split the class into two groups: one group presenting and the other group observing or reviewing the posters. The observers use a simple rubric to summarize their evaluation of the poster under review after asking the presenter a number of questions. With a number of observers reviewing several posters, each presenter receives diverse feedback about his or her work and presentation. This serves as a very effective peer review. Before a final grade for the lab work is assigned, the student is encouraged to revise his or her poster (mini-poster) based on feedback from the observers. The two groups then switch roles for the second half of the presentation time. The effectiveness and efficiency of the process are enhanced by appropriate time management by the teacher or by a student assigned to the task. The NABT blog entry includes information and links to information about contents of a simple rubric.
■ SUPPLEMENTAL RESOURCESThe first five resources provide students and teachers with examples of research that focuses specifically on the concepts and organisms in this laboratory. The hope is that students and teachers will find inspiration for their own work in these references. The final reference (Williams and Hill, 1986) is a paper that introduces the model organism suggested for this laboratory, the Wisconsin Fast Plant.Agrawal, A. A., S. Y. Strauss, and M. J. Stout. Costs of induced responses and tolerance
to herbivory in male and female fitness components of wild radish. Evolution 53, no. 4 (August 1999): 1093–1104.
Agren, Jon, and Douglas W. Schemske. The cost of defense against herbivores: an experimental study of trichome production in brassica rapa. The American Naturalist 141, no. 2 (February 1993): 338–350.
Marshall, Carolyn B., Germán Avila-Sakar, and Edward G. Reekie. Effects of nutrient and CO2 availability on tolerance to herbivory in brassica rapa. Plant Ecology 196, no. 1 (May 2008): 1–13.
Orre, G. U .S., S. D. Wratten, M. Jonsson, and R. J. Hale. Effects of an herbivore-induced plant volatile on arthropods from three trophic levels in brassicas. Biological Control 53, no. 1 (April 2010): 62–67. http://dx.doi.org/10.1016/j.biocontrol.2009.10.010.
Siemens, David H., Shannon H. Garner, Thomas Mitchell-Olds, and Ragan M. Callaway. Cost of defense in the context of plant competition: brassica rapa may grow and defend. Ecology 83, no. 2 (February 2002): 505–517.
Williams, Paul H., and Curtis B. Hill. Rapid-cycling populations of brassica. Science 232, no. 4756 (June 1986): 1385–1389.
BigIdea
Investigation 10 S125
Interactions 4investigation 10
eneRgY DYnaMiCsWhat factors govern energy capture, allocation, storage, and transfer between producers and consumers in a terrestrial ecosystem?
■■ BACKGROUNDAlmost all life on this planet is powered, either directly or indirectly, by sunlight. Energy captured from sunlight drives the production of energy-rich organic compounds during the process of photosynthesis. These organic compounds create biomass. The net amount of energy captured and stored by the producers in a system is the system’s net productivity. Gross productivity is a measure of the total energy captured. In terrestrial systems, plants play the role of producers. Plants allocate that biomass (energy) to power their life processes or to store energy. Different plants have different strategies of energy allocation that reflect their role in various ecosystems. For example, annual weedy plants allocate a larger percentage of their biomass production to reproductive processes and seeds than do slower growing perennials. As plants, the producers are consumed or decomposed, and their stored chemical energy powers additional individuals, the consumers, or trophic levels of the biotic community. Biotic systems run on energy much as economic systems run on money. Energy is generally in limited supply in most communities. Energy dynamics in a biotic community is fundamental to understanding ecological interactions.
To model ecosystem energy dynamics, you will estimate the net primary productivity (NPP) of Wisconsin Fast Plants (the producers) growing under lights and the flow of energy from plants to cabbage white butterfly larvae (the consumers) as the larvae eat cabbage-family plants.
The following exercises describe skills and methods for estimating energy flow in a terrestrial ecosystem. Note and record any questions that occur to you as you work through this activity.
Questions might include the following:• What kinds of things affect plant productivity, the growth of cabbage white butterfly
larvae, or the interactions of these organisms?
• How do you keep track of energy as it moves through the biological system? Can the techniques used for tracking energy be improved?
• What is the role of energy in ecosystems?
3p0
S126■■Investigation 10
One or more of these questions will help guide you through the final part of this laboratory, where you are expected to carry out your own research project based on one of your questions.
■■ Learning■Objectives• To design and conduct an experiment to investigate a question about energy capture
and flow in an ecosystem
• To explain community/ecosystem energy dynamics, including energy flow, NPP, and primary and secondary producers/consumers
• To predict interspecific ecological interactions and their effects
• To use mathematical analyses in energy accounting and community modeling
• To make the explicit connection between biological content and the investigative experience
■■ General■Safety■Precautions• Cabbage white butterflies (Pieris rapae) are listed as a pest species by the USDA.
Therefore, no butterflies or larvae raised in the laboratory should be released to the wild.
• Euthanize the butterflies or larvae by freezing them when your investigation is complete. The plants and soil can simply be discarded.
• Disease outbreaks are common in cultured populations of organisms. Although the diseases associated with the organisms in this investigation are not dangerous to humans, it is important to maintain cleanliness in the laboratory and of your experimental equipment to minimize possible impacts on the study caused by disease.
• Long-term culturing for plants or butterflies requires cleanliness. Be sure to clean all culturing chambers and wipe them down with dilute Clorox (and dry completely) before starting another generation of plants or butterflies. Use new materials if you have any doubts.
• Cultures involve artificial light sources and liquids; caution should be exercised to keep the two separate.
Investigation 10 S127
big iDea 4: inteRaCtions
■■ THE■INVESTIGATIONS
■■ Getting■StartedThese questions and tasks are designed to help you understand energy dynamics and prepare for your investigations.
1.The economy of a business or household is somewhat like the energetics of a biological community. A well-run household or business creates a budget based on a careful accounting of money coming in and money going out. Likewise, the energy dynamics of a biological community can be modeled by accounting for the energy coming in and going out through different members of the community. Keeping track of money is relatively straightforward — you count it. You count how much money is coming in and how much is going to various expenses and savings. How do you keep track of energy in living organisms? It is a challenge. Producers capture light energy and convert it into chemical energy stored in energy-rich molecules. These molecules have mass, so the energy in biological systems can be indirectly measured by mass — biomass. With your lab team, take a moment to brainstorm how you can account for energy use and, in a biological community, transfer it in a manner similar to the ways in which people account for money.
2.This investigation requires you to take care of and maintain healthy populations of living organisms — plants and animals. In fact, before you begin this investigation, you will need to start both plant and animal cultures. Wisconsin Fast Plants and cabbage white butterflies are both easily raised in the classroom or laboratory. Neither takes up much time or equipment, but they both need to be tended regularly. As a lab team, discuss the care and maintenance of the organisms you use in this lab. Prepare a schedule and divide up responsibilities for long-term care and maintenance. (This includes taking care of animal wastes.) Check out online information on care and maintenance of the organisms you and your teacher select for this investigation at http://fastplants.ning.com/video/2038532:Video:13 and http://fastplants.ning.com/video/juan-enriquez-wants-to-grow. See the butterfly life cycle in Figure 1.
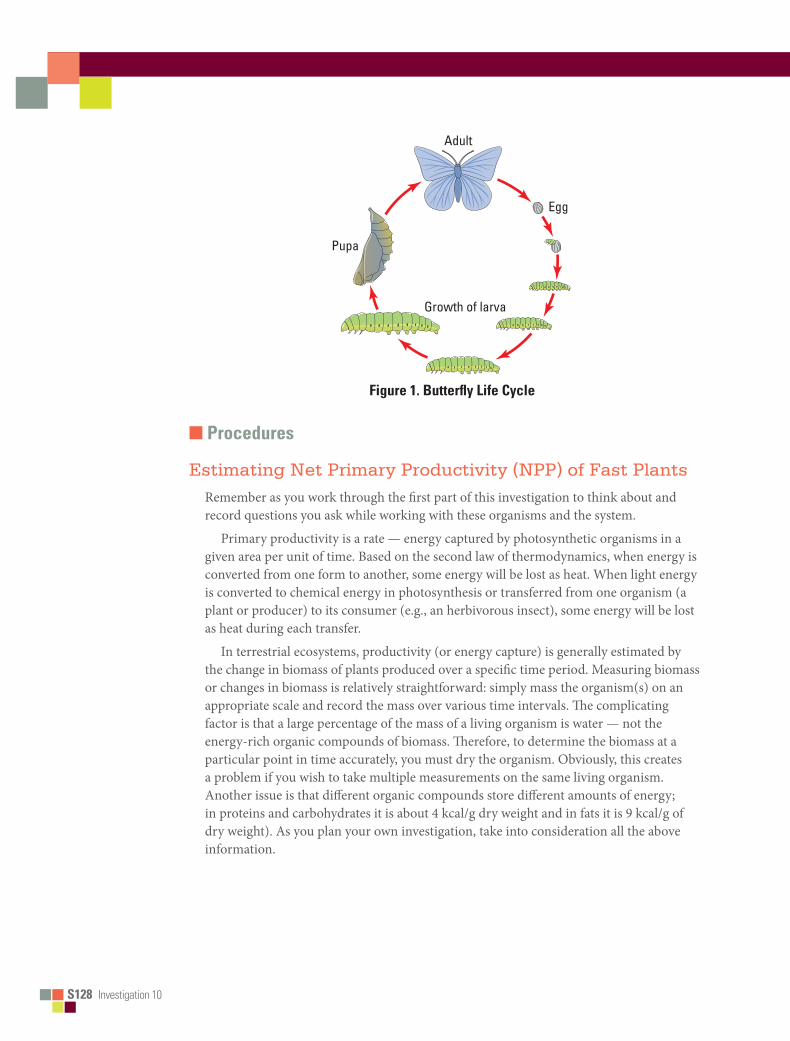
S128■■Investigation 10
Adult
Egg
Pupa
Growth of larva
Figure■1.■Butterfly■Life■Cycle
■■ Procedures
Estimating Net Primary Productivity (NPP) of Fast PlantsRemember as you work through the first part of this investigation to think about and record questions you ask while working with these organisms and the system.
Primary productivity is a rate — energy captured by photosynthetic organisms in a given area per unit of time. Based on the second law of thermodynamics, when energy is converted from one form to another, some energy will be lost as heat. When light energy is converted to chemical energy in photosynthesis or transferred from one organism (a plant or producer) to its consumer (e.g., an herbivorous insect), some energy will be lost as heat during each transfer.
In terrestrial ecosystems, productivity (or energy capture) is generally estimated by the change in biomass of plants produced over a specific time period. Measuring biomass or changes in biomass is relatively straightforward: simply mass the organism(s) on an appropriate scale and record the mass over various time intervals. The complicating factor is that a large percentage of the mass of a living organism is water — not the energy-rich organic compounds of biomass. Therefore, to determine the biomass at a particular point in time accurately, you must dry the organism. Obviously, this creates a problem if you wish to take multiple measurements on the same living organism. Another issue is that different organic compounds store different amounts of energy; in proteins and carbohydrates it is about 4 kcal/g dry weight and in fats it is 9 kcal/g of dry weight). As you plan your own investigation, take into consideration all the above information.
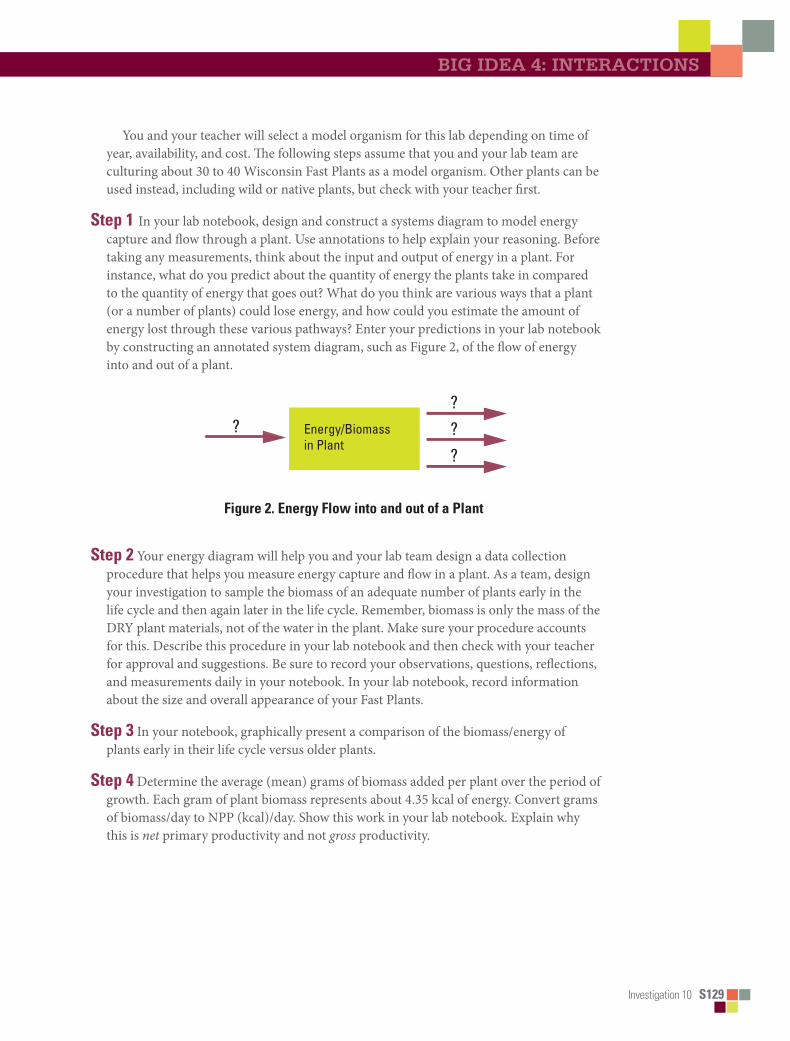
Investigation 10 S129
big iDea 4: inteRaCtions
You and your teacher will select a model organism for this lab depending on time of year, availability, and cost. The following steps assume that you and your lab team are culturing about 30 to 40 Wisconsin Fast Plants as a model organism. Other plants can be used instead, including wild or native plants, but check with your teacher first.
Step■1 In your lab notebook, design and construct a systems diagram to model energy capture and flow through a plant. Use annotations to help explain your reasoning. Before taking any measurements, think about the input and output of energy in a plant. For instance, what do you predict about the quantity of energy the plants take in compared to the quantity of energy that goes out? What do you think are various ways that a plant (or a number of plants) could lose energy, and how could you estimate the amount of energy lost through these various pathways? Enter your predictions in your lab notebook by constructing an annotated system diagram, such as Figure 2, of the flow of energy into and out of a plant.
Energy/Biomass in Plant
? ??
?
Energy/Biomass Butterfly Larvae
? ??
?
Figure■2.■Energy■Flow■into■and■out■of■a■Plant■
Step■2 Your energy diagram will help you and your lab team design a data collection procedure that helps you measure energy capture and flow in a plant. As a team, design your investigation to sample the biomass of an adequate number of plants early in the life cycle and then again later in the life cycle. Remember, biomass is only the mass of the DRY plant materials, not of the water in the plant. Make sure your procedure accounts for this. Describe this procedure in your lab notebook and then check with your teacher for approval and suggestions. Be sure to record your observations, questions, reflections, and measurements daily in your notebook. In your lab notebook, record information about the size and overall appearance of your Fast Plants.
Step■3 In your notebook, graphically present a comparison of the biomass/energy of plants early in their life cycle versus older plants.
Step■4 Determine the average (mean) grams of biomass added per plant over the period of growth. Each gram of plant biomass represents about 4.35 kcal of energy. Convert grams of biomass/day to NPP (kcal)/day. Show this work in your lab notebook. Explain why this is net primary productivity and not gross productivity.
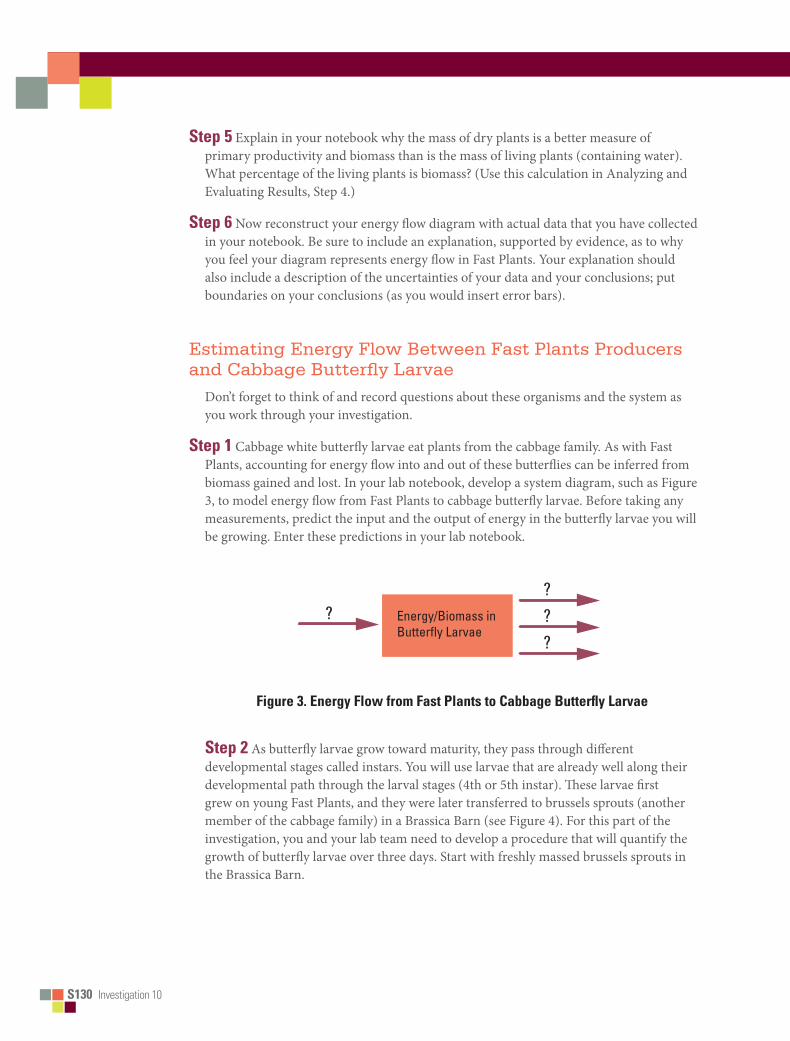
S130■■Investigation 10
Step■5 Explain in your notebook why the mass of dry plants is a better measure of primary productivity and biomass than is the mass of living plants (containing water). What percentage of the living plants is biomass? (Use this calculation in Analyzing and Evaluating Results, Step 4.)
Step■6 Now reconstruct your energy flow diagram with actual data that you have collected in your notebook. Be sure to include an explanation, supported by evidence, as to why you feel your diagram represents energy flow in Fast Plants. Your explanation should also include a description of the uncertainties of your data and your conclusions; put boundaries on your conclusions (as you would insert error bars).
Estimating Energy Flow Between Fast Plants Producers and Cabbage Butterfly Larvae
Don’t forget to think of and record questions about these organisms and the system as you work through your investigation.
Step■1 Cabbage white butterfly larvae eat plants from the cabbage family. As with Fast Plants, accounting for energy flow into and out of these butterflies can be inferred from biomass gained and lost. In your lab notebook, develop a system diagram, such as Figure 3, to model energy flow from Fast Plants to cabbage butterfly larvae. Before taking any measurements, predict the input and the output of energy in the butterfly larvae you will be growing. Enter these predictions in your lab notebook.
Energy/Biomass in Butterfly Larvae
? ??
?
Figure■3.■Energy■Flow■from■Fast■Plants■to■Cabbage■Butterfly■Larvae
■Step■2 As butterfly larvae grow toward maturity, they pass through different developmental stages called instars. You will use larvae that are already well along their developmental path through the larval stages (4th or 5th instar). These larvae first grew on young Fast Plants, and they were later transferred to brussels sprouts (another member of the cabbage family) in a Brassica Barn (see Figure 4). For this part of the investigation, you and your lab team need to develop a procedure that will quantify the growth of butterfly larvae over three days. Start with freshly massed brussels sprouts in the Brassica Barn.
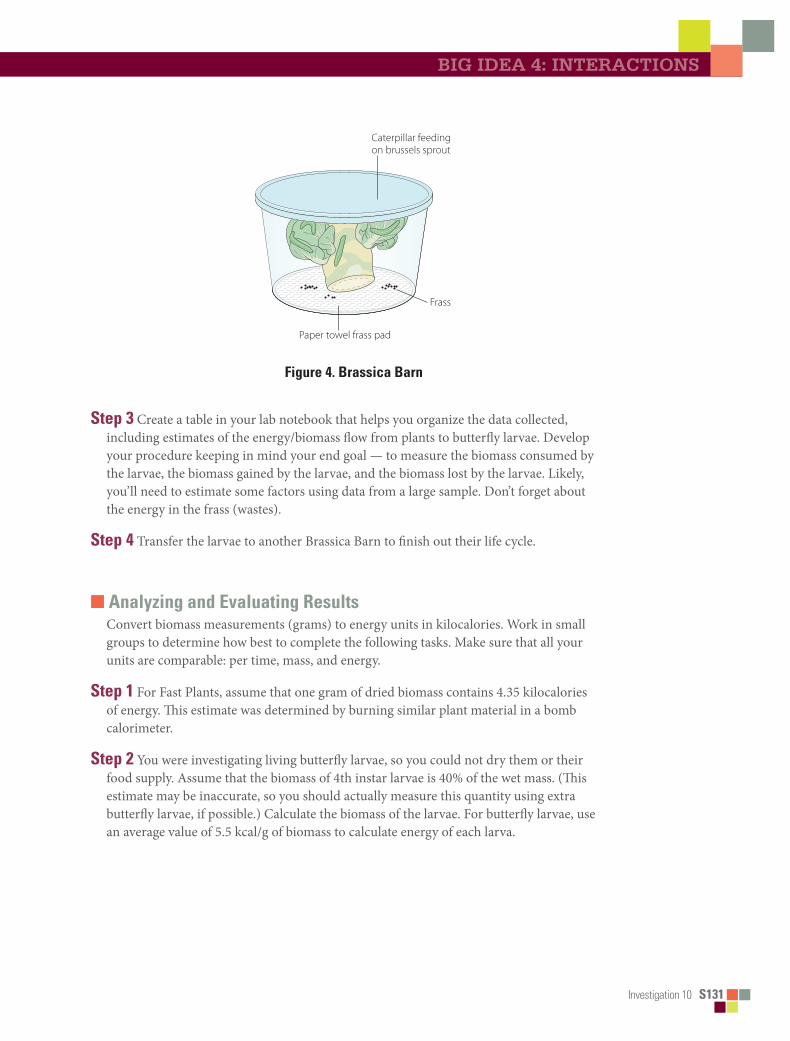
Investigation 10 S131
big iDea 4: inteRaCtions
Bio_S_Lab10_01
Caterpillar feedingon brussels sprout
Frass
Paper towel frass pad
Figure■4.■Brassica■Barn■
Step■3 Create a table in your lab notebook that helps you organize the data collected, including estimates of the energy/biomass flow from plants to butterfly larvae. Develop your procedure keeping in mind your end goal — to measure the biomass consumed by the larvae, the biomass gained by the larvae, and the biomass lost by the larvae. Likely, you’ll need to estimate some factors using data from a large sample. Don’t forget about the energy in the frass (wastes).
Step■4 Transfer the larvae to another Brassica Barn to finish out their life cycle.
■■ Analyzing■and■Evaluating■ResultsConvert biomass measurements (grams) to energy units in kilocalories. Work in small groups to determine how best to complete the following tasks. Make sure that all your units are comparable: per time, mass, and energy.
Step■1 For Fast Plants, assume that one gram of dried biomass contains 4.35 kilocalories of energy. This estimate was determined by burning similar plant material in a bomb calorimeter.
Step■2 You were investigating living butterfly larvae, so you could not dry them or their food supply. Assume that the biomass of 4th instar larvae is 40% of the wet mass. (This estimate may be inaccurate, so you should actually measure this quantity using extra butterfly larvae, if possible.) Calculate the biomass of the larvae. For butterfly larvae, use an average value of 5.5 kcal/g of biomass to calculate energy of each larva.

S132■■Investigation 10
Step■3 To determine the energy content in the larval frass, use 4.76 kcal of energy/g of frass. Calculate the frass lost per individual larva.
Step■4 To determine the energy content of the brussels sprouts eaten by each larva, convert the wet mass of the sprout to dry mass and multiply by 4.35 kcal/g. Use the estimated percentage of biomass (dry mass) in fresh Fast Plants calculated in estimating the Fast Plants’ net primary productivity (NPP), Step 5 on page S130, to estimate the biomass of each brussels sprout.
Step■5 These procedures are similar to an energy audit. Because energy is neither created nor destroyed, you must account for all energy in the system. (That is why you need to determine frass mass.) Combine your two earlier energy flow diagrams into one, and now include all the information that you measured. For those energy pathways that you did not explicitly measure, provide an estimated energy quantity. For instance, the amount of light energy in the system is more difficult to estimate. What other parts of the energy flow diagram could you not actually measure?
Step■6 Graph your results. For the plants and for the butterfly larvae, design and construct appropriate graphs of your results. Enter sketches of these graphs in your lab notebook and prepare more finished copies for your mini-poster presentation when you complete this lab. If you use bar graphs for illustrating the means, standard error bars should be included to display the range of the data. In your notebook (and mini-poster presentation), describe the data and their presentation. Follow that with conclusions that you can support with your data about energy capture and flow in this artificial lab community.
■■ Designing■and■Conducting■Your■InvestigationIn the previous procedures, you began to develop your skills by applying methods to the problem of energy capture and flow in an ecosystem. You were encouraged to note and record questions about this system as you worked through the investigation. Now it is time to select one of those questions, propose your hypothesis, design your investigation, and carry it out. Be sure to connect your work to your overall understanding of energy and ecosystems.
The following are questions that could be investigated; however, you should have developed your own question(s) and considered a possible investigation(s).• Do all plants have the same percentage of biomass?
• Is the percentage of biomass the most important characteristic of a plant in terms of its effect on the growth of an animal?
• How do plants with different life strategies allocate biomass in different organs?
• How much is allocated to reproduction?
• How much energy is allocated to plant defense?
• How much energy does it cost an animal to process different plant sources?

Investigation 10 S133
big iDea 4: inteRaCtions
Review and consolidate your questions into a list of possibilities. Consult with your teacher and other students. After choosing your question, hypothesis, and design, submit the plan (proposal) for your investigation to your teacher for approval. Be sure to refer to the rubric provided by your teacher that will be used to evaluate your work. Consider working as a team on a single question to reduce your overall workload.
Step■1 Conduct your investigation or construct and test your mathematical model.
Step■2 Prepare a mini-poster that addresses the requirements outlined in the rubric.
Step■3 Present your mini-poster to your peers and invited guests in class. Encourage your peers to review and critique your work based on the rubric guidelines. Use those reviews to improve your mini-poster after the presentation. Your teacher will use the same rubric, along with your lab notebook, to determine your final grade for this investigation.

This page is intentionally left blank.
Investigation 11 T189
BigIdeaInteractions 4investigation 11
tRansPiRation*What factors, including environmental variables, affect the rate of transpiration in plants?
■ BACKGROUNDCells and organisms must exchange matter with the environment to grow, reproduce, and maintain organization, and the availability of resources influences responses and activities. For example, water and macronutrients are used to synthesize new molecules, and, in plants, water is essential for photosynthesis. Organisms have evolved various mechanisms for accumulating sufficient quantities of water, ions, and other nutrients and for keeping them properly balanced to maintain homeostasis.
In general, animals possess one or more mechanisms, such as those involved in excretion, that let them ingest solutions of nutrients and transport and/or eliminate any excess ions or water. However, plants take a different approach; they absorb and transport water, nutrients, and ions from the surrounding soil via osmosis, diffusion, and active transport. Once water and dissolved nutrients have entered the root xylem, they are transported upward to the stems and leaves as part of the process of transpiration (the evaporation of water from the plant surface). The amount of water needed daily by plants for the growth and maintenance of tissues is small in comparison to the amount that is lost through transpiration. Too much water loss can be detrimental to plants; they can wilt and die.
The transport of water upward from roots to shoots in the xylem is governed by differences in water (or osmotic) potential, and these differences account for water movement from cell to cell or over long distances in the plant. Several factors, including environmental pressure and solute concentration, contribute to water potential, with water always moving from an area of high water potential (higher free energy, more water) to lower potential (less free energy, less water). The process is facilitated by osmosis, root pressure, and the physical and chemical properties of water. Transpiration creates a lower osmotic potential in the leaf, and the TACT (transpiration, adhesion, cohesion, and tension) mechanism describes the forces that move water and dissolved nutrients up the xylem, as modeled in Figure 1.
* Transitioned from the AP Biology Lab Manual (2001)
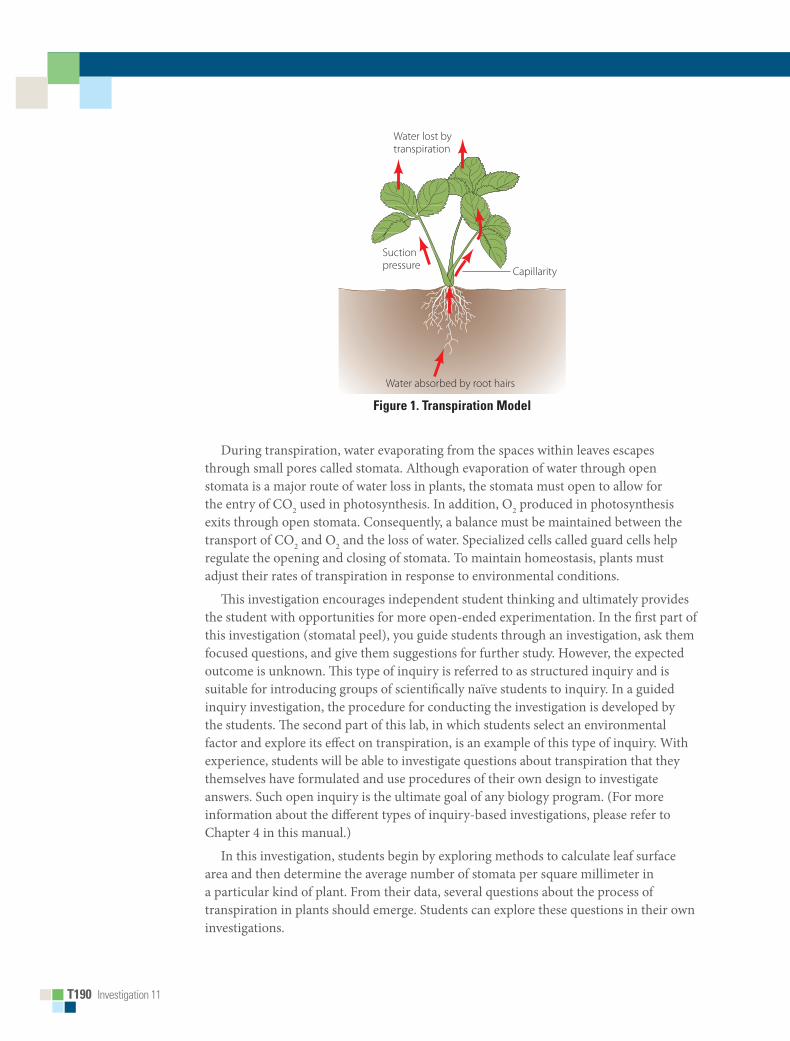
T190 Investigation 11
Bio_T_Lab11_01
Water lost bytranspiration
Water absorbed by root hairs
Suctionpressure Capillarity
Figure 1. Transpiration Model
During transpiration, water evaporating from the spaces within leaves escapes through small pores called stomata. Although evaporation of water through open stomata is a major route of water loss in plants, the stomata must open to allow for the entry of CO2 used in photosynthesis. In addition, O2 produced in photosynthesis exits through open stomata. Consequently, a balance must be maintained between the transport of CO2 and O2 and the loss of water. Specialized cells called guard cells help regulate the opening and closing of stomata. To maintain homeostasis, plants must adjust their rates of transpiration in response to environmental conditions.
This investigation encourages independent student thinking and ultimately provides the student with opportunities for more open-ended experimentation. In the first part of this investigation (stomatal peel), you guide students through an investigation, ask them focused questions, and give them suggestions for further study. However, the expected outcome is unknown. This type of inquiry is referred to as structured inquiry and is suitable for introducing groups of scientifically naïve students to inquiry. In a guided inquiry investigation, the procedure for conducting the investigation is developed by the students. The second part of this lab, in which students select an environmental factor and explore its effect on transpiration, is an example of this type of inquiry. With experience, students will be able to investigate questions about transpiration that they themselves have formulated and use procedures of their own design to investigate answers. Such open inquiry is the ultimate goal of any biology program. (For more information about the different types of inquiry-based investigations, please refer to Chapter 4 in this manual.)
In this investigation, students begin by exploring methods to calculate leaf surface area and then determine the average number of stomata per square millimeter in a particular kind of plant. From their data, several questions about the process of transpiration in plants should emerge. Students can explore these questions in their own investigations.
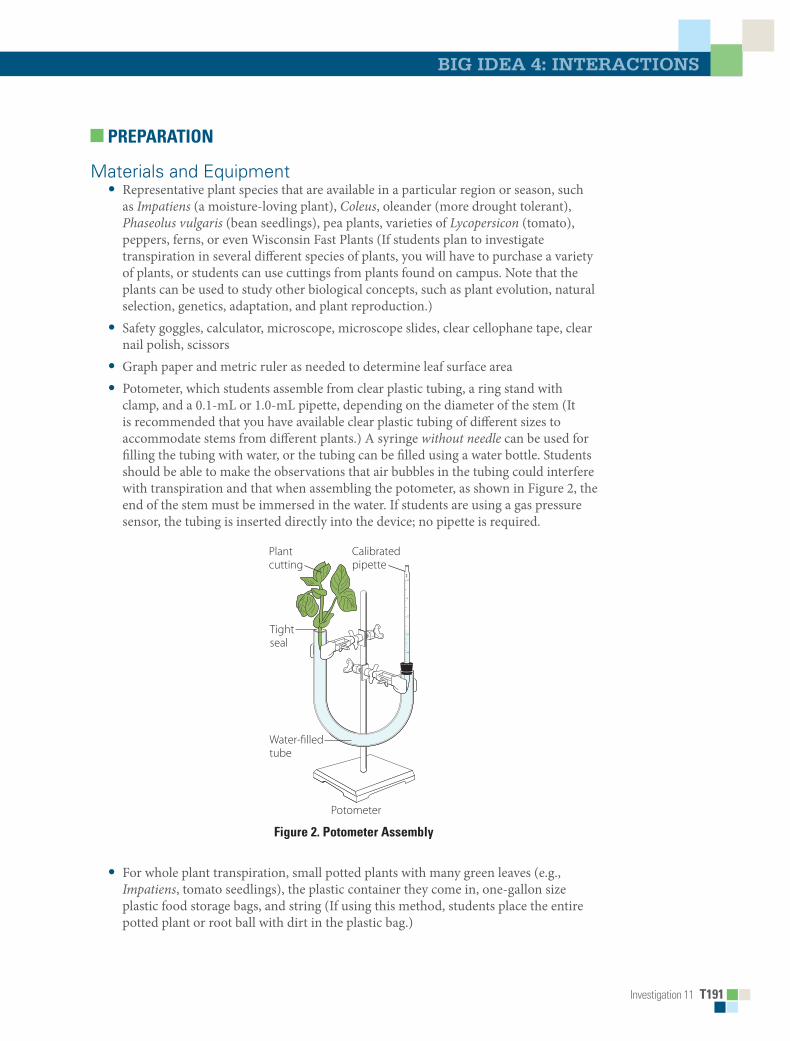
Investigation 11 T191
Big idea 4: inteRactions
PREPARATION
Materials and Equipment• Representative plant species that are available in a particular region or season, such
as Impatiens (a moisture-loving plant), Coleus, oleander (more drought tolerant), Phaseolus vulgaris (bean seedlings), pea plants, varieties of Lycopersicon (tomato), peppers, ferns, or even Wisconsin Fast Plants (If students plan to investigate transpiration in several different species of plants, you will have to purchase a variety of plants, or students can use cuttings from plants found on campus. Note that the plants can be used to study other biological concepts, such as plant evolution, natural selection, genetics, adaptation, and plant reproduction.)
• Safety goggles, calculator, microscope, microscope slides, clear cellophane tape, clear nail polish, scissors
• Graph paper and metric ruler as needed to determine leaf surface area• Potometer, which students assemble from clear plastic tubing, a ring stand with
clamp, and a 0.1-mL or 1.0-mL pipette, depending on the diameter of the stem (It is recommended that you have available clear plastic tubing of different sizes to accommodate stems from different plants.) A syringe without needle can be used for filling the tubing with water, or the tubing can be filled using a water bottle. Students should be able to make the observations that air bubbles in the tubing could interfere with transpiration and that when assembling the potometer, as shown in Figure 2, the end of the stem must be immersed in the water. If students are using a gas pressure sensor, the tubing is inserted directly into the device; no pipette is required.
Bio_T_Lab11_02
0
mm
1
2
3
4
5
Calibratedpipette
Plantcutting
Tightseal
Water-filledtube
Potometer
Figure 2. Potometer Assembly
• For whole plant transpiration, small potted plants with many green leaves (e.g., Impatiens, tomato seedlings), the plastic container they come in, one-gallon size plastic food storage bags, and string (If using this method, students place the entire potted plant or root ball with dirt in the plastic bag.)
T192 Investigation 11
• Fan, heat lamp, water, small plastic bag, spray bottle with water, salt, and other chemicals provided by you
• Petroleum jelly to make an airtight seal between the cut end of the stem and tubing filled with water (You can also use small clamps to seal without the “goop.”)
If students choose to consider an environmental variable for which you don’t have materials available, they will ask for advice.
■ Timing and Length of LabThis investigation requires approximately four lab periods of about 45 minutes each. This includes one period for students to calculate leaf surface area and the number of stomata, one period for students to design an experiment(s), a minimum of one period to conduct an experiment(s), and one period for students to discuss and share their results and conclusions with the class. (If students have prepared and examined a stomatal peel in a prerequisite biology course, they might be able to skip this part of the investigation.)
If students are using a potometer method to determine transpiration rate(s), data collected over a 24-hour period provide more quantifiable results; if using the whole plant method, students need to determine the mass of their plant(s) for several days. If time is an issue, the prelab and summative assessments can be assigned for homework.
Students can work in pairs or small groups to accommodate different class sizes.
■ Safety and Housekeeping• Remind students to be careful when assembling their equipment and when using a
razor blade or scalpel to cut the stem of their plant cutting to a 45° angle. • Students should wear safety goggles while conducting their experiments. • Nail polish is toxic by ingestion and inhalation; students should also avoid eye contact
with it. • Plant cuttings can be disposed of in the trash, and any paper waste should be recycled. • Plastic tubing and pipettes can be reused. • If a syringe is used to assemble the potometer, make sure the needle is removed. • Students should always be supervised while working in the lab.
■ ALIGNMENT TO THE AP BIOLOGY CURRICULUM FRAMEWORKThis investigation can be conducted during the study of concepts pertaining to cellular processes (big idea 2) or interactions (big idea 4). In addition, some questions raised can connect to evolution and natural selection (big idea 1). As always, it is important to make connections between big ideas and enduring understandings, regardless of where in the curriculum the lab is taught. The concepts align with the enduring understandings and learning objectives from the AP Biology Curriculum Framework, as indicated below.
Investigation 11 T193
Big idea 4: inteRactions
■ Enduring Understandings• 1A2: Natural selection acts on phenotypic variations in populations.• 2A3: Organisms must exchange matter with the environment to grow, reproduce, and
maintain organization.• 2B1: Cell membranes are selectively permeable due to their structure.• 2B2: Growth and dynamic homeostasis are maintained by the constant movement of
molecules across membranes.• 2D1: All biological systems from cells and organisms to populations, communities,
and ecosystems are affected by complex biotic and abiotic interactions involving the exchange of matter and free energy.
• 4A4: Organisms exhibit complex properties due to interactions between their constituent parts.
• 4A6: Interactions among living systems and with their environment result in the movement of matter and energy.
■ Learning Objectives• The student is able to connect evolutionary changes in a population over time to a
change in the environment (1A2 & SP 7.1).• The student is able to use calculated surface area-to-volume ratios to predict which
cell(s) might eliminate wastes or procure nutrients faster by diffusion (2A3 & SP 2.2).• The student is able to justify the selection of data regarding the type of molecules that
an animal, plant, or bacterium will take up as necessary building blocks and excrete as waste products (2A3 & SP 4.1).
• The student is able to represent graphically or model quantitatively the exchange of molecules between an organism and its environment, and the subsequent use of these molecules to build new molecules that facilitate dynamic homeostasis, growth, and reproduction (2A3 & SP 1.1, SP 1.4).
• The student is able to predict the effects of change in a component(s) of a biological system on the functionality of an organism(s) (4A4 & SP 6.4).
• The student is able to apply mathematical routines to quantities that describe interactions among living systems and their environment that result in the movement of matter and energy (4A6 & SP 2.2).
• The student is able to use visual representation to analyze situations or solve problems qualitatively to illustrate how interactions among living systems and with their environment result in the movement of matter and energy (4A6 & SP 1.4).
T194 Investigation 11
■ ARE STUDENTS READY TO COMPLETE A SUCCESSFUL INQUIRY-BASED, STUDENT-DIRECTED INVESTIGATION?
Before students tackle this investigation, they should be able to demonstrate understanding of the following concepts. The concepts may be scaffolded according to level of skills and conceptual understanding. • The relationship between cell structure and function• The physical and chemical properties of water• The movement of molecules and ions across cell membranes by the processes of
osmosis, diffusion, and active transport• Photosynthesis, particularly the transport and roles of CO2, O2, and H2O• The exchange of matter between biological systems and the environment
This investigation reinforces the following skills:• Measuring distance, volume, and/or mass using the metric system• Estimating leaf surface area• Using a microscope to examine cell structure• Constructing data tables and graphs• Communicating results and conclusions
If students have not acquired these skills previously, the procedures in this lab will help them develop them.
■ Skills DevelopmentStudents will develop the following skills:• Preparing a stomatal peel using nail polish • Making a wet mount of leaf epidermal tissue for microscopy• Calculating leaf surface area and number of stomata/surface area• Assembling a potometer • Calculating transpiration rates • If equipment is available, learning how to use a gas pressure sensor and computer
interface
■ Potential ChallengesIf students have a solid understanding of the aforementioned concepts, they should be able to select an environmental variable and design an experiment around the effect of the variable on the rate of transpiration. The skills and concepts may be taught through a variety of methods in an open-inquiry investigation. Transpiration rates may be measured by several means, including the use of a potometer with or without a gas pressure sensor and computer interface or the use of the whole plant method. Only two

Investigation 11 T195
Big idea 4: inteRactions
methods are detailed, and any alternative procedure may be equally and successfully substituted.
The equipment is simple, the materials are few, and the cost is low (with the exception of the initial purchase of probes and computer interfaces, which can be used for myriad investigations). Staining of stomatal peels is not necessary; if contrast is low, direct students to adjust (close) the condenser aperture diaphragm. A typical stomatal peel prepared for observation without staining looks something like Figure 3.
©C
arol
ina
Biol
ogic
al S
uppl
y C
ompa
ny/P
hoto
take
Figure 3. Micrograph of Stomatal Peel
The potometer is easy to assemble from common materials found in a biology or physical science laboratory, and the experiments can be performed using a 0.1-mL or 1.0-mL pipette in place of a gas pressure sensor. (The size of the pipette depends on the diameter of the stem from the plant used for investigation. Some plants naturally have larger stems!)
If students are unfamiliar with the use of the gas pressure sensor and computer interface, they may have to review their use prior to collecting data. The applications of mathematics are straightforward, and it’s your choice whether you provide students with formulas, data tables, and graph paper. However, it is suggested that students develop their own visuals to record their data. It also is recommended that students help each other analyze data and present their individual/group data and conclusions to the class as a means to develop both written and verbal communication skills. Refer to Chapter 6 in this guide for suggestions for student presentations.
If using potometers, when inserting the plant cutting into the plastic tubing, students often leave a small gap between the end of the stem and the top of the column of water; the column of water must make direct contact with the xylem in the stem for transpiration to occur. Students also struggle with filling the plastic tubing with water without forming air bubbles. One trick is to attach a small plastic syringe (without a needle) to the end of the pipette with a piece of rubber tubing and use the syringe to

T196 Investigation 11
pull water up into the potometer, leaving the syringe attached to keep the water under negative tension.
Once the plant cutting is in place and the tubing/pipette completely filled with water, the syringe is carefully removed. In place of using petroleum jelly to prevent the apparatus from leaking, small, inexpensive clamps work well. If using a 0.1-mL pipette to record water loss, students can have difficulty reading the small increments on the pipette. Assembly of potometers can be challenging; as a result, you might opt to suggest that students use the whole plant method to determine transpiration rates. However, keep in mind that although students might struggle as they assemble equipment, in the process they are learning new lab skills and will experience satisfying “ah-ha” moments when they are finally successful.
Students are asked to investigate methods for calculating leaf surface area. However, it is recommended that students use the leaf tracing method described in the following paragraph. Using a common alternate method, leaf mass, presents several inherent problems. The method is dependent upon the part of the leaf from which a section is cut because leaves usually have variation in thickness; thus, the calculated surface area of a 1-cm2 section could vary significantly from one group to another. A modified leaf tracing method can be done without removing leaves from the plant, thus rendering the purchase of more plants unnecessary.
Leaf Trace Method to Calculate Leaf Surface AreaLeaf surface area may be calculated with the leaves still attached to the plant. Alternatively, students may cut off several leaves, arrange them on a piece of graph paper or grid (constructed so that a square of 4 blocks equals 1 cm2), and trace the edge pattern directly onto the graph paper. Count all the grids (squares) that are completely within the tracing and estimate the number of grids that lie partially within the tracing. The total surface area can then be calculated by dividing the total number of blocks covered by 4. Leaf surface area is recorded in cm2. Students are then asked to calculate leaf surface area in mm2.
THE INVESTIGATIONS
■ Getting Started: Prelab AssessmentYou may assign the following for homework; as a think, pair/group, share activity, in which pairs or small groups of students brainstorm ideas and then share them with other groups; or as a whole-class discussion to assess students’ understanding of key concepts pertaining to transpiration in plants:
1. If a plant cell has a lower water potential than its surrounding environment, make a prediction about the movement of water across the cell membrane. In other words, will the cell gain water or lose water? Explain your answer in the form of a diagram with annotation.

Investigation 11 T197
Big idea 4: inteRactions
2. In the winter, salt is sometimes spread over icy roads. In the spring, after the ice has melted, grass often dies near these roads. What causes this to happen? Explain your answer in the form of a diagram with annotations.
3. Prepare a thin section of stem from your plant, and then examine it under the microscope to identify the vascular tissues (xylem and phloem) and the structural differences in their cells. Describe how the observed differences in cellular structure reflect differences in function of the two types of vascular tissue.
Data Tables and ChartsIf using the gas pressure sensor to measure water loss, students might find the following tables useful for recording their data/results. However, it is recommended that students construct their own visuals, including tables and graphs, for reporting data. Although the computer interface will generate graphs on the screen, you may elect to have students draw, label, and annotate their own graph.
You may need to explain kPa. The pascal (Pa) is a unit of pressure, and there are 1,000 pascals in 1 kilopascal (kPa). One kPa is approximately the pressure exerted by a 10-g mass resting on a 1-cm2 area. If students have studied chemistry and/or physical science or physics, they may recognize that 101.3 kPa = 1 atm of pressure.
Table 1. Individual/Group Data
Test Rate
(kPa/min)
Surface Area
(cm2)
Rate/Area
(kPa/min/cm2)
Adjusted Rate
(kPa/min/cm2)
Experimental
(Experimental 2)
Control
Table 2. Class Data
Test Variable Adjusted Rate (kPa/min/cm2)
T198 Investigation 11
■ Designing and Conducting Independent InvestigationsStudents begin by investigating methods to calculate leaf surface area and then determine the average number of stomata per square millimeter in a particular kind of plant. Several questions about the process of transpiration in plants should emerge from the data, including the following:• Do all plants have stomata? Is there a relationship between the number of stomata and
the environment in which the plant evolved?• Are leaf surface area and the number of stomata related to the rate of transpiration?
What might happen to the rate of transpiration if the number of leaves or the size of leaves is reduced?
• Do all parts of a plant transpire?• Do all plants transpire at the same rate? Is there a relationship between the habitat in
which plants evolved to their rate of transpiration?• What other factors, including environmental variables, might contribute to the rate of
transpiration?• What structural features and/or physiological processes help plants regulate the
amount of water lost through transpiration? How do plants maintain the balance between the transport of CO2 and O2 and the amount of water lost through transpiration?
Students are then asked to design an experiment to investigate one or more questions, and their exploration will likely generate more questions about transpiration. For a supplemental activity, students can make thin sections of stems, identify xylem and phloem cells, and relate the function of these vascular tissues to observations made about the structure of these cells.
The lab also provides an opportunity for students to apply, review, and/or scaffold concepts they have studied previously, including the relationship between cell structure and function, evolution of plant structures, the movement of molecules and ions across cell membranes, the physical and chemical properties of water, the forces provided by differences in water potential, photosynthesis, and the exchange of matter between biological systems and the environment.
■ Summative AssessmentThe following are suggested as guidelines to assess students’ understanding of the concepts presented in the investigation, but you are encouraged to develop your own methods of postlab assessment. Some of the tasks can be assigned for homework following completion of the investigation.
1. Have the students record their experimental design, data, results, and conclusions in a lab notebook, formal lab report, or mini-poster. Students can prepare a class graph reflecting their conclusions about the effects of environmental variables on the rate of transpiration in plants. Based on the students’ product, do you think students have met the learning objectives of the investigation?

Investigation 11 T199
Big idea 4: inteRactions
2. Were the students able to construct a graph from a data table? Did they correctly label the X and Y axes and appropriately title the graph?
3. Have the students prepare a lesson on transpiration for younger students at the school, following the adage that “you can’t really learn something until you have to teach it.”
4. Have the students come up with a list of common misconceptions they had about the process of transpiration before conducting their investigations.
5. Did the students have an adequate (i.e., basic) understanding of water potential and the movement of water and nutrients across cell membranes before designing their experiment to investigate transpiration? Did the students have an adequate understanding of the physical and chemical properties of water before investigating transpiration?
6. Were the students able to determine leaf surface by using appropriate mathematical skills? Which applications of mathematical skills were challenging for the students?
7. If you used the suggested gas pressure sensor protocol, were the students able to navigate through the computer interface to the lab investigation without much difficulty? Why or why not? If the students had difficulty, ask them to teach other students how to use the equipment.
8. Have the students write one or two questions based on the concepts in this investigation that could appear on an AP Exam.
■ Where Can Students Go from Here?
The following are possible extension activities for students:
1. Investigate how guard cells control the opening and closing of stomata, including the role of abscisic acid and K+.
2. Design an experiment to investigate transpiration in two different types of plants — one that is drought tolerant and one that requires a significant amount of water. What predictions can you make about the rate of transpiration in each?
3. If you had to revise the design of your experiment, what suggestions would you make? Why would you make them?

T200 Investigation 11
■ SUPPLEMENTAL RESOURCES
■ Prelab Activitieshttp://www.cjhs.org/teacherssites/taylor/accbio/PLANTS/STOMATE%20
LAB.pdf This resource, Flinn Scientific, Bio Fax!, “Lasting Impressions: Counting Stomata,” Publication #10226, provides a quick lesson and protocol on preparing a thin section of leaf epidermis (stomatal peel) to view cell structure and stomata.
http://www.phschool.com/science/biology_place/labbench/lab1/intro.html This resource provides an interactive review of the processes of osmosis, diffusion, and active transport, including the concept of water potential. This would be a great way to introduce students to the concept of transpiration.
http://www.mhhe.com/biosci/genbio/virtual_labs/BL_10/BL_10.html In this virtual investigation, students study the process of transpiration in vascular plants and compare the rates of transpiration for several species under varying environmental conditions. This is a simple review of major concepts involved in the process of transpiration.
http://www.ucopenaccess.org/course/view.php?id=15 In these AP-level virtual investigations, students explore the major concepts of osmosis, diffusion, and transpiration. They can work through the diffusion lab as a prelab review of the principles of movement of water, ions, and molecules across cell membranes by the processes of osmosis and diffusion.
http://www.visionlearning.com/library/module_viewer.php?mid=57&l This resource provides a simple explanation of the structure of the water molecule, hydrogen bonding between water molecules, and the ways in which the molecular structure of water leads to unique properties, including adhesion and cohesion.

Investigation 11 T201
Big idea 4: inteRactions
■ Procedural Resourceshttp://www.pbs.org/teachers/connect/resources/4423/preview/ This resource
provides an alternative method for calculating leaf surface area using a geometric model. An advantage of the method is that a leaf does not have to be removed from the plant.
http://local.brookings.k12.sd.us/krscience/open/plants/Whole%20Plant%20Transpirationteacherguide.doc Using the whole plant method, this resource presents an alternative procedure to using potometers to determine transpiration rates.
■ Resources for Extensions of Investigationhttp://www.accessexcellence.org/AE/AEC/AEF/1994/case_leaf.php This
resource provides supplemental activities for students to investigate stomata and their role in transpiration in plants.
http://biology.arizona.edu/sciconn/lessons2/Loredo/Overview.htm In this resource, students initially describe differences between plants that seem healthy and those that appear unhealthy. Based on their observations, the students propose hypotheses and design and conduct experiments. The resource contains a thorough teacher’s guide, student material, an assessment piece, and student evaluation.
http://www.nature.com/nature/journal/v455/n7210/abs/nature07226.html This article, The transpiration of water at negative pressures in a synthetic tree, is a resource for teachers, and perhaps students, who want to learn more about real-world applications of transpiration, including using the principles behind transpiration for technological uses of water under tension.

This page is intentionally left blank.
BigIdea
Investigation 11 S135
Interactions 4investigation 11
tRansPiRation*
What factors, including environmental variables, affect the rate of transpiration in plants?
■■ BACKGROUNDCells and organisms must exchange matter with the environment to grow, reproduce, and maintain organization, and the availability of resources influences responses and activities. For example, water and macronutrients are used to synthesize new molecules, and, in plants, water is essential for photosynthesis. Organisms have evolved various mechanisms for accumulating sufficient quantities of water, ions, and other nutrients and for keeping them properly balanced to maintain homeostasis.
Plants absorb and transport water, nutrients, and ions from the surrounding soil via osmosis, diffusion, and active transport. Once water and dissolved nutrients have entered the root xylem, they are transported upward to the stems and leaves as part of the process of transpiration, with a subsequent loss of water due to evaporation from the leaf surface. Too much water loss can be detrimental to plants; they can wilt and die.
The transport of water upward from roots to shoots in the xylem is governed by differences in water (or osmotic) potential, with water molecules moving from an area of high water potential (higher free energy, more water) to an area of low water potential (lower free energy, less water). (You may have studied the concept of water potential in more detail when exploring the processes of osmosis and diffusion in Investigation 4 in this manual.) The movement of water through a plant is facilitated by osmosis, root pressure, and the physical and chemical properties of water. Transpiration creates a lower osmotic potential in the leaf, and the TACT (transpiration, adhesion, cohesion, and tension) mechanism describes the forces that move water and dissolved nutrients up the xylem.
* Transitioned from the AP Biology Lab Manual (2001)
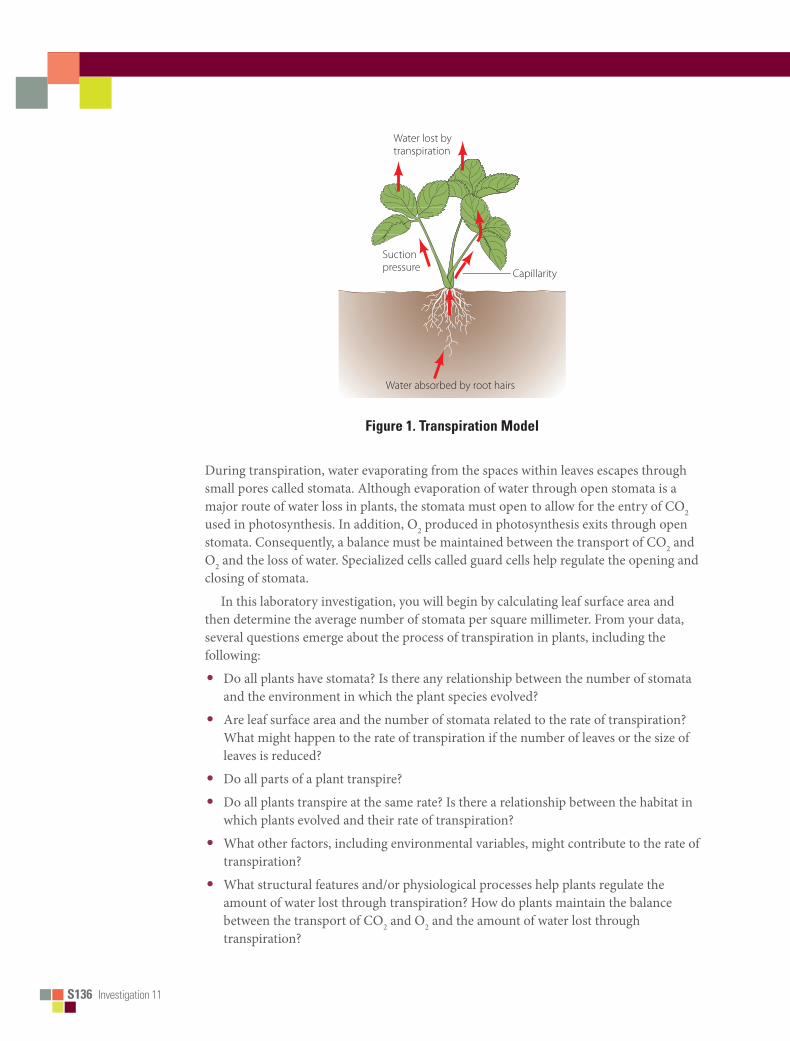
S136■■Investigation 11
Bio_T_Lab11_01
Water lost bytranspiration
Water absorbed by root hairs
Suctionpressure Capillarity
Figure■1.■Transpiration■Model
During transpiration, water evaporating from the spaces within leaves escapes through small pores called stomata. Although evaporation of water through open stomata is a major route of water loss in plants, the stomata must open to allow for the entry of CO2 used in photosynthesis. In addition, O2 produced in photosynthesis exits through open stomata. Consequently, a balance must be maintained between the transport of CO2 and O2 and the loss of water. Specialized cells called guard cells help regulate the opening and closing of stomata.
In this laboratory investigation, you will begin by calculating leaf surface area and then determine the average number of stomata per square millimeter. From your data, several questions emerge about the process of transpiration in plants, including the following:
• Do all plants have stomata? Is there any relationship between the number of stomata and the environment in which the plant species evolved?
• Are leaf surface area and the number of stomata related to the rate of transpiration? What might happen to the rate of transpiration if the number of leaves or the size of leaves is reduced?
• Do all parts of a plant transpire?
• Do all plants transpire at the same rate? Is there a relationship between the habitat in which plants evolved and their rate of transpiration?
• What other factors, including environmental variables, might contribute to the rate of transpiration?
• What structural features and/or physiological processes help plants regulate the amount of water lost through transpiration? How do plants maintain the balance between the transport of CO2 and O2 and the amount of water lost through transpiration?

Investigation 11 S137
big idea 4: inteRactions
You will then design an experiment to investigate one of these questions or a question of your own. As a supplemental activity, you can examine microscopically thin sections of stems, identify xylem and phloem cells, and relate the function of these vascular tissues to observations made about the structure of these cells.
The investigation also provides an opportunity for you to apply and review concepts you have studied previously, including the relationship between cell structure and function; osmosis, diffusion, and active transport; the movement of molecules and ions across cell membranes; the physical and chemical properties of water; photosynthesis; and the exchange of matter between biological systems and the environment.
■■ Learning■Objectives• To investigate the relationship among leaf surface area, number of stomata, and the
rate of transpiration
• To design and conduct an experiment to explore other factors, including different environmental variables, on the rate of transpiration
• To investigate the relationship between the structure of vascular tissues (xylem and phloem) and their functions in transporting water and nutrients in plants
■■ General■Safety■PrecautionsIf you investigate transpiration rates using a potometer, you should be careful when assembling your equipment and when using a razor blade or scalpel to cut the stem of a plant, cutting to a 45° angle.
When appropriate, you should wear goggles for conducting investigations. Nail polish used in the investigation is toxic by ingestion and inhalation, and you should avoid eye contact. All materials should be disposed of properly as per your teacher’s instructions.
■■ THE■INVESTIGATIONS
■■ Getting■StartedThese questions are designed to help you understand concepts related to transpiration in plants before you design and conduct your investigation(s).
1.If a plant cell has a lower water potential than its surrounding environment, make a prediction about the movement of water across the cell membrane. In other words, will the cell gain water or lose water? Explain your answer in the form of a diagram with annotations.

S138■■Investigation 11
2.In the winter, salt is sometimes spread over icy roads. In the spring, after the ice has melted, grass often dies near these roads. What causes this to happen? Explain your answer in the form of a diagram with annotations.
3.Prepare a thin section of stem from your plant and examine it under the microscope to identify the vascular tissues (xylem and phloem) and the structural differences in their cells. Describe how the observed differences in cellular structure reflect differences in function of the two types of vascular tissue.
4.If you wanted to transplant a tree, would you choose to move the tree in the winter, when it doesn’t possess any leaves but it’s cold outside, or during the summer, when the tree has leaves and it’s warm and sunny? Explain your answer.
■■ Procedure
Materials
• Living representative plant species available in your region/season, such as Impatiens (a moisture-loving plant), Coleus, oleander (more drought toler-ant), Phaseolus vulgaris (bean seed-lings), pea plants, varieties of Lycoper-sicon (tomato), peppers, and ferns
• Calculator, microscope, microscope slides, clear cellophane tape, clear nail polish, and scissors
• Additional supplies that you might need after you choose a method to determine leaf surface area (Step 1 below). Ask your teacher for advice.
Record data and any answers to questions in your lab notebooks, as instructed by your teacher.
Step■1 Form teams of two or three and investigate methods of calculating leaf surface area. (You will need to calculate leaf surface area when you conduct your experiments.) Think about and formulate answers to the following questions as you work through this activity:
a.How can you calculate the total leaf surface area expressed in cm2? In mm2?
b.How can you estimate the leaf surface area of the entire plant without measuring every leaf?
c.What predictions and/or hypotheses can you make about the number of stomata per mm2 and the rate of transpiration?
d.Is the leaf surface area directly related to the rate of transpiration?
e.What predictions can you make about the rate of transpiration in plants with smaller or fewer leaves?
f. Because most leaves have two sides, do you think you have to double your calculation to obtain the surface area of one leaf? Why or why not?

Investigation 11 S139
big idea 4: inteRactions
g.Water is transpired through stomata, but carbon dioxide also must pass through stomata into a leaf for photosynthesis to occur. There is evidence that the level of carbon dioxide in the atmosphere has not always been the same over the history of life on Earth. Explain how the presence of a higher or lower concentration of atmospheric carbon dioxide would impact the evolution of stomata density in plants.
h.Based on the data in the following table, is there a relationship between the habitat (in terms of moisture) to which the plants are adapted and the density of stomata in their leaves? What evidence from the data supports your answer?
Table■1.■Average■Number■of■Stomata■per■Square■Millimeter■(mm2)■of■Leaf■Surface■Area
PLANT IN■UPPER■EPIDERMIS IN■LOwER■EPIDERMIS
Anacharis 0 0Coleus 0 141Black Walnut 0 160Kidney Bean 40 176Nasturtium 0 130Sunflower 85 156Oats 25 23Corn 70 88Tomato 12 130Water Lily 460 0
Step■2 Make a wet mount of a nail polish stomatal peel to view leaf epidermis using the following technique:
a.Obtain a leaf. (The leaf may remain on the plant or be removed.)
b.Paint a solid patch of clear nail polish on the leaf surface being studied. Make a patch of at least one square centimeter.
c.Allow the nail polish to dry completely.
d.Press a piece of clean, clear cellophane tape to the dried nail polish patch. Using clear (not opaque) tape is essential here. You might also try pulling the peel away from the leaf without using any tape and then preparing a wet mount of the peel with a drop of water and a cover slip.
e.Gently peel the nail polish patch from the leaf by pulling a corner of the tape and peeling the nail polish off the leaf. This is the leaf impression that you will examine. (Make only one leaf impression on each side of the leaf, especially if the leaf is going to be left on a live plant.)
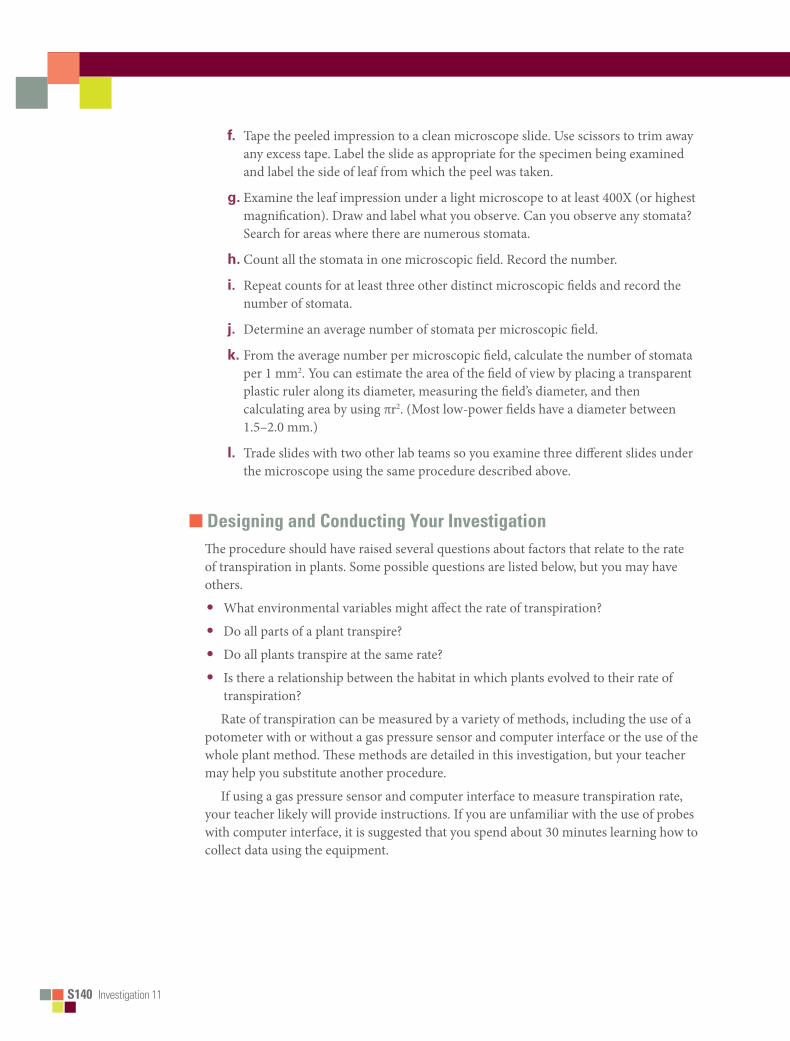
S140■■Investigation 11
f. Tape the peeled impression to a clean microscope slide. Use scissors to trim away any excess tape. Label the slide as appropriate for the specimen being examined and label the side of leaf from which the peel was taken.
g.Examine the leaf impression under a light microscope to at least 400X (or highest magnification). Draw and label what you observe. Can you observe any stomata? Search for areas where there are numerous stomata.
h.Count all the stomata in one microscopic field. Record the number.
i. Repeat counts for at least three other distinct microscopic fields and record the number of stomata.
j. Determine an average number of stomata per microscopic field.
k.From the average number per microscopic field, calculate the number of stomata per 1 mm2. You can estimate the area of the field of view by placing a transparent plastic ruler along its diameter, measuring the field’s diameter, and then calculating area by using πr2. (Most low-power fields have a diameter between 1.5–2.0 mm.)
l. Trade slides with two other lab teams so you examine three different slides under the microscope using the same procedure described above.
■■ Designing■and■Conducting■Your■InvestigationThe procedure should have raised several questions about factors that relate to the rate of transpiration in plants. Some possible questions are listed below, but you may have others.
• What environmental variables might affect the rate of transpiration?
• Do all parts of a plant transpire?
• Do all plants transpire at the same rate?
• Is there a relationship between the habitat in which plants evolved to their rate of transpiration?
Rate of transpiration can be measured by a variety of methods, including the use of a potometer with or without a gas pressure sensor and computer interface or the use of the whole plant method. These methods are detailed in this investigation, but your teacher may help you substitute another procedure.
If using a gas pressure sensor and computer interface to measure transpiration rate, your teacher likely will provide instructions. If you are unfamiliar with the use of probes with computer interface, it is suggested that you spend about 30 minutes learning how to collect data using the equipment.

Investigation 11 S141
big idea 4: inteRactions
Step■1 Design an experiment to investigate one of the aforementioned questions or one of your own questions to determine the effect of an environmental variable(s) on the rate of transpiration in plants. When identifying your design, be sure to address the following questions:
• What is the essential question being addressed?
• What assumptions are made about the questions being addressed?
• Can those assumptions be easily verified?
• Will the measurement(s) provide the necessary data to answer the question under study?
• Did you include a control in your experiment?
Step■2 Make a hypothesis/prediction about which environmental factors will have the greatest effect on transpiration rates. Be sure to explain your hypothesis.
Step■3 Conduct your experiment(s) and record data and any answers to your questions in your lab notebooks or as instructed by your teacher. Write down any additional questions that arose during this study that might lead to other investigations that you can conduct.
■■ Option■1:■Potometer with or Without Gas Pressure Sensor
Materials
• Representative plant species available in your region/season, such as Impatiens (a moisture-loving plant), Coleus, oleander (more drought toler-ant), Phaseolus vulgaris (bean seed-lings), pea plants, varieties of Lycoper-sicon (tomato), peppers, and ferns
• Potometer, which you assemble from clear plastic tubing, a ring stand with clamp, and a 0.1-mL or 1.0-mL pipette, depending on the diameter of the stem of the plant you choose. Your teacher will have several different sizes of plastic tubing available. (The tubing can be filled using a water bottle or plastic syringe without a needle.) If using a syringe, attach it to the end of the pipette and pull water into the
potometer. (Why should the tubing be free of air bubbles? Why must the stem be completely immersed in the water?) If using a gas pressure sensor, the tubing is inserted directly into the device, with no pipettes required. (The potometer assembly is illustrated in Figure 2.)
• Fan, heat lamp, water, small plastic bag, spray bottle with water, salt, and other materials provided by your teacher to simulate an environmental variable
• Petroleum jelly to make an airtight seal between the cut end of stem and tubing filled with water (You can also use small clamps to seal without the “goop.”)
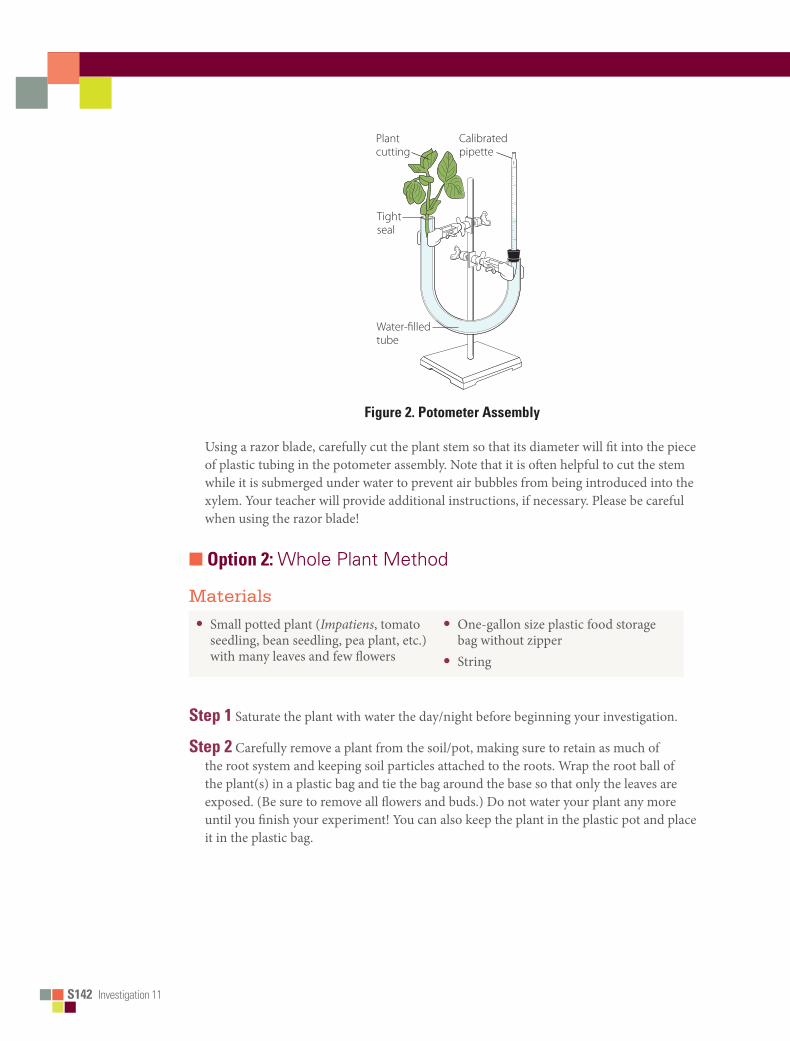
S142■■Investigation 11
Bio_T_Lab11_02
0
mm
1
2
3
4
5
Calibratedpipette
Plantcutting
Tightseal
Water-filledtube
PotometerFigure■2.■Potometer■Assembly
Using a razor blade, carefully cut the plant stem so that its diameter will fit into the piece of plastic tubing in the potometer assembly. Note that it is often helpful to cut the stem while it is submerged under water to prevent air bubbles from being introduced into the xylem. Your teacher will provide additional instructions, if necessary. Please be careful when using the razor blade!
■■ Option■2:■Whole Plant Method
Materials
• Small potted plant (Impatiens, tomato seedling, bean seedling, pea plant, etc.) with many leaves and few flowers
• One-gallon size plastic food storage bag without zipper
• String
Step■1 Saturate the plant with water the day/night before beginning your investigation.
Step■2 Carefully remove a plant from the soil/pot, making sure to retain as much of the root system and keeping soil particles attached to the roots. Wrap the root ball of the plant(s) in a plastic bag and tie the bag around the base so that only the leaves are exposed. (Be sure to remove all flowers and buds.) Do not water your plant any more until you finish your experiment! You can also keep the plant in the plastic pot and place it in the plastic bag.

Investigation 11 S143
big idea 4: inteRactions
Step■3 Determine the mass of each plant and then its mass for several days under your environmental condition(s).
Step■4 Record your data in your lab notebook or as instructed by your teacher.
■■ Calculations:■■Determining Surface Area and Transpiration Rates
Step■1 In the first part of this lab, you were asked to investigate methods to calculate leaf surface area and the surface area of all the leaves on a plant or plant cutting (depending on your experimental setup). Your teacher may suggest a particular method. Determine the total surface area of the leaves in cm2 and record the value.
Step■2 Calculate the rate of transpiration/surface area. If you are using a gas pressure sensor to collect data, you can express these rate values as kPa/min/cm2, where kPa (kilopascal) is a unit of pressure. Record the rate.
Step■3 After the entire class agrees on an appropriate control, subtract the control rate from the experimental value. Record this adjusted rate.
Step■4 Record the adjusted rate for your experimental test on the board to share with other lab groups. Record the class results for each of the environmental variables investigated.
Step■5 Graph the class results to show the effects of different environmental variables on the rate of transpiration. You may need to convert data to scientific notation with all numbers reported to the same power of 10 for graphing purposes.
Step■6 Your teacher may suggest you perform statistical analysis (e.g., a T-test) of your data, comparing results of experimental variable(s) to controls.
■■ Analyzing■Results
1.How was the rate of transpiration affected by your choice of experimental variable as compared to the control?
2.Think of a way you can effectively communicate your results to other lab groups. By comparing results and conclusions, explain how changes or variables in environmental conditions affect transpiration rates.
3.Based on data collected from different lab groups, which environmental variable(s) resulted in the greatest rate of water loss through transpiration? Explain why this factor might increase water loss when compared to other factors.
4.Why did you need to calculate leaf surface area to determine the rate(s) of transpiration?

S144■■Investigation 11
5.What structural or physiological adaptations enable plants to control water loss? How might each adaptation affect transpiration?
6.Make a prediction about the number of stomata in a leaf and the rate of transpiration. What type(s) of experiments could you conduct to determine the relationship between the number of stomata and the rate of transpiration?
7.Create a diagram with annotation to explain how the TACT (transpiration, adhesion, cohesion, tension) mechanism enables water and nutrients to travel up a 100-ft. tree. Predict how a significant increase in ambient (environmental) temperature might affect the rate of transpiration in this tree. Explain your prediction in terms of TACT and the role of guard cells in regulating the opening and closing of stomata.
■■ Evaluating■Results
1.Was your initial hypothesis about the effect of your environmental variable on the rate of transpiration supported by the data you collected? Why or why not?
2.What were some challenges you had in performing your experiment? Did you make any incorrect assumptions about the effect of environmental variables on the rate(s) of transpiration?
3.Were you able to perform without difficulty the mathematical routines required to analyze your data? Which calculations, if any, were challenging or required help from your classmates or teacher?
■■ where■Can■You■Go■from■Here?■
1.Investigate how guard cells control the opening and closing of stomata, including the role of abscisic acid and K+.
2.Design an experiment to investigate transpiration in two different types of plants — one that is drought tolerant and one that requires a significant amount of water. What predictions can you make about the rate of transpiration in each?
3.If you had to revise the design of your experiment, what suggestions would you make? Why would you make them?
4.If your investigations generated other questions that you might want to research, ask your teacher if you can conduct other experiments.
BigIdea4
Investigation 12 T203
Interactions
investigation 12
FRUit FLY BeHavioRWhat environmental factors trigger a fruit fly response?
■ BACKGROUNDDrosophila melanogaster is an organism that has been studied in the scientific community for more than a century. Thomas Hunt Morgan began using Drosophila melanogaster for genetic studies in 1907. The common fruit fly lives throughout the world and feeds on the fungi of rotting fruit. It is a small fly, and one could question why so much time and effort have been directed to this organism. It is about the size of President Roosevelt’s nose on a dime, but despite its small size, the fly is packed with interesting physical and behavioral characteristics. Its genome has been sequenced, its physical characteristics have been charted and mutated, its meiotic processes and development have been investigated, and its behavior has been the source of many experiments. Because of its scientific usefulness, Drosophila is a model research organism. Its name is based on observations about the fly; the fly follows circadian rhythms that include sleeping during the dark and emerging as an adult from a pupa in the early morning. This latter behavior gave rise to the Drosophila genus name, which means “lover of dew.” The explanation for the species name melanogaster should be clear after observing the fly’s physical features. It has a black stomach. No doubt the dew-loving, black-bellied fly will continue to make contributions to the scientific community and to student projects.
These investigations explore the environmental choices that fruit flies make. A choice chamber is designed to give fruit flies two choices during any one test, although students could also think about how to build an apparatus that would give fruit flies more than two choices. Adult fruit flies are attracted to substances that offer food or an environment in which to lay eggs and develop larvae. Typically those environments are rotting or fermenting fruit. Adult fruit flies are attracted to bright light, and their larvae move away from bright light. Adult fruit flies also demonstrate a negative geotaxis; they climb up in their chambers or vials against gravity. Movement toward a substance is a positive taxis. Consistent movement or orientation away from a substance is a negative taxis. In most cases, the experiments done in the choice chamber will be chemotactic experiments, as indicated by the number of flies that collect on one end of the chamber or another in response to a chemical stimulus. At some point, students may wish to investigate if the chemotactic response is greater than a geotactic or phototactic

T204 Investigation 12
response. The flies could also exhibit a behavior that is not oriented toward or away from the stimulus; rather, the stimulus elicits a random response. Such behavior would be considered a kinesis.
As students investigate the choices of fruit flies, it will be important for them to identify the ingredients in the household materials they are testing. Can they discover a pattern to the behavior of the flies? Are there substances that can attract fruit flies down in a vertically held chamber? If fruit flies are attracted to a picnic table or a counter in the kitchen, what attracts them? Are they attracted to the capers in a salad or the fruit on the counter? Are the fruit flies attracted more to light than to the picnic items? The substances to which fruit flies are attracted, such as capers or mustard, typically share one ingredient, vinegar. However, it is important NOT to tell students about vinegar or alcohol before they complete the lab. The investigation will allow them to discover a pattern in fruit fly behavior, so help them look for patterns in the data that they collect using the choice chambers. Which of the three responses — geotaxis, chemotaxis, or phototaxis — is the strongest for the flies that the students are using?
Although some activities in this investigation are open inquiry, the components in the beginning are structured inquiry, allowing for students to learn and practice key skills before they move on to more independent research. In structured inquiry, you provide a general procedure, but the expected outcome is unknown; once students are comfortable with techniques and the construction of the choice chambers, they can design and conduct their own investigation based on questions they have raised. Structured inquiry is particularly suited for introducing scientifically naïve students to inquiry.
■ PREPARATION
Materials and Equipment
• Fruit fly cultures (approximately 30–40 fruit flies per lab group each day)• Choice chambers constructed from two matching plastic water bottles and caps per
lab group• Extra caps to fit water bottles (at least six extra caps per lab group)• Cotton balls with tape to secure the cotton balls (20 per lab group)• A variety of materials to test on Day 2 of the experiment. Use household substances,
including condiments like capers, mayonnaise, mustard, ketchup, salad dressing, jelly or jam, peanut butter, and yeast; fruits like bananas, melons, apples, etc.; and lab chemicals like ethanol, ammonia, and distilled water. Small quantities (20 mLs) are needed.
• Safety goggles or glasses• Timers (one for each lab group)• Clear plastic packing tape (one roll)• Droppers for each substance (20 or more)• Dissecting microscopes (one per team)
Investigation 12 T205
Big idea 4: inteRactions
■ Timing and Length of LabThis investigation can be conducted during the study of many topics throughout the year. It would also be an excellent final lab activity to draw together many of the concepts and big ideas and science practices from the AP Biology Curriculum Framework. The investigation pulls together topics such as genetics, animal behavior, development, plant and animal structures from cells to organs, cell communication, fermentation, and evolution.
This lab requires two to four 50-minute class periods. The basic part of the lab can be completed in two class periods. This would include the initial experiment with geotaxis and the basic construction and experimental setup with the choice chamber and food item taxis. The student-directed investigation could take up to two additional 50-minute class periods for the completion of the experiments and collaboration with classmates. Be flexible in planning the lab because some students groups will take more time than others.
It is important to allow enough class time for students to complete several trials of their experiments. Additional time outside of class would be required to complete data tables and a chi-square analysis of data collected. Set aside class time for presentations of results by students.
■ Safety and Housekeeping• You should monitor the use of chemicals that students use. They should not have
access to stock bottles of any chemical, such as an acid or a base, including vinegar, ammonia, or bleach. As students request materials, the chemicals should be allocated to dropper bottles or other small bottles.
• All chemicals, including household materials, should have a clear label and be disposed of properly.
• Students should wear safety goggles or glasses when working with liquid chemicals.• Students should not eat any of the food items.• Have students bring clear bottles and caps to class. Remind them that a softer plastic
bottle, such as a water bottle, is easier to cut than a harder plastic bottle, such as a Gatorade bottle. Choice chamber bottles should be 12–16 oz. in size for the initial experiments, but students may want to bring smaller or bigger bottles for their independent work.
• Remind students to use small amounts of liquid. (Five–10 drops should be enough.) More liquid can cause overflow into the chamber. The substance must remain on the cotton balls in the cap to ensure an accurate test of choice.
• In one class session, several choice experiments can be done. Small pieces of fruit could also be used, but students should be sure to firmly adhere the fruit to the cotton. It is important to change (or clean and dry) the cap after each choice unless the same substance is used again.
• New flies should be added if the experiment continues beyond the first day. However, if the flies are still active at the end of the first day, students can return them to a culture vial by tapping the chamber into a funnel placed in the culture vial.
T206 Investigation 12
■ ALIGNMENT TO THE AP BIOLOGY CURRICULUM FRAMEWORK This investigation can be conducted during the study of concepts pertaining to interactions (big idea 4) or to cellular processes (big idea 2), specifically the capture, use, and storage of free energy. In addition, some of the questions are likely to connect to big idea 1 if students explore the evolution of observed behaviors. As always, it is important to make connections between big ideas and enduring understandings, regardless of where in the curriculum the lab is taught. The concepts align with the enduring understandings and learning objectives from the AP Biology Curriculum Framework, as indicated below.
■ Enduring Understandings• 2D1: Reinforce the concept that all biological systems from cells and organisms to
populations, communities, and ecosystems are affected by complex biotic and abiotic interactions involving exchange of matter and free energy.
• 2E3: Timing and coordination of behavior are regulated by various mechanisms and are important in natural selection.
• 4A6: Interactions among living systems and with their environment result in the movement of matter and energy.
• 4B4: Interactions between and within populations influence patterns of species distribution and abundance.
■ Learning Objectives• The student is able to refine scientific models and questions about the effect of
complex biotic and abiotic interactions on all biological systems from cells and organisms to populations, communities, and ecosystems (2D1 & SP 1.3, SP 3.2).
• The student is able to design a plan for collecting data to show that all biological systems (cells, organisms, populations, communities, and ecosystems) are affected by complex biotic and abiotic interactions (2D1 & SP 4.2, SP 7.2).
• The student is able to analyze data to identify possible patterns and relationships between a biotic or an abiotic factor and a biological system (cells, organisms, populations, communities, or ecosystems) (2D1 & SP 5.1).
• The student is able to analyze data to support the claim that response to information and communication of information affect natural selection (2E3 & SP 5.1).
• The student is able to justify claims, using evidence, to describe how timing and coordination of behavioral events in organisms are regulated by several mechanisms (2E3 & SP 6.1).
• The student is able to connect concepts in and across domain(s) to predict how environmental factors affect response to information and change behavior (2E3 & SP 7.2).
• The student is able to apply mathematical routines to quantities that describe interactions among living systems and their environment that result in the movement of matter and energy (4A6 & SP 2.2).
Investigation 12 T207
Big idea 4: inteRactions
• The student is able to use visual representations to analyze situations or solve problems qualitatively to illustrate how interactions among living systems and with their environments result in the movement of matter and energy (4A6 & SP 1.4).
• The student is able to predict the effects of a change of matter or energy availability on communities (4A6 & SP 6.4).
• The student is able to use data analysis to refine observations and measurements regarding the effect of population interactions on patterns of species distribution and development (4B4 & SP 5.2).
■ ARE STUDENTS READY TO COMPLETE A SUCCESSFUL INQUIRY-BASED, STUDENT-DIRECTED INVESTIGATION?Before students attempt this investigation, they should be able to demonstrate understanding of the following concepts. The concepts may have been taught at different times of the year, but they give a conceptual understanding that could help students formulate questions related to the behavior of Drosophila.
• An insect life cycle that includes a complete metamorphosis (egg, larva, pupa, and adult)
• The role of apoptosis in metamorphosis• The genetic basis of behavior and role of a taxis• The types of environmental factors that trigger a behavior• The generalized structure of sensory organs and neurons
■ Skills DevelopmentStudents will develop the following skills and reinforce their observation skills. They may have worked with fruit flies in previous investigations, so they may be familiar with some of these skills. If the students are new to working with fruit flies (or other research animals), care must be taken to ensure the proper care and handling of living organisms.
• Determining the sex of fruit flies: While the investigation can be completed without knowing the sex of the fruit flies, sex identification does give students a more complete understanding of the organism. Use clear visuals (not diagrams) and dissecting microscopes when instructing students how to determine the sex of the flies. You can show students Figure 1 to help them determine the sex of fruit flies. The sexing of the flies can be completed at any time in the curriculum.
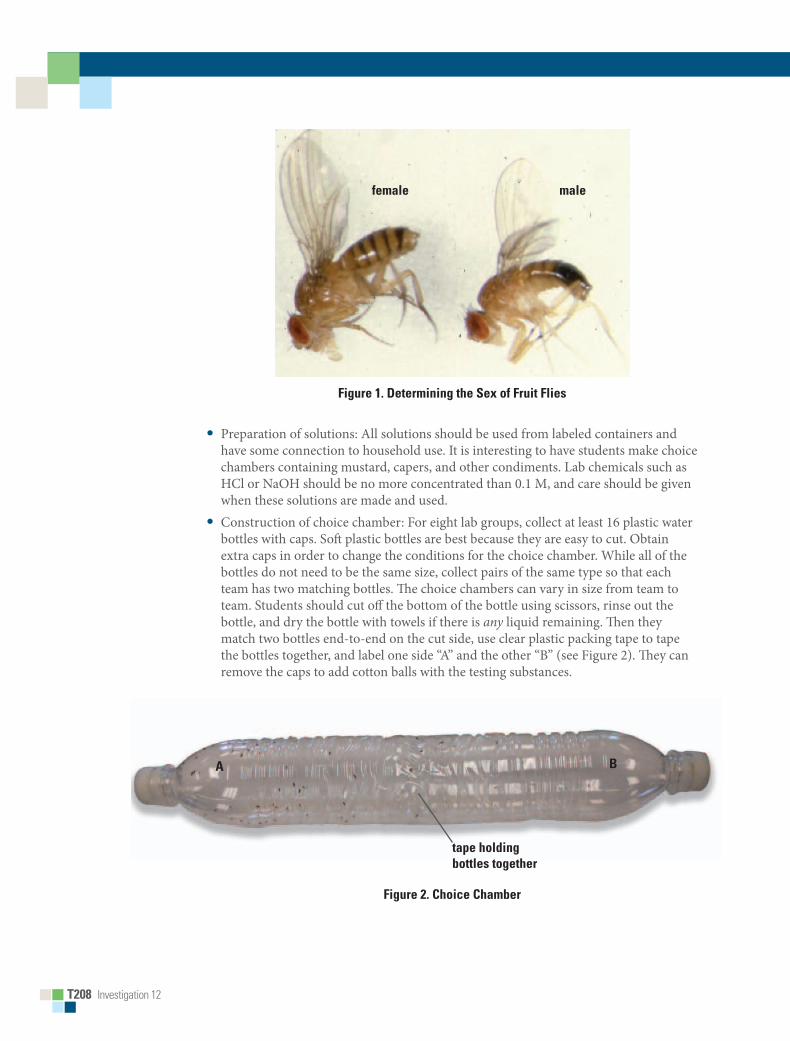
T208 Investigation 12
female male
Figure 1. Determining the Sex of Fruit Flies
• Preparation of solutions: All solutions should be used from labeled containers and have some connection to household use. It is interesting to have students make choice chambers containing mustard, capers, and other condiments. Lab chemicals such as HCl or NaOH should be no more concentrated than 0.1 M, and care should be given when these solutions are made and used.
• Construction of choice chamber: For eight lab groups, collect at least 16 plastic water bottles with caps. Soft plastic bottles are best because they are easy to cut. Obtain extra caps in order to change the conditions for the choice chamber. While all of the bottles do not need to be the same size, collect pairs of the same type so that each team has two matching bottles. The choice chambers can vary in size from team to team. Students should cut off the bottom of the bottle using scissors, rinse out the bottle, and dry the bottle with towels if there is any liquid remaining. Then they match two bottles end-to-end on the cut side, use clear plastic packing tape to tape the bottles together, and label one side “A” and the other “B” (see Figure 2). They can remove the caps to add cotton balls with the testing substances.
Figure 2. Choice Chamber
A B
tape holding bottles together
Investigation 12 T209
Big idea 4: inteRactions
• Use of different-aged fruit flies: Some experiments could be designed using fruit flies of different ages. To set up those cultures, be sure to have flies arrive at least two weeks before the experiments. Isolate any adult flies into a new vial of food. These flies will then be two weeks old for your tests. Young flies will not emerge until about two weeks later in the new culture. The original culture can then be used as young flies if the adults are let out of the culture the day or two before the experiments.
• Use of larvae: Students could design experiments using fruit fly larvae. The third instar larvae leave the moist food in a culture and climb up into the dryer environment of the vial to get ready for pupation. Students should place larvae on a glass slide to test for chemotaxis or phototaxis. The larvae will move more easily if a layer of non-nutrient agar is placed on the slide. Students make the 2% agar by mixing agar powder and water (2 g and 100 mL water) and heating it. Then they place it with an eyedropper in a puddle on the slide. They need to wait for the agar to harden to use as a platform for any experiments using larvae. They could also use Knox gelatin to make a smooth surface by following the recipe to make gelatin with one package of Knox gelatin to 1 cup of water.
■ Potential ChallengesStudents must design a controlled experiment for the choice chamber. They must be sure to test the chamber with distilled water to determine if there are any variables, such as light or the angle of the chamber, that could affect the experiment. They should be advised to make observations and then turn the chamber to see if the fruit flies respond differently.
Although it is difficult to count fruit flies accurately, the students should work as a team to count as accurately as possible. One technique that works is to divide the chamber into quadrants that are counted separately by four different students. Vestigial wing flies take longer to arrive at the ends of a choice chamber, but they may be easier to transfer and count because they do not fly.
Students should be warned that fruit flies are escape artists, and care should be taken to keep the flies contained. Some “lost” flies can be recaptured by making a fly trap with a small amount of vinegar or piece of fruit such as a banana or banana peel placed in a container with a funnel. Be sure that there is space at the bottom of the funnel so that the flies can enter the beaker to explore the vinegar or fruit. They typically do not escape back up through the funnel.
Moving flies from one container to another can be challenging. Flies are tossed by using their tendency to move up (their negative geotaxis) to help control their transfer. To toss flies, students should gently tap a culture of flies on a table to force them down to the bottom of the culture. They must quickly remove the plug from the culture and place an empty vial on top of the fly culture. Some flies will walk up into the empty vial, or students could turn the empty vial to the bottom and tap flies into the empty vial. Students must immediately plug the two vials. To toss flies into a choice chamber, they use the same technique to tap flies into the bottom of a culture and then quickly invert the culture into a funnel that is placed into one end of a choice chamber, making sure that the cap is on the other end of the chamber. Students then tap the culture to place at
T210 Investigation 12
least 30–40 flies into the chamber, lift up the culture vial, and immediately plug the vial and cap the chamber. If a culture vial is upside down even with flies in it, very few flies will escape before it is plugged again.
An additional technique to avoid the problem of flies escaping is to refrigerate them before the transfer. If vials are chilled for at least 15–30 minutes before tossing, they are easier to transfer. Be sure that the chilling does not add moisture to the culture, as moisture can make the flies stick to the vials.
Students may have the misconception that fruit flies are attracted to fruit, but they will determine that it is not the fruit but rather the rotting fruit and the accompanying chemotaxis to various products, such as vinegar or alcohol, of this decomposition process that prompts the fly’s behavior. How can you help students identify the difference without telling them? Is the chemotaxis a strong taxis? Does a geotaxis or phototaxis override the chemotaxis?
■ THE INVESTIGATIONS
■ Getting Started: Prelab AssessmentYou may assign the following as a think, pair/group, share activity, in which pairs or small groups of students brainstorm ideas and then share them with other groups, or as a whole-class discussion to assess students’ understanding of key concepts pertaining to fruit flies:
Day 1 1. During this discussion, you can assess if your students know what fruit flies are and
when and where they have seen them. The class should make a list of when and where they notice fruit flies. They should generate a list that may include a bowl of fruit, a picnic dinner, and someone’s glass of wine. Students should also view pictures of fruit flies to recall previous experiments with these model research organisms used in genetics or population studies.
2. Have the students make observations about fruit fly behavior by conducting the following very simple geotactic experiment. Students can work in small groups.
a. Using fruit fly cultures, toss at least 10 flies into an empty vial. Do not anesthetize the flies before this or any of the behavior experiments.
b. Observe the position of the flies in an upright vial sitting in a test tube rack on the lab table. Do not touch the vial while making observations.
c. Invert the vial and observe the position of the flies after 15 seconds and after 30 seconds. Make a list of observed behaviors.
d. Observations should generate questions, including What was the flies’ response? Was there an orientation movement? If so, what was the stimulus? Could this be considered a taxis? Explain your answers.

Investigation 12 T211
Big idea 4: inteRactions
■ Designing and Conducting Independent Investigations
Day 2When developing their own investigations, students should choose substances to test that are interesting to them. They may have experiences with fruit flies in their home and can think about what attracts flies. They also may want to find a substance that would repel a fly. They can bring substances from home to test, but make sure they obtain your permission to use the substances before they conduct their tests. The students should work in groups to determine the chemotactic response to various food items. They should share and graphically illustrate their results.
Days 3–4+The following are suggestions for the student-directed lab activities based on questions students ask during their preliminary study of the fruit flies. Their questions might include the following: Does the age of a fruit fly affect the speed of their negative geotactic response? What wavelengths of light stimulate a phototactic response in fruit flies?
Possible investigations generated from students’ observations and questions include the following. However, it is suggested that students generate their own questions to explore.
• From an ingredient list, select substances (such as vinegar) that students think might be affecting fly behavior. Isolate the materials and give the flies a choice.
• Determine if the sex of the fly makes a difference in their choice. (An F1 population of flies with white-eyed males and red-eyed females could be made available.)
• Determine if the sight of the material makes a difference by covering up the cotton ball in parafilm.
• Find the effect of light by changing the light source at different ends of the chamber or by studying how flies make choices in different colors of light. (Different ends of the chambers could be wrapped in transparent colored films or acetate.)
• Determine if the ripeness of the fruit makes a difference. For example, ripe bananas could be compared to green bananas.
• Determine if fruit flies are attracted to or repelled by carbon dioxide by placing pieces of Alka-Seltzer in moist cotton balls.
• Determine the effect of age or the developmental stage of the fruit fly on choice by using newly emerged flies in the chamber and/or the third instar larva on a glass slide.
• Work with different mutants of fruit flies to determine if vestigial or white-eyed flies (or other mutants) make the same choices. Determine if the Adh-negative mutant affects the flies’ response to alcohol. Determine if mutant eye colors (white, cinnabar, brown) affect the flies’ response to light.
• Are there other organisms that respond like fruit flies? Can you think of any organisms that respond differently?
Students should verify the results of their experiment by conducting several trials and changing the position of the substances at the ends of the chamber.
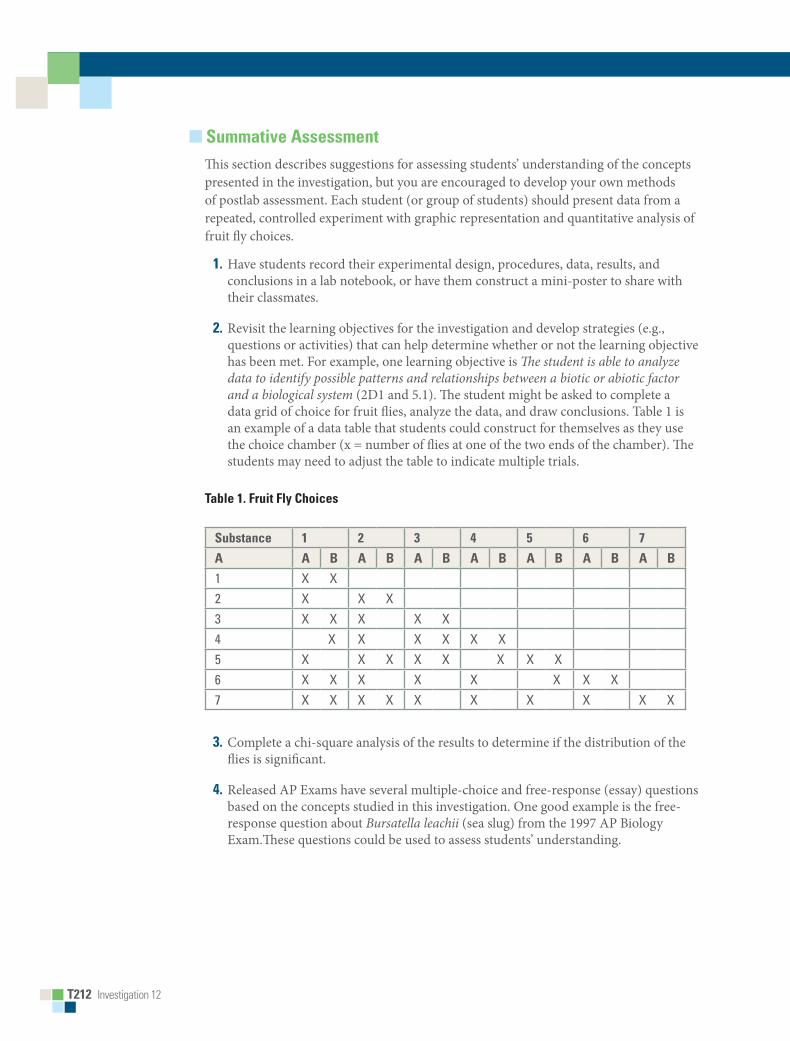
T212 Investigation 12
■ Summative AssessmentThis section describes suggestions for assessing students’ understanding of the concepts presented in the investigation, but you are encouraged to develop your own methods of postlab assessment. Each student (or group of students) should present data from a repeated, controlled experiment with graphic representation and quantitative analysis of fruit fly choices.
1. Have students record their experimental design, procedures, data, results, and conclusions in a lab notebook, or have them construct a mini-poster to share with their classmates.
2. Revisit the learning objectives for the investigation and develop strategies (e.g., questions or activities) that can help determine whether or not the learning objective has been met. For example, one learning objective is The student is able to analyze data to identify possible patterns and relationships between a biotic or abiotic factor and a biological system (2D1 and 5.1). The student might be asked to complete a data grid of choice for fruit flies, analyze the data, and draw conclusions. Table 1 is an example of a data table that students could construct for themselves as they use the choice chamber (x = number of flies at one of the two ends of the chamber). The students may need to adjust the table to indicate multiple trials.
Table 1. Fruit Fly Choices
Substance 1 2 3 4 5 6 7
A A B A B A B A B A B A B A B
1 x x2 x x x3 x x x x x4 x x x x x x5 x x x x x x x x6 x x x x x x x x7 x x x x x x x x x x
3. Complete a chi-square analysis of the results to determine if the distribution of the flies is significant.
4. Released AP Exams have several multiple-choice and free-response (essay) questions based on the concepts studied in this investigation. One good example is the free-response question about Bursatella leachii (sea slug) from the 1997 AP Biology Exam.These questions could be used to assess students’ understanding.
Investigation 12 T213
Big idea 4: inteRactions
■ Where Can Students Go from Here?One possible extension for this investigation is to ask students to identify another organism that behaves similarly to the fruit fly and one that they expect would behave differently. For example, students could substitute ladybugs, houseflies, or mealworms for fruit flies and construct choice chambers using other substances that they think might be attractive to these organisms.
■ SUPPLEMENTAL RESOURCES
www.fruitfly.org The Berkeley Drosophila Genome Project includes links to images and other resources for teachers and students. Teachers should consider looking through this website before beginning the lab to appreciate the breadth of information about Drosophila.
Flagg, Raymond. The Carolina Drosophila Manual. Burlington, NC: Carolina Biological Supply Company, 1988.
This is a useful manual that comes with each Drosophila culture order from Carolina. It may be ordered separately (order number 45-2620 from Carolina Biological Supply Company). Excellent photographs help teachers and students identify different mutants and give guidance for sexing the flies.
http://www.Flybase.org This is a classic database of Drosophila genes and genomes used extensively by researchers and educators. This resource is cited on many other sites, including the Berkeley Drosophila Genome Project. It is a general database that could be used by teachers or students who would like to have more information about any particular mutant.
Gargano, Julia Warner, Ian Martin, Poonam Bhandari, and Michael S. Grotewiel. Rapid iterative negative geotaxis (RING): a new method for assessing age-related locomotor decline in Drosophila. Experimental Gerontology 40, no. 5 (May 2005): 386–395.
Fruit flies’ negative geotaxis response declines with age. This resource would be helpful for teachers or students who have designed experiments that use the age of the fruit fly as a variable.
http://www.hhmi.org The Howard Hughes Medical Center includes multiple resources for teachers about fruit flies. This is a general resource that could lead to ideas for experiments or general information about fruit flies before the class begins the experiments. It includes links to other resources for general information and the scope of research about Drosophila. This resource includes very accessible material that would be helpful as a teacher begins the experiments.

T214 Investigation 12
www.ncbi.nlm.nih.gov The National Center for Biotechnology Information website offers access to biomedical and genomic information. The database could be used as extensions for students or teachers interested in some of the specific sequences of DNA or proteins that are characteristic of some of the different Drosophila mutants.
Raman, Baranidharan, Iori Ito, and Mark Stopfer. Bilateral olfaction: two is better than one for navigation. Genome Biology 9, no. 3 (2008): 212.
Fruit fly larvae can localize odor sources using unilateral inputs from a single functional sensory neuron. This resource documents the techniques and results of chemotaxis experiments with Drosophila larvae. It would be useful for teachers or students interested in designing a lab using the larvae rather than the adult flies.
http://www.ceolas.org/fly This is a general resource about fruit flies that has links to many other resources. Teachers or students interested in finding more information about a particular mutant or images of fruit flies or understanding the scope of research about Drosophila will find this resource to be useful.
Weiner, Jonathan. Time, Love, Memory: A Great Biologist and His Quest for the Origins of Behavior. New York: Alfred A. Knopf, Inc., 1999.
This book is a classic read about the behavior of fruit flies as investigated by Seymour Benzer, one of the great biologists of the 20th century. This text is a very good summary of research completed in classical experiments in physiology and behavior. It sets the stage for a teacher interested in working with fruit flies. It would be an excellent book for students to read after completing the experiments because of the engaging connections made between Drosophila and the researchers.
BigIdea
Investigation 12 S145
Interactions 4investigation 12
FRUit FLY BeHavioRWhat environmental factors trigger a fruit fly response?
■■ BACKGROUNDDrosophila melanogaster, the common fruit fly, is an organism that has been studied in the scientific community for more than a century. Thomas Hunt Morgan began using it for genetic studies in 1907. The common fruit fly lives throughout the world and feeds on fruit and the fungi growing on rotting fruit. It is a small fly, and one could question why scientists have spent so much time and effort on this tiny insect. It is about the size of President Roosevelt’s nose on a dime, but despite its small size, the fly is packed with many interesting physical and behavioral characteristics. Its genome has been sequenced, its physical characteristics have been charted and mutated, its meiotic processes and development have been investigated, and its behavior has been the source of many experiments. Because of its scientific usefulness, Drosophila is a model research organism. Its name is based on observations about the fly; the fly follows circadian rhythms that include sleeping during the dark and emerging as an adult from a pupa in the early morning. This latter behavior gave rise to the name Drosophila, which means “lover of dew.” The explanation for the species name melanogaster should be clear after observing the fly’s physical features. It has a black “stomach,” or abdomen. No doubt the dew-loving, black-bellied fly will continue to make contributions to the scientific community and to student projects.
We begin our investigation with a few simple questions. What do you know about fruit flies? Have you seen fruit flies outside the lab and, if so, where? Describe where and when you have noted fruit flies.
3p0

S146■■Investigation 12
■■ Learning■Objectives• To investigate the relationship between a model organism, Drosophila, and its
response to different environmental conditions
• To design a controlled experiment to explore environmental factors that either attract or repel Drosophila in the laboratory setting
• To analyze data collected in an experiment in order to identify possible patterns and relationships between environmental factors and a living organism
• To work collaboratively with others in the design and analysis of a controlled experiment
• To connect and apply concepts (With the fruit fly as the focal organism, your investigation could pull together many topics, such as genetics, animal behavior, development, plant and animal structures from cells to organs, cell communication, fruit ripening, fermentation, and evolution.)
■■ General■Safety■Precautions• Do not add substances to the choice chamber unless your teacher has approved them.
• If the substance you add is flammable, such as ethanol, use precaution and do not conduct your experiment near a heat source or flame.
• Many of the substances used in this experiment are food items, but you should not consume any of them.
• Fruit flies are living organisms that should not be released to the environment. After all the investigations are complete, flies should be tapped into a “morgue” through a funnel. The morgue typically is a 150-mL beaker that contains about 50 mL of salad oil or 70% alcohol.
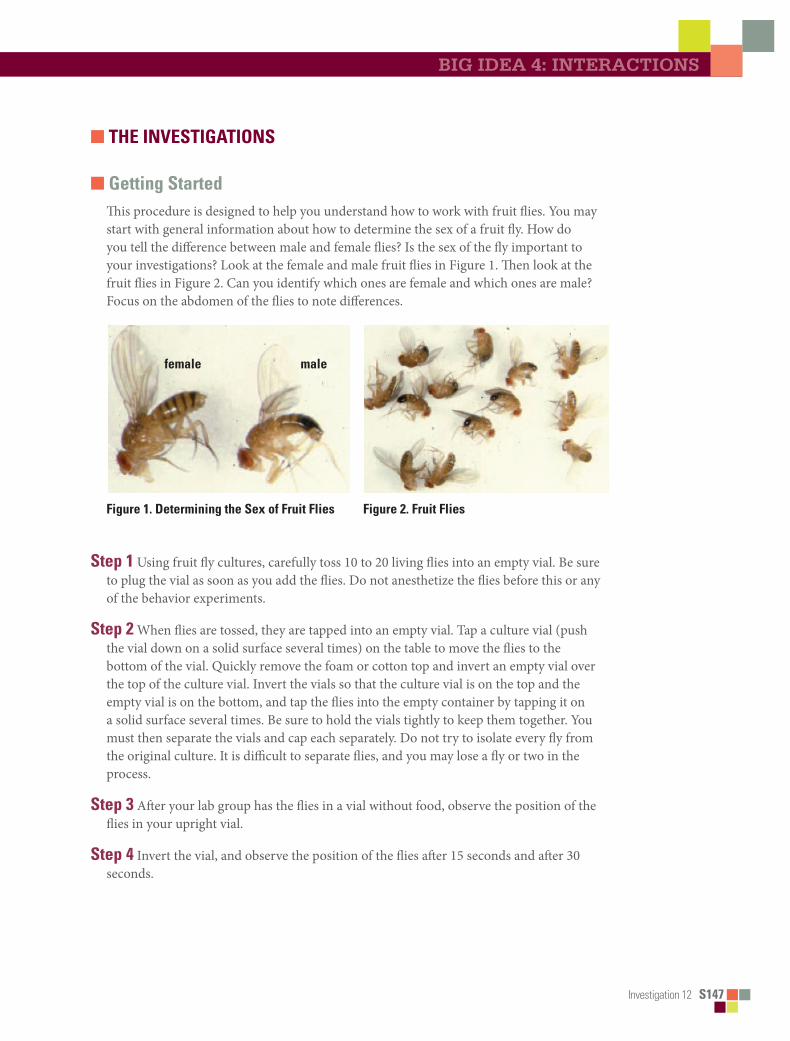
Investigation 12 S147
Big idea 4: inteRactions
■■ THE■INVESTIGATIONS
■■ Getting■StartedThis procedure is designed to help you understand how to work with fruit flies. You may start with general information about how to determine the sex of a fruit fly. How do you tell the difference between male and female flies? Is the sex of the fly important to your investigations? Look at the female and male fruit flies in Figure 1. Then look at the fruit flies in Figure 2. Can you identify which ones are female and which ones are male? Focus on the abdomen of the flies to note differences.
Figure■1.■Determining■the■Sex■of■Fruit■Flies■ Figure■2.■Fruit■Flies
Step■1 Using fruit fly cultures, carefully toss 10 to 20 living flies into an empty vial. Be sure to plug the vial as soon as you add the flies. Do not anesthetize the flies before this or any of the behavior experiments.
Step■2 When flies are tossed, they are tapped into an empty vial. Tap a culture vial (push the vial down on a solid surface several times) on the table to move the flies to the bottom of the vial. Quickly remove the foam or cotton top and invert an empty vial over the top of the culture vial. Invert the vials so that the culture vial is on the top and the empty vial is on the bottom, and tap the flies into the empty container by tapping it on a solid surface several times. Be sure to hold the vials tightly to keep them together. You must then separate the vials and cap each separately. Do not try to isolate every fly from the original culture. It is difficult to separate flies, and you may lose a fly or two in the process.
Step■3 After your lab group has the flies in a vial without food, observe the position of the flies in your upright vial.
Step■4 Invert the vial, and observe the position of the flies after 15 seconds and after 30 seconds.
malefemale

S148■■Investigation 12
Step■5 What was the flies’ response? Did most/all of the flies move in the same general direction? If so, this might be an “orientation movement,” which is a movement that is in response to some stimulus. Based on how you manipulated the vial, to what stimulus might the flies be responding? Do you think that they were responding to some chemical change in the vial? Did your observations generate other questions? Explain your answers.
■■ ProcedureAnimals move in response to many different stimuli. A chemotaxis is a movement in response to the presence of a chemical stimulus. The organism may move toward or away from the chemical stimulus. What benefit would an organism gain by responding to chemicals in their environment? A phototactic response is a movement in response to light. A geotactic response is a movement in response to gravity.
You will investigate fruit fly movement using a choice chamber that exposes the flies to different substances that you insert into the chamber. Because flies are very common in households (in fact, fruit flies live almost everywhere that humans live), think about using foods or condiments that might result in a positive or a negative chemotactic response from the flies. What foods or condiments do you think would attract or repel flies? Why? Do fruit flies exhibit a response to light or to gravity? How can you alter the chamber to investigate those variables?
Step■1 Prepare a choice chamber by labeling both ends with a marker — one end “A” and the other “B” (see Figure 3). Cut the bottom of the bottles, dry the interior thoroughly, and tape them together. Remove any paper labels.
tape■holding■■bottles■together
A B
Figure■3.■Choice■Chamber
Place a cap on one end of a chamber before adding flies. Insert a small funnel in the open end of the chamber and place the chamber upright on the capped end. Tap 20–30 fruit flies into the choice chamber using the funnel.

Investigation 12 S149
Big idea 4: inteRactions
Step■2 After transfer, quickly cap the other end of the chamber.
Step■3 Begin your study of the choice of flies by placing a few (5–10) drops of distilled water on two cotton balls, and adhere one moist cotton ball to each end of the chamber. (Do not add too much of any chemical to the cotton; too much liquid will drip down into the chamber and affect the experiment by sticking flies to the bottle.) What is the importance of using distilled water at both ends of the chamber?
Step■4 Lay the chamber down on a white surface or on white paper.
Step■5 Give the flies at least 5 minutes of undisturbed time, and then count (or closely approximate) the number of flies at each end of the chamber. Create a table to record the number of flies you find at each end (A and B) of the chamber.
Step■6 List all of the substances that you will be testing, and predict what you think the flies will prefer based on your knowledge of fruit flies.
Step■7 Begin to test each substance you are including in your investigation. Place a few drops of one substance on a cotton ball. Remove cap A, place the cotton ball in the cap, and replace the cap on the chamber. Place a cotton ball with distilled water on the other end. How might you determine which of the substances stimulate a negative chemotaxis and which stimulate a positive chemotaxis?
Step■8 Lay the chamber down on a light colored surface (or on white paper) and observe the flies.
Step■9 Give the flies at least 5 minutes of undisturbed time, and then count the number of flies at each end of the chamber.
Step■10 Change the caps, and give the fruit flies another substance.
Step■11 Gather data for at least four different substances. Which substances do fruit flies prefer? Which do they avoid?
Step■12■Quantify the results and express them graphically. Complete a chi-square analysis of your results. Using data from the entire class, construct a preference table. Were your hypotheses about the preferences of fruit flies supported or not? Did the flies demonstrate a chemotaxis in relation to any of the substances you chose? Can you think of any reasons for their preferences?

S150■■Investigation 12
■■ Designing■and■Conducting■Your■InvestigationNow that you have discovered the preferences for individual substances, design an experiment using the choice chamber to compare the preferences of fruit flies to all test substances or the chemotactic responses of your flies. Create a table that includes the results comparing all of the substances you tested.
The following are questions that you could investigate; however, as you worked through the beginning of this lab, you should have developed your own question and an investigation to answer that question:• Are all substances equally attractive or repellant to the fruit flies?
• Which substances do fruit flies prefer the most?
• Which substances do fruit flies prefer the least?
• Do preferred substances have any characteristic in common?
• What other factors might affect whether or not the fruit flies moved from one part of your choice chamber to another?
• Do you think that it is the fruit itself that attracts the flies? Should they be called fruit flies or something else?
• Some experiments could be designed using fruit fly larvae. Do larvae respond the same way that adults respond? Are there other factors in the environment that affect the choice?
• What factors must be controlled in an experiment about environmental variables and behavior?
• What is the difference among phototaxis, chemotaxis, and geotaxis? Do fruit flies demonstrate all of them?
• Does a phototactic response override a chemotactic response?
• Does the age of the fruit fly change its geotactic response?
• Are there other organisms that respond the same as fruit flies? Are there other organisms that respond differently from fruit flies?
■■ Analyzing■ResultsLook for patterns in fly behavior based on the number and ratio of fruit flies on different ends of your choice chamber. How will you determine which of the substances stimulate the greatest negative chemotactic response and positive chemotactic response? Do you see any patterns about materials or forces to which fruit flies are attracted?
Develop a method for sharing your results and conclusions to classmates — and then share them!

Investigation 12 S151
Big idea 4: inteRactions
■■ Evaluating■Results
1.Is there anything that was shared by all of the environmental factors to which the flies were attracted?
2.Is there anything that was shared by all of the environmental factors to which the flies were repelled?
3.How do you explain the behavior of fruit flies in someone’s kitchen or in nature based on the information you collected? Do your data explain all fruit fly movements? Explain your answers.
■■ Where■Can■You■Go■from■Here?One possible extension for this investigation is to identify another organism that behaves similarly to the fruit fly and one that you expect would behave differently. For example, you could substitute ladybugs, houseflies, or mealworms for fruit flies and construct choice chambers using other substances that you think might be attractive to these organisms.

This page is intentionally left blank.
Investigation 13 T215
BigIdeaInteractions 4investigation 13
enZYMe aCtivitY*How do abiotic or biotic factors influence the rates of enzymatic reactions?
■■ BACKGROUNDEnzymes speed up chemical reactions by lowering activation energy (that is, the energy needed for a reaction to begin). In every chemical reaction, the starting materials (the substrate(s) in the case of enzymes) can take many different paths to forming products. For each path, there is an intermediate or transitional product between reactants and final products. The energy needed to start a reaction is the energy required to form that transitional product. Enzymes make it easier for substrates to reach that transitional state. The easier it is to reach that state, the less energy the reaction needs.
Enzymes are biological catalysts. They are large protein molecules, folded so that they have very specifically shaped substrate binding sites. These binding sites make substrates go into the transition state. To catalyze the reaction, several regions of the binding site must be precisely positioned around the substrate molecules. Any change in the shape of the overall folded enzyme molecule can change the shape of the binding site.
The optimum reaction conditions are different for each enzyme. The correct environmental conditions, proper substrates, and, often, particular cofactors associated with an enzyme are needed. In some instances, the optimum conditions can be deduced fairly accurately based on the following:• The organism from which the enzyme is derived • The part of the organism in which the enzyme functions• The environmental conditions in which that organism lives
For example, this investigation mentions lactase, the enzyme that catabolizes the disaccharide sugar lactose into the two monosaccharides, glucose and galactose. In humans, lactase is found mostly in the small intestine, where the pH is around 7. It would be reasonable to hypothesize that human lactase is optimally active at pH 7 and at 37°C. Free-living decomposer fungi in soil also produce lactase. However, soil pH usually is between 5 and 6.5. As could be predicted, the purified enzyme from a common soil fungus has a pH optimum of 5.5. The main enzyme for this lab, peroxidase, is found in many different forms, with optimum pHs ranging from 4 to 11 depending on the source and optimum temperatures varying from 10 to 70°C.
* Transitioned from the AP Biology Lab Manual (2001)

T216■■Investigation 13
One suggestion for extending the inquiry activities in this lab is to have students compare peroxidase extracted from different vegetables. Ask them, What could you predict based on what you know about how each vegetable grows? What observations could you make of the vegetables before extracting enzyme? With this prompt, it is very likely that one or more students will think about potential differences in tissue pH or normal growing temperature for root versus leaf versus fruit. A pH test strip would give a reasonable estimate of tissue pH, and there will be a large difference (which students can look up or measure themselves) in the average temperature of a turnip root in soil versus the aboveground leaves of the same plant.
Before starting this laboratory, students should understand how proteins are made and establish their final structure. The final structure of the protein (in this investigation, an enzyme) is determined by interactions between its amino acids and the surrounding environment. Primary structure is the protein’s unique sequence of amino acids. The protein chain will contain hundreds to a few thousand amino acids (sometimes more) and can be identified with an amino end and a carboxyl end. Secondary structure produces ß pleated sheets or α helices formed by hydrogen bonding throughout the molecule. Tertiary structure occurs because of the numerous interactions of the backbone amino acids with various side chains (R groups), such as hydrophilic or hydrophobic interactions, ionic bonds, and disulfide bridges associated with the amino acid cysteine. At this point the protein may be active or become a component of the quaternary structure when two or more subunits unite to form a larger protein. A good example of a quaternary protein is hemoglobin, which is made up of two α and two ß subunits associated with four molecules of heme (a nonpolypeptide component), each of which contains an iron atom that binds oxygen.
Enzymatic proteins are fundamental to the survival of any living system and are organized into a number of groups depending on their specific activities. Two common groups are catabolic enzymes (“cata-” or “kata-” from the Greek word for “break down”; for instance, amylase breaks complex starches into simple sugars) and anabolic enzymes (“a-” or “an-” from the Greek word anabole, meaning to “build up”). You can remind students of stories about athletes who have been caught using anabolic steroids to build muscle.
Catalytic enzymes that break down proteins, which are called proteases, are found in many organisms; one example is bromelain, which comes from pineapple and can break down gelatin and is often an ingredient in commercial meat marinades. Papain is an enzyme that comes from papaya and is used in some teeth whiteners to break down the bacterial film on teeth. People who are lactose intolerant cannot digest milk sugar (lactose); they can take supplements containing lactase, the enzyme they are missing. All of these enzymes hydrolyze large, complex molecules into their simpler components; bromelain and papain break proteins down to amino acids, while lactase breaks lactose down to simpler sugars.
Investigation 13 T217
Big idea 4: interaCtions
Anabolic enzymes are equally vital to all living systems. One example is ATP synthase, the enzyme that stores cellular energy in ATP by combining ADP and phosphate. Another example is rubisco, an enzyme involved in the anabolic reactions of building sugar molecules in the Calvin cycle of photosynthesis.
To begin this investigation, students will focus on a specific enzyme, peroxidase, which is obtained from turnips, one of numerous sources of this enzyme. (The peroxidases are a large family of catalytic enzymes that include “cousins” cytochrome c peroxidase and catalase.) Using peroxidase, students will develop essential skills to explore their own questions about enzymes, including the following:
What is the effect of using a variety of temperature ranges on the overall rate of reaction?
How will different pH buffers in the reaction affect the rate of reaction? Which has a greater effect on the rate of reaction—changing the concentration of
enzyme or changing the concentration of substrate? What other abiotic or biotic changes could affect an enzyme’s activity? After developing specific skills to determine enzymatic activity of peroxidase, students
will have an opportunity to explore the properties of this enzyme on their own. The investigation provides an opportunity for students to apply and review concepts they have studied previously, including the levels of protein structure, energy transfer, entropy and enthalpy, abiotic and biotic influences on molecular structure, and the role of enzymes in maintaining homeostasis. The laboratory allows students to investigate more deeply the relationship between structure and function of enzymes; to develop a concise understanding of a specific enzymatic reaction; and then to apply their knowledge and newly acquired skills to answer their own question(s) about enzymatic activity.
■■ Key■VocabularyBaseline is a universal term for most chemical reactions. In this investigation, the term is used to establish a standard for a reaction. Thus, when manipulating components of a reaction (in this case, substrate or enzyme) you have a reference point to help understand what occurred in the reaction. The baseline may vary with different scenarios pertinent to the design of the experiment, such as altering the environment in which the reaction occurs. In this scenario, different conditions can be compared, and the effects of changing an environmental variable (e.g., pH) can be determined.
Rate can have more than one applicable definition because this lab has two major options of approach, i.e., using a color palette and/or a spectrophotometer to measure percent of light absorbance. When using a color palette to compare the change in a reaction, you can infer increase, decrease, or no change in the rate; this inference is usually called the relative rate of the reaction. When using a spectrophotometer (or other measuring devices) to measure the actual percent change in light absorbance, the rate is usually referred to as absolute rate of the reaction. In this case, a specific amount of time can be measured, such as 0.083 absorbance/minute.
T218■■Investigation 13
■■ PREPARATION
Materials and Equipment• Turnip peroxidase: Extracted from a
turnip of choice (possibly one grown in your local area): Cut the outer 2–4 mm of the root surface (a potato peeler is recommended) and use a blender in the pulse mode to liquefy 20 grams in 500 mL of distilled water. Filter through triple layers of cheesecloth and then filter the filtrate using coarse grade filter paper or a coffee filter. Keep refrigerated. Store in brown bottles.
• Some root vegetables have a large amount of starch. Prepared extracts may contain a variable amount of fine white powder floating in suspension. This is excess starch, and it will not go into solution. If this should appear, simply place the solution in the refrigerator for a few hours so that the starch will settle. Then, decant the liquid and proceed with the experiment. Peroxidase can also be extracted from rutabaga (Brassica napobrassica), which is available from commercial vendors and produces no powdery starch.
• Concentrations of peroxidase vary from species to species, from different growing environments and even the time of the year. Thus, the sample you make must be sufficient to run all intended experiments so that there is consistency of the enzyme concentration in each phase. Your sample may be frozen if time does not
permit you to complete your intended series and used at a later time, as long as the frozen material is not older than three months.
• Hydrogen Peroxide (0.1%): A standard solution of 3% H2O2 is available at most drug stores. Combine 15 mL of H2O2 with 435 mL of distilled water to make a 0.1% solution. Keep refrigerated, and store in brown bottles.
• Guaiacol: Available from numerous suppliers. Dilute 1.5 mL with 500 mL distilled water. Although very rarely, guaiacol has been reported as a skin irritant at high concentrations. Care should be taken when making the first dilution since the stock solution is 96–98 percent pure. Guaiacol is weakly soluble in water, so make the solution the day before and store it in a refrigerator. On the day of the experiment, place the solution in small brown bottles and keep cold. Keep out of direct light because guaiacol is light sensitive. As long as the original stock bottle is kept in the refrigerator, it will last for years.
• Buffers: You can make your own phosphate buffers to fit the needs of your experiment, but for simplicity and storage, pHydrion buffers are recommended. A good range of buffers is pH 3 - 5 - 6 - 7 - 8 - 10.
Other Supplies
• Laboratory notebook• Distilled or deionized water• Test tubes of approximately 16 x 150
mm and appropriate test tube rack. Each student group will need approximately 14 test tubes.
• Timer• 1, 5, and 10 mL graduated pipettes,
pipette pumps, or syringes, probably as series of 1, 2, 5, and 10 mL.
This laboratory investigation is designed to be performed without a spectrophotometer, but a spectrophotometer or probes with computer interface can be used.

Investigation 13 T219
Big idea 4: interaCtions
■■ Timing■and■Length■of■LabThis investigation requires approximately three to four lab periods of about 45 minutes each, depending on student interest and how far students want to take their investigation. The skills set requires approximately 40 minutes for students to work through it. Students can work in pairs or small groups to accommodate different class sizes. Time should be allotted for students to research their questions before designing their experiment. Plan additional time for students to present their results and conclusions to their peers, perhaps in the form of a mini-poster session or traditional laboratory report.
■■ Safety■and■HousekeepingInstructors and students should always adhere to general laboratory safety procedures and wear proper footwear, safety goggles or glasses, laboratory coats, and gloves. Use proper pipetting techniques; use pipette pumps, syringes, or rubber bulbs, and never use your mouth. Dispose of any broken glass in the proper container. Since the concentrations of the reactive materials in this laboratory are environmentally friendly (0.1% hydrogen peroxide and 0.3% guaiacol), they can be rinsed down a standard laboratory drain. The concentrations used in the investigations are deemed to be safe by all chemical standards, but recall that any compound has the potential to harm the environment.
■■ ALIGNMENT■TO■THE■AP■BIOLOGY■CURRICULUM■FRAMEWORK■This investigation can be conducted during the study of concepts pertaining to cellular processes (big idea 2), including the structure and function of enzymes, or while exploring interactions at the molecular level (big idea 4). As always, it is important to make connections between big ideas and enduring understandings, regardless of where in the curriculum the lab is taught. The concepts align with the enduring understandings and learning objectives from the AP Biology Curriculum Framework, as indicated below.
■■ Enduring■Understandings• 2D1: All biological systems from cells and organisms to populations, communities,
and ecosystems are affected by complex biotic and abiotic interactions involving exchange of matter and free energy.
• 4A1: The subcomponents of biological molecules and their sequence determine the properties of that molecule.
• 4B1: Interactions between molecules affect their structure and function.

T220■■Investigation 13
■■ Learning■Objectives• The student is able to design a plan for collecting data to show that all biological
systems are affected by complex biotic and abiotic interactions (2D1 & SP 4.2, SP 7.2).• The student is able to use models to predict and justify that changes in the
subcomponents of a biological polymer affect the functionality of the molecule (4A1 & SP 6.1, SP 6.4).
• The student is able to analyze data to identify how molecular interactions affect structure and function (4B1 & SP 5.1).
■■ ■ARE■STUDENTS■READY■TO■COMPLETE■A■SUCCESSFUL■INQUIRY-BASED,■STUDENT-DIRECTED■INVESTIGATION?Before students investigate enzymes, they should be able to demonstrate understanding of the following concepts. The concepts may be scaffolded according to level of skills and conceptual understanding. • Basic protein structure• The concept of induced fit• The role of enzymes• That structure, function, and environment are all required for maximal function of
enzymatic reactions
■■ Skills■DevelopmentStudents will develop/reinforce the following skills:• Using pipettes to measure solutions• Using pH indicators to determine environmental conditions that may influence the
reaction activity of enzymes
■■ Potential■ChallengesOne challenge for students is coordinating the timing of the enzymatic reaction(s) and collecting data. Instruct students that as soon as they combine the contents of the test tube with substrate and the test tube with enzyme, they must immediately begin timing the reaction.
The key to having excellent results is measuring the amount of each solution as accurately as possible. Check that both tubes (substrate and enzyme) have equal amounts of liquid by holding the tubes next to each other. The student must always use a clean measuring apparatus for each solution. Make sure that students label each measuring device for the specific solution used and then use it for only that material (e.g., distilled water, guaiacol, hydrogen peroxide, and enzyme).
For Procedure 2, students must replace the 6.0 mL of distilled water in their original enzyme tube with 6.0 mL of a specific pH buffer. Students then compare reaction rates.
Investigation 13 T221
Big idea 4: interaCtions
■■ THE■INVESTIGATIONS
■■ Getting■Started:■Prelab■AssessmentHave students review the importance of the structure of an organic molecule to its overall function. Make sure that students review the laboratory equipment they are to use and understand units of measure, especially since a 1.0 mL pipette is used and its divisions are 0.1 and 0.01 mL. An error in measurement may then be expressed by a power of 10.
■■ Procedure■1:■■Developing a Method for Measuring Peroxidase in Plant Material and Determining a Baseline
Procedures 1 and 2 are designed to help students understand concepts related to the activity of enzymes before they design and conduct their own investigation.
A basic enzymatic and substrate reaction can be depicted as follows:
Enzyme + Substrate → Enzyme-Substrate Complex → Enzyme + Products + ∆ G
For this investigation the specific reaction is as follows:
(Peroxidase + Hydrogen Peroxide → Complex → Peroxidase + Water + Oxygen)
2H2O2 → 2H2O + O2 (gas)
Peroxidase is an enzyme that breaks down peroxides, such as hydrogen peroxide, and is produced by most cells in their peroxisomes. Peroxide is a toxic byproduct of aerobic metabolism. Various factors — abiotic and biotic — could have a major influence on the efficiency of this reaction.
To determine the rate of an enzymatic reaction, a change in the amount of at least one specific substrate or product is measured over time. In a decomposition reaction of peroxide by peroxidase (as noted in the above formula), the easiest molecule to measure is oxygen gas, a final product. This can be done by measuring the actual volume of oxygen gas released or by using an indicator. In this experiment an indicator for oxygen will be used. The compound guaiacol has a high affinity for oxygen, and in solution, it binds instantly with oxygen to form tetraguaiacol, which is brownish in color. The greater the amount of oxygen produced, the darker brown the solution will become.
Qualifying color is a difficult task, but a series of dilutions can be made and then combined on a palette, which can represent the relative changes occurring in the reaction. A color palette ranging from 1 to 10 (Figure 1) is sufficient to compare relative amounts of oxygen produced, or the color change can be recorded as a change in absorbency using a variety of available meters, such as a spectrophotometer or a probe system. Using a color palette is a relative way to compare a change and is therefore qualitative. To collect quantitative data, a spectrophotometer or probe system is required.

T222■■Investigation 13
A sample baseline palette is shown in Figure 2.Another suggestion is to make a maximally converted solution of tetraguaiacol and then prepare serial dilutions.
■ 1.■Prepare a mixture equivalent to 10 replicate reactions containing the buffer, enzyme, and substrate.
■ 2.■ Incubate the mixture overnight so that all of the guaiacol converts to product. The concentration of guaiacol in the original mixture is known, so the concentration of brown product is simply that same concentration divided by 4 (tetraguaiacol). Make a series of dilutions (10% brown product, 20% brown product, etc.) and place them in test tubes. Students now have a color comparison chart that provides a specific concentration of final product.
■ 3.■You and your students can use the amount of product formed overall to construct a graph and calculate enzyme reaction rate.
■■ Procedure■2:■■Determining the Effect of pH on Enzymatic Activity
Numerous variables can be employed to observe the effects on the rate of an enzymatic reaction and possibly the specific fit of the enzyme with the substrate. In Procedure 2, students examine the effects of various pH solutions via the color change and then compare their results by graphing pH versus color change (if using a spectrophotometer the pH to percent of light absorbance, as shown in the sample data table in Table 1).
Table■1.■Sample■Data■Table:■Changes■in■Absorbance■at■Different■pH
pH 3 5 6 7 8 10
-0.001 0.663 0.347 0.170 0.047 0.003
Figure■1.■Turnip■Peroxidase■Color■Chart Figure■2.■Turnip■Peroxidase■Baseline
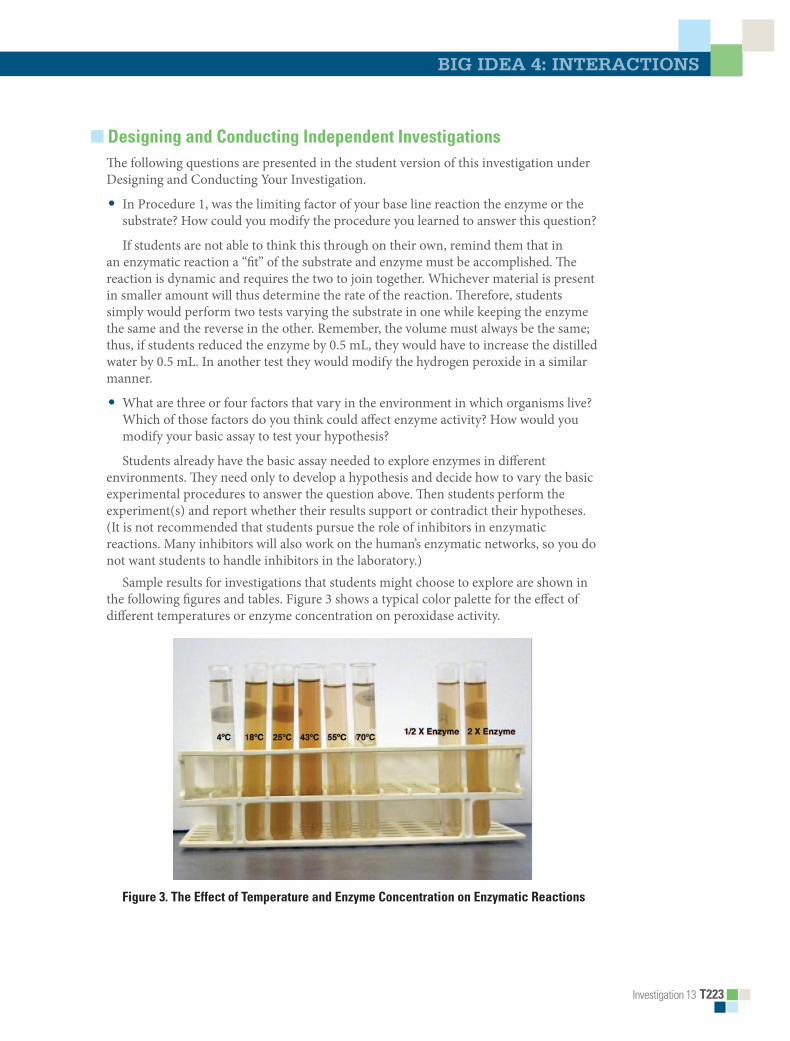
Investigation 13 T223
Big idea 4: interaCtions
■■ Designing■and■Conducting■Independent■InvestigationsThe following questions are presented in the student version of this investigation under Designing and Conducting Your Investigation.
• In Procedure 1, was the limiting factor of your base line reaction the enzyme or the substrate? How could you modify the procedure you learned to answer this question?
If students are not able to think this through on their own, remind them that in an enzymatic reaction a “fit” of the substrate and enzyme must be accomplished. The reaction is dynamic and requires the two to join together. Whichever material is present in smaller amount will thus determine the rate of the reaction. Therefore, students simply would perform two tests varying the substrate in one while keeping the enzyme the same and the reverse in the other. Remember, the volume must always be the same; thus, if students reduced the enzyme by 0.5 mL, they would have to increase the distilled water by 0.5 mL. In another test they would modify the hydrogen peroxide in a similar manner.
• What are three or four factors that vary in the environment in which organisms live? Which of those factors do you think could affect enzyme activity? How would you modify your basic assay to test your hypothesis?
Students already have the basic assay needed to explore enzymes in different environments. They need only to develop a hypothesis and decide how to vary the basic experimental procedures to answer the question above. Then students perform the experiment(s) and report whether their results support or contradict their hypotheses. (It is not recommended that students pursue the role of inhibitors in enzymatic reactions. Many inhibitors will also work on the human’s enzymatic networks, so you do not want students to handle inhibitors in the laboratory.)
Sample results for investigations that students might choose to explore are shown in the following figures and tables. Figure 3 shows a typical color palette for the effect of different temperatures or enzyme concentration on peroxidase activity.
Figure■3.■The■Effect■of■Temperature■and■Enzyme■Concentration■on■Enzymatic■Reactions
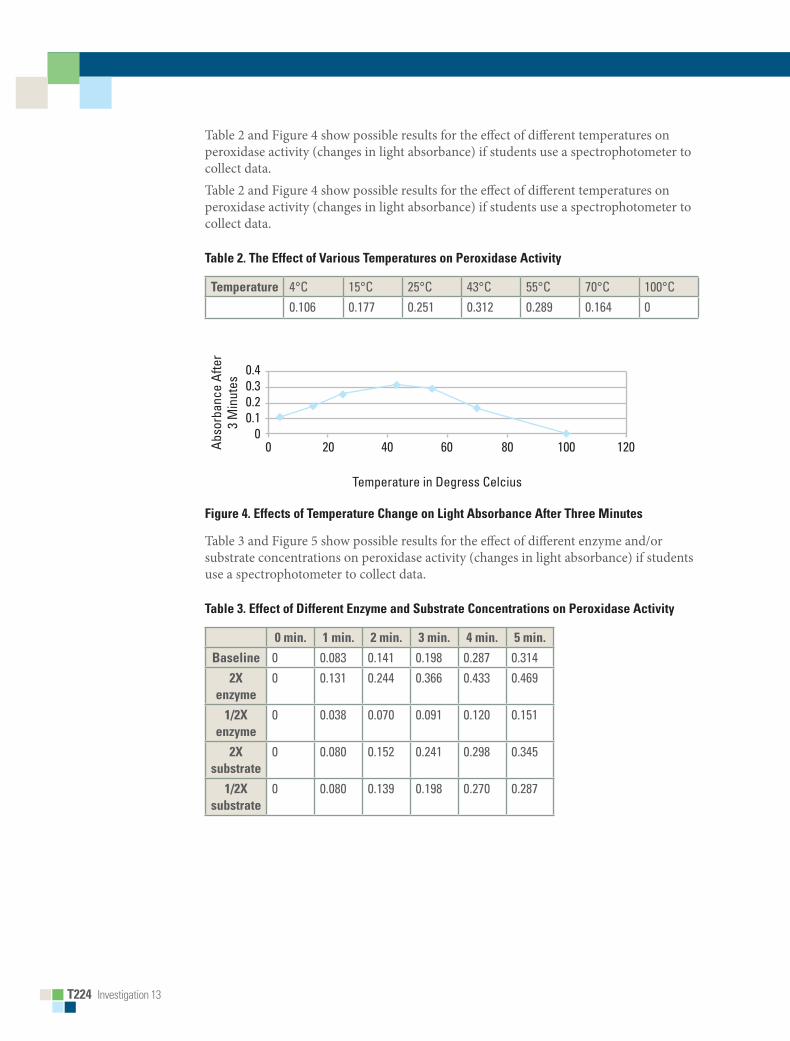
T224■■Investigation 13
Table 2 and Figure 4 show possible results for the effect of different temperatures on peroxidase activity (changes in light absorbance) if students use a spectrophotometer to collect data. Table 2 and Figure 4 show possible results for the effect of different temperatures on peroxidase activity (changes in light absorbance) if students use a spectrophotometer to collect data.
Table■2.■The■Effect■of■Various■Temperatures■on■Peroxidase■Activity
Temperature 4°C 15°C 25°C 43°C 55°C 70°C 100°C0.106 0.177 0.251 0.312 0.289 0.164 0
Temperature in Degress Celcius
0 20 40 60 80 100 120
0.40.30.20.1
0
Abso
rban
ce A
fter
3 M
inut
es
Figure■4.■Effects■of■Temperature■Change■on■Light■Absorbance■After■Three■Minutes
Table 3 and Figure 5 show possible results for the effect of different enzyme and/or substrate concentrations on peroxidase activity (changes in light absorbance) if students use a spectrophotometer to collect data.
Table■3.■Effect■of■Different■Enzyme■and■Substrate■Concentrations■on■Peroxidase■Activity
0■min. 1■min. 2■min. 3■min. 4■min. 5■min.
Baseline 0 0.083 0.141 0.198 0.287 0.3142X■
enzyme0 0.131 0.244 0.366 0.433 0.469
1/2X■enzyme
0 0.038 0.070 0.091 0.120 0.151
2X■substrate
0 0.080 0.152 0.241 0.298 0.345
1/2X■substrate
0 0.080 0.139 0.198 0.270 0.287

Investigation 13 T225
Big idea 4: interaCtions
Minutes
Baseline2x enzyme_x enzyme2x substrate_x substrate
0 1 2 3 4 5
0.5
0.4
0.3
0.2
0.1
0
Abso
rban
ce
Figure■5.■Effect■of■Different■Enzyme■and■Substrate■Concentrations■on■Peroxidase■Activity
■■ Investigating■Other■Enzymes■and■Reactions■This section is supplemental, as not all students will be ready for it. Similarly, not all schools will have the requisite time and resources. It requires that the student “think outside the box” to conduct outside online or library research on an enzyme of specific interest or explore a particular enzyme-catalyzed process in more detail. If included, a nonlab mini-research project requires additional time for students to present their results and conclusions to their peers, perhaps in the form of a mini-poster session or traditional laboratory report.
Before students proceed to designing and conducting their own nonlab investigations/research projects based on the following suggested topics, it is helpful to steer them in the right direction to gather some preinvestigation information.
Topic A: Ask students to investigate enzymes that appear to be conserved across all living domains (bacteria, fungi, plants, and animals). Students’ research should raise questions, including How similar are the enzymes in function, structure, and usage? For example, a specific dehydrogenase has been found in E. coli, corn, horse liver, and sheep. Does this mean that the enzyme evolved numerous times in numerous organisms or just once early in the history of life? Does the enzyme function the same in each organism? How similar is the DNA for this enzyme? How do organisms live in extreme environments, such as hot springs? There are many similar enzyme systems — both catabolic and anabolic — that are found across our current and historical living domains. Students can find examples on the Internet and develop presentations for the class that address concerns, ideas, and conclusions.
Considering Topic A: Students must search the Internet for a specific enzyme. Using bioinformatics, students can investigate specific DNA sequences that are common for a particular enzyme. Resources for this type of information include http://www.ncbi.nlm.nih.gov/Class/minicourses/ and “Incorporation of Bioinformatics Exercises into the Undergraduate Biochemistry Curriculum” (see Supplemental Resources).
Topic B: To understand how organisms’ survival is linked to enzymatic reactions, the role of abiotic factors needs to be addressed. Ask the students to assume the role of a farmer growing soybeans. What would be the best soil conditions for maximum productivity? Can you find examples that would support or reject the concept that survival is a matter of a best-fit scenario for the organism and its abiotic and biotic pressures as related to enzymes? Can you suggest which abiotic factors need to be examined and then perform an experiment that might support your hypothesis? Develop a presentation for the class that helps to address your conclusions.

T226■■Investigation 13
Considering Topic B: Soil science is a major course of study in agricultural programs. Many specialty farmers use soil science to enhance their crops. For example, Nalo Farms in Hawaii will condition the soil to be slightly acidic when growing leafy vegetables or slightly basic when growing tomatoes. Some seeds will germinate better in light (tobacco) while others germinate in darkness. The same preferences can be noted for temperature conditions and soil salinity. Numerous colleges and universities have available soil science sites on the Internet. Students can explore these websites to gather information to begin their investigative research.
Topic C: Ask students to consider evolutionary questions such as Have plants evolved different characteristics to cope with specific abiotic conditions, such as salt marsh (salinity issues), high mountain pastures, deserts, acidified environments (acid rain), and estuaries? Are there different optimums for the same abiotic factors within different plants? Have plants evolved over time because of the influence or selectivity due to the abiotic factors associated with their environments? Students can develop presentations for the class that help address their conclusions.
Considering Topic C: The key to understanding evolution and natural selection is grasping that variations in a population of a species aid in the selective forces of the environment. To investigate this concept, some students might simply buy a few packages of seeds of a particular leafy vegetable, root vegetable, tomato, etc., and then grow them in varying conditions (salinities, temperatures, and so forth). Other students may choose to do nonlab mini-research projects on the topic. Although the links among growth, environment, and enzymes are more difficult to connect, regardless of their approach, students are establishing a protocol to do further work on those plants that vary tremendously from each other.
■■ Summative■Assessment■ 1.■Review the learning objectives and students’ answers to analysis questions that you
ask. Do students understand the concepts? You can use the learning objectives to generate questions.
■ 2.■Review the students’ experimental evidence. Did they make the appropriate measurements and graphs to reflect their results? Can they draw conclusions from their data?
■ 3.■Have the students prepare laboratory notebooks and record their experimental designs, data, graphs, results, and conclusions. They can also present their work in the form of a mini-poster.
Homeostasis is also discussed when studying hormonal interactions (e.g., sugar balance with insulin and glucagon or water balance with diuretics and antidiuretics). Ask students to make a strong argument for the role of enzymes in maintaining homeostasis at the cellular level.

Investigation 13 T227
Big idea 4: interaCtions
■■ SUPPLEMENTAL■RESOURCESAssay for peroxidase and guaiacol, Faizyme Laboratories, http://faizyme.com/assaperg.htmThis website contains general information about the peroxidase and guaiacol reaction.
“Incorporation of Bioinformatics Exercises into the Undergraduate Biochemistry Curriculum” provides information if students opt to investigate Topic A as a supplemental mini-research project. http://bioquest.org/bedrock/san_diego_01_07/projectfiles/fulltext_ID=113449540&PLACEBO=IE.pdf
Kubo, Akihiri, Hikan, et al., “Cloning and Sequencing of a cDNA Encoding Ascorbate Peroxidase from Arabidopsis thaliana,” Molecular Biology, Vol. 18, Number 4, 691–701. This paper supports supplemental research Topic A. http://www.ncbi.nlm.nih.gov/pubmed/1558944
http://www.ncbi.nlm.nih.gov/Class/minicourses/ This site introduces available online resources and is valuable if students choose to investigate supplemental research Topic A.
Soil Food Web. Students who would like to investigate supplemental research Topic B can perform a Google search to explore literally thousands of entries on soil, food, plant growth, and the role of the environmental in crop production.

This page is intentionally left blank.
BigIdea
Investigation 13 S153
Interactions 4investigation 13
enZYMe aCtivitY*How do abiotic or biotic factors influence the rates of enzymatic reactions?
■■ BACKGROUNDEnzymes are the catalysts of biological systems. They speed up chemical reactions in biological systems by lowering the activation energy, the energy needed for molecules to begin reacting with each other. Enzymes do this by forming an enzyme-substrate complex that reduces energy required for the specific reaction to occur. Enzymes have specific shapes and structures that determine their functions. The enzyme’s active site is very selective, allowing only certain substances to bind. If the shape of an enzyme is changed in any way, or the protein denatured, then the binding site also changes, thus disrupting enzymatic functions.
Enzymes are fundamental to the survival of any living system and are organized into a number of groups depending on their specific activities. Two common groups are catabolic enzymes (“cata” or “kata-” from the Greek “to break down”) — for instance, amylase breaks complex starches into simple sugars — and anabolic enzymes (“a-” or “an-” from the Greek “to build up”). (You may know this second word already from stories about athletes who have been caught using anabolic steroids to build muscle.)
Catalytic enzymes, called proteases, break down proteins and are found in many organisms; one example is bromelain, which comes from pineapple and can break down gelatin. Bromelain often is an ingredient in commercial meat marinades. Papain is an enzyme that comes from papaya and is used in some teeth whiteners to break down the bacterial film on teeth. People who are lactose intolerant cannot digest milk sugar (lactose); however, they can take supplements containing lactase, the enzyme they are missing. All of these enzymes hydrolyze large, complex molecules into their simpler components; bromelain and papain break proteins down to amino acids, while lactase breaks lactose down to simpler sugars.
Anabolic enzymes are equally vital to all living systems. One example is ATP synthase, the enzyme that stores cellular energy in ATP by combining ADP and phosphate. Another example is rubisco, an enzyme involved in the anabolic reactions of building sugar molecules in the Calvin cycle of photosynthesis.
* Transitioned from the AP Biology Lab Manual (2001)

S154■■Investigation 13
3p4
To begin this investigation, you will focus on the enzyme peroxidase obtained from a turnip, one of numerous sources of this enzyme. Peroxidase is one of several enzymes that break down peroxide, a toxic metabolic waste product of aerobic respiration. Using peroxidase, you will develop essential skills to examine your own questions about enzyme function.
Later, you will have an opportunity to select an enzyme, research its properties and mode of reaction, and then design an experiment to explore its function. The investigation also provides an opportunity for you to apply and review concepts you have studied previously, including the levels of protein structure, energy transfer, abiotic and biotic influences on molecular structure, entropy and enthalpy, and the role of enzymes in maintaining homeostasis.
■■ Learning■Objectives■• To understand the relationship between enzyme structure and function
• To make some generalizations about enzymes by studying just one enzyme in particular
• To determine which factors can change the rate of an enzyme reaction
• To determine which factors that affect enzyme activity could be biologically important
■■ General■Safety■PrecautionsFollow general laboratory safety procedures. Wear proper footwear, safety goggles or glasses, a laboratory coat, and gloves. Use proper pipetting techniques, and use pipette pumps, syringes, or rubber bulbs. Never pipette by mouth! Dispose of any broken glass in the proper container. Since the concentrations of the reactive materials in this laboratory are environmentally friendly (0.1% hydrogen peroxide and 0.3% guaiacol), they can be rinsed down a standard laboratory drain. The concentrations used here are deemed to be safe by all chemical standards, but recall that any compound has the potentiality of being detrimental to living things and the environment. When you develop your individual investigations you must always consider the toxicity of materials used.
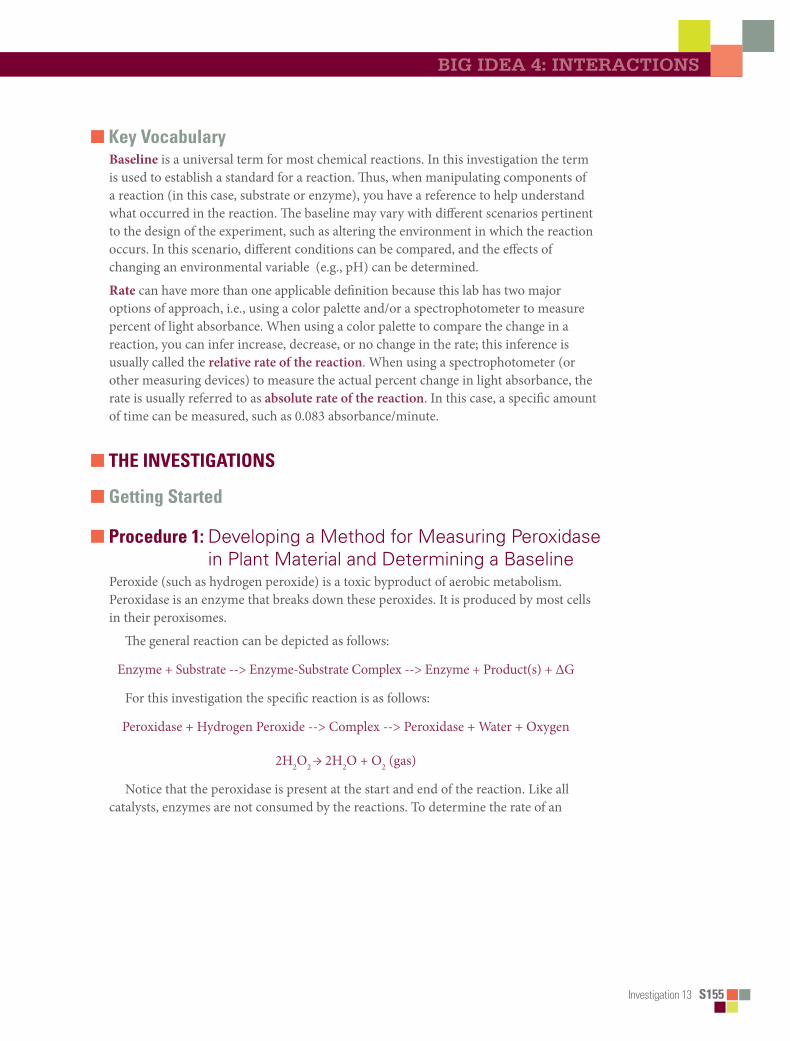
Investigation 13 S155
big idea 4: interaCtions
■■ Key■VocabularyBaseline is a universal term for most chemical reactions. In this investigation the term is used to establish a standard for a reaction. Thus, when manipulating components of a reaction (in this case, substrate or enzyme), you have a reference to help understand what occurred in the reaction. The baseline may vary with different scenarios pertinent to the design of the experiment, such as altering the environment in which the reaction occurs. In this scenario, different conditions can be compared, and the effects of changing an environmental variable (e.g., pH) can be determined.
Rate can have more than one applicable definition because this lab has two major options of approach, i.e., using a color palette and/or a spectrophotometer to measure percent of light absorbance. When using a color palette to compare the change in a reaction, you can infer increase, decrease, or no change in the rate; this inference is usually called the relative rate of the reaction. When using a spectrophotometer (or other measuring devices) to measure the actual percent change in light absorbance, the rate is usually referred to as absolute rate of the reaction. In this case, a specific amount of time can be measured, such as 0.083 absorbance/minute.
■■ THE■INVESTIGATIONS
■■ Getting■Started
■■ Procedure■1:■■Developing a Method for Measuring Peroxidase in Plant Material and Determining a Baseline
Peroxide (such as hydrogen peroxide) is a toxic byproduct of aerobic metabolism. Peroxidase is an enzyme that breaks down these peroxides. It is produced by most cells in their peroxisomes.
The general reaction can be depicted as follows:
Enzyme + Substrate --> Enzyme-Substrate Complex --> Enzyme + Product(s) + ∆G
For this investigation the specific reaction is as follows:
Peroxidase + Hydrogen Peroxide --> Complex --> Peroxidase + Water + Oxygen
2H2O2 → 2H2O + O2 (gas)
Notice that the peroxidase is present at the start and end of the reaction. Like all catalysts, enzymes are not consumed by the reactions. To determine the rate of an

S156■■Investigation 13
3p4
enzymatic reaction, you must measure a change in the amount of at least one specific substrate or product over time. In a decomposition reaction of peroxide by peroxidase (as noted in the above formula), the easiest molecule to measure would probably be oxygen, a final product. This could be done by measuring the actual volume of oxygen gas released or by using an indicator. In this experiment, an indicator for oxygen will be used. The compound guaiacol has a high affinity for oxygen, and in solution, it binds instantly with oxygen to form tetraguaiacol, which is brownish in color. The greater the amount of oxygen gas produced, the darker brown the solution will become.
Qualifying color is a difficult task, but a series of dilutions can be made and then combined on a palette, which can represent the relative changes occurring during the reaction. A color palette/chart ranging from 1 to 10 (Figure 1) is sufficient to compare relative amounts of oxygen produced. Alternatively, the color change can be recorded as a change in absorbency using a variety of available meters, such as a spectrophotometer or a probe system. (Information about the use of spectrophotometers and/or probe systems is found in the Additional Information section of this investigation.)
Figure■1.■Turnip■Peroxidase■Color■Chart

Investigation 13 S157
big idea 4: interaCtions
Materials• Turnip peroxidase• 0.1% hydrogen peroxide• Guaiacol• Distilled (deionized) water• 2 test tubes (approximately 16 x 150
mm) and appropriate test tube rack
• Timer• 1, 5, and 10 mL graduated pipettes,
pipette pumps, or syringes (1, 2, 5, and 10 mL)
This investigation is designed to be performed without a spectrophotometer, but your teacher may ask you to use a spectrophotometer or probe system. If so, additional equipment may be required.
Step■1 Using two 16 x 150 mm test tubes, mark one “substrate” and the other tube “enzyme.” To the substrate tube, add 7 mL of distilled water, 0.3 mL of 0.1 percent hydrogen peroxide, and 0.2 mL guaiacol for a total volume of 7.5 mL. Cover the test tube with a piece of Parafilm® and gently mix.
Step■2 To the enzyme tube, add 6.0 mL of distilled water and 1.5 mL of peroxidase for a total volume of 7.5 mL. Cover the test tube with a piece of Parafilm and gently mix.
Step■3 Combine the contents of the two tubes (subtrate and enzyme) in another 16 x 150 mL test tube, cover the tube with Parafilm, invert twice to mix, and place the tube in a test tube rack. Immediately begin timing the reaction.
Step■4 Observe the color change for the next 5 minutes. Rotate the tube before each reading. Record the observed color at 0, 1, 2, 3, 4, and 5 minutes. (A cell phone and/or camera are excellent ways to record color change.)
Step■5 Use the color palette/chart (Figure 1) to help you quantify changes in color over time. Graph your data in your laboratory notebook.
Consider the following questions before you proceed to the next experiment:• You measured the color change at different times. Which time will you use for your
later assays? Why? (The time/color change that you select will serve as your baseline for additional investigations.)
• When you use this assay to assess factors that change enzyme activity, which components of the assay will you change? Which will you keep constant?
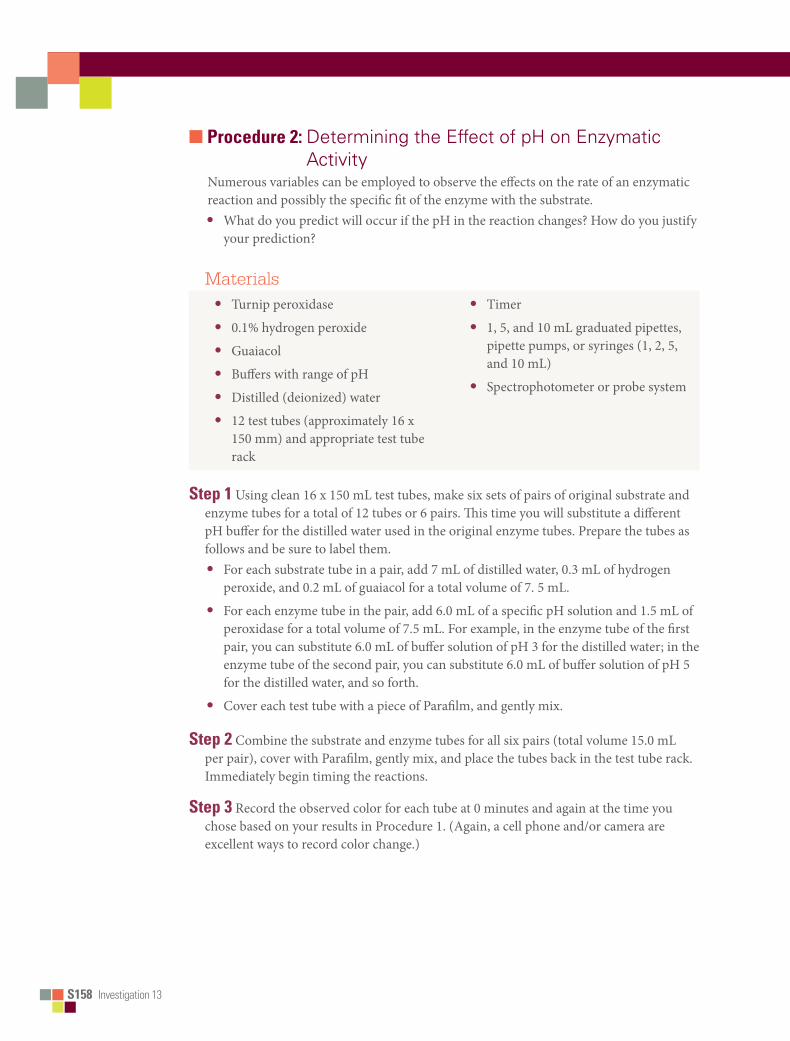
S158■■Investigation 13
3p4
■■ Procedure■2:■■Determining the Effect of pH on Enzymatic Activity
Numerous variables can be employed to observe the effects on the rate of an enzymatic reaction and possibly the specific fit of the enzyme with the substrate. • What do you predict will occur if the pH in the reaction changes? How do you justify
your prediction?
Materials• Turnip peroxidase
• 0.1% hydrogen peroxide
• Guaiacol
• Buffers with range of pH
• Distilled (deionized) water
• 12 test tubes (approximately 16 x 150 mm) and appropriate test tube rack
• Timer
• 1, 5, and 10 mL graduated pipettes, pipette pumps, or syringes (1, 2, 5, and 10 mL)
• Spectrophotometer or probe system
Step■1 Using clean 16 x 150 mL test tubes, make six sets of pairs of original substrate and enzyme tubes for a total of 12 tubes or 6 pairs. This time you will substitute a different pH buffer for the distilled water used in the original enzyme tubes. Prepare the tubes as follows and be sure to label them.• For each substrate tube in a pair, add 7 mL of distilled water, 0.3 mL of hydrogen
peroxide, and 0.2 mL of guaiacol for a total volume of 7. 5 mL.
• For each enzyme tube in the pair, add 6.0 mL of a specific pH solution and 1.5 mL of peroxidase for a total volume of 7.5 mL. For example, in the enzyme tube of the first pair, you can substitute 6.0 mL of buffer solution of pH 3 for the distilled water; in the enzyme tube of the second pair, you can substitute 6.0 mL of buffer solution of pH 5 for the distilled water, and so forth.
• Cover each test tube with a piece of Parafilm, and gently mix.
Step■2 Combine the substrate and enzyme tubes for all six pairs (total volume 15.0 mL per pair), cover with Parafilm, gently mix, and place the tubes back in the test tube rack. Immediately begin timing the reactions.
Step■3 Record the observed color for each tube at 0 minutes and again at the time you chose based on your results in Procedure 1. (Again, a cell phone and/or camera are excellent ways to record color change.)

Investigation 13 S159
big idea 4: interaCtions
Step■4 Use the palette/color chart (Figure 1) to help you quantify the changes you observe. Graph your data as color intensity versus pH. What conclusions can you draw from your results?
■■ Designing■and■Conducting■Your■InvestigationYou now have the basic information and tools needed to explore enzymes in more depth on your own. In this part of the lab, you will do just that. You will have the chance to develop and test your own hypotheses about enzyme activity. To help you get started, read the following questions, and write your answers in your laboratory notebook. • In Procedure 1, was the limiting factor of your baseline reaction the enzyme or the
substrate? How could you modify the procedure you learned to answer this question?
• What are three or four factors that vary in the environment in which organisms live? Which of those factors do you think could affect enzyme activity? How would you modify your basic assay to test your hypothesis?
Design and conduct an experiment to investigate an answer(s) to one of the questions above or another question that might have been raised as you conducted Procedures 1 and 2. Remember, the primary objective of the investigation is to explore how biotic and abiotic factors influence the rate of enzymatic reactions.
■■ Analyzing■ResultsFrom the data that you collected from your independent investigation, graph the results. Based on the graph and your observations, compare the effects of biotic and abiotic environmental factors on the rate(s) of enzymatic reactions and explain any differences.
■■ Additional■InformationIf a spectrophotometer is available, the following information is useful.
The use of measuring devices can better quantify your results. Using a spectrophotometer, you can select a specific wavelength to fit the color/pigment expected in an experiment. The change in the amount or concentration of color/pigment may be measured as absorbance (amount of the wavelength trapped by the pigment) or transmittance (amount of the wavelength that is not trapped by the pigment).
For Procedure 1:
1.Turn on your spectrophotometer approximately 10 to 15 minutes prior to starting the investigation so that it will warm up appropriately.
2.To measure the amount of the compound tetraguaiacol, set the wavelength to 470 nm.

S160■■Investigation 13
3p4
3.Set your machine at zero absorbance using a blank containing all the appropriate materials except the substrate (i.e., 13.3 mL of distilled water, 0.2 mL of guaiacol, and 1.5 mL of enzyme extract = 15 mL total).
4.Determine the baseline.
A.Using two 16 x 150 mm test tubes, label one “substrate” and the other “enzyme.” Substrate tube: 7 mL of distilled water, 0.3 mL of hydrogen peroxide, and 0.2 mL guaiacol (total volume 7.5 mL) Enzyme tube: 6 mL of distilled water and 1.5 mL of peroxidase (total volume 7.5 mL)
B.Combine the materials of the substrate and enzyme tubes. Mix the tubes twice and pour into a cuvette. (When mixing or rotating always cover the opening of the cuvette with Parafilm.)
C.Place the cuvette into the spectrophometer and record absorbance; this is your initial or “0” time reading. Remove the tube. Repeat recording absorbance at 1, 2, 3, 4, and 5 minutes. Be sure to rotate (use Parafilm to cover) the tube and also clean its surface with a scientific cleaning wipe before each reading.
5.Record and graph your data.
For Procedure 2:
Follow steps 1, 2, and 3 above. In step 4, set up as outlined above. Make an initial reading at time “0” and a second reading at the time you chose as optimal based on results obtained in Procedure 1. Record and graph your data.

Appendix A A1
Appendix A
AP BIOLOGY EQUATIONS AND FORMULAS
Statistical Analysis and Probabilityx = sample mean
n = size of the sample
s = sample standard deviation (i.e., the sample-based estimate of the standard deviation of the population)
o = observed results
e = expected results
Degrees of freedom are equal to the number of distinct possible outcomes minus one.
Mean Standard Deviation*
xn
xii
n
==∑1
1 Sx x
ni
=−
−∑( )2
1
Standard Error of the Mean* Chi-Square
SExsn
= χ 22
= −∑ ( )o ee
Chi-Square Table
p value
Degrees of Freedom1 2 3 4 5 6 7 8
0.05 3.84 5.99 7.82 9.49 11.07 12.59 14.07 15.51
0.01 6.64 9.21 11.34 13.28 15.09 16.81 18.48 20.09
Laws of ProbabilityIf A and B are mutually exclusive, then:
P (A or B) = P (A) + P (B)If A and B are independent, then:
P (A and B) = P (A) × P (B)
Hardy-Weinberg Equationsp2 + 2pq + q2 = 1 p = frequency of the dominant allele
in a populationp + q = 1 q = frequency of the recessive allele
in a population
Metric Prefixes
Factor Prefix Symbol
109 giga G
106 mega M
103 kilo k
10-2 centi c
10-3 milli m
10-6 micro μ
10-9 nano n
10-12 pico p
Mode = value that occurs most frequently in a data set
Median = middle value that separates the greater and lesser halves of a data set
Mean = sum of all data points divided by number of data points
Range = value obtained by subtracting the smallest observation (sample minimum) from the greatest (sample maximum)
* For the purposes of the AP Exam, students will not be required to perform calculations using this equation; however, they must understand the underlying concepts and applications.

A2 Appendix A
Rate and Growth dY = amount of change
dt = change in time
B = birth rate
D = death rate
N = population size
K = carrying capacity
rmax
= maximum per capita growth rate of population
Water Potential (Ψ)
Ψ = ΨP + Ψ
S
ΨP = pressure potential
ΨS = solute potential
The water potential will be equal to the solute potential of a solution in an open container because the pressure potential of the solution in an open container is zero.
The Solute Potential of a SolutionΨ
S = –iCRT
i = ionization constant (this is 1.0 for sucrose because sucrose does not ionize in water)
C = molar concentration
R = pressure constant (R = 0.0831 liter bars/mole K)
T = temperature in Kelvin (ºC + 273)
RatedYdt
Population GrowthdNdt = B – D
Exponential GrowthdNdt
r N=max
Logistic Growth
dNdt
r N K NK
= max−
Temperature Coefficient Q10
†
Primary Productivity Calculation
mg OL
0.698 mLmg
=mL O
L2 2×
mL OL
0.536 mg C fixedmL O
= mg C fixedL
2
2×
(at standard temperature and pressure)
T2 = higher temperature
T1 = lower temperature
k2 = reaction rate at T
2
k1 = reaction rate at T
1
Q10
= the factor by which the reaction rate increases when the temperature is raised by ten degrees
Surface Area and VolumeVolume of a SphereV = 4
3πr3
Volume of a Rectangular SolidV = lwhVolume of a Right CylinderV = πr2hSurface Area of a SphereA = 4πr2
Surface Area of a CubeA = 6s2
Surface Area of a Rectangular SolidA = Σ surface area of each side
r = radius
l = length
h = height
w = width
s = length of one side of a cube
A = surface area
V = volume
Σ = sum of all
Dilution (used to create a dilute solution from a concentrated stock solution)C
iV
i = C
fV
f
i = initial (starting) C = concentration of solutef = final (desired) V = volume of solution
Gibbs Free EnergyΔG = ΔH – TΔSΔG = change in Gibbs free energyΔS = change in entropyΔH = change in enthalpyT = absolute temperature (in Kelvin)
pH* = – log10
[H+]
* For the purposes of the AP Exam, students will not be required to perform calculations using this equation; however, they must understand the underlying concepts and applications.
† For use with labs only (optional).

Appendix B A3
Appendix B
ConstruCting Line graphs*Suppose we are studying some chemical reaction in which a substance, A, is being used up. We begin with a large quantity (100 mg) of A, and we measure in some way how much A is left after different times. The results of such an experiment might be presented pictorially like this:
100 mg A
12.00 1.00 2.00 3.00
80 mg A 60 mg A 40 mg A
Figure A.1
This is the kind of picture graph that you often see in newspapers. This information can be presented much more simply on a graph — a line graph is permissible — because our experience tells us that when A is disappearing in a chemical reaction, it is disappearing more or less smoothly and will not suddenly reappear. In other words, the progress of a chemical reaction is a continuous process, and because time is a continuous process it is permissible to relate the two kinds of information to one another on a line graph. The procedure for constructing the line graph is shown in Figure A.2.
100 mg A
12.00
1.00
2.00
3.00
80 mg A
60 mg A
40 mg ATime
Mg
of A
Rem
aini
ng
12.00 1.00 2.00 3.00 4.000
20
40
60
80
100
Figure A.2
* Based on a handout by Dr. Mary Stiller, Purdue University.
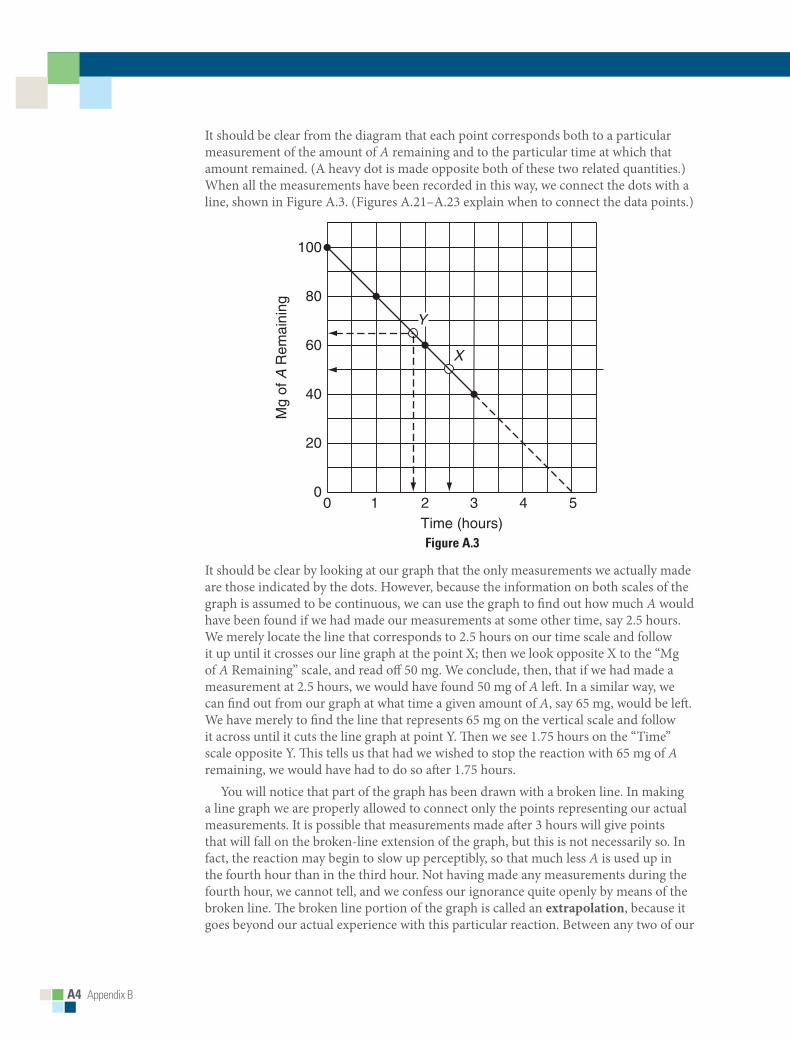
A4 Appendix B
It should be clear from the diagram that each point corresponds both to a particular measurement of the amount of A remaining and to the particular time at which that amount remained. (A heavy dot is made opposite both of these two related quantities.) When all the measurements have been recorded in this way, we connect the dots with a line, shown in Figure A.3. (Figures A.21–A.23 explain when to connect the data points.)
1 2 3 4 50
0
Y
X
20
Time (hours)
Mg
of A
Rem
aini
ng
40
60
80
100
Figure A.3
It should be clear by looking at our graph that the only measurements we actually made are those indicated by the dots. However, because the information on both scales of the graph is assumed to be continuous, we can use the graph to find out how much A would have been found if we had made our measurements at some other time, say 2.5 hours. We merely locate the line that corresponds to 2.5 hours on our time scale and follow it up until it crosses our line graph at the point X; then we look opposite X to the “Mg of A Remaining” scale, and read off 50 mg. We conclude, then, that if we had made a measurement at 2.5 hours, we would have found 50 mg of A left. In a similar way, we can find out from our graph at what time a given amount of A, say 65 mg, would be left. We have merely to find the line that represents 65 mg on the vertical scale and follow it across until it cuts the line graph at point Y. Then we see 1.75 hours on the “Time” scale opposite Y. This tells us that had we wished to stop the reaction with 65 mg of A remaining, we would have had to do so after 1.75 hours.
You will notice that part of the graph has been drawn with a broken line. In making a line graph we are properly allowed to connect only the points representing our actual measurements. It is possible that measurements made after 3 hours will give points that will fall on the broken-line extension of the graph, but this is not necessarily so. In fact, the reaction may begin to slow up perceptibly, so that much less A is used up in the fourth hour than in the third hour. Not having made any measurements during the fourth hour, we cannot tell, and we confess our ignorance quite openly by means of the broken line. The broken line portion of the graph is called an extrapolation, because it goes beyond our actual experience with this particular reaction. Between any two of our
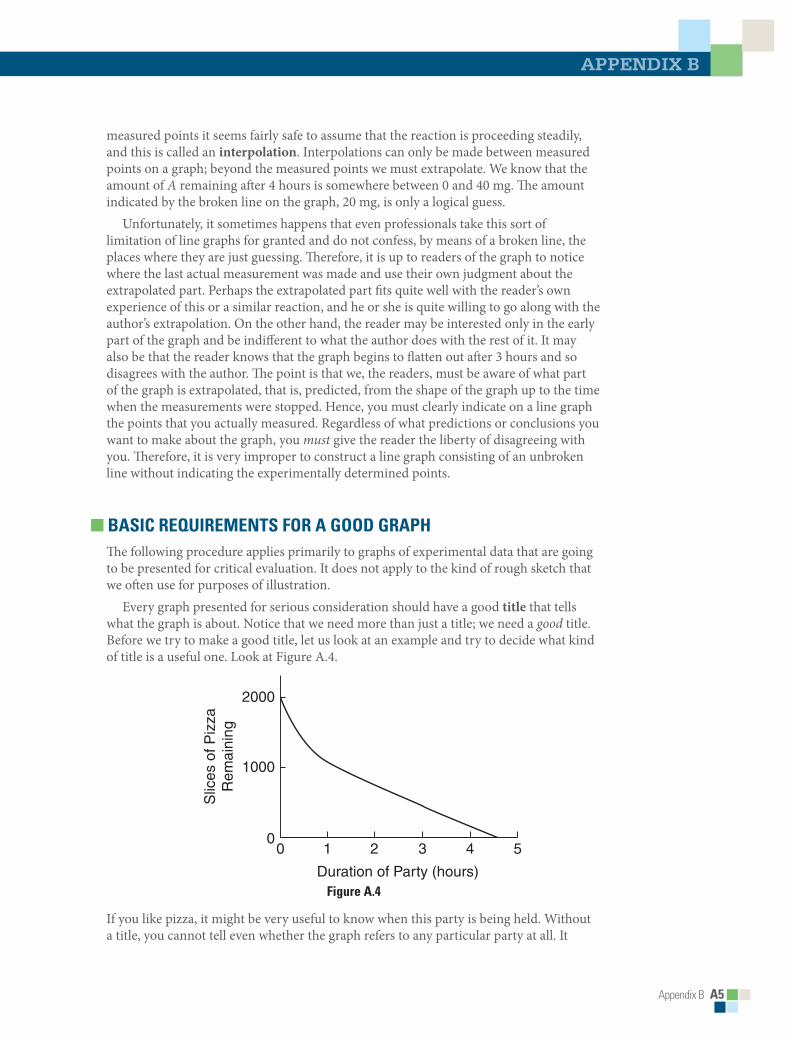
Appendix B A5
appendiX B
measured points it seems fairly safe to assume that the reaction is proceeding steadily, and this is called an interpolation. Interpolations can only be made between measured points on a graph; beyond the measured points we must extrapolate. We know that the amount of A remaining after 4 hours is somewhere between 0 and 40 mg. The amount indicated by the broken line on the graph, 20 mg, is only a logical guess.
Unfortunately, it sometimes happens that even professionals take this sort of limitation of line graphs for granted and do not confess, by means of a broken line, the places where they are just guessing. Therefore, it is up to readers of the graph to notice where the last actual measurement was made and use their own judgment about the extrapolated part. Perhaps the extrapolated part fits quite well with the reader’s own experience of this or a similar reaction, and he or she is quite willing to go along with the author’s extrapolation. On the other hand, the reader may be interested only in the early part of the graph and be indifferent to what the author does with the rest of it. It may also be that the reader knows that the graph begins to flatten out after 3 hours and so disagrees with the author. The point is that we, the readers, must be aware of what part of the graph is extrapolated, that is, predicted, from the shape of the graph up to the time when the measurements were stopped. Hence, you must clearly indicate on a line graph the points that you actually measured. Regardless of what predictions or conclusions you want to make about the graph, you must give the reader the liberty of disagreeing with you. Therefore, it is very improper to construct a line graph consisting of an unbroken line without indicating the experimentally determined points.
■ BAsic RequiRements FoR A Good GRAphThe following procedure applies primarily to graphs of experimental data that are going to be presented for critical evaluation. It does not apply to the kind of rough sketch that we often use for purposes of illustration.
Every graph presented for serious consideration should have a good title that tells what the graph is about. Notice that we need more than just a title; we need a good title. Before we try to make a good title, let us look at an example and try to decide what kind of title is a useful one. Look at Figure A.4.
2000
1000
00
Duration of Party (hours)
Slic
es o
f Piz
zaR
emai
ning
1 2 3 4 5
Figure A.4
If you like pizza, it might be very useful to know when this party is being held. Without a title, you cannot tell even whether the graph refers to any particular party at all. It
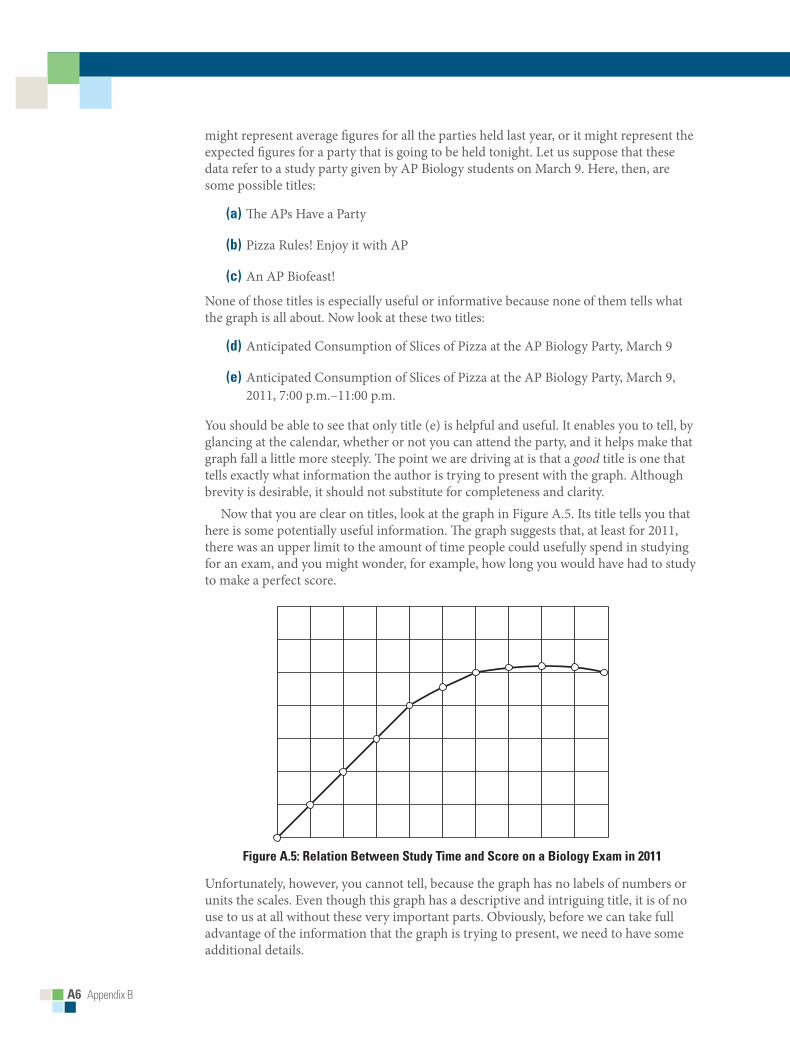
A6 Appendix B
might represent average figures for all the parties held last year, or it might represent the expected figures for a party that is going to be held tonight. Let us suppose that these data refer to a study party given by AP Biology students on March 9. Here, then, are some possible titles:
(a) The APs Have a Party
(b) Pizza Rules! Enjoy it with AP
(c) An AP Biofeast!
None of those titles is especially useful or informative because none of them tells what the graph is all about. Now look at these two titles:
(d) Anticipated Consumption of Slices of Pizza at the AP Biology Party, March 9
(e) Anticipated Consumption of Slices of Pizza at the AP Biology Party, March 9, 2011, 7:00 p.m.–11:00 p.m.
You should be able to see that only title (e) is helpful and useful. It enables you to tell, by glancing at the calendar, whether or not you can attend the party, and it helps make that graph fall a little more steeply. The point we are driving at is that a good title is one that tells exactly what information the author is trying to present with the graph. Although brevity is desirable, it should not substitute for completeness and clarity.
Now that you are clear on titles, look at the graph in Figure A.5. Its title tells you that here is some potentially useful information. The graph suggests that, at least for 2011, there was an upper limit to the amount of time people could usefully spend in studying for an exam, and you might wonder, for example, how long you would have had to study to make a perfect score.
Figure A.5: Relation Between study time and score on a Biology exam in 2011
Unfortunately, however, you cannot tell, because the graph has no labels of numbers or units the scales. Even though this graph has a descriptive and intriguing title, it is of no use to us at all without these very important parts. Obviously, before we can take full advantage of the information that the graph is trying to present, we need to have some additional details.

Appendix B A7
appendiX B
In Figure A.6 the additional information has been supplied, information that seems to make the graph more useful to us in preparing for the exam.
Figure A.6: Relation Between study time and score on a Biology exam in 2011
This additional information includes scales, or axes, that are carefully marked with numbers, and labels and units that are neatly presented. Obviously, one cannot label all the points along the axes; that would make the numbers crowd together and look sloppy. The units should be marked at intervals that correspond more or less to the intervals between the experimental points. The small marks, called index marks, can be drawn in if the experimental points are very widely spaced. Most elegantly, a frame is put around the whole graph, and index marks are placed all around. This makes it easy to lay a ruler across the graph when interpolating between the experimental points. The diagram in Figure A.7 summarizes some features of a good graph.
INDEX MARKS
INDEX MARKS
NUMBERS
NUMBERS
POINTS CLEARLY MARKED
60
40
20
00 1 2 3 4 5
LABELS
UNITS
Study Time (hours)
UNITS
Sco
re (
no. c
orre
ct o
ut o
f 60)
Figure A.7: Relation Between study time and score on a Biology exam in 2011
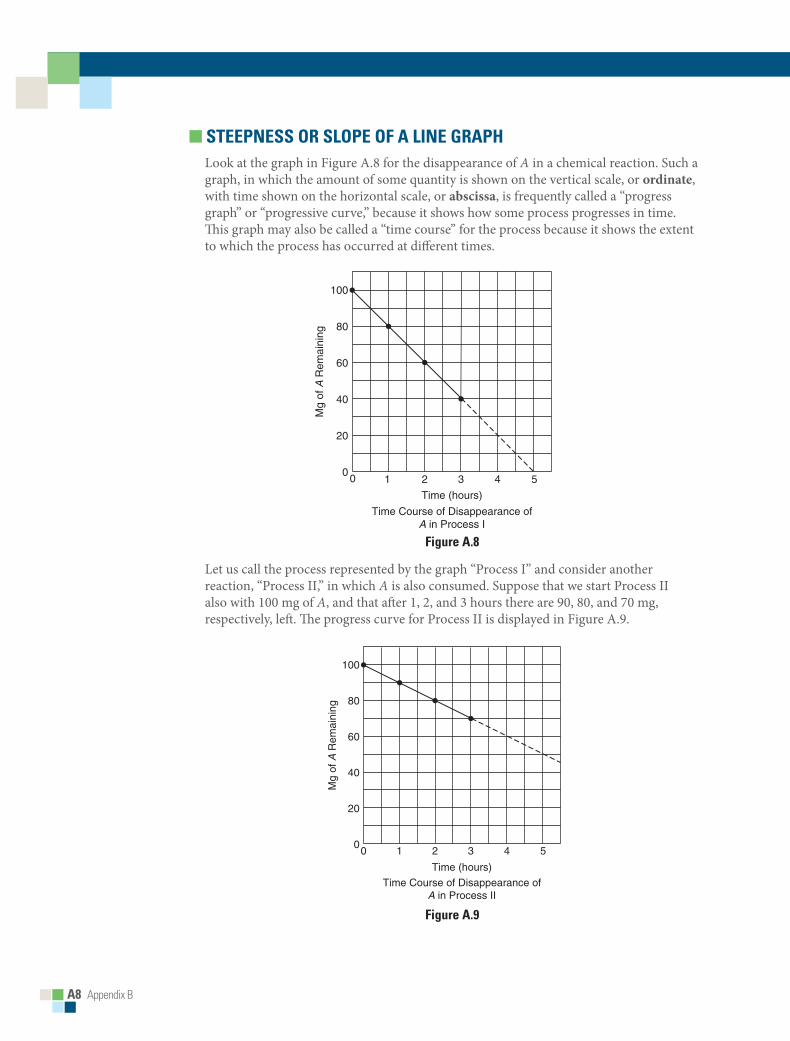
A8 Appendix B
■ steepness oR slope oF A line GRAphLook at the graph in Figure A.8 for the disappearance of A in a chemical reaction. Such a graph, in which the amount of some quantity is shown on the vertical scale, or ordinate, with time shown on the horizontal scale, or abscissa, is frequently called a “progress graph” or “progressive curve,” because it shows how some process progresses in time. This graph may also be called a “time course” for the process because it shows the extent to which the process has occurred at different times.
1 2 3 4 50
0
20
Time (hours)
Time Course of Disappearance ofA in Process I
Mg
of A
Rem
aini
ng
40
60
80
100
Figure A.8
Let us call the process represented by the graph “Process I” and consider another reaction, “Process II,” in which A is also consumed. Suppose that we start Process II also with 100 mg of A, and that after 1, 2, and 3 hours there are 90, 80, and 70 mg, respectively, left. The progress curve for Process II is displayed in Figure A.9.
1 2 3 4 50
0
20
Time (hours)
Time Course of Disappearance ofA in Process II
Mg
of A
Rem
aini
ng
40
60
80
100
Figure A.9
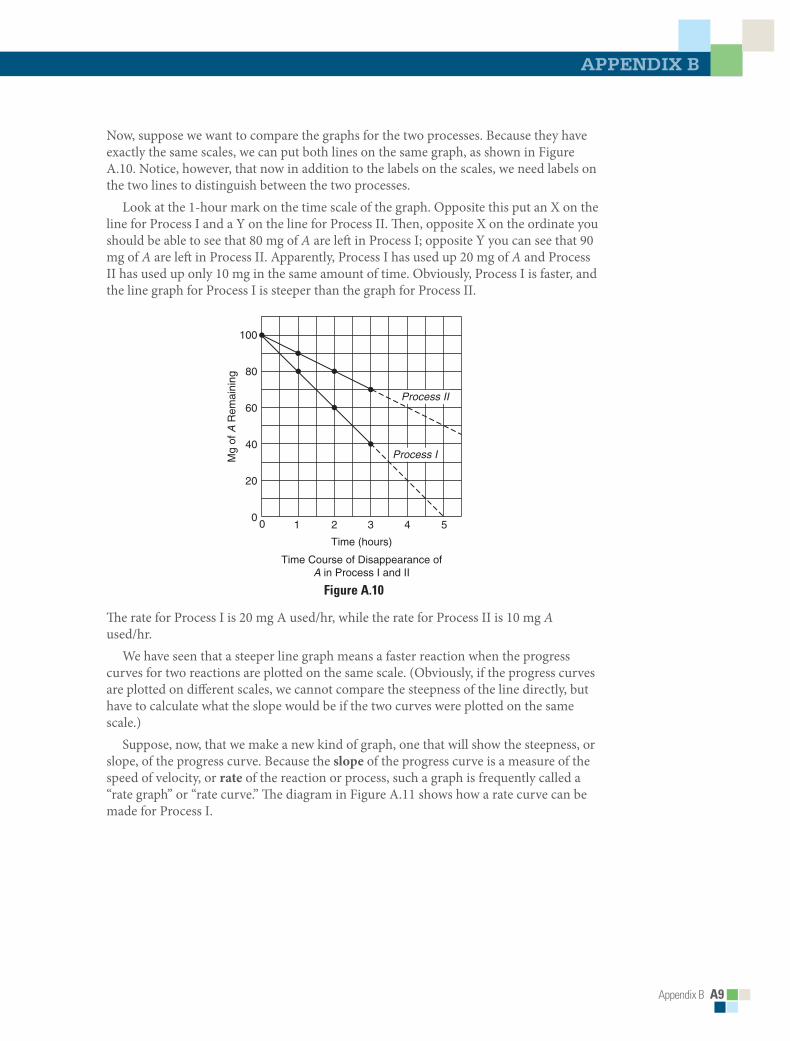
Appendix B A9
appendiX B
Now, suppose we want to compare the graphs for the two processes. Because they have exactly the same scales, we can put both lines on the same graph, as shown in Figure A.10. Notice, however, that now in addition to the labels on the scales, we need labels on the two lines to distinguish between the two processes.
Look at the 1-hour mark on the time scale of the graph. Opposite this put an X on the line for Process I and a Y on the line for Process II. Then, opposite X on the ordinate you should be able to see that 80 mg of A are left in Process I; opposite Y you can see that 90 mg of A are left in Process II. Apparently, Process I has used up 20 mg of A and Process II has used up only 10 mg in the same amount of time. Obviously, Process I is faster, and the line graph for Process I is steeper than the graph for Process II.
1 2 3 4 50
0
20
Time (hours)
Time Course of Disappearance ofA in Process I and II
Mg
of A
Rem
aini
ng
40
60
80
100
Process II
Process I
Figure A.10
The rate for Process I is 20 mg A used/hr, while the rate for Process II is 10 mg A used/hr.
We have seen that a steeper line graph means a faster reaction when the progress curves for two reactions are plotted on the same scale. (Obviously, if the progress curves are plotted on different scales, we cannot compare the steepness of the line directly, but have to calculate what the slope would be if the two curves were plotted on the same scale.)
Suppose, now, that we make a new kind of graph, one that will show the steepness, or slope, of the progress curve. Because the slope of the progress curve is a measure of the speed of velocity, or rate of the reaction or process, such a graph is frequently called a “rate graph” or “rate curve.” The diagram in Figure A.11 shows how a rate curve can be made for Process I.

A10 Appendix B
Figure A.11
Notice that the time scale of this rate graph is exactly like the time scale of the progress curve from which it was derived, but that the ordinate is different. The ordinate of the progress curve shows milligrams of A remaining; the ordinate of the rate curve shows milligrams of A used per hour. Obviously, a rate graph must always show rate on one of its scales, and it is ordinarily the vertical one that is used. This is because the rate of a reaction or process is what mathematicians call a dependent variable. Time is the independent variable in this experiment; it is independent of changes in the dependent variable (the rate of reaction), and it is the variable that is shown on the horizontal axis. Regardless of whether the process is the increase in height or weight of a plant, or the using up or producing of something in a reaction, the rate graph for the process must always show amount of something per unit time on one of its axes. One very common type of rate graph is the one shown in Figure A.11, with a rate on the ordinate and the time on the abscissa. Other kinds of rate graphs may have temperature or molarity on the abscissa. The rate of growth of a plant, for example, depends on how many factors that we might wish to vary, and so we can have as many different kinds of rate graphs for that process as there are independent variables.
Let us emphasize: a progress curve always shows amount of reaction on the vertical scale and time on the horizontal scale. The corresponding rate curve may show time or some other variable on the horizontal scale, but it always shows rate, or amount of reaction per unit time, on the vertical scale. This point is very important. When we look at a rate curve that has time on the horizontal scale, we must visualize the progress curve from which the rate curve was derived. When we look at a rate curve that has any other variable except time on the horizontal scale, we shall see that each point on the rate curve represents a separate progress curve.
In the same way as for Process I, a rate curve can be made for Process II. Plotted on the same graph, the two should look something like the diagram in Figure A.12.
1 2 3 4 50
0
20
Time (hours)
Mg
of A
Rem
aini
ng
40
00 1 2
Time (hours)
3 4 5
20
40
60
8020 mg A used upin first hour20 mg A used upin second hour20 mg A used upin third hour
100
Mg
of A
Use
d/H
our
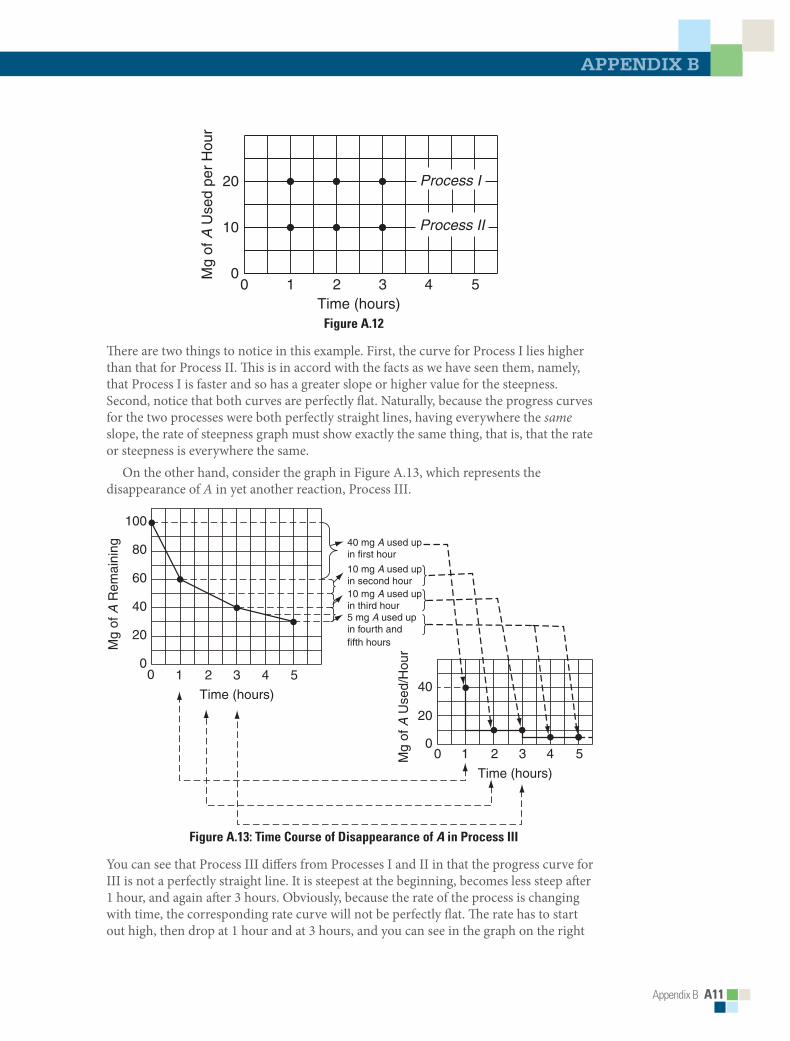
Appendix B A11
appendiX B
00
10
20
1 2Time (hours)
Mg
of A
Use
d pe
r H
our
3
Process I
4 5
Process II
Figure A.12
There are two things to notice in this example. First, the curve for Process I lies higher than that for Process II. This is in accord with the facts as we have seen them, namely, that Process I is faster and so has a greater slope or higher value for the steepness. Second, notice that both curves are perfectly flat. Naturally, because the progress curves for the two processes were both perfectly straight lines, having everywhere the same slope, the rate of steepness graph must show exactly the same thing, that is, that the rate or steepness is everywhere the same.
On the other hand, consider the graph in Figure A.13, which represents the disappearance of A in yet another reaction, Process III.
1 2 3 4 50
0
20
Time (hours)
40 mg A used upin first hour
10 mg A used upin second hour10 mg A used upin third hour5 mg A used upin fourth andfifth hoursM
g of
A R
emai
ning
40
60
80
100
Mg
of A
Use
d/H
our
00 1 2
Time (hours)
3 4 5
20
40
Figure A.13: time course of disappearance of A in process iii
You can see that Process III differs from Processes I and II in that the progress curve for III is not a perfectly straight line. It is steepest at the beginning, becomes less steep after 1 hour, and again after 3 hours. Obviously, because the rate of the process is changing with time, the corresponding rate curve will not be perfectly flat. The rate has to start out high, then drop at 1 hour and at 3 hours, and you can see in the graph on the right
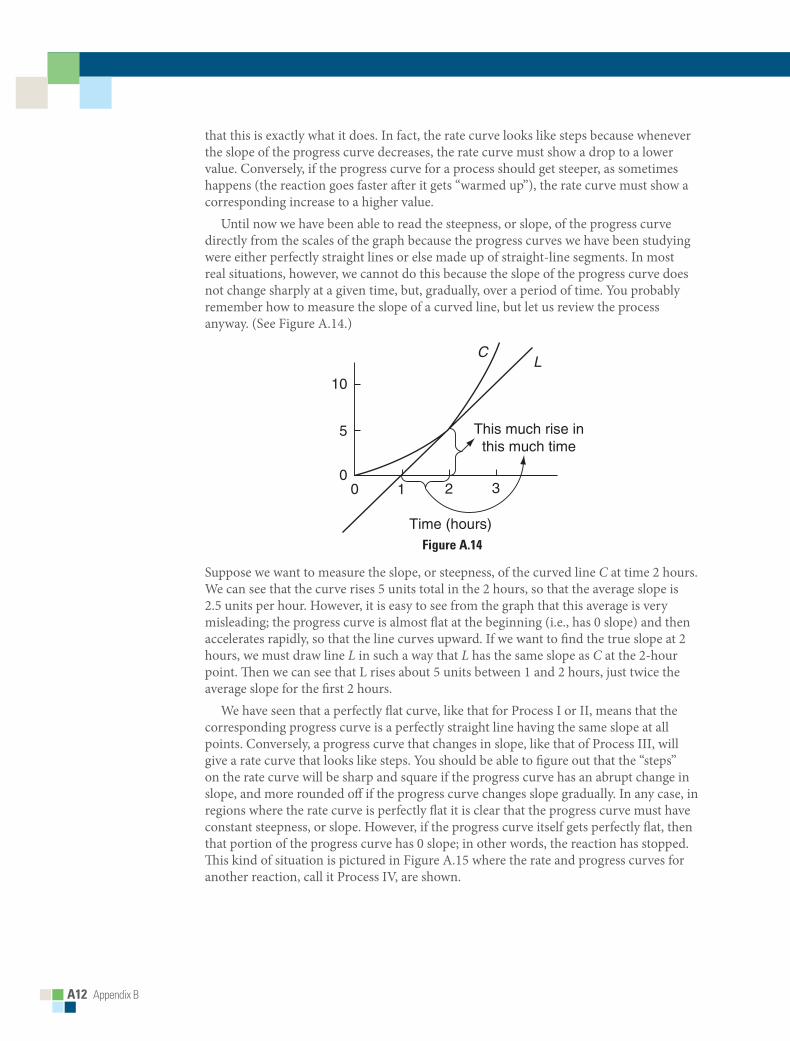
A12 Appendix B
that this is exactly what it does. In fact, the rate curve looks like steps because whenever the slope of the progress curve decreases, the rate curve must show a drop to a lower value. Conversely, if the progress curve for a process should get steeper, as sometimes happens (the reaction goes faster after it gets “warmed up”), the rate curve must show a corresponding increase to a higher value.
Until now we have been able to read the steepness, or slope, of the progress curve directly from the scales of the graph because the progress curves we have been studying were either perfectly straight lines or else made up of straight-line segments. In most real situations, however, we cannot do this because the slope of the progress curve does not change sharply at a given time, but, gradually, over a period of time. You probably remember how to measure the slope of a curved line, but let us review the process anyway. (See Figure A.14.)
10
0
5
CL
0 1 32
Time (hours)
This much rise inthis much time
Figure A.14
Suppose we want to measure the slope, or steepness, of the curved line C at time 2 hours. We can see that the curve rises 5 units total in the 2 hours, so that the average slope is 2.5 units per hour. However, it is easy to see from the graph that this average is very misleading; the progress curve is almost flat at the beginning (i.e., has 0 slope) and then accelerates rapidly, so that the line curves upward. If we want to find the true slope at 2 hours, we must draw line L in such a way that L has the same slope as C at the 2-hour point. Then we can see that L rises about 5 units between 1 and 2 hours, just twice the average slope for the first 2 hours.
We have seen that a perfectly flat curve, like that for Process I or II, means that the corresponding progress curve is a perfectly straight line having the same slope at all points. Conversely, a progress curve that changes in slope, like that of Process III, will give a rate curve that looks like steps. You should be able to figure out that the “steps” on the rate curve will be sharp and square if the progress curve has an abrupt change in slope, and more rounded off if the progress curve changes slope gradually. In any case, in regions where the rate curve is perfectly flat it is clear that the progress curve must have constant steepness, or slope. However, if the progress curve itself gets perfectly flat, then that portion of the progress curve has 0 slope; in other words, the reaction has stopped. This kind of situation is pictured in Figure A.15 where the rate and progress curves for another reaction, call it Process IV, are shown.
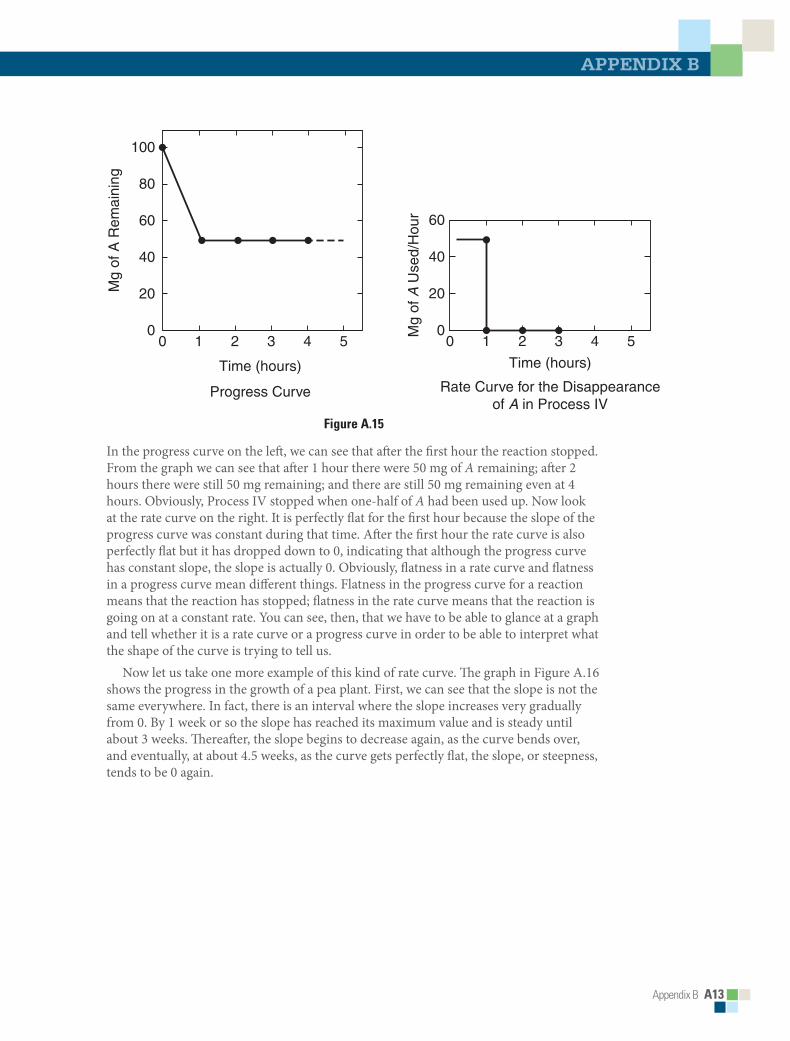
Appendix B A13
appendiX B
Time (hours)
Progress Curve
100
80
60
Mg
of A
Rem
aini
ng
40
20
00 1 2 3 4 5 0
0
20
40
Mg
of A
Use
d/H
our
Time (hours)
Rate Curve for the Disappearanceof A in Process IV
60
1 2 3 4 5
Figure A.15
In the progress curve on the left, we can see that after the first hour the reaction stopped. From the graph we can see that after 1 hour there were 50 mg of A remaining; after 2 hours there were still 50 mg remaining; and there are still 50 mg remaining even at 4 hours. Obviously, Process IV stopped when one-half of A had been used up. Now look at the rate curve on the right. It is perfectly flat for the first hour because the slope of the progress curve was constant during that time. After the first hour the rate curve is also perfectly flat but it has dropped down to 0, indicating that although the progress curve has constant slope, the slope is actually 0. Obviously, flatness in a rate curve and flatness in a progress curve mean different things. Flatness in the progress curve for a reaction means that the reaction has stopped; flatness in the rate curve means that the reaction is going on at a constant rate. You can see, then, that we have to be able to glance at a graph and tell whether it is a rate curve or a progress curve in order to be able to interpret what the shape of the curve is trying to tell us.
Now let us take one more example of this kind of rate curve. The graph in Figure A.16 shows the progress in the growth of a pea plant. First, we can see that the slope is not the same everywhere. In fact, there is an interval where the slope increases very gradually from 0. By 1 week or so the slope has reached its maximum value and is steady until about 3 weeks. Thereafter, the slope begins to decrease again, as the curve bends over, and eventually, at about 4.5 weeks, as the curve gets perfectly flat, the slope, or steepness, tends to be 0 again.
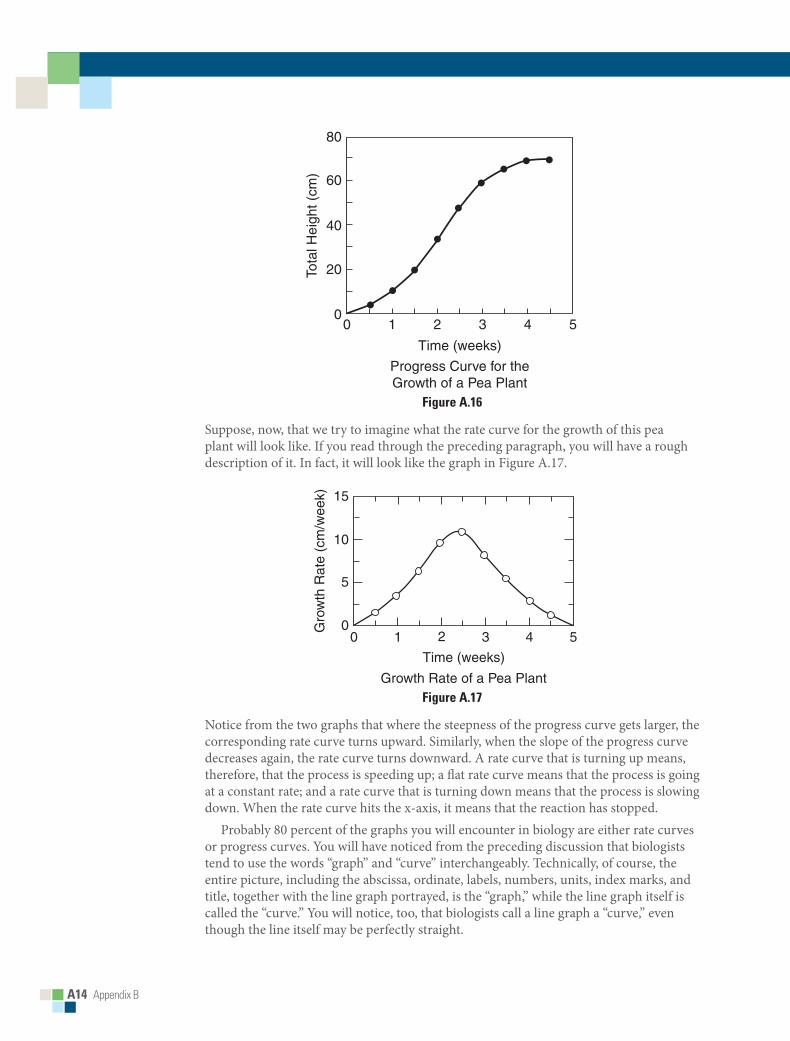
A14 Appendix B
Time (weeks)
Progress Curve for theGrowth of a Pea Plant
1 2 3 4 50To
tal H
eigh
t (cm
)0
20
40
60
80
Figure A.16
Suppose, now, that we try to imagine what the rate curve for the growth of this pea plant will look like. If you read through the preceding paragraph, you will have a rough description of it. In fact, it will look like the graph in Figure A.17.
Gro
wth
Rat
e (c
m/w
eek)
Time (weeks)
Growth Rate of a Pea Plant
00 1 2 3 4 5
5
10
15
Figure A.17
Notice from the two graphs that where the steepness of the progress curve gets larger, the corresponding rate curve turns upward. Similarly, when the slope of the progress curve decreases again, the rate curve turns downward. A rate curve that is turning up means, therefore, that the process is speeding up; a flat rate curve means that the process is going at a constant rate; and a rate curve that is turning down means that the process is slowing down. When the rate curve hits the x-axis, it means that the reaction has stopped.
Probably 80 percent of the graphs you will encounter in biology are either rate curves or progress curves. You will have noticed from the preceding discussion that biologists tend to use the words “graph” and “curve” interchangeably. Technically, of course, the entire picture, including the abscissa, ordinate, labels, numbers, units, index marks, and title, together with the line graph portrayed, is the “graph,” while the line graph itself is called the “curve.” You will notice, too, that biologists call a line graph a “curve,” even though the line itself may be perfectly straight.

Appendix B A15
appendiX B
To summarize, remember that a progress curve is made from measurements at different times during the progress of a reaction that is continuous with time. A graph that shows how much or to what extent a reaction has occurred at different times is a progress or time-course curve. In contrast, a rate curve is a picture of the steepness of one or more progress curves, and any graph that has rate on one of its scales is a rate curve.
So far we have been considering only rate graphs that have time on the abscissa; we could call these time-rate curves. As we have seen, a time-rate curve can be made from any progress curve. Next, we are going to consider rate curves that do not have time as the abscissa. As you shall see, such curves are made by combining data from several progress curves, each representing the time course of the reaction under a different set of conditions.
■ otheR Kinds oF RAte GRAphsLet us look at and try to analyze the graph in Figure A.18. Obviously, it is a progress curve because it shows an amount of something on the ordinate and time on the abscissa. There are several different curves all plotted on the same graph, and each is labeled with a different temperature. The title indicates that this graph is trying to tell us how Process I behaves at different temperatures.
1 2 3 4 50
0
20
Time (hours)
Temperature Dependence of Process I
Mg
of A
Rem
aini
ng
40
60
80
100 30°C
40°C
50°C
10°C
20°C
Figure A.18
Before we try to construct the rate curve for this graph, we should try to imagine how this experiment was carried out. It seems clear that the experiment must have started with several different batches of A and that each reaction mixture was kept at a different temperature. Then, every half-hour, the amount of A remaining was measured and the amount consumed was calculated. The results might have been plotted in five separate progress curves, as shown in Figure A.19.

A16 Appendix B
Mg
A C
onsu
med
00
20
40
60
80
1 2 3 0 1 2 3 0 1 2 3 0 1 2 3 0 1 2 3
10° 20° 30° 40° 50°
Time (hours) Time (hours) Time (hours) Time (hours) Time (hours)
Figure A.19
When all these progress curves are plotted on the same graph, as was done in Figure A.18, we have what is called a “family” of curves. If we look at the slopes of the various members of the family of curves for Process I, we see that the steepest slope does not correspond to the highest temperature. In fact, the curve for 30° is the steepest, whereas the curve for 50° is the least steep; the curve for 10°, the lowest temperature, has an intermediate slope. By analyzing and comparing the slopes of the family of curves in this way we can get a reasonably good notion of the effect of temperature on Process I, but this effect could be shown much more clearly in a rate graph that has temperature as the abscissa. Such a graph would show us at a glance how the rate varies with temperature and, of course, would be preferable, as the whole point in making a graph is to present information simply and clearly. The diagram in Figure A.20 shows how a rate-temperature graph would be constructed from this family of curves for Process I.
00 1 2
Time (hours)
This much in 1 hr at 30°
30°
40°20°
10°
50°
This much in 1 hr at 40°This much in 1 hr at 20°This much in 1 hr at 10°This much in 1 hr at 50°
3 4
20
40
60
80
100
00 10 20
Temperature (°C)
30 40 50
20
40
60
Mg
A C
onsu
med
/Hou
r
Figure A.20
Having found, as shown in Figure A.20, the five points for our rate graph, we are faced with the question of whether or not it is legitimate to connect these points with a
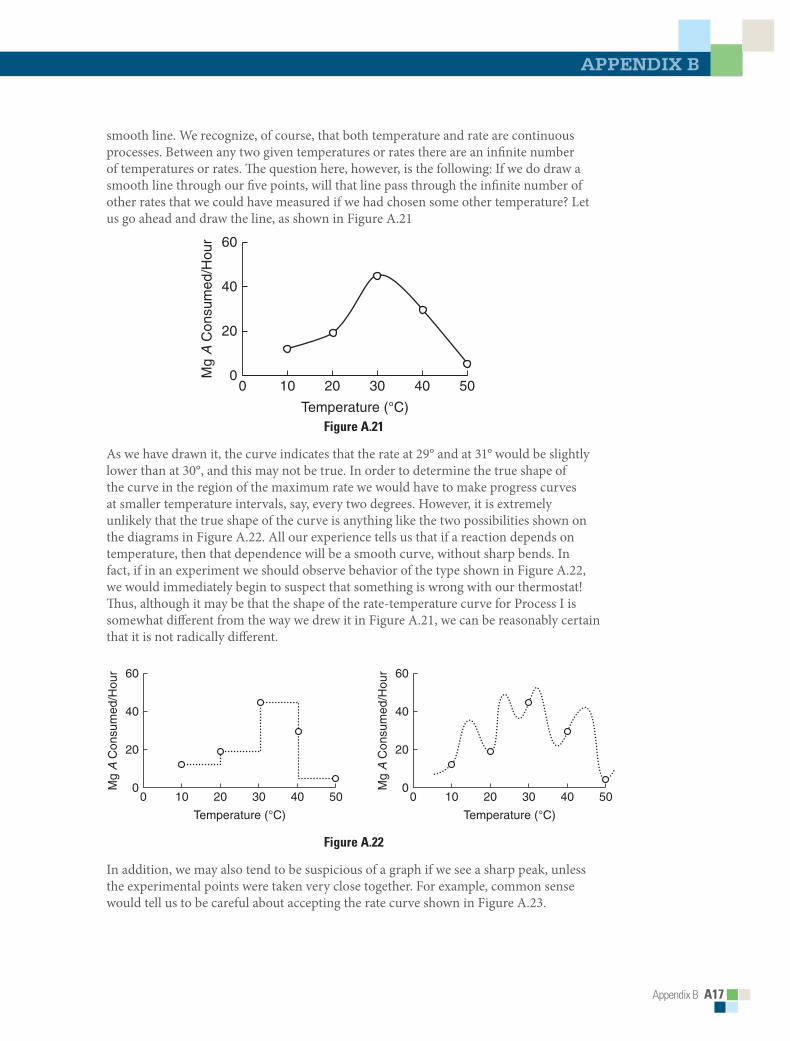
Appendix B A17
appendiX B
smooth line. We recognize, of course, that both temperature and rate are continuous processes. Between any two given temperatures or rates there are an infinite number of temperatures or rates. The question here, however, is the following: If we do draw a smooth line through our five points, will that line pass through the infinite number of other rates that we could have measured if we had chosen some other temperature? Let us go ahead and draw the line, as shown in Figure A.21
20
40
60
010 20
Temperature (°C)
Mg
A C
onsu
med
/Hou
r
30 40 500
Figure A.21
As we have drawn it, the curve indicates that the rate at 29° and at 31° would be slightly lower than at 30°, and this may not be true. In order to determine the true shape of the curve in the region of the maximum rate we would have to make progress curves at smaller temperature intervals, say, every two degrees. However, it is extremely unlikely that the true shape of the curve is anything like the two possibilities shown on the diagrams in Figure A.22. All our experience tells us that if a reaction depends on temperature, then that dependence will be a smooth curve, without sharp bends. In fact, if in an experiment we should observe behavior of the type shown in Figure A.22, we would immediately begin to suspect that something is wrong with our thermostat! Thus, although it may be that the shape of the rate-temperature curve for Process I is somewhat different from the way we drew it in Figure A.21, we can be reasonably certain that it is not radically different.
20
40
60
010 20
Temperature (°C)
Mg
A C
onsu
med
/Hou
r
30 40 500
20
40
60
010 20
Temperature (°C)
Mg
A C
onsu
med
/Hou
r
30 40 500
Figure A.22
In addition, we may also tend to be suspicious of a graph if we see a sharp peak, unless the experimental points were taken very close together. For example, common sense would tell us to be careful about accepting the rate curve shown in Figure A.23.

A18 Appendix B
40
80
120
020 40
Temperature (°C)M
g A
Con
sum
ed/H
our
60 80 1000
Figure A.23
Obviously, most of the shape is given to the profile by the one measurement at 60°. In biology, as in everything else, mistakes can be made, so the experimenter would have to check the validity of that measurement very carefully. The easiest way to do that would be to make more measurements slightly above and slightly below 60° to see whether these would fall on the line the experimenter has drawn. Alternatively, the experimenter could play it safe and draw only a bar graph for these spaced temperatures. Another useful dodge would be to connect the points with a smooth but broken line rather than a continuous line. As always, the broken line would suggest the tentative and provisional nature of the curve as drawn.
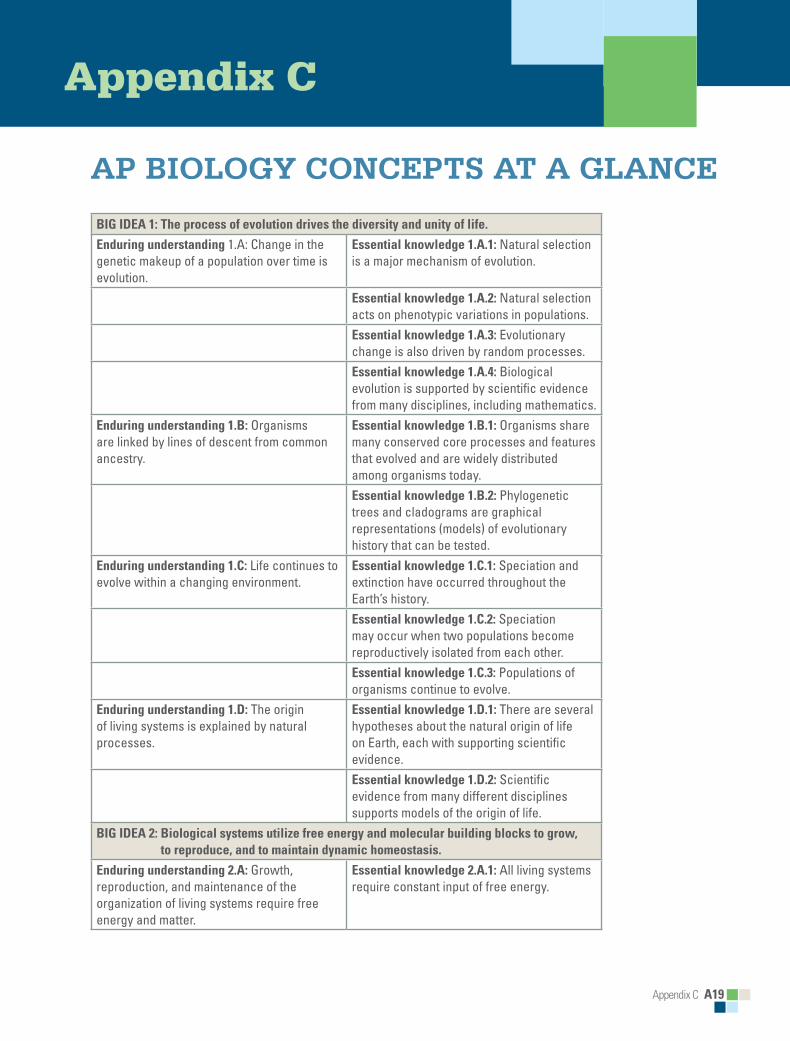
Appendix C A19
Appendix C
AP Biology ConCePts At A glAnCe
Big ideA 1: The process of evolution drives the diversity and unity of life.
enduring understanding 1.A: Change in the genetic makeup of a population over time is evolution.
essential knowledge 1.A.1: Natural selection is a major mechanism of evolution.
essential knowledge 1.A.2: Natural selection acts on phenotypic variations in populations.essential knowledge 1.A.3: Evolutionary change is also driven by random processes.essential knowledge 1.A.4: Biological evolution is supported by scientific evidence from many disciplines, including mathematics.
enduring understanding 1.B: Organisms are linked by lines of descent from common ancestry.
essential knowledge 1.B.1: Organisms share many conserved core processes and features that evolved and are widely distributed among organisms today.essential knowledge 1.B.2: Phylogenetic trees and cladograms are graphical representations (models) of evolutionary history that can be tested.
enduring understanding 1.C: Life continues to evolve within a changing environment.
essential knowledge 1.C.1: Speciation and extinction have occurred throughout the Earth’s history.essential knowledge 1.C.2: Speciation may occur when two populations become reproductively isolated from each other.essential knowledge 1.C.3: Populations of organisms continue to evolve.
enduring understanding 1.d: The origin of living systems is explained by natural processes.
essential knowledge 1.d.1: There are several hypotheses about the natural origin of life on Earth, each with supporting scientific evidence.essential knowledge 1.d.2: Scientific evidence from many different disciplines supports models of the origin of life.
Big ideA 2: Biological systems utilize free energy and molecular building blocks to grow, to reproduce, and to maintain dynamic homeostasis.
enduring understanding 2.A: Growth, reproduction, and maintenance of the organization of living systems require free energy and matter.
essential knowledge 2.A.1: All living systems require constant input of free energy.

A20 Appendix C
essential knowledge 2.A.2: Organisms capture and store free energy for use in biological processes.essential knowledge 2.A.3: Organisms must exchange matter with the environment to grow, reproduce, and maintain organization.
enduring understanding 2.B: Growth, reproduction, and dynamic homeostasis require that cells create and maintain internal environments that are different from their external environments.
essential knowledge 2.B.1: Cell membranes are selectively permeable due to their structure.
essential knowledge 2.B.2: Growth and dynamic homeostasis are maintained by the constant movement of molecules across membranes.essential knowledge 2.B.3: Eukaryotic cells maintain internal membranes that partition the cell into specialized regions.
enduring understanding 2.C: Organisms use feedback mechanisms to regulate growth and reproduction, and to maintain dynamic homeostasis.
essential knowledge 2.C.1: Organisms use feedback mechanisms to maintain their internal environments and respond to external environmental changes.essential knowledge 2.C.2: Organisms respond to changes in their external environments.
enduring understanding 2.d: Growth and dynamic homeostasis of a biological system are influenced by changes in the system’s environment.
essential knowledge 2.d.1: All biological systems from cells and organisms to populations, communities, and ecosystems are affected by complex biotic and abiotic interactions involving exchange of matter and free energy.essential knowledge 2.d.2: Homeostatic mechanisms reflect both common ancestry and divergence due to adaptation in different environments.essential knowledge 2.d.3: Biological systems are affected by disruptions to their dynamic homeostasis.essential knowledge 2.d.4: Plants and animals have a variety of chemical defenses against infections that affect dynamic homeostasis.

Appendix C A21
APPendiX C
enduring understanding 2.e: Many biological processes involved in growth, reproduction, and dynamic homeostasis include temporal regulation and coordination.
essential knowledge 2.e.1: Timing and coordination of specific events are necessary for the normal development of an organism, and these events are regulated by a variety of mechanisms.essential knowledge 2.e.2: Timing and coordination of physiological events are regulated by multiple mechanisms.essential knowledge 2.e.3: Timing and coordination of behavior are regulated by various mechanisms and are important in natural selection.
Big ideA 3: Living systems store, retrieve, transmit, and respond to information essential to life processes.
enduring understanding 3.A: Heritable information provides for continuity of life.
essential knowledge 3.A.1: DNA, and in some cases RNA, is the primary source of heritable information.essential knowledge 3.A.2: In eukaryotes, heritable information is passed to the next generation via processes that include the cell cycle and mitosis or meiosis plus fertilization.essential knowledge 3.A.3: The chromosomal basis of inheritance provides an understanding of the pattern of passage (transmission) of genes from parent to offspring.essential knowledge 3.A.4: The inheritance pattern of many traits cannot be explained by simple Mendelian genetics.
enduring understanding 3.B: Expression of genetic information involves cellular and molecular mechanisms.
essential knowledge 3.B.1: Gene regulation results in differential gene expression, leading to cell specialization.essential knowledge 3.B.2: A variety of intercellular and intracellular signal transmissions mediate gene expression.
enduring understanding 3.C: The processing of genetic information is imperfect and is a source of genetic variation.
essential knowledge 3.C.1: Changes in genotype can result in changes in phenotype.
essential knowledge 3.C.2: Biological systems have multiple processes that increase genetic variation.essential knowledge 3.C.3: Viral replication results in genetic variation, and viral infection can introduce genetic variation into the hosts.
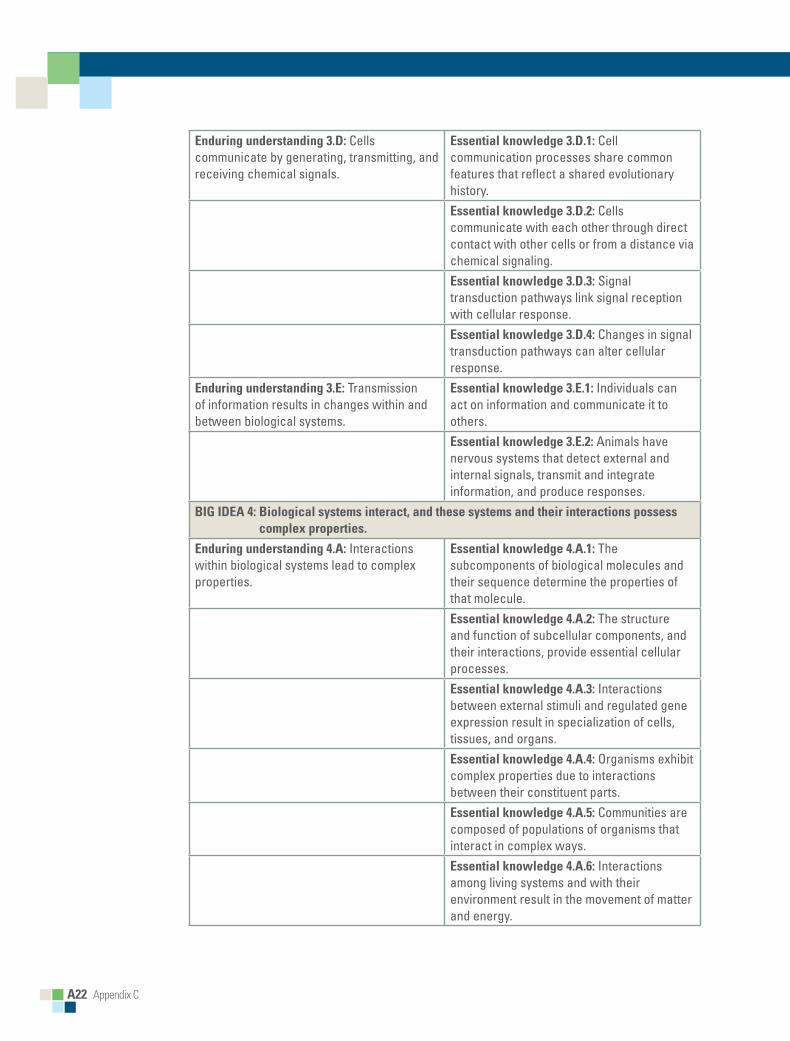
A22 Appendix C
enduring understanding 3.d: Cells communicate by generating, transmitting, and receiving chemical signals.
essential knowledge 3.d.1: Cell communication processes share common features that reflect a shared evolutionary history.essential knowledge 3.d.2: Cells communicate with each other through direct contact with other cells or from a distance via chemical signaling.essential knowledge 3.d.3: Signal transduction pathways link signal reception with cellular response.essential knowledge 3.d.4: Changes in signal transduction pathways can alter cellular response.
enduring understanding 3.e: Transmission of information results in changes within and between biological systems.
essential knowledge 3.e.1: Individuals can act on information and communicate it to others.essential knowledge 3.e.2: Animals have nervous systems that detect external and internal signals, transmit and integrate information, and produce responses.
Big ideA 4: Biological systems interact, and these systems and their interactions possess complex properties.
enduring understanding 4.A: Interactions within biological systems lead to complex properties.
essential knowledge 4.A.1: The subcomponents of biological molecules and their sequence determine the properties of that molecule.essential knowledge 4.A.2: The structure and function of subcellular components, and their interactions, provide essential cellular processes.essential knowledge 4.A.3: Interactions between external stimuli and regulated gene expression result in specialization of cells, tissues, and organs.essential knowledge 4.A.4: Organisms exhibit complex properties due to interactions between their constituent parts.essential knowledge 4.A.5: Communities are composed of populations of organisms that interact in complex ways.essential knowledge 4.A.6: Interactions among living systems and with their environment result in the movement of matter and energy.
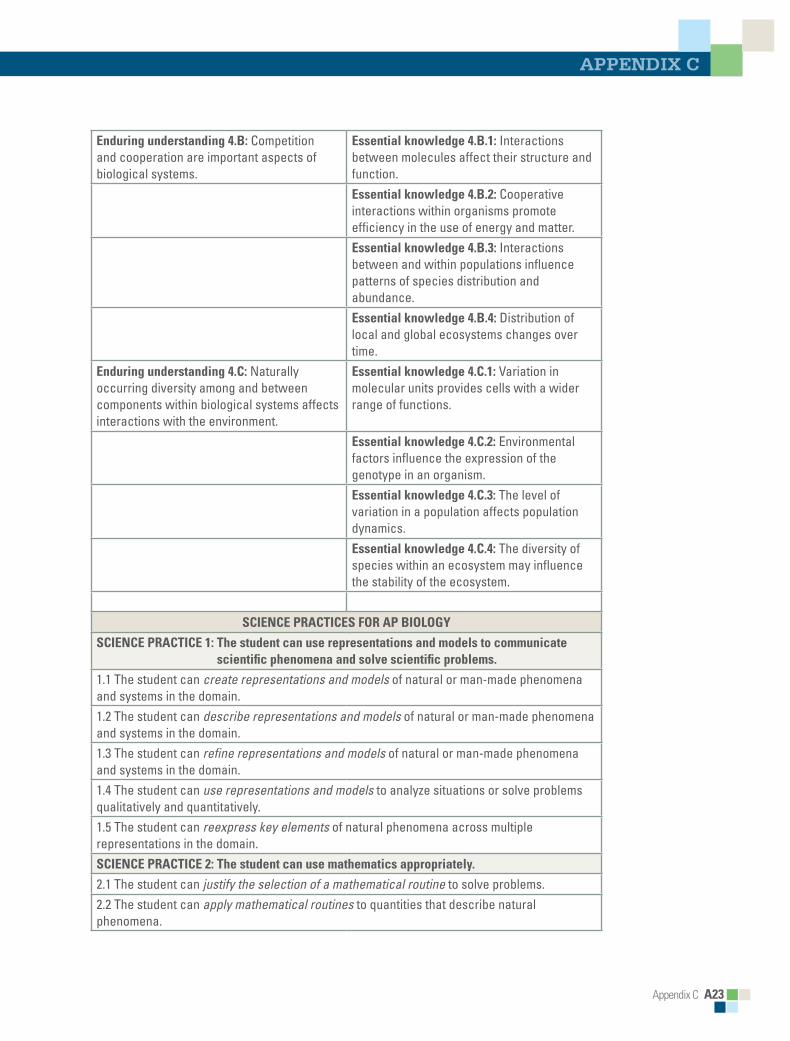
Appendix C A23
APPendiX C
enduring understanding 4.B: Competition and cooperation are important aspects of biological systems.
essential knowledge 4.B.1: Interactions between molecules affect their structure and function.essential knowledge 4.B.2: Cooperative interactions within organisms promote efficiency in the use of energy and matter.essential knowledge 4.B.3: Interactions between and within populations influence patterns of species distribution and abundance.essential knowledge 4.B.4: Distribution of local and global ecosystems changes over time.
enduring understanding 4.C: Naturally occurring diversity among and between components within biological systems affects interactions with the environment.
essential knowledge 4.C.1: Variation in molecular units provides cells with a wider range of functions.
essential knowledge 4.C.2: Environmental factors influence the expression of the genotype in an organism.essential knowledge 4.C.3: The level of variation in a population affects population dynamics.essential knowledge 4.C.4: The diversity of species within an ecosystem may influence the stability of the ecosystem.
SCienCe PrACTiCeS for AP BioLogy
SCienCe PrACTiCe 1: The student can use representations and models to communicate scientific phenomena and solve scientific problems.
1.1 The student can create representations and models of natural or man-made phenomena and systems in the domain.1.2 The student can describe representations and models of natural or man-made phenomena and systems in the domain.1.3 The student can refine representations and models of natural or man-made phenomena and systems in the domain.1.4 The student can use representations and models to analyze situations or solve problems qualitatively and quantitatively.1.5 The student can reexpress key elements of natural phenomena across multiple representations in the domain.SCienCe PrACTiCe 2: The student can use mathematics appropriately.
2.1 The student can justify the selection of a mathematical routine to solve problems.2.2 The student can apply mathematical routines to quantities that describe natural phenomena.
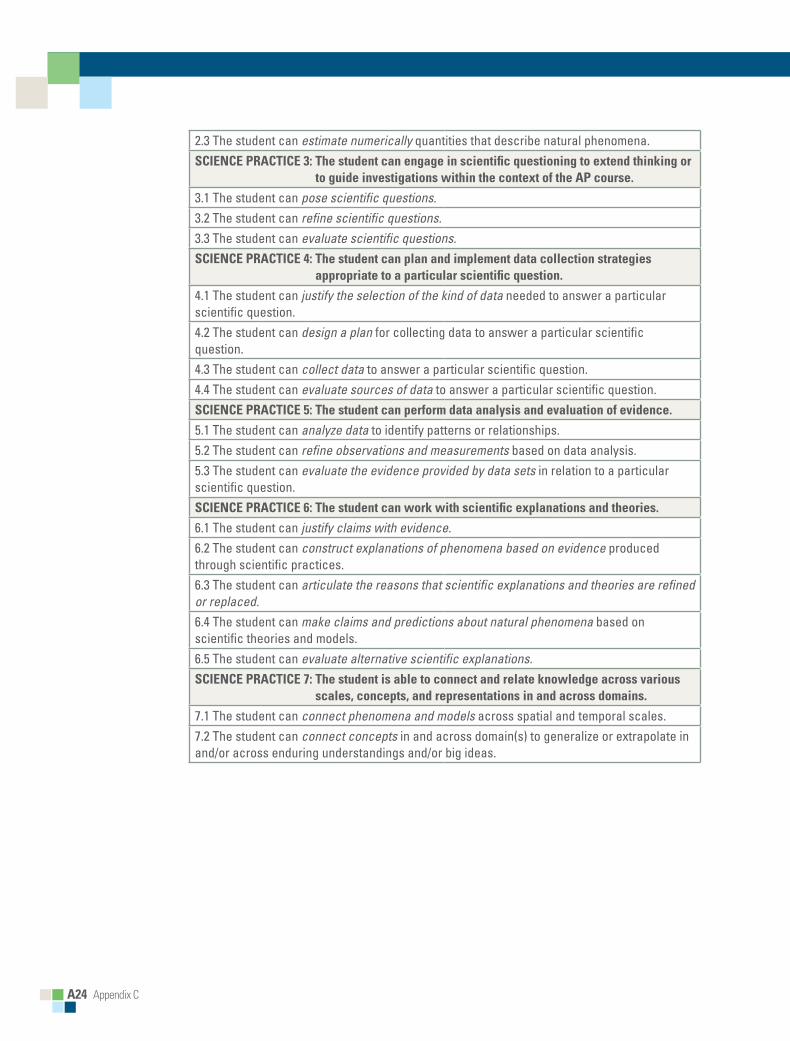
A24 Appendix C
2.3 The student can estimate numerically quantities that describe natural phenomena.SCienCe PrACTiCe 3: The student can engage in scientific questioning to extend thinking or
to guide investigations within the context of the AP course.
3.1 The student can pose scientific questions.3.2 The student can refine scientific questions.3.3 The student can evaluate scientific questions.SCienCe PrACTiCe 4: The student can plan and implement data collection strategies
appropriate to a particular scientific question.
4.1 The student can justify the selection of the kind of data needed to answer a particular scientific question.4.2 The student can design a plan for collecting data to answer a particular scientific question.4.3 The student can collect data to answer a particular scientific question.4.4 The student can evaluate sources of data to answer a particular scientific question.SCienCe PrACTiCe 5: The student can perform data analysis and evaluation of evidence.
5.1 The student can analyze data to identify patterns or relationships.5.2 The student can refine observations and measurements based on data analysis.5.3 The student can evaluate the evidence provided by data sets in relation to a particular scientific question.SCienCe PrACTiCe 6: The student can work with scientific explanations and theories.
6.1 The student can justify claims with evidence.6.2 The student can construct explanations of phenomena based on evidence produced through scientific practices.6.3 The student can articulate the reasons that scientific explanations and theories are refined or replaced.6.4 The student can make claims and predictions about natural phenomena based on scientific theories and models.6.5 The student can evaluate alternative scientific explanations.SCienCe PrACTiCe 7: The student is able to connect and relate knowledge across various
scales, concepts, and representations in and across domains.
7.1 The student can connect phenomena and models across spatial and temporal scales.7.2 The student can connect concepts in and across domain(s) to generalize or extrapolate in and/or across enduring understandings and/or big ideas.
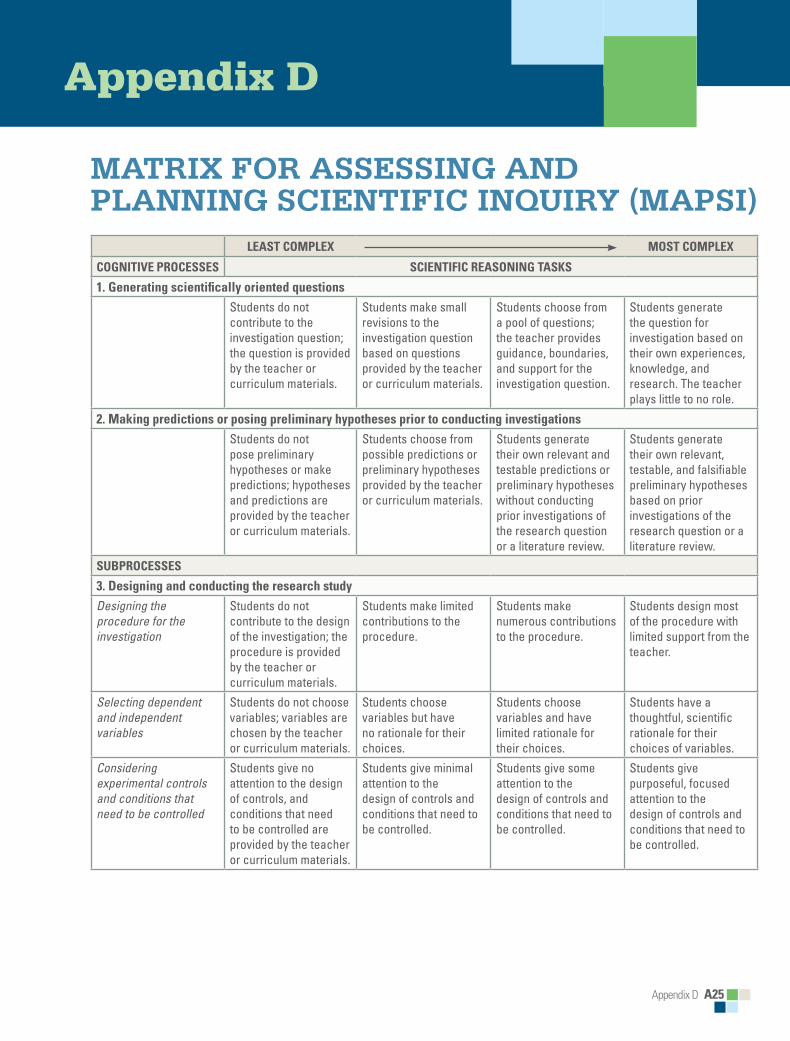
Appendix D A25
Appendix D
Matrix for assessing and Planning scientific inquiry (MaPsi)
LeAst compLex most compLex
cognitive processes scientific reAsoning tAsks
1. generating scientifically oriented questionsStudents do not contribute to the investigation question; the question is provided by the teacher or curriculum materials.
Students make small revisions to the investigation question based on questions provided by the teacher or curriculum materials.
Students choose from a pool of questions; the teacher provides guidance, boundaries, and support for the investigation question.
Students generate the question for investigation based on their own experiences, knowledge, and research. The teacher plays little to no role.
2. making predictions or posing preliminary hypotheses prior to conducting investigationsStudents do not pose preliminary hypotheses or make predictions; hypotheses and predictions are provided by the teacher or curriculum materials.
Students choose from possible predictions or preliminary hypotheses provided by the teacher or curriculum materials.
Students generate their own relevant and testable predictions or preliminary hypotheses without conducting prior investigations of the research question or a literature review.
Students generate their own relevant, testable, and falsifiable preliminary hypotheses based on prior investigations of the research question or a literature review.
subprocesses
3. Designing and conducting the research studyDesigning the procedure for the investigation
Students do not contribute to the design of the investigation; the procedure is provided by the teacher or curriculum materials.
Students make limited contributions to the procedure.
Students make numerous contributions to the procedure.
Students design most of the procedure with limited support from the teacher.
Selecting dependent and independent variables
Students do not choose variables; variables are chosen by the teacher or curriculum materials.
Students choose variables but have no rationale for their choices.
Students choose variables and have limited rationale for their choices.
Students have a thoughtful, scientific rationale for their choices of variables.
Considering experimental controls and conditions that need to be controlled
Students give no attention to the design of controls, and conditions that need to be controlled are provided by the teacher or curriculum materials.
Students give minimal attention to the design of controls and conditions that need to be controlled.
Students give some attention to the design of controls and conditions that need to be controlled.
Students give purposeful, focused attention to the design of controls and conditions that need to be controlled.
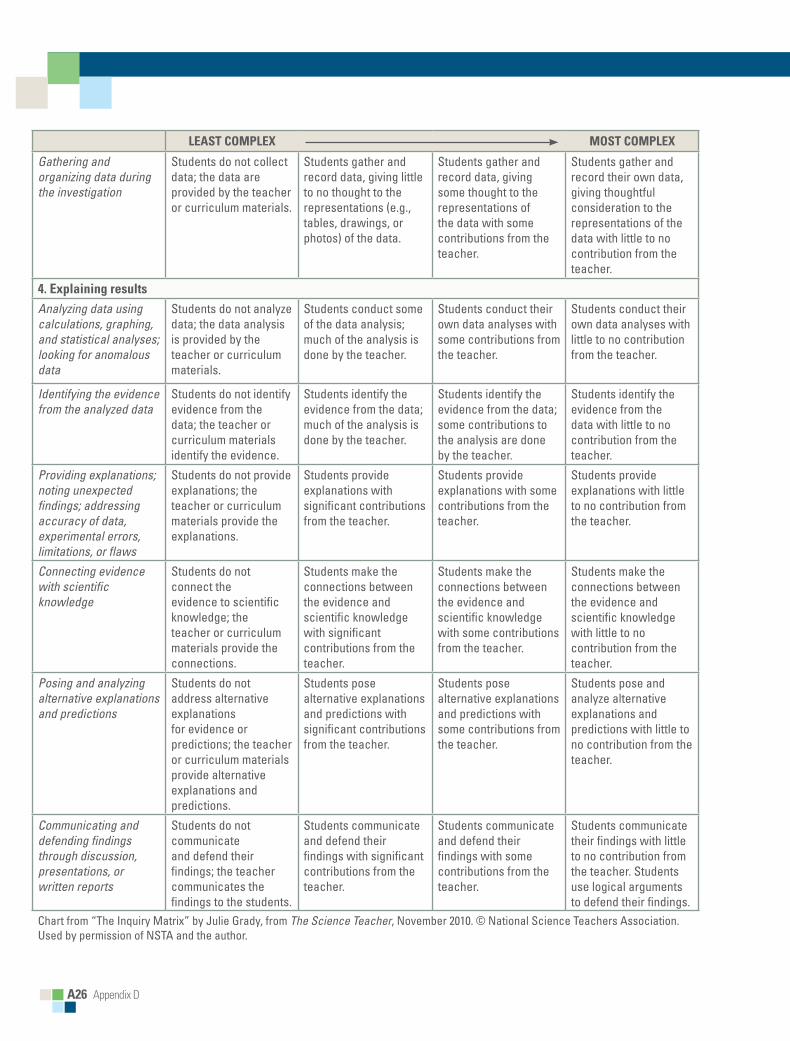
A26 Appendix D
LeAst compLex most compLex
Gathering and organizing data during the investigation
Students do not collect data; the data are provided by the teacher or curriculum materials.
Students gather and record data, giving little to no thought to the representations (e.g., tables, drawings, or photos) of the data.
Students gather and record data, giving some thought to the representations of the data with some contributions from the teacher.
Students gather and record their own data, giving thoughtful consideration to the representations of the data with little to no contribution from the teacher.
4. explaining resultsAnalyzing data using calculations, graphing, and statistical analyses; looking for anomalous data
Students do not analyze data; the data analysis is provided by the teacher or curriculum materials.
Students conduct some of the data analysis; much of the analysis is done by the teacher.
Students conduct their own data analyses with some contributions from the teacher.
Students conduct their own data analyses with little to no contribution from the teacher.
Identifying the evidence from the analyzed data
Students do not identify evidence from the data; the teacher or curriculum materials identify the evidence.
Students identify the evidence from the data; much of the analysis is done by the teacher.
Students identify the evidence from the data; some contributions to the analysis are done by the teacher.
Students identify the evidence from the data with little to no contribution from the teacher.
Providing explanations; noting unexpected findings; addressing accuracy of data, experimental errors, limitations, or flaws
Students do not provide explanations; the teacher or curriculum materials provide the explanations.
Students provide explanations with significant contributions from the teacher.
Students provide explanations with some contributions from the teacher.
Students provide explanations with little to no contribution from the teacher.
Connecting evidence with scientific knowledge
Students do not connect the evidence to scientific knowledge; the teacher or curriculum materials provide the connections.
Students make the connections between the evidence and scientific knowledge with significant contributions from the teacher.
Students make the connections between the evidence and scientific knowledge with some contributions from the teacher.
Students make the connections between the evidence and scientific knowledge with little to no contribution from the teacher.
Posing and analyzing alternative explanations and predictions
Students do not address alternative explanations for evidence or predictions; the teacher or curriculum materials provide alternative explanations and predictions.
Students pose alternative explanations and predictions with significant contributions from the teacher.
Students pose alternative explanations and predictions with some contributions from the teacher.
Students pose and analyze alternative explanations and predictions with little to no contribution from the teacher.
Communicating and defending findings through discussion, presentations, or written reports
Students do not communicate and defend their findings; the teacher communicates the findings to the students.
Students communicate and defend their findings with significant contributions from the teacher.
Students communicate and defend their findings with some contributions from the teacher.
Students communicate their findings with little to no contribution from the teacher. Students use logical arguments to defend their findings.
Chart from “The Inquiry Matrix” by Julie Grady, from The Science Teacher, November 2010. © National Science Teachers Association. Used by permission of NSTA and the author.
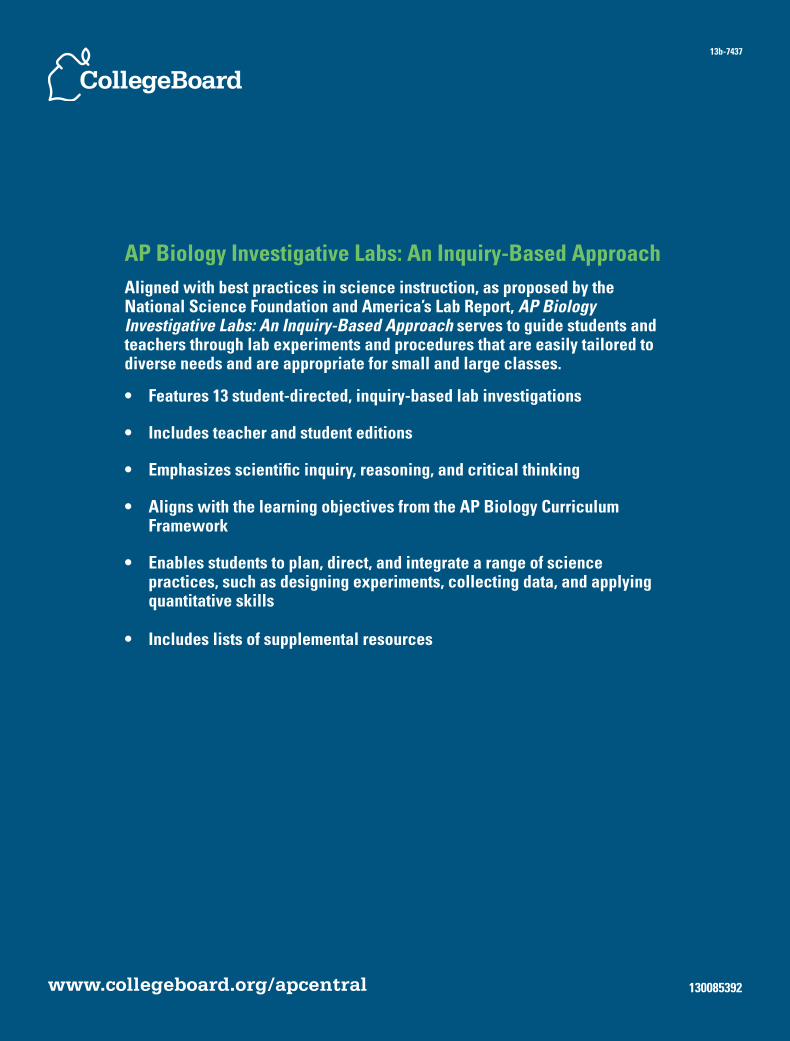
AP Biology Investigative Labs: An Inquiry-Based ApproachAligned with best practices in science instruction, as proposed by the National Science Foundation and America’s Lab Report, AP Biology Investigative Labs: An Inquiry-Based Approach serves to guide students and teachers through lab experiments and procedures that are easily tailored to diverse needs and are appropriate for small and large classes.
• Features 13 student-directed, inquiry-based lab investigations
• Includes teacher and student editions
• Emphasizes scientific inquiry, reasoning, and critical thinking
• Aligns with the learning objectives from the AP Biology Curriculum Framework
• Enables students to plan, direct, and integrate a range of science practices, such as designing experiments, collecting data, and applying quantitative skills
• Includes lists of supplemental resources
www.collegeboard.org/apcentral
13b-7437
130085392