inventory of some global and sub-global remote sensing
TRANSCRIPT
63© The Author(s) 2015 G.T. Yengoh et al., Use of the Normalized Difference Vegetation Index (NDVI) to Assess Land Degradation at Multiple Scales, SpringerBriefs in Environmental Science, DOI 10.1007/978-3-319-24112-8
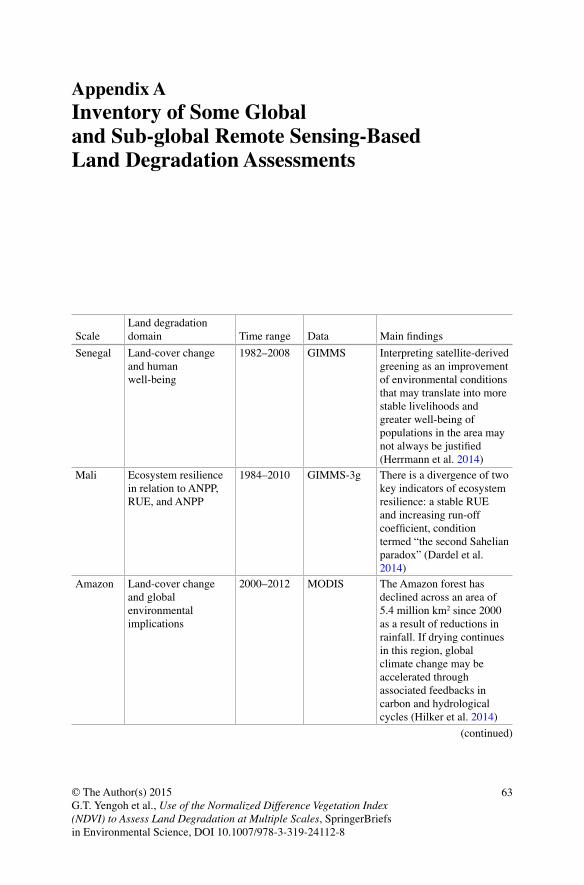
Appendix A Inventory of Some Global and Sub-global Remote Sensing-Based Land Degradation Assessments
ScaleLand degradation domain Time range Data Main findings
Senegal Land-cover change and human well-being
1982–2008 GIMMS Interpreting satellite-derived greening as an improvement of environmental conditions that may translate into more stable livelihoods and greater well-being of populations in the area may not always be justified (Herrmann et al. 2014)
Mali Ecosystem resilience in relation to ANPP, RUE, and ANPP
1984–2010 GIMMS-3g There is a divergence of two key indicators of ecosystem resilience: a stable RUE and increasing run-off coefficient, condition termed “the second Sahelian paradox” (Dardel et al. 2014)
Amazon Land-cover change and global environmental implications
2000–2012 MODIS The Amazon forest has declined across an area of 5.4 million km2 since 2000 as a result of reductions in rainfall. If drying continues in this region, global climate change may be accelerated through associated feedbacks in carbon and hydrological cycles (Hilker et al. 2014)
(continued)
64
ScaleLand degradation domain Time range Data Main findings
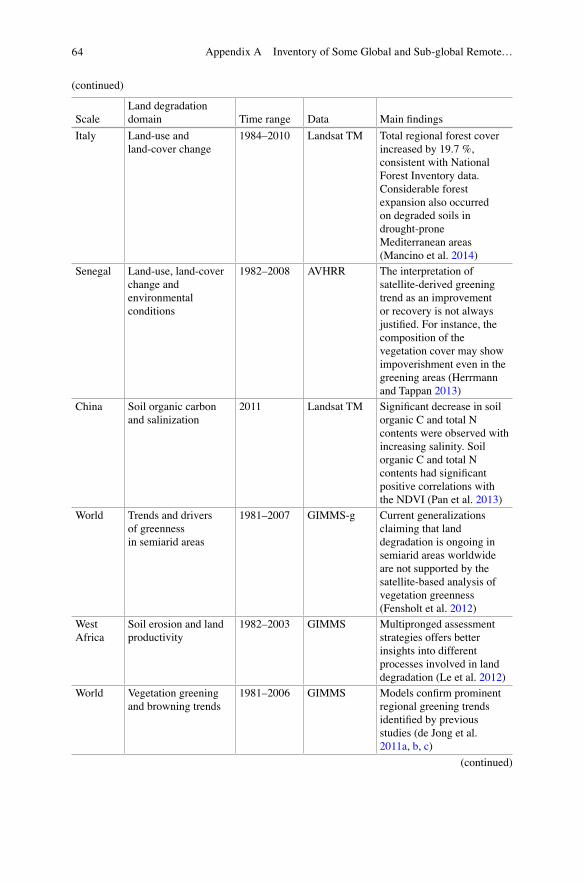
Italy Land-use and land-cover change
1984–2010 Landsat TM Total regional forest cover increased by 19.7 %, consistent with National Forest Inventory data. Considerable forest expansion also occurred on degraded soils in drought- prone Mediterranean areas (Mancino et al. 2014)
Senegal Land-use, land-cover change and environmental conditions
1982–2008 AVHRR The interpretation of satellite-derived greening trend as an improvement or recovery is not always justified. For instance, the composition of the vegetation cover may show impoverishment even in the greening areas (Herrmann and Tappan 2013)
China Soil organic carbon and salinization
2011 Landsat TM Significant decrease in soil organic C and total N contents were observed with increasing salinity. Soil organic C and total N contents had significant positive correlations with the NDVI (Pan et al. 2013)
World Trends and drivers of greenness in semiarid areas
1981–2007 GIMMS-g Current generalizations claiming that land degradation is ongoing in semiarid areas worldwide are not supported by the satellite-based analysis of vegetation greenness (Fensholt et al. 2012)
West Africa
Soil erosion and land productivity
1982–2003 GIMMS Multipronged assessment strategies offers better insights into different processes involved in land degradation (Le et al. 2012)
World Vegetation greening and browning trends
1981–2006 GIMMS Models confirm prominent regional greening trends identified by previous studies (de Jong et al. 2011a, b, c)
(continued)
(continued)
Appendix A Inventory of Some Global and Sub-global Remote…
65
ScaleLand degradation domain Time range Data Main findings
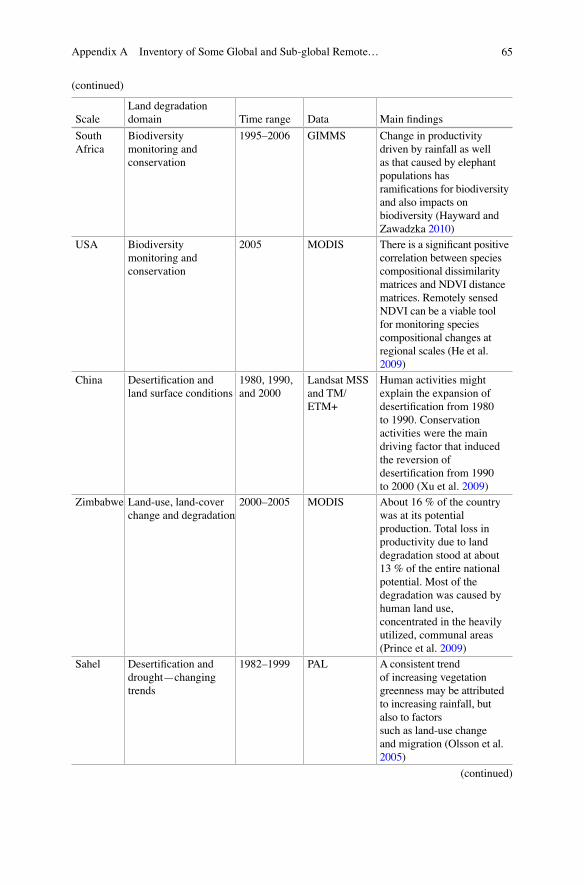
South Africa
Biodiversity monitoring and conservation
1995–2006 GIMMS Change in productivity driven by rainfall as well as that caused by elephant populations has ramifications for biodiversity and also impacts on biodiversity (Hayward and Zawadzka 2010)
USA Biodiversity monitoring and conservation
2005 MODIS There is a significant positive correlation between species compositional dissimilarity matrices and NDVI distance matrices. Remotely sensed NDVI can be a viable tool for monitoring species compositional changes at regional scales (He et al. 2009)
China Desertification and land surface conditions
1980, 1990, and 2000
Landsat MSS and TM/ETM+
Human activities might explain the expansion of desertification from 1980 to 1990. Conservation activities were the main driving factor that induced the reversion of desertification from 1990 to 2000 (Xu et al. 2009)
Zimbabwe Land-use, land-cover change and degradation
2000–2005 MODIS About 16 % of the country was at its potential production. Total loss in productivity due to land degradation stood at about 13 % of the entire national potential. Most of the degradation was caused by human land use, concentrated in the heavily utilized, communal areas (Prince et al. 2009)
Sahel Desertification and drought—changing trends
1982–1999 PAL A consistent trend of increasing vegetation greenness may be attributed to increasing rainfall, but also to factors such as land-use change and migration (Olsson et al. 2005)
(continued)
(continued)
Appendix A Inventory of Some Global and Sub-global Remote…
66
ScaleLand degradation domain Time range Data Main findings
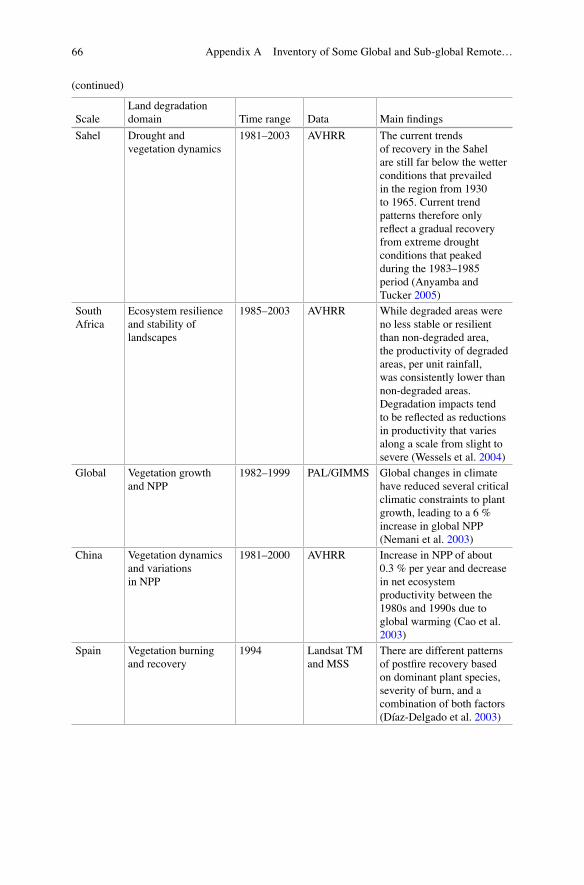
Sahel Drought and vegetation dynamics
1981–2003 AVHRR The current trends of recovery in the Sahel are still far below the wetter conditions that prevailed in the region from 1930 to 1965. Current trend patterns therefore only reflect a gradual recovery from extreme drought conditions that peaked during the 1983–1985 period (Anyamba and Tucker 2005)
South Africa
Ecosystem resilience and stability of landscapes
1985–2003 AVHRR While degraded areas were no less stable or resilient than non-degraded area, the productivity of degraded areas, per unit rainfall, was consistently lower than non-degraded areas. Degradation impacts tend to be reflected as reductions in productivity that varies along a scale from slight to severe (Wessels et al. 2004)
Global Vegetation growth and NPP
1982–1999 PAL/GIMMS Global changes in climate have reduced several critical climatic constraints to plant growth, leading to a 6 % increase in global NPP (Nemani et al. 2003)
China Vegetation dynamics and variations in NPP
1981–2000 AVHRR Increase in NPP of about 0.3 % per year and decrease in net ecosystem productivity between the 1980s and 1990s due to global warming (Cao et al. 2003)
Spain Vegetation burning and recovery
1994 Landsat TM and MSS
There are different patterns of postfire recovery based on dominant plant species, severity of burn, and a combination of both factors (Díaz-Delgado et al. 2003)
(continued)
Appendix A Inventory of Some Global and Sub-global Remote…
67© The Author(s) 2015 G.T. Yengoh et al., Use of the Normalized Difference Vegetation Index (NDVI) to Assess Land Degradation at Multiple Scales, SpringerBriefs in Environmental Science, DOI 10.1007/978-3-319-24112-8
Appendix B Use of Remote Sensing-Derived Land Productive Capacity Dynamics for the New World Atlas of Desertification (WAD)
Courtesy of Michael Cherlet, Hrvoje Kutnjak, Marek Smid, and Stefan Sommer of the European Commission, Joint Research Centre, Ispra, Italy; and Eva Ivits, Eva of the European Environment Agency, Copenhagen, Denmark
Background and Rationale
The European Commission’s Joint Research Centre of the (JRC), together with UNEP and supported by a global network of international research institutions and experts, is developing the new World Atlas of Desertification (WAD).
Monitoring and assessing land degradation dynamics involves extracting the most relevant information from time series of global satellite observations. The dynamics of the Earth’s standing vegetation biomass is considered a valid approxi-mation of land system productive capacity dynamics thus, also reflecting the under-lying ecological conditions and possible constraints for primary productivity, such as soil fertility, water availability, land use/management, etc., and hence related to land degradation. In fact, reduction or loss of land productive capacity, mostly bio-logical and/or economical, is one common denominator in the various definitions of land degradation.
The longest available satellite observation datasets with global coverage at 1-km resolution, from, e.g., the SPOT VGT sensor, have a continuous frequent temporal sampling over a long enough period, now 15 years, to allow extraction of proxy information on the phenology and seasonal productivity for each 1-km2 area on Earth. Even longer continuous time series, more than 30 years, are available through the GIMMS NDVI product, dating back as far as to 1981. However, its spatial reso-lution is only 8 × 8 km, which may well be suitable for the analysis of broader land-atmosphere interaction but which has limitations for monitoring and assessing the human- ecosystem interactions at landscape level. These operate and function typi-cally at smaller scales than can be depicted at the spatial resolution of GIMMS. Nevertheless, the length of this NDVI time series raises interest in ways to combine it with higher-resolution products for enhanced analysis.
68
Methodology for Time Series Processing and Analyses
Building on numerous studies that use time series of remotely sensed vegetation indices (e.g., NDVI, Fapar) as base layer, we expand this set of variables by calcu-lating phenological metrics from time series of the vegetation index. Disaggegation of the original time series into phenological metrics yields additional information on various aspects of vegetation/land-cover functional composition in relation to dynamics of ecosystem functioning and land use (Ivits et al. 2012a). This can pro-vide a quantitative basis to monitor such information on ecosystem dynamic equi-librium and change, envisaged to provide users with an independent measure on how ecosystems respond to external impacts, be it human induced or natural vari-ability (Ivits et al. 2012b).
The resulting remote sensing-derived spatial layers are then combined with ancillary biophysical and socioeconomic information in order to flag areas that show signals of actual land degradation. This includes attributions to different lev-els of intensity and probability of major causes, which will include major land deg-radation/desertification issues and the associated land-use transitions considered in the WAD. They are summarized below (Sommer et al. 2011):
1. Overuse of agricultural land, intensification, inappropriate agricultural practices/non-SLM, and increased soil erosion
2. Increase in intensive irrigation, overuse of water resources, and salinization 3. Grazing mismanagement, overgrazing, and decreasing NPP in rangelands, soil
degradation, and sand encroachment 4. Deforestation 5. Increased aridity or drought 6. Socioeconomic issues, changes in population distribution and density, rural
migration/land abandonment, and urban sprawl 7. Uncontrolled expansion of mining and industrial activities, extensive air and
water pollution, and soil contamination
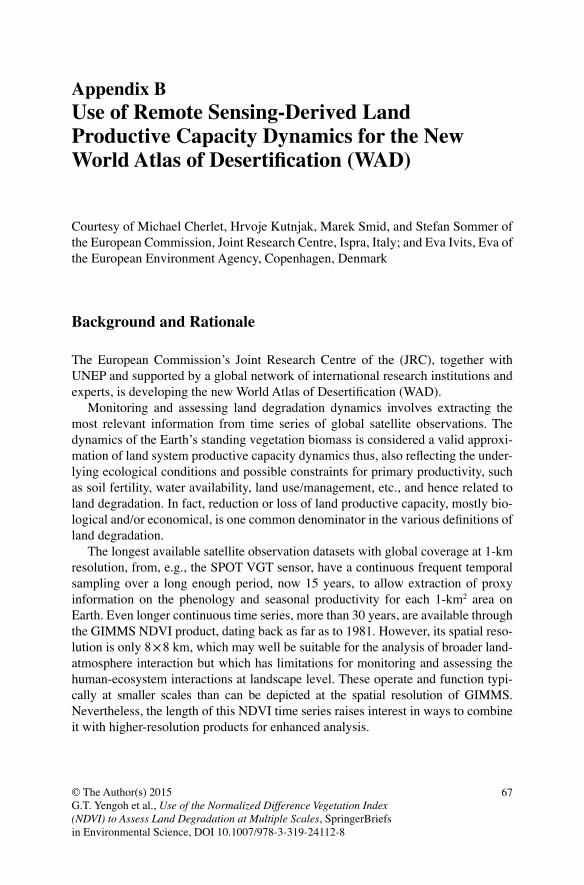
Analysis of long-term changes and current efficiency levels of vegetative or standing biomass are combined into land-productivity dynamics according to Fig. B.1. According to this scheme, the evaluation proceeds as follows:
Analysis of long-term changes and current efficiency levels of vegetative stand-ing biomass are combined into land productive capacity dynamics. Output from both the long-term change maps and current status map was combined with start levels at the beginning of the time series, with the state change of productivity, and with a relative productivity map based on the principles of local net scaling approach (Prince et al. 2009), relating all pixels within an ecosystem functional unit (Ivits et al. 2012a) to the productivity of the best performing samples of that respective unit.
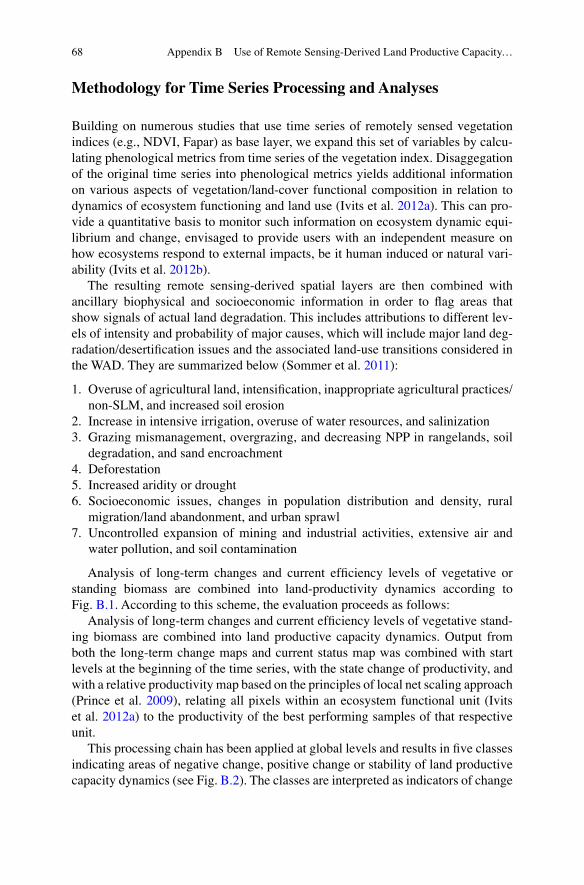
This processing chain has been applied at global levels and results in five classes indicating areas of negative change, positive change or stability of land productive capacity dynamics (see Fig. B.2). The classes are interpreted as indicators of change
Appendix B Use of Remote Sensing-Derived Land Productive Capacity…
69
Fig. B.1 Processing scheme for deriving land productive capacity dynamics from the remote sensing time series (note that the approach was applied both to NOAA GIMMS 3G NDVI (Cherlet et al. 2013) as indicated above and also to 15 years SPOT VEGETATION NDVI 1999)
Fig. B.2 Global map of land system productive capacity dynamics derived from SPOT VEGETATION 15-year time series (1999–2013)
Appendix B Use of Remote Sensing-Derived Land Productive Capacity…
70
or stability of the land’s apparent capacity to sustain its dynamic equilibrium of primary productivity during the given observation period, which is now further ana-lyzed in relation to available information on land-cover/land-use and environmental change relevant to the issues listed in 1–7 above.
Preliminary Findings and Conclusions
This product should not be seen as a direct map of global land degradation, but as a globally mapped indicator which should be further evaluated in an integrated inter-pretation framework as proposed by the WAD or possibly also as outlined by the UNCCD ad hoc expert group (AGTE) for the new set of progress indicators.
Therefore, the land system productive capacity data are now further analyzed and evaluated in relation to available information on land-cover/land-use and envi-ronmental change relevant to the issues listed in Table 1.
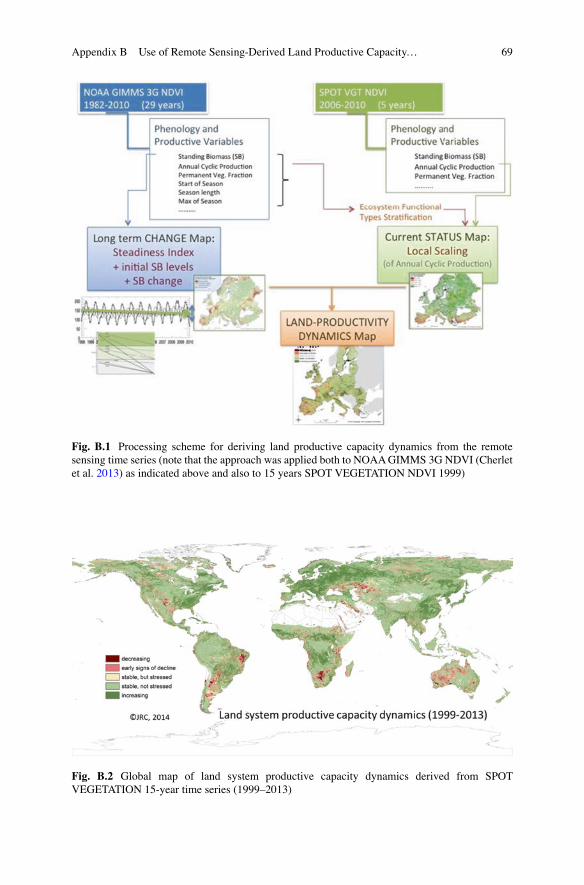
An example of potential agricultural overexploitation of land is given below for Nigeria in Fig. B.3. Convergence of evidence is elaborated for interpreting the land productive capacity in the light of identifying and mapping ongoing critical land-use system transformations. Areas where the dynamics are decreasing are mostly areas where a number of land stress factors are coinciding, potentially threatening to a sustained use of the land. These are highlighted for further analysis. Stress
Fig. B.3 Interpretation example in Nigeria: The Kainji reservoir in Nigeria enabled expansion of agriculture in areas around the Dagida Game reserve (green area on the above map frame indicat-ing a long-term stable land productive capacity). The map suggests that the capacity of the land to sustain a stable land-productivity dynamic equilibrium is declining in those areas of irrigated agri-culture expansion around the protected areas; this highlights for further analysis to identify coin-ciding intensification and stresses
Appendix B Use of Remote Sensing-Derived Land Productive Capacity…
71
factors can be natural, e.g., drought, or human induced such as overextraction of soil nutrients by demanding irrigated crops as shown below.
A broader statistical analysis and evaluation is also underway but needs to be carefully framed and integrated with the data and information provided within the thematic WAD chapters.
Nevertheless, some general observations of observed trends and patterns, here from the 15-year time series, appear coherent with other studies.
While excluding land areas with no significant vegetal primary productivity, i.e., hyperarid, Arctic, and very-high altitude mountain regions from statistics, it is evident that indications of decreasing land system productive capacity can be observed globally. About 20 % of the land surface, involving all vegetation cover types, are showing signs of decreasing land system productive capacity. Only 19.5 % of the considered vegetal productive land surface is cropland, of which 18.5 % show clearly decreasing trends or early signs, while for the rest of the non-cropland, 19.8 % is affected (which however accounts for 80 % of the overall area with declining land system productive capacity). Considering that strong efforts and resources are committed to maintain the productivity of agricultural land and the fact that there are clear limitations to further expansion of croplands, these figures are an issue of concern. The huge seminatural and rangeland areas affected (approx. 18 million sq. km), however, highlight the enormous dimension of the critical dynamically changing ecological conditions worldwide.
The picture is much more complex when breaking down the statistics to conti-nental, regional, and subregional levels. As mentioned before, when entering into this necessary exercise, the increased use of additional thematic information for setting up a more stratified analytical approach is strongly recommended, although it is much-more time-consuming and cumbersome.
Nevertheless, when just looking at croplands at continental level, we notice sub-stantial differences in the dimension/extension of potentially critical areas, which will require careful consideration and more in-depth analysis.
In Africa, about 20.6 % of the considered land surface is cropped of which 21.7 % show signs of decreasing land productive capacity. The relative proportion of concerned cropland is similar to that of seminatural rangelands. This is above the global average but not extremely. In turn, surprisingly, South America with about 21.4 % cropland shows a much higher percentage of potentially affected croplands, up to 31.9 %, also proportionally higher than for seminatural/rangelands areas (25.84 %).
Europe is the continent with the relatively highest extension of croplands, i.e., about 32 %, of which 15.75 % may be confronted with critical develop-ments of land productive capacity, especially in the south of Eastern Europe but also the Iberian Peninsula, which is proportionally higher than for other land-cover/land-use types (10.3 %).
While human factors will need to be further analyzed at regional to subregional level, first analyses at global level dealt with the correlation of some spots of decreasing productive capacity in the shorter time-series product (i.e., 15 years, from 1999 to 2013) against actual global drought monitoring data. These revealed
Appendix B Use of Remote Sensing-Derived Land Productive Capacity…
72
strong correlations of areas in southern Africa (between Botswana, Namibia and South Africa), northeastern Brazil, and Australia–Oceania with recent recurrent droughts. In this respect, it will be also a clear issue in the WAD to analyze in more in-depth the possible differences of dynamics between drylands and non-drylands.
Issues of uncertainty of remote sensing time-series-derived products as function of length of the time-series, spatial, and spectral characteristics will also need to be better addressed. It could be recommended that scientific groups developing moni-toring products should join forces, for example, by addressing these issues in a kind of ensemble analysis aiming at ways to take benefit from combinations of longer time series and higher spatial detail, thus stimulating additional options and criteria for generating new elements of convergence of evidence.
Appendix B Use of Remote Sensing-Derived Land Productive Capacity…
73© The Author(s) 2015 G.T. Yengoh et al., Use of the Normalized Difference Vegetation Index (NDVI) to Assess Land Degradation at Multiple Scales, SpringerBriefs in Environmental Science, DOI 10.1007/978-3-319-24112-8
Appendix C Developments with GLADA
Courtesy of Zhanguo Bai, ISRIC – World Soil Information, Wageningen, The Netherlands
A Different View of the World
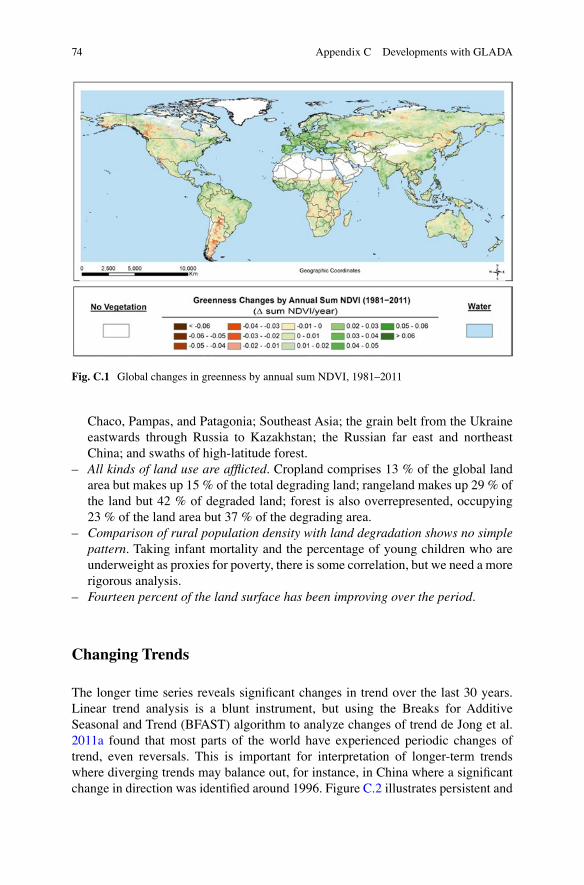
The original Global Assesment of Land Degradation (GLADA, Bai et al. 2008) set out to answer questions about the global extent, severity and cost of land deg-radation using GIMMS data for 1981–2003. In particular: Is land degradation a global issue or just a collection of local problems? Which places are hardest hit? Is it mainly a problem of drylands? Is it mainly associated with farming – or pov-erty? The results were against received wisdom and, therefore, contested. A some-what different picture is revealed by further analysis of the extended GIMMS3g dataset for 1981–2011 (Fig. C.1). The differences are not just because of the lon-ger run of data but because of changes in GIMMS data processing to better correct for the periodic replacement of AVHRR sensors as one satellite replaced another, especially AVHRR 2 to AVHRR 3 (Pinzon and Tucker 2014a, b). The original calibration of the data from successive AVHRR instruments assumed stationarity, i.e., that there was no underlying trend. We now know that NDVI exhibits com-plex long-term trends. Reprocessing of the whole dataset has removed biases introduced by the initial calibration and better reveals the underlying trends. Changes like this in the fundamental data do nothing for credibility, but we are confident that the fundamental data are now much improved – other datasets do not have the advantage of these corrections.
We can now give straight answers to our original policy questions:
– Land degradation is a global issue with 22 % of the land degrading over the last 30 years, representing a loss of net primary production of some 150 million tons of carbon but a loss of soil organic carbon orders of magnitude more.
– The areas hardest hit are Africa, especially south of the equator with an arm of degradation extending north to the Ethiopian highlands and two outliers in the Sahel—the Nile provinces of Sudan and Koulikoro Province, Mali; the Gran
74
Chaco, Pampas, and Patagonia; Southeast Asia; the grain belt from the Ukraine eastwards through Russia to Kazakhstan; the Russian far east and northeast China; and swaths of high-latitude forest.
– All kinds of land use are afflicted. Cropland comprises 13 % of the global land area but makes up 15 % of the total degrading land; rangeland makes up 29 % of the land but 42 % of degraded land; forest is also overrepresented, occupying 23 % of the land area but 37 % of the degrading area.
– Comparison of rural population density with land degradation shows no simple pattern. Taking infant mortality and the percentage of young children who are underweight as proxies for poverty, there is some correlation, but we need a more rigorous analysis.
– Fourteen percent of the land surface has been improving over the period.
Changing Trends
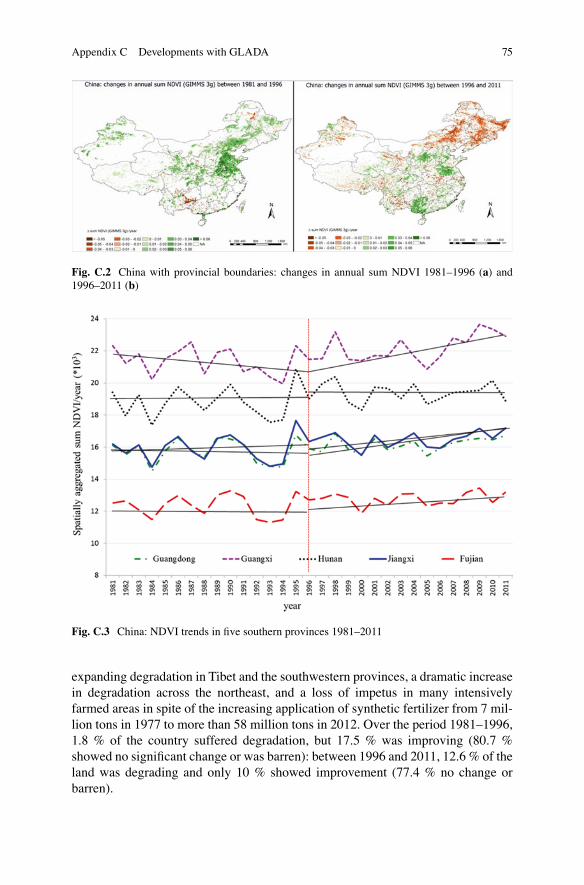
The longer time series reveals significant changes in trend over the last 30 years. Linear trend analysis is a blunt instrument, but using the Breaks for Additive Seasonal and Trend (BFAST) algorithm to analyze changes of trend de Jong et al. 2011a found that most parts of the world have experienced periodic changes of trend, even reversals. This is important for interpretation of longer-term trends where diverging trends may balance out, for instance, in China where a significant change in direction was identified around 1996. Figure C.2 illustrates persistent and
Fig. C.1 Global changes in greenness by annual sum NDVI, 1981–2011
Appendix C Developments with GLADA
75
expanding degradation in Tibet and the southwestern provinces, a dramatic increase in degradation across the northeast, and a loss of impetus in many intensively farmed areas in spite of the increasing application of synthetic fertilizer from 7 mil-lion tons in 1977 to more than 58 million tons in 2012. Over the period 1981–1996, 1.8 % of the country suffered degradation, but 17.5 % was improving (80.7 % showed no significant change or was barren): between 1996 and 2011, 12.6 % of the land was degrading and only 10 % showed improvement (77.4 % no change or barren).
Fig. C.2 China with provincial boundaries: changes in annual sum NDVI 1981–1996 (a) and 1996–2011 (b)
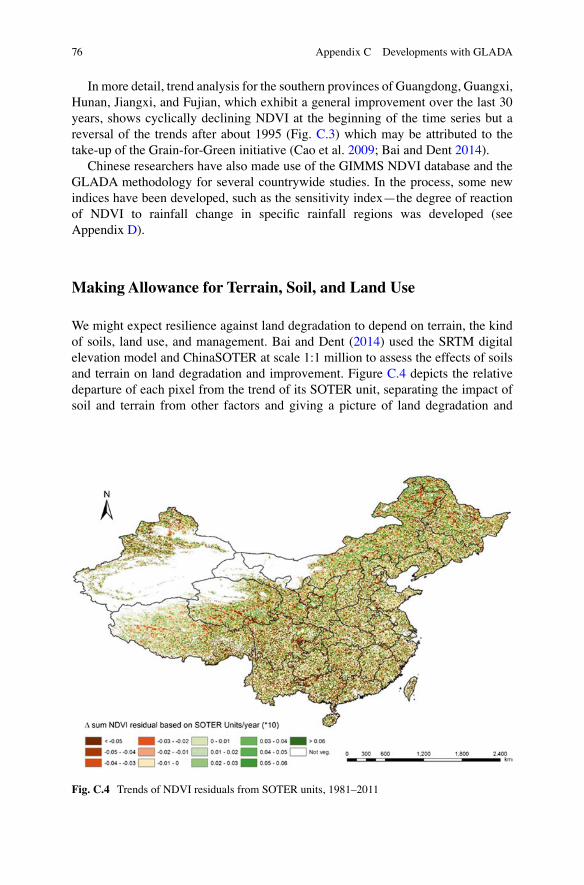
Fig. C.3 China: NDVI trends in five southern provinces 1981–2011
Appendix C Developments with GLADA
76
In more detail, trend analysis for the southern provinces of Guangdong, Guangxi, Hunan, Jiangxi, and Fujian, which exhibit a general improvement over the last 30 years, shows cyclically declining NDVI at the beginning of the time series but a reversal of the trends after about 1995 (Fig. C.3) which may be attributed to the take-up of the Grain-for-Green initiative (Cao et al. 2009; Bai and Dent 2014).
Chinese researchers have also made use of the GIMMS NDVI database and the GLADA methodology for several countrywide studies. In the process, some new indices have been developed, such as the sensitivity index—the degree of reaction of NDVI to rainfall change in specific rainfall regions was developed (see Appendix D).
Making Allowance for Terrain, Soil, and Land Use
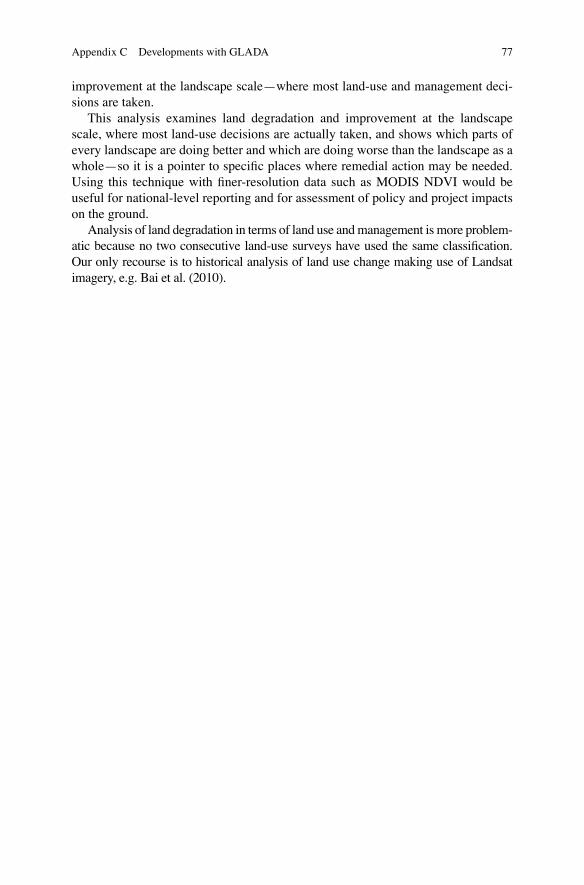
We might expect resilience against land degradation to depend on terrain, the kind of soils, land use, and management. Bai and Dent (2014) used the SRTM digital elevation model and ChinaSOTER at scale 1:1 million to assess the effects of soils and terrain on land degradation and improvement. Figure C.4 depicts the relative departure of each pixel from the trend of its SOTER unit, separating the impact of soil and terrain from other factors and giving a picture of land degradation and
Fig. C.4 Trends of NDVI residuals from SOTER units, 1981–2011
Appendix C Developments with GLADA
77
improvement at the landscape scale—where most land-use and management deci-sions are taken.
This analysis examines land degradation and improvement at the landscape scale, where most land-use decisions are actually taken, and shows which parts of every landscape are doing better and which are doing worse than the landscape as a whole—so it is a pointer to specific places where remedial action may be needed. Using this technique with finer-resolution data such as MODIS NDVI would be useful for national- level reporting and for assessment of policy and project impacts on the ground.
Analysis of land degradation in terms of land use and management is more problem-atic because no two consecutive land-use surveys have used the same classification. Our only recourse is to historical analysis of land use change making use of Landsat imagery, e.g. Bai et al. (2010).
Appendix C Developments with GLADA

79© The Author(s) 2015 G.T. Yengoh et al., Use of the Normalized Difference Vegetation Index (NDVI) to Assess Land Degradation at Multiple Scales, SpringerBriefs in Environmental Science, DOI 10.1007/978-3-319-24112-8
Appendix D China’s Experiences on the Usefulness of GLADA
Courtesy of Zhang Kebin, Beijing Forestry University, Key Authority implement-ing LADA in China and the PRC-GEF Land Degradation Partnership.
Introduction
Based on the practice and experience of the LADA program, the choice of the GLADA methodology as the standard method for global assessment of drylands is a good decision. The bedrock of the GLADA approach is the use of NDVI as the basic indicator, enabling consistency and comparability. Assessment methods for land degradation at the national level (LADA-national) have adopted a layered approach whereby a comprehensive analysis incorporating social information can be conducted on various environments so as to broaden the perspective of people when observing land degradation.
Rightly embracing the fundamentals of GLADA and the LADA-national approach, GLADIS leads to the improvement and enhancement of GLADA. From this point of view, GLADIS is applicable to and ready for the assessment on global land degradation and, also, at the national level for countries with a large land area, including China. Of course, at the national level, the remote sensing data should be at an appropriate resolution.
Certainly, the methodology needs constant improvement so as to make the assessment more realistic. For example, according to the GLADA assessment, since the early 1980s, subsequent years have witnessed land degradation both in arid areas and, also, increasing appearance of hot spots of degradation in more humid areas. This is the case in China, but we cannot tell whether it is a coincidence or the result of methodological problems.
NDVI is affected by various factors such as climate (rainfall), soil, kind of till-age, and so on. Fluctuations in climate (especially those of rainfall) often lead to fluctuations in NDVI. Especially in arid areas, a high sensitivity of vegetation to rainfall always results in fluctuations of NDVI according to those of rainfall. In this case, NDVI changes do not mean that the quality or long-lasting production poten-
80
tial of land has changed accordingly; that is to say, the land quality may exhibit no degradation or improvement. So, if we rely solely on the change of NDVI as an indicator of land degradation, such judgment possibly may draw out wrong assess-ment conclusions. So to eliminate the interference of rainfall fluctuations, GLADA employs the concept of RUE.
When testing the GLADA assessment against China’s actual situation and an anal-ysis of the impact of rainfall on NDVI, it is found that the actual situation is compli-cated; rainfall has a great impact on NDVI, but this impact is not homogeneous—it reduces gradually as rainfall increases. In fact, with rainfall reaching a certain level, the impact of increasing rainfall on NDVI gradually weakens until, in the humid area with abundant rainfall, the impact of fluctuation of rainfall on the change in NDVI becomes very small, even negligible. If RUE is still used as an indicator of land deg-radation in these humid areas, then we are not certain that it is appropriate. [Editor’s comment: There appears to be some misunderstanding here. GLADA uses RUE to mask drought effects only in those areas where there is a direct correlation between NDVI and rainfall—essentially this applies to drylands. In humid areas (and irrigated areas), NDVI is used unmodified as a proxy for biological productivity.]
For this consideration, combining with the actual situation in China, and through an analysis of the relation between NDVI and rainfall, we have tried to determine the quantitative impact of rainfall on NDVI under different rainfall conditions (i.e., different regions), so as to use different corrective factors for different areas accord-ing to actual rainfall when eliminating the impact of rainfall on NDVI, so that it is more scientific to use NDVI as an assessment indicator for land degradation and also to supplement the GLADA method.
Data
GIMMS-8 km-NDVI data: The Chinese team used the GIMMS 2g dataset of NOAA-AVHRR NDVI 15-day synthesized data from July 1981 to September 2006 (a total of 26 years). The average value of the two fortnightly data points was taken as a monthly value, and the annual accumulated NDVI value is the sum of 12 monthly values. Data resolution is 8 km.
Rainfall data: The rainfall data come from the China National Meteorological Information Center which stores and shares historical and real-time meteorological data; all data passing a quality test are recompiled. The rainfall data used in this study comprised 26 years measured data from 707 meteorological stations in main-land China from 1981 to 2006, matching the time period of NDVI data.
Appendix D China’s Experiences on the Usefulness of GLADA
81
The Relation Between NDVI and Rainfall
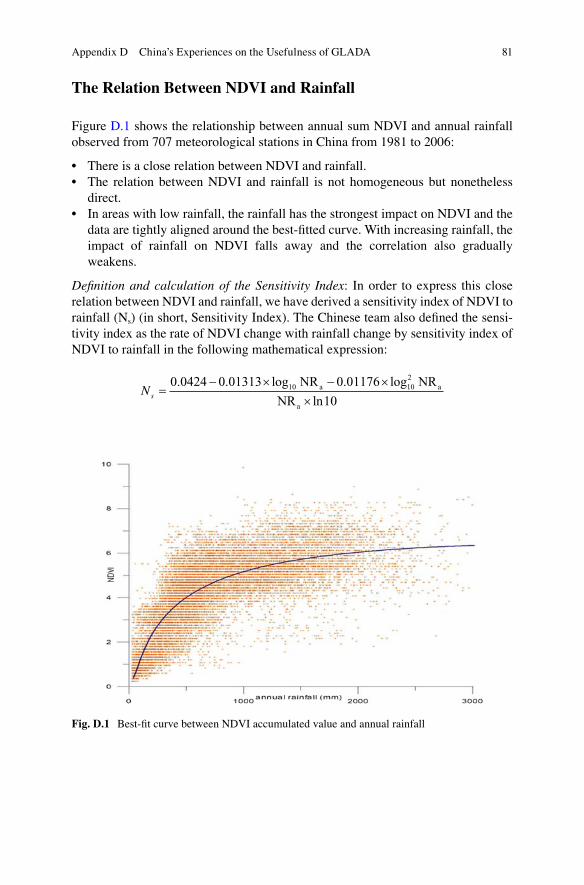
Figure D.1 shows the relationship between annual sum NDVI and annual rainfall observed from 707 meteorological stations in China from 1981 to 2006:
• There is a close relation between NDVI and rainfall.• The relation between NDVI and rainfall is not homogeneous but nonetheless
direct.• In areas with low rainfall, the rainfall has the strongest impact on NDVI and the
data are tightly aligned around the best-fitted curve. With increasing rainfall, the impact of rainfall on NDVI falls away and the correlation also gradually weakens.
Definition and calculation of the Sensitivity Index: In order to express this close relation between NDVI and rainfall, we have derived a sensitivity index of NDVI to rainfall (Ns) (in short, Sensitivity Index). The Chinese team also defined the sensi-tivity index as the rate of NDVI change with rainfall change by sensitivity index of NDVI to rainfall in the following mathematical expression:
Ns =- ´ - ´
´0 0424 0 01313 0 01176
1010 10
2. . log . log
ln
NR NR
NRa a
a
Fig. D.1 Best-fit curve between NDVI accumulated value and annual rainfall
Appendix D China’s Experiences on the Usefulness of GLADA
82
The Sensitivity Index quantitatively reveals the rate of change of NDVI with the change of rainfall under any rainfall conditions. More importantly, the Sensitive Index may be used as the parameter for eliminating the impact of rainfall on NDVI in the assessment of land degradation.
Future Studies
More studies should be carried out on the relationship of NDVI and rainfall.
Appendix D China’s Experiences on the Usefulness of GLADA
83© The Author(s) 2015 G.T. Yengoh et al., Use of the Normalized Difference Vegetation Index (NDVI) to Assess Land Degradation at Multiple Scales, SpringerBriefs in Environmental Science, DOI 10.1007/978-3-319-24112-8
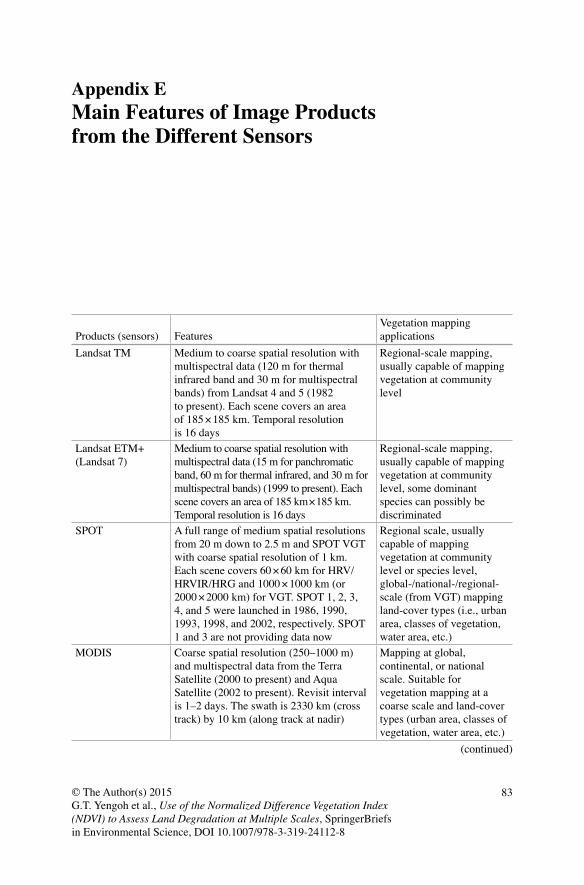
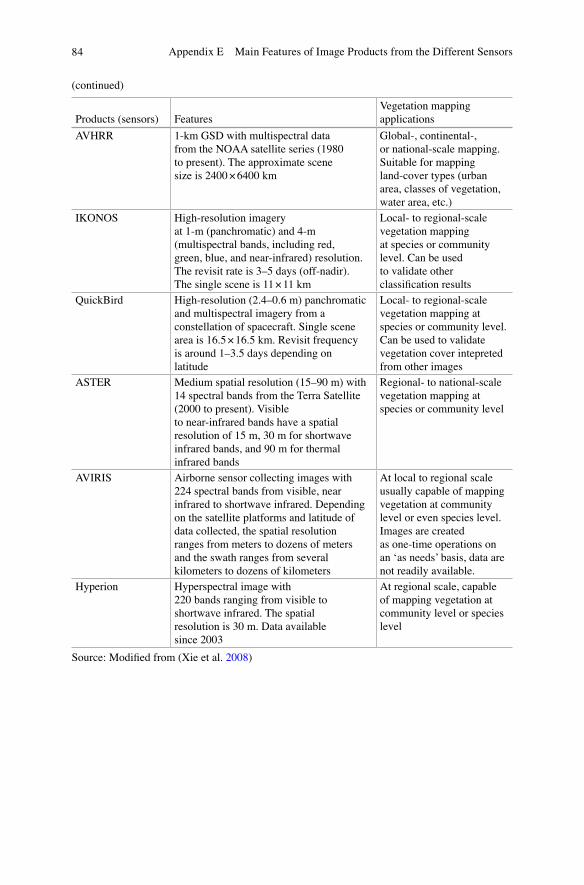
Appendix EMain Features of Image Products from the Different Sensors
Products (sensors) FeaturesVegetation mapping applications
Landsat TM Medium to coarse spatial resolution with multispectral data (120 m for thermal infrared band and 30 m for multispectral bands) from Landsat 4 and 5 (1982 to present). Each scene covers an area of 185 × 185 km. Temporal resolution is 16 days
Regional-scale mapping, usually capable of mapping vegetation at community level
Landsat ETM+ (Landsat 7)
Medium to coarse spatial resolution with multispectral data (15 m for panchromatic band, 60 m for thermal infrared, and 30 m for multispectral bands) (1999 to present). Each scene covers an area of 185 km × 185 km. Temporal resolution is 16 days
Regional-scale mapping, usually capable of mapping vegetation at community level, some dominant species can possibly be discriminated
SPOT A full range of medium spatial resolutions from 20 m down to 2.5 m and SPOT VGT with coarse spatial resolution of 1 km. Each scene covers 60 × 60 km for HRV/HRVIR/HRG and 1000 × 1000 km (or 2000 × 2000 km) for VGT. SPOT 1, 2, 3, 4, and 5 were launched in 1986, 1990, 1993, 1998, and 2002, respectively. SPOT 1 and 3 are not providing data now
Regional scale, usually capable of mapping vegetation at community level or species level, global-/national-/regional-scale (from VGT) mapping land-cover types (i.e., urban area, classes of vegetation, water area, etc.)
MODIS Coarse spatial resolution (250–1000 m) and multispectral data from the Terra Satellite (2000 to present) and Aqua Satellite (2002 to present). Revisit interval is 1–2 days. The swath is 2330 km (cross track) by 10 km (along track at nadir)
Mapping at global, continental, or national scale. Suitable for vegetation mapping at a coarse scale and land-cover types (urban area, classes of vegetation, water area, etc.)
(continued)
84
Products (sensors) FeaturesVegetation mapping applications
AVHRR 1-km GSD with multispectral data from the NOAA satellite series (1980 to present). The approximate scene size is 2400 × 6400 km
Global-, continental-, or national-scale mapping. Suitable for mapping land- cover types (urban area, classes of vegetation, water area, etc.)
IKONOS High-resolution imagery at 1-m (panchromatic) and 4-m (multispectral bands, including red, green, blue, and near-infrared) resolution. The revisit rate is 3–5 days (off-nadir). The single scene is 11 × 11 km
Local- to regional-scale vegetation mapping at species or community level. Can be used to validate other classification results
QuickBird High-resolution (2.4–0.6 m) panchromatic and multispectral imagery from a constellation of spacecraft. Single scene area is 16.5 × 16.5 km. Revisit frequency is around 1–3.5 days depending on latitude
Local- to regional-scale vegetation mapping at species or community level. Can be used to validate vegetation cover intepreted from other images
ASTER Medium spatial resolution (15–90 m) with 14 spectral bands from the Terra Satellite (2000 to present). Visible to near-infrared bands have a spatial resolution of 15 m, 30 m for shortwave infrared bands, and 90 m for thermal infrared bands
Regional- to national-scale vegetation mapping at species or community level
AVIRIS Airborne sensor collecting images with 224 spectral bands from visible, near infrared to shortwave infrared. Depending on the satellite platforms and latitude of data collected, the spatial resolution ranges from meters to dozens of meters and the swath ranges from several kilometers to dozens of kilometers
At local to regional scale usually capable of mapping vegetation at community level or even species level. Images are created as one-time operations on an ‘as needs’ basis, data are not readily available.
Hyperion Hyperspectral image with 220 bands ranging from visible to shortwave infrared. The spatial resolution is 30 m. Data available since 2003
At regional scale, capable of mapping vegetation at community level or species level
Source: Modified from (Xie et al. 2008)
(continued)
Appendix E Main Features of Image Products from the Different Sensors
85© The Author(s) 2015 G.T. Yengoh et al., Use of the Normalized Difference Vegetation Index (NDVI) to Assess Land Degradation at Multiple Scales, SpringerBriefs in Environmental Science, DOI 10.1007/978-3-319-24112-8
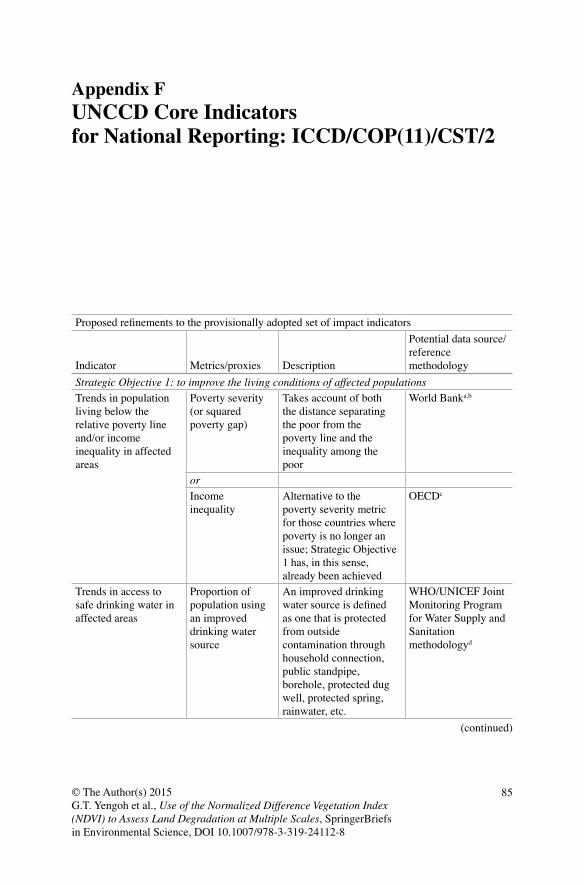
Appendix F UNCCD Core Indicators for National Reporting: ICCD/COP(11)/CST/2
Proposed refinements to the provisionally adopted set of impact indicators
Indicator Metrics/proxies Description
Potential data source/reference methodology
Strategic Objective 1: to improve the living conditions of affected populations
Trends in population living below the relative poverty line and/or income inequality in affected areas
Poverty severity (or squared poverty gap)
Takes account of both the distance separating the poor from the poverty line and the inequality among the poor
World Banka,b
or
Income inequality
Alternative to the poverty severity metric for those countries where poverty is no longer an issue; Strategic Objective 1 has, in this sense, already been achieved
OECDc
Trends in access to safe drinking water in affected areas
Proportion of population using an improved drinking water source
An improved drinking water source is defined as one that is protected from outside contamination through household connection, public standpipe, borehole, protected dug well, protected spring, rainwater, etc.
WHO/UNICEF Joint Monitoring Program for Water Supply and Sanitation methodologyd
(continued)
86
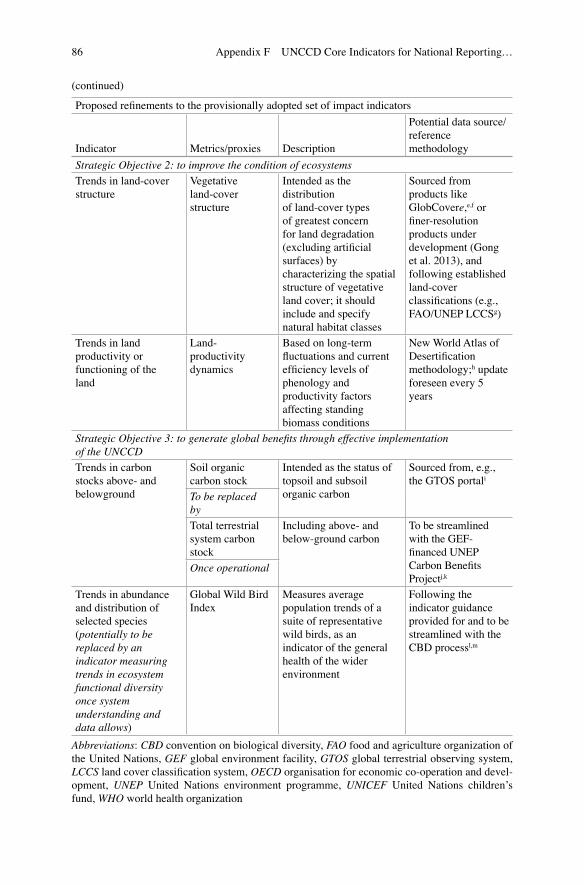
Proposed refinements to the provisionally adopted set of impact indicators
Indicator Metrics/proxies Description
Potential data source/reference methodology
Strategic Objective 2: to improve the condition of ecosystems
Trends in land-cover structure
Vegetative land-cover structure
Intended as the distribution of land-cover types of greatest concern for land degradation (excluding artificial surfaces) by characterizing the spatial structure of vegetative land cover; it should include and specify natural habitat classes
Sourced from products like GlobCovere,e,f or finer-resolution products under development (Gong et al. 2013), and following established land-cover classifications (e.g., FAO/UNEP LCCSg)
Trends in land productivity or functioning of the land
Land-productivity dynamics
Based on long-term fluctuations and current efficiency levels of phenology and productivity factors affecting standing biomass conditions
New World Atlas of Desertification methodology;h update foreseen every 5 years
Strategic Objective 3: to generate global benefits through effective implementation of the UNCCD
Trends in carbon stocks above- and belowground
Soil organic carbon stock
Intended as the status of topsoil and subsoil organic carbon
Sourced from, e.g., the GTOS portali
To be replaced by
Total terrestrial system carbon stock
Including above- and below-ground carbon
To be streamlined with the GEF-financed UNEP Carbon Benefits Projectj,k
Once operational
Trends in abundance and distribution of selected species (potentially to be replaced by an indicator measuring trends in ecosystem functional diversity once system understanding and data allows)
Global Wild Bird Index
Measures average population trends of a suite of representative wild birds, as an indicator of the general health of the wider environment
Following the indicator guidance provided for and to be streamlined with the CBD processl,m
Abbreviations: CBD convention on biological diversity, FAO food and agriculture organization of the United Nations, GEF global environment facility, GTOS global terrestrial observing system, LCCS land cover classification system, OECD organisation for economic co-operation and devel-opment, UNEP United Nations environment programme, UNICEF United Nations children’s fund, WHO world health organization
(continued)
Appendix F UNCCD Core Indicators for National Reporting…
87
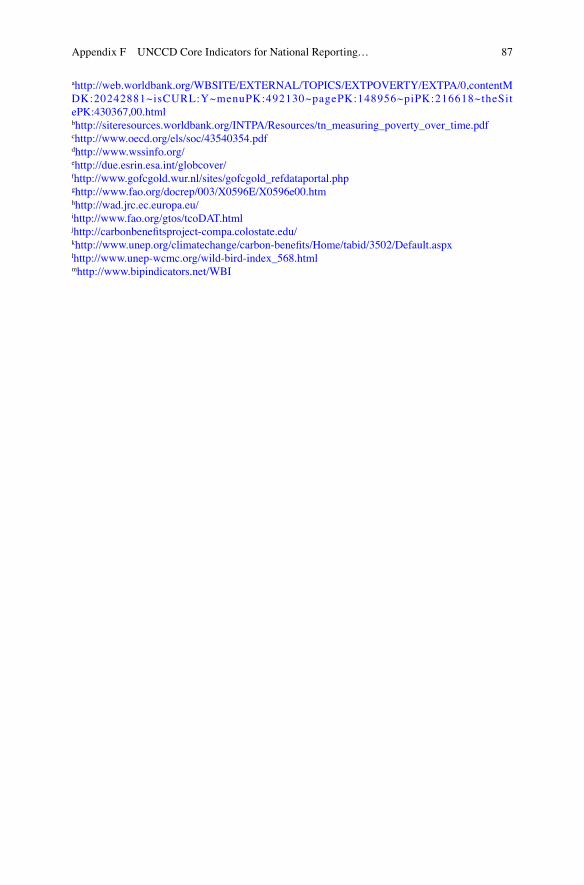
ahttp://web.worldbank.org/WBSITE/EXTERNAL/TOPICS/EXTPOVERTY/EXTPA/0,contentMDK:20242881~isCURL:Y~menuPK:492130~pagePK:148956~piPK:216618~theSitePK:430367,00.htmlbhttp://siteresources.worldbank.org/INTPA/Resources/tn_measuring_poverty_over_time.pdfchttp://www.oecd.org/els/soc/43540354.pdfdhttp://www.wssinfo.org/ehttp://due.esrin.esa.int/globcover/fhttp://www.gofcgold.wur.nl/sites/gofcgold_refdataportal.phpghttp://www.fao.org/docrep/003/X0596E/X0596e00.htmhhttp://wad.jrc.ec.europa.eu/ihttp://www.fao.org/gtos/tcoDAT.htmljhttp://carbonbenefitsproject-compa.colostate.edu/khttp://www.unep.org/climatechange/carbon-benefits/Home/tabid/3502/Default.aspxlhttp://www.unep-wcmc.org/wild-bird-index_568.htmlmhttp://www.bipindicators.net/WBI
Appendix F UNCCD Core Indicators for National Reporting…

89© The Author(s) 2015 G.T. Yengoh et al., Use of the Normalized Difference Vegetation Index (NDVI) to Assess Land Degradation at Multiple Scales, SpringerBriefs in Environmental Science, DOI 10.1007/978-3-319-24112-8
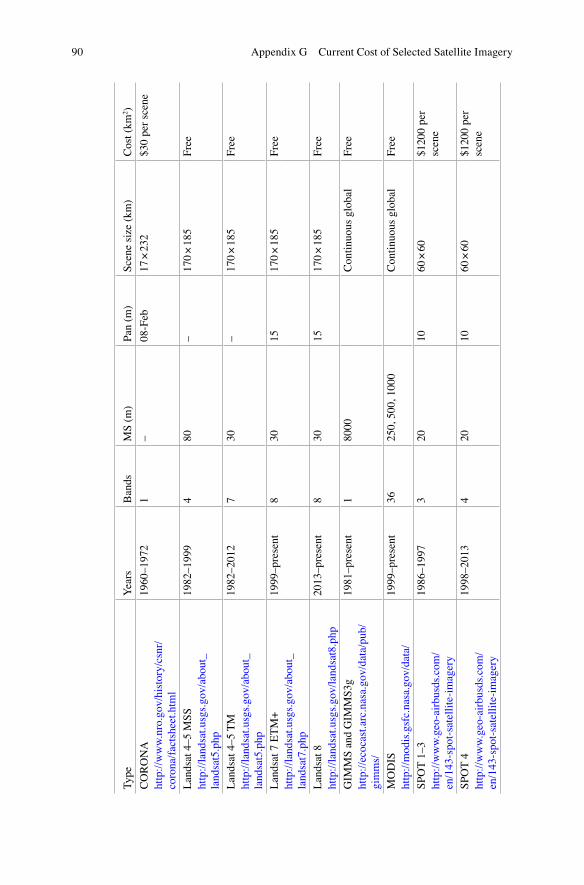
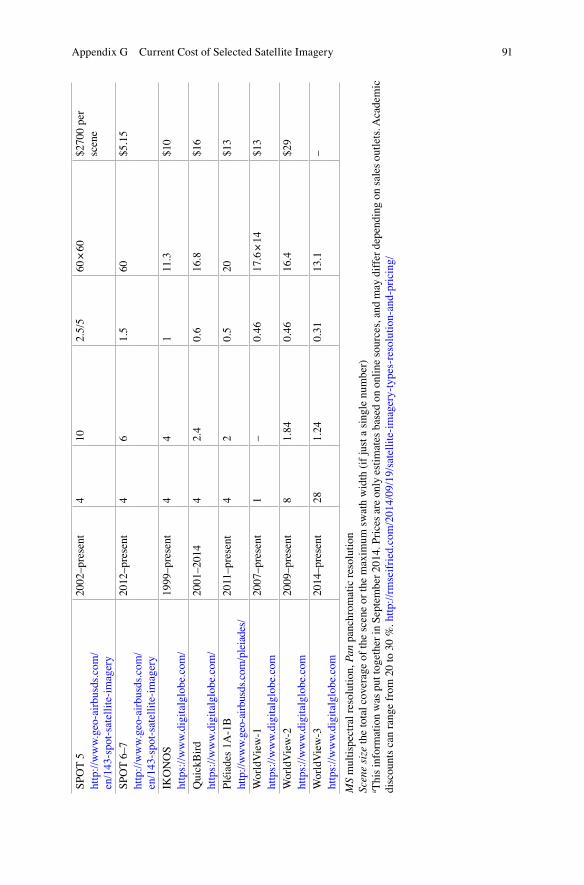
Appendix G Current Costa of Selected Satellite Imagery
90
Typ
eY
ears
Ban
dsM
S (
m)
Pan
(m
)S
cene
siz
e (k
m)
Cos
t (k
m2 )
CO
RO
NA
1960
–197
21
–08
-Feb
17 ×
232
$30
per
scen
e
http
://w
ww
.nro
.gov
/his
tory
/csn
r/
coro
na/f
acts
heet
.htm
l
Lan
dsat
4–5
MS
S19
82–1
999
480
–17
0 ×
185
Fre
e
http
://l
ands
at.u
sgs.
gov/
abou
t_
land
sat5
.php
Lan
dsat
4–5
TM
1982
–201
27
30–
170
× 1
85F
ree
http
://l
ands
at.u
sgs.
gov/
abou
t_
land
sat5
.php
Lan
dsat
7 E
TM
+19
99–p
rese
nt8
3015
170
× 1
85F
ree
http
://l
ands
at.u
sgs.
gov/
abou
t_
land
sat7
.php
Lan
dsat
820
13–p
rese
nt8
3015
170
× 1
85F
ree
http
://l
ands
at.u
sgs.
gov/
land
sat8
.php
GIM
MS
and
GIM
MS
3g19
81–p
rese
nt1
8000
Con
tinu
ous
glob
alF
ree
http
://e
coca
st.a
rc.n
asa.
gov/
data
/pub
/gi
mm
s/
MO
DIS
1999
–pre
sent
3625
0, 5
00, 1
000
Con
tinu
ous
glob
alF
ree
http
://m
odis
.gsf
c.na
sa.g
ov/d
ata/
SP
OT
1–3
1986
–199
73
2010
60 ×
60
$120
0 pe
r sc
ene
http
://w
ww
.geo
-air
busd
s.co
m/
en/1
43-s
pot-
sate
llit
e-im
ager
y
SP
OT
419
98–2
013
420
1060
× 6
0$1
200
per
scen
eht
tp:/
/ww
w.g
eo-a
irbu
sds.
com
/en
/143
-spo
t-sa
tell
ite-
imag
ery
Appendix G Current Cost of Selected Satellite Imagery
91
SP
OT
520
02–p
rese
nt4
102.
5/5
60 ×
60
$270
0 pe
r sc
ene
http
://w
ww
.geo
-air
busd
s.co
m/
en/1
43-s
pot-
sate
llit
e-im
ager
y
SP
OT
6–7
2012
–pre
sent
46
1.5
60$5
.15
http
://w
ww
.geo
-air
busd
s.co
m/
en/1
43-s
pot-
sate
llit
e-im
ager
y
IKO
NO
S19
99–p
rese
nt4
41
11.3
$10
http
s://
ww
w.d
igit
algl
obe.
com
/
Qui
ckB
ird
2001
–201
44
2.4
0.6
16.8
$16
http
s://
ww
w.d
igit
algl
obe.
com
/
Plé
iade
s 1A
-1B
2011
–pre
sent
42
0.5
20$1
3
http
://w
ww
.geo
-air
busd
s.co
m/p
leia
des/
Wor
ldV
iew
-120
07–p
rese
nt1
–0.
4617
.6 ×
14
$13
http
s://
ww
w.d
igit
algl
obe.
com
Wor
ldV
iew
-220
09–p
rese
nt8
1.84
0.46
16.4
$29
http
s://
ww
w.d
igit
algl
obe.
com
Wor
ldV
iew
-320
14–p
rese
nt28
1.24
0.31
13.1
–
http
s://
ww
w.d
igit
algl
obe.
com
MS
mul
tisp
ectr
al r
esol
utio
n, P
an p
anch
rom
atic
res
olut
ion
Scen
e si
ze t
he t
otal
cov
erag
e of
the
sce
ne o
r th
e m
axim
um s
wat
h w
idth
(if
jus
t a
sing
le n
umbe
r)a T
his
info
rmat
ion
was
put
tog
ethe
r in
Sep
tem
ber
2014
. Pri
ces
are
only
est
imat
es b
ased
on
onli
ne s
ourc
es, a
nd m
ay d
iffe
r de
pend
ing
on
sale
s ou
tlet
s. A
cade
mic
di
scou
nts
can
rang
e fr
om 2
0 to
30
%. h
ttp:
//rm
seif
ried
.com
/201
4/09
/19/
sate
llit
e-im
ager
y-ty
pes-
reso
luti
on-a
nd-p
rici
ng/
Appendix G Current Cost of Selected Satellite Imagery

93© The Author(s) 2015 G.T. Yengoh et al., Use of the Normalized Difference Vegetation Index (NDVI) to Assess Land Degradation at Multiple Scales, SpringerBriefs in Environmental Science, DOI 10.1007/978-3-319-24112-8
Appendix HSoftware for Processing Satellite Images to Develop the NDVI
Common Commercial Software for Processing Satellite Images to Develop the NDVI
ArcGIS. ArcGIS is the most popular geospatial product in the industry. According to its creators, the Environmental Systems Research Institute (ESRI), the ArcGIS platform is a complete GIS suite that permits users to conduct spatial analysis, man-age data effectively, explore data content, automate advanced workflows, create maps, and undertake advanced operations with, and analysis of, imagery. It com-prises a range of software tools and extensions (most of which are available to users depending on the license level of their platforms) with sophisticated desktop GIS functionality such as spatial analysis, 3D, geostatistics, server-based data manage-ment, and geo-processing that leverage Oracle or SQLServer type databases. While a range of operations on imagery can be achieved through the use of tools in exten-sions such as Spatial Analyst, the Image Analyst has functionality for performing basic tasks such as image subtraction, vegetation indices, and others. More on the features of ArcGIS for Desktop, its extensions and capabilities can be found here: http://www.esri.com/software/arcgis/arcgis-for-desktop.
94
Erdas Imagine. Erdas Imagine is a powerful but simple-to-use geospatial imagery processing application. It is renowned for its ability to enhance satellite imagery to make it more meaningful and facilitate complex analysis. It has built-in tools for the interchange of numerous file formats and has an extensive array of vector editing and analysis capabilities and the ability to design custom geospatial-analysis tools, handle multispectral and hyperspectral data, as well as advanced classification tech-niques. More on Erdas Imagine can be found here: http://www.hexagongeospatial.com/products/remote-sensing/erdas-imagine.
ER Mapper. ER Mapper is a geographic image processing software product, which runs on a range of PCs running Windows. This software can be used to display, integrate, and enhance raster data, display and edit vector data, and link with data from Geographic and Land Information Systems, Database Management Systems, or indeed most other sources. The outstanding feature and benefit of ER Mapper is its ease of use and processing on the fly feature. This means that different image-processing algorithms can be launched simultaneously, and the results instantly dis-played on the user’s screen. This reduces the time it takes for other applications to do the same tasks, because, generally, a new file would have to be created before the results are displayed. All processing information can be saved in project files called Algorithms where all the processing steps are on the image or images. More on ER Mapper can be found here: http://www.hexagongeospatial.com/products/remote-sensing/erdas-er-mapper.
IDRISI. IDRISI GIS and image processing application is developed by Clark Labs at Clark University. It has been seen by many in the remote sensing community as affordable and robust and is widely used for both professional operations and edu-cation. IDRISI is currently in the Selva version. This is an integrated GIS and Image Processing software package with over 300 modules for the processing, analysis, and display of digital spatial information. It may be considered the most extensive set of GIS and Image Processing tools in the industry in a single, affordable
Appendix H Software for Processing Satellite Images to Develop the NDVI
95
package. It includes tools such as neural network classifiers and change detection modules that are not available out-of-the-box in any other software. TerrSet is a recent integrated geospatial software system for monitoring and modeling the earth system for sustainable development. It incorporates the IDRISI GIS Analysis and image processing tools along with a collection of vertical applications to perform complex analysis of issues of sustainability in the earth system. More on IDRISI and its associated sets of integrated tools can be found here: http://www.clarklabs.org/.
ENVI. ENVI products create the primary geospatial software foundation to convert, preprocess, process, and analyze all types of imagery and data such as multispectral, hyperspectral, LiDAR, and SAR. They are known for their design which permits easy acquaintance with and use by everyone regardless of prior experience with imagery—from GIS professionals to image analysts and image scientists. ENVI products interoperate well with many geospatial applications. For example, all ENVI products integrate with ArcGIS, and can be easily customized to meet unique needs of users across disciplines. More about ENVI and its family of products can be found here: http://www.exelisvis.com/ProductsServices/ENVIProducts/ENVI.aspx.
PCI Geomatica. PCI Geomatica is an integrated software featuring the majority of tools needed by professionals for remote sensing, digital photogrammetry, image analysis, map production, and mosaicking. A strong point is the ease of loading satellite and aerial imagery and its capability of faster data processing with advanced modules to handle complex processes. Geomatica is also known for its comprehen-sive routines for automation of data processing tasks. Geomatica has been and con-tinues to be used by many educational institutions and scientific programs throughout the world for a range of remote sensing projects. More about PCI Geomatics can be found here: http://www.pcigeomatics.com.
Appendix H Software for Processing Satellite Images to Develop the NDVI
96
Common Open-Source Software
Courtesy of GISGeography.com (with some modifications)1
SAGA GIS: System for Automated Geoscientific Analyses. SAGA GIS is on the top of the list of free remote sensing softare, and for good reason. SAGA GIS is ideal for most GIS and remote sensing needs, having a rich library of modules that offerpossibilities for quick, reliable raster analyses and manipulation. What gives SAGA GIS a kick is its quick and reliable raster processing. The official user guide is avail-able here: http://www.saga-gis.org/en/
Opticks. The neat part about this software is the long list of extensions you can add. There are plug-ins for raster math, radar processing, and hyper-/multispectral data processing. It is important to always make sure to check the compatibility before downloading an extension. You might have to scale back your Opticks version in order for the extension to work properly. For all information concerning Optiks, as well as the download of the software, go here: http://opticks.org/confluence/display/opticks/Welcome+To+Opticks.
GRASS: Geographic Resources Analysis Support System. GRASS may be one of the most popular software package on this list. GRASS is full of functionality: image classification, PCA, edge detection, radiometric corrections, 3D, geostatis-tics analysis, and filtering options. Another key feature of GRASS is the LiDAR processing and analysis. You can filter LiDAR points, create contours, and
1 We greatly acknowledge the contribution of GISGeography.com in permitting the use of its sum-mary of current freely available remote sensing software below (with some modifications). The original resource provided by GISGeography can be found here: http://gisgeography.com/open-source-remote-sensing-software-packages/.
Appendix H Software for Processing Satellite Images to Develop the NDVI
97
generate DEMs. The official user guide is available here: https://grass.osgeo.org/grass70/manuals/.
ORFEO: Optical and Radar Federated Earth Observation. The ORFEO toolbox was a cooperative project developed by France and Italy. It is a library of remote sensing image processing specifically aimed at high spatial resolution. ORFEO pro-vides a wide range of remote sensing functions: radiometry, PCA, change detection, pan sharpening, image segmentation, classification, and filtering. An interesting aspect of this software is the capability to do object-based image analysis. This is a rare feature in software nowadays. The official user guide is available here: https://www.orfeo-toolbox.org/SoftwareGuide/SoftwareGuidech33.html.
OSSIM: Open-Source Software Image Map. OSSIM is a high-performance open- source remote sensing software application for high spatial resolution imagery. It has been actively developed for almost two decades, funded through US depart-ments such as in intelligence and defense. Key features are compatibility with more than 100 raster and vector formats and over 4000 different projections and datums. It supports numerous sensors, but some may require additional plug-ins.
InterImage. InterImage is a bit different from the other open-source remote sensing software on this list. It specializes in automatic image interpretation. The core theme of automatic image interpretation is object-based classification (OBIA). This involves segmentation, exploring attributes, and supervised classification. Although developed in Brazil, documentation is available in English. More can be found here: http://www.lvc.ele.pucrio.br/projects/interimage/
Appendix H Software for Processing Satellite Images to Develop the NDVI
98
ILWIS: Integrated Land and Water Information System. ILWIS has been around for more than 25 years. It has had over 27,000 downloads since its first release. It wasn’t until recently that it has become available for public use. ILWIS was originally built for researchers and students. For this reason, effort was concentrated on developing a user-friendly environment. The other main focus was compatibility with raster and vector formats. This has been done by full integration with the GDAL library. The practical uses of ILWIS make it a prime choice for remote sensing activities. Moreon ILWIS can be found here: http://www.ilwis.org/
gvSIG. gvSIG is known for its wide variety of rich features and powerful capabili-ties: supervised classification, defining ROIs, band algebra, and decision trees. gvSIG stands for Generalitat Valenciana Geographic Information System. Generalitat Valenciana is the Spanish regional authority the system was designed for. More on gvSIG can be found here: http://www.gvsig.com/en
Quantum GIS (QGIS). QGIS is one of the most powerful open-source GIS software packages available for free. This software package allows users to visualize, ana-lyze, interpret, and understand spatial data. Plug-ins are the key to its operations. Raster manipulation includes neighborhood analysis, map algebra, surface interpo-lation, hydrologic modeling, and terrain analysis like slope and aspect. There are plug-ins for, among other operations, semiautomated classification, BEAM and NEST framework, multitemporal raster analysis, viewshed analysis. The official site of QGIS is found here: http://www.qgis.org/en/site/.
Appendix H Software for Processing Satellite Images to Develop the NDVI
99© The Author(s) 2015 G.T. Yengoh et al., Use of the Normalized Difference Vegetation Index (NDVI) to Assess Land Degradation at Multiple Scales, SpringerBriefs in Environmental Science, DOI 10.1007/978-3-319-24112-8
References
Achard F, DeFries R, Eva H, Hansen M, Mayaux P, Stibig H (2007) Pan-tropical monitoring of deforestation. Environ Res Lett 2(4):045022
Adger WN (2000) Social and ecological resilience: are they related? Prog Hum Geogr 24(3):347–364
Ai L, Fang N, Zhang B, Shi Z (2013) Broad area mapping of monthly soil erosion risk using fuzzy decision tree approach: integration of multi-source data within GIS. Int J Geogr Inf Sci 27(6):1251–1267
Albalawi EK, Kumar L (2013) Using remote sensing technology to detect, model and map deserti-fication: a review. J Food Agric Environ 11:791–797
Albergel J (1988) Genèse et prédétermination des crues au Burkina Faso: du m2 au km2: étude des paramètres hydrologiques et de leur évolution. Ph.D. Thesis. Editions de l’Orstom, 1988, 330p, Université Paris 6
Anyamba A, Tucker C (2005) Analysis of Sahelian vegetation dynamics using NOAA-AVHRR NDVI data from 1981–2003. J Arid Environ 63(3):596–614
Anyamba A, Tucker CJ (2012) Historical perspective of AVHRR NDVI and vegetation drought monitoring. Remote Sens Drought: Innovative Monit Approaches 23
Bai Z, Dent D (2014) Mapping soil degradation by NDVI, vol 2, Encyclopedia of soil science. Taylor & Francis, New York
Bai ZG, Dent DL, Olsson L, Schaepman ME (2008) Proxy global assessment of land degradation. Soil Use Manag 24(3):223–234
Bai Z, Dent D, Wu Y, de Jong R (2013) Land degradation and ecosystem services. In: Lal R, Lorenz K, Hüttl RF, Schneider BU, von Braun J (eds) Ecosystem services and carbon seques-tration in the biosphere. Springer, Dordrecht, pp 357–381
Bajocco S, De Angelis A, Perini L, Ferrara A, Salvati L (2012) The impact of land use/land cover changes on land degradation dynamics: a Mediterranean case study. Environ Manage 49(5):980–989
Bandyopadhyay N, Saha AK (2014) Analysing meteorological and vegetative drought in Gujarat. In: Singh M, Singh RB, Hassan I (eds) Climate change and biodiversity: proceedings of IGU Rohtak conference, vol 1. Springer, Japan, pp 61–71
Bartholomé E, Belward A (2005) GLC2000: a new approach to global land cover mapping from Earth observation data. Int J Remote Sens 26(9):1959–1977
Beck P, Karlsen S, Skidmore A, Nielsen L, Høgda K (2005) The onset of the growing season in northwestern Europe, mapped using MODIS NDVI and calibrated using phenological ground
100
observations. In: 31st International Symposium on remote Sensing on Environment–Global Monitoring for Sustainability and Security, pp 20–24
Beck HE, McVicar TR, van Dijk AI, Schellekens J, de Jeu RA, Bruijnzeel LA (2011) Global evaluation of four AVHRR–NDVI data sets: intercomparison and assessment against Landsat imagery. Remote Sens Environ 115(10):2547–2563
Bennett R, Welham K, Hill RA, Ford AL (2012) The application of vegetation indices for the prospection of archaeological features in grass‐dominated environments. Archaeol Prospect 19(3):209–218
Bernoux M, Chevallier T (2014) Carbon in dryland soils—Multiple essential functions, 10th edn, Les dossiers thématiques du CSFD. CSFD/Agropolis International, Montpellier, p 40 pp
Bierman R, Stocking M, Bouwman H, Cowie A, Diaz S, Granit J, Patwardhan A, Sims R, Duron G, Gorsevski V, Hammond T, Wellington-Moore C (2014) Delivering global environmental benefits for sustainable development. Report of the Scientific and Technical Advisory Panel (STAP) to the 5th GEF Assembly, México 2014. Global Environment Facility, Washington, DC
Birth GS, McVey GR (1968) Measuring the color of growing turf with a reflectance spectropho-tometer. Agron J 60(6):640–643
Bradley BA, Mustard JF (2008) Comparison of phenology trends by land cover class: a case study in the Great Basin, USA. Glob Chang Biol 14(2):334–346
Brandt M, Mbow C, Diouf AA, Verger A, Samimi C, Fensholt R (2014) Ground and satellite based evidence of the biophysical mechanisms behind the greening Sahel. Global change biology 21(4):1610–1620
Cao M, Prince SD, Li K, Tao B, Small J, Shao X (2003) Response of terrestrial carbon uptake to climate interannual variability in China. Glob Chang Biol 9(4):536–546
Cao S, Chen L, Liu Z (2009) An investigation of Chinese attitudes toward the environment: case study using the Grain for Green Project. AMBIO 38(1):55–64
CEISIN (2004) Global Rural–urban mapping project: urban/rural extents. Center for International Earth Science Information Network, Columbia University, Palisades
CEISIN (2007) Socioeconomic data applications center. Center for International Earth Science Information Network, Columbia University, Palisades
Cepicky J, Becchi L (2007) Geospatial processing via internet on remote servers-PyWPS. OSGeo J 1(5):39–42
Chen D, Huang J, Jackson TJ (2005) Vegetation water content estimation for corn and soybeans using spectral indices derived from MODIS near- and short-wave infrared bands. Remote Sens Environ 98(2–3):225–236
Chen T, Niu RQ, Li PX, Zhang LP, Du B (2011) Regional soil erosion risk mapping using RUSLE, GIS, and remote sensing: a case study in Miyun Watershed, North China. Environ Earth Sci 63(3):533–541
Cherlet M, Ivits E, Sommer S, Tóth G, Jones A, Montanarella L, Belward A (2013) Land- productivity dynamics in Europe. Towards valuation of land degradation in the European Union. European Commission, Joint Research Centre, Ispra. http://wad.jrc.ec.europa.eu/data/EPreports/LPDinEU_final_no-numbers.pdf. Accessed 17 Dec 2014
Chuvieco E, Cocero D, Riano D, Martin P, Martınez-Vega J, de la Riva J, Pérez F (2004) Combining NDVI and surface temperature for the estimation of live fuel moisture content in forest fire danger rating. Remote Sens Environ 92(3):322–331
Conijn J, Bai Z, Bindraban P, Rutgers B (2013) Global changes of net primary productivity, affected by climate and abrupt land use changes since 1981. Towards mapping global soil deg-radation. Report 2013/01, ISRIC–World Soil Information, Wageningen. ISRIC Report 1
Cook BI, Pau S (2013) A global assessment of long-term greening and browning trends in pasture lands using the GIMMS LAI3g dataset. Remote Sens 5(5):2492–2512
Cowie A, Penman T, Gorissen L, Winslow M, Lehmann J, Tyrrell T, Twomlow S, Wilkes A, Lal R, Jones J (2011) Towards sustainable land management in the drylands: scientific connections in monitoring and assessing dryland degradation, climate change and biodiversity. Land Degrad Dev 22(2):248–260
Cui X, Gibbes C, Southworth J, Waylen P (2013) Using remote sensing to quantify vegetation change and ecological resilience in a semi-arid system. Land 2(2):108–130
References
101
Dardel C, Kergoat L, Hiernaux P, Mougin E, Grippa M, Auda Y, Tucker CJ (2013) 30 years of remote sensing imagery in Sahel confronted to field observations (Gourma, Mali). In: EGU General Assembly Conference Abstracts, p 12872
Dardel C, Kergoat L, Hiernaux P, Grippa M, Mougin E, Ciais P, Nguyen C-C (2014) Rain-use- efficiency: what it tells us about the conflicting Sahel greening and Sahelian Paradox. Remote Sens 6(4):3446–3474
De Angelis A, Bajocco S, Ricotta C (2012) Modelling the phenological niche of large fires with remotely sensed NDVI profiles. Ecol Model 228:106–111
De Beurs K, Henebry G (2005) A statistical framework for the analysis of long image time series. Int J Remote Sens 26(8):1551–1573
de Jong R (2010) Trends in soil degradation publications. IUSS Bulletin 116:21–25de Jong R, de Bruin S, de Wit A, Schaepman ME, Dent DL (2011a) Analysis of monotonic green-
ing and browning trends from global NDVI time-series. Remote Sens Environ 115(2):692–702. doi:http://dx.doi.org/10.1016/j.rse.2010.10.011
de Jong R, de Bruin S, Schaepman M, Dent D (2011b) Quantitative mapping of global land degra-dation using Earth observations. Int J Remote Sens 32(21):6823–6853
de Jong R, Verbesselt J, Schaepman ME, De Bruin S (2011c) Detection of breakpoints in global NDVI time series. In: 34th International Symposium on Remote Sensing of Environment (ISRSE), pp 10–15
Dee D, Uppala S, Simmons A, Berrisford P, Poli P, Kobayashi S, Andrae U, Balmaseda M, Balsamo G, Bauer P (2011) The ERA‐interim reanalysis: configuration and performance of the data assimilation system. Q J Roy Meteorol Soc 137(656):553–597
DeFries R, Townshend J (1994) NDVI-derived land cover classifications at a global scale. Int J Remote Sens 15(17):3567–3586
Delbart N, Kergoat L, Le Toan T, Lhermitte J, Picard G (2005) Determination of phenological dates in boreal regions using normalized difference water index. Remote Sens Environ 97(1):26–38
Dent D (2007) Environmental geophysics mapping salinity and water resources. Int J Appl Earth Obs Geoinf 9(2):130–136
Dent D, Bai Z, Schaepman M, Olsson L (2009) Letter to the editor. Soil Use Manag 25(1):93–97Despland E, Rosenberg J, Simpson SJ (2004) Landscape structure and locust swarming: a satel-
lite’s eye view. Ecography 27(3):381–391Di Gregorio A (2005) Land cover classification system: classification concepts and user manual:
LCCS, vol 8, 8th edn, FAO environment and natural resources service series. Food and Agriculture Organization of the United Nations, Rome
Díaz-Delgado R, Lloret F, Pons X, Terradas J (2002) Satellite evidence of decreasing resilience in Mediterranean plant communities after recurrent wildfires. Ecology 83(8):2293–2303
Díaz-Delgado R, Lloret F, Pons X (2003) Influence of fire severity on plant regeneration by means of remote sensing imagery. Int J Remote Sens 24(8):1751–1763
Diouf A, Lambin E (2001) Monitoring land-cover changes in semi-arid regions: remote sensing data and field observations in the Ferlo, Senegal. J Arid Environ 48(2):129–148
Duro DC, Coops NC, Wulder MA, Han T (2007) Development of a large area biodiversity moni-toring system driven by remote sensing. Prog Phys Geogr 31(3):235–260
Eldeiry A, Garcia L (2010) Comparison of ordinary kriging, regression kriging, and cokriging techniques to estimate soil salinity using LANDSAT images. J Irrig Drain Eng 136(6):355–364. doi:10.1061/(ASCE)IR.1943-4774.0000208
Erian WF (2005) Arab network of the remote sensing centers for desertification monitoring and assessment. ed. In: Remote sensing and geoinformation processing in the assessment and mon-itoring of land degradation and desertification. Trier, Germany, pp 452–459
Evans J, Geerken R (2004) Discrimination between climate and human-induced dryland degrada-tion. J Arid Environ 57(4):535–554
FAO (2009) High level expert forum—how to feed the world in 2050. Office of the Director, Agricultural Development Economics Division, Economic and Social Development Department, Rome
FAO (2013) Land use systems of the world. Land cover and land use. Food and Agriculture Organization of the United Nations (FAO), Rome. http://www.fao.org/climatechange/54270/en/. Accessed 15 June 2013
References
102
Farifteh J, Farshad A, George R (2006) Assessing salt-affected soils using remote sensing, solute modelling, and geophysics. Geoderma 130(3):191–206
Fensholt R, Proud SR (2012) Evaluation of Earth Observation based global long term vegetation trends—Comparing GIMMS and MODIS global NDVI time series. Remote Sens Environ 119:131–147. doi:http://dx.doi.org/10.1016/j.rse.2011.12.015
Fensholt R, Rasmussen K (2011) Analysis of trends in the Sahelian ‘rain-use efficiency’ using GIMMS NDVI, RFE and GPCP rainfall data. Remote Sens Environ 115(2):438–451
Fensholt R, Langanke T, Rasmussen K, Reenberg A, Prince SD, Tucker C, Scholes RJ, Le QB, Bondeau A, Eastman R, Epstein H, Gaughan AE, Hellden U, Mbow C, Olsson L, Paruelo J, Schweitzer C, Seaquist J, Wessels K (2012) Greenness in semi-arid areas across the globe 1981–2007—an Earth Observing Satellite based analysis of trends and drivers. Remote Sens Environ 121:144–158. doi:10.1016/j.rse.2012.01.017
Fensholt R, Rasmussen K, Kaspersen P, Huber S, Horion S, Swinnen E (2013) Assessing land degradation/recovery in the African Sahel from long-term earth observation based primary productivity and precipitation relationships. Remote Sens 5(2):664–686
Field CB, Randerson JT, Malmström CM (1995) Global net primary production: combining ecol-ogy and remote sensing. Remote Sens Environ 51(1):74–88
Foley JA, Ramankutty N, Brauman KA, Cassidy ES, Gerber JS, Johnston M, Mueller ND, O’Connell C, Ray DK, West PC (2011) Solutions for a cultivated planet. Nature 478:337–342
Foth HD (1991) Fundamentals of soil science, vol Ed. 8. Wiley, New YorkFriedl MA, McIver DK, Hodges JC, Zhang X, Muchoney D, Strahler AH, Woodcock CE, Gopal
S, Schneider A, Cooper A (2002) Global land cover mapping from MODIS: algorithms and early results. Remote Sens Environ 83(1):287–302
Fu B, Liu Y, Lü Y, He C, Zeng Y, Wu B (2011) Assessing the soil erosion control service of eco-systems change in the Loess Plateau of China. Ecol Complex 8(4):284–293
Gallo K, Ji L, Reed B, Eidenshink J, Dwyer J (2005) Multi-platform comparisons of MODIS and AVHRR normalized difference vegetation index data. Remote Sens Environ 99(3):221–231
Gao B-C (1996) NDWI—a normalized difference water index for remote sensing of vegetation liquid water from space. Remote Sens Environ 58(3):257–266
GEF (2014) EF-6 programming directions. GEF/R.6/20/Rev.04, 31 March 2014. Global Environment Facility, Washington, DC
Gentemann CL, Wentz FJ, Mears CA, Smith DK (2004) In situ validation of Tropical Rainfall Measuring Mission microwave sea surface temperatures. J Geophys Res: Oceans (1978–2012) 109(C4):C04021
Gibbes C, Southworth J, Waylen P, Child B (2014) Climate variability as a dominant driver of post-disturbance savanna dynamics. Appl Geogr 53:389–401
Gilabert M, González-Piqueras J, Garcıa-Haro F, Meliá J (2002) A generalized soil-adjusted veg-etation index. Remote Sens Environ 82(2):303–310
Goetz SJ, Prince SD, Goward SN, Thawley MM, Small J (1999) Satellite remote sensing of primary production: an improved production efficiency modeling approach. Ecol Model 122(3):239–255
Gottwald M, Bovensmann H, Lichtenberg G, Noel S, von Bargen A, Slijkhuis S, Piters A, Hoogeveen R, von Savigny C, Buchwitz M (2006) SCIAMACHY, monitoring the changing Earth’s atmosphere. DLR, Germany
Goward SN, Huemmrich KF (1992) Vegetation canopy PAR absorptance and the normalized dif-ference vegetation index: an assessment using the SAIL model. Remote Sens Environ 39(2):119–140
Goward SN, Tucker CJ, Dye DG (1985) North American vegetation patterns observed with the NOAA-7 advanced very high resolution radiometer. Vegetatio 64(1):3–14
Grainger A (2013) The threatening desert: controlling desertification. Routledge, LondonGreen RM, Hay SI (2002) The potential of Pathfinder AVHRR data for providing surrogate cli-
matic variables across Africa and Europe for epidemiological applications. Remote Sens Environ 79(2):166–175
Haboudane D, Miller JR, Pattey E, Zarco-Tejada PJ, Strachan IB (2004) Hyperspectral vegetation indices and novel algorithms for predicting green LAI of crop canopies: modeling and valida-tion in the context of precision agriculture. Remote Sens Environ 90(3):337–352
References
103
Haigh MJ (2002) Land use, land cover and soil sciences—land rehabilitation, vol IV, Encyclopedia of life support systems (EOLSS). UNESCO-EOLSS, Oxford
Hansen M, DeFries R, Townshend JR, Sohlberg R (2000) Global land cover classification at 1 km spatial resolution using a classification tree approach. Int J Remote Sens 21(6–7):1331–1364
Hassan R, Scholes R, Ash N (2005) Ecosystems and human well-being: current state and trends, vol 1. Island Press, Washington, DC
Hayward MW, Zawadzka B (2010) Increasing elephant Loxodonta Africana density is a more important driver of change in vegetation condition than rainfall. Acta Theriol 55(4):289–298
Haywood J, Randall J (2008) Trending seasonal data with multiple structural breaks. NZ visitor arrivals and the minimal effects of 9/11. Research report 08/10. Victoria, New Zealand, University of Wellington. Vol. p 26
He KS, Zhang J, Zhang Q (2009) Linking variability in species composition and MODIS NDVI based on beta diversity measurements. Acta Oecol 35(1):14–21
Henricksen B, Durkin J (1986) Growing period and drought early warning in Africa using satellite data. Int J Remote Sens 7(11):1583–1608
Herrmann SM, Sop T (2015) The map is not the territory. How satellite remote sensing and ground evidence have (Re-)Shaped the image of Sahelian desertification. In: Behnke R, Mortimore M (eds) Desertification: science, politics and public perception. Springer (Earth System Science Series), New York
Herrmann SM, Tappan GG (2013) Vegetation impoverishment despite greening: a case study from central Senegal. J Arid Environ 90:55–66
Herrmann SM, Anyamba A, Tucker CJ (2005) Recent trends in vegetation dynamics in the African Sahel and their relationship to climate. Glob Environ Chang 15(4):394–404
Herrmann SM, Sall I, Sy O (2014) People and pixels in the Sahel: a study linking coarse-resolution remote sensing observations to land users’ perceptions of their changing environment in Senegal. Ecol Soc 19(3):29
Hickler T, Eklundh L, Seaquist JW, Smith B, Ardö J, Olsson L, Sykes MT, Sjöström M (2005) Precipitation controls Sahel greening trend. Geophys Res Lett 32(21)
Higginbottom TP, Symeonakis E (2014) Assessing land degradation and desertification using veg-etation index data: current frameworks and future directions. Remote Sens 6(10):9552–9575
Hilker T, Lyapustin AI, Tucker CJ, Hall FG, Myneni RB, Wang Y, Bi J, de Moura YM, Sellers PJ (2014) Vegetation dynamics and rainfall sensitivity of the Amazon. Proc Natl Acad Sci 111(45):16041–16046
Hoekstra JM, Boucher TM, Ricketts TH, Roberts C (2005) Confronting a biome crisis: global disparities of habitat loss and protection. Ecol Lett 8(1):23–29
Holben BN (1986) Characteristics of maximum-value composite images from temporal AVHRR data. Int J Remote Sens 7(11):1417–1434
Holling CS (1973) Resilience and stability of ecological systems. Annu Rev Ecol Syst 4:1–23Horion S, Fensholt R, Tagesson T, Ehammer A (2014) Using earth observation-based dry season
NDVI trends for assessment of changes in tree cover in the Sahel. Int J Remote Sens 35(7):2493–2515
Hubert B, Rosegrant M, van Boekel M, Ortiz R (2010) The future of food: scenarios for 2050. Crop Sci 50(Suppl 1):33–50
Huete A, Didan K, Miura T, Rodriguez EP, Gao X, Ferreira LG (2002) Overview of the radiomet-ric and biophysical performance of the MODIS vegetation indices. Remote Sens Environ 83(1):195–213
Huffman GJ, Adler RF, Bolvin DT, Gu G (2009) Improving the global precipitation record: GPCP version 2.1. Geophys Res Lett 36(17):L17808
Hutchinson C (1991) Uses of satellite data for famine early warning in sub-Saharan Africa. Int J Remote Sens 12(6):1405–1421
Isaev A, Korovin G, Bartalev S, Ershov D, Janetos A, Kasischke E, Shugart H, French N, Orlick B, Murphy T (2002) Using remote sensing to assess Russian forest fire carbon emissions. Clim Change 55(1–2):235–249
ISRIC (2008a) Enhanced soil information for LADA partner countries, scale 1:1 million. World Soil Information (ISRIC), Wageningen
References
104
ISRIC (2008b) Global SOTER landform classification scale 1:1 million. World Soil Information (ISRIC), Wageningen
Ito A, Oikawa T (2002) A simulation model of the carbon cycle in land ecosystems (Sim-CYCLE): a description based on dry-matter production theory and plot-scale validation. Ecol Model 151(2):143–176
Ivits E, Cherlet M, Sommer S, Mehl W (2012a) Ecosystem Functional Units characterized by satellite observed phenology and productivity gradients: a case study for Europe. Ecol Indic 27:17–28
Ivits E, Cherlet M, Toth G, Sommer S, Mehl W, Vogt J, Micale F (2012b) Combining satellite derived phenology with climate data for climate change impact assessment. Global Planet Change 88–89:85–97
Jackson TJ, Chen D, Cosh M, Li F, Anderson M, Walthall C, Doriaswamy P, Hunt E (2004) Vegetation water content mapping using Landsat data derived normalized difference water index for corn and soybeans. Remote Sens Environ 92(4):475–482
Jacquin A, Sheeren D, Lacombe J-P (2010) Vegetation cover degradation assessment in Madagascar savanna based on trend analysis of MODIS NDVI time series. Int J Appl Earth Obs Geoinf 12:S3–S10
James M, Kalluri SN (1994) The Pathfinder AVHRR land data set: an improved coarse resolution data set for terrestrial monitoring. Int J Remote Sens 15(17):3347–3363
Jensen J (2007) Remote sensing of the environment. Pearson Prentice Hall, Upper Saddle RiverJiang Z, Huete AR, Didan K, Miura T (2008) Development of a two-band enhanced vegetation
index without a blue band. Remote Sens Environ 112(10):3833–3845Joiner J, Yoshida Y, Vasilkov A, Middleton E (2011) First observations of global and seasonal ter-
restrial chlorophyll fluorescence from space. Biogeosciences 8(3):637–651Joiner J, Yoshida Y, Vasilkov A, Middleton E, Campbell P, Kuze A (2012) Filling-in of near-
infrared solar lines by terrestrial fluorescence and other geophysical effects: simulations and space-based observations from SCIAMACHY and GOSAT. Atmos Meas Tech 5(4):809–829
Joiner J, Guanter L, Lindstrot R, Voigt M, Vasilkov A, Middleton E, Huemmrich K, Yoshida Y, Frankenberg C (2013) Global monitoring of terrestrial chlorophyll fluorescence from moderate spectral resolution near-infrared satellite measurements: methodology, simulations, and appli-cation to GOME-2. Atmos Meas Tech Discuss 6(2):3883–3930
Jones P, Harris I (2013) CRU TS3.21: Climatic Research Unit (CRU) Time-Series (TS) Version 3.21 of high resolution gridded data of month-by-month variation in climate (Jan 1901–Dec 2012). University of East Anglia Climatic Research Unit (CRU), NCAS British Atmospheric Data Centre. http://badc.nerc.ac.uk/view/badc.nerc.ac.uk
Jordan CF (1969) Derivation of leaf-area index from quality of light on the forest floor. Ecology 50:663–666
Jong R et al. (2012) Trend changes in global greening and browning: contribution of short-term trends to longerterm change. Glob Chang Biol 18(2):642–655
Justice CO, Townshend J, Holben B, Tucker CJ (1985) Analysis of the phenology of global vegeta-tion using meteorological satellite data. Int J Remote Sens 6(8):1271–1318
Karnieli A, Dall’Olmo G (2003) Remote-sensing monitoring of desertification, phenology, and droughts. Manag Environ Qual 14(1):22–38
Karnieli A, Agam N, Pinker RT, Anderson M, Imhoff ML, Gutman GG, Panov N, Goldberg A (2010) Use of NDVI and land surface temperature for drought assessment: merits and limita-tions. J Climate 23(3):618–633
Khorram S, Koch FH, van der Wiele CF, Nelson SA (2012) Remote sensing. Springer, New YorkKinzig AP, Ryan P, Etienne M, Allison H, Elmqvist T, Walker BH (2006) Resilience and regime
shifts: assessing cascading effects. Ecol Soc 11(1):23Krupenikov IA, Dent D, Boincean BP (2011) The black earth: ecological principles for sustainable
agriculture on chernozem soils, vol 10. Springer, DordrechtLambin EF, Ehrlich D (1997) Land-cover changes in sub-Saharan Africa (1982–1991): application
of a change index based on remotely sensed surface temperature and vegetation indices at a continental scale. Remote Sens Environ 61(2):181–200
References
105
Lambin EF, Geist HJ, Lepers E (2003) Dynamics of land-use and land-cover change in tropical regions. Annu Rev Environ Resour 28(1):205–241
Landmann T, Dubovyk O (2014) Spatial analysis of human-induced vegetation productivity decline over eastern Africa using a decade (2001–2011) of medium resolution MODIS time- series data. Int J Appl Earth Obs Geoinf 33:76–82
Lanorte, A, et al. (2014) Fisher–Shannon information plane analysis of SPOT/VEGETATION Normalized Difference Vegetation Index (NDVI) time series to characterize vegetation recovery after fire disturbance. International Journal of Applied Earth Observation and Geoinformation, 26, 441–446
Le Houerou HN (1984) Rain use efficiency: a unifying concept in arid-land ecology. J Arid Environ 7(3):213–247
Le QB, Tamene L, Vlek PLG (2012) Multi-pronged assessment of land degradation in West Africa to assess the importance of atmospheric fertilization in masking the processes involved. Global Planet Change 92–93:71–81. doi:10.1016/j.gloplacha.2012.05.003
Le QB, Nkonya E, Mirzabaev A (2014) Biomass productivity-based mapping of global land deg-radation hotspots. ZEF-Discussion Papers on Development Policy (193)
Leon JRR, van Leeuwen WJ, Casady GM (2012) Using MODIS-NDVI for the modeling of post- wildfire vegetation response as a function of environmental conditions and pre-fire restoration treatments. Remote Sens 4(3):598–621
Li J, Lewis J, Rowland J, Tappan G, Tieszen L (2004) Evaluation of land performance in Senegal using multi-temporal NDVI and rainfall series. J Arid Environ 59(3):463–480
Liang S (2005) Quantitative remote sensing of land surfaces, vol 30. Wiley, New YorkLiu W, Juárez RN (2001) ENSO drought onset prediction in northeast Brazil using NDVI. Int
J Remote Sens 22(17):3483–3501Lobell D, Lesch S, Corwin D, Ulmer M, Anderson K, Potts D, Doolittle J, Matos M, Baltes M
(2010) Regional-scale assessment of soil salinity in the Red River Valley using multi-year MODIS EVI and NDVI. J Environ Qual 39(1):35–41
Lunetta RS, Knight JF, Ediriwickrema J, Lyon JG, Worthy LD (2006) Land-cover change detection using multi-temporal MODIS NDVI data. Remote Sens Environ 105(2): 142–154
Malak DA, Pausas JG (2006) Fire regime and post-fire Normalized Difference Vegetation Index changes in the eastern Iberian peninsula (Mediterranean basin). Int J Wildland Fire 15(3):407–413
Mancino G, Nolè A, Ripullone F, Ferrara A (2014) Landsat TM imagery and NDVI differencing to detect vegetation change: assessing natural forest expansion in Basilicata, southern Italy. iFor-est-Biogeosci Forestry 7(2):76
Mas J-F (1999) Monitoring land-cover changes: a comparison of change detection techniques. Int J Remote Sens 20(1):139–152
Mather P, Koch M (2011) Computer processing of remotely-sensed images: an introduction. Wiley, Chichester
Mayaux P, Eva H, Brink A, Achard F, Belward A (2008) Remote sensing of land-cover and land- use dynamics. In: Chuvieco E (ed) Earth observation of global change. Springer, New York, pp 85–108
Mbow C, Fensholt R, Nielsen TT, Rasmussen K (2014) Advances in monitoring vegetation and land use dynamics in the Sahel. Geografisk Tidsskrift-Danish J Geogr 114(1):84–91
MEA (2005) Millennium ecosystem assessment: ecosystems and human well-being. Statement from the Board. Millennium ecosystem assessment. Full Report. http://www.millenniumas-sessment.org
Metternicht G, Zinck J (2003) Remote sensing of soil salinity: potentials and constraints. Remote Sens Environ 85(1):1–20
Mishra AK, Singh VP (2010) A review of drought concepts. J Hydrol 391(1–2):202–216. doi:http://dx.doi.org/10.1016/j.jhydrol.2010.07.012
Mishra U, Lal R, Liu D, Van Meirvenne M (2010) Predicting the spatial variation of the soil organic carbon pool at a regional scale. Soil Sci Soc Am J 74(3):906–914
References
106
Mitchell TD, Jones PD (2005) An improved method of constructing a database of monthly climate observations and associated high‐resolution grids. Int J Climatol 25(6):693–712
Mitchell JE, Roundtable SR (2010) Criteria and indicators of sustainable rangeland management. University of Wyoming/Cooperative Extension Service, Laramie
Monteith J, Moss C (1977) Climate and the efficiency of crop production in Britain [and discus-sion]. Philos Trans Royal Soc London B, Biol Sci 281(980):277–294
Morton DC, Nagol J, Carabajal CC, Rosette J, Palace M, Cook BD, Vermote EF, Harding DJ, North PR (2014) Amazon forests maintain consistent canopy structure and greenness during the dry season. Nature 506(7487):221–224
Mulianga B, Bégué A, Simoes M, Clouvel P, Todoroff P (2013) Estimating potential soil erosion for environmental services in a sugarcane growing area using multisource remote sensing data. In: SPIE remote sensing. International Society for Optics and Photonics, pp 88871W-88810
Myneni RB, Hall FG, Sellers PJ, Marshak AL (1995) The interpretation of spectral vegetation indexes. IEEE Trans Geosci Remote Sens 33(2):481–486
Myneni R. B. et al. (2014) Attribution of global vegetation photosynthetic capacity from 1982 to 2014. Global Change Biology (in review)
Nemani RR, Keeling CD, Hashimoto H, Jolly WM, Piper SC, Tucker CJ, Myneni RB, Running SW (2003) Climate-driven increases in global terrestrial net primary production from 1982 to 1999. Science 300(5625):1560–1563
Nkonya E, Gerber N, Baumgartner P, Von Braun J, De Pinto A, Graw V, Kato E, Kloos J, Walter T (2011) The economics of desertification, land degradation, and drought: toward an integrated global assessment. ZEF Discussion Papers on Development Policy
Novella NS, Thiaw WM (2013) African rainfall climatology version 2 for famine early warning systems. J Appl Meteorol Climatol 52(3):588–606
Oindo BO, de By RA, Skidmore AK (2000) Interannual variability of NDVI and bird species diversity in Kenya. Int J Appl Earth Obs Geoinf 2(3):172–180
Oldeman L, Hakkeling R, Sombroek W (1990) World map on status of human-induced soil degra-dation (GLASOD) UNEP. ISRIC, Nairobi
Olsson L, Eklundh L, Ardö J (2005) A recent greening of the Sahel—trends, patterns and potential causes. J Arid Environ 63(3):556–566
Orr BJ (2011) Scientific review of the UNCCD provisionally accepted set of impact indicators to measure the implementation of strategic objectives 1, 2 and 3. Office of Arid Lands Studies. University of Arizona, Arizona
Orr BJ (2014) Personal communication on: the use of normalized difference vegetation index for land degradation assessment—country applications. Interviewed on 13 Oct 2014
Pan C, Zhao H, Zhao X, Han H, Wang Y, Li J (2013) Biophysical properties as determinants for soil organic carbon and total nitrogen in grassland salinization. PLoS One 8(1), e54827
Pearson RL, Miller LD (1972) Remote mapping of standing crop biomass for estimation of the productivity of the shortgrass prairie. Remote Sens Environ VIII:1355
Pedelty J, Devadiga S, Masuoka E, Brown M, Pinzon J, Tucker C, Roy D, Ju J, Vermote E, Prince S (2007) Generating a long-term land data record from the AVHRR and MODIS instruments. In: Proceedings of the IEEE 2007 International Geoscience and Remote Sensing Symposium, Barcelona, Spain, pp 1021–1025
Perrings C (1998) Resilience in the dynamics of economy-environment systems. Environ Resour Econ 11(3–4):503–520
Pettorelli N (2013) The normalized difference vegetation index. Oxford University Press, OxfordPettorelli N, Vik JO, Mysterud A, Gaillard J-M, Tucker CJ, Stenseth NC (2005) Using the satellite-
derived NDVI to assess ecological responses to environmental change. Trends Ecol Evol 20(9):503–510
Pettorelli N, Safi K, Turner W (2014) Satellite remote sensing, biodiversity research and conserva-tion of the future. Philos Trans R Soc, B 369(1643):20130190
Piao S, Fang J, Ciais P, Peylin P, Huang Y, Sitch S, Wang T (2009) The carbon balance of terrestrial ecosystems in China. Nature 458(7241):1009–1013
Pinzon J, Tucker C (2014) A non-stationary 1981–2012 AVHRR NDVI3G time series. Remote Sens 6(8):6929–6960
References
107
Platonov A, Noble A, Kuziev R (2013) Soil salinity mapping using multi-temporal satellite images in agricultural fields of syrdarya province of Uzbekistan. In: Shahid SA, Abdelfattah MA, Taha FK (eds) Developments in soil salinity assessment and reclamation: innovative thinking and use of marginal soil and water resources in irrigated agriculture. Springer, London, pp 87–98
Porter JR, Xie L, Challinor A, Cochrane K, Mark Howden M, Iqbal MM, Lobell D, Travasso MT (2014) Food security and food production systems. In: Field CB, Barros VR, Dokken DJ et al (eds) Climate change 2014: impacts, adaptation, and vulnerability. Part A: global and sectoral aspects. Contribution of Working Group II to the Fifth Assessment Report of the Intergovernmental Panel on Climate Change, vol 1. Cambridge University Press, Cambridge
Prasannakumar V, Vijith H, Abinod S, Geetha N (2012) Estimation of soil erosion risk within a small mountainous sub-watershed in Kerala, India, using Revised Universal Soil Loss Equation (RUSLE) and geo-information technology. Geosci Front 3(2):209–215
Prince SD, Goward SN (1995) Global primary production: a remote sensing approach. J Biogeogr 22:815–835
Prince SD, Colstoun D, Brown E, Kravitz L (1998) Evidence from rain‐use efficiencies does not indicate extensive Sahelian desertification. Glob Chang Biol 4(4):359–374
Prince S, Becker-Reshef I, Rishmawi K (2009) Detection and mapping of long-term land degrada-tion using local net production scaling: application to Zimbabwe. Remote Sens Environ 113(5):1046–1057
Propastin P, Kappas M, Muratova N (2008) Application of geographically weighted regression analysis to assess human-induced land degradation in a dry region of Kazakhstan. In: shaping the change, XXIII FIG congress
Purkis SJ, Klemas VV (2011) Remote sensing and global environmental change. Wiley, OxfordQuarmby N, Milnes M, Hindle T, Silleos N (1993) The use of multi-temporal NDVI measurements
from AVHRR data for crop yield estimation and prediction. Int J Remote Sens 14(2):199–210Renschler CS, Frazier A, Arendt L, Cimellaro G-P, Reinhorn AM, Bruneau M (2010) A frame-
work for defining and measuring resilience at the community scale: the PEOPLES resilience framework. MCEER, Buffalo
Rienecker MM, Suarez MJ, Gelaro R, Todling R, Bacmeister J, Liu E, Bosilovich MG, Schubert SD, Takacs L, Kim G-K (2011) MERRA: NASA’s modern-era retrospective analysis for research and applications. J Climate 24(14):3624–3648
Rockström J, Steffen W, Noone K, Persson Å, Chapin FS, Lambin EF, Lenton TM, Scheffer M, Folke C, Schellnhuber HJ (2009) A safe operating space for humanity. Nature 461(7263):472–475
Ross J (1981) The radiation regime and architecture of plant stands, vol 3. Springer, DordrechtRouse J Jr, Haas R, Schell J, Deering D (1974) Monitoring vegetation systems in the Great Plains
with ERTS. NASA Spec Publ 351:309Rudolf B, Beck C, Grieser J, Schneider U (2005) Global precipitation analysis products of the
GPCC. Climate monitoring—Tornadoklimatologie–Aktuelle Ergebnisse des Klimamonitorings, Germany, pp 163–170
Running SW, Nemani RR, Heinsch FA, Zhao M, Reeves M, Hashimoto H (2004) A continuous satellite-derived measure of global terrestrial primary production. Bioscience 54(6):547–560
Saatchi SS, Harris NL, Brown S, Lefsky M, Mitchard ET, Salas W, Zutta BR, Buermann W, Lewis SL, Hagen S (2011) Benchmark map of forest carbon stocks in tropical regions across three continents. Proc Natl Acad Sci 108(24):9899–9904
Safriel UN (2007) The assessment of global trends in land degradation. In: Sivakumar MK, Ndiang’ui N (eds) Climate and land degradation, Environmental science and engineering: envi-ronmental science. Springer, Berlin, pp 1–38
Saleska SR, Didan K, Huete AR, Da Rocha HR (2007) Amazon forests green-up during 2005 drought. Science 318(5850):612
Scheftic W, Zeng X, Broxton P, Brunke M (2014) Intercomparison of seven NDVI products over the United States and Mexico. Remote Sens 6(2):1057–1084
Schlerf M, Atzberger C, Hill J (2005) Remote sensing of forest biophysical variables using HyMap imaging spectrometer data. Remote Sens Environ 95(2):177–194
References
108
Schneider U et al. (2008) Global precipitation analysis products of the GPCC. Global Precipitation Climatology Centre (GPCC), DWD, Internet Publikation, 112
Sellers P, Tucker C, Collatz G, Los S, Justice C, Dazlich D, Randall D (1994) A global 1 by 1 NDVI data set for climate studies. Part 2: the generation of global fields of terrestrial biophysi-cal parameters from the NDVI. Int J Remote Sens 15(17):3519–3545
Shalaby A, Tateishi R (2007) Remote sensing and GIS for mapping and monitoring land cover and land-use changes in the Northwestern coastal zone of Egypt. Appl Geogr 27(1):28–41
Sietse O (2010) ISLSCP II FASIR-adjusted NDVI, 1982–1998. ISLSCP Initiative II Collection Data set Available on-line [http://daac.ornl.gov/] from Oak Ridge National Laboratory Distributed Active Archive Center, Oak Ridge, TN, USA
Simoniello T, Lanfredi M, Liberti M, Coppola R, Macchiato M (2008) Estimation of vegetation cover resilience from satellite time series. Hydrol Earth Syst Sci Discuss 5(1):511–546
Sivakumar MV, Stefanski R (2007) Climate and land degradation—an overview. In: Climate and land degradation. Springer, New York, pp 105–135
Sobrino J, Raissouni N (2000) Toward remote sensing methods for land cover dynamic monitor-ing: application to Morocco. Int J Remote Sens 21(2):353–366
Sommer S, Zucca A, Grainger M, Cherlet R, Zougmore Y, Sokona J, Hill R, Della-Peruta J, Wang G (2011) Application of indicator systems for monitoring and assessment of desertification from national to global scales. Land Degrad Dev 22:184–197
Sonneveld B, Dent D (2009) How good is GLASOD? J Environ Manage 90(1):274–283Steiniger S, Hunter AJS (2013) The 2012 free and open source GIS software map—a guide to
facilitate research, development, and adoption. Comput Environ Urban Syst 39:136–150. doi:http://dx.doi.org/10.1016/j.compenvurbsys.2012.10.003
Sternberg T, Tsolmon R, Middleton N, Thomas D (2011) Tracking desertification on the Mongolian steppe through NDVI and field-survey data. Int J Digital Earth 4(1):50–64
Stocking M, Murnaghan N (2000) Land degradation–guidelines for field assessment. Overseas Development Group, University of East Anglia, Norwich, p 121
Stow DA, Hope A, McGuire D, Verbyla D, Gamon J, Huemmrich F, Houston S, Racine C, Sturm M, Tape K (2004) Remote sensing of vegetation and land-cover change in Arctic Tundra Ecosystems. Remote Sens Environ 89(3):281–308
Strand H, Höft R, Strittholt J, Horning N, Miles L, Fosnight E, Turner W (2007) Sourcebook on remote sensing and biodiversity indicators, vol Technical Series no. 32. Secretariat of the Convention on Biological Diversity, Montreal
Strittholt J, Steininger M (2007) Trends in selected biomes, habitats, and ecosystems: forests. In: Strand H, Höft R, Strittholt J et al (eds) Sourcebook on remote sensing and biodiversity indica-tors, vol Technical Series No. 32. Secretariat of the Convention on Biological Diversity, Montreal, p 203
Strzepek K, Boehlert B (2010) Competition for water for the food system. Philos Trans R Soc, B 365(1554):2927–2940
Symeonakis E, Drake N (2004) Monitoring desertification and land degradation over sub-Saharan Africa. Int J Remote Sens 25(3):573–592
Thorén H, Persson J (2014) A concept of resilience for sustainability science: some remarks on ostensive and stipulative definitions. Soc Nat Resour 11(1):64–74
Tilman D (2010) Understanding the present and projecting the future of global food demand. Paper presented at the AAAS Annual Meeting 2010, San Diego
Tilman D, Cassman K, Matson P, Naylor R, Polasky S (2002) Agricultural sustainability and inten-sive production practices. Nature 418(6898):671–677
Townshend JR, Goff TE, Tucker CJ (1985) Multitemporal dimensionality of images of normalized difference vegetation index at continental scales. IEEE Trans Geosci Remote Sens 6:888–895
Townshend JR, Masek JG, Huang C, Vermote EF, Gao F, Channan S, Sexton JO, Feng M, Narasimhan R, Kim D (2012) Global characterization and monitoring of forest cover using Landsat data: opportunities and challenges. Int J Digital Earth 5(5):373–397
Tucker CJ (1979) Red and photographic infrared linear combinations for monitoring vegetation. Remote Sens Environ 8(2):127–150
References
109
Tucker CJ, Garratt MW (1977) Leaf optical system modeled as a stochastic process. Appl Optics 16(3):635–642
Tucker CJ, Nicholson SE (1999) Variations in the size of the Sahara Desert from 1980 to 1997. Ambio 28:587–591
Tucker CJ, Holben BN, Elgin JH Jr, McMurtrey JE III (1981) Remote sensing of total dry-matter accumulation in winter wheat. Remote Sens Environ 11:171–189
Tucker C, Vanpraet CL, Sharman M, Van Ittersum G (1985) Satellite remote sensing of total her-baceous biomass production in the Senegalese Sahel: 1980–1984. Remote Sens Environ 17(3):233–249
Tucker CJ, Pinzon JE, Brown ME, Slayback DA, Pak EW, Mahoney R, Vermote EF, El Saleous N (2005) An extended AVHRR 8‐km NDVI dataset compatible with MODIS and SPOT vegeta-tion NDVI data. Int J Remote Sens 26(20):4485–4498
Turner BL, Meyer WB (1994) Global land-use and land-cover change: an overview. In: Changes in land use and land cover: a global perspective, vol 4. Cambridge University Press, Cambridge, p 3
Turner W, Spector S, Gardiner N, Fladeland M, Sterling E, Steininger M (2003) Remote sensing for biodiversity science and conservation. Trends Ecol Evol 18(6):306–314
Udelhoven T, Stellmes M (2007) Changes in land surface conditions on the Iberian Peninsula (1989 to 2004) detected by means of time series analysis from hypertemporal remote sensing data, Proceedings of MultiTemp 2007 International Workshop on the Analysis of Multi-Temporal Remote Sensing Images. MultiTemp, Leuven, Belgium, pp 1–6
UN (2013) World population prospects: the 2012 revision, highlights and advance tables. Working Paper, vol ESA/P/WP.228. United Nations, Department of Economic and Social Affairs, Population Division, New York
UNCCD (1994) Elaboration of an international convention to combat desertification in countries experiencing serious drought and/or desertification, particularly in Africa. United Nations Convention to Combat Desertification, Paris
UNEP (2007) Global environment outlook GEO4—environment for development. United Nations Environmental Programme (UNEP), Nairobi
UNEP (2012a) Environment for the future we want. In: GEO 5—Global Environment Outlook. United Nations Environment Programme, Nairobi
UNEP (2012b) Sahel atlas of changing landscapes: tracing trends and variations in vegetation cover and soil condition. United Nations Environment Programme, Nairobi
United Nations (2011) Millennium development goals report 2011. ISBN 978-92-1-101244-6. http://www.refworld.org/docid/4e42118b2.html. Accessed 1 Oct 2014
Vacik H, Wolfslehner B, Seidl R, Lexer MJ (2007) Integrating the DPSIR approach and the ana-lytic network process for the assessment of forest management strategies. In: Reynolds K, Thomson A, Köhl M, Shannon M, Ray D, Rennolls K (eds) Sustainable forestry: from moni-toring and modelling to knowledge management and policy science. CAB International, Cambridge, pp 393–411
Veldkamp A, Lambin EF (2001) Predicting land-use change. Agr Ecosyst Environ 85(1):1–6Verbesselt J, Hyndman R, Newnham G, Culvenor D (2010a) Detecting trend and seasonal changes
in satellite image time series. Remote Sens Environ 114(1):106–115Verbesselt J, Hyndman R, Zeileis A, Culvenor D (2010b) Phenological change detection while
accounting for abrupt and gradual trends in satellite image time series. Remote Sens Environ 114(12):2970–2980
Verón SR, Oesterheld M, Paruelo JM (2005) Production as a function of resource availability: slopes and efficiencies are different. J Veg Sci 16(3):351–354
Verrelst J, Koetz B, Kneubühler M, Schaepman M (2006) Directional sensitivity analysis of veg-etation indices from multi-angular Chris/PROBA data. In: ISPRS Commission VII Mid-term symposium, pp 677–683
Vlek P, Le Q, Tamene L (2010) Assessment of land degradation, its possible causes and threat to food security in Sub-Saharan Africa. In: Lal R, Stewart BA (eds) Food security and soil quality, Advances in soil science. Taylor & Francis, Boca Raton, pp 57–86
References
110
Vogt JV, Safriel U, Von Maltitz G, Sokona Y, Zougmore R, Bastin G, Hill J (2011) Monitoring and assessment of land degradation and desertification: towards new conceptual and integrated approaches. Land Degrad Dev 22(2):150–165. doi:10.1002/ldr.1075
Walker B, Holling CS, Carpenter SR, Kinzig A (2004) Resilience, adaptability and transformabil-ity in social—ecological systems. Ecol Soc 9(2):5
Walker B, Abel N, Andreoni F, Cape J, Murdock H, Norman C (2014) General resilience: a discus-sion paper based on insights from a catchment management area workshop in South Eastern Australia. Resilience Alliance, Australia
Wang J, Sammis TW, Gutschick VP, Gebremichael M, Dennis SO, Harrison RE (2010) Review of satellite remote sensing use in forest health studies. Open Geogr J 3:28–42
Warren A (2002) Land degradation is contextual. Land Degrad Dev 13(6):449–459Wessels K (2009) Letter to the editor: comments on ‘Proxy global assessment of land degradation’
by Bai et al. (2008). Soil Use Manag 25:91–92Wessels KJ, Prince SD, Frost PE, van Zyl D (2004) Assessing the effects of human-induced land
degradation in the former homelands of northern South Africa with a 1 km AVHRR NDVI time-series. Remote Sens Environ 91(1):47–67. doi:http://dx.doi.org/10.1016/j.rse.2004.02.005
Wessels KJ, Prince SD, Malherbe J, Small J, Frost PE, VanZyl D (2007) Can human-induced land degradation be distinguished from the effects of rainfall variability? A case study in South Africa. J Arid Environ 68(2):271–297
Wessels K, Van Den Bergh F, Scholes R (2012) Limits to detectability of land degradation by trend analysis of vegetation index data. Remote Sens Environ 125:10–22
Xie Y, Sha Z, Yu M (2008) Remote sensing imagery in vegetation mapping: a review. J Plant Ecol 1(1):9–23
Xu D, Kang X, Qiu D, Zhuang D, Pan J (2009) Quantitative assessment of desertification using landsat data on a regional scale–a case study in the Ordos plateau, China. Sensors 9(3):1738–1753
Yan H, Wang S, Wang C, Zhang G, Patel N (2005) Losses of soil organic carbon under wind ero-sion in China. Glob Chang Biol 11(5):828–840
Yeqiao W (2011) Remote sensing of protected lands. Remote sensing applications series. CRC Press, Boca Raton, pp 1–26. doi: 10.1201/b11453-210.1201/b11453-2
Yin H, Udelhoven T, Fensholt R, Pflugmacher D, Hostert P (2012) How normalized difference vegetation index (ndvi) trends from advanced very high resolution radiometer (AVHRR) and système probatoire d’observation de la terre vegetation (spot vgt) time series differ in agricul-tural areas: an inner mongolian case study. Remote Sens 4(11):3364–3389
Yoshida Y, Joiner J, Tucker C, Berry J, Lee J-E, Walker G, Reichle R, Koster R, Lyapustin A, Wang Y (2014) The 2010 Russian drought impact on satellite measurements of solar-induced chloro-phyll fluorescence: insights from modeling and comparisons with the Normalized Differential Vegetation Index (NDVI). Remote Sens Environ 166:163–177
Yuan D, Elvidge C (1998) NALC land cover change detection pilot study: Washington DC area experiments. Remote Sens Environ 66(2):166–178
Zargar A, Sadiq R, Naser B, Khan FI (2011) A review of drought indices. Environ Rev 19(NA):333–349. doi:10.1139/a11-013
Zhang Y, Peng C, Li W, Fang X, Zhang T, Zhu Q, Chen H, Zhao P (2013) Monitoring and estimat-ing drought-induced impacts on forest structure, growth, function, and ecosystem services using remote-sensing data: recent progress and future challenges. Environ Rev 21(2):103–115. doi:10.1139/er-2013-0006
Zhou P, Luukkanen O, Tokola T, Nieminen J (2008) Effect of vegetation cover on soil erosion in a mountainous watershed. Catena 75(3):319–325
Zinck A, Metternicht G (2008) Soil salinity and salinization hazard. In: Metternicht G, Zinck A (eds) Remote sensing of soil salinization: impact on land management. CRC Press, Boca Raton
References