intrusive mechanism of the 2002 ne-rift eruption at mt etna (italy) modelled using gps and gravity...
TRANSCRIPT
Geophys. J. Int. (2007) 169, 339–347 doi: 10.1111/j.1365-246X.2006.03249.x
GJI
Vol
cano
logy
,ge
othe
rmic
s,flui
dsan
dro
cks
Intrusive mechanism of the 2002 NE-rift eruption at Mt Etna (Italy)modelled using GPS and gravity data
Alessandro Bonforte, Daniele Carbone, Filippo Greco and Mimmo PalanoIstituto Nazionale di Geofisica e Vulcanologia – Sez. di Catania, Piazza, Roma 2-95123 Catania, Italy. E-mails: [email protected]
Accepted 2006 September 27. Received 2006 September 27; in original form 2005 October 21
S U M M A R YMicrogravity and GPS data collected at Mt Etna during a 1-yr time interval encompassing the2002 NE-rift eruption are analysed. The common GPS-gravity profile traverses the summitarea of Mt Etna, between the summit craters (about 3000 m) and the northernmost tip of theeruptive fractures (2500 m). Displacements (up to 2 m in both the horizontal and verticaldirections) and gravity variations (up to 350 μGal, after having removed the effect of elevationchanges) observed during this period are among the largest ever recorded at Etna.
Displacements and gravity changes have been modelled separately, assuming a magma influxfrom the summit feeder pipe to the NE-rift. Models obtained through surface deformation datapartially overlap with those explaining the gravity data but in general are narrower and extendto a greater depth. The discrepancies found between gravity and deformation models aresignificant and can be regarded as due to the different structural features encountered by theintruding magma during its downslope propagation along the NE-rift. In particular, on thegrounds of our result, we infer that both the eastward sliding of the east flank of the volcanoand the curved shape of the NE-rift influenced the 2002 intrusive process.
Key words: deformation, density, dislocation, gravity anomalies, magma flow, rifts, volcanicactivity.
1 T H E 2 0 0 2 N E - R I F T E RU P T I O N
The NE-rift, one of the main intrusion zones of Etna, covers a
2-km wide and 7-km long area which stretches from 2500 to
1700 m a.s.l. (Fig. 1). It consists of subparallel eruptive fissures
with azimuth values between 42◦E and 62◦E (Kieffer 1975). The
NE-rift is affected by strong extensional tectonics which several
authors consider to be controlled by the gravitational collapse of
Etna’s eastern flank towards ESE (Borgia et al. 1992; Lo Giudice &
Rasa 1992; Froger et al. 2001). During the last 300 yr, several erup-
tive events occurred from fissure systems which formed from the
base of the summit craters down to the NE-rift zone (Romano &
Sturiale 1982; Branca & Del Carlo 2003).
The 2002 NE-rift eruption was heralded by a seismic swarm be-
ginning at about 20:12 GMT on October 26 (Andronico et al. 2005).
In the early morning of October 27, a set of extensional fractures
formed in the Piano delle Concazze area, (2800 m a.s.l.; Fig. 1) and
during the following hours, the fissure system propagated downslope
along the eastern border of the NE-rift, until 1900 m a.s.l. (Fig. 1),
producing both explosive and effusive activity.
Lava was first erupted (October 27) from vents located at 2400 and
2250 m a.s.l. Afterwards, a new vent located at 2150 m a.s.l. started
outpouring lava at a high effusion rate. It flowed northeastwards to
the Piano Provenzana area (Fig. 1) and then eastward. In the early
morning of the 28th, another vent opened at the lower tip of the
eruptive fissure system at 1920–1900 m a.s.l. and two lava flows
were emitted, northeastwards and eastwards. During the following
days the effusion rate from all the vents gradually decreased and by
November the eruption came to an end. About 10 × 106 m3 of lava
was erupted from these NE fractures (Andronico et al. 2005).
2 N E T W O R K A N D S U RV E Y S
In the present study, GPS and gravity surveys, carried out on Mt Etna
along a common profile on the summit area of the volcano (Fig. 1)
and during a time interval (2002 June–2003 July) encompassing the
2002 NE-rift eruption, are analysed. The profile includes 15 gravity
and 13 GPS stations (11 in common, i.e. within 200 m from each
other), which lie between the summit craters zone (about 3000 m
a.s.l.) and the Piano Provenzana area (about 1770 m a.s.l.; Fig. 1).
Along this profile measurements are usually performed when the
snow cover does not prevent the stations from being accessed by
car (measurements can usually be accomplished between June and
October).
GPS measurements along this profile are usually carried out by
the semi-kinematic method, which allows great spatial detail to be
achieved in less time than the static method, used to measure the
other stations on the volcano (Bonforte & Puglisi 2003; Bonforte
et al. 2004) and with an acceptable accuracy. The semi-kinematic
sessions are carried out using at least three static stations of the Mt
C© 2007 The Authors 339Journal compilation C© 2007 RAS
340 A. Bonforte et al.
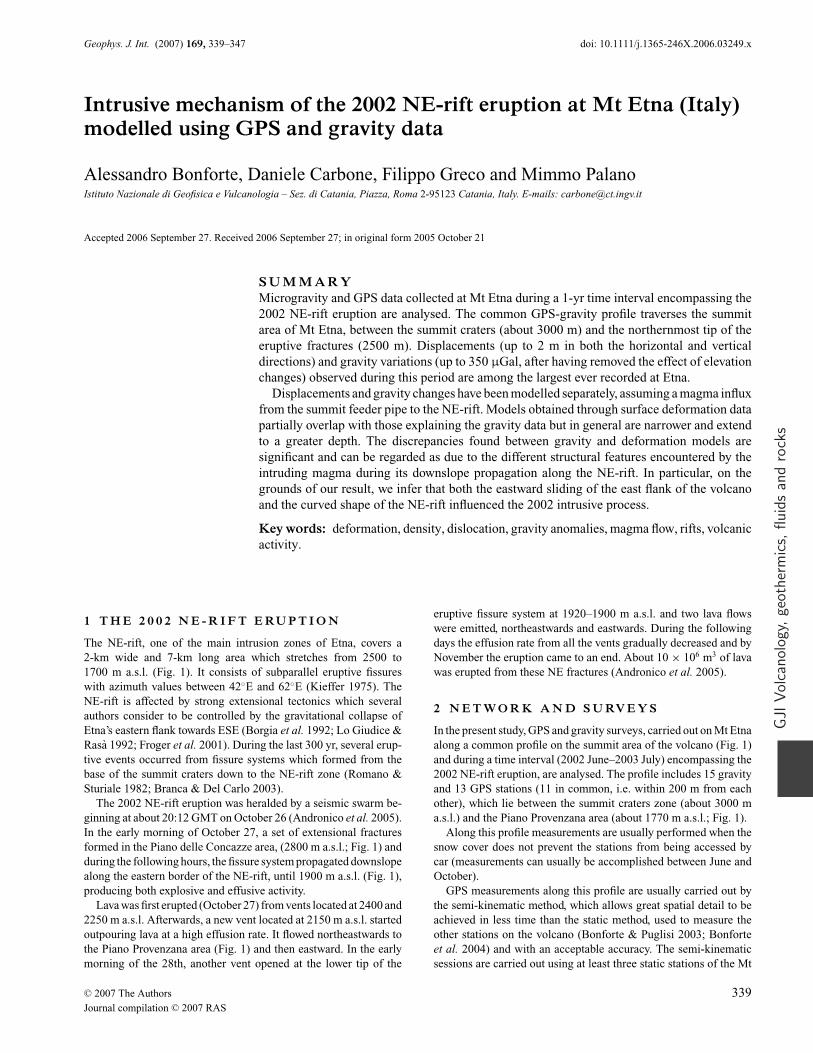
Figure 1. Schematic map showing the position of the GPS and gravity benchmarks and the area covered by the lava flows from Etna’s 2002 NE-rift eruption.
Inset legend: (1) fault; (2) eruptive fissure; (3) lava flow; (4) gravity benchmark and (5) GPS benchmark.
Etna GPS monitoring network as reference, while a roving receiver
moves from one benchmark to another along the NS profile. The
benchmarks are occupied in sequence, the profile being remeasured
two times. Exceptionally, during the July 2003 survey, the above
profile was surveyed by the static method, and thus a better accuracy
could be achieved.
Dual frequency Trimble GPS receivers (4000 SSI and SSE mod-
els), equipped with Choke Ring or microcentred L1/L2 (with
ground plane) antennas were used to accomplish all the GPS mea-
surements.
The gravity stations are also measured in sequence and the profile
is traversed two or three times for each survey (profile method; Torge
1989). Gravity measurements presented here were performed using
a Scintrex CG-3M gravimeter (serial # 9310234; Budetta & Carbone
1997).
3 G P S DATA : P R E S E N TAT I O N
A N D M O D E L L I N G
GPS data collected during the surveys carried out in 2002 July
and 2003 July along the profile described in the previous sec-
tion were processed together with those from stations outside the
volcanic edifice, in order to link Etna’s network to the ITRF sys-
tem (Bonforte & Puglisi 2003). Trimble Geomatics Office soft-
ware package (release 1.5) and precise ephemerides were uti-
lized to process the data. In order to improve the precision of
the antenna phase centre location, antenna calibration models by
NGS (http://www.ngs.noaa.gov/ANTCAL/) were introduced. The
data were processed using both L1 and L2 GPS frequencies. The
ionosphere-free observable (L3) was also used for baselines longer
than 10 km, for which ionospheric noise could become significant.
The two-step method described by Puglisi et al. (2001) was followed
to adjust the baseline solutions. Furthermore, in order to achieve a
better accuracy in the stop-and-go initialization, a free (inner con-
straint) adjustment was performed before processing the kinematic
data. Typically, the static positioning is affected by uncertainties of
3–4 and 6–7 mm on the horizontal and vertical components, respec-
tively. The use of self-centring benchmarks (Puglisi et al. 2001),
allowing station set-up errors to be avoided, improves the precision
on the kinematic positioning. It is affected by typical uncertainties
of 6–8 mm on the horizontal component and twice that value on
the vertical component (Bonforte & Puglisi 2003; Bonforte et al.2004). The error on displacements along the summit profile during
the 2002 July–2003 July period is estimated at 16 and 8 mm, for the
vertical and horizontal component, respectively.
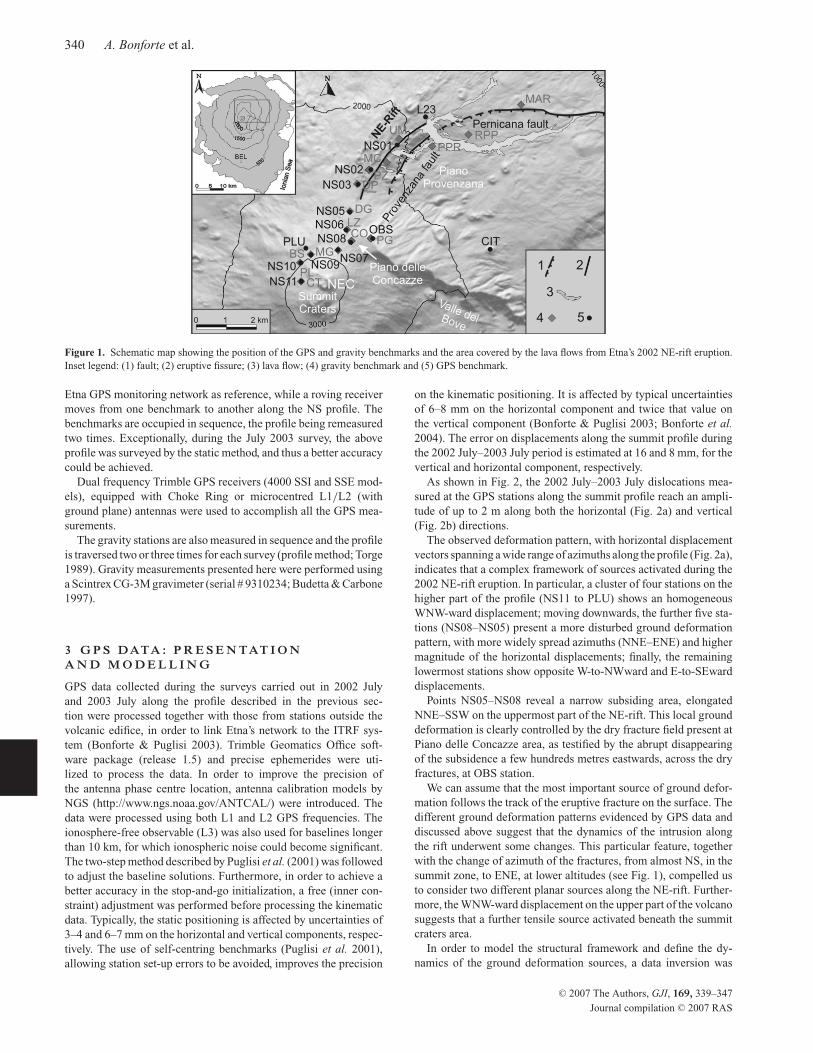
As shown in Fig. 2, the 2002 July–2003 July dislocations mea-
sured at the GPS stations along the summit profile reach an ampli-
tude of up to 2 m along both the horizontal (Fig. 2a) and vertical
(Fig. 2b) directions.
The observed deformation pattern, with horizontal displacement
vectors spanning a wide range of azimuths along the profile (Fig. 2a),
indicates that a complex framework of sources activated during the
2002 NE-rift eruption. In particular, a cluster of four stations on the
higher part of the profile (NS11 to PLU) shows an homogeneous
WNW-ward displacement; moving downwards, the further five sta-
tions (NS08–NS05) present a more disturbed ground deformation
pattern, with more widely spread azimuths (NNE–ENE) and higher
magnitude of the horizontal displacements; finally, the remaining
lowermost stations show opposite W-to-NWward and E-to-SEward
displacements.
Points NS05–NS08 reveal a narrow subsiding area, elongated
NNE–SSW on the uppermost part of the NE-rift. This local ground
deformation is clearly controlled by the dry fracture field present at
Piano delle Concazze area, as testified by the abrupt disappearing
of the subsidence a few hundreds metres eastwards, across the dry
fractures, at OBS station.
We can assume that the most important source of ground defor-
mation follows the track of the eruptive fracture on the surface. The
different ground deformation patterns evidenced by GPS data and
discussed above suggest that the dynamics of the intrusion along
the rift underwent some changes. This particular feature, together
with the change of azimuth of the fractures, from almost NS, in the
summit zone, to ENE, at lower altitudes (see Fig. 1), compelled us
to consider two different planar sources along the NE-rift. Further-
more, the WNW-ward displacement on the upper part of the volcano
suggests that a further tensile source activated beneath the summit
craters area.
In order to model the structural framework and define the dy-
namics of the ground deformation sources, a data inversion was
C© 2007 The Authors, GJI, 169, 339–347
Journal compilation C© 2007 RAS
Intrusive mechanism of the 2002 NE-rift eruption 341
Figure 2. Displacements in the horizontal (a) and vertical (b) directions and gravity changes (c) observed between June 2002 and July 2003 along the common
GPS-gravity profile on the summit area of Mt Etna. Inset legend in (a): (1) gravity benchmark; (2) GPS benchmark; (3) trace of the ABC profile and (4) scale
of horizontal displacements.
performed through the Okada (1985) dislocation model and a least-
squares algorithm (LSA) approach. The use of a LSA implies an
appropriate set of starting values to be assumed for each parame-
ter of the source. The Okada model implies 10 parameters to be
inverted. We fix the position and the orientation of the three disloca-
tion planes based on field observations (position of dry and eruptive
fractures). Thus, three parameters (easting, northing and azimuth;
see Table 1) for each model-source are fixed. Furthermore, rely-
ing on the homogeneous WNW-ward displacement observed at the
southernmost stations of the profile (see Fig. 2), we assume GPS
source 1 to be a pure tensional fracture, and hold both its dip-slip
and strike-slip fixed at zero (see Table 1). In conclusion, 19 param-
eters are to be inverted against 42 observations (three-component
deformation measured at 14 stations).
The solutions, referred in the local UTM (zone 33N) frame, are
reported in Table 1. The resulting composite model consists of one
vertical tensile structure located beneath the summit area and two
normal faults dipping eastwards (the projection of the modelled
sources onto the horizontal plane is shown in Fig. 3a). This frame-
work matches the scenario hypothesized by Del Negro et al. (2004)
Table 1. Parameter of the sources modelled through surface deformation
data. Model numbers refer to Fig. 4. Coordinates are in UTM projection.
Fixed parameters are marked with italic style letters.
Parameters GPS source 1 GPS source 2 GPS source 3
Easting (km) 499.7 (fixed) 500.9 (fixed) 502.6 (fixed)
Northing (km) 4179.3 (fixed) 4182.0 (fixed) 4183.7 (fixed)
Azimuth N13◦E (fixed) N29◦E (fixed) N55◦E (fixed)
Depth (km) a.s.l. 2.5 ± 0.1 2.1 ± 0.2 1.8 ± 0.1
Length (km) 1.9 ± 0.1 3.0 ± 0.3 1.7 ± 0.1
Width (km) 2.6 ± 0.1 2.2 ± 0.2 1.3 ± 0.1
Dip 89.4◦ ± 0.5◦ 60.6◦ ± 1.0◦ 43.3◦ ± 0.5◦Strike (cm) 0 (fixed) 66.0 ± 2.1 113.0 ± 4.3
Dip (cm) 0 (fixed) 278.0 ± 3.3 178.0 ± 3.3
Opening (cm) 117.0 ± 4.5 54.0 ± 4.1 221.0 ± 5.4
who analysed data from two magnetic stations (within 1 km from
the NE-rift), and assumed the magnetic changes to be due to stress
redistributions within the edifice.
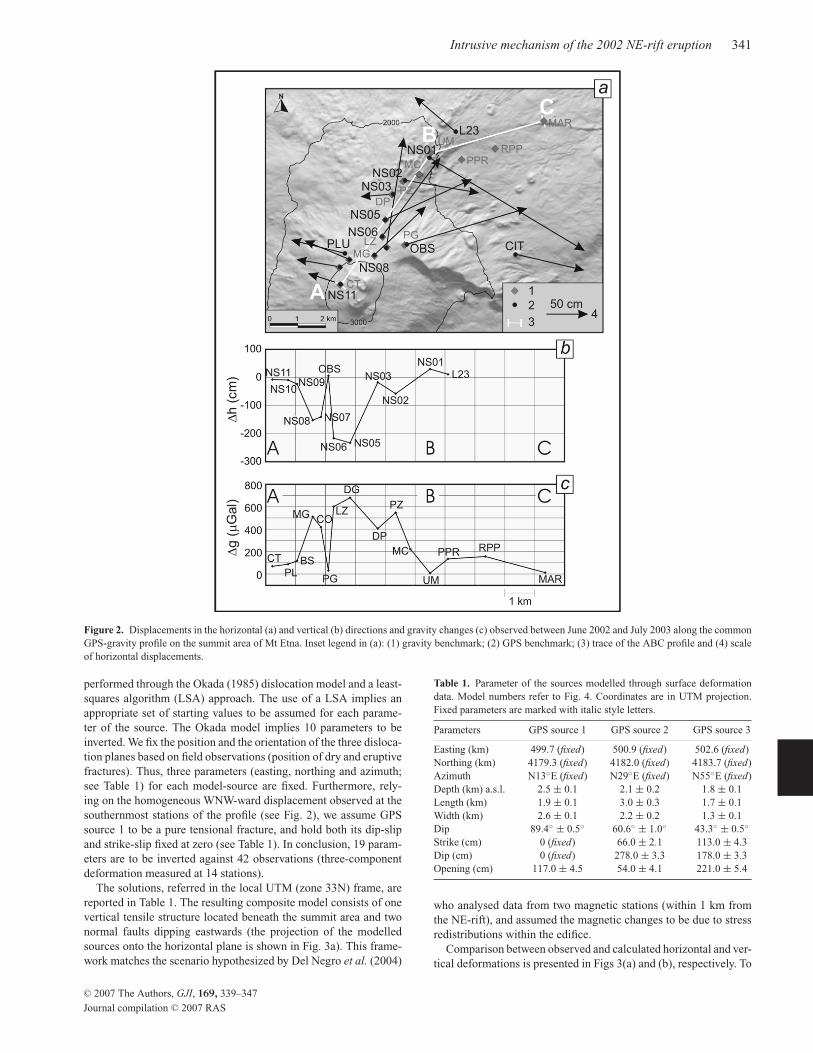
Comparison between observed and calculated horizontal and ver-
tical deformations is presented in Figs 3(a) and (b), respectively. To
C© 2007 The Authors, GJI, 169, 339–347
Journal compilation C© 2007 RAS
342 A. Bonforte et al.
Figure 3. Comparison between displacements (a and b) and gravity changes (c) observed during the June2002–July 2003 period on the summit area of Mt
Etna and the effect of the best-fitting model sources discussed in the text. Inset legend in (a): (1) gravity benchmark; (2) GPS benchmark; (3) trace of the
ABC profile; (4) source modelled through GPS data; (5) source modelled through gravity data; (6) scale of observed horizontal displacements and (7) scale of
calculated horizontal displacements.
assess the quality of the model a paired t-test is performed (Goulden
1956). It tests the hypothesis that the mean of the differences be-
tween the observed deformations (horizontal deformations are split
into east and north components) and the corresponding calculated
effect of the model is equal to zero. The p-value obtained (0.55)
indicates that there are 55 in 100 chances that the hypothesized
zero mean difference would occur by chance. The above result in-
dicates that, in spite of the minimization performed by the LSA
algorithm, the misfit remains quite high, especially in the vertical di-
rection, along which only the overall shape of the observed changes
could be reproduced (Fig. 3b). That may be due to the following
reasons:
(1) During the 2002–2003 eruption the kinematic response of the
eastern flank of Etna was controlled by a complex interaction be-
tween volcanic and tectonic processes, as inferred by Barberi et al.(2004) on the grounds of syn-eruptive seismic data, and thus the ob-
served dislocations are likely to be the effect of various, contempo-
raneously acting deformation mechanisms, not entirely explainable
by simple elastic models.
(2) The 2002–2003 eruptive fracture field formed over a medium
already weakened by the eastward sliding (Borgia et al. 1992; Lo
Giudice & Rasa 1992; Froger et al. 2001), which could have lo-
cally reacted in a non-elastic manner, producing inhomogeneities
in the overall ground deformation pattern [e.g. a set of extensional
N–S-trending dry fractures formed in the Piano delle Concazze area
(Branca et al. 2003; see Section 1.) and strongly affected the defor-
mation data from NS07 and NS08].
(3) A significant contribution to the misfit found between ob-
served and calculated ground deformation is made by the vertical
displacements at NS05 to NS08 benchmarks that are located inside
a graben-like structure (between the northernmost tip of the erup-
tive fracture and the dry fractures at Piano delle Concazze), where
a local ground deformation pattern occurs.
(4) Our data come from comparison of two surveys spanning a
1-yr period and thus, beside reflecting the processes which occurred
C© 2007 The Authors, GJI, 169, 339–347
Journal compilation C© 2007 RAS
Intrusive mechanism of the 2002 NE-rift eruption 343
during the 2002 NE-rift eruption, other minor effects which took
place before and/or after it could also affect the final difference.
It is worth stressing that a significant ground deformation was
observed by GPS, EDM, levelling, tilt and DInSAR data on the NE
flank of the volcano one month before the eruption onset (Bonforte
et al., 2007), revealing an acceleration of the slip rate along the
Pernicana fault (from the usual value of about 3 cm yr−1 to about
10 cm yr−1) and an extension of the EDM lines crossing the Proven-
zana fault (1–3 cm). Subsequently, until the summer of 2003, mea-
surements at the summit zone of Etna were not possible because of
the volcanic activity and, lately, because of the snow cover. How-
ever, daily GPS measurements carried out during the 2002 eruption,
along the lower portion of the Pernicana fault, revealed exceptional
values of the slip-rates (up to about 800 cm yr−1). The slip rate grad-
ually decreased during the last part of the eruption and soon after it,
but it reached its usual value only 1 yr after the end of the eruption
(Palano et al. 2007).
Thus, even though within the summit deformation observed be-
tween 2002 July and 2003 July it is not possible to distinguish the
syn- from the pre- and post-eruptive deformation, the observed
higher slip rates along the lower portion of the Pernicana fault
are likely to indicate the accommodation of anomalous large-scale
movements of the eastern flank of Etna during a period spanning the
eruption and lasting more than 1 yr. These movements are in turn
expected to increase the residuals between the observed 2002 July
and 2003 July summit deformation and the corresponding deforma-
tion calculated through a model which takes into account only the
elastic behaviour of the medium in response to the intrusive process
(Okada model).
4 G R AV I T Y DATA : P R E S E N TAT I O N
A N D M O D E L L I N G
During the 2002 June–2003 July period, gravity changes among
the strongest ever observed at Mt Etna took place along the profile
under study (Fig. 2). The data were reduced for tidal effect in the
field using a suitable software loaded into the memory of the digital
Scintrex CG3-M gravimeter (Scintrex Ltd 1992). This software is
based on Longman’s formula (1959) and allows a standard earth tide
correction to be generated. All measurements were then corrected
for instrumental drift (Rymer 1989) and referred to a station (BEL;
see Fig. 1), located about 16 km south of the eruption site, where it
is assumed that the gravity field does not change over time.
To evaluate the precision of the Scintrex CG-3M 9310234
gravimeter under the conditions encountered on Mt Etna, the in-
strument was site tested during the first year of its employment.
Using 237 differences between measurements obtained at each sta-
tion of the summit profile during a single campaign, a standard
deviation of 5.8 μGal was calculated (Budetta & Carbone 1997;
Carbone et al. 2003), yielding an uncertainty of ±11 μGal at the
95 per cent confidence interval. The error on temporal gravity dif-
ferences is estimated by calculating√
2∗e (Rymer 1989), where e
is the error on a single survey. Thus, at the 95 per cent confidence
interval, the error on temporal gravity differences along the summit
profile is 15 μGal.
Using GPS data, gravity data were corrected for the free-air effect
through the theoretical −308.6 μGal m−1 free-air gradient. It is
worth stressing that, due to the 16 mm error over height changes
(see previous section), the free-air correction implies a rise in the
amplitude of the error bar on the gravity changes from 15 μGal
(see above) to√
152 + (fae)2 μGal (fae is the free-air effect due to a
16 mm height change and is equal to 5 μGal), that is, to about
16 μGal.
Stations MC, PPR, RPP and MAR, on the northern edge of the
profile (Fig. 1), lack the elevation control. Accordingly, the first three
stations were not taken into account when calculating the model for
the 2002 NE-rift intrusion, while the datum from MAR (a quasi-zero
value on the northernmost edge of the profile), was considered to
better constrain the calculation. It is worth stressing that most of the
gravity changes observed at stations PPR and RPP are likely to be the
effect of the nearby emplacement of the 2002 lava flow field (Fig. 1).
Residual gravity changes, which reflect mass redistributions under
the surface, reach the maximum amplitude (around 350 μGal) at
stations DP and PZ (Fig. 3c). Moving towards south, the amplitude
of the gravity change decreases sharply, being almost within the
error bar at benchmarks CO, PG, LZ and DG and than rises again
(up to about 60 μGal) over the four southernmost benchmarks of
the profile (CT, PL, BS and MG), which lay in the summit crater
zone.
The high amplitude of the residual variations of the gravity field
(after reduction for the free-air effect) suggests that an important
mass redistribution, not directly associated to the ensuing displace-
ment, occurred. Accordingly, the residual gravity changes are not
inverted through elastic modelling. Rather, they are assumed to be
due to underground mass changes. To assess the geometrical char-
acteristic of the best-fitting model and the amount of mass involved
in the redistribution process, a 3-D program, able to calculate at
any observation point (in its actual position on the topographic sur-
face) the effect of buried masses, is utilized. This program is called
GRAVERSE and was designed on-purpose under the LabVIEW®
environment (Carbone 2001). The program simulates the effect of
the buried homogeneous mass by representing it as a lattice of point
masses (in the case of a parallelepiped-shaped body (dyke), the
program utilizes 1000 nodes). The program calculates the vertical
component of the gravity effect due to each node of the lattice at
the observation points. The effects due to the nodes in the lattice are
then added, to calculate the total effect of the body.
The above described characteristic of the residual change, with
two separate positive anomalies, suggest that two distinct sources
activated, one close to the active summit craters of Etna and the other
close to the southernmost edge of the eruptive fractures. This view
is in keeping with the results of the previous analysis over the GPS
data (at least as for the two southernmost source bodies) and indicate
that, even though the observed gravity changes and deformation are
not due to the same mechanism, they result from the same overall
(intrusive) process.
The ease and functionality of the GRAVERSE interface (possibil-
ity of changing all the model parameters through graphical controls;
charts showing the projection onto profiles of the observed and cal-
culated gravity changes to check in real-time the overall goodness
of the fit) make it possible to solve the inverse problem through
a trial-and-error procedure. We started from the model parameters
obtained through the above analysis over the GPS data and refined
them until a satisfactory fit was assessed.
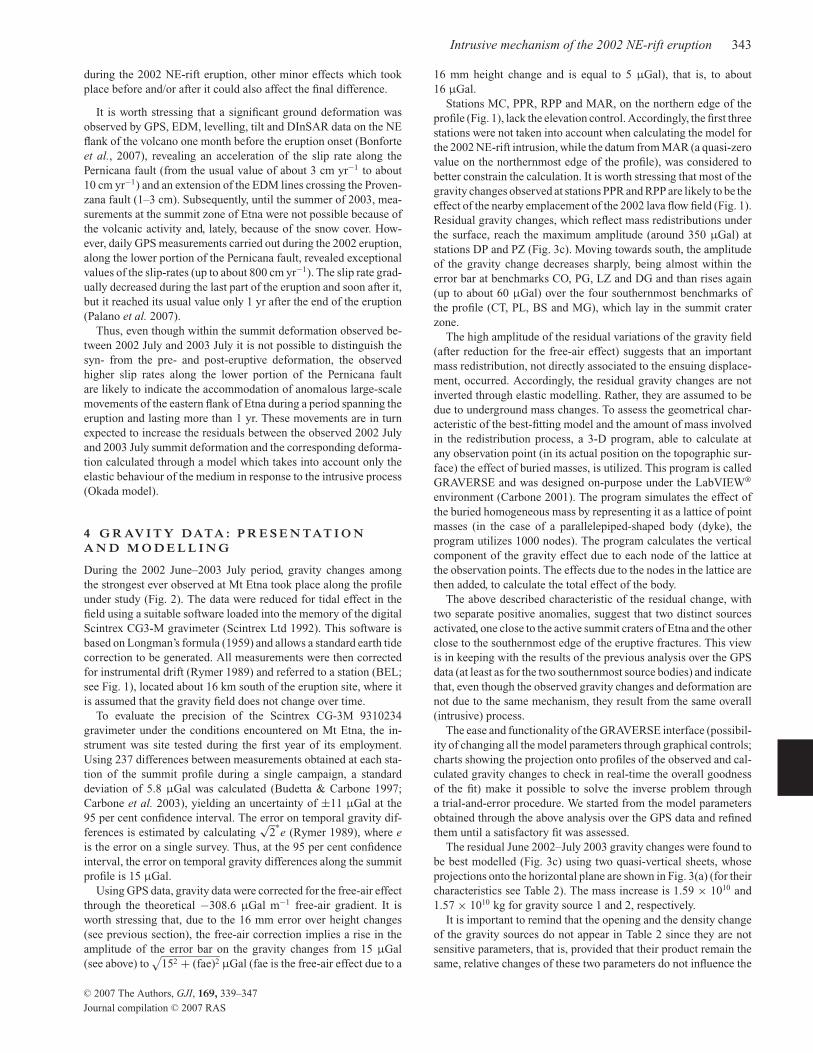
The residual June 2002–July 2003 gravity changes were found to
be best modelled (Fig. 3c) using two quasi-vertical sheets, whose
projections onto the horizontal plane are shown in Fig. 3(a) (for their
characteristics see Table 2). The mass increase is 1.59 × 10¹⁰ and
1.57 × 10¹⁰ kg for gravity source 1 and 2, respectively.
It is important to remind that the opening and the density change
of the gravity sources do not appear in Table 2 since they are not
sensitive parameters, that is, provided that their product remain the
same, relative changes of these two parameters do not influence the
C© 2007 The Authors, GJI, 169, 339–347
Journal compilation C© 2007 RAS
344 A. Bonforte et al.
Table 2. Parameter of the sources modelled through surface grav-
ity data. Model numbers refer to Fig. 4. Coordinates are in UTM
projection.
Parameters Gravity source 1 Gravity source 2
Easting (km) 499.7 501.1
Northing (km) 4179.2 4182.2
Azimuth N18◦E N42◦E
Depth (km) a.s.l. 2.8 2.4
Length (km) 1.9 1.2
Width (km) 1.7 1.2
Dip 90.0◦ 84.5◦�M (kg) 1.59 × 10¹⁰ 1.57 × 10¹⁰
effect of the model source. Thus an a priori assumption must be
made on one of these parameters, to assess the value of the other
one. For example, if the density of the intruding magma is set to
2700 kg m−3, with a porosity of the medium of 0.3, the opening of
gravity source 1 results equal to 6 m, while the opening of gravity
source 2 results equal to 13 m
In keeping with the good fit obtained (Fig. 3c), the paired t-test
returns a high probability (greater than 95 per cent) of 0-difference
between observed and calculated data.
A further point that is worth stressing is that a lateral intrusion
along the NE-rift implies a mass decrease within the volume where
the intruding magma comes from. The eruptive dynamics of the
2002 NE-rift eruption suggests that the intruding magma was sup-
plied by the fast empting of the central conduit (Branca et al. 2003).
A 3-D calculation performed with GRAVERSE (Cylinder Kernel;
Carbone 2001) shows that a mass decrease, comparable with the
increase along the NE-rift and occurring within a cylinder-shaped
source whose projection on the horizontal plane roughly coincides
with the position of the summit craters and whose top depth and
width coincide with those of gravity source 1 (Table 2), has a sig-
nificant effect only at stations CT and PL, the closest stations to the
summit craters (Fig. 1). The negative gravity effect at those stations
would imply that the calculated mass increase within gravity source
1 (Table 2) is overestimated by about 40 per cent (gravity source 1
would be shorter and its centre would be shifted towards north).
5 D I S C U S S I O N
Mt Etna is nowadays one of the best monitored volcanoes in the
world. The large amount of geophysical and volcanological data
available makes the 2002–2003 Etna eruption a very thoroughly
studied one. Accordingly, various papers focusing on that event can
be found in the literature (Aloisi et al. 2003; Branca et al. 2003;
Neri et al. 2003; Andronico et al. 2005; Barberi et al. 2004; Del
Negro et al. 2004; Gambino et al. 2004). Most of the available
geophysical papers deal with continuous data sequences, through
which the Authors were able to set strict constraints on the timing of
the paroxysmal events. Nevertheless, in the case of both Del Negro
et al. (2004), who analyse geomagnetic data from two continuous
stations, and Branca et al. (2003), who deal with continuous gravity
data from only one station, geometrical constraints on the source
models could not be defined and the Authors are only able to verify
the compatibility of the variations they observe with models built
from seismological and volcanological data.
Data from a continuously recording gravity meter working at a
site (OBS in Fig. 1) very close to the eruptive fissures along the
NE-rift, evidenced a marked decrease (about 400 μGal in less
than 1 hr) about 4 hr before lava was first emitted (Branca et al.
2003). This anomaly reversed soon afterward at a high rate (roughly
100 μGal hr−1), until the gravity signal returned to the mean level it
had before the anomaly took place. Accordingly, the change of the
gravity field observed at PG (the benchmark of the discrete grav-
ity array closer to the site where the continuous gravity station is
installed) between July 2002 and July 2003 is negligible (within
15 μGal). The lack of continuous GPS data, at a rate suitable to
reduce the continuous gravity sequence, prevents strict constraints
from being set on the sin-intrusive mechanism leading to the ob-
served 2-hr-lasting gravity anomaly (Branca et al. 2003). As a con-
sequence, it is difficult to infer which kind of connection exists
between the mechanism leading to the temporary gravity change
detected by the continuous gravity station and the ‘permanent’ grav-
ity increase detected along the summit profile through the repeated
measurements.
Using the data collected between 2002 October 26 and 27, from
permanent tilt and GPS stations, Aloisi et al. (2003) modelled a
single 6.6 km long radial intrusion in the NE flank of the volcano
whose projection on the horizontal plane roughly coincide with the
projection of the models we found. The model by Aloisi et al. (2003)
is placed at depths between 1500 m a.s.l. and 3100 m b.s.l. and thus
is both larger and deeper than the models calculated in the present
paper (Table 1 and Fig. 4).
This discrepancy can be explained by a combination of two
factors:
(1) Aloisi et al. (2003) inverted a one-day-long continuous data
set, while we utilize discrete GPS data spanning a period of 1 yr.
Likely, while only the effect of the radial intrusion leading to the
eruption is present in the one-day-lasting sequence, other phenom-
ena altering the deformation pattern at the surface could have oc-
curred during the 1-yr period between the two GPS/microgravity
campaigns, that is, structural readjustments after the main intrusive
event such as closing of the deeper part of the intrusive path by
lithostatic pressure.
(2) The data of Aloisi et al. (2003), come from stations at ele-
vations below 2000 m and thus the large width of the model they
found could result from the marked eastward sliding of the east flank
(Bonforte & Puglisi 2003) which amplified the horizontal displace-
ments recorded from the GPS stations located in the low eastern
sector. Our data come from stations on the summit zone of the vol-
cano which are supposed to be less affected by the movement of the
east flank.
It is to be stressed that, since the data we present here comes from
the comparison between two discrete gravity/GPS surveys spanning
a 1-yr period, we cannot set any constraints on the timing of the
events discussed. However, relying on (i) a dense network in the
summit northeastern zone of the volcano and (ii) the availability of
contemporaneous gravity and GPS data, we can deliver a detailed
model as for both geometry and mechanism of the intrusive process,
at least for the shallower part of the intrusive path.
The models which best fit our surface deformation data partially
overlap with those explaining our gravity data but are in general
both narrower and deeper (Tables 1 and 2; Fig. 4). The agreement
between the structures modelled through deformation data and those
obtained through gravity data as for position, azimuth and horizontal
length is better in the summit crater zone than further north, along
the NE-rift. In spite of the limitations of (i) the approach followed
here (separate inversion of gravity and GPS data) and (ii) the above
discussed misfit between observed and calculated surface deforma-
tion data, we think that the discrepancies found are significant. In
our view, the facts that (1) along the southernmost part of the rift,
C© 2007 The Authors, GJI, 169, 339–347
Journal compilation C© 2007 RAS
Intrusive mechanism of the 2002 NE-rift eruption 345
Figure 4. 3-D perspective showing the sources modelled through surface ground deformation and gravity data.
at shallower depths a process causing mass changes with negligi-
ble deformation is predominant while, at greater depth, processes
leading to surface dislocation are increasingly more important and
(2) along the northernmost portion of the NE-rift only deformation
processes occur, both result from structural features of the rift it-
self. The NE-rift has a curved shape in plan-view, with its azimuth
changing gradually from NS, in the highest part, to NNE, and then
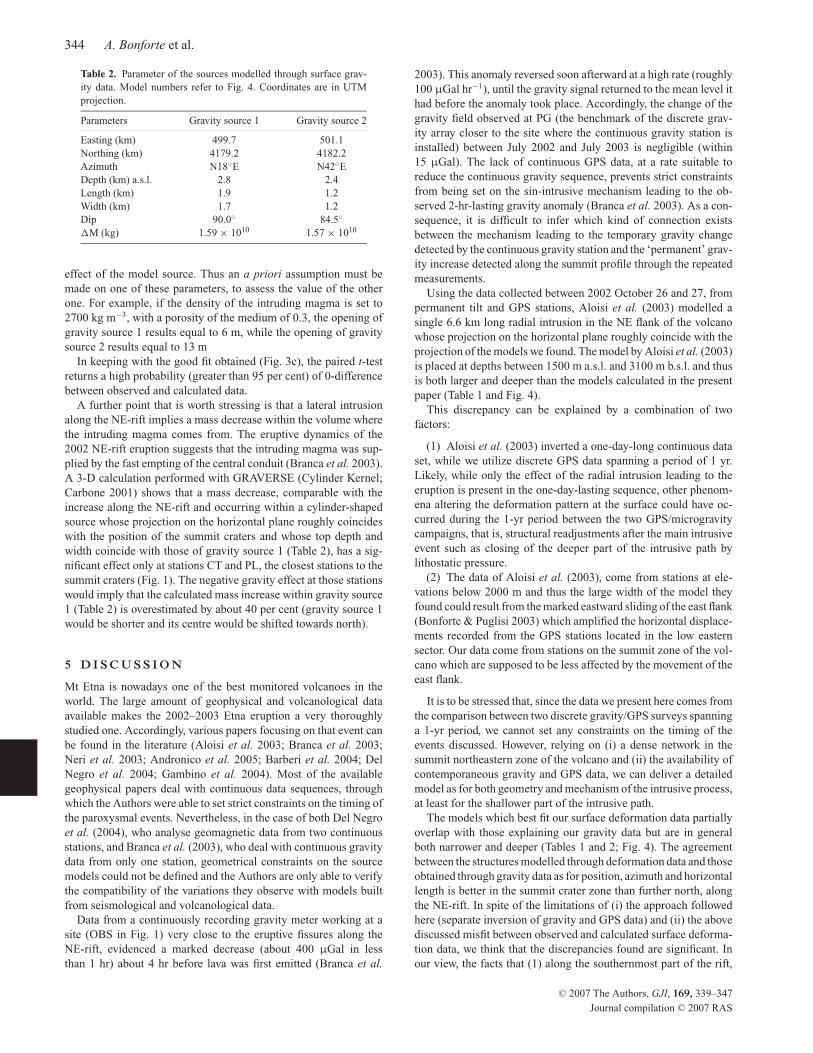
Figure 5. Simplified block diagram (not to scale) illustrating the geometrical relationships between the 2002 magma influx from the central conduit and the
curved Etna NE-rift, undergoing an ESE gravitational sliding.
to ENE, at its northeastern termination (Figs 1 and 5; Tibaldi &
Groppelli 2002). Coupled with the extensional tectonics affecting
the NE-rift along the ESE direction, and produced by the sliding of
the eastern flank of Etna (Bonforte 2002; Bonforte & Puglisi 2003;
Palano 2003; Puglisi & Bonforte 2004), this curved shape results in
different kinematics between the northern and southern parts of the
rift: pure extension, with the maximum fissuring dilation, occurs in
C© 2007 The Authors, GJI, 169, 339–347
Journal compilation C© 2007 RAS
346 A. Bonforte et al.
the southernmost and central segments, while a transcurrent, left-
lateral component characterizes the NE segment (Fig. 5). In other
words, a kinematic S–N readjustment leads to the replacement of
the extensional tectonics by the transtensional movements typical
of the Pernicana fault (Tibaldi & Groppelli 2002).
Therefore, during the intrusion leading to the 2002 eruption, the
magma, moving from the central conduit towards lower portions
of the NE-rift, encountered changeable structural features in both
the horizontal and vertical directions (Fig. 5). Our analysis shows
that a ‘pure’ mass increase (i.e. not accompanied by an overpressure
within the space(s) hosting the new mass), a phenomenon likely due
to filling of pre-existing voids, occurred at shallow depths along the
southernmost part of the rift. The position of the modelled gravity
sources in the area where the maximum fissuring dilation occurs
is in keeping with this interpretation. Following the calculation in
the previous section, one can conclude that open voids along the
southernmost and central segments of the NE-rift are more abun-
dant within the top 1–1.5 km below the surface. Open voids become
progressively less abundant (1) at greater depths along the south-
ernmost and central portions of the NE-rift, likely because of the
lithostatic loading and (2) at any depth, towards the northeastern
edge of the NE-rift where, as stated before, because of the mor-
phology of the rift itself, extensional forces are progressively less
effective (Fig. 5). Within those portions of the NE-rift where open
voids are less abundant, the intruding magma had to push its way
forward. Therefore, it produced a significant displacement on the
surface on one hand and a negligible gravity effect on the other,
given (1) the less effective contribution in generating gravity varia-
tions of the magma/host-rocks density contrast with respect to the
magma/voids density contrast (in the case of void-filling) and (b)
the relatively small opening of the forceful dykes.
6 C O N C L U D I N G R E M A R K S
In this paper, new evidence on the intrusive mechanism of the 2002
NE-rift eruption at Mt Etna is provided through the analysis of
ground deformation and gravity data from a common network. Dis-
placement and gravity changes measured over the summit NE sec-
tor of the volcano between July 2002 and July 2003 are among the
largest ever observed on Mt Etna.
Gravity data were reduced for the effect of elevation changes
and inverted separately from ground deformation data. Results pro-
vide complementary information and indicate a composite intrusive
mechanism with the magma moving passively through the upper part
of the intrusive path and more forcefully with depth and towards the
northeastern segment of the NE-rift, as open voids are progressively
less abundant.
Unfortunately, the shortcomings discussed in Section 3, which
affect our ground deformation data, especially over the central part
of the profile of common stations, prevent the accuracy in the mod-
elling that could be achieved through our local array from being
assessed.
The present work represents a further evidence of what many au-
thors have already concluded (Sanderson et al. 1983; Rymer et al.1993; Budetta & Carbone 1998; Carbone et al. 2003): that in a struc-
tural framework such as Etna’s rift zones (Acocella & Neri 2003;
Lanzafame et al. 2003), where tectonic movements and gravitational
collapses are likely to take place together with volcanic processes
(Neri et al. 2003; Barberi et al. 2004), the synergistic use of defor-
mation and gravity data can allow a more complete picture of the
dynamics of any intrusive processes to be gained, as ‘passive’ in-
trusions (gravity changes occur without deformation) and forceful
intrusions of relatively small magma bodies (measurable surface de-
formations accompanied by negligible changes of the gravity field)
can be recognized.
A C K N O W L E D G M E N T S
This study was performed with financial support from the ETNA
project (DPC–INGV 2004–2006 contract) and the VOLUME
project (European Commission FP6–2004-Global-3). Thanks are
due to the technicians of INGV (section of Catania) for their un-
flinching help in collecting the data in the field.
R E F E R E N C E S
Acocella, V. & Neri, M., 2003. What controls flank eruptions? The 2001
Etna eruption and the possible triggering mechanisms, Bull. Volcanol.,65, 517–529.
Aloisi, M., Bonaccorso, A., Gambino, S., Mattia, M. & Puglisi, G., 2003.
Etna 2002 eruption imaged from continuous tilt and GPS data, Geophys.Res. Lett., 30, 2214–2218.
Andronico, D. et al., 2005. A multi-disciplinary study of the 2002–03 Etna
eruption: insights into a complex plumbing system, Bull. Volcanol., 67,314–330.
Barberi, G., Cocina, O., Maiolino, V., Musumeci, C. & Privitera, E., 2004.
Insight into Mt. Etna (Italy) kinematics during 2002–2003 eruption as
inferred by seismic stress and strain tensors inversion, Geophys. Res. Lett.,31, L2164, doi:10.1029/2004GL020918.
Bonforte, A., 2002. Study of the north-eastern sector of the hyblean plateau
and of the eastern flank of Mt. Etna by GPS spatial techniques, PhD thesis,
Universita degli Studi di Catania, Italy.
Bonforte, A. & Puglisi, G., 2003. Magma uprising and flank dynamics on
Mt. Etna volcano, studied by GPS data (1994–1995), J. geophys. Res.,108(B3), 2153–2162.
Bonforte, A., Guglielmino, F., Palano, M. & Puglisi, G., 2004. A syn-eruptive
ground deformation episode measured by GPS, during the 2001 erup-
tion on the upper southern flank of Mt. Etna, Bull. Volcanol., 66, 336–
341.
Bonforte, A., Gambino, S., Guglielmino, F., Obrizzo, F., Palano, M. &
Puglisi, G., 2007. Ground deformation modeling of flank dynamics prior
to the 2002 eruption of Mt. Etna, Bull. Volcanol., doi: 10.1007/s00445-
006-0106-1.
Borgia, A., Ferrari, L. & Pasquare, G., 1992. Importance of gravitational
spreading in the tectonic and volcanic evolution of Mount Etna, Nature,357, 231–235.
Branca, S. & Del Carlo, P., 2003. Eruptions of Mt. Etna during the past
3,200 years: a revised compilation integrating the historical and strati-
graphic records, in Etna Volcano Laboratory, pp. 1–27, eds Calvari, S.,
Bonaccorso, A., Coltelli, M., Del Negro, C. & Falsaperla, S., Geophys.
Monogr. Ser, AGU (Geophysical monograph series).
Branca, S., Carbone, D. & Greco, F., 2003. Intrusive mechanism of the 2002
NE-Rift eruption at Mt. Etna (Italy) inferred through continuous micro-
gravity data and volcanological evidences, Geophys. Res. Lett., 30(20),
2077, doi:10.1029/2003GL018250.
Budetta, G. & Carbone, D., 1997. Potential application of the Scintrex CG-
3M gravimeter for monitoring volcanic activity: results of field trials on
Mt. Etna, Sicily, J. Volc. Geotherm. Res., 66, 199–214.
Budetta, G. & Carbone, D., 1998. Temporal variations in gravity at Mt Etna
(Italy) associated with the 1989 and 1991 eruptions, Bull. Volcanol., 59,311–326.
Carbone, D., 2001. Gravity monitoring of Mount Etna (Italy) through discrete
and continuous measurements, PhD thesis, The Open University, Milton
Keynes, UK.
C© 2007 The Authors, GJI, 169, 339–347
Journal compilation C© 2007 RAS

Intrusive mechanism of the 2002 NE-rift eruption 347
Carbone, D., Budetta, G. & Greco, F., 2003. Possible mechanisms of magma
redistribution under Mt Etna during the 1994–1999 period detected
through microgravity measurements, Geophys. J. Int., 153, 187–200.
Del Negro, C., Currenti, G., Napoli, R. & Vicari, A., 2004. Volcano-
magnetic changes accompanying the onset of the 2002–2003 erup-
tion of Mt. Etna (Italy), Earth planet. Sci. Lett., 229(1-2), 1–14,
doi:10.1016/j.epsl.2004.10.033.
Froger, J.L., Merle, O. & Briole, P., 2001. Active spreading and regional
extension at Mount Etna imaged by SAR interferometry, Earth planet.Sci. Lett., 187, 245–258.
Gambino, S., Mostaccio, A., Patane, D., Scarfı, L. & Ursino, A.,
2004. High-precision locations of the microseismicity preceding the
2002–2003 Mt. Etna eruption, Geophys. Res. Lett., 31, L18604,
doi:10.1029/2004GL020499.
Goulden, C.H., 1956. Methods of Statistical Analysis, 2nd ed., Wiley, New
York, p. 443.
Kieffer, G., 1975. Sur l’existence d’une “Rift zone” a L’Etna, C.R. Acad.Sci. Paris D. 280, 236–266.
Lanzafame, G., Neri, M., Acocella, V., Billi, A., Funiciello, R. & Giordano,
G., 2003. Structural features of the July-August 2001 Mount Etna erup-
tion: evidence for a complex magma supply system, J. Geol. Soc. Lond.,160, 531–544.
Lo Giudice, E. & Rasa, R., 1992. Very shallow earthquakes and brittle defor-
mation in active volcanic areas: the Etnean region as an example, Tectono-physics, 202, 257–268.
Longman, I.M., 1959. Formulas for computing the tidal accelerations due to
the Moon and the Sun, J. geophys. Res., 64(12), 2351–2355.
Neri, M., Acocella, V. & Behncke, B., 2003. The role of the Pernicana
Fault System in the spreading of Mt. Etna (Italy) during the 2002–2003
eruption, Bull. Volcanol., 66, doi:10.1007/s00445-003-0322-x.
Okada, Y., 1985. Surface deformation due to shear and tensile fault in half-
space, Bull. seism. Soc. Am., 75, 1135–1154.
Palano, M., 2003. InSar techniques in structural geology: some applica-
tion to Mt. Etna volcano, PhD thesis, Universita degli Studi di Catania,
Italy.
Palano, M. et al., 2007. Kinematics and strain analyses of the eastern segment
of the Pernicana fault (Mt. Etna, Italy) derived from geodetic techniques
(1997–2005), Ann. Geophys., in press.
Puglisi, G. & Bonforte, A., 2004. Dynamics of Mt Etna volcano inferred
from static and kinematic GPS measurements, J. geophys. Res., 109(B11),
B11404, doi:10.1029/2003JB002878.
Puglisi, G., Bonforte, A., & Maugeri, S.R., 2001. Ground deformation pat-
terns on Mt. Etna, between 1992 and 1994, inferred from GPS data, Bull.Volcanol., 62, 371–384.
Romano, R. & Sturiale, C., 1982. The historical eruptions of Mt. Etna (Vol-
canological data), Mem. Soc. Geol. It., 23, 75–97.
Rymer, H., 1989. A contribution to precision microgravity data analy-
sis using LaCoste and Romberg gravity meters, Geophys. J., 97, 311–
322.
Rymer, H., Murray, J.B., Brown, G.C., Ferrucci, F. & McGuire J., 1993.
Mechanisms of magma eruption and emplacement at Mt Etna between
1989 and 1992, Nature, 361, 439–441.
Sanderson, T.J.O., Berrino, G., Corrado, G. & Grimaldi, M., 1983. Ground
deformation and gravity changes accompanying the March 1981 eruption
of Mount Etna, J. Volc. Geotherm. Res., 16, 299–315.
Scintrex Limited Autograv, 1992. Operator manual version 4.4.
Tibaldi, A. & Groppelli, G., 2002. Volcano-tectonic activity along structures
of the unstable NE flank of Mt. Etna (Italy) and their possible origin,
J. Volc. Geotherm. Res., 115, 277–302.
Torge, W., 1989. Gravimetry, de Gruyter, Berlin.
C© 2007 The Authors, GJI, 169, 339–347
Journal compilation C© 2007 RAS