intra/inter-ply shear behaviors of continuous fiber reinforced thermoplastic composites in...
TRANSCRIPT
Composite Structures 93 (2011) 1692–1703
Contents lists available at ScienceDirect
Composite Structures
journal homepage: www.elsevier .com/locate /compstruct
Intra/inter-ply shear behaviors of continuous fiber reinforced thermoplasticcomposites in thermoforming processes
Qianqian Chen a, Philippe Boisse b, Chung Hae Park a,⇑, Abdelghani Saouab a, Joël Bréard a
a Laboratoire d’Ondes et Milieux Complexes, FRE 3102 CNRS, University of Le Havre, 53 rue Prony, F76600 Le Havre, Franceb Laboratoire de Mécanique des Contacts et des Structures, UMR 5159 CNRS, INSA Lyon, 18-20 rue des Sciences, F69621 Villeurbanne, France
a r t i c l e i n f o
Article history:Available online 14 January 2011
Keywords:Continuous fiber reinforced thermoplasticcompositesThermoforming processIn-plane shearInter-ply slipCohesive element
0263-8223/$ - see front matter � 2011 Elsevier Ltd Adoi:10.1016/j.compstruct.2011.01.002
⇑ Corresponding author.E-mail address: [email protected] (C
a b s t r a c t
The thermoforming of continuous fiber reinforced thermoplastic (CFRTP) composite panels generallyinvolves significant in-plane shear deformation. In the present work, the in-plane shear behavior ofwoven thermoplastic composites (Carbon/Polyphenylene Sulfide) over a range of processing tempera-tures is studied by bias-test experiments at different velocities. The experimental data of force versusdisplacement and force versus shear strain are presented for different extension velocities and tempera-tures. A thermo-visco-elastic model for numerical simulations of woven thermoplastic composite form-ing is proposed considering the influences of temperature and of strain rate. We applied a largedisplacement three-dimensional cohesive element with eight nodes which has been used for crack anal-ysis in fracture mechanics by other authors, to investigate the inter-ply shear mechanism of woven ther-moplastic composites. Applying three-dimensional cohesive elements, multi-plies forming simulationsare performed to show inter-ply slip behaviors at different temperatures. The proposed models can beuseful to predict from the properties of reinforcement and resin the intra/inter-ply shear behaviors ofwoven thermoplastic composites at high temperatures if experimental characterization of compositelaminate behaviors is difficult to conduct.
� 2011 Elsevier Ltd All rights reserved.
1. Introduction
Continuous fiber reinforced thermoplastic (CFRTP) compositesare becoming popular in industrial applications owing to theiradvantages such as high performances, short processing cycle, easein stocking, possibility of repairing and welding. Accordingly, thedevelopment of numerical method for forming process simulationsbecomes more and more important [1–4]. A CFRTP forming processis normally conducted at a processing temperature which is overthe melting temperature of thermoplastic resin. In this case, the re-sin can be considered as liquid, of which the influence to the tensilestiffness seems to be very weak. Thus, the resin behavior can be ig-nored when the tensile mechanism is considered during the form-ing process. The in-plane shear stiffness of CFRTP, however, hasbeen recognized as a dominant factor of wrinkle formation inzones where the three-dimensional deformation of CFRTP is re-quired, such as at corners or over spherical regions. It is not onlyaffected by the relative movement of weft and warp of textile rein-forcement during deformation but also by the resin behavior [5–8].Hence, the resin behavior should be taken into account if thein-plane shear mechanism of CFRTP is considered. Rogers proposed
ll rights reserved.
.H. Park).
firstly theoretical models for the forming of composite materialswith one or two fiber orientations [9]. The fibers were supposedto be inextensible. With an assumption of material incompressibil-ity, a suitable anisotropic constitutive relationship was proposed.Rogers noted that the existing theoretical work on linear elasticmaterials could be applied to linear visco-elastic and viscous mate-rials by invoking the visco-elastic correspondence principle. Basedon those studies, McGuiness et al. proposed a model integrating apower law considering the non-linearity of viscosity at the formingtemperature [10]. Those models can easily be integrated in stan-dard finite element (FE) computation with shell or membrane ele-ments. As the textile material is composed of warp and weft yarns,however, the representative elementary volume cannot be consid-ered to be continuous. Thus, the stress obtained by those models isnot well defined.
The accuracy of numerical simulations depends strongly on themeasurements of material properties [11–15]. Among the charac-terization methods of the in-plane shear behavior of woven CFRTP,the bias extension test and the picture frame test are commonlyused. Since the picture frame test lacks of reproducibility due toan inherent difficulty to properly align the fibers with the frame[16–18], we use the bias extension test method for the shearbehavior characterization in this work. Laminate specimens aretested at high temperature above the melting temperature of thethermoplastic resin where material forming is done.
Q. Chen et al. / Composite Structures 93 (2011) 1692–1703 1693
Recently, a cohesive element method has emerged as one of themost popular techniques for computational fracture mechanics[19–25]. This kind of element can be easily implanted into a finiteelement code, and it is usually used to simulate crack initiation,propagation and eventual branching and coalescence in a singlecomputational framework. In this present work, we use a large dis-placement three-dimensional cohesive element to investigate theinterface mechanism of woven CFRTP, since the inter-ply mecha-nism at the interface between adjacent plies is very importantwhen CFRTP panels composed of several plies are manufactured.This cohesive element is composed of two superimposed elementswith a combination of original and imaginary nodes. A model is im-planted into this element considering the temperature, the normalpressure, and the relative displacements at those nodes. The cohe-sive element model has a couple of advantages over the conven-tional contact calculation which has been used by other authorsto describe the interface mechanism in composite forming. Wecan consider the cohesive force existed between the adjacent plies.In terms of numerical efficiency, moreover, computational effortcan be reduced since iterative computations required by the con-ventional contact calculation are not needed.
In the present work, we investigate both the intra-ply and inter-ply shear behaviors of woven thermoplastic composites. We con-duct modeling and simulation to characterize the shear behaviorsof the composite materials at high temperatures over the resinmelting point, using the properties of the constituents which arethe resin and the fiber reinforcement. A thermo-visco-elastic mod-el is proposed and validated by the comparison with the biasextension test results at the processing temperatures of resin. Acohesive element is employed to consider the inter-ply slip at hightemperatures and simulation results are compared with the exper-imental results in the literature.
2. Characterization of intra-ply shear behavior
2.1. Material and experimental set-up
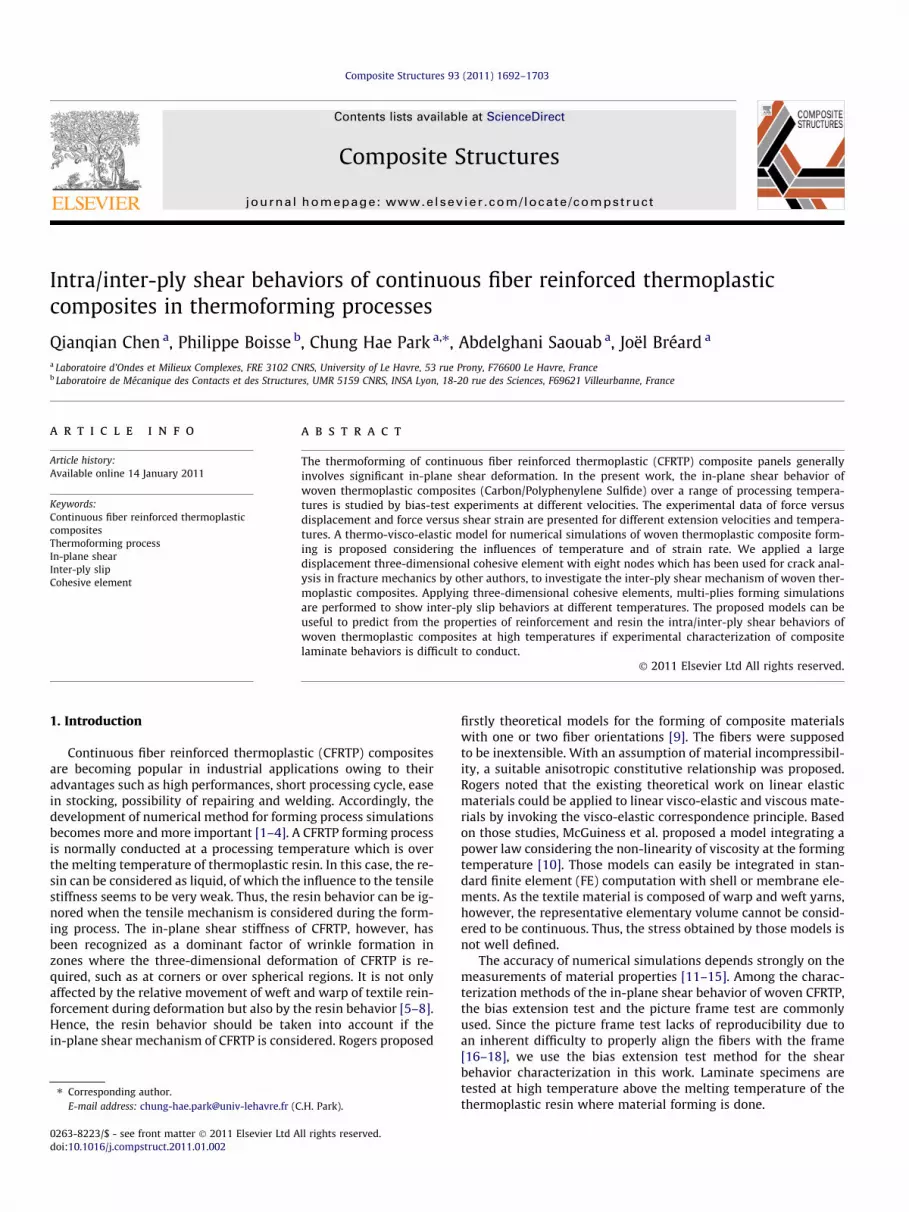
A bias extension test apparatus was designed to produce ahomogenous in-plane shear flow in a flat laminate of CFRTPcomposite. A schematic of the apparatus loaded in a tensile test
(a) Schematic of bias test
Sensor of displacement
Chamber for heating
(b)cham
δ
Fig. 1. Equipment of b
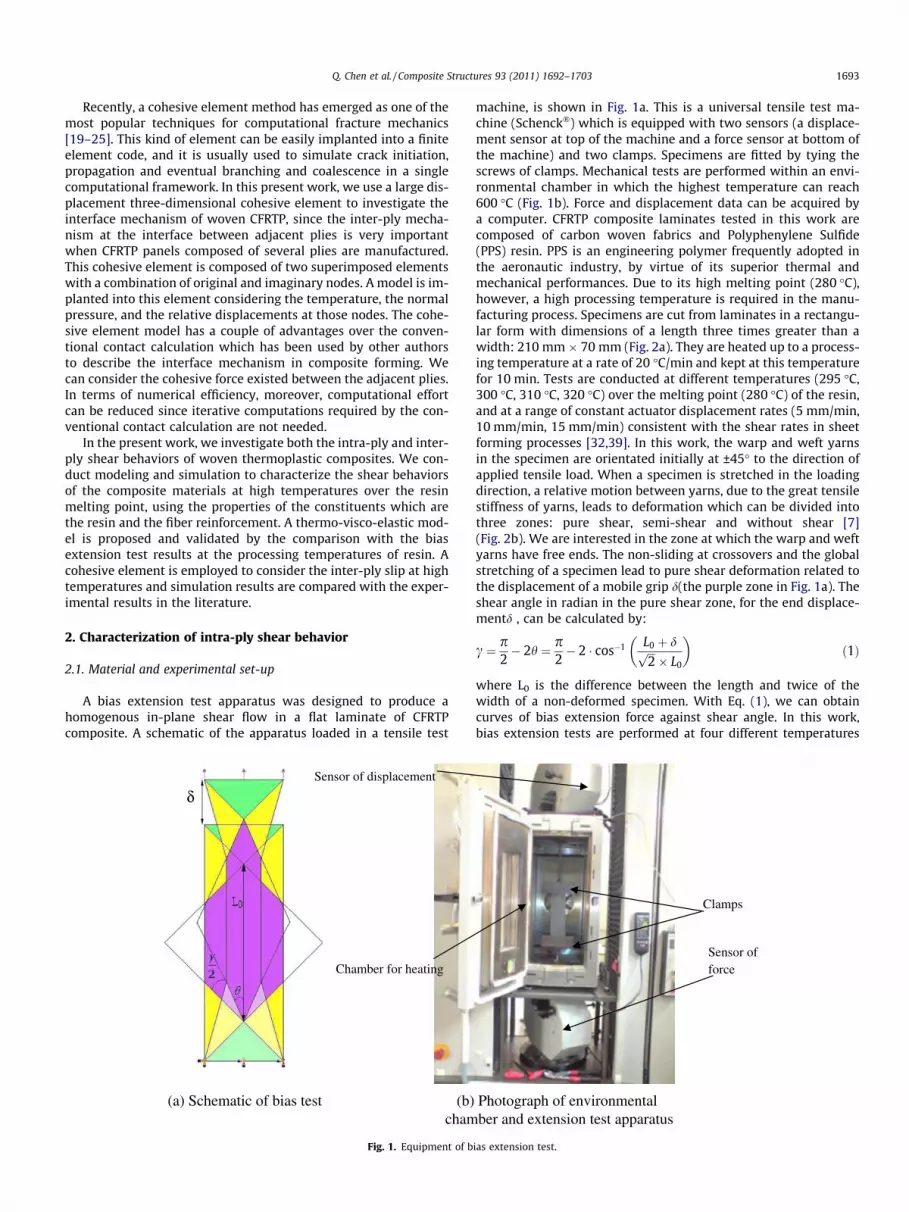
machine, is shown in Fig. 1a. This is a universal tensile test ma-chine (Schenck�) which is equipped with two sensors (a displace-ment sensor at top of the machine and a force sensor at bottom ofthe machine) and two clamps. Specimens are fitted by tying thescrews of clamps. Mechanical tests are performed within an envi-ronmental chamber in which the highest temperature can reach600 �C (Fig. 1b). Force and displacement data can be acquired bya computer. CFRTP composite laminates tested in this work arecomposed of carbon woven fabrics and Polyphenylene Sulfide(PPS) resin. PPS is an engineering polymer frequently adopted inthe aeronautic industry, by virtue of its superior thermal andmechanical performances. Due to its high melting point (280 �C),however, a high processing temperature is required in the manu-facturing process. Specimens are cut from laminates in a rectangu-lar form with dimensions of a length three times greater than awidth: 210 mm � 70 mm (Fig. 2a). They are heated up to a process-ing temperature at a rate of 20 �C/min and kept at this temperaturefor 10 min. Tests are conducted at different temperatures (295 �C,300 �C, 310 �C, 320 �C) over the melting point (280 �C) of the resin,and at a range of constant actuator displacement rates (5 mm/min,10 mm/min, 15 mm/min) consistent with the shear rates in sheetforming processes [32,39]. In this work, the warp and weft yarnsin the specimen are orientated initially at ±45� to the direction ofapplied tensile load. When a specimen is stretched in the loadingdirection, a relative motion between yarns, due to the great tensilestiffness of yarns, leads to deformation which can be divided intothree zones: pure shear, semi-shear and without shear [7](Fig. 2b). We are interested in the zone at which the warp and weftyarns have free ends. The non-sliding at crossovers and the globalstretching of a specimen lead to pure shear deformation related tothe displacement of a mobile grip d(the purple zone in Fig. 1a). Theshear angle in radian in the pure shear zone, for the end displace-mentd , can be calculated by:
c ¼ p2� 2h ¼ p
2� 2 � cos�1 L0 þ dffiffiffi
2p� L0
� �ð1Þ
where L0 is the difference between the length and twice of thewidth of a non-deformed specimen. With Eq. (1), we can obtaincurves of bias extension force against shear angle. In this work,bias extension tests are performed at four different temperatures
Sensor of force
Clamps
Photograph of environmentalber and extension test apparatus
ias extension test.
(a) Specimen before deformation
(b) Specimen after deformation
Pure shear zone
Without shear zone
Semi-shear zone
Fig. 2. Specimen of bias extension test.
0
10
20
30
40
50
60
70
80
90
0 10 20 30 40 50 60 70 80
Shear Angle (°)
Laminate 300°CLaminate 310°CTextile
0
20
40
60
80
100
120
140
0 10 20 30 40 50 60 70 80Shear Angle (°)
Laminate 295°CLaminate 300°CLaminate 310°CLaminate 320°CTextile
Forc
e (N
) Fo
rce
(N)
(a) Tensile speed: 5mm/min
(b) Tensile speed: 15mm/min
Fig. 3. Experimental measurements of tensile force against angle between warp and weft in bias extension test.
1694 Q. Chen et al. / Composite Structures 93 (2011) 1692–1703
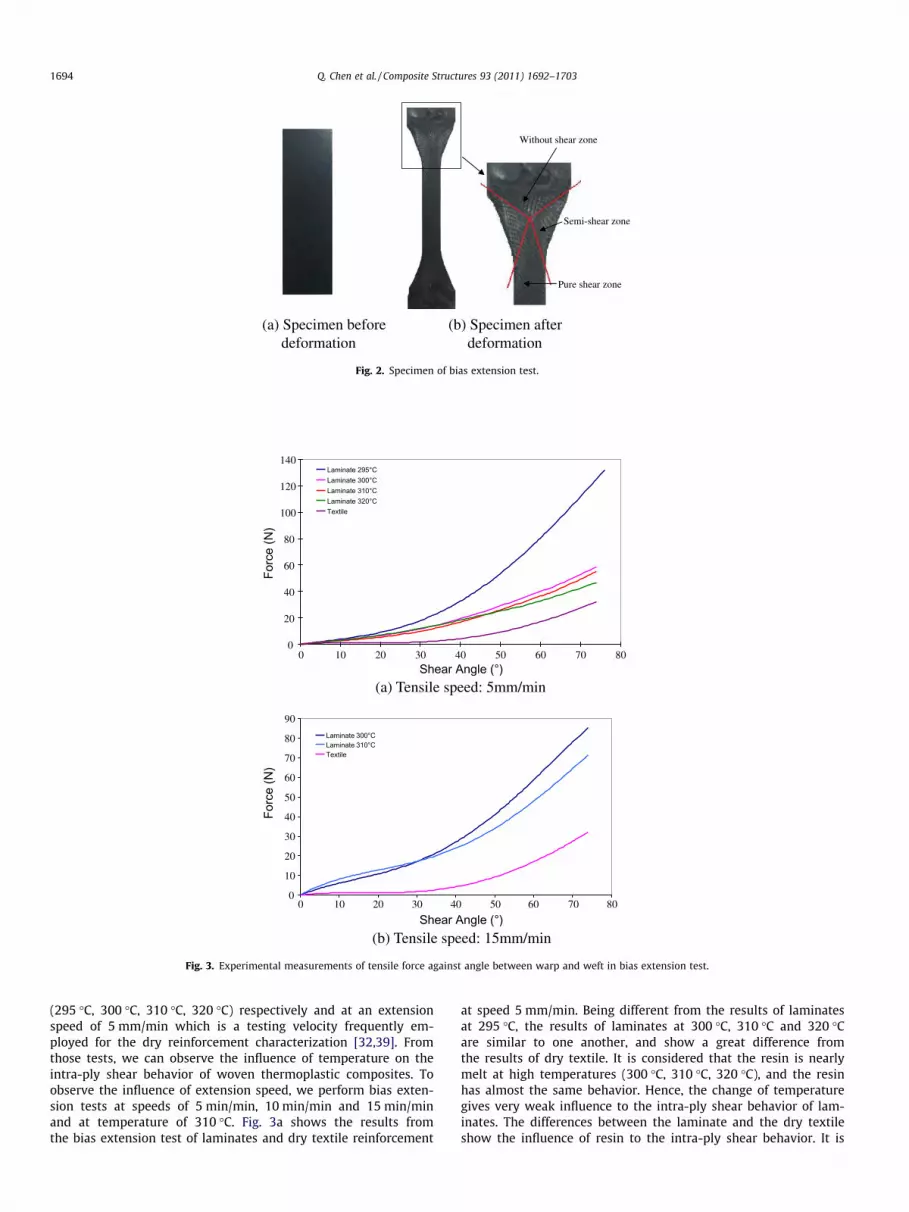
(295 �C, 300 �C, 310 �C, 320 �C) respectively and at an extensionspeed of 5 mm/min which is a testing velocity frequently em-ployed for the dry reinforcement characterization [32,39]. Fromthose tests, we can observe the influence of temperature on theintra-ply shear behavior of woven thermoplastic composites. Toobserve the influence of extension speed, we perform bias exten-sion tests at speeds of 5 min/min, 10 min/min and 15 min/minand at temperature of 310 �C. Fig. 3a shows the results fromthe bias extension test of laminates and dry textile reinforcement
at speed 5 mm/min. Being different from the results of laminatesat 295 �C, the results of laminates at 300 �C, 310 �C and 320 �Care similar to one another, and show a great difference fromthe results of dry textile. It is considered that the resin is nearlymelt at high temperatures (300 �C, 310 �C, 320 �C), and the resinhas almost the same behavior. Hence, the change of temperaturegives very weak influence to the intra-ply shear behavior of lam-inates. The differences between the laminate and the dry textileshow the influence of resin to the intra-ply shear behavior. It is

21
3 4η
ς-1 1
1
-1
ζ
η
ξ
Fig. 4. Schematic of solid-shell element.
Q. Chen et al. / Composite Structures 93 (2011) 1692–1703 1695
noteworthy that the force at 295 �C is much greater than theother ones. At this temperature, the resin viscosity increasesgreatly, and, subsequently, the shear stiffness of laminates is alsoincreased.
Fig. 3b shows the results from bias extension test at speed15 mm/min. We can see that the forces at 300 �C and 310 �C aremuch greater than the textile case. They are similar until the shearangle of 30�, which can be considered as the locking angle of thereinforcement. Above this angle, the results become different. Oncethe locking angle is reached, the lubrication effect of resin becomesmore important to the composite shear mechanism, even greaterat high temperature case, which leads to different experimental re-sults above 30�. It should be noted that the results at 5 mm/minand 15 mm/min are different at the same temperature (at thebeginning of test, the slope at high speed case is greater than thatat low speed case). This phenomenon shows the influence of strainrate to the resin. A higher strain rate decreases the viscosity of re-sin [38]. At the beginning of test, however, the strain rate makesgreater influence on the stress which can be computed by theproduct of the viscosity and the strain rate. Eventually, this leadsto a greater slope at high speed (high stain rate) case. We cansee that the material behavior of CFRTP is affected by the strainrate at high temperatures.
2.2. Modeling of single ply CFRTP forming using solid-shell element
For the finite element analysis of CFRTP forming, a solid-shellelement is employed [26–31]. This kind of element has only trans-lational but no rotational nodal degree of freedom. The solid-shellelement is composed of top and bottom elementary surfaces andmid-surface between these two elementary surfaces. The nodaldegree of freedom is the translation at the nodes at top and bottomsurfaces or the mid-surface translation plus the relative translationbetween the nodes at top and bottom surfaces. A schematic of so-lid-shell element is shown in Fig. 4.
The interpolated undeformed position vector X and the dis-placement vector U can be written by:
Xð1;g; nÞ ¼ Xoð1;gÞ þ zXnð1;gÞ ¼X4
i¼1
Nið1;gÞXoi þ zX4
i¼1
Nið1;gÞXni
ð2Þ
Uð1;g; nÞ ¼ Uoð1;gÞ þ zUnð1;gÞ
¼X4
i¼1
Nið1;gÞðUoi þ zUniÞ
¼ N zN½ �fug ¼ Nofug þ zNnfugð3Þ
where Xo and Uo are the mid-surface positions and displacements,Xn and Un are the translations and the relative displacements be-tween the two nodes at top and bottom surfaces. 1, g, n are the localcoordinates in an element, and z ¼ h
2 n. N is the shape function thatcan be written as:
fNg ¼
N1ð1;gÞN2ð1;gÞN3ð1;gÞN4ð1;gÞ
8>>><>>>:
9>>>=>>>;¼ 1
4
1111
8>>><>>>:
9>>>=>>>;þ 1
�111�1
8>>><>>>:
9>>>=>>>;þ g
�1�111
8>>><>>>:
9>>>=>>>;þ 1g
1�11�1
8>>><>>>:
9>>>=>>>;
0BBB@
1CCCA
ð4Þ
@N@1
� �¼ 1
4�1 1 1 �1h i þ 1
4g 1 �1 1 �1h i ð5Þ
@N@g
� �¼ 1
4�1 �1 1 1h i þ 1
41 1 �1 1 �1h i ð6Þ
No ¼ N1I N2I N3I N4I 0 0 0 0½ � ð7Þ
Nn ¼ 0 0 0 0 N1I N2I N3I N4I½ � ð8Þ
where I is the identity matrix.A majority of codes for material forming simulations are based
on an explicit dynamic approach to consider time-dependent evo-lution although the forming process has often been considered as aquasi-static case [34]. We also use an explicit dynamic approach inthe current work. The dynamic equation in a set of degree of free-dom can be written as:
M€uþ Fint ¼ Fext ð9Þ
where u is the displacement vector, M is the mass matrix, Fint is theinternal force vector and Fext is the applied load vector. The explicitdynamics analysis procedure is based on the implementation of anexplicit integration rule with the use of diagonal (‘‘lumped’’) ele-ment mass matrix. The equations of body motion are integratedusing an explicit central-difference scheme:
_uNiþ1=2 ¼ _uN
i�1=2 þDtiþ1 þ Dti
2€uN
i ð10Þ
uNiþ1 ¼ uN
i þ Dtiþ1 _uNiþ1=2 ð11Þ
where the superscript N is the node number and the subscript i isthe increment number in an explicit dynamics step. The accelera-tions at the beginning of the increment are computed by [37]:
€ui ¼M�1 Fexti � Fint
i
� �ð12Þ
To resolve Eq. (12), we should calculate the internal force vectorwhich can be obtained from the deformation energy Gint:
Fint ¼ @Gint
@uð13Þ
In the case of CFRTP, we can consider that the textile reinforcementhas the same strain as the resin but different stress. It is assumedthat the textile reinforcement is an elastic material and the temper-ature has weak influences on the material behavior. Since the form-ing process of woven thermoplastic composites is normallyperformed at a processing temperature which is over the resin’s
Textile reinforcement
Resin
Fig. 5. Schematic of visco-elastic model for laminates.
1696 Q. Chen et al. / Composite Structures 93 (2011) 1692–1703
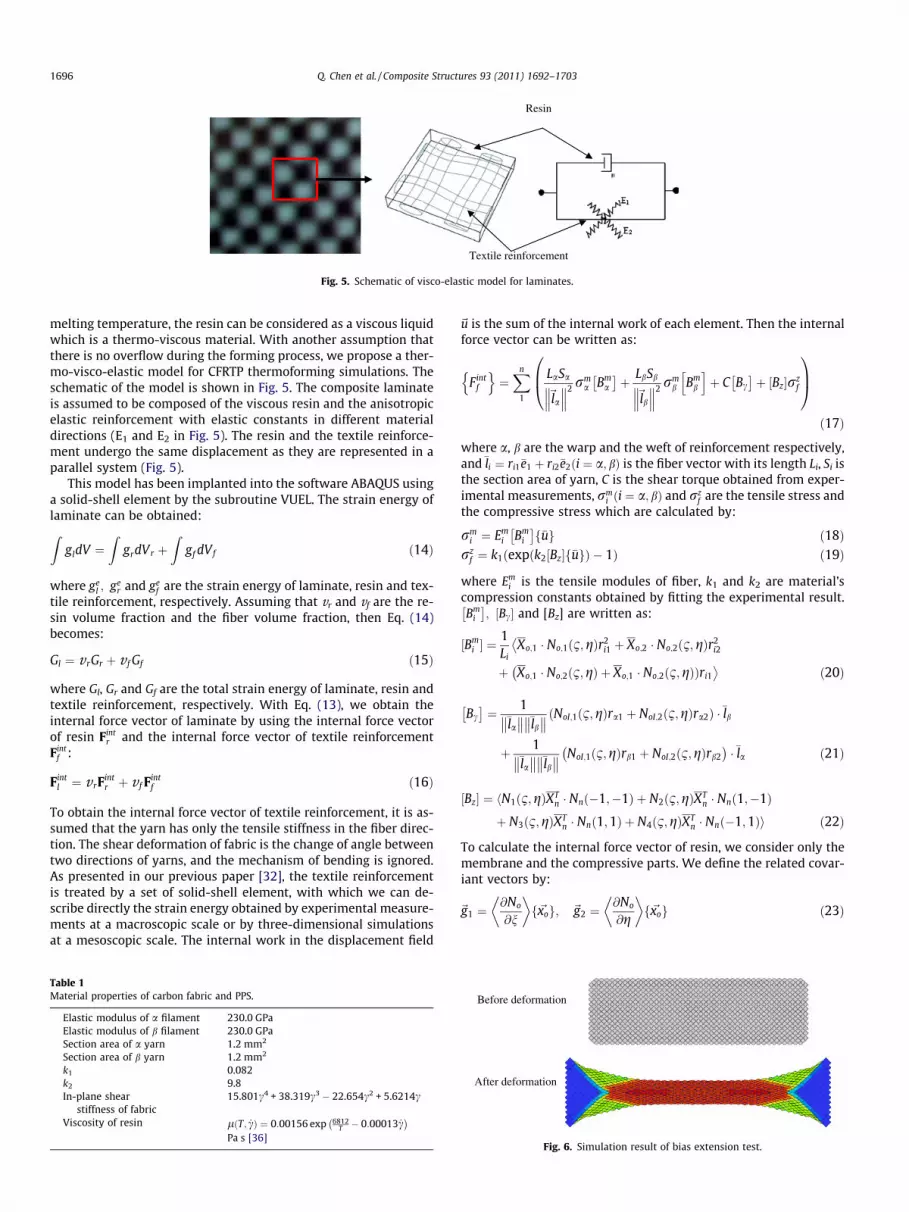
melting temperature, the resin can be considered as a viscous liquidwhich is a thermo-viscous material. With another assumption thatthere is no overflow during the forming process, we propose a ther-mo-visco-elastic model for CFRTP thermoforming simulations. Theschematic of the model is shown in Fig. 5. The composite laminateis assumed to be composed of the viscous resin and the anisotropicelastic reinforcement with elastic constants in different materialdirections (E1 and E2 in Fig. 5). The resin and the textile reinforce-ment undergo the same displacement as they are represented in aparallel system (Fig. 5).
This model has been implanted into the software ABAQUS usinga solid-shell element by the subroutine VUEL. The strain energy oflaminate can be obtained:Z
gldV ¼Z
grdVr þZ
gf dVf ð14Þ
where gel ; ge
r and gef are the strain energy of laminate, resin and tex-
tile reinforcement, respectively. Assuming that vr and vf are the re-sin volume fraction and the fiber volume fraction, then Eq. (14)becomes:
Gl ¼ v rGr þ v f Gf ð15Þ
where Gl, Gr and Gf are the total strain energy of laminate, resin andtextile reinforcement, respectively. With Eq. (13), we obtain theinternal force vector of laminate by using the internal force vectorof resin Fint
r and the internal force vector of textile reinforcementFint
f :
Fintl ¼ v rF
intr þ v f Fint
f ð16Þ
To obtain the internal force vector of textile reinforcement, it is as-sumed that the yarn has only the tensile stiffness in the fiber direc-tion. The shear deformation of fabric is the change of angle betweentwo directions of yarns, and the mechanism of bending is ignored.As presented in our previous paper [32], the textile reinforcementis treated by a set of solid-shell element, with which we can de-scribe directly the strain energy obtained by experimental measure-ments at a macroscopic scale or by three-dimensional simulationsat a mesoscopic scale. The internal work in the displacement field
Table 1Material properties of carbon fabric and PPS.
Elastic modulus of a filament 230.0 GPaElastic modulus of b filament 230.0 GPaSection area of a yarn 1.2 mm2
Section area of b yarn 1.2 mm2
k1 0.082k2 9.8In-plane shear
stiffness of fabric15.801c4 + 38.319c3 � 22.654c2 + 5.6214c
Viscosity of resin l T; _cð Þ ¼ 0:00156 exp 6812T � 0:00013 _c
�Pa s [36]
~u is the sum of the internal work of each element. Then the internalforce vector can be written as:
Fintf
n o¼Xn
1
LaSa
~la 2 rm
a Bma
�þ LbSb
~lb 2 rm
b Bmb
h iþ C Bc
�þ Bz½ �rz
f
0B@
1CA
ð17Þ
where a, b are the warp and the weft of reinforcement respectively,and�li ¼ ri1�e1 þ ri2�e2ði ¼ a;bÞ is the fiber vector with its length Li, Si isthe section area of yarn, C is the shear torque obtained from exper-imental measurements, rm
i ði ¼ a;bÞ and rzf are the tensile stress and
the compressive stress which are calculated by:
rmi ¼ Em
i Bmi
��uf g ð18Þ
rzf ¼ k1 expðk2½Bz� �uf gÞ � 1ð Þ ð19Þ
where Emi is the tensile modules of fiber, k1 and k2 are material’s
compression constants obtained by fitting the experimental result.Bm
i
�; ½Bc� and [Bz] are written as:
½Bmi � ¼
1Li
Xo;1 � No;1 1;gð Þr2i1 þ Xo;2 � No;2 1;gð Þr2
i2
�þ Xo;1 � No;2 1;gð Þ þ Xo;1 � No;2 1;gð ÞÞri1 �
ð20Þ
Bc �
¼ 1�la �lb
NoI;1 1;gð Þra1 þ NoI;2 1;gð Þra2ð Þ ��lb
þ 1�la �lb
NoI;1 1;gð Þrb1 þ NoI;2 1;gð Þrb2 �
��la ð21Þ
½Bz� ¼ N1h 1;gð ÞXTn � Nnð�1;�1Þ þ N2ð1;gÞXT
n � Nnð1;�1Þþ N3ð1;gÞXT
n � Nnð1;1Þ þ N4ð1;gÞXTn � Nnð�1;1Þi ð22Þ
To calculate the internal force vector of resin, we consider only themembrane and the compressive parts. We define the related covar-iant vectors by:
~g1 ¼@No
@n
� �~xof g; ~g2 ¼
@No
@g
� �~xof g ð23Þ
Before deformation
After deformation
Fig. 6. Simulation result of bias extension test.
0
40
80
120
160
200
Displacement (mm)
Forc
e (N
)
Experiment 1Experiment 2Experiment 3Simulation
0
20
40
60
80
100
120
Displacement (mm)
Forc
e (N
)
Experiment 1Experiment 2Experiment 3Simulation
0
10
20
30
40
50
60
70
0 10 20 30 40 50 60 70 80 0 10 20 30 40 50 60 70 80
0 10 20 30 40 50 60 70
Displacement (mm)
Forc
e (N
)
Experiment 1Experiment 2Experiment 3Simulation
(a) Temperature: 295°C (b) Temperature: 300°C
(c) Temperature: 310°C
0
5
10
15
20
25
30
35
40
0 10 20 30 40 50 60 70
Displacement (mm)
Forc
e (N
)
Experiment 1Experiment 2Experiment 3Simulation
(d) Temperature: 320°C
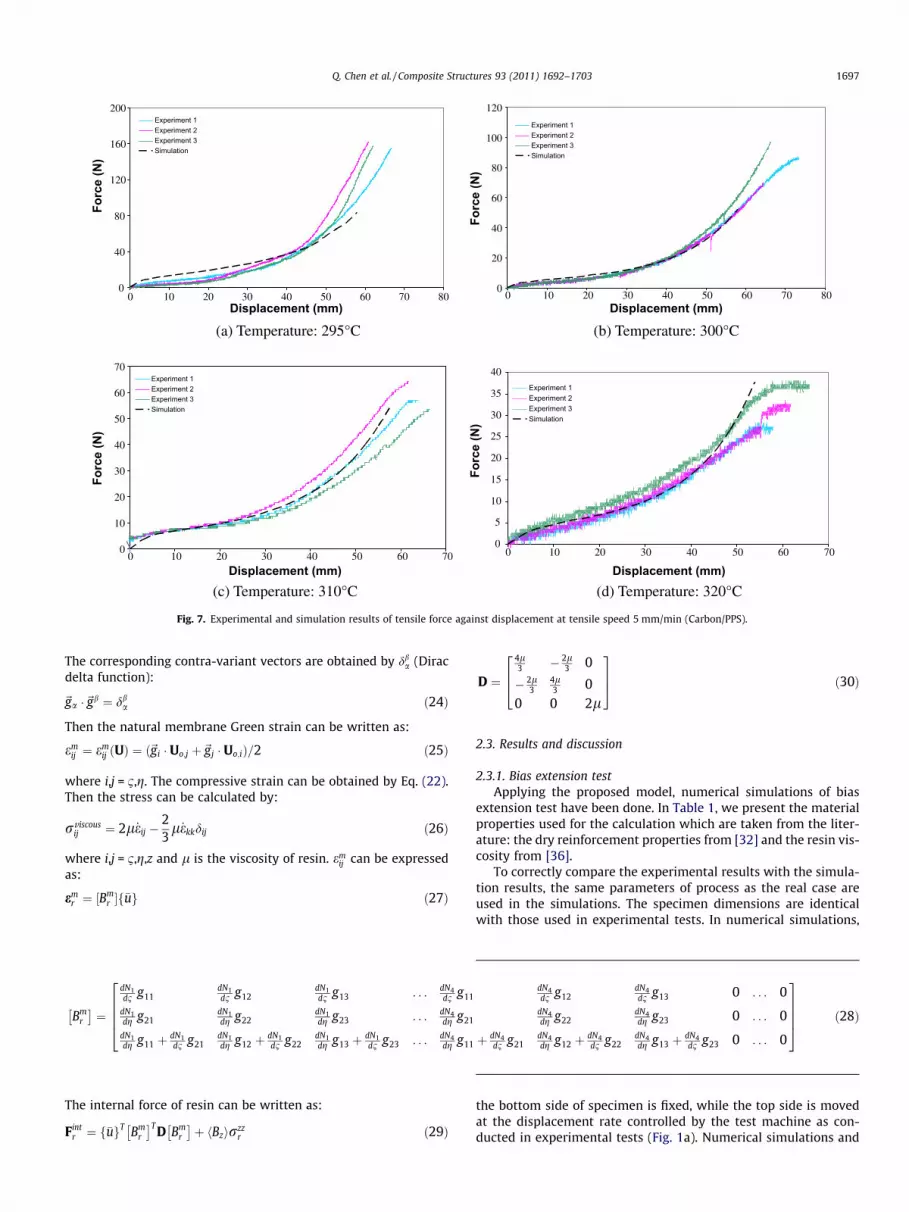
Fig. 7. Experimental and simulation results of tensile force against displacement at tensile speed 5 mm/min (Carbon/PPS).
Q. Chen et al. / Composite Structures 93 (2011) 1692–1703 1697
The corresponding contra-variant vectors are obtained by dba (Dirac
delta function):
~ga �~gb ¼ dba ð24Þ
Then the natural membrane Green strain can be written as:
emij ¼ em
ij ðUÞ ¼ ð~gi � Uo;j þ~gj � Uo;iÞ=2 ð25Þ
where i,j = 1,g. The compressive strain can be obtained by Eq. (22).Then the stress can be calculated by:
rviscousij ¼ 2l _eij �
23l _ekkdij ð26Þ
where i,j = 1,g,z and l is the viscosity of resin. emij can be expressed
as:
emr ¼ ½B
mr � �uf g ð27Þ
Bmr
�¼
dN1d1 g11
dN1d1 g12
dN1d1 g13 . . . dN4
d1 g11dN4d1 g12
dN4d1 g13 0 . . . 0
dN1dg g21
dN1dg g22
dN1dg g23 . . . dN4
dg g21dN4dg g22
dN4dg g23 0 . . . 0
dN1dg g11 þ dN1
d1 g21dN1dg g12 þ dN1
d1 g22dN1dg g13 þ dN1
d1 g23 . . . dN4dg g11 þ dN4
d1 g21dN4dg g12 þ dN4
d1 g22dN4dg g13 þ dN4
d1 g23 0 . . . 0
26664
37775 ð28Þ
The internal force of resin can be written as:
Fintr ¼ f�ug
T Bmr
�T D Bmr
�þ hBzirzz
r ð29Þ
D ¼
4l3 � 2l
3 0
� 2l3
4l3 0
0 0 2l
264
375 ð30Þ
2.3. Results and discussion
2.3.1. Bias extension testApplying the proposed model, numerical simulations of bias
extension test have been done. In Table 1, we present the materialproperties used for the calculation which are taken from the liter-ature: the dry reinforcement properties from [32] and the resin vis-cosity from [36].
To correctly compare the experimental results with the simula-tion results, the same parameters of process as the real case areused in the simulations. The specimen dimensions are identicalwith those used in experimental tests. In numerical simulations,
the bottom side of specimen is fixed, while the top side is movedat the displacement rate controlled by the test machine as con-ducted in experimental tests (Fig. 1a). Numerical simulations and
0
10
20
30
40
50
60
70
80
0 10 20 30 40 50 60 70 80Displacement (mm)
Forc
e (N
)
Experiment 1Experiment 2Experiment 3Simulation
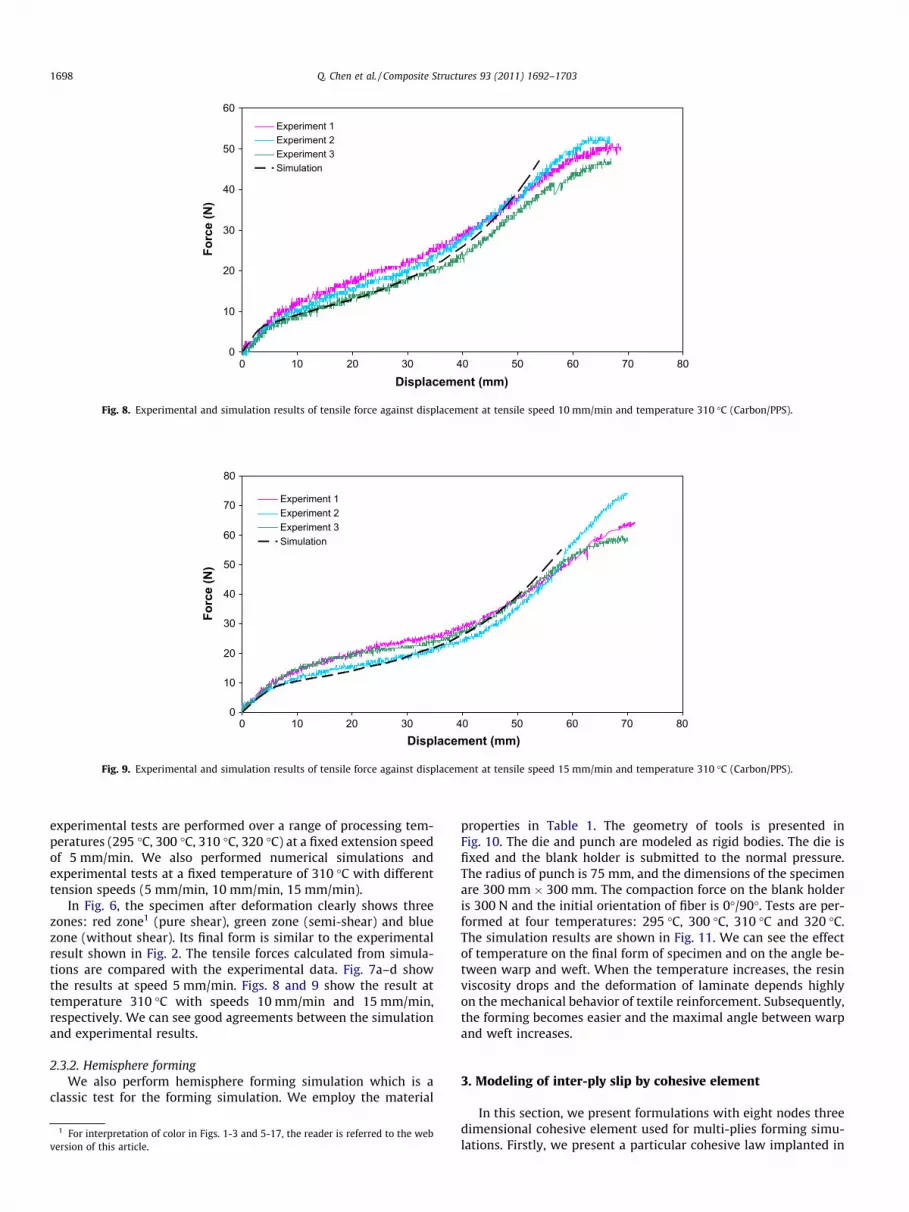
Fig. 9. Experimental and simulation results of tensile force against displacement at tensile speed 15 mm/min and temperature 310 �C (Carbon/PPS).
0
10
20
30
40
50
60
0 10 20 30 40 50 60 70 80
Displacement (mm)
Forc
e (N
)
Experiment 1Experiment 2Experiment 3Simulation
Fig. 8. Experimental and simulation results of tensile force against displacement at tensile speed 10 mm/min and temperature 310 �C (Carbon/PPS).
1698 Q. Chen et al. / Composite Structures 93 (2011) 1692–1703
experimental tests are performed over a range of processing tem-peratures (295 �C, 300 �C, 310 �C, 320 �C) at a fixed extension speedof 5 mm/min. We also performed numerical simulations andexperimental tests at a fixed temperature of 310 �C with differenttension speeds (5 mm/min, 10 mm/min, 15 mm/min).
In Fig. 6, the specimen after deformation clearly shows threezones: red zone1 (pure shear), green zone (semi-shear) and bluezone (without shear). Its final form is similar to the experimentalresult shown in Fig. 2. The tensile forces calculated from simula-tions are compared with the experimental data. Fig. 7a–d showthe results at speed 5 mm/min. Figs. 8 and 9 show the result attemperature 310 �C with speeds 10 mm/min and 15 mm/min,respectively. We can see good agreements between the simulationand experimental results.
2.3.2. Hemisphere formingWe also perform hemisphere forming simulation which is a
classic test for the forming simulation. We employ the material
1 For interpretation of color in Figs. 1-3 and 5-17, the reader is referred to the webversion of this article.
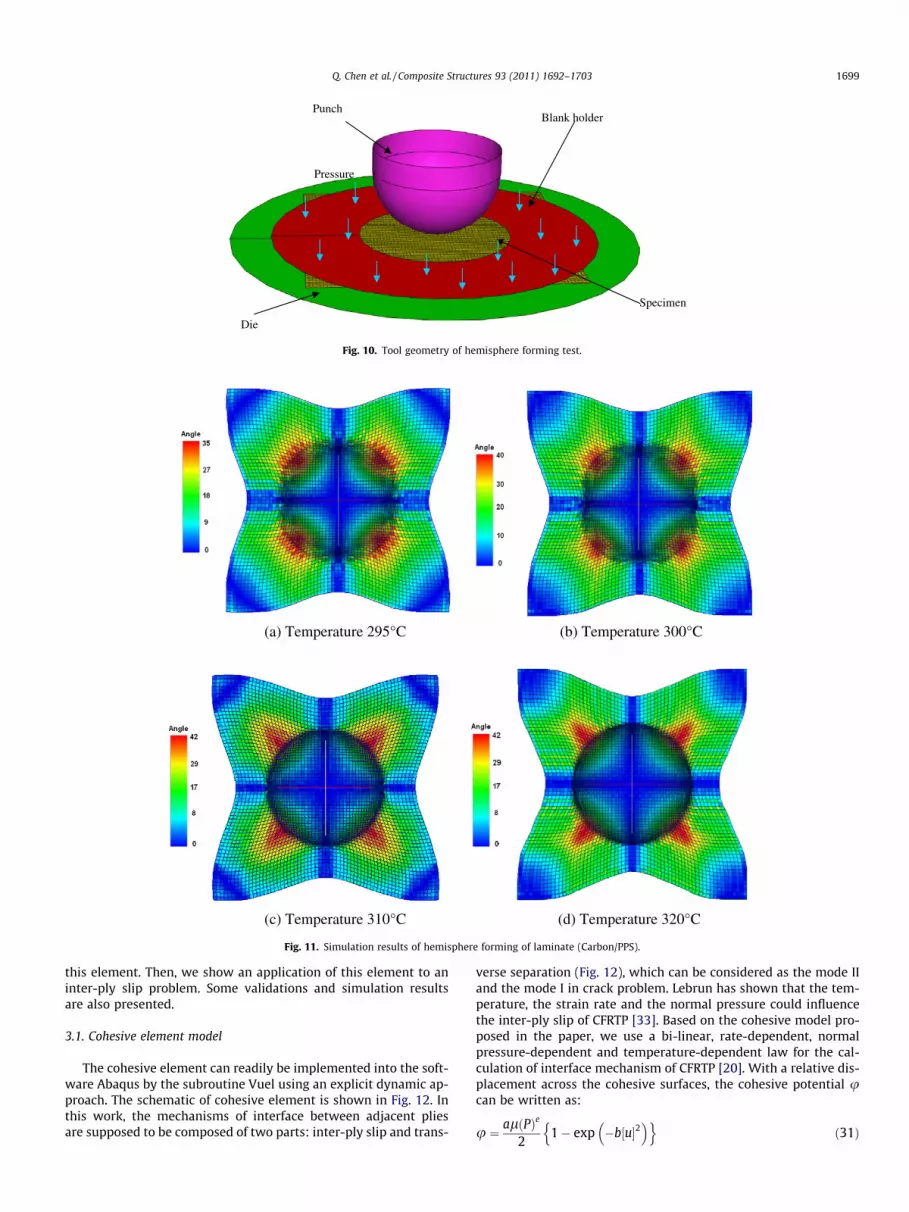
properties in Table 1. The geometry of tools is presented inFig. 10. The die and punch are modeled as rigid bodies. The die isfixed and the blank holder is submitted to the normal pressure.The radius of punch is 75 mm, and the dimensions of the specimenare 300 mm � 300 mm. The compaction force on the blank holderis 300 N and the initial orientation of fiber is 0�/90�. Tests are per-formed at four temperatures: 295 �C, 300 �C, 310 �C and 320 �C.The simulation results are shown in Fig. 11. We can see the effectof temperature on the final form of specimen and on the angle be-tween warp and weft. When the temperature increases, the resinviscosity drops and the deformation of laminate depends highlyon the mechanical behavior of textile reinforcement. Subsequently,the forming becomes easier and the maximal angle between warpand weft increases.
3. Modeling of inter-ply slip by cohesive element
In this section, we present formulations with eight nodes threedimensional cohesive element used for multi-plies forming simu-lations. Firstly, we present a particular cohesive law implanted in
(a) Temperature 295°C (b) Temperature 300°C
(c) Temperature 310°C (d) Temperature 320°C
Fig. 11. Simulation results of hemisphere forming of laminate (Carbon/PPS).
Punch
Die
Specimen
Blank holder
Pressure
Fig. 10. Tool geometry of hemisphere forming test.
Q. Chen et al. / Composite Structures 93 (2011) 1692–1703 1699
this element. Then, we show an application of this element to aninter-ply slip problem. Some validations and simulation resultsare also presented.
3.1. Cohesive element model
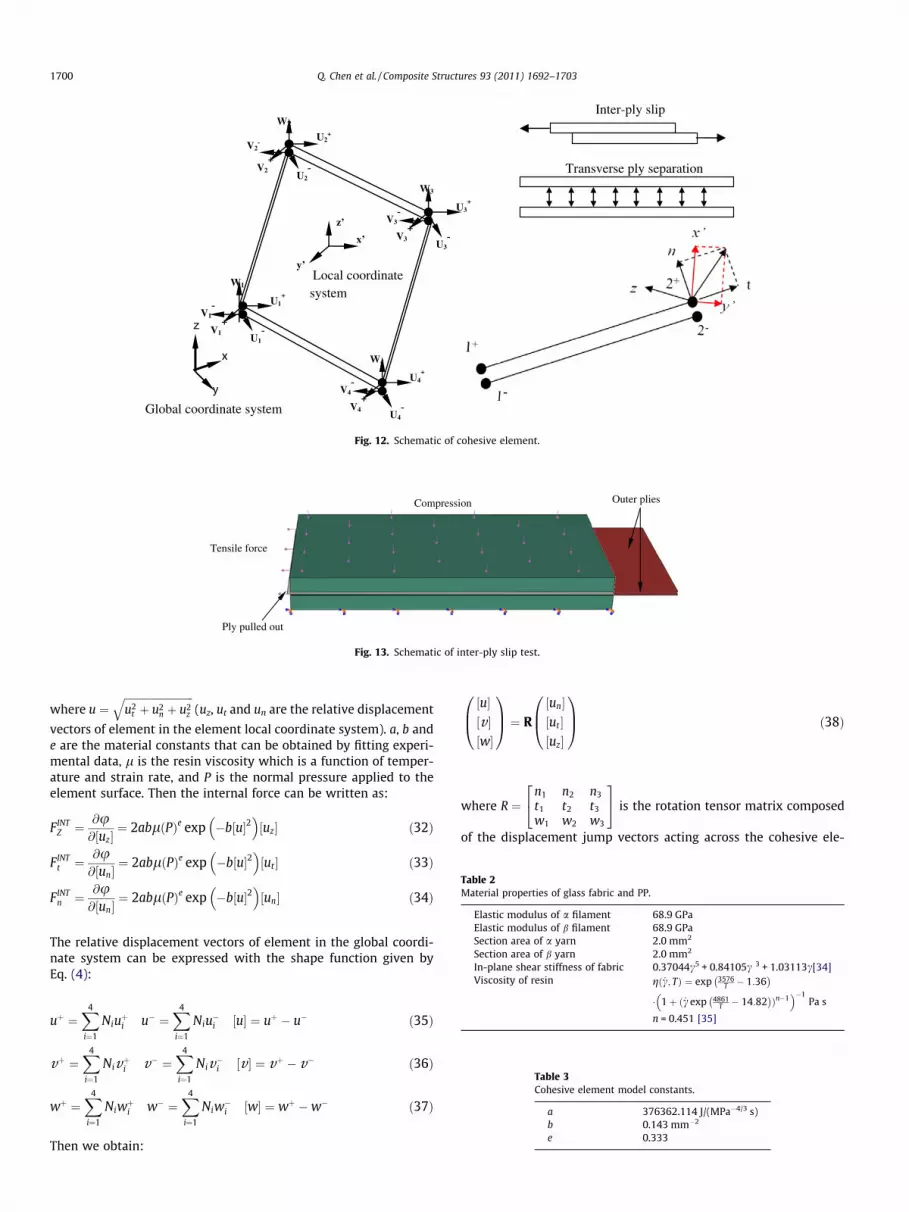
The cohesive element can readily be implemented into the soft-ware Abaqus by the subroutine Vuel using an explicit dynamic ap-proach. The schematic of cohesive element is shown in Fig. 12. Inthis work, the mechanisms of interface between adjacent pliesare supposed to be composed of two parts: inter-ply slip and trans-
verse separation (Fig. 12), which can be considered as the mode IIand the mode I in crack problem. Lebrun has shown that the tem-perature, the strain rate and the normal pressure could influencethe inter-ply slip of CFRTP [33]. Based on the cohesive model pro-posed in the paper, we use a bi-linear, rate-dependent, normalpressure-dependent and temperature-dependent law for the cal-culation of interface mechanism of CFRTP [20]. With a relative dis-placement across the cohesive surfaces, the cohesive potential ucan be written as:
u ¼ alðPÞe
21� exp �b½u�2
� �n oð31Þ
Ply pulled out
Outer plies
Tensile force
Compression
Fig. 13. Schematic of inter-ply slip test.
Table 2Material properties of glass fabric and PP.
Elastic modulus of a filament 68.9 GPaElastic modulus of b filament 68.9 GPaSection area of a yarn 2.0 mm2
Section area of b yarn 2.0 mm2
In-plane shear stiffness of fabric 0.37044c5 + 0.84105c 3 + 1.03113c[34]Viscosity of resin gð _c; TÞ ¼ exp 3576
T � 1:36 �
� 1þ ð _c exp 4861T � 14:82
�Þn�1
� ��1Pa s
n = 0.451 [35]
Table 3Cohesive element model constants.
a 376362.114 J/(MPa�4/3 s)b 0.143 mm�2
e 0.333
z
y Global coordinate system
y’
z’
x’
V2-
U2-V2
+
U2+
W2
V3-
U3-V3
+
U3+
W3
V1-
U1-V1
+
U1+
W1
V4-
U4-V4
+
U4+
W4
Local coordinate system
Inter-ply slip
Transverse ply separation
Fig. 12. Schematic of cohesive element.
1700 Q. Chen et al. / Composite Structures 93 (2011) 1692–1703
where u ¼ffiffiffiffiffiffiffiffiffiffiffiffiffiffiffiffiffiffiffiffiffiffiffiffiffiffiffiu2
t þ u2n þ u2
z
q(uz, ut and un are the relative displacement
vectors of element in the element local coordinate system). a, b ande are the material constants that can be obtained by fitting experi-mental data, l is the resin viscosity which is a function of temper-ature and strain rate, and P is the normal pressure applied to theelement surface. Then the internal force can be written as:
FINTZ ¼ @u
@½uz�¼ 2ablðPÞe exp �b½u�2
� �½uz� ð32Þ
FINTt ¼ @u
@½un�¼ 2ablðPÞe exp �b½u�2
� �½ut � ð33Þ
FINTn ¼ @u
@½un�¼ 2ablðPÞe exp �b½u�2
� �½un� ð34Þ
The relative displacement vectors of element in the global coordi-nate system can be expressed with the shape function given byEq. (4):
uþ ¼X4
i¼1
Niuþi u� ¼X4
i¼1
Niu�i ½u� ¼ uþ � u� ð35Þ
vþ ¼X4
i¼1
Nivþi v� ¼X4
i¼1
Niv�i ½v � ¼ vþ � v� ð36Þ
wþ ¼X4
i¼1
Niwþi w� ¼X4
i¼1
Niw�i ½w� ¼ wþ �w� ð37Þ
Then we obtain:
½u�½v �½w�
0B@
1CA ¼ R
½un�½ut �½uz�
0B@
1CA ð38Þ
where R ¼n1 n2 n3
t1 t2 t3
w1 w2 w3
24
35 is the rotation tensor matrix composed
of the displacement jump vectors acting across the cohesive ele-

Q. Chen et al. / Composite Structures 93 (2011) 1692–1703 1701
ment surface shown in Fig. 12. Hence, the internal force in the glo-bal coordinate system is:
Fint ¼ RURT u ¼ R
ablðPÞe exp �b½u�2� �
0
0 ablðPÞe exp �b½u�2� �
0 0 ablð
266664
0
10
20
30
40
50
60
70
80
90
100
0 2 4 6 8Displac
Forc
e (N
)
Fig. 14. Experimental and simulation results of tensile force
0
0.05
0.1
0.15
0.2
0.25
0.3
0.027 0.029 0.031 0.033 0.035
Pressu
Coe
ffici
ent o
f fric
tion
Fig. 15. Experimental and simulation results of friction coefficient
NC is defined as:
Nc ¼N1 0 0 �N4 0 00 N1 0 � � � 0 �N4 00 0 N1 0 0 �N4
24
35 ð40Þ
0
0
PÞe exp �b½u�2� �
377775RT NCu ð39Þ
10 12 14 16 18 20ement (mm)
Experiment 35mm/min,185°CExperiment 20mm/min,185°CExperiment 5mm/min,185°CSimulation 35mm/min,185°CSimulation 20mm/min,185°CSimulation 5mm/min,185°C
against displacement at temperature 185 �C (Glass/PP).
0.037 0.039 0.041 0.043 0.045
re (MPa)
Experiment 5 mm/min, 185°CExperiment 20mm/min, 185°CExperiment 35mm/min, 185°C
Simulation 35mm/min, 185°CSimulation 20mm/min, 185°CSimulation 5 mm/min, 185°C
against compaction pressure at temperature 185 �C (Glass/PP).
Punch
Die CFRTP plies
Fig. 16. Tool geometry of multi-plies forming simulation.
1702 Q. Chen et al. / Composite Structures 93 (2011) 1692–1703
3.2. Results and discussion
3.2.1. Ply pull-out testTo validate the proposed model, we simulate the inter-ply slip
tests described in the reference [33]. The tool geometry used forthis simulation is shown in Fig. 13. The ply pulled out is connectedby cohesive elements to the outer plies with the specimen dimen-sions of 228 mm � 51 mm. The warp and weft directions for thethree plies are parallel to the sides of the flat mold, and the com-paction pressure is applied to the mold. The material properties(Glass/Polypropylene) are shown in Table 2 [34,35]. Model con-stants in Eq. (31) are obtained by experimental data fitting (Table3). Load against displacement and friction coefficient against nor-mal pressure curves are shown in Figs. 14 and 15. Experimentaltests are performed at 185 �C with an initial normal pressure0.028 Mpa for three tensile velocities (5 mm/min, 20 mm/min,
(a) Temperature: 100°C (i
(b) Temperature: 320°C
Fig. 17. Multiplies forming simulati
35 mm/min). At the initial stage of the test, we can observe the fastincrease of shear force which is associated with the elastic behav-ior. Meanwhile, the shear stress at the interface reaches a maxi-mum peak and eventually leads to the onset of inter-ply slip,which is analogous to the yield stress. Beyond this peak, inter-ply slip and the corresponding relative motion of adjacent pliestake place and the shear stress continues to drop. Consequently,the irreversible and permanent displacement is produced duringthe inter-ply slip.
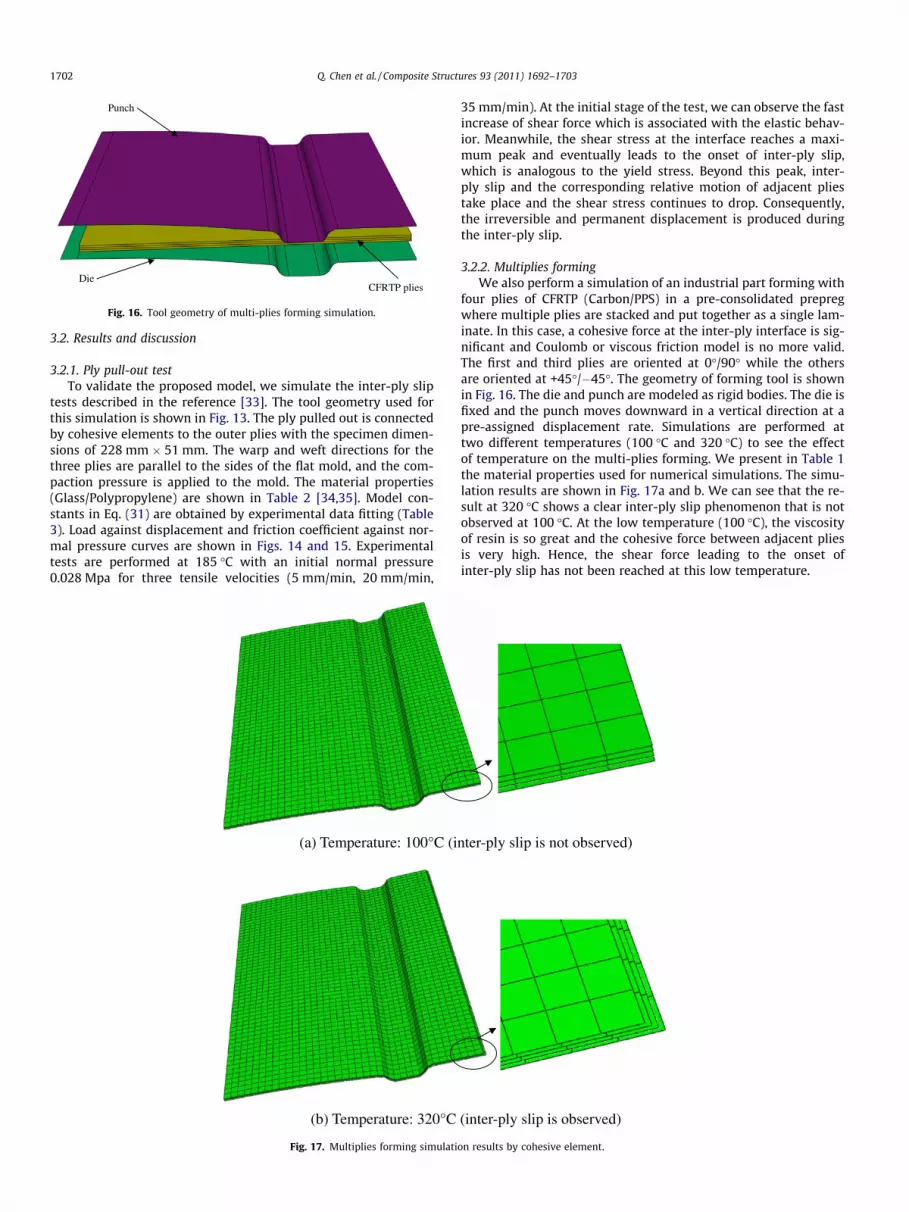
3.2.2. Multiplies formingWe also perform a simulation of an industrial part forming with
four plies of CFRTP (Carbon/PPS) in a pre-consolidated prepregwhere multiple plies are stacked and put together as a single lam-inate. In this case, a cohesive force at the inter-ply interface is sig-nificant and Coulomb or viscous friction model is no more valid.The first and third plies are oriented at 0�/90� while the othersare oriented at +45�/�45�. The geometry of forming tool is shownin Fig. 16. The die and punch are modeled as rigid bodies. The die isfixed and the punch moves downward in a vertical direction at apre-assigned displacement rate. Simulations are performed attwo different temperatures (100 �C and 320 �C) to see the effectof temperature on the multi-plies forming. We present in Table 1the material properties used for numerical simulations. The simu-lation results are shown in Fig. 17a and b. We can see that the re-sult at 320 �C shows a clear inter-ply slip phenomenon that is notobserved at 100 �C. At the low temperature (100 �C), the viscosityof resin is so great and the cohesive force between adjacent pliesis very high. Hence, the shear force leading to the onset ofinter-ply slip has not been reached at this low temperature.
nter-ply slip is not observed)
(inter-ply slip is observed)
on results by cohesive element.

Q. Chen et al. / Composite Structures 93 (2011) 1692–1703 1703
4. Conclusion
In the present work, the in-plane shear behavior of woven ther-moplastic composite (Carbon/PPS) over a range of processing tem-peratures and stain rates is characterized by bias-test experiments.A thermo-visco-elastic model has been proposed for CFRTP form-ing simulations using a solid-shell element, which is based on aparallel connection system considering a calculation of the internalforce of resin and of textile reinforcement respectively. By the pres-ent model, we can clearly see the effects of temperature and ofstrain rate. The comparison of numerical and experimental resultsdemonstrates the validity of the model when the resin is totallymelted. A large displacement three-dimensional cohesive elementwith eight nodes is used to investigate the interface mechanism ofCFRTP, especially the inter-ply slip phenomenon. We used this ele-ment to replace the contact calculation in the multi-plies simula-tion case. Using the cohesive element model, we can consider thecohesive force at the interface of adjacent thermoplastic plies,which is not considered in the conventional contact calculation.Furthermore, computational costs can be saved by the cohesiveelement method since it does not require iterative calculations thatshould be done in the conventional contact calculation. The pro-posed model was validated by a comparison with the experimentalresults of inter-ply slip test in the literature. Our present workshows that, in the numerical calculation, the intra/inter-ply shearmechanisms of composites can be modeled from the propertiesof resin and of reinforcement using a rule of mixture. This will behelpful in the composite material characterization if experimentalmeasurements of composite laminates are difficult to conduct,especially at high temperatures such as the processing tempera-ture of high performance thermoplastic resin.
Acknowledgments
This work has been performed in collaboration with academicand industrial partners in the MOV’EO competitiveness cluster (SA-FRAN/Aircelle, AMPA, AXS Ingénierie, University of Le Havre, ENSICaen, Ecole des Mines de Paris and INSA Rouen) under the researchprogram of ‘‘TOUPIE.’’ The authors also would like to acknowledgethe financial support from the ‘‘DGCIS (Direction Générale de laCompétitivité, de l’Industrie et des Services)’’ and ‘‘Région HauteNormandie.’’ In particular, the authors thank SAFRAN/Aircelle forproviding the CFRTP (Carbon/PPS) materials and the tooling geom-etry information.
References
[1] Boisse P, Borr M, Buet K, Cherouat A. Finite element simulation of textilecomposite forming including the biaxial fabric behaviour. Composites Part B1997;28(4):453–64.
[2] Shuler SF, Advani SG. Transverse squeeze flow of concentrated aligned fibers inviscous fluids. J Non-Newton Fluid Mech 1996;65(1):47–74.
[3] Harrison P, Clifford MJ, Long AC, Rudd CD. Constitutive modeling ofimpregnated continuous fibre reinforced composites: a micro-mechanicalapproach. Plast Rubber Compos 2002;31(2):76–86.
[4] Yu WR, Pourboghrat F, Chung K, Zampaloni M, Kang TJ. Nonorthogonalconstitutive equation for woven fabric reinforced thermoplastic composites.Composites Part A 2002;33(8):1095–105.
[5] McGuinness GB, ÓBrádaigh CM. Characterization of thermoplastic compositemelts in rhombus-shear: the picture-frame experiment. Composites Part A1998;29(1–2):115–32.
[6] Milani AS, Nemes JA, Abeyaratne RC, Holzapfel GA. A method for theapproximation of non-uniform fiber misalignment in textile compositesusing picture frame test. Composites Part A 2007;38(6):1493–501.
[7] Harrison P, Clifford MJ, Long AC. Shear characterization of viscous woventextile composites: a comparison between picture frame and bias extensionexperiments. Compos Sci Technol 2004;64(10–11):1453–65.
[8] Lebrun G, Bureau NM, Denault J. Evaluation of bias-extension and picture-frame test methods for the measurement of intraply shear properties of PP/glass commingled fabrics. Compos Struct 2003;64(4):341–52.
[9] Rogers TG. Rheological characterisation of anisotropic materials. Composites1989;30:21–7.
[10] McGuinness GB, ÓBrádaigh CM. Development of rheological models forforming flows and picture-frame shear testing of fabric reinforcedthermoplastic sheets. J Non-Newton Fluid Mech 1997;73(1–2):1–28.
[11] Cogswell FN, Groves DJ. The melt rheology of continuous fibre reinforcedstructural composite materials. In: Proceedings of the 10th internationalcongress on rheology, Sidney; 1988. p. 275–87.
[12] Scobbo JJ, Nakajima N. Dynamic mechanical analysis of molten thermoplastic/continuous graphite fiber composites in simple shear deformation. In:Proceedings of the 21st international SAMPE technical conference; 1989. p.730–43.
[13] Roberts RW, Jones RS. Rheological characterization of continuous fibrecomposites in oscillatory flow. Compos Manuf 1995;6(3–4):161–7.
[14] Martin TA, Bhattacharyya D, Collins IF. Bending of fibre reinforcedthermoplastic sheets. Compos Manuf 1995;6(3–4):177–87.
[15] Goshawk JA, Jones RS. Structure reorganisation during the rheologicalcharacterisation of continuous fibre-reinforced composites in plane shear.Composites Part A 1996;27(4):279–86.
[16] Lomov SV, Barburski M, Stoilova T, Verpoest I, Akkerman R, ten Thije RHW,et al. Carbon composites based on multiaxial multiply stitched preforms. Part3: Biaxial tension, picture frame and compression tests of the preforms.Composites Part A 2005;36(9):1188–206.
[17] Peng XQ, Cao J, Chen J, Xue P, Lussier DS, Liu L. Experimental and numericalanalysis on normalization of picture frame tests for composite materials.Compos Sci Technol 2004;64(1):11–21.
[18] Cao J, Akkerman R, Boisse P, Chen J, Cheng HS, Graaf EFD, et al.Characterization of mechanical behavior of woven fabrics: experimentalmethods and benchmark results. Composites Part A 2008;39(6):1037–53.
[19] Rahulkumar P, Jagota A, Bennison SJ, Saigal S. Polymer interfacial fracturesimulations using cohesive elements. Acta Mater 1999;47(15):4161–9.
[20] Rahulkumar P, Jagota A, Bennison SJ, Saigal S. Cohesive element modeling ofviscoelastic fracture: application to peel testing of polymers. Int J Solids Struct2000;37(13):1873–97.
[21] Maiti S, Philippe HG. Cohesive modeling of fatigue crack retardation inpolymers: crack closure effect. Eng Fract Mech 2006;73(1):22–41.
[22] Kim H, Buttlar WG. Finite element cohesive fracture modeling of airportpavements at low temperatures. Cold Reg Sci Technol 2009;57(2–3):123–30.
[23] Geißler G, Kaliske M. Time-dependent cohesive zone modelling for discretefracture simulation. Eng Fract Mech 2010;77(1):153–69.
[24] Lu WB, Wu J, Song J, Hwang KC, Jiang LY, Huang Y. A cohesive law for interfacesbetween multi-wall carbon nanotubes and polymers due to the Van der Waalsinteractions. Comput Methods Appl Mech Eng 2008;197(41–42):3261–7.
[25] Turon A, Camanho PP, Costa J, Renart J. Accurate simulation of delaminationgrowth under mixed-mode loading using cohesive elements: definition ofinterlaminar strengths and elastic stiffness. Compos Struct2010;92(8):1857–64.
[26] Kim YH, Lee SW. A solid element formulation for large deflection analysis ofcomposite shell structures. Comput Struct 1988;30(1–2):269–74.
[27] Sze KY, Ghali A, plates An hexahedral element for. shells and beams byselective scaling. Int J Numer Methods Eng 1993;36(9):1519–40.
[28] Bischoff M, Ramm E. Shear deformable shell elements for large strains androtations. Int J Numer Methods Eng 1997;40(23):4427–49.
[29] Hauptmann R, Schweizerhof K. A systematic development of solid shellelement formulations for linear and non-linear analysis employing onlydisplacement degrees of freedom. Int J Numer Methods Eng1998;42(1):49–69.
[30] Klinkel S, Gruttmann F, Wagner W. A continuum based three dimensional shellelement for laminated structures. Comput Struct 1999;71(1):43–62.
[31] El-Abbasi N, Meguid SA. A new shell element accounting for through thicknessdeformation. Comput Methods Appl Mech Eng 2000;189(3):841–62.
[32] Chen QQ, Boisse P, Saouab A, Park CH, Bréard J. Woven thermoplasticcomposite forming simulation with solid-shell element method. Int J SimulMultidisc Des Optim 2010;3(2):337–43.
[33] Lebrun G, Bureau MN, Denault J. Thermoforming-stamping of continuous glassfiber/polypropylene composites: interlaminar and tool–laminate shearproperties. J Thermoplast Compos Mater 2004;17(2):17–47.
[34] Hamila N, Boisse P. Simulations of textile composite reinforcement drapingusing a new semi-discrete three node finite element. Composites Part B2009;39(6):123–30.
[35] Vanclooster K, Lomov SV, Verpoest I. Investigation of interply shear incomposite forming. Int J Mater Form 2008(Suppl. 1):957–60.
[36] ten Thije RHW, Akkerman R, van der Meer L, Ubbinkt MP. Tool-ply friction inthermoplastic composite forming. Int J Mater Form 2008(Suppl. 1):953–6.
[37] Zienkiewicz CO, Talyor RL. Finite element method, 5th ed., vol. 1; 2000. p. 689.[38] Seo JW, Lee WI. A model of resin impregnation in thermoplastic composite. J
Compos Mater 1991;25(9):1127–42.[39] Chen QQ. Simulation de la mise en forme des matériaux composites à fibres
continues et à matrice thermoplastique. Doctoral dissertation, Université duHavre, France; 2010.